SYNERGISTIC INNOVATIONS IN INTERNATIONALLY DISPERSED R&D LABS Aditha N. S. Penaud B. Soc. Sc. @an.); MA (Banhg and Fiance); MMS A Thesis submitted to Faculty of Graduate Studies and Research In partial fidfillment of the requirements of the degree of Doctor of Philosophy School of Business Carieton University Ottawa, Ontario December, 1999 0 copyright 1999, Aditha N.S. Persaud

Welcome message from author
This document is posted to help you gain knowledge. Please leave a comment to let me know what you think about it! Share it to your friends and learn new things together.
Transcript
SYNERGISTIC INNOVATIONS IN
INTERNATIONALLY DISPERSED R&D LABS
Aditha N. S. Penaud
B. Soc. Sc. @an.); M A (Banhg and Fiance); M M S
A Thesis submitted to
Faculty of Graduate Studies and Research
In partial fidfillment of
the requirements of the degree of
Doctor of Philosophy
School of Business
Carieton University
Ottawa, Ontario
December, 1999
0 copyright 1999, Aditha N.S. Persaud
National Library 1*1 ofCanada Bibliotheque nationale du Canada
Acquisitions and Acquisitions et Bibliographie Services services bibliographiques 395 Weilirigtm Street 395. me WeUingt~r, OttawaON K l A W OctawaON K I A ON4 Canada canada
The author has granted a non- L'auteur a accordé une licence non exclusive licence aiîowing the exclusive permettant à la National Library of Canada to Bibliothèque nationale du Canada de reproduce, loan, distnbute or seii reproduire, prêter, distribuer ou copies of this thesis in microform, vendre des copies de cette thèse sous paper or electronic formats. la forme de microfiche/nlm, de
reproduction sur papier ou sur format électronique.
The author retains ownership of the L'auteur conseme la propriété du copyright in this thesis. Neither the droit d'auteur qui protège cette thèse. thesis nor substantial extracts fiom it Ni la Wse ni des extraits substantiels may be p ~ t e d or othexwise de celle-ci ne doivent être imprimés reproduced without the author's ou autrement reproduits sans son permission. autorisation.
Acknowledgements
This thesis is the result of three years of consistent support and encouragement fiom severai
people, al1 of whom deserve my sincerest gratitude. 1 wodd Iike to thank my CO-supe~sors,
Professors Vinod and Uma Kumar for guiding me through this very challenging process. The
academic guidance received combined with very generous financial support certainly eased
many of the chalienges and anxieties associated with a doctoral program. Thanks a million,
Professors Vinod and Uma Kumar. The advise provided by Professor Roland Thomas on
various methodo logical and statistical aspects of the research has heiped to improve
substantially the quality of the research. Professor Shibu Pal's engaging discussions and
sometimes intriguing advice has helped me to crystallize some of the theoretical
underpimings of the study. 1 thank you both. Thanks to Professor Katherine Graham fiom
the School of Public Administration for providing insightful comments at the proposal
defense. Thanks to Professor George Haines for giving me a small hancial contribution for
data collection. Jean Blair, the graduate secretary, and Lorraine Douglas, both of whom have
provided me with excellent administrative support unparalleled anywhere eise in the
University. Thanks, Jean and Lorraine. Thanks to Dr. Wynne Chin for making available a
beta version of the PLS software to me and for promptly answering al1 my e-mails on how to
use the software. Thanks to Beveriy Kitchen of TechBC for taking on the challenge of
editing the thesis within a few &YS.
1 would like to also thank al1 my colleagues in the Ph.D program as weU as the support staff
of the School of Business - Michel Fuksa, Yves Decady, Greg Schmidt, Marilyn Wissel,
Bemie Rawlins, and Pam Norris.
1 would also like to thank Carleton University and the Social Sciences Humanities Research
Council of Canada (SSHRC) for financial support in the fom of assistantships, scholarships,
and fellowships. Five years of guaranteed funding fiom Carleton combined with two years of
SSHRC doctoral fellowship fiinding did it for me, A Doctoral Award fiom Grad Studies for
the thesis research is greatly appreciated. I would like to thank Ted Jackson and Norean
Sheppard for giving me the opportunity to enhance my research skills through CSTIER
research projects. The opportunity to teach both graduate and undergraduate courses in the
School of Business significantly enhanced my skills, capabilities, character and
marketability.
Finally, 1 wodd like to thank my farnily, îiiends, and church members for their emotional
and spiritual support throughout my program.
1 would like to make it clear that 1 take M l responsibility for dl errors and omissions of this
study .
Ajax Persaud
Abstract
This study examined the extent to which networking among intemationally dispersed
research and development (R&D) laboratones (labs) of multinational corporations (MNCs)
enhanced their capacity to create synergistic innovations. Networking was expressed as the
set of formal and informal relationships among the labs. These relationships were studied in
the context of four structural elements characterizing intemationdly dispersed R&D labs.
These are autonomy, fomalization, socialkation, and communication among the labs.
Communication among the labs was andyzed at two levels, namely, communication between
HQ and subsidiary labs and communication among subsidiary labs. Synergistic innovative
capacity was initially operationalized as a unidimensional constnict compnsing twelve items
which reflect the innovativeness of a fm. A sample of 79 R&D labs owned by North
Amencan, European and Japanese MNCs provided data for this study by means of a survey
questionnaire. Results fiom a variety of quantitative techniques including multivariate
regression, factor analysis, and Partial Least Squares (PLS) analysis suggest that the
structural variables explained approximately 40 percent of the variations in synergistic
innovative capacity. It was also fond that synergistic innovative capacity consists of four
distinct dimensions and that the structural elements had different impacts on the four
dimensions of s ynergistic innovative capacity .
iii
Table of Contents
Page Acceptance Sheet Acknowledgements Abstract Table of Contents List of Tables List of Figures
Chapter 1 Introduction
Chapter 2 Literature Review 2.1 Introduction 2.2 Reasons for Internationalization of R&D 2.3 Extent and Pattern of International R&D
2.3.1 Data on Intemationalization of R&D 2.3.2 Evidence on Internationalization of R&D
2.4 Management of International M D 2.4.1 Autonomy of R&D Labs 2.4.2 Coordination and Integration of R&D Labs 2.4.3 Communication among R&D Labs
2.5 Conclusion
Chapter 3 Theoretical Framework 3.1 Background 3.2 ResearchQuestion 3.3 Research Mode1
3.3.1 S ynergistic Innovative Capac 3.3.2 Subsidiary Labs' Attributes
3 -3.2.1 Autonomy 3.3.2.2 Formalization 3 -3.2.3 Shared C o p r a t e Goals and Culture 3 -3.2.4 Communications with HQ 3.3.2.5 Inter-subsidiary Labs Communications
3.3 -3 Moderating Muences 3.3.3.1 Cultural Diversity 3 -3.3.2 Trust among R&D Labs 3.3.3.3 Resource Levels 3 -3.3.4 Environmental Complexity
Chapter 4 Research Methodology 4.1 Data Collection 4.2 Data Analysis
Chapter 5 Descriptive Statistics 5.1 Introduction 5.2 Profile of Sample Companies and R&D Labs
5.2.1 HQ Lab Participants 5.3 Reliability of Measurement Scales 5.4 Correiation of Key Constnicts
Chapter 6 Regression and Factor Anaiysis 6.1 Overview of Data Analysis Strategy 6.2 Regression Analysis
6.2.1 Main Model Regression 6.2.2 Moderating Variables Regressions
6.3 Factor Analysis 6.3.1 S ynergistic Innovative Capacity : Dependent Variable 6.3.2 Autonomy 6.3.3 Trust and Formalization
6.4 Application of Factor Analysis Results
Chapter 7 PLS Andysis 7.1 Introduction 7.2 The Case for PLS 7.3 PLS and LISREL Compared 7.4 Analytical and Interpretive Framework of PLS
7.4.1 Measurement Model Assessment 7.4.2 Structurai Model Assessment
7.5 Results of PLS Andysis 7.5.1 PLSModel 1 7.5.2 PLS Mode12
7.6 Summary of PLS Findings
Chapter 8 Organization of International R&D 8.1 Introduction 8.2 Organizational Structure of International R&D
8.2.1 Fonnal R&D Organizational Structures 8.2.2 Quasi-Forma1 Organizational Structures 8.2.3 Contract Research 8.2.4 Recentralization of R&D 8.2.5 Organizational Structures Revisited
Chapter 9 Coordination Structures in International R&D 9.1 Coordination Issues and Structures 9.2 Modeling Coordination Structures
Chapter 10 Discussion and Implications of Results 10.1 Introduction 10.2 Importance of Structural Elements
Chapter 1 1
Chapter 12
References
Appendix 1 Appendix 2 Appendix 3 Appendix 4 Appendix 5 Appendix 6 Appendix 7 Appendix 8
1 0.3 S ynergïstic Innovative Capacity 1 0.3.1 Strategic R&D Synergy 10.3.2 Managerial and Operational Synergy 10.3.3 Knowledge Creation and Management Synergy 1 0.3.4 Innovative Proficiency Synergy 10.3.5 Mderating Variables
10.4 Coordination and Control Structures 10.5 Recentralization of R&D Activities 1 0.6 Future Research
Benefits and Limitations 11 - 1 Benefits 11.2 Limitations
Conclusion
Subsidiary Survey - English Version HQ Survey - English Version Subsidiary Survey - French Version HQ Survey - French Version Subsidiary Survey - German Version HQ Survey - German Version Subsidiary Survey - Japanese Version HQ Survey - Japanese Version
List of Tables
Table 2.1
Table 2.2
Table 2.3
Table 2.4
Table 5.1
TabIe 5.2
Table 5.3
Table 5.4
Table 5.5
TabIe 5.6
Table 5.7
Table 5.8
Table 5.9
Table 5.10
Table 5.1 1
Table 6.1
Table 6.2
Table 6.3
Table 6.4
Table 6.5
Table 6.6
Factors Favoring the Centraiization and Decentrakation of R&D
R&D Intensities in the United States by Country in 1994
Correspondences among Technology Unit Types
Taxonomies of Organizational Structures
Geographic Distribution of Sample Labs
Year Labs Established by Region of Parent Company
Industry Distribution of Labs
Distribution of R&D Employees of Labs
Distribution of Basic and Applied R&D Expenditures of Labs
Basic R&D Expenditures Overseas by Region of Parent Company
Pairwise Group Cornparison of Basic Overseas R&D
Revenues, Number of Employees, R&D Intensity and the Nurnber of R&D R&D Labs of Responding vs. Non-Responding MNCs
Nature of Collaboration among R&D Labs
Reliability Statistics for Muiti-item Constructs
Correlation of Means of Dependent and Independent Variables
Main Model Regression
Regression with Socialization and Cu1 tural D iversity
Regression with Socialization and Tnist
Regression with Socialization and Environmental Uncertainty
Regression with Socidization and Resource Levels
Factor Analysis on Synergistic Innovative Capacity: Dependent Variable 98
vii

Table 6.7
Table 6.8
Table 6.9
Tabie 6.1 O
Table 6.1 1
Table 6.12
Table 7.1
Table 7.2
Table 7.3
Table 7.4
Table 7.5
Table 7.6
Table 7.7
Table 7.8
Table 8.1
Table 8.2
Table 9.1
Factor Adysis on Autonomy
Factor Analysis on Trust
Factor Analysis on F o d i z a t i o n
Regression on Knowledge Creation and Management
Regression on Strategic R&D
Regression on hovative Proficiency
Indicators of Measurement (Outer) Model
Four Components of Synergistic hovative Capacity 119
Individual Item Reliability: PLS Mode1 1 122
Correlation of Constructs: PLS Mode1 1 123
Path Estimates of Structural Modei: PLS Mode1 1 125
Loadings, Intemal Consistency & Correlation of Constructs: PLS Model 2 129
Path Esthates of Structural Model: PLS Mode1 2 130
Relationship between Variables and Synergistic Innovative Capacity 134
Distribution of R&D Labs by Organizational Structural Types 137
Distribution of R&D Labs by Principal Type of Research Activities 138
Coordination and ïntegration Structures of International R&D 159
viii
List of Figures
Figure 3.1
Figure 7.1
Figure 7.2
Figure 7.3
Figure 8. I
Figure 8.4
Figure 9.1
Figure 10.1
Conceptual Model of Synergistic Innovative Capacity
An Iilustrative PLS Model
PLS Model 1
PLS Model 2
Stnichiral Types of Global R&D Organizations
Sample R&D Organizational Charts
Model of Coordination Structures in International R&D
Empirical Model of S ynergistic Innovative Capaci ty
Page
47
114
121
127
137
148
165
168
CHAPTER 1
INTRODUCTION
Throughout the 1960s and 1970s, the majority of multinational corporations (MNCs)
performed rnost of their research and development (R&D) activities in their home country
@e Meyer and Minishirna, 1989; Dunnuig, 1992; Hakanson, 1992; Pearce and Singh,
1992; Patel and Pavitt, 1992). During this period, the overseas subsidiary laboratories'
(labs) primary role was to mod* the products of the parent MNC to suit local market
conditions (Ronstadt, 1977; Hewitt, 1980; Pearce and Singh, 1992). Basically, the MNC's
headquarter (HQ) was viewed as the provider of innovations that were subsequently
exploited overseas through the MNC's overseas subsidiaries (Vernon, 1966).
For decades, the philosophy of concentrating the most sensitive R&D activities at the HQ
and assigning primarily adaptive R&D activities to subsidiary labs has served MNCs well
(Hedlund, 1 986; Bartlett and Ghoshal, 1 989; Dunning, 1 992). Several researchers,
however, observed that rapid technological development especially in information and
communications technologies, intense international cornpetition and substantial market
changes in the early 1980s have eroded the effectiveness of this approach (Hedlund,
1986; Bartlett and Ghoshal, 1989; Prahalad and Doz, 1987; Grandstand er al., 1992;
Nohria and Ghoshal, 1997). Based on anecdotal case study evidence fiom a few
companies, these authors contended that MNCs, which reiied on the traditional
unidirectional HQ to subsidiary innovation process, would be unable to generate
innovations at the speed and scale necessary to sustain competitive advantage.
Multinational corporations were thus looking for new ways to foster innovations and to
maximize their innovative capacity. In tbis process, many leading MNCs seem to have
di scovered a tremendous amount of capabilities throughout their worldwide uni& that
were previously untapped (Prahalad and Doz, 1987; Bartlett and Ghoshal, 1989;
Granstrand et al., 1992; Nohria and Ghoshai, 1997). A major challenge which managers
faced, is to design theu organizations in ways that would enable them to sirnultaneously
tap into these capabilities, promote worldwide leaniing within the MNC and foster
innovativeness in their organizations. David Withwam, the Chief Executive Officer of
Whirlpool Corporation, described this challenge as, "king able to leverage your
capabilities around the world so that the Company as a whole is greater than the sum of its
parts" (Manrca, 1994, p. 134). Essentially, companies were looking for ways to organize
their global activities to create synergies among the various parts of the multinational
system.
Recognizing the strategic importance of the R&D h c t i o n towards the long-run survivid
and competitive advantage of the firm, many MNCs began experimenting with a variety
of approaches aimed at forging c loxr links among their worldwide R&D labs.
Researchers investigating organizationai development in MNCs have reported a trend
towards decentralization of key fiinctions and activities (Hedlund, 1986; Bartiett and
Ghoshal, 1986; Prahalad and Doz, 1987). These authors argued that the former
hierarchical structure which emphasizes the division of the MNC into a HQ and several
foreign subsidiaries is being replaced by more ambiguous and flexible foms of
operatiom. Foreign subsidiaries are now regarded as strategic contributors baving global
or regional responsibility for a particular product or hct ion, thereby playing a bigger
role in corporate decision making. Essentially, the new organizational arrangements are
designed to substantially reduce the degree of hierarchy, which in turn is expected to
enhance interactions among subsidiaries. Hedlund and Rolander (1990) believed that the
new trend towards greater decentralization and networking among subsidiaries has the
potential of tuming the entire MNC into an arena of entrepreneurs because the emphasis
is on innovation and knowledge generation by subsidiaries rather than exclusively by HQ.
Thus, the assumption underlying the trend towards greater decentralization of R&D
activities and closer collaboration among worldwide R&D wiits seems to be that greater
synergies in innovative activities will be realized.
The trend towards greater decentralization and closer collaboration has different names.
However, it appears that researchers are converging around the general description of the
Network Organizarion (Westney, 1993). in a network of R&D labs, the labs are basically
equd partners with close interactions, sharing equally in the nsks and rewards of the
network. It has been argued that the success of such decentralized structure cruciaiiy
depends on effective interounit coordination and communication as integrative devices
(Lawerence and Lorsch, 1967; Bartlett and Ghoshal, 1986; Hedlund, 1986). For such
effective cross-border coordination and communication to take place among RBcD labs,
the labs must be given the autonomy to establish fomal and idormal networks with other
labs within the MNC group (Buckley and Brooke, 1992; Brockhoff and Schmad, 1996;
Medcof, 1997; Mainight, 1996; Chiesa, 1996). The assumption seems to be that ody
when managers, project leaders, and R&D professionals of intemationaliy dispersed R&D
labs are able to establish strong personai networks among themselves will the MNC be
able to exploit its worldwide capabilities.
Previous research on the intemationalization of R&D has focussed on the determinants of
intemationalization (Granstand et al. 1992; Dunning, 1 992; Pearce, 1989; De Meyer,
1993; Odagiri, 1996), the establishment processes of R&D activities in foreign countries
(Hakanson, 1992; De Meyer and Mimshima, 1989; Kuemmerle, 1997; Reddy, 1994), the
activities performed by overseas R&D labs (Casson, 1 992; Hewitt, 1 980; Ronstadt, 1 977;
Pearce, 1989; Reddy, 1994), and the organizational structures of international R&D labs
(Buckley and Brooke, 1992; Brockhoff and Schrnaui, 1996; Medcof, 1997; Malnight,
1996; Chiesa, 1996).
It is observed that a disproportionately large number of studies in the early stages of the
internationaiization of R&D focused on the reasons for intemationaiization and the
location decisions for R&D labs. Research on the organizationai structures of
international R&D labs and its attendant management challenges is a more recent
development. Research which examines the impact of the internationalization of R&D on
the innovativeness of MNCs is virtually non-existent (Brockhoff and Schmaul, 1996;
Chiesa, 1996). Thus, it seems that the research focus on the intematiodization of R&D
has fotlowed an evolutionary path beginning with the reasons for intemationalization, to
the extent and patterns of internationalization, to the management challenges following
internationaiization, to the impact of intemationalization of R&D on the MNC.
Despite the rhetoric regarding the internationalization of R&D and networking among
internationally dispersed R&D labs, and the increasing trend among MNCs to
internationalize R&D, there is no systematic evidence which shows that the
intemationalization of R&D has enhanced the synergistic innovative capacity of MNCs.
The lack of systematic evidence makes it very difficult to draw conclusions concerning
the effectiveness of international R&D labs in exploiting worldwide technical and
managerial resources for rapid technologicai innovations and sustainable cornpetitive
advantage. The current study will shed light on this very criticai issue.
The current study is a first attempt to anaiyze the extent to which the formal and UlformaI
collaborative relationships between the HQ lab and subsidiary labs and among
internationally disperseci subsidiary labs enhance the synergistic innovative capacity of
the W C . In this study, synergistic innovative capacity refers to the hcremental
improvements in the labs innovative capacities attributed to the interdependence among
the labs. Synergistic innovative capacity is measured by the extent to which the
capabilities of R&D labs have changed, using thirteen performance dimensions'.
It is argued here that the ability of subsidiary R&D labs to estabfish forma1 and informal
networking relationships among themselves is infiuenced by the following factors2:
1. Autonomy of subsidiary labs in decision making, that is, the degree to which a
subsidiary lab has contrd over the strategic decisions affecthg its direction
and operations (Nohria and Ghoshal, 1997; Mintzberg, 1979; Brooke, 1 984;
Medcof, 1997; Brockhoff and Schrnaul, 1996; Chiesa, 1996). Injluence which
is closely related to autonomy refers to the degree to which a subsidiary lab
may affect the strategic decision outcornes of the HQ regding its own lab or
other labs within the MNC group (Nohria and Ghoshal, 1997; Mintzberg,
1 979; Brooke, 1984);
2. Forrnalization of decision making based on systematic rules and procedures
(Hedlund, 1986; Nohria and Ghoshal, 1997; Mintzberg, 1979; Brooke, 1984);
I Detailed descriptions of the measures are provided in Chapter 3. The actual rneasurcs are listed in question 12 of the questionnaire sent to subsidiary labs.
' Discussion of the rationale for selecting the four factors is presented in Chapter 3. 6
3. Shmed Corporute Goals, Values and Culture as a basis for decision making,
that is, the degree to which decision making in subsidiary labs are infiuenced
by common goals and shared values between subsidiary labs and the HQ
(Nohria and Ghoshal, 1997; Birkinshaw and Momson, 1995; Mintzberg,
1979); and
4. Communication between the HQ and subsidiary labs as well as inter-
subsidiary labs communication patterns (Nohria and Ghoshal, 1997; Medcof,
1997; Stock et al., 1996; Chiesa, 1996).
A mode1 of the relationship between these four elements and the synergistic innovative
capacity of R&D labs is proposed. Factors that may moderate the impact of networking
on synergistic innovative capacity are also identified and discussed. These factors include
the level of trust arnong R&D managers and staff, cultural diversity, the resource levels of
the labs, and the uncertainty of the environment in which the labs operate.
This study is based on a sample of Canadian, American, European and Japanese hi&
technology manufacturing MNCs operating principally in the electrical and electronics,
chernical and pharmaceutical, and automotive industries3. Fimis within these indusaial
sectors are selected because the evidence on the extent and pattern of internationalization
of R&D indicates that these sectors are the most intemationalized (OECD, 1998).
Sofhvare firms (e.g., Microsofi) are not hcluded in this study.

Similarly, the bulk of R&D internationalization activities (close to 90 percent) are located
in the triad regions of North America, Europe and Japan. The unit of analysis is the R&D
lab.
Daîa was collected from the most senior R&D p e r s o ~ e l at the labs (Vice Presidents,
Managïng Directon, and Directors) by means of a questioMaire. In addition, follow-up
telephone interviews were conducted with several respondents. The qualitative data fiom
these interviews provided context for the interpretation of the quantitative data obtained
fiom the questionnaires.
This study contributes to ongoing academic research, discussions and debates on the
internationalization of R&D in several unique ways. First, this study provides a
conceptual framework of the relationship between networking among intemationally
dispersed R&D labs and the creation of synergistic innovative capacity of MNCs.
Conceptual models of the relationship between the structural characteristics of
internationally dispersed R&D labs and the labs' innovative performance are lacking
(Medcof, 1998; Brockhoff and Schmaul, 1996; Chiesa, 1996).
Second, this study is the f k t to investigate empirically the relationship between
networking arnong intemationally dispersed labs and the innovativeness of the labs using
data fkom a cross-section of R&D intensive fïrms.

Third, the concept and measurement of synergLrric innovative capaciîy proposed in this
snidy are new and have not been used elsewhere to study the impact of
intemationalization of R&D. Several individual measures of innovative performance
have been used in previous studies but no measure of synergistic innovative capacity was
found in the Iiterahire.
Finally, a number of previous studies which investigated the organizational structures of
international R&D labs have reported that managers still face serious challenges in
finding practical organizing b e w o r k s that enable them to exploit their worldwide
capabilities for maximum competitive advantage. As noted by several researchers,
competitive advantage can only be sustained by continually innovating quickly with a
series of winning products (Burgleman er al. 1996; Tushman and Anderson, 1997) or as
Peters (1990) puts it, "get innovative or get dead." From a practical standpoint, the
findings of the study will provide a benchmark of current practices regarding the
organizational structure and management practices of intemationally dispersed R&D labs.
An understanding of current practices and their efficacy could help managers develop
appropriate R&D organizations which will enhance their managerial and operational
efficiency and avoid duplication and waste-
The remainder of this thesis is organized into twelve chapters. Chapter two presents a
review of the literature. Chapter three describes the theoretical framework on which the
study is based. Chapter four discusses the data collection and analysis methodology.
Chapters five through nine present the findings based on various quantitative and qualitative
analyses. Chapter ten discusses the implications of the fïndings. Chapter eleven highlights
the benefits and Limitations of the study. This is followed with the conclusion in Chapter
twelve.
CHAPTER 2
LITERATURE REVIEW
2. l Introduction
Although the trend towards the internationalization of R&D by MNCs c m be traced back
to the 1 970s, it was only around the mid-eighties that a Iarger nurnber of MNCs began
decentraiizing their corporate R&D function overseas (Granstand et al. 1992). Since
then, a substantial arnount of research has been published on issues such as the reasons for
internationalization of R&D (Granstand et al. 1992; Dunning, 1992; Pearce, 1989; De
Meyer, 1993; Odagiri, 1996), the establishment processes of R&D activities in foreign
countries (Hakanson, 1992; De Meyer and Mizushima, 1989; Kuemmerle, 1997; Reddy,
1994; 1996; Reddy and Sigurdson, 1996), the types of activities performed by foreign
R&D labs (Casson, 1992; Hewitt, 1980; Ronstadt, 1977; Pearce, 1989; Reddy, 1994,
i 996; Reddy and Sigurdson, 1996), and the organizational structures of international R&D
labs @uckley and Brooke, 1992; Brockhoff and Schmaul, 1996; Medcof, 1997; Malnight,
1996; Chiesa, 1996).
The Iiterature review is organized around three broad themes, namely, the reasons for
internationalization of R&D, the pattern of the internationalization of R&D, and the
organization of internationally dispersed R&D labs.
2 2 Reasons for Internatioaalization of R&D
The internationalization of R&D is viewed as a prucess of distributing R&D labs in
different countries around the world (OECD, 1998). MNCs may establish an R&D presence
in a foreign country either by deliberately establishing an R&D Iab, by quiring the R&D
facility of another company, or by using an existing production or marketing facility as an
R&D lab (Casson and Singh, 1992). Acquisition is the most cornmon means used to
establish overseas R&D labs (OECD, 1 998).
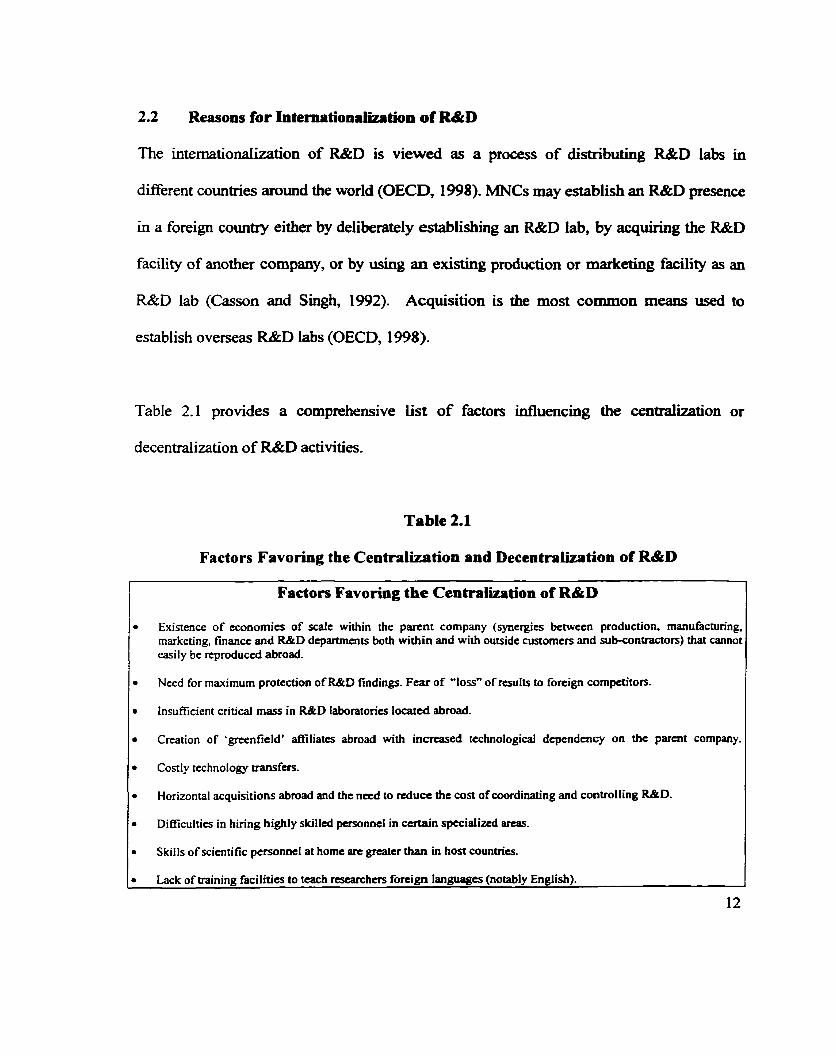
Table 2.1 provides a comprehensive List of factors infiuencing the centralization or
decentralization of R&D activities.
Table 2.1
Factors Favoring the Centralization and Decentralization of R&D
Factors Favoring the Centralizzrtion of R&D
Existence of economics of scale within the parent company (synergies between production. manufacturing marketing, finance and R&D dcpartments both within and with outside customcrs and sub-conûacton) that cannoi easily be reproduced abroad.
Need for maximum protection of R&D findings. Fear of "loss" of results to foreign cornpetitors.
Creation of 'greenfield' affiliates abroad with increased technological depcndcnçy on the parent company.
Costly technoIopy transfen.
Horizontal acquisitions abroad and the nctd to rcducc the cost of coordinaîing and controlling M D .
Dificulties in hiring highly skilled personnel in certain specidited areas.
Skills of scientific personnel at home are grcaicr than in host countrics.
Lack of training facilities to t a c h rcsearchers forcign languages (notably English).
12
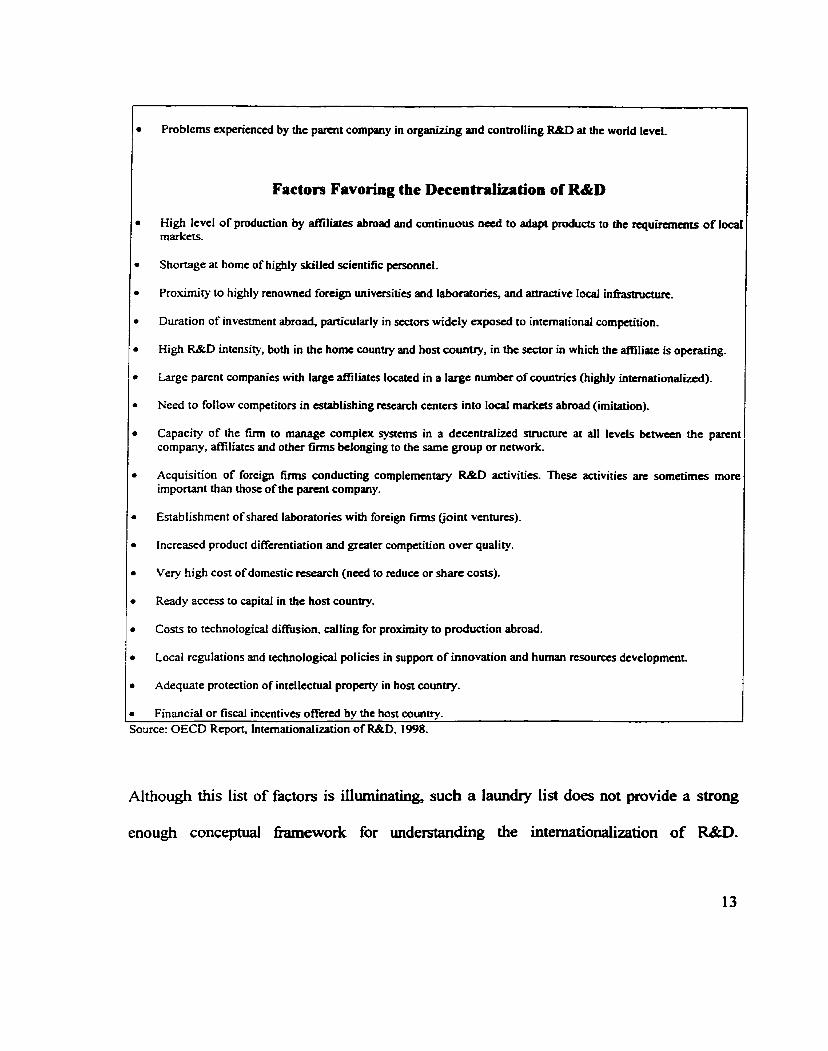
Problerns experienced by the parent company in organizing and controlling R&D at ihe world Icvel.
Factors Favoring the Decentralizritioa of R&D
High level of production by f i l i a t e s abroad and continuous necd to adapt pmducts to the rcquircmcnts of loca markets.
Shortage at home of highly skilled scientific personnel.
Pro?Umity to highly renowned foreign univcrsities and laboratories, and attractive local infiastructurc.
Duration of investmcnt abroad, panicularly in sectors widely exposcd to intemationai compctition.
High R&D intensity, both in the home country and host country, in the =or in which the affiliate is operating.
Large parent cornpanics with large affiliates located in a large number of wuntrics (highly intcmationalizcd).
Need to follow cornpetitors in d l i s h i n g rcsearch centcrs into lofal markets abroad (imitation).
Capacity of the firm to manage complex systems in a decentralized structure at d l levels betwœn the parcni company, affiliates and other finns belonging to the samt group or network.
Acquisition of foreign finns conducting complemmtary R&D activitics. These activitics am sometimes more important than those of the parent company.
Establishment of shared laboratories with foreign firms (joint ventures).
Increased product differmtiation and grtater cornpetition over quality.
Very high con of domestic rcsearch (nced to d u c e or share costs).
Ready access to capital in the host country.
Costs to technological diffusion. calling for proximity to production abroad.
Local regdations and technological policies in support of innovation and human resources development
Adequate protection of intellectual property in hon country.
Financial or tiscal incentives offercd by the host counw. ource: OECD Report. Intemationalization of R&D. 1998.
Although this list of factors is illuminating, such a iaundry list does not provide a strong
enough conceptuai Eramework for understanding the intemationalization of MD.
Recognizing this deficiency in conceptual understanding, s e v d researchers have a d v a n d
various fiameworks. Some of the fhmeworks are discussed in the remainder of this section.
Perhaps, one of the most fiequently used arguments is that the i n t e m a t i o ~ t i o n of R&D
follows the globaiization of industrial production or manufacturing activities (Hymer, 1972;
Knickerbocker, 1973; Lall, 1979). Acccirding to this view, MNCs which seek to extend
their control over a foreign market will establish R&D labs in these markets to support
product differentiation through product innovation and development. Basically, the d e of
these labs is to extend the life of the MNCs' technology through minor product adaptations
to suit local market conditions so that the MNC could maintain control over the market-
One limitation of this approach is that it fails to provide adequate explanations for cases
where a MNC has established a lab or has acquired a lab in a market where it has no
production facilities. For example, in analyzing the pattern of industrial R&D of Swedish
MNCs, it is observed that a number of Swedish companies have R&D facilities in the
United States although they have no production facilities in the USA. Similarly, this
argument breaks down when R&D intensities (R&D/Manufacturing Turnover) are
substantially greater than 1 as is the case for several countries shown in Table 2.2.
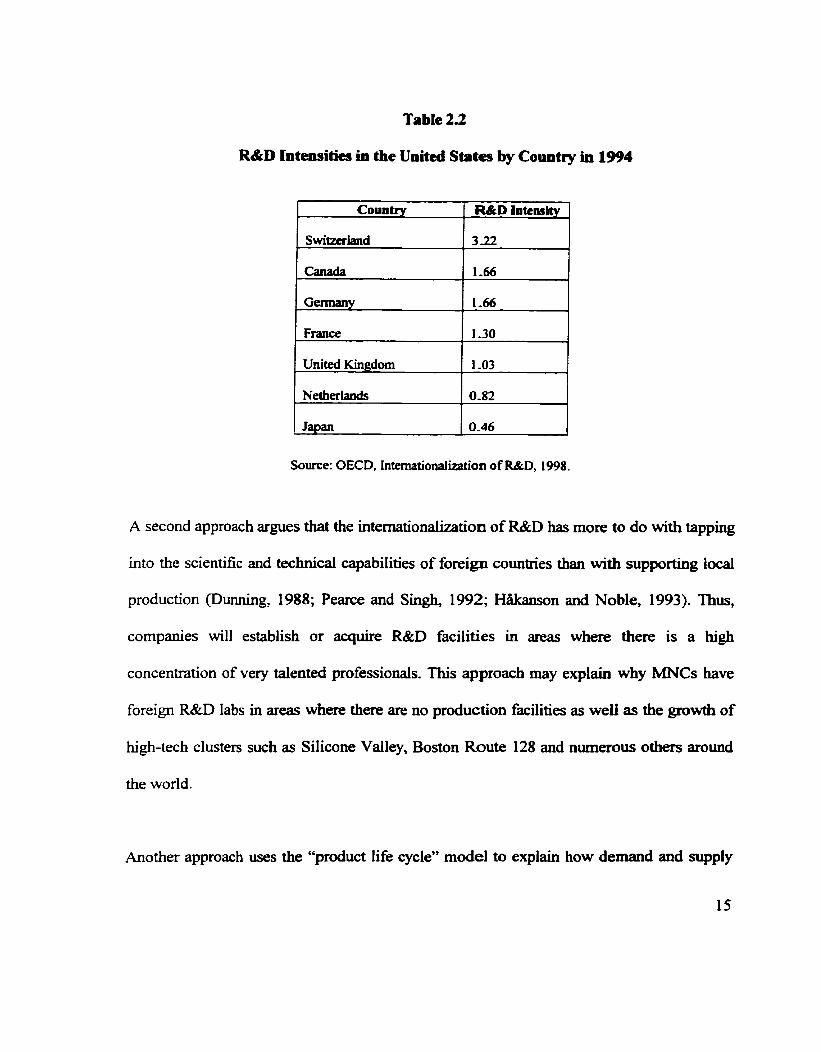
Tabk 23
R&D Intensities in the United States by Country in 1994
Country R&D Intcnsity
Canada 1-66
France
1 Japan 1 0.46
1-30
United Kingdom
Source: OECD, intemationalization of M D , 1998.
1-03
A second approach argues that the internationalkation of R&D has more to do with tapping
into the scientific and technical capabilities of foreign comtries than with supporting local
production (Dunning, 1988; Pearce and Singh, 1992; Hakanson and Noble, 1993). Thus,
companies will establish or acquire R&D facilities in areas where there is a high
concentration of very talented professionals. This approach may explain why MNCs have
foreign R&D labs in areas where there are no production facilities as weii as the growth of
hi&-tech clusters such as Silicone Valley, Boston Route 128 and numemus others around
the world.
Another approach uses the 'product life cycle" mode1 to explain how demand and supply
15
factors drive the internationalization of R&D (Dunnhg, 1992; Hakanson, 1992; Hakanson
and Noble, 1993; Pearce and Singh, 1992)~. This h e w o r k combines the various
phases of the product life cycle with the stages of its innovation in domestic and foreign
markets (Vernon, 1966). The argument is that in the initial stages of a . innovation, there
is a need for close coordination of scientific, engineering, marketing and financial
activities, and because of the high nsks involved in R&D activities, they should be kept
under close surveillance in physical proximity to the parent Company. Once the
technology is developed and production is transferred abroad, the associated levels of
R&D will be high enough not to require the input of additional R&D resources from
overseas (Vernon, 1 977; Cantwell, 1992).
Although this framework provides explmation of the dominant role the HQ still plays in
R&D activities, it fails to account for the increasing number of overseas R&D labs which
engage in upstream R&D (basic research or new product development rather than just
product adaptations). Mowery and Rosenberg (1979) argued that the internationalization
of production and the increasing sophistication of foreign market demand make it
necessary for MNCs to develop a iarger number of innovations overseas. Behnnan and
Fischer (1 980) argue that MNCs whose activities are primarily focussed on the domestic
Demand factors include locating technical support labs in large manufactwing subsidiaries in signi ficant markets; regdations by host countries' govemments to set up local adaptive IUD; market proximity; integration with Iocal production; and local ambitions arnong overseas labs. Suppfy factors include access to scientific and technological skills and knowledge; strategic inm-firm cwperation or acquisition; tapping into foreign scientific infiastnicturc; cost differentials; availability of R&D inputs; and subsidies by national govemments to encourage foreign companies to establish M D in the* countrics.
16
market, tend to establish overseas R&D labs that perform adaptive R&D. In contrast,
MNCs oriented more towards world markets tend to set up labs that perforrn the full
range of R&D activities, ranging fiom product adaptations, to applied research, to even
basic research.
Yet another perspective was advanced by De Meyer (1992, 1993a), who argued that the
underlying explanation can be summarized through the concept of learning. In this view,
the contribution of international R&D to the technological strategy of the fhn lies in the
improvement of the company's learning about the long-term evolution of markets,
technologies, cornpetitors and suppliers. Linking learning to technological strategy
requires an extremely well organized diffiision of knowledge throughout the fm. This
difision c m be stimulated by seeing the R&D organization as a 'network of labs' which
are comected with each other inside as well as outside the Company (De Meyer, 1993b).
A nurnber of international management researchers argue that MNCs intemationalize
their R&D for strategic rasons rather than for purely cost considerations (Pearce and
Singh, 1992; Patel and Pavitt, 1992; Hedlund, 1986; Bartlett and Ghoshal, 1989; Prahalad
and Doz, 1987; Porter, 1990; White and Poynter, 1990; Nohria and Ghoshal, 1997).
According to this view, intense international cornpetition has made it increasingly
difficult for MNCs to sustain cornpetitive advantage by centralking R&D at the HQ
because this strategy cannot adequately generate innovations at the speed necessary to
remain cornpetitive. To survive, MNCs must create distributed innovations by king able
to exploit the technical, managerial and marketing competencies of its subsidiaries to
create products, processes and administrative practices that cm be used locally and
globally. Instead of relying exclusively on the HQ for innovations, MNCs must maximize
their "combinative capacity" - the ability to generate innovative combinations based on
knowledge and capabilities throughout the multinational system (Kogut and Zander,
1992). In this regard, the internationabation of M D is regarded as an essential first step.
This latter view seems to have gained widespread acceptance among management
researchers.
Finally, Reddy (1994, 1996) contended that the intemationalkation process has passed
through four waves and the major driving forces are different at each wave. The major
driving force at the first wave (which lasted up to the 1960s) is the desire of MNCs to
enter into local markets abroad. Building market share overseas and national government
policies are the main driving forces for the second wave (1970s). The need for world-
wide leaming and new technology inputs characterize the third wave (1980s); and, access
to scarce R&D personnel and increasing R&D costs are the major driving forces of the
fourth wave (1 990s).

23 Extent and Pattern of International R&D
2.3.1 Data on InrernarionaIization of R&D
While there are no disputes among researchers that the trend towards the
internationalization of R&D is increasing, there seems to be disagreement over its scale
and significance. Two reasons may account for much of the disagreement-
The first reason relates to the data on which conclusions are made regarding the extent of
R&D internationalization. The &ta on which rnuch of the literature is based were
obtained fiom one of three principal sources:
1. National data provided by statisticd agencies of individual countries such as
Statistics Canada, National Science Foundation, US Department of
Commerce, and Fortune 500.
2. Cross-country data provided by international institutions such as the OECD.
3. Data collected by individual researchers through surveys and case studies.
As expected under these circumstances, the data on which the research is based are
fiagmented, incomplete and not directly comparable because the methodologies
underlying their collection Vary significantly fiom source to source. In an attempt to
address this deficiency, the OECD has released its 6nt ever Activities of Foreign
Affiliates (MA) database which currently tracks 18 variables including R&D
expenditures and M D p e r s o ~ e l (OECD, 1998). It is also worth noting that the United
States is the only OECD country that has legislation requiring companies to disclose their
overseas R&D activities. Thus, the US data sources represent the most complete and
reliable source of information on the intemationalization of R&D.
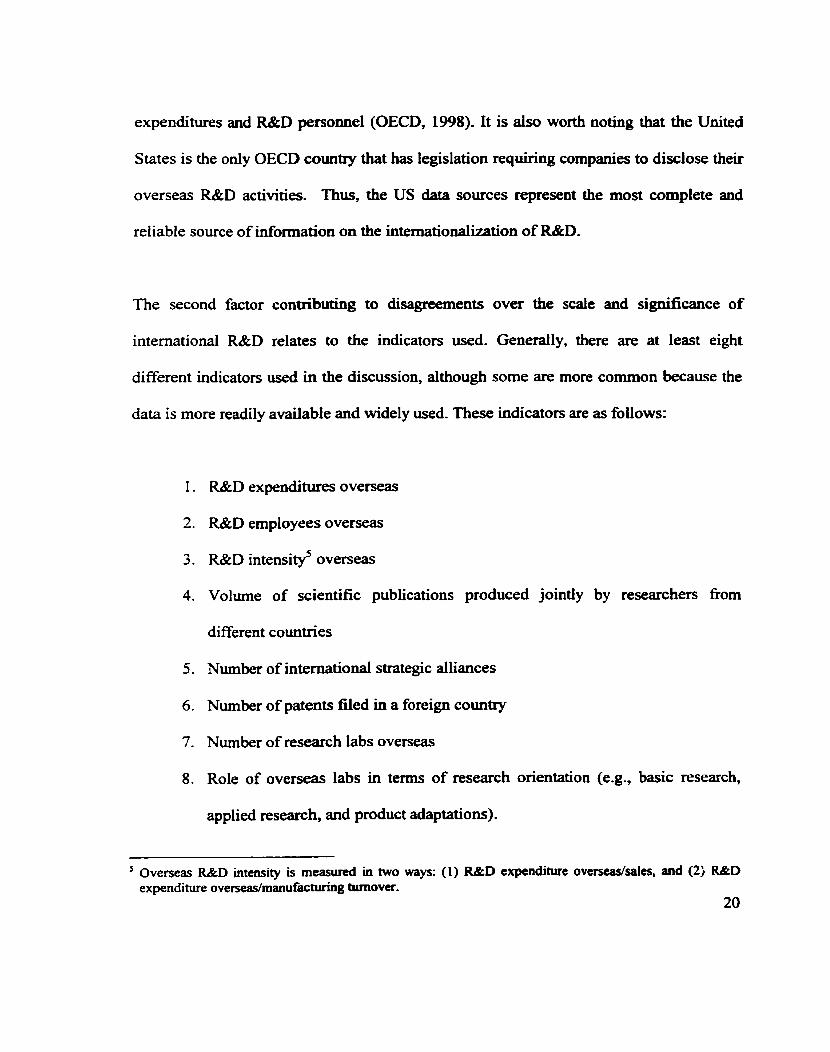
The second factor contributing to disagreements over the scale and significance of
international R&D relates to the indicators used. Generally, there are at least eight
different indicators used in the discussion, although some are more common because the
data is more readily available and widely used. These indicators are as follows:
R&D expenditures overseas
R&D employees overseas
R&D intensig overseas
Volume of scientific publications produced jointly by researchers fiom
different countries
Number of international strategic alliances
Number of patents filed in a foreign country
Number of research labs overseas
Role of overseas labs in terms of research orientation (e.g., basic research,
applied research, and product adaptations).
Overseas R&D intensity is measured in two ways: (1) RgtD expenditure overseas/sales, and (2; RgtD
A discussion of the ments and limitations of each of these measures is considered outside
the scope of the current study. Suffice to say, however, that data on some of the indicators
is very dificult to obtain and even when they are obtaiwd, the reliability is ofien
doubtfiil.
2.3.2 Evidence of lnternatio~litation of R&D
Several key trends on the extent and pattern of internationalization are reported by the
OECD (1998). Some of the more notable, general and specific country trends are
summarized below:
Overseas R&D expenditures among the 15 OECD countries averaged about
12 percent of the total R&D expenditures of the OECD countries in 1994.
In most countries, the R&D of foreign afEliates is concentrated in a few
industrial sectors: electricd; electronics; cornputers; pharmaceutical;
chernical; and automotive industries.
A signifiant proportion of R&D internationalization cornes fiom the
acquisition of foreign R&D labs. For example, when a Canadian company
buys the R&D lab of a UK company.
In the United States more than 105,000 R&D jobs and approximately 10
percent of the total industrial R&D of the US were related to the research
activities of foreign companies in the US.
Japan's overseas R&D expenditure in 1993 reached 2.1 percent compared to
less than 0.5 percent at the be-g of the decade.
R&D expenditures by foreign companies in Cermany were 16 percent of the
country's total indusirial R&D and the number R&D jobs related to foreign
companies was about 15 percent.
R&D expenditures by foreign atliliates in France were 16 percent of the
country's totai industrial R&D.
R&D spending by foreign affiliates in the UK reached 37 percent in 1995, the
highest arnong al1 OECD countries.
in Canada, about 40 percent of the country's R&D spending are attributed to
foreign M s , mainly U.S. h s . About 80 percent of pharmaceutical and
automobile R&D is done by foreign affiliates while about 70 percent of the
R&D in aerospace and the cornputer industry is under foreign control. In tenns
of manufacturing R&D intensities, Canadian h s have a higher level than
foreign affiliates in Canada.
In 1995, the R&D expenditures of Swedish MNCs abroad and foreign
affiliates in Sweden were approxïmately 20 percent respectively.
Dunning (1992, 1994) showed that there is some convergence of innovatory capacity at
the country-Ievel since the 1970s. For example, in 1970, the former USSR Canada and
USA accounted for 65.4 percent of the world's R&D expenditure and 57.4 percent of the
scientists and engineers. Moreover, 75 percent of al1 US patents were granted to North

American firms. However, by the early 1980s, these proportions had fallen to 47.7
percent, 54.6 percent and 57 percent respectively. The most noticeable convergence
occurred among the five leading industrial countries (Le., US, France, Gennany, UK and
Japan).
The innovatory capacity of developing counaies has also increased markedly over the
same period. For example, developing countries' contribution to world R&D
expenditures increased fiom 2.5 percent to 6.2 percent between 1970 and 1987; their
share of world patenting doubled during the same period, and R&D scientists and
engineers increased fiom 8.5 percent to 11.2 percent by 1984 (Dunning, 1992, 1994). In
spite of this convergence, the author concludes that the relative importance of foreign
R&D activities varies greatly between countries and industries, and foreign RdtD tends to
follow the pattern of international sales and production. That is, MNCs tend to set up
R&D Iabs where they have large production facilities and significant markets because
overseas R&D labs tend to perform more adaptive work.
in spite of the trend towards greater geographicai dispersion, Dunning (1992, 1994) and
Patel and Pavitt (1992) argued that the world's R&D and technological activities are fa.
fiom globalized in two senses. First, in most of the countries at the world's technological
fiontier, foreign R&D and technological activities are still insignificant. For example, in
1982, only 12 percent of the R&D expenditures of 792 of the world's leading MNCs were
undertaken outside their home country. Second, large fïrms' technologicai performance
strongly depends on the performance of their home country, rather than independent of it.
Pearce and Singh (1992) observed that only a very small number of R&D facilities
deliberately set up abroad are more than twenty years old. htemationalized R&D was
found to be established in UK corporations and other European companies with below
average tendency among U.S. and Japanese MNCs. At the industry level, a global
perspective of R&D is most clearly estsiblished in pharmaceuticals and least established
in aerospace and metal manufacture and products.
According to Cantwell (1992), wherever the world's largest MNCs have dispersed their
activities, they have generally been attracted to the main centers of innovation for their
industries. For example, between 1978- 1986, most foreign firms in the pharmaceutical
industry were located in the U.K. because it was among the world's leaders in
pharmaceutical R&D. Similady, in Japan most foreign firms were keen to invest in the
electrical equipment, motor vehicles, and professional and scientific instruments
industries. Furthemore, although many leading MNCs (IBM, ICI and Sony) establ ished
R&D labs in North America, Western Europe and Japan, their R&D labs tend to cluster
within specific regions in the triad such as Califomia's Silicone Valley.
Casson and Singh (1992) observed a shifi in the focus of R&D at the parent R&D labs
arnong US, European and Japawse MNCs. Many US. aud European MNCs are moving
towards more applied research and less basidoriginal research, while the Japanese MNCs
are moving towards more basic/original research and away fiorn applied research. They
suggested that this tendency is consistent with the view that Western h s invest in Japan
in order to get access to Japanese corporate how-how, whilst the Japanese try to get
access to Westem institutions of basic/originai research.
Odagiri and Yasuda (1996) in their study of Japanese fïrms' R&D practices, observed that
the motive for overseas R&D difKers between the R&D in developed countries, such as
the USA and Europe, and that of developing countries, such as those in Asia Japanese
firms appear to conduct R&D in the US and Europe, to gain access to the leading
scientific and technologicai knowledge or to recruit highquality researchers. in Asia, the
firms appear to set up R&D labs to support local manufacturing.
In terms of the types of activities undertaken by foreign R&D labs, the evidence indicates
that, with some exceptions, they still supply support senices or perform product and
process adaptations. For exarnple, Granstrand and Sjolander (1 990, 1992) indicate that
adaptive research is the dominant motivation for US MNCs to undertake foreign R&D.
Casson and Singh (1992) found thai 57 percent of a sample of 2 18 Japanese MNCs in
1990 indicated that support seMces are the main objective of their foreign labs. Except
for a few sectors, notably mining, food processing and pharmaceuticals, and in a few
developing countries (e.g., Brazil, hdia and South Korea), it is the only R&D carried out.
Casson and Singh (1992) and Pearce and Sin& (1991, 1992) observed that overseas
R&D plays an increasingly distinctive roie in many leading MNCs in at least two ways.
Fint, development work replaces adaptation, so that R&D labs work with marketing and
engineering units to develop distinct product variants using the MNCs technology.
Second, some overseas R&D labs provide market-support services for a range of markets.
Limited support was found for the view that overseas R&D labs play a role in
basic/onginal research prograrns. Further, where overseas facilities perfomed
basic/original research, there was a strong propensity for this to be integrated into
intemationally networked programs. For instance, Bell Northem Research and Northern
Telecom overseas R&D labs perform a variety of tasks ranging fiom technology scanning
to product adaptations to new product development.
Finally, within the international network of MNCs, technological activity is becoming
broader. First, there is increasing extemal and cross-border acquisition of technology
among MNCs through acquisitions, licensing, contract R&D, international joint ventures,
and tec hno logy scanning . The internationalization of R&D has irnproved the e fficiency
of sourcing of new technologies because R&D activities are established geographically
near the source of these technologies. Second, there is a trend, in varying degrees, for
R&D to become more diversified, especially in labs located in the US and UK, and to a
lesser extent, Japan and Sweden. The tendency towards technology diversification tends
to increase the pressure for extemal technology acquisition which codd lead to M e r
technology specialization of countries (Granstrand and Sjolander, 1992).
2.4 Management of International R&D
The literature on the organization and management of international R&D focused on two
interdependent issues. The k t issue pertains to developing an understanding of the
structural relationships between the HQ lab and overseas labs, and among overseas labs
themselves. The second issue pertains to developing an understanding of the role overseas
labs play within the broad range of R&D activities undertaken by the MNC group.
B ased primaril y on empincal research, researchers have, over the years, developed an
array of taxonomies to describe international R&D labs in terms of their structural
relationships and the activities they perform. Tables 2.3 and 2.4 below provide a summary
of the taxonomies as presented in Medcof (1998). Medcof's (1998) schema is based on
conceptual arguments which have not been tested empirically as yet.
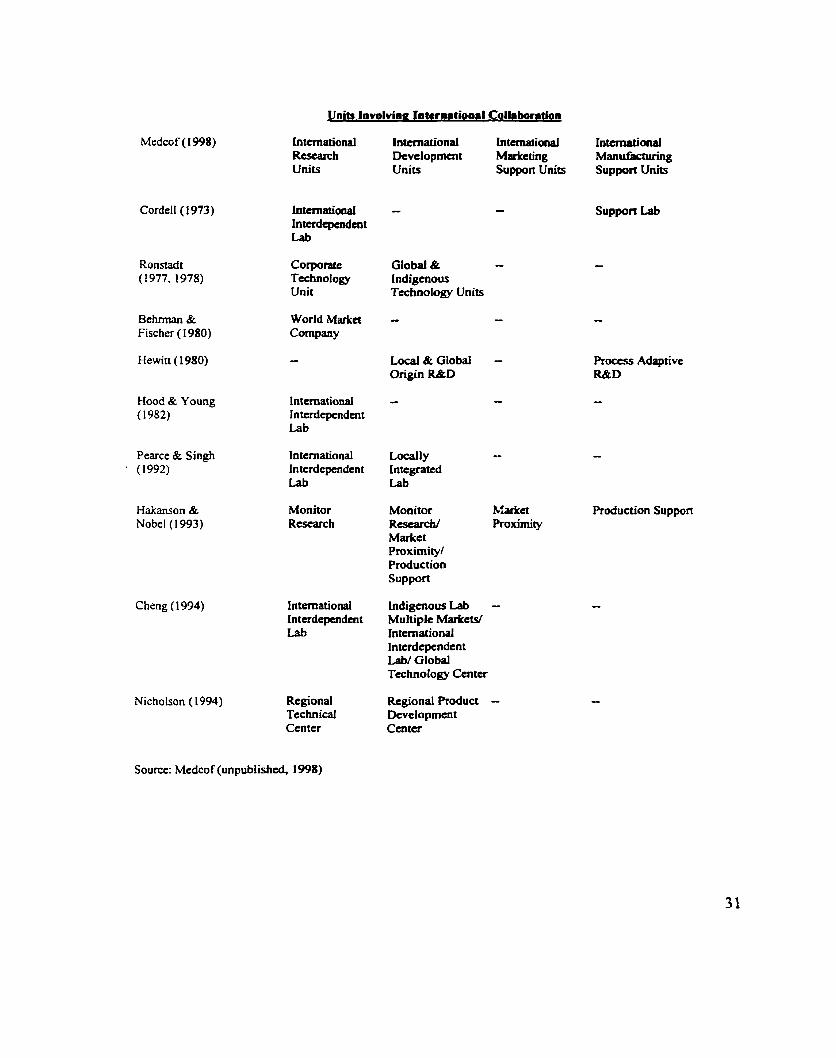
In Table 2.3, Medcof (1998) classified research labs into four groups based on the type of
R&D activities they perform and whether these activities are carried out at the local or
international level. Using these classifications, Medcof (1998) mapped the taxonomies
£iom previous studies on to his schema in order to arrive at a h e w o r k that will allow

for cornparisons among previous studies.
A similar approach has been adopted in Table 2.4 with respect to the organizational
stnictures of overseas R&D labs. In Table 2.4, overseas research labs are classified as
belonging to either a network, cluster or hub structure depending on the level of
autonomy and influence they enjoy in decision making, the strategic significance of the
R&D tasks they perform, and the nature of communications arnong the labs. Generally,
networks labs have the greatest autonomy, undertake work of higher strategic significance
and have more fiequent and dense communications with a larger number of Iabs. Labs
that are subjected to greater control by the HQ, have very little interactions with other
labs, and perfom work of lower strategic significance are referred to as 'hub' structure
iabs.
A cursory examination of Tables 2.3 and 2.4 suggests that there are serious contradictions
resulting fiom the proliferation of taxonomies. For example, in Table 2.4, the definitions
of the network structure advanced by Medcof s (1998), MalNght (1996) and Buckley and
Brooke (1992) appear to be inconsistent with that advanced by Brockhoff and Schmaul
(1996). Similarly, how can Chiesa's (1996) global specialized lab be consistent with
Brockhoff and Schmaul's definition of the network structure?
In Table 2.3, how can Ronstadt (1 977 and 1978) Technology Transfer Unit fit with three
of Medcof s taxonomies (Local Development Units, Local Marketing Support Units, and
Local Manufacturing Support Units)? According to Medcof (1998), one of the reasons
for the apparent contradictions in this body of research is that while excellent field
research has been conducted, there is a lack of conceptual models to guide empirical
investigations. Nohna and Ghoshal (1997) cailed for new conceptual and analytical
fi.ameworks of MNCs which capture and explain the new organizationai realities of
MNCs as well as the rapidly changing and complex environment under which they
operate.
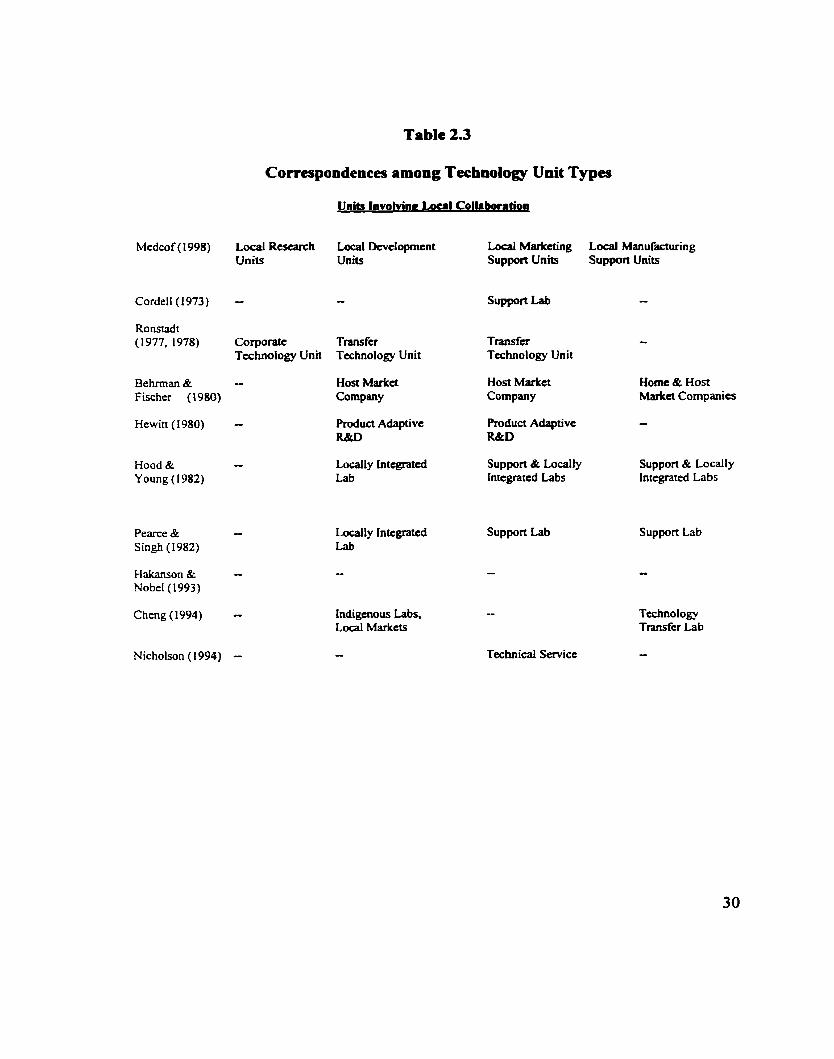
Table 2.3
Correspondences among Technology Unit Types
Units Iavolvinn Lou1 Collrborrtion
Medcof ( 1998) Local Research Local Dcvtlopmcnt Local Marketing Units Units Support Units
Local Manufacturing Support Uni&
Corporatc Transfcr Tmnsfcr Technology Unit Technology Unit Tcchnology Unit
Behnnan & Fischer ( 1 980)
Hast Marka Company
Host Market Company
Home & Hon Marka Companics
Product Adaptive Product Adaptive R&D R&D
Hewin ( 1980)
Local iy Intcgratcd Support & Locally Suppon & Locally Lab lntegratcd Labs lntcgrated Labs
Hood & Young ( 1982)
Locally Integratcd Suppon Lab Lab
Support Lab
-
Pearce & Singh (1982)
Hakanson & Nobel (1993)
Cheng (1994) Indigcnous Labs, Local Markets
Technology Transfer Lab
Nicholson ( 1994) , Technical Service
Medcof ( I998) international Rcsearch Units
Intcniational International Devciopment Marketing Units Suppon Units
International Manufactunng Support Units
international Interdependen t Lab
Support Lab
Corporate Tcchnology Unit
Global & - Indigrnous Tcchnology Units
Wortd Marka Company
Behrman & Fischer ( 1980)
Hewin (1 980) Local & Global - Origin M D
Procas Adaptive M D
Hood & Young ( 1 982)
International Interdepcndcnt Lab
-
Production Support
P a c e & Singh ( 1992)
International Interdepcndent Lab
Hakartson & Nobel (1 993)
Monitor Research
Monitor RcscarcM Markc t Proximity/ Production support
Cheng ( 1994) international Interdependent Lab
Indigenous Lab - Multiple Markets/ International In terdependen t Lab/ Global Technology Centcr
Nicha Ison ( 1994) Regional Technical Center
Regional Product - Dcvclopment Centcr
Source: Medcof (unpublishcd, 1998)
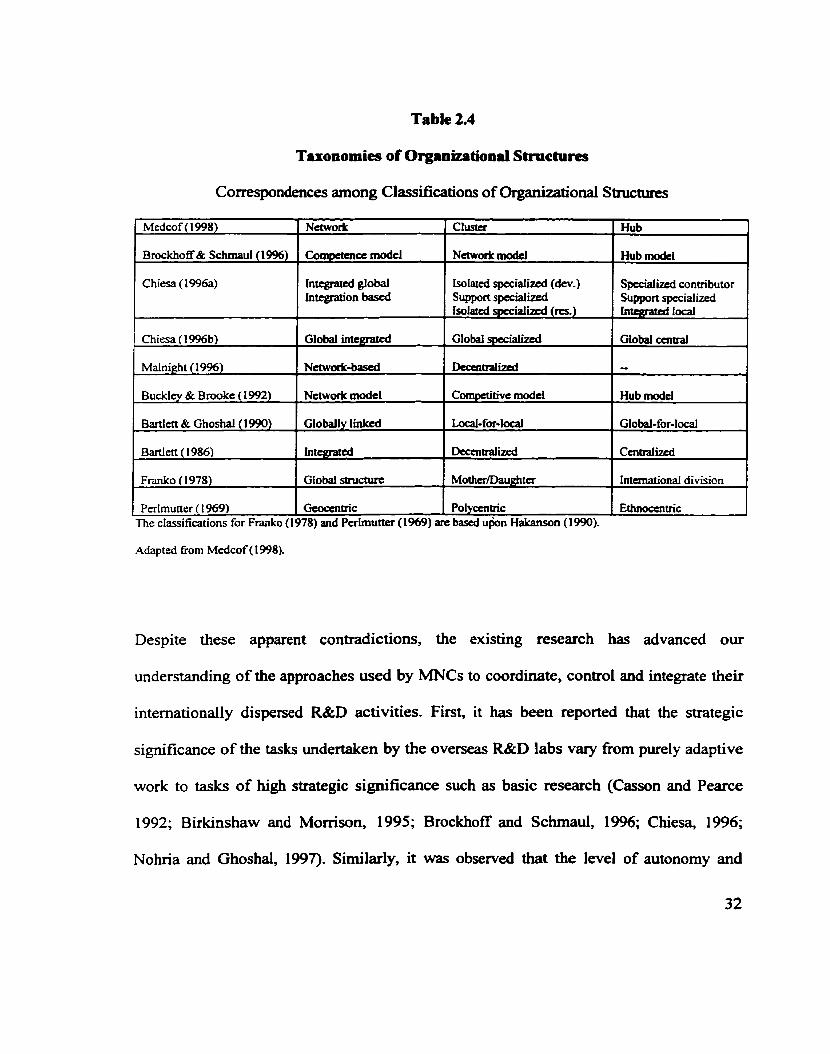
Table 2.4
Taxonomies of Organizational Structures
Correspondences among Ciassifications of Organkational structures
Medcof ( 1998)
Brockhoff & Schmaul(19%)
Chiesa ( 1996a)
Chiesa (19%b)
Malnight ( 1996)
Buckley & Brookc (1992)
Bartlen & Ghoshal(1990)
1 Perlmutter ( 1969) 1 Gtoccntnc 1 Polyccntric 1 Ethnocaaic 1 The ~Iassitications for Franko (1978) and Palmutter (1969) are b a d u+n Hakanson (1990).
Nctwork
Cornpetencc mode1
Cluner
Nctwork mode1
Bartlett ( 1986)
Franko ( 1978)
Adapted Grorn Medcof (1 998).
. Hub
Hub mode1
Integrarcd global lntegration bascd
Global inttarated
N c t w o r k M
Nctworic d e l
Despite these apparent contradictions, the existing research has advanced our
understanding of the approaches used by MNCs to coordinate, control and integrate their
internationally dispersed R&D activities. First, it has been reported that the strategic
signi ficance of the tasks undertaken by the overseas R&D labs vary fiom purely adaptive
work to tasks of high strategic significance such as basic research (Casson and Pearce
1992; Birkinshaw and Momson, 1995; Brockhoff and Schmaul, 1996; Chiesa, 1996;
Nohria and Ghoshd, 1997). Similady, it was observeci that the level of autonomy and
In-
Giobal suucnirc
Isolatcd sptcialirtd (dev.) Support specialized isolatai spa5aliatd (ces.)
Global spccialized
DecffinalM
Cogmitive model,
Spaializcd conaibutor Support specialized [mcgmcd local
Global central
- Hub modcl
l
Dccentral ized
Motfier/Daughter
Ccnaalizcd
Intcmational division
patterns of communication and coordination by overseas R&D labs are not uniform
across al1 labs. That is, while some labs are given greater fieedom to decide their
research directions and have dense interactions with other labs, others are stil closely
controlled fiom the HQ.
An important question here is what factors determine the extent of autonomy and
strategic significance of the R&D tasks assigned to overseas labs? The underlying reasons
are not yet well understwd. However, Bartlett and Ghoshal (1989) and Nohria and
Ghoshal (1997) suggested that the iabs' administrative heritage, resource levels, and the
complexity of the environment in which they operate are possible explanations. The
differentiated network mode1 of MNCs advanced by Nobria and Ghoshal (1997) is an
attempt to ilIustrate both conceptually and empirically how these factors may help explain
the observed variations.
in a ~ . attempt to develop a deeper understanding of how MNCs organize their international
R&D, researchers have focusseci on the structurai elements characterizhg the complex
relationships among worldwide R&D labs. Three interdependent issues dominate this body
of research. One issue concerns the level of autonomy grand to overseas subsidiary labs
to make strategic decisions and how autonomous labs relate to the rpa of the labs within the
MNC group. The second issue concems the mrdulation structure uxd to integrate and
control globally distributed R&D labs. The third issw relates to the communication
patterns among the labs. The research on each of these issues is discussed below.
2.4.1 Autonomy of R&D Labs
Generally, in HQ-subsidiary relationships, control is a central issue. Child (1 973) defines
control as regulating the activities within an organization so that they are in accord with the
expectations established in policies, plans and targets. In the traditional hierarchical model,
control is primarily 'bureaucratie' and managers are monitored to prevent opportunistic
behavior (Birkinshaw, 1994). The network model proposes a system of primarily
'normative' or cultural controls, whereby managers are imbued with the values and goals of
the MNC and thus, act in accordance with them (Hedlund, 1986; White and Poynter, 1990).
Bureaucratie control is still neceswy, but is of secondary importance.
De Meyer and Mizushima (1989) identified three factors that determine the amount of
local autonomy given to overseas R&D labs. These are as follows:
1. A Company orientation towards centralization, that is, companies that were highiy
centralized tended to centralize their international R&D as well.
2. Tirne pressure. The greater the time pressure to complete an R&D project, the greater
the tendency towards centralization.
3. Size of the R&D lab. The smailer the overseas R&D lab, the stronger the corporate
control exercised over them.

B d e t t and GhoshaI (1989) observed that the level of autonomy of overseas labs Vary
with the innovation tasks performed. R&D labs that only created innovations had the
greatest autonomy while those that created, adopte4 and diffiised innovations had
intermediate amounts of autonomy. Theù data did not support the view that autonomy
facilitates creation and diffusion of innovations, or that it irnpedes adoption.
Behrrnan and Fischer (1980) identified four management styles in relation to foreign
R&D: absolute centraiization; participative centralization; supervised freedom; and total
freedom. However, participative centralization and supenised ûeedom were the two
most commonly used management styles. Firms with a home-market orientation
(emphasize the home market) appeared to be more centralized than firms with a host-
market or global market orientation (emphasize the foreign or world market). Among
firms with a host-market orientation, those in high-tech industries such as electronics,
phannaceuticals and chemicals, tended to use participative centralization.
Casson and Singh (1992) charactenzed the relationship between the HQ R&D facility and
overseas R&D labs that performed basic/original research as 'supervised fieedorn'. De
Meyer and Mizushima (1989) found that among the companies they studied, managerial
decision making was closer to participative centralization than to supervised fieedom.
Accordhg to Voisey (1992), some Japanese fhns have been internationaiking their R&D
by adopting a more localized strattegy which he describeci as 'supplier MD' instead of
indigenous offshore development by a division, or acquisition of offshore capabilities
followed by mandated integration within the MNC network. The 'supplier R&D'
establishment pmcess is one of acquisition of an offshore capability followed by non-
assimilation within the MNC in a fonnd sense. In other words, the local MNC-owned
organization retains nearly aii of its pre-existing management systems and intenial
consistency, but nevertheless develops a strong and effective relationship with the Japanese
parent.
Kuemrnerle (1997) suggested that managers who are responsible for intemationalking
R&D should foilow a two-stage strategy. First, a local (offshore) R&D lab that is as closely
integrated into the local environment as possible should be established - acquisition of a
local high-tech Company is one way of achieving this. The second stage is one of non-
formal integration. This means giving primacy to the local R&D subsidiary in order to
interact with and respond to the various isomorphic pressures of its environment without
interference. ùistead, the HQ role becomes more of a facilitator, by providing every
reasonable opporhuiitty for the offshore R&D center to gradually develop ties at multiple
levels throughout the MNC.
2.4.2 Coordination and Integrution of R&D Labs
One outcome of establishing intemationally dispersed R&D labs is that coordination
becomes much more difficult due to geographic, tirne and cultural differences. Advances
in information and co~nmunications technologies have helped to mitigate some of the
coordination difficulties. Nonetheless, significantly more time and resources are needed
to achieve effective coordination, compared to the traditionai approach where R&D is
centrdized.
Nohria and Ghoshal (1 997) reported that MNCs use a combination of formalization and
socialization mechanisms to coordinate and control the activities of their decentraiized
subsidiaries6. Many researchers argue that coordination and control of intemationally
dispersed R&D labs is achieved more effectively through socialization or normative
culniral contra1 rather than by rules and edicts (Baliga and Jaeger, 1984; Nohria and
Ghoshal, 1997; Marschan, 1996; Neff, 1995; Gwynne, 1995; Krogh, 1995; Ouchi, 1980;
Kanter, 1988). According to Coleman (1990), socialization is important for building trust
and shared values; for leamhg the organization's code of conduct; and for monitoring in
order to ensure cornpliance with the nonns. Both trust and shared vaiues reduce
coordination costs within organizations (Ring and Van de Ven, 1992).
Formalization refers to coordination and control through the use of systematic rules, procedures and policies. Socialkation refers to coordination and control through the cmition of comrnon goals and shared values (Nohria and Ghoshal, 1997).
Nohria and Ghoshai (1997) argued that socidization ailows the multinational to leverage
its worldwide pool of resources much more effectively than through the formai structure.
Hence, as the need to tap into the innovative potentiai of its ove- R&D labs increases,
the multinational must devote more resources into building its social capital - the
individual's network of contacts.
Mechanisms which have k e n used to encourage socialization inçlude corporate training
prograrns, joint planning involving personnel from HQ and overseas labs, intemally
sponsored conferences for R&D staff, job rotation, exchange visits, using expatriate
managers to head overseas R&D labs, mentorship prograrns, social and recreational
events, Ianguage and cultural sensitivity training, and open communications throughout
the organization (Neff, 1995; Gwynne, 1995; Medcof, 1998, Brockhoff and Schmaul,
1 996, Kuemmerle, 1997).
2.4.3 Communication among R&D Labs
Within internationally dispersed R&D labs, communication must be managed both
between the HQ and oveneas labs and among the overseas labs. The importance of
intemal communications for innovation is well established in both the theoretical and
empirical literature on innovations (Tushan and Anderson, 1997). in the traditional
hierarchical organization, communication is achieved through the formal structure, while
in the networked organization, lateral and personal communications replace the formai
structure and function as integrative devices connecting various parts of the organization.
Stock et al., (1996) examined the communication patterns between HQ and subsidiaries
of European and Japanese biotechnology MNCs in the US with respect to processing
technical information. They observed that processing technical R&D information in an
international setting substantiaiiy increases the complexity and difEcuity of such
processing. However, the effectiveness of such processing grealy influences hovative
performance. Stock et al., (1996) reported that HQ-subsidiary communication of
technical R&D information differs significantly between European and Japanese MNCs.
Differences were observed at the organizational, technological and cultural levels.
Nohria and Ghoshd (1997) observed a comection between HQ-subsidiaries
communication patterns and innovations within the context of their four structurai types
(i.e., local-for-local, Local-for-global, center-for-global and global-for-global). Local-for-
1 ocal types are charactenzed b y hi&-density communication within subsidiaries. Locd-
for-global have high-density communication both within and among subsidiaries. Center-
for-global structures are characterized by high-density communication between HQ and
subsidiaries. Global-for-global types have high-density communication within
subsidiaries, among subsidiaries, and between HQ and subsidiaries. In addition,
interpersonal networking has substantial positive effects on M D managers'
communication, both with the HQ and with other subsidiaries.
Bartlett and Ghoshal (1989) reported that subsidiaries that had higher levels of inter-lab
communications were also more effective in the creation of innovations. Strong inter-
subsidiary communication is facilitated through organizational directives fiom corporate
HQ and the use of advanced communication technologies. Hakanson and Zander (1988)
noted that extensive inter-subsidiary communication, particularly lateral information
flows among subsidiaries, is a primary contributing factor to achieving international co-
ordination among foreign subsidiaries.
De Meyer and Mizushima (1989) found two patterns of communication in the context of
international R&D in Iarge MNCs. In the fmt one, the HQ lab collects technical
information and disseminates it to overseas R&D labs. in the other, which they describe
as a network organization, the labs are intercomected and information flows through the
network. De Meyer (1992) found that although most MNCs are using electronic
communications media, most managers d l prefer personal contacts and the traditional
'handshake' to build mutual trust and confidence. It appears that the handshake is an
important pre-condition for the effective use of electronic communication systems.
Finally, Marschan (1996) examined the impact of less-hierarchical structures or networks
on horizontal and personal communications within a single multinational, ICONE
elevators. The author found that the adoption of a less-hierarchical structure has many
different consequences on communication patterns at different organizational levels. For

instance, top management communication patterns improved, but middle management
and those at the operating level expenenced barriers in their idonnation exchange with
other labs. Communications at the top management level becarne less formai, while at the
middle and operating levels the perception was that communication had become more
formal.
2.5 Conclusion
The studies reviewed here have certainly improved our understanding of the critical
issues involved in managing international R&D globally. However, a number of issues
require much more rigorou~ and extensive research in order to draw fkm conclusions
regarding the way MNCs organize and manage their world-wide R&D labs. For instance,
although case study evidence suggests that the intemationalization of R&D has resulted
in improved performance, there is hardly any systematic study confïrming this trend.
indeed, the impact of the intemationalization of R&D on the ability of MNCs to innovate
has yet to be explored. Even though the studies done by Bartlett and Ghoshal (1990) and
Nohria and Ghoshal (1997) are two exceptions, they include al1 types of organizational
innovations (administrative, product and process) and focus on a wide range of
multinational subsidiaries, rather than just R&D operatiom. The extent to which their
findings apply to the performance of overseas R&D labs in the advanced high-technology
sectors needs to be validated.
Granstrand et al.. (1992) contended chat the shifi in paradigm h m the traditional
hierarchy to the network mode1 has created the need for new theories of multinational
R&D in order to reach normative conclusions regarding the structure and management
processes required to CO-ordinate and control decentraiized R&D labs. Medcof (1998)
noted that excellent field research has been conducted but there is an obvious lack of
theory-based research.
in addition, the literature review indicates that network-based MNCs have been associated
with expanding horizontal linkages among labs through an array of mechanisms such as
greater autonomy for overseas labs and greater involvement of overseas labs in higher
value-added research. However, the evidence available suggests that to date the majority of
overseas labs, particularly those in developing countries still perform adaptive R&D (Le.
product modification to suit local market conditions). This trend suggests that there is a lot
to be learned in terms of enhancing the role of HQ, while simultaneousiy promoting
efficiency and allocating more value-added R&D to the overseas labs.
CHAPTER 3
THEORETICAL FRAMEWORK
3.1 Background
The preceding literature review indicates that the trend towards the internationalization of
R&D has k e n increasing since the mid-1980s. Several management researchers contend
that MNCs have realized that the traditional approach of centralizing R&D in the home
country is no longer a viable option for maintainhg strate& advantage (Hedlund, 1986;
Bartlett and Ghoshal, 1989; Prahaiad and Doz, 1987; Grandstand et al., 1992; Nohria and
Ghoshal, 1997). A popuiar view among managers of MNCs and some academicians is
that only those corporations that can leverage their worldwide capabilities to create
synergies will survive in the fiercely cornpetitive international arena. The phenomenal
increase in the rate of intra-fhn and inter-firm collaborations among research labontories
of the world's Leading MNCs is probably one indication of tiow serious and widespread
this view is. The increasing research focus on finding ways to eEectively organize and
manage globally distnbuted R&D labs in order to achieve the synergies expected fiom
CO llaborations underline the difficulties involved in managing R&D within the new
boundary conditions.
In spite of the push for greater collaborative R&D arnong research labs, a key question
still remains unanswered: Does greater collaborative R&D enhances the innovative

capabilities of research labs? Reports in the popular press suggest that greater
collaboration has a positive impact on the creativity of cornpanies. However, there are
few systematic, large-scale empirical studies supporthg this claim. This is precisely the
issue which the present study addresses.
3.2 Research Question
The centrai focus of this study is the extent to which collaboration in the fomi of greater
networking among intemationally dispersed R&D labs of MNCs enhances the synergistic
innovative capacity of the MNC. Specifically, the study addresses the foiiowhg question:
To what extent does networking among the R&D labs of a MNC group enhances the synergistic innovative capacity of MNCs?
In this study, networking refers to the set of formal and informal relationships existing
between the HQ and the subsidiary R&D labs and arnong subsidiary labs. These
relationships range f?om information sharing to joint R&D projects involving fiequent
contacts either by electronic means or in-person by R&D managers and scientists and
engineers from the various labs.
Since the landmark study of the Aston Group (1 967), centraikation and formalization
have become central constnicts in the analysis of intemal relations in complex
organizations (Pugh, Hickson, Hinuigs and Tumer, 1968; Pugh, Hickson and Hinings,
1969). Similarly, since the studies of Edstrom and Galbraith (1973) and Ouchi (1980),
normative integration or socialization has been rreated as another primary structural
element in the anaiysis of multi-unit o r g ~ t i o n s . Studies by Lawrence and Lorsch
(1967), Burns and Stalker (l961), Aiken and Hage (1971), Rogers (1995) and Burt (1982)
emphasize the importance of effective communications across units for the creation of
innovations. Thus, it can be plausibly asserted that centraZization, f o d i z a t i o n ,
socializarion and communication7, analyzed individually and together, constitue a fairly
comprehensive characterizaion of the nature of the intemal relationships between and
among uni& in complex multi-unit organizations such as MNCs.
In the context of intemationally dispersed R&D labs, centralization refers to a situation
where strategic decision-making at the subsidiary labs is controlled by the MNC HQ. For
the purpose of this study, centralization is operationalized by its obverse, subsidiary labs
autonomy, as suggested by De Bodinat (1975) in order to be consistent with previous
studies in this research domain.
Formalizarion is operationalized by the extent to which decision-making at subsidiary
- - -
These constructs are defined and discussed in greater detail in the noted that the three constmcts are not entirely independent. Tiie
following section. At this point it is study by the Aston Group reported
correlation of -.O2 between fomalization and centralization (Pugh et al., 1967). Aikcn and ~ & e (1968) reported correlation of -28 and Nohria and Ghoshai (1997) reported correlation of 0.18. Nohria and Ghoshal (1997) reported correlation of -.22 between socialization and cenaalization and -42 benveen socialization and fonnalization.
45

labs is controlled thraugh systematic d e s and procedures established by the HQ.
SociaIization or normative integration emphasizes the creation of common and s h e d
understandings of goals, values, and practices to influence both how subsidiary labs
perceive their interests and how they act. Socialkation is operationalized as the extent to
which the labs share the corporate goals, values and cuZtwe.
Communications among internationally dispersed R&D labs is anaiyzed at two levels: 1)
communications between the HQ and the subsidiary Iabs; and 2) communications among
the subsidiary labs. It is operationalized as the frequency of communication, both
electronic and in-person, between top managers, project managers and R&D staff of the
labs.
Thus, the research question posed above is thus broken down into five subquestions as
What is the relationship, if any, between the autonomy of subsidiary labs and the synergistic innovative capacity of these labs?
What is the relationship, if any, between the formalization of decision-making at the subsidiary Iabs and the synergistic innovative capacity of these labs?
What is the relationship, if any, between the shared corporate goals, values and culture and the synergistic innovative capacity of subsidiary labs?
What is the relationship, if any, between the ievel of communication between the HQ and subsidiary labs and the synergistic imovative capacity of subsidiary labs?
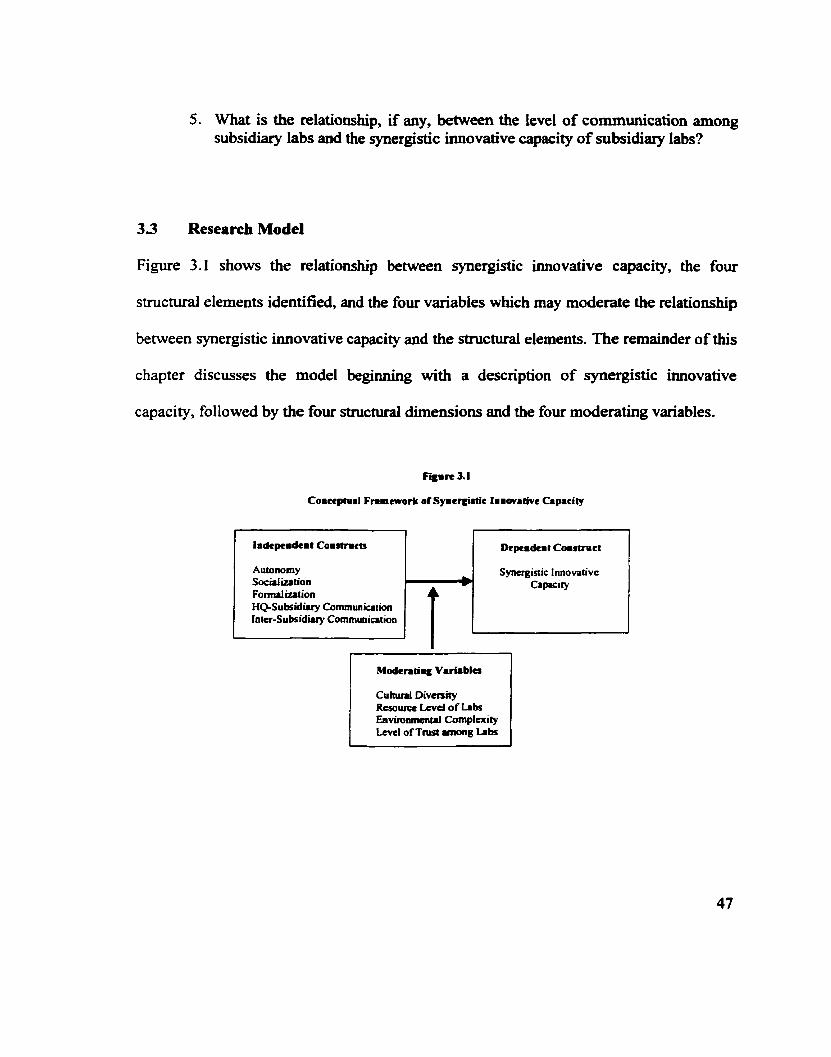
5. What is the relationship, if any, between the level of communication among subsidiary labs and the synergistic innovative capacity of subsidiary labs?
3.3 Reaearch Mode1
Figure 3.1 shows the relationship between synergistic innovative capacity, the four
structural elements identifiai, and the four variables which may moderate the relationship
between synergistic innovative capacity and the structurai elements. The remainder of this
chapter discusses the mode1 beginnulg with a description of synergistic innovative
capaci ty, fol 10 wed by the four structurai dimensions and the four moderating variables.
Autonomy Socid izrtion Fomula.tion HQ-Subridüry Communication Inter-SutKidiary Communication
Syncrgistic Innovative Capacity
Culninl Divcnity Resourcc Levd of Labs Environmcnîai Complatity Lcvcl of Trust unong Labs
3.3.1 Synergistic Innovative Capaciîy
The word synergy is derived fiom the Greek word synergos, which means "to work
together" (Corning, 1998). It connotes combined eEécts or the outcomes of coiiperative
interactions. Though it is ofien associated with the slogan "the whole is greater than the
surn of its parts," it would be more accurate to Say that synergy refers to effects that the
parts cannot achieve alone, effects that are interdependent. Wholes are not necessarily
greater than the sum of their parts, they may just be different.
Extrapolating fkom this conceptualization of synergy, synergistic innovative crrpaciîy is
defined as the ability of the MNC to create new knowledge or to recombine existing
knowledge to create new products, processes and technologies more efficiently by
exploiting the unique capabilities of its worldwide R&D labs. In this study, synergistic
innovative capaciy is measured by ascertaining the outcomes in each R&D lab that can
be attributed to the labs working interdependently. A number of possible outcomes are
discussed below.
First, through greater networking, the research labs could participate in a larger number of
projects or even major projects in terms of resources, complexity and newness, which
might otherwise not be possible if the labs were working independently of each other. In
addition, subsidiary labs may be able to broaden the scope of their research efforts by
applying its R&D knowledge to expand its product range in ternis of new or related
products. For example, in one Company, a lab with expertise in polymer and fiber
technology has teamed up with another lab with expertise in chernid technology to
develop a range of agricultural products. Hence, both labs were able to enter new lines of
businesses because they combined their existing knowledge capabilities.
Second, advances in information and communication technologies (ICT), substantially
increase the opportunities for greater networking among intemationally dispersed R&D
labs and could result in more efficient utilization of R&D resources. For exarnple,
discussions with an international R&D manager of an Ottawa-based high technology nmi
revealed that during the day the company's Canadian R&D labs use its transmission
facilities to work on a project and downioads the redts on a database at the end of the
day. At nights, while the Ottawa lab is closed, the company's R&D lab in Bangalore,
India, accesses the results on the database, uses the transmission facilities to continue
working on the project, and then downloads its result on the database which is accessed
the next day by the Canadian labs. Thus, the transmission facilities are used around the
clock except for maintenance, a situation that may not have been possible without the
interdependence between the labs. It is conceivable that this type of collaboration could
result in a reduction of the development cycle time for the projects.
Third, a potential benefit resulting fiom subsidiary labs working interdependently is the
sharing of complementary know-how, skills and technologies. Also, by networking
closely with labs in other countries, a lab could access not only the MNCs interna1
knowledge networks but also the networks outside the MNC group. For example, the
Ottawa-based R&D lab of a Canadian company may be able to access the knowledge
networks established by its Bangalore R&D lab with other Indian companies, universities
and government research institutes. The same possibility may exist for the Ottawa-based
R&D lab to share in the knowledge networks established by its labs in China, ireland,
U.K., U.S.A., Malaysia, Brazil and France. Indeed, it is possible for all the subsidiary
labs to access the networks established by each other. Tapping into these knowledge
networks can allow a company to develop newer products more rapidly, to enter new
markets with existing products or to improve their own intemal production and
administrative processes.
Summarizing the foregoing discussion, it is expected that networking among subsidiary
R&D labs codd produce the following synergistic innovative effects:
1. A higher number of innovations undertaken b y subsidiary labs;
2. A higher number of complex R&D projects undertaken by subsidiary labs;
3. A wider rangehariety of innovations undertaken by subsidiary labs;
4. Improvements in the quality of the labs existing product or technology;
5. Improvements in the technicol aspects of the production process;
6. Improvernents in the munagerial aspects of the labs;
7. More efficient utilization of R&D resources;
8. Higher impulse for new innovations;
9. Improvements in the success rate of new innovations;
1 O. Improvements in the technical capabilities of R&D staff,
1 1. Access to a wider number of new knowledge sources;
1 2 . Reduced R&D costs; and
1 3. Faster development rime for innovations.
Each of the foregoing measures of synergistic innovative capacity is measured on a scale of 1 to 5 where:
1 = decreased substantiaily
2 = decreased
3 = no change
4 = increased
5 = increased substantially.
(The scale was reversed for the 1s t two measures)
3.3.2 Subsidiary Labs ' At!ribures
As alluded to in the beginning of this chapter and as shown in Figure 3.1, the ability of a
subsidiary R&D lab to enhance its innovative capacity largely depends on the following
four dimensions as they relate to decision making in the labs:
1. Autonomy;
2. Formakation;
3. Shared corporate goals, values and culture; and
4. Communication both arnong subsidiaries and with the HQ.
3.3.2.1 Autonomy
Ln the context of subsidiary R&D labs, autonomy refers to the degree to which a
subsidiary lab is able to make or influence the strategic and operational decisions of the
lab. This definition recognizes the possibility that although a subsidiary lab may not have
the legitimacy to make the decision, it may have considerable leverage to influence the
decision in its favor (Mintzberg, 1979; Brooke, 1984; Medcof, 1997; Nohria and
Ghoshal, 1997).
The effects of centralization or of its obverse, autonomy, on innovations have been
studied extensively by organization thecjrists. The accepted view is that a high degree of
bureaucratic control inhibits creativity and innovation (Thompson, 1967; Aiken and
Hage, 197 1 ; Amabile, 1988). Mohr (1 982) points out that even intuitively it is obvious
that a certain amount of fieedom to experiment and to do things outside a forma1 role is
necessary for innovation. Empirical research by Kanter (1988) provides support for this
intuitive belief. Kanter (1 988) identifies severai organizations that have established a
budget for experirnental research and provided tirne-off for R&D staff to conduct
experirnental research. Some organizations even provide incentives for successfùl
projects generated fiom such experirnental research. Unsuccessfbi experirnental ideas are
not used in employees performance evaluations. In the context of the multinational
organization, several researchers have found that greater levels of centralization have a
negative impact on the innovativeness of subsidiaries (Gates and Egelhoff, 1986).
With respect to subsidiary M D labs, the effeas of greater autonomy on their
innovativeness have not been tested empirically although a number of studies have
inferred a positive relationship based on research at the corporate level. As noted in the
literature review, many MNCs granted greater autonomy to their international M D labs
with the hope that this wiii enhance the innovative capacity of the multinational system.
However, it has not been proven empirically that such autonomy has actually resulted in
substantial irnprovements in the innovative capacity of the labs.
In this study, it is contended that managers of autonomous labs have greater fieedom to
establish formal or informa1 arrangements with other labs to work cooperatively on
research projects that match their technical and organizational expertise. The incentive to
collaborate would likely be p a t e r in situations where the labs have complementary
skills, the costs of the projects are more than what an individual lab could &ord or the
risk is too much for a single lab to undertake. Therefore, by networking with other labs
within the multinational system, it is possible that the synergistic innovative capacity of
participating labs could be enhanced substantially.
On the other hand, it is acknowledged that, because autonomy shifts the focus of power
asymmetrically in favor of subsidiary labs, it can lead to situations where some labs may
want to act opportunistically pursuing their own research projects independently rather
than enter into networbg arrangements with other labs. Such behaviors couid reduce the
potentid contribution to synergistic innovative capacity because the lab may pursue
projects with limited applications elsewhere within the MNC group or the rest of the labs
cannot benefit fiom the expertise of the lab.
Using the approach advancecl by De Bodinat (1975), autonomy of subsidiary labs is
measured by the extent of HQ or subsidiary labs' infiuence on the following decisions
1. making signifiant changes to existing products;
2. m o d i m g the production process of the lab;
3. restructuring the lab;
4. recruiting scientists and engineers for the lab;
5. deciding the career paths of scientists and engheers;
6. number of projects undertaken by the Iab;
7. selecting the types of projects undertaken by the lab;
8. setting project priorities for the lab;
9. conducting joint R&D with other labs within the MNC group;
10. sharing information with other labs within the MNC group;
1 1. exchanging R&D staff with other labs within the MNC group; and
12. collaborating with organizations extemai to the MNC group;
The following 5-point scale was used to measure autonomy:
1 = The HQ decides aione
2 = The HQ decides, but the subsidiw lab can and does provide suggestions
3 = Both the HQ and subsidiary lab have roughly equal influence
4 = The subsidiary lab decides but the HQ can and does provide suggestions
5 = The subsidiary lab decides alone

3.3.2.2 Formukation
Formalization refers to decision-making based on formal systems, established rules, and
prescribed procedures (Pugh et al., 1963; Child, 1972; Mintzberg, 1979). Analyzing HQ-
subsidiary reIations of MNCs, Hedlund (1 980, 1 98 1) reported that formalkation reduces
the power of both the HQ and the subsidiaries as it constrains the exchange relation to an
impersonal set of d e s that may be used to curtail unwanted behaviors. Formalization
codd be used to reduce conflict among subsidiary labs by reducing ambiguity and
providing a stntctured context for collaboration among labs. It may dso be used as a
mechanism to reduce opportunistic behavior on the part of subsidiary labs. Thus, it is
expected that formalization would be positively correlated to situations of potential
conflict among labs.
Mintzberg (1979) advocates that in adhocracies innovative organizattions must avoid
highly formalized behaviors as control and coordination mechanisms because they inhibit
flexibility and informal interactions thai are necessary to promote innovations. Kanter
(1988) reported that empirical research supports the finding that fomalization has a
negative impact on creativity and innovation. SirnilarIy, based on a review of the research
on control and coordination in MNCs, Gates and Egelhoff (1986) concluded that
formalization is negatively related to innovativeness in subsidiaries of MNCs.
According to BurgIeman (1983), forrnalization is expected to increase with higher levels
of interdependence between HQ and subsidiaries to the extent that it provides a structured
context for reciprocity of exchange. Although formalization is negatively associated with
innovativeness, some amount of formakation may be necessary to regdate the behavior
of subsidiaries that enter into collaborative arrangements involving innovative research.
However, in highly uncertain environments, d e s become a iiability and reduce a lab's
flexibility to respond to changïng cucumstances. This latter point is borne out by
Hakamon (1993), who, following an empirical study of forty-nine R&D collaborations,
concluded that detailed specifications of procedures for implementation should be
avoided because they tend to reduce the flexibility required in uncertain innovative
projects.
Because formalization sh ih the focus of power asymrnetrically in favor of those making
the rules (Mintzberg, 1979) which in the case of the MNC organization would most Iikely
be the HQ, subsidiary Iabs could either be restricted, forced or given the fieedom to
network with other labs. To the extent that fomalization is used to restrict networking
arnong subsidiary labs, it will have a dampening effect on synergistic innovative capacity
of the labs. The HQ may feel it necessary to restrict a lab to network with another lab in a
country where it may not have adequate control over the way R&D information is
gathered and disseminated.
Adapting the approach developed by Aiken and Hage (1968) and modified by Nohria and

Ghoshal (1997), formalhtion of decision-making is measured by extent of truth or
falsehood of the following statements:
The HQ has provided a fairly defhed set of d e s and policies governing collaborations among labs within the MNC group;
The HQ has provideû a fairly defined set of rules and policies governing collaborations with organizations outside the MNC group;
The HQ has provided a fairly defined set of d e s and policies to deal with conflicts among labs engaged in joint R&D; and
The HQ monitors the labs to ensure that d e s and policies are observed.
Subsidiary labs must subrnit regular and formal progress reports to the HQ on the status of the collaboration in terms of problems, solutions and achievements.
The extent of tmth or falsehood of each of the statement is measured on a 5-point scale where 1 = definitely true and 5 = definitely false.
3.3.2.3 Shared Corporate Goals, Values and Culture
Socialization refers to the process by which members of an orgaaization learn the value
system, noms and required behaviors of the organization (Schien, 1968). It is a process
that is used by the HQ to control decision-making in worldwide subsidiary labs. It is
based on the belief that subsidiary R&D managers whose values, beliefs and goals are
closely aligned with that of the corporation would be more inclined to act in the interest
of the overall corporation rather than that of their own labs (Ouchi, 1980). For example, if
the corporate view is that joint R&D among labs would be beneficial to the organization,
then R&D managers around the world would actively seek out opportunities to
collaborate with other labs. According to Kanter (1988), socialization facilitates the
creation of innovation not only by motivating subsidiaries to be entrepreneurid but also
by enhancing the HQ' responsiveness to subsidiary needs and initiatives.
Getting managers, scientists and engineers of internationally dispersed R&D labs to
develop shared corporate goals, values and culture is a long, difficult and wstly process
(Neff, 1995; Gwynne, 1995; Krogh, 1994). Means used to socialize international R&D
staff include constant travel, language training, conferences and seminars, social and
sporting events, job rotation, exchange visits, corporate-sponsored training programs,
fiequent electronic communication, joint planning sessions involving R&D personne1
fkom around the world, and using expatriate managers to lead overseas labs. Through
these activities, R&D managers, scientists and engineers fiom around the world would
become more knowledgeable about the work being done by the different labs and the
expertise within the labs. They would also get to know their couterparts fiom other labs
better and may be more willing to communicate with and trust each other. The
expectation among HQ staff is that greater awareness, communication and trust will
translate into stronger networking arnong the labs, and this will in tum enhance
synergistic innovative capacity.
The extent to which the labs share similar corporate goals, values and culture is assessed
by asking respondents to indicate what proportion of the labs they collaborated with
s h e d ttieir goals, values and cuiture.
3.3.2.4 Communications with H Q
With internationally disperseci R&D labs, processing technical and scientific information
is expected to be more complex and difficdt because different labs are embedded in
different cultures and may have different attitudes towards the development and flow of
information. Consequently, effective communication among labs could ultimately
determine the long-nin value of a collaborative network of labs (Stock et al., 1996). The
facilitating role of communications on innovations is well established in the innovation
f iterature (Allen, 1977; Mohr, 1982; Rogers, 1995; Tushman, 1988). Prior research shows
that the effectiveness with which the members of an R&D group are able to cornmunicate
influences the performance of the group in innovative activities (Fischer, 1980).
Communication between the HQ and subsidiary labs represents the vertical flow of
information wiuiin the R&D organization. The vertical flow of information is one of the
ways the HQ exercises control over subsidiary labs. Communication with the HQ could
be multilevel and multidimensional. It may involve communication between managers,
scientists and engineen fiom both labs on issues ranging fiom routine reporting to
extensive project collaboration. Communications with the HQ may be effected through
electronic media or face-to-face meetings. Subsidiary labs performing joint R&D with the
HQ are likely to have more fiequent communications with the HQ.
Effective communications between the HQ and subsidiary labs could lead to a better
understanding of each other's situations that could result in improved relations through
trust and mutual respect. Greater trust may encourage subsidiary labs to work more
cooperatively with the HQ voluntarily on joint innovations. Both labs may exploit
technological complementarities existing between them. In this respect, communications
bemeen the HQ and subsidiary labs could resuit in the creation of new innovations.
No hri a and Ghos ha1 ( I 997) observed that dense HQ-subsidiary co~lltnunïcation facilitated
the adoption of HQ's innovations by subsidiaries. They also noted that intense HQ-
subsidiary communication could facilitate the diffusion of innovations across the MNC
group because the HQ could act as a clearinghouse for information on the projects,
expertise and ideas of its worldwide labs which individual labs could access. For
example, the HQ may learn about an innovative solution in one lab and may encourage its
adoption in another lab where it knows managers are struggling with the same problem.
The HQ could also act as a coordination center to coordinate the activities of labs that are
working collaboratively. It could use its knowledge of the entire organization to build
teams to work on specific innovations. The HQ could play a usefd role as a referee in
conflicts among subsidiary labs that are working collaboratively. Effective performance
of these roles by the HQ could have a positive effect on synergistic innovative capacity.
Fo llowing Marschan ( 1 996), communication between the HQ and overseas subsidiary
R&D labs is measured by the frequency of the following types of communications:
1. eiectronic communication between top managers; 2. electronic communication between project managers; 3. electronic communication between scientists; 4. in-person communication between top managers; 5. in-person communication between project managers; and 6. in-person communication between scientists.
A 5-point scale is used where:
1 = yearly 2 = quarterly 3 = monthiy 4 = weekly 5 = daily
3.3.2.5 Inter-subsidiary Labs Communications
Communications among subsidiary labs represent the horizontal flow of information
wi thin the in ternational R&D organization. Horizontal communication systems function
as integrating devices comecting the various subsidiary labs. Horizontal or lateral
communications among subsidiary labs benefit fiom informal personal networks and,
therefore tend to speed up, for instance, decision making processes and enhance mist
arnong members (Marschan, 1 996). Laterd networking encourages the sharing,
developing and leveraging of knowledge, which could have a positive effect on
synergistic innovative capacity.
Effective lateral co~ll~~lunications among subsidiaries are critical for building trust, which
is crucial for successfûl collaboration. Effective inter-subsidiary communications promote
better understanding of the strengths, limitations and complementarities among subsidiary
labs which could lead to resources being utilized more efficiently through enhanced
coordination and reduced duplication. However, collaboration among labs may increase
the demand on managerial resources due to increased coordination efforts.
Frequent communications among intemationdly disperseci subsidiary labs are possible by
advanced communications technologies such as e-mail, videoconferencing, telephone,
and fax. Hakamon and Zander (1988) observed that extensive communications among
su bsidiary Iabs are a primary contri but ing factor to achieving international coordination
among foreign subsidiaries. By being in contact with several subsidiary labs, a lab c m
leam about interesting developrnents in other locations. Moreover, it can use its network
connections to search more eficiently for the resources required for innovation.
Communications among subsidiary labs is measured in exactly the same way as
communications between the HQ and subsidiary labs, mentioned in the preceding section.
3.3.3 Moderating Infiences
International management researchers8 have identified several factors which influence the
performance of subsidiaries. It can be inferred fiom this îiterature that some of these
factors couid have a moderating effect on synergistic hovative capacity. Four
moderating factors are investigated in this study. These are cultural diversity among R&D
labs, the level of trust among managers and R&D staf f of overseas labs, the resource
levels of the labs, and the environment in which the labs operate.
The impacts of these factors on the creation of synergistic innovation capacity are
discussed next.
3.3.3.1 Cultural Diversiîy
Because R&D activities by their very nature are open-ended and involves a lot of
creativity and experimentation by highly qudified professionals, the success of most
R&D collaborations depend heaviiy upon the cultural context within which they are
executed (Voisey, 1992). The cultural dimension takes on added significance in situations
where the collaboration involve R&D labs fiom several culturally diverse coutries even
though the Iabs may belong to the same MNC group. Culturai differences among R&D
labs exist both in terms of national culture and organizational culture. However, cross-
' Voisey (1992); Ouchi (1980); Schein (1981); Bartlett and Yoshihara (1988); Maccaby (1995); Gwynne (1 995); Neff (1 995); Shane (1 994); Kuemmerle (1 997); Krogh (1995); Nohria and Ghoshal, (1997).
63
national studies support the primacy of national culture over corporate culture in
explaining behavioral ciifferences among people (Shane, 1994).
Anecdotal evidence demonstrates that cultural ciifferences are a source of
misunderstandings and conflicts in international R&D collaborations (Maccoby, 1995;
Shane, 1994; Gwynne, 1995). Maccoby (1 995) noted that cultural values could interfere
with communications and cause distnist unless they are well understood. In a study of
4,000 managers fiom 32 countries in 8 organizations, Shane (1994) found that the styles
used by managers to champion innovations Vary significantly across cultures and that
culturally appropriate styles are not always the ones that promote the most innovations.
He argued that using a championing style in a country where the overarching cultural
values are different could create conflicts that could reduce the hovativeness of
organizations.
Cultural differences in management styles and the work ethics of scientists and engineers
could also hinder the effectiveness of R&D collaborations and hence the ability of the
MNC to create synergistic innovative capacity. For exarnple, some R&D staff and even
managers rnay avoid working with labs where the culture is diEerent fkom their own
because they feel uncornfortable or are unwilling to learn and adapt to another culture.
Language is another cultural artifact that may influence the outcome of collaborations
64
among labs that speak different languages because of the potential for misunderstandings.
Numerous examples of how language differences exert a negative impact on international
R&D collaborations are provided in the popular press and academic papers (Gwynne,
1 995). Linguistic differences could also discourage some labs fiom participating in
collaborative R&D. Opportunities for misunderstandings and miscommunications couid
become more evident when the communication is remote and the information is of a
highly technical nature. Viewed fiom this angle, linguistic differences could conceivably
reduce the synergistic efTects fiom networking among R&D labs.
in order to counter the effects of cultural diversity on performance, many MNCs are
utilizing a variety of approaches such as cross-national multi-fbnctional project teams and
cross-national management teams. Ancona and Caldwell (1992) noted that these teams
are by definition designed with deliberate differences in ethnic and demographic diversity
and technical specialization in mind. It is believed that diversity leads to greater variance
in ideas, creativity, and innovation, thus, generating better group performance (Cox,
1 993; Jackson et al., 1995).
Research by Hambrick and Mason (1 984) and Finkelstein and Hambrick (1 996) on upper
echelons theory show a link between the top management team diversity and a variety of
organizational processes and outcornes. For example, top management team is used to
predict strategic consensus or whether top management is acting on a common set of
strategic pnorities, performance, strategic change, management turnover, and
organizational innovation. Top management team diversity have been shown to influence
the fiequency, quantity and ease of communication, reduce misundersbndings, and foster
innovations due to greater variance in ideas (Smith et al-, 1994; Wagner et al., 1 984). Top
management team diversity could also lead to greater conflict and political activity
(Eisenhardt and Schoonhoven, 1990; Pfeffer, 198 1). Top management team diversity was
found to be a strong indicator of the impact of cultural diversity in MNCs (Nohria and
Ghoshal, 1997).
Thus, in this study, top management team diversity is used as a proxy measure for
cultural diversity. Top management team diversity is ascertained by determining the
proportion of the labs' top management team that is fiomg:
1. the country where the lab is located;
2. the home country of the parent Company; and
3. a country other than where the lab is located or the country of the parent compuiy.
3.3.3.2 T w r among R&D Labs
Kuemmerle (1997) contended that the HQ could play a pivotal role in fostering
networking among M D labs by creating an envimnment in which managers feel
cornfortable to estabiish foxmal and informal relationships. A restrictive posture by HQ
managers could severely restrict the willingness of labs to network with each other. HQ
managers codd encourage networking by, for example, sponsoring joint research
projects, organizing and coordinathg cross-cultural teams, organizuig joint planning
sessions and research seminars, and providing incentives to labs that engage in
cooperative R&D (Neff, 1995; Nicholoson, 1 994; Gwynne, 1995; Zadoks, 1997).
R&D managers have a powerful impact not only on the culture of the lab but also on its
Iong-term research agenda and performance. Consequently, managers who feel secure
enough to allow their scientists and engineers to collaborate with their counterparts in
other labs couid play a positive role in enhancing the creative capacities of their labs. On
the other hand, managers who are uncornfortable with collaborative relationships could
inhibit the creation of synergistic innovative capacity because they may be less supportive
of joint innovative projects (Bartlett and Ghoshal, 1 994; Neff, 1 995; Gwynne, 1 995).
A wide range of rneasures for trust have been proposed in the literature, however, for
reasons of parsimony, the influence of trust on synergistic innovative capacity is
measured by the following five items:
1. Technical competency of the other lab;
2. Complementarity of the labs' technology;
3. Collaboration experience with the other lab;
4. Willingness of the other lab to keep its promises; and
5. Trustworthiaess of the other labs' R&D staff.
A 5-point scale is used, where 1 = no influence at all and 5 = extremely influentid.
3.3.3.3 Resource Levels
Nunierous conceptual and empirical studies have shown that the level of resources
available within an organization for creative activities is critical for innovations (Bartlett
and Ghoshal, 1989; Nohria and Ghoshai, 1997). Subsidiaries with higher Ievels of
resources tend to register higher performance than their counterparts with lower level
resources. The level of R&D resources available to a lab could be expressed in two ways.
First, whether or not the available resources are above or below the average for similar
labs within the MNC group, and second, the amount of slack resources a lab possesses.
Slack resources refer to the pool of resources within the lab that are in excess of the
minimum necessary to produce a given Ievel of output (Nohria and Ghoshal, 1997). Some
theorists argue that slack resources play a crucial role in allowing organizations to

innovate because they permit organizations to experiment with new innovations that
mîght not orctinarily be approved in a more resource constrained environment (Galbraith,
1973; Nohria and Ghoshal, 1997). Opponents of slack resources argw that slack simply
promotes uadisciplined investment in R&D activities that rarely yield economic benefits
(Antle and Fellingham, 1990). Slack is viewed as organizational inefficiency.
A study by Nohria and Ghoshal (1 997) sought to reconcile these opposing views
regarding slack. The authors argue that too rnuch slack could lead to inefficiency and too
little slack unnecessarily constrains the innovative ability of the organization. They
proposed and tested a curvilinear, inverse U-shaped relationship between innovation and
siack.
Based on the preceding arguments, it can be inferred that slack could have a positive
effect on synergistic innovative capacity because labs with slack rnay be more likely to
enter into collaborative partnerships. Also, through collaboration among labs, the MNC
could harness its worldwide slack resources which codd have a positive effect on the
synergistic innovative capacity of the organization. Labs facing tight resources may not be
willing to enter into collaborations out of concerns that existing projects may suEer.
The resource levels of labs were ascertained by asking respondents to indicate on a 5-
point scale whether or not the resource levels of their labs were above or below the
average within the MNC group. Slack was measured by the extent to which a 10 percent
reduction in the time spent by al1 scientists and engineers and a 10 percent reduction in
the labs' orieratinp; budget wïli affect the labs ability to perform their work.
3.3.3.4 Environmental Complexity
Environmental complexity refers to rapidly changing or very unstable environments in
tems of resource availability, innovations and markets. Lawerence and Lorsch (1967),
Thompson (1967), Mintzberg (1979) and many others have argued that organizational
units operating in complex environments require greater flexibility and &dom to make
decisions in order to be able to respond to changes in a the ly manner. Lack of fieedom
could lead to inflexibility and the inability to respond tirnely, which rnay result in missed
opportunities.
Nohria and Ghoshal (1997) view environmental complexity as a stimulus for greater
collaboration because of the increased vulnerability of the subsidiaries to rapid changes in
the environment. Labs that cooperate with the HQ and other subsidiaries will be better
equipped to manage the complexities. Through interdependence and collaboration
subsidiaries c m share idonnation, personnel and other resources to their mutual benefit
thereby reducing their vulnerability to environmental ïnstability.
Thus, it seems that environmental complexity has a direct relationship to autonomy and
subsidiaries performance. That is, subsidiaries operating in more complex environments
are likely to have greater autonomy in decision-making in order to be able to respond to
rapid changes in the environment. Similarly, by coilaborating with other subsidiaries, a
subsidiary c m reduce its dependence for resources IÎom its immediate environment and
may be able to secure these faster thereby increasing its performance. Also, subsidiaries
operating in more complex environments are likely to be more innovative because they
are 'forced' by environmental pressures to be innovative in order to maintain their
competitive advantage. In less complex environments, the pressure to innovate is not as
great and subsidiaries tend to be less innovative.
In this study, environmental complexity is determined by ascertainhg the rate of changes
in the following three items:
1. Intensity of competition within the industry in tenns of market for products;
2. intensity of competition within the industry in recruiting scientists and engineers; and
3. Rate of product/process innovations within the induse .
The scale for the first 2 items is 1 = not much competition and 5 = extremely intense
competition. The scale for the last item is 1= very low and 5 = very high.
CHAPTER 4
RESEARCH METHODOLOGY
4.1 Data Collection
The study is based on a survey of 231 R&D labs belonging to forty-five Canadian,
Amencan, Japanese and European high technology manufacturing MNCs principally in
the electrical and electronics, pharmaceuticals and chemicals, and automotive industries.
According to the Organization of Economic Cooperation Development (OECD), these
sectors are the most intemationaiized based on indicators such as the level of overseas
R&D expenditure, the number of R&D employees overseas, and the number of foreign
patents filed (OECD, 1998). The companies were selected through convenience
sampling. The sample was drawn fiom Fortune 500 database, European industrial
Research Management Association (EIRMA) database, and the List of Top 100 Canadian
R&D Performers, al1 of which are available on the intemet.
The process began with a list of the names and telephone and fax nurnbers of the
companies most senior R&D executives (Vice Presidents and Directors) in the United
States, obtained fiom the web site of the Industrial Research Institute 0. Information
on non-US labs was obtained from the web sites of the companies and in some cases
through e-mail or telephone requests to individuals within the companies. in sorne cases

the R&D labs were listed as stand aione facilities while in other cases the R&D labs were
part of a larger subsidiary which performed other fiinctions such as production and
marketing.
A nurnber of R&D executives from the United States, United Kingdom and Sweden were
contacted by telephone and e-mail to seek their participation in the study. In the majority
of cases, the questionnaires were sent to the labs by fax to the contact name obtained
uirough the search process described above. if' there was no contact name available, the
questionnaires were simply addressed to the Vice President of MD.
Two versions of the questionnaire were developed and administered: one version for the
executives of the subsidiary labs; and another version for the executives of the HQ lab.
Both versions of the questionnaire were translated fiom English to French, German, and
Japanese. The French and Japanese translations were done by students fiom the
University of Ottawa and Carleton respectively, while the German translation was done
by a reputable professional translation agency in Ottawa. in the case of the French and
Japanese translations, the researcher met in person with the translater to review the
translation. During the meeting, the tramlators explained each question in English by
looking only at their translated version while the researcher double-checked the
translation with the English version. This was not done with the German questionnaire
because of the high cost charged by the agency. Following this, the French, Japanese and

German questionnaires were given to a different set of students who were then asked to
re-translate the questionnaires into English orally. It is believed that this process has
resulted in minimal discrepancies with respect to the meanings of questions and
instructions (i.e. a hi& level of meaning equivaiency was achieved).
The self-administered questionnaire consisted of a combination of rating scale, yesho,
quantitative questions and a couple of open-ended questions. The questionnaire sought
information on a wide range of issues including the following:
types of R&D activities the labs performed i.e. basic, applied, adaptive, etc.;
level of autonomy of the labs to make strategic decisions afZecting their operations;
level of fonnalization of decision-making at the labs;
extent to which the labs goals and management values are congruent with that of the
HQ;
communication patterns among the labs;
resource levels of the iabs;
nature of the environment in which the labs operate;
extent of networking with other labs and hindrances to effective networking;
the impact of networking among the labs on their innovative capacity; and
demographic data such as R&D budget, sales, industry sector, number of R&D
em~lovees. and their ane. education and ex~erience.
The questionnaire was pre-tested on three R&D executives; two Canadians and one
American. These executives were told that in addition to filling out the questionnaire they
should comment on its overall design, the appropriateness of the questions, and whether
other questions should be included. Two respondents replied providing very detailed
comrnents rnost of which were adopted since they were mainly editorial in nature. One
respondent pointed out that in his view the underlying mode1 of the questionnaire, where
research labs are dichotomized into HQ labs and subsidiary labs may be inconsistent with
the current practice of some companies. This suggestion was noted but not adopted since
this would have required fundamental changes to the questionnaire.
In addition to the questionnaire, telephone interviews were conducted with seven very
expzrienced R&D executives, some of whom had worked for several companies. These
qualitative interviews provided in-depth information on the current practices in the
organization and management of internationally dispersed R&D activities. Also, several
respondents provided additional information such as conference papers they had
presented, published research articles, and web site addresses where more information
may be obtained. Although the additional information was quite interesting, some of it
was not directly relevant to the current study. Additional demographic data of the entire
MNC group were obtained from the Fortune 500 and the Top 100 R&D Canadian R&D
Performers databases. This data which relate to worldwide revenues, profits, industrial
sector, HQ location, and so on were used to develop a profile of the sample fïrms
included in the study. Descriptive statistics profiling the participating labs are preseated
in the first section of Chapter 5.
4.2 Data Analysis
Data was collected fiom subsidiary R&D labs for several reasons. First, subsidiary labs
managers are more likely to have a better understanding of their roles in joint innovation
projects and the impacts of such participation on their labs than someone h m the HQ.
Also, since synergistic innovative capacity involves the creation of new knowledge at the
level of individual R&D labs, it would be appropriate to have respondents h m the labs
identi@ the new learning resulting fiom working interdependently with other labs.
Second, given the nature of information sought fiorn respondents it is believed that
subsidiary labs are likely to provide more complete and reliable information. It is highly
uniikely to fmd a respondent within the HQ that will be able to provide adequate
information on al1 of the worldwide R&D labs of the corporation. Although the HQ
managers may be able to provide information on the effects of the labs working
collaborativeiy at the overall corporate level, they would be unable to describe the nature
of the informal linkages that the subsidiary labs have with each other.
Two principal multivariate analysis techniques, Ordinary Least Squares Regression (OLS)
76
and Partial Least Squares (PLS), are employed to estimate and test specific regression and
PLS models. The resuits of these analyses are presented in Chapters 6 and 7. Prior to
analyzing the data using regression anaiysis and PLS, a number of other preliminary
statistical analyses were conducted in order to get an understanding of the nature of the
data collected. Some of the statistics computed include means, correlations, Cronbach's
alpha for multi-item conshucts, t-test of ciifference of means and various cross
tabdations. These statistics dong with a brief discussion are presented in Chapter 5.
Findings based on qualitative information obtained are presented in Chapters 8 and 9.
CHAPTER 5
DESCRIPTIVE STATISTICS
5.1 Introduction
This chapter presents a set of descriptive statistics in order to give some understanding of the
structure of the data gathered and the types of labs participating in the study. The chapter
begins with a description of the profüe of sample labs that participated in the study. This is
followed by an examination of the reliability of the multi-item sale measures, and the
correlations among the key variables of this study.
5.2 Profile of Sample Companies and R&D Labs
Table 5.1 shows that a total of 23 1 labs were contacted to seek their participation in the
study. Seventy-nine of the 231 labs responded to our request, yielding a response rate of
approximately 35 percent. Of the 23 1 labs that were sent questionnaires, 104 are situated in
North Arnenca, 90 in Europe, 22 in Japan, and 15 in other couutries such as Australia, New
Zealand, india and Singapore.
Although several Japanese labs situated within North America and Europe participated in the
study, none of the 22 labs within Japan that were sent questionnaires responded, despite
reminder notices sent to each lab. Although the precise reason for this situation is not clear, it
is believed that the targeted R&D personnel (Managing Directors) at the labs may have never
received the questionnaire. This belief is based on the fact that in no instance was the
researcher aliowed to talk directly to the Managing Directors and was told that requests such
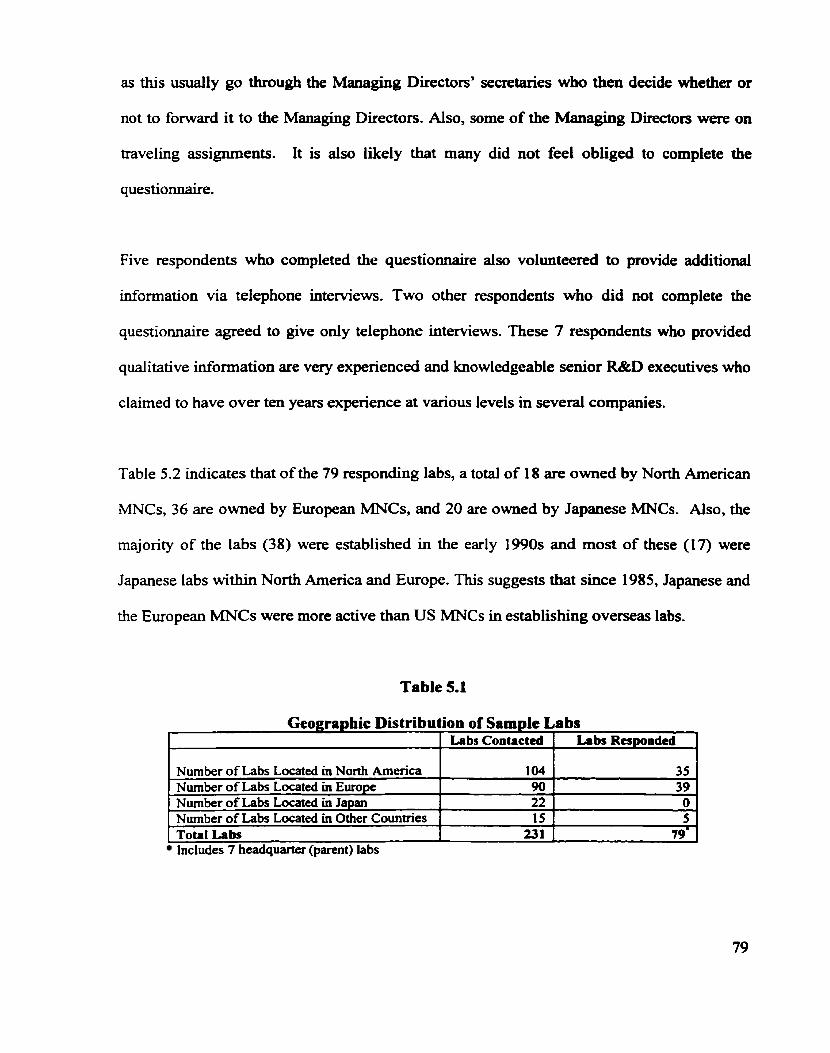
as this usually go through the Managing Directors' secretaries who then decide whether or
not to forward it to the Managing Directors. Also, some of the Managing Directors were on
traveling assignments. It is also likeiy that many did not feel obliged to complete the
questionnaire.
Five respondents who completed the questionnaire also volunteered to provide additional
information via telephone interviews. Two other respondents who did not cornpiete the
questionnaire agreed to give ody telephone interviews. These 7 respondents who provideci
qualitative idormation are very experienced and knowledgeable senior R&D executives who
claimed to have over ten years experience at various levels in several companies.
Table 5.2 indicates that of the 79 responding labs, a total of 18 are owned by North American
MNCs, 36 are owned by European MNCs, and 20 are owned by Japanese MNCs. Also, the
majority of the labs (38) were established in the early 1990s and most of these (17) were
Japanese labs withùi North America and Europe. This suggests that since 1985, Japanese and
the European MNCs were more active than US MNCs in establishing overseas Iabs.
Table 5.1
Geographic Distribution of Sample Labs Labs Contactcd
Number of Labs Located in North America Number of Labs Located in Europe Number of Labs Located in Japan Number of Labs Located in Other Countries Totml Labs
Labs Responded
Includes 7 headquarter (parent) labs
104 90 22 15
231
3 5 39
O 5
79.
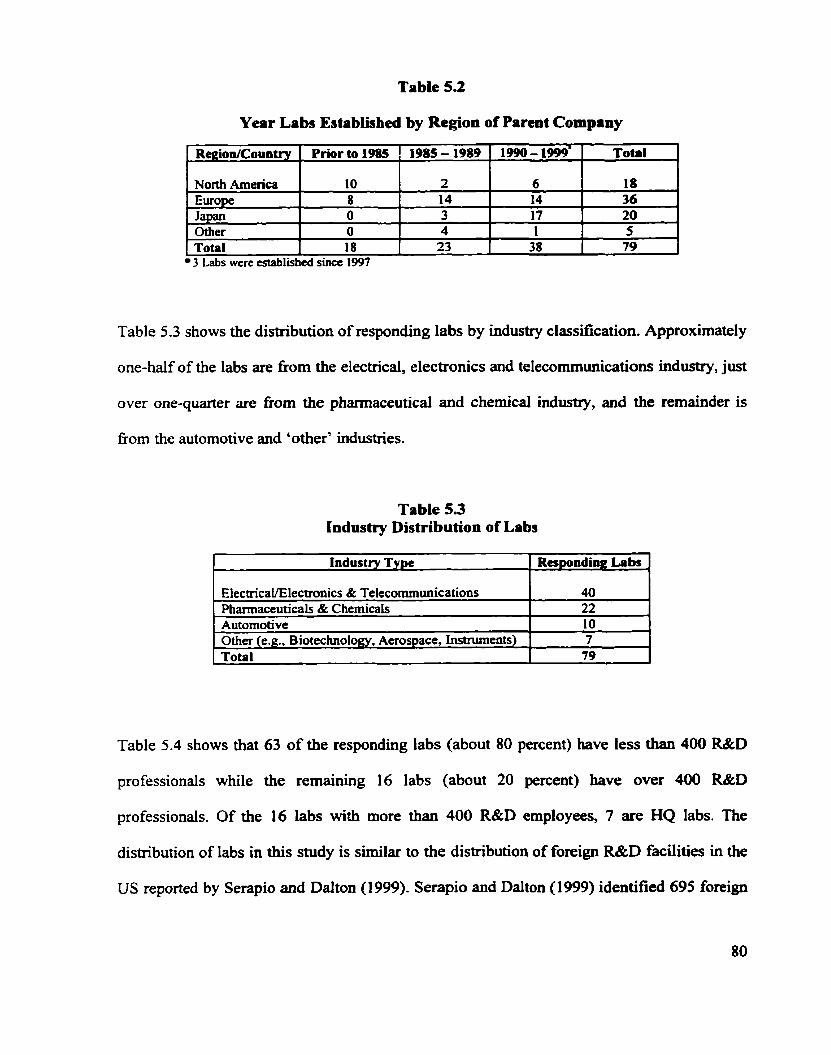
Table 5.2
Year Labs Established by Region of Parcnt Company
North America 1 O 2 6 18 Europe 8 14 14 36
O 3 17 20 Other 7 4 1 5 Total 18 23 3 8 79 3 Labs wcre established since 1997
Table 5.3 shows the distribution of responding iabs by industry classification. Approximately
one-half of the labs are fiom the electrical, electronics and telecommunications industry, just
over one-quarter are fiom the phannaceutical and chemical industry, and the remainder is
fiom the automotive and 'other' industries.
Table 5.3 Industry Distribution of Labs
I Industry Type 1 Responding! Labs I
ElectricaüElectronics & Telecommunications Pharmaceuticals & Chemicals
Table 5.4 shows that 63 of the responding labs (about 80 percent) have less than 400 R&D
professionals while the remaining 16 labs (about 20 percent) have over 400 R&D
professionals. Of the 16 labs with more than 400 R&D employees, 7 are HQ labs. The
distribution of labs in this study is similar to the distribution of foreign R&D facilities in the
US reported by Serapio and Dalton (1 999). Serapio and Dalton (1 999) identified 695 foreign
40 22
Automotive Other (e.g, Biotechnology, Aerospace, Instruments)
1 O 7
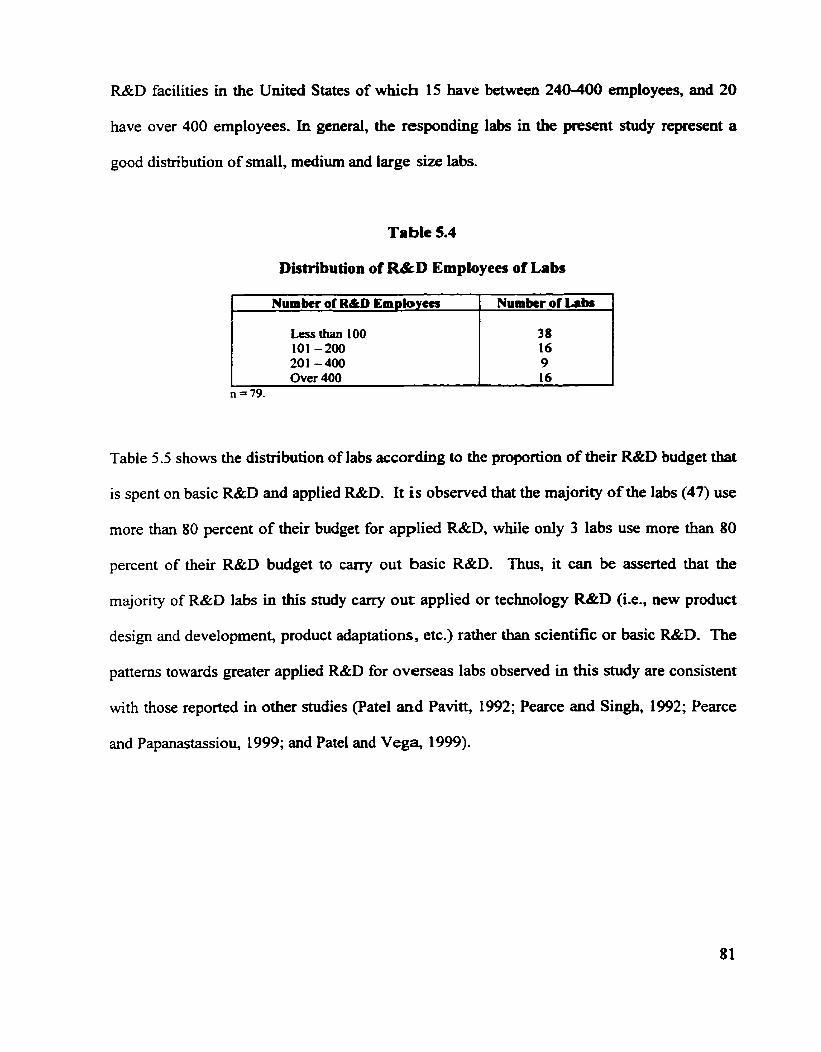
R&D facilities in the United States of which 15 have between 240-400 employees, and 20
have over 400 employees. In general, the responding labs Ui the present study represent a
good distribution of small, medium and large size labs.
Table 5.4
Distribution of R&D Employees o f Labs
Numbtr of R&D Employccs
Table 5.5 shows the distribution of labs according to the proportion of their R&D budget that
is spent on basic R&D and applied R&D. It is observed that the majority of the labs (47) use
more than 80 percent of their budget for applied R&D, while only 3 labs use more than 80
percent of their R&D budget to cany out basic R&D. Thus, it can be asserted that the
majority of R&D labs in this study cary out applied or technology R&D (Le., new product
design and development, product adaptations, etc.) rather tbao scientific or basic R&D. The
patterns towards greater applied R&D for overseas labs observed in this study are consistent
with those reported in other studies (Patel and Pavitt, 1992; Pearce and Singh, 1992; Pearce
and Papanastassiou, 1999; and Patel and Vega, 1999).
Numkr of h b s
Less than 100 101 -200 201 -400 Over 400
38 16 9 16
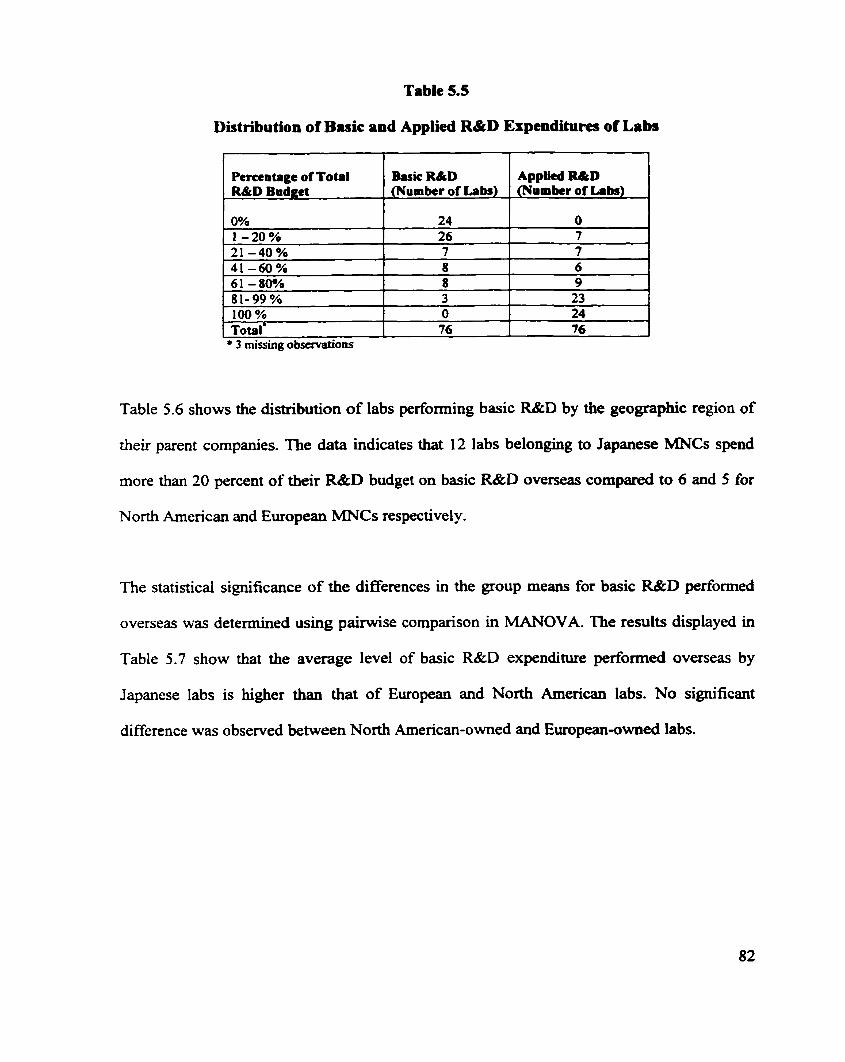
Table 5.5
Distribution of Basic and Applied R&D Expendituics of Labs
Table 5.6 shows the distribution of labs perfonning basic R&D by the geographic region of
their parent companies. The data indicates that 12 labs belonging to Japanese MNCs spend
more than 20 percent of their R&D budget on basic R&D overseas compared to 6 and 5 for
North Arnerican and European MNCs respectively.
Perceotage of Total R&D Budget
The statistical significance of the differences in the group means for basic R&D perfonned
overseas was determined using pairwise cornparison in MANOVA. The results displayed in
Table 5.7 show that the average level of basic R&D expendinire performed overseas by
Japanese labs is higher than that of European and North American labs. No significant
difference was observed betsveen North American-owned and European-owned labs.
Basic R&D (Numkr of Labs)
Applied M D (Numkr of Labs)

Table 5.6
Basic R&D Expenditures Overseru by Region of Parent Company
Table 5.7 Pairwise Croup Cornparison of Basic Overseos R&D Expendituns
Percenîage of R&D Budget Spent on Basic R&D
Less than 20 21 -40 41 -60 61 -80 81 - 100 Total
1 (33 l)b 1 (.O0 ilb 1 a = t-statistic; b = levtl of significance; degrces of ûadom = 1,68
3 misçing observations
Number of M D i a b s of
Raion Europe
in order to determine the extent to which the findings of this study may be generalized
beyond the responding MNCs, a one-way ANOVA test between responding and non-
responding companies was conducted on four key characteristics which are fiequently used
in analyzing bigh-tech companies. Two of the four characteristics are coprate level
measures (worldwide revenues and the number of employees worldwide) while the other two
North American MNCs
1 1 2 O 3 1 17
Nortb America 3 -479. (-060)~
Otùcr Countries
2 O 2 O 1 5
Europe
Total
50 7 8 8 3 76'
Europcrin MNCs
30 1 2 2 O 35
J8p8~eSC M N C s
7 4 4 3 1 19
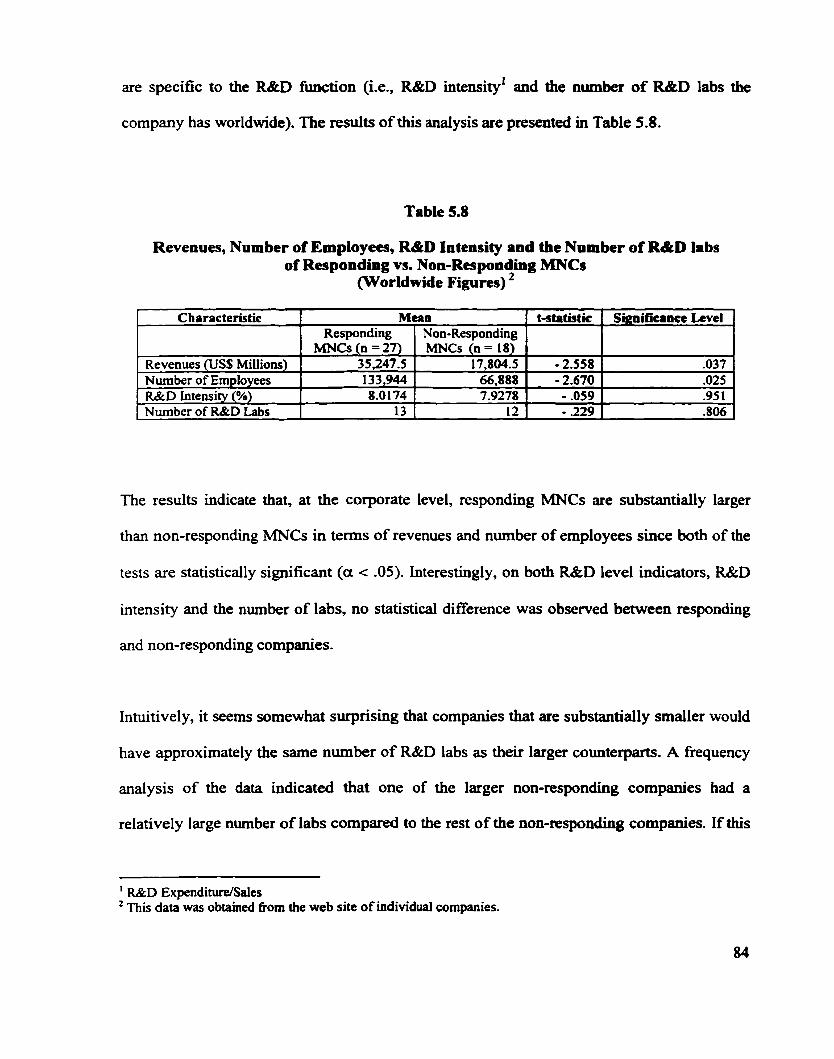
are specific to the R&D fùnction (Le., R&D intensityl and the number of R&D labs the
Company has worldwide). The results of this andysis are presented in Table 5.8.
Table 5.8
Revenues, Number of Employees, R&D Intensity and the Number of R&D Iabs of Responding vs. Non-Responding MNCs
(Worldwide Figures)
The results indicate that, at the corporate level, responding MNCs are substantially larger
than non-responding MNCs in terms of revenues and number of employees since both of the
tests are statistically significant (a < -05). interestingly, on both R&D level indicators, R&D
intensity and the number of labs, no statistical difference was observed between responding
and non-responding companies.
Intuitively, it seems somewhat surprising that companies that are substantiaily smaller would
have approximately the same number of R&D labs as their larger counterparts. A fiequency
analysis of the data indicated that one of the larger non-responding companies had a
relatively large number of labs compared to the rest of the non-responding companies. If this
r Characteristic 1 Mean
' R&D ExpenditurelSales This data was obtained fiom the web site of individual companies.
t-dathtic
- 2.558 - 2.670 - .O59
Revenues (US$ Millions) Number of Employees R&D Intensity (%)
Significanec Ltvel
.O37
.O25 -95 1 -806 Nurnber of R&D Labs
Responding MNCs (n = 27)
35,247.5 133,944 8.0 1 74
Non-Responding MNCs (n = 18)
17,804.5 66,888 7.9278
13 12 1 - 229
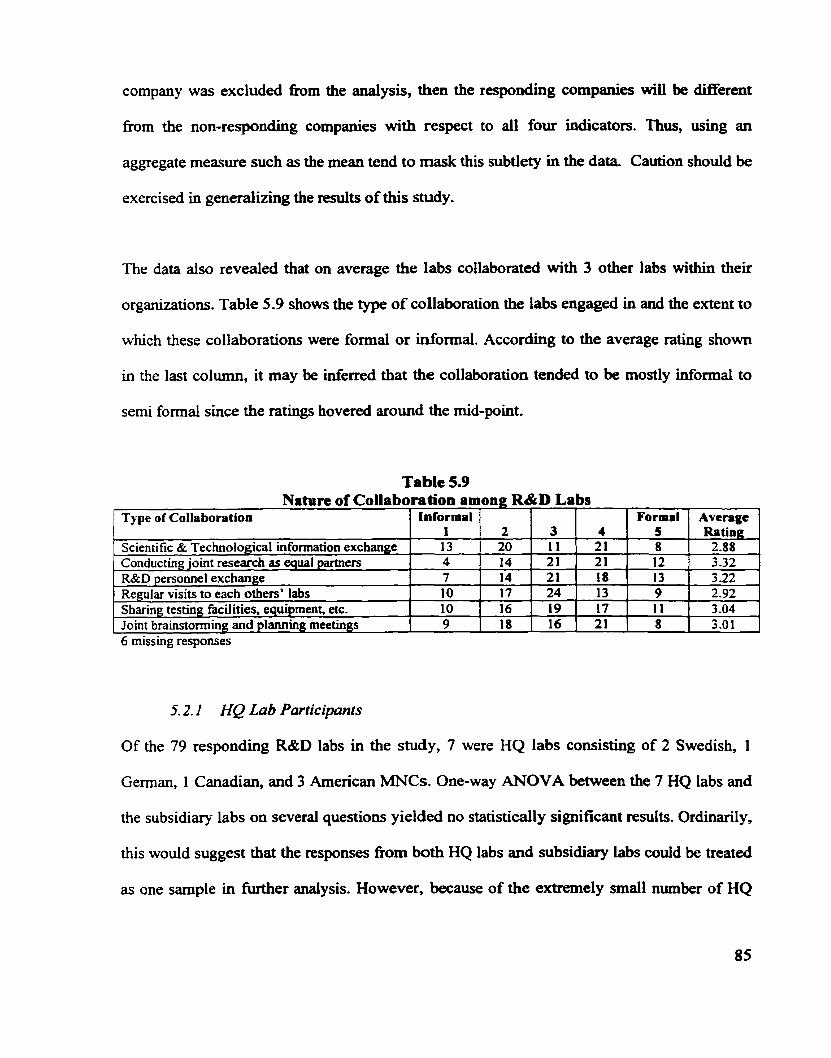
Company was excluded nom the anaiysis, then the responding companies wiil be different
fkom the non-responding companies with respect to ail four inâicators. Thus, using an
aggregate measure such as the mean tend to mask this subtlety in the data. Caution should be
exercised in generalizing the results of this study.
The data also revealed that on average the labs collaborated with 3 other labs within their
organizations. Table 5.9 shows the type of collaboration the labs engaged in and the extent to
which these collaborations were formal or informal. According to the average rating shown
in the last column, it may be inferred that the collaboration tended to be mostly informai to
semi formal since the ratings hovered around the rnid-point.
-- -
d missing responses
Table 5.9 Nature of Collaboration amonp: R&D Labs
5.2.1 HQ Lab Participants
Of the 79 responding R&D labs in the study, 7 were HQ labs consistuig of 2 Swedish, 1
German, 1 Canadian, and 3 Amencan MNCs. One-way ANOVA between the 7 HQ labs and
the subsidiary labs on several questions yieided no statistically significant results. Ordinarily,
this would suggest that the responses fiom both HQ labs and subsiâiary labs couid be treated
as one sarnple in M e r anaiysis. However, because of the extremely small number of HQ
3 11 21 2 1 24 19 16
Type of Collaboration
Scientific & Technological information exchange Conducting joint research as equal partners R&D personnel exchange Regular visits to each others' labs Sharing testing facilities, equipment, etc. Joint brainstorming and planning meetings
4 2 1 21 18 13 17 2 1
In formal 1 13 4 7 1 O 10 9
Formd 5 8 12 13 9 11 8
2 20 14 14 17 16 18
Average Rating
2.88 3 -32 3 -22 2.92 3 .O4 3 .O 1
labs, the m e r of the test to detect differences, particularly srnall differences, is very weak.
Another approach used to examine whether HQ labs responses are statistically different fiom
that of subsidiary labs involve perfonning certain analysis (e.g., regression and factor
analysis) with and without HQ responses. Small differences were observeci in a few cases
mainly with respect to the magnitude of the estimates. However, these were not statistically
different. It was not possible to report conclusively whether the observed changes were due
to respondent differences or because of a m e r reduction in the sample when the HQ
responses were removed.
Given the above circumstances and the already small sample size of this study, a choice had
to be made between omitting HQ responses and giving up the information provided or
include the information and nui the risk of having some amount of bias, if the responses are
in fact different. The decision was made to include the HQ responses in al1 further analysis3.
5.3 Reliabiiity of Measurement Scales
Several of the constructs used in this study consist of multiple items measured on a 5-point
scale. To determine the extent to which the items used in constructing the scale are internally
consistent, Cronbach's alpha, the most comrnonly used test of scale reliability, was computed
for each of the construct. Usually, a Cronbach alpha of .70 or greater is used as the
benchmark for acceptable levels of reliability (Nunnally, 1978).
Since the questionnaire sent to HQ lab respondents is somewhat different h m that sent to subsidiary lab's respondents, HQ responses were trcatcd as misshg in cases where the variables do not overlap. For example, the autonomy variable was rneasurcd diffcrcntly and in regression analysis, HQ mponses were trcated as missing values.
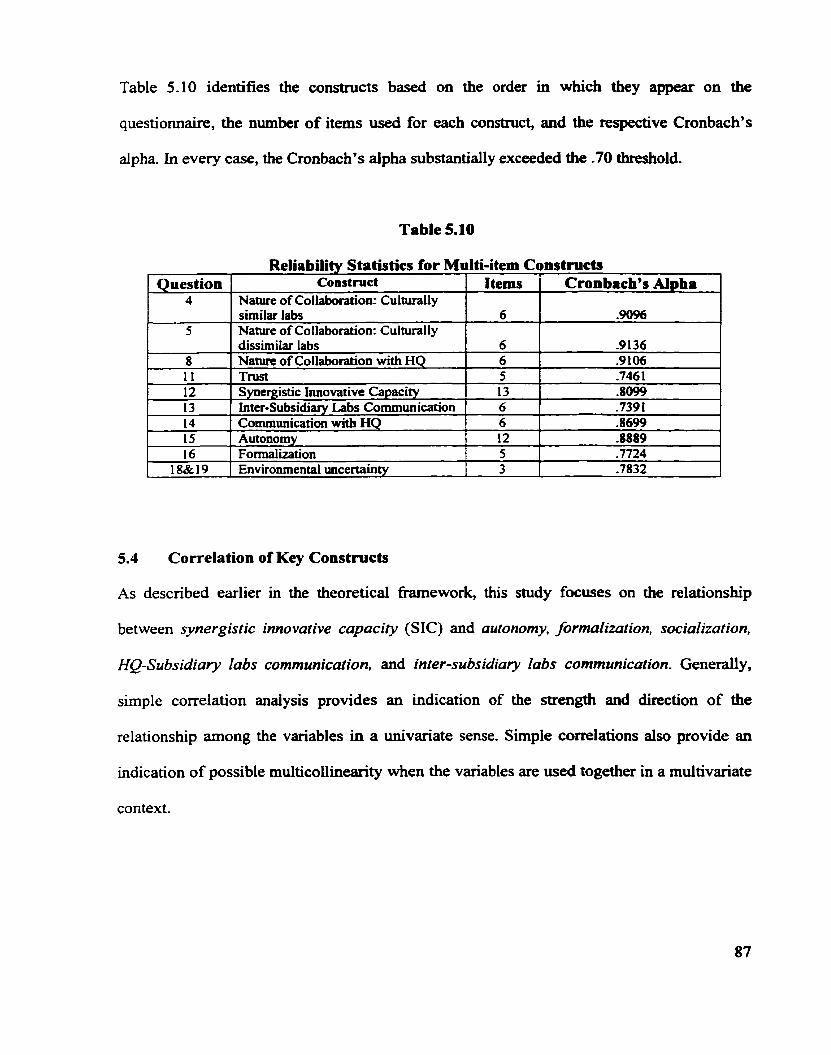
Table 5.10 identifies the constructs based on the order in which they appear on the
questionnaire, the number o f items used for each construct, and the respective Cronbach's
alpha In every case, the Cronbach's alpha substantially exceeded the .70 thrrshold.
Table 5.10
Reiiability Statistics for Multi-item Constructs
5.4 Correlation of Key Constructs
As described earlier in the theoretical h e w o r k , this study focuses on the relationship
between synergistic innovative capacity (SIC) and autonomy, formaiization, socialization,
HQ-Subsidiary Iabs communication. and inter-subsidiary labs communication. Generally,
simple correlation analysis provides an indication of the strength and direction of the
relationship among the variables in a univariate sense. Simple correlations also provide an
indication of possible multicollinearity when the variables are used together in a multivariate
context.
8 I I 12 13 14 15 16
1 8& 19
Question 4
5
Construct Nature of Collaboration: Culturally similar labs Nature of Collaboration: Culturally
1
dissirnitar labs Nature o f Collaboration with HQ T w t Synergistic Innovative Capacity inter-Subsidiary Labs Communication Communication with HQ Autonorny Formalhtion Environmental uncertaintv
Items
6
Cronbach9s Alpha
.9096
6 6 5 13 6 6 12 5 3
-9 136 -9106 -746 1 -8099 -739 1 3699 -8889 .7724 -7832
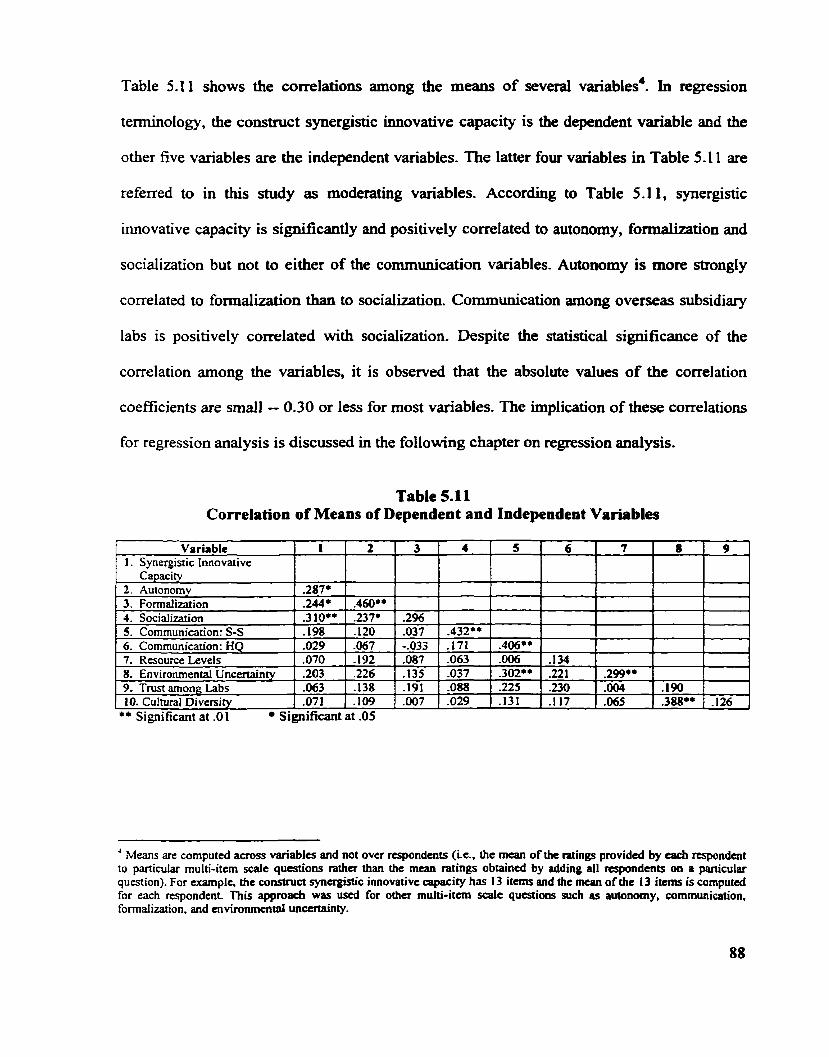
Table 5.1 1 shows the correlations among the means of several variables4. In regression
terminology, the construct synergistic innovative capacity is the dependent variable and the
other five variables are the independent variables. The latter four variables in Table 5.1 1 are
referred to in this study as moderating variables. According to Table 5.1 1, synergistic
innovative capacity is significantly and positively correlated to autonomy, formaikation and
sociaiization but not to either of the communication variables. Autonomy is more strongly
correlated to formalization than to sociaiization. Communication among overseas subsidiary
labs is positively correlated with socialization. Despite the statistical significance of the
correlation arnong the variables, it is observed that the absolute values of the correlation
coefficients are small - 0.30 or less for most variables. The implication of these correlations
for regression analysis is discussed in the following chapter on regression anaiysis.
Table 5.11 Correlation of Means of Dependent and Independent Variables
** Significant at .O 1 Significant at .O5
' Means are cornputcd across variables and not over rcspondents (Le., the rncan of the ratings providcd by cach rrspondent to particular multi-item scalc questions rathn than the mean ratings obtained by adding al1 rcspondents on a particular question). For example, the constnict syncrgistic innovative capacity has 13 items and the mean of the 13 items is cornputcd for each tespondent This approach was used for 0 t h multi-item scale questions such as autonomy, communication, formalization, and environmcntal uncenainty.
CHAPTER 6
REGRESSION and FACTOR ANALYSIS
6.1 Ovewiew of Data Anabsis Strategy
This sub-section provides an overview of the data aoalysis strategy employed in this study.
Bas ically, the data was analyzed usuig three multivariate statisticai techniques, namel y,
regression analysis, factor analysis and panial least squares (PLS) anaiysis.
Initially, separate regression analyses were run between the dependent variable, synergistic
innovative capacity, and the independent variables, autonomy, formaZization, socialization,
HQ-subsidiary labs communication, and inter-subsidiary Iabs communication. In these
regressions, al1 the multi-item variables were treated as unidimensional constructs in the
sense that the simple arithmetic means across the variables of the constnicts were used as the
measures of the constructs. For example, the construct aufonomy consists of 12 items or
variables and for each respondent the mean response over the 12 items was computed and
this was used as the measure of autonomy. This same procedure was applied to other multi-
item scaled variables including the dependent variable.
In the second step of the analysis, the dimensionality of multi-item constnicts was explored
using factor analysis. This analysis was undertaken because the multi-item constructs were
employed in this study for the f ia t time although some individual items may have k e n used
in other situations. Once the dimensionality of the constructs was determined, the regression
analysis was re-nui with the new dimensions as additional variables in the model.
Following the regression and factor analyses, the data was analyzed using PLS analysis. PLS
is an alternative analytical fiamework for analyzing the relationship between multiple
dependent and independent constructs.
The PLS analysis was conducted in two steps. The f k t set of PLS analysis basically mimic
the h t set of regressions where the d t i - i t e m constructs were treated as unidimensional
constnicts. The second step of the PLS analysis involve runs with the multi-dimensionality of
the constnicts accounted for. The resulting PLS analysis yielded two competing models
which are discussed in chapter 7.
Due to the different statistical properties, assumptions and algorithms between regression and
PLS the results cannot be strictïy compared. They provide a somewhat different but in some
ways a complementary view of the relationship between the independent and dependent
variables or constmcts.
This chapter presents the results obtained fkom the various regression and factor analysis
carried out. The following chapter presents the results of the PLS analysis. Chapters 8 and 9
present the results of the qualitative information obtained. Chapter 10 discusses the
implications of the results fiom both the quantitative and qualitative analyses.
6.2 Regression halysis
Multivariate regression analysis was employed to investigate the relationship between the
dependent variable, synergistic innovutive capacity, and five independent variables
(autonomy, socializution. formallization, HQ-Subsidiary communication, and inter-subsidiary
communication) and four moderating variables (resource levels, environmental uncertainiy,
h ~ s f and cultural diversity). Essentially, the focus is on the extent to which the combined
effects of the independent variables provide adequate explanation of variations in the
dependent variable.
Regression analysis was performed into two stages: At stage one, various regressions were
executed with only the 5 independent variables (main model regressions). At stage two, a
series of regressions were executed with the moderating variables included as interaction
terms in the models. One limitation is that the number of interaction tenns which can be
included in any single regression model is limited because the sample size is small.
Consequently, the interaction terms entered the models sequentially.
6.2.1 Main Mode1 Regression
Table 6.1 presents the resdts of the main mode1 regression involving only the independent
variables as describeci in the theoretical h e w o r k in Chapter 3. Prelimuiary regression runs
indicate that greater explanation is obtained when the two communication variables are
grouped according to the communication media involved. Also, the variable formulization
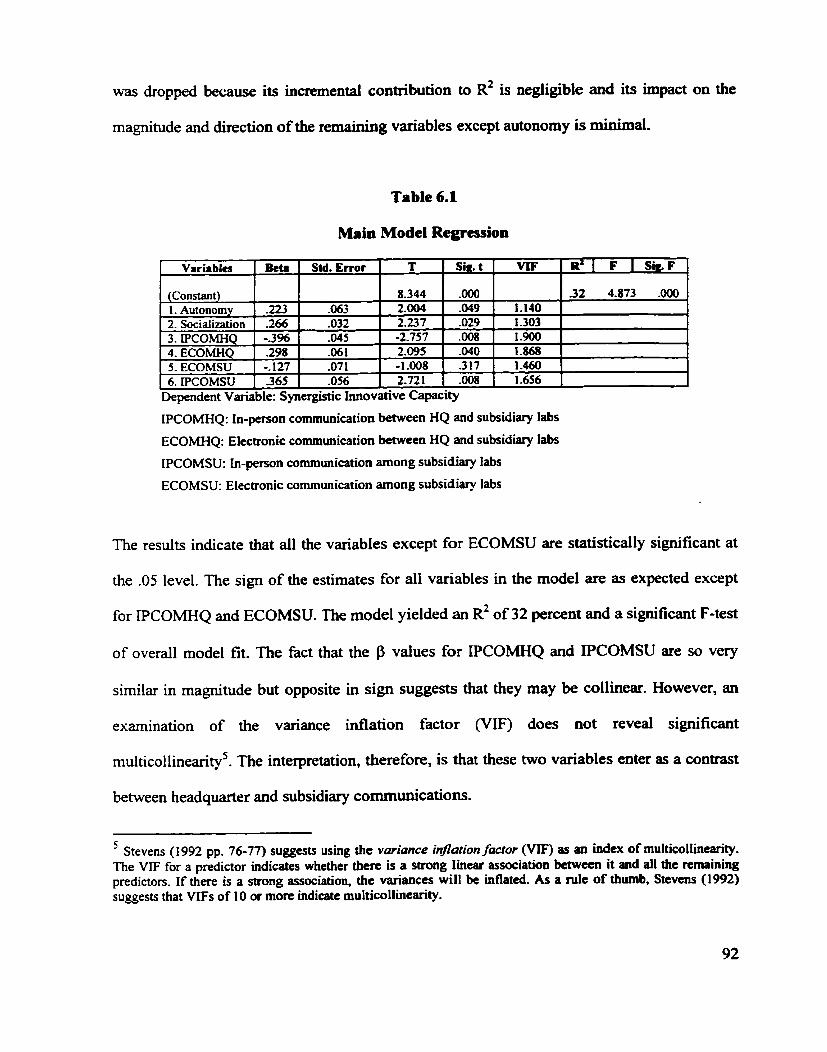
was dropped because its incremental contribution to R' is negligible and its impact on the
magnitude and direction of the remaining variables except autonomy is minimal.
Table 6.1
Main Model Regression
Variablu 1 Beta 1 Std. Error 1 T 1 sia.t 1 MF I R ' [ F 1 Sk.F I I I I I r
IPCOMHQ: In-person communication between HQ and subsidiary labs
ECOMZIQ: Electronic communication between HQ and subsidiary labs
IPCOMSU: In-person communication among subsidiary Iabs
ECOMSU: Electronic communication among subsidiary labs
The results indicate that al1 the variables except for ECOMSU are statistically significant at
the .O5 level. The sign of the estimates for al1 variables in the model are as expected except
for IPCOMHQ and ECOMSU. The model yielded an R~ of 32 percent and a significant F-test
of overall model fit. The fact that the f3 values for IPCOMHQ and IPCOMSU are so very
similar in magnitude but opposite in sign suggests that they may be collinear. However, an
examination of the variance inflation factor (VIF) does not reveal significant
multicollinearity5. The interpretation, therefore, is that these two variables enter as a contrast
between headquarter and subsidiary communications.
Stevens (1992 pp. 76-77) suggests ushg the variance injlorion/actor as an index of rnultiwllineariiy. The VIF for a predictor indicates whether there is a strong Iinear association betwten it and a11 the rcmaining predictors. If there is a strong association, the variances will be inflated. As a rule of thumb, Stevens (1992) suggests that VIFS of 10 or more indicate rnulticollinearity.
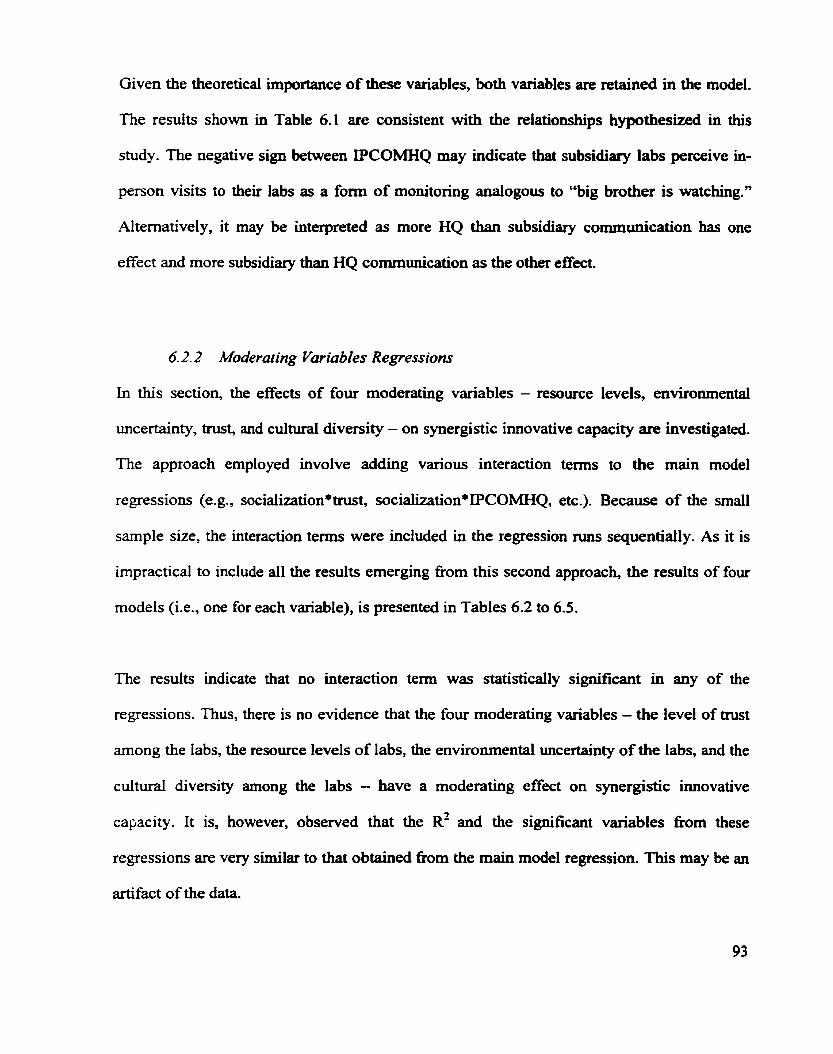
Given the theoretical importance of these variables, both variables are retained in the model.
The results shown in Table 6.1 are consistent with the relationships hypothesized in this
study. The negative sign between IPCOMHQ rnay indicate that subsidiary labs perceive in-
person visits to theu labs as a form of monitoring analogous to "big brother is watching."
Alternatively, it may be interpreted as more HQ than subsidiary communication has one
effect and more subsidiq t h HQ communication as the other effect.
6.2.2 Moderating Variables Regressions
In this section, the effects of four moderating variables - resource levels, environmental
uncertainty, trust, and cultural diversity - on synergistic innovative capacity are investigated.
The approach employed involve adding various interaction terms to the main model
regressions (e.g., socialization*tnist, socialization*IPCOMHQ, etc.). Because of the small
sample size, the interaction terms were included in the regression nuis sequentiaily. As it is
impractical to inciude al1 the results emerging from this second approach, the results of four
models (Le., one for each variable), is presented in Tables 6.2 to 6.5.
The results indicate that no interaction tenn was statistically signifiant in any of the
regressions. Thus, there is no evidence that the four moderating variables - the level of trust
among the labs, the resource levels of labs, the environmental uncednty of the labs, and the
cultural diversity among the labs - have a moderating effect on synergistic innovative
capacity. It is, however, observed that the R~ and the significant variables fiom these
regressions are very similar to that obtained fiom the main model regression. This may be an
artifact of the data.
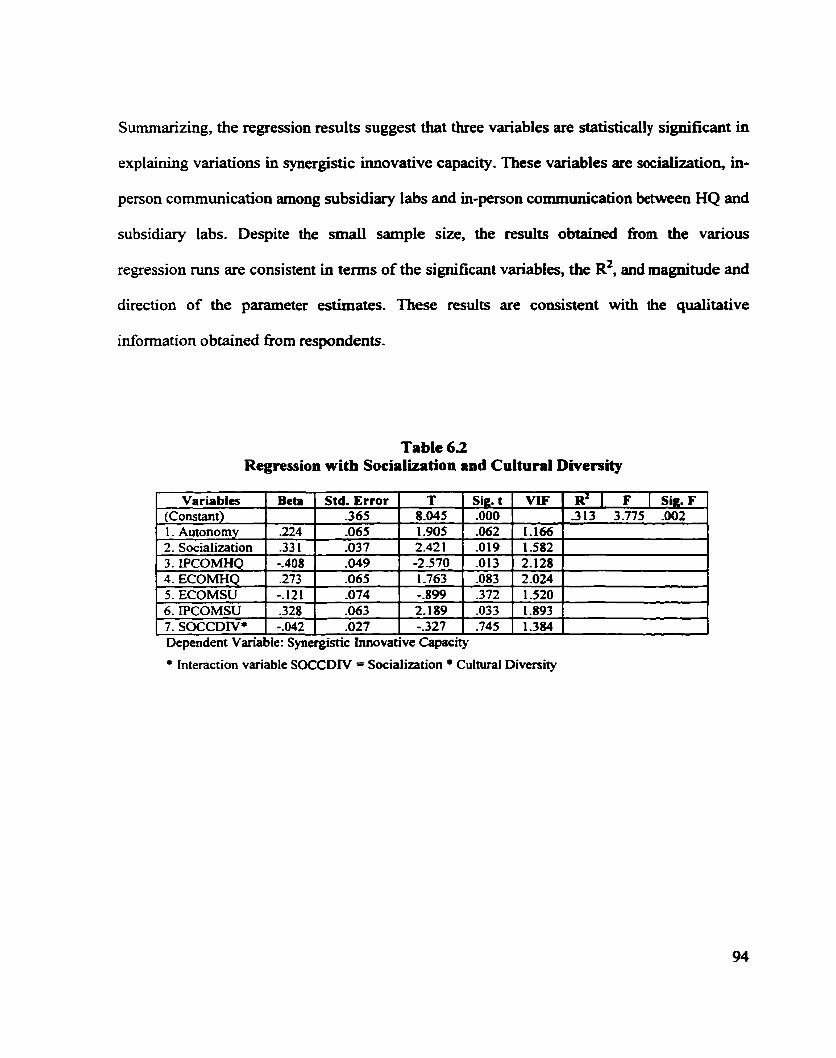
Summarizing, the regression results suggest that three variables are statistically simiificant in
explaining variations in synergistic innovative capacity. These variables are socialization, in-
person communication among subsidiary labs and in-person communication between HQ and
subsidiary labs. Despite the smaii sample size, the results obtained fiom the various
regression runs are consistent in terms of the significant variables, the R~, and magnitude and
direction of the parameter estimates. These results are consistent with the qualitative
information O btained fiom respondents.
Table 6.2 Regression with Socialization and Cultural Diversity
~ependent Variable: ~yÜer&tic Innovative Capacity
Variables (Constant) 1 . Autonomy 2. Socialization 3. PCOMHQ 4. ECOMHQ 5. ECOMSU 6. IPCOMSU 7. SOCCDlV*
Interaction variable SOCCDiV = Socialization Cultural Diversity
T 8.045 1.905 2.421 5.570
Beta
-224 .33 1 -.408
R' 1 F 1 Sig.F -3 13 3.775 .O02
Sig.t .O00 .O62 .O19 .O13 .O83 -372 -033 -745
Std. Error -365 -065 .O3 7 .O49
VIF
. 1.166 1.582 2.128 2.024 1.520 1.893 1.384
-273 -.121 .328 -.O42
.O65
.O74
.O63
.O27
1.763 9.899 2,189 -.327
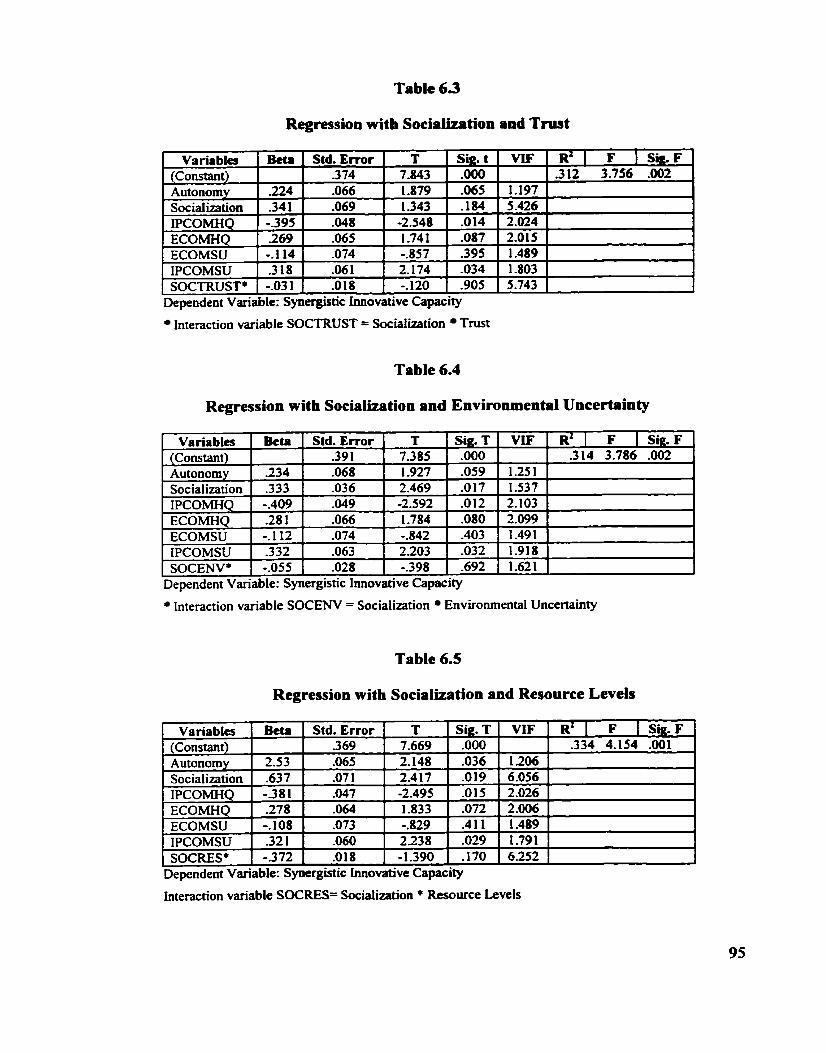
Table 6.3
Regression with Sociaiization and Trust
Table 6.4
Regression with Socialization and Environmental Uncertainty
interaction variable SOCENV = Socialization Environmental Uncertainty
Dependent Variable: Synergistic hovat ive Capacity
Interaction variable SOCTRUST = Socialization Trust
Sig. t .O00 -065 .184 -014 -087 -395 -034 -905
VIF
1.197 5.426 2.024 2.015 1.489 1.803 5.743
Table 6.5
Regression with Socialization and Resource Levels
R' 1 F 1 Sig. F .3 12 3.756 -002
J
1
1
,
Variables (Constant) Autonomy Socialization IPCOMHQ ECOMHQ ECOMSU IPCOMSU SOCTRUST*
.. Std. Error -3 74 -066 -069 .O48 .O65 .O74 .O6 1 .O 18
Bcta
224 -341 -.395 269 0.1 14 .3 18 903 1
Dependent Variable: Synergistic Innovative Capacity
Sig. T .O00 .O59 .O17 .O12 .O80 -403 .O32 .692
W
1.25 1 1.537 2.103
T 7.843 1.879 1.343 -2.548 1.741 -A57 2.174 -.120
R' 1 F 1 Sig. F , .314 3.786 .O02
Variables (Constant) Autonomy Socialization IPCOMHQ ECOMHQ ECOMSU IPCOMSU SOCENV*
2.099 1 1.491 1.918 1.621
Std. Error -39 1 .O68 .O36 -049 .O66 .O74 .O63 .O28
Beta
-234 -333 -.409 -28 1 -.I 12 -332 -.O55
T 7.385 1.927 2.469 -2.592 1.784 -A42 2.203 -.398

6.3 Factor Analysis
In the preceding regression analysis, al1 the scale variables used were treated as
unidimensional constructs in the sense that the simple arithmetic mean of al1 the items for the
respective constnicts were used as the appropnate measures for the constniccts. Since these
scales in their exact format have not been used in previous studies, there are no test results
regarding their reliability or dimensionality. Therefore, it was decided that the scales be
tested for their dimensiodty using factor analysis with varimax rotation- The results are
displayed in Tables 6.6 to 6.9.
6.3.1 Synergistic Innovative Capacity: The Dependent Variable
Factor analysis on the dependent variable synergistic innovative capacity yielded four
components based on items with eigenvalues greater than 1. The "scree test" (Stevens, 1992)
would suggest removing components three and four fiom the analysis, particularly since the
dataset is srnaIl. However, the four components are retained because of the consistency of
these results with that obtained later with PLS. Also, the four components and the items
comprising them are consistent with theoretical constnicts in the management of technology
area of research. The loadùlgs of the items comprising each component are identified in bold
in Tables 6.6 to 6.9. Together, these four components explain 68 percent of the variance in
the constnict.
ïhe first component is named Knowledge Creation and Management because the four items
comprising this component deal with issues involved in knowledge creation, transfer and
management within organizations (Inkpen, 1997; Nonaka, 1990; De Meyer, 1992; Pearce,
1 999).
The second component is named Munagerial anci Operariod Eflciency because the items
comprishg this component deds with issues relating to efficiency in the utilization of
managerial and operationai resources.
The third component indicates the increasing participation of subsidiary labs in a larger
nurnber of complex and sophisticated R&D projects as opposed to their traditional roles of
simply adapting HQ generated products to local market conditions. In the international R&D
literature this new role is often described as strategic R&D (Howells, 1990; Chisea, 1996;
Medcof, 1998; Brockhoff and Schmaul, 1996). Consequently, this dimension is named,
Strategic R &D.
The fourth component describes the capability of subsidiary R&D labs to develop
innovations faster at lower costs. Together, these two seemingly contradictory dimensions of
new innovations reflect the competencies of the labs in generating new and successfid
innovations proficiently. Thus, this component is named lnnovafive Proficiency.
Aithough the four components reported in this study are consistent with existing theories in
the area of management of technology, m e r testing of the consenicts using the same scale
items are needed to validate the statistical properties of the constnicts. Until such replication
studies become available, it can be inferred from this study that the concept of synergistic
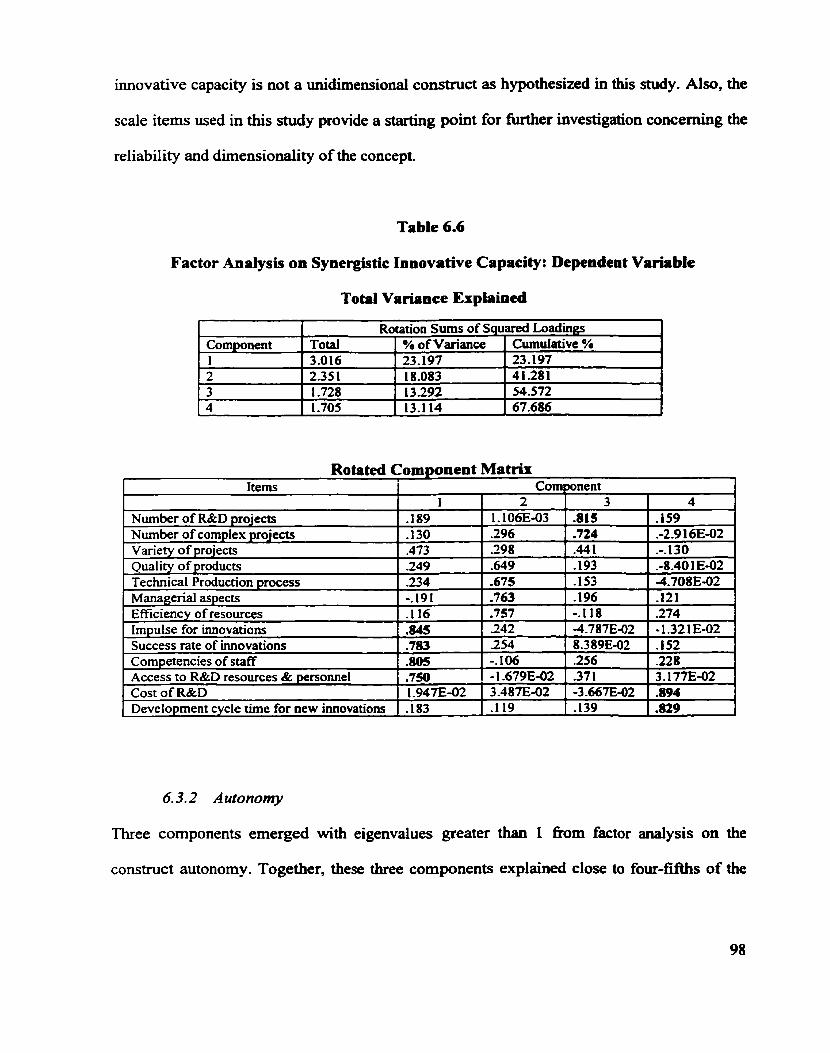
innovative capacity is not a unidimensional constnict as hypothesized in this study. Also, the
scale items used in this study provide a starting point for further investigation concerning the
reliability and dirnensionaiity of the concept.
Table 6.6
Factor Analysis on Synergistic Innovative Capacity: Dependent Variable
Total Variance Expiained
Rotated Component Matrix Items 1 Component
1 I 2 I 3 1 4
, Component 1 2 3 4
6.3.2 Autonomy
Three components emerged with eigenvalues greater than 1 h m factor analysis on the
constnict autonomy. Together, these three components explained close to four-fifths of the
r Rotation Sums of Squared Loadings
t
Number of R&D projects 1 -189 Number of complex projects 1 -130
Cumulative % _ 23.197 4 1.281 54.572 67.686
Total 3.016
. 2.351 1.728 1.705
Variety of projects Quality o f products Technical Production process Managerial aspects Eff~ciency of resources Impulse for innovations Success rate of innovations Competencies o f staff Access to R&D resources & personnel Cost o f R&D Development cycle t h e for new innovations
% of Variance 23.197 18.083 13292 13.1 14
I -159 .-2.9 16E-02 .-. 130 -08.40 1 E-02 -4.708E-02 ,121 -274 -1.321E-02 -152
d
-228 3.1 77E-02 .894 -829
-
1.1 06E-03 .296 298 -649 .675 .763 .757 242 -254 -. 1 06 - 1 -679E-02 3 -487E-02 .Il9
-473 -249 234 -.191 .116 .845 .783 305 .7SO 1 -947E-02 -183
-81 5 .724 -44 1 -193 -153 -196 -.Il8 -4.787E-02 8.389E-02 -256 -37 1 -3 -667E-02 -139
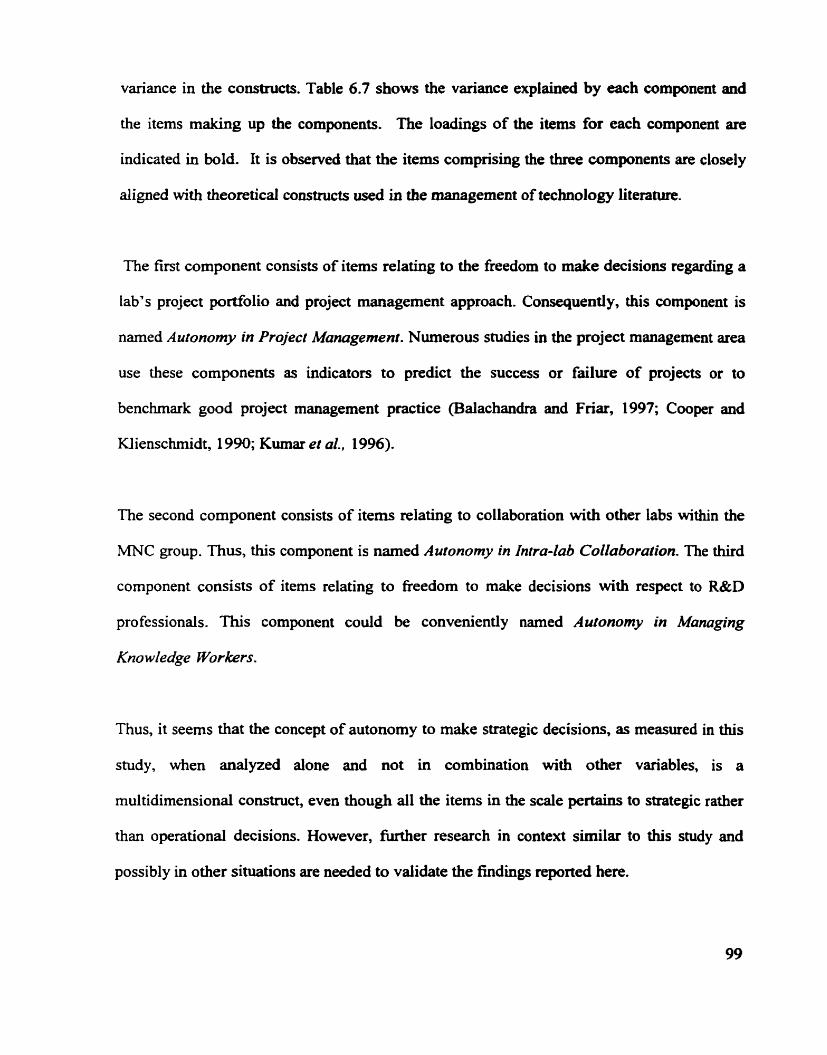
variance in the constructs. Table 6.7 shows the variance explained by each component and
the items making up the components. The loadings of the items for each component are
indicated in bold. It is observed that the items comprising the three components are closely
aligned with theoretical constructs used in the management of technology literature.
The first component consists of items relating to the fieedom to make decisions regarding a
lab's project portfolio and project management approach. Consequently, this component is
named Autonomy in Project Management. Numerous studies in the project management area
use these components as indicators to predict the success or failure of projects or to
benchmark good project management practice (Balachandra and Fnar, 1997; Cooper and
IUienschmidt, 1 990; Kumar et al., 1 996).
The second component consists of items relating to collaboration with other labs within the
MNC group. Thus, this component is named Autonomy in Intra-Zab Collaboration. The third
component consists of items relating to fieedom to make decisions with respect to R&D
professionals. This component codd be conveniently named Aufonorny in Manuging
Knowledge Workers.
Thus, it seems that the concept of autonomy to make strategic decisions, as measured in this
study, when analyzed alone and not in combination with other variables, is a
multidimensional construct, even though al1 the items in the s a l e pertains to strategic rather
than operational decisions. However, fùrther research in context similar to this study and
possibly in other situations are needed to validate the findings reported here.

Table 6.7
Factor Analysis on Autonomy
Rotated Component Matrix Items 1 Component
i
1 I 2 1 3
Total Variance Erplahed
Recruit scientists and ennineers -101 .218 .886 Deciding the career paths of scientists and 9.923E-02 -254 .a99
Component I 2
[ engineers 1 I I I
6.3.3 Trust and Formalization
Unlike the constructs Autonomy and Synergistic Innovative Capacify, which consists of 12
and 13 items respectively, Trust consists of only 5 items. Factor analysis indicates that the
concept as measured in this study consists of two components (See Table 6.8). The first
component is related to the technological aspects of collaborations while the second
component more closely reflects the social aspects of collaborations. Thus, the components
could be narned TechnuZogy-based CoZZaborution and Relariumhip-based Cuhboration.
Since both components explain similar proportion of variance, they are retained as two
distinct constructs.
Rotation Sums of Squared Loadings Cumulative % 35.916 60.090 _ 78.466
Total 3 .592 2.417
3 1 1.838
% of Variance 35.9 16 24.1 74 1 8.376

The construct Forrnalization also consists of five items which yielded two cornponents when
factor analysis was employed (See Table 6.9). However, fiom a theoretical perspective, it is
much more difficdt to decompose the items for this constnict. Thus, it is suggested that this
construct should be retained as a single dimension constnict as originally proposed.
Table 6.8
Factor Analysis on Trust
Total Variance Explained
Rotated Component Matrir
Component 1 2
I Items 1 Component 1 I 2 l
I -
Collaboration based on technical competency of lab 1 .900 1 -152 1
Rotation Sums of Squared Loadings
[ ~ollabor&ion basedon complementary technology ] 339 1 -109 I
Total 1.81 1 1.790
1 Collaboration based on experience 1 .522 1 -605 1
% of Variance 36.229 35.798
Table 6.9
Factor Analysis on Formalization
Total Variance Explained
Cumulative % 36.229 72.027
collaboration based on keepinp; promises Collaboration based on trust
-142 7.182E-02
Component 1 2
.845
.8tl
Rotation Surns of Squared Loadinp Total 1.985 1.705
% of Variance 39.706 34.096
Cumulative % 39.706 73.800
6.4 Application of Factor Analysis Results
Since the results of factor analysis revealed that the dependent variable synergistic innovative
capacity and two of the independent variables, autonomy and trust have four, three and two
components respectively, it was decided to re-nui the regression analysis with these new
larger set of variables. Thus, there are now nine independent variables in the main mode1
regression - autoproj, autocollab, autoHR (the components of autonomy), fomalization,
socialization, IPCOMHQ, IPCOMSU, ECOMHQ, and ECOMSU. Regressions were run with
these nine independent variables and each of the four dependent variables xquentially. The
four dependent variables are the four components which emerged from the factor anaiysis on
synergistic innovative capaciry, the original unidimensional dependent variable. The names
assigned to the four dependent variables are:
Table 6.9 Continued Rotated Component Matrix
Knowledge Creation and Management
Managerial and Operational Efficiency
Strategic R&D
Innovative Proficiency
Items
HQ: Rules for conflicts HQ: Monitors lab HQ: Lab submit report HQ: Rules for extemai collaboration HQ: Rules for interna1 collaboration
Componcnt ,
1 -
-69 1 A91 .816 -141 -167
2 . .48 1 ,
5.430E-02 -176 .867 .829

The regression resdts fiom this analysis are shown in Tables 6.10 to 6.12. As shown in Table
6.10, the regression with Knowledge Creation and Management as the dependent yielded
three statistically significant variables at the 0.1 level. Al1 three variables pertain to
communication among research labs. It is observed that in-person communication among
subsidiary labs has a positive effect on knowledge generation and management whereas in-
person communication between the HQ and subsidiary labs is having the opposite effect.
However, technologically supported communication between HQ and subsidiary labs has a
positive effect on kmwledge generation and management.
These resdts seem to suggest that knowledge creation and transfer among subsidiary labs is
accomplished much more effectively in face-to-face settings than by technologically
supported media. In particular, technical knowledge, a large part of which is considered tacit
knowledge, is transfened more effectively when scientists and engineers meet in-person. At
this point in tirne, it seems that technologically supported communication may be more
effective in communicating explicit knowledge. The positive impact of electronic
communication between HQ and subsidiary labs (ECOMHQ) could be interpreted as the HQ
being quite effective as a clearinghouse for information generated throughout the MNC.
Table 6.1 1 shows that four variables: AutoHR, ECOMHQ, ECOMSU and IPCOMSU are
having a positive and sigdicant impact on Strategk R&D (at the 0.1 level). As defined
earlier, strategic R&D refers to the ability of subsidiary labs to undertake a larger d e in the
more strategic aspects of their company's R&D activities. This role is measured by the extent
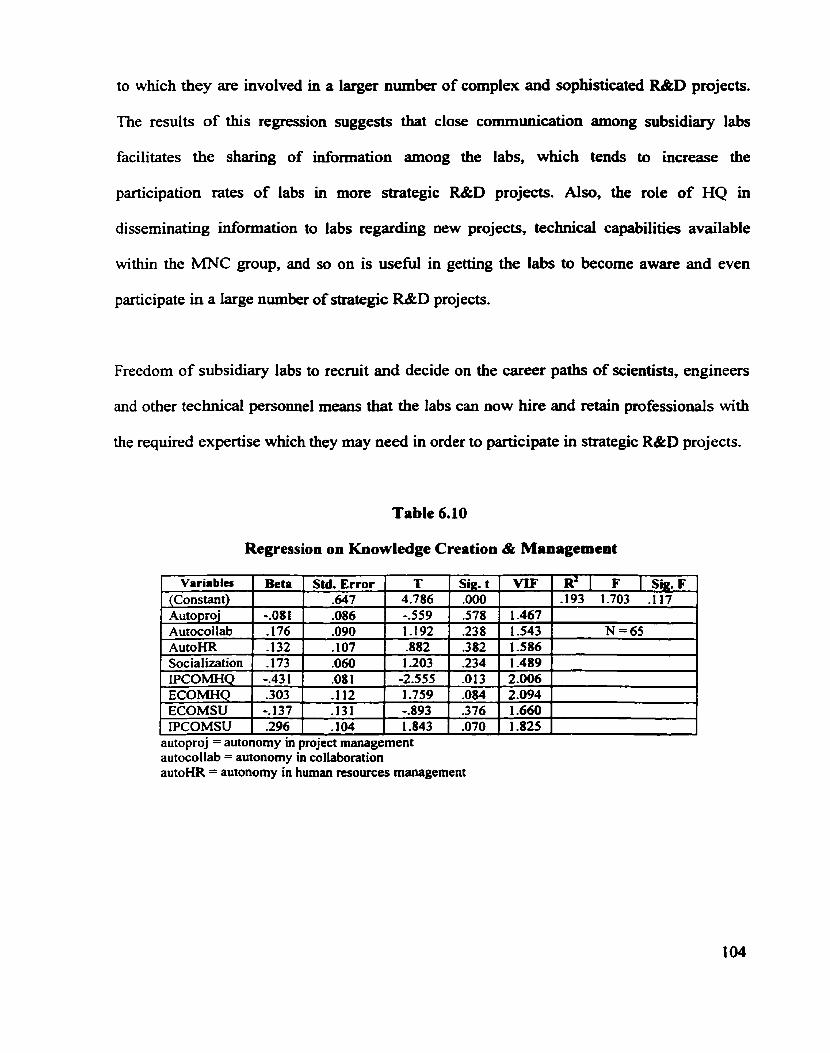
to which they are involved in a larger number of complex and sophisticated R&D projects.
The results of this regression suggests that close communication among subsidiary labs
facilitates the sharing of information among the labs, which tends to increase the
participation rates of labs in more strategic R&D projects. Also, the role of HQ in
dissemùiating information to labs regarding new projects, technical capabilities available
within the MNC group, and so on is usefiil in getting the labs to become aware and even
participate in a large number of stratîegic R&D projects.
Freedom of subsidiary labs to recruit and decide on the career paths of scientists, engineers
and other technicai personnel means that the labs c m now hire and retain professionals with
the required expertise which they may need in order to participate in strategic R&D projects.
Table 6.10
Regression on Knowledge Creation & Management
-
autoproj = autonomy in projcct management autocollab = autonomy in collaboration autom = autonomy in human resources management
R' 1 F 1 Sig. F -193 1.703 .Il7
N=65
Variabl=
(Cons tant) Autoproj Autocollab AutoHR Socialization IPCOMHQ ECOMHQ ECOMSU IPCOMSU
Beta
-.O8 1
T 4.786 -.559
Std. Error .647 .O86
-176 -132 .173 -.43 1 .303 -.137 .296
Sig. t .O00 -578
YIF
1.467 1.543 1.586 1.489 2.006 2.094 1.660 1.825
.238
.382
.234
.O13
.O84 -376 .O70
.O90 1 1.192
.IO7
.O60
.O8 1 -1 12 .131 -104
-882 1203
-2.555 1.759 -.893 1.843
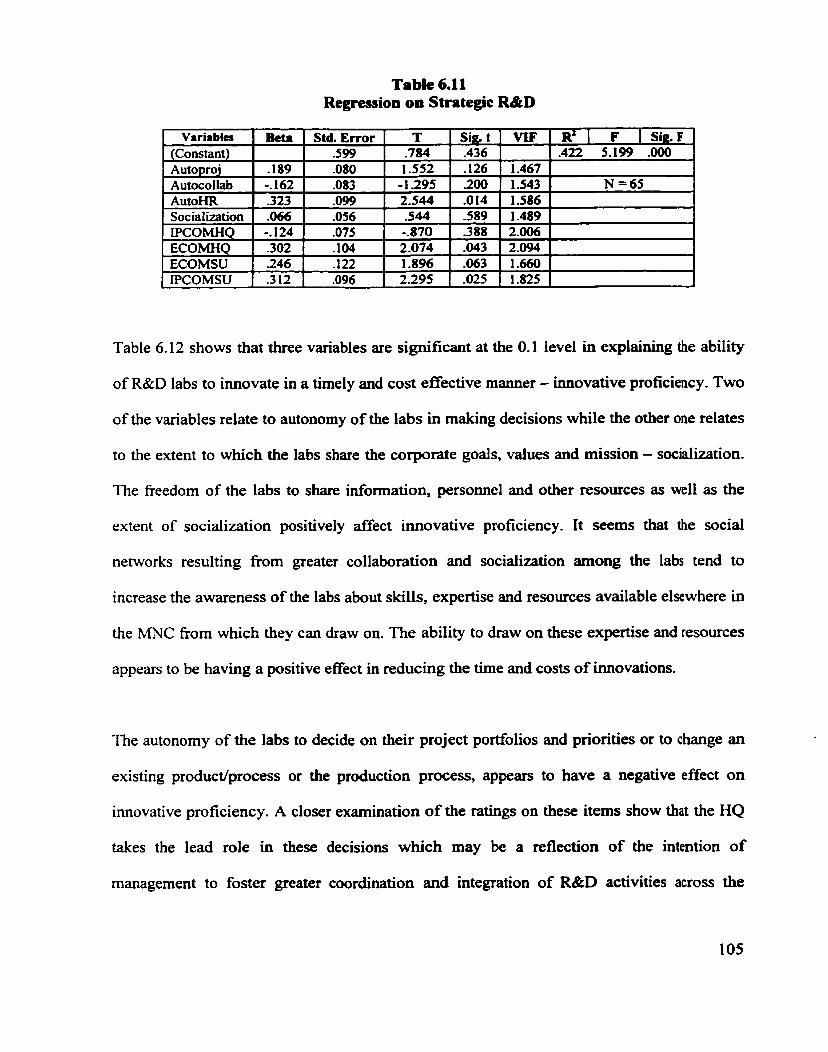
Table 6.1 1 Regression on Strategic R&D
Table 6.12 shows that three variables are significant at the 0.1 level in explaining the ability
of R&D labs to innovate in a timely and cost effective manner - innovative proficiency. Two
of the variables relate to autonomy of the labs in making decisions while the other one relates
to the extent to which the labs share the corporate goals, values and mission - socialization.
The freedom of the labs to share information, personnel and other resources as well as the
extent of socialization positively affect innovative proficiency. It seems that the social
networks resulting fiom greater collaboration and socialization among the labs tend to
increase the awareness of the labs about skills, expertise and resources available elsewhere in
the MNC fiom which they can draw on. The ability to draw on these expertise and resources
appears to be having a positive effect in reducing the tirne and costs of imovations.
The autonomy of the labs to decide on their project portfolios and pnonties or to change an
existing product/process or the production process, appears to have a negative eflect on
innovative proficiency. A closer examination of the ratings on these items show that the HQ
takes the lead role in these decisions which may be a reflection of the intention of
management to foster greater coordination and integration of R&D activities across the

corporation. However, regdess of the motivations, subsidiary labs seem to perceive the
lack of fieedom as constraining their ability to innovate timely and cost effectively.
Table 6.12 Regression on Innovative Proficiency
( Variable 1 &ta 1 Std. Error 1 T Isig.l.1 VIF 1 R' 1 F 1 S & F ] (Constant) 1
Autocollab AutoHR Socialkation PCOMHQ ECOMHO
Autoproj 1 -.238 -094 -1.719 -091 1.467 *
,704
L \ . - - - - -. - . -
282 -.OS0 -454 -.133 -.O01
ECOMSU IPCOMSU
4.528 1 .O00 -252 2.404 -326
.O98 -117 .O65 .O88 -122
-.O87 -1 13
.143 -1 13
1.984 -.349 3280 -.820 -.O09
1.543 1.586 1.489 2.006 2.094
- .O52 -728 -002 -416 -993
jq = 6 5
1
1 _
-.Sm -733 ,
-558 .466
1.660 1.825
PLS ANALYSIS
7.1 Introduction
PLS is an altemative analytical framework for anaiyzing the relationship between the
dependent variable, synergzsric innovative capacity, and the five independent and four
moderating variables identified earlier in the theoretical mode1 shown in Figure 3.1. This
chapter begins with a discussion of the value-added of using PLS over traditional regression
and factor anaiysis, followed by a cornparison of PLS and LISREL. Both PLS and LISREL
are structural equation modeling techniques, each with its own distinct characteristics,
however, since many researchers believe that LISREL is superior to PLS, some justification
for using PLS over LISREL is in order. Also, since PLS is not yet a widely used data
analysis technique in this field of study, the analytical fiamework of PLS is described.
Finally, the results of two PLS models are presented and discussed.
7.2 The Case for PLS
Causal or structurai equation models provide a way to simultaneously assess the reliability
and validity of measures of theoretical constructs and estirnate the relationships among
constructs. LISREL, EQS and PLS are three widely known causal modeling techniques.
According to Fornell (1982), by incorporating multiple dependent constmcts, explicitly
recognizing error terms, and explicitly integrating theory with empirical data, these
techniques provide the capability to advance understanding to an extent not possible with
traditional multivariate techniques such as multiple regression, factor andysis, principal
components and cluster analysis.
For example, assume that a dependent variable consists of two dimensions and the
researcher is interested in andyzing the relationship between the dependent variable and a set
of predictors ushg multivariate regression. To analyze this relationshiy, two separate
regressions would have to be undertaken - one with the f h t component of the dependent
variable and another with the second component. In PLS this would not be necessary since
PLS can simultaneousIy analyze the relationship between the predictors and both
components of the dependent variable in a single mode1 execution.
Other advantages of PLS over traditional multivariate techniques are illustrated using a study
b y Snell and Dean ( 1 992), which examined the relationship between integrated
manufacturing and human resource management. In the study, multiple measures were
collected for the constmct Advanced Manufacturing Techniques (2 8 items), Total Quality
Management (10 items), and Just-in-Time inventory control (10 items). Principal
components factor analysis with varimax rotation was employed to define three factors and
remove 'weak' items (Le. items with Loading Iess than -30). Factor analysis was also used to
refine 5 multiple-item human resources constructs (i.e. staffing, training, appraisal, extemally
equitable rewards, and individually equitable rewards). Once the dependent and independent
factors were defined, Snell and Dean (1992), then formed aggregate variable (Le. construct)
scores by combining the scale items for the respective constnicts. They then employed
multiple regression to predict each human resource construct with the set of integrated
manufacturing variables.
If Snell and Dean (1992) had used PLS with the same data and theoretical model, the
measures and the relationship between the constnicts would have been estimateci
simultaneously. With PLS it would have been unnecessary to aggregate the measures to form
constmct scores in an a priori fashion and the psychomeûic properties of the various scaie
constructs would have been reassessed each time the model was evaiuated with a different
dependent variable. This is in contrast to the two-stage process they used which separates
data, &om measurement, and fiom theory. Furthemore, assumptions regarding the
appropriate way to combine items into construct scores would not have been made; PLS
handles this.
In some ways, the approach used by Snell and Dean (1992) were employed in this study with
respect to the data analysis reported in the previous chapter. In the regression analysis
conducted in the preceding section, the scales for each of the constructs in the model were
added to form a single variable, which was then employed in the regression. For example, the
dependent variable, synergistic innovative capacity, was computed as follows: for each
respondent, the mean score was obtained fiom the responses provided across the 13 items
defining the construct. A similar procedure was employed for the other scale variables used
in the model. This procedure assumes that the constnict is unidimensional and, therefore, the
items are additive. Although a high Cronbach alpha indicate good scaie reliability, it does not
indicate whether the construct is unidimensional or multidimensional. Simply aggregating
scale items in a multi-item construct to form new variables without considering the
dimensionality of the construct or its relationship to other constructs in the study is arbitrary
and could lead to rnisleading results. GeneralIy, for m y linear model, it is necessary to decide
on the number of constnicts there are and the relationships among hem at the beginning of
the study based on theory and ernpirical evidence.
PLS ailows for a closer integration of data, measurement and theory. For example, take a
constnict like w t , which in this study consists of five items measured on a five-point scale.
Assuming the researcher is interested in evaluating the relationship between levels of trust
and synergistic innovative capacity using regression analysis, the researcher would have to
add the five items and then artifïcially disaggregate the resulting variable into hi&, medium
or low levels of trust before running the regression. It would be unlikely that the five items
would have been used as five separate variables because of sarnple size considerations. In
PLS, al1 five measures are used, the actual responses provided by respondents are used, and
the underlying theory influencing the design of the constnict is preserved. in these cases, PLS
makes greater use of the actual data.
7.3 PLS and LISREL Compared
Some researchers suggest that PLS is complementary, even a precursor, to LISREL, the most
widely known structural equation modeling technique (Barclay et ai., 1995; Judge, 1995;
Chin, 1995). The a h of LISREL is to estimate causal model parameters (e.g., loadings and
paths) such that the discrepancies between the initial ernpirical covariance data matrix, and
the covariance deduced fiom the model structure and the parameter estimates are minirnized.
It is concerned with the entire covariance matrix. The emphasis is on overall model fit. The
objective of PLS, on the other hand, is to maximize the variance explained in constructs
and/or variables, depending on model specification. This difference in objective makes

LISREL "closer to the model, more confirmatory and more data analytic, and PLS closer to
the data, more explorative and more data analytic" (Lohdlier, 1989). While LISREL and
PLS use full information, usually in the maximum likelihood sense, PLS estimates
parameters via a sequence of regressions, each of which uses partial information, hence the
name Partial Least Squares.
There are other features of LISREL which are theoretically more compelling than PLS but
may not apply to the current research. For example, LISREL is more elegant with respect to
the types of models that can be proposed. It handles non-recursive relationships, allows the
testing of nested models, permits the cornparison of the fit of a model between groups, and
allows for the modeling of correlated error terms. The current version of PLS used in this
study does not allow for these specifications and assumes uncorrelated errors as in regression
(Barclay et al., 1995).
LISREL offers a nwnber of measures of overall 'fit' such as the X2 goodness-of-fit; PLS does
not have these overall measures, relying instead on variance explained, R ~ , as an indicator of
how well PLS has met its objective. in PLS, the constructs are weighted linear aggregates of
their indicators, completely defined by their indicators, and capable of producing component
scores. In LISREL the estimation approach is usually based on Maximum Likelihood. Data is
thus assumed to be multivariate normal and interval-scaled, and sample size must be
relatively large. Other estimation procedures6 recently built-in to LISREL are less stringent
with respect to data requirement but can generate parameter estirnates with less than optimal
Generalized h a s t Squares (GLS), Unweighted Least Squares (ULS), and Weighted Lcast Squahs (WLS)
11 1
properties. Chin (1 995) notes that even with distributional violation, the MLE procedure for
LISREL can be quite robust and may possibly produce better estimates of the population
parameters than PLS.
It is noted that LISREL based on maximum likelihood rnay not converge when sample sizes
are small because the likelihood surface in this case may be flat and because some
parameters (e-g., variances) may be close to their boundary values (Le., O). This is a sign that
the sarnple size is too small or that the mode1 is wrong. PLS, however, wili produce answers.
Provided that the model is reasonable and provided that jack-knifed variances are produced,
PLS can be usefûl. PLS can be thought of as an exploratory step towards a more ngorous and
complete analysis. Given replicated studies with larger sample sizes, the results can be
validated with LISREL and other causal modeling techniques.
PLS is a distribution-free approach to parameter estimation. It can be used effectively with
small samples and complex causal models. According to Barclay et al. (1995); Chin (1 995);
and Hulland (1999), the parameter estimates fiom PLS approximate those obtained fiom
LISREL only under the joint condition of a large number of measures per construct and large
sample sizes.
Regarding the capability of PLS to accommodate small sample studies, Lohmoller (1982)
presents examples where a model with 27 variables was appropnately estimated with only 10
data cases, and a model with 96 indicators and 26 constructs was estimated with 100 cases.
As noted above, only under the joint condition of a large sample size and a large number of
indicators per construct will estirnates of the loadings and structurai paths approximate that
of LISREL. Otherwise, the loadings in PLS tend to be overestimated and the structural paths,
conversely, underestimated. Chin (1995) suggests that this becornes less of a concern if the
objective is to account for multivariate variance in a predictive sense, and in studies where
theoretical knowledge is low, the more conservative estimate of a model's structurai paths
rnay be more appropriate. Two sample re-use techniques, jack-kn@ng and bootstrapping, can
be used in PLS to test the statistical significance of the loadings and paths.
Ofien it has been stated that on practical grounds, PLS is considered to be superior to
LISREL. For example, PLS is computationally more efficient in the same sense as a
component analysis is faster than a MLE factor analysis. LISREL estimation time increases
dramatically as the number of indicators increase. However, with the kind of computing
power available today, this is less of a concem.
In this study, PLS is used because of sample size considerations.
7.4 Analytical and Interpretive Framework of PLS
To facilitate a proper understanding of the results generated fiom PLS analysis, a simple PLS
mode1 consisting of three constructs is presented in order to illustrate the conceptual and
analytical underpinnings of the PLS fiamework (Figure 7.1).

Figure 7.1
An Illustrative PLS Mode1
cl and 5 2 : exogenous constructs q : endogenous constmct xi . . . x3: x variables, measures or indicators y 1 . . . y2 : y variables, measures, or indicators z 1 . . . I C ~ : regression weights Li...Ll : loadings E 1 . . . €3 : error terms (1 - &l) p: residuai in the structurai mode1 bl, b, : path coefficients or simple regression coefficient between 5 and q
As shown in Figure Tl, a PLS model consists of two related components (Le., the
measurement or outer mode1 and the structural or inner model). The measurement model
consists of the variables that define the constructs (x, and y,) and the structural mode1
consists of the paths linking the exogenous and endogenous constructs (b,). The indicators of
construct ci are called formative measures while the indicators of 4 are referred to as
reflective measures. Decisions on whether the measures are formative or reflective shouid be
based on theory but reflective indicators are generally used especially in exploratory studies
or where theoretical knowledge is low.
Although the measurement and structurai models are estimated together, a PLS mode1 is
usuaIly analyzed and interpreted sequentially in two stages. The first stage involves assesshg
the reliabiIity and validity of the measurement model, and the second stage involves
assessing the structural model. This sequence ensures that reliable and valid measures of the
measurement mode1 are fmt obtained before attempting to draw conclusions about the
structurai relationships among the constnicts. The measurement mode1 is assessed by
evaluating individual item reliabilities, intemal consistency7, and the discriminant validity!
7 .41 Measurement (Outer) Model Assessrnent
Individual item reliability is assessed by examining the loadings, or simple correlations of
the measures with their respective constructs (the n, 0 and A). A d e of thurnb is to accept
loadings of .70 or more, which implies more shared variance between construct and its
measures than error variance. However, Grant and Higgins (1991) suggest that individual
7 OAen used interchangeably with convergent validity or composite reliability of s a l e items. * OAen used interchangeably with average item reliability or average variance extracteci by cach construct.
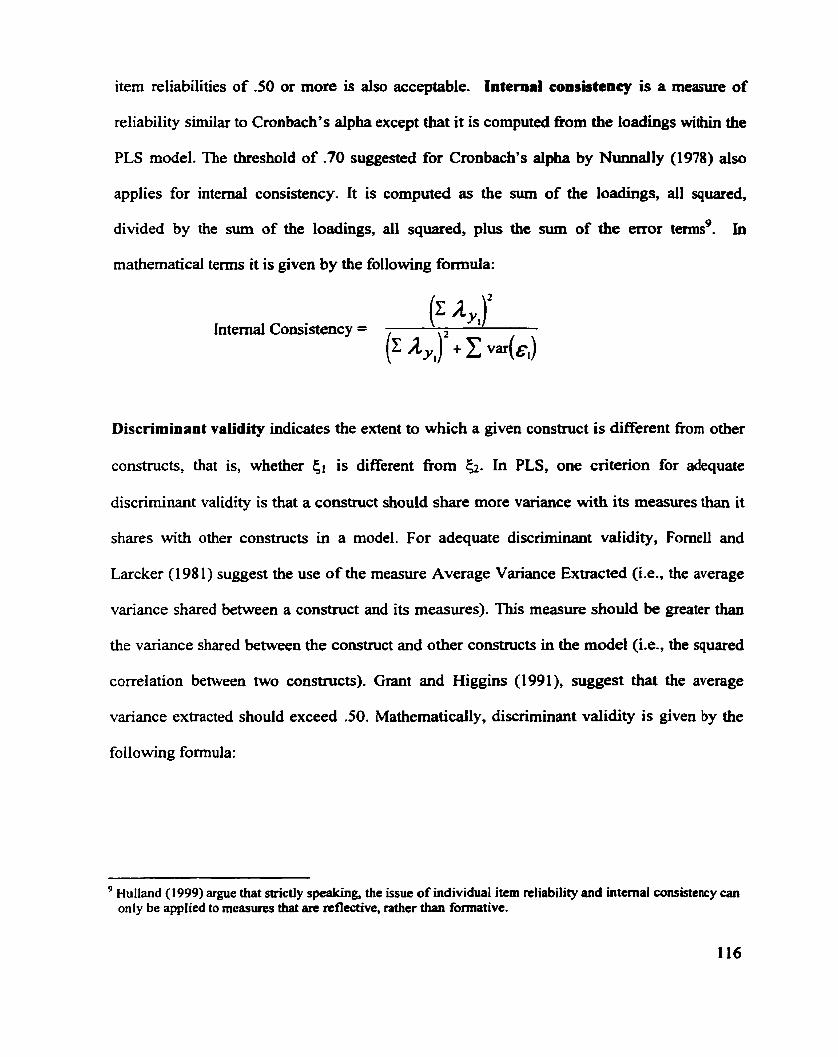
item reliabilities of -50 or more is also acceptable. Internal consistency is a measure of
reliability simila. to Cronbach's alpha except that it is computed fiom the loadings within the
PLS model. The threshold of .70 suggested for Cronbach's alpha by Nunnally (1978) also
applies for interna1 consistency. It is computed as the sum of the loadings, al1 squared,
divided by the sum of the loadings, d l squared, plus the sum of the error tems9. In
mathematical terms it is given by the following formula:
Discriminant validity indicates the extent to which a given constmct is different fiom other
constnicts, that is, whether ci is different from 52. In PLS, one criterion for adequate
discriminant validity is that a coastnict should share more variance with its measures than it
shares with other constructs in a model. For adequate discriminant vaiidity, Fomell and
Larcker (1 98 1) suggest the use of the measure Average Variance Extracted (Le., the average
variance shared between a construct and its measures). This masure should be greater than
the variance shared between the constmct and other constnicts in the mode1 (Le., the squared
conelation between two constructs). Grant and Higgins (1991), suggest that the average
variance extracted should exceed .50. Mathematically, discriminant validity is given by the
following formula:
Hulland (1999) argue that strictly speakùig, the issue of individual item reliability and interna1 consistency can only be apptied to measures that are rcflective, rather than formative.
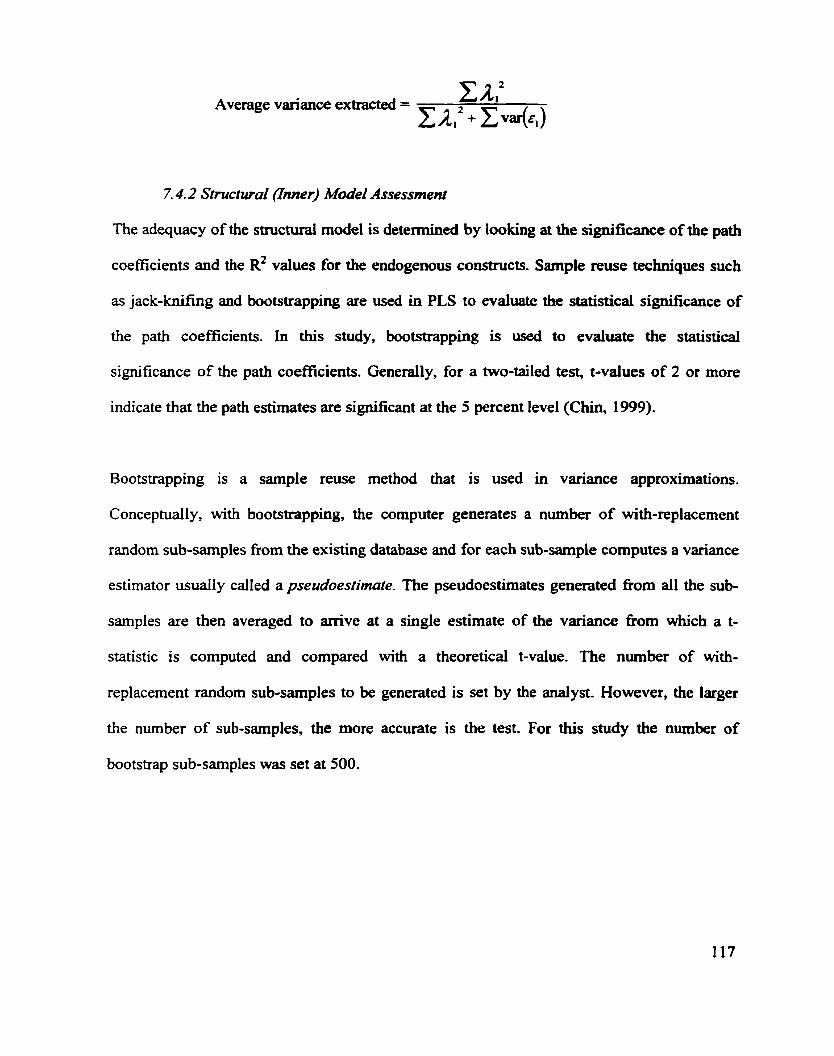
Average variance extracted = CA,' + Cv44
7.4.2 Structural (llnner) Midel Assessrnent
The adequacy of the structural mode1 is determined by iooking at the significance of the path
coefficients and the R~ values for the endogenous constructs. Sample reuse teîhniques such
as jack-knifing and bootstrapping are used in PLS to evaluate the statistical significance of
the path coefficients. In this study, bootstrapping is used to evaluate the statistical
significance of the path coefficients. Generally, for a two-tailed test, t-values of 2 or more
indicate that the path estimates are significant at the 5 percent level (Chin, 1999).
Bootstrapping is a sample reuse method that is used in variance approximations.
Conceptuaily, with bootstrapping, the cornputer generates a number of with-replacement
random sub-samples fiom the existing database and for each sub-sample computes a variance
estimator usually caIIed a pseudoesfimafe. The pseudoestimates generated fiom al1 the sub-
sarnples are then averaged to arrive at a single estimate of the variance fiom which a t-
statistic is computed and compared with a theoretical t-value. The number of with-
replacement random sub-samples to be generated is set by the analyst. However, the larger
the number of sub-samples, the more accurate is the test. For this study the number of
bootstrap sub-samples was set at 500.
7.5 Results of PLS Analysis
In order to evaluate the extent to which the five structural variables chosen for this study (i.e.,
autonomy, socialization, fomalization, HQ-mbsidiary labs communication, and inter-
subsidiary co~ll~~lunication) provide adequate explmation for variations in the outcome
variable ~ y n e r ~ s t i c innovarive capcity, a systematic analysis of various PLS models was
carried out. Through successive model refinement based on theoreticai plausibility and
statisticd soundness two models have been selected for further analysis. Before analyzing
these two models, a digression is made to briefly descnbe the procedure w d in developing
and evaluating various PLS models.
The initial model consisted of nine exogenous or independent constnicts and the four
endogenous or dependent constructs. The nine exogenous constnicts are autonomy,
formalization, socialization, HQ-subsidiary labs communication, inter-subsidiary labs
communication, resource level of labs, uncertainty of labs operating environment, trust, and
cultural diversity. Although, factor analysis performed earlier indicated that the constmcts
autonomy, formakarion and trust are not unidimensional, in this analysis they are retained as
unidimensional constructs since preliminary PLS analysis indicate unïdimensionality. The
four endogenous constxucts which are components of synergistic innovative capacity, the
original dependent construct, are similar to those obtained in factor analysis - Knowledge
Creation and Management, Strategic R&D, Managerial and Operational Eficiency, and
Innovative Proficiency. The number of indicators defining each constnict is shown in Table
7.1.
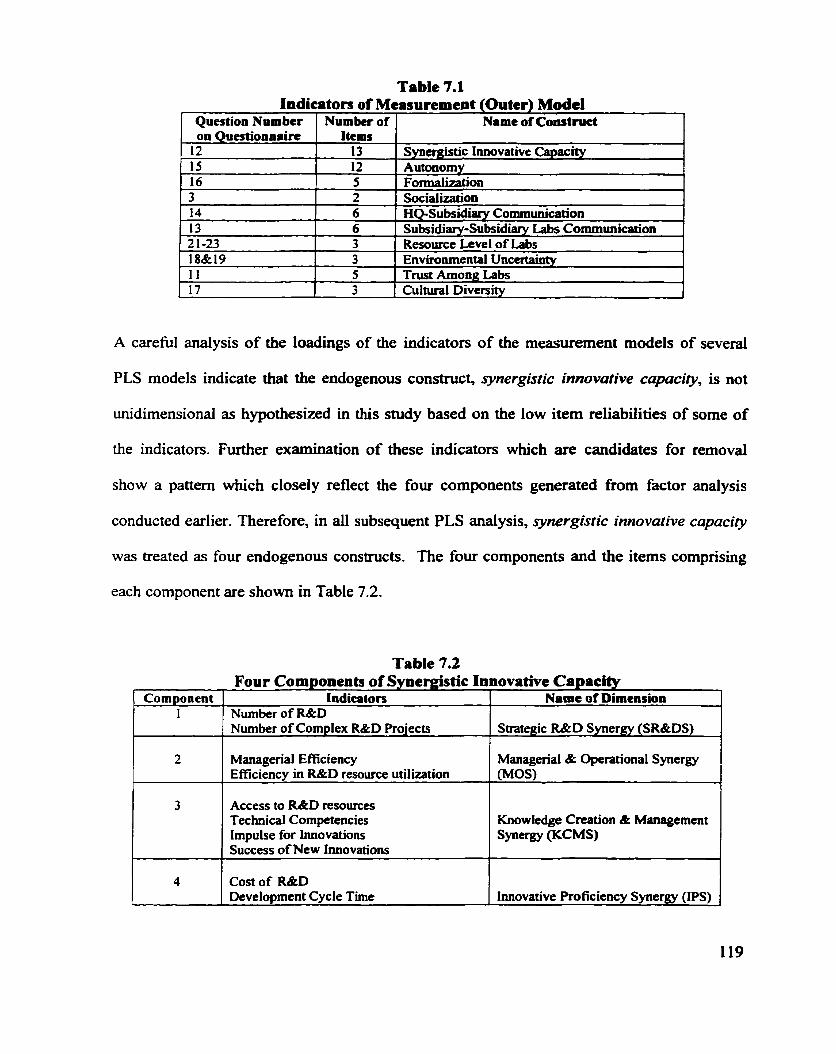
Table 7.1 Indicators of Measurement (Outer) M d e l
1 QuationNumber 1 Numberot 1 Name of Coiutruet 1 on Questionnaire
12 15 16 3 14 13 2 1-23 18&19
A carefùl analysis of the loadings of the indicators of the measurement models of several
PLS models indicate that the endogenous construct, synergistic innovative capcity, is not
unidimensionai as hypothesized in this sîudy based on the low item reiiabilities of some of
the indicators. Further examination of these indicators which are candidates for removal
show a pattern wbich closely refiect the four components generated fiom factor analysis
conducted earlier. Therefore, in al1 subsequent PLS analysis, synergistic innovative cupaciîy
was treated as four endogenous constructs. The four components and the items comprising
each component are shown in Table 7.2.
1 1 17
Items 13 12 5 2 6 6 3 3
Synergistic Innovative Capacity Autoaomy Formaikation Socialidon HQ-Subsidiary Communication Subsidiary-Subsidiary Labs Communication Resourcc Level of Labs Environmental Uncertainty
5 3
Table 7.2 Four Components of Synergistic Innovative Capacity
~ ~
Trust Among Labs Cultural Diversity
Componeat 1
2
3
4
lndicators Number of R&D Number of Complex R&D Projects
Managerial Efficiency Efficiency in W D resource utilization
Access to R&D resources Technical Competencies Impulse for Innovations Success of New innovations
Cost of R&D Developrnent Cycle Time
Nome of Dimension
Stratepric R&D Synergy (SR&DS)
Managerial & Operational Synergy ( M W
Knowledge Creation & Management S ynergy (KCMS)
Innovative Proficiency Synergy (PS)
It is also observed that substantial improvements are obtained in both the measurement and
structural models when the two communication constnicts are re-grouped into four constructs
based on the communication medium. That is, when headquarter-subsidiary communication
and subsidiary-subsidiary communication are separated into eiectronic communication and
in-person communication. Thus, M e r PLS modeling was done using these four c o ~ c t s
to represent the nature of communication among R&D labs of MNCs.
7.5.1 PLS Model I
As mentioned above, two PLS models were selected for M e r investigation. Model 1 is
shown in Figure 7.2 and the relevant statistical results are shown in Tables 7.3 and 7.4.
According to the Ioadings displayed in Table 7.3, al1 the indicators of the constnicts are
substantially higher than the .70 benchmark except for two with respect to resource levels
and two for cultural diversity. The construct measuring trust has four indicators in the -63 to
.68 range which are still acceptable but slightiy below the -70 threshold.
The intemal consistency measures for the constmcts resource levels, trust and cultural
diversity are lower than the .7 threshold (See Table 7.4). This is not surprishg since the
intemal consistency measure is derived from the indicator loadings obtained fiom the model.
The intemal consistency for the constnict innovative proficiency is marginally below the
threshold while al1 those of the other rernaining constmcts are above the threshold.
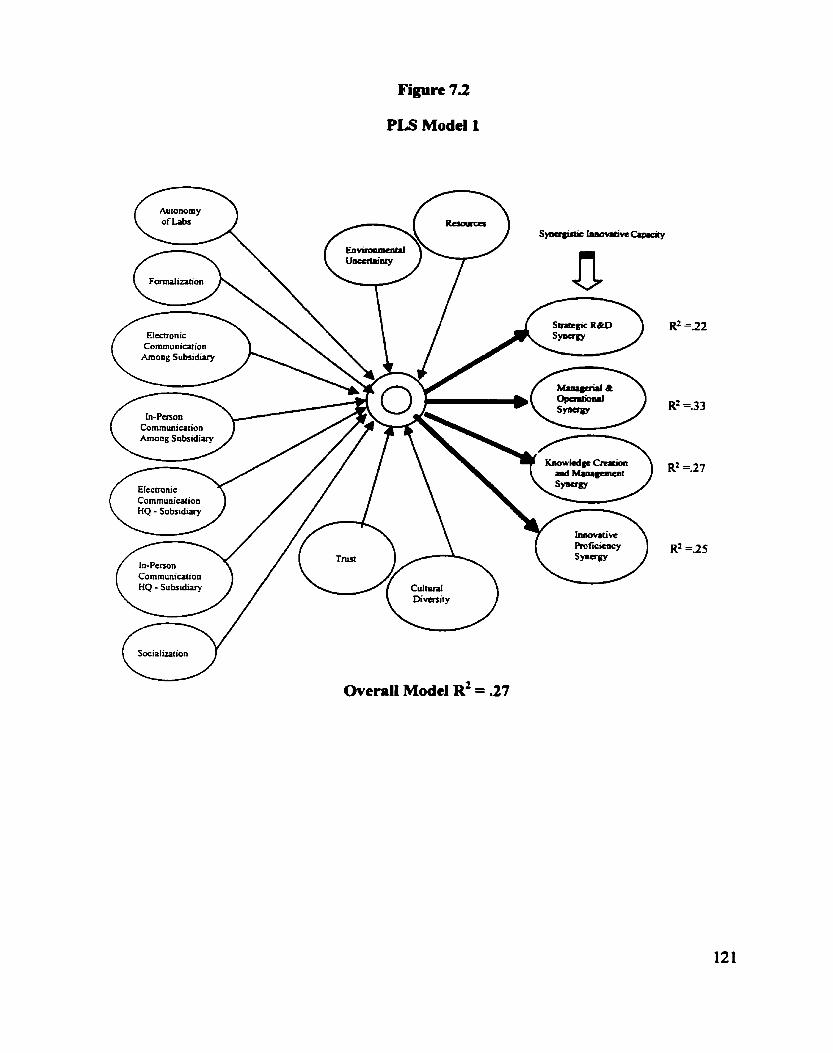
Figure 7.2
PLS Mode1 1
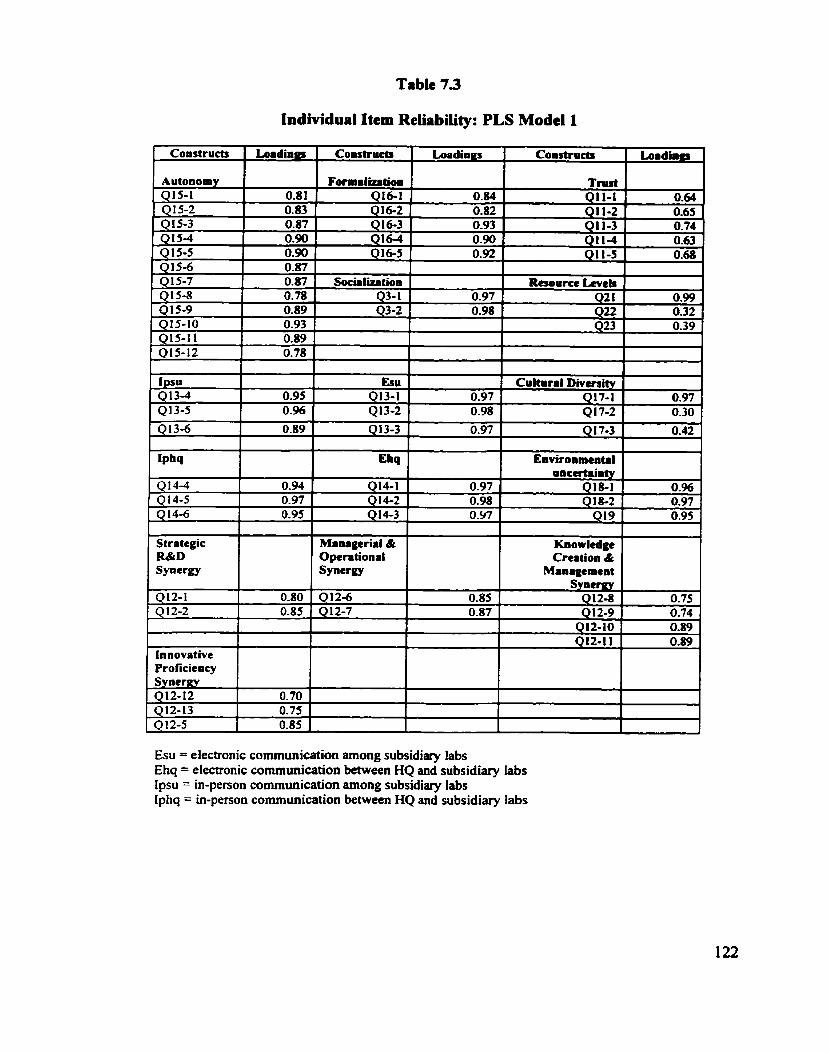
Table 7.3
Individual Item Reliability: PLS Mode1 1
Esu = electronic communication among subsidiary labs Ehq = electronic communication between HQ and subsidiary labs Ipsu = in-person communication among subsidiary labs Iphq = ui-person communication between HQ and subsidiary labs
Stratcgic R&D Synergy
QI2-1 Q 12-2
Innovitive Proficicncy Synerw Q 12- 12 412-13 Q 12-5
0.80 0.85
0.70 0.75 0.85 ,
Managerial & Opcritionrl S yncrgy
QI26 Q12-7
0.85 0.87
Knowltâge Creation &
Management Synerpy Q 12-8 Q 12-9 012-IO 912-1 1
0.75 0.74 0.89 0.89
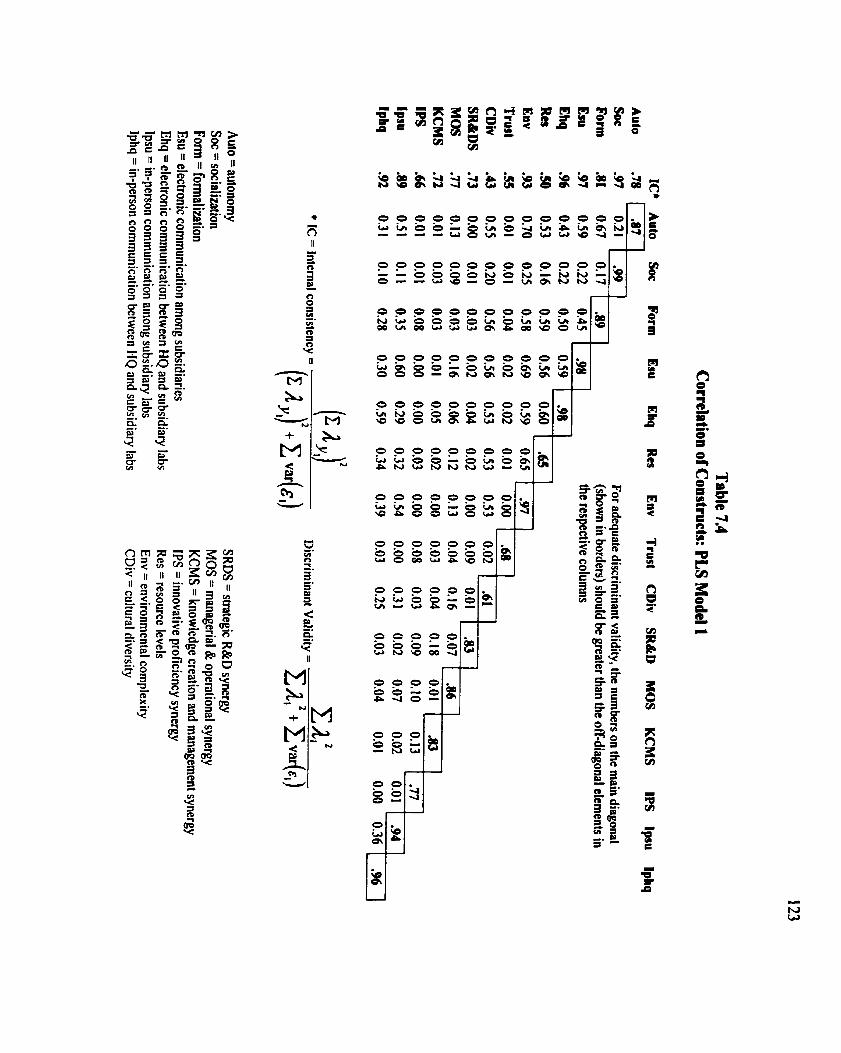
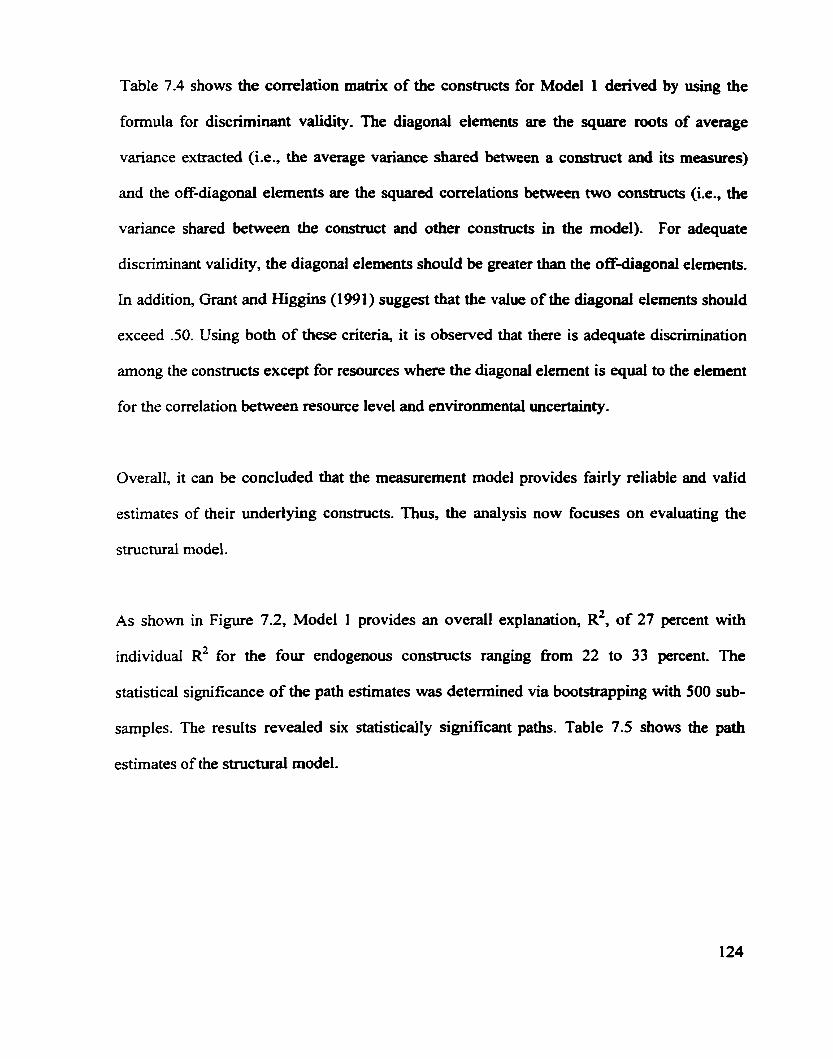
Table 7.4 shows the correlation matrbc of the constructs for Model 1 denved by using the
formula for discriminant validity. The diagonal elements are the square mots of average
variance extracted (Le., the average variance shared between a construct and its measures)
and the off-diagonal eiements are the squared correlations between two constnicts (i.e., the
variance shared between the construct and other constructs in the model). For adequate
discriminant validity, the diagonal elements should be greater than the off-diagonal elements.
In addition, Grant and Higgins (199 1) suggest that the value of the diagonal elements shouid
exceed -50. Using both of these criteria, it is observed that there is adequate discrimination
among the constructs except for resources where the diagonal element is equaî to the element
for the correlation betweea resource level and environmental uncertainty .
Overall, it c m be concluded that the measurement model provides fairly reliable and valid
estimates of their underlying constnicts. Thus, the analysis now focuses on evaluating the
structural model.
As shown in Figure 7.2, Model 1 provides an overall explanation, R', of 27 percent with
individual R~ for the four endogenous constructs ranging fiom 22 to 33 percent. The
statistical significance of the path estimates was detennined via bootstrapping with 500 sub-
samples. The results revealed six statistically significant paths. Table 7.5 shows the path
estimates of the structural model.
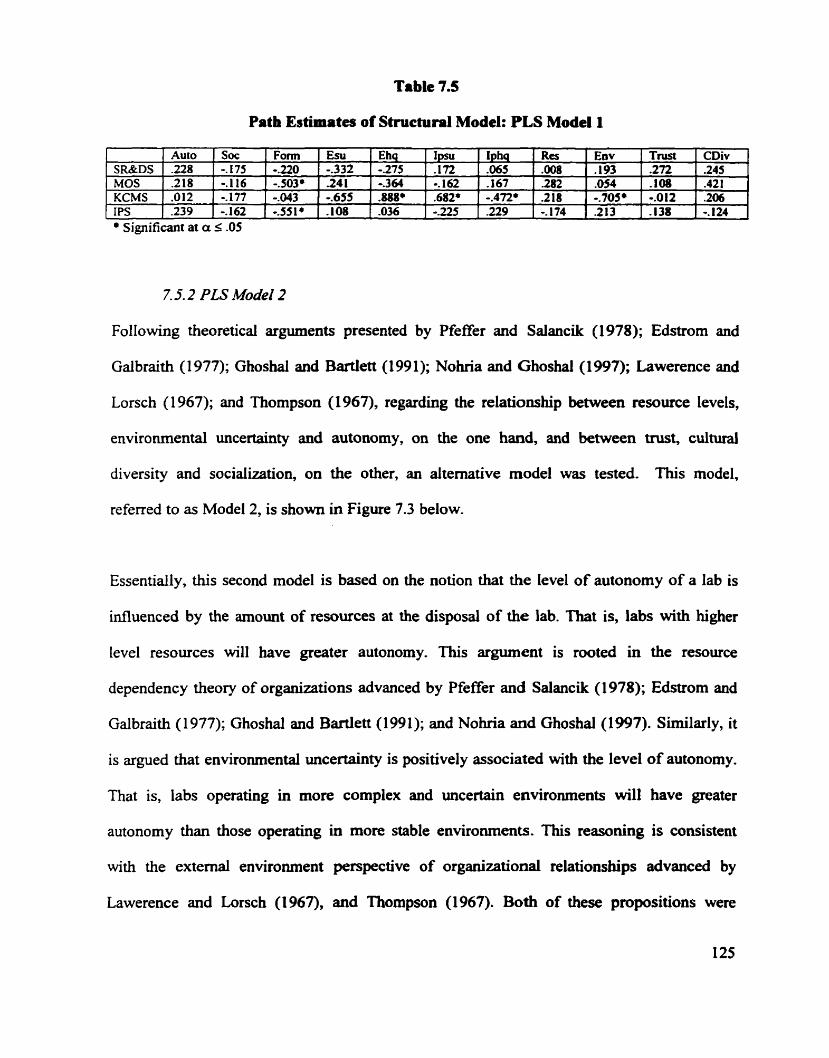
Table 7.5
Path Estimates of Structural Model: PLS Model 1
Signifiant at a ,< .O5
7.5.2 PLS Model 2
Following theoretical arguments presented by PfeEer and Salancik (1978); Edstrom and
Galbraith (1 977); Ghoshai and Bartlett (1991); Nohria and Ghoshal (1 997); Lawerence and
Lorsch (1967); and Thompson (1967), regarding the relationship between resource levels,
environmental uncertainty and autonorny, on the one haud, and between trust, cultural
diversity and socialization, on the other, an alternative model was tested. This model,
referred to as Model 2, is shown in Figure 7.3 below.
Essentiaily, this second model is based on the notion that the Ievel of autonomy of a lab is
influenced by the amount of resources at the disposal of the lab. That is, labs whh higher
level resources will have greater autonomy. This argument is rooted in the resource
dependency theory of organizations advanced by Pfeffer and Salancik (1978); Edstrom and
Galbraith (1977); Ghoshal and Bartlett (1991); and Nohrïa and Ghoshal(1997). Similady, it
is argued that environmental uncertainty is positively associated with the level of autonomy.
That is, labs operating in more complex and uncertain environments will have greater
autonomy than those operating in more stable environments. This reasoning is consistent
with the extemal enviromnent perspective of organizational relationships advanced by
Lawerence and Lorsch (1967), and Thornpson (1967). Both of these propositions were
empirically verified by Pfeffer and Salancik (1978) and Nohria and Ghoshd (1997). Trust
and cultural diversity were also shown to be critical elements in fostering the socialization
process in muiti-unit global corporations like MNCs (Schein, 1968; Ouchi, 1980; Ring and
Van de Ven, 1992; Nohria and Ghoshal, 1997; Edstrom and Galbraith, 1977). Essentially,
when trust is established among the various organizational units there is increased
socialization. Simïlarly, when cultural diversity is low, there is greater socialization.
However, when cultural diversity is high, socialkation will take place but would require
more deIiberate policies and efforts to achieve.
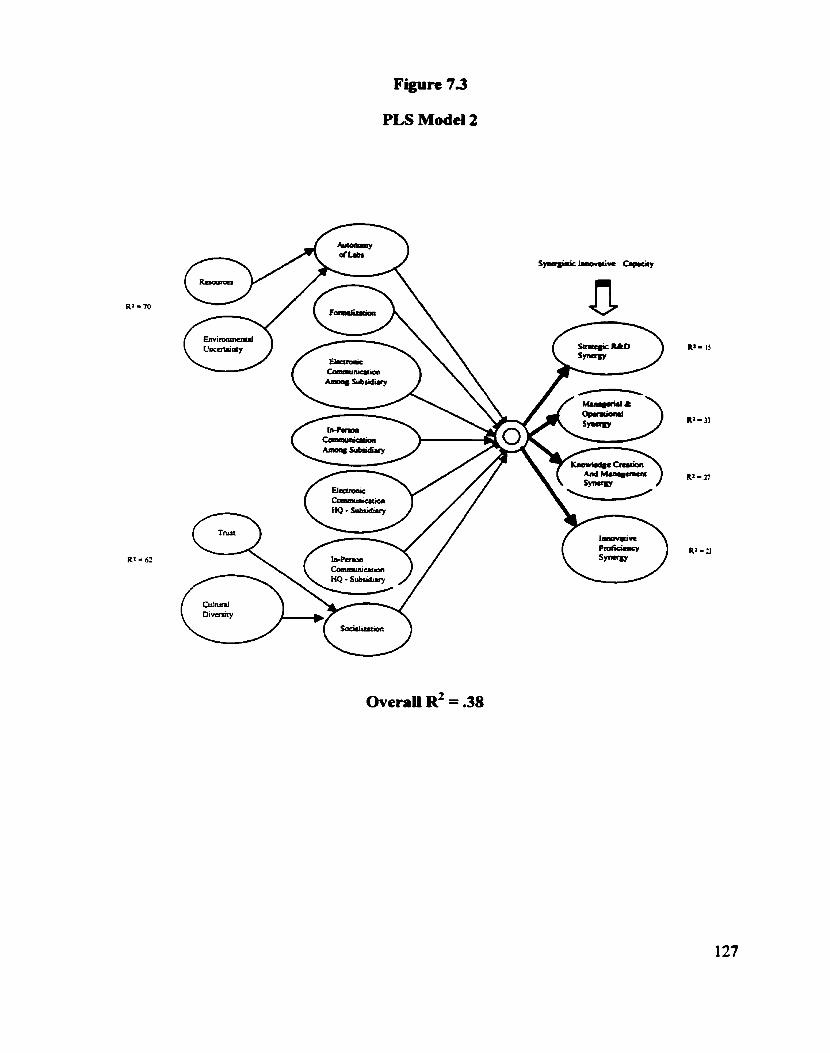
Figure 7 3
PLS Mode1 2
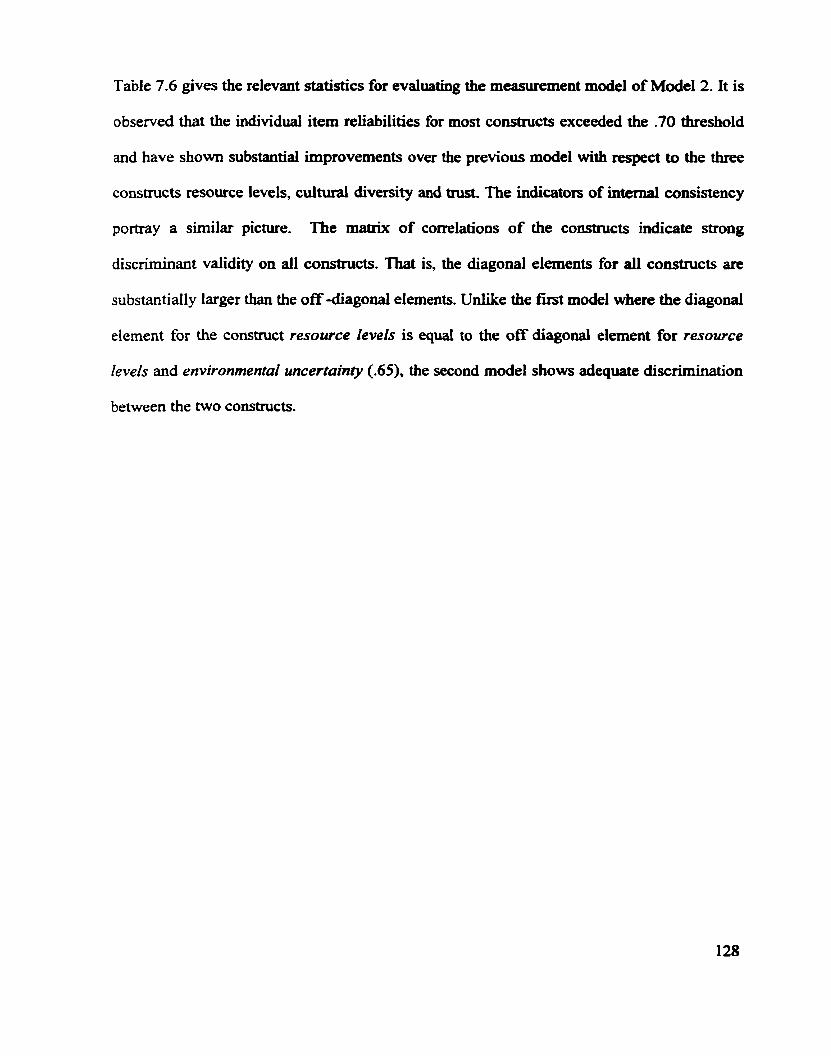
Table 7.6 gives the relevant statistics for evaluating the measurement model of Modei 2. It is
observed that the individual item reliabilities for most constructs exceeded the .70 threshold
and have shown substantial irnprovements over the previous model with respect to the three
constructs resource levels, cultural diversity and trust. The indicators of internal consistency
portray a similar picture. The ma& of correlations of the constnicts indicate strong
discriminant validity on al1 wnstnicts. That is, the diagonal elements for al1 constructs are
substantiaiiy larger than the off -diagonal elements. Unlike the first model where the diagonai
element for the construct resozuce levels is equal to the off diagonal element for resource
levels and environmental uncerfainty (.65), the second model shows adequate discrimination
between the two comtructs.
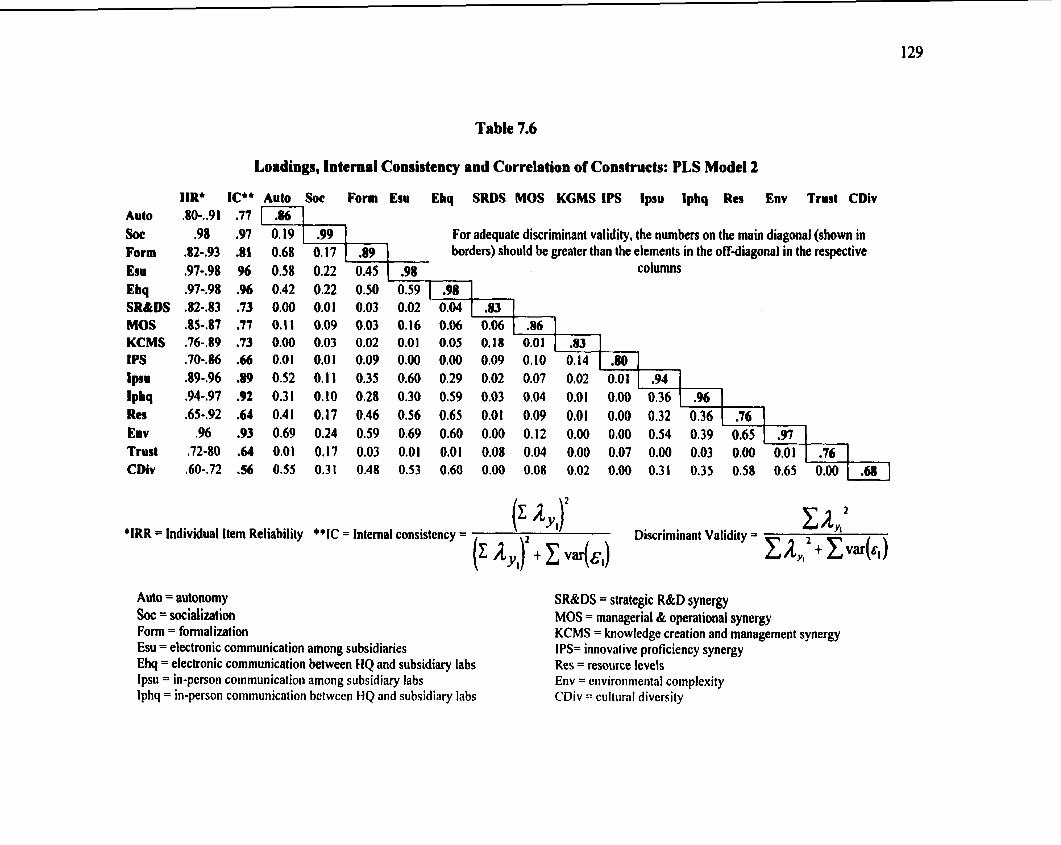
Table 7.6
Loadings, Internal Consistency and Correlation of Constructs: PLS Mode1 2
IIR* IC** Auto Soc Form Esu Ehq SRDS MOS KCMS IPS lpsu Iphq Rcs Env Trust CDiv Auto .80-..91 .77 E l Soc .98 .97 0.19 1 .99 \ .98 For adequate discriminant validity, the numbers on the main diagonal (show in Form .82-.93 .81 0.68 0.17 borders) should be greater than the elements in the offdiagonal in the respective Esu ,97-.98 96 0.58 0.22 0.45 columns Ebq .97-.98 .% 0.42 0,22 0.50 0.59 SR&DS .82-.83 .73 0.00 0,01 0,03 0.02 MOS KCMS IPS lpsu Iphq Res Env Trust CDiv
+IRR = lndividuat Item Reliability **IC = Intemal consistency = Discriminant Validity =
Auto = autonomy SR&DS = strategic R&D synergy Soc = socialization MOS = managerid & operational synergy Form = formalization KCMS = knowledge creation and management synergy Esu = electronic communication among subsidiaries IPS= innovative proficiency synergy Ehq = electronic communication between HQ and subsidiary labs Res = resource levels lpsu = in-person corn muni cati or^ among subsidiary labs Env = environmental complexity Iphq = in-person communication bctween H Q and subsidiary labs CDiv = cultiiral diversity
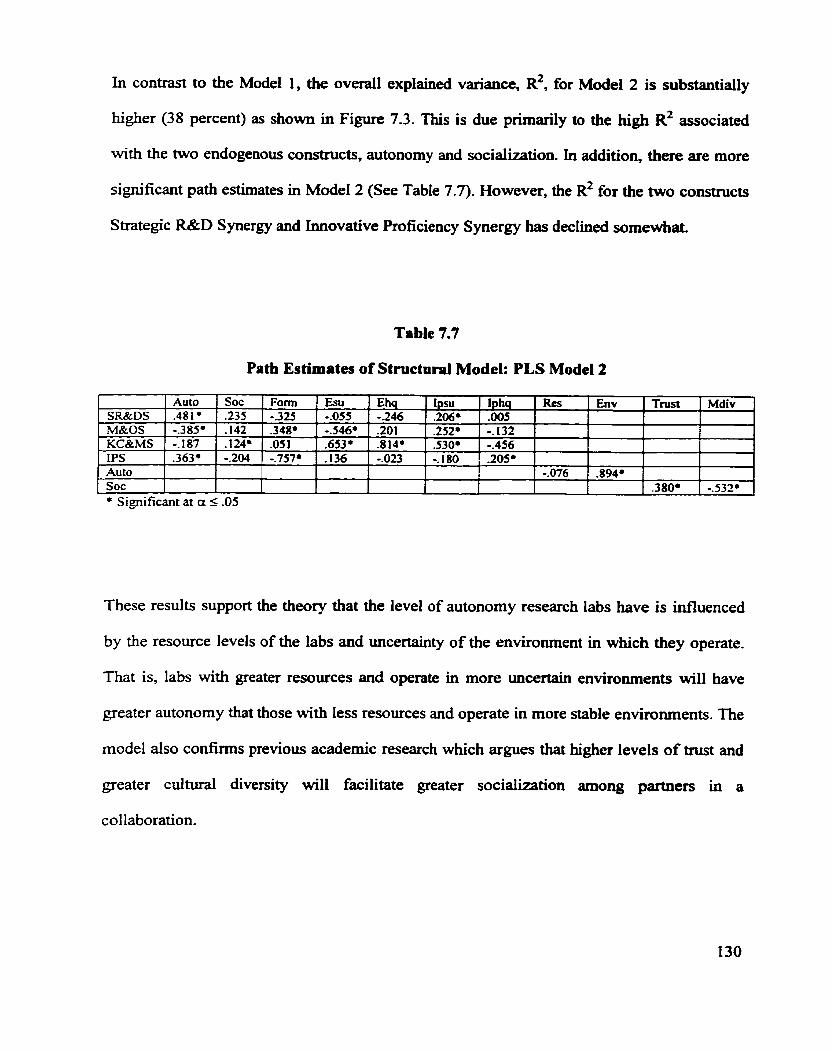
In contrast to the Model 1, the overall explaineci variance, R ~ , for Model 2 is substantially
higher (38 percent) as shown in Figure 7.3. 'Iàis is due primarily to the high R~ associated
with the two endogenous constnicts, autonomy and socialization. In addition, there are more
signifiant path estimates in Mode1 2 (See Table 7.7). However, the R~ for the two constructs
Strategic R&D Synergy and hovative Proficiency Synergy has declined somewhat.
Table 7.7
Path Estimates of Structural Model: PLS Model 2
* Signifiant at a 5 .O5
These results support the theory that the level of autonomy research labs have is infïuenced
by the resource levels of the labs and uncertainty of the environment in which they operate.
That is, labs with greater resourçes and operate in more uncertain environments will have
greater autonomy that those with less resources and operate in more stable environments. The
mode1 also confirms previous academic research which argues that higher levels of trust and
greater cuitural diversity will facilitate greater socialization arnong partners in a
collaboration.
The resuits also indicate that Model 2 formulation is statisticdy more appealing in that it
provides greater explanation - the overall R~ is 1 1 percent more than Model 1 - and a larger
nurnber of path estimates are statistically significant.
In terms of the four dimensions of synergistic innovative capacity, the following statistically
significant relationships are observed:
Smtegic R&D Synergy (SR&DS) is positively related to autonomy, socialization and in-
person communication among subsidiaries
Managerial and Operational Synergy (M&OS) is negatively related to autonomy and
electronic communication among subsidiaries but positively related to fonnalization and
in-person communication arnong subsidiaries
Know[edge Creation and Management (KCBrMS) is positively related to socialization,
communication with HQ (both electronic and in-person) and in-person communication
among subsidiaries
Innovative Projkiency Synergy (IPS) is positively associated with autonomy and
socialization and negatively to formalization
In addition, some path estirnates are not statistically significant while a few others are close
to zero. In strictly statistical tenns, these paths can be eliminated fiorn the mode1 since their
contribution to expiaining the variations in the dependent variables are insignificant. Also,
because of the small sarnple size, statistical power to detect some non-zero paths may be too
iow. Statistically insignificant paths do not mean that these paths are not theoretically
important. On the contrary, it means that they do not add further explanation over and above
that of the significant paths. However, these paths are retained because they lend greater
theoretical plausibility to the mode1 and are consistent with previous studies.
A detailed analysis of the reasons for and implications of these finduigs in relation to the
research question of this study is deferred to chapter 10 (Discussion and Implications) where
both the quantitative and qualitative findings can be incorporateci.
7.6 Summary of PLS Findings
The preceding PLS analysis have produced several important f'indings regarding the nature of
the relationship between the dependent variable, Synergistic Innovative Capacity, and the
five independent variables (Autonomy, Socialization, Formalization, HQ-subsidiary
Communication, and inter-subsidiary Cummunicafion) and the four moderating variables
(Resource Levels, Environmental Uncertainty, Levels of Trust, and Cultural Diversity). For
convenience and at the risk of k ing repetitive, these hdings are summarized below.
First, it is noted that the statistical properties (individual item reliabilities, internai
consistency and discriminant vaiidity) of the PLS models are above cornmonly used
threshold levels. This Unplies that the PLS measurement models are both reliable and valid
and therefore inferences cm be drawn regarding the structural relationships among the
constmcts, In other words, vaîid inferences c m be drawn regarding the relationship between
the dependent, independent and moderating variables used in the analysis.
Second, it is observed that the dependent variable, Synergistic Innovative Capaciry, is
comprised of four components, which together provide a relatively good description of the
constmct. The four components are Stmtegic R&D Synergy, M a ~ g e r i d and Operatiord
Synergy, Knowledge Creation and Management Synergy, and humvative Proficiency
Synergy.
%rd, the four moderating variables appear to have greater explanatory effect when they are
treated as antecedents instead of moderators as s h o w in Model 2. Not oniy is Model 2
statistically more appealing, it is also theoretically plausible.
Fourth, the independent variable Socialization has a strong and positive impact on three of
the four components of synergy, narnely, Strategic R&D Synergv, Knowledge Creation and
Management Synergv, and Innovative Proficiency Synergy (Table 7.8). In the regression
andysis, Socializarion had a similar effect on these components.
Fim, the independent variable Autonomy has a positive influence on Swiegic R&D Synergy
and Innovative Proficiency Synergy but a negative influence on Managerial and Operational
Synergv (Table 7.8).
Sixth, the independent variable Formakation has a positive impact on Managerial and
Operational Synergy but a negative impact on Innovative Proficiency Synergy (Table 7.8).
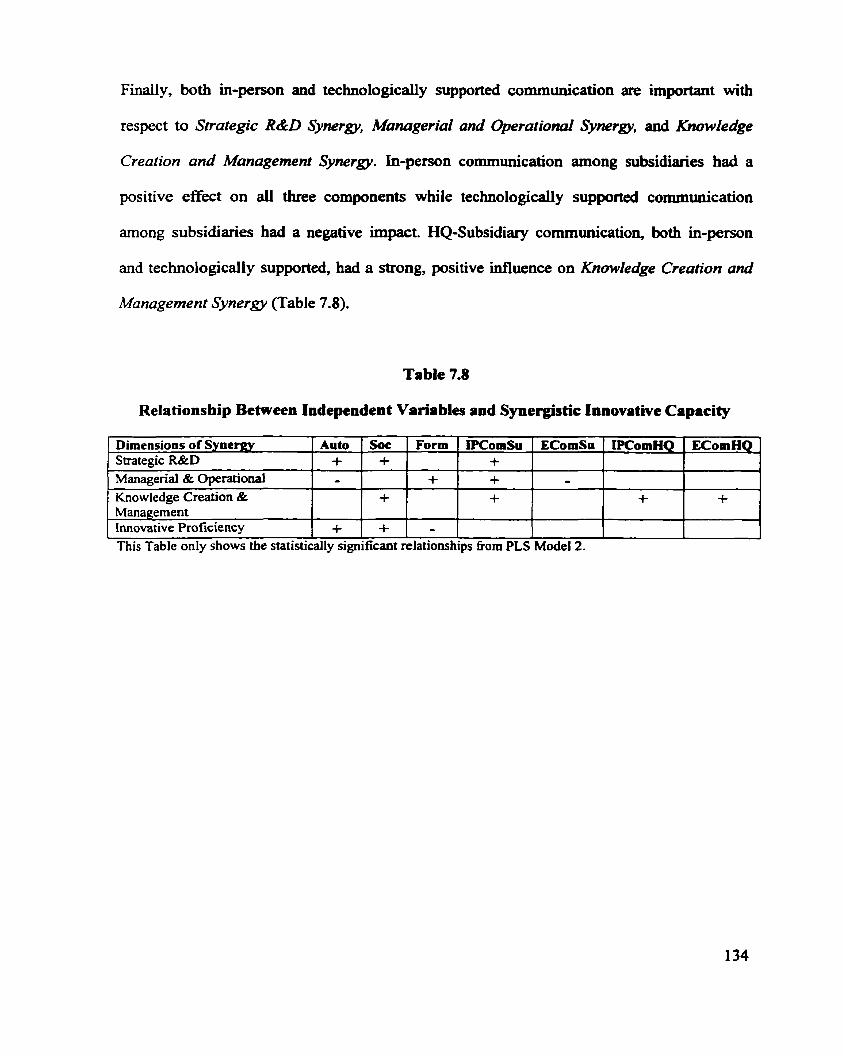
Finally, both in-person and technologically supported communication are important with
respect to Snategic R&D Synergy, Managerial and Operat io~l Synergy, and ffiowledge
Crearion and Management Synergy. In-person communication among subsidiaties had a
positive effect on al1 three components while technologically supported cornmuuication
among subsidiaries had a negative impact. HQ-Subsidiary communication, both in-person
and technologically supported, had a strong, positive influence on Knowledge Creation and
Management Synergy (Table 7.8).
Table 7.8
Relationsbip Between Independent Variables and SynergWtic Innovative Capacity
I I
This Table only shows the statistically significant relationships fiom PLS Model2.
Dimensions of Syaergy Strategic R&D Managerial & Operational Knowledge Creation & Management Innovative Proficiency
iPComSu + + +
Auto + -
+
EComSu
- Soc +
+ +
Form
+
IPComHQ
+ -
EComHQ
+
Chapter 8
Organization of International R&D
8.1 Introduction
Chapters 8 and 9 discuss the strategies MNCs use to organize and coordinate their
international R&D activities. Some of the strattegies overlap and are interdependent.
However, to streamline the discussion, they are presented in two separate chapters. This
chapter presents the findings on how MNCs organize their intemational R&D activities. The
next chapter discusses the strategies MNCs use to coordinate and integrate their international
R&D activities. The discussion draws heavily on information provided by the respondents
who were interviewed by telephone.
Several respondents stated that a cntical issue in effectively organizing global R&D is king
able to maintain an appropriate balance between centralized and decentraiized research. This,
they argue, is perhaps the most challenging and elusive goal facing international R&D
managers, and academic researchers are also stniggling to propose strategies to achieve this
balance in a practical way. Three concems were raised by some participants of this study
regarding the organization of international R&D. These are as follows:
1. What research activities should be done overseas and what should be done at
home?
2. How to integrate central R&D and overseas R&D into a seamless whole?
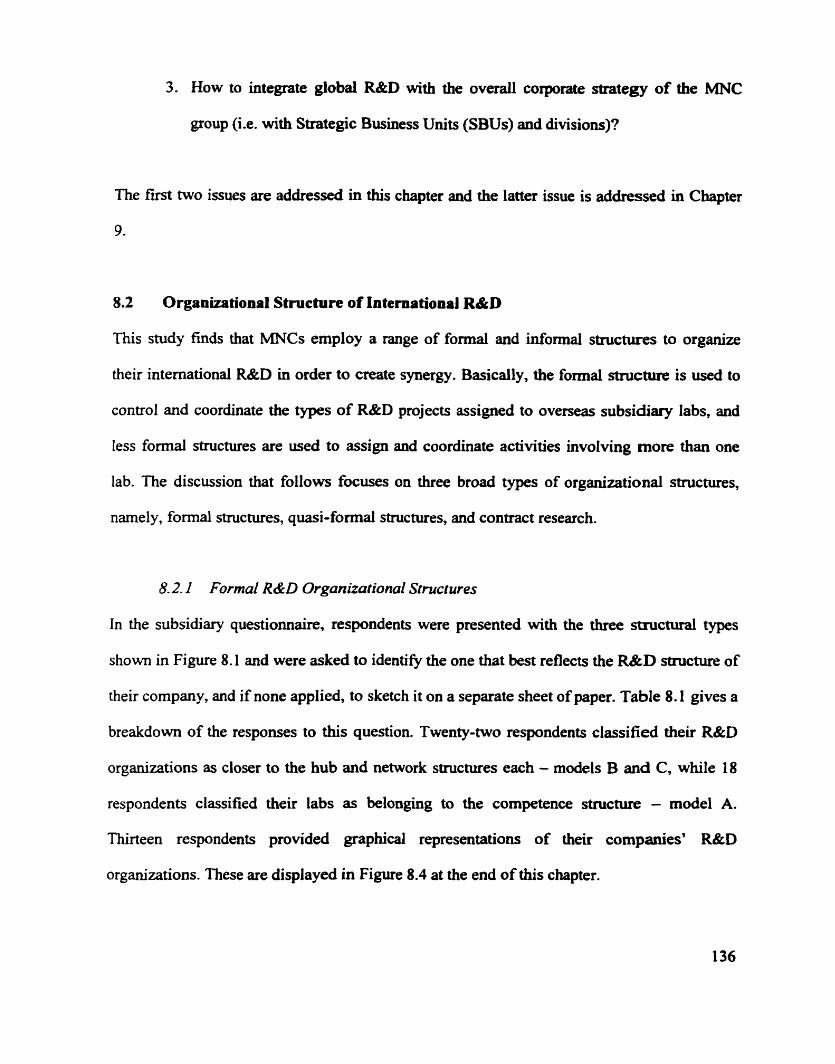
3. How to integrate globai R&D with the overaii coprate strategy of the MNC
group (Le. with Strategic Business Units (SBUs) and divisions)?
The first two issues are addressed in this chapter and the latter issue is addressed in Chapter
9 -
8.2 Organizational Structure of International R&D
niis snidy finds that MNCs employ a range of fomal and informal structures to organize
their international R&D in order to create synergy. Basically, the formal structure is used to
control and coordinate the types of R&D projects assigned to oveneas subsidiary labs, and
less formal structures are used to assign and coordinate activities involving more than one
lab. The discussion that follows focuses on three broad types of organizational structures,
namely, forma1 structures, quasi-formai structures, and contract research.
8.2.1 Formal R&D Organizational Structures
In the subsidiary questionnaire, respondents were presented with the three ~ c t u r a l types
shown in Figure 8.1 and were asked to identiw the one that best reflects the R&D structure of
their Company, and if none applied, to sketch it on a separate sheet of paper. Table 8. L gives a
breakdown of the responses to this question. Twenty-two respondents classified their R&D
organizations as closer to the hub and network structures each - models B and C, while 18
respondents classified their labs as belonging to the cornpetence structure - mode1 A.
Thirteen respondents provided graphical representations of theü companies' R&D
organizations. These are displayed in Figure 8.4 at the end of this chapter.
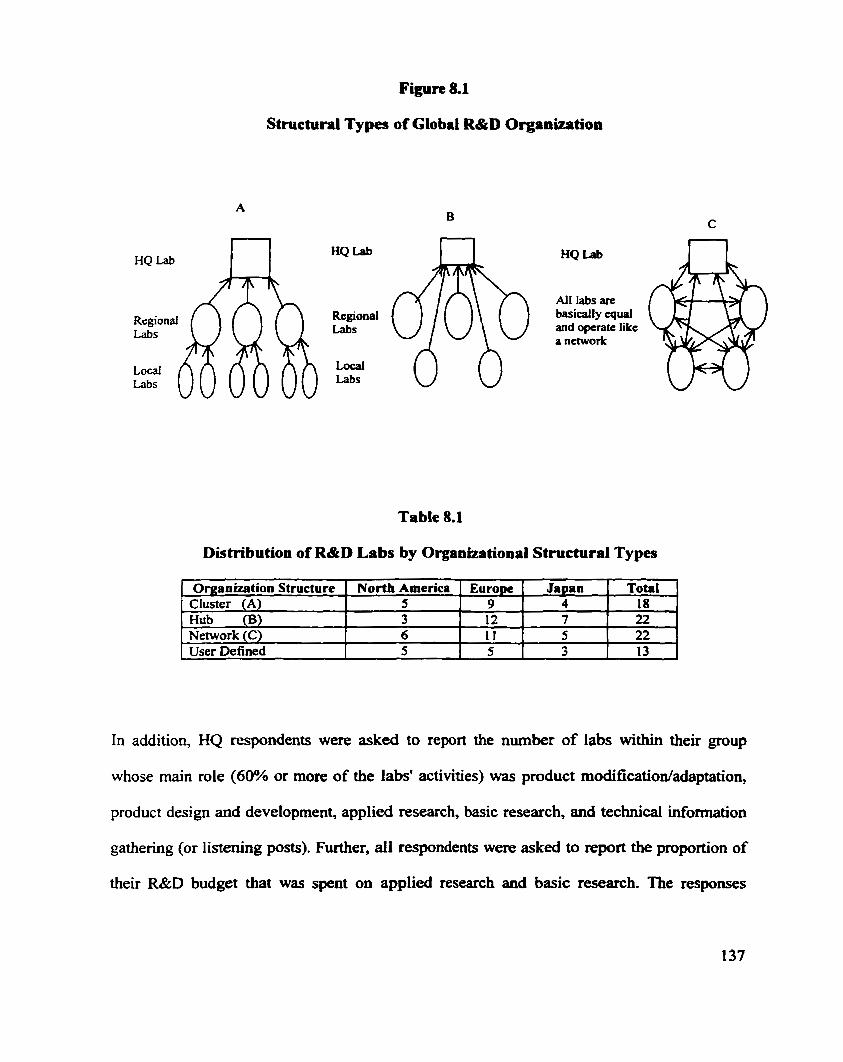
Figure 8.1
Structural Types of Global R&D Orgaaizatïon
Regionai Labs
Local Labs
Regional Labs
Local Labs
Al1 labs arc basicaity quai and operate likc a nawork
Table 8.1
Distribution of R&D Labs by Organizational Stmctural Types
1 Organization Structure 1 North America 1 Europe 1 Japan 1 Total 1
In addition, HQ respondents were asked to report the number of labs within their group
whose main role (60% or more of the labs' activities) was product modification/adaptation,
product design and development, applied research, basic research, and technical information
g a t h e ~ g (or listenhg posts). Further, al1 respondents were asked to report the proportion of
their R&D budget that was spent on applied research and basic research. The responses
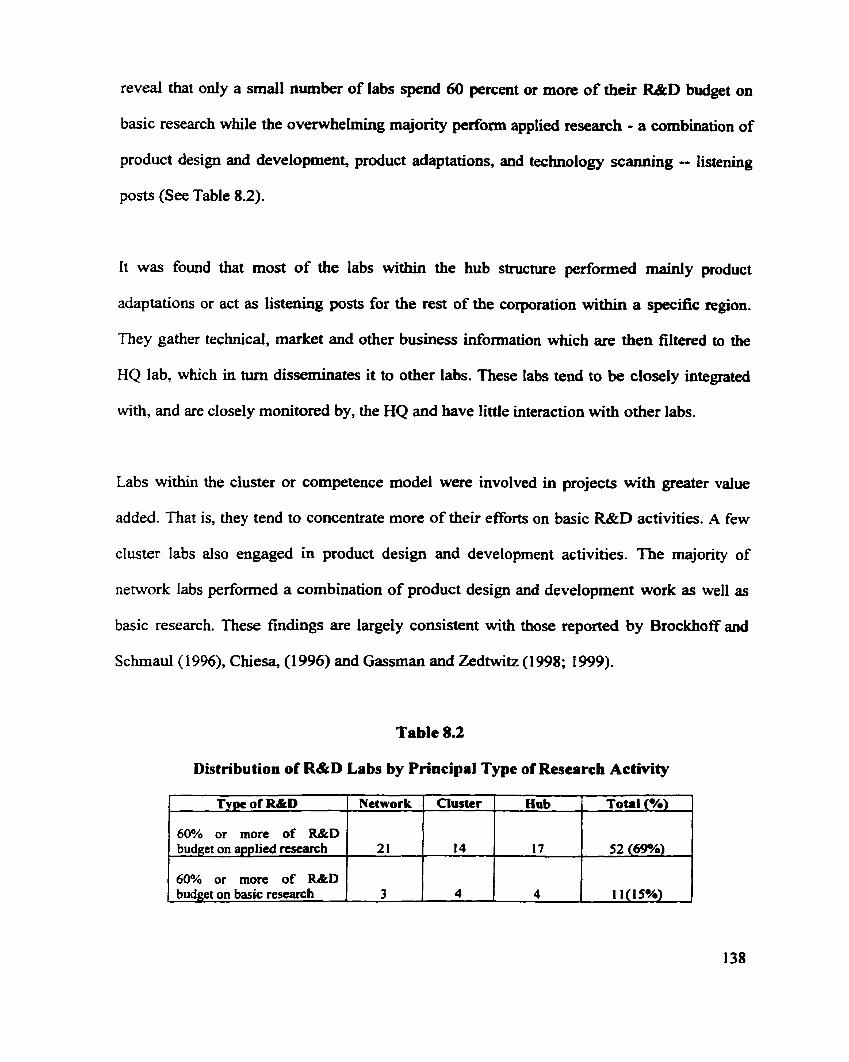
reveal that only a smail number of labs spend 60 percent or more of their R&D budget on
basic research while the ovemhelming majority perfonn applied research - a combination of
product design and development, product adaptations, and technology scanaing - listening
posts (See Table 8.2).
It was found that most of the labs within the hub structure performed mainly product
adaptations or act as listening posts for the rest of the corporation within a specific region.
They gather technicd, market and other business information which are then filtered to the
HQ lab, which in mm disseminates it to other labs. These labs tend to be closely integrated
with, and are closely monitored by, the HQ and have little interaction with other labs.
Labs within the cluster or cornpetence mode1 were involved in projects with greater value
added. That is, they tend to concentrate more of their efforts on basic R&D activities. A few
cluster labs also engaged in product design and development activities. The majority of
network labs performed a combination of product design and development work as well as
basic research. These findings are largely consistent with those reported by Brockhoff and
Schmaul(1996), Chiesa, (1 996) and Gassman and Zedtwitz (1998; 1999).
Table 8.2
Distribution of R&D Labs by Principal Type of Research Activity
Type of R&D
60% or more of R&D budget on applied rexarch
60% or more of R&D budget on basic research
Network
21
Cluster Hub
3
Total (OA)
14
4
17 52 (69?/0)
4 1 1 (1 5%)
The R&D organization charts depicted in Figure 8.4 indicate that in order to o r g e their
global R&D activities effectively, MNCs have created various types of labs around a
particular technology or technology platform. The types of labs range from corporate labs for
a particular country, to regional labs, to divisional labs and uitimately individual labs. These
charts show the vertical links or reporting relationships of the labs but rarely shows the
horizontal or lateral links among the labs. This is because the lateral links among wrporate
labs, regionai labs, divisional labs and individual labs are primarily less formal and usuaiiy
take place outside the formai structure.
8.2.2 Quasi F o r d Organizutiond Strucfures
In addition to using the formai structure to coordinate and integrate global R&D, MNCs also
use a number of Iess formai or quasi-formal organizational structures. These structures do not
fail within the strict purview of either the formal or informal structures but lie somewhere
between these two points. These structures pertain to the use of multifunctional, cross-
national project teams and segrnenting the corporate research agenda according to strategic
focus and assignuig various projects to different groups.
The uniqueness of these quasi-formal structures is that they tend to happen outside the formal
structure in the sense that they have limited life span, and authority is mostly based on the
technical expertise and personality of those involved. For example, when a multi-fùnctional
team is formed to work on a specific project with a limited Iife span, the project team usually
operates as a relatively independent group, and the authority of the project leader or team is

based on their technical expertise, personality and strategic significance of the project. ïhey
do not have line authority and are not usually placed under Liw authority.
Many sampie labs have rnulti-bctionai cross-national teams that work on dedicated projects
which benefit not only their lab but also other labs withiu the MNC group. These projects
tend to have a limited life span and team members may return to their originai jobs or are
transferred to another department or project.
Several labs indicated that their cornpanies have pnoritized their corporate R&D agendas
according to strategic focus in order to facilitate coordination and integration of R&D on a
global scale. For example, one Japanese company classifies al1 its R&D projects into either
"global projects" or "local contribution projects." In this company, global projects usually
invoIve the HQ lab and severai overseas labs. Local contribution projects are usually product
modification R&D for the local market which may be a region, for example, Asia or South
Amerka. In this company, one local contribution lab located in Singapore is serving the
product needs of al1 îhe company's production facilities in Asia.
In another company, global R&D is broken down into three categones, strategic projects,
çore projects and product development projects. Strategic projects involve more basic
research, have a life span of 10-15 years, draw on the expertise of a wide range of labs and
R&D people, are usually larger than any single lab can handle, and top management is the
champion of the projects. These projects are intended to set new strategic directions for the
company. Core projects, on the other hand, tend to be of shorter duration and is used to

coordinate the development of several technologies. These projects tend to cut across
technology fields and departments and are aimed at creating new technologies using the
existing expertise of the company. Product development R&D relates to the refinement of
existing technologies and products to new trends in the market.
Another company uses the concept of "core technologies" to guide its research agenda. In
this company, the technology pladorm is developed at the HQ lab or at one of its corporate
lab and then transferred to other labs where small variations may be effected. To ensure
standardization, those R&D labs wishing to modi@ the platfom must provide adequate
justification of the changes in terms of resources, capability, and market potentiai.
Several labs in this study reported that the Chief Technology Officer (CTO) plays a criticai
role in the coordination and integration of their global R&D program. A number of corporate
labs indicated that their CTOs are very senior persons assigned fiom corporate HQ to ensure
the overseas labs are adequately equipped to do their job and to maintain close contact with
the HQ. In a couple of Japanese corporate labs, the CTO for both the United States and
Europe are board members of the corporation. Regular meetings among the heads of the
corporate labs and the HQ lab help ensure effective planning and coordination of research
pro gram S.
8.2.3 Contracr Research
Apart fiom the formal and quasi-formal structures described above, labs in this study also
reported that they perfocm contract or sponsored research for various business units within

the company on a routine basis. With contract or sponsored research the Strategic Business
Units (SBUs) or divisions request that specific research projects be camied out for them by
R&D, and the SBUs or divisions making the request usuaiiy pays for the research. Since
R&D labs do not start projects autonomously, they are actively encouraged to compete for
projects fiom the SBUs. In one North American MNC, the company's corporate labs must
compete with extemal organizations for the R&D contracts of SBUs because SBUs are now
allowed to acquire technology by either doing their own M D , or going to a university, to a
govenunent lab, or even to a cornpetitor. The only restriction is that the SBUs must not cut
their funding to the corporate labs by more than 20 percent in any one year.
In the sample of firms in this study, contract research appears to be more widespread among
North Arnerican and European MNCs than among Japanese MNCs. Most Japanese MNCs
still perform mainly independent research as opposed to contract research. However, one
respondent thinks that this practice would likely change as R&D budgets get tighter. Among
some North American and European R&D labs, contract research represents about 50 to 70
percent of their funding. Only a few of labs that perform contract research exclusively. One
prominent Japanese company recently reduced the level of contract research h m 70 to 55
percent.
Contract research is consistent with decentralized R&D structures because decisions
regarding R&D is delegated to individual business units. From a corporate perspective,
contract research of the type described here couid increase the complexity of managing the
R&D activities of business units because of the fieedom to choose R&D partners. Despite
these challenges, many MNCs are experimenting with new ways to organize international
R&D activities and to assist them in deciding what activities should be done in-house within
the Company, what should be contracted out, and what should be done overseas.
8.2.4 Recenrralization of R&D
fn the introduction to this snidy, it was stated that the trend towards internationalization of
R&D really began around 1985 and since then it has been on the increase. Not only were the
level of R&D expenditures and the number of R&D employees overseas increasing sharply
for most MNCs but so did the number of R&D labs also. Japanese MNCs were seen to be the
ones leading the trend in establishing R&D labs in Europe, North America and Asia,
particularly in the early 1990s. However, since around 1997, a slowdown in the trend
towards the establishment of new labs was observed (Gassman and Zedwitz, 1999; Patel,
1998).
According to interview respondents the slowdown in the number of overseas R&D labs has
to do with the attempt by MNCs to rationalize their international R&D facilities into a few
leading centers to make them more effective and efficient. Coordination problems, escalating
costs and time overruns are the main drivers of this new trend. Many of the smaller labs
were closed, merged with other labs or divested, and larger labs were k ing created. These
are now called corporate labs.
An examination of the R&D organization charts presented in Figure 8.4 reveal that most
companies have corporate labs covering an entire country or region and they tend to focus on
a specific technology group or platform. For example, the company represented by the chart
shown in Figure 8.4.1 now has 7 corporate labs compared to dozens of smail R&D facilities
which were previously located in profit-centers around the world. Simiiarly, the company
represented by chart 8.4.2 has two regional labs - one in Europe and one in Iapan and both of
these labs do ail the R&D for their respective regions on both of the company's two
technology platfoms. The company represented by Figure 8.4.3 has two corporate labs - the
Central Research Lab and the Advanceci Research Lab, three major research centen, and 20
R&D labs around the world instead of 35 small labs which it had previously.
In many of the companies, the corporate labs work on platform technologies which are then
transferred to other local labs which do the adaptive R&D to suit the culture of the local
market. For example, in one automotive MNC, the R&D for the chassis and other key
'invisible parts' are done at the HQ and the local labs perform regional differentiation of the
'visible parts'.
8.2.5 Organirarionai Structures Revisited
It is reasonable to question whether the organization charts presented in Figure 8.4.1 to
8.4.1 1 are really different or îhey seem different due to different graphies. It is contended
here that, although there may be some similarities, there are fundamental differences among
the structures. For example, the R&D organizations represented by Figures 8.4.1 and 8.4.2
share the cornmon elernent of having corporate labs organized by country and technology.
However, in Figure 8.4.2 there is another layer of labs, some of which tend to perform work
across more than one technology platfom and country. These labs tend to have a more global
rather than local focus and may report to another individual at HQ depending on the strategic
significance of the projects the labs are involved in.
Also, it is acknowledged that some of the organization structures described above share
elements that are characteristic of the hybrid structure, matrix structure and project structure,
and this could lead one to characterize the labs as such. It is not unusual for the R&D
organization of a MNC group to display characteristics of the hybnd, matrix and project
structure simultaneously. Consequently, it is contended here that the organization structures
described above are much more complex than either the hybnd, matrix or project structures.
The following arguments are advanced in support of this view.
First, the labs tend to combine features fiom a variety of structures in order to create
flexibility and to increase their effectiveness and efficiency. So while the R&D organization
chart shows corporate labs according to geographic location and technology platforms, the
labs may employ ad hoc international project tearns for specific technologies that may or may
not be re1ated to the technology platfonn of the country where the team is located. For
example, one Japanese corporate lab in the U.K. whose primary focus is fundamental
research into future semiconductor technologies became responsible for a group of scientists
who were located in another part of the U.K. but were working on a Ewopean Union
ESPRIT project involving MIT?, several European parmm and the lab's scientists. The
project was initiated in Japan but the U.K. lab became partiy responsibie for the project
because of its proximity to the European partners. The project was not in semiconductor
technology and was rnostly appiied R&D. In this example, the appropriate structure to
describe this arrangement is uncleat.
Second, in one Company al1 its scientists and engineers fiom across the worid are piaced in
an international pool headed by a single director who then assigns them to pmjects in
different parts of the world. Regardless of where they are located, the scientists and engineers
report to the director of the international pool. Upon completion of the project, the engineers
and scientists retums to the pool and is subsequently reassigned to another usually more
significant project. This is really a virtud pool because the scientists are located in their
home country and may also report their home lab. In some instances, the scientists may
report to the project leader, the R&D manager of the lab, and the director of the international
pool, depending on the project they are assigned. In this setting, there is no 'fixed' structure
as such.
Third, the rate at which these ad hoc international project teams are created and disbanded as
well as the composition and reporting relationships of tearn members rarely fit either the
project, hybrid or matrix structure as described in standard organization theory texts (Da
1998). The fluidity of the structures coupled with the mix of formal and infornial structures
are unique features of these newer forms of structures. It is not unusual to find that in a single
lab some of the scientists and engineers are working on local projects and reporting to the
' Japan's Ministry of Trade and Industry.
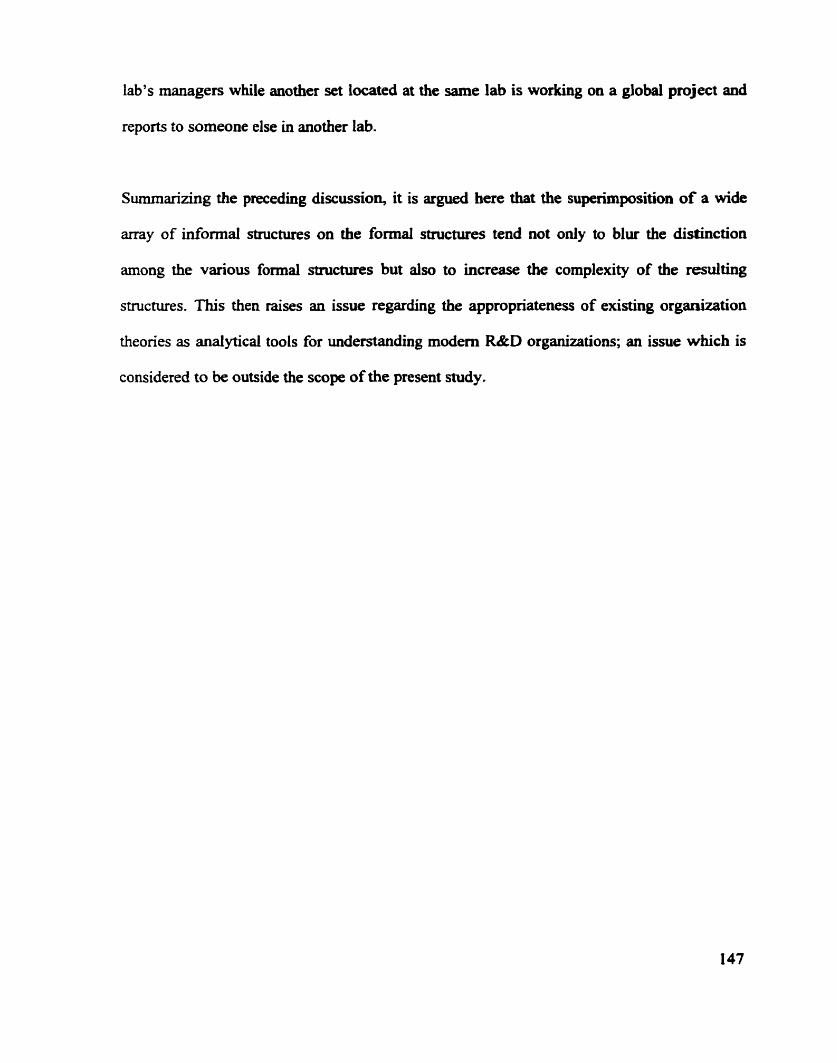
lab's managers while another set located at the same lab is working on a global project and
reports to someone else in another lab.
Summarizing the preceding discussion, it is argued here that the superimposition of a wide
array of informal structures on the formal structures tend not only to blur the distinction
arnong the various forma1 structures but also to increase the complexity of the resulting
structures. This then raises an issue regarding the appropriateness of existing organization
theories as analytical tools for understanding modem R&D organizations; an issue which is
considered to be outside the scope of the present study.
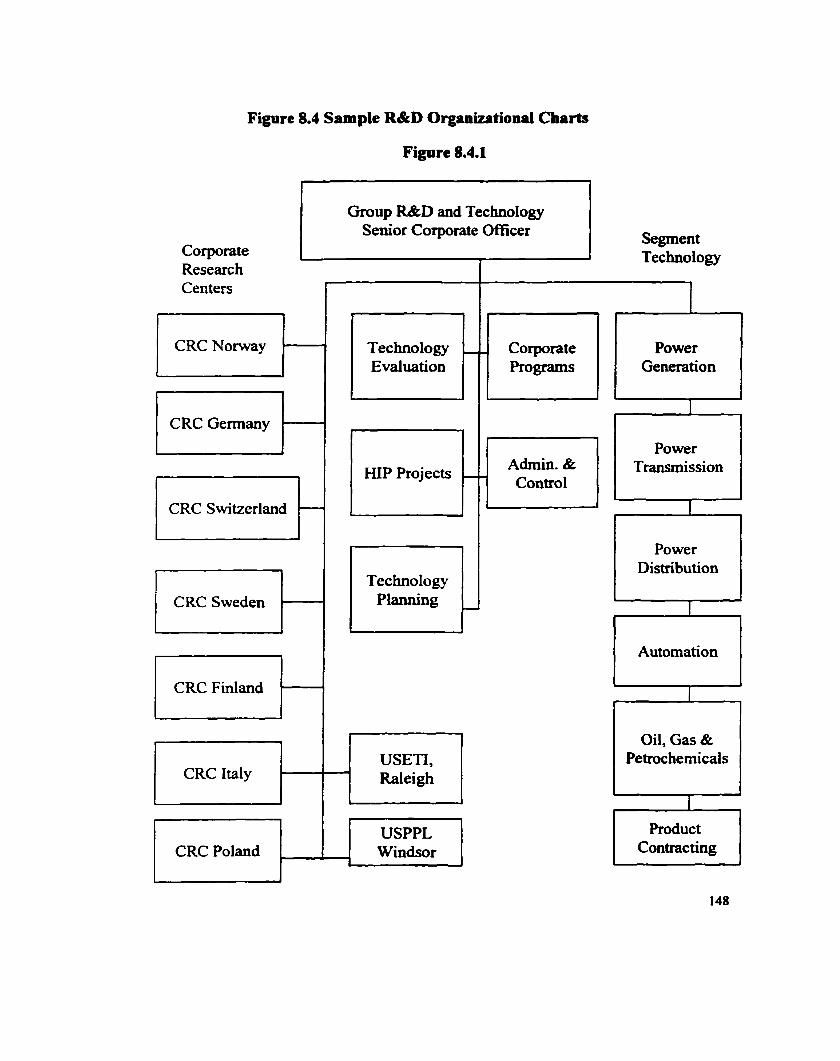
Figure 8.4 Sample R&D Organizational Cbarts
Corporate Researc h Centers
Figure 8.4.1
Group R&D and Technology Senior Corporate Officer
CRC Germany t CRC S witzerland t CRC Sweden s CRC Finland F CRC Italy c
Technology Evaluation
HIP Projects
Technology Planning u
1 Raleigh I USPPL
Segment Technology
Coprate Programs
1
Power Generation
1
Power Transmission
Power Distribution
Automation cl 1
Oil, Gas & Petrochemicals
1
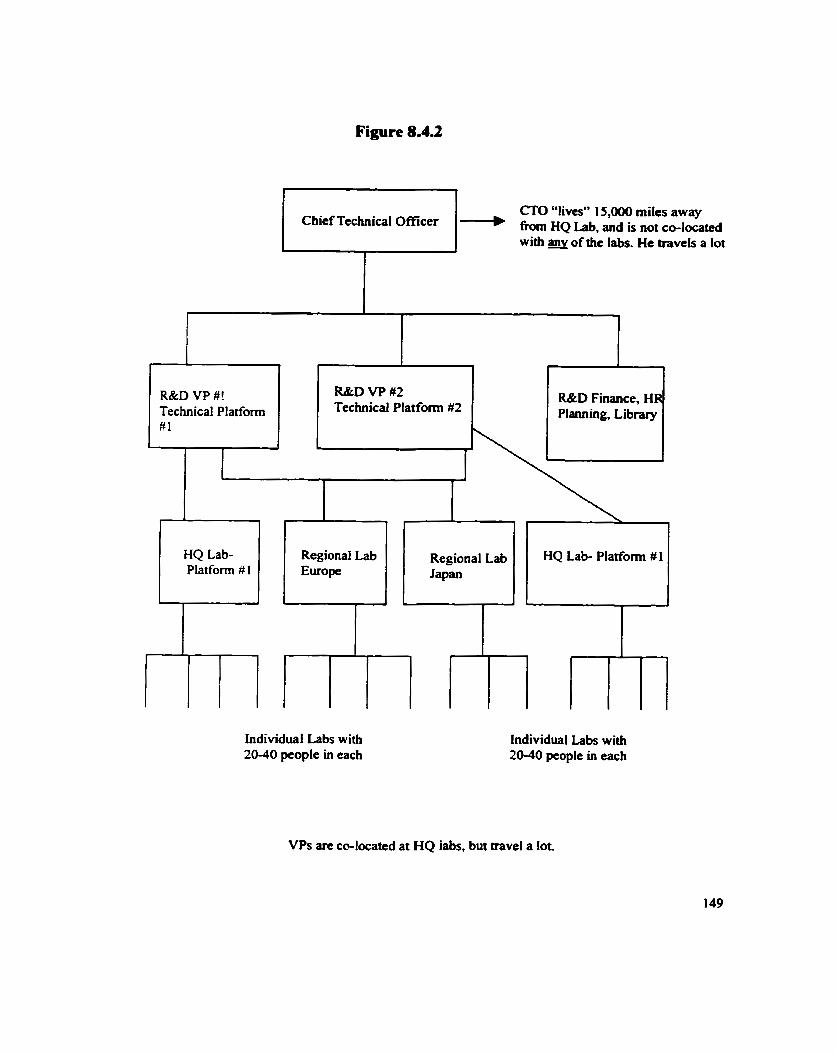
Figure 8.43
CTO "lives" 15,000 miles away - fiom HQ Lab, and is not CO-located with of the labs. He travels a lot
( Technical Platform 1 R&D VP #2 R&D Finance, H Technical Plarform #2 Planning, Library
Individual Labs with 20-40 people in each
I
Individual Labs with 20-40 people in each
HQ Lab- Platform # 1
VPs are co-located at HQ iabs, but aavel a lot.
Regional Lab Regional Lab HQ Lab- Platfofm Europe Japan
#
Figure 8.4.3
Figure 8.4.4
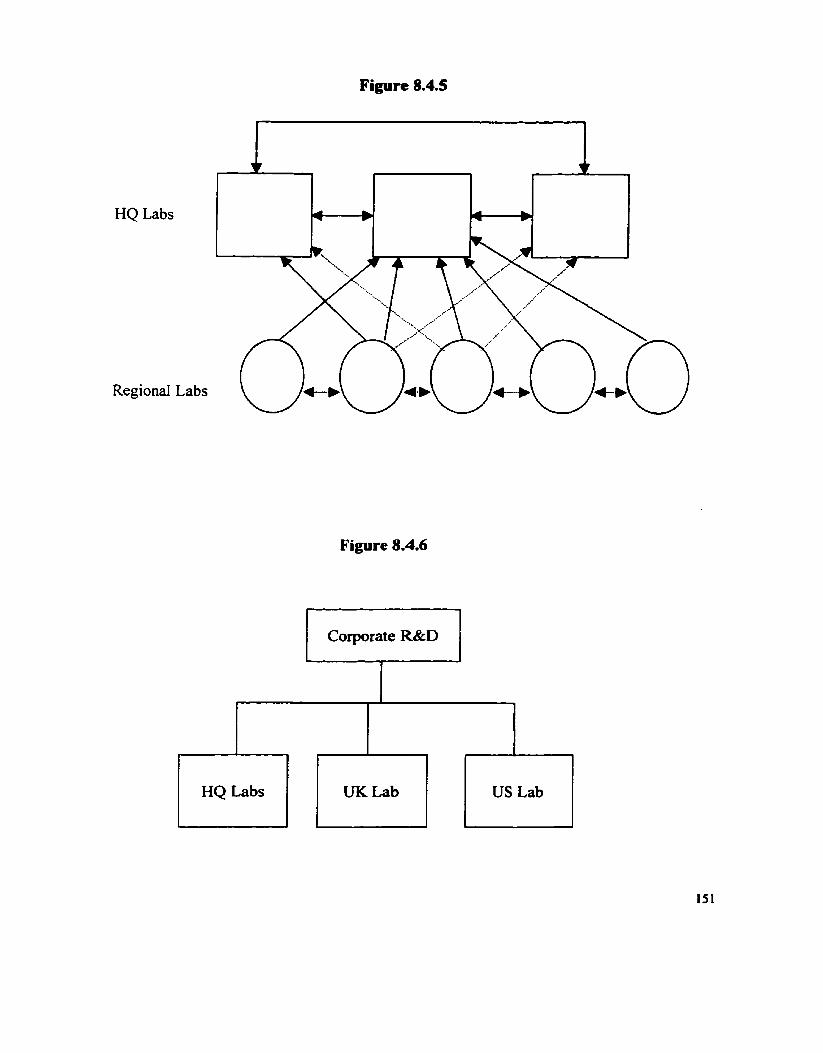
HQ Labs
Reg ionai Labs
Figure 8.4.6
Corporate R&D I

Figure 8.4.7
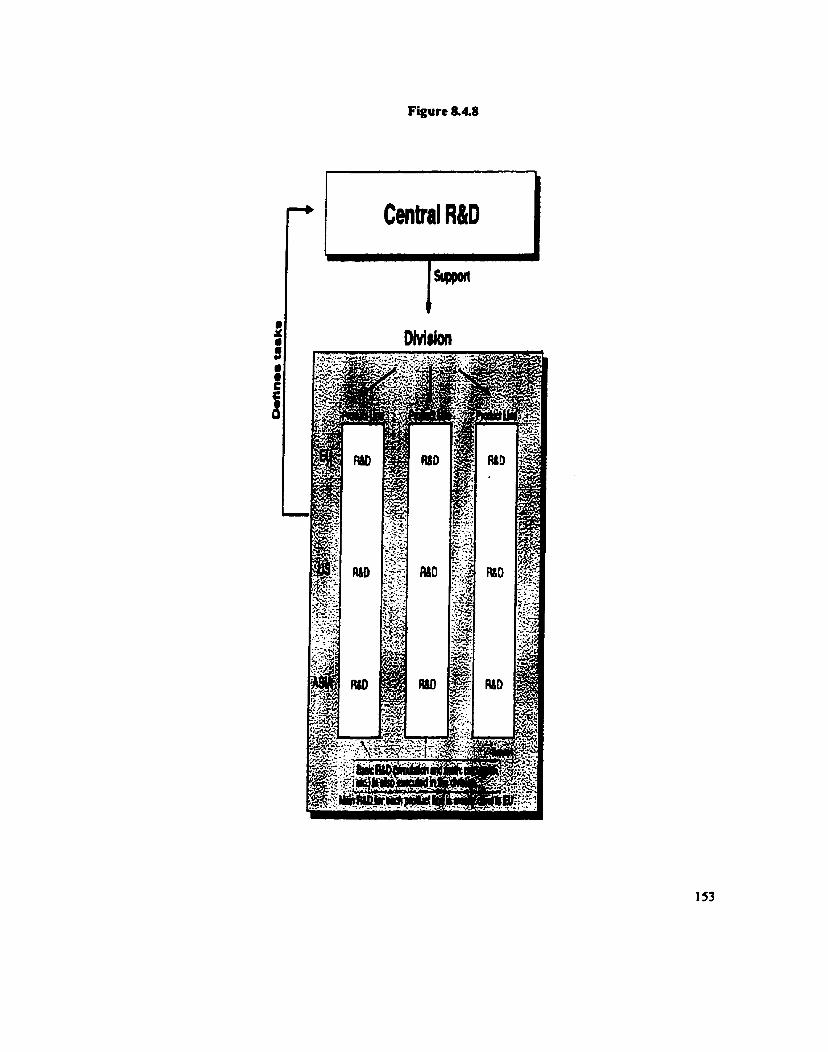
Figure 8.4.8
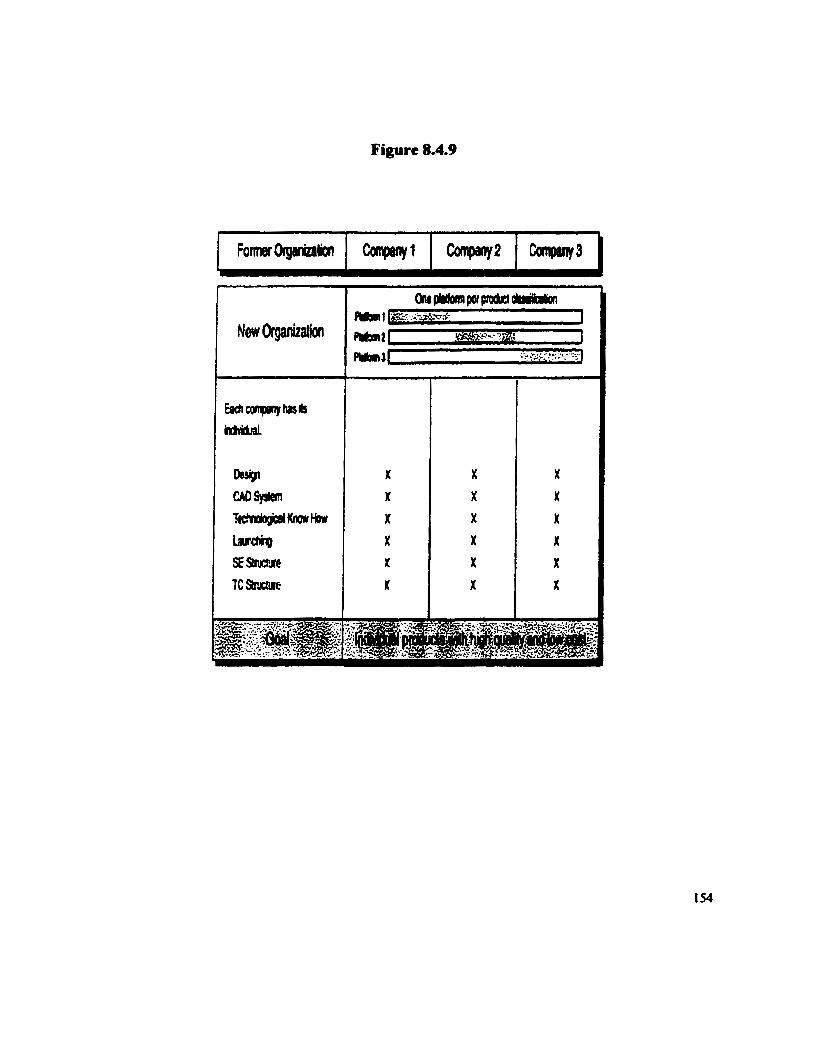
Figure 8.4.9

Figure 8.4.10
CORPORATE RESEARCH CENTER
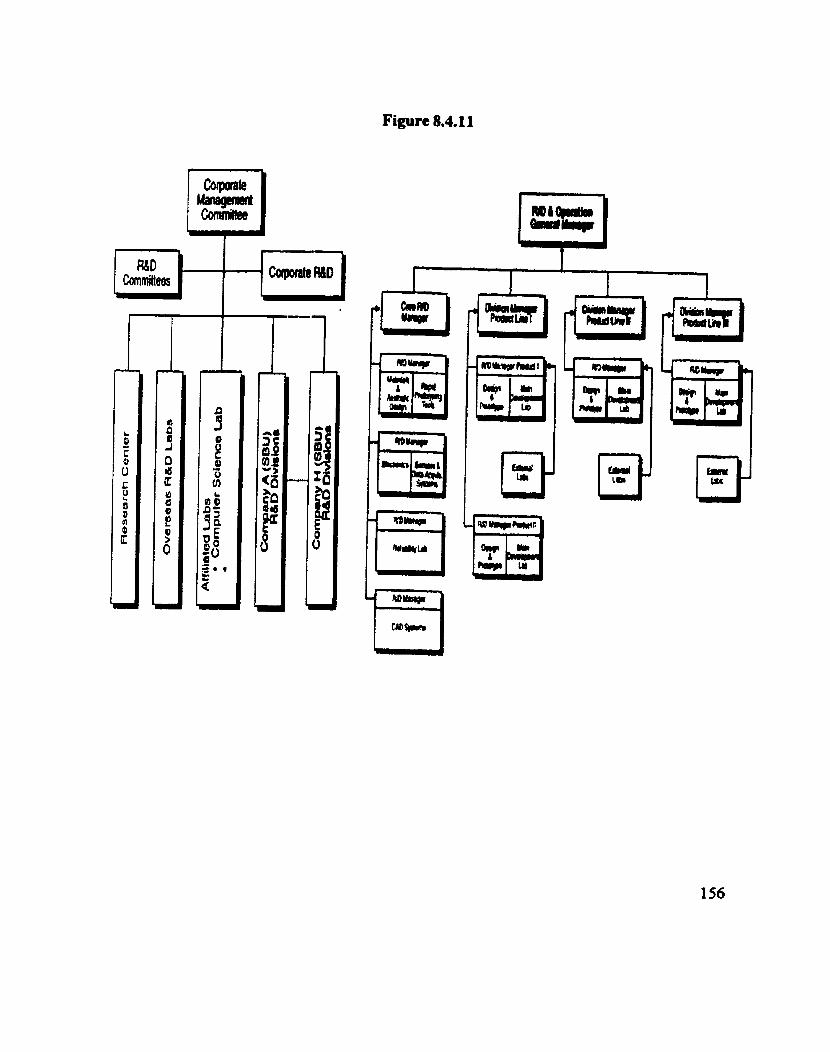
Figure 8.4.1 1
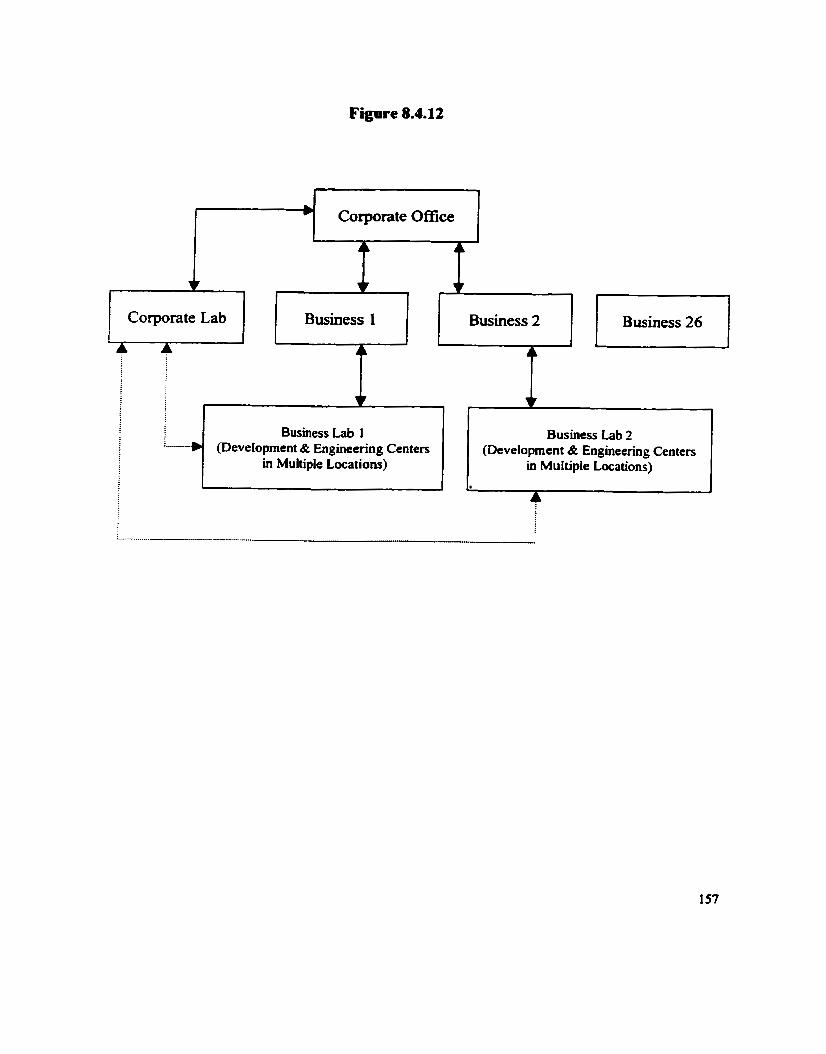
Figure 8.4.12
m Corporate Office I l
A
* w
Corporate Lab Business I
A A 4 A 1 w v
Business 2
-)
Business 26
A A
---
Business Lab 1 (DeveIopment & Engineering Centers
in Multiple Locations)
Business Lab 2 (Development & Engineering Centers
in MuItiple Locations)
Chapter 9
Coordination Structures in International R&D
9.1 Coordination Issues and Structures
The previous chapter describes some of the structures -itiNCs use to organize their
international R&D activities. This chapter extends the discussion by examining a broder
range of strategies used by MNCs to coordinate and integrate their international R&D.
Basically, this chapter focuses on how decentralized labs and projects are brought back
together into a well-fùnctioning whole.
MNCs employ a host of formal, informal and quasi-formal strategies to coordinate and
control their international R&D activities. Table 8.9 combines information obtained f?om the
survey questionnaire, telephone interviews, supplementary information provided by some
respondents, and information downloaded fiom the web sites of the companies and labs in
order to give a flavor of the array of strategies employed.
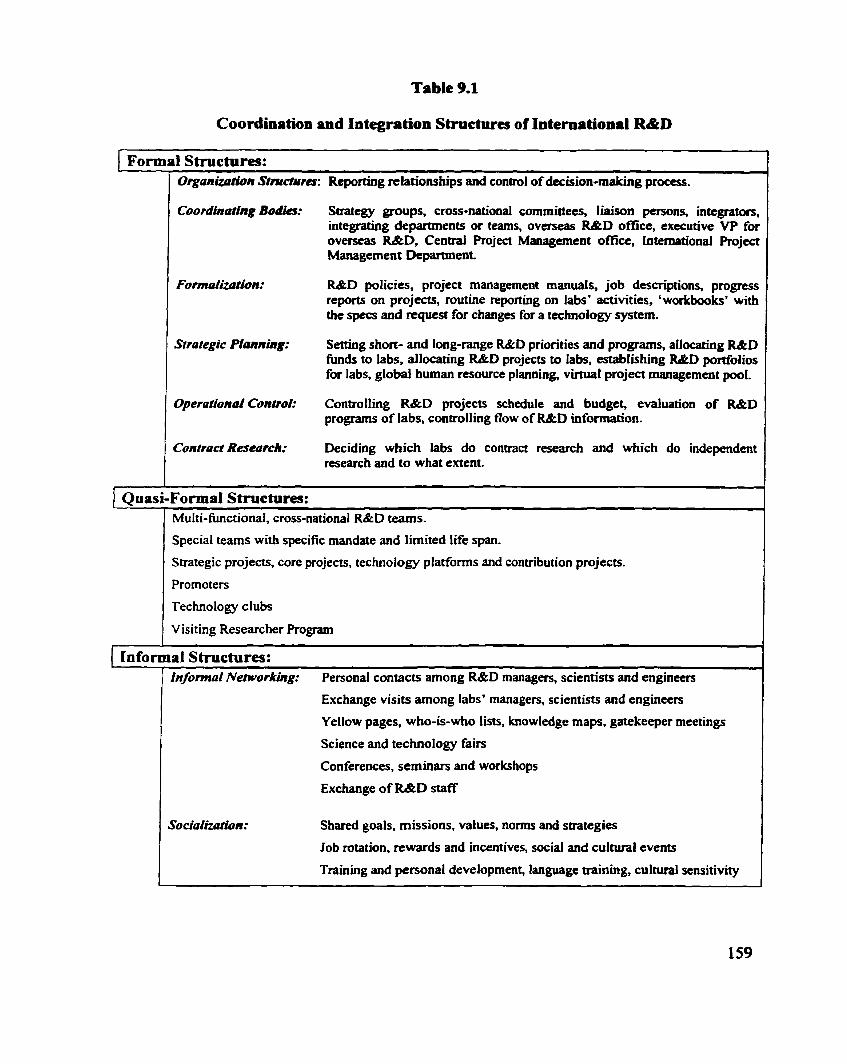
Table 9.1
Coordination and Integration Structures of International R&D
[ Formal Structures: Orgonization Srrudures: Reporthg relationships and control of decision-making pmcess.
Strategic Planning=
Strategy groups, cross-national cornmittees, liaison persons, integrators, integrating department. or teams, overseas R&D office, exccutive VP for overseas R&D, Central Project Management office, International Roject Management Department.
RgtD policies, project management manuais, job descriptions, progress reports on projects, routine reponing on labs' activities, 'workbooks' with the spccs and request for changes for a tcchnoiogy system.
Setting short- and long-range R&D priorities and programs, allocating R&D fiinds to labs. allocating M D projects to labs, establishing M D portfolios for labs, global human resource planning, virtual project management pooI,
Controlling R&D projects schedule and budget, evaluation of R&D programs of labs, controlling flow of R&D information.
Deciding which labs do contract research and which do independent research and to what extent.
Multi-functional, cross-national R&D teams.
Special teams with specific mandate and limited life span.
Strategic projects, core projects, technology platforms and contribution projects.
Promoters
Technology clubs
Vis i ting Researc her Program L
1 Informai Structures: Informal Neiworking: Personal contacts arnong R&D managers, scientists and enginecrs
Exchange visits among labs' managers, scientists and engineers
Yellow pages, who-is-who lists, knowledge maps, gatekeeper meetings
Science and technology fairs
Conferences, seminars and workshops
Exchange of R&D staff
Socialization: Shared goals, missions, values, noms and strategies
Job rotation, rewards and incentives, social and cultural events
Training and personal development, language training, cultural sensitivity
According to interviewees, some companies have used some of these structures quite
successfidîy, while others have been less than successful. They contended that companies
should not employ a particular technique or imitate the strategy of another company jwt
because it was used successfully in the other company. Instead. managers should carefully
study ami understand their company and then select structures that are compatibk with their
own systems, processes, and corporate culture. Top management support and dedicated
resources are necessary for successful implementation. Thus, it seems that the success of any
of the strategies described in Table 8.9 is contingent upon how the particuiar strategy is
implemented, among other considerations.
Many interviewees were also emphatic in stating that companies with the most successful
international R&D programs are those that are to able complement their formal structures
with appropriate idormal and quasi-formal structures. Aimost dl of the participahg
companies in this study made extensive use of quasi-formai and informal structures to
coordinate and integrate their global R&D activities. Japanese companies tended to rely more
on formal structures than either European or North Amencan MNCs. Decision m a b g
among Japanese companies is much more centralized and a larger proportion of sensitive
R&D is kept at home. According to one respondent, Japanese companies make greater use of
coordinating cornmittees with senior R&D and carporate personnel and hold more regular
meetings. It has been his experience that the President of a Japanese MNC attends some of
the strategy meetings on a reguiar basis.
Another respondent observed that many European MNCs underestimate the importance of
informa1 and quasi-forma1 mechanisms in coordinating their international M D programs.
Instead, they rely more on internai contract research with their SBUs and divisions as a
means to coordinate research efforts.
It is important to note that the labs made extensive use of electronic communication
technologies throughout aU organizational levels (i.e., top management, project managers,
and scientists and engineers). Face-to-face communication was also used at al1 levels but
with less fkequency. These communication efforts were complemented with regular visits to
each other's labs and exchange of R&D personnel. Although, no discemable pattern was
detected in the rating of the extent to which sorne of these elements were used formally or
informal1 y, labs of North Arnerican MNCs tended to be more idormal than those of Japanese
MNCs. According to one very experienced respondent, face-to-face communication is an
important prerequisite for the effective use of electronic communication media - it helps
when you can attach a face to a voice.
The survey questionnaire asked respondents to report the problems they experience in
collaborathg with other labs within the MNC group. The rnajority stated that linguistic
difference, tirne zones and lack of knowledge about subtle aspects of other labs' culture are
the main problems. For instance, one Arnerican respondent reported that in his experience
"the French scientists sometimes prefer more narrowly defined, systematic projects to
broader, open-ended projects which many Americans prefer." The same respondent also
noted that "it is extremely difficuit to buy people off in Japan." Many respondents stated that
substantiai progress has k e n made in reducing cultural problems, through the
irnplementation of various training programs. Such programs hclude language training,
holding debriefhg sessions with staff members upon their return eom overseas visits, having
extemal consultants (e.g., university professors provide cultural training sessions to their
employees), and having a more cross-national interdisciplinary top management team. One
respondent noted that the experience gained fiom having several interdisciplinary, cross-
national teams working together has virtually eliminated al1 the squabbles they had which
was attributed to cultural differences.
9.2 Modeling Coordination Structures
An interesting observation emerging fiom this study is that the majority of companies
represented by the organization charts displayed in Figure 8.4 in the preceding chapter
characterize their R&D organization as a network. Yet, the charts look more like hierarchies
than networks as portrayed in Chiesa (1996), Medcof (1998) and Gassman and Zedwitz
(1 999).
According to one R&D vice president, hierarchies evolve over time and cannot be dismantled
overnight without putting the organization at nsk. Restructuring is a painfiil and
demordizing experience and many MNCs only go that route when they are "forced" to do so.
In his view, because managers are not always willing to get rid of hierarchies for fear of loss
of control, they look for other ways to complement the hierarchy. Hence, the proliferation of
informal structures. He believed that it is the pervasiveness of these informal and quasi-
formal structures across al1 levels in the organizattion that has led to the description of the
network organization. Not that the hierarchy bas been replaced with a new structure called
the network structure.
If this reasoning is accurate, then it seems that researchea ought to, then, keep in mind what
"network structure" really means and not to ascribe to it characteristics that it does not
possess. It would appear h m this study that the network structure as described in the
international R&D literaîure or even the international management literature is more an
idealized state and different organizations are at different states in moving towards that
idealized state.
Figure 9.1 depicts the basic elements of the coordination structure of international R&D
emerging from this study. This model suggests that there are four inter-linked and
interdependent eiements to be considered in managing intemationai R&D in the
multinational corporations. The first element, the globe, indicates the global character of
R&D, the second element, the hierarchical structure, explicitly recognizes the existence of
formal structures in establishing and organizing international R&D, the third and fourth
elements, the two boxes, are complementary to and superimposes on forma1 structures. The
ellipses are s ym bolic of the interactions and networking among global1 y dispersed R&D
units. In essence, this model recognizes that international R&D is a very complex activity
arising fiom different time zones, cultures, geography, and other conditions, and that reliance
alone on a forma1 structure is an ineffective way to manage these complexities. MNCs could
achieve greater efficiency and effectiveness in their efforts to leverage their worldwide
capabilities by complementing the fonnal structure with informal and quasi-formai
structures.
The uniqueness of the modeling fiamework depicted in Figure 9.1 is that it represents a
major shift in the fundamentais of organlzational analysis away h m the bureaucratic model
of comrnand and control through the fonnal structure to substantially less formal structures.
Also, unlike more recent formulations that are based on the network structure, this model
framework presents a more realistic and practicd way of analyzing organizations. The
explicit recognition of the formai bureaucratic structure upon which is superimposed the
informai structure stands in contrast to the notion that the network structure has somehow
replaced the formal structure. This conceptualization is not supported in this study.
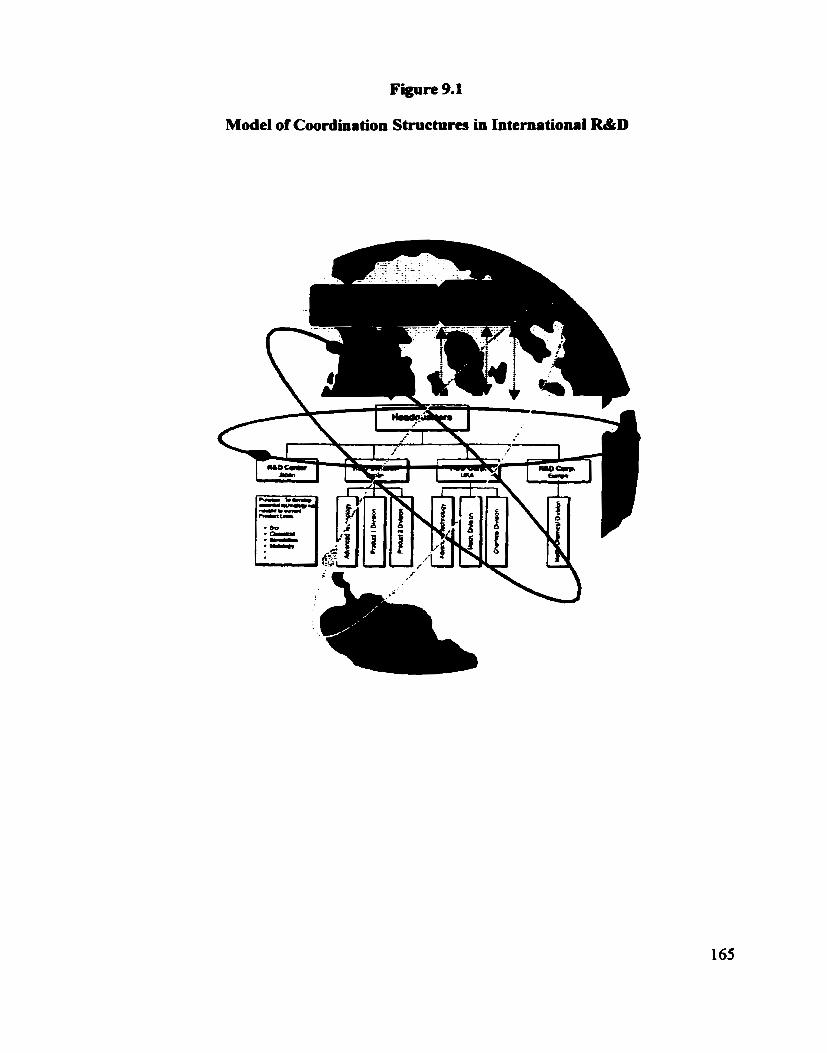
Figure 9.1
Mode1 of Coordination Structures in International R&D
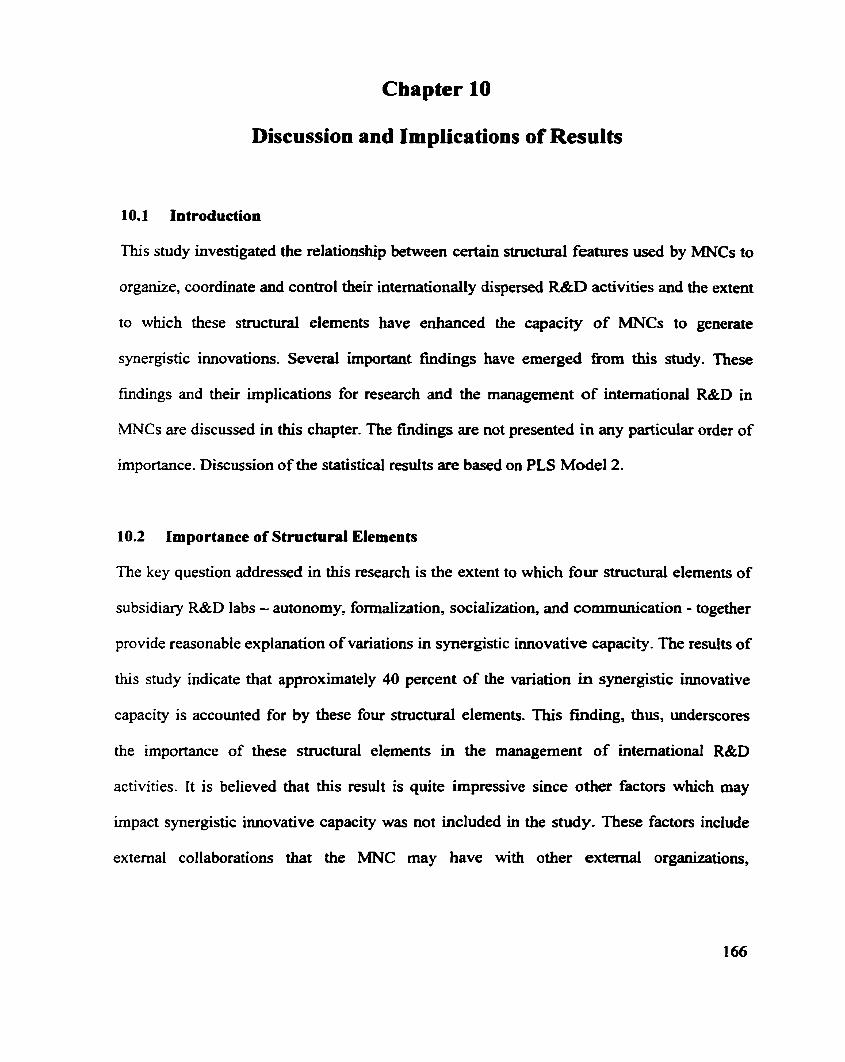
Chapter 10
Discussion and Implications of Results
10.1 Introduction
This study investigated the relationship between certain stnictural features used by MNCs to
organize, coordinate and control their internationally dispersed R&D activities and the extent
to which these structural elements have enhanced the capacity of MNCs to generate
synergistic innovations. Several important hdings have emerged fiom this study. These
fmdings and their implications for research and the management of international R&D in
MNCs are discussed in this chapter. The findings are not presented in any particular order of
importance. Discussion of the statistical results are based on PLS Mode1 2.
10.2 Importance of Structural Etements
The key question addressed in this research is the extent to which four structural elements of
subsidiary R&D labs - autonomy, formalization, socialization, and communication - together
provide reasonable explanation of variations in synergistic innovative capacity. The results of
this study indicate that approximately 40 percent of the variation in synergistic innovative
capacity is accounted for by these four structural elements. This fhding, thus, underscores
the importance of these structural elements in the management of international R&D
activities. It is believed that this result is quite impressive since other factors which may
impact synergistic innovative capacity was not included in the study. These factors include
external collaborations that the MNC may have with other external organizattions,

collaborations between R&D labs and other SBUs and divisions of the MNCs, research
intensity, and size.
The relationship between the four structural elements and synergistic imovative capacity is
discussed below.
10.3 Synergistic Innovative Capacity
This study proposed and empiricaily tested the validity of the notion that synergistic
innovative capacity in large, complex MNCs with internationally distributed R&D activities
can be measured as a single const~ct . The fmdings indicate that synergistic innovative
capacity has four distinct dimensions whiçh together describe the innovative capabilities
resulting fiom greater collaboration arnong R&D labs (See Figure 10.1)'. The four
dimensions can be thought of as four indices of innovative capacity. Thus, researchers can
now use these indices rather than relying on single measures or a couple of unrelated
measures to analyze imovative capacity. Although more studies may be needed to validate
and refme the indices, this study provides a useful staning point for furiher research. Each of
the four indices of imovative synergy is discussed below.
1 0.3.1 Strategic R&D Synergy
Strategic R&D synergy is defmed as the extent to which collaborations arnong R&D labs
have resulted in increased participation by these labs in a larger number of complex projects
' Figure 10.1 is identical to Figure 7.2 which was discussed at length in Chapter 7. ft is show here again for the convenience of readers in following the discussion on the implications of the Findings.
167
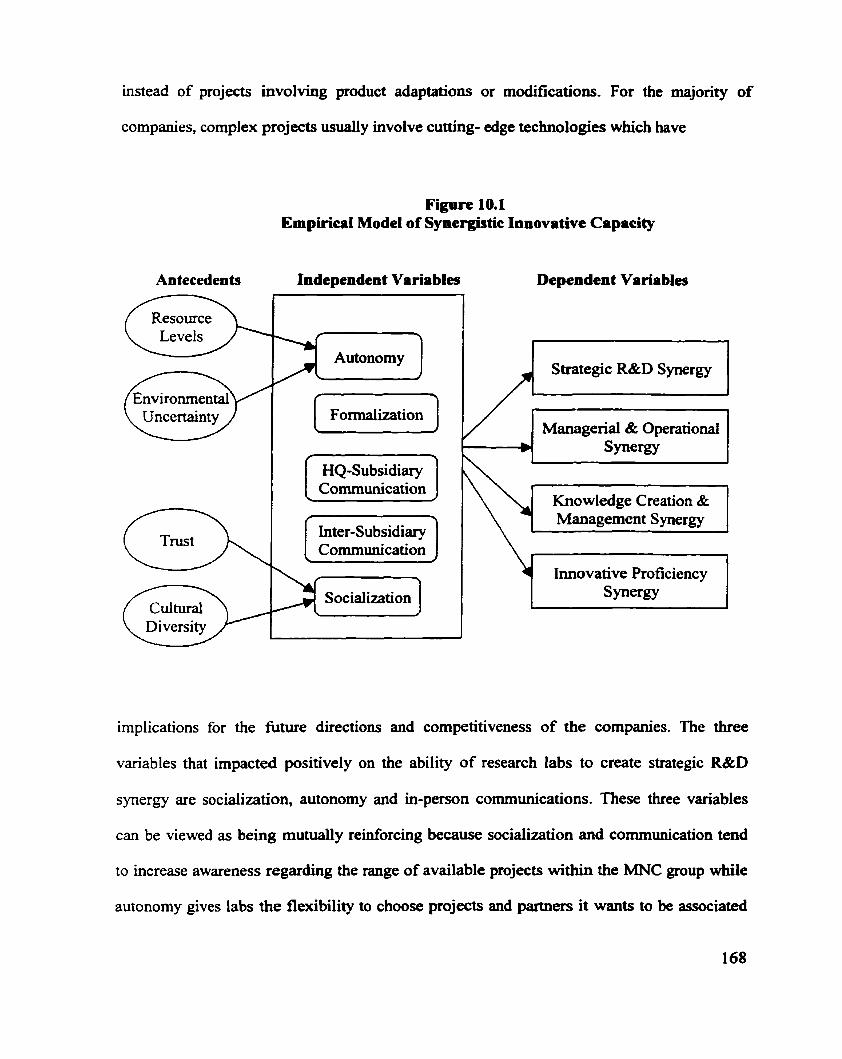
instead of projects uivolving product adaptations or modifications. For the majority of
companies, complex projects usually involve cutting- edge technologies which have
Figure 10.1 EmpincaI Mode1 of Synergistic Innovative Capacity
An tecedents
Resource Levels
Cultural
Independent Variables
HQ-Subsidiary Communication 1 Inter-Subsidiary Communication 1
Dependent Variables
Strategic R&D Synergy
Managerial & Operationai
\ Knowledge Creation &
Innovative Proficiency
implications for the fùture directions and cornpetitiveness of the companies. The three
variables that impacted positively on the ability of research labs to create stmtegic R&D
synergy are socialization, autonomy and in-person communications. These three variables
can be viewed as being mutually reùiforcing because socialization and communication tend
to increase awareness regarding the range of available projects within the MNC group while
autonomy gives labs the flexibility to choose projects and partners it wants to be associated

with. Also, greater socialization and in-person communication imply pa ter interactions
arnong labs which tend to open-up new opportunities for the labs to get a better idea of how
the work they do complement each other and how they can foster closer collaborative
relationships.
Socialization and in-person communication are important for building-up a Iab's social
capital, that is, the extent of its informal networks. These informal networks generally make
it easier for labs to share their R&D resources and ideas for their mutual benefit. Also, when
labs have closer and wider informal networks they can access resources much more quickly
2nd easily because they can cal1 on their contacts any time for help with the technical aspects
of projects. Through these informal networks, labs can learn of other projects in which they
wouid like to participate in. For instance, the New York lab of an American film Company
launched a project to develop a high speed, high quality film but were having difficulties
with their holographie images. The project was stalled for a while until one team member
recalled that he had met a scientist in their lab in Gerrnany who has worked on this
technology previously. He contacted the scientist in Gerrnany by telephone and withui a few
days he was at the New York lab trying to get the project back on track. Through this
expenence, the two labs began collaborating on other advanced projects in this area.
Although the findings reported here regarding the relationship between strategic R&D
synergy and the three variables are not strictly comparable to those reported in other studies,
a strong, positive association between innovative activities, autonomy, socidization and
inter-unit communication arnong subsidiarîes of MNCs was reported in Bartlett and Ghoshal
(1 990), Brikinshaw and Momson (1995), Brockhoff and Schmaul (1996), and Pearce and
Papanastassiou (1 996).
1 O. 3.2 Munagerial and Operationai Synergv
Managerial and operational synergy is defmed as the extent to which the efficiency of a iab's
managerial and operational resources are enhanced as a consequence of working
coIlaboratively with other labs. Formalization and in-person communication among
subsidiary labs appear to have had a positive effect while autonomy and electronic
communication had a negative effect. This suggests that greater synergy in resource
utilization is achieved when collaboration is conducted within a structured context. That is,
when the procedures for collaboration and reporting are defined. A stnictured context for
collaboration combined with personal interactions seem to facilitate hnproved understanding
and trust among the labs which in turn has minimized conflicts and unnecessary delays to
resolve conflicts. In these circumstances, greater synergy is achieved because the labs feel
more cornfortable working with the other labs and are more willing to share information,
resources, and persorinel with each other. By sharing knowledge, resources and personnel,
the labs are able to minimize deiays in trying to locate needed resources or personnel. One
respondent opined that networking, if done properly, can direct a development project dong
new paths, or highlight the impossibility of others, which in tum saves tirne, costs, efforts,
and fiutration. In another Company, the collaborating labs created severai speciaiized
databases based on the project they were working on. This database resulted in substantiai
savings when it was used subsequently by other project teams. The combined effects of ail of
these have resulted in the labs realizing greater managerial and operational synergy.
The negative impact of autonomy on managerial efficiency is consistent with the view that
autonomy is intended to give labs the flexibility needed to deal with uncertainty and
complexity rather than to increase their efficiency. According to transaction costs theory
greater efliciency is achieved in centralized organizations as opposed to decentralized
organizations because of reduced transaction costs (Mintzberg, 1979; Brooke, 1992; Stopford
and Wells, 1992; Rugrnan, 1994). Since autonomous labs have greater fkedom to decide
whether or not to collaborate or the nature of their role in a collaborative partnership, they
may be more selective in their collaborative projects choosing ody those ones that is most
beneficial to them and rejecting the others irrespective of efficiency considerations. Under
these circumstances, the impact on managerial and operational synergy may be limited.
The negative effect of electronic communication among subsidiary labs suggest that either it
is an ineffective communication medium or that subsidiary labs have not yet mastered the art
of using technologically supported communication to their advantage. An examination of the
fiequency of technologically supported communication revealed that labs communicate by
electronic media on a daily basis across al1 three organizational levels (Le., managers, project
leaders, and scientists and engineers). E-mail communication is by far the most common and
the least costly technologically supported method of communication. The ease of
communicating by e-mail has encouraged excessive and unwarranted communication
resulting in managers, project leaders and scientists spending an inordinate amount of tirne
reading and responding to e-mails, thus reducing the amount of tirne spent working on
projects. According to some interviewees, it is not unusuai for them to receive in excess of 50
e-mails each day in addition to faxes and telephone calls. Previous research has also found
that it is much more difficult to communicate technical information and tacit knowledge
through technologically supported media (Stock et al., 1996; Inkpen; 1 997; Reger, 1999).
10.3.3 Knowledge Creation and Managerneni Synergy
Knowledge creation and management synergy is defmed as the extent to which collaboration
has increased the ability of R&D labs to create new knowledge and to harness that
knowledge for the creation of new products and competencies. It is the ability of labs to
leverage knowledge, ideas, people, tecbnology, and organizational competencies and systems
for the creation of new, more successfùl innovations. This study found that knowledge
creation and management synergy is facilitated through greater socialization and
communication arnong the labs. Both face-to-face and technologically supported
communications are important in this process.
Greater interaction, particuiarly in-person interaction, is touted as the most effective way to
transfer tacit knowledge. Explicit knowledge such as blueprints, databases, and written
reports are more effectively and efficiently transferred through technologically supported
media. Greater socialization among managers, scientists and engineers of internationally
dispersed labs builds trust and facilitates the sharing of information, ideas, technologies and
people arnong collaborating partners. Knowledge generation is fostered through job rotation,
exchange visits, top management team diversity, language Ûaùiing and other approaches that
bring people together.

Knowledge sharing creates a heightened awareness among labs regarding the range of
expertise, projects, and collaborative opportunities present within the MNC group. This
awareness has resulted in many successful collaborative partnerships as evidenced by the
high rating given by respondents on the question relating to the extent to which collaboration
has increased the success rate of new products. The high rating on questions regarding the
extent to which the quality of the labs' products and production processes have improved
indicate the extent to which the labs were successful in leveraging knowledge from across the
MNC group.
Interviewees also provided several examples where the MNC group was able to successfuily
develop and launch several new products which would not have happened if they were not
able to harness the expertise fiom several of their labs fiom across the world. Interviewees
provided several anecdotal stones of how Japanese MNCs have used their US and European
labs to leapfiog into the area of digital technology when they realized that they were behind
the US and Europe in this technology field. Despite the success of the labs in creating
knowledge management synergy, one respondent opined that MNCs have not been able to
realize the fidl potential of their collaborative efforts. In his view, MNCs are good at creating
new knowledge and disseminating this knowledge but they have not invested the time and
resources to protect this knowledge; it goes out the door every t h e an employee leaves the
Company. Also, only a small fraction of the knowledge generated gets translated into new
innovations. He expressed serious reservations regarding the efficiency of the approaches
used by many MNCs to manage their knowledge resources and intellectual capital.
1 O. 3.4 innovative Proficiency Synergy
Innovative proficiency synergy is defined as the extent to which collaboration has increased
the capability of R&D labs to generate new and successful innovations quicker and at lower
costs. Autonomy of subsidiary labs and socialization among managers and employees of
worldwide labs had a positive effect on innovative proficiency synergy, while fonnalization
had a negative impact. These results are consistent with existing hdings conceming the
drivers of innovative proficiency. For example, Nohria and Ghoshal (1997), Bartlett and
Ghoshal (1989), Medcof (1998), and Asakawa (1996) show how too much formalization
reduces the flexibility of an organization to respond to rapid changes in dynamic, complex
environments. The negative relationship observed here suggests that the level of
formalization in the f o m of monitoring and reporting is perceived by the labs to be excessive
and is, therefore, reducing their ability to respond quickly to changes in their environments.
The positive effect of socialization in creating synergy in innovative proficiency suggests that
labs have successfully used their Uiformal networks to generate new ideas and products more
proficiently. This may be possible through timely access to necessary resources, referrals,
and expertise withia their MNC group. Knowing who in the Company has what expertise
which the lab needs and having the relationship to access the expertise c m ceriainly reduce
search time and costs. It is aiso not unusual for labs to access very specialized and costly
expertise at very low cos& fiom partner labs through their informa1 networks or personnel
exchange programs. This could result in project stoppage or delays for these reasons to be
minimized. The example of the American film Company descnbed earlier is also instructive
here.
The positive effect of autonomy on innovative proficiency synergy indicates that labs which
are fiee to make decisions regarding their project portfolio, human resources, and
collaborative partners are likely to be more proficient at generating new and successfbl
innovations. Labs with this fieedom will have greater flexibility to decide which ideas or
projects to pursue, the resources to commit to the projects, the personnel to be assigned to the
projects, and when to m o d e , shelve or abandon the projects. Also, knowing that they have
this fieedom, labs may have a greater impulse to explore new ideas and technologies which it
may not be able to pursue othenvise. Labs without this fieedorn may have to wait for
instructions, approval and resources fiom someone other lab and this could result in long
delays or potentially good projects not k i n g approved. This finding is consistent with those
reported by Nohria and Ghoshai (1997), Brockhoff and Schmaul(1996) and Birkinshaw and
Momson (1 995) regarding the positive relationship between innovations and autonomy of
subsidiaries of MNCs.
The positive effect of autonomy on innovative proficiency synergy indicates that autonomous
labs did not used their autonomy to work on projects of their own choice independently.
Instead, it appears that the labs have recognized the mutuat benefits of working
interdependently with other Iabs and have actually pursued collaborative projects which
turned out to be successfbl. The data indicate that the labs have had extensive forma1 and
informa1 working relationships with several other labs. On average, the labs in this study
indicated that they have collaborated with 3 other labs, sharing technological and scientific
information, visiting each others' labs, and exchanging R&D personnel.

1 O. 3.5 Moderating Variables
In the theoretical model of this study, it was proposed that four constructs, trust, cultural
diversity, environmentai uncertainty and the resource levels of the labs would bave
moderating effects on synergistic innovative capacity. This proposition was not supported by
the statistical analysis. In fact, it appears that the effects of these constructs on synergistic
innovative capacity are better accounted for through their effects on two other exogenous
constructs, namely, autonomy and socialization. Within the conceptual fkamework of this
study, there is greater statistical support for treating these variables as antecedents to
synergistic innovative capacity as displayed in PLS Mode1 2.
A review of the Iiterature on orgidzational design indicates that fiom the point of view of
resource dependency theory and contingency theory, autonomy is detennined by the level of
resources at the disposal of the organizational unit and the complexity of its environment.
Similady, trust and cultural diversity are important in facilitating socialization. in light of the
statistical resdts and the theoretical plausibility of the model tested in this study, the initial
theoretical model is refined accordingly (Figure 10.1 ).
10.4 Coordination and Control Structures
This study finds that MNCs use a wide array of fomal, informal and quasi-forma1 structures
to coordinate and control their international R&D activities. The notion that MNCs replace
their companies' hierarchical structure in favor of the network stnicture is not supported by
the fmdings of this study. Mead, most, if not dl, MNCs seem to retain their hierarchical
structure but complement it with a variety of quasi-fonnal and informai structures. This
fmding calls into question the appropnateness of the much touted 'network model' as an
analytical tool for analyzing the R&D organizations of MNCs. Altematively, as stated
earlier, this suggests that researchers ought to be careful not to assign characteristics to the
'network model' whkh it does not possess. It seems that a more realistic anaiytical
framework is one that explicitly incorporates the complementary role of quasi-formal and
informal structures in supporting and transcending the hierarchy.
It is not the intention of this study to suggest that MNCs have not made changes to the
hierarchy to make it more effective and efficient. However, the notion that they have
repIaced it is sirnply not tenable. The characterization of the MNCs R&D organization as a
network in the popular press and by some academics could be attributed to the widespread
use of informal networks to an extent never seen before, rather than hdarnental structural
changes in the hierarchy.
10.5 Re-centralization of R&D Activities
This study fmds evidence supporting the view that a new trend towards re-centraiization of
international R&D activities has been emerging over the last couple of years. M e r
establishing several small R&D labs in many countries, MNCs fiom al1 regions are perhaps
finding it extremely difficult to effectively coordinate them. Duplication and waste is another
major driver of the trend towards re-cenealization. A large number of MNCs in this study
have either closed, divested or merged many of their smaller R&D labs and have created
several larger labs, called corporate labs, in specific countries or regions and around specific
technology or technology platfonns. It is the contention of tbis study that the trend towards
the recentraiization of R&D activities has more to do with the inability of MNCs to generate
the synergy expected fiom their global operations than merely duplication or waste of
resources. In other words, duplication and waste of resources is merely the symptom and lack
of synergy is the real problem.
Fid ly , the HQ-Subsidiary characterization of the R&D organization used in this study is
increasingly becorning irrelevant. Future studies involving MNCs R&D organization should
reflect the new and growing taxonomies being used to descnbe the MNCs R&D organization
(i.e. central research, corporate labs, regionai labs, individual labs, support labs, etc).
10.6 Future Research
As stated in the beginning, this research represents one of the earliest attempts to study the
link between certain organizational characteristics of internationally dispersed R&D labs and
the innovative performance of these labs. Consequently, more studies dong the lines of this
study using MNCs fiom other industries and larger samples are needed to confïrm the
findings of this study, and to extend the body of knowledge on this issue. In-depth case
studies of leading-edge organizations could also prove quite usefiil. Future studies should
also 'experiment' with different data collection and analysis approaches.
There is a need for more conceptual research models in order to provide greater
understanding of ho-* and why MNCs decentralize their R&D activities globdly. A review
of literature revealed the imbalance of the research focus and a bias towards empirid
research.
Despite the volume of research on how MNCs organize and manage their global M D
activities, several managers indicated that still there are very few studies that have resulted in
practical solutions to their management dilemma Studies with a more managerial rather than
academic focus, it seems, wiil help in this area. Studies aimed at benchmarkhg best practices
in international R&D management may be quite usefU1.
in response to cornpetitive pressures, MNCs in the early 1980s have moved away fiom the
centraiized approach to more decentralized approaches in orgsnizing theu M D activities. It
was found that since the mid-1990s MNCs have begun to re-centralize theu R&D. The
cirivers of this trend and the future directions of the MNC R&D organization will make for
interesting research.
More studies are needed to develop appropriate measures to evaluate the innovativeness of
overseas R&D in order to provide a concrete basis to judge the effectiveness of
intemationalizing R&D activities. Several managers expressed skepticism believing that this
is yet another marketing gimmick and the benefits do not justify the effort and cos& of
intemationalizing R&D.
Although this study did not address the public policy implications of global R&D, there are
many public poiicy challenges that require M e r investigation. The impact on the
competitiveness of the country of foreign takeover of local WkD labs and when local
companies do the buk of their R&D offshore are two such issues.

CHAPTER 11
BENEFITS AND LIMITATIONS
11.1 Benefits
This study contributes to on-going academic research on the internationdhtion of R&D in
several ways. First, this study is the first to empirically investigate the link between the
structurai attributes of subsidiary R&D labs and the synergistic innovative capacity of these labs
using a cross-section of research-intensive MNCs. The d t s of this study underscore the
importance of these variables in understanding how MNCs leverage their worldwide capabilitia
to create synergy arnong its globally distributeci R&D labs. The study also points to the need to
explore other constructs such as collaborations with extemai organhtions, interna1
collaborations between R&D and other SBUs and divisions of the MNCs, and R&D intensity.
This study also provides confirmatory support for a number of propositions advanceà by other
studies, particularly with respect to the relationship between the structural variables and
innovations.
Second, this study is the first to develop and empirically test the validity of the idea that a single
index can be used to measure synergistic innovative capacity, rather than a series of ad hoc and
somethes unrelateci measures. Most commonly used single measures in previous studies
include cost of innovations, newness of innovations, number of innovations, and type of
innovations. The ixnding that synergistic innovative capacity is a multi-faceted constnict with
four key dimensions is instnictive and could be used as a starting point to study innovations in a
broader, more rigorous way. Further research to refine the individuai measures of each of the
four dimensions and the four dimensions themselves are needed.

Third, this study is the k t to adopt a structural equation modeling approach to analyze the
relationship between synergistic innovative capacity and various structural variables. Most other
studies used traditional mdtivariate techniques such as regression, factor and cluster auaiysis or
are based on qualitative anaiysis. PLS analysis adopted in this study is statistidy more
appealing than the traditional multivariate techniques particulariy when sample sizes are small; a
situation h t is so characteristic of research in technology management, and intemational R&D
in particdar.
Fourth, this study provides an alternative anaiytical t'ramework to the nehivork mode1 for
understanding and anaiyzing MNCs R&D organization. The h e w o r k explicitly ailows for the
incorporation of the hierarchy in the d y s i s instead of assuming it does not exist.
Fif i . this study provîdes usefiil ideas that can be adopted in the design of fùture studies in the
area of international R&D. For example, the growing irrelevance of the description HQ-
Subsidiary Labs c m be avoided and some of the more current taxonomies adopted. Similarly,
the empirïcal m d e l denved h m the PLS anaiysis a n be a starting point guiding fbture
analysis. The range of research topics emerging from this study could guide future investigation
in the area of international R&D management.
From a practical point of view, this study presents managers with findings which could be used
to structure and better coordinate their global R&D activities. For example, knowledge of how
the structural constructs affect the innovative capacity of R&D labs could be used to decide on
what are the most appropriate coordination structures for labs with certain characteristics.

1 1.2 Limitatioiw
The time and cost involved in conducting this study imposeû severe consiraints on what can be
done within a realistic tirnefiame and budget. One of the outcornes of these constraints is the
relatively small sample size, which, in tum, proved to be a major masoaint in conducting
certain types of quantitaîive analyses. For example, it was not possible to conduct regression
analysis with the appropriate number of interaction tems in a single remsion model.
The smaii nurnber of HQ respondents also restricted the ability to pediorm analysis between HQ
respondents and subsidiary lab respondents. Thus, =me of the evidence presented here may not
directiy apply to HQ Iabs.
Also, since the study participants were mainly h m large research-intensive MNCs in only three
sectors, it cannot be stated with any confidence whether the findings apply to smaller MNCs
within these industries or to MNCs h m other industries.
Finally, since this study investigated ody the structurai aspects of the R&D organization of
MNCs, it was Iimited in its capability to explain the impact of other related comtnicts such as
inter-firm collaboration and R&D labs collaboration witb other business unit. and divisions of
the MNC group. Both of these dimensions could infiuence synergistic innovative capacity.
Chapter 12
Conclusion
This research examined the extent to which networking among R&D labs enhances the
synergistic innovative capacity of MNCs. Networking includes both the formal and informai
relationships arnong the labs of an MNC. In cornplex, multi-unit organizations such as
MNCs. these relationships can be expressed in terms of the degree of autonomy,
fonnalization (Pugh et al., l967), socialkation (Schein, 1967; Ouchi, 1980; Edstrorn and
Galbraith, 1977), and communication arnong the labs (Thompson, 1967; Bartlen and
Ghoshal, 1986; Nohria and Ghoshal, 1997). Communication was analyzed as communication
between HQ and subsidiary labs and cornniunication among subsidiary labs.
Four variables were investigated as having a moderating effect on the relationship between
the structural elements and synergistic innovative capacity. These are the Ievel of trust among
the labs, cultural diversity, resource levels of the labs, and uncertainty of the labs operating
environment. S ynergistic innovative capaci ty was conceptualized as a unidimensional
construct comprising of 13 items identified fiom the innovation management literature.
This study was based on a sample of 79 R&D labs owned by North American MNCs,
European MNCs, and Japanese MNCs. These labs were fiom the electricai, electronics,
telecommunications, computing, pharmaceuticd, chernical, and automotive industries. The
data was collected through a survey questionnaire but was complemented with qualitative
and archivai data provided by respandents.
The principal data analysis methods used were ANOVA, MANOVA, multivariate regression,
factor analyses, and Partial L,east Squares (PLS) anaiysis. Although the resuits fiom PLS are
not strictly comparable to that obtained fiom regression and factor analyses, there is a fair
arnount of consistency of the results obtained fiom the diEerent analyses. Essentiaiiy, they
portray a similar picture.
The results indicate that the dependent constnict, synergistic innovative capucity, is muiti-
dimensional and not unidimensional as was uiitially conceptualized. Basically, networkïng
among intemationally dispersed R&D labs resulted in the achievement of four distinct types
of synergy, as follows:
1. Strategic R&D Synergy
2. manage rial and Operational S ynergy
3. Knowledge Creation and Management Synergy
4. Innovative Proficiency Synergy
Together, the four structural elements characterizing R&D labs explains just under 40
percent of changes in synergistic innovative capacity. The analysis also suggests that the
effects of the four moderating variables are much more substantial when they are treated as
antecedents to the independent variables. in particular, when the moderating variables,
resource Ievels and environmental uncertainsr, are analyzed as influencing autonomy, and
trust and cultural diversi@, as influencing socidization.
It was found that the independent variable socialization has a strong, positive impact on
strategic R&D synergy, knowledge creation and management synergy, and innovative
proficiency synergy. In the regression analysis, socialkation had a similar effect on these
four components. Autonomy had a positive influence on strategic R&D synergv and
innovative proficiency synergy but a negative influence on managerial and operationaZ
synergy. Formalization had a positive impact on managerial and o p e r a f i o ~ l synergy but a
negative impact on innovative prujiciency synergy.
Both in-person and technologicaily supported communication were important in creating
spategic R&D synergy, managerial and operational synergy, and knowledge creation and
management synergy. in-person communication among subsidiaries had a positive effect on
d l three components while technologicaily supported communication among subsidiaries
had a negative impact. HQ-Subsidiary communication, both in-person and technologicalIy
supported, had a strong, positive infiuence on knowledge creation and management synergy.
The qualitative data revealed that MNCs applied a wide array of ùIformal structural
rnechanisms to complement the forma1 structure. The hierarchy stiH exists in various forms
but is complemented and transcended by these informal structures. The pervasiveness of the
informal mechanisms across al1 levels of the organizations has probably led many to describe
the R&D organizations as network. The notion that MNCs have replaced the forma1
bureaucratic structure with a nehvork structure was not supported in this study. Researchers
should, therefore, be more cautious not to ascribe characteristics to the network organization
which it does not have.
Like most empirical study in technology management, this study has some limitations which
tend to limit its generalizability. One limitation is the relatively small sample size which to
some extent reflect the difficulties of conducting a study of this nature given time and budget
constraints. The small sample size imposed certain limitations on the type of analyses which
was possible. Also, since the labs in this study are fiom large MNCs within the high-
technology sector, care must be exercised in generaiizing the fmdings to MNCs from other
sectors or of srnaller size.
Despite these limitations, this study is the £ïrst to examine the relationship between the
structurai elements of R&D labs and the innovative performance of the labs in terms of
creating synergy. There are still many unanswered questions. This study is only the
beguining but its findings codd be instructive in guiding future research in this area. The
PLS method used in this study demonstrate that even with small samples, researchers c m
conduct fairly rigorous statistical analyses of multi-item, rnulti-faceted constructs.
References
Aiken, M., and Hage, J., "Organimtional Interdependence and Intraorganizational Sbiicturc," American Sociological Review, Vol. 33, pp. 9 1 2-930 (1 968).
Aiken, M., and Hage, I., "The Organic Organization and Innovation," Sociologv, Vol. 5, pp. 63-82 (1 97 1 ).
Allen, T.J., Managing the Flow ofTechnology, Cambridge, MA, MIT Press (1977).
ArnabiIe, T.M., "A Model of Creativity and innovation in Organizations," in B.M. Staw and L.L. Cummings (eds.), Reseurch in Orgunuutional Behavior, Vol. 10, Greenwich, CT: JAI Press (1988).
Anthanassiou, N., and Nigh, D., " The impact of U.S. Company Internationdization on Top Management Tearn Advice networks: A Tacit Knowledge Perspective", Smegic Management Journal, Vol. 20, pp. 83- 92 ( 1999).
Antle, R, and Fellingham, I., "Resource Rationing and Organizational Slack in a Two-Period Model," Journal of Accounting Research, Vol. 28, No. 1, pp. 1-24 (1 990).
Anmura, S., "How Matsushita Electric and Sony Manage Global R&Dn, Research Technology Management, March-April, pp. 4 1 -52 (1 999).
Asakawa, K., "External Lmkages and Overseas Autonomy-Control Tension: The Management Dilemma of Japanese R&D in Europe," IEEE Tramactioas on Engineering Managemenf. Vol. 43, No. 1, pp. 24-32 ( 1 996).
Baiachandra, R. and Friar, J. H., "Factors for Success in R&D Projects and New Product hovation: A Contextual Framework", IEEE Tramactions on Engineering Management, Vol. 44, No. 3, (1 997).
BaIiga, B.R and Jaeger, A.M., "MultinationaI Corporations: Control Systems and Delegation Issues," Journal oflnfernarional Business, Vol. 15, pp. 25-40 (1984).
Barclay, D., Higgins, C., and Thompson, R, "The Partial Least Squares (PLS) Approach to Casual Modeling: Persona1 Computer Adoption and Use as an Illustration", in Urs E. Gattiker (ed), Technology Studies, Vol. 2, no. 2, Walter de Gmyter, Berlin, New York, pp. 285-324 (1995).
Bartlen, C.A. and Ghosal S., "Building and Managing the Transnational: The New Organizational Challenge," in M.€. Porter (ed.), Cornpetition in GIobal Indusfries, Harvard Business School Press, MA., pp. 367-40 1 (1 986).
Bartiett, C.A. and Ghoshal, S., Managing Across Borders, Harvard Business School P m , MA. (1 989).
Bartlett, C.A. and Ghoshal, S., "Managing Innovation in the Transnational Corporation," in Managing the Global Firm, Bartlett et al. Eds., Routledge, Londonmew York, (1990).
Bartlett, C.A., Doz, Y. and Hedlund, G. (eds), Managing the Global Firm, Routledge, LondoniNew York, ( l99O).
Behrman, J. N. and Fischer, W. A., Overseus R&D Activiries of Tramnational Companies. Cambridge, MA: Oelgeschlager, Gunn and Hain (1980).
Birkinshaw, J., "Approaching Heterarchy: A Review of the Literature on Multinational Strategy and Structure", Advances in Comparative Management, Vol. 9, (1 994).
Birkinshaw, J. and Momson., "Configurations of Strategy and Structure in Subsidiaries of Multinational Corporations," Journal ofInternational Business Srudies. Fourth Quatter, pp. 729-753 (1 995).
Blau, J., "Daimler-Benz Research Centralizes for Value," Research Technology Management. Vo1.38, No. 1, pp. 6-7 (1 995).
Brockhoff, K. and Schrnaul, B., "Organization, Autonomy, and Success in Lnternationally Disperscd R&D Facilities," IEEE Transactions on Engineering Management, Vol. 43, No. 1, pp. 33-40 (1 996).

Brooke, M, Z., Autonomy and Cennalitation, Holt, Rinehart and W i o n , (1984).
Buckley, P.J. and Brooke, M. Z., lnfernational Bauiness Strrdies, Oxford: Blackwell Publishers, (1992).
Burgleman, RA., "A Model of the hteraction of Strategic Behavior, Corporate Context, and the Concept of Sîrategy," Academy of Management Review, Vol. 8, pp. 6 1-70 (1983).
Burgleman, RA., Maidique, M. and Wheelwright, S. C., Szraregic Mimagement of Technology and Innovation, 2 ed., Inrvur McGraw-Hill. (19%).
Burns, T., and Stalker G.M., me Management oflnnovotion, London, Tavistock (1961).
Burt, RS., Toward a Structura/ Theoq ofAction, Orlando, FL, Acadcmic Rcss (1 982).
Cantwell, J., "The Intemationalization of Technological Activity and its Implications for Competitiveness," in Granstrand, et al., Technologv Management and hrernationak Business, John Wiley & Sons Ltd., England ( 1 992).
Casson, M., Pearce, R and Singh, S., "Busintss Cufture and Internationd Technology: Research Managers' Perceptions of Recent Changes in Corporate RBtD," in Granstrand, et al., Technology Mmagemenz and International Business, John Wiley & Sons Ltd., England (1 992).
Cheng, J.L.C. and Bolon, D. S., "The Management of Multinational R&D: A Neglected Topic in International Business Research," Jownal oflnternational Business Sfudies. First Quarter, pp. 1 - 19 (1 993).
Chiesa, V., "Strategies for Global MD," Research te ch no log^ Management. Sept-Oct-, pp. 19-25 (1996).
Child, J., "Strategies of Control and Organizational Bebaviour," Administrative Science QLtmerly, Mach, pp. 1- 17 (1973).
Chin, W. W., "The Partial Least Squares (PLS) Approach to Casual Modeling: Penonal Computer Adoption and Use as an Illustration", in Urs E. Ganiker (ed), Technology Studies, Vol. 2, no. 2, Walter de Gmyter, Berlin, New York, pp. 285-324 (1995).
Coleman, J. S., Foundations of Social Theoty. Cam bridge:MA. Harvard University Press, Beihap Press. (1 990).
Cooper, R G. and Kleinschrnidt, E. J-, 'Wew product success factors: A cornparison of 'kills' venus successes and failures", R&D Management, Vol. 20, No. 1. pp. 47-63 (1990).
Cordell, A. J., "Innovation, the Multinational Corporation: Some Policy Implications for National Science Policy", Long Range Pkanning, Vol. 6, pp. 22-29 (1973).
Cox, T.H., Cultural Diversity in Organhfions: Theory Research Praciice. Barret-Koehler, San Franscisco, CA ( 1993)-
De Bodinat, If., "influence in the Multinational Corporation: The Case of Manufacturing," Ph-D. Thesis, Harvard University ( 1 975).
De Meyer, A., "Management of R&D Operations," in O. Granstrand, , L. Hakanson, and S. Sjolander, Technology Management and international Business, John Wiley & Sons Ltd., England ( 1 992).
De Meyer, A., ''Internationalizing R & D lmproves a F h ' s Technical Leaming," Research Technology Management, July-August, pp. 42-49 (1 993a).
De Meyer, A., "Management of an International Network of industrial R&D Laboratories," R&D Management, Vol. 23, No. 2 (1993b).
De Meyer, A. and Miaishima, A., "Global M D Management," R&D Management, Vol. 19. Pp. 135-146 (1 989).
Dunning, J.H., "Multinational Enterprises and the Globalization of Innovatory Capacity," in O. Granstrand, L HWson , and S. Sjolander, Techologv Management und Inzernationaf Business. John Wiley & Sons Ltd., England, (1 992).
Dunning, J.H., "Multinational Enterprises and the Globalization of Imovatory Capacity," Resewch Policy, Vol. 23, pp. 67-88 (1994).
Edstrom, A., and Galbraith J.R., "Transfer of Managers as a Coordination and Control Strategy in Multinational Organizations," Administrative Science Quarterfy, Vol. 22, pp. 248-263 (1977).
Egelhoff, W.G., Organizing the Multinational Enterpise: An Idormation-Processing Perspective. New York, BalIinger (1 988).
Eisenhardt, K.M. and Schoonhoven, C., "Organizational Growth: LUikmg Founding Team, Strategy, Environment and Growth among US Semiconductor Ventures," AdminLrtratNe Science Quarteriy, Vol. 35 pp. 504-529 (1990).
Falk, F., and Miller, N, B., A Primer for Sofi Modeling, The University of Akron Press, Ahn, Ohio, (1 992).
Finkektein, S. and Harnbrick, D.C., Strategic Leadership: Top Executives and their Efects on Organirations, West, St- Paul, MN ( 1996).
Fischer, W.A., "Scientific and Technical information and the Performance of R&D Groups," T I . Studies in the Management Science, No. 15, pp. 67-89 (1980).
Franko, L., The European Multinational, London: Harper and Row, (1978).
Galbraith, J.R, Designing Complex Organirarions, Reading, MA, Addison-Wesley (1973).
Gassman, O., and Zedwitz, M., "Organization of Industrial R&D on a Global Scale", R&D Management, Vol. 28, No. 3, pp. 147-161 (1998).
Gassman, O., and Zedwitz, M., 'Wew Concepts and Trends in International R&D Organization", Research Policy, Vol. 28, pp. 23 1-250 (1999).
Gates, S.R, and Egelhoff, W.G., "Centralization in Parent Headquarters-Subsidiw Relationship," Journal of lnternutionaf Business, Vol. 17, No. 2 pp. 7 1-92 (1986)
Ghoshal, S. and Bartlett C., "The Multinational Corporation as an interorganizational Nerwork," Academy ofManagement Review, Vol. 1 5, No. 4, ( 1 99 1).
Ghoshal, S. and Bartlett C., "Creation, Adoption and D i h i o n of Innovation by Subsidiaries of MuItinational Corporations," Journal of International Business Studies, (1 988).
Granstrand, O. Hakanson, L and Sj6lander1 S., Technology Management and International Business, John Wiley & Sons Ltd., England, (1992)-
Granstrand, O., and Sjolander, S., "Internationalization and Diversification of Multi-technology Corporations", in Gransirand, et al., Technology Management and International Business, John Wiley & Sons Ltd., England, (1 992).
Granstrand, O., and Sjolander, S., "Managing Innovation in Multi-technology Corporations," Research Poficy, 19 No. 1, pp. 35-60 (1 990).
Granstrand, O., "lntemationalization of Corporate R&D: A Study of Japanese and Swedish Corporations", Research Policy, Vo1.28, pp. 275-302 (1 999).
Gupta, A.K. and Govindarajan, V., "Knowledge Flows and the Stmcture of Control within Multinational Corporations," Academy of Management Review, Vol. 16, pp. 768-792 (1 99 1).
Gwynne, P., "Directhg Technology in Asia's Dragons," Research Technologv Management, March-April, pp. 12-15 (1993).
Gwynne, P., "Managing 'Mu Itidomestic' R&D at ABB," Research Technology Management, Jan-Feb., pp. 30-33 (1995).
Hair (Jr.) J.F., Anderson RE., Tatham R.L., and Black W.C., Multivmiate Data Analyslj with Readings, MacMillian Publishing, (1992).
Hakansoa, L., "International Decmîraiizaîion of R&D - The OrganUational Challenges," in Bartlea, et al. (eds.) Managing the Global Firm, New York: Routledge, (1 990).
HAkanson, L and Noble, R, "Determinants of Foreign R&D in Swedish Multinationals," Research Policy, Vol- 22, pp. 397-41 1 (1993).
Hakanson, L., "Locational Deteminants of Foreign RgtD in Swedish Multinationals," in Granstrand, et ai., Technology Management and International Business, John Wiley & Sons Ltd., England, (1 992).
H h s o n , L. and Zander, U., "International Management of MD: The Swedish Experience," RcW Management, Vol. 18, No.3, pp. 2 17-226 (1 988).
Hambrick, D. C., and Mason, P.A., "Upper Echelons: The Organizstion as a Retlection of its Top Managers," Academy of hfanagement Review, Vol. 9 pp. 193-207 (1 984).
Hedlund, G., "The Role of Foreign Subsidiaries in Smtegic Decision Making in Swedish Multinational Corporations," Strategic Management Journal, Vol. 1, pp. 23-36 (1980)
Hedlund, G., "Autonomy of Subsidiaries and Formalization of Headquarters-Subsidiary Relations in Swedish MNCs," in L. Otterbeck (ed.), The Management of Headguariers-Subsidiary Relatiom in MuIrinarional Corporations, Hampshire, UK, Gower ( 1 98 1 ).
Hedlund, Ci., "The Hpermodem MNC: A Heterarchy," Human Resource Management, Vol. 25, No.1, pp. 9-35, (1986).
Hediund, G., "A Mode1 of Knowledge Management and the N-fonn Corporation," Shrrlegic Management Journal, Vol. 1 5 (1 994).
Hedlund, G. and Rolander, D., "Action in Heterarchies: New Approaches to Managing the MNC", in C. Bartlett, Y. Doz and G. Hedlund (eds), Managing the Global Firm, Routledge, London, (1 990).
Herbert, E., "How Japanese Companies Set R&D Directions", Research Technology Management, September-October, pp. 28-37 (1990).
Hewitt, G., "Research and Development Performed Abroad by U.S. Manufacturing Multinationals," Kykfos, Vol. 33, (1980).
Howells, J., "The Location and Organization of Research and Development: New Horizons," Research Polis>, Vol. 19, pp. 133-146 (1990).
Hulland, J., "Use of Partial Least Squares (PLS) in Strategic Management Research: A Review of Four Recent S tudies", Strategic Management Journal, Vol. 20, pp. 1 95-204 ( 1 999).
H p e r , S. H., The International Operutions of Multinational Firm: A Sruày of Foreign Direct Investmem, MIT Press, Boston (1976).
Inkpen, A C , "The Management of Knowledge in International Alliances: The Role of Collaborative Process," Conference Proceedings ofthe CBi, USA (1997).
Jackson, S., May, K.E. and Whitney, K., "Understanding the Dynarnics of Divenity in Decision Making Tearns" in R.A. G u a o and E. Salas (eds.), Team Efectiveness and Decision Making in Organizafions, Jossey-Bass, San Francisco, CA pp. 204-26 1 (1995).
Kanter, R.M., "When a Thousand Flowers Bloom: Strucntral, Collective, and Social Conditions for Imovation in Organizations," Ui B.M. Staw and L.L. Curnmings (eds.), Reseorch in Orgonirational Behavior, Vol. 1 O, Greenwich, CT: JAI Press (1 988).
Knickerbocker, F. T., Oligopolistic Remion and Multinational Enterprises, MIT Press, Cambridge (1973).
Knight, D., Pearce, C., Smith, K. G., Olian, J., Sims, H., Smith, K., A., and Flood, P., "Top Management Tearn Diversity, Group Process, and Strategic Consensus", Strategic Management Journal, Vol. 20, pp. 445-465 (1999).

Kogut, B. and Zander, U., "Knowledge of the Firm and the Replication o f Technology," Organùation Science, Vol. 3, pp. 383-397 (1 992).
Krogh, L.C., "Managing R&D Globally: People and FÏnanciaI Considetations," Research Technology Managemenl, July-August, pp. 25-28 (1994).
Kuemmerle, W., "Building EReca've R&D Capabilities Abroad," Horvrvd Business Rewiew, March-April, pp. 6 1-70 (1 997).
Kuemmerle, W., " Foreign Direct hvestment in industrial Research in the Pharmaceutical and Electronics Industries: Results 6om a Survey of Multinationd Firms", Reseurch Policy, Vol. 28, pp. 1 79- 1 93 (1 999).
Kumar, U., Kumar, V., and Persaud, A., "To Terminate or Not an Ongoing M D Project: A Managerial Dilemma", IEEE Transactions on Engineering Management, vol. 43, No. 3, pp.273-284 (1 996).
Lall, S., "The International Allocation of Research Activity by US Multinationals", W d Bulletin of Economics and StatrStics, Vol. 4 1, pp. 3 13-33 1 (1 979).
Lawrence, P. and Dyer D., Renewing American HLrtory, New York Free Press, (1983).
Lawrence, P. R, and Lorsch, J. W., OrganUation and Environment: Managing Diflèrentiation and Inregration, Boston: Graduate Schoof of Business Administration, Harvard University, (1 967).
Maccoby, M., "Human Engineering Leads to Operating Ptinciples for Global Management," Research Technology Management. Sept.-Oct, pp. 58-60 (1 995).
Malnight, T. W., "The Transition from Decentralized to Nenivork-Based Structures: An Evolutionary Perspective," Journal oflnternational Business Studies, First Quater, pp. 43-65 (1 996).
Marschan, R, "New Structural Fonns in Multinational: Decentralization at the Expense of Personal Communication Networks?" international Journal of Technology Management, Vol. 1 1 , Nos. 1 &2, pp. 192-206 (1 996).
Mamca, R F., "The Right Way to go Global: An Interview with Whirlpool CE0 David Whitwam," Harvard Business Review, March-April, pp. 1 35- 1 45 (1 994).
Medcof, J., "A Taxonomy of internationatly Dispersed Technology Units and its Application to Management Issues," The A cademy of Managemenr Annual Meeting, Boston, ( 1 998).
Medcof, J., "Strategic Contingencies and Power in Networks of Internationally Dispersed R&D Facilities," McMaster University, Hamilton, Canada, (1997).
Minaberg, H., The Smcrure urfOrganizations: A Synthesis ofthe Research, Prentice-Hall, Inc., (1979).
Mo hr, L. B ., Explaining Organïzational Behavior, San Francisco, JosepBass ( 1 982).
Mowery, D. C. and Rosenberg, N., "The Influence of Market Dernand upon Innovation: A critical Review of Some Recent Empiricai Studies", Research Policy, Vol. 8, pp. 103-153 (1979).
Neff, P., "Cross-Cultural Research Teams Ui a Global Enterprise," Research Technology Managemenr, May-June, pp. 15- 19 (1 995).
Nicholson, Ci., "How 3 M Manages i ts Global Laboratory Network," Research Technology Managemenr, July-August, pp. 2 1-24 (1 994)-
No hria, N. and G hoshal, S., The Dt~erentiuted Network: Organizing Multinational Corporatiom for Value Crearion. Jossey-Bass Publishers, San Francisco, (1997).
Norling, P., "Network or Not Work: Hamessing Technology Networks in DuPont," Resemch Technology Management, January-February, pp. 42-48 (1 996).
Nonaka, I., and Takeuchi, H., The Knowledge-Creating Compav. How Japanese Companies Create the Dynamicr oflnnovation. New York: Oxford University Press (1995).
Odagiri, H. and Yasuda H., "The Detmninants of Overseas M D by lapanese FÏms: An EmpUical Study at the Industry and Company Leveis," Research P olicy, Vol. 25, pp. 1059- 1079 (1 9%).
Ouchi, W.G., "Markets, Bureaucraties and Clans," Administrative Science @mer&, Vol. 25, pp. 129-14 1 (1980).
Papanastassiou, M. and Pearce, R "The ïntcrnationalization of Research and Development by lapanese Enterprises," RcW Management, Vol. 24,2 (1 994)
Patel, P. and Pavitt, K., "The international Distribution and Dctenninants of Technological Activities," Ojord Review ofEconomic Policy, Whtcr, Vol. 4, pp. 35-55 (1988).
Patel, P. and Pavitt, K., " k g e Finns in Western Europe's Technological Competitiveness," in Mattsson, L- G and Stymne, B. (eds), Corporate and fnhsny Srrategiesfbr Europe, North Holland, Amsterdam (1990).
Patel, P. and Pavitt, K., "Large Firms in the Production of the Worlds Technology: An hportaiit Case of Non-Globalization," in Granstrand, et al., Technology Management and International Business, John Wiley & Sons Ltd., England (1992)-
Patel, P., and Vega, M., "Patterns of htcmationalization of Corporate Technology: Location vs. Home Country Advantages", Reservch Policy, Vol. 28, pp. 145- 155 (1999).
Pearce, RD., The Internarionalkation of Research and Development by Multinational Enterprises," Macmillan, London (1989).
Pearce, R.D. and Singh, S., Globalking Research and Datelopment, Macmillan, London (199 1).
Pearce, R and Suigh, S., "Intemationalization of Research and Development Among the World's Leading Enterprises: Survey Analysis of Organdion and Motivation," in Granstrand, et al., Technology Management and International Business, John Wiley & Sons Ltd., England (1992).
Pearce, R. and Papanastassiou, M., "R&D Networks and Innovation: Decentralized Product Development in Multinational Enterprises". R&D Management, Vol. 26, No. 4, pp. 3 15-333 (1996).
Pearce, R and Papanastassiou, M., "Overseas R&D and the Strategic Evolution of MNEs: Evidence from Laboratories in the U K , Research Policy, Vo1.28, pp. 23-4 1 (1 999).
Pearce, R D., "Decenmlized R&D and Strategic Competitiveness: Globalised Approaches to Generation and Use of Technology in Multinational Enterprises", Research Polis: Vol. 28, pp. 157- 179 (1 999).
Perhutter, H., "The Torturous Evolution of the Multinatianal Corporation," Columbia Journal of World Business, Vol. 4, ( 1969).
Pfeffer, J., Power in Organùatiom, Pitman, Marshfield, MA (1 98 1).
Pfeffer, J. and Salancik, GR, The External Conrrol of Organ~arions: A Resource Dependency Perspective. New York, Harper Collins (1978).
Porter, MX., The Cornpetitive Aubanrage of Natiom, Macmillan, London, (1990).
Prahalad, C., and Doz, Y., The Multinational Miwion: Balancing Local Demandr and Global Vision, The Free Press, New York, U.S.A. (1 987).
Pugh, D.S., Hickson D.J. and Hinings C.R., "The Contcxt of Organizational Stmcture," Auhinistrative Science Quarterly, Vol. 14, pp. 9 1 - 1 14 (1 969).
Pugh, D.S., Hickson D.J. and Turner C., "The Dimensions of Organization Stnicture," Administrative Science Quarterly, Vol. 13, pp. 65-105 (1968).
Reddy, A.S.P., 'Wew Trends in Locating Corporate R&D in Developing and East Europcan Countries by Transnational Corporations and thcu implications," United Nations Indurtriai Organüarion. Dec. (1994).
Reddy, A.S.P., "New Trends in Globalisation of Corporate R&D and Implications for innovation Capability in Host Countries: The Case of India," Resecuch Polis, Imtimte, University of Lund, Sweden, EADI VIIIth General Conference on Globalisation, Competitiveness and Human Security, Sept. 1 1-14 (1996).
Reddy, A.S.P. and J. Sigurdson., "TNC Globalisation: Emerging Patterns of Globalisation of Corporate R&D and Scope for Innovative Capability Building in Developing Counmcs?" Science and Public Policy, Vol. 21, No. 5, pp. 283-294 (1994).
Reger, G., "Benchmarking the intemationalization and Co-ordination of R&D of Westem E u r o p and Japanese Multinational Corporations", International Journal of lnnovdion Management, Vol. 1, no. 3, pp. 299-33 1 (1 997).
Reger, G., "How R&D is Coordinated in Japanese and Western European Multinationals", R&D Management, Vol. 29, NO. 1, pp. 1-88 (1999)
Rogers, E., Dimion o/lnnovations, (4". Ed), New York, F m Press (1995).
Ronstadt, R. C., Research und Development Abroad by US, Muftinutionak New Yo*: Praegcr (1977).
Ring, P.S. and Van de Ven, A.H., "Smic tu~g Cooperative Relationships between Organizations," Srraregic Management Journal, Vol. 1 3, pp. 483498 ( 1992).
Rugman, A.M., 'Wew Theories of the Multinational Enterprise: An Assessment of Intemalization Theory," Bulletin ofEconomic Resecvch, Vol. 2 pp. 101-1 18.
Schein, E. H., "Organizational Socialization and the Performance of Management," Inrhcrtrial Management Review, Winter, pp. 1 - 16 (1 968).
Serapio, Jr.M.G. and Dalton, D.H., "Foreign R&D Facilities in the United States," Resemch Technolo~ Management, November-December, pp. 33-39 ( 1993).
Serapio, Jr.M.G. and Dalton, D.H., "Foreign M D Facilities in the United States," Resewch Policy, Vol. 28 (1999).
Serapio, M. G. Jr., "Growth of Japan-U.S. Cross-border Investments in the Electronics Industry," Research Technology Management, Vol. 38, No. 6, pp. 42-27 (1995).
Shane, S., "Championing Innovation in the Global Corporation," Research Technology Management, July- August, pp. 29-35 (1994).
Smith, KG., Smith, K.A., O'Bannon, D.P., Olian, J.D., Sims, H.P., and Scully, J., "Top Management Team Demography and Process: The Role of Social Integration and Communication," Administtat~e Science Quarterly, Vol. 39, pp. 4 12-438 (1994).
Stock, G. N., Greis, N. P. and Dibner, M. D., "Parent-Subsidiary Communication in International Biotechnoiogy R&D, ZEEE Transactionr on Engineering, Vol. 43, No. 1, pp. 56-68 (1 996).
Stopford, J. M., Wells, L. T., Managzng the Multinational Enterprise, New York: Basic Books (1972).
Telesis Staff., "The Power of a Global R&D Network," Telesk, No. 99, December, pp. 48-61 (1994).
Thompson, J. D., Organizationr in Action, New York: McGraw-Hill, (1967).
Tushman, M. and Anderson P.. Managing Strrrtegic Innovation und Change, New York: Oxford University Press, (1 997).
Tripsas, M., Schrader S., and Sabrera M.., "Discouraging Opportunistic Behavior in Collaborative M D : A New Role for Goveniment," Reseorch Policy, Vol. 24, pp. 367-389 (1995).
Vernon, R. E., "International lnvestment and International Trade in the Product Cycle," Quarterly journal of Economics, Vol. 80, pp. 190-207 (1966).
Vernon, R. E. and Moore W., Readings in the Management ofInnovation, 2" edition, Harper Business: A Division of Harper Collins Publishers, (1988).
Voisey, C. J., "Supplier Research and Devclopment: How Japanese Multinational Companies are Innovating in their Global Networks," MITJP 92-13, Centre for International Studies, MIT (1992).
Voisey, C. i., "Managing R&D with Constrained Resourccs in Japan's High Technology Companies," MITJP 93-05, Centre for Internaîioaal Studies, MIT (1993).
Wagner, G.W., Pfeffer, J., and O'Reilly, C.A. "Organizational Demography and Turnover in Top Management Groups," A&ninisIrative Science Quarte& VOL 29, pp. 74-92 (1984).
Westney, D., "Cross-Pacific Intemationalization of R&D by U.S. and Japanese Fi-," R&D Management, Vol. 23, No. 2 (1993).
White, R E. and Poynter, T. A., "Organizing for World-wide Advanrage", In C. A. Bartlett, Y.L. Doz and G. Hedlund, editors, Managing the Global Firm London: Routledge (1990).
Zadoks, A., "Managing Technology at Caterpillar," Research Technology Management. Jan.-Feb., pp. 49- 5 1 (1 997).
Zajac, E.J., Golden, B.R, and Shortell, S.M., "New Organizationai Forms for Enhancing Innovation: The Case of interna1 Corporate Joint Ventures," Managemeni Science, Vol. 37, pp. 1 70- 1 84 (1 99 1).
APPENDIX 1
SUBSIDIARY SURVEY - ENGLISH VERSION
195 Ajax Persaud, School of Busùtess, Carleton Uniwmity, Ortawu, Ont&, KI S 586, Canada

Carleton U N i V O R S l T V
Creating Innovations through Global Partnerships: A Survey of the World's Leading Companies
Dear Sir or Madam:
My name is Ajax Persaud. 1 am a Phi3 candidate in the School of Business at Carleton University, Ottawa, Canada- My area of specialization is Management of Technology. 1 am currently working on my thesis research which examines the extent to which collaborations among the research labs (or unitdfaci lities) of multinational corporations (MNCs) enhance their ability to generate innovations quickIy and efficiently.
Reports in the popular press and in academic joumals indicate that collaborations among worldwide units of MNCs, if done correctly, could result in substantial benefits to these companies. These same reports also suggest that few companies have been able to organise their global operations successfûlly. The results of this study could provide valuable insights into how companies manage their global research activities, and the factors that account for their success or failure. Preliminaq discussions with managers of some companies reaffirm the need for research of the kind proposed here.
Your company is one of the leading MNCs 1 have selected to participate in this study. 1 am asking rhar you parric@are in rhis srudy by complering the following questionnaire. AI1 information provided will be treated in strict confidence. Responses will be aggregated so that no individual Derson. lab or company will be identified in the final reporting. Your participation will significantly enhance my ability to complete the study in a timely fashion.
Should you need further information, please contact me by phone at (6 13) 520-2600 ext. 10 1 7 or by e- mail - [email protected]. You are also welcome to contact my thesis supervisor, Professor Vinod Kumar, at 520-2379 for fiirther information. A copy of the findings of the study will be sent to interested participants.
Thank you for taking the time to participate in this study. Please send your reply either by fax or mail. /-
Fax: (6 1 3) 260-2642
Mail: Ajax Persaud School of Business, Carleton University Ottawa, Ontario K I S 5B6, Canada
Sincerely, Ajax Persaud
1%
Ajax Persaud, School of Business, Catleton UniuetsiîyB OttauM, OntarioB KIS 5B6, Canada
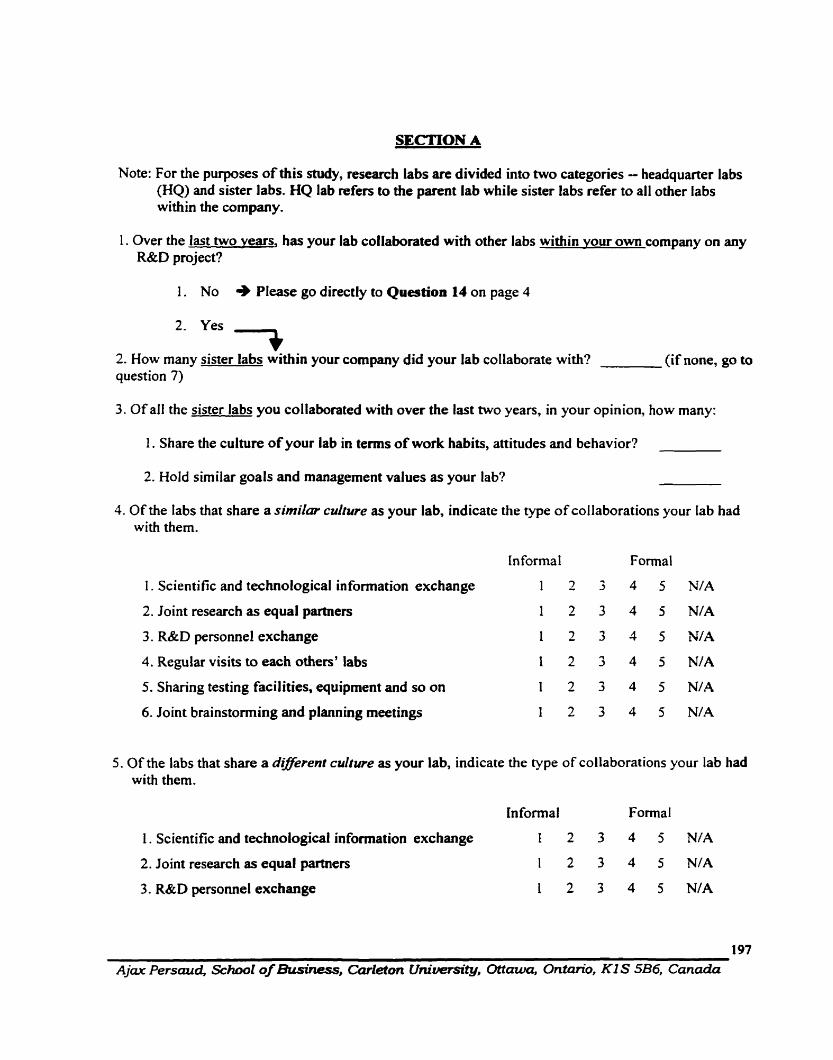
Note: For the purposes of this study, research labs are divided into two categories - headquarter labs (HQ) and sister labs. HQ lab refers to the parent lab while sister labs refer to al1 other labs within the company.
1. Over the last two vears, has your lab collaborated with other labs within vour own company on any R&D project?
1. No Please go directly to Question 14 on page 4
2. How many sister labs within your company did your lab collaborate with? (if none, go to question 7)
3. Of al1 the sister labs you collaborated with over the last two years, in your opinion, how many:
1. Share the culture of your lab in tems of work habits, attitudes and behavior?
2. Hold similar goals and management values as your lab?
4. Of the labs that share a similw culture as your lab, indicate the type of collaborations your lab had with them.
In formal Forma1
1. Scientific and technological information exchange 1 2 3 4 5 N/A
2. Joint research as equal partners 1 2 3 4 5 N/A
3. R&D personnel exchange 1 2 3 4 5 N/A
4. Regular visits to each others' labs 1 2 3 4 5 N/A
5. Sharing testing facilities, equipment and so on 1 2 3 4 5 N/A
6. Joint brainstorming and planning meetings 1 2 3 4 5 N/A
5. Of the labs that share a d#erent cuifure as your lab, indicate the type of collaborations your lab had with them.
Informai Formal
1. Scientific and technological information exchange I 2 3 4 5 N / A
2. Joint research as equal partners 1 2 3 4 5 NIA
3. R&D personnel exchange 1 2 3 4 5 N/A
197
Ajax Persaud, School of Business, Carleton UmNuersiîy, Ottawa, Ontan'o, Kl S 5B6, Canada
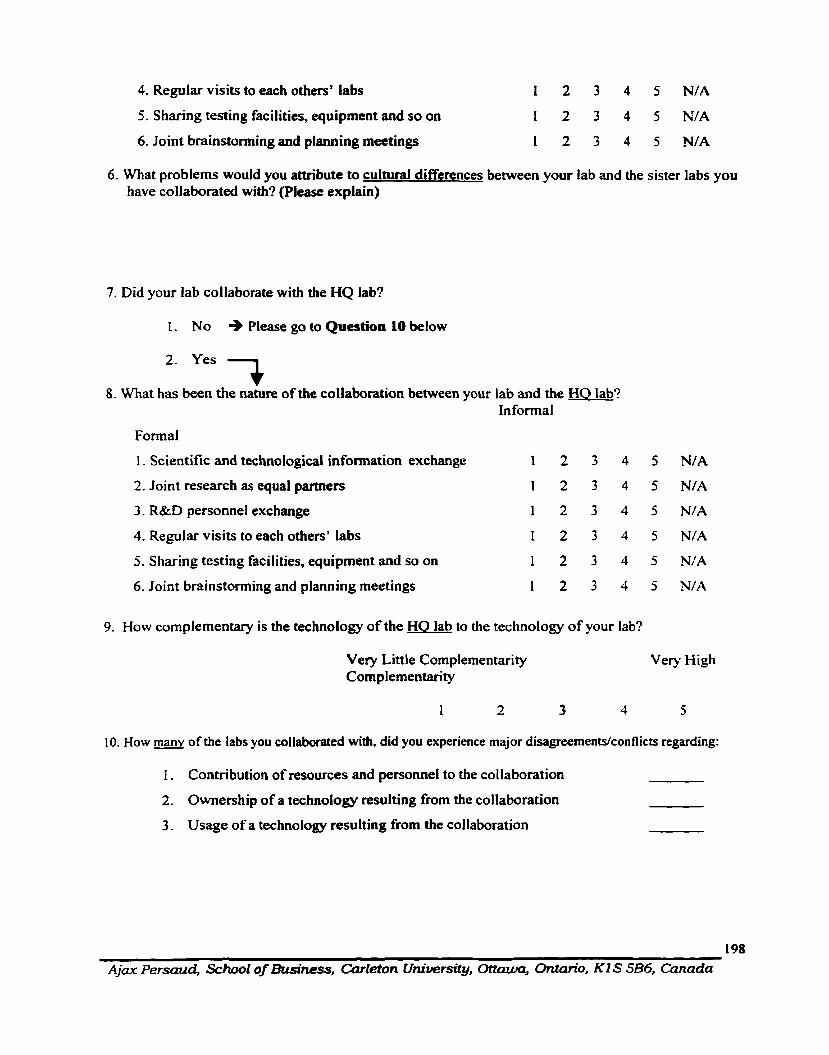
4. Regular visits to each others' labs
5. Sharing testing facilities, equipment and so on
6. Joint brainstorming and planning meetings
6. What problems would you attribute to cultutal differences between your lab and the sister labs you have collaborated with? (Please explain)
7. Did your lab collaborate with the HQ lab?
1. No .) Please go to Question 10 below
- 7 What has been the nature of the collaboration between your lab and the HO lab?
In formal
Formal
I . Scientific and technotogical information exchange 1 2 3 4 5 N / A
2. Joint research as equal partners 1 2 3 4 5 N l A
3. R&D personnel exchange 1 2 3 4 5 N / A
4. Regular visits to each others' labs 1 2 3 4 5 N / A
5. Sharing testing facilities, equipment and so on 1 2 3 4 5 N/A
6. Joint brainstorming and planning meetings 1 2 3 4 N l A
9. How compfementary is the technology of the HO lab to the technology of your lab?
Very Little Complementarity Complementarity
Very High
10. How many of the labs you collaborated with, did you experience major disagreements/conflicts regarding:
1. Contribution of resources and personnel to the cotlaboration
2. Ownership of a technology resulting fiom the collaboration
3. Usage of a technology resulting fiom the collaboration
198
Ajax P e r s a d , School of Business, Carleton Unimrsity, Ottawa, Ontario, KI S 5B6, Canada
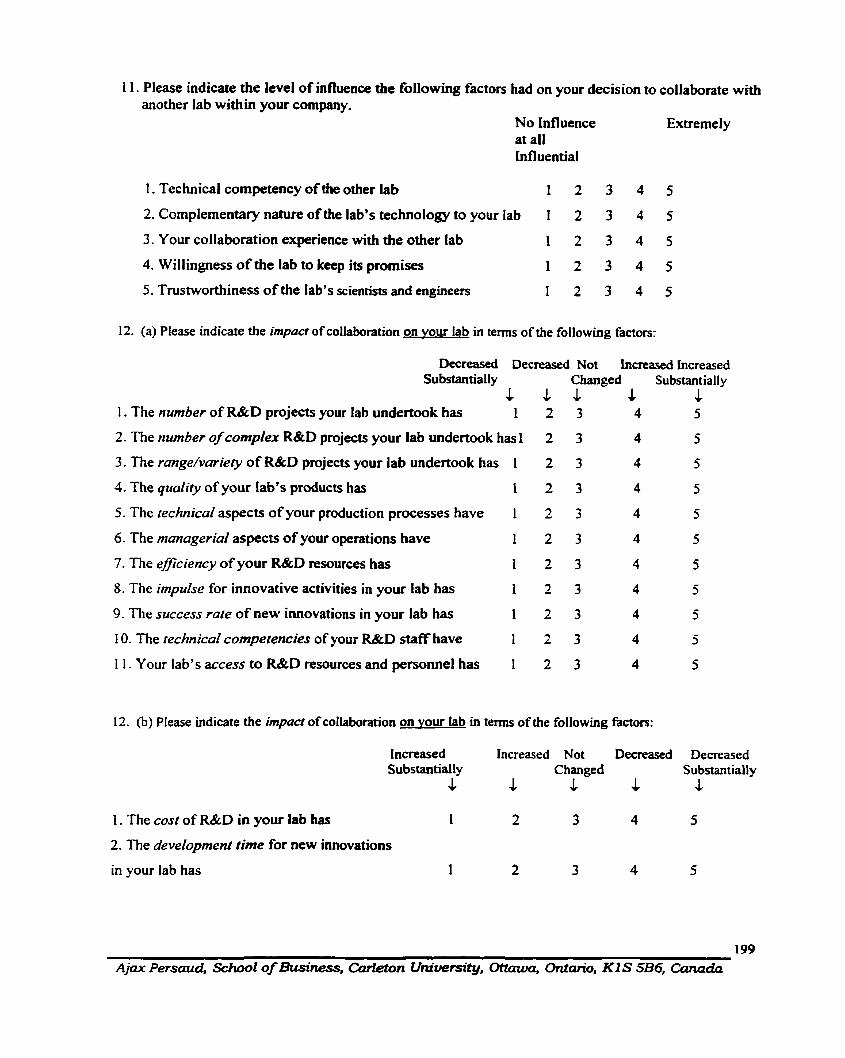
1 1. Please indicate the level of influence the following factors had on your decision to collaborate with another lab within your Company.
No influence Extremely at al1 hfluentiai
1. Technical cornpetency of the other lab 1 2 3 4 5
2. Complementary nature of the lab's technology to your lab 1 2 3 4 5
3. Your collaboration experience with the other lab 1 2 3 4 5
4. Willingness of the lab to keep its promises 1 2 3 4 5
5. Tmstworthiness of the lab's scientists and engineers 1 2 3 4 5
12. (a) Please indicate the impact of collaboration on vour lab in terms of the following factors:
Decreased Decreased Not Increased Increased Substantiaily Changed Substantially
L L 1 -l 1 . The number of R&D projects your lah undertwk has 1 2 3 4 5
2. The number of cornplex R&D projects your lab undertook has 1 2 3 4 5
3 . The range/variety of R&D projects your lab undertook has 1 2 3 4 5
4. The quality of your [ab's products has 1 2 3 4 5
5. The technical aspects of your production processes have 1 2 3 4 5
6. The managerial aspects of your operations have 1 2 3 4 5
7. The eflciency of your R&D resources has 1 2 3 4 5
8. The impulse for innovative activities in your lab has 1 2 3 4 5
9. The success rare of new innovations in your lab has 1 2 3 4 5
I O . The technical comperencies of your R&D s t a f f have 1 2 3 4 5
1 1. Your Iab' s access to R&D tesources and personnel has 1 2 3 4 5
12. (b) Please indicate the impact of collaboration on vour lab in t e m of the following factors:
Increased increased Not Decreased Decreased Substantially Changed Substantially
.L -L L 4 JI
1 . The cost of R&D in your lab has 1 2 3 4 5
2. The developmenf fime for new innovations
in your lab has 1 2 3 4 5
1 99 Ajax Persaud, School of Business, Cavkton University, Ottawa, Ontario, KI S 5B6, Canada

13. Please indicate the frequency of communication between your lab and other sister labs.
Yearly Quarterly Monthly Weekly Daily Electronic communication between top managers 1 2 3 4 5
Electronic communication between projet managers1 2 3 4 5
Electronic communication between R&D Staff 1 2 3 4 5
In-person communication between top managers 1 2 3 4 5
In-person communication between pmject managers 1 2 3 4 5
in-person communication between R&D Staff 1 2 3 4 5
14. Please indicate the frequency of communication between your lab and the HO lab.
Yearly Quarterly Monthly Weekly Daily
Electronic communication between top managers 1 2 3 4 5
Eiectronic communication between project managers 1 2 3 4 5
Electronic communication between R&D S M 1 2 3 4 5
In-person communication behveen top managers 1 2 3 4 5
In-person communication between project managers 1 2 3 4 5
In-person communication between R&D Staff 1 2 3 4 5
15. Please indicate how the following decisions are usually made at vour lab:
1 = HQ decides alone 2 = HQ decides, but your lab provides suggestions 3 = both HQ and your lab have roughly equal influence 4 = your lab decides, but the HQ provides suggestions 5 = your lab decides alone
HQ Decides Your Lab Alone Decides Alone
I . Making significant changes to an existing product 1 2 3 4 5
2. ModiQing a production process at your lab 1 2 3 4 5
3. Restructuring your lab 1 2 3 4 5
4. Recruiting scientists and engineers for your lab 1 2 3 4 5
5. Deciding on the career paths of scientists and engineers 1 2 3 4 5
6. Number of projects undertaken by your lab 1 2 3 4 5
7. Selecting the type of projects undertaken by your lab 1 2 3 4 5
8. Setting project priorities for your Iab 1 2 3 4 5
9. Conducting joint R&D with other labs in your Company 1 2 3 4 5
A j u Persad, S e h l of Business, Carleion University, Ottawa, Ontario, KI S 5B6, Canada
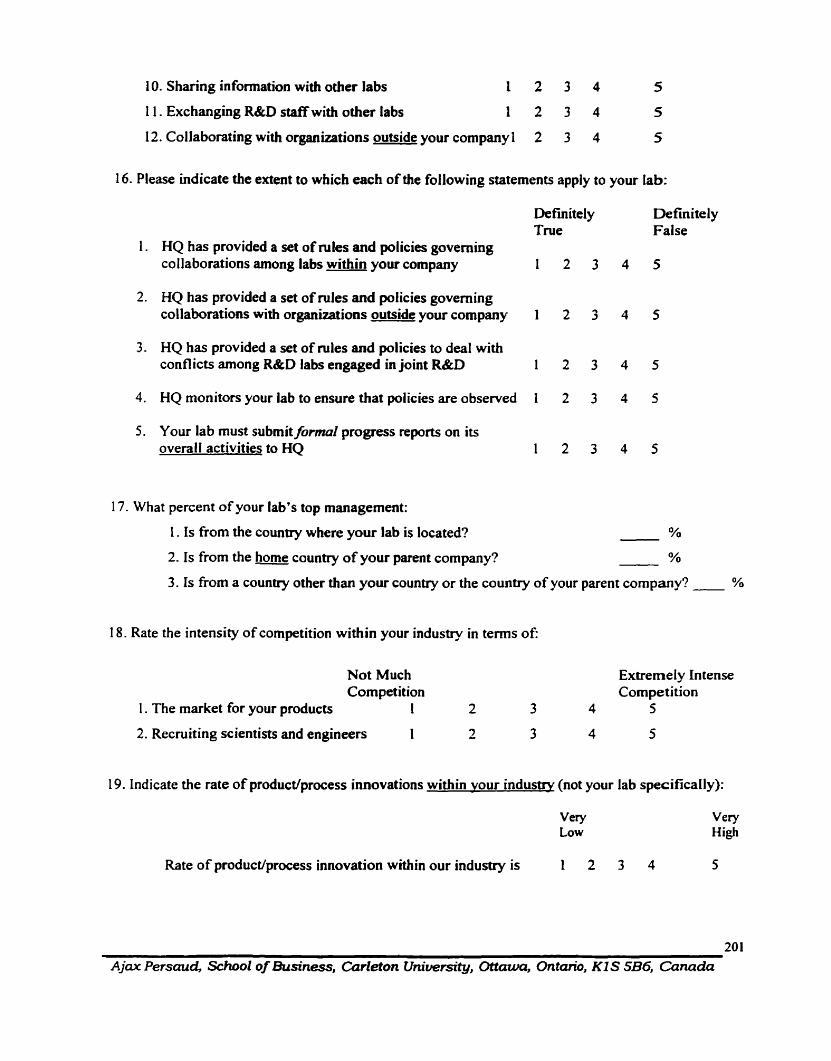
10. Sharing information with other labs 1 2 3 4 5
1 1. Exchanging R&D staff with other labs 1 2 3 4 5
12. Collaborating with organizations outside your companyl 2 3 4 5
1 6. Please indicate the extent to which each of the following statements apply to your lab:
Defmitely Definitely True False
1. HQ has provided a set of niles and policies goveming collaborations among labs within your Company 1 2 3 4 5
2. HQ has provided a set of rules and poiicies governing collaborations with organizations outside yow company 1 2 3 4 5
3. HQ has provided a set of niles and policies to deal with conflicts among R&D labs engaged in joint R&D 1 2 3 4 5
4. HQ monitors your lab to ensure that policies are observed 1 2 3 4 5
5 . Your lab must submitformal progress reports on its overall activities to HQ 1 2 3 4 5
17. What percent of your lab's top management:
1.1s fiom the country where your lab is located? YO
2.1s front the home country of your parent company? YO
3.1s fiom a country other than your country or the country of your parent cornpany? 'Y0
18. Rate the intensity of cornpetition within your industry in terms of:
Not Much ExtremeIy Intense Corn petition Cornpetition
1. The market for your products 1 2 3 4 5
2. Recniiting scientists and engineers 1 Li 3 3 4 5
19. Indicate the rate of product/process innovations within vour industry (not your lab specifically):
Vew Low
V e v High
Rate of product~process innovation within our industry is 1 2 3 4 5
20 1
Ajax Persaud, School of BusinessJ Carleton UniversityJ Ottawa, Ontaria, KI S 5B6, Canada
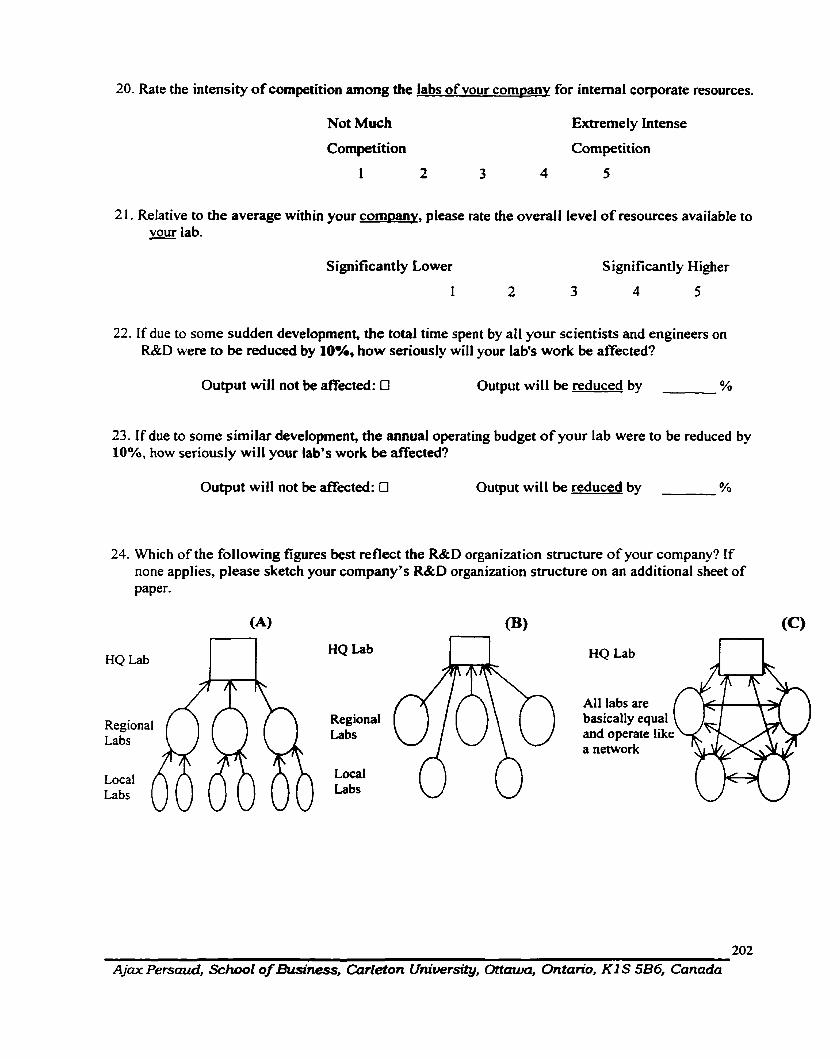
20. Rate the intensity of cornpetition among the labs of vour comvany for intemal corporate resources.
Not Much Extremely intense
Cornpetition Competition
1 2 3 4 5
2 1. Relative to the average within your compn_y, please rate the overall level of resources avaiiable to m r lab.
Significantiy Lower S ignificantly Higher
1 2 3 4 5
22. If due to some sudden development, the total time spent by al1 your scientists and engineers on R&D were to be reduced by 10?& how seriously will your lab's work be aec ted?
Output will not be affected: O Output will be reduced by YO
23. If due to some similar development, the annual operating budget of your lab were to be reduced by IO%, how seriously will your lab's work be affected?
Output will not be afTected: Ei Output will be reduced by YO
24. Which of the following figures best reflect the R&D organization structure of your company? If none applies, please sketch your company's R&D organization structure on an additional sheet of paper.
(4
HQ Lab n HQ Lab
Regional Labs
Local Labs
(C)
HQ Lab n
Ajax Persaud, School of Business,~~arleton University, Ottawa, Ontario, KI S 586, Canada
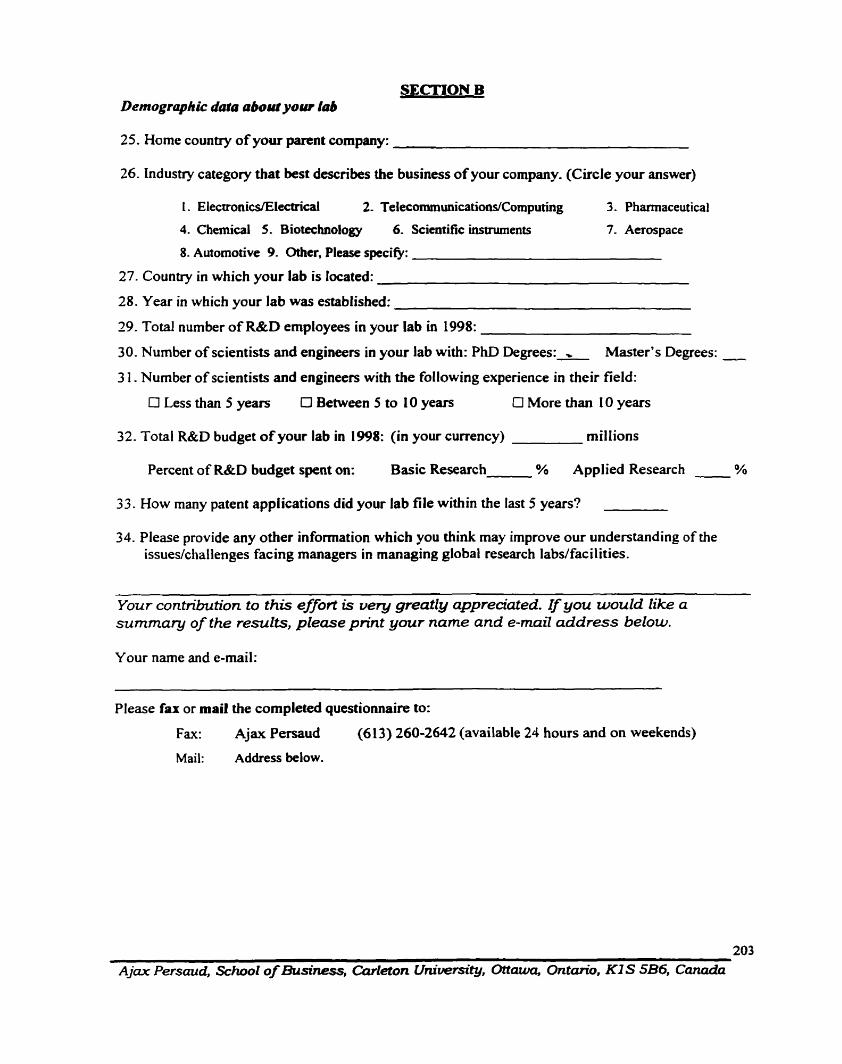
Demographic data abou your lab
25. Home country of your parent company:
26. Industry category that best describes the business of your company. (Circle your answer)
1. Electronics/Electncai 2. Telecommunications/Computing 3. Phamaceutical
4. Chernical 5. Biotechnology 6. Scicntific instruments 7. Aerospace
8. Automotive 9. Othcr, Please speciQ:
27. Country in which your lab is focated:
28. Year in which your lab was established:
29. Total number of R&D ernployees in your lab in 199%:
30. Number of scientists and engineers in your lab with: PhD Degrees: , Master's Degrees: - 3 1. Number of scientists and engineers with the fotlowing experience in their field:
O Less than 5 years O Between 5 to 10 years O More than 10 years
32. Total R&D budget of your lab in 1998: (in your currency) millions
Percent of R&D budget spent on: Basic Research % Applied Research '%O
33. How rnany patent applications did your lab file within the last 5 years?
34. Please provide any other information which you think may improve our understanding of the issues/challenges facing managers in managing global research labs/facilities.
Your contribution to this effort is very greatly appreciated. If you would like a surnmary of the results, pbasepnnt your name and e-mail address below.
Your narne and e-mail:
Please far or mail the completed questionnaire to:
Fax: Ajax Persaud (61 3) 260-2642 (available 24 hours and on weekends)
Mail: Address below.
203
Ajax Persaud, School of Business, Carteton UmIUwers@j, Ottawa, Ontario, KI S 5B6, Canada
APPENDIX 2 HEADQUARTER SURVEY- ENGLISH VERSION
204
Ajax Persaud, School of Business, Carleton UniuemtStty, Ottawa, Ontario, KIS 5B6, Canada
Carleton U N I V E R S I T Y
Creating Innovations through Global Partnerships: A Survey of the World's Leading Companies
Dear SirMadam:
My name is Ajax Persaud. 1 am a PhD candidate in the School of Business at Carleton University, Ottawa, Canada. My area of specialization is Management of Technology. 1 am currently working on my thesis research which examines the extent to which collaborations arnong the research labs (or unitdfacilities) of multinational corporations (MNCs) enhance their ability to generate innovations quickly and eficiently.
Reports in the popular press and in academic journals indicate that collaborations among worldwide units of MNCs, if done correctly, could result in substantial benefits to these companies. These same reports also suggest that few companies have been able to organise their global operations successfutly. The results of this study could provide valuable insights into how companies manage their global research activities, and the factors that account for their success or failure. Preliminary discussions with managers of some companies reafirm the need for research of the kind proposed here.
Your Company is one of the leading MNCs 1 have selected to participate in this study. 1 am asking that you particbate in rhis stuCjr by cornpleting the following quesfionnai~e. All information provided will be treated in strict confidence. Responses wilI be aggregated so that no individual Derson. lab or comDanv will be identified in the final reporting. Your participation will significantly enhance my ability to cornpiete the study in a timely fashion.
Should you need fiirther inforrnation, please contact me by phone at (6 13) 520-2600 ext. 10 17 or by e-mail - [email protected]. You are also welcome to contact my thesis supervisor, Professor Vinod Kumar, at 520-2379 for firther information. A copy of the findings of the study will be sent to interested participants.
Thank you for taking the tirne to participate in this study. Please send your reply either by fax or mail.
Fax: (6 13) 260-2642
Mail: Ajax Persaud School of Business, Carleton University Ottawa, Ontario KI S 5B6, Canada
Sincerely,
Ajax Persaud
205
Ajax Persmd, School of Bwimss, Grleton University, Ottawa, Ontmo, K l S 586, Canada
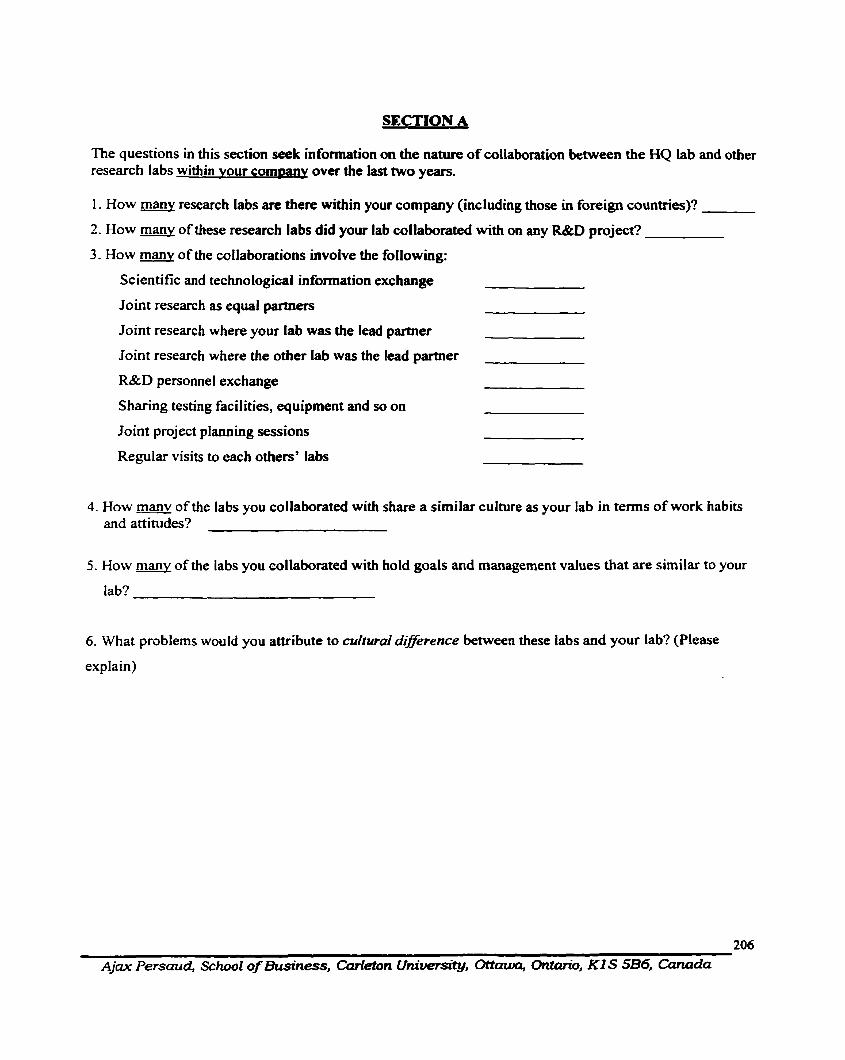
The questions in this section seek information on the nature of collaboration between the HQ lab and other research labs within vour comuany over the 1s t two years.
1 . How manv researc h Iabs are there within your Company (inc luding those in foreign countries)?
2. How manv of these research labs did your lab collaborated with on any R&D project?
3. How many of the coIIaborations involve the following:
Scientific and technological information exchange
Joint research as equal partners
Joint research where your lab was the lead partner
Joint research where the other lab was the lead partner
R&D personnel exchange
Sharing testing facilities, equipment and so on
Joint project planning sessions
Regular visits to each others' labs
4. How manv of the labs you collaborated with share a similar culture as your lab in terms of work habits and attitudes?
How manv of the labs you collaborated with hold goals and management values that are similar to your
[ab?
What problems would you attribute to cultural difjCerence between these labs and your Lab? (Please
explain)
206
Ajax Persaud, School of Business, Carleton University, Ottauna, 0ntononoJ KI S 5B6, Canada
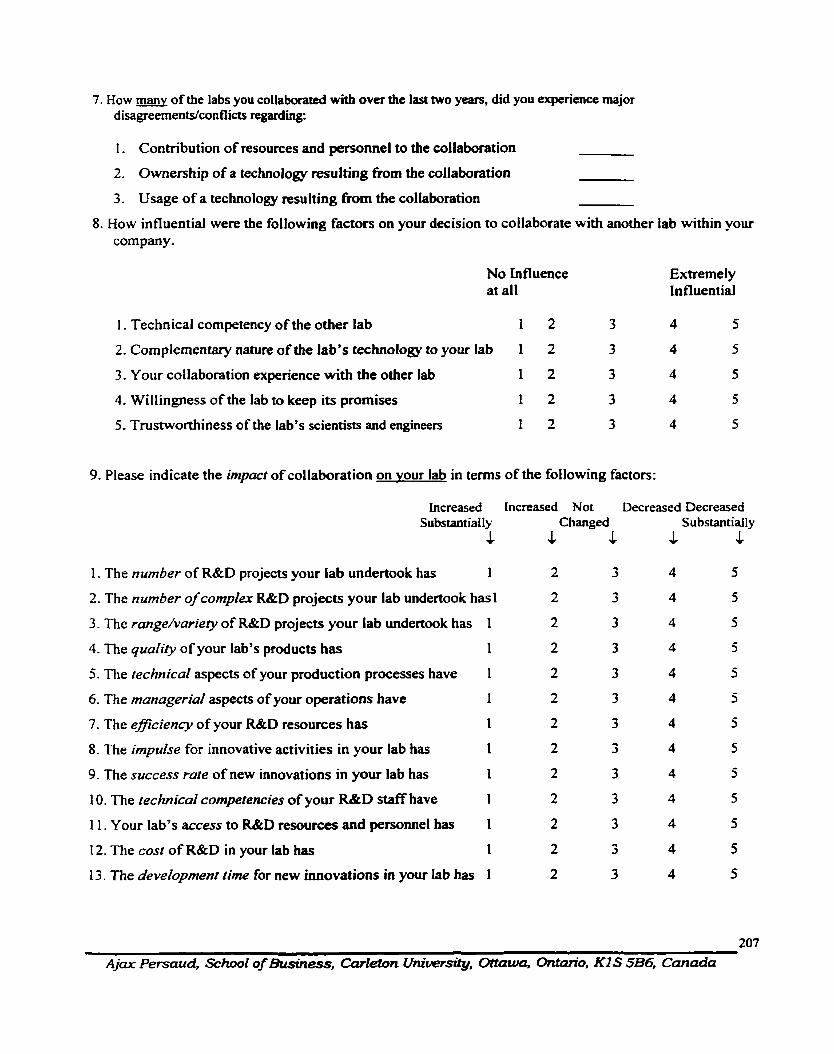
7. How manv of the labs you collaborated with over the last two years, did you experience major disagreements/conflicts regarding:
1. Contribution of resources and personnel to the collaboration
2. Ownership of a technology resulting fiom the collaboration
3. Usage of a technology resulting fiom the collaboration
8. How influential were the following factors on your decision to collaborate with another lab within your Company.
No Influence at al1
Extremel y Influentid
1. Technical cornpetency of the other [ab 1 2 3 4 5
2. Cornplernentary nature of the lab's technology to your lab 1 2 3 4 5
3. Your collaboration experience with the other lab 1 2 3 4 5
4. WiIlingness of the lab to keep its promises 1 2 3 4 5
5. Trustworthiness of the lab's scientists and enguieers 1 2 3 4 5
9. Please indicate the impact of collaboration on vour lab in terms of the following factors:
hcreased hcreased Not Decreased Decreased Substantially Changed Substantially
JI & JI L &
1. The number of R&D projects your lab undertook has 1 2 3 4 5
2. The number of complex R&D projects your lab undertook hasl 2 3 4 5
3. The range/variety of R&D projects your lab undertook has 1 2 3 4 5
4. The qualiîy of your lab's products has 1 2 3 4 5
5. The rechnical aspects of your production processes have 1 2 3 4 5
6. The mager ia l aspects of your operations have
7. The eficiency of your R&D resources has
8. The impulse for innovative activities in your lab has
9. The success rate of new innovations in your lab has
1 0. The technical cornpetencies of your R&D staff have
1 1. Your Iab's access to R&D resources and personnel has
12. The cost of R&D in your lab has
13. The develcpment rime for new innovations in your lab has
207
Ajax Persaud, School of Business, Carleton UniuemfSLty, Ottatua, Ontario, KI S 5B6, Canada
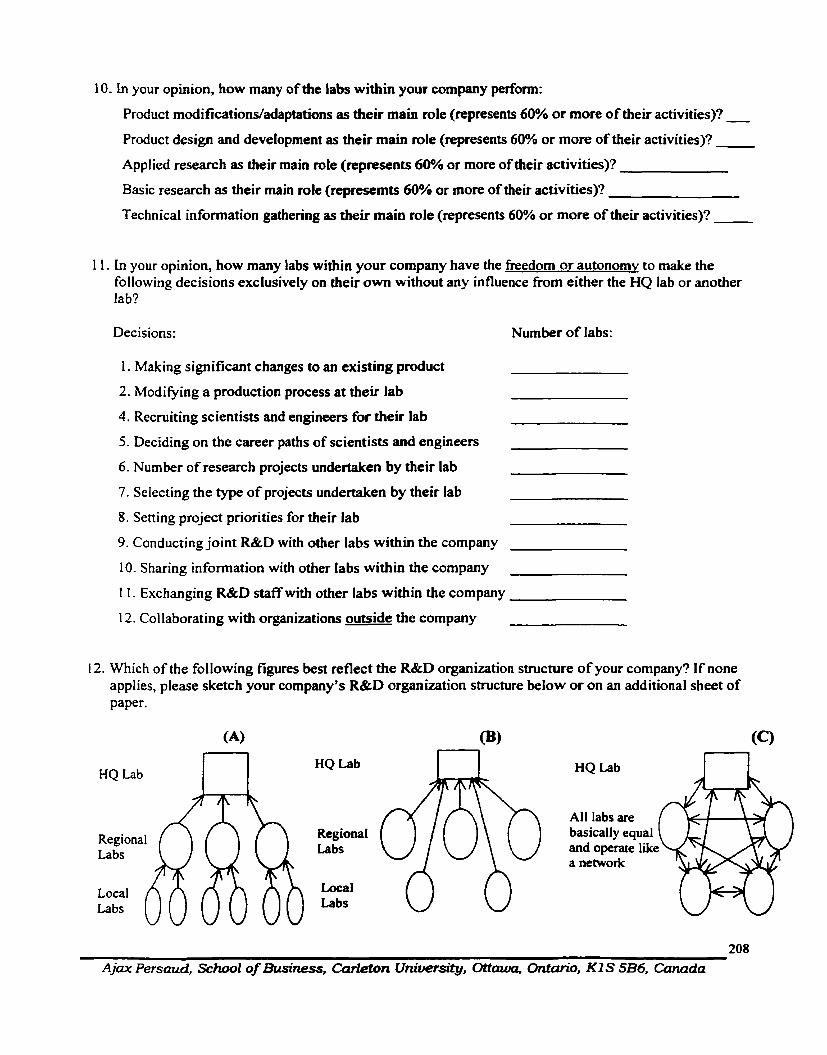
10. In your opinion, how many of the labs within your company perfonn:
Product modifications/adaptations as their main nile (represents 60% or more of their activities)? - Product design and development as their main role (represents 60% or more of their activities)?
Applied research as their main d e (represents 60% or more of their activities)?
Basic research as their main role (represemts 60% or more of their activities)?
Technical information gathering as their main role (represents 60% or more of their activities)?
1 1. Ln your opinion, how many labs within your company have the freedom or autonomy to make the following decisions exclusively on their own without any influence from either the HQ lab or another lab?
Decisions: Number of labs:
1. Making significant changes to an existing product
2. Modiwing a production process at their lab
4. Recmiting scientists and engineers for their lab
5. Deciding on the career paths of scientists and engineers
6. Nurnber of research projects undertaken by their lab
7. Selecting the type of projects undertaken by their lab
8. Setting project priorities for their lab
9. Conducting joint R&D with other labs within the company
10. Sharing information with other labs within the company
1 I . Exchanging R&D staff with other labs within the company
1 2. Collaborating with organizations outside the cornpany
12. Which of the following figures best reflect the R&D organization structure of your company? I f none applies, please sketch your company's R&D organization structure below or on an additional sheet of paper.
(A)
HQ Lab n HQ Lab
RegionaI Labs
Local Labs
(Cl
HQ Lab n
208 Ajax P e r s a d , School of Business, Carleton University, Ottawa, Ontcuicuio, KIS SB6, Canada

13. Home counûy of your parent company:
14. industry category that best describes the business of your company. (Circle al1 that applies)
1. Electronics/Electrical 2. Telecommunications~computing 3. Pharmaceuticd 4. Chernical
5. Biotechnology 6. Scientific instruments 7. Aerospace
8. Other, Please specim:
15. Year your lab was established:
16. Total number of R&D employees in your lab in 1998:
17. Number of scientists and engineers in your lab in 1998 with:
PhD Degrees: Master's Degrees as their highest degree:
Less than 5 years experience in their field:
Between 5-1 0 years experience in their field:
More than 10 years experience in their field:
18. Total R&D budget of your lab in 1998: (in your country's currency) miilions
Percent of R&D budget spent on: Basic Research: YO Applied Research: %
1 9. How many patent applications did your lab file within the last 3 years?
20. Please provide any other information which you think may improve our understanding of the issues/challenges facing managers in managing global R&D.
Your contribution to this effoort is very greatly appreciated. If you would like a summary of the results, please print your name and e-mail address below.
Your name and e-mail:
PIease fax or mail the completed questionnaire to:
Fax: Ajax Persaud (6 13) 520-2532
Mail: Address below.
209 Ajax Persauà, School of BusinessJ Carleton UntntuersityJ Ottawa, O n t e KIS 5B6, Canada
APPENDIX 3
smsmrm SURVEY - FRENCH VERSION
Carleton U N I V E R S I T Y
"Création d'innovations Q travers le partenariat global: Une enquête sur 1- compagnies tête de file à travers le monde."
Je me nomme Ajax Persaud. Je suis un candidat au programme de doctorat au "School of Business" à l'université de Carleton, Ottawa, Canada. Ma spécialization est la gestion de technologie. Je développe présentement la recherche de ma thèse qui examine comment la collaboration entre les différents laboraioires de recherche des corporations multinationales (CMN) améliorent rapidement et efficacement leur capacité à produire des innovations.
Les rapports dans la presse populaire et dans les journaux académiques indiquent que le coilaborations adéquates entre tes différentes unités des CMN peuvent entraîner des bénifices considérables pour ces compangnies. Ces mêmes rapports suggèrent que très peu de compagnies ont été capables d'organiser leur opérations globales avec succès. Les résultats de cette recherche pourraient apporter un éclairage pécieux sur la façon qu'ont les compagnies de gérer leur activités GLOBALES de recherche et les facteurs qui expliquent leur succès ou leur échec. Les discussions préliminaires avec les gérants de certaines compagnies réafirment le besoin d'une telle recherche.
Votre compagnie est l'une des CMN que j'ai sélectionnée pour participer a cette recherche. Je solicite votre participation en vous demandant de compléter le questionnaire suivant. Tout information donné sera traité dans la plus stricte confidentialité. Les réponses seront compilées de façon à ce qu'aucun individu, laboratoire ou compagnie ne puissent être identifiés dans le report final. Votre participation me permettera de compléter plus facilement cette recherche dans un délai raisonnable.
Pour de pIus amples rensignements, vous pouvez me rejoindre par téléphone au (6 13) 520-2600 poste 10 17 ou par courriel a [email protected]. Vous pouvez également communiquer avec mon directeur de thèse, Vinod Kumar, au (613) 520-2379. Les résultats de cette recherche seront envoyée sur demande à tous les participants intéressés.
Je vous remercie de votre collaboration. Vous pouvez faire parvenir votre réponse soit par fax Our par courier.
Fax: (6 13) 260-2642
Poste: Ajax Persaud School of Business, Carleton University Ottawa, Ontario K 1 S 5B6, Canada
Sincerement,
Ajax Persaud
21 1
Ajax Persaud, School of Business, Carleton Uiuuersity, Ottawu, Ontanano, KI S 5B6, Canada

Partie A
Note: Pour les buts de cette étude, les laboratoires de recherche sont divisés en deux catégories : laboratoire de la maison mère (MM) et laboratoire associes (LA). Lm laboratoire associes (LA) désignent les autres laboratoires à l'intérieur de la compagnie.
1. Au courant des deux dernières années, votre laboratoire a-t-il collaboré a des projets RD avec d'autres laboratoires à l'intérieur de votre compagnie. (LA) 1. No (allez directement à la question 12 à la page 4) 2. Oui (continuez le questionnaire)
2. Avec combien d e u à l'intérieur de votre compagnie avez-vous collaboré? (aucun, allez à la question 7)
3. Selon vous, combien des m a v e c lesquelle vous avez collaborés durant les 2 dernières années: 1. Partagent la culture de votre laboratoire en termes d'habitudes, d'attitudes et de
comportement?
2. Partagent des objecifs et des valeurs administratives semblables à celles de votre laboratoire?
4. Indiquez le type de collaboration votre laboratoire a eu avec les laboratoires qui partagent une culture semblable a celle de votre laboratoire
informel formel
Echange d'information scientifique et technologique 1 2 3 4 5
Recherche conjointe à titre de partenaires égaux 1 2 3 4 5
Echange de personnelle en RD 1 2 3 4 5
Visites régulières aux autres laboratoires 1 2 3 4 5
Partage d'installations de testing, d'équipement, etc. 1 2 3 4 5
Brainstorming conjoint et plannificaiton des réunions 1 2 3 4 5
5 . Indiquez le type de collaboration votre laboratoire a eu avec les laboratoires qui ont une culture d~fférente de la vôtre.
informel formel
Echange d'information scientifique et technologique 1 2 3 4 5
Recherche conjointe a titre de partenaires égaux 1 2 3 4 5
Echange de personnelle en RD 1 2 3 4 5
Ajax Persaud, School of BusViess, Carleton Uniuersity, Ottawa, Ontano, KIS 586, Canada
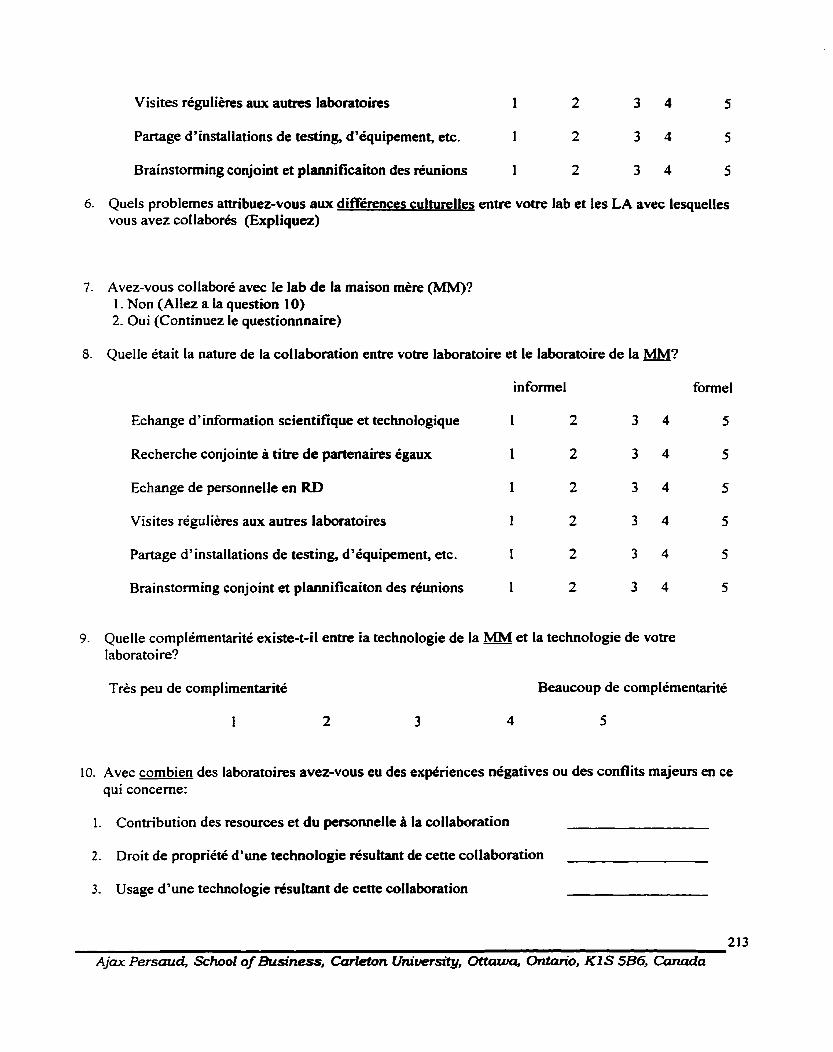
Visites régulières aux autres laboratoires 1 2 3 4 5
Partage d'installations de testing, d'équipement, etc. 1 2 3 4 5
Brainstorming conjoint et plannificaiton des réunions 1 2 3 4 5
6. Quels problemes attribuez-vous aux différences culturelles entre votre lab et les LA avec lesquelles vous avez coIlaborés (Expliquez)
7. Avez-vous collaboré avec le lab de la maison mère (MM)? 1. Non (Allez a la question 1 0) 2. Oui (Continuez le questio~naire)
8. Quelle était la nature de la collaboration entre votre laboratoire et le laboratoire de la MM?
informel formel
Echange d'information scientifique et technologique 1 2 3 4 5
Recherche conjointe à titre de partenaires égaux 1 2 3 4 5
Echange de personnelle en RD 1 2 3 4 5
Visites régulières aux autres laboratoires 1 2 3 4 5
Partage d'installations de testing, d'équipement, etc. 1 2 3 4 5
Brainstorming conjoint et plannificaiton des réunions 1 2 3 4 5
9. Quelle complémentarité existe-t-il entre ia technologie de la MM et la technologie de votre laboratoire?
Très peu de complimentarité Beaucoup de complémentarité
10. Avec combien des laboratoires avez-vous eu des expériences négatives ou des conflits majeurs en ce qui concerne:
1. Contribution des resources et du personnelle à la collaboration
2. Droit de propriété d'une technologie résultant de cette collaboration
3. Usage d'une technologie résultant de cette collaboration
213 Ajax Persaud, School of Business, Carleton Uniuersity, Ottaiuo, Ontanono, KI S 5B6, Canada

1 1. Quelle influence les facteurs suivants ont-ils eu sur votre décision de collaborer avec un autre laboratoire à l'intérieur de votre compagnie.
Aucune Beaucoup influence d' influence
La compétence technique de l'autre laboratoire 1 2 3 4 5
La complémentarité de la technologie de ce laboratoire par rapport au vôtre 1 2 3 4 5
Votre expérience de collaboration avec l'autre Laboratoire 1 2 3 4 5
La volonté du laboratoire de garder ses promesses 1 2 3 4 5
La fiabilité des scientifiques et des ingénieurs du 1 2 3 4 5 laboratoire
12. (a) S'il vous plaît, indiquez I'impocte de cette collaboration sur votre laboratoire selon les facteurs suivants:
diminué diminué aucun augmenté augmenté considérablement changement considérablement
3
3
1 . Le nombre de projets RD que votre laboratoire a entreprit a . . . 1
2. Le nombre de projets complexes de RD que votre laboratoire a entreprit a . . . 1
3. La garnme/variété de projets RD que votre Iaboratoire a entreprit a . . . 1
4. La qualité des produits de votre laboratoire a... 1
5. Les aspects techniques de vos procédés de production ont.. . 1
6. Les aspect gesrionnaires de vos opérations ont.. . 1
7. L eficucité de vos resources de RD a.. . 1
S. La motivation pour des activités innovatrices dans votre laboratoire a.. . 1
9. Le t m de succès des nouvelles innovations dans votre laboratoire a.. . 1 2 3 4 5
2 14
Ajax Persaud, School of Business, Carleton Uniwrsity, Ottawa, Ontario, KI S 586, Canada
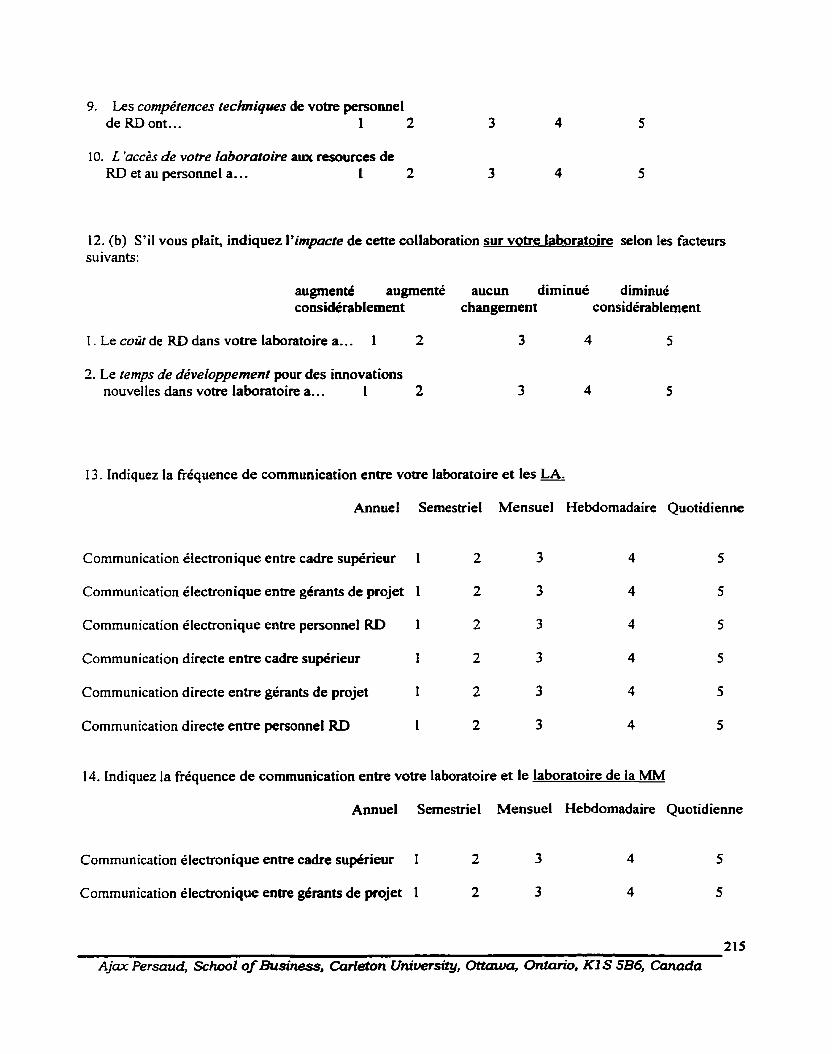
9. Les compétences techniques de votre persorinel de RD ont.. . 1 2
IO. L 'accès de votre laboratoire aux resources de RD et au personnel a.. . 1 2
12. (6) S'il vous plaît, indiquez I'impucte de cette collaboration sur votre laboratoire selon les facteurs suivants:
augmenté augmenté aucun diminué diminué considérablement changement considérablement
1. Le coût de RD dans votre laboratoire a.. . 1 2 3 4 5
2. Le temps de développement pour des imovations nouvelles dans votre laboratoire a.. . 1 2 3 4 5
13. Indiquez la fiéquence d e communication entre votre laboratoire et les LA.
Annuel Semestriel Mensuel Hebdomadaire Quotidienne
Communication électronique entre cadre supérieur 1 2 3 4 5
Communication électronique entre gérants de projet 1 2 3 4 5
Communication électronique entre personnel RD 1 2 3 4 5
Communication directe entre cadre supérieur I 2 3 4 5
Communication directe entre gérants de projet 1 2 3 4 5
Communication directe entre personnel RD 1 2 3 4 5
14. Indiquez la fréquence d e communication entre votre laboratoire e t le laboratoire de la MM
Annuel Semestriel Mensuel Hebdomadaire Quotidienne
Communication électronique entre cadre supérieur 1 2 3
Communication électronique entre gérants de projet 1 2 3
215
Ajax Persuud, School of Business, Carleton Uniuem.îy, Ottawa, Ontario, KIS 5B6, Canada
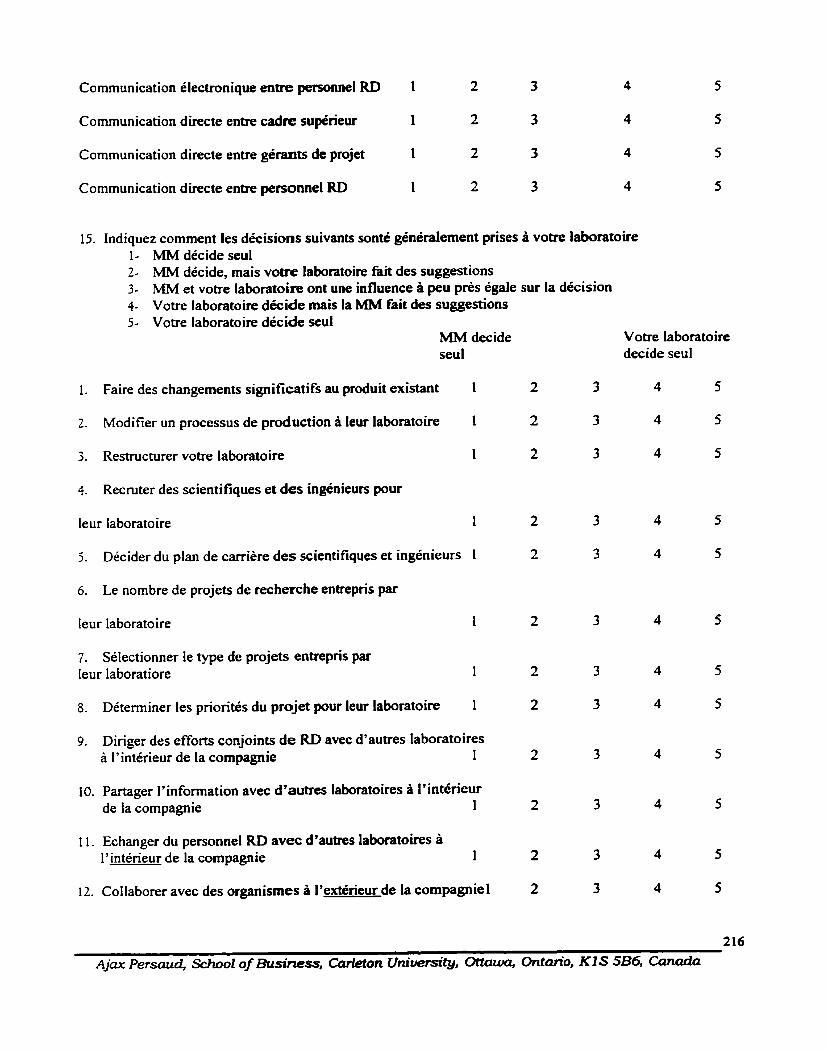
Communication électronique entre personnel RD 1 2 3 4
Communication directe entre cadre supérieur 1 2 3 4
Communication directe entre gérants de projet 1 2 3 4
Communication directe entre personnel RD 1 2 3 4
15. Indiquez comment les décisions suivants sonté généralement prises a votre laboratoire 1- MM décide seul 2- MM décide, mais votre laboratoire fait des suggestions 3- MM et votre laboratoire ont une influence à peu près égale sur la décision 4- Votre laboratoire décide mais la MM fait d g suggestions 5- Votre laboratoire décide seul
MM decide seul
1. Faire des changements significatifs au produit existant 1
2. Modifier un processus de production a leur laboratoire 1
3. Restructurer votre laboratoire 1
4. Recruter des scientifiques et des ingénieurs pour
leur laboratoire I
5. Décider du plan de carrière des scientifiques et ingénieurs 1
6. Le nombre de projets de recherche entrepris par
leur laboratoire f
7. Sélectionner le type de projets entrepris par leur laboratiore 1
8. Déterminer les priorités du projet pour leur laboratoire 1
9. Diriger des efforts conjoints d e RD avec d'autres laboratoires à l'intérieur de la compagnie 1
10. Partager l'information avec d'autres laboratoires à l'intérieur de la compagnie 1
1 1. Echanger du personnel RD avec d'autres laboratoires à l'intérieur de la compagnie 1
12. Collaborer avec des organismes à l'extérieur de la compagnie 1
Votre laboratoire decide seuI
Ajax Persaud, School of Busiriess, Curieion University, Onaw, 0ntm.0, KI S 5B6, anada
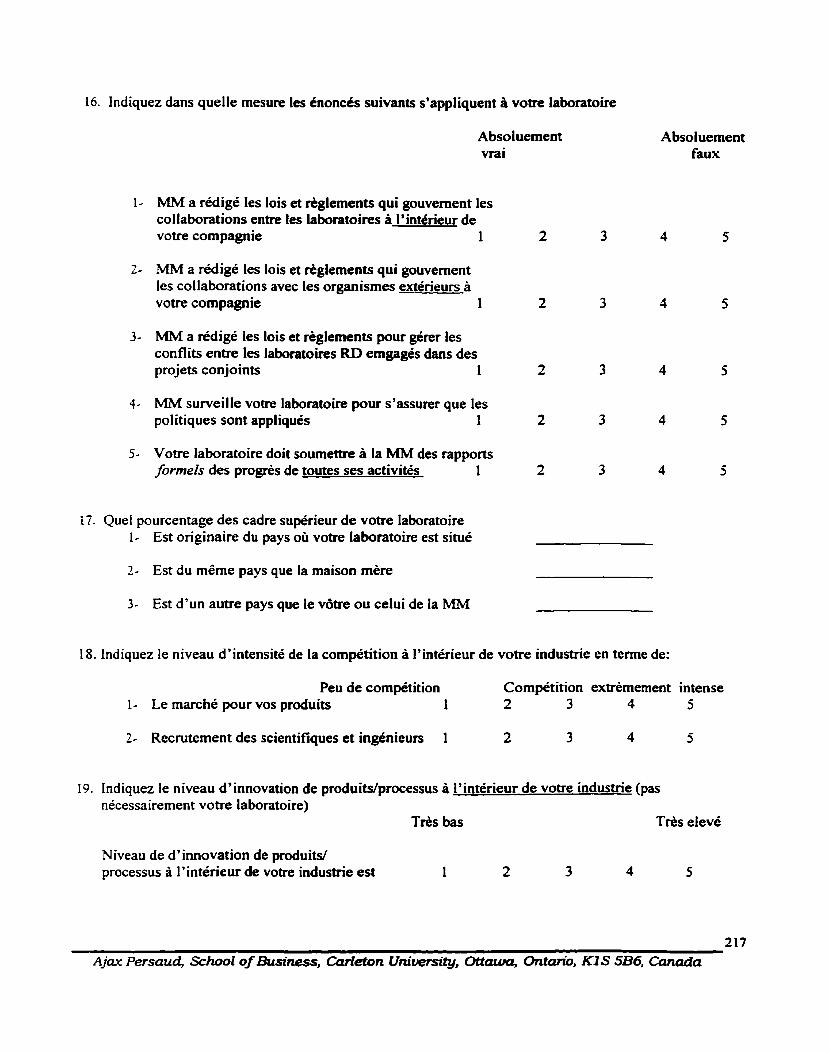
16. Indiquez dans quelle mesure les énoncés suivants s'appliquent à votre laboratoire
Absoluement vrai
1- MM a rédigé les lois et règlements qui gouvement les collaborations entre les laboratoires à l'intérieur de votre compagnie 1 2
2- MM a rédigé les lois et règlements qui gouvement les collaborations avec les organismes extérieurs à votre compagnie 1 2
3- MM a rédigé les lois et règlements pour gérer les conflits entre les laboratoires RD emgagés dans des projets conjoints 1 2
4- MM surveille votre laboratoire pour s'assurer que Ies politiques sont appliqués 1 2
5- Votre laboratoire doit soumettre à la MM des rapports formels des progrès de toutes ses activités 1 2
Absoluement faux
17. Quel pourcentage des cadre supérieur de votre laboratoire 1- Est originaire du pays où votre laboratoire est situé
2- Est du même pays que la maison mère
3- Est d'un autre pays que le vôtre ou celui de la MM
18. indiquez le niveau d'intensité de la compétition à l'intérieur de votre industrie en terme de:
Peu de compétition Compétition extrèmement intense 1- Le marché pour vos produits 1 2 3 4 5
2- Recrutement des scientifiques et ingénieurs 1 2 3 4 5
19. Indiquez le niveau d'innovation de produits/processus a l'intérieur de votre industrie (pas nécessairement votre laboratoire)
Très bas Très elevé
Niveau de d'innovation de produits/ processus à l'intérieur de votre industrie est 1 2
217 Ajax Persaud, School of BusinessJ Carleton Uniuersity, Otîawa, M o J K1S 5B6, Canada
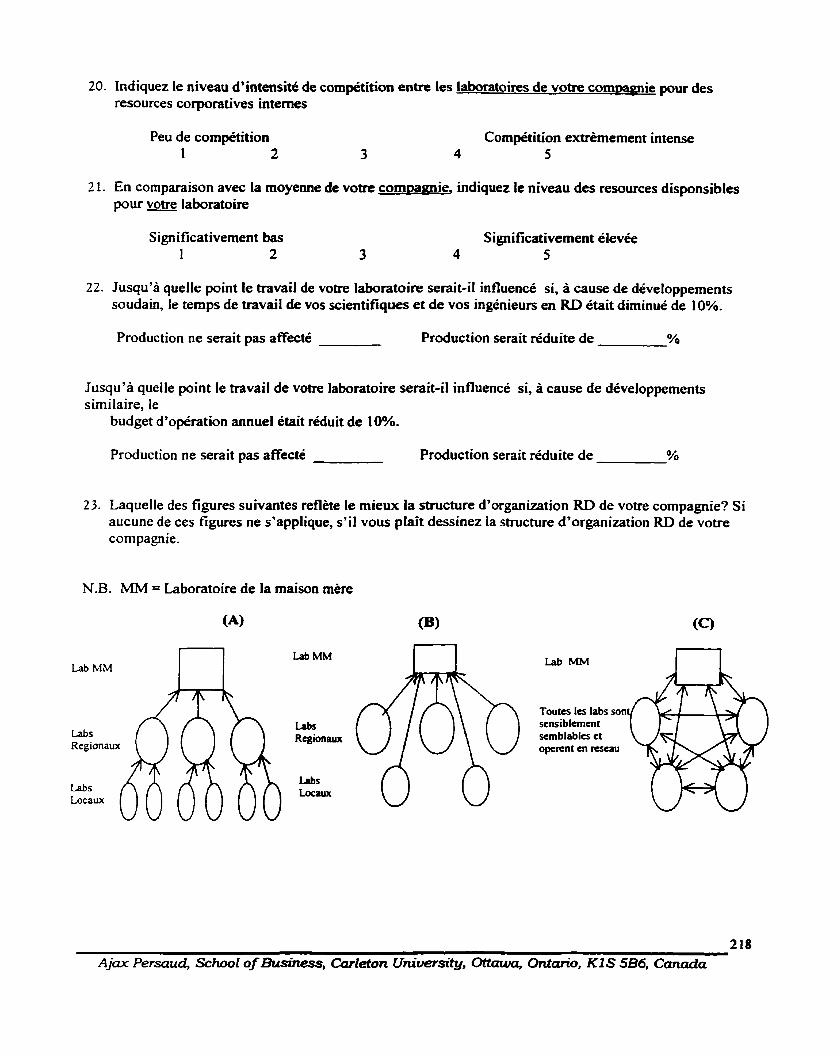
20. Indiquez le niveau d'intensité de compétition entre les laboratoires de votre cornDamie pour des resources corporatives internes
Peu de compétition Compétition extrèmernent intense 1 2 3 4 5
2 1. En comparaison avec la moyenne de votre c o m ~ a m i e , indiquez le niveau des resources disponsibles pour votre laboratoire
Significativement bas Significativement élevée 1 2 3 4 5
22. Jusqu'à quelle point le travail de votre laboratoire serait41 influencé si, à cause de développements soudain, le temps de travail de vos scientifiques et d e vos ingénieurs en RD était diminué de 10%.
Production ne serait pas affecte Production serait réduite de YO
Jusqu'à quelle point le travail de votre laboratoire serait-il influencé si, à cause de développements similaire, le
budget d'opération annuel était réduit de 10%.
Production ne serait pas affecté Production serait réduite de YO
23. Laquelle des figures suivantes reflète le mieux la structure d'organization RD de votre compagnie? Si aucune de ces figures ne s'applique, s'il vous plaît dessinez la structure d'organization RD de votre compagnie.
N.B. MM = Laboratoire de la maison mère
Lab MM
Labs Regionaux
Toutes les labs sont scnsiblemcn t semblables et opcrcnt en rcsuui
218 A j m Persaud, School of Business* Carleton University, Octawu, Ontario, KlS 5B6, Canada
Partie B Données démographiques concernant votre laboratoire
25. Pays d'origine de la maison mère de votre compagnie
26. Catégorie qui décrit le mieux les affaires de votre compagnie (Encerclez tout ce qui s'applique)
1. Electronique/Electrique 2. Télécommunications/Informatique 3. Pharmaceutique 4. Chimique 5. Biotechnologie 6. Instruments scientifiques 7. Aérospatiale 8. Autre (spécifie& s'il vous plaît)
Pays où se trouve votre laboratoire
L'année que votre laboratoire f i t établit
Nombre total d'employés RD dans votre laboratoire en 1998
Nombre total de scientifiques et d'ingénieurs dans votre laboratoire en 1998 avec:
Doctorat Maîtrise
Nombre total de scientifiques et d'ingénieurs dans votre laboratoire en 1998 avec:
Moins de 5 ans d'expérience dans leur domaine
Entre 5- 1 0 ans d'expérience dans leur domaine
Plus de 1 0 ans d'expérience dans leur domaine
Budget total de RD de votre laboratoire en 1998 (en monnaie de votre pays) millions
Pourcentage du budget RD dépensé pour la recherche de base VO
La recherche appliquée '%O
Combien de demandes de brevet est-ce que votre laboratoire a enregistré au cours des trois dernières années?
S'il vous plaît inclure tout autre information qui pourrait améliorer notre compréhension des questions/défis auquels sont confiontés les gérants dans la gestion globale des laboratoires de recherche.
Votre contriburion à cer e#ort est grandement apprécié. Si vous v o u k un résumé des résultats, s'il vous plaît imprimez votre nom et adresse électronique.
Nom et courriel:
Faxez ou postez le questionnaire complété à Ajax Persaud Fax : (613) 260-2642 (disponisble 24 heures et les fin de semaines)

APPENDIX 4
HEADQUARTER SURVEY- FRENCH VERSION
220 Ajax Persaud, School of BusViess, Carleton UniuemTS1tyJ Ottawa, OntanoJ KI S 5B6, Canada
Carleton U N I V E R S I T Y
"Création d'innovatioas P travers le partenariat global: Une enquête sur les compagnies tête de file à travem le monde."
Je me nomme Ajax Persaud. Je suis un candidat au programme de doctorat au "School of Business" à l'université de Carleton, Ottawa, Canada. Ma spécialization est la gestion de technologie. Je développe présentement la recherche de ma thèse qui examine comment la collaboration entre les différents laboratoires de recherche des corporations multinationales (CMN) améliorent rapidement et eficacement leur capacité a produire des innovations.
Les rapports dans la presse populaire et dans les journaux académiques indiquent que le collaborations adéquates entre les différentes unités des CMN peuvent entraîner des bénifices considérables pour ces compangnies. Ces mêmes rapports suggèrent que très peu de compagnies ont été capables d'organiser leur opérations globales avec succès. Les résultats de cette recherche pourraient apporter un éclairage pécieux sur la façon qu'ont les compagnies de gérer leur activités GLOBALES de recherche et les facteurs qui expliquent leur succès ou leur échec. Les discussions préliminaires avec les gérants de certaines compagnies réaffirment le besoin d'une telle recherche.
Votre compagnie est l'une des CMN que j'ai sélectionnée pour participer à cette recherche. Je solicite votre participation en vous demandant de compléter le questionnaire suivant. Tout information donné sera traité dans la plus stricte confidentialité. Les réponses seront compilées de façon à ce qu'aucun individu, laboratoire ou compagnie ne puissent être identifiés dans le report final. Votre participation me permettera de compléter plus facilement cette recherche dans un délai raisonnable.
Pour de plus amples rensignements, vous pouvez me rejoindre par téléphone au (6 13) 520-2600 poste 10 17 ou par courriel à [email protected]. Vous pouvez également communiquer avec mon directeur de thèse, Vinod Kumar, au (613) 520-2379. Les résultats de cette recherche seront envoyée sur demande à tous les participants intéressés-
Je vous remercie de votre collaboration. Vous pouvez faire parvenir votre réponse soit par fax Our par courier.
Fax: (6 13) 260-2642
Poste: Ajax Persaud School of Business, Carleton University Ottawa, Ontario K 1 S 586, Canada
Ajax Persaud
22 1
Ajax Persaud, S c h l of Business, Corleton Uniuersity, Ottawa, Ontanano, KIS SB6, Cancrda
Partie A
Les questions de cette partie recherchent de l'information sur la nature de la collaboration entre le laboratoire de la maison mère et les autres laboratoires de recherche a l'intérieur de votre organisme au courant des deux dernières années.
1. Combien de laboratoires de recherche y a-t-il dans votre compagnie (incluant ceux à 1 'étranger)
2. Avec combien de ces laboratoires de recherche votre laboratoire a-t-il collaboré pour
des projets de Recherche et Développement (RD)
3. Combien de ces collaborations impliquent les points suivant:
Echange d'information scientifique et technologique
Recherche conjointe à titre de partenaires égaux
Recherche conjointe où votre laboratoire a assumé le leadership
Recherche conjointe où un autre laboratoire a assumé le leadership
Echange de personnelle en RD
Partage d'installations de testing, d'équipement, etc.
Projets conjoints de sessions de plannification
Visites régulières aux autres laboratoires
Combien des laboratoires avec lesquels vous avez collaboré partagent une culture sembiable en termes d'habitudes de travaille et d'attitudes?
Combien des laboratoires avec lesquels vous avez collaboré ont des objectifs et des valeurs de gestions semblable au vôtre?
Quels problèmes attribuez-vous aux dipierences culturelles entres ces laboratoires et le vôtre? (Expliquez)
Avec combien de ces laboratoires avez-vous eu des expériences négatives ou des conflits majeurs au courant des deux dernières années en ce qui concerne:
1. Contribution des resources et du personnelle a la collaboration 2. Droit de propriété d'une technologie résultant de cette collaboration 3. Usage d'une technologie résultant de cette collaboration
222 Ajax Persaud, School of Business, Carleton University, Ottaura, -0, KI S 586, Cancrda
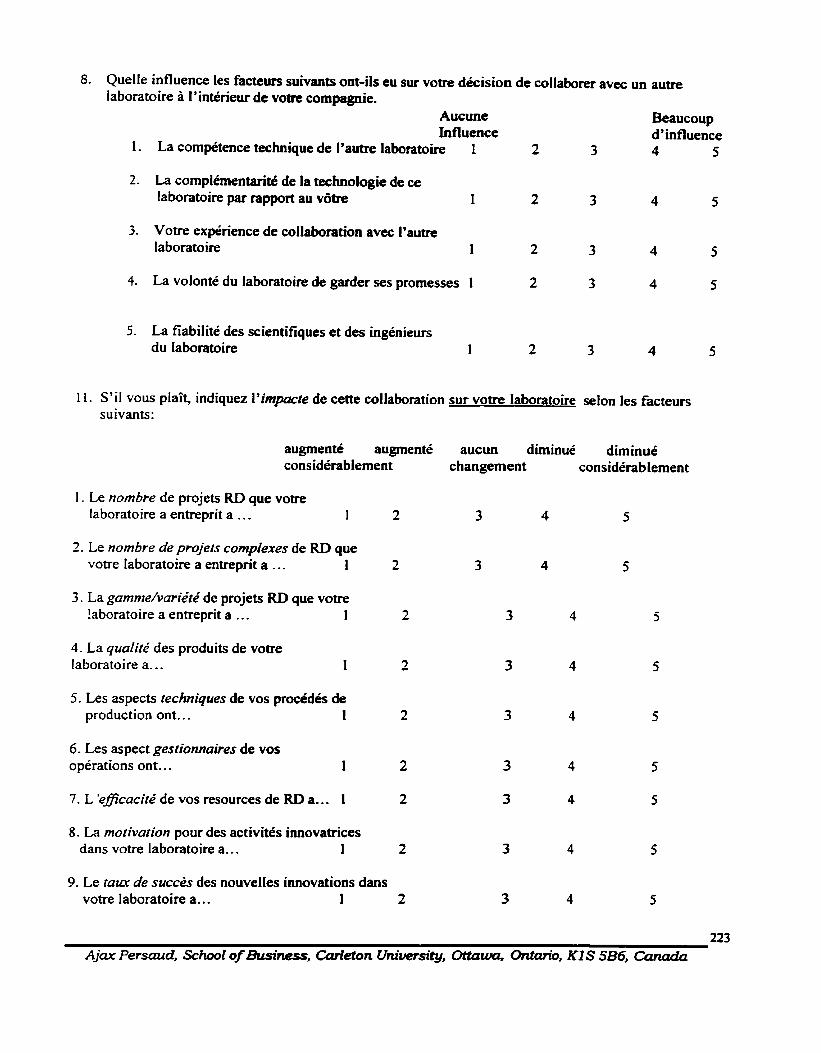
8. Quelle influence les facteurs suivants ont-ils eu sur votre décision de collaborer avec un autre laboratoire a l'intérieur de votre compagnie.
Aucune Beaucoup influence d' influence
1. La compétence technique de l'autre laboratoire 1 2 3 4 5
2. La complémentarité de la technologie de ce laboratoire par rapport au vôtre 1 2 3 4 5
3. Votre expérience de collaboration avec l'autre laboratoire 1 2 3 4 5
4. La volonté du laboratoire de garder ses promesses 1 2 3 4 5
5. La fiabilité des scientifiques et des ingénieurs du laboratoire 1 2 3 4
11. S'il vous plaît, indiquez I'impacte de cette collaboration sur votre laboratoire selon les facteurs suivants:
augmenté augmenté aucun diminué diminué considérablement changement considérablement
1 . Le nombre de projets RD que votre laboratoire a entreprit a . . . 1
2 . Le nombre de projets complexes de RD que votre Iaboratoire a entreprit a . . . 1
3 . La gamme/variété de projets RD que votre !aboratoire a entreprit a . . . 1
4 . La qudité des produits de votre laboratoire a.. . 1
5 . Les aspects techniques de vos procédés de production ont.. . 1
6 . Les aspect gestionnaires de vos opérations ont.. . 1
7. L 'eBcacité de vos resources de RD a.. . 1
8. La motivation pour des activités innovatrices dans votre laboratoire a.. . 1
9. Le tcna de succès des nouvelles innovations dans votre laboratoire a.. . 1 2 3 4 5
u 3
Ajax Persaud, School of Business, Carleton University, Ottawu, Ontmano, KIS 586, Conoda

12. Les compétences techniques de votre personnel de RD ont ... 1 2 3 4
13. L 'accès de votre laboratoire aux resources de RD et au personnel a.. . 1 2
12. Le coût de RD dans votre laboratoire a.. . 1 2 3 4
1 3. Le temps de développement pour des innovations nouvelles dans votre laboratoire a. .. 1 2
10. Selon vous, combien des laboratoires dans votre compagnie ont comme tâche première:
Modifications/adaptations de produits (60% ou plus de leurs activités)?
Design et dévelopement de produits (60% ou plus de leurs activités)?
Recherche appliqué (60% ou plus de leurs activités)?
Recherche de base (60% ou plus de leurs activités)?
Cueillette d'information technique (60% ou plus de leurs activités)?
i 1. Selon vous, combien des laboratoires à l'intérieur de votre compagnie ont suffisament de liberté ou d'autonomie pour prendre seuls les décisions suivantes sans l'influence de la maison mère ou d'un autre laboratoire?
Décisions:
Faire des changements significatifs au produit existant
Modifier un processus de production à leur laboratoire
Recruter des scientifiques et des ingénieurs pour leur laboratoire
Décider du plan de carrière des scientifiques et ingénieurs
Le nombre de projets de recherche entrepris par leur laboratoire
Sélectionner le type de projets entrepris par leur laboratiore
Déterminer les priorités du projet pour leur laboratoire
Nombre de laboratoires:
224
Ajax Persaud, School of Business, Carleton University, Ottawa, Ontario, KIS 586, Canada
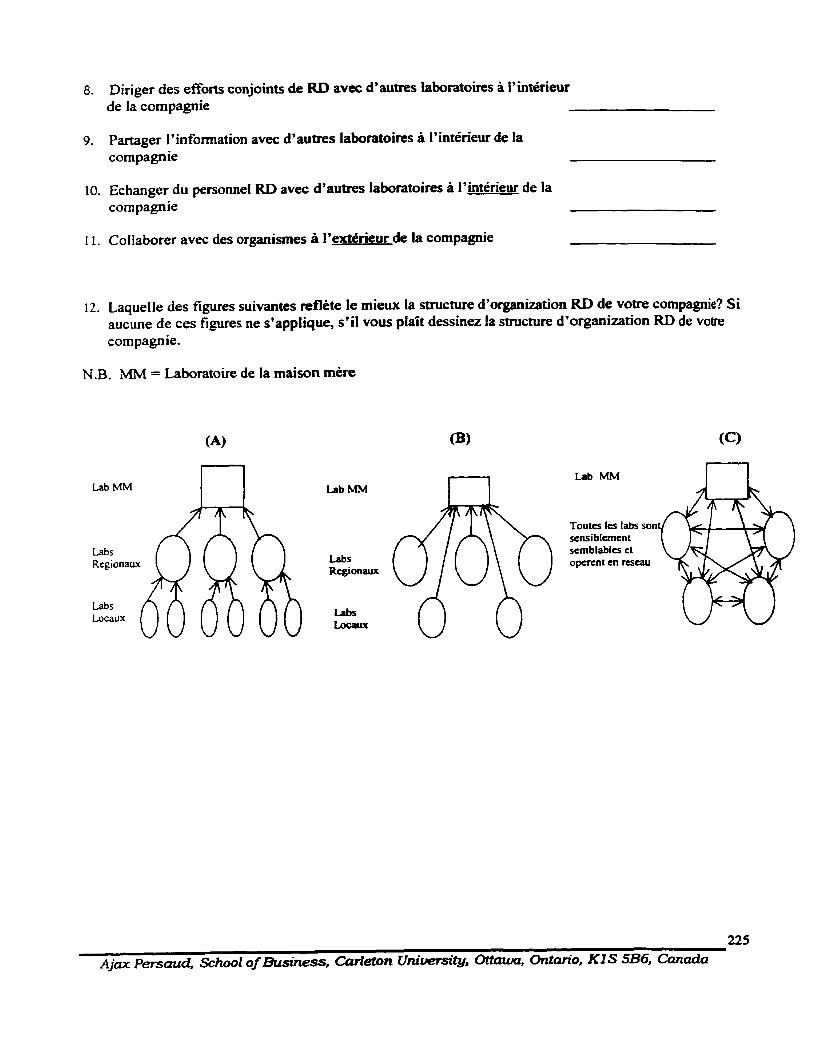
8. Diriger des efforts conjoints de RD avec d'autres laboratoires à l'intérieur de la compagnie
9. Partager l'information avec d'autres laboratoi~s a l'intérieur de la compagnie
10. Echanger du personnel RD avec d'autres laboratoiru a l'intérieur de la compagnie
I l . Collaborer avec des organismes a l'extérieur de la compagnie
12. Laquelle des figures suivantes reflète le mieux la structure d'organization RD de votre compagnie? Si aucune de ces figures ne s'applique, s'il vous plaît dessinez la structure d'organization RD de votre compagnie.
N.B. MM = Laboratoire de la maison mère
(A)
Lab MM n Labs Rcgionaux
Labs ~ u x
Toutts les labs sont scnsiblcmcn~ semblabla et opcrcnt en rcseau
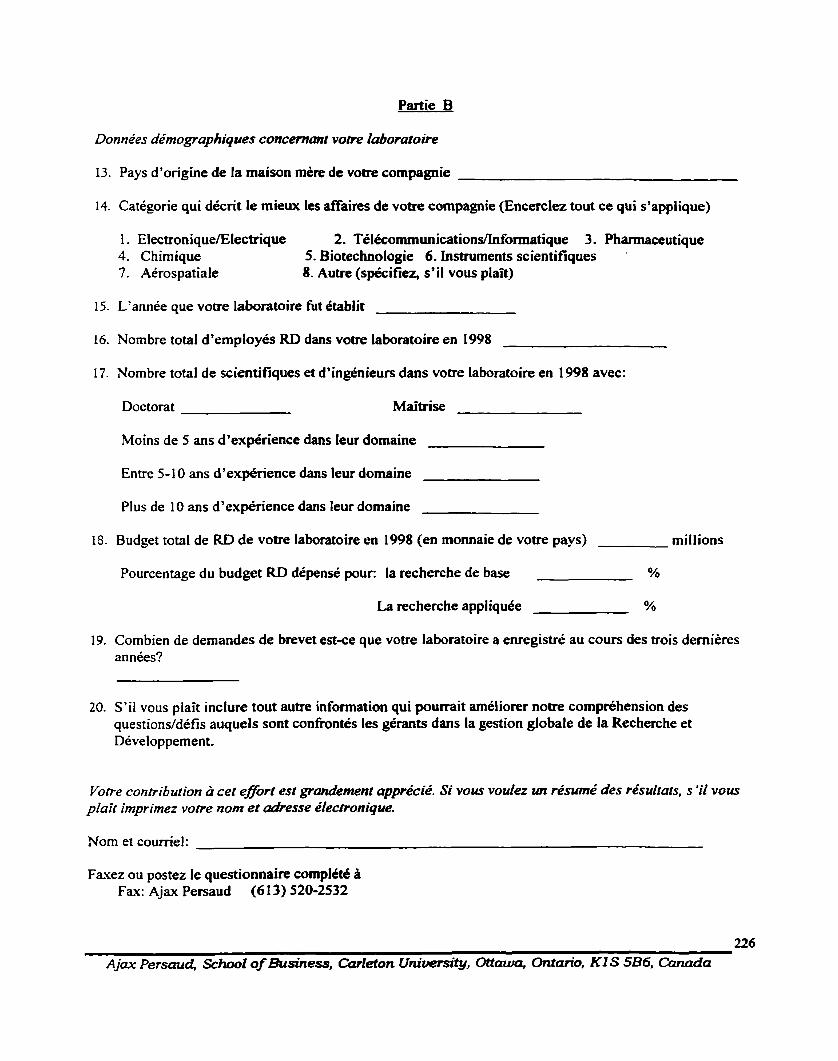
Partie B
Données démographiques concernant votre laboratoire
13. Pays d'origine de la maison mère de votre compagnie
14. Catégorie qui décrit le mieux tes affaires de votre compagnie (Encerclez tout ce qui s'applique)
1. Electronique/Electrîque 2. Télécommunications/Informatique 3. Pharmaceutique 4. Chimique 5. Biotechnologie 6. Instruments scientifiques .
7. Aérospatiale 8. Autre (spécifiez, s'il vous plaît)
L'année que votre laboratoire fut établit
Nombre total d'employés RD dans votre laboratoire en 1998
Nombre total de scientifiques et d'ingénieurs dans votre laboratoire en 1998 avec:
Doctorat Maitrise
Moins de 5 ans d'expérience dans leur domaine
Entre 5- 1 0 ans d'expérience dans leur domaine
Plus de 10 ans d'expérience dans leur domaine
Budget total de RD de votre laboratoire en 1998 (en monnaie de votre pays) millions
Pourcentage du budget RD dépensé pour: la recherche de base 'Y0
La recherche appliquée YO
Combien de demandes de brevet est-ce que votre laboratoire a enregistré au cours des trois dernières années?
S'il vous plaît inclure tout autre information qui pourrait améliorer notre compréhension des questions/défis auquels sont confrontés les gérants dans la gestion globale de la Recherche et Développement.
Votre conniburion à cet eflort est grandement apprécié. Si vous voulez un résume des résulrars, s 'il vous plaît imprimez vorre nom et adresse électronique.
Nom et coumel:
Faxez ou postez le questionnaire complété a Fax: Ajax Persaud (6 13) 520-2532
226
Ajax Persaud, School of Business, Clwieîon Utu'uersity, Otîaum, Ontano, KI S 5B6, Canada

APPENDIX 5
SUBSIDIARY SURVEY - GERMAN VERSION
Ajax Persaud, School of Business, CarCeton Umluuersiîy, Ottawa, OnîmQVIo, KI S 5B6, Canada

Carleton U N I V E R S I T Y
Innovrtioatn durcb globale Partnerschaft: Eine U~tersuchung aber die mhnnden Untemebmen in der Welt
Males: Sehr geehrter Herr + last name, Femaies: Sehr geehrte Frau + last name, If you do not know the name: Sehr geehrte Damcn und Henen,
mein Name ist Ajax Persaud. Ich bin Doktorand an der School of Business an der Carleton University in Ottawa, Kanada. Mein Schwerprrnktgebiet ist Tcchnologiemar~agernent. Ich d i t e nu Zeit an meiner Dissertation, die sich mit dem Thema beschaftigt, inwieweit die Zusammenarbeit zwischen Forschungslaboren (oder -abteilungen/- euirichrungen) multinationaler Unternehmen bessere Bedingungen fiir die schnelle und etlïziente Entwicklung von hovationen schafft.
Berichten in der Presse und akademischen Fachblatteni ist ni entnehmen, ci& die Zusammenarbeit zwischen weltweiten Einrichtungen von multinationalen Untemehmen, wenn diese entsprechend durchgeflihrt wird, tiir diese Unternehmen einen enomen Nutzen haben konnte. Diesen Berichten ist damber hinaus zu entnehmen, daû es bisher nur wenigen Unternehrnen gelungen ist, ihre weltweiten Operationen erfolgreich tu stniktuneren. Die Ergebnisse dieser Studie kUnnten wertvolle Infonnationen darüber liefern, welche Strategien Untemehmen bei ihrer globalen ForschungsGitigkeit einsetzen und AufschluD aber die Faktoren geben, die zum Erfolg oder MiDerfolg beitragen. Mit FiihningskMlen einiger Untemehmen gemhrte Vorgespr2iche haben bekriiftigt, daB Studien dieser Art notwendig sind.
Ihr Unternehmen gehUrt zu den Rlhrenden muItinationalen Unternehmen, die ich Alr die Teilnahme an dieser Studie ausgewahlt habe. Ich bitte Sie. an dieser Studie reihnehmen, indem Sie den beigefigren Fragebogen ausfiillen. Alle Informationen werden strene vertraulich behandelt- Die Antworten werden als Gesamtheit ausgewenet, so daB keine E inzelperson und kein einzeines Labor oder Untemehmen im AbschluBbericht bezeichnet wird- ihre Teilnahme wird es mir ermUglichen, die Studie in einem angemessenen zeitlichen Rahmen abzuschlieBen.
SolIren noch Fragen offenstehen, bin ich telefonisch unter der Nummer O0 I 6 13 520 2600 Apparat (Extension) 10 17 sowie per E-Mail unter [email protected] zu erreichen. Sie kUmen sich zwecks weiterer Informationen auch geme mit meinem Doktorvater H e m Professor Vinod Kumar unter der Nummer 001 613 520 2379 in Verbindung setzen. interessierte Teilnehmer erhalten ein Exemplar der Studienergebnisse.
Ich danke Ihnen viehals für Ihre Teilnahme an dieser Studie. Bitte iibcrsenden Sie den ausgefüllten Fragebogca en tweder per Fax oder Post.
Fax: O 0 1 6 13 260 2642
Postanschrift: Ajax Persaud School of Business, Carleton University Ottawa, Ontario K 1 S 5B6, Canada
Mit freundlichen GrUBen
Ajax Persaud
228
Ajax Persaud, School of Business, Carleton UnîuerSrty, Otrawu, Ontano, KIS 586, Canada
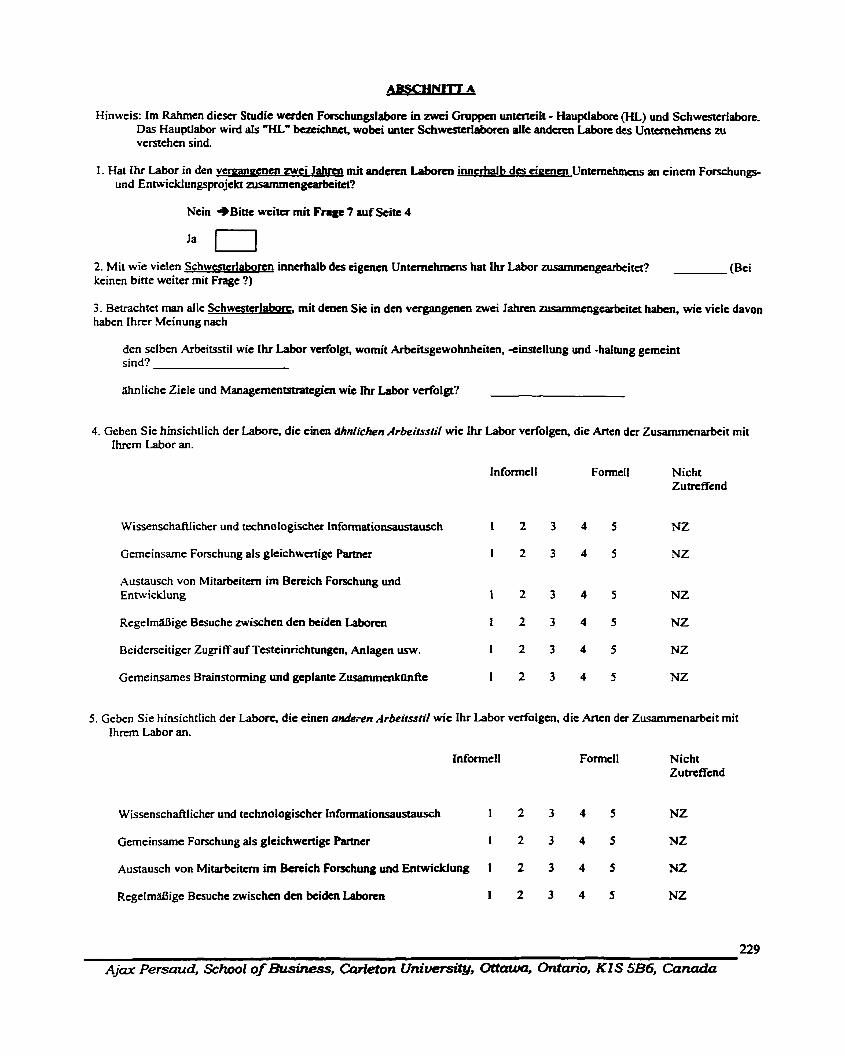
Hinweis: Im Rahmcn ditscr Studie werdcn Forschungslabore in mci Gruppen untcricilt - Hauptlabocc (HL) und Schwesterlaborc. Das Hauptlabor wird aIs "HLa batichnct, wobci unter Schwesterlabortn aile a n d m Labore des Untemehmcns ar vemehen sind.
1. Hat Ihr Labor in den vcrnanncnen zwci Jahm mit a n d m Laborea inncrhalb des einmcn Untemchmcns an cincm Forschungs- und En twicklungsprojckt zusammcngearbcitet?
Ncin +Bitte wcitcr mit Fmge 7 wf Seitc 4
2. Mit wie vielen Schwesterlaborm imtrhalb des eigcncn Untcrnchmens hat ihr b r nisammcngcarbeitct? @ci keinen bitte weiter mit Frage ?)
3. Betrachtet man alle Schwcstcrlatrsrr. mit denen Sie in den vergangenen zwei Jahm msammcngearbciut haben, wie viele davon haben Ihrer Mcinung nach
den selben Arbeitsstil wie Ihr Labor vcrfolgt, womit Arbcitsgewohnhcitcn, -einstcllung und -haItung gcmcint sind?
iihnliche ZieIe und ManagcmcntSPatcgicn wic nir Labor verfolgt?
4. Geben Sie hinsichtlich der Labom. die cinen 9Michen ArbeitsstiI wie Ihr Labor verfolgen, die M e n der Zusammenar;beit mit Ihrem Labor an.
Informell FormeIl Nicht Zutrcffend
Wissenschafllicher und technologischer Infonnationsaustausch 1 2 3 4 5 NZ
Gemeinsame Forschung als glcichwertigc Partncr 1 2 3 4 5 NZ
Austausch von Mitarbeitem im Berrich Forschung und Ennvicklung
RegelrnaOige Besuchc zwischcn den bcidcn Labom
Beiderseitiger Zugriff auf Tcstcimkhtungm, Anlagen m. 1 2 3 4 5 NZ
Gerneinsarnes Brainstorming und gcplantc Zusammcnkanfte 1 2 3 4 5 NZ
5. Geben Sie hinsichtlich der Labott, die eincn amken Arbeitsstil wic Ihr Labor vcrfolgen. die M e n der Zusammenaheit mit Ihrem Labor an.
Forrncll Nicht Zuaffcnd
Wissenschaftlicher und technologixhcr Informationsaustausch 1 2 3 4 5 NZ
Gerneinsame Forschung als glcichwcrtigc Partner 1 2 3 4 5 NZ
Austausch von Mitarbcitern im Bcreich Forschung und Enhvicldung 1 2 3 4 5 NZ
RegeImaBige Besuche zwischcn dcn bciden tabom 1 2 3 4 5 NZ
--
Ajax Persaud, School of BusVlessJ Cculeton Wmkumsi@, O t t o ~ ~ , Ontanano, KlS SBGJ Canada

Beiderseitigcr Zugriff auf Testcinrichnuigcn, Anlagcn usw. 1 2 3 4 5 NZ
Gemcinsames Brainstorming und geplantt Z w m m d d M k 1 2 3 4 5 NZ
6. Welche Problemc würden Sie auf die Tatsache zurûclduhmi, da6 ïhr Labor eincn g n d m Arbcitsstil vcrfolgt als die Schwesterlabore, mit dcncn Sic aisammmgcarbcitct habcn? (Bitu nahcr crliiutcm)
7. Hat Ihr Labor mit dem HL zusammcngcarbcitct?
Nein +Bitte weittf mit Fragc 10
8. Wie wûrden Sie die Art der Zusammenarbeit zwischen I h m Labor und d a n beschrciben?
Infomcll Formel1 Nicht Zumffcnd
Wissenschafllicher und technologischer informationsaustausch 1 2 3 4 5 NZ
Gemeinsarne Forschung ais gleichwertige Partna 1 2 3 4 5 NZ
Austausch von Mitarbeitcm im Bercich Forschung und Entwicklung 1 2 3 4 5 NZ
RegelmUige Besuche zwischen den bcidcn Labom 1 2 3 4 5 NZ
Beiderseitiger Zugriff auf Tcstcinrichningcn, AnIagen m. 1 2 3 4 5 NZ
Gemeinsames Brainstorming und gcpIante Zusammenkûnfte 1 2 3 4 5 NZ
9. Inwieweit stellt die im HL eingesctztc Technologie cine E r g W g zu der Technologie in threm Labor dar?
Schr gcringc Ergihung Schr hohc Ergibzung 1 2 3 4 5
10. Mit wie vielen der Labore, mit dcnen Sie zusammcngcarbeitct haben, gab es grUBere Mcinungsvcrschicdenheiten/Konflikte Uber:
Die Bereitstellung von Rcssourccn und Mitarbeitern fùr die Zusammcnarbcit
Die Besiwerhiiltnisse bei eincr im Rahmcn der Zusammcnarbeit entwickeltm Technologie
Die Venvendung ciner im Rahmcn der Zusammenarbeit entwickcltcn Technologie
230
Ajax Persaud, School of Business, Carleton UniversityJ Ottawa, OntanQRoJ KIS 5B6, Canada
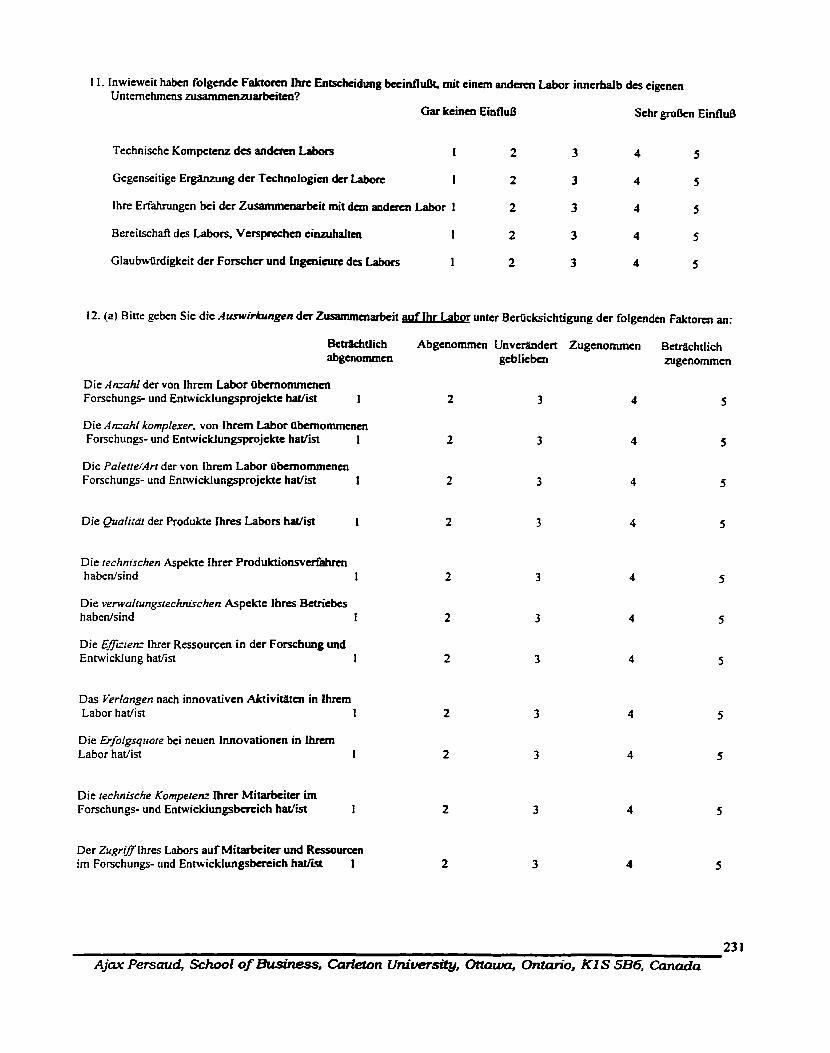
1 1. Inwieweit haben folgende Faktorcn lhrc Entschcidung betinfluDt, mit einem a n d c m Labor inncrhalb des cigencn Unternehmcns nisammcnzuarbtitcn?
Gar kcincn Einfld Sehr g r o k EUifluB
Technische Kompetenz des a n d m Labots 1 2 3 4 5
Gegenseitige Ergmzung der Technologicn der Labore I 2 3 4 5
Ihre Erfahningen bei der Zusammcnarbcit mit d m andcm Labor 1 2 3 4 5
Bereitschafl des Labors, Vcrsprcchcn einzuhaltcn 1 2 3 4 5
Glau bwûrdigkeit der Forschcr und Ingcnicun d a Labors 1 2 3 4 5
12. (a) Bine geben Sie die Awwirbuigen d a Zusamrnenarbeit auf h r Labor ontcr Berûcksichtigung der folgcnden Faktorm an:
Bcmhtlich Abgcnommen Unveriindert Zugenomrnen Betrachtlich abgenornmcn geblieben zugenomrnen
Die Anzahl der von Ihrem Labor ilbernommcncn Forschungs- und Entwicklungsprojekte h a V i 1 2 3
Die Aniahl komplexer, von Ihrem Labor ilbernommenen Forschungs- und Entwicklungsprojekte hatlist 1
Die PalettdArt der von Ihrem Labor (ibtmommenen Forschungs- und Ennvicklungsprojekte hat/in 1
Die Qualitat der Produkte ihres Labors hat/ist 1 2 3 4 5
Die technischen Aspekte Ihrer Produktionsvcrfahren habenlsind 1 2 3
Die verwaltungstechnischen Aspekte Ihres Betriebes habcnkind 1
Die E m e x Ihrer Ressourcen in der Forschung und Ennvicklung havin 1
Das Verlangen nach innovativen Aktivitaten in Ihrcm Labor hatlist 1
Die Erfolgsquote bei neuen Innovationen in Ihrtrn Labor hatlist 1
Die rechnische Kompetenz I k r Mitarbeiter im Forschungs- und Enhvickiungsbercich hat/ist I
Der ZugrtflIhres Labors auf Mitarbciter und Rcssourccn im Forschungs- und Entwicklungskich hat/ist 1
LJ 1
Ajax Persaud, School of Business, Carleton University, O f t ~ t t a u r c r , Onfm*o, KI S SB6, Canada
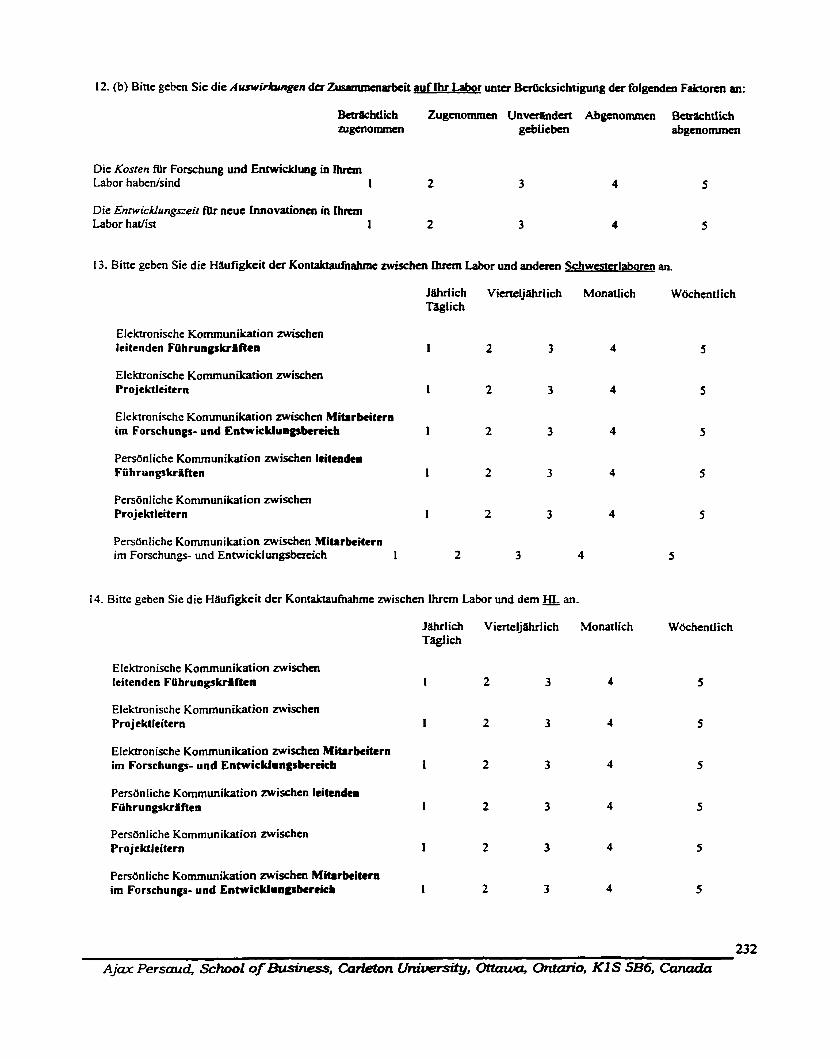
12. (b) Bine geben Sic die Auswirhgen d a Zusammenarbcit auf Ihr Labor unter Bcrûcksichtigwig der folgcndcn Faictorcn an:
Die Kosten filr Forschung und Entwicklung in ihmn Labor habedsind 1 2 3
Die EnfwicWungszeit fùr ncuc Innovationen in nYtm Labor hat/ist 1 2 3
13. Bitte geben Sie die Haufigkcit der Kontaktaufiiahmc mischen ihmn Labor und andmn Schwestalaborcn an.
Elekaonische Kommunikation mischen leitenden FLlhrungskrllRen
Elektronische Kommunikation zwischen Projektlcitern
Elekvonische Kommunikation zwischm Mitarbeittrn im Forschungs- und EntwÙWunpbertich
PenUnliche Kommunikation mischcn leitendta Führungskriftcn
PersUnliche Kommunilcation zwischcn Projektlcitern
Personliche Kommunikation zwischen Mitarbtitern im Forschungs- und Enhkricklungsbmeich 1
Vieneljahrlich Monatlich
14. Bitte geben Sie die Haufigkeit der Kontaktaufnahme zwischen Ihrem Labor und dem an.
Elektronische Kommunikation zwischcn leitenden FiihrungskrMten
Elektronische Kommunikation mischen Projektleitcrn
Elektronische Kommunikation mischcn Mitarbeitern im Forschungs- und EntwicWungsbereicb
Personliche Kommunikation zwischen leitenden FiihrungskrSften
Personliche Kommunikation mischen Projektleitern
Personliche Kommunikation zwischcn Mitarbtitern im Forschungs- und EntwicWungsbtreich
Vicrtelj&rlich Monatlich
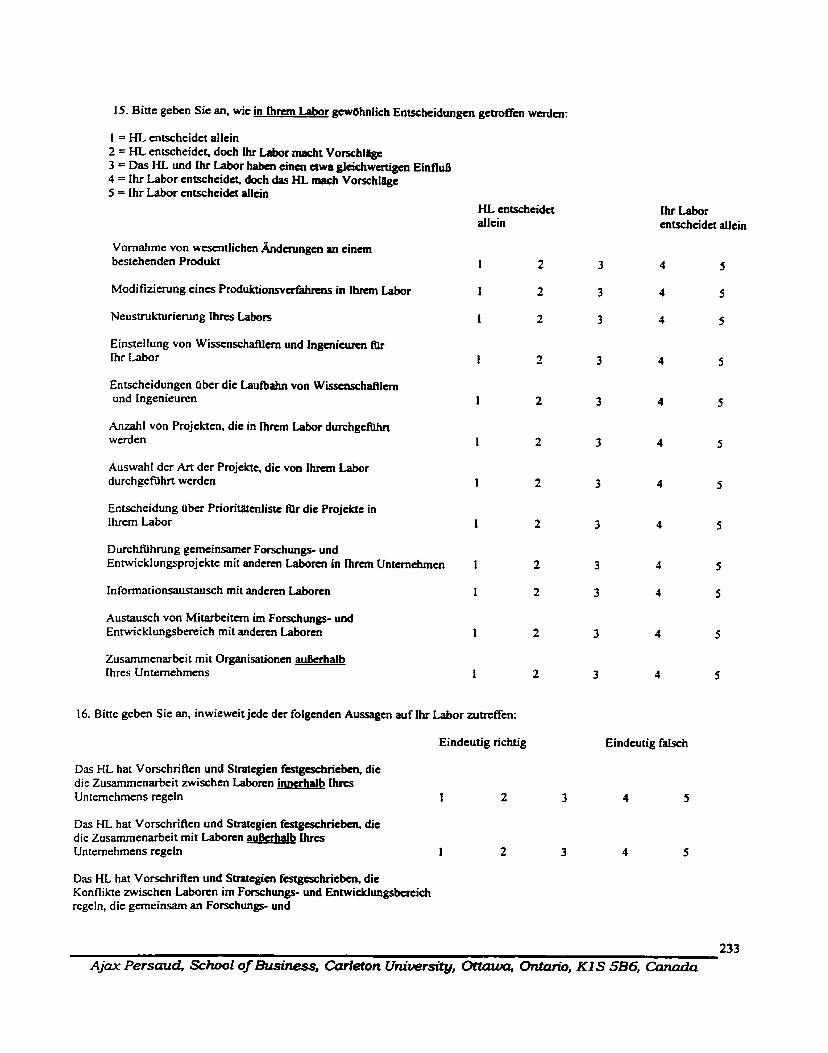
15. Bitte gebcn Sic an, wic in ihm Labor gcwtihnlich Entscheidungen getroffcn wcrdtn:
1 = HL entschcidct allein 2 = HL entschcidct, doch Uir Labor macht Vorschlagc 3 = Das HL und hr Labor haben cincn chva glcichwcrtigcn EMuD 4 = Ihr Labor entschcidct, doch das HL mach Vorxhlagc 5 = Ihr Labor entscheidet allcin
Vornahme von wesentlichcn h d m i n g e n an cinem bestehenden Produkt
Modifiùenrng eines Produktionsvcrfahrrns in I h m Labor
Neustnikturimng Ihra Labors
Einstellung von Wisscnschaftlcrn und Ingenicurcn Rlr Ihr Labor
Entscheidungen aber die Laufiahn von Wissenschafklcrn und Ingenieuren
Anzahl von Projekten, die in Ihrcm Labor durchgefihn werden
Auswahl der Art der Projckte, die von Ihrcrn Labor durchgefiihn werden
Entscheidung aber Prioritatcnlistc mr die Projekte in Ihrem Labor
Durchführung gemeinsarncr Forschungs- und Entwicklungsprojekte mit andercn Laborcn in Ihrcm Untemehmcn
Informationsaustausch mit anderen Laboren
Austausch von Mitarbeitm im Forschungs- und Ennvicklungsbereich mit anderen Labom
Zusarnmenarbeit mit Organisationen auûcrhalb Ihres Unternehmens
HL entxhcidct allcin
16. Bitte geben Sie an, inwieweit jcde der folgcndcn Aussagen auf lhr Labor zutrcffen:
Eindeutig richtig
Das HL hat Vorschnften und Strategien fcstgeschricbm, die die Zusammenarbeit zwischcn Laborcn inncrhalb Ihm Untemehmens regeln 1 2
Das HL hat Vonchrifien und Strategien fcstgeschrieberi, di t die Zusammenarbeit mit Laborcn auGmalh ihrcs Unternehrnens regtln 1 2
ihr Labor entscheidct allein
Eindeutig fdsch
Das HL hat Vorschrificn und Stratcgicn fcstgcschricbcn, die Kon fl ikte zwischen Laborcn im Forschungs- und Entwicklungsbcrcich regeln, die gerneinsam an Fotschungs- und
255
Ajax Persad , School of BusuiessJ Corleton UluluuersïtyJ Ott- Ontario, KIS 5B6, Canada
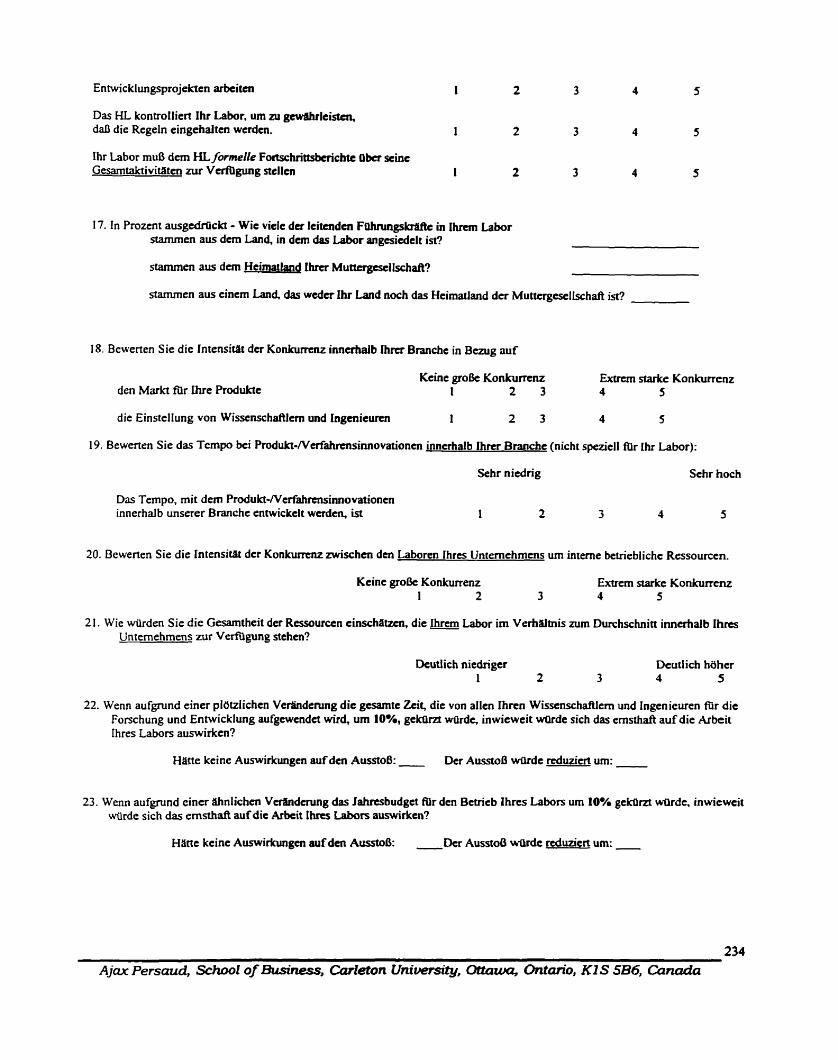
Entwicklungsprojekten arbciten 1 2 3 4
Das HL kontrollien Ihr Labor, um ai gwtihrleistcn, daD die Regeln eingehaltcn werdcn.
Ihr Labor muB d m HL formelle Fonschrittsbcrichtc Qkr seine Gesamtaktivitatcn nu Vcrfùgung stcllcn 1 2 3 4
17. In Prozent ausgcdrCickt - Wic viele d a kiundcn Fûhrungsbaftc in Ihmn Labor stammen aus dem Land, in dan das Labor angcsiedelt ist?
starnrnen aus d m Heimatland Ihm Muttcrgcxllxhaft?
stammen aus einem Land, das wedcr Ihr Land noch das Heirnatland der MuttergcsclIschaft ist?
18. Bewenen Sie die Intensitat der Konkurrcnz inncrhalb lhrcr Branche in B m g auf
den Markt f i r Ilire Produkte Keine grok Konkurrenz E m m starke Konkutrenz
1 2 3 4 5
die Einstellung von Wissenschaftleni und Ingcnieuren 1 2 3 4 5
19. Bewenen Sie das Tempo bei Produkt-Nerfahsinnovationcn inncrhalb I h m Branche (nicht speziell fùr Ihr Labor):
Sehr niedrig Sehr hoch
Das Tempo, mit dem Produkt-Nerfahrcnsinnovationen innerhalb unserer Branche entwickelt werden, ist
20. Bewerten Sie die Intensitat der Konkuncnz mischen den Laborrn Ihres Unternehmens urn interne betriebliche Ressourcen.
Keinc grok Konkurrenz Extrem starkt Konkurrmz 1 2 3 4 5
2 1. Wie wilrden Sie die Gesamtheit der Ressourccn cinschatzcn, die Ihrem Labor im VerMtnis m m Durchschnitt inncrhalb Ihres Untemehmens zur Vefigung stehen?
Dcutiich niedngcr Deutl ich ht3her 1 2 3 4 5
22. Wenn aufgmnd einer pl6tzlichen Verandermg die gcsamte Zcit, die von allen Ihrcn Wissenschaftlem und Ingenieuren für die Forschung und Enhvicklung aufgewcndct wird, um IO%, gehrz t wûrde, inwieweit wiirde sich das ernsthafl auf die Arbeit Ihres Labors auswirken?
Hatte keine Auswirkungcn auf den AusstoD: - Der AusstoB Mrde rrduziert um:
23. Wenn a u f p n d einer ahnlichm Vcmdcning das lahresbudgct mr den Betrieb lhrcs Labors urn 10% gekûrzt würde, inwiewcit würde sich das ernsttiaft auf die Arbcit Ihres Labors auswirkcn?
Ham kcinc Auswirkungcn auf den AusstoB: - ûer AusstoO wûrde reduziert urn: -
Ajax P e r s a d , Scbol of Business, Carleton Uniuersity, Ottawa, Ontano, KI S S B , Canada
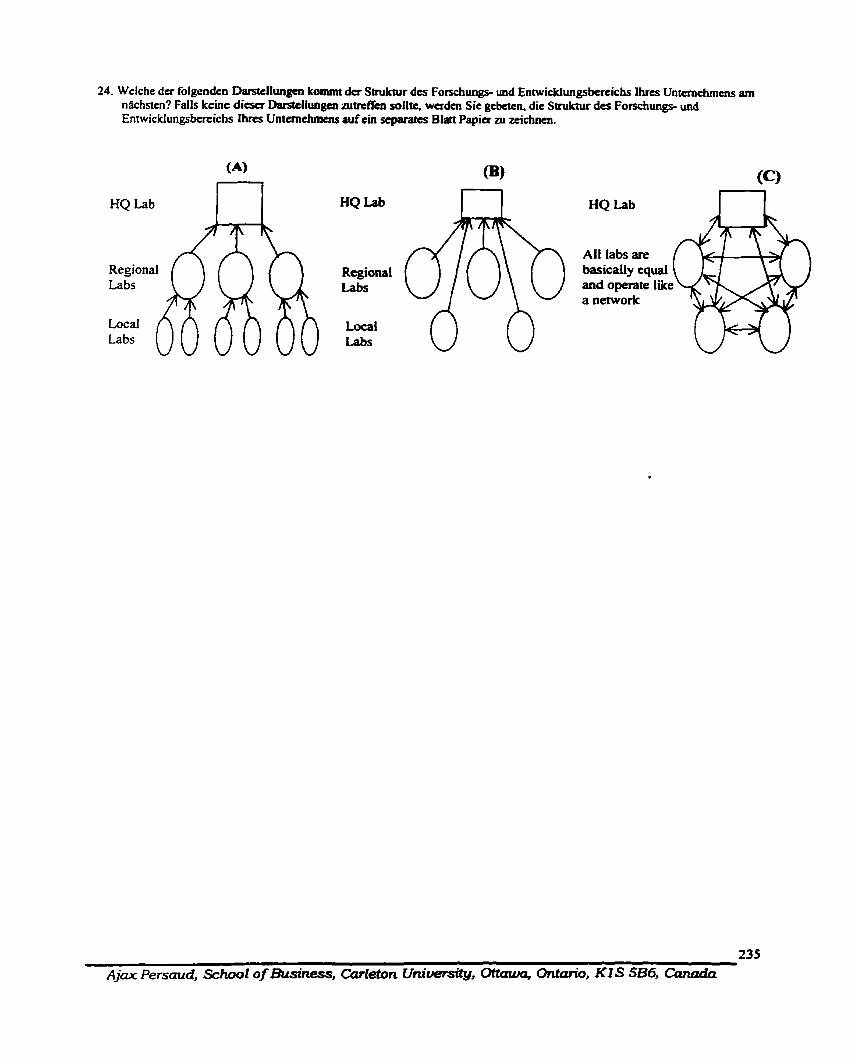
24. Welche der folgendcn Darstcllungcn kommt der Stniidur d a Forschungs- und Entwickfungsbcrcichs Ihres Untemehais am ngchstcn? Falls kcinc dicscr Dantcliungm zutrcffcn sollte, wcrdcn Sic gcbetcn, die Stnrktur d u Forschungs- und EntwicUungsbereichs Ihres Untenichmens auf ein ~eparates Blatt Papia ai ztichnen.
(4
HQ Lab n
Local iabs
(c)
a network
235
Ajax Persaud, School of BusVressJ Carleton Uni-# Ottawa, OntonoJ Ki S 586, Canada
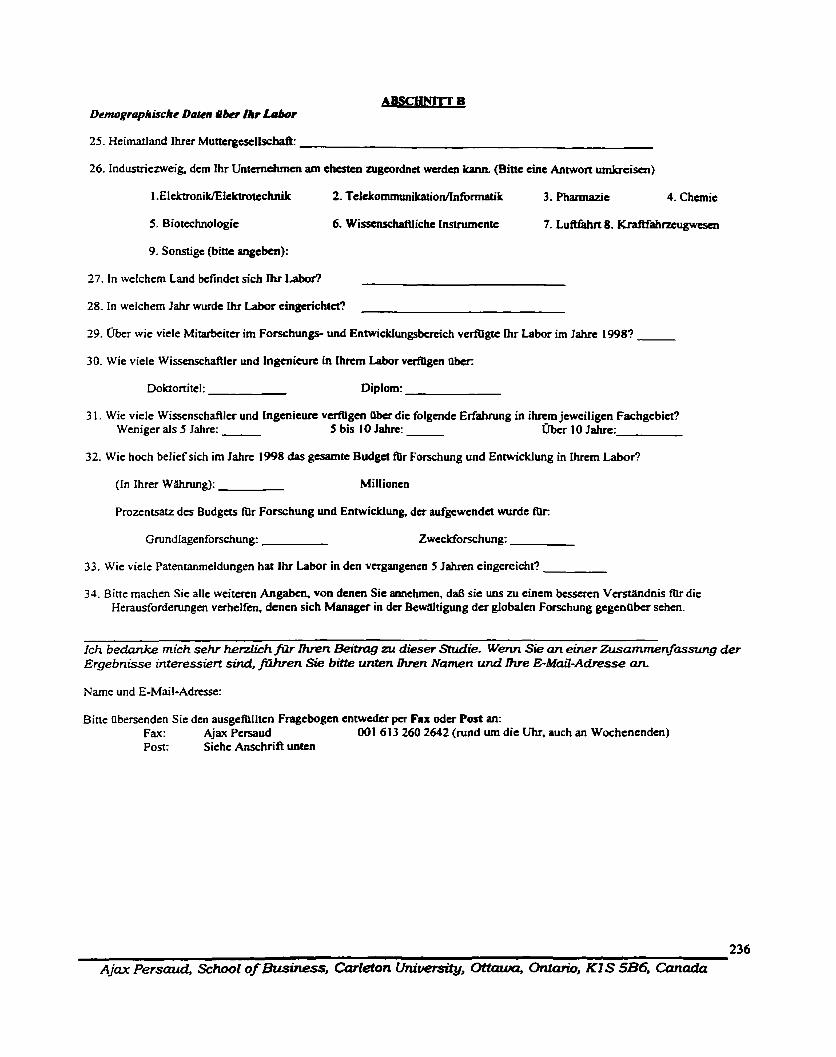
Ihrer
26. Indumienveig, dcrn Ihr Untcrnehmcn am chesten zugeordncr wcrdcn kann. (Bitte cine Annvon wnbciscn)
5. Biotechnologie 6. Wissenschaftliche Instnrmcntc 7. Luftfahrt 8. Kraftfahrzcugwesen
9. Sonnigc (bitte angeben):
27. In welchem Land bcfindct sich Ihr Labor?
28. In welchem Jahr wurdc Ihr Labor cingdchtct?
29. Über wie viele Mitatbeita im Forschungs- und Entwicklungsbcrcich vedllgte Ihr Labor irn Jahrc 1998?
30. Wie viele Wissenschaîllcr und Ingenieure in I k m Labor v d g t n Ilber:
Doktonitel: Diplom:
3 1. Wie viele Wissenschafller und Ingenieure vcrfügcn Ilber dic folgendc Erfahnuig in ihrcm jewtiligcn Fachgcbiet? Weniger als 5 Jahre: 5 bis 10 Jahre: b r 10 Jahre:
32. Wie hoch belief sich im Jahrc 1998 das gcsarnte Budget fùr Forschung und Entwicklung in ihrern Labof?
(In Ihrer Wahrung): Millionen
Prozentsatz des Budgets fùr Forschung und Ennvicklung, der aufgewendct wurde für:
Grundlagenfonchung: Zweckforschung:
33. Wie viele Patenmmeldungen hat Ihr Labor in den vcrgangcncn 5 Jahrcn eingereicht?
34. Bitte machen Sie alle weiteren Angabcn, von dcnen Sic annehmcn, daB sic uns zu eincm bessercn Ve-dnis filr die Herausforderungen verhelfen, denen sich Manager in der Bewaltigung der globalen Forschung gcgenflber schen.
Ich bedanke mich sehr herzlich fflr h n Beitmg zu dieser Studie. Wenn Sie an einer Zusammenfossung der Ergebnisse interessiert sind, jÜiven Sie bitte unten Ihren Namen und Ihre E-Maif-Adresse an.
Name und E-Mail-Adresse:
Bitte Llbenendcn Sie den ausgefûlltcn Fragebogen ennvcdcr pcr Fax oder Post an: Fm: Ajax Pcrsaud 001 6 13 260 2642 (mnd um die Uhr. auch an Wochcnendcn) Post: Siehc Anschrifi unten
236
Ajax Persaud, School of Susinessl Carleton U~ÙvetSity~ Ott- Ontanano, KI S 586, Ccuuzda
APPENDIX 6
HEADQUARTER SURVEY - GERMAN VERSION
237 Ajax Persaud, School of Business, Carleton University, Ottawa., Ontanano, KI S 5B6, Canada

Carleton U N I V E R S I T Y
Innovationen durch globale Partnerschaft: Eine Untersuchung aber die fiihrenden Unternehmen in der Welt
Males: Sehr geehrter Hem + last name, Fernales: Sehr geehrte Frau + iast name, If you do not know the narne: Sehr geehrte Damen und Herren,
mein Name ist Ajax Persaud. Ich bin Doktorand an der School of Business an der Carleton University in Ottawa, Kanada. Mein Schwerpunktgebiet ist Technologiemanagement Ich arbeite zur Zeit an meiner Dissertation, die sich mit dem Thema beschafiigt, inwieweit die Zusamrnenarbeit zwischen Forschungslaboren ( d e r -abteilmgen/- einrichtungen) multinationaler Unternehmen bessere Bedingungen fUr die schnelle und effiziente Entwicklung von innovationen schafft.
Berichten in der Presse und aicademischen Fachblilttern k t zu entnehmen, dai3 die Zusammenarbeit zwischen weltweiten Einrichtungen von multinationalen Unternehmen, wenn diese entsprechend durchgeführt wird, für diese Untemehmen einen enormen Nutzen haben konnte. Diesen Berichten ist darûber hinaus ni enmehmen, daB es bisher nur wenigen Untemehmen gelungen ist, ihre weltweiten Operationen erfolgreich ai stnikturieren. Die Ergebnisse dieser Studie komten w e ~ o l l e lnfonnationen darûber liefem, welche Strategien Untemehmen bei ihrer globalen ForschungstlItigkeit einsetzen und AufschluB Qber die Faktoren geben, die zum Erfolg oder MiBerfoIg beitragen. Mit Fnhnuigskri4fien einiger Untemehrnen gefûhrte Vorgespdche haben bemftigt, dai3 Studien dieser Art nonvendig sind.
Ihr Untemehmen geh6rt ni den fWwnden multinationalen Untemehmen, die ich iür die Teilnahme an dieser Studie ausgewalt habe. Ich bitte Sie, an dieser Studie reikunehmen. indem Sie den beigemen Fragebogen ausjùllen. AIle Informationen werden streng verrraulich behandelt, Die Antwonen werden ais Gesamtheit ausgewenet, so dai3 keine Einzei~erson und keïn einzelnes Labor d e r Unternehmen im AbschluDbericht bezeichnet wird. Ihre Teilnahme wird es mir ermoglichen, die Studie in einem angemessenen zeitlichen Rahmen abzuschliekn.
Sollten noch Fragen offenstehen, bin ich telefonisch unter der Nurnmer 00 1 6 13 520 2600 Apparat (Extension) 101 7 sowie per E-Mail unter [email protected] ni erreichen. Sie kamen sich zwecks weiterer informationen auch gerne mit meinem Doktorvater H e m Professor Vinod Kumar unter der Numrner 001 613 520 2379 in Verbindung setzen. Interessierte Teilnehmer erhaiten e h Exemplar der Studienergebnisse.
Ich danke ihnen vielmais Air Ihre Teilnahme an dieser Studie. Bitte iibersenden Sie den ausgcfûlltcn Fragebogen entweder per Fax oder Posî.
Fax: 001 613 260 2642
Postanschri fi: Ajax Persaud School of Business, Carleton University Ottawa, Ontario K 1 S 5B6, Canada
Mit fieundlichen Gd3en
Ajax Persaud
238 Ajax Persaud, School of Business, Carleton University, Ottawa, Ontmo, Kl S 5B6, Canada
Die Fragen in diesem Abschnia bcfasscn sich mit der An der Zusammcnarbcit zwischen dan HL und a n d m Forschungslaboren innerhaib h c s Unternehmcns im Valauf der vergangenen zwi J a k .
1. Über wie viele Forschungslaborc vcrfùgt Ihr Untmehrnen (einschlieBlich dem, die sich im Ausland befinden)?
2. Mit wie vielen dieser Forschungslaborc hat Ihr Labor an Forschungs- und Entwickiungsprojektcn aisammengcarbeitet?
3. Wie der gemeinsamen Projekte umfaBtcri folgcndcs:
Wissenschaîllicher und tcchnologischa Infomiationsaustausch?
Gemeinsame Fonchung ais gbichwcrtige Parmer?
Gemeinsame Forschungsprojektt, bei denen Ihr Labar cinc mhrmdc Stellung einnahm?
Gemeinsame Forschungsprojektt, bci denen das anderc Labor eine führcnde Stellung einnahm?
Austausch von Mitarbcitem im Bercich Forschung und Entwicflung?
Regelmaige Besuche zwischcn dcn bciden Laborm?
Beiderseitiger Zugriff auf Testeinrichtungcn, Anlagcn usw.?
Gemeinsarnes Brainstorming und geplante Zusamrnenkilnftc?
4. Wie y& der Labore, mit denen Sie zusanuncngcarbeitet haben, verfolgen den selben Arbeitsstil wie Ihr Labor in bezug auf Arbeitsgewohnheiten und -einstcllungen?
5. Wie vJe& der Labore. mit denen Sie zusamrncngcarbeitet haben, vcrfolgen Ziele und FllhrungsstiIe, die denen Ihres Labors fineln?
6. Welche Probleme wûrden Sie auf dic Tatsachc zurûckfùhrcn, daB Ihr Labor cinen anderen Arbeitssril verfolgt als dicse Labore? (Bitte n*er erliiutern)
7. Mit wie vielen der Labore, mit denen Sic aisammengearbeitct haben, gab es gr(li3ere Meinungsverschiedcnheiten/Konflikte ilber:
Die Bereitstellung von Ressourccn und Mitarbcitem filr dic Zusarnmenarbcit
Die Besitmerhatnisse bei ciner im Rahrncn der Zusammenarbeit entwickeltcn Technologie
Die Venvendung einer irn Rahmen der Zusammenarbeit entwickelten Technologie
8. Inwieweit haben folgende Faktoren I h Entschcidung becinfluBt, mit einem anderen Labor innerhalb des eigenen Unternehmens nisammenzuarbcitcn?
Gar kcincn EinfluB Schr g rokn EinfluD
Technische Kompetenz des anderen Labors 1 2 3 4 5
Gegenseitige Erghzung der Tcchnologien d a k r c 1 2 3 4 5
23 9
Ajax Persaud, School of Business, Carleton Universi-/, Ottawa, Ontario, KI S 5B6, Canada
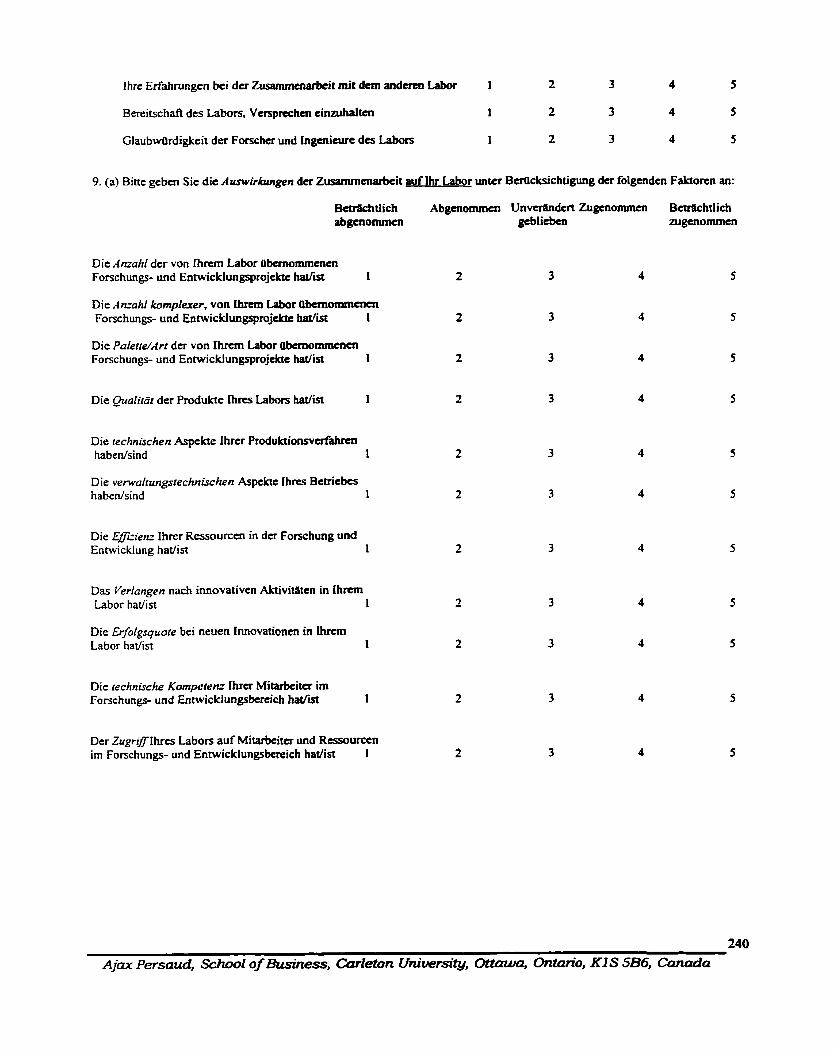
Ihre Erfahmngcn bei der Zusammenarbtit mit d a n and- Labor 1 2 3 4 5
Bereitschaft des Labon, Verspmhcn cinaihaltcn 1 2 3 4 5
GlaubwOrdigkeit der Forscha und Ingcnieure des Labors 1 2 3 4 5
9. (a) Bine geben Sic die Auswkhngen der Zusammcnarbcit auf Ihr Labor unter BcrOcksichtigung der folgendm Faktorcn an:
Die Anzahl der von Ihrcm Labor tibernommenm Forschungs- und EntwicWungsprojclac hatfist 1 2 3 4 5
Die Ansahl komplerer, von ban Labor Obcmomnrcnen Forschungs- und Entwicklungspmjcktc W i 1 2 3 4 5
Die Paletre/Iirt der von Ihrcm Labor Dbcrnommmen Forschungs- und Entwicklungsprojelcte ha!/& 1 2 3
Die Qualitat der Produkte Ihres Labors hatlist 1 2 3 4 5
Die rechnischen Aspekte Ihrcr Produktionsvcrfahrcn habenlsind 1
Die verwaltungsrechnljchen Aspektc Ihres Bctriebes habenlsind 1
Die Eflcien. Ihrer Ressourccn in der Forschung und Entwicklung hat/in 1
Das Verlangen nach innovativen Aktivitatcn in l h m Labor hatlin 1
Die ~ u l g s q u o t e bei neuen Innovationcn in Ihrem Labor hatlist 1
Die technische Kompeteru I h m Mitarbciter im Farschungs- und Entwicklungsbcreich h d s t 1
Der ZugrrTIhres Labors auf Mitarbciter und Rcssourcen im Forschungs- und Ennvicklungsbcteich hatlist 1
240
Ajax Persaud, School of Business, Carleton Udtersity, Ottawa, M o , KI S 5B6, Canada
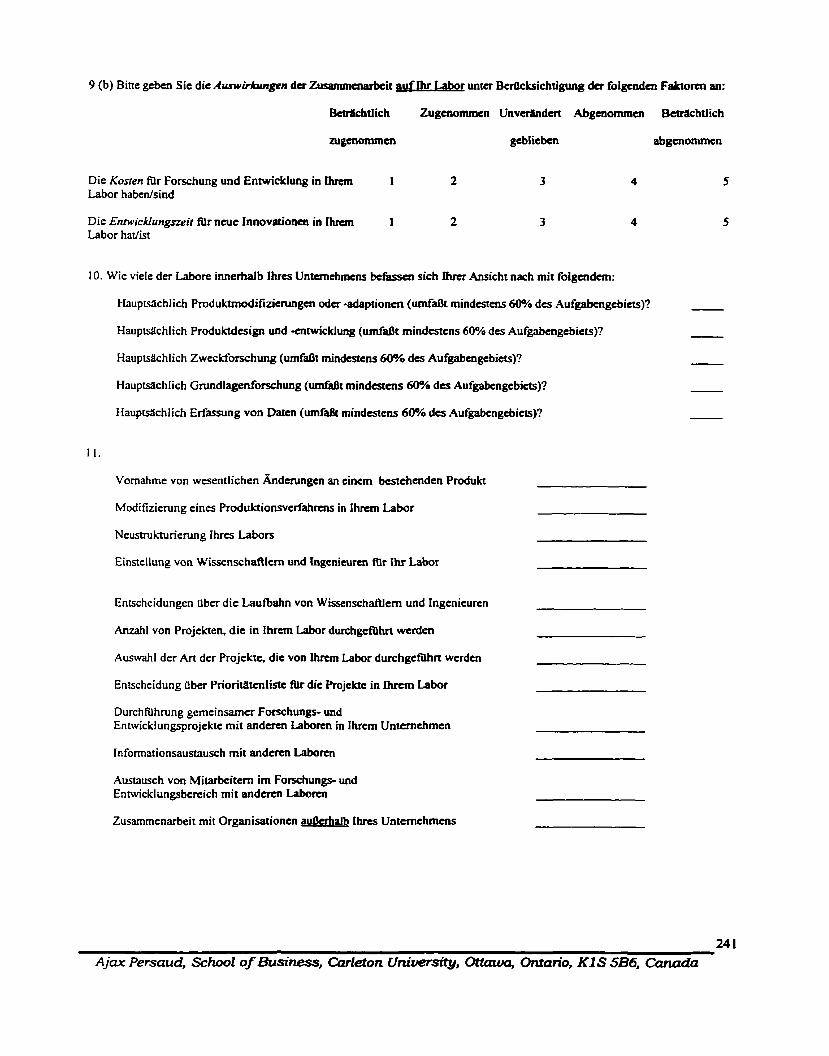
9 (b) Bine geben Sic die Aunuirhuigen der Zusammcnarbcit auf Ihr Labor unur Berticksichtigung der folgcnden Faktom an:
BalfchtIich Zugcnommcn Unvtrandm Abgenommen m h t l i c h
mgenommtn geblicbcn abgrnommm
Die Kosten für Forschung und Entwicflung in Ihrcm 1 Labor habenkind
Die Entwicklungszeit fùr ncue Innovationai in I h m 1 Labor hat/ist
IO. Wie viele der Labore imerhalb k e s Untmchmcns bcfâsscn sich hm Ansicht nach mit folgendem:
HaupUchI ich Produktmodi fizieningcn odcr -adaptioncn (umfdt mindestem 60% des Aufgabtngebiets)?
HaupWichlich Produktdcsign und nnvicklung (umfdt mindestcns 60% des Aufgabengcbicts)?
Hauptsachlich Zweckforschung (umfdt mindtstcns 60% des Aufgabengcbiets)?
HaupWchlich Grundlagenforsçhung (urnfit mindestcns 60% des Aufgabcngcbicts)?
Haupts2ichlich Erfassung von Datcn (umfaBt mindestem 60% des Aufgabengcbiets)?
Vornahme von wesentlichen Ànderungtn an tinem bcstehenden Produkt
Modifizierung eines Produktionsvcrfahfcns in Ihrcm Labor
Neustruknirierung Ihres Labors
Einstellung von Wisscnschafllcrn und Ingcnieuren fiir Ihr tabor
Entscheidungen aber die Laufbahn von Wissensch&lem und Ingenieurcn
Anzahl von Projekten, die in Ihrcm Labor durchgcfùhrt werdcn
Auswahl der Art der Projcktt, die von I h m Labor durchgefühn werdcn
Entscheidung Dber Priori~tcntistc Alr die Projektc in Ihmn Labor
Durchfùhrung gemeinsamcr Forschungs- und Entwicklungsprojekte mit anderen Laboren in Ihrem Unternehmen
Informationsaustausch mit andenn Labom
Austausch von Mirarbcitem im Forschungs- und Entwicklungsbcrcich mit a n d m tabom
Zusammenarbei t mit Organisationen aukrhalb Ihres Untanchmens
24 1 Ajax Persaud, School of Business, Carleton UmÙersity, ottaura, Ontano, KI S 5B6, Canada
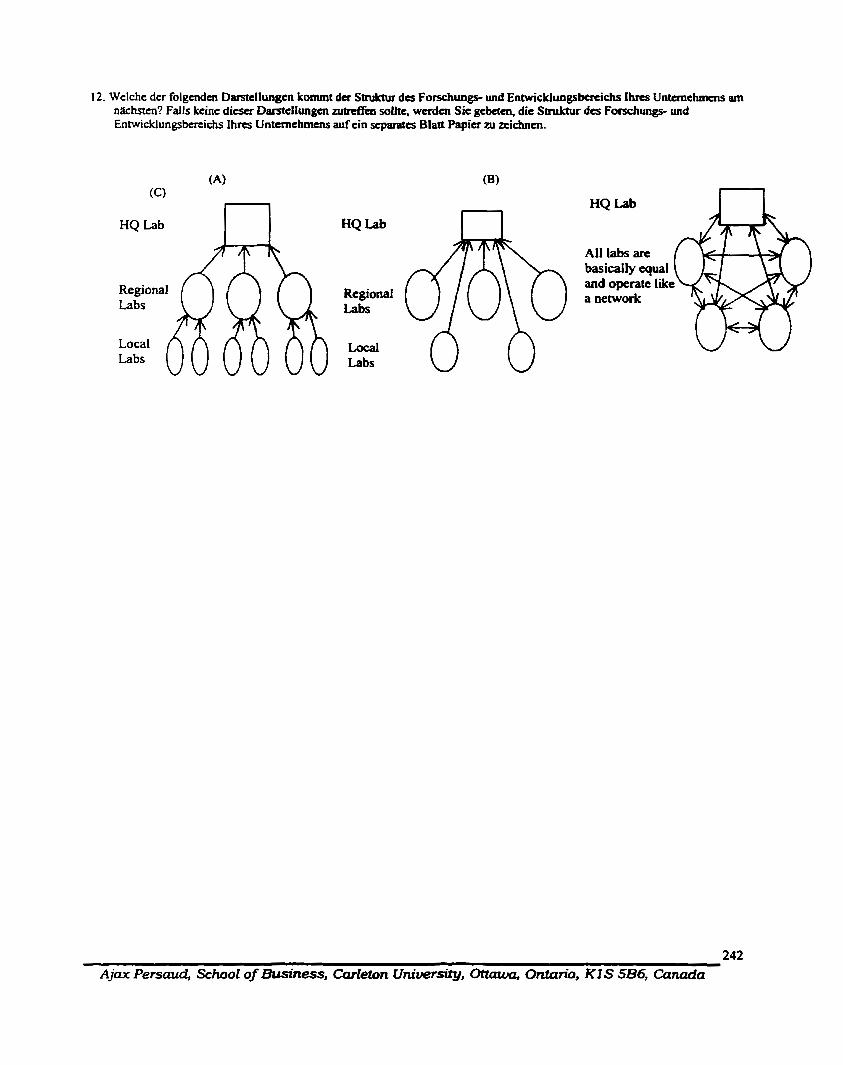
12. Welche der folgendcn Darstcllungcn kommt der Smiimir des Fonehwigs- und Entwicklungsbertichs Ihres Untanchmens am nkhnen? Falls kcine di- Darstellungcn nitrrffai solltq mdm Sie gcbctcn, die Struktur des Forschmg, und Enhvicklungsbercichs I h Untcmchmens auf cin separates Blaa Papia ni zeichncn.
HQ Lab
Regional Labs
Local Labs
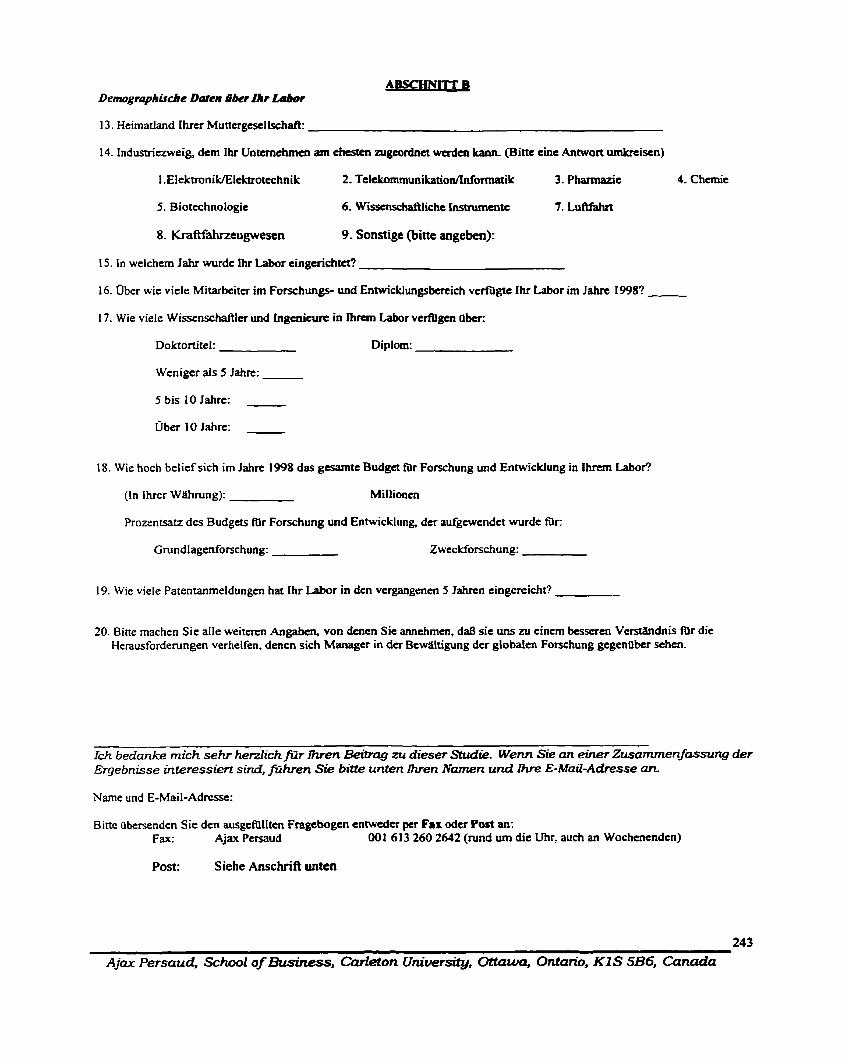
ABSCHNTTB Demogrophische Daim liber lhr Labof
13. Heimatland Ihrer Muttcrgescllschaft:
14. Industriezweig, dem Ihr Untcrnehmen am chesten mgcorcina werden kann. (Bitte cinc Anmort umbeisen)
1 .Elektroni~lektrotechnik 2. Tclckommunikation/lnfomiatik 3. Pharmazic 4. Chcmic
5. Biotechnologie 6. Wisscnschaftliche instrumente 7. Lufffghrt
8. Kraftfahrzeugwesen 9. Sonstige (bitte angeben):
15. In welchem Jahr wurde Ihr Labor eingerichn?
16. Über wie viele Mitarbciter im Forschungs- und Entwicklungsbereich vtrîùgtc Ihr Labor im Jahrc 1998?
17. Wie viele Wissenschaftler und Ingcnicurc in Ihrcm tabor vcrfngcn O h :
Doktonitel: Diplom:
Weniger als 5 Jahre:
5 bis 10 iahre:
Über IO Jahre:
1 S. Wie hoch belief sich im Jahre 1998 das gcsamte Budget filr Forschung und Entwicklung in Ihrem Labor?
(In Ihrer W m n g ) : Millionen
Prozentsatz des Budgets für Forschung und Entwickiung, der aufgewendet wurde fûr:
Gmndlagenfonchung: Zwcckforschung:
1 9. Wie viele Patentanrneldungen hat Ihr Labor in den vergangenen 5 Jahren eingereicht?
20. Bine machen Sie alle weiteren Angabcn, von dcncn Sie annchrnen, daB sic uns zu eincm besseren Ventandnis fùr die Herausforderungen verhelfen, denen sich Manager in der Bcwaltigung der globaien Forschung gcgcnnber sehen.
Ich bedanice mich sehr herzlich fiïr Ihren Beiîrag zu dieser Stuàie. Wenn Sie an eYler Zusammenf~~sung der Ergebnïsse interessiert sUrd, fllhren Sie bitte unten men Namen und lhre E-Mail-Adresse an.
Narne und E-Mail-Adresse:
Bitte Ubersenden Sie den ausgcRlIIttn Fragcbogcn entwcder pcr Fax oder Post an: Fax: Ajax Pcrsaud 00 1 6 13 260 2642 (rund um die Uhr, auch an Wochcnenden)
Post: Siehe Anschrifi unten
243
Ajax Persauci, School of Business, Carleton University, Ottawa, Ontanano, KIS 586, Canada
APPENDlX 7
SUBSIDIARY SURVEY- JAPANESE VERSION
Fax: (6 1 3) 260-2642
Mail: Ajax P e n u d Schodl of Business, Culdori Univenity Otuwi, Ontario KlS 586,
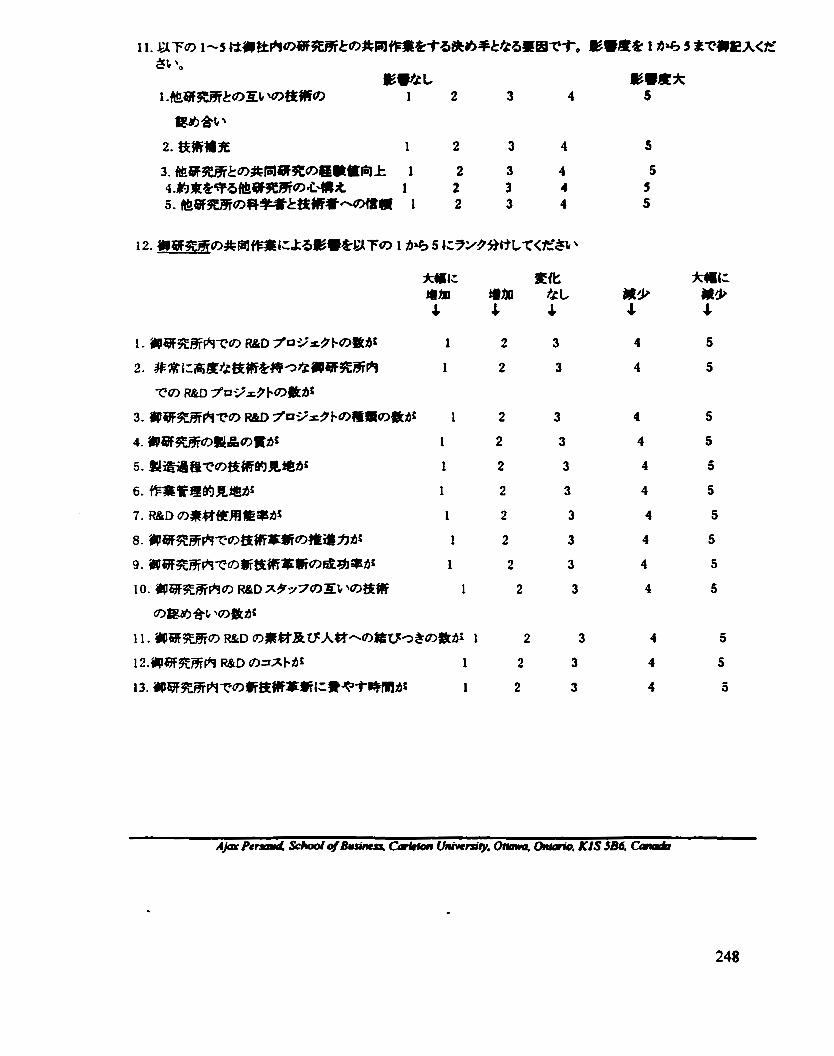
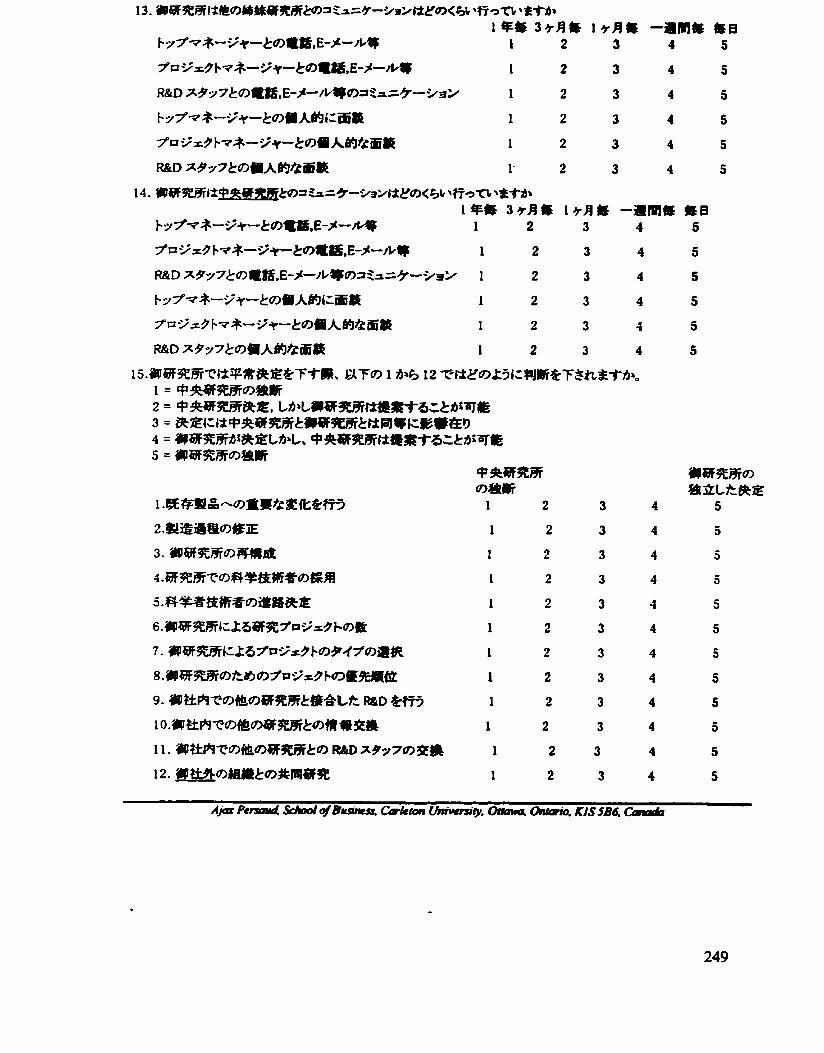
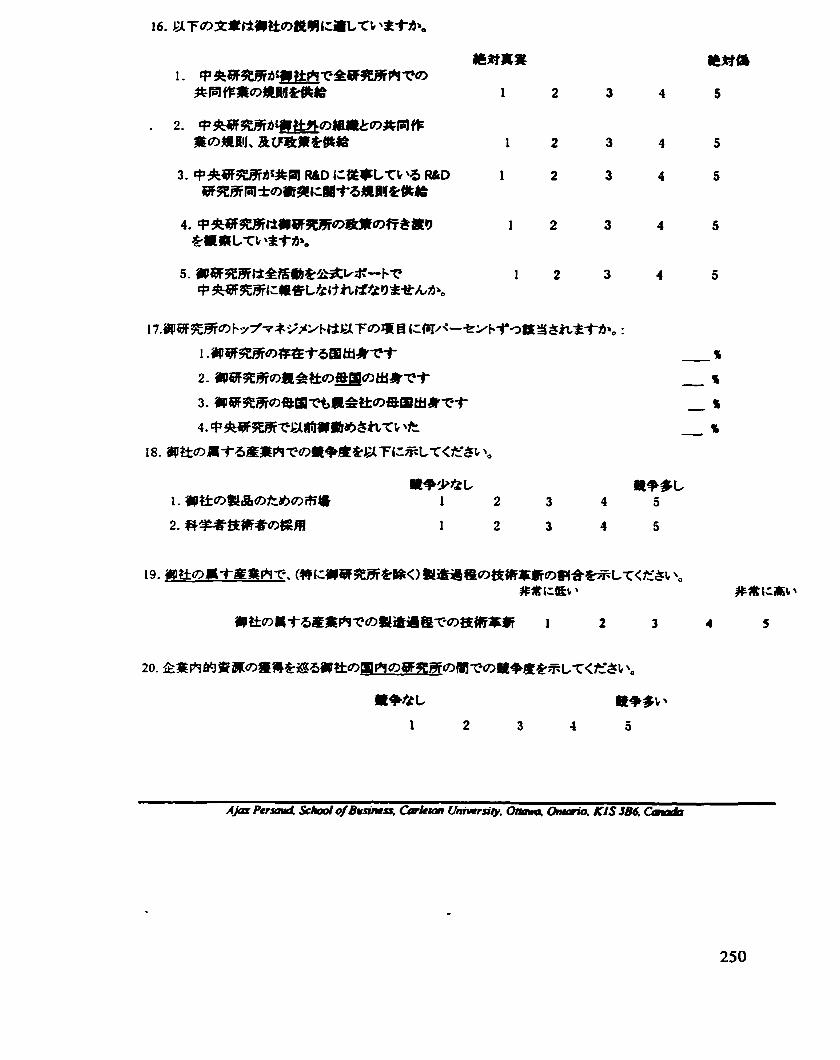
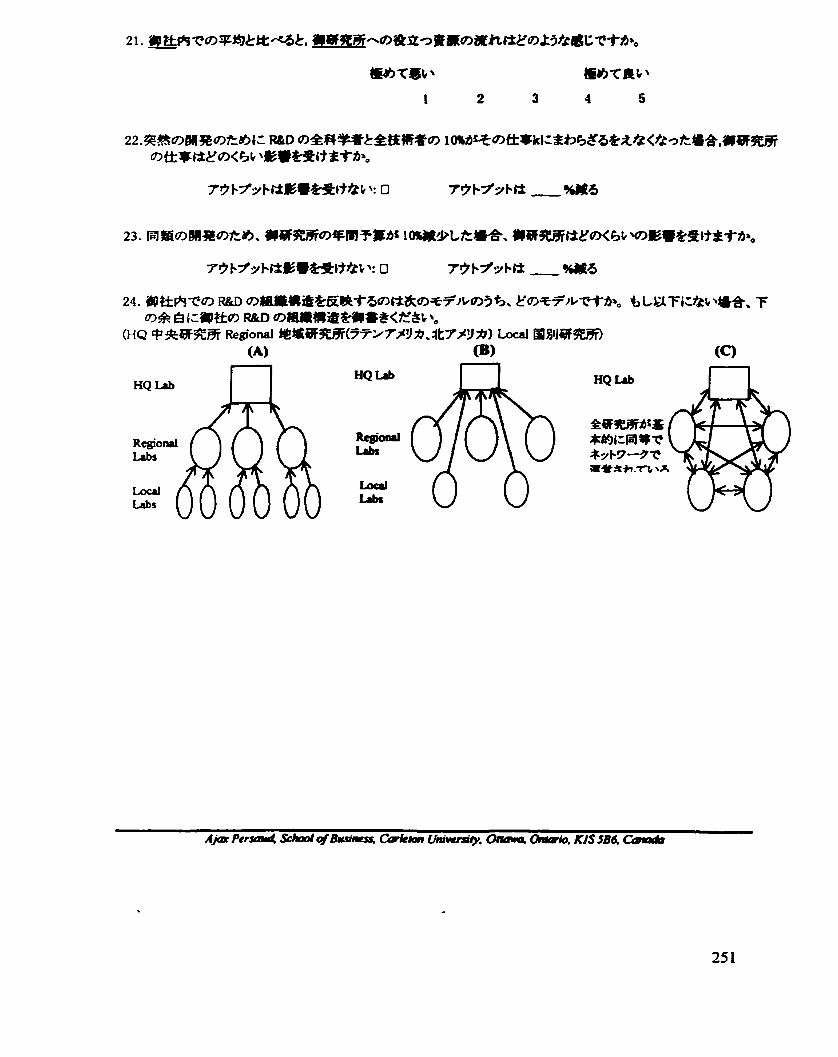

APPENDIX 8
IIEADQUARTER SURVEY - JAPANESE VERSION
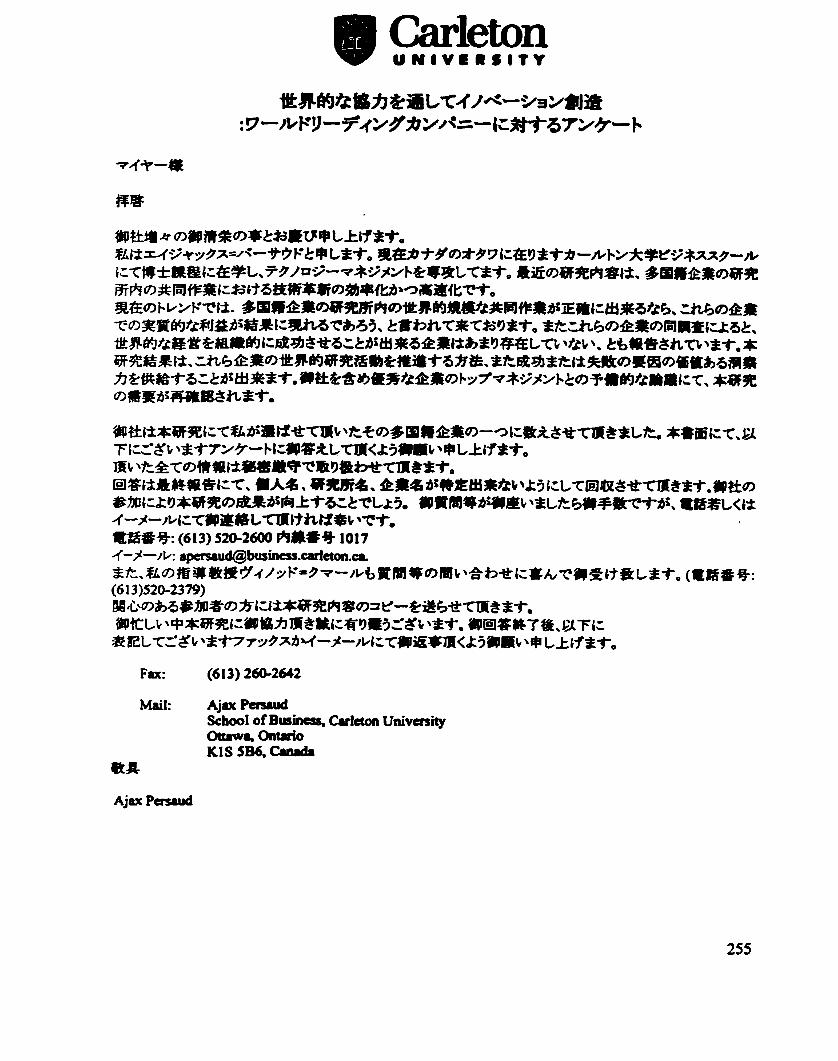
Carleton U W I V I R S I T V
Fax: (6 13) 26Q-2642
MUI: Ajax P d Scbaol of BusimSa, Culeton University Otuw8, - KI S SM, CM&
eata Ajax P d

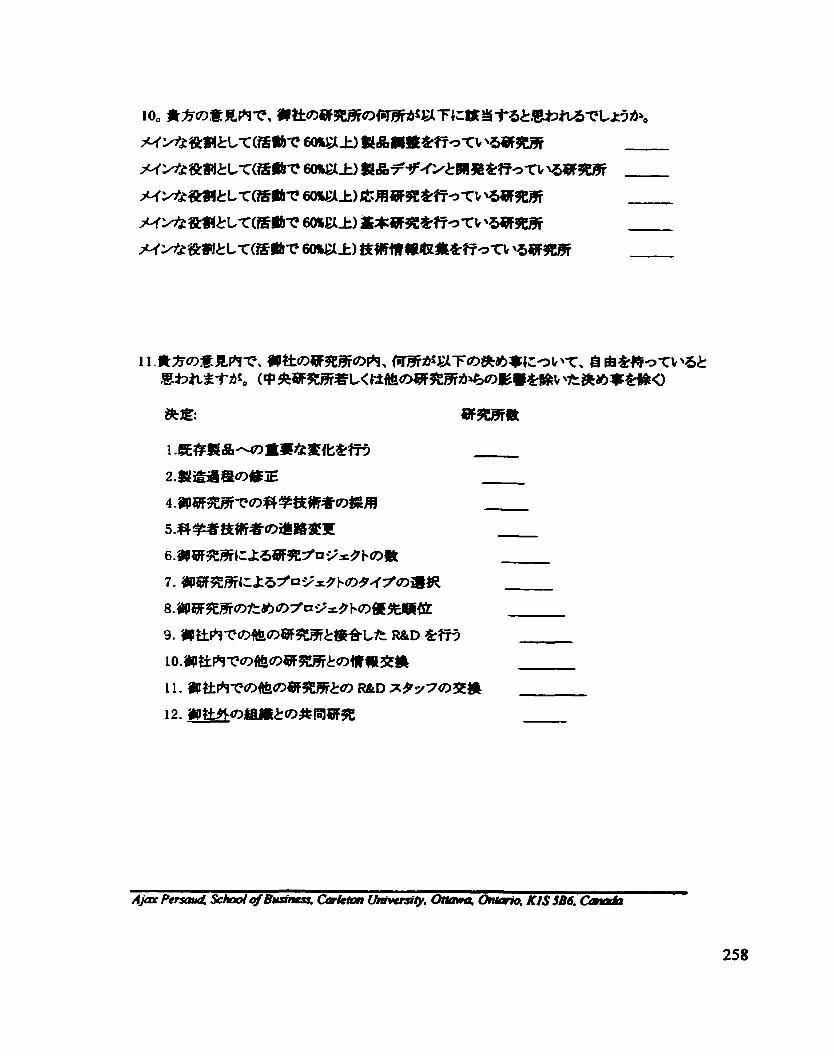

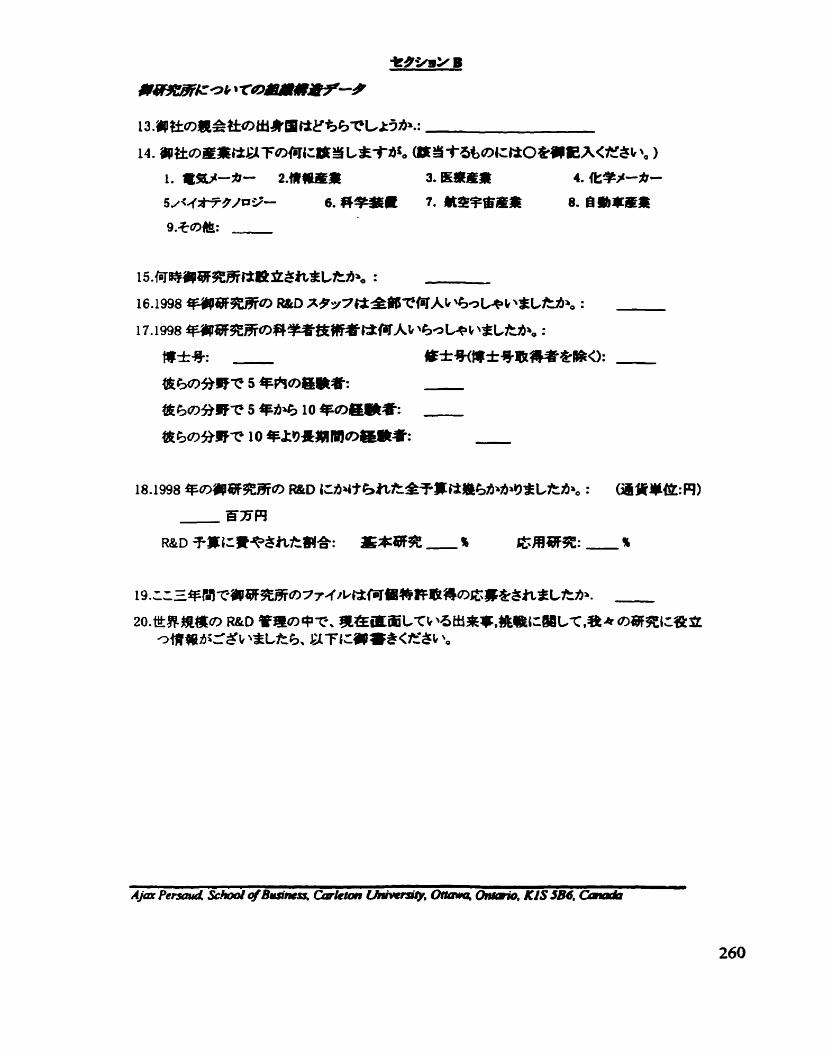
Fax: Ajax P d (6 13) 52û-2532
Mail: Ajsr P a s 4 School of Business Carleton University, Ottawa, Onûxio KlS-SB6
Related Documents