GLOBAL SYNDICATED LOANS REVIEW REUTERS / Stefan Wemuth GLOBAL SYNDICATED LOANS REVIEW MANAGING UNDERWRITERS Fi t H lf 2017 First Half 2017

Welcome message from author
This document is posted to help you gain knowledge. Please leave a comment to let me know what you think about it! Share it to your friends and learn new things together.
Transcript
GLOBAL SYNDICATED LOANS REVIEW
REUTERS / Stefan Wemuth
GLOBAL SYNDICATED LOANS REVIEWMANAGING UNDERWRITERS
Fi t H lf 2017First Half 2017

Global Syndicated Loans
Global Loans - Bookrunners (R1) 1
2
2
Leading Underwriters for 2017
Asia Loans - Asian Currency (S3i)
Table of Contents
Global Loans - Mandated Arrangers (R3)
Global Deals Intelligence
Top 10 Global Syndicated Loans
1
1
Global Scorecard 2
Global Loans Rankings - Last Ten Years 3
EMEA Mandated Lead Arrangers (R19) 7
Asia Loans - Bookrunners (S5c)
EMEA Sponsored Loans (P13)
Asia Pacific (Excl. Japan) Syndicated Loans
Asia & Australia Deals Intelligence
Global Debt & Syndicated Loans (DL1) 2
European Leveraged Loans (P10) 8
Top Asia Syndicated Loans
First Half 2017
MANAGING UNDERWRITERS
SYNDICATED LOANS REVIEW
9
8
9
9
9
10
11
11
Japan Loans - Mandated Arrangers (S12a)
Thomson Reuters Solutions for the Deal Making Community
10
Syndicated Loans Criteria Summary 13
Regional Contacts
10
14
12
Americas Syndicated Loans
EMEA Syndicated Loans
Japan Syndicated Loans
5
EMEA Deals Intelligence 7
Americas Deals Intelligence 4
US Leveraged Loans - Bookrunners (R11a)
Top Australia Syndicated LoansTop Americas Syndicated Loans 4
6
Australia Loans - Bookrunners (S7)
Australia Loans - Mandated Arrangers (S6a)
Japan Deals Intelligence
Top Japan Syndicated Loans
Japan Loans - Bookrunners (S12b)
Latin America Loans - Mandated Lead Arrangers (R16)
Top EMEA Syndicated Loans 7
US Investment Grade Loans - Bookrunners (R11b)
North America Loans - Bookrunners (R9) 5
5
EMEA Bookrunners (R17) 7
6
Americas Loans - Mandated Arrangers (R8c)
US Loans - Bookrunners (R11) 5
Americas Loans - Bookrunners (R7)
13
Ranking Criteria Summary
11
4
Asia Loans - Mandated Arrangers (S5b) 9
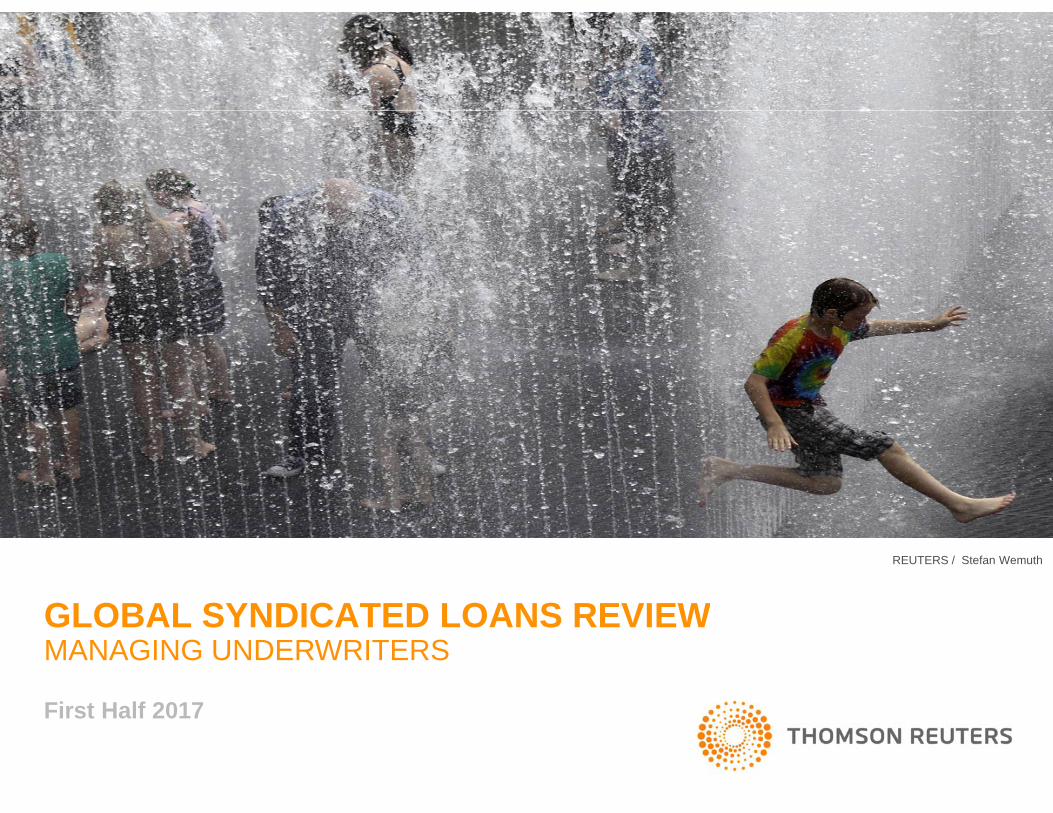
AMERICAS LENDING UP 24% FROM 2016American loans totaled US$1.4 trillion, representing 65% of global loan volume in the first half of 2017.European lending activity increased 5% year-over-year, with US$399.2 billion from 586 loans. Asia-Pacificloan activity decreased 23% compared to last year, with US$204.7 billion in transactions. Japanesesyndicated loan volume decreased 3% compared to the first half of 2016, with US$116.4 billion in loans.
GLOBAL SYNDICATED LENDING HITS US$2.1 TRILLIONGlobal Syndicated lending activity increased 8.6% compared to the first half of 2016, totaling US$2.1 trillionfrom 4,605 transactions. The United States contributed the largest share of the global market, with US$1.3trillion in loan volume, representing 60% of overall proceeds. Lending in the United Kingdom increased 48%compared to the same period last year, totaling US$111.6 billion.
ACQUISITION FINANCING TRIPLES IN CONSUMER STAPLES, INDUSTRIALS, AND TELECOM Acquisition financing in the Consumer Staples, Industrials, and Telecommunications industries tripledcompared to the same period in 2016, with notable M&A borrowing by British American Tobacco and ReckittBenckiser. Despite the significant uptick in loan volume, the number of loans in these sectors remained flat.United Kingdom acquisition financing increased eightfold compared to last year, with US$64.6 billion incompleted loans.
First Half 2017
MANAGING UNDERWRITERS
SYNDICATED LOANS REVIEWGlobal Syndicated Lending Totals US$2.1 trillion, up 9% I Americas Lending Up 24% | Syndicated Lending Fees Up 23% I Bank of America Merrill Lynch Tops Rankings
Global Syndicated Loans VolumeGlobal Deals Intelligence
ENERGY, FINANCIALS AND INDUSTRIALS LENDING ACCOUNT FOR 42% OF TOTAL VOLUME
9,533
10,518 10,183
9,639
4,620
0
2,000
4,000
6,000
8,000
10,000
12,000
$0 0
$1.0
$2.0
$3.0
$4.0
$5.0
# of
Issu
es
Proc
eeds
(US$
t)
Q4 Volume (US$t) Q3 Volume (US$t) Q2 Volume (US$t) Q1 Volume (US$t) # of Deals
▼
8.8
11.0 ▲11.9
0.1▲ Societe Generale1.2
-30.7%
3.94.74.75.3 ▲ TD Securities Inc
▲▲
-2.4
13.7
▲▲
-1.2
5.314.27.1
9.0
-6.1
45.1
11.1
▼
4.2
US Bancorp 20
18,778.3
23,845.5
25
26SunTrust Banks1.31.3
78.4
2722
5923,023.924
21
9.1
12.4%
Jefferies LLC2423
Bookrunner Total▲Top Twenty Five Total
PNC Financial Services Group▲
1,955,757.9
Industry % Change from Last Quarter -6.7%Industry % Change from Same Period Last Year ▲
▼
71
4,139
▼▼
4.4
-2.2% 22.5%
-92
▲0.8
100.08,592.4
1.4▲
1.71.0
100.0
▲ ▲
4.0 ▲
122.6
4.5187
481.2 2.8115
▼▲▲
0.00.1
2.90.0
166
20
1180.3 ▲
186
6,089.6
▲▲
▲
▲ 158
-
-3.8
200
3.2134
4.54.8
149
▲
313.6
23-6
31
▼
109.96
-12
82.7
90.6
21
-10.3%
▲
▲0.2 ▲
1,531,454.7
▲311.4131.0
--▲
▲
-0.4
1.5
117.4▼▲
▲
-0.1
0.7
▼▲
▼
▼0.9
▲
▲
2.1
0.5
0.31.8
1.6
3.6
1.0
2.0
0.0
-0.3
1.11.4
0.9
152.2
256.1 3.0
90
0.11.2
1.30.7
71.2
101.0
0.1
4.3
2.92.7229.0
250.6
2.3
173.2
-0.4
84 ▲▲
▼▼
▲▲
▼▼
▲▲
0.5
Market Manager# of MarketShare Ch.Fees# of Deals
Global Loans - Bookrunners (R1)
MarketImputed Fees (US$m)
Jan 1 - Jun 30
Proceeds per Bookrunner (US$m)MarketMarket
# of Deals per Bookrunner2017 Rank Share Ch.Bookrunner Proceeds
2016 Rank Share%
Change in
2 2
5 7
8 5
Bank of America Merrill Lynch 1
Mitsubishi UFJ Financial GroupMizuho Financial Group
RBC Capital Markets
JP Morgan
Current Qtr Market Share
(%)
Share %Deals
607 ▲67
Share%700
158,884.21 184,602.5 85 ▲9.4 -0.5 ▼ 16.9 -1.5543.3
-0.39.4477.0 -0.4
6.3
-0.812.5 49 ▲ 3.6304.87.0 0.5 ▲
5.6387 60 ▲
14.7418.9 4.9
▼
▼Citi 3 3 136,471.7
5.0 -0.4
8.1 -0.6
83,065.180,293.4
Wells Fargo & Co 4 4 98,140.6BarclaysDeutsche Bank
320 ▲ 331.17.74.3 0.9 ▲ 110517
▲3.8 0.5
-0.6 ▼▼
3.9-0.26.54.1 1.06 8 93 3.4271 ▲ 289.5▲
67,401.07 6 67,449.7
3.53.5 ▼ 539 ▲-1.0
-1.410
332.2 3.9 0.90.7▲ 294.7
326.8
6.3 137▼
13.0▲380 9.2 -56 ▼
11 12
Goldman Sachs & Co 9 13 66,995.2Credit Suisse
238
5.0
5.810 15 60,076.7 3.157,668.0 ▲3.0
▲
8.6- 4.8197
186
238
355▼ 208
▲
45
22-4
4.55.8
▼193.4
0139.2
-▲
1122
BMO Capital Markets 19Bank of China Ltd
18
BNP Paribas SA16
18Credit Agricole CIB
12HSBC Holdings PLC 10Morgan Stanley
Scotiabank
Sumitomo Mitsui Finl Grp Inc13
1514
29,363.9
1732,230.7
24,463.2
27,336.719
31,963.617
25,904.021
16
1.5
2.4
20 31,986.1
46,851.9
57,475.051,451.6
45,732.29
1.2
0.71.22.9
-0.1
0.0-0.6
1.4
1.7 0.50.30.0
▲
2.6
1.6
2.3▼
1.6▲
0.4311.03.43.4
1.2 3.6126 ▲▲ 259
▲▲▼▼
35.6
Mkt. Share Chg. from Last Qtr (%)
15.6
Market SectorGlobal Loans (R1)Americas Loans (R7)North American Loans (R9)US Loans (R11)US Leveraged Loans (R11a)
Latin America Loans (R15)
Asia-Pacific ex. Japan ex. Australia (S5c)
Latin America Loans (R16)EMEA Loans (R17)EMEA Leveraged Loans (P10)
Citi
Bank of China LtdBank of China Ltd
Asia-Pacific ex. Japan ex. Australia (S5b)
Mizuho Financial GroupCommonwealth Bank of Australia
CitiCiti
4.1
21.8
11.5 5.2
18.7 9.2
Leading Underwriters During the Second Quarter of 2017
CitiCitiCredit Agricole CIBCredit Agricole CIB
No. 1 ManagerCiti
US Investment Grade Loans (R11b)
Japan Loans (S12b)Australian Loans (S7)
Sumitomo Mitsui Finl Grp IncJapan Loans (S12a)
21.0 ▲
Citi
Borrowing in the Energy sector totaled US$323.5 billion during the first half of 2017, down 5% compared tolast year. Financials loan activity increased 5%, totaling US$310.6 billion during the opening six months of2017. Industrials lending activity reached US$259.8 billion, down 4% compared to same period last year.Borrowing activity in the Telecommunications industry increased 82% compared to a year ago, with US$94.1in deal volume.
RELATIVE STABILITY AT THE TOP OF THE BOOKRUNNER RANKINGSBank of American Merrill Lynch maintained the top ranking for global bookrunners during the first half of 2017,capturing 9% of the global syndicated loans market share with US$184.6 billion from 700 transactions. JPMorgan retained the second spot with US$158.9 billion in loans, representing an 8% market share. Citi andWells Fargo retained their third and fourth ranks, respectively, and Barclays climbed two spots to fifth.
SYNDICATED LENDING FEES UP 23%Estimated bookrunner fees increased 23% compared to the previous year, with US$8.6 billion in total feesearned. Total fees for the top five banks during the first half of 2017 increased 6% compared to last year,totaling US$2.1 billion, despite a collective loss of 3.6 market share points.
Bank of America Merrill Lynch 9.1
16.2
0$0.02013 2014 2015 2016 2017
https://www.thomsonone.comVisit http://dmi.thomsonreuters.com to View Archives and Order Custom League Tables
1

30,103.48940
17
Italy
30,588.6
12,381.714
Eastern Europe
11
41,977.1
United Kingdom
Germany
1,187.1
Spain
Luxembourg
Denmark
37,645.8
42
Global
Switzerland
4,022.4
20,418.9
21,767.6
Netherlands
Market
100.0Western Europe
Sweden
20,449.7
mputed Bookrunning Fees (US$mMarket
▼
Norway9,153.8
2
-5.6% ▼
6.5
Deals
6932148,877.0
2-1.20.3 65
17.2
-1641
# of Deals
1,381,669.4
98,521.7
33
61,462.2
377,385.238,280.7
39
1,630.2300.0
110
1,110,803.5
242
7,297.4
7,456.713
2,0512,291
Fees58
Share%
▼
Market
-10.4%
JP Morgan
# of
Industry % Change from Last Quarter
1
-10.2%
Market
Industry % Change from Same Period Last Year
Mandated ArrangersMarket
Share Ch.
Global Loans - Mandated Arrangers (R3)
-4.2%
Industry Total
2017 Rank
Bank of America Merrill Lynch
Proceeds per Mandated Arranger US$m)
1
14,076
Proceeds
2,380,330.54,980,169.4
▼
139,581.6
6.8
3.5
1,190.3
670.3
9.6
15.0
8,616.0
7.2%
Share % Share Ch.
486.5▲
1,190.2
▲
0.4▲
4.5-0.4-0.1
-32
Jan 1 - Jun 30
▲ 5.95.1
556.9
Europe
France▼
5.9▼-0.4
Colombia▲
Manager
-7.3%
▲
42.2
▲
111,611.6
0.1
▼-0.7
0.2 3,729.6Mexico▲
0.6Central America
▲
3.4South America▼
2.43.6
Chile
▼▲0.2
▲▲
800.8
3.3
North America3.91,397,207.5▼
Change in Share %
0.7Region/Nation
First Half 2017 | Syndicated Loans | Managing Underwriters
Market
Global 2,148,589.0
1/1/2017 - 6/30/2017
Proceeds (US$m)
23
109
586
80
17
9
2,068.3
Canada
2,655.5
1,978,026.7
16,018.0
3,279.3
2,332
12 6,112.2
102
1,283,147.7United States of America
399,152.8544
16,440.4
1/1/2016 - 6/30/2016
Scorecard: Global Syndicated Loans
2,071
5 ▼▼
-55.3
▲-46.1
-48.1
342.6
91.0▼-49.0
-24.7
▼
776
207
38,419.4
15
▼
40,025.4
75,393.468
▲
28
66
19,283.5
30,682.7
12441,757.0
# of Issues
710
8,274.6
2,129
118
4,820
381,038.9
10647.2
# of Issues4,605
Proceeds (US$m)
339,061.8
241
1,125,990.2
1,832
15
1,017,602.9
690.0
23
2,657.8
5,204.7
2
93,200.6
8
-2.0
▼
▲
▲
▼
▲
5.7
▲
▼-37.0
▲
-39.0
26.1
▼-11.8
▼
▲
-56.5 ▼-38.7
24.124.4
▲
▲24.811.34.8
56.148.0
▲
▲▲
34
% Chge in Proceeds
8.6
Change in
19
758.7 3.7
Americas
3.1 -0.5 ▼
100.0
6.9
Top Ten Total 47.9
Share%2016 Rank
▼
▼
792▼▲
# of Deals per MA
Morgan Stanley 9 9 183,560.5 3.7
-4.9
-0.9BNP Paribas SA 151,652.2
684.9Deutsche Bank 8 8 183,736.0 3.7 ▲▼
10
6Goldman Sachs & Co 7 7 183,822.4 3.7 -0.5
764
Share Ch.▼
Wells Fargo & Co 6 6 191,516.6 3.9
▲
-0.2HSBC Holdings PLC 5
-0.6
1544 4 219,281.7
# of Deals
▼Barclays
492.15.5 78 726.9
710.5
5.4
886 6.35.8 -0.2▲5.8
Market# of Deals per MA
4.4 -0.2▼ 835 5.93.9 -0.2▼
▼
62710772
137▼7.1
3
-0.1
78▼ 1256 8.9
5 196,133.1
-14 ▼
698 5.0 ▲261006
▲
134616 ▲ 1,391.3
# of Market ManagerMarketFeesMandated Arrangers
10.0Share%
371,129.7-0.4 ▼
Market2016 Rank
JP Morgan
3 349,462.8 7.0 -1.3Bank of America Merrill Lynch 2 2 350,035.5 7.0Citi
1 1 7.5 -0.6 ▼ 1408Share Ch.Proceeds
Jan 1 - Jun 30Global Debt & Syndicated Loans (DL1)
Imputed Fees (US$m)
Deals2017 Rank Share%
Proceeds per Mandated Arranger US$m)
27
p
Russian Federation
1.6
117.2
11,035.9TurkeyCzech Republic
0.7
208.8
45,140.6
-0.3
31,123.8
2,678.9
325.0
9,464.1
204,735.4110,945.8
1,207.6
100
19
8,900.4 15
1
27
200.0
4
1,328.3
19,908.1Middle East
North Asia2.1
0.5
88
0.7 Kuwait
5/31/2017
▼
13,991.7Singapore10,248.6
Malaysia
6,535.8
6/5/2017 PepsiCo Inc
United States
16.4% ▲
General Corp. Purp.
7,500.0United States
Ford Motor CoUnited States
990
1
Industry % Change from Last Quarter
377
-215
120,490.8
975.3Australasia
14
5
5,871.9Australia
1,289.7Philippines36,867.7
▲
▲
1.4146.3
82.51.1
1.6163.2
1.6
General Corp. Purp.France
4/28/20175/22/2017
General Corp. Purp.
3/16/2017 8,000.0Semyrhamis SADuke Energy Corp
13,400.0
2
213
115
25
683
41,655.7
14,075.0
▼
8,731.4 15,986.8
-
265,531.7
57,949.5
24
4,765.060,728.4
1,658.984,975.0 84
1220,775.4701
5,670.0
-0.27.5
340.64.1
3.7 344
592
▲
5
129,585.54.24 6
33
3.43.1
2.9
1.3-0.2
▲
-0.12.8
▼2.6▲
0.91.3
1.6
▼
▼
▲
4.5261
42
372
▼
5.7 -16-10
▲
7▲
▼
0.4
351-0.2-0.1 262
▼
▲
11.0
15.2
10.3
-31
5.2241
5.7
4.6
5.6260
8▲
6.4 13019508
294
275 130296 ▲
163
-9
7.6
4.3
▲
6.4214
4.7
6.0
218
828.1
3.5
4.9 13
14
4,605
▲▲
26
1.7
27-26▼
▲265
▲
0.2-0.1 5.8
▲
0.10.0
15
2002.0
▲
1.5 0.0
27
1.5
1.3
18
1.226,015.5
19
SunTrust Banks
Credit Agricole CIB
100.04.6
-0.2
0.21.2
2,148,589.0
26
72.9
▲
23
24,217.7
8.6%
1,564,750.02225
▲▲ 224
88
356.3▼
438.4
320.1
-87
18
1.10.2
3.0
6.0
-1.3
▲
-
▼
206
60,018.412
2.4
1.5
▼
1.619
31,697.8
56,630.5
16
63,883.6
7
61,938.41714
79,397.48
66,542.1
62,085.3
4
476
0.7
g
9
▲CitiWells Fargo & Co
6Barclays 8
Closing Date
PNC Financial Services Group
13Bank of China Ltd17
Industry Total
TD Securities Inc
Societe Generale 23
Top Twenty Five Total
24
Deutsche BankMizuho Financial Group
1310
7Goldman Sachs & Co 9
Wal-Mart Stores Inc
32,440.9
4/23/2017
3/10/20175/17/2017
27,434.0
1/16/2017
22
United StatesAtlantia SpA
10
BNP Paribas SA
72,434.3
Reckitt Benckiser Group PLC
Top 10 Global Syndicated Loans
42,041.6
Sumitomo Mitsui Finl Grp Inc
RBC Capital Markets
ING
Scotiabank 20
BMO Capital Markets 21
88,674.63.8
89,355.1
82,021.71.0
33,265.637,288.9
11
Morgan Stanley14
16
51,029.0
US Bancorp
HSBC Holdings PLC11
Target Market
25,481.3
Borrower
24
20
18
21
-6.1%Industry % Change from Same Period Last Year
32,812.2
358.0301.0
2.7
0.5▲3.43.2
▼▲
▲
Hong Kong
152.1
▲
-
299.7
3.8
▲2.5
4.6▲
3.9
306.93.6▲8.6
-16 ▼
12.9 ▼
88
73
305.5372.8
▼
30
0.9
-0.3
▼Ghana
▼
▲
▲
South Africa▲
▼
Africa/Middle East/Central Asia
IndiaSouth Asia
▲
Taiwan
Southeast Asia▼
▲
500.0
China
Poland▲▼
53,449.9
▲10.6
▼
100.0
149.7
▲
0.1-0.4
90.50.9
-0.4
0.0
100.8
256.5
-0.1
2.2
234.2
0.1
2.7
134.4
1.0
1.7
256.9
0.5-0.6
69.1
0.9
-0.8
1.2
-0.4
3.8
0.3
0.9
▲
▲3.2
0.4
3.2
3.2▼
1,652.6
5
12,338.6
Bahrain
Asia-Pacific (ex Central Asia)
Sub-Saharan Africa
Acquisition Fin.
9,697.216,724.3
62
852.0
45
890.0
25,711.9
312
2,520.1
32,794.83,162.9
118
4
84
36
Japan 116,369.6-11.1%
Becton Dickinson & Co
Primary UOPBritish American Tobacco PLC
▼
United Kingdom
Italy
5/9/2017 Depository Trust Co
* The Global Scorecard comprises deal volume and counts from club and bookrun deals, mirroring the mandated arranger rankings.
1,004▼▼-4.5%
United States
United Kingdom
Package Amt (US$m)
-30.6%
25,061.9
4,912.3
New Zealand
Vietnam
31,210.0
2,804.4
114
5
Indonesia
463.0
91
104
23,958.9
19,049.091
29,568.4
63
835
42
35,440.4
14
-46.1
86,398.5
185,641.4
▼
23,253.1
-45.4
▲▲
-3.4
7.8
▼
10.9
▲
▼
3
7024
123
8
55-95.8
-86.3
-26.5
-47.899
-46.8
93528
-7.8▼
-41.3-22.9
25
-32.5
▼
-50.3
▼▼
▲
▼
▼
32.292.2
▼
4.0▲
▼
▼
7.3
▼
108.6
-25.1
94
▼
51.9▼
▲
▲
▲
▼
-63.4
-10.6
▼
-80.3
-67.2▼▼
-72.7
General Corp. Purp.General Corp. Purp.
15,700.0
Other
14,250.0
10,073.1
▼
Acquisition Fin.31,826.821,216.0
21
164,476.8
Jan 1 - Jun 30
Acquisition Fin.
-54.9
United States
▲
2.9Credit Suisse
15
Mitsubishi UFJ Financial Group 5
467
-0.1
-0.6
▼0.5
▼
398
10.1
▼
▲
16,413.6 Acquisition Fin.
▲▲
Visit http://dmi.thomsonreuters.com to View Archives and Order Custom League Tables https://www.thomsonone.com
2
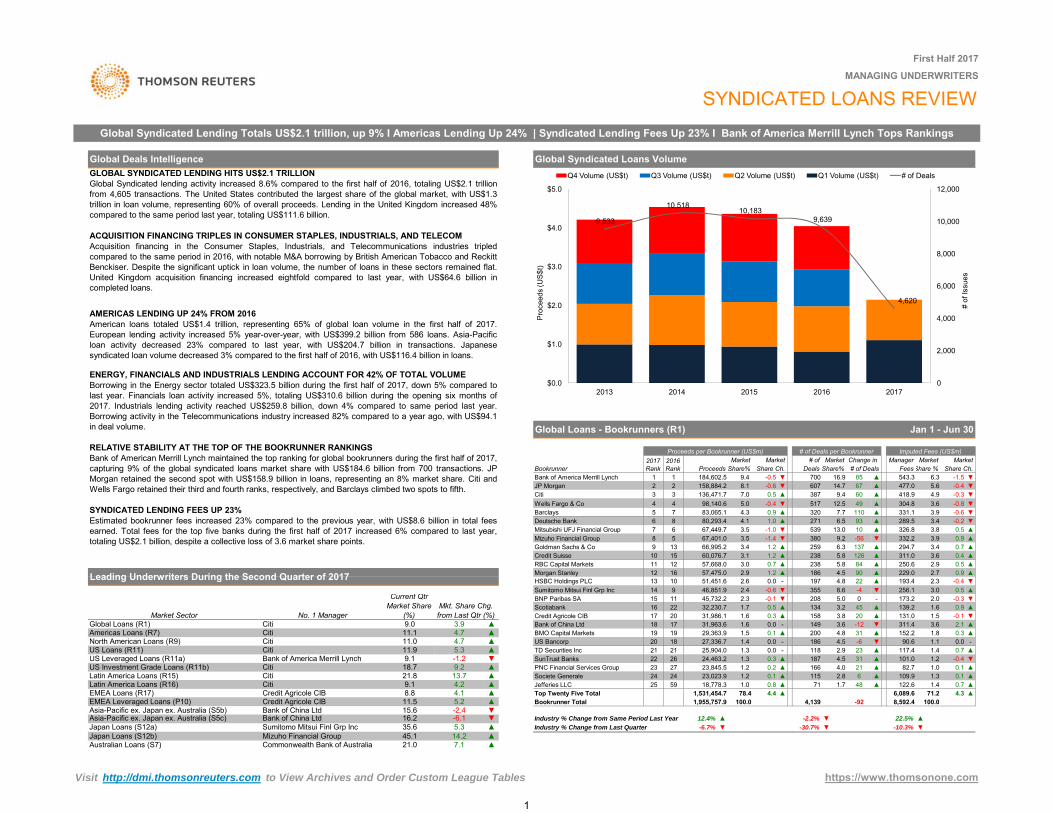
Global Loans Bookrunner Ranking - Last Ten Years*First Half 2017 | Syndicated Loans | Managing Underwriters
1
2
3
4
1
2
3
4
Bank of America Merrill Lynch
JP Morgan
Citi
Wells Fargo & Co
5
6
7
8
9
10
5
6
7
8
9
10
2008 2009 2010 2011 2012 2013 2014 2015 2016 2017
Ran
k
Barclays
Deutsche Bank
Mitsubishi UFJ Financial Group
Mizuho Financial Group
Goldman Sachs & Co
Credit Suisse
*League Table positions reflect consolidation within the banking sector. Rankings shown are as of the current quarter end in each calendar year.
Visit http://dmi.thomsonreuters.com to View Archives and Order Custom League Tables https://www.thomsonone.com
3
Primary UOP
Top Americas Syndicated LoansClosing Date Target Market
JP Morgan ▼
Package Amt (US$m)
2▲
US Bancorp 15 12
▲Barclays 5 5 73,732.6 5.3
Market2016 Rank
34
559▼
344 14.8 77
Share%482.1 ▼28.1 77 8.8Fees Share Ch.
▲ -2.6
Americas Deals Intelligence
# ofImputed Fees (US$m)Proceeds per Bookrunner (US$m) # of Deals per Bookrunner
ManagerChange in
First Half 2017 | Syndicated Loans | Managing Underwriters
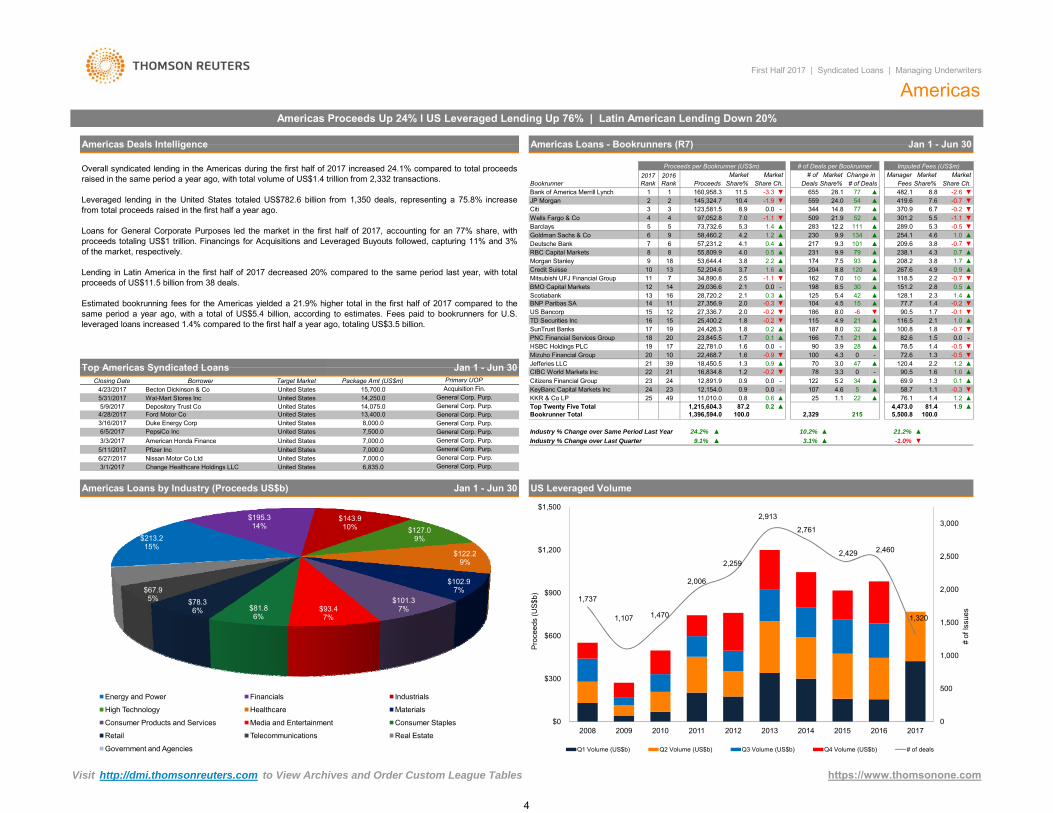
AmericasAmericas Proceeds Up 24% l US Leveraged Lending Up 76% | Latin American Lending Down 20%
Americas Loans - Bookrunners (R7) Jan 1 - Jun 30
MarketMarket2017 Rank
MarketMarket
2 145,324.7
DealsBank of America Merrill Lynch 1 655Bookrunner Proceeds
160,958.3 11.5 -3.3Share%Share%
1# of DealsShare Ch.
-0.7▲ 419.610.4 -1.9 24.0 54 7.6 ▼Citi 3 3 123,581.5 8.9 0.0 - -0.2 ▼370.9 6.7Wells Fargo & Co 4 4 97,052.8 7.0 -1.1 21.9 52 301.2▼ 509 5.5 -1.1 ▼
1.4 ▲ -0.5 ▼283 12.2 111 ▲ 289.0 5.3Goldman Sachs & Co 6 9 58,460.2 4.2 1.2 9.9 134▲ 230 4.6 1.0▲ 254.1 ▲Deutsche Bank 7 6 57,231.2 4.1 0.4 ▲ -0.7 ▼217 9.3 101 ▲RBC Capital Markets 8 8 55,809.9 4.0 0.5
209.6 3.89.9 79 ▲ 238.1▲ 231 4.3 0.7 ▲
Morgan Stanley 9 18 53,644.4 3.8 2.2 ▲ 1.7 ▲174 7.5 93 ▲ 208.2 3.8Credit Suisse 10 13 52,204.6 3.7 1.6 8.8 120▲ 204 4.9 0.9▲ 267.6 ▲Mitsubishi UFJ Financial Group 11 7 34,890.8 2.5 -1.1 ▼ -0.7 ▼BMO Capital Markets 12 14 29,036.6
162 7.0
0.3 ▲2.1 0.0 - 198
118.5 2.28.5 30 ▲ 151.2
10 ▲2.8
1.4 ▲125 5.40.5
BNP Paribas SA 14 11 27,356.9 4.5 15 ▲ 77.72.0
▲Scotiabank 13 16 28,720.2 2.1 42 ▲ 128.1 2.3
2.1 1.0-0.1▼
▲ 116.5
-0.3 ▼ 104▼90.5 1.7
1.4 -0.2 ▼▼ 186 8.0 -6
TD Securities Inc 16 15 25,400.22.0 -0.227,336.7
-0.7 ▼1.8 -0.2 4.9 21▼ 115 ▲1.8
PNC Financial Services Group 18 20 23,845.5SunTrust Banks 17 19 24,426.3 187 8.0
1.7 0.1 ▲ 1660.2 ▲ 100.8 1.8
7.1 21 ▲ 82.6 1.532 ▲
0.0 -HSBC Holdings PLC 19 17 22,781.0 1.6 0.0 - -0.5
1.6 -0.9▼90 3.9 28 ▲ 78.5 1.4
▲4.3 0▼ 100 -0.5- 72.6
Jefferies LLC 21 39 18,450.5Mizuho Financial Group 20 10 22,468.7
1.6 1.01.3 70 3.0
▼1.30.9 ▲ 120.4
▲
47 ▲ 2.23.3 0 - 90.5
1.2▲
▲ 69 9 1 321 16,834.8
122 5 2 0 1Citizens Financial Group 23 24 12 891 9 0 9 0 0CIBC World Markets Inc 22 1.2 -0.2 ▼ 78Jan 1 - Jun 30
Borrower
Overall syndicated lending in the Americas during the first half of 2017 increased 24.1% compared to total proceedsraised in the same period a year ago, with total volume of US$1.4 trillion from 2,332 transactions.
Leveraged lending in the United States totaled US$782.6 billion from 1,350 deals, representing a 75.8% increasefrom total proceeds raised in the first half a year ago.
Loans for General Corporate Purposes led the market in the first half of 2017, accounting for an 77% share, withproceeds totaling US$1 trillion. Financings for Acquisitions and Leveraged Buyouts followed, capturing 11% and 3%of the market, respectively.
Lending in Latin America in the first half of 2017 decreased 20% compared to the same period last year, with totalproceeds of US$11.5 billion from 38 deals.
Estimated bookrunning fees for the Americas yielded a 21.9% higher total in the first half of 2017 compared to thesame period a year ago, with a total of US$5.4 billion, according to estimates. Fees paid to bookrunners for U.S.leveraged loans increased 1.4% compared to the first half a year ago, totaling US$3.5 billion.
14,075.0
Primary UOP
5/31/20175/9/2017
American Honda Finance6/5/2017
Duke Energy Corp
3/3/2017
Depository Trust Co
6,835.0
General Corp. Purp.General Corp. Purp.
4/23/2017Closing Date
3/16/2017 8,000.013,400.0
7,000.0
United States
Jan 1 - Jun 30
United States
Target Market
United StatesWal-Mart Stores Inc
Ford Motor Co United States1.9
5,500.881.4
▼
87.24/28/2017
United States
PepsiCo Inc 7,500.0
US Leveraged Volume
100.0 2151,396,594.0General Corp. Purp.
1.1 1.4▲ 1.2 ▲▲
Package Amt (US$m)15,700.0
3423 12,154.0
▲1.1
-0.9 - 107
▲ 69.9 1.3▲0.0
4,473.0
122 5.2
0.658.75
▲
General Corp. Purp.United States
0.1-0.3
General Corp. Purp.
100.0
25
Citizens Financial Group 23
76.1
24 12,891.9 0.9 0.0
11,010.049 222524 4.6United States
Top Twenty Five Total
Acquisition Fin. KeyBanc Capital Markets Inc0.8General Corp. Purp.14,250.0 KKR & Co LP
Industry % Change over Last Quarter
1,215,604.3
3.1%Industry % Change over Same Period Last Year
0.2 ▲
9.1%
Bookrunner Total 2,329
▲10.2% ▲-1.0%
24.2% 21.2%▲
▲▼▲
5/11/2017 General Corp. Purp.United States
General Corp. Purp.Nissan Motor Co Ltd
United States6/27/2017
Pfizer Inc
Americas Loans by Industry (Proceeds US$b)
Change Healthcare Holdings LLC United States3/1/2017General Corp. Purp.
7,000.07,000.0
Becton Dickinson & CoBorrower
$213.215%
$195.314%
$143.910% $127.0
9%
$122.29%
$102.97%
$101.37%$93.4
7%$81.86%
$78.36%
$67.95%
$3.10%
Energy and Power Financials Industrials
High Technology Healthcare Materials
Consumer Products and Services Media and Entertainment Consumer Staples
Retail Telecommunications Real Estate
Government and Agencies
1,737
1,107 1,470
2,006
2,259
2,913
2,761
2,429 2,460
1,320
0
500
1,000
1,500
2,000
2,500
3,000
$0
$300
$600
$900
$1,200
$1,500
2008 2009 2010 2011 2012 2013 2014 2015 2016 2017
# of
Issu
es
Proc
eeds
(US$
b)
Q1 Volume (US$b) Q2 Volume (US$b) Q3 Volume (US$b) Q4 Volume (US$b) # of deals
Visit http://dmi.thomsonreuters.com to View Archives and Order Custom League Tables https://www.thomsonone.com
4
-1.1-0.5
TD Securities Inc
Deutsche Bank
US Bancorp
RBC Capital Markets
0.5
▼ Mitsubishi UFJ Financial Group
Morgan Stanley
8.8
North America Loans - Bookrunners (R9)
Share% 1
BookrunnerBank of America Merrill Lynch
# of
77.81.0
ScotiabankBNP Paribas SA
Barclays
BMO Capital Markets
238.1
Credit Suisse
BMO Capital Markets31,488.0
932,336.7
7.6
▼
▲
80
75,878.5
91.4
84.1
▲10.8
57,538.1
20
56
Wells Fargo & Co1.1
2.8
4.3
12Mitsubishi UFJ Financial Group 11
11.7Goldman Sachs & Co
▲74.3
56,529.6
60,390.20.84.1
▲8
16.4578
0.4
▲-1.0 ▼
10.2
0.1
# of Deals
3.9
▲
▲
2.2251273
95237 ▲
▲
13.4209.6
▲
25
267.6
-2611.4
131
-7
-0.7
-218▼
▼
129
▼
1.4 -0.5224
-0.2
78.582.4
120.41.3
Scotiabank
US Bancorp2.7
0.2
215
16
11.016
13
9.422015
▼2.4
52,414.2
177
10
14
7
12
▲
1319
33,265.6
1.8
37,080.33.8
25,406.7
23,702.2
0.1
-1.1 ▼
--0.5
▲0.02.3
-0.4
-0.51.7-0.4
-0.11.3
2.325,908.7
25,119.1
256
▲
3.35.7
▼ 5.2
5.0
154
9.3 26
-106.9
6.6
4.5 0
12
▲
▼
21
134
5.5▲
▼122160
▼
2.3
1.41.5
2.1
9.2
1.3
9.6
208.2▲
▲1442
1.8
▲
118.5▼4.9
151.2▲90.5
▲
72.6
0.1
-0.8
▲1.2
▼-0.4
▼-0.5
0.9
25,644.3SunTrust Banks
24 12,813.7
20
22
0.9
11
HSBC Holdings PLC
-▼
1.917
BNP Paribas SA 18
Citizens Financial Group
19 14
1.8
23,781.8
90.5▲ 2.2
1.7
69.9
36.7
▲ ▲43.3
Bank of America Merrill Lynch
0.70.8
▼
1-0.7
9.6 ▼
Proceeds per Mandated Arranger (US$m)Change in
Share%705 30.2 47 -2.6 ▼1
8.1
Market Market
133,431.42
265
6.3
123,264.0
56
▼-0.8113,121.8
1.688
0.1
48
3.8
116.2
▼
118
37
-0.72.20.9
0.0▲
100.6▲
1
12▲
▲
PNC Financial Services Group 17
190
87,824.5
54,138.1Morgan Stanley
15
10
4
-0.2
4
2Citi 3
18
RBC Capital MarketsDeutsche BankBarclays
JP Morgan3
8.8
3.8
370.9
5.3312
382
▲
613
5.433
-3.6
▼▼289.0▲
481.8
0.0▼
6.85.5
12
28.5 79145,064.1 ▼
11.610.5 54
-0.7
▲8.1
1.0
▲1.8
1.4
-0.11.7
76
▲
104
▼
160,759.92 -1.9
# of Deals per Bookrunner
556
# of Deals per MA Imputed Fees (US$m)
Americas
Market
Jan 1 - Jun 30
128.1
0.3
3.8 1.71.7
4.6▲▲ 8
▲
Share Ch.
-7.6
2016 RankDealsProceeds
Jan 1 - Jun 30
First Half 2017 | Syndicated Loans | Managing Underwriters
Imputed Fees (US$m)
Share Ch.
▼
Proceeds per Bookrunner (US$m)2017 Rank
2016 Rank
Manager
87▲
254.0
Market
▲
JP MorganCiti
0.7
Market
26.3
Share%
24.8
▲
Market
58 417.1
301.269
MarketMarketShare%Fees Share Ch.
Change in ManagerProceeds
2017 Rank
# of MarketMandated Arranger
Mizuho Financial Group 1161.7 -0.9
MarketShare%
TD Securities Inc
- 1.119,730.8 ▼1.4Jefferies LLC
21 2142
CIBC World Markets Inc
240.10.0
18,107.61.023
1.0
Sumitomo Mitsui Finl Grp Inc 25 22 12,510.2
3.025 13,483.8
71▲
Fifth Third Bancorp 1▲
10
4
▲▲
12
16
PNC Financial Services Group 18
Wells Fargo & Co
▲6Goldman Sachs & Co
96,936.5
Credit Suisse
9 58,460.2
13 52,204.6
3 3 121,705.5 8.8508
-0.1 ▼ 335▼4
Share Ch.▼ ▲
14.6 76 ▲24.3
Deals-3.3 653
▲▼-2.8481.3 8.8
Fees# of Deals
-0.1 ▼
Share%
363.8 6.7-0.77.7 ▼418.4
-1.2300.9111 ▲
22.2 54 ▲ ▼2835 5 73,732.6 289.0 5.3
7.0 -1.2 5.5
2305.3 1.3 ▲4.2 1.2 ▲ 4.7
12.31.0 ▲10.0 135 ▲ 254.1
-0.6 ▼
-0.87 6 57,231.2 4.1 ▼217 9.5 101 ▲ 209.3 3.88 55,309.9 4.0 0.5 10.0 78▲ 230 0.8▲ 237.0 ▲4.4
9 18 53,644.4 3.9 2.3 1.7 ▲174 7.6 93 ▲ 3.8▲
208.28.9 120 ▲ 267.3204
▲4.9 0.9 ▲
11 7 34,089.7 2.5 -1.1 ▼ -0.8
186
▼156 6.8 10 ▲ 115.4 2.1198 2.8 0.4▲ 150.814 29,036.6 2.1 0.0 8.6
114
▲13 12 27,336.7 2.0 -0.2 ▼
30--0.1 ▼
14 16 27,006.6 2.0 0.2 ▲ 5.0 35 ▲ 121.6 2.28.1 -6 ▼ 90.5 1.7
1.3 ▲15 11 26,888.8 1.9 -0.4 ▼ -0.2 ▼101 4.4 12 ▲ 76.0 1.4
15 25,400.2 1.8 -0.2 5.0 21▼ 115 2.1 1.0▲ 116.5 ▲SunTrust Banks 17 19 24,426.3 1.8 0.2 ▲ -0.6 ▼187 8.2 32 ▲ 1.9
20 23,845.5 1.7 0.1100.8
7.2 21 ▲ 82.6▲ 166 1.5 0.0 -HSBC Holdings PLC 19 17 22,240.5 1.6 -0.1 ▼ -0.4 ▼87 3.8 27 ▲ 76.5 1.4Mizuho Financial Group 20 10 21,990.0 1.6 -0.8 4.2 5▼ 96 1.3 -0.4▲ 70.0 ▼Jefferies LLC 21 39 18,450.5 1.3 0.9 ▲ 1.2 ▲70 3.1 47 ▲CIBC World Markets Inc 22 21 16,834.8 1.2 -0.2
120.4 2.23.4 1 ▲ 90.3▼ 78 1.7 1.1 ▲
Citizens Financial Group 23 24 12,891.9 0.9 0.0 - 0.1 ▲122 5.3 34 ▲ 69.9 1.3KeyBanc Capital Markets Inc 24 23 12,154.0 0.9 0.0 4.7 5- 107 1.1 -0.3▲ 58.7 ▼KKR & Co LP 25 49 11,010.0 0.8 0.6 ▲ 1.2 ▲25 1.1 22 ▲ 76.1 1.4
Americas Loans - Mandated Arrangers (R8c)
▼▲2.0▲▲▼
▼▲
254.1
7.2
Market
0.5
2.00.2
0.1
-0.6
22
0.7
-2.1 ▼
Market
▼
▲
▼
▲
▲
-0.4
26.4% ▲
1,286,905.2
▲
▲
▲
100.0
▲
-1.3
0.01,130,142.2
11.1
0.8
▼16.1
Market
5.1
3.2
▲
0.1
Market
▲
-2.4Share Ch.
0.1
2.2 -0.7
▲100.080.6
US Loans - Bookrunners (R11)
Industry % Change over Same Period Last Year
JP Morgan
2016 Rank
▲
-
142,288.2
4.2
Change in
▲
100.8
Share%
-0.5 ▼
5,497.54,414.7
Jan 1 - Jun 30
▼-0.8%
203
▼9.6
Manager
▲
p
Industry Total
21.0%
Top Twenty Five Total 1,174,909.9
9.5%
2,3321,397,207.5
▲24.1%
100.084.3
▲
Top Twenty Five Total 1,208,651.0 87.3 -0.2 4,445.4▼ 81.7 1.7 ▲Bookrunner Total 1,385,426.9 100.0 2,292 223 5,445.3 100.0
▲ 3.0% ▲ -1.3%Industry % Change over Same Period Last Year ▲ 10.8% 21.9%
8.7%24.7%
▼
Jan 1 - Jun 30
▲▲
Proceeds per Bookrunner (US$m) # of Deals per Bookrunner Imputed Fees (US$m)
Industry % Change over Last Quarter3.2%Industry % Change over Last Quarter 9.2%
Bookrunner Proceeds# of
Share% Share Ch.2017 Rank
Market
649Fees# of DealsDeals Share%
31.6 475.384Bank of America Merrill Lynch 1 1 159,468.3 12.4 -3.6552 26.9 57 ▲ 402.5 8.1
Citi 3 3 119,605.5 9.3 -0.2 76 ▲ 357.7▼ 330Wells Fargo & Co 4 4 96,659.0 7.5 -1.2 -0.9 ▼505 24.6 56 ▲ 298.3 6.0Barclays 5 5 73,240.8 5.7 1.4 13.8 112▲ 283 5.8 -0.3▲ 286.8 ▼Goldman Sachs & Co 6 8 58,460.2 4.5 1.2 ▲ 1.2 ▲230 11.2 135 ▲Deutsche Bank 7 6 57,200.9 4.4 0.3 10.5 102 ▲ 209.1▲ 216Morgan Stanley 8 15 53,144.4 4.1 2.3 173 8.4 92 ▲ 206.6 4.2Credit Suisse 9 12 52,204.6 4.1 1.8 9.9 120▲ 204 5.4 1.2▲ 267.3RBC Capital Markets 10 13 39,872.7 3.1 1.0 177 8.6 82 ▲ 160.1Mitsubishi UFJ Financial Group 11 7 33,065.6 2.6 7.5 11 ▲ 108.5▼ 153US Bancorp 12 11 27,336.7 2.1 -0.3 ▼ -0.1 ▼186 9.1 -6 ▼ 90.3 1.8BNP Paribas SA 13 10 26,461.8 2.1 -0.4 4.8 11▼ 99 1.5 -0.1▲ 73.4
22
▼SunTrust Banks 14 14 24,426.3 1.9 0.1 ▲ -0.6PNC Financial Services Group 15 16 23,845.5 1.9 0.2 ▲ 82.6▲ 166 1.7
187 9.1 ▲328.1
Mizuho Financial Group 16 9 21,990.0 1.7 -0.9 ▼ -0.3 ▼96 4.7 7 ▲ 70.0 1.4HSBC Holdings PLC 17 17 19,687.3 1.5 -0.1 3.8 24▼ 78 1.3 -0.6▲ 62.9 ▼Jefferies LLC 18 37 18,450.5 1.4 1.0 ▲ 1.4 ▲70 3.4 47 ▲BMO Capital Markets 19 19 15,359.1 1.2 0.0
120.4 2.47.0 25 ▲ 84.0144 1.7 -0.3 ▼
Citizens Financial Group 20 21 12,690.0 1.0 0.1 ▲120 5.8 32 ▲ 69.1 1.4KeyBanc Capital Markets Inc 21 20 12,154.0 0.9 -0.1 5.2 5▼ 107 1.2 -0.2▲ 58.5 ▼KKR & Co LP 22 47 11,010.0 0.9 0.7 ▲ 1.3 ▲25 1.2 22 ▲Macquarie Group 23 38 10,878.7 0.9 0.6
76.1 1.52.8 34 ▲ 71.157 1.4 0.5 ▲
Scotiabank 24 26 10,780.9 0.8 0.2▲ 49.1
▲63 3.1 28 ▲ 39.1 0.8 0.4UBS 25 22 9,861.2Top Twenty Five Total ▲
1.0 -0.7 ▼0.6
94,073.7
100.0221
2.5-87.9
5282.1
4,944.9
-0.5% ▼
Bookrunner Total
Industry % Change over Last Quarter 4.7%Industry % Change over Same Period Last Year 12.1% ▲ 15.4%
US Leveraged Loans - Bookrunners (R11a)
Proceeds per Bookrunner (US$m) # of Deals per Bookrunner
424 104
2017 Rank
2016 Rank Proceeds
Market MarketShare% Share Ch.
Manager Market# of Deals
Imputed Fees (US$m)Market
Fees Share% Share Ch.# of Market Change in
Bank of America Merrill Lynch 1 1 76,444.2Deals Share%Bookrunner
▼ ▼81
8.2 -2.8-1.1 ▼6.6▲
▲ 290.18.4 -1.39.8 -3.2
16.4▼ 333
31.4
245.11177.4 1.6235.4JP Morgan 2 2 65,862.5 24.7
▲Barclays 3 5 58,107.3 ▲ 6.9 0.1▲ 221Wells Fargo & Co 4 3 52,016.8 6.7 -2.7 ▼ ▼309 22.9 44 ▲ 157.2 4.4 -2.4Citi 5 4 50,608.7 6.5 0.3 15.0 94▲ 203 5.5 -0.6▲ 195.9 ▼Goldman Sachs & Co 6 8 49,119.1 6.3 2.7 ▲ 2.8 ▲204 15.1 130 ▲Credit Suisse 7 7 48,059.1 6.1 1.6
228.0 6.414.1 119 ▲ 252.5▲ 191 7.1 2.1 ▲
Deutsche Bank 8 6 47,587.6 6.1 1.4 ▲ 0.5 ▲196 14.5 113 ▲ 187.2 5.3Morgan Stanley 9 11 43,018.4 5.5 2.7 11.5 89▲ 155 4.8 2.4▲ 170.4 ▲RBC Capital Markets 10 10 31,682.1 4.1 1.2 ▲ 0.9 ▲148 11.0 82 ▲SunTrust Banks 11 9 19,712.2 2.5 -0.9
134.1 3.810.4 12 ▲ 85.0▼ 140 2.4 -0.7 ▼
Jefferies LLC 12 26 18,450.5 2.4 1.5 ▲ 2.1 ▲70 5.2 47 ▲ 120.4 3.4PNC Financial Services Group 13 14 12,373.5 1.6 -0.3 6.3 -5▼ 85 1.4 -0.1▼ 50.2 ▼BMO Capital Markets 14 13 12,322.2 1.6 -0.4 ▼ -0.2 ▼120 8.9 24 ▲KKR & Co LP 15 36 11,010.0 1.4 1.0
72.6 2.11.9 22 ▲ 76.1▲ 25 2.1 1.9 ▲
Macquarie Group 16 28 10,878.7 1.4 0.6 ▲ 0.9 ▲57 4.2 34 ▲ 71.1 2.0Citizens Financial Group 17 18 10,316.4 1.3 -0.2 7.4 30▼ 100 1.7 0.2▲ 60.2 ▲HSBC Holdings PLC 18 17 9,832.5 1.3 -0.3 ▼ -0.8 ▼52 3.9 20 ▲Mitsubishi UFJ Financial Group 19 12 9,795.1 1.3 -1.0
39.8 1.13.6 1 ▲ 47.7▼ 49 1.3 -1.1 ▼
US Bancorp 20 15 9,631.5 1.2 -0.7 ▼ -0.7 ▼74 5.5 -3 ▼ 35.5 1.0KeyBanc Capital Markets Inc 21 19 9,412.6 1.2 -0.2
-0.5 ▼5.7 10▼ 77 1.4 -0.1▲ 48.8
1.2 -0.5
▼BNP Paribas SA 22 20 9,409.8 1.2 -0.2 ▼ 1.0
3.7 10 ▲ 46.946 3.4 13 ▲
Antares Capital Corp 24 23 7,614.0 1.0
36.8UBS 23 16 9,055.2
1.7▼ 50 1.3 -0.8 ▼
▼0.0 - -0.1 ▼84 6.2 22 ▲ 61.4
Fifth Third Bancorp 25 22 7,268.4 0.9 -0.3 56 0.8 -0.7▼ 30.0 ▼4.1 -2Top Twenty Five Total 689,588.4 88.4 2.4 1.2 ▲
782,576.6 1,350100.02,978.4 83.7
215▲
3,548.4 100.02,052
-21.7%1.4%Industry % Change over Same Period Last Year ▲ 18.9% ▲
Bookrunner Total
-7.4% ▼ ▼▲▼Industry % Change over Last Quarter ▼ -6.0%
75.8%-15.2%
▲
https://www.thomsonone.comVisit http://dmi.thomsonreuters.com to View Archives and Order Custom League Tables
5

13.9 -4.6
Market
▼
▼
▲
▲ 2.8
1.013.8
Imputed Fees (US$m)
13.3
Market
0.4
▼
▼
▲
2.8
-32
-
1
2016 Rank
1
33
5 5
2
Share%
Proceeds per Bookrunner (US$m)
Share Ch.
0.2
73,837.578,602.0
▲16.0
0.3
Proceeds
25
-2.5
62
3
16
▲▲
2.01.0
22,739.840,598.9
3.314,416.8
▼
▲▲
1 076 2
1.0
3.1
4.9
65
▼
-1
169
Deals206
Share%
205
Market
51.5
5.8
-1
5
-5
12-9
358
▼
7
24
23
27▼
4.8 ▼▲6.0
19▲▲
4.0
1.8
10.5
1.0
2.0
2.827.7
12.5
3.6
45.4
4.9
▲
▼
▼
3.4
▲
19.7
-0.4
2.4
▲
-0.1▼
Americas
0.4
0.4▲0.6
▲
9.6
0.7▲
Share%
3.9
▲▲
# ofBookrunner
2017 Rank
0 1
16,233.9
3,666.3
15,133.4
Market
-0.7
17.1
▲-0.1
2.2
2.0
8.8
▲
▲
0.2
0.5
Market
▼
-1.8
0.8
5,421.6
3,356.0
3,716.7
254,659.3
1727
2223
1121 21
25 2,647.6
3,733.3
▼2433
435 271 3
3,062.615
Goldman Sachs & Co 14
1813
Sumitomo Mitsui Finl Grp IncTD Securities IncRabobank NV
22
4.0
▼6.3 ▲
Deutsche Bank
158
13
19
7
▼0.7
94 4▲
▼
80.316
2.811
Bank of China Ltd
2019Industrial & Comm Bank China
1718
Credit Suisse
RBC Capital Markets
SunTrust Banks
Scotiabank 16
Lloyds Bank
Credit Agricole CIB
11.10.6
0.692 3
12.30.1
0.80.3
1.1
10.89.3
-3.8
0.7
0.9
21.7
0.2
2.0
1.0
▼
Share Ch.
▲
▲
155.8
2.0
1.1
0.4-3.6
31.7126
94112.2
12.2-7
611
82
-1
-2751.8
-11
33.141.7-4
23.6
-12
57.642.5
# of Deals per Bookrunner
▲
▲
0.2
▲▲
▲▲
0.1
0.7
▲
▼
11
7
US Investment Grade Loans - Bookrunners (R11b)
2
# of Deals
Barclays
9,961.7 16.320.6
▼
10.6
16.3▼
15
▼9
652.2 ▲14
3.5 42
0.311▼
Bank of America Merrill Lynch
13,305.8
7,751.0
9,312.99,686.4
US Bancorp
16
9,300.8
CitiJP Morgan
PNC Financial Services Group33.2
23.2
8.8
▲▲
8,025.319
Morgan Stanley10
2.0
0.6
0.8
0.7
2.1
1.7
0.7
0.8
0.8
1.7
-0.4
▲
▲
▲
0.1
0.3
▲
0.1-1.6
1.1
0.2
▲▲
-0.0
▲
15.6
▼-29 ▼
12
8
4
62.9
68,971.8 15.0
▲ Americas Yield Type0.6
3,853.4 0.8 0.31.50.80.2
Mitsubishi UFJ Financial Group6 10BNP Paribas SA
Wells Fargo & Co
9Mizuho Financial Group
4
HSBC Holdings PLC
Change in
Jan 1 - Jun 30
162.3
161.6
Manager
First Half 2017 | Syndicated Loans | Managing Underwriters
Jan 1 - Jun 30
▼
3
2
22.9
22.2
39.7
11.1
-3
▼
▲
-3
1.7
▼
1.0
1.9
▲
3
-1
4
1.9
0
0.3
2.8
1.26.8
6.40 1
2.0
Top 10 Americas Loans Use of Proceeds (US$b)
0.2▲
23 -0.3
0.9
Top Twenty Five Total
3,276.5
Fees
0.1
$1,047.677%
$154.011%
$38.03%
$22.82%
$16.91%
$16.51%
General Corporate Purposes Acquisition Financing Working Capital Leveraged Buyout
Dividend Recapitalization Sponsored Buyout Project Finance Property Acquisition
Refinancing Capital Expenditures
600
700
800
▲
*tie
Industry % Change over Same Period Last Year -20.0% ▼
Top Twenty Five Total
UniCredit 2.6 ▲
First Half
1
-1
2.6
5
11
▲
-33.3% ▼
3.2
▲
▲
38
1
▲ 2.6
▲
.3▲
1.2
-19
1.7 1.71.7 1.7
100.0
▲
▲
16.7%
▼
Market
0.21.7
1.7
6.4
1 ▲
1,076.2
44.8
▲
3.8
▼2.5
Jan 1 - Jun 30
4.4
3.5 6.0
Share%
▲
Share%34.2
Market
-5824.1
0.1
22
-
1,009.9
▼
Latin America Loans - Mandated Lead Arrangers (R16)
Industry % Change over Last Quarter 47.9% ▲
435,271.3
Industry % Change over Same Period Last Year
Scotiabank
94.4
▲
2.7
1.1
2.0
▲
▼
▲
-0.1
Share Ch.
▲
1.0
▲0.4
78.0 2.7
.3 0.6
.3
-6.0
0.6 0.6
1.5
2.9
0.6 0.6
Americas Imputed Fees - Mandated Arrangers
▲
FeesMarket
▼
▲
▼
1.6
6.7
92.3
6.5101
2016 Rank
Proceeds per Mandated Arranger (US$m)
▲
# ofDeals
11.3
Market# of Deals per MA
100.0
70.6%
8.8
1 ▲
8▲ 7
13
6 15.8
-5
▲
-4.6▼
▼
4.926.3 -1
18.44.5
2.85.5
2.6▼ -5
▼
-0.1398
▼-12.4
▲ 54.8%▼
# of DealsChange in Manager
23.79
0.05.2
0.1
-0.6
23.7
5.2
▼
603.3-3
Market
▼4.7
Proceeds
875.17.2 9
2017 Rank
7.6
Share% Share Ch.
2 -1.1
Mandated Arranger
3BBVA
5
Citi 12
593.236
Mitsubishi UFJ Financial Group 9Mizuho Financial Group 4 4
Itau Unibanco 7 75.0 ▼ 21.1Santander
563.9574.6 -2.1
-01.0
Sumitomo Mitsui Finl Grp Inc 9 6 481.6ING 8 539.5 6 ▲ 2.9 5.0 3.03.5 23.79
13.2 -3 ▼ 1.4▼ 54.2
10▲
3
▲
-1.14.74.9
Bank of America Merrill Lynch 11 13 322.9ABN AMRO Bank
-23.1 2.7 ▲
.810 37* 351.9 7.9 2 ▲ .9
31.32.6 ▼
1.5-0.3
41.510.5 ▼
-0.5▼ 42.8
BNP Paribas SA 13 27 268.1Credit Agricole CIB 12 12 293.7
2.3▼10.5 -2 ▼ 2.1 3.7
1.77.9
HSBC Holdings PLC 15 5 223.7Banco Nacional de Mexico SNC 14 25 237.1
▲
1.6
2.1 1.1 1 ▲▲ 1.27.9 1.9
.9▼
3
3
7.9
2.61.7
7.9
10
Natixis -2.41.9Deutsche Bank 17*
200.0-200.0
200.0200.0
RBC Capital Markets 17*16*
BMO Capital Markets 17* -17*
76.3 4.88,781.811,513.0Industry Total
▲
▼ 316 8 219.2 ▼
1.9 -3.4
85.4%
57.4
▼41.2%
100.0
▲-30.4%
▼
2.1
-2.8-0.7
3.3
-68
▲
▼-3.6
Imputed Fees (US$m)
7.1
-3.6-6-2
2.0
▲Top Twenty Five Total
▼▲▲
-
▲
0.0
Industry % Change over Last Quarter
-14.6%
Bookrunner Total 1,169.4
12.2%-13.2%
460,562.8 100.0
0
100
200
300
400
500
600
1Q 2Q 3Q 4Q 1Q 2Q 3Q 4Q 1Q 2Q 3Q 4Q 1Q 2Q 3Q 4Q 1Q 2Q 3Q 4Q 1Q 2Q 3Q 4Q 1Q 2Q 3Q 4Q 1Q 2Q
2010 2011 2012 2013 2014 2015 2016 2017
Proc
eeds
(US$
b)Highly Leveraged (US$b) Leveraged (US$b) Undisclosed (US$b) Investment Grade (US$b)
$1.9 $1.5 $2.4 $4.5 $4.1 $6.1 $7.1 $5.5 $4.5 $5.5
1,873
938
1,402
2,1332,030
2,2832,442
2,2532,129
2,332
0
500
1,000
1,500
2,000
2,500
3,000
0.0
1.0
2.0
3.0
4.0
5.0
6.0
7.0
8.0
2008 2009 2010 2011 2012 2013 2014 2015 2016 2017
# of
Issu
es
Tota
l Im
pute
d Fe
es (U
S$b)
Total Imputed Fees (US$b) Number of deals
https://www.thomsonone.comVisit http://dmi.thomsonreuters.com to View Archives and Order Custom League Tables
6
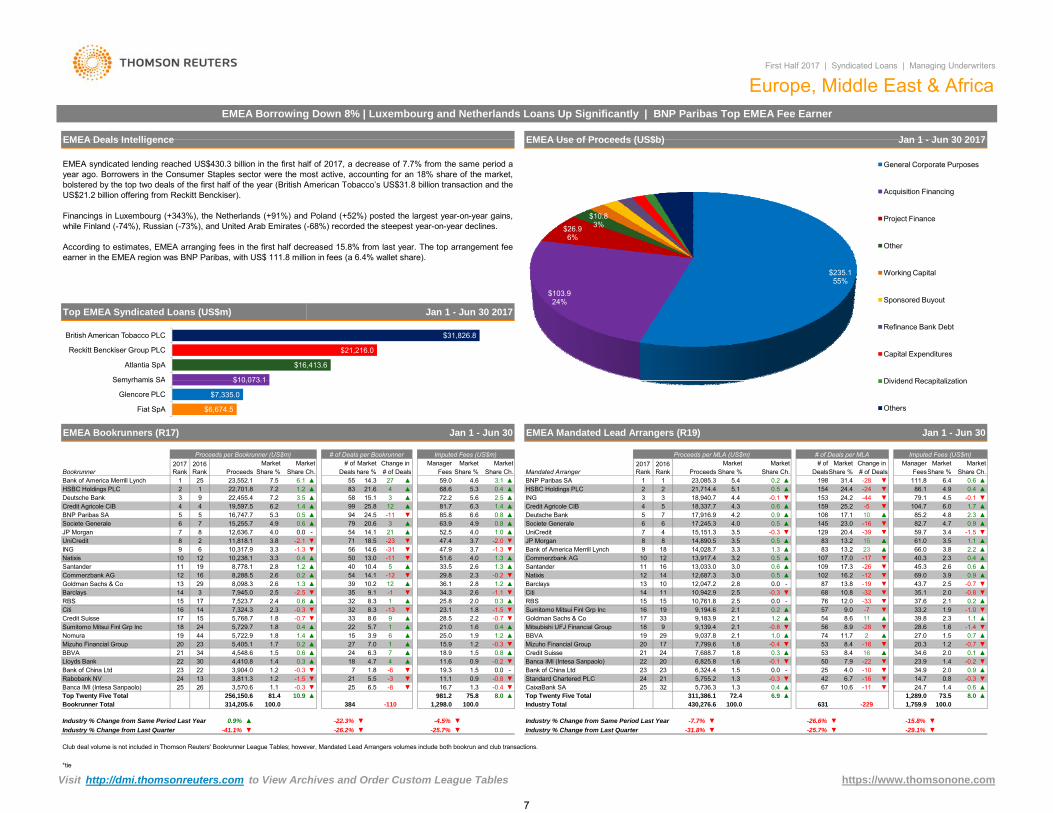
EMEA syndicated lending reached US$430.3 billion in the first half of 2017, a decrease of 7.7% from the same period ayear ago. Borrowers in the Consumer Staples sector were the most active, accounting for an 18% share of the market,bolstered by the top two deals of the first half of the year (British American Tobacco’s US$31.8 billion transaction and theUS$21.2 billion offering from Reckitt Benckiser).
Financings in Luxembourg (+343%), the Netherlands (+91%) and Poland (+52%) posted the largest year-on-year gains,while Finland (-74%), Russian (-73%), and United Arab Emirates (-68%) recorded the steepest year-on-year declines.
According to estimates, EMEA arranging fees in the first half decreased 15.8% from last year. The top arrangement feeearner in the EMEA region was BNP Paribas, with US$ 111.8 million in fees (a 6.4% wallet share).
Jan 1 - Jun 30 2017
Europe, Middle East & AfricaEMEA Borrowing Down 8% | Luxembourg and Netherlands Loans Up Significantly | BNP Paribas Top EMEA Fee Earner
EMEA Use of Proceeds (US$b) Jan 1 - Jun 30 2017
Top EMEA Syndicated Loans (US$m)
First Half 2017 | Syndicated Loans | Managing Underwriters
EMEA Deals Intelligence
$31,826.8
$21,216.0
$16,413.6
$10 073 1
British American Tobacco PLC
Reckitt Benckiser Group PLC
Atlantia SpA
Semyrhamis SA
$235.155%
$103.924%
$26.96%
$10.83%
General Corporate Purposes
Acquisition Financing
Project Finance
Other
Working Capital
Sponsored Buyout
Refinance Bank Debt
Capital Expenditures
Dividend Recapitalization
-26.2% -25.7%
314,205.6256,150.6Top Twenty Five Total
16.7
▼
▼ 25981.2
▲-0.3
-4.5%
▼1.2
100.0
▼▼
100.0
0.61,289.0
1.424.773.5
-110
-7.7%-31.8%
▼
▼
▲75.825
▼Industry % Change from Last Quarter -41.1%
1.1
1,298.081.4
-826Banca IMI (Intesa Sanpaolo)
Industry % Change from Last Quarter
▼1.3
Industry % Change from Same Period Last Year 0.9% ▲ ▼-22.3%▼
Bookrunner Total
3,570.6 678.0
100.0
6.510.9 ▲
0.6
1.8 -6 ▼5.5▼ 21
724 21▼-0.80.9
1.5 -▼
19.3▼
7
0.0
384
-0.4
Industry Total
32
Industry % Change from Same Period Last Year
4,410.8 0.330 0.9▲▲ 18▲
11.1Rabobank NV 24-0.3Bank of China Ltd 23 22
Lloyds Bank 22 1.4 -0.24.7 11.64BBVA 21 34
13 3,811.3 -31.23,904.0
-1.5
▲Mizuho Financial Group 20 23 5,405.1 1.7Nomura 19 63.9
0.2 15.9▲0.81.518.9▲24▲ 6.3
-0.31.21.9▲ 25.0
▼
Sumitomo Mitsui Finl Grp Inc 18 24 5,729.7Credit Suisse 17 1.8 -0.7 ▼
221.8 0.4 ▲33
44 5,722.9 ▲ 151.8 1.4
150.4
4,548.6
-1.5
1 ▲ 21.0
▼▲8.6 28.59
▲2.2 -0.71.6
▼5.7
5,768.7
27 7.0 1 ▲ 1.21.5
Goldman Sachs & Co
32 ▲RBS 15 17Barclays 14 3
25.87,324.3
2.4 ▲2.0 0.38.3 12.3
7,523.7▼ 32 8.3 23.1Citi 16 14 -0.3 1.8-13 ▼
13
▲0.6
2.339 10.2
0.2 ▲
34.312
7,945.0 ▼8,098.3 ▲
35▼2.62.5 -1 ▼
33.5
29 ▲-0.2 ▼54 14.1 -12
36.1▼ 29.8
1.3 ▲9.1-2.5 -1.1
2.8 1.22.6
Natixis6 56 14.610,317.9
51.610 12 10,238.1 503.3 -11 ▼▲
Commerzbank AG 12 16 8,288.5 2.62.8 1.2 ▲ 40Santander 11 19 8,778.1 2.6 1.310.4 5 ▲
UniCredit 8 2 11,818.13.3 -1.3 ▼
JP Morgan-2.0 ▼71 18.5 -23 ▼▼
0.047.4
▼ 47.9-31
-7 8 12,636.73.73.7 -1.3 ▼ING 9
Societe Generale 6 7 15,255.7 4.9▲4.0 1.014.1 214.0
▲
▲ 72.2▲
20.624.55.3
1.4 ▲99
0.6 ▲0.5 ▲5
7985.8
3 ▲
Bank of America Merrill Lynch 1
Credit Agricole CIB 4 4 19,597.5 6.2Deutsche Bank 3 58
12 ▲ 81.7▲2.515.1
4.9BNP Paribas SA 5
HSBC Holdings PLC 2 1 22,701.83.1
1.494
6.325.89 22,455.4
16,747.7 ▼
# ofShare Ch.
6.1 ▲
ManagerImputed Fees (US$m)
MarketDeals
Change in Proceeds per Bookrunner (US$m)
# of Deals14.3
2017 Rank
2016 Rank
Markethare % Share %
59.0 4.6
EMEA Mandated Lead Arrangers (R19)
# of Deals per MLA
198
EMEA Bookrunners (R17)
MarketShare %Bookrunner Proceeds Proceeds Share % Share Ch. DealsShare %
2016 RankFees
1 23,085.3 5.4 0.2BNP Paribas SA 1▲
7.2 3.57.2 1.2 ▲
# of Deals per Bookrunner
5.63
Jan 1 - Jun 30
Proceeds per MLA (US$m)Change in
Jan 1 - Jun 30
68.6▲
MarketImputed Fees (US$m)
2017 Rank
Market
54 ▲ 52.5
4 ▲83 21.6▲
▲6.6 0.8
▼
3.5
5.3
Manager Market MarketMandated Arranger
Market # of Market# of Deals FeesShare % Share Ch.
Market
63.9-11
-28
-25.7%
25
17.1
23,552.1 7.5 55 27 ▲0.4
▲154
0.8
24.4 -24
2.5 0.0 -2.5
231.3 ▲
Share Ch.
3.8 -2.1
1.3 ▲4.013.00.4 ▲
▲
-11 ▼
-0.7
4.8▲▼
1.1
4.73.4
2.01.2
▲ 34.6
66.061.0
▲
▲ 3.80.4
2.3▲ 85.2
-1.5▲
▼
▲▲
2.2 ▲3.5▲
2.3▼
Societe Generale 6
4.4 -0.1
4.0Deutsche Bank 5 7 17,916.9
17,245.3
ING 3
10
▼-0.3
1084.2 0.9 ▲6
129 20.4UniCredit -39
▼-5 ▼
18 14,028.7 3.3
1.7
0.90.5 ▲
▲-0.1
▲
6.079.1 4.5
▲31.4
HSBC Holdings PLC 2 2 21,714.4 5.1▼▼
86.1 4.9 0.40.5111.8 6.4 0.6▼ ▲
Credit Agricole CIB 104.7-44
145
▼24.2153
7 4 15,151.3 3.5▼ 82.7
59.723.0 -16
3 18,940.74 5 18,337.7 4.3 0.6 ▲ 159 25.2
▼15
1070.5Commerzbank AG 10
JP Morgan 8 8 14,890.5 83 13.2
12 13,917.4
0.5 ▲
17.083
3.2 -1713.2
▲Bank of America Merrill Lynch 9
0.6
11 10,942.913.8 -19Barclays 13 10 12,047.2
Natixis 12Santander 11
10216 13,033.0 10914 12,687.3 3.0
▼- 872.8 0.0
17.33.0 0.6 ▲
Citi 142.5
▲
37.633.2
45.369.00.5
-26 ▼
-32▼ 43.7
28.6▲2.3111.2 ▲ ▲ 39.854 8.6
-0.8 56
-0.3
1.61.1
▲
3.9 0.9
-0.8
▼
▼Sumitomo Mitsui Finl Grp Inc 57 9.0
40.3
▼ 35.168
2.6
2.12.1
0.2
2.1 ▼
16.2 -12 ▼▲
2.010.82.1 0.21.9 -1.0
76 12.0 -33 ▼ ▲▼
-0.7 ▼
16
▼251.47.9
14.7
19
11.7 2Mizuho Financial Group 20 17 7,799.6 8.4
742.1 1.0BBVA 19 29 9,037.8Mitsubishi UFJ Financial Group 18 9 9,139.4Goldman Sachs & Co 17 33 9,183.9
8.9 -28
9,194.6
▼
34.96.7 0.8 -0.3 ▼
2.0 0.96,324.4
430,276.6311,386.1
16
▲
0.3 ▲-1653 ▼
1.6 -0.1 500.1 ▲
▼0.0 - ▲
1.3 -0.3
20.3
▼42-10
RBS 15 15 10,761.8
27.0 1.5
-7
-1.4
100.0
1.3 0.4 ▲5,736.3Top Twenty Five Total
▼-26.6% ▼ -15.8%
631
▲0.7
1.5
▼ -29.1%
1,759.9▲
10.6
Club deal volume is not included in Thomson Reuters' Bookrunner League Tables; however, Mandated Lead Arrangers volumes include both bookrun and club transactions.
7,688.7
CaixaBank SA
▼53
6,825.88.4
1.8 -0.4 ▼
▲
Credit Suisse 21 24 1.8▼
-16
8.0
-22 ▼ 23.9 ▼
-229
4.0-0.222 20
255,755.2
72.4 6.9
Banca IMI (Intesa Sanpaolo)
Standard Chartered PLCBank of China Ltd 23 23
$10,073.1
$7,335.0
$6,674.5
Semyrhamis SA
Glencore PLC
Fiat SpA
Dividend Recapitalization
Others
*tie
Visit http://dmi.thomsonreuters.com to View Archives and Order Custom League Tables https://www.thomsonone.com
7
Scotiabank 24 37 1,143.6 1.0 0.5 ▲ 5 3.4 3 ▲ 4.5 0.7 0.4 ▲
Market2016 Rank
2017 Rank Deals
Europe, Middle East & AfricaFirst Half 2017 | Syndicated Loans | Managing Underwriters
Share Ch.
8.07,432.53 1
# of Deals per Bookrunner
EMEA Quarterly Syndicated Loan Volume
MarketBookrunner
European Leveraged Loans (P10)
Proceeds per Bookrunner (US$m)
Jan 1 - Jun 30
MarketFees Share %
Market# of Market Change in Imputed Fees (US$m)
hare % # of Deals
▲4.915
▼
▲
58.3 8.843 29.1 22 9,314.31.7 27.7 ▲2.31241 ▲ 8.053.0
Manager
1 3 9,855.9 ▲Share Ch.
4 5.5 0.620.918.2
2.56.0 2.8 ▲27Societe Generale
32.6
8.4Credit Agricole CIB
23.635-3.0 ▼-1.4
6.431
Proceeds Share %
▲5.4 1.0▲ 35.9
▲
▲
0.620JP Morgan
Goldman Sachs & Co▲5.2 1.1▲ 36,391.5
BNP Paribas SA 2
8▲ 273.0
6 6,325.87 17 6,095.3Bank of America Merrill Lynch
4 14 7,021.0
23.9
34.41.3
▲
5 ▲Natixis 6
5.25.4
5.1 1.118.2
37 25.0 188
22.9
27.9
▲38.1
Nomura 9 19 5,722.9 ▲9
15 ▲31
10.14.9 3.2
17.6▲ ▲12
▲2.02.75.7
1.2
-1.1
-0.20.6
4.2
3.43.7
3.724.936.7
6 2.4
▲ 24 16.2▲ 3.6
7 ▲
Deutsche Bank
Credit Suisse 12 3.7 2612 4,309.8 0.4
▲8
▲
7 5,507.124.814.9
▲
4,470.1 ▲
5.5
▲▼HSBC Holdings PLC 10
Barclays 114.7
8▲20.90.6
0.5 ▲
ING 15 5 2,718.420 3,136.8 17
2.8 24 16.211.52.7
▼▲
UniCredit 13 10 3,231.3Morgan Stanley 14
2.3 -2.3 18 12.2▼1.0
-0.9
Citi 20 11 2,017.3
30CaixaBank SA 19
1.8
9.5
1.61.7
2,075.9UBS 1872,056.0 1.6 ▲ 4.7
81.31.1
1.8▲ 10
18 2,628.2 2.3
46
0.1▲
Rabobank NV 22 22
Commerzbank AG 25 16 1,102.2 0.9 -1.4 ▼ 5 3.4 -5
RBC Capital Markets 23 43 0.9▼
-1.11.5
-0.2
1.3 -0.3 5▲ 9 6.1
RBS28 2,545.5
16Santander 17 2.2 14.4
▲Bankia 21
Jan 1 - Jun 30 20171.06.60.9
0.8-0.55.8
▼
▲
▲
1.5
▼▼
1.1
▲▲
▲-2.0
▲▼
1,474.11.2 EMEA Syndicated Loans by Industry (US$b)
- 1,815.8
4
53
5,988.9
3.8 22
▲
1.7
41.6-1.7
▲
▲▲
▲
▼
-2.03.5
8▲
9.5
19
▲5.413.9
-1.016.9
2 ▲0.82.5
22.7 3.4
▼
1.22.7
6.8 5
2.1
0.51.01.4
-4 23.4
1,393.6
▼-54
10 6.8
142.2
13
▲
▼▲
▼7.99.9
▲6.810
11.5
▼ 10.2
▼
1.5
$18.54%
$17.04% $12.2 Consumer Staples
223
276
249
264265
341
315
362379
464
418400
300
390
315
355
355
387
389
406
356
513
479473
454 556
497556
389
473
447415
362
269
0
100
200
300
400
500
600
$0
$50,000
$100,000
$150,000
$200,000
$250,000
$300,000
$350,000
$400,000
$450,000
Q1Q2Q3Q4Q1Q2Q3Q4Q1Q2Q3Q4Q1Q2Q3Q4Q1Q2Q3Q4Q1Q2Q3Q4Q1Q2Q3Q4Q1Q2Q34QQ1Q2
2009 2010 2011 2012 2013 2014 2015 2016 2017
# of
Issu
es
EMEA Proceeds (US$m)Number of deals
Proc
eeds
(US$
m)
*tie
16 461.0 100.015.6 ▲
100.0 148 11 666.1 100.0
13
▼
Santander 25
87 ▲
-1 ▼
2
6.7
6
4 ▲
-0.8
-0.43.9
2.0
▲
17
407.7
▲
▼▲8
4
3 2.9 2 ▲ 4.0 0.9 0.6 ▲66,501.8 91.1 11.5 ▲ 88.4
1.0
18.3-3.2
▲1.6
▼
5.860.3
0.4-
0.8▲▲5.81.0
116,845.0
Credit Suisse 8 4 3,049.1Goldman Sachs & Co 9
Deutsche Bank 510.62.6 ▲
2 4,600.6
12.5
6.3
5.2 2.917 3,808.9
-0.4 ▼
24Nomura 6 14 4,106.1 115.6JP Morgan
27.9
7
29
23.115.919.2 3.59 ▲
3.53.9
▲ 58.79▼▼
▼
▲
16.27 ▲
4 ▲-3
19 ▲ 22.5▲
▼
1.21.3
3.7
4 ▲11 10.6
4
-0.6
2.6
1.32.4
▲2.1
3.3 -0.119
98
11.1 -0.1
2.812.8
7.6
0.9▲
0.3
▲7
▼
37.7
Barclays 16 15
1.2
12.1
1,098.0
▲1516.35 ▲
▲ 1716.3 3
18
-2.6
-0.3-3.2
▲ 44.9
1.7
6.5 1.4 1.4
12.3
5.8
2.7
▼
6.77.7
Sumitomo Mitsui Finl Grp Inc 22▼
Top Twenty Five Total
8.7
Citi 17 11 1,227.5 1.7 -1.9
21 922.9 -0.3RBSRabobank NV 19
16 -0.9
32 718.721 805.1
RBC Capital Markets 20 -Bank of Ireland 19
903.4 1.21.1 -0.6
4KKR & Co LP 23 3.8Credit Mutuel SA 24
▲Industry % Change from Last Quarter 1.4% ▲ -40.0% ▼ -3.8% ▼
2.7%▲ ▲120.7%
38 547.9 0.8 0.5 ▲
Bookrunner Total 72,952.4 100.0 104
1,515.2
13 2,431.1ING 12
13
Bank of America Merrill LynchHSBC Holdings PLC 10
3.3 -1.2
3 2,404.0Morgan Stanley
-0.6
3.3
-0.8
2,558.811 18 2,526.1 3.5
-1.7
8 2,435.61.6
UBS
BNP Paribas SA 1 ▲1 9.8
Industry % Change from Last Quarter -31.8%-29.7%
# of Deals per Bookrunner
Bookrunner Total
Industry % Change from Same Period Last Year
7,106.4 29.8▲ 22
5.2 ▲21.24.9Natixis 3 12 6,150.6
Bookrunner
2.76.55.4
7 5,401.5
15 24 1,563.6UniCredit 14
34 549.5 0.8 ▲690.1
▲
▲
▼
Societe Generale 4
hare %Market
Share %# of2017
Rank
Credit Agricole CIB 2 9
7.51.1
4.7
▲
▲20.3 4.4
EMEA Sponsored Loans (P13)
8.0%
8.4
18.2%
1.0
2.1 0.7
3.5
-0.9
1.01.5
12
▼▼
16.3
▲
▲13 ▲ 3.3
ManagerShare %
▲
▼
-28.9%
▼
▲6.5 0.94.5
▲
4.9
▼
2.7
1.1
40.0
▼0.6
7.7
▼
EMEA Imputed Fees Jan 1 - Jun 30
▼
▼
-0.9
0.917.7
0.2
3.0
▼
-3.33.8
▲
▲
▲
▲
▼
8.7
Jan 1 - Jun 30
ProceedsChange in Market Market
7,136.7
▼
Proceeds per Bookrunner (US$m) Imputed Fees (US$m)
▲
10 2,792.3
29.84 ▲ 20.713
3.8 17-1.2 ▼ 204.2
▲ 35.630.22.9 ▲ 23 22.1
12.3
34 32.7
▼▲ -0.6%
6
Market Market# of Deals
10.5
Top Twenty Five Total 570.6 85.7 14.4▲
▼
20 19.26 17.7
7.4
105,773.8 90.7
Industry % Change from Same Period Last Year
75.7% ▲
9.7
2016 Rank Share Ch.
▲Deals
3.231
Share Ch.48.2▲
7 ▲
Fees
2,563.3 1,692.7 1,547.0 2,163.6 1,627.6 2,028.4 2,754.1 2,410.1 2,137.2 1,759.9
764
499
606
842
689 741
868
1,003
859
631
0
200
400
600
800
1000
1200
$0
$1,000
$2,000
$3,000
2008 2009 2010 2011 2012 2013 2014 2015 2016 2017
# of
Issu
es
Tota
l Im
pute
d Fe
es (U
S$m
)
Total Imputed Fees (US$m)Number of Deals
$75.218%
$65.715%
$55.013%
$53.412%
$39.49%
$47.2, 5%
$44.8, 5%
$20.75%
$19.95%
4% 4% 3% Industrials
Energy and Power
Financials
Materials
Healthcare
Telecommunications
Retail
High Technology
Consumer Products and Services
Media and Entertainment
Real Estate
Government and Agencies
Visit http://dmi.thomsonreuters.com to View Archives and Order Custom League Tables https://www.thomsonone.com
8

Agricultural Dev Bank of China
23 1,131.2Mizuho Financial Group 14
21Mega Financial Holding Co 22 18
-0.41.0 ▼ 1.2▼2.8-1.0
▼0.4 -0.74.0
▼11.8121.0 -0.3 ▼ ▼
▲ -4 -0.19.7 1.0-12
▼919.6
▼13
▲
-8
▼1▲
20
311,159.4 3.1
0.22.1
Bank of Taiwan 1911.1
ING▲2.0
1,295.1 1.1 0.41.1
▲3.8 -13 ▼ 3.0 ▼2.8 -12 0.2
0.312
2.020 - 1,296.0-0.3
1.116
▼ 11.10.6
1.1 -0.1
1,600.90.4
1,306.91,580.6 ▲
▲Credit Suisse 17 28 1.418 24Fubon Financial Holding Co Ltd 1.4
▲▲
▲ 13.29▲ 6
4 0.51.4 0.212.3 1.2-6 ▼2.1 1.3
1.61.4 0.1
1.4Malayan Banking Bhd 15Citi 16 19 1,649.9
8 ▲ 11.6-3
▲ 11
▲▼
9 ▼
180.5
▼ 1.60.6
▲1.2 1.0-1.8China Merchants Bank
2.667 1,849.91.7 -1.714 7
▲ 316.21,968.9
3▼ 2.1
0.7
ANZ Banking Group 1.9 0.0
Bank of Shanghai 13 - 2,105.94.2 -0.517.9
1.81.81.8
▲-0.5 ▼
6.29 2,430.0 -15 ▼2.1DBS Group Holdings 12
▼ 19.1
▼3.737.0
170.01.6
0.915
11 13 2,608.2 -3.5 -4 16.0 -4.0 -9
2,647.7 2.3 0.1 ▲0.12.2
-5.71.9 -1.522.2
-4 ▼▼
▼
-12.5 ▼China Development Bank 9 3
Mitsubishi UFJ Financial Group 10 11
▼2,906.5
8China Construction Bank 8 4 2,942.44-4.3
2.22.5 -2.9 ▼6Agricultural Bank of China 7 1.4
2.78 3,024.3 13.9
▼1222.6
▲1.4
Standard Chartered PLC 5 5 4,287.74.5 -9196 3,975.6Axis Bank Ltd
2431 7.3-
5,106.93.7 0.04.4 5.6
Industrial & Comm Bank China 2 1 9,926.57.1
6State Bank of India 3HSBC Holdings PLC 4
Bank of China Ltd
MarketShare%
273.530.4 -8Share%
1 2 22,725.4
3.5▲
8.5 -7.717.6
15▲42
4.76.4
▼39.7
-1.827.0
▲1.8 ▲
▼
▼3.0-17
-5▲ 55.2 5.6
4.03
▼
▲3.9▲
▲27.563.1 ▼
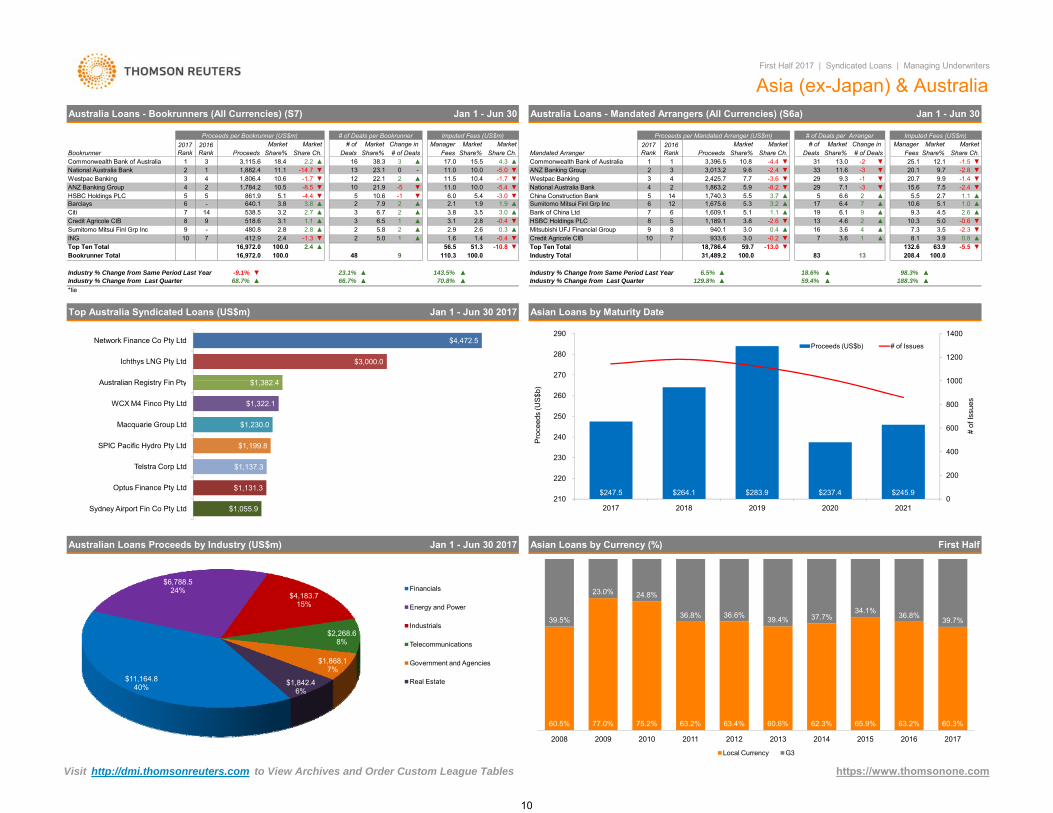
Syndicated lending in Asia (ex Australia) reached US$167.7 billion from 578 deals, down 27.1% compared to the US$230.1billion raised in the same period last year. Companies from the Financials sector borrowed US$36.4 billion, making it the mostactive industry in terms of volume in the region. Alibaba Group’s US$5.2 billion deal was the largest syndicated deal in Asia during the first six months of 2017. Proceeds fromthe loan were to used for general corporate purposes. Australian syndicated lending reached US$31.5 billion from 83 deals in the first half of 2017, marking an increase of 6.5%compared to the same period last year. Borrowing in the Financials sector dominated Australian syndicated loan activityduring the first half, accounting for 40% of all lending in the region. The AU$5.9 billion (US$4.5 billion) borrowed by NetworkFinance was the largest Australian syndicated lending transaction during the first half of the year. The proceeds were raised tofund the acquisition of a 50.4% interest in the Australian state-owned Endeavour Energy by an investor group led byMacquarie Group's Infrastructure arm. According to estimates, fees from Asian syndicated lending totaled US$1.3 billion in the first half of the year, increasing 16.7%compared to the same time last year. In Australia, estimated fees were US$208.4 million, an increase of US$99.1 million overthe same period in the previous year.
Market Change in
-6.3
Fees
-0.30.1
29.5
MarketShare% Share Ch.
Imputed Fees (US$m)
-82 ▼129
9.9
# of Deals▼
First Half 2017 | Syndicated Loans | Managing Underwriters
Asia (ex-Japan)Asian Syndicated Loans Down l Refinancing at 25% of the Market l Australian Volume Increases by 7%
Asia Loans - Bookrunners (All Currencies) (S5c) Jan 1 - Jun 30Asia & Australia Deals Intelligence
Share Ch.Bookrunner Proceeds
Proceeds per Bookrunner (US$m) # of Deals per Bookrunner2016 Rank
MarketManagerDeals
2017 Rank
Market # of
▼10 8,269.5
19.5 ▲7.8
0.7
3.4 1.3▼-0.6
▲
Jan 1 - Jun 30 2017Top Asia Syndicated Loans (Ex Japan, Ex Australia)
$5,150.0
$4,650.0
Alibaba.com Ltd
Tencent Asset Mgmt Ltd
Bookrunner
Jan 1 - Jun 30Asia Loans - Bookrunners (US$, EURO, JPY, A$, HK$ & S$) (S3i)
13058,414.4
6.3% ▲ 46.6%-23.1%▼-20.5% ▼
24.9%
40,481.4 69.6 ▼
Industry % Change from Same Period Last Year
100.0
Industry % Change from Last Quarter ▲
100.0496.5
17.8% ▲
-39
▲▲ ▲3.1%
309.4
-10.5% ▼ -46.3% ▼
Industry Total
16.7%▼
167,674.6123,050.0
100.0
Industry % Change from Same Period Last Year -27.1% ▼ -22.0%
578
4.224
-16372.8
1,331.7 100.0965.5
0.0 - -23 -0.5 ▼4.1▼
0.31,534.7‐0.8
▼▼
▼-0.4▼ 8.3 ▼0.6
0.9 -1.2▼ 11.8-15-2
Korea Development Bank 24 20 1,569.1BNP Paribas SA 23
-0.31.1
▼ 15 2.60.9▲ 25 4.3
3.8 ▼ 1.1 0.314.30.2
-3▼-0.614 1,991.7
▲1.1 0.3 ▲ 22▼21 -1.83.6 0.8-7 ▼ 10.6
-1019 16 2,388.0
1.3 0.1 ▲ 2.91717
▼8.6 0.7▼ -1.3▲▼ 19.6 1.5 0.2▼ 2.9 -10
0.6 ▼7.4-3 ▼▲19.9 -1.6 ▼
-0.3-5
3.5▼-2.1
20
2,657.5 32▲1.6 0.5212,626.8
▲1.21 ▲3.6 1.55.5
▼0.115.6
▼5.5 -9 ▼ -0.2
-0.924.0 1.8
1.722.0Mizuho Financial Group 14 3,425.0China Merchants Bank 15 9 2,800.2 -2
19 3,529.645-0.3
4.512
-0.9
39
▼ 26
▲2.12.0 0.0 -
▼2.1
1.7
7.8▲
32▼ 18.5
▼1.4 ▼-4 -1.1
20.3 1.58 ▲6.7
2.22.33,598.4
▲4.5 -6 ▼ 30.1 ▼6.2
-1.1-10
-1.32.2362.2 0.226
0.7▼▲10 17
Axis Bank Ltd 1.3▼▲▼
20929.03,648.3
4,234.0 2.5 -16 ▼-0.62.3
9.0▼0.1
-0.42.53.0
- 33.6 ▲▼
0
2.0-14-0.139.9 3.0
▲▼
-47.1%
Proceeds per Mandated Arranger (US$m) # of Deals per Arranger
1.0
116,717.7
▼
100.0
▼3.140.0
-3.4▼ 1.9 010.0
-
p
25Korea Development Bank
▼
Imputed Fees (US$m)
▼
425
1,117.390,032.0
Asia Loans - Mandated Arrangers (All Currencies) (S5b)
▲7.9 ▼
Bookrunner Total
-29.0%
24
Industry % Change from Same Period Last Year
Top Twenty Five Total
Sumitomo Mitsui Finl Grp Inc
▼-27.7%
▼1617
1,119.3
Industry % Change from Last Quarter -11.3%
Change in
-1630.6
7-0.4▼
▲▲▼
7.8%
100.0
▼
25.3%
1.0
▲77.4
11▼-0.4 2.6
992.9
6.50.81.60.7
-0.5747.2
-1075.2 6.9
-7 -1.0
Jan 1 - Jun 30
184
1,856.7
25 25
21 2,090.5
22 2821
Industry % Change from Last Quarter
24
17
Bank of Communications Co Ltd
Citi
Top Twenty Five Total
Bank of East Asia Ltd
Mega Financial Holding Co
China CITIC Bank Corp Ltd
Agricultural Bank of China
20
▼
# ofMarketMarketProceeds
2017 RankMandated Arranger
2016 Rank # of Deals
DBS Group Holdings10
China Development BankHSBC Holdings PLC
264.410,708.3
DealsShare Ch.
2
8
China Construction Bank
MarketShare%
28,373.9 200
Standard Chartered PLC
-0.9
3.5
5
United Overseas Bank Ltd
ANZ Banking Group
Sumitomo Mitsui Finl Grp Inc
8
15
Oversea-Chinese Banking
56
Mitsubishi UFJ Financial Group
18
16
11
2,586.8
7,695.1
5,387.1
3,887.2
22
1112
▲1.4
▲34.6
Share%▲
6.1
3 4.011.0
MarketShare Ch.Fees Share%
MarketManager
6.4▼
1,779.8
3,525.8
3.9 ▲
13
76 3.2
16.9
-7.4
0.0
7
Bank of China Ltd
3
1
3
2
113
Industrial & Comm Bank China4
State Bank of India10,384.1
4,896.4 45-
2.952
58
1.65,875.0
6.2▲
0.4
13.5
Shanghai Pudong Development Bk
4
14
4.5▲71
297.7 22.4▲ 5.2▲
69.4
7.8
7840.811
-15 ▼
27.0
1.5
0.8
1.2
0.973.4
1.4
1.6
0.1
-0.10.1
‐0.6
-94 5.4▼
▼
0.7
▲ 80.6▼
4.63.5
▲
12.3 -5.072.4
20.5
▲
▼
-3.11.70.5
▲
▲
5.6 ▲
▲
Share Ch.Market
0.55.16.3 2.0
-0.2▲
7.8▼
▼
▲
2.1
Imputed Fees (US$m)
1.5
▲3.8 0.2
-0.2 ▼
2.7 1.2
-0.9
▼
▲
▲3.7
3.2
4.1
2.9
▲
3.6 2.6
3.3
2.0 0.7
-0.6
▼
HSBC Holdings PLC 1 1Standard Chartered PLC 2
43 2,717.1 4.7
Proceeds per Bookrunner (US$m) # of Deals per Arranger
4 3,664.5 6.3
Citi
State Bank of India 5
2017 Rank
-0.2 ▼ 25 19.20.4
Market2016 Rank
38.9Proceeds Share%
4,935.9# of Deals
8.5Fees
Market Change in Share%Share Ch.
MarketManagerShare%
▼
Market # ofDeals
▲ 22 16.9 -6-13 ▼ 25.5
Bank of China Ltd 3 5 3,030.6 5.2 -1.2 ▼ 15 11.5 -10 ▼ 31.2China Construction Bank 4 2 2,826.7 4.8 -3.3 ▼ 7 5.4 0 -
4.2 ▲ 5 3.8 2 ▲ 17.6ANZ Banking Group 6 8 2,608.2 4.5 -0.1 ▼ 17 13.1 -9 ▼ 19.1Industrial & Comm Bank China 7 12 2,212.8 3.8 1.8 ▲ 9 6.9 -2 ▼ 18.6DBS Group Holdings 8 6 2,211.4 3.8 -1.5 ▼ 16 12.3 -13 ▼ 16.5Mitsubishi UFJ Financial Group 9 7 2,142.3 3.7 -1.3 ▼ 13 10.0 -6 ▼ 14.4China Merchants Bank 10 3 1,968.9 3.4 -4.1 ▼ 9 6.9 -3 ▼ 16.1Malayan Banking Bhd 11 48 1,616.0 2.8 2.4 ▲ 9 6.9 6 ▲ 10.3
12 10 1,610.2 2.8 -0.2 ▼ 6 4.6 -6 12.0 2.4Credit Suisse 13 14 1,600.9 2.7 1.0 ▲ 9ING 14 16 1,255.4 2.2 ▲
6.9 4 ▲▼
13.29 6.9 -4 1.9 -0.2
Fubon Financial Holding Co Ltd 15 22 1,148.5 2.0 0.9 70.7
-3 ▼ 10.25.4▼ 9.4
▲▼ 6.3Sumitomo Mitsui Finl Grp Inc 16 11 1,106.2 1.9 -0.7
Mizuho Financial Group 17 9 1,091.5 1.9 -2.218 58
1.3 -1.5 ▼
▲
▼ 9 6.9 -5▼ 12 9.2▲
▼China Everbright Bank 1.48.4 1.7
▼952.3 1.6 1.3 3 2.3
51.4 ▲ 6 4.6 ▲ 6.7 1.4 1.4
2.311.3-5▲2
-0.7
▼ABN AMRO Bank 19 65 942.0 1.6
62.2-0.7Mega Financial Holding Co 20 19 840.0 1.4 0.1 4.6 -3▲ 6
Top Twenty Total -0.63.2 0.6
Bookrunner Total
$3,888.1
$3,500.0
$3,385.3
$3,374.0
$3,355.2
$2,834.7
$2,471.7
$2,390.2
Huadian Jinsha Hydropower
Ant Financial Services Group
CT Brilliant Invest Hldg Ltd
Shanghai Metro Line 15 Dvlp
PT Bhumi Jati Power
Sun Hung Kai Properties Ltd
Guangzhou Subway Co
BPRL
https://www.thomsonone.comVisit http://dmi.thomsonreuters.com to View Archives and Order Custom League Tables
9
------
▼
23.1% ▲ 143.5%
100.0
▲
51.3110.3 100.0
70.8%
-10.8
▲
18,786.4 59.7100.0 2.4 56.5▲
-5.4▼21.9-8.5 -5-4.4 6.0
18.411.0
3▼
4 ▼ 10 11.012
2.2
10.42▼10.6 22.113
11.5-14.7
▲ 15.538.323.1 -5.0-
1610.0
-2.38 940.1 3.6 7.3
Market # ofDeals Share% Share Ch.
9▲3.0
Imputed Fees (US$m)
Share% Share Ch. Fees2017 Rank
MarketProceeds per Bookrunner (US$m) # of Deals per Bookrunner
Credit Agricole CIB 7
▲59.4% ▲
5.11,609.1
138
10
1.1
Mitsubishi UFJ Financial Group
Australia Loans - Bookrunners (All Currencies) (S7)
Market
Commonwealth Bank of Australia
Change in
Jan 1 - Jun 30
125.5
5.1
933.6
14
1,189.167
5.3 3.2
3.8 -2.6
▼
▲-0.2 7
▼
13
19
16
▲
295▲
9
▼
1,740.3 3.75
98.3%
-13.0208.4
3,013.2 -2.4▼
▲4 2 1,863.2 -8.2 ▼ -2.4
▼
20.7
-4.4
29▼
10.8▼
7.5
3.55.0
MarketChange in
20.1
▼
9.7▼▼ -1.49.9
▼31
4.5
-3-1 ▼
# of Deals per Arranger Imputed Fees (US$m)
▼-1.5-2.8
Share%
9.3
2.715.6
Market
▼ 12.1
▲
66.7% ▲
MarketShare%
-5.5 ▼
2.6
▼
▲
National Australia Bank-1.73
1 3 3,115.61,882.4
Westpac Banking 4 1,806.4
Industry % Change from Last Quarter 68.7% ▲
Top Ten Total 16,972.0Bookrunner Total
▼
Proceeds per Mandated Arranger (US$m)
Share%# of Deals Proceeds Share% # of DealsDeals
First Half 2017 | Syndicated Loans | Managing Underwriters
3.98.1
▲ 10.32
132.6 63.914 ▲
Fees13.0
6.1
7.1 -3
25.1-2
▲6.4
1
10.6
▲
▲
17.00
3
Commonwealth Bank of Australia 1
-1.75.9
▲
9.69.3
4.6
2,425.7 7.7 -3.633 11.6
31,489.2
Industry % Change from Last Quarter 129.8%
0.4
10.0 ▼
Industry Total
5.4
ANZ Banking Group 243
Share Ch.Manager Market# of
Australia Loans - Mandated Arrangers (All Currencies) (S6a) Jan 1 - Jun 30
Market Market
3,396.5Mandated Arranger Share Ch.
2016 Rank
Industry % Change from Same Period Last Year
1,675.6
National Australia Bank
Manager 2017 Rank
HSBC Holdings PLC
Westpac Banking
HSBC Holdings PLC 861.95 5
3.6
▲
217
▲188.3%
100.0
18.6%
▲
83
▲
100.0
▼
▲
1.010.6
-0.6
1.17
6.6 5.5-3.0
Bank of China Ltd
▼
Market
4.3 ▲▼
Jan 1 - Jun 30 2017
5
▲ 6Sumitomo Mitsui Finl Grp IncChina Construction Bank
6
ANZ Banking Group
0.83.0
Top Ten Total
6.5%
5.1▲
-1
3 6.7 3.5
5 ▼▼
11.1
2016 Rank Proceeds
Asia (ex-Japan) & Australia
Bookrunner
2 1
▼- 640.1
2 1,784.2
Barclays
10.5
9
2.1 1.9 1.9▲ 2 7.9 2 ▲3.8 3.8
Asian Loans by Maturity Date
48
▲
3.0 ▲Citi 7 14 538.5 3.2 2.76.5 ▲
2 ▲ 3.8
2.8▲
▲3
▲Credit Agricole CIB 8 9 518.6 3.1 1.1 ▼
2.9Sumitomo Mitsui Finl Grp Inc 9 - 480.8 2.8 ▲2.83.1 -0.4
▼▲ 2 5.8 2 2.6 0.3
5.0
1
▼412.9 2.4 1 ▲ 1.6-1.3
Industry % Change from Same Period Last Year
Top Australia Syndicated Loans (US$m)
16,972.0
-9.1%
2 1.4ING 10 7
*tie
-0.4
1000
1200
1400
270
280
290 Proceeds (US$b) # of Issues
$4,472.5
$3,000.0
$1 382 4
Network Finance Co Pty Ltd
Ichthys LNG Pty Ltd
A t li R i t Fi Pt
Jan 1 - Jun 30 2017 Asian Loans by Currency (%) First HalfAustralian Loans Proceeds by Industry (US$m)
$11,164.840%
$6,788.524%
$4,183.715%
$2,268.68%
$1,868.17%
$1,842.46%
Financials
Energy and Power
Industrials
Telecommunications
Government and Agencies
Real Estate
60.5% 77.0% 75.2% 63.2% 63.4% 60.6% 62.3% 65.9% 63.2% 60.3%
39.5%
23.0% 24.8%
36.8% 36.6% 39.4% 37.7%34.1% 36.8% 39.7%
2008 2009 2010 2011 2012 2013 2014 2015 2016 2017
Local Currency G3
$247.5 $264.1 $283.9 $237.4 $245.90
200
400
600
800
1000
210
220
230
240
250
260
2017 2018 2019 2020 2021
# of
Issu
es
Proc
eeds
(US$
b)
$1,382.4
$1,322.1
$1,230.0
$1,199.8
$1,137.3
$1,131.3
$1,055.9
Australian Registry Fin Pty
WCX M4 Finco Pty Ltd
Macquarie Group Ltd
SPIC Pacific Hydro Pty Ltd
Telstra Corp Ltd
Optus Finance Pty Ltd
Sydney Airport Fin Co Pty Ltd
https://www.thomsonone.comVisit http://dmi.thomsonreuters.com to View Archives and Order Custom League Tables
10

Japanese syndicated lending for the first half of 2017 reached US$116.4 billion from 990 deals, representing a 3.4% decrease inproceeds and a 1.4% decrease in number of deals compared to the same period last year. USJ Co Ltd’ US$4 billion refinancing dealled the market, which was arranged by Bank of Tokyo-Mitsubishi UFJ, Mizuho Bank Ltd, and Sumitomo Mitsui Banking Corp. No non-Japanese borrowers accessed the Japanese market in the second quarter. The last quarter of purely domestic Japanese loan activitywas the second quarter of 2004.
Borrowing in the Industrial sector secured 15.6% of the Japanese loan activity, with US$18.1 billion during the first six months of 2017,representing a 19.5% decrease compared to the same period in 2016. Mitsubishi Heavy Industries' US$2 billion facility in Junecontributed to this activity.
With a 47.1% market share during the first half of the year, working capital remained the primary driver for Japanese syndicated loansactivity, with proceeds worth US$53.8 billion - a 4.1% increase compared to the same period last year. Six out of the top ten dealsduring the first half of 2017 were attributed to working capital.
Top Twenty Total108,183.8Bookrunner Total
▲0.3108,162.5 100.0-20
0 -14.2 0.0 0.0 - 1 0.1
966100.0
6/30/20173/23/20172/24/2017
Leveraged BuyoutWorking Capital
Working CapitalCK Holdings
Marubeni CorpGeneral Corp. Purp.
Top Ten DealsClosing Date
2,693.42,658.3
Working Capital
USJ Co Ltd5/1/2017 4,023.9
Sumitomo Corp3,874.72,941.6 Daishi Bank Ltd 20 22
Japan Deals Intelligence
Package Amt (US$m)Borrower
Jan 1 - Jun 30 2017
RefinancingPrimary UOP 16
2/28/2017
JP Morgan
-
262.5
102.8
CTBC Financial Holding Co Ltd
18
130.4Nishi-Nippon Finl Hldg Inc
4,007.7
3/31/2017
JXTG Holdings Inc
Sony Corp
320.2-
13
624.9
201.2
1,249.8
38-0.50.6
0.1
669.9 0.1
11 584.711
0.3
15
7
14274.6
-0.10.1
First Half 2017 | Syndicated Loans | Managing Underwriters
JapanJapanese Syndicated Lending down 3% | USJ Refinancing – Largest Deal
7 0.8Sumitomo Mitsui Trust Holdings
26,038.93
Sh %Change in
Shinsei Bank 16
0.6
12BNP Paribas SA
10Resona Holdings Inc 10
Aozora Bank Ltd9
Sapporo Hokuyo Holdings Inc 1314
1Sumitomo Mitsui Finl Grp Inc
12
5 6
7
33,160.8-6.6
# of
28624.6 ▼
▲8▲ 29.62
Share %▼
671.5
30.7
870.1
Share Ch.Proceeds
3,377.5
35.0
2016 Rank
2017 Rank
Mitsubishi UFJ Financial Group 34
Bookrunner
Citi 4
Mizuho Financial Group 238
Jan 1 - Jun 30
-50
Market Market
Japan Loans - Bookrunners (S12b)
Deals37,890.7
Proceeds per Bookrunner (US$m) # of Deals per BookrunnerMarket
3.1 0.3 -0
# of Deals
2.335.1
Development Bank of Japan Inc
9
58
Credit Agricole CIB8
Concordia Financial Group6
145
1,637.3 ▲1.5
339▲24.1
▲0.3
▲▲ 0.5
0.6
14
0.0
1.2
3.9
▼-0.1 1.4
521 2.2▼
0.1
▲1
443
4
4.5▲ -6-
▼▲
▲127 0.7 ▲
▼
1.2
42
▲
▲
▲-1
0.7
-10▼0.43.9
0.20.50.3
2▲0.2
▲-0
20.30.1-0.2
0.1
▼10.0
0.1▼▲
-▲0.3 2▲0.4 1
00.9
1-
0.0
4
9
0.110.0
3-0.1
0.044.9- ▲0.1
▲-1 10.0
0.2
Shinkin Central Bank 35.619
2115
Shikoku Bank Ltd17
Fukuoka Financial Group Inc
,
Industry % Change from Same Period Last Year -7.9% ▼ -2.0% ▼Industry % Change from Last Quarter -59.1% ▼ -78.5% ▼
Working Capital
Takeda Pharmaceutical Co Ltd
1,912.9
p p
6/7/2017
3/31/2017
,TOSHIBA Corp
2,519.0Working Capital
6/29/2017 2,048.4NEC Corp
2,525.64/3/2017
Overall Japan Loans Volume
Working CapitalMitsubishi Heavy Industries
Acquisition Fin.
y p
Japan Loans Proceeds by Industry (US$b) Jan 1 - Jun 30 2017
1,661 1,686
1,826 1,8651,958
2,0261,992
990
0
500
1,000
1,500
2,000
2,500
$0
$50
$100
$150
$200
$250
$300
$350
2010 2011 2012 2013 2014 2015 2016 2017
# of
Dea
ls
Proc
eeds
(US$
b)
Q4 Proceeds (US$b) Q3 Proceeds (US$b) Q2 Proceeds (US$b) Q1 Proceeds (US$b) # of Issues
$18.115.6%
$15.613.4%
$15.413.2%
$14.312.3%
$13.411.5%
$7.96.8%
$6.15.3%
$6.05.2%
$5.95.1%
Industrials Energy and Power
Materials Financials
High Technology Consumer Staples
Retail Real Estate
Healthcare Consumer Products and Services
Media and Entertainment Government and Agencies
.
https://www.thomsonone.comVisit http://dmi.thomsonreuters.com to View Archives and Order Custom League Tables
11
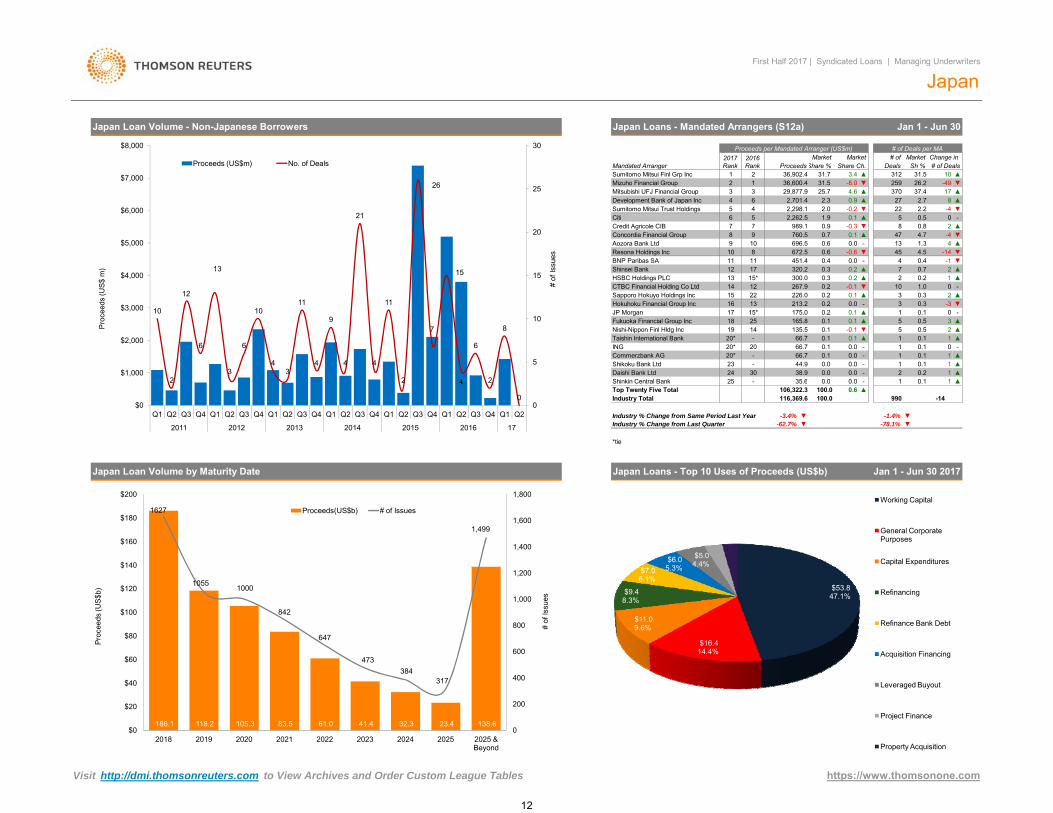
▲
-
1
5
47▲
0.0
▲0.2
696.5Resona Holdings Inc 10
0.311
320.2118
-
Concordia Financial Group
Nishi-Nippon Finl Hldg Inc 19 135.5
BNP Paribas SA
Aozora Bank Ltd
-30
Shinkin Central Bank
18
0.0
0.1
1316JP Morgan
165.8Fukuoka Financial Group Inc
Hokuhoku Financial Group Inc
15*12
Shinsei Bank 1712HSBC Holdings PLCCTBC Financial Holding Co Ltd
-
66.7
0.10.0
267.9
175.00.2
0.1-
25
300.0-
0.0
17 15*
14
0.114
213.2
13
▲▼
226.00.2 -0.1
Sapporo Hokuyo Holdings Inc 2215
▲1
▼89
0.5
▲
210
20*
66.720
44.9
INGCommerzbank AGShikoku Bank Ltd
Taishin International Bank66.7
23238.9
0 0 1Daishi Bank Ltd 0.00.0
2524
0 10 035 6
1 0.1▲
1-
-
▲2
▼
0
0.2
-▲
2-33
3
1-
0.50
-1
▼11
0.11 ▲
0.10.1
0
2
0.1 -▲
▲
1.0
-4
0.8
2.2
2
44.7
-144.5
-4
4
▲
-1
0.2
▼
8
▲7
45
0.71
0.4 ▼
▼
989.1 -0.30.9
451.4 0.4672.5
Change in
37.4827 ▲2.7
Deals10
-
0.7
1.9
0.6 13
5▼
259
22
26.2 ▼
▲
0
1.3
0.5
▲ ▲17370
Sh %Market
31.5
# of Deals per MA
10
7
▲
31.731.525.7
2
2,262.5
▲
▲
0.0
0.1
0.6
0.2
▲▼
-0.6
0.2-
▲
Proceeds
36,600.4
2016 Rank
0.1
0.3
Share %
2.0
29,877.96
Japan
▲
First Half 2017 | Syndicated Loans | Managing Underwriters
Japan Loan Volume - Non-Japanese Borrowers
Share Ch.
Japan Loans - Mandated Arrangers (S12a)
Market
36,902.4
Jan 1 - Jun 30
1 ▼▲
-49
Proceeds per Mandated Arranger (US$m)
312
# of# of Deals
Market
0.0
3
Mandated Arranger1
2,701.4
-8.0Sumitomo Mitsui Finl Grp Inc
2017 Rank
3.4
3Mizuho Financial Group 2
5
4.6
4 2,298.12.3
Sumitomo Mitsui Trust Holdings0.9
Credit Agricole CIBCiti
0.1
4
70.1
760.5
-0.25
9
0.11
Mitsubishi UFJ Financial GroupDevelopment Bank of Japan Inc
6
0.15
▼
20*20*
0.20.30.3
▲
0.1
0.0
3
-0.1
10
2
12
6
13
3
6
10
43
11
4
9
4
21
4
11
2
26
7
15
4
6
2
8
5
10
15
20
25
30
$1,000
$2,000
$3,000
$4,000
$5,000
$6,000
$7,000
$8,000
# of
Issu
es
Proc
eeds
(US$
m)
Proceeds (US$m) No. of Deals
-62.7% ▼ -78.1% ▼
116,369.6 100.0
▼
Japan Loan Volume by Maturity Date
Shinkin Central Bank
Japan Loans - Top 10 Uses of Proceeds (US$b)
▲10.0 1-25106,322.3
Industry % Change from Same Period Last Year
0.1-0.035.6
-1.4%-3.4%
100.0
▼
990▲Top Twenty Five Total
Industry Total0.6
Jan 1 - Jun 30 2017
-14
*tie
Industry % Change from Last Quarter
2 2 4 2
00$0
Q1 Q2 Q3 Q4 Q1 Q2 Q3 Q4 Q1 Q2 Q3 Q4 Q1 Q2 Q3 Q4 Q1 Q2 Q3 Q4 Q1 Q2 Q3 Q4 Q1 Q2
2011 2012 2013 2014 2015 2016 17
186.1 118.2 105.3 83.5 61.0 41.4 32.3 23.4 138.6
1627
1055 1000
842
647
473384
317
1,499
0
200
400
600
800
1,000
1,200
1,400
1,600
1,800
$0
$20
$40
$60
$80
$100
$120
$140
$160
$180
$200
2018 2019 2020 2021 2022 2023 2024 2025 2025 & Beyond
# of
Issu
es
Proc
eeds
(US$
b)
Proceeds(US$b) # of Issues
$53.8 47.1%
$16.4 14.4%
$11.0 9.6%
$9.4 8.3%
$7.0 6.1%
$6.0 5.3%
$5.0 4.4%
$3.0 2.6%
$2.5 2.2%
Working Capital
General Corporate Purposes
Capital Expenditures
Refinancing
Refinance Bank Debt
Acquisition Financing
Leveraged Buyout
Project Finance
Property Acquisition
.
https://www.thomsonone.comVisit http://dmi.thomsonreuters.com to View Archives and Order Custom League Tables
12
-
-
-
-
-
-
-
-
Asia-Pacific
Ewelina JareckaTel: +44 207 542 2246E-mail: [email protected]
Tel: +852 2912 6603Emily Au
E-mail: [email protected]
Imputed fees are generated using a proprietary Thomson Reuters algorithm when spreads or fees are not disclosed. Deal fees are on a gross basis before all expenses. Each underwriter
Japan
Bookrunner league tables will give full credit to the bookrunner, equal if joint. In cases of consolidation, credit will be given to the surviving/parent firm
Ai Hashimoto
First Half 2017 | Syndicated Loans | Managing Underwriters
Ranking Criteria Summary
Tel: +1 646 223-8455E-mail: [email protected]
Europe
E-mail: [email protected]: +813 6441 1155
Bilateral, self-arranged, commercial and unknown loans are excluded from league tables as well as loans with a maturity of less than 90 days.
If you would like to participate in the submission process, receive quarterly press releases, orhave questions about league table criteriaplease contact:
AmericasSalvatore Reres
Mandated Arranger league tables will give equal credit to the Non-Americas mandated arranger and equal credit to the Americas Tier 1 agent. In cases of consolidation, credit will be giviento the surviving/parent firm.
Global, Americas, EMEA, Asia-Pacific and Japan bookrunner and mandated arranger league table volumes and rankings are based on general close date instead of financial close date.
Database coverage includes all loan transactions that have reached financial close by the submission deadline and of which Thomson Reuters has been made aware. All current andprevious year's data is as of 9:00am EDT on June 30, 2017.
All league tables are based on deal proceeds unless otherwise specified. Regional league tables are based on Target Market.
Market Segments (i.e. leveraged, investment grade) in this report are based on SDC 'yield type' which is defined separately from Thomson Reuters LPC 'market segments'. Please speakto your contributor relations representative for more details.
-
-
-
-
-
or advisor is allocated its share of deal fees using the Thomson Reuters allocation methodology, based on the number of underwriters or advisors on the deal and their role. No fees areallocated to non-lead loan syndicate members. Fee estimates presented in the Quarterly Review for deals updated prior to February 1st, 2017 were generated by Freeman Consulting inpartnership with Thomson Reuters.
Thomson Reuters Investment Banking loans data is compiled in conjunction with Loan Pricing Corporation (LPC). In combination, Thomson Reuters Investment Banking and LPC offer the most comprehensive and accurate view of the syndicated loans market available.
League table volumes for Mitsubishi UFJ Financial Group and Morgan Stanley, included herein, reflect changes after the commencement of their jointly established securities firms in Japan: (1) Mitsubishi UFJ Morgan Stanley Securities and (2) Morgan Stanley MUFG Securities. Credit for the newly established joint ventures rolls up to Morgan Stanley. For Japanese involvement league tables Morgan Stanley will be represented as "Mitsubishi UFJ Morgan Stanley".
Bookrunner league tables include club syndicate transactions that are sold down in the syndication process to firms that were not part of the original club syndicate. Mandated Arranger league tables include all club syndicate transactions, regardless of sell-down process.
Non-US dollar denominated transactions are converted to the US dollar equivalent at the time of pricing.
Bookrunner and Mandated Arranger league tables only include amendments that require 100% lender vote for the following amendments: decrease in pricing, change in tenor if maturity is extended by a period of more than 90 days, guarantor or collateral release. An increase in deal size after syndication has ended will be reflected as an add on tranche.
While Thomson Reuters has used reasonable endeavors to ensure that the information provided in this document is accurate and up to date as at the time of issue, neither Thomson Reuters nor its third party content providers shall be liablefor any errors, inaccuracies or delays in the information, nor for any actions taken in reliance thereon, nor does it endorse any views or opinions of any third party content provider. Thomson Reuters disclaims all warranties, express orimplied, as to the accuracy or completeness of any of the content provided, or as to the fitness of the content for any purpose to the extent permitted by law. The content herein is not appropriate for the purposes of making a decision to carryout a transaction or trade and does not provide any form of advice (investment, tax, legal) amounting to investment advice, nor make any recommendations or solicitations regarding particular financial instruments, investments or products,including the buying or selling of securities. Thomson Reuters has not undertaken any liability or obligation relating to the purchase or sale of securities for or by any person in connection with this document.
© 2017 Thomson Reuters. All rights reserved.
Thomson Reuters and the Thomson Reuters logo are registered trademarks and trademarks of Thomson Reuters and its affiliated companies. Any third party name or mark herein belongs to the relevant third party.
https://www.thomsonone.com13
Thomson Reuters Solutions for the Deal Making Community
FOR STRATEGY AND PLANNING TEAMSFOR INFORMATION PROFESSIONALSSDC Platinum is the world’s foremost financial transactions database, covering new issues, M&A, syndicated loans, private equity, project finance, poison pills, and more.
Solution for:• Market Analysis & Trends (Geography, Sector, Asset Class, Deal Type, Deal Size, etc.)• Deal Origination (Debt Maturity Analysis, Company Lifecycle including Private Equity)• Pitch Creation (Firm Credentials, Representative Acquirors)• M&A Targeting (Active Strategic/Sponsor Acquirors, Target Company Screener)• Negotiation (T&C Benchmarking)
Thomson Reuters Deals Business Intelligence enables you to slice and dice our renowned Deals and Fees data to create ad hoc reports, analyze market trends, benchmark your performance and identify opportunities – all within a tool built into your workflow in Excel®, saving you valuable time and giving you a competitive edge.
Solution for:• Conducting market analysis and identifying trends• Benchmarking your performance and monitoring competitors• Targeting clients by wallet size and banking relationship• Allocating resources more effectively by evaluating and analyzing lost deals
FOR INVESTMENT BANKERS
evaluating and analyzing lost deals
Send us a sales enquiry at: financial.thomsonreuters.com/salesRead more about our products at: financial.thomsonreuters.com/products
To purchase individual Thomson reuters Deals or League Table reports, please contact our Thomson Reuters On Demand group:
Email: [email protected]
Access unique analysis for free anytime using Thomson Reuters Deals Intelligence website and receive regular updates, delivered direct to your inbox.
Go to: dmi.thomsonreuters.com/dealsintelligence
Thomson Reuters Eikon is the most intuitive and comprehensive way of staying informed. With natural-language search, you can quickly find global information,news, charts and analytics. Company and industry views provide top-level summaries, and then detailed information is just a click away. Identify new opportunities and gain deep understanding of markets, industries, companies and events.
Thomson Reuters Eikon also includes an Add-In for Microsoft® Office to help you increase your efficiency. From screening and targeting to comparables analysis, building league tables, valuing a company
and developing a client pitch book, you can do all this without leaving Microsoft Office. Search and autosuggest features in Excel make model-building easier.
Solution for:• Managing Client Relationships• Deal Origination• New Issues Pre-Marketing/Roadshows• Financial Modeling• Customized League Tables• Simple Deals screening• Valuation analysis and comparabledeal screening• On-brand pitch book creation
©2017 Thomson ReutersThomson Reuters and the Kinesis logo are trademarks of Thomson Reuters.
14
Related Documents