Synchrotron radiation-induced total reflection X-ray fluorescence analysis F. Meirer, A. Singh, G. Pepponi, C. Streli, T. Homma, P. Pianetta Synchrotron radiation-induced total reflection X-ray fluorescence (SR-TXRF) analysis is a high sensitive analytical technique that offers limits of detection in the femtogram range for most elements. Besides the analytical aspect, SR-TXRF is mainly used in combination with angle-dependent measurements and/or X-ray absorption near-edge structure (XANES) spectroscopy to gain additional information about the investigated sample. In this article, we briefly discuss the fundamentals of SR-TXRF and follow with several exam- ples of recent research applying the above-mentioned combination of tech- niques to analytical problems arising from industrial applications and environmental research. ª 2010 Elsevier Ltd. All rights reserved. Keywords: Angle-dependent measurement; GI-XRF; Glancing incident; SR-TXRF; Synchrotron radiation; Total reflection X-ray fluorescence analysis; TXRF; TXRF-XANES; X-ray absorption near-edge structure spectroscopy 1. Introduction The ability of X-rays to undergo total reflection was experimentally discovered in the 1920s by Compton ([1] reprinted in [2]), who observed that the reflectivity of a flat target increased at angles below 0.1°. However, it took almost 50 years until Yoneda and Horiuchi [3] in 1971 realized that this effect could be used to enhance the sensitivity of X-ray fluores- cence (XRF) analysis by putting the sample on the surface of such a flat reflector. Subsequently, this technique was refined by Wobrauschek in his PhD thesis [4] followed by several authors [5–8] and called ‘‘total reflection X-ray fluorescence analysis’’ (TXRF). By 1954, Parrat had already used the angle dependence of the intensity of the (totally) reflected X-ray beam to investi- gate surfaces [9]. But the angular depen- dence of the fluorescence intensity for angles in the range of the critical angle of total reflection was first observed in 1983 by Becker et al. [10]. Today, TXRF is mainly used for non- destructive surface-contamination analy- sis in the semiconductor industry and for chemical-trace analysis, as it offers limits of detection (LDs) in the pg range for excitation with X-ray tubes and even in the fg region if synchrotron radiation (SR) is used. The effect of the angular depen- dence of the fluorescence intensity is used non-destructively to investigate surface impurities, thin surface layers and multi- layer structures and is called ‘‘grazing incidence’’ or ‘‘glancing incidence’’ (GI) XRF [11]. Recent reviews about TXRF and GI-XRF have been provided by Wobrau- schek [12] and von Bohlen [13]. The use of SR is highly beneficial for TXRF and for angle-dependent XRF in general, because its properties (e.g., high intensity, linear polarization, small source size, and natural collimation) make it ideally matched to the requirements of these techniques. The first SR experiments were published in 1986 by Iida et al. [14] followed by results of several other authors [15–17]. A recent review on SR-TXRF analysis was given by Streli et al. [18]. The sensitivity of SR-induced TXRF (SR-TXRF) is several orders of magnitude greater than what can be achieved using conventional sources (e.g., X-ray tubes) [12,16,19–24]. Furthermore, if the SR is monochromatized with a high-resolution crystal monochromator, instead of a wide band pass system such as a multilayer, the technique can be extended to X-ray absorption spectroscopy (XAS) to gain chemical information on a specific element of interest [25–29]. Monochromatization results in a flux reduction of about two orders of magnitude, but it is still sufficient F. Meirer*, A. Singh, P. Pianetta Stanford Synchrotron Radiation Lightsource, SLAC National Accelerator Laboratory, Menlo Park, CA, USA G. Pepponi CMM, Fondazione Bruno Kessler, FBK - irst, Povo, Trento, Italy F. Meirer, C. Streli Institute of Atomic and Subatomic Physics, Vienna University of Technology, Vienna, Austria T. Homma Waseda University, Dept. of Applied Chemistry, Shinjuku, Tokyo 169-8555, Japan * Corresponding author. E-mail: [email protected] Trends in Analytical Chemistry, Vol. xxx, No. x, 2010 Trends 0165-9936/$ - see front matter ª 2010 Elsevier Ltd. All rights reserved. doi:10.1016/j.trac.2010.04.001 1 ARTICLE IN PRESS Please cite this article in press as: F. Meirer et al., Trends Anal. Chem. (2010), doi:10.1016/j.trac.2010.04.001

Welcome message from author
This document is posted to help you gain knowledge. Please leave a comment to let me know what you think about it! Share it to your friends and learn new things together.
Transcript

Trends in Analytical Chemistry, Vol. xxx, No. x, 2010 Trends
ARTICLE IN PRESS
Synchrotron radiation-induced totalreflection X-ray fluorescenceanalysisF. Meirer, A. Singh, G. Pepponi, C. Streli, T. Homma, P. Pianetta
Synchrotron radiation-induced total reflection X-ray fluorescence (SR-TXRF)
analysis is a high sensitive analytical technique that offers limits of detection
in the femtogram range for most elements. Besides the analytical aspect,
SR-TXRF is mainly used in combination with angle-dependent measurements
and/or X-ray absorption near-edge structure (XANES) spectroscopy to gain
additional information about the investigated sample. In this article, we
briefly discuss the fundamentals of SR-TXRF and follow with several exam-
ples of recent research applying the above-mentioned combination of tech-
niques to analytical problems arising from industrial applications and
environmental research.
ª 2010 Elsevier Ltd. All rights reserved.
Keywords: Angle-dependent measurement; GI-XRF; Glancing incident; SR-TXRF;
Synchrotron radiation; Total reflection X-ray fluorescence analysis; TXRF; TXRF-XANES;
X-ray absorption near-edge structure spectroscopy
F. Meirer*,
A. Singh,
P. Pianetta
Stanford Synchrotron Radiation
Lightsource, SLAC National
Accelerator Laboratory, Menlo
Park, CA, USA
G. Pepponi
CMM, Fondazione Bruno
Kessler, FBK - irst, Povo, Trento,
Italy
F. Meirer,
C. Streli
Institute of Atomic and
Subatomic Physics, Vienna
University of Technology,
Vienna, Austria
T. Homma
Waseda University, Dept. of
Applied Chemistry, Shinjuku,
Tokyo 169-8555, Japan
*Corresponding author.
E-mail: [email protected]
0165-9936/$ - see front matter ª 2010
Please cite this article in press as
1. Introduction
The ability of X-rays to undergo totalreflection was experimentally discoveredin the 1920s by Compton ([1] reprinted in[2]), who observed that the reflectivity of aflat target increased at angles below�0.1�. However, it took almost 50 yearsuntil Yoneda and Horiuchi [3] in 1971realized that this effect could be used toenhance the sensitivity of X-ray fluores-cence (XRF) analysis by putting thesample on the surface of such a flatreflector. Subsequently, this technique wasrefined by Wobrauschek in his PhD thesis[4] followed by several authors [5–8] andcalled ‘‘total reflection X-ray fluorescenceanalysis’’ (TXRF).
By 1954, Parrat had already used theangle dependence of the intensity of the(totally) reflected X-ray beam to investi-gate surfaces [9]. But the angular depen-dence of the fluorescence intensity forangles in the range of the critical angle oftotal reflection was first observed in 1983by Becker et al. [10].
Elsevier Ltd. All rights reserved. doi:10.1016/j.trac.2010.04.001
: F. Meirer et al., Trends Anal. Chem. (2010), doi:10.1016
Today, TXRF is mainly used for non-destructive surface-contamination analy-sis in the semiconductor industry and forchemical-trace analysis, as it offers limitsof detection (LDs) in the pg range forexcitation with X-ray tubes and even inthe fg region if synchrotron radiation (SR)is used. The effect of the angular depen-dence of the fluorescence intensity is usednon-destructively to investigate surfaceimpurities, thin surface layers and multi-layer structures and is called ‘‘grazingincidence’’ or ‘‘glancing incidence’’ (GI)XRF [11]. Recent reviews about TXRF andGI-XRF have been provided by Wobrau-schek [12] and von Bohlen [13].
The use of SR is highly beneficial forTXRF and for angle-dependent XRF ingeneral, because its properties (e.g., highintensity, linear polarization, small sourcesize, and natural collimation) make itideally matched to the requirements ofthese techniques. The first SR experimentswere published in 1986 by Iida et al. [14]followed by results of several other authors[15–17]. A recent review on SR-TXRFanalysis was given by Streli et al. [18].
The sensitivity of SR-induced TXRF(SR-TXRF) is several orders of magnitudegreater than what can be achieved usingconventional sources (e.g., X-ray tubes)[12,16,19–24]. Furthermore, if the SR ismonochromatized with a high-resolutioncrystal monochromator, instead of a wideband pass system such as a multilayer, thetechnique can be extended to X-rayabsorption spectroscopy (XAS) to gainchemical information on a specific elementof interest [25–29]. Monochromatizationresults in a flux reduction of about twoorders of magnitude, but it is still sufficient
1
/j.trac.2010.04.001
Trends Trends in Analytical Chemistry, Vol. xxx, No. x, 2010
ARTICLE IN PRESS
for X-ray absorption near edge structure (XANES)analysis at ppb level [25,26,30,31]. This allows anextension of XAS to:(1) the trace-element level in droplet samples where
only small amounts are available [25,26]; and,(2) the investigation of thin-layered materials and
implantations utilizing the GI-XRF set-up.In the latter case, even extended X-ray absorption fine
structure (EXAFS) analysis is possible, where the inves-tigation of the fine structure of the absorption coefficientallows determination of parameters related to the localatomic structure of the sample. The combination ofGI-XRF and EXAFS analysis therefore allows the char-acterization of the dopant in ultra-shallow implants,distinguishing contributions from the topmost anddeeper regions. Over the past two decades, the combi-nation of GI-XRF and XAFS analysis was successfullyapplied to various analytical problems and has been re-viewed by several authors (e.g. [29,32–34]).
SR-TXRF has already demonstrated capabilities forultra-high sensitivity that exceeds what can be donewith conventional TXRF by several orders of magnitude.However, the advancements made in vapor-phasedecomposition (VPD) TXRF have improved the effectivesensitivity of this technique to compete with SR-TXRF.Furthermore, VPD-TXRF measurements can be per-formed within the semiconductor factory, making thisthe technique of choice for semiconductor-metrologyapplications. However, the collimation and the tunabil-ity of SR enables SR-TXRF to be used for XANES studiesas described here, even EXAFS at the higher concen-trations, as well as non-destructive depth-profilingstudies. This is a promising aspect for future SR-TXRF
Figure 1. (adapted from [21]). Typical exp
2 http://www.elsevier.com/locate/trac
Please cite this article in press as: F. Meirer et al., Trends Anal. Chem. (2
studies, as this allows chemical speciation at trace levelsin and on surfaces, which is extremely difficult or evenimpossible to achieve with other techniques.
2. Fundamentals
2.1. TXRF analysisAs mentioned above, TXRF is mainly used for surface-contamination analysis in the semiconductor industryand for chemical-trace analysis, as it offers excellent LDsand simple sample preparation. In addition to studyingsubstrates, such as silicon wafers, directly, small quan-tities of solutions or suspensions can be dried on samplecarriers, which show sufficient optical flatness (e.g., sil-icon wafers, quartz or Plexiglas reflectors). During thedrying process, the residue on the surface of the reflectorforms a very thin sample. Subsequently the sample isexcited under glancing angle (below the critical angle oftotal external reflection) and the emitted fluorescenceradiation is collected by an energy-dispersive detector.Fig. 1 shows a typical experimental arrangement.
The main advantages of the TXRF set-up are the fol-lowing.� Due to the total reflection of the incident photons,
only a very small part of the primary beam penetratesinto the sample carrier. This leads to a dramaticallyreduced spectral background contribution, whichoriginates from scattering on the substrate.
� The incident beam is totally reflected from the samplecarrier and the sample is excited by both the incidentand the reflected beam, resulting in a doubled fluores-cence intensity.
erimental set-up for TXRF analysis.
010), doi:10.1016/j.trac.2010.04.001

Trends in Analytical Chemistry, Vol. xxx, No. x, 2010 Trends
ARTICLE IN PRESS
� The extreme grazing incidence geometry allows thedetector to be placed very close to the sample surface.This results in a large solid angle for the detection ofthe fluorescence radiation.As a consequence, the sensitivity in TXRF analysis is
very high and the LDs are improved by several orders ofmagnitude when compared to conventional XRF anal-ysis. Furthermore, the angular dependence of the fluo-rescence radiation for angles in the range of the criticalangle of total reflection can be utilized to investigatesurface impurities, thin near-surface layers, and evenmolecules adsorbed on flat surfaces.
The theoretical basis for TXRF can be derived usingformalisms analogous to the theory of light optics. In thefollowing, we present only a brief summary, and detailscan be found in the references [21,35–37].
One starts with the interaction of an electromagneticwave hitting the interface between vacuum and amedium with complex index of refraction, n, as shown inFig. 2. The calculations are based on classical dispersion
Figure 2. Optical paths of incident, reflected and transmitted beams at thevacuum or air) is larger that that of medium 2 (the reflector material).
Figure 3. (adapted from [38]). The interference zone (standing wave fieldwavelengths k showing nodes and antinodes with a period D.
Please cite this article in press as: F. Meirer et al., Trends Anal. Chem. (2
theory and assume a perfectly flat interface between thetwo media. Although a real reflector surface shows acertain roughness on a microscopic scale, experimentalresults have shown that this approach gives goodagreement with theory. For X-rays, medium 2 (thereflector material) has a smaller index of refraction thanvacuum (or air), therefore the refracted beam is deflectedtowards the boundary (which is contrary to usual lightoptics).
An important aspect of TXRF is the interference ofincident and reflected beams above the reflector surface.The superposition of the plane electromagnetic wavesresults in a variation of the intensity depending on thedistance above the surface described as a standing-wavefield. This is in contrast to standard XRF analysiswhere the intensity of X-rays is assumed to be constantin the vacuum and exponentially decreasing in the solid.To first order, in TXRF or GIXRF, the strength of theprimary beam appears as a standing-wave field abovethe surface of the reflector with a periodic intensity
interface of two media. The refraction index of medium 1 (usually
) between the incident (E0) and the reflected (ER) plane waves with
http://www.elsevier.com/locate/trac 3
010), doi:10.1016/j.trac.2010.04.001

Trends Trends in Analytical Chemistry, Vol. xxx, No. x, 2010
ARTICLE IN PRESS
variation (Figs. 3 and 4), whose period is a function ofthe angle of incidence and the wavelength of the radia-tion. The distribution of the nodes and antinodes abovethe surface (i.e. the radiation intensity within the wavefield) is given by [21,38]:
IðuI; zÞ ¼ I0ð1þ RðuIÞ þ 2ffiffiffiffiffiffiffiffiffiffiffiffiRðuIÞ
pcosð2pz=a� /ðuIÞÞÞ
ð1ÞHere, I0 is the intensity of the primary beam, which is
assumed to be constant. R is the reflectivity of thesubstrate, z is the height above the surface of the sub-strate and the argument of the cosine represents thephase difference of the incoming and reflected waves (thetravel distance 2pz/a and a phase shift A). This phaseshift occurs only in the region of total reflection (A = 0for uI > ucrit) and is given by:
/ðuIÞ ¼ arccosð2ðuI=ucritÞ2 � 1Þ ð2Þ
Fig. 3 shows a sketch of the geometry – the prism-shaped volume defined by incoming and reflected beamis filled with nodes and antinodes each separated bydistance D. For small angles, D is given by:
D ¼ k sinðuIÞ1� cosð2uIÞ
� k2uI
ð3Þ
In Fig. 4, examples of the intensity distribution above(and below) the reflector surface are displayed. As shownin Equation (3), D changes with the incident angle (andthe energy of the incident radiation, which is assumed tobe constant here). For an ideal surface (reflectivity = 1),the intensity varies between 0 and four times theintensity of the incident radiation (at nodes andantinodes) for angles below the critical angle of totalreflection. For smaller reflectivity values (R < 1), themaximum intensity is decreased to values smaller than
Figure 4. (from [12]). X-ray intensities above (within the standing wave fieldIt can be seen that the dependence of distance D between nodes and antinosity decreases as a function of the refraction angle. Calculated for Mo-Ka
4 http://www.elsevier.com/locate/trac
Please cite this article in press as: F. Meirer et al., Trends Anal. Chem. (2
the four-fold intensity of the primary radiation. Fur-thermore, it can be seen that the intensity below thesurface follows the well-known exponential decay.However, as the boundary condition at the interface hasto be satisfied, the intensity at the surface varies dra-matically with the angle of incidence. This means thatthe penetration depth, defined as the depth where theintensity of the penetrating beam is reduced to 1/e, alsochanges significantly with angle.
Since, the intensity of the fluorescence radiationemitted by atoms on or in the reflector surface is directlyproportional to the field intensity of the standing wave,the angular dependence of the fluorescence radiationmay be used to probe the elemental composition of thesample in depth and thus provide for non-destructivedetermination of concentration depth profiles as well asanalysis of layered structures and of nanoparticles on thesurface of the reflector.
The analysis of nanoparticles has resulted in furtherdevelopments in the theoretical understanding of thisphenomenon that we discuss in the next sub-section.
2.2. Angle-dependent TXRF or grazing incident XSWanalysis and the influence of coherence lengthThe increasing interest in nanoparticles and related re-search during the past few years led to studies investi-gating the applicability of TXRF or grazing-incidenceX-ray standing wave (XSW) measurements for theanalysis of nanoparticles on surfaces. This method is alsocalled XSW analysis because it utilizes the standing-wave field and the nodes and antinodes of the fieldintensity above the reflector surface (see Figs. 3 and 4).
Within the prism-shaped intersection volume com-prising the region of overlap between the incoming andthe reflected beam, the interference fringes show a
) and below a thick Si flat calculated for different angles of incidence.des is a function of the incident angle. Inside the medium, the inten-
radiation; the critical angle is at 1.8 mrad.
010), doi:10.1016/j.trac.2010.04.001
Trends in Analytical Chemistry, Vol. xxx, No. x, 2010 Trends
ARTICLE IN PRESS
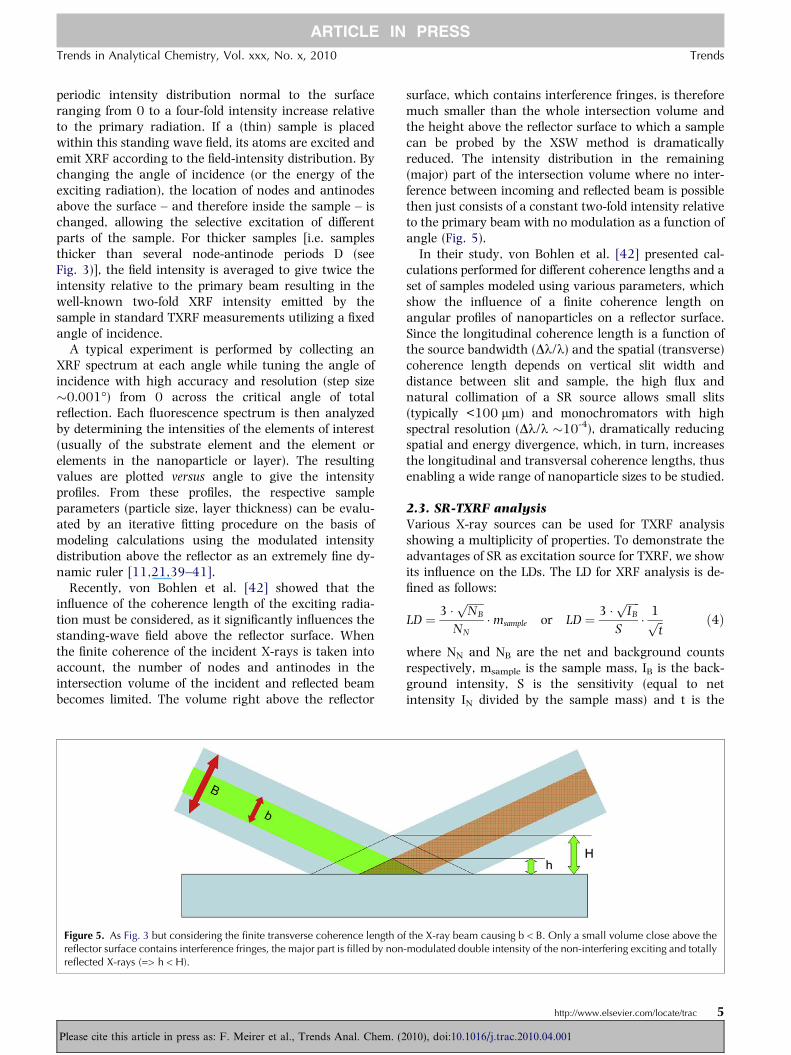
periodic intensity distribution normal to the surfaceranging from 0 to a four-fold intensity increase relativeto the primary radiation. If a (thin) sample is placedwithin this standing wave field, its atoms are excited andemit XRF according to the field-intensity distribution. Bychanging the angle of incidence (or the energy of theexciting radiation), the location of nodes and antinodesabove the surface – and therefore inside the sample – ischanged, allowing the selective excitation of differentparts of the sample. For thicker samples [i.e. samplesthicker than several node-antinode periods D (seeFig. 3)], the field intensity is averaged to give twice theintensity relative to the primary beam resulting in thewell-known two-fold XRF intensity emitted by thesample in standard TXRF measurements utilizing a fixedangle of incidence.
A typical experiment is performed by collecting anXRF spectrum at each angle while tuning the angle ofincidence with high accuracy and resolution (step size�0.001�) from 0 across the critical angle of totalreflection. Each fluorescence spectrum is then analyzedby determining the intensities of the elements of interest(usually of the substrate element and the element orelements in the nanoparticle or layer). The resultingvalues are plotted versus angle to give the intensityprofiles. From these profiles, the respective sampleparameters (particle size, layer thickness) can be evalu-ated by an iterative fitting procedure on the basis ofmodeling calculations using the modulated intensitydistribution above the reflector as an extremely fine dy-namic ruler [11,21,39–41].
Recently, von Bohlen et al. [42] showed that theinfluence of the coherence length of the exciting radia-tion must be considered, as it significantly influences thestanding-wave field above the reflector surface. Whenthe finite coherence of the incident X-rays is taken intoaccount, the number of nodes and antinodes in theintersection volume of the incident and reflected beambecomes limited. The volume right above the reflector
Figure 5. As Fig. 3 but considering the finite transverse coherence length ofreflector surface contains interference fringes, the major part is filled by nonreflected X-rays (=> h < H).
Please cite this article in press as: F. Meirer et al., Trends Anal. Chem. (2
surface, which contains interference fringes, is thereforemuch smaller than the whole intersection volume andthe height above the reflector surface to which a samplecan be probed by the XSW method is dramaticallyreduced. The intensity distribution in the remaining(major) part of the intersection volume where no inter-ference between incoming and reflected beam is possiblethen just consists of a constant two-fold intensity relativeto the primary beam with no modulation as a function ofangle (Fig. 5).
In their study, von Bohlen et al. [42] presented cal-culations performed for different coherence lengths and aset of samples modeled using various parameters, whichshow the influence of a finite coherence length onangular profiles of nanoparticles on a reflector surface.Since the longitudinal coherence length is a function ofthe source bandwidth (Dk/k) and the spatial (transverse)coherence length depends on vertical slit width anddistance between slit and sample, the high flux andnatural collimation of a SR source allows small slits(typically <100 lm) and monochromators with highspectral resolution (Dk/k �10-4), dramatically reducingspatial and energy divergence, which, in turn, increasesthe longitudinal and transversal coherence lengths, thusenabling a wide range of nanoparticle sizes to be studied.
2.3. SR-TXRF analysisVarious X-ray sources can be used for TXRF analysisshowing a multiplicity of properties. To demonstrate theadvantages of SR as excitation source for TXRF, we showits influence on the LDs. The LD for XRF analysis is de-fined as follows:
LD ¼ 3 �ffiffiffiffiffiffiNB
p
NN
�msample or LD ¼ 3 �ffiffiffiffiffiIB
p
S� 1ffiffitp ð4Þ
where NN and NB are the net and background countsrespectively, msample is the sample mass, IB is the back-ground intensity, S is the sensitivity (equal to netintensity IN divided by the sample mass) and t is the
the X-ray beam causing b < B. Only a small volume close above the-modulated double intensity of the non-interfering exciting and totally
http://www.elsevier.com/locate/trac 5
010), doi:10.1016/j.trac.2010.04.001
Trends Trends in Analytical Chemistry, Vol. xxx, No. x, 2010
ARTICLE IN PRESS
measuring time. It is obvious from Equation (4) thatthere are three possibilities to improve the LDs:
1) increasing the sensitivity S (IN/m);2) reducing the background; or,3) increasing the measuring time, which is limited for
practical reasons.Net intensity IN is proportional to the intensity of the
exciting radiation. Using SR with its high flux is there-fore advantageous in comparison to using X-ray tubes. Afurther increase in sensitivity can be attained by using atunable excitation source, which enables adjustment ofthe exciting energy just above the absorption edge of theelement of interest, resulting in optimized excitationconditions for this element.
Apart from using total reflection geometry to reducethe spectral background (and doubling the fluorescenceintensity), another possibility to reduce the backgroundis to decrease the scatter contributions from the sampleitself by utilizing linearly polarized primary radiation[43,44]. Due to the anisotropic emission characteristicsof the scattered radiation based on the classical dipoleoscillator emission, it is advantageous to place a detec-tor in such a position that only the isotropic emission ofthe fluorescence signal is detected – hence the combi-nation of TXRF with polarized radiation leads to a lowerbackground. Further, the use of monochromatic pri-mary radiation improves the background conditionsbecause only photons of one specific energy are scat-tered.
All these improvements can be accomplished whenusing SR. The intense beam with a continuous spectraldistribution from photon energies in the infrared regionto high-energy photons as well as the linear polarizationin the orbit plane and its natural collimation are featuresbest suited to excitation in total reflection geometry.
2.4. SR-TXRF-XAFS analysisIn past decades, a few experimental studies were per-formed utilizing the combination of TXRF and XANES,showing the applicability of the method to several ana-lytical problems (e.g., [25,26,30,31]). As mentioned inthe introduction, the motivation to utilize this powerfulmethod is to extend XAS, and therefore chemical speci-ation, to samples that are available in small amounts(e.g., ll of solutions, ng of nanoparticles or aerosols, andthin films) and show elemental concentrations at the ppblevel. However, it is well known that fluorescenceacquisition of XAS spectra of concentrated samplessuffers from self absorption, which causes damping andalso broadening of the oscillations.
Some authors have performed quantitative speciationthrough analysis of XANES spectra by fitting them withanalytical functions [45,46]. Another approach dealswith corrections of the measured spectra to account forself absorption. Many authors have investigated self-
6 http://www.elsevier.com/locate/trac
Please cite this article in press as: F. Meirer et al., Trends Anal. Chem. (2
absorption effects in XAS using fluorescence acquisitiondepending on the angle of incidence and detection andhave proposed correction models [47,48]. Due to irreg-ular sample shape and the very shallow angle of inci-dence, these models are not applicable to TXRF. Theextreme grazing incidence geometry used by TXRF en-hances these self-absorption effects due to the extendedpath length of the incident beam in the droplet. Thispath length is equivalent to the penetration depth of theincident beam and is therefore energy dependent.
As the energy changes during a XANES scan, thevolume where the fluorescence photons originate fromvaries. Higher absorption means a smaller excitedvolume and therefore less fluorescence intensity (andvice versa). Consequently, this leads to damping of theoscillations of the absorption coefficient above theabsorption edge. The phenomenon is relevant at higherconcentrations, such as would be used in the measure-ment of standards to have a good counting statistic in arelatively short measurement time. Any absorption ofthe fluorescence radiation within the sample can beneglected because it remains constant during an energyscan.
Recently, Meirer et al. [49] compared measurementswith theoretical calculations to investigate the influenceof self-absorption effects on TXRF-XANES analysis. Theeffect of the sample shape as well as the one of differentconcentrated droplet samples was studied. The experi-mental results showed clearly a linear correlation of thedamping of the oscillations with the total mass of thesamples. A simple Monte-Carlo algorithm was developedto simulate the self-absorption effect and the resultsshowed good agreement with the measurements. Theirwork proposed a rather simple way to study a priori theabsorption effects that will show up in TXRF XANES andallow the scientist to prepare the sample according toneeds (measuring time, acceptable self absorption) of theexperiment.
Based on these results, the same authors studied theapplicability of the inverse TXRF geometry – the grazingexit (GE) set-up – to XANES analysis [50], because it wassuggested that a normal incidence-grazing-exit geome-try would not suffer from self-absorption effects in XAFSanalysis due to the minimized path length of the incidentbeam through the sample. Their results proved thisassumption and, in turn, confirmed the occurrence ofthe self-absorption effect for TXRF geometry. However,due to its lower sensitivity (one order of magnitudelower than for TXRF), it is difficult to apply the GEgeometry to XAFS analysis of trace amounts (few ng) ofsamples. However, the self-absorption effect in the TXRFgeometry decreases rapidly with smaller sampleamounts, so it could be advantageous for future XAFSanalyses to measure higher concentrated standardsamples in a GE set-up and highly diluted samples inTXRF geometry.
010), doi:10.1016/j.trac.2010.04.001

Trends in Analytical Chemistry, Vol. xxx, No. x, 2010 Trends
ARTICLE IN PRESS
3. Recent research
Recently, the trend in SR-TXRF has clearly changedfrom the hunt for LDs motivated by semiconductorindustry to studies combining the advantages of TXRFwith the possibilities offered by angle-dependent mea-surements and absorption spectroscopy. In the following,we present several selected studies that exploit the pos-sibilities of such combined approaches.
As TXRF has become a routine analysis tool forsurface inspection in semiconductor industry, manySR-TXRF studies have been motivated by problems re-lated to semiconductor technology that address morespecialized questions. In addition, TXRF has been appliedto environmental research utilizing its excellent LDs, thesimple sample preparation and the fact that only smallsample amounts (in the ll range) are necessary in(SR-)TXRF analysis. We focus on studies in which TXRFhas been used to address problems that go beyond theidentification of surface elements and address thechemical speciation in particulate samples.
3.1. SR-TXRF analyses of metallic contaminationon silicon wafersFor over 30 years, the device density of silicon chips hasbeen increasing, leading to more stringent requirementsfor surface cleanliness. Metallic contaminations on thesurface of Si wafers are known to be a serious limitingfactor to yield and reliability of complementary metal-oxide semiconductor (CMOS)-based integrated circuits[51], as they can degrade the performance of the ultra-thin SiO2 gate dielectrics that form the heart of theindividual transistors.
In laboratory-based instruments, TXRF offers LDsdown to the 5E9 at/cm2 [52]. When higher sensitivity isrequested, monitoring is typically carried out by VPD ofthe native oxide layer and analysis by means of labora-tory based TXRF and/or inductively coupled plasmamass spectrometry (ICP-MS) at the expense of the loss ofthe information relative to the location and the distri-bution of the contamination on the wafer [12,53–56].To trace the source of the contamination, not only thedistribution of the contamination is very valuable butalso additional information on the chemical state of theelement can be helpful. Understanding the chemicalstate is an important method to gain information on thesource of contamination; if more metallic in nature, thecontamination could be particles from wear or shearingof moving parts; or, if the metal is an oxide, corrosionmay be taking place. Other species may indicate unex-pected chemical reactions taking place.
Another important topic related to this problem is thewafer-cleaning process itself; to remove metal atomsfrom the silicon surface, in addition to particles andorganics, various cleaning solutions are used, including
Please cite this article in press as: F. Meirer et al., Trends Anal. Chem. (2
ultra-pure water (UPW) for rinse steps. Since cleaningsolutions, especially UPW, can often be a source ofcontamination, it is vital to understand how metalspecies in solution interact with silicon surfaces.
In the following discussion, we present two studies inmore detail to show the application of SR-TXRF to theanalysis of surface residues on Si wafers that may orig-inate from wafer handling or cleaning using contami-nated UPW.
3.1.1. SR-TXRF-XANES analysis of ironcontamination on a silicon wafer surfaceRecently, Meirer et al. [57–59] investigated the feasibilityof a SR-TXRF-XANES analysis to determine the chemicalstate of Fe contaminations on a silicon-wafer surfacethat should help in determining the true source of thecontamination problem. This type of information is notreadily accessible with standard laboratory equipment.The main purpose of the study was to test the method fora contamination issue as it appears in a microelectronicVLSI production fab.
An Si wafer from IBM laboratories showing surfacecontaminations in the 4E12 at/cm2 range for Fe hasbeen investigated. The contamination was not inten-tionally prepared, but resulted from real contaminationdue to fabrication processes. SR-TXRF XANES mea-surements were performed at the bending magnetbeamline L at HASYLAB using a modified micro-XRF set-up. This set-up allowed TXRF measurements withscanning capability. The wafer with 200-mm diameterwas mounted vertically on a custom-made holder on ax,y,z,h-stage in front of the side-looking detector to allowarea scans and scans over the angle of incidence.
3.1.1.1. TXRF and angle-dependent XRF analysis. Priorto the SR-TXRF analysis, the sample was scanned using alaboratory TXRF wafer analyzer (Rigaku TXRF 300) tolocate areas of interest showing high Fe concentrations.These areas were scanned at the synchrotron to findpoints with maximum Fe concentration. At these points,angular and energy (XANES) scans were performed tofurther characterize the Fe contamination. Fig. 6 showsthe Ca and Fe distribution maps recorded in the labora-tory (left, whole wafer) and at the synchrotron (right,marked areas A5, A7, A21). For maps recorded with SR-TXRF, the lateral resolution is determined by the size ofthe collimator of the detector (8 mm diameter) and thevertical beam dimension (1.6 mm). The maps of theelemental distributions for the other elements found onthe wafer surface were used to double-check that thecorrect position of interest was found (e.g., the Ca mapshown in Fig. 6). The angular scans and XANES analyseswere performed at the positions labeled P5, P7 and P21.Furthermore, LDs of the set-up for Fe were determined byevaluating fluorescence spectra recorded at the points ofinterest for 100-s lifetime (LD100). The LD100 value was
http://www.elsevier.com/locate/trac 7
010), doi:10.1016/j.trac.2010.04.001

Figure 6. (from [57]). Laboratory TXRF maps (left) with marked regions of the areas scanned by means of SR-TXRF (right). The marked regions onthe left correspond to the areas on the right. The white boxes on the right localize the points of maximum Fe contamination, which were selectedfor further investigation (P21, P5 and P7).
Trends Trends in Analytical Chemistry, Vol. xxx, No. x, 2010
ARTICLE IN PRESS
calculated [see Equation (4)] using the quantificationresults of the analysis performed with the laboratory tooland was found to be in the range of 750 fg.
Figure 7. (from [57]). Intensities vs. angle of incidenc
8 http://www.elsevier.com/locate/trac
Please cite this article in press as: F. Meirer et al., Trends Anal. Chem. (2
The results of the angular scans showed the typicalangular intensity curve [60] of the Fe Ka fluorescence,indicating that all contaminations at these points were
e (position of rotator h) recorded at position P5.
010), doi:10.1016/j.trac.2010.04.001

Table 1. Oxidation states and edge positions of standards andsamples
Compound Edge position [eV]
FeS Iron(II)-sulfide 7117FeCl2 Iron(II)-chloride 7119FeSO4 Iron(II)-sulfate 7119.5Fe3O4 Iron(II,III)-oxide 7119.5FeC2O4 Iron(II)-oxalate 7120.5(NH4)2Fe(SO4)2 Ammonium-Iron(II)-sulfate 7122.5NH4Fe(SO4)2 Ammonium-Iron(III)-sulfate 7123Fe2O3 Iron(III)-oxide 7123.5Fe(NO3)3 Iron(III)-nitrate 7125Fe2(SO4)3 Iron(III)-sulfate 7126Wafer at P5 Fe(III) 7125Wafer at P7 Fe(II) 7121.5Wafer at P21 Fe(III) 7124.5
Table 2. Results and fit parameters of the best fit for P5
Fe2O3 [%] Fe(NO3)3[%] Fe2(SO4)3[%] R-factor chi-square
P5 26 ± 7 48 ± 8 26 ± 10 0.001424 0.1478
Trends in Analytical Chemistry, Vol. xxx, No. x, 2010 Trends
ARTICLE IN PRESS
present as �thick� residues on the wafer surface (i.e.samples thicker than several node-antinode periods ofthe standing-wave field above the reflectors surface) (seeintroduction). To give an example, Fig. 7 shows theangular profile recorded at point P5. For the givenexperimental parameters (exciting energy, angularrange, slits) and using Equation (3), the thickness of thecontamination can therefore be estimated to be not lessthan 1 lm. Considering a finite coherence length, thisthickness can be somewhat smaller, but the contami-nants were definitely not nanoparticles (i.e. <100 nm).
3.1.1.2. TXRF-XANES measurements. The authorscompared two methods to extract the XANES spectrafrom the series of fluorescence spectra recorded at eachenergy:
a) as commonly accepted, the XANES spectra werebuilt summing all counts within the Fe-KaRegion-Of-Interest (ROI); and,
b) each fluorescence spectrum of the scan was fittedusing the QXAS peak-fitting software package [61]and the calculated net intensities (fitted peak areas)were used to generate the XANES spectra.
This comparison was performed to make sure thatmethod a) was acceptable for such low concentrations.The results revealed no significant differences betweenthe scans generated in the two ways mentioned, exceptan increased signal in the low-energy range of the pre-edge region of the scan generated using the ROI method.This effect can be explained by a contribution of thescatter peak increasing the counts of the Fe-Ka ROI atlow energies far below the edge. However, as the signal-to-noise ratio was not improved using the peak-fittingmethod, the authors used the ROI evaluation.
To perform chemical speciation of an unknownsample, XANES spectra are usually compared to spectraof possible reference materials. For a completely un-known sample, a reliable determination of the com-pound might be impossible and the investigator must besatisfied with a qualitative indication about the oxidationstate of the element examined.
In the study presented, 10 common reference ironcompounds were measured using the same experimentalset-up [25] to be compared with the XANES recorded atthe points of interest (high Fe concentrations). Thenumber of standards measured was certainly a keyfactor in the trade-off between overall time of investi-gation and quality of the results or even success orfailure. Table 1 presents the edge positions determined(first inflection point of the XANES spectrum) and theoxidation states of all measured standards and samples.The Fe oxidation states of the samples were determinedby comparison with the standards.
The poor counting statistics for P7 and P21 due to theextremely low concentrations made doubtful the resultsof further investigations of the Fe compound on the
Please cite this article in press as: F. Meirer et al., Trends Anal. Chem. (2
wafer surface. For P5, it was possible to perform linearcombination fits to have an estimation of the composi-tion of the Fe contamination. The three most appropriatestandards (Fe2O3, Fe(NO3)3 and Fe2(SO4)3) were usedfor a linear combination least squares fitting using allpossible combinations (four) of these standards. Theresults and fit parameters of the best fit (best R-factor)are reported in Table 2 and shown in Fig. 8.
3.1.1.3. Conclusions. The authors could show that SR-TXRF in combination with XAS enabled XANES analysisof wafer-surface contaminations even in the pg regionwithin a reasonable time frame (all measurements wereperformed within 48 h). The set-up allowed a spatiallyresolved multi-element analysis of the wafer surface. Inaddition, the type of contaminations (�thick� residuals onthe surface) and the oxidation state of iron at threepoints could be determined. Due to the extremely low Feconcentrations and the limited measurement time, asatisfactory determination of the iron compound couldbe achieved only for one of the three points (P5) showingthe (unexpected) presence of iron nitrate and iron sul-fate. All these investigations were done non-destruc-tively using the same experimental set-up.
3.1.2. Nucleation and growth of copper nanoclusterson Si surfaces from UPW solutionsGiven the importance of aqueous solutions employingUPW in semiconductor processes, it is important tounderstand the effect of low levels of metal contamina-tion in these solutions. One such study by Singh et al.
http://www.elsevier.com/locate/trac 9
010), doi:10.1016/j.trac.2010.04.001

Figure 8. (from [57]). Result of the best linear combination fit for sample P5.
Trends Trends in Analytical Chemistry, Vol. xxx, No. x, 2010
ARTICLE IN PRESS
[30,62,63] used a number of SR techniques to studytrace-copper (Cu) contamination of silicon-wafer sur-faces from deoxygenated and non-deoxygenated UPWsolutions – in particular, to understand the role thatdissolved oxygen plays in the deposition mechanism.
Since Cu is a fast diffuser in silicon and can quicklyreach active device areas [64], it is particularly impor-tant to understand Cu contamination from UPW solu-tions. For Cu contamination during the wet cleaningprocess, there are two alternative reaction pathwaysdepending upon the pH value of the solution. In lowerpH solutions, it is expected that Cu ions are electro-
Figure 9. (adapted from [63]). TXRF spectra of silicon samples dipped in deUPW spiked with 10 (left) and 100 ppb Cu (right). Besides the Cu peaks, a smdetected.
10 http://www.elsevier.com/locate/trac
Please cite this article in press as: F. Meirer et al., Trends Anal. Chem. (2
chemically reduced and deposited on the surface asmetallic particles [65]. Conversely, in higher pH solu-tions, Cu ions are precipitated and included in the oxidelayer as a metal oxide/hydroxide [66]. Since UPW has aneutral pH, both reaction mechanisms are available forCu deposition, so it is expected that other factors (e.g.,amount of dissolved oxygen) play an important role inthe deposition of Cu on silicon surfaces from UPWsolutions.
Experiments were predominantly done at Beamline 6-2at the Stanford Synchrotron Radiation Laboratory (SSRL),utilizing SR-TXRF, angle-dependent XRF (GIXRF) and
oxygenated (shown in gray) and non-deoxygenated (shown in black)all unintentional contamination (less than 1E9 atoms/cm2) of Fe was
010), doi:10.1016/j.trac.2010.04.001
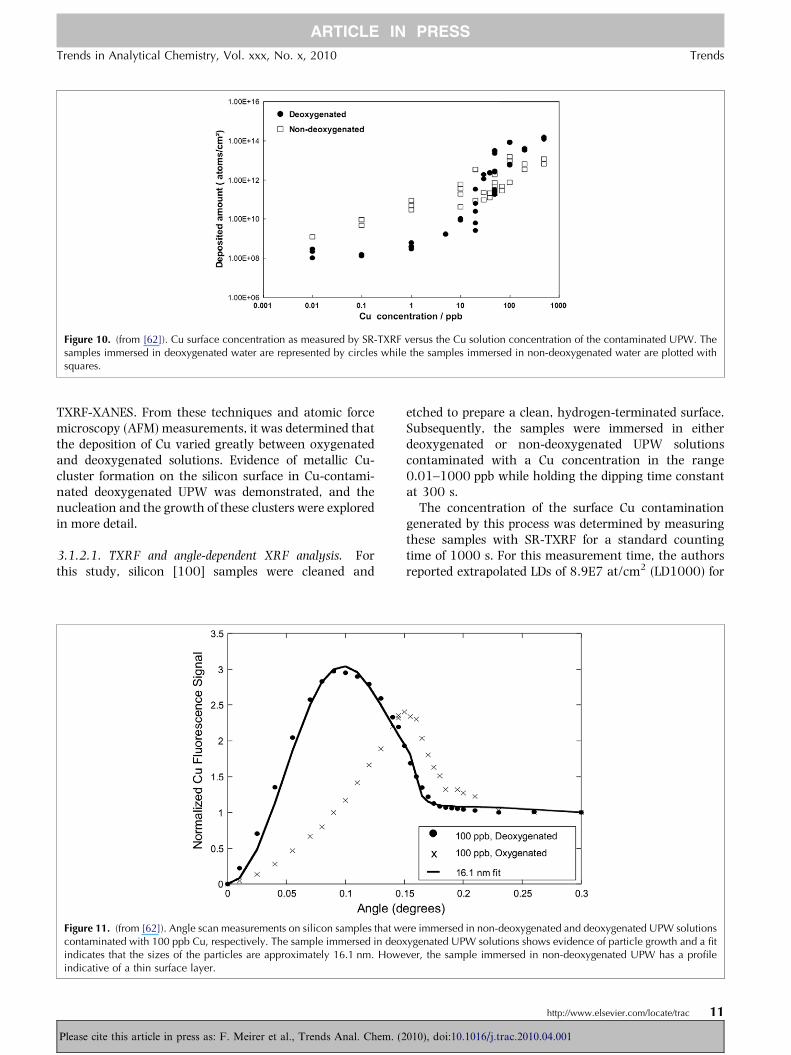
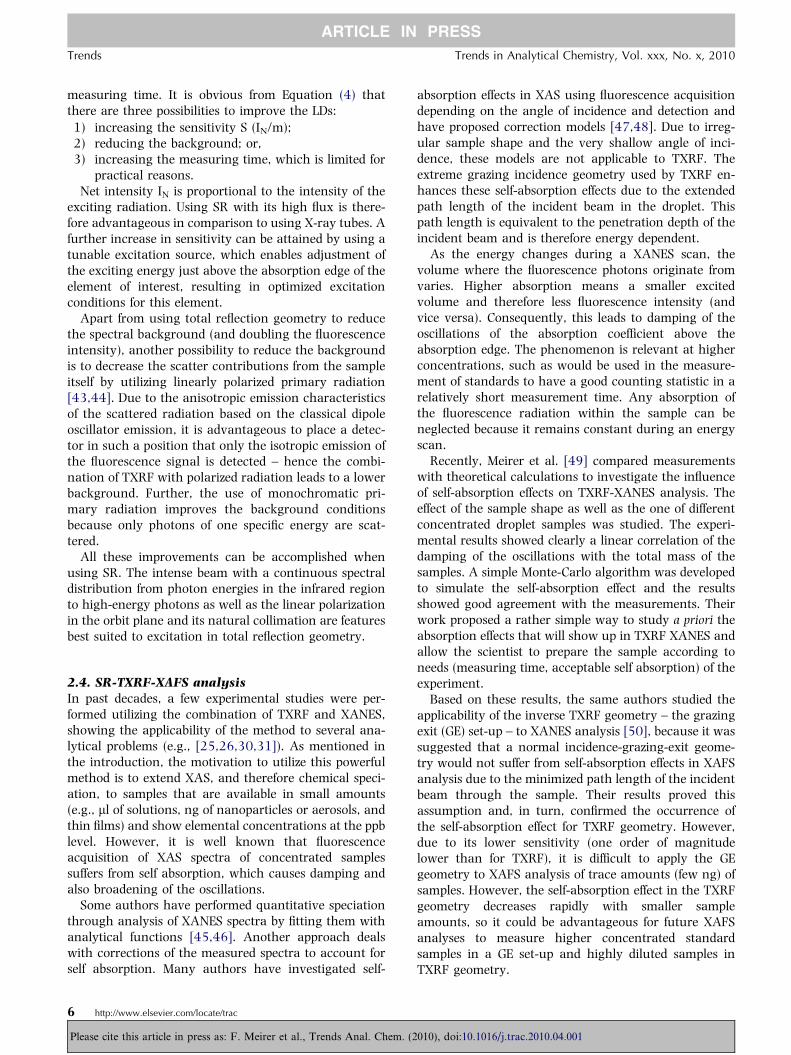
Figure 10. (from [62]). Cu surface concentration as measured by SR-TXRF versus the Cu solution concentration of the contaminated UPW. Thesamples immersed in deoxygenated water are represented by circles while the samples immersed in non-deoxygenated water are plotted withsquares.
Trends in Analytical Chemistry, Vol. xxx, No. x, 2010 Trends
ARTICLE IN PRESS
TXRF-XANES. From these techniques and atomic forcemicroscopy (AFM) measurements, it was determined thatthe deposition of Cu varied greatly between oxygenatedand deoxygenated solutions. Evidence of metallic Cu-cluster formation on the silicon surface in Cu-contami-nated deoxygenated UPW was demonstrated, and thenucleation and the growth of these clusters were exploredin more detail.
3.1.2.1. TXRF and angle-dependent XRF analysis. Forthis study, silicon [100] samples were cleaned and
Figure 11. (from [62]). Angle scan measurements on silicon samples that wecontaminated with 100 ppb Cu, respectively. The sample immersed in deoxindicates that the sizes of the particles are approximately 16.1 nm. Howeindicative of a thin surface layer.
Please cite this article in press as: F. Meirer et al., Trends Anal. Chem. (2
etched to prepare a clean, hydrogen-terminated surface.Subsequently, the samples were immersed in eitherdeoxygenated or non-deoxygenated UPW solutionscontaminated with a Cu concentration in the range0.01–1000 ppb while holding the dipping time constantat 300 s.
The concentration of the surface Cu contaminationgenerated by this process was determined by measuringthese samples with SR-TXRF for a standard countingtime of 1000 s. For this measurement time, the authorsreported extrapolated LDs of 8.9E7 at/cm2 (LD1000) for
re immersed in non-deoxygenated and deoxygenated UPW solutionsygenated UPW solutions shows evidence of particle growth and a fitver, the sample immersed in non-deoxygenated UPW has a profile
http://www.elsevier.com/locate/trac 11
010), doi:10.1016/j.trac.2010.04.001
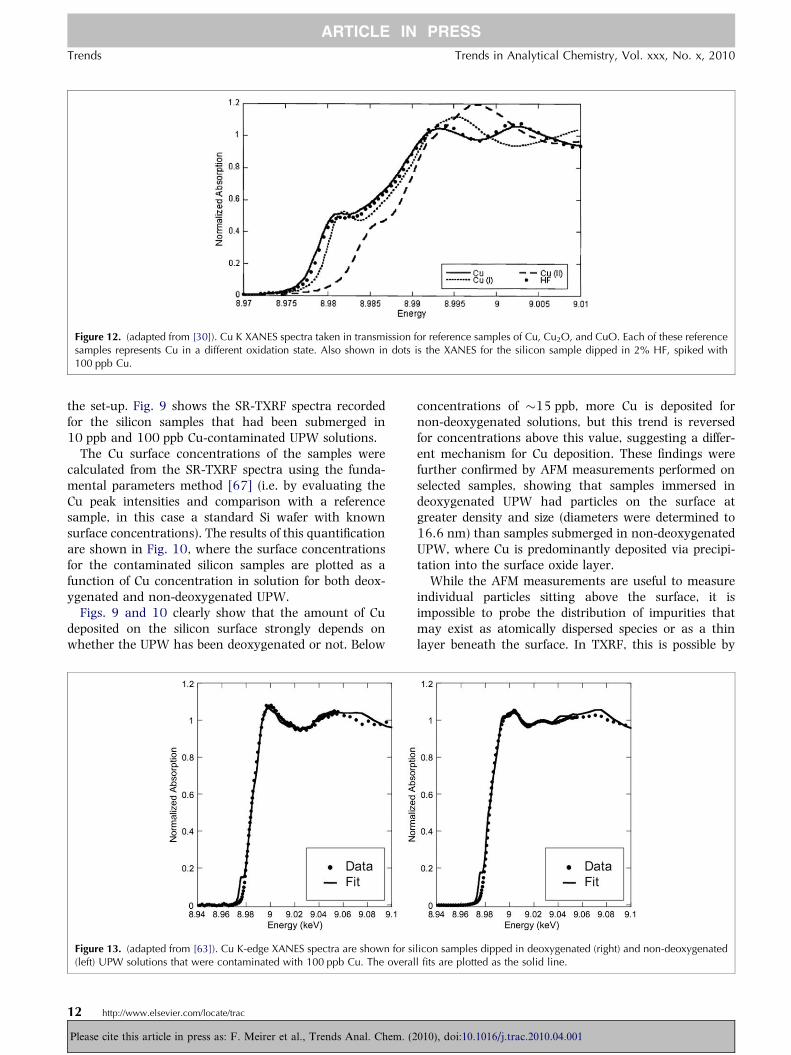
Figure 12. (adapted from [30]). Cu K XANES spectra taken in transmission for reference samples of Cu, Cu2O, and CuO. Each of these referencesamples represents Cu in a different oxidation state. Also shown in dots is the XANES for the silicon sample dipped in 2% HF, spiked with100 ppb Cu.
Trends Trends in Analytical Chemistry, Vol. xxx, No. x, 2010
ARTICLE IN PRESS
the set-up. Fig. 9 shows the SR-TXRF spectra recordedfor the silicon samples that had been submerged in10 ppb and 100 ppb Cu-contaminated UPW solutions.
The Cu surface concentrations of the samples werecalculated from the SR-TXRF spectra using the funda-mental parameters method [67] (i.e. by evaluating theCu peak intensities and comparison with a referencesample, in this case a standard Si wafer with knownsurface concentrations). The results of this quantificationare shown in Fig. 10, where the surface concentrationsfor the contaminated silicon samples are plotted as afunction of Cu concentration in solution for both deox-ygenated and non-deoxygenated UPW.
Figs. 9 and 10 clearly show that the amount of Cudeposited on the silicon surface strongly depends onwhether the UPW has been deoxygenated or not. Below
Figure 13. (adapted from [63]). Cu K-edge XANES spectra are shown for si(left) UPW solutions that were contaminated with 100 ppb Cu. The overal
12 http://www.elsevier.com/locate/trac
Please cite this article in press as: F. Meirer et al., Trends Anal. Chem. (2
concentrations of �15 ppb, more Cu is deposited fornon-deoxygenated solutions, but this trend is reversedfor concentrations above this value, suggesting a differ-ent mechanism for Cu deposition. These findings werefurther confirmed by AFM measurements performed onselected samples, showing that samples immersed indeoxygenated UPW had particles on the surface atgreater density and size (diameters were determined to16.6 nm) than samples submerged in non-deoxygenatedUPW, where Cu is predominantly deposited via precipi-tation into the surface oxide layer.
While the AFM measurements are useful to measureindividual particles sitting above the surface, it isimpossible to probe the distribution of impurities thatmay exist as atomically dispersed species or as a thinlayer beneath the surface. In TXRF, this is possible by
licon samples dipped in deoxygenated (right) and non-deoxygenatedl fits are plotted as the solid line.
010), doi:10.1016/j.trac.2010.04.001

Figure 14. Fractional contributions for the XANES fits.
Trends in Analytical Chemistry, Vol. xxx, No. x, 2010 Trends
ARTICLE IN PRESS
evaluating the fluorescence intensity as a function ofincident-beam angle; moreover, by using TXRF, theaverage over a large number of particles is measured andthat is useful to determine particle sizes at low concen-trations where the particle density is low. Here, suchmeasurements indicated that particle growth in deoxy-genated UPW solutions occurs readily.
In Fig. 11, the Cu fluorescence intensity is plotted as afunction of the angle for samples immersed in 100 ppbCu-contaminated UPW. As can be seen, the sampleprepared in non-deoxygenated UPW has a profile indic-ative of atomically dispersed Cu near the surface, wherethe maximum in fluorescence intensity occurs at thecritical angle of 0.16�. However, the sample immersed indeoxygenated UPW has a fluorescence maximum at 0.1�suggesting that Cu particles are present on the surface. Afit of the angle scan for the deoxygenated sample wasconducted by using a concentration profile representingparticles (spherical caps) sitting on a thin surface layerextending beneath the surface. Further details regardingthe concentration-profile model used for this fit areavailable [62]. The results of this fit indicated the pres-ence of nanoparticles with a mean diameter of 16.1 nm± 0.3 nm, agreeing well with the AFM measurements.
It was suggested that these differences in Cu depositionoccur because, in non-deoxygenated UPW solutions, thegrowing oxide uses most of the nucleation sitespreventing Cu clusters from nucleating. However, indeoxygenated UPW, the oxide grows more slowlyallowing for Cu to nucleate mainly as metallic particles.To further confirm this hypothesis, XANES analyses wereperformed to determine whether Cu is present as an oxideor metal.
3.1.2.2. TXRF-XANES analysis. Fig. 12 shows the Cu1s absorption spectra of the Cu reference samples (Cu,Cu2O and CuO) having the oxidation state 0, I, and II,respectively. Also plotted in Fig. 12 is the Cu metal on
Please cite this article in press as: F. Meirer et al., Trends Anal. Chem. (2
silicon sample that was created by intentionally con-taminating a clean silicon wafer in 2% HF spiked withCu at a concentration of 1000 ppb. Since reductivedeposition dominates in low-pH solutions, it would beexpected that any Cu deposited in 2% HF would bemetallic in nature [68]. This is confirmed by the XANESspectrum, which clearly shows that the metal on siliconsample resembles the Cu metal foil spectrum.
Fig. 13 shows the Cu 1s absorption spectra of siliconsamples that were contaminated in deoxygenated andnon-deoxygenated UPW solutions with an intentional Cuconcentration of 100 ppb. Using the reference samplesshown in Fig. 12, least squares fits were made using theWinXAS program [69] to determine the percentagecontribution of Cu metal, Cu(I) oxide, and Cu(II) oxide.
From these fits of the X-ray absorption spectra, it wasdetermined that the Cu deposited onto the silicon samplesurface for the deoxygenated solution was mostly metalin character. By contrast, the Cu deposited onto thesilicon sample surface for the non-deoxygenated UPWsolutions comprised less Cu metal and more Cu oxides.This provides further evidence that, in the absence ofdissolved oxygen, Cu species in UPW solutions willdeposit reductively onto the silicon surface, resulting insurface species that are mostly metallic in character.However, the presence of dissolved oxygen inhibitsreductive deposition and Cu species are predominantlyincorporated into a growing oxide, resulting in surfacespecies that are more oxide in character.
Fig. 14 shows the results of the fits performed for allmeasured samples, summarizing the percent contribu-tions of Cu metal, Cu(I) oxide and Cu(II) oxide to each fit.From these results the following conclusions can bedrawn.(1) Samples immersed in deoxygenated solutions have
greater metal content, which increases with solu-tion concentration, suggesting that metallic Cucan freely deposit on the surface.
http://www.elsevier.com/locate/trac 13
010), doi:10.1016/j.trac.2010.04.001

Trends Trends in Analytical Chemistry, Vol. xxx, No. x, 2010
ARTICLE IN PRESS
(2) The corresponding non-deoxygenated solutionshad surface species that were a mixture of Cuoxides and metallic Cu, indicating that the presenceof dissolved oxygen increases the rate of oxidativedeposition for Cu, while inhibiting the reductivedeposition of metallic Cu.
(3) For the samples immersed in solutions containingonly 15 ppb Cu, the differences between deoxygen-ated and non-deoxygenated samples were minimalas both samples have large amounts of Cu oxides,in addition to some Cu metal, implying that, evenin the absence of dissolved oxygen, the Cu concen-tration in the solution is just not high enough toallow for the growth of metallic Cu particles. Theseresults agree well with the data shown in Fig. 10,where the surface concentration for samples sub-merged in deoxygenated UPW solutions exhibiteda precipitous drop when the Cu concentration inthe UPW solution was less than 15 ppb.
(4) This effect is even more pronounced for the samplesimmersed in UPW solutions with 5 ppb Cu, as thesesamples had surface species that were predomi-nantly Cu(II) oxide, with some metallic species thatare most likely Cu particle embryos, which areunstable in solution.
3.1.2.3. Conclusions. It was demonstrated that thedeposition of Cu onto silicon surface from UPW solutionsis strongly influenced by the presence of dissolvedoxygen. TXRF measurements revealed that there is acritical concentration threshold, above which theamount of Cu deposited in deoxygenated UPW solutionswas greater than that of non-deoxygenated UPW. Belowthis concentration threshold, the reverse is true and theCu deposited is less for deoxygenated solutions. Thesedifferences suggest that the deposition mechanisms areinfluenced by the presence of dissolved oxygen and thatreductive deposition occurs predominantly in deoxy-genated UPW, while oxidative deposition primarilyoccurs in non-deoxygenated UPW. In addition, bymeasuring the Cu fluorescence as a function of the angleof incidence, the presence of Cu particles on the siliconsurface was revealed for samples immersed in deoxy-genated UPW, which was further confirmed with AFMimages. Since reductive deposition would result in theplating of metallic Cu onto the silicon surface, the pres-ence of particles confirmed that reductive depositionoccurs in deoxygenated UPW. Finally, the chemical stateof the deposited Cu was determined using XANES anal-ysis. Samples immersed in deoxygenated UPW had ahigh metal Cu content, demonstrating that reductivedeposition is the principal mechanism for deposition,while samples immersed in non-deoxygenated UPW hada high Cu(I) and Cu(III) oxide content, indicating thatmost of the Cu deposited on the silicon surface wasincorporated into the oxide.
14 http://www.elsevier.com/locate/trac
Please cite this article in press as: F. Meirer et al., Trends Anal. Chem. (2
3.2. SR-TXRF analyses of atmospheric aerosolsUnderstanding the effects of aerosols on human healthand global climate requires not only a detailed under-standing of sources, transport and fate of atmosphericparticles but also knowledge about their physical andchemical properties. An analysis of aerosols shouldtherefore provide information about size and elementalcomposition of the particles. Furthermore, it might behelpful or even necessary to get information about thechemical state of a specific element of interest present inthe particles.
Cascade impactors are devices designed for size-re-solved sampling of particles according to their aerody-namic diameter. The particles can be directly collectedon collector plates, which, in turn, can be used asreflectors for TXRF analysis (e.g., silicon wafers, Plexiglasor quartz carriers). TXRF analysis is especially suitablefor the investigation of aerosols because it allows non-destructive multi-element analysis of trace and ultra-trace amounts (ng) of most elements. Multi-elementanalysis is one of the most appropriate tools for derivingfingerprints of different sources of fine particulate matterand hence enables the origin of air pollutants to betraced. If SR is used as excitation source, the samplingtime (i.e. the time needed to collect the aerosols with theimpactor) can be diminished because even smaller totalsample masses (in the fg region) can be analyzed. Thisenables more precise time resolution of atmosphericevents. Furthermore, the application of SR allowsXANES measurements to gain chemical informationabout a specific element of interest. The oxidation state ofelements is of relevance for their environmental impact,as the toxicity [e.g., Cr(III)/Cr(VI), As(III)/As(V)] orenvironmental activity [e.g., Fe(II)/Fe(III)] of an elementmay differ considerably depending on its oxidation state.Here, another advantage of SR-TXRF analysis is that theaerosols can be measured directly after collecting themon the reflector surface, so additional sample prepara-tion, which could influence the chemical state of thesample, is unnecessary.
In the following, we present two studies that usedSR-TXRF to analyze aerosols with special emphasis onA) high temporal resolution and B) the oxidation state ofFe present in the particles.
3.2.1. Analysis of airport-related aerosol particleswith high time resolution using SR-TXRFGroma et al. [70] reported the analysis of impactor-col-lected aerosols to monitor local air pollution. Urban air-quality research is an important part of environmentalscience, since air quality has a strong effect on humanhealth. The air quality at airport areas is of increasinginterest due to the dynamic growth of air traffic. Themost critical pollutant here is fine particulate matter(PM2.5) (i.e. particles with aerodynamic diameterssmaller that 2.5 lm) – originating from the emissions of
010), doi:10.1016/j.trac.2010.04.001

Trends in Analytical Chemistry, Vol. xxx, No. x, 2010 Trends
ARTICLE IN PRESS
aircrafts, ground-handling vehicles and passenger-related cars [71]. There is strong evidence that PM2.5
causes more severe health effects than particles withlarger aerodynamic diameters [72]. Another reason whythe study focused on aerosols with smaller-sized particles(0.25–4 lm aerodynamic diameter) was that largerparticles naturally occur at lower concentrations (par-ticles/m3). To allow statistically significant evaluation ofthese larger particles, longer sampling times would havebeen required – preventing measurements with a timeresolution in the range of aircraft movements. However,the possibility to perform a multi-element analysis with ahigh temporal resolution (620 min) was an importantpoint for the investigation of the aerosols to identifypotential particle sources, so short collection times werenecessary, and required special instrumentation and ahighly sensitive analytical technique. Size-fractionatedaerosol samples were collected on silicon wafers using aseven-stage May cascade impactor and were analyzed bymeans of SR-TXRF using the set-up installed at beamlineL at HASYLAB, Hamburg, Germany [25,73]. This ap-proach allowed quantitative determination of ultra-traceconcentrations (pg/m3) of most elements from samplescollected for less than 20 min, while retaining the fullsize resolution of the impactor. The sampling and trace-element analysis were performed at airport sites (Buda-pest Airport) near sources which show high spatial andtemporal variability.
3.2.1.1. Results. Elemental concentrations in thesamples were calculated based on the SR-TXRF fluores-cence spectra using Cr as internal standard. LDs achievedfor 20-min sampling time ranged from ng/m3 for the lightelements (Al, Si) to pg/m3 for the medium Z elements (Rband Sr) in the present matrix (see Table 3). The LDs werecalculated for 100 s measuring time (LD100).
Aerosols were collected at three different sites at theairport (runway, Terminal 2 (high traffic) and Terminal
Table 3. Detection limits for 100-s measuring time (LD100) calcu-lated for each element detected in the aerosol particles collected atairport sites
Element LD100 (pg/m3)
S 451.3Cl 282.8K 107.9Ca 70.2Ti 48.7Cr 23.4Fe 12.4Cu 4.5Zn 3.5Se 2.6Br 2.4Sr 3.4Pb 5.3
Please cite this article in press as: F. Meirer et al., Trends Anal. Chem. (2
1 (low traffic)) in four different size fractions and wereanalyzed with respect to the elemental composition ofeach size fraction. The quantification of the elementsfound in the samples was performed using the funda-mental parameter method [67] (internal standard: Cr).To trace the particle sources, the results of the quanti-fication were discussed in three different aspects:
(i) magnitude of concentration values at differentsites;
(ii) typical elements at different sites; and,(iii) size distribution.
The data confirmed facts that were previouslyexpected for typical suburban areas, besides results thatshowed special characteristics of airport-related aerosols.Aerosols originate from long-range transport, city plumeand from local sources, which showed large variability atthe airport, since aircraft, ground-supporting vehiclesand passenger cars have to be taken into account. Theemission characteristics are all different and can be usedto identify the sources.
In this study, the authors could identify typical air-craft-related particles from extremely small samplingvolumes. Special, aircraft-related particles were detectednear the runway and showed high Cu concentrationsdue to aircraft-brake erosion. Size-fractioned samplingallowed determination of particles unrelated to airportcombustion processes (e.g., aerosols of larger size frac-tions containing Ca, Ti and Fe due to resuspension).Furthermore, elements originating from wood-burningprocesses (e.g., S and K), which are connected to atmo-spheric transport, could be identified by comparingconcentration magnitudes at different sites. This waspossible due to the excellent features of SR-TXRF show-ing LDs in the range of pg/m3 for 20-min sampling time.This short collection time allowed study of temporalvariation (e.g., due to aircraft landing and movement) ofelemental concentrations in size-fractioned aerosols.
3.2.2. Characterization of atmospheric aerosolsusing SR-TXRF and Fe K-edge TXRF-XANESIn this study, Fittschen et al. [74] investigated theelemental composition of atmospheric aerosols usingSR-TXRF and determined the oxidation state of Fe in theaerosols by means of Fe K-edge XANES in total reflectiongeometry.
For the same reasons mentioned in sub-section 3.2.1above, this study focused on elemental determinationaccording to the particle size with special interest insmall aerosol particles [i.e. fine (PM10) and ultra-finedust (PM2.5)]. Furthermore the research focused on lead,which is known for its toxicity [75], and iron, which actsas a micro nutrient for phytoplankton, the basis ofmarine life.
Since the 1970s, abatement measures for Pb as addi-tive in fuel led to reduced levels in the atmosphericenvironment [76]. Nonetheless, Pb is again object of
http://www.elsevier.com/locate/trac 15
010), doi:10.1016/j.trac.2010.04.001
Trends Trends in Analytical Chemistry, Vol. xxx, No. x, 2010
ARTICLE IN PRESS
public discussion about its concentration in electronicdevices and toys. Iron is the most abundant transitionmetal in atmospheric aerosols and is transported fromthe great land masses into the ocean. Iron oxides origi-nating from the Earth�s crust mainly contain Fe(III). Formarine organisms, the uptake of Fe(II) is much easierthan that of Fe(III), so a change in oxidation state is veryimportant. As iron undergoes reactions in the atmo-sphere [77], it is likely that the oxidation state is differentfor various particle-size fractions. To achieve a highparticle-size resolution, a 12-stage round-nozzle low-pressure Berner impactor covering the size range 16–0.015 lm (aerodynamic particle diameters) was used.The sampling time for the aerosols over the city ofHamburg was kept as short as possible to avoid oxidationof Fe during sampling and to test the feasibility of themethod for analysis of aerosols collected during shortsample times (<1 h), which enables the detection ofchanges that may occur due to day and night time anddifferent meteorological conditions. The samples wereanalyzed at beamline L at HASYLAB, Hamburg,
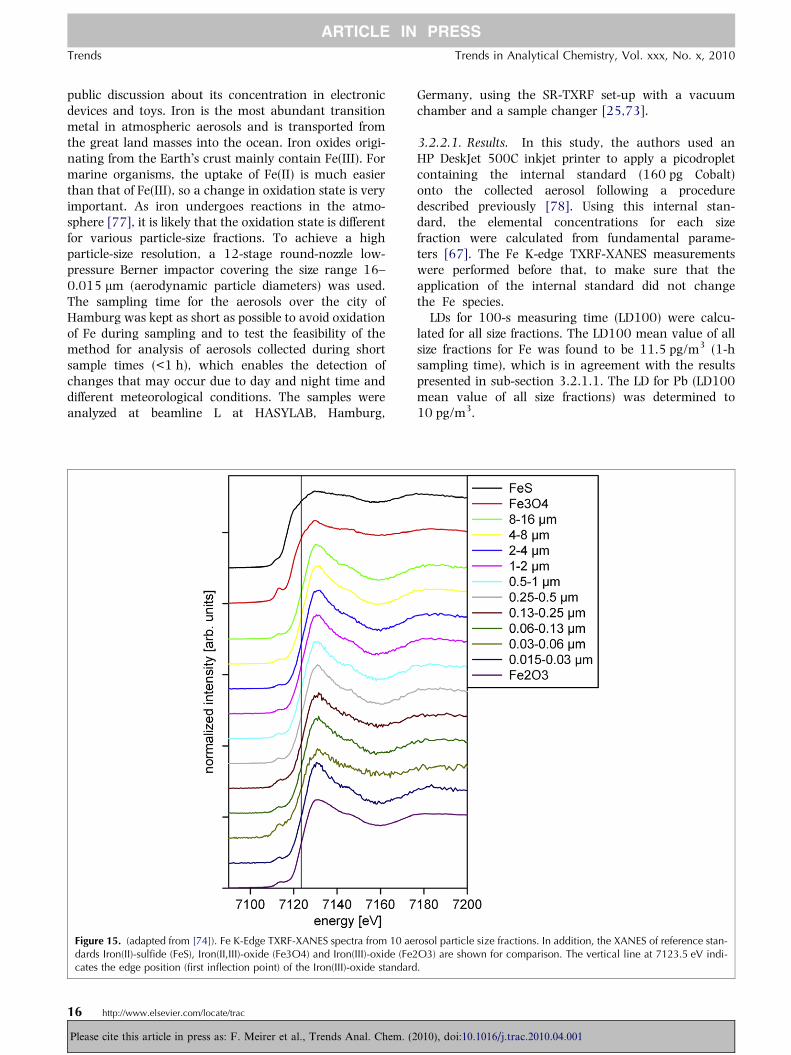
Figure 15. (adapted from [74]). Fe K-Edge TXRF-XANES spectra from 10 aedards Iron(II)-sulfide (FeS), Iron(II,III)-oxide (Fe3O4) and Iron(III)-oxide (Fe2cates the edge position (first inflection point) of the Iron(III)-oxide standard
16 http://www.elsevier.com/locate/trac
Please cite this article in press as: F. Meirer et al., Trends Anal. Chem. (2
Germany, using the SR-TXRF set-up with a vacuumchamber and a sample changer [25,73].
3.2.2.1. Results. In this study, the authors used anHP DeskJet 500C inkjet printer to apply a picodropletcontaining the internal standard (160 pg Cobalt)onto the collected aerosol following a proceduredescribed previously [78]. Using this internal stan-dard, the elemental concentrations for each sizefraction were calculated from fundamental parame-ters [67]. The Fe K-edge TXRF-XANES measurementswere performed before that, to make sure that theapplication of the internal standard did not changethe Fe species.
LDs for 100-s measuring time (LD100) were calcu-lated for all size fractions. The LD100 mean value of allsize fractions for Fe was found to be 11.5 pg/m3 (1-hsampling time), which is in agreement with the resultspresented in sub-section 3.2.1.1. The LD for Pb (LD100mean value of all size fractions) was determined to10 pg/m3.
rosol particle size fractions. In addition, the XANES of reference stan-O3) are shown for comparison. The vertical line at 7123.5 eV indi-.
010), doi:10.1016/j.trac.2010.04.001
Trends in Analytical Chemistry, Vol. xxx, No. x, 2010 Trends
ARTICLE IN PRESS
The results of the quantification showed that traffic-related particles containing Zn and Pb occur in fineaerosols. The samples collected during night timeshowed lower concentrations of these elements soproving that Zn and Pb can be related to city traffic.Summation of Pb concentrations over all stages gavebulk elemental concentrations of 5 ng/m3 for samplescollected during the day and 2 ng/m3 for samples col-lected during night. These concentrations are very sim-ilar to those reported by Groma et al. [70] (low trafficperiod) and are the same order of magnitude as theconcentrations (1.6–90 ng/m3) determined during alarge-scale campaign on post-abatement Pb levels inseveral urban and rural sites in Germany. In this cam-paign, the aerosols were collected over a time period of24 h [79].
To learn more about the redox characteristics of Fepresent in atmospheric particulate matter, its oxidationstate was analyzed by Fe K-edge TXRF-XANES withrespect to particle size. As several studies reported, Fe isphotochemically reduced in the atmosphere, so itseemed possible that Fe(II) was enriched in specificparticle-size fractions according to its generation. Totalamounts of Fe found on the collection plates were low(500–900 pg) but sufficient for XANES analysis bycomparison with different Fe standards. All measure-ments were performed in vacuum and repetitive scansdid not show changes of the fine structure, confirmingthat oxidation of the samples did not occur during themeasurements.
Fig. 15 displays the results of the XANES analysisshowing that Fe was present in the oxidation state +3(predominately in the form of Fe(III) oxide) in allcollected aerosols and all particle-size fractions. This is ingood agreement with other studies, which all foundpredominately Fe(III) in the aerosol particulates [80–82], although high amounts of Fe(II) were reported inrain and cloud samples [83,84].
4. Conclusion
A clear trend has become evident in the development ofSR-TXRF analysis, due to its versatility. The excellentLDs of SR-TXRF can be readily used in combination withabsorption spectroscopy, enabling XAS studies ofsamples available only in small amounts and/or at verylow concentrations. Furthermore, samples applied to ornaturally found on or in the surface of a reflecting sub-strate material can be characterized by angle-dependentmeasurements of their fluorescence. Recent studies haveshown that SR-TXRF is especially suitable for analysesutilizing the standing-wave field on top of a reflectorsurface generated by the interference of incident andreflected beams.
Please cite this article in press as: F. Meirer et al., Trends Anal. Chem. (2
References[1] A.H. Compton, Philos. Mag. 45 (1923) 1121.
[2] R.S. Shankland (Editor), Scientific Papers of Arthur Holly Comp-
ton: X-Ray and Other Studies, University of Chicago Press,
Chicago, IL, USA, 1973.
[3] Y. Yoneda, T. Horiuchi, Rev. Sci. Instr. 42 (1971) 1069.
[4] P. Wobrauschek, Totalreflexions Rontgenfluoreszenzanalyse, PhD
Thesis, Atominstitut der osterreichischen Universitaten, Technical
University of Vienna, Austria, 1975.
[5] H. Aiginger, P. Wobrauschek, Nucl. Instrum. Methods 114
(1974) 157.
[6] P. Wobrauschek, H. Aiginger, Anal. Chem. 47 (1975) 852.
[7] J. Knoth, H. Schwenke, Fresenius� J. Anal. Chem. 291 (1978) 200.
[8] H. Schwenke, J. Knoth, Nucl. Instrum. Methods 193 (1982) 239.
[9] L.G. Parratt, Phys. Rev. 95 (1954) 359.
[10] R.S. Becker, J.A. Golovchenko, J.R. Patel, Phys. Rev. Lett. 50
(1983) 153.
[11] D.K.G. de Boer, Phys. Rev. B 44 (1991) 498.
[12] P. Wobrauschek, X-Ray Spectrom. 36 (2007) 289.
[13] A. von Bohlen, Spectrochim. Acta, Part B 64 (2009) 821.
[14] A. Iida, A. Yoshinaga, K. Sakurai, Y. Gohshi, Anal. Chem. 58
(1986) 394.
[15] P.A. Pella, R.C. Dobbyn, Anal. Chem. 60 (1988) 684.
[16] S. Brennan, W. Tompkins, N. Takaura, P. Pianetta, S.S. Laderman,
A. Fischer-Colbrie, J.B. Kortright, M.C. Madden, D.C. Wherry, Nucl.
Instrum. Methods Phys. Res., Sect. A 347 (1994) 417.
[17] F. Hegedus, P. Wobrauschek, C. Streli, P. Winkler, R. Rieder, W.
Ladisich, M. Victoria, R.W. Ryon, W.F. Sommer, X-Ray Spectrom.
24 (1995) 253.
[18] C. Streli, P. Wobrauschek, F. Meirer, G. Pepponi, J. Anal. At.
Spectrom. 23 (2008) 792.
[19] R. Rieder, P. Wobrauschek, W. Ladisich, C. Streli, H. Aiginger, S.
Garbe, G. Gaul, A. Knochel, F. Lechtenberg, Nucl. Instrum.
Methods Phys. Res., Sect. A 355 (1995) 648.
[20] P. Wobrauschek, R. Gorgl, P. Kregsamer, C. Streli, S. Pahlke, L.
Fabry, M. Haller, A. Knochel, M. Radtke, Spectrochim. Acta, Part
B 52 (1997) 901.
[21] R. Klockenkamper, Total Reflection X-Ray Fluorescence Analysis,
Wiley-Interscience, New York, USA, 1997.
[22] C. Streli, X-Ray Spectrom. 29 (2000) 203.
[23] P. Kregsamer, C. Streli, P. Wobrauschek, Total-Reflection X-ray
Fluorescence, in: R. Van Grieken, A. Markowicz (Editors), Hand-
book of X-Ray Spectrom, Marcel Dekker, Inc., New York, USA,
2001, pp. 559–602.
[24] F. Meirer, G. Pepponi, C. Streli, P. Wobrauschek, P. Kregsamer, N.
Zoger, G. Falkenberg, Spectrochim. Acta, Part B 63 (2008) 1496.
[25] C. Streli, G. Pepponi, P. Wobrauschek, C. Jokubonis, G. Falken-
berg, G. Zaray, X-Ray Spectrom. 34 (2005) 451.
[26] G. Falkenberg, G. Pepponi, C. Streli, P. Wobrauschek, Spectro-
chim. Acta, Part B 58 (2003) 2239.
[27] J. Kawai, S. Hayakawa, Y. Kitajima, Y. Gohshi, Spectrochim. Acta,
Part B54 (1999) 215.
[28] K. Baur, S. Brennan, P. Pianetta, R. Opila, Anal. Chem. 74 (2002)
609A.
[29] D. Norman, J. Phys. C: Solid State Phys. 19 (1986) 3273.
[30] A. Singh, K. Baur, S. Brennan, T. Homma, N. Kubo, P. Pianetta,
MRS Proc. 716 (2002) 23.
[31] F. Meirer, G. Pepponi, C. Streli, P. Wobrauschek, V.G. Mihucz, G.
Zaray, V. Czech, J.A.C. Broekaert, U.E.A. Fittschen, G. Falkenberg,
X-Ray Spectrom. 36 (2007) 408.
[32] E.A. Stern, S.M. Heald, Basic principles and applications of EXAFS,
in: E.E. Koch (Editor), Handbook on Synchrotron Radiation,
North-Holland Publishing Company, Amsterdam, The Nether-
lands, 1983.
[33] H. Oyanagi, X-ray Absorption Fine Structure, in: H. Saisho, Y.
Gohshi (Editors), Applications of Synchrotron Radiation to Mate-
http://www.elsevier.com/locate/trac 17
010), doi:10.1016/j.trac.2010.04.001
Trends Trends in Analytical Chemistry, Vol. xxx, No. x, 2010
ARTICLE IN PRESS
rials Analysis, Elsevier, Amsterdam, The Netherlands, pp. 207–
305.
[34] J. Stohr, SEXAFS: Everything you always wanted to know about
SEXAFS but were afraid to ask, in: D.C. Koningsberger, R. Prins
(Editors), X-Ray Absorption: Principles, Applications, Techniques
of EXAFS, SEXAFS and XANES, John Wiley & Sons, Inc., New
York, USA, 1988, pp. 443–572.
[35] P. Kregsamer, Rontgenfluoreszenzanalyse von seltenen Erden in
Totalreflexionsgeometrie, PhD Thesis, Atominstitut der osterrei-
chischen Universitaten, Technical University of Vienna, Austria,
1990.
[36] R. Rieder, Verbesserung der Nachweisgrenzen bei der Totalreflex-
ions-Rontgenfluoreszenzanalyse durch den Einsatz von Synchro-
tronstrahlung und Bau einer neuen Meßkammer, PhD Thesis,
Atominstitut der osterreichischen Universitaten, Technical Uni-
versity of Vienna, Austria, 1994.
[37] G. Pepponi, Synchrotron Radiation induced Total Reflection X-
Ray Fluorescence Analysis applied to Material Science, PhD
Thesis, Atominstitut der osterreichischen Universitaten, Technical
University of Vienna, Austria, 2002.
[38] M.J. Bedzyk, G.M. Bommarito, J.S. Schildkraut, Phys. Rev. Lett. 62
(1989) 1376.
[39] D.K.G. de Boer, A.J.G. Leenaers, W.W. van den Hoogenhof, X-Ray
Spectrom. 24 (1995) 91.
[40] U. Weisbrod, R. Gutschke, J. Knoth, H. Schwenke, Appl. Phys. A:
Mater. Sci. Process. 53 (1991) 449.
[41] M. Kramer, A. von Bohlen, C. Sternemann, M. Paulus, R.
Hergenroder, Appl. Surf. Sci. 253 (2007) 3533.
[42] A. Von Bohlen, M. Kramer, C. Sternemann, M. Paulus, J. Anal. At.
Spectrom. 24 (2009) 792.
[43] R.W. Ryon, J.D. Zahrt, in: R. Van Grieken, A. Markowicz (Editors),
Handbook of X-Ray Spectrom., Marcel Dekker, Inc., New York,
USA, 1993, pp. 491-515.
[44] H. Aiginger, P. Wobrauschek, C. Brauner, Nucl. Instrum. Methods
120 (1974) 541.
[45] J. Osan, B. Torok, S. Torok, K.W. Jones, X-Ray Spectrom. 26
(1997) 37.
[46] F. Goodarzi, F.E. Huggins, Energy Fuels 19 (2005) 905.
[47] L. Troger, D. Arvanitis, K. Baberschke, H. Michaelis, U. Grimm, E.
Zschech, Phys. Rev. B 46 (1992) 3283.
[48] P. Pfalzer, J.P. Urbach, M. Klemm, S. Horn, M.L. denBoer, A.I.
Frenkel, J.P. Kirkland, Phys. Rev. B 60 (1999) 9335.
[49] F. Meirer, G. Pepponi, C. Streli, P. Wobrauschek, P. Kregsamer, N.
Zoeger, G. Falkenberg, Spectrochim. Acta, Part B 63 (2008) 1496.
[50] F. Meirer, G. Pepponi, C. Streli, P. Wobrauschek, N. Zoeger, J.
Appl. Phys. 105 (2009) 074906.
[51] A.A. Istratov, H. Hieslmair, E.R. Weber, Appl. Phys. A: Mater. Sci.
Process. 70 (2000) 489.
[52] </www.technos-intl.com/trex630.php/>, The Technos Interna-
tional homepage, 2008.
[53] </www.rigaku.com/semi/txrf-v300.html/>, The Rigaku home-
page, 2008.
[54] L. Fabry, S. Pahlke, L. Kotz, G. Tolg, Fresenius� J, Anal. Chem. 349
(1994) 260.
[55] S. Pahlke, L. Fabry, L. Kotz, C. Mantler, T. Ehmann, Spectrochim.
Acta, Part B56 (2001) 2261.
[56] G. Settembre, E. Debrah, Micro 16 (1998) 79.
[57] F. Meirer, C. Streli, G. Pepponi, P. Wobrauschek, M.A. Zaitz, C.
Horntrich, G. Falkenberg, Surf. Interface Anal. 40 (2008) 1571.
18 http://www.elsevier.com/locate/trac
Please cite this article in press as: F. Meirer et al., Trends Anal. Chem. (2
[58] F. Meirer, Applications of SR-TXRF Analysis in XAS, Sudwest-
deutscher Verlag fur Hochschulschriften, Saarbrucken, Germany,
2009.
[59] F. Meirer, Applications of Synchrotron Radiation induced Total
Reflection X-Ray Fluorescence Analysis in Absorption Spectros-
copy, Dissertation, Atominstitut der Osterreichischen Universita-
ten, Technical University of Vienna, Austria, 2008.
[60] H. Schwenke, J. Knoth, Total reflection XRF, in: R.E. Van
Griecken, A.A. Markowicz (Editors), Handbook of X-Ray Spec-
trometry: Methods and Techniques, Marcel Dekker, New York,
USA, 1993, pp. 453–489.
[61] </www.iaea.or.at/programmes/ripc/physics/faznic/qxas.htm./>.
[62] A. Singh, The nucleation and growth of Cu nanoclusters on
Silicon surfaces from deoxygenated ultra pure water solutions,
Dissertation, Department of Materials Science and Engineering,
Stanford University, CA, USA, 2003.
[63] A. Singh, K. Luening, S. Brennan, T. Homma, N. Kubo, P.
Pianetta, Physica Scripta T115 (2005) 714.
[64] E.R. Weber, Appl. Phys. A: Mater. Sci. Process. 30 (1983) 1.
[65] H. Morinaga, M. Suyama, T. Ohmi, J. Electrochem. Soc. 141
(1994) 2834.
[66] H. Morinaga, M. Aoki, T. Maeda, M. Fujisue, H. Tanaka, M.
Toyoda, Mat. Res. Soc. Symp. Proc. 477 (1997).
[67] D.K.G. de Boer, Spectrochim. Acta, Part B 44 (1989) 1171.
[68] T. Homma, W. Chidsey, J. Phys. Chem. B 102 (1998) 7919.
[69] T. Ressler, J. Synchrotron Radiat. 5 (1998) 118.
[70] V. Groma, J. Osan, A. Alsecz, S. Torok, F. Meirer, C. Streli, P.
Wobrauschek, G. Falkenberg, J. Hungarian Meteorol. Service 112
(2008) 83.
[71] V. Groma, B. Alfoldy, J. Osan, S. Kugler, M. Kalocsai, Impact of the
airport related traffic on the urban particulate pollution, Proc.
Eur. Aerosol Conf., Salzburg, Austria (9–14 Sept. 2007).
[72] M. Kampa, E. Castanas, Environ. Pollut. 151 (2008) 362.
[73] C. Streli, G. Pepponi, P. Wobrauschek, C. Jokubonis, G. Falken-
berg, G. Zaray, J. Broekaert, U. Fittschen, B. Peschel, Spectrochim.
Acta, Part B 61 (2006) 1129.
[74] U.E.A. Fittschen, F. Meirer, C. Streli, P. Wobrauschek, J. Thiele, G.
Falkenberg, G. Pepponi, Spectrochim. Acta, Part B 63 (2008)
1489.
[75] J. Jaworski, Lead, in: T.C. Hutchinson, K.M. Meema (Editors),
SCOPE 31: Lead, Mercury, Cadmium and Arsenic in the
Environment, John Wiley & Sons, Chichester, West Sussex, UK,
1987, pp. 3–16.
[76] R.M. Harrison, W.T. Sturges, Atmos. Environ. 17 (1983) 311.
[77] M.O. Andreae, P.J. Crutzen, Science (Washington, DC) 276
(1997) 1052.
[78] U.E.A. Fittschen, S. Hauschild, M.A. Amberger, G. Lammel, C.
Streli, S. Forster, P. Wobrauschek, C. Jokubonis, G. Pepponi, G.
Falkenberg, J.A.C. Broekaert, Spectrochim. Acta, Part B 61 (2006)
1098.
[79] G. Lammel, A. Rohrl, H. Schreiber, Environ. Sci. Pollut. Res. 9
(2002) 397.
[80] P. Hoffmann, A.N. Dedik, J. Ensling, S. Weinbruch, S. Weber, T.
Sinner, P. Gutlich, H.M. Ortner, J. Aerosol Sci. 27 (1996) 325.
[81] M. Hirabayashi, M. Matsuo, Anal. Sci. 17 (2001) i1581.
[82] G. Zhang, Hyperfine Interactions 151–152 (2003) 299.
[83] G. Zhuang, Z. Yi, G.T. Wallace, Mar. Chem. 50 (1995) 41.
[84] R.J. Kieber, B. Peake, J.D. Willey, B. Jacobs, Atmos. Environ. 35
(2001) 6041.
010), doi:10.1016/j.trac.2010.04.001
Related Documents