Radiation Physics and Chemistry 77 (2008) 1–8 Synchrotron microscopic X-ray fluorescence analysis of the effects of chronic arsenic exposure in rat brain Marcelo Rubio a,d,e, , Roberto D. Perez a,d,e , Carlos A. Perez c , Aldo H. Eynard b,e , Guillermina A. Bongiovanni b,e a Centro de Excelencia en Productos y Procesos—CEPROCOR, Agencia Co´rdoba Ciencia S.E., Av. Alvarez de Arenales N1 230, B1 Juniors, (X5004AAP) Co´rdoba, Argentina b Facultad de Ciencias Me´dicas, Instituto de Biologı´a Celular, Universidad Nacional de Co´rdoba, M. Allende y Barros, (5000) Ciudad Universitaria, Co´rdoba, Argentina c Laborato ´rio Nacional de Luz Sı´ncrotron—LNLS, POB 6192, 13084-971 Campinas, SP, Brazil d Facultad de Matema ´tica, Astronomı´a y Fı´sica, Universidad Nacional de Co´rdoba, M. Allende y H. De La Torre, (5000) Ciudad Universitaria, Co´rdoba, Argentina e Consejo Nacional de Investigaciones Cientı´ficas y Te´cnicas—CONICET, Rivadavia 1917, (1033) Buenos Aires, Argentina Received 6 October 2006; accepted 22 June 2007 Abstract Synchrotron microscopic X-ray fluorescence (m-SRXRF) scanning and conventional XRF analysis were applied for studying elemental concentrations in lyophilised brain rat slices. The animals received drinking water—100 ppm of sodium arsenite—ad libitum for 30 and 60 days. Accumulation of arsenic was corroborated and its dependence with arsenic dosage suggests the existence of a protection mechanism which limits the transport of inorganic arsenic to the brain. Chlorine, potassium and iron were reduced changing their spatial distributions while copper and zinc were redistributed. r 2007 Elsevier Ltd. All rights reserved. Keywords: Rat brain; Arsenic; XRF; Microanalysis 1. Introduction Arsenic is a naturally occurring element widely present in the environment. The levels of arsenic in the soils of various countries range from 0.1 to 40 ppm (Mandal and Suzuki, 2002), being the parent rock and human activities the principal factors influencing the concentration of the element. In Argentina, the average of arsenic in all types of soils and sediments is 5 ppm. Arsenic is found at low concentration in natural water. The maximum permissible concentration of arsenic in drinking water is 50 ppb and recommended value is 10 ppb by the US Environmental Protection Agency (1975) and World Health Organisation (2001). It is known that groundwater contamination represents a major source of exposure of human and animals to toxic levels of arsenic upon utilisation of such ground waters for irrigation purposes. Some zones of Argentina char- acterised by agricultural aptitudes suffer limitations be- cause they are arsenic-affected regions. Rural population and animals of the eastern region of the province of Co´rdoba and the province of La Pampa have high exposures to toxic levels of inorganic arsenic from naturally contaminated drinking water (Hopenhayn-Rich et al., 1998). In both places, arsenic concentrations from 100 up to 3000 ppb have been reported in groundwater aquifers. The disease ascribed to arsenic contamination in Argentina was called ‘chronic endemic regional hydroarsenism’ (Hopenhayn-Rich et al., 1996; Sbarato and Sa´nchez, 2001; Mandal and Suzuki, 2002). ARTICLE IN PRESS www.elsevier.com/locate/radphyschem 0969-806X/$ - see front matter r 2007 Elsevier Ltd. All rights reserved. doi:10.1016/j.radphyschem.2007.06.010 Corresponding author. Centro de Excelencia en Productos y Procesos—CEPROCOR, Agencia Co´rdoba Ciencia S.E., Av. Alvarez de Arenales N1 230, B1 Juniors, (X5004AAP) Co´rdoba, Argentina. Fax: +54 3541 488181. E-mail address: [email protected] (M. Rubio).

Welcome message from author
This document is posted to help you gain knowledge. Please leave a comment to let me know what you think about it! Share it to your friends and learn new things together.
Transcript
ARTICLE IN PRESS
0969-806X/$ - s
doi:10.1016/j.ra
�CorrespondProcesos—CEP
Arenales N1 23
Fax: +54 3541
E-mail addr
Radiation Physics and Chemistry 77 (2008) 1–8
www.elsevier.com/locate/radphyschem
Synchrotron microscopic X-ray fluorescence analysis of theeffects of chronic arsenic exposure in rat brain
Marcelo Rubioa,d,e,�, Roberto D. Pereza,d,e, Carlos A. Perezc,Aldo H. Eynardb,e, Guillermina A. Bongiovannib,e
aCentro de Excelencia en Productos y Procesos—CEPROCOR, Agencia Cordoba Ciencia S.E.,
Av. Alvarez de Arenales N1 230, B1 Juniors, (X5004AAP) Cordoba, ArgentinabFacultad de Ciencias Medicas, Instituto de Biologıa Celular, Universidad Nacional de Cordoba, M. Allende y Barros,
(5000) Ciudad Universitaria, Cordoba, ArgentinacLaboratorio Nacional de Luz Sıncrotron—LNLS, POB 6192, 13084-971 Campinas, SP, Brazil
dFacultad de Matematica, Astronomıa y Fısica, Universidad Nacional de Cordoba, M. Allende y H. De La Torre,
(5000) Ciudad Universitaria, Cordoba, ArgentinaeConsejo Nacional de Investigaciones Cientıficas y Tecnicas—CONICET, Rivadavia 1917, (1033) Buenos Aires, Argentina
Received 6 October 2006; accepted 22 June 2007
Abstract
Synchrotron microscopic X-ray fluorescence (m-SRXRF) scanning and conventional XRF analysis were applied for studying elemental
concentrations in lyophilised brain rat slices. The animals received drinking water—100 ppm of sodium arsenite—ad libitum for 30 and
60 days. Accumulation of arsenic was corroborated and its dependence with arsenic dosage suggests the existence of a protection
mechanism which limits the transport of inorganic arsenic to the brain. Chlorine, potassium and iron were reduced changing their spatial
distributions while copper and zinc were redistributed.
r 2007 Elsevier Ltd. All rights reserved.
Keywords: Rat brain; Arsenic; XRF; Microanalysis
1. Introduction
Arsenic is a naturally occurring element widely present inthe environment. The levels of arsenic in the soils ofvarious countries range from 0.1 to 40 ppm (Mandal andSuzuki, 2002), being the parent rock and human activitiesthe principal factors influencing the concentration ofthe element. In Argentina, the average of arsenic in alltypes of soils and sediments is 5 ppm. Arsenic is found atlow concentration in natural water. The maximumpermissible concentration of arsenic in drinking water is50 ppb and recommended value is 10 ppb by the US
ee front matter r 2007 Elsevier Ltd. All rights reserved.
dphyschem.2007.06.010
ing author. Centro de Excelencia en Productos y
ROCOR, Agencia Cordoba Ciencia S.E., Av. Alvarez de
0, B1 Juniors, (X5004AAP) Cordoba, Argentina.
488181.
ess: [email protected] (M. Rubio).
Environmental Protection Agency (1975) and WorldHealth Organisation (2001).It is known that groundwater contamination represents a
major source of exposure of human and animals to toxiclevels of arsenic upon utilisation of such ground watersfor irrigation purposes. Some zones of Argentina char-acterised by agricultural aptitudes suffer limitations be-cause they are arsenic-affected regions. Rural populationand animals of the eastern region of the province ofCordoba and the province of La Pampa have highexposures to toxic levels of inorganic arsenic fromnaturally contaminated drinking water (Hopenhayn-Richet al., 1998). In both places, arsenic concentrations from100 up to 3000 ppb have been reported in groundwateraquifers. The disease ascribed to arsenic contaminationin Argentina was called ‘chronic endemic regionalhydroarsenism’ (Hopenhayn-Rich et al., 1996; Sbaratoand Sanchez, 2001; Mandal and Suzuki, 2002).
ARTICLE IN PRESSM. Rubio et al. / Radiation Physics and Chemistry 77 (2008) 1–82
Humans are exposed to inorganic and organic arsenicsspecies present in food and water. The bioavailability ofingested inorganic arsenic will depend on the matrix inwhich it is ingested, the solubility of arsenic compoundsand interaction with other nutrients in the gastrointestinaltract. Inorganic arsenic exposure via drinking water hasbeen associated with cancer and serious injury in variousinternal organs. It has been reported gastrointestinal,haematological, hepatic, renal, dermal, neurological,reproductive, carcinogenic and other effects in humansdue to ingestion of heavy doses sub-acute poisoning orrepeated exposures to arsenic (Frumkin and Thun, 2001;Mandal and Suzuki, 2002; Ratnaike, 2003). Althougharsenic is a recognised human carcinogen, the mechanismby which arsenic induces cancer is unknown, in large partdue to the lack of an appropriate animal model. Today,arsenic seems to be a cancer promoter rather than cancerinitiator and the cancer risk will seem to be dose-dependent, declining again when the arsenic exposureceases and the substance is cleared from the body.
Recent studies suggest that arsenic compounds duringtheir metabolism in cells generate reactive oxygen specieswhich results in oxidative stress (Kitchin, 2001). A reportof an in vivo study demonstrated the formation ofhydroxyl radicals in the rat striatum, which were inducedby direct infusion of sodium arsenite (Garcıa-Chavez et al.,2003). Among the possible reactive oxygen species,hydroxyl radical is generally assumed to be the criticalreactive species that directly attacks DNA. The acceptedoxidative stress theory of arsenic carcinogenesis indicatesthat hydroxyl radicals are produced in a Haber–Weiss typeprocess catalysed by a free transition metal. It is thoughtthat iron is one of the possible catalysts of this reaction inmammals because arsenic compounds are good releasers offree iron from ferritin (Kitchin and Ahmad, 2003). Sinceferritin is the most important source of iron for the cells, itis clear that arsenic plays an important role in the ironmetabolism.
Copper is another element influenced by arsenic ex-posure. Copper has a strong interaction with inorganicarsenic in rats that result in its accumulation in brain(Ademuyiwa and Elsenhans, 2000). At present, thechemical reactions involved in the arsenic–copper interac-tion are unknown. However, recent studies demonstratedthat copper accumulation in brain rats is due to the lackof efficient methylation of inorganic arsenic (Ademuyiwaet al., 1996). Since inorganic arsenic crosses theblood–brain barrier (Rodrıguez et al., 2005), the methyla-tion process is produced in the brain which suggest thatcopper concentration may be modified in the brain.
Inorganic arsenic exposure has been related to beha-vioural alterations in rodents, such as disruption in operantlearning and alteration in locomotor activity (Rodrıguez etal., 2001). Since some of these alterations could be relatedto specific changes in several brain regions, informationabout the spatial distribution of arsenic after exposure toinorganic arsenic is of critical importance. Moreover, given
that arsenic affects the metabolism of other elements, toknow a multi-elemental spatial distribution is also veryimportant.Synchrotron radiation (SR) emitted from bending
magnets of powerful electron accelerators has been usedas an excellent X-ray source. It can be used to excite X-rayfluorescence (XRF) and this approach leads to very lowdetection limits on micrometric areas on very smallsamples. Synchrotron microscopic XRF, a trace-levelmicroanalytical method, allows quantitative study of thenature and degree of heterogeneity of inorganic traceconstituents in biological samples. This microbeam meth-od, due to intrinsic characteristics of SR, is able toimplement multi-elemental spectrochemical analysis withspatial resolution on the micrometre scale. It shows highefficiency for trace element determination and short time ofanalysis requirements. In the present work, we appliedsynchrotron microscopic X-ray fluorescence (m-SRXRF) tostudy brain sections of wistar rats provided with arsenicalwater (50 ppm of As) during 0, 30 and 60 days.
2. Materials and methods
2.1. Instrumentation
Mapping of XRF intensities in freeze-dried brainsections were done at the Synchrotron Light NationalLaboratory (Laboratorio Nacional de Luz Sıncrotron,LNLS) (Perez et al., 1999). It is an internationalsynchrotron research facility located in Campinas, Brazil.The energy of the electron bunch inside the storage ringreaches 1.37GeV. A dipolar bending magnet—1.65 Tmagnetic field intensity—accelerates the electrons emittinga photon spectrum with a critical energy of 2.08 keV. Suchphotons are guided into the DO09B beamline where isplaced the XRF set-up. XRF mapping was performedexciting pixel by pixel the brain slices with the whitesynchrotron spectrum.Each sample was positioned in the image plane within an
accuracy of 0.5 mm with a three-axis (x, y, z) remote-controlled stage. A video microscope (magnification500� ) was used to spot the pixels of reference preciselyin the incoming microbeam. XRF measurements wereperformed using a standard geometry (45–451), excitationbeam was collimated by an orthogonal slit (300 mm�300 mm). In this way, pixels of 300 mm� 300 mm were gotkeeping a high flux of photons on the sample. Thefluorescence spectra were recorded with an Si(Li) detectorof 165 eV FWHM at 5.9 keV in air atmosphere. It was setin the horizontal plane at 901 from the incident beam tominimise scattering. The Ka X-ray fluorescent intensitiesof Cl, K, Fe, Cu, Zn and As were processed, so that atwo-dimensional distribution of fluorescent intensitiescould be mapped for each brain sample.On the other hand, a conventional wavelength dispersive
XRF spectrometer was used to determine the bulkelemental concentrations of brain required for m-SRXRF
ARTICLE IN PRESSM. Rubio et al. / Radiation Physics and Chemistry 77 (2008) 1–8 3
mapping calibration. This is a BRUKER SRS3400 XRFspectrometer located at CEPROCOR in Cordoba wherethe standard samples were also prepared. The aboveelements were standardised using primary reference mate-rials and the standard addition method.
2.2. Sample preparation
2.2.1. Rat brain samples
Nine male wistar rats of 50 days old were included in thepresent investigation. The animals were divided into threeequal groups, three rats each. Two groups receiveddrinking water containing 100 ppm of NaAsO2 (SigmaChemicals, USA) ad libitum for different periods of time.One group received arsenic dose for 30 days and the otherone for 60 days. The remaining non-treated group was thecontrol group and it did not receive arsenic dose (0 day).The animals were provided with standard rodent chow(Cargill) ad libitum. This food was analysed by conven-tional XRF obtaining a total arsenic level less than 1 ppm.After the administration of the last arsenic dose, theanimals were given a 1-day rest and were sacrificed underlight ether anaesthesia. Brains were removed, cut in slicesof 2-mm thickness and snap-frozen in liquid nitrogen. Theslices were lyophilised and then one slice of each group wasfixed in acrylic resin for m-SRXRF measure experiences.The other brain slices were analysed by conventional XRFto determine the bulk elemental composition. Once thesynchrotron mapping experiences were carried out, theslices were removed from acrylic and also processed todetermine the bulk concentrations by conventional XRF.
Animal handling and experimental procedures wereexecuted in agreement with the Guidelines for the Careand Use of Laboratory Animals approved by the AnimalCare Committee from ‘Universidad Nacional de Cordoba’,Argentina. Rats conditioning as well as brain samplespreparation were performed at the ‘Instituto de BiologıaCelular’ of the ‘Universidad Nacional de Cordoba’.
2.2.2. Sample preparation for XRF analysis
Each brain slice was ground with a 5100 SPEX Mixer/Mill and sieved in a plastic sieve of 100 mesh. Then,cellulose was added to the sample up to the total mass of0.5 g. The powder was mixed with 0.125 g of wax and theproduct was uniformly deposited on a cellulose substratecontained in an aluminium cup of 40-mm diameter.Finally, the product was pressed at 10 ton in a pellet diewith tungsten carbide pellet. As a result, a solid and stable40mm sample disc was obtained with the sample located inthe surface thickness.
2.2.3. Standards for bulk XRF analysis
A minimum of five standard samples with predeterminedamount of each element of interest (Cl, K, Fe, Cu, Zn andAs) were prepared using standard aqueous solutions. Tomake a standard sample, a known volume of standardsolution was added to 0.5 g of cellulose (cellulose binder,
SPEX CertiPrep, Inc., USA). After that, the wet samplewas dried at 60 1C during 24 h. Then, the sample was mixedfor 15min with 0.125 g of wax (Hoechst wax C micro-powder, Merck, Germany) using a 5100 SPEX Mixer/Mill.After that, the sample was uniformly deposited on acellulose substrate contained by a 40mm aluminium cup.Finally, the product was pressed at 10 ton in a pellet diewith tungsten carbide pellet forming a stable 40mm sampledisc. This disc was similar to that obtained for brainsamples, which simplified the bulk quantification process.For all elements, except Cl, the standard samples wereprepared using standard water solutions (Titrisol stan-dards, Merck, Germany). For Cl calibration it was used awater solution of Cl at 1000 ppm made with dried salt ofNaCl (Sigma Chemicals, USA).
2.3. Measurement and calibration of conventional XRF
Conventional XRF analyses of the nine brain slices wereperformed. Bulk concentrations of the elements weredetermined in this work by a conventional BRUKERquantification routine using fundamental parametersmethod. The standard samples were used to calibrate thespectrometer. Samples and standards mass per unit areawere introduced into the routine to calculate thin samplematrix corrections.
2.4. Measurement and calibration of m-SRXRF
X-ray fluorescence (x, y) scanning of one brain slice fromeach group of rats was performed. The two-dimensionalscanning selected area was a representative part of thebrain and covered near 1
2of the total sample approximately.
It contained cortex, striatum, hippocampus, amygdaloidarea, hypothalamus and thalamus. The counting live-timefor each pixel (300 mm� 300 mm) was 10 s/step and the stepsize was 300 mm/step in both directions. For the evaluationof the resulting SXRF pixel spectra, the AXIL (Analysis ofX-ray spectra by Iterative Least Squares) code wasemployed (Van Grieken and Markowikz, 1993).For each mapped pixel, the correlation between syn-
chrotron X-ray fluorescent intensities and weight concen-trations was done using the fundamental parametermethod. In this algorithm, the equation for the X-rayfluorescent intensity of element i produced in pixel j can bewritten as
I ið~rjÞ ¼ �iCið~rjÞMiðC1ð~rjÞ; . . . ;CNð~rjÞÞ, (1)
where ~rj is the position of pixel j; ei the instrument-relatedfactor; Cið~rjÞ the weight concentration of element i in pixelj; and Mi is the matrix effect function of element i in pixel j.For each brain, we applied an iterative method to obtainthe mapping of elemental concentrations. This kind ofmethod needs an estimation of the pixel compositions tostart the iterations. It is known that a faster convergence ofiterative methods is obtained when the first estimation ofcomposition is closed to the final result. A good estimation
ARTICLE IN PRESS
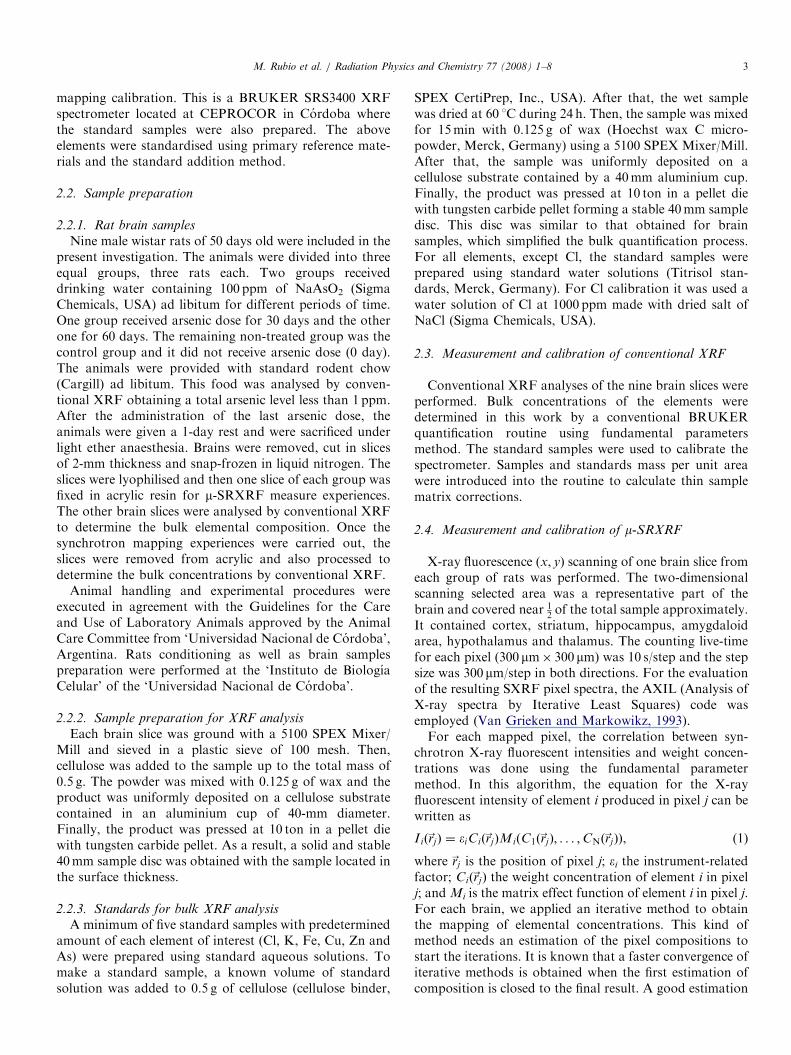
Table 1
Average bulk elemental concentrations of rat brain for different arsenic
dosage obtained by conventional X-ray fluorescence analysis (XRF)
0 day (ppm) 30 days (ppm) 60 days (ppm)
Cl 37007100 34007100 29007100
K 151007500 142007400 124007700
Fe 73725 47712 21715
Cu 772 572 672
Zn 35712 26715 33711
As – 1574 1873
Samples correspond to the brain slices that were (x, y) mapped.
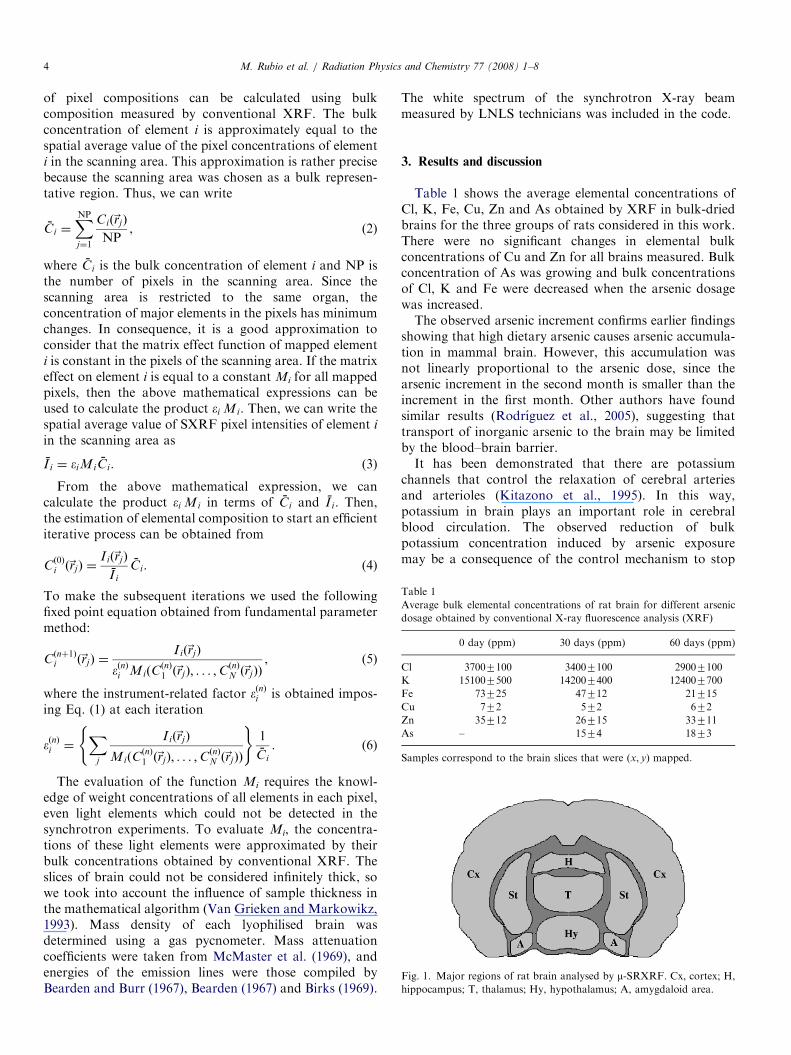
Fig. 1. Major regions of rat brain analysed by m-SRXRF. Cx, cortex; H,
hippocampus; T, thalamus; Hy, hypothalamus; A, amygdaloid area.
M. Rubio et al. / Radiation Physics and Chemistry 77 (2008) 1–84
of pixel compositions can be calculated using bulkcomposition measured by conventional XRF. The bulkconcentration of element i is approximately equal to thespatial average value of the pixel concentrations of elementi in the scanning area. This approximation is rather precisebecause the scanning area was chosen as a bulk represen-tative region. Thus, we can write
Ci ¼XNP
j¼1
Cið~rjÞ
NP, (2)
where Ci is the bulk concentration of element i and NP isthe number of pixels in the scanning area. Since thescanning area is restricted to the same organ, theconcentration of major elements in the pixels has minimumchanges. In consequence, it is a good approximation toconsider that the matrix effect function of mapped elementi is constant in the pixels of the scanning area. If the matrixeffect on element i is equal to a constant Mi for all mappedpixels, then the above mathematical expressions can beused to calculate the product �i Mi. Then, we can write thespatial average value of SXRF pixel intensities of element i
in the scanning area as
I i ¼ �iMiCi. (3)
From the above mathematical expression, we cancalculate the product �i Mi in terms of Ci and I i. Then,the estimation of elemental composition to start an efficientiterative process can be obtained from
Cð0Þi ð~rjÞ ¼
I ið~rjÞ
I i
Ci. (4)
To make the subsequent iterations we used the followingfixed point equation obtained from fundamental parametermethod:
Cðnþ1Þi ð~rjÞ ¼
I ið~rjÞ
�ðnÞi MiðCðnÞ1 ð~rjÞ; . . . ;C
ðnÞN ð~rjÞÞ
, (5)
where the instrument-related factor �ðnÞi is obtained impos-ing Eq. (1) at each iteration
�ðnÞi ¼X
j
I ið~rjÞ
MiðCðnÞ1 ð~rjÞ; . . . ;C
ðnÞN ð~rjÞÞ
( )1
Ci
. (6)
The evaluation of the function Mi requires the knowl-edge of weight concentrations of all elements in each pixel,even light elements which could not be detected in thesynchrotron experiments. To evaluate Mi, the concentra-tions of these light elements were approximated by theirbulk concentrations obtained by conventional XRF. Theslices of brain could not be considered infinitely thick, sowe took into account the influence of sample thickness inthe mathematical algorithm (Van Grieken and Markowikz,1993). Mass density of each lyophilised brain wasdetermined using a gas pycnometer. Mass attenuationcoefficients were taken from McMaster et al. (1969), andenergies of the emission lines were those compiled byBearden and Burr (1967), Bearden (1967) and Birks (1969).
The white spectrum of the synchrotron X-ray beammeasured by LNLS technicians was included in the code.
3. Results and discussion
Table 1 shows the average elemental concentrations ofCl, K, Fe, Cu, Zn and As obtained by XRF in bulk-driedbrains for the three groups of rats considered in this work.There were no significant changes in elemental bulkconcentrations of Cu and Zn for all brains measured. Bulkconcentration of As was growing and bulk concentrationsof Cl, K and Fe were decreased when the arsenic dosagewas increased.The observed arsenic increment confirms earlier findings
showing that high dietary arsenic causes arsenic accumula-tion in mammal brain. However, this accumulation wasnot linearly proportional to the arsenic dose, since thearsenic increment in the second month is smaller than theincrement in the first month. Other authors have foundsimilar results (Rodrıguez et al., 2005), suggesting thattransport of inorganic arsenic to the brain may be limitedby the blood–brain barrier.It has been demonstrated that there are potassium
channels that control the relaxation of cerebral arteriesand arterioles (Kitazono et al., 1995). In this way,potassium in brain plays an important role in cerebralblood circulation. The observed reduction of bulkpotassium concentration induced by arsenic exposuremay be a consequence of the control mechanism to stop
ARTICLE IN PRESSM. Rubio et al. / Radiation Physics and Chemistry 77 (2008) 1–8 5
the uptake of inorganic arsenic in the brain. For controland diseased brains, bulk chlorine concentration isproportional to bulk potassium concentration. It maybe necessary to maintain the ionic neutrality of
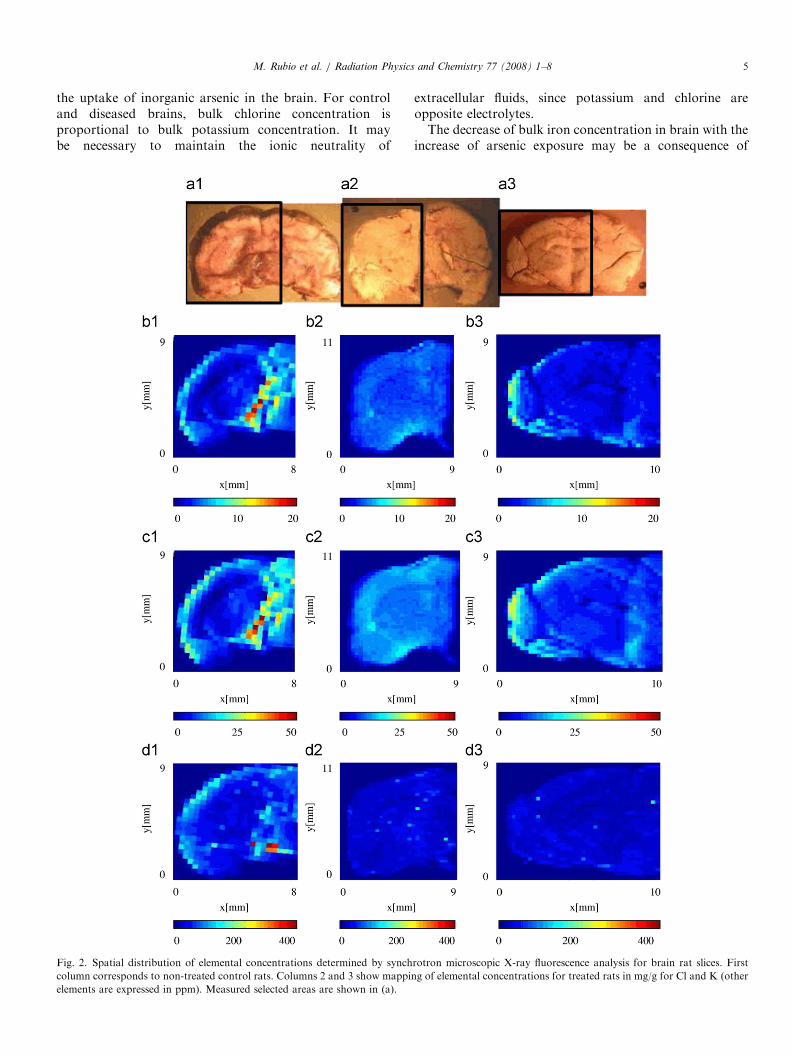
Fig. 2. Spatial distribution of elemental concentrations determined by synch
column corresponds to non-treated control rats. Columns 2 and 3 show mappin
elements are expressed in ppm). Measured selected areas are shown in (a).
extracellular fluids, since potassium and chlorine areopposite electrolytes.The decrease of bulk iron concentration in brain with the
increase of arsenic exposure may be a consequence of
rotron microscopic X-ray fluorescence analysis for brain rat slices. First
g of elemental concentrations for treated rats in mg/g for Cl and K (other
ARTICLE IN PRESS
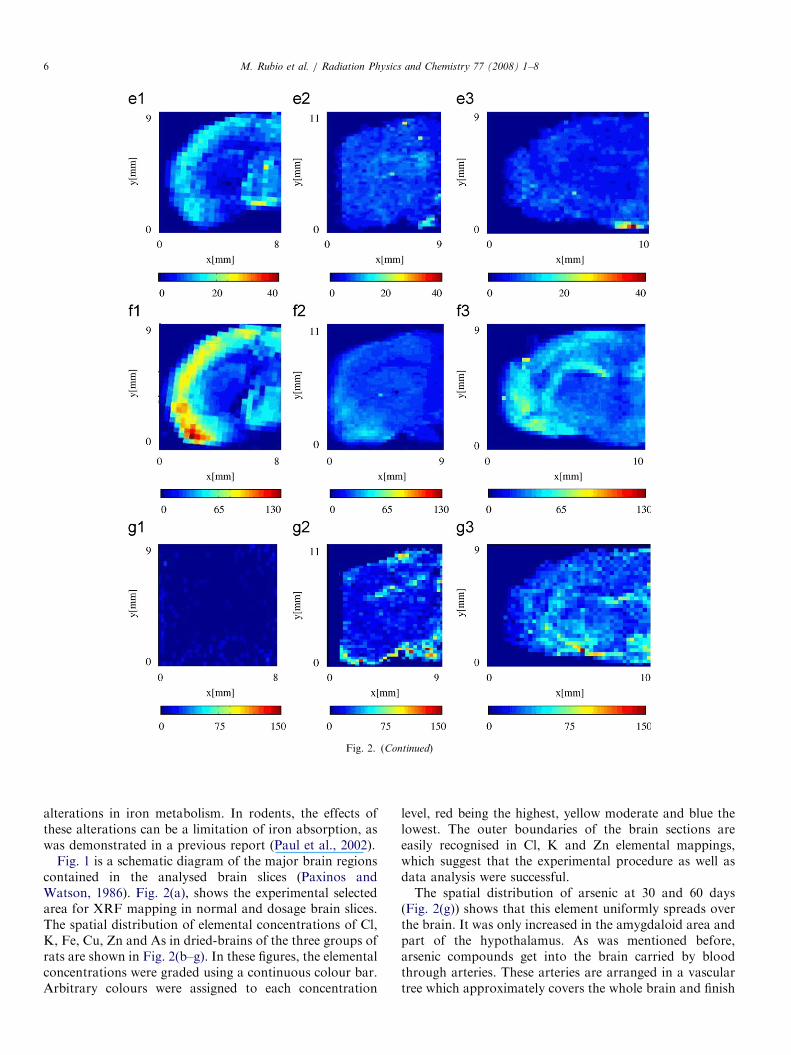
Fig. 2. (Continued)
M. Rubio et al. / Radiation Physics and Chemistry 77 (2008) 1–86
alterations in iron metabolism. In rodents, the effects ofthese alterations can be a limitation of iron absorption, aswas demonstrated in a previous report (Paul et al., 2002).
Fig. 1 is a schematic diagram of the major brain regionscontained in the analysed brain slices (Paxinos andWatson, 1986). Fig. 2(a), shows the experimental selectedarea for XRF mapping in normal and dosage brain slices.The spatial distribution of elemental concentrations of Cl,K, Fe, Cu, Zn and As in dried-brains of the three groups ofrats are shown in Fig. 2(b–g). In these figures, the elementalconcentrations were graded using a continuous colour bar.Arbitrary colours were assigned to each concentration
level, red being the highest, yellow moderate and blue thelowest. The outer boundaries of the brain sections areeasily recognised in Cl, K and Zn elemental mappings,which suggest that the experimental procedure as well asdata analysis were successful.The spatial distribution of arsenic at 30 and 60 days
(Fig. 2(g)) shows that this element uniformly spreads overthe brain. It was only increased in the amygdaloid area andpart of the hypothalamus. As was mentioned before,arsenic compounds get into the brain carried by bloodthrough arteries. These arteries are arranged in a vasculartree which approximately covers the whole brain and finish
ARTICLE IN PRESSM. Rubio et al. / Radiation Physics and Chemistry 77 (2008) 1–8 7
in thin capillaries. Thus, the almost uniform spatialdistribution of arsenic observed in brain is probablyconsequence of the uniform blood irrigation of brain.
It is possible to see in Fig. 2(d) that the increase of thearsenic dose gradually changed the spatial distribution ofiron. While maximum levels of iron were observed inthe periphery and central region of the control rat’s brain(Fig. 2(d1)), at 30 days and 60 days (Fig. 2(d2) and (d3))iron was almost uniformly distributed.
The increase of the arsenic dose also changed the spatialdistribution of copper. Copper was spread over the brainshowing maximum levels in the cortex, hypothalamus andthalamus in control rats (Fig. 2(e1)). At 30 and 60 days ofarsenic exposure (Fig. 2(e2 and e3)), it was uniformlyspread in the brain with a small increment in thehypothalamus. Since the bulk concentration of copperwas not changed, the obtained results show that copperwas redistributed in the brain. As was mentioned before,it may be caused by the methylation process of inorganicarsenic which induces an interaction between copper andarsenic.
Zinc spatial distribution was also affected by arsenicexposure. For control rats (Fig. 2(f1)), zinc was spread overthe brain showing maximum levels in the cortex andhypothalamus. For the two administered arsenic doses(Fig. 2(f2) and (f3)), zinc was raised in the striatum butlowered in the cortex having a tendency to a uniformspatial distribution. Since observed arsenic spatial distribu-tion is almost uniform, the zinc redistribution produced amore efficient arsenic–zinc interaction which may be aprotective mechanism against arsenic exposure. Effectively,previous studies show that zinc protects sulfhydryl groupsagainst oxidation and prevents reactive oxygen speciesproduction, having antagonistic actions to arsenic (Modiet al., 2005).
It is important to note that the observed copper and zincredistribution is not easy to observe with conventionalXRF and other non-microscopic analytical techniques.Effectively, non-microscopic analytical techniques usuallymeasure the average concentration of copper and zinc,which had not significant changes in rat brain under arsenicexposure.
Fig. 2(b) and (c), shows that chlorine and potassiumwere co-distributed in the brains of rats. These twoelements are opposite electrolytes, so their similar spatialdistributions could be necessary to maintain ionic neutral-ity in extracellular fluids. The decrease of chlorine andpotassium concentration induced by arsenic exposure weremajor in the cortex and central brain, which produces moreuniform spatial distributions of these elements in thediseased brains.
4. Conclusions
The results of this work indicate that chronic intake ofarsenical water induces arsenic accumulation and reductionof chlorine, potassium and iron in rat brain. The percentage
increase in the bulk arsenic concentration diminishes witharsenic dose suggesting that it exists a saturation value forthe bulk arsenic concentration in brain. Arsenic spatialdistribution was almost uniform in brains probably causedby the homogeneous blood irrigation of brain. Theexperimental scanning results showed that the distributionmaps of chlorine, potassium, iron, copper and zinc changewith the arsenic dose enhancement. For these elements, weobserved that arsenic exposure induces a tendency toward auniform spatial distribution, which was more marked incopper. Chlorine and potassium were correlated showingsimilar spatial distributions probably due to their oppositeelectrolytes signs.These results demonstrate that m-SRXRF technique
can be used successfully to know the spatial distributionand the local element levels in mammal tissues. The resultsobtained by m-SRXRF suggest interesting hypothesisthat motivate further studies in brain as well as other rattissues.
Acknowledgements
The authors would like to thank the financial supportfrom the Brazilian Synchrotron Light Source (underproposal LNLS D09B-XRF-4142/05); CONICET andAGENCIA CORDOBA CIENCIA S.E. from Argentina.We are also grateful to the whole CEPROCOR and LNLSteam for perfect running conditions.
References
Ademuyiwa, O., Elsenhans, B., 2000. Time course of arsenite-induced
copper accumulation in rat kidney. Biol. Trace Elem. Res. 74, 81–92.
Ademuyiwa, O., Elsenhans, B., Nguyen, P.T., Forth, W., 1996.
Arsenic–copper interaction in the kidney of the rat: influence of
arsenic metabolites. Pharmacol. Toxicol. 78, 154–160.
Bearden, J.A., 1967. X-ray wavelength. Rev. Mod. Phys. 39, 78–124.
Bearden, J.A., Burr, A.F., 1967. Reevaluation of X-ray atomic energy
levels. Rev. Mod. Phys. 39, 125–142.
Birks, L.S., 1969. Handbook of Spectroscopy. CRC Press, Cleveland,
OH.
Frumkin, H., Thun, M.J., 2001. Arsenic. CA Cancer J. Clin. 51, 254–262.
Garcıa-Chavez, E., Santamarıa, A., Dıaz-Barriga, F., Mandeville, P.,
Juarez, B.I., Jimenez-Capdeville, M.E., 2003. Arsenite-induce forma-
tion of hydroxyl radical in the striatum of awake rats. Brain Res. 976,
82–89.
Hopenhayn-Rich, C., Biggs, M.L., Fuchs, A., Bergoglio, R., Tello, E.E.,
Nicolli, H., Smith, A.H., 1996. Bladder cancer mortality associated
with arsenic in drinking water in Argentina. Epidemiology 2, 117–124.
Hopenhayn-Rich, C., Biggs, M.L., Smith, A., 1998. A lung and kidney
cancer mortality associated with arsenic in drinking water in Cordoba,
Argentina. Epidemiology 27, 561–569.
Kitazono, T., Faraci, F.M., Taguchi, H., Heistad, D.D., 1995. Role
of potassium channels in cerebral blood vessels. Stroke 26,
1713–1723.
Kitchin, K.T., 2001. Recent advances in arsenic carcinogenesis: modes of
action, animal model systems, and methylated arsenic metabolites.
Toxicol. Appl. Pharmacol. 172, 249–261.
Kitchin, K.T., Ahmad, S., 2003. Oxidative stress as a possible mode of
action for arsenic carcinogenesis. Toxicol. Lett. 137, 3–13.
Mandal, B.K., Suzuki, K.T., 2002. Arsenic round the world: a review.
Talanta 58, 201–235.
ARTICLE IN PRESSM. Rubio et al. / Radiation Physics and Chemistry 77 (2008) 1–88
McMaster, W.H., Kerr del Grande, N., Mallet, J.H., Hubbell, J., 1969.
Compilation of X-ray cross section. Report UCRL 50174, Sect 2, Rev
1, Lawrence Livermore National Laboratory, Livermore, CA.
Modi, M., Pathak, U., Kalia, K., Flora, S.J.S., 2005. Arsenic antagonism
studies with monoisoamyl DMSA and zinc in male mice. Environ.
Toxicol. Pharmacol. 19, 131–138.
Paul, P.C., Misbahuddin, M., Nasimuddin Ahmed, A.N., Dewan, Z.F.,
Mannan, M.A., 2002. Accumulation of arsenic in tissues of iron-
deficient rats. Toxicol. Lett. 135, 193–197.
Paxinos, G., Watson, C., 1986. The Rat Brain in Stereotaxic Coordinates,
second ed. Academic Press, Sydney.
Perez, C.A., Radtke, M., Sanchez, H.J., Tolentino, H., Neuensh-wander, R.T.,
Barg, W., Rubio, M., Bueno, M.I.S., Raimundo, I.M., Rohwedder, J.J.R.,
1999. Synchrotron radiation X-ray fluorescence at LNLS: beam-line
instrumentation and experiments. X-ray Spectrom. 28, 320–326.
Ratnaike, R.N., 2003. Acute and chronic arsenic toxicity. Postgrad. Med.
J. 79, 391–396.
Rodrıguez, V.M., Carrizales, L., Jimenez-Capdeville, M.E., Dufour, L.,
Giordano, M., 2001. The effects of sodium arsenite exposure on
behavioural parameters in the rat. Brain Res. Bull. 55, 301–308.
Rodrıguez, V.M., Del Razo, L.M., Limon-Pacheco, J.H., Giordano, M.,
Sanchez-Pena, L.C., Eileen, U.-Q., Gutierrez-Ospina, G., Gonsebatt,
M.E., 2005. Glutathione reductase inhibition and methylated
arsenic distribution in Cd1 mice brain and liver. Toxicol. Sci. 84,
157–166.
Sbarato, V.M., Sanchez, H.J., 2001. Analysis of arsenic pollution in
groundwater aquifers by X-ray fluorescence. Appl. Radiat. Isot. 54,
737–740.
US Environmental Protection Agency, 1975. Interim Primary Drinking
Water Standards, Fed. Reg. 40. EPA, USA, 1975.
Van Grieken, R., Markowikz, A.A., 1993. Handbook of X-ray
Spectrometry. Marcel Dekker, New York.
World Health Organisation, 2001. WHO Arsenic Compounds, Environ-
mental Health Criteria 224, second ed. WHO, Geneva.
Related Documents