SYNAPTIC PLASTICITY IN MURINE AUTISM SPECTRUM DISORDER MODELS: AN ELECTROPHYSIOLOGICAL PERSPECTIVE Amanda Jass A THESIS SUBMITTED TO THE FACULTY OF GRADUATE STUDIES IN PARTIAL FULFILLMENT OF THE REQUIREMENTS FOR THE DEGREE OF MASTER OF SCIENCE GRADUATE PROGRAM IN BIOLOGY YORK UNIVERSITY TORONTO, ONTARIO June 2021 © Amanda Jass, 2021

Welcome message from author
This document is posted to help you gain knowledge. Please leave a comment to let me know what you think about it! Share it to your friends and learn new things together.
Transcript
SYNAPTIC PLASTICITY IN MURINE AUTISM SPECTRUM
DISORDER MODELS:
AN ELECTROPHYSIOLOGICAL PERSPECTIVE
Amanda Jass
A THESIS SUBMITTED TO THE FACULTY OF
GRADUATE STUDIES IN PARTIAL FULFILLMENT
OF THE REQUIREMENTS FOR THE DEGREE OF
MASTER OF SCIENCE
GRADUATE PROGRAM IN BIOLOGY
YORK UNIVERSITY
TORONTO, ONTARIO
June 2021
© Amanda Jass, 2021
ii
Abstract
Changes in synaptic strength of small neuronal populations are difficult to observe in the live
human brain; however, these alterations are necessary to study in order to better understand the
mechanisms that underlie neurodevelopmental disorders, such as autism spectrum disorder
(ASD). Substituting the mouse brain for experimental study in this area is beneficial because
mice have similar brain structures and genes homologous to humans. Through manipulation of
genes and environmental toxin exposure implicated in the etiology of ASD, we can generate
ASD mouse models suitable for gaining insight into synaptic plasticity abnormalities and
strategies for restoration. In the following report, I explore how to set up electrophysiology
equipment for efficient measure of neuronal population responses in the mouse hippocampus. I
then characterize synaptic plasticity aberrations in the prostaglandin E2 (PGE2) mouse model of
ASD, a developmental toxins model whereby the pregnant mouse is injected with PGE2. The
offspring of PGE2-injected mice were found to have diminished baseline synaptic response and
enhanced potentiation during the first 10 minutes following single-train, high-frequency stimulus
in the CA3-CA1 region of the hippocampus. Lastly, I discuss therapeutic applications and the
need to further investigate synaptic plasticity in a variety of ASD mouse models.
iii
Acknowledgments
For your guidance and support throughout this journey, thank you to my supervisor Dr. Steven
Connor, my advisor Dr. Jennifer Steeves, the current and previous members of my research lab –
Sandra Bak, Michael Udom, Raman Abbaspour, Parisa Tari, Georg S. Zoidl, and Olga Fedorets
– and my PGE2 project collaborators Dr. Dorota Anna Crawford, Ashby Kissoondoyal, and
Shalini Iyer.
For helping me stay “on track” and motivated during the zombie apocalypse, thank you to my
COVID-19 Partners on Track team – Elia Grieco, Chun Chih Chen, Pavan Singh, Jay Kwon,
Henry Cameron, and Aarun Verma.
Statement of Contribution
Electrophysiology experiments were conducted by Amanda Jass. PGE2-injected mouse models
were generated by Ashby Kissoondoyal.
iv
Table of Contents
Abstract……………………………………………………………………………………………i
Acknowledgements……………………………………………………………………………….ii
Statement of Contribution………………………………………………………………..……….ii
Table of Contents……………………………………………….………………………..………iii
List of Tables……………………………………………………………………………………..vi
List of Figures……………………………………………………………………………………vii
CHAPTER 1: Background Information
1. General Introduction
1.1 Synaptic plasticity and autism spectrum disorder………………………………………....2
1.2 Brain morphology and synaptic plasticity in autism………………………………………6
1.3 Autism genes and synapse organization………………………………………………….. 9
1.4 Plasticity-based therapeutics for autism………………………………………………… 12
1.5 Historical summary………………………………………………………………………13
1.6 Overview of the hippocampus…………………………………………………………... 14
1.7 Overview of the C57BL/6 mouse……………………………………………………….. 17
1.8 Objectives and hypotheses……………………………………………………………….19
CHAPTER 2: Assembly of electrophysiology equipment
2.1 Introduction
2.1.1 Mouse hippocampal slice recording…………………………………………………….20
2.1.2 Cricket cercal system as an alternative model…………………………………………. 21
2.1.3 Electrical noise…………………………………………………………………………. 22
2.2 Materials & Methods
2.2.1 Mouse Hippocampal Slice Preparation…………………………………………………23
2.2.2 Mouse hippocampal slice recording using the Kerr Tissue Recording System………...24
2.2.3 Mouse hippocampal slice recording using the Axon Instruments recording system…...25
2.2.4 Cricket cercal system recording………………………………………………………... 26
2.2.5 Statistical analyses…………………………………………………………………....... 27
2.3 Results
2.3.1 Overview of the Kerr Tissue Recording System………………………………………..28
2.3.2 Troubleshooting the Kerr Tissue Recording System with mouse brain slices………….28
2.3.3 KSI troubleshooting with crickets………………………………………………………30
2.3.4 KSI troubleshooting with electrical noise reduction……………………………………31
2.3.5 Defining low resolution fEPSP responses using the KSI system……………………… 34
2.3.6 Overview of the Axon Instruments recording system……………………………….… 36
2.3.7 Reduction of electrical noise by grounding…………………………………………….37
2.3.8 Troubleshooting LTP Induction……………………………………………………..… 38
2.4 Discussion
v
2.4.1 Mouse hippocampal slice recording from the KSI rig……………………………….…40
2.4.2 Cricket cercal system activity………………………………………………………….. 41
2.4.3 Factors affecting background noise and stimulus artefact using the KSI rig…………...42
2.4.4 fEPSP run-up and run-down…………………………………………….……………... 43
CHAPTER 3: Characterizing synaptic plasticity in the PGE2 mouse model of autism
3.1 Introduction
3.1.1 PGE2 mouse model of autism………………………………………………………….. 45
3.1.2 Developmental differences of the mouse and human brain…………………………….47
3.2 Materials & Methods
3.2.1 Generating the PGE2-injected mouse model of autism…………………………………49
3.3 Results
3.3.1 Defining electrophysiological properties in the hippocampus of the PGE2-injected
mouse model of autism……………………………………………………………………….50
3.3.2 Input-output responses………………………………………………………………….50
3.3.3 Early long-term potentiation……………………………………………………………51
3.3.4 Paired-pulse facilitation………………………………………………………………... 54
3.4 Discussion
3.4.1 Synaptic plasticity differences between saline- and PGE2-injected mice………………54
CHAPTER 4: Therapeutic applications and utility of ASD mouse models
4.1 Introduction
4.1.1 Hebbian and homeostatic plasticity in autism spectrum disorder………………………57
4.2 Methodology planning
4.2.1 Designing methods for testing homeostatic-Hebbian interaction………………………58
4.2.2 Troubleshooting incubation chambers for drug application…………………………… 59
4.2.3 Determining autism mouse models suitable for testing homeostatic-Hebbian
interaction……………………………………………………………………………………. 61
4.3 Discussion…………………………………………………………………………………...65
CHAPTER 5: General conclusion
REFERENCES
vi
List of Tables
Table 2.2.11 Recovery solution for mouse hippocampal brain slices…………………………...24
Table 2.2.12 Recording solution (aCSF) for mouse hippocampal brain slices………………….24
Table 2.2.4 Acheta Ringer’s solution composition……………………………………………... 27
Table 4.2.31 comparison of autism mouse models for use in the homeostatic-Hebbian interaction
experiment………………………………………………….……………………………………62
Table 4.2.32: Scoring system applied to determine the most suitable autism mouse model(s) for
use in exploring homeostatic-Hebbian interaction ………………………………………..……. 65
vii
List of Figures
Figure 1.7 C57BL/6 mouse……………………………………………………………….……...19
Figure 2.1.1 Cricket cercal sensory system ………………………………………...….……….. 22
Figure 2.3.1 Kerr tissue recording system………………………………………………………. 28
Figure 2.3.21 Optimization of hippocampal slice preparation …………………………………. 29
Figure 2.3.22 Waveforms obtained using the KSI Tissue Recording System …………………. 29
Figure 2.3.31 Method of cricket dissection to access the cercal ganglion ………………….….. 30
Figure 2.3.32 Representative examples of potential cercal ganglion fEPSPs ………….………. 31
Figure 2.3.41 Background noise reduction ………………………………….…………………..32
Figure 2.3.42 Lowest noise level achieved …………………………………….………………..33
Figure 2.3.43 Effect of solution concentration on background noise……………………….…...33
Figure 2.3.44 Effect of solution concentration and volume on background noise……….……... 33
Figure 2.3.45 Effect of solution concentration and volume on stimulus artefact strength….….. 34
Figure 2.3.51 fEPSPs generated using the KSI portable rig …………………….………………35
Figure 2.3.6 The Axon Instruments non-portable rig ………………….……………………….. 37
Figure 2.3.7 The effect of grounding on fEPSP recordings ………….………………………… 37
Figure 2.3.81 LTP induction attempts using the Axon Instruments rig ………….…………….. 39
Figure 2.3.82 The effect of stimulator battery depletion on fEPSP slope…..……….………….. 40
Figure 3.3.2 Hippocampal input-output responses in PGE2-injected mice …………….………. 51
Figure 3.3.31 Individual trials of early LTP induction in PGE2-injected mice ………….…….. 52
Figure 3.3.32 Analysis of LTP responses in PGE2-injected mice ………………………….…... 53
Figure 3.3.4 Paired-pulse facilitation in PGE2-injected mice …………………….……………..54
Figure 4.2.11 Hippocampal slice preparation from whole mouse brain ………………………...50
viii
Figure 4.2.12 Procedure for studying homeostatic scaling and Hebbian LTP interaction……… 59
Figure 4.2.21 Options available for drug treatment incubation of hippocampal slices ………… 59
Figure 4.2.22 LTP in a heated interface chamber and room temperature Petri dish …………… 60
1
CHAPTER 1: BACKGROUND INFORMATION
GENERAL INTRODUCTION
The mammalian brain is comprised of an elaborate network of neural connections capable of
change and regeneration over time. This ability to augment form and function of neurons,
networks, and whole brain structures is known collectively as brain plasticity. The core
mechanisms that allow for brain plasticity exist at the synaptic level, the point of signal transfer
between two neurons. Activity at the neuronal junction or “synapse” is thought to regulate
synaptic plasticity, which is defined as the strengthening or weakening of neural connections at
the cellular level. Aberrant synaptic plasticity has been implicated in a number of psychiatric
disorders including Alzheimer’s disease, Parkinson’s disease, schizophrenia, and autism
spectrum disorder (ASD) (Taoufik et al., 2018).
ASD is currently the fastest-growing neurodevelopmental disorder in North America
(Christensen et al., 2018; Ofner et al., 2018). Approximately 1 in 66 Canadians aged 5-17 are
diagnosed with ASD (Ofner et al., 2018), a disorder characterized by impairments in
communication, lack of social interaction, and repetitive, stereotyped behaviour (Ousley &
Tracy, 2014). The role of synaptic plasticity in autism is of particular significance because this
disorder is marked by imbalances of excitatory to inhibitory synapses (E/I ratio) (Nelson &
Valakh, 2015). For instance, there is evidence of over-excitation in the brains of those with ASD
(Takarae & Sweeney, 2017), and reports indicate frequent co-occurrence with seizures (an
outcome of hyper-excitation) (Tuchman & Rapin, 2002). Additionally, common mutations in
genes that code for synapse organizing proteins have been discovered in a disproportionate
amount of autism cases (Bucan et al., 2009). Thus, there is growing interest in identifying how
2
exactly synaptic plasticity is altered in ASD, with the intent of developing ways to restore
synaptic balance and thereby mitigate symptomology.
1.1 Synaptic plasticity and autism spectrum disorder
Although the origin of plasticity in relation to the nervous system remains unclear, one of the
earliest records of this concept was put forth by Santiago Ramon y Cajal, a Spanish
neuroscientist who is considered by many to be the father of modern neuroscience. In 1892, he
presented a theory called the cerebral gymnastics hypothesis, which proposed that the strength
between neurons could increase with exposure to certain stimuli by development of additional
connections (Cajal, 1892). However, despite this theory, Cajal’s stance on brain plasticity is
difficult to interpret, because in some instances he seemed to agree with the prevailing dogma
that neurons in the adult brain are fixed and unchanging. For example, he also claimed that ‘once
development was ended [neuronal] growth…dried up irrevocably’ (Cajal, 1913). The actual term
“plasticity” in reference to the nervous system is thought to come from Ernesto Lugaro, an
Italian psychiatrist (Berlucchi, 2002). In 1906, he proposed that chemotropic activities lead to
organized changes of the nervous system throughout the life span. He was inspired by his teacher
Eugenio Tanzi, who predicted in 1893 that memories are formed by decreasing the distance
between neurons through growth in neuronal length (Berlucchi, 2002). Although the idea of
synaptic plasticity was suggested prior to and during the early 20th century, it was not widely
accepted, and many people assumed that the adult brain could not change in any capacity beyond
degeneration with age (Gage, 2004). A paradigm shift in thinking then took place in 1949, when
Donald Hebb, a Canadian psychologist, outlined his theory on synaptic plasticity in his book The
Organization of Behaviour. In an attempt to explain how learning takes place at all ages, he
stated that, “When an axon of cell A is near enough to excite a cell B and repeatedly or
3
persistently takes part in firing it, some growth process or metabolic change takes place in one or
both cells such that A's efficiency, as one of the cells firing B, is increased” (Hebb, 1949; page
62). This pivotal hypothesis suggested that synaptic efficiency arises from repeated activity
among pre- and postsynaptic neurons, and it helped spark interest in adult neuroplasticity. Two
decades later, in 1973, Hebb’s postulate was confirmed with experimental evidence in a
landmark study by neuroscientists Tim Bliss and Terje Lømo. They demonstrated that when
neurons are stimulated with brief high-frequency electrical pulses, which mimic the neuronal
action potential, a long-lasting state of heightened excitability can be induced (Bliss & Lømo,
1973). Using live rabbits anesthetized with urethane, they incorporated a two-microelectrode set-
up to stimulate the axons of the perforant path (a neuronal pathway in the hippocampus of the
brain) and to record subsequent postsynaptic activity. They found that changing the rate of
stimulation could alter neuronal strength, where increased firing rate led to heightened synaptic
response. Additionally, they showed that repeated trains of stimuli applied over time evoked
increased strength of nerve impulses (potentiation). It was from these experiments that the
concept of long-term potentiation (LTP), referring to the phenomena of heightened excitability
following a recent stimulus, came to light as a model for Hebb’s theory. It confirmed that prior
activity between neurons does indeed strengthen their synaptic efficacy.
It was later found that LTP differs depending on the amount and intensity of the stimulus
applied, and thus can be divided into two distinct phases – early (E-LTP), and late (L-LTP)
(Huang, 1998). For instance, E-LTP can be induced by one train of stimuli whereas L-LTP
requires multiple repeated trains. Not only are the induction processes distinct, but so are the
mechanisms underlying each type of LTP; E-LTP is thought to occur by modification of pre-
existing connections, while L-LTP involves gene activation and new synapse formation (Kandel,

4
2001). E-LTP is similar to short-term memory, whereas L-LTP appears more similar to long-
term memory. For example, synaptic strength after 1 train of stimuli decays within a few hours,
while multiple trains induce synaptic strength that is stable over many hours (Huang, 1998).
The reverse process of LTP is known as long-term depression (LTD), which is defined as an
activity-dependent decrease in synaptic strength (Bliss, 2011). Unlike LTP, the exact origin of
the concept of LTD is obscure; however, one of the earliest studies demonstrating LTD arose in
1980 by German Barrionuevo and his research team. They conducted electrophysiological
studies using live male rats anesthetized with Nembutal (Barrionuevo et al., 1980). A low-
frequency electrical stimulus was applied to the CA1-CA3 hippocampal region with and without
prior high-frequency LTP treatment. They observed a significant reduction of potentiated
response in the group that received the previous LTP induction. In contract, there was no
significant difference when a low-frequency stimulus was applied to the group that did not
receive LTP induction. This clearly indicated that LTP can be reversed, and it provided one of
the first observable demonstrations of LTD as a process in specific opposition to LTP. It has
since been theorized that LTD serves as a model for the process of forgetting (Tsumoto, 1993),
while LTP forms the basis of learning and memory (Lynch, 2004). Impairments in both LTP and
LTD have been implicated in autism.
Autism spectrum disorder as a medical diagnosis is a relatively recent development;
however, it is likely that autism cases existed without label throughout human history. One of the
first documented cases of autism comes from J.M.G. Itard’s 19th century account of Victor of
Aveyron (Wing, 1997). Victor was found as a child of about 12 years old living on his own in the
wilderness of France. He was adopted by Itard, a French physician, who provided him with
education and documented his behaviour with detailed written descriptions. Itard described

5
Victor as having a shifting and expressionless gaze, rocking back and forth, lacking social
attachment as well as ability to speak, and having a great sense of order (Wolff, 2004), which are
all traits that conform to a present-day autism diagnosis. The actual term “autism” was first
described in 1908 by psychiatrist Eugen Bleuler as a subcategory of schizophrenia in which
individuals were excessively withdrawn and out of touch with the external world. The term was
based on the Greek word “autos” meaning self, reflecting the characteristic egocentric nature of
ASD (Greydanus, & Toledo-Pereyra, 2012). In 1943, Leo Kanner, an American-Austrian
psychiatrist, conducted case studies on 11 children with similar autistic features (Kanner, 1943).
He described all cases as falling under a unique category of disorder, which he referred to as
‘inborn autistic disturbances of affective contact.’ Common symptoms among these children
included stereotypy (repetitive acts), echolalia (repetition of words), lack of social attachment,
and preference for objects over people. Interestingly, he noted that many of the families from
which these children came from were cold and dysfunctional, indicating that lack of warmth in
parenting style may be a contributing factor; however, it has since been accepted that parenting
style does not cause autism (Ventola et al., 2017). In 1944, Hans Asperger, an Austrian
pediatrician, independently reported on a group of children with similar characteristics as
described by Kanner a year prior; although, the group that Asperger described had less severe
symptoms, including one-sided conversations, lack of empathy, and difficulty forming
friendships (Asperger, 1944). Autism first appeared in the 3rd version of the Diagnostic and
Statistical Manual of Mental Disorders (DSM-3) in 1980, officially making it a stand-alone
disorder separate from schizophrenia. Then in 1994, the 4th edition of the DSM (DSM-4) divided
autism into subtypes, such as Asperger syndrome (AS) and pervasive developmental disorder-not
otherwise specified (PDD-NOS), which helped distinguish individuals on different levels of the
6
autism spectrum. In 2013, the DSM-5 collapsed all autism subtypes into one diagnosis called
‘autism spectrum disorder.’ Thus, today both high- and low-functioning individuals on the
autism spectrum are grouped together under the single label of ASD. This broadening of the
diagnostic label has likely contributed to the increasing rates of ASD diagnosis. However, there
is some concern that the rising rates of autism may be connected to environmental contaminants,
such as heavy metal poisoning. For example, a 2013 study by Al-Farsi et al. found that children
with ASD had higher levels of heavy metal exposure. Using mass spectrometry, they analyzed
hair samples from 27 ASD children and compared the results to 27 matched non-ASD controls,
accounting for age, gender, ethnicity, socio-demographic background, and diet. Heavy metals
such as aluminum, chromium, cadmium, cobalt, nickel, boron, and barium were all significantly
higher in the ASD group. It is of importance to note: the authors of this study conclude that these
findings do not necessarily indicate that heavy metals contribute to pathophysiology, and there
continues to be a great deal of ambiguity in relation to the role of the environment in causing
ASD. Nonetheless, autism continues to have a profound impact, affecting approximately 7.7
million people worldwide. The aim of synaptic plasticity research in ASD is to uncover the
unique neural basis of this disorder, leading to improvement and development of plasticity-based
therapeutics.
1.2 Brain morphology and synaptic plasticity in autism
Distinct differences are often observed in the brain morphology and neural circuitry of those with
ASD, constituting anomalies that likely have an impact on synaptic efficiency. At the cellular
level, there is evidence of aberrant neuronal number and organization. For instance, a study by
Courchesne et al. (2001) used stereological analysis to count the number of neurons in post-
mortem prefrontal tissue of 7 autistic and 6 control males aged 2-16 years old. They found that
7
the autistic group had significantly more neurons in the prefrontal cortex; however, these results
must be interpreted with caution due to limited sample size. The authors speculate that this could
be caused by failure of apoptotic mechanisms to remove subplate neurons in early postnatal life.
Another study by Hutsler et al. (2007) found differences in cortical thickness and patterning.
Using Nissl-stain sectioning, they analyzed the post-mortem cortex of 8 ASD individuals and 8
age-matched controls. They found that, in some ASD cases, cortical patterning was similar to
controls, but in a select few there were abnormal layer boundaries, neuronal clumping, and
increased neuron number. That some ASD cases had normal cortical patterns, while others did
not, highlights how ASD can manifest in a variety of ways, and brain structure abnormalities can
differ on a case-by-case basis. Additionally, this study noted an age-dependent effect, where
cortical thickness decreases significantly with increasing age in autism. In addition to direct
neuronal abnormalities, protein markers of neuronal deficits have also been observed in the
cerebral spinal fluid (CSF) of ASD individuals. Using an enzyme-linked immunosorbent assay
(ELISA), a study by Ahlsén et al. (1993) found increased amounts of glial fibrillary acid (GFA)
protein in the CSF. Heightened GFA serves as a marker for brain abnormalities, including nerve
cell death, brain degeneration, and/or increased turnover of central nervous system synapses.
Modifications at the neural and synaptic level likely contribute to overall structural
changes, such as alterations in brain and skull size. For example, a study by Hazlett et al. (2005)
used magnetic resonance imaging (MRI) and retrospective data to compile head circumference
measures from 164 ASD children and 214 non-ASD controls. They found that ASD individuals
had significantly larger head circumferences. Additionally, they also observed that the growth
trajectory of the head in ASD is relatively normal during the first 12 months of development, but
after one year of age it begins growing at an enhanced rate. Furthermore, another study
8
uncovered several forebrain structure alterations in infantile autism; Gaffney et al. (1989) used
MRI imaging in 13 autism subjects, and found larger lateral ventricles, larger anterior horns, and
a smaller right lenticular nucleus.
Prominent structural changes likely contribute to functional aberrations and symptoms.
For instance, one study linked learning deficits in ASD to hippocampal abnormalities; Cooper et
al. (2017) used functional magnetic resonance imaging (fMRI) to observe brain activity in 24
ASD individuals and 24 controls while the subjects performed a memory encoding and retrieval
task. The fMRI results revealed that the ASD group had reduced left prefrontal cortex activity
during memory retrieval, and hippocampal reduction in functional connectivity to the
inferior/middle frontal gyrus, a pathway thought to allow for monitoring of recollected
information. It was also found that the ASD group had reduced success in the retrieval phase of
the experiment.
Synaptic pathologies also contribute to the formation of unstable cortical networks. A
study by Lewne et al. (1999) used non-invasive magnetoencephalography to evaluate patterns of
heightened activity (epileptic form activity) in 50 autistic children during stage 3 sleep. They
found that 68% had epileptic form activity, indicating that in some cases ASD is marked by
hyper-excitability of cortical networks. This implied that there may be an unbalanced ratio of
excitatory to inhibitory synapses (E/I ratio). The E/I ratio hypothesis was strongly supported by
Antoine et al. (2019) in a study demonstrating that multiple types of autism mouse models
display reduced inhibitory synaptic response leading to overall increase of E/I ratio. The four
genetically altered mouse models tested in this study included Fmr1-/y, Cntnap2-/-, 16p11.2del-/+,
and Tsc2+/-; however, these are just a few of the many genes implicated in autism. Genome-wide
analyses of individuals with ASD reveal hundreds of implicated genes, many of which are
9
involved in synaptic organization (Bucan et al., 2009). To better understand synaptic plasticity in
ASD, structural aberrations as well as genetic changes must be considered.
1.3 Autism genes and synapse organization
When Leo Kanner first described the features of autism in 1943, he hinted at a genetic influence
when he wrote, “…these children have come into the world with innate inability to form the
usual, biologically provided affective contact with people” (Kanner, 1943). To investigate the
genetic component of ASD, psychiatrists Susan Folstein and Michael Rutter conducted twin
studies in 1977. They examined 21 pairs of twins, where at least one sibling had autism; 11 pairs
were monozygotic (sharing 100% of the same genes), and 10 pairs were dizygotic (sharing 50%
of the same genes). They found that 4/11 of the monozygotic twins were concordant for autism,
while 0/10 of the dizygotic twins were concordant, representing an almost significant finding (P
= 0.055) in favour of a genetic influence. Then in 2011, another twin study was conducted by
Hallmayer et al., and this study found a definitive genetic influence in autism. They used a much
larger sample size, consisting of 192 twin pairs, where 54 were monozygotic and 138 were
dizygotic. Concordance rates for ASD were reported as 77% among the monozygotic pairs and
31% among the dizygotic pairs, representing a significant factor of genetic heritability. Although
twin studies could indicate an overall influence of genetics, these studies could not answer
precisely which genes were responsible for this effect. To determine the specific genes involved
in this disorder, genome-wide scans for autism-susceptibility genes would be required.
The first genome-wide scan for autism genes was conducted by the International
Molecular Genetic Study of Autism Consortium in 1998 (Bailey et al., 1998). To help ensure that
testing covered ASD individuals demonstrating a genetic influence (rather than environmental),
only relative-pairs, where both members were affected by ASD, were included. Using a
10
fluorescence-based semi-automatic genotyping method on 99 familial ASD-pairs, several loci of
interest were identified including a notable region on chromosome 7q. However, in this study,
only general regions were identified, which contain multiple potential candidate genes. Thus,
further fine mapping would be required to refine the analysis to the single gene level. A year
later, in 1999, Philippe et al. conducted another genome-wide autism scan. Using a similar
method, they analyzed the genomes of 51 ASD relative-pairs. They found 11 chromosomal
regions positively linked to autism, including the region on chromosome 7q identified in the
earlier study. In 2009, Bucan et al. conducted a more refined genome-wide analysis for exon
copy number variants in ASD. They used a much larger sample size (ASD cases from 912
different families, and 1488 healthy controls), and included an additional independent replication
cohort to ensure accuracy. They identified specific autism-susceptibility genes by observation of
exon deletions and duplications present in ASD subjects. Interestingly, they identified a number
of genes that have a known role in synapse organization, including neurexin-1 (Nrxn1),
neuroligin-1 (Nlgn1), and MAM domain containing glycosylphosphatidylinositol anchor-2
(Mdga2). At the synapse, NRXNs and NLGNs function as cell-adhesion proteins, helping to
keep pre- and postsynaptic neurons in contact. NLGNs are located on the postsynaptic membrane
and physically bind to NRXNs located on the presynaptic membrane. MDGA2 regulates this
interaction by selectively binding to NLGN, preventing NLGN-NRXN association (Connor et
al., 2019; Elegheert et al., 2017). Evidence suggests that the NLGN-MDGA2 interaction
specifically inhibits the formation of excitatory synapses in vivo (Connor et al., 2016).
Identification of these and other specific autism genes allowed for the development of autism
mouse models.
11
Gene knockout mice for NRXNs, NLGNs, and MDGA2 have recently been created and
all demonstrate behavioural phenotypes that bear similarities to ASD in humans. For example, in
2014, Dachtler et al. studied behaviour in α-neurexin II (Nrxn2α) knockout (KO) mice. They
used a three-chambered assay for sociability, and reported that, unlike wild-type (WT) mice,
Nrxn2α KO mice prefer spending time in the empty side of the chamber as opposed to the side
with an unfamiliar mouse. In addition to deficits in social behaviour, they also noted increased
anxiety, as assessed by spending more time at the periphery of an open field than WT mice.
Additionally, a separate study by Grayton et al. (2013) found that α-neurexin I (Nrxn1α) KO
mice also display social deficits, as assessed by a similar three-chamber method, and anxiety-like
behaviours, assessed using an elevated plus maze test. ASD phenotypes have been observed in
neuroligin-3 (Nlgn3) deficient mice as well; a 2009 study by Radyushkin et al. demonstrated that
Nlgn3 KO mice have reduced vocalizations and altered social memory. Furthermore, a study by
Connor et al. (2016) found that happloinsufficient Mdga2+/- mice display several phenotypic
ASD traits including repetitive motions, reduced social interaction, elevated E/I ratio, and long-
term memory impairments. Taken together, the findings from genome-wide scans and
subsequent mouse models indicate that synapse organization proteins likely play an important
role in the etiology of this disorder.
Mutation of autism-susceptibility genes are thought to lead not only to synapse
disorganization, but also to the disruption of certain types of synaptic plasticity, including LTP
and LTD. Electrophysiological studies for LTP have been conducted in hippocampal brain slices
of Mdga2+/- mice, demonstrating enhanced E-LTP and impaired L-LTP (Connor et al., 2016).
Alterations in LTP coincided with memory deficits, where Mdga2+/- mice took a significantly
longer time to re-find a previously identified hidden platform in water (Morris Water Maze)
12
compared to WT mice. Furthermore, in a contextual fear conditioning task, Mdga2+/- mice
appeared to forget that a certain chamber elicited a foot-shock, as assessed by less freezing
behaviour than WT when put back into the environment where a previous shock had been given
(Connor et al., 2016). Many other genetic mouse models of autism also demonstrate altered
synaptic plasticity. For example, a 2018 study by Letellier et al. found that a single point
mutation in NLGN1 (Y782A/F) results in severe impairment of LTP in mice hippocampal brain
slices; a study by Takeuchi et al. (2013) found disrupted LTP and LTD in a phosphatase and
tension (PTEN) mouse model of autism; a 2010 study by Bozdagi et al. found impaired LTP, but
unaltered LTD in a SHANK3 (SH3 and multiple ankyrin repeat domains 3) mouse model of
autism; and a 2019 study by Shin et al. found that mice deficient for autism-implicated gene
Scn2a display supressed LTP, but normal LTD. These are just a few of the many notable studies
that have shown altered LTP and/or LTD in mouse models of autism. Thus, it is well established
that certain genes have a role in autism, and many of these genes have a negative impact on LTP
and LTD, corresponding to learning and memory impairments. Although numerous studies have
focused on identifying synaptic plasticity aberrations in genetically altered mouse models of
autism, few have devised methods for actual restoration of these deficits. An important question
is raised from these studies – might it be possible to reverse LTP-LTD deficits in ASD using
novel plasticity-based treatments?
1.4 Plasticity-based therapeutics for autism
Currently, plasticity-based therapeutics for autism are unavailable, but there is growing interest
in this field of research. The strong evidence supporting LTP-LTD impairments and E/I ratio
imbalances in ASD has led to the theory that perhaps other forms of plasticity can be used to
restore these deficits. For example, there is another type of synaptic plasticity, known as

13
“homeostatic scaling” that could potentially be utilized to this end. Homeostatic scaling was first
discovered in 1998 by neuroscientist Gina Turrigiano and her research group. They discovered
that when neurons are silenced for 2 days, there is subsequent overall heightened excitability
once the activity-blockade is removed (homeostatic upscaling). They also found that when
neurons are chemically induced to be excessively active for 2 days, there is subsequent
heightened inhibition of activity once the stimulation is removed (homeostatic downscaling)
(Turrigiano et al., 1998). Homeostatic scaling appears to be a promising method for raising or
lowering overall excitation within the brain, and, in the case of ASD where the brain is often
over-excited, this may prove to be a useful therapy. Furthermore, if synaptic over-excitation is
the cause of impaired LTP and LTD in autism, homeostatic scaling could potentially be utilized
to improve these deficits, resulting in the restoration of learning and memory as well. These
possibilities remain as open questions.
1.5 Historical summary
In summary, many historical developments have led to the intersection of synaptic plasticity and
ASD, an important reference point for future therapeutic intervention. From its first description
by J.M.G Itard and Leo Kanner in the late 19th and early 20th centuries, autism appeared to be a
disorder characterized by mis-wiring of the brain. This was supported by morphological studies
which revealed marked differences in neuronal organization and number. Early on, genetics were
thought to have a significant role in this disorder, and eventually twin studies confirmed the
influence of genetic heritability. The specific genes involved were identified in the 1990s and
2000s, implicating the contribution of a number of synapse organizing proteins. With the advent
of genetically modified mouse models of autism, specific studies could be conducted to examine
LTP and LTD deficits in conjunction with certain genetic mutations. Findings support that many
14
of the autism-susceptibility genes have a crucial role in synaptic plasticity, suggesting that autism
may primarily be the result of aberrant synaptic changes. If this is the case, perhaps treatments
would be most effective if targeted toward the restoration of known synaptic inefficiencies, such
as LTP-LTD deficits, and E/I ratio imbalances. Independent developments in the field of
synaptic plasticity, such as the discovery of homeostatic scaling, provide new avenues by which
plasticity-based therapeutics can be explored. Continued research in ASD synaptic pathology has
great potential to improve the lives of millions impacted by this disorder.
1.6 Overview of the hippocampus
The human hippocampus is a brain structure located in the medial temporal lobe. Each
hemisphere of the brain contains one of two hippocampi, seated generally in the area above the
brainstem and below the thalamus. The hippocampus is part of the limbic system, a group of
brain structures, including the hypothalamus, amygdala, thalamus, and hippocampus, that work
together to control emotion (Rajmohan & Mohandas, 2007). The shape of the hippocampus is
curled resembling a ram’s horn, which is why some of its anatomical regions are referred to
presently as cornu ammonis (CA) 1, 2, and 3. “Cornu ammonis” is Latin for “ram horn,” and was
the original name of the structure as a whole. The name was later changed to “hippocampus”
after the fish genus for seahorses, as it also resembles the body shape of this category of fish
(Andersen et al., 2006). The hippocampal formation consists of a number of different regions
including the hippocampus proper, dentate gyrus, entorhinal cortex, and subiculum. The
connections between the various locations within the hippocampal formation form specific
pathways. For example, neural projections from the entorhinal cortex to the dentate gyrus and
CA3 form the perforant pathway; projections from the dentate gyrus to CA3 form the mossy
fiber pathway; and projections from the CA3 to CA1 form the Schaffer collateral pathway
15
(Andersen et al., 2006). The types of neurons also differ depending on the hippocampal region.
The dentate gyrus is composed primarily of granule cells, while the hippocampus proper is
comprised mainly of pyramidal cells. Pyramidal neurons are characterized by a pyramid-shaped
soma and extensive branching at the apical and basal dendrites, whereas granule cells have a
more rounded cell body, and are typically smaller than pyramidal cells (Johns, 2014). The
hippocampus is present in other vertebrates, including fish, reptiles, birds, and mammals (Allen
& Fortin, 2013). It retains a similar structure across species and serves a critical role in spatial
memory. Cells specific for encoding cognitive maps – spatial relations among objects or
landmarks in the external world – were discovered within the hippocampus proper and entorhinal
cortex. Place cells are a type of pyramidal cell in the hippocampus proper that demonstrate
heightened activity in a specific environmental location. Using implanted electrodes to measure
single-unit activity in the rat hippocampus, John O’Keefe and Jonathan Dostrovsky (1971)
observed that place cells were only active when the rat was pushed and restrained by hand to
particular locations in a boxed environment. In 2005, an additional location-specific cell was
discovered – the grid cell. Hafting et al. (2005) observed that certain cells in the rat entorhinal
cortex fire in accordance with a triangular lattice pattern traversing the ground plane of a circular
enclosure. In their experiment, live rats were implanted with tetrodes in the dorsocaudal medial
entorhinal cortex (dMEC) to record neuronal firing from multiple cells as the rats freely explored
a flat, 2-meter diameter environment. The firing pattern of some cells coincided with the vertices
of a 2-dimensional triangular lattice on the ground of the space explored. The researchers called
these cells grid cells, owing to the dependence of neuronal firing on grid placement in the
external environment. In addition to encoding spatial relations, the hippocampal formation is
essential for creating new memories about facts and events (declarative or explicit memories).
16
The case of patient Henry Molaison (H.M.) highlights the function of the hippocampus in
declarative/explicit memory, rather than procedural/implicit memory. At age 27, H.M. suffered
severe seizures that were thought to stem from brain trauma caused by a bicycle accident at age 7
(Squire, 2009). H.M. underwent experimental surgery to alleviate the seizures, having large
portions of his medial temporal lobes removed (bilateral medial temporal-lobe resection),
including the amygdala and hippocampus in both hemispheres of the brain (Scoville & Milner,
1954). Although the surgery lessened the severity of his seizures, H.M. was left with the inability
to form new memories (anterograde amnesia). For example, it was observed that he could only
remember new facts and events for about 30 seconds. In contrast, he could easily recall events
from his early life; however, he experienced some loss of previous memories (retrograde
amnesia) that worsened leading up to 1-2 years before the surgical procedure. The amnesic
effects severely impacted H.M.’s ability to lead a normal life, and he was dependent upon
assisted living until his death in 2008 at age 82. He described his ongoing state of mind as like
“waking from a dream,” where the present moment is clear, but what happened just before is
unknown (Milner et al., 1968). Interestingly, H.M. was able to learn new implicit, procedural
tasks, such as how to use a walker, and improved on experimental motor skill-learning tasks
(Shah et al., 2014). This finding implied that there are different types of memories encoded by
different parts of the brain, and that the hippocampus in particular enables long-term storage of
declarative memories, but is not responsible for unconscious motor learning. Similar memory
deficits have been noted in other cases of hippocampal ablation in humans. For example, in the
1960s when hippocampectomy was performed on a number of cancer patients as a last resort for
pain relief, many of these patients experienced anterograde amnesia following removal of the
hippocampus (Gol & Faibish, 1967). In summary, the hippocampus has a vital role in the
17
formation of declarative memories and spatial navigation. It houses a complex system of
neuronal pathways that communicate within the limbic system, and with brain structures beyond,
to convert snapshots of the present moment into long-term memories and cognitive maps.
1.7 Overview of the C57BL/6 mouse
The C57BL/6 mouse is one of the most commonly used strains for research on medical diseases
and disorders. It is an inbred strain originating from a colony bred by Abbie E. C. Lathrop in the
early 1900s in Granby, Maryland. Lathrop provided “mouse #57” to Clarence Cook Little, who
founded Jackson Laboratory, a facility that produces many different types of mice for scientific
research purposes. Little bred from mouse 57 an all-black strain of identical mice, known as the
C57BL/6J strain (Steensma et al., 2010). Due to genetic drift, there are now different substrains.
For example, in the 1950s, Jackson Laboratory sent mice to the National Institutes of Health, and
after many generations, this formed the new substrain C57BL/6N. The 6N and 6J substrains have
notable differences in traits related to pain sensitivity, ethanol consumption, and fear learning
(Bryant, 2011). A study by Fertan et al. (2020) found that behavioural traits of the Mdga2+/-
mouse model of ASD vary depending on the background substrain used, where the C57BL/6N
performed better than C57BL/6J on tasks measuring visual ability and learning. Thus, it is
important when conducting research with C57BL/6 mice to take into account the substrain used.
Appearance-wise, the C57BL/6 mouse has a dark brown fur coat, which almost appears black,
and can have small patches of white, typically behind the ears. Behaviour-wise, the C57BL/6
mouse can be distinguished from other strains by its extensive tendency to “barber.” Barbering
refers to the action of one mouse plucking fur from another, resulting in bald patches. It is
thought to be an indication of social hierarchy, where the more dominant mice “barber” the less
dominant (Kalueff et al., 2006). C57BL/6 mice also have unique temperament traits that
18
distinguish them from other widely used inbred strains of lab mice, such as the BALB/c. In a
study by Sultana et al. (2019), C57BL/6 mice were found to demonstrate heightened propensity
for exploration. There is also evidence that C57BL/6 mice have higher levels of empathy
compared to the BALB/c strain (Chen et al., 2009). The C57BL/6 mice also exhibit less
hierarchical-based aggression; a study by Bisazza et al. (1981) showed that C57BL/6 male mice
were less territorial and aggressive towards each other than the BALB/c strain. The development
of unique morphological and behavioural features of the C57BL/6 mouse was facilitated by
human influence, through evolutionary commensal relationships and selective breeding for
certain traits.
The C57BL/6 strain has provided a means for many important breakthroughs in scientific
research. For example, they have been used to discover genes for human deafness (Bryda, 2013),
and for the development of chemotherapy and HIV treatments (DeVita & Chu, 2008; Marsden,
2020). Through manipulation of genes and environment, they have also been useful as models
for neurodevelopmental and neurodegenerative disorders, including autism, schizophrenia,
Alzheimer’s disease and fragile X syndrome. For example, by using an Fmr1-KO C57BL/6
mouse to study synaptic plasticity in fragile X syndrome, Huber et al. (2002) discovered that
FMRP has a functional role in regulating long-term depression, which has led to new ideas for
therapeutic approaches to this disorder (Bear, 2005). Mice in general are helpful in medical
research because of their genetic similarities to humans. Many of the genes implicated in human
neurological conditions are also found in mice, where similar mutations between mice and
humans cause similar phenotypes. Additionally, because mice have a relatively short lifespan (~2
years) and produce high volumes of offspring, scientists can study developmental disorders in
19
mice at an accelerated pace. Lastly, mice are relatively cheap and
easy to maintain, costing about $1 per day to be cared for in an
animal care facility. Use of the C57BL/6 mouse further enhances
the utility of mice because it provides a stable genetic
background for experiments; when different labs are using the
same common inbred strains, cross-study analysis and
interpretation can be accomplished with higher accuracy.
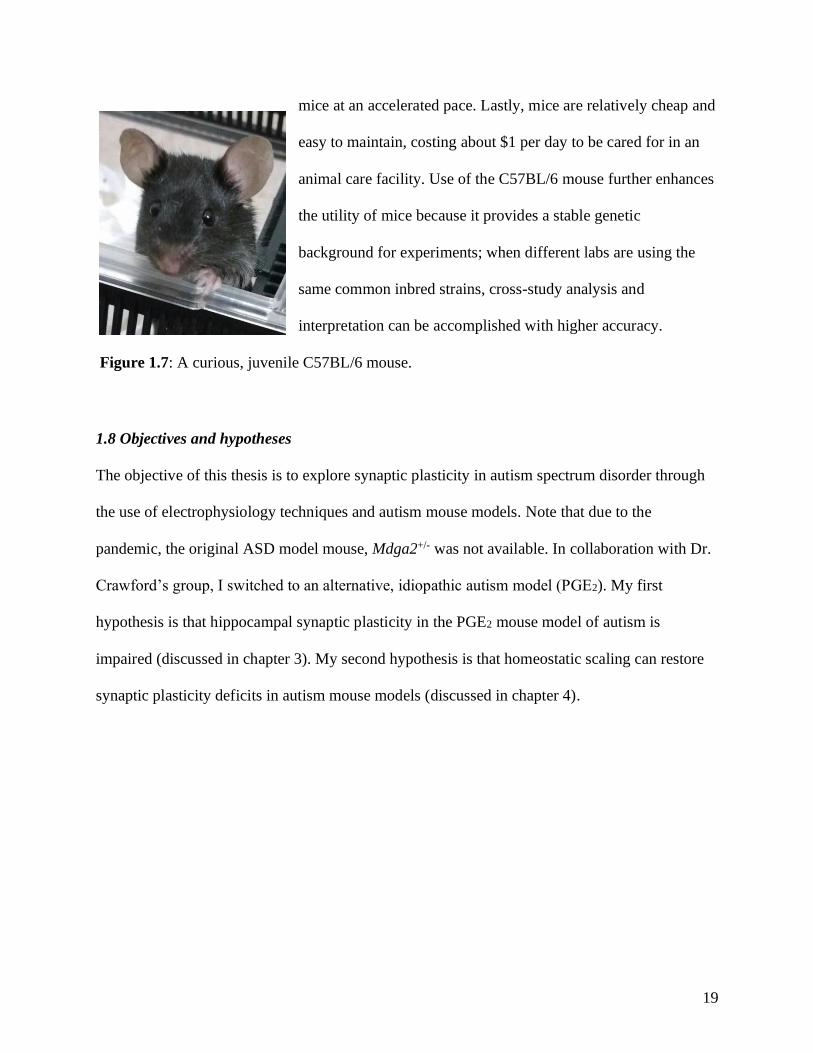
Figure 1.7: A curious, juvenile C57BL/6 mouse.
1.8 Objectives and hypotheses
The objective of this thesis is to explore synaptic plasticity in autism spectrum disorder through
the use of electrophysiology techniques and autism mouse models. Note that due to the
pandemic, the original ASD model mouse, Mdga2+/- was not available. In collaboration with Dr.
Crawford’s group, I switched to an alternative, idiopathic autism model (PGE2). My first
hypothesis is that hippocampal synaptic plasticity in the PGE2 mouse model of autism is
impaired (discussed in chapter 3). My second hypothesis is that homeostatic scaling can restore
synaptic plasticity deficits in autism mouse models (discussed in chapter 4).
20
CHAPTER 2: ASSEMBLY OF ELECTROPHYSIOLOGY
EQUIPMENT
2.1 INTRODUCTION
2.1.1 Mouse hippocampal slice recording
Before any hypotheses can be tested, it is essential that proper equipment is assembled and
working methods are devised. Investigating LTP in autism mouse models is not possible unless
baseline field excitatory post-synaptic potentials (fEPSPs) are able to be seen within the
recording system of choice. fEPSPs are extracellularly recorded excitatory post-synaptic
potentials (EPSPs) that capture responses from a population of neurons. In the mouse
hippocampal CA1 region, fEPSP waveforms have different shapes depending on whether
recording took place at the cell bodies or the dendrites. In stratum pyramidale (cell body layer),
fEPSPs are upward-deflected, whereas in stratum radiatum (dendritic region), fEPSPs are
downward-deflected (Sweatt, 2009). There are three main components to a fEPSP waveform,
namely, the stimulus artefact, fibre volley, and population EPSP. The stimulus artefact is a result
of the stimulus itself, the fibre volley is the signal from the pre-synaptic action potentials, and the
EPSP arises from the activation of the post-synaptic neurons. Most LTP studies utilize rodent
hippocampal slices, as this form of experimental substrate offers retained synaptic circuits and
easy accessibility for electrophysiological recording (Lein et al., 2011). Furthermore, rodents are
simple to maintain in the laboratory, and many features of the rodent hippocampus are applicable
to humans as well. However, fEPSPs have been successfully recorded in many other classes of
animals including primates, fish, reptiles, and insects.
21
2.1.2 Cricket cercal system as an alternative model
Although mouse hippocampal slices are ideal for studying LTP, they may not be the most
efficient material for use in troubleshooting equipment set-up. For example, when testing if
electrophysiology equipment can pick up general biological signals, or when learning how to
navigate new software, simpler life-forms may be better suited for the task. House crickets could
potentially be a better alternative to mice in such situations, as they are cheaper, easier to
maintain, and do not require as much time or resources to dissect and prepare. For instance, one
cricket only costs 14 cents and, because crickets continue to respire through the sides of their
body during dissection, no oxygen bubbling is required. For testing biological signal resolution,
fEPSPs in crickets may provide sufficient indication of whether or not a set-up is working.
fEPSPs have previously been successfully recorded from the cricket cercal system (Ogawa &
Mitani, 2015). The cercal system consists of a mechanosensory processing pathway, allowing the
cricket to respond appropriately to environmental stimuli. It involves distinct structures known as
cerci, which are two antenna-like structures extending from the posterior end of the abdomen.
The cerci are covered in fine hairs that allow the cricket to sense faint movements of surrounding
air. Vibration of the mechanoreceptor hairs on the cerci propagate action potentials towards the
abdomen, into the terminal (cercal) ganglion, containing cell bodies of the giant interneurons that
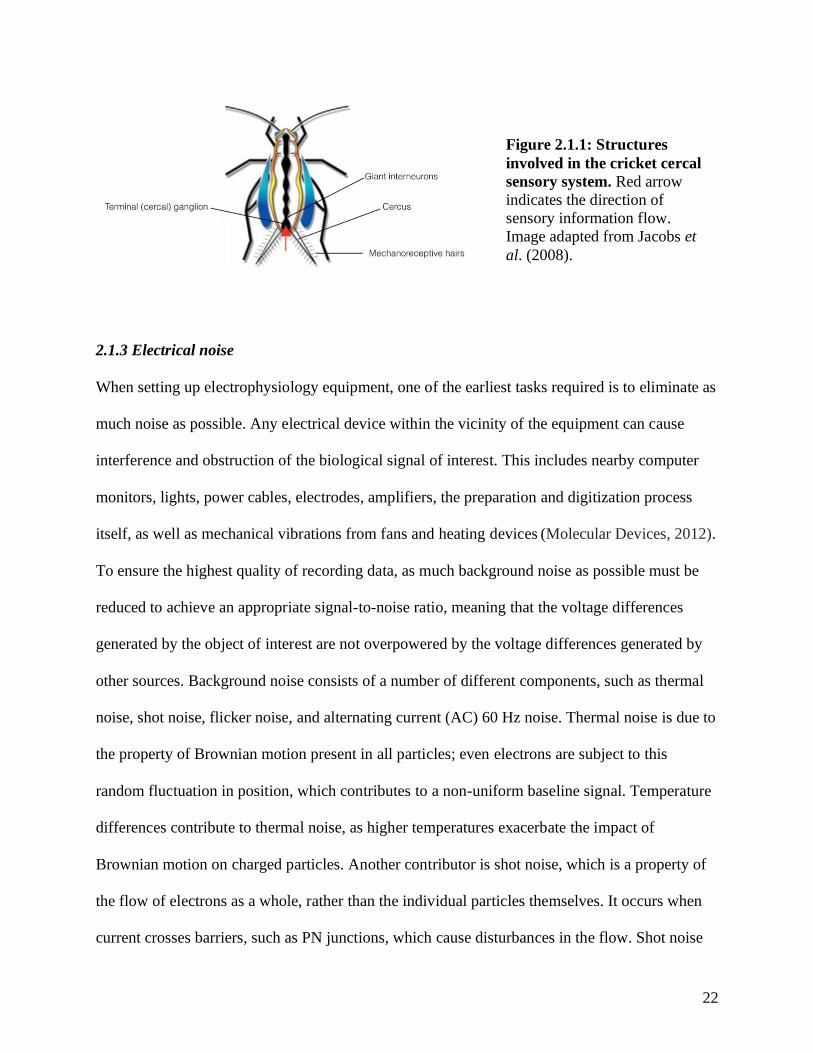
extend anteriorly to inform responsive leg and head movements (Figure 2.1.1) (Jacobs et al.,
2008; Mendenhall & Murphey, 1974).
22
2.1.3 Electrical noise
When setting up electrophysiology equipment, one of the earliest tasks required is to eliminate as
much noise as possible. Any electrical device within the vicinity of the equipment can cause
interference and obstruction of the biological signal of interest. This includes nearby computer
monitors, lights, power cables, electrodes, amplifiers, the preparation and digitization process
itself, as well as mechanical vibrations from fans and heating devices (Molecular Devices, 2012).
To ensure the highest quality of recording data, as much background noise as possible must be
reduced to achieve an appropriate signal-to-noise ratio, meaning that the voltage differences
generated by the object of interest are not overpowered by the voltage differences generated by
other sources. Background noise consists of a number of different components, such as thermal
noise, shot noise, flicker noise, and alternating current (AC) 60 Hz noise. Thermal noise is due to
the property of Brownian motion present in all particles; even electrons are subject to this
random fluctuation in position, which contributes to a non-uniform baseline signal. Temperature
differences contribute to thermal noise, as higher temperatures exacerbate the impact of
Brownian motion on charged particles. Another contributor is shot noise, which is a property of
the flow of electrons as a whole, rather than the individual particles themselves. It occurs when
current crosses barriers, such as PN junctions, which cause disturbances in the flow. Shot noise
Figure 2.1.1: Structures
involved in the cricket cercal
sensory system. Red arrow
indicates the direction of
sensory information flow.
Image adapted from Jacobs et
al. (2008).
23
can be thought of as similar to the effect of turbulence in flowing water. Flicker noise, or 1/f
noise, is also a property of current, and it is most apparent at low frequency. The reason behind
why flicker noise occurs is not entirely clear. It may be due to the random build up and release of
charge in the circuit, or another possibility is that it may be caused by slight differences in
current mobility throughout the path of motion (Chauhan et al., 2015). Lastly, 60 Hz noise is a
product of the AC voltage fluctuations as current moves in alternating directions. It is easy to
identify, as its characteristic voltage oscillation cycle occurs ~60 times per second. Taken
together, all these types of noise – AC, flicker, shot, and thermal – contribute to the overall
background disturbances that can be disruptive to the recording of biological signals. It is
important to be aware of the causes of background noise to aid in the task of its reduction.
2.2 MATERIALS & METHODS
2.2.1 Mouse Hippocampal Slice Preparation
C57BL/6 mice were ordered from supplier Charles River and maintained at the York University
animal facility, department of Biology (Toronto, ONT, Canada). Mice had continual access to
food and water, and were housed at room temperature on a 12h:12h light:dark cycle. Mice were
acclimatized to the facility for at least one week upon arrival before use in experiments. Juvenile
and adult mice, between the ages of 5 - 26 weeks old, were sacrificed by cervical dislocation
followed by decapitation. The brain was removed and rapidly cooled for ~45 seconds in ice-cold
recovery solution (Table1) or aCSF (Table 2) bubbled with carbogen (95% O2, 5% CO2). The
brain was then hemisected and hippocampi were removed from both hemispheres. Hippocampi
were sliced using a manual tissue slicer to a width of 400 microns. Recovery time,
24
electrophysiology rig equipment, and synaptic plasticity protocols varied depending on the
particular experiment.
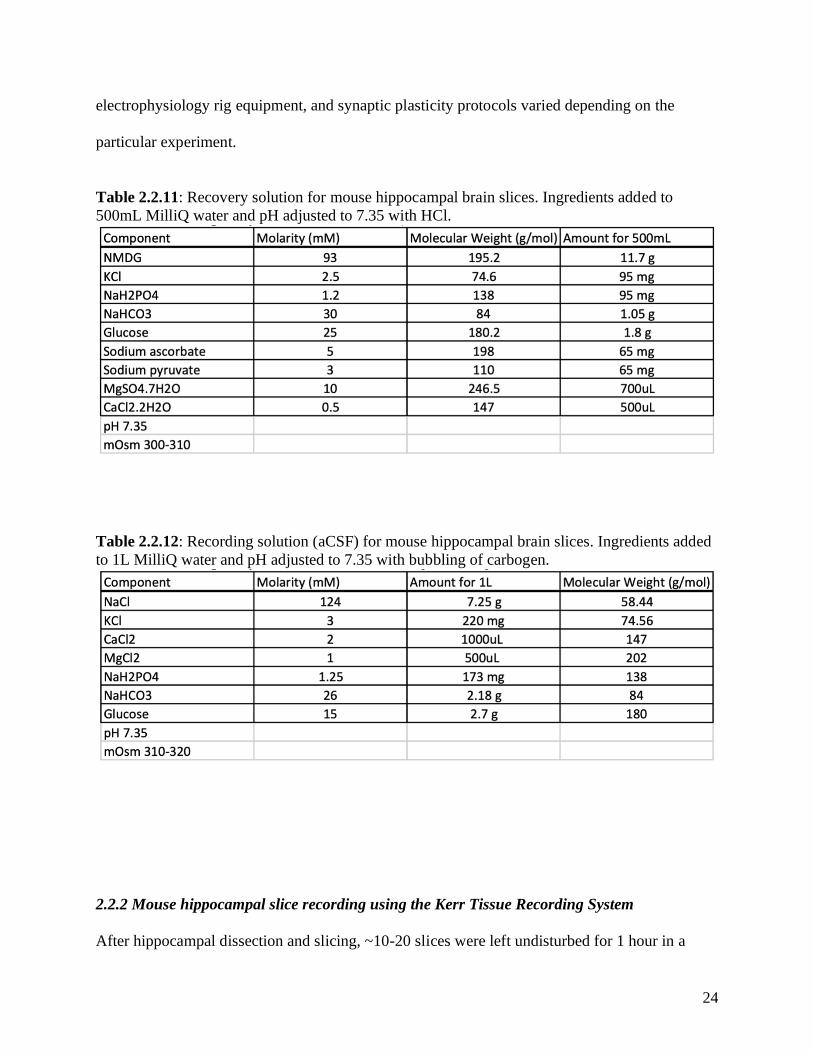
Table 2.2.11: Recovery solution for mouse hippocampal brain slices. Ingredients added to
500mL MilliQ water and pH adjusted to 7.35 with HCl.
Table 2.2.12: Recording solution (aCSF) for mouse hippocampal brain slices. Ingredients added
to 1L MilliQ water and pH adjusted to 7.35 with bubbling of carbogen.
2.2.2 Mouse hippocampal slice recording using the Kerr Tissue Recording System
After hippocampal dissection and slicing, ~10-20 slices were left undisturbed for 1 hour in a
25
recovery submersion chamber heated to 32°C using a general purpose water bath (Thermo Fisher
Scientific, FisherbrandTM, IsotempTM). Within the recovery chamber, slices were incubated in
carbogenated artificial cerebrospinal fluid (aCSF). After 1 hour at 32°C, the recovery chamber
was removed from the water bath for an additional recovery period of 1 hour at room
temperature (21°C). Slices were then transferred using a disposable Pasteur pipette to the Kerr
Scientific Instruments (KSI) Tissue Recording SystemTM chamber. Extracellular recordings of
field excitatory postsynaptic potentials (fEPSPs) were conducted using the recording and
stimulating electrodes supplied by the KSI Tissue Recording System™. During the measuring
period, a constant flow of carbogenated aCSF was maintained through the recording chamber, at
a rate of 1-2mL/min. Signal information was relayed to an ADInstruments PowerLab 4/26 data
acquisition device and interpreted by the computer software LabChart 8.
2.2.3 Mouse hippocampal slice recording using the Axon Instruments recording system
When recording from the Axon Instruments rig, slices were no longer incubated in a separate
submersion chamber for recovery; rather, after dissection and slicing, ~10-20 slices were placed
in a heated interface chamber (BSC1-2; Scientific Systems Design Inc) and allowed to recover
undisturbed for 1.5 hours. The interface chamber was heated to 30°C using a PTC03 Scientific
Systems Design Inc. proportional temperature control unit. The stimulating electrode was
constructed from 0.002 inch nichrome wire (80% nickel/20% chromium; A-M SystemsTM),
threaded through a 1.5mm width borosilicate glass capillary (TW150F-4; World Precision
Instruments), with ends sealed using ArmorCoatTM quick setting epoxy. The stimulating
electrode was connected to a DS3 Isolated Current Stimulator (Digitimer, LLC) to control the
strength and duration of the electrical stimulus. The recording microelectrode was also
constructed from a 1.5mm width borosilicate glass capillary (TW150F-4; World Precision
26
Instruments), pulled to a fine tip using a P-97 Flaming/Brown type micropipette puller. The
recording electrode was backfilled with aCSF and secured to an Axon Instruments CV-7B
current/voltage clamp headstage. A new recording electrode was constructed for each slice
recording measurement, with an acceptable resistance of 1-3MΩ. Signal information from the
recording electrode was relayed from the headstage to an AxonTM Digidata® 1550B low-noise
data acquisition system with HumSilencerTM, and MultiClampTM 700B computer-controlled
current and voltage clamp amplifier. Signal information was converted to readable output data
using the computer software AxonTM pCLAMPTM 11. Mechanical noise reduction was achieved
by using a Newport air table to support the brain slice interface chamber and surrounding
equipment, including the electrode micromanipulators (M3301; World Precision Instruments)
and LaxcoTM LMS-Z200 Stereo Zoom microscope.
2.2.4 Cricket cercal system recording
Juvenile house crickets, Acheta domesticus, were obtained from a colony maintained at PetSmart
(Lawrence Allen Centre, Toronto, ONT, Canada). Upon arrival at York University, crickets were
housed at room temperature in a 15.5cm (length) X 8.5cm (width) X 10cm (height) portable
plastic pet carrier. A maximum of 12 crickets were held in the container at one time. Crickets
were maintained on a diet of fresh apple slices, provided daily for 1-2 weeks, the time span after
which all crickets were used. The container was enriched with layers of cardboard egg cartons to
prevent cannibalism and fighting among cagemates. Crickets were anesthetized by placement in
a -20°C freezer for ~3min. Crickets were then rapidly decapitated and de-limbed on ice using
fine-pointed micro-scissors. A makeshift dissection surface was constructed from a metal washer
wrapped in multiple layers of Parafilm®, on which sewing pins were used to immobilize the
crickets’ thorax and abdomen during dissection. Crickets were dissected by cutting down the
27
midline of the dorsal exoskeleton and removing most of the abdominal organs (midgut, hindgut,
Malpighian tubules, testes, ovaries) to access the underlying terminal ganglion. During and after
dissection, cricket preparations were bathed in Acheta Ringer’s solution (Table 2.2.4), isotonic
and of similar composition to cricket circulatory fluid (hemolymph). Extracellular recordings of
field excitatory postsynaptic potentials (fEPSPs) were conducted using the KSI Tissue Recording
System. Signal information was relayed to an ADInstruments PowerLab 4/26 data acquisition
device and interpreted by the computer software LabChart 8.
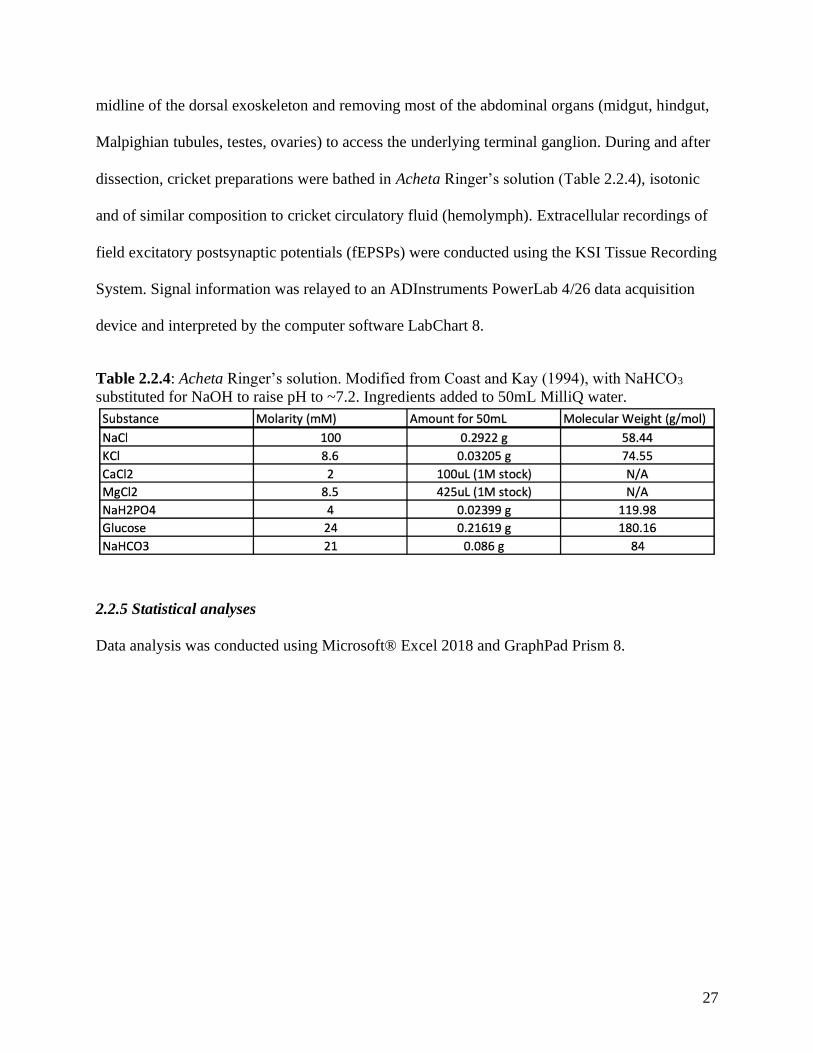
Table 2.2.4: Acheta Ringer’s solution. Modified from Coast and Kay (1994), with NaHCO3
substituted for NaOH to raise pH to ~7.2. Ingredients added to 50mL MilliQ water.
2.2.5 Statistical analyses
Data analysis was conducted using Microsoft® Excel 2018 and GraphPad Prism 8.
28
2.3 RESULTS
2.3.1 Overview of the Kerr Tissue Recording System
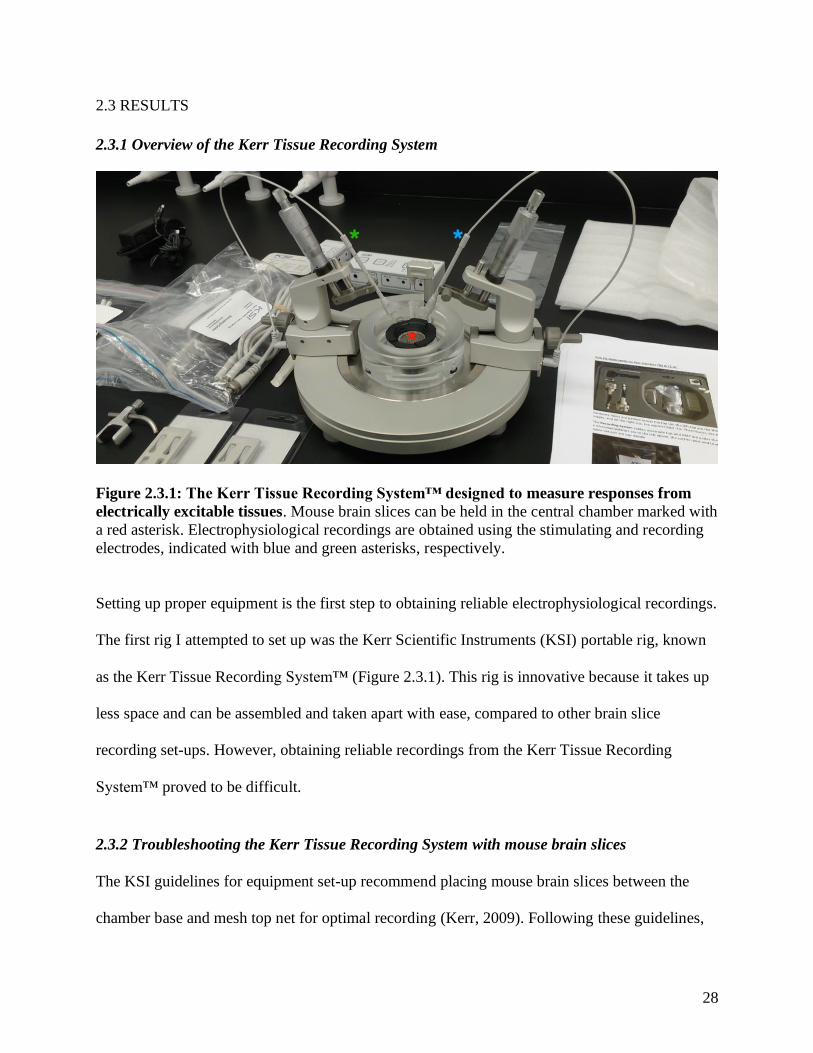
Figure 2.3.1: The Kerr Tissue Recording System™ designed to measure responses from
electrically excitable tissues. Mouse brain slices can be held in the central chamber marked with
a red asterisk. Electrophysiological recordings are obtained using the stimulating and recording
electrodes, indicated with blue and green asterisks, respectively.
Setting up proper equipment is the first step to obtaining reliable electrophysiological recordings.
The first rig I attempted to set up was the Kerr Scientific Instruments (KSI) portable rig, known
as the Kerr Tissue Recording System™ (Figure 2.3.1). This rig is innovative because it takes up
less space and can be assembled and taken apart with ease, compared to other brain slice
recording set-ups. However, obtaining reliable recordings from the Kerr Tissue Recording
System™ proved to be difficult.
2.3.2 Troubleshooting the Kerr Tissue Recording System with mouse brain slices
The KSI guidelines for equipment set-up recommend placing mouse brain slices between the
chamber base and mesh top net for optimal recording (Kerr, 2009). Following these guidelines,
29
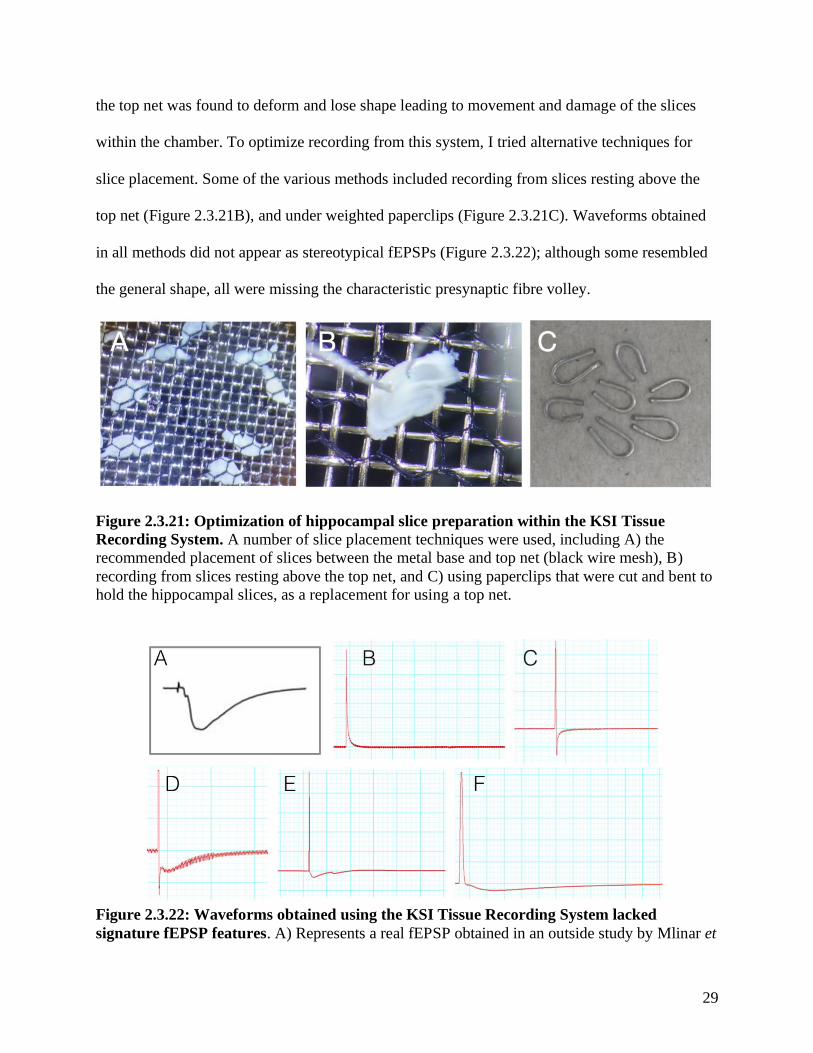
the top net was found to deform and lose shape leading to movement and damage of the slices
within the chamber. To optimize recording from this system, I tried alternative techniques for
slice placement. Some of the various methods included recording from slices resting above the
top net (Figure 2.3.21B), and under weighted paperclips (Figure 2.3.21C). Waveforms obtained
in all methods did not appear as stereotypical fEPSPs (Figure 2.3.22); although some resembled
the general shape, all were missing the characteristic presynaptic fibre volley.
Figure 2.3.21: Optimization of hippocampal slice preparation within the KSI Tissue
Recording System. A number of slice placement techniques were used, including A) the
recommended placement of slices between the metal base and top net (black wire mesh), B)
recording from slices resting above the top net, and C) using paperclips that were cut and bent to
hold the hippocampal slices, as a replacement for using a top net.
Figure 2.3.22: Waveforms obtained using the KSI Tissue Recording System lacked
signature fEPSP features. A) Represents a real fEPSP obtained in an outside study by Mlinar et
30
al. (2008). B & C) The appearance of the stimulus artefact during KSI recording was variable. D,
E, & F) Representative examples of suspected hippocampal fEPSPs obtained using the KSI rig;
however, whether these are truly fEPSPs remains unknown because they lack visible presynaptic
fiber volleys.
The use of mice for ongoing troubleshooting of equipment may not be necessary. The
Canadian Council on Animal Care (CCAC) recommends replacement of sentient life forms (e.g.
mice) where possible with non-living substitutes or species with lower potential for pain
perception (CCAC, 2019). In following these guidelines, I decided to replace the use of mice for
crickets in further troubleshooting experiments.
2.3.3 KSI troubleshooting with crickets
The use of crickets within the KSI Tissue Recording System was explored as a less costly and
ethical alternative to using mice for troubleshooting purposes. A number of cricket dissection
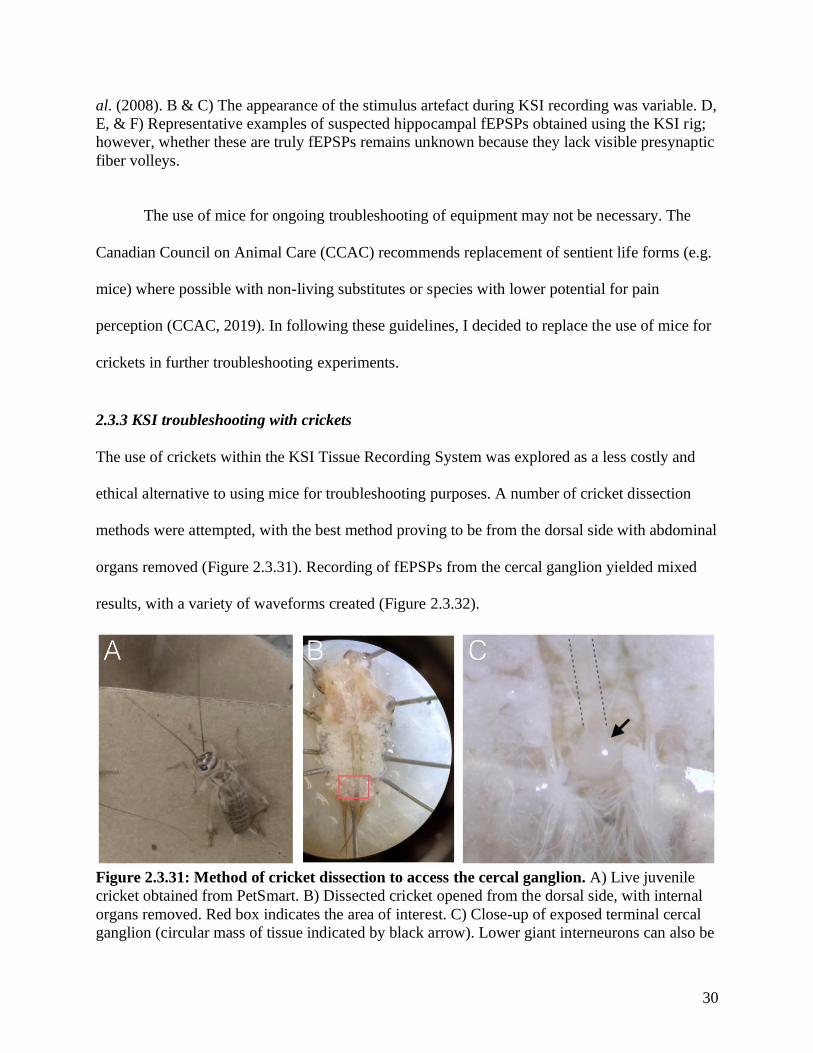
methods were attempted, with the best method proving to be from the dorsal side with abdominal
organs removed (Figure 2.3.31). Recording of fEPSPs from the cercal ganglion yielded mixed
results, with a variety of waveforms created (Figure 2.3.32).
Figure 2.3.31: Method of cricket dissection to access the cercal ganglion. A) Live juvenile
cricket obtained from PetSmart. B) Dissected cricket opened from the dorsal side, with internal
organs removed. Red box indicates the area of interest. C) Close-up of exposed terminal cercal
ganglion (circular mass of tissue indicated by black arrow). Lower giant interneurons can also be
31
accessed by this method; dotted lines highlight the path of giant interneurons (translucent)
extending from the cercal ganglion.
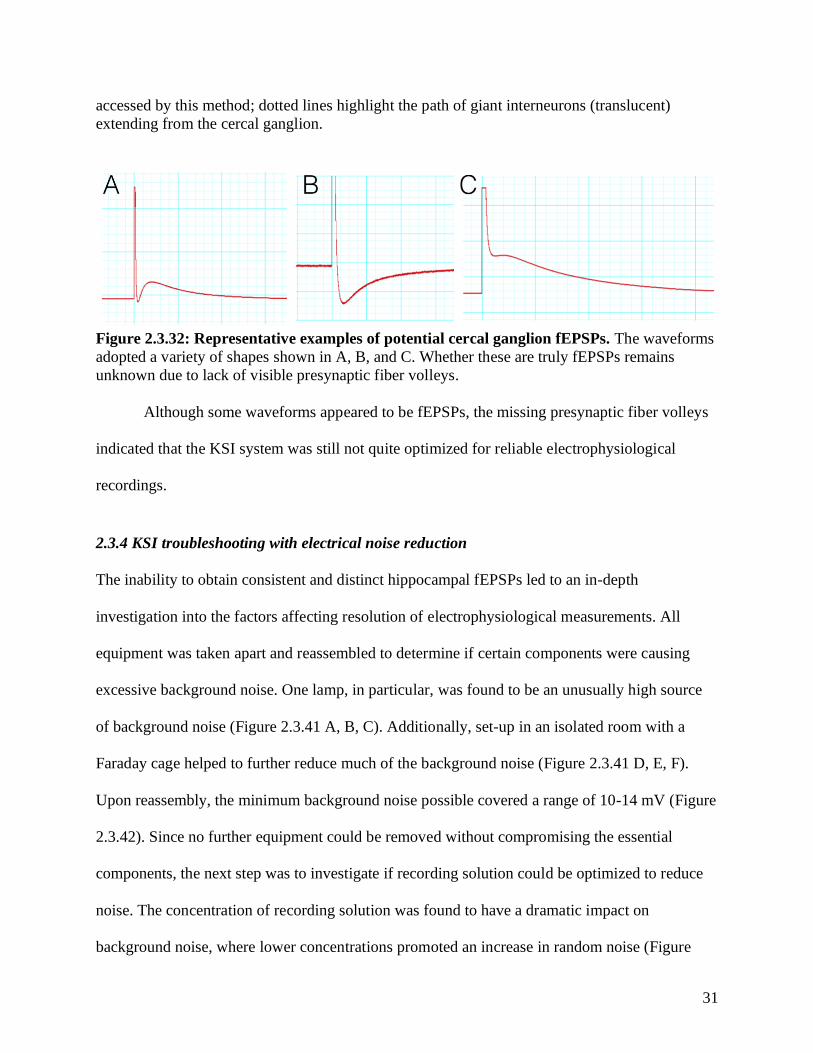
Figure 2.3.32: Representative examples of potential cercal ganglion fEPSPs. The waveforms
adopted a variety of shapes shown in A, B, and C. Whether these are truly fEPSPs remains
unknown due to lack of visible presynaptic fiber volleys.
Although some waveforms appeared to be fEPSPs, the missing presynaptic fiber volleys
indicated that the KSI system was still not quite optimized for reliable electrophysiological
recordings.
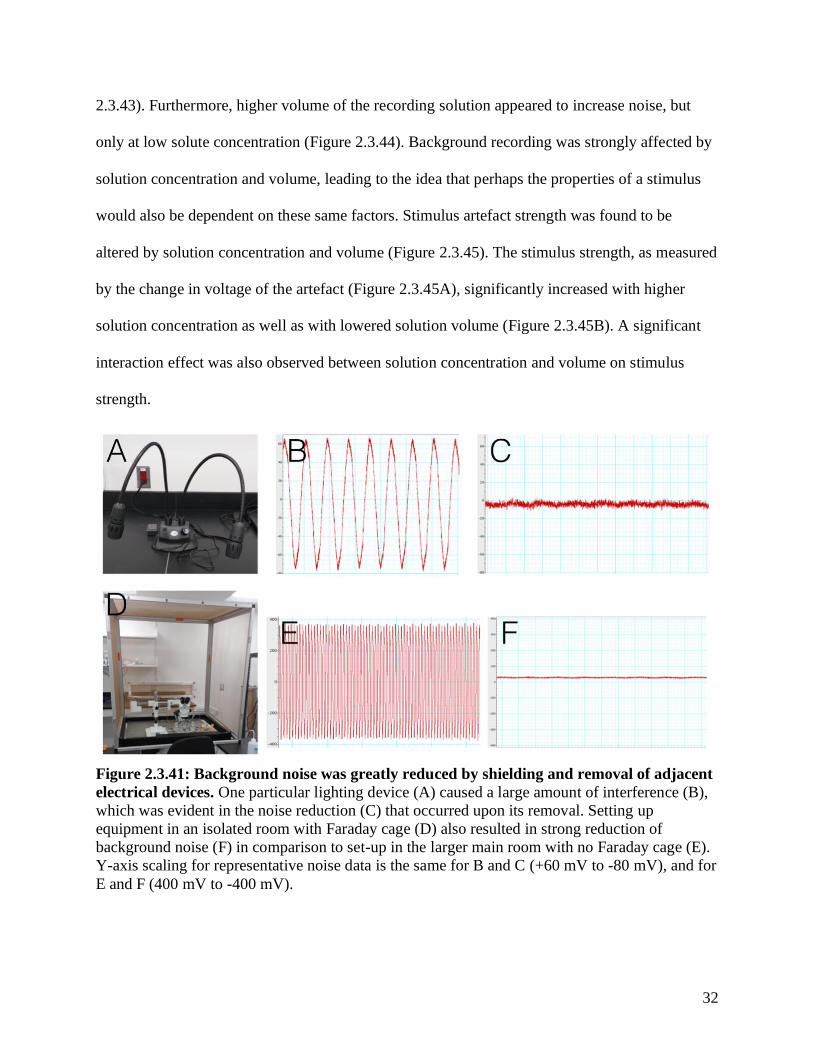
2.3.4 KSI troubleshooting with electrical noise reduction
The inability to obtain consistent and distinct hippocampal fEPSPs led to an in-depth
investigation into the factors affecting resolution of electrophysiological measurements. All
equipment was taken apart and reassembled to determine if certain components were causing
excessive background noise. One lamp, in particular, was found to be an unusually high source
of background noise (Figure 2.3.41 A, B, C). Additionally, set-up in an isolated room with a
Faraday cage helped to further reduce much of the background noise (Figure 2.3.41 D, E, F).
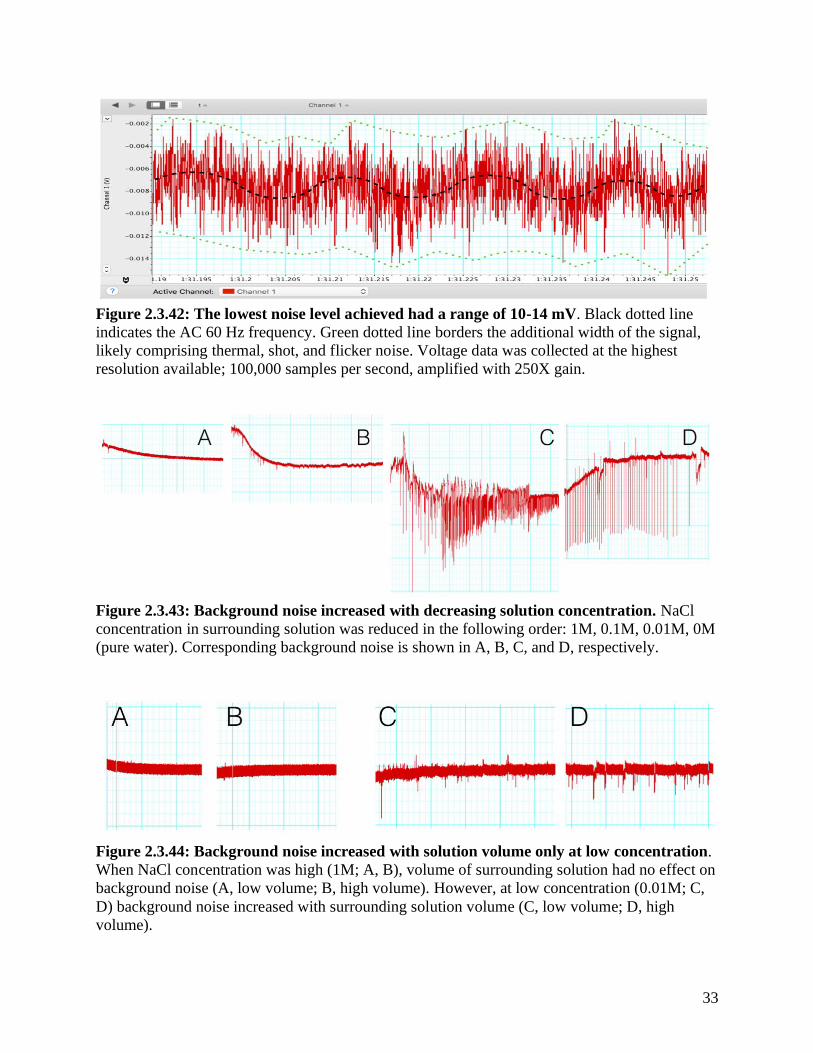
Upon reassembly, the minimum background noise possible covered a range of 10-14 mV (Figure
2.3.42). Since no further equipment could be removed without compromising the essential
components, the next step was to investigate if recording solution could be optimized to reduce
noise. The concentration of recording solution was found to have a dramatic impact on
background noise, where lower concentrations promoted an increase in random noise (Figure
32
2.3.43). Furthermore, higher volume of the recording solution appeared to increase noise, but
only at low solute concentration (Figure 2.3.44). Background recording was strongly affected by
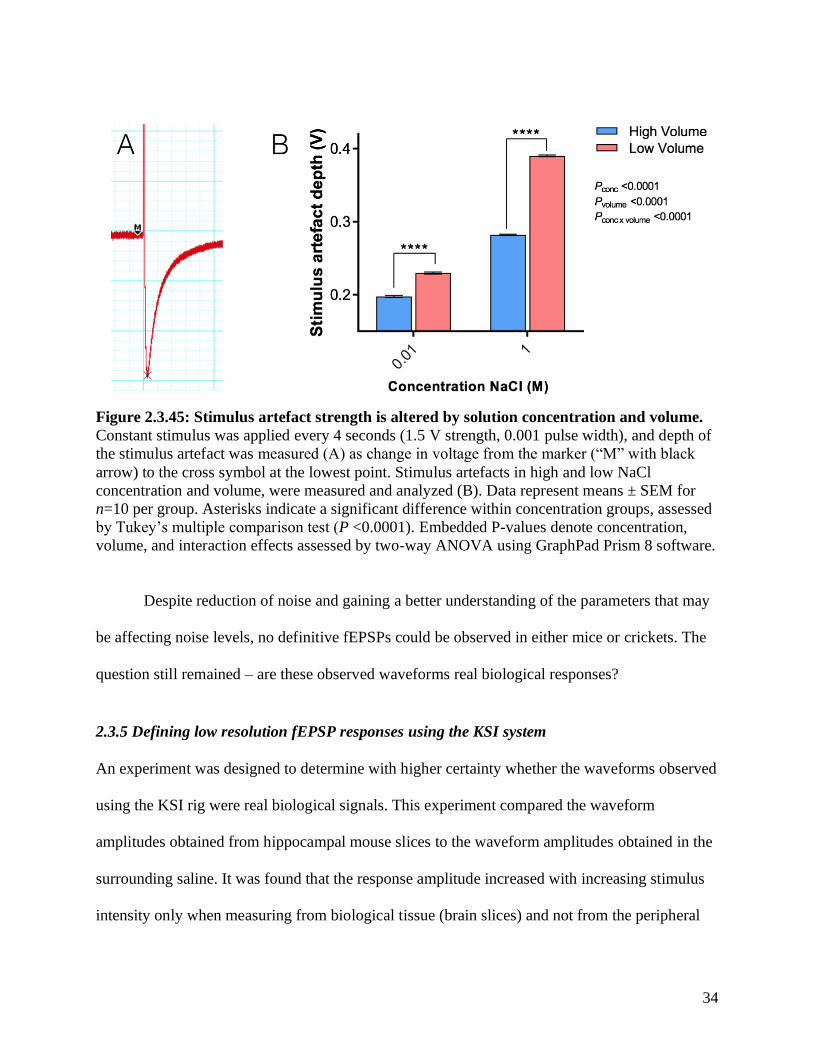
solution concentration and volume, leading to the idea that perhaps the properties of a stimulus
would also be dependent on these same factors. Stimulus artefact strength was found to be
altered by solution concentration and volume (Figure 2.3.45). The stimulus strength, as measured
by the change in voltage of the artefact (Figure 2.3.45A), significantly increased with higher
solution concentration as well as with lowered solution volume (Figure 2.3.45B). A significant
interaction effect was also observed between solution concentration and volume on stimulus
strength.
Figure 2.3.41: Background noise was greatly reduced by shielding and removal of adjacent
electrical devices. One particular lighting device (A) caused a large amount of interference (B),
which was evident in the noise reduction (C) that occurred upon its removal. Setting up
equipment in an isolated room with Faraday cage (D) also resulted in strong reduction of
background noise (F) in comparison to set-up in the larger main room with no Faraday cage (E).
Y-axis scaling for representative noise data is the same for B and C (+60 mV to -80 mV), and for
E and F (400 mV to -400 mV).
33
Figure 2.3.42: The lowest noise level achieved had a range of 10-14 mV. Black dotted line
indicates the AC 60 Hz frequency. Green dotted line borders the additional width of the signal,
likely comprising thermal, shot, and flicker noise. Voltage data was collected at the highest
resolution available; 100,000 samples per second, amplified with 250X gain.
Figure 2.3.43: Background noise increased with decreasing solution concentration. NaCl
concentration in surrounding solution was reduced in the following order: 1M, 0.1M, 0.01M, 0M
(pure water). Corresponding background noise is shown in A, B, C, and D, respectively.
Figure 2.3.44: Background noise increased with solution volume only at low concentration.
When NaCl concentration was high (1M; A, B), volume of surrounding solution had no effect on
background noise (A, low volume; B, high volume). However, at low concentration (0.01M; C,
D) background noise increased with surrounding solution volume (C, low volume; D, high
volume).
34
Figure 2.3.45: Stimulus artefact strength is altered by solution concentration and volume.
Constant stimulus was applied every 4 seconds (1.5 V strength, 0.001 pulse width), and depth of
the stimulus artefact was measured (A) as change in voltage from the marker (“M” with black
arrow) to the cross symbol at the lowest point. Stimulus artefacts in high and low NaCl
concentration and volume, were measured and analyzed (B). Data represent means ± SEM for
n=10 per group. Asterisks indicate a significant difference within concentration groups, assessed
by Tukey’s multiple comparison test (P <0.0001). Embedded P-values denote concentration,
volume, and interaction effects assessed by two-way ANOVA using GraphPad Prism 8 software.
Despite reduction of noise and gaining a better understanding of the parameters that may
be affecting noise levels, no definitive fEPSPs could be observed in either mice or crickets. The
question still remained – are these observed waveforms real biological responses?
2.3.5 Defining low resolution fEPSP responses using the KSI system
An experiment was designed to determine with higher certainty whether the waveforms observed
using the KSI rig were real biological signals. This experiment compared the waveform
amplitudes obtained from hippocampal mouse slices to the waveform amplitudes obtained in the
surrounding saline. It was found that the response amplitude increased with increasing stimulus
intensity only when measuring from biological tissue (brain slices) and not from the peripheral
35
saline (Figure 2.3.51). Response amplitude became significantly greater in the brain slices at
stimulus intensity 5V and upwards, as assessed by Bonferroni’s multiple comparisons test. The
response curves showed visibly distinct features when obtained from tissue slices (Figure
2.3.51B) compared to the saline-only condition (Figure 2.3.51C). Waveforms from slices
demonstrated a downward deflection below baseline immediately following stimulation, which
is characteristic of fEPSPs. In contrast, the waveforms obtained from the peripheral saline
showed no shift in voltage following stimulus artefact.
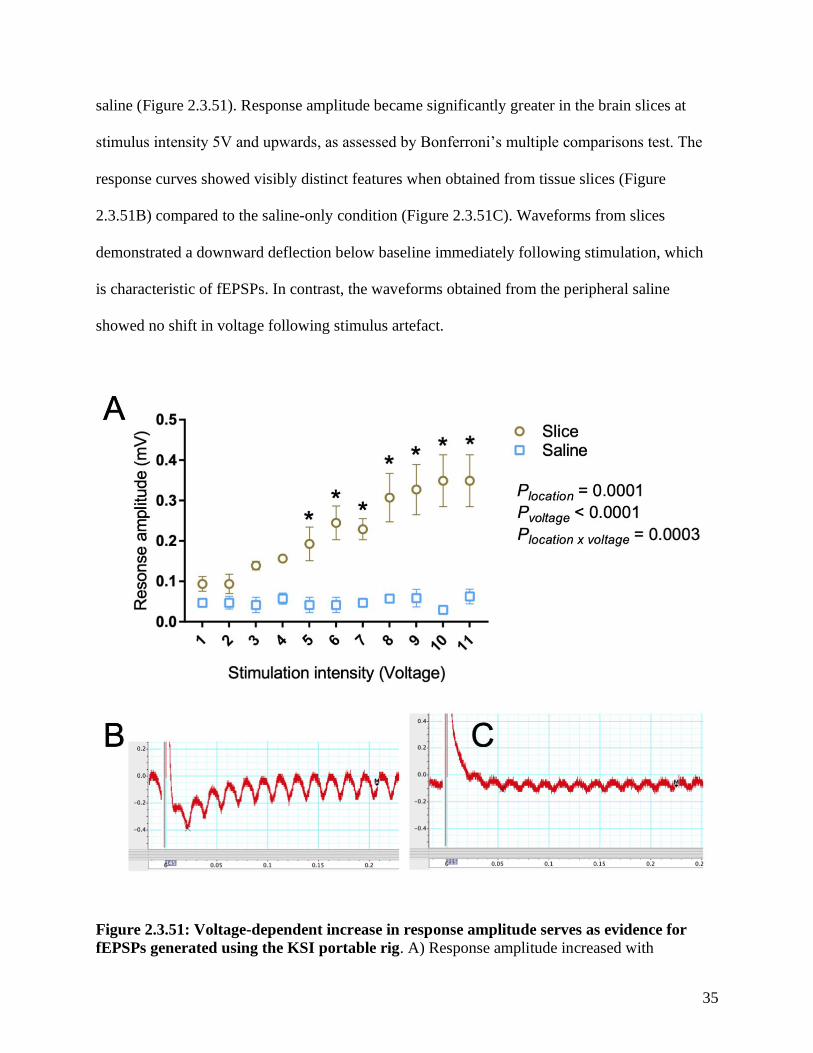
Figure 2.3.51: Voltage-dependent increase in response amplitude serves as evidence for
fEPSPs generated using the KSI portable rig. A) Response amplitude increased with
36
increasing stimulation intensity only when recordings were taken from the CA3-CA1 region of
hippocampal slices. No voltage-dependent change in response amplitude was observed when
recording in the absence of slices (recording in aCSF only). n=3 slices for the slice location
group, and n=3 separate locations in saline for the saline group. All slices were obtained from
one mouse. There were significant effects of location (slice versus saline, P = 0.0001), voltage (P
< 0.0001), and interaction between location and voltage (P = 0.0003), as assessed by two-way
ANOVA. Asterisks indicate a significant difference (P < 0.05) between slice and saline groups at
a particular stimulation intensity, as assessed by Bonferroni’s multiple comparisons test. B) A
representative trace in LabChart depicting a potential fEPSP elicited from an 11V stimulus in a
hippocampal slice. Recordings were taken at 250x gain with 100k/s sampling resolution. C) A
representative trace depicting a response to an 11V stimulus in the absence of a hippocampal
slice (saline only). Response amplitude was measured as the difference between the midpoint of
the noise near time 0.2 seconds after stimulus (indicated by the marker ‘M’) and the lowest point
following stimulus within 0.06 seconds (indicated by the cross)
Although this provided evidence that fEPSPs can be measured using the KSI rig, the
resolution was still suboptimal. The visibility of the presynaptic fiber volley is an important
indicator of slice health and field measurement consistency. Since to date no presynaptic fiber
volley has been observed using the KSI system, this set-up in its current state is unable to
provide the waveform refinement needed to ensure accuracy.
2.3.6 Overview of the Axon Instruments recording system
37
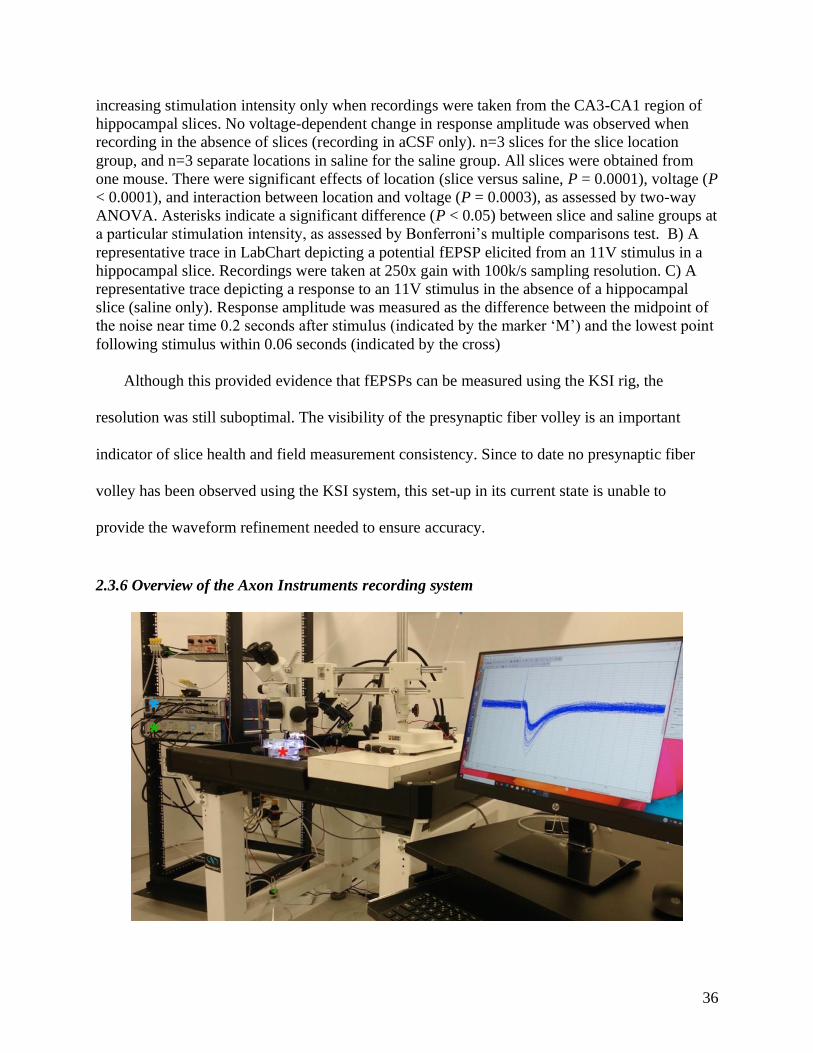
Figure 2.3.6: The Axon Instruments non-portable rig. Mouse brain slices are placed in the
interface chamber, marked with a red asterisk. Voltage responses from biological tissue are
translated into measurable waveforms using the Axon Instruments digitizer (blue asterisk) and
amplifier (green asterisk).
Another rig by Axon Instruments was available for measuring fEPSPs (Figure 2.3.6). Since
extensive troubleshooting with the KSI portable rig did not yield recordings of high enough
resolution, I decided to try using this new Axon Instruments set-up.
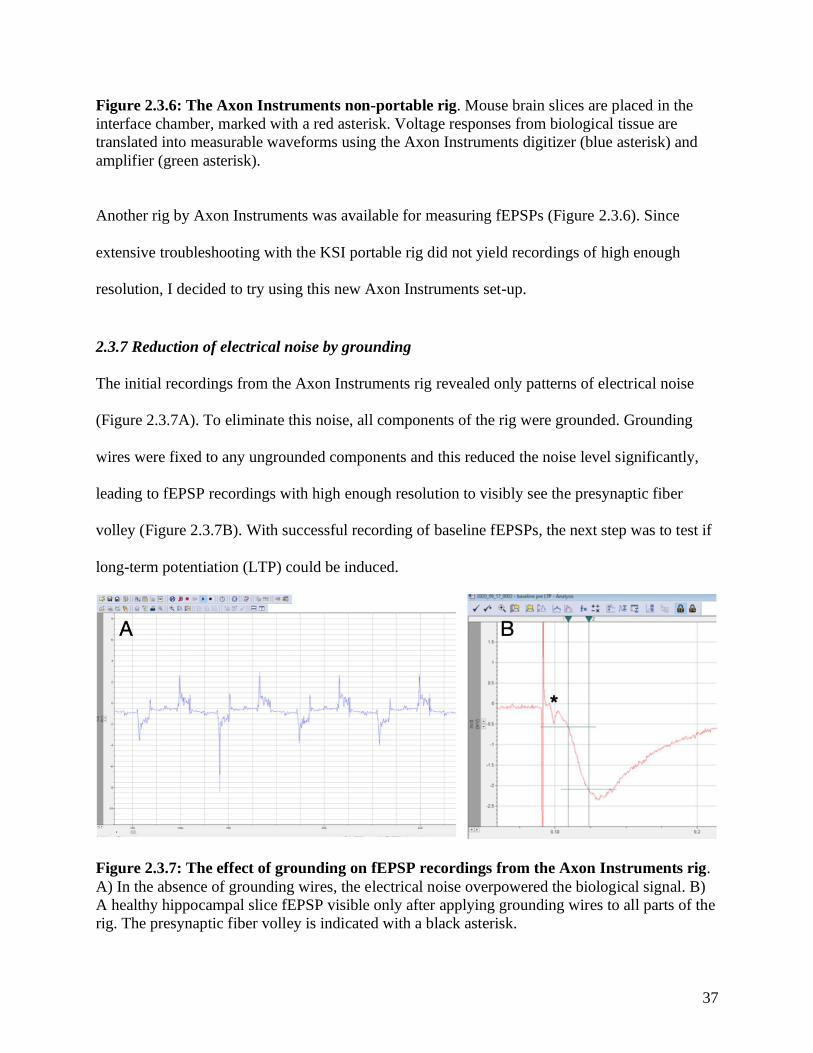
2.3.7 Reduction of electrical noise by grounding
The initial recordings from the Axon Instruments rig revealed only patterns of electrical noise
(Figure 2.3.7A). To eliminate this noise, all components of the rig were grounded. Grounding
wires were fixed to any ungrounded components and this reduced the noise level significantly,
leading to fEPSP recordings with high enough resolution to visibly see the presynaptic fiber
volley (Figure 2.3.7B). With successful recording of baseline fEPSPs, the next step was to test if
long-term potentiation (LTP) could be induced.
Figure 2.3.7: The effect of grounding on fEPSP recordings from the Axon Instruments rig.
A) In the absence of grounding wires, the electrical noise overpowered the biological signal. B)
A healthy hippocampal slice fEPSP visible only after applying grounding wires to all parts of the
rig. The presynaptic fiber volley is indicated with a black asterisk.
38
2.3.8 Troubleshooting LTP Induction
To induce LTP, baseline recordings were taken for 20 minutes with 1 single-pulse stimulation
applied per minute, and then 1 x 100 Hz stimulation was applied. Comparison of baseline
responses before and after the 1 x 100 Hz stimulation demonstrated that LTP induction was
possible using the Axon Instruments rig. Figure 2.3.81 displays the first 6 attempts at LTP
induction. It was apparent from all experiments that after high-frequency stimulation (HFS), the
slope of the fEPSPs increased; however, the decay of this increase was inconsistent among the
various trials. For trial A, C, and E (Figure 2.3.81 A, C, & E) the slope of the fEPSPs continued
to increase after HFS. The baseline recordings, between time 0-20 minutes, in trial A also
showed a trend of increasing slope. In trial B, D, and F (Figure 2.3.81 B, D, & F) the slope of the
fEPSPs continually decreased after HFS to levels below baseline. The baseline slopes also
demonstrated a downward trend. In trial B, the slope abruptly dropped to zero after time ~40
minutes. This was likely due to stimulator battery depletion which occurred during another trial,
where the effect of stimulator battery strength was tested (Figure 2.3.82). It was found that
having low battery charge in the stimulator results in a downward trend of fEPSP slopes both
during baseline recording and after HFS (see Figure 2.3.82 time 0-50 minutes). This downward
trend eventually led to a sharp drop of slope levels to zero (Figure 2.3.82 time 50-65 minutes).
To investigate if stimulator batteries were the source of this effect, I switched the old batteries
for newly charged ones and the slope recordings returned back to heightened levels (Figure
2.3.82 time 70 minutes).
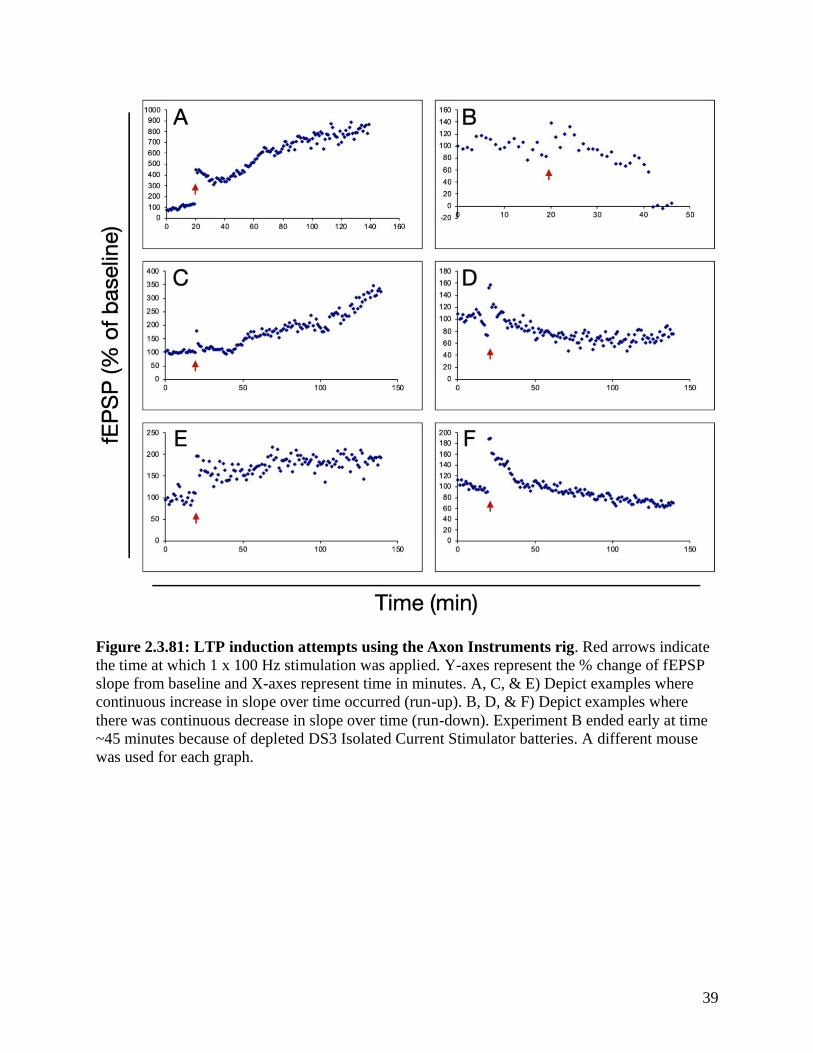
39
Figure 2.3.81: LTP induction attempts using the Axon Instruments rig. Red arrows indicate
the time at which 1 x 100 Hz stimulation was applied. Y-axes represent the % change of fEPSP
slope from baseline and X-axes represent time in minutes. A, C, & E) Depict examples where
continuous increase in slope over time occurred (run-up). B, D, & F) Depict examples where
there was continuous decrease in slope over time (run-down). Experiment B ended early at time
~45 minutes because of depleted DS3 Isolated Current Stimulator batteries. A different mouse
was used for each graph.

40
Figure 2.3.82: The effect of stimulator battery depletion on fEPSP slope. All data points are
from the same slice and recording location. A) Application of 1 train LTP induction (1 x 100 Hz)
at time 20 minutes. B) The sudden drop of slope to zero at time 50 minutes. C) The stimulator
batteries were changed at time 65 minutes. D) LTP induction (1 x 100 Hz) was applied for a
second time at 74 minutes. The stimulator used in this experiment was a Digitimer DS3 Isolated
Current Stimulator requiring eleven 9V batteries.
2.4. DISCUSSION
2.4.1 Mouse hippocampal slice recording from the KSI rig
Recording from mouse hippocampal slices did not yield any waveforms that could be considered
real fEPSPs. Despite extensive troubleshooting within the KSI Tissue Recording System, the
reason behind why fEPSP waveforms were not observed is still unclear. This outcome could be
due to several issues. Firstly, mechanical damage could be compromising slice health, resulting
in the atypical field responses (Figure 2.3.32). If the damage occurred during the dissection
process, it may be possible to improve this by dissecting under a microscope. For improved
hippocampal slice preparation, Villers and Ris (2013) recommend dissecting under a surgical
microscope (25X), and taking care to not touch or stretch the hippocampus, apart from gently
Time (min)
fEP
SP
(%
of
bas
elin
e)
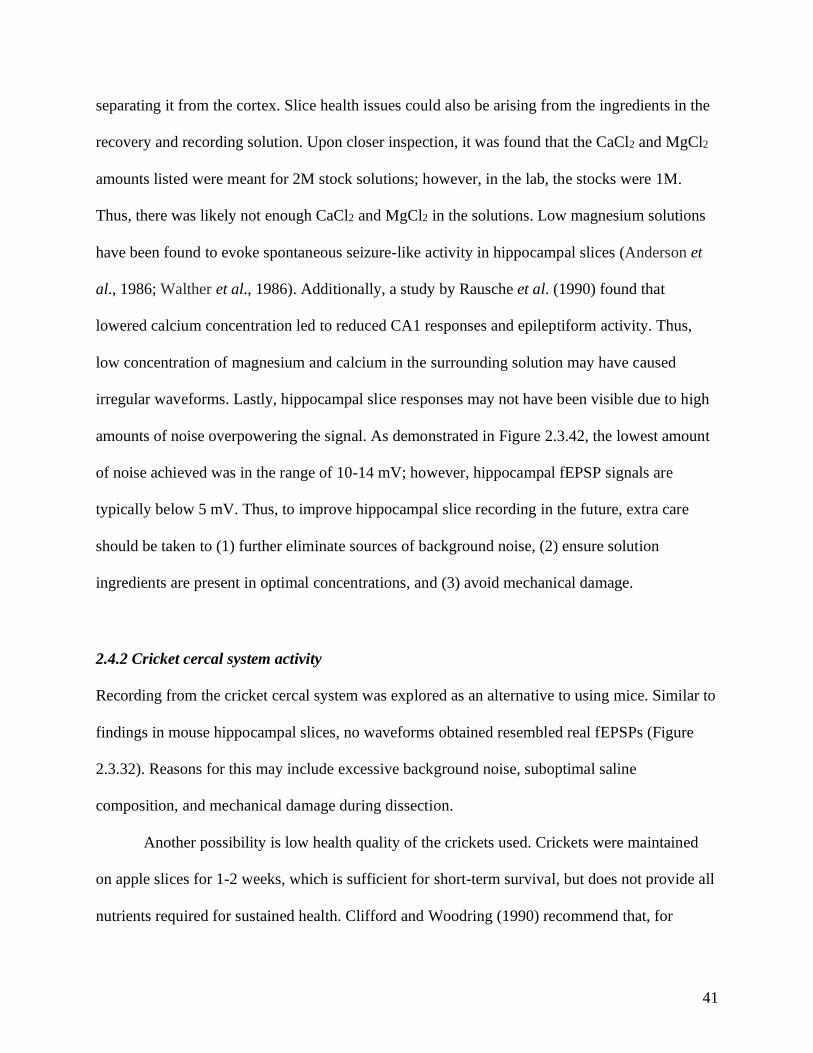
41
separating it from the cortex. Slice health issues could also be arising from the ingredients in the
recovery and recording solution. Upon closer inspection, it was found that the CaCl2 and MgCl2
amounts listed were meant for 2M stock solutions; however, in the lab, the stocks were 1M.
Thus, there was likely not enough CaCl2 and MgCl2 in the solutions. Low magnesium solutions
have been found to evoke spontaneous seizure-like activity in hippocampal slices (Anderson et
al., 1986; Walther et al., 1986). Additionally, a study by Rausche et al. (1990) found that
lowered calcium concentration led to reduced CA1 responses and epileptiform activity. Thus,
low concentration of magnesium and calcium in the surrounding solution may have caused
irregular waveforms. Lastly, hippocampal slice responses may not have been visible due to high
amounts of noise overpowering the signal. As demonstrated in Figure 2.3.42, the lowest amount
of noise achieved was in the range of 10-14 mV; however, hippocampal fEPSP signals are
typically below 5 mV. Thus, to improve hippocampal slice recording in the future, extra care
should be taken to (1) further eliminate sources of background noise, (2) ensure solution
ingredients are present in optimal concentrations, and (3) avoid mechanical damage.
2.4.2 Cricket cercal system activity
Recording from the cricket cercal system was explored as an alternative to using mice. Similar to
findings in mouse hippocampal slices, no waveforms obtained resembled real fEPSPs (Figure
2.3.32). Reasons for this may include excessive background noise, suboptimal saline
composition, and mechanical damage during dissection.
Another possibility is low health quality of the crickets used. Crickets were maintained
on apple slices for 1-2 weeks, which is sufficient for short-term survival, but does not provide all
nutrients required for sustained health. Clifford and Woodring (1990) recommend that, for
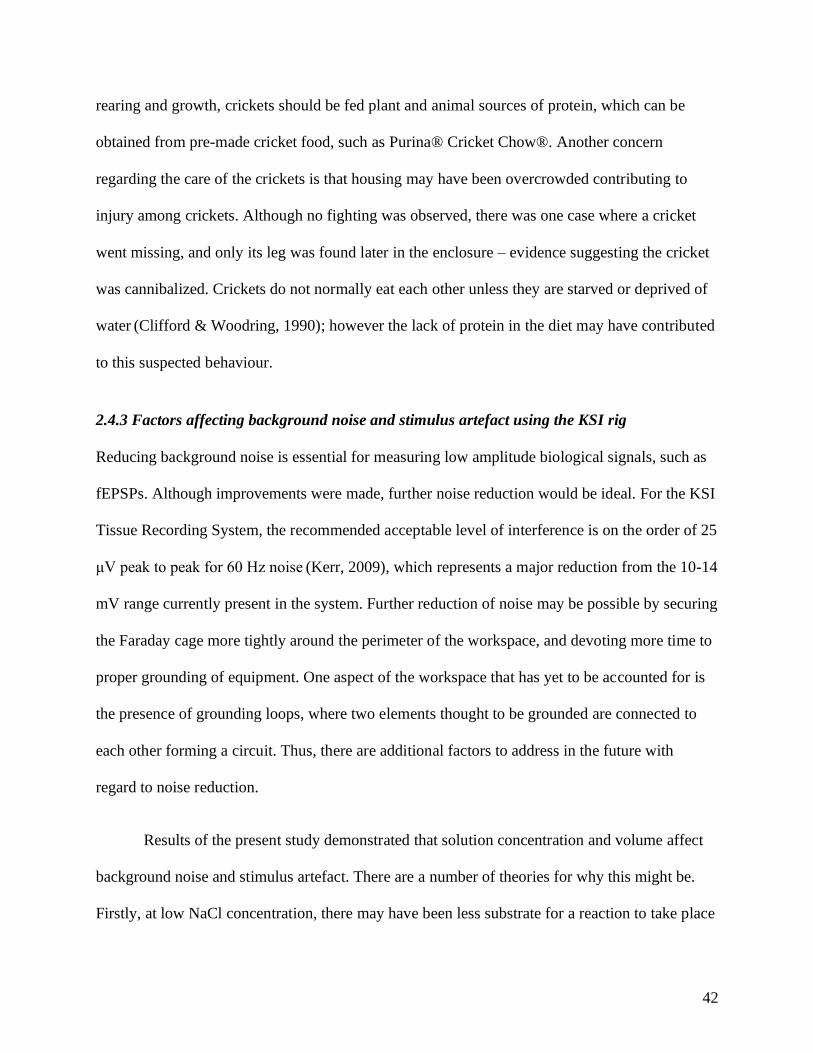
42
rearing and growth, crickets should be fed plant and animal sources of protein, which can be
obtained from pre-made cricket food, such as Purina® Cricket Chow®. Another concern
regarding the care of the crickets is that housing may have been overcrowded contributing to
injury among crickets. Although no fighting was observed, there was one case where a cricket
went missing, and only its leg was found later in the enclosure – evidence suggesting the cricket
was cannibalized. Crickets do not normally eat each other unless they are starved or deprived of
water (Clifford & Woodring, 1990); however the lack of protein in the diet may have contributed
to this suspected behaviour.
2.4.3 Factors affecting background noise and stimulus artefact using the KSI rig
Reducing background noise is essential for measuring low amplitude biological signals, such as
fEPSPs. Although improvements were made, further noise reduction would be ideal. For the KSI
Tissue Recording System, the recommended acceptable level of interference is on the order of 25
μV peak to peak for 60 Hz noise (Kerr, 2009), which represents a major reduction from the 10-14
mV range currently present in the system. Further reduction of noise may be possible by securing
the Faraday cage more tightly around the perimeter of the workspace, and devoting more time to
proper grounding of equipment. One aspect of the workspace that has yet to be accounted for is
the presence of grounding loops, where two elements thought to be grounded are connected to
each other forming a circuit. Thus, there are additional factors to address in the future with
regard to noise reduction.
Results of the present study demonstrated that solution concentration and volume affect
background noise and stimulus artefact. There are a number of theories for why this might be.
Firstly, at low NaCl concentration, there may have been less substrate for a reaction to take place
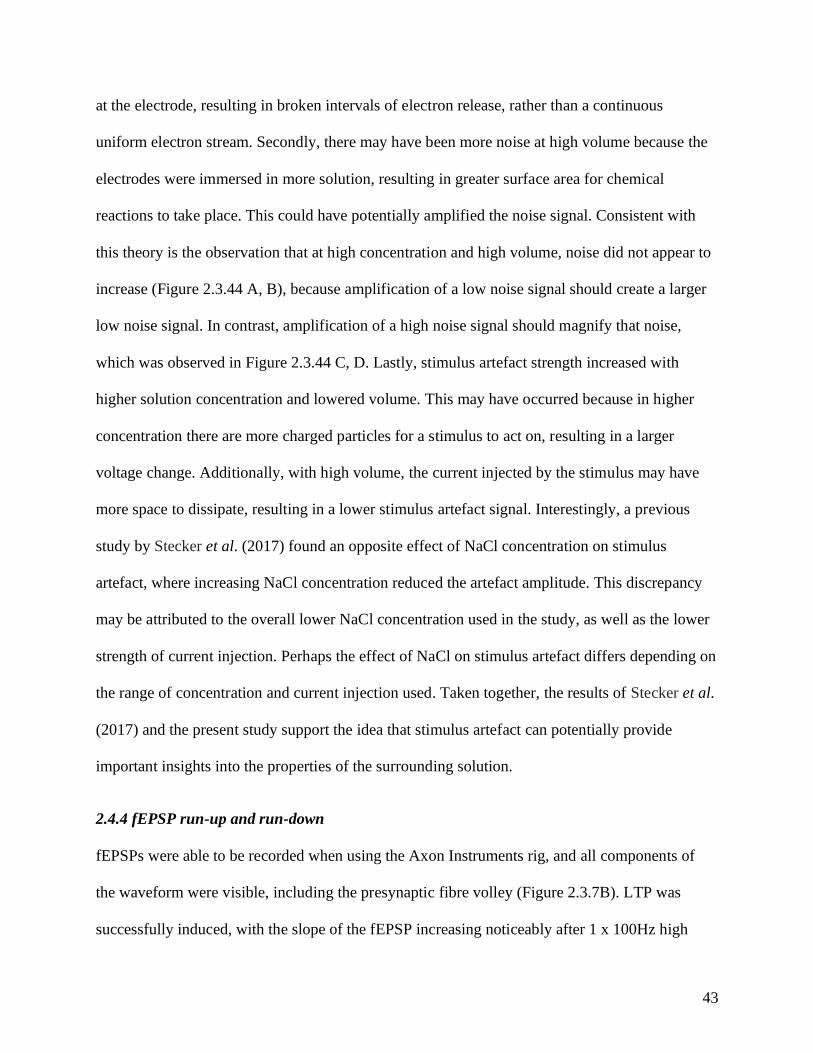
43
at the electrode, resulting in broken intervals of electron release, rather than a continuous
uniform electron stream. Secondly, there may have been more noise at high volume because the
electrodes were immersed in more solution, resulting in greater surface area for chemical
reactions to take place. This could have potentially amplified the noise signal. Consistent with
this theory is the observation that at high concentration and high volume, noise did not appear to
increase (Figure 2.3.44 A, B), because amplification of a low noise signal should create a larger
low noise signal. In contrast, amplification of a high noise signal should magnify that noise,
which was observed in Figure 2.3.44 C, D. Lastly, stimulus artefact strength increased with
higher solution concentration and lowered volume. This may have occurred because in higher
concentration there are more charged particles for a stimulus to act on, resulting in a larger
voltage change. Additionally, with high volume, the current injected by the stimulus may have
more space to dissipate, resulting in a lower stimulus artefact signal. Interestingly, a previous
study by Stecker et al. (2017) found an opposite effect of NaCl concentration on stimulus
artefact, where increasing NaCl concentration reduced the artefact amplitude. This discrepancy
may be attributed to the overall lower NaCl concentration used in the study, as well as the lower
strength of current injection. Perhaps the effect of NaCl on stimulus artefact differs depending on
the range of concentration and current injection used. Taken together, the results of Stecker et al.
(2017) and the present study support the idea that stimulus artefact can potentially provide
important insights into the properties of the surrounding solution.
2.4.4 fEPSP run-up and run-down
fEPSPs were able to be recorded when using the Axon Instruments rig, and all components of
the waveform were visible, including the presynaptic fibre volley (Figure 2.3.7B). LTP was
successfully induced, with the slope of the fEPSP increasing noticeably after 1 x 100Hz high
44
frequency stimulation (Figure 2.3.81). However, the LTP attempts showed signs of run-up and
run-down. Run-up refers to a steady increase in slope over time, while run-down refers to a
steady decrease in slope. This can be an indication that the slices are not healthy or that there is
something wrong with the electrodes. Abrahamson et al. (2016) suggest a number of reasons for
why this might occur in slice recordings. It may be the case that the electrodes are drifting
(gradually moving); the slice may be subtly shifting position; the oxygen levels may be dropping
or increasing; temperature could be changing; and/or the slice may be damaged (Abrahamson et
al., 2016). Furthermore, it appears that declining battery life in the amplifier also results in run-
down (Figure 2.3.82). In order to improve the LTP response and eliminate run-up and run-down,
all these factors must be considered.
45
CHAPTER 3: CHARACTERIZING SNAPTIC PLASTICITY IN THE
PGE2 MOUSE MODEL OF AUTISM
3.1 INTRODUCTION
3.1.1 PGE2 mouse model of autism
Lipids have structural and functional roles in the brain. They form the cell membrane of neurons
and are involved in signal transduction (Agranoff et al., 2005). Prostaglandin E2 (PGE2) is a lipid
molecule that has hormone-like effects in the brain and throughout the body. For example, it
induces smooth muscle contraction, influences blood pressure, regulates body temperature, and
is involved in inflammation processes (Legler et al., 2010). PGE2 is formed from membrane
phospholipids. The tail of the phospholipid consists of the fatty acid arachidonic acid (AA). AA
is separated from the phospholipid head by the enzyme phospholipase A2, and is then converted
to prostaglandin by the enzyme cyclooxygenase (COX) (Legler et al., 2010). Abnormal levels of
prostaglandins during pregnancy have been associated with neurodevelopmental defects in the
child, as evident from use of the drug misoprostol, a prostaglandin E1 analog. Misoprostol is
distributed under the brand name Cytotec®, and is used for prevention of gastric ulcers, labor
induction, and abortion. The long-term developmental effects of in utero misoprostol exposure
can be observed in abortion survivors, and has been shown to result in birth defects, such as
clubfoot, cranial nerve abnormalities, and joint contractures. These defects may be caused by
disruption of blood flow to the fetus during misoprostol-induced uterine contractions (Gonzalez
et al., 1998). Möbius syndrome is a common outcome in abortion attempts using Cytotec
(Pastuszak et al., 1998). Möbius syndrome is characterized by complete or partial nerve paralysis
of the face, often accompanied by limb malformations and, less commonly, ocular nerve palsies
and incomplete development of the tongue (Kumar, 1990). Autism often co-occurs with Möbius
46
syndrome; a study by Strömland et al. (2002) examined 25 cases of Möbius syndrome and found
7 had autistic traits. This demonstrated that the likelihood of autism among people with Möbius
syndrome is higher than among the general population. Furthermore, a study by Bandim et al.
(2003) found, when examining the history of patients with a combination of Möbius syndrome
and autism, there was an association between autism and fetal misoprostol exposure.
Specifically, 3/5 of these children (60%) were positive for misoprostol exposure. Although
misoprostol exposure during fetal development can be detrimental, exposure during birth, such
as when used for labor induction, is not considered harmful for neurodevelopment. A study by
Koenig et al. (2012) found no negative effects in mice injected with misoprostol, at clinical-level
doses, and at post-natal day (pnd) 7, which correlates with human age at birth. In addition to
learning about misoprostol exposure at birth, mice can be used to conveniently study misoprostol
exposure during pregnancy and the subsequent neurodevelopmental effects on offspring. The
PGE2 mouse model of autism involves subcutaneous injection of PGE2 into a pregnant mouse to
mimic the effects of misoprostol. A study by Tamiji & Crawford (2010) found that misoprostol
and PGE2 act similarly on neuronal cells in culture by reducing the amount and length of neurite
extensions. This provides evidence that, although misoprostol is a PGE1 analog, it can likely
exert similar effects in the brain as PGE2. However, PGE2 and PGE1 have slightly different
effects on uterine contractions, which is important to note because contractions may be
responsible for disrupting blood flow to the fetus leading to birth defects (Marques‐Dias et al.,
2003). A study by Chiossi et al. (2012) found that PGE1 produced significantly higher
contractility in human myometrial (uterine) living tissue samples than PGE2 during the first 180
minutes of exposure. Given the differences in action between PGE2 and PGE1 on uterine
contractions, neurodevelopmental findings based on PGE2 exposure during pregnancy may not
47
generalize to the effects of misoprostol exposure. However, the PGE2 mouse model appears to
display some autistic behavioural traits, which may be potentially useful for studying autism.
Offspring of PGE2-injected mice display abnormal social behaviour, as assessed by preference
for objects over other mice in the 3-chamber test; repetitive behaviour, as assessed by increased
propensity to bury marbles; and anxiety, as assessed by preference to stay along the edges of an
open arena rather than the center (open field test) (Crawford, 2021). PGE2 exposure may also
affect forms of synaptic plasticity, such as long-term potentiation (LTP). Akaneya and Tsumoto
(2006) found that PGE2 enhances LTP in the rat visual cortex. They propose that this
enhancement is due to trafficking of PGE2 receptors, where theta burst stimulation helps produce
PGE2 at the postsynaptic membrane, leading to a shift in PGE2 receptor composition. PGE2 then
binds to the receptors leading to the activation of CREB and synthesis of proteins needed for
sustained L-LTP (Akaneya, 2007). Another study by Chen et al. (2002) found that PGE2 is
needed for normal LTP responses from the hippocampal perforant pathway. They found that
LTP was reduced when slices were incubated in COX-2 inhibitors, but this reduction could be
restored by exogenous application of PGE2. This suggests that COX-2 regulates PGE2, which is
needed for proper LTP responses. Since synaptic plasticity is dependent on PGE2 signalling,
perhaps its disruption during development will lead to noticeable LTP deficits in later life. This
section explores if in utero exposure to PGE2 leads to hippocampal synaptic plasticity changes in
adult life.
3.1.2 Developmental differences of the mouse and human brain
The mouse brain develops and ages at an accelerated pace compared to humans. In general,
roughly 9 days of a mouse’s life is equivalent to 1 human year, but this varies depending on life
stage. For example, during the weaning period, mice develop slower compared to development
48
during the juvenile stages (Dutta & Sengupta, 2016). In terms of brain development, a review by
Semple et al. (2014) highlights the ages at which mice and humans share important milestones.
They note that axon and dendrite density increases during the mouse pnd 7-10, similar to the
human brain of a newborn infant; the prefrontal cortex structurally matures at pnd 20-21, similar
to a 4-10 year old human child; and the brain takes on distinct adult characteristics (synaptic
density, neurotransmitter, myelination, and grey matter levels) at pnd 60+, similar to a 20+ year
old human. Although the function of the hippocampus in memory is conserved across
mammalian species (Allen & Fortin, 2013), its structural morphology is simplified in mice
compared to humans. In rodents, the excitatory connections in the CA1 region are more clearly
delineated to specific layers, whereas, in humans, the apical and basal dendrites overlap and do
not separate into specific layers, suggesting connectivity differences between species
(Benavides-Piccione et al., 2020). In support of connectivity differences, Bergmann et al. (2016)
observed with fMRI that the mouse hippocampus is functionally connected to cortical sensory
networks, while the human hippocampus is functionally connected to cortical association areas.
This implies that sensory information is relayed to association areas before connecting with the
hippocampus in humans, whereas in mice, sensory processing from the cortex channels directly
to the hippocampus. The hippocampus varies in size and shape across different mammals, such
as rodents, rabbits, monkeys, and humans, but it retains a set of distinct morphological areas,
including the CA regions and dentate gyrus (Andersen et al., 2006). Differences and similarities
have been observed in the development of the hippocampus between mice and humans. A study
by Zhong et al. (2020) found that gene expression in the hippocampus of humans at gestational
week 16-27 was most similar to hippocampal gene expression in mice at pnd 0-5; however, the
overall correlation between mice and human gene expression during these time periods was

49
approximately 0.5 or less. The mouse brain has its differences from the human brain in terms of
development and structure; however, when research requires the use of mice, particularly in the
study of the hippocampus, the similarities prove useful. Studies on mice can lead to important
insights about humans, as long as we remember to take into account the differential
developmental timelines, morphology, and functional connections.
3.2 MATERIALS AND METHODS
3.2.1 Generating the PGE2-injected mouse model of autism
All mice were housed at the York University animal facility, department of Biology (Toronto,
ONT, Canada), maintained on a 12hr light/dark cycle with food and water available ad libitum.
Protocols were approved by the York University ACC. C57BL/6 pregnant mice were injected
with PGE2 at embryonic day 11 (E11). The subcutaneous injection was applied dorsally between
the skin and muscle at the base of the neck. 0.25µg of 16, 16-dimethyl prostaglandin E2 (item
number 14750; Cayman Chemical Company) was injected per gram of mouse. The injection
volume was fixed at 300uL with mixture of saline. Pregnant control mice were injected using the
same procedure, except using saline only rather than a saline-PGE2 mixture. Offspring of the
injected pregnant mice became the experimental subjects at postnatal day 92-120 (P92-P120).
All experiments were conducted using the Axon Instruments electrophysiology rig (see section
2.2.3 for details about slice recording using this system). For dissection and slicing procedures
see chapter 2 methods page 24.
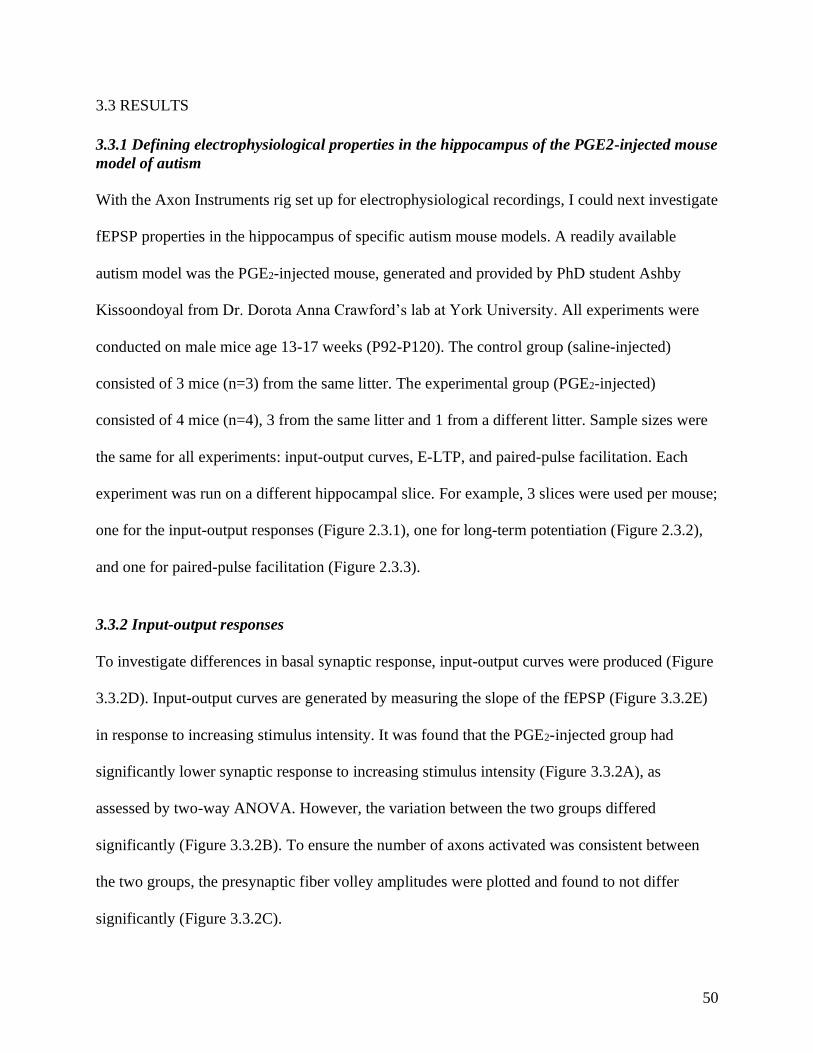
50
3.3 RESULTS
3.3.1 Defining electrophysiological properties in the hippocampus of the PGE2-injected mouse
model of autism
With the Axon Instruments rig set up for electrophysiological recordings, I could next investigate
fEPSP properties in the hippocampus of specific autism mouse models. A readily available
autism model was the PGE2-injected mouse, generated and provided by PhD student Ashby
Kissoondoyal from Dr. Dorota Anna Crawford’s lab at York University. All experiments were
conducted on male mice age 13-17 weeks (P92-P120). The control group (saline-injected)
consisted of 3 mice (n=3) from the same litter. The experimental group (PGE2-injected)
consisted of 4 mice (n=4), 3 from the same litter and 1 from a different litter. Sample sizes were
the same for all experiments: input-output curves, E-LTP, and paired-pulse facilitation. Each
experiment was run on a different hippocampal slice. For example, 3 slices were used per mouse;
one for the input-output responses (Figure 2.3.1), one for long-term potentiation (Figure 2.3.2),
and one for paired-pulse facilitation (Figure 2.3.3).
3.3.2 Input-output responses
To investigate differences in basal synaptic response, input-output curves were produced (Figure
3.3.2D). Input-output curves are generated by measuring the slope of the fEPSP (Figure 3.3.2E)
in response to increasing stimulus intensity. It was found that the PGE2-injected group had
significantly lower synaptic response to increasing stimulus intensity (Figure 3.3.2A), as
assessed by two-way ANOVA. However, the variation between the two groups differed
significantly (Figure 3.3.2B). To ensure the number of axons activated was consistent between
the two groups, the presynaptic fiber volley amplitudes were plotted and found to not differ
significantly (Figure 3.3.2C).
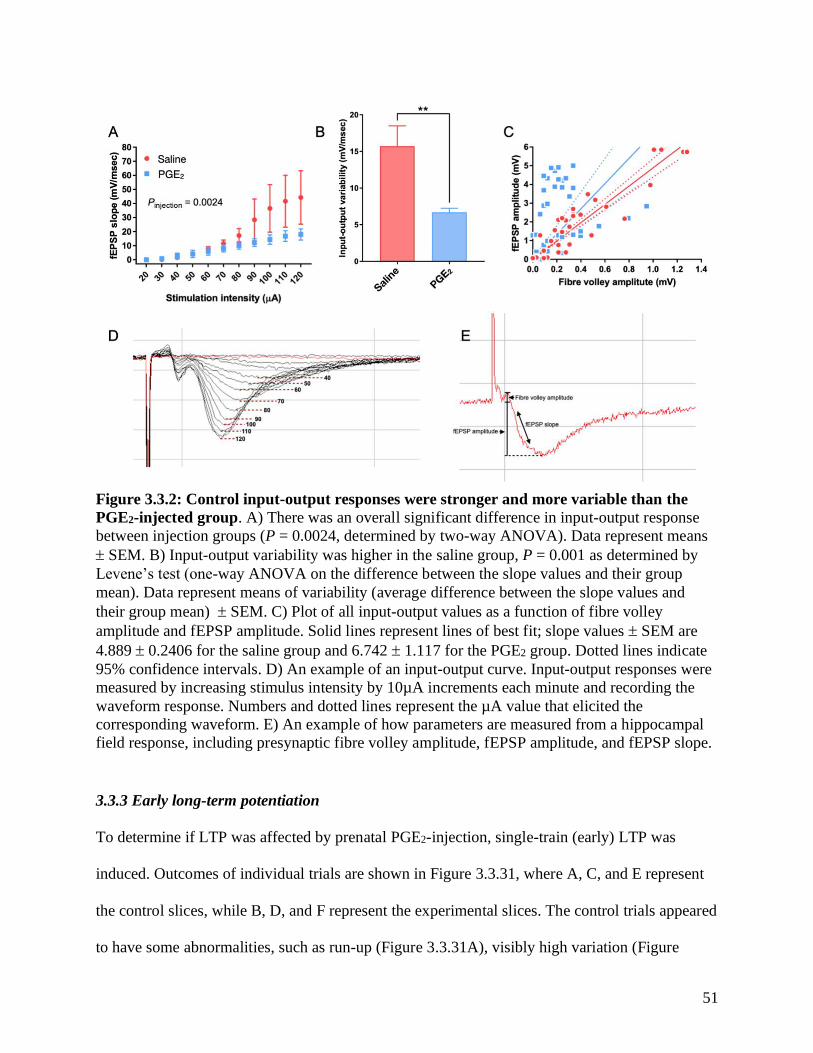
51
Figure 3.3.2: Control input-output responses were stronger and more variable than the
PGE2-injected group. A) There was an overall significant difference in input-output response
between injection groups (P = 0.0024, determined by two-way ANOVA). Data represent means
SEM. B) Input-output variability was higher in the saline group, P = 0.001 as determined by
Levene’s test (one-way ANOVA on the difference between the slope values and their group
mean). Data represent means of variability (average difference between the slope values and
their group mean) SEM. C) Plot of all input-output values as a function of fibre volley
amplitude and fEPSP amplitude. Solid lines represent lines of best fit; slope values SEM are
4.889 0.2406 for the saline group and 6.742 1.117 for the PGE2 group. Dotted lines indicate
95% confidence intervals. D) An example of an input-output curve. Input-output responses were
measured by increasing stimulus intensity by 10µA increments each minute and recording the
waveform response. Numbers and dotted lines represent the µA value that elicited the
corresponding waveform. E) An example of how parameters are measured from a hippocampal
field response, including presynaptic fibre volley amplitude, fEPSP amplitude, and fEPSP slope.
3.3.3 Early long-term potentiation
To determine if LTP was affected by prenatal PGE2-injection, single-train (early) LTP was
induced. Outcomes of individual trials are shown in Figure 3.3.31, where A, C, and E represent
the control slices, while B, D, and F represent the experimental slices. The control trials appeared
to have some abnormalities, such as run-up (Figure 3.3.31A), visibly high variation (Figure
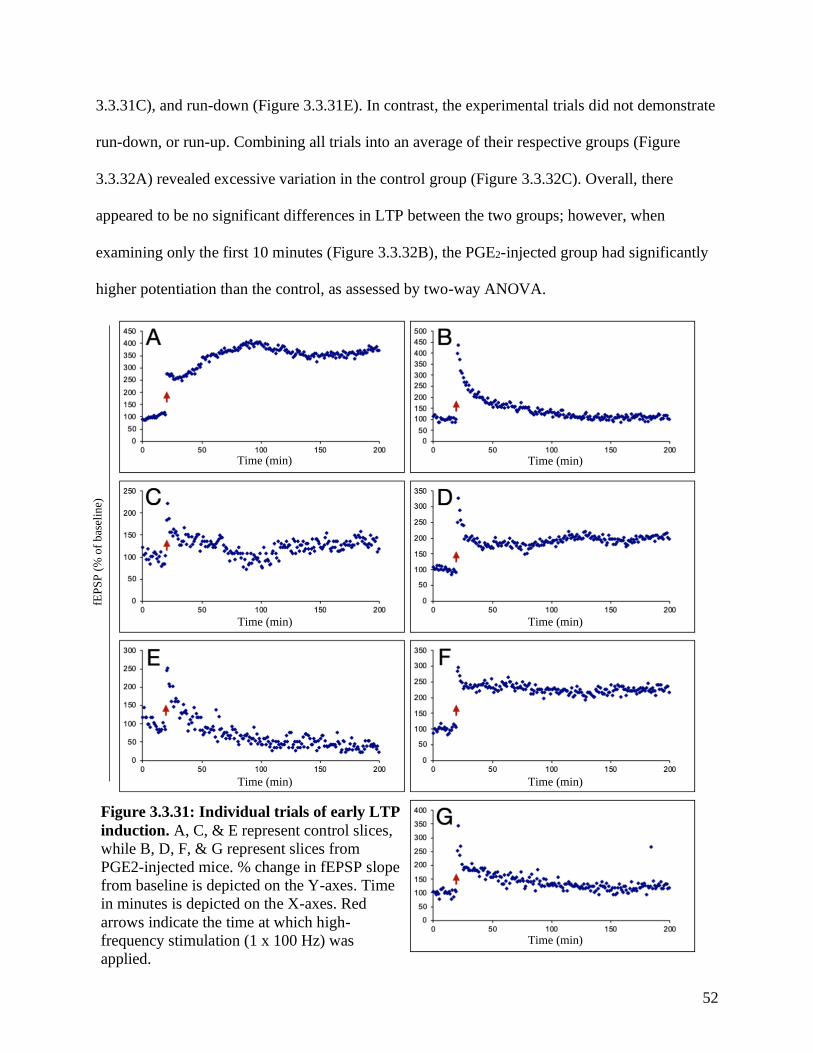
52
3.3.31C), and run-down (Figure 3.3.31E). In contrast, the experimental trials did not demonstrate
run-down, or run-up. Combining all trials into an average of their respective groups (Figure
3.3.32A) revealed excessive variation in the control group (Figure 3.3.32C). Overall, there
appeared to be no significant differences in LTP between the two groups; however, when
examining only the first 10 minutes (Figure 3.3.32B), the PGE2-injected group had significantly
higher potentiation than the control, as assessed by two-way ANOVA.
Figure 3.3.31: Individual trials of early LTP
induction. A, C, & E represent control slices,
while B, D, F, & G represent slices from
PGE2-injected mice. % change in fEPSP slope
from baseline is depicted on the Y-axes. Time
in minutes is depicted on the X-axes. Red
arrows indicate the time at which high-
frequency stimulation (1 x 100 Hz) was
applied.
Time (min) Time (min)
Time (min) Time (min)
Time (min) Time (min)
Time (min)
fEP
SP
(%
of
bas
elin
e)
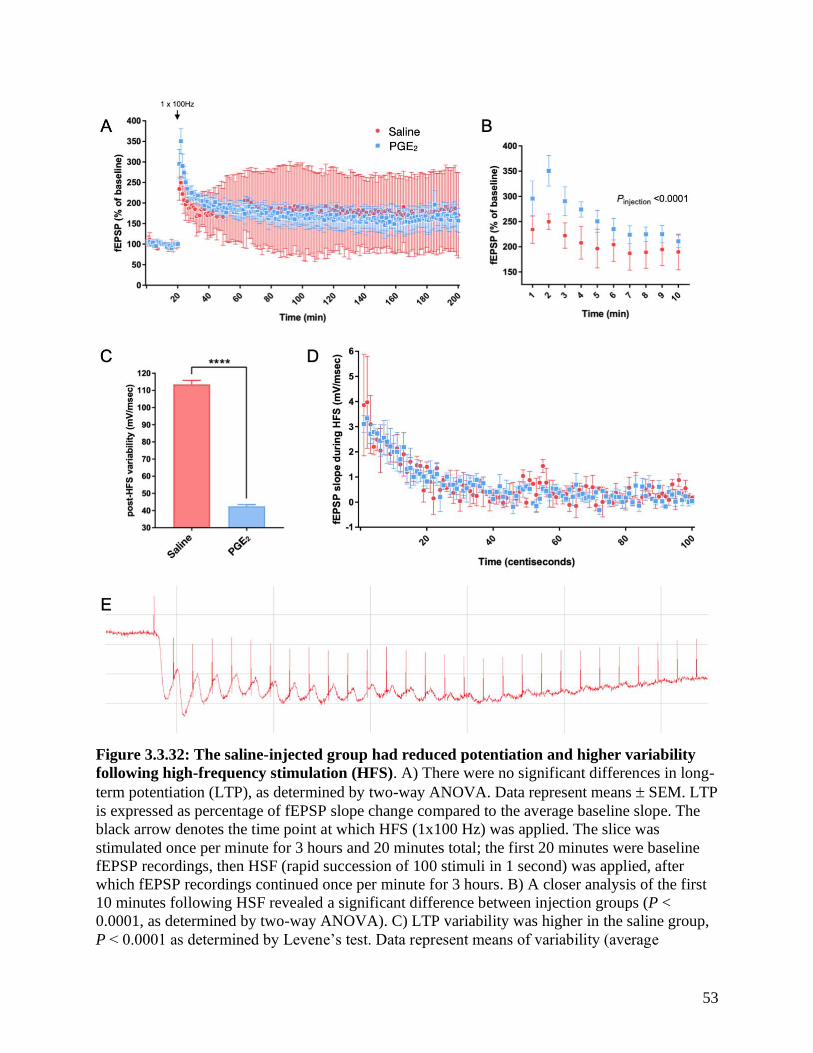
53
Figure 3.3.32: The saline-injected group had reduced potentiation and higher variability
following high-frequency stimulation (HFS). A) There were no significant differences in long-
term potentiation (LTP), as determined by two-way ANOVA. Data represent means SEM. LTP
is expressed as percentage of fEPSP slope change compared to the average baseline slope. The
black arrow denotes the time point at which HFS (1x100 Hz) was applied. The slice was
stimulated once per minute for 3 hours and 20 minutes total; the first 20 minutes were baseline
fEPSP recordings, then HSF (rapid succession of 100 stimuli in 1 second) was applied, after
which fEPSP recordings continued once per minute for 3 hours. B) A closer analysis of the first
10 minutes following HSF revealed a significant difference between injection groups (P <
0.0001, as determined by two-way ANOVA). C) LTP variability was higher in the saline group,
P < 0.0001 as determined by Levene’s test. Data represent means of variability (average
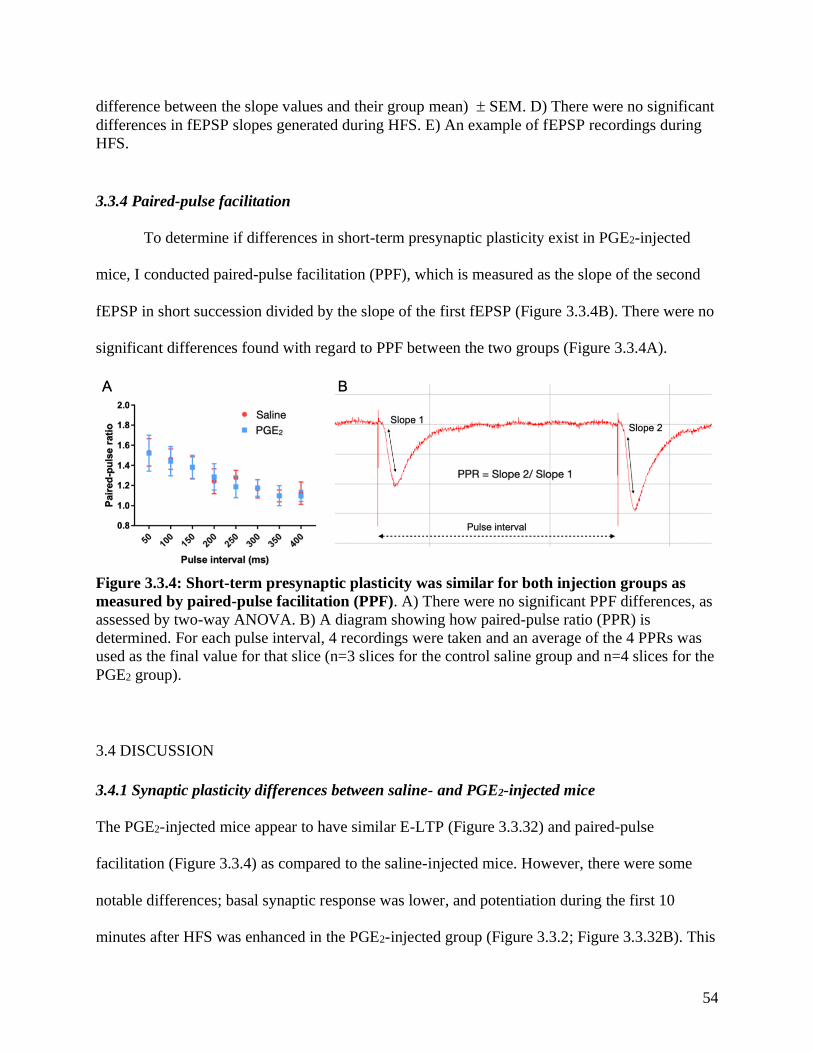
54
difference between the slope values and their group mean) SEM. D) There were no significant
differences in fEPSP slopes generated during HFS. E) An example of fEPSP recordings during
HFS.
3.3.4 Paired-pulse facilitation
To determine if differences in short-term presynaptic plasticity exist in PGE2-injected
mice, I conducted paired-pulse facilitation (PPF), which is measured as the slope of the second
fEPSP in short succession divided by the slope of the first fEPSP (Figure 3.3.4B). There were no
significant differences found with regard to PPF between the two groups (Figure 3.3.4A).
Figure 3.3.4: Short-term presynaptic plasticity was similar for both injection groups as
measured by paired-pulse facilitation (PPF). A) There were no significant PPF differences, as
assessed by two-way ANOVA. B) A diagram showing how paired-pulse ratio (PPR) is
determined. For each pulse interval, 4 recordings were taken and an average of the 4 PPRs was
used as the final value for that slice (n=3 slices for the control saline group and n=4 slices for the
PGE2 group).
3.4 DISCUSSION
3.4.1 Synaptic plasticity differences between saline- and PGE2-injected mice
The PGE2-injected mice appear to have similar E-LTP (Figure 3.3.32) and paired-pulse
facilitation (Figure 3.3.4) as compared to the saline-injected mice. However, there were some
notable differences; basal synaptic response was lower, and potentiation during the first 10
minutes after HFS was enhanced in the PGE2-injected group (Figure 3.3.2; Figure 3.3.32B). This

55
may indicate a higher responsiveness to HFS in the PGE2 group, perhaps due to developmental
and structural changes caused by in utero PGE2 exposure. Since exogenously applied PGE2 is
known to enhance potentiation in hippocampal slices (Chen et al., 2002) through a mechanism
thought to involve PGE2 receptor upregulation (Akaneya, 2007), it may be possible that early
exposure to PGE2 influences PGE2 receptor composition. It could also be possible that the
lowered basal synaptic response allows for a greater % change in potentiation following HFS.
However, the effect of heighted potentiation may be the result of other confounding factors
related to the experimental procedure. Based on the individual trials of LTP induction (Figure
3.3.31), there is a possibility that the slices of the control group were not as healthy as the slices
in the experimental group, which could account for the diminished potentiation response of the
control. All three trials of the control group had visible abnormalities, including run-up (Figure
3.3.31A), run-down (Figure 3.3.31E), and heightened variability (Figure 3.3.31C). Some of these
issues could be observed in the experimental group, but to a much lesser extent. For example,
there was slight run-up in trial D and slight run-down in trial B. Given that run-up and run-down
could indicate poor slice health, drifting electrodes, gradual shifts in position of the slices,
temperature changes, and/or oxygen level changes during the experiment (Abrahamsson et al.,
2016), there is concern that the findings of higher potentiation in the experimental group could
simply be due to these procedural factors. On the other hand, it could be the case that the PGE2
model’s hippocampus is less susceptible to run-up and run-down, and the procedural factors that
often cause these effects. Perhaps PGE2-induced alterations afford the hippocampus a higher
level of robustness and ability to stay ‘healthy’ despite inevitably harmful experimental
conditions (i.e. slicing and maintenance in an artificial setting).
56
When trying to identify the mechanism of action that in utero exposure to PGE2 has on
development, it can be difficult to discern whether effects are due to direct PGE2 exposure or
indirect ischemia. In humans, Möbius syndrome is thought to be caused by abortion attempts
using misoprostol because the resulting uterine contractions restrict blood flow to the fetus,
damaging the facial nerves (Gonzalez et al., 1998). Thus, when studying the physiological
differences of PGE2 mice, one can question whether the differences are connected to early
restriction of blood flow, and/or direct exposure to heightened PGE2 levels in the body.
More studies will be needed to determine if LTP and other forms of synaptic plasticity
are altered in the PGE2 mouse model of autism. The present study is limited by small sample
size, run-up and run-down on control trials, and exclusion of female mice.
57
CHAPTER 4: THERAPEUTIC APPLICATIONS AND UTILITY OF
ASD MOUSE MODELS
4.1 INTRODUCTION
4.1.1 Hebbian and homeostatic plasticity in autism spectrum disorder
Connections between neurons, known as “synapses”, can be strengthened with learning or
weakened with forgetting – changes which represent the “Hebbian” form of plasticity
(Cruikshank & Weinberger, 1996). Hebbian plasticity was first postulated by Donald Hebb in
1932 as a process whereby repeated firing between two neurons strengthens the connection
between them (Brown & Milner, 2003). Hebb’s postulate was later confirmed with experimental
evidence when, in 1973, Bliss and Lømo reported long-term potentiation (LTP); they observed
that when neurons are repeatedly induced to fire by electrical stimuli, a subsequent long-lasting
state of heightened synaptic strength occurs. Their observations supported Hebb’s postulate by
demonstrating that when connected neurons fire often over time, the specific response between
those neurons is enhanced. In contrast to the specificity of Hebbian plasticity, homeostatic
plasticity acts by globally scaling neuronal activity to maintain balance and prevent over- or
under-excitation (Turrigiano & Nelson, 2004). For example, it has been observed that chronically
blocking neuron activity results in subsequent hyper-excitability once the blockade is removed,
presumably due to the homeostatic mechanism working to maintain a set-point level of network
activity (Ramakers et al., 1990; Van Den Pol et al., 1996). Maintenance of a target activity range
is essential to ensure optimal functioning because Hebbian mechanisms can lead to increasing
extremes of excitatory or inhibitory synaptic strength (Turrigiano & Nelson, 2004). Given that
the interaction between Hebbian and homeostatic plasticity is essential for proper learning and
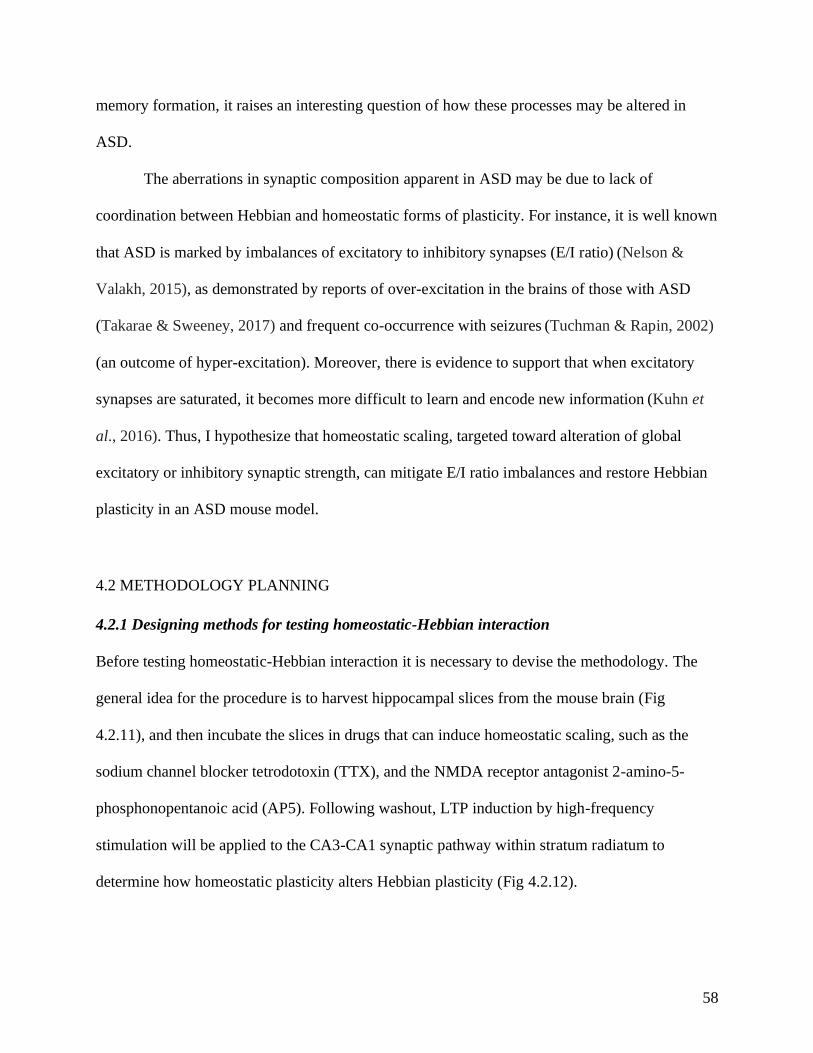
58
memory formation, it raises an interesting question of how these processes may be altered in
ASD.
The aberrations in synaptic composition apparent in ASD may be due to lack of
coordination between Hebbian and homeostatic forms of plasticity. For instance, it is well known
that ASD is marked by imbalances of excitatory to inhibitory synapses (E/I ratio) (Nelson &
Valakh, 2015), as demonstrated by reports of over-excitation in the brains of those with ASD
(Takarae & Sweeney, 2017) and frequent co-occurrence with seizures (Tuchman & Rapin, 2002)
(an outcome of hyper-excitation). Moreover, there is evidence to support that when excitatory
synapses are saturated, it becomes more difficult to learn and encode new information (Kuhn et
al., 2016). Thus, I hypothesize that homeostatic scaling, targeted toward alteration of global
excitatory or inhibitory synaptic strength, can mitigate E/I ratio imbalances and restore Hebbian
plasticity in an ASD mouse model.
4.2 METHODOLOGY PLANNING
4.2.1 Designing methods for testing homeostatic-Hebbian interaction
Before testing homeostatic-Hebbian interaction it is necessary to devise the methodology. The
general idea for the procedure is to harvest hippocampal slices from the mouse brain (Fig
4.2.11), and then incubate the slices in drugs that can induce homeostatic scaling, such as the
sodium channel blocker tetrodotoxin (TTX), and the NMDA receptor antagonist 2-amino-5-
phosphonopentanoic acid (AP5). Following washout, LTP induction by high-frequency
stimulation will be applied to the CA3-CA1 synaptic pathway within stratum radiatum to
determine how homeostatic plasticity alters Hebbian plasticity (Fig 4.2.12).
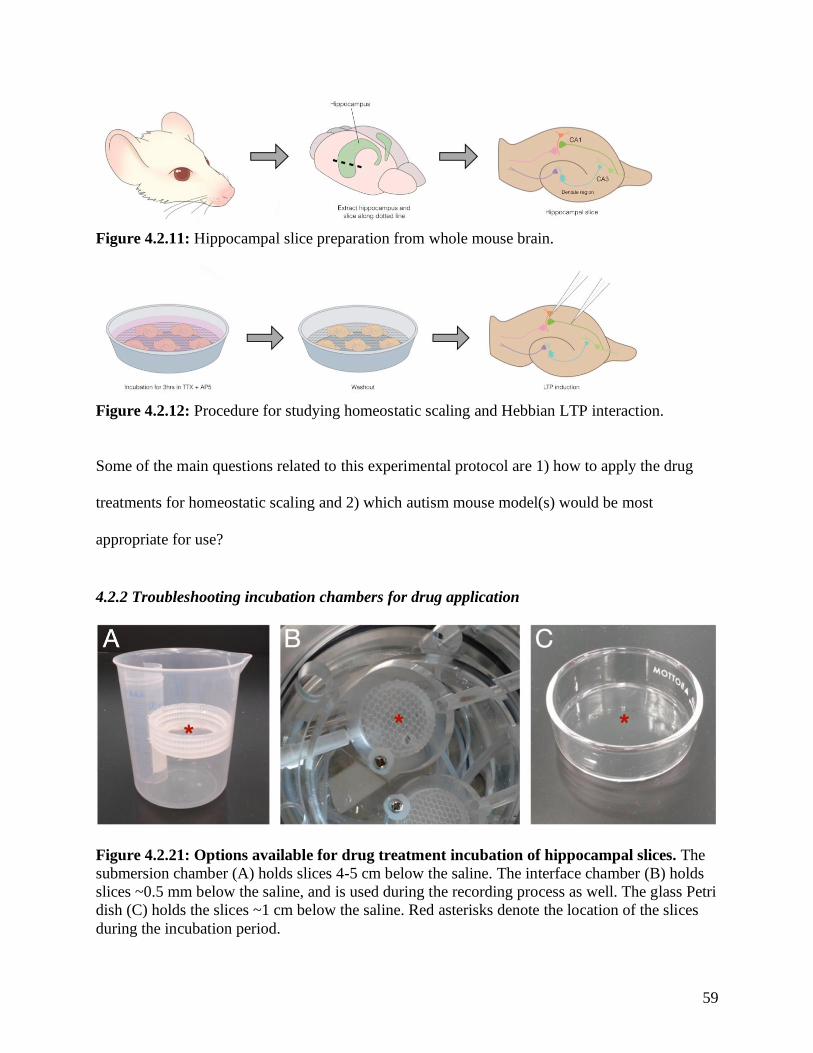
59
Figure 4.2.11: Hippocampal slice preparation from whole mouse brain.
Figure 4.2.12: Procedure for studying homeostatic scaling and Hebbian LTP interaction.
Some of the main questions related to this experimental protocol are 1) how to apply the drug
treatments for homeostatic scaling and 2) which autism mouse model(s) would be most
appropriate for use?
4.2.2 Troubleshooting incubation chambers for drug application
Figure 4.2.21: Options available for drug treatment incubation of hippocampal slices. The
submersion chamber (A) holds slices 4-5 cm below the saline. The interface chamber (B) holds
slices ~0.5 mm below the saline, and is used during the recording process as well. The glass Petri
dish (C) holds the slices ~1 cm below the saline. Red asterisks denote the location of the slices
during the incubation period.
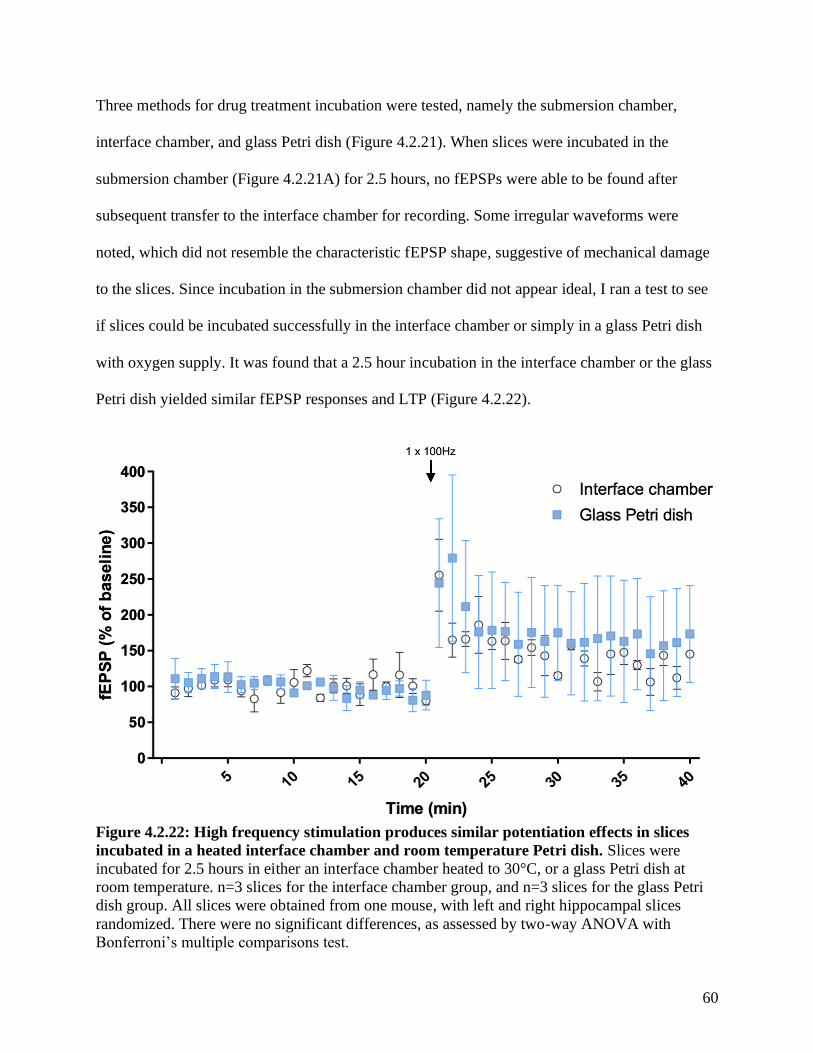
60
Three methods for drug treatment incubation were tested, namely the submersion chamber,
interface chamber, and glass Petri dish (Figure 4.2.21). When slices were incubated in the
submersion chamber (Figure 4.2.21A) for 2.5 hours, no fEPSPs were able to be found after
subsequent transfer to the interface chamber for recording. Some irregular waveforms were
noted, which did not resemble the characteristic fEPSP shape, suggestive of mechanical damage
to the slices. Since incubation in the submersion chamber did not appear ideal, I ran a test to see
if slices could be incubated successfully in the interface chamber or simply in a glass Petri dish
with oxygen supply. It was found that a 2.5 hour incubation in the interface chamber or the glass
Petri dish yielded similar fEPSP responses and LTP (Figure 4.2.22).
Figure 4.2.22: High frequency stimulation produces similar potentiation effects in slices
incubated in a heated interface chamber and room temperature Petri dish. Slices were
incubated for 2.5 hours in either an interface chamber heated to 30°C, or a glass Petri dish at
room temperature. n=3 slices for the interface chamber group, and n=3 slices for the glass Petri
dish group. All slices were obtained from one mouse, with left and right hippocampal slices
randomized. There were no significant differences, as assessed by two-way ANOVA with
Bonferroni’s multiple comparisons test.
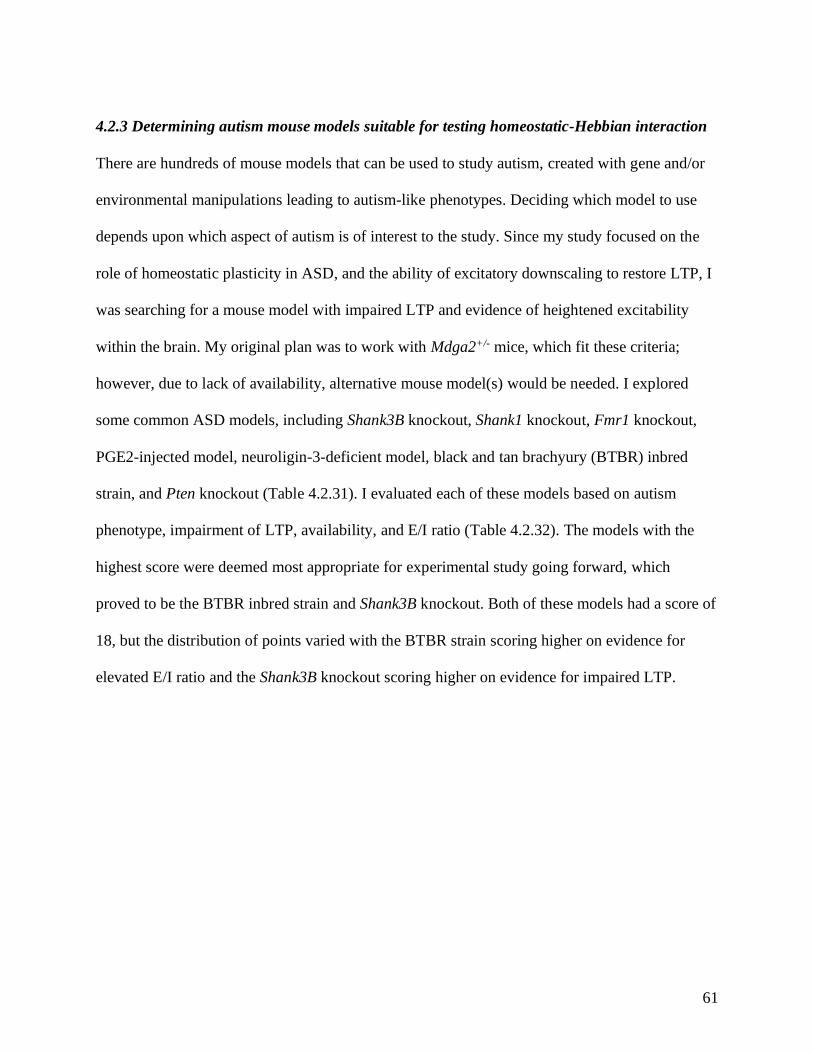
61
4.2.3 Determining autism mouse models suitable for testing homeostatic-Hebbian interaction
There are hundreds of mouse models that can be used to study autism, created with gene and/or
environmental manipulations leading to autism-like phenotypes. Deciding which model to use
depends upon which aspect of autism is of interest to the study. Since my study focused on the
role of homeostatic plasticity in ASD, and the ability of excitatory downscaling to restore LTP, I
was searching for a mouse model with impaired LTP and evidence of heightened excitability
within the brain. My original plan was to work with Mdga2+/- mice, which fit these criteria;
however, due to lack of availability, alternative mouse model(s) would be needed. I explored
some common ASD models, including Shank3B knockout, Shank1 knockout, Fmr1 knockout,
PGE2-injected model, neuroligin-3-deficient model, black and tan brachyury (BTBR) inbred
strain, and Pten knockout (Table 4.2.31). I evaluated each of these models based on autism
phenotype, impairment of LTP, availability, and E/I ratio (Table 4.2.32). The models with the
highest score were deemed most appropriate for experimental study going forward, which
proved to be the BTBR inbred strain and Shank3B knockout. Both of these models had a score of
18, but the distribution of points varied with the BTBR strain scoring higher on evidence for
elevated E/I ratio and the Shank3B knockout scoring higher on evidence for impaired LTP.
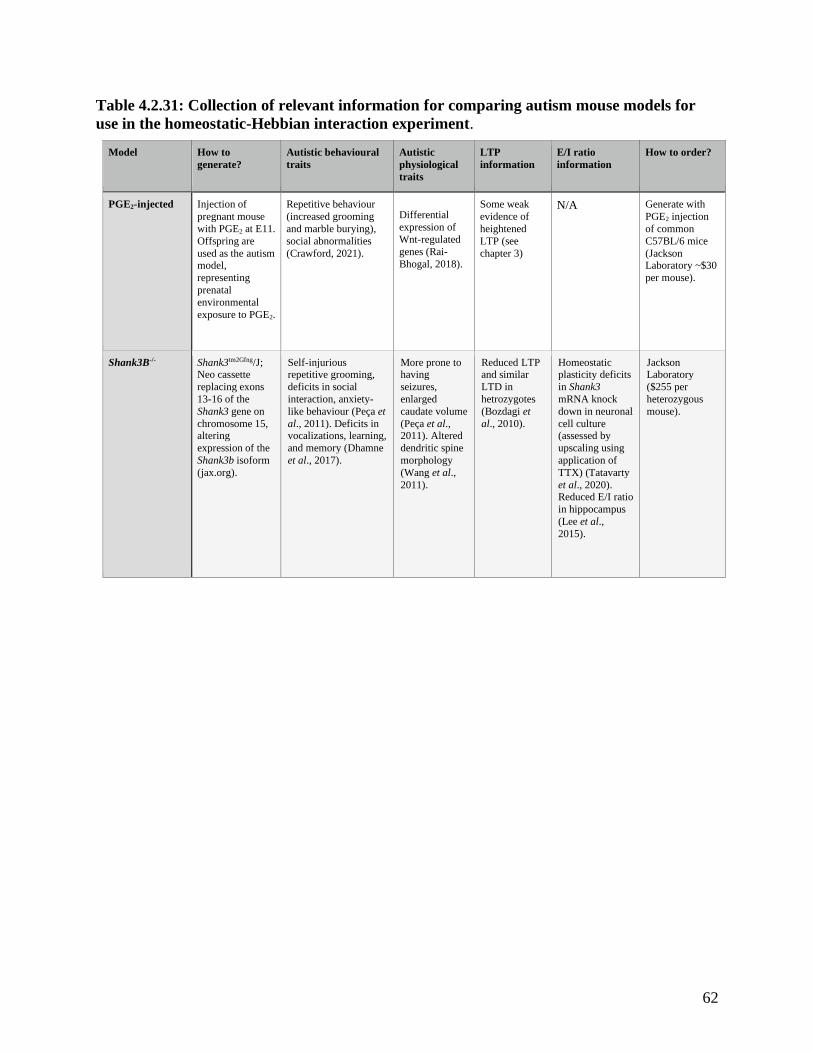
62
Table 4.2.31: Collection of relevant information for comparing autism mouse models for
use in the homeostatic-Hebbian interaction experiment.
Model How to
generate? Autistic behavioural
traits Autistic
physiological
traits
LTP
information E/I ratio
information How to order?
PGE2-injected Injection of
pregnant mouse
with PGE2 at E11.
Offspring are
used as the autism model,
representing
prenatal
environmental
exposure to PGE2.
Repetitive behaviour
(increased grooming
and marble burying),
social abnormalities
(Crawford, 2021).
Differential
expression of
Wnt-regulated
genes (Rai-
Bhogal, 2018).
Some weak
evidence of
heightened
LTP (see
chapter 3)
N/A Generate with
PGE2 injection
of common
C57BL/6 mice
(Jackson Laboratory ~$30
per mouse).
Shank3B-/- Shank3tm2Gfng/J; Neo cassette
replacing exons
13-16 of the
Shank3 gene on
chromosome 15, altering
expression of the
Shank3b isoform
(jax.org).
Self-injurious repetitive grooming,
deficits in social
interaction, anxiety-
like behaviour (Peça et
al., 2011). Deficits in vocalizations, learning,
and memory (Dhamne
et al., 2017).
More prone to having
seizures,
enlarged
caudate volume
(Peça et al., 2011). Altered
dendritic spine
morphology
(Wang et al.,
2011).
Reduced LTP and similar
LTD in
hetrozygotes
(Bozdagi et
al., 2010).
Homeostatic plasticity deficits
in Shank3
mRNA knock
down in neuronal
cell culture (assessed by
upscaling using
application of
TTX) (Tatavarty
et al., 2020). Reduced E/I ratio
in hippocampus
(Lee et al.,
2015).
Jackson Laboratory
($255 per
heterozygous
mouse).
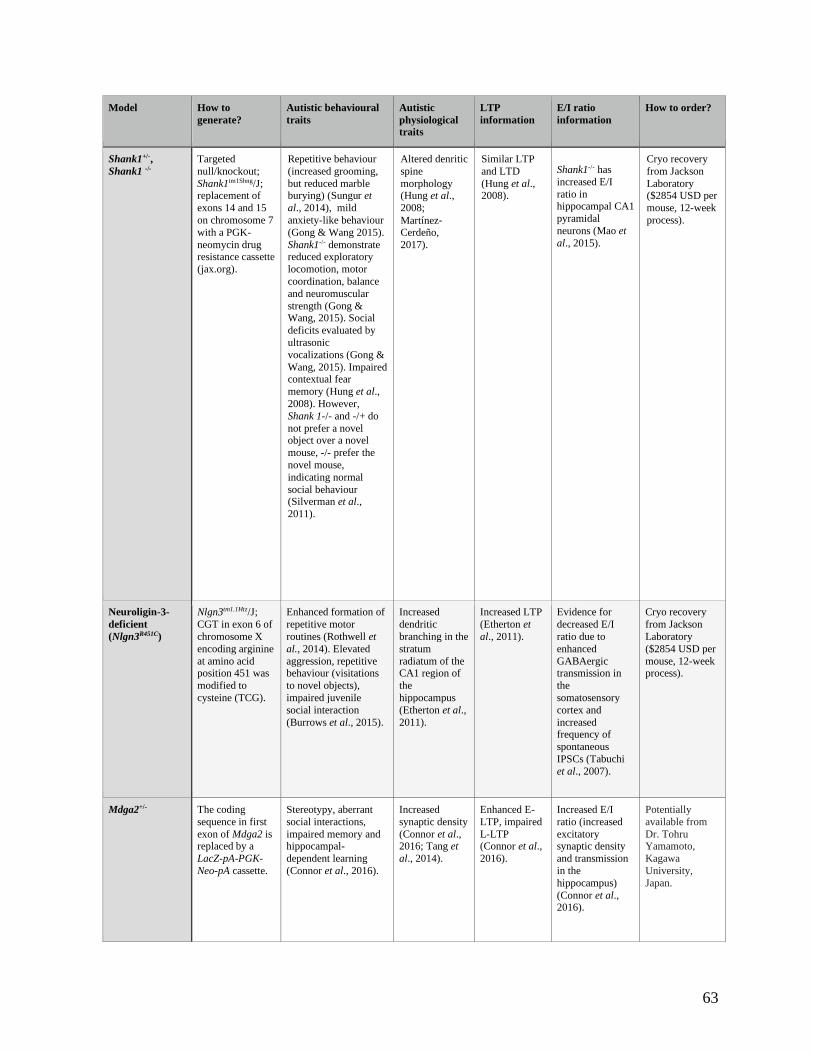
63
Model How to
generate? Autistic behavioural
traits Autistic
physiological
traits
LTP
information E/I ratio
information How to order?
Shank1+/-,
Shank1 -/- Targeted
null/knockout;
Shank1tm1Shng/J; replacement of
exons 14 and 15
on chromosome 7
with a PGK-
neomycin drug resistance cassette
(jax.org).
Repetitive behaviour
(increased grooming,
but reduced marble burying) (Sungur et
al., 2014), mild
anxiety-like behaviour
(Gong & Wang 2015).
Shank1-/- demonstrate reduced exploratory
locomotion, motor
coordination, balance
and neuromuscular
strength (Gong & Wang, 2015). Social
deficits evaluated by
ultrasonic
vocalizations (Gong &
Wang, 2015). Impaired contextual fear
memory (Hung et al.,
2008). However,
Shank 1-/- and -/+ do
not prefer a novel object over a novel
mouse, -/- prefer the
novel mouse,
indicating normal
social behaviour (Silverman et al.,
2011).
Altered denritic
spine
morphology (Hung et al.,
2008;
Martínez‐Cerdeño,
2017).
Similar LTP
and LTD
(Hung et al., 2008).
Shank1-/- has
increased E/I
ratio in hippocampal CA1
pyramidal
neurons (Mao et
al., 2015).
Cryo recovery
from Jackson
Laboratory ($2854 USD per
mouse, 12-week
process).
Neuroligin-3-
deficient
(Nlgn3R451C)
Nlgn3tm1.1Htz/J;
CGT in exon 6 of
chromosome X
encoding arginine
at amino acid position 451 was
modified to
cysteine (TCG).
Enhanced formation of
repetitive motor
routines (Rothwell et
al., 2014). Elevated
aggression, repetitive behaviour (visitations
to novel objects),
impaired juvenile
social interaction
(Burrows et al., 2015).
Increased
dendritic
branching in the
stratum
radiatum of the CA1 region of
the
hippocampus
(Etherton et al.,
2011).
Increased LTP
(Etherton et
al., 2011).
Evidence for
decreased E/I
ratio due to
enhanced
GABAergic transmission in
the
somatosensory
cortex and
increased frequency of
spontaneous
IPSCs (Tabuchi
et al., 2007).
Cryo recovery
from Jackson
Laboratory
($2854 USD per
mouse, 12-week process).
Mdga2+/- The coding
sequence in first
exon of Mdga2 is replaced by a
LacZ-pA-PGK-
Neo-pA cassette.
Stereotypy, aberrant
social interactions,
impaired memory and hippocampal-
dependent learning
(Connor et al., 2016).
Increased
synaptic density
(Connor et al., 2016; Tang et
al., 2014).
Enhanced E-
LTP, impaired
L-LTP (Connor et al.,
2016).
Increased E/I
ratio (increased
excitatory synaptic density
and transmission
in the
hippocampus)
(Connor et al., 2016).
Potentially
available from
Dr. Tohru Yamamoto,
Kagawa
University,
Japan.
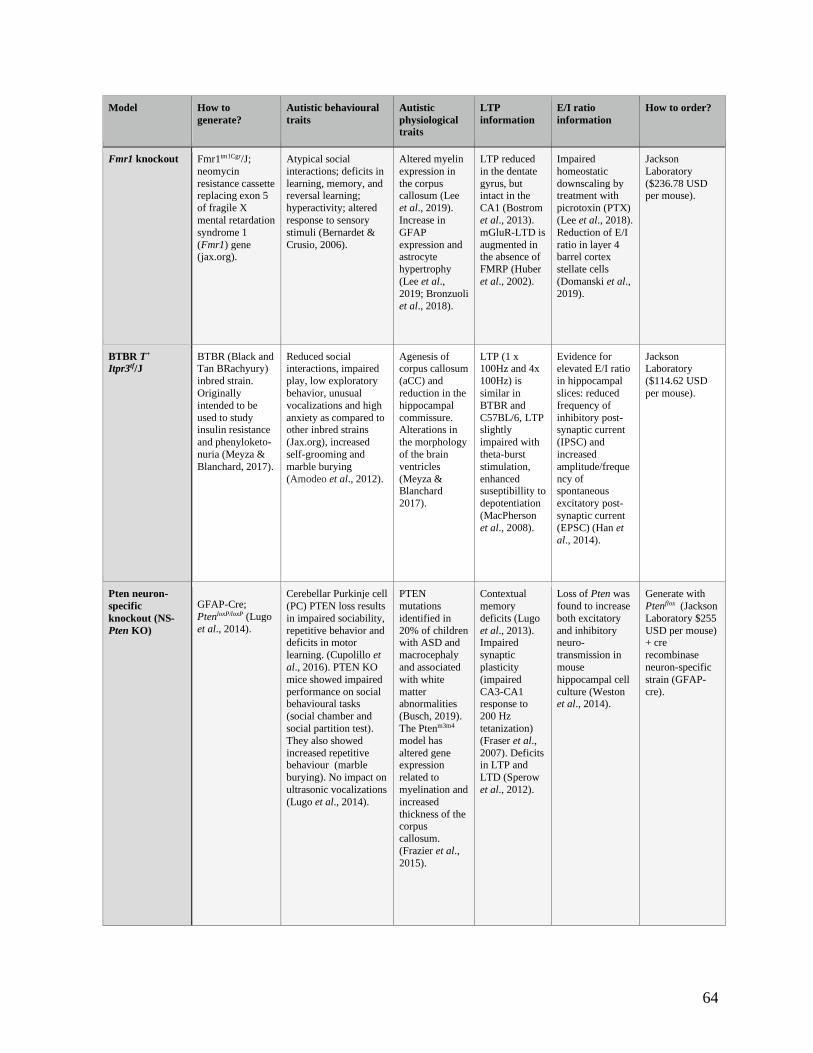
64
Model How to
generate? Autistic behavioural
traits Autistic
physiological
traits
LTP
information E/I ratio
information How to order?
Fmr1 knockout Fmr1tm1Cgr/J;
neomycin
resistance cassette replacing exon 5
of fragile X
mental retardation
syndrome 1
(Fmr1) gene (jax.org).
Atypical social
interactions; deficits in
learning, memory, and reversal learning;
hyperactivity; altered
response to sensory
stimuli (Bernardet &
Crusio, 2006).
Altered myelin
expression in
the corpus callosum (Lee
et al., 2019).
Increase in
GFAP
expression and astrocyte
hypertrophy
(Lee et al.,
2019; Bronzuoli
et al., 2018).
LTP reduced
in the dentate
gyrus, but intact in the
CA1 (Bostrom
et al., 2013).
mGluR-LTD is
augmented in the absence of
FMRP (Huber
et al., 2002).
Impaired
homeostatic
downscaling by treatment with
picrotoxin (PTX)
(Lee et al., 2018).
Reduction of E/I
ratio in layer 4 barrel cortex
stellate cells
(Domanski et al.,
2019).
Jackson
Laboratory
($236.78 USD per mouse).
BTBR T+
Itpr3tf/J BTBR (Black and Tan BRachyury)
inbred strain.
Originally
intended to be
used to study insulin resistance
and phenyloketo-
nuria (Meyza &
Blanchard, 2017).
Reduced social interactions, impaired
play, low exploratory
behavior, unusual
vocalizations and high
anxiety as compared to other inbred strains
(Jax.org), increased
self-grooming and
marble burying
(Amodeo et al., 2012).
Agenesis of corpus callosum
(aCC) and
reduction in the
hippocampal
commissure. Alterations in
the morphology
of the brain
ventricles
(Meyza & Blanchard
2017).
LTP (1 x 100Hz and 4x
100Hz) is
similar in
BTBR and
C57BL/6, LTP slightly
impaired with
theta-burst
stimulation,
enhanced suseptibillity to
depotentiation
(MacPherson
et al., 2008).
Evidence for elevated E/I ratio
in hippocampal
slices: reduced
frequency of
inhibitory post-synaptic current
(IPSC) and
increased
amplitude/freque
ncy of spontaneous
excitatory post-
synaptic current
(EPSC) (Han et
al., 2014).
Jackson Laboratory
($114.62 USD
per mouse).
Pten neuron-
specific
knockout (NS-
Pten KO)
GFAP-Cre;
PtenloxP/loxP (Lugo
et al., 2014).
Cerebellar Purkinje cell
(PC) PTEN loss results
in impaired sociability,
repetitive behavior and deficits in motor
learning. (Cupolillo et
al., 2016). PTEN KO
mice showed impaired
performance on social behavioural tasks
(social chamber and
social partition test).
They also showed
increased repetitive behaviour (marble
burying). No impact on
ultrasonic vocalizations
(Lugo et al., 2014).
PTEN
mutations
identified in
20% of children with ASD and
macrocephaly
and associated
with white
matter abnormalities
(Busch, 2019).
The Ptenm3m4
model has
altered gene expression
related to
myelination and
increased
thickness of the corpus
callosum.
(Frazier et al.,
2015).
Contextual
memory
deficits (Lugo
et al., 2013). Impaired
synaptic
plasticity
(impaired
CA3-CA1 response to
200 Hz
tetanization)
(Fraser et al.,
2007). Deficits in LTP and
LTD (Sperow
et al., 2012).
Loss of Pten was
found to increase
both excitatory
and inhibitory neuro-
transmission in
mouse
hippocampal cell
culture (Weston et al., 2014).
Generate with
Ptenflox (Jackson
Laboratory $255
USD per mouse) + cre
recombinase
neuron-specific
strain (GFAP-
cre).
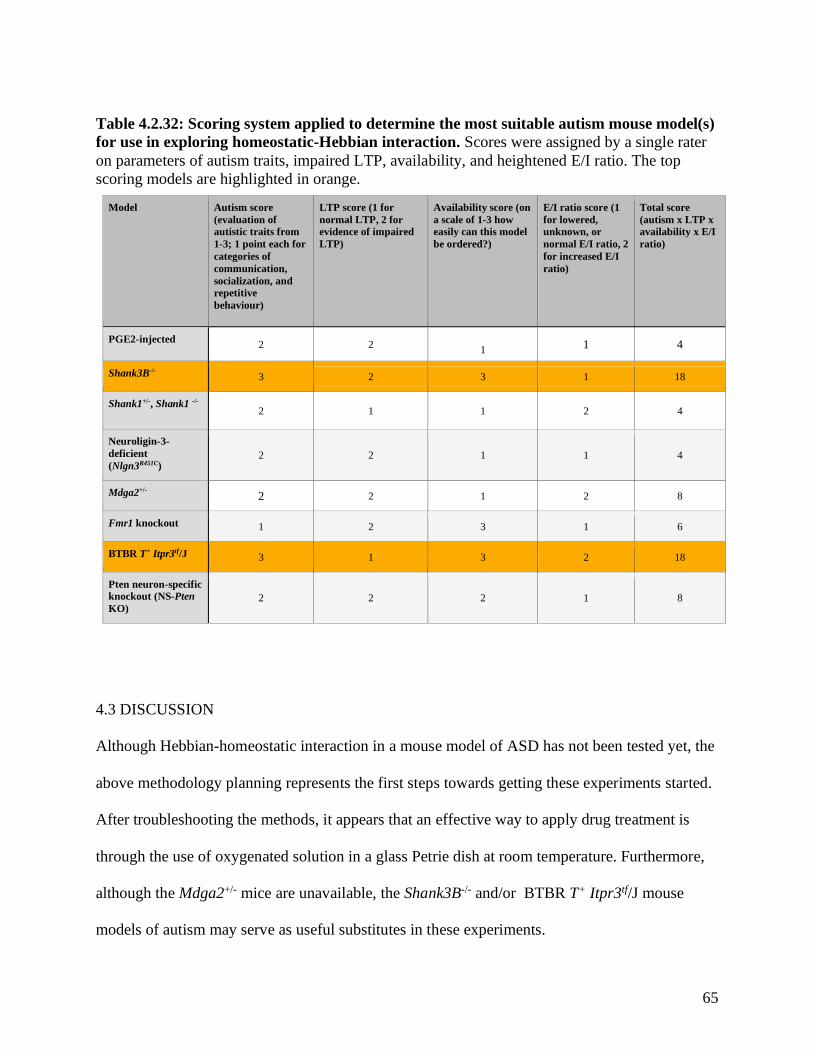
65
Table 4.2.32: Scoring system applied to determine the most suitable autism mouse model(s)
for use in exploring homeostatic-Hebbian interaction. Scores were assigned by a single rater
on parameters of autism traits, impaired LTP, availability, and heightened E/I ratio. The top
scoring models are highlighted in orange.
Model Autism score
(evaluation of
autistic traits from
1-3; 1 point each for
categories of
communication,
socialization, and
repetitive
behaviour)
LTP score (1 for
normal LTP, 2 for
evidence of impaired
LTP)
Availability score (on
a scale of 1-3 how
easily can this model
be ordered?)
E/I ratio score (1
for lowered,
unknown, or
normal E/I ratio, 2
for increased E/I
ratio)
Total score
(autism x LTP x
availability x E/I
ratio)
PGE2-injected 2 2
1 1 4
Shank3B-/- 3 2 3 1 18
Shank1+/-, Shank1 -/- 2 1 1 2 4
Neuroligin-3-
deficient
(Nlgn3R451C) 2 2 1 1 4
Mdga2+/- 2 2 1 2 8
Fmr1 knockout 1 2 3 1 6
BTBR T+ Itpr3tf/J 3 1 3 2 18
Pten neuron-specific
knockout (NS-Pten
KO) 2 2 2 1 8
4.3 DISCUSSION
Although Hebbian-homeostatic interaction in a mouse model of ASD has not been tested yet, the
above methodology planning represents the first steps towards getting these experiments started.
After troubleshooting the methods, it appears that an effective way to apply drug treatment is
through the use of oxygenated solution in a glass Petrie dish at room temperature. Furthermore,
although the Mdga2+/- mice are unavailable, the Shank3B-/- and/or BTBR T+ Itpr3tf/J mouse
models of autism may serve as useful substitutes in these experiments.
66
The total score for the mouse models (Table 4.2.32) was obtained by multiplication rather
than addition to help emphasize the divide between the options. Use of addition would give a
similar outcome. The factors of autism score and availability score were weighted slightly higher
(on a scale of 1-3, rather than 1-2) because these are essential attributes. For example, if the
model is highly applicable to autism by demonstrating strong autism traits, then regardless of
LTP or E/I ratio score, it may be worth using for exploration of homeostatic-Hebbian interaction.
Availability was ranked similarly in weight as autism score because the experiments are heavily
dependent on access to the mouse models. LTP and E/I ratio score were given slightly lower
weights because regardless of how these appear individually, the experiment is assessing
homeostatic-Hebbian interaction. Even though it would be ideal to explore a model with
impaired LTP and heightened E/I ratio, models without this criteria will still be of interest for
exploring homeostatic-Hebbian interface in autism.
In researching different types of autism mouse models, it is apparent that no one mouse
model perfectly represents this disorder. Autism is complex, being caused by combinations of
many different genes and environmental factors, and manifesting in symptoms that differ for
each unique individual. Thus, when using mouse models to study autism, it is important to use a
variety of types to best capture the wide spectrum of this disorder.
67
GENERAL CONCLUSION
The use of electrophysiology techniques to study synaptic plasticity in autism mouse models can
reveal important functional insights, that would otherwise be impossible to study in humans.
Optimization of equipment and planning of methodology are the first steps in tackling research
questions related to this field. A large portion of this project focused on equipment set-up and
troubleshooting (Chapter 2). Then in Chapter 3, synaptic plasticity was studied in the PGE2
mouse model of autism, demonstrating reduced basal synaptic response and heightened
potentiation during the first 10 minutes following HFS. Lastly, a potential therapeutic application
of synaptic plasticity in autism was proposed, involving the interaction between Hebbian and
homeostatic plasticity (Chapter 4). By understanding how synaptic plasticity is altered in ASD
models and how it can be potentially restored, we are able to discover and support new avenues
for ASD treatments and therapies.

68
REFERENCES
Abrahamsson, T., Lalanne, T., Watt, A. J., & Sjöström, P. J. (2016). Long-term potentiation by
theta-burst stimulation using extracellular field potential recordings in acute hippocampal
slices. Cold Spring Harbor Protocols, 2016(6), pdb-prot091298.
Agranoff, B.W., Benjamins, J.A., & Hajra, A.K. (2005). Properties of Brain Lipids. Basic
Neurochemistry: Molecular, Cellular and Medical Aspects, 33.
Ahlsén, G., Rosengren, L., Belfrage, M., Palm, A., Haglid, K., Hamberger, A., & Gillberg, C.
(1993). Glial fibrillary acidic protein in the cerebrospinal fluid of children with autism and other
neuropsychiatric disorders. Biological Psychiatry, 33(10), 734-743.
Akaneya, Y. (2007). The remarkable mechanism of prostaglandin E2 on synaptic
plasticity. Gene Regulation and Systems Biology, 1, 117762500700100009.
Akaneya, Y., & Tsumoto, T. (2006). Bidirectional trafficking of prostaglandin E2 receptors
involved in long-term potentiation in visual cortex. Journal of Neuroscience, 26(40), 10209-
10221.
Al-Farsi, Y.M., Waly, M.I., Al-Sharbati, M.M., Al-Shafaee, M.A., Al-Farsi, O.A., Al-Khaduri,
M.M., Gupta, I., Ouhtit, A., Al-Adawi, S., Al-Said, M.F. & Deth, R.C. (2013). Levels of heavy
metals and essential minerals in hair samples of children with autism in Oman: a case–control
study. Biological Trace Element Research, 151(2), 181-186.
Allen, T. A., & Fortin, N. J. (2013). The evolution of episodic memory. Proceedings of the
National Academy of Sciences, 110(Supplement 2), 10379-10386.
Amodeo, D. A., Jones, J. H., Sweeney, J. A., & Ragozzino, M. E. (2012). Differences in BTBR
T+ tf/J and C57BL/6J mice on probabilistic reversal learning and stereotyped
behaviors. Behavioural Brain Research, 227(1), 64-72.
Andersen, P., Morris, R., Amaral, D., Bliss, T., & O'Keefe, J. (Eds.). (2006). The Hippocampus
Book. Oxford university press.
Anderson, W. W., Lewis, D. V., Swartzwelder, H. S., & Wilson, W. A. (1986). Magnesium-free
medium activates seizure-like events in the rat hippocampal slice. Brain Research, 398(1), 215-
219.
Antoine, M. W., Langberg, T., Schnepel, P., & Feldman, D. E. (2019). Increased excitation-
inhibition ratio stabilizes synapse and circuit excitability in four autism mouse
models. Neuron, 101(4), 648-661.
Asperger, H. (1944). Die “Autistischen Psychopathen” im Kindesalter. European Archives of
Psychiatry and Clinical Neuroscience, 117, 76-136.
69
Bailey, A. et al. (1998). Full genome screen for autism with evidence for linkage to a region on
chromosome 7q. International Molecular Genetic Study of Autism Consortium. Human
Molecular Genetics, 7, 571–578.
Bandim, J. M., Ventura, L. O., Miller, M. T., Almeida, H. C., & Costa, A. E. S. (2003). Autism
and Möbius sequence: an exploratory study of children in northeastern Brazil. Arquivos de
Neuro-psiquiatria, 61(2A), 181-185.
Barrionuevo, G., Schottler, F. & G. Lynch. (1980). The effects of repetitive low frequency
stimulation on control and “potentiated” synaptic responses in the hippocampus. Life Sciences,
27, 2385-2391.
Bear, M. F. (2005). Therapeutic implications of the mGluR theory of fragile X mental
retardation. Genes, Brain and Behavior, 4(6), 393-398.
Benavides-Piccione, R., Regalado-Reyes, M., Fernaud-Espinosa, I., Kastanauskaite, A., Tapia-
González, S., León-Espinosa, G., Rojo, C., Insausti, R., Segev, I. & DeFelipe, J. (2020).
Differential structure of hippocampal CA1 pyramidal neurons in the human and mouse. Cerebral
Cortex, 30(2), 730-752.
Bergmann, E., Zur, G., Bershadsky, G. & Kahn, I. (2016). The organization of mouse and
human cortico-hippocampal networks estimated by intrinsic functional connectivity. Cerebral
Cortex, 1-16.
Berlucchi, G. (2002). The origin of the term plasticity in the neurosciences: Ernesto Lugaro and
chemical synaptic transmission. Journal of the History of the Neurosciences 11, 305-309.
Bernardet, M., & Crusio, W. E. (2006). Fmr1 KO mice as a possible model of autistic features.
The Scientific World Journal, 6, 1164-1176.
Bisazza, A. (1981). Social organization and territorial behaviour in three strains of mice. Italian
Journal of Zoology, 48(2), 157-167.
Bliss, T. & Lømo, T. (1973). Long‐lasting potentiation of synaptic transmission in the dentate
area of the anaesthetized rabbit following stimulation of the perforant path. The Journal of
Physiology, 232, 331-356.
Bliss, T. & Sam F. C. (2011). Long-term potentiation and long-term depression: a clinical
perspective. Clinics, 66, 3-17.
Bostrom, C. A., Majaess, N. M., Morch, K., White, E., Eadie, B. D., & Christie, B. R. (2015).
Rescue of NMDAR-dependent synaptic plasticity in Fmr1 knock-out mice. Cerebral
Cortex, 25(1), 271-279.
Bozdagi, O., Sakurai, T., Papapetrou, D., Wang, X., Dickstein, D.L., Takahashi, N., Kajiwara,
Y., Yang, M., Katz, A.M., Scattoni, M.L. & Harris, M.J. (2010). Haploinsufficiency of the
70
autism-associated Shank3 gene leads to deficits in synaptic function, social interaction, and
social communication. Molecular Autism, 1(1), 1-15.
Bronzuoli, M.R., Facchinetti, R., Ingrassia, D., Sarvadio, M., Schiavi, S., Steardo, L.,
Verkhratsky, A., Trezza, V. & Scuderi, C. (2018). Neuroglia in the autistic brain: evidence from
a preclinical model. Molecular Autism, 9(1), 1-17.
Brown, R. E., & Milner, P. M. (2003). The legacy of Donald O. Hebb: more than the Hebb
synapse. Nature Reviews Neuroscience, 4(12), 1013.
Bryant, C. D. (2011). The blessings and curses of C57BL/6 substrains in mouse genetic
studies. Annals of the New York Academy of Sciences, 1245, 31.
Bryda, E. C. (2013). The Mighty Mouse: the impact of rodents on advances in biomedical
research. Missouri Medicine, 110(3), 207.
Bucan, M., Abrahams, B.S., Wang, K., Glessner, J.T., Herman, E.I., Sonnenblick, L.I., Retuerto,
A.I.A., Imielinski, M., Hadley, D., Bradfield, J.P. & Kim, C. (2009). Genome-wide analyses of
exonic copy number variants in a family-based study point to novel autism susceptibility
genes. PLoS Genetics, 5(6), p.e1000536.
Bunyavanich, S., Donovan, M., Sherry, J., & Diamond, D. (2013). Immunotherapy for mouse
bite anaphylaxis and allergy. Annals of allergy, asthma & immunology: official publication of the
American College of Allergy, Asthma, & Immunology, 111(3), 223.
Burrows, E. L., Laskaris, L., Koyama, L., Churilov, L., Bornstein, J. C., Hill-Yardin, E. L., &
Hannan, A. J. (2015). A neuroligin-3 mutation implicated in autism causes abnormal aggression
and increases repetitive behavior in mice. Molecular Autism, 6(1), 1-11.
Busch, R.M., Srivastava, S., Hogue, O., Frazier, T.W., Klaas, P., Hardan, A., Martinez-Agosto,
J.A., Sahin, M. and Eng, C. (2019). Neurobehavioral phenotype of autism spectrum disorder
associated with germline heterozygous mutations in PTEN. Translational Psychiatry, 9(1), 1-9.
Cruikshank, S. J., & Weinberger, N. M. (1996). Evidence for the Hebbian hypothesis in
experience-dependent physiological plasticity of neocortex: a critical review. Brain Research
Reviews, 22(3), 191-228.
Chiossi, G., Costantine, M.M., Bytautiene, E., Kechichian, T., Hankins, G.D., Sbrana, E., Saade,
G.R. & Longo, M. (2012). The effects of PGE1 and PGE2 on in vitro myometrial contractility
and uterine structure. American Journal of Perinatology, 29(8), 615.
Cajal, R. S. (1892) El nuevo concepto de la histología de los centros nerviosos. La Revista de
Ciencias Médicas de Barcelona, 18, 361–376.
71
Cajal, R. S. (1913). Sobre la degeneración y regeneración del sistema nervioso. Imprenta de
Hijos de Nicolás Moya, Madrid, 2.
Chauhan, Y. S., Lu, D. D., Sriramkumar, V., Khandelwal, S., Duarte, J. P., Payvadosi, N.,
Niknejad, A., & Hu, C. (2015). FinFET modeling for IC simulation and design: using the BSIM-
CMG standard. Chapter 8 - Noise. Academic Press.
Chen, C., Magee, J. C., & Bazan, N. G. (2002). Cyclooxygenase-2 regulates prostaglandin E2
signaling in hippocampal long-term synaptic plasticity. Journal of Neurophysiology, 87(6),
2851-2857.
Chen, Q., Panksepp, J. B., & Lahvis, G. P. (2009). Empathy is moderated by genetic background
in mice. PloS One, 4(2), e4387.
Christensen, D.L., Braun, K.V.N., Baio, J., Bilder, D., Charles, J., Constantino, J.N., Daniels, J.,
Durkin, M.S., Fitzgerald, R.T., Kurzius-Spencer, M. & Lee, L.C. (2018). Prevalence and
characteristics of autism spectrum disorder among children aged 8 years—autism and
developmental disabilities monitoring network, 11 sites, United States, 2012. MMWR
Surveillance Summaries, 65(13), 1.
Clifford, C. W., & Woodring, J. P. (1990). Methods for rearing the house cricket, Acheta
domesticus (L.), along with baseline values for feeding rates, growth rates, development times,
and blood composition. Journal of Applied Entomology, 109(1‐5), 1-14.
Coast, G. M., & Kay, I. A. I. N. (1994). The effects of Acheta diuretic peptide on isolated
Malpighian tubules from the house cricket Acheta domesticus. Journal of Experimental
Biology, 187(1), 225-243.
Connor, S.A., Elegheert, J., Xie, Y. & Craig, A.M. (2019). Pumping the brakes: suppression of
synapse development by MDGA–neuroligin interactions. Current Opinion in Neurobiology, 57,
71-80.
Connor, S.A., Ammendrup-Johnsen, I., Chan, A.W., Kishimoto, Y., Murayama, C., Kurihara,
N., Tada, A., Ge, Y., Lu, H., Yan, R. and LeDue, J.M. (2016). Altered cortical dynamics and
cognitive function upon haploinsufficiency of the autism-linked excitatory synaptic suppressor
MDGA2. Neuron, 91(5), 1052-1068.
Cooper, R.A., Richter, F.R., Bays, P.M., Plaisted-Grant, K.C., Baron-Cohen, S. & Simons, J.S.
(2017). Reduced hippocampal functional connectivity during episodic memory retrieval in
autism. Cerebral Cortex, 27(2), 888-902.
Courchesne, E., Mouton, P.R., Calhoun, M.E., Semendeferi, K., Ahrens-Barbeau, C., Hallet,
M.J., Barnes, C.C. & Pierce, K. (2011). Neuron number and size in prefrontal cortex of children
with autism. Jama, 306(18), 2001-2010.
72
Crawford, D. (2021). Neurobiology of Lipid Signalling in the Developing Brain: Link to Autism
Spectrum Disorders. Department of Biology Seminar. York University. March 22, 2021.
Cupolillo, D., Hoxha, E., Faralli, A., De Luca, A., Rossi, F., Tempia, F., & Carulli, D. (2016).
Autistic-like traits and cerebellar dysfunction in Purkinje cell PTEN knock-out mice.
Neuropsychopharmacology, 41(6), 1457-1466.
Dachtler, J., Glasper, J., Cohen, R.N., Ivorra, J.L., Swiffen, D.J., Jackson, A.J., Harte, M.K.,
Rodgers, R.J. & Clapcote, S.J. (2014). Deletion of α-neurexin II results in autism-related
behaviors in mice. Translational Psychiatry, 4(11), pp.e484-e484.
DeVita, V. T., & Chu, E. (2008). A history of cancer chemotherapy. Cancer Research, 68(21),
8643-8653.
Dhamne, S.C., Silverman, J.L., Super, C.E., Lammers, S.H., Hameed, M.Q., Modi, M.E.,
Copping, N.A., Pride, M.C., Smith, D.G., Rotenberg, A. & Crawley, J.N. (2017). Replicable in
vivo physiological and behavioral phenotypes of the Shank3B null mutant mouse model of
autism. Molecular Autism, 8(1), 1-19.
Domanski, A. P., Booker, S. A., Wyllie, D. J., Isaac, J. T., & Kind, P. C. (2019). Cellular and
synaptic phenotypes lead to disrupted information processing in Fmr1-KO mouse layer 4 barrel
cortex. Nature Communications, 10(1), 1-18.
Dutta, S., & Sengupta, P. (2016). Men and mice: relating their ages. Life Sciences, 152, 244-248.
Elegheert, J., Cvetkovska, V., Clayton, A.J., Heroven, C., Vennekens, K.M., Smukowski, S.N.,
Regan, M.C., Jia, W., Smith, A.C., Furukawa, H. & Savas, J.N. (2017). Structural mechanism for
modulation of synaptic neuroligin-neurexin signaling by MDGA proteins. Neuron, 95(4), 896-
913.
Etherton, M., Földy, C., Sharma, M., Tabuchi, K., Liu, X., Shamloo, M., Malenka, R.C. &
Südhof, T.C. (2011). Autism-linked neuroligin-3 R451C mutation differentially alters
hippocampal and cortical synaptic function. Proceedings of the National Academy of
Sciences, 108(33), 13764-13769.
Folstein, S. & Rutter, M. (1977). Infantile Autism: A Genetic Study of 21 Twin Pairs. Journal of
Child Psychology and Psychiatry, 18, 297–321.
Foster, E. S., Signs, K. A., Marks, D. R., Kapoor, H., Casey, M., Stobierski, M. G., & Walker,
E. D. (2006). Lymphocytic choriomeningitis in Michigan. Emerging Infectious Diseases, 12(5),
851.
Fraser, M. M., Bayazitov, I. T., Zakharenko, S. S., & Baker, S. J. (2008). Pten deficiency in
brain causes defects in synaptic structure, transmission and plasticity, and myelination
abnormalities. Neuroscience, 151(2), 476.
73
Frazier, T. W., Embacher, R., Tilot, A. K., Koenig, K., Mester, J., & Eng, C. (2015). Molecular
and phenotypic abnormalities in individuals with germline heterozygous PTEN mutations and
autism. Molecular Psychiatry, 20(9), 1132-1138.
Gaffney, G. R., Kuperman, S., Tsai, L. Y. & Minchin, S. (1989). Forebrain Structure in Infantile
Autism. Journal of the American Academy of Child & Adolescent Psychiatry, 28, 534–537.
Gage, F. H. (2004). Structural plasticity of the adult brain. Dialogues in Clinical Neuroscience,
6, 135.
Gol, A., & Faibish, G. M. (1967). Effects of human hippocampal ablation. Journal of
Neurosurgery, 26(4), 390-398.
Gong, X., & Wang, H. (2015). SHANK1 and autism spectrum disorders. Science China Life
sciences, 58(10), 985-990.
Gonzalez, C. H., Marques-Dias, M. J., Kim, C. A., Sugayama, S. M., Da Paz, J. A., Huson, S.
M., & Holmes, L. B. (1998). Congenital abnormalities in Brazilian children associated with
misoprostol misuse in first trimester of pregnancy. The Lancet, 351(9116), 1624-1627.
Grayton, H. M., Missler, M., Collier, D. A. & Fernandes, C. (2013). Altered Social Behaviours
in Neurexin 1α Knockout Mice Resemble Core Symptoms in Neurodevelopmental Disorders.
PLoS One, 8, e67114.
Greydanus, D. E., & Toledo-Pereyra, L. H. (2012). Historical perspectives on autism: Its past
record of discovery and its present state of solipsism, skepticism, and sorrowful
suspicion. Pediatric Clinics, 59(1), 1-11.
Hafting, T., Fyhn, M., Molden, S., Moser, M. B., & Moser, E. I. (2005). Microstructure of a
spatial map in the entorhinal cortex. Nature, 436(7052), 801-806.
Hallmayer, J., Cleveland, S., Torres, A., Phillips, J., Cohen, B., Torigoe, T., Miller, J., Fedele,
A., Collins, J., Smith, K. & Lotspeich, L. (2011). Genetic heritability and shared environmental
factors among twin pairs with autism. Archives of General Psychiatry, 68(11), 1095-1102.
Hazlett, H. C., Poe, M., Gerig, G., Smith, R. G., Provenzale, J., Ross, A., Gilmore, J. and Piven,
J. (2005). Magnetic resonance imaging and head circumference study of brain size in autism:
birth through age 2 years. Archives of General Psychiatry, 62(12), 1366-1376.
Hebb, D. O. (1949). The first stage of perception: growth of the assembly. The Organization of
Behavior, 4, 60-78.
Huang, E. P. (1998). Synaptic plasticity: going through phases with LTP. Current Biology, 8,
R350-R352.
74
Huber, K. M., Gallagher, S. M., Warren, S. T., & Bear, M. F. (2002). Altered synaptic plasticity
in a mouse model of fragile X mental retardation. Proceedings of the National Academy of
Sciences, 99(11), 7746-7750.
Hung, A.Y., Futai, K., Sala, C., Valtschanoff, J.G., Ryu, J., Woodworth, M.A., Kidd, F.L., Sung,
C.C., Miyakawa, T., Bear, M.F. & Weinberg, R.J. (2008). Smaller dendritic spines, weaker
synaptic transmission, but enhanced spatial learning in mice lacking Shank1. Journal of
Neuroscience, 28(7), 1697-1708.
Hutsler, J. J., Love, T. & Zhang, H. (2007). Histological and Magnetic Resonance Imaging
Assessment of Cortical Layering and Thickness in Autism Spectrum Disorders. Biological
Psychiatry 61, 449–457.
Jacobs, G. A., Miller, J. P., & Aldworth, Z. (2008). Computational mechanisms of
mechanosensory processing in the cricket. Journal of Experimental Biology, 211(11), 1819-
1828.
Johns, P. (2014). Neurons and glial cells. Clinical Neuroscience: An Illustrated Colour Text, 5,
61.
Kalueff, A. V., Minasyan, A., Keisala, T., Shah, Z. H., & Tuohimaa, P. (2006). Hair barbering in
mice: implications for neurobehavioural research. Behavioural Processes, 71(1), 8-15.
Kandel, E. R. (2001). The molecular biology of memory storage: a dialogue between genes and
synapses. Science 294, 1030-1038.
Kanner, L. (1943). Autistic disturbances of affective contact. Nervous Child, 2, 217-250.
Kerr, D. (2009). Kerr Scientific Instruments Tissue Recording System Owner’s Guide. New
Zealand: Kerr Scientific Instruments.
Koenig, C. M., Walker, C. K., Qi, L., Pessah, I. N., & Berman, R. F. (2012). Lack of evidence
for neonatal misoprostol neurodevelopmental toxicity in C57BL6/J mice. PloS One, 7(6),
e38911.
Kuhn, M., Wolf, E., Maier, J. G., Mainberger, F., Feige, B., Schmid, H., Bürklin, J., Maywald,
S., Mall, V., Jung, N.H., & Reis, J. (2016). Sleep recalibrates homeostatic and associative
synaptic plasticity in the human cortex. Nature Communications, 7, 12455.
Kumar, D. (1990). Moebius syndrome. Journal of Medical Genetics, 27(2), 122.
Lee, F. H., Lai, T. K., Su, P., & Liu, F. (2019). Altered cortical Cytoarchitecture in the Fmr1
knockout mouse. Molecular Brain, 12(1), 1-12.
75
Lee, J., Chung, C., Ha, S., Lee, D., Kim, D. Y., Kim, H., & Kim, E. (2015). Shank3-mutant mice
lacking exon 9 show altered excitation/inhibition balance, enhanced rearing, and spatial memory
deficit. Frontiers in Cellular Neuroscience, 9, 94.
Lee, K. Y., Jewett, K. A., Chung, H. J., & Tsai, N. P. (2018). Loss of fragile X protein FMRP
impairs homeostatic synaptic downscaling through tumor suppressor p53 and ubiquitin E3 ligase
Nedd4-2. Human Molecular Genetics, 27(16), 2805-2816.
Legler, D. F., Bruckner, M., Uetz-von Allmen, E., & Krause, P. (2010). Prostaglandin E2 at new
glance: novel insights in functional diversity offer therapeutic chances. The International Journal
of Biochemistry & Cell Biology, 42(2), 198-201.
Lein, P. J., Barnhart, C. D., & Pessah, I. N. (2011). Acute hippocampal slice preparation and
hippocampal slice cultures. In Vitro Neurotoxicology (pp. 115-134). Humana Press, Totowa, NJ.
Letellier, M., Szíber, Z., Chamma, I., Saphy, C., Papasideri, I., Tessier, B., Sainlos, M.,
Czöndör, K. and Thoumine, O. (2018). A unique intracellular tyrosine in neuroligin-1 regulates
AMPA receptor recruitment during synapse differentiation and potentiation. Nature
Communications, 9(1), 1-17.
Lewine, J.D., Andrews, R., Chez, M., Patil, A.A., Devinsky, O., Smith, M., Kanner, A., Davis,
J.T., Funke, M., Jones, G. and Chong, B. (1999). Magnetoencephalographic patterns of
epileptiform activity in children with regressive autism spectrum disorders. Pediatrics, 104(3),
405-418.
Lugo, J. N., Smith, G. D., Morrison, J. B., & White, J. (2013). Deletion of PTEN produces
deficits in conditioned fear and increases fragile X mental retardation protein. Learning &
Memory, 20(12), 670-673.
Lugo, J. N., Smith, G. D., Arbuckle, E. P., White, J., Holley, A. J., Floruta, C. M., Ahmed, N.,
Gomez, M. C. & Okonkwo, O. (2014). Deletion of PTEN produces autism-like behavioral
deficits and alterations in synaptic proteins. Frontiers in Molecular Neuroscience, 7, 27.
Lynch, M. A. (2004). Long-Term Potentiation and Memory. Physiological Reviews. 84, 87–136.
MacPherson, P., McGaffigan, R., Wahlsten, D., & Nguyen, P. V. (2008). Impaired fear
memory, altered object memory and modified hippocampal synaptic plasticity in split-brain
mice. Brain Research, 1210, 179-188.
Mao, W., Watanabe, T., Cho, S., Frost, J. L., Truong, T., Zhao, X., & Futai, K. (2015). Shank1
regulates excitatory synaptic transmission in mouse hippocampal parvalbumin‐expressing
inhibitory interneurons. European Journal of Neuroscience, 41(8), 1025-1035.
Marques‐Dias, M. J., Gonzalez, C. H., & Rosemberg, S. (2003). Möbius sequence in children
exposed in utero to misoprostol: neuropathological study of three cases. Birth Defects Research
Part A: Clinical and Molecular Teratology, 67(12), 1002-1007.
76
Marsden, M. D. (2020). Benefits and limitations of humanized mice in HIV persistence
studies. Retrovirology, 17, 1-6.
Martínez‐Cerdeño, V. (2017). Dendrite and spine modifications in autism and related
neurodevelopmental disorders in patients and animal models. Developmental Neurobiology,
77(4), 393-404.
Mendenhall, B., & Murphey, R. K. (1974). The morphology of cricket giant
interneurons. Journal of Neurobiology, 5(6), 565-580.
Meyza, K. Z., & Blanchard, D. C. (2017). The BTBR mouse model of idiopathic autism –
Current view on mechanisms. Neuroscience & Biobehavioral Reviews, 76, 99-110.
Milner, B., Corkin, S., & Teuber, H. L. (1968). Further analysis of the hippocampal amnesic
syndrome: 14-year follow-up study of HM. Neuropsychologia, 6(3), 215-234.
Molecular Devices. (2012). The Axon Guide, A Guide to Electrophysiology & Biophysics
Laboratory Techniques. Sunnyvale: MDS Analytical Technologies.
Morrissey, R. E., & Edwards, J. S. (1981). Effects of ethanol on sensory processing in the
central nervous system of an insect: the cercal-to-giant interneuron system of the house
cricket. Comparative Biochemistry and Physiology Part C: Comparative Pharmacology, 70(2),
159-169.
Nelson, S. B., & Valakh, V. (2015). Excitatory/inhibitory balance and circuit homeostasis in
autism spectrum disorders. Neuron, 87(4), 684-698.
Ofner, M., Coles, A., Decou, M.L., Do, M.T., Bienek, A., Snider, J. & Ugnat, A. (2018). Autism
spectrum disorder among children and youth in Canada 2018. Ottawa, ON: Public Health
Agency of Canada.
Ogawa, H., & Mitani, R. (2015). Spatial dynamics of action potentials estimated by dendritic
Ca2+ signals in insect projection neurons. Biochemical and Biophysical Research
Communications, 467(2), 185-190.
O'Keefe, J., & Dostrovsky, J. (1971). The hippocampus as a spatial map: preliminary evidence
from unit activity in the freely-moving rat. Brain Research.
Ousley, O. & Tracy C. (2014). Autism spectrum disorder: defining dimensions and
subgroups. Current Developmental Disorders Reports 1, 20-28.
Pastuszak, A. L., Schüler, L., Speck-Martins, C. E., Coelho, K. E. F., Cordello, S. M., Vargas,
F., Brunoni, D., Schwarz, I. V., Larrandaburu, M., Safattle, H. & Meloni, V. F. (1998). Use of
misoprostol during pregnancy and Möbius' syndrome in infants. New England Journal of
Medicine, 338(26), 1881-1885.

77
Peça, J., Feliciano, C., Ting, J. T., Wang, W., Wells, M. F., Venkatraman, T. N., Lascola, C. D.,
Fu, Z. & Feng, G. (2011). Shank3 mutant mice display autistic-like behaviours and striatal
dysfunction. Nature, 472(7344), 437-442.
Philippe, A., Martinez, M., Guilloud-Bataille, M., Gillberg, C., Råstam, M., Sponheim, E.,
Coleman, M., Zappella, M., Aschauer, H., Van Maldergem, L. & Penet, C. (1999). Genome-
wide scan for autism susceptibility genes. Human Molecular Genetics, 8(5), 805-812.
Radyushkin, K., Hammerschmidt, K., Boretius, S., Varoqueaux, F., El‐Kordi, A., Ronnenberg,
A., Winter, D., Frahm, J., Fischer, J., Brose, N. & Ehrenreich, H. (2009). Neuroligin‐3‐deficient
mice: model of a monogenic heritable form of autism with an olfactory deficit. Genes, Brain and
Behavior, 8(4), 416-425.
Rai-Bhogal, R., Wong, C., Kissoondoyal, A., Davidson, J., Li, H., & Crawford, D. A. (2018).
Maternal exposure to prostaglandin E2 modifies expression of Wnt genes in mouse brain – An
autism connection. Biochemistry and Biophysics Reports, 14, 43-53.
Rajmohan, V., & Mohandas, E. (2007). The limbic system. Indian Journal of Psychiatry, 49(2),
132.
Ramakers, G. J. A., Corner, M. A., & Habets, A. M. M. C. (1990). Development in the absence
of spontaneous bioelectric activity results in increased stereotyped burst firing in cultures of
dissociated cerebral cortex. Experimental Brain Research, 79(1), 157-166.
Rausche, G., Igelmund, P., & Heinemann, U. (1990). Effects of changes in extracellular
potassium, magnesium and calcium concentration on synaptic transmission in area CA1 and the
dentate gyrus of rat hippocampal slices. Pflügers Archiv, 415(5), 588-593.
Rothwell, P.E., Fuccillo, M.V., Maxeiner, S., Hayton, S.J., Gokce, O., Lim, B.K., Fowler, S.C.,
Malenka, R.C. & Südhof, T.C. (2014). Autism-associated neuroligin-3 mutations commonly
impair striatal circuits to boost repetitive behaviors. Cell, 158(1), 198-212.
Sattelle, D. B., Lummis, S. C., Wong, J. F., & Rauh, J. J. (1991). Pharmacology of insect GABA
receptors. Neurochemical Research, 16(3), 363-374.
Scoville, W. B., & Milner, B. (1957). Loss of recent memory after bilateral hippocampal
lesions. Journal of Neurology, Neurosurgery, and Psychiatry, 20(1), 11.
Semple, B. D., Blomgren, K., Gimlin, K., Ferriero, D. M., & Noble-Haeusslein, L. J. (2013).
Brain development in rodents and humans: Identifying benchmarks of maturation and
vulnerability to injury across species. Progress in Neurobiology, 106, 1-16.
Shah, B., Pattanayak, R. D., & Sagar, R. (2014). The study of patient Henry Molaison and what
it taught us over past 50 years: Contributions to neuroscience. Journal of Mental Health and
Human Behaviour, 19(2), 91.
78
Shin, W., Kweon, H., Kang, R., Kim, D., Kim, K., Kang, M., Kim, S. Y., Hwang, S. N., Kim, J.
Y., Yang, E. & Kim, H. (2019). Scn2a haploinsufficiency in mice suppresses hippocampal
neuronal excitability, excitatory synaptic drive, and long-term potentiation, and spatial learning
and memory. Frontiers in Molecular Neuroscience, 12, 145.
Silverman, J. L., Turner, S. M., Barkan, C. L., Tolu, S. S., Saxena, R., Hung, A. Y., Sheng, M.
& Crawley, J. N. (2011). Sociability and motor functions in Shank1 mutant mice. Brain
Research, 1380, 120-137.
Soderlund, D. M., Clark, J. M., Sheets, L. P., Mullin, L. S., Piccirillo, V. J., Sargent, D.,
Stevens, J.T., & Weiner, M. L. (2002). Mechanisms of pyrethroid neurotoxicity: implications for
cumulative risk assessment. Toxicology, 171(1), 3-59.
Sperow, M., Berry, R. B., Bayazitov, I. T., Zhu, G., Baker, S. J., & Zakharenko, S. S. (2012).
Phosphatase and tensin homologue (PTEN) regulates synaptic plasticity independently of its
effect on neuronal morphology and migration. The Journal of Physiology, 590(4), 777-792.
Squire, L. R. (2009). The legacy of patient HM for neuroscience. Neuron, 61(1), 6-9.
Stecker, M. (2017). Factors Affecting Stimulus Artifact: Solution Factors. EC Neurology, 5, 52-
61.
Steensma, D. P., Kyle, R. A., & Shampo, M. A. (2010). Abbie Lathrop, the “mouse woman of
Granby”: rodent fancier and accidental genetics pioneer. Mayo Clinic Proceedings, 85(11), e83.
Stenseth, N.C., Leirs, H., Skonhoft, A., Davis, S.A., Pech, R.P., Andreassen, H.P., Singleton,
G.R., Lima, M., Machang'u, R.S., Makundi, R.H. & Zhang, Z. (2003). Mice, rats, and people: the
bio‐economics of agricultural rodent pests. Frontiers in Ecology and the Environment, 1(7), 367-
375.
Strömland, K., Sjögreen, L., Miller, M., Gillberg, C., Wentz, E., Johansson, M., Nylén, O.,
Danielsson, A., Jacobsson, C., Andersson, J. & Fernell, E. (2002). Möbius sequence — a
Swedish multidiscipline study. European Journal of Paediatric Neurology, 6(1), 35-45.
Sultana, R., Ogundele, O. M., & Lee, C. C. (2019). Contrasting characteristic behaviours among
common laboratory mouse strains. Royal Society Open Science, 6(6), 190574.
Sungur, A. Ö., Vörckel, K. J., Schwarting, R. K., & Wöhr, M. (2014). Repetitive behaviors in
the Shank1 knockout mouse model for autism spectrum disorder: developmental aspects and
effects of social context. Journal of Neuroscience Methods, 234, 92-100.
Sweatt, J. D. (2009). Long-Term Potentiation — A Candidate Cellular Mechanism for
Information Storage in the Central Nervous System. Mechanisms of Memory, 7, 151-189.
79
Tabuchi, K., Blundell, J., Etherton, M. R., Hammer, R. E., Liu, X., Powell, C. M., & Südhof, T.
C. (2007). A neuroligin-3 mutation implicated in autism increases inhibitory synaptic
transmission in mice. Science, 318(5847), 71-76.
Takarae, Y. & Sweeney, J. (2017). Neural Hyperexcitability in Autism Spectrum Disorders.
Brain Sciences. 7, 129.
Takeuchi, K., Gertner, M. J., Zhou, J., Parada, L. F., Bennett, M. V. & Zukin, R. S. (2013).
Dysregulation of synaptic plasticity precedes appearance of morphological defects in a Pten
conditional knockout mouse model of autism. Proceedings of the National Academy of
Sciences, 110(12), 4738-4743.
Tamiji, J., & Crawford, D. A. (2010). Prostaglandin E2 and misoprostol induce neurite
retraction in Neuro-2a cells. Biochemical and Biophysical Research Communications, 398(3),
450-456.
Tang, G., Gudsnuk, K., Kuo, S. H., Cotrina, M. L., Rosoklija, G., Sosunov, A., Sonders, M. S.,
Kanter, E., Castagna, C., Yamamoto, A. & Yue, Z. (2014). Loss of mTOR-dependent
macroautophagy causes autistic-like synaptic pruning deficits. Neuron, 83(5), 1131-1143.
Taoufik, E., Kouroupi, G., Zygogianni, O. & Matsas, R. (2018). Synaptic dysfunction in
neurodegenerative and neurodevelopmental diseases: an overview of induced pluripotent stem-
cell-based disease models. Open Biology, 8(9), 180138.
Tatavarty, V., Pacheco, A. T., Kuhnle, C. G., Lin, H., Koundinya, P., Miska, N. J., Hengen, K.
B., Wagner, F. F., Van Hooser, S. D. & Turrigiano, G. G. (2020). Autism-associated Shank3 is
essential for homeostatic compensation in rodent V1. Neuron, 106(5), 769-777.
Tsumoto, T. (1993). Long-term depression in cerebral cortex: a possible substrate of
“forgetting” that should not be forgotten. Neuroscience Research, 16(4), 263-270.
Tuchman, R., & Rapin, I. (2002). Epilepsy in autism. The Lancet Neurology, 1(6), 352-358.
Turrigiano, G. G., Leslie, K. R., Desai, N. S., Rutherford, L. C., & Nelson, S. B. (1998).
Activity-dependent scaling of quantal amplitude in neocortical neurons. Nature, 391(6670), 892-
896.
Turrigiano, G. G., & Nelson, S. B. (2004). Homeostatic plasticity in the developing nervous
system. Nature Reviews Neuroscience, 5(2), 97-107.
Van Den Pol, A. N., Obrietan, K., & Belousov, A. (1996). Glutamate hyperexcitability and
seizure-like activity throughout the brain and spinal cord upon relief from chronic glutamate
receptor blockade in culture. Neuroscience, 74(3), 653-674.
80
Ventola, P., Lei, J., Paisley, C., Lebowitz, E., & Silverman, W. (2017). Parenting a child with
ASD: Comparison of parenting style between ASD, anxiety, and typical development. Journal of
Autism and Developmental Disorders, 47(9), 2873-2884.
Villers, A., & Ris, L. (2013). Improved preparation and preservation of hippocampal mouse
slices for a very stable and reproducible recording of long-term potentiation. Journal of
Visualized Experiments: JoVE, (76).
Walther, H., Lambert, J. D. C., Jones, R. S. G., Heinemann, U., & Hamon, B. (1986).
Epileptiform activity in combined slices of the hippocampus, subiculum and entorhinal cortex
during perfusion with low magnesium medium. Neuroscience Letters, 69(2), 156-161.
Wang, X., McCoy, P. A., Rodriguiz, R. M., Pan, Y., Je, H. S., Roberts, A. C., Kim, C. J.,
Berrios, J., Colvin, J. S., Bousquet-Moore, D. & Lorenzo, I. (2011). Synaptic dysfunction and
abnormal behaviors in mice lacking major isoforms of Shank3. Human Molecular
Genetics, 20(15), 3093-3108.
Weissbrod, L., Marshall, F. B., Valla, F. R., Khalaily, H., Bar-Oz, G., Auffray, J. C., Vigne, J.
D. & Cucchi, T. (2017). Origins of house mice in ecological niches created by settled hunter-
gatherers in the Levant 15,000 y ago. Proceedings of the National Academy of Sciences, 114(16),
4099-4104.
Weston, M. C., Chen, H., & Swann, J. W. (2014). Loss of mTOR repressors Tsc1 or Pten has
divergent effects on excitatory and inhibitory synaptic transmission in single hippocampal
neuron cultures. Frontiers in Molecular Neuroscience, 7, 1.
Wing, L. (1997). The history of ideas on autism: legends, myths and reality. Autism, 1(1), 13-23.
Wolff, S. (2004). The history of autism. European Child & Adolescent Psychiatry, 13(4), 201-
208.
Zhong, S., Ding, W., Sun, L., Lu, Y., Dong, H., Fan, X., Liu, Z., Chen, R., Zhang, S., Ma, Q. &
Tang, F. (2020). Decoding the development of the human hippocampus. Nature, 577(7791), 531-
536.
Related Documents