ARTICLE Received 15 Oct 2012 | Accepted 18 Jan 2013 | Published 26 Feb 2013 Synapsin II desynchronizes neurotransmitter release at inhibitory synapses by interacting with presynaptic calcium channels Lucian Medrihan 1,2 , Fabrizia Cesca 1 , Andrea Raimondi 1 , Gabriele Lignani 1 , Pietro Baldelli 1,2 & Fabio Benfenati 1,2 In the central nervous system, most synapses show a fast mode of neurotransmitter release known as synchronous release followed by a phase of asynchronous release, which extends over tens of milliseconds to seconds. Synapsin II (SYN2) is a member of the multigene synapsin family (SYN1/2/3) of synaptic vesicle phosphoproteins that modulate synaptic transmission and plasticity, and are mutated in epileptic patients. Here we report that inhi- bitory synapses of the dentate gyrus of Syn II knockout mice display an upregulation of synchronous neurotransmitter release and a concomitant loss of delayed asynchronous release. Syn II promotes g-aminobutyric acid asynchronous release in a Ca 2 þ -dependent manner by a functional interaction with presynaptic Ca 2 þ channels, revealing a new role in synaptic transmission for synapsins. DOI: 10.1038/ncomms2515 OPEN 1 Department of Neuroscience and Brain Technologies, Istituto Italiano di Tecnologia, Via Morego 30, 16163 Genoa, Italy. 2 Department of Experimental Medicine, University of Genoa, Viale Benedetto XV 3, 16132 Genoa, Italy. Correspondence and requests for materials should be addressed to L.M. (email: [email protected]). NATURE COMMUNICATIONS | 4:1512 | DOI: 10.1038/ncomms2515 | www.nature.com/naturecommunications 1 & 2013 Macmillan Publishers Limited. All rights reserved.

Welcome message from author
This document is posted to help you gain knowledge. Please leave a comment to let me know what you think about it! Share it to your friends and learn new things together.
Transcript
ARTICLE
Received 15 Oct 2012 | Accepted 18 Jan 2013 | Published 26 Feb 2013
Synapsin II desynchronizes neurotransmitterrelease at inhibitory synapses by interactingwith presynaptic calcium channelsLucian Medrihan1,2, Fabrizia Cesca1, Andrea Raimondi1, Gabriele Lignani1, Pietro Baldelli1,2 & Fabio Benfenati1,2
In the central nervous system, most synapses show a fast mode of neurotransmitter release
known as synchronous release followed by a phase of asynchronous release, which extends
over tens of milliseconds to seconds. Synapsin II (SYN2) is a member of the multigene
synapsin family (SYN1/2/3) of synaptic vesicle phosphoproteins that modulate synaptic
transmission and plasticity, and are mutated in epileptic patients. Here we report that inhi-
bitory synapses of the dentate gyrus of Syn II knockout mice display an upregulation of
synchronous neurotransmitter release and a concomitant loss of delayed asynchronous
release. Syn II promotes g-aminobutyric acid asynchronous release in a Ca2þ -dependent
manner by a functional interaction with presynaptic Ca2þ channels, revealing a new role in
synaptic transmission for synapsins.
DOI: 10.1038/ncomms2515 OPEN
1 Department of Neuroscience and Brain Technologies, Istituto Italiano di Tecnologia, Via Morego 30, 16163 Genoa, Italy. 2 Department of ExperimentalMedicine, University of Genoa, Viale Benedetto XV 3, 16132 Genoa, Italy. Correspondence and requests for materials should be addressed to L.M.(email: [email protected]).
NATURE COMMUNICATIONS | 4:1512 | DOI: 10.1038/ncomms2515 | www.nature.com/naturecommunications 1
& 2013 Macmillan Publishers Limited. All rights reserved.
Neurotransmitter release is a tightly regulated process thatallows neurons to communicate with each other. Most ofthe fast communication at the synaptic level is based on a
synchronous process of neurotransmitter release in response tothe action potential. However, the majority of CNS synapses alsoshow an asynchronous component of neurotransmitter releasefollowing stimulation1–7. Asynchronous release is not fully time-locked to the presynaptic stimulus, is Ca2þ -dependent, and isusually enhanced by the residual build-up of Ca2þ after repetitivestimulation5,7,8. Synaptotagmins, a family of presynapticCa2þ -sensor proteins, have a fundamental role in the controlof the synchronous and asynchronous modes of release, withdistinct isoforms regulating different components of release9–12.Doc2, another presynaptic Ca2þ sensor, promotes asynchronousneurotransmitter release at excitatory synapses13 and VAMP4, avesicle-associated SNARE protein, maintains asynchronousrelease at inhibitory synapses14.
Synapsins (Syn I, II and III) are a family of phosphoproteinsthat coat synaptic vesicles (SVs) and have important roles inneural development, synaptic transmission and plasticity15. Thebest described function of Syns is the control of neurotransmitterrelease by clustering SVs and tethering them to the actincytoskeleton, thus maintaining the integrity of the reserve SVpool15,16. Moreover, at least in inhibitory synapses, Syns appearto control downstream events of SV exocytosis, such as dockingand fusion and, implicitly, the size of the readily releasable pool(RRP)16,17. Mutant mice lacking one or more Syn isoforms are allprone to epileptic seizures, with the exception of Syn III knockout(KO) mice15,18. Genetic mapping analysis identified SYN2 amonga restricted number of genes significantly contributing to epilepsypredisposition19,20 and mutations in the SYN1 gene have beenreported to have a causal role in epilepsy and/or autism21,22.Synapsin II appears to have a specific role in preventing synapticdepression and maintaining the reserve pool of SV at centralexcitatory synapses and neuromuscular junction23–25, but its rolein inhibitory synaptic transmission is not yet understood.
Here, we investigated the consequences of Syn II deletion onbasal neurotransmitter release and short-term plasticity athippocampal inhibitory and excitatory synapses. The deletion ofSyn II results in an increase of synchronous inhibitorytransmission, while the asynchronous component of neurotrans-mitter release is virtually abolished selectively in inhibitorysynapses. Moreover, we show that this action of Syn II isCa2þ -dependent and that Syn II interacts directly with presynapticCa2þ channels to modulate the ratio between synchronous andasynchronous GABA (g-aminobutyric acid) release.
ResultsPost-docking roles of Syn II at inhibitory synapses. We firstinvestigated the functional effects of Syn II deletion on neuro-transmitter release at both inhibitory and excitatory synapses. Tothis purpose, we made whole-cell voltage-clamp recordings ofdentate gyrus granule neurons in hippocampal slices of 3-week-old Syn II KO and age-matched WT mice. We employed extra-cellular stimulation (see Methods) of the medial perforant path toelicit monosynaptic inhibitory26 (Supplementary Fig. S1) orexcitatory (Supplementary Fig. S2) responses in granule cells.While no changes were observed in the evoked excitatorypostsynaptic currents (Supplementary Fig. S2), the amplitude ofevoked inhibitory postsynaptic currents (eIPSCs) wassignificantly higher in KO neurons (78.14±7.83 pA; n¼ 36neurons/17 mice for WT neurons; 120.11±9.85 pA, n¼ 39neurons/20 mice for KO neurons; P¼ 0.001) (Fig. 1a,b). Thisincrease in amplitude was not accompanied by changes in thetotal area of the response (4.11±0.39 and 4.24±0.43 pC, for WT
and KO neurons, respectively, P¼ 0.52) (Fig. 1b), suggestingalterations in the kinetics of release. By fitting the deactivationtime-course of the eIPSCs with a biexponential function, weobserved that the fast component (tfast) of the response wasunchanged between genotypes (10.57±0.72 and 9.75±0.97 ms,for WT and KO neurons, respectively, P¼ 0.49), whereas the slowcomponent (tslow) of the decay was significantly faster in KOneurons (35.29±2.01 and 28.75±1.92 ms, for WT and KOneurons, respectively, P¼ 0.029) (Fig. 1c). This effect can explainthe apparent inconsistency between the lack of difference in thetotal charge and the clear increase of the eIPSC amplitude(Fig. 1b,c).
Differences in the amplitude and kinetics of the inhibitoryresponse may have a postsynaptic origin, as changes in thesubunit composition of GABAA receptors can influence bothparameters27. To clarify this matter, we recorded miniatureinhibitory postsynaptic currents (mIPSCs) from granule neuronsin the presence of 0.3 mM TTX. We noticed a reduction in thefrequency of mIPSCs in KO neurons (5.91±1.00 and3.18±0.42 Hz, for WT and KO neurons, respectively; P¼ 0.011;Fig. 1d,e), pointing to a presynaptic defect. Neither amplitude(23.43±2.51 and 22.19±3.04 pA, for WT and KO neurons,respectively, P¼ 0.75) nor kinetics of mIPSCs (rise time 10–90%:0.73±0.10 and 0.72±0.09 ms, P¼ 0.90; tfast: 3.09±0.62 and3.67±0.58 ms, P¼ 0.516; tslow: 22.01±3.33 and 25.40±3.20 ms,P¼ 0.48; n¼ 9 neurons/4 mice and n¼ 13 neurons/6 mice forWT and KO neurons, respectively) were modified betweengenotypes, suggesting a normal postsynaptic function in KO mice(Fig. 1d,e). The slower decay kinetics of evoked responses withrespect to the miniature currents in WT neurons has beenpreviously attributed to higher level of asynchronous vesiclerelease28. Thus, these data suggest that the absence of Syn IIfavours synchronous release at dentate gyrus inhibitory synapses.
Short-term plasticity in Syn II KO neurons. The data reportedin Fig. 1 suggest that SVs in inhibitory nerve terminals of KOmice are more prone to undergo exocytosis in response to asudden increase in Ca2þ following the action potential. Wetested this possibility by using a paired-pulse stimulation proto-col, which is tightly affected by changes in the intraterminalCa2þ concentration29,30. The paired-pulse depression (PPD)induced at short inter-stimulus intervals (ISIs) was similarbetween genotypes at short ISIs, but it significantly increased inKOs when ISIs were increased to 2 or 3 s (Fig. 2a,b). PPD at shortISIs (PPDfast) is highly dependent on Ca2þ , while at longer ISIs(PPDslow) the Ca2þ -dependence is progressively lost29. Thus, themore intense PPDslow observed in the KO slices, could result froma larger depletio of the SV pool induced by the first stimulation,whose amplitude was larger in KO than in WT neurons. Toevaluate this possibility, we compared the normalized amplitudesof the first and second responses at 2-s ISI29,31 (Fig. 2c) andfurther evaluated synaptic depression in response to differenttrains of stimuli (Figs 2e,f and 3a,b). The lack of correlationbetween the two parameters suggests that the depression of thesecond eIPSC is independent of the amount of SVs released bythe first stimulus (Fig. 2c). Next, we investigated whether PPDhad either a presynaptic or postsynaptic origin. The variation inthe peak current amplitude during the first and second IPSCs wasevaluated for inter-pulse intervals of 2 and 3 s (12 pairs for WTand 16 pairs for KO using an analysis developed by Malinow andTsien31,32 (see Methods). Figure 2d shows a summary plot of theinverse of the square of the CV (CV� 2) versus the meanamplitude of the second response, both normalized to the valuesof the first IPSC for both WT and KO neurons. Most of theexperimental points fell under the identity line, indicating a
ARTICLE NATURE COMMUNICATIONS | DOI: 10.1038/ncomms2515
2 NATURE COMMUNICATIONS | 4:1512 | DOI: 10.1038/ncomms2515 | www.nature.com/naturecommunications
& 2013 Macmillan Publishers Limited. All rights reserved.

presynaptic origin of the increased PPDslow observed in KO slices.Several studies report that the lack of Syns causes higherdepression in response to various stimulation frequencies inboth excitatory and inhibitory synapses17,25. In contrast, weobserved that Syn II deletion had no effects on synapticdepression induced by stimulation at either 10 or 40 Hz in bothinhibitory (Figs 2e,f and 3a,b) and excitatory (Supplementary Fig.S3a–c) synapses.
Syn II deletion enhances the synchronous RRP. Based on theprevious observations, we then investigated the properties of thesynchronous and asynchronous GABA release by using high-frequency stimulation. By analysing the cumulative amplitudeprofile during a high-frequency train (2 s at 40 Hz; Fig. 3c), weobserved a larger amplitude of the first response in the train inKO neurons (86.86±16.86, n¼ 16 neurons/5 mice and192.3±29.56 pA; n¼ 14 neurons/8 mice for WT and KO
50 pA
20 ms
0.0 ms-28.1 pAWT KO
τfast τslow
20 ms
KO
WT
WT KO
100 ms
50pA
WT
KO0
5
10
15
20
τ fast
(m
s)
*
WT
KO0
25
50
75
τ slo
w (
ms)
WT
KO0
15
30
45
Am
plitu
de (
pA)
WT
KO0
1
2
Ris
e tim
e 10
–90%
(m
s)
WT
KO0
5
10
τ fast
(m
s)
WT
KO0
25
50
τ slo
w (
ms)
WT
KO0
5
10
Freq
uenc
y (H
z)
*
WT
KO
0
100
200
300
Am
plitu
de (
pA)
**
WT KO
0
5
10C
harg
e (p
C)
Figure 1 | Syn II deletion modifies the dynamics of the evoked GABA response. (a) Representative traces of eIPSCs from WT and KO dentate gyrus
granule neurons (the average trace is shown in black). (b) Mean (±s.e.m.) amplitude and charge of eIPSCs (closed and open circles represent single
experiments for WTand KO neurons, respectively). (c) The decay of the WTeIPSC (left panel; black trace) was normalized to the peak amplitude of the KO
eIPSC (grey trace). A two-exponential model was used to fit the fast and slow components of the decay (tfast and tslow) and their average values (±s.e.m.)
are shown in the middle and right panels, respectively. *Po0.05, two-tailed unpaired Student’s t-test. n¼ 23 and n¼ 30 neurons for WT (10 mice) and KO
(15 mice), respectively. Analysis of eIPSC kinetics showed that the latency (2.06±0.19 and 1.78±0.28 ms, for WT and KO neurons, respectively, P¼0.45)
and rise time (2.74±0.34 and 2.85±0.32 ms, for WT and KO neurons, respectively, P¼0.81) were similar between genotypes (data not shown).
(d) Representative traces of mIPSCs recorded in dentate gyrus granule neurons from WT (black) and KO (grey) mice. (e) Aligned dot plots of frequency,
amplitude and kinetic parameters (rise time; tfast; tslow ) of mIPSCs in neurons from WT (closed symbols) and KO (open symbols) mice. Each dot
represents one experiment. *Po0.05, two-tailed unpaired Student’s t-test. n¼9 and n¼ 13 neurons from WT (4 mice) and KO (6 mice), respectively.
NATURE COMMUNICATIONS | DOI: 10.1038/ncomms2515 ARTICLE
NATURE COMMUNICATIONS | 4:1512 | DOI: 10.1038/ncomms2515 | www.nature.com/naturecommunications 3
& 2013 Macmillan Publishers Limited. All rights reserved.
neurons, respectively, P¼ 0.003; Fig. 3d). Such increase of thesynchronous response is due to an increase in the readily relea-sable pool size (RRPsyn) (591.8±79.5 versus 1,058.0±181.9 pA,for WT and KO neurons respectively, P¼ 0.02) and not to achange in the vesicular release probability (Pves) (0.21±0.04versus 0.25±0.04, for WT and KO neurons respectively, P¼ 0.56;Fig. 3d). We further studied the quantal parameters of inhibitorysynaptic transmission using the multiple fluctuation probabilityanalysis17. This method (Supplementary Methods), that providesdirect information on the average quantal release probability(Prav), number of independent release sites (Nmin) and averagepostsynaptic quantal size (Qav), fully confirmed the data obtainedby the cumulative amplitude analysis indicating that an increasein Nmin is responsible for the increased eIPSC amplitude(Supplementary Fig. S4). However, the RRP size determinedwith these methods is an underestimation of the total RRP, as itrepresents only the synchronously released part of SVs33. Thecumulative area method gives a better estimation of the totalRRP33, as it includes also the asynchronous component of theresponse (Fig. 3e). Not only the area of the first response of thetrain did not change between genotypes (1.47±0.33 and
1.75±0.33 pC, for WT and KO neurons, respectively, P¼ 0.55)(Figs 3f and 1b), but also the RRPtot, measured with thecumulative area method, resulted similar between genotypes(7.93±1.07 and 8.37±1.46 pC, for WT and KO neurons,respectively, P¼ 0.80; Fig. 3f).
We next used electron microscopy (Supplementary Methods)to morphologically evaluate the number and spatial distributionof SVs within the inhibitory GABA-immunopositive terminals inthe molecular layer of the dentate gyrus of KO and WT slices(Fig. 4g,h). The total density of SVs was significantly decreased inKO synapses (120.8±9.1, n¼ 100 terminals/4 mice and88.2±3.9 SVs per mm2, n¼ 69 terminals/4 mice, for WT andKO, respectively, P¼ 0.016; Fig. 3g,h). However, the number ofdocked SVs, putatively corresponding to the functional RRP34,did not differ between genotypes (7.97±0.80, n¼ 39 terminals/4mice, and 7.85±1.11 SVs per mm, n¼ 72 terminals/4 mice, forWT and KO, respectively, P¼ 0.93) (Fig. 3g,h). Together, theseresults strengthen the indication that the synchronous andasynchronous release appear to compete for a common pool ofrelease-ready SVs35 and that the ratio between the two modalitiesof release is modified in the absence of Syn II.
50 pA0.5 s
WT
KO
100 ms 2 s
A1 A2 A2
WT 100 ms 2 sKO
A1 A2 A2
10–20
0
20
40
60
80
100
1,00
0
10,0
00
KO (11/8)WT (12/5)
2 s at 10 Hz
PP
D (
%)
**
Paired-pulse–depression
0 500 1,000 1,500 2,000
0.0
0.5
1.0
Time (ms)
Nor
mal
ized
dep
ress
ion
KOWT
01 2
1
2
Normalized A1 A2/A1
Nor
mal
ized
A2
ISI=2 s; [Ca2+]extra = 2 mM ISI=2 s; [Ca2+]extra = 2 mM
1 20
1
2
CV
2–2/C
V1–2
KOWT
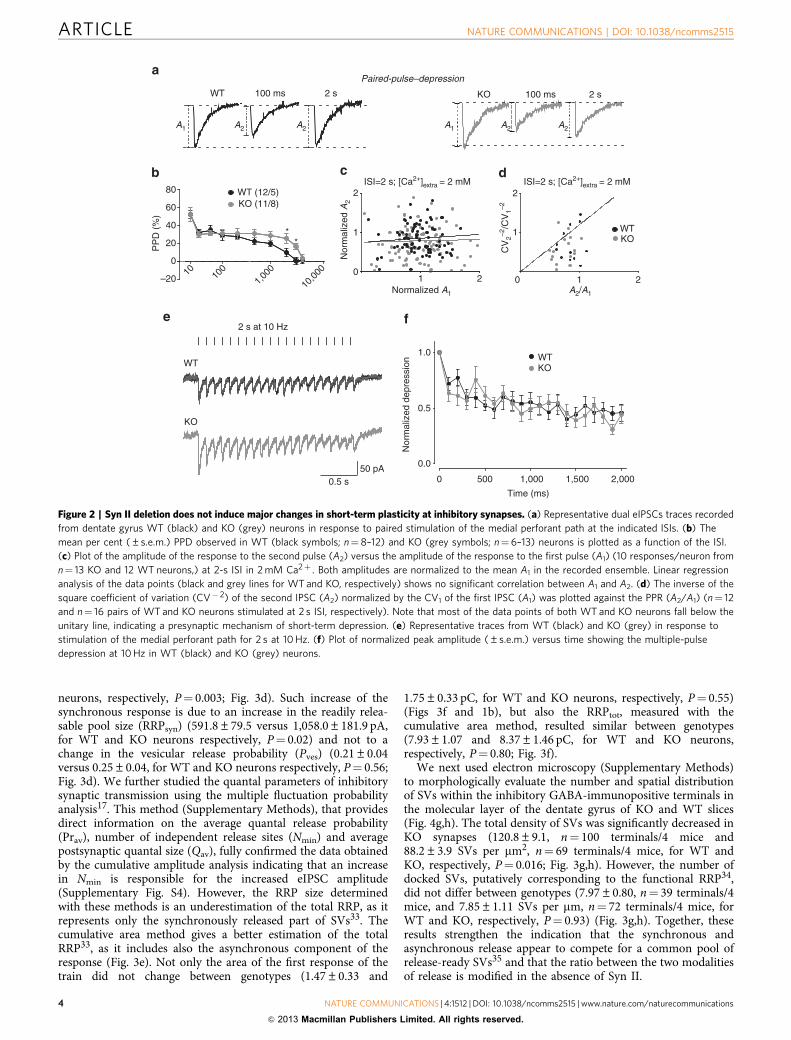
Figure 2 | Syn II deletion does not induce major changes in short-term plasticity at inhibitory synapses. (a) Representative dual eIPSCs traces recorded
from dentate gyrus WT (black) and KO (grey) neurons in response to paired stimulation of the medial perforant path at the indicated ISIs. (b) The
mean per cent (±s.e.m.) PPD observed in WT (black symbols; n¼ 8–12) and KO (grey symbols; n¼6–13) neurons is plotted as a function of the ISI.
(c) Plot of the amplitude of the response to the second pulse (A2) versus the amplitude of the response to the first pulse (A1) (10 responses/neuron from
n¼ 13 KO and 12 WT neurons,) at 2-s ISI in 2 mM Ca2þ . Both amplitudes are normalized to the mean A1 in the recorded ensemble. Linear regression
analysis of the data points (black and grey lines for WT and KO, respectively) shows no significant correlation between A1 and A2. (d) The inverse of the
square coefficient of variation (CV� 2) of the second IPSC (A2) normalized by the CV1 of the first IPSC (A1) was plotted against the PPR (A2/A1) (n¼ 12
and n¼ 16 pairs of WT and KO neurons stimulated at 2 s ISI, respectively). Note that most of the data points of both WT and KO neurons fall below the
unitary line, indicating a presynaptic mechanism of short-term depression. (e) Representative traces from WT (black) and KO (grey) in response to
stimulation of the medial perforant path for 2 s at 10 Hz. (f) Plot of normalized peak amplitude (±s.e.m.) versus time showing the multiple-pulse
depression at 10 Hz in WT (black) and KO (grey) neurons.
ARTICLE NATURE COMMUNICATIONS | DOI: 10.1038/ncomms2515
4 NATURE COMMUNICATIONS | 4:1512 | DOI: 10.1038/ncomms2515 | www.nature.com/naturecommunications
& 2013 Macmillan Publishers Limited. All rights reserved.
Delayed asynchronous release is reduced in Syn II KO mice.High-frequency stimulation trains lead to delayed asynchronousrelease that persists for tens/hundreds of milliseconds to secondsin excitatory and inhibitory synapses4–5,7,36. Thus, we measuredthe delayed asynchronous release in response to trains of 40 Hz
(Fig. 4a,b). The extent of spontaneous network activity precedingthe application of the train may influence the amount ofasynchronous release induced by the train. To eliminate thispossibility, we measured the frequency of spontaneous IPSCs(sIPSCs) before the train stimulus, and observed similar values in
WT
KO0
0.2
0.4
Pve
s
WT
KO0
500
1,000
1,500
RR
Psy
n (p
A)
*
WT
KO0
5
10
RR
Pto
t (pC
)
WT
KO0
1
2
Firs
t are
a (p
C)
WT KO
WT
KO0
50
100
150
SV
per
μm
2
Total SVs Docked SVs
*
WT
KO0
5
10
SV
per
μm
WT
KO0
100
200
Firs
t am
plitu
de (
pA) **
50 pA
0.5 s
0 500 1,000 1,500 2,000
0
500
1,000
1,500
2,000
2,500WTKO
Time (ms)
Cum
ulat
ive
ampl
itude
(pA
)
0 500 1,000 1,500 2,000
0.0
0.5
1.0
Time (ms)
Nor
mal
ized
dep
ress
ion WT
KO
0 500 1,000 1,500 2,000
0
10
20
30
Cum
ulat
ive
area
(pC
)
Time (msec)
WTKO
2 s at 40 Hz
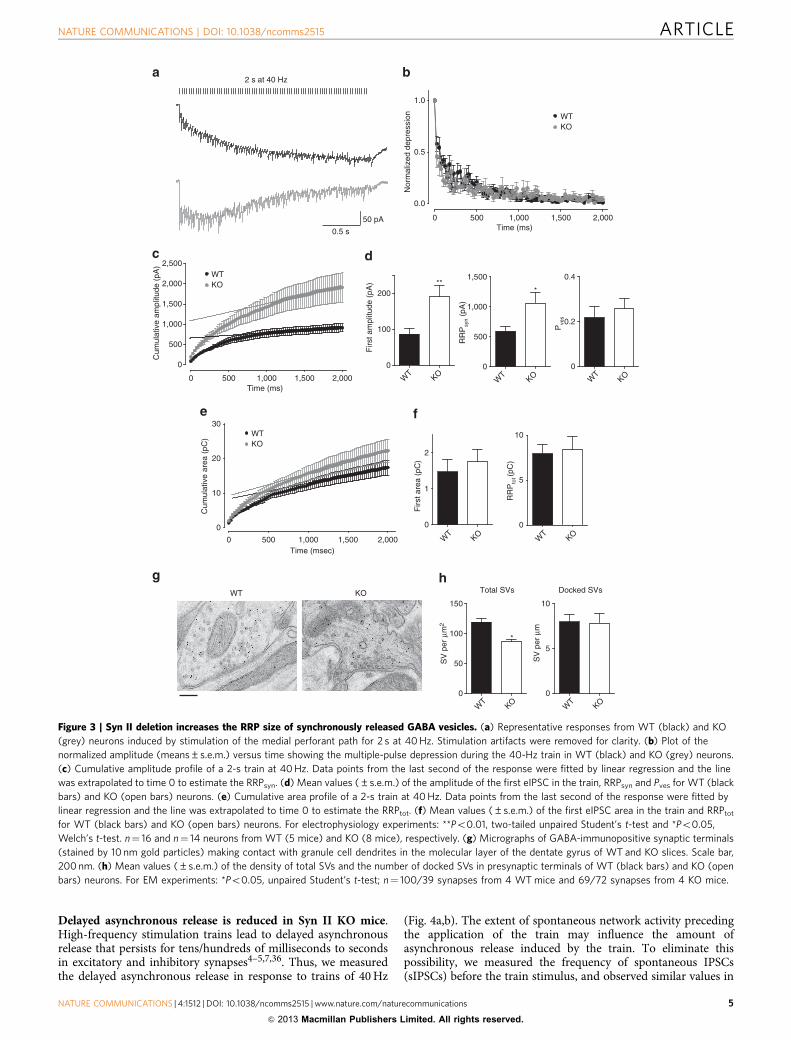
Figure 3 | Syn II deletion increases the RRP size of synchronously released GABA vesicles. (a) Representative responses from WT (black) and KO
(grey) neurons induced by stimulation of the medial perforant path for 2 s at 40 Hz. Stimulation artifacts were removed for clarity. (b) Plot of the
normalized amplitude (means±s.e.m.) versus time showing the multiple-pulse depression during the 40-Hz train in WT (black) and KO (grey) neurons.
(c) Cumulative amplitude profile of a 2-s train at 40 Hz. Data points from the last second of the response were fitted by linear regression and the line
was extrapolated to time 0 to estimate the RRPsyn. (d) Mean values (±s.e.m.) of the amplitude of the first eIPSC in the train, RRPsyn and Pves for WT (black
bars) and KO (open bars) neurons. (e) Cumulative area profile of a 2-s train at 40 Hz. Data points from the last second of the response were fitted by
linear regression and the line was extrapolated to time 0 to estimate the RRPtot. (f) Mean values (±s.e.m.) of the first eIPSC area in the train and RRPtot
for WT (black bars) and KO (open bars) neurons. For electrophysiology experiments: **Po0.01, two-tailed unpaired Student’s t-test and *Po0.05,
Welch’s t-test. n¼ 16 and n¼ 14 neurons from WT (5 mice) and KO (8 mice), respectively. (g) Micrographs of GABA-immunopositive synaptic terminals
(stained by 10 nm gold particles) making contact with granule cell dendrites in the molecular layer of the dentate gyrus of WT and KO slices. Scale bar,
200 nm. (h) Mean values (±s.e.m.) of the density of total SVs and the number of docked SVs in presynaptic terminals of WT (black bars) and KO (open
bars) neurons. For EM experiments: *Po0.05, unpaired Student’s t-test; n¼ 100/39 synapses from 4 WT mice and 69/72 synapses from 4 KO mice.
NATURE COMMUNICATIONS | DOI: 10.1038/ncomms2515 ARTICLE
NATURE COMMUNICATIONS | 4:1512 | DOI: 10.1038/ncomms2515 | www.nature.com/naturecommunications 5
& 2013 Macmillan Publishers Limited. All rights reserved.
the two genotypes (9.07±0.87, n¼ 11 neurons/5 mice and9.61±0.93, n¼ 10 neurons/9 mice for WT and KO neurons,respectively, P¼ 0.67; Fig. 4c,d). WT synapses showed enhancedasynchronous release after the train that slowly returned tobaseline within 10 s, while in KO synapses the asynchronousrelease was tenfold lower and returned to baseline value within2 s after the train (Fig. 4e). The delayed asynchronous release atexcitatory synapses was not altered in KO neurons(Supplementary Fig. S3d), indicating the specificity of thisphenotype for inhibitory synapses. The virtual absence ofdelayed asynchronous release of GABA may participate in thedevelopment of the strong epileptic phenotype of adult Syn IIKO mice. Thus, we repeated the experiments in the dentate gyrusof adult symptomatic mice and found a closely similardepression of the delayed asynchronous release of GABA(Supplementary Fig. S5).
It was of interest to check whether Syn I, the most abundantSyn isoform, had any effect in the modulation of asynchronousrelease. Interestingly, we observed that Syn I deletion increasedthe asynchronous release in inhibitory synapses of primaryhippocampal neurons, conforming with a non-redundantfunction of Syn I on release dynamics that is opposite to thatof Syn II (Supplementary Fig. S6). Moreover, the increase in theasynchronous response of Syn I KO inhibitory neurons wasassociated with decreased eIPSC amplitude and RRP size17,which are opposite respect to the changes observed in Syn II KOneurons (Figs 1 and 3).
Syn II modulates release in a Ca2þ -dependent manner. Bothsynchronous and asynchronous release are Ca2þ -dependent,but they are likely to be mediated by two distinct Ca2þ sensorswith different Ca2þ affinities: a low-affinity sensor that sustainsfast synchronous release and a high-affinity sensor that isinvolved in the slow asynchronous release7,8. We attemptedto experimentally desynchronize the inhibitory synaptictransmission by replacing extracellular Ca2þ with Sr2þ , asthe distinct Ca2þ sensors have the same affinity for Sr2þ
(refs 4,37–39). In the single-pulse protocol, Sr2þ (2 mM)induced a reduction in the peak amplitude of the synchronouscurrent in both WT (106.31±26.36 versus 56.42±12.06 pA,P¼ 0.018, n¼ 5 neurons/3 mice) and KO neurons (245.62±37.16 versus 87.99±20.49 pA, P¼ 0.005, n¼ 4 neurons/3 mice)(Fig. 5a,b). However, the per cent reduction in the peakamplitude induced by Sr2þ was higher in KO than in WTneurons (45.48±6.050% and 64.99±4.997%, for WT and KO,respectively, P¼ 0.047; Fig. 5c). Also, the fast component (tfast)of the response in Sr2þ had similar values as in Ca2þ and wasunchanged between genotypes (9.94±5.35 and 9.85±3.84 msfor WT and KO neurons, respectively, P¼ 0.99), while the slowcomponent (tslow) of the decay was significantly slower in Sr2þ ,yet still unchanged between WT and KO neurons (84.27±37.78and 63.11±32.16 ms, for WT and KO neurons, respectively,P¼ 0.69; Fig. 5d). Changing the extracellular solution fromCa2þ to Sr2þ severely desynchronized the sIPSCs in both WTand KO neurons, but when high-frequency stimulation trains
Pre-train
1 s
0.1 s
WT
1 s
0.1 s
KO
Time after the train (s)
sIPSCsWT
KO
50 pA
1 s 0
0
2
4
6
8
1 2 3 4 5 6 7 8 9 10
***
******
** ** *
Nor
mal
ized
del
ayed
rel
ease
WTKO
WT
KO
0
5
10
15Fr
eque
ncy
(Hz)
2 s at 40 Hz 2 s at 40 Hz
2 s at 40 Hz
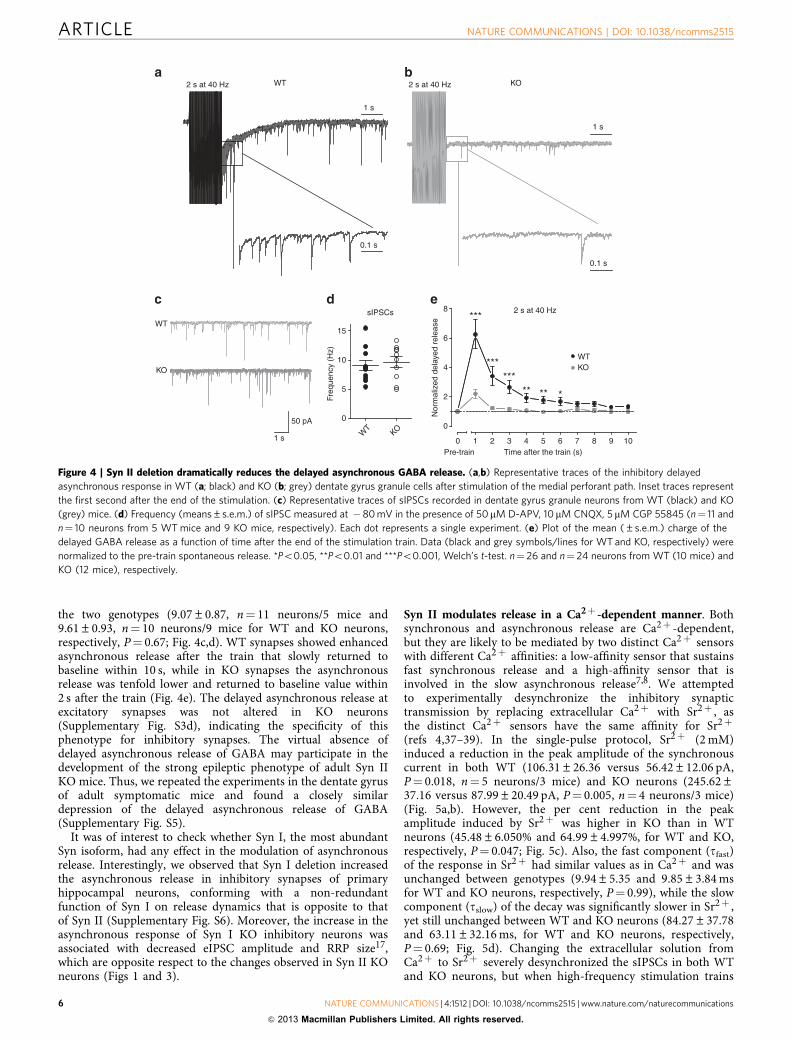
Figure 4 | Syn II deletion dramatically reduces the delayed asynchronous GABA release. (a,b) Representative traces of the inhibitory delayed
asynchronous response in WT (a; black) and KO (b; grey) dentate gyrus granule cells after stimulation of the medial perforant path. Inset traces represent
the first second after the end of the stimulation. (c) Representative traces of sIPSCs recorded in dentate gyrus granule neurons from WT (black) and KO
(grey) mice. (d) Frequency (means±s.e.m.) of sIPSC measured at �80 mV in the presence of 50mM D-APV, 10 mM CNQX, 5 mM CGP 55845 (n¼ 11 and
n¼ 10 neurons from 5 WT mice and 9 KO mice, respectively). Each dot represents a single experiment. (e) Plot of the mean (±s.e.m.) charge of the
delayed GABA release as a function of time after the end of the stimulation train. Data (black and grey symbols/lines for WT and KO, respectively) were
normalized to the pre-train spontaneous release. *Po0.05, **Po0.01 and ***Po0.001, Welch’s t-test. n¼ 26 and n¼ 24 neurons from WT (10 mice) and
KO (12 mice), respectively.
ARTICLE NATURE COMMUNICATIONS | DOI: 10.1038/ncomms2515
6 NATURE COMMUNICATIONS | 4:1512 | DOI: 10.1038/ncomms2515 | www.nature.com/naturecommunications
& 2013 Macmillan Publishers Limited. All rights reserved.
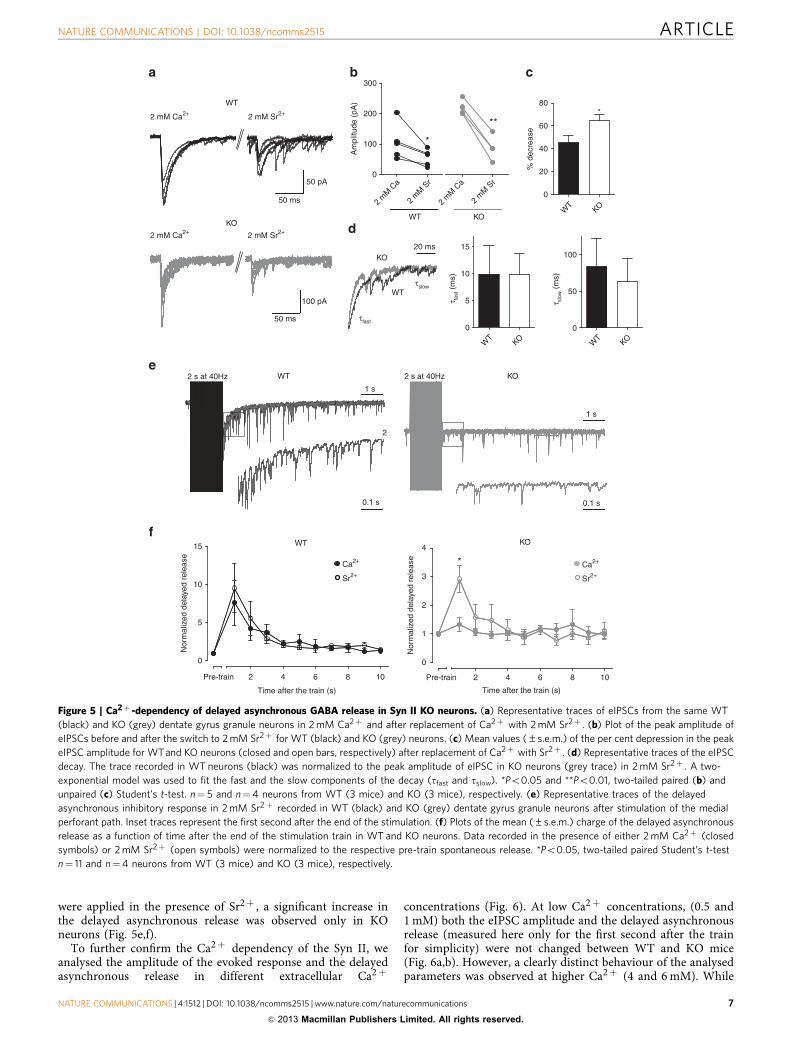
were applied in the presence of Sr2þ , a significant increase inthe delayed asynchronous release was observed only in KOneurons (Fig. 5e,f).
To further confirm the Ca2þ dependency of the Syn II, weanalysed the amplitude of the evoked response and the delayedasynchronous release in different extracellular Ca2þ
concentrations (Fig. 6). At low Ca2þ concentrations, (0.5 and1 mM) both the eIPSC amplitude and the delayed asynchronousrelease (measured here only for the first second after the trainfor simplicity) were not changed between WT and KO mice(Fig. 6a,b). However, a clearly distinct behaviour of the analysedparameters was observed at higher Ca2þ (4 and 6 mM). While
50 ms
50 pA
2 mM Ca2+ 2 mM Sr2+
WT
1 s
2
0.1 s
WT KO
1 s
0.1 s
Pre-train
0
5
10
15
2 4 6 8 10
Nor
mal
ized
del
ayed
rel
ease Ca2+
Sr2+
WT
2 mM Ca2+ 2 mM Sr2+
50 ms
100 pA
KO
WT
KO
0
20
40
60
80
% d
ecre
ase
*
20 ms
τfast
τslow
KO
WT
**
WT KO
2 m
M C
a
2 m
M S
r0
100
200
300
Am
plitu
de (
pA)
*
2 m
M C
a
2 m
M S
r
KO
0
1
2
3
4
2 4 6 8 10
Ca2+
Sr2+
Pre-train
Time after the train (s)
*
Nor
mal
ized
del
ayed
rel
ease
WT
KO
0
50
100
τ slow
(m
s)
WT
KO
0
5
10
15
τ fast (
ms)
2 s at 40Hz 2 s at 40Hz
Time after the train (s)
Figure 5 | Ca2þ -dependency of delayed asynchronous GABA release in Syn II KO neurons. (a) Representative traces of eIPSCs from the same WT
(black) and KO (grey) dentate gyrus granule neurons in 2 mM Ca2þ and after replacement of Ca2þ with 2 mM Sr2þ . (b) Plot of the peak amplitude of
eIPSCs before and after the switch to 2 mM Sr2þ for WT (black) and KO (grey) neurons. (c) Mean values (±s.e.m.) of the per cent depression in the peak
eIPSC amplitude for WTand KO neurons (closed and open bars, respectively) after replacement of Ca2þ with Sr2þ . (d) Representative traces of the eIPSC
decay. The trace recorded in WT neurons (black) was normalized to the peak amplitude of eIPSC in KO neurons (grey trace) in 2 mM Sr2þ . A two-
exponential model was used to fit the fast and the slow components of the decay (tfast and tslow). *Po0.05 and **Po0.01, two-tailed paired (b) and
unpaired (c) Student’s t-test. n¼ 5 and n¼4 neurons from WT (3 mice) and KO (3 mice), respectively. (e) Representative traces of the delayed
asynchronous inhibitory response in 2 mM Sr2þ recorded in WT (black) and KO (grey) dentate gyrus granule neurons after stimulation of the medial
perforant path. Inset traces represent the first second after the end of the stimulation. (f) Plots of the mean (±s.e.m.) charge of the delayed asynchronous
release as a function of time after the end of the stimulation train in WT and KO neurons. Data recorded in the presence of either 2 mM Ca2þ (closed
symbols) or 2 mM Sr2þ (open symbols) were normalized to the respective pre-train spontaneous release. *Po0.05, two-tailed paired Student’s t-test
n¼ 11 and n¼4 neurons from WT (3 mice) and KO (3 mice), respectively.
NATURE COMMUNICATIONS | DOI: 10.1038/ncomms2515 ARTICLE
NATURE COMMUNICATIONS | 4:1512 | DOI: 10.1038/ncomms2515 | www.nature.com/naturecommunications 7
& 2013 Macmillan Publishers Limited. All rights reserved.

the amplitude of eIPSC increased linearly with the Ca2þ
concentration in the KO mice, remaining significantly higherthan the WT (Fig. 6c), the delayed asynchronous response of KOneurons remained at basal levels and was completely insensitiveto the increasing Ca2þ concentration (Fig. 6d). On the contrary,short-term plasticity in WT and KO inhibitory responses wasnot affected by the different Ca2þ levels (SupplementaryFig. S7). Taken together, these data further demonstrate that theabsence of Syn II from inhibitory synapses abolishes the delayedasynchronous release in favour of evoked synchronous release.
Syn II interacts with Ca2þ channels to modulate GABArelease. While Syn I displays a Ca2þ -binding site involving a
glutamate residue (E373), Syn II does not share this key acidicresidue indispensable for Ca2þ coordination and has a basicresidue instead (K374)40. On this basis, Syn II is predicted not tobind Ca2þ and, accordingly, ATP binding to Syn II is not Ca2þ -dependent40. Thus, Syn II cannot theoretically controlasynchronous release by direct binding of Ca2þ . However,recent data by proteomics41 reported that Syn I and Syn II mayinteract with Ca2þ channels. To confirm this possibility,we performed functional experiments with blockers ofdistinct subtypes of presynaptic Ca2þ currents. Addition ofo-Agatoxin-IVA, a blocker of P/Q-type Ca2þ currents, reducedthe peak amplitude of the GABA synchronous response by 50%in both phenotypes (49.9±13.04% and 50.0±12.64%, n¼ 6
0.5 1 2 4.0 6.0
0
100
200
300
Am
plitu
de e
IPS
C (
pA) WT
KO
*
*
Ca2+ concentration (μM)
0
5
10
Asy
nchr
onou
s (n
orm
aliz
ed a
rea)
0.5 1 2 4.0 6.0
WT
KO*
***
Ca2+ concentration (μM)
eIPSC (synchronous) Asynchronous
50 pA25 ms
0.5 mM Ca2+
2 mM Ca2+
6 mM Ca2+
*
250 ms
2 s at 40Hz 2 s at 40Hz
Figure 6 | Syn II deletion modulates the synchronous/asynchronous release in a Ca2þ -dependent manner. (a) Representative traces of eIPSCs from
WT (black) and KO (grey) dentate gyrus neurons at low (0.5 mM), normal (2 mM) and high (6 mM) extracellular Ca2þ concentrations. (b) Representative
traces of the first second after a 2-s train at 40 Hz from WT (black) and KO (grey) neurons at different Ca2þ concentrations. (c,d) eIPSCs peak amplitude
(c) and normalized area of the first second after the train (d) in WT and KO slices as a function of the increasing extracellular Ca2þ concentration.
*Po0.05, **Po0.01, Welch’s t-test. n¼ 10 neurons/6 mice for WT and n¼ 9 neurons/5 mice for KO.
Figure 7 | Syn II modulates GABA asynchronous release by interacting with presynaptic Ca2þ channels. (a) Representative traces of eIPSCs from WT
and KO dentate gyrus granule neurons before (black and grey for WT and KO, respectively) and after blockade of P/Q-type Ca2þ current with 0.5 mM
o-Agatoxin-IVA (blue) or of N-type Ca2þ current with 1mM o-Conotoxin-GVIA (green). (b) Aligned dot plot of the per cent reduction in peak amplitude of
eIPSCs in WT (closed circles) and KO (open circles) neurons after the addition of either o-Agatoxin-IVA (AGA; 0.5mM) or o-Conotoxin-GVIA (CONO;
1mM). (c) Representative traces of the delayed asynchronous inhibitory response in WT and KO neurons (black and grey, respectively) and its modulation
by Ca2þ -channel blockers. Inset traces represent the first second after the end of the stimulation under control conditions and after the addition of
o-Agatoxin-IVA (0.5mM; blue) or o-Conotoxin-GVIA (1mM; green). (d) Plots of the mean (±s.e.m.) charge of the delayed asynchronous release as a
function of time after the end of the stimulation train in WT and KO neurons. Data recorded under control conditions (black/grey circles) or in the presence
of o-Agatoxin-IVA (0.5mM; closed/open blue circles) were normalized to the respective pre-train spontaneous release. *Po0.05, two-tailed paired
Student’s t-test. n¼ 5 neurons from both WT (4 mice) and KO (4 mice), respectively. (e) Same as for d, but in the presence of o-Conotoxin-GVIA (1 mM;
closed/open green circles) **Po0.01, two-tailed paired Student’s t-test. n¼ 5 and n¼6 neurons from WT (4 mice) and KO (3 mice), respectively.
(f,g) Cortical neuron lysates were immunoprecipitated with anti-SynII antibodies or anti-HA antibodies, as indicated (immunoprecipitation (IP)). After
electrophoretic separation of the immunocomplexes, membranes were probed with antibodies specific for anti-Cav2.1 (P/Q-type), anti-Cav2.2 (N-type)
and anti-Cav2.3 (R-type) Ca2þ channel subunits, as indicated (western blotting (WB)). A representative immunoblot is shown (f), together with the
quantification of the immunoreactive signal in the immunoprecipitated samples (g), normalized to the binding to the HA control (means±s.e.m.; n¼ 3
independent experiments). T, 100mg of total lysate; FT, 100mg of flow-through after immunoprecipitation.
ARTICLE NATURE COMMUNICATIONS | DOI: 10.1038/ncomms2515
8 NATURE COMMUNICATIONS | 4:1512 | DOI: 10.1038/ncomms2515 | www.nature.com/naturecommunications
& 2013 Macmillan Publishers Limited. All rights reserved.

neurons/4 mice and n¼ 5 neurons/4 mice for WT and KO,respectively, P¼ 0.99; Fig. 7a,b). Similarly, addition ofo-Conotoxin-GVIA, a blocker of N-type Ca2þ currents, causeda similar B50% reduction in the amplitude of the GABAsynchronous current in both WT and KO neurons(51±10.33% and 56.75±7.98%, n¼ 5 neurons/5 mice andn¼ 6 neurons/3 mice for WT and KO, respectively, P¼ 0.670;Fig. 7a,b). Importantly, neither o-Agatoxin-IVA noro-Conotoxin-GVIA had any effect on the delayed asynchronousrelease in Syn II KO neurons, but reduced it significantly in WTslices (Fig. 7c–e). To further support these functional data, we
performed co-immunoprecipitation experiments on corticalneuron lysates, using anti-Syn I and anti-Syn II antibodies.While no interaction was present between Syn II and Cav2.2 (N-type)/ Cav2.3 (R-type) channels, a specific interaction wasdetected between Syn II and Cav2.1 (P/Q-type; Fig. 7f,g).Interestingly, the interaction appeared to be specific for Syn II,as virtually no interaction between Syn I and all tested Ca2þ
channels was detected (Supplementary Fig. S8). Taken together,these data suggest that Syn II controls the amount ofasynchronous release at inhibitory synapses through aninteraction with a specific subtype of Ca2þ channels.
WT
KO WT
KO0
20
40
60
80
100
% d
epre
ssio
n
AGA CONO
40 pA
50 ms
598.45 ms-6.2 pAKO
WT
2 s
0.2 s
WT
AGA
CONO
WT
0
2
4
6
8
10
2 4 6 8 10
WTWT_AGAKOKO_AGA
Nor
mal
ized
del
ayed
rele
ase
Pre-trainTime after the train (s)
*
2 s
0.2 s
KO
AGA
CONO
KO
0
2 4
1
2
3
4
5
6 8 10
WTWT_CONOKOKO_CONO
Pre-trainTime after the train (s)
**
Nor
mal
ized
del
ayed
rele
ase
Cav2.1
***
synII HA synII HA synII HA
P/Q R N
4
8
12
Nor
mal
ized
Ca2+
cha
nnel
co-
IP
*
0
Cav2.3
Cav2.2
syn I
syn II
T FT FTIP IPWB:
IP: syn II HAMW
(kDa)
250
130
100
70
55
250
130
NATURE COMMUNICATIONS | DOI: 10.1038/ncomms2515 ARTICLE
NATURE COMMUNICATIONS | 4:1512 | DOI: 10.1038/ncomms2515 | www.nature.com/naturecommunications 9
& 2013 Macmillan Publishers Limited. All rights reserved.
DiscussionWe examined the dynamics of basal neurotransmitter release andshort-term plasticity in mouse hippocampal inhibitory synapseslacking Syn II. For the first time, we report that Syn II has aspecific post-docking role in inhibitory synapses, influencingbasal GABA release and leading to subtle changes in short-termplasticity (Figs 1, 2 and 3). More importantly, Syn II appears tomodify the dynamics of GABA release by promoting asynchro-nous SV release at the expense of synchronous release (Fig. 4).Finally, we demonstrate that Syn II interacts with presynapticCa2þ channels to promote GABA asynchronous release(Figs 5, 6 and 7).
Inhibitory synapses lacking Syn I, Syn III or all three Synisoforms show a decrease in the amplitude of the IPSCs evoked bysingle action potentials16,17,42,43. We have found that the deletionof Syn II increases the peak amplitude of evoked responses andreduces the frequency of the mIPSCs at hippocampal inhibitorysynapses. Opposite to the findings from Syn I KO mice in whichsynaptic depression at inhibitory synapses was enhanced17, theSyn II deletion lead to no changes in synaptic depression andminute changes in PPD. These data suggest that the various Synisoforms are endowed with distinct post-docking functions atinhibitory synapses.
The increased inhibitory response to single stimulation in SynII KO neurons appears to be induced by acceleration of thedynamics of GABA release. Deletion of SYN2 strongly enhancedsynchronous SV release, while the delayed asynchronous releasewas virtually abolished. These results imply that the function ofSyn II is to desynchronize SV release, opposite to Syn I that washypothesized to facilitate release synchronization44,45. Indeed, wefound that deletion of Syn I increased the asynchronous release ininhibitory synapses, an effect opposite to that of Syn II deletion.Thus, the possibility exists that Syns I and II have non-redundantfunctions and constitute a push–pull mechanism regulating theratio between synchronous and asynchronous release in thesynapses in which they are co-expressed.
An important question is how Syn II changes the ratio betweensynchronous and asynchronous neurotransmitter release. As bothSyn I and Syn II do not apparently affect the pool of docked SVs,we suggest that they might directly affect downstream exocytoticevents and regulate the dynamics of release. The synchronousrelease has been so far connected with members of thesynaptotagmin family of Ca2þ sensors9–11. Synaptotagmin-1 orsynaptotagmin-2 deletions lead to a complete loss of synchronousrelease at both excitatory and inhibitory synapses9–11, whileasynchronous release is preserved and even enhanced at highstimulation frequencies10. The knockdown of synaptotagmin-7 atthe zebrafish neuromuscular junction reduces asynchronousrelease46, however it has no effect on synchronous/asynchronous release in central synapses47. We detected nointeraction of either Syn I or Syn II with the varioussynaptotagmin isoforms (� 1, � 2 and � 7) in coimmuno-precipitation experiments (data not shown), suggesting that theaccelerated neurotransmitter release in Syn KO II slices isindependent of a possible impairment of the synaptotagminnormal function. On the other hand, the mechanisms behindasynchronous release are still far from being understood, withrecent work proposing several hypotheses. One proposedmechanism involves a slow presynaptic Ca2þ sensor, Doc2,that binds Ca2þ with slower kinetics and its knockdown inhippocampal cultures results in reduced asynchronous release48.Another recent paper reports that the SNARE protein VAMP2drives synchronous release, while its isoform VAMP4 boostsasynchronous release14. Moreover, it was recently shown thatboth voltage-gated presynaptic Cav-2.1 and Cav-2.2 channels,that conduct P/Q-type and N-type Ca2þ currents respectively,
are characterized by a prolonged Ca2þ current that promotesasynchronous release49.
The sensitivity of both evoked synchronous and delayedasynchronous release to Sr2þ versus Ca2þ and to variousconcentrations of extracellular Ca2þ in Syn II KO slices supportsthe idea that the postdocking functions of Syn II are Ca2þ
dependent. One possible explanation for this Ca2þ -dependencyis that Syns modulate neurotransmitter release by coupling SVswith presynaptic Ca2þ channels. Indeed, several studiesdemonstrated that Ca2þ channels are tightly coupled with SVsin the nanodomain range50 and, in addition, a potentialinteraction between Syn I and Syn II with distinct Ca2þ
channel subunits was recently reported by means ofproteomics41. In our experiments, addition of blockers ofeither P/Q- or N-type of Ca2þ currents reduced thesynchronously evoked and delayed asynchronous current inWT slices, but the delayed asynchronous release was not affectedby both Ca2þ -channel blockers in Syn II KO slices. Our patch-clamp experiments were performed at non-specific hippocampalinhibitory synapses, where at least a subset includes outputsynapses from interneurons expressing P/Q or N-type Ca2þ
channels, as Ca2þ channels are interneuron specific2,50.Interestingly, we found for the first time that, Syn II
specifically interacts with Cav-2.1 type Ca2þ channels, butnot with Cav-2.2 or Cav-2.3 types, while Syn I does notco-immunoprecipitate with any of the main presynapticCa2þ -channel subunits, indicating a physiologically importantand non-redundant function of Syn II with respect to Syn I. Wecannot exclude that the interaction between Syn II and Cav-2.1type Ca2þ -channels is indirect and mediated by modulatoryproteins of the active zone, such as via the Rab3-RIM-Ca2þ -channel pathway. This hypothesis is supported by thefact that Syns interact with Rab351,52 and may thereby interferewith RIM binding to N and P/Q-type Ca2þ channels at theactive zone53, decreasing the efficiency, speed and synchrony ofrelease. As Syn II appears to bind more tightly to SVs than Syn I(F. Benfenati, unpublished observations), it is possible that SynII remains to a large extent attached to SVs during the post-docking steps of release, possibly acting as a brake for thesynchronous release of SVs docked in the vicinity of a specificCa2þ channel. The genetic deletion of Syn II may decrease thephysical distance between Ca2þ channels and SVs atGABAergic synapses, thus speeding up neurotransmitterrelease with respect to the incoming action potential. Underthese conditions, if a train of action potentials invades thepresynaptic site, then the SVs available for release are morerapidly exhausted, thus explaining the lack of delayedasynchronous release in the Syn II KO neurons. Although SynII specifically interacts only with P/Q-type Ca2þ channels, itsdeletion occluded the effects of both P/Q- and N-type Ca2þ
channel blockers. This suggests that the Syn II effect on theasynchronous release is downstream of the asynchronous Ca2þ
current, and that both types of channels contribute to the bulkintraterminal Ca2þ that drives asynchronous release.
Strikingly, the effect of Syn II deletion was restricted toinhibitory neurons, and no effects on release dynamics orshort-term plasticity were observed in excitatory synapses.We demonstrated that, in inhibitory neurons, the effects ofSyn II deletion on release dynamics occur only at physiologicalCa2þ concentrations, while decreasing extracellular Ca2þ todecrease Pr virtually abolishes this phenotype (Fig. 6). It istherefore possible that the effects of Syn II on release dynamicsrequire high Pr values and therefore emerge under physiologicalCa2þ conditions in inhibitory synapses, but not in excitatorysynapses that are characterized by significantly lower Prvalues54,55.
ARTICLE NATURE COMMUNICATIONS | DOI: 10.1038/ncomms2515
10 NATURE COMMUNICATIONS | 4:1512 | DOI: 10.1038/ncomms2515 | www.nature.com/naturecommunications
& 2013 Macmillan Publishers Limited. All rights reserved.
This desynchronizing effect of Syn II on inhibitory synapsesmay have pathologic consequences, as Syn II KO mice areepileptic, with seizures starting after 2–3 months of life25,56.Changes in GABA asynchronous release between specific neuronsfrom human epileptic and non-epileptic tissue have been recentlyreported57. After trains of APs or in some cases just one AP, long-lasting IPSCs generated by asynchronous GABA release occurringwith significant delays can increase the effectiveness ofinhibition58,59. Asynchronous GABA release apparently allowsan inhibitory compensatory tuning proportional to the extent ofpresynaptic activity, and is markedly increased when synapses arestimulated with behaviourally relevant high-frequencypatterns5,36. Interestingly, we have recently shown thatpresymptomatic Syn I/II/III KO mice display an impaired toniccurrent, due to defects in GABA release and spillover, leading todiffuse hyperexcitability of hippocampal pyramidal neurons42. Itis tempting to speculate that the lack of asynchronous inhibitoryrelease in the hippocampus of Syn II mice, by decreasing the tonicinhibition of excitatory neurons, directly contributes to theaberrant network synchronization and epileptogenesis.
MethodsAnimals. Experiments were performed on homozygous Syn II KO mice generatedby homologous recombination and age-matched C57BL/6J wild-type (WT) ani-mals. All experiments were carried out in accordance with the guidelines estab-lished by the European Communities Council (Directive 2010/63/EU of 22September 2010) and were approved by the Italian Ministry of Health.
Preparation of slices. After anaesthesia with isoflurane, horizontal hippocampalslices (400 mm thickness) from 3-week-old WT and KO mice were cut using aMicrom HM 650 V microtome equipped with a Microm CU 65 cooling unit(Thermo Fisher Scientific, Waltham, MA) at 2 �C in a solution containing (in mM):87 NaCl, 25 NaHCO3, 2.5 KCl, 0.5 CaCl2, 7 MgCl2, 25 glucose, 75 sucrose andsaturated with 95% O2 and 5% CO2. After cutting, we let the slices recover for30–45 min at 35 �C and for 1 h at room temperature in recording solution.
Patch-clamp recordings. Whole-cell recordings were performed with a Multi-clamp 700B/Digidata1440A system (Molecular Devices, Sunnyvale, CA) on visuallyidentified dentate granule cells using an upright BX51WI microscope (Olympus,Tokyo). We recorded mature dentate granule neurons in which Rmo300 MO26.The extracellular solution used for the recordings contained (mM): 125 NaCl, 25NaHCO3, 25 glucose, 2.5 KCl, 1.25 NaH2PO4, 2 CaCl2 and 1 MgCl2 (bubbled with95% O2–5% CO2). In some experiments, CaCl2 was replaced with an equimolarconcentration of SrCl2. For all experiments, we used a high-chloride intracellularsolution containing (in mM): 126 KCl, 4 NaCl, 1 MgSO4, 0.02 CaCl2, 0.1 BAPTA,15 glucose, 5 HEPES, 3 ATP and 0.1 GTP in which the pH was adjusted to 7.3 withKOH and osmolarity was adjusted to 290 mosmol l� 1 with sucrose. Experimentswere performed at room temperature apart from a subset of data (Fig. 6) performedat 34 �C. Recordings of evoked and spontaneous inhibitory postsynaptic currents(eIPSCs and sIPSCs) were done at a holding potential (Vh) of � 80 mV in thepresence of 50 mM D-APV, 10mM CNQX, 5 mM CGP 55845 (all from TocrisBioscience, Ellisville, MO) and of mIPSCs after subsequently adding 0.3 mM TTX(Tocris Bioscience) to the above-mentioned drugs. Evoked excitatory postsynapticcurrents were done at a holding potential (Vh) of � 80 mV in the presence of30mM bicuculline and 5 mM CGP 55845 (all from Tocris Bioscience, Ellisville, MO)0.5 mM o-Agatoxin IVA and 1 mM o-Conotoxin GVIA (Tocris Bioscience,Ellisville, MO) were used to block P/Q and N-type Ca2þ channels, respectively.eIPSCs were evoked in granule cells in response to extracellular stimulation of themedial perforant path with a monopolar glass electrode (intensity: 50–150 mA,duration: 30 ms) filled with ACSF and connected with an isolated pulse stimulator(A-M Systems, Carlsborg, WA). The criteria used to define the extracellularstimulation were: (1) no failures in response to repeated 0.1 Hz stimulation; (2)postsynaptic responses at least threefold higher than the square root of noise; (3)latency and shape of synaptic current remained invariant. After finding a cell thatmet these criteria, we continued all the experiments at stimulation intensity 10%higher than the minimal needed, to avoid possible failures. See SupplementaryMethods for additional details on the electrophysiology of primary neuronalcultures
Data analysis. All data were acquired with Clampex 10.2 and analysed offline withClampfit 10.2 (pClamp, Molecular Devices, Sunnyvale, CA) and MiniAnalysis(Synaptosoft, Decatur, GA). We inspected eIPSCs visually and considered onlythose that met the stimulation criteria (see above) and were not contaminated byspontaneous activity. Because of the high intrinsic variability of eIPSCs, 10–30
consecutive responses (at a stimulation frequency of 0.1 Hz) were averaged beforethe calculation of the peak amplitude and of the kinetic parameters. We consideredthe peak amplitude as the difference between baseline and the peak of the evokedresponse; charge as the area under the response; latency as the time from thestimulus artifact to the initiation of a postsynaptic response; rise time as the10–90% time from the initiation of a response to the peak amplitude; The eIPSCand mIPSC deactivation response was fitted by double exponential equations of theform I(t)¼Afast exp(� t/tfast)þAslow exp(� t/tslow), where I(t) was the amplitudeof IPSCs at time t, Afast and Aslow were the amplitudes of the fast and slow decaycomponents, respectively, and tfast and tslow the corresponding decay timeconstants.
The size of the RRP of synchronous release (RRPsyn) and the probability that anygiven SV in the RRP will be released (Pves) were calculated using the cumulativeamplitude analysis17,33. RRPsyn was determined by summing up the peakamplitudes of IPSC responses during a 2-s stimulation train at 40 Hz. The last 40data points were fitted by linear regression and back-extrapolated to time 0. Theintercept with the y axis yielded the RRPsyn, and the ratio between the first eIPSCamplitude and RRPsyn yielded the Pves. In the same way, we measured RRPtot bycalculating the total area of the response induced by each stimulus of the train17,33,after subtracting the offset to the baseline.
We measured the delayed asynchronous release as the 1-s area of thepostsynaptic current following a 40 Hz train, normalized to the 1-s area precedingthe train (sIPSC area averaged from 5–10 s before the train). This measure ofdelayed asynchronous release considers both the offset of the last response of thestimulus train to the baseline, as well as the increase in the frequency of thespontaneous postsynaptic currents.
To analyse PPD, two brief stimulation pulses were applied at ISIs rangingbetween 10 and 4,000 ms (10–20 sweeps for each trial). Paired-pulse ratio (PPR)was calculated from the equation: PPR¼ 100� (I2� I1)/I1, where I1 and I2 are themean amplitudes of the eIPSCs evoked by the conditioning and test stimuli,respectively17. Analysis of the pre/postsynaptic locus of PPD was performed asdescribed by Malinow and Tsien32. We calculated:
CV¼s=A; and CV� 2 ¼A2=s2 ð1Þ
where CV is the coefficient of variation, A is the peak amplitude of each responseand s is the variance of the peak amplitudes in a series of consecutive responses.From the binomial distribution of transmitter release:
A¼Npvz; and CV� 2 ¼Np= 1� pð Þ ð2Þ
because A2/s2¼ (Npvz)2/Np (1� p) (vz)2¼Np/(1� p), where p is the probabilityof release for each available quanta (N), v is the vesicular content and z is thepostsynaptic response to a fixed amount of transmitter. On a linear plot (Fig. 2),the depression induced by the second stimulus (A2/A1) with respect to the ratio ofcoefficients of variation ((CV2/CV1)� 2) should fall under the line if the cause ofthe depression is presynaptic according to equations (1) and (2)31–32.
Immunoprecipitation. Cortical neurons at 10–14 DIV were lysed in RIPA buffer(50 mM Tris–HCl pH 7.4, 150 mM NaCl, 2 mM EDTA, NP40 1%, SDS 0.1%) plusprotease inhibitors (complete EDTA-free protease inhibitors, Roche Diagnostic,IN) for 1 h at 4 �C under constant agitation. After centrifugation at 16,000g for30 min, protein concentration was quantified with Bradford Protein Assay (BioRad,Segrate, Italy). Protein lysates (1.5 mg per sample) were precleared using 25 mlprotein G-Sepharose Fast Flow (GE Healthcare) for 1 h at 4 �C. Precleared lysateswere incubated overnight at 4 �C with 5 mg of syn I or syn II antibodies, or anti-HAantibodies as control; immunocomplexes were then isolated by adding eitherprotein G-Sepharose for synII, or anti-mouse IgG-coated Sepharose beads(no. 5946 Cell Signaling) for syn I, for 3 h at 4 �C. SDS–PAGE and western blottingwere performed on precast 4–12% NuPAGE Novex Bis-Tris Gels (Life Technol-ogies, Monza, Italy). After incubation with primary antibodies, membranes wereincubated with fluorescently-conjugated secondary antibodies (ECL Plex goat a-rabbit IgG-Cy5, ECL Plex goat a-mouse IgG-Cy3) and revealed by a TyphoonTRIOþ Variable Mode Imager (both GE Healthcare, Milano). The followingprimary antibodies were used: monoclonal anti-Syn I (clone 10.2260), anti-Syn II(clone 19.2160) and anti-HA (no. 32-6700 Life Technologies), polyclonal antibodiesanti-Cav2.1 (P/Q), anti-Cav2.2 (N) and anti-Cav2.3 (R) (no. C1353, C1478 andC1853, Sigma, Milano, Italy).
Statistical analysis. All data are presented as mean±s.e.m. with n¼ neurons/mice. For each group of data, an F-test for the comparison of the variances wasused before the statistical testing. In case of non-homogeneity of variance, thestatistical analysis was performed using the non-parametric Welch’s t-test forunequal variances. In the case of equal variances, we used the two-tailed unpairedStudent’s t-test. Paired t-tests were used according to the experimental design.
References1. Daw, M. I., Tricoire, L., Erdelyi, F., Szabo, G. & McBain, C. J. Asynchronous
transmitter release from cholecystokinin-containing inhibitory interneurons iswidespread and target-cell independent. J. Neurosci. 29, 11112–11122 (2009).
NATURE COMMUNICATIONS | DOI: 10.1038/ncomms2515 ARTICLE
NATURE COMMUNICATIONS | 4:1512 | DOI: 10.1038/ncomms2515 | www.nature.com/naturecommunications 11
& 2013 Macmillan Publishers Limited. All rights reserved.

2. Hefft, S. & Jonas, P. Asynchronous GABA release generates long-lastinginhibition at a hippocampal interneuron-principal neuron synapse. Nat.Neurosci. 8, 1319–1328 (2005).
3. Otsu, Y. et al. Competition between phasic and asynchronous release forrecovered synaptic vesicles at developing hippocampal autaptic synapses.J. Neurosci. 24, 420–433 (2004).
4. Hagler, Jr D. J. & Goda, Y. Properties of synchronous and asynchronous releaseduring pulse train depression in cultured hippocampal neurons.J. Neurophysiol. 85, 2324–2334 (2001).
5. Lu, T. & Trussell, L. O. Inhibitory transmission mediated by asynchronoustransmitter release. Neuron 26, 683–694 (2000).
6. Jensen, K., Lambert, J. D. & Jensen, M. S. Tetanus-induced asynchronousGABA release in cultured hippocampal neurons. Brain Res. 880, 198–201(2000).
7. Atluri, P. P. & Regehr, W. G. Delayed release of neurotransmitter fromcerebellar granule cells. J. Neurosci. 18, 8214–8227 (1998).
8. Goda, Y. & Stevens, C. F. Two components of transmitter release at a centralsynapse. Proc. Natl Acad. Sci. USA 91, 12942–12946 (1994).
9. Geppert, M. et al. Synaptotagmin I: a major Ca2þ sensor for transmitterrelease at a central synapse. Cell 79, 717–727 (1994).
10. Maximov, A. & Sudhof, T. C. Autonomous function of synaptotagmin 1 intriggering synchronous release independent of asynchronous release. Neuron48, 547–554 (2005).
11. Nishiki, T. & Augustine, G. J. Synaptotagmin I synchronizes transmitter releasein mouse hippocampal neurons. J. Neurosci. 24, 6127–6132 (2004).
12. Sun, J. et al. A dual-Ca2þ -sensor model for neurotransmitter release in acentral synapse. Nature 450, 676–682 (2007).
13. Walter, A. M., Groffen, A. J., Sorensen, J. B. & Verhage, M. Multiple Ca2þsensors in secretion: teammates, competitors or autocrats? Trends Neurosci. 34,487–497 (2011).
14. Raingo, J. et al. VAMP4 directs synaptic vesicles to a pool that selectivelymaintains asynchronous neurotransmission. Nat. Neurosci. 15, 738–745(2012).
15. Cesca, F., Baldelli, P., Valtorta, F. & Benfenati, F. The synapsins: key actors ofsynapse function and plasticity. Prog. Neurobiol. 91, 313–348 (2010).
16. Gitler, D. et al. Different presynaptic roles of synapsins at excitatory andinhibitory synapses. J. Neurosci. 24, 11368–11380 (2004).
17. Baldelli, P., Fassio, A., Valtorta, F. & Benfenati, F. Lack of synapsin I reducesthe readily releasable pool of synaptic vesicles at central inhibitory synapses.J. Neurosci. 27, 13520–13531 (2007).
18. Fassio, A., Raimondi, A., Lignani, G., Benfenati, F. & Baldelli, P. Synapsins:From synapse to network hyperexcitability and epilepsy. Semin. Cell Dev. Biol.22, 408–415 (2011).
19. Cavalleri, G. L. et al. Multicentre search for genetic susceptibility loci insporadic epilepsy syndrome and seizure types: a case-control study. LancetNeurol. 6, 970–980 (2007).
20. Lakhan, R., Kalita, J., Misra, U. K., Kumari, R. & Mittal, B. Association ofintronic polymorphism rs3773364 A4G in synapsin-2 gene with idiopathicepilepsy. Synapse 64, 403–408 (2010).
21. Fassio, A. et al. SYN1 loss-of-function mutations in autism and partialepilepsy cause impaired synaptic function. Hum. Mol. Genet. 20, 2297–2307(2011).
22. Garcia, C. C. et al. Identification of a mutation in synapsin I, a synaptic vesicleprotein, in a family with epilepsy. J. Med. Genet. 41, 183–186 (2004).
23. Coleman, W. L. et al. Synapsin II and calcium regulate vesicle docking and thecross-talk between vesicle pools at the mouse motor terminals. J. Physiol. 586,4649–4673 (2008).
24. Gitler, D., Cheng, Q., Greengard, P. & Augustine, G. J. Synapsin IIa controls thereserve pool of glutamatergic synaptic vesicles. J. Neurosci. 28, 10835–10843(2008).
25. Rosahl, T. W. et al. Essential functions of synapsins I and II in synaptic vesicleregulation. Nature 375, 488–493 (1995).
26. Liu, Y. B., Ye, G. L., Liu, X. S., Pasternak, J. F. & Trommer, B. L. GABAAcurrents in immature dentate gyrus granule cells. J. Neurophysiol. 80,2255–2267 (1998).
27. Farrant, M. & Nusser, Z. Variations on an inhibitory theme: phasicand tonic activation of GABA(A) receptors. Nat. Rev. Neurosci. 6, 215–229(2005).
28. Isaacson, J. S. & Walmsley, B. Counting quanta: direct measurements oftransmitter release at a central synapse. Neuron 15, 875–884 (1995).
29. Kirischuk, S., Clements, J. D. & Grantyn, R. Presynaptic and postsynapticmechanisms underlie paired pulse depression at single GABAergic boutons inrat collicular cultures. J. Physiol. 543, 99–116 (2002).
30. Zucker, R. S. & Regehr, W. G. Short-term synaptic plasticity. Annu Rev. Physiol.64, 355–405 (2002).
31. Kraushaar, U. & Jonas, P. Efficacy and stability of quantal GABA release at ahippocampal interneuron-principal neuron synapse. J. Neurosci. 20, 5594–5607(2000).
32. Malinow, R. & Tsien, R. W. Presynaptic enhancement shown by whole-cellrecordings of long-term potentiation in hippocampal slices. Nature 346,177–180 (1990).
33. Stevens, C. F. & Williams, J. H. Discharge of the readily releasable pool withaction potentials at hippocampal synapses. J. Neurophysiol. 98, 3221–3229(2007).
34. Schikorski, T. & Stevens, C. F. Morphological correlates of functionally definedsynaptic vesicle populations. Nat. Neurosci. 4, 391–395 (2001).
35. Otsu, Y. & Murphy, T. H. Optical postsynaptic measurement of vesicle releaserates for hippocampal synapses undergoing asynchronous release during trainstimulation. J. Neurosci. 24, 9076–9086 (2004).
36. Manseau, F. et al. Desynchronization of neocortical networks by asynchronousrelease of GABA at autaptic and synaptic contacts from fast-spikinginterneurons. PLoS Biol. 8, e1000492 (2010).
37. Xu-Friedman, M. A. & Regehr, W. G. Presynaptic strontium dynamics andsynaptic transmission. Biophys. J. 76, 2029–2042 (1999).
38. Xu-Friedman, M. A. & Regehr, W. G. Probing fundamental aspects of synaptictransmission with strontium. J. Neurosci. 20, 4414–4422 (2000).
39. Rumpel, E. & Behrends, J. C. Sr2þ -dependent asynchronous evokedtransmission at rat striatal inhibitory synapses in vitro. J. Physiol. 514(Pt 2),447–458 (1999).
40. Hosaka, M. & Sudhof, T. C. Synapsins I and II are ATP-binding proteins withdifferential Ca2þ regulation. J. Biol. Chem. 273, 1425–1429 (1998).
41. Muller, C. S. et al. Quantitative proteomics of the Cav2 channel nano-environments in the mammalian brain. Proc. Natl Acad. Sci. USA 107,14950–14957 (2010).
42. Farisello, P. et al. Synaptic and extrasynaptic origin of the excitation/inhibitionimbalance in the Hippocampus of Synapsin I/II/III Knockout Mice. Cereb.Cortex. (doi: 10.1093/cercor/bhs041) (2012).
43. Corradi, A. et al. Synapsin-I- and synapsin-II-null mice display an increasedage-dependent cognitive impairment. J. Cell Sci. 121, 3042–3051 (2008).
44. Fassio, A. et al. The synapsin domain E accelerates the exoendocytoticcycle of synaptic vesicles in cerebellar Purkinje cells. J. Cell Sci. 119, 4257–4268(2006).
45. Hilfiker, S. et al. Two sites of action for synapsin domain E in regulatingneurotransmitter release. Nat. Neurosci. 1, 29–35 (1998).
46. Wen, H. et al. Distinct roles for two synaptotagmin isoforms in synchronousand asynchronous transmitter release at zebrafish neuromuscular junction.Proc. Natl Acad. Sci. USA 107, 13906–13911 (2010).
47. Maximov, A. et al. Genetic analysis of synaptotagmin-7 function in synapticvesicle exocytosis. Proc. Natl Acad. Sci. USA 105, 3986–3991 (2008).
48. Yao, J., Gaffaney, J. D., Kwon, S. E. & Chapman, E. R. Doc2 is a Ca2þsensor required for asynchronous neurotransmitter release. Cell 147, 666–677(2011).
49. Few, A. P. et al. Asynchronous Ca2þ current conducted by voltage-gatedCa2þ (CaV)-2.1 and CaV2.2 channels and its implications for asynchronousneurotransmitter release. Proc. Natl Acad. Sci. USA 109, E452–E460 (2012).
50. Eggermann, E., Bucurenciu, I., Goswami, S. P. & Jonas, P. Nanodomaincoupling between Ca(2) channels and sensors of exocytosis at fast mammaliansynapses. Nat. Rev. Neurosci. 13, 7–21 (2012).
51. Coleman, W. L. & Bykhovskaia, M. Cooperative regulation of neurotransmitterrelease by Rab3a and synapsin II. Mol. Cell. Neurosci. 44, 190–200 (2010).
52. Giovedi, S., Darchen, F., Valtorta, F., Greengard, P. & Benfenati, F. Synapsinis a novel Rab3 effector protein on small synaptic vesicles. II. Functionaleffects of the Rab3A-synapsin I interaction. J. Biol. Chem. 279, 43769–43779(2004).
53. Kaeser, P. S. et al. RIM proteins tether Ca2þ channels to presynaptic activezones via a direct PDZ-domain interaction. Cell 144, 282–295 (2011).
54. Chiappalone, M. et al. Opposite changes in glutamatergic and GABAergictransmission underlie the diffuse hyperexcitability of synapsin I-deficientcortical networks. Cereb. Cortex 19, 1422–1439 (2009).
55. Scholz-Starke, J., Cesca, F., Schiavo, G., Benfenati, F. & Baldelli, P. Kidins220/ARMS is a novel modulator of short-term synaptic plasticity in hippocampalGABAergic neurons. PLoS ONE 7, e35785 (2012).
56. Etholm, L., Bahonjic, E., Walaas, S. I., Kao, H. T. & Heggelund, P.Neuroethologically delineated differences in the seizure behavior of Synapsin 1and Synapsin 2 knock-out mice. Epilepsy Res. 99, 252–259 (2012).
57. Jiang, M. et al. Enhancement of asynchronous release from fast-spikinginterneuron in human and rat epileptic neocortex. PLoS Biol. 10, e1001324(2012).
58. Balakrishnan, V., Kuo, S. P., Roberts, P. D. & Trussell, L. O. Slow glycinergictransmission mediated by transmitter pooling. Nat. Neurosci. 12, 286–294(2009).
59. Capogna, M. & Pearce, R. A. GABA A,slow: causes and consequences. TrendsNeurosci. 34, 101–112 (2011).
60. Vaccaro, P. et al. Anti-synapsin monoclonal antibodies: epitope mapping andinhibitory effects on phosphorylation and Grb2 binding. Brain Res. Mol. BrainRes. 52, 1–16 (1997).
ARTICLE NATURE COMMUNICATIONS | DOI: 10.1038/ncomms2515
12 NATURE COMMUNICATIONS | 4:1512 | DOI: 10.1038/ncomms2515 | www.nature.com/naturecommunications
& 2013 Macmillan Publishers Limited. All rights reserved.
AcknowledgementsWe thank Drs H.-T. Kao (Brown University, Providence, RI) and P. Greengard (TheRockefeller University, New York, NY) for providing us with the Syn II mutant mousestrain. We also thank Dr J. Scholz-Starke for help in the design of experiments and usefuldiscussions. This study was supported by research grants from the Italian Ministry ofUniversity and Research (PRIN to F.B. and P.B.), the Italian Ministry of Health ProgettoGiovani (to P.B.) and the Compagnia di San Paolo, Torino (to F.B. and P.B.). Thesupport of Telethon-Italy (Grant GGP09134 to F.B. and GGP09066 to P.B.) is alsoacknowledged.
Author contributionsL.M., P.B. and F.B. design the study and planned the experiments. L.M. (patch-clamp),A.R. (electron microscopy) and F.C. (biochemistry) performed the experiments andanalysed the data. G.L. analysed the electrophysiology data. L.M., P.B. and F.B. wrote themanuscript.
Additional informationSupplementary Information accompanies this paper at http://www.nature.com/naturecommunications
Competing financial interests: The authors declare no competing financial interests.
Reprints and permission information is available online at http://npg.nature.com/reprintsandpermissions/
How to cite this article: Medrihan, L. et al. Synapsin II desynchronizes neurotransmitterrelease at inhibitory synapses by interacting with presynaptic calcium channels.Nat. Commun. 4:1512 doi: 10.1038/ncomms2515 (2013).
This work is licensed under a Creative Commons Attribution-NonCommercial-ShareAlike 3.0 Unported License. To view a copy of
this license, visit http://creativecommons.org/licenses/by-nc-sa/3.0/
NATURE COMMUNICATIONS | DOI: 10.1038/ncomms2515 ARTICLE
NATURE COMMUNICATIONS | 4:1512 | DOI: 10.1038/ncomms2515 | www.nature.com/naturecommunications 13
& 2013 Macmillan Publishers Limited. All rights reserved.
Related Documents