arXiv:0704.0170v2 [cond-mat.str-el] 30 Oct 2007 Symmetry disquisition on the TiOX phase diagram Daniele Fausti, * Tom T. A. Lummen, Cosmina Angelescu, Roberto Macovez, Javier Luzon, Ria Broer, Petra Rudolf, and Paul H.M. van Loosdrecht † Zernike Institute for Advanced Materials, University of Groningen, 9747 AG Groningen, The Netherlands. Natalia Tristan and Bernd B¨ uchner IFW Dresden, D-01171 Dresden, Germany Sander van Smaalen Laboratory of Crystallography, University of Bayreuth, 95440 Bayreuth, Germany Angela M¨oller, Gerd Meyer, and Timo Taetz Institut f¨ ur Anorganische Chemie, Universit¨ at zu K¨ oln, 50937 K¨ oln, Germany (Dated: June 18, 2013) Abstract The sequence of phase transitions and the symmetry of in particular the low temperature incom- mensurate and spin-Peierls phases of the quasi one-dimensional inorganic spin-Peierls system TiOX (TiOBr and TiOCl) have been studied using inelastic light scattering experiments. The anomalous first-order character of the transition to the spin-Peierls phase is found to be a consequence of the different symmetries of the incommensurate and spin-Peierls (P2 1 /m) phases. The pressure dependence of the lowest transition temperature strongly suggests that magnetic interchain interactions play an important role in the formation of the spin-Peierls and the incom- mensurate phases. Finally, a comparison of Raman data on VOCl to the TiOX spectra shows that the high energy scattering observed previously has a phononic origin. PACS numbers: 68.18.Jk Phase transitions 63.20.-e Phonons in crystal lattices 75.30.Et Exchange and superexchange interactions 75.30.Kz Magnetic phase boundaries (including magnetic transitions, metamagnetism, etc.) 78.30.-j Infrared and Raman spectra 1

Welcome message from author
This document is posted to help you gain knowledge. Please leave a comment to let me know what you think about it! Share it to your friends and learn new things together.
Transcript
arX
iv:0
704.
0170
v2 [
cond
-mat
.str
-el]
30
Oct
200
7
Symmetry disquisition on the TiOX phase diagram
Daniele Fausti,∗ Tom T. A. Lummen, Cosmina Angelescu, Roberto Macovez,
Javier Luzon, Ria Broer, Petra Rudolf, and Paul H.M. van Loosdrecht†
Zernike Institute for Advanced Materials,
University of Groningen, 9747 AG Groningen, The Netherlands.
Natalia Tristan and Bernd Buchner
IFW Dresden, D-01171 Dresden, Germany
Sander van Smaalen
Laboratory of Crystallography, University of Bayreuth, 95440 Bayreuth, Germany
Angela Moller, Gerd Meyer, and Timo Taetz
Institut fur Anorganische Chemie, Universitat zu Koln, 50937 Koln, Germany
(Dated: June 18, 2013)
AbstractThe sequence of phase transitions and the symmetry of in particular the low temperature incom-
mensurate and spin-Peierls phases of the quasi one-dimensional inorganic spin-Peierls system TiOX
(TiOBr and TiOCl) have been studied using inelastic light scattering experiments. The anomalous
first-order character of the transition to the spin-Peierls phase is found to be a consequence of the
different symmetries of the incommensurate and spin-Peierls (P21/m) phases.
The pressure dependence of the lowest transition temperature strongly suggests that magnetic
interchain interactions play an important role in the formation of the spin-Peierls and the incom-
mensurate phases. Finally, a comparison of Raman data on VOCl to the TiOX spectra shows that
the high energy scattering observed previously has a phononic origin.
PACS numbers: 68.18.Jk Phase transitions
63.20.-e Phonons in crystal lattices
75.30.Et Exchange and superexchange interactions
75.30.Kz Magnetic phase boundaries (including magnetic transitions, metamagnetism, etc.)
78.30.-j Infrared and Raman spectra
1

I. INTRODUCTION
The properties of low-dimensional spin systems are one of the key topics of contemporarycondensed matter physics. Above all, the transition metal oxides with highly anisotropicinteractions and low-dimensional structural elements provide a fascinating playground tostudy novel phenomena, arising from their low-dimensional nature and from the interplaybetween lattice, orbital, spin and charge degrees of freedom. In particular, low-dimensionalquantum spin (S=1/2) systems have been widely discussed in recent years. Among them,layered systems based on a 3d9 electronic configuration were extensively studied in viewof the possible relevance of quantum magnetism to high temperature superconductivity1,2.Though they received less attention, also spin=1/2 systems based on early transition metaloxides with electronic configuration 3d1, such as titanium oxyhalides (TiOX, with X=Bror Cl), exhibit a variety of interesting properties3,4. The attention originally devoted tothe layered quasi two-dimensional 3d1 antiferromagnets arose from considering them as theelectron analog to the high-Tc cuprates5. Only recently TiOX emerged in a totally new light,namely as a one-dimensional antiferromagnet and as the second example of an inorganicspin-Peierls compound (the first being CuGeO3)
6,7.The TiO bilayers constituting the TiOX lattice are candidates for various exotic electronic
configurations, such as orbital ordered3, spin-Peierls6 and resonating-valence-bond states8.In the case of the TiOX family the degeneracy of the d orbitals is completely removed by thecrystal field splitting, so that the only d−electron present, mainly localized on the Ti site,occupies a nondegenerate energy orbital3. As a consequence of the shape of the occupiedorbital (which has lobes oriented in the b− and c−directions, where c is perpendicular tothe layers), the exchange interaction between the spins on different Ti ions arises mainlyfrom direct exchange within the TiO bilayers, along the b crystallographic direction3. This,in spite of the two-dimensional structural character, gives the magnetic system of the TiOXfamily its peculiar quasi one-dimensional properties6. Magnetic susceptibility6 and ESR3
measurements at high temperature are in reasonably good agreement with an antiferromag-netic, one-dimensional spin-1/2 Heisenberg chain model. At low temperature (Tc1) TiOXshows a first-order phase transition to a dimerised nonmagnetic state, discussed in termsof a spin Peierls state6,9,10. Between this low temperature spin Peierls phase (SP) and theone-dimensional antiferromagnet in the high temperature phase (HT), various experimentalevidence4,11,12,13 showed the existence of an intermediate phase, whose nature and originis still debated. The temperature region of the intermediate phase is different for the twocompounds considered in this work, for TiOBr Tc1 = 28 K and Tc2 = 48 K while for TiOClTc1 = 67 K and Tc2 = 91 K. To summarize the properties so far reported, the intermediatephase (Tc1 < Tc2) exhibits a gapped magnetic excitation spectrum4, anomalous broadeningof the phonon modes in Raman and IR spectra9,13, and features of a periodicity incom-mensurate with the lattice14,15,16,17. Moreover, the presence of a pressure induced metal toinsulator transition has been recently suggested for TiOCl18. Due to this complex phasebehavior, both TiOCl and TiOBr have been extensively discussed in recent literature, andvarious questions still remain open: there is no agreement on the crystal symmetry of thespin Peierls phase, the nature and symmetry of the incommensurate phase is not clear andthe anomalous first-order character of the transition to the spin Peierls state is not explained.
Optical methods like Raman spectroscopy are powerful experimental tools for revealingthe characteristic energy scales associated with the development of broken symmetry groundstates, driven by magnetic and structural phase transitions. Indeed, information on the
2
nature of the magnetic ground state, lattice distortion, and interplay of magnetic and latticedegrees of freedom can be obtained by studying in detail the magnetic excitations and thephonon spectrum as a function of temperature. The present paper reports on a vibrationalRaman study of TiOCl and TiOBr, a study of the symmetry properties of the three phasesand gives coherent view of the anomalous first order character of the transition to the spinPeierls phase. Through pressure-dependence measurements of the magnetic susceptibility,the role of magnon-phonon coupling in determining the complex phase diagram of TiOX isdiscussed. Finally, via a comparison with the isostructural compound VOCl, the previouslyreported13,19 high energy scattering is revisited, ruling out a possible interpretation in termsof magnon excitations.
II. EXPERIMENT
Single crystals of TiOCl, TiOBr, and VOCl have been grown by a chemical vapor trans-port technique. The crystallinity was checked by X-ray diffraction12. Typical crystal di-mensions are a few mm2 in the ab−plane and 10-100 µm along the c−axis, the stackingdirection15. The sample was mounted in an optical flow cryostat, with a temperature sta-bilization better than 0.1 K in the range from 2.6 K to 300 K. The Raman measurementswere performed using a triple grating micro-Raman spectrometer (Jobin Yvon, T64000),equipped with a liquid nitrogen cooled CCD detector (resolution 2 cm−1 for the consideredfrequency interval). The experiments were performed with a 532 nm Nd:YVO4 laser. Thepower density on the sample was kept below 500 W/cm2 to avoid sample degradation andto minimize heating effects.
The polarization was controlled on both the incoming and outgoing beam, giving accessto all the polarizations schemes allowed by the back-scattering configuration. Due to themacroscopic morphology of the samples (thin sheets with natural surfaces parallel to theab−planes) the polarization analysis was performed mainly with the incoming beam parallelto the c−axis (c(aa)c, c(ab)c and c(bb)c, in Porto notation). Some measurements were per-formed with the incoming light polarized along the c−axis, where the k−vector of the lightwas parallel to the ab−plane and the polarization of the outgoing light was not controlled.These measurements will be labeled as x(c⋆)x.
The magnetization measurements were performed in a Quantum Design Magnetic Prop-erty Measurement System. The pressure cell used is specifically designed for measurementof the DC-magnetization in order to minimize the cell’s magnetic response. The cell wascalibrated using the lead superconducting transition as a reference, and the cell’s signal(measured at atmospheric pressure) was subtracted from the data.
III. RESULTS AND DISCUSSION
The discussion will start with a comparison of Raman experiments on TiOCl and TiOBrin the high temperature phase, showing the consistency with the reported structure. After-wards, through the analysis of Raman spectra the crystal symmetry in the low temperaturephases will be discussed, and in the final part a comparison with the isostructural VOCl willbe helpful to shed some light on the origin of the anomalous high energy scattering reportedfor TiOCl and TiOBr13,19.
3
A. High Temperature Phase
The crystal structure of TiOX in the high temperature (HT) phase consists of buckledTi-O bilayers separated by layers of X ions. The HT structure is orthorhombic with spacegroup Pmmn. The full representation20 of the vibrational modes in this space group is:
Γtot = 3Ag + 2B1u + 3B2g + 2B2u + 3B3g + 2B3u. (1)
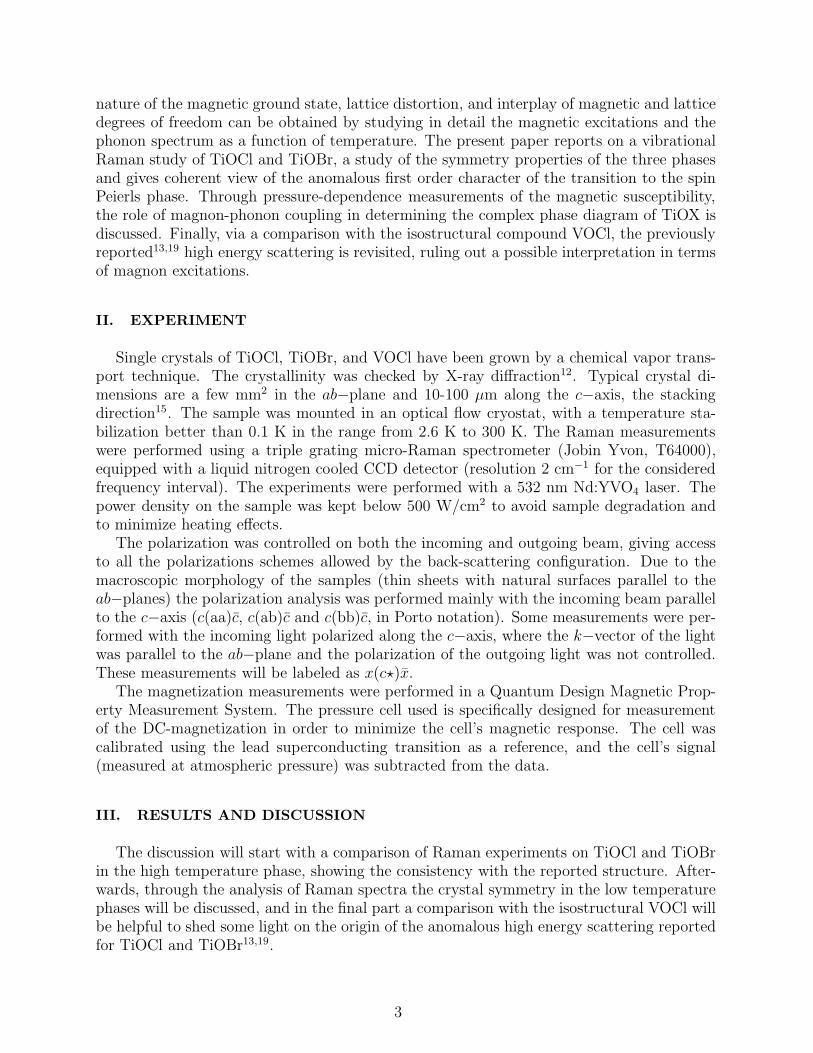
Among these, the modes with symmetry B1u, B2u, and B3u are infrared active in the polar-izations along the c, b, and a crystallographic axes9, respectively. The modes with symmetryAg, B2g, and B3g are expected to be Raman active: The Ag modes in the polarization (aa),(bb), and (cc); the B2g modes in (ac) and the B3g ones in (bc). Fig.1 shows the room tem-
100 200 300 400 100 200 300 400
Intens
ity
Energy (cm-1)
c(bb)c
TiOBr (T=100 K)
c(aa)c
TiOCl (T=300 K)
FIG. 1: (Color online) Polarized Raman spectra (Ag) of TiOCl and TiOBr in the high temperature
phase, showing the three Ag modes. Left panel: (bb) polarization; right panel: (aa) polarization.
perature Raman measurements in different polarizations for TiOCl and TiOBr, and Fig.2displays the characteristic Raman spectra for the three different phases of TiOBr, the spec-tra are taken at 100 (a), 30 (b) and 3K (c). At room temperature three Raman active modesare clearly observed in both compounds for the c(aa)c and c(bb)c polarizations (Fig.1), whilenone are observed in the c(ab)c polarization. These results are in good agreement with thegroup theoretical analysis. The additional weakly active modes observed at 219 cm−1 forTiOCl and at 217 cm−1 for TiOBr are ascribed to a leak from a different polarization. Thisis confirmed by the measurements with the optical axis parallel to the ab-planes (x(c⋆)x) onTiOBr, where an intense mode is observed at the same frequency (as shown in the inset ofFig.2(a)). In addition to these expected modes, TiOCl displays a broad peak in the c(bb)cpolarization, centered at around 160 cm−1 at 300K; a similar feature is observed in TiOBras a broad background in the low frequency region at 100K. As discussed for TiOCl13, thesemodes are thought to be due to pre-transitional fluctuations. Upon decreasing the tempera-ture, this ”peaked” background first softens, resulting in a broad mode at Tc2 (see Fig.2(b)),and then locks at Tc1 into an intense sharp mode at 94.5 cm−1 for TiOBr (Fig.2(c)) and at131.5 cm−1 for TiOCl.
The frequency of all the vibrational modes observed for TiOCl and TiOBr in their hightemperature phase are summarized in Table I. Here, the infrared active modes are taken fromthe literature7,9 and for the Raman modes the temperatures chosen for the two compoundsare 300K for TiOCl and 100K for TiOBr. The observed Raman frequencies agree well with
4

100 200 300 400 500 600
c(aa)c
c(ab)c
(c)
Intens
ity
Energy (cm-1)
c(bb)c
T=3 K
T=30 K
c(aa)c
c(ab)c
c(bb)c
(b)
200 250 550 600
Inte
nsity
Energy (cm-1)
TiOBr - Pol x(c*)x
T=100 K
c(aa)c
c(ab)c
c(bb)c
(a)
FIG. 2: (Color online) Polarization analysis of the Raman spectra in the three phases of TiOBr,
taken at 3 (a), 30 (b) and 100K (c). The spectra of TiOCl show the same main features and closely
resemble those of TiOBr. Table IV reports the frequencies of the TiOCl modes. The inset shows
the TiOBr spectrum in the x(c∗)x polarization (see text).
previous reports13. The calculated values reported in Table I are obtained with a spring-model calculation based on phenomenological longitudinal and transversal spring constants(see Appendix). The spring constants used were optimized using the TiOBr experimentalfrequencies (except for the ones of the B3g modes due to their uncertain symmetry) and keptconstant for the other compounds. The frequencies for the other two compounds are obtainedby merely changing the appropriate atomic masses and are in good agreement with theexperimental values. The relative atomic displacements for each mode of Ag symmetry areshown in Table II. The scaling ratio for the lowest frequency mode (mode 1) between the twocompounds is in good agreement with the calculation of the atomic displacements. The lowfrequency mode is mostly related to Br/Cl movement and, indeed, the ratio νT iOCl/νT iOBr =1.42 is similar to the mass ratio
√MBr/
√MCl. The other modes (2 and 3) involve mainly
Ti or O displacements, and their frequencies scale with a lower ratio, as can be expected.
B. Low Temperature Phases
Although the symmetry of the low temperature phases has been studied by X-ray crys-tallography, there is no agreement concerning the symmetry of the SP phase; different works
5

TABLE I: (a)Vibrational modes for the high temperature phase in TiOCl, TiOBr and VOCl. The
calculated values are obtained with a spring model. The mode reported in italics in Table I are
measured in the x(c⋆)x polarization they could therefore have either B2g or B3g symmetry (see
experimental details).
(a) TiOBr TiOCl VOCl
Exp. Cal. Exp. Cal. Exp. Cal.
Ag (σaa, σbb, σcc) 142.7 141 203 209.1 201 208.8
329.8 328.2 364.8 331.2 384.9 321.5
389.9 403.8 430.9 405.2 408.9 405.2
B2g(σac) 105.5 157.1 156.7
328.5 330.5 320.5
478.2 478.2 478.2
B3u(IR, a) 77a 75.7 104b 94.4 93.7
417a 428.5 438b 428.5 425.2
B3g(σbc) 60 86.4 129.4 129.4
216 336.8 219 c 336.8 327.2
598 586.3 586.3 585.6
B2u(IR, b) 131a 129.1 176b 160.8 159.5
275a 271.8 294b 272.1 269.8
B1u(IR, c) 155.7 194.1 192.4
304.8 301.1 303.5
aValue taken from Ref.7.bValue taken from Ref.9.cValue obtained considering the leakage in the σyy polarization.
TABLE II: The ratio between the frequency of the Ag Raman active modes measured in TiOBr
and TiOCl is related to the atomic displacements of the different modes as calculated for TiOBr
(all the eigenvectors are fully c−polarized, the values are normalized to the largest displacement).
(b) Mode ν(TiOBr) νCl/νBr Ti O Br
1 142.7 1.42 0.107 0.068 1
2 329.8 1.11 1 0.003 0.107
3 389.9 1.11 0.04 1 0.071
proposed two different space groups, P21/m14,15,16 and Pmm221.
The possible symmetry changes that a dimerisation of Ti ions in the b−direction cancause are considered in order to track down the space group of the TiOX crystals in the lowtemperature phases. Assuming that the low temperature phases belong to a subgroup ofthe high temperature orthorhombic space group Pmmn, there are different candidate spacegroups for the low temperature phases. Note that the assumption is certainly correct forthe intermediate phase, because the transition at Tc2 is of second-order implying a symme-try reduction, while it is not necessarily correct for the low temperature phase, being thetransition at Tc1 is of first-order.
6

FIG. 3: (Color online) Comparison of the possible low temperature symmetries. The low temper-
ature structures reported are discussed, considering a dimerisation of the unit cell due to Ti-Ti
coupling and assuming a reduction of the crystal symmetry. The red rectangle denotes the unit
cell of the orthorhombic HT structure. Structure (a) is monoclinic with its unique axis parallel to
the orthorhombic c−axis (space group P2/c), (b) shows the suggested monoclinic structure for the
SP phase (P21/m), and (c) depicts the alternative orthorhombic symmetry proposed for the low
T phase Pmm2.
Fig.3 shows a sketch of the three possible low temperature symmetries considered, andTable III reports a summary of the characteristic of the unit cell together with the number ofphonons expected to be active for the different space groups. Depending on the relative po-sition of the neighboring dimerised Ti pairs, the symmetry elements lost in the dimerisationare different and the possible space groups in the SP phase are P2/c (Table III(a)), P21/m(b) or Pmm2 (c). The first two are monoclinic groups with their unique axis perpendicularto the TiO plane (along the c−axis of the orthorhombic phase), and lying in the TiO plane(‖ to the a−axis of the orthorhombic phase), respectively. The third candidate (Fig.3(c))has orthorhombic symmetry.
The group theory analysis based on the two space groups suggested for the SP phase(P21/m
14 and Pmm221) shows that the number of modes expected to be Raman active is
7

TABLE III: Comparison between the possible low temperature space group.
(a) Space group P2/c
Unique axis ⊥ to TiO plane, C42h
4TiOBr per unit cell
Γ = 7Ag + 6Au + 9Bg + 11Bu
7Ag Raman active σxx, σyy, σzz, σxy
11Bg Raman active σxz, σyz
6Au and 9Bu IR active
(b) Space group P21/m
Unique axis in the TiO plane, C22h
4 TiOBr per unit cell
Γ = 12Ag + 5Au + 6Bg + 10Bu
12Ag Raman active σxx, σyy, σzz, σxy
6Bg Raman active σxz, σyz
5Au and 10Bu IR active
(c) Space group Pmm2
4 TiOBr per unit cell
Γ = 11A1 + A2 + 4B1 + 5B2
11A1 Raman active σxx, σyy, σzz
A2 Raman active σxy
4B1 and 5B2 Raman active in σxz and σyz
different in the two cases (Table III(b) and (c)). In particular, the 12 fully symmetric vibra-tional modes (Ag), in the P21/m space group, are expected to be active in the σxx, σyy, σzz
and σxy polarizations, and 6Bg modes are expected to be active in the cross polarizations(σxz and σyz). Note that in this notation, z refers to the unique axis of the monocliniccell, so σyz corresponds to c(ab)c for the HT orthorhombic phase. For Pmm2 the 11 A1
vibrational modes are expected to be active in the σxx, σyy, σzz polarizations, and only onemode of symmetry A2 is expected to be active in the cross polarization (σxy or c(ab)c). Theexperiments, reported in Table IV for both compounds and in Fig.2 for TiOBr only, showthat 10 modes are active in the c(aa)c and c(bb)c in the SP phase (Fig.2(c)), and, moreimportantly, two modes are active in the cross polarization c(ab)c. This is not compatiblewith the expectation for Pmm2. Hence the comparison between the experiments and thegroup theoretical analysis clearly shows that of the two low temperature structures reportedin X-ray crystallography15,21, only the P21/m is compatible with the present results.
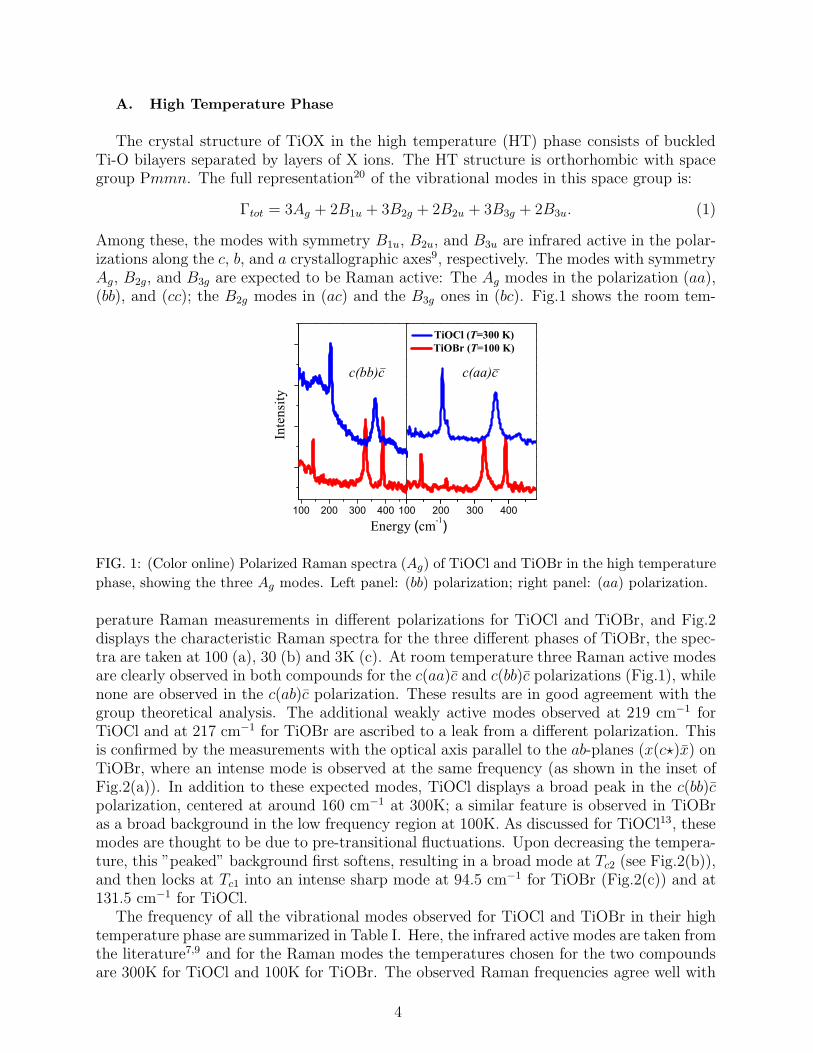
As discussed in the introduction, the presence of three phases in different temperatureintervals for TiOX is now well established even though the nature of the intermediate phaseis still largely debated7,12,15. The temperature dependence of the Raman active modes forTiOBr between 3 and 50 K, is depicted in Fig.4. In the spin-Peierls phase, as discussedabove, the reduction of the crystal symmetry16 increases the number of Raman active modes.Increasing the temperature above Tc1 a different behavior for the various low temperaturephonons is observed. As shown in Fig.4, some of the modes disappear suddenly at Tc1
(labeled LT ), some stay invariant up to the HT phase (RT ) and some others undergo asudden broadening at Tc1 and slowly disappear upon approaching Tc2 (IT ). The polarizationanalysis of the Raman modes in the temperature region Tc1 < T < Tc2 shows that the number
8
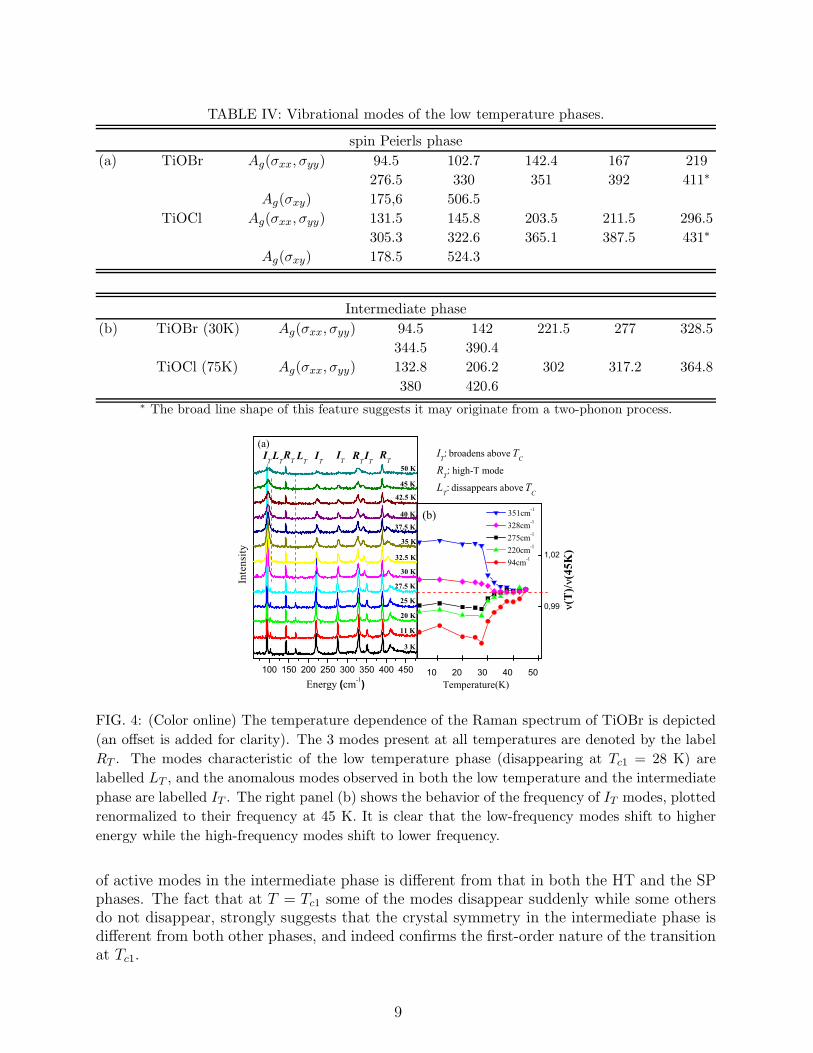
TABLE IV: Vibrational modes of the low temperature phases.
spin Peierls phase
(a) TiOBr Ag(σxx, σyy) 94.5 102.7 142.4 167 219
276.5 330 351 392 411∗
Ag(σxy) 175,6 506.5
TiOCl Ag(σxx, σyy) 131.5 145.8 203.5 211.5 296.5
305.3 322.6 365.1 387.5 431∗
Ag(σxy) 178.5 524.3
Intermediate phase
(b) TiOBr (30K) Ag(σxx, σyy) 94.5 142 221.5 277 328.5
344.5 390.4
TiOCl (75K) Ag(σxx, σyy) 132.8 206.2 302 317.2 364.8
380 420.6∗ The broad line shape of this feature suggests it may originate from a two-phonon process.
100 150 200 250 300 350 400 450 10 20 30 40 50
0,99
1,02
LTRTITRT
ITITRTLT
Inte
nsity
Energy (cm-1)
3 K
11 K
20 K
25 K
27.5 K
30 K
32.5 K
35 K
37.5 K
40 K
42.5 K
45 K
50 K
IT: broadens above TC
RT: high-T mode
LT: dissappears above TC
IT(a)
351cm-1
328cm-1
275cm-1
220cm-1
94cm-1
Temperature(K)
(T
)/(45K
)
(b)
FIG. 4: (Color online) The temperature dependence of the Raman spectrum of TiOBr is depicted
(an offset is added for clarity). The 3 modes present at all temperatures are denoted by the label
RT . The modes characteristic of the low temperature phase (disappearing at Tc1 = 28 K) are
labelled LT , and the anomalous modes observed in both the low temperature and the intermediate
phase are labelled IT . The right panel (b) shows the behavior of the frequency of IT modes, plotted
renormalized to their frequency at 45 K. It is clear that the low-frequency modes shift to higher
energy while the high-frequency modes shift to lower frequency.
of active modes in the intermediate phase is different from that in both the HT and the SPphases. The fact that at T = Tc1 some of the modes disappear suddenly while some othersdo not disappear, strongly suggests that the crystal symmetry in the intermediate phase isdifferent from both other phases, and indeed confirms the first-order nature of the transitionat Tc1.
9

In the X-ray structure determination15, the intermediate incommensurate phase is dis-cussed in two ways. Firstly, starting from the HT orthorhombic (Pmmn) and the SP mon-oclinic space group (P21/m - unique axis in the TiO planes, ‖ to a), the modulation vectorrequired to explain the observed incommensurate peaks is two-dimensional for both spacegroups. Secondly, starting from another monoclinic space group, with unique axis perpen-dicular to the TiO bilayers (P2/c), the modulation vector required is one-dimensional. Thelatter average symmetry is considered (in the commensurate variety) in Fig.3(a) and TableIII(a).
In the IP, seven modes are observed in the σxx, σyy and σzz geometry on both compounds(see Table IV(b)), and none in the σxy geometry. This appears to be compatible with all thespace groups considered, and also with the monoclinic group with unique axis perpendicularto the TiO planes (Table III(a)). Even though from the evidence it is not possible to ruleout any of the other symmetries discussed, the conjecture that in the intermediate incom-mensurate phase the average crystal symmetry is already reduced, supports the descriptionof the intermediate phase as a monoclinic group with a one-dimensional modulation15, andmoreover it explains the anomalous first-order character of the spin-Peierls transition at Tc1.The diagram shown in Fig.5 aims to visualize that the space group in the spin-Peierls state
FIG. 5: (Color online) The average crystal symmetry of the intermediate phase is proposed to be
monoclinic with the unique axis parallel to the c−axis of the orthorhombic phase. Hence the low
temperature space group is not a subgroup of the intermediate phase, and the transition to the
spin-Peierls phase is consequently of first order.
(P21/m) is a subgroup of the high temperature Pmmn group, but not a subgroup of any ofthe possible intermediate phase space groups suggested (possible P2/c). This requires thephase transition at Tc1 to be of first order, instead of having the conventional spin-Peierlssecond-order character.
Let us return to Fig.4(b) to discuss another intriguing vibrational feature of the interme-diate phase. Among the modes characterizing the intermediate phase (IT ), the ones at lowfrequency shift to higher energy approaching Tc2, while the ones at high frequency move tolower energy, seemingly converging to a central frequency (≃300 cm−1 for both TiOCl andTiOBr). This seems to indicate an interaction of the phonons with some excitation around300 cm−1. Most likely this is in fact arising from a strong, thermally activated couplingof the lattice with the magnetic excitations, and is consistent with the pseudo-spin gapobserved in NMR experiments4,22 of ≈430 K (≃300 cm−1).
10

C. Magnetic Interactions
As discussed in the introduction, due to the shape of the singly occupied 3d orbital, themain magnetic exchange interaction between the spins on the Ti ions is along the crystallo-graphic b−direction. This, however, is not the only effective magnetic interaction. In fact,
FIG. 6: (Color online) (a) Magnetization as a function of temperature measured with fields 1 T
and 5 T (the magnetization measured at 1 T is multiplied by a factor of 5 to evidence the linearity).
The inset shows the main magnetic interactions (see text). (b) Pressure dependence of Tc1. The
transition temperature for transition to the spin-Peierls phase increases with increasing pressure.
The inset shows the magnetization versus the temperature after subtracting the background signal
coming from the pressure cell.
one also expects a superexchange interaction between nearest and next-nearest neighborchains (J2 and J3 in the insert of Fig.6(a))23. The situation of TiOX is made more interest-ing by the frustrated geometry of the interchain interaction, where the magnetic coupling J2
between adjacent chains is frustrated and the exchange energies can not be simultaneouslyminimized. Table V reports the exchange interaction values for the three possible magneticinteractions calculated for TiOBr. These magnetic interactions were computed with a DFTBroken symmetry approach24 using an atom cluster including the two interacting atomsand all the surrounding ligand atoms, in addition the first shell of Ti3+ ions was replacedby Al3+ ions and also included in the cluster. The calculations were performed with theGaussian03 package25 using the hybrid exchange-correlation functional B3LYP26 and the6-3111G* basisset.
TABLE V: Calculated Exchange interactions in TiOBr
TiOBr
J1 = −250 K
J2 = −46.99 K
J3 = 11.96 K
Although the computed value for the magnetic interaction along the b−axis is half of thevalue obtained from the magnetic susceptibility fitted with a Bonner-Fisher curve accounting
11

for a one-dimensional Heisenberg chain, it is possible to extract some conclusions from theab-initio computations. The most interesting outcome of the results is that in addition to themagnetic interaction along the b−axis, there is a relevant interchain interaction (J1/J2 = 5.3)in TiOBr. Firstly, this explains the substantial deviation of the Bonner-Fisher fit fromthe magnetic susceptibility even at temperature higher than Tc2. Secondly, the presenceof an interchain interaction, together with the inherent frustrated geometry of the bilayerstructure, was already proposed in literature12 in order to explain the intermediate phaseand its structural incommensurability.
The two competing exchange interactions J1 and J2 have different origins: the first arisesfrom direct exchange between Ti ions, while the second is mostly due to the superexchangeinteraction through the oxygen ions23. Thus, the two exchange constants are expected todepend differently on the structural changes induced by hydrostatic pressure, J1 shouldincrease with hydrostatic pressure (increases strongly with decreasing the distance betweenthe Ti ions), while J2 is presumably weakly affected due only to small changes in the Ti–O–Ti angle (the compressibility estimated from the lattice dynamics simulation is similaralong the a and b crystallographic directions). The stability of the fully dimerized state isreduced by the presence of an interchain coupling, so that Tc1 is expected to be correlatedto J1/J2. Pressure dependent magnetic experiments have been performed to monitor thechange of Tc1 upon increasing hydrostatic pressure. The main results, shown in Fig.6, indeedis consistent with this expectation: Tc1 increases linearly with pressure; unfortunately it isnot possible to address the behavior of Tc2 from the present measurements.
D. Electronic Excitations and Comparison with VOCl
The nature of the complex phase diagram of TiOX was originally tentatively ascribed tothe interplay of spin, lattice and orbital degrees of freedom7. Only recently, infrared spec-troscopy supported by cluster calculations excluded a ground state degeneracy of the Ti dorbitals for TiOCl, hence suggesting that orbital fluctuations can not play an important rolein the formation of the anomalous incommensurate phase27,28. Since the agreement betweenthe previous cluster calculations and the experimental results is not quantitative, the energyof the lowest 3d excited level is not accurately known, not allowing to discard the possibilityof an almost degenerate ground state. For this reason a more formal cluster calculation hasbeen performed using an embedded cluster approach. In this approach a TiO2Cl4 clusterwas treated explicitly with a CASSCF/CASPT2 quantum chemistry calculation. This clus-ter was surrounded by eight Ti3+ TIP potentials in order to account for the electrostaticinteraction of the cluster atoms with the shell of the first neighboring atoms. Finally, thecluster is embedded in a distribution of punctual charges fitting the Madelung’s potentialproduced by the rest of the crystal inside the cluster region. The calculations were per-formed using the MOLCAS quantum chemistry package29 with a triple quality basis set; forthe Ti atom polarization functions were also included. The calculations reported in TableVI, confirmed the previously reported result27 for both TiOCl and TiOBr. The first excitedstate dxy is at 0.29-0.3 eV (> 3000 K) for both compounds, therefore the orbital degrees offreedom are completely quenched at temperatures close to the phase transition.
A comparison with the isostructural compound VOCl has been carried out to confirmthat the phase transitions of the TiOX compounds are intimately related to the unpairedS=1/2 spin of the Ti ions. The V3+ ions have a 3d2 electronic configuration. Each ioncarries two unpaired electrons in the external d shell, and has a total spin of 1. The crystal
12

TABLE VI: Crystal field splitting of 3d1 Ti3+ in TiOCl and TiOBr (eV).
TiOCl TiOBr
xy 0.29-0.29 0.29-0.30
xz 0.66-0.68 0.65-0.67
yz 1.59-1.68 1.48-1.43
x2 − r2 2.30-2.37 2.21-2.29
field environment of V3+ ions in VOCl is similar to that of Ti3+ in TiOX, suggesting thatthe splitting of the degenerate d orbital could be comparable. The electrons occupy the twolowest t2g orbitals, of dy2−z2 (responsible for the main exchange interaction in TiOX) anddxy symmetry respectively. Where the lobes of the latter point roughly towards the Ti3+
ions of the nearest chain (Table VI). It is therefore reasonable to expect that the occupa-tion of the dxy orbital in VOCl leads to a substantial direct exchange interaction betweenions in different chains in VOCl and thus favors a two-dimensional antiferromagnetic order.Indeed, the magnetic susceptibility is isotropic at high temperatures and well described bya quadratic two-dimensional Heisenberg model, and at TN = 80 K VOCl undergoes a phasetransition to a two-dimensional antiferromagnet30.
200 300 400
1000 1500
3 K 20 K 40 K 60 K 78 K 98 K 116 K
Intens
ity
Frequency (cm-1)
(b)
VOCl (3 K) TiOCl (3 K)
(a) TiOBr (10 K)
FIG. 7: (Color online) Raman scattering features of VOCl. (a) High energy scattering of TiOCl/Br
and VOCl, and (b) temperature dependence of the vibrational scattering features of VOCl. No
symmetry changes are observed at TN = 80 K.
The space group of VOCl at room temperature is the same as that of TiOX in the hightemperature phase (Pmmn), and, as discussed in the previous section, three Ag modes areexpected to be Raman active. As shown in Fig.7(b), three phonons are observed throughoutthe full temperature range (3 − 300 K), and no changes are observed at TN . The modesobserved are consistent with the prediction of lattice dynamics calculations (Table I).
In the energy region from 600 to 1500 cm−1, both TiOBr and TiOCl show a similar
13

highly structured broad scattering continuum, as already reported in literature13,19. Thefact that the energy range of the anomalous feature is consistent with the magnetic exchangeconstant in TiOCl (J=660 K) suggested at first an interpretation in terms of two-magnonRaman scattering13. Later it was shown that the exchange constant estimated for TiOBris considerably smaller (J=406 K) with respect to that of TiOCl while the high energyscattering stays roughly at the same frequency. Even though the authors of ref.19 stillassigned the scattering continuum to magnon processes, it seems clear taht the considerablysmaller exchange interaction in the Br compound (J=406 K) falsifies this interpretationand that magnon scattering is not at the origin of the high energy scattering of the twocompounds. Furthermore, the cluster calculation (Table VI) clearly shows that no excitedcrystal field state is present in the energy interval considered, ruling out a possible orbitalorigin for the continuum. These observations are further strengthened by the observationof a similar continuum scattering in VOCl (see fig. 7(a)) which has a different magneticand electronic nature. Therefore, the high energy scattering has most likely a vibrationalorigin. The lattice dynamics calculations, confirmed by the experiments, show that a ”high”energy mode (≃600 cm−1) of symmetry B3g (Table I) is expected to be Raman active inthe σyz polarization. Looking back at Fig.2, the inset shows the measurements performedwith the optical axis parallel to the TiOX plane, where the expected mode is observed at598 cm−1. The two phonon process related to this last intense mode is in the energy rangeof the anomalous scattering feature and has symmetry Ag (B3g ⊗ B3g). The nature of theanomalies observed is therefore tentatively ascribed to a multiple-phonon process. Furtherdetailed investigations of lattice dynamics are needed to clarify this issue.
IV. CONCLUSION
The symmetry of the different phases has been discussed on the basis of inelastic lightscattering experiments. The high temperature Raman experiments are in good agreementwith the prediction of the group theoretical analysis (apart from one broad mode which isascribed to pre-transitional fluctuations). Comparing group theoretical analysis with thepolarized Raman spectra clarifies the symmetry of the spin-Peierls phase and shows thatthe average symmetry of the incommensurate phase is different from both the high temper-ature and the SP phases. The conjecture that the intermediate phase is compatible with adifferent monoclinic symmetry (unique axis perpendicular to the TiO planes) could explainthe anomalous first-order character of the transition to the spin-Peierls phase. Moreover, ananomalous behavior of the phonons characterizing the intermediate phase is interpreted asevidencing an important spin-lattice coupling. The susceptibility measurements of TiOBrshow that Tc1 increases with pressure, which is ascribed to the different pressure dependenceof intrachain and interchain interactions. Finally, we compared the TiOX compounds withthe ”isostructural” VOCl. The presence of the same anomalous high energy scattering fea-ture in all the compounds suggests that this feature has a vibrational origin rather than amagnetic or electronic one.
Acknowledgements The authors are grateful to Maxim Mostovoy, Michiel van der Vegte,Paul de Boeij, Daniel Khomskii, Iberio Moreira and Markus Gruninger for valuable andinsightful discussions. This work was partially supported by the Stichting voor FundamenteelOnderzoek der Materie [FOM, financially supported by the Nederlandse Organisatie voorWetenschappelijk Onderzoek (NWO)], and by the German Science Foundation (DFG).
14

V. APPENDIX: DETAILS OF THE SPRING MODEL CALCULATION
The spring model calculation reported in the paper, was carried out using the softwarefor lattice-dynamical calculation UNISOFT31 (release 3.05). In the calculations the Born-von Karman model was used; here the force constants are treated as model parametersand they are not interpreted in terms of a special interatomic potential. Only short rangeinteractions between nearest neighbor ions are taken into account. Considering the forces tobe central forces, the number of parameters is reduced to two for each atomic interaction:
the longitudinal and transversal forces respectively defined as L =d2V (ri,j)
dr2 and T = 1r
dV (ri,j)
dr.
A custom made program was interfaced with UNISOFT to optimize the elastic constants.Our program proceeded scanning the n dimensional space (n = number of parameters) witha discrete grid, to minimize the squared difference between the calculated phonon frequenciesand the measured experimental frequencies for TiOBr, taken from both Raman and infraredspectroscopy. The phonon frequencies of TiOCl and VOCl were obtained using the elasticconstants optimized for TiOBr and substituting the appropriate ionic masses. The optimizedforce constants between different atoms are reported in N/m in the following Table.
TABLE VII: Elastic constants used in the spring model calculation. The label numbers refer to
Fig. ??, while the letters refer to the different inequivalent positions of the ions in the crystal.
Number Ions Longitudinal (L) (N/m) Transversal (T) (N/m)
1 Ti(a)-Ti(b) 18.5 32.7
2 Ti(a)-O(a) 18.5 11.1
3 Ti(a)-O(b) 53.1 9.5
4 Ti(a)-X(a) 29.0 4.4
5 O(a)-O(b) 20.6 7.3
6 X(a)-O(a) 18.5 3.5
7 X(a)-X(b) 11.7 0.7
∗ Electronic address: [email protected]† Electronic address: [email protected] M. Imada, A. Fujimori, and Y. Tokura, Rev. Mod. Phys. 70, 1039 (1998).2 E. Dagotto, Rep. Prog. Phys. 62, 1525 (1999).3 V. Kataev, J. Baier, A. Moller, L. Jongen, G. Meyer, , and A. Freimuth, Phys. Rev. B 68,
140405 (2003).4 T. Imai and F. C. Choub, cond-mat 0301425 (2003), URL
http://xxx.lanl.gov/abs/cond-mat/0301425.5 C. H. Maule, J. N. Tothill, P. Strange, and J. A. Wilson, J. Phys. C 21, 2153 (1988).6 A. Seidel, C. A. Marianetti, F. C. Chou, G. Ceder, and P. A. Lee, Phys. Rev. B 67, 020405
(2003).7 G. Caimi, L. Degiorgi, P. Lemmens, and F. C. Chou, J. Phys. Cond. Mat. 16, 5583 (2004).8 R. J. Beynon and J. A. Wilson, J. Phys. Cond. Mat. 5, 1983 (1993).
15

9 G. Caimi, L. Degiorgi, N. N. Kovaleva, P. Lemmens, and F. C. Chou, Phys. Rev. B 69, 125108
(2004).10 M. Shaz, S. van Smaalen, L. Palatinus, M. Hoinkis, M. Klemm, S. Horn, and R. Claessen, Phys.
Rev. B 71, 100405 (2005).11 J. Hemberger, M. Hoinkis, M. Klemm, M. Sing, R. Claessen, S. Horn, and A. Loidl, Phys. Rev.
B 72, 012420 (2005).12 R. Ruckamp, J. Baier, M. Kriener, M. W. Haverkort, T. Lorenz, G. S. Uhrig, L. Jongen,
A. Moller, G. Meyer, and M. Gruninger, Phys. Rev. Lett. 95, 097203 (2005).13 P. Lemmens, K. Y. Choi, G. Caimi, L. Degiorgi, N. N. Kovaleva, A. Seidel, and F. C. Chou,
Phys. Rev. B 70, 134429 (2004).14 L. Palatinus, A. Schoenleber, and S. van Smaalen, Acta Crystallogr. Sect. C 61, 148 (2005).15 S. van Smaalen, L. Palatinus, and A. Schoenleber, Phys. Rev. B 72, 020105(R) (2005).16 A. Schoenleber, S. van Smaalen, and L. Palatinus, Phys. Rev. B 73, 214410 (2006).17 A. Krimmel, J. Strempfer, B. Bohnenbuck, B. Keimer, M. Hoinkis, M. Klemm, S. Horn, A. Loidl,
M. Sing, R. Claessen, et al., Phys. Rev. B 73, 172413 (2006).18 C. A. Kuntscher, S. Frank, A. Pashkin, M. Hoinkis, M. Klemm, M. Sing, S. Horn, and
R. Claessen, Phys. Rev. B 74, 184402 (2006).19 P. Lemmens, K. Y. Choi, R. Valenti, T. Saha-Dasgupta, E. Abel, Y. S. Lee, and F. C. Chou,
New Journal of Pysics 7, 74 (2005).20 D. L. Rousseau, R. P. Bauman, and S. P. S. Porto, Journal of Raman Spectroscopy 10, 253
(1981).21 T. Sasaki, T. Nagai, K. Kato, M. Mizumaki, T. Asaka, M. Takata, Y. Matsui, H. Sawa, and
J. Akimitsu, Sci. Tech. Adv. Mat. 7, 17 (2006).22 P. J. Baker, S. J. Blundell, F. L. Pratt, T. Lancaster, M. L. Brooks, W. Hayes, M. Isobe,
Y. Ueda, M. Hoinkis, M. Sing, et al., Phys. Rev. B 75, 094404 (2007).23 R. Macovez (2007), unpublished.24 L. Noodleman and J. G. Norman, J. Chem. Phys. 70, 4903 (1979).25 M. J. F. et al., Gaussian 03, revision c.02, gaussian, Inc., Wallingford, CT, 2004.26 A. D. Becke, J. Chem. Phys. 98, 5648 (1993).27 R. Ruckamp, E. Benckiser, M. W. Haverkort, H. Roth, T. Lorenz, A. Freimuth, L. Jongen,
A. Moller, G. Meyer, P. Reutler, et al., New Journal of Physics 7, 1367 (2005).28 D. V. Zakharov, J. Deisenhofer, H. A. K. von Nidda, P. Lunkenheimer, J. Hemberger,
M. Hoinkis, M. Klemm, M. Sing, R. Claessen, M. V. Eremin, et al., Phys. Rev. B 73, 094452
(2006).29 G. Karlstro, R. Lindh, P. Malmqvist, B. Roos, U. Ryde, V. Veryazov, P. Widmark, M. Cossi,
B. Schimmelpfennig, P. Neogrady, et al., Comput. Mater. Sci. 28, 222 (2003).30 A. Wiedenmann, J. R. Mignod, J. P. Venien, and P. Palvadeau, JMMM 45, 275 (1984).31 G. Eckold, UNISOFT - A Program Package for Lattice Dynamical Calculations: Users Manual
(1992).
16
Related Documents