Welcome message from author
This document is posted to help you gain knowledge. Please leave a comment to let me know what you think about it! Share it to your friends and learn new things together.
Transcript
1
Title: Syllable intelligibility for temporally-�ltered LPC cepstral trajectories
Authors: Takayuki Arai1, Misha Pavel2;3, Hynek Hermansky3;4, and Carlos Avendano5
A�liation: 1 Department of Electrical and Electronics Engineering
Sophia University, 7{1 Kioi-cho, Chiyoda-ku, Tokyo, Japan
2 AT&T Labs West, 75 Willow Rd., Menlo Park, CA 94025, USA
3 Oregon Graduate Institute of Science & Technology,
P.O. Box 91000, Portland, OR 97291-1000, USA
4 International Computer Science Institute,
1947 Center St., Berkeley, CA 94704, USA
5 CIPIC, University of California, Davis, CA 95616, USA
Running Title: Syllable intelligibility for �ltered cepstral trajectories
Received:
T. Arai et al., \Syllable intelligibility for �ltered cepstral trajectories," JASA 2
Abstract
We measured the intelligibility of syllables whose cepstral trajectories were
temporally �ltered. The speech signals were transformed to their LPC cepstral
coe�cients, and these coe�cients were passed through di�erent �lters. We re-
combined these �ltered trajectories with the residuals and reconstructed the
speech signal. We then measured the intelligibility of the reconstructed speech
segments in two perceptual experiments for Japanese syllables. We report on
the e�ect of various low-pass, high-pass, and band-pass �ltering and summa-
rize the results using a theoretical approach based on the independence of the
contributions in di�erent modulation bands. The overall results suggest that
speech intelligibility is not severely impaired as long as the �ltered spectral
components have a rate of change between 1 Hz and 16 Hz.
PACS No.: 43.72.Ar, 43.66.Mk, 43.71.Es
T. Arai et al., \Syllable intelligibility for �ltered cepstral trajectories," JASA 3
1 INTRODUCTION
One of the main objectives of front-end processing in robust automatic speech recog-
nition (ASR) is to preserve critical linguistic information while suppressing such ir-
relevant information as speaker-speci�c characteristics, channel characteristics, and
additive noise. The information suppressed in the front end of the recognizer is lost
for the recognition process. To determine information to be preserved we need to
identify those features of the signal that are necessary for human speech recognition.
One way to identify the useful features is to suppress a given feature, reconstruct the
speech, and determine its intelligibility through perceptual experiments.
Temporal processing, or �ltering the time trajectories, of the logarithmic spec-
trum or cepstral coe�cients is becoming a common procedure in current ASR. One
reason for this type of processing is that the convolutional distortion, such as the
frequency characteristics of a communications channel, is an additive component in
the logarithmic spectrum and the cepstrum domains. These channel characteristics
are often �xed or only slowly varying in time. Therefore, cepstral mean subtraction
(CMS) is often used to eliminate the channel characteristics by subtracting the mean
(or dc component) of the time trajectory of each cepstral coe�cient [1]. The delta
features are calculated as linear regression coe�cients over a short segment of a time
trajectory to emphasize the dynamic characteristics of the original features [6]. This
delta technique is e�ectively equivalent to applying an FIR band-pass �lter which
T. Arai et al., \Syllable intelligibility for �ltered cepstral trajectories," JASA 4
eliminates the dc component of the time trajectory and applies 6 dB/oct emphasis
on changes up to approximately 12 Hz.
The RelAtive SpecTrAl (RASTA) technique suppresses the spectral components
that change more slowly or quickly than the typical range of change of spectral enve-
lope [8] 1. The RASTA technique is implemented by the following steps: 1) compute
the spectral amplitude, 2) transform the spectral amplitude through a compressing
static nonlinear transformation, 3) �lter the time trajectory of each transformed spec-
tral component, 4) transform the �ltered speech representation through an expanding
static nonlinear transformation, and 5) perform optional processing. The logarith-
mic function is often used for the non-linear transformation. RASTA processing also
eliminates the dc component but, unlike the delta feature computation, it passes com-
ponents between 1 Hz and 12 Hz unattenuated. Both delta and RASTA techniques
appear to achieve some degree of robustness to channel variations.
Thus, the front end suppresses some information from the speech signal by �l-
tering the time trajectories of the cepstral coe�cients. The relatively slow rates of
cepstral change, or low modulation frequencies, include such information as channel
characteristics, speaker information and voice quality, which are assumed not cru-
cial for human speech communication. Similarly, the relatively fast rates of cepstral
1Please note that throughout this paper we address the rate of change of spectral envelope, i.e.,
the rate at which the source signal is being modulated by changes in the vocal tract shape, not the
rate of change of the signal itself.
T. Arai et al., \Syllable intelligibility for �ltered cepstral trajectories," JASA 5
change, or high modulation frequencies, might be less important for human speech
communication.
To justify this approach, it is essential to identify the contribution of di�erent
modulation frequency bands of cepstral coe�cients to in human speech recognition.
In this paper, we used the LPC-based approach for at least two reasons. First, LPC
is the most common technique in speech engineering, therefore our results are directly
applicable to many LPC-based ASR systems. Second, the results can enhance our
understanding of the temporal properties of the speech signals. This is due to the
fact that, at least in theory, the LPC analysis separates speech information into
two components: the sound source and the vocal tract. Hence the LPC technique
allows us to manipulate these components independently and permits us to study the
dynamics of each.
The goal of this study is to examine the e�ect of �ltering the time trajectories of
the spectral envelope on the intelligibility of the reconstructed speech.
Drullman [2, 3] reported the e�ect of temporal �ltering of the spectral envelope
on the intelligibility of speech. In his study, the original speech was split into a series
of frequency bands. The magnitude envelope of the analytic signal for each band was
then low-pass and high-pass �ltered. He concluded that low-pass �ltering below 16
Hz or high-pass �ltering above 4 Hz does not appreciably reduce speech intelligibility.
Drullman's results showed that the low and high modulation frequencies of the
T. Arai et al., \Syllable intelligibility for �ltered cepstral trajectories," JASA 6
magnitude spectrum are not essential for the intelligibility of speech. These results
are, in principle, consistent with RASTA processing.
In this paper, we will focus on the following question: \How will speech intelligi-
bility be a�ected if:
1) �ltering is done in the cepstral trajectories,
2) the �lters are band-pass �lters, and
3) the energy contour is unmodi�ed?"
Prior work does not address these questions for the following reasons. First, Drull-
man applied the �ltering to the magnitude envelope of the analytic signal, which
e�ectively implies �ltering of the magnitude spectrum of the speech. It is not obvi-
ous that Drullman's results generalize to other features, such as cepstrum, that are
typically used for speech recognition. Filtering in a di�erent domain might a�ect
human speech perception di�erently. This is particularly true if the �ltering is per-
formed on a non-linear transformation of the signal, e.g., the logarithmic function.
In contrast to Drullman's study, we examined the e�ects of temporal �ltering of the
time trajectories of the LPC cepstrum. Thus, our results have direct implications for
cepstrum-based ASR systems.
Second, it is not obvious whether his results for the low-pass and the high-pass
experiments can be used to draw any conclusions about band-pass �ltering because of
a non-linearity of the human auditory system. Therefore, we investigated empirically
T. Arai et al., \Syllable intelligibility for �ltered cepstral trajectories," JASA 7
the e�ect of band-pass �ltering.
Third, because the temporal change of the magnitude envelope was �ltered in
Drullman's experiment, the energy contour and the temporal change of the spectrum
were both a�ected. Instead, we focus on the only the modi�cation of the spectral
change; in our experiment the energy contour of the modi�ed signal is kept the same
as that of the original signal.
In this paper, we �rst describe the signal processing based on a residual-excited
LPC vocoder. This signal processing consists of the LPC cepstral analysis of the
speech signal, temporal �ltering of the cepstrum, and reconstruction of the speech.
The stimuli for the perceptual experiments are describe in Section 3. In the same
section, the experimental procedure, subjects, and data analysis are described. We
then describe two experiments with low-pass and high-pass conditions (Experiment
I), and band-pass conditions (Experiment II). Finally, we discuss further issues based
on the experimental results including the information for intelligibility using a density
function over the modulation frequency (in Section 5).
2 SIGNAL PROCESSING
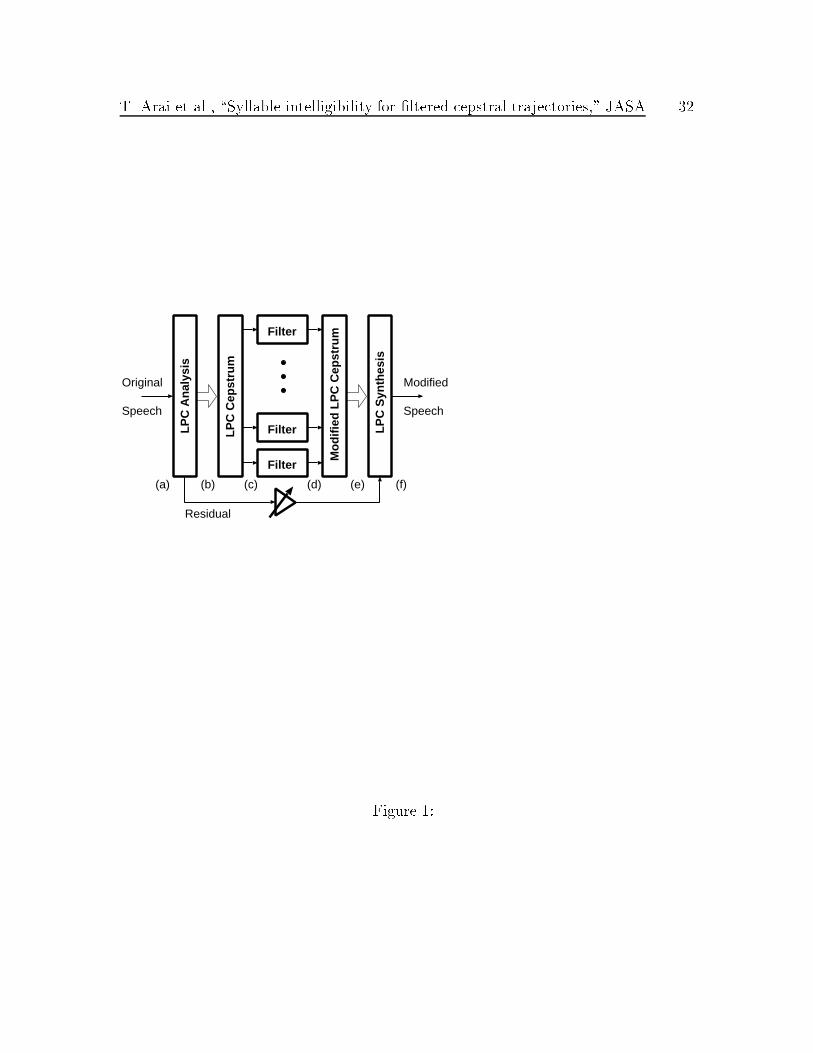
An overview of our signal-processing method is illustrated in Fig. 1. It consists of
applying a frame-by-frame LPC analysis to the original speech, then �ltering the time
trajectories of the resulting LPC cepstral coe�cients. Subsequently, the modi�ed
T. Arai et al., \Syllable intelligibility for �ltered cepstral trajectories," JASA 8
speech signal is reconstructed by an LPC synthesis technique. The �lters used in this
study were either low-pass, high-pass or band-pass, with di�erent cuto� frequencies
covering the frequency band of interest.
The signal processing technique was based on a residual-excited LPC vocoder.
This approach permits the construction of the entire continuum from the non-�ltered
signal to the complete removal of all LPC information. In the range between those two
extremes, we were able to examine speech intelligibility as a function of the frequency
content of the temporal trajectories of the LPC cepstral coe�cients.
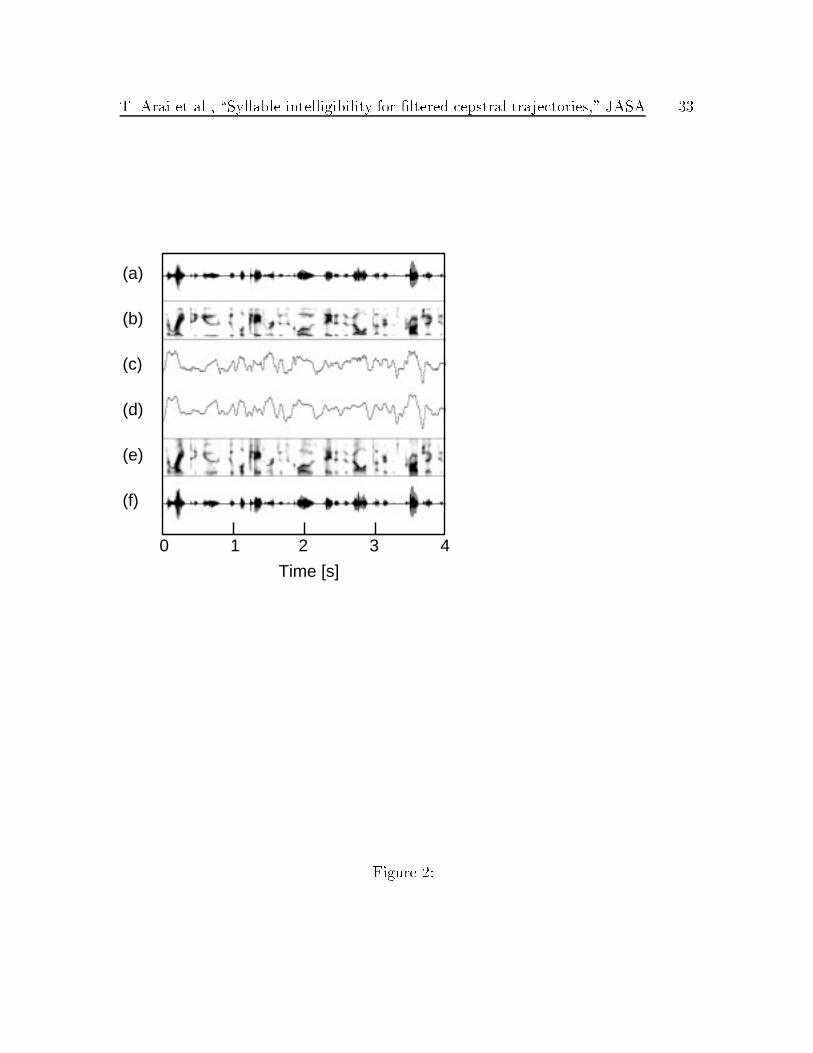
Figure 2 shows an example of an utterance: (a) the original speech and (b) its
spectrogram, the time trajectory of the �rst LPC cepstral coe�cient (c) before and
(d) after �ltering, and (f) the modi�ed speech and (e) its spectrogram. In the orig-
inal time trajectory, one can see very high modulation frequencies as well as the dc
component (Fig. 2(c)). After band-pass �ltering between 1 Hz and 16 Hz, fast and
slow modulations are removed, but the major components remain (Fig. 2(d)). A com-
parison of the spectrograms of Fig. 2 (b) and (e) indicates that the major spectral
transitions were preserved.
2.1 LPC cepstral representation
The speech signals were �rst analyzed by a 12th-order linear prediction technique,
with pre-emphasis. The energy and the 12 LPC coe�cients were calculated at each
T. Arai et al., \Syllable intelligibility for �ltered cepstral trajectories," JASA 9
frame using the parameters shown in Table 1. Following the LPC analysis, the LPC
coe�cients were converted to cepstral coe�cients. To achieve a logarithmic spec-
trum with a su�ciently high resolution, we calculated all cepstral coe�cients up to
a quefrency of 16 ms.
2.2 Filtering of the cepstral coe�cients
The time trajectory of each cepstral coe�cient was processed by a temporal �lter. The
�lters were identical at all quefrencies except that the coe�cient at zero quefrency
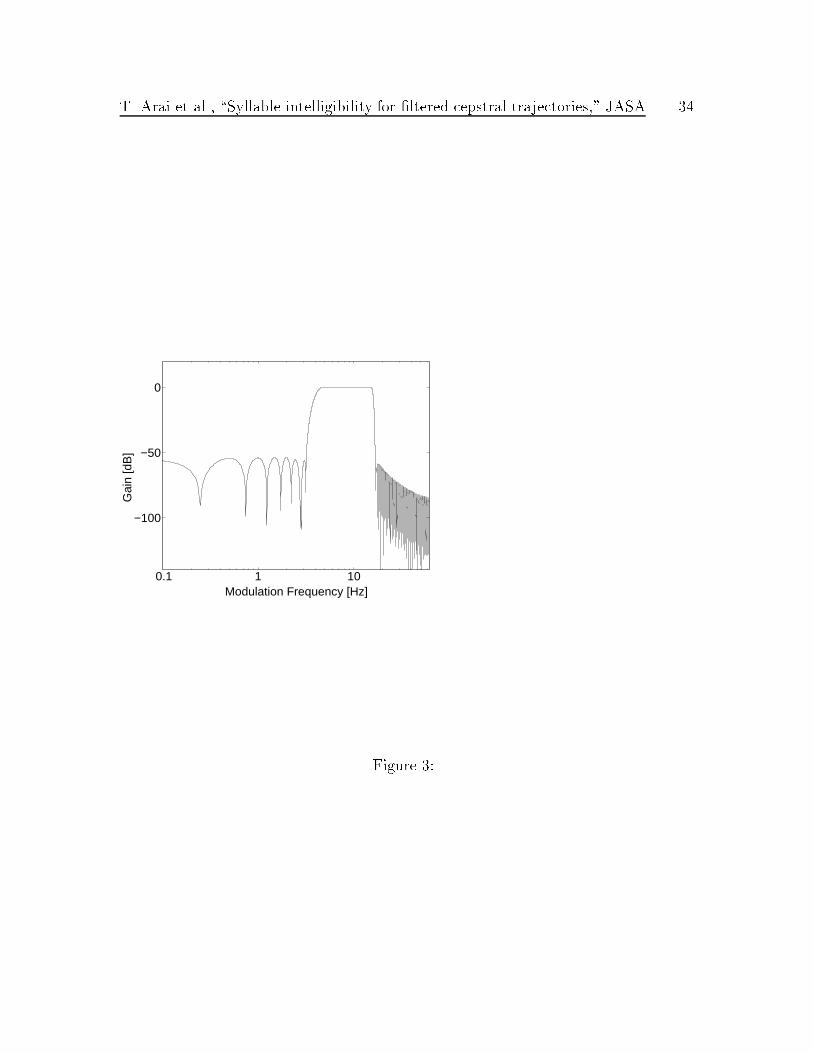
was discarded. The band-pass �lters (BPFs) were implemented as 257-tap �nite
impulse response (FIR) �lters with linear phase. Their coe�cients were designed
by the windowing method (Hamming window). For each �lter, the slope within the
transient band is approximately 48 dB/Hz. Figure 3 shows the magnitude frequency
characteristics of a sample band-pass �lter.
2.3 Reconstruction of the speech
The �ltered LPC cepstral coe�cients were used to compute the modi�ed power spec-
trum at each frame. A 12th-order LPC �lter was calculated from the auto-correlation
function obtained by applying the inverse Fourier transform of the power spectrum.
In the last stage of the signal processing, we reconstructed speech sounds using the
modi�ed LPC coe�cients together with the residual signal.
T. Arai et al., \Syllable intelligibility for �ltered cepstral trajectories," JASA 10
Ideally, the residual signal would contain only the sound source information. In
practice, however, the residual signal may also contain some information about the
vocal tract shape, so the LPC residual sometimes yields a relatively intelligible signal.
In the �rst half of this study (Experiment I), we further whitened the residual signal
to reduce the intelligibility. The whitening was not as helpful as we expected, so we
did not whiten the residual signal in the second half of this study (Experiment II).
Finally, to avoid measuring the e�ect of modifying the energy contour, we matched
the total energy in each frame of the reconstructed speech to the energy in the related
frame of the original speech. Thus, our reconstructed speech had the same energy
contour as the original speech but its spectral envelope structure was modi�ed.
3 STIMULUS
3.1 Speech samples
The original speech sounds were obtained from a Japanese syllable database used for
articulation tests at NTT Japan. To generate stimuli for this study, we selected the
voice of a 24-year-old female. Each sentence contained a target Japanese syllable in
the carrier phrase \Kankonbai oruso." The original speech signal was quantized
with a 16 bit resolution and sampled at 48 kHz. Our stimuli were processed and
presented at an 8 kHz sampling rate.
T. Arai et al., \Syllable intelligibility for �ltered cepstral trajectories," JASA 11
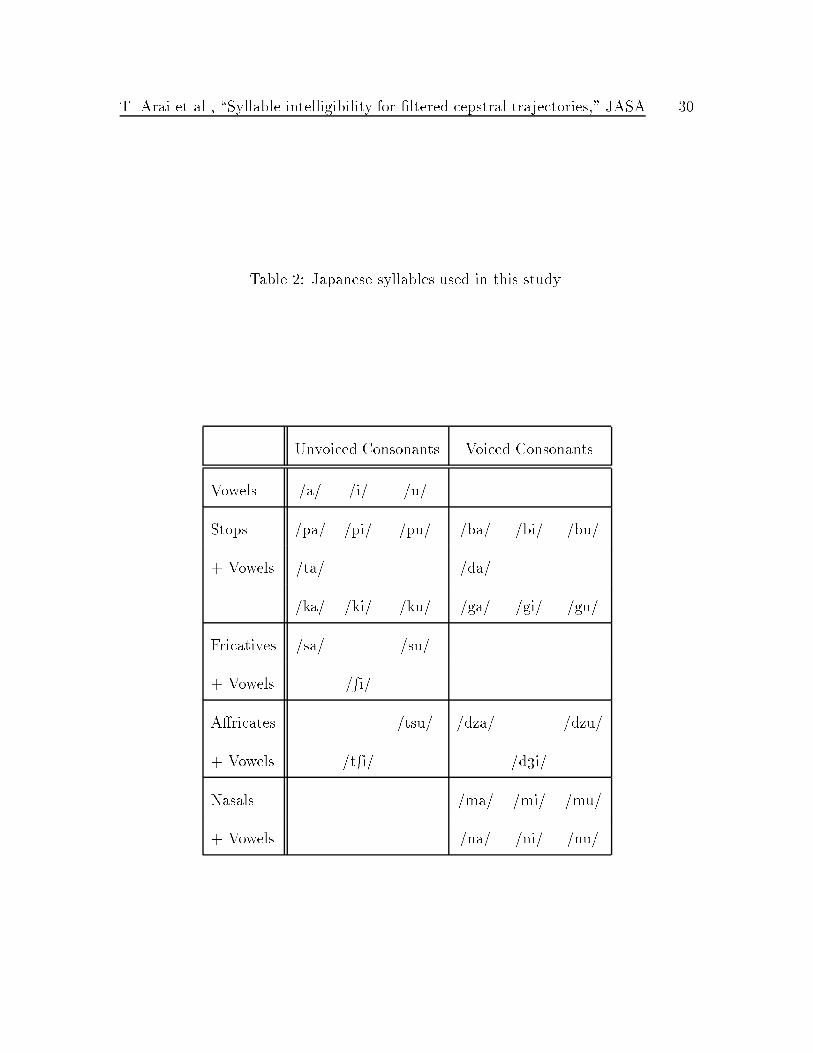
The original data set contained 100 Japanese syllables. We selected a subset of 31
syllables covering the three corner vowels /a/, /i/ and /u/, and Japanese consonants
/p/, /b/, /t/, /d/, /k/, /g/, /s/, /R/, /ts/, /t
R/, /dz/, /d3/, /n/, /m/. The 31
syllables are shown in Table 2. Each syllable is a vowel (V) or consonant-vowel (CV)
syllable.
3.2 Stimulus conditions
Stimuli were divided into conditions according to the amount of low-pass, high-pass,
and band-pass �ltering of the LPC cepstral coe�cients.
For Experiment I, the time trajectories of the LPC cepstral coe�cients were �l-
tered with low-pass and high-pass �lters with cuto� frequencies fC, where fC = f0,
1, 2, 3, 4, 5, 6, 8, 12, 24, 48, fNg [Hz], where fN is equal to half of the frame rate, i.e.,
fN = 62.5 Hz. A complete set of the 13 conditions (including clean speech) applied to
all 31 syllables was presented to our subjects in a session consisting of 403 (=13�31)
stimuli.
For Experiment II, the time trajectories of the LPC cepstral coe�cients were
�ltered with band-pass �lters. The band-pass �lters had lower cuto� frequencies fL
and upper cuto� frequencies fU , where fL = f0, 1, 2, 4, 8, 16, 32, fNg [Hz] and fU
= f0, 1, 2, 4, 8, 16, 32, fNg [Hz] (fL � fU ). Note that when fL = 0 the �lter is a
low-pass �lter, and when fU = fN the �lter is a high-pass �lter. A complete set of
T. Arai et al., \Syllable intelligibility for �ltered cepstral trajectories," JASA 12
the 30 conditions (including clean speech) applied to all 31 syllables was presented to
our subjects in a session consisting of 930 (=30�31) stimuli.
3.3 Procedure
We used the method of constant stimuli, with stimuli presented in random order.
Each subject participated in four sessions. Combinations of syllables and �ltering
conditions were randomized across sessions and subjects.
The stimuli were generated by the digital-to-analog (D/A) converter of a SPARC-
20 workstation at 8 kHz sampling rate and presented using high quality headphones
(Sennheiser HD 250 II) at a comfortable listening level. On each trial, the subject
heard an isolated syllable preceded and followed by one-second intervals of silence.
Following each stimulus presentation, subjects indicated their answer and then initi-
ated the next trial. Each stimulus was presented only once.
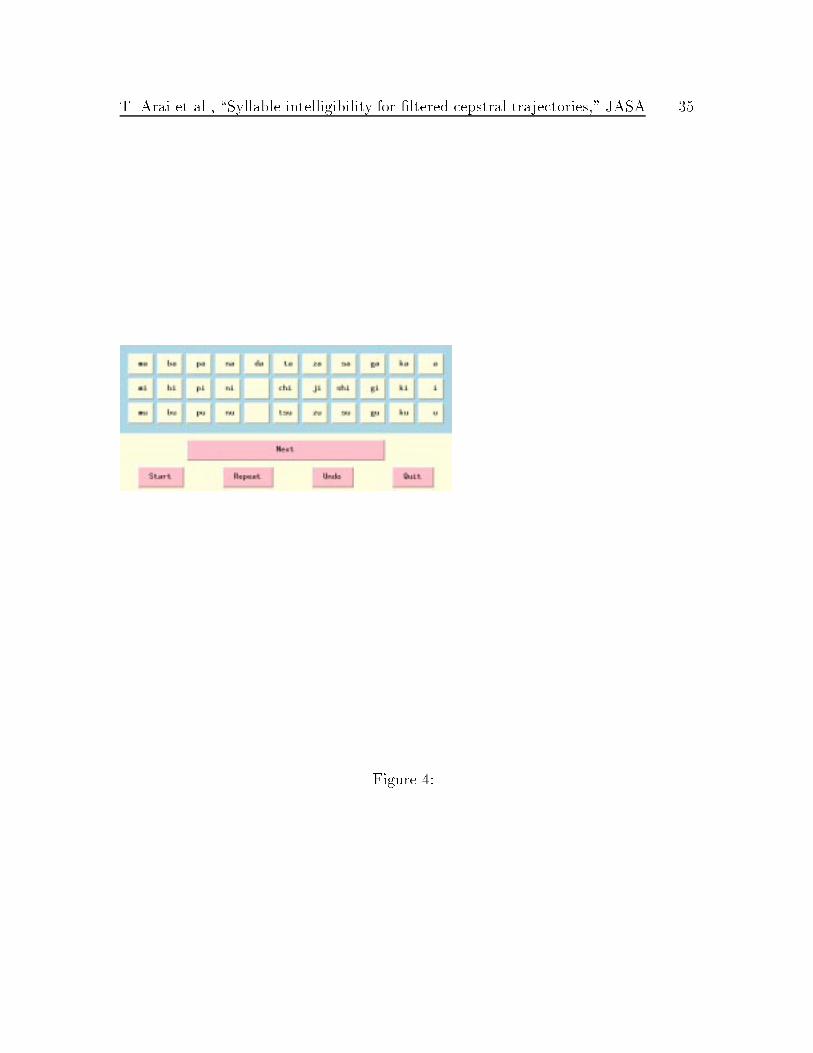
Subjects interacted with the experimental setup using a graphical user interface
and a mouse input device. As shown in Fig. 4, the monitor screen showed icons for
all 31 possible stimuli and subjects were asked to select the icon of the most likely
stimulus. In addition to the stimulus icons, there were buttons to allow corrections
and to indicate completion of trials.
T. Arai et al., \Syllable intelligibility for �ltered cepstral trajectories," JASA 13
3.4 Subjects
A total of 20 Japanese native speakers participated in the study. The subjects were
paid for their participation. Of the 20 subjects, 16 participated in Experiment I and
four in Experiment II. No subject reported having any previous hearing problem.
3.5 Data analysis
We summarized the data for each condition and each stimulus in terms of the propor-
tion of correct responses to total responses. The proportion of correct CV syllables
is de�ned as Pc(CV), and a response was scored as correct only if both constituents
(phonemes)|vowel and consonant|were recognized correctly. The resulting overall
proportions of correct responses were averaged over all stimuli for each condition. In
addition, we analyzed the results for each phonetic category. The proportion correct
for each category is denoted as Pc(category), e.g., Pc(C) for consonants and Pc(V) for
vowels.
4 EXPERIMENTAL RESULTS
4.1 Experiment I
Experiment I consisted of low-pass and high-pass �ltering of the LPC cepstral tra-
jectories. The overall summary of the results averaged over stimuli and subjects is
T. Arai et al., \Syllable intelligibility for �ltered cepstral trajectories," JASA 14
shown in Fig. 5. The abscissa of the graph shows cuto� frequencies and the ordinate
represents the proportion of correct responses Pc(CV) of each CV. Each point is an
average of 31 stimuli, eight subjects and four sessions for a total of 992 (=31�8�4)
trials. Assuming a binomial distribution of responses, the largest standard error of
the estimates is less than 2%. The corresponding error bars were omitted for clarity.
The performance for the original speech averaged over the four subjects was 85.8%
and ranged from 75.8 to 99.2%. The average score for the residual signal was 18.5%
and ranged from 7.3 to 27.4%. The useful range of the information in the LPC
cepstral trajectories was therefore 18.5{85.8%.
In the low-pass condition, the performance begins to decrease gradually below
24 Hz. In the high-pass condition, the decrease in performance begins above 1 Hz.
The low-pass and high-pass curves intersect between 3 and 4 Hz. This modulation
frequency indicates the center of information, where the information is equally divided
into lower and higher modulation bands. This modulation frequency is consistent with
the average syllabic rate of speech [9].
4.2 Experiment II
Four native Japanese subjects participated in Experiment II. Each subject partici-
pated in four experimental sessions. Each session consisted of 930 stimuli.
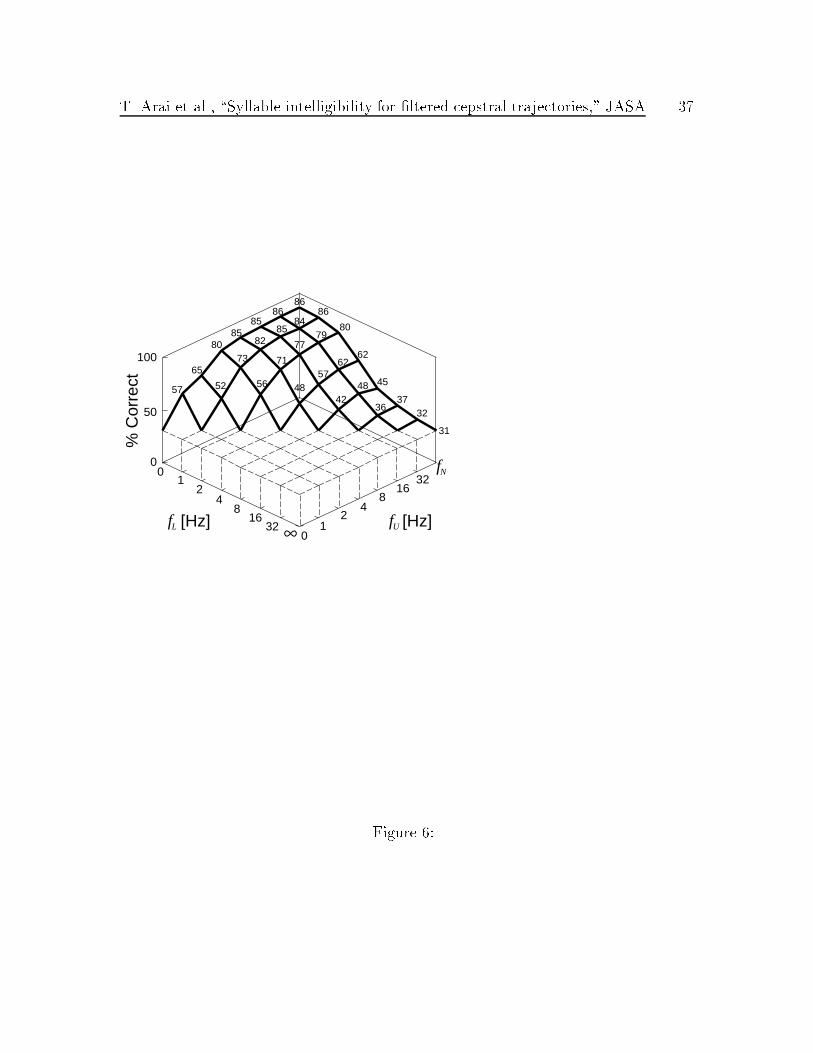
The results for the band-pass condition are shown in Fig. 6. The vertical axis is
T. Arai et al., \Syllable intelligibility for �ltered cepstral trajectories," JASA 15
the proportion of correct responses Pc(CV), while the other two axes are the cuto�
frequencies, fL and fU . Each point is an average of 31 stimuli, four subjects and four
sessions for a total of 496 (=31�4�4) trials. The largest standard error of a binomial
distribution with the same number of trials is less than 2%.
In Experiment II the performance for the original speech averaged over four sub-
jects was 86.1% and ranged from 84.7 to 89.5%. The average score for the residual
signal was 30.6% and ranged from 17.7 to 41.9%. The useful range of the information
in the LPC cepstral trajectories was therefore 30.6{86.1%.
The data from this experiment are also consistent with those of the low-pass and
high-pass conditions in Experiment I.
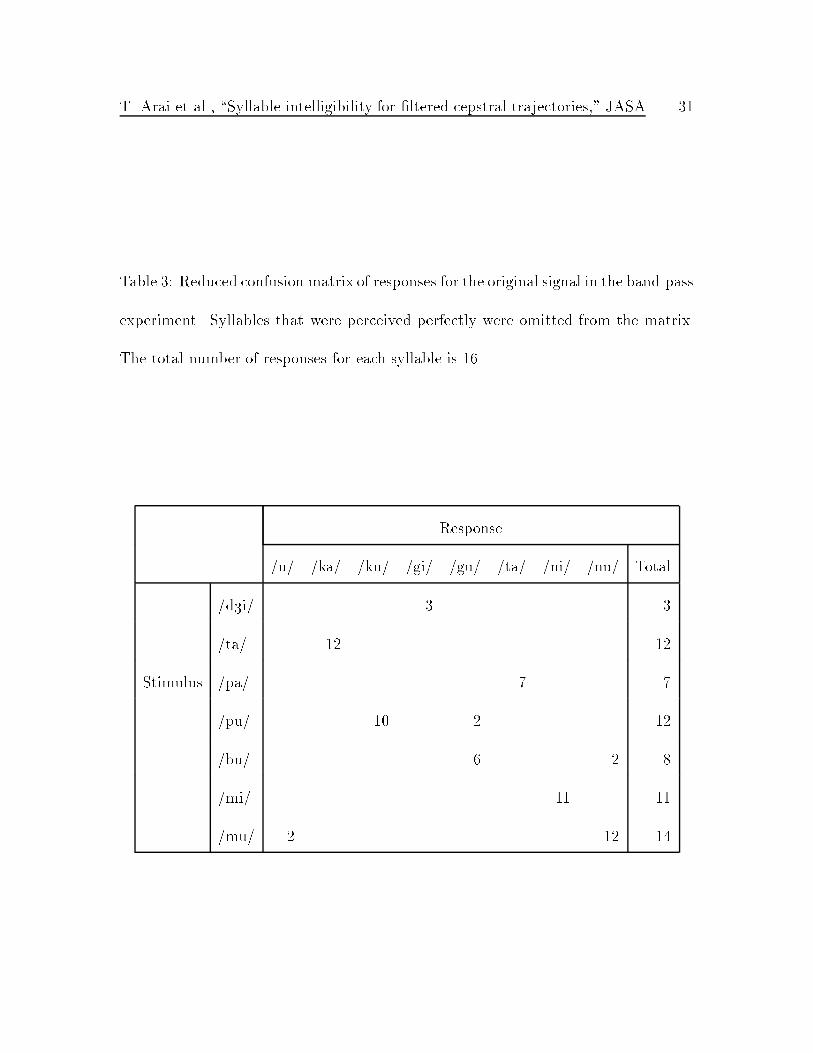
Table 3 is the confusion matrix for the original signal in Experiment II. As shown
in this table, there are several syllables for which the original signal is hard to un-
derstand. This could be attributed to the low sound quality of the 8 kHz sampled
stimuli. Misperception of the consonant of the syllables was common, while most
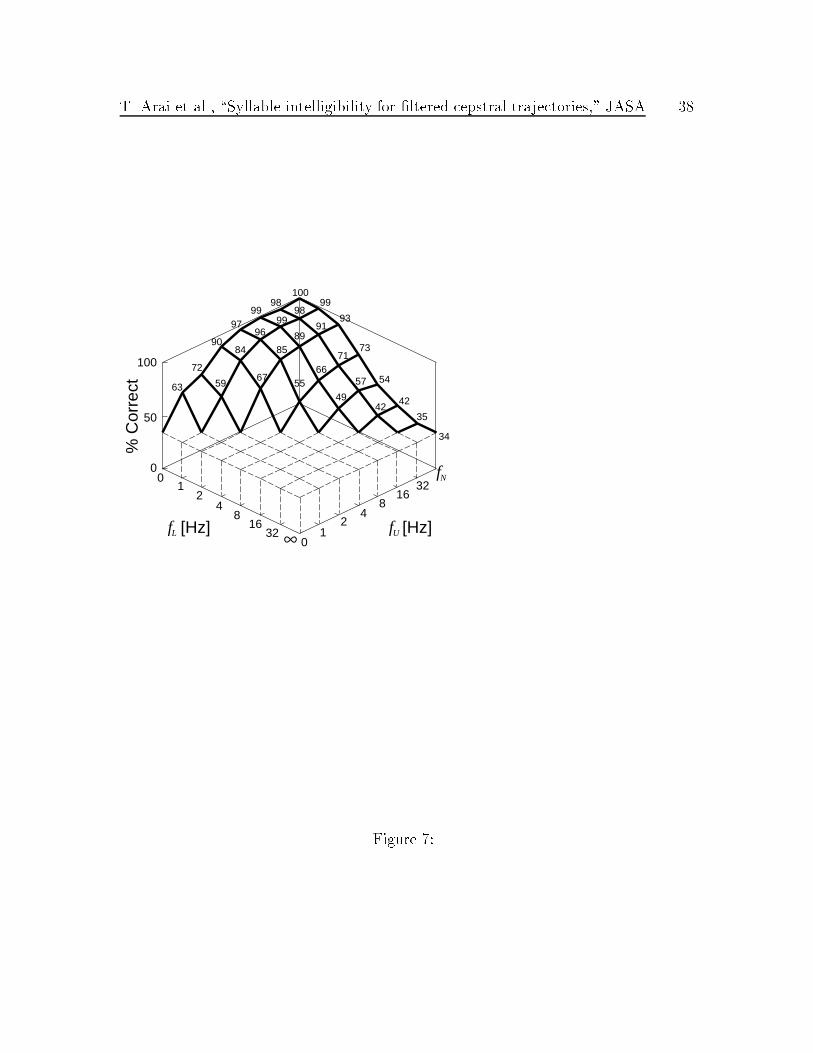
of the vowels were perceived correctly. Figure 7 shows the proportion of correct re-
sponses for the 21 CV syllables which are perceived perfectly for the original signal
(/ka/, /ki/, /ku/, /ga/, /gi/, /gu/, /sa/, /Ri/, /su/, /dza/, /dzu/, /t
Ri/, /tsu/, /da/,
/na/, /ni/, /nu/, /pi/, /ba/, /bi/, /ma/).
As can be seen in Fig. 7 (subset) and Fig. 6 (full set), the global trends in both
cases are the same. As in Fig. 6, the trend in Fig. 7 is not a�ected when the time
T. Arai et al., \Syllable intelligibility for �ltered cepstral trajectories," JASA 16
trajectories have components between 1 Hz and 16 Hz.
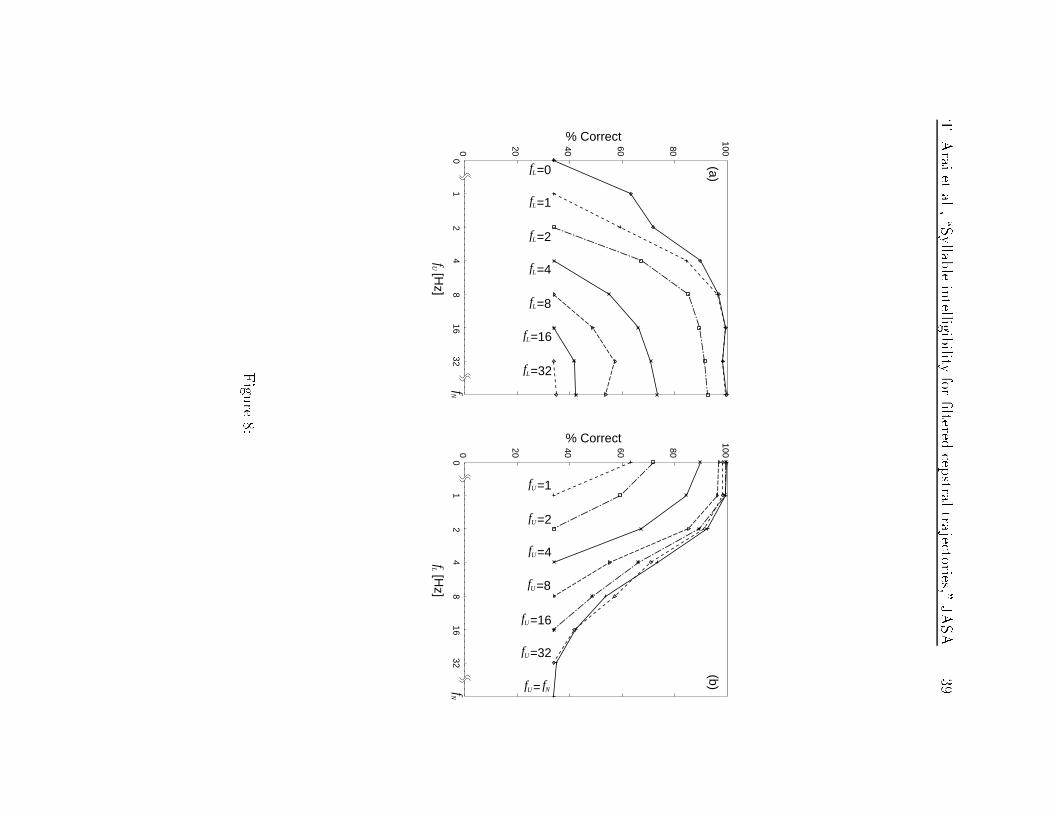
4.3 Cue trading
To maintain the original phonetic information for human perception, a decrease in
one feature can be o�set by an increase in another cue; this tradeo� is known as cue
trading [11]. To illustrate the phenomenon of cue trading, we projected Fig. 7 onto
two di�erent planes. The two planes are shown in Fig. 8: (a) the proportion of correct
syllables Pc(CV) versus fU and (b) the proportion of correct syllables Pc(CV) versus
fL. In Fig. 8 (a), the graphs of fL = 0 Hz and fL = 1 Hz match when fU > 4 Hz,
while the graphs of fL = 0 Hz and fL = 1 Hz do not match when fU � 4 Hz. That
is, if we have components at 4 Hz and above, then we can compensate for the lost
cues below 1 Hz, but if we lose the components at 4 Hz and above then we cannot
compensate for those lost cues. Similarly, in Fig. 8 (b) the graphs of fU = 16 Hz and
fU = fN match when fL < 4 Hz, while the graphs of fU = 16 Hz and fU = fN do not
match when fL � 4 Hz. That is, if we have the components at 4 Hz and below, then
we can compensate for the lost cues above 16 Hz, but if we lose the components at 4
Hz and below then we cannot. This suggests that the component at 4 Hz is necessary
for cue trading. A modulation frequency of 4 Hz corresponds to the average syllabic
rate of speech [9].
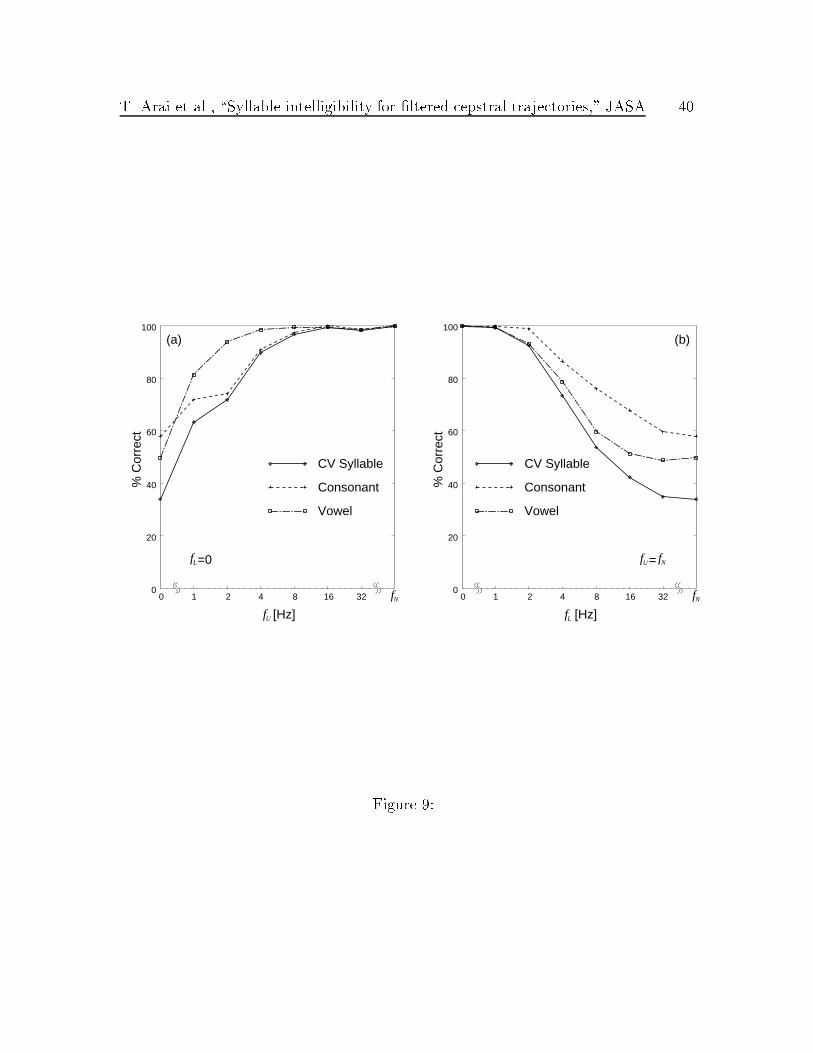
Figure 9 shows the results in terms of proportion of correct CV syllables Pc(CV),
T. Arai et al., \Syllable intelligibility for �ltered cepstral trajectories," JASA 17
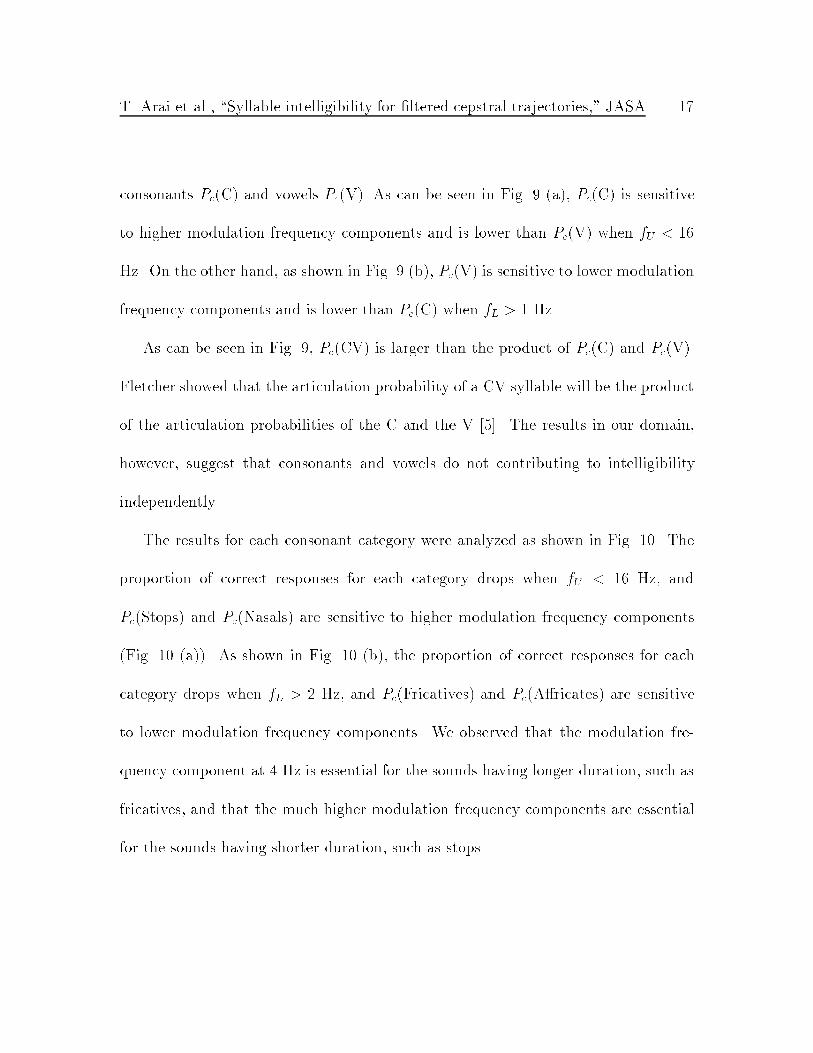
consonants Pc(C) and vowels Pc(V). As can be seen in Fig. 9 (a), Pc(C) is sensitive
to higher modulation frequency components and is lower than Pc(V) when fU < 16
Hz. On the other hand, as shown in Fig. 9 (b), Pc(V) is sensitive to lower modulation
frequency components and is lower than Pc(C) when fL > 1 Hz.
As can be seen in Fig. 9, Pc(CV) is larger than the product of Pc(C) and Pc(V).
Fletcher showed that the articulation probability of a CV syllable will be the product
of the articulation probabilities of the C and the V [5]. The results in our domain,
however, suggest that consonants and vowels do not contributing to intelligibility
independently.
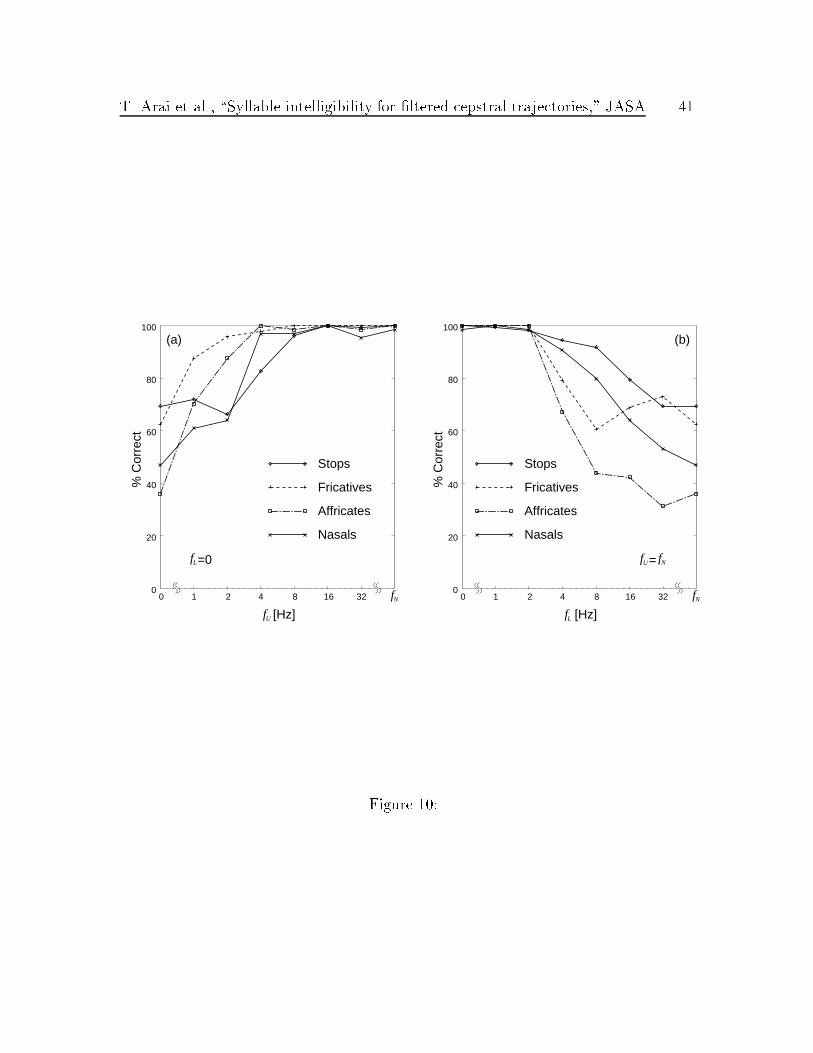
The results for each consonant category were analyzed as shown in Fig. 10. The
proportion of correct responses for each category drops when fU < 16 Hz, and
Pc(Stops) and Pc(Nasals) are sensitive to higher modulation frequency components
(Fig. 10 (a)). As shown in Fig. 10 (b), the proportion of correct responses for each
category drops when fL > 2 Hz, and Pc(Fricatives) and Pc(A�ricates) are sensitive
to lower modulation frequency components. We observed that the modulation fre-
quency component at 4 Hz is essential for the sounds having longer duration, such as
fricatives, and that the much higher modulation frequency components are essential
for the sounds having shorter duration, such as stops.
T. Arai et al., \Syllable intelligibility for �ltered cepstral trajectories," JASA 18
5 DISCUSSION
In Drullman's experiment, the temporal change of the magnitude envelope was �l-
tered. As a result, both the energy contour and the temporal change of the spectrum
were a�ected. We primarily mainly modi�ed the rate of change of the spectral com-
ponents but kept the LPC residual and the energy contour unchanged.
The LPC residual contains timing information such as plosive bursts, fricative
onset, and vowel onset. Therefore, the modi�ed speech signal also contains such
timing information as seen in the spectrogram, Fig. 2 (e). This technique, however,
e�ectively smears the formant structure of speech as well as the formant transitions.
Thus, both vowel and consonant intelligibilities were a�ected as seen in Fig. 9. For
the residual signal itself the proportion of correct CV syllables was 34%, whereas for
the original signal the proportion of correct CV syllables was 100%. Therefore, our
results are valid in the range between those two extremes, and we focus on the relative
importance of the modulation frequency.
Figure 6 shows that the modi�ed speech is more intelligible when fL � 1 Hz
and fU � 16 Hz. The lower limit of 1 Hz suggests that the slowly varying and static
components, such as channel characteristics, do not contribute signi�cantly to human
speech communication. Similarly the very fast-changing components above 16 Hz
seem to have little e�ect on intelligibility. In fact, the upper limit of the modulation
frequency has important implications for parametric speech coding, particularly for
T. Arai et al., \Syllable intelligibility for �ltered cepstral trajectories," JASA 19
de�ning how fast we can sample the speech envelope for e�cient transmission of
speech signals [4].
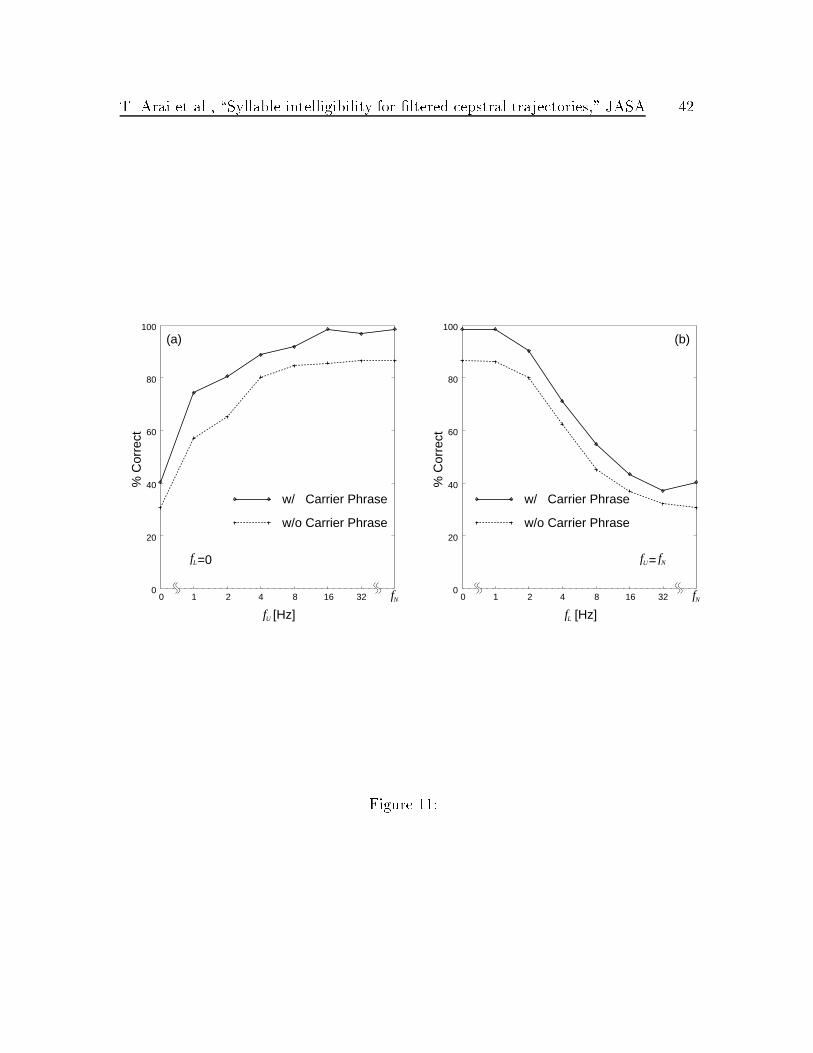
In this study, only a target syllable was presented during the experiments. Those
syllables were extracted from a longer carrier phrase after temporal �ltering. We also
conducted a small separate experiment in which we included the carrier phrase as well
as the target syllable to see the e�ect of environmental cues on speech intelligibility.
Two native Japanese subjects participated in one experimental session consisting of
465 stimuli. Figure 11 shows the results in terms of proportion of correct responses
with and without the carrier phrase. From Fig. 11 there is approximately 10% gain
on average when the target is presented with the carrier phrase. It appears that this
gain is due to formant transitions into the consonants of the target syllables. However
the general trend was remains the same.
5.1 Theoretical analysis
The regularity of the relationship between the cuto� frequencies and intelligibility
suggests that the information relevant for speech communication is distributed over
the temporal modulation frequency range. In this section we develop a quantitative
model that relates the intelligibility and information density as a function of the
energy at di�erent modulation frequencies. This model was motivated by the model
of the articulation index developed by Fletcher [5].
T. Arai et al., \Syllable intelligibility for �ltered cepstral trajectories," JASA 20
The general notion is that each modulation frequency component contributes inde-
pendently to the collection of features that are necessary for recognition. In particular,
if the information in two non-overlapping bands A and B is combined, the resulting
intelligibility, i.e., the probability of a correct response, Pc, is given by
Pc(A+B) = 1� [1� Pc(A)][1� Pc(B)]; (1)
where the intelligibility of each band separately is given by Pc(A) and Pc(B). More-
over, if Pc(A+ B) is an additive function of information IA and IA then Pc has the
form
Pc = 1 � e�(IA+IB): (2)
Given this formulation, we need to determine the relationship between the infor-
mation measure I and the intervals of the modulation frequency. We assume that
the amount of information in a small neighborhood of frequency f , I(f; f + �f), is
proportional to a continuous density function D so that I(f +�f) = D(f)�f: The
amount of information in a band (interval) of frequencies f1 < f2 is then given by the
integral
I(f1; f2) =Z f2
f1
D(f)df: (3)
The information density function D(�) must be determined empirically.
Given this model, we can compute the probability of correct identi�cation of the
syllables in Experiment II (shown in Fig. 7) by integrating information between low
T. Arai et al., \Syllable intelligibility for �ltered cepstral trajectories," JASA 21
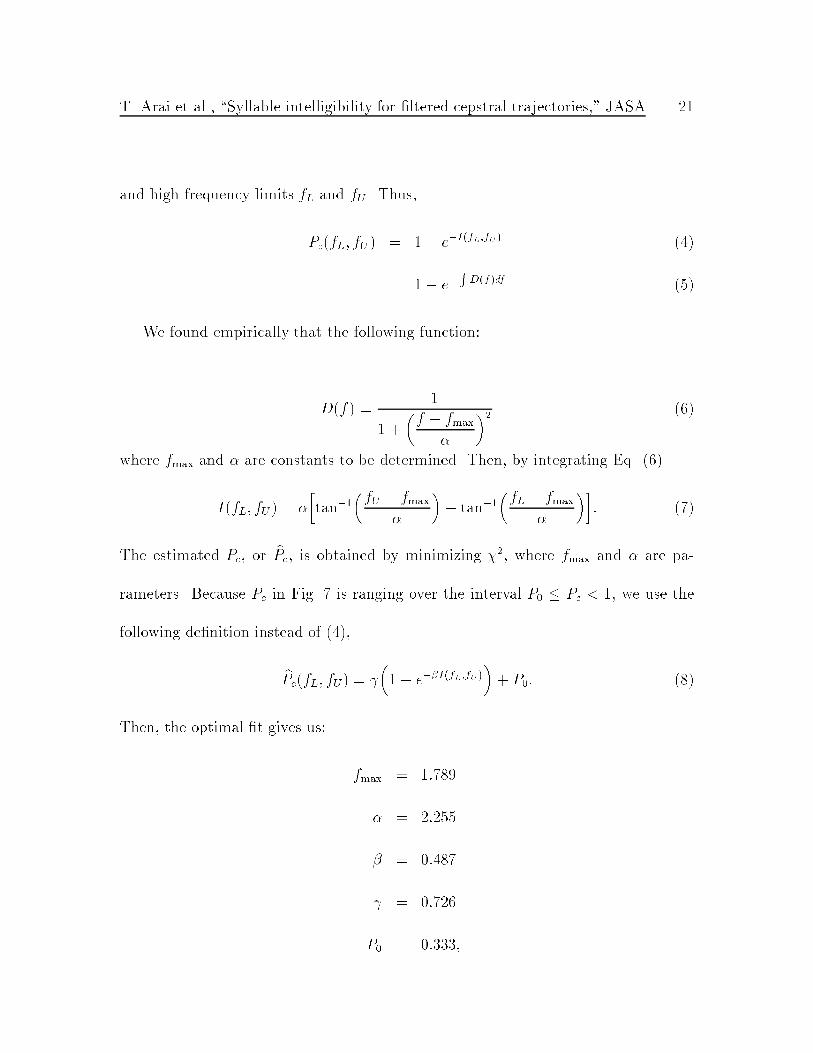
and high frequency limits fL and fU . Thus,
Pc(fL; fU ) = 1� e�I(fL;fU) (4)
= 1� e�RD(f)df (5)
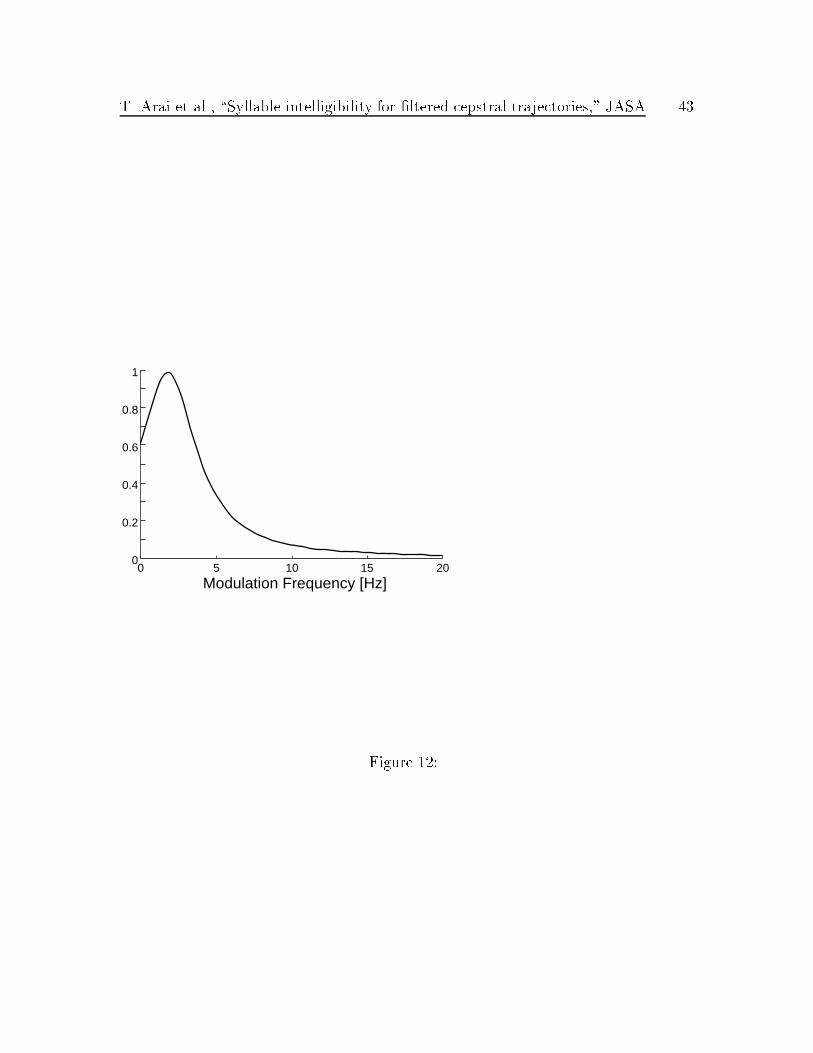
We found empirically that the following function:
D(f) =1
1 +�f � fmax
�
�2 (6)
where fmax and � are constants to be determined. Then, by integrating Eq. (6)
I(fL; fU ) = �
�tan�1
�fU � fmax
�
�� tan�1
�fL � fmax
�
��: (7)
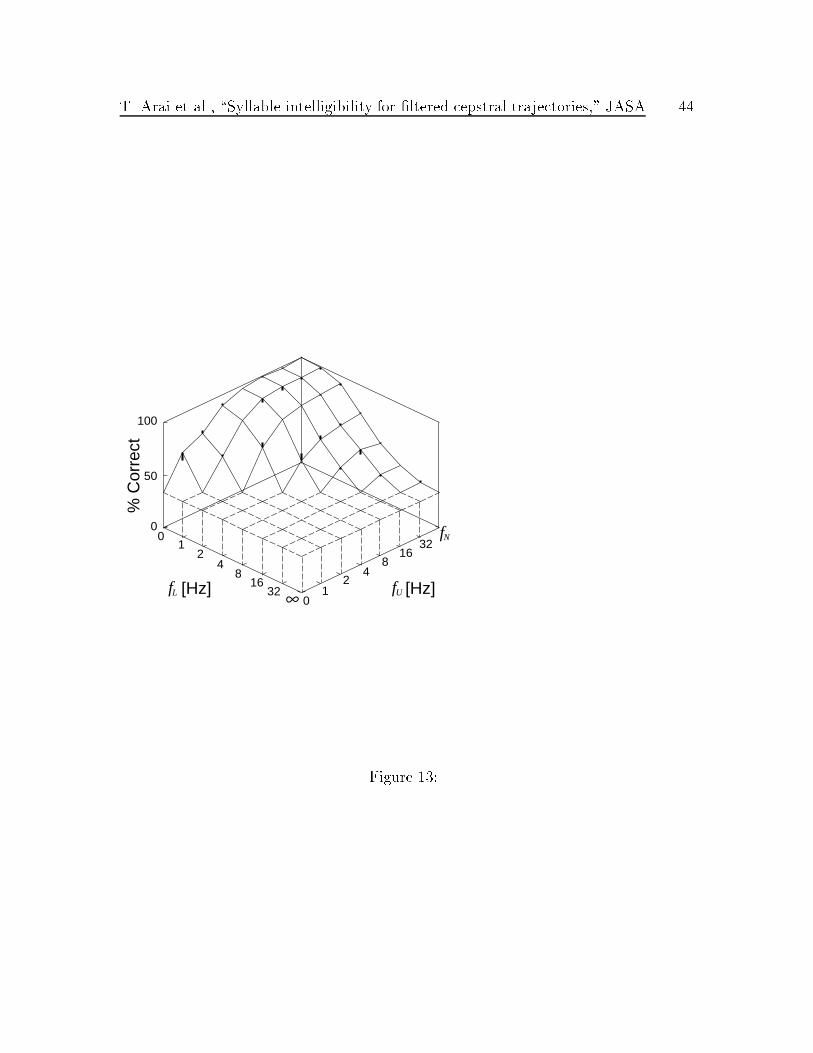
The estimated Pc, or bPc, is obtained by minimizing �2, where fmax and � are pa-
rameters. Because Pc in Fig. 7 is ranging over the interval P0 � Pc < 1, we use the
following de�nition instead of (4),
bPc(fL; fU) =
�1 � e��I(fL;fU)
�+ P0: (8)
Then, the optimal �t gives us:
fmax = 1:789
� = 2:255
� = 0:487
= 0:726
P0 = 0:333;
T. Arai et al., \Syllable intelligibility for �ltered cepstral trajectories," JASA 22
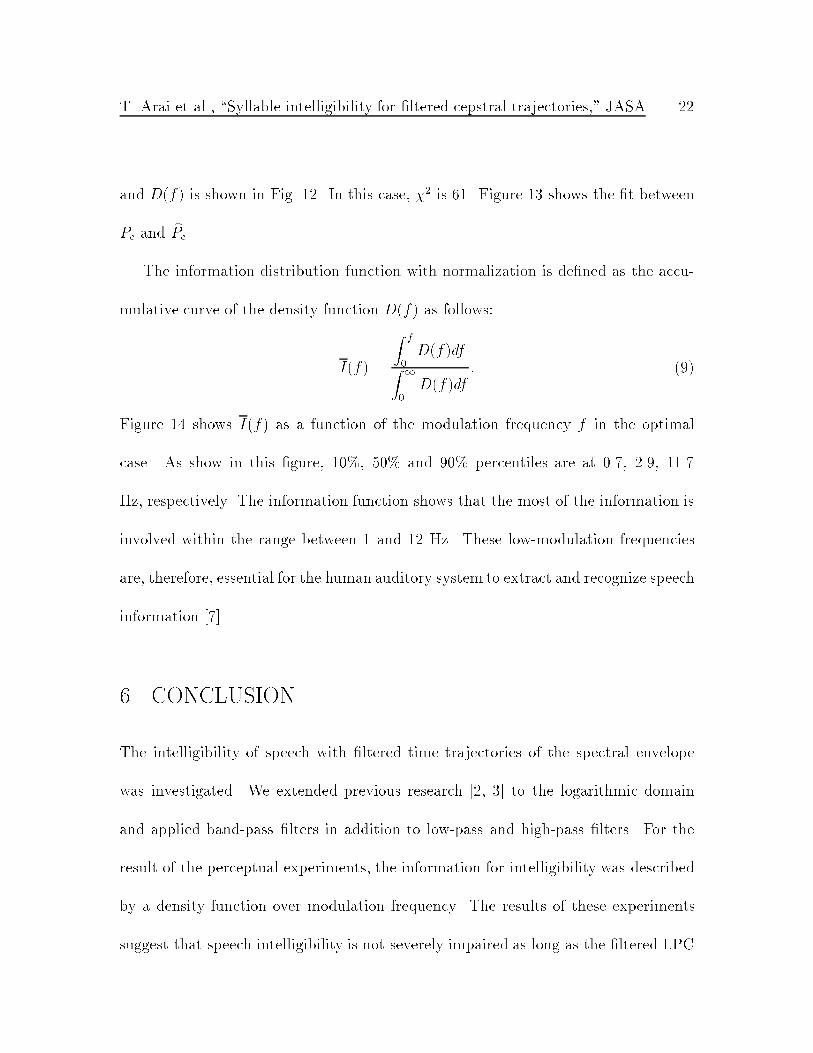
and D(f) is shown in Fig. 12. In this case, �2 is 61. Figure 13 shows the �t between
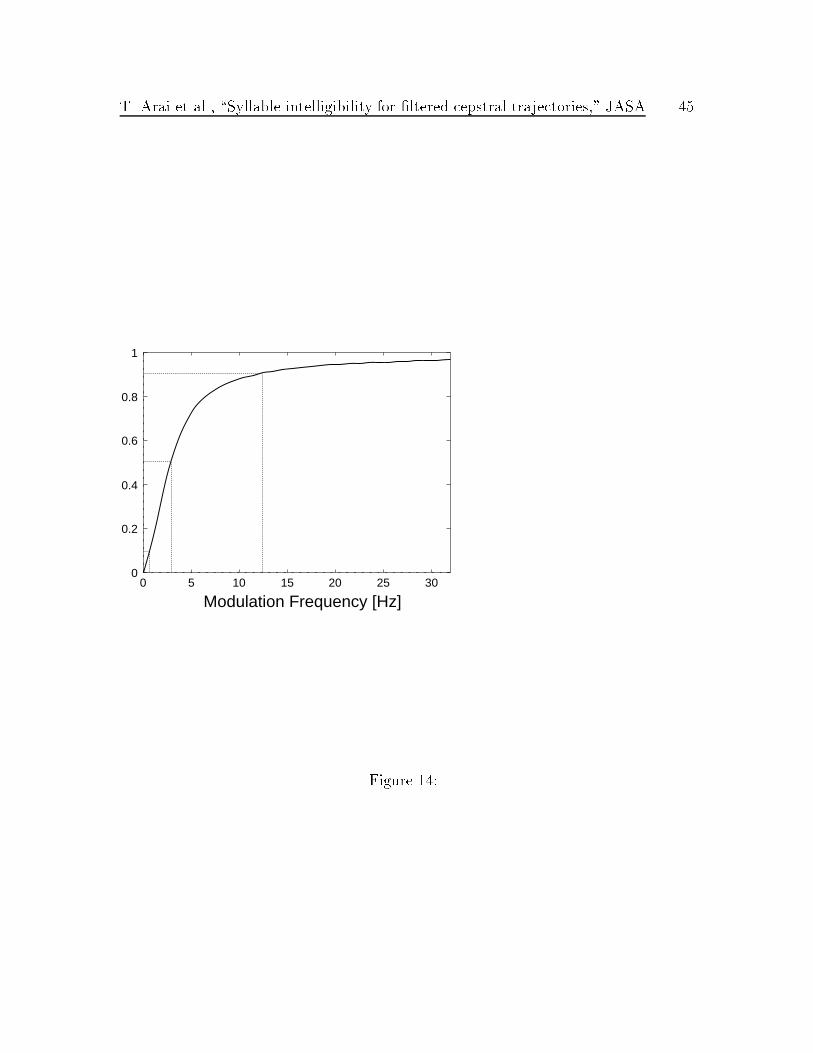
Pc and bPc.The information distribution function with normalization is de�ned as the accu-
mulative curve of the density function D(f) as follows:
I(f) =
Z f
0D(f)dfZ
1
0D(f)df
: (9)
Figure 14 shows I(f) as a function of the modulation frequency f in the optimal
case. As show in this �gure, 10%, 50% and 90% percentiles are at 0.7, 2.9, 11.7
Hz, respectively. The information function shows that the most of the information is
involved within the range between 1 and 12 Hz. These low-modulation frequencies
are, therefore, essential for the human auditory system to extract and recognize speech
information [7].
6 CONCLUSION
The intelligibility of speech with �ltered time trajectories of the spectral envelope
was investigated. We extended previous research [2, 3] to the logarithmic domain
and applied band-pass �lters in addition to low-pass and high-pass �lters. For the
result of the perceptual experiments, the information for intelligibility was described
by a density function over modulation frequency. The results of these experiments
suggest that speech intelligibility is not severely impaired as long as the �ltered LPC
T. Arai et al., \Syllable intelligibility for �ltered cepstral trajectories," JASA 23
cepstral coe�cients have a rate of change between 1 Hz and 16 Hz.
In contrast to Drullman's study, the e�ects of temporal �ltering of the time tra-
jectories of the cepstrum were examined in this study. In particular, we determined
the e�ect of band-pass �ltering. Thus, our results may have direct implications for
cepstrum-based ASR systems, and they are important as a benchmark of how the
spectral representations used in ASR relate to human speech recognition.
Recently, Kanedera showed that the performance of the speech recognition for
the 13 word Bellcore digit database task and the 216 Japanese word recognition task
had the highest recognition rate when the band-pass �lter between 1 Hz and 16 Hz
was used [10]. This result is consistent with that of our perceptual experiment. The
results provide additional support for RASTA-like processing of cepstral features in
ASR.
T. Arai et al., \Syllable intelligibility for �ltered cepstral trajectories," JASA 24
Acknowledgments
We acknowledge the assistance of Yonghong Yan, Troy Bailey, Brian Mak and Ronald
Cole of the Oregon Graduate Institute of Science & Technology (OGI), who helped
with the setup of the initial perceptual experiment; Steven Greenberg of the Inter-
national Computer Science Institute (Berkeley, California), Robert Damper of the
University of Southampton and Pieter Vermeulen of OGI, who gave us useful com-
ments; and Karen Ward of OGI, who helped us to proofread this manuscript. Thanks
to Sadaoki Furui of the Tokyo Institute of Technology and the former members of
his laboratory at NTT for lending their speech database and for their helpful com-
ments. We would also like to thank the subjects who participated in the experiments.
Finally, we would like to thank the two anonymous reviewers, who gave us many valu-
able suggestions. This research was supported in part by grants from the DoD under
MDA-904-94-C-6169 and the NSF/ARPA under IRI-9314959, with additional funding
provided by the member companies of the Center for Spoken Language Understanding
(CSLU).
T. Arai et al., \Syllable intelligibility for �ltered cepstral trajectories," JASA 25
References
[1] Atal, B. S. (1974). \E�ectiveness of Linear Prediction Characteristics of the
Speech Wave for Automatic Speaker Identi�cation and Veri�cation," J. Acoustic.
Soc. Amer., 55, 1304{1312.
[2] Drullman, R., Festen, J. M., and Plomp, R. (1994). \E�ect of Temporal Envelope
Smearing on Speech Reception," J. Acoustic. Soc. Amer., 95, 1053{1064.
[3] Drullman, R., Festen, J. M., and Plomp, R. (1994). \E�ect of Reducing Slow
Temporal Modulations on Speech Reception," J. Acoustic. Soc. Amer., 95, 2670{
2680.
[4] Flanagan, J. L. (1980). \Parametric Coding of Speech Spectra," J. Acoustic.
Soc. Amer., 68, 412{419.
[5] Fletcher, H. (1953). Speech and Hearing in Communication, (Krieger, Hunting-
ton, NY).
[6] Furui, S. (1986). \Speaker-Independent Isolated Word Recognition Using Dy-
namic Features of Speech Spectrum," IEEE Trans. Acoust., Speech, Signal Proc.,
ASSP-34, 52{59.
[7] Greenberg, S. (1996). \Understanding Speech Understanding: Towards a Uni�ed
Theory of Speech Perception," Proc. of the ESCA Tutorial and Advanced Re-

T. Arai et al., \Syllable intelligibility for �ltered cepstral trajectories," JASA 26
search Workshop on the Auditory Basis of Speech Perception, W.A. Ainsworth
and S. Greenberg (eds.), Keele University, UK, 1{8.
[8] Hermansky, H., Morgan, N. (1994). \RASTA Processing of Speech," IEEE Trans.
Speech and Audio Proc., 2, 578{589.
[9] Houtgast, T., Steeneken, H. J. M. (1985). \A Review of the MTF Concept in
Room Acoustics and its Use for Estimating Speech Intelligibility in Auditoria,"
J. Acoustic. Soc. Amer., 77, 1069{1077.
[10] Kanedera, N., Arai, T., Hermansky, H., Pavel, M. (1997). \On The Importance
of Various Modulation Frequencies for Speech Recognition," Proc. of the 5th
European Conf. on Speech Communication and Technology, 3, Greece, 1079{
1082.
[11] Moore, B. C. J. (1989). An Introduction to the Psychology of Hearing, (Academic
Press, New York, NY).
T. Arai et al., \Syllable intelligibility for �ltered cepstral trajectories," JASA 27
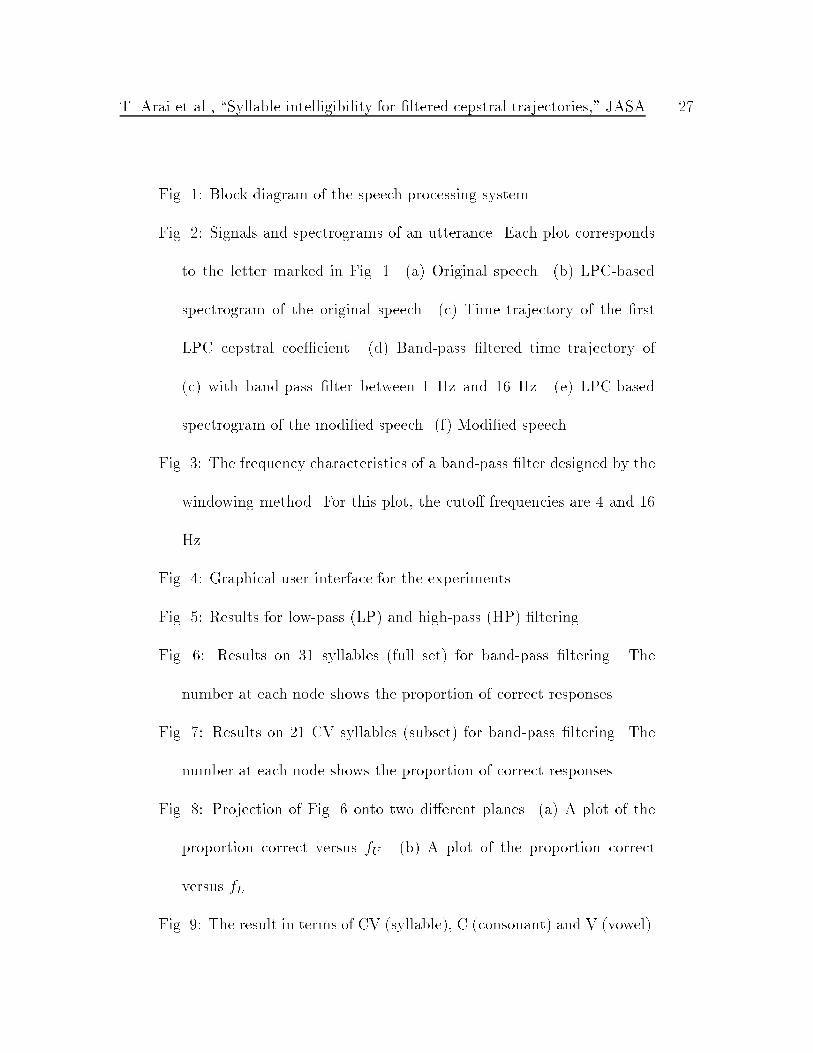
Fig. 1: Block diagram of the speech processing system.
Fig. 2: Signals and spectrograms of an utterance. Each plot corresponds
to the letter marked in Fig. 1. (a) Original speech. (b) LPC-based
spectrogram of the original speech. (c) Time trajectory of the �rst
LPC cepstral coe�cient. (d) Band-pass �ltered time trajectory of
(c) with band-pass �lter between 1 Hz and 16 Hz. (e) LPC-based
spectrogram of the modi�ed speech. (f) Modi�ed speech.
Fig. 3: The frequency characteristics of a band-pass �lter designed by the
windowing method. For this plot, the cuto� frequencies are 4 and 16
Hz.
Fig. 4: Graphical user interface for the experiments.
Fig. 5: Results for low-pass (LP) and high-pass (HP) �ltering.
Fig. 6: Results on 31 syllables (full set) for band-pass �ltering. The
number at each node shows the proportion of correct responses.
Fig. 7: Results on 21 CV syllables (subset) for band-pass �ltering. The
number at each node shows the proportion of correct responses.
Fig. 8: Projection of Fig. 6 onto two di�erent planes. (a) A plot of the
proportion correct versus fU . (b) A plot of the proportion correct
versus fL.
Fig. 9: The result in terms of CV (syllable), C (consonant) and V (vowel).
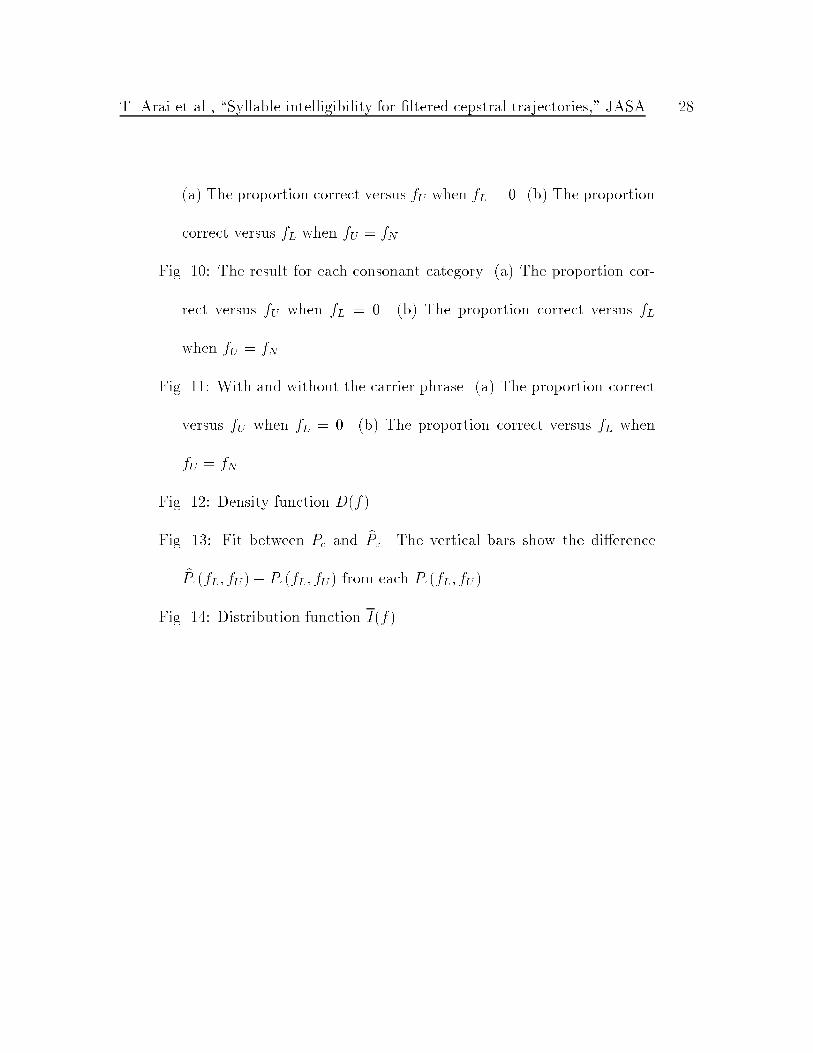
T. Arai et al., \Syllable intelligibility for �ltered cepstral trajectories," JASA 28
(a) The proportion correct versus fU when fL = 0. (b) The proportion
correct versus fL when fU = fN .
Fig. 10: The result for each consonant category. (a) The proportion cor-
rect versus fU when fL = 0. (b) The proportion correct versus fL
when fU = fN .
Fig. 11: With and without the carrier phrase. (a) The proportion correct
versus fU when fL = 0. (b) The proportion correct versus fL when
fU = fN .
Fig. 12: Density function D(f).
Fig. 13: Fit between Pc and bPc. The vertical bars show the di�erence
bPc(fL; fU)� Pc(fL; fU) from each Pc(fL; fU ).
Fig. 14: Distribution function I(f).
T. Arai et al., \Syllable intelligibility for �ltered cepstral trajectories," JASA 29
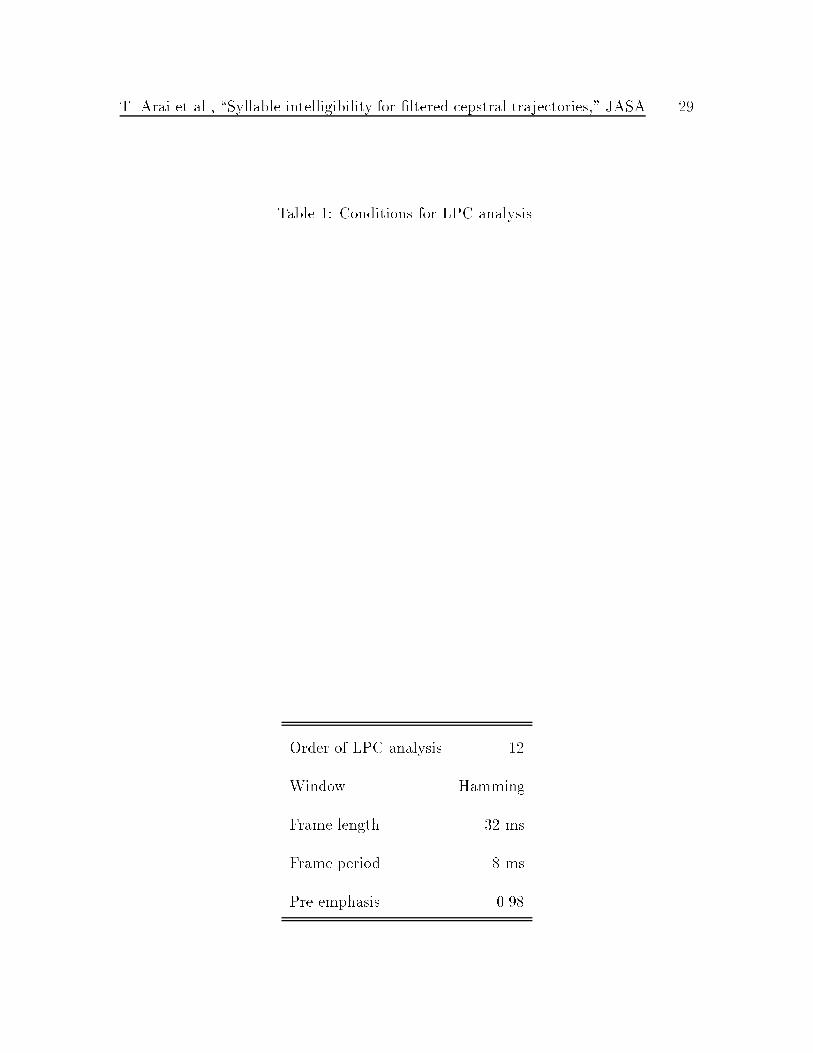
Table 1: Conditions for LPC analysis.
Order of LPC analysis 12
Window Hamming
Frame length 32 ms
Frame period 8 ms
Pre-emphasis 0.98
T. Arai et al., \Syllable intelligibility for �ltered cepstral trajectories," JASA 30
Table 2: Japanese syllables used in this study.
Unvoiced Consonants Voiced Consonants
Vowels /a/ /i/ /u/
Stops /pa/ /pi/ /pu/ /ba/ /bi/ /bu/
+ Vowels /ta/ /da/
/ka/ /ki/ /ku/ /ga/ /gi/ /gu/
Fricatives /sa/ /su/
+ Vowels /Ri/
A�ricates /tsu/ /dza/ /dzu/
+ Vowels /tRi/ /d3i/
Nasals /ma/ /mi/ /mu/
+ Vowels /na/ /ni/ /nu/
T. Arai et al., \Syllable intelligibility for �ltered cepstral trajectories," JASA 31
Table 3: Reduced confusion matrix of responses for the original signal in the band-pass
experiment. Syllables that were perceived perfectly were omitted from the matrix.
The total number of responses for each syllable is 16.
Response
/u/ /ka/ /ku/ /gi/ /gu/ /ta/ /ni/ /nu/ Total
/d3i/ 3 3
/ta/ 12 12
Stimulus /pa/ 7 7
/pu/ 10 2 12
/bu/ 6 2 8
/mi/ 11 11
/mu/ 2 12 14
T. Arai et al., \Syllable intelligibility for �ltered cepstral trajectories," JASA 32
Original
Speech
Modified
Speech
LP
C A
nal
ysis
LP
C C
epst
rum
LP
C S
ynth
esis
Mo
dif
ied
LP
C C
epst
rumFilter
Filter
Residual
Filter
(a) (b) (c) (d) (e) (f)
Figure 1:
T. Arai et al., \Syllable intelligibility for �ltered cepstral trajectories," JASA 33
4
(a)
(b)
(c)
(d)
(e)
(f)
0
Time [s]
1 2 3
Figure 2:
T. Arai et al., \Syllable intelligibility for �ltered cepstral trajectories," JASA 34
0.1 1 10
−100
−50
0
Modulation Frequency [Hz]
Gai
n [d
B]
Figure 3:
T. Arai et al., \Syllable intelligibility for �ltered cepstral trajectories," JASA 35
Figure 4:

T. Arai et al., \Syllable intelligibility for �ltered cepstral trajectories," JASA 36
% C
orre
ct
Cutoff Frequency [Hz]
0
20
40
60
80
100
0 1 2 3 456 812 24 48
LP
HP
fC
fN
Figure 5:
T. Arai et al., \Syllable intelligibility for �ltered cepstral trajectories," JASA 37
0
50
100
01
24
816
32 12
48
1632
0
% C
orre
ct
[Hz]fL [Hz]fU
31
57
65
80
8585
8686
52
73
8285
8486
56
71
7779
80
4857
6262
4248 45
3637
32
fN
Figure 6:
T. Arai et al., \Syllable intelligibility for �ltered cepstral trajectories," JASA 38
0
50
100
01
24
816
32 12
48
1632
0
% C
orre
ct
[Hz]fL [Hz]fU
34
63
72
90
9997
98100
59
84
9699
9899
67
8589
9193
5566
7173
49
57 54
4242
35
fN
Figure 7:
T.Arai
etal.,
\Syllab
leintelligib
ilityfor
�ltered
cepstral
trajectories,"
JASA
39
0 20 40 60 80
100
01
24
816
32
[Hz]
fU
fL=16
fL=32
fL=8
fL=4
% Correct
fL=2
fL=1
fL=0
(a)
fNfN
0 20 40 60 80
100
01
24
816
32
[Hz]
fL
% Correct
(b)
fU=1
fU=2
fU=4
fU=8
fU=
fU=32
fU=16
fN
Figu
re8:
T. Arai et al., \Syllable intelligibility for �ltered cepstral trajectories," JASA 40
fN0
20
40
60
80
100
0 1 2 4 8 16 32
[Hz]
% C
orre
ct
fU
CV Syllable
Consonant
Vowel
fL=0
(a)
0
20
40
60
80
100
0 1 2 4 8 16 32
[Hz]fL
% C
orre
ct
CV Syllable
Consonant
Vowel
(b)
fN
fU= fN
Figure 9:
T. Arai et al., \Syllable intelligibility for �ltered cepstral trajectories," JASA 41
0
20
40
60
80
100
0 1 2 4 8 16 32
[Hz]
% C
orre
ct
fU
Stops
Fricatives
Affricates
Nasals
fL=0
(a)
fN0
20
40
60
80
100
0 1 2 4 8 16 32
[Hz]fL
% C
orre
ct
Stops
Fricatives
Affricates
Nasals
(b)
fN
fU= fN
Figure 10:
T. Arai et al., \Syllable intelligibility for �ltered cepstral trajectories," JASA 42
fN0
20
40
60
80
100
0 1 2 4 8 16 32
[Hz]
% C
orre
ct
fU
w/ Carrier Phrase
w/o Carrier Phrase
fL=0
(a)
0
20
40
60
80
100
0 1 2 4 8 16 32
[Hz]fL
% C
orre
ct
w/ Carrier Phrase
w/o Carrier Phrase
(b)
fN
fU= fN
Figure 11:
T. Arai et al., \Syllable intelligibility for �ltered cepstral trajectories," JASA 43
Modulation Frequency [Hz]
0
0.2
0.4
0.6
0.8
1
0 5 10 15 20
Figure 12:
T. Arai et al., \Syllable intelligibility for �ltered cepstral trajectories," JASA 44
0
50
100
01
24
816
32 12
48
1632
0
% C
orre
ct
[Hz]fL [Hz]fU
fN
Figure 13:
T. Arai et al., \Syllable intelligibility for �ltered cepstral trajectories," JASA 45
0
0.2
0.4
0.6
0.8
1
0 5 10 15 20 25 30
Modulation Frequency [Hz]
Figure 14:
Related Documents