ORIGINAL PAPER SYBR Ò Green qPCR screening methods for the presence of ‘‘35S promoter’’ and ‘‘NOS terminator’’ elements in food and feed products Elodie Barbau-Piednoir • Antoon Lievens • Guillaume Mbongolo-Mbella • Nancy Roosens • Myriam Sneyers • Amaya Leunda-Casi • Marc Van den Bulcke Received: 30 June 2009 / Revised: 28 September 2009 / Accepted: 11 October 2009 / Published online: 7 November 2009 Ó The Author(s) 2009. This article is published with open access at Springerlink.com Abstract The Cauliflower Mosaic Virus ‘‘35S promotor’’ (p35S) and the Agrobacterium ‘‘Nopaline Synthase’’ ter- minator (tNOS) are the most represented generic recom- binant elements in commercial genetically modified crops to date. A set of four new SYBR Ò Green qPCR methods targeting the ‘‘p35S’’ and ‘‘tNOS’’ core elements have been developed. These qPCR methods generate short amplicons of 147 and 75 bp for the ‘‘p35S’’ element and 172 and 69 bp for the ‘‘tNOS’’ element. Single target plasmids containing these amplicons were constructed and allow determining the nominal melting temperature (T m value) of each amplicon. The four methods are specific for their respective targets, and moreover, three of them are highly sensitive (up to 1–2 copies detectable) at a PCR efficiency ranging between 95 and 100%. The latter methods can detect their respective targets at 0.1% (w/w) gDNA levels and are suitable for detecting low levels of genetically modified materials containing the ‘‘p35S’’ and/or ‘‘tNOS’’ elements. Keywords Real-time PCR Food and feed analysis GMO detection 35S promoter NOS terminator SYBR Ò Green Introduction In the European Union, the development of genetically modified organisms (GMO) is subject to a complex legal framework. The most important GMO EC legislations are the environmental directive EC/2001/18 [1], the GM Food/ Feed regulations EC/2003/1829 [2] and EC/2003/1830 [3], the EC Recommendation EC/787/2004 [4] and the Enforcement regulation EC/882/2004 [5]. Within these legislations, the detection of GMO represents an important element for compliance with the conditions set in the authorizations. Molecular characteristics (especially DNA sequence information) represent the most important iden- tification criterion and legal basis for the presence of a particular GMO in a product [2–4]. Consequently, the EU enforcement framework is pri- marily based on molecular DNA methodology. Within the GM Food/Feed legislation, authorizations of new GM products require the availability of validated (quantitative) product-specific detection methods. Most elaborate in this respect are the so-called event-specific detection methods for GM crops validated by the Community Reference Laboratory for Genetically Modified Organisms (CRL- GMO) of the EC-JRC (Ispra, Italy) [6]. E. Barbau-Piednoir A. Lievens G. Mbongolo-Mbella N. Roosens (&) M. Sneyers A. Leunda-Casi M. Van den Bulcke Division of Biosafety and Biotechnology (SBB), Scientific Institute of Public Health, J. Wytsmanstraat 14, 1050 Brussels, Belgium e-mail: [email protected]; [email protected] E. Barbau-Piednoir e-mail: [email protected] A. Lievens e-mail: [email protected] G. Mbongolo-Mbella e-mail: [email protected] M. Sneyers e-mail: [email protected] A. Leunda-Casi e-mail: [email protected] M. Van den Bulcke e-mail: [email protected] 123 Eur Food Res Technol (2010) 230:383–393 DOI 10.1007/s00217-009-1170-5

Welcome message from author
This document is posted to help you gain knowledge. Please leave a comment to let me know what you think about it! Share it to your friends and learn new things together.
Transcript
ORIGINAL PAPER
SYBR�Green qPCR screening methods for the presenceof ‘‘35S promoter’’ and ‘‘NOS terminator’’ elementsin food and feed products
Elodie Barbau-Piednoir • Antoon Lievens • Guillaume Mbongolo-Mbella •
Nancy Roosens • Myriam Sneyers • Amaya Leunda-Casi • Marc Van den Bulcke
Received: 30 June 2009 / Revised: 28 September 2009 / Accepted: 11 October 2009 / Published online: 7 November 2009
� The Author(s) 2009. This article is published with open access at Springerlink.com
Abstract The Cauliflower Mosaic Virus ‘‘35S promotor’’
(p35S) and the Agrobacterium ‘‘Nopaline Synthase’’ ter-
minator (tNOS) are the most represented generic recom-
binant elements in commercial genetically modified crops
to date. A set of four new SYBR�Green qPCR methods
targeting the ‘‘p35S’’ and ‘‘tNOS’’ core elements have been
developed. These qPCR methods generate short amplicons
of 147 and 75 bp for the ‘‘p35S’’ element and 172 and
69 bp for the ‘‘tNOS’’ element. Single target plasmids
containing these amplicons were constructed and allow
determining the nominal melting temperature (Tm value) of
each amplicon. The four methods are specific for their
respective targets, and moreover, three of them are highly
sensitive (up to 1–2 copies detectable) at a PCR efficiency
ranging between 95 and 100%. The latter methods can
detect their respective targets at 0.1% (w/w) gDNA levels
and are suitable for detecting low levels of genetically
modified materials containing the ‘‘p35S’’ and/or ‘‘tNOS’’
elements.
Keywords Real-time PCR � Food and feed analysis �GMO detection � 35S promoter � NOS terminator �SYBR�Green
Introduction
In the European Union, the development of genetically
modified organisms (GMO) is subject to a complex legal
framework. The most important GMO EC legislations are
the environmental directive EC/2001/18 [1], the GM Food/
Feed regulations EC/2003/1829 [2] and EC/2003/1830 [3],
the EC Recommendation EC/787/2004 [4] and the
Enforcement regulation EC/882/2004 [5]. Within these
legislations, the detection of GMO represents an important
element for compliance with the conditions set in the
authorizations. Molecular characteristics (especially DNA
sequence information) represent the most important iden-
tification criterion and legal basis for the presence of a
particular GMO in a product [2–4].
Consequently, the EU enforcement framework is pri-
marily based on molecular DNA methodology. Within the
GM Food/Feed legislation, authorizations of new GM
products require the availability of validated (quantitative)
product-specific detection methods. Most elaborate in this
respect are the so-called event-specific detection methods
for GM crops validated by the Community Reference
Laboratory for Genetically Modified Organisms (CRL-
GMO) of the EC-JRC (Ispra, Italy) [6].
E. Barbau-Piednoir � A. Lievens � G. Mbongolo-Mbella �N. Roosens (&) � M. Sneyers � A. Leunda-Casi �M. Van den Bulcke
Division of Biosafety and Biotechnology (SBB),
Scientific Institute of Public Health, J. Wytsmanstraat 14,
1050 Brussels, Belgium
e-mail: [email protected]; [email protected]
E. Barbau-Piednoir
e-mail: [email protected]
A. Lievens
e-mail: [email protected]
G. Mbongolo-Mbella
e-mail: [email protected]
M. Sneyers
e-mail: [email protected]
A. Leunda-Casi
e-mail: [email protected]
M. Van den Bulcke
e-mail: [email protected]
123
Eur Food Res Technol (2010) 230:383–393
DOI 10.1007/s00217-009-1170-5
Table 1 Specificity assessment of the four SYBR�Green qPCR methods: ‘‘p35S-long’’ and ‘‘p35S-short’’, ‘‘tNOS-long’’ and ‘‘tNOS-short’’
A. Determination of the nominal Tm value of each amplicon applying ‘‘Sybricon’’ plasmids as DNA template
Sample name Origin/BCCM number 200 copies
Ct Tm (�C)
Sybricon010 (p35S-long) LMBP5460 32.04 80
Sybricon017 (p35S-short) LMBP5662 29.81 76.5
Sybricon001 (tNOS-long) LMBP5451 28.56 73.3
Sybricon006 (tNOS-short) LMBP5456 29.51 72.5
B. Specificity assessment of the four SYBR�Green qPCR methods: ‘‘p35S-long’’ and ‘‘p35S-short’’, ‘‘tNOS-long’’ and ‘‘tNOS-short’’ using
gDNA from EU-authorized GM events as template
Sample name Species GM
percentage
(m/m)
Origin p35S-
target
presence
p35S long p35S-short tNOS-
target
presence
tNOS-long tNOS-short
Ct Tm Ct Tm Ct Tm Ct Tm
Sybricon010 (p35S-long) NA NA BCCM Yes ? ? ? ? No – – – –
Sybricon017 (p35S-short) NA NA BCCM Yes – – ? ? No – – – –
Sybricon001 (tNOS-long) NA NA BCCM No – – – – Yes ? ? – –
Sybricon006 (tNOS-short) NA NA BCCM No – – – – Yes – – ? ?
A 2704-12 Soyabean 100 AOCS Yes ? ? ? ? No – – – –
GTS40-3-2 Soyabean 5 IRMM Yes ? ? ? ? Yes ? ? ? ?
MON 89788 Soyabean 1 AOCS No – – – ? No – – – ?
Wt Maize Maize 0 IRMM No – – – – No – – – –
Bt11 Maize 5 IRMM Yes ? ? ? ? Yes ? ? ? ?
Bt176c Maize 5 IRMM Yes ? ? ? ? No – – – –
DAS59122 Maize 9.86 IRMM Yes ? ? ? ? No – – – ?
GA21 Maize 1 IRMM No –a ? –a ? Yes – ? ? ?
MIR 604b Maize 10 IRMM No – – – – Yes ? ? ? ?
Mon810 Maize 5 IRMM Yes ? ? ? ? Yes/no – – – ?
MON863 Maize 9.85 IRMM Yes ? ? ? ? Yes – ? ? ?
NK603 Maize 1 IRMM Yes ? ? ? ? Yes ? ? ? ?
T25 Maize 100 Bayer Yes ? ? ? ? No – – – –
TC1507 Maize 9.86 IRMM Yes ? ? ? ? No – – –a ?
Wt Oilseed rape Oilseed rape 0 AOCS No – – – – No – – – –
GT73 Oilseed rape 1 Bayer No – – – ? No – – –a ?
Rf1c Oilseed rape 100 Bayer No – – – ? Yes ? ? ? ?
Rf2c Oilseed rape 100 Bayer No –a ? –a ? Yes ? ? ? ?
Rf3 Oilseed rape 1 Bayer No – – – – Yes ? ? ? ?
T45 Oilseed rape 1 Bayer Yes ? ? ? ? No – – ? ?
MS1c Oilseed rape 100 Bayer No – – – – Yes ? ? ? ?
MS8 Oilseed rape 100 Bayer No –a ? –a ? Yes ? ? ? ?
Topas 19/2c Oilseed rape 100 Bayer Yes ? ? ? ? No – – –a ?
Wt Rice Rice 0 AOCS No – – – – No – – – –
LL62b Rice 100 Bayer Yes ? ? ? ? No – – – –
LL62b Rice 100 AOCS Yes ? ? ? ? No – – – –
Wt Cotton Cotton 0 IRMM No – – – – No – – –a ?
MON 1445 Cotton 100 AOCS Yes ? ? ? ? Yes ? ? ? ?
MON 531 Cotton 100 AOCS Yes ? ? ? ? Yes ? ? ? ?
MON 15985 Cotton 100 AOCS Yes ? ? ? ? Yes ? ? ? ?
LL25 Cotton 100 Bayer Yes ? ? ? ? Yes ? ? ? ?
Wt Sugarbeet Sugarbeet 0 IRMM No – – – – No – – – –
384 Eur Food Res Technol (2010) 230:383–393
123
In 2007 on a global basis, about 114.3 million hectares
GM crops were cultivated, especially soy, maize and oil-
seed rape [7]. The most common recombinant elements in
these GM crops are the so-called ‘‘35S’’ promoter and
‘‘NOS’’ terminator sequences [8]. The 35S promoter
(p35S) and NOS terminator (tNOS) are both transcription-
regulating sequences [9, 10]. To date, many EU-authorized
GMOs (17/24) contain either the ‘‘p35S’’ (15/24) or the
‘‘tNOS’’ (15/24) or both (9/24) [8, 11, 12] (for more details
see Table 1). In order to assess the presence of GM
material in a product, screening by ‘‘p35S’’ and/or ‘‘tNOS’’
PCR is very often performed [13]. Several detection
methods have already been published for ‘‘p35S’’ and
‘‘tNOS’’ detection in a broad range of matrices. In most
cases, either end-point detection on agarose gel or real-
time qPCR with TaqMan� probe technology is applied
[13–19].
In only a few cases, SYBR�Green qPCR methods
were developed for detecting GM targets [e.g., 20, 21].
‘‘SYBR�Green I’’, is an asymmetrical cyanine dye [22]
which has been reported to specifically detect the presence
of double-stranded (ds) DNA [23]. Two criteria are rou-
tinely taken into account when assessing the outputs of
PCR amplification by SYBR�Green qPCR analysis: the
threshold cycle value (Ct) and the melting temperature
(Tm). The Ct value of qPCR amplification represents the
time-point at which a PCR reaction reaches a prior-set
threshold level for the reaction. This threshold level takes
into account fluctuations in the background level during
early reaction steps and the start of measurable expo-
nential amplification [24, 25]. As such, the lack of a
measurable Ct value in a qPCR is to be interpreted as the
absence of any (exponential) amplification above back-
ground level. The Tm value represents the temperature at
which 50% of the SYBR�Green fluorescence is lost due
to denaturation and strand separation of the PCR end
product. The Tm is a physical parameter inherent to the
sequence of the amplified product (esp. the GC content)
and influenced by chemical factors that affect double-
strand DNA stability (e.g., salt concentration, DMSO,
formamide, etc.) [26].
In a GMO screening approach, SYBR�Green qPCR
offers a number of advantages over other fluorescence-
based PCR methods: (1) SYBR�Green qPCR monitors the
increase in total fluorescence throughout the amplification,
allowing to estimate the presence of non-specific amplifi-
cation, (2) the melting temperature analysis allows post-
PCR identification of the amplification not only of the
expected target but also scoring the presence of closely
related target(s), (3) the SYBR�Green technology is
(rather) cost-effective as no dye-labeled oligonucleotide
probes are required.
In this study, four SYBR�Green qPCR methods were
developed allowing detecting core ‘‘p35S’’ and ‘‘tNOS’’
DNA sequences. Representative amplicons for each
method were cloned in pENGLTM-like vectors and char-
acterized by DNA sequencing. The nominal Tm value of
the amplicons was determined by using these plasmids as
template DNA with each of the SYBR�Green qPCR
methods. The specificity of the methods was tested on a
range of commodity crop species and on all EU-authorized
GMO (date March 2009). Their respective sensitivity was
estimated by applying different low-level detection criteria
on various GM reference materials.
Materials and methods
Materials
Plant materials
To study the specificity of the different SYBR�Green qPCR
methods, genomic DNA (gDNA) from either Certified
Table 1 continued
Sample name Species GM
percentage
(m/m)
Origin p35S-
target
presence
p35S long p35S-short tNOS-
target
presence
tNOS-long tNOS-short
Ct Tm Ct Tm Ct Tm Ct Tm
H7-1 Sugarbeet 100 IRMM No – – – – No – – – –
Wt Potato Potato 0 IRMM No –a ? –a ? No – – – –
EH92-527-1b Potato 100 IRMM No – – – – Yes ? ? ? ?
NTC NA NA NA No – – – – No – – – –
Yes target is present, No target is absent, NA not applicable. For the Ct values: ‘‘?’’ means (exponential) amplification and a Ct value above the
LOD, ‘‘–’’ means no amplification or amplification below the LOD. For the Tm values: ‘‘?’’ means that the observed Tm value equals the Tm of
the complementary Sybricon ±1 �C, while a ‘‘–’’ means that the observed Tm value differs more than ±1 �C from the Tm of the complementary
Sybricona Weak-positive signal, b GM event not authorized in EU, c GM event only tolerated below 0.9% in EU
Eur Food Res Technol (2010) 230:383–393 385
123
Reference Materials (CRM) or from in-house grown plants
is used. The CRM are obtained from the Institute of Ref-
erence Materials and Methods (IRMM) (Geel, Belgium),
American Oil Chemists’ Society (AOCS) (Urbana, USA) or
Bayer CropScience (Ghent, Belgium). In-house leaf mate-
rial is produced from seeds obtained from the Biotech
Companies or from the local commercial market. All plants
are grown in a Snijders Scientific (Tilburg, The Nether-
lands) S1084 plant growth chamber under standard condi-
tions (16/8 h day/night regime at 25 �C/80% humidity). A
list of all applied materials is given in Table 1.
Chemicals, PCR reagents and PCR primers
All applied chemical products are analytical grade (NaCl,
EDTA, Tris, boric acid, HCl, CTAB, chloroform, isopro-
panol, ethanol). The applied enzyme products are: Ribo-
nuclase A (Sigma–Aldrich), Proteinase K (Sigma–
Aldrich), EcoRI (Invitrogen) and T4 DNA polymerase
(Invitrogen). DNase and RNase free water was purchased
from ACROS organics.
All kit-products were used according to the manufac-
turer’s recommendation: Quant-iTTM PicoGreen� dsDNA
Assay Kit, TOPO TA Cloning� Kit, pCR� 2.1-TOPO�
vector, TOP10F0 competent cells (Invitrogen); Genome lab,
Dye Terminator Cycle Sequencing (DTCS) kit (Beckman
Coulter), QIAGEN Plasmid Midi kit (QIAGEN).
Pre-casted ‘‘Ready AgaroseTM 96 Plus Gel (3%)’’
(BioRad) gels and ‘‘EZ Load HT molecular weight markers
(100 bp–2 kb)’’ (Biorad) were used for agarose gel
analysis.
In the PCR reactions, Amplitaq Gold DNA polymerase
(Applied Biosystems), Oligold� oligonucleotides (Euro-
gentec), and SYBR�Green PCR Mastermix [Diagenode
(ref: GMO-GS2X-A300)] were used.
Methods
The CTAB gDNA extraction, the qPCR analysis, the
agarose gel analysis methods, the applied criteria and the
analytical procedures were accredited under ISO-17025 by
the official Belgian ISO accreditation organisation ‘‘Belac’’
(2006)
Bioinformatic development of primer pair
All bioinformatic analysis of DNA sequences are per-
formed using the wEMBOSS software package [27–29].
Relevant DNA sequences were collected from public data
bases (NCBI and EMBL), patents and scientific literature
as well as from in-house DNA sequencing. A uniform
primer design approach was applied in the development of
primer pairs for the respective targets. A first step consists
of identifying regions with high DNA sequence homology
within the ‘‘p35S’’ and ‘‘tNOS’’ regions from the different
GM events or retrieved DNA sequences. Next, several
different primer pairs, comprised within the common target
region(s), are designed using the ‘‘Primer Express’’ pro-
gram from Applied Biosystems (version 3.0) using stan-
dard program configuration. An in silico specificity
analysis for each primer is performed by probing it against
several public and GMO DNA sequence dbases [30, 31] as
well as the available in-house sequence information. Any
primer showing homology with a non-relevant DNA
sequence is discarded from further analysis. The remaining
primers are organized in pairs, where as much as possible
the primer pairs proposed by Primer Express are retained,
and tested experimentally.
Extraction of genomic DNA
A CTAB-based extraction method was applied for the
extraction of genomic DNA from all test matrices.
Prior to extraction, leaf tissue is homogenized to powder
in a mortar and pestle after liquid nitrogen freezing. Small
amounts of seeds (\30 g) are homogenized by crushing in
a blender (Kika-Werke Corp.).
Genomic DNA (gDNA) is extracted using a CTAB-
based method adapted from Dellaporta et al. 1983 [32]. To
a particular powder mass, four volumes (w:v) of CTAB
extraction buffer (NaCl 1.4 M, EDTA 0.02 M, Tris–Hcl
0.1 M, CTAB 2%), supplemented with Ribonuclase A (at a
final concentration of 15 ng/ll) is added, mixed and
incubated for 30 min at 65 �C. Next, Proteinase K (at a
final concentration of 100 ng/ll) is added and incubated for
45 min at 65 �C. Upon centrifugation (20 min at 13,000g),
0.2 volume of chloroform is added to the supernatant.
After mixing and centrifuging (20 min at 13,000g), the
upper phase is collected and two volumes of CTAB pre-
cipitation buffer (NaCl 0.04 M, CTAB 0.5%) are added.
After gently mixing, the gDNA is precipitated by incuba-
tion at room temperature for 1 h. Upon centrifugation
(10 min at 13,000g), the gDNA pellet is resuspended in
700 ll NaCl (1.2 M) and 700 ll chloroform, mixed and
centrifuged for 15 min at 13,000g. The aqueous phase is
collected and 0.6 volume isopropanol is added, mixed and
centrifuged (10 min at 13,000g). The pellet is washed with
500 ll of 70% ethanol and centrifuged after washing
(10 min at 13,000g). Washing is repeated and the cleaned
pellet is dried for 30 min at 28 �C in a dry bath (Fisher
Bioblock). Finally, the pellet is resuspended in 200 ll of
DNase and RNase free water and allowed to dissolve
overnight at 4 �C under agitation. The extracted gDNA is
quantified using a VersaFluorTM Fluorometer (Biorad)
using the Quant-iTTM PicoGreen� dsDNA Assay Kit.
Finally, the gDNA is stored at -20 �C.
386 Eur Food Res Technol (2010) 230:383–393
123
Real-time PCR
All qPCR assays are performed on an ABI 7300 PCR
System (Applied Biosystems) in 25 ll reaction volume
containing 5 ll of template (10 ng/ll gDNA), 19
SYBR�Green PCR Mastermix, and 250 nM of each pri-
mer. The following thermal program is applied: a single
cycle of DNA polymerase activation for 10 min at 95 �C
followed by 40 amplification cycles of 15 s at 95 �C
(denaturing step) and 1 min at 60 �C (annealing-extension
step). Subsequently, melting temperature analysis of the
obtained amplification products is performed by gradually
increasing the temperature from 60 to 95 �C in 20 min
(±0.6�/20 s). The fluorescent reporter signal is normal-
ized against the internal reference dye (ROX) signal and
the threshold limit setting is performed in automatic
mode, according to the ABI Sequence Detection Software
version 1.4, unless manual adjustment is considered
necessary.
Amplicon cloning, sequencing and plasmid deposit
PCR fragments obtained by ‘‘classical’’ PCR amplification
using Bt11 leaf gDNA as template are cloned in a pUC18
plasmid applying common ‘‘Good Laboratory Cloning
Practices’’ [33]. The respective amplification products are
subcloned in pCR�2.1 TOPO using the TOPO TA
Cloning� Kit and characterized by restriction analysis.
Plasmid DNA from a correct clone is then prepared
(QIAGEN Plasmid Midi kit), and the corresponding gel-
separated EcoRI fragment isolated and T4-ligated into
pUC18 vector DNA (Invitrogen). These plasmids are
designated as ‘‘Sybricons’’, standing for ‘‘SYBR�Green
amplicon’’.
The respective amplicons are characterized by dideoxy-
sequence analysis on a CEQ8000 Genetic Analysis System
(Beckman Coulter) with the Genome lab, Dye Terminator
Cycle Sequencing (DTCS) Quick start Kit. Each obtained
sequence is verified by DNA sequence analysis using the
alignment ClustalW2 program [34].
The Sybricon plasmids are registered under ‘‘Safe
Deposit’’ or ‘‘Patent deposit’’ at the ‘‘Belgian Culture
Collection for Micro-organisms’’ in the ‘‘Plasmid and DNA
Library Collection’’ ([35] (BCCM/LMBP) (Ghent, Bel-
gium) (see Table 1). Authenticity testing for each plasmid
is performed by the BCCM/LMBP prior to acceptance and
certification.
SYBR�Green qPCR assay specificity assessment
Primer pair specificity is assessed by testing amplification
of reference materials for target-containing and target-
lacking GM events (for an overview see Table 1). Four
criteria were set to define what is considered as a ‘‘specific
signal’’ generated in SYBR�Green qPCR analysis: (1) an
(exponential) amplification above the threshold level is
obtained with template DNA comprising the target
sequence(s), while negative controls [the so-called ‘‘No
Template Controls’’ (NTC) and the gDNA from wild-type
crop plants] do not yield such amplification; with all target-
containing template DNA, the obtained PCR product(s)
represents (2) a single peak upon melting analysis with a
unique Tm value corresponding to the nominal Tm value
obtained with the respective Sybricon as template DNA
(with an acceptable SD ± 1 �C), while no specific peaks
are detectable in the negative controls, and (3) a single
band on agarose gel analysis with (4) a molecular weight
corresponding to the predicted size (SD ± 10 bp).
In each analysis, 50 ng of DNA template is applied. ‘‘No
Template’’ controls (NTC) are included in each assay to
assess primer dimers formation or specific background
fluorescence.
SYBR�Green qPCR assay sensitivity assessment
In this study the sensitivity of the assays was estimated
according to the former AFNOR Norm XP V03-020-2 [36]
and the IUPAC guidelines [37]. The so-called ‘‘LOD6’’ of a
qPCR method for detection of a particular target represents
the estimated haploid genome equivalent (HGE), at which
level within a linear serial dilution analysis, each of the six
repeats provides a positive signal (n = 6; 6/6 specific
signals).
In this study, gDNA obtained from leaf tissue of
Roundup Ready� soy GTS40-3-2 (RRS) is used as the
model system. The calculation of the target copy numbers
of ‘‘p35S’’ and ‘‘tNOS’’ in RRS genomic leaf tissue DNA
took into consideration the following: (1) an estimated
1.25 pg Haploid Genome Weight for soy as described by
Arumugunathan and Earle [38], (2) the homozygous status
for the GTS40-3-2 locus in the applied reference material
(gDNA from leaf tissue of homozygous seeds (Monsanto
Company)), and (3) the available information on the
inserted DNA present in RRS [8, 11, 12, 39, 40]. Based on
these data, the ‘‘Roundup Ready GTS 40-3-2’’ locus
comprises 1 copy of ‘‘p35S’’ and 1 copy of ‘‘tNOS’’ per
haploid genome.
The SYBR�Green qPCR assay sensitivity is assessed by
(1) serial dilution (in water) of leaf tissue DNA from
homozygous Roundup Ready� soy GTS40-3-2 (RRS)
(40.000–0.1 HGE), and (2) a dilution of the same leaf
tissue DNA RRS in leaf tissue DNA Wt Soybean at 100, 1
and 0.1% RRS. All analyses are repeated sixfold and the
LOD6 is determined. From these analyses, also the PCR
efficiency (E) for each of the methods can be calculated
according to: [41]
Eur Food Res Technol (2010) 230:383–393 387
123
E ¼ 10 �1=slope� �
� 1
The PCR efficiency (E) could be expressed in percentage:
E ¼ 10 �1=slope� �
� 1� �
� 100
Agarose gel analysis
Agarose gel electrophoresis (3% precast gels, Biorad) is
performed using 0.59 TBE (45 mM Tris–borate–1 mM
EDTA) at 100 V for 15 min, including a 100 bp–2 kb
Molecular Marker (BioRad).
Results and discussion
Identification of core target DNA regions in the ‘‘p35S
and ‘‘tNOS’’ elements present in the ‘‘EU-authorized
GMO’’ Universe (March 2009), primer design and
selection
Most EU-authorized GMOs contain either the ‘‘p35S’’ or
the ‘‘tNOS’’ element, or both of them (see Table 1) [8, 11,
12]. In order to develop primer sets that specifically
amplify all the ‘‘p35S’’ or the ‘‘tNOS’’ elements as present
in the EU-authorized GM plants, a Bioinformatics DBase
was compiled containing all the available relevant DNA
sequences. Within both elements, a highly conserved core
region could be identified: a 366-bp sequence for the
‘‘p35S’’ (reference GenBank: V00141.1, position 7,072–
7,437) and a 256 bp for ‘‘tNOS’’ (reference GenBank:
V00087.1, position 1,844–2,099). A common strategy for
the development and selection of primer sets for both core
elements was then applied (see ‘‘Materials and methods’’).
Several primer pairs were developed and a limited
assessment of their amplification efficiency, selectivity,
and specificity on gDNA of several target-containing GMO
was performed (data not shown). The primer pairs listed in
Table 2 performed best in this assessment. The corre-
sponding qPCR methods are further designated as ‘‘p35S-
long’’, ‘‘p35S-short’’, ‘‘tNOS-long’’, and ‘‘tNOS-short’’,
respectively. To guarantee that these qPCR methods
amplified the correct target sequences, so-called ‘‘Sybr-
icon’’ plasmids containing the respective amplification
products are constructed using gDNA from Bt11 maize leaf
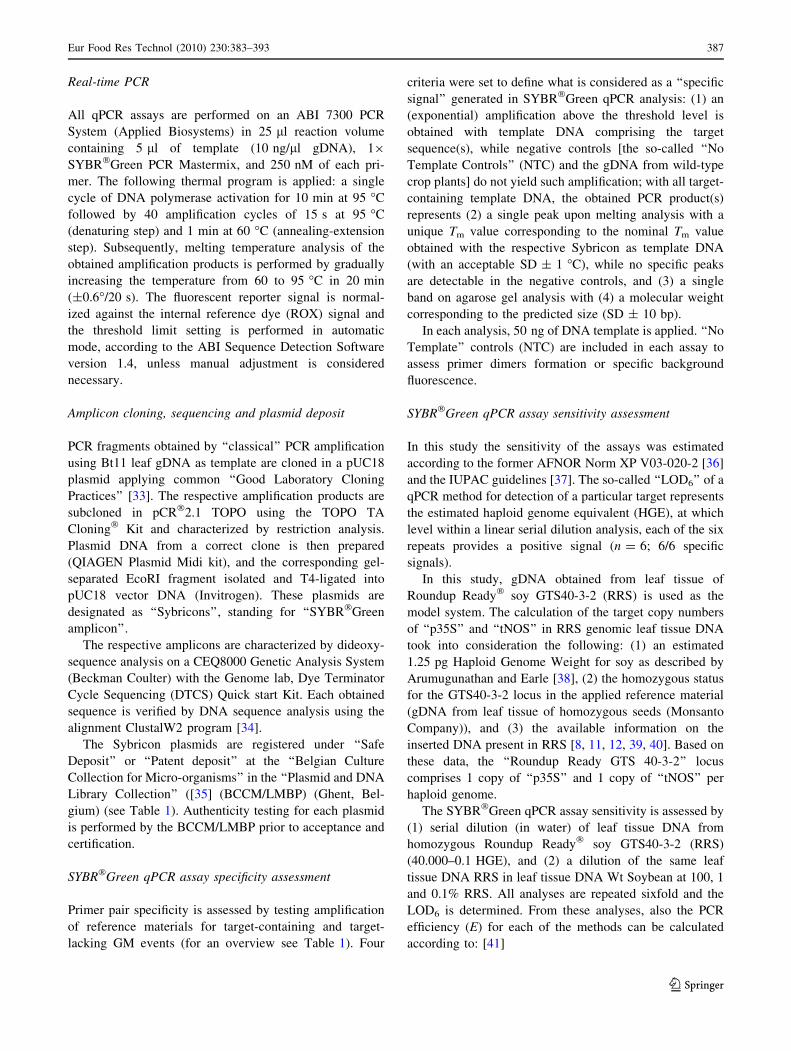
tissue as template DNA. The DNA sequences of the cloned
amplicons are shown in Fig. 1. The obtained sequences
match perfectly with the sequence from which the primers
were designed. ‘‘p35S-long’’ amplicon matches reference
GenBank: V00141.1 (position 7,249–7,395), ‘‘p35S-short’’
amplicon matches reference GenBank: V00141.1 (position
7,323–7,397), and ‘‘tNOS-long’’ amplicon matches refer-
ence GenBank: V00087.1 (position 1,850–2,021). The
‘‘tNOS-short’’ amplicon matches reference GenBank:
Table 2 Primer pairs and amplicon size for each SYBR�Green qPCR method
SYBR�Green qPCR
method name
Target Primer name Primer sequence Amplicon
size (bp)
References
‘‘p35S-long’’ CaMV 35S promoter 35S-3 GACAGTGGTCCCAAAGATGG 147 [42]
35S-6 GTCTTGCGAAGGATAGTGGG
‘‘p35S-short’’ CaMV 35S promoter 35S_N3Fwd AAAGCAAGTGGATTGATGTGATA 75 This study
35S_N3 Rev GGGTCTTGCGAAGGATAGTG
‘‘tNOS-long’’ tNOS trait specific tNOS NEW Fwd1 CGTTCAAACATTTGGCAATAAAG 172 This study
tNOS NEW Rev1 AAATGTATAATTGCGGGACTCTAATC
‘‘tNOS-short’’ tNOS trait specific tNOS_NN_Fwd GATTAGAGTCCCGCAATTATACATTTAA 69 This study
tNOS D REV TTATCCTAGKTTGCGCGCTATATTTa
a K represents a degenerate nucleotide equaling a G or T at that position
C
B
A
D
Fig. 1 DNA sequence of the ‘‘p35S-long’’, ‘‘p35S-short’’, ‘‘tNOS-
long’’ and ‘‘tNOS-short’’ amplicons obtained by SYBR�Green qPCR
using ‘‘Sybricon’’ reference plasmids as template DNA. a Sybr-
icon010 (p35S-long qPCR). b Sybricon017 (p35S-short qPCR). cSybricon001 (tNOS-long qPCR). d Sybricon006 (tNOS-short qPCR).
The reverse and forward sequencing primers are indicated in bold
388 Eur Food Res Technol (2010) 230:383–393
123
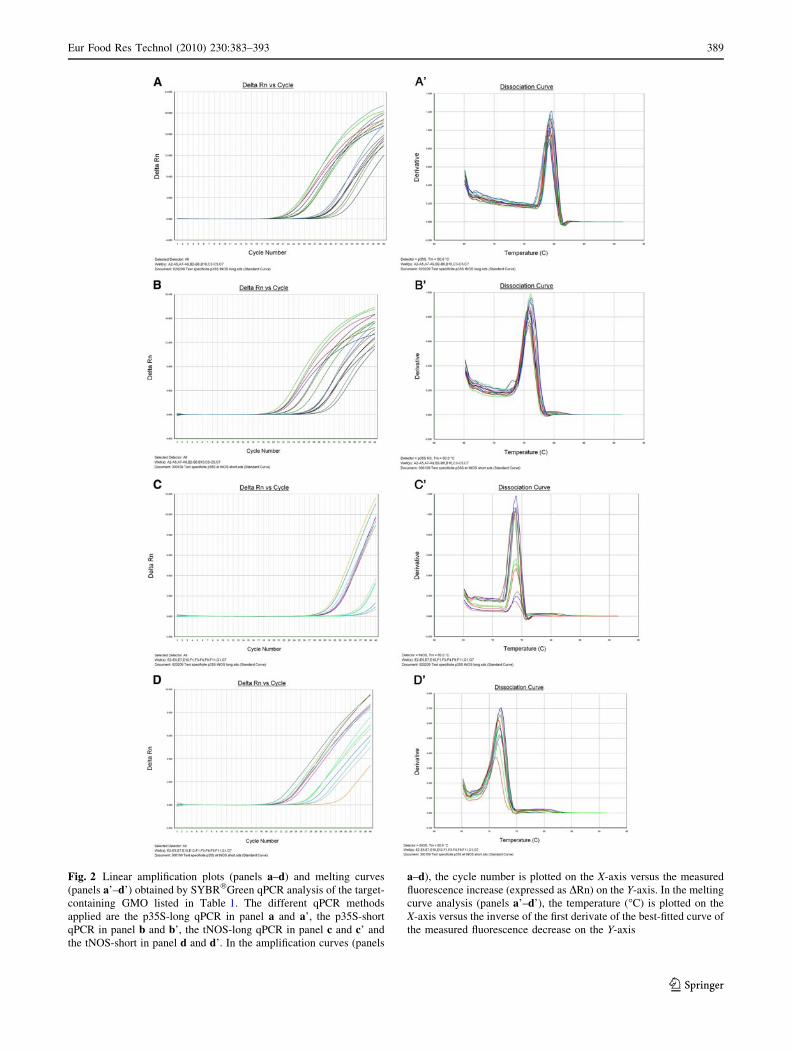
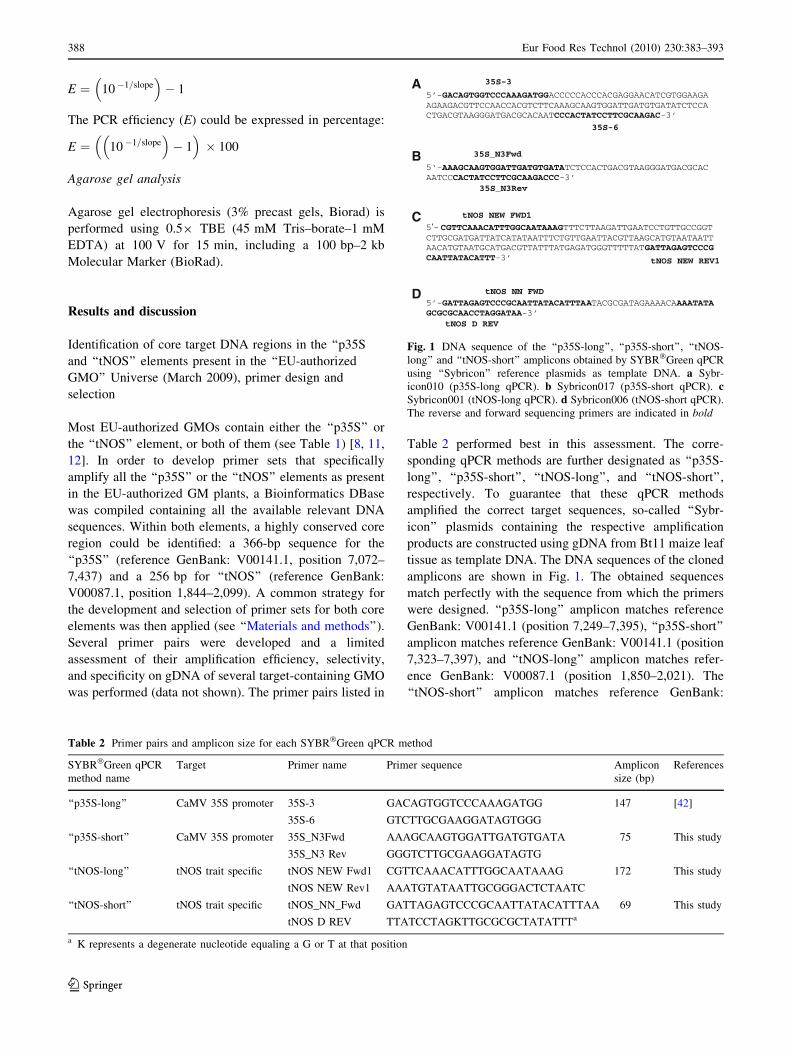
Fig. 2 Linear amplification plots (panels a–d) and melting curves
(panels a’–d’) obtained by SYBR�Green qPCR analysis of the target-
containing GMO listed in Table 1. The different qPCR methods
applied are the p35S-long qPCR in panel a and a’, the p35S-short
qPCR in panel b and b’, the tNOS-long qPCR in panel c and c’ and
the tNOS-short in panel d and d’. In the amplification curves (panels
a–d), the cycle number is plotted on the X-axis versus the measured
fluorescence increase (expressed as DRn) on the Y-axis. In the melting
curve analysis (panels a’–d’), the temperature (�C) is plotted on the
X-axis versus the inverse of the first derivate of the best-fitted curve of
the measured fluorescence decrease on the Y-axis
Eur Food Res Technol (2010) 230:383–393 389
123
V00087.1 (position 1,996–2,064) with a single mismatch in
position 2,055 (A ? C) due to a degenerate nucleotide in
the reverse primer (Table 2). The respective sequences
match perfectly the expected ones as notified for Bt11
maize and recognize all to date ‘‘p35S’’ and ‘‘tNOS’’
containing EU-authorized GMO [as evaluated through
blast analysis of the CCSIS Bioinformatics data analysis
[40] (data not shown).
Tm value determination for the ‘‘p35S’’ and ‘‘tNOS’’
SYBR�Green qPCR amplicons with ‘‘reference
plasmids’’ as DNA template
To minimize bias due to the genetic background in deter-
mining the nominal value of the melting temperature for
each target, the ‘‘Sybricon’’ plasmids containing the
respective amplification products were used to generate
each of the ‘‘p35S’’ and ‘‘tNOS’’ amplicons. The Tm values
for the different ‘‘p35S’’ and ‘‘tNOS’’ amplicons are distinct
from each other with a Tm value at 80 and 76.5 �C for the
‘‘p35S-long’’ and ‘‘p35S-short’’, respectively, and at 73.3
and 72.5 �C for the ‘‘tNOS-long’’ and ‘‘tNOS-short’’,
respectively (Table 1A). It is generally accepted that the Tm
obtained with SYBR�Green qPCR could vary between 0.5
and 1 �C for the same amplicon [43, 44]. Therefore, to
cover slight deviations in the Tm value between reference
materials (Sybricons) and samples due to analyte impuri-
ties, a standard deviation of ±1 �C on the nominal Tm value
will be applied, as the acceptance range, in further analysis.
Determination of ‘‘p35S’’ and ‘‘tNOS’’ SYBR�Green
qPCR specificity
Using the 4 SYBR�Green qPCR methods, all target-con-
taining GM-event samples give specific signal for ‘‘p35S’’
and/or ‘‘tNOS’’ (Table 1B). All NTC samples are negative
and also all WT crop templates do not yield any specific
signals. It can thus be concluded that all four methods are
specific for their targets. In several CRM (8 out of 35
materials), however, weak-positive signals are detectable
(indicated with ‘‘–a’’ in Table 1B.). These weak-positive
signals are most probably due to the presence of low
amounts of GMO impurities in the reference materials
because the Ct levels of the signals reside at or below the
LOD of the methods (see below) and a DCt [ 6 between
these aberrant signals and any target-positive element is
observed. The CRM are certified for the presence of a
specific target at a particular mass% but are not certified for
the absence of any other GM targets that could be present
at low level [45, 46]. Due to the very low quantities
present, the nature of these impurities was not further
investigated.
All specific signals in the target-containing GMO gen-
erate a unique peak in melting analysis and the Tm values
of the PCR products differ less than 1 �C from the nominal
Tm value of the corresponding Sybricon plasmids (see
Table 1B and Fig. 2). No additional peaks were observed
in these analyses. Thus, the 4 SYBR�Green qPCR reac-
tions generate a single specific signal without major addi-
tional amplification products.
Agarose gel analysis of the respective PCR products
yields a single band at the expected molecular weight in all
target-containing GMO (147 bp for ‘‘p35S-long, 75 bp for
‘‘p35S-short’’, 175 bp for ‘‘tNOS-long’’ and 69 bp for
‘‘tNOS-short’’). Again, no major additional amplification
products are observed (Fig. 3).
BM 1 2 3 4 5 6 7 10 11 12 13 14 16 19 20 21 22 M
AM 1 2 3 4 5 6 7 10 11 12 13 14 16 19 20 21 22 M
DM 1 2 3 4 5 8 9 11 12 15 17 18 22 M
CM 1 2 3 4 5 8 9 11 12 15 17 18 22 M
Fig. 3 Agarose gel electrophoresis of the ‘‘p35S’’ and ‘‘tNOS’’ PCR
products amplified by SYBR�Green qPCR from gDNA extracted
from reference material containing these elements. The respective
qPCR methods applied were: panel a the p35S-long qPCR (expected
amplicon length: 147 bp), panel b the p35S-short qPCR (expected
amplicon length: 75 bp), panel c the tNOS-long qPCR (expected
amplicon length: 172 bp), and panel d the tNOS-short qPCR
(expected amplicon length: 69 bp). Tested GMO events containing
these elements are: 1 ‘‘MON1445’’, 2 ‘‘MON531’’, 3 ‘‘MON15985’’,
4 ‘‘LL25’’, 5 ‘‘BT11’’, 6 ‘‘BT176’’, 7 ‘‘DAS 59122’’, 8 ‘‘GA21’’, 9‘‘MIR604’’, 10 ‘‘MON810’’, 11 ‘‘MON863’’, 12 ‘‘NK603’’, 13‘‘T25’’, 14 ‘‘TC1507’’, 15 ‘‘RF3’’, 16 ‘‘T45’’, 17 ‘‘MS8’’, 18‘‘EH92-527-1’’, 19 ‘‘LL62’’ (Bayer material), 20 ‘‘LL62’’ (AOCS
material), 21 ‘‘A2704-12’’, 22 ‘‘GTS 40-3-2’’. M EZ load HT
molecular marker, 100 bp–2 kb (5 bands: 100, 200, 500, 1,000,
2,000 bp)
390 Eur Food Res Technol (2010) 230:383–393
123
Sensitivity of the 4 SYBR�Green qPCR methods
for ‘‘p35S’’ and ‘‘tNOS’’ analytes on ‘‘model’’
reference materials
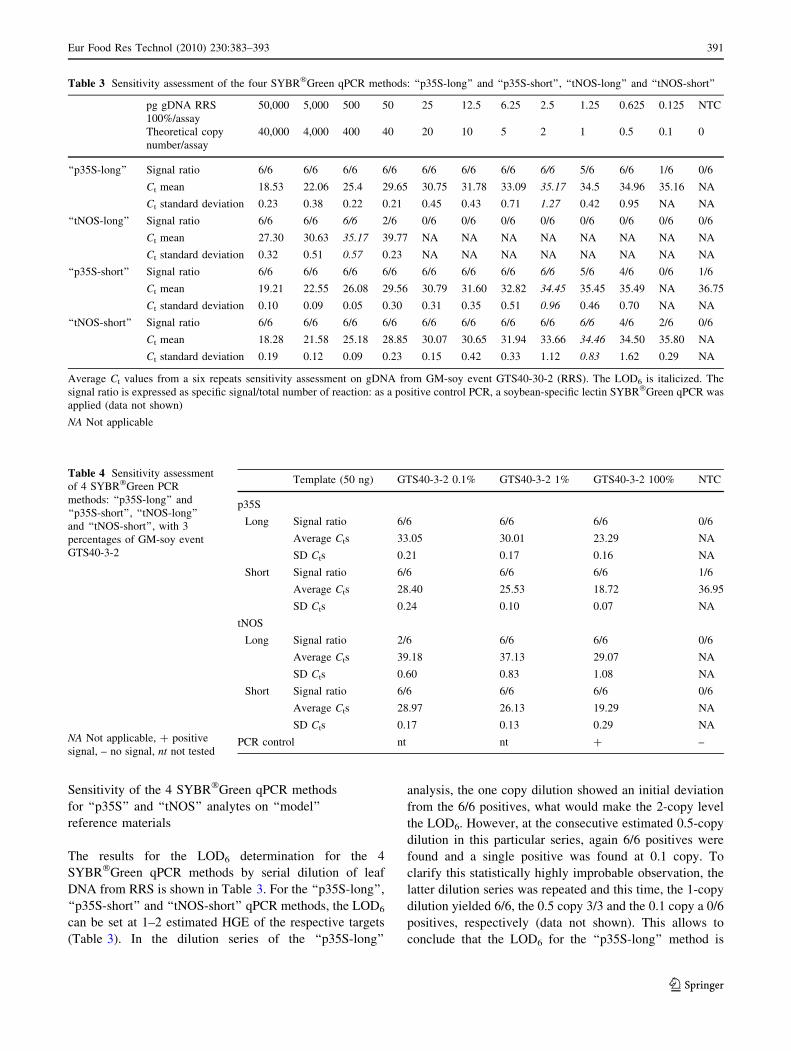
The results for the LOD6 determination for the 4
SYBR�Green qPCR methods by serial dilution of leaf
DNA from RRS is shown in Table 3. For the ‘‘p35S-long’’,
‘‘p35S-short’’ and ‘‘tNOS-short’’ qPCR methods, the LOD6
can be set at 1–2 estimated HGE of the respective targets
(Table 3). In the dilution series of the ‘‘p35S-long’’
analysis, the one copy dilution showed an initial deviation
from the 6/6 positives, what would make the 2-copy level
the LOD6. However, at the consecutive estimated 0.5-copy
dilution in this particular series, again 6/6 positives were
found and a single positive was found at 0.1 copy. To
clarify this statistically highly improbable observation, the
latter dilution series was repeated and this time, the 1-copy
dilution yielded 6/6, the 0.5 copy 3/3 and the 0.1 copy a 0/6
positives, respectively (data not shown). This allows to
conclude that the LOD6 for the ‘‘p35S-long’’ method is
Table 3 Sensitivity assessment of the four SYBR�Green qPCR methods: ‘‘p35S-long’’ and ‘‘p35S-short’’, ‘‘tNOS-long’’ and ‘‘tNOS-short’’
pg gDNA RRS
100%/assay
50,000 5,000 500 50 25 12.5 6.25 2.5 1.25 0.625 0.125 NTC
Theoretical copy
number/assay
40,000 4,000 400 40 20 10 5 2 1 0.5 0.1 0
‘‘p35S-long’’ Signal ratio 6/6 6/6 6/6 6/6 6/6 6/6 6/6 6/6 5/6 6/6 1/6 0/6
Ct mean 18.53 22.06 25.4 29.65 30.75 31.78 33.09 35.17 34.5 34.96 35.16 NA
Ct standard deviation 0.23 0.38 0.22 0.21 0.45 0.43 0.71 1.27 0.42 0.95 NA NA
‘‘tNOS-long’’ Signal ratio 6/6 6/6 6/6 2/6 0/6 0/6 0/6 0/6 0/6 0/6 0/6 0/6
Ct mean 27.30 30.63 35.17 39.77 NA NA NA NA NA NA NA NA
Ct standard deviation 0.32 0.51 0.57 0.23 NA NA NA NA NA NA NA NA
‘‘p35S-short’’ Signal ratio 6/6 6/6 6/6 6/6 6/6 6/6 6/6 6/6 5/6 4/6 0/6 1/6
Ct mean 19.21 22.55 26.08 29.56 30.79 31.60 32.82 34.45 35.45 35.49 NA 36.75
Ct standard deviation 0.10 0.09 0.05 0.30 0.31 0.35 0.51 0.96 0.46 0.70 NA NA
‘‘tNOS-short’’ Signal ratio 6/6 6/6 6/6 6/6 6/6 6/6 6/6 6/6 6/6 4/6 2/6 0/6
Ct mean 18.28 21.58 25.18 28.85 30.07 30.65 31.94 33.66 34.46 34.50 35.80 NA
Ct standard deviation 0.19 0.12 0.09 0.23 0.15 0.42 0.33 1.12 0.83 1.62 0.29 NA
Average Ct values from a six repeats sensitivity assessment on gDNA from GM-soy event GTS40-30-2 (RRS). The LOD6 is italicized. The
signal ratio is expressed as specific signal/total number of reaction: as a positive control PCR, a soybean-specific lectin SYBR�Green qPCR was
applied (data not shown)
NA Not applicable
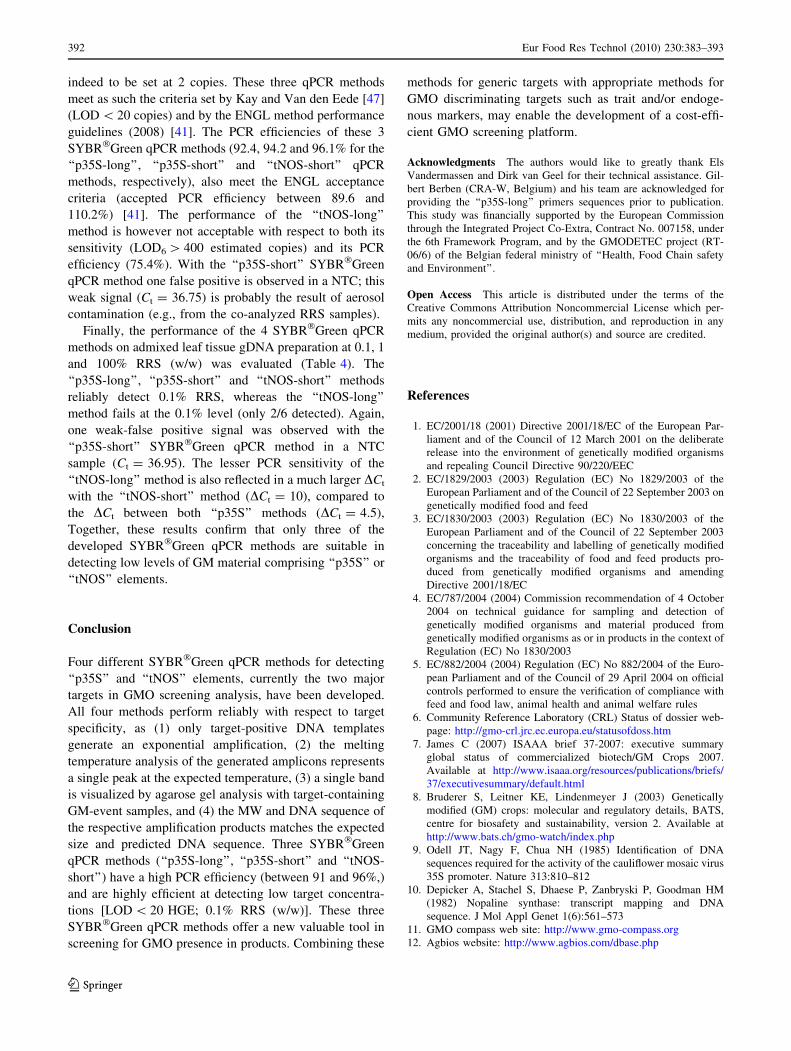
Table 4 Sensitivity assessment
of 4 SYBR�Green PCR
methods: ‘‘p35S-long’’ and
‘‘p35S-short’’, ‘‘tNOS-long’’
and ‘‘tNOS-short’’, with 3
percentages of GM-soy event
GTS40-3-2
NA Not applicable, ? positive
signal, – no signal, nt not tested
Template (50 ng) GTS40-3-2 0.1% GTS40-3-2 1% GTS40-3-2 100% NTC
p35S
Long Signal ratio 6/6 6/6 6/6 0/6
Average Cts 33.05 30.01 23.29 NA
SD Cts 0.21 0.17 0.16 NA
Short Signal ratio 6/6 6/6 6/6 1/6
Average Cts 28.40 25.53 18.72 36.95
SD Cts 0.24 0.10 0.07 NA
tNOS
Long Signal ratio 2/6 6/6 6/6 0/6
Average Cts 39.18 37.13 29.07 NA
SD Cts 0.60 0.83 1.08 NA
Short Signal ratio 6/6 6/6 6/6 0/6
Average Cts 28.97 26.13 19.29 NA
SD Cts 0.17 0.13 0.29 NA
PCR control nt nt ? –
Eur Food Res Technol (2010) 230:383–393 391
123
indeed to be set at 2 copies. These three qPCR methods
meet as such the criteria set by Kay and Van den Eede [47]
(LOD \ 20 copies) and by the ENGL method performance
guidelines (2008) [41]. The PCR efficiencies of these 3
SYBR�Green qPCR methods (92.4, 94.2 and 96.1% for the
‘‘p35S-long’’, ‘‘p35S-short’’ and ‘‘tNOS-short’’ qPCR
methods, respectively), also meet the ENGL acceptance
criteria (accepted PCR efficiency between 89.6 and
110.2%) [41]. The performance of the ‘‘tNOS-long’’
method is however not acceptable with respect to both its
sensitivity (LOD6 [ 400 estimated copies) and its PCR
efficiency (75.4%). With the ‘‘p35S-short’’ SYBR�Green
qPCR method one false positive is observed in a NTC; this
weak signal (Ct = 36.75) is probably the result of aerosol
contamination (e.g., from the co-analyzed RRS samples).
Finally, the performance of the 4 SYBR�Green qPCR
methods on admixed leaf tissue gDNA preparation at 0.1, 1
and 100% RRS (w/w) was evaluated (Table 4). The
‘‘p35S-long’’, ‘‘p35S-short’’ and ‘‘tNOS-short’’ methods
reliably detect 0.1% RRS, whereas the ‘‘tNOS-long’’
method fails at the 0.1% level (only 2/6 detected). Again,
one weak-false positive signal was observed with the
‘‘p35S-short’’ SYBR�Green qPCR method in a NTC
sample (Ct = 36.95). The lesser PCR sensitivity of the
‘‘tNOS-long’’ method is also reflected in a much larger DCt
with the ‘‘tNOS-short’’ method (DCt = 10), compared to
the DCt between both ‘‘p35S’’ methods (DCt = 4.5),
Together, these results confirm that only three of the
developed SYBR�Green qPCR methods are suitable in
detecting low levels of GM material comprising ‘‘p35S’’ or
‘‘tNOS’’ elements.
Conclusion
Four different SYBR�Green qPCR methods for detecting
‘‘p35S’’ and ‘‘tNOS’’ elements, currently the two major
targets in GMO screening analysis, have been developed.
All four methods perform reliably with respect to target
specificity, as (1) only target-positive DNA templates
generate an exponential amplification, (2) the melting
temperature analysis of the generated amplicons represents
a single peak at the expected temperature, (3) a single band
is visualized by agarose gel analysis with target-containing
GM-event samples, and (4) the MW and DNA sequence of
the respective amplification products matches the expected
size and predicted DNA sequence. Three SYBR�Green
qPCR methods (‘‘p35S-long’’, ‘‘p35S-short’’ and ‘‘tNOS-
short’’) have a high PCR efficiency (between 91 and 96%,)
and are highly efficient at detecting low target concentra-
tions [LOD \ 20 HGE; 0.1% RRS (w/w)]. These three
SYBR�Green qPCR methods offer a new valuable tool in
screening for GMO presence in products. Combining these
methods for generic targets with appropriate methods for
GMO discriminating targets such as trait and/or endoge-
nous markers, may enable the development of a cost-effi-
cient GMO screening platform.
Acknowledgments The authors would like to greatly thank Els
Vandermassen and Dirk van Geel for their technical assistance. Gil-
bert Berben (CRA-W, Belgium) and his team are acknowledged for
providing the ‘‘p35S-long’’ primers sequences prior to publication.
This study was financially supported by the European Commission
through the Integrated Project Co-Extra, Contract No. 007158, under
the 6th Framework Program, and by the GMODETEC project (RT-
06/6) of the Belgian federal ministry of ‘‘Health, Food Chain safety
and Environment’’.
Open Access This article is distributed under the terms of the
Creative Commons Attribution Noncommercial License which per-
mits any noncommercial use, distribution, and reproduction in any
medium, provided the original author(s) and source are credited.
References
1. EC/2001/18 (2001) Directive 2001/18/EC of the European Par-
liament and of the Council of 12 March 2001 on the deliberate
release into the environment of genetically modified organisms
and repealing Council Directive 90/220/EEC
2. EC/1829/2003 (2003) Regulation (EC) No 1829/2003 of the
European Parliament and of the Council of 22 September 2003 on
genetically modified food and feed
3. EC/1830/2003 (2003) Regulation (EC) No 1830/2003 of the
European Parliament and of the Council of 22 September 2003
concerning the traceability and labelling of genetically modified
organisms and the traceability of food and feed products pro-
duced from genetically modified organisms and amending
Directive 2001/18/EC
4. EC/787/2004 (2004) Commission recommendation of 4 October
2004 on technical guidance for sampling and detection of
genetically modified organisms and material produced from
genetically modified organisms as or in products in the context of
Regulation (EC) No 1830/2003
5. EC/882/2004 (2004) Regulation (EC) No 882/2004 of the Euro-
pean Parliament and of the Council of 29 April 2004 on official
controls performed to ensure the verification of compliance with
feed and food law, animal health and animal welfare rules
6. Community Reference Laboratory (CRL) Status of dossier web-
page: http://gmo-crl.jrc.ec.europa.eu/statusofdoss.htm
7. James C (2007) ISAAA brief 37-2007: executive summary
global status of commercialized biotech/GM Crops 2007.
Available at http://www.isaaa.org/resources/publications/briefs/
37/executivesummary/default.html
8. Bruderer S, Leitner KE, Lindenmeyer J (2003) Genetically
modified (GM) crops: molecular and regulatory details, BATS,
centre for biosafety and sustainability, version 2. Available at
http://www.bats.ch/gmo-watch/index.php
9. Odell JT, Nagy F, Chua NH (1985) Identification of DNA
sequences required for the activity of the cauliflower mosaic virus
35S promoter. Nature 313:810–812
10. Depicker A, Stachel S, Dhaese P, Zanbryski P, Goodman HM
(1982) Nopaline synthase: transcript mapping and DNA
sequence. J Mol Appl Genet 1(6):561–573
11. GMO compass web site: http://www.gmo-compass.org
12. Agbios website: http://www.agbios.com/dbase.php
392 Eur Food Res Technol (2010) 230:383–393
123
13. Waiblinger HU, Ernst B, Anderson A, Pietsch K (2008) Valida-
tion and collaborative study of p35S and T-nos duplex real-time
PCR screening method to detect genetically modified organisms
in food products. Eur Food Res Technol 226:1221–1228
14. Fernandez S, Charles-Delobel C, Geldreich A, Berthier G, Boyer
F, Collonier C, Coue-Philippe, Diolez A, Duplan MN, Kebdani
N, Romanick M, Feinberg M, Bertheau Y (2005) Quantification
of the 35 S promoter in DNA extracts from genetically modified
organisms using real-time polymerase chain reaction and speci-
ficity assessment on various genetically modified organisms, part
I: operating procedure. J AOAC Int 88(2):547–557
15. Hohne M, Santisi CR, Meyer R (2002) Real-time multiplex PCR:
an accurate method for detection and quantification of 35S-
CaMV promoter in genetically modified maize-containing food.
Eur Food Res Technol 215:59–64
16. Corbisier P, Trapmann S, Gancberg D, Hannes L, Van Iwaarden
P, Berben G, Schimmel H, Emons H (2005) Quantitative deter-
mination of Roundup Ready soybean (Glycine max) extracted
from highly processed flour. Anal Bioanal Chem 383(2):282–290
17. Yang LT, Shen HF, Pan AH, Chen JX, Huang C, Zhang DB
(2005) Screening and construct-specific detection methods of
transgenic Huafan No 1 tomato by conventional and real-time
PCR. J Sci Food Agric 85(13):2159–2166
18. Pardigol A, Guillet S, Popping B (2003) A simple procedure for
quantification of genetically modified organisms using hybrid
amplicon standards. Eur Food Res Technol 216:412–420
19. Reiting R, Broll H, Waiblinger HU, Grohman L (2007) Collab-
orative study of T-nos real-time PCR method for screening of
genetically modified organisms in food products. J Verbr Le-
bensm 2:116–121
20. Hernandez M, Rodriguez-Lazaro D, Esteve T, Prat S, Pla M
(2003) Development of melting temperature-based SYBR Green
I polymerase chain reaction methods for multiplex genetically
modified organism detection. Anal Biochem 323:164–170
21. Li Y, Xing D, Zhang C (2009) Rapid detection of genetically
modified organisms on a continuous-flow polymerase chain
reaction. Anal Biochem 385:42–49
22. Zipper H, Brunner H, Bernhagen J, Vitzthum F (2004) Investi-
gations on DNA intercalation and surface binding by SYBR
Green I, its structure determination and methodological impli-
cations. Nucleic Acids Res 32(12):e103
23. Haugland RP (2002) Handbook of fluorescence probes and
research products, Ninth edn. Molecular Probes, Eugene, OR
24. Bustin SA (2000) Absolute quantification of mRNA using real-
time reverse transcription polymerase chain reaction assays. J
Mol Endocrinol 25:169–193
25. Tse C, Capeau J (2003) Quantification des acides nucleiques par
PCR quantitative en temps reel. Ann Biol Clin 61(3):279–293
26. Ye J, Parra EJ, Sosnoski DM, Hiester K, Underhill PA, Shriver
MD (2002) Melting curve SNP (McSNP) genotyping: a useful
approach for diallelic genotyping in forensic science. J Forensic
Sci 47:593–600
27. wEMBOSS is an Open Source software: http://wemboss.
sourceforge.net/
28. Rice P, Longden I, Bleasby A (2000) EMBOSS the European
molecular biology open software suite. Trends Genet 16(6):276–
277
29. Sarachu M, Colet M (2005) wEMBOSS: a web site interface for
EMBOSS. Bioinformatics 21(4):540–541
30. EMBL database: http://www.ebi.ac.uk/embl/
31. RefSeq NCBI database: http://www.ncbi.nlm.nih.gov/RefSeq/
32. Dellaporta SL, Wood J, Hicks JB (1983) A Plant DNA Mini-
preparation Version II. Plant Mol Biol Report 1(4):19–21
33. Sambrook J, Russell DW (2001) Molecular cloning, a laboratory
manual, vol 1, 2, 3, 3rd edn. Cold Spring Harbor Laboratory
Press, Cold Spring Harbor
34. ClustalW2 program on EMBL-EBI website:http://www.ebi.ac.
uk/Tools/clustalw2/index.html
35. BCCM/LMBP plasmids catalogue website: http://bccm.belspo.
be/db/lmbp_search_form.php
36. Norme AFNOR XP V03-020-2 (04/2005) Produits alimentaires–
Detection et quantification des organismes vegetaux genetique-
ment modifies et produits derives–Partie 2: methodes basees sur
la reaction de polymerisation en chaıne
37. Thompson M, Ellison SLR, Wood R (2002) Harmonized guide-
lines for single-laboratory validation of methods of analysis,
(IUPAC Technical Report). Pure Appl Chem 74(5):835–855
38. Arumugunathan K, Earle ED (1991) Nuclear DNA content of
some important plant species. Plant Mol Biol Report 9:208–218
39. Windels P, Taverniers I, Depicker A, Van Bockstaele E, De
Loose M (2001) Characterisation of the Roundup Ready soybean
insert. Eur Food Res Technol 213:107–112
40. Central Core DNA Sequence Information System (CCSIS):
http://bgmo.jrc.ec.europa.eu/home/bioinformatics/bioinformatics.
html
41. Definition of minimum performance requirements for analytical
methods of GMO testing, European Network of GMO Labora-
tories (ENGL), 13 October 2008. Available at http://gmo-crl.jrc.
ec.europa.eu/
42. Berben G, Dardenne P (2001) Tracage et authentification des
produits a base d’organismes genetiquement modifies, Recher-
ches financees par les SSTC dans le cadre du programme de
‘‘Recherche pre-nominative dans le secteur alimentaire’’, CRA-
W, rapport finale contract NP/42/026
43. Donohoe GG, Laaksonen M, Pulkki K, Ronnemaa T, Kairisto V
(2000) Rapid single-tube screening of the C282Y hemochroma-
tosis mutation by real-time multiplex allele-specific PCR without
fluorescent probes. Clin Chem 46(10):1540–1547
44. Herrmann MG, Durtschi JD, Wittwer CT, Voelkerding KV
(2007) Expanded instrument comparison of amplicon dna melting
analysis for mutation scanning and genotyping. Clin Chem
53(8):1544–1548
45. AOCS certified material: http://members.aocs.org/source/orders/
index.cfm?section=orders&task=1&CATEGORY=H-CRMS&
DESCRIPTION=Certified%20Reference%20Materials&CFTOKEN
=38450281&continue=1&SEARCH_TYPE=find
46. IRMM certified material catalogue: http://irmm.jrc.ec.europa.eu/
html/reference_materials_catalogue/catalogue/index.htm
47. Kay S, Van den Eede G (2001) The limit of GMO detection. Nat
Biotechnol 19:405 405
Eur Food Res Technol (2010) 230:383–393 393
123
Related Documents


