1 Switching costs in telecommunications: conclusions from a Hungarian survey 1 László Lőrincz + , Péter Nagy + 1 Introduction On the telecommunication markets, even if competition intensifies, it is often bounded by switching costs, which customers experience. Customers may face monetary switching costs: the most typical example is loyalty commitments. Additionally, transaction costs, such as managing the switching itself, differences in auxiliary services, access to help desk may make switching costly. Increasing switching costs is a strategic asset for operators with dominant position, thus information on them is necessary when analyzing dominance. In this study we first overview theoretical models of switching costs, with special regard to telecommunication markets and regulation. Second, we review literature on methods of estimating switching costs. Next, we present survey results on the extent and elements of switching costs in Hungarian telecommunication services. Results include some comparison with U.K. data, and results on effect of multi-play offers. Additionally, we compare results of two methods for estimating switching costs and draw methodological conclusions. 1.1 Elements of switching costs Switching costs can be divided in several sub-categories. Transaction costs include the costs, which are related to canceling and entering to the new contract. 2 They arise about every service, when customers contract for subscription. 1 This research was supported by the Hungarian Competition Authority in the GVH-VKK 2007 framework + Infrapont Consulting, Hungary. Correspondence: [email protected] , [email protected] 2 In a narrow sense. In broader sense, each of the following types can be regarded as transaction costs, except learning costs. (Klemperer and Farell, 2006)

Welcome message from author
This document is posted to help you gain knowledge. Please leave a comment to let me know what you think about it! Share it to your friends and learn new things together.
Transcript
1
Switching costs in telecommunications: conclusions from a
Hungarian survey1
László Lőrincz+,
Péter Nagy+
1 Introduction
On the telecommunication markets, even if competition intensifies, it is often bounded by
switching costs, which customers experience. Customers may face monetary switching costs:
the most typical example is loyalty commitments. Additionally, transaction costs, such as
managing the switching itself, differences in auxiliary services, access to help desk may make
switching costly. Increasing switching costs is a strategic asset for operators with dominant
position, thus information on them is necessary when analyzing dominance.
In this study we first overview theoretical models of switching costs, with special regard to
telecommunication markets and regulation. Second, we review literature on methods of
estimating switching costs. Next, we present survey results on the extent and elements of
switching costs in Hungarian telecommunication services. Results include some comparison
with U.K. data, and results on effect of multi-play offers. Additionally, we compare results of
two methods for estimating switching costs and draw methodological conclusions.
1.1 Elements of switching costs
Switching costs can be divided in several sub-categories.
Transaction costs include the costs, which are related to canceling and entering to the new
contract.2 They arise about every service, when customers contract for subscription.
1 This research was supported by the Hungarian Competition Authority in the GVH-VKK 2007 framework
+Infrapont Consulting, Hungary. Correspondence: [email protected], [email protected]
2 In a narrow sense. In broader sense, each of the following types can be regarded as transaction costs, except
learning costs. (Klemperer and Farell, 2006)

2
Compatibility costs arise, when after purchasing the original products, customers need to buy
auxiliary products, such as toners for printers, etc. An example for these in telecommunication
services is sim-locking.
Contract costs are typically monetary costs. These include penalties, which a customer have
to pay if canceling the contract before it expires, but also the lost of discounts, which loyal
customers may earn.
Learning costs are relevant about more complex products and services, when customers need
to learn the use of the new product/service.
Risk and uncertainty arises about every service, which are not fully standardized, as
customers are not certain, whether the new service or product fulfills their expectations.
Psychological costs may emerge, when the customer emotionally sticks to a given product,
service or service provider.
Search costs almost always emerge about switching; however, some authors (Wilson, 2006)
do not regard them as switching costs. While the above switching costs are usually additives,
an increase in search costs may decrease other costs, such as uncertainty. Furthermore, search
costs are not necessarily connected to switching, as they also emerge, when the customer
searches for options but finally decides to remain with the original product or service.
The empirical study of Burnham et al (2003) identified three categories of switching costs, in
which the elements highly correlate. These are:
- Procedural costs, which include managing transactions, learning costs, comparing
alternatives and uncertainty.
- Financial costs, which incorporate penalties for canceling a contract and loosing loyalty
discounts
- Relational costs, which comprise the psychological and emotional costs of breaking the
existing relations
Another possible division about switching costs is whether they are induced by the operator
(endogenous), or they are the consequence of the switching itself (exogenous). This
distinction is important when analyzing, whether they restrict competition.
3
1.2 Competition with switching costs
At first glance, switching costs make it possible for operators to restrict switching of their
customers, thus they may become able to raise prices above the competition level by the
extent of switching cost. However, scholars have shown that the case is usually not so simple,
and switching costs often do not restrict competition. (NERA, 2003) From a dynamic point of
view, on markets with switching costs operators may increase profits by extending their
customer base. This may affect their pricing strategy: in the first period of the product life
cycle, the operators’ major strategic goal is to attract customers even by under-cost pricing,
and they compensate their losses by increasing prices in the second period (bargain and rip-
off strategy). As a result of this pricing strategy there is no supernormal profit taking into
account the whole product life cycle.
Switching costs are especially relevant in telecommunication markets, having incumbent
operators, which typically have an existing customer base despite to new entrant alternative
operators. Market outcomes in this setting are different, depending on the possibility of price
discrimination between existing and new customers (Klemperer and Farell, 2006). If price
discrimination is not possible, for incumbents with significant customer base it may be
profitable to concentrate on existing customers, and keep the prices high (rip-off). In this
setting smaller new entrants can aim new customers, who they can easily attract by offering
lower prices. For such markets, entry can even be too easy. New entrants with higher costs
than the incumbents can enter to the market. On the other hand, when price discrimination is
possible, incumbents do not face the dilemma, whether to concentrate on old or new
customers. They can offer higher prices for the old ones and reduced prices to new ones. This
worsens the position of new entrants, who must offer high discounts.
Furthermore, it is a critical question, at which stage of the product life-cycle was the market
liberalized. If it happened relatively early, prospect of the competition is favorable, even in
the case of price discrimination. Significant base of potential new customers may be attractive
for the new entrants, even if they must compete for them heavily with incumbents.
Additionally, relatively low proportion of old customers provides only limited resources
(profit) for the incumbents, which they can use in the competition for new customers. A more
troublesome case is when liberalization has happened later, like in case of fixed voice
telephony. In this case incumbents did not face competition in the first period of the product
life cycle, thus ex-ante competition did not happen. Moreover, incumbents have a large,
locked-in customer-base, which can be used to realize positive profit. If price discrimination
4
is possible, they can use this profit in the competition for new customers to offer below-cost
pricing.
1.3 Regulatory consequences
Based on the previous analysis, when switching costs exist, regulators should take a dynamic
approach taking into account the whole product life cycle. Otherwise serious regulatory
failure can emerge On competitive (from the beginning of the product life-cycle) markets
using static approach, over-cost pricing in the second period may indicate need for regulatory
action. However, introducing price regulation in this case may be harmful for the industry,
and result in net losses overall on the two period, as operators competed intensively with
under-cost pricing in the first one. In this case, a more liberal approach is favorable (NERA,
2003)
On the other hand, as, it was presented, lack of regulation is not beneficial, when
liberalization has happened later on the product life cycle. In this case, as a consequence of
switching costs, incumbents’ foreclosure strategy does not even necessarily result in under-
cost pricing. Thus, this case demands a tighter approach on regulation of foreclosure, than the
general one.
An alternative instrument of regulators is to decrease switching costs themselves. In some
cases decreasing switching costs may enhance competition, even if they are exogenous to the
operators’ activity. Different practices of this type can be found across European
telecommunication regulation:
- Number portability is a specific instrument in telecommunication to eliminate switching
cost originating from changing telephone number
- Regulating seamless transition on wholesale markets (LLU, bitstream access) to eliminate
unserved transition period, when the customer chooses to switch to an alternative operator
using these wholesale inputs
- Regulating / standardizing service contracts may decrease transaction costs connected to
them
- A price-comparison tool may make it easier to compare complex offers of
telecommunication providers

5
2 Methods
2.1 Practices for estimating switching costs
There is no single standard method for estimating switching costs in economic research.
Examples of previous estimations use different methods (NERA 2003). The NERA study
differentiates two ways of measurements: direct and indirect ones. Direct methods analyze
actual behavior of consumers, while indirect ones use aggregate industry data. Indirect
methods can be based either on estimating cross-price elasticity or on prices and price
margins.
In empirical literature, switching costs are often measured using discrete choice models,
which correspond to direct measurements (Chen and Hitt, 2002, Forman and Chen, 2003,
Grzybowski, 2007). This method uses regression models of choosing a service provider,
including price of the service, and the switching variable (whether the consumer used the
same service in the previous period) as independent variables. Switching costs can be easily
derived from the model: by dividing the coefficient of the switching variable by the price
variable one can see how much money can be devoted to the fact that a customer does not
change supplier. Beside the fact that this analysis requires panel data, prices are usually very
difficult to determine, especially in telecommunication as operators use complex pricing. This
may be the reason, why none of the above attempts have succeeded to estimate switching
costs by analyzing the effect of the price variable.
A second way of estimating switching cost is based on Shy’s (2002) method. The method was
used by Krafft és Salies (2006), and Salies (2006) for estimating switching costs on the
British electricity and the French broadband market. Szolnoki and Tóth (2008) used the model
for forecasting the effect of liberalization on electricity prices in Hungary. The method
assumes that operators set prices on equilibrium level, where assuming that their competitors
undercut their prices by the extent of switching costs, it results in negative profits for the
competitors. On the bases of the model switching costs are easy to determine from prices and
market shares. Although it is easy to apply, it is based on the strong assumption that operators
are aware of the extent of switching costs, and they set their prices based on them.
A third way of estimating switching cost is based on direct, hypothetical questions. This
method is not based on revealed preferences, but on stated preferences. As such, its validity
depends on the extent; that respondents can forecast their future behavior. Therefore, for valid

6
measurements, it is critical to create real-like scenarios for the hypothetical decisions, which
are close to ones, in which respondents have experience. Beside its drawbacks, the method’s
advantage is that effect of several factors can be analyzed in hypothetical situations, which
would not be possible in revealed preference models.
Our estimation method is based on this third method. Additionally, in section 3.5 we compare
our survey results with ones, which could be estimated by the Shy method.
2.2 Sample
The research is based on an online questionnaire (N=2500), carried out by NRC Market
Research in September 2007. The sample represents internet users in Hungary. 47% of
respondents were women, 53% men. 40% of them were ages 18 to 29, 26% were 30 to 39,
17% were 40 to 49, and 17% were 50 to 69 years old. 3% had elementary or less education,
16% had skilled worker degree, 48% finished secondary school, and 33% hold BA or MA.
Switching costs were estimated for three telecommunication services: fixed line telephone,
mobile telephone, and internet service. 58% of respondents had fixed line telephone, 98% had
mobile phone, and 86% had internet access at home. (The remainders had internet access only
at work / school).
2.3 Measurements
When estimating switching costs, attempt was made to create real-like hypothetical situations.
For avoiding problems of time discounting, a short time frame was included in the questions.
Two questions were created for estimating switching costs. The first considers monthly
savings, which corresponds to real decision situations better, and the second a single amount,
which corresponds to economic theory better:
1. At what level of saving in your monthly bill would you switch operator in two weeks, if the
new operator would even cover the penalty for breaking your loyalty commitment (if you have
one). However, both selecting the new operator and managing the switching would be your
task.
2. Assume, that you were compensated for switching operator. What sum of single
compensation (which would be provided for you in cash now) would be necessary for you to
switch operator in two weeks. (For this sum, selecting the new operator, managing the
switching, and also financial costs would be your responsibility).

7
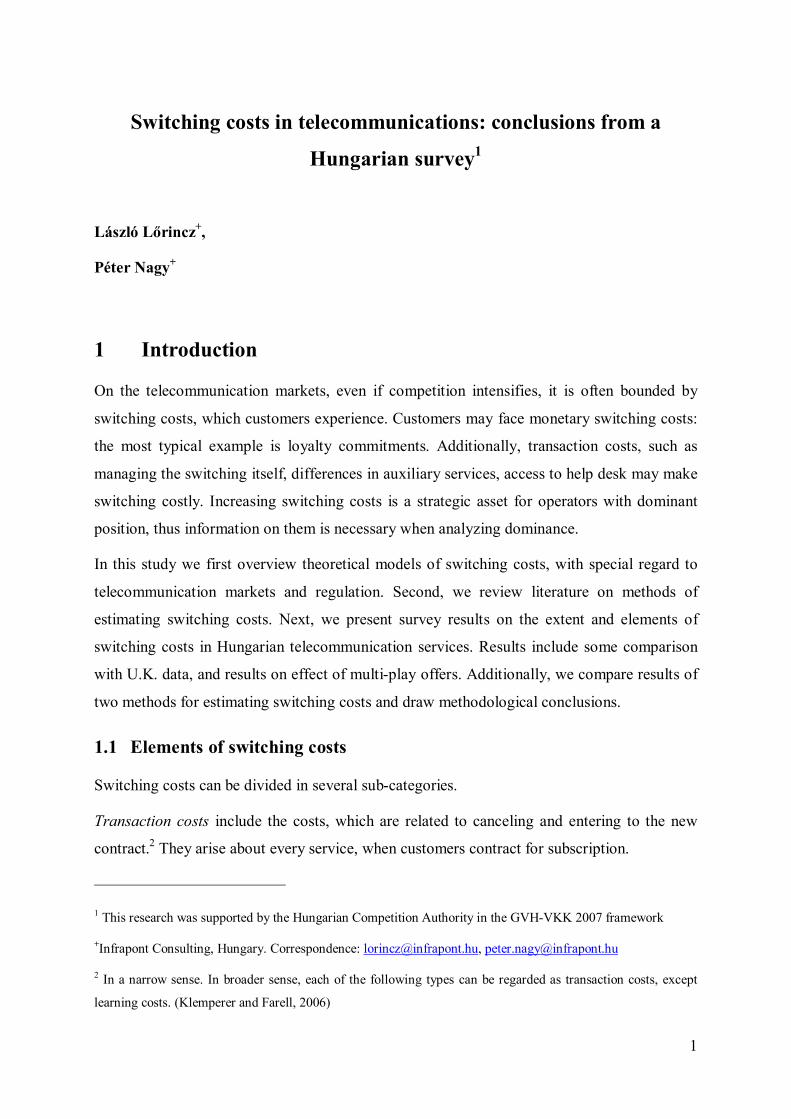
In addition, the research design made it possible to analyze elements of switching costs. The
following factors were analyzed:
1. searching for offers
2. comparing relevant offers
3. canceling old contract
4. making new contract
5. learning the use of new service
6. installing new service (when relevant)
7. perceived risk or uncertainty
8. operator satisfaction
9. loyalty contract
Factors 1 to 6 were regarded as efforts/difficulties, and they were measured by five grade
questions, like “When switching operator, what extent of effort would it demand from you, to
search for offers of operators. 1: not at all 5: very much”. Additionally, it was asked, how
much effort would it mean to switch operator at all (considering all of the factors). Perceived
risk and uncertainty was also measured on a 1 to 5 scale: When changing operator, how risky
is that you do not get the expected quality of services? Measuring operator satisfaction was
done by using a 1 to 5 scale question too, while effect of loyalty contract was measured by the
question, whether the customer actually have one. On the theoretical level, effects of these
factors on the different measurements of switching costs are presented in figure Figure 1
8
Figure 1: Factors of switching costs Searching for offers
Comparing relevant offers
Canceling old contract
Making new contract
Learning the use of new service
Risk and uncertainty
Installation
Breaking loyalty commitment
Perceived difficulty
Satisfaction with present operator
Expected monthly saving, if costs of loyalty commitment is paid by new operator
Cost of broken loyalty commitment
Time discounting factor (not observed)
Sum of single payment as compensation for switching

9
3 Results
3.1 Difficulty of switching and actual switching
Perceived difficulty of switching was evaluated using a five grade scale in the case of the
Hungarian customers. Frequency distribution shows that the level of difficulty is almost
identical in case of the fixed line telephone and internet services, and switching mobile
operator was reported somewhat easier than those two ones.
Figure 2: Perceived difficulty of switching: Hungarian customers
14%
25%
16%
15%
18%
15%
35%
30%
34%
21%
15%
22%
14%
12%
14%
0% 20% 40% 60% 80% 100%
internet
mobile
land line
1 very easy 2 3 4 5 very difficult
Considering the British customers (based on the Ofcom’s Customer Experience Report 2006 ,
the same pattern can be observed: switching mobile operator is somewhat easier than
switching fixed line operator or internet service provider. However, comparing the level of
difficulty for the British and Hungarian customers, switching was found significantly easier
for the British ones. 15% of British customers found fairly or very difficult switching fixed
operator, 10% of them found fairly or very difficult switching mobile operator, and this ratio
in 16% for internet services. On the other hand, these figures are 35%, 27% and 36% for the
Hungarian respondents respectively, however, as a five grade scale was used in the Hungarian
questionnaire in contrast to the four grade one in the UK survey, these ratios should be lower
in Hungary assuming similar difficulty.

10
Figure 3: Perceived difficulty of switching: British customers
30%
41%
30%
54%
48%
56%
11%
8%
10%
5%
2%
5%
0% 20% 40% 60% 80% 100%
internet
mobile
land line
Very easy Fairly easy Fairly difficult Very difficult
Source: Ofcom: The Customer Experience, 2006
Additionally, comparing actual switching behavior of the Hungarian and British customers, it
becomes visible that actual switching is much rarer in Hungary. On the other hand, the
difference is lower in the case of Internet services than the one for telephony, which suggests
that beside the difficulty of switching, other factors influence actual switching behavior. This
factor may be the range of choice and the trends in prices. From 2005 to 2007 average
expenditures of Hungarian households decreased by 11% for fixed, by 6% for mobile
telephony, and by 26% for Internet in nominal terms.

11
Figure 4: Switching telecommunication operator in Hungary and the UK in the two
previous years
25%
10%
15%
28%
34%
38%
0%
10%
20%
30%
40%
internet fixed line mobile
Hungary UK
3.2 Factors of switching difficulty
In the next step, elements of the switching difficulties were analyzed. According to the model
presented in figure Figure 1: Factors of switching costs six elements of this difficulty was
analyzed: searching for offers, comparing relevant offers, canceling old contract, making new
contract, learning the use of new service, and installing new service. Additionally, the
perceived risk or uncertainty was asked from respondents, and the fact, whether they have a
loyalty contract. Effects of these elements were analyzed using linear regression models.
Additionally, demographic control variables were included in the equations. Explanatory
power (R2) of the models was unusually high for such cross-sectional surveys. Considering
the demographic variables, effect of the age was significant statistically for Internet services,
showing that people over 30 years cope easier with switching operator. Considering the
elements of switching, effect of searching difficulty and learning the use of new service was
negligible. Two elements: comparing the offers and making the new contracts have
significant, but minor effect on the difficulty, but another one, canceling the old contract is the
major contributor to overall difficulty. Perceived risk or uncertainty is another major factor in
switching difficulty. Having loyalty contract also has a considerable effect, however,
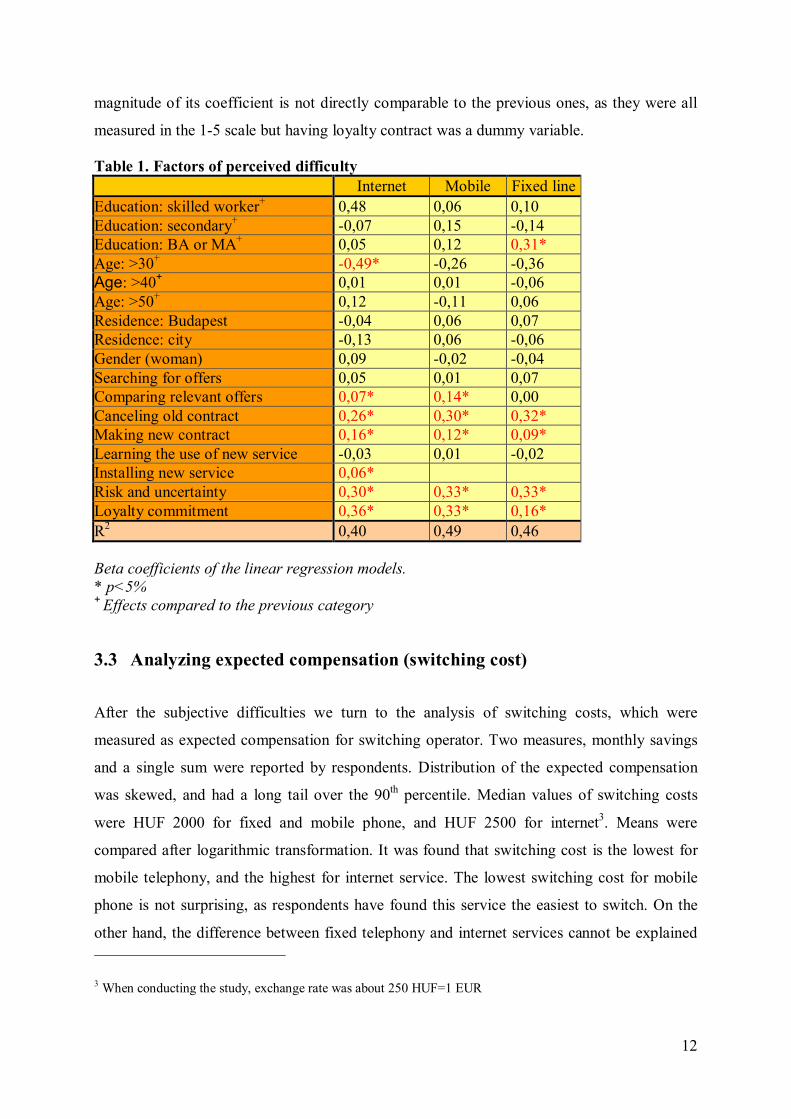
12
magnitude of its coefficient is not directly comparable to the previous ones, as they were all
measured in the 1-5 scale but having loyalty contract was a dummy variable.
Table 1. Factors of perceived difficulty Internet Mobile Fixed line Education: skilled worker+ 0,48 0,06 0,10 Education: secondary+ -0,07 0,15 -0,14 Education: BA or MA+ 0,05 0,12 0,31* Age: >30+ -0,49* -0,26 -0,36 Age: >40+ 0,01 0,01 -0,06 Age: >50+ 0,12 -0,11 0,06 Residence: Budapest -0,04 0,06 0,07 Residence: city -0,13 0,06 -0,06 Gender (woman) 0,09 -0,02 -0,04 Searching for offers 0,05 0,01 0,07 Comparing relevant offers 0,07* 0,14* 0,00 Canceling old contract 0,26* 0,30* 0,32* Making new contract 0,16* 0,12* 0,09* Learning the use of new service -0,03 0,01 -0,02 Installing new service 0,06* Risk and uncertainty 0,30* 0,33* 0,33* Loyalty commitment 0,36* 0,33* 0,16* R2 0,40 0,49 0,46 Beta coefficients of the linear regression models. * p<5% + Effects compared to the previous category
3.3 Analyzing expected compensation (switching cost)
After the subjective difficulties we turn to the analysis of switching costs, which were
measured as expected compensation for switching operator. Two measures, monthly savings
and a single sum were reported by respondents. Distribution of the expected compensation
was skewed, and had a long tail over the 90th percentile. Median values of switching costs
were HUF 2000 for fixed and mobile phone, and HUF 2500 for internet3. Means were
compared after logarithmic transformation. It was found that switching cost is the lowest for
mobile telephony, and the highest for internet service. The lowest switching cost for mobile
phone is not surprising, as respondents have found this service the easiest to switch. On the
other hand, the difference between fixed telephony and internet services cannot be explained
3 When conducting the study, exchange rate was about 250 HUF=1 EUR

13
by difference in difficulty. The comparison of means was done by paired samples t-tests for
respondents, who have both internet and fixed telephone, and fixed and mobile telephone
respectively. This method excludes the alternative explanation, that differences in switching
costs may be a consequence of differences in social background of the users of these services.
It must be noticed that although the differences are statistically significant, magnitude of them
are not high.
Figure 2: Comparing switching costs (expected monthly saving, means after logarithmic transformation)
7,54 7,34 7,11
0
2
4
6
8
10
12
Internet Fixed line Mobile
** **
**: p<0.01 using paired samples t-tests
Next, antecedents of switching cost were analyzed. For this, linear regression models were
used, with logarithms of switching costs as dependent variables. The above used factors of
difficulties, and demographic variables were included in the model. Additionally, the level of
overall difficulty, operator satisfaction and sum of monthly expenditure of the specific service
was included. Results show that some of the elements, or the difficulty overall have some
effect on switching cost, however, these are not systematic major effects in the six models.
When analyzing expected savings in the monthly bill, monthly expenditure have a systematic
effect, showing that people tend to compare these savings to the monthly bill. When
considering single compensation, demographic variables play significant role: more educated
and younger respondents have higher switching cost generally. Having loyalty commitment
increased switching costs in all cases, although the question about monthly savings

14
formulated a hypothetical situation, when the new operator covers the costs of the broken
loyalty commitment. Being a contract mobile phone customer increased switching costs
compared to pre-paid users. On the other hand, reported switching costs did not differ
between the three mobile operators in either model.
Table 2.: Factors of switching costs Monthly saving Single sum Internet Mobile Fixed line Internet Mobile Fixed line Education: skilled worker+ 0,68 0,27* 0,45 0,59 0,57 0,46 Education: secondary+ 1,09 1,47 1,79* 1,29 1,39 1,76* Education: BA or MA+ 1,27 1,02 0,85 1,47* 1,44 0,86 Age: >30+ 1,12 2,95 1,80 1,22 1,60 1,82 Age: >40+ 0,98 0,72 1,06 0,65* 0,55* 1,07 Age: >50+ 0,99 0,79 0,77 0,78 0,87 0,78 Residence: Budapest 0,94 1,05 0,86 0,93 0,96 0,86 Residence: city 0,88 0,84 0,91 0,79 0,82 0,92 Monthly expenditure (1000 HUF) 1,18* 1,08* 1,17* 1,02 1,00 1,17* Searching for offers 0,84* 1,03 0,82* 0,94 1,11 0,82* Comparing relevant offers 1,22* 1,08 1,20* 1,13 1,02 1,20* Canceling old contract 0,96 1,19* 0,99 0,98 0,98 0,99 Making new contract 1,02 0,87* 1,05 1,06 1,02 1,05 Learning the use of new service 1,03 1,05 1,05 0,91 0,89 1,04 Installing new service 1,07 1,05 Risk and uncertainty 1,00 1,05 0,91 1,13* 1,08 0,91 Perceived difficulty 0,99 0,95 1,06 0,99 1,34* 1,06 Loyalty commitment 1,24* 1,41* 2,79* 1,74* Operator satisfaction 1,10* 0,95 0,89 1,11 1,18* 0,90 Mobile: personal subscription 1,25 1,38 Mobile: contract customer 1,53* 1,31 Mobil: Pannon 1,05 1,04 Mobil: Vodafone 1,06 0,94 R2 0,11 0,12 0,13 0,10 0,08 0,13
Beta coefficients of the linear regression models. * p<5% + Effects compared to the previous category
3.4 Multi-play services
Multi-play offers became widespread in recent years considering telecommunication services.
In this case, customers may subscribe to two, three or four services at one time. This may also
effect switching costs: they can switch more services with a single action, which may result in
lower switching costs, than switching two services separately. On the other hand, if one
15
subscribe to multi-play services, it may become more difficult to switch only a single service,
as it affect(s) the other service(s) too. In this study we analyzed the first type of effect
comparing switching cost of a bundle to the sum of the single switching costs, which this
bundle includes. Considering the analyzed three services, a usual multi-play offer is internet
and fixed line phone bundle. Customers, who have both of these services, were asked our first
type switching cost question, which expresses switching costs as saving in the monthly bill.
Median value of switching costs was HUF 5.000 for switching to the multi-play service,
similarly to the median of sum of switching fixed line phone and internet separately.
Comparison of the means of the two variables was done using independent samples t-test after
logarithmic transformation of the variables. This comparison did not show significant
difference either.
3.5 Survey results compared to the Shy method
this study may have a novel interesting methodological consequence, if we compare our
estimates based on the survey results to ones, we could compute based on Shy’s (2002)
method. This can be easily carried out considering mobile services. To estimate switching
costs based on the Shy method, prices and market shares are necessary. Mobile market shares
are reported by HCA’s “Monthly report on mobile telecommunications”. They were 45.04%,
33.35%, and 21.61% for T-Mobile, Pannon, and Vodafone at the examined period. Estimating
prices is possible using our survey. Average monthly spending on mobile phones were HUF
5987, 5756, and 5566 respectively. Of course, this estimation is a very rough one. For
example, it does not take into account existing differences in usage patterns of the customer
bases of the three providers. However, when one compares per minute prices of different
pricing plans of the operators, the order of the prices are the same, and the difference is under
10%, which supports the usability of the survey results. Using the data presented, switching
costs of the three operators are HUF 3538 for T-Mobile, HUF 2316 for Pannon, and HUF
1520 for Vodafone. The magnitude of the switching costs is roughly parallel to our estimate,
in which median switching cost was HUF 2000 expressed as monthly savings. However, our
models (Table 2) did not indicate differences among the three operators. No statistically
significant difference can be found either, when no multivariate models are used, but pure
means of the logarithms of switching costs are compared using one-way ANOVA.

16
4 Conclusions
Based on survey results, our study found significant switching costs in telecommunication
services, median values amounting about a third of the average spending of these services.
Difficulty of switching was reported considerably severe in Hungary than one found by
Ofcom in the United Kingdom. However, comparing switching costs and actual switching
indicate that, beside switching costs, other factors may influence switching activity of
customers. These can be the choice of services and the trend in prices (whether they
dynamically decrease or remain stable), however, analyzing these factors are out of the scope
of the present study.
Our results indicate that two factors constitute the major difficulty in switching: canceling the
old contract and uncertainty. Two further minor factors are creating the new contract and
searching for the relevant offers.
Loyalty commitments also significantly increase switching costs. Moreover, they not only do
it by the amount of the penalty, one has to pay, but it also creates additional psychological or
transaction costs. These are illustrated by the fact that having loyalty commitment increased
switching difficulty, and it increased switching costs, even when the question supposed that
the new operator covers this penalty.
Beside the difficulties, other factors influence switching costs. These include social-economic
variables. This result is not surprising assuming that alternative cost of the time (which one
would need to devote to switching operators) is different socially. Results also may indicate,
that people tend to relate switching costs to monthly spending, (and decide to switch, if the
expected saving reaches some proportion of the monthly bill).
Results considering multi-pay offers regarded the comparison of switching to a double-play
offer to switching to two separate ones. Although theoretically customers may save some
switching costs when choosing the double-play offer, results did not support this hypothesis.
This result indicates that the switching cost decreasing nature of multi-pay offers is not
evident, however, further research is necessary on this issue. Beside the one examined, further
effects of multiple-play offers could be tested, such as switching between two multi-play
offers (further decrease in switching costs), and switching only a single service of the
previously used multi-play offer (increase in switching costs).

17
An interesting methodological conclusion can be drawn comparing the survey estimates of
switching costs to the ones got by the Shy method for mobile telecommunication. While the
former did not show differences among the three operators, using the latter a two-fold
difference was found. The survey method for forecasting customer actions and estimating
reservation prices can be criticized on several bases. For example, it is evident that people
discount cost of actions in these hypothetical situations, thus the method in default
overestimates the magnitude of consumer’s action. (On the other hand, the compensation
offered in the questionnaire is also a hypothetical one, which results in an opposite bias):
However, it is highly unlikely that if two-fold difference were in the switching costs, the
survey would not find it. Rather, it seems that assumptions of the Shy method are too strong
and was not realized in the examined example. This may regard either the cost-setting method
of operators, or the distribution of switching cost in population. Thus, the awareness of these
limitations is advised, when using that method for estimating switching costs for
telecommunication services.
18
References
Burnham, Thomas A, Frels, Judy K, and Mahajan, Vijay (2003): The antecedents and consequences of consumer switching costs. Journal of the Academy of Marketing Science 31(2): 109-126
Chen, Pei-Yu and Hitt, Lorin M. (2002): Measuring switching costs and the determinants of costumer retention in Internet-enabled Businesses: A Study of the Online Brokerage Industry information Systems Research 13(3): 255-274
Forman, Chris and Chen, Pei-Yu (2003): Switching Costs and Network Effects in the Market for Routers and Switches. NET Institute Working Paper 03-3
Grzbowski, Lukasz(2008): Estimating Switching Costs in Mobile Telephony in the UK. Journal of Industry, Competition and Trade 8(2). 113-132.
Klemperer, Paul, and Farell, Joseph. (2006): Coordination and lock-in: Competition with switching costs and network effects. CEPR Discussion Paper No. 5798
Krafft, Jackie and Salies, Evans (2006): The cost of switching Internet providers in the French broadband industry, or why ADSL has diffused faster than other innovative technologies. Observatorie Francais des Conjonctures Economiques.
NERA (2003): Switching costs Economic Discussion Paper 5 Part one: Economic models and policy implications. A report prepared for the Office of Fair Trading and the Department of Trade and Industry by National Economic Research Associates
Hungarian Communications Authority (2007): Monthly report on mobile telecommunications. (September, 2007)
Ofcom (2006): The Consumer Experience. Research Report.
Salies, Evans: A Measure of Switching Costs in the GB Electricity Retail Market (2006)
Shy, Oz (2002): A quick-and-easy method for estimating switching costs. International Journal of Industrial Organization 20, 71-87.
Szolnoki, Pálma and Tóth, András (2008): Szolgáltatóváltás a magyar lakossági árampiacon, 2008-ban. In: Valentiny Pál – Kiss Ferenc László (Eds): Verseny és Szabályozás 2007. MTA-KTKI, Budapest
Wilson, Chris M. (2006): Markets with Search and Switching Costs, ESRC Centre for Competition Policy Working Paper 06-10.
Related Documents


