http://www.jstor.org Swimming Upstream: Trends in the Gender Wage Differential in the 1980s Author(s): Francine D. Blau and Lawrence M. Kahn Source: Journal of Labor Economics, Vol. 15, No. 1, Part 1, (Jan., 1997), pp. 1-42 Published by: The University of Chicago Press on behalf of the Society of Labor Economists and the National Opinion Research Center. Stable URL: http://www.jstor.org/stable/2535313 Accessed: 03/06/2008 12:57 Your use of the JSTOR archive indicates your acceptance of JSTOR's Terms and Conditions of Use, available at http://www.jstor.org/page/info/about/policies/terms.jsp. JSTOR's Terms and Conditions of Use provides, in part, that unless you have obtained prior permission, you may not download an entire issue of a journal or multiple copies of articles, and you may use content in the JSTOR archive only for your personal, non-commercial use. Please contact the publisher regarding any further use of this work. Publisher contact information may be obtained at http://www.jstor.org/action/showPublisher?publisherCode=ucpress. Each copy of any part of a JSTOR transmission must contain the same copyright notice that appears on the screen or printed page of such transmission. JSTOR is a not-for-profit organization founded in 1995 to build trusted digital archives for scholarship. We enable the scholarly community to preserve their work and the materials they rely upon, and to build a common research platform that promotes the discovery and use of these resources. For more information about JSTOR, please contact [email protected].

Welcome message from author
This document is posted to help you gain knowledge. Please leave a comment to let me know what you think about it! Share it to your friends and learn new things together.
Transcript

http://www.jstor.org
Swimming Upstream: Trends in the Gender Wage Differential in the 1980sAuthor(s): Francine D. Blau and Lawrence M. KahnSource: Journal of Labor Economics, Vol. 15, No. 1, Part 1, (Jan., 1997), pp. 1-42Published by: The University of Chicago Press on behalf of the Society of Labor Economistsand the National Opinion Research Center.Stable URL: http://www.jstor.org/stable/2535313Accessed: 03/06/2008 12:57
Your use of the JSTOR archive indicates your acceptance of JSTOR's Terms and Conditions of Use, available at
http://www.jstor.org/page/info/about/policies/terms.jsp. JSTOR's Terms and Conditions of Use provides, in part, that unless
you have obtained prior permission, you may not download an entire issue of a journal or multiple copies of articles, and you
may use content in the JSTOR archive only for your personal, non-commercial use.
Please contact the publisher regarding any further use of this work. Publisher contact information may be obtained at
http://www.jstor.org/action/showPublisher?publisherCode=ucpress.
Each copy of any part of a JSTOR transmission must contain the same copyright notice that appears on the screen or printed
page of such transmission.
JSTOR is a not-for-profit organization founded in 1995 to build trusted digital archives for scholarship. We enable the
scholarly community to preserve their work and the materials they rely upon, and to build a common research platform that
promotes the discovery and use of these resources. For more information about JSTOR, please contact [email protected].

Swimming Upstream: Trends in the Gender Wage Differential
in the 1980s
Francine D. Blau, Cornell University and National Bureau
of Economic Research
Lawrence M. Kahn, Cornell University
Using Michigan Panel Study of Income Dynamics data for 1979 and 1988, we analyze how a falling gender wage gap occurred despite changes in wage structure unfavorable to low-wage workers. The decrease is traced to "gender-specific" factors which more than coun- terbalanced changes in measured and unmeasured prices working against women. Supply shifts net of demand were unfavorable for women generally and hurt high-skilled more than middle- and low- skilled women. By analyzing wages, we find support for the notion of a gender twist in supply and demand having its largest negative effect on high-skilled women.
I. Introduction The U.S. labor market experienced two dramatic developments during
the 1980s: a falling male-female pay gap and a rising level of labor market
This article is based on "The Impact of Wage Structure on Trends in U.S. Gender Wage Differentials: 1975-87," National Bureau of Economic Research (NBER) Working Paper no. 4748. We have benefited from the helpful comments of Anders Bjorklund, Janet Currie, Claudia Goldin, Lawrence Katz, and partici- pants at the American Economic Association meetings in Boston, January 1994, the National Bureau of Economic Research Labor Studies Meeting, the Arne Ryde Symposium in Rungsted, Denmark, and the University of Illinois, Cornell University, Johns Hopkins University, University of Pennsylvania, and Syracuse Labor Economics Workshops. We are indebted to Jennifer Berdahl and Deborah Anderson for excellent research assistance.
[Journal of Labor Economics, 1997, vol. 15, no. 1, pt. 1] C 1997 by The University of Chicago. All rights reserved. 0734-306X/97/1501-0003$01.50

2 Blau/Kahn
inequality. After 2 decades of near-constancy at about 60%, the ratio of women's to men's pay began to rise in the late 1970s. For example, the female-male ratio of median weekly earnings of full-time wage and salary workers, which was 62.4% in 1967 and 1979, rose to 74.0% in 1991 (U.S. Bureau of Labor Statistics 1980, 1992). During the 1980s, there were also substantial increases in overall wage inequality for both men and women. Wage inequality rose both within and between education and experience groups and has been interpreted as reflecting primarily higher returns to both measured and unmeasured labor market skills (Bound and Johnson 1992; Katz and Murphy 1992; Juhn, Murphy, and Pierce 1993).
When analyzing gender differentials, economists commonly focus on male-female differences in skills and on the relative treatment of women by employers (i.e., discrimination). Both of these may be considered gender-specific factors influencing the pay gap. However, the overall wage structure can also have an important effect on the gender differential. Wage structure describes the array of prices set for various labor market skills (measured and unmeasured) and the rents received for employment in particular sectors of the economy. So, for example, since women on average have less experience than men, an increase in the return to experi- ence (as, in fact, occurred during the 1980s) would cause the gender pay gap to widen, even if women's relative level of experience and their gender-specific treatment by employers remained the same.
In earlier work (Blau and Kahn 1992b, 1995, and 1996), we found overall wage inequality to be very important in explaining international differences in the gender pay gap. In particular, our results indicate that the higher level of wage inequality in the United States fully accounts for the larger gender pay gap here in comparison to countries such as Sweden or Australia with relatively small gender differentials. Wage structure has also been found to play a role in U.S. trends in black-white and immi- grant-native wage differentials (Juhn, Murphy, and Pierce 1991; LaLonde and Topel 1992).
In this article, we address a puzzle suggested by this earlier work: how has the dramatic decline in the gender gap been achieved in the face of changes in overall wage structure that were increasingly unfavorable to low-wage workers? We use a technique developed by Juhn et al. (1991) in their analysis of trends in black-white wage differentials to assess the effects of wage inequality on the male-female pay gap. This technique allows one to parcel out the sources of changes in the gender pay gap into a gender-specific portion and a component due to changing prices in the labor market. Applying this approach to data from the Michigan Panel Study of Income Dynamics (PSID), we find that rising inequality did slow women's progress during the 1980s, "reclaiming" about one- third to two-fifths of women's potential relative wage gains. Nonetheless, the male-female pay gap declined substantially. We trace this decrease

Gender Wage Differentials 3
to favorable gender-specific factors that were more than sufficient to counterbalance unfavorable shifts in both measured and unmeasured prices that worked against women during this period. Specifically, wom- en's relative experience levels increased and their occupational distribu- tion improved compared to those of men; there was also a larger negative impact of deunionization for men than for women. In addition, the "un- explained" portion of the pay gap declined.
The notion that women were swimming upstream, adversely affected by the rising rewards to skill in the 1980s, assumes that skill prices changed comparably for men and women over the period. However, recent find- ings by Katz and Murphy (1992), confirmed by additional evidence that we present below, suggest that shifts in the composition of demand bene- fited women relative to men at lower levels of labor market skills but men relative to women at higher levels. This suggests the possibility that changes in skill prices affected men and women differently and that, as a consequence, women at different levels of the skill distribution may have progressed at different rates over the period. However, the rising relative supply of women over this period would be expected to restrain women's relative wage gains, all else being equal. We analyze this issue in a simple supply and demand framework and find that the net effect of supply and demand was unfavorable for women as a group. Thus, women's overall relative wage gains must be explained by other factors such as improve- ments in their relative skill levels, reductions in discrimination, or within- industry and -occupation increases in relative female demand, all working against the increase in net supply and rising skill prices.
Looking across skill groups, we find that relative net supply shifts were particularly unfavorable for high-skilled, compared to low- and middle- skilled, women. We look for evidence of the effect of these shifts by comparing the effects of industrial and occupational shifts on female relative to male wages by skill group. We find evidence that industrial restructuring and deunionization had positive effects on women's wages relative to men's among low- and middle-skilled women but benefited men relative to women among high-skilled workers. In addition, the demand and supply shifts imply greater unexplained convergence in wages for lower-skilled workers, a finding that also receives some support.
II. Analyzing Changes in the Gender Gap in the 1980s Factors affecting the gender gap in pay over time can be divided concep-
tually into those that are gender-specific and those that are related to wage structure in general. Previous research suggests that both of these aspects of the labor market have influenced recent trends in women's relative pay. Gender-specific factors include women's relative levels of labor market qualifications and discrimination. Over the past 2 decades, there has been considerable improvement in women's relative skills. Per-

4 Blau/Kahn
haps most importantly, women's levels of actual labor market experience grew relative to men's in the 1980s (O'Neill and Polachek 1993; Welling- ton 1993). Further, the quality of women's education and experience improved, as illustrated by the rising percentages of MD, MBA, and law degrees received by women since the 1960s and the continued declines in occupational segregation (O'Neill 1990; Blau and Ferber 1992). However, government efforts to reduce discrimination appear to have stalled in the 1980s (Leonard 1989). It is possible, however, that women's relative wage gains in the 1980s are in part due to the indirect effect of government antidiscrimination activity in the 1960s and 1970s, which encouraged women to train for and enter traditionally male fields. Moreover, the increasing labor force commitment of women may have contributed to a reduction in statistical discrimination against them.
Increasing wage inequality has been associated with rising prices of labor market skills, both measured and unmeasured, due to increases in the demand for skills (Katz and Murphy 1992; Juhn, Murphy, and Pierce 1993). These demand increases have been attributed to technological change, which has reduced the relative demand for unskilled labor within industries (Bound and Johnson 1992; Krueger 1993; Berman, Bound, and Griliches 1994), as well as to changes in the industrial composition of demand due to international trade; these trade-induced changes have also lowered the relative demand for unskilled workers overall (Murphy and Welch 1991; Borjas and Ramey 1995).1 Some evidence also links rising male inequality to the deunionization of male workers (Freeman 1993; Card 1996).
While women have improved their relative levels of skills, these changes in overall wage structure imply that they have been swimming upstream against the changing wage distribution. As the prices of measured skills have risen, women, who continue to have less experience and to be located in lower-paying sectors of the labor market, are increasingly penalized. In addition, labor market discrimination and/or actual female deficits in unmeasured skills result in employers treating women as if they have lower unmeasured as well as measured skills. Thus, as the prices of unmea- sured skills have increased, further downward pressure is exerted on fe- male relative wages. In this scenario, the recent declines in the gender gap could occur only if women's skills and/or the treatment of women improved sufficiently to offset the negative effect of trends in wage struc- ture. Some indirect evidence for the assumption that similar factors deter- mine the relative rewards of women and of their male comparables is that, as noted above, overall wage inequality in the United States has been
' The growth of "high tech" industries has also contributed to the rising skill premium (Bartel and Lichtenberg 1987).

Gender Wage Differentials 5
increasing among both men and women (see Katz and Murphy [1992] and our findings below).2 Similarly, in our international comparison, we found that the levels of male and female wage inequality in a country were extremely highly correlated: labor markets with high levels of male inequality also tended to have high levels of female inequality (Blau and Kahn 1992b) 1995, and 1996).
However, men and women appear to be viewed as imperfect substitutes in the labor market. This is suggested by the considerable differences in the occupations and industries in which they work, as well as the substan- tial pay differences that exist for men and women with the same measured characteristics (e.g., Blau and Ferber 1992). Thus, while rising skill prices may be expected to widen the gender pay gap, such changes need not affect men and women in precisely the same way. Three kinds of evidence lead us to expect that rising skill prices did not have the same effect on men and women. First, as noted above, Katz and Murphy (1992) find that between 1979 and 1987, shifts in demand for output across industry- occupation cells favored women over men for educational levels below a college degree but men over women among those with a college degree. Second, shifts in industrial representation (notably, the decline in durable goods manufacturing) have also favored women's relative pay, as has the decline in union coverage which was greater for men than for women (Sorensen 1991; Blau and Kahn 1992a; O'Neill and Polachek 1993). Third, Topel (1994) finds that the supply of high-skilled women grew faster than that of low-skilled women from 1972 to 1990. Topel's result, com- bined with Katz and Murphy's (1992) findings on the demand for high- skilled men versus women, suggest that the combined effect of supply and demand may have changed to the detriment of high-skilled women. This is a central concern of this article.
Such a "gender twist" in demand relative to supply may potentially affect the relative gains of women within skill groups in two ways, all else being equal. First, changes in final demand relative to supply alter the industrial composition of employment. Such shifts will directly affect relative pay to the extent that some sectors pay higher wages (rents) than others for similarly qualified workers. Thus larger industrial representa- tion effects favoring lower-skilled relative to higher-skilled women would be consistent with changes in demand relative to supply working to the detriment of high-skilled women. Second, since shifts in final demand produce changes in overall demand relative to supply for gender-skill
2 Like Katz and Murphy (1992), we also find an increase in the 90-10 differential in residual inequality for both men and women. However, we find an increase in the residual standard deviation for men but a decrease for women; Katz and Murphy (1992) did not report results for this measure. We return to the issue of residual inequality below.

6 Blau/Kahn
groups, they may be expected to alter relative wages in all sectors, even the ones not initially affected by the change in output demand. Thus a more favorable ceteris paribus gender effect (after adjusting for shifts in unmeasured prices) for lower-skilled than for high-skilled women would also be consistent with more favorable relative net supply shifts for lower- skilled than high-skilled women.
Other factors, in addition to relative supply or demand changes, also potentially affect the rate of convergence of the gender gap within skill groups, including the extent of improvement in women's relative skills (i.e., human capital) and the extent of increases in the price of skills, measured and unmeasured. Thus, in evaluating the effect of the gender twist in demand and supply, it is important to net out the effect of changes in personal characteristics and prices at different parts of the skill distribution.
III. Analytical Framework
Juhn et al. (1991) have devised a method that allows us to decompose the 1979-88 difference in the gender pay gap into a portion due to gender- specific factors and a portion due to changes in the overall level of wage inequality. Following their notation, suppose that we have for male worker i and year t a male wage equation:
Yit = XitBt + ateitI (1)
where Yit is the log of wages, X-t is a vector of explanatory variables, Bt is a vector of coefficients, 0it is a standardized residual (i.e., with mean zero and variance one for each year), and at is the residual standard deviation of male wages for that year (i.e., its level of male residual wage inequality). Note that, following Juhn et al. (1991), we do not impose normality on the distribution of residuals. Our procedure for empirically implementing their decomposition is described below.
The male-female log wage gap for year t is
Dt- Ynt - Yft = AXtBt + ytAO\, (2)
where the m and f subscripts refer to male and female averages, respec- tively, and a A prefix signifies the average male-female difference for the variable immediately following. Equation (2) states that the pay gap can be decomposed into a portion due to gender differences in measured qualifications (AXt) weighted by the male returns (Bt) and a portion due to gender differences in the standardized residual from the male equation (AOt) multiplied by the money value per unit difference in the standard-

Gender Wage Differentials 7
ized residual (6t).3 Note that the final term of (2) corresponds to what is usually termed the unexplained differential in a standard decomposition of the gender differential when the contribution of the means is evaluated using the male function.
The difference in the gender pay gap between 2 years 0 and 1 can then be decomposed using (2):
DI - Do = (AX1 - AXO)BI + AXO(BI - BO)
+ (A01 - A00)y1 + AO0(y1 -(T)
The first term in (3), the "observed X's effect," reflects the contribution of changing male-female differences in observed labor market qualifica- tions (X). For example, as mentioned earlier, the declining gender gap in experience contributed to the recent reduction in the pay gap. The second term, the "observed prices effect," reflects the effect of changing prices of observed labor market qualifications for males. For example, given that women have lower actual experience levels, a rising male return to experience, as in fact has occurred in recent years, would weight the female experience deficit more heavily and hence raise the pay gap, ceteris paribus.
The third term, the "gap effect," measures the effect of changing differ- ences in the relative wage positions of men and women after controlling for observed characteristics (i.e., whether women rank higher or lower within the male residual wage distribution). That is, it gives the contribu- tion to the change in the gender gap that would result if the level of residual male wage inequality had remained the same and only the percen- tile rankings of the female wage residuals had changed.
Finally, the fourth term of equation (3), the "unobserved prices effect," reflects the effect of differences in residual inequality between the 2 years. It measures the contribution to the change in the gender gap that would result if the percentile rankings of the female wage residuals had remained the same and only the extent of male residual wage inequality had changed. Suppose, as is likely, that unmeasured deficits in relative skills or discrimination lower women's position in the male distribution of
'This formulation is based on a male wage equation. One could alternatively have used a female or a pooled wage equation. Male-female differences in regres- sion coefficients can reflect either discrimination or sex-correlated measurement errors in variables measuring productivity. In using the male wage equation for this decomposition analysis, we in effect simulate what the wage equation in a nondiscriminatory labor market would look like (although the elimination of discrimination might change the male as well as the female reward structure). We present both male and female wage equations for each year in appendix table A2.

8 Blau/Kahn
wage residuals. The larger the penalty to being below average in the distribution, the larger the pay gap will be.
Following Juhn et al. (1991), we estimate the gap and the unmeasured prices effects empirically using the entire distribution of male and female wage residuals from the 1979 and 1988 male wage equations. Specifically, to compute (A\O1 - AO,,)61, we first give each woman in 1979 (year 0) a percentile number based on the ranking of her wage residual (from the 1979 male wage regression) in the 1979 distribution of male wage residu- als. We then impute the wage residual of each woman in 1979, given her percentile ranking in 1979 and the distribution of male wage residuals in 1988 (year 1). So, for example, if a woman ranks at the 20th percentile of the male distribution of wage residuals in 1979, she would be given the residual corresponding to the 20th percentile of the 1988 male distri- bution of wage residuals. The average of these imputed residuals (multiplied by -1) is our estimate of AO0o6T. (Recall that the mean male residual is always zero.) The average 1988 female residual from the 1988 male wage regression (multiplied by -1) constitutes our estimate of AO\16. The difference between the actual and imputed residuals yields (AO, - A\o)o1. The fourth term of (3), AO0O(61 - (0), is obtained analo- gously. Note that by using the actual distribution of male residuals, we do not impose normality on the residual distribution.
According to equation (3), the full effect of gender-specific factors is reflected in the sum of the first and third terms, the effect of gender differences in qualifications and of gender differences in wage rankings at a given level of observed characteristics. Wage structure is reflected in the sum of the second and fourth terms, the effect of changing returns to observed and unobserved characteristics. Within the framework of a traditional decomposition, the sum of the third and fourth terms repre- sents the change in the unexplained differential, which is commonly taken as an estimate of discrimination.
The possibility of discrimination complicates the interpretation of the unobserved price effect. With labor market discrimination, this term in part reflects the interaction between year O's level of discrimination (which pushes women down the distribution of male wage residuals) and the change in the overall level of inequality, which determines how large the penalty is for that lower position in the distribution (Juhn et al. 1991). Similarly, the observed prices effect may reflect gender discrimination as well as rewards for productivity characteristics and rents if, for example, women are "crowded" by exclusion into certain sectors, lowering relative earnings there even for men (Bergmann 1974).
A further issue to note in interpreting our results is that they may be affected by selectivity bias (Heckman 1980). This is of particular concern because female labor force participation rates have changed over time, although the direction of the bias is unclear since it is theoretically possible

Gender Wage Differentials 9
for labor force participants to be either a positively or negatively selected group in terms of their unmeasured characteristics (Blau and Beller 1988). A conventional approach to adjusting for selectivity bias in unmeasured characteristics is to employ a Heckman (1980) selectivity bias correction to obtain consistent estimates of the coefficients in the earnings equation. This approach has, however, come under increasing criticism for its lack of robustness (e.g., see Manski 1989). For this reason, we do not employ it here. Our use of the male earnings function to perform the decomposi- tion helps to ameliorate this difficulty since male participation rates have been considerably more stable. It is nonetheless true that the estimated gap effects in each year may include the impact of gender differences in unmeasured characteristics as well as discrimination. While this is of course always the case in such decompositions, changes in female partici- pation rates over time may influence the magnitude of these two compo- nents because of changes in the unmeasured selectivity of female labor force participants. This is not of undue concern for our study, however, since our major interest is in identifying the role of wage structure versus gender-specific factors rather than identifying the importance of discrimi- nation per se. Gender-specific factors include the effect of gender differ- ences in both measured and unmeasured characteristics as well as discrimi- nation.
The major advantage of the Juhn et al. (1991) technique is that it allows us to decompose changes in the residual into price and quantity effects and thus permits us to reach conclusions about the relative importance of gender-specific factors and wage structure in the narrowing of the gender pay gap. There are two major potential drawbacks to using this procedure. The first is its strong interpretation of changes in the distribu- tion of male wage residuals. Under ideal conditions, we would like to interpret these as changes in the prices of skills or rents not measured by the included X variables. However, changes in sample composition, equation misspecification, measurement errors, and the distribution of unmeasured male productivity characteristics will also affect the distribu- tion of male residuals. The issue of sample composition may particularly affect the PSID, which follows people over time and also incorporates new sample members as they enter existing PSID households or form their own households. We investigate these issues by comparing the PSID and the Current Population Survey (CPS) wage residuals and conclude that the sampling frame of the PSID does not appear to produce anoma- lous results (see the data appendix). Second, the use of the male equation implies that the same set of prices that affects men also affects women. We present some data suggesting that this assumption has some plausibility in that inequality increased for both men and women, implying that the same underlying forces raising inequality affected both men and women. Nonetheless, these forces may not have affected men and women identi-

10 Blau/Kahn
cally, and our disaggregation of the male and female work forces into skill groups will shed light on this possibility.
IV. Implementation of the Decomposition
We implement the Juhn et al. (1991) decomposition using two specifi- cations. First, in the "human capital" specification, we use as explanatory variables, Xhk, a vector including a race dummy variable WHITE (equal to one for whites) and the following human capital variables:4
EDYRS = years of schooling completed, COLLDEG = dummy variable for completion of a college degree with
no graduate degree, ADVDEG = dummy variable for completion of a graduate degree,
EXPF = years of full-time work experience since age 18, EXPFSQ = EXPF*EXPF,
EXPP = years of part-time work experience since age 18, and EXPPSQ = EXPP*EXPP.
Second, in the "full" specification, we use the explanatory variables in vector Xfull in which the race and human capital information is augmented with collective bargaining coverage (CB) and dummy variables for one- digit industry and occupation. The full specification is of interest since it captures the impact of the changes in workers' occupations, industries, and union status implied by changes in the demand for skill and deunion- ization. However, since discrimination may take the form of differential access to occupations, industries, and union coverage, the human capital equation is also of interest as in some sense it is a reduced-form model with respect to possible discrimination.5
We have not controlled for marital status or number of children al- though they may be important factors influencing the pay gap. An alterna- tive would have been to include them as productivity characteristics. However, such an approach is problematic since these variables may well
4 We investigated the possibility of different functional forms for the education- experience impacts on wages. First, we included higher-order polynomials in education and experience; second, we tested for differences in the slopes for years of school depending on college degree status; and finally, we tested for interaction effects between education and experience. In no case did any of these alternative functional forms have an effect on the estimated ceteris paribus gender pay gap or the distribution of residuals.
5Of course, gender differences in industry, occupation, and union status may also reflect unmeasured productivity. However, work experience or educational differences may reflect actual or anticipated discrimination. Thus, interpreting ceteris paribus gender gaps in the context of a human capital wage equation may give biased estimates of the extent of discrimination, although the direction of the bias is unclear a priori.

Gender Wage Differentials 11
proxy higher skills for men (see Korenman and Neumark [1991] for the analysis of marital status), but possibly lower skills for women, even controlling for actual labor market experience. The approach we have followed allows us to place a sharper interpretation in the decomposition on the effect of differences in labor market skills.
The specification of our earnings equations, including human capital variables, industry, occupation, and union status, is fairly standard in the analysis of wages (Willis 1986). Our results may thus be readily compared to the existing literature. Further, while there are other variables that could be included, such as seniority or health status, many would be to some degree endogenous to wage outcomes. We have thus opted for a fairly parsimonious specification and our models may be viewed as re- duced forms with respect to these intermediate variables.
Our data for examining the relationship between trends in wage struc- ture and the gender pay gap are the Michigan Panel Study of Income Dynamics for 1980 and 1989 which provides data on 1979 and 1988 earnings. The PSID is a panel dating from 1968 on roughly 5,000 families.6 Labor market data are collected each year on male and female heads of households as well as on wives. Thus, the data include both married men and women and unmarried individuals, as long as the latter are heads of their households (including single-person households). Panel respondents are followed where possible even if they leave the household, and new household members become members of the panel as well. This refreshing of the panel through children's growing up and through single respon- dents' marriages mirrors the normal demographic patterns that one would observe in labor force surveys. The response rate tends to be high: for example, in 1989, it was 96.6%, where people who died or were too ill to respond were counted as part of the possible survey group (University of Michigan 1992).
We begin at 1979 since it is at roughly this point that inequality begins to accelerate and the gender gap begins to fall. We use the PSID because it is the only survey of the labor force covering all age groups with information on actual labor market experience of individuals. Because of the higher incidence of career interruptions by women, actual labor mar- ket experience is an important source of the male-female pay gap (Mincer and Polachek 1974); moreover, women's rising relative experience levels have been credited with causing a major portion of the closing of the male-female pay gap in the 1980s (O'Neill and Polachek 1993; Wellington 1993). Data bases such as the Current Population Survey do not contain
6 The PSID includes a special poverty sample. All of our analyses exclude this group and use only the portion of the PSID that is from a random sample of the U.S. population.

12 Blau/Kahn
information on actual experience, while the National Longitudinal Sur- veys' data contain actual experience information but only for limited age groups.
Retrospective data on experience were collected for existing panel mem- bers in 1976 and 1985 and for new panel members when they were first surveyed. Both heads and wives were asked to provide the number of years since age 18 that they had worked as well as the number of years that they had worked full time for most or all of the year. Work experience over the previous year may be obtained in each annual survey. We use this information to compute, for example, 1979 full-time and part-time experience (EXPF and EXPP) as follows. We first estimate total experi- ence (the number of years in which one had worked) as of 1979 as the sum of experience as of 1976 (or when one joined the panel) and the number of years since 1976 (or since joining the panel) in which one worked, basing the latter on the annual surveys. Full-time experience as of 1979 is then computed as the sum of full-time experience as of 1976 (or when one joined the panel) and the number of intervening years between 1976 (or joining the panel) and 1979 in which one worked at least 1,500 hours. Part-time experience is the difference between total experience and full-time experience.
For each of the 2 years analyzed, we restrict the sample to workers who were as of the survey date full-time, nonagricultural employees aged 18-65 years. Self-employed individuals were excluded. The earnings mea- sure used is average real hourly earnings for the previous year; wages are expressed in real terms using the 1983 consumer price index. We excluded anyone earning less than $1 per hour or more than $250 per hour in 1983 dollars. Variable means and regression results for both specifications are shown in appendix tables Al and A2. In the data appendix and associated tables, we analyze in detail the representativeness of the PSID compared to the CPS as well as the quality of the PSID's experience measures. Overall, we conclude that the PSID and CPS data are quite comparable and that the measure of actual experience in the PSID contains consider- able empirical content. This gives us some confidence that the PSID is an appropriate database to use in analyzing the gender wage gap.
Table 1 summarizes the overall trends for all full-time workers from the PSID. Between 1979 and 1988, the implied gender ratio rose over 10 percentage points from 62.2% in 1979 to 72.4% in 1988. In a descriptive sense, the closing of the gender differential reflected a trend toward declin- ing male real wages which fell by 9.9%, while women's real wages rose 4.9%. An additional indicator of women's labor market progress shown in table 1, the mean of women's percentiles in the male wage distribution, rose from 23.0 to 33.1. This indicates that the male comparable of the typical woman ranked considerably higher in the male wage distribution in 1988 than in 1979 and is a gender-specific indicator of women's prog-

Gender Wage Differentials 13
Table 1 Overview of Wage Trends (1983 Dollars), 1979-88
1979 1988
Log male wage 2.4437 2.3396 (.5025) (.5543)
Log female wage 1.9687 2.0168 (.4939) (.5381)
Differential (D) .4750 .3228 Mean female percentile in the male wage distribution" 23.0 33.1
NOTE.-Table contains full-time, nonfarm, wage and salary employees aged 18-65 years from the Michigan Panel Study of Income Dynamics. Wages are computed as annual earnings divided by annual hours.
Computed by assigning each woman a percentile ranking in the indicated year's male wage distribu- tion and calculating the female mean of these percentiles.
ress that is not contaminated by the increasing spread of the male wage distribution. The rise in the average female percentile may reflect relative improvements in women s measured labor skills and/or declines in the unexplained gender gap. Our detailed analysis of these trends below will shed light on the sources of this shift. Table 1 also indicates that the wage distribution widened for both men and women over the period, with overall inequality rising a bit less for women (0.0442 log points) than for men (0.0518 log points).
Figure 1 shows the changes in the gender pay gap by selected percen- tiles. The percentile rankings refer to each sex group's own wage distribu- tion. The pay gap declined dramatically at all points in the distribution. However, female gains tended to be larger in the middle than at either of the tails and somewhat larger at the bottom than at the top. On the surface, these trends are not particularly consistent with a gender twist in the supply and demand for skill to the detriment of high-skilled women. However, to test that view we must see how these changes at various points in the wage distribution map onto a measure of skill and also determine the reasons for the differing trends across skill groups. We examine these questions below.
V. Evidence on the Effect of Rising Wage Inequality on the Gender Pay Gap: The Overall Effect of Rising Inequality
The decomposition of the 1979-88 trends for the human capital and full specifications is shown in table 2. Before focusing on the decomposition in panel B, we note several interesting findings regarding the trends in panel A.
First, while overall wage inequality increased for both sexes during this period (table 1), table 2 indicates that the residual standard deviation (from own sex wage regressions) rose for men for each specification but declined slightly for women. In contrast, similar to Katz and Murphy's (1992) findings for CPS, we find that the 90-10 gap in the residuals in

14 Blau/Kahn
0.60
C
E 0.55 0.55
LU
.f 0.50
AL/'47Z 0.4 6 0.45 0.4
42
W 0.40
i, 0.35 '- -0- 0 3 033
/CU ?-3?;W29 ,0'28 ---s,0.31 , W' 0.30
0.25 -+--I-- - l l l
10 20 30 40 50 60 70 80 90
Percentile
It1979 --19881
FIG. 1.-Gender log wage gaps by distribution percentile
the human capital specification rose for both men and women.7 Further, while Katz and Murphy (1992) do not report results for the residual standard deviation of log wages, our comparison of PSID and CPS results in the data appendix shows a rising residual standard deviation for both men and women in both data sets when we employ a potential experience specification (table A7). One explanation for this discrepancy is that the increases in the standard deviation of female residuals from regressions based on potential experience reflects growing inequality in the quantities of unmeasured skills (i.e., actual experience) rather than the prices of unmeasured skills. This disparity serves to underline that, while we would like to interpret trends in residual inequality as reflecting shifts in the return to unmeasured skills, they are also influenced by trends in the quantities of unmeasured skills as well as by changes in the degree of measurement error and specification bias. To the extent that the gender difference in changes in residual inequality in the 1980s reflects unmea- sured prices, it suggests that men and women may not have been affected in exactly the same way by rising wage inequality. Our disaggregated analysis presented below is designed to shed further light on this issue.
Second, within each year, the mean female residual from the male wage equation declines in absolute value as we add more variables to the model; and it falls dramatically in absolute value over time within each specifica- tion. This residual is the conventional measure of discrimination, although
7The 90-10 residual difference rose from 0.9969 to 1.1144 for men and from 0.9322 to 1.0275 for women.

Gender Wage Differentials 15
Table 2 Decomposition of Changes in the Gender Pay Gap, 1979-88
Human Capital Plus Human Capital Only IND OCC CB
A. Descriptive statistics: Male residual SD:,-'
1979 .4296 .4089 1988 .4542 .4139
Female residual SD:t 1979 .4334 .3964 1988 .4256 .3866
Mean female residual from male wage regression:
1979 -.3354 -.2536 1988 -.2167 -.1259
Mean female residual percentile 1979 26.4 30.0 1988 35.3 40.5
B. Decomposition of change: Change in differential (D88 - D79) -.1522 -.1522 Observed X's:
All X's -.0755 -.1244 Education variables -.0110 -.0088 Experience variables -.0636 -.0529 Occupation variables . .. -.0458 Collective bargaining ... -.0175 Industry variables ... .0012
Observed prices: All B's .0419 .0997 Education variables .0035 .0013 Experience variables .0353 .0219 Occupation variables ... .0441 Collective bargaining ... .0081 Industry variables ... .0215
Gap -.1456 -.1420 Unobserved prices .0269 .0143
Sum gender-specific -.2211 -.2664 Sum wage structure .0688 .1140
NOTE.-The change in the differential is the change in the male-female log wage differential between 1979 and 1988. The components of the decomposition are defined as follows: observed X's effect = (AX, - AXO)B,, observed prices effect = AXo(B, - Bo), gap effect = (AOl - A00o)GY, and unobserved prices effect = Aio(cY - Go), where the subscripts 1 and 0 refer to 1979 and 1988, X is a vector of explanatory variables, B is a vector of estimated coefficients from a male wage equation, 0 is a standardized residual, a is the residual standard deviation of male wages, and a A prefix denotes the average male- female difference in the variable immediately following.
Estimated using male wage regressions. t Estimated using female wage regressions. t Computed by assigning each woman a percentile ranking in the indicated year's residual male wage
distribution and calculating the female mean of these percentiles.
it is generally acknowledged to combine the effects of possible discrimina- tion and omitted productivity differences between women and men not accounted for by the other explanatory variables. The results indicate that controlling for the human capital variables, including actual labor market experience, the adjusted female-male wage ratio increased from 71.5% in 1979 to 80.5% in 1988. When we add controls for occupation, industry,

16 Blau/Kahn
and collective bargaining status, the increase was from 77.6% in 1979 to 88.2% in 1988.
Since the unadjusted gender gap also fell during the period, the "ex- plained" portion of the differential did not change greatly over the period in the human capital specification. Women's lower levels of human capital (primarily full-time experience) explain roughly one-third of the pay gap in 1988 compared to 29.4% in 1979.8 When industry, occupation, and union status are added to the model, the explained portion of the pay gap rises more substantially from 46.6% in 1979 to 61.0% in 1988. In each year, women were more likely to be in lower-paying industries and occupations and less likely to be covered by collective bargaining than men, even controlling for education and actual experience. These gender differences in unionism, occupation, and industry accounted for 17.2% of the pay gap in 1979 but 28.1% in 1988.
Third, the mean female residual percentiles show a similar pattern to the actual residuals. As we add more variables, the mean female residual percentile rises; within groups (e.g., controlling for race and human capi- tal), women's labor market outcomes are comparable to men ranked higher in the male pay distribution than is the case between groups (e.g., not controlling for race or human capital-see table 1). Further, the mean female residual percentile is higher in 1988 than in 1979 for each specification, increasing from 26 to 35 in the human capital specification and from 30 to 41 in the full specification. Again, women were progressing even within groups.
We now turn to table 2, panel B, which shows the decomposition of the closing of the male-female pay gap into gender-specific and wage structure effects. The pay gap narrowed by 0.1522 log points over the period. Under the "Observed X's" heading, the row for "All X's" indi- cates that women's improved levels of the explanatory variables were sufficient to account for 49.6% (.0755/.1522) of the convergence in the human capital specification and 81.7% (.1244/.1522) in the full speci- fication.
Disaggregating by type of variable, we find that, in the human capital specification, women's rising relative experience levels were sufficient to account for the bulk (84.2%) of the "all X's" effect (and 41.8% of the convergence in the gender gap).9 Over this period, the gender gap in full- time experience fell from 7.5 to 4.6 years (table Al). When industry, occupation, and unionism are added to the model, we find that women's
' While race is also a variable in these equations, its effects are never large since the percent white is very similar for men and for women (table Al).
9 O'Neill and Polachek (1993) and Wellington (1993) also find that rising rela- tive experience levels among women were important causes of the reduction of the gender pay gap in the 1980s.

Gender Wage Differentials 17
higher relative experience levels continue to account for a substantial share of the "all X's" effect (42.5%) and of the reduction of the gap (34.8%). A comparison of the results for experience in the two columns of the table indicates that the overwhelming proportion of the effect of the increase in women's relative experience (83%) was due to its direct effect on relative earnings, controlling for industry, occupation, and unionism; the remainder was due to its indirect effect in causing an up- grading in women's job characteristics.
In terms of the job characteristics, shifts in occupations accounted for 30.1% of the convergence as the fraction of women employed as professionals and managers rose by more than for men; the overrepresen- tation of women in clerical jobs declined; and the fraction of men em- ployed as laborers or service workers increased while that of women fell. The changing industrial distribution of male and female workers (including union status as an industry variable) accounted for a consider- ably smaller proportion (10.5%) of the closing and was entirely due to the greater decline in unionism among men than women (11.1 vs. 4.2 percentage points).10 However, as we shall see below, the effect of indus- try shifts was not uniform across the skill distribution; among low-skilled workers there were substantial industry representation effects favoring women, while the opposite pattern prevailed among higher-skilled workers.
The observed prices effect is positive in each specification, indicating that the prices of skills or rents have changed so as to widen the male- female pay gap. That is, male returns tended to increase for characteristics where men initially had an advantage; the greater weight placed on these female deficit areas in 1988 worked to raise the gender gap, ceteris paribus. The total observed prices effect is considerably larger for the full specifi- cation (0.0997) than for the human capital specification (0.0419).
In the human capital specification, the rising male return to experience accounts for most of the observed prices effect. In previous work, O'Neill and Polachek (1993) and Wellington (1993) place considerable emphasis on relative increases in measures of women's experience in narrowing the pay gap in the 1980s. Our findings suggest that some of these improve- ments were needed simply to offset the potentially adverse effect of the rising male return to experience: over half (.0353/.0636) of the closing of the gender differential attributable to the increase in the relative experi- ence levels of women was required simply to compensate for the greater weight placed on experience in determining earnings in 1988 than in 1979.
" In earlier work (Blau and Kahn 1992a) we also found that industry represen- tation had small effects leading to some closing of the male-female pay gap in the 1980s.

18 Blau/Kahn
In the full specification, rising returns to experience continue to be important in accounting for the observed prices effect, as are changes in occupation and industry wage effects which favored men. A small positive effect was also obtained for the collective bargaining variable. Thus, these prices appear to have changed to the detriment of low-paid workers in general and women in particular. As we shall see below, this was the case even at the lower end of the skill distribution where the decrease in male representation in higher-paid sectors was substantial. These unfavorable price changes explain why, even though the distribution of women across occupations, industries, and union/nonunion jobs improved relative to men's during the 1980s, as noted above, the portion of the gender pay gap that was attributable to these factors rose.
The gap and unobserved prices effects result from the decomposition of changes in the residual into gender-specific and wage structure effects. For example, controlling for human capital variables, in 1979, women were comparable to men at about the 26th percentile of the male residual wage distribution, on average. Between 1979 and 1988, the male residual distribution widened, and the residuals of men at the bottom fell relative to the male mean. Had each woman fared as well as her 1979 male compa- rable (i.e., remained at her 1979 percentile in the male distribution), we estimate that the male-female differential would have increased by 0.0269 log points (i.e., the unobserved prices effect). However, as may be seen in table 2, women in fact advanced up the male residual distribution to about the 35th percentile, on average. This upward movement, which was evaluated using the 1988 distribution, decreased the gender differential by 0.1456 log points (i.e., the gap effect) and was more than sufficient to offset the adverse effect of changes in unmeasured prices. On net, the ceteris paribus gender differential controlling for race, education, and experience was reduced by 0.1187 log points.
In the full specification, the unobserved prices effect was again positive, working to raise the ceteris paribus gender differential by 0.0143 log points, while the gap effect was negative and considerably larger, working to reduce the ceteris paribus gender differential by 0.1420 log points. On net, this resulted in a decrease of 0.1277 log points in the ceteris paribus gender differential within industries and occupations.
When we add the gender-specific components (observed X's plus gap effects) and the wage structure components (observed prices plus unob- served prices effects), we arrive at an overall answer as to the effect of the changing wage structure on the gender pay gap. The gender-specific effects imply a reduction of the pay gap of 0.22 to 0.26 log points, while the widening wage distribution implies an increase of the pay gap of 0.07 to 0.11 log points. Thus, under the assumption that price changes affected men and women equally, rising inequality reclaimed about one-third to two-fifths of the gains women would have made had these price changes

Gender Wage Differentials 19
not occurred (i.e., the sum of the wage structure effects divided by the sum of the gender-specific effects).
The results of the decomposition in table 2 give us some confidence in this method of separating out the effects of gender-specific factors from those of wage structure on the gender pay gap. In particular, the effects of observed and unobserved prices in each case go in the same direction; and changes in measured X's and the gap effects also go in the same direction. Further, as noted above, overall inequality rose for both men and women, implying that a framework treating both groups as affected by similar labor market trends may have some validity. However, residual wage inequality increased for men but showed an ambiguous trend for women. Moreover, the sizable gap effects raise the possibility that these trends did not affect men and women in exactly the same way. To shed fuller light on this question we examine the disaggregated trends below.
VI. Evidence on the Effect of Rising Wage Inequality on the Gender Pay Gap: Disaggregating the Effect of Wage Inequality
Our objective in this section is to determine whether the patterns of changes in the gender gap, and the reasons for those patterns, are consis- tent with a gender twist in supply and demand. To shed light on these questions, we examine changes in the gender pay gap at different points of the skill distribution by dividing the sample into three skill groups (i.e., high, medium, and low) as follows. We first estimate a wage equation using the human capital specification for a pooled 1979 and 1988 sample of male workers.11 The predicted wages from these regressions largely reflect measured labor market skill. We then divide men and women into three skill categories based on the (within sex group) percentile ranking of their predicted wage from the male regression using the 1979 male and female cutoffs for predicted wages in both years: 0-20, 20-80, 80_100.12 Thus, skill is in effect considered to be an absolute concept, and the relative sizes of the low-, middle-, and high-skill groups among men or among women can change over time.
The skill groups are based on a market-weighted average principally of education and actual experience (although race is included, it does not have a major impact on our comparisons). The skill index allows us to combine education and actual work experience, which are both important measures of skill. We use male wage weights simply to construct a consis- tent measure across men and women. An alternative procedure would be
The dependent variable is measured in 1983 dollars, and a year dummy variable is included to account for productivity trends.
12 Each interval is closed at the bottom and open at the top of its range, except for the top group, which included the highest predicted wage earner.

20 Blau/Kahn
0.55 j /
0.50
<x 0.45
? ~~~~~~~~~~~~~~~~~~~0.43
n 0.40
CO
- -0.36 0.35
0f.30 0.30 - ---+ i-_-_ -
0-20 20-80 80-100
Skill Percentile
1979 -- 1988
FIG. 2.-Unadjusted gender log wage differentials by skill groups
to use education-experience groups; we have not done so because the larger number of required groups using that approach would unduly dilute the sample.'3
Figure 2 shows the trend in the unadjusted gender gaps for the skill groups. The gender pay gap falls substantially for each of the skill catego- ries and is qualitatively similar (0.11 to 0.12 log points) across groups. These patterns differ somewhat from those in figure 1, which gives the actual closing of the gap across the wage distribution and indicates greater convergence at the middle than at the bottom and the top. However, for purposes of analysis, disaggregating on the basis of a skill index is methodologically superior as well as easier to interpret than disaggregat- ing on the basis of actual wages."4 It may be noted that the pattern of convergence in the gender gap across the three skill groups is not on the surface consistent with a gender twist in supply and demand favoring
13 For example, one would want a minimum of (and probably more than) two education and two experience groups. In addition, while the skill index treats as comparable men and women who rank similarly even if they are imperfect substi- tutes in the labor market, so would a comparison of, say, high school graduates with 0-9 years of experience. The purpose of the skill-group analysis is to ask whether the relative wage changes of these groups match up with measured changes in their relative supplies and demands.
14 So, e.g., below we implement the Juhn et al. (1991) decomposition by estimat- ing separate regressions within skill groups; this would not be a sensible procedure for groups truncated on the basis of observed wages, the dependent variable.

Gender Wage Differentials 21
low-skilled relative to high-skilled women. However, much depends on the reasons for the progress of women in each of the skill groups. Before examining this issue, we briefly present the results of our own analysis of supply and demand changes for each group. Our work supplements Katz and Murphy (1992) in that our demand and supply indexes are constructed for the time period analyzed here and take into account actual experience, information that is not available in the CPS data they used. In addition, Katz and Murphy (1992) did not study women's supply changes disaggregated by skill level.
Turning first to demand, we wish to know whether changes in the composition of output by sector (and the consequent derived demand for labor) favored some gender-skill groups over others during the 1979- 88 period. Following Katz and Murphy (1992), we construct industry- occupation cells and view the "output" of particular occupation groups as an intermediate product.15 A demand index, ln(1 + ADk), was computed for each gender-skill group k:
ADk = S Cok(AE0/Ek), (4)
where o refers to occupation-industry cell, Cok is gender-skill group k's share of employment in occupation-industry cell o in 1979, AEo is the difference between the 1988 and the 1979 share of total labor input em- ployed in cell o, and Ek is the 1979 share of total labor input accounted for by gender-skill group k. The demand index thus measures the degree to which 1979-88 shifts in occupation-industry structure favor gender- skill group k, using 1979 weights.
Supply indexes ASk are computed as follows:
ASk = ln EkI - ln Eko, (5)
where EkI and Eko are, respectively, the share of total labor input in 1988 and 1979 consisting of skill group k. Thus, the supply indexes compare the relative representation of each skill group in the 1988 and the 1979 workforce.
15 The industries are (1) mining, construction, and durable goods manufactur- ing; (2) nondurable goods manufacturing; (3) transportation, communications, and utilities; (4) wholesale trade; (5) retail trade; (6) finance, insurance, and real estate; (7) services; (8) government. The occupations are (1) professional and technical workers; (2) clerical and sales workers; (3) operatives, craftsworkers, laborers, and service workers.

22 Blau/Kahn
Table 3 Supply, Demand, and Net Supply Indexes, 1979-88
Supply Demand Net Supply
A. All men and women: Men -.1123 -.0054 -.1069 Women .1838 .0101 .1737 Men - women -.2961 -.0155 -.2806
B. Skill group 0-20: Men -.3979 -.0790 -.3189 Women -.3292 -.0417 -.2875 Men - women -.0687 -.0373 -.0314
C. Skill group 20-80: Men -.1038 -.0229 -.0809 Women .1071 .0065 .1006 Men - women -.2109 -.0294 -.1815
D. Skill group 80-100: Men .0452 .0931 -.0479 Women .7035 .0746 .6289 Men - women -.6583 .0185 -.6768
NOTE.-Labor input is defined as total work hours. For definitions of supply, demand, and net supply, see text.
We may then compute net supply as
ANSk = ASk - ln(1 + ADk), (6)
where ADk and ASk are defined in equations (4) and (5) above. (Recall that all magnitudes are in log points and have been normalized relative to 1979.) As Katz and Murphy (1992) show using a simple equilibrium model, differences across years in relative wages for each gender-skill group will be negatively related to differences in net supply, ANSk. Intu- itively, the larger the shifts in supply of skill group k relative to the shifts in demand, the worse skill group k will fare in 1988 compared to 1979, all else being equal.
Table 3 shows the results for the supply and demand indexes.16 Looking first at the aggregate results (where only two groups k of workers are defined-men and women), we see in panel A that the relative supply of women grew substantially. While demand changes slightly favored women as well, the net effect of supply and demand in the aggregate was to greatly raise the net supply of women, while the net supply of men fell. Our results thus suggest that women's overall relative wage gains came despite their rising relative net supply. This conclusion must, how-
16 Labor input is defined as work hours. Results were unchanged when earnings replaced hours as the measure of labor input. For the purposes of computing labor input, we included part-time workers and the self-employed.

Gender Wage Differentials 23
ever, be qualified in a number of respects. First, precisely because of these wage gains, we have likely overestimated the increase in women's relative supply and understated the rise in the relative demand for women that would have occurred at constant relative wages. Second, there may have been within industry-occupation demand changes favoring women that our measure of demand shifts cannot detect.17 Nonetheless, these findings are of interest in calling attention to the potentially negative effect on women's wages of the large supply shifts that occurred over this period. Our results suggest that women's overall wage gains must be explained by factors other than changes in the supply of and demand for women as conventionally measured. These factors include rising relative produc- tivity due to measured and unmeasured characteristics and improved treatment by employers, as suggested by the results in table 2, as well as favorable within-industry and occupation demand shifts that are not measured by our demand index.
Turning to the disaggregated indexes in table 3 (panels B-D), female relative to male changes in both supply and demand are less favorable for high-skilled women than they are for the middle- and low-skilled women. Thus, while shifts in net supply favor men very slightly over women among low-skilled workers (an index of -.0314 log points), they favor men over women by substantially more among middle-skilled (-.18 15 log points) and especially high-skilled workers (-.6788 log points). The more favorable female relative to male demand indexes among low- and middle-skill groups are consistent with Katz and Murphy's (1992) results for demand indexes defined by gender-education groups, while the very large growth in relative supply of high-skilled women is consistent with Topel's (1994) finding that the supply of high-skilled women grew faster than that of low-skilled women. Our results support the idea of a gender twist in net supply working to slow the progress of high-skilled women relative to middle- and low- skilled women.
Table 4 contains the results of applying the Juhn et al. (1991) decompo- sition to each of the three skill groups. To allow for the possibility that the returns to characteristics vary across skill groups, separate male wage regressions are estimated within each skill group.18 (Means of the explana- tory variables by skill group are shown in table A3.)
The first major finding from table 4 is that women at the top had greater improvement in their relative human capital levels: women's hu- man capital improved relative to men's in each skill group, but the gains
17 Similarly, the above results suggest that low-skilled men should have fared better than middle- and high-skilled men over the period because their net supply fell by more. It is likely that similar qualifications apply to this finding.
18 For example, Chamberlain (1991) and Card (1996) present evidence that the union-wage effect is larger at the bottom of the wage distribution than at the top.

24 Blau/Kahn
Table 4 Decomposition of Changes in the Gender Pay Gap by Skill Groups
0-20 20-80 80-100
Human Human Human Skill Group Specification Capital Full Capital Full Capital Full
A. Descriptive statistics: Mean female residual:
1979 -.2887 -.2593 -.3305 -.2216 -.3226 -.2671 1988 -.1799 -.0449 -.2343 -.1566 -.2646 -.1560
Mean female residual percentile:
1979 28.4 29.0 25.8 31.6 31.2 34.5 1988 38.2 45.2 33.7 37.8 33.3 40.0
B. Decomposition of change:
Change in differential (D88 - D79) -.1087 -.1087 -.1073 -.1073 -.1178 -.1178
Observed X's: All X's -.0122 -.0834 -.0159 -.0702 -.0612 -.0976 Education variables .0089 .0111 .0137 .0094 -.0211 -.0181 Experience variables -.0100 -.0115 -.0325 -.0240 -.0451 -.0404 Occupation variables ... -.0410 ... -.0314 ... -.0597 Collective bargaining ... -.0216 ... -.0273 ... .0010 Industry variables ... -.0119 ... .0010 ... .0189
Observed prices: All B's .0124 .1891 .0049 .0281 .0014 .0909 Education variables .0101 .0045 -.0059 -.0029 .0325 -.0104 Experience variables .0023 .0432 .0097 -.0200 -.0210 -.0456 Occupation variables ... .0825 ... .0277 ... .1179 Collective bargaining ... .0135 ... .0167 ... -.0086 Industry variables ... .0436 ... .0067 ... .0444
Gap -.1237 -.2241 -.1372 -.0866 -.0586 -.1064 Unobserved prices .0149 .0097 .0410 .0216 .0006 -.0047
Sum gender-specific -.1359 -.3075 -.1531 -.1568 -.1198 -.2040 Sum wage structure .0273 .1988 .0459 .0497 .0020 .0862
NOTE.-See table 2 for definitions of terms.
attributable to this source (given by the "all X's" effect for the human capital specification) were considerably larger among high-skilled work- ers and about the same in the low- and middle-skill groups. While our method for allocating individuals to skill groups means that gains in human capital are in effect capped for the low- and middle-skill groups but not for the high-skill group, it is nonetheless of interest that women in the highest category based on the 1979 female cutoffs improved their human capital so much relative to their male counterparts (i.e., men in the highest category based on the 1979 male cutoffs).'9 Overall, the observed human capital variables are sufficient to explain 52.0% of the closing of
19 The large increase in the supply of high-skilled women is in part due to the upgrading of women's labor market skills.

Gender Wage Differentials 25
the gender gap over the period for high-skilled women compared to 14.8% for middle-skilled and 11.2% for low-skilled women. With respect to specific factors, rising relative experience of women was important to various degrees for all skill groups; however, high-skilled women were the only ones to significantly upgrade their relative educational attainment. Within the human capital specification, women at the top also benefited from relatively favorable changes in wage structure compared to women at the bottom and the middle. The wage structure effect (i.e., the sum of the observed and unobserved prices effects) was 0.03 to 0.05 log points for low- and middle-skilled women but close to zero for high-skilled women. In contrast, the gap effect was considerably smaller for high- skilled women than for middle- and low-skilled women.
Thus, the results for the human capital specification are roughly what one would expect based on a gender twist in net supply. Although the unadjusted gender gap closed slightly faster at the top than at the middle or the bottom of the skill distribution, this reflected greater relative im- provement in measured X's for high-skilled women as well as more favor- able shifts in measured and unmeasured prices. The gap effects favor low- and middle-skilled women, as would be predicted by a gender twist in net supply. One qualification, however, is that while net supply trends of women relative to men favor low-skilled relative to middle-skilled women, the gap effect is more favorable for the latter than the former.
Looking at the results for the full specification, we see a picture that is consistent with a gender twist in net supply, principally operating through industry and union representation effects, which worked to nar- row the gender pay gap among low- and middle-skilled workers but to increase it among high-skilled workers. Specifically, changes in industry and unionism lowered the gender gap by 0.0335 log points at the bottom (changes in unionism accounted for about two-thirds of this effect) and by 0.0263 log points at the middle (all due to changes in unionism). In contrast, changes in these variables increased the gender gap by 0.0199 log points among high-skilled workers (almost entirely reflecting industry shifts). These results imply that changes in industry and unionism slowed the convergence at the top by 0.0534 log points relative to the bottom and by 0.0462 log points relative to the middle. The larger positive effects of the human capital variables and of occupational shifts for high-skilled women were sufficient to outweigh these effects and thus the total mea- sured X's effect for the full specification is largest for high-skilled women. Whether the occupational changes should be included with industry and unionism in evaluating the effects of the gender twist in net supply is somewhat questionable since they may be more influenced by human capital improvements or reductions in discrimination than shifts in de- mand for final products. However, even including occupation as poten- tially a demand-side factor, the combined effects of changes in industry,

26 Blau/Kahn
occupation, and unionism still worked to reduce the gender gap by more among low-skilled (0.0745 log points) and middle-skilled (0.0577 log points) workers than among high-skilled workers (0.0398 log points).
Further decompositions of the wage effects of changes in characteristics over the period for each skill group separately by sex (results not shown) show that the reduction in gender differences in industry and union status at the bottom and middle was largely due to a deterioration in men's status rather than an improvement in women's status. In the low-skill group, the largest effect was for deunionization, which lowered men's wages by 0.051 log points compared to a drop of 0.029 points for women. Men's industrial distribution also changed adversely, lowering their wages by 0.028 log points, while women's changed by less, decreasing their wages by 0.016. Trends were similar in the middle-skill group, although there deunionization played the major role, lowering men's wages by 0.046 log points compared to a decrease of only 0.019 log points for women. (Industry shifts lowered both men's and women's wages by about the same amount-0.011 log points for men and 0.012 log points for women.) In contrast, men at the top actually upgraded their industrial distribution, raising their wages by 0.023 log points, while changes in women's industrial distribution raised their wages only very slightly (0.004 log points). (The effect of changes in unionism was negligible.)
Table 4 also shows that, while changes in observed prices worked to slow the progress of women in all skill categories, these adverse effects were largest among low-skilled workers, possibly camouflaging the prog- ress they would have otherwise made because of favorable net supply conditions. However, this also means that, if net supply changes did indeed benefit low-skilled women, they were not manifested in price shifts favoring industries where women tend to be highly represented. Moreover, despite deunionization, the return to unionized employment continued to rise, benefiting men in the low- and middle-skill groups.
A further result that is consistent with a gender twist in net supply is that the magnitude of the favorable gap effect in the full specification was much larger for the low-skill than for the middle- or high-skill groups. However, the gap effect in the full specification was slightly higher in the high-skill group than in the middle group, seemingly contradicting the rankings of net supply changes. It may be that improvements in unmeasured skills or reductions in discrimination were sufficient to offset the effect of negative demand- and supply-side factors on high-skilled women. In addition, we cannot identify shifts in demand within industries that may have occurred due to technological change or reductions in discrimination. If such within-industry shifts favored high-skilled women compared to the other two skill groups, it may be that demand conditions were more favorable for women at the top than our demand index suggests.

Gender Wage Differentials 27
Table 5 Summary Results for Gender Twist Factors in Accounting for Changes in the Gender Pay Gap by Skill Group, 1979-88
Change in Log Wage Gap
Gap Plus Industry and Union- Gap Plus Industry, Union, and Skill Group Measured X Effects Occupation-Measured X Effects
0-20 -.2576 -.2986 20-80 -.1149 -.1463 80-100 -.0865 -.1462
NOTE.-The data in the table are based on the full specification.
While there are some inconsistencies among the components, as may be seen in table 5, when we consider all the components together, the gender twist view is supported. That is, summing gap and industry and union measured X effects, we find that low-skilled women benefited the most from these changes taken together, middle-skilled women benefited somewhat less, and high-skilled women benefited the least. Even includ- ing occupation as a demand-side factor indicates that low-skilled women benefited the most, although the totals for the middle- and high-skill groups including occupation variables are about the same.
In general, our findings do not appear to support the notion of a glass ceiling afflicting high-skilled women. In the full specification, the gap effect is not smaller for high-skilled women than for the middle-skill group. This means that within occupation-industry groups, high-skilled women's gains relative to men's gains were as rapid as the gains of the other skill group. If a glass ceiling disproportionately affects the highly skilled, then we would have expected a smaller gap effect for this group. The progress of high-skilled women is particularly impressive in light of the evidence presented earlier indicating that net supply shifts particularly favored men relative to women at the top.
The results in table 4 do imply, however, that high-skilled women were less able than low- and middle-skilled women to translate the gains they experienced within industries and occupations into a comparable reduc- tion in the overall unexplained gap (i.e., in the human capital specifica- tion). This is the combined result of two factors. First, taken together, the distribution of high-skilled women across occupations, industries, and union/nonunion jobs improved less than the other two skill groups; this, in turn, was due to adverse changes in their industry distribution compared to that of men. Second, the wage penalty they paid for their continued less favorable distribution by industry, occupation, and union- ism grew over the period, as indicated by the substantial measured prices effect for these variables in the full specification. Low-skilled women also faced substantial unfavorable changes in measured prices but were able

28 Blau/Kahn
to overcome them due to greater improvements in their industry and union distribution. Our findings suggest that to the extent there was a greater problem for high-skilled women than the others it could better be characterized as "glass walls" than "glass ceilings."
In addition to market forces, changes in labor market institutions po- tentially affected the relative rates of progress for women in the three skill groups over the 1979-88 period. We have already seen that deunion- ization was a significant factor working to decrease the gender gap among the low- and middle-skill groups. The sharply declining real value of the federal minimum wage during this time is an additional institutional factor to be considered, one that most likely worked to widen the gender gap, particularly among low-skilled workers where a substantial portion of women earn the minimum wage. To get a crude indication of the quantita- tive impact of the declining minimum wage, we employed a simple simula- tion (see Bound and Freeman 1992). We assumed that anyone earning between the 1988 minimum and the 1979 minimum in real value earned the 1979 minimum, we inflated the wages of those earning less than the 1988 minimum by the ratio of the 1979 minimum to the 1988 minimum, and we assumed no employment effects of these changes. We found that, as expected, the largest effect of a constant real minimum wage would have been on the gender gap for low-skilled workers, narrowing it by an additional 0.051 log points, with considerably smaller effects on the mid- dle-skill (0.017 log points) and high-skill (0.006 log points) groups. The effect on the overall gap would have been a relatively modest 0.0156 log points. These results are consistent with recent findings by DiNardo, Fortin, and Lemieux (1996) that the declining real value of the minimum over the 1979-88 period widened the gap between the 10th and the 50th percentiles of the women's log wage distribution by more than it did for men. It is likely then that the results in table 4 understate the relative gains low-skilled women would have made had the minimum wage been indexed to its 1979 value.
VII. Did the Rising Supply of Women Workers in the 1980s Adversely Affect the Wages of Men?
Thus far we have concentrated on the possible effect of differential changes in the demand for and supply of men and women within skill groups on the rate of convergence in the gender gap for the group. It is also possible, however, that rising supplies of one group can affect the wages of other groups through substitution effects. For example, Topel (1994) argues that high-skilled women (those predicted to be above the median in the female wage distribution using 1972 cutoffs) compete with low-skilled men (those predicted to be in the bottom third of the male wage distribution using 1972 cutoffs). He finds that nearly all (91%) of the decline in the relative wages of low-skilled men (compared to other
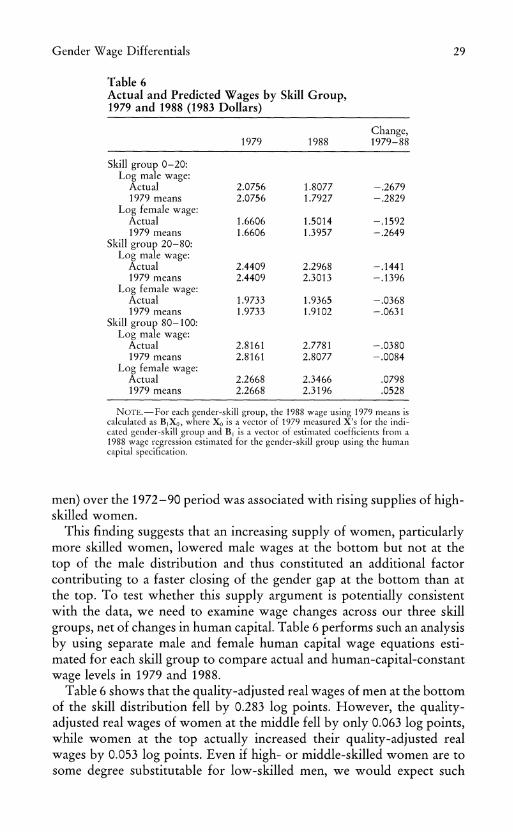
Gender Wage Differentials 29
Table 6 Actual and Predicted Wages by Skill Group, 1979 and 1988 (1983 Dollars)
Change, 1979 1988 1979-88
Skill group 0-20: Log male wage:
Actual 2.0756 1.8077 -.2679 1979 means 2.0756 1.7927 -.2829
Log female wage: Actual 1.6606 1.5014 -.1592 1979 means 1.6606 1.3957 -.2649
Skill group 20-80: Log male wage:
Actual 2.4409 2.2968 -.1441 1979 means 2.4409 2.3013 -.1396
Log female wage: Actual 1.9733 1.9365 -.0368 1979 means 1.9733 1.9102 -.0631
Skill group 80-100: Log male wage:
Actual 2.8161 2.7781 -.0380 1979 means 2.8161 2.8077 -.0084
Log female wage: Actual 2.2668 2.3466 .0798 1979 means 2.2668 2.3196 .0528
NOTE.-For each gender-skill group, the 1988 wage using 1979 means is calculated as B1XO, where XO is a vector of 1979 measured X's for the indi- cated gender-skill group and B. is a vector of estimated coefficients from a 1988 wage regression estimated for the gender-skill group using the human capital specification.
men) over the 1972-90 period was associated with rising supplies of high- skilled women.
This finding suggests that an increasing supply of women, particularly more skilled women, lowered male wages at the bottom but not at the top of the male distribution and thus constituted an additional factor contributing to a faster closing of the gender gap at the bottom than at the top. To test whether this supply argument is potentially consistent with the data, we need to examine wage changes across our three skill groups, net of changes in human capital. Table 6 performs such an analysis by using separate male and female human capital wage equations esti- mated for each skill group to compare actual and human-capital-constant wage levels in 1979 and 1988.
Table 6 shows that the quality-adjusted real wages of men at the bottom of the skill distribution fell by 0.283 log points. However, the quality- adjusted real wages of women at the middle fell by only 0.063 log points, while women at the top actually increased their quality-adjusted real wages by 0.053 log points. Even if high- or middle-skilled women are to some degree substitutable for low-skilled men, we would expect such

30 Blau/Kahn
women to be even more substitutable for themselves. If their rising rela- tive supply were the entire cause of the decline in low-skilled men's relative wages, then the negative changes in quality-adjusted real wages for high- and middle-skilled women should have been at least as large as for these men. Since the real wage decline of middle-skilled women was much smaller than that of low-skilled men and since high-skilled women actually increased their real wages, we infer that, at least for this period, other causes must also have been important.
In addition, quality-adjusted changes in real wages for women at the middle or top of the distribution are much closer to those of men in their own skill group than to those of men in the low-skill group. Among women, it is those in the low-skill group whose quality-adjusted real wage-decline (0.268) most closely approximates that of men at the bottom. These patterns call into question the notion that high- or middle-skilled women substitute more for low-skilled than for high- or middle-skilled men. Rather, they suggest that the largest degree of substitutability is between men and women within the same skill group.
An alternative interpretation of Topel's (1994) results that is more consistent with this evidence on wage shifts is that they reflect a pattern of biased technical change within industries. For example, Berman et al. (1994) find that for manufacturing industries over the 1959-89 period, the within-industry demand for white-collar labor rose relative to that for blue-collar labor. It is possible that in manufacturing (and in other industries as well) female (and male) professional, managerial, and clerical workers were substituted for lower-skilled production workers. This could both increase the relative wages of the higher-skill groups and lower the relative wages of low-skilled males. A related factor concerning technological change is women's greater likelihood of working with com- puters than that of men (Krueger 1993). This component of technological change is, in effect, profemale and may help to explain women's greater overall progress.
VIII. Conclusions
This article uses data from the Michigan Panel Study of Income Dy- namics for 1979 and 1988 to address a puzzle: how was the dramatic decline in the gender gap achieved in the face of changes in overall wage structure that were increasingly unfavorable to low-wage workers? We find that rising wage inequality and higher rewards to skills did indeed retard women's progress during this period, "reclaiming" about one- third to two-fifths of women's potential gains in relative wages. Nonethe- less, the male-female pay gap declined substantially during this period. This decrease is traced to "gender-specific" factors, which were more than sufficient to counterbalance changes in both measured and unmea- sured prices, that worked against women. Specifically, improvements in

Gender Wage Differentials 31
women s relative qualifications, especially their experience and occupa- tions, and a larger negative effect of deunionization on male than female workers contributed to a narrowing of the gap. In addition, the unex- plained portion of the pay gap declined substantially. A decline in the unexplained gap is generally viewed as reflecting either an upgrading of women s unmeasured labor market skills or a decline in labor market discrimination against them. Both interpretations are credible for this period. Since women improved their relative level of measured character- istics, it is plausible that they also enhanced their relative level of unmea- sured characteristics. Further, as women increased their commitment to the labor force and their other job skills, it is possible that the rationale for statistical discrimination against them diminished. With this increasing labor force commitment, the marketability of women's education and the quality of their experience may have also improved, as suggested by the large recent increases in the share of law, business, and medical students who are women.20
We then investigated whether changes in the gender pay gap could be explained by demand and supply shifts. We found that while demand shifts favored women overall, rising supplies of women implied that sup- ply shifts were larger than demand shifts, yielding net supply changes (i.e., supply shifts net of demand shifts) unfavorable to women in the aggregate. Women's overall progress, then, must be seen as taking place despite these unfavorable net supply shifts.
Our aggregate results assume that skill prices changed in the same way for men and women. However, our analysis of shifts in the compo- sition of supply and demand suggests that demand changes favored women over men at low-skill and middle-skill levels but men over women at high-skill levels. The growth in the supply of women was also considerably larger at high-skill levels. We examined the sources of convergence in the gender gap separately by skill category and found that the evidence was broadly consistent with the notion of a gender twist in net supply working to the detriment of high-skilled women. Although the rate of convergence in the unadjusted gap was slightly faster for high-skilled women, industry and union representation ef- fects strongly favored women at the bottom and middle of the skill distribution relative to those at the top. Further, gains for low-skilled women would likely have been greater had the minimum wage not
20 Greater representation in these high-powered fields may have also led to more on-the-job training for women to the extent that education and such training are complementary, thus raising the quality of women's experience as well. In fact, our results in table A2 for the human capital specification show that the return to full-time experience rose more for women than for men, a finding consistent with this reasoning. See also O'Neill and Polachek (1993).

32 Blau/Kahn
declined in real value over this period. In addition, after controlling for human capital characteristics, industry, occupation, and unionism, the magnitude of the favorable gap effect, that is, the decline in the unexplained pay gap after controlling for changes in unmeasured prices, was largest for low-skilled women, another finding consistent with the gender twist. High-skilled women nonetheless advanced at a similar pace as the other groups due to the large improvement in their human capital characteristics and occupational distribution. The prog- ress of high-skilled women is particularly impressive given the rela- tively unfavorable demand and supply shifts they faced.
Data Appendix
In this section we discuss issues relating to the quality of the data in the PSID. Since our major reason for using the PSID is its inclusion of actual labor market experience, we first examine whether these measures of experience have reasonable empirical content. We then consider a vari- ety of issues related to the representativeness of the PSID data. Overall, we conclude that the PSID is quite comparable to the CPS, a nationally representative data set, and that the measures of actual labor market expe- rience included in the PSID do have substantial empirical content.
To investigate the empirical content of the PSID actual experience measure, we estimated 1988 male human capital log wage equations of two forms: one with the array of experience and other variables shown above for the human capital specification and one with the actual full- and part-time experience variables replaced by potential experience (age - EDYRS - 6) and its square. The average female residual from the specification using the actual experience variables is -.2167; when we use potential experience, the average female residual becomes -.2939. Since the overall gender log wage gap in 1988 was -.3228 (table 1), using potential experience would imply that only 8.95% (i.e., (.3228 - .2939)/ .3228) of the gender pay gap was due to human capital differences. How- ever, using the PSID's actual experience measures, we find that human capital differences explain 32.9% ((.3228 - .2167)/.3228) of the pay gap. In addition, the impact of potential experience on wages was much smaller for women than the impact of actual full-time experience: the 1988 coeffi- cients on potential experience and its square for women were 0.0320 (0.0045) and -0.00048 (0.0001); table A2 shows a steeper actual full-time experience-wage relationship. However, the effects of actual and potential experience were similar for men: the coefficients on potential experience and its square for 1988 were .0466 (.0041) and -.0006 (.0001), respectively, close to the values for full-time experience in table A2. These results are as expected since women's less continuous work experience would pro- duce such differences between the return to actual and potential experi- ence, while men are likely to be continuously employed. Further, as we will see below, changes in potential experience cannot explain the closing

Gender Wage Differentials 33
of the gender pay gap.21 Thus, the actual experience measures in the PSID do appear to contain gender-relevant information.
While the PSID may contain some useful information on experience, it is still not a random survey of all adult workers. This is the case, in part, because it collects labor market information only on heads and wives but not for other adults in the household. In addition, for the purposes of comparing changes over time, using the 1988 and 1979 PSID files may not produce the same results as taking two independent cross sections since some of the same individuals appear twice. To examine the severity of these potential problems, we performed some comparisons of the PSID with the March Current Population Survey data for 1980 and 1989. We constructed samples using the same rules as our PSID-based files. Specifi- cally, we took individuals aged 18-65 years who were employed as of the survey date in full-time, nonfarm, wage and salary jobs. We computed an hourly earnings measure for the CPS respondents that was analogous to that of the PSID: annual labor earnings for the previous year divided by the product of weeks worked and average hours worked per week in that year. Unlike the PSID, the CPS topcoded the earnings variable at $50,000 in 1979 and $199,998 in 1988. Following Katz and Murphy's (1992) procedure for analyzing the CPS, we multiplied the top-coded values by 1.45, although our results were not sensitive to assumptions about top-coding. Finally, we expressed hourly earnings in 1983 dollars and deleted anyone with hourly earnings less than $1.00 or greater than $250 in 1983 dollars.
Table A4 gives some basic demographic information in the two data files. The samples look similar with respect to age, years of schooling, and years of potential experience;22 however, not surprisingly, the PSID respondents are more likely to be married, spouse present. Nonetheless, changes in the incidence of being married are similar for the CPS and the PSID: in each case, men become less likely to be married by 1989 (by 4- 6 percentage points), while women's likelihood of being married stays about the same. While education levels are slightly higher in the PSID (by .05-.34 years), the changes in education are similar across data sets. Finally, there are no big changes in relative (i.e., males vs. females) poten- tial experience levels in either data set. Thus, for the purposes of exploring changes in the gender wage gap, the two data bases look comparable with respect to these demographic characteristics. Moreover, the results suggest that focusing on potential experience is not likely to lead to any important conclusions on the sources of the changing gender pay gap.
21 Similarly, Polachek (1990), also using the PSID, reports that between 1973 and 1978 neither the gender pay gap nor the gender gap in actual experience closed; however, between 1978 and 1986 both closed substantially.
22 In the PSID, years of schooling are truncated at 17. We follow the same procedure for the CPS for comparability and use the truncated education variable in computing potential experience. The truncation makes very little difference in practice.

34 Blau/Kahn
Tables A5 and A6 examine wage patterns in the two data sets. Table A5 shows that wage inequality, as measured by either the 90-10 log wage differential or the standard deviation of log wages, rose for both men and women in both data sets. Thus the PSID is able to pick up the well- known phenomenon of rising wage inequality. Inequality among men in the CPS does appear to grow somewhat less than in the PSID, however. Table A6 shows that the gender gap fell substantially overall in both data sets, with a larger fall in the PSID (.1522 log points) than in the CPS (.1128 log points). Looking across the distribution, the decrease in the gap in both data sets is larger in the middle ranges than in the top or the bottom. In addition, Table A6 shows declining average male real wages and increasing average female real wages for both data sets, as well as sharp declines at the bottom of the distribution for both men and women (with men at the bottom suffering much larger decreases). Thus, with regard to overall wage trends, the PSID and CPS are comparable.
Earlier it was suggested that the error terms of equations using the PSID, and therefore the Juhn et al. (1991) decomposition, could be con- taminated by the possibility, of repeat observations on the same individu- als in 1980 and 1989. To shed light on this issue, we examined the residuals for human capital log wage equations with the same specification in both the CPS and the PSID.23 The results are shown in Table A7. As can be seen, the actual values of the residual at the specific percentiles of the residual distribution shown (10, 25, 50, 75, and 90) are very similar in the CPS and PSID for each year and gender. And the increase in residual inequality is therefore also very similar across data sets. Since the CPS for 1980 and 1989 does consist of independent cross sections, we conclude that there is little evidence that the sampling frame of the PSID produces anomalous results for the residuals.
Finally, Tables Al and A8 show occupational and industrial distribu- tions in the two data sets. Again, the distributions are similar in the PSID and CPS. Both data sets indicate occupational and industrial segregation by gender. Further, both data sets show deindustrialization as measured by the decreasing relative employment share of (the sum of) manufactur- ing, mining, and construction and the growth of services and trade. Both data sets also indicate growing shares for women in high-level (profes- sional, technical, and managerial) jobs, although the PSID shows a larger relative increase in female professionals, while the CPS shows a larger relative increase in female managers.
23 The included variables were WHITE, EDYRS, and potential experience and its square.

Table Al Mean Values of Explanatory Variables
Explanatory Variable Men, 1979 Women, 1979 Men, 1988 Women, 1988
WHITE .925 .893 .921 .894 EDYRS 12.831 12.749 13.366 13.378 COLLDEG .176 .165 .197 .194 ADVDEG .072 .037 .084 .067 EXPF 18.928 11.402 17.409 12.791 EXPFSQ 496.520 207.820 407.310 233.720 EXPP 1.207 2.339 1.607 2.463 EXPPSQ 7.818 16.111 9.515 21.258 CB .333 .213 .222 .171 PROF .196 .199 .195 .295 MGR .166 .082 .189 .117 CLER .050 .369 .039 .313 SALES .051 .034 .053 .034 CRAFT .277 .015 .239 .013 OPER .196 .157 .188 .102 LABSERV .064 .143 .097 .126 MICODUR .367 .164 .299 .115 MANNON .089 .068 .101 .082 TRANS .121 .049 .120 .041 WTRADE .031 .017 .059 .023 RTRADE .089 .130 .100 .122 FIRE .034 .082 .036 .106 SERVS .184 .411 .192 .450 GOVT .084 .079 .094 .062
N 1,784 1,081 1,591 1,149
SOURCE.-Michigan Parent Study of Income Dynamics. NOTE.-See text for variable definitions.

Table A2 Ordinary Least Squares Regression Results Dependent Variable: Log of Hourly Earnings
Men, 1979 Women, 1979 Men, 1988 Women, 1988
Coefficient SE Coefficient SE Coefficient SE Coefficient SE
A. Human capital specifcation:
WHITE .1088 .0389 .1214 .0438 .2052 .0426 .0958 .0411 EDYRS .0656 .0058 .0840 .0098 .0901 .0081 .0836 .0105 COLLDEG .0211 .0379 .0270 .0546 .0647 .0438 .2269 .0511 ADVDEG .0869 .0513 .2079 .0865 .1150 .0573 .2700 .0703 EXPF .0420 .0035 .0289 .0044 .0458 .0041 .0573 .0048 EXPFSQ -.0006 .0001 -.0005 .0001 -.0006 .0001 -.0011 .0001 EXPP .0012 .0081 -.0022 .0078 -.0038 .0082 -.0162 .0068 EXPPSQ .0005 .0004 .0004 .0005 .0005 .0004 .0009 .0003 CONSTANT 1.0061 .0833 .5498 .1225 .3843 .1094 .3040 .1370
R 2 .2725 .2357 .3320 .3789 N 1,784 1,081 1,591 1,149 Residual standard
deviation .4296 .4334 .4542 .4256 B. Full specification:
WHITE .0595 .0375 .0880 .0407 .1428 .0392 .0609 .0381 EDYRS .0565 .0061 .0543 .0099 .0711 .0080 .0497 .0102 COLLDEG .0310 .0374 -.0411 .0530 .0250 .0408 .1921 .0486 ADVDEG .1043 .0516 .1407 .0829 .1105 .0540 .2497 .0664 EXPF .0372 .0034 .0191 .0041 .0344 .0038 .0453 .0045 EXPFSQ -.0006 .0001 -.0003 .0001 -.0004 .0001 -.0008 .0001 EXPP -.0005 .0077 -.0017 .0073 -.0066 .0075 -.0106 .0063 EXPPSQ .0007 .0004 .0002 .0004 .0007 .0004 .0007 .0003 CB .1828 .0230 .1564 .0313 .2506 .0267 .2047 .0322 MGR .0142 .0348 -.0335 .0569 .0740 .0359 .0037 .0432 CLER -.1438 .0526 -.2470 .0434 -.3291 .0604 -.1721 .0370 SALES -.0512 .0547 -.2484 .0829 -.1848 .0565 -.1299 .0725 CRAFT -.1386 .0361 -.0706 .1068 -.2087 .0393 -.3941 .1074 OPER -.2615 .0404 -.3923 .0627 -.3585 .0418 -.3977 .0555 LABSERV -.3490 .0501 -.4269 .0523 -.4043 .0479 -.3324 .0451 MICODUR .1464 .0383 .2472 .0577 .0464 .0419 .0205 .0602 MANNON .0926 .0480 .0554 .0733 -.0295 .0493 - .1436 .0657 TRANS .0809 .0446 .2606 .0704 .0352 .0471 .0998 .0735 WTRADE .0731 .0667 -.0087 .1039 -.0574 .0591 .0480 .0900 RTRADE -.0666 .0498 -.1800 .0592 -.2164 .0509 -.3708 .0598 FIRE .0249 .0652 -.0027 .0615 .0167 .0672 .0064 .0595 SERVS -.0531 .0417 -.0183 .0494 -.2425 .0431 -.1779 .0511 CONSTANT 1.2251 .1051 1.2100 .1446 .9958 .1287 1.1121 .1530
R 2 .3462 .3668 .4503 .4937 N 1,784 1,081 1,591 1,149 Residual standard
deviation .4089 .3964 .4139 .3866
SOURCE.-Michigan Panel Study of Income Dynamics.
36

ON No n C) ONNONt 00
a L) cr, 0 ou NttOtttNOo
00~~~~~O 0c
o un Oo 00
L)C ) 0 ) N- r o 4 o Lr " en r nC
00 -4 r, Ln "o "o o u4 n Lr cr 00 C 4- r, "o CN 4 eu -~<< n s t o o o O
a~~~~~r ) O o e n L ) en 4- Lr o- o4 o ) o3 o3 o3 o3 o o C
0
00 C o cr)r, ncr, en 4ONOCN Lr C )O0e4cON0C) en 0 0
r ")"r
oo S 4 ?N
4 Un
o~~~~~~~~~~" -
w~~~~~0 a), oo 4 oo r, 0 C) rl O4 -- "o 0 en en "o t eo en 4 o _~~~~~r "o Lr C) rl " en r 4- -- 00 Lr ) o or o
en o, o "o o o4
O 0 N O C)C C)c)c)41C)C)C)C)C4crC N~~~~
00 'O C) l- en un Lr l-- l-- 0 00 O ONOOO
0
S un tt
00 00
ON~~~
C) 3 'IO al C 00 C) 'IO 4 t o 0N N XC
0 a ") oo "' - o 4 'I L n 'I u
n Cr C3C en oo en 'I N 'I 0 o
00 ') 0 - 00000
0
"o cC o r- 3 4 "oC o--cc,--" - oL - 0" L
0 qr,
oo~~~~~~r ON
oN N 00 C) C) N 0 t 00 - N ' O IO L ON cr 00 ON cr C)
:4 t
O ~ w :~~~~r 4- C) c 4- -4 O4 en 4 -- C) C) cn - ) cn C) - C) C)
S. N .
o oo . . .
oo . . .
o o
'O 'IO- 0 00 o 4 o 0 n n oo t 'IO 0
00 00
ONS N N
3 : C)- 4 N N " L en 0 C ) C)e o N N a00c) c c o N C o o o cn " N oo 8 C) Q~~~~~~~~~L Or o " ) o) C) C) cn oon " c n -- C) oo o- C) -- C)
ce N N ooNo e e CNO o 4 N O 4 o o o N 'ON
Q~~~~~~~e O " cr C) r" c, l- oo l- o" 'O 'O O4 -4 3 CN 14 'O O O
ON
OOONOt t00 C) N00 -00C )c00) C 00 kC :~~~~~~~~L en Ln " en 4 ent en en " 4- 4- -- C 0 en t
; S ms O0O~6 0 000 ,Lf0
37

Table A4 Means of Selected Demographic Variables in the CPS and PSID, 1980 and 1989
Database Married, Potential and Year Age Education Spouse Present Experience
Men: 1980:
CPS 37.4035 12.6262 .7490 18.6549 PSID 39.1216 12.8313 .8929 20.2909
1989: CPS 37.9381 13.0231 .6870 18.8158 PSID 37.6738 13.3658 .8510 18.3080
Women: 1980:
CPS 36.2560 12.6987 .5674 17.4877 PSID 37.3478 12.7493 .7271 18.5994
1989: CPS 37.6574 13.1308 .5653 18.3977 PSID 36.8825 13.3777 .7389 17.5048
NOTE.-Years of education are truncated at 17 as in the PSID; potential experience is calculated accordingly. CPS Current Population Survey and PSID = Panel Study of Income Dynamics.
Table A5 Log Wage Inequality in the CPS and PSID, 1979 and 1988
90-10 Differential SD
CPS: Men:
1979 1.2934 .5436 1988 1.4396 .5762
Women: 1979 1.1285 .4769 1988 1.3212 .5291
PSID: Men:
1979 1.1928 .5025 1988 1.4137 .5543
Women: 1979 1.1415 .4939 1988 1.3692 .5381
NOTE.-CPS = Current Population Survey and PSID = Panel Study of Income Dynamics.
38

Table A6 Gender Log Wage Gap by Distribution Percentile, Full-Time, Nonfarm, Wage and Salary Workers, 1979 and 1988, CPS and PSID
1979 1988 Change in Difference:
Men Women Difference Men Women Difference 1979-88
CPS: Percentile:
10 1.6261 1.3080 .3181 1.4821 1.2332 .2489 -.0692 20 1.8879 1.5028 .3851 1.7742 1.4689 .3054 -.0797 30 2.0613 1.6368 .4245 1.9772 1.6464 .3308 -.0937 40 2.2023 1.7433 .4590 2.1182 1.7998 .3185 -.1405 50 2.3350 1.8570 .4780 2.2930 1.9268 .3662 -.1118 60 2.4661 1.9617 .5044 2.4204 2.0594 .3610 -.1434 70 2.5990 2.0882 .5108 2.5609 2.2060 .3549 -.1560 80 2.7230 2.2423 .4807 2.7038 2.3484 .3554 -.1254 90 2.9195 2.4365 .4830 2.9217 2.5544 .3672 -.1158
All 2.3038 1.8585 .4453 2.2411 1.9086 .3325 -.1128 PSID:
Percentile: 10 1.8303 1.4148 .4155 1.5970 1.3087 .2883 -.1273 20 2.0518 1.5816 .4701 1.8831 1.5985 .2846 -.1855 30 2.2236 1.6906 .5331 2.0900 1.7484 .3416 -.1914 40 2.3564 1.8281 .5284 2.2439 1.8964 .3475 -.1808 50 2.4877 1.9357 .5520 2.3710 2.0226 .3484 -.2037 60 2.6100 2.0781 .5319 2.5027 2.1713 .3314 -.2005 70 2.6973 2.2288 .4684 2.6325 2.3207 .3118 -.1566 80 2.7940 2.3577 .4363 2.7717 2.4893 .2825 -.1538 90 3.0231 2.5563 .4668 3.0107 2.6779 .3328 -.1340
All 2.4437 1.9687 .4750 2.3396 2.0168 .3228 -.1522
NOTE.-CPS = Current Population Survey and PSID = Panel Study of Income Dynamics.
Table A7 Residuals from Own-Sex Log Wage Equations
1979 1988
CPS PSID CPS PSID
Men: Percentile:
10 -.5680 -.5232 -.6177 -.5716 25 -.2698 -.2601 -.2863 -.2883 50 .0269 .0290 .0371 .0391 75 .2936 .2605 .3229 .2937 90 .5366 .4789 .5624 .5324
SD .4745 .4298 .4899 .4561 90-10 difference 1.1046 1.0021 1.1801 1.1040
Women: Percentile:
10 -.5078 -.5118 -.5894 -.5864 25 -.2475 -.2645 -.2795 -.2524 50 .0126 .0101 .0258 .0309 75 .2658 .2636 .3060 .2921 90 .5060 .4832 .5575 .5356
SD .4348 .4350 .4685 .4521 90-10 difference 1.0138 .9950 1.1469 1.1220
NOTE.-Included variables are race, years of education, and potential experience, and its square. CPS = Current Population Survey and PSID = Panel Study of Income Dynamics.
39

40 Blau/Kahn
Table A8 Occupational and Industrial Representation, CPS 1980 and 1989
1980 1989
Variable Men Women Men Women
MICODUR .323 .122 .293 .099 MANNON .106 .104 .106 .095 TRANS .098 .045 .107 .054 WTRADE .052 .027 .057 .026 RTRADE .116 .139 .120 .134 FIRE .075 .117 .051 .107 SERVS .147 .382 .197 .421 GOVT .083 .063 .069 .064 PROF .171 .200 .176 .217 MGR .142 .079 .164 .137 CLER .067 .380 .062 .310 SALES .052 .038 .063 .069 CRAFT .239 .020 .222 .020 OPER .190 .136 .173 .106 LABSERV .138 .147 .139 .141
NOTE.-CPS Current Population Survey.
References
Bartel, Ann, and Lichtenberg, Frank. "The Comparative Advantage of Educated Workers in Implementing New Technology." Review of Eco- nomics and Statistics 69 (February 1987): 1-11.
Bergmann, Barbara R. "Occupational Segregation, Wages and Profits When Employers Discriminate by Race or Sex." Eastern Economic Journal 1 (April-July 1974): 103-10.
Berman, Eli; Bound, John; and Griliches, Zvi. "Changes in the Demand for Skilled Labor within U.S. Manufacturing Industries: Evidence from the Annual Survey of Manufactures." Quarterly Journal of Economics 109 (May 1994): 367-97.
Blau, Francine D., and Beller, Andrea H. "Trends in Earnings Differen- tials by Gender: 1971-81." Industrial and Labor Relations Review 41 (July 1988): 513-29.
Blau, Francine D., and Ferber, Marianne. The Economics of Women, Men, and Work. 2d ed. Englewood Cliffs, NJ: Prentice-Hall, 1992.
Blau, Francine D., and Kahn, Lawrence M. "Race and Gender Pay Differ- entials." In Research Frontiers in Industrial Relations and Human Re- sources, edited by D. Lewin, 0. Mitchell, and P. Sherer, pp. 381-416. Madison, WI: Industrial Relations Research Association, 1992. (a)
"The Gender Earnings Gap: Learning from International Com- parisons." American Economic Review 82 (May 1992): 533-38. (b)
. ",The Gender Earnings Gap: Some International Evidence." In Differences and Changes in Wage Structures, edited by Richard Free- man and Lawrence Katz, pp. 105-43. Chicago: University of Chicago Press, 1995.

Gender Wage Differentials 41
"Wage Structure and Gender Earnings Differentials: An Interna- tional Comparison." Economica 63 (May 1996): S29-S62.
Borjas, George, and Ramey, Valerie. "Foreign Competition, Market Power, and Wage Inequality." Quarterly Journal of Economics 110 (November 1995): 1075-1110.
Bound, John, and Freeman, Richard B. "What Went Wrong? The Erosion of Relative Earnings and Employment among Young Black Men in the 1980s." Quarterly Journal of Economics 107 (February 1992): 201-32.
Bound, John, and Johnson, George. "Changes in the Structure of Wages in the 1980's: An Evaluation of Alternative Explanations." American Economic Review 82 (June 1992): 371-92.
Card, David. "The Effect of Unions on the Structure of Wages: A Longi- tudinal Analysis." Econometrica 64 (July 1996): 957-79.
Chamberlain, Gary. "Quantile Regression, Censoring, and the Structure of Wages." Photocopied. Cambridge, MA: Harvard University, June 1991.
DiNardo, John; Fortin, Nicole M.; and Lemieux, Thomas. "Labor Market Institutions and the Distribution of Wages, 1973-1992: A Semipara- metric Approach." Econometrica 64 (September 1996): 1001-44.
Freeman, Richard B. "How Much has De-unionization Contributed to the Rise in Male Earnings Inequality?" In Uneven Tides: Rising In- equality in America, edited by Sheldon Danziger and Peter Gottschalk, pp. 133-63. New York: Russell Sage Foundation, 1993.
Heckman, James J. "Sample Selection Bias as a Specification Error." In Female Labor Supply: Theory and Estimation, edited by James P. Smith, pp. 206-48. Princeton, NJ: Princeton University Press, 1980.
Juhn, Chinhui; Murphy, Kevin M.; and Pierce, Brooks. "Accounting for the Slowdown in Black-White Wage Convergence." In Workers and Their Wages, edited by Marvin Kosters, pp. 107-43. Washington, DC: AEI Press, 1991.
. "Wage Inequality and the Rise in Returns to Skill." Journal of Political Economy 101 (June 1993): 410-42.
Katz, Lawrence F., and Murphy, Kevin M. "Changes in Relative Wages, 1963-87: Supply and Demand Factors." Quarterly Journal of Econom- ics 107 (February 1992): 35-78.
Korenman, Sanders, and Neumark, David. "Does Marriage Really Make Men More Productive?"Journal of Human Resources 26 (Spring 1991): 282-307.
Krueger, Alan B. "How Computers Have Changed the Wage Structure: Evidence from Microdata, 1984-1989." Quarterly Journal of Econom- ics 107 (February 1993): 35-60.
LaLonde, Robert J., and Topel, Robert H. "The Assimilation of Immi- grants in the U.S. Labor Market." In Immigration and the Work Force, edited by G. Borjas and R. Freeman, pp. 67-92. Chicago: University of Chicago Press, 1992.
Leonard, Jonathan. "Women and Affirmative Action." Journal of Eco- nomic Perspectives 3 (Winter 1989): 61-75.

42 Blau/Kahn
Manski, Charles F. "Anatomy of the Selection Problem." Journal of Human Resources 24 (Summer 1989): 343-60.
Mincer, Jacob, and Polachek, Solomon. "Family Investments in Human Capital: Earnings of Women." Journal of Political Economy 82, pt. 2 (March/April 1974): S76-S108.
Murphy, Kevin M., and Welch, Finis. "The Role of International Trade in Wage Differentials." In Workers and Their Wages, edited by Marvin Kosters, pp. 39-69. Washington, DC: AEI Press, 1991.
O'Neill, June. "Women and Wages." American Enterprise 1 (November/ December 1990): 25-33.
O'Neill, June, and Polachek, Solomon. "Why the Gender Gap in Wages Narrowed in the 1980s."Journal of Labor Economics 1 1 (January 1993): 205-28.
Polachek, Solomon. "Trends in Male-Female Wages: Differences between the 1970s and the 1980s." Paper presented at the American Economic Association meeting, Washington, DC, December 1990.
Sorensen, Elaine. "Gender and Racial Pay Gaps in the 1980s: Accounting for the Different Trends." Photocopied. Washington, DC: Urban Insti- tute, November 1991.
Topel, Robert. "Wage Inequality and Regional Labor Market Perfor- mance in the United States." In Labour Market and Economic Perfor- mance: Europe, Japan, and the USA, edited by Toshiaki Tachibanaki. New York: St. Martin's, 1994.
University of Michigan. Survey Research Center. A Panel Study of In- come Dynamics: Procedures and Tape Codes (Documentation), 1989 Interviewing Year. Ann Arbor: University of Michigan, Institute for Social Research, 1992.
U.S. Bureau of Labor Statistics. Handbook of Labor Statistics, 1979. Washington, DC: U.S. Government Printing Office, 1980.
Employment and Earnings 39 (January 1992). Monthly Labor Review. Washington, DC: U.S. Government
Printing Office, various issues. Wellington, Alison J. "Changes in the Male/Female Wage Gap, 1976-
85." Journal of Human Resources 28 (Spring 1993): 383-411. Willis, Robert. "Wage Determinants: A Survey and Reinterpretation of
Human Capital Earnings Functions." In Handbook of Labor Econom- ics, edited by Orley Ashenfelter and Richard Layard, pp. 525-602. Amsterdam: North-Holland, 1986.
Related Documents