electronic reprint Journal of Applied Crystallography ISSN 1600-5767 Structural, electronic and magnetic properties of YMnO 3 /La 0.7 Sr 0.3 MnO 3 heterostructures Amitesh Paul, Carlos Zandalazini, Pablo Esquinazi, Carmine Autieri, Biplab Sanyal, Panagiotis Korelis and Peter B¨ oni J. Appl. Cryst. (2014). 47, 1054–1064 Copyright c International Union of Crystallography Author(s) of this paper may load this reprint on their own web site or institutional repository provided that this cover page is retained. Republication of this article or its storage in electronic databases other than as specified above is not permitted without prior permission in writing from the IUCr. For further information see http://journals.iucr.org/services/authorrights.html Many research topics in condensed matter research, materials science and the life sci- ences make use of crystallographic methods to study crystalline and non-crystalline mat- ter with neutrons, X-rays and electrons. Articles published in the Journal of Applied Crys- tallography focus on these methods and their use in identifying structural and diffusion- controlled phase transformations, structure-property relationships, structural changes of defects, interfaces and surfaces, etc. Developments of instrumentation and crystallo- graphic apparatus, theory and interpretation, numerical analysis and other related sub- jects are also covered. The journal is the primary place where crystallographic computer program information is published. Crystallography Journals Online is available from journals.iucr.org J. Appl. Cryst. (2014). 47, 1054–1064 Amitesh Paul et al. · Properties of YMnO 3 /La 0.7 Sr 0.3 MnO 3 heterostructures

Welcome message from author
This document is posted to help you gain knowledge. Please leave a comment to let me know what you think about it! Share it to your friends and learn new things together.
Transcript
electronic reprint
Journal of
AppliedCrystallography
ISSN 1600-5767
Structural, electronic and magnetic properties ofYMnO3/La0.7Sr0.3MnO3 heterostructures
Amitesh Paul, Carlos Zandalazini, Pablo Esquinazi, Carmine Autieri,Biplab Sanyal, Panagiotis Korelis and Peter Boni
J. Appl. Cryst. (2014). 47, 1054–1064
Copyright c© International Union of Crystallography
Author(s) of this paper may load this reprint on their own web site or institutional repository provided thatthis cover page is retained. Republication of this article or its storage in electronic databases other than asspecified above is not permitted without prior permission in writing from the IUCr.
For further information see http://journals.iucr.org/services/authorrights.html
Many research topics in condensed matter research, materials science and the life sci-ences make use of crystallographic methods to study crystalline and non-crystalline mat-ter with neutrons, X-rays and electrons. Articles published in the Journal of Applied Crys-tallography focus on these methods and their use in identifying structural and diffusion-controlled phase transformations, structure-property relationships, structural changes ofdefects, interfaces and surfaces, etc. Developments of instrumentation and crystallo-graphic apparatus, theory and interpretation, numerical analysis and other related sub-jects are also covered. The journal is the primary place where crystallographic computerprogram information is published.
Crystallography Journals Online is available from journals.iucr.org
J. Appl. Cryst. (2014). 47, 1054–1064 Amitesh Paul et al. · Properties of YMnO3/La0.7Sr0.3MnO3 heterostructures
research papers
1054 doi:10.1107/S1600576714005871 J. Appl. Cryst. (2014). 47, 1054–1064
Journal of
AppliedCrystallography
ISSN 1600-5767
Received 25 October 2013
Accepted 17 March 2014
# 2014 International Union of Crystallography
Structural, electronic and magnetic properties ofYMnO3/La0.7Sr0.3MnO3 heterostructures
Amitesh Paul,a* Carlos Zandalazini,b‡ Pablo Esquinazi,b Carmine Autieri,c Biplab
Sanyal,c Panagiotis Korelisd and Peter Bonia
aTechnische Universitat Munchen, Physik Department E21, Lehrstuhl fur Neutronenstreuung,
James-Franck-Strasse 1, D-85748 Garching bei Munchen, Germany, bDivision of Superconductivity
and Magnetism, University of Leipzig, D-04103 Leipzig, Germany, cDepartment of Physics and
Astronomy, Uppsala University, Box 516, SE-75120, Uppsala, Sweden, and dLaboratory for
Neutron Scattering, Paul Scherrer Institut, CH-5232 Villigen, Switzerland. Correspondence e-mail:
Heterostructures with competing magnetic interactions are often exploited for
their tailored new functionalities. Exchange bias is one such outcome of
interfacial coupling across ferromagnetic–antiferromagnetic, multiferroic–
ferromagnetic, two antiferromagnetic, or antiferromagnetic and paramagnetic
interfaces. Apart from the usual horizontal shift of the hysteresis loop (exchange
bias shift), a small ‘vertical shift’ of the hysteresis loops along the magnetization
axis has also been seen, but it was always relatively small. Recently, an unusually
large ‘vertical shift’ in epitaxial bilayer heterostructures comprising ferromag-
netic La0.7Sr0.3MnO3 and multiferroic orthorhombic YMnO3 layers was
reported. Here, using polarized neutron reflectometry, the magnetic proximity
effect in such bilayers has been investigated. A detailed magnetic depth profile
at the interface, elucidating the intrinsic nature of the vertical shift in such
heterostructures, is reported. Further corroboration of this observation has been
made by means of first-principles calculations, and the structural and electronic
properties of YMnO3/La0.7Sr0.3MnO3 heterostructures are studied. Although in
the bulk, the ground state of YMnO3 is an E-type antiferromagnet, the YMnO3/
La0.7Sr0.3MnO3 heterostructure stabilizes the ferromagnetic phase in YMnO3 in
the interface region. It is found that, in the hypothetical ferromagnetic phase of
bulk YMnO3, the polarization is suppressed, and owing to a large difference
between the lattice constants in the ab plane a strong magnetocrystalline
anisotropy is present. This anisotropy produces a high coercivity of the unusual
ferromagnetic YMnO3 phase at the interface, which is responsible for the large
vertical shift observed in experiment.
1. Introduction
In perovskite-based heterostructures, magnetic interactions
are particularly fascinating as they can show interface ferro-
magnetism between two antiferromagnets or between an
antiferromagnet and a paramagnet (Ueda et al., 1998).
Competing magnetic interactions, which give rise to proximity
coupling such as exchange bias, have found technological
applications in magnetoresistive sensors. However, its micro-
scopic origin often raises debate, particularly regarding the
coupling configurations at the interface (Meiklejohn & Bean,
1956). Magnetic oxide heterostructures showing exchange bias
have been reported earlier (Panagiotopoulos et al., 1999;
Moutis et al., 2001; Ziese et al., 2011, 2010). In oxide hetero-
structures, electronic and orbital reconstruction has received
immense attention owing to its potential in relation to emer-
ging novel electric and magnetic ground states. Combinations
of ferroelectric (FE) and magnetic ordering in multiferroic
oxides such as TbMnO3 and YMnO3, possessing noncollinear
spin order, with collinear ferromagnets such as La0.7Sr0.3Mn-
O3, La0.7Ca0.3MnO3 and Co have drawn considerable atten-
tion recently (Tian et al., 2013; Barzola-Quiquia et al., 2012;
Zandalazini et al., 2011).
Magnetic frustrations and noncollinear spin structures in
the antiferromagnetic (AF) layer can often contribute to
exchange bias in such functional thin-film heterostructures.
Orthorhombic YMnO3 (o-YMO) is ferroelectric as well. For
hexagonal YMnO3, TFE ’ 900 K and TN ’ 80 K, and for
o-YMO, TFE ’ 30 K and TN ’ 42 K. It appears that ferro-
electricity in hexagonal manganites is associated with a tilting‡ Present address: Laboratorio de Fısica del Solido, Universidad Nacional deTucuman, 4000, Tucuman, Argentina.
electronic reprint
of the Mn—O octahedra, whereas in o-YMO it has been
proposed that it may result from the existence of a magnetic
transition below TN ’ 42 K – from sinusoidal to helical spin
order – that breaks the spatial inversion symmetry, thus
allowing the existence of ferroelectricity. The Mn moments
form an antiparallel spin order in the ac plane and can be
characterized as a spin density wave with a helical angle
propagating along the b axis. The propagation vector kysubsequently experiences a magnetic reordering transition at
some lower temperature (26 K) and locks into an incom-
mensurate magnetic (ICM) structure (Munoz et al., 2002). In
this work, we focus on the coupling between FE o-YMO and
ferromagnetic (FM) La0.7Sr0.3MnO3 (LSMO).
Magnetic heterostructures showing a ‘horizontal shift’ of
the hysteresis loop along the field axis have been commonly
observed for conventional (Paul, 2012) as well as unconven-
tional bilayer combinations (He et al., 2012; Gibert et al.,
2012). However, an uncommonly observed effect of exchange
coupling – across an AF–FM interface – is the shift along the
magnetization axis or the ‘vertical shift’ (Hong et al., 2006).
Element-specific magnetic studies with X-rays of FeF2/Co
and CoO/Fe (Ohldag et al., 2003, 2006; Gruyters & Schmitz,
2008) layered structures confirmed the existence of this
vertical shift and revealed its relation to specific uncompen-
sated moments in the antiferromagnet. This vertical shift was
often conjectured to be either correlated or not correlated to
the bias field (Paul et al., 2013). No convincing experiment
could be carried out to possibly confirm this correlation owing
to the extremely small magnitude of the vertical shift.
Recently, a positive vertical shift in magnetization was shown
to be related to the formation of an Fe3O4 ferrimagnetic
interfacial layer (de la Venta et al., 2012). Fitzsimmons et al.
(2009) showed that only pinned spins within DyFe2 would play
a direct role in establishing the mshift (vertical shift) in hard–
soft ferrimagnetic DyFe2/YFe2 layers. Noncollinear magnetic
structure was predicted to be responsible for the vertical shift
in an Fe/MnO2 sample (Passamani et al., 2006). Minor loop
shifts are often mistaken as vertical shifts such as in the
layered cobaltite (Geshev, 2008).
However, a recent study on heteroepitaxial interfaces invol-
ving La0.7Sr0.3MnO3/YMnO3 bilayers showed an unusually
large vertical shift. It was also shown that this vertical shift was
not correlated with the horizontal shift (Zandalazini et al.,
2011). Samples with a larger horizontal shift showed a smaller
vertical shift and vice versa. In this paper, we establish that the
ferromagnetic layer and the interdiffused layer between the
AF–FM interface play a decisive role in determining the
vertical shift of exchange-coupled heterostructural systems,
which is strongly supported by our first-principles calculations.
The paper is organized as follows. In x2, we discuss sample
preparation and characterization. In x3, we show and discuss
the experimental polarized neutron reflectivity results. In x4,we provide the first-principles calculations starting from bulk
o-YMO and considering the structural, magnetic and elec-
tronic properties of the superlattices, and propose a micro-
scopic mechanism to explain the large vertical shift. In x5, wepresent a summary and concluding remarks.
2. Samples and characterization
Bilayer heterostructures of [La0.7Sr0.3MnO3 (80 A)/YMnO3
(3750 A)] (LASMO) and [La0.7Sr0.3MnO3 (300 A)/YMnO3
(3750 A)] (LBSMO) were grown with pulsed laser deposition
on 5 � 5 mm (100) SrTiO3 (STO) substrates. The o-YMO
layers were found to have orthorhombic structure. Details of
the sample deposition and characterization are given by
Zandalazini et al. (2011). The epitaxial nature of the growth
was confirmed, along with the orthorhombic phase of the
3750 A o-YMO layer. This layer presumably turns into an
antiferromagnet or a dilute antiferromagnet in an external
field (DAFF) at TN ’ 42 K, as outlined from the super-
conducting quantum interference measurements (SQUID)
given by Zandalazini et al. (2011). However, the DAFF state
disappears below 21 K (Okuyama et al., 2011).
research papers
J. Appl. Cryst. (2014). 47, 1054–1064 Amitesh Paul et al. � Properties of YMnO3/La0.7Sr0.3MnO3 heterostructures 1055
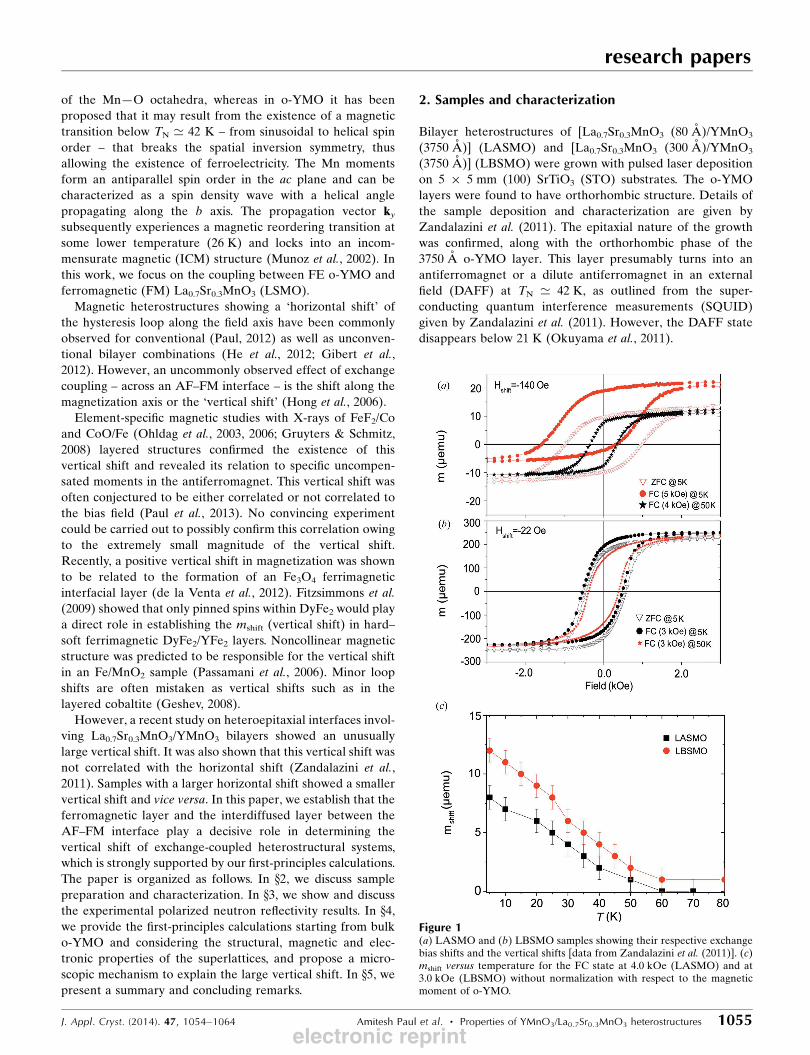
Figure 1(a) LASMO and (b) LBSMO samples showing their respective exchangebias shifts and the vertical shifts [data from Zandalazini et al. (2011)]. (c)mshift versus temperature for the FC state at 4.0 kOe (LASMO) and at3.0 kOe (LBSMO) without normalization with respect to the magneticmoment of o-YMO.
electronic reprint
The temperature dependence of the remnant magnetization
of the ferromagnetic LSMO layers showed a sudden change in
slope close to the Neel temperature of the underlying o-YMO
layer (Zandalazini et al., 2011). Field hysteresis measurements
were made for the field-cooled (FC) and the zero-field-cooled
(ZFC) cases as the samples were cooled from above TN down
to 5 K. All the hysteresis loops showed the expected hori-
zontal shift and also the ‘vertical shifts’ for both samples. The
difference in the increase of the coercivities with lowering of
temperature from 50 to 5 K indicates the different magnetic
coupling at two different interfaces.
The horizontal shifts, defined by Hshift [= (Hc+ + Hc
�)/2,where Hc
+/� are the coercive fields along the two branches of
the loop], in the sample scale with the FM thickness (inter-
facial magnetic dilution with FM thickness). Note that the FM-
layer thickness in the LASMO sample is around four times
smaller than that in the LBSMO sample. However, the vertical
shift [here we have defined the vertical shift as mshift = (ms+ +
ms�)/2] shows an anomaly as depicted in Figs. 1(a) and 1(b).
The anomaly lies in the fact that the LASMO sample shows a
largerHshift and a lowermshift as compared with a smallerHshift
but larger mshift in the LBSMO sample. Fig. 1(c) shows the
mshift without normalizing with respect to the magnetization of
o-YMO. The LBSMO sample shows a 50% increase in mshift
compared with the LASMO sample. Here ms+ and ms
� are the
saturation moments along the two branches of the loops. This
mshift was in surplus of any shift arising from the o-YMO
magnetization (Zandalazini et al., 2011). This became evident
as the normalized mshift (normalized to the magnetization in
the o-YMO layer measured separately) was shown to possess
a larger value in LBSMO than in LASMO (increased from 7
to 13 memu; 1 emu = 10�3 A m2). This implies that the mshift in
LASMO can be, to some extent, due to the o-YMO layer
magnetization below 42 K. Therefore, the AF layer is not
solely responsible for the observed mshift as o-YMO was
deposited under similar conditions possessing the same
thickness. Fig. 2 shows the ZFC and FC (0.5 kOe; 1 Oe = 103/
4� A m�1) measurements for the o-YMO and the LBSMO
samples. The bifurcation of the FC and ZFC curves of o-YMO
(3750 A) gives the onset of the antiferromagnetic ordering
temperature. The bifurcation of the ZFC and FC curves for
LBSMO occurs at a much higher temperature, which is the
blocking temperature (TB = 230 K) of the system. Following
the initial report by Zandalazini et al. (2011), we felt the need
to elucidate the intrinsic nature of the mshift. We therefore
used a depth-sensitive technique, namely polarized neutron
reflectometry (PNR), to obtain the magnetic profile of the
interface.
PNR measurements were performed at the AMOR
instrument at SINQ of PSI in Villigen (Switzerland). The data
have been corrected for the imperfect polarization of the
neutron beam. An in-plane magnetic field of�5 kOe was used
to saturate the FM layer before the samples were cooled using
a closed-cycle cryostat in the presence/absence of a field down
to 50 and 10 K, respectively. The two temperatures were
chosen so as to include (10 K) or exclude (50 K) the effect of
enhanced o-YMO layer magnetization on the bilayer system.
Note that the accessibility of the scattering vector (Qz) is
limited, probably because of the buckling of the STO
substrates below 104 and 64 K owing to structural transitions.
Also note that the PNR data were measured at 50 and 10 K,
which are below the buckling temperature of STO. Thus
whatever changes one expects, as we compare the two data
sets, would be independent of the buckling effect. It may be
worth mentioning that the PNR measurements were techni-
cally extremely challenging given the small sizes (5� 5 mm) of
the samples. The magnetic field, perpendicular to the scat-
tering plane, was produced with Helmholtz coils. The data
treatment was carried out with in-house programs.
3. Polarized neutron scattering results and discussions
Owing to the comparatively large FE layer (3700 A), an
estimation of the individual FM-layer thickness was difficult
from routine X-ray reflectivity (XRR) measurements. To get
an estimate of the layer thicknesses, interface roughness, and
nuclear (�n) and saturation magnetic (�m) scattering length
density (SLD) values from the PNR data, the samples were
measured at a saturation field of 5.0 kOe after cooling the
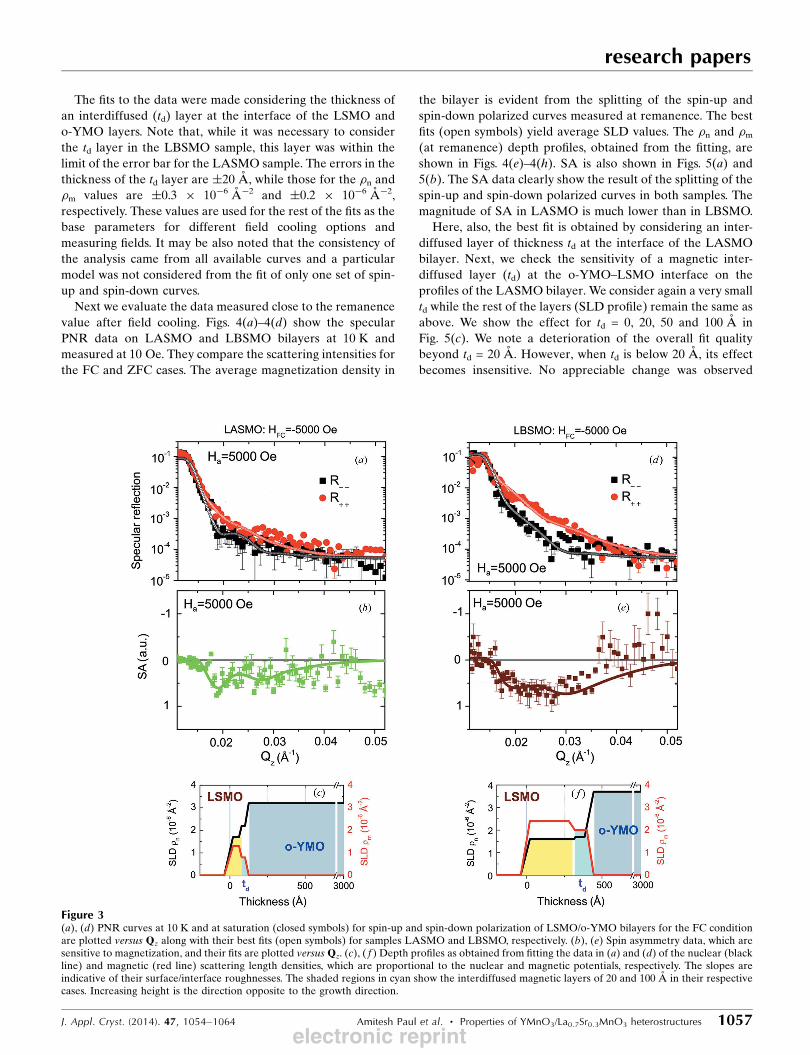
samples down to 10 K in a cooling field of �5.0 kOe. Figs. 3(a)
and 3(d) display our specular PNR data of LASMO and
LBSMO bilayers.
The best fits (Figs. 3a and 3d, open symbols) with a simple
model of block potentials yield average SLD values. One
should note that PNR, unlike XRR, is highly sensitive to the
magnetization of the layer stack irrespective of the thickness
of the non-magnetic or antiferromagnetic layer at the bottom
or at the top. The spin asymmetry (SA) in Figs. 3(b) and 3(e),
expressed as the ratio of the difference and sum of spin-up and
spin-down reflectivities, is also shown. The �m and �n depth
profiles, obtained from the fitting, are shown in Figs. 3(c) and
3( f). The errors in the thickness of the LSMO (o-YMO) layers
are �2 nm (�100 nm), while those for the �n and �m values
are�0.3� 10�6 A�2 (�0.5� 10�6 A�2) and�0.2� 10�6 A�2
(�0.2 � 10�6 A�2), respectively.
research papers
1056 Amitesh Paul et al. � Properties of YMnO3/La0.7Sr0.3MnO3 heterostructures J. Appl. Cryst. (2014). 47, 1054–1064
Figure 2SQUID FC (at �0.5 kOe) and ZFC measurements for the o-YMO layerand that of LBSMO. The kink at TN in FC LBSMO shows that aferromagnetic moment is created in the o-YMO.
electronic reprint
The fits to the data were made considering the thickness of
an interdiffused (td) layer at the interface of the LSMO and
o-YMO layers. Note that, while it was necessary to consider
the td layer in the LBSMO sample, this layer was within the
limit of the error bar for the LASMO sample. The errors in the
thickness of the td layer are �20 A, while those for the �n and�m values are �0.3 � 10�6 A�2 and �0.2 � 10�6 A�2,
respectively. These values are used for the rest of the fits as the
base parameters for different field cooling options and
measuring fields. It may be also noted that the consistency of
the analysis came from all available curves and a particular
model was not considered from the fit of only one set of spin-
up and spin-down curves.
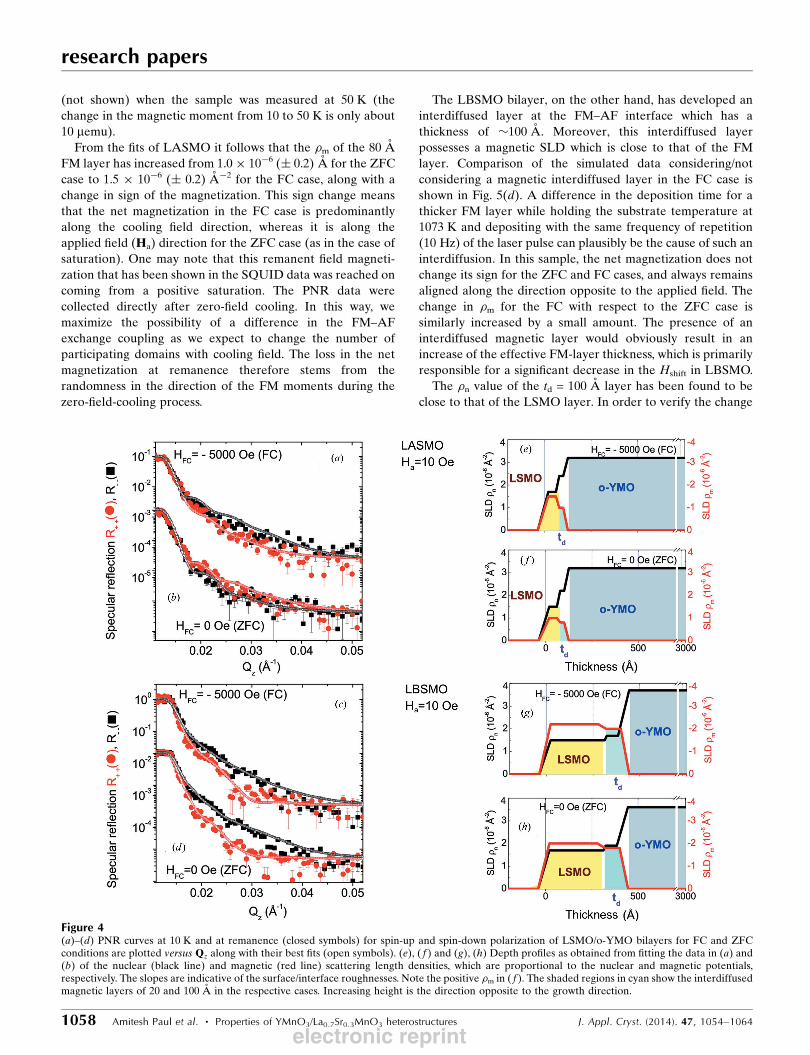
Next we evaluate the data measured close to the remanence
value after field cooling. Figs. 4(a)–4(d) show the specular
PNR data on LASMO and LBSMO bilayers at 10 K and
measured at 10 Oe. They compare the scattering intensities for
the FC and ZFC cases. The average magnetization density in
the bilayer is evident from the splitting of the spin-up and
spin-down polarized curves measured at remanence. The best
fits (open symbols) yield average SLD values. The �n and �m(at remanence) depth profiles, obtained from the fitting, are
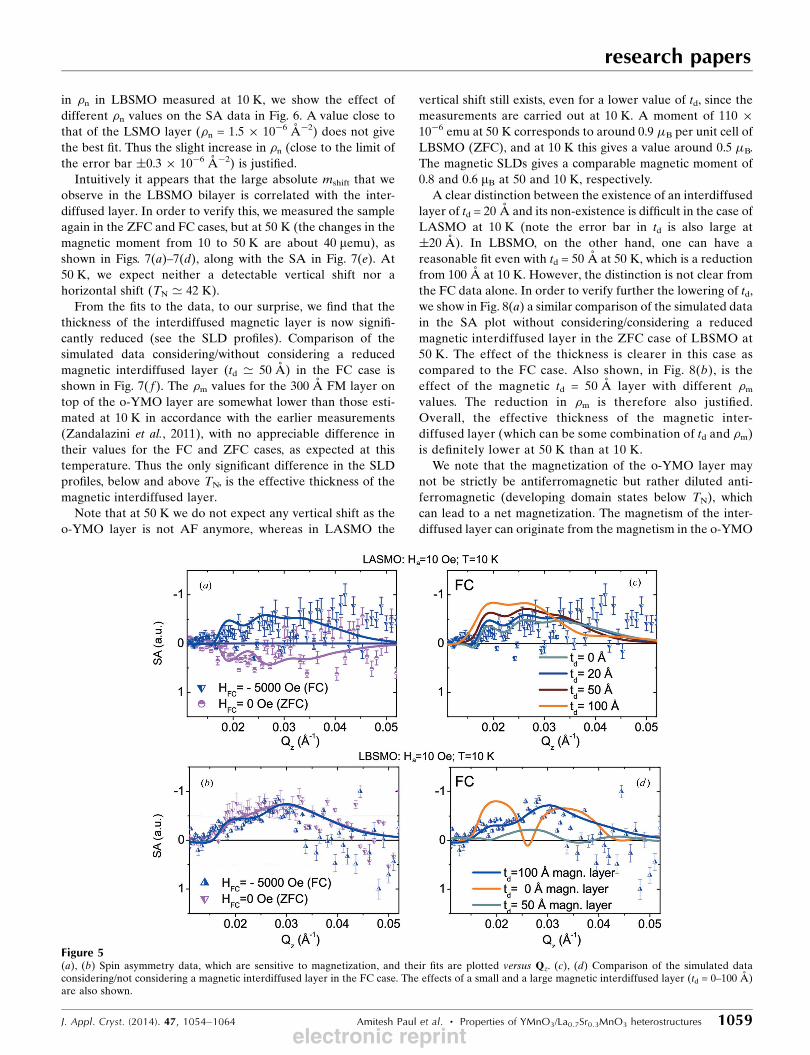
shown in Figs. 4(e)–4(h). SA is also shown in Figs. 5(a) and
5(b). The SA data clearly show the result of the splitting of the
spin-up and spin-down polarized curves in both samples. The
magnitude of SA in LASMO is much lower than in LBSMO.
Here, also, the best fit is obtained by considering an inter-
diffused layer of thickness td at the interface of the LASMO
bilayer. Next, we check the sensitivity of a magnetic inter-
diffused layer (td) at the o-YMO–LSMO interface on the
profiles of the LASMO bilayer. We consider again a very small
td while the rest of the layers (SLD profile) remain the same as
above. We show the effect for td = 0, 20, 50 and 100 A in
Fig. 5(c). We note a deterioration of the overall fit quality
beyond td = 20 A. However, when td is below 20 A, its effect
becomes insensitive. No appreciable change was observed
research papers
J. Appl. Cryst. (2014). 47, 1054–1064 Amitesh Paul et al. � Properties of YMnO3/La0.7Sr0.3MnO3 heterostructures 1057
Figure 3(a), (d) PNR curves at 10 K and at saturation (closed symbols) for spin-up and spin-down polarization of LSMO/o-YMO bilayers for the FC conditionare plotted versus Qz along with their best fits (open symbols) for samples LASMO and LBSMO, respectively. (b), (e) Spin asymmetry data, which aresensitive to magnetization, and their fits are plotted versusQz. (c), ( f ) Depth profiles as obtained from fitting the data in (a) and (d) of the nuclear (blackline) and magnetic (red line) scattering length densities, which are proportional to the nuclear and magnetic potentials, respectively. The slopes areindicative of their surface/interface roughnesses. The shaded regions in cyan show the interdiffused magnetic layers of 20 and 100 A in their respectivecases. Increasing height is the direction opposite to the growth direction.
electronic reprint
(not shown) when the sample was measured at 50 K (the
change in the magnetic moment from 10 to 50 K is only about
10 memu).
From the fits of LASMO it follows that the �m of the 80 A
FM layer has increased from 1.0� 10�6 (� 0.2) A for the ZFC
case to 1.5 � 10�6 (� 0.2) A�2 for the FC case, along with a
change in sign of the magnetization. This sign change means
that the net magnetization in the FC case is predominantly
along the cooling field direction, whereas it is along the
applied field (Ha) direction for the ZFC case (as in the case of
saturation). One may note that this remanent field magneti-
zation that has been shown in the SQUID data was reached on
coming from a positive saturation. The PNR data were
collected directly after zero-field cooling. In this way, we
maximize the possibility of a difference in the FM–AF
exchange coupling as we expect to change the number of
participating domains with cooling field. The loss in the net
magnetization at remanence therefore stems from the
randomness in the direction of the FM moments during the
zero-field-cooling process.
The LBSMO bilayer, on the other hand, has developed an
interdiffused layer at the FM–AF interface which has a
thickness of �100 A. Moreover, this interdiffused layer
possesses a magnetic SLD which is close to that of the FM
layer. Comparison of the simulated data considering/not
considering a magnetic interdiffused layer in the FC case is
shown in Fig. 5(d). A difference in the deposition time for a
thicker FM layer while holding the substrate temperature at
1073 K and depositing with the same frequency of repetition
(10 Hz) of the laser pulse can plausibly be the cause of such an
interdiffusion. In this sample, the net magnetization does not
change its sign for the ZFC and FC cases, and always remains
aligned along the direction opposite to the applied field. The
change in �m for the FC with respect to the ZFC case is
similarly increased by a small amount. The presence of an
interdiffused magnetic layer would obviously result in an
increase of the effective FM-layer thickness, which is primarily
responsible for a significant decrease in the Hshift in LBSMO.
The �n value of the td = 100 A layer has been found to be
close to that of the LSMO layer. In order to verify the change
research papers
1058 Amitesh Paul et al. � Properties of YMnO3/La0.7Sr0.3MnO3 heterostructures J. Appl. Cryst. (2014). 47, 1054–1064
Figure 4(a)–(d) PNR curves at 10 K and at remanence (closed symbols) for spin-up and spin-down polarization of LSMO/o-YMO bilayers for FC and ZFCconditions are plotted versus Qz along with their best fits (open symbols). (e), ( f ) and (g), (h) Depth profiles as obtained from fitting the data in (a) and(b) of the nuclear (black line) and magnetic (red line) scattering length densities, which are proportional to the nuclear and magnetic potentials,respectively. The slopes are indicative of the surface/interface roughnesses. Note the positive �m in ( f ). The shaded regions in cyan show the interdiffusedmagnetic layers of 20 and 100 A in the respective cases. Increasing height is the direction opposite to the growth direction.
electronic reprint
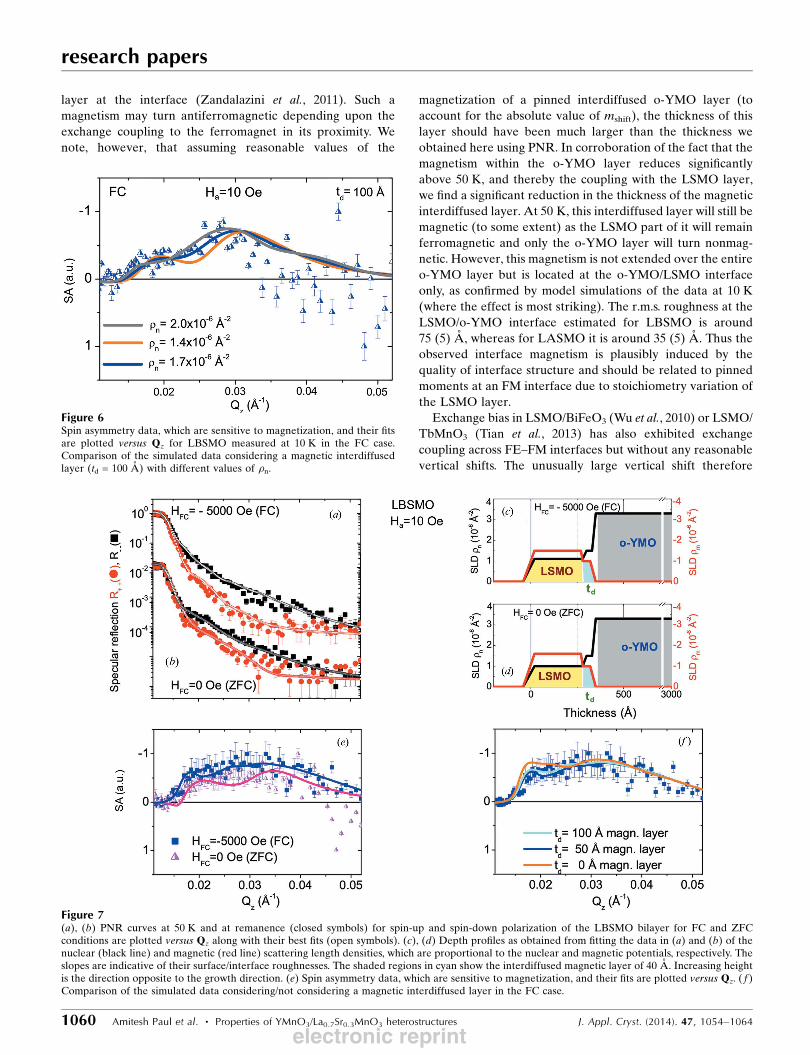
in �n in LBSMO measured at 10 K, we show the effect of
different �n values on the SA data in Fig. 6. A value close to
that of the LSMO layer (�n = 1.5 � 10�6 A�2) does not give
the best fit. Thus the slight increase in �n (close to the limit of
the error bar �0.3 � 10�6 A�2) is justified.
Intuitively it appears that the large absolute mshift that we
observe in the LBSMO bilayer is correlated with the inter-
diffused layer. In order to verify this, we measured the sample
again in the ZFC and FC cases, but at 50 K (the changes in the
magnetic moment from 10 to 50 K are about 40 memu), as
shown in Figs. 7(a)–7(d), along with the SA in Fig. 7(e). At
50 K, we expect neither a detectable vertical shift nor a
horizontal shift (TN ’ 42 K).
From the fits to the data, to our surprise, we find that the
thickness of the interdiffused magnetic layer is now signifi-
cantly reduced (see the SLD profiles). Comparison of the
simulated data considering/without considering a reduced
magnetic interdiffused layer (td ’ 50 A) in the FC case is
shown in Fig. 7( f). The �m values for the 300 A FM layer on
top of the o-YMO layer are somewhat lower than those esti-
mated at 10 K in accordance with the earlier measurements
(Zandalazini et al., 2011), with no appreciable difference in
their values for the FC and ZFC cases, as expected at this
temperature. Thus the only significant difference in the SLD
profiles, below and above TN, is the effective thickness of the
magnetic interdiffused layer.
Note that at 50 K we do not expect any vertical shift as the
o-YMO layer is not AF anymore, whereas in LASMO the
vertical shift still exists, even for a lower value of td, since the
measurements are carried out at 10 K. A moment of 110 �10�6 emu at 50 K corresponds to around 0.9 �B per unit cell of
LBSMO (ZFC), and at 10 K this gives a value around 0.5 �B.
The magnetic SLDs gives a comparable magnetic moment of
0.8 and 0.6 mB at 50 and 10 K, respectively.
A clear distinction between the existence of an interdiffused
layer of td = 20 A and its non-existence is difficult in the case of
LASMO at 10 K (note the error bar in td is also large at
�20 A). In LBSMO, on the other hand, one can have a
reasonable fit even with td = 50 A at 50 K, which is a reduction
from 100 A at 10 K. However, the distinction is not clear from
the FC data alone. In order to verify further the lowering of td,
we show in Fig. 8(a) a similar comparison of the simulated data
in the SA plot without considering/considering a reduced
magnetic interdiffused layer in the ZFC case of LBSMO at
50 K. The effect of the thickness is clearer in this case as
compared to the FC case. Also shown, in Fig. 8(b), is the
effect of the magnetic td = 50 A layer with different �mvalues. The reduction in �m is therefore also justified.
Overall, the effective thickness of the magnetic inter-
diffused layer (which can be some combination of td and �m)is definitely lower at 50 K than at 10 K.
We note that the magnetization of the o-YMO layer may
not be strictly be antiferromagnetic but rather diluted anti-
ferromagnetic (developing domain states below TN), which
can lead to a net magnetization. The magnetism of the inter-
diffused layer can originate from the magnetism in the o-YMO
research papers
J. Appl. Cryst. (2014). 47, 1054–1064 Amitesh Paul et al. � Properties of YMnO3/La0.7Sr0.3MnO3 heterostructures 1059
Figure 5(a), (b) Spin asymmetry data, which are sensitive to magnetization, and their fits are plotted versus Qz. (c), (d) Comparison of the simulated dataconsidering/not considering a magnetic interdiffused layer in the FC case. The effects of a small and a large magnetic interdiffused layer (td = 0–100 A)are also shown.
electronic reprint
layer at the interface (Zandalazini et al., 2011). Such a
magnetism may turn antiferromagnetic depending upon the
exchange coupling to the ferromagnet in its proximity. We
note, however, that assuming reasonable values of the
magnetization of a pinned interdiffused o-YMO layer (to
account for the absolute value of mshift), the thickness of this
layer should have been much larger than the thickness we
obtained here using PNR. In corroboration of the fact that the
magnetism within the o-YMO layer reduces significantly
above 50 K, and thereby the coupling with the LSMO layer,
we find a significant reduction in the thickness of the magnetic
interdiffused layer. At 50 K, this interdiffused layer will still be
magnetic (to some extent) as the LSMO part of it will remain
ferromagnetic and only the o-YMO layer will turn nonmag-
netic. However, this magnetism is not extended over the entire
o-YMO layer but is located at the o-YMO/LSMO interface
only, as confirmed by model simulations of the data at 10 K
(where the effect is most striking). The r.m.s. roughness at the
LSMO/o-YMO interface estimated for LBSMO is around
75 (5) A, whereas for LASMO it is around 35 (5) A. Thus the
observed interface magnetism is plausibly induced by the
quality of interface structure and should be related to pinned
moments at an FM interface due to stoichiometry variation of
the LSMO layer.
Exchange bias in LSMO/BiFeO3 (Wu et al., 2010) or LSMO/
TbMnO3 (Tian et al., 2013) has also exhibited exchange
coupling across FE–FM interfaces but without any reasonable
vertical shifts. The unusually large vertical shift therefore
research papers
1060 Amitesh Paul et al. � Properties of YMnO3/La0.7Sr0.3MnO3 heterostructures J. Appl. Cryst. (2014). 47, 1054–1064
Figure 7(a), (b) PNR curves at 50 K and at remanence (closed symbols) for spin-up and spin-down polarization of the LBSMO bilayer for FC and ZFCconditions are plotted versus Qz along with their best fits (open symbols). (c), (d) Depth profiles as obtained from fitting the data in (a) and (b) of thenuclear (black line) and magnetic (red line) scattering length densities, which are proportional to the nuclear and magnetic potentials, respectively. Theslopes are indicative of their surface/interface roughnesses. The shaded regions in cyan show the interdiffused magnetic layer of 40 A. Increasing heightis the direction opposite to the growth direction. (e) Spin asymmetry data, which are sensitive to magnetization, and their fits are plotted versus Qz. ( f )Comparison of the simulated data considering/not considering a magnetic interdiffused layer in the FC case.
Figure 6Spin asymmetry data, which are sensitive to magnetization, and their fitsare plotted versus Qz for LBSMO measured at 10 K in the FC case.Comparison of the simulated data considering a magnetic interdiffusedlayer (td = 100 A) with different values of �n.
electronic reprint
indicates the role of the magnetic interfacial coupling in our
o-YMO-FM system. One may note that the large mshift that is
observed here or in Co/o-YMO (Barzola-Quiquia et al., 2012)
is related to the influence of the o-YMO layer interface,
whereas in Co/CoO the mshift is still observed but of much
smaller magnitude (Zandalazini et al., 2011). The noncollinear
ICM spiral magnetic order that sets in for o-YMO at around
26 K may have important consequences for the proximity
effect in these bilayers. Noncollinear magnetic order cannot be
detected with the PNR technique as it probes the average FM
component.
4. First-principles calculations
In order to elucidate the origin of the vertical shift which is
correlated to the intermixed interface layer as inferred from
the PNR data, we have performed first-principles density
functional calculations by using the VASP package (Kresse &
Furthmuller, 1996), based on a plane wave basis set and
projector augmented wave method (Kresse & Joubert, 1999).
For the treatment of exchange correlation, the Perdew–
Burke–Ernzerhof (Perdew et al., 1996) generalized gradient
approximation has been considered. In order to include strong
electron correlations, we have considered a Hubbard U
approach, commonly used to describe the electronic structures
of correlated oxides. For the bulk parts of LSMO and o-YMO,
we have considered U values of 3 and 4 eV for the Mn d
orbitals, respectively, following the recommendations in the
literature. As the appropriate value of the Coulomb parameter
U is unknown for the interface part, we have varied U (1–
5 eV) for interface Mn atoms and have examined the magnetic
structures. In all calculations, the exchange parameter J was
kept as 0.7 eV. A 6� 4� 1 k-points set was used for Brillouin-
zone integrations in the Monkhorst–Pack scheme for the
heterostructures. For bulk calculations, we have used a 6� 6�6 k-points mesh. The geometries were relaxed until the forces
on all atoms were reduced to 5 meVA�1.
4.1. Bulk YMnO3
First, we have studied the properties of bulk o-YMO using
the crystal structure provided by Okuyama et al. (2011) with
lattice parameters a = 5.246, b = 5.830 and c = 7.330 A. It was
shown that the charge on Mn atoms points towards the b
direction, creating a strong anisotropy between the two in-
plane directions (Picozzi et al., 2006). Depending upon the
value of the Coulomb parameter U, we have three magnetic
phases as the ground state: E-type, A-type and FM-type. Our
results are in agreement with the results published by Picozzi
et al. (2006). Our calculated polarization is along the �a
direction, which is in agreement with the results in the
literature (Okuyama et al., 2011). The experimental value of
polarization (Okuyama et al., 2011) is between 0.25 and
0.5 mC cm�2. However, in the FM phase, the electronic
polarization is zero.
4.2. LSMO/o-YMO superlattices
Now we discuss the results for a heterostructure with two
o-YMO layers, two LSMO layers and two interface layers. The
layer between o-YMO and LSMO is named as the ‘interface
layer’. For simplicity, we have considered a sharp interface in
this study. In our simulations, o-YMO is considered as the
substrate for LSMO. We have used the experimental values of
YMnO3 for the in-plane lattice constants of the supercell
(Okuyama et al., 2011). For the initial structural model for the
geometry optimization, the average out-of-plane separation
between o-YMO and LSMO at the interface along the c axis
was considered. Relaxation of the atomic positions was
performed for all the atoms including those at the interface
until the forces acting on all the atoms became small.
In our interface model, we have a layer of YO, a layer of
MnO2 and another layer of LaSrO that closes the cage around
the octahedra. However, the exact stoichiometry of the LaSrO
layer at the interface is unknown. We have calculated the total
energies for different magnetic phases and different Coulomb
repulsion parameters and we find that the interface with only
La atoms has always the lowest energy. Probably, the La atoms
are energetically favored because of their atomic radii being
very similar to the Y radii. Therefore, at the interface, we have
the MnO6 octahedra enclosed in a cage with Yon one side and
research papers
J. Appl. Cryst. (2014). 47, 1054–1064 Amitesh Paul et al. � Properties of YMnO3/La0.7Sr0.3MnO3 heterostructures 1061
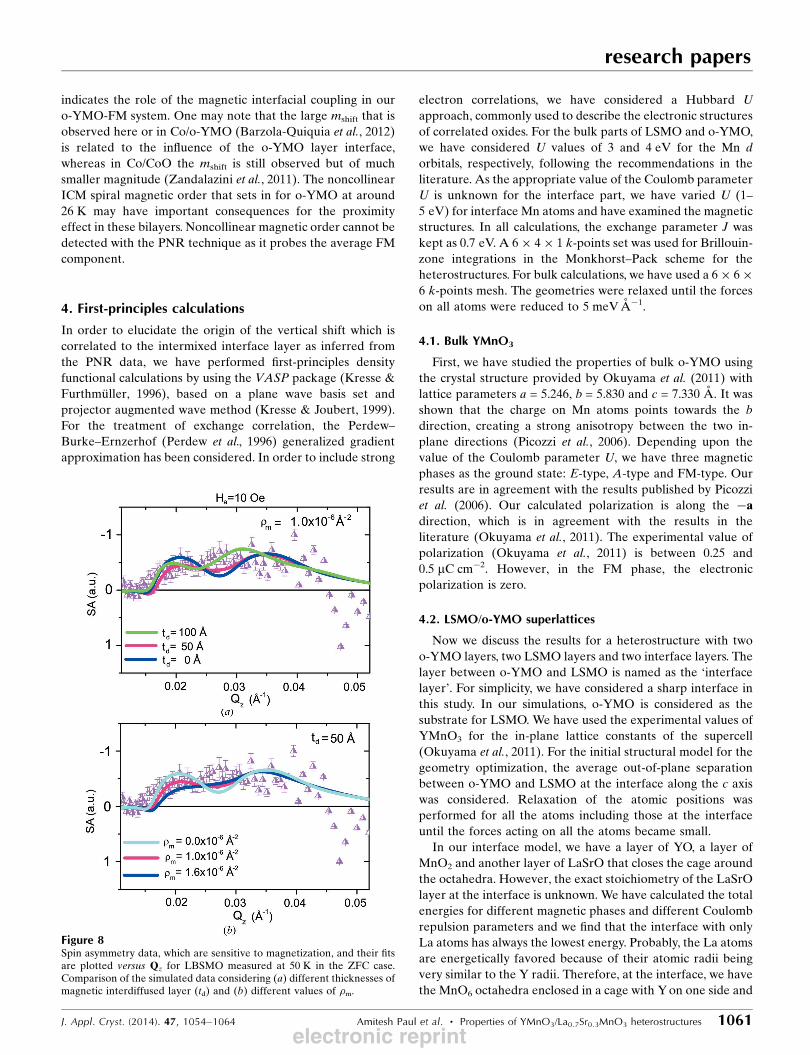
Figure 8Spin asymmetry data, which are sensitive to magnetization, and their fitsare plotted versus Qz for LBSMO measured at 50 K in the ZFC case.Comparison of the simulated data considering (a) different thicknesses ofmagnetic interdiffused layer (td) and (b) different values of �m.
electronic reprint
La on the other side. Because Y and La are electronically
equivalent, there is no charge doping and hence the double
exchange mechanism is not active at the interface. Thus the
interface layer can be metallic or an insulator depending on
the magnetic phase. On the other hand, the inner layers of
LSMO will always be metallic because of the presence of Sr,
which produces a charge doping. We find that the structural
properties of the interface layer are intermediate between
o-YMO and LSMO. For instance, the in-plane Mn—O—Mn
bond angle is 148.0� for the interface layer, while it is 143.2�
for o-YMO and 163.7� for LSMO for the fully ferromagnetic
solution.
Here we discuss the most stable magnetic phases, but also
G-type, A-type and E-type magnetic phases were studied at
the interface. The three following magnetic phases are the
most stable: (a) a fully ferromagnetic phase; (b) an anti-
ferromagnetic E-type in o-YMO and a ferromagnetic phase in
LSMO and the interface; (c) a ferromagnetic phase with spin
up in o-YMO and a ferromagnetic with spin down in LSMO
and the interface. The geometries along with the magnetic
structures are shown in Fig. 9.
We find that, in the range of typical Coulomb interaction
(U = 2–4 eV) for interface Mn atoms, the ground state of the
heterostructure is a completely ferromagnetic phase with a
magnetic configuration 3d4" in o-YMO. The anti-
ferromagnetic E-type in o-YMO and ferromagnetic in LSMO
and the interface is the sum of the two bulk ground states.
However, it is never the ground state of the heterostructure,
although is very close in energy to the fully ferromagnetic
solution. The E-type phase is the ground state in o-YMO bulk,
and the energy difference between FM and AF is 3 meV per
formula unit. However, the heterostructure stabilizes the
ferromagnetic phase in o-YMO near the interface. Because of
the different polarizations of the ferromagnetic phase of
o-YMO, we should experimentally observe a reduction of
polarization proportional to the number of layers that become
ferromagnetic.
4.3. Large vertical shift
Zandalazini et al. (2011) found experimentally a vertical
shift mshift in the YMnO3/La0.7Sr0.3MnO3 heterostructure at
10 K and this vertical shift was attributed to the properties of
the DAFF state. Instead, the nature of the large vertical shift
might be found in the interdiffused ferromagnetic layer at the
interface composed also by an unusual o-YMO ferromagnetic
phase. Themshift effect can be explained with a large coercivity
of the ferromagnetic phase of o-YMO at the interface. To
calculate the coercivity, we use the theory of single-domain
reversal, which requires taking into account the magnetic field
and the magnetocrystalline anisotropy energy. We suppose
that all the anisotropies of the system originate from o-YMO,
but in principle it is possible to have anisotropy also in
orthorhombic LSMO near the interface or in the interface
layer.
Considering a sample of 5 � 5 mm and a magnetization of
4 �B per Mn atom in o-YMO, we estimate that every fully
ferromagnetic layer will give us a magnetization of 6.1 memu.
This value is very close to the value found for the LASMO
sample at low temperature in Fig. 1(c). Therefore, we expect to
have approximately one ferromagnetic layer in LASMO and
two ferromagnetic layers in LBSMO at the interface. As there
are two ferromagnetic layers, we cannot have the ferro-
magnetism just at the interface layer and we have at least one
research papers
1062 Amitesh Paul et al. � Properties of YMnO3/La0.7Sr0.3MnO3 heterostructures J. Appl. Cryst. (2014). 47, 1054–1064
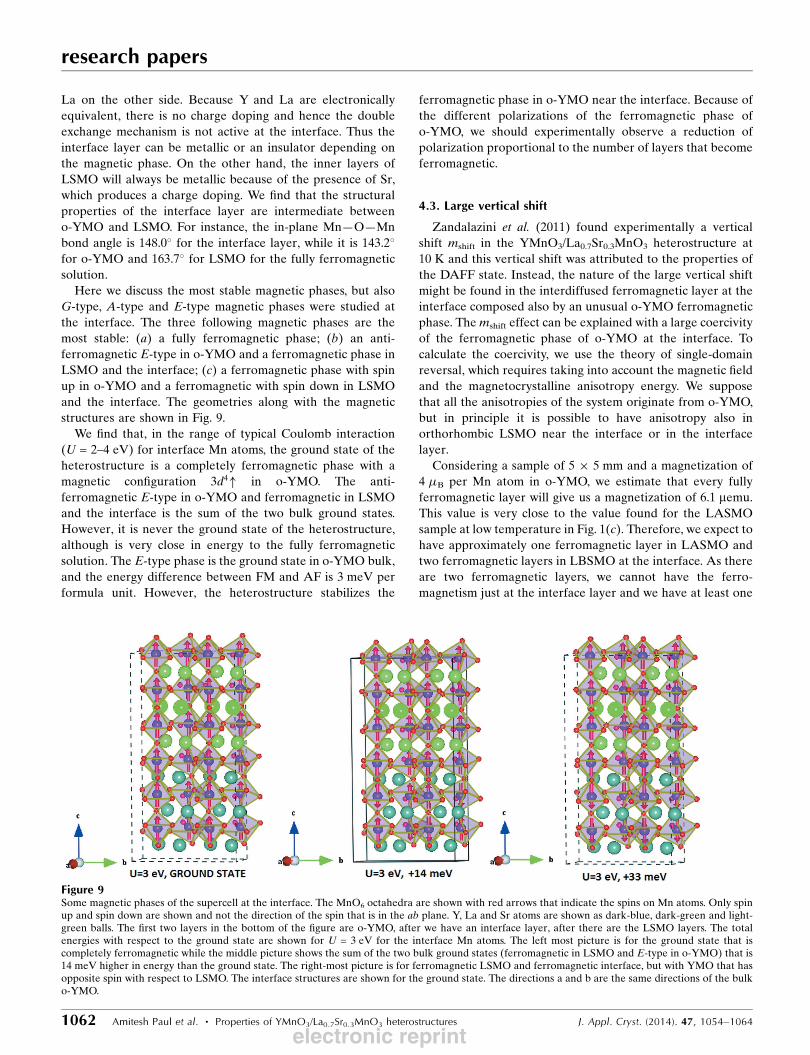
Figure 9Some magnetic phases of the supercell at the interface. The MnO6 octahedra are shown with red arrows that indicate the spins on Mn atoms. Only spinup and spin down are shown and not the direction of the spin that is in the ab plane. Y, La and Sr atoms are shown as dark-blue, dark-green and light-green balls. The first two layers in the bottom of the figure are o-YMO, after we have an interface layer, after there are the LSMO layers. The totalenergies with respect to the ground state are shown for U = 3 eV for the interface Mn atoms. The left most picture is for the ground state that iscompletely ferromagnetic while the middle picture shows the sum of the two bulk ground states (ferromagnetic in LSMO and E-type in o-YMO) that is14 meV higher in energy than the ground state. The right-most picture is for ferromagnetic LSMO and ferromagnetic interface, but with YMO that hasopposite spin with respect to LSMO. The interface structures are shown for the ground state. The directions a and b are the same directions of the bulko-YMO.
electronic reprint
FM layer of o-YMO. This is the case for a sharp interface, but
we expect that a large roughness at the interface may give us a
large ferromagnetic interdiffused layer and hence a large
mshift. Therefore, one can safely conclude that the results
obtained for a sharp interface are also valid for an inter-
diffused interface but with a larger effect.
4.3.1. Magnetocrystalline anisotropy of bulk YMnO3. From
the above discussion, one may come to the conclusion that a
ferromagnetic o-YMO region may exist at the interface. Now
we study the magnetic anisotropy energy of a hypothetical o-
YMO ferromagnetic phase. As the magnetic field in the
experiment is applied in the ab plane, we are interested in
studying the magnetic anisotropy for the same situation. The
formula for the anisotropy energy EA in the ab plane for this
system is
EAð’Þ ¼ K2 cos2 ’; ð1Þ
where ’ is the angle between the a axis and the magnetization
in the ab plane. Our calculated ab initio value of the magne-
tocrystalline anisotropy parameter for the ferromagnetic
phase is K2 = 0.561 meV per formula unit = 160 � 104 J m�3 =
160� 105 erg cm�3. We findK2 > 0, and therefore the easy axis
is along the b axis for ’ = 90�, while the hard axis is along the aaxis for ’ = 0�. The calculated values of K2 are quite big
compared to the values found in the literature for usual
magnetic materials (Landolt–Bornstein, 1986; Cullity et al.,
2005; Daalderop et al., 1990). Probably these large values
come from the large ratio b/a = 1.1114 between the lattice
parameters. We also calculate the energy with the spin along
the c-axis direction, and we find that c axis is almost as hard as
the a axis. Therefore we do not need to take into account the c
axis in the anisotropy energy.
To simulate the hysteresis we need to take into account the
interaction of the magnetic system with the external magnetic
field. The effect of the magnetic field on the energy is repre-
sented by the Zeeman energy EH, which is expressed as
EHð’Þ ¼ �MH cosð’� ’HÞ; ð2Þwhere ’H is the direction of the external magnetic field H and
’� ’H is the angle between the magnetic field and the
magnetic moment M.
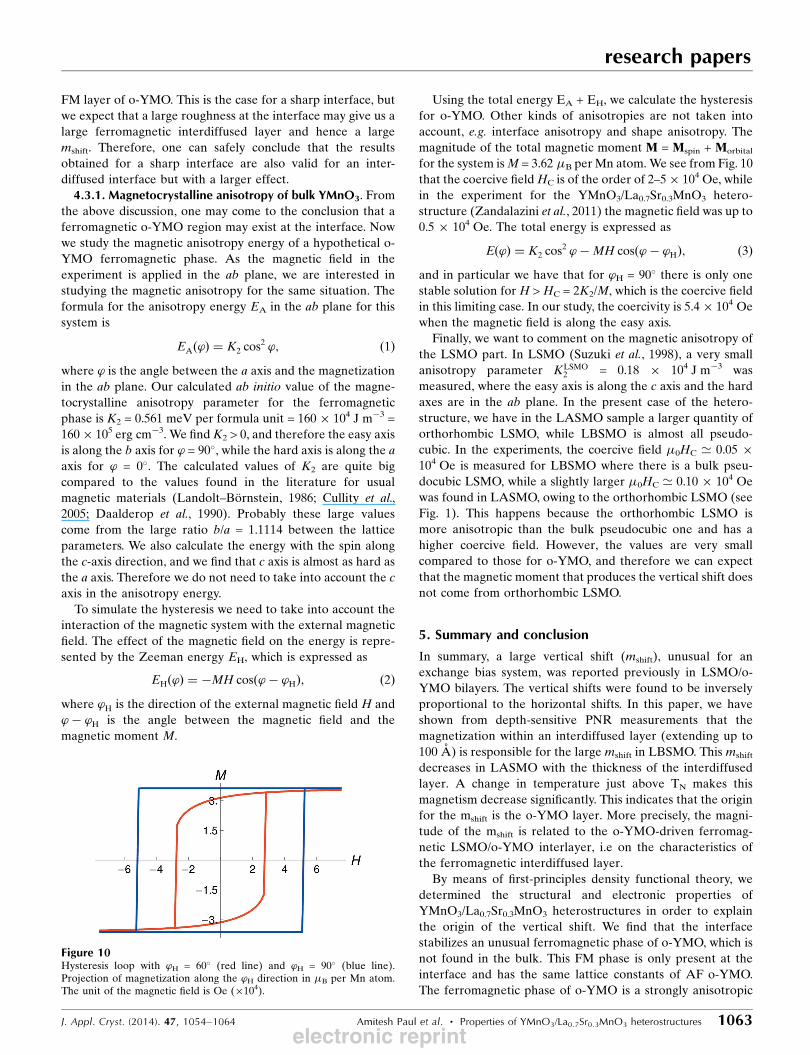
Using the total energy EA + EH, we calculate the hysteresis
for o-YMO. Other kinds of anisotropies are not taken into
account, e.g. interface anisotropy and shape anisotropy. The
magnitude of the total magnetic moment M = Mspin + Morbital
for the system isM = 3.62 �B perMn atom. We see from Fig. 10
that the coercive fieldHC is of the order of 2–5� 104 Oe, while
in the experiment for the YMnO3/La0.7Sr0.3MnO3 hetero-
structure (Zandalazini et al., 2011) the magnetic field was up to
0.5 � 104 Oe. The total energy is expressed as
Eð’Þ ¼ K2 cos2 ’�MH cosð’� ’HÞ; ð3Þ
and in particular we have that for ’H = 90� there is only one
stable solution for H >HC = 2K2/M, which is the coercive field
in this limiting case. In our study, the coercivity is 5.4� 104 Oe
when the magnetic field is along the easy axis.
Finally, we want to comment on the magnetic anisotropy of
the LSMO part. In LSMO (Suzuki et al., 1998), a very small
anisotropy parameter KLSMO2 = 0.18 � 104 J m�3 was
measured, where the easy axis is along the c axis and the hard
axes are in the ab plane. In the present case of the hetero-
structure, we have in the LASMO sample a larger quantity of
orthorhombic LSMO, while LBSMO is almost all pseudo-
cubic. In the experiments, the coercive field �0HC ’ 0.05 �104 Oe is measured for LBSMO where there is a bulk pseu-
docubic LSMO, while a slightly larger �0HC ’ 0.10 � 104 Oe
was found in LASMO, owing to the orthorhombic LSMO (see
Fig. 1). This happens because the orthorhombic LSMO is
more anisotropic than the bulk pseudocubic one and has a
higher coercive field. However, the values are very small
compared to those for o-YMO, and therefore we can expect
that the magnetic moment that produces the vertical shift does
not come from orthorhombic LSMO.
5. Summary and conclusion
In summary, a large vertical shift (mshift), unusual for an
exchange bias system, was reported previously in LSMO/o-
YMO bilayers. The vertical shifts were found to be inversely
proportional to the horizontal shifts. In this paper, we have
shown from depth-sensitive PNR measurements that the
magnetization within an interdiffused layer (extending up to
100 A) is responsible for the large mshift in LBSMO. This mshift
decreases in LASMO with the thickness of the interdiffused
layer. A change in temperature just above TN makes this
magnetism decrease significantly. This indicates that the origin
for the mshift is the o-YMO layer. More precisely, the magni-
tude of the mshift is related to the o-YMO-driven ferromag-
netic LSMO/o-YMO interlayer, i.e on the characteristics of
the ferromagnetic interdiffused layer.
By means of first-principles density functional theory, we
determined the structural and electronic properties of
YMnO3/La0.7Sr0.3MnO3 heterostructures in order to explain
the origin of the vertical shift. We find that the interface
stabilizes an unusual ferromagnetic phase of o-YMO, which is
not found in the bulk. This FM phase is only present at the
interface and has the same lattice constants of AF o-YMO.
The ferromagnetic phase of o-YMO is a strongly anisotropic
research papers
J. Appl. Cryst. (2014). 47, 1054–1064 Amitesh Paul et al. � Properties of YMnO3/La0.7Sr0.3MnO3 heterostructures 1063
Figure 10Hysteresis loop with ’H = 60� (red line) and ’H = 90� (blue line).Projection of magnetization along the ’H direction in �B per Mn atom.The unit of the magnetic field is Oe (�104).
electronic reprint
ferromagnet with a large coercivity. If we compare this result
with the experimental values of the vertical shift, we observe
that the FM phase is composed of one to two interface layers
of o-YMO. The YMnO3/La0.7Sr0.3MnO3 heterostructure is an
interface between an isotropic ferromagnet (LSMO) and
strongly anisotropic ferromagnet (o-YMO near the interface).
In conclusion, it was experimentally and theoretically
shown that the magnetization within the interdiffused layer is
responsible for the large vertical shift. The origin for the
vertical shift is related to the o-YMO-driven ferromagnetic
LSMO/o-YMO interface layer. Indeed, a relatively small
magnetic field applied to the entire heterostructure can rotate
the spin in LSMO, while the spin in o-YMO is constant
because of the large coercivity. This constant magnetic
moment in o-YMO is the vertical mshift.
Thus our study, in general, would instigate revisits of
various other systems showing such vertical shifts.
BS and CA acknowledge financial support from Carl
Tryggers Stiftelse (grant No. CTS 12:419). Also super-
computing time allocation from the Swedish National Infra-
structure for Computing is greatly acknowledged.
References
Barzola-Quiquia, J., Lessig, A., Ballestar, A., Zandalazini, C.,Bridoux, G., Bern, F. & Esquinazi, P. (2012). J. Phys. Condens.Matter, 24, 366006.
Cullity, B. D. & Graham, C. D. (2005). Introduction to MagneticMaterials. Hoboken: Wiley–IEEE Press.
Daalderop, G. H. O., Kelly, P. J. & Schuurmans, M. F. H. (1990). Phys.Rev. B, 41, 11919.
Fitzsimmons, M. R., Dufour, C., Dumesnil, K., Dou, J. & Pechan, M.(2009). Phys. Rev. B, 79, 144425.
Geshev, J. (2008). J. Appl. Phys. 104, 023914.Gibert, M., Zubko, P., Scherwitzl, R., Iniguez, J. & Triscone, J.-M.(2012). Nat. Mater. 11, 195–198.
Gruyters, M. & Schmitz, D. (2008). Phys. Rev. Lett. 100, 077205.He, C., Grutter, A. J., Gu, M., Browning, M. D., Yakamura, Y., Kirby,B. J., Borchers, J. A., Kim, J. W., Fitzsimmons, M. R., Zhai, X.,Mehta, V. V., Wong, F. J. & Suzuki, Y. (2012). Phys. Rev. Lett. 109,197202.
Hong, J.-I., Leo, T., Smith, D. J. & Berkowitz, A. E. (2006). Phys. Rev.Lett. 96, 117204.
Kresse, G. & Furthmuller, J. (1996). Comput. Mat. Sci. 6, 15–50.Kresse, G. & Joubert, D. (1999). Phys. Rev. B, 59, 1758–1775.Meiklejohn, W. H. & Bean, C. P. (1956). Phys. Rev. 102, 1413.Moutis, N., Christides, C., Panagiotopoulos, I. & Niarchos, D. (2001).Phys. Rev. B, 64, 094429.
Munoz, A., Alonso, J. A., Casais, M. T., Martinez-Lope, M. J.,Martinez, J. L. & Fernandez-Diaz, M. T. (2002). J. Phys. Condens.Matter, 14, 3285.
Landolt-Bornstein (1986).Magnetic Properties of Metals, New Series,Group III, Vol. 19a, edited by H. P. J. Wijn. Heidelberg: Springer-Verlag.
Okuyama, D., Ishiwata, S., Takahashi, Y., Yamauchi, K., Picozzi, S.,Sugimoto, K., Sakai, H., Takata, M., Shimano, R., Taguchi, Y.,Arima, T. & Tokura, Y. (2011). Phys. Rev. B, 84, 054440.
Ohldag, H., Scholl, A., Nolting, F., Arenholz, E., Maat, S., Young,A. T., Carey, M. & Stohr, J. (2003). Phys. Rev. Lett. 91, 017203.
Ohldag, H., Shi, H., Arenholz, E., Stohr, J. & Lederman, D. (2006).Phys. Rev. Lett. 96, 027203.
Panagiotopoulos, I., Christides, C., Pissas, M. & Niarchos, D. (1999).Phys. Rev. B, 60, 485–491.
Passamani, E. C., Larica, C., Proveti, J. R., Marques, C., Takeuchi,A. Y. & Sanchez, F. H. (2006). J. Magn. Magn. Mater. 299, 11–20.
Paul, A. (2012). Pramana, 78, 1–58.Paul, A., Paul, N., Jutimoosik, J., Yimnirun, R., Rujirawat, S.,Hopfner, B., Lauermann, I., Lux-Steiner, M., Mattauch, S. & Boni,P. (2013). Phys. Rev. B, 87, 014431.
Perdew, J. P., Burke, K. & Ernzerhof, M. (1996). Phys. Rev. Lett. 77,3865–3868.
Picozzi, S., Yamauchi, K. & Bihlmayer, G. & Blugel, S. (2006). Phys.Rev. B, 74, 094402.
Suzuki, Y., Hwang, H. Y., Cheong, S. W., Siegrist, T., Van Dover, R. B.,Asamitsu, A. & Tokura, Y. (1998). J. Appl. Phys. 83, 7064–7066.
Tian, Y. F., Ding, J. F., Lin, W. N., Chen, Z. H., David, A., He, M., Hu,W. J., Chen, L. & Wu, T. (2013). Sci. Rep. 3, 1094.
Ueda, K., Tabata, H. & Kawai, T. (1998). Science, 280, 1064–1066.Venta, J. de la, Erekhinsky, M., Wang, S., West, K. G., Morales, R. &Schuller, I. K. (2012). Phys. Rev. B, 85, 134447.
Wu, S. M., Cybart, S. A., Yu, P., Rossell, M. D., Zhang, J. X., Ramesh,R. & Dynes, R. C. (2010). Nat. Mater. 9, 756–761.
Zandalazini, C., Esquinazi, P., Bridoux, G., Barzola-Quiquia, J.,Ohldag, H. & Arenholz, E. (2011). J. Magn. Magn. Mater. 323,2892–2898.
Ziese, M., Pippel, E., Nikulina, E., Arredondo, M. & Vrejoiu, I.(2011). Nanotechnology, 22, 254025.
Ziese, M., Vrejoiu, I., Pippel, E., Esquinazi, P., Hesse, D., Etz, C.,Henk, J., Ernst, A., Maznichenko, I. V., Hergert, W. & Mertig, I.(2010). Phys. Rev. Lett. 104, 167203.
research papers
1064 Amitesh Paul et al. � Properties of YMnO3/La0.7Sr0.3MnO3 heterostructures J. Appl. Cryst. (2014). 47, 1054–1064
electronic reprint
Related Documents


![+9 Swift Heavy ion Irradiation: Augmented Removal of ... IJTAS-4-2017-SUKRITI.pdf · etching, electron beam and ion beam irradiation [9-10]. Ion beam irradiation due to its intense](https://static.cupdf.com/doc/110x72/5e1eb1dbc6517250c168f9c4/9-swift-heavy-ion-irradiation-augmented-removal-of-ijtas-4-2017-sukritipdf.jpg)