Swift as sound. Design and evolution of the echolocation system in Swiftlets (Apodidae: Collocaliini) Thomassen, H.A. Citation Thomassen, H. A. (2005, June 16). Swift as sound. Design and evolution of the echolocation system in Swiftlets (Apodidae: Collocaliini). Retrieved from https://hdl.handle.net/1887/3024 Version: Corrected Publisher’s Version License: Licence agreement concerning inclusion of doctoral thesis in the Institutional Repository of the University of Leiden Downloaded from: https://hdl.handle.net/1887/3024 Note: To cite this publication please use the final published version (if applicable).

Welcome message from author
This document is posted to help you gain knowledge. Please leave a comment to let me know what you think about it! Share it to your friends and learn new things together.
Transcript
Swift as sound. Design and evolution of the echolocation system inSwiftlets (Apodidae: Collocaliini)Thomassen, H.A.
CitationThomassen, H. A. (2005, June 16). Swift as sound. Design and evolution of the echolocationsystem in Swiftlets (Apodidae: Collocaliini). Retrieved fromhttps://hdl.handle.net/1887/3024 Version: Corrected Publisher’s Version
License: Licence agreement concerning inclusion of doctoral thesis in theInstitutional Repository of the University of Leiden
Downloaded from: https://hdl.handle.net/1887/3024 Note: To cite this publication please use the final published version (if applicable).

Swift as sound
Design and evolution of the echolocation system in Swiftlets (Apodidae: Collocaliini)
Henri Thomassen
Swift as sound Design and evolution of the echolocation system in Swiftlets (Apodidae: Collocaliini) Thomassen, Hendrik Aalbert Thesis, Leiden University Cover design: Henri Thomassen Illustration from “Brehms Tierleben” (1911) Printed by: Print Partners Ipskamp B.V., Enschede Copyright © Henri Thomassen, 2005
Swift as sound
Design and evolution of the echolocation system in Swiftlets (Apodidae: Collocaliini)
Proefschrift
ter verkrijging van de graad van Doctor aan de Universiteit Leiden,
op gezag van de Rector Magnificus Dr. D.D. Breimer, hoogleraar in de faculteit der Wiskunde en
Natuurwetenschappen en die der Geneeskunde, volgens besluit van het College voor Promoties
te verdedigen op donderdag 16 juni 2005 klokke 16.15 uur
door
Hendrik Aalbert Thomassen geboren te Harderwijk
in 1975
Promotiecommissie Promotor: Prof. dr. G.A. Zweers Copromotor: Dr. G.D.E. Povel Referenten: Prof. dr. W.F.S. Decraemer (Universiteit Antwerpen) Prof. dr. P. de Knijff Overige leden: Prof. dr. J.L. Dubbeldam Prof. dr. E. van der Meijden Prof. dr. M.K. Richardson Dr. H. Slabbekoorn Prof. dr. S. Somadikarta (University of Indonesia) Prof. dr. J.J. Videler (Rijksuniversiteit Groningen) Sample collection for this thesis was made possible by travel grants from the Leiden University Fund (LUF), the Netherlands Foundation for the Advancement of Tropical Research (NWO-WOTRO) and the Society for the Advancement of Research in the Tropics (Treub-Mij). The reproduction of colour figures in this thesis was made possible by a grant from the Leiden University Fund (LUF).
Voor pa. Ik wou, dat je er nog bij kon zijn. ~
Voor ma ~
Voor Els


Don’t expect anything original from an echo.


9
Contents Chapter 1 Introduction. 11 Chapter 2 Swiftlet phylogeny. 25
2.1 A new phylogeny of Swiftlets (Aves: Apodidae) based on cytochrome-b DNA. 27
2.2 Phylogenetic relationships of some Swifts and Swiftlets: a multi locus approach. 41
Chapter 3 From sound to sound production. 69 3.1 Comparative and phylogenetic analysis of echo clicks and
social vocalisations of Swifts and Swiftlets (Aves: Apodidae). 71 3.2 Echo click design in Swiftlets: single as well as double clicks. 97 3.3 Are there differences in syringeal morphology between
echolocating and non-echolocating Swiftlets? 103 Chapter 4 Do Swiftlets have an ear for echolocation?
Functional morphology of Swiftlets’ middle ears. 115 Chapter 5 Size differences in auditory nuclei between echolocating and
non-echolocating Swiftlets. 139 Chapter 6 Evolutionary development of echolocation in Swiftlets in
association with their biogeographical distribution. 157 Chapter 7 General discussion and summary 175 General acknowledgements 187 Nederlandse samenvatting 189 References 203 Nawoord 217 Curriculum vitae 219

10

11
CHAPTER 1
INTRODUCTION

12
CHAPTER 1
On the 20th of April 1854 Alfred Russel Wallace, an English naturalist and evolutionist, set foot on Singapore. Doing this he entered one of the biologically richest areas of the world: Southeast Asia. He spent the following eight years in this region, where he would gather a large amount of animal and plant species. Among the bird species that he added to his collection were eye-catching ones such as Birds of Paradise, to which Wallace even dedicated a complete chapter in his book “The Malay Archipelago” (Wallace 1869). However, he also collected more inconspicuous bird species, such as Swiftlets (Fig. 1). Inconspicuous in appearance, these small grey-brown birds constitute a very common and interesting group in this region. Of particular commercial interest are the valuable edible nests that are produced by several species and that have been famous among the Chinese for centuries. Swiftlets became especially interesting for biological science after the discovery in 1959 that the majority of the Swiftlets are able to echolocate.
Swiftlets Swiftlets (Collocaliini) (Fig. 1) are small Swifts (Aves: Apodidae). Although often confused with Swallows (Hirundinidae), which have a resembling appearance and obtain a similar food niche of aerial insects, they are only extremely remotely related, belonging to different superorders. Swiftlets are insectivorous and first-class flyers with high velocity and manoeuvrability (Videler et al. 2004). Their prominent flying abilities enable them to catch their prey in the air or from leaves while fluttering through tree canopies (pers. obs.). Swiftlets occur at all altitudes, from lowland to high in the mountains. As a group, they occupy a rather wide range of feeding habitat, covering dense forests, open cultivated land, barren mountain ranges, and even towns, which provide buildings as modern cave-like nest sites. One of the notable features of Swiftlets is that they roost and nest in caves or cave-like structures. These can be crevices within volcano craters, small caves with vertical entrances or caves with horizontal entrances such as the enormous Gomantong caves and Madai caves in Sabah (Borneo, Malaysia) (Fig. 2), and buildings. There is even one
Fig. 1. Collocalia esculenta Swiftlet on its saliva-cemented nest in a garage in Kota Kinabalu, Sabah, Borneo, Malaysia.

13
INTRODUCTION
species, Hydrochous gigas, that nests behind or near a waterfall. Population size in this species is the smallest, numbering only a few to a dozen individuals. Generally, however Swiftlets tend to flock in large numbers. Estimations for Gomantong caves, home to four different species, are up to one million Swiftlets. There, Swiftlets coexist with approximately two million bats and many insects and crustaceans that are all part of the cave’s own ecosystem (Whitten et al. 1996).
Swiftlets are probably best known for the edible nests that are produced by several species (Kang et al. 1991; Manuel 1937). Already in the thirteenth and probably as early as the seventh century their nests were famous among the Chinese, who attribute healing powers to the nests. This is the reason that many Chinese make tinctures and soups with Swiftlet nests as one of the ingredients. The edible part of the nests consists of the hardened Swiftlet saliva that is used to glue twigs or feathers together and to the wall of a cave. Some species developed nest building even further and produce nests that
Fig. 2. Gomantong (left and inset) and Madai caves (right) in Sabah, Borneo, Malaysia. Both caves are inhabited by large breeding populations of several species of Swiftlets. The populations are guarded year round to protect them from looters, who have their eye on the valuable nests. People are dwarfed in the huge entrances of the caves.
14
CHAPTER 1
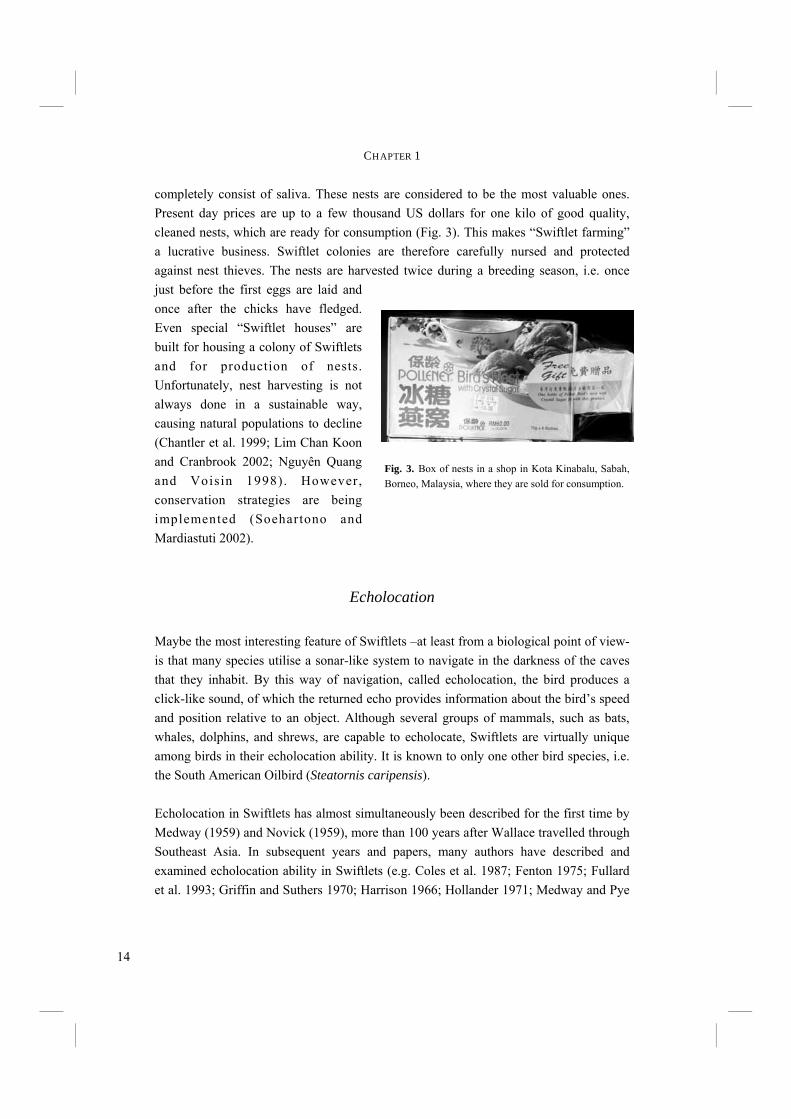
completely consist of saliva. These nests are considered to be the most valuable ones. Present day prices are up to a few thousand US dollars for one kilo of good quality, cleaned nests, which are ready for consumption (Fig. 3). This makes “Swiftlet farming” a lucrative business. Swiftlet colonies are therefore carefully nursed and protected against nest thieves. The nests are harvested twice during a breeding season, i.e. once just before the first eggs are laid and once after the chicks have fledged. Even special “Swiftlet houses” are built for housing a colony of Swiftlets and for production of nests. Unfortunately, nest harvesting is not always done in a sustainable way, causing natural populations to decline (Chantler et al. 1999; Lim Chan Koon and Cranbrook 2002; Nguyên Quang and Voisin 1998). However, conservation strategies are being implemented (Soehartono and Mardiastuti 2002).
Echolocation Maybe the most interesting feature of Swiftlets –at least from a biological point of view- is that many species utilise a sonar-like system to navigate in the darkness of the caves that they inhabit. By this way of navigation, called echolocation, the bird produces a click-like sound, of which the returned echo provides information about the bird’s speed and position relative to an object. Although several groups of mammals, such as bats, whales, dolphins, and shrews, are capable to echolocate, Swiftlets are virtually unique among birds in their echolocation ability. It is known to only one other bird species, i.e. the South American Oilbird (Steatornis caripensis). Echolocation in Swiftlets has almost simultaneously been described for the first time by Medway (1959) and Novick (1959), more than 100 years after Wallace travelled through Southeast Asia. In subsequent years and papers, many authors have described and examined echolocation ability in Swiftlets (e.g. Coles et al. 1987; Fenton 1975; Fullard et al. 1993; Griffin and Suthers 1970; Harrison 1966; Hollander 1971; Medway and Pye
Fig. 3. Box of nests in a shop in Kota Kinabalu, Sabah, Borneo, Malaysia, where they are sold for consumption.

15
INTRODUCTION
1977; Smyth and Roberts 1983). While bats use echolocation to locate their small insect prey, the frequencies of echolocation sounds that are used by Swiftlets are much lower than those of bats and therefore not suitable to detect such small objects. Echolocation acuity of Swiftlets was examined by several authors (Fenton 1975; Griffin and Suthers 1970; Griffin and Thompson 1982; Smyth and Roberts 1983) who found smallest detectable objects to range between 6.3 mm and 10 mm. Thus, with prey items that are much smaller than the smallest detectable objects, Swiftlets can only use echolocation for navigation.
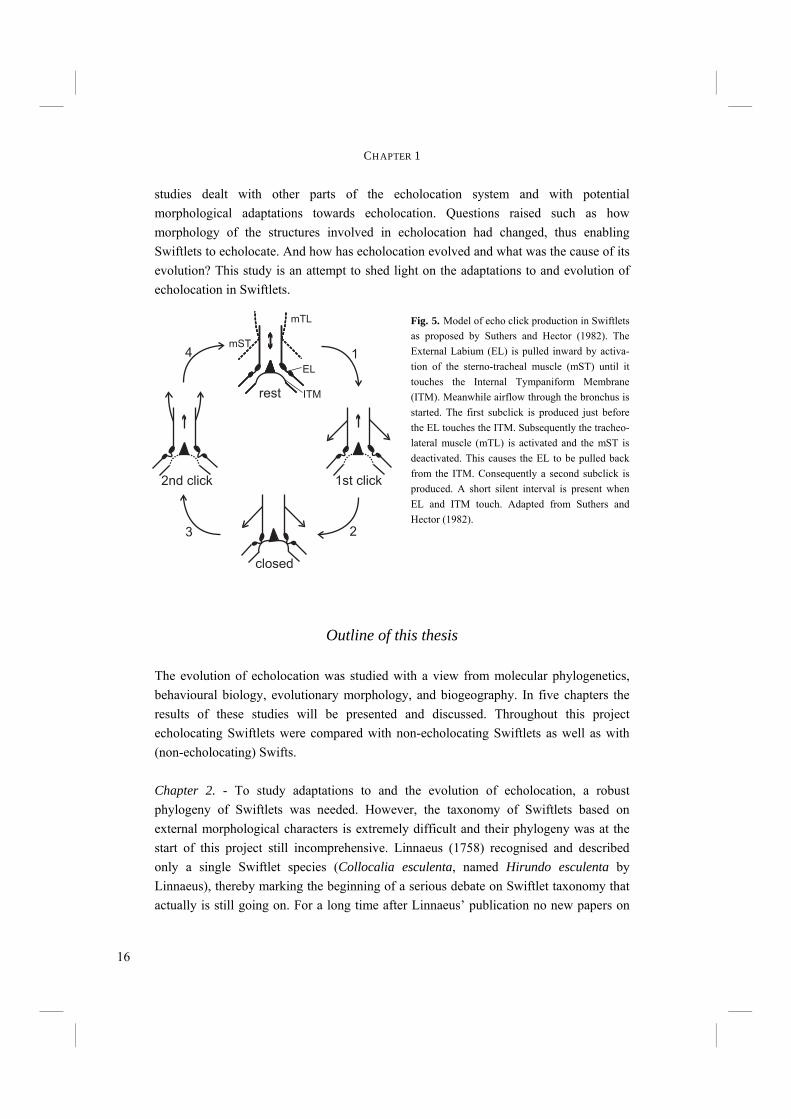
The echolocation sound of Swiftlets is a short click-like sound with a sharp on- and offset (Fig. 4). It is often, though not always, of a double click design (Chapters 3.1 and 3.2), which is because of the very short silent interval interpreted by humans as one, single click. It is likely that Swiftlets, like most birds, cannot distinguish the two subclicks either (Fay 1988). Suthers and Hector (1982) were the first to study the click production system in detail. They found that echo clicks are produced in the syrinx. They proposed a model for production of the double click in which the External Labium (EL) of the syrinx is pulled inwards when the sterno-tracheal muscle is activated (Fig. 5). Airflow through the bronchus is generated and the EL is pulled further inwards, so that it finally touches the Internal Tympaniform Membrane (ITM). Subsequently the sterno-tracheal muscle is deactivated and the tracheo-lateral muscle activated, causing the syrinx to straighten and the EL to be pulled off the ITM. This all happens very quickly, within approximately 0.015 s. Just before and after the EL touches the ITM, the latter is put into vibration and the first and second subclicks are produced respectively (Fig. 5). The ability of Swiftlets to echolocate presented the question what the morphological and evolutionary basis for such a behavioural trait could be. Although the mechanism of click production appeared to have been unravelled (Suthers and Hector 1982), few
10
0.010
0.03time (s)
fre
qu
en
cy
(kH
z)
Fig. 4. Echo click of Aerodramus vulcanorum, typical for echolocating Swiftlets. The click is of double click design, with a very short interval. The short duration of the silent interval causes the double click to be interpreted as a single click by humans.
16
CHAPTER 1
studies dealt with other parts of the echolocation system and with potential morphological adaptations towards echolocation. Questions raised such as how morphology of the structures involved in echolocation had changed, thus enabling Swiftlets to echolocate. And how has echolocation evolved and what was the cause of its evolution? This study is an attempt to shed light on the adaptations to and evolution of echolocation in Swiftlets.
Outline of this thesis The evolution of echolocation was studied with a view from molecular phylogenetics, behavioural biology, evolutionary morphology, and biogeography. In five chapters the results of these studies will be presented and discussed. Throughout this project echolocating Swiftlets were compared with non-echolocating Swiftlets as well as with (non-echolocating) Swifts. Chapter 2. - To study adaptations to and the evolution of echolocation, a robust phylogeny of Swiftlets was needed. However, the taxonomy of Swiftlets based on external morphological characters is extremely difficult and their phylogeny was at the start of this project still incomprehensive. Linnaeus (1758) recognised and described only a single Swiftlet species (Collocalia esculenta, named Hirundo esculenta by Linnaeus), thereby marking the beginning of a serious debate on Swiftlet taxonomy that actually is still going on. For a long time after Linnaeus’ publication no new papers on
Fig. 5. Model of echo click production in Swiftlets as proposed by Suthers and Hector (1982). The External Labium (EL) is pulled inward by activa-tion of the sterno-tracheal muscle (mST) until it touches the Internal Tympaniform Membrane (ITM). Meanwhile airflow through the bronchus is started. The first subclick is produced just before the EL touches the ITM. Subsequently the tracheo-lateral muscle (mTL) is activated and the mST is deactivated. This causes the EL to be pulled back from the ITM. Consequently a second subclick is produced. A short silent interval is present when EL and ITM touch. Adapted from Suthers and Hector (1982).
rest
closed
1st click2nd click
mTL
mST
ITM
EL
1
23
4

17
INTRODUCTION
Swiftlets were published, but in the nineteenth century and onwards several authors described new species and subspecies (e.g. Bernstein 1857; Bonaparte 1855; Gray 1866; Hartert 1892; Horsfield and Moore 1854; Salvadori 1879; Wallace 1863). From the late nineteenth, early twentieth century many more Swiftlet species became known, but Swift taxonomy was still not clarified. Mayr (1937) remarked: “Every author who has worked with these small Swiftlets of the Indo-Australian region will contend that their classification presents the most difficult problems in the taxonomy of birds.” Further: “…most of the species are of the same dull sooty gray coloration with almost the same development of the structural characters, such as bill, feet, wing-formula, etc.” Later Peters (1940) came to the same conclusion: “The genus Collocalia constitutes one of the most difficult of all groups of birds.” While Swiftlets were often treated as comprising only one genus, i.e. Collocalia, Brooke (1970, 1972) divided them into three different genera, i.e. 1) Aerodramus, of which all species are echolocating, 2) Collocalia s.s., of which now is known that one species is able to echolocate (Price et al. 2004), and 3) Hydrochous, non-echolocating and containing only one species, H. gigas. Later on these genera were lumped together again into a single genus (e.g. by Salomonson in 1983 and by Chantler and Driessens in 1995) or split up after all into two (Sibley and Monroe 1990) or three genera (Chantler et al. 1999). Currently, about 24 Swiftlet species are recognized (Chantler et al. 1999; Table 1). About half of these species are subdivided into several subspecies, numbering up to 31 for C. esculenta. Most of the species are known to be either or not able to echolocate. However, some species are so elusive and rare that it is not certain whether they can echolocate or not. Nevertheless, it is at least suspected, if not probable that they can. The first attempt to construct a phylogenetic in stead of a taxonomic classification was based on part of cytochrome-b mitochondrial DNA sequences (Lee et al. 1996). However, this phylogeny had some peculiarities in it. For example, Swiftlets were paraphyletically grouped with other Swifts and the genus Aerodramus was paraphyletic with Hydrochous. Bootstrap supports for these groupings were however very low. So the need for a phylogeny that was well supported by bootstrap values was still present. Therefore, a new, independent phylogeny was based on complete cytochrome-b mtDNA (Chapter 2.1), 12S rRNA, and nuclear β-fibrinogen intron 7 (Fib 7) sequences (Chapter 2.2). Recently, a cytochrome-b and ND2 mtDNA based tree comprising more species was presented (Price et al. 2004). However, Price et al. (2004) lacked the elusive H. gigas, which was in the present study incorporated into their data (Chapter 2.2). The results of these phylogenetic analyses were used in the following studies of this thesis in order to understand the behavioural and anatomical analyses and the evolution of echolocation.
18
CHAPTER 1
Echolocation system. - The presence of morphological adaptations towards echolocation has been investigated in the various structures that comprise the echolocation system (Chapters 3, 4, and 5). The system can be divided into three main components. The first is the sound production apparatus, where echo clicks are emitted. In Swiftlets this is the syrinx. The second main component of the echolocation system is the sound reception device, or the ear, where incoming sounds are transduced and transformed into electrical potentials in the brain. Finally, the central nervous system functions in the interpretation of the echoes on the one hand and in the control of the syrinx on the other hand.
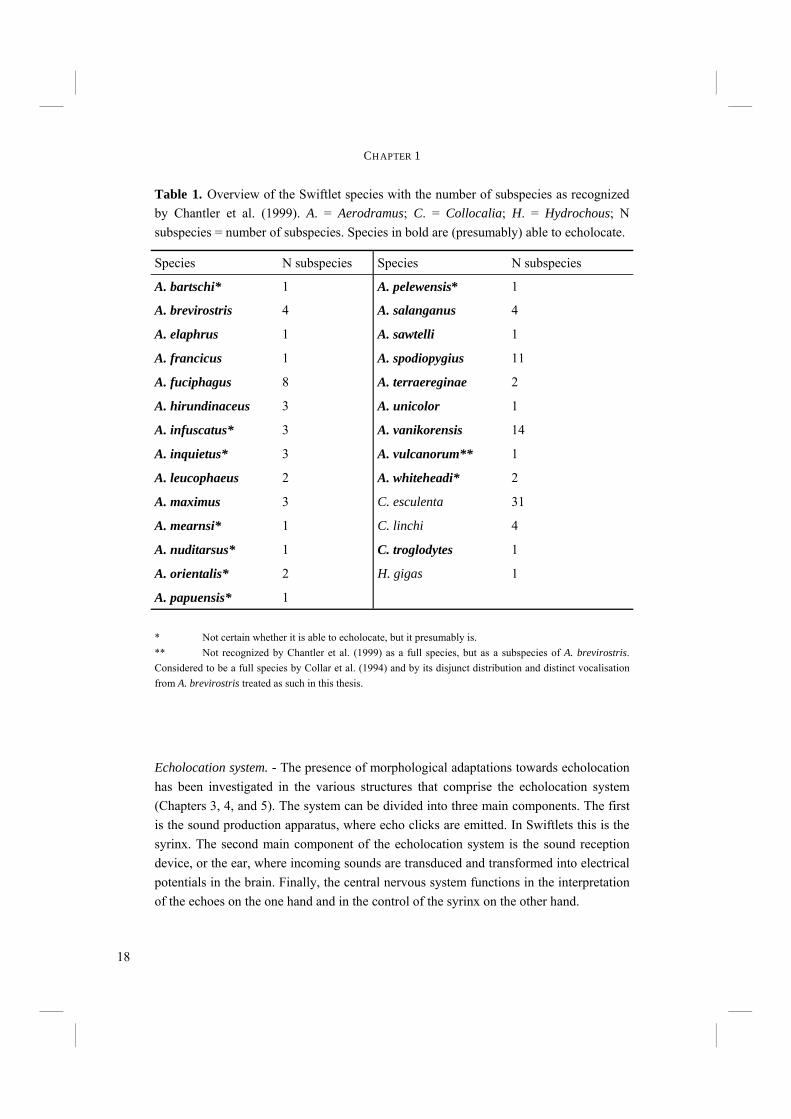
Table 1. Overview of the Swiftlet species with the number of subspecies as recognized by Chantler et al. (1999). A. = Aerodramus; C. = Collocalia; H. = Hydrochous; N subspecies = number of subspecies. Species in bold are (presumably) able to echolocate.
* Not certain whether it is able to echolocate, but it presumably is. ** Not recognized by Chantler et al. (1999) as a full species, but as a subspecies of A. brevirostris. Considered to be a full species by Collar et al. (1994) and by its disjunct distribution and distinct vocalisation from A. brevirostris treated as such in this thesis.
Species N subspecies Species N subspecies
A. bartschi* 1 A. pelewensis* 1
A. brevirostris 4 A. salanganus 4
A. elaphrus 1 A. sawtelli 1
A. francicus 1 A. spodiopygius 11
A. fuciphagus 8 A. terraereginae 2
A. hirundinaceus 3 A. unicolor 1
A. infuscatus* 3 A. vanikorensis 14
A. inquietus* 3 A. vulcanorum** 1
A. leucophaeus 2 A. whiteheadi* 2
A. maximus 3 C. esculenta 31
A. mearnsi* 1 C. linchi 4
A. nuditarsus* 1 C. troglodytes 1
A. orientalis* 2 H. gigas 1
A. papuensis* 1

19
INTRODUCTION
Chapter 3. – In the first part of Chapter 3 the acoustic structures of the emitted echo clicks as well as of the social vocalisations are treated (Chapter 3.1). Social vocalisations are expected to be species specific, like in other bird species. Echo clicks, however, are restricted by functional demands and may therefore be similar across species. The differences in acoustic structure of echo clicks and social vocalisations between various Swiftlet and Swift species were examined. Furthermore, the usefulness of echo clicks and social vocalisations for phylogeny reconstruction was investigated. Although behavioural traits are often considered to be unsuitable for phylogenetic inference, in some cases these traits proved to contain considerable phylogenetic information (Bretagnolle 1995; Kennedy et al. 1996; McCracken and Sheldon 1997; Patterson et al. 1995; Price and Lanyon 2002; Prum 1990; Winkler and Sheldon 1993). Vocalisation characters may in Swiftlets be hierarchically informative due to the important role that vocal abilities appear to have played in the evolution of echolocation. Finally, social vocalisations were studied to determine whether echo click features, such as the very short duration, are present in social vocalisations and whether such features form a pattern in social vocalisation structure towards echolocation (Chapter 3.1). The second part of Chapter 3 treats the single and double click designs of echo clicks. Previously, several Swiftlet species were assumed to emit only single echo clicks. This assumption led to the hypothesis that echolocation evolved several times or that at least different mechanisms underlie echolocation (Fullard et al. 1993). We studied echo clicks of several species to determine whether this hypothesis is likely to be true (Chapter 3.2). The various vocalisations that are discussed in the first two parts of Chapter 3 are produced by the syrinx. In the third and final part of Chapter 3 the morphology of the syrinx and its relation to echolocation ability is discussed (Chapter 3.3). Smyth (1979) and Suthers and Hector (1982) hypothesised that the Swiftlet syrinx, in order to be able to emit echo clicks, might possess adaptations in the size of its External Labia, thickness of the Internal Tympaniform Membranes, and amount of ossification and fusion of the first bronchial and tracheal rings. The anatomical structure of the syrinx of several additional Swiftlet species was compared between echolocaters and non-echolocaters to validate these hypotheses. Furthermore, since the introduction of the model for echo click production (Suthers and Hector 1982) much more has become known about the mechanism of sound production in the avian syrinx in general. Based on recent insights (e.g. Goller and Larsen 1997, 2002; Mindlin et al. 2003) and new morphological data, a modified model for echo click production is speculated about (Chapter 3.3).

20
CHAPTER 1
Chapter 4. - After an echo click is emitted by the syrinx, the sound is partly reflected by surrounding objects. The next step in echolocation is the reception of the returning echo by the ear. The ear comprises external, middle, and inner ears. The external ear is formed by the pinnae, which are absent in birds, and the external ear canal (Fig. 6). The middle ear comprises the tympanic membrane, the oval window on the cochlea and the structures in between (Fig. 6). Vibrations in air that enter via the external ear canal are by the middle ear transduced to the inner ear, where inner ear fluid is set into vibration. Finally, the cochlea, or inner ear, contains structures such as the basilar membrane, where vibrations are transformed into electric potentials. The middle and inner ears are most likely to display adaptations towards echolocation. Potential improvements in sensitivity to all or particular frequencies can be best achieved in the middle and inner ears. Chapter 4 treats the middle ears of echolocating and non-echolocating Swiftlets. The middle ear might be morphologically modified in order to improve sensitivity to low pressure (low volume) sounds and to improve amplitude amplification at the cochlea. In co-operation with the Department of Physics, Antwerp University, we compared the morphology of the middle ear between echolocating and non-echolocating species. Three-dimensional micro Computer Tomographic reconstructions of middle ears were used to accomplish this. Furthermore, we developed a 2D model in order to describe middle ear function. The model was used to investigate potential differences in middle ear performance between Swiftlets. Moreover, it was used to assess whether and to what extent amplitude amplification of the columellae of middle ears could be improved at all.
external ear canal
tympanumcolumella
basilar membrane
cochlea
middle ear
lateralmedial
oval window
Fig. 6. Schematic overview of a transverse section through the avian ear with nomenclature of the various structures.

21
INTRODUCTION
Chapter 5. - To conclude the search for morphological adaptations towards echolocation, the auditory nuclei of the central nervous system were studied in Chapter 5. Echolocation probably requires an above average accuracy in sound localisation and in detection of frequency shifts. The primary auditory nuclei play a crucial role in these. Sound pressure level and time differences must be detected and processed in a network of these central nuclei. Improvements in the auditory nuclei may possibly lie in an increase in the number of cells within the nuclei and/or an increase in nucleus size (e.g. Dooling et al. 2000). Auditory nucleus size was measured and compared in non-echolocating and echolocating Swifts and Swiftlets. Subsequently, the results were mapped on the independently derived DNA-based phylogeny to test whether there is a relationship of auditory nucleus size with echolocation ability.
Chapter 6. - During and after his eight years residence in Southeast Asia, Wallace started to understand and model biogeography. Although he had published some works on biogeography while in the Amazon region, it was really his work in Southeast Asia that made him develop a biogeographic theory. One of the reasons for the biological diversity in Southeast Asia is that two major biogeographic regions meet. One is the Indo-Malayan region of continental Asia and the western islands of the Malay Archipelago. The other is the Australian region covering Australia and the eastern islands of the Archipelago (Fig. 7). Both regions have their own distinct flora and fauna, but with an overlapping region of mixture –or transition zone- where they meet. Wallace observed and described the biodiversity and the phenomenon of transition in the Malay Archipelago during the time he spent there. Many scientists have studied the area of mixture since and to honour Wallace it has been called Wallacea (Fig. 7). Biogeography is nowadays an integral part of biology. In a study of the evolution of echolocation, it is
Fig. 7. Map of the Southeast Asian region with Wallacea (grey): the transition zone of the two major biogeographic regions, i.e. the Indo-Malayan and the Australian regions.
22
CHAPTER 1
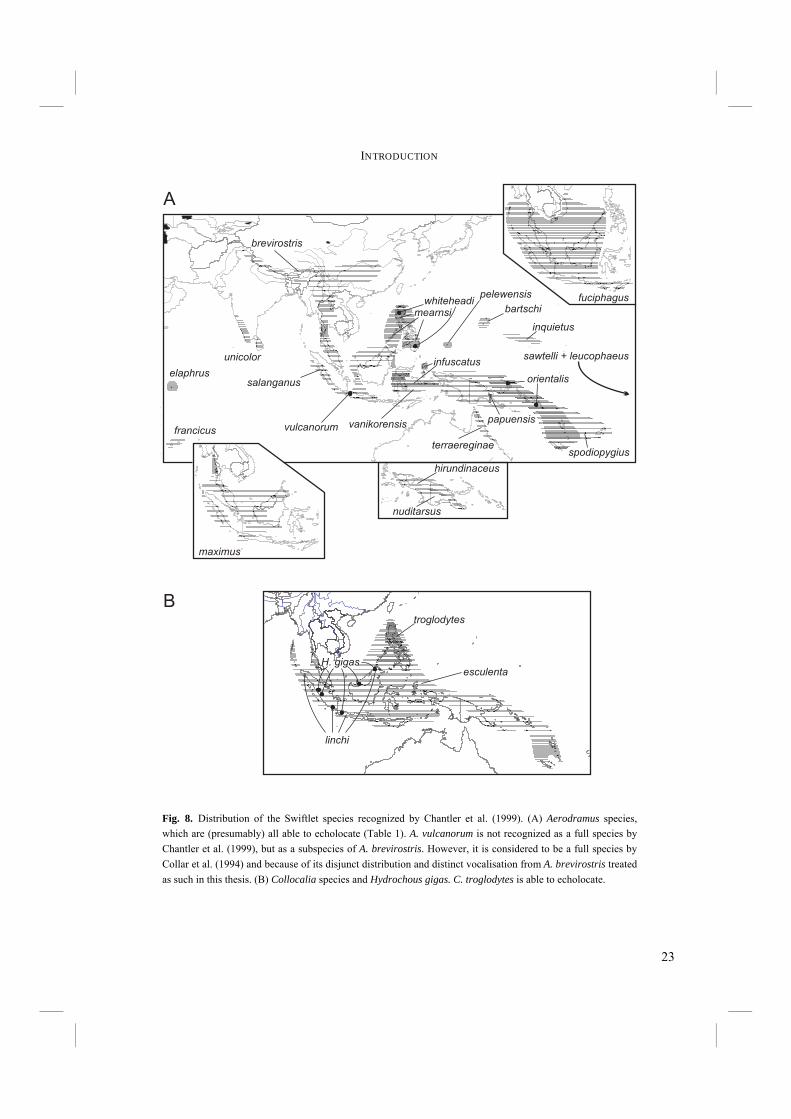
important to incorporate biogeographic data in an attempt to understand how and under what circumstances echolocation might have evolved. Although the majority of Swiftlet species occurs in Southeast Asia, they are not restricted to that area. Their distribution is as far west as the Indian Ocean, where they occur on the Seychelles and Mascarenes. In the east Swiftlets range as far as the Marquesas islands and have even been introduced to Hawaii. The distribution of the species is very variable, that is, some species occupy a vast range of Southeast Asia, whereas others are confined to a few mountain tops (Fig. 8). In some cases, the latter species are even known from only a few type specimens. To conclude this thesis, the distribution of Swiftlets and its geological context will be used to explain the radiation of Swiftlets and the evolution of echolocation (Chapter 6). The evolution of echolocation and the environmental conditions under which echolocation evolved will be discussed. Chapter 7. – This final Chapter summarizes the most important findings, discussions, and conclusions of this thesis.
23
INTRODUCTION
Fig. 8. Distribution of the Swiftlet species recognized by Chantler et al. (1999). (A) Aerodramus species, which are (presumably) all able to echolocate (Table 1). A. vulcanorum is not recognized as a full species by Chantler et al. (1999), but as a subspecies of A. brevirostris. However, it is considered to be a full species by Collar et al. (1994) and because of its disjunct distribution and distinct vocalisation from A. brevirostris treated as such in this thesis. (B) Collocalia species and Hydrochous gigas. C. troglodytes is able to echolocate.
elaphrus
francicus
unicolor
mearnsi
infuscatus
spodiopygiusterraereginae
brevirostris
whiteheadi
orientalissalanganus
vanikorensis
pelewensis
bartschi
inquietus
sawtelli + leucophaeus
fuciphagus
maximus
papuensisvulcanorum
A
esculenta
troglodytes
linchi
xx
H. gigas
B
nuditarsus
hirundinaceus
24
CHAPTER 1
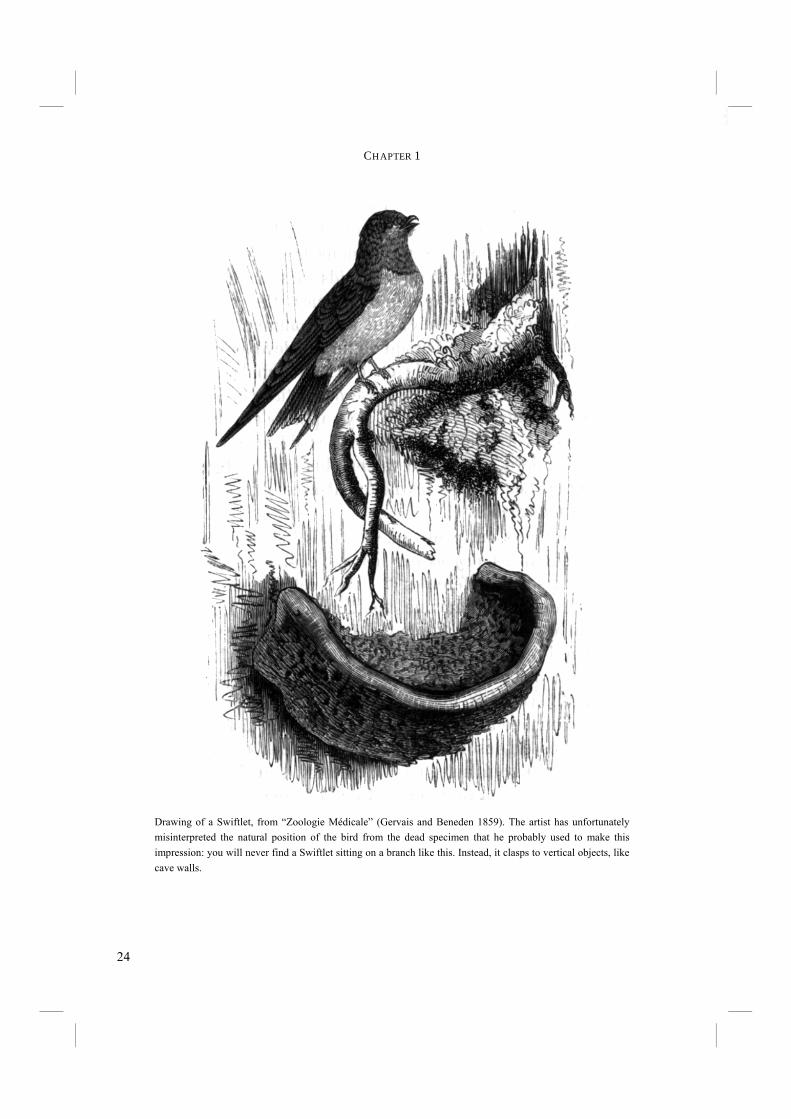
Drawing of a Swiftlet, from “Zoologie Médicale” (Gervais and Beneden 1859). The artist has unfortunately misinterpreted the natural position of the bird from the dead specimen that he probably used to make this impression: you will never find a Swiftlet sitting on a branch like this. Instead, it clasps to vertical objects, like cave walls.
25
CHAPTER 2
SWIFTLET PHYLOGENY
2.1 A NEW PHYLOGENY OF SWIFTLETS (AVES: APODIDAE) BASED ON CYTOCHROME-B DNA.
2.2 PHYLOGENETIC RELATIONSHIPS OF SOME SWIFTS AND
SWIFTLETS; A MULTI LOCUS APPROACH.

26
CHAPTER 2.1
27
CHAPTER 2.1
A NEW PHYLOGENY OF SWIFTLETS (AVES: APODIDAE)
BASED ON CYTOCHROME-B DNA.
This chapter has also been published as: Thomassen, H.A.a, Wiersema, A.T.b, de Bakker, M.A.G.a, de Knijff, P.c,
Hetebrij, E.a and Povel, G.D.E.a (2003) A new phylogeny of Swiftlets (Aves: Apodidae) based on cytochrome-b DNA. Molecular Phylogenetics and Evolution 29: 86-93.
a Section of Evolutionary Morphology, Institute of Biology Leiden, Leiden University b Dept. of Stem Cell Biology, University of Groningen c Forensic Laboratory for DNA-Research, MGC-Department of Human and Clinical Genetics, Leiden University Medical Center
28
CHAPTER 2.1
Abstract Due to a lack of distinctive morphological characters, Swift taxonomy and phylogeny has always been an area of disagreement. To shed more light on this subject, we reconstructed Swift and Swiftlet phylogeny based on 1143 base pairs of mitochondrial cytochrome-b DNA sequence. Although this is not the first attempt to reconstruct Swift phylogeny using molecular data, our results show higher support for many of the branches due to our much longer sequences. However, placement of Hydrochous is still unexpected. Implementation of more conservative genetic regions and sampling of more taxa could solve this problem. Most importantly, the Collocaliini resolve as a monophyletic group. The internal structure of the group shows that non-echolocating Collocalia and echolocating Aerodramus form two distinct clades. This is in congruence with earlier classifications based on morphological characters, but in contrast with more recent classifications.

29
SWIFTLET PHYLOGENY I
Introduction Swifts are insectivorous birds that have a worldwide distribution, except for the Arctic and Antarctic. Swiftlets (tribe Collocaliini) are small Swifts that occur from the Indian Ocean, through South and South East Asia, to North Australia and the Pacific Islands. Several species are able to use echolocation to navigate in the dark, especially in the darkness of the caves in which they roost and nest. Some species are famous because of their nests, made of saliva and a delicacy to many people in the region. There have been many disputes about the taxonomy of Swifts and Swiftlets. Mayr (1937) mentioned as a reason for this controversy the high morphological similarity between Swiftlet species. They have been shuffled and reshuffled into one, two or three different genera several times, each time based on outer morphological and/or nest characters. Originally they were placed in one genus, Collocalia. Brooke (1970) placed them into three different subgenera, i.e. Collocalia, comprising small non-echolocating species, Aerodramus, consisting of all echolocating species, and the monotypic Hydrochous, which is relatively large and roosts behind waterfalls. Later he assigned these subgenera a generic status (Brooke 1972). He also placed the genus Schoutedenapus, erected by De Roo (1968) “for the time being” (Brooke 1970) within the Collocaliini, but had great doubts that it belonged there. Salomonsen (1983) in his revision reclassified the Swiftlets into the original single genus Collocalia. Sibley and Monroe (1990) disputed these classifications and placed the three disputed genera into two different genera, i.e. Collocalia, comprising Brooke’s Collocalia and Aerodramus, and Hydrochous, which is the same as the one recognized by Brooke. Chantler and Driessens (1995) returned to the original classification of a single genus, Collocalia, whereas Chantler et al. (1999) reused Brooke’s classification. Obviously, morphological characters do not contain enough information to be able to produce reliable phylogenetic relationships. Lee et al. (1996) turned to molecular evidence, using cytochrome-b mitochondrial DNA to investigate the phylogeny of Swiftlets. They used Brooke’s (1972) nomenclature and found Collocalia separated from Aerodramus and Hydrochous. However, the position of Hydrochous within Aerodramus was unexpected, as was the position of Apus, Chaetura, and Cypsiurus. None of the latter three genera had previously been assigned to the Collocaliini, but they were now placed between Collocalia and the Aerodramus-Hydrochous complex, thus making Collocaliini sensu lato paraphyletic.
30
CHAPTER 2.1
As Lee et al. only sequenced 406 base pairs of cytochrome-b the amount of phylogenetic information may have been too low. Lee et al (1996) proposed that for a more reliable classification a longer DNA segment should be sequenced. Therefore, to shed more light on Swiftlet taxonomy, especially the status of the disputed genera Collocalia, Aerodramus, and Hydrochous, we greatly increased the amount of genetic information by sequencing 1143 base pairs of the cytochrome-b gene.
Material and methods Blood samples of 7 species from the Indo-Australian region were used as sources for DNA (Table 1). One species, Apus apus, is Eurasian. The blood samples were taken at the spot of their capture in the wild, immediately after the individuals were sacrificed for forthcoming morphological study. The samples were collected on specially prepared filter papers and kept dry using silica gel. DNA was extracted using the Chelex-100 (BioRad) method of Walsh (1991). The complete cytochrome-b mitochondrial DNA gene totaling 1143 base pairs was amplified by means of PCR with primers ND5 and Thr (see Table 2 and below). This product was run on a 1% agarose gel, cut out and purified using the Qiagen Gel Extraction Kit. The cleaned PCR product was diluted 10-
5 and used as input for half-nested PCR’s with one of the internal primers and one of the external primers (see Table 2 and below). Amplification of a relatively large piece of mitochondrial DNA with conserved primers and usage of this product to amplify a smaller piece with less conserved internal primers for sequencing is one of the methods Sorenson and Quinn (1998) recommend to avoid Numts (mitochondrial insertions in nuclear DNA, a particular problem when working, as we did, with avian blood as DNA source). The sequences thus obtained were checked for stop codons and aligned with known cytochrome-b sequences to be sure no Numts were sequenced. The internal primers were indeed less specific and gave with some samples difficulties in the PCR’s and sequence reactions. With the two newly designed internal primers based on the already sequenced DNA we overcame these problems (see Table 2 and below). The large PCR product from the original amplification was used to sequence about 800 base pairs using the Big Dye Terminator Cycle Sequencing Ready Reaction Kit of Applied Biosystems and electrophoresed on an ABI 377 automated sequencer. The purified half-nested products were also directly sequenced with the used internal primer.

31
SWIFTLET PHYLOGENY I
Table 1. Samples sequenced for cytochrome-b. All C. esculenta specimens are of the subspecies C. esculenta cyanoptila.
Species GenBank accession numbers Aerodramus fuciphagus AY135627 Aerodramus fuciphagus AY135628 Aerodramus fuciphagus AY135629 Aerodramus fuciphagus AY135630 Aerodramus fuciphagus AY135631 Aerodramus fuciphagus AY135632 Aerodramus maximus AY135619 Aerodramus maximus AY135620 Aerodramus maximus AY135621 Aerodramus maximus AY135622 Aerodramus maximus AY135623 Aerodramus maximus AY135624 Aerodramus vulcanorum AY135634 Apus apus AY135633 Collocalia linchi AY135614 Collocalia linchi AY135615 Collocalia linchi AY135616 Collocalia linchi AY135617 Collocalia linchi AY135618 Collocalia esculenta AY135604 Collocalia esculenta AY135605 Collocalia esculenta AY135606 Collocalia esculenta AY135607 Collocalia esculenta AY135608 Collocalia esculenta AY135609 Collocalia esculenta AY135610 Collocalia esculenta AY135611 Collocalia esculenta AY135612 Collocalia esculenta AY135613 Hydrochous gigas AY135625 Hydrochous gigas AY135626 Rhaphidura leucopygialis AY135603
32
CHAPTER 2.1
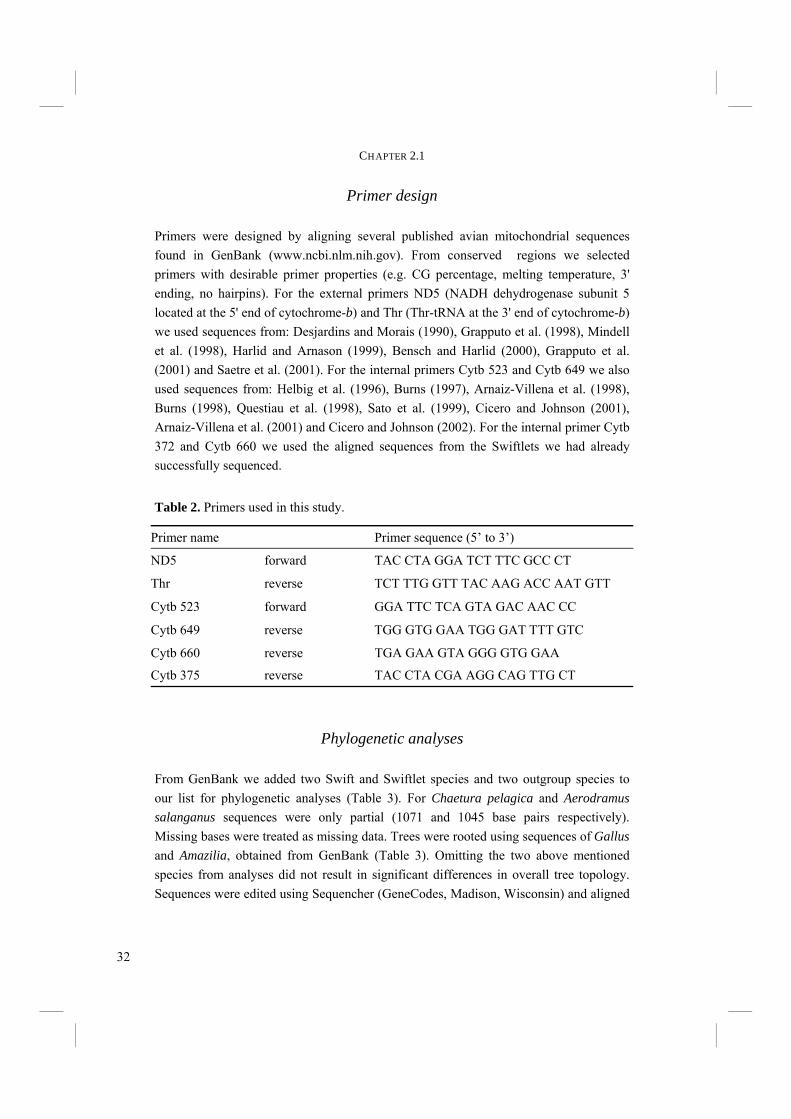
Primer design Primers were designed by aligning several published avian mitochondrial sequences found in GenBank (www.ncbi.nlm.nih.gov). From conserved regions we selected primers with desirable primer properties (e.g. CG percentage, melting temperature, 3' ending, no hairpins). For the external primers ND5 (NADH dehydrogenase subunit 5 located at the 5' end of cytochrome-b) and Thr (Thr-tRNA at the 3' end of cytochrome-b) we used sequences from: Desjardins and Morais (1990), Grapputo et al. (1998), Mindell et al. (1998), Harlid and Arnason (1999), Bensch and Harlid (2000), Grapputo et al. (2001) and Saetre et al. (2001). For the internal primers Cytb 523 and Cytb 649 we also used sequences from: Helbig et al. (1996), Burns (1997), Arnaiz-Villena et al. (1998), Burns (1998), Questiau et al. (1998), Sato et al. (1999), Cicero and Johnson (2001), Arnaiz-Villena et al. (2001) and Cicero and Johnson (2002). For the internal primer Cytb 372 and Cytb 660 we used the aligned sequences from the Swiftlets we had already successfully sequenced.
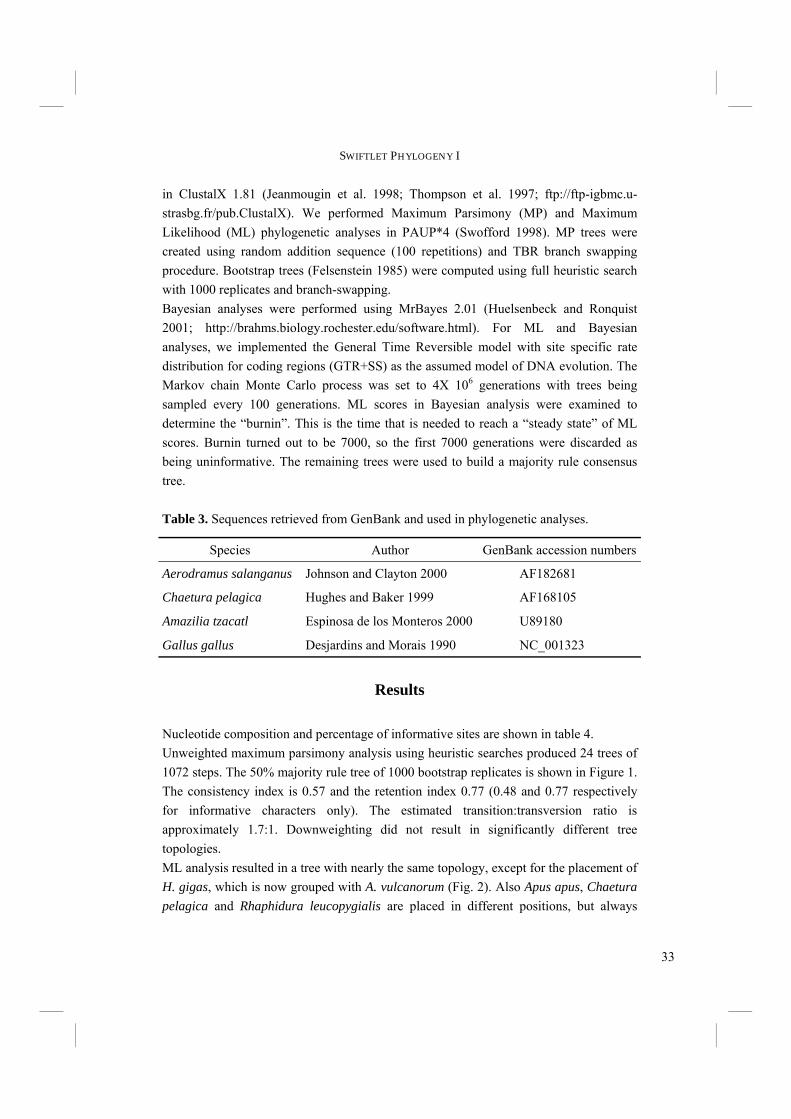
Phylogenetic analyses From GenBank we added two Swift and Swiftlet species and two outgroup species to our list for phylogenetic analyses (Table 3). For Chaetura pelagica and Aerodramus salanganus sequences were only partial (1071 and 1045 base pairs respectively). Missing bases were treated as missing data. Trees were rooted using sequences of Gallus and Amazilia, obtained from GenBank (Table 3). Omitting the two above mentioned species from analyses did not result in significant differences in overall tree topology. Sequences were edited using Sequencher (GeneCodes, Madison, Wisconsin) and aligned
Table 2. Primers used in this study.
Primer name Primer sequence (5’ to 3’)
ND5 forward TAC CTA GGA TCT TTC GCC CT
Thr reverse TCT TTG GTT TAC AAG ACC AAT GTT
Cytb 660 reverse TGA GAA GTA GGG GTG GAA
Cytb 375 reverse TAC CTA CGA AGG CAG TTG CT
Cytb 649 reverse TGG GTG GAA TGG GAT TTT GTC
Cytb 523 forward GGA TTC TCA GTA GAC AAC CC
33
SWIFTLET PHYLOGENY I
in ClustalX 1.81 (Jeanmougin et al. 1998; Thompson et al. 1997; ftp://ftp-igbmc.u-strasbg.fr/pub.ClustalX). We performed Maximum Parsimony (MP) and Maximum Likelihood (ML) phylogenetic analyses in PAUP*4 (Swofford 1998). MP trees were created using random addition sequence (100 repetitions) and TBR branch swapping procedure. Bootstrap trees (Felsenstein 1985) were computed using full heuristic search with 1000 replicates and branch-swapping. Bayesian analyses were performed using MrBayes 2.01 (Huelsenbeck and Ronquist 2001; http://brahms.biology.rochester.edu/software.html). For ML and Bayesian analyses, we implemented the General Time Reversible model with site specific rate distribution for coding regions (GTR+SS) as the assumed model of DNA evolution. The Markov chain Monte Carlo process was set to 4X 10⁶ generations with trees being sampled every 100 generations. ML scores in Bayesian analysis were examined to determine the “burnin”. This is the time that is needed to reach a “steady state” of ML scores. Burnin turned out to be 7000, so the first 7000 generations were discarded as being uninformative. The remaining trees were used to build a majority rule consensus tree.
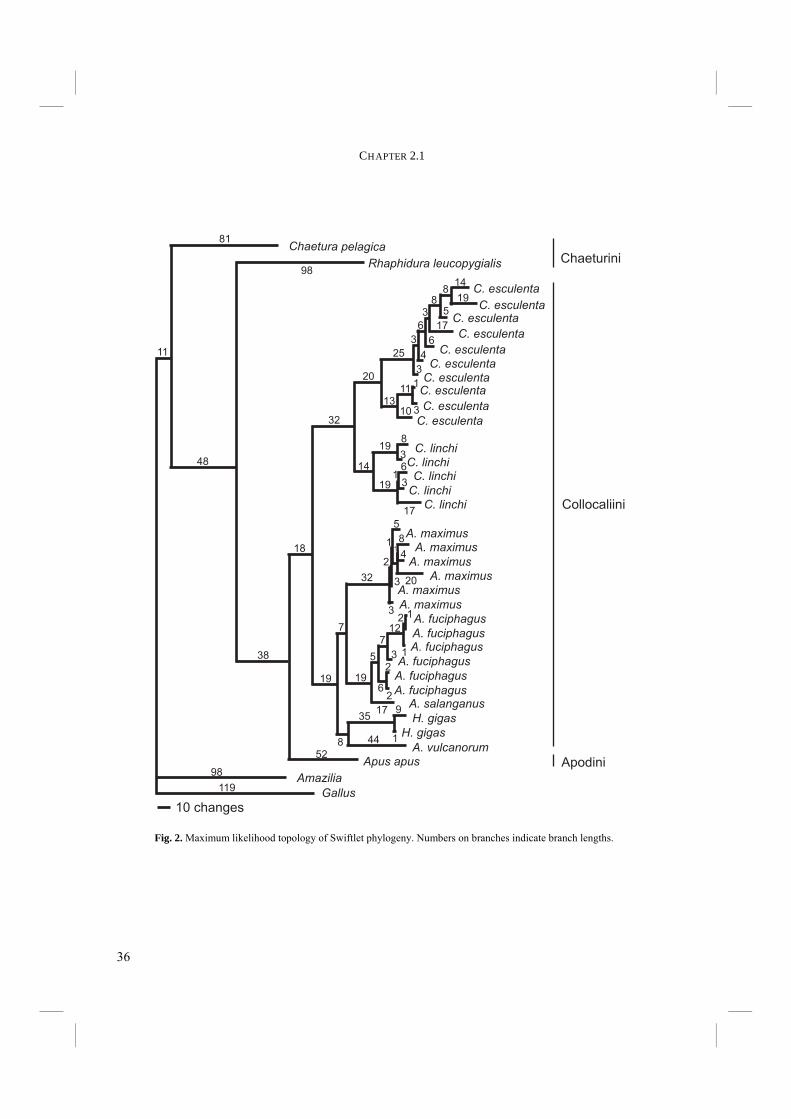
Results Nucleotide composition and percentage of informative sites are shown in table 4. Unweighted maximum parsimony analysis using heuristic searches produced 24 trees of 1072 steps. The 50% majority rule tree of 1000 bootstrap replicates is shown in Figure 1. The consistency index is 0.57 and the retention index 0.77 (0.48 and 0.77 respectively for informative characters only). The estimated transition:transversion ratio is approximately 1.7:1. Downweighting did not result in significantly different tree topologies. ML analysis resulted in a tree with nearly the same topology, except for the placement of H. gigas, which is now grouped with A. vulcanorum (Fig. 2). Also Apus apus, Chaetura pelagica and Rhaphidura leucopygialis are placed in different positions, but always
Table 3. Sequences retrieved from GenBank and used in phylogenetic analyses.
Species Author GenBank accession numbers
Aerodramus salanganus Johnson and Clayton 2000 AF182681
Chaetura pelagica Hughes and Baker 1999 AF168105
Amazilia tzacatl Espinosa de los Monteros 2000 U89180
Gallus gallus Desjardins and Morais 1990 NC_001323

34
CHAPTER 2.1
Rhaphidura leucopygialis
Chaetura pelagica
C. esculenta
C. linchi
A. maximus
H. gigas
H. gigas
A. fuciphagus
A. salanganus
A. vulcanorum
Apus apus
Amazilia
Gallus
99
36
52
67
100
100
100
37
49
44
9199
93
99
100
100
51
84
35
100
76
70
5824
100
35
99
99
96
100
84
100
91
C. esculenta
C. esculenta
C. esculenta
C. esculenta
C. esculenta
C. esculenta
C. esculenta
C. esculenta
C. esculenta
C. linchi
C. linchi
C. linchiC. linchi
A. maximus
A. maximus
A. maximus
A. maximus
A. maximus
A. fuciphagus
A. fuciphagus
A. fuciphagus
A. fuciphagus
A. fuciphagus
1886
65
14
198
8
3
6
3
5
17
6
4
3
1
311
10
25
18
34
13
14
21
12
6
10
1
4
12
30
48
21
8
32
2
3
3
7
4
20
0
32
3
346
4
6
17
8
7
12
21
0
1
3
62
2
14
45
100
101
113
12
Fig. 1. Bootstrap consensus tree of 1000 replicates computed using Maximum Parsimony. Numbers on each branch represent branch lengths. Numbers on the nodes (in circles) represent bootstrap percentages.
35
SWIFTLET PHYLOGENY I
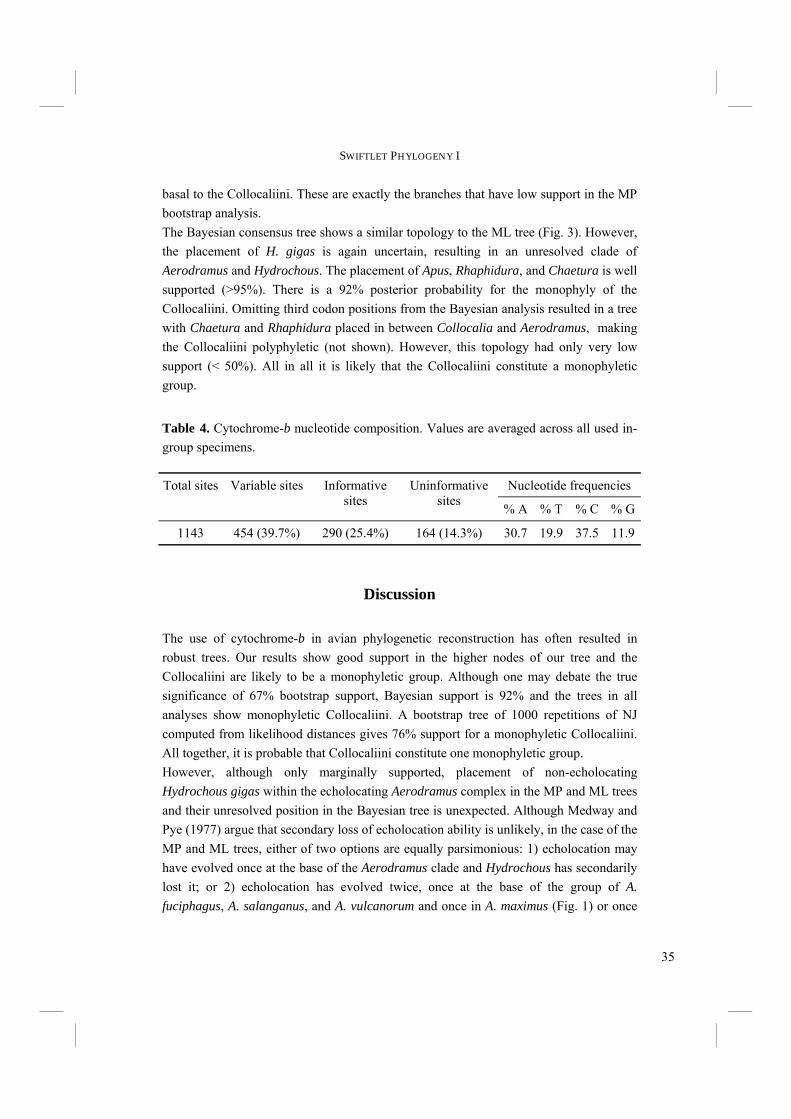
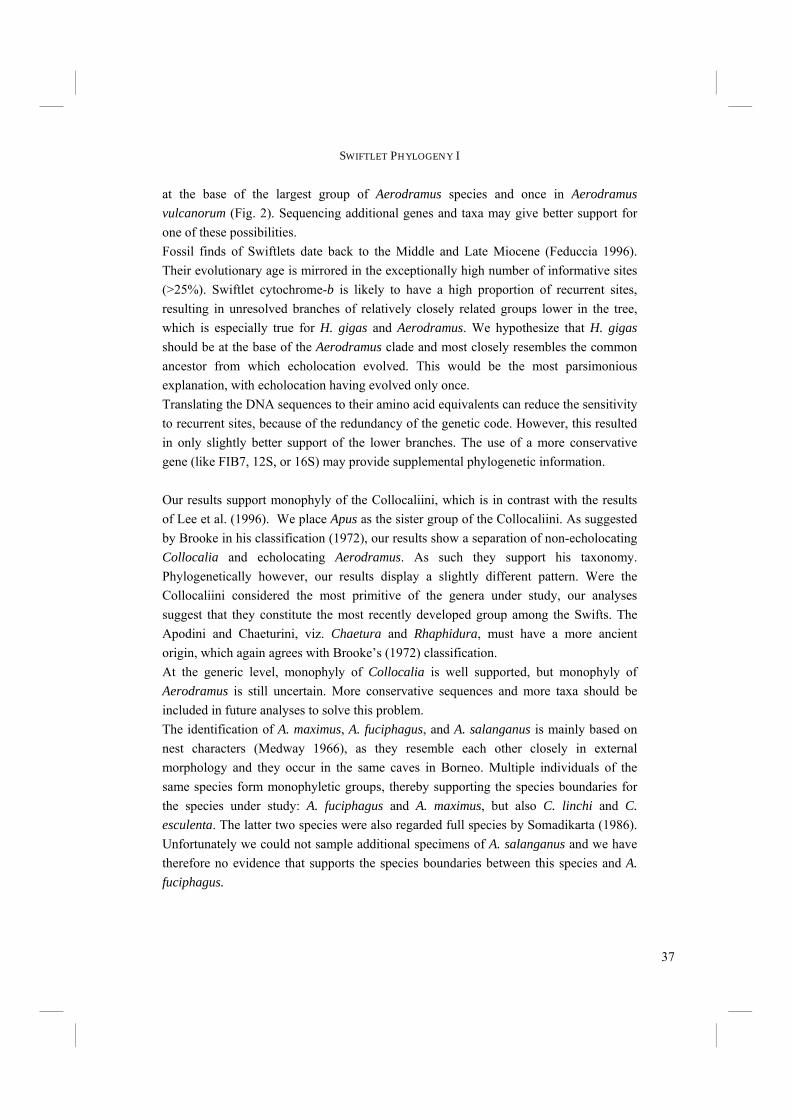
basal to the Collocaliini. These are exactly the branches that have low support in the MP bootstrap analysis. The Bayesian consensus tree shows a similar topology to the ML tree (Fig. 3). However, the placement of H. gigas is again uncertain, resulting in an unresolved clade of Aerodramus and Hydrochous. The placement of Apus, Rhaphidura, and Chaetura is well supported (>95%). There is a 92% posterior probability for the monophyly of the Collocaliini. Omitting third codon positions from the Bayesian analysis resulted in a tree with Chaetura and Rhaphidura placed in between Collocalia and Aerodramus, making the Collocaliini polyphyletic (not shown). However, this topology had only very low support (< 50%). All in all it is likely that the Collocaliini constitute a monophyletic group.
Discussion The use of cytochrome-b in avian phylogenetic reconstruction has often resulted in robust trees. Our results show good support in the higher nodes of our tree and the Collocaliini are likely to be a monophyletic group. Although one may debate the true significance of 67% bootstrap support, Bayesian support is 92% and the trees in all analyses show monophyletic Collocaliini. A bootstrap tree of 1000 repetitions of NJ computed from likelihood distances gives 76% support for a monophyletic Collocaliini. All together, it is probable that Collocaliini constitute one monophyletic group. However, although only marginally supported, placement of non-echolocating Hydrochous gigas within the echolocating Aerodramus complex in the MP and ML trees and their unresolved position in the Bayesian tree is unexpected. Although Medway and Pye (1977) argue that secondary loss of echolocation ability is unlikely, in the case of the MP and ML trees, either of two options are equally parsimonious: 1) echolocation may have evolved once at the base of the Aerodramus clade and Hydrochous has secondarily lost it; or 2) echolocation has evolved twice, once at the base of the group of A. fuciphagus, A. salanganus, and A. vulcanorum and once in A. maximus (Fig. 1) or once
Table 4. Cytochrome-b nucleotide composition. Values are averaged across all used in-group specimens.
Total sites Variable sites Informative sites
Nucleotide frequencies
% A % T % C % G
1143 454 (39.7%) 290 (25.4%) 164 (14.3%) 30.7 19.9 37.5 11.9
Uninformative sites
36
CHAPTER 2.1
9
6
2
2 1
1
2
8
13
11
7
5
3
3
Collocaliini
Apodini
Chaeturini
C. esculenta
C. linchi
A. maximus
A. fuciphagus
A. salanganus
H. gigas
H. gigas
A. vulcanorum
Apus apus
38
18
32
20
25
6
88
14
19
5
17
6
4
3
13
1
310
14
198
36
17
19
7
32
1
5
3
14
20
3
19
12
13
2
17
8
35
144
52
C. esculenta
C. esculenta
C. esculentaC. esculentaC. esculenta
C. esculenta
C. esculenta
C. esculentaC. esculenta
19
C. linchi
C. linchi
C. linchiC. linchi
A. maximus
A. maximus
A. maximus
A. maximus
A. maximus
A. fuciphagus
A. fuciphagus
A. fuciphagus
A. fuciphagusA. fuciphagus
Rhaphidura leucopygialis
Chaetura pelagica
Amazilia
Gallus
98
81
98
119
10 changes
48
11
Fig. 2. Maximum likelihood topology of Swiftlet phylogeny. Numbers on branches indicate branch lengths.
37
SWIFTLET PHYLOGENY I
at the base of the largest group of Aerodramus species and once in Aerodramus vulcanorum (Fig. 2). Sequencing additional genes and taxa may give better support for one of these possibilities. Fossil finds of Swiftlets date back to the Middle and Late Miocene (Feduccia 1996). Their evolutionary age is mirrored in the exceptionally high number of informative sites (>25%). Swiftlet cytochrome-b is likely to have a high proportion of recurrent sites, resulting in unresolved branches of relatively closely related groups lower in the tree, which is especially true for H. gigas and Aerodramus. We hypothesize that H. gigas should be at the base of the Aerodramus clade and most closely resembles the common ancestor from which echolocation evolved. This would be the most parsimonious explanation, with echolocation having evolved only once. Translating the DNA sequences to their amino acid equivalents can reduce the sensitivity to recurrent sites, because of the redundancy of the genetic code. However, this resulted in only slightly better support of the lower branches. The use of a more conservative gene (like FIB7, 12S, or 16S) may provide supplemental phylogenetic information. Our results support monophyly of the Collocaliini, which is in contrast with the results of Lee et al. (1996). We place Apus as the sister group of the Collocaliini. As suggested by Brooke in his classification (1972), our results show a separation of non-echolocating Collocalia and echolocating Aerodramus. As such they support his taxonomy. Phylogenetically however, our results display a slightly different pattern. Were the Collocaliini considered the most primitive of the genera under study, our analyses suggest that they constitute the most recently developed group among the Swifts. The Apodini and Chaeturini, viz. Chaetura and Rhaphidura, must have a more ancient origin, which again agrees with Brooke’s (1972) classification. At the generic level, monophyly of Collocalia is well supported, but monophyly of Aerodramus is still uncertain. More conservative sequences and more taxa should be included in future analyses to solve this problem. The identification of A. maximus, A. fuciphagus, and A. salanganus is mainly based on nest characters (Medway 1966), as they resemble each other closely in external morphology and they occur in the same caves in Borneo. Multiple individuals of the same species form monophyletic groups, thereby supporting the species boundaries for the species under study: A. fuciphagus and A. maximus, but also C. linchi and C. esculenta. The latter two species were also regarded full species by Somadikarta (1986). Unfortunately we could not sample additional specimens of A. salanganus and we have therefore no evidence that supports the species boundaries between this species and A. fuciphagus.
38
CHAPTER 2.1
98
Rhaphidura leucopygialis
C. esculenta
C. linchi
A. maximus
H. gigas
H. gigas
A. fuciphagus
A. salanganus
A. vulcanorum
Apus apus
Chaetura pelagica
Amazilia
Gallus
100
98
99
92
100
100
100
60
8173
100100
100100
100
100
94
87
100
73100
57
100
100
100
100100
100
100
C. esculenta
C. esculenta
C. esculenta
C. esculenta
C. esculenta
C. esculentaC. esculenta
C. esculenta
C. esculenta
100
C. linchi
C. linchi
C. linchi
C. linchi
A. maximus
A. maximus
A. maximus
A. maximus
A. maximus
A. fuciphagus
A. fuciphagus
A. fuciphagus
A. fuciphagus
A. fuciphagus
Fig. 3. Bayesian analysis consensus tree for 4 x 10⁶ generations (burnin = 7000 generations). Numbers on branches indicate the posterior probability.

39
SWIFTLET PHYLOGENY I
Unfortunately we were not able to sample more taxa. Museum material was not usable as DNA source. To gain more insight in the exact position of Hydrochous, more taxa and more conservative genes should be sampled. However, it was possible to clearly show monophyly of the Swiftlets and to associate echolocation with one clade of Aerodramus and its absence within the other clade of Collocalia.
Acknowledgements Dr. J.E. Jeffery and Dr. G.C. Zuccarello (Leiden University, The Netherlands) are kindly acknowledged for reviewing the paper and for their comments on the phylogenetic analyses.

40
CHAPTER 2.1
Top: Danum Valley Research Centre. Left and middle: our “labs” at Mnt. Kinabalu and in Sukau (Kinabatangan river). Bottom: on our way to another cave along the Kinabatangan river.
41
CHAPTER 2.2
PHYLOGENETIC RELATIONSHIPS OF SOME SWIFTS AND SWIFTLETS; A MULTI LOCUS APPROACH.
This chapter has also been submitted for publication as: Thomassen, H.A., den Tex, R.-J., de Bakker, M.A.G. and Povel, G.D.E. Phylogenetic
relationships of some Swifts and Swiftlets; a multi locus approach. Section of Evolutionary Morphology, Institute of Biology Leiden, Leiden University

42
CHAPTER 2.2
Abstract Due to a lack of distinctive morphological characters, the phylogeny of Swiftlets has since long been a difficult issue. In the previous chapter we have constructed a phylogeny based on the complete cytochrome-b mtDNA molecule. However, this classification was still inconclusive. In particular, the precise relationship of Hydrochous gigas with Aerodramus spp. remained unclear. In an attempt to clarify this issue, two additional DNA regions, 12S rRNA (12S), and β-fibrinogen intron 7 (Fib7) were now incorporated. A Partition Homogeneity (PH) Test, used to determine the degree of phylogenetic congruence between two sets of gene sequences, suggested that 12S and Fib7 are congruent, but that cytochrome-b is incongruent with Fib7. However, according to an additional procedure, in which the original data sets are shuffled at random and the newly created data sets are subject to a PH test, this apparent incongruence is most probably caused by the relatively high variability of cytochrome-b. Separate and combined analyses of the various genes unambiguously placed Hydrochous as the sistergroup of Aerodramus. Furthermore, monophyly of the Swiftlets is supported. Additional evidence comes from the pooled data sets of a previously published phylogeny based on combined cytochrome-b and ND2 sequences and newly added sequences of H. gigas. H. gigas is again placed as the sistergroup of Aerodramus and Swiftlets are shown to be monophyletic. However, the mutual relationship of Aerodramus species remains unclear. Echolocation has long been thought to exist only in Aerodramus. However, it has been shown in a previous publication to be present in Collocalia as well. Echolocation ability has therefore lost its value as discriminative character between Aerodramus and Collocalia. Furthermore, external morphological characters and nest characters have previously been shown not to support the split of Swiftlets into different genera. It therefore appears to be appropriate to revert to the original taxonomical classification of Swiftlets into a single genus, i.e. Collocalia Gray 1840. Tachymarptis (Apus) melba melba was placed within the Apus clade. This supports the inclusion in Apus rather than in Tachymarptis. Echolocation may have arisen either once at the base of the Swiftlets or twice, i.e. in Aerodramus and C. troglodytes.
43
SWIFTLET PHYLOGENY II
Introduction Swifts (Apodidae) and Swiftlets (Apodidae: Collocaliini) have always been controversial in terms of their taxonomy and phylogeny. Swiftlets are highly unusual among birds for their echolocation ability, which is only shared with the South American Oilbird (Steatornis caripensis). Among the Swifts, the taxonomic and phylogenetic classification of particularly Swiftlets has always been difficult. Mayr (1937) stated that “their classification presents the most difficult problem in the taxonomy of birds”. As a reason for this he mentioned that “most of the species are of practically the same dull sooty gray coloration with almost the same development of the structural characters”. Originally all Swiftlets were placed into a single genus, Collocalia (Gray 1840) and this classification has been used for over a hundred years. However, in 1959 echolocation was discovered in Swiftlets almost simultaneously by Medway (1959) and Novick (1959). Echolocation ability was for Brooke (1970, 1972) the main reason to revise Swiftlet taxonomy. Brooke (1970, 1972) split the genus Collocalia s.l. into three different genera, i.e. non-echolocating Collocalia s.s., non-echolocating Hydrochous, and echolocating Aerodramus. However, no consensus was reached on Brooke’s classification. In subsequent publications these three genera were pooled into a single genus Collocalia s.l. again (e.g. Chantler and Driessens 1995; Salomonsen 1983) or split up into two or three different genera after all (e.g. Chantler et al. 1999; Sibley and Monroe 1993). The first attempt to create a phylogenetic rather than a taxonomic classification of Swiftlets was by Lee et al. (1996), who used mtDNA sequence data. However, Lee et al. (1996) sequenced only a limited (406 bp) portion of cytochrome-b DNA, resulting in a phylogeny with many peculiarities and unanswered questions. Thomassen et al. (2003) and Van den Berge (unpublished) sequenced the complete cytochrome-b gene (Chapter 2.1.) and the resulting tree supported Swiftlet monophyly. Furthermore, echolocation was assigned to a single genus, i.e. Brooke’s (1970, 1972) Aerodramus. The placement of Hydrochous was nonetheless still uncertain. The high amount of variation in cytochrome-b may have caused this uncertainty. The uncertain classification of Hydrochous was not solved in a subsequent phylogeny by Price et al. (2004). Price et al. (2004) incorporated more Swifts and Swiftlets in their analyses than previously had been done. Moreover, besides most of cytochrome-b (1058 bp) they used sequences (1078 bp) from an additional mitochondrial gene, NADH dehydrogenase subunit 2 (ND2). The resulting tree once more was in support of monophyly of Swiftlets and the subdivision of Swiftlets into two clades, i.e. Collocalia and Aerodramus. However, echolocation ability could not be attributed to a single genus any more. Price et al. (2004) discovered that C. troglodytes is able to echolocate, but that it was grouped with other members of non-echolocating Collocalia. Thus echolocation

44
CHAPTER 2.2
ability is present in two different clades of Swiftlets. Unfortunately Price et al. (2004) were not able to incorporate the non-echolocating Hydrochous gigas. We incorporated two additional genes in our original dataset of cytochrome-b sequences (Thomassen et al. 2003; Chapter 2.1) to investigate the phylogenetic relationship of Hydrochous gigas with other members of Swiftlets. The added genes, mitochondrial 12S rRNA (12S) and nuclear non-coding β-fibrinogen intron 7 (Fib7), evolve more conservatively than cytochrome-b. It was expected that inclusion of these genes in the phylogenetic analyses would resolve the uncertain phylogenetic relationship of H. gigas with other Swiftlets. To gain additional evidence for the placement of H. gigas, we also sequenced cytochrome-b and ND2 mtDNA of two specimens of H. gigas. These sequences were added to the data of Price et al. (2004). In this paper we will present the resulting phylogenies. Furthermore, we will discuss the combined use of multiple genes with different levels of saturation in a single phylogenetic reconstruction.
Material and methods Blood samples of seven Swift and Swiftlet species from the Indo-Australian region and two Swift species from Eurasian origin have been used as DNA source (Table 1). The blood samples were collected on the spot of the capture of the birds. Samples were stored on FTA papers (Whatman Bioscience, Whatman Group, USA; courtesy of Prof. P. de Knijff, Leiden University, The Netherlands) and kept dry using silica gel. The samples of Apus melba (courtesy of Dr. P. Bize, University of Bern, Switzerland) were stored in EDTA buffer. Samples from museum specimens were not suitable for DNA sequencing (Van den Berge, unpublished). One Hummingbird species (courtesy of W. van Gestel (M.Sc.), Wageningen University, The Netherlands) was included in the analyses, as Hummingbirds are generally supposed to be the sistergroup of the Swifts (e.g. Sibley and Alquist 1990). We used pieces of muscle tissue as a source of DNA. DNA isolation from dried blood samples and muscle tissue was performed using the DNEasy Tissue Kit (Qiagen, Hilden, Germany). The manufacturer’s protocol for animal tissue was followed, and lysis was done overnight. The blood samples stored in EDTA buffer were treated according to the protocol for isolation of genomic DNA from whole nucleated blood. Using PCR, the complete nuclear DNA β-fibrinogen intron 7 (Fib7) and the complete mitochondrial ribosomal subunit 12S rRNA (12S) were directly amplified from the

45
SWIFTLET PHYLOGENY II
isolated DNA. Primers used are listed in Table 2, including those that were used for amplification of cytochrome-b (cyt-b) by Thomassen et al. (2003) (Chapter 2.1). Because the available primers did not always give good results, three new primers were designed based on conservative parts in the already successfully sequenced specimens. From these regions we selected primers with desirable primer properties (e.g. CG percentage, melting temperature, 3' ending, no hairpins). For the primer design for cytochrome-b we refer to Thomassen et al. (2003) (Chapter 2.1). We used slightly modified internal primers of Price et al. (2004) and external primers of Hackett (1996) and Johnson and Sorenson (1998) (Table 2) to sequence ND2 mitochondrial DNA of two specimens of H. gigas, which were included in the dataset of Price et al. (2004). The cleaned PCR products (Qiagen Qiaquick PCR Purification Kit) were run on a 1%
Table 1. Used samples with origin and GenBank accession numbers. For cytochrome-b see also Thomassen et al. 2003 (Chapter 2.1). ND2 has only been sequenced for H. gigas. A. Aerodramus; Am. Amazilia; Ap. Apus; C. Collocalia; H. Hydrochous; R. Rhaphidura.
Species GenBank accession numbers
cytochrome-b 12S Fib7 ND2
Swiftlets
A. fuciphagus Borneo AY135627-..32 AY513103-..06 AY513075-..79 -
A. maximus Borneo AY135619-..24 AY513126-..29 AY513097-..100 -
A. vulcanorum Java AY135634 AY513125 AY513102 -
C. esculenta cyanoptila
Borneo AY135604-..13 AY513114-..20 AY513082-..88 -
C. linchi Java AY135614-..18 AY513109-..13 AY513081, ..89-..92
-
H. gigas Java AY135625-..26 AY513107-..08 AY513079-..80 AY808062-..63
Swifts
Ap. apus Neth. AY135633 AY513124 AY513096 -
Ap. melba Switz. AY526106-..08 AY513121-..23 AY513093-..95 -
R. leucopygialis Borneo AY135603 AY513130 AY513101 -
Hummingbirds
Am. tzacatl see Table 3 see Table 3 AY547286 -
Origin

46
CHAPTER 2.2
Table 2. Primers used in this study. Cytochrome-b primers used in Thomassen et al. (2003) (Chapter 2.1) are also summarised.
Gene Primer name Primer sequence (5’-3’) Source Cyt-b ND5 TAG CTA GCA TCT TTC
GCC CT Thomassen et al. 2003
Thr TCT TTG GTT TAC AAG ACC AAT GTT
Thomassen et al. 2003
Cytb 523 GGA TTC TCA GTA GAC AAC CC
Thomassen et al. 2003
Cytb 649 TGG GTG GAA TGG GAT TTT GTC
Thomassen et al. 2003
Cytb 660 TGA GAA GTA GGG GTG GAA
Thomassen et al. 2003
Cytb 375 TAC CTA CGA AGG CAG TTG CT
Thomassen et al. 2003
12S L1263 tRNAPhe ACA CAA AGC ATG GCA CTG AA
Sorensen et al. 1999
H1858 12S r RNA TCG ATT ATA GAA CAG GCT CCT CTA G
Sorensen et al. 1999
L1753 12S rRNA AAA CTG GGA TTA GAT ACC CCA CTA T
Sorensen et al. 1999
H2294 tRNAVal CTT TCA GGT GTA AGC TGA (AG)T GCT T
Sorensen et al. 1999
Fib7 FIB-B17L TCC CCA GTA GTA TCT GCC ATT AGG GTT
Prychitko and Moore 1997
FIB-B17U GGA GAA AAC AGG ACA ATG ACA ATT CAC
Prychitko and Moore 1997
Fib7swiftF CAA TTA CTT GCA GTT CAT AAT GAT
This study
Fib7swiftF2 TGC TAA TTA CAA TTA CTT GCA GT
This study
Fib7swiftR GGA ATA TTG GTA CTC ATT CCA GA
This study
ND2 L5215 TAT CGG GCC CAT ACC CCG AAA AT
Hackett 1996
H6313 CTC TTA TTT AAG GCT TTG AAG GC
Johnson and Sorenson 1998
L5758sHT GGT TGA ATG GGA CTT AAC CAG AC
This study (modified from Price et al. 2004)
H5766sHT GAT GAG AAG GCT AGG ATT TTT CG
This study (modified from Price et al. 2004)
47
SWIFTLET PHYLOGENY II
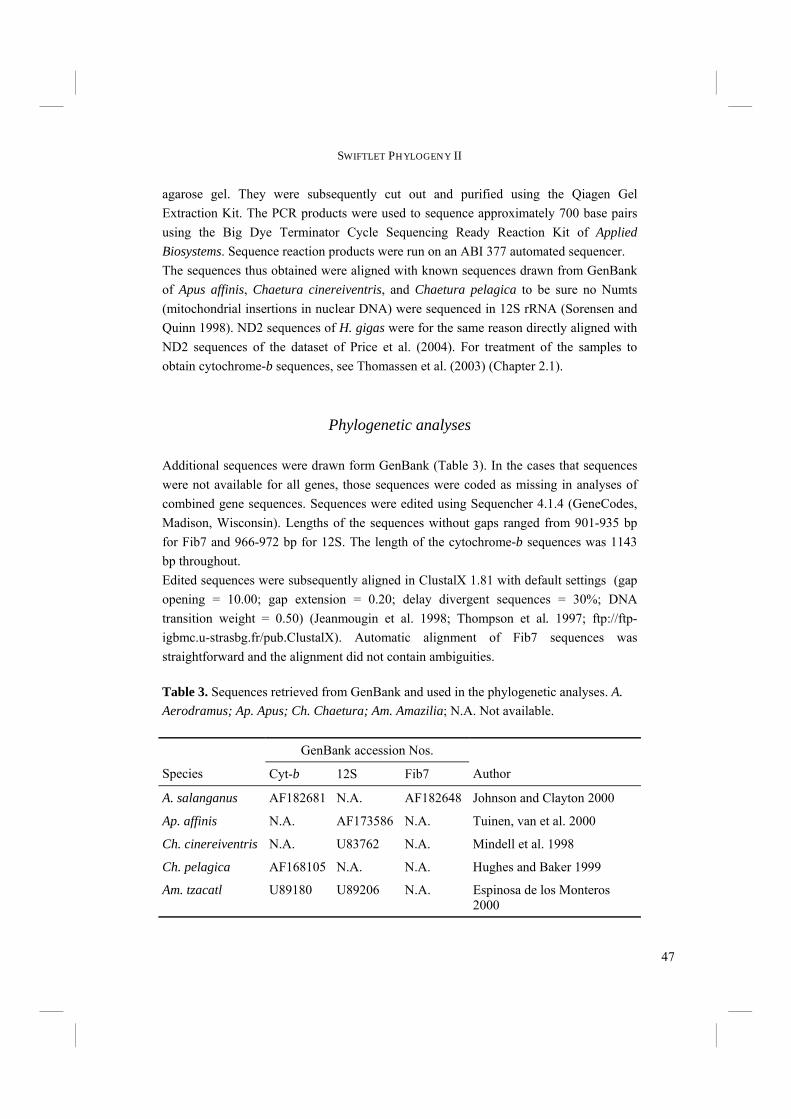
agarose gel. They were subsequently cut out and purified using the Qiagen Gel Extraction Kit. The PCR products were used to sequence approximately 700 base pairs using the Big Dye Terminator Cycle Sequencing Ready Reaction Kit of Applied Biosystems. Sequence reaction products were run on an ABI 377 automated sequencer. The sequences thus obtained were aligned with known sequences drawn from GenBank of Apus affinis, Chaetura cinereiventris, and Chaetura pelagica to be sure no Numts (mitochondrial insertions in nuclear DNA) were sequenced in 12S rRNA (Sorensen and Quinn 1998). ND2 sequences of H. gigas were for the same reason directly aligned with ND2 sequences of the dataset of Price et al. (2004). For treatment of the samples to obtain cytochrome-b sequences, see Thomassen et al. (2003) (Chapter 2.1).
Phylogenetic analyses Additional sequences were drawn form GenBank (Table 3). In the cases that sequences were not available for all genes, those sequences were coded as missing in analyses of combined gene sequences. Sequences were edited using Sequencher 4.1.4 (GeneCodes, Madison, Wisconsin). Lengths of the sequences without gaps ranged from 901-935 bp for Fib7 and 966-972 bp for 12S. The length of the cytochrome-b sequences was 1143 bp throughout. Edited sequences were subsequently aligned in ClustalX 1.81 with default settings (gap opening = 10.00; gap extension = 0.20; delay divergent sequences = 30%; DNA transition weight = 0.50) (Jeanmougin et al. 1998; Thompson et al. 1997; ftp://ftp-igbmc.u-strasbg.fr/pub.ClustalX). Automatic alignment of Fib7 sequences was straightforward and the alignment did not contain ambiguities.
Table 3. Sequences retrieved from GenBank and used in the phylogenetic analyses. A. Aerodramus; Ap. Apus; Ch. Chaetura; Am. Amazilia; N.A. Not available.
Species Cyt-b 12S Fib7 Author
A. salanganus AF182681 N.A. AF182648 Johnson and Clayton 2000
Ap. affinis N.A. AF173586 N.A. Tuinen, van et al. 2000
Ch. cinereiventris N.A. U83762 N.A. Mindell et al. 1998
Ch. pelagica AF168105 N.A. N.A. Hughes and Baker 1999
Am. tzacatl U89180 U89206 N.A. Espinosa de los Monteros 2000
GenBank accession Nos.
48
CHAPTER 2.2
Around a few indels in the 12S rRNA alignment ambiguities arose. Maximum Parsimony trees of the automatic alignment and of several manually adjusted alignments were compared to test whether differences in the alignment would result in different tree topologies. However, no clear differences were found. Further analyses have therefore been performed using the automatic alignment. Ti-distances of cyt-b, 12S, and Fib7 sequences were plotted against the corresponding Tv-distances to estimate the amount of saturation. A non-linear relationship of Ti:Tv distances is assumed to be indicative for saturation (e.g. Johnson et al. 2001). Partition Homogeneity Tests (Farris et al. 1994, 1995; Mickevich and Farris 1981) were performed to determine whether the genes contain congruent phylogenetic information. If the phylogenetic information is significantly different between two or more sequences, those sequences should not be pooled into a single analysis (Farris et al. 1994, 1995; Mickevich and Farris 1981). Maximum Parsimony (MP) and Maximum Likelihood (ML) analyses were performed in PAUP* version 4.0b10 (Swofford 1998). Bayesian analyses were performed in MrBayes 3.0B (Huelsenbeck and Ronquist 2001; http://brahms.biology.rochester.edu/software.html).
MP trees were created using full heuristic search (Tree-Bisection-Resection) using random addition sequence (100 repetitions for our own dataset and 10 repetitions for the combined data sets of H. gigas and that of Price et al. (2004)) and equally weighted unordered characters. Bootstrap trees (Felsenstein 1985) were computed using full heuristic search with 1000 replicates and branch swapping algorithm and random addition sequence (10 repetitions).
For each gene MrModelblock (Nylander 2004) was used to calculate the parameters of 24 different evolutionary models in PAUP* version 4.0b10 (Swofford 1998) in order to estimate the most likely evolutionary model of DNA change. The outcomes from MrModelblock were subsequently tested in MrModeltest 2.0 (Nylander 2004; http://www.ebc.uu.se/systzoo/staff/nylander.html). The Akaike Information Criterion (AIC) (Akaike 1974) was used to select the optimal evolutionary model to be implemented in ML and Bayesian analyses. For cytochrome-b the Hasegawa-Kishino-Yano model with invariant sites and gamma distribution (HKY + I + G) was used. For 12S rRNA the General Time Reversible model with gamma distribution (GTR + G) and for Fib7 the Hasegawa-Kishino-Yano model with invariant sites (HKY + I) came out to be the most probable models for DNA evolution. For ML analysis of combined genes the General Time Reversible model with gamma distribution and invariant sites (GTR + G + I) was
49
SWIFTLET PHYLOGENY II
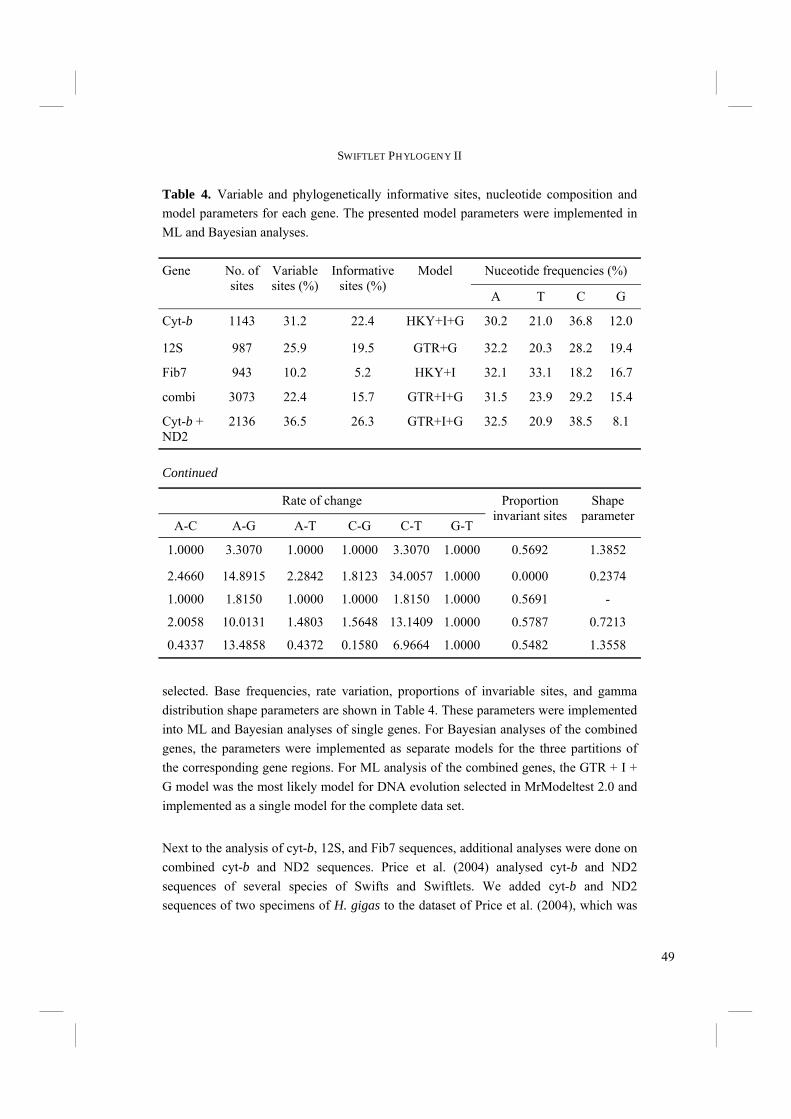
selected. Base frequencies, rate variation, proportions of invariable sites, and gamma distribution shape parameters are shown in Table 4. These parameters were implemented into ML and Bayesian analyses of single genes. For Bayesian analyses of the combined genes, the parameters were implemented as separate models for the three partitions of the corresponding gene regions. For ML analysis of the combined genes, the GTR + I + G model was the most likely model for DNA evolution selected in MrModeltest 2.0 and implemented as a single model for the complete data set.
Next to the analysis of cyt-b, 12S, and Fib7 sequences, additional analyses were done on combined cyt-b and ND2 sequences. Price et al. (2004) analysed cyt-b and ND2 sequences of several species of Swifts and Swiftlets. We added cyt-b and ND2 sequences of two specimens of H. gigas to the dataset of Price et al. (2004), which was
Continued
Table 4. Variable and phylogenetically informative sites, nucleotide composition and model parameters for each gene. The presented model parameters were implemented in ML and Bayesian analyses.
Rate of change Proportion invariant sites
A-C A-G A-T C-G C-T G-T
1.0000 3.3070 1.0000 1.0000 3.3070 1.0000 0.5692 1.3852
2.4660 14.8915 2.2842 1.8123 34.0057 1.0000 0.0000 0.2374
1.0000 1.8150 1.0000 1.0000 1.8150 1.0000 0.5691 -
2.0058 10.0131 1.4803 1.5648 13.1409 1.0000 0.5787 0.7213
0.4337 13.4858 0.4372 0.1580 6.9664 1.0000 0.5482 1.3558
Shape parameter
Gene No. of sites
Variable sites (%)
Informative sites (%)
Nuceotide frequencies (%)
A T C G
Cyt-b 1143 31.2 22.4 HKY+I+G 30.2 21.0 36.8 12.0
12S 987 25.9 19.5 GTR+G 32.2 20.3 28.2 19.4
Fib7 943 10.2 5.2 HKY+I 32.1 33.1 18.2 16.7
combi 3073 22.4 15.7 GTR+I+G 31.5 23.9 29.2 15.4
Cyt-b + ND2
2136 36.5 26.3 GTR+I+G 32.5 20.9 38.5 8.1
Model

50
CHAPTER 2.2
obtained from GenBank. The dataset was limited to Swiftlets and the Swifts Hemiprocne comata and Cypsiurus balasiensis. H. comata was used as outgroup. In subsequent analyses we followed the procedure of Price et al. (2004). A Partition Homogeneity Test (Farris et al. 1994, 1995; Mickevich and Farris 1981) revealed no conflicting signal between the cyt-b and ND2 data sets. The most likely model for DNA evolution of the combined data sets was estimated in MrModeltest 2.0 (Nylander 2004; http://www.ebc.uu.se/systzoo/staff/nylander.html). The General Time Reversible model with gamma distribution and invariant sites (GTR + G + I) could not be rejected in favour of simpler models. The parameters estimated by this analysis (Table 4) were incorporated in subsequent ML and Bayesian analyses. The remaining analyses were performed following the same procedures as described for cyt-b, 12S, and Fib7. For Bayesian analyses, the Markov Chain Monte Carlo process (MCMC) was set so that 4 chains ran simultaneously for 1.5x10⁶ generations, with trees being sampled every 100 generations. ML scores in Bayesian analyses were examined to determine the “burnin”. This is the time that is needed to reach a “steady state” of ML scores. The trees that were generated before burnin was reached were discarded as being uninformative. The remaining trees were used to build a majority rule consensus tree. Burnin was 1000 trees for 12S and Fib7, and 1500 trees for combined analysis of cytochrome-b, 12S, and Fib7. Burnin turned out to be 300 trees for combined analysis of cyt-b and ND2 of the merged data sets of Price et al. (2004) and H. gigas.
R2
= 0.4487
0
0.02
0.04
0.06
0.08
0.1
0.12
0.14
0.16
0 0.01 0.02 0.03 0.04
Uncorrected Tv distance 12S
Un
co
rre
cte
dT
id
ista
nc
e1
2S
R2
= 0.8124
0
0.01
0.02
0.03
0.04
0.05
0 0.005 0.01 0.015 0.02 0.025
Uncorrected Tv distance Fib7
Un
co
rre
cte
dT
id
ista
nc
eF
ib7
A
B
C
R2 = 0,2475
0
0,02
0,04
0,06
0,08
0,1
0,12
0,14
0 0,02 0,04 0,06
Uncorrected Tv distances Cyt-b
Un
co
rre
cte
dT
id
ista
nc
es
Cy
t-b
Uncorrected Tv distances cyt-b
Un
co
rre
cte
dT
id
ista
nce
scyt-
b
00.02 0.04 0.06
0.04
0.08
0.12
0.02 0.040
0.06
0.12
Uncorrected Tv distances 12S
Un
co
rre
cte
dT
id
ista
nce
s1
2S
0.020.01
0.02
0.04
Uncorrected Tv distances Fib 7
Un
co
rre
cte
dT
id
ista
nce
sF
ib7
Fig. 1. Plots of pairwise divergence of transitions (Ti) against transversions (Tv) for (A) cytochrome-b (B) 12S and (C) Fib7.

51
SWIFTLET PHYLOGENY II
Results
Cytochrome-b, 12S, and Fib7
Sequence variation
Nucleotide composition and percentage of informative sites for all three genes are shown in Table 4. The two mitochondrial genes show much higher fractions of variable and phylogenetically informative sites than Fib7. We plotted for each gene Ti-distances versus Tv-distances to check whether the high variability of the mtDNA genes could be so severe that it caused the sequences to be saturated (Fig. 1). Cytochrome-b appears to be slightly saturated, but transversions appear to be still suitable for deeper node phylogeny (Meyer 1994). The Ti:Tv plot for 12S does not seem to be clearly different from that of cyt-b. Fib7 appears to be slightly less saturated than the mtDNA sequences. Overall, no obvious problems due to saturation were expected. Weighting schemes based on estimated Ti:Tv ratios were applied to assess whether this would result in different tree topologies.
12S rRNA
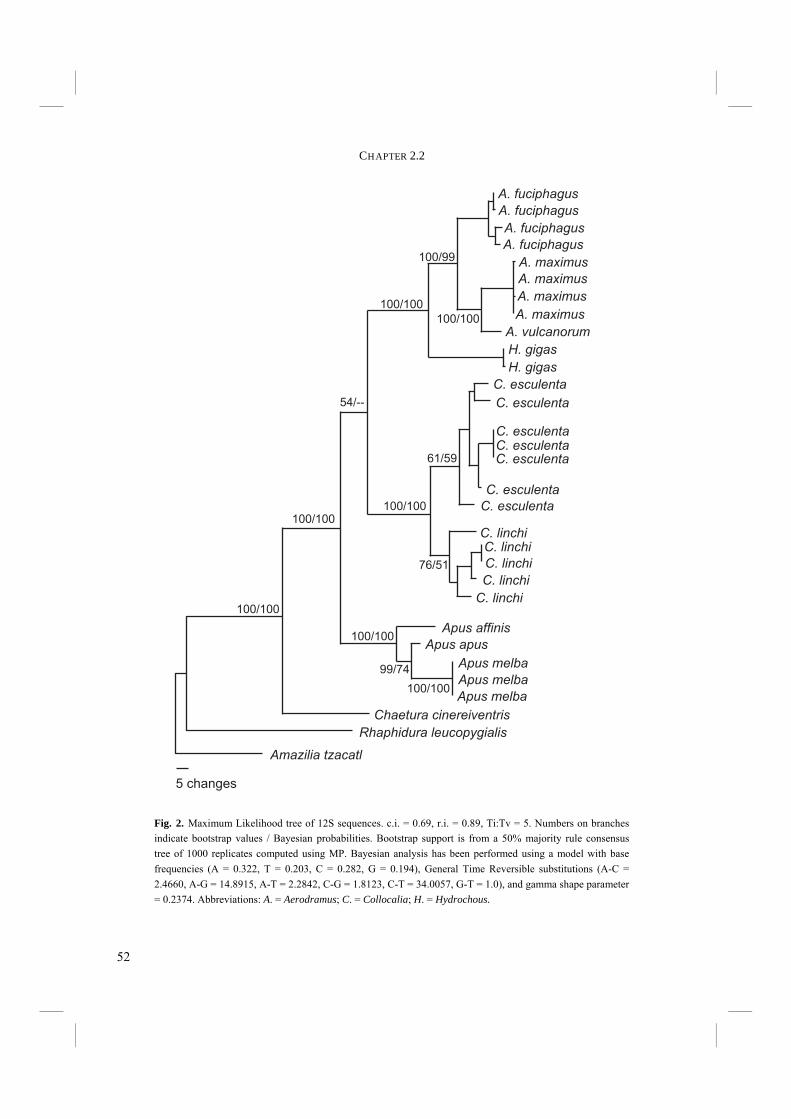
Unweighted MP analysis of 12S rRNA resulted in two trees with a length of 435 steps (c.i. = 0.69; r.i. = 0.89). The trees only differ in the internal relationship of C. esculenta specimens. The 50% majority rule consensus tree of 1000 bootstrap replicates has an identical topology to the strict consensus tree of the MP trees (Fig. 2). The estimated Ti:Tv ratio was 5:1. Weighting with this ratio generated a tree with identical topology and similar bootstrap values. The MP trees are not completely resolved in the shallower nodes. Bootstrap values are generally high (Fig. 2). H. gigas is placed as the sistergroup of Aerodramus with 100% bootstrap support. However, the branch leading to the Collocaliini is not well supported with a bootstrap value of only 54%. Also the branch leading to C. esculenta is not particularly well supported (61%). ML analysis using a GTR + G model (Table 4) resulted in one tree with a topology that is similar to that of the MP bootstrap tree (Fig. 2). However, in the ML tree the relation between Collocalia, Aerodramus+Hydrochous, and Apus is not resolved at all. Shallower nodes are partly unresolved as in the MP bootstrap tree.
52
CHAPTER 2.2
Fig. 2. Maximum Likelihood tree of 12S sequences. c.i. = 0.69, r.i. = 0.89, Ti:Tv = 5. Numbers on branches indicate bootstrap values / Bayesian probabilities. Bootstrap support is from a 50% majority rule consensus tree of 1000 replicates computed using MP. Bayesian analysis has been performed using a model with base frequencies (A = 0.322, T = 0.203, C = 0.282, G = 0.194), General Time Reversible substitutions (A-C = 2.4660, A-G = 14.8915, A-T = 2.2842, C-G = 1.8123, C-T = 34.0057, G-T = 1.0), and gamma shape parameter = 0.2374. Abbreviations: A. = Aerodramus; C. = Collocalia; H. = Hydrochous.
Rhaphidura leucopygialis
C. linchi
A. maximus
A. fuciphagus
A. vulcanorum
Apus apus
H. gigas
H. gigas
C. esculenta
C. esculenta
C. esculentaC. esculentaC. esculenta
C. esculenta
C. esculenta
C. linchi
C. linchi
C. linchi
C. linchi
A. maximus
A. maximus
A. maximus
A. fuciphagus
A. fuciphagus
A. fuciphagus
Amazilia tzacatl
Apus melba
Apus melba
Apus melba
Apus affinis
Chaetura cinereiventris
5 changes
100/100
100/99
100/100
100/100
61/59
76/51
100/100
99/74
100/100
54/--
100/100
100/100
53
SWIFTLET PHYLOGENY II
The Bayesian consensus tree with GTR + G model (Fig. 2) shows identical topology to the tree resulting from ML analysis. The majority of the nodes is strongly supported. However, support is low for nodes within the C. esculenta clade (59%), within C. linchi clade (51%), and within the Apus clade (74%). The placement of H. gigas as the sistergroup of Aerodramus is again strongly supported, but monophyly of the Swiftlets is uncertain.
Fib7 Unweighted MP analysis of Fib7 sequences resulted in 64 equally parsimonious trees of 107 steps (c.i. = 0.95 and r.i. = 0.85). The strict consensus tree is shown in Figure 3. The main differences of the 64 MP trees are in the placement of the clades Aerodramus + Hydrochous, Collocalia, and Apus. There are also differences in the shallower nodes of the trees. The placement of Hydrochous is in all trees unambiguously as the sistergroup of Aerodramus. The 50% majority rule tree of 1000 replicates bootstrapped MP analysis (Fig. 4) has many unresolved intra-species nodes, similar to the MP consensus tree. The position of Hydrochous as the sistergroup of Aerodramus is resolved, but not well supported (65%). Weighting with the estimated Ti:Tv ratio of 1.8:1 did not result in a different tree topology nor in very different bootstrap values. ML analysis with the HKY + I model (Table 4) resulted in two most likely trees that only differ in placement of specimens within a species clade (Fig. 5). Apus is placed as the sistergroup of the Collocaliini and Hydrochous is placed as the sistergroup of Aerodramus. However, Bayesian probabilities are low for those two nodes (Fig. 4). The displayed placement of Apus in relation to the Collocaliini is present in only 57% of the trees. Furthermore, Hydrochous is in only 75% of the trees placed as the sistergroup of Aerodramus.
Combined analysis of cyt-b, 12S, and Fib7 The Partition Homogeneity (PH) test is commonly used to assess whether two different data sets are congruent in their phylogenetic signal (Farris et al. 1994, 1995). A PH test for our data sets showed that 12S and Fib7 as well as 12S and cyt-b have essentially the same phylogenetic information (p > 0.05). However, cytochrome-b is significantly different from Fib7 (p < 0.01). Consequently, the data sets should not be combined
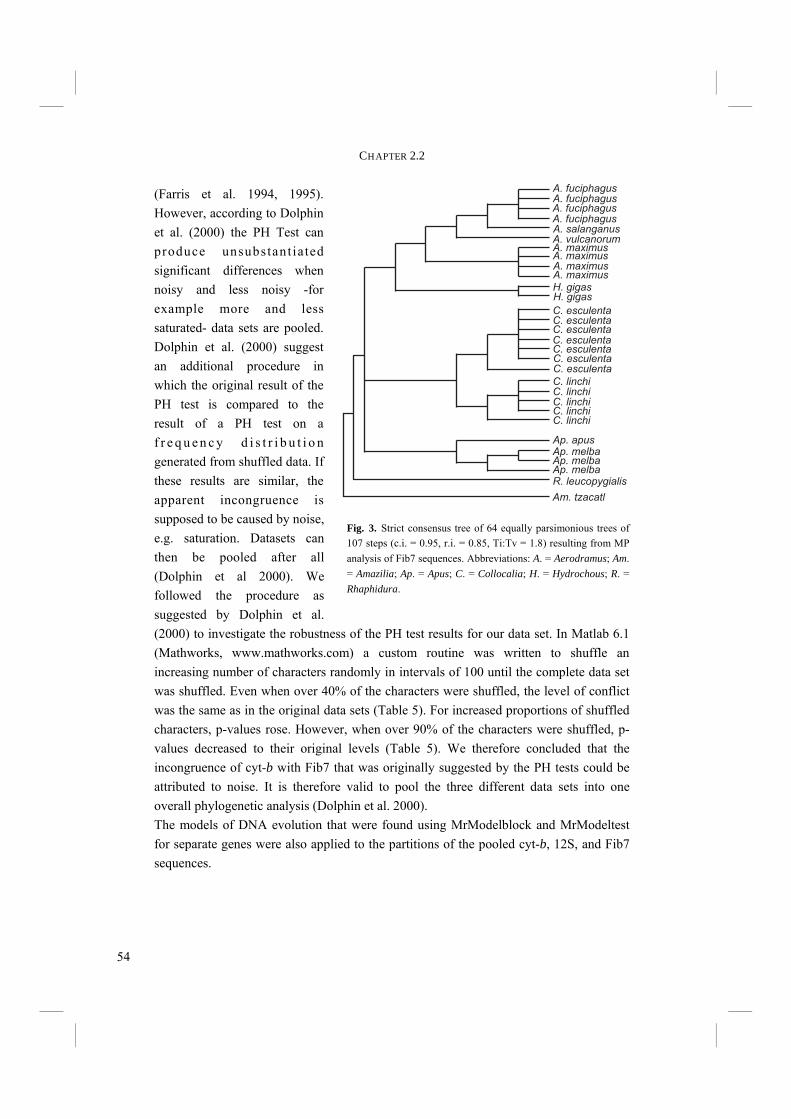
54
CHAPTER 2.2
(Farris et al. 1994, 1995). However, according to Dolphin et al. (2000) the PH Test can produce unsubstant iated significant differences when noisy and less noisy -for example more and less saturated- data sets are pooled. Dolphin et al. (2000) suggest an additional procedure in which the original result of the PH test is compared to the result of a PH test on a f r e q u e n c y d i s t r i b u t i o n generated from shuffled data. If these results are similar, the apparent incongruence is supposed to be caused by noise, e.g. saturation. Datasets can then be pooled after all (Dolphin et al 2000). We followed the procedure as suggested by Dolphin et al. (2000) to investigate the robustness of the PH test results for our data set. In Matlab 6.1 (Mathworks, www.mathworks.com) a custom routine was written to shuffle an increasing number of characters randomly in intervals of 100 until the complete data set was shuffled. Even when over 40% of the characters were shuffled, the level of conflict was the same as in the original data sets (Table 5). For increased proportions of shuffled characters, p-values rose. However, when over 90% of the characters were shuffled, p-values decreased to their original levels (Table 5). We therefore concluded that the incongruence of cyt-b with Fib7 that was originally suggested by the PH tests could be attributed to noise. It is therefore valid to pool the three different data sets into one overall phylogenetic analysis (Dolphin et al. 2000). The models of DNA evolution that were found using MrModelblock and MrModeltest for separate genes were also applied to the partitions of the pooled cyt-b, 12S, and Fib7 sequences.
A. fuciphagus
A. salanganusA. vulcanorum
A. maximus
H. gigas
R. leucopygialisAp. melba
Ap. apus
C. linchi
C. esculenta
A. fuciphagusA. fuciphagusA. fuciphagus
A. maximusA. maximus
A. maximus
H. gigas
C. esculentaC. esculentaC. esculenta
C. esculentaC. esculentaC. esculenta
C. linchi
C. linchi
C. linchi
C. linchi
Ap. melbaAp. melba
Am. tzacatl
Fig. 3. Strict consensus tree of 64 equally parsimonious trees of 107 steps (c.i. = 0.95, r.i. = 0.85, Ti:Tv = 1.8) resulting from MP analysis of Fib7 sequences. Abbreviations: A. = Aerodramus; Am. = Amazilia; Ap. = Apus; C. = Collocalia; H. = Hydrochous; R. = Rhaphidura.
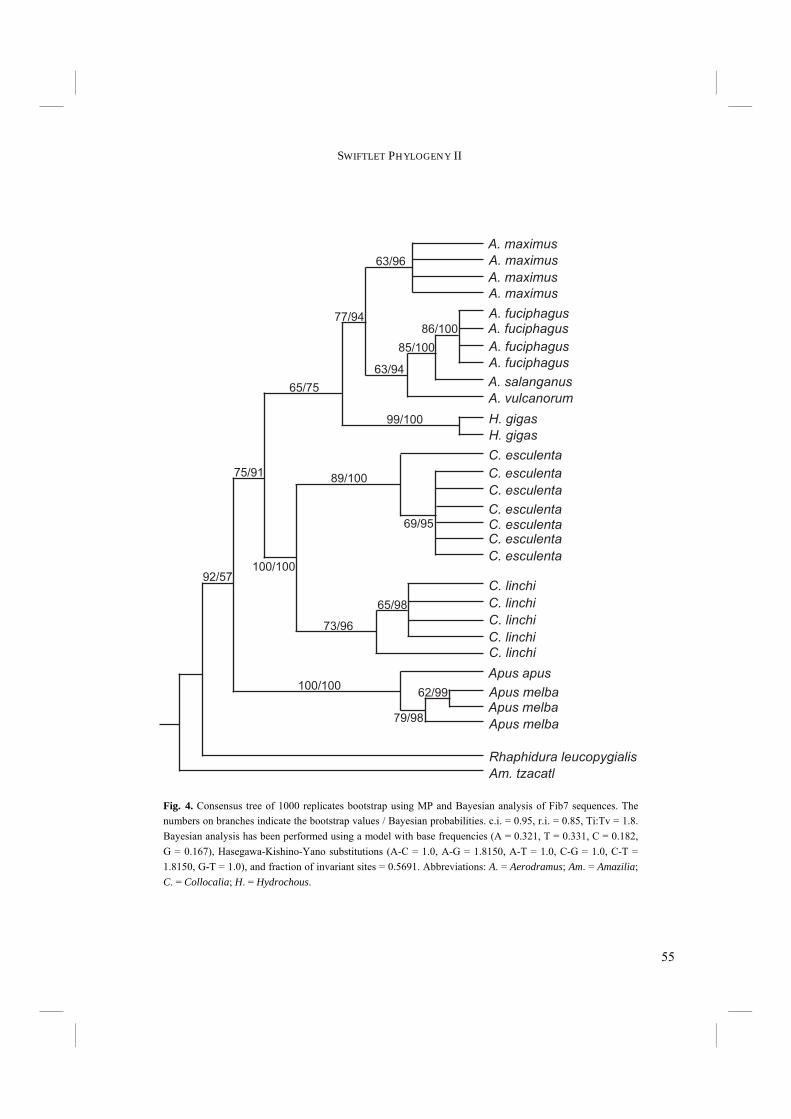
55
SWIFTLET PHYLOGENY II
Rhaphidura leucopygialis
C. linchi
A. maximus
A. fuciphagus
A. salanganus
A. vulcanorum
Apus apus
H. gigas
H. gigas
C. esculenta
C. esculentaC. esculentaC. esculenta
C. esculenta
C. esculenta
C. esculenta
C. linchiC. linchi
C. linchi
C. linchi
A. maximus
A. maximus
A. maximus
A. fuciphagus
A. fuciphagus
A. fuciphagus
Apus melba
Apus melbaApus melba
Am. tzacatl
63/96
77/94
85/100
63/94
86/100
99/100
65/75
89/100
69/95
100/100
75/91
92/57
100/100
73/96
65/98
79/98
62/99
Fig. 4. Consensus tree of 1000 replicates bootstrap using MP and Bayesian analysis of Fib7 sequences. The numbers on branches indicate the bootstrap values / Bayesian probabilities. c.i. = 0.95, r.i. = 0.85, Ti:Tv = 1.8. Bayesian analysis has been performed using a model with base frequencies (A = 0.321, T = 0.331, C = 0.182, G = 0.167), Hasegawa-Kishino-Yano substitutions (A-C = 1.0, A-G = 1.8150, A-T = 1.0, C-G = 1.0, C-T = 1.8150, G-T = 1.0), and fraction of invariant sites = 0.5691. Abbreviations: A. = Aerodramus; Am. = Amazilia; C. = Collocalia; H. = Hydrochous.
56
CHAPTER 2.2
Unweighted MP analysis of the combined data sets resulted in three trees of equal length (1388 steps; c.i. = 0.60 and r.i. = 0.82) (Fig. 6). The three trees only differ in the relationship of Rhaphidura and Chaetura. One of the species of Chaetura is in two trees placed with Rhaphidura, while in only one tree both Chaetura species are placed together as the sistergroup of Rhaphidura. The 1000 replicates bootstrap tree of MP analysis is well resolved, but shows fairly weak support of 67% for the
branch leading to Collocalia and Hydrochous + Aerodramus (Fig. 7). Chaetura is unresolved and bootstrap support between two individuals of Ap. melba is weak, but in the remainder of the tree bootstrap support is strong. Furthermore, Hydrochous is robustly placed as the sistergroup of Aerodramus. ML analysis resulted in one tree. The ML tree and Bayesian consensus tree are identical and completely resolved (Fig. 7). The majority of the nodes are well supported. Only two nodes do not have high Bayesian probabilities. The placement of Chaetura sp. is present in only 51% of the trees and the presented placement of Apus apus and Apus affinis is present in just 71% of the trees. The Apus clade is placed basal to the Collocaliini, which constitute a well supported (99%) monophyletic group. Collocalia is the sistergroup of Hydrochous + Aerodramus and Hydrochous is at the root of the Aerodramus clade.
Fig. 5. Consensus of the two most likely trees resulting from ML analysis of Fib7 sequences under a model with base frequencies (A = 0.321, T = 0.331, C = 0.182, G = 0.167), Hasegawa-Kishino-Yano substitutions (A-C = 1.0, A-G = 1.8150, A-T = 1.0, C-G = 1.0, C-T = 1.8150, G-T = 1.0), and fraction of invariant sites = 0.5691. Abbreviations: A. = Aerodramus; Am. = Amazilia; Ap. = Apus; C. = Collocalia; H. = Hydrochous; R. = Rhaphidura.
5 changes
A. fuciphagus
A. salanganusA. vulcanorum
A. maximus
H. gigas
R. leucopygialisAp. melba
Ap. apus
C. linchi
C. esculenta
A. fuciphagusA. fuciphagusA. fuciphagus
A. maximusA. maximus
A. maximus
H. gigas
C. esculentaC. esculentaC. esculenta
C. esculentaC. esculentaC. esculenta
C. linchi
C. linchi
C. linchi
C. linchi
Ap. melbaAp. melba
Am. tzacatl

57
SWIFTLET PHYLOGENY II
Chaetura pelagica
Chaetura cinereiventris
10 changes
A. fuciphagus
A. salanganus
A. vulcanorumA. maximus
H. gigas
R. leucopygialis
Ap. melba
Ap. apus
C. linchi
C. esculenta
A. fuciphagusA. fuciphagus
A. fuciphagus
A. maximusA. maximus
A. maximus
H. gigas
C. esculentaC. esculenta
C. esculenta
C. esculentaC. esculenta
C. esculenta
C. linchi
C. linchi
C. linchi
C. linchi
Ap. melbaAp. melba
Am. tzacatl
Ap. affinis
Fig. 6. Consensus tree from three MP trees (1388 steps; c.i. = 0.60 and r.i. = 0.82) resulting from analysis of combined data sets of cyt-b, 12S, and Fib7. Abbreviations: A. = Aerodramus; Am. = Amazilia; Ap. = Apus; C. = Collocalia; H. = Hydrochous; R. = Rhaphidura.
Table 5. Results of Partition Homogeneity Tests for cytochrome-b and Fib7 with increasing number of shuffled characters. Number of replicates = 1000, maximum number of trees (maxtree) is set to 6000.
% of shuffled characters 8 17 25 33 42 50 58 67 75 83 92 100
P-value .001 .001 .001 .001 .001 .731 .371 .099 .305 .044 .001 .001
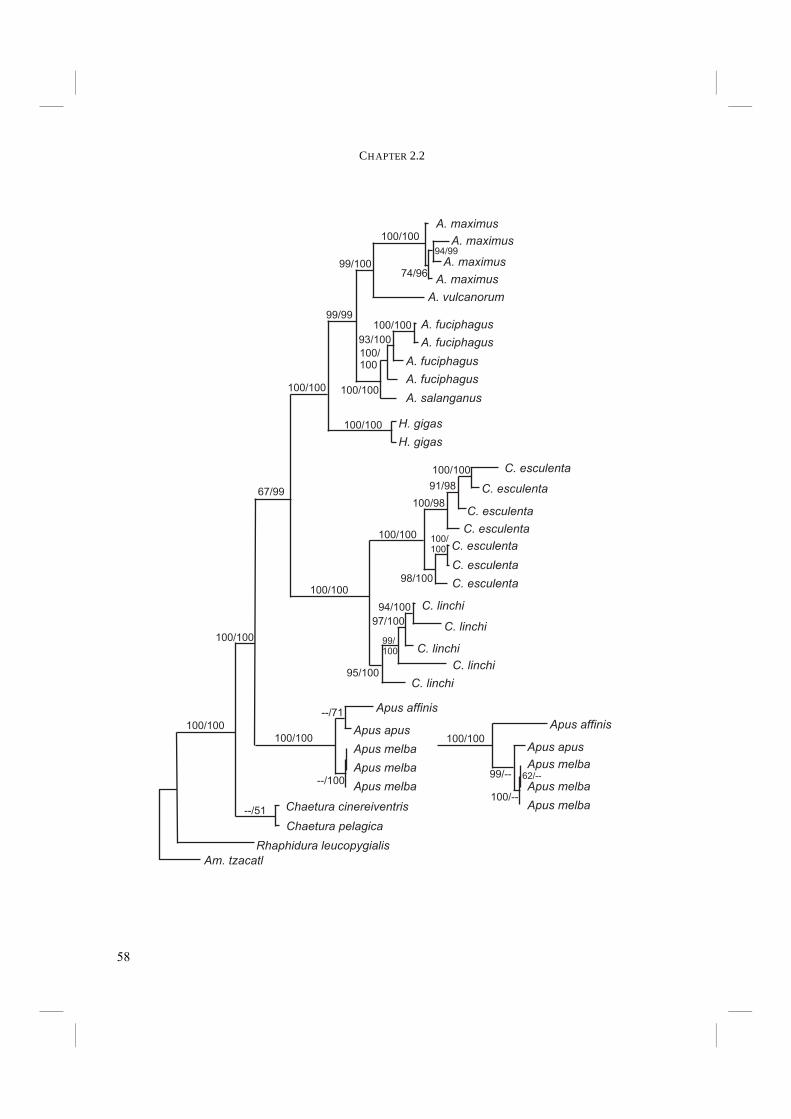
58
CHAPTER 2.2
98/100
94/100
97/100
Rhaphidura leucopygialis
C. linchi
A. maximus
A. fuciphagus
A. salanganus
A. vulcanorum
Apus apus
Chaetura pelagica
100/100
67/99
100/100
100/100
100/98
91/98
100/100
100/100
95/100
99/100
99/99
100/100
74/96
100/100
94/99
H. gigas
H. gigas100/100
100/100
100/100
93/100
100/100
C. esculenta
C. esculenta
C. esculenta
C. esculenta
C. esculenta
C. esculenta
C. esculenta
99/100
C. linchi
C. linchi
C. linchi
C. linchi
A. maximus
A. maximus
A. maximus
A. fuciphagus
A. fuciphagus
A. fuciphagus
Chaetura cinereiventris
Apus melba
Apus affinis
Apus melba
Apus melba
--/51
--/100
--/71
100/100Apus apus
Apus melba
Apus affinis
Apus melba
Apus melba100/--
62/--
100/100
99/--
Am. tzacatl
100/100

59
SWIFTLET PHYLOGENY II
Cytochrome-b and ND2
Sequence variation Nucleotide composition and percentages of informative sites for the combined data sets of cyt-b and ND2 are shown in Table 4. The total percentage of informative sites is even higher than in cyt-b alone.
Combined analysis of cyt-b and ND2 A partition homogeneity test of cyt-b and ND2 suggested that the two data sets are compatible and can be combined without problems (p = 0.47). MP analysis of the combined cyt-b and ND2 sequences resulted in 8 equally parsimonious trees (1170 steps; c.i. = 0.54; r.i. = 0.83). The strict consensus of the 8 MP trees is shown in Figure 8. The main difference between the trees is the placement of the clade comprising A. terraereginae and A. whiteheadi. Furthermore, within species clades specimens are shuffled among the trees. The uncertain placement of A. terraereginae and A. whiteheadi is reflected in the 1000 replicates MP bootstrap consensus tree (Fig. 9) in which this branch is supported by a bootstrap value of 70%. Furthermore, the placement of A. spodiopygius is uncertain as
Facing page: Fig. 7. Most likely tree resulting from ML analysis and consensus tree from Bayesian analysis of the pooled cyt-b, 12S, and Fib7 data sets. For ML analysis the following model was used: base frequencies (A = 0.315, T = 0.239, C = 0.292, G = 0.154), General Time Reversible substitutions (A-C = 2.0058, A-G = 10.0131, A-T = 1.4803, C-G = 1.5648, C-T = 13.1409, G-T = 1.0), gamma shape parameter = 0.7213, and fraction of invariant sites = 0.5787. Bayesian analysis was performed under models for each partition: cyt-b base frequencies (A = 0.302, T = 0.210, C = 0.368, G = 0.120), Hasegawa-Kishino-Yano substitutions (A-C = 1.0, A-G = 3.3070, A-T = 1.0, C-G = 1.0, C-T = 3.3070, G-T = 1.0), gamma shape parameter = 1.3852, and fraction of invariant sites = 0.5692; 12S: base frequencies (A = 0.322, T = 0.203, C = 0.282, G = 0.194), General Time Reversible sub-stitutions (A-C = 2.4660, A-G = 14.8915, A-T = 2.2842, C-G = 1.8123, C-T = 34.0057, G-T = 1.0), and gamma shape parameter = 0.2374; Fib7: base frequencies (A = 0.321, T = 0.331, C = 0.182, G = 0.167), Hase-gawa-Kishino-Yano substitutions (A-C = 1.0, A-G = 1.8150, A-T = 1.0, C-G = 1.0, C-T = 1.8150, G-T = 1.0), and fraction of invariant sites = 0.5691. Numbers on branches indicate bootstrap values / Bayesian probabili-ties. Bootstrap analysis was performed using MP and 1000 replicates. Bayesian analysis was performed using the model described above for ML analysis. The Apus clade differed in topology between bootstrap and Bayes-ian analysis. The topology shown in the tree resulted from Bayesian analysis, the topology shown as inset resulted from bootstrap analysis. Abbreviations: A. = Aerodramus; Am. = Amazilia; C. = Collocalia; H. = Hydrochous.
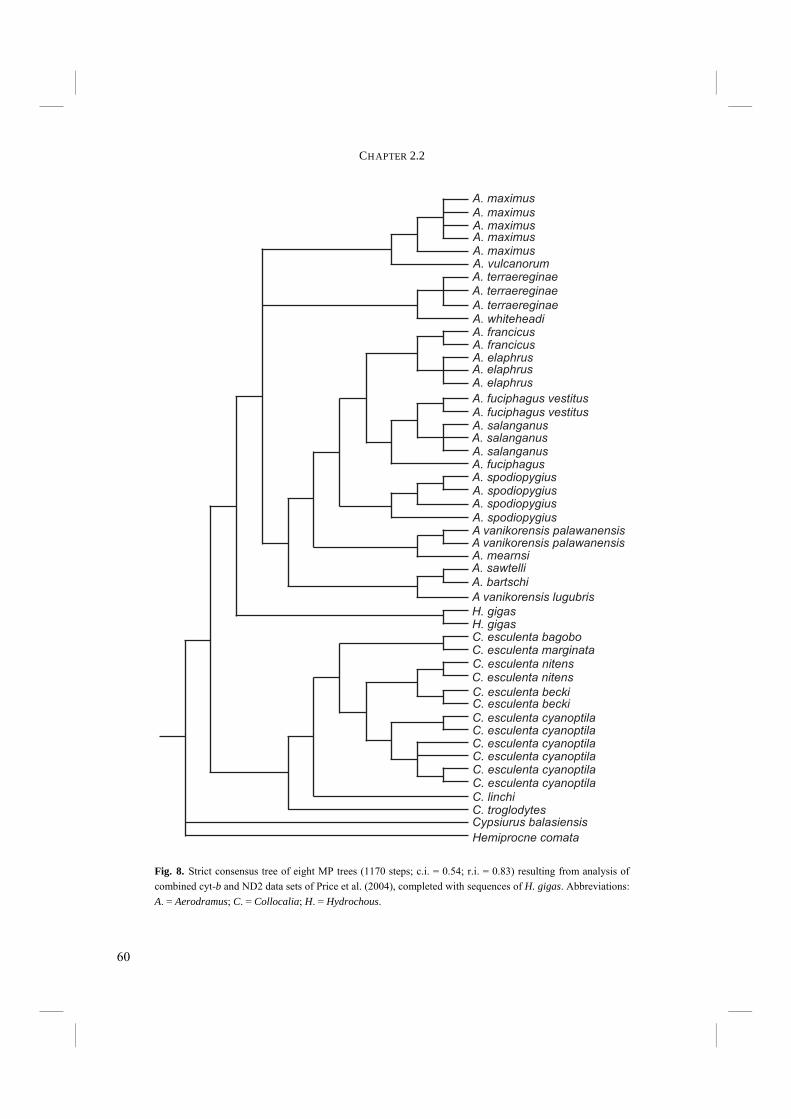
60
CHAPTER 2.2
Fig. 8. Strict consensus tree of eight MP trees (1170 steps; c.i. = 0.54; r.i. = 0.83) resulting from analysis of combined cyt-b and ND2 data sets of Price et al. (2004), completed with sequences of H. gigas. Abbreviations: A. = Aerodramus; C. = Collocalia; H. = Hydrochous.
Cypsiurus balasiensisC. troglodytesC. linchi
C. esculenta beckiC. esculenta becki
C. esculenta nitensC. esculenta nitensC. esculenta marginataC. esculenta bagobo
Hemiprocne comata
H. gigasH. gigas
A. sawtelli
A. bartschi
A. mearnsi
A. spodiopygiusA. spodiopygiusA. spodiopygiusA. spodiopygius
A. salanganusA. salanganusA. salanganus
A. maximusA. maximus
A. maximus
A. maximus
A. maximus
A. vulcanorum
A. terraereginae
A. terraereginae
A. terraereginae
A. whiteheadi
A. francicusA. francicus
A. elaphrusA. elaphrusA. elaphrus
A. fuciphagus vestitusA. fuciphagus vestitus
A. fuciphagus
A vanikorensis lugubris
A vanikorensis palawanensisA vanikorensis palawanensis
C. esculenta cyanoptilaC. esculenta cyanoptilaC. esculenta cyanoptilaC. esculenta cyanoptila
C. esculenta cyanoptilaC. esculenta cyanoptila
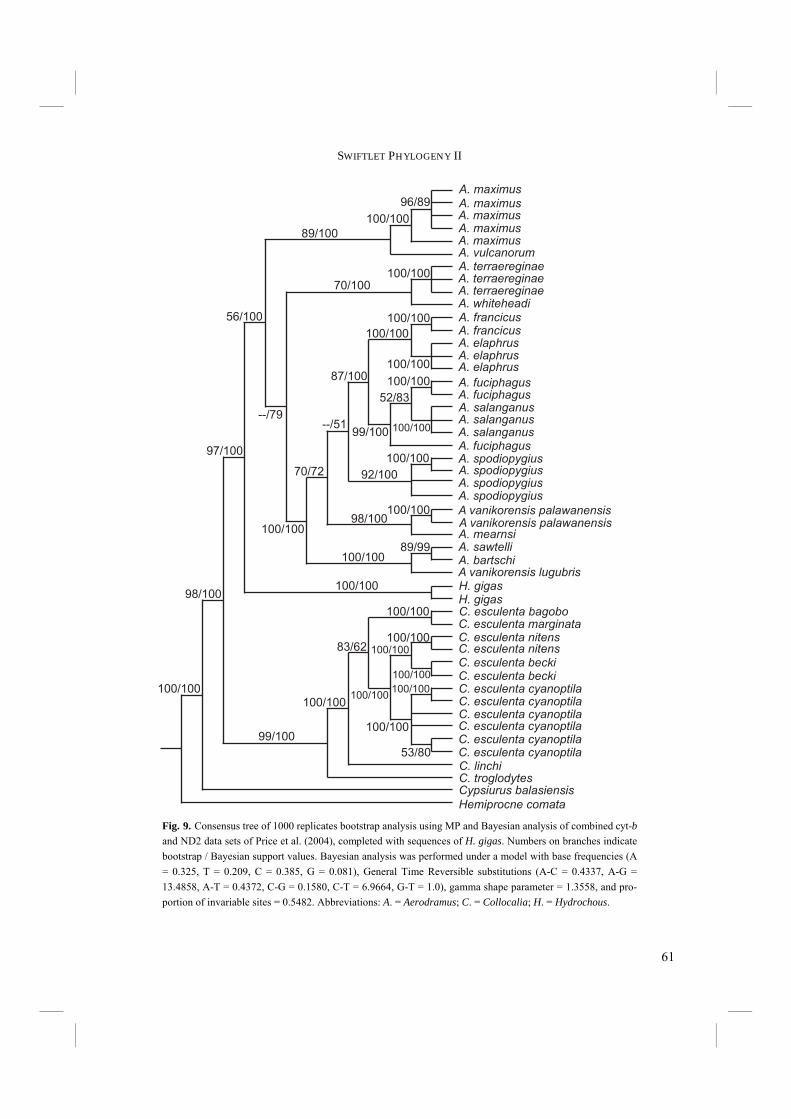
61
SWIFTLET PHYLOGENY II
Fig. 9. Consensus tree of 1000 replicates bootstrap analysis using MP and Bayesian analysis of combined cyt-b and ND2 data sets of Price et al. (2004), completed with sequences of H. gigas. Numbers on branches indicate bootstrap / Bayesian support values. Bayesian analysis was performed under a model with base frequencies (A = 0.325, T = 0.209, C = 0.385, G = 0.081), General Time Reversible substitutions (A-C = 0.4337, A-G = 13.4858, A-T = 0.4372, C-G = 0.1580, C-T = 6.9664, G-T = 1.0), gamma shape parameter = 1.3558, and pro-portion of invariable sites = 0.5482. Abbreviations: A. = Aerodramus; C. = Collocalia; H. = Hydrochous.
Cypsiurus balasiensisC. troglodytesC. linchi
C. esculenta beckiC. esculenta beckiC. esculenta nitensC. esculenta nitensC. esculenta marginataC. esculenta bagobo
Hemiprocne comata
H. gigasH. gigas
A. sawtelliA. bartschi
A. mearnsi
A. spodiopygiusA. spodiopygiusA. spodiopygiusA. spodiopygius
A. salanganusA. salanganusA. salanganus
A. maximusA. maximus
A. maximusA. maximus
A. maximus
A. vulcanorum
A. terraereginaeA. terraereginaeA. terraereginae
A. whiteheadi
A. francicusA. francicus
A. elaphrusA. elaphrusA. elaphrus
A. fuciphagusA. fuciphagus
A. fuciphagus
A vanikorensis lugubris
A vanikorensis palawanensisA vanikorensis palawanensis
C. esculenta cyanoptilaC. esculenta cyanoptilaC. esculenta cyanoptilaC. esculenta cyanoptila
C. esculenta cyanoptilaC. esculenta cyanoptila
96/89
100/100
89/100
100/10070/100
100/100
100/100
100/100
100/10087/100
56/100
--/79--/51
99/100
52/83
100/100
97/100
70/72
100/10098/100
92/100
100/100
89/99100/100
100/100
100/100
98/100
100/100
99/100
100/100
83/62 100/100100/100
100/100
100/100100/100
100/100
53/80
100/100
62
CHAPTER 2.2
well. Within Aerodramus support for several nodes is rather weak. The Collocaliini form a well supported monophyletic group (bootstrap value of 98%). The placement of Hydrochous as the sistergroup of Aerodramus is not well supported by its bootstrap value (56%). ML analysis with GTR + I + G model (Table 4) resulted in two trees that differ only slightly in relationships within species (Fig. 10). Bayesian analysis with the same model parameters resulted in nearly identical tree topology. Bayesian probabilities are shown on the corresponding nodes of the MP bootstrap tree (Fig. 9). Within Aerodramus several nodes are not well supported. However, placement of Hydrochous is consistent with the other trees and well supported by Bayesian probability (100%). Aerodramus as well as Collocalia form monophyletic groups (both 100% Bayesian support).
Discussion The position of Hydrochous is consistent throughout the various analyses as the sistergroup of Aerodramus, but not in each case supported by high bootstrap values. However, whereas analysis of the single gene cytochrome-b could not resolve the precise relationship of Hydrochous with Aerodramus (Thomassen et al. 2003; Chapter 2.1), analyses of single genes 12S and Fib7 as well as of pooled cyt-b, 12S, and Fib7 and pooled cyt-b and ND2 revealed that they are most likely sistergroups. Aerodramus and Collocalia form monophyletic clades in all trees. However, monophyly of the Collocaliini is not supported by all analyses. In certain trees Apus is placed within the Collocaliini. Nevertheless, monophyly of the Collocaliini seems substantiated by the analyses of pooled cyt-b, 12S, and Fib7, as well as of pooled cyt-b and ND2 sequences (this Chapter and Price et al. (2004)). Moreover, based on cyt-b (Thomassen et al. 2003; Chapter 2.1) monophyly of the Collocaliini was previously shown to be likely. Within the monophyletic Swiftlets, Collocalia is the sistergroup of Hydrochous + Aerodramus. The internal relationship of Aerodramus species was inconclusive in the trees presented by Price et al. (2004). Although the ML and Bayesian trees that result from combined analysis of cyt-b and ND2 (Fig. 9) are fully dichotomous at the species level and higher, Bayesian probabilities for several branches within Aerodramus remain unconvincing. The clades formed by A. terraereginae + A. whiteheadi and by A. spodiopygius appear to be the most problematic ones. Nevertheless, several clades have strong support. A. fuciphagus and A. salanganus are in all trees closely related. A. maximus and A. vulcanorum are in trees resulting from analyses of combined gene regions each others’ sistergroup. Furthermore, clades formed by A. vanikorensis lugubris + A. bartschi + A.

63
SWIFTLET PHYLOGENY II
Cypsiurus balasiensisC. troglodytes
C. linchi
C. esculenta beckiC. esculenta beckiC. esculenta nitensC. esculenta nitensC. esculenta marginataC. esculenta bagobo
Hemiprocnecomata
H. gigasH. gigas
A. sawtelliA. bartschi
A. mearnsi
A. spodiopygiusA. spodiopygiusA. spodiopygiusA. spodiopygius
A. salanganusA. salanganusA. salanganus
A. maximusA. maximus
A. maximusA. maximus
A. maximus
A. vulcanorum
A. terraereginaeA. terraereginaeA. terraereginae
A. whiteheadi
A. francicusA. francicus
A. elaphrusA. elaphrusA. elaphrus
A. fuciphagusA. fuciphagus
A. fuciphagus
A vanikorensis lugubris
A vanikorensis palawanensisA vanikorensis palawanensis
C. esculenta cyanoptilaC. esculenta cyanoptilaC. esculenta cyanoptilaC. esculenta cyanoptila
C. esculenta cyanoptilaC. esculenta cyanoptila
0.01 substitutions per site
Fig. 10. Consensus of two ML trees resulting from ML analysis of combined cyt-b and ND2 data sets of Price et al. (2004), completed with sequences of H. gigas. The two ML trees only differed in placements of specimens within species. ML analysis was performed using a model with base frequencies (A = 0.325, T = 0.209, C = 0.385, G = 0.081), General Time Reversible substitutions (A-C = 0.4337, A-G = 13.4858, A-T = 0.4372, C-G = 0.1580, C-T = 6.9664, G-T = 1.0), gamma shape parameter = 1.3558, and proportion of invariable sites = 0.5482. Abbreviations: A. = Aerodramus; C. = Collocalia; H. = Hydrochous.
64
CHAPTER 2.2
sawtelli and A. vanikorensis palawanensis + A. mearnsi are highly supported, just as those formed by A. francicus + A. elaphrus and several higher level clades (Fig. 9). The analyses of cyt-b (Thomassen et al. 2003; Chapter 2.1) and cyt-b, 12S, and Fib7 are based on a rather limited number of Swiftlet species, which might call the robustness of the conclusions based on that particular data set into question. However, from analyses of cyt-b and ND2, which include a more diverse set of species, the same conclusions can be drawn about monophyly of the Collocaliini and the position of Hydrochous and Collocalia.
Swiftlet taxonomy Price et al. (2004) have shown that Aerodramus spp. are not the only Swiftlets that are able to echolocate. Although C. troglodytes is a member of Collocalia, which was previously assumed to comprise only non-echolocating Swiftlets, it is without doubt able to echolocate. Furthermore, its position within the Collocalia clade is supported by the phylogenetic analyses of Price et al. (2004) and those presented in this study. These findings impair the current taxonomical classification of Swiftlets. The main argument advanced to subdivide Swiftlets into three different genera was based on echolocation ability (Brooke 1970, 1972). However, as echolocation ability is shown to be a paraphyletic trait, it has lost its power to discriminate between Aerodramus and Collocalia. Furthermore, external morphological characters, such as glossiness, as well as nest characters were shown to be of no or at most limited use in the taxonomical division of Swiftlets into three genera (e.g. Lee et al. 1996; Oberholser 1906; Salomonsen 1983; Somadikarta pers. com.). For example, the nests of A. whiteheadi are not of the “self-supporting bracket-shaped” type, regarded typically for the echolocating Aerodramus species, but described as “rounded vegetable nests…. apparently not incorporating nest cement” and are collected from a hollow tree (Chantler and Driessens 1995: 123-124; Medway 1966) Therefore, reverting to the original classification of Swiftlets into a single genus Collocalia s.l. Gray 1840 appears to be appropriate. The various subspecies studied of C. esculenta are relatively distantly related to each other, compared to several within-Aerodramus species relationships, e.g. A. francicus and A. elaphrus, or A. sawtelli, A. bartschi, and A. vanikorensis lugubris. Although the genetic divergence on its own can not be used to determine species boundaries, the results presented here do indicate that the C. esculenta complex in fact may comprise several different species. Other factors, such as vocalisations (Chapter 3.1) may also point in that direction.

65
SWIFTLET PHYLOGENY II
The treatment of placing Ap. melba melba together with an African species in a separate genus Tachymarptis (Chantler and Driessens 1995; Chantler et al. 1999; Sibley and Monroe 1990, 1993) is not substantiated by our results. We suggest it is better placed within the genus Apus.
Incongruence of data sets There is no clear consensus in the literature on the combined use of several different genes in a single analysis. Neither is there consensus on the combination of seemingly incongruent data sets. Our results appear to be consistent with the observation of Dolphin et al. (2000) that data sets, which are at first sight incongruent based on a partition homogeneity test, might in fact not be incongruent and consequently can be combined into a single analysis after all. The reason why a PH test of cyt-b and Fib7 suggested that they are incongruent remains unclear. No major differences between cyt-b and 12S in for example the amount of saturation are observed, but 12S is congruent with Fib7, whereas cyt-b is not. Nevertheless, the higher percentage of variable sites in cyt-b might be the reason for the incongruence that was originally suggested by the PH test. Analyses of 12S and Fib7 result in trees that are unresolved at places that are resolved in trees resulting form analyses of cyt-b. The other way around, cyt-b trees are unresolved in nodes that are well supported in 12S and Fib7 trees. Thus, inconclusiveness for certain nodes in one gene region appears to be complemented by conclusiveness of the other gene region. Inclusion of “incongruent” cytochrome-b with the combined dataset of 12S and Fib7 resulted in a better resolved and better supported tree (Fig. 7) than any of the trees that resulted from separate analyses (Fig. 2-6). Different genes evolving a range of rates thus resolve different parts of the phylogeny and advantages of all sets of information are as such combined.
Evolution of echolocation Echolocation might have arisen either once or twice. If it has evolved only once, i.e. at the base of the Swiftlets, it should consequently have been lost twice, i.e. in Hydrochous and in the branch leading to C. linchi and C. esculenta. Alternatively, echolocation might have evolved independently in Aerodramus and C. troglodytes. Theoretically, the former explanation would involve three events, whereas the latter explanation only needs two events. This would suggest that the latter explanation is the more likely one. However,

66
CHAPTER 2.2
echolocation ability depends on the co-operation of several subunits of the echolocation system. Acquiring echolocation ability might involve several events in each subunit, whereas loosing echolocation ability could be accomplished by loss of only one of several acquired features. Thus, biologically it might be easier to loose echolocation ability than to acquire it. Whether echolocation in Swiftlets evolved once or twice therefore remains unresolved. In the following chapters an attempt will be made to find out which of the two hypotheses is the most likely.
Acknowledgements. We are grateful to Dr. P. Bize (University of Bern, Switzerland) for putting the Apus melba samples at our disposal and to W. van Gestel (M.Sc.) (Wageningen University, The Netherlands) for Hummingbird samples. Prof. P. de Knijff (Leiden University) has advised us in preservation and storage of blood samples. Dr. R.G. Bout (Leiden University) is acknowledged for writing a randomization routine to shuffle characters in Matlab. Dr. H.C. den Bakker (National Herbarium of the Netherlands, Leiden) is kindly acknowledged for reviewing the paper and comments on the phylogenetic analyses.
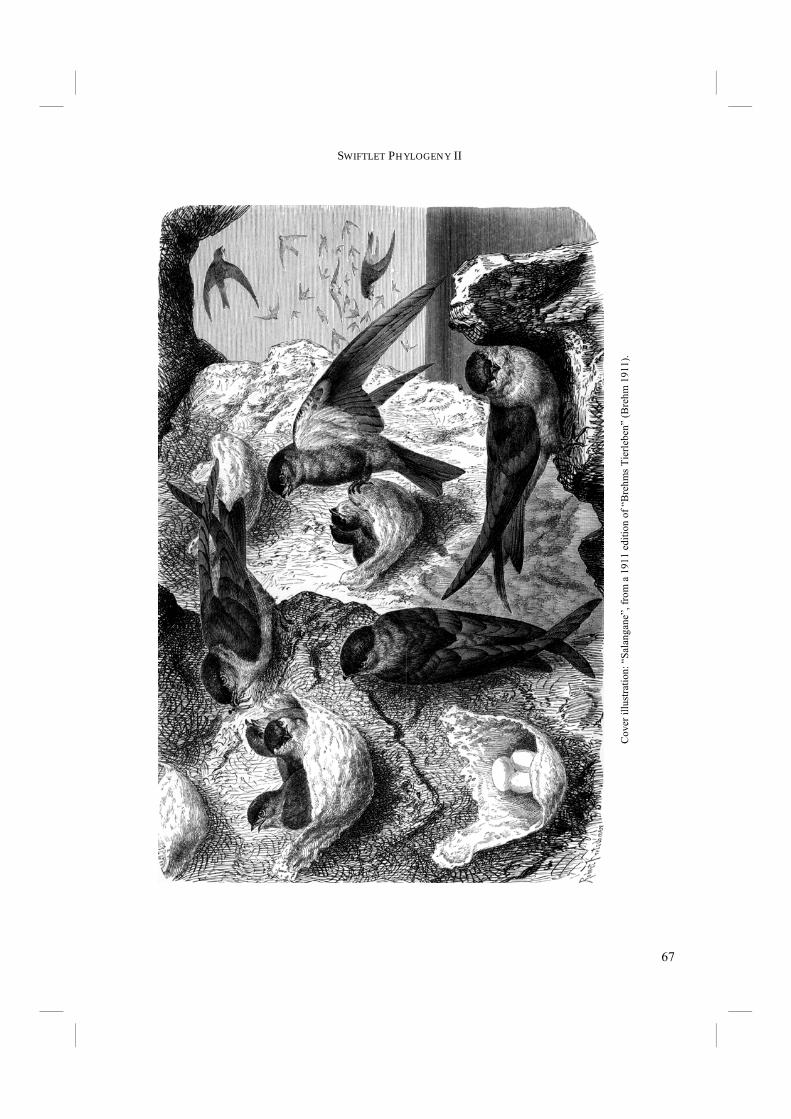
67
SWIFTLET PHYLOGENY II
Cov
er il
lust
ratio
n: “
Sala
ngan
e”, f
rom
a 1
911
editi
on o
f “B
rehm
s Tie
rlebe
n” (B
rehm
191
1).

68
CHAPTER 2.2
“Salangane swallow” from “Reptiles and birds” (Figuier, L. 1869. Cassell, London). Because of their highly resembling appearance and niche, the Swiftlets were sometimes thought to belong to the Swallows, which explains the title of the illustration.

69
CHAPTER 3
FROM SOUND TO SOUND PRODUCTION
3.1 COMPARATIVE AND PHYLOGENETIC ANALYSIS OF THE ECHO CLICKS AND SOCIAL VOCALISATIONS OF SWIFTS AND
SWIFTLETS (AVES: APODIDAE).
3.2 ECHO CLICK DESIGN IN SWIFTLETS: SINGLE AS WELL AS DOUBLE CLICKS.
3.3 SYRINGEAL DIFFERENCES BETWEEN ECHOLOCATING AND NON-ECHOLOCATING SWIFTLETS.

70
CHAPTER 3.1
71
CHAPTER 3.1
COMPARATIVE AND PHYLOGENETIC ANALYSIS OF THE ECHO CLICKS AND SOCIAL VOCALISATIONS OF SWIFTS
AND SWIFTLETS (AVES: APODIDAE).
This chapter has also been submitted for publication as: Thomassen, H.A. and Povel, G.D.E. Comparative and phylogenetic analysis of the echo
clicks and social vocalisations of Swifts and Swiftlets (Aves: Apodidae). Section of Evolutionary Morphology, Institute of Biology Leiden, Leiden University
72
CHAPTER 3.1
Abstract Several species of Swiftlets echolocate to find their way in the darkness of the caves where these birds nest. Vocal abilities may have played an important role in the evolution of echolocation. We investigated whether echo clicks and social vocalisations are different among species and whether they can be used in phylogenetic inference. Furthermore, we briefly discussed whether echo click features are present in social vocalisations and whether these features in social vocalisations form a consistent pattern towards the evolution of echolocation. We incorporated echo clicks of 8 Swiftlet species as well as the social vocalisations of 27 echolocating and non-echolocating Swifts and Swiftlets in our analyses. Characters in the frequency and time domain were measured and analysed in a multivariate way. We used Non Parametric Multivariate Analysis of Variance (NPMANOVA), Principal Components Analysis (PCA), and Stepwise Discriminant Analysis (SDA) to investigate differences between species. Furthermore, we performed Maximum Parsimony (MP) analyses and character mapping to investigate phylogenetic signal and evolutionary patterns of Swiftlet vocalisations. Echo clicks turned out to be species-specific. We hypothesise that echo clicks are not only used for navigation, but also in recognition of conspecifics. Differences might in some cases be caused by character displacement in co-occurring species. Social vocalisations are species-specific as well. The amount of phylogenetic interpretable information in the echo clicks and social vocalisations is minimal. MP trees of echo clicks as well as MP trees of social vocalisations were almost completely unresolved. Moreover, the branches that were resolved showed no congruence to a previously obtained DNA-based tree. Furthermore, mapping of the social vocalisation characters on the independent DNA-based tree did not result in consistent patterns for any of the measured characters. An evolutionary pattern of echo click features in social vocalisations towards echolocation was not apparent.

73
VOCALISATIONS
Introduction Vocalisations of Swiftlets (Apodidae: Collocaliini) are particularly interesting, because Swiftlets are almost unique among birds by the ability of some species to echolocate. The only other bird that is known to echolocate is the South American Oilbird (Steatornithidae: Steatornis caripensis). Swiftlets are small Swifts, occurring in Southeast Asia and islands of the Indian and Pacific Oceans. Like the Oilbird, Swiftlets roost and nest gregariously in caves or crevices. Swiftlets comprise of three genera, i.e. echolocating Aerodramus, non-echolocating Hydrochous and Collocalia, of which C. troglodytes is able to echolocate (Price et al. 2004). H. gigas nests next to or even behind a waterfall. Non-echolocating Swiftlets of the genus Collocalia inhabit the front ends of caves, where light conditions are still good enough to navigate on sight, whereas echolocating Swiftlets occupy the dark regions of caves. Echolocation is used to navigate in those dark parts of the caves. The sounds that Swiftlets use for echolocation are rather stereotyped clicks, which are usually of a double click, but sometimes also of a single click design (Fullard et al. 1993; Medway and Pye 1977; Thomassen et al. 2004, Chapter 3.2). The “double-click” echo click consists of two subsequent subclicks, which are perceived together as a single click by humans, but also by most birds (Fay 1988) and likely by Swiftlets. Although Swiftlets are insectivores, the frequencies of their echo clicks are because of the relatively long wavelengths not suitable for detection of small items, such as tiny insects (Griffin and Suthers 1970; Griffin and Thompson 1982; Langham 1980; Medway 1962, 1967, 1969). The use and acuity of echolocation have been studied quite extensively in several species (e.g. Carlson-Smith and Wiener 1996; Coles et al. 1987; Fenton 1975, 1980; Fullard et al. 1993; Griffin and Suthers 1970; Griffin and Thompson 1982; Medway and Pye 1977; Suthers and Hector 1982). However, as yet less attention has been paid to inter specific comparison of the structure of echo clicks. Similar echolocation systems in Aerodramus Swiftlets are expected due to their phylogenetically close relationship (Price et al. 2004; Thomassen et al. 2003; Chapter 2). The part of the echolocation system that from an evolutionary point of view is most likely to vary among species is the echo click. However, for optimal performance, an echolocation system may be limited in its design by physical properties of the sound producing apparatus and of the medium in which sound travels (Bradbury and Vehrencamp 1998). The echo click should be short in duration and with sharp on- and offset. It should be of large enough bandwidth, but the precise frequencies are likely to be of less importance (Suthers 2004). The habitat in which echolocation is used by the various echolocating Swiftlets is very similar for all species. Most echolocating Swiftlets
74
CHAPTER 3.1
roost and nest in limestone caves. In our sample, A. brevirostris and A. vulcanorum are the only exceptions, nesting in (volcanic) rock crevices. In such similar environmental conditions one may also expect similar echolocation systems across species. We examined whether the acoustic structure of the echo clicks of Swiftlets differs among species. Besides the inter specific comparison of echo clicks, even less attention has been paid to the structure of social vocalisations of Swiftlets. Chantler and Driessens (1995) and Fullard et al. (1993) made verbal descriptions of the uttered sounds. Smyth (1979) created sonograms of social vocalisations of C. esculenta and A. terraereginae. However, the analyses of Smyth (1979) were greatly complicated by the high amount of noise in his sound recordings (Smyth 1979). To our knowledge additional studies of the structure of social vocalisations of Swiftlets do not exist. We therefore investigated the species specificity of social vocalisations of Swiftlets and some Swifts.
Phylogenetic context The taxonomic classifications and phylogenetic relationships of Swiftlets have been debated for many years. Recent DNA-based phylogenies of Swiftlets confirm their originally assumed monophyletic status (Price et al. 2004; Thomassen et al. 2003; Chapter 2; see also Fig. 3). Furthermore, Swiftlets constitute at least two major clades. One is Collocalia Gray (1840) and the other is Aerodramus Oberholser (1906) + Hydrochous Brook (1972). Hydrochous is the sistergroup of Aerodramus and contains only one species, H. gigas (Chapter 2.2). The ability to produce echo clicks must have played an important role in the evolutionary development of echolocation. The novelty of echo click production may have merely been depending on a change in behaviour, but one or more morphological adaptations may also have been crucial. Because vocalisations appear to play such an important role in the evolution of echolocation, we investigated whether Swiftlet vocalisations are useful in phylogeny reconstruction. Behavioural characters such as vocalisations are often considered less reliable for phylogenetic inference than morphological and genetic characters, but several studies suggest that this assumption may not be valid. Nevertheless, homologous characters may be difficult to recognise and the hierarchical information difficult to find (e.g. Bretagnolle 1995; Kennedy et al. 1996; McCracken and Sheldon 1997; Patterson et al. 1995; Price and Lanyon 2002; Prum

75
VOCALISATIONS
1990; Winkler and Sheldon 1993). Besides the use of echo clicks and social vocalisations for phylogeny reconstruction, we also investigated whether echo click features can be found in social vocalisations of echolocating or of non-echolocating Swiftlets. Furthermore, if such features are present, we investigated whether these features appear to follow a consistent pattern towards echolocation ability. Recapitulating, we examined whether and how echo clicks and social vocalisations differ between Swift and Swiftlet species and between echolocating and non-echolocating Swiftlets. We measured several time and frequency parameters of the vocalisations. These parameters were analysed in a multivariate way to check for differences. Subsequently, the measured parameters were used to infer phylogenies based on echo click and social vocalisation parameters. These phylogenies were compared with the independently derived DNA-based phylogeny (Chapter 2.2; see also Fig. 3) to assess whether vocalisation characters are useful in phylogeny reconstruction. Finally, the social vocalisation characters were mapped on the DNA-based phylogeny to check whether echo click features in social vocalisations are restricted to (echolocating) Swiftlets or commonly found in many different species.
Material and methods
Recordings Vocalisations from different recordings, different localities and different contexts were included in the analyses. From personal field observations and recordings of vocalisations of Swifts and Swiftlets we know that the calls are fairly stereotyped within species at different times of the day, whether the birds are alone, flying in a flock, or are on or near the nest. The taxonomic nomenclature of Chantler et al. (1999) was followed except for A. vulcanorum. A. vulcanorum is not recognised as a separate species by Chantler et al. (1999), but as a subspecies of A. brevirostris. We recorded echo clicks and social vocalisations of A. fuciphagus, A. maximus, and A. vulcanorum. Furthermore, we recorded social vocalisations of C. esculenta, C. linchi, and Apus apus. Recordings were made with a Sony WM-D3 Professional tape recorder and Sony ECM-261 microphone. Additional recordings of A. vulcanorum and

76
CHAPTER 3.1
Species No. ech
No. ind
No. voc
No. ind
Distribution Reference numbers
Apodidae
Collocaliini
A. brevirostris 24 24 6 6 Him to Singapore NSA: pa62
A. elaphrus 25 24 Seychelles NSA: 28945
A. fuciphagus 26 11 10 6 Mal, S, J, B, L, Bo
NSA: 22460; 22459; 22461; Own rec.
A. hirundinaceus 13 6 Papua Courtesy of Dr. S. van Balen
A. maximus 10 10 9 6 Bo, J, S, Mal NSA: 22458; MB3 c4; MB6 c17; bbccdr/016/23; bbccdr/016/24; Own rec.
A. ocistus 8 8 Marquesas Islands NSA: 47716
A. salanganus 24 24 2 2 J, (S), Bo NSA: bbccdr/016/16b; bbccdr/016/17; bbccdr/016/18
A. terraereginae 24 20 6 6 N. Queensland (Australia)
NSA: 16497; DAS M31/47; DSAS MA 8/7
A. unicolor 6 6 S. India, Sri Lanka
NSA: WA1996/40
A. vanikorensis 14 10 4 4 Phil, Su, Papua NSA: 22463 LNS: 5509
A. vulcanorum 18 4 8 7 mountaintops J Own rec.; courtesy of Dr. S. van Balen
C. esculenta cyanoptila
10 10 Indo-Austr, except J
NSA: 7589; Own rec.
C. esculenta marginata
6 6 Phil NSA: WA(97/23-38b)
C. linchi 8 5 J, B, L, (S) Own rec.
H. gigas 6 4 mountaintop J NSA: 47788; Own rec.
Table 1. List of species for which sound recordings were analysed with reference numbers to recordings of NSA: National Sound Archive (British Library, London, UK), and LNS: Library of Natural Sounds (Cornell Lab of Ornithology, Ithaca, New York, USA). No. ech: number of echo clicks that were analysed; No. voc: number of vocalisations that were analysed; No. ind: number of individual birds that were incorporated in analysis of the echo clicks and vocalisations respectively (previous columns); A: Aerodramus; Ap: Apus; C: Collocalia; Ch: Chaetura; Cyp: Cypsiurus;

77
VOCALISATIONS
Cypse: Cypseloides; H: Hydrochous; He: Hemiprocne; Hir: Hirundapus; R: Rhaphidura; S: Streptoprocne; Austr: Australia; B: Bali; Bo: Borneo; Him: Himalaya; J: Java; L: Lombok; Mal: Malaysia; Phil: Philippines; S: Sumatra; Su: Sulawesi. For a more detailed description of distribution of species, see Chapter 1, Chapter 6, Chantler and Driessens (1995) or Chantler et al. (1999). Continued
Species No. ech
No. ind
No. voc
No. ind
Distribution Reference numbers
Apodini
Ap. apus 8 6 Palearctic Own rec.
Ap. pacificus 18 15 E and SE Asia NSA: WA1995/41:M24/9; WA 1995/41:M22/8; 14877
Cyp. balasiensis 20 15 S and SE Asia LNS: 2 71484
Cyp. parvus 27 20 sub-Saharan Africa NSA: cc1695; cc1696; cc1697; cc1698
Chaeturini
Ch. vauxi 41 20 M- and N-America LNS: 1 28313; 63125; 63130
Hir. caudacutus 3 3 Him, China, Austr NSA: WZZ006/5:3 88
Hir. cochinchinensis
7 7 Him, Bang, (Mal, S, J)
NSA: WA1995/06:3b
R. sabini 18 8 W- to Central- Africa
NSA: cc1689; cc20241
Cypseloidini
Cypse. niger 6 6 M- and N-America LNS: 5998
S. zonaris 10 5 M- and S-America NSA: 25143
Hemiprocnidae
He. comata 17 10 Phil, Mal, Bo, S NSA: 65236; 06389; 32541
He. longipennis 16 12 Mal, S, J, Bo, Su NSA: 14878; 33416
He. mystacea 16 14 Papua and surrounding islands
NSA: 29647; 43176

78
CHAPTER 3.1
recordings of A. hirundinaceus were kindly put to our disposal by Dr. S. van Balen (Wageningen University, The Netherlands). The remaining recordings were obtained from the National Sound Archive (British Library, London, United Kingdom) and the Library of Natural Sounds (Cornell Lab of Ornithology, Ithaca, New York, USA) (Table 1). Recordings were sampled using a sampling rate of 44.1 kHz. Sonograms were made on a PC using Avisoft SASLab Pro 3.82b (R. Specht, www.avisoft.de). Measurements were made with an FFt-size of 512 pt with resolution of 86 Hz in the frequency domain and
FFt-size of 256 pt with a resolution of 0.18 ms in the temporal domain. Analyses were performed on two data sets, i.e. that of echo clicks and that of social vocalisations. Echo clicks are by their sound and acoustic structure in a sonogram clearly distinguishable from social vocalisations. Echo clicks consist usually of two subclicks (Fig. 1) and are used for navigation in the dark. Sometimes echo clicks of only a single click are emitted (e.g. Suthers and Hector 1982; Thomassen et al. 2004; Chapter 3.2). These single clicks are probably the second subclick in echo clicks of double click design (Suthers and Hector 1982). In this study only double click echo clicks were included. Occasionally echo clicks are also emitted while flocking in front of a cave (Medway 1962; pers. obs.). We analysed echo clicks of 8 species (Table 1), including 4 to 24 individuals per species. Each individual was represented by 1 to 5 vocalisations,
E1 E2
FMIN2
FMAX2
FMIN1
FMAX1
DT1 DT2DTINT
DF2DF1
00.01 0.03
10
time (s)
fre
qu
en
cy
(kH
z)
Fig. 1. Typical echo click, consisting of two subclicks, with measurements. E1 = first subclick; E2 = second subclick; FMIN1, FMAX1 = minimal and maximal frequencies of first subclick; FMIN2, FMAX2 = minimal and maximal frequencies of second subclick; DF1 = frequency bandwidth of first subclick; DF2 = frequency bandwidth of second subclick; DT1, DT2 = durations of first and second subclick; DTINT = duration of the silent interval between the subclicks.
79
VOCALISATIONS
which were averaged per individual (Table 1). A total of 165 echo clicks were included in the analyses. On some recordings only a single individual bird was identified by the recorder. On others a larger flock of vocalising birds was recorded. In many cases individual birds could be identified when passing over, repeatedly vocalising. We assumed that birds thus identified at different times of a recording of a large flock were different individuals. For the remaining two echolocating species included in Table 1, recordings of echo clicks were not available or suffered from high amounts of noise when echo clicks were emitted. However, good quality social vocalisations of these species were available and analysed. Social vocalisations are of much longer duration than echo clicks (Fig. 2). The acoustic structure of social vocalisations is very different from that of echo clicks and varies among species. Social vocalisations are used in general intraspecific communication. The only Swift known to use context-specific call types is Apus apus (Bretagnolle 1993). However, differences across call types are rather small. We included the common “Duet Screaming Call” of Ap. apus (type 6, Bretagnolle 1993) in our analyses. In total 27 species in 11 genera (Table 1) were included in our analyses of social calls. Of these species 10 are known to be able to echolocate. We analysed 2 to 20 individuals per species and each individual was represented by 1 to 3 vocalisations (Table 1), totalling 210 social vocalisations.
Analyses A typical echo click consists of two short subclicks with a silent interval (Fig. 1). The following echo click characters were measured: minimal and maximal frequencies of the first and second subclick (FMIN1, FMAX1, FMIN2, and FMAX2 respectively), bandwidth of the subclicks (DF1 and DF2), duration of both subclicks (DT1 and DT2), and duration of the silent interval between the two subclicks (DTINT). The measurements of social vocalisations comprise discrete characters (ordinal and nominal) as well as continuous ones (see also Fig. 2). The social vocalisations, or calls, were split up into syllables based on their acoustic structure. The number of syllables differed across species. It is difficult, if not impossible, to assess which syllables in one species are homologous with which syllables in other species. In an analysis of the complete vocalisation, this would cause numerous missing values for all non existing

80
CHAPTER 3.1
DTINTAV
FMAXFbMAX
FbMIN
DTSYL
FTMAX
FTMIN
DTCALL
S1 S2 S3
0.6
5
10
A. ocistus
A. salanganus
A. vanikorensis
A. vulcanorum
0.2 0.4 0.6
5
10
5
10
5
10
5
10
0.8
0.10 0.20
0.10 0.20
0.10 0.20
0.30
0.30
A. hirundinaceus
A. fuciphagus
A. terraereginae
0.2 0.4 0.6
5
10
0.40.2
5
10
0.10
A. unicolor
5
10
0.10 0.20
0.10
5
10A. maximus
frequency
(kH
z)
time (s)
Axis labels
FMIN
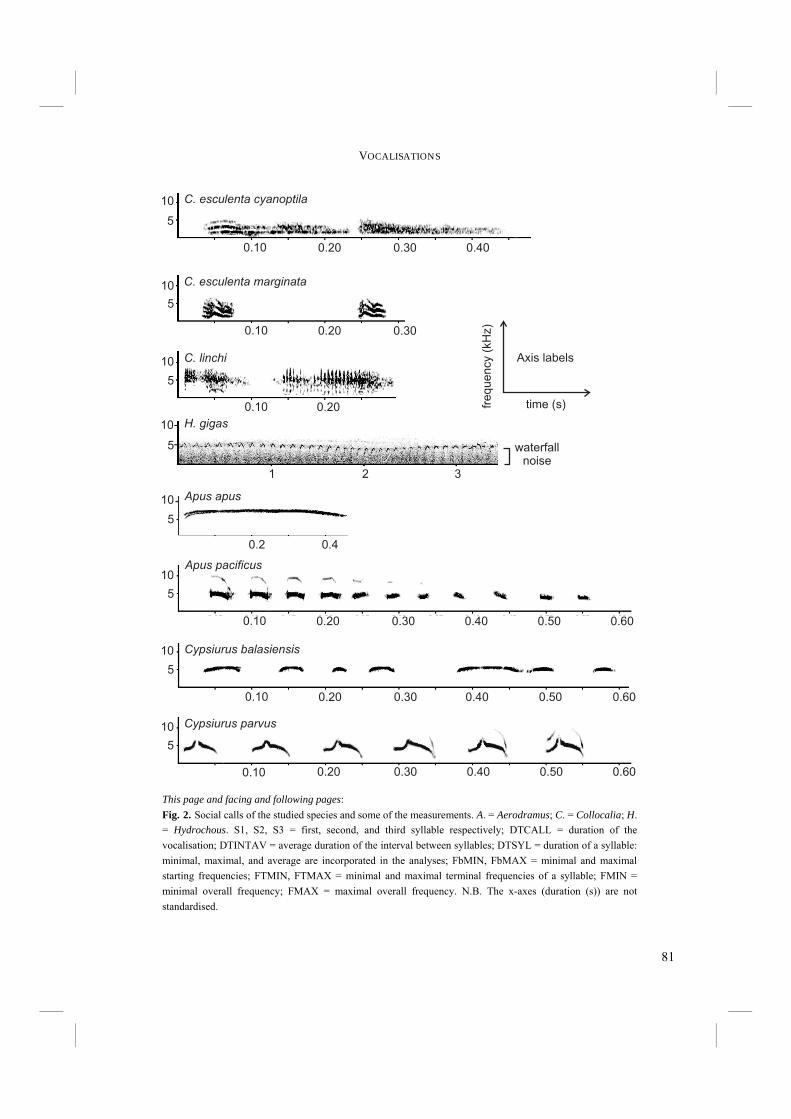
81
VOCALISATIONS
This page and facing and following pages: Fig. 2. Social calls of the studied species and some of the measurements. A. = Aerodramus; C. = Collocalia; H. = Hydrochous. S1, S2, S3 = first, second, and third syllable respectively; DTCALL = duration of the vocalisation; DTINTAV = average duration of the interval between syllables; DTSYL = duration of a syllable: minimal, maximal, and average are incorporated in the analyses; FbMIN, FbMAX = minimal and maximal starting frequencies; FTMIN, FTMAX = minimal and maximal terminal frequencies of a syllable; FMIN = minimal overall frequency; FMAX = maximal overall frequency. N.B. The x-axes (duration (s)) are not standardised.
C. esculenta cyanoptila
C. linchi
C. esculenta marginata
5
10
1 2 3
H. gigas
Apus apus
Apus pacificus
Cypsiurus balasiensis
0.10 0.20 0.30 0.40
0.10 0.20 0.30
0.10 0.20
0.10 0.20 0.30 0.40 0.50 0.60
0.10 0.20 0.30 0.40 0.50 0.60
0.2 0.4
5
10
5
10
5
10
5
10
5
10
5
10 Cypsiurus parvus
0.10 0.20 0.30 0.40 0.50 0.60
waterfallnoise
10
5
frequency
(kH
z)
time (s)
Axis labels
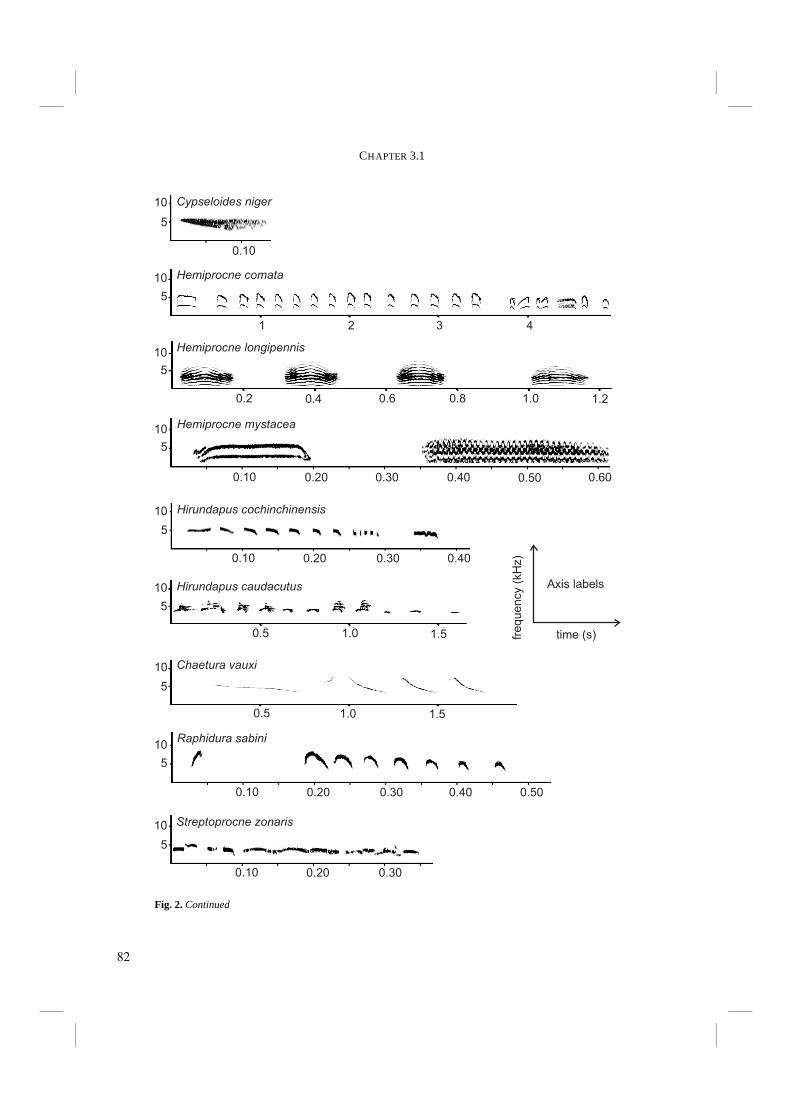
82
CHAPTER 3.1
Cypseloides niger
Hemiprocne comata
Hemiprocne longipennis
Hemiprocne mystacea
Hirundapus cochinchinensis
Hirundapus caudacutus
Chaetura vauxi
Raphidura sabini
Streptoprocne zonaris
0.10 0.20 0.30 0.40 0.50 0.60
0.10 0.20 0.30 0.40
0.10 0.20 0.30 0.40 0.50
0.10 0.20 0.30
0.10
1 2 3 4
0.2 0.4 0.6 0.8 1.0 1.2
0.5 1.0 1.5
0.5 1.0 1.5
10
5
10
5
10
5
10
5
10
5
10
5
10
5
10
5
10
5
frequency
(kH
z)
time (s)
Axis labels
Fig. 2. Continued
83
VOCALISATIONS
syllables in a vocalisation containing less than the observed maximal number of syllables. It was therefore impossible to analyse the vocalisations with each syllable included. Therefore, measurements were done on each syllable from which a description a complete vocalisation was subsequently made. The following measurements were carried out: total duration of the vocalisation (DTCALL); number of syllables in a vocalisation (NRSYL); minimal and maximal frequency at the start of the vocalisation (FSMIN, FSMAX) and at the end of the vocalisation (FEMIN, FEMAX); overall minimal and maximal frequencies (FMIN and FMAX); minimal and maximal starting frequencies (FbMIN and FbMAX) and terminal frequencies (FTMIN and FTMAX) of syllables, averaged for a vocalisation; maximal bandwidth (BW) in a vocalisation; minimal, maximal, and average duration of the syllables (DTSYLMIN, DTSYLMAX, and DTSYLAV); average length of the intervals between syllables (DTINTAV); number of rattles (short clicks) in the vocalisation (NRRATT); average duration of rattles, if present, and of the interval between rattles (DTRAT and DTINTRAT); overall shape of the syllable (i.e. straight ⎯, inclining /, declining \, u-shaped ∪, n-shaped ∩, or a complex of these last two ~) (SYLSHAPE); type of syllable (SYLTYPE: 1. without clear frequency structure or noisy; 2. line shape, or single frequency; or 3. a rattle; for examples see also Fig. 2); and presence or absence of harmonics (HARM) and Frequency Modulation (FM). Presence of different shapes and types of syllables in a complete vocalisation was coded in binary values. For presence or absence of harmonics and frequency modulation, the ratio was taken between the number of syllables in a call with harmonics or FM and the total number of syllables in the call. Statistical analyses were performed using SPSS 10.0. Continuous variables were not normally distributed and could not be transformed to become so. An NPMANOVA as implemented in PAST (Hammer et al. 2001) was used to check for significant differences between species and between echolocating and non-echolocating species. Euclidean distances were used for continuous data, Hamming distances were used for analyses of categorical data. Principal Components Analysis (PCA) with correlation matrix was used to analyse the variation among species and to check whether separate groups, i.e. species versus species or echolocaters versus non-echolocaters, could be recognised. Furthermore, Stepwise Discriminant Analysis (SDA) was performed to further test for differences between species and between echolocaters and non echolocaters in a multivariate way. SDA maximises group distances and allows for assessing the contribution of characters to the separation of groups. It can also test whether based on the measured characters members of an a priori set group are likely to belong to that group or more probably to

84
CHAPTER 3.1
another (leaving-one-out cross validation). An SDA with Wilks’ lambda was performed to check whether cases were a posteriori correctly classified into their a priori group. Furthermore, we inferred the important characters for group differentiation. To derive a data set that was suitable for phylogenetic analyses, continuous characters were first transformed into discrete ones using step-matrix gap-weighting (Wiens 2001). Additionally, in order to equally weight these transformed continuous and the discrete binary characters, step-matrices for discrete binary characters were created simply by giving the transformation from 0 to 1 the maximum weight of 1000. Maximum Parsimony (MP) trees were subsequently constructed using PAUP* version 4.10b (Swofford 1998), with random addition sequence (100 repetitions) and TBR branch swapping procedure. Bootstrap trees were calculated using full heuristic search with 1000 replicates and branch swapping. For the tree based on echo click parameters, an all-zeros outgroup was used, whereas for the analysis of social calls Hemiprocne (Hemiprocnidae) was used as the outgroup. The resulting trees were compared with an independently derived DNA-based tree (Fig. 3; Chapter 2.2). Finally, the echo clicks and social vocalisation characters of corresponding taxa were mapped on the independently derived DNA-based tree (Fig. 3; Chapter 2.2) using simple parsimony in MacClade 4.0 (Maddison and Maddison 2000). Each character was checked visually on its pattern on the tree and consistency and retention indices were calculated.
C. troglodytes
C. linchi
Swifts
H. gigas
A. sawtelliA. bartschi
A. mearnsi
A. spodiopygius
A. salanganus
A. maximusA. vulcanorum
A. terraereginae
A. whiteheadiA. francicus
A. elaphrus
A. fuciphagus vestitus
A. fuciphagus germani
A vanikorensis lugubris
A vanikorensis palawanensis
C. esculenta cyanoptila
89/100
70/100
100/100
87/100
56/100
--/79 --/5199/100
52/83
97/100 70/72
100/100
98/100
89/99100/100
98/100
99/100100/100 C. esculenta marginata
85
VOCALISATIONS
Results
Echo clicks Averages and standard deviations of the measured echo click characters of each species are shown in Table 2. An NPMANOVA with Euclidean distance showed significant differences between species (F=18.36, p<0.001). Total variance is larger than the variance within species (total sum of squares = 6.17; within species sum of squares = 3.47). A PCA on the ranged echo click parameters shows the total variation among the analysed species. The first principal component (PC1) explained 36.0% of total variance. PC2 and PC3 explained 23.1% and 18.3% of total variance, respectively. A componentplot of PC1 against PC2 shows considerable overlap between species (Fig. 4A). However, some species are distinguishable from others. For example, A. vulcanorum forms in a plot of PC1 and PC2 (Fig. 4A) a separate group from A. salanganus, A. maximus, and A. brevirostris. Furthermore, in the same plot A. vanikorensis is different from A. maximus and A. salanganus (Fig. 4A). Figure 4B illustrates the characters by their factor loadings for the two principal axes. The maximum frequencies and the bandwidths of the first and second subclick are the main cause for the observed variance along PC1, whereas the minimal frequencies and durations of the subclicks contribute most to the observed variance along PC2 (Fig. 4B). The first four discriminant functions of an SDA on the echo click variables with species as a priori groups cumulatively explained 99.1% of total variance. Maximum frequencies of the subclicks are contributing the most to interspecific variation. Leaving-one-out cross validation classified 70.5% of the originally grouped cases correctly. By chance alone, one would expect about 12.5% correctly classified cases.
Facing page: Fig. 3. Independently derived DNA-based phylogeny (Chapter 2.2). The tree is a consensus of 1000 replicates bootstrap analysis using MP, which has the same topology as the consensus of Bayesian analysis of combined cyt-b and ND2 data sets of Price et al. (2004), completed with sequences of H. gigas (Chapter 2.2). Numbers on branches indicate bootstrap / Bayesian support values. Bayesian analysis was performed under a model with base frequencies (A = 0.325, T = 0.209, C = 0.385, G = 0.081), General Time Reversible substitutions (A-C = 0.4337, A-G = 13.4858, A-T = 0.4372, C-G = 0.1580, C-T = 6.9664, G-T = 1.0), gamma shape parameter = 1.3558, and proportion of invariable sites = 0.5482. Abbreviations: A. = Aerodramus; C. = Collocalia; H. = Hydrochous.
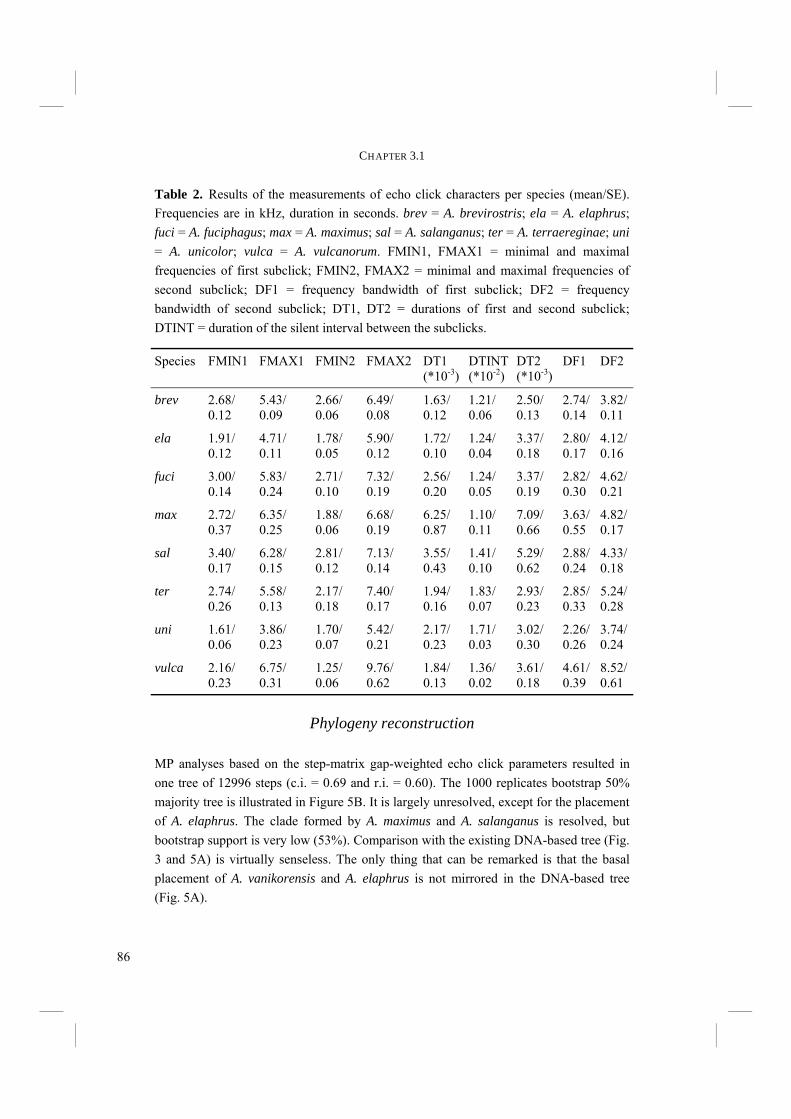
86
CHAPTER 3.1
Phylogeny reconstruction MP analyses based on the step-matrix gap-weighted echo click parameters resulted in one tree of 12996 steps (c.i. = 0.69 and r.i. = 0.60). The 1000 replicates bootstrap 50% majority tree is illustrated in Figure 5B. It is largely unresolved, except for the placement of A. elaphrus. The clade formed by A. maximus and A. salanganus is resolved, but bootstrap support is very low (53%). Comparison with the existing DNA-based tree (Fig. 3 and 5A) is virtually senseless. The only thing that can be remarked is that the basal placement of A. vanikorensis and A. elaphrus is not mirrored in the DNA-based tree (Fig. 5A).
Species FMIN1 FMAX1 FMIN2 FMAX2 DT1 (*10-3)
DTINT (*10-2)
DT2 (*10-3)
DF1 DF2
brev 2.68/ 0.12
5.43/ 0.09
2.66/ 0.06
6.49/ 0.08
1.63/ 0.12
1.21/ 0.06
2.50/ 0.13
2.74/ 0.14
3.82/ 0.11
ela 1.91/ 0.12
4.71/ 0.11
1.78/ 0.05
5.90/ 0.12
1.72/ 0.10
1.24/ 0.04
3.37/ 0.18
2.80/ 0.17
4.12/ 0.16
fuci 3.00/ 0.14
5.83/ 0.24
2.71/ 0.10
7.32/ 0.19
2.56/ 0.20
1.24/ 0.05
3.37/ 0.19
2.82/ 0.30
4.62/ 0.21
max 2.72/ 0.37
6.35/ 0.25
1.88/ 0.06
6.68/ 0.19
6.25/ 0.87
1.10/ 0.11
7.09/ 0.66
3.63/ 0.55
4.82/ 0.17
sal 3.40/ 0.17
6.28/ 0.15
2.81/ 0.12
7.13/ 0.14
3.55/ 0.43
1.41/ 0.10
5.29/ 0.62
2.88/ 0.24
4.33/ 0.18
ter 2.74/ 0.26
5.58/ 0.13
2.17/ 0.18
7.40/ 0.17
1.94/ 0.16
1.83/ 0.07
2.93/ 0.23
2.85/ 0.33
5.24/ 0.28
uni 1.61/ 0.06
3.86/ 0.23
1.70/ 0.07
5.42/ 0.21
2.17/ 0.23
1.71/ 0.03
3.02/ 0.30
2.26/ 0.26
3.74/ 0.24
vulca 2.16/ 0.23
6.75/ 0.31
1.25/ 0.06
9.76/ 0.62
1.84/ 0.13
1.36/ 0.02
3.61/ 0.18
4.61/ 0.39
8.52/ 0.61
Table 2. Results of the measurements of echo click characters per species (mean/SE). Frequencies are in kHz, duration in seconds. brev = A. brevirostris; ela = A. elaphrus; fuci = A. fuciphagus; max = A. maximus; sal = A. salanganus; ter = A. terraereginae; uni = A. unicolor; vulca = A. vulcanorum. FMIN1, FMAX1 = minimal and maximal frequencies of first subclick; FMIN2, FMAX2 = minimal and maximal frequencies of second subclick; DF1 = frequency bandwidth of first subclick; DF2 = frequency bandwidth of second subclick; DT1, DT2 = durations of first and second subclick; DTINT = duration of the silent interval between the subclicks.

87
VOCALISATIONS
Fig. 4. Results of a PCA on the echo click parameters. (A) Plot of the individuals along the first and second main axes (PC1 and PC2). Species are indicated by symbols; large symbols are the centroides of species distri-bution. The boundaries of the distributions of the various species are indicated by closed surfaces. (B) Factor plot along PC1 and PC2. Vectors indicate amount and direction of the contribution of corresponding characters to the total observed variation. PC1 explained 36.0% of total variance. PC2 and PC3 each explained 23.1% and 18.3% of total variance. FMIN1, FMAX1 = minimal and maximal frequencies of first subclick; FMIN2, FMAX2 = minimal and maximal frequencies of second subclick; DF1 = frequency bandwidth of first subclick; DF2 = frequency bandwidth of second subclick; DT1, DT2 = durations of first and second subclick; DTINT = duration of the silent interval between the subclicks.
PC 1
PC
2
DTINT
FMIN2 FMIN1
DT1
DT2
FMAX1
DF1
FMAX2
DF2
-1.0 -0.5 0.0 0.5 1.0
-1.0
-0.5
0.0
0.5
1.0
PC
2
PC 1
0.0 2.01.0 4.03.0-1.0-2.0-3.0-2.0
-1.0
0.0
1.0
2.0
3.0
4.0 A. brevirostrisA. elaphrusA. fuciphagusA. maximusA. salanganusA. terraerreginaeA. vanikorensisA. vulcanorum
A
B

88
CHAPTER 3.1
Character mapping Mapping of the echo click variables on the DNA-based tree (Fig. 3 and 5A; Chapter 2.2) did not suggest a clear pattern. Consistency indices for mapped characters varied from 0.83 to 1.00, but retention indices were 0.00 across variables. Also rescaled consistency indices were 0.00 for each variable. We observed differences between Swiftlet species in the structure of their echo clicks, but these differences could not be related to a phylogenetic pattern (see above). We therefore plotted the similarities of the averaged species against their geographical distance to examine whether echo click differences are related to species distribution (Fig. 6). Distances between the centres of species distributions were used as a measure for geographical distance. The result revealed that there is no correlation between similarity in echo click structure and geographical distance. However, two species-pairs that are geographically distant (i.e. A. elaphrus with A. vanikorensis and with A. terraereginae) produce similar echo clicks. A. elaphrus occurs at the Seychelles whereas A. vanikorensis occurs in Sulawesi, Papua and the Philippines, and A. terraereginae in the northern part of Queensland, Australia (Chantler and Driessens 1995). The remaining species-pairs comprise distant pairs with similar clicks, close pairs with similar clicks, distant pairs with different clicks, and close pairs with different clicks. Similarity or dissimilarity is obviously a relative measure: the two most similar species (A. brevirostris and A. fuciphagus) still differ significantly in 5 of the 9 measured characters (FMIN1, FMAX2, DT1, DT2 DF1; Mann-Whitney u-test, p < 0.05).
A. sawtelliA. bartschi
A. mearnsi
A. spodiopygius
A. salanganus
A. maximusA. vulcanorum
A. terraereginaeA. whiteheadi
A. francicusA. elaphrusA. fuciphagus vestitus
A. fuciphagus germani
A. vanikorensis palawanensis
A. vanikorensis
A. brevirostris
A. fuciphagus
A. terraereginae
A. salanganus
A. elaphrus
A. vanikorensis
A. maximus
A. vulcanorum
B
OG
91
5390
A DNA-based based on echo clicks
Fig. 5. Comparison of the Aerodramus clade in (A) a DNA-based phylogeny (Fig. 3; Chapter 2.2) with (B) the 50% majority rule bootstrap consensus tree of echo click parameters based on step-matrix gap-weighting maximum parsimony analysis. The echo click tree is rooted on an all-zeros outgroup. Numbers on branches indicate bootstrap values. Species in bold in the DNA-based tree correspond with the species in the echo click based tree.
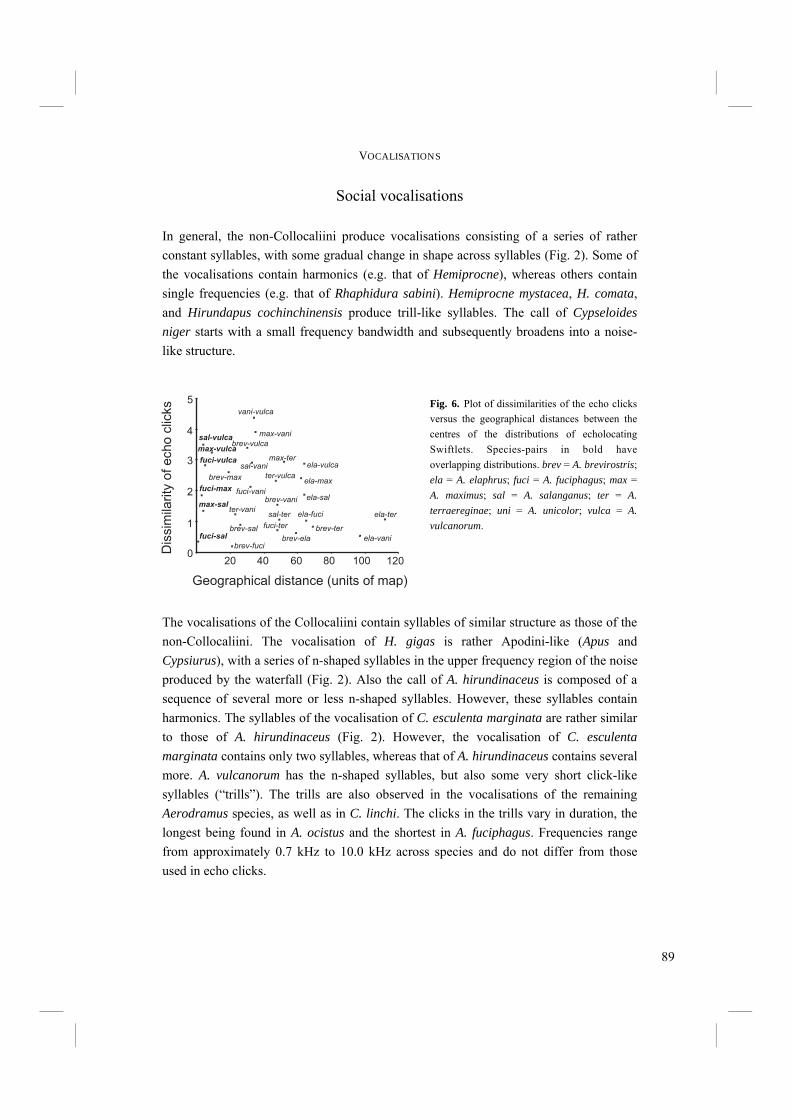
89
VOCALISATIONS
Social vocalisations In general, the non-Collocaliini produce vocalisations consisting of a series of rather constant syllables, with some gradual change in shape across syllables (Fig. 2). Some of the vocalisations contain harmonics (e.g. that of Hemiprocne), whereas others contain single frequencies (e.g. that of Rhaphidura sabini). Hemiprocne mystacea, H. comata, and Hirundapus cochinchinensis produce trill-like syllables. The call of Cypseloides niger starts with a small frequency bandwidth and subsequently broadens into a noise-like structure.
The vocalisations of the Collocaliini contain syllables of similar structure as those of the non-Collocaliini. The vocalisation of H. gigas is rather Apodini-like (Apus and Cypsiurus), with a series of n-shaped syllables in the upper frequency region of the noise produced by the waterfall (Fig. 2). Also the call of A. hirundinaceus is composed of a sequence of several more or less n-shaped syllables. However, these syllables contain harmonics. The syllables of the vocalisation of C. esculenta marginata are rather similar to those of A. hirundinaceus (Fig. 2). However, the vocalisation of C. esculenta marginata contains only two syllables, whereas that of A. hirundinaceus contains several more. A. vulcanorum has the n-shaped syllables, but also some very short click-like syllables (“trills”). The trills are also observed in the vocalisations of the remaining Aerodramus species, as well as in C. linchi. The clicks in the trills vary in duration, the longest being found in A. ocistus and the shortest in A. fuciphagus. Frequencies range from approximately 0.7 kHz to 10.0 kHz across species and do not differ from those used in echo clicks.
Geographical distance (units of map)
20 40 60 80 100 120
vani-vulca
max-vani
brev-vulcasal-vulca
max-vulca
sal-vani ela-vulca
ela-max
ela-sal
ela-ter
ela-vani
max-ter
ter-vulca
fuci-vanibrev-vani
sal-ter ela-fuci
brev-ela
brev-sal
fuci-vulca
fuci-max
max-salter-vani
brev-fuci
fuci-sal
brev-max
fuci-ter brev-ter
0
1
2
3
4
5
Dis
sim
ilarity
ofecho
clic
ks Fig. 6. Plot of dissimilarities of the echo clicks
versus the geographical distances between the centres of the distributions of echolocating Swiftlets. Species-pairs in bold have overlapping distributions. brev = A. brevirostris; ela = A. elaphrus; fuci = A. fuciphagus; max = A. maximus; sal = A. salanganus; ter = A. terraereginae; uni = A. unicolor; vulca = A. vulcanorum.

90
CHAPTER 3.1
The results of species averages and standard errors are due to the size of the data set not shown. The NPMANOVA in PAST (Hammer et al. 2001) does not allow for a comparison of more than 9 groups. We therefore tested for differences between genera with exclusion of the Cypseloidinae and Hemiprocnidae. Euclidean distances were used on the continuous characters. The NPMANOVA revealed significant differences between genera (F = 17.55, p < 0.001). Vocalisations are relatively uniform within genera compared to between genera (total sum of squares = 14.63; within group sum of squares = 7.97). Analysis of the categorical characters using Hamming distances revealed the same patterns: p < 0.001; F = 12.99; total sum of squares = 18.82; within group sum of squares = 11.28. Various NPMANOVA’s between species, within genera also resulted in significant differences between species. For example, species within Aerodramus are significantly different (p < 0.001; F = 15.95; total sum of squares = 1.70; within groups sum of squares = 0.43 for continuous characters with Euclidean distances and p < 0.001; F = 36.13; total sum of squares = 3.81; within groups sum of squares = 0.49 for categorical data with Hamming distances), just as species within Collocalia (p < 0.001; F = 20.33; total sum of squares = 0.85; within groups sum of squares = 0.21 for continuous characters with Euclidean distances and p < 0.001; F = 94.78; total sum of squares = 0.79; within groups sum of squares = 0.05 for categorical data with Hamming distances). Also an NPMANOVA was used to check for differences between echolocaters and non-echolocaters. Significant differences based on continuous variables with Euclidean distances turned out to be present (F = 8.90, p < 0.001). However, the variance between echolocaters and non-echolocaters was almost as large as the variance within the two groups (total sum of squares = 14.63, within sum of squares = 12.63). Similar results were found for categorical data with Hamming distances (F = 13.58, p < 0.001). The total variance is not much larger than within group variance (total sum of squares = 18.82, within group sum of squares = 15.16).
Facing page: Fig. 7. Results of a PCA on the social vocalisation parameters. (A) Plot of the individuals along the first and second main axes (PC1 and PC2). Species are indicated by symbols; large symbols are the centroides of species distribution. The boundaries of the distributions of the various species are indicated by closed surfaces. (B) Factor plot along PC1 and PC2. Vectors indicate amount and direction of the contribution of corresponding characters to the total observed variation. BW = maximal bandwidth; DTCALL = duration of the vocalisation; DTINTAV = duration of the interval between syllables; DTSYLAV, DTSYLMIN, DTSYLMAX = average, minimal and maximal duration of the different syllables in a vocalisation; FM = fraction of a vocalisation that frequencies incline of decline; FTMIN, FTMAX = minimal and maximal terminal frequencies; FMIN = minimal overall frequency; FMAX = maximal overall frequency; HARM = fraction of vocalisation that harmonics are present; NRRATT = number of rattles in trill-like syllables; NRSYL = number of syllables in a vocalisation. PC1 explained 25.7% of total variance. PC2, PC3, and PC4 each explained 18.6%, 15.2%, and 11.9% respectively.
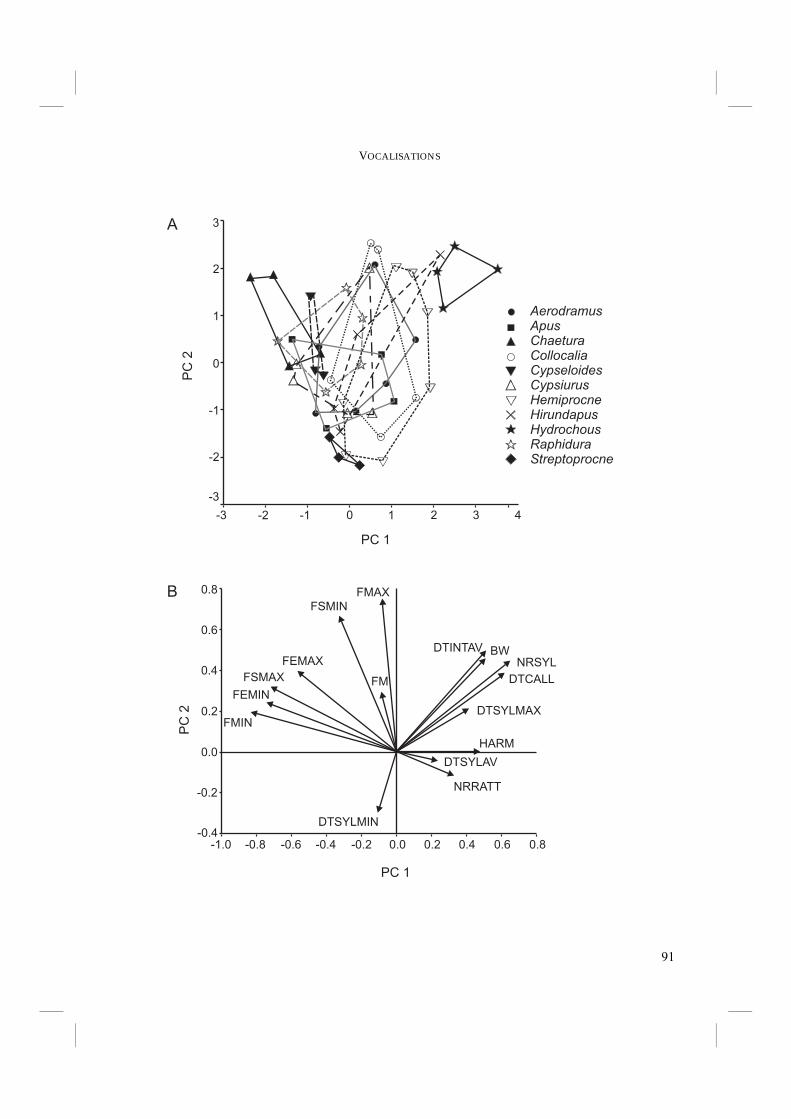
91
VOCALISATIONS
43210-3
3
2
1
0
-1
-2
-3
PC 1
PC
2
0.0 0.2 0.4 0.6 0.8-0.2-0.4-0.6-0.8-1.0
0.0
0.2
0.4
0.6
0.8
-0.2
-0.4
FMAX
FSMIN
FEMAX
FMFSMAX
FEMIN
FMIN
HARM
DTINTAV
DTCALL
NRSYL
DTSYLMAX
BW
NRRATT
DTSYLMIN
DTSYLAV
PC 1
PC
2
AerodramusApusChaeturaCollocaliaCypseloidesCypsiurusHemiprocneHirundapusHydrochousRaphiduraStreptoprocne
A
B
-2 -1

92
CHAPTER 3.1
A PCA with correlation matrix was performed on the continuous characters to investigate the distribution of the variance. PC1 explained 25.7% of total variance. PC2, PC3, and PC4 each explained 18.6%, 15.2%, and 11.9% respectively. Several species as well as several genera (Fig. 7) form distinct groups. A scatterplot of the species is not shown, because the rather large number of groups in the plot does not clearly illustrate the various distinct groups. Whereas species and genera form different groups, echolocating (Aerodramus) and non-echolocating species do not appear to differ at all (Fig. 7). Characters in the frequency as well as in the time domain contribute most to the observed total variance (Fig. 7). Different SDA’s were performed, i.e. with genera, species and echolocater versus non echolocater as a priori groups. An SDA with genera as groups resulted in a classification based on ten characters (NRSYL, DTCALL, DTSYLAV, DTSYLMAX, DTINTAV, BW, FSMIN, FSMAX, FEMAX, FMIN). The discriminant function a posteriori correctly classified 65.5% of cross-validated grouped cases into their own a priori group (mean expected = 9.09%). The specimens of echolocating Aerodramus spp. were correctly classified for 61.7% of the cases. At random classification would yield 23.1% correctly classified cases of Aerodramus by chance, on average. Classification results of Collocalia and Cypseloides did not deviate from at random classification. SDA with species as grouping variable was performed to check for species-specificity of vocalisations. The number of syllables (NRSYL), durations of the vocalisations (DTCALL) and of the syllables (DTSYLAV, DTSYLMAX), and the overall minimal frequency (FMIN) were particularly important in species differentiation. The SDA resulted in 67.6% correctly classified cross-validated grouped cases. At random classification would yield on average 3.7% correctly classified cases. Thus the vocalisations are well defined for each species. An SDA with echolocating and non-echolocating species as groups resulted in 85.4% correctly classified cross-validated grouped cases. Of non-echolocaters, 94.5% was correctly classified (76.9% expected at random). Of the specimens of echolocating species 55.0% of the cases were correctly classified (23.1% expected at random). So, although a PCA did not appear to show differences between echolocaters and non-echolocaters, an SDA can discriminate between echolocating and non-echolocating species. A PCA uses total variance, whereas SDA maximises between-group variance. As such it is possible to find group differences with SDA that are not detected with just a PCA. Characters related to the rattles and frequencies are the main cause for the differences between echolocaters and non-echolocaters.

93
VOCALISATIONS
Phylogeny reconstruction A step-matrix gap-weighting MP analysis of the social vocalisation parameters resulted in one tree of 83268 steps (c.i. = 0.31, r.i. = 0.47). It did not group species of the same genus together, nor did it cluster Collocaliini together (not shown). Furthermore, echolocating species were not classified as a monophyletic group either. A 1000 replicates bootstrap analysis yielded a tree that is completely unresolved (not shown).
Character mapping Although at first sight a general pattern was assumed (see above), mapping of categorical and step-matrix gap-weighted continuous characters did not show a clear pattern in character evolution. Consistency indices were fairly high (c.i = 0.90), but the retention indices were low (r.i = 0.25). Also the rescaled consistency indices were low: 0.23.
Discussion
Echo clicks Although at first sight the echo clicks looked similar, significant interspecific differences were found. Apparently there is enough leeway in optimal design of echo clicks to tolerate some variation without functional consequences. Differences are mainly found in frequencies. Frequencies are also the most likely components to vary among recordings due to differences in the environments and recording equipment. However, also within-species recordings with different equipment and in different environments were used. The variance within these species is smaller than the variance among species, indicating that the observed dissimilarities represent real biological differences in stead of variation due to environment and/or recording equipment. Geographically distant and close species produce similar and dissimilar echo clicks (Fig.6). In some cases close or co-occurring species produce rather different clicks. We hypothesise that echo clicks are not solely used for echolocation, but also for intraspecific communication. Moreover, before entering the cave at dusk, echo clicks are used by Swiftlets aggregating in front of the cave (Medway 1962; pers. obs.). Species

94
CHAPTER 3.1
specificity would make it possible for co-occurring species to use their echo clicks as a means to recognise their conspecifics. This may also be of help, for example to locate the roosting flock of conspecifics in a cave inhabited by multiple Swiftlet species. This could facilitate locating suitable roost and nesting sites for conspecifics and the site of individual breeding pairs’ nests. If the echo clicks are also used in intraspecific communication, the observed differences between the echo clicks may, at least partly, be explained by character displacement in species that geographically occur together. We could not recognise phylogenetically interpretable information in the echo clicks. Most branches in the tree resulting from phylogenetic analysis of the echo clicks are unresolved (Fig. 5B). Although two bootstrap values are high (≥ 90%), these groupings are incongruent with the DNA-based tree (Fig. 5A). The clicks of A. brevirostris and A. vulcanorum have the third highest dissimilarity of the observed species-pairs. However the latter is sometimes considered to be a subspecies of the former (Chantler and Driessens 1995; Deignan 1955; Stresemann 1931). The separation of the clicks of the two taxa indicates that a differentiation into two different species is reasonable.
Social vocalisations The NPMANOVA’s and PCA showed that variation within species and genera is smaller than total variation among those groups. Although variation within species, e.g. local dialects or non-homologous calls through context-specific differences, is probably present, this variation is not that large that it blurs species specificity. The vocalisations are relatively uniform within species, compared to between species differences. Furthermore, SDA also revealed that the vocalisations are species-specific. Based on NPMANOVA as well as SDA, the social vocalisations appeared to differ between echolocating and non-echolocating species. However, the NPMANOVA also showed, that variation within echolocaters and non-echolocaters is large compared to total variation. This was also predicted by a PCA, which showed large overlap of echolocaters and non-echolocaters (Fig. 7). It therefore appears unlikely that social vocalisations of echolocaters are different from those of non-echolocaters. Some social vocalisations contain trill-like syllables (e.g. C. linchi, Fig. 2) . This is interesting, because a typical feature of an echo click is the sharp on- and offset and the short duration of the first and second subclicks and of the interval in-between. These features can also be found in the trill-like syllables in which brief clicks are separated by brief periods of silence. Several of the echolocating Aerodramus species use those trills
95
VOCALISATIONS
in their social vocalisations (Fig. 2), whereas much less non-echolocating Swiftlets use trills in their vocalisations. This probably causes the high amount of correctly classified cases in SDA with echolocation versus non-echolocation ability as groups. However, not all Aerodramus species use such a trill in their social vocalisations, while some non-ecolocating species, viz. C. linchi, do use these trills. If echolocation evolved once at the base of the Collocaliini and was lost in the branch to C. linchi, part of the system might still persist. C. linchi has been reported to occupy the dark parts of Swiftlet farms, instead of staying in the lighter parts (Mardiastuti pers. com.). It might therefore possibly still be able to orient itself by sound, however not in a specialised way such as true echolocaters. Sound orientation might also still be present in H. gigas, which returns from foraging after dark. It might use the constant sound of the waterfall to navigate to its roosting site, but it does not appear to be necessarily specialised in sound orientation to accomplish this. The high percentage of echolocating species using a rattle suggests that there might be a relation with the use of echolocation, but it does not seem to be a prerequisite. Generally speaking, there seems to be a pattern that vocalisations in non-Collocaliini consist of a series of similar n-shaped syllables, whereas vocalisations in Collocaliini contain much more trills and noisy syllables. This pattern is not completely consistent, however. H. gigas produces a vocalisation that resembles those of non-Collocaliini, such as R. sabini (Fig. 2). Slabbekoorn and Peet (2003) have shown that Parus major in noisy environments raises its pitch, so that its song is not masked by the noise. H. gigas may have to act similarly, as it roosts and nests behind or near waterfalls. The pitch of the call of H. gigas stays largely above the loudest part of the constant noise of the waterfall (Fig. 2). Echo clicks as well as social vocalisations of Swifts and Swiftlets are species specific. Echo clicks differ mainly in the used frequencies, whereas social vocalisations differ in the frequency as well as in the time domain. However, neither echo clicks nor social vocalisations are of use in phylogeny inference. Although most echolocating species use echo click like trills in their social vocalisations, some non-echolocating species also use such trills. A relation of the use of such trills with echolocation is not obvious.

96
CHAPTER 3.1
Acknowledgements We are grateful to Dr. S. van Balen (Wageningen University, The Netherlands) for his kind donation of several sound recordings. Dr. H. Slabbekoorn and Dr. J.E. Jeffery (Leiden University) are kindly acknowledged for reviewing the paper. Two anonymous reviewer have helped in improving a previous version of this manuscript.
97
CHAPTER 3.2
ECHO CLICK DESIGN IN SWIFTLETS: SINGLE AS WELL AS
DOUBLE CLICKS. This chapter has also been published as: Thomassen, H.A., Djasim, U.M. and Povel, G.D.E. (2004) Echo click design in
Swiftlets: single as well as double clicks. Ibis 146: 173-174. Section of Evolutionary Morphology, Institute of Biology Leiden, Leiden University
98
CHAPTER 3.2
Abstract Echolocating Southeast Asian Swiftlets are often thought to consist of species that either emit a single click or a double click, but not both types within a species or individual. This led to the hypothesis that there might be a change in the design of the echo click from Swiftlets in the western part to Swiftlets in the eastern part of their distribution. In this study it was investigated in five Swiftlet species whether they emit only single or double clicks or both types of clicks. Of these species, four were shown to emit both types of clicks. In one of these species, i.e. A. vulcanorum, it was shown that a single individual can emit single as well as double clicks. We therefore hypothesise that all Swiftlet species are able to emit both types of echo clicks and that there is no principal change in echo click design from western to eastern Swiftlets.

99
SINGLE AND DOUBLE ECHO CLICKS
Introduction Echolocation is rare in birds, occurring only in the South American Oilbird (Steatornis caripensis) and the South East Asian Swiftlet genus Aerodramus. Both groups use echolocation for navigation in the darkness of the caves they roost and nest in. Several studies have been conducted on echolocation acuity and echo click design of different species (e.g. Coles et al. 1987, Fenton 1975, Fullard et al. 1993, Griffin and Suthers 1970, Griffin and Thompson 1982, Medway 1967, Medway and Pye 1977, Suthers and Hector 1982, Suthers and Hector 1985). Most studies described the echo clicks as being of double click design (viz. Fig. 1A). The click consists of two subclicks separated by a silent interval. The subclicks are not distinguishable to humans and most birds (Fay 1988), but heard as only one click. It is not known whether Swiftlets can distinguish between the two subclicks, but it seem unlikely. The only species that have been described as emitting solely single clicks are A. maximus (Medway and Pye 1977) and A. sawtelli (Fullard et al. 1993). Although Suthers and Hector (1982) described double clicks as well as a single click in A. terraereginae, the latter was under surgical conditions and therefore not confirmed for wild birds (Fullard et al. 1993). So to date, Swiftlet species are considered to use either double clicks or single clicks, but not both. Fullard et al. (1993) hypothesise that the single click design of A. sawtelli indicates a change from the double click design in western Pacific Swiftlets towards a single click in eastern Pacific Swiftlets. In contrast with this, Suthers and Hector (1985) showed that Oilbirds emit single as well as double clicks. We investigated whether Swiftlet species are really using either single or double clicks, or that they can emit both types of clicks.
Material and methods We made spectrograms of echo click-recordings of A. fuciphagus, A. maximus, A. salanganus, A. vanikorensis and A. (brevirostris) vulcanorum. Recordings were obtained from National Sound Archive (British Library, London, UK), Library of Natural Sounds (Cornell Lab of Ornithology, Ithaca, New York, USA), and recordings made by the authors with a Sony WM-D3 Professional tape recorder and a Sony ECM-261 microphone (Table 1). These were resampled using a sample rate of 44.1 kHz. Sonograms were made on a PC using Avisoft SASLab Pro 3.82b (R. Specht, www.avisoft.de) with a FFt-size of 6 ms, bandwidth of 172 Hz and resolution of 0.18 ms
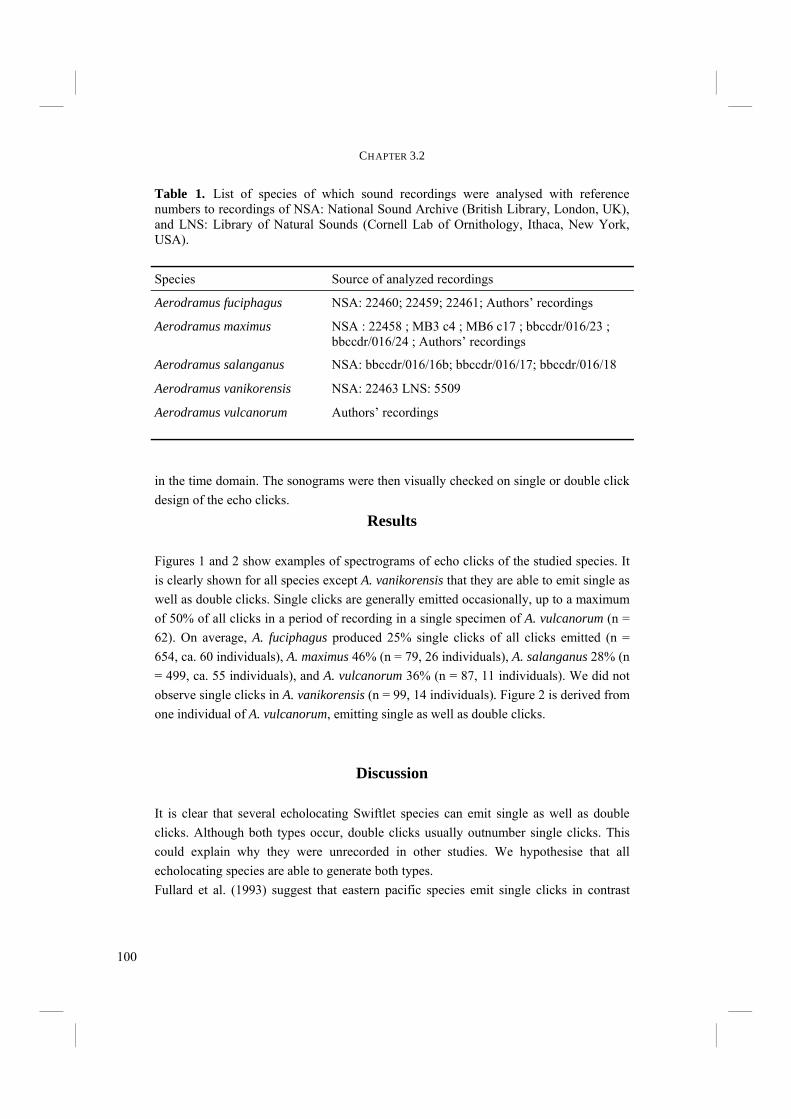
100
CHAPTER 3.2
in the time domain. The sonograms were then visually checked on single or double click design of the echo clicks.
Results Figures 1 and 2 show examples of spectrograms of echo clicks of the studied species. It is clearly shown for all species except A. vanikorensis that they are able to emit single as well as double clicks. Single clicks are generally emitted occasionally, up to a maximum of 50% of all clicks in a period of recording in a single specimen of A. vulcanorum (n = 62). On average, A. fuciphagus produced 25% single clicks of all clicks emitted (n = 654, ca. 60 individuals), A. maximus 46% (n = 79, 26 individuals), A. salanganus 28% (n = 499, ca. 55 individuals), and A. vulcanorum 36% (n = 87, 11 individuals). We did not observe single clicks in A. vanikorensis (n = 99, 14 individuals). Figure 2 is derived from one individual of A. vulcanorum, emitting single as well as double clicks.
Discussion It is clear that several echolocating Swiftlet species can emit single as well as double clicks. Although both types occur, double clicks usually outnumber single clicks. This could explain why they were unrecorded in other studies. We hypothesise that all echolocating species are able to generate both types. Fullard et al. (1993) suggest that eastern pacific species emit single clicks in contrast
Species Source of analyzed recordings
Aerodramus fuciphagus NSA: 22460; 22459; 22461; Authors’ recordings
Aerodramus maximus NSA : 22458 ; MB3 c4 ; MB6 c17 ; bbccdr/016/23 ; bbccdr/016/24 ; Authors’ recordings
Aerodramus salanganus NSA: bbccdr/016/16b; bbccdr/016/17; bbccdr/016/18
Aerodramus vanikorensis NSA: 22463 LNS: 5509
Aerodramus vulcanorum Authors’ recordings
Table 1. List of species of which sound recordings were analysed with reference numbers to recordings of NSA: National Sound Archive (British Library, London, UK), and LNS: Library of Natural Sounds (Cornell Lab of Ornithology, Ithaca, New York, USA).
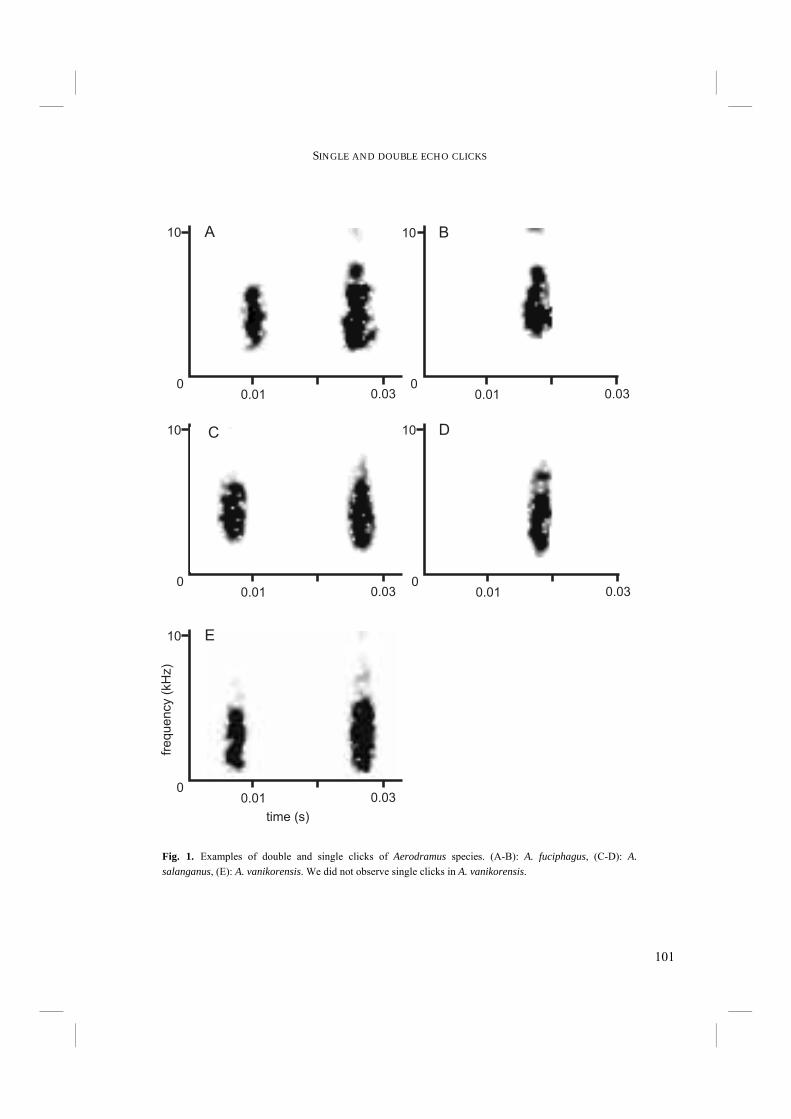
101
SINGLE AND DOUBLE ECHO CLICKS
10
0.010
0.03
10
0.010
0.03
10
0.010
0.03
10
0.010
0.03
10
0.010
0.03
frequency
(kH
z)
time (s)
A B
C D
E
Fig. 1. Examples of double and single clicks of Aerodramus species. (A-B): A. fuciphagus, (C-D): A. salanganus, (E): A. vanikorensis. We did not observe single clicks in A. vanikorensis.

102
CHAPTER 3.2
with more western occurring species. However, although we could not include the easternmost species, A. vanikorensis is shown to emit double clicks and has a distribution as far east as New Caledonia. Moreover, the other species studied are distributed well west of Papua, but show single clicks in their repertoire. The use of a single click does not undermine the model for double clicks by Suthers and Hector (1982), where the external labium is bend inward and touches the medial tympaniform membrane. Just before and after contact, the membrane is brought into vibration, generating the first and second subclick respectively. The short moment that the external labium touches the membrane, represents the silent interval between the two subclicks. The first subclick is much more variable than the second (Chapter 3.1). Therefore it is likely that in agreement with their model for click production in the Oilbird (Suthers and Hector 1985), it is the second subclick of the double click design that is emitted in the single click type. The external labium then touches the membrane, but airflow is absent prior to contact. Airflow only starts when the external labium is retracted, resulting in a click. It remains a question why Swiftlets sometimes use single clicks in stead of double ones. The double click might be functional in estimating the distance from an object. Between approximately 2.5 – 3.5 m from an object, the echo of the first subclick will concur with the emission of the second subclick, which may be informative to the bird.
0.01
10
00.03 0.12 0.14
time (s)
frequency
(kH
z)
Fig. 2. Example of one individual of A. vulcanorum emitting a double and a single click.

103
CHAPTER 3.3
ARE THERE DIFFERENCES IN SYRINGEAL MORPHOLOGY BETWEEN ECHOLOCATING AND NON-ECHOLOCATING
SWIFTLETS?
This chapter has also been submitted for publication as: Thomassen, H.A. and Povel, G.D.E. Are there differences in syringeal morphology
between echolocating and non-echolocating Swiftlets?
Section of Evolutionary Morphology, Institute of Biology Leiden, Leiden University

104
CHAPTER 3.3
Abstract Morphological adaptations to echolocation in the syrinx of Swiftlets were hypothesised in previous studies. Echolocating Swiftlets would possess a larger External Labium (EL) than non-echolocating Swiftlets, so that the EL could reach the Internal Tympaniform Membrane (ITM), which was hypothesised to be necessary for echo click production. Furthermore, echolocaters would have a thinner ITM than non-echolocaters. Finally, first bronchial rings in echolocating Swiftlets would be fused with the first tracheal rings. The reasons for these last two hypothesised adaptations were not clearly stated. The present study examined whether the hypothesised adaptations were consistent in echolocating and non-echolocating Swiftlets. It was revealed that the size of the EL does not differ between echolocating and non-echolocating species. Furthermore, both echolocating and non-echolocating species comprise individuals that possess fused first bronchial and tracheal rings as well as individuals that do not have fused rings. Finally, echolocating Aerodramus Swiftlets have thinner ITM’s than non-echolocating Collocalia Swiftlets and some Swifts. However, non-echolocating Hydrochous Swiftlet as well as non-echolocating R. leucopygialis Swift also possess thin ITM’s. Furthermore, in a previous study was shown that the echolocating Oilbird (Steatornis caripensis) has thick ITM’s. A thin ITM may be advantageous in echo click production, but does not seem to be necessary. The mechanism of echo click production in Swiftlets was investigated in a previous study. However, based on recent insights on sound production in the avian syrinx that model may need modifications, which are speculated about in this study.
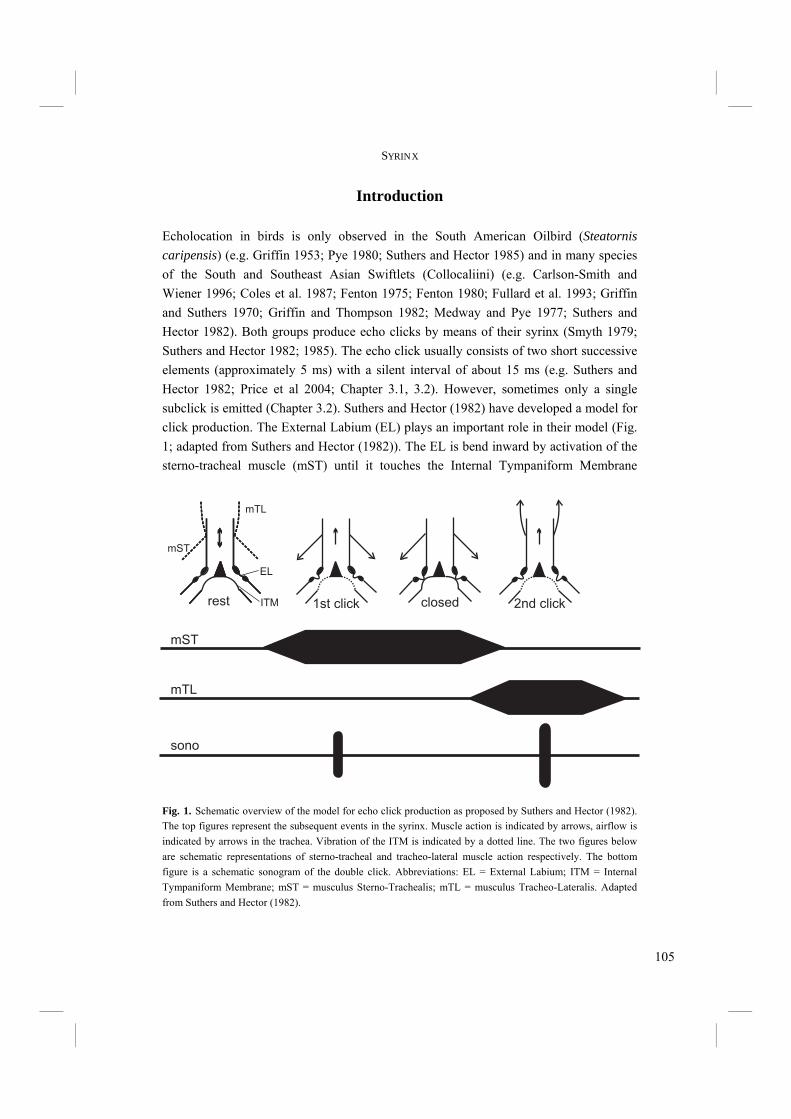
105
SYRINX
Introduction Echolocation in birds is only observed in the South American Oilbird (Steatornis caripensis) (e.g. Griffin 1953; Pye 1980; Suthers and Hector 1985) and in many species of the South and Southeast Asian Swiftlets (Collocaliini) (e.g. Carlson-Smith and Wiener 1996; Coles et al. 1987; Fenton 1975; Fenton 1980; Fullard et al. 1993; Griffin and Suthers 1970; Griffin and Thompson 1982; Medway and Pye 1977; Suthers and Hector 1982). Both groups produce echo clicks by means of their syrinx (Smyth 1979; Suthers and Hector 1982; 1985). The echo click usually consists of two short successive elements (approximately 5 ms) with a silent interval of about 15 ms (e.g. Suthers and Hector 1982; Price et al 2004; Chapter 3.1, 3.2). However, sometimes only a single subclick is emitted (Chapter 3.2). Suthers and Hector (1982) have developed a model for click production. The External Labium (EL) plays an important role in their model (Fig. 1; adapted from Suthers and Hector (1982)). The EL is bend inward by activation of the sterno-tracheal muscle (mST) until it touches the Internal Tympaniform Membrane
Fig. 1. Schematic overview of the model for echo click production as proposed by Suthers and Hector (1982). The top figures represent the subsequent events in the syrinx. Muscle action is indicated by arrows, airflow is indicated by arrows in the trachea. Vibration of the ITM is indicated by a dotted line. The two figures below are schematic representations of sterno-tracheal and tracheo-lateral muscle action respectively. The bottom figure is a schematic sonogram of the double click. Abbreviations: EL = External Labium; ITM = Internal Tympaniform Membrane; mST = musculus Sterno-Trachealis; mTL = musculus Tracheo-Lateralis. Adapted from Suthers and Hector (1982).
closed1st click 2nd clickrest
mTL
mST
ITM
EL
mST
mTL
sono
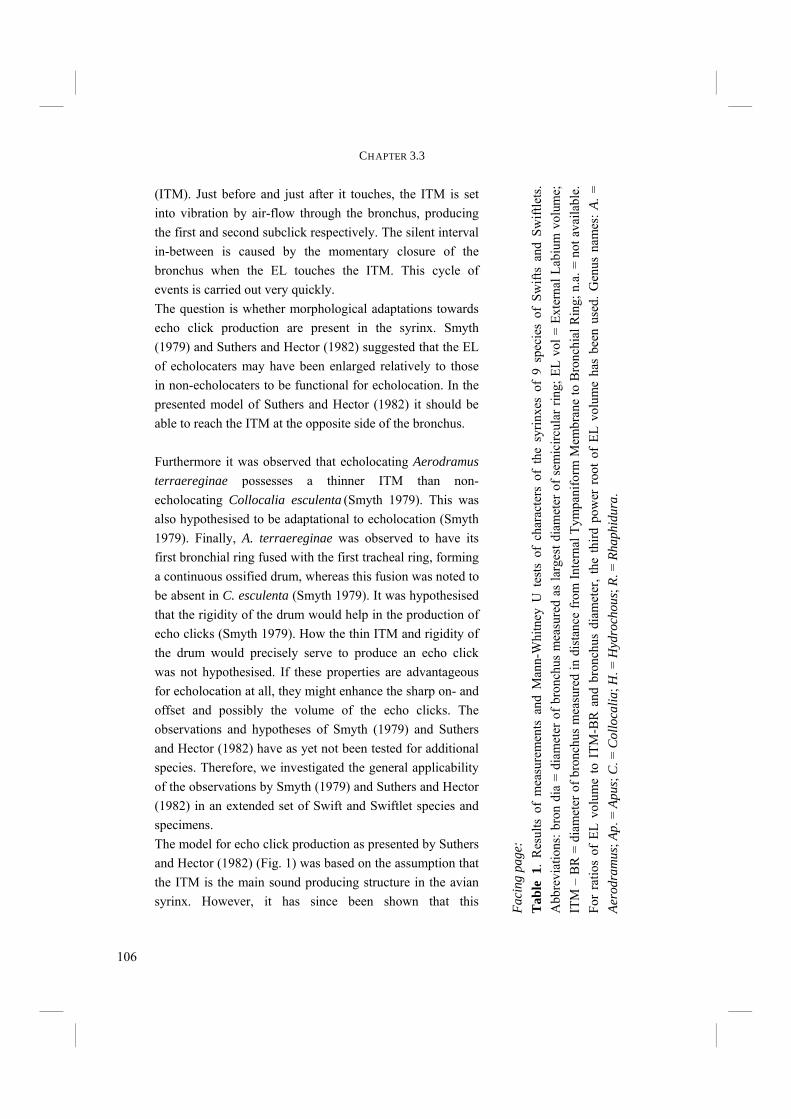
106
CHAPTER 3.3
(ITM). Just before and just after it touches, the ITM is set into vibration by air-flow through the bronchus, producing the first and second subclick respectively. The silent interval in-between is caused by the momentary closure of the bronchus when the EL touches the ITM. This cycle of events is carried out very quickly. The question is whether morphological adaptations towards echo click production are present in the syrinx. Smyth (1979) and Suthers and Hector (1982) suggested that the EL of echolocaters may have been enlarged relatively to those in non-echolocaters to be functional for echolocation. In the presented model of Suthers and Hector (1982) it should be able to reach the ITM at the opposite side of the bronchus. Furthermore it was observed that echolocating Aerodramus terraereginae possesses a thinner ITM than non-echolocating Collocalia esculenta (Smyth 1979). This was also hypothesised to be adaptational to echolocation (Smyth 1979). Finally, A. terraereginae was observed to have its first bronchial ring fused with the first tracheal ring, forming a continuous ossified drum, whereas this fusion was noted to be absent in C. esculenta (Smyth 1979). It was hypothesised that the rigidity of the drum would help in the production of echo clicks (Smyth 1979). How the thin ITM and rigidity of the drum would precisely serve to produce an echo click was not hypothesised. If these properties are advantageous for echolocation at all, they might enhance the sharp on- and offset and possibly the volume of the echo clicks. The observations and hypotheses of Smyth (1979) and Suthers and Hector (1982) have as yet not been tested for additional species. Therefore, we investigated the general applicability of the observations by Smyth (1979) and Suthers and Hector (1982) in an extended set of Swift and Swiftlet species and specimens. The model for echo click production as presented by Suthers and Hector (1982) (Fig. 1) was based on the assumption that the ITM is the main sound producing structure in the avian syrinx. However, it has since been shown that this Fa
cing
pag
e:
Tab
le 1
. R
esul
ts o
f m
easu
rem
ents
and
Man
n-W
hitn
ey U
tes
ts o
f ch
arac
ters
of
the
syrin
xes
of 9
spe
cies
of
Swift
s an
d Sw
iftle
ts.
Abb
revi
atio
ns: b
ron
dia
= di
amet
er o
f bro
nchu
s m
easu
red
as la
rges
t dia
met
er o
f sem
icirc
ular
ring
; EL
vol =
Ext
erna
l Lab
ium
vol
ume;
IT
M –
BR
= d
iam
eter
of b
ronc
hus
mea
sure
d in
dis
tanc
e fr
om In
tern
al T
ympa
nifo
rm M
embr
ane
to B
ronc
hial
Rin
g; n
.a. =
not
ava
ilabl
e.
For
ratio
s of
EL
volu
me
to I
TM-B
R a
nd b
ronc
hus
diam
eter
, the
third
pow
er r
oot o
f EL
vol
ume
has
been
use
d. G
enus
nam
es: A
. =
Aero
dram
us; A
p. =
Apu
s; C
. = C
ollo
calia
; H. =
Hyd
roch
ous;
R. =
Rha
phid
ura.
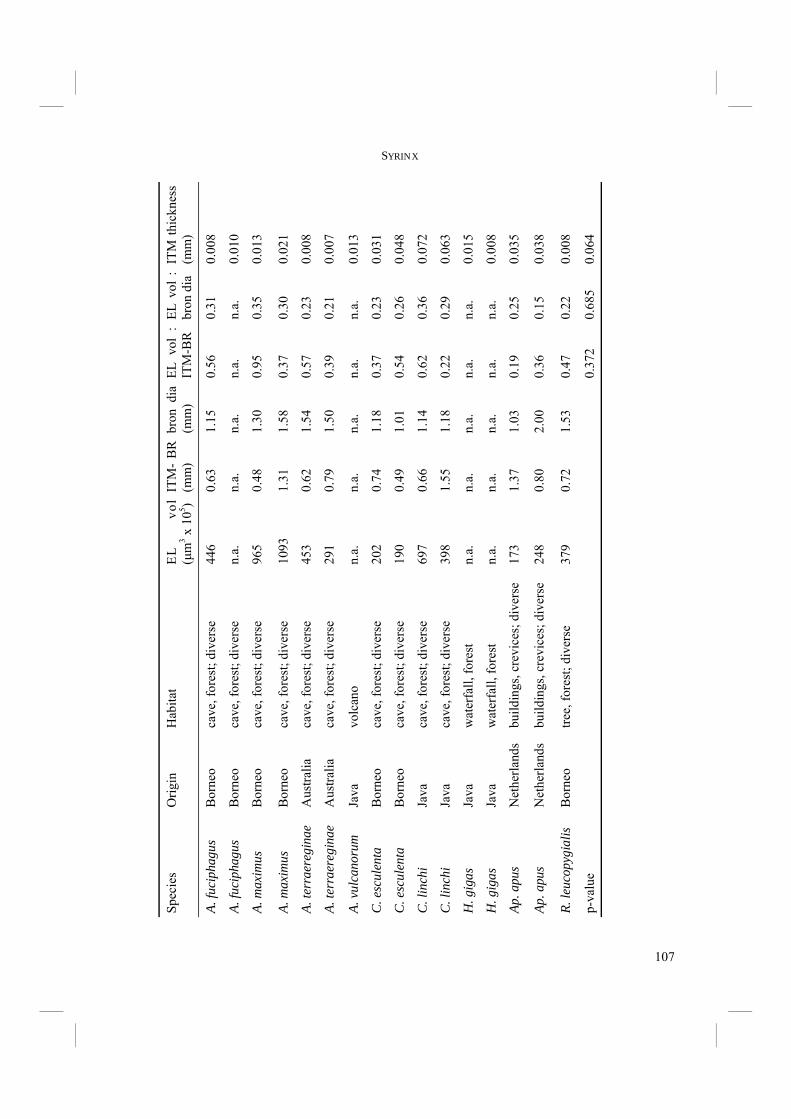
107
SYRINX Sp
ecie
s O
rigin
H
abita
t E
L
vol
(µm
3 x 1
05 ) IT
M-
BR
(m
m)
bron
dia
(m
m)
EL v
ol :
IT
M-B
R
EL v
ol :
br
on d
ia
ITM
thic
knes
s (m
m)
A. fu
ciph
agus
B
orne
o ca
ve, f
ores
t; di
vers
e 44
6 0.
63
1.15
0.
56
0.31
0.
008
A. fu
ciph
agus
B
orne
o ca
ve, f
ores
t; di
vers
e n.
a.
n.a.
n.
a.
n.a.
n.
a.
0.01
0
A. m
axim
us
Bor
neo
cave
, for
est;
dive
rse
965
0.48
1.
30
0.95
0.
35
0.01
3
A. m
axim
us
Bor
neo
cave
, for
est;
dive
rse
1093
1.
31
1.58
0.
37
0.30
0.
021
A. te
rrae
regi
nae
Aus
tralia
ca
ve, f
ores
t; di
vers
e 45
3 0.
62
1.54
0.
57
0.23
0.
008
A. te
rrae
regi
nae
Aus
tralia
ca
ve, f
ores
t; di
vers
e 29
1 0.
79
1.50
0.
39
0.21
0.
007
A. v
ulca
noru
m
Java
vo
lcan
o n.
a.
n.a.
n.
a.
n.a.
n.
a.
0.01
3
C. e
scul
enta
B
orne
o ca
ve, f
ores
t; di
vers
e 20
2 0.
74
1.18
0.
37
0.23
0.
031
C. e
scul
enta
B
orne
o ca
ve, f
ores
t; di
vers
e 19
0 0.
49
1.01
0.
54
0.26
0.
048
C. l
inch
i Ja
va
cave
, for
est;
dive
rse
697
0.66
1.
14
0.62
0.
36
0.07
2
C. l
inch
i Ja
va
cave
, for
est;
dive
rse
398
1.55
1.
18
0.22
0.
29
0.06
3
H. g
igas
Ja
va
wat
erfa
ll, fo
rest
n.
a.
n.a.
n.
a.
n.a.
n.
a.
0.01
5
H. g
igas
Ja
va
wat
erfa
ll, fo
rest
n.
a.
n.a.
n.
a.
n.a.
n.
a.
0.00
8
Ap. a
pus
Net
herla
nds
build
ings
, cre
vice
s; d
iver
se
173
1.37
1.
03
0.19
0.
25
0.03
5
Ap. a
pus
Net
herla
nds
build
ings
, cre
vice
s; d
iver
se
248
0.80
2.
00
0.36
0.
15
0.03
8
R. le
ucop
ygia
lis
Bor
neo
tree,
fore
st; d
iver
se
379
0.72
1.
53
0.47
0.
22
0.00
8
p-va
lue
0.
372
0.68
5 0.
064
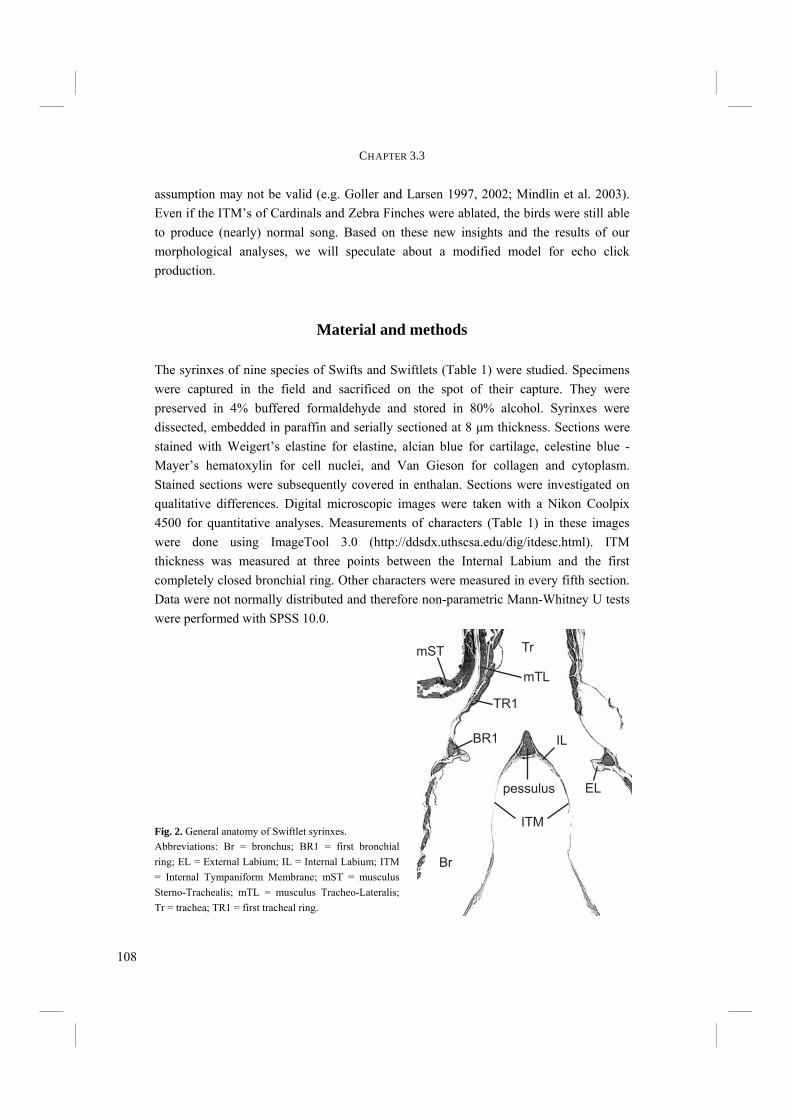
108
CHAPTER 3.3
assumption may not be valid (e.g. Goller and Larsen 1997, 2002; Mindlin et al. 2003). Even if the ITM’s of Cardinals and Zebra Finches were ablated, the birds were still able to produce (nearly) normal song. Based on these new insights and the results of our morphological analyses, we will speculate about a modified model for echo click production.
Material and methods The syrinxes of nine species of Swifts and Swiftlets (Table 1) were studied. Specimens were captured in the field and sacrificed on the spot of their capture. They were preserved in 4% buffered formaldehyde and stored in 80% alcohol. Syrinxes were dissected, embedded in paraffin and serially sectioned at 8 µm thickness. Sections were stained with Weigert’s elastine for elastine, alcian blue for cartilage, celestine blue - Mayer’s hematoxylin for cell nuclei, and Van Gieson for collagen and cytoplasm. Stained sections were subsequently covered in enthalan. Sections were investigated on qualitative differences. Digital microscopic images were taken with a Nikon Coolpix 4500 for quantitative analyses. Measurements of characters (Table 1) in these images were done using ImageTool 3.0 (http://ddsdx.uthscsa.edu/dig/itdesc.html). ITM thickness was measured at three points between the Internal Labium and the first completely closed bronchial ring. Other characters were measured in every fifth section. Data were not normally distributed and therefore non-parametric Mann-Whitney U tests were performed with SPSS 10.0.
ITM
ELpessulus
Tr
Br
mTL
mST
BR1
TR1
IL
Fig. 2. General anatomy of Swiftlet syrinxes. Abbreviations: Br = bronchus; BR1 = first bronchial ring; EL = External Labium; IL = Internal Labium; ITM = Internal Tympaniform Membrane; mST = musculus Sterno-Trachealis; mTL = musculus Tracheo-Lateralis; Tr = trachea; TR1 = first tracheal ring.
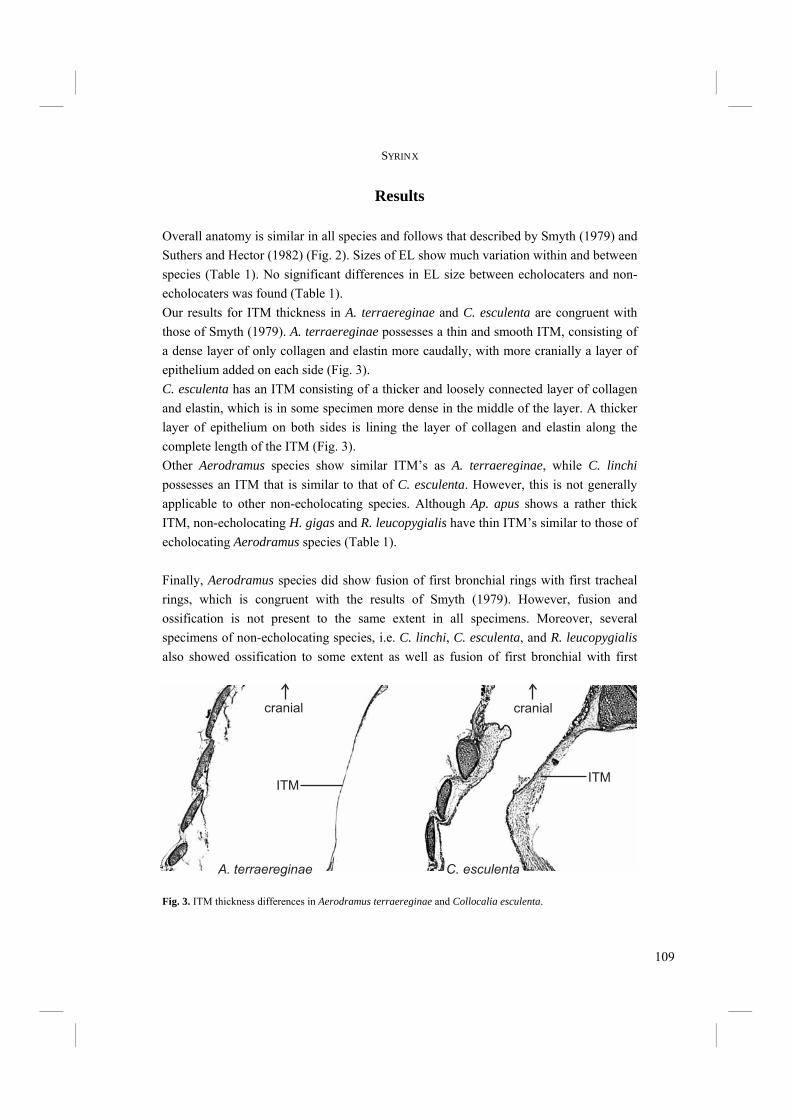
109
SYRINX
Results Overall anatomy is similar in all species and follows that described by Smyth (1979) and Suthers and Hector (1982) (Fig. 2). Sizes of EL show much variation within and between species (Table 1). No significant differences in EL size between echolocaters and non-echolocaters was found (Table 1). Our results for ITM thickness in A. terraereginae and C. esculenta are congruent with those of Smyth (1979). A. terraereginae possesses a thin and smooth ITM, consisting of a dense layer of only collagen and elastin more caudally, with more cranially a layer of epithelium added on each side (Fig. 3). C. esculenta has an ITM consisting of a thicker and loosely connected layer of collagen and elastin, which is in some specimen more dense in the middle of the layer. A thicker layer of epithelium on both sides is lining the layer of collagen and elastin along the complete length of the ITM (Fig. 3). Other Aerodramus species show similar ITM’s as A. terraereginae, while C. linchi possesses an ITM that is similar to that of C. esculenta. However, this is not generally applicable to other non-echolocating species. Although Ap. apus shows a rather thick ITM, non-echolocating H. gigas and R. leucopygialis have thin ITM’s similar to those of echolocating Aerodramus species (Table 1). Finally, Aerodramus species did show fusion of first bronchial rings with first tracheal rings, which is congruent with the results of Smyth (1979). However, fusion and ossification is not present to the same extent in all specimens. Moreover, several specimens of non-echolocating species, i.e. C. linchi, C. esculenta, and R. leucopygialis also showed ossification to some extent as well as fusion of first bronchial with first
A. terraereginae C. esculenta
ITMITM
cranialcranial
Fig. 3. ITM thickness differences in Aerodramus terraereginae and Collocalia esculenta.

110
CHAPTER 3.3
tracheal rings (Fig. 4). Only in Ap. apus no fusion of bronchial and tracheal rings was observed. The extent of ossification may depend on the age of the Swiftlets. Although all studied specimens were adults, the exact age was not known.
Mechanism for echo click production In the period that Suthers and Hector (1982) developed their model to explain echo click production, the general idea was that vibration by the ITM was the main sound source in the avian vocalisation apparatus. However, subsequent studies (e.g. Goller and Larsen 1997, 2002; Mindlin et al. 2003) revealed that the External and Internal Labia (EL and IL) may play a much more important role than the ITM, as ablation of the ITM in Cardinals and Zebra Finches did not result in very different songs. Vibration of the EL is a more probable sound source. It thereby blocks the airflow through the bronchus for short periods so that short pulses of air are generated each time that the EL is released from the ITM or IL. We therefore hypothesise that the model of Suthers and Hector (1982) needs modification. We here speculate about such a modified model for echo click production in Swiftlets (Fig. 5). The model starts the same with contraction of the mST, which causes the EL to bend into the bronchus, towards the ITM or –more likely (e.g. Goller and Larsen 1997, 2002;
A BTr
Br
Tr
BrBr Br
Fig. 4. Ventral views of three dimensional reconstructions of µCT scans of the ossified and fused first bronchial and tracheal rings, which form the tympanic drum in (A) echolocating Aerodramus maximus and (B) non-echolocating Collocalia esculenta. The trachea and bronchi are schematically represented by bold lines. The images are approximately to scale. However, due to the 3D perspective, no exact scale can be given. Top is cranial. Br = bronchus; Tr = trachea. Figures have been created in close co-operation with S. Gea, S. Maas, and W. F. Decraemer of Laboratory of Biomedical Physics, Department of Physics, Univerity of Antwerp, Belgium.
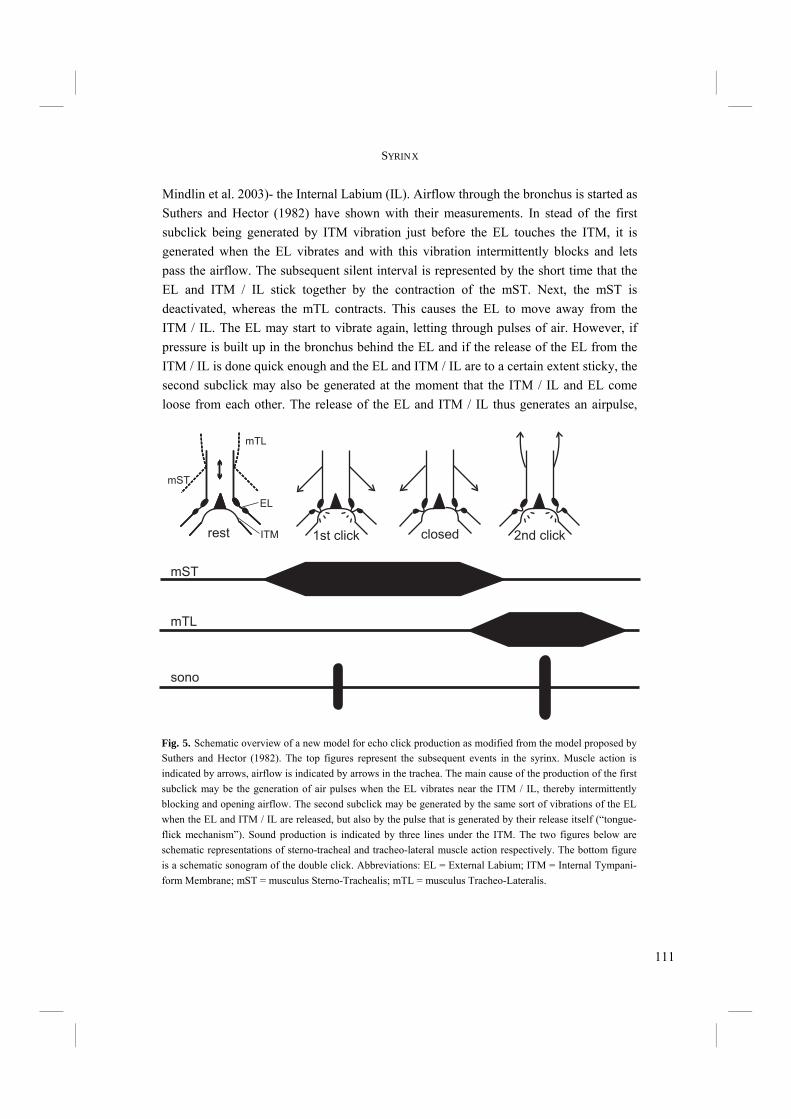
111
SYRINX
Mindlin et al. 2003)- the Internal Labium (IL). Airflow through the bronchus is started as Suthers and Hector (1982) have shown with their measurements. In stead of the first subclick being generated by ITM vibration just before the EL touches the ITM, it is generated when the EL vibrates and with this vibration intermittently blocks and lets pass the airflow. The subsequent silent interval is represented by the short time that the EL and ITM / IL stick together by the contraction of the mST. Next, the mST is deactivated, whereas the mTL contracts. This causes the EL to move away from the ITM / IL. The EL may start to vibrate again, letting through pulses of air. However, if pressure is built up in the bronchus behind the EL and if the release of the EL from the ITM / IL is done quick enough and the EL and ITM / IL are to a certain extent sticky, the second subclick may also be generated at the moment that the ITM / IL and EL come loose from each other. The release of the EL and ITM / IL thus generates an airpulse,
closed1st click 2nd clickrest
mTL
mST
ITM
EL
mST
mTL
sono
Fig. 5. Schematic overview of a new model for echo click production as modified from the model proposed by Suthers and Hector (1982). The top figures represent the subsequent events in the syrinx. Muscle action is indicated by arrows, airflow is indicated by arrows in the trachea. The main cause of the production of the first subclick may be the generation of air pulses when the EL vibrates near the ITM / IL, thereby intermittently blocking and opening airflow. The second subclick may be generated by the same sort of vibrations of the EL when the EL and ITM / IL are released, but also by the pulse that is generated by their release itself (“tongue-flick mechanism”). Sound production is indicated by three lines under the ITM. The two figures below are schematic representations of sterno-tracheal and tracheo-lateral muscle action respectively. The bottom figure is a schematic sonogram of the double click. Abbreviations: EL = External Labium; ITM = Internal Tympani-form Membrane; mST = musculus Sterno-Trachealis; mTL = musculus Tracheo-Lateralis.
112
CHAPTER 3.3
like in tongue flicking. It is likely that such a mechanism for the second subclick facilitates a more powerful click than sole vibration of the EL. This may be mirrored by the intensity difference between the first and second subclick, the first sometimes even being completely absent.
Discussion Morphological adaptations to echolocation in the syrinx are not immediately obvious. With the mechanism of click production in mind (either that of Suthers and Hector (1982) or that speculated about in this paper), enlargement of the EL in echolocaters compared to that in non-echolocaters would have been a good candidate. However, it was shown here that echolocaters in general do not have larger EL’s than non-echolocaters (Table 1). So although it seems clear that for echo click production the EL should not become so small, that the ITM or IL can not be reached, it seems unlikely that it should have been modified during evolution in order to be able to echolocate at all. Although the ITM is consistently thinner in echolocating Aerodramus than in non-echolocating C. esculenta and C. linchi, also the non-echolocating species H. gigas Swiftlet and R. leucopygialis Swift possess thin ITM’s. However, echolocation might have evolved before the branching off of H. gigas, i.e. at the base of the Swiftlets (Chapter 2.2). Consequently, H. gigas must have lost its echolocation ability, possibly retaining a previously for echolocation advantageous thin ITM. It might for example have lost echolocation ability, while still using the sound of the waterfall, where it nests, to orient itself back to its nesting site after dark. Alternatively, H. gigas may have never been able to echolocate. Thickness of the ITM may in that case be genetically constrained in the clade formed by Aerodramus and Hydrochous. It still remains a question whether a thin ITM is advantageous for echo click production. The thin ITM’s are not only thin, but also very smooth, whereas the thicker ITM’s are much more irregular. A smooth ITM may be sticking better to the EL than an irregular ITM, thus ensuring a forceful release of EL and ITM. However, if the EL is in contact with the IL instead of with the ITM, the smoothness of the ITM does not seem to be related to echo click production. Gaunt et al. (1982) and Elemans et al. (2004) have shown that doves possess exceptionally fast syringeal muscles and hypothesised that other bird species are likely to have such fast syringeal muscles as well. The speculative model for echo click production requires such fast syringeal muscles to produce double clicks with very short intervals and sharp on- and offsets. Swiftlets are therefore good candidates for having fast syringeal muscles.
113
SYRINX
Fusion of the first bronchial ring with the first tracheal ring is rather plastic, varying between individuals within species and present in echolocating as well as non-echolocating species. Generally, fusion of those rings seems to be more pronounced and occurring more often in echolocaters than in non-echolocaters. However, the inconsistency of the trait in echolocaters as well as in non-echolocaters indicates that it is not an adaptation towards echolocation. Instead, it may be related to age. Investigation of the ITM’s of other echolocating birds may give a clue whether thickness or smoothness of the ITM are advantageous for echolocation. First, although phylogenetically grouped with non-echolocating Collocalia species, C. troglodytes is also able to echolocate. If C. troglodytes also possesses a thin and/or smooth ITM, this might well be an adaptation to echolocation. Alternatively, if it has a thicker and/or looser ITM, similar to those of non-echolocating Collocalia species, the structure of the ITM is less likely to be related to the evolutionary development of echolocation ability. The second and only other non-Swiftlet bird that is able to echolocate is the South American Oilbird (Steatornis caripensis). The Oilbird has thicker ITM’s than echolocating Aerodramus Swiftlets, more similar to those of non-echolocating Collocalia Swiftlets (Suthers and Hector 1985). Furthermore, Oilbirds produce echo clicks that are similar to those of Swiftlets (Suthers and Hector 1985). These observations make the necessity of a thin ITM for echolocation less likely.
Acknowledgements We are grateful to Prof. Dr. W.F. Decraemer, S. Gea (M.Sc.), and S. Maas (M.Sc.) (University of Antwerp, Belgium) who enabled us to create micro Computer Tomographic scans of the tympanic drums of syrinxes and helped us doing so. Dr. C.P.H. Elemans (Wageningen University, The Netherlands) and Dr. G.J.L. Beckers (Leiden University) are thanked for valuable discussions on syringeal functioning.

114
CHAPTER 3.3
Segama river in Danum Valley (Sabah, Borneo, Malaysia), where individuals of Rhaphidura leucopygialis often flock after or during rain showers.

115
CHAPTER 4
DO SWIFTLETS HAVE AN EAR FOR ECHOLOCATION? THE
FUNCTIONAL MORPHOLOGY OF SWIFTLETS’ MIDDLE EARS.
This chapter has also been submitted for publication as: Thomassen, H.A.a, Gea, S.b, Maas, S.b, Bout, R.G.a, Dirckx, J.J.J.b, Decraemer, W.F.b
and Povel, G.D.E.a Do Swiftlets have an ear for echolocation? The functional morphology of Swiftlets’ middle ears.
a Section of Evolutionary Morphology, Institute of Biology Leiden, Leiden University b Laboratory of Biomedical Physics, Department of Physics, University of Antwerp
116
CHAPTER 4
Abstract The Oilbird and many Swiftlet species are unique among birds for their ability to echolocate. Echolocaters might benefit from improved hearing performance, i.e. having lower threshold pressure levels. Therefore, morphological adaptations to echolocation might be present in echolocating birds’ middle ears. To investigate whether this is true, we studied middle ear functional morphology of four echolocating and five non-echolocating Swiftlet species. Three dimensional (3D) reconstructions were made from micro Computer Tomographic (µCT) scans. The reconstructions were used in functional morphological analyses and model calculations. A two dimensional (2D) model was developed to study middle ear amplitude amplification and to predict optimal middle ear configuration for a maximum amplitude at the oval window. A 3D Finite Element model was used to predict middle ear movement and investigate the justification of the 2D approach. No morphological adaptations towards echolocation were found in the middle ear lever system or in the mass impedance of the middle ear. A wide range of optimal middle ear configurations is available and all investigated species are congruent with the predicted best configurations. It is therefore unlikely, that changes in the middle ear configuration would result in improved hearing. Instead, changes in the cochlea or auditory nervous system could accomplish improvements for echolocation in hearing ability.
117
MIDDLE EAR
Introduction Morphological adaptations to echolocation have been studied extensively in mammals (primarily bats and cetaceans) (e.g. Bradbury and Vehrencamp 1998 and references therein), but not in birds. The only known bird species that are able to echolocate are the South American Oilbird (Steatornis caripensis) (e.g. Griffin 1953; Konishi and Knudsen 1979; Pye 1980; Suthers and Hector 1985) and several species of Southeast Asian Swiftlets (Collocaliini), i.e. Aerodramus spp. (e.g. Medway 1967; Griffin and Suthers 1970; Fenton 1975; Smyth 1979; Suthers and Hector 1982) and Collocalia troglodytes (Price et al. 2004). The echo clicks of the Oilbird are single or double clicks between approximately 0.5 and 15 kHz (Suthers and Hector 1985). The clicks of Swiftlets are also of single as well as double click design (Suthers and Hector 1982; Chapter 3) and range roughly between 1 and 10 kHz. Echolocation in Steatornis caripensis and Collocaliini is primarily used for navigation in the darkness of their roosting and nesting caves. They do not use echolocation to locate food. Steatornis caripensis is frugivorous, but only very occasionally echolocates while outside a cave. Collocaliini locate their insect prey visually. Wave lengths of the frequencies they use to echolocate are too large to detect small prey items. Although several studies exist on echolocation acuity (e.g., Fenton 1975; Fullard et al. 1993; Griffin and Suthers 1970; Griffin and Thompson 1982; Smyth and Roberts 1983), there is little knowledge about morphological characteristics that make echolocation possible. The physiology of syringeal click production has been studied in both the Oilbird (Suthers and Hector 1985) as well as Swiftlets (Suthers and Hector 1982). We studied and compared the functional morphology of the middle ear in Swifts and Swiftlets and examined the potential presence of morphological adaptations towards echolocation. An echolocation system may have several demands imposed on it (Bradbury and Vehrencamp 1998). First, clicks need to have a sharp onset and must be short, so that they do not interfere with the returning echo. Second, they need to be broad-banded, to be able to gain as much information as possible. They should be loud enough and the hearing organ needs to be sensitive enough with high temporal resolution for good hearing of the echoes and intervals. Finally, the central nervous system should be able to transform the sounds into a three dimensional audio-image of the surroundings. As a device that transduces sound waves from air to oscillations in the cochlear fluid, the middle ear may play a crucial role in the evolution of echolocation. The frequency range that can be detected has long been thought to be mainly determined by the middle ear. However, Ruggero and Temchin (2002) made clear that middle ears may well be wide-band transformers, spanning (and possibly exceeding) all frequencies of hearing. They

118
CHAPTER 4
argue that each component of the ear is functionally optimised to meet the requirements of the system as a whole. It therefore seems likely, that the middle ear of echolocaters is not specifically adapted to transduce a certain range of frequencies better than that of non-echolocaters. However, middle ears of different species may still differ in the absolute minimum power (Sound Pressure Level) that can be detected. We hypothesise that the minimum threshold pressure level of echolocaters should be lower than of non-echolocaters. The low frequencies of an echo are masked by the low frequencies of background noise. High frequencies are less masked and therefore more informative in echolocation. The problem is that higher frequency sounds are attenuated stronger with distance than lower frequency sounds. Moreover, the echo has travelled twice the distance of the bird to the reflecting object, which considerably increases damping out. The middle ear should therefore be able to detect and amplify these high frequency sounds with low pressure levels. To accomplish this, the middle ear of echolocaters may be morphologically adapted to be a better transducer, i.e. detect sounds of lower pressure levels and transduce and amplify these low SPL sounds sufficiently well for detection by the inner ear. Lower minimum detection levels could be accomplished in the middle ear by (1) higher sensitivity of the middle ear itself to incoming sound and (2) better amplification by the middle ear in order to gain larger oscillation amplitudes of the footplate at the oval window in the cochlea. Consequently, the cochlea could detect oscillations more easily. Besides amplification of sounds, the crucial function of the middle ear is bridging the impedance difference between air and the cochlea (e.g. Saunders et al. 2000). In the lever system model of the middle ear (e.g. Gaudin 1968; Norberg 1978) (Fig. 1) a trade-off is present between amplification and impedance matching. The lever system is defined as the Force Lever (FL) and Resistance Lever (RL). The ratio FL : RL is proportional to the output force and therefore to the impedance. However, FL : RL is inversely proportional to the displacement of the RL. The amplitude of the oscillation of the columella decreases when FL : RL increases. Thus modification of the lever arms for increased amplification will result in decreased impedance matching performance and the other way around. Decreased impedance matching performance of the lever system can however be compensated by an increase in the area ratio of tympanum and oval window. The middle ear, i.e. the lever system of the extracolumella and columella could therefore be modified towards a better amplification function without repercussions on the impedance matching performance. Increasing tympanum area may also increase the sensitivity to incoming sound waves. Because there is an impedance difference between air and the middle ear itself as well, decreasing this difference could also result in improved sensitivity.
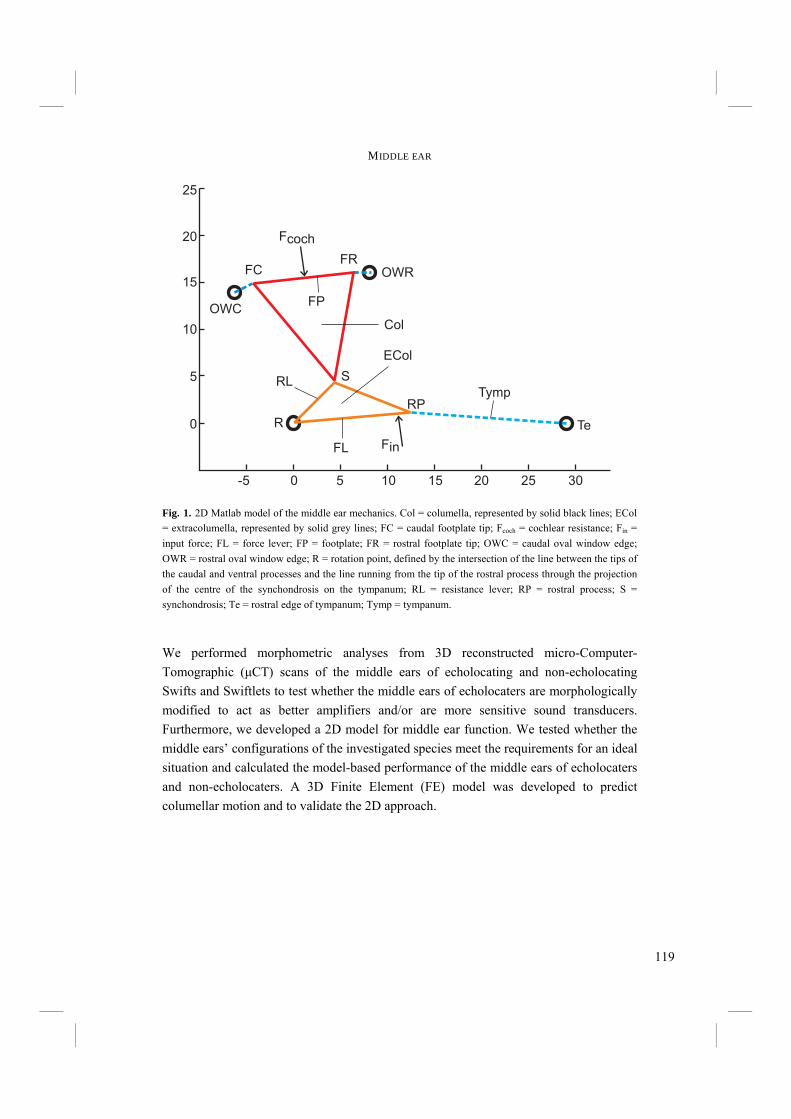
119
MIDDLE EAR
We performed morphometric analyses from 3D reconstructed micro-Computer-Tomographic (µCT) scans of the middle ears of echolocating and non-echolocating Swifts and Swiftlets to test whether the middle ears of echolocaters are morphologically modified to act as better amplifiers and/or are more sensitive sound transducers. Furthermore, we developed a 2D model for middle ear function. We tested whether the middle ears’ configurations of the investigated species meet the requirements for an ideal situation and calculated the model-based performance of the middle ears of echolocaters and non-echolocaters. A 3D Finite Element (FE) model was developed to predict columellar motion and to validate the 2D approach.
-5 0 5 10 15 20 25 30
0
5
10
15
20
25
S
RP
R
FCFR
Te
OWC
OWR
Tymp
Col
ECol
Fin
Fcoch
FL
RL
FP
Fig. 1. 2D Matlab model of the middle ear mechanics. Col = columella, represented by solid black lines; ECol = extracolumella, represented by solid grey lines; FC = caudal footplate tip; Fcoch = cochlear resistance; Fin = input force; FL = force lever; FP = footplate; FR = rostral footplate tip; OWC = caudal oval window edge; OWR = rostral oval window edge; R = rotation point, defined by the intersection of the line between the tips of the caudal and ventral processes and the line running from the tip of the rostral process through the projection of the centre of the synchondrosis on the tympanum; RL = resistance lever; RP = rostral process; S = synchondrosis; Te = rostral edge of tympanum; Tymp = tympanum.
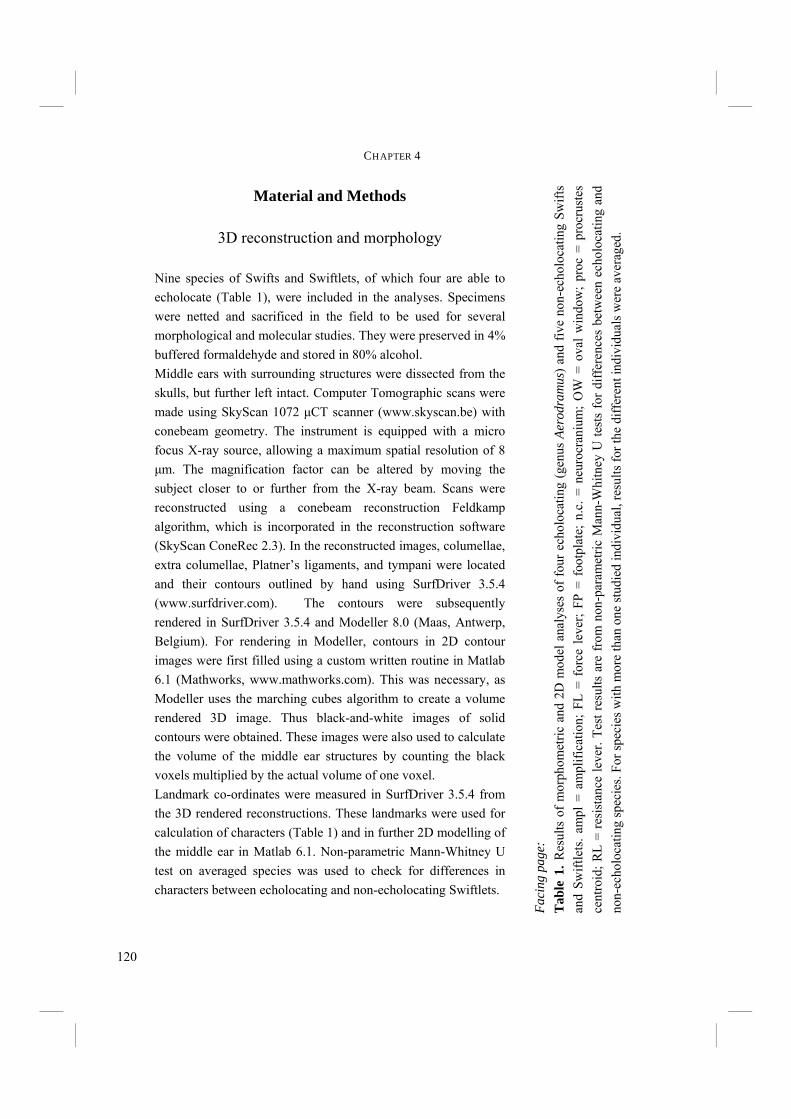
120
CHAPTER 4
Material and Methods
3D reconstruction and morphology Nine species of Swifts and Swiftlets, of which four are able to echolocate (Table 1), were included in the analyses. Specimens were netted and sacrificed in the field to be used for several morphological and molecular studies. They were preserved in 4% buffered formaldehyde and stored in 80% alcohol. Middle ears with surrounding structures were dissected from the skulls, but further left intact. Computer Tomographic scans were made using SkyScan 1072 µCT scanner (www.skyscan.be) with conebeam geometry. The instrument is equipped with a micro focus X-ray source, allowing a maximum spatial resolution of 8 µm. The magnification factor can be altered by moving the subject closer to or further from the X-ray beam. Scans were reconstructed using a conebeam reconstruction Feldkamp algorithm, which is incorporated in the reconstruction software (SkyScan ConeRec 2.3). In the reconstructed images, columellae, extra columellae, Platner’s ligaments, and tympani were located and their contours outlined by hand using SurfDriver 3.5.4 (www.surfdriver.com). The contours were subsequently rendered in SurfDriver 3.5.4 and Modeller 8.0 (Maas, Antwerp, Belgium). For rendering in Modeller, contours in 2D contour images were first filled using a custom written routine in Matlab 6.1 (Mathworks, www.mathworks.com). This was necessary, as Modeller uses the marching cubes algorithm to create a volume rendered 3D image. Thus black-and-white images of solid contours were obtained. These images were also used to calculate the volume of the middle ear structures by counting the black voxels multiplied by the actual volume of one voxel. Landmark co-ordinates were measured in SurfDriver 3.5.4 from the 3D rendered reconstructions. These landmarks were used for calculation of characters (Table 1) and in further 2D modelling of the middle ear in Matlab 6.1. Non-parametric Mann-Whitney U test on averaged species was used to check for differences in characters between echolocating and non-echolocating Swiftlets.
Faci
ng p
age:
T
able
1. R
esul
ts o
f mor
phom
etric
and
2D
mod
el a
naly
ses
of fo
ur e
chol
ocat
ing
(gen
us A
erod
ram
us) a
nd fi
ve n
on-e
chol
ocat
ing
Swift
s an
d Sw
iftle
ts. a
mpl
= a
mpl
ifica
tion;
FL
= fo
rce
leve
r; FP
= f
ootp
late
; n.c
. = n
euro
cran
ium
; O
W =
ova
l win
dow
; pr
oc =
pro
crus
tes
cent
roid
; RL
= re
sist
ance
leve
r. Te
st re
sults
are
from
non
-par
amet
ric M
ann-
Whi
tney
U te
sts
for d
iffer
ence
s be
twee
n ec
holo
catin
g an
d no
n-ec
holo
catin
g sp
ecie
s. Fo
r spe
cies
with
mor
e th
an o
ne st
udie
d in
divi
dual
, res
ults
for t
he d
iffer
ent i
ndiv
idua
ls w
ere
aver
aged
.

121
MIDDLE EAR O
W a
rea
(105 µ
m)
tym
p ar
ea
(105 µ
m)
ampl
FL
le
ngth
(µ
m)
RL
leng
th
(µm
)
ampl
vo
lum
e (1
08 µm
3 ) Fo
otpl
ate
disp
lace
men
t
unsc
aled
sc
aled
to
FP
leng
th
proc
n.
c. le
ngth
bo
dy m
ass
Echo
loca
ting
A. fu
ciph
agus
4.
113
53.0
58
12.9
0 12
01
580
2.07
2.
61
10.9
7.
9 5.
5 0.
220
0.32
7
A. fu
ciph
agus
3.
632
54.3
79
14.9
7 84
2 33
5 2.
51
1.75
12
.3
9.0
4.8
0.23
6 0.
335
A. m
axim
us
4.68
2 63
.980
13
.67
1423
43
5 3.
27
2.81
11
.5
9.5
9.1
0.22
6 0.
227
A. m
axim
us
4.37
8 78
.154
17
.85
1393
53
2 2.
62
3.49
11
.8
9.2
6.5
0.21
9 0.
205
A. te
rrae
regi
nae
1.52
7 29
.624
19
.40
600
407
1.48
2.
20
8.7
7.4
4.2
0.22
6 0.
334
A. te
rrae
regi
nae
2.57
1 39
.983
15
.55
784
319
2.46
1.
31
10.3
8.
4 9.
9 0.
209
0.37
9
A. v
ulca
noru
m
3.56
7 61
.833
17
.33
1243
65
8 1.
89
2.27
11
.7
8.2
3.9
0.21
6 0.
262
Ave
rage
(±SE
)
15
.97
(0.8
9)
2.33
(0
.22)
2.
9 (0
.61)
11
.04
(0.4
6)
8.51
(0
.28)
6.
27
(0.9
1)
0.22
2 (0
.003
) 0.
296
(0.0
24)
Non
-ech
oloc
atin
g
C. e
scul
enta
2.
920
40.6
53
13.9
2 11
76
547
2.15
2.
67
9.1
8.7
5.1
0.23
5 0.
416
C. l
inch
i 2.
425
30.3
28
12.5
1 85
7 41
9 2.
04
3.34
11
.0
8.3
5.7
0.27
4 0.
609
H. g
igas
5.
502
84.9
40
15.4
4 14
88
957
1.56
5.
53
7.9
7.9
2.0
0.16
2 0.
105
R. le
ucop
ygia
lis
3.48
5 57
.963
16
.63
1193
73
5 1.
62
2.24
10
.7
8.0
3.0
N.A
. 0.
218
Ap. a
pus
4.95
6 75
.101
15
.15
1361
10
95
1.24
5.
74
10.4
7.
6 4.
3 0.
118
0.10
5
Ave
rage
(±SE
)
14
.72
(0.7
0)
1.72
(0
.17)
3.
70
(0.8
3)
9.84
(0
.59)
8.
12
(0.1
9)
3.99
(0
.67)
0.
197
(0.0
35)
0.29
1 (0
.098
)
p-va
lue
0.37
2
0.
088
0.68
5 0.
123
0.29
1 0.
167
0.85
0 0.
685
spec
imen

122
CHAPTER 4
Model development
2D model A model of middle ear function was developed in Matlab 6.1. It is a 2D representation of the lever system of Gaudin (1968) and Norberg (1978) (Fig. 1). 2D co-ordinates were calculated from the 3D reconstruction and are projections of the 3D co-ordinates on a plane that is defined by the force lever (FL) and resistance lever (RL) (Fig. 1 and 2). The force lever is defined by the line that runs from the tip of the rostral process through the projection of the centre of the synchondrosis on the tympanum. This line crosses the line between the tips of the ventral and caudal processes (Fig. 2). The force lever is the line between this point and the tip of the rostral process. The lengths of footplates in the 2D model were calculated directly from the 3D reconstructions. The 2D model calculates the static equilibrium given an input force (Fin) that is applied to the force lever (FL), a cochlear resistance (Fcoch) at the oval window, and the elasticity of the membranes (Fig. 1). Amplification is measured as the displacement of the footplate, which is represented by the area between the configuration of the footplate when no force is applied and the configuration when a static force (Fin) is applied on FL (Fig. 1). The used forces are not realistic estimations of forces in real middle ears. They are arbitrarily chosen and as such no attempt is made to predict realistic absolute footplate displacements. Therefore, no units are displayed for footplate displacements. However, the results are mutually comparable and can be used to estimate relative performance of middle ears. The relative performance of the examined middle ears was studied using standardised configurations. However, standardisation of middle ear configurations is difficult. In the model certain assumptions are made about stiffness of the tympanum and oval window membranes. It is not known how these membrane properties scale with middle ear size. A procrustes fit was used to scale the points describing the middle ear configuration of single species to the same average centroid. Note that relative footplate length and therefore the resistance of the inner ear is consequently not equal in all cases. This will result in different footplate displacements for two configurations that only differ in footplate length, but are equal in the remaining points. To investigate shape differences with respect to a constant inner ear resistance, we scaled middle ear configurations to a constant footplate length. The resulting footplate displacements may only be compared within the same scaling method. However, physical properties of sound work on actual, unstandardised middle ears. Absolute sizes may therefore be important in realising an
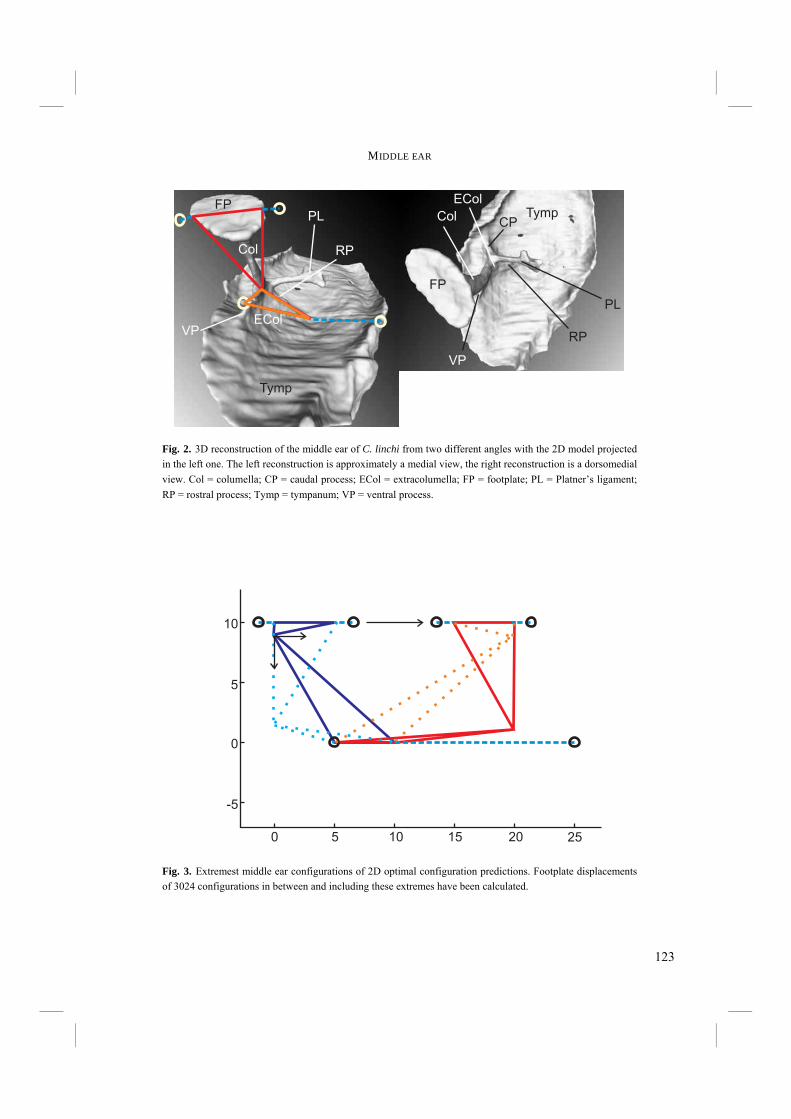
123
MIDDLE EAR
TympCol
ECol
PL
FP
RP
VP
CP
Tymp
FP
PL
Col
EColVP
RP
Fig. 2. 3D reconstruction of the middle ear of C. linchi from two different angles with the 2D model projected in the left one. The left reconstruction is approximately a medial view, the right reconstruction is a dorsomedial view. Col = columella; CP = caudal process; ECol = extracolumella; FP = footplate; PL = Platner’s ligament; RP = rostral process; Tymp = tympanum; VP = ventral process.
250 5 10 15 20
-5
0
5
10
Fig. 3. Extremest middle ear configurations of 2D optimal configuration predictions. Footplate displacements of 3024 configurations in between and including these extremes have been calculated.
124
CHAPTER 4
optimal sound transmission apparatus. Therefore, displacements of the footplates were also calculated for unstandardised middle ear configurations. Finally, these results of unstandardised middle ears were subsequently scaled to neurocranium length or body mass. We examined whether an optimal middle ear configuration or a range of optimal configurations exists. The configurations of the studied middle ears were compared with the predicted optimal configurations to check whether real middle ear configurations can be changed to increase footplate displacement or whether they are already conform the best possible configuration. For a sequence of 3024 different artificial middle ear configurations, footplate displacements were calculated. In this sequence of artificial middle ear configurations, the rotation axis of the lever complex as well as the length of the force lever where kept fixed. Furthermore, the lengths of the membranes were constant throughout the sequence as well. The positions of the synchondrosis and the footplate were varied independently between two extreme values (Fig. 3). The position of the synchondrosis was varied vertically and horizontally, whereas the position of the footplate was varied only in a horizontal direction. In a second sequence the influence of varying angles of the footplate relative to the columella was examined. Finally, the total length of the columella and extra columella was varied. The optimal configuration is thought to be represented by the one(s) resulting in the largest displacement(s) of the footplate.
3D Finite Element model Gaudin (1968) and Norberg (1978) observed different movements of the columellae. Gaudin (1968) described the movements of the footplates in several species of owls, falcons, crows, pigeons, geese, and hens as reminding him “of a musician’s foot tapping as it rests on the heel.” Norberg (1978) on the other hand, pictured the footplate of the Tengmalm’s Owl (Aegolius funereus) to be moving in a piston like manner. A Finite Element (FE) model was constructed from 3D rendered images to predict the actual movement of the columellae of Swiftlets. The results were used to examine whether the 2D approach is a good estimation of columella movement. To create the FE model, the surface model was converted into a volume model using WinGID (http://gid.cimne.com). The model consisted of 4748 nodes and 15774 trilinear tetrahedral elements. For all parts of the model a linear elastic model was chosen. As no Young’s moduli for bird middle ear structures are known from the literature, Young’s
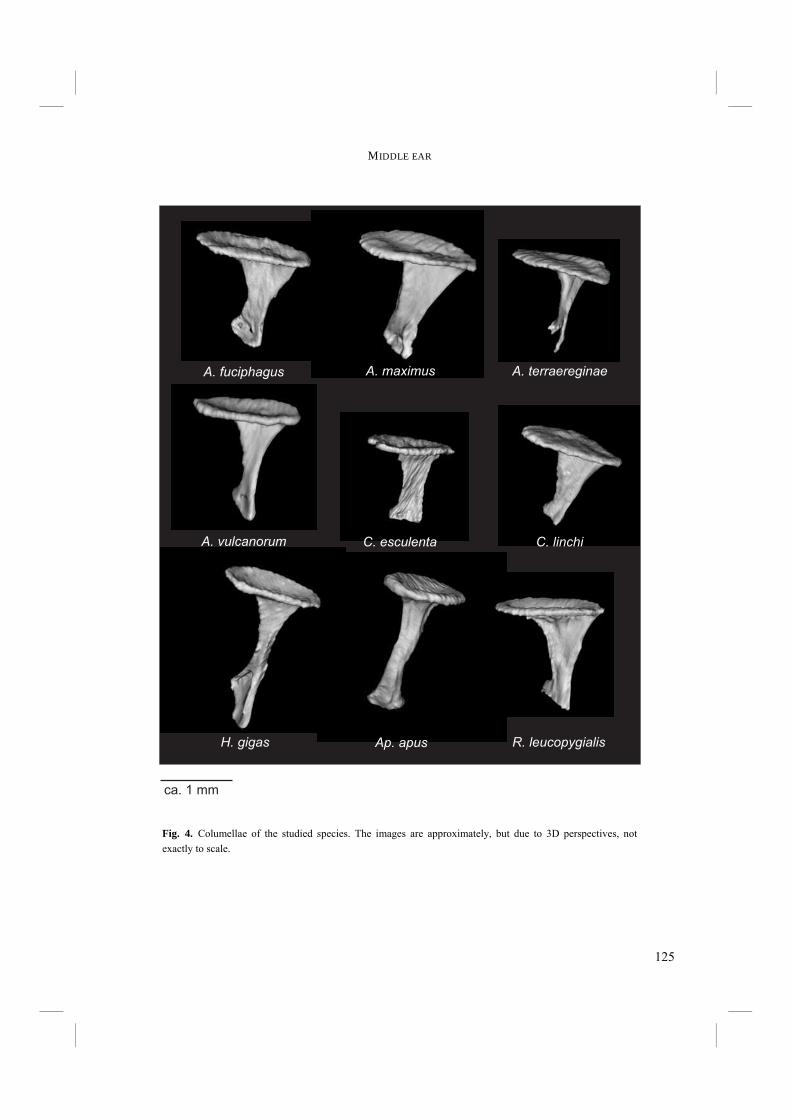
125
MIDDLE EAR
Fig. 4. Columellae of the studied species. The images are approximately, but due to 3D perspectives, not exactly to scale.
A. fuciphagus A. maximus A. terraereginae
A. vulcanorum C. esculenta C. linchi
R. leucopygialisH. gigas Ap. apus
ca. 1 mm
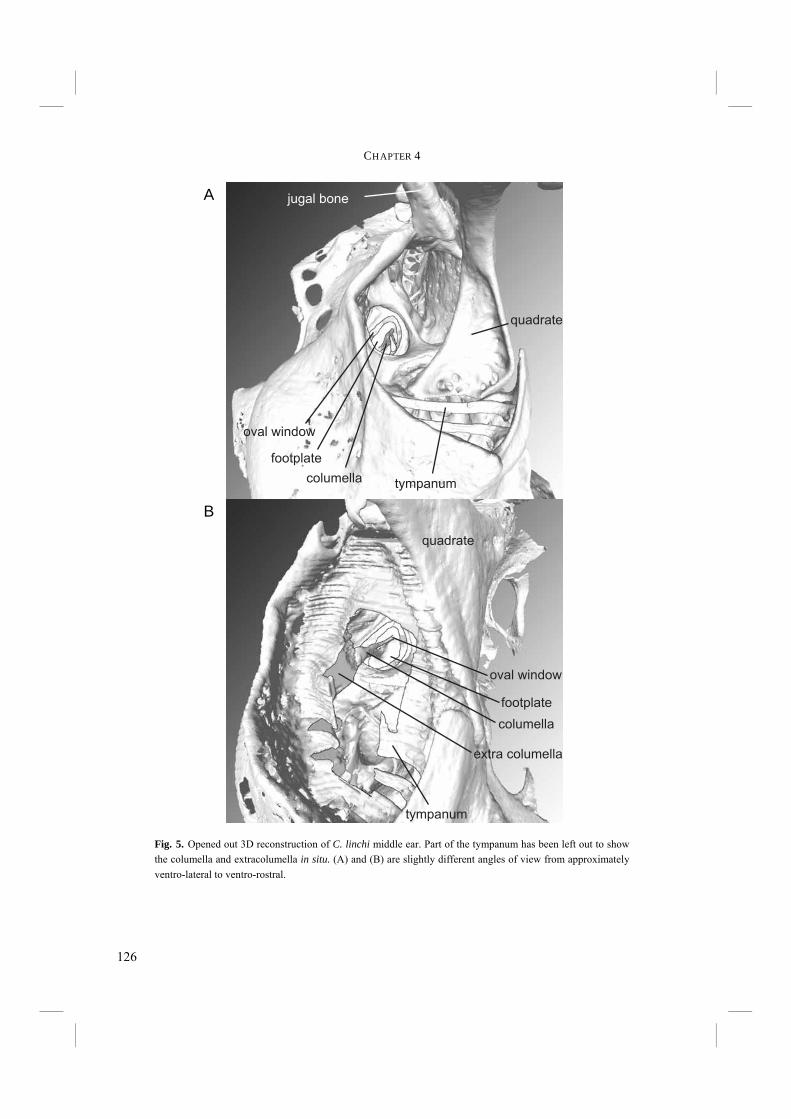
126
CHAPTER 4
quadrate
tympanum
oval window
footplate
columella
jugal bone
quadrate
tympanum
oval window
footplate
columella
extra columella
Fig. 5. Opened out 3D reconstruction of C. linchi middle ear. Part of the tympanum has been left out to show the columella and extracolumella in situ. (A) and (B) are slightly different angles of view from approximately ventro-lateral to ventro-rostral.
B
A
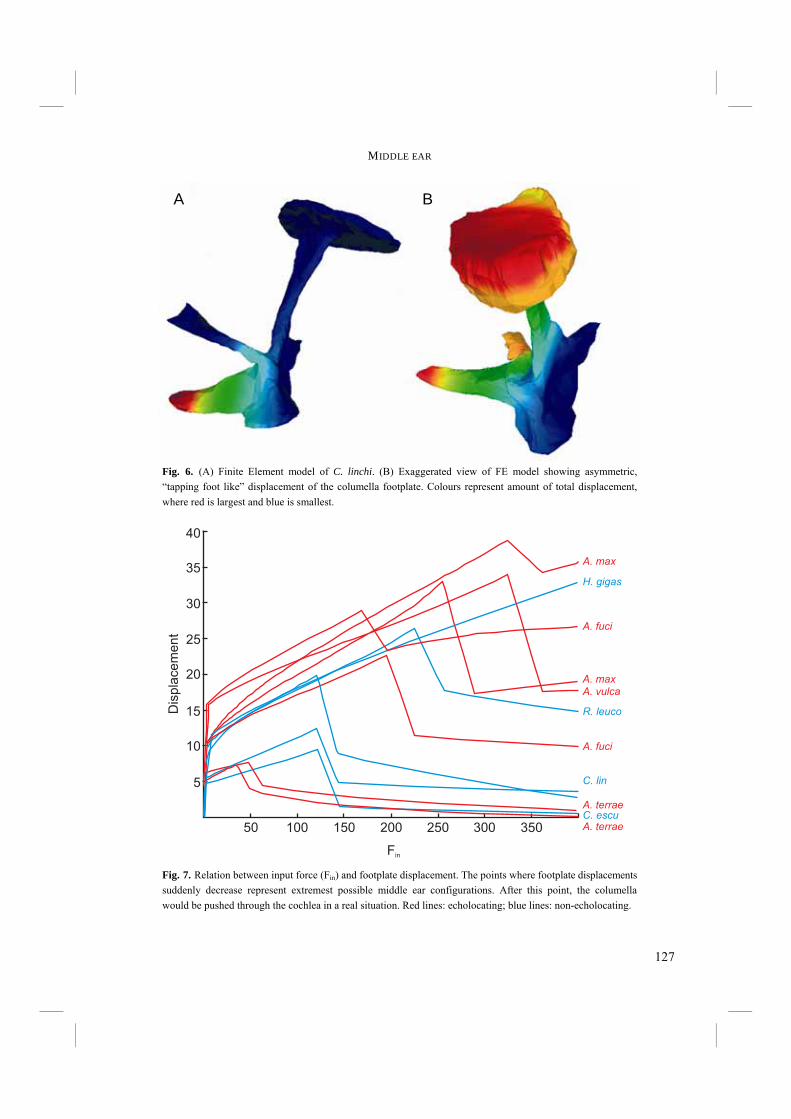
127
MIDDLE EAR
A B
Fig. 7. Relation between input force (Fin) and footplate displacement. The points where footplate displacements suddenly decrease represent extremest possible middle ear configurations. After this point, the columella would be pushed through the cochlea in a real situation. Red lines: echolocating; blue lines: non-echolocating.
50 100 150 200 250 300 350
5
10
15
20
25
30
35
40
A. vulca
C. escu
A. fuci
A. fuci
H. gigas
C. lin
A. max
A. max
R. leuco
Fin
Dis
pla
ce
me
nt
A. terrae
A. terrae
Fig. 6. (A) Finite Element model of C. linchi. (B) Exaggerated view of FE model showing asymmetric, “tapping foot like” displacement of the columella footplate. Colours represent amount of total displacement, where red is largest and blue is smallest.
128
CHAPTER 4
moduli were based on those found in human middle ears (Koike et al. 2002). The columella is made of bone (Young’s modulus = 12 GPa), the extra columella of cartilage (0.01 GPa), and Platner’s ligament (0.021 GPa) and the membrane of the oval window (0.02 GPa) consist of collagen. The Poisson ratio was chosen to be 0.33 for all materials. Subsequently a linear (quasi-) static FE analysis was performed with FEMStudio (Maas, Antwerp, Belgium). The behaviour of the columella was simulated by applying a positive pressure difference from the external ear canal to the surface of the extra columella. The tilting behaviour of the extra columella was simulated with and without fixed tips of the ventral and caudal processes. No qualitative differences between these two methods were observed.
Results
Morphology and morphometrics 3D rendered images of the columellae are shown in Fig. 4. All investigated species have similarly shaped columellae. Footplates are more or less oval and depressed towards the middle. The columellae are flattened and twisted, bringing the length axis of the footplate nearly parallel to the plane of the force lever and resistence lever system. The columellae are at their broadest at the connection to the footplate, have a narrow middle part and finally broaden again at their distal ends towards the synchondrosis with the extracolumella. The columella of Ap. apus is less twisted than those of other species. Proximally broadest columellae are found in A. fuciphagus, A. maximus, and R. leucopygialis, followed by C. esculenta and C. linchi. The appearance of the columellae of A. terraereginae, Ap. apus, H. gigas, and to a lesser extent of A. vulcanorum is more slender (Fig. 4). Opened out 3D reconstructions are shown in Fig. 5. The tympanum has been partly left out of the reconstruction in order to show the columella and extracolumella in situ. A 3D reconstruction of the middle ear of C. linchi is illustrated in Fig. 2. The angle of the columella with the tympanum varies among and within species (see for a 2D representation also Fig. 8). Caudal and ventral processes of the extra columellae (Fig. 2) are in most species attached to the tympanum along the entire length of the processes, except in H. gigas. Distal tips of the extra columellae are in all studied Swifts and Swiftlets still at the tympanum, terminating at its marginal edge. This is also the case in many passerines (Saunders et al. 2000), but differs from the situation in the Boreal Owl
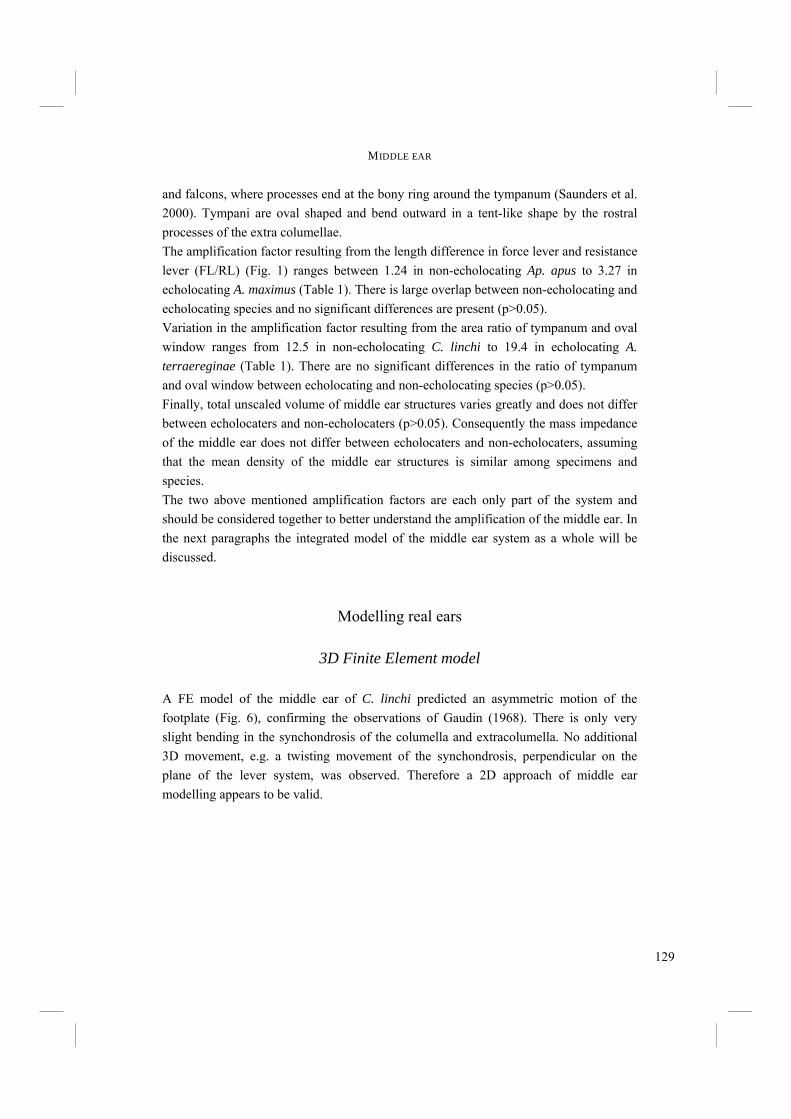
129
MIDDLE EAR
and falcons, where processes end at the bony ring around the tympanum (Saunders et al. 2000). Tympani are oval shaped and bend outward in a tent-like shape by the rostral processes of the extra columellae. The amplification factor resulting from the length difference in force lever and resistance lever (FL/RL) (Fig. 1) ranges between 1.24 in non-echolocating Ap. apus to 3.27 in echolocating A. maximus (Table 1). There is large overlap between non-echolocating and echolocating species and no significant differences are present (p>0.05). Variation in the amplification factor resulting from the area ratio of tympanum and oval window ranges from 12.5 in non-echolocating C. linchi to 19.4 in echolocating A. terraereginae (Table 1). There are no significant differences in the ratio of tympanum and oval window between echolocating and non-echolocating species (p>0.05). Finally, total unscaled volume of middle ear structures varies greatly and does not differ between echolocaters and non-echolocaters (p>0.05). Consequently the mass impedance of the middle ear does not differ between echolocaters and non-echolocaters, assuming that the mean density of the middle ear structures is similar among specimens and species. The two above mentioned amplification factors are each only part of the system and should be considered together to better understand the amplification of the middle ear. In the next paragraphs the integrated model of the middle ear system as a whole will be discussed.
Modelling real ears
3D Finite Element model A FE model of the middle ear of C. linchi predicted an asymmetric motion of the footplate (Fig. 6), confirming the observations of Gaudin (1968). There is only very slight bending in the synchondrosis of the columella and extracolumella. No additional 3D movement, e.g. a twisting movement of the synchondrosis, perpendicular on the plane of the lever system, was observed. Therefore a 2D approach of middle ear modelling appears to be valid.
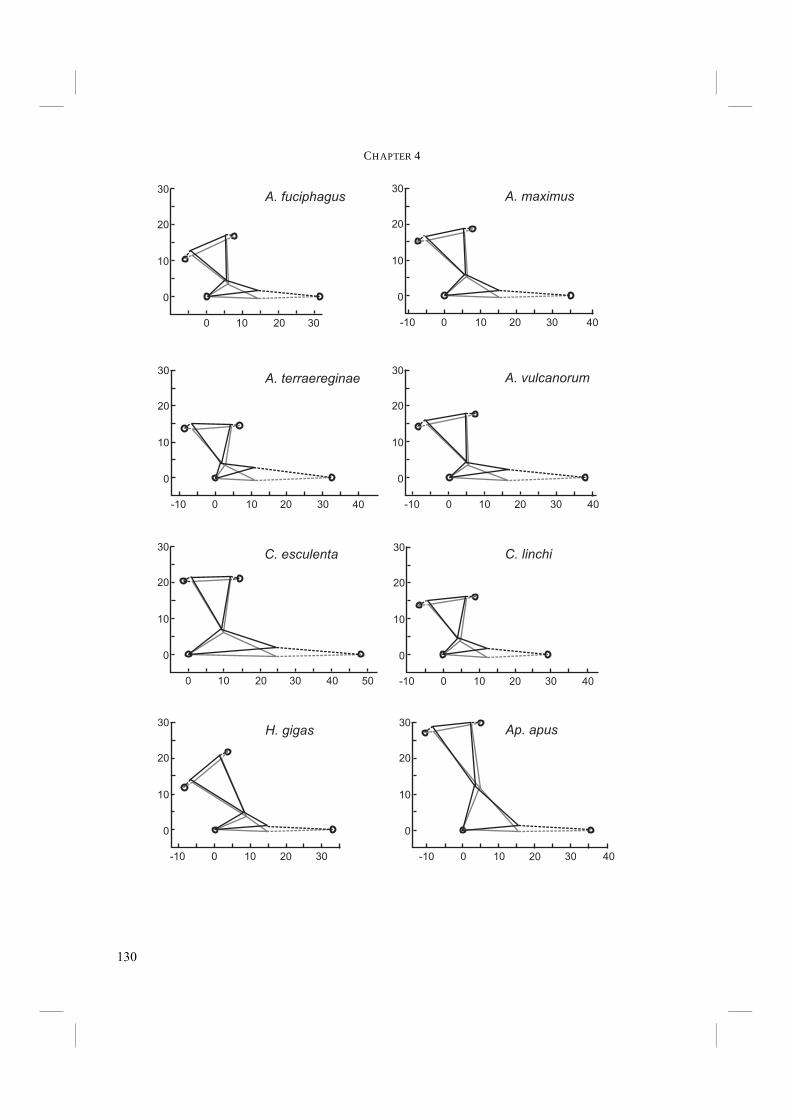
130
CHAPTER 4
0
0 5010 4020 30
10
20
30
0
-10 400 3010 20
10
20
30
0
0 10 20 30
10
20
30
0
-10 400 3010 20
10
20
30
0
-10 400 3010 20
10
20
30
0
-10 400 3010 20
10
20
30
0
-10 0 3010 20
10
20
30
0
-10 0 3010 20
10
20
30
40
A. fuciphagus A. maximus
A. terraereginae A. vulcanorum
C. esculenta C. linchi
H. gigas Ap. apus
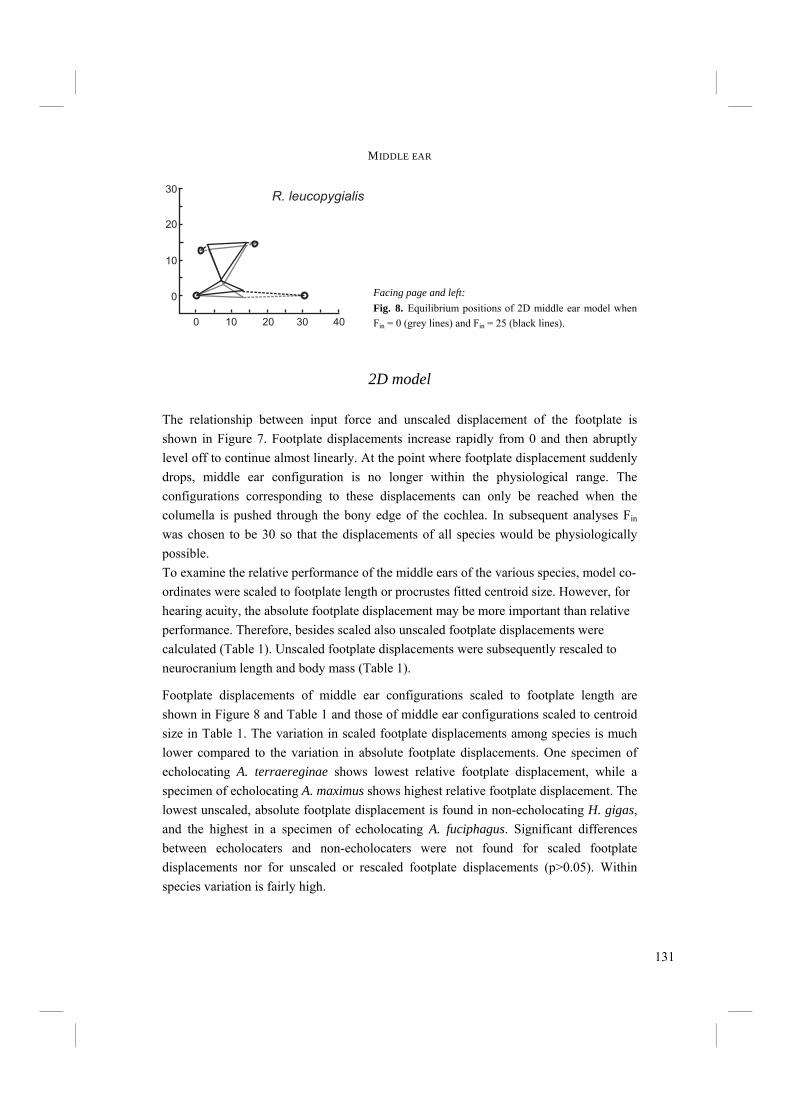
131
MIDDLE EAR
2D model The relationship between input force and unscaled displacement of the footplate is shown in Figure 7. Footplate displacements increase rapidly from 0 and then abruptly level off to continue almost linearly. At the point where footplate displacement suddenly drops, middle ear configuration is no longer within the physiological range. The configurations corresponding to these displacements can only be reached when the columella is pushed through the bony edge of the cochlea. In subsequent analyses Fin was chosen to be 30 so that the displacements of all species would be physiologically possible. To examine the relative performance of the middle ears of the various species, model co-ordinates were scaled to footplate length or procrustes fitted centroid size. However, for hearing acuity, the absolute footplate displacement may be more important than relative performance. Therefore, besides scaled also unscaled footplate displacements were calculated (Table 1). Unscaled footplate displacements were subsequently rescaled to neurocranium length and body mass (Table 1).
Footplate displacements of middle ear configurations scaled to footplate length are shown in Figure 8 and Table 1 and those of middle ear configurations scaled to centroid size in Table 1. The variation in scaled footplate displacements among species is much lower compared to the variation in absolute footplate displacements. One specimen of echolocating A. terraereginae shows lowest relative footplate displacement, while a specimen of echolocating A. maximus shows highest relative footplate displacement. The lowest unscaled, absolute footplate displacement is found in non-echolocating H. gigas, and the highest in a specimen of echolocating A. fuciphagus. Significant differences between echolocaters and non-echolocaters were not found for scaled footplate displacements nor for unscaled or rescaled footplate displacements (p>0.05). Within species variation is fairly high.
0
0 10 4020 30
10
20
30R. leucopygialis
Facing page and left: Fig. 8. Equilibrium positions of 2D middle ear model when Fin = 0 (grey lines) and Fin = 25 (black lines).

132
CHAPTER 4
Model predictions Although there is a large variation in shape of the middle ear among species, calculated footplate displacements do not differ between echolocating and non-echolocating Swiftlets. The question rises what the cause is for this absence of differences. Several explanations might be applicable. First, echolocating Swiftlets might not need improvement of the middle ear after all. Alternatively, alteration of the middle ear might be constrained or might not result in improvement of amplitude amplification. To examine whether footplate displacements can increase at all, footplate displacements of a series of different artificial middle ear configurations were calculated. The extreme positions of the series of different middle ear configurations are shown in Figure 3. The extreme positions were chosen in such a way that the configurations would cover as much different configurations as possible, including exceptional configurations that are very different from observed configurations of the middle ears. The sequence was started with the left configuration (Fig. 3). Horizontal and vertical positions of the synchondrosis and the horizontal position of the footplate were varied independently in steps of 1 unit and footplate displacements were calculated until the final extreme configuration was reached (the right-hand configuratoin in Fig. 3). The remaining points of the model as well as the lenghts of the membranes were kept fixed throughout the sequence. In the remainder of this chapter Sh will refer to the horizontal position of the synchondrosis, Sv to the vertical position of the synchondrosis, and FPh to the horizontal position of the footplate. Numbers behind these references indicate the number of units from the starting configuration. Figure 9 shows the footplate displacements for all generated model configurations. Horizontal lines of markers in Figure 9A represent the horizontal variation of the configuration of the synchondrosis (Sh). For each line Sh is constant, but Sv and FPh vary between their extreme values. Thus, markers within a line are footplate displacements for different Sv and FPh, but for only one value of Sh. The bottom line represents the starting configuration of Sh, whereas the uppermost line represents the maximal value of Sh (Sh = 19). Figure 9B represents an enlargement of the middle part of Figure 9A for a single value of Sh (Sh = 6). Note that scales of the y-axes of Figures 9A and 9B differ. What looked like a horizontal line in Figure 9A, is in fact a set of curved horizontal lines in Figure 9B. These horizontal curved lines represent vertical differences in position of the synchondrosis for various horizontal footplate positions at a single height of the synchondrosis. The lower line represents the vertical starting configuration (Sv = 0), while the upper line represents the maximal vertical configuration (Sv = 8). Circles on a

133
MIDDLE EAR
Fig. 9. 2D model predictions of footplate displacement for 3024 different artificial middle ear configurations. Y-axes are numbered according to the order in which artificial middle ear configurations were altered in the calculation sequence. (A) Plot of all predicted footplate displacements. Lines Sh represent different horizontal positions of the synchondrosis. The bottom line is the starting configuration; the uppermost line is the terminal configuration. Markers in each line are footplate displacements for varying vertical positions of the synchondrosis (Sv) and varying horizontal positions of the footplate (FPh). (B) Plot for Sh = 6. The horizontal position of the synchondrosis is 6 units from the starting position. Horizontal lines represent the vertical positions of the synchondrosis (Sv), with markers representing footplate displacements for varying horizontal positions of the footplate. Circles represent left positions of the footplate, squares represent right positions. For this position of the synchondrosis (Sh = 6), maximal footplate displacement is reached when Sv = 8 and the footplate is still close to its starting position (left position in Fig. 3) (FPh is small).
0 4 8 12
0
1000
2000
3000
footplate displacement
configura
tion
num
ber
0 4 8 12
footplate displacement
configura
tion
num
ber
1200
1300
S = 0h
S = 19h
S = 0v
S = 8v
A
B
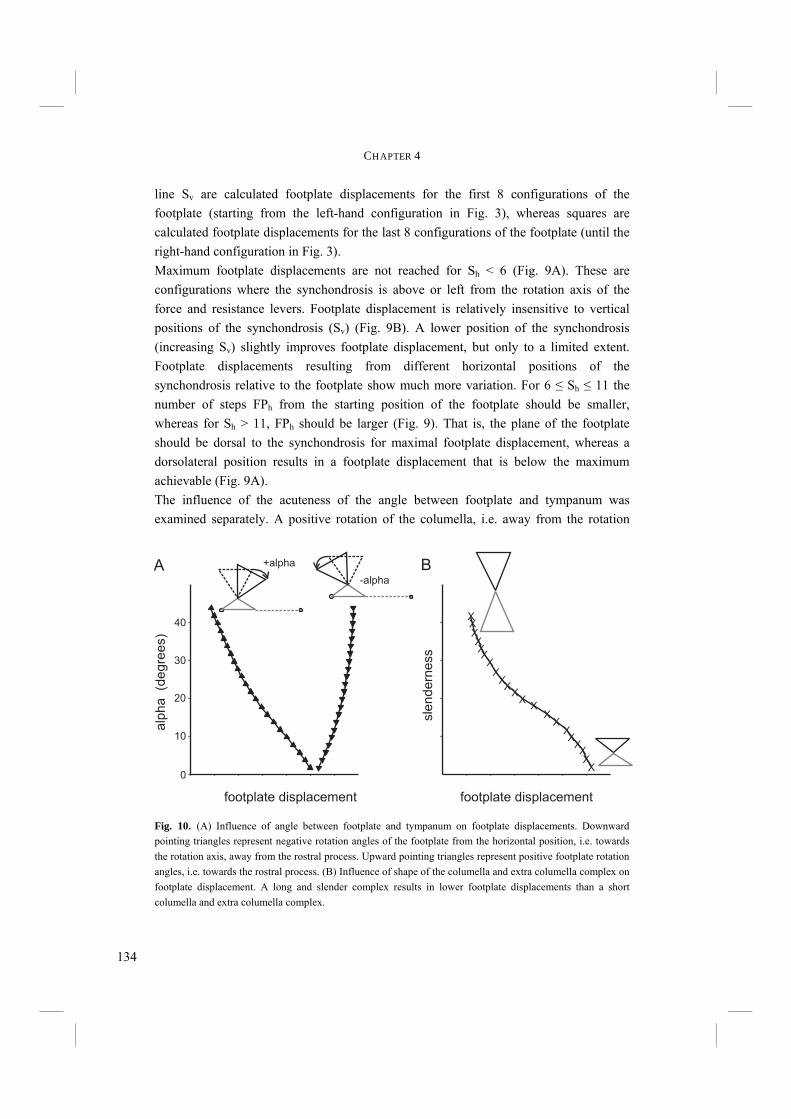
134
CHAPTER 4
line Sv are calculated footplate displacements for the first 8 configurations of the footplate (starting from the left-hand configuration in Fig. 3), whereas squares are calculated footplate displacements for the last 8 configurations of the footplate (until the right-hand configuration in Fig. 3). Maximum footplate displacements are not reached for Sh < 6 (Fig. 9A). These are configurations where the synchondrosis is above or left from the rotation axis of the force and resistance levers. Footplate displacement is relatively insensitive to vertical positions of the synchondrosis (Sv) (Fig. 9B). A lower position of the synchondrosis (increasing Sv) slightly improves footplate displacement, but only to a limited extent. Footplate displacements resulting from different horizontal positions of the synchondrosis relative to the footplate show much more variation. For 6 ≤ Sh ≤ 11 the number of steps FPh from the starting position of the footplate should be smaller, whereas for Sh > 11, FPh should be larger (Fig. 9). That is, the plane of the footplate should be dorsal to the synchondrosis for maximal footplate displacement, whereas a dorsolateral position results in a footplate displacement that is below the maximum achievable (Fig. 9A). The influence of the acuteness of the angle between footplate and tympanum was examined separately. A positive rotation of the columella, i.e. away from the rotation
0
10
20
30
40
alp
ha
(degre
es)
footplate displacement
+alpha
-alpha
footplate displacement
XXXXXX
XXX
XX
XX
XX
XX
XX
X
X
sle
ndern
ess
A B
Fig. 10. (A) Influence of angle between footplate and tympanum on footplate displacements. Downward pointing triangles represent negative rotation angles of the footplate from the horizontal position, i.e. towards the rotation axis, away from the rostral process. Upward pointing triangles represent positive footplate rotation angles, i.e. towards the rostral process. (B) Influence of shape of the columella and extra columella complex on footplate displacement. A long and slender complex results in lower footplate displacements than a short columella and extra columella complex.
135
MIDDLE EAR
axis of the force and resistance levers and towards the rostral process, results in decreasing footplate displacements (Fig. 10A). A negative rotation, i.e. towards the rotation axis, results in steadily increasing footplate displacements. Finally, a shorter, less slender shape of the columella and extra columella results in larger footplate displacements than long, slender columella and extra columella shapes (Fig. 10B).
Discussion The middle ear may act not only as an impedance matching device, but also as an amplitude amplifier. Compared to non-echolocaters, echolocaters could benefit from an improved amplification performance. However, no differences between echolocating and non-echolocating species were found. The lack of differences could be explained in two ways. First, echolocaters may not need improved amplification at all. The middle ear may either perform optimally or suboptimally, but still suitably for echolocation in the way it is used by Swiftlets. Second, if echolocaters do need improved amplification, this is not established by adaptations in the middle ear. The reason for this might be that the middle ear already performs optimally and improvements can not be made. Furthermore, improvements in the middle ear may not be substantial for what is needed for echolocation. Alternatively, improvements may be constrained by the primary function of the middle ear, i.e. impedance matching. The middle ear bridges the impedance difference between air and inner ear fluid by transforming high amplitude, low pressure oscillations in air into small amplitude, large pressure oscillations in the cochlear fluid. This function may constrain the anatomy of the middle ear so much, that changes to improve amplitude amplification do not easily evolve. Predictions of footplate displacements were made for a range of different middle ear configurations to investigate whether amplitude amplification of observed middle ear configurations could be improved at all. The 2D model predictions suggest that there is a fairly wide range of middle ear configurations that result in almost maximal footplate displacement. These configurations may all be sufficient for the amplification function. Furthermore, the influence on footplate displacement of the angle between the tympanum and the columella was examined. A small rotation of the footplate towards the lever system rotation axis already results in an increase in footplate displacement (Fig. 10A). However, this increase levels off for larger rotations. A rotation of the footplate to the opposite side clearly decreases for footplate displacement, which even

136
CHAPTER 4
becomes negative for rotation angles over 24o. Finally, we investigated the influence of the length of the columella and extra columella on footplate displacement. A shorter shape of the middle ear structures resulted in higher footplate displacement than a very long and slender shape (Fig. 10B). Comparison of the studied middle ears with the results for model middle ear configurations reveals that all middle ears are congruent with the predicted set of best performing configurations. The results of model middle ear configurations show that variation in the position of the synchondrosis can cause the footplate to have either a negative or a positive displacement. The synchondrosis should be at such a position that the footplate is not pulled out of the cochlea, which results in negative displacement. The horizontal position Sh of the synchondrosis relative to the footplate and the lever system rotation axis have a large effect on footplate displacement. The synchondrosis should be dorsomedially to the rotation axis to gain maximum footplate displacement. The vertical position of the synchondrosis is of less influence, but a position closer to the tympanum slightly improves footplate displacement. While all investigated species are congruent with the predicted position of the synchondrosis, Ap. apus deviates to some extent from the rest. The vertical position of its synchondrosis is higher than in the other investigated species. However, columella length is still larger than extracolumella length. Furthermore, the effect of vertical synchondrosis position on footplate displacement is relatively small. Therefore, even Ap. apus is congruent with the model prediction. The horizontal position of the synchondrosis relative to the rotation axis is in congruence with the prediction as well. The horizontal position of the synchondrosis relative to the footplate is at first sight not in each species congruent with the predicted optimal position. With the footplate parallel to the tympanum, the model predicts that it should be ventral to the footplate. A more ventromedial or ventrolateral placement would result in a rearward movement of the columella and a negative footplate displacement. In several species, the synchondrosis is not directly ventral to the footplate. However, due to the angle between footplate and tympanum, the displacement of the columella is still forward, into the cochlea. Footplate displacement calculations for different angles of the columella predicted that an acute angle of the footplate with the tympanum increases footplate displacement. Thus, the observed middle ears again match the predicted best configurations for footplate displacement. Finally, the shape of the real middle ears is in each species short, rather than slender. A short shape of extra columella and columella results in larger footplate displacements than a slender shape. So, once more, real ears appear to perform maximally.
137
MIDDLE EAR
Impedance matching is not only performed by the lever system of the extra columella, but also by the difference in area of the tympanum and oval window. These area ratios vary considerably among species (Table 1). There are no significant differences between echolocaters and non-echolocaters. Tympanum : oval window area ratios are relatively low to average compared to other bird species. Many birds, like Galliformes, Laridae, and Falconiformes have higher area ratios, ranging between 20 and 30 (e.g., Saunders 1985; Schwartzkopff 1952, 1957; Starck 1992). Auditory specialised birds like owls have highest area ratios, as large as 40. Thus, although echolocating Swiftlets are also auditory specialised, presence of improved area ratio impedance matching is not found. Volumes of middle ear structures do not differ between echolocaters and non-echolocaters. Assuming that the mean density of the structures does not differ between echolocaters and non-echolocaters, the mass impedance of the middle ear does not differ either. Thus, also in middle ear mass impedance, no adaptations towards echolocation seem to be present. A complicating factor in the comparison of echolocating and non-echolocating Swiftlets is that C. troglodytes, the sistergroup of and placed basal to C. linchi and C. esculenta, is also able to echolocate (Price et al. 2004). The genus Collocalia is the sistergroup of a clade formed by echolocating Aerodramus and non-echolocating Hydrochous gigas (Chapter 2). Echolocation may either have evolved once and subsequently lost twice or it evolved twice independently. In both cases echolocation ability may potentially be morphologically present in Collocalia, either completely or in certain parts of the system. However, comparison of the Collocaliini with outgroups R. leucopygialis and Ap. apus does not indicate any clear differences in middle ear morphology. Thus, presence of latent echolocative adaptations in the middle ears of C. linchi and C. esculenta is unlikely. The FE model prediction of columella movement comes close to what Gaudin (1968) has described as a “tapping foot”, in contrast with the piston like motion seen by Norberg (1978). This asymmetric motion can also be observed in the 2D model (Fig. 8), but in this model specimens showing a piston like movement are also present. Whether the footplate moves symmetric or asymmetric depends on the position of the synchondrosis relative to the footplate and to the rotation axis. Furthermore it depends on the acuteness of the angle between footplate and tympanum. Both symmetric as well as asymmetric movements can however result in maximum footplate displacements. It seems likely that tapping foot as well as piston like movements can be found among bird species, where the actual middle ear configuration is determined by other factors.

138
CHAPTER 4
The physics of bird middle ears have been described as a series of mathematical equations (e.g. Relkin 1988; Starck 1992). However, the use of an integrated model to describe middle ear function is new. We acknowledge that the presented model is a simplification and should be improved. Although a 2D approach seems legitimate, a 3D FE model could potentially have even higher predictive value. However, additional knowledge of tissue properties and the behaviour of oscillating membranes is necessary to further extend and evaluate the FE model. This was beyond the scope of this research. Although different configurations are observed in Swiftlet middle ears, each configuration is close to optimal. This is supported by the scaled footplate displacement calculations, which fall within a small range (Table 1). These displacements are probably the maximum that is achievable. We conclude that middle ears of echolocating Swiftlets can not be improved in order to gain larger footplate displacements, because they appear to perform maximally in echolocating as well as non-echolocating Swiftlets. Unless a completely different middle ear system would develop, functional morphological changes to accomplish increased amplitude amplification in the middle ear are unlikely. Therefore, evolution of echolocation does not seem to depend on adaptations in the middle ear of Swiftlets. Improved hearing performance may also be accomplished by adaptations in the cochlea, e.g. more and denser placement of tactile hair cells on the basilar membrane. Furthermore, morphological adaptations in the auditory nervous system could result in improved hearing and/or sound localization ability (Chapter 5).

139
CHAPTER 5
SIZE DIFFERENCES IN AUDITORY NUCLEI BETWEEN
ECHOLOCATING AND NON-ECHOLOCATING SWIFTLETS
This chapter has also been submitted for publication as: Thomassen, H.A., Hetebrij, E. and Povel, G.D.E. Size differences in auditory nuclei
between echolocating and non-echolocating Swiftlets. Section of Evolutionary Morphology, Institute of Biology Leiden, Leiden University
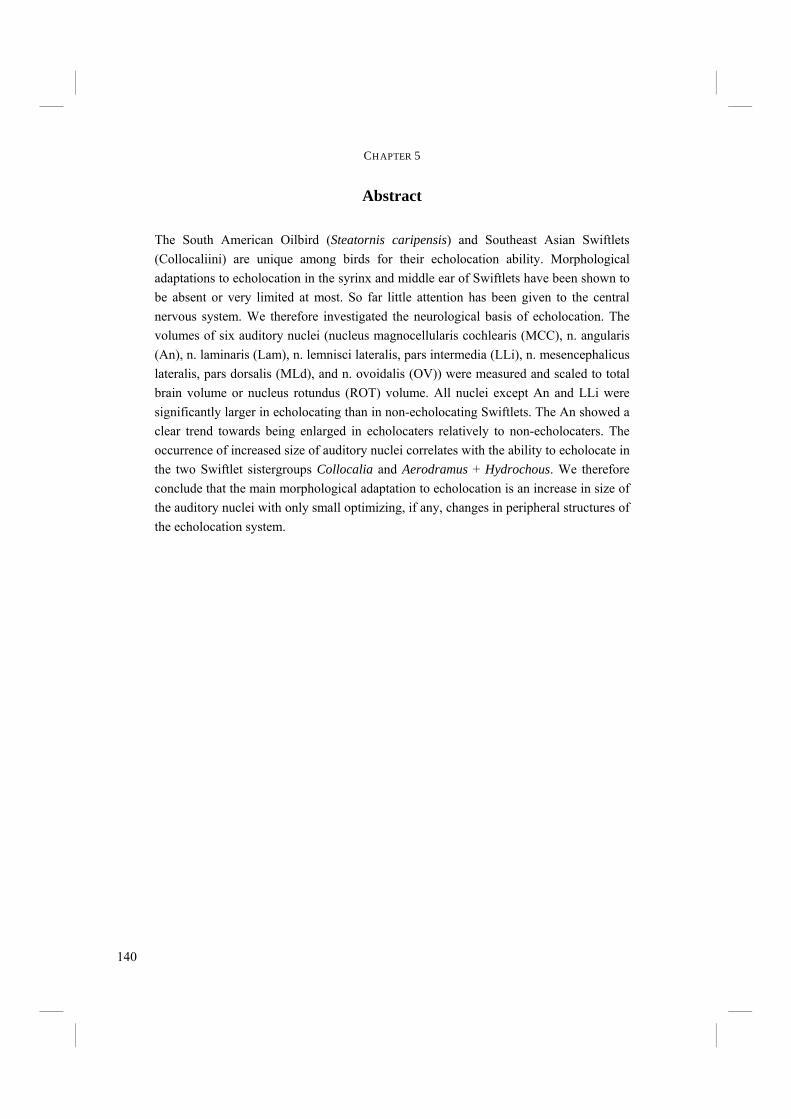
140
CHAPTER 5
Abstract The South American Oilbird (Steatornis caripensis) and Southeast Asian Swiftlets (Collocaliini) are unique among birds for their echolocation ability. Morphological adaptations to echolocation in the syrinx and middle ear of Swiftlets have been shown to be absent or very limited at most. So far little attention has been given to the central nervous system. We therefore investigated the neurological basis of echolocation. The volumes of six auditory nuclei (nucleus magnocellularis cochlearis (MCC), n. angularis (An), n. laminaris (Lam), n. lemnisci lateralis, pars intermedia (LLi), n. mesencephalicus lateralis, pars dorsalis (MLd), and n. ovoidalis (OV)) were measured and scaled to total brain volume or nucleus rotundus (ROT) volume. All nuclei except An and LLi were significantly larger in echolocating than in non-echolocating Swiftlets. The An showed a clear trend towards being enlarged in echolocaters relatively to non-echolocaters. The occurrence of increased size of auditory nuclei correlates with the ability to echolocate in the two Swiftlet sistergroups Collocalia and Aerodramus + Hydrochous. We therefore conclude that the main morphological adaptation to echolocation is an increase in size of the auditory nuclei with only small optimizing, if any, changes in peripheral structures of the echolocation system.

141
AUDITORY NUCLEI
Introduction Echolocation is fairly common in mammals such as bats and cetaceans, but rare in birds. Only the South American Oilbird (Steatornis caripensis) (e.g. Griffin 1953; Suthers and Hector 1985) and the Swiftlets, occupying South and Southeast Asia and Pacific islands, (Aerodramus spp. and Collocalia troglodytes) are able to echolocate (e.g. Carlson-Smith and Wiener 1996; Coles et al. 1987; Fenton 1975; Fenton 1980; Fullard et al. 1993; Griffin and Suthers 1970; Griffin and Thompson 1982; Medway and Pye 1977; Price et al. 2004; Suthers and Hector 1982). These birds use echolocation as a means to find their way in the darkness of the caves in which they form breeding colonies. The Oilbird is a nocturnal frugivore and echolocates only very occasionally while outside a cave (Suthers and Hector 1985). Swiftlets are insectivores, but the frequencies they use are not suitable to detect their small aerial prey. The adaptations, which enable these birds to echolocate remain largely unknown. The most noticeable adaptation is that Swiftlets as well as Oilbirds make use of short vocalisations, i.e. clicks (e.g. Suthers and Hector 1982, 1985) that are similar in the two groups. Such a click is very suitable for use as echolocation sound by its wide bandwidth, short duration, and sharp on- and offset (Bradbury and Vehrencamp 1998). We have speculated about modifications that might be necessary in the model for the production of these clicks by Suthers and Hector (1982, 1985) (Chapter 3.3). Other adaptations towards echolocation are less apparent. We showed that a difference exists in syringeal morphology of Swiftlets (Chapter 3.3), but that this difference is not consistent in all non-echolocating species. However, this difference might represent a genetic constraint, rather than an adaption for echolocation. Nevertheless, it cannot be ruled out that the difference in syringeal morphology is advantageous for echolocation. In the middle ear adaptations towards echolocation could not be found either (Chapter 4). Middle ear morphology is in both echolocaters and non-echolocaters configured to result in a maximal displacement of the footplate at the oval window. Changes in middle ear morphology to gain higher amplitude amplification have very little effect (Chapter 4). With relatively minor, if any, adaptations in the peripheral systems of the echolocation system, i.e. syrinx (Chapter 3.3) and middle ear (Chapter 4), the one system left that could potentially possess adaptations towards echolocation is the central nervous system. The auditory system in birds is in general well understood (see for a review Dooling et al. 2000). For example, Barn Owls (Tyto alba) localize their prey by the sound that their prey makes. It is known, that several of the auditory nuclei in the brainstem of the Barn Owl are relatively larger than those of birds that are not auditory specialized (e.g. Carr

142
CHAPTER 5
and Boudreau 1991; Carr et al. 1996; Köppl 2001; Kubke et al. 2004; Winter and Schwartzkopf 1961). Furthermore, echolocating bats possess hypertrophied auditory nuclei relative to non-echolocating bats (Hutcheon et al. 2002). Consequently, one could expect similar adaptations in birds that also rely heavily on auditory acuity, such as Swiftlets. Hollander (1971) stated that there are small differences in size in some auditory nuclei between echolocating and non-echolocating Swiftlets. However, he did not relate this to echolocation, probably due to the fact that one of the species he investigated, i.e. C. troglodytes, was until recently unknown to echolocate (Price et al. 2004). We extended the number of species and auditory nuclei examined by Hollander (1971) in order to further investigate whether and to which extent there are anatomical adaptations to echolocation in the brains of echolocating Swiftlets. The volumes of 6 auditory nuclei in echolocating and non-echolocating species were measured and compared.
Materials and methods A total of 11 Swiftlet brains of 4 echolocating and 3 non-echolocating species (Table 1) were obtained from specimens that were caught in the field. The birds were sacrificed with an overdose of Nembutal (Sanofi Synthelabo B.V., Maassluis, The Netherlands) for several functional morphological and molecular studies (this thesis). Specimens of A. terraereginae were donated by Dr. Suthers (Indiana University, Bloomington, USA). Immediately after the birds were sacrificed, the skull was opened in order to let 4% buffered formaldehyde preservative flow in freely. After approximately two weeks, specimens were stored in 80% alcohol. This method worked well for the preservation of most brains. However, the brain of a specimen of H. gigas turned out to be improperly preserved and unusable for further analyses. Total brain volume was measured using a graduated cylinder and a balance. The weight of the brain (mb) was measured, as well as the weight of the empty cylinder (mempty), of the cylinder filled with a certain volume of water (mw) and the weight of the cylinder with the brain and filled with water to the same volume as for measurement without brain (mw+b). The volume of the brain is then given by:
Vb = (mw - mw+b + mb) / ρw and:
ρw = (mw - mempty) / Vw
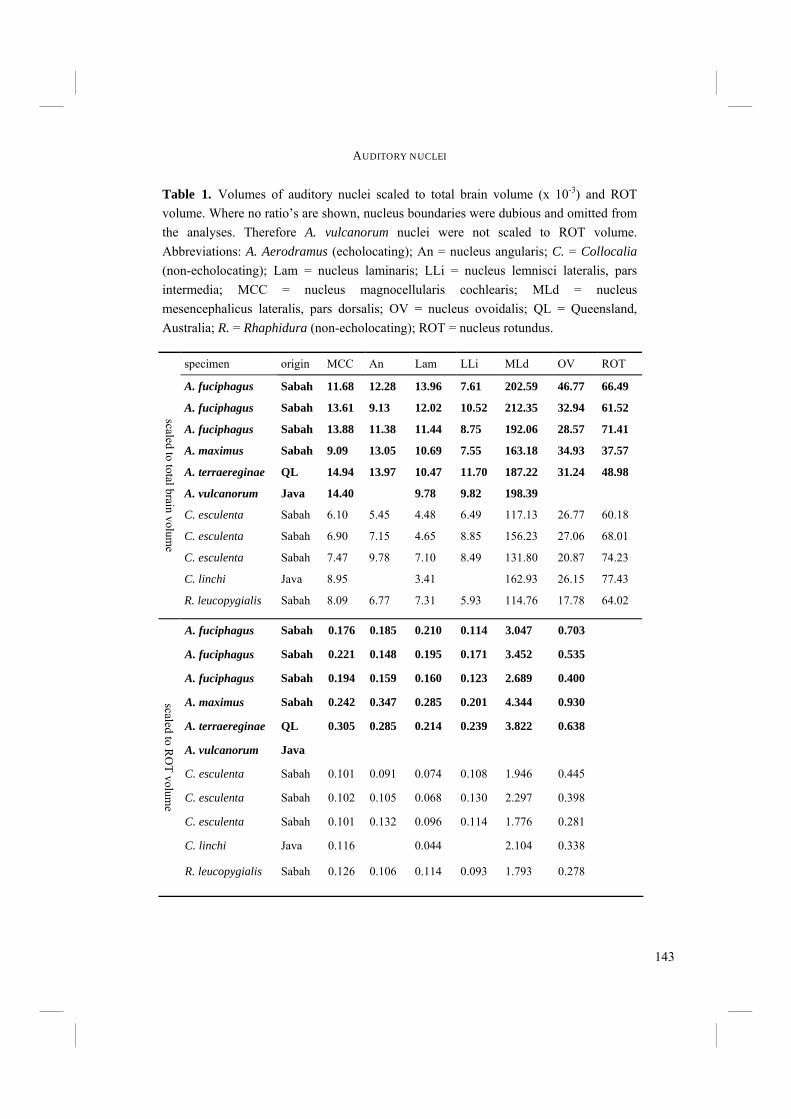
143
AUDITORY NUCLEI
scaled to RO
T volume
A. fuciphagus Sabah 0.176 0.185 0.210 0.114 3.047 0.703
A. fuciphagus Sabah 0.221 0.148 0.195 0.171 3.452 0.535
A. fuciphagus Sabah 0.194 0.159 0.160 0.123 2.689 0.400
A. maximus Sabah 0.242 0.347 0.285 0.201 4.344 0.930
A. terraereginae QL 0.305 0.285 0.214 0.239 3.822 0.638
A. vulcanorum Java
C. esculenta Sabah 0.101 0.091 0.074 0.108 1.946 0.445
C. esculenta Sabah 0.102 0.105 0.068 0.130 2.297 0.398
C. esculenta Sabah 0.101 0.132 0.096 0.114 1.776 0.281
C. linchi Java 0.116 0.044 2.104 0.338
R. leucopygialis Sabah 0.126 0.106 0.114 0.093 1.793 0.278
Table 1. Volumes of auditory nuclei scaled to total brain volume (x 10-3) and ROT volume. Where no ratio’s are shown, nucleus boundaries were dubious and omitted from the analyses. Therefore A. vulcanorum nuclei were not scaled to ROT volume. Abbreviations: A. Aerodramus (echolocating); An = nucleus angularis; C. = Collocalia (non-echolocating); Lam = nucleus laminaris; LLi = nucleus lemnisci lateralis, pars intermedia; MCC = nucleus magnocellularis cochlearis; MLd = nucleus mesencephalicus lateralis, pars dorsalis; OV = nucleus ovoidalis; QL = Queensland, Australia; R. = Rhaphidura (non-echolocating); ROT = nucleus rotundus.
specimen origin MCC An Lam LLi MLd OV ROT
A. fuciphagus Sabah 11.68 12.28 13.96 7.61 202.59 46.77 66.49
A. fuciphagus Sabah 13.61 9.13 12.02 10.52 212.35 32.94 61.52
A. fuciphagus Sabah 13.88 11.38 11.44 8.75 192.06 28.57 71.41
A. maximus Sabah 9.09 13.05 10.69 7.55 163.18 34.93 37.57
A. terraereginae QL 14.94 13.97 10.47 11.70 187.22 31.24 48.98
A. vulcanorum Java 14.40 9.78 9.82 198.39
C. esculenta Sabah 6.10 5.45 4.48 6.49 117.13 26.77 60.18
C. esculenta Sabah 6.90 7.15 4.65 8.85 156.23 27.06 68.01
C. esculenta Sabah 7.47 9.78 7.10 8.49 131.80 20.87 74.23
C. linchi Java 8.95 3.41 162.93 26.15 77.43
R. leucopygialis Sabah 8.09 6.77 7.31 5.93 114.76 17.78 64.02
scaled to total brain volume
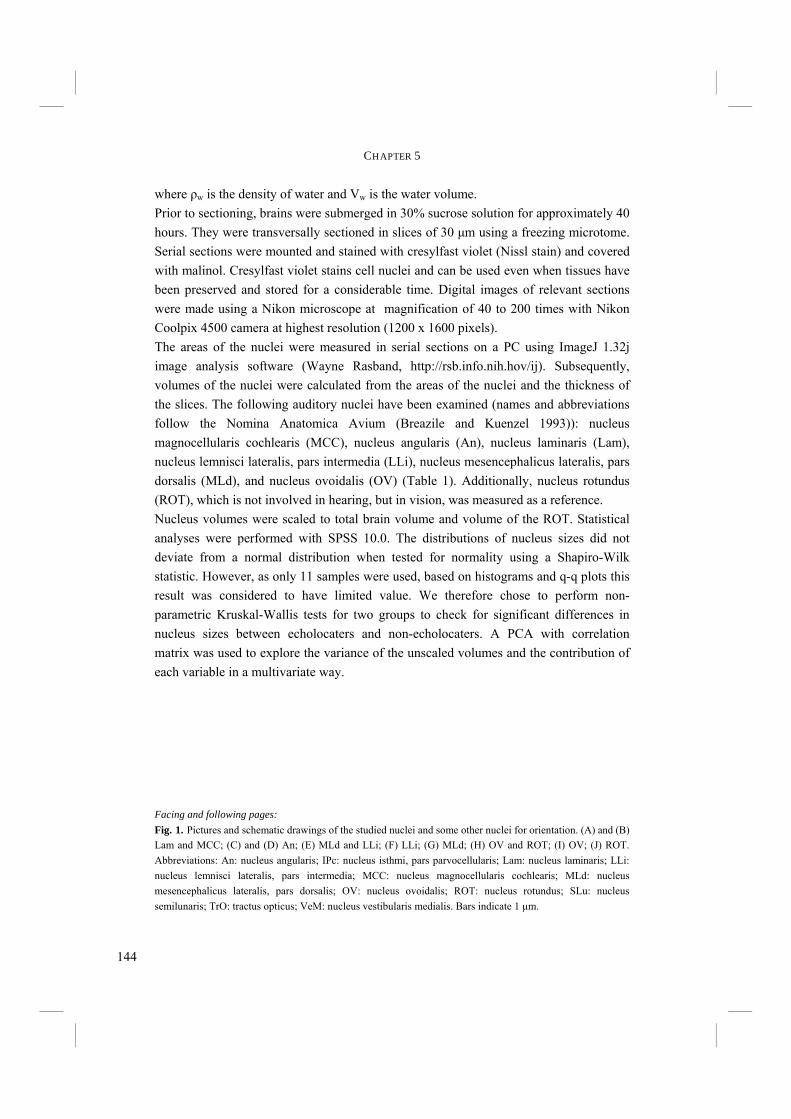
144
CHAPTER 5
where ρw is the density of water and Vw is the water volume. Prior to sectioning, brains were submerged in 30% sucrose solution for approximately 40 hours. They were transversally sectioned in slices of 30 µm using a freezing microtome. Serial sections were mounted and stained with cresylfast violet (Nissl stain) and covered with malinol. Cresylfast violet stains cell nuclei and can be used even when tissues have been preserved and stored for a considerable time. Digital images of relevant sections were made using a Nikon microscope at magnification of 40 to 200 times with Nikon Coolpix 4500 camera at highest resolution (1200 x 1600 pixels). The areas of the nuclei were measured in serial sections on a PC using ImageJ 1.32j image analysis software (Wayne Rasband, http://rsb.info.nih.hov/ij). Subsequently, volumes of the nuclei were calculated from the areas of the nuclei and the thickness of the slices. The following auditory nuclei have been examined (names and abbreviations follow the Nomina Anatomica Avium (Breazile and Kuenzel 1993)): nucleus magnocellularis cochlearis (MCC), nucleus angularis (An), nucleus laminaris (Lam), nucleus lemnisci lateralis, pars intermedia (LLi), nucleus mesencephalicus lateralis, pars dorsalis (MLd), and nucleus ovoidalis (OV) (Table 1). Additionally, nucleus rotundus (ROT), which is not involved in hearing, but in vision, was measured as a reference. Nucleus volumes were scaled to total brain volume and volume of the ROT. Statistical analyses were performed with SPSS 10.0. The distributions of nucleus sizes did not deviate from a normal distribution when tested for normality using a Shapiro-Wilk statistic. However, as only 11 samples were used, based on histograms and q-q plots this result was considered to have limited value. We therefore chose to perform non-parametric Kruskal-Wallis tests for two groups to check for significant differences in nucleus sizes between echolocaters and non-echolocaters. A PCA with correlation matrix was used to explore the variance of the unscaled volumes and the contribution of each variable in a multivariate way.
Facing and following pages: Fig. 1. Pictures and schematic drawings of the studied nuclei and some other nuclei for orientation. (A) and (B) Lam and MCC; (C) and (D) An; (E) MLd and LLi; (F) LLi; (G) MLd; (H) OV and ROT; (I) OV; (J) ROT. Abbreviations: An: nucleus angularis; IPc: nucleus isthmi, pars parvocellularis; Lam: nucleus laminaris; LLi: nucleus lemnisci lateralis, pars intermedia; MCC: nucleus magnocellularis cochlearis; MLd: nucleus mesencephalicus lateralis, pars dorsalis; OV: nucleus ovoidalis; ROT: nucleus rotundus; SLu: nucleus semilunaris; TrO: tractus opticus; VeM: nucleus vestibularis medialis. Bars indicate 1 µm.
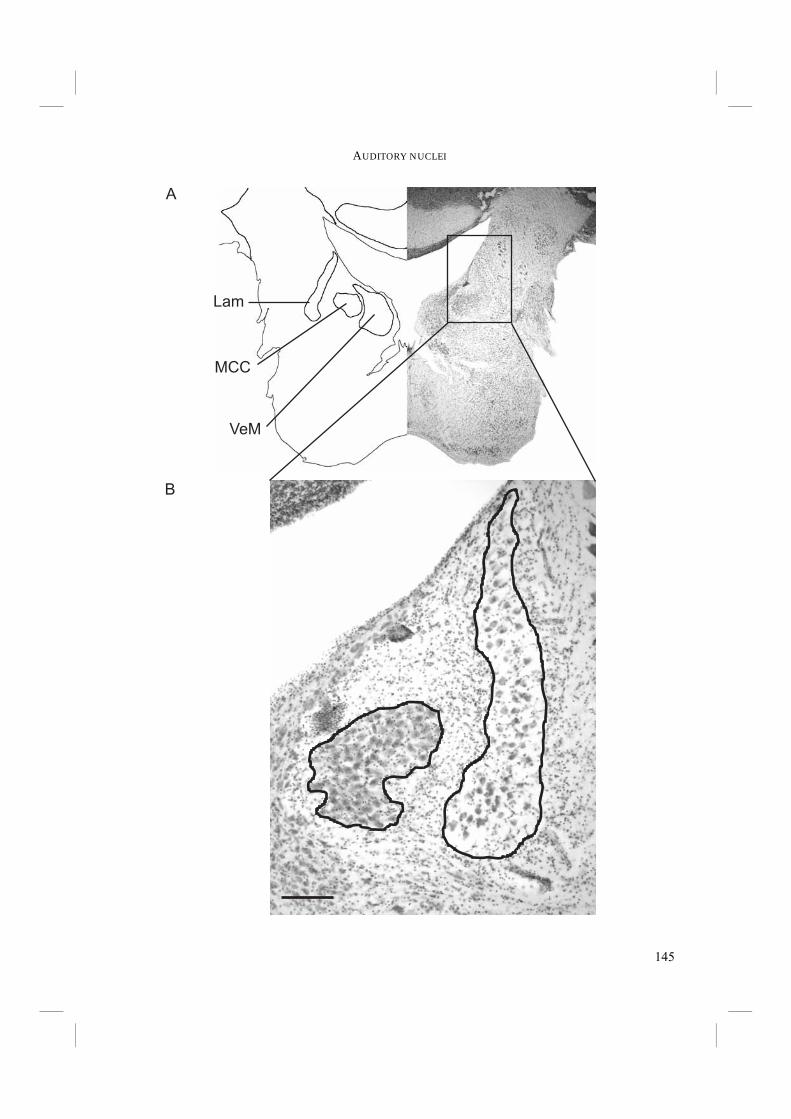
145
AUDITORY NUCLEI
VeM
Lam
MCC
A
B

146
CHAPTER 5
An
C
D
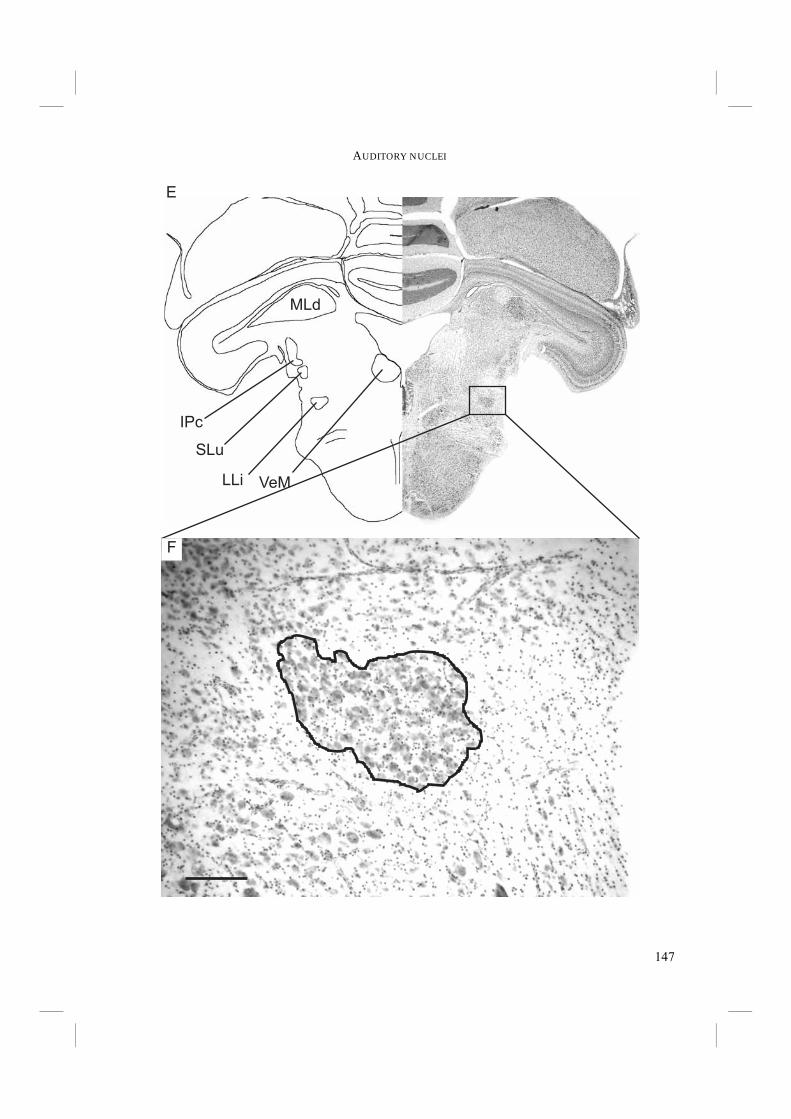
147
AUDITORY NUCLEI
MLd
LLi VeM
SLu
IPc
E
F
148
CHAPTER 5
OV
ROT
TrO
H
G
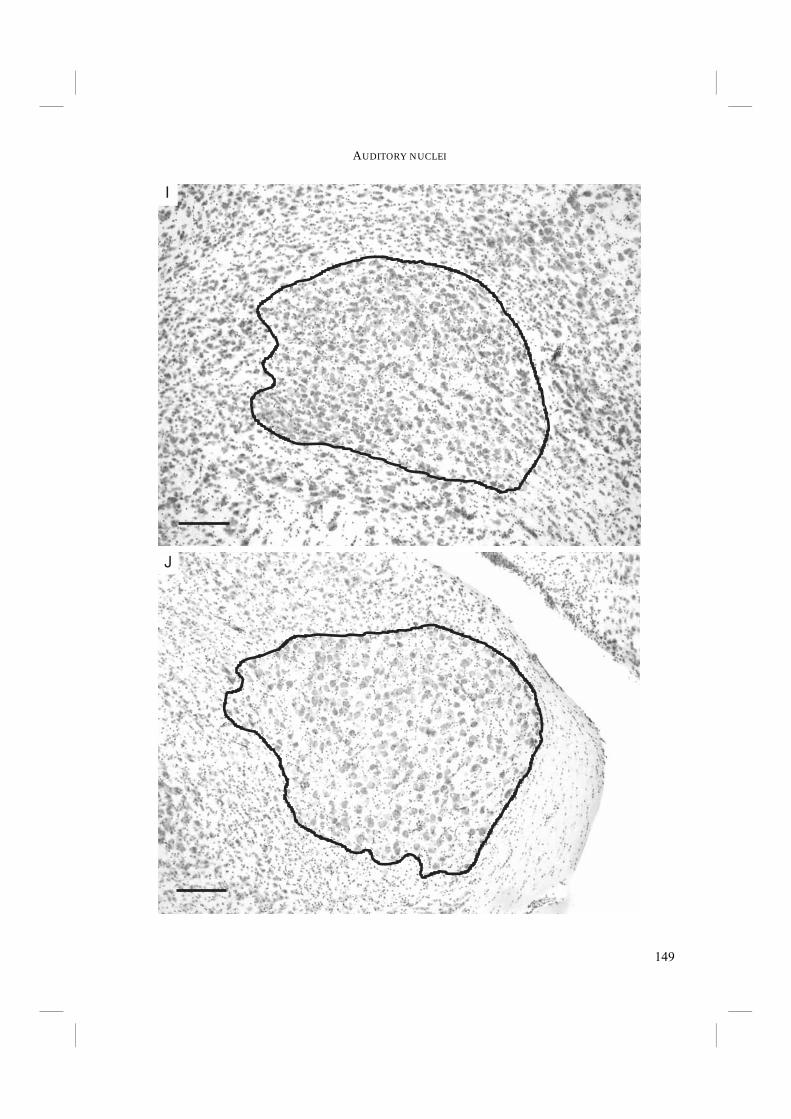
149
AUDITORY NUCLEI
I
J

150
CHAPTER 5
Results Pictures and schematic drawings of the studied nuclei are displayed in Figure 1. Nucleus boundaries were as a rule well distinguishable. However, in some cases boundaries were obscure. If this was the case, these measurements for that particular specimen were not included in further analyses. Boundaries of the nucleus olivaris superior, were also rather difficult to determine. Therefore this nucleus was not incorporated in the present study at all. However, its integration level is rather high, so that size differences may not be present at all. The MCC is situated medially to the Lam (see below) and laterally to the nucleus vestibularis medialis (VeM). The MCC appears as an area of densely distributed cell nuclei with approximately the same size as those of the Lam (Fig. 1A and B). The An is situated in slightly more caudal sections than the Lam and MCC. It lies dorsal to the radix nervi octavi at the peripheral edge of the brainstem (Fig. 1C). It appears as a rather irregularly shaped area with cells that are more densely distributed at the lateral edge, but sparser towards the medial edge (Fig. 1D). The Lam appears as an elongated, curved, and pale area surrounded by more densely stained tissue (Fig. 1A and B). Within the paler area, cell nuclei are irregularly and relatively sparsely distributed. The LLi is a relatively small area of cells with heavily stained cell nuclei in sections rostral to the Lam and MCC (Fig. 1E and F). It is irregularly shaped and visible in only a small number of slides. The MLd is situated in the lobus mesencephalicus, ventral to the ventriculus tecti mesencephali. It is a large nucleus, present in many sections. In the sections it appears usually as a relatively large area, more or less egg shaped with a sharp tip at the lateral side (Fig. 1E and G). Surrounding tissues appear to curve around the area of slightly larger cell nuclei of the MLd. The OV is recognisable as a round to oval area of rather dense and darkly stained cell nuclei in more rostrally located sections in the diencephalon (Fig. 1H and I). It lies medial to the well recognisable ROT and is surrounded by fibres of the tractus nuclei ovoidalis and tractus thalamopallialis. Finally, the ROT is a well distinguishable round to slightly oval area (Fig. 1H and J). Its lateral edge lies against the tractus opticus. The relatively large, round cell nuclei are evenly distributed over the area and are less densely distributed than in surrounding tissue.

151
AUDITORY NUCLEI
A Principal Components Analysis of the unscaled nucleus sizes with correlation matrix explains 69.2 % of total variance along the first main axis and 12.8 % and 11.3 % along the second and third axes respectively. Echolocating and non-echolocating Swifts and Swiftlets form separate groups along the first principal component (Fig. 2). All individuals of non-echolocating Swiftlets are plotted left of the origin, whereas those of echolocating Swiftlets are plotted at the right side of the origin, except A. maximus. The auditory nuclei all contribute to this separation (Fig. 2). However, the ROT hardly contributes to this separation, indicating once more that this nucleus is independent from the auditory nuclei.
Volumes of the nuclei are shown in Table 1. The measurements of the three specimens of A. fuciphagus and C. esculenta were replaced by their means to avoid bias of the inclusion of different numbers of specimens per species (inflation of degrees of freedom). Scaled to ROT volume or to total brain volume, differences in size between echolocaters and non-echolocaters are significant for 4 of the 6 nuclei (P<0.05) (Table 2). When scaled to total brain volume or to ROT volume, the volume of the LLi is not
PC 1
PC
2
-2.0 -1.0 0 1
0
-1.0
-2.0
1
leuco
escu
max
fuci
lin
escu
escu
fuci
fuci
vulca
ter
ROT
LLi
MCCMLd
An
LamOV
Fig. 2. Results of a PCA on the correlation matrix of the unscaled nucleus sizes. PC 1 against PC 2. Squares represent echolocating species, circles represent non-echolocating species. Echolocating species are separated from non-echolocating species along PC 1. escu = C. esculenta; fuci = A. fuciphagus; leuco = R. leucopygialis; lin = C. linchi; max = A. maximus; ter = A. terraereginae; vulca = A. vulcanorum. Arrows indicate the amount and direction of their contribution to total variance. An: nucleus angularis; Lam: nucleus laminaris; LLi: nu-cleus lemnisci lateralis, pars intermedia; MCC: nucleus magnocellularis cochlearis; MLd: nucleus mesen-cephalicus lateralis, pars dorsalis; OV: nucleus ovoidalis; ROT: nucleus rotundus.
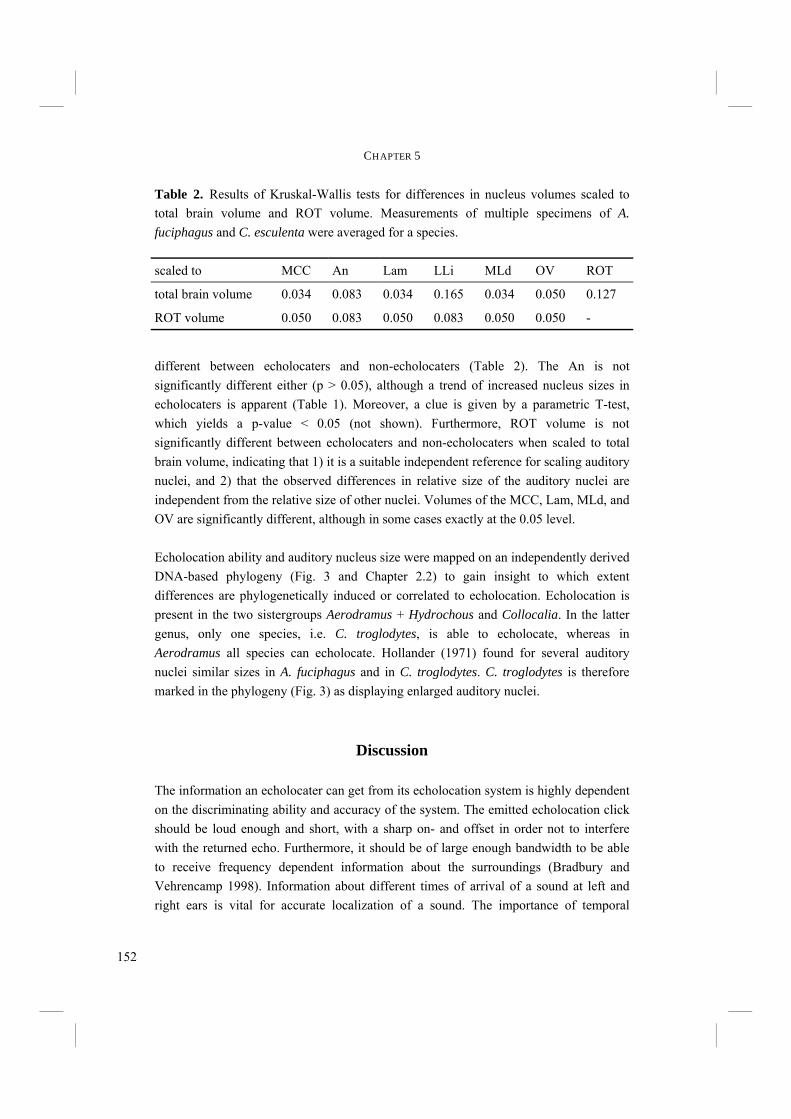
152
CHAPTER 5
different between echolocaters and non-echolocaters (Table 2). The An is not significantly different either (p > 0.05), although a trend of increased nucleus sizes in echolocaters is apparent (Table 1). Moreover, a clue is given by a parametric T-test, which yields a p-value < 0.05 (not shown). Furthermore, ROT volume is not significantly different between echolocaters and non-echolocaters when scaled to total brain volume, indicating that 1) it is a suitable independent reference for scaling auditory nuclei, and 2) that the observed differences in relative size of the auditory nuclei are independent from the relative size of other nuclei. Volumes of the MCC, Lam, MLd, and OV are significantly different, although in some cases exactly at the 0.05 level. Echolocation ability and auditory nucleus size were mapped on an independently derived DNA-based phylogeny (Fig. 3 and Chapter 2.2) to gain insight to which extent differences are phylogenetically induced or correlated to echolocation. Echolocation is present in the two sistergroups Aerodramus + Hydrochous and Collocalia. In the latter genus, only one species, i.e. C. troglodytes, is able to echolocate, whereas in Aerodramus all species can echolocate. Hollander (1971) found for several auditory nuclei similar sizes in A. fuciphagus and in C. troglodytes. C. troglodytes is therefore marked in the phylogeny (Fig. 3) as displaying enlarged auditory nuclei.
Discussion The information an echolocater can get from its echolocation system is highly dependent on the discriminating ability and accuracy of the system. The emitted echolocation click should be loud enough and short, with a sharp on- and offset in order not to interfere with the returned echo. Furthermore, it should be of large enough bandwidth to be able to receive frequency dependent information about the surroundings (Bradbury and Vehrencamp 1998). Information about different times of arrival of a sound at left and right ears is vital for accurate localization of a sound. The importance of temporal
scaled to MCC An Lam LLi MLd OV ROT
total brain volume 0.034 0.083 0.034 0.165 0.034 0.050 0.127
ROT volume 0.050 0.083 0.050 0.083 0.050 0.050 -
Table 2. Results of Kruskal-Wallis tests for differences in nucleus volumes scaled to total brain volume and ROT volume. Measurements of multiple specimens of A. fuciphagus and C. esculenta were averaged for a species.
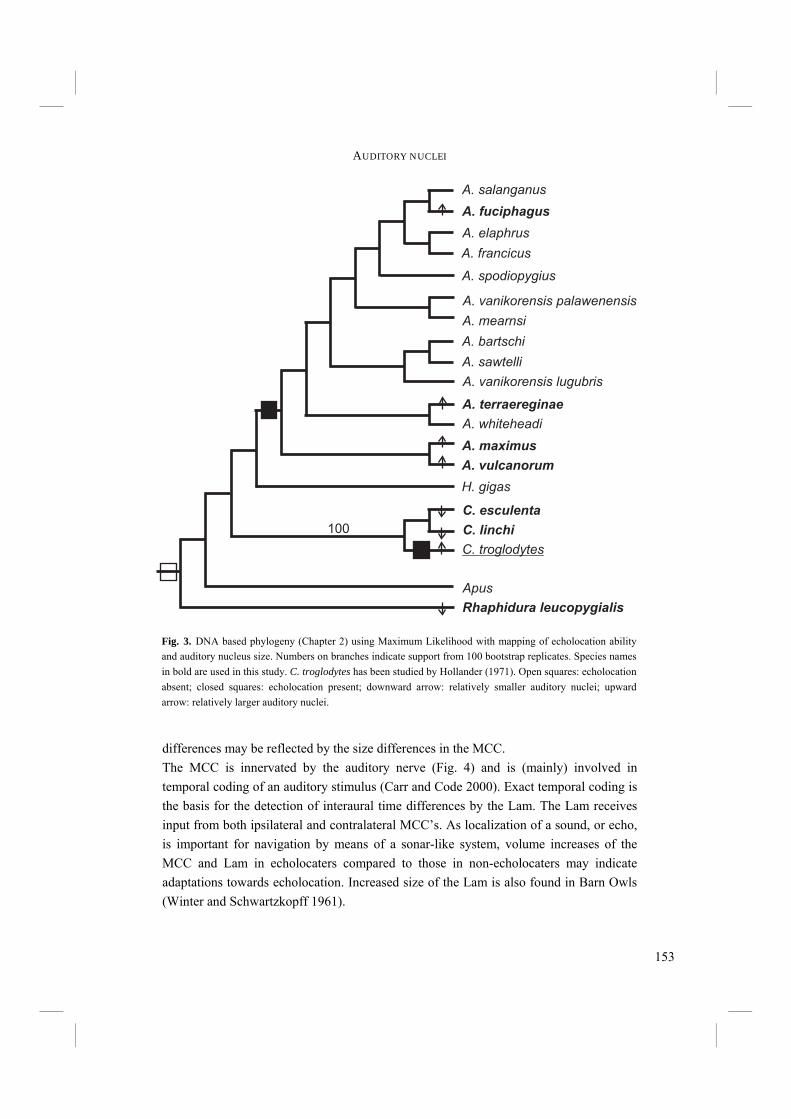
153
AUDITORY NUCLEI
differences may be reflected by the size differences in the MCC. The MCC is innervated by the auditory nerve (Fig. 4) and is (mainly) involved in temporal coding of an auditory stimulus (Carr and Code 2000). Exact temporal coding is the basis for the detection of interaural time differences by the Lam. The Lam receives input from both ipsilateral and contralateral MCC’s. As localization of a sound, or echo, is important for navigation by means of a sonar-like system, volume increases of the MCC and Lam in echolocaters compared to those in non-echolocaters may indicate adaptations towards echolocation. Increased size of the Lam is also found in Barn Owls (Winter and Schwartzkopff 1961).
A. salanganus
A. fuciphagus
A. elaphrus
A. francicus
A. bartschi
A. sawtelli
A. vanikorensis lugubris
A. vanikorensis palawenensis
A. mearnsi
A. spodiopygius
A. maximus
A. vulcanorum
A. terraereginae
A. whiteheadi
C. esculenta
C. linchi
C. troglodytes
Apus
Rhaphidura leucopygialis
100
H. gigas
Fig. 3. DNA based phylogeny (Chapter 2) using Maximum Likelihood with mapping of echolocation ability and auditory nucleus size. Numbers on branches indicate support from 100 bootstrap replicates. Species names in bold are used in this study. C. troglodytes has been studied by Hollander (1971). Open squares: echolocation absent; closed squares: echolocation present; downward arrow: relatively smaller auditory nuclei; upward arrow: relatively larger auditory nuclei.
154
CHAPTER 5
There may potentially be information in the echo about the composition of an object, which reflects and absorbs specific frequencies. An echolocater may therefore benefit from accurate detection of sound pressure level differences between frequencies in the returned echo. Furthermore, sound pressure level differences between left and right ears are of importance in sound localization. The accurate detection of sound pressure levels may be reflected by the trend in size increase of the nucleus angularis (An), which projects to nuclei of the lateral lemniscus, where sound pressure level differences are computed (Carr and Code 2000). The An is innervated by the auditory nerve and projects besides to the lemniscal nuclei also to the MLd and OS (Fig. 4). The metencephalic nuclei of the lateral lemniscus project also to the MLd and to the nucleus basalis of the telencephalon (Arends and Zeigler 1986; Carr and Code 2000; Hall et al. 1993; Schall and Delius 1986; Schall et al. 1986) (Fig. 4). The LLi receives bilateral input from the An and relays specific auditory input to the nucleus basalis (Carr and Code 2000; Wild et al. 2001). Potential size differences may be obscured by the fact that the auditory status of part of the LLi, i.e. the nucleus lemnisci lateralis, pars rostralis (LLir), is questionable (Wild et al. 2001). More specific labelling of the truly auditory regions of the LLi could reveal whether or not differences between echolocaters and non-echolocaters exist.
The mesencephalic MLd receives input from, e.g., the Lam and nuclei of the lateral lemniscus (Carr and Code 2000). In Barn Owls it contains a tonotopical map of auditory spatial directions and is sensitive to changes in interaural time as well as interaural sound pressure level differences (Carr and Code 2000). Accurate detection of interaural time differences is important for correct localization of a sound. Thus the MLd plays an important role in sound localization, which is crucial for accurate auditory navigation. The MLd projects to the OV. The OV (Fig. 4) is, in Barn Owls, also tonotopically organized (Proctor and Konishi 1997). It is an important relay in the auditory neural system in birds. It is involved in the accurate processing of temporal, spatial as well as sound pressure level information. In Barn Owls sound localization and gaze control are tightly interconnected (Knudsen et al.1993 and references therein). It is not known whether such close relationships between auditory and optic nuclei exist in Swiftlets. However, they might well be present, accounting for a connection between sound-based echolocation and the interpretation of that sound into a visual image of the surroundings. Several of the auditory nuclei in Swiftlets appear to be significantly larger in echolocaters than in non-echolocaters. Yet, differences are only significant at the 0.05 level and only 11 specimens of 7 species have been examined. We therefore
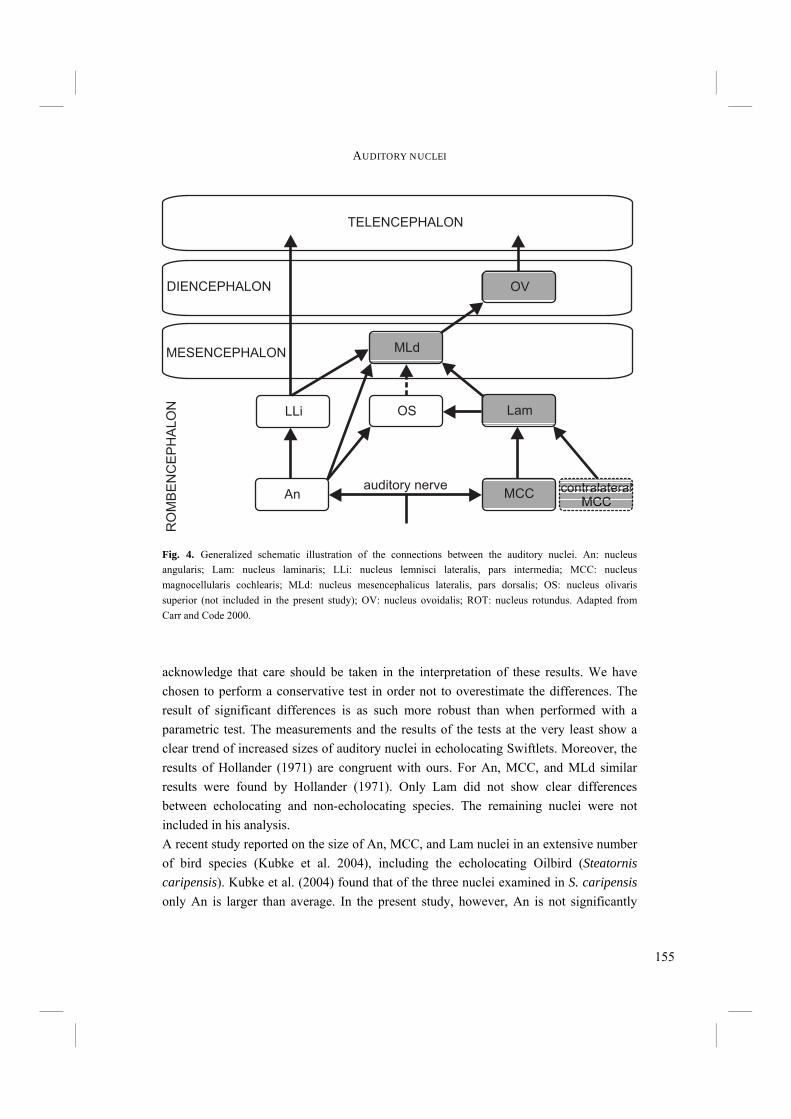
155
AUDITORY NUCLEI
acknowledge that care should be taken in the interpretation of these results. We have chosen to perform a conservative test in order not to overestimate the differences. The result of significant differences is as such more robust than when performed with a parametric test. The measurements and the results of the tests at the very least show a clear trend of increased sizes of auditory nuclei in echolocating Swiftlets. Moreover, the results of Hollander (1971) are congruent with ours. For An, MCC, and MLd similar results were found by Hollander (1971). Only Lam did not show clear differences between echolocating and non-echolocating species. The remaining nuclei were not included in his analysis. A recent study reported on the size of An, MCC, and Lam nuclei in an extensive number of bird species (Kubke et al. 2004), including the echolocating Oilbird (Steatornis caripensis). Kubke et al. (2004) found that of the three nuclei examined in S. caripensis only An is larger than average. In the present study, however, An is not significantly
MCC
Lam
An
OV
LLi
MLd
TELENCEPHALON
auditory nerve
OS
contralateralMCC
DIENCEPHALON
MESENCEPHALON
RO
MB
EN
CE
PH
ALO
N
Fig. 4. Generalized schematic illustration of the connections between the auditory nuclei. An: nucleus angularis; Lam: nucleus laminaris; LLi: nucleus lemnisci lateralis, pars intermedia; MCC: nucleus magnocellularis cochlearis; MLd: nucleus mesencephalicus lateralis, pars dorsalis; OS: nucleus olivaris superior (not included in the present study); OV: nucleus ovoidalis; ROT: nucleus rotundus. Adapted from Carr and Code 2000.

156
CHAPTER 5
larger in echolocating species than in non-echolocating species, whereas MCC and Lam are enlarged. It is difficult to interpret the meaning of the different results in Swiftlets and the Oilbird, however, because Kubke et al. (2004) used brainstem index (Portmann 1947) and bodyweight rather than total brain volume or the volume of a supposedly independently functioning nucleus to scale auditory nucleus size. We conclude that the correlation between nucleus size and echolocation present in our study indicates an adaptation to echolocation. This is supported by the results of Hollander (1971) for C. troglodytes. Nucleus sizes in C. troglodytes were larger than those of C. esculenta and as large as those of A. fuciphagus. Only recently it became known that C. troglodytes is the only member of its clade Collocalia that is able to echolocate (Price et al. 2004) (Fig. 3). So while non-echolocating members of Collocalia retained their smaller nuclei, C. troglodytes may have independently from Aerodramus developed larger auditory nuclei, enabling it to echolocate. Another explanation might be that echolocation and large auditory nuclei evolved only once, i.e. at the base of the Swiftlets (Fig. 3). Consequently, non-echolocating Collocalia species and H. gigas must later have lost both echolocation ability as well as relatively large auditory nuclei. Whether one of the explanations is more likely than the other depends among others on the plasticity of brain nuclei and the ease with which they decrease or increase in size in subsequent generations. The correlation between increased sizes of auditory nuclei and the ability to echolocate (Fig. 3) indicates a causal relationship. Morphological adaptations in the peripheral system appear to be absent or at best optimizing the echolocation system, rather than being necessary. A thin Internal Tympaniform Membrane (ITM) in the syrinx may be advantageous for echolocation. However, also several non-echolocating Swifts and Swiftlets possess thin ITM’s (Chapter 3.3). Furthermore, no adaptations towards echolocation are present in the middle ear (Chapter 4). Therefore, changes in the brain appear to be the main morphological adaptations –besides changes in behaviour- that made echolocation possible for Swiftlets.
Acknowledgements We are gratefull to Prof. J.L. Dubbeldam (Leiden University), who helped interpreting brain sections and contributed valuable comments to earlier versions of this manuscript. Also Dr. R.G. Bout (Leiden University) is thanked for reviewing an earlier version of this manuscript. We thank A.M. den Boer-Visser (M.Sc.) and E. Hetebrij (M.Sc.) (Leiden University) for their help and advise in brain sectioning and staining.

157
CHAPTER 6
EVOLUTIONARY DEVELOPMENT OF ECHOLOCATION IN SWIFTLETS (AVES: APODIDAE) IN ASSOCIATION WITH
THEIR BIOGEOGRAPHICAL DISTRIBUTION.

158
CHAPTER 6
Abstract Swiftlets (Collocaliini) have radiated into many different species and subspecies. They are distributed from Indian Ocean islands in the west to Pacific Ocean islands in the east and from Nepal in the north to the northern part of Queensland (Australia) in the south. Most Swiftlet species are able to echolocate, which is very rare in birds. We intend to explain the evolution of echolocation in Swiftlets based on biogeographical patterns of Swiftlets and an ND2 and cytochrome-b mtDNA based gene tree. Swiftlets arose in the Late Miocene and echolocation evolved either once or twice in Late Miocene to Early Pliocene. Although vicariance effects are in some cases possible, biogeographical patterns in Swiftlets are likely to be largely caused by dispersal. A primary BPA based area cladogram is in part congruent with a consensus area cladogram of South and Southeast Asia from a previous study. However, the Philippines are taking position with easterly regions in the Swiftlet area cladogram, which is in contrast with its western position in the consensus area cladogram. Echolocation seems likely to have originated in the Sundaland region in the late Miocene to early Pliocene. There, ancestral non-echolocating Swiftlets that nested in the front sites of caves may have “learned” that vocalising in a cave resulted in echoes that eventually are usable for sonar-navigation.
159
BIOGEOGRAPHY AND EVOLUTION OF ECHOLOCATION
Introduction Swiftlets (Collocaliini) have a rather wide distribution, from the Indian Ocean Seychelles and Mascarene islands eastwards to Pacific islands as far as the Marquesas islands (Chantler and Driessens 1995) and Hawaii (Price et al. 2004). They have radiated into at least 26 species and many more subspecies (Chantler and Driessens 1995; Chantler et al. 1999) of which most are found in Southeast Asia. Their taxonomic and phylogenetic status has been debated throughout the years. A lot of the subspecies may be assigned the species status in future studies, as molecular techniques might reveal larger DNA variations than would be expected from the small morphological differences, which form the present taxonomic basis. Swiftlets are insectivorous, but occupy slightly different food niches, varying in altitude of foraging –from within tree canopies (pers. obs.) to high above the forests and from lowlands to mountain areas- and in the kind of insects they prey on (Lourie and Tompkins 2000). Together with the South American Oilbird (Steatornis caripensis) Swiftlets are unique among birds in their echolocation ability, which is primarily used to navigate in the darkness of the caves where they roost and nest. By far most species occupy limestone caves. However, species nesting in (volcanic) crevices, i.e. Aerodramus vulcanorum and A. brevirostris, and near or behind waterfalls, i.e. Hydrochous gigas, are also found (Chantler and Driessens 1995). Swiftlets produce single and double clicks with frequencies up to approximately 10 kHz as echolocation sounds (e.g. Carlson-Smith and Wiener 1996; Coles et al. 1987; Fenton 1975; Fenton 1980; Fullard et al. 1993; Griffin and Suthers 1970; Griffin and Thompson 1982; Medway and Pye 1977; Price et al. 2004; Suthers and Hector 1982; Thomassen et al. 2004, Chapter 3.1 and 3.2). It was shown, that functional morphological adaptations to echolocation are mainly located in the central nervous system (Chapter 5). Of the peripheral parts of the echolocation system, only the syrinx might possess an optimization to echolocation. It is still unclear whether this is also a necessary specialisation (Chapter 3.3). The middle ear is not significantly different between echolocating and non-echolocating Swiftlets and seems to perform optimally for both groups of Swiftlets (Chapter 4). Questions now rise such as how echolocation evolved and what caused it to evolve. In this chapter we will discuss the biogeographical patterns that can be recognised in Swiftlets. We will make an attempt to clarify the distribution of Swiftlets by vicariance (breaking up of previously continuous distribution area, possibly followed by speciation through isolation) and dispersal (extension of the distribution area by dispersing individuals, possibly followed by speciation, for example because of a lack of gene flow from the mother population) events.

160
CHAPTER 6
Furthermore, the evolution of echolocation will be explained in a (bio)geographical and geological setting. The timing of the rise of echolocation will be coupled to the environmental conditions under which echolocation may have evolved during that period.
Material and methods Price et al. (2004) have presented a phylogeny of 15 Swift species and 23 echolocating and non-echolocating Swiftlet species and subspecies, based on combined analysis of cytochrome-b (cyt-b) and ND2 mtDNA. However, they lacked the elusive, non-echolocating H. gigas. We added the cytochrome-b and ND2 sequences of 2 specimens of H. gigas to their data and performed Maximum Likelihood and Bayesian analyses (Chapter 2.2). The placement of H. gigas as a sistergroup of Aerodramus is supported by independent analyses of combined cyt-b and 12S mtDNA and Fib7 nuclear DNA (Chapter 2.2). The gene tree based on cyt-b and ND2 was used as a basis for further (biogeographical) analyses (Fig. 1). Moments of cladogenesis were calculated by means of the “2%-rule” as an approximation for the cytochrome-b mutation rate. We realise that the actual mutation rate may deviate from this generally used 2 % per Ma between lineages (Lovette 2004). However very few Swiftlet fossils are currently known to science and it is therefore not possible to accurately callibrate the molecular clock for Swiftlets. Data of the approximate distributions of the investigated species and subspecies were derived from Chantler and Driessens (1995). The joint distribution of Aerodramus species is shown in Figure 2 and that of Collocalia species in Figure 3. The geographical units were based on the distribution descriptions (Chantler and Driessens 1995). Mostly single islands were used as the geographical units. The gene tree that was obtained for Swiftlets in Chapter 2 (Fig. 1) was considered to represent the phylogenetic relationships of the species. This gene tree, together with the distribution of the Swiftlet species was used for obtaining a taxon-area cladogram by substitution of taxon names by their respective distributions. Subsequently a new binary matrix was generated with the areas as taxonomical units and tips and nodes of the cladogram as characters. The distribution in areas was coded for presence (1) or absence (0) of taxa at the tips and nodes. An additional all-zero area with a 1 for the root of the taxon cladogram (Veller, van et al. 2000) was created to be used as outgroup. On the resulting matrix, a primary Brooks Parsimony Analysis (BPA) (Brooks 1990; Brooks et al. 2001) was performed with PAUP* 4.02b. The outcome of a BPA is an area cladogram in which the areas are the “taxonomic” units. The same procedure has been followed without hypothetical
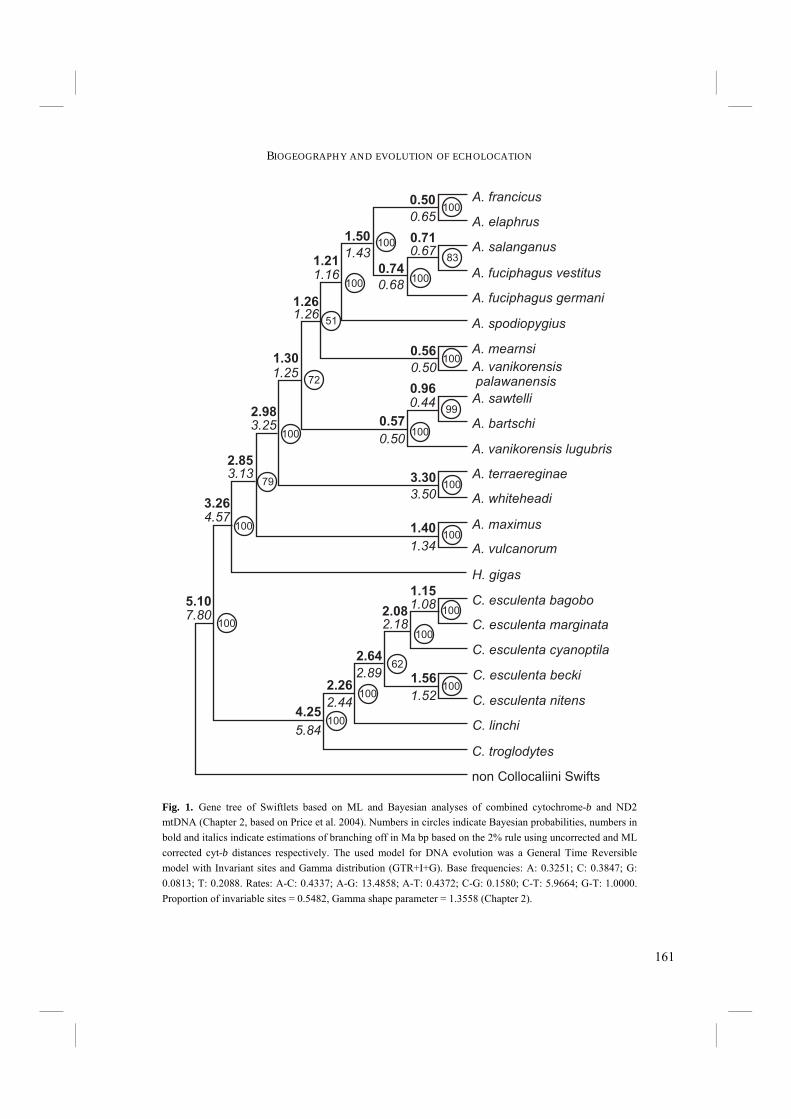
161
BIOGEOGRAPHY AND EVOLUTION OF ECHOLOCATION
A. vanikorensispalawanensis
A. francicus
A. elaphrus
A. fuciphagus vestitus
A. salanganus
A. fuciphagus germani
A. spodiopygius
A. mearnsi
A. sawtelli
A. bartschi
A. vanikorensis lugubris
A. terraereginae
A. whiteheadi
A. maximus
A. vulcanorum
H. gigas
C. esculenta cyanoptila
C. esculenta bagobo
C. esculenta marginata
C. esculenta becki
C. esculenta nitens
C. linchi
C. troglodytes
non Collocaliini Swifts
0.50
1.50
1.21
0.56
1.26
0.96
0.57
1.30
3.30
1.40
2.98
2.85
3.26
5.101.15
2.08
1.56
2.64
2.26
4.25
4.57
7.801.08
2.18
1.52
2.89
2.44
5.84
1.34
3.50
0.65
0.50
0.44
0.50
1.43
1.16
1.26
0.710.67
0.74
0.68
1.25
3.25
3.13
100
62
100
100
100
100
100
100
100
100
100
100
100
100100
100
100
79
72
51
83
99
Fig. 1. Gene tree of Swiftlets based on ML and Bayesian analyses of combined cytochrome-b and ND2 mtDNA (Chapter 2, based on Price et al. 2004). Numbers in circles indicate Bayesian probabilities, numbers in bold and italics indicate estimations of branching off in Ma bp based on the 2% rule using uncorrected and ML corrected cyt-b distances respectively. The used model for DNA evolution was a General Time Reversible model with Invariant sites and Gamma distribution (GTR+I+G). Base frequencies: A: 0.3251; C: 0.3847; G: 0.0813; T: 0.2088. Rates: A-C: 0.4337; A-G: 13.4858; A-T: 0.4372; C-G: 0.1580; C-T: 5.9664; G-T: 1.0000. Proportion of invariable sites = 0.5482, Gamma shape parameter = 1.3558 (Chapter 2).

162
CHAPTER 6
xx
x
xx
x
x
xxx
x
xx
x
Fig. 2. Distribution of Aerodramus species (shaded area) and Hydrochous gigas (crosses) (Chantler and Driessens 1995).
Fig. 3. Distribution of Collocalia species (Chantler and Driessens 1995).
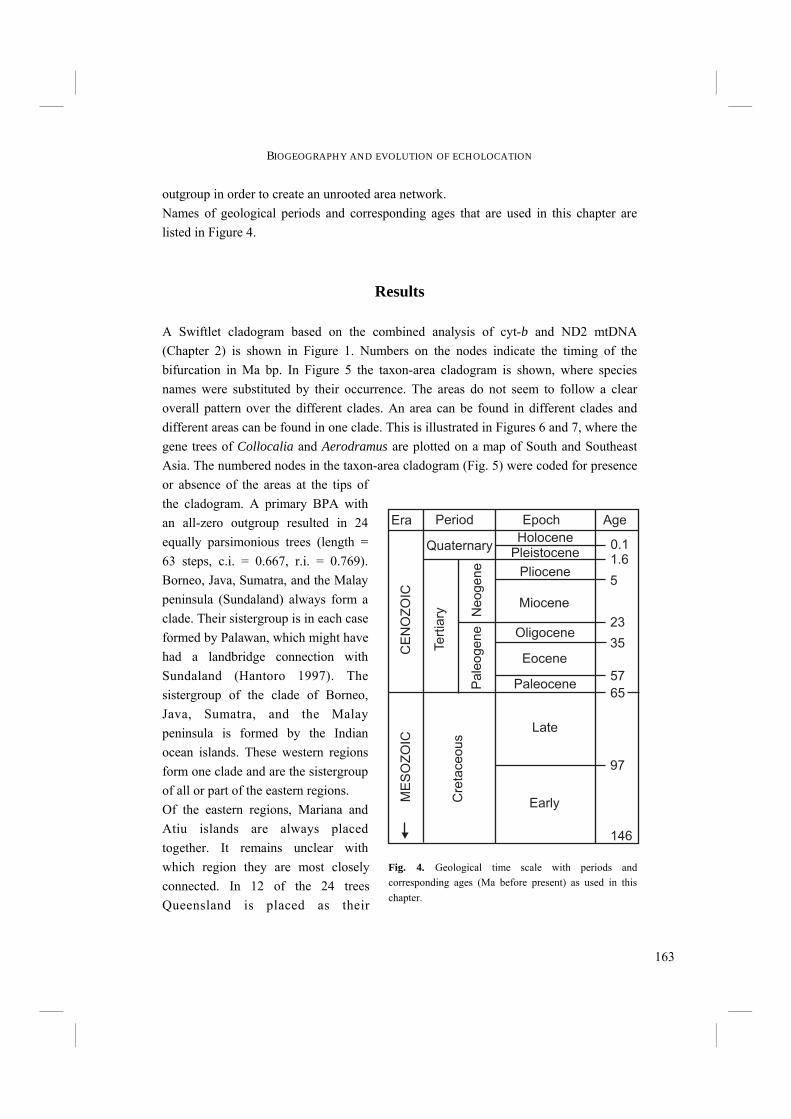
163
BIOGEOGRAPHY AND EVOLUTION OF ECHOLOCATION
outgroup in order to create an unrooted area network. Names of geological periods and corresponding ages that are used in this chapter are listed in Figure 4.
Results A Swiftlet cladogram based on the combined analysis of cyt-b and ND2 mtDNA (Chapter 2) is shown in Figure 1. Numbers on the nodes indicate the timing of the bifurcation in Ma bp. In Figure 5 the taxon-area cladogram is shown, where species names were substituted by their occurrence. The areas do not seem to follow a clear overall pattern over the different clades. An area can be found in different clades and different areas can be found in one clade. This is illustrated in Figures 6 and 7, where the gene trees of Collocalia and Aerodramus are plotted on a map of South and Southeast Asia. The numbered nodes in the taxon-area cladogram (Fig. 5) were coded for presence or absence of the areas at the tips of the cladogram. A primary BPA with an all-zero outgroup resulted in 24 equally parsimonious trees (length = 63 steps, c.i. = 0.667, r.i. = 0.769). Borneo, Java, Sumatra, and the Malay peninsula (Sundaland) always form a clade. Their sistergroup is in each case formed by Palawan, which might have had a landbridge connection with Sundaland (Hantoro 1997). The sistergroup of the clade of Borneo, Java, Sumatra, and the Malay peninsula is formed by the Indian ocean islands. These western regions form one clade and are the sistergroup of all or part of the eastern regions. Of the eastern regions, Mariana and Atiu islands are always placed together. It remains unclear with which region they are most closely connected. In 12 of the 24 trees Queensland is placed as their
Era Period Epoch Age
CE
NO
ZO
ICM
ES
OZ
OIC
Tert
iary
Pale
ogene
Neogene
QuaternaryHolocene
Pleistocene
Pliocene
Miocene
Oligocene
Eocene
Paleocene
Cre
taceous
Late
Early
0.11.6
23
35
57
97
146
5
65
Fig. 4. Geological time scale with periods and corresponding ages (Ma before present) as used in this chapter.
164
CHAPTER 6
sistergroup, but in the remaining 12 trees the sistergroup is formed by the Philippine and Solomon islands or Philippines, Solomons, Papua, and Queensland. Papua is in some trees closely related to the Solomon islands and/or the Philippines, but also as sistergroup of all other regions. A consensus tree does not resolve many of the branches of eastern regions (Fig. 8). A primary BPA without a hypothetical outgroup resulted in 2 equally parsimonious trees (c.i. = 0.677, r.i. = 0.765). These trees only differ in one tree showing bifurcation of Sumatra and the Malay peninsula from Borneo, but the other tree showing these three regions as unresolved (Fig. 9). The western regions show a similar pattern as described above for the analysis with an outgroup. However, the eastern regions are now better resolved in two sistergroups. In one group Queensland is placed as the sistergroup of the Mariana and Atiu islands. In a second group the Solomons are sistergroup of Papua and the Solomons and Papua are on their turn the sistergroup of the Philippines.
Discussion Turner et al. (2001) and Welzen, van et al. (2003) have investigated the biogeography of Southeast Asia based on a large number of animal and plant groups, thereby summarizing the resulting trees in a single consensus area cladogram. The primary BPA based area cladogram of Swiftlets (Fig. 9) is partly congruent with this consensus cladogram, but in other parts it is not. Both cladograms place the Malay peninsula, Borneo, Java, and Sumatra together at the same mutual positions. An east-west division can be observed in both cladograms, which is congruent with Weber’s line in the consensus cladogram (Turner et al. 2001; Welzen, van et al. 2003). However, in the Swiftlet cladogram the division follows Huxley’s line (Huxley 1868). This is caused by the different positions of Palawan and the Philippines. In the Swiftlet area cladogram Palawan is placed as the sistergroup of Sundaland region (Fig. 8 and 9), whereas it is grouped with the Philippines in the consensus area cladogram of Turner et al. (2001) and Welzen, van et al. (2003). Thus in the Swiftlet cladogram the Philippines are grouped with the eastern regions and Palawan with the western, whereas both are grouped with the western regions in the consensus cladogram. Our primary BPA data suggest that in the case of Swiftlets Palawan is more closely related to Borneo and other Sundaland islands than to the Philippines (Figs. 8 and 9). However, contrasting patterns in the
Fig. 5. Taxon-area cladogram of Swiftlets. Species names of the mtDNA-based gene tree (Fig. 1) have been substituted by their corresponding distributions. A. salanganus (tip node 3) is extinct from Palawan (Reis and Garong 2001). This particular distribution for A. salanganus is therefore not included in the primary BPA.

165
BIOGEOGRAPHY AND EVOLUTION OF ECHOLOCATION
Palawan
Seychelles
Mascarenes
Bor Sum
Bor Jav Sum (Pal )†
Malay pen
Solomons
Philippines Palawan
Atiu
Guam
Solomons
Queensland
Philippines
Bor Jav Sum Malay pen
Bor Jav Sum
Bor Jav Sum
Bor Sum Malay pen
Philippines
Philippines
Solomons
Papua
Java
Philippines Palawan
1
2
3
4
5
6
7
8
9
10
11
12
13
14
15
16
17
18
19
20
21
22
23
24
25
26
27
28
29
30
31
32
33
34
35
36
37
38
39
40
41
42
43
44
45
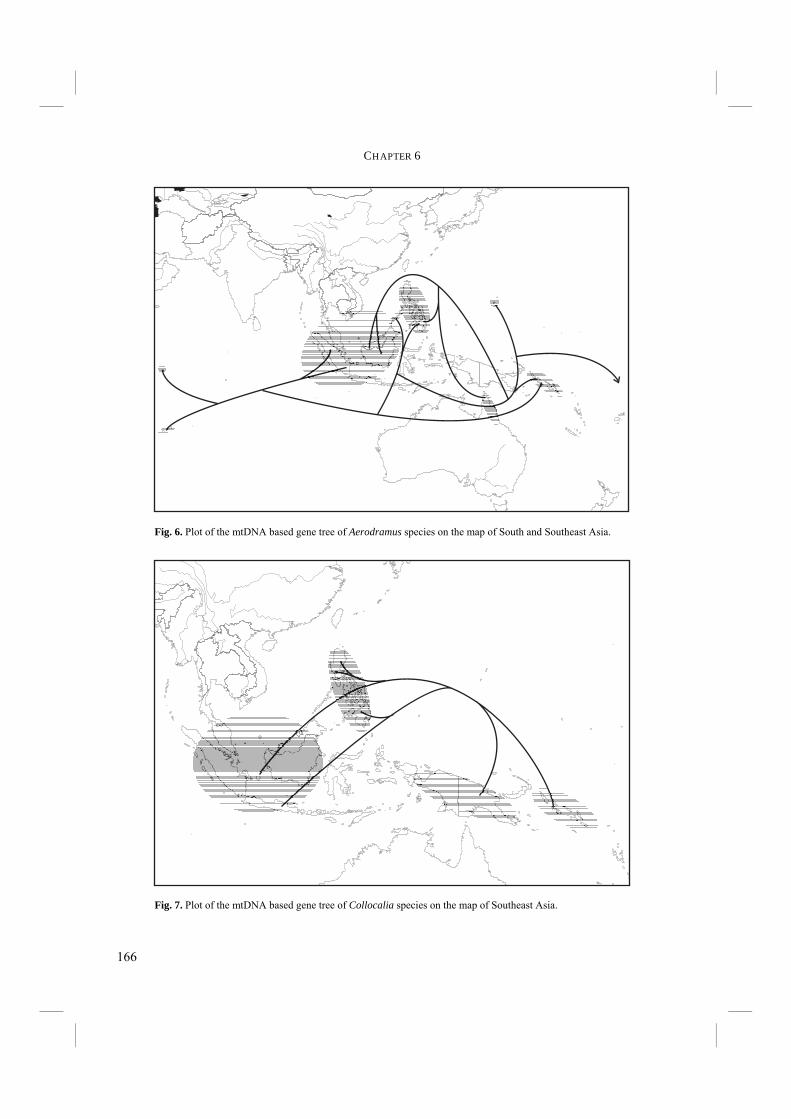
166
CHAPTER 6
Fig. 6. Plot of the mtDNA based gene tree of Aerodramus species on the map of South and Southeast Asia.
Fig. 7. Plot of the mtDNA based gene tree of Collocalia species on the map of Southeast Asia.
167
BIOGEOGRAPHY AND EVOLUTION OF ECHOLOCATION
taxon-area cladogram suggest that dispersal of Swiftlets between Palawan and Borneo, but also between Palawan and the Philippines are probable (see below) (Fig. 5).
When did echolocation arise? Echolocation ability is not only present in Aerodramus spp., but also in C. troglodytes (Price et al. 2004), which is a member of the sistergroup of Aerodramus + Hydrochous (Fig. 1). Considering the gene tree of Swiftlets (Fig. 1 and Chapter 2.2), two explanations for the time of the rise of echolocation are possible. First, echolocation may have evolved once at the base of the Collocaliini. Consequently, it should have been lost twice thereafter: once in the branch leading to C. esculenta and C. linchi, and once in H. gigas. Alternatively, echolocation may have evolved twice independently, i.e. at the base of Aerodramus spp. and in C. troglodytes. If we assume that the acquisition of echolocation involves as many changes as the loss of echolocation, the explanation of echolocation having evolved twice is, with only two events against three in the alternative explanation, the most parsimonious one. The first time that echolocation could have evolved in Aerodramus is at the split of Aerodramus and Hydrochous. In C. troglodytes, this time is at the split of C. troglodytes and the branch leading to C. linchi and C. esculenta (Fig. 1). Applying the 2 % rule for deviation of lineages, Aerodramus split off from Hydrochous approximately 3.26 Ma according to uncorrected cyt-b distances and 4.57 Ma according to ML corrected distances (Fig. 1). The split off of C. troglodytes took place around 4.25 – 5.84 Ma according to uncorrected and ML corrected distances respectively. Thus, according to our analyses and under the hypothesis that echolocation evolved twice, echolocation evolved earlier in Collocalia than in Aerodramus, with the earliest possible time estimated at 5.84 Ma. By this time most of the southeast Asian region was on its place (Hall 1998) (Fig. 10). Swiftlet cyt-b sequences are slightly saturated (Chapter 2) and its variation may despite the ML correction therefore still be an underestimation of the actual variation, especially for deeper nodes. Even taking this into account, a multiple of the estimated times for the origin of echolocation seems unlikely. Vicariance effects due to plate tectonics are therefore unlikely.
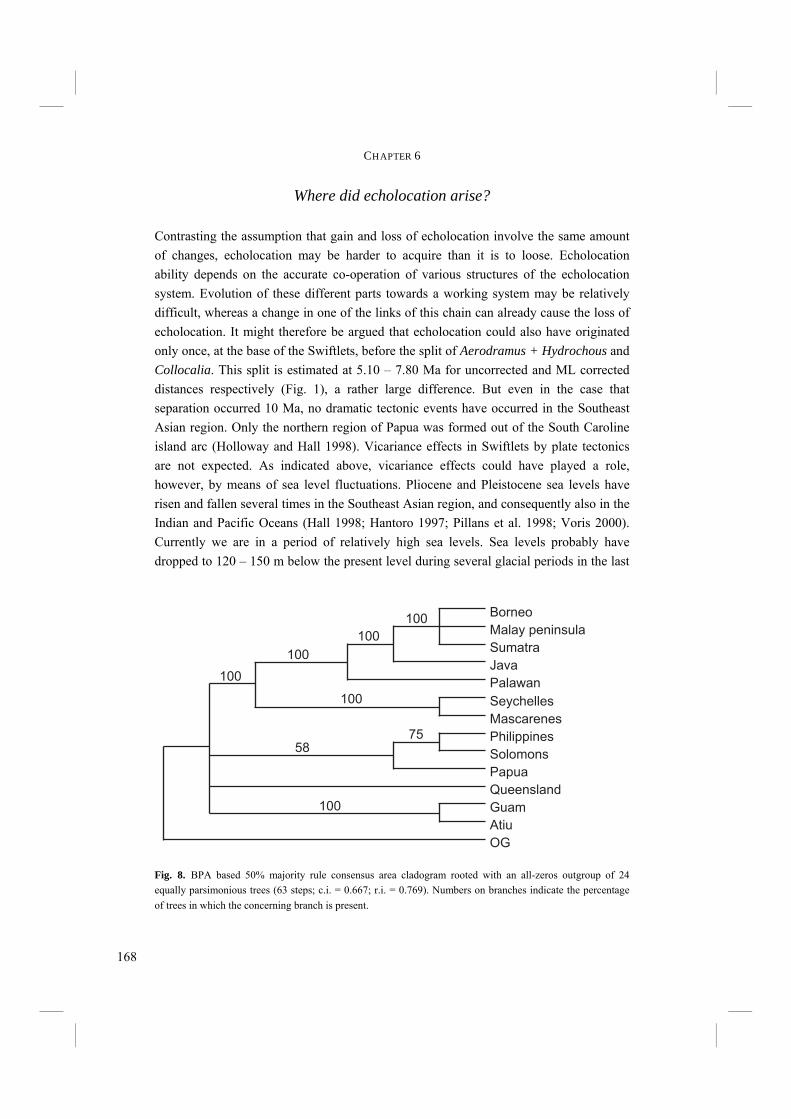
168
CHAPTER 6
Where did echolocation arise? Contrasting the assumption that gain and loss of echolocation involve the same amount of changes, echolocation may be harder to acquire than it is to loose. Echolocation ability depends on the accurate co-operation of various structures of the echolocation system. Evolution of these different parts towards a working system may be relatively difficult, whereas a change in one of the links of this chain can already cause the loss of echolocation. It might therefore be argued that echolocation could also have originated only once, at the base of the Swiftlets, before the split of Aerodramus + Hydrochous and Collocalia. This split is estimated at 5.10 – 7.80 Ma for uncorrected and ML corrected distances respectively (Fig. 1), a rather large difference. But even in the case that separation occurred 10 Ma, no dramatic tectonic events have occurred in the Southeast Asian region. Only the northern region of Papua was formed out of the South Caroline island arc (Holloway and Hall 1998). Vicariance effects in Swiftlets by plate tectonics are not expected. As indicated above, vicariance effects could have played a role, however, by means of sea level fluctuations. Pliocene and Pleistocene sea levels have risen and fallen several times in the Southeast Asian region, and consequently also in the Indian and Pacific Oceans (Hall 1998; Hantoro 1997; Pillans et al. 1998; Voris 2000). Currently we are in a period of relatively high sea levels. Sea levels probably have dropped to 120 – 150 m below the present level during several glacial periods in the last
Borneo
Malay peninsula
Sumatra
Java
Palawan
Seychelles
Mascarenes
Philippines
Solomons
Papua
Queensland
Guam
Atiu
OG
100
100
100
100
100
5875
100
Fig. 8. BPA based 50% majority rule consensus area cladogram rooted with an all-zeros outgroup of 24 equally parsimonious trees (63 steps; c.i. = 0.667; r.i. = 0.769). Numbers on branches indicate the percentage of trees in which the concerning branch is present.

169
BIOGEOGRAPHY AND EVOLUTION OF ECHOLOCATION
1 Ma alone (Fig. 11, adapted from Hantoro 1997). During those periods and periods that sea levels were 50 m and more below present day levels Borneo, Java, Sumatra and the Malay peninsula constituted one large landmass with intervening seas, known as Sundaland (Hall 1998; Holloway and Hall 1998; Hantoro 1997; Voris 2000). It still remains a question whether Palawan was also connected by a landbridge to Sundaland (Hantoro 1997) or whether a landbridge was absent and the strait between Sundaland and Palawan was reduced to a width of approximately 12 km (Voris 2000). During periods of sea levels 75 m and more below present levels, the Philippine islands except Palawan were largely interconnected (Holloway and Hall 1998). However, there is no evidence that the Philippines have been connected to other land masses. Sea levels of only 10 m below present already resulted in a landbridge between Papua and Australia at the northern tip of present day Queensland (Hall 1998). The amount of surfacing land increased rapidly from levels 50 m and more below present (Voris 2000). In the Indian Ocean the Seychelles and Mascarene island are currently remote neighbours without land connections. However, the Mascarene ridge, a shallow arc stretching between the Seychelles and Mascarene islands has probably formed an island arc at times that sea levels were low, creating potential stepping stones for organisms to disperse between the two now remaining archipellagos.
Java
SumatraMalay peninsula
Borneo
Palawan
Atiu
Guam
Queensland
Solomons
Papua
Philippines
Mascarenes
Seychelles
Fig. 9. BPA based strict consensus unrooted area network of 2 equally parsimonious trees (c.i. = 0.677; r.i. = 0.765).
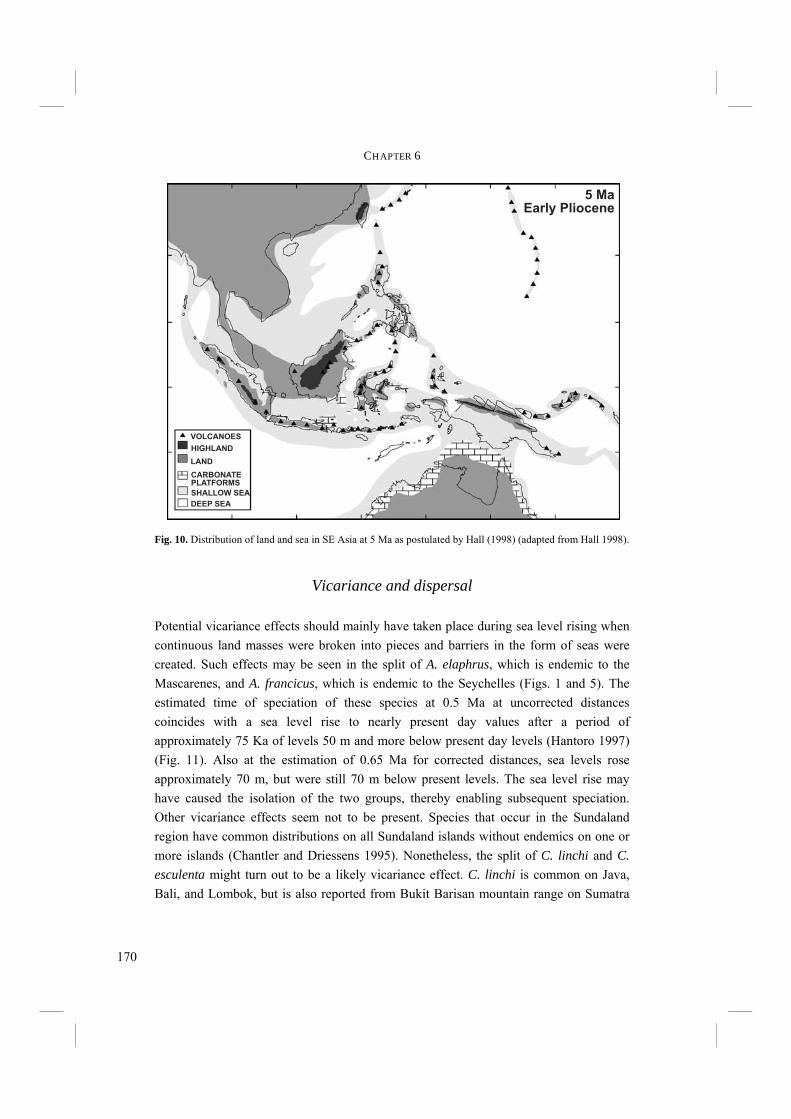
170
CHAPTER 6
Vicariance and dispersal Potential vicariance effects should mainly have taken place during sea level rising when continuous land masses were broken into pieces and barriers in the form of seas were created. Such effects may be seen in the split of A. elaphrus, which is endemic to the Mascarenes, and A. francicus, which is endemic to the Seychelles (Figs. 1 and 5). The estimated time of speciation of these species at 0.5 Ma at uncorrected distances coincides with a sea level rise to nearly present day values after a period of approximately 75 Ka of levels 50 m and more below present day levels (Hantoro 1997) (Fig. 11). Also at the estimation of 0.65 Ma for corrected distances, sea levels rose approximately 70 m, but were still 70 m below present levels. The sea level rise may have caused the isolation of the two groups, thereby enabling subsequent speciation. Other vicariance effects seem not to be present. Species that occur in the Sundaland region have common distributions on all Sundaland islands without endemics on one or more islands (Chantler and Driessens 1995). Nonetheless, the split of C. linchi and C. esculenta might turn out to be a likely vicariance effect. C. linchi is common on Java, Bali, and Lombok, but is also reported from Bukit Barisan mountain range on Sumatra
Fig. 10. Distribution of land and sea in SE Asia at 5 Ma as postulated by Hall (1998) (adapted from Hall 1998).
5 MaEarly Pliocene
HIGHLAND
DEEP SEA
SHALLOW SEA
LAND
CARBONATEPLATFORMS
VOLCANOES

171
BIOGEOGRAPHY AND EVOLUTION OF ECHOLOCATION
and from Mnt. Kinabalu on Borneo (Chantler and Driessens 1995). However, the distinction from C. esculenta, which does not occur on Java, but is present at Sumatra and Borneo, is rather difficult. If these reported C. linchi specimens are shown to be actually C. esculenta, the endemism of C. linchi and absence of C. esculenta on Java may be due to vicariance. Although most species have more or less continuous distribution patterns over one or more adjacent islands, H. gigas shows a disjunct distribution (Figs. 2, 3). It is an elusive Swiftlet, nesting near or behind waterfalls in mountainous areas (e.g. Chantler and Driessens 1995; Somadikarta 1968). It is known with certainty to breed on Java, but it is also reported from several sites on Borneo, Sumatra, and the Malay peninsula (Chantler and Driessens 1995). These populations might be relicts from a large continuous distribution over the Sundaland region. Arid conditions during the periods of glaciation (Meijaard 2003 and references therein) may have forced them back to their present day distribution. However, why they have not rehabilitated to other sites in the present relatively wet period, remains a question. The remaining of biogeographical patterns are likely to be cases of dispersal, which is facilitated by the excellent flying capabilities of Swiftlets. This greatly complicates the explanation of the biogeographical pattern. Any dispersal scenario starting from any region can be made to result in the observed biogeographical pattern of extant species and an overall pattern cannot be found. Nevertheless, parts of the pattern can be explained or made probable and will be discussed below. Although it cannot be completely ruled out, it seems unlikely that Aerodramus originated at Indian Ocean islands. On the contrary, dispersal of Aerodramus from Southeast Asia towards the Indian Ocean seems most likely. The Andaman and Nicobar islands and Maldive and Chagos archipellagos may have served as stepping stones,
0 100 200 300 400 500 600 700 800 900 1000-200
-100
0
years (Ka)
sea
level(m
)
Fig. 11. Pleistocene and Holocene sea level changes in SE Asia (from Hantoro 1997).
172
CHAPTER 6
especially during periods of lower sea levels when larger parts of the island arcs were exposed. Strong (monsoon) winds may have aided in long distance dispersal over sea. Although A. unicolor, which occurs on Sri Lanka and in South India, was not sampled, it is hypothesised that it might be placed between A. salanganus + A. fuciphagus and A. elaphrus + A. francicus clades, because its distribution is between the distributions of these two clades (Figs. 1, 2, 3, and 5). The most likely dispersal route is from Southeast Asia via the Andamans to Sri Lanka and South India and further to the Seychelles and Mascarene islands (Fig. 6). Dispersal between the two adjacent areas of Sundaland islands and Palawan and Philippine islands probably has taken place several times in Aerodramus as well as in Collocalia clades (Figs. 1, 5, 6, and 7). In several clades these areas form sistergroups or are part of each others sistergroups. Palawan constitutes an important intermediate between Sundaland and Philippine islands. For example, A. mearnsi occurs on the Philippines, but also on Palawan, just like C. troglodytes (Fig. 1 and 5). The subspecies A. vanikorensis palawanensis occurs on Palawan, but has conspecifics on the Philippines. On the other hand, A. fuciphagus occurs on Sundaland islands, but also on Palawan. Furthermore, based on fossil evidence A. salanganus, which is now restricted to Borneo, Java, and Sumatra, has probably also occurred on Palawan (Reis and Garong 2001). The intermediate position of Palawan, sharing Swiftlet species with Borneo as well as the Philippines, is also seen in other groups of organisms such as Cyrtandra plants (Atkins et al. 2001) and frogs (Brown and Guttman 2002; Evans et al. 2003). Dispersal between the Philippines and Australia, as suggested by the sistergroup placement of A. whiteheadi and A. terraereginae (Figs. 1 and 5), seems to be unlikely. However, Aerodramus species from the areas in between, i.e. the Moluccan islands and Papua, are extant, but not sampled. A somewhat biased view may therefore exist and dispersal between the Philippines and Australia may well have taken place via Moluccan islands and Papua. An eastward route from the Philippines via Papua and/or Australia to the Solomon and Cook islands seems to be likely to explain the distribution of A. vanikorensis lugubris and A. sawtelli. A. bartschi may have reached Guam from the Philippines in the west, but also from Papua in the south.
Echolocation and Swiftlet biogeography. To understand the evolution of echolocation it is important to know where it originated and under what circumstances. However, as mentioned earlier, the direction of dispersal and with that the “area of origin” can hardly be determined by the biogeographical pattern and gene tree alone. The distribution of land and sea at the estimated time of

173
BIOGEOGRAPHY AND EVOLUTION OF ECHOLOCATION
evolution of echolocation can give a hint. During the early Pliocene, ca. 5 Ma, only small fractions of easterly islands of Papua, Moluccas, and Philippines were surfacing. On the other hand Borneo, Java, Sumatra, and the Malay peninsula were largely above sea level, together with a large part of the South China sea (Hall 1998) (Fig. 10). By the fact alone that the Sundaland region covered a much larger area than other regions, chances are that echolocation evolved in Sundaland rather than in other regions. Furthermore, areas where caves or crevices could easily develop, such as limestone platforms, volcanoes, and mountainous areas were present in this region. Many volcanoes were also surfacing along present day Lesser Sunda islands and Sulawesi. The surfacing fractions of the Philippine islands knew comparatively few volcanoes, limestone platforms or mountainous areas. The estimated times that echolocation first could have evolved independently in Aerodramus and C. troglodytes all fall into periods with sea levels that are approximately equal to that of 5 Ma (Moss et al. 2004). If echolocation evolved only once at the base of the Swiftlets, this could have occurred before 8.80 Ma. At approximately 10 Ma similar conditions as described above were applicable (Hall 1998). Sundaland covered an even larger area than 5 Ma and easterly regions were mostly submerged. Supposing that caves have been crucial in the evolution of echolocation, conditions seem to have made the evolution of echolocation in the Sundaland region more likely than on the Philippines or other Southeast Asian regions.
How did echolocation originate? Questions rise such as by what cause and how echolocation evolved and for what reason caves were inhabited. Caves may provide a relatively safe haven from predators that otherwise might be able to reach nest sites in e.g. trees. They also ensure a relatively stable climate with constant temperature and humidity. This all could enable both parents to stay out for long periods to catch food for their young, which are safe during their absence. Ancestral Swiftlets may have occupied the front ends of horizontal caves, with good light conditions. Extant non-echolocating Swiftlets still inhabit those light areas of caves. Echolocation may have subsequently evolved from social vocalisations, which often contain click-like trills (Chapter 3.1). This would have enabled the Swiftlets to occupy also the dark parts of the caves they were already inhabiting and in addition to that also vertical caves that are almost completely covered in darkness. Echolocation appears to be a completely novel trait rather than the spin-off of a different trait. Enlarged auditory nuclei are advantageous in the localisation of sound. However, echolocating Swiftlets catch their prey visually, like non-echolocating Swiftlets. Also in other behavioural aspects echolocating and non-echolocating Swiftlets resemble each

174
CHAPTER 6
other. Improved sound localisation does not seem to be advantageous in Swiftlets for other functions besides merely for echolocation. Echolocation is scarce in birds, only found in the Oilbird (Steatornis caripensis) and Swiftlets. In mammals, however, echolocation has evolved several times. Bats use echolocation to find their prey, cetaceans to navigate and find their prey, and also shrews (Buchler 1976; Forsman and Malmquist 1988; Gould et al. 1964; Tomasi 1979) and tenrecs (Fenton 1991) are known to locate their prey by means of a sonar system. Particularly bats and cetaceans have a very sophisticated and complicated echolocation system with (functional morphological) adaptations in several parts of the system. It is unclear why echolocation in birds has evolved only in the Oilbird and in Swiftlets, although it is of a relatively simple design with only few functional morphological adaptations. Echolocation might facilitate foraging and navigation in the dark. However, in general birds seem to rely more on vision and on sounds produced by prey than on a sonar system. Although they are able to echolocate, even Swiftlets have very good visibility. They can find their tiny prey on sight and echolocating as well as non-echolocating Swiftlets can see and avoid a mistnet during dusk against the dark background of a cave (pers. obs.). Despite their good vision, the innovation of echolocation has however opened new possibilities and a new niche for Swiftlets to explore.
Acknowledgements Dr. M.G.P. van Veller (Wageningen University) is kindly acknowledged for valuable comments on a previous version of this manuscript.

175
CHAPTER 7
GENERAL DISCUSSION AND SUMMARY

176
CHAPTER 7
Swiftlets (Aves: Apodidae) are, together with the South American Oilbird (Steatornis caripensis), unique among birds in their echolocation ability (e.g. Griffin 1953; Medway 1959; Novick 1959; Pye 1980; Suthers and Hector 1982, 1985). Swiftlets use echolocation to navigate in the darkness of caves in which they roost and nest. However, not all Swiftlet species are able to echolocate. This dichotomy in echolocation ability within the Swiftlets provided the opportunity to study the morphological and evolutionary basis of this behavioural trait. An attempt was made to find the answers on questions such as: what morphological adaptations to echolocation have evolved; how has echolocation evolved; and what may have been the cause of its origination? Chapter 2: Phylogeny. - In a study of the evolution of echolocation, a robust phylogeny of Swifts and Swiftlets is of vital importance, e.g. in establishing whether echolocation has evolved once or several times. However, due to difficulties in taxonomy and phylogeny of Swiftlets, such a phylogeny was lacking at the start of this project. Therefore, a new phylogeny, based on the complete cytochrome-b gene, was inferred (Thomassen et al. 2003; Chapter 2.1). This resulted in a tree where monophyly of Swiftlets was well supported. Collocalia was placed as the sistergroup of Aerodramus + Hydrochous gigas (Chapter 2.1). However, the status of H. gigas was still unresolved. It was either placed within Aerodramus or as sistergroup of Aerodramus. This ambiguity was caused by the high variability of the cytochrome-b molecule (39.7% variable sites, of which 25.4% informative). Therefore, two additional regions of more conservative DNA, i.e. 12S rRNA and β-fibrinogen intron 7 nuclear DNA were included in order to increase resolving power. With the inclusion of these genes, the phylogenetic position of H. gigas now became clear. It was placed as the sistergroup of Aerodramus with high support (Chapter 2.2). Meanwhile, Price et al. (2004) had studied the phylogeny of Swifts and Swiftlets based on a part of the cytochrome-b and a part of the ND2 mtDNA molecules. Price et al. (2004) included more species than previously had been done, and could resolve the relationships within genera with more precision. However, some branches within Aerodramus had low support. Furthermore, Price et al. did not include H. gigas. Therefore, in a subsequent analysis we sequenced ND2 mtDNA of two specimens of H. gigas and added these to the data of Price et al. (2004) to confirm the placement of H. gigas. In the resulting tree H. gigas was again placed as the sistergroup of Aerodramus, with bootstrap values and Bayesian probabilities of 100%. Because the same mtDNA genes were used as in the study of Price et al. (2004), the internal relationships of Aerodramus remained incompletely resolved. Given the robust placement of the Swiftlets as a group, it is unlikely that inclusion of previously unsampled species –such as Apus nipalensis, which closely resembles Swiftlets– would change the internal
177
GENERAL DISCUSSION AND SUMMARY
phylogenetic configuration of the Swiftlets. An important discovery of Price et al. (2004) in the glossy-feathered genus Collocalia is that C. troglodytes, which is closely related to C. linchi and C. esculenta, is also able to echolocate. The decision of Brooke (1970, 1972) to divide Swiftlets into three different genera was largely based on echolocation ability. Aerodramus spp. were, at that time, the only Swiftlets known to echolocate and formed as such a monophyletic group. However, with the discovery of echolocation in Collocalia troglodytes (Price et al. 2004), echolocation ability as a character became homoplasious. It is therefore considered to be unsuitable as a taxonomic identifier. Furthermore, external morphological characters, such as glossiness, and nest characters have previously shown not to support a subdivision of Swiftlets into different genera (e.g. Lee et al. 1996; Oberholser 1906; Salomonsen 1983; Somadikarta pers. com.). It may therefore be better to return to the original classification of Swiftlets into the single genus Collocalia Gray (1840). For the sake of consistency and clarity, in this thesis the classification of Brooke (1970, 1972) and Chantler et al. (1999), who used three different genera, will be followed. C. esculenta comprises many different subspecies. However, the genetic divergence between the subspecies is relatively large. Although this in itself is not enough to determine species boundaries, it does point out the possibility that at least several of these subspecies may be real species. Although one may still debate the taxonomic nomenclature of Swiftlets, the results of the phylogenetic analyses (Chapter 2) provided a firm base to continue studying the evolution of echolocation. Echolocation system. - The echolocation system can be subdivided into three units. First of all, the echolocative sound has to be emitted by the echolocater. In Swiftlets, this sound is a short click, produced in the syrinx (Smyth 1979; Suthers and Hector 1982). This echo click is often, though not always, of double click design, but is perceived by humans as a single click. Probably, Swiftlets are not able to hear the subclicks separately either (Fay 1988). The second unit is the ear, which receives the returning echo and transforms vibrations in the air into electrical stimuli in the auditory nerve. Finally, the echo has to be processed and interpreted so that an “image” of the environment can be created. This is accomplished in the central nervous system, which, to complete the circle, also controls the echo click production in the syrinx. Swiftlets vocalisations and the three subunits of the echolocation system were studied in the three following chapters.

178
CHAPTER 7
Chapter 3: Vocalisations and the syrinx. - Generally, avian social vocalisations are species specific. However, echo clicks might be similar across species due to functional demands posed on the auditory structure of echo clicks. Using frequency and time-based characters, species specificity of social vocalisations as well as of echo clicks was investigated in a multivariate way (Chapter 3.1). Social vocalisations turned out to differ significantly among species, as was expected. However, the echo clicks also proved to be species specific. Despite functional constraints on the echo clicks, differences in the frequencies used are apparently possible. The exact frequency range was also expected to be less restricted by functional demands than other characters of echo clicks. Species specificity may, in some cases, be explained by character displacement. It is suggested that echolocation is not the only function of echo clicks, but that the clicks may also be used in intraspecific communication. In caves, species specificity of echo clicks may facilitate the localisation and recognition of conspecifics. Behavioural characters are often thought to be unreliable in phylogeny reconstruction. However, in some cases such characters proved to work well (Bretagnolle 1995; Kennedy et al. 1996; McCracken and Sheldon 1997; Patterson et al. 1995; Price and Lanyon 2002; Prum 1990; Winkler and Sheldon 1993). Vocal abilities of Swiftlets may have played an important role in the evolution of echolocation and might therefore contain hierarchical information that is suitable for phylogenetic inference. However, phylogenetic analyses of step-matrix gap-weighted continuous vocalisation characters combined with discrete characters resulted in almost completely unresolved trees for analyses of social vocalisations as well as of echo clicks. Thus, Swiftlet vocalisations are not suitable for phylogeny reconstruction (Chapter 3.1). Mapping of social vocalisation characters did not reveal a clear pattern of echo click-like features in social vocalisations that can be related to the evolutionary development of echolocation (Chapter 3.1). The echo clicks emitted are usually of double click design. However, some species were thought to emit only single clicks, whereas others were thought to emit just double clicks. Based on those results Fullard et al. (1993) hypothesised that single and double click design would be related to different evolutionary pathways towards echolocation. In the present study, echo clicks of several species were investigated to test that hypothesis (Chapter 3.2). Most of the species studied sometimes emit single echo clicks. Although single clicks are generally much less frequently produced than double clicks, it seems likely that all echolocating Swiftlets occasionally emit such single clicks. The results do not therefore support the hypothesis of Fullard et al. (1993).
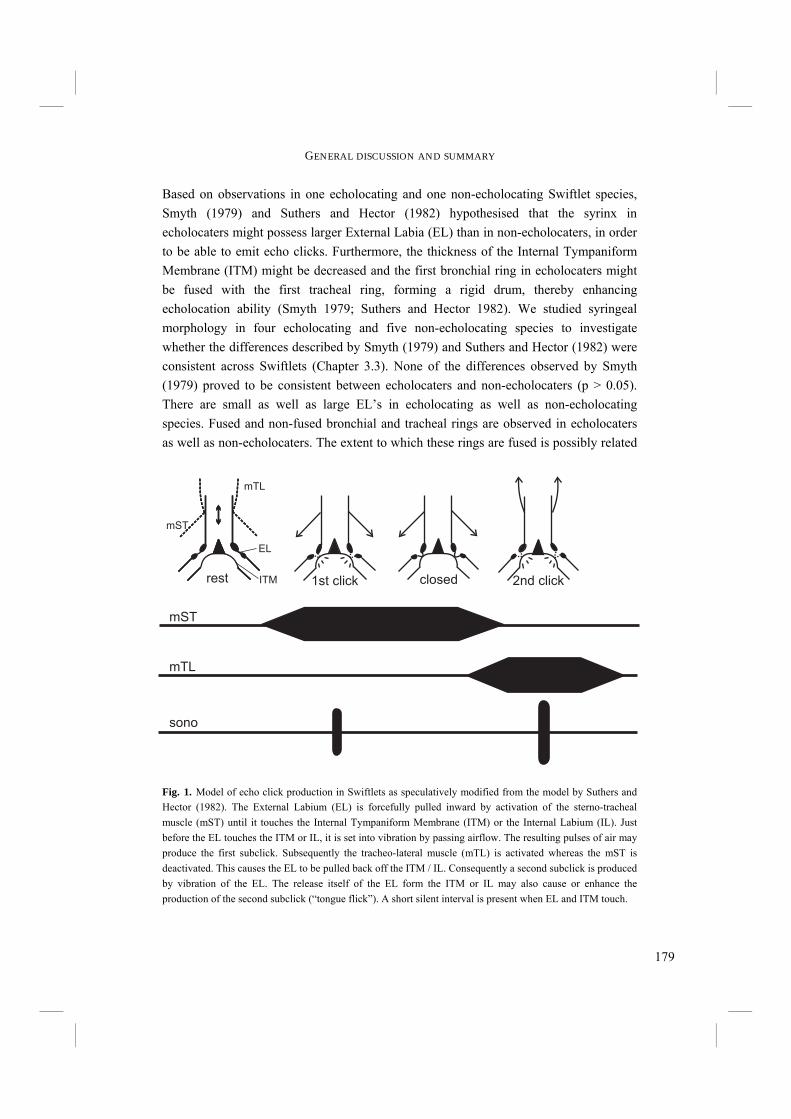
179
GENERAL DISCUSSION AND SUMMARY
Based on observations in one echolocating and one non-echolocating Swiftlet species, Smyth (1979) and Suthers and Hector (1982) hypothesised that the syrinx in echolocaters might possess larger External Labia (EL) than in non-echolocaters, in order to be able to emit echo clicks. Furthermore, the thickness of the Internal Tympaniform Membrane (ITM) might be decreased and the first bronchial ring in echolocaters might be fused with the first tracheal ring, forming a rigid drum, thereby enhancing echolocation ability (Smyth 1979; Suthers and Hector 1982). We studied syringeal morphology in four echolocating and five non-echolocating species to investigate whether the differences described by Smyth (1979) and Suthers and Hector (1982) were consistent across Swiftlets (Chapter 3.3). None of the differences observed by Smyth (1979) proved to be consistent between echolocaters and non-echolocaters (p > 0.05). There are small as well as large EL’s in echolocating as well as non-echolocating species. Fused and non-fused bronchial and tracheal rings are observed in echolocaters as well as non-echolocaters. The extent to which these rings are fused is possibly related
closed1st click 2nd clickrest
mTL
mST
ITM
EL
mST
mTL
sono
Fig. 1. Model of echo click production in Swiftlets as speculatively modified from the model by Suthers and Hector (1982). The External Labium (EL) is forcefully pulled inward by activation of the sterno-tracheal muscle (mST) until it touches the Internal Tympaniform Membrane (ITM) or the Internal Labium (IL). Just before the EL touches the ITM or IL, it is set into vibration by passing airflow. The resulting pulses of air may produce the first subclick. Subsequently the tracheo-lateral muscle (mTL) is activated whereas the mST is deactivated. This causes the EL to be pulled back off the ITM / IL. Consequently a second subclick is produced by vibration of the EL. The release itself of the EL form the ITM or IL may also cause or enhance the production of the second subclick (“tongue flick”). A short silent interval is present when EL and ITM touch.
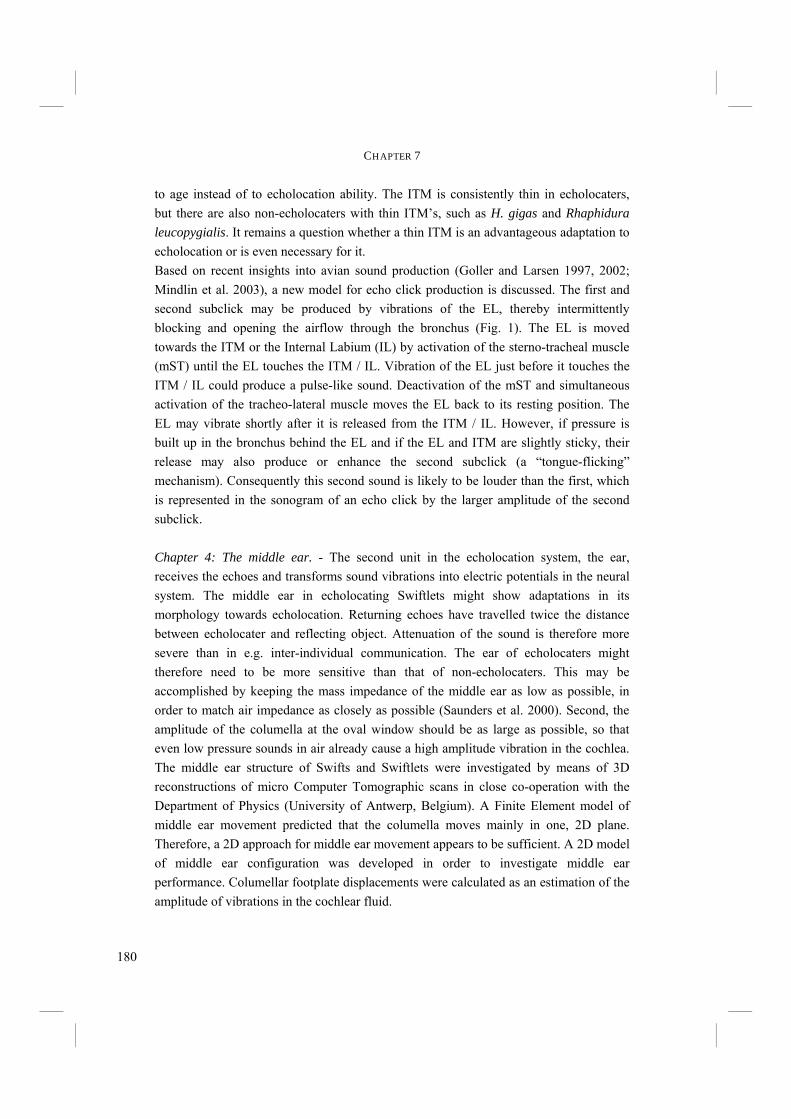
180
CHAPTER 7
to age instead of to echolocation ability. The ITM is consistently thin in echolocaters, but there are also non-echolocaters with thin ITM’s, such as H. gigas and Rhaphidura leucopygialis. It remains a question whether a thin ITM is an advantageous adaptation to echolocation or is even necessary for it. Based on recent insights into avian sound production (Goller and Larsen 1997, 2002; Mindlin et al. 2003), a new model for echo click production is discussed. The first and second subclick may be produced by vibrations of the EL, thereby intermittently blocking and opening the airflow through the bronchus (Fig. 1). The EL is moved towards the ITM or the Internal Labium (IL) by activation of the sterno-tracheal muscle (mST) until the EL touches the ITM / IL. Vibration of the EL just before it touches the ITM / IL could produce a pulse-like sound. Deactivation of the mST and simultaneous activation of the tracheo-lateral muscle moves the EL back to its resting position. The EL may vibrate shortly after it is released from the ITM / IL. However, if pressure is built up in the bronchus behind the EL and if the EL and ITM are slightly sticky, their release may also produce or enhance the second subclick (a “tongue-flicking” mechanism). Consequently this second sound is likely to be louder than the first, which is represented in the sonogram of an echo click by the larger amplitude of the second subclick. Chapter 4: The middle ear. - The second unit in the echolocation system, the ear, receives the echoes and transforms sound vibrations into electric potentials in the neural system. The middle ear in echolocating Swiftlets might show adaptations in its morphology towards echolocation. Returning echoes have travelled twice the distance between echolocater and reflecting object. Attenuation of the sound is therefore more severe than in e.g. inter-individual communication. The ear of echolocaters might therefore need to be more sensitive than that of non-echolocaters. This may be accomplished by keeping the mass impedance of the middle ear as low as possible, in order to match air impedance as closely as possible (Saunders et al. 2000). Second, the amplitude of the columella at the oval window should be as large as possible, so that even low pressure sounds in air already cause a high amplitude vibration in the cochlea. The middle ear structure of Swifts and Swiftlets were investigated by means of 3D reconstructions of micro Computer Tomographic scans in close co-operation with the Department of Physics (University of Antwerp, Belgium). A Finite Element model of middle ear movement predicted that the columella moves mainly in one, 2D plane. Therefore, a 2D approach for middle ear movement appears to be sufficient. A 2D model of middle ear configuration was developed in order to investigate middle ear performance. Columellar footplate displacements were calculated as an estimation of the amplitude of vibrations in the cochlear fluid.

181
GENERAL DISCUSSION AND SUMMARY
Middle ear configurations were different among species, but not between echolocaters and non-echolocaters. Volumes of middle ear structures did not differ between echolocating and non-echolocating species, indicating that no difference in mass impedance exists. Moreover, middle ear model calculations showed that there are no differences in footplate displacement either. Thus, no significant differences in performance of the middle ear seem to exist between echolocating and non-echolocating Swiftlets. Improvement of the middle ear towards echolocation might either not have been necessary or not possible. 2D model calculations on a variety of simulated middle ear configurations were performed in order to investigate whether improvement of real middle ears could be accomplished. A wide range of different middle ear configurations turned out to be resulting in maximal displacement of the footplate. The columella should not be too much skewed relative to the plane of the tympanum. Middle ears of all species investigated fell into the predicted range of workable configurations. It is therefore unlikely that middle ears, as they are, could be improved any further towards echolocation. The middle ears of non-echolocating as well as of echolocating Swiftlets reach maximal possible amplitudes of the columellar footplate. If there are any adaptations towards echolocation in the ear (external, middle, or inner), these should be located in the inner ear. Chapter 5: Auditory nuclei. - The last step in the echolocation process is the interpretation of the echoes by the central nervous system. Accurate processing of time (difference) and level (difference) information in the auditory nuclei is of vital importance in localising a sound or echo (Carr and Code 2000). One might expect that echolocating Swiftlets possess hypertrophied auditory nuclei, representing increased acuity of these nuclei such as in Barn Owls and echolocating bats (e.g. Carr and Boudreau 1991; Carr et al. 1996; Hutcheon et al. 2002; Köppl 2001; Winter and Schwartzkopf 1961). Nucleus sizes of four echolocating and three non-echolocating Swiftlets were measured. Nucleus laminaris (Lam), nucleus magnocellularis cochlearis (MCC), nucleus mesencephalicus lateralis, pars dorsalis (MLd), and nucleus ovoidalis (OV) were all larger in echolocaters than in non-echolocaters. Although not significantly different, the nucleus angularis (An) showed a trend of increased size in echolocaters relative to non-echolocaters. Only the size of nucleus lemnisci lateralis, pars intermedia (LLi) was not different. The function of this nucleus is probably not only related to hearing, but also to vision (Carr and Code 2000 and references therein). Therefore, potential size differences may be masked by its other function. Sizes of nucleus rotundus (ROT), which is related to vision, did not differ either between echolocaters and non-echolocaters. Thus, only auditory nuclei are enlarged. Large auditory nuclei are not only found in echolocating Aerodramus, but also in echolocating C. troglodytes (Smyth
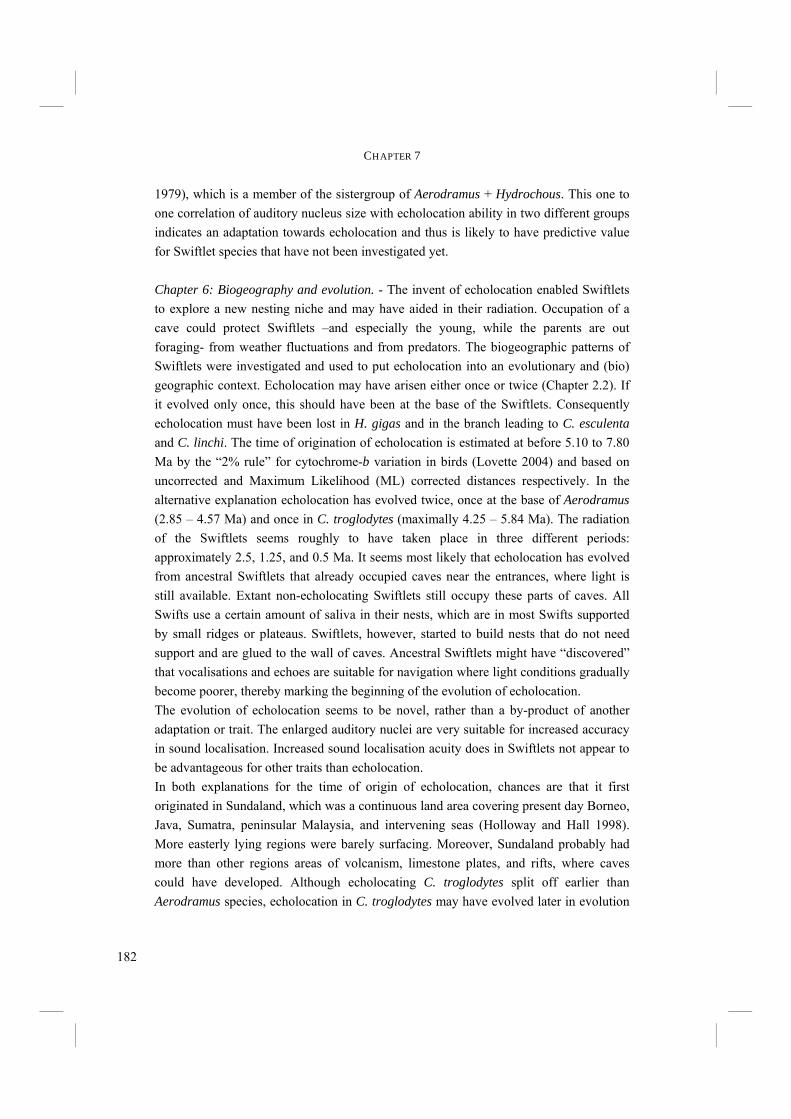
182
CHAPTER 7
1979), which is a member of the sistergroup of Aerodramus + Hydrochous. This one to one correlation of auditory nucleus size with echolocation ability in two different groups indicates an adaptation towards echolocation and thus is likely to have predictive value for Swiftlet species that have not been investigated yet. Chapter 6: Biogeography and evolution. - The invent of echolocation enabled Swiftlets to explore a new nesting niche and may have aided in their radiation. Occupation of a cave could protect Swiftlets –and especially the young, while the parents are out foraging- from weather fluctuations and from predators. The biogeographic patterns of Swiftlets were investigated and used to put echolocation into an evolutionary and (bio)geographic context. Echolocation may have arisen either once or twice (Chapter 2.2). If it evolved only once, this should have been at the base of the Swiftlets. Consequently echolocation must have been lost in H. gigas and in the branch leading to C. esculenta and C. linchi. The time of origination of echolocation is estimated at before 5.10 to 7.80 Ma by the “2% rule” for cytochrome-b variation in birds (Lovette 2004) and based on uncorrected and Maximum Likelihood (ML) corrected distances respectively. In the alternative explanation echolocation has evolved twice, once at the base of Aerodramus (2.85 – 4.57 Ma) and once in C. troglodytes (maximally 4.25 – 5.84 Ma). The radiation of the Swiftlets seems roughly to have taken place in three different periods: approximately 2.5, 1.25, and 0.5 Ma. It seems most likely that echolocation has evolved from ancestral Swiftlets that already occupied caves near the entrances, where light is still available. Extant non-echolocating Swiftlets still occupy these parts of caves. All Swifts use a certain amount of saliva in their nests, which are in most Swifts supported by small ridges or plateaus. Swiftlets, however, started to build nests that do not need support and are glued to the wall of caves. Ancestral Swiftlets might have “discovered” that vocalisations and echoes are suitable for navigation where light conditions gradually become poorer, thereby marking the beginning of the evolution of echolocation. The evolution of echolocation seems to be novel, rather than a by-product of another adaptation or trait. The enlarged auditory nuclei are very suitable for increased accuracy in sound localisation. Increased sound localisation acuity does in Swiftlets not appear to be advantageous for other traits than echolocation. In both explanations for the time of origin of echolocation, chances are that it first originated in Sundaland, which was a continuous land area covering present day Borneo, Java, Sumatra, peninsular Malaysia, and intervening seas (Holloway and Hall 1998). More easterly lying regions were barely surfacing. Moreover, Sundaland probably had more than other regions areas of volcanism, limestone plates, and rifts, where caves could have developed. Although echolocating C. troglodytes split off earlier than Aerodramus species, echolocation in C. troglodytes may have evolved later in evolution

183
GENERAL DISCUSSION AND SUMMARY
by anagenesis. Alternatively, C. troglodytes may have gone extinct on islands that belonged to Sundaland, but it cannot be completely ruled out, that echolocation did evolve for the first time in C. troglodytes on the Philippines. Echolocating Swiftlets occur from the Seychelles and Mascarenes in the Indian Ocean eastwards towards the Pacific islands of Marquesas (Chantler and Driessens 1995). Most of Southeast Asia was by the time Swiftlets arose (between approximately 8 to 10 Ma) on its place (Holloway and Hall 1998). Vicariance effects due to plate tectonics are improbable, but in some cases vicariance may have occurred due to sea level fluctuations. Nevertheless, most of the distribution patterns of Swiftlets are likely to be caused by dispersal. Swiftlets occupy many different habitats, but the presence of caves or crevices as roosting and nesting site is essential. The distribution pattern itself is rather complicated. A BPA-based area cladogram was largely congruent with a consensus cladogram based on many different groups (Turner et al. 2001; Welzen, van et al. 2003). The most remarkable difference is the position of the Philippines, which was grouped with easterly regions in the Swiftlet area cladogram, whereas it was grouped with westerly regions in the consensus area cladogram (Turner et al. 2001; Welzen, van et al. 2003). It thereby occupies both geographically and biogeographically an intermediate position. A taxon-area cladogram, nevertheless, suggested that dispersal between regions has probably taken place several times. Evolution of echolocation once or twice? - Figure 2 summarizes the resulting framework of this thesis, together with literature findings about echolocation in Swiftlets and in the Oilbird (Steatornis caripensis). The times at which various speciation events took place are illustrated in the phylogenetic tree. Differences in morphological characters are depicted next to the species in the tree. The question that is still unanswered is when echolocation evolved in Swiftlets. Echolocation may have evolved either once, at the base of the Swiftlets, or twice, in Aerodramus and in C. troglodytes. If it evolved at the base of the Swiftlets, echolocation must consequently have been lost in H. gigas and in the branch leading to C. linchi + C. esculenta. The ancestor of the Collocalia clade may have either been C. troglodytes-like, but just as well C. linchi-like or C. esculenta-like. The results that are described in this thesis, together with results from the literature could give an indication of whether echolocation evolved once or twice. Differences between echolocaters and non-echolocaters have been found in the thickness of the ITM in the syrinx. However, although all echolocating Aerodramus species possess thin ITM’s, several non-echolocating Swiftlets (H. gigas) and Swifts also

184
CHAPTER 7
possess such thin ITM’s. Moreover, the Oilbird has much thicker ITM’s than Aerodramus species, but produces echo clicks in the same frequency range. It therefore seems not likely that the thickness of the ITM is necessary for echolocation. The only consistent difference between echolocating and non-echolocating Swiftlets seems to be the size of the auditory nuclei. Both Aerodramus and C. troglodytes have large auditory nuclei relative to non-echolocating Collocalia and Swifts. Although several auditory nuclei are enlarged, enlargement of these nuclei as an evolutionary process seems to be coupled (referred to as mosaic evolution, Barton and Harvey 2000; Clack et al. 2001; Glendenning and Masterton 1998). That is, enlargement of one of the nuclei seems to be useless unless the other nuclei are also enlarged. Moreover, enlargement of one of the nuclei is likely to result in more afferents and efferents. Other nuclei in the network therefore will have to enlarge as well. Enlargement of the auditory nuclei in the evolution towards echolocation therefore seems to be a single event in stead of different events of each separate nucleus. Consequently, being a single system, acquisition and loss of echolocation require the same number of events. Acquisition requires a change in behaviour to produce echo clicks together with enlargement of the auditory nuclei, whereas loss of echolocation depends on a change in behaviour to not produce echo clicks any more together with a decrease in size of the auditory nuclei. If evolution and loss of echolocation depend on the same number of evolutionary events, then independent evolution in Aerodramus and C. troglodytes is more parsimonious than evolution at the base of the Swiftlets with subsequent independent loss of echolocation in H. gigas and C. linchi + C. esculenta. H. gigas might use the constant sound of the waterfall to orientate itself. If echolocation evolved once, this species might even have retained larger auditory nuclei. However, a specialisation in auditory nucleus size to accomplish orientation to the roar of a waterfall does not seem to be necessary, since “unspecialised” localisation of an external sound source is common throughout the avian world. H. gigas is known to have extremely good vision and is most likely to be a
Facing page: Fig. 2. Summary of the most important results of this thesis together with some previous results of studies on echolocation in Swiftlets and Oilbirds. The ages of nodes are in million years before present and are based on the 2%-rule for uncorrected and Maximum Likelihood corrected cyt-b distances in birds (Chapter 6). Species in bold are able to echolocate. Closed arrows indicate gain of echolocation, dashed arrows indicate loss of echolocation. Numbers with arrows correspond to the two alternative hypotheses for echolocation having evolved either once or twice. Vertical lines at the right side of the tree represent groups in the tree for which the statement at the right side of the line is valid. Brains differ in having large (large, shaded picture) auditory nuclei in echolocating species and small (small, blank picture) auditory nuclei in non-echolocating species. Oilbirds have at least a larger than average nucleus angularis (Kubke et al. 2004). Syrinxes differ in having thin or thick ITM’s, but this does not seem to be related to echolocation. No differences in the middle ears were found. Echo clicks differ significantly between species, mainly in the used frequencies. Social vocalisations also differ between species. Question marks indicate gaps in present knowledge.

185
GENERAL DISCUSSION AND SUMMARY
4.57
C. troglodytes
C. linchi
Swifts
H. gigas
A. sawtelli
A. bartschi
A. mearnsi
A. spodiopygius
A. salanganus
A. maximus
A. vulcanorum
A. terraereginae
A. whiteheadi
A. francicus
A. elaphrus
A. fuciphagus vestitus
A. fuciphagus germani
A vanikorensis lugubris
A vanikorensis palawanensis
C. esculenta
ech
olo
ca
tio
n(b
old
)
5.107.80
4.255.84
3.26
ag
e(M
a)
/u
nc
orr
ec
ted
ML
co
rre
cte
d
Oilbird
syrin
x
?
ech
oclic
k
so
cia
lvo
ca
lisa
tio
n
diffe
ren
ta
mo
ng
sp
ecie
s
?
diffe
ren
ta
mo
ng
sp
ecie
s
sim
ilar
toS
wiftle
ts
mid
dle
ea
rn
od
iffe
ren
ce
sb
etw
ee
nsp
ecie
s
?
au
dito
ryn
ucle
i
?
7.809.84
time (approximately)
1
1
1
2
2

186
CHAPTER 7
diurnal, but also crepuscular feeder (Chantler and Driessens 1995). It is therefore most probable that it is able to find its nesting or roosting site visually. However, if H. gigas would be proven to have larger auditory nuclei than other non-echolocating Swiftlets, the number of events for a single moment of evolution of echolocation would be the same as for evolution twice independently. In that case it would, after all, be likely that echolocation did evolve only once and that H. gigas stopped using active echolocation, while still using the benefit of enlarged auditory nuclei. Although the acquisition of echolocation seems intuitively more difficult than its loss, based on what is presently known about echolocation in Swiftlets and on parsimony theory, echolocation has likely evolved twice independently in Swiftlets. It is acknowledged that evolution does not necessarily follow the rules of parsimony. Future studies may acquire additional data that could prove otherwise. Conclusions. - To conclude, the morphological basis for the behavioural trait echolocation is mainly based in the central nervous system. It remains unclear whether the syrinx is adapted to echolocation by possessing a thin and smooth ITM. It seems, however, not to be a necessary trait. Most probably, the remainder of the echolocation system was already suited for echolocation. The observed morphological changes do not appear to be a by-product of another trait. Therefore, echolocation in Swiftlets was probably completely novel. The invention of echolocation opened a whole new niche for Swiftlets to be explored and may have enabled them to leave their juveniles safe from predators and weather influences while foraging outside. Besides morphological changes in the brain, a change in use of the system, i.e. in behaviour, was the most important step in the evolution of echolocation. This change in behaviour may have been triggered when non-echolocating, cave inhabiting ancestral Swiftlets “learned” that vocalising in caves resulted in echoes, which can be used for navigation. This probably occurred twice independently in Sundaland, from where Swiftlets dispersed to their vast present distributions. There, biologists from all over the world are nowadays time and again puzzled by new questions about Swiftlets.
187
GENERAL ACKNOWLEDGEMENTS
Prof. Dr. S. Somadikarta of the University of Indonesia (Depok, W. Java) and Dr. A. Mardiastuti of the Bogor Agricultural University (IPB, Bogor, W. Java, Indonesia) are kindly acknowledged for their help in Swiftlet collection. In Malaysia Mr. P. Malim of Sabah Wildlife Department (Kota Kinabalu, Sabah, Borneo) is greatly acknowledged for being our local counterpart. Mrs. Munirah Abd. Manan of Economic Planning Unit (Putrajaya), Mr. P. Chong of Danum Valley Management Committee - Sabah Foundation (Kota Kinabalu, Sabah, Borneo), Mr. H. Nayan and Mr. M. Lakim of Sabah Parks (Kota Kinabalu, Sabah, Borneo), and Dr. M. Schilthuizen of University Malaysia Sabah (Kota Kinabalu, Sabah, Borneo) are acknowledged for their co-operation and their help and support in acquiring all the needed documents to perform fieldwork. We thank the staff of the research sites we visited for their help. E. Hetebrij (M.Sc.) (Leiden University) is thanked for her help in the collection of Swiftlets. Dr. R.A. Suthers (Indiana University, Bloomington, USA) is kindly acknowledged for putting A. terraereginae specimen at our disposal. W. van den Berge (M.Sc.) (Leiden University) is acknowledged for her help in Swiftlet collection and (ancient) DNA sequencing. Vogelopvang Oegstgeest is thanked for putting Apus apus specimens that they could not save at our disposal. Everyone else who has helped us collecting samples is kindly acknowledged. We thank the Netherlands Foundation for the Advancement of Tropical Research (WOTRO), the Society for the Advancement of Research in the Tropics (Treub-Mij), the Leiden University Fund (LUF), and the Leiden International Study Fund (LISF) for their financial support in sample collection.

188
SWIFT AS SOUND

189
NEDERLANDSE SAMENVATTING
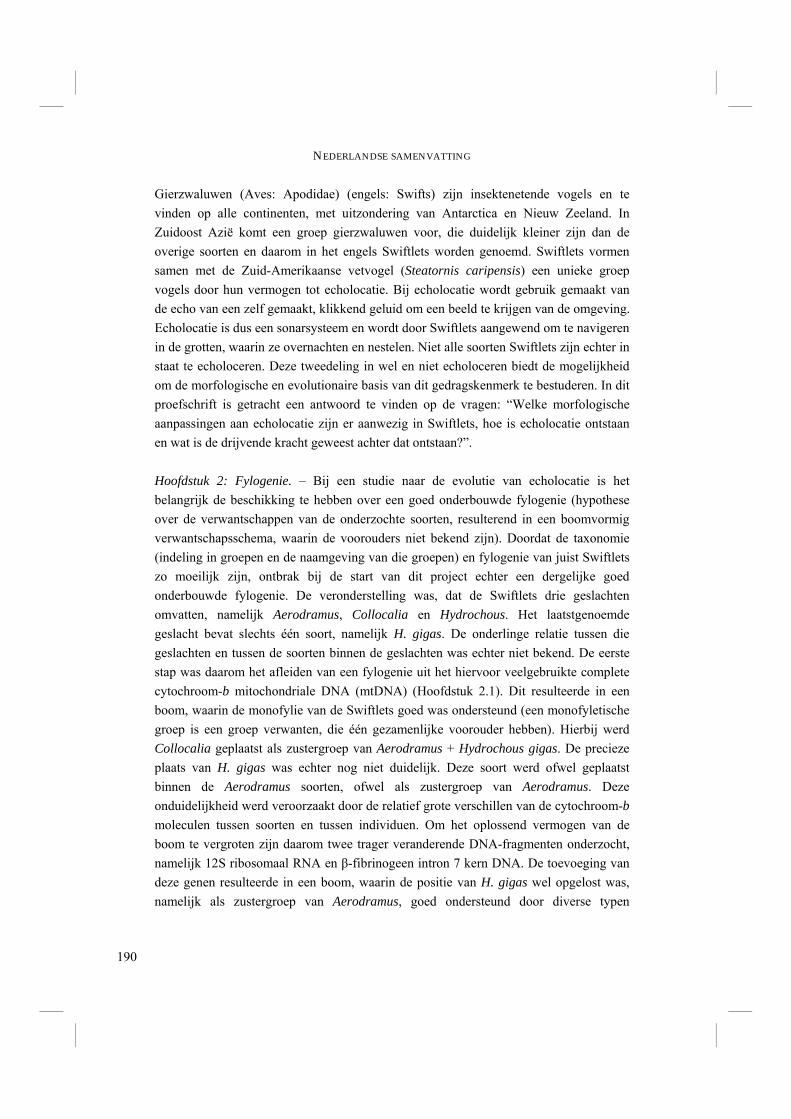
190
NEDERLANDSE SAMENVATTING
Gierzwaluwen (Aves: Apodidae) (engels: Swifts) zijn insektenetende vogels en te vinden op alle continenten, met uitzondering van Antarctica en Nieuw Zeeland. In Zuidoost Azië komt een groep gierzwaluwen voor, die duidelijk kleiner zijn dan de overige soorten en daarom in het engels Swiftlets worden genoemd. Swiftlets vormen samen met de Zuid-Amerikaanse vetvogel (Steatornis caripensis) een unieke groep vogels door hun vermogen tot echolocatie. Bij echolocatie wordt gebruik gemaakt van de echo van een zelf gemaakt, klikkend geluid om een beeld te krijgen van de omgeving. Echolocatie is dus een sonarsysteem en wordt door Swiftlets aangewend om te navigeren in de grotten, waarin ze overnachten en nestelen. Niet alle soorten Swiftlets zijn echter in staat te echoloceren. Deze tweedeling in wel en niet echoloceren biedt de mogelijkheid om de morfologische en evolutionaire basis van dit gedragskenmerk te bestuderen. In dit proefschrift is getracht een antwoord te vinden op de vragen: “Welke morfologische aanpassingen aan echolocatie zijn er aanwezig in Swiftlets, hoe is echolocatie ontstaan en wat is de drijvende kracht geweest achter dat ontstaan?”. Hoofdstuk 2: Fylogenie. – Bij een studie naar de evolutie van echolocatie is het belangrijk de beschikking te hebben over een goed onderbouwde fylogenie (hypothese over de verwantschappen van de onderzochte soorten, resulterend in een boomvormig verwantschapsschema, waarin de voorouders niet bekend zijn). Doordat de taxonomie (indeling in groepen en de naamgeving van die groepen) en fylogenie van juist Swiftlets zo moeilijk zijn, ontbrak bij de start van dit project echter een dergelijke goed onderbouwde fylogenie. De veronderstelling was, dat de Swiftlets drie geslachten omvatten, namelijk Aerodramus, Collocalia en Hydrochous. Het laatstgenoemde geslacht bevat slechts één soort, namelijk H. gigas. De onderlinge relatie tussen die geslachten en tussen de soorten binnen de geslachten was echter niet bekend. De eerste stap was daarom het afleiden van een fylogenie uit het hiervoor veelgebruikte complete cytochroom-b mitochondriale DNA (mtDNA) (Hoofdstuk 2.1). Dit resulteerde in een boom, waarin de monofylie van de Swiftlets goed was ondersteund (een monofyletische groep is een groep verwanten, die één gezamenlijke voorouder hebben). Hierbij werd Collocalia geplaatst als zustergroep van Aerodramus + Hydrochous gigas. De precieze plaats van H. gigas was echter nog niet duidelijk. Deze soort werd ofwel geplaatst binnen de Aerodramus soorten, ofwel als zustergroep van Aerodramus. Deze onduidelijkheid werd veroorzaakt door de relatief grote verschillen van de cytochroom-b moleculen tussen soorten en tussen individuen. Om het oplossend vermogen van de boom te vergroten zijn daarom twee trager veranderende DNA-fragmenten onderzocht, namelijk 12S ribosomaal RNA en β-fibrinogeen intron 7 kern DNA. De toevoeging van deze genen resulteerde in een boom, waarin de positie van H. gigas wel opgelost was, namelijk als zustergroep van Aerodramus, goed ondersteund door diverse typen
191
NEDERLANDSE SAMENVATTING
waarschijnlijkheidswaarden (Hoofdstuk 2.2). Ondertussen was de fylogenie van de gierzwaluwen tevens door Price et al. (2004) bestudeerd, en wel aan de hand van cytochroom-b en ND2 mtDNA sequenties. Zij waren in staat meer soorten op te nemen in hun analyses en daarmee de onderlinge relaties binnen de geslachten Collocalia en Aerodramus met grotere precisie vast te stellen. Enkele takken van de boom binnen het geslacht Aerodramus waren echter slecht ondersteund door waarschijnlijkheidswaarden. Bovendien was H. gigas niet in hun analyses opgenomen. Daarom hebben wij in een volgende analyse het ND2 molecuul van twee individuen van H. gigas gesequenced en deze toegevoegd aan de dataset van Price et al. (2004). Zodoende kon de positie van H. gigas nogmaals bevestigd worden. H. gigas werd wederom als zustergroep van Aerodramus geplaatst, met 100% ondersteuning door waarschijnlijkheidswaarden. Omdat dezelfde genen zijn gebruikt als in de studie van Price et al. (2004), bleven de interne relaties van de Aerodramus soorten echter niet geheel duidelijk. De robuuste groepering van de Swiftlets als groep maakt het onwaarschijnlijk, dat toevoeging van een nog niet onderzochte Swift –zoals de veel op Swiftlets lijkende Apus nipalensis– iets zou veranderen aan de interne plaatsing van de Swiftlets. Een belangrijke ontdekking van Price et al. (2004) was, dat naast de Aerodramus-soorten, ook Collocalia troglodytes –nauw verwant aan de niet echolocerende C. linchi en C. esculenta- in staat is te echoloceren. Ruim dertig jaar eerder waren de Swiftlets door Brook (1970, 1972) opgesplitst in de drie genoemde geslachten. De beslissing van Brooke (1970, 1972) om dat te doen was grotendeels gebaseerd op het vermogen te echoloceren. Toendertijd was namelijk alleen van de Aerodramus soorten bekend, dat deze kunnen echoloceren. Met de ontdekking dat ook C. troglodytes hiertoe in staat is, verloor het kenmerk echolocatie echter zijn unieke waarde om verschillende geslachten binnen de Swiftlets te onderscheiden. Bovendien is uit eerder onderzoek bekend, dat een onderverdeling van de Swiftlets ook niet gerechtvaardigd wordt door externe morfologische kenmerken (zoals verentekening of glans) of door nest-kenmerken. Het is daarom wellicht beter om terug te keren naar het gebruik van de originele indeling van Swiftlets in één enkel genus Collocalia (Gray 1840). Voor de duidelijkheid ten aanzien van echolocatie zal in het vervolg van dit proefschrift echter nog steeds de indeling in drie verschillende genera worden gebruikt, namelijk Aerodramus, Hydrochous en Collocalia. C. esculenta omvat in de huidige taxonomie vele ondersoorten. De genetische divergentie tussen die ondersoorten is echter relatief groot. Hoewel genetisch divergentie niet op zichzelf gebruikt kan worden voor het bepalen van soortsgrenzen, wijzen deze resultaten wel in de richting, dat tenminste een aantal van de ondersoorten van C. esculenta de status van soort zouden moeten krijgen.
192
NEDERLANDSE SAMENVATTING
Hoewel de naamgeving van de Swiftlets dus nog steeds discutabel is, vormden de resultaten van de fylogenetische analyses een goede basis om de evolutie van echolocatie verder te bestuderen. Echolocatie-systeem. – Het echolocatiesysteem kan verdeeld worden in drie verschillende onderdelen, elk met een eigen functie. Ten eerste moet er een echolocatie-geluid worden geproduceerd door de echoloceerder. Dit geluid is een korte klik, die bij Swiftlets geproduceerd wordt in de syrinx. De syrinx is het “stemorgaan” van vogels en wordt bij Swiftlets gevormd door dunnere en dikkere membranen in de bronchiën, dichtbij de overgang naar de luchtpijp. De echoklik bestaat meestal uit twee korte subkliks, gescheiden door een interval, waarin geen geluid wordt geproduceerd. De twee subkliks en het interval zijn zo kort, dat ze door mensen, maar waarschijnlijk ook door de Swiftlets zelf, worden geïnterpreteerd als één enkele klik. Het tweede onderdeel van het echolocatiesysteem wordt gevormd door het oor. Het oor ontvangt de weerkaatste echo en zet de geluidstrillingen uit de lucht om in zenuwpulsen in de hersenen. Het ontvangt tevens het geluid van de echoklik zelf, wat als referentie kan dienen voor de interpretatie van de echo. De hersenen vormen, tenslotte, het derde onderdeel van het echolocatie-systeem. De zenuwpulsen, die door het oor gevormd zijn uit de echo, worden in de gehoorkernen verwerkt en vervolgens geïnterpreteerd als een beeld van de omgeving. Om de cirkel rond te maken, wordt de syrinx weer aangestuurd vanuit bij de vocalisatie betrokken kernen in de hersenen om een volgende echoklik te produceren. De vocalisaties en de drie onderdelen van het echolocatie-systeem zijn bestudeerd in de volgende drie hoofdstukken. Hoofdstuk 3: Vocalisaties en de syrinx. – Over het algemeen zijn vocalisaties (geluiden) van vogels soort-specifiek. Mogelijk verschillen echokliks echter niet tussen soorten, omdat er specifieke eisen worden gesteld aan het ontwerp van een echoklik om als sonar nog functioneel te zijn. Gebruik makend van frequentie- en tijds-kenmerken is onderzocht of echokliks en sociale vocalisaties (gebruikt voor communicatie tussen individuen) van Swiftlets verschillen tussen soorten (Hoofdstuk 3.1). Zoals verwacht bleken sociale vocalisaties inderdaad te verschillen. De echokliks bleken echter ook soort-specifieke kenmerken te hebben. Ondanks functionele eisen aan de echokliks, is variatie in met name de gebruikte frequenties wel degelijk mogelijk. Het lag ook in de lijn van de verwachting, dat het precieze frequentiebereik -door minder strenge functionele eisen- minder beperkt wordt, dan andere kenmerken van een echoklik. Verschillen tussen soorten kunnen in enkele gevallen verklaard worden door “character displacement”. Hierbij gaan twee soorten, die in hetzelfde gebied voorkomen, in een bepaald kenmerk extra van elkaar verschillen omdat er anders sprake zou zijn van

193
NEDERLANDSE SAMENVATTING
bijvoorbeeld onduidelijke herkenning van soortgenoten of een te grote concurrentie tussen de betreffende soorten. Echolocatie is dus mogelijk niet de enige functie van echokliks. De kliks worden mogelijk ook gebruikt in communicatie tussen soortgenoten, zoals de sociale vocalisaties. In grotten zouden de kliks bijvoorbeeld kunnen helpen bij het localiseren en herkennen van soortgenoten en, omdat soortgenoten graag in elkaars buurt nestelen, daarmee van een goede nestplaats. Gedragskenmerken, waaronder vocalisaties, worden vaak verondersteld onbetrouwbaar te zijn voor het maken van een fylogenie (“fylogenie reconstructie”). In bepaalde gevallen bleken zulke kenmerken echter wel degelijk goed bruikbaar. Door de noodzaak van een goede, functionele echoklik, hebben de vocale vermogens van Swiftlets mogelijk een belangrijke rol gespeeld in de evolutie van echolocatie. Daarom zouden de vocalisaties hierarchische informatie kunnen bevatten, die geschikt is voor fylogenie reconstructie. Fylogenetische analyses van de vocalisaties van Swiftlets toonden echter aan, dat ook deze niet geschikt zijn voor het bouwen van een fylogenie (Hoofdstuk 3.1). Bovendien bleek, dat kenmerken van de echokliks niet volgens een herkenbaar evolutionair patroon terug te vinden zijn in de sociale vocalisaties. Zoals gezegd, bestaat een echoklik over het algemeen uit twee subkliks (dubbele klik). Van enkele soorten Swiftlets waren echter alleen enkelvoudige kliks bekend, terwijl andere soorten alleen dubbele kliks leken te maken. Er werd daarom verondersteld, dat enkele en dubbele kliks indicatief zouden zijn voor verschillende evolutionaire ontwikkelingen van echolocatie. In hoofdstuk 3.2 is onderzocht hoe waarschijnlijk die hypothese is. De vijf onderzochte soorten waren allen in staat zowel enkele als dubbele kliks te produceren. Hierbij waren soorten waarvan tot voor kort alleen maar enkele of alleen maar dubbele kliks bekend waren. Hoewel de enkele kliks veel minder frequent voorkomen dan dubbele kliks, lijkt het waarschijnlijk, dat alle echolocerende Swiftlets in staat zijn beide typen kliks te produceren. Het is dus onwaarschijnlijk, dat aan enkele en dubbele kliks verschillende evolutionaire ontwikkelingen ten grondslag liggen. De productie van echokliks stelt mogelijk speciale eisen aan de klik-generator, dit is de syrinx. Op basis van observaties in een echolocerende en een niet-echolocerende Swiftlet, veronderstelden Smyth (1979) en Suthers en Hector (1982), dat de syrinx in echolocerende soorten een groter Extern Labium (EL) bezit dan in niet-echolocerende soorten. Dit zou belangrijk zijn bij echolocatie, omdat het EL het tegenoverliggende Intern Tympaniform Membraan (ITM) zou moeten kunnen bereiken om een klik te produceren. Bovendien zou volgens hen het ITM dunner zijn in echoloceerders en de eerste bronchiale ring zou in echoloceerders vergroeid zijn met de eerste tracheale (luchtpijp) ring. De ringen zouden zo een stevige holte vormen, die de productie van een
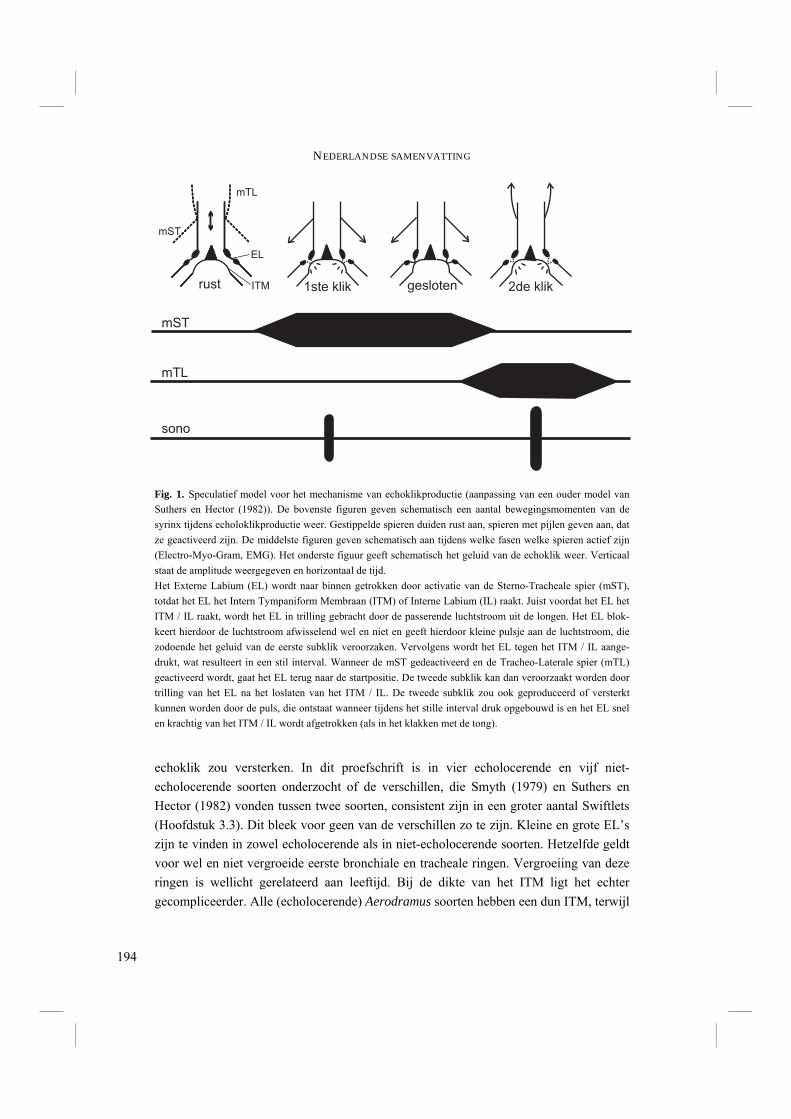
194
NEDERLANDSE SAMENVATTING
echoklik zou versterken. In dit proefschrift is in vier echolocerende en vijf niet-echolocerende soorten onderzocht of de verschillen, die Smyth (1979) en Suthers en Hector (1982) vonden tussen twee soorten, consistent zijn in een groter aantal Swiftlets (Hoofdstuk 3.3). Dit bleek voor geen van de verschillen zo te zijn. Kleine en grote EL’s zijn te vinden in zowel echolocerende als in niet-echolocerende soorten. Hetzelfde geldt voor wel en niet vergroeide eerste bronchiale en tracheale ringen. Vergroeiing van deze ringen is wellicht gerelateerd aan leeftijd. Bij de dikte van het ITM ligt het echter gecompliceerder. Alle (echolocerende) Aerodramus soorten hebben een dun ITM, terwijl
Fig. 1. Speculatief model voor het mechanisme van echoklikproductie (aanpassing van een ouder model van Suthers en Hector (1982)). De bovenste figuren geven schematisch een aantal bewegingsmomenten van de syrinx tijdens echoloklikproductie weer. Gestippelde spieren duiden rust aan, spieren met pijlen geven aan, dat ze geactiveerd zijn. De middelste figuren geven schematisch aan tijdens welke fasen welke spieren actief zijn (Electro-Myo-Gram, EMG). Het onderste figuur geeft schematisch het geluid van de echoklik weer. Verticaal staat de amplitude weergegeven en horizontaal de tijd. Het Externe Labium (EL) wordt naar binnen getrokken door activatie van de Sterno-Tracheale spier (mST), totdat het EL het Intern Tympaniform Membraan (ITM) of Interne Labium (IL) raakt. Juist voordat het EL het ITM / IL raakt, wordt het EL in trilling gebracht door de passerende luchtstroom uit de longen. Het EL blok-keert hierdoor de luchtstroom afwisselend wel en niet en geeft hierdoor kleine pulsje aan de luchtstroom, die zodoende het geluid van de eerste subklik veroorzaken. Vervolgens wordt het EL tegen het ITM / IL aange-drukt, wat resulteert in een stil interval. Wanneer de mST gedeactiveerd en de Tracheo-Laterale spier (mTL) geactiveerd wordt, gaat het EL terug naar de startpositie. De tweede subklik kan dan veroorzaakt worden door trilling van het EL na het loslaten van het ITM / IL. De tweede subklik zou ook geproduceerd of versterkt kunnen worden door de puls, die ontstaat wanneer tijdens het stille interval druk opgebouwd is en het EL snel en krachtig van het ITM / IL wordt afgetrokken (als in het klakken met de tong).
gesloten1ste klik 2de klikrust
mTL
mST
ITM
EL
mST
mTL
sono

195
NEDERLANDSE SAMENVATTING
veel niet-echolocerende soorten een dik ITM hebben. Er zijn echter ook niet-echoloceerders, zoals H. gigas en Rhaphidura leucopygialis, die net als echoloceerders een dun ITM bezitten. De vraag blijft of een dun ITM van voordeel is voor echolocatie. Het lijkt in ieder geval niet strict noodzakelijk te zijn, omdat ook de echolocerende vetvogel een dik ITM bezit. Op basis van recente inzichten in het mechanisme van geluidsproductie in vogels, wordt in dit proefschrift een nieuw model voor het mechanisme van echoklikproductie bediscussieerd. Dit model is een aanpassing aan een bestaand model, dat ontwikkeld werd door Suthers en Hector (1982). Beide subkliks van een echoklik worden mogelijk geproduceerd door de oscillatie van het EL (Fig. 1), die zeer snel afwisselend een luchtstroom door laat en tegenhoudt en zo korte pulsjes aan de luchtkolom geeft. Het EL wordt naar het ITM of het Interne Labium (IL) bewogen door activatie van de Sterno-Tracheale spieren (mST), totdat het EL het ITM of IL raakt. Vibratie van het EL door de luchtstroom net voordat het EL tegen het ITM / IL aangedrukt wordt, zou de eerste subklik kunnen veroorzaken. Deactivatie van de mST en simultane activatie van de Tracheo-Laterale spier (mTL) beweegt het EL vervolgens terug naar de uitgangspositie. Kort nadat het EL weer loslaat van het ITM / IL, kan op dezelfde manier als bij de eerste subklik ook de tweede subklik geproduceerd worden. Als echter druk wordt opgebouwd achter de afsluiting van de bronchus door het EL en ITM / IL en als deze snel genoeg van elkaar worden afgetrokken, zou deze beweging op zichzelf al een puls –en dus geluid– kunnen geven aan de luchtstroom (als bij klakken met de tong). Hierdoor zou de tweede subklik ook geproduceerd kunnen worden. Het zou op zijn minst die subklik kunnen versterken. Dit wordt ondersteund door de amplitude (“volume”) van de tweede subklik, die hoger is dan die van de eerste subklik. Hoofdstuk 4: Middenoor. – Het tweede onderdeel van het echolocatie-systeem, het oor, ontvangt de echo en zet die om in zenuwpulsen in de hersenen. Het oor bestaat grofweg uit drie onderdelen. Het eerste onderdeel is het externe oor, met de oorschelp (afwezig bij vogels) en de gehoorgang. Vervolgens het middenoor, met het trommelvlies en gehoorbeentjes, die in de middenoorholte gelegen zijn. Het middenoor vangt het geluid op en geeft het door aan het binnenoor, dat de trillingen tenslotte omzet in zenuwpulsen. Er werd rekening mee gehouden, dat het middenoor van echolocerende Swiftlets mogelijk morfologisch aangepast is aan echolocatie. Terugkerende echo’s hebben namelijk twee maal de afstand van zender/ontvanger tot object afgelegd. Uitdemping van het geluid is dus ook twee keer zo groot dan in bijvoorbeeld communicatie tussen individuen. Het oor van echoloceerders zou daarom wellicht gevoeliger moeten zijn dan dat van niet-echoloceerders. Dit zou onder andere bereikt kunnen worden door de

196
NEDERLANDSE SAMENVATTING
traagheid van de massa –dus de massa zelf– van het middenoor zo laag mogelijk te houden. De minimum energie, die het geluid moet hebben om het middenoor in trilling te brengen blijft dan ook laag. Ten tweede moet de amplitude van de columella (het gehoorbeentje bij vogels) zo groot mogelijk zijn, zodat ook geluiden van een laag volume nog opgevangen kunnen worden door het binnenoor. In samenwerking met de Sectie Natuurkunde van de Universiteit van Antwerpen is daarom de morfologische structuur van het middenoor onderzocht door middel van 3D reconstructies van micro Computer Tomografische (CT) scans. Een Eindige Elementen model van een van die reconstructies voorspelde, dat de beweging van de columella zich voornamelijk in een plat vlak, dus 2D, voordeed. Vervolgens is een 2D model ontwikkeld om de prestatie van het middenoor te onderzoeken. Met dit model werd, als representatie voor de amplitude, de verplaatsing van de columella berekend. De morfologie van de middenoren van verschillende soorten bleek te variëren. Tussen echolocerende en niet-echolocerende soorten werden echter geen verschillen gevonden. Ook de massa’s van de middenoren verschilden niet tussen echoloceerders en niet-echoloceerders. Bovendien bleek, dat de prestaties van de middenoren, dat wil zeggen de verplaatsing van de columella, niet verschilden tussen wel- en niet-echoloceerders. Er lijken dus in het middenoor geen aanpassingen te zijn aan echolocatie. Een verklaring hiervoor zou kunnen zijn, dat een aanpassing niet nodig was. Een alternatieve verklaring is, dat een verbetering van de prestatie van het oor wel wenselijk was, maar niet mogelijk in het middenoor. Om te onderzoeken of een aanpassing in het middenoor überhaupt kan leiden tot een verbeterde prestatie, zijn met het 2D model verplaatsingen van de columella berekend voor een reeks van verschillende artificiële middenoren. Het bleek, dat een groot aantal verschillende configuraties van het middenoor steeds weer resulteerde in een maximaal haalbare verplaatsing van de columella. Het belangrijkste is, dat de columella onder een niet te grote hoek moet staan ten opzichte van het trommelvlies. De middenoren van de onderzochte soorten voldeden allemaal aan de eisen voor een maximale prestatie. Het is dus onwaarschijnlijk, dat de middenoren van echolocerende Swiftlets zouden kunnen worden aangepast om beter te presteren. Mochten er desalniettemin aanpassingen zijn in het oor, dan liggen deze niet in het middenoor, maar in het binnenoor. Het binnenoor is echter niet nader onderzocht in dit proefschrift. Hoofdstuk 5: Gehoorkernen in de hersenen. – De laatste stap in het echolocatie-proces is de interpretatie van de echo door de hersenen. Een accurate verwerking van informatie over tijd(-sverschillen) en volume(-verschillen) door de gehoorkernen in de hersenen is van groot belang om een geluid (in dit specifieke geval van een echo) te localiseren. Men zou kunnen verwachten, dat echolocerende Swiftlets vergrote gehoorkernen

197
NEDERLANDSE SAMENVATTING
bezitten. Vergroting van de gehoorkernen kan namelijk duiden op een vergrote gevoeligheid en accuraatheid van die kernen. Dit is ook het geval in bijvoorbeeld de kerkuil (die het geluid van zijn prooi moet localiseren) en echolocerende vleermuizen. In dit proefschrift zijn de volumes van gehoorkernen van vier echolocerende en drie niet-echolocerende soorten gierzwaluwen gemeten. Deze kernen zijn de nucleus (kern) laminaris (Lam), nucleus magnocellularis cochlearis (MCC), nucleus angularis (An), nucleus lemnisci lateralis, pars intermedia (LLi), nucleus mesencephalicus lateralis, pars dorsalis (MLd) en de nucleus ovoidalis (OV). De Lam, MCC, MLd en OV bleken allemaal significant groter te zijn in echoloceerders dan in niet-echoloceerders. De An was niet significant verschillend, maar vertoonde wel een trend in de richting van vergroting in echoloceerders. Slechts de LLi verschilde in het geheel niet. De functie van deze kern is behalve gerelateerd aan horen ook gerelateerd aan zien. Eventuele volumeverschillen zouden door deze dubbele functie gemaskeerd kunnen worden. De volumes van de nucleus rotundus (ROT), welke gerelateerd is aan zien, verschilde niet tussen echoloceerders en niet-echoloceerders. Het zijn dus alleen gehoorkernen, die vergroot zijn. Vergrote gehoorkernen zijn niet alleen aanwezig in de Aerodramus soorten, maar ook in de echolocerende C. troglodytes (Smyth 1979). Deze één op één relatie tussen het vermogen te echoloceren en het hebben van vergrote gehoorkernen duidt op een echte aanpassing aan echolocatie. Hoofdstuk 6: Biogeografie en evolutie van echolocatie. – In hoofdstuk 6 is de biogeografie van Swiftlets onderzocht en gebruikt om de evolutie van echolocatie in een geografische context te verklaren. De fylogenetische analyses maken het namelijk mogelijk een schatting te maken van de momenten van de splitsingen tussen soorten. De radiatie van de Swiftlets lijkt ruwweg in drie perioden te hebben plaatsgevonden: rond 2.5 Ma, 1.25 Ma en 0.5 Ma. Echolocatie is waarschijnlijk ofwel één ofwel twee keer ontstaan (Hoofdstuk 2.2). Als het één keer ontstaan is, moet dit aan de basis van de Swiftlets geweest zijn. Noodzakelijkerwijs moet het dan twee keer verloren gegaan zijn, namelijk in H. gigas en in de tak naar C. linchi en C. esculenta. De tijd van ontstaan van echolocatie wordt voor dit geval geschat op meer dan 5.10 tot 7.80 miljoen jaar geleden (Ma). Deze schatting is gebaseerd op de “2%-regel” voor cytochroom-b variatie in vogels en op respectieflijk ongecorrigeerde en gecorrigeerde (volgens een Maximum Likelihood (ML) model voor de meest waarschijnlijke evolutie van het DNA) cytochroom-b afstanden tussen soorten.

198
NEDERLANDSE SAMENVATTING
In de alternatieve hypothese is echolocatie twee keer ontstaan, namelijk in Aerodramus (maximaal 2.85 tot 4.57 Ma) en in C. troglodytes (maximaal 4.25 tot 5.84 Ma). Het lijkt waarschijnlijk, dat echolocatie is ontstaan uit mogelijk uitgestorven voorouderlijke Swiftlets, die voorin grotten nestelden, waar nog licht aanwezig was. Ook nu nog levende niet-echolocerende Swiftlet soorten bezetten deze delen van grotten. Voorouder-Swiftlets hebben mogelijk “ontdekt”, dat vocalisaties en hun echo’s geschikt zijn om te navigeren in die delen van een grot, waar de lichtomstandigheden minder gunstig zijn. Het nestelen in een grot zou voordelig kunnen zijn, omdat de vogels –en met name hun jongen- daar beschermd zijn tegen weersfluctuaties en roofdieren. Zo kunnen de volwassen vogels ook langer weg blijven om insekten te vangen, terwijl hun jongen relatief veilig in het nest zitten. De evolutie van echolocatie lijkt volledig nieuw te zijn en geen gevolg van een andere aanpassing of een ander kenmerk. Echolocatie is weliswaar een specialisatie van reeds bestaande structuren, maar de vergrote gehoorkernen zijn bij uitstek geschikt om een geluid te localiseren. Een grotere accuraatheid in geluidslocalisatie lijkt niet van voordeel te zijn voor een ander kenmerk behalve dan voor echolocatie. In beide verklaringen voor het moment van het ontstaan van echolocatie is het waarschijnlijk, dat het voor het eerst ontstond in Sundaland. Sundaland was een grote landmassa en bestreek het huidige Borneo, Java, Sumatra en het Maleisisch schiereiland met alle daar nu tussenliggende zeeën. De huidige, verder naar het oosten liggende regio’s kwamen in die periode nauwelijks boven de zeespiegel uit. Bovendien had Sundaland grotere gebieden met vulkanisme, kalksteen en riften, waar makkelijk grotten konden ontstaan. Hoewel de echolocerende C. troglodytes nu alleen op de Filippijnen voorkomt en eerder is afgesplitst dan Aerodramus soorten, hoeft echolocatie in C. troglodytes niet noodzakelijkerwijs op het moment van afsplitsing ontstaan te zijn. Dit kan ook later, anagenetisch, gebeurd zijn. Anderzijds is het mogelijk, dat C. troglodytes is uitgestorven op eilanden, die tot Sundaland hebben behoord. Het is echter niet geheel uit te sluiten, dat echolocatie toch als eerste op de Filippijnen is ontstaan. Echolocerende Swiftlets komen thans voor vanaf de Seychellen en Mascarenen in de Indische oceaan tot aan de Pacifische Marquesas eilanden in het oosten. In de tijd dat Swiftlets zich afsplitsten van andere gierzwaluwen (8 tot 10 Ma) lag het grootste deel van Zuidoost Azië op zijn huidige plaats. Vicariantie-effecten (het opbreken van een verspreidingsgebied van een soort in meerdere kleinere delen, waardoor er meerdere van elkaar geïsoleerde populaties ontstaan en vervolgens mogelijk speciatie optreedt) door platentektoniek lijken daarom onwaarschijnlijk, maar zijn wel mogelijk door fluctuaties in zeeniveaus. Niettemin lijkt het grootste deel van het verspreidingspatroon van de verschillende Swiftlet soorten verklaard te moeten worden door dispersie (de
199
NEDERLANDSE SAMENVATTING
verspreiding van individuen naar gebieden, waar organismen uit een groep nog niet eerder voorkwamen, met mogelijke isolatie van populaties en daarop volgende speciatie). Swiftlets bezetten zeer diverse typen habitat, maar de aanwezigheid van grotten is essentieel. Het verspreidingspatroon van Swiftlets is tamelijk gecompliceerd. Een areaal cladogram (een “fylogenie” van gebieden), gebaseerd op een primaire Brooks Parsimonie Analyse (BPA) is in grote delen congruent met een consensus areaal cladogram van een groot aantal andere groepen dieren en planten. Het meest opvallende verschil is de positie van de Filippijnen. De Filippijnen werden in het Swiftlet areaal cladogram gegroepeerd bij oostelijk gelegen eilanden, maar in het consensus areaal cladogram met meer westelijk gelegen eilanden. De Filippijnen lijken daardoor zowel geografisch als biogeografisch een middenpositie in te nemen. Ondanks de grote overeenkomsten tussen de areaal cladogrammen, laat een taxon-areaal cladogram (soorten in een boom zijn daarin vervangen door hun corresponderende verspreidingsgebieden) echter zien, dat dispersie van Swiftlets tussen verschillende regio’s en daarop volgende soortvorming zeer waarschijnlijk is. Evolutie van echolocatie. Eén of twee maal? – In figuur 2 staan de belangrijkste resultaten uit dit proefschrift samengevat, samen met enkele gegevens over echolocatie uit de literatuur. De mogelijke periodes, waarin echolocatie ontstaan zou kunnen zijn, zijn weergegeven in de boom. Daarnaast is weergegeven of er verschillen bestaan in de diverse onderdelen van het echolocatie-systeem. De vraag, die nog steeds niet beantwoord is, is of echolocatie in Swiftlets één of twee keer is ontstaan. Bij een eenmalig ontstaan aan de basis van de Swiftlets moet echolocatie bijgevolg verloren zijn gegaan in H. gigas en in de tak naar C. linchi en C. esculenta. H. gigas zou wellicht nog gebruik kunnen maken van het constante geluid van de waterval om zich te oriënteren, maar specialisatie in de grootte van de gehoorkernen lijkt daarbij niet noodzakelijk. Alle vogels kunnen namelijk een geluid van een externe bron goed localiseren zonder vergrote gehoorkernen te hebben. Bij een tweemalig ontstaan van echolocatie moet dit onafhankelijk gebeurd zijn in Aerodramus en C. troglodytes. Het is niet duidelijk hoe de vooroudersoort van de huidige Collocalia soorten er uit hebben gezien. Deze zou C. troglodytes-achtig geweest kunnen zijn, maar ook C. linchi-achtig of C. esculenta-achtig, of helemaal anders. De resultaten van dit proefschrift en bevindingen uit de literatuur zouden wel een indicatie kunnen geven over de waarschijnlijkheid van een een- of tweemalig ontstaan van echolocatie.
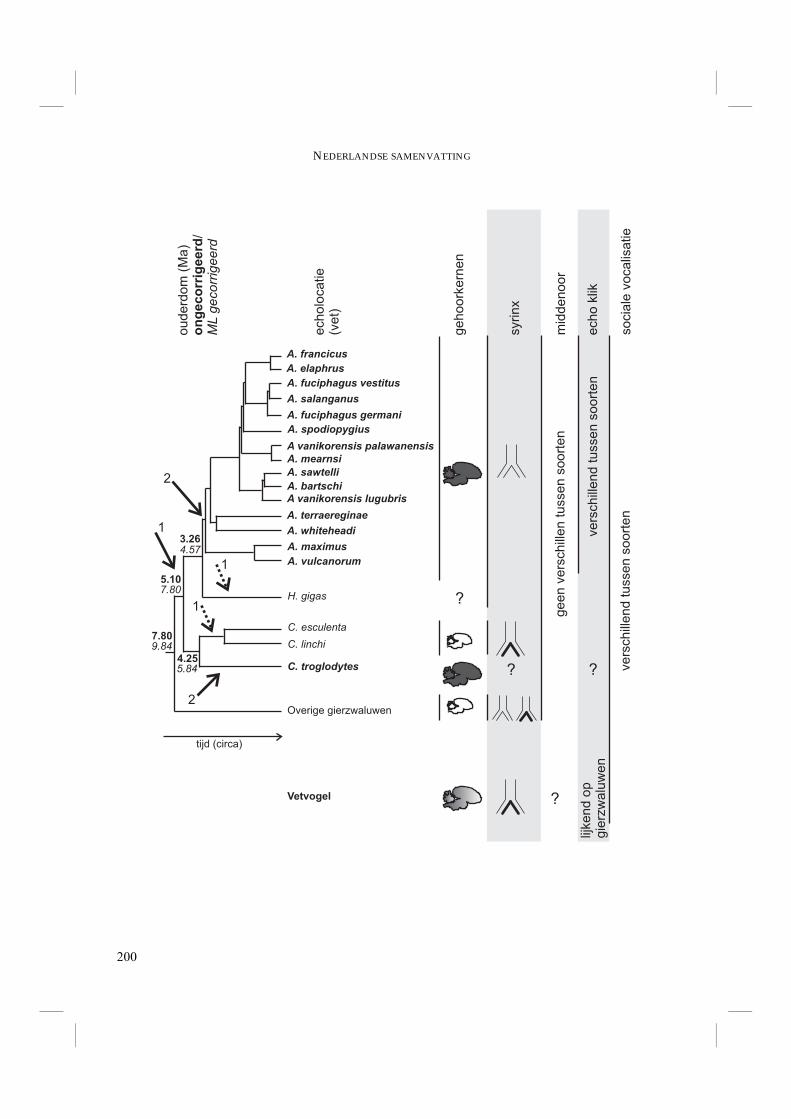
200
NEDERLANDSE SAMENVATTING
C. troglodytes
C. linchi
Overige gierzwaluwen
H. gigas
A. sawtelli
A. bartschi
A. mearnsi
A. spodiopygius
A. salanganus
A. maximus
A. vulcanorum
A. terraereginae
A. whiteheadi
A. francicus
A. elaphrus
A. fuciphagus vestitus
A. fuciphagus germani
A vanikorensis lugubris
A vanikorensis palawanensis
C. esculenta
ech
olo
ca
tie
(ve
t)
ou
de
rdo
m(M
a)
/o
ng
ec
orr
ige
erd
ML
ge
co
rrig
ee
rd
Vetvogel
syrin
x
?
ech
oklik
so
cia
levo
ca
lisa
tie
ve
rsch
ille
nd
tusse
nso
ort
en
? ve
rsch
ille
nd
tusse
nso
ort
en
lijke
nd
op
gie
rzw
alu
we
n
mid
de
no
or
ge
en
ve
rsch
ille
ntu
sse
nso
ort
en
?
ge
ho
ork
ern
en
?
4.57
5.107.80
4.255.84
3.26
7.809.84
tijd (circa)
1
1
1
2
2
201
NEDERLANDSE SAMENVATTING
Ten eerste zijn er geen verschillen gevonden in de morfologie van het middenoor tussen echoloceerders en niet-echoloceerders. Hoewel er wel verschillen zijn gevonden in de dikte van het ITM in de syrinx, zijn deze verschillen niet consistent tussen echoloceerders en niet-echoloceerders. Bovendien is bekend, dat de vetvogel (Steatornis caripensis), die gelijksoortige echokliks produceert als de Swiftlets, dikke ITM’s heeft. De dikte van het ITM lijkt daarmee niet persé gerelateerd te zijn aan echolocatie. Het enige consistente morfologische verschil tussen echoloceerders en niet-echoloceerders is de grootte van de gehoorkernen in de hersenen. Zowel Aerodramus als C. troglodytes hebben grotere gehoorkernen dan niet-echolocerende soorten. Hoewel het meerdere kernen zijn, die allemaal vergroot zijn, lijkt het waarschijnlijk, dat vergroting van deze kernen als evolutionair proces gekoppeld is. Dat wil zeggen, vergroting van één van de kernen lijkt functioneel zinloos zonder vergroting van de overige kernen. Bovendien leidt vergroting van een kern door toename van het aantal cellen waarschijnlijk ook tot een toename van het aantal verbindingen van en naar ander kernen. Om deze toename in verbindingen op te kunnen vangen, zullen andere gehoorkernen waarschijnlijk ook groter moeten worden. Het groter worden van de gehoorkernen als aanpassing aan echolocatie lijkt daarom één enkele (maar wel graduele) evolutionaire verandering te zijn. Als dit zo is, is de evolutie van echolocatie in Swiftlets afhankelijk van hetzelfde aantal gebeurtenissen als het verlies van echolocatie. Het ontstaan van echolocatie is dan afhankelijk van een toename in de grootte van de gehoorkernen en een verandering in het gedrag, namelijk echoklik- productie. Het verlies van echolocatie is op basis van de waarnemingen in C. esculenta en C. linchi op dezelfde manier afhankelijk van een afname in de grootte van de gehoorkernen en het ophouden echokliks te produceren. Uitgaande van de theorie van
Vorige pagina: Fig. 2. Schematische samenvatting van de belangrijkste resultaten van dit proefschrift en van enkele gegevens uit de literatuur. De tijdsperioden (in miljoenen jaren voor heden) op de fylogenie zijn gebaseerd op de 2%-regel voor veranderingen in het cytochroom-b molecuul in vogels voor ongecorrigeerde en Maximum Likelihood gecorrigeerde cytochroom-b afstanden. Soorten in vet afgedrukt zijn in staat te echoloceren. Gesloten pijlen geven mogelijk ontstaan van echolocatie aan; gestippelde lijnen geven mogelijk verlies van echolocatie aan. Getallen bij de pijlen corresponderen met de twee alternatieve hypothesen voor het ontstaan van echolocatie, namelijk ofwel één maal ofwel twee maal. Verticale lijnen rechts van de boom geven de groepen in de boom aan, waarvoor de stelling aan de rechterzijde van die lijnen geldig is. De hersenen verschillen tussen echolocerende en niet-echolocerende soorten in de grootte van de gehoorkernen. Grote, donkere figuren van hersenen geven soorten aan, waarin de gehoorkernen groot zijn. Kleine, lichte figuren van hersenen geven soorten aan, die kleine gehoorkernen hebben. Bij vetvogels is in ieder geval de nucleus angularis groter dan gemiddeld. Syrinxen verschillen in de dikte van het ITM, maar dit lijkt niet gerelateerd aan echolocatie. De morfologie van de middenoren verschilt niet tussen soorten. Echokliks verschillen tussen soorten, met name in de gebruikte frequenties. Ook sociale vocalisaties zijn verschillend tussen soorten. Vraagtekens geven lacunes aan in wat er nu bekend is.
202
NEDERLANDSE SAMENVATTING
parsimonie, waarin een zo klein mogelijk aantal stappen in de evolutie het meest waarschijnlijk wordt geacht, is een tweemalige, onafhankelijke evolutie van echolocatie (twee gebeurtenissen) waarschijnlijker dan een eenmalig ontstaan en tweemalig verlies (totaal drie gebeurtenissen). Hoewel echolocatie verliezen intuitief wellicht makkelijker lijkt dan echolocatie ontwikkelen, lijkt op basis van de huidige resultaten een onafhankelijk ontstaan op twee momenten dus het waarschijnlijkst. Daarbij moet aangetekend worden, dat evolutie niet persé volgens de theorie van parsimonie hoeft te lopen. Toekomstige onderzoeken zouden extra gegevens op kunnen leveren, die één van beide mogelijkheden meer of minder ondersteunen. Mocht bijvoorbeeld blijken, dat H. gigas toch ook vergrote gehoorkernen heeft, dan is op basis van parsimonie geen uitspraak te doen over het één of twee keer ontstaan van echolocatie. In dat geval lijkt het echter waarschijnlijker dat H. gigas niet meer actief echoloceert, maar wel het voordeel van vergrote gehoorkernen gebruikt voor passieve oriëntatie op het constante geluid van de waterval. Dit zou erop wijzen, dat echolocatie toch éém keer is ontstaan, aan de basis van de Swiftlets. Conclusies. – De morfologische basis voor echolocatie ligt voornamelijk in de hersenen. Het blijft nog onduidelijk of een dun ITM van voordeel is voor echolocatie. Het lijkt in ieder geval niet noodzakelijk. De overige delen van het echolocatie-systeem waren waarschijnlijk al geschikt om te echoloceren. De gevonden morfologische aanpassingen lijken niet het gevolg te zijn van een andere functie. Echolocatie is daarom waarschijnlijk volledig nieuw geweest. Deze “uitvinding” heeft een wereld geopend voor de Swiftlets, die het mogelijk maakte om hun jongen veilig voor predatoren en weersinvloeden langere tijd achter te laten, terwijl ze zelf op jacht zijn naar insekten. Naast een morfologische verandering in de hersenen, is een verandering in het gedrag, namelijk de productie van echokliks, de belangrijkste stap in de evolutie naar echolocatie. Deze stap kan gemaakt zijn toen niet-echolocerende, in grotten nestelende voorouder-Swiftlets “leerden” dat vocaliseren in een grot echo’s veroorzaakt, die geschikt zijn om te navigeren. Dit is waarschijnlijk twee maal onafhankelijk gebeurd in Sundaland. Van daaruit hebben Swiftlets zich verspreid over een veel groter gebied tot waar ze nu voorkomen en biologen van over de hele wereld voor steeds weer nieuwe vragen stellen.

203
REFERENCES
204
REFERENCES
Akaike, H. (1974) A new look at the statistical model identification. IEEE Transactions on Automatic Control 19: 716-723.
Arends, J.J.A. and Zeigler, H.P. (1986) Anatomical identification of an auditory pathway from a nucleus of the lateral lemniscal system to the frontal telencephalon (nucleus basalis) of the pigeon. Brain Research 398: 375-381.
Arnaiz-Villena, A., Alvarez-Tejado, M., Ruiz-del-Valle, V., Garcia-de-la-Torre, C., Varela, P., Recio, M.J., Ferre, S. and Martinez-Laso, J. (1998) Phylogeny and rapid northern and southern hemisphere speciation of goldfinches during the Miocene and Pliocene epoch. Cellular and Molecular Life Sciences 54: 1031-1041.
Arnaiz-Villena, A., Guillen, J., Ruiz-del-Valle, V., Lowy, E., Zamora, J., Varela, P., Stefani, D. and Allende, L.M. (2001) Phylogeography of crossbills, bullfinches, grosbeaks, and rosefinches. Cellular and Molecular Life Sciences 58: 1159-1166.
Atkins, H., Preston, J. and Cronk, Q.C.B. (2001) A molecular test of Huxley’s line: Cyrtandra (Gesneriaceae) in Borneo and the Philippines. Biological Journal of the Linnean Society 72: 143-159.
Barton, R.A. and Harvey, P.H. (2000) Mosaic evolution of brain structure in mammals. Nature 405: 1055-1058.
Bensch S. and Harlid A. (2000) Mitochondrial genomic rearrangements in songbirds. Molecular Biology and Evolution 17 (1): 107-113.
Bernstein, H.A. (1857) Beiträge zur näheren Kentniss der Gattung Collocalia, Gr. (Cyselus esculentus et Nidificus). Nova Acta Academiae Caesareae Leopoldino-Carolinae Germanicae Naturae Curiosorum XXVI: 13-86.
Bonaparte, C.L. (1855) Note sur les Salanganes et sur leurs nids. Comptes Rendus Paris XLI: 976-979.
Bradbury, J.W. and Vehrencamp, S.L. (1998) Principles of animal communication. Sinauer Press, Massachusetts. 958 pp.
Breazile, J.E. and Kuenzel, W.J. (1993) Systema nervosum centrale. In: Baumel, J.J. (ed.). Handbook of avian anatomy: Nomina Anataomica Avium, second ed. Nuttall Ornithological Club, Cambridge, MA. pp. 493-554.
Brehm, A. (1911) Brehms Tierleben. Allgemeine Kunde des Tierreichs. Vögel - Dritter Band. Vierte, vollständig neubearbeitete Auflage. Bibliografisches Institut, Leipzig und Wien.
Bretagnolle, V. (1993) Call types of the Common Swift Apus apus: adult call given at the nest. Avocetta 17: 141-146.
Bretagnolle, V. (1995) Systematics of the Soft-plumaged Petrel Pterodroma mollis (Procellariidae): new insight from the study of vocalizations. Ibis 137: 207-218.

205
REFERENCES
Brooke, R.K. (1970) Taxonomic and evolutionary notes on the subfamilies, tribes, genera and subgenera of the Swifts (Aves: Apodidae). Durban Museum Novitates 9: 13-24.
Brooke, R.K. (1972) Generic limits in old world Apodidae and Hirundinidae. Bulletin of the British Ornithologists' Club 92: 53-57.
Brooks, D.R. (1990) Parsimony analysis in historical biogeography: methodological and theoretical update. Systematic Zoology 39: 14-30.
Brooks, D.R., van Veller, M.G.P. and McLennan, D.A. (2001) How to do BPA, really. Journal of Biogeography 28 (3): 345-358.
Brown, R.M. and Guttman, S.I. (2002) Phylogenetic systematics of the Rana signata complex of Philippine and Bornean stream frogs: reconsideration of Huxley's modification of Wallace's Line at the Oriental-Australian faunal zone interface. Biological Journal of the Linnean Society 76 (3): 393-461.
Buchler, E.R. (1976) Use of echolocation by Wandering Shrew (Sorex vagrans). Animal Behaviour 24: 858-873.
Burns K.J. (1997) Molecular systematics of tanagers (Thraupinae): Evolution and biogeography of a diverse radiation of Neotropical birds. Molecular Phylogenetics and Evolution 8 (3): 334-348.
Burns K.J. (1998) Molecular phylogenetics of the genus Piranga: Implications for biogeography and the evolution of morphology and behavior. The Auk 115 (3): 621-634.
Carlson-Smith, C. and Wiener, W.R. (1996) The auditory skills necessary for echolocation: a new explanation. Journal of Visual Impairment and Blindness 1: 21-35.
Carr, C.E., Amagai, S., Kubke, M.F. and Massoglia, D.P. (1996) Evolution of time coding systems. In: Elsner, N. and U. Schnitzler (eds.) The Proceedings of the Goettingen Neurobiology Conference. Thieme, Stuttgart, Germany.
Carr, C.E. and Boudreau, R.E. (1991) Central projections of auditory-nerve fibers in the Barn Owl. Journal of Comparative Neurology 314 (2): 306-318.
Carr, C.E. and Code, R.A. (2000) The central auditory system of reptiles and birds. In: Dooling, R. J., Fay, R. R. and A. N. Popper (eds.). Comparative hearing: birds and reptiles. Springer-Verlag, New York, USA. pp. 197-248.
Chantler, P. and Driessens, G. (1995) Swifts: A Guide to the Swifts and Treeswifts of the World. Pica Press, Sussex, UK. 237 pp.
Chantler, P., Wells, D.R. and Schuchmann, K.L. (1999) Order Apodidae. In: Del Hoyo, J., Elliott, A. and Sargatal, J. (eds.) Handbook of the birds of the world. Volume 5. Barnowls to Hummingbirds. Lynx Edicions, Barcelona. pp. 338-457.
206
REFERENCES
Cicero, C. and Johnson, N.K. (2002) Phylogeny and character evolution in the Empidonax group of tyrant flycatchers (Aves : Tyrannidae): A test of W. E. Lanyon's hypothesis using mtDNA sequences. Molecular Phylogenetics and Evolution 22 (2): 289-302.
Cicero, C. and Johnson, N.K. (2001) Higher-level phylogeny of new world Vireos (Aves : Vireonidae) based on sequences of multiple mitochondrial DNA genes. Molecular Phylogenetics and Evolution 20 (1): 27-40.
Clack, D., Mitra, P. and Wang, S. (2001) Scalable architecture of mammalian brains. Nature 411: 189-193.
Collar, N.J., Crosbey, M.J. and Stattersfield, A.J. (1995) Birds to watch 2. The world list of threatened birds. Birdlife International, Cambridge. 407 pp.
Coles, R.B., Konishi, M. and Pettigrew, J.D. (1987) Hearing and echolocation in the Australian Swiftlet, Collocalia spodiopygia. Journal of Experimental Biology 129: 365-371.
Deignan, H.G. (1955) The races of the Swiftlet, Collocalia brevirostris (McClelland). Bulletin of the British Ornithological Club 75: 116-118.
Desjardins, P.A. and Morais, R. (1990) Sequences and Gene Organization of the Chicken Mitochondrial Genome. Journal of Molecular Biology 212 (4): 599-634.
Dolphin, K., Belshaw, R., Orme, C.D.L. and Quicke, D.L.J. (2000) Noise and incongruence: interpreting results of the Incongruence Length Difference Test. Molecular Phylogenetics and Evolution 17: 401-406.
Dooling, R.J., Fay, R.R. and Popper, A.N. (eds.) (2000) Comparative hearing: birds and reptiles. Springer Handbook of Auditory Research. Springer-Verlag, New York. 394 pp.
Elemans, C.P.H., Spierts, I.L.Y., Muller, U.K., Van Leeuwen, J.L. and Goller, F. (2004) Superfast muscles control dove’s trill. Nature 431 (7005): 146.
Espinosa de los Monteros, A. (2000) Higher-level phylogeny of Trogoniformes. Molecular Phylogenetics and Evolution 14 (1): 20-34.
Evans, B.J., Brown, R.M., McGuire, J.A., Supriatna, J, Andayani, N., Diesmos, A., Iskandar, D, Melnick, D.J. and Cannatella, D.C. (2003) Phylogenetics of Fanged Frogs: testing biogeographical hypotheses at the interface of the Asian and Australian faunal zones. Systematic Biology 52 (6): 794-819.
Farris, J.S., Källersjö, M., Kluge, A.G. and Bult, C. (1994) Testing significance of incongruence. Cladistics 10: 315-319.
Farris, J.S., Källersjö, M., Kluge, A.G. and Bult, C. (1995) Constructing a significance test for incongruence. Systematic biology 44: 570-572.
Fay, R.R. (1988) Hearing in vertebrates: A psychophysics databook. Hill-Fay Associates, Winnetka, IL. 621 pp.
207
REFERENCES
Feduccia, A. (1996) The origin and evolution of birds. Yale Univ. Press. 420 pp.
Felsenstein, J. (1985) Confidence limits on phylogenies: An approach using the bootstrap. Evolution 39: 783-791.
Fenton, M.B. (1975) Acuity of echolocation in Collocalia hirundinacea (Aves: Apodidae), with comments on the distribution of echolocating Swiftlets and Molossid bats. Biotropica 7 (1): 1-7.
Fenton, M.B. (1980) Adaptiveness and ecology of echolocation in terrestrial (aerial) systems. In: Busnel, R.-G. and Fish, J. F. (eds.). Animal sonar systems. Plenum Press, New York. pp. 427-446.
Fenton, M.B. (1991) Seeing in the dark. Bats 9 (2): 9-13.
Forsman, K.A. and Malmquist, M.G. (1988) Evidence for echolocation in the Common Shrew, Sorex araneus. Journal of Zoology 216: 655-662.
Fullard, J.H., Barclay, R.M.R. and Thomas, D.W. (1993) Echolocation in free-flying Atiu Swiftlets (Aerodramus sawtelli). Biotropica 25 (3): 334-339.
Gaudin, E.P. (1968) On the middle ear of birds. Acta Oto-Laryngolica 65: 316-326.
Gaunt, A.S., Gaunt, S.S.L. and Casey, R.M. (1982) Syringeal mechanics reassessed: evidence form Streptopelia. The Auk 99: 474-494.
Gervais, P. and Beneden, P.-J. van (1859) Zoologie Médicale. Exposé méthodique du règne animal. Basé sur l’anatomie, l’embryogénie et la paléontologie. Comprenant la description des espèces employé en médecine de celles qui sont venimeuses et de celles qui sont parasites de l’homme et des animaux. J.-B. Bailleres et Fils, Londres et New York.
Glendenning, K. and Masterton, R. (1998) Comparative morphometry of mammalian central auditory systems: Variation in nuclei and form of the ascending system. Brain, Behavior and Evolution 51: 59-89.
Goller, F. and Larsen, O.N. (1997) A new mechanism of sound generation in songbirds. Proceedings of the National Academy of Sciences USA 94: 14787-14791.
Goller, F. and Larsen, O.N. (2002) New perspectives on mechanisms of sound generation in songbirds. Journal of Comparative Physiology A 188: 841-850.
Gould, E., Novick, A. and Negus, N.C. (1964) Evidence for echolocation in Shrews. Journal of Experimental Zoology 156 (1): 19.
Grapputo, A., Pilastro, A. and Marin, G. (1998) Genetic variation and bill size dimorphism in a passerine bird, the reed bunting Emberiza schoeniclus. Molecular Ecology 7 (9): 1173-1182.

208
REFERENCES
Grapputo, A., Pilastro, A., Baker, A.J. and Marin, G. (2001) Molecular evidence for phylogenetic relationships among buntings and American sparrows (Emberizidae). Journal Of Avian Biology 32 (2): 95-101.
Gray, G.R. (1840) A list of the genera of birds, with an indication of the typical species of each genus. London.
Gray, G.R. (1866) Annals and Magazine of Natural History 17: 121.
Griffin, D.R. (1953) Acoustic orientation in the oil bird, Steatornis. Proceedings of the National Academy of Sciences USA 39: 884-893.
Griffin, D.R. and Suthers, R.A. (1970) Sensitivity of echolocation in Cave Swiftlets. Biological Bulletin 139: 495-501.
Griffin, D.R. and Thompson, D. (1982) Echolocation by cave Swiftlets. Behavioural Ecology and Sociobiology 10: 119-123.
Hackett, S.J. (1996) Molecular phylogenetics and biogeography of tanagers in the genus Ramphocelus (Aves). Molecular Phylogenetics and Evolution 5: 368-382.
Hall, R. (1998) The plate tectonics of Cenozoic SE Asia and the distribution of land and sea. In: Hall, R. and Holloway, J.D. (eds) Biogeography and geological evolution of SE Asia. Backhuys Publishers, Leiden. pp. 99-131.
Hall, W.S., Cohen, P.L. and Brauth. S.E. (1993) Auditory projections to the anterior telencephalon in the Budgerigar (Melopsittacus undulatus). Brain, Behavior and Evolution 41: 97-116.
Hammer, Ø., Harper, D.A.T. and Ryan, P.D. (2001) PAST: Paleontological statistics software package for education and data analysis. Palaeontologia Electronica 4 (1): 9.
Hantoro, W.S. (1997) Quaternary sea level variations in the Pacific-Indian ocean gateways: response and impact. Quaternary Journal 37: 73-80.
Harlid, A. and Arnason, U. (1999) Analyses of mitochondrial DNA nest ratite birds within the Neognathae: supporting a neotenous origin of ratite morphological characters. Proceedings of the Royal Society of London B 266: 305-309.
Harrison, T. (1966) Onset of echolocation clicking in Collocalia Swiftlets. Nature 212: 530-531.
Hartert, E. (1892) Notes on the Caprimulgidae. Ibis 4: 274-288.
Helbig, A.J., Martens, J., Siebold, I., Henning, F., Schottler, B. and Wink, M. (1996) Phylogeny and species limits in the Palaeartic chiffchaff Phylloscoupes collybita complex: mitochondrial genetic differentiation and bioacoustic evidence. Ibis 38: 650-666.
209
REFERENCES
Hollander, P. (1971) Adaptations for echolocation in Cave Swiftlets (Collocalia). Unpublished dissertation. Yale University, Australia.
Holloway, J. D. and R. Hall. (1998) SE Asian geology and biogeography: an introduction. In: Hall, R. and Holloway, J.D. (eds) Biogeography and geological evolution of SE Asia. Backhuys Publishers, Leiden. pp. 1-23.
Horsfield, T. and Moore, F. (1854) A catalogue of the birds in the museum of the East-India Company. Volume I. London.
Huelsenbeck, J.P. and Ronquist, F.R. (2001) “MrBayes: Bayesian inference of phylogeny” Biometrics 17 (8): 754-755.
Hughes, J.M. and Baker, A.J. (1999) Phylogenetic relationships of the enigmatic hoatzin (Opisthocomus hoazin) resolved used mitochondrial and nuclear gene sequences. Molecular Biology and Evolution 16 (9): 1300-1307.
Hutcheon, J.M., Kirsch, J.A.W. and Garland Jr., T. (2002) A comparative analysis of brain size in relation to foraging ecology and phylogeny in the Chiroptera. Brain, Behavior and Evolution 60 (3): 165-180.
Huxley, T.H. (1868) On the classification and distribution of the Alectoromorphae and Heteromorphae. Proceedings of the Zoological Society of London: 294-319.
Jeanmougin, F., Thompson, J.D., Gouy, M., Higgins, D.G. and Gibson, T.J. (1998) Multiple sequence alignment with ClustalX. Trends in Biochemical Sciences 23: 403-405.
Johnson, K.P. and Clayton, D.H. (2000) Nuclear and mitochondrial genes contain similar phylogenetic signal for pigeons and doves (Aves: Columbiformes). Molecular Phylogenetics and Evolution 14 (1): 141-151.
Johnson, K.P., de Kort, S.R., Dinwoodey, K., Mateman, A.C., ten Cate, C., Lessells, C.M. and Clayton, D.H. (2001) A molecular phylogeny of the dove genera Streptopelia and Columba. The Auk 118: 874-887.
Johnson, K.P. and Sorenson, M.D. (1998) Comparing molecular evolution in two mitochondrial protein coding genes (cytochrome b and ND2) in the dabbling ducks (Tribe: Anatini). Molecular Phylogenetics and Evolution 10: 82-94.
Kang, N. and Lee, P.G. (1991) The Edible-nest swiftlets Aerodramus spp. Nature Malaysiana 16: 44-51.
Kennedy, M., Spencer, H.G. and Gray, R.D. (1996) Hop, step and gape: do the social displays of the Pelicaniformes reflect phylogeny? Animal Behaviour 51 (2): 273-291.
Knudsen, E.I., Knudsen P.F. and Masino, T. (1993) Parallel pathways mediating both sound localization and gaze control in the forebrain and midbrain of the Barn Owl. Journal of Neuroscience 13: 2837-2852.

210
REFERENCES
Koike, T., Wada, H. and Kobayashi, T. (2002) Modelling of the human middle ear using the finite element method. Journal of the Acoustical Society of America 111 (3): 1306-1317.
Konishi, M. and Knudsen, E.I. (1979) The oilbird: Hearing and echolocation. Science 204: 425-427.
Köppl, C. (2001) Tonotopic projections of the auditory nerve to the cochlear nucleus angularis in the barn owl. Journal of the Association for Research in Otolaryngology 2 (1): 41-53.
Kubke, M.F., Massoglia, D.P. and Carr, C.E. (2004) Bigger brains or bigger nuclei? Regulating the size of auditory structures in birds. Brain, Behavior and Evolution 63: 169-180.
Langham, N. (1980) Breeding biology of the Edible-nest Swiftlet Aerodramus fuciphagus. Ibis 122: 447-461.
Lee, P.L.M., Clayton, D.H., Griffiths, R. and Page, R.D.M. (1996) Does behaviour reflect phylogeny in swiftlets (Aves: Apodidae)? A test using cytochrome b mitochondrial DNA sequences. Proceedings of the National Academy of Sciences USA 93: 7091-7096.
Lim Chan Koon and Earl of Cranbrook (2002) Swiftlets of Borneo: builders of edible nests. Natural History Publications, Borneo. 185 pp.
Linnaeus, C. (1758) Systema Naturae 10 (1): 191.
Lourie, S.A. and Tompkins, D.M. (2000) The diets of Malaysian Swiftlets. Ibis 142: 596-602.
Lovette, I.J. (2004) Mitochondrial dating and mixed support for the “2% rule” in birds. The Auk 121 (1): 1-6.
Maddison, D.R. and Maddison, W.P. (2000) MacClade: analysis of phylogeny and character evolution. Version 4.0. Sinauer, Sunderland, MA.
Mayr, E. (1937) Birds collected during the Whitney South Sea expedition. XXXIII. Notes on New Guinea birds I. American Museum Novitates 915: 1-19.
McCracken, K.G. and Sheldon, F.H. (1997) Avian vocalizations and phylogenetic signal. Proceedings of the National Academy of Sciences USA 94: 3833-3836.
Medway L. (1959) Echolocation among Collocalia. Nature 184: 1352-1353.
Medway, L. (1962) The Swiftlets (Collocalia) of Niah cave, Sarawak. –Part 1. Breeding biology. Ibis 104: 45-66.
Medway, L. (1966) Field characters as a guide to the specific relations of swiftlets. Proceedings of the Linaean Society London 177 (2): 151-177.
211
REFERENCES
Medway, L. (1967) The function of echonavigation among Swiftlets. Animal Behaviour 15: 416-420.
Medway, L. (1969) Studies on the biology of the Edible-nest Swiftlets of South-East Asia. Malayan Nature Journal 22 (1): 57-63.
Medway, L. and Pye, J.D. (1977) Echolocation and the systematics of swiftlets. In: Stonehouse, B. and Perrins, C. (eds) Evolutionary Ecology. University Park Press, Baltimore. pp. 225-238.
Meijaard, E. (2003) Mammals of the south-east Asian islands and their Late Pleistocene environments. Journal of Biogeography 30: 1245-1257.
Meyer, A. (1994) Shortcomings of the cytochrome b gene as a molecular marker. Trends in Ecology and Evolution 9 (8): 278-280.
Mickevich, M.F. and Farris, J.S. (1981) The implications of congruence in Menidia. Systematic Zoology 30: 351-370.
Mindell, D.P, Sorenson, M.D. and Dimcheff, D.E. (1998) Multiple independent origins of mitochondrial gene order in birds. Proceedings of the National Academy of Sciences USA 95 (18): 10693-10697.
Mindlin, G.B., Gardner, T.J., Goller, F. and Suthers, R. (2003) Experimental support for a model of birdsong production. Physical Review E 68: art. nr. 041908.
Moss, G.D., Cathro, D.L. and Austin Jr, J.A. (2004) Sequence biostratigraphy of prograding clinoforms, Northern Carnarvon Basin, Western Australia: a proxy for variations in Oligocene to Pliocene global sea level? Palaios 19: 206-226.
Nguyên Quang, P. and Voisin, J.-F. (1998) Influence of cave structure, microclimate, and nest harvesting on the breeding of the White-nest Swiftlet Collocalia fuciphaga germani in Vietnam. Ibis 140: 257-264.
Norberg, R.A. (1978) Skull asymmetry, ear structure and function, and auditory localization in Tengmalm's owl, Aegolius funereus (Linné). Philosophical Transactions of the Royal Society of London B 282: 325-410.
Novick, A. (1959) Acoustic communication in the cave swiftlet. Biological Bulletin 117: 497-503.
Nylander, J.A.A. (2004) MrModeltest 2.0. Program distributed by the author. Evolutionary Biology Centre, Uppsala University.
Oberholser, H.C. (1906) A monograph of the genus Collocalia. Proceedings of the Academy of Natural Sciences Philadelphia 58: 177-212.
Patterson, A.M., Wallis, G.P. and Gray, R.D. (1995) Penguins, petrels, and parsimony: does cladistic analysis of behavior reflect seabird phylogeny? Evolution 49 (5): 974-989.
Peters, J.L. (1940) Check-list of birds of the world. 4. Harvard University Press, Cambridge, Mass.
212
REFERENCES
Pillans, B., Chappell, J. and Naish, T.R. (1998) A review of the Milankovitch climatic beat: template for Plio-Pleistocene sea-level changes and sequence stratigraphy. Sedimentary Geology 122: 5-21.
Portmann, A. (1947) Études sur la cérébralisation chez les oiseaux: II Les indices intra cérébraux. Alauda 15: 1-15.
Price, J.J., Johnson, K.P. and Clayton, D.H. (2004) The evolution of echolocation in swiftlets. Journal of Avian Biology 35: 135-143.
Price, J.J. and Lanyon, S.M. (2002) Reconstructing the evolution of complex bird song in the Oropendolas. Evolution 56 (7): 1514-1529.
Proctor, L. and Konishi, M. (1997) Representation of sound localization cues in the auditory thalamus of the Barn Owl. Proceedings of the National Academy of Sciences USA 94: 10421-10425.
Prum, R.O. (1990) Phylogenetic analysis of the evolution of display behavior in the Neotropical Manakins (Aves: Pipridae). Ethology 84: 202-231.
Prychitko, T.M. and Moore, W.S. (1997) The utility of DNA sequences of an intron from the beta-fibrinogen gene in phylogenetic analysis of woodpeckers (Aves: Picidae). Molecular Phylogenetics and Evolution 8 (2): 193-204.
Pye, J.D. (1980) Echolocation signals and echoes in air. In: Busnel, R.-G. and Fish, J. F. (eds.) Animal sonar systems. New York, Plenum Press. pp. 309-354.
Questiau, S.M.-C.E., Gaginskaya, A.R., Gielly, L. and Taberlet, P. (1998) Recent divergence between two morphologically differentiated subspecies of bluethroat (Aves: Muscicapidae: Luscinia svecica) inferred from mitochondrial DNA sequence variation. Molecular Evolution 7: 239-245.
Reis, K.R. and Garong, A.M. (2001) Late Quaternary terrestrial vertebrates from Palawan Island, Philippines. Palaeogeography, Palaeoclimatology, Palaeoecology 171: 409-421.
Relkin, E.M. (1988) Introduction to the analysis of middle-ear function. In: Jahn, A.F. and Santos-Sacchi J. (eds.) Physiology of the Ear. Raven Press, New York. pp. 103-123.
De Roo, A. (1968) Taxonomic notes on swifts, with description of a new genus (Aves: Apodidae). Revue de Zoologique et Botanique Africaines 77: 412-417.
Ruggero, M.A. and Temchin, A.N. (2002) The roles of the external, middle, and inner ears in determining the bandwidth of hearing. Proceedings of the National Academy of Sciences USA 99 (20): 13206-13210.
Saetre G.P., Borge, T., Lindell, J., Moum, T., Primmer, C.R., Sheldon, B.C., Haavie, J., Johnsen, A. and Ellegren, H. (2001) Speciation, introgressive hybridization and non-linear rate of molecular evolution in flycatchers. Molecular Ecology 10 (3): 737-749.
213
REFERENCES
Salomonsen, F. (1983) Revision of the Melanesian Swiftlets (Apodes, Aves) and their conspecific forms in the Indo-Australian and Polynesian region. Biologiske Skrifter Kongelige Danske Videnskabernis Selskab 23 (5): 1-112.
Salvadori, T. (1879) Osservazioni intorno ad alcune specie del genere Collocalia, G.R. Atti della Accademia della Scienze de Torino 15: 343-350.
Sato, A., O'hUigin, C., Figueroa, F., Grant, P.R., Grant, B.R., Tichy, H. and Klein, J. (1999) Phylogeny of Darwin's finches as revealed by mtDNA sequences. Proceedings of the National Academy of Sciences USA 96: 5101-5106.
Saunders, J.C. (1985) Auditory structure and function in the bird middle ear: An evaluation by SEM and capacitive probe. Hearing Research 18: 253-268.
Saunders, J.C., Duncan, R.K., Doan, D.E. and Werner, Y.L. (2000) The middle ear of reptiles and birds. In: Dooling, R.J., Fay, R.R. and Popper, A.N. (eds.) Comparative hearing: birds and reptiles. Springer Verlag, New York.
Schall, U. and Delius, J.D. (1986) Sensory inputs to the nucleus basalis prosencephali, a feeding-pecking centre in the pigeon. Journal of Comparative Physiology A 159: 33-41.
Schall, U., Güntürkün, O. and Delius, J.D. (1986) Sensory projections to the nucleus basalis prosencephali of the pigeon. Cell and Tissue Research 245: 539-546.
Schwartzkopff, J. (1952) Untersuchungen über die Arbeitsweise des Mittelohres und das Richtungshören der Singvögel unter Verwendung von Cochlea-Potentialen. Zeitschrift für vergleigende Physiologie 34: 46-68.
Schwartzkopff, J. (1957) Die Grössenverhaltnisse von Trommelfell, Columella-Fussplatte und Schnecke bei Vögeln verschiedenen Gewichts. Zeitschrift für Morphologie und Ökologie der Tiere 45: 365-378.
Sibley, C.G. and Alquist, J.E. (1990) Phylogeny and Classification of Birds: a study in molecular evolution. Yale University Press, New Haven, CT. 999 pp.
Sibley, C.G. and Monroe, B.L. (1990) Distribution and Taxonomy of Birds of the World. Yale University Press, New Haven, CT. 1135 pp.
Sibley, C.G. and Monroe, B.L. (1993) A Supplement to Distribution and Taxonomy of the Birds of the World. Yale University Press, New Haven, CT. 114 pp.
Slabbekoorn, H. and Peet, M. (2003) Birds sing at a higher pitch in urban noise. Great tits hit the high notes to ensure that their mating calls are heard above the city’s din. Nature 424 (6946): 627-627.
Smyth, D.M. (1979) Studies on echolocation by the Grey Swiftlet Aerodramus spodiopygius. Unpublished PhD thesis, Department of Zoology, James Cook University of North Queensland, Townsville, Queensland, Australia.
Smyth, D.M. and Roberts, J.R. (1983) The sensitivity of echolocation by the Grey Swiftlet Aerodramus spodiopygius. Ibis 125: 339-345.

214
REFERENCES
Soehartono, T. and Mardiastuti, A. (2002) CITES implementation in Indonesia. Nagao NEF, Jakarta.
Somadikarta, S. (1968) The Giant Swiftlet, Collocalia gigas Hartert and Butler. The Auk 85 (4): 549-559.
Somadikarta, S. (1986) Collocalia linchi Horsfield & Moore - a revision. Bulletin of the British Ornithological Club 106 (1): 32-40.
Sorensen, M.D. and Quinn, T.W. (1998) Numts: A challenge for avian systematics and population biology. The Auk 115 (1): 214-221.
Starck, J.M. (1992) Towards a model of the functional morphology of the avian middle ear- The transfer function. Zoologisches Jahrbuch der Anatomie 122: 287-302.
Stresemann, E. (1931) Notes on the systematics and distribution of some Swiftlets (Collocalia) of Malaysia and adjacent subregions. Bulletin of the Raffles Museum 6: 83-101.
Suthers, R.A. (2004) How birds sing and why it matters. In: Marler, P.R. and Slabbekoorn, H. (eds.) Nature’s music. The science of birdsong. Elsevier Academic Press, London, San Diego. pp. 272-295.
Suthers, R.A. and Hector, D.D. (1982) Mechanism for the production of echolocating clicks by the Grey Swiftlet, Collocalia spodiopygia. Journal of Comparative Physiology 148: 457-470.
Suthers, R.A. and Hector, D.D. (1985) The physiology of vocalization by the echolocating oilbird, Steatornis caripensis. Journal of Comparative Physiology A 156: 243-266.
Swofford, D.L. (1998) “PAUP*”, Phylogenetic Analysis Using Parsimony (* and other methods), version 4, Sinauer Associates, Sunderland, MA.
Thomassen, H.A., Djasim, U.M. and Povel, G.D.E. (2004) Echoclick design in swiftlets: single as well as double clicks. Ibis 146: 173-174.
Thomassen, H.A., Wiersema, A.T., Bakker, M.A.G. de, Knijff, P. de, Hetebrij, E. and Povel, G.D.E. (2003) A new phylogeny of swiftlets (Aves: Apodidae) based on cytochrome-b DNA. Molecular Phylogenetics and Evolution 29:86-93.
Thompson, J.D., Gibson, T.J., Plewniak, F., Jeanmougin, F. and Higgins, D.G. (1997) The ClustalX windows interface: flexible strategies for multiple sequence alignment aided by quality analysis tools. Nucleic Acids Research 24: 4876-4882.
Tomasi, T.E. (1979) Echolocation by the Short-tailed Shrew, Blarina brevicauda. Journal of Mammalogy 60 (4): 751-759.
Tuinen, M. van, Sibley, C.G. and Hedges, S.B. (2000) The early history of modern birds inferred from DNA sequences of nuclear and mitochondrial ribosomal genes. Molecular Biology and Evolution 17 (3): 451-457.

215
REFERENCES
Turner, H., Hovenkamp, P. and Van Welzen, P.C. (2001) Biogeography of Southeast Asia and the West Pacific. Journal of Biogeography 28: 217-230.
Veller, M.G.P. van, Kornet, D.J. and Zandee, M. (2000) Methods in vicariance biogeography: assessment of the implementations of assumptions 0, 1, and 2. Cladistics 16: 319-345.
Videler, J.J., Stamhuis, E.J. and Povel, G.D.E. (2004) Leading-edge vortex lifts Swifts. Science 306: 1960-1962.
Voris, H.K. (2000) Maps of Pleistocene sea levels in Southeast Asia: shorelines, river systems and time durations. Journal of Biogeography 27: 1153-1167.
Wallace, A.R. (1863) On the identification of the Hirundo esculenta, Linn., with a synopsis of the described species of Collocalia. Proceedings of the Scientific Meetings of the Zoological Society of London 1863: 382-385.
Wallace, A.R. (1869) The Malay archipelago. The land of the orang-utan and the bird of paradise. A narrative of travel, with studies of man and nature. MacMillan and Co. London.
Walsh, P.S., Metzger, D.A. and Higuchi, R. (1991). Chelex 100 as a medium for sample extraction of DNA for PCR-based typing from forensic material. BioTechniques 10 (4): 506-513.
Welzen, P.C. v., Turner, H. and Hovenkamp, P. (2003) Historical biogeography of Southeast Asia and the West Pacific, or the generality of unrooted area networks as historical biogeographic hypotheses. Journal of Biogeography 30: 181-192.
Whitten, T., Soeriatmadja, R.E. and Afiff, S.A. (1996) The ecology of Java and Bali. Periplus Editions, Singapore. 991 pp.
Wiens, J.J. (2001) Character analysis in morphological phylogenetics: Problems and solutions. Systematic Biology 50 (5): 689-699.
Wild, J.M., Kubke, M.F. and Carr, C.E. (2001) Tonotopic and somatotopic representation in the nucleus basalis of the Barn Owl, Tyto alba. Brain, Behavior and Evolution 57: 39-62.
Winkler, D.W. and Sheldon, F.H. (1993) Evolution of nest construction in Swallows (Hirundinidae): A molecular phylogenetic perspective. Proceedings of the National Academy of Sciences USA 90: 5705-5707.
Winter, P. and Schwartzkopf, J. (1961) Form und Zellzahl der akustischen Nervenzentren in der Medulla oblongata von Eulen (Striges). Experientia 17: 515-516.

216
SWIFT AS SOUND
217
NAWOORD Vier jaar lang werk je aan een proefschrift en dan is het af, klaar. Nou ja, ècht af zal het wel nooit zijn…. Op zo’n boekje staat slechts één naam, maar in feite zijn er veel meer mensen bij de totstandkoming daarvan betrokken geweest. Wat betreft de wetenschappelijke bijdrage zijn verschillende personen al genoemd in de “Acknowledgements” aan het eind van de diverse hoofdstukken en in de “General acknowledgements” aan het eind van het wetenschappelijke gedeelte van dit proefschrift. Er zijn echter ook vele andere bijdragen geweest van mensen, die ik in het bijzonder wil bedanken. Dichtbij m’n bureau in het Van der Klaauw beginnend, wil ik allereerst mijn kamergenoten en collega-aio’s Marian van der Meij, Karin Kurk en –al weer iets langer geleden- Angelique van der Leeuw bedanken voor de gezellige en wetenschappelijke discussies. Een kamer verderop gaat mijn dank uit naar Herman Berkhoudt, altijd in voor een praatje en vol goede raad. De kenmerkende citaten zal ik hier maar achterwege laten, maar iedereen, die Herman kent, weet wat ik bedoel. En natuurlijk bedankt voor het elke maand lenen van “Naturfoto”! Ron Bout, je hebt altijd een nuchtere en verduidelijkende, maar bovenal realistische kijk op de zaken. Belangrijk als je door de bomen het overzicht van ‘t bos even dreigt kwijt te raken. Gelukkig weet je met een Matlab routine of goede raad iedereen weer op het juiste spoor te krijgen! Peter Snelderwaard, vaak liep ik even bij je binnen voor een praatje of om je hulp te vragen. Ik wil je graag niet alleen bedanken voor je wetenschappelijk hulp, maar ook voor je bijstand als er iets mis was met computer of auto. En niet te vergeten voor de gezelligheid en het overheerlijke eten tijdens borrels in de stad en bij jou en Angelique thuis! Ook bij Ardie den Boer en Merijn de Bakker ben ik vaak binnen gelopen. Bedankt voor jullie gezelligheid en alles wat jullie me hebben bijgebracht. René Glas en Marcel Eurlings, wie weet kom ik nog weer eens een epje Taq bij jullie halen. Jullie zijn toch de mensen, die het werk in het lab mogelijk maken; bedankt voor jullie ondersteuning. Anita Wiersema, hoewel je niet echt student was bij mij, heb je wel veel werk verzet in het sequencen. Gelukkig hebben we het weten om te zetten in een artikel, iets wat eigenlijk bij elk studentenonderwerp zou moeten gebeuren. Urville Djasim, ook jouw werk heeft bijgedragen aan een artikel, hoewel misschien niet over het onderwerp, waar je het meest mee bezig geweest bent. Bedankt voor je inzet. Tot slot mijn dank aan
218
SWIFT AS SOUND
Robert-Jan den Tex. Ik heb goede hoop, dat jouw gedreven, harde werken beloond zal worden met een publicatie. Ik hoop, dat jullie alle drie met plezier aan dit project hebben gewerkt en er misschien zelfs wel inspiratie in hebben gevonden om zelf promotie onderzoek te gaan doen. Buiten het instituut wil ik in het bijzonder Stefan Gea en Steve Maas bedanken. Jullie hebben veel tijd gestoken in hulp bij de 3D reconstructies, welke hopelijk beloond gaat worden met een publicatie. Daarnaast hebben jullie mij meegesleept tijdens de lunches en thuis laten voelen op de Universiteit Antwerpen. Dank jullie wel daarvoor! Lieve ma, jij en pa hebben me altijd gestimuleerd te doen, wat ik leuk vond. Ik vond biologie leuk en ben dat gaan studeren en nu ben ik er zelfs (bijna) in gepromoveerd. Er zijn te veel dingen om op te noemen, waarvoor ik jullie zou willen bedanken, dus daarom alleen maar: bedankt! Lieve pa, ik mis je, je zou er nog bij moeten zijn…. Tot slot, lieve Els, wil ik ook jou bedanken. Wat denk ik niet zo vaak voorkomt, is dat een partner tevens nog een wetenschappelijke bijdrage levert. En dat heb jij wel gedaan! Maar dat is natuurlijk niet het enige. Bedankt voor je geduld, bedankt voor het koken als ik weer eens aan m’n proefschrift moest werken, bedankt voor je liefde, bedankt voor het zijn wie je bent. Zonder jou was het niet gelukt.

219
CURRICULUM VITAE Op 9 december 1975 kwam ik ter wereld in een ziekenhuis in Harderwijk. Ik groeide op in Kootwijk en omringende bossen. Mijn voorliefde voor fotografie en natuur brachten mij al vroeg op het idee dat ik bioloog wilde worden. In 1988 ging ik naar de brugklas van het Christelijk Lyceum Apeldoorn, later herdoopt tot het Sprengeloo. In 1994 behaalde ik mijn gymnasium diploma en begon aansluitend met de studie Biologie in Leiden. Ik koos in de differentiatiefase voor de populatie-richting, maar kwam door toeval toch in het morfologisch onderzoek terecht. Tijdens mijn studie deed ik drie studentenstages. De eerst stage betrof een onderzoek aan het kaakapparaat van cichliden, onder begeleiding van Dr. Frans Witte (Integratieve Zoologie, Evolutionaire en Ecologische Wetenschappen (EEW)). Een tweede onderzoek, onder begeleiding van Dr. David Povel, (Evolutionaire Morfologie, EEW), bracht mijn eerste ervaring met veldwerk in de tropen met zich mee. Het project aan echolocatie bij gierzwaluwen werd uitgevoerd in samenwerking met Prof. dr. S. Somadikarta, University of Indonesia. In het kader van dat project heb ik enkele maanden veldwerk verricht in Indonesië. De laatste stage heb ik uitgevoerd onder begeleiding van Dr. Annet Louwerse, (Gedragsbiologie, Universiteit Utrecht / Biomedical Primate Research Center, Rijswijk). In dit onderzoek heb ik mede onderzocht hoe eenzame rhesusmakaken het beste gerehabiliteerd kunnen worden in een sociale groep. In 1999 studeerde ik af en na een intermezzo van een aantal maanden, waarin ik wat van de wereld heb kunnen zien, begon ik in juni 2000 aan mijn promotieonderzoek bij de vakgroep Evolutionaire Morfologie van Prof. dr. Gart Zweers (EEW, Universiteit Leiden). Mijn interesse in vogels en evolutie brachten mij wederom bij deze vakgroep. Het aio-project ‘Ontwerp en evolutie van echolocatie bij gierzwaluwen’ was een vervolg op de stage, die ik had gedaan bij Dr. David Povel. Het huidige project vereiste ook weer veldwerk. Er moest materiaal, vogels, verzameld worden voor nader onderzoek. Samen met mijn vriendin Elske Hetebrij heb ik daarvoor in 2001 twee geweldige maanden veldwerk gedaan in Sabah (Borneo, Maleisië). We hebben met succes vogels en bloedmonsters verzameld, waardoor ik genoeg materiaal had voor de daarop volgende jaren. De resultaten van mijn werk heb ik op verschillende congressen uiteengezet in Leiden, Antwerpen, Jena en in Beijing.

220
SWIFT AS SOUND
PUBLICATIONS
Thomassen, H.A., Djasim, U.M. and Povel, G.D.E. (2004) Echoclick design in swiftlets:
single as well as double clicks. Ibis 146: 173-174.
Thomassen, H.A., Wiersema, A.T., Bakker, M.A.G. de, Knijff, P. de, Hetebrij, E. and
Povel, G.D.E. (2003) A new phylogeny of swiftlets (Aves: Apodidae) based on cytochrome-b DNA. Molecular Phylogenetics and Evolution 29: 86-93.
Related Documents