1 Swelling Kinetics of Unsaturated Polyester–layered Silicate Nanocomposite Depending on the Fabrication Method Sunain Katoch 1 , Vinay Sharma 2 , P. P. Kundu 1,2* 1 Department of Chemical Technology, Sant Longowal Institute of Engineering & Technology, Sangrur, Punjab-148106, India 2 Department of Polymer Science & Technology, University of Calcutta, University College of Science & Technology, 92, APC Road, Kolkata-700009, India (received 04 February 2010, received in final form 22 March 2010, accepted 20 May 2010) Abstract Kinetics of swelling and sorption behavior of unsaturated polyester nanocomposite (based on glycolyzed PET, maleic anhydride, styrene, and montmorillonite) synthesized by two different mixing methods, simultaneous and sequential is studied in acetic acid at different temperatures. The values of n in the transport equation are found to be below 0.5, showing non-Fickian or pseudo-Fickian transport in the polymers. The dependence of diffusion coefficient on the mixing methods and temperature has also been studied for the unsaturated polyester nanocomposite. The diffusion coefficients in simultaneous mixing samples decrease with an increase in the mixing time in the samples. In case of the sequential mixing samples, the diffusion coefficient increases with an increase in mixing time. The diffusion coefficient increases with an increase in temperature for all the unsaturated polyester nanocomposite samples. The sorption coefficient increases with an increase in the The Open-Access Journal for the Basic Principles of Diffusion Theory, Experiment and Application © 2010, S. Katoch diffusion-fundamentals.org 13 (2010) 1, pp 1-31

Welcome message from author
This document is posted to help you gain knowledge. Please leave a comment to let me know what you think about it! Share it to your friends and learn new things together.
Transcript
1
Swelling Kinetics of Unsaturated Polyester–layered Silicate Nanocomposite
Depending on the Fabrication Method
Sunain Katoch1, Vinay Sharma2, P. P. Kundu1,2*
1Department of Chemical Technology, Sant Longowal Institute of Engineering &
Technology, Sangrur, Punjab-148106, India
2Department of Polymer Science & Technology, University of Calcutta,
University College of Science & Technology, 92, APC Road, Kolkata-700009, India
(received 04 February 2010, received in final form 22 March 2010, accepted 20 May 2010)
Abstract
Kinetics of swelling and sorption behavior of unsaturated polyester
nanocomposite (based on glycolyzed PET, maleic anhydride, styrene, and
montmorillonite) synthesized by two different mixing methods, simultaneous and
sequential is studied in acetic acid at different temperatures. The values of n in the
transport equation are found to be below 0.5, showing non-Fickian or pseudo-Fickian
transport in the polymers. The dependence of diffusion coefficient on the mixing
methods and temperature has also been studied for the unsaturated polyester
nanocomposite. The diffusion coefficients in simultaneous mixing samples decrease with
an increase in the mixing time in the samples. In case of the sequential mixing samples,
the diffusion coefficient increases with an increase in mixing time. The diffusion
coefficient increases with an increase in temperature for all the unsaturated polyester
nanocomposite samples. The sorption coefficient increases with an increase in the
The Open-Access Journal for the Basic Principles of Diffusion Theory, Experiment and Application
© 2010, S. Katochdiffusion-fundamentals.org 13 (2010) 1, pp 1-31

2
mixing time for all the samples synthesized by in-situ mixing method. The crosslink
density (calculated from the CH3COOH swelling) ranges from 5.014 to 7.092 × 10²
mol/cm3 for simultaneous mixed samples and 5.212 to 7.192 × 10² mol/cm3 for
sequentially mixed samples.
* To whom all correspondence should be addressed.
E-mail: [email protected]
Keywords: Unsaturated polyester nanocomposite, montmorillonite, sorption, non-
Fickian diffusion, simultaneous mixing, sequential mixing.
1 Introduction
Polymer nano-composites are the future of the global industries [1]. The polymer
nano-composites are prepared by dispersing a nano-filler into the polymer [2-3]. These
platelets are then distributed into a polymer matrix creating multiple parallel layers,
which force flow of gases and liquids through the polymer in a torturous path, forming a
complex barrier [4]. Different types of fillers are utilized for the preparation of nano-
composites. Amongst these, the most common is a nano-clay called montmorillonite - a
layered smectite clay [5-10]. Additional nano-fillers include carbon nano-tubes, graphite
platelets, carbon nano-fibers, etc [8, 11-13]. The barrier properties of the nano-
composites are supposed to increase due to nano-clay loading [4, 14].
Sorption and diffusion of the solvents in and through polymers have been widely
investigated from both theoretical as well as experimental point of view [15–18]. The
swelling technique is a commonly used method to determine various coefficients such as
diffusion, sorption, and permeability coefficient [18–22]. In swelling experiments, the
polymer of known dimension is dispersed in a solvent, and the solvent mass uptake
© 2010, S. Katochdiffusion-fundamentals.org 13 (2010) 1, pp 1-31
3
versus time is recorded and the data is used to calculate the various coefficients. These
coefficients give an idea about the use of polymers in various applications such as
membranes, ion-exchangers, controlled release systems, packaging, microchip
manufacturing, etc.
Sorption kinetics in polymers exhibit a variety of deviations from normal Fickian
behavior, attributable to (a) slow viscous relaxations of the swelling polymer or (b)
differential swelling stresses generated by the constraints imposed on local swelling
during sorption. Several models have been proposed for the study of swelling behavior
of the polymers [23-25]. In situ study by FTIR-ATR is also carried out by many
researchers for the prediction the sorption behavior of the polymers [26-28].
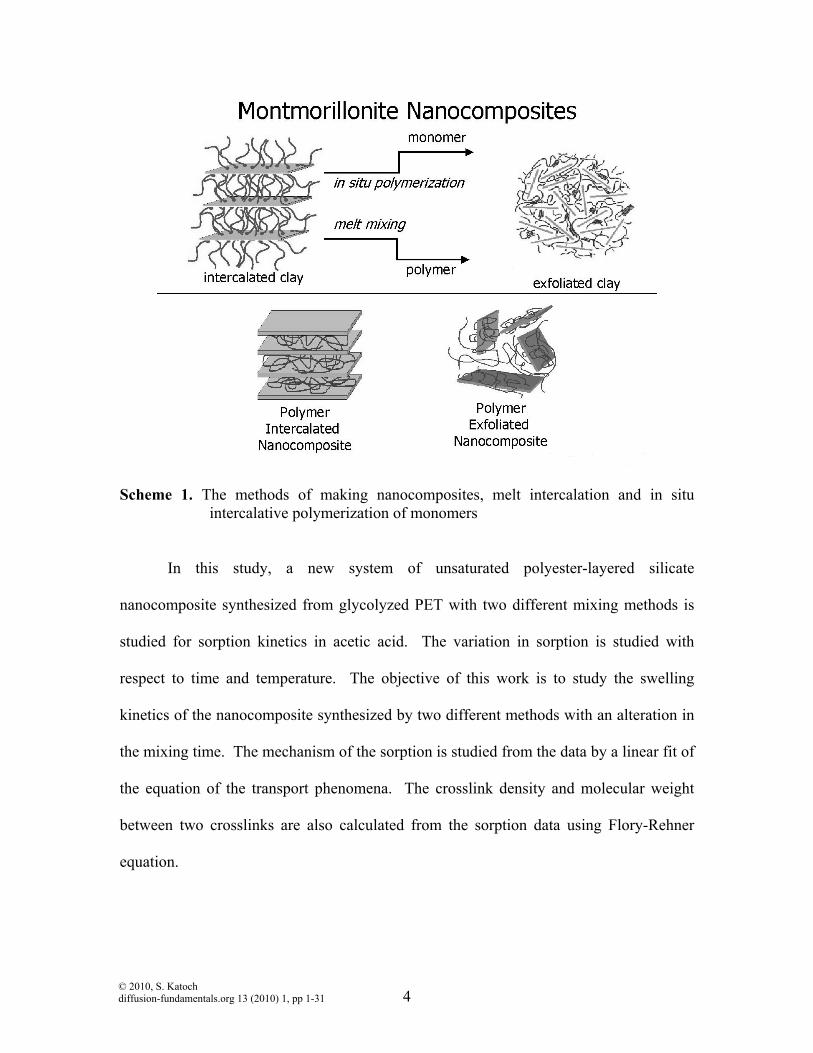
The properties of unsaturated polyester (UP)/montmorillonite (MMT)
nanocomposite greatly depend on the preparation procedure because of the chemical
reactions and physical interactions involved. In general, there are two methods of
making nanocomposites, melt intercalation and in situ intercalative polymerization of
monomers (scheme 1). The nanocomposite of thermoset polymer can be prepared by the
in situ intercalative polymerization method [29]; phenol resins, epoxy resins [30,31] and
unsaturated polyester resins are included in this category. These thermosetting
nanocomposite materials are prepared by first swelling the various organo-modified
montmorillonite (MMT) with the proper polymerizable monomers, followed by
crosslinking reactions.
© 2010, S. Katochdiffusion-fundamentals.org 13 (2010) 1, pp 1-31
4
Scheme 1. The methods of making nanocomposites, melt intercalation and in situ intercalative polymerization of monomers
In this study, a new system of unsaturated polyester-layered silicate
nanocomposite synthesized from glycolyzed PET with two different mixing methods is
studied for sorption kinetics in acetic acid. The variation in sorption is studied with
respect to time and temperature. The objective of this work is to study the swelling
kinetics of the nanocomposite synthesized by two different methods with an alteration in
the mixing time. The mechanism of the sorption is studied from the data by a linear fit of
the equation of the transport phenomena. The crosslink density and molecular weight
between two crosslinks are also calculated from the sorption data using Flory-Rehner
equation.
© 2010, S. Katochdiffusion-fundamentals.org 13 (2010) 1, pp 1-31
5
2 Experimental
2.1 Materials
Discarded PET bottles from soft drinks were procured from scrapers, cleaned
thoroughly and cut in to small pieces (6 mm x 6 mm). Zinc acetate, minimum assay
99%, Ethylene glycol, diethylene glycol and styrene were procured from E. Merck
(India) Pvt. Ltd, Bombay. Phthalic anhydride (PA), Maleic anhydride, benzoyl peroxide
and Hydroquinone obtained from CDH (India), montmorillonite (K-10) having surface
area 270 m2/g and pH 3-4, dodecyltrimethylammonium bromide (DTAB) C15H34BrN, are
purchased from Aldrich Chemical Company (Milwaukee, MI) and are used as received.
2.2 Synthetic Work
2.2.1 Modification of Montmorillonite
Montmorillonite Clays are dispersed in DI water by stirring. Dodecyl trimethyl
ammonium bromide (DTAB) is added to dispersion. The whole dispersion is heated at
80 oC for 6 hr with vigorous stirring. A white precipitate formed, which was isolated by
filtration and washed several times with hot water/ethanol 50:50 by volume mixture until
no trace of chloride was detected in the filtrate by one drop of 0.1 N AgNO3 solution.
The treated clay was dried at 100 °C in the vacuum oven for 24 h until all moisture was
removed and a constant weight was obtained.
2.2.2 Glycolysis of PET Waste
Glycolysis of PET scrap has been done in a five necked reaction glass kettle with
mechanical agitator assembly. Molar ratio of PET to glycol has been taken 1:2
respectively. The mixture of diols DEG:EG are charged in the ratio 80:20 respectively.
Zn(CH3COO)2 used as trans-esterification catalyst. The reactants are heated in the
© 2010, S. Katochdiffusion-fundamentals.org 13 (2010) 1, pp 1-31
6
temperature range 120-140 oC for first three hours and then at 180 oC for subsequent 5
hours. The whole reaction is carried out in inert atmosphere (nitrogen atmosphere) under
reflux with constant stirring. After 8 h the contents in the reactor were allowed to cool to
room temperature.
2.2.3 Synthesis of Unsaturated Polyester from Glycolyzed PET
Unsaturated polyester synthesized from glycolyzed PET by reacting glycolyzed
PET with maleic anhydride in presence of p-toluenesulphonic acid. The desired amount
of reactants is charged in a reaction kettle. The temperature is maintained in the range of
120-150 oC for first five hours and then to 170 oC for subsequent 3 hours. Distillation is
done through reaction to ensure water removal. 30ppm hydroquinone is added to prevent
premature gelation of resin. Then prepolymer is dissolved in 35% wt styrene. It is
mechanically mixed for 3 hours. Constant stirring is done throughout the reaction. To
initiate polymerization, 1 wt% of a free-radical peroxide initiator, benzoyl peroxide
(BPO) is added at 60 oC.
2.2.4 Synthesis of Unsaturated Polyester Nanocomposite (Simultaneous Mixing)
The desired amount of monomers (glycolyzed PET, maleic anhydride) was fed
together to the five necked glass reactor having mechanical agitator assembly. The whole
reaction is carried out 8 hours with constant stirring at temperature up to 180 oC.
Hydroquinone is added to prevent premature gelation of resin. Then, the prepolymer and
modified clay is dissolved in 35% wt. styrene with varying mixing times of 15, 30, 60,
120 and 180 min at 60 oC. It is mechanically mixed for 3 hours. The curing is done by
initiator at 2%. The initiator is thoroughly dispersed in unsaturated polyester matrix in a
glass vial. Materials are cured for 6 h at 60 oC. The temperature is gradually increased
© 2010, S. Katochdiffusion-fundamentals.org 13 (2010) 1, pp 1-31
7
from room temperature to 60 oC at the beginning and then cooled from 60 oC to room
temperature at the end of the curing stage in order to prevent craze and cracks due to
sudden crosslinking and cooling. The detailed conditions are reported in Table 1. The
nomenclature used in this work is based on the original composition of reactants (shown
in Table 1).
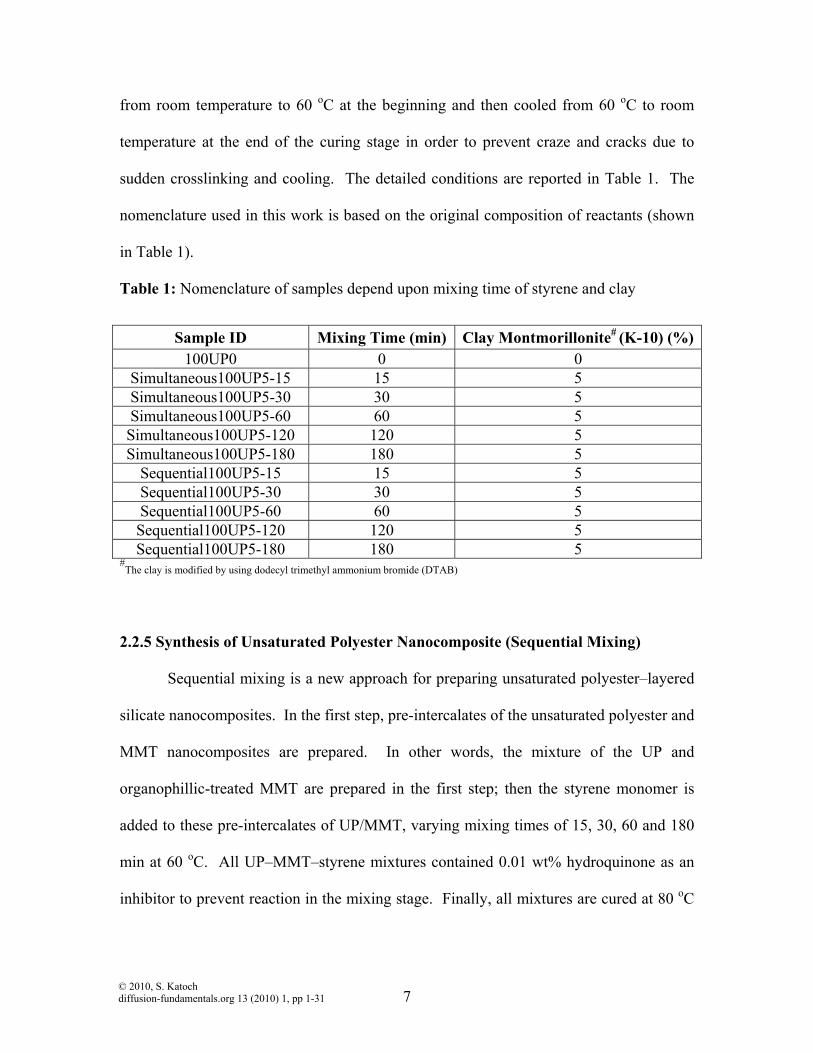
Table 1: Nomenclature of samples depend upon mixing time of styrene and clay
#The clay is modified by using dodecyl trimethyl ammonium bromide (DTAB)
2.2.5 Synthesis of Unsaturated Polyester Nanocomposite (Sequential Mixing)
Sequential mixing is a new approach for preparing unsaturated polyester–layered
silicate nanocomposites. In the first step, pre-intercalates of the unsaturated polyester and
MMT nanocomposites are prepared. In other words, the mixture of the UP and
organophillic-treated MMT are prepared in the first step; then the styrene monomer is
added to these pre-intercalates of UP/MMT, varying mixing times of 15, 30, 60 and 180
min at 60 oC. All UP–MMT–styrene mixtures contained 0.01 wt% hydroquinone as an
inhibitor to prevent reaction in the mixing stage. Finally, all mixtures are cured at 80 oC
Sample ID Mixing Time (min) Clay Montmorillonite# (K-10) (%)100UP0 0 0
Simultaneous100UP5-15 15 5 Simultaneous100UP5-30 30 5 Simultaneous100UP5-60 60 5 Simultaneous100UP5-120 120 5 Simultaneous100UP5-180 180 5
Sequential100UP5-15 15 5 Sequential100UP5-30 30 5 Sequential100UP5-60 60 5 Sequential100UP5-120 120 5 Sequential100UP5-180 180 5
© 2010, S. Katochdiffusion-fundamentals.org 13 (2010) 1, pp 1-31

8
for 3 h and post-cured for 4 h at 120 oC. All UP/MMT nanocomposites contained UP of
60 wt%, styrene monomer of 35 wt% and MMT 5 wt%.
2.3 Swelling Experiments
The samples are cut into circular form, using a die of 12 mm diameter. The
thickness of the samples is measured by means of a screw gauge. The dry samples are
weighed on an electronic balance and then kept in the solvent in screwed bottles. The
samples are taken out of the solvent at specific intervals and the excess solvent is rubbed
off. The samples are then weighed and again immersed in the solvent, till equilibrium is
attained (i.e. 144 h). The time for measuring weight of the sample is kept minimal (about
30 sec), so that the escape of solvent from the sample is negligible. Equilibrium swelling
experiments at different temperature are carried out at 20, 30, 40 and 50 oC (±1 oC) to
study the effect of temperature on swelling. For temperatures higher than room
temperature, the samples are kept in a microprocessor controlled hot air oven. The mole
percent uptake (Qt) at each time interval is calculated by using equation 1 [32].
ir
tt M
100MM
Q ×= (1)
where Mt is the mass of solvent taken up at time interval t, Mr is the relative molar mass
of the solvent and Mi is the mass of the dry sample. Equilibrium swelling experiments
are also performed at 20 ±1 oC to determine the solubility parameter of samples of
unsaturated polyester and their nano-composites. The swelling is carried out in various
solvents ranging from 8.85 to 23.5 (cal/cm3)1/2. From the plots of mole percent uptake
(Qt) versus solubility parameter (δ), acetic acid gives the maximum value of Q in all the
samples and hence is used for further kinetic studies. Figure 1 shows the representative
plot of mole percent uptake versus solubility parameter for unsaturated polyester samples.
© 2010, S. Katochdiffusion-fundamentals.org 13 (2010) 1, pp 1-31

9
8 10 12 14 16 18 20 22 24
0.0
0.5
1.0
1.5
2.0
Qt (M
ole
%)
Solubility Parameter (cal/cm3)1/2
60UP0 60UP4
Figure 1. Plot of volume equilibrium of swelling (Q) versus solubility parameter (δ) for simultaneous 100UP5-15 and Sequential 100UP5-180 at 20 oC. The (δ) values in (cal/cm3)1/2 of the used solvents are 8.85 (xylene), 10.1 (acetic acid), 12.14 (dimethyl formamide), 14.28 (methanol).and 23.5 (water).
3. Results and Discussion
3.1 Effect of Simultaneous Mixing Method with Varying Mixing Time
The mole percent uptake of the solvent is plotted against square root of time. The
plots for the mole percent uptake are shown in Figure 2 for the nano-composite polymer
(5% modified clay) synthesized by in-situ method with varying mixing time 15, 30, 60,
120, 180 min at a temperature of 20±1 oC. It is observed that on increasing the mixing
time the solvent uptake increases in the matrix. The solvent uptake is minimum for
sample 100UP0 a pure cured unsaturated polyester and maximum for in-situ 100UP5-180
nanocomposite having maximum mixing time. It is further noteworthy that in-situ
© 2010, S. Katochdiffusion-fundamentals.org 13 (2010) 1, pp 1-31

10
samples the solvent uptake has lowest value for 100UP5-15 and increase with increasing
mixing time. The sorption curves for all the samples are almost asymptotic with very
little increase in the swelling after 64 h except for 100UP0. In the present case, the
increase in the solvent uptake with an increase in the mixing time can be explained on the
basis of following assumption.
0 2 4 6 8 10 120.0
0.5
1.0
1.5
2.0
2.5
Qt (
mol
%)
(Time)1/2 in hrs
100UP0 simultaneous 100UP5-15 simultaneous 100UP5-30 simultaneous 100UP5-60 simultaneous 100UP5-120 simultaneous 100UP5-180
Figure 2. Sorption curve showing mole percent uptake of unsaturated polyester
nanocomposite with varying mixing time (fixed clay 5 %) at 20 oC (Synthesized by simultaneous method).
UP chains, styrene monomers and organic organophilic MMT (O-MMT) coexist
in the mixing medium. The styrene monomers diffuse into the gallery of the O-MMTs
much faster than the UP chains. Solvents and monomers have diffusion coefficients on
the order of 10-5 (cm2/s), while polymers have the diffusion coefficient on the order of 10-
7 (cm2/s) [33,34]. If the curing reaction starts in these conditions, the styrene homo-
© 2010, S. Katochdiffusion-fundamentals.org 13 (2010) 1, pp 1-31
11
polymer is produced primarily in the interlayer of the O-MMT and the crosslinking
density decreases inside and outside of the O-MMT, because the styrene monomers are
concentrated on the interlayer and styrene monomers are insufficient for the crosslinking
the reactive double bonds of the unsaturated polyester. For this reason, the UP/MMT
nanocomposite manufactured by the in-situ mixing method (conventional) method has a
lower Tg and lower crosslinking density than that of the pure cured UP [35]. Thus, with
increase in the mixing time the rate of diffusion of styrene in-to the silicate gallery goes
on increasing leads to decrease in crosslinking density. The decrease in the crosslink
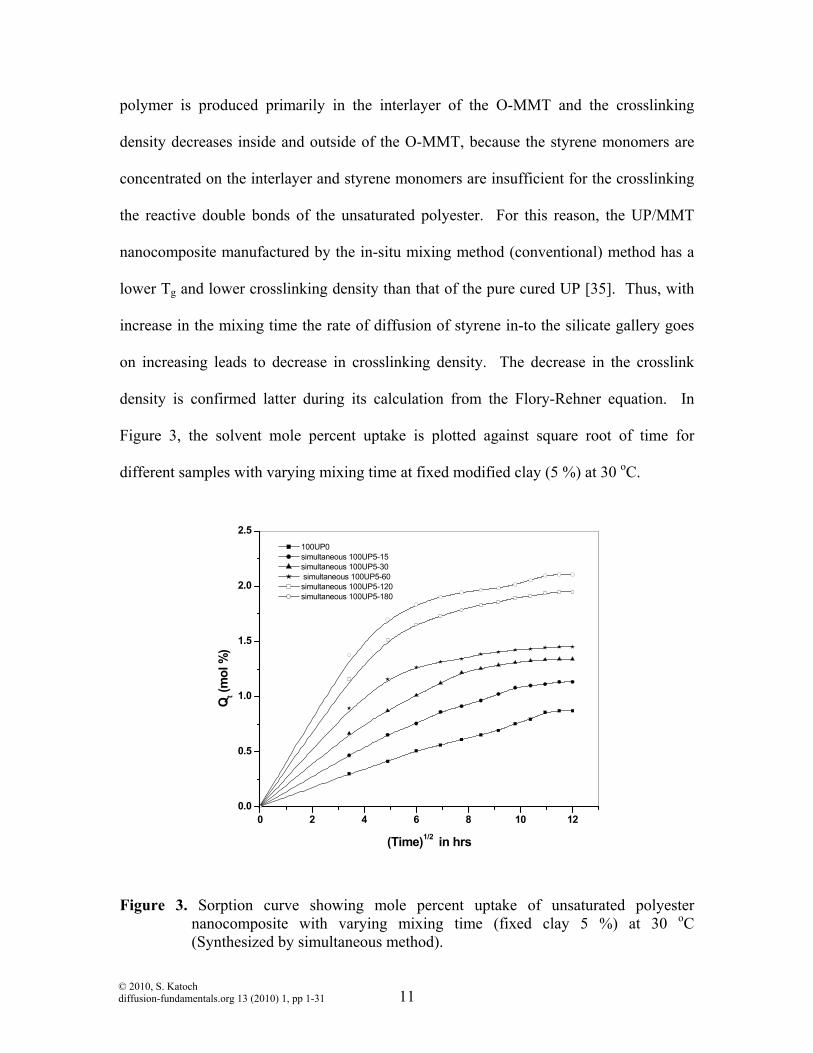
density is confirmed latter during its calculation from the Flory-Rehner equation. In
Figure 3, the solvent mole percent uptake is plotted against square root of time for
different samples with varying mixing time at fixed modified clay (5 %) at 30 oC.
0 2 4 6 8 10 120.0
0.5
1.0
1.5
2.0
2.5
Qt (
mol
%)
(Time)1/2 in hrs
100UP0 simultaneous 100UP5-15 simultaneous 100UP5-30 simultaneous 100UP5-60 simultaneous 100UP5-120 simultaneous 100UP5-180
Figure 3. Sorption curve showing mole percent uptake of unsaturated polyester nanocomposite with varying mixing time (fixed clay 5 %) at 30 oC (Synthesized by simultaneous method).
© 2010, S. Katochdiffusion-fundamentals.org 13 (2010) 1, pp 1-31

12
The sample 100UP0 shows the lowest solvent uptake followed by in-situ100UP5-
15. The same trend is also observed in Figure 4 and 5. The sample with 30, 60, and 120
min shows intermediate swelling. All the samples show regular increase in swelling with
time. The rate of uptake increases at first as sorption proceeds, but later decreases as the
final equilibrium is approached. These curves are often referred to as sigmoid sorption
curves [36]. They are generated because of the reason that the surface equilibrium
conditions are not established instantaneously.
0 2 4 6 8 10 120.0
0.5
1.0
1.5
2.0
2.5
Qt (
mol
%)
(Time)1/2 in hrs
100UP0 simultaneous 100UP5-15 simultaneous 100UP5-30 simultaneous 100UP5-60 simultaneous 100UP5-120 simultaneous 100UP5-180
Figure 4. Sorption curve showing mole percent uptake of unsaturated polyester
nanocomposite with varying mixing time (fixed clay 5 %) at 40 oC
(Synthesized by simultaneous method).
© 2010, S. Katochdiffusion-fundamentals.org 13 (2010) 1, pp 1-31
13
0 2 4 6 8 10 120.0
0.5
1.0
1.5
2.0
2.5
Qt (
mol
%)
(Time)1/2 in hrs
100UP0 simultaneous 100UP5-15 simultaneous 100UP5-30 simultaneous 100UP5-60 simultaneous 100UP5-120 simultaneous 100UP5-180
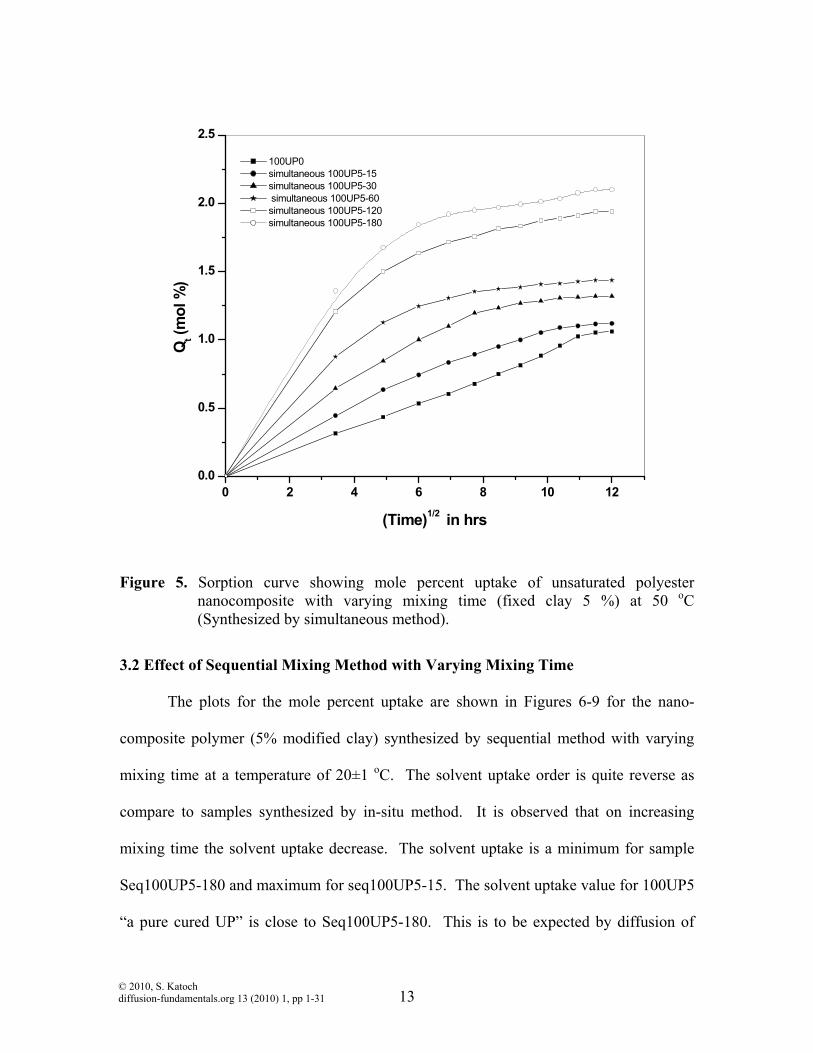
Figure 5. Sorption curve showing mole percent uptake of unsaturated polyester
nanocomposite with varying mixing time (fixed clay 5 %) at 50 oC (Synthesized by simultaneous method).
3.2 Effect of Sequential Mixing Method with Varying Mixing Time
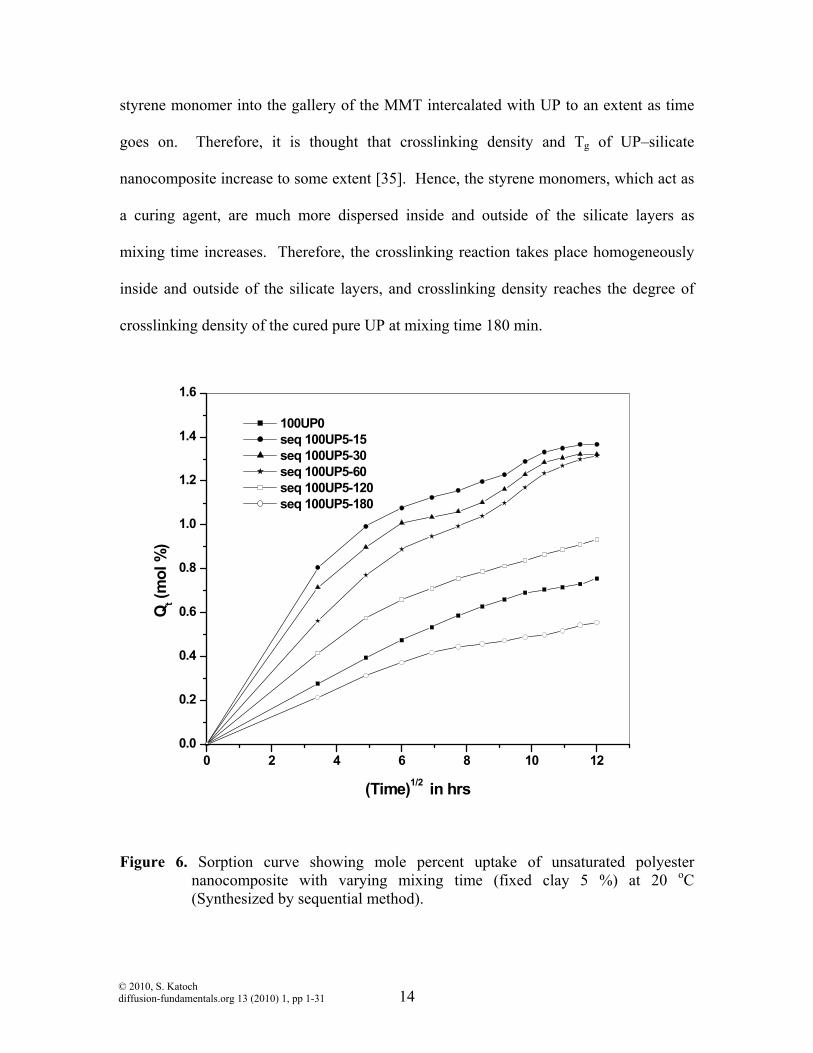
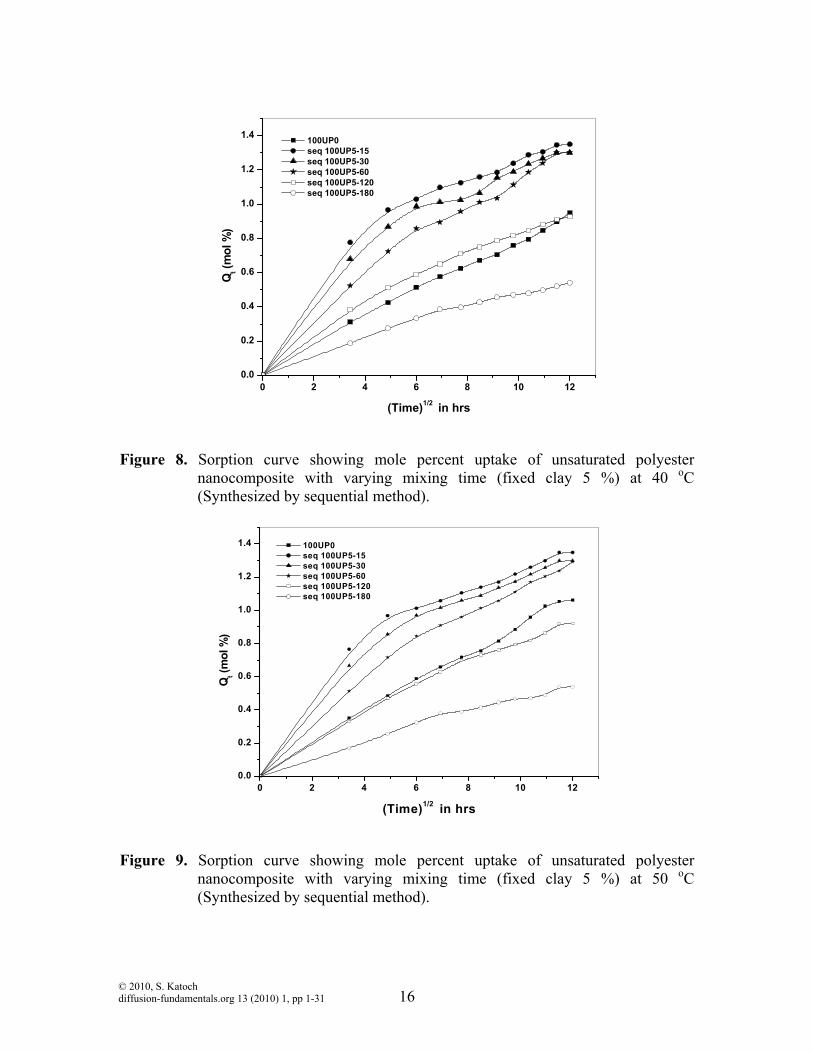
The plots for the mole percent uptake are shown in Figures 6-9 for the nano-
composite polymer (5% modified clay) synthesized by sequential method with varying
mixing time at a temperature of 20±1 oC. The solvent uptake order is quite reverse as
compare to samples synthesized by in-situ method. It is observed that on increasing
mixing time the solvent uptake decrease. The solvent uptake is a minimum for sample
Seq100UP5-180 and maximum for seq100UP5-15. The solvent uptake value for 100UP5
“a pure cured UP” is close to Seq100UP5-180. This is to be expected by diffusion of
© 2010, S. Katochdiffusion-fundamentals.org 13 (2010) 1, pp 1-31
14
styrene monomer into the gallery of the MMT intercalated with UP to an extent as time
goes on. Therefore, it is thought that crosslinking density and Tg of UP–silicate
nanocomposite increase to some extent [35]. Hence, the styrene monomers, which act as
a curing agent, are much more dispersed inside and outside of the silicate layers as
mixing time increases. Therefore, the crosslinking reaction takes place homogeneously
inside and outside of the silicate layers, and crosslinking density reaches the degree of
crosslinking density of the cured pure UP at mixing time 180 min.
0 2 4 6 8 10 120.0
0.2
0.4
0.6
0.8
1.0
1.2
1.4
1.6
Qt (
mol
%)
(Time)1/2 in hrs
100UP0 seq 100UP5-15 seq 100UP5-30 seq 100UP5-60 seq 100UP5-120 seq 100UP5-180
Figure 6. Sorption curve showing mole percent uptake of unsaturated polyester nanocomposite with varying mixing time (fixed clay 5 %) at 20 oC (Synthesized by sequential method).
© 2010, S. Katochdiffusion-fundamentals.org 13 (2010) 1, pp 1-31

15
The increase in the crosslink density is confirmed latter during its calculation
from the Flory-Rehner equation. In Figure 6, the solvent mole percent uptake is plotted
against square root of time for different samples with varying mixing time at fixed
modified clay (5 %) at 20 oC. The samples with 100UP0 and Seq100UP5-180 show
lowest and lower solvent uptake, respectively. The same trend is also observed in
Figures 7, 8 and 9. The sample with 30, 60 and 120 min shows intermediate swelling.
All the samples show regular increase in swelling with time.
0 2 4 6 8 10 120.0
0.2
0.4
0.6
0.8
1.0
1.2
1.4
Qt (
mol
%)
(Time)1/2 in hrs
100UP0 seq 100UP5-15 seq 100UP5-30 seq 100UP5-60 seq 100UP5-120 seq 100UP5-180
Figure 7. Sorption curve showing mole percent uptake of unsaturated polyester nanocomposite with varying mixing time (fixed clay 5 %) at 30 oC (Synthesized by sequential method).
© 2010, S. Katochdiffusion-fundamentals.org 13 (2010) 1, pp 1-31
16
0 2 4 6 8 10 120.0
0.2
0.4
0.6
0.8
1.0
1.2
1.4
Qt (m
ol %
)
(Time)1/2 in hrs
100UP0 seq 100UP5-15 seq 100UP5-30 seq 100UP5-60 seq 100UP5-120 seq 100UP5-180
Figure 8. Sorption curve showing mole percent uptake of unsaturated polyester
nanocomposite with varying mixing time (fixed clay 5 %) at 40 oC (Synthesized by sequential method).
0 2 4 6 8 10 120.0
0.2
0.4
0.6
0.8
1.0
1.2
1.4
Qt (m
ol %
)
(Time)1/2 in hrs
100UP0 seq 100UP5-15 seq 100UP5-30 seq 100UP5-60 seq 100UP5-120 seq 100UP5-180
Figure 9. Sorption curve showing mole percent uptake of unsaturated polyester
nanocomposite with varying mixing time (fixed clay 5 %) at 50 oC (Synthesized by sequential method).
© 2010, S. Katochdiffusion-fundamentals.org 13 (2010) 1, pp 1-31
17
3.3 Effect of Temperature
The samples are also studied for the change in diffusion and sorption due to the
change in temperature (20, 30, 40 and 50 oC) and are shown in Figures 2-9. It is
observed for the samples via simultaneous mixing (Figures 2-5), solvent uptake decreases
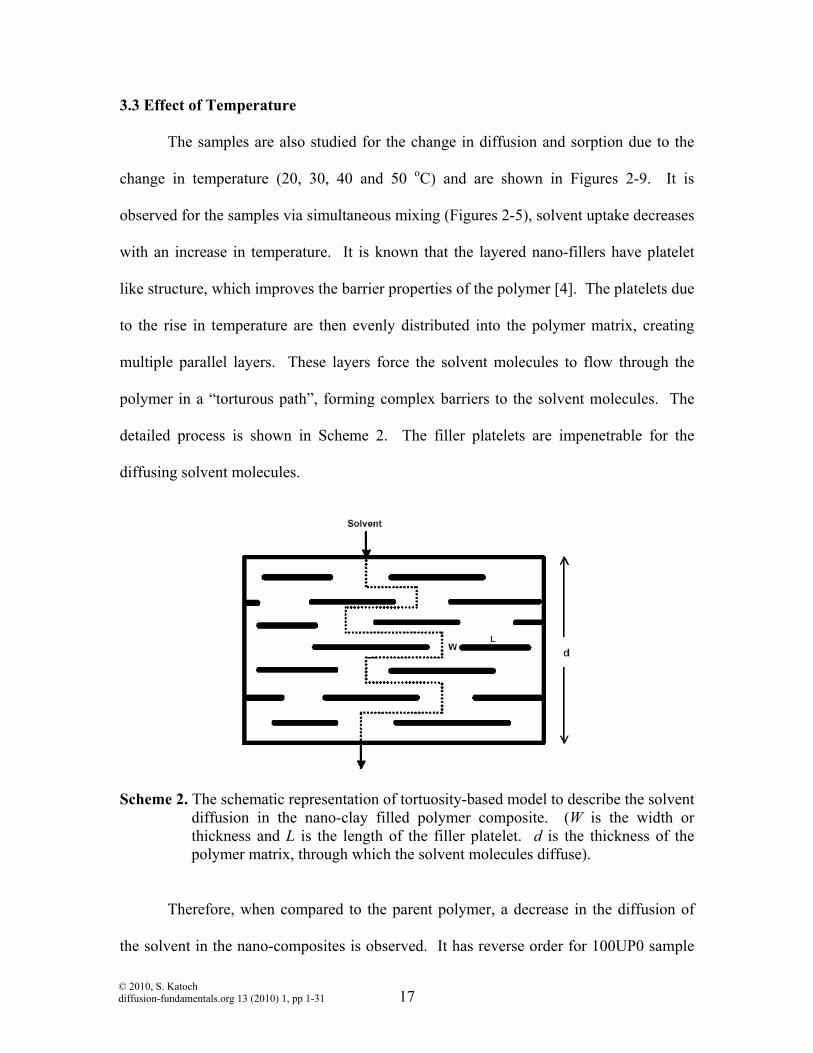
with an increase in temperature. It is known that the layered nano-fillers have platelet
like structure, which improves the barrier properties of the polymer [4]. The platelets due
to the rise in temperature are then evenly distributed into the polymer matrix, creating
multiple parallel layers. These layers force the solvent molecules to flow through the
polymer in a “torturous path”, forming complex barriers to the solvent molecules. The
detailed process is shown in Scheme 2. The filler platelets are impenetrable for the
diffusing solvent molecules.
Scheme 2. The schematic representation of tortuosity-based model to describe the solvent diffusion in the nano-clay filled polymer composite. (W is the width or thickness and L is the length of the filler platelet. d is the thickness of the polymer matrix, through which the solvent molecules diffuse).
Therefore, when compared to the parent polymer, a decrease in the diffusion of
the solvent in the nano-composites is observed. It has reverse order for 100UP0 sample
© 2010, S. Katochdiffusion-fundamentals.org 13 (2010) 1, pp 1-31
18
(neat polymer) with temperature. It is due to an increase in the solvent penetration with
increase in temperature, resulting in higher swelling of the polymer. For the samples
obtained by sequential mixing (Figures 6-9), the similar trend is observed as that for the
samples obtained by simultaneous mixing. The solvent uptake is a maximum for
simultaneous mixing samples. It is observed that at 50 oC for simultaneous100UP5-180
the solvent uptake is four fold as compare to seq100UP5-180.
Diffusion Kinetics
In order to find out the mechanism of swelling, the diffusion data is fitted into an
empirical equation (eq. 3) [37] derived from equation of transport phenomena (eq. 2) [32]
nt ktQQ
=∞ (2)
tlnnklnQQ
ln t +=∞
(3)
where Qt and Q∞ are the mole percent uptake of solvent at time ‘t’ and at infinity
or equilibrium. ‘k’ is a constant, which depends upon both on the polymer-solvent
interaction between and on the structure of polymer. The regression coefficient (r) varies
between 0.86 and 0.99 for samples synthesized by in-situ method. The value of (r) lies
between 0.94 and 0.99 for samples obtained by sequential method. The values of
constant ‘k’ and ‘n’ obtained from the equation (3) and Q∞ are represented in Tables 2a
and 2b. The value of ‘n’ gives an idea of the mechanism of sorption [38]. When the
value of n is 0.5, the mechanism of swelling is termed as Fickian transport. This occurs,
when the rate of diffusion of solvent is less than that of polymer segmental mobility. The
transport is considered as a non-Fickian, if the value of ‘n’ is not ‘0.5’. In particular, if ‘n
= 1’, the transport is called ‘case II’ transport [38]. It is a special case, where the solvent
© 2010, S. Katochdiffusion-fundamentals.org 13 (2010) 1, pp 1-31
19
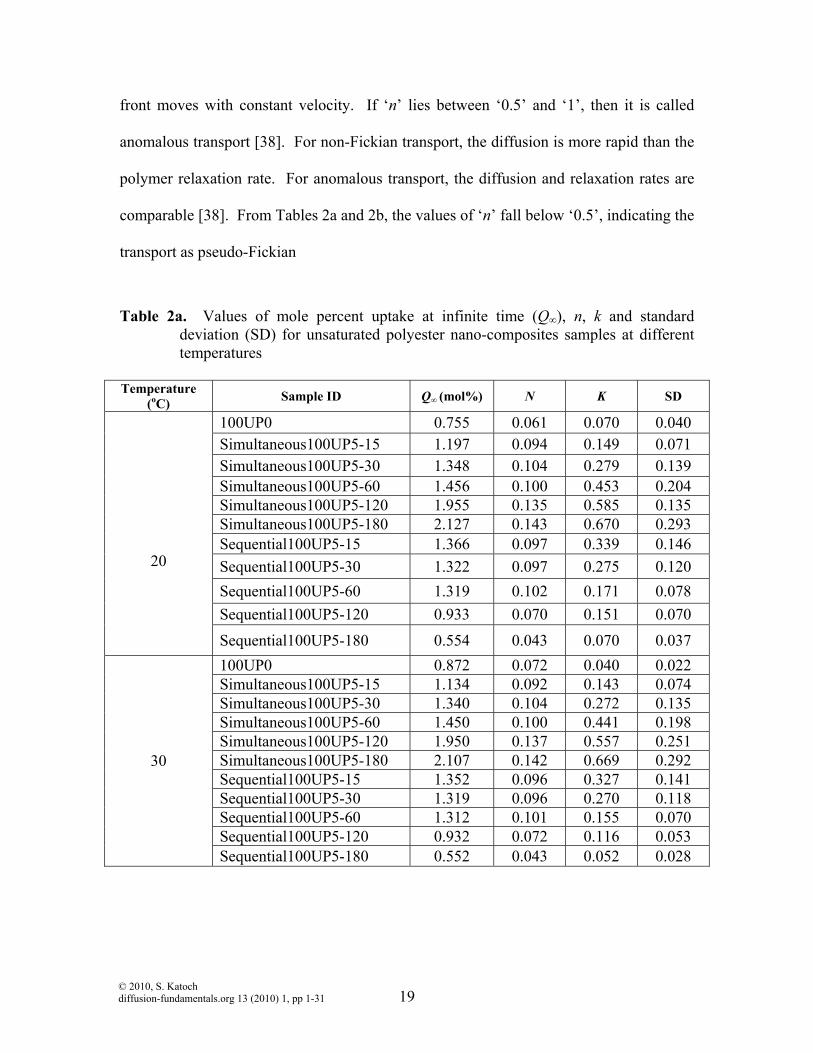
front moves with constant velocity. If ‘n’ lies between ‘0.5’ and ‘1’, then it is called
anomalous transport [38]. For non-Fickian transport, the diffusion is more rapid than the
polymer relaxation rate. For anomalous transport, the diffusion and relaxation rates are
comparable [38]. From Tables 2a and 2b, the values of ‘n’ fall below ‘0.5’, indicating the
transport as pseudo-Fickian
Table 2a. Values of mole percent uptake at infinite time (Q∞), n, k and standard deviation (SD) for unsaturated polyester nano-composites samples at different temperatures
Temperature
(oC) Sample ID Q∞ (mol%) N K SD
100UP0 0.755 0.061 0.070 0.040 Simultaneous100UP5-15 1.197 0.094 0.149 0.071 Simultaneous100UP5-30 1.348 0.104 0.279 0.139 Simultaneous100UP5-60 1.456 0.100 0.453 0.204 Simultaneous100UP5-120 1.955 0.135 0.585 0.135 Simultaneous100UP5-180 2.127 0.143 0.670 0.293 Sequential100UP5-15 1.366 0.097 0.339 0.146 Sequential100UP5-30 1.322 0.097 0.275 0.120 Sequential100UP5-60 1.319 0.102 0.171 0.078 Sequential100UP5-120 0.933 0.070 0.151 0.070
20
Sequential100UP5-180 0.554 0.043 0.070 0.037 100UP0 0.872 0.072 0.040 0.022 Simultaneous100UP5-15 1.134 0.092 0.143 0.074 Simultaneous100UP5-30 1.340 0.104 0.272 0.135 Simultaneous100UP5-60 1.450 0.100 0.441 0.198 Simultaneous100UP5-120 1.950 0.137 0.557 0.251 Simultaneous100UP5-180 2.107 0.142 0.669 0.292 Sequential100UP5-15 1.352 0.096 0.327 0.141 Sequential100UP5-30 1.319 0.096 0.270 0.118 Sequential100UP5-60 1.312 0.101 0.155 0.070 Sequential100UP5-120 0.932 0.072 0.116 0.053
30
Sequential100UP5-180 0.552 0.043 0.052 0.028
© 2010, S. Katochdiffusion-fundamentals.org 13 (2010) 1, pp 1-31
20
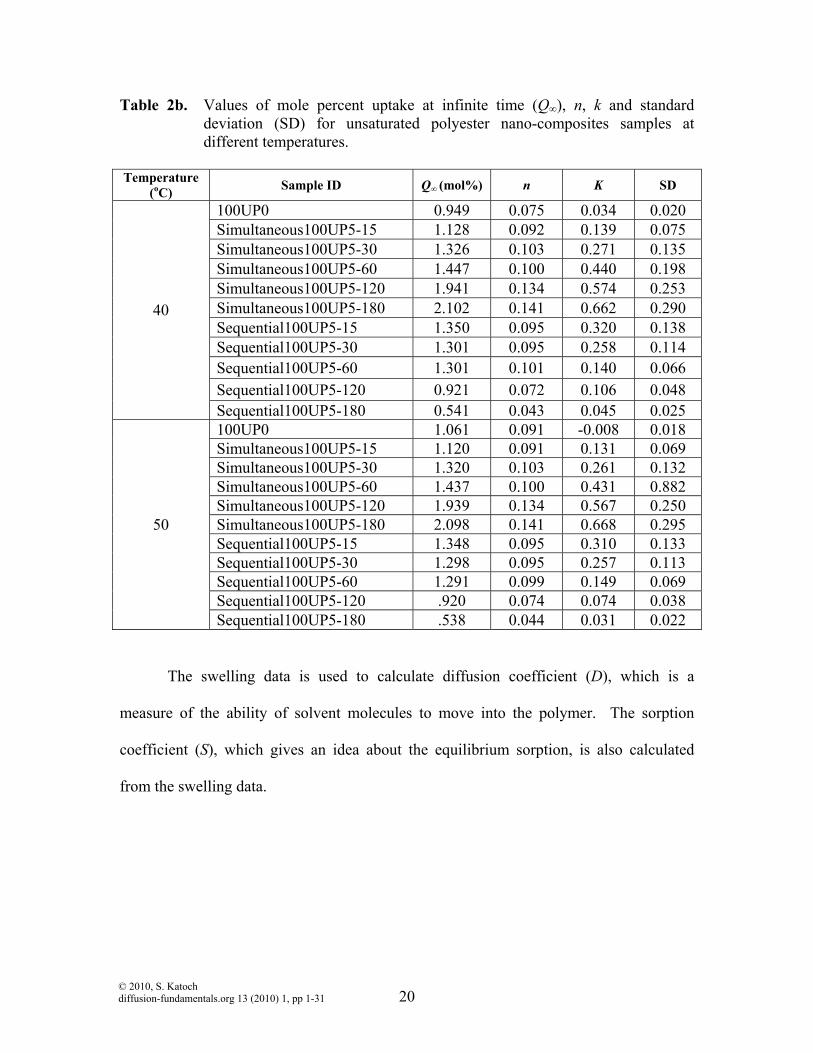
Table 2b. Values of mole percent uptake at infinite time (Q∞), n, k and standard deviation (SD) for unsaturated polyester nano-composites samples at different temperatures.
Temperature
(oC) Sample ID Q∞ (mol%) n K SD
100UP0 0.949 0.075 0.034 0.020 Simultaneous100UP5-15 1.128 0.092 0.139 0.075 Simultaneous100UP5-30 1.326 0.103 0.271 0.135 Simultaneous100UP5-60 1.447 0.100 0.440 0.198 Simultaneous100UP5-120 1.941 0.134 0.574 0.253 Simultaneous100UP5-180 2.102 0.141 0.662 0.290 Sequential100UP5-15 1.350 0.095 0.320 0.138 Sequential100UP5-30 1.301 0.095 0.258 0.114 Sequential100UP5-60 1.301 0.101 0.140 0.066 Sequential100UP5-120 0.921 0.072 0.106 0.048
40
Sequential100UP5-180 0.541 0.043 0.045 0.025 100UP0 1.061 0.091 -0.008 0.018 Simultaneous100UP5-15 1.120 0.091 0.131 0.069 Simultaneous100UP5-30 1.320 0.103 0.261 0.132 Simultaneous100UP5-60 1.437 0.100 0.431 0.882 Simultaneous100UP5-120 1.939 0.134 0.567 0.250 Simultaneous100UP5-180 2.098 0.141 0.668 0.295 Sequential100UP5-15 1.348 0.095 0.310 0.133 Sequential100UP5-30 1.298 0.095 0.257 0.113 Sequential100UP5-60 1.291 0.099 0.149 0.069 Sequential100UP5-120 .920 0.074 0.074 0.038
50
Sequential100UP5-180 .538 0.044 0.031 0.022
The swelling data is used to calculate diffusion coefficient (D), which is a
measure of the ability of solvent molecules to move into the polymer. The sorption
coefficient (S), which gives an idea about the equilibrium sorption, is also calculated
from the swelling data.
© 2010, S. Katochdiffusion-fundamentals.org 13 (2010) 1, pp 1-31
21
The diffusion coefficient (D) is calculated as [39]
D=2
Q4h
⎟⎟⎠
⎞⎜⎜⎝
⎛
∞
θπ (4)
where π = 3.14; h is the thickness of the dry sample and θ is the slope of the initial
linear portion of the curve Qt versus √t; and Q∞ is the mole percent uptake of the solvent
at infinite time. The sorption coefficient (S) is calculated as [39]
PMMS ∞
= (5)
where M∞ is the mass of solvent uptake at equilibrium and Mp is the mass of dry
sample. The sorption and diffusion coefficients are used to calculate permeability
coefficient (P) of samples, which is given by [39]
SDP ×= (6)
Values of these coefficients are reported in Tables 3a and 3b. The data in Tables
3a and 3b indicates that the mixing methods and mixing time influence the diffusion
behavior of nanocomposites. The properties of unsaturated polyester
(UP)/montmorillonite (MMT) nanocomposite greatly depend on the preparation
procedure because of the chemical reactions and physical interactions involved. In case
of in-situ mixing, Simultaneous100UP5-15 sample with 15 min mixing time has
maximum and Simultaneous100UP5-180 sample with 180 min shows a minimum
diffusion coefficient. It is noteworthy that neat polymer (100UP0) shows maximum
diffusion coefficient as compare to all samples synthesized by in-situ mixing method.
The diffusion coefficient is inversely proportional to the mole percent uptake of the
solvent (equation 4). The experimental results indicate that the diffusion of the solvent
through nano-composite increases with increase in the mixing time. The diffusion
© 2010, S. Katochdiffusion-fundamentals.org 13 (2010) 1, pp 1-31

22
coefficient shows an increase with an increase in the temperature for all samples obtained
by in-situ mixing with 5% clay, while for neat polymer diffusion coefficient decreases.
Table 3a. Diffusion coefficient (D), Sorption coefficient (S) and permeability coefficient (P) in acetic acid medium for the samples at different temperatures
Temperature
(oC) Sample ID D × 104 (cm2/sec) S (g/g) P×104 (cm2/sec) 100UP0 4.943 0.453 2.239 Simultaneous100UP5-15 4.427 0.718 3.178 Simultaneous100UP5-30 4.065 0.809 3.288 Simultaneous100UP5-60 3.766 0.873 3.287 Simultaneous100UP5-120 3.462 1.173 4.060 Simultaneous100UP5-180 3.157 1.276 4.028 Sequential100UP5-15 2.725 0.820 2.234 Sequential100UP5-30 3.049 0.793 2.418 Sequential100UP5-60 3.242 0.791 2.564 Sequential100UP5-120 3.698 0.560 2.071
20
Sequential100UP5-180 4.382 0.332 1.454 100UP0 3.247 0.484 1.571 Simultaneous100UP5-15 4.992 0.680 3.394 Simultaneous100UP5-30 4.634 0.804 3.726 Simultaneous100UP5-60 4.416 0.870 3.842 Simultaneous100UP5-120 3.665 1.170 4.288 Simultaneous100UP5-180 3.160 1.264 3.994 Sequential100UP5-15 3.252 0.811 2.638 Sequential100UP5-30 3.631 0.791 2.872 Sequential100UP5-60 3.848 0.787 3.029 Sequential100UP5-120 3.846 0.559 2.150
30
Sequential100UP5-180 4.395 0.331 1.454
In case of neat polymer (100UP0), the diffusion coefficient is the highest at 20 oC,
which keeps on decreasing with temperature and decreases almost two fold at 50 oC. In
case of samples obtained by sequential mixing, Seq100UP5-15 sample (with 15 min
mixing time) shows a minimum and Seq100UP5-180 sample (with 180 min mixing time)
shows a maximum diffusion coefficient. The neat polymer (100UP0) shows maximum
© 2010, S. Katochdiffusion-fundamentals.org 13 (2010) 1, pp 1-31
23
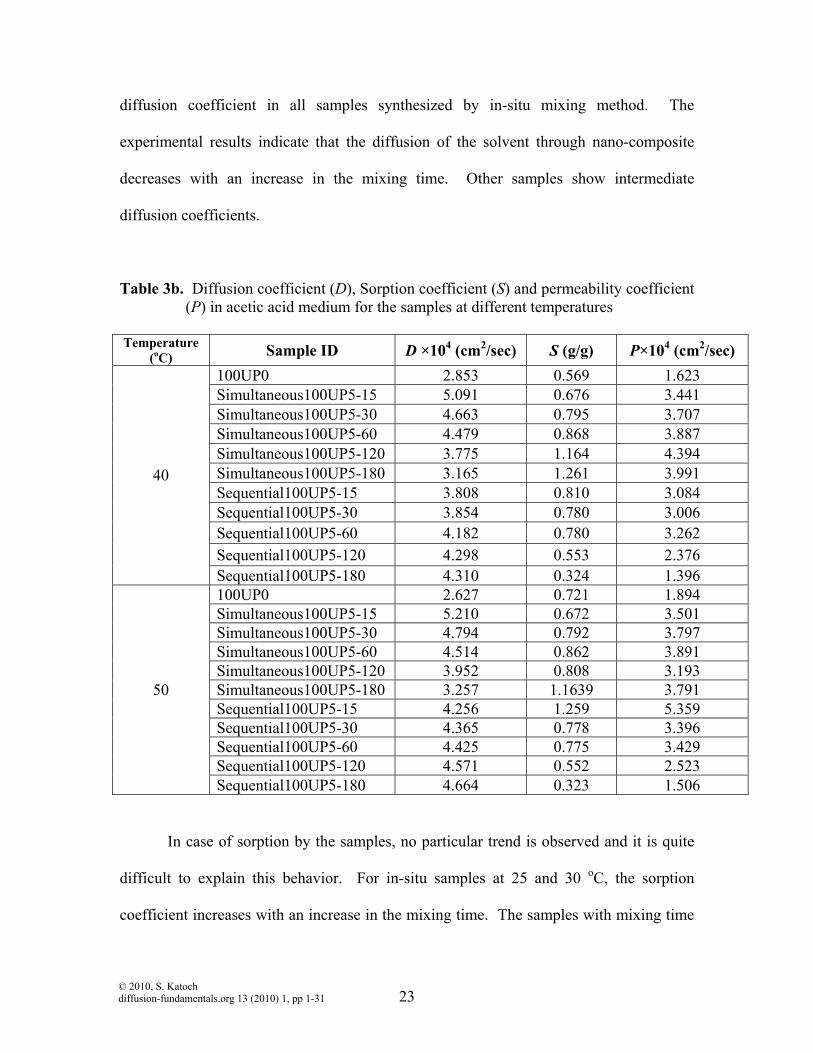
diffusion coefficient in all samples synthesized by in-situ mixing method. The
experimental results indicate that the diffusion of the solvent through nano-composite
decreases with an increase in the mixing time. Other samples show intermediate
diffusion coefficients.
Table 3b. Diffusion coefficient (D), Sorption coefficient (S) and permeability coefficient (P) in acetic acid medium for the samples at different temperatures
Temperature
(oC) Sample ID D ×104 (cm2/sec) S (g/g) P×104 (cm2/sec) 100UP0 2.853 0.569 1.623 Simultaneous100UP5-15 5.091 0.676 3.441 Simultaneous100UP5-30 4.663 0.795 3.707 Simultaneous100UP5-60 4.479 0.868 3.887 Simultaneous100UP5-120 3.775 1.164 4.394 Simultaneous100UP5-180 3.165 1.261 3.991 Sequential100UP5-15 3.808 0.810 3.084 Sequential100UP5-30 3.854 0.780 3.006 Sequential100UP5-60 4.182 0.780 3.262 Sequential100UP5-120 4.298 0.553 2.376
40
Sequential100UP5-180 4.310 0.324 1.396 100UP0 2.627 0.721 1.894 Simultaneous100UP5-15 5.210 0.672 3.501 Simultaneous100UP5-30 4.794 0.792 3.797 Simultaneous100UP5-60 4.514 0.862 3.891 Simultaneous100UP5-120 3.952 0.808 3.193 Simultaneous100UP5-180 3.257 1.1639 3.791 Sequential100UP5-15 4.256 1.259 5.359 Sequential100UP5-30 4.365 0.778 3.396 Sequential100UP5-60 4.425 0.775 3.429 Sequential100UP5-120 4.571 0.552 2.523
50
Sequential100UP5-180 4.664 0.323 1.506
In case of sorption by the samples, no particular trend is observed and it is quite
difficult to explain this behavior. For in-situ samples at 25 and 30 oC, the sorption
coefficient increases with an increase in the mixing time. The samples with mixing time
© 2010, S. Katochdiffusion-fundamentals.org 13 (2010) 1, pp 1-31
24
30 min and 180 min show a minimum and a maximum sorption coefficient, respectively.
On comparison with neat polymer it is found that sorption coefficient has minimum value
for 100UP0 and maximum for Simultaneous100UP-180. A small decrease in the
sorption coefficient with an increase in the temperature is observed. In case of sequential
mixing method, the order is reverse. At 20 to50 oC, the samples show a decrease in the
sorption coefficients with an increase in the mixing time.
A small decrease in the sorption coefficient with an increase in the temperature is
observed. The sorption coefficient is a maximum and a minimum for the samples with
mixing time 15 min and 180 min, respectively. The value of sorption coefficient is found
to be a minimum for sample Seq100UP5-180 even on comparison with sample 100UP0.
This shows a decrease in sorption with an increase in mixing time. Other samples show
intermediate sorption coefficients. The sorption coefficient is a direct indicator of the
absorbed solvent in the polymer. The decrease in the sorption coefficient with
temperature indicates the decrease in the solvent absorption capacity of the nano-
composite material.
In all of the systems, it is observed that the sorption and diffusion coefficients
decrease with an increase in the temperature. It is reported elsewhere [40] for natural
rubber that these coefficients show an increase with a rise in the temperature. But in our
case, these coefficients decrease with temperature. This can be explained by the dual
mode model for diffusion in the polymers below glass transitions [41]. According to this
model, glassy polymers contain a distribution of microvoids frozen into a structure as the
polymer is cooled through its glass transition temperature. The free segmental rotations
of the polymer chains in the glassy state are restricted, which results in the fixed
© 2010, S. Katochdiffusion-fundamentals.org 13 (2010) 1, pp 1-31
25
microvoids throughout the polymer. The microvoids in the glassy polymer network
immobilize the solvent molecules by entrapment. These entrapments increase the size of
the polymer, resulting in the enlargement of the microvoids. The enlargement of
microvoids further leads to initiate the macro-fractures in the polymer.
The permeability coefficients of the samples are the product of diffusion and
sorption coefficients. For in-situ samples the permeability coefficients show an increase
with the increasing in mixing time. The permeability coefficient also increases with an
increase in temperature. For neat polymer the sorption coefficient decreases with an
increase in temperature. At 25 oC, the permeability coefficient is observed to be
minimum and maximum for the sample 100UP5-15 (neat polymer) and 100UP5-120,
respectively.
On comparison with virgin polymer the sample without clay shows a minimum
and the sample with 100UP-120 shows a maximum permeability coefficient. The same
order is follow for all samples from 20 to 40 oC. At 50 oC, the permeability coefficient is
observed to be maximum and minimum for 100UP5-180 and 100UP5-15, respectively.
For the samples synthesized by sequential mixing, the permeability coefficient increases
with an increase in temperature. The value of permeability coefficient increases with
mixing time up to 60 min after that coefficient values decrease.
© 2010, S. Katochdiffusion-fundamentals.org 13 (2010) 1, pp 1-31

26
Crosslink Density and Molecular Weight
The sorption data is also used to calculate the crosslink density of the polymer
networks using Flory-Rehner’s equation [42]
)V5.0V(VVV)V1ln(
p3/1
p
2ppp
−
++−−=
χν (7)
where Vp is the volume fraction of the polymer in the mixture, χ is the polymer-solvent
interaction parameter and V1 is the molar volume of the solvent. Vp and χ are obtained by
the following equations [42]
V
solvent ofDensity solvent ofWeight
polymer ofDensity polymer ofWeight
polymer ofDensity polymer ofWeight
p +=
(8)
34.0RT
)(V 2sp1
sH +−
=+=δδ
χχχ (9)
Where χH and χS are the enthalpic and entropic components of χ, δ1 and δ2 are the
solubility parameters of polymer and solvent, respectively. The solubility parameter of
the polymer is obtained by fitting the swelling coefficients of the polymer in various
solvents. The results are reported in Table 6. The molecular weight between two
crosslinks ( cM ) is also calculated for all the samples by the following equation [40]
ν21M c = (10)
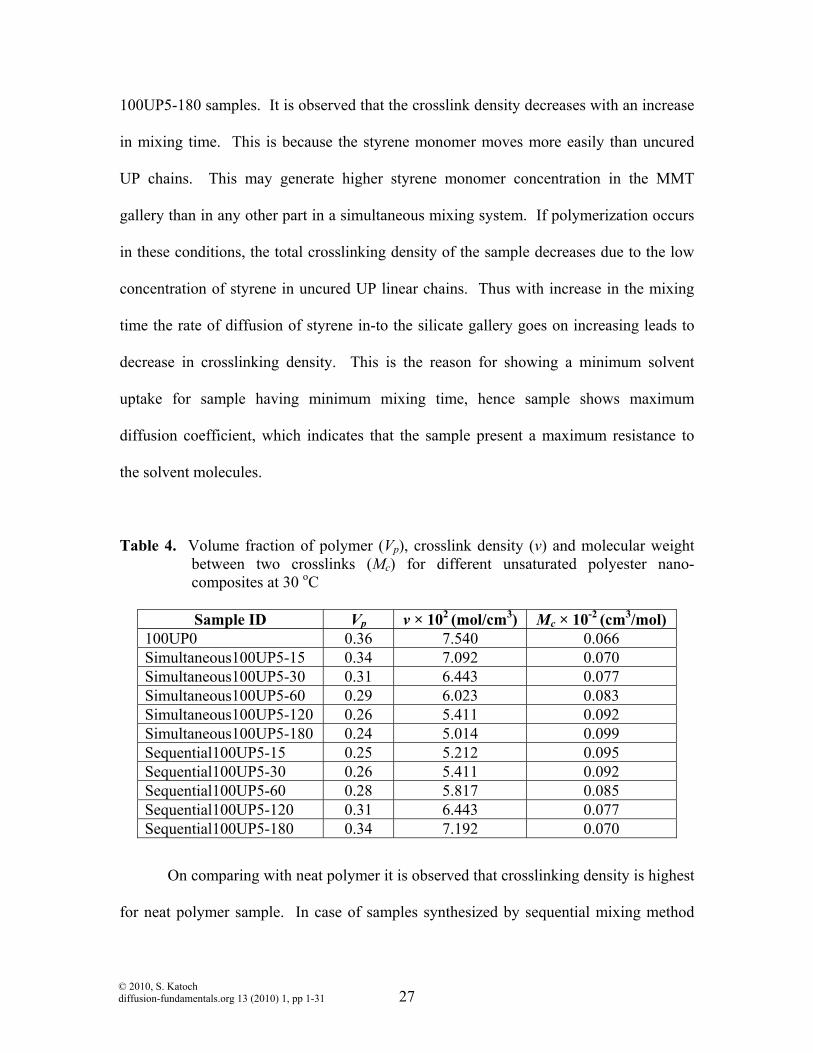
The values of the crosslink density and cM are reported in Table 4. The
crosslinking density ranges from 5.014 to 7.092 × 10² mol/cm3 for the simultaneous
mixed samples and 5.212 to 7.192 × 10² mol/cm3 for the sequential mixed samples. The
crosslink density for in-situ sample is the highest for 100UP5-15 and the lowest for
© 2010, S. Katochdiffusion-fundamentals.org 13 (2010) 1, pp 1-31
27
100UP5-180 samples. It is observed that the crosslink density decreases with an increase
in mixing time. This is because the styrene monomer moves more easily than uncured
UP chains. This may generate higher styrene monomer concentration in the MMT
gallery than in any other part in a simultaneous mixing system. If polymerization occurs
in these conditions, the total crosslinking density of the sample decreases due to the low
concentration of styrene in uncured UP linear chains. Thus with increase in the mixing
time the rate of diffusion of styrene in-to the silicate gallery goes on increasing leads to
decrease in crosslinking density. This is the reason for showing a minimum solvent
uptake for sample having minimum mixing time, hence sample shows maximum
diffusion coefficient, which indicates that the sample present a maximum resistance to
the solvent molecules.
Table 4. Volume fraction of polymer (Vp), crosslink density (ν) and molecular weight between two crosslinks (Mc) for different unsaturated polyester nano-composites at 30 oC
Sample ID Vp ν × 102 (mol/cm3) Mc × 10-2 (cm3/mol)
100UP0 0.36 7.540 0.066 Simultaneous100UP5-15 0.34 7.092 0.070 Simultaneous100UP5-30 0.31 6.443 0.077 Simultaneous100UP5-60 0.29 6.023 0.083 Simultaneous100UP5-120 0.26 5.411 0.092 Simultaneous100UP5-180 0.24 5.014 0.099 Sequential100UP5-15 0.25 5.212 0.095 Sequential100UP5-30 0.26 5.411 0.092 Sequential100UP5-60 0.28 5.817 0.085 Sequential100UP5-120 0.31 6.443 0.077 Sequential100UP5-180 0.34 7.192 0.070
On comparing with neat polymer it is observed that crosslinking density is highest
for neat polymer sample. In case of samples synthesized by sequential mixing method
© 2010, S. Katochdiffusion-fundamentals.org 13 (2010) 1, pp 1-31
28
this order is reversed. The crosslink density increases with an increase in mixing time. It
is the highest for 100UP5-180 and lowest for the sample 100UP5-15. The increase in
crosslink density decreases the solvent uptake. This explains the solvent uptake trends
for the sequential mixing samples, which is in good agreement with sorption kinetics.
With increase in the mixing time the crosslinking density increases because the styrene
monomer diffuses to the gallery of the MMT intercalated with UP to an extent as time
goes on. Therefore, it is thought that crosslinking density and Tg of UP–silicate
nanocomposite increase to some extent. Hence, the styrene monomers, which act as a
curing agent, are much more dispersed inside and outside of the silicate layers as mixing
time increases. Therefore, the crosslinking reaction takes place homogeneously inside
and outside of the silicate layers, and crosslinking density reaches the degree of
crosslinking density of the cured pure UP. It is noteworthy that crosslinking density for
the sample 100UP5-180 is even highest for neat polymer.
Conclusion
A new system of unsaturated polyester nanocomposite depending upon
fabrication method is investigated for the sorption and diffusion studies. The kinetics of
the sorption is studied by using the equation of transport phenomena. The solvent
resistance properties of the montmorillonite filled unsaturated polyester nanocomposite
based on glycolyzed PET are studied in acetic acid medium for food packaging
application point of view. The values of ‘n’ in the transport equation are found to be
below ‘0.5’, showing the non-Fickian diffusion in the polymer. The dependence of the
diffusion coefficient on the mixing time and temperature has been studied for the
nanocomposite samples. The diffusion coefficient increases with an increase in mixing
© 2010, S. Katochdiffusion-fundamentals.org 13 (2010) 1, pp 1-31
29
time and temperature for all of the unsaturated polyester nanocomposite synthesized by
sequential mixing method, while decrease for simultaneous samples. The crosslink
density shows decreasing trend with an increase in mixing time for all simultaneous
samples. For sequential mixing samples, the cross linking density increases with increase
in the mixing time. The crosslinking density (calculated from the CH3COOH swelling)
ranges from5.014 to 7.092 × 10² mol/cm3 for the simultaneous mixed samples and 5.212
to 7.192 × 10² mol/cm3 for the sequential mixed samples.
References
[1]. Lange J, Wyser Y (2003) Pack Tech Sci 16: 149-158.
[2]. Ray S, Okamoto K, Okamoto M (2003) Macromol 36: 2355-2367.
[3]. Giannelis EP (1996) Adv Mater 8, 29-35.
[4]. Lu C, Mai YW (2005) Phy Rev Lett 95: 088303, 1-4.
[5]. Saminathan K, Selvakumar P, Bhatnagar N (2008) Polym Test 27: 296-.
[6]. Wilkinson AN, Man Z, Stanford JL, Matikainen P, Clemens MN, Lees GC,
Liauw CM (2007) Compos Sci Tech 67: 3360-3368.
[7]. Drown EK, Mohanty AK, Parulekar Y, Hasija H, Harte BR, Misra M,
Kurian JV (2007) Compos Sci Tech 67: 3168-3175.
[8]. Bergaya FA (2008) Micro Meso Mater 107: 141-148.
[9]. Xue S, Pinnavaia TJ (2008) Micro Meso Mater 107: 134-140.
[10]. Ding Y, Zhang X, Xiong R, Wu S, Zha M, Tang H (2008) Euro Polym J 44:
24-31.
[11]. Syzdek J, Borkowska R, Perzyna K, Tarascon JM, Wieczorek W (2007) J
Pow Sour 173: 712-720.
© 2010, S. Katochdiffusion-fundamentals.org 13 (2010) 1, pp 1-31
30
[12]. Ahmadi B, Kassiriha M, Khodabakhshi K, Mafi ER (2007) Prog Org Coat
60: 99-104.
[13]. Eitan A, Fisher FT, Andrews R, Brinson LC, Schadler LS (2006) Compos
Sci Tech 66: 1162-1173.
[14]. Hackman I, Hollaway L (2005) Proceedings of the International Symposium
on Bond Behaviour of FRP in Structures (BBFS) 525-530.
[15]. Gouanve F, Marais S, Bessadok A, Langevin D, Metayer M (2007) Eur
Polym J 43: 586-598.
[16]. Hansen CM (2004) Prog Org Coat 51: 55-66.
[17]. Tanigami T, Yano K, Yamaura K, Matsuzawa S (1995) Polymer 36: 2941-
2946.
[18]. Cussler EL (2007) Diffusion Fundamentals 6: 72.1-72.12
[19]. Zhu Q, Shentu B, Liu Q, Weng Z (2006) Eur Polym J 42: 1417-1422.
[20]. Detallante V, Langevin D, Chappey C, Metayer M, Mercier R, Pineri M
(2002) Desalination 148: 333-339.
[21]. Kumar R, Srivastava SK, Mathur GN (1985) J Elast Plast 17: 89-96.
[22]. Han H, Gryte CC, Ree M (1995) Polymer 36: 1663-1672.
[23]. Singh P, Kaushik A, Gupta P (2005) J Reinf Plast Compos 24: 1479-1491.
[24]. Sen M, Guven O (2000) Comput Theor Polym Sci 11: 475-482.
[25]. Singh PP, Cushman JH, Maier DE (2003) Chem Eng Sci 58: 2409-2419.
[26]. Altinkaya SA, Ramesh N, Duda JL (2006) Polymer 47: 8228-8235.
[27]. Fieldson GT, Barbari TA (1993) Polymer 34: 1146-1153.
© 2010, S. Katochdiffusion-fundamentals.org 13 (2010) 1, pp 1-31
31
[28]. Philippe L, Sammon C, Lyon SB, Yarwood J (2004) Prog Org Coat 49: 302-
314.
[29]. Philippe L, Sammon C, Lyon SB, Yarwood J (2004) Prog Org Coat 49: 315-
323.
[30]. Akelah A, Moet A (1996) J Mater Sci 31: 3589-3596.
[31]. Lan T, Kaviratna PD, Pinnavaia TJ (1995) Chem Mater 7: 2144-2150.
[32]. Lee DC, Jang LW (1998) J Appl Polym Sci 68: 1997-2005.
[33]. Ajithkumar S, Patel NK, Kansara SS (1998) Polym Gel Net 6: 137-147.
[34]. Welty JR, Wicks CE, Wilson RE, Rorrer GL (1984) Fundamentals of
momentum, heat, and mass transfer. 3rd ed. New York: Wiley.
[35]. Brandrup J, Immmergut EH (1989) Polymer handbook. 3rd ed New York:
Wiley.
[36]. Zeng C, Li J, Li P, Chen T, Lin Y, Wang D, Chen C (2006) Chem Eng Sci
61: 1892-1900.
[37]. Suh DJ, Lim YT, Park OO (2000) Polymer 41: 8557-8563.
[38]. George SC, Knorgen M, Thomas S (1999) J Membr Sci 163: 1-17.
[39]. Crank J. (1975) Chapter 11. The Mathematics of Diffusion; 2nd ed.
Clarendon Press. Oxford.
[40]. Ajithkumar S, Patel NK, Kansara SS (2000) Euro Polym J 36: 2387-2393.
[41]. Mathew AP, Packirisamy S, Kumaran MG, Thomas S (1995) Polymer 36:
4935-4942.
[42]. Meares P (1954) J Am Chem Soc 76: 3415-3422.
[43]. Zhu L, Wool RP (2006) Polymer 47: 8106-8115.
© 2010, S. Katochdiffusion-fundamentals.org 13 (2010) 1, pp 1-31
Related Documents