Claremont Colleges Scholarship @ Claremont CGU Faculty Publications and Research CGU Faculty Scholarship 4-11-2013 Sweetened Drink and Snacking Cues in Adolescents. A Study Using Ecological Momentary Assessment Jerry L. Grenard Claremont Graduate University Alan W. Stacy Claremont Graduate University Saul Shiffman University of Pisburgh - Main Campus Amanda N. Baraldi Arizona State University David P. MacKinnon Arizona State University See next page for additional authors is Article - postprint is brought to you for free and open access by the CGU Faculty Scholarship at Scholarship @ Claremont. It has been accepted for inclusion in CGU Faculty Publications and Research by an authorized administrator of Scholarship @ Claremont. For more information, please contact [email protected]. Recommended Citation Jerry L. Grenard, Alan W. Stacy, Saul Shiffman, Amanda N. Baraldi, David P. MacKinnon, Ginger Lockhart, Yasemin Kisbu-Sakarya, Sarah Boyle, Yuliyana Beleva, Carol Koprowski, Susan L. Ames, Kim D. Reynolds, Sweetened drink and snacking cues in adolescents. A study using ecological momentary assessment, Appetite, Volume 67, 1 August 2013, Pages 61-73, ISSN 0195-6663, 10.1016/ j.appet.2013.03.016. Post-print. (hp://www.sciencedirect.com/science/article/pii/S0195666313001293)

Welcome message from author
This document is posted to help you gain knowledge. Please leave a comment to let me know what you think about it! Share it to your friends and learn new things together.
Transcript

Claremont CollegesScholarship @ Claremont
CGU Faculty Publications and Research CGU Faculty Scholarship
4-11-2013
Sweetened Drink and Snacking Cues inAdolescents. A Study Using Ecological MomentaryAssessmentJerry L. GrenardClaremont Graduate University
Alan W. StacyClaremont Graduate University
Saul ShiffmanUniversity of Pittsburgh - Main Campus
Amanda N. BaraldiArizona State University
David P. MacKinnonArizona State University
See next page for additional authors
This Article - postprint is brought to you for free and open access by the CGU Faculty Scholarship at Scholarship @ Claremont. It has been accepted forinclusion in CGU Faculty Publications and Research by an authorized administrator of Scholarship @ Claremont. For more information, pleasecontact [email protected].
Recommended CitationJerry L. Grenard, Alan W. Stacy, Saul Shiffman, Amanda N. Baraldi, David P. MacKinnon, Ginger Lockhart, Yasemin Kisbu-Sakarya,Sarah Boyle, Yuliyana Beleva, Carol Koprowski, Susan L. Ames, Kim D. Reynolds, Sweetened drink and snacking cues in adolescents.A study using ecological momentary assessment, Appetite, Volume 67, 1 August 2013, Pages 61-73, ISSN 0195-6663, 10.1016/j.appet.2013.03.016. Post-print. (http://www.sciencedirect.com/science/article/pii/S0195666313001293)

AuthorsJerry L. Grenard, Alan W. Stacy, Saul Shiffman, Amanda N. Baraldi, David P. MacKinnon, Ginger Lockhart,Yasemin Kisbu-Sakarya, Sarah Boyle ABD, Yuliyana Beleva ABD, Carol Koprowski, Susan L. Ames, and KimD. Reynolds
This article - postprint is available at Scholarship @ Claremont: http://scholarship.claremont.edu/cgu_fac_pub/122
Elsevier Editorial System(tm) for Appetite Manuscript Draft Manuscript Number: APPETITE-D-12-00441R2 Title: Sweetened Drink and Snacking Cues in Adolescents: A Study Using Ecological Momentary Assessment Article Type: Full length paper Keywords: adolescents; diet; food habits; cues; Ecological Momentary Assessment Corresponding Author: Dr. Jerry L. Grenard, Ph.D. Corresponding Author's Institution: Claremont Graduate University First Author: Jerry L. Grenard, Ph.D. Order of Authors: Jerry L. Grenard, Ph.D.; Alan W Stacy, Ph.D.; Saul Shiffman, Ph.D.; Amanda N Baraldi, MA; David P MacKinnon, PhD; Ginger Lockhart, PhD; Yasemin Kisbu-Sakaryac, PhD; Sarah Boyle; Yuliyana Beleva, MA; Carol Koprowski, PhD, RD; Susan L Ames, PhD; Kim D Reynolds, PhD Abstract: The objective of this study was to identify physical, social, and intrapersonal cues that were associated with the consumption of sweetened beverages and sweet and salty snacks among adolescents from lower SES neighborhoods. Students were recruited from high schools with a minimum level of 25% free or reduced cost lunches. Using Ecological Momentary Assessment, participants (N=158) were trained to answer brief questionnaires on handheld PDA devices: (a) each time they ate or drank, (b) when prompted randomly, and (c) once each evening. Data were collected over 7 days for each participant. Participants reported their location (e.g., school grounds, home), mood, social environment, activities (e.g., watching TV, texting), cravings, food cues (e.g., saw a snack), and food choices. Results showed that having unhealthy snacks or sweet drinks among adolescents was associated with being at school, being with friends, feeling lonely or bored, craving a drink or snack, and being exposed to food cues. Surprisingly, sweet drink consumption was associated with exercising. Watching TV was associated with consuming sweet snacks but not with salty snacks or sweet drinks. These findings identify important environmental and intrapersonal cues to poor snacking choices that may be applied to interventions designed to disrupt these food-related, cue-behavior linked habits.

Manuscript: APPETITE-D-12-00441R2
Highlights:
We identified situations associated with snacks and sweet drinks among adolescents.
We used ecological momentary assessment techniques.
School, friends, loneliness, boredom, and food cues were associated with snacking.
Exercising was associated with consuming sweetened drinks.
Watching TV was not associated with consuming sweet drinks or salty snacks.
*Highlights (for review)
1
Running head: Snacking Cues in Adolescents
Sweetened Drink and Snacking Cues in Adolescents: A Study Using Ecological Momentary
Assessment
Jerry L. Grenarda, Alan W. Stacya, Saul Shiffmanb, Amanda N. Baraldic, David P. MacKinnonc,
Ginger Lockhartd, Yasemin Kisbu-Sakaryac, Sarah Boylee, Yuliyana Belevae, Carol Koprowskif,
Susan L. Amesa, Kim D. Reynoldsa
a School of Community and Global Health, Claremont Graduate University, 675 West foothill
Blvd. Suite 310, Claremont, CA 91711-3475, USA.
b Department of Psychology, University of Pittsburgh, 3130 Sennott Square, 210 S. Bouquet
Street, Pittsburgh, PA 15260, USA.
c Department of Psychology, Arizona State University, PO Box 871104, 950 S. McAllister,
Room 237, Tempe, AZ 85287-1104, USA.
d Department of Psychology, Utah State University, 2810 Old Main Hill, Logan, UT 84322-2810,
USA.
e School of Behavioral and Organizational Science, Claremont Graduate University, 150 East
10th Street, Claremont, CA 91711-3475, USA.
f Institute for Health Promotion & Disease Prevention Research, University of Southern
California, 2001 N Soto Street, 3rd Floor, MC 9239, Los Angeles, CA 90033-9045, USA
Corresponding Author: Jerry L. Grenard, Ph.D., Email: [email protected]. Telephone:
909-607-6001. Fax: 909-621-5221.
Word Count: 7,235
Tables: 5
Figures: 0
*ManuscriptClick here to view linked References

2
Abstract
The objective of this study was to identify physical, social, and intrapersonal cues that were
associated with the consumption of sweetened beverages and sweet and salty snacks among
adolescents from lower SES neighborhoods. Students were recruited from high schools with a
minimum level of 25% free or reduced cost lunches. Using Ecological Momentary Assessment,
participants (N=158) were trained to answer brief questionnaires on handheld PDA devices: (a)
each time they ate or drank, (b) when prompted randomly, and (c) once each evening. Data
were collected over 7 days for each participant. Participants reported their location (e.g., school
grounds, home), mood, social environment, activities (e.g., watching TV, texting), cravings, food
cues (e.g., saw a snack), and food choices. Results showed that having unhealthy snacks or
sweet drinks among adolescents was associated with being at school, being with friends, feeling
lonely or bored, craving a drink or snack, and being exposed to food cues. Surprisingly, sweet
drink consumption was associated with exercising. Watching TV was associated with
consuming sweet snacks but not with salty snacks or sweet drinks. These findings identify
important environmental and intrapersonal cues to poor snacking choices that may be applied to
interventions designed to disrupt these food-related, cue-behavior linked habits.
Key words: adolescents, diet, food habits, cues, Ecological Momentary Assessment

3
Introduction
The proportion of adolescents in the US who are overweight or obese is a critical public
health concern (Ogden, Carroll, Curtin, Lamb, & Flegal, 2010). Nationwide, the prevalence of
being overweight and obese (BMI > 85 percentile) is 34.2% among all adolescents 12-19 years
of age (Ogden et al., 2010). The prevalence of obesity is especially high among lower income
families. In California, where this study was conducted, teens 12-17 years of age from lower
income families (<300% Federal Poverty Level) are at elevated levels of risk of being
overweight (20.7%) or obese (15.4%) compared to teens from higher income families (>300%
FPL: 11.8% overweight and 7.5% obese) according to the California Health Interview Survey
(California Health Interview Survey, 2012). Adolescents with high BMI are at increased risk for
chronic diseases including cardiovascular disease and type 2 diabetes mellitus among others
(Freedman, Mei, Srinivasan, Berenson, & Dietz, 2007; Knight, 2011).
Obesity is, of course, closely related to diet (Baranowski et al., 2000; Goran, 2001; Hill,
Melanson, & Wyatt, 2000; Mendlein, Baranowski, & Pratt, 2000), including snacking and
sweetened beverage consumption. Evidence is accumulating that consumption of sugar-
sweetened beverages is linked to increased body weight (Malik, Schulze, & Hu, 2006) and
increased risk of medical problems including diabetes (Centers for Disease Control and
Prevention (CDC), 2011; Malik et al., 2010; Vartanian, Schwartz, & Brownell, 2007). In addition,
there is evidence that excess consumption of energy-dense snack foods is associated with an
unhealthy weight gain (Piernas & Popkin, 2011; Swinburn, Caterson, Seidell, & James, 2004).
The current study uses real-world, real-time data collected via Ecological Momentary
Assessment (EMA: (Shiffman, 2009; Stone & Shiffman, 1994)) techniques to identify
environmental and intrapersonal cues associated with habitual consumption of high calorie
snacks and sweetened beverages.
Over time, some dietary behaviors may evolve through learning into habits that are
initiated by situational cues (stimulus-driven habits). Research in neuroscience (Knowlton,
4
Mangels, & Squire, 1996; Yin & Knowlton, 2006a; Yin & Knowlton, 2006b), memory (Nelson &
Goodmon, 2003), social psychology (Bargh & Williams, 2006; Dijksterhuis, Smith, van Baaren,
& Wigboldus, 2005), and research on appetitive behavior (LaBar et al., 2001) have consistently
shown the importance of cues in spontaneously triggering habits and related cognitions. A
situation such as a location, social setting, or mood may become a cue for a behavior after
repeated co-occurrence with that behavior, especially when the behavior has immediate
rewards such as consumption of palatable foods. A friend, for example, may not be associated
with having a snack initially, but after repeatedly meeting the friend after school to buy chips and
a soda, the sight of the friend may become a cue for the behavior. The current study was
especially interested in stimulus-response (S-R) habits formed by this type of instrumental
learning that may be highly resistant to modification (Yin & Knowlton, 2006b). After a strong (S-
R) habit is formed, the cue (stimulus) can initiate the behavior (response) regardless of
anticipated outcomes (Wood & Neal, 2007; Yin & Knowlton, 2006a). The habit is likely to persist
even after the outcome contingency has changed (i.e., negative consequences are encountered
due to excessive weight gain) and despite learning new facts about obesity (e.g., through
traditional education). Habit is supported by neural systems that reflect a set of processes
classified as procedural memory, which is independent from declarative or explicit memory
(e.g., memory for new facts through education), as documented in a series of studies on
multiple brain systems (Knowlton et al., 1996; Ryan & Cohen, 2003). Frameworks incorporating
these findings and non-declarative processes have been increasingly applied to a range of
appetitive behaviors (for recent reviews, see (Stacy & Wiers, 2010; Stacy, Ames, Wiers, &
Krank, 2010)). Poor dietary habits that are allowed to continue unchecked can lead to a lifetime
struggle with obesity and related chronic diseases. It is vitally important therefore to identify
cues that trigger maladaptive dietary habits to facilitate the design of interventions that will
disrupt the cue-behavior link and encourage healthy diets.
5
Participants may not be aware of the cues that trigger their habits (Dijksterhuis et al.,
2005; Knowlton et al., 1996; Wood & Neal, 2007). Self-reports on the causes of behavior may
not fully reflect the cue-habit process (Bargh, 2005; Dijksterhuis et al., 2005), and this makes it
difficult to assess the cue-habit link with traditional surveys where participants are asked to
introspect about their behavior in the previous days or months. It is possible that assessing
behavior in real time may better identify cue-behavior patterns that are not captured by
conventional, retrospective questionnaires (Shiffman, 1993; Shiffman, Stone, & Hufford, 2008).
Real time assessment may be particularly helpful in identifying these linkages if the procedures
simply record cue and behavior co-occurrences, facilitating the study of their empirical linkages
without requiring participant awareness of the link.
EMA (Shiffman et al., 2008) is an assessment technique with several key features: (a)
participants respond to questions during their typical activities in the real-world environment,
which permits researchers to generalize the findings to the real lives of the participants, (b)
responses of the participants focus on their current situation, activities, and feelings, which can
eliminate recall bias associated with assessments that ask for recall of events over longer
periods of time, (c) questions are asked at strategically selected times to capture situations,
activities, and feelings during target events such as eating and, for purposes of comparison,
during random times when participants may not be doing the target activity (i.e., non-eating
situations), and (d) data are typically collected multiple times in a day and over several days to
capture how behavior changes across situations and to accumulate multiple instances of the
events of interest. The design and technology may differ by study question and behavior, but all
EMA studies collect data repeatedly from participants on their current state or situation in their
natural environment. Researchers then may examine how situations, activities, and feeling
states influence the behavior of interest.
EMA has been widely used over a period of more than 20 years to measure health
behaviors and antecedents related to smoking (Shiffman, 2005), exercise (Dunton, Whalen,
6
Jamner, & Floro, 2007; Gorely, Marshall, Biddle, & Cameron, 2007; Hausenblas, Gauvin,
Downs, & Duley, 2008), and diet (Glanz & Murphy, 2007; Greeno, Wing, & Shiffman, 2000; le
Grange, Gorin, Catley, & Stone, 2001), with considerable evidence supporting its validity and
utility among adults and youth. EMA procedures have shown less recall bias than retrospective
questionnaires among adolescents and children as young as 7 years (van den Brink, Bandell-
Hoekstra, & Abu-Saad, 2001), and previous EMA studies among children and adolescents
include, for example, physical activity (Dunton et al., 2007; Dunton, Liao, Intille, Spruijt-Metz, &
Pentz, 2011) smoking cessation (Gwaltney, Bartolomei, Colby, & Kahler, 2008), and mood
(Weinstein & Mermelstein, 2007; Weinstein, Mermelstein, Hankin, Hedeker, & Flay, 2007). Prior
EMA studies have successfully examined dietary behavior but largely among participants
recruited from obese populations and/or those with eating disorders (Engel et al., 2009; Greeno
et al., 2000; Hilbert & Tuschen-Caffier, 2007; Smyth et al., 2009).
The objective of the current study was to empirically identify situations or cues
associated with unhealthy snacking and sugar-sweetened beverage consumption among
participants recruited from public high schools in lower SES neighborhoods. We anticipated
that, although the development of habits is likely to be idiosyncratic, common life experiences
across participants would result in some common cue-behavior associations that can be
identified using EMA. We also anticipated that multiple situations may cue snacking behaviors
and that some of those situations might be related but not co-occurring. We reasoned, for
example, that development of a habitual response to one cue (e.g., feeling happy) would not
necessarily exclude the development of the same habitual response to a related cue (e.g.,
feeling sad). The analyses contrasted situational factors associated with consumption of these
unhealthy drinks and snacks with those associated with non-sweetened drinks, healthy snacks,
meals, and non-eating or drinking occasions. The study focused on cues associated with the
consumption of sugar-sweetened drinks, sweet snacks, and salty snacks, which are associated
with weight gain and related medical problems (Carels et al., 2001; Centers for Disease Control

7
and Prevention (CDC), 2011; Malik et al., 2010; Piernas & Popkin, 2011; Vartanian et al., 2007).
In addition, consumption of these food items is more likely to be under the control of
adolescents, compared to meals prepared by adults in the home, making sweetened drinks and
energy dense snacks ideal targets for behavioral interventions among adolescents.
Methods
Participants
Participants were recruited from high schools that met the following criteria: (a) minimum
of 25% of students in a free or reduced price meal program, (b) minimum of 25% Hispanic
students, (c) maximum of 25% Asian students, (d) minimum enrollment of 100, (e) included
students between 14 and 17 years of age, and (f) were within 30 miles of the assessment site in
San Dimas, CA. The intention was to recruit a sample of students from lower income families at
elevated risk of being overweight or obese for whom improved interventions may be especially
beneficial. Lower income populations have fewer interventions developed on their behalf, and
we wanted to target this underserved group. Schools were excluded if they were classified as
adult education, alternative, charter, continuation, community, or special education schools.
Flyers were distributed during lunch periods or at other times approved by those schools that
met the criteria and approved onsite recruitment. Flyers briefly described the study objectives,
participant activities (see procedure below), and the compensation for participating. Recruiters
collected contact information on site from students expressing interest in participating, and then
called the parents to assess eligibility and schedule a baseline appointment.
Students were eligible to participate if they were: (a) 14 to 17 years old, (b) able to speak
and write English, (c) free of major illness, (d) not currently receiving treatment for obesity, and
(e) able to travel to the assessment site with a parent or guardian. Only one child was eligible
from each family, and no more than 15 students were recruited from each school. Spanish
speaking recruiters and data collectors were available to parents who only spoke Spanish.
8
Approximately 3,000 flyers were distributed, and 1,423 students expressed interest in
the study. The parents of these students were then randomly selected from within each school
and invited by phone to participate in the study. In total, 251 families were screened by
telephone for eligibility (recruiters stopped screening students when the target number of
participants was met), 243 were scheduled for an appointment to be assessed and receive
training on the PDAs. Of those, 158 participants (65.02%) representing 13 schools attended the
appointments and completed the EMA protocol. Participants included 90 (57.0%) females (see
Table 1). Self-reported ethnicity included 67.7% Hispanic/Latinos, 4.4% African American, 2.5%
Asian, 5.1% White, 2.5% Native American, 15.8% mixed, and 1.1% other or missing. Parent
education level is one proxy measure for family SES, and approximately half of the participant‟s
parents did not finish high school. Sixty percent of the participants resided with both parents. A
high percentage of participants were obese (25%) compared to results from the Youth Risk
Behavior Surveillance System. In Los Angeles County in 2011, 13% of all high school students
were obese and 15% of Hispanic students were obese (CDC, 2012).
< Insert Table 1 about here>
Procedures
Each participant and a parent or guardian came to a university facility for assessment
and training prior to beginning the EMA protocol. During this session, parents read and signed a
consent form, and participants signed an assent form after reviewing the forms with trained
research assistants. The forms were available in Spanish for parents as needed. After obtaining
consent and assent to proceed, data collectors guided participants through a series of baseline
measurement and training tasks: (a) individual measurement of height and weight by research
staff data collectors, (b) individual training on the PDA, (c) one-to-one interviews with data
collectors regarding snacking and afterschool activities, and (d) assessment of baseline
characteristics using self-report, computer-based questionnaires and tasks. A standardized
procedure was used to train participants on how to operate the PDA and how to place the
9
device in the cradle for charging and data transfer. Participants practiced entering data on the
PDA and setting up the cradle for charging and data transfer during the training sessions at the
university facility.
Baseline Assessment. Participants completed a series of assessments at the university
facility after receiving the EMA training. Baseline assessments included weight, height, a brief
interview, and self-administered questionnaires taken on laptop computers (demographics,
eating behaviors, and family relationships). The current report focuses exclusively on
assessments collected using EMA techniques and those procedures and measures are
described below.
EMA Procedures
As described in the introduction, EMA procedures permit the assessment of behaviors
as participants go about their normal daily activities. This is critical to identify links between
situations and behaviors of which the participants themselves may not be aware (Dijksterhuis et
al., 2005). EMA software was developed to the project‟s specifications (invivodata, Inc.,
Pittsburgh, PA), and implemented on Palm E2 PCA devices, along with a wireless Enfora
modem (Novatel Wireless, Richardson, TX). Data were transferred automatically to a central
server at the end of each day when a participant placed the PDA in the wireless
modem/recharging cradle. The systems were thoroughly tested, and software and assessments
were piloted with participants.
Participants were told that the current training day (day1) and the next day (day 2) could
be used to practice using the device and that the following 7 days (days 3-9) would be the
critical test days. Before leaving the facility, parents were briefly introduced to the PDA device
and data collectors emphasized the importance for the student of following the EMA protocol as
instructed. Compensation for the time required of the participant to attend the training session
and complete the EMA protocol was $200, and it was sent to each participant after the device
was returned.
10
Eating Event Reports. During the 7-day monitoring period participants were instructed to
complete assessments on their PDAs on three types of occasions: eating events, random
prompts, and evening reports. For the eating events, participants were instructed to record each
food or drink they consumed within 15 minutes after consumption. A drink was defined as any
time the participant drank any liquid such as water, juice, milk, or soda; a meal was defined as
eating at a time that the participant considered to be breakfast, lunch, or dinner; and a snack
was defined as eating at a time that the participant did not consider to be breakfast, lunch, or
dinner. Participants were also provided with a worksheet (available from the authors) to help
them categorize on the PDA the types of food and drinks they consumed. The worksheet listed
types of foods that participants would select from on the PDA: (a) snacks, (b) fruits/vegetables,
(c) carbohydrates, (d) protein, and (e) drinks. For each food type, the sub-categories were also
listed as they appeared on the PDA after a participant selected a food type. If a participant
selected protein, for example, the following sub-categories would appear: Chicken/pork/beef,
beans/nuts, dairy, fish, and eggs/tofu. The worksheet also provided examples for each PDA
sub-category (e.g., for chicken/pork/beef: chicken nuggets, hamburger, hot dog, taco), but these
examples did not appear on the PDA. Participants used these examples to guide selection of
food categories when they entered data on the foods they consumed into the PDA device.
Participants did not record eating events that occurred during school hours (i.e., 8am to 3pm on
school days); schools were unwilling to have students interact with the EMA devices during
school hours.
Random Prompt Reports. In addition to recordings that participants self-initiated on the
PDA for eating events, the PDA prompted participants at random times during the day to
complete a similar set of questions at the time the PDA alarm went off – this was called a
random prompt. The questions were equivalent to those asked in the eating event report. On
school days, one random prompt was issued between 3 and 6pm and one between 6 and 9 pm,

11
whereas on non-school days 4 prompts were issued, one each in the following 3-hour intervals:
9am-noon, noon-3pm, 3pm-6pm, and 6pm-9pm.
Evening Reports. Finally, at the end of each day, participants were instructed to
complete an evening report between 6pm and 11:45pm to assess their level of stress and the
availability of food in the home throughout the day. An alarm on the PDA went off if a participant
had not entered the evening report by 8pm and a second alarm occurred at 9pm.
Compliance. A specific procedure was followed by data collectors to promote
compliance with the EMA protocol among the participants. Trained coordinators/data collectors
monitored daily the incoming EMA data from each participant, and participants had the
opportunity to call the coordinators if any problems or questions arose. Monitoring was
supported by a website where coordinators could review summaries of participants‟ entries and
compliance. Participants were contacted by phone to promote compliance if any of the following
occurred: (a) they missed data transfer in the evening, (b) they reported less than three
eating/drinking events on the previous day, (c) they missed more than two random prompts in
the past two days, or (d) they missed the two most recent evening reports. PDA coordinators
reported and tracked all communication with study participants on a secure online data
management system.
Eating and Random Event Measures
Momentary assessments in response to eating events and random prompts were
completed on the PDA, which displayed one question at a time on the screen. The EMA items
were selected partially based on information collected from focus groups with adolescents to
learn about their eating patterns, with a special focus on snacking (locations, social
environment, types of snacks and drinks, etc.), mood scales, and food-related cues such as the
sight or smell of food identified in studies on restrained eating (Coelho, Polivy, Herman, &
Pliner, 2008; Fedoroff, Polivy, & Herman, 2003; Polivy, Herman, & Coelho, 2008). The random
prompts and eating event assessments consisted of questions about participants‟ location,
12
social environment, mood, and food-related behaviors. The random prompt assessment
included an item in the beginning asking participants if they were eating or drinking anything,
with a binary response option “yes”/“no.” If the response was “yes,” they were asked what they
were consuming: (1) drink only, (2) snack with or without a drink, and (3) meal with or without a
drink. The self-initiated eating event report asked participants what they had just consumed with
the same three response options. The random event and eating event assessments were
otherwise identical in content. The following paragraphs describe the questions assessed on the
PDA.
Location. Participants reported on their physical location just before they began eating
(“Where were you just before eating/drinking?”), first choosing between general location (e.g.,
home, school, store, etc.), and then providing more details about their immediate location within
the broader categories. The report was completed after eating per instructions during training,
and the report might not have occurred in the same location as the eating event. The situations
encountered just before eating were important to consider as potential cues to eating behaviors.
Each of the following situations was assessed in a similar manner.
Social Setting. Participants responded to two questions asking if they were alone (yes or
no), and if not alone, whom they were with just before eating.
Family Influence. Participants were asked three questions about the context of their
eating, including what happened just before they ate or drank and family members they were
with just before eating. This scale also included questions about family influence over
adolescents‟ food behaviors such as, “Criticized by family member about what you were
eating?”
Current Mood. Thirteen items about participants‟ emotional states were adapted from the
Daily Affect Scale previously used in EMA data collection with adolescents (Weinstein &
Mermelstein, 2007; Weinstein et al., 2007), which included mood adjectives such as tired,
stressed, relaxed, cheerful, etc., rated on a sliding scale ranging from 0 to 100 and anchored at
13
“Not and all” to “Very much.” Factor analyses on the data (principal components with varimax
rotation) was consistent with the four-factor structure reported by Weinstein and colleagues: 1)
Positive Affect (Happy, Relaxed, Cheerful, Energetic, alpha=.72); 2) Negative Affect (Lonely,
Embarrassed, Sad, Angry, Left-Out, alpha=.79); 3) Stressed/Frustrated (Frustrated and
Stressed, alpha=.76); and 4) Tired/Bored (Tired, Bored, alpha=.41). The four subscales were
created by taking the average of the items (Scale remains on a 0 – 100 scale).
Activities. Participants were asked what they were doing at the moment, and response
options included “using electronic media”, “coming from school”, “working”, “hanging with
friends”, “sleeping”, “exercising”, “studying/reading”, and “other activity”. If participants answered
“using electronic media”, they were asked more detailed questions about the type of media they
were using: “watching TV”, “computer/video games”, “working on a computer”, “IM/email on
computer”, “texting”, “listening to music”, and “other”.
Appetite/Craving. Questions about participants‟ food and drink cravings were adapted
from Greeno, Wing and Shiffman (2000) (Greeno et al., 2000). Participants responded to the
question “What were you craving?” for each of the following categories: sweet snack, salty
snack, sweetened drink, non-sweetened drink, fruit/vegetables, and meal. Response options
were “yes” or “no” for each category.
Binge Eating. Binge eating episodes were assessed using two items from the Binge-
Eating Disorder Subscale of the Eating Disorder Diagnostic Scale (Sierra-Baigrie, Lemos-
Giráldez, & Fonseca-Pedrero, 2009; Stice, Telch, & Rizvi, 2000).
Food Consumption. A detailed assessment of food consumption asked participants what
they were eating or drinking and listed detailed items as response options, including lists of
drinks, snacks, fruit/vegetables, carbohydrates, protein, and meat from which participants could
select the type of food they had just consumed. The items included healthy as well as unhealthy
items. In the current analyses, we contrast situational correlates of sweetened drink and snack
consumption to other situations, which might include consumption of healthy items. Some of

14
the drink and snack items were grouped together to create three new binary variables: (1)
consumption of sweetened beverages, (2) consumption of sweet snacks, and (3) consumption
of salty snacks. These served as the main dependent/outcome variables in our analyses (see
Table 2 for a list of target drinks and foods).
< Insert Table 2 here >
Evening Report Measures
The evening report (items not shown) assessed events or situations that might change
daily but not on an hour to hour basis, including items about stress level and food availability in
the home.
Stress. Each evening assessment asked participants to report on their stress level.
Cohen‟s Perceived Stress Scale was used for this assessment (Cohen, Kamarck, &
Mermelstein, 1983). This 7-item scale has been previously used in EMA studies and shown to
be reliable (Shiffman & Waters, 2004). Three additional items asked about good and bad events
during the day: “Did you have a good/bad thing happen today?”, “Was it related to: parent,
sibling, friend, other person, job, school, other?” and “How good/bad was this event?”
Food Availability. Participants completed a 12-item measure of daily food availability
asking them “What snacks or drinks were available to you in your home today?” with seven
items about drinks (bottled/vitamin water, fruit juice, soda, diet soda, sport/energy drink,
dairy/soy milk, and none of the above), and five items about snacks (fruit/vegetables,
cereal/granola bars, chips/pretzels/crackers, cookies/pastries/candy, and none of the above).
The response options were binary (yes/no).
Exercise. Participants answered the following question (yes or no) taken from the
Patient-Centered Assessment and Counseling for Exercised Plus Nutrition screening measure
(Prochaska, Sallis, & Long, 2001) to assess their physical activity that day “Were you physically
active for a total of at least 60 minutes today?”

15
Analysis
The analytic dataset included the combined self-initiated, momentary eating event
reports (drinks, snacks, and meals) and all momentary random event reports including events
where participants were not eating at the time of the prompt and events where they were eating
by chance at the time of the random prompt. In addition, evening report data were linked to the
momentary observations.
Univariate regressions identified which of the EMA cues were significantly associated
with each of the following outcome variables: (a) sweetened drink consumption, (b) sweet snack
consumption, and (c) salty snack consumption. These binary outcome variables contrasted
target outcome events against all other events including consumption of non-sweetened drinks,
healthy snacks, and meals as well as random prompt events where drinks or food were not
being consumed. Meals were not considered snacks even if a sweet drink, sweet snack, or salty
snack was consumed as part of the meal.
The odds ratios were estimated using a SAS (Version 9.2) Proc Glimmix Multilevel
Model where momentary observations were the Level 1 variables and persons/participants were
the Level 2 variables. Within person odds ratios were estimated by first group mean centering
(i.e. centering within person) each potential cue and then running a multilevel logistic equation
with one cue variable. The resulting odds ratios represented the increase in odds for a unit
change in the value of the cue variable. For example, the binary cue variable, “home”, (assigned
a value “1”) would be contrasted to all other response options (“0”). For continuous cue
variables, the odds ratios represented the change in odds due to a change of one standard
deviation in the cue value. The odds ratios are a measure of the effect size for the association
between the cue and outcome (Ellis, 2010). Relatively large odds ratios were expected to be
suggestive of cue-behavior (S-R) habits. As this was regarded as an exploratory analysis and
the first of its kind in the field, we did not correct for multiplicity.

16
Multiple logistic regression models included cue variables that were significant (OR>1.0)
and non-redundant in the univariate models. Only those cues that were suggestive of cue-
behavior (S-R) habits for consuming more sweet drinks or snacks (OR>1.0) were included to
address the research question in the current study. Separate models were fit to the data for
each target outcome including sweet drinks, sweet snacks, and salty snacks. The models were
used to determine whether the cues were independent predictors providing additional evidence
suggestive of S-R habits.
Results
Assessments and compliance
Participants (n=158) were monitored for an average of 6.70 (SD=0.25) days; 98.73%
were monitored for the full 7 days. A total of 3992 momentary assessments were recorded:
1868 random prompts (1.69 per participant day), 2124 eating event reports including having a
drink only, eating a snack, or having a meal (1.92 per participant day), and 1043 evening reports
were also recorded (0.94 per participant day). Participants completed 71% of the assessments
solicited by random prompting, and 95% of scheduled evening reports. On 615 (32.92%) of
randomly-prompted assessments, participants reported they were eating or drinking when
prompted. These assessments were treated as eating events, resulting in a total of 2739 eating
or drinking events, and 1253 randomly-prompted, non-eating events. Table 3 shows the
distribution of eating behaviors reported by self-initiated eating events and captured on random
prompt occasions.
< Insert Table 3 about here >
Descriptive Statistics for Snack and Drink Consumption
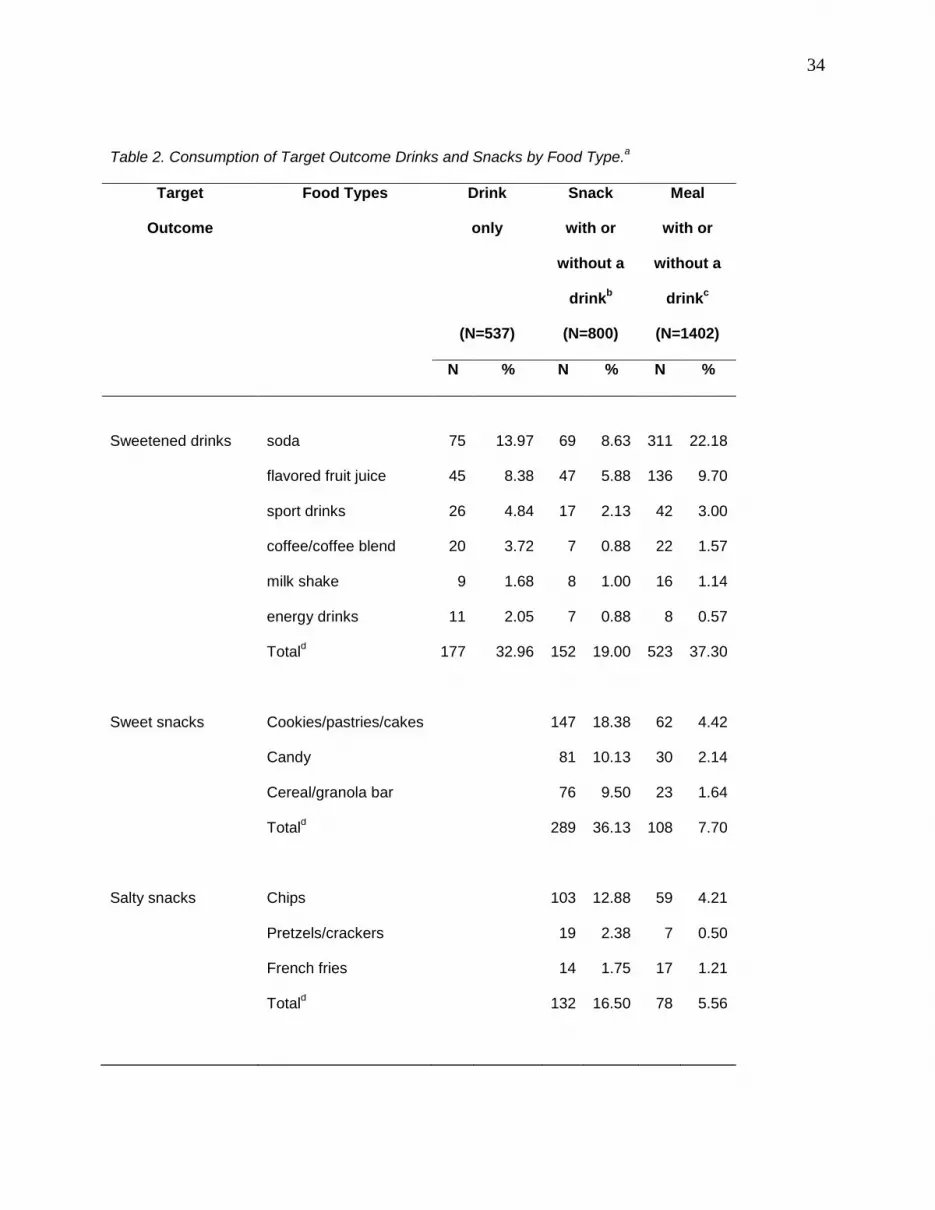
Drink and snack consumption across the 7 days of EMA data collection for all
participants is shown in Table 2. Sweet drinks were consumed on 177 (32.96%) of the drink
only occasions and 152 (19.00%) of the snack occasions. The combination of these two types
of occasions (n=329) represent the total events coded “1” and all other events were coded “0”

17
for the sweet drink outcome variable. Sweet drink consumption accounted for 31.1% of all
drinks consumed at all drink only, snack, or meal events. Soda was the most common sweet
drink at 16.7% of all events (see Table 2), whereas water was the most frequently consumed
non-sweet drink at 31.5% of all events (not shown). Sweet snacks were consumed on 289
(36.13%) of the snack events and these occasions were coded “1” for the sweet snack outcome
variable. Salty snacks were consumed on 132 (16.50%) of the snack events and these
occasions were coded “1 for the salty snack outcome variable. On 29 snacking events (3.63%),
both a sweet and salty snack were consumed. This small overlap occurred because participants
could indicate consumption of multiple items during an eating event. Participants consumed an
unhealthy sweet or salty snack during 49.00% of the snacking events. Sweet drinks, sweet
snacks, and salty snacks were consumed during meal events on some occasions, but all of
these events were coded “0” according to our a priori definition of drink and snack occasions as
excluding meals. Meals comprised about half (51.2%) of the drinking and eating events
reported. Most meal events included a fruit/vegetable, carbohydrate, and/or a protein (92.3%).
None of the meal events was a drink only, and almost none of the meal events included snack
items only (2.8%).
Although the PDA devices were disabled during school hours, participants did report that
some events occurred at a school location (n=274, 5.4% of total). Events at school occurred
mainly during a weekday (n=258, 94.8%) and after 3pm (n=203, 74.6%) when participants may
have been attending after school events. The main locations recorded for events at school were
on the school grounds (36.0%), in classrooms (23.5%), or at the gym (15.8%). Events recorded
as occurring during school hours were primarily between noon and 3pm (n=46, 16.9%), and
these few events were recorded retrospectively after school hours.
Univariate Logistic Regressions: Binary EMA Cue Variables
Results for the univariate regressions are presented in Tables 4 and 5 depending upon
whether the response type for a cue variable was binary or continuous. Table 4 presents results

18
for cues with binary (yes/no) response options (e.g., location in the home, yes or no). The three
target outcome (dependent) variables are listed in the column headings, and the cues are listed
by row in the tables. For each cue in a row, the table lists the proportion of yes responses for
that cue, the between person standard deviation of the proportion, and the univariate
association between the cue and each of the three target outcomes, sweetened drink, sweet
snack, and salty snack consumption. The proportions were calculated by determining the
proportion or mean of reports for each day (endorsing a cue once in 4 reports on a given day
would result in a proportion of 0.25 for that cue on that day) for each participant using all
available days and then calculating the mean proportion per day for the week. Participants who
missed an entire day had that day excluded from the calculation (e.g. if a participant only
responded 6 out of 7 days the mean would be calculated using a denominator of 6).
< Insert Tables 4 and 5 about here >
Participants frequently reported being at home (64% of the momentary assessment
occasions each day), and the cue, being at home, was related to a 25% decreased odds of one
target outcome, sweet drink consumption (OR=0.75, p=.031). This implies that if a participant
was at home (versus all other response options), then the participant was 25% less likely to
report consuming a sweet drink (versus reporting any other non-sweet drink event). The target
outcome, sweet snack consumption was associated positively with the cues, being at school, in
the family/game room, and on school grounds but occurred most frequently in the family/game
room (14% of occasions). This implies that if a participant reported being at school, in the
family/game room, or on school grounds (versus all other events that did not report one of these
locations), then the participant was more likely to report consuming sweet snacks (versus
reporting any other non-sweet snack event). Sweet snack consumption was less likely when
outdoors (M=0.06; OR=0.39, p=.007). The target outcome, salty snack consumption was
positively associated with the cue, being at school. Participants commonly reported being alone
(37%) just before drinking or eating something (or just before a random prompt), but being alone
19
before eating or drinking was not associated with any of the outcome variables. Certain other
social contexts predicted both increased and decreased likelihoods of consuming sweet drinks
and salty snacks. The target outcome, consuming sweet drinks was significantly less likely to
occur in the presence of the cue, among family members (M=0.42; OR=0.77, p=.047) and was
more likely to be consumed in the presence of the cue, among friends (M=0.26; OR=1.38,
p=.023). For the target outcome, salty snacks, being in the presence of co-workers as a cue
was associated with a greater likelihood of consumption, but reports of being with co-workers
when completing assessments were very rare (0.4% of occasions). Only 15 participants (9.49%)
reported that they had work after school on one or more days during the week following the
baseline assessment.
Using electronic media and watching television were two activities reported fairly often at
time of assessments. These activities were associated with an increased likelihood of the target
outcome, sweet snack consumption, but not the target outcomes, consumption of sweet drinks
or salty snacks. Hanging with friends, an activity reported less often, was associated with a
greater likelihood of sweet drink consumption. Reporting the cue, sleeping, was associated with
reduced salty snack consumption as a target outcome.
Participants also reported what happened just before consumption occurred, and both
visual and social food cues were associated with the outcomes, sweet and salty snack
consumption. The cue, seeing snacks, was related to substantially increased odds of
consuming sweet drinks (OR=2.19, p<.001), sweet snacks (OR=7.37, p<.001), and salty snacks
(OR=5.47, p<.001). The cue, seeing a friend eat (food type not specified), also predicted a
greater likelihood of salty snack consumption, and the cue, being offered food by a friend (food
type not specified), was related to increased odds of consuming both sweet drinks and salty
snacks. Conversely, the cue, being offered food by family members (food type not specified),
was associated with decreased odds of sweet drink, sweet snack and salty snack consumption.
Participants rarely reported the cue, buying a drink or snack before eating, but as might be

20
expected, buying a drink or a snack before eating was associated with consumption of
sweetened drinks (OR=2.88, p<.001), sweet snacks (OR=1.63, p=.037), and salty snacks
(OR=2.21, p=.011).
In contrast to the previous social cue findings noted above, the cue, being alone while
eating, was related to sweet snack consumption, and the cue, being with a friend while eating,
was related to a greater likelihood of consuming sweet drinks and salty snacks. The cue
variable, being with family members while eating, was associated with an increase in the odds
of consuming sweet drinks.
Most of the remaining questions with binary response options on the random prompt and
eating event reports asked about specific foods and drinks that were consumed. These
questions were not included in Table 4 because many of these associations are for overlapping
variables such as the regression of the sweet drink outcome variable on soda as a drink option.
It is possible, however, that certain other food types may be associated with consumption of the
target outcome drinks or snacks acting as cues, substitutes, or complements. For example, the
cue, drinking water, was negatively associated with sweetened drink consumption (OR=0.70,
p=.042) suggesting that it may be a substitute for drinking soda. Drinking soda may be a
substitute for eating sweet snacks (OR=0.55, p=.015) and a cue or a complement for eating
salty snacks (OR=1.96, p=.008). Milk may be a substitute for consumption of sweetened drinks
(OR=0.31, p=.002) and a cue or complement for eating sweet snacks (or eating sweet snacks
may be a cue for drinking a glass of milk: OR=3.99, p<.001). Pure fruit juices appear to
substitute for consumption of sweetened drinks (OR=0.27, p=.002) and sweet snacks
(OR=0.28, p=.003). Eating sweet snacks and salty snacks may also cue or complement each
other. Eating salty snacks was strongly associated with the cues, cookies/pastries/cakes
(OR=2.04, p=.023) and candy (OR=3.87, p<.001). Sweet snack consumption was associated
with the cues, eating chips (OR=1.72, p=039) and pretzels/crackers (OR=3.58, p=.016).

21
Univariate Logistic Regressions: Continuous EMA Cue Variables.
Table 5 presents results for cues with continuous response options (e.g., mood, craving,
and binging) ranging from 0 to 100 and anchored at „Not and all‟ to „Very much.‟ The
associations between a continuous situational antecedent (a cue) and a binary target outcome
(consumption of sweet snacks, salty snacks, or sweet drinks) is reported as an odds ratio that
indicate the change in odds of an outcome occurring relative to one standard deviation change
in the cue.
Among emotional antecedents, both feeling lonely, a cue with a relatively low mean
(M=12.32; OR=1.11, p=.043), and feeling energetic, a cue with a moderate mean rating
(M=36.83; OR=1.12, p=.010), were associated with the target outcome, sweet drink
consumption. Feeling bored, another emotional cue with a moderate mean rating, was
associated with increased sweet snack consumption (M=32.63; OR=1.11, p=.044). None of the
aggregated mood scales (i.e., positive mood, negative mood, stress/frustration, tired/bored)
tested as cues were associated with the target outcomes.
Food craving cues (0= „not at all‟ and 100=„very much‟) also showed an interesting
pattern of associations to sweet/salty consumption outcomes. Craving a sweetened drink or a
sweetened snack was associated with increased probability of all three target outcomes,
consuming a sweet snack, salty snack, or a sweet drink (Table 5). In contrast, the cue, craving
a salty snack, was only associated with consuming a salty snack (OR=1.55, p<.001). The cue,
craving a meal, which had the highest mean rating among the craving variables (M=42.90), was
negatively associated with consuming a sweetened drink (OR=0.87, p<.001) and sweet snack
(OR=0.78, p=.004).
Family members rarely criticized participants‟ food choices, restricted quantity of food, or
encouraged them to eat more. Means for these questions ranged from 1.39 to 4.09 on a scale
from 0 to 100, and there were no significant associations among these cues and the target
outcomes. The last two questions on the random prompt and eating event reports asked about

22
binge eating on a scale from 0 to 100 and included (a) eating so much that you would be
embarrassed (M=7.10) and (b) losing control (M=7.48). These means suggested a low
occurrence of binging among these participants, and neither of these cue items was significantly
associated with the target outcomes.
Univariate Logistic Regressions: Evening Report Variables (binary and continuous).
Evening reports assessed each day‟s experience with emotional events, food/drink
availability, and activity cues in relation to sweet/salty consumption that day. There was only
one evening report per day, but the univariate regression analysis was still two levels, event/day
and person (results were not tabled for space considerations). For emotional cues (0= „not at all‟
and 100=„very much‟), participants rated having things go their way fairly high, and this positive
emotional cue was associated with a greater likelihood of the target outcome, salty snack
consumption (OR=1.17, p=.034). Participants reported having had a good event take place on a
given day fairly often (M=0.64), and when the cue was a reported good event related to a friend
(M=0.30), the odds of consuming sweet drinks were greater (OR=1.57, p=.020). In contrast, bad
events occurred less often, (M =0.37), and these bad event cues were not significantly
associated with any of the sweet or salty consumption outcome variables.
The availability of food and drinks in the home was associated with target outcome
consumption patterns in a logical way. Generally, if sweet/salty snack foods and sweet drinks
were available in the home as potential cues to eat they were more likely to be consumed that
day. Conversely, if healthy snacks and drinks were available in the home as cues to eat on a
given day, target outcome consumption of unhealthy sweet/salty snacks and sweet drinks was
less likely. The presence of soda in the home as a cue to consume sweet drinks, reported by
about half of participants on each evening report (M=0.48), was related to a greater likelihood of
sweet drink consumption (OR=1.45, p=.030). Meanwhile, the presence of dairy or soy milk in
the home as a cue to consume more healthy drinks was reported by about 60% of participants
and was associated with decreased odds of sweet drink consumption (OR=0.50, p<.001). The

23
presence of chips, pretzels and crackers in the home as cues, reported by about half of
participants (M=0.54), predicted substantial increase in odds of salty snack consumption
(OR=3.12, p<.001). Slightly less intuitive were the consumption patterns when cereal/granola
bars (M=0.58) and cookies/pastries/candies (M=0.52) were available in the home as cues to
eat. When cereal/granola bars were available in the home on a given day, consumption of
sweet drinks was less likely (OR=.61, p=.010). The availability of cookies, pastries, candies in
the home, was not associated with sweet snack consumption as one might expect, but did
predict significantly decreased odds of salty snack consumption (OR=.61, p=.041).
Finally, being physically active for 60 minutes or more on a given day, which was
reported by about 60% of participants, was a cue associated with a greater likelihood of the
target outcome, sweet drink consumption (OR=1.40, p=.036), but not sweet or salty snack
consumption.
Multiple Logistic Regression
A multiple logistic regression model for each of the three outcome variables was fit to the
data in an attempt to determine if the cues were independent predictors of the target outcomes.
Cues were included as predictors in the multiple logistic models if they were significant and non-
redundant in the univariate regression models. There was a slight reduction in the magnitude of
the odds ratios across all cues in the multiple logistic models compared to cues in the univariate
logistic models, and some of the cues became non-significant in the multiple logistic models.
However, the relative strength of the associations did not change. For example, the multiple
logistic regression model for the target outcome, sweet drink consumption, included the
following seven predictor cues: bought a drink, saw snacks, hanging with friends, craving a
sweet drink, with friends, feeling energetic, and feeling lonely (OR: 2.38, 1.39, 1.29, 1.01, 1.13,
1.00, 1.01, respectively). These effect sizes were smaller in size with 3 of 7 cues becoming non-
significant, but the effect sizes were generally in the same rank order as those for the univariate
logistic model (OR: 2.88, 2.19, 1.63, 1.43, 1.38, 1.12, and 1.11, respectively). It appears that
24
there might be some overlap in variance among the cues in the multiple logistic models
suggesting that the cues are not completely independent of each other. However, the relative
effect sizes (odds ratios) observed in the univariate models are useful indicators of the relative
strengths of the associations between the cues and outcomes. The regression results for the
sweet snack and salty snack outcomes were similar and are not reported here for space
considerations.
Discussion
This is the first study, of which we are aware, to use Ecological Momentary Assessment
(EMA) to identify contexts and cues associated with the consumption of sweetened drinks and
sweet and salty snacks in a non-clinical sample of adolescents. The objective was to find cue-
behavior links that over time might have become stimulus-response (S-R) habits; the
identification of these cue-behavior associations has practical implications for the development
of dietary behavior interventions. Relatively strong effect sizes (OR>2.0) suggestive of common
S-R habits were observed for several social cues and proximal food-related cues. Friend-related
cues had relatively strong effect sizes for sweet drinks and salty snacks, with the latter also
much more likely to be consumed in the presence of co-workers, who are also likely to be
peers. In contrast, sweet snacks were more likely to be eaten when alone. Food-related cues
with relatively strong effect sizes included seeing snacks, buying a drink/snack, and consuming
food from another sweet drink or snack category (e.g., eating a salty snack was associated with
having a sweet drink). The availability of drinks or snacks in the home had a strong effect size
for salty snacks, though it was less important for sweet drinks or sweet snacks. These
associations suggest the fairly strong influence of social cues and cues specifically associated
with food and its availability.
Relatively moderate effect sizes (OR between 1.5 and 2.0) that may also be suggestive
S-R habits were observed for two types of cues. Being at school or on school grounds had

25
moderate effect sizes but only for sweet snacks and salty snacks. Craving a drink or snack also
had relatively moderate effect sizes.
A range of mood and other cues were observed with relatively small effect sizes (OR
between 1.0 and 1.5), but these are less likely to suggest common S-R habits than those with
larger effect sizes. Mood related cues including feeling lonely, energetic, or bored had relatively
small effect sizes for sweet drinks and salty snacks and were non-significant for sweet snacks.
Although distressed mood has been shown to be an important antecedent in disordered eating
populations (see discussion below), it seemed to play a minor role in unhealthy eating in this
population. A number of other cues had small effects sizes for sweet drinks (with a family
member, physically active 60 minutes during the day), sweet snacks (family/game room,
watching TV, using electronic media), and salty snacks (having things go your way during the
day).
Multiple logistic regression models fit to the data included predictors that were significant
in univariate analyses. The effect sizes (odds ratios) were smaller with some cues losing
significance in the multiple logistic models compared to those observed in the univariate
models, which suggests that there was some amount of overlap in variance among the cues.
However, the rank order for the size of the odds ratios in the multiple logistic models remained
similar to those in the univariate models. The odds ratios observed in the univariate models
provide useful indications of the relative strengths of the associations between the cues and the
target outcomes.
Participants may be unaware of the associations detected by these analyses, and might
not be able to accurately endorse these specific cues on traditional surveys that ask participants
to recall cues linked to their behaviors retrospectively (Dijksterhuis et al., 2005). EMA permits
assessment of the co-occurrence of situations and behaviors in real-world contexts without
participants‟ introspection on cause and effect. An important advantage of the EMA design we
used is that it captures base rates (e.g., non-sweet drink and healthy snack events) as well as
26
the target events (e.g., sweet drink events and unhealthy snacks), which in the current study,
allows a reliable estimation of the associations between cues and drink or snack events. This
study focused on consumption of sweet drinks and snacks likely to be unhealthy because
studies indicate that sweet drinks and snacks play a major role in adolescent obesity, and
because adolescents may have more control over snacks than over meals.
These findings derive from adolescents from lower income families, in contrast to other
EMA diet studies, which have targeted adolescents with eating disorders. The current sample
included a high proportion of Hispanic adolescents, a vulnerable population known to be at risk
of obesity (CDC, 2012). The results for the current study are somewhat different from previous
studies using EMA, possibly due to differences in study populations and/or in target behaviors.
The influence of mood, for example, was limited in the current study but has been important in
other populations, especially those with eating disorders or who were trying to achieve or
maintain weight loss (Carels et al., 2001; Carels, Douglass, Cacciapaglia, & O'Brien, 2004;
Engel et al., 2009; Greeno et al., 2000; Greeno et al., 2000; Hilbert & Tuschen-Caffier, 2007; le
Grange et al., 2001; Smyth et al., 2009; Wegner et al., 2002). In the current sample, however,
mood did not seem to play a major role in unhealthy snacking. Feeling lonely was associated
with having a sweetened drink, but the prevalence of this mood was low compared to feeling
energetic, which was also associated with having a sweetened drink. This finding was in
contrast to an EMA-based study among obese female adolescents enrolled in a weight
management course where negative mood in addition to rumination about daily hassles (stress)
was associated with emotional eating (Kubiak, Vogele, Siering, Schiel, & Weber, 2008).
The current study is the first of which we are aware that has used EMA procedures to
examine the association of watching TV with eating snacks among a group of adolescents. Prior
research has linked snacking with television viewing among youth primarily using traditional
surveys (Barr-Anderson, van den Berg, Neumark-Sztainer, & Story, 2008; Boynton-Jarrett et al.,
2003; Park, Blanck, Sherry, Brener, & O'Toole, 2012; Skatrud-Mickelson, Adachi-Mejia, &

27
Sutherland, 2011; Vader, Walters, Harris, & Hoelscher, 2009) or observing behavior in
controlled laboratory settings (Blass et al., 2006; Harris, Bargh, & Brownell, 2009). In the current
study, watching TV was a relatively common reported activity but was only differentially
associated with having a sweet snack, but not with other unhealthy snacks. This may be due to
a difference in methodology and/or to the study population. The EMA procedure captures data
in real time providing a better measure of the temporal association of TV viewing and snack
consumption than traditional surveys and has more ecological validity than laboratory
observations, but additional research is needed to clarify reasons for the difference in findings.
The current study is consistent with the results of previous studies on the association
between food-related cues and eating behaviors. There is an extensive literature demonstrating
increased consumption of food after exposure to food cues such as the sight or aroma of
appetizing food (Coelho et al., 2008; Fedoroff et al., 2003; Painter, Wansink, & Hieggelke, 2002;
Polivy et al., 2008). Studies that manipulate the availability of food have shown an increased
consumption of foods when availability is high (Painter et al., 2002; Thomas, Doshi, Crosby, &
Lowe, 2011). This effect was similar in the current study where having chips or soda available in
the home was associated with having salty snacks or sweetened drinks. Seeing snacks was
also commonly reported in the current study and was strongly associated with consuming a
sweetened beverage, a sweet snack, or a salty snack. Buying a drink or snack (after seeing it
on the shelf) was also associated with the target behaviors. It was not possible in this study to
determine if a participant decided to have a drink or snack before or after seeing it, but the
current results are consistent with laboratory studies (Painter et al., 2002). In addition,
consumption of sweet snacks was associated with eating salty snack items, exemplifying how
eating can be a trigger for further eating. Smelling food, on the other hand, was negatively
associated with snack consumption in the current study probably because the smell of food
cooking preceded a meal rather than a snack. The current study replicates results from
controlled laboratory experiments on food cues in a more ecologically valid setting.

28
The current study is somewhat consistent with previous findings on the significant
influence of peers on dietary behavior (Lally, Bartle, & Wardle, 2011; Wouters, Larsen, Kremers,
Dagnelie, & Geenen, 2010). Being with friends and being offered food by friends were
associated with consumption of sweetened drinks and salty snacks. In contrast, however, sweet
snacks appear to be consumed alone, which is contrary to previous findings. The cited studies
did not discriminate between sweet and salty snack types, which may have contributed to the
difference with the current study.
Consumption of sweet drinks was positively associated with physical activity during the
day in the current study whereas consumption of sweetened soda was negatively associated to
physical activity in two national data sets, the 2009 National Youth Risk Behavior Survey and
the 2010 National Youth Physical Activity and Nutrition Study (Park et al., 2012; Park, Sherry,
Foti, & Blanck, 2012). In both national studies, those who were physically active on 5 or more
days per week consumed sweetened soda less often than those who were active on less than 5
days per week. However, those active on 5 or more days consumed more sweetened sport
drinks in the latter study (Park et al., 2012). There was no way to determine which type of sweet
drink was closely associated in time with physical activity in the current data because the
physical activity was assessed in the evening report and beverage consumption was assessed
during each event throughout the day. It is unlikely, however, that consumption of sport drinks
accounted for the positive association between physical activity and consuming sweetened
drinks in the current study. Sport drinks accounted for only 3.2% of the drink events, while
participants reported 60 minutes of physical activity on 60% of the evening reports.
Note that the national datasets find that individuals who engage in more physical activity
(>60 minutes per day for >5 days per week) are less likely to drink sweet drinks one or more
times per day, whereas our somewhat more detailed analysis shows that sweet drinks were
more likely to be consumed on the particular days when subjects also engaged in physical
activity, addressing a slightly different within-subjects question. It is possible that sweet drink

29
consumption may differ if the physical activity occurs during organized sports when access to
drinks is limited by adult supervision compared to leisure-type physical activities that are
unsupervised. A second possibility is that at least some physically active youth may not be
sufficiently hydrated during or immediately after exercise; they may then be prone to drink more
impulsively later the same day, that is, to drink whatever good-tasting drink is readily available
later on. This could be a momentary effect during the day, reflecting a distinct process only
revealed through EMA. It is quite conceivable that momentary effects during the day can be at
odds with correlations between general activity level and general levels of sweetened drink
consumption revealed in retrospective surveys. However, additional research is needed to
empirically evaluate these possible explanations for the surprising finding.
There are several limitations to the current study. First, the correlation between the cue
and snacking behaviors reported in the current study does not provide irrefutable evidence of a
habitual or causal (S-R) cue-behavior link. Despite strong suggestive evidence, a third variable
may be responsible for one or more of the associations. Moreover, the analyses represent
contemporaneous or slightly retrospective associations (i.e., participants had already eaten
when they made their reports); prospective analyses might provide stronger evidence of the role
of cues in eating. Nonetheless, the correlations provide useful information about salient
concomitants in the situation preceding the behavior, and these immediate antecedents can be
used in a variety of different intervention strategies even if their causal status remains unclear
(Stacy et al., 2010; Wood & Neal, 2007), Indeed, the EMA procedure provides an effective
combination of real time measures in a naturalistic setting and captures the temporal
association of the cue and behavior.
Second, the current analyses were restricted to univariate and multiple regressions that
were unadjusted for potential confounds in the data such as time-of-day, day-of-week, gender,
BMI, ethnicity, etc. Adjustment for these potential confounds were beyond the scope of this
study, which was intended to provide a description of the EMA data set and general results. The

30
current findings provide important guidance, however, for future studies. Future analysis should
examine differences in the links between week days and weekend days and the influence of
time of day on the cue associations. Future research should also examine the influence of
clusters of cues as well as moderators. Some of the small effects observed in the current data
may reflect the fact that participants have idiosyncratic cues that would not emerge in the
analysis, or the fact that combinations of cues may be important. An important cluster to
examine, for example, may be craving a snack, with a friend, and seeing chips in the kitchen
cabinet. Analysis of clusters of cues may also help explain contradictory findings in the current
study (e.g., the mixed findings on being with family when having a sweet drink).
A third limitation is that school hours were excluded from the EMA, preventing collection
of information about drinks and snack consumption during school hours. Important cues to
eating snacks while at school may not be represented in the current results. Finally, the sample
of low SES students with a high proportion of Hispanics participants from Southern California
may not be representative of low SES students from other areas in the country, but it is very
important to study the dietary behaviors of this at-risk population. Future analyses may usefully
examine differences between Hispanic and non-Hispanic teens.
Application to Interventions
Research suggests ways of intervening either before or after a habit cue is encountered
(Stacy et al., 2010; Wood & Neal, 2007). It may be possible to change the “upstream”
circumstances associated with habits to disrupt the cue-habit link (Wood, Tam, & Witt, 2005),
and awareness of the situations and cues identified in the current study would be critical to this
intervention. For example, unhealthy snack food items may be removed from the home to
eliminate the visual cue to eat those items in the kitchen, and to limit their availability. Cues
cannot always be removed from a person‟s environment, but the strategy could certainly be
used more frequently where it can be controlled by intervention steps (e.g., in the home, at
school). An alternative, “downstream” approach links new actions or other preventive steps in

31
memory with cues previously linked with an undesirable behavior (Stacy et al., 2010; Wood &
Neal, 2007). One of the most promising strategies of this type, termed „implementation
intentions‟, instructs participants to form if-then action plans in which a specific cue is linked to a
planned preventive behavior (Gollwitzer, 1999). An example is the following: “If I come home
from school hungry, then I will eat an apple.” Some success has been observed for this
technique to alter dietary behaviors (Adriaanse, Vinkers, De Ridder, Hox, & De Wit, 2011). For
example, obese and overweight young women lowered consumption of unhealthy snacks and
increased consumption of healthy snacks using implementation intentions (Adriaanse et al.,
2010). The cognitive mechanisms for these action plans are still being studied (Adriaanse,
Gollwitzer, De Ridder, de Wit, & Kroese, 2011; McDaniel & Scullin, 2010), but it seems clear
that the cues applied to implementation intentions must be relevant to the behavior (Adriaanse
et al., 2010). The current study will help researchers identify these cues. More generally, a
range of interventions addressing the links between cues and unhealthy behaviors may be
fruitful when addressing any appetitive behavior (Stacy et al., 2010; Wood & Neal, 2007) that
exhibits underlying neural processes common in habit formation (Yin & Knowlton, 2006b).
Collecting real-world data on the linkage between cues and unhealthy eating is a foundational
first step towards potentially effective interventions.
Acknowledgments
Support for this research was provided by the National Institutes of Health (U01
HL097839-01). We especially wish to thank James Pike and Kim Massie for their excellent
management of the project and all of the research assistants that help recruit participants and
collect data.

32
Table 1. Descriptive statistics age, ethnicity, SES, and weight.
Male Female Total
Participants N 68 90 158
% 43.04 56.96 100.00
Age (years) M 15.97 15.99 15.98
SD 1.02 1.04 1.03
Hispanic N 44 63 107
% 64.71 70.00 67.72
SES Proxies
Live with N 43 47 90
Both Parents % 65.15 55.95 60.00
Live with N 14 23 37
Mother Only % 21.21 27.38 24.67
Mother Completed N 37 39 76
High School % 54.41 43.33 48.10
Father Completed N 34 41 75
High School % 50.00 45.56 47.47
Weight Indicators
Height (cm) M 173.11 160.93 166.17
SD 5.99 5.35 8.25
Weight (kg) M 75.06 66.73 70.32
SD 17.88 16.39 17.49
BMI M 24.99 25.67 25.38
SD 5.5 5.65 5.58
BMI Percentile M 69.93 73.65 72.05
SD 27.92 24.64 26.08
Normal BMI N 40 50 90

33
% 59 56 57
Overweight N 10 19 29
% 15 21 18
Obese N 18 21 39
% 26 23 25
Note. Categories based on CDC definitions of normal BMI (5th – 85th percentile), overweight (85th – 95th percentile), and obese (> 95th percentile). No participants met the criteria for the CDC definition of underweight (BMI < 5th percentile). Males in the sample were both significantly taller than females, t(156) = 13.469, p < .001, and significantly heavier than females, t(156) = 3.042, p = .003. There was no significant difference in BMI for males and females, t(156) = .760, p = .448.
34
Table 2. Consumption of Target Outcome Drinks and Snacks by Food Type.a
Target
Outcome
Food Types Drink
only
(N=537)
Snack
with or
without a
drinkb
(N=800)
Meal
with or
without a
drinkc
(N=1402)
N % N % N %
Sweetened drinks soda 75 13.97 69 8.63 311 22.18
flavored fruit juice 45 8.38 47 5.88 136 9.70
sport drinks 26 4.84 17 2.13 42 3.00
coffee/coffee blend 20 3.72 7 0.88 22 1.57
milk shake 9 1.68 8 1.00 16 1.14
energy drinks 11 2.05 7 0.88 8 0.57
Totald
177 32.96 152 19.00 523 37.30
Sweet snacks Cookies/pastries/cakes 147 18.38 62 4.42
Candy 81 10.13 30 2.14
Cereal/granola bar 76 9.50 23 1.64
Totald
289 36.13 108 7.70
Salty snacks Chips 103 12.88 59 4.21
Pretzels/crackers 19 2.38 7 0.50
French fries 14 1.75 17 1.21
Totald
132 16.50 78 5.56

35
Sweet or salty snack Totald 392 49.00 160 11.41
a Food types for contrasting categories of healthy drinks, snacks, and meals are not presented for space
considerations. b Each snack event/occasion may or may not include a drink.
c Each meal event/occasion may or may not include a drink.
d Multiple items could be consumed and reported for in a single eating event, so total events may be less
than the sum of individual items.

36
Table 3. Number of eating events entered by type of EMA report.
Random Prompt Entriesa
Eating Event Entries All Eating Assessments
N N/dayb
N N/dayb
N N/dayb
Just a drink 167 0.15 370 0.33 537 0.48
Snack with or
without a drink
188 0.17 612 0.55 800 0.72
Meal with or
without a drink
260 0.24 1142 1.03 1402 1.27
Total 615 0.56 2124 1.92 2739 2.48
a A total of 2637 random prompts were issued and participants responded to 1868 (70.84%) of those
prompts (mean per day = 1.69). Participants reported drinking and/or eating something on 615 (32.92%) of the 1868 prompts to which they responded (one additional participant abandoned a random event report after indicating she/he was eating something on the first question). b Based upon the actual number of responses and actual days completed by participants.

37
Table 4. Random event/eating event binary items frequencies and bivariate odds ratios.
Question Option Mean SD Odds Ratioc
per
Daya
per
Dayb
Sweet
Drinks
Sweet
Snacks
Salty
Snacks
Where were you
just before
eating/drinking? Home 0.643 0.186 0.753* 1.069 0.712
Other person‟s home 0.086 0.108 1.142 0.762 1.110
Stores/entertainment 0.037 0.062 1.625 0.851 0.549
School 0.084 0.101 0.879 1.706* 1.948*
Vehicle 0.049 0.069 1.533 1.242 1.201
Outdoors 0.065 0.094 1.066 0.387** 1.215
None of the above 0.037 0.063 1.466 1.098 1.271
[If at home…]
Where at
home? Bedroom 0.311 0.203 0.766 0.906 0.744
Kitchen/dining room 0.151 0.127 0.789 1.030 0.817
Family/game room 0.143 0.156 1.129 1.471* 1.232
Yard 0.013 0.031 1.532 0.930 0.264
Bathroom 0.011 0.025 1.129 0.082 0.593
Other 0.014 0.038 0.628 0.855 0.884
Not applicable 0.357 0.186 1.327* 0.935 1.404
[If in a store…]
What kind of
store? Grocery store 0.005 0.018 1.493 0.927 1.528
Mall/food court 0.010 0.030 0.753 1.086 0.245
Restaurant/fast food 0.014 0.034 2.162 0.524 0.198
Movie theater 0.001 0.004 6.898 0.000 0.274
Gaming store 0.001 0.011 0.227 0.000 1.000
Other 0.007 0.021 1.290 1.417 0.976
Not applicable 0.963 0.062 0.615 1.176 1.820
[If at school…]
Where at
school? Classroom 0.016 0.035 0.755 1.960 1.556
Cafeteria 0.006 0.024 0.692 0.878 3.244

38
Question Option Mean SD Odds Ratioc
per
Daya
per
Dayb
Sweet
Drinks
Sweet
Snacks
Salty
Snacks
Gym 0.015 0.051 0.698 1.838 1.251
Library 0.002 0.008 0.564 0.177 1.000
School grounds 0.032 0.057 1.319 2.100* 1.715
Parking lot 0.003 0.016 0.140 0.006 0.161
Other 0.010 0.032 0.679 1.097 3.532
Not applicable 0.916 0.101 1.138 0.586* 0.513*
Were you
alone? 0.367 0.199 1.090 0.944 0.725
[If not alone…]
Who were you
with? (Check all
that apply) Family 0.415 0.208 0.770* 1.058 0.829
Friends 0.263 0.178 1.377* 0.864 1.459
Teams/Clubs/Groups 0.036 0.071 1.566 0.798 1.882
Classmates/peers 0.043 0.073 0.787 1.362 0.811
Co-workers 0.004 0.017 0.083 1.123 6.727**
Others 0.025 0.069 0.620 0.971 1.252
What were you
doing? (Check
all that apply) Using electronic media 0.418 0.223 1.145 1.324* 1.048
Coming from school 0.070 0.077 1.359 1.545 1.130
Working 0.023 0.053 0.906 0.713 0.728
Hanging with friends 0.139 0.132 1.634** 0.968 1.202
Sleeping 0.088 0.087 0.692 0.616 0.420*
Exercising 0.078 0.111 1.387 0.761 0.754
Studying/reading 0.085 0.102 0.736 0.845 0.782
Other activity 0.296 0.208 0.983 0.997 1.607*
[if electronic
media…] What
electronic
media? (Check
all that apply) Watching TV 0.217 0.178 1.289 1.461* 0.911
Computer/video games 0.103 0.122 0.764 1.112 0.948

39
Question Option Mean SD Odds Ratioc
per
Daya
per
Dayb
Sweet
Drinks
Sweet
Snacks
Salty
Snacks
Working on a computer 0.029 0.055 0.753 0.896 1.038
IM/email on computer 0.027 0.064 1.086 1.164 1.775
Texting 0.164 0.203 1.203 1.162 1.336
Listening to music 0.101 0.138 0.998 0.869 0.642
Other 0.024 0.103 0.357 0.429 0.470
What happened
just before you
drank/ate?
(Check all that
apply) Smelled food 0.156 0.154 0.845 0.354*** 1.078
Saw snacks 0.143 0.147 2.191*** 7.371*** 5.470***
Saw friend eating 0.039 0.068 1.076 0.670 2.248*
Friend offered food 0.054 0.075 1.728* 0.921 2.205*
Family offered food 0.153 0.132 0.546** 0.525** 0.426**
Bought drink/snack 0.060 0.072 2.878*** 1.627* 2.211*
None of the above 0.565 0.217 0.708** 0.417*** 0.300***
Did you eat by
yourself?
0.437 0.223 1.120 2.377*** 1.421
[If not alone..]
Who were you
with? (Check all
that apply) Friend 0.160 0.133 2.204*** 1.344 2.204***
Family member 0.246 0.174 1.445** 0.788 0.894
Classmate/peer 0.019 0.041 0.958 0.936 1.347
Others 0.028 0.060 2.503** 0.491 1.267
a Mean proportion of „yes‟ responses per day: Response options were „Yes‟ or „No‟ (Yes=1, No=0).
b Standard deviation of the between person means.
c Odds ratios are the increase in odds for an outcome (sweet drinks, sweet snacks, or salty snacks) for
the designation response option relative to all other options for a single question. d Sweetened drinks;
e Sweet snacks;
f Salty snacks.
*p<.05 **p<.01 ***p<.001

40
Table 5. Random event/eating events for continuous items means and odds ratios.
Question Option Mean SD Odds Ratioc
per
Daya
per
Dayb
Sweet
Drinks
Sweet
Snacks
Salty
Snacks
Were you
feeling… Tired 45.509 21.437 0.985 0.965 0.941
(range 0 – 100) Stressed 22.583 18.681 1.005 1.048 1.003
Sad 15.812 16.765 1.076 1.046 0.961
Relaxed 54.710 19.990 1.014 0.953 0.972
Lonely 12.324 16.247 1.106* 1.002 0.997
Left-out 8.410 12.528 1.052 1.043 0.993
Happy 57.436 18.489 1.035 0.979 1.049
Frustrated 22.335 18.517 0.975 1.000 0.901
Energetic 36.829 19.517 1.120** 1.026 0.994
Embarrassed 7.244 9.919 1.074 1.018 1.003
Cheerful 42.312 21.241 1.038 1.094 1.132
Bored 32.629 22.822 0.958 1.110* 1.029
Angry 14.842 13.841 1.008 0.972 1.021
Aggregate
Positive Mood
(not a question) 39.700 13.648 1.104 1.017 1.051
Aggregate
Mood –
Stress/frustratio
n (not a
question) 51.390 52.561 1.096 1.018 0.992
Aggregate
Mood –
Tired/bored (not
a question) 44.929 35.305 0.987 1.030 0.940
Aggregate
Negative Mood
(not a question) 78.161 37.847 0.961 1.034 0.963
Were you
craving a …. Sweet snack 28.477 19.292 1.113** 1.742*** 1.164**
(range 0 – 100) Salty snack 19.915 17.364 1.060 1.013 1.549***

41
Question Option Mean SD Odds Ratioc
per
Daya
per
Dayb
Sweet
Drinks
Sweet
Snacks
Salty
Snacks
Sweetened drink 38.477 23.090 1.428*** 1.139** 1.166*
Non-sweetened drink 37.263 24.341 0.959 1.038 1.023
Fruits or vegetables 34.572 21.137 1.026 1.000 1.027
Meal 42.898 19.389 0.867*** 0.781*** 0.919
Were you
criticized by
family member
about what you
were eating? (range 0 – 100) 1.390 2.740 1.005 0.999 0.947
Did a family
member limit
what you could
eat? (range 0 – 100) 2.171 6.800 1.011 1.050 0.971
Did a family
member
encourage you
to eat more? (range 0 – 100) 4.086 7.496 0.991 0.980 0.996
Binge Eating 1 Eating so much, would
be embarrassed if seen 7.101 12.505 1.056 0.911 0.952
Binge Eating 2 Feeling a loss of control 7.480 10.291 1.081 0.919 1.056
a Means for response options on a range of 0 – 100 and anchored „Not at all‟ and „Very much.‟
b Standard deviation of the between person means.
c Odds ratios are the increase in odds for an outcome (sweet drinks, sweet snacks, or salty snacks) for
one standard deviation change in the response option. *p<.05 **p<.01 ***p<.001
42
References
Adriaanse, M. A., Gollwitzer, P. M., De Ridder, D. T., de Wit, J. B., & Kroese, F. M. (2011).
Breaking habits with implementation intentions: A test of underlying processes. Personality
& Social Psychology Bulletin, 37(4), 502-513.
Adriaanse, M. A., Oettingen, G., Gollwitzer, P. M., Hennes, E. P., De Ridder, Denise T. D., & De
Wit, John B. F. (2010). When planning is not enough: Fighting unhealthy snacking habits by
mental contrasting with implementation intentions (MCII). European Journal of Social
Psychology, 40(7), 1277-1293.
Adriaanse, M. A., Vinkers, C. D. W., De Ridder, D. T. D., Hox, J. J., & De Wit, J. B. F. (2011).
Do implementation intentions help to eat a healthy diet? A systematic review and meta-
analysis of the empirical evidence. Appetite, 56, 183–193.
Baranowski, T., Mendlein, J., Resnicow, K., Frank, E., Cullen, K., & Baranowski, J. (2000).
Physical activity and nutrition in children and youth: An overview of obesity prevention.
Preventive Medicine, 31(2), S1-S10.
Bargh, J. A. (2005). Bypassing the will: Toward demystifying the nonconscious control of social
behavior. In R. R. Hassin, J. S. Uleman, J. A. Bargh, R. R. Hassin, J. S. Uleman & J. A.
Bargh (Eds.), The new unconscious. (pp. 37-58). New York, NY US: Oxford University
Press.
Bargh, J. A., & Williams, E. L. (2006). The automaticity of social life. Current Directions in
Psychological Science, 15(1), 1-4.
Barr-Anderson, D. J., van den Berg, P., Neumark-Sztainer, D., & Story, M. (2008).
Characteristics associated with older adolescents who have a television in their bedrooms.
Pediatrics, 121(4), 718-724.

43
Blass, E. M., Anderson, D. R., Kirkorian, H. L., Pempek, T. A., Price, I., & Koleini, M. F. (2006).
On the road to obesity: Television viewing increases intake of high-density foods.
Physiology & Behavior, 88(4-5), 597-604.
Boynton-Jarrett, R., Thomas, T. N., Peterson, K. E., Wiecha, J., Sobol, A. M., & Gortmaker, S.
L. (2003). Impact of television viewing patterns on fruit and vegetable consumption among
adolescents. Pediatrics, 112(6 Pt 1), 1321-1326.
California Health Interview Survey. (2012). CHIS 2009 teen public use file. Los Angeles, CA:
UCLA Center for Health Policy Research, January 2012.
Carels, R. A., Douglass, O. M., Cacciapaglia, H. M., & O'Brien, W. H. (2004). An ecological
momentary assessment of relapse crises in dieting. Journal of Consulting & Clinical
Psychology, 72(2), 341-8.
Carels, R. A., Hoffman, J., Collins, A., Raber, A. C., Cacciapaglia, H., & O'Brien, W. H. (2001).
Ecological momentary assessment of temptation and lapse in dieting. Eating Behaviors,
2(4), 307-321.
CDC. (2012). Youth online: High school YRBS los angeles, CA 2011 results. Retrieved July 12,
2012, from http://apps.nccd.cdc.gov/youthonline
Centers for Disease Control and Prevention (CDC). (2011). Beverage consumption among high
school students --- united states, 2010. MMWR.Morbidity and Mortality Weekly Report,
60(23), 778-780.
Coelho, J. S., Polivy, J., Herman, C. P., & Pliner, P. (2008). Effects of food-cue exposure on
dieting-related goals: A limitation to counteractive-control theory. Appetite, 51(2), 347-349.
Cohen, S., Kamarck, T., & Mermelstein, R. (1983). A global measure of perceived stress.
Journal of Health and Social Behavior, 24, 385-396.
Dijksterhuis, A., Smith, P. K., van Baaren, R. B., & Wigboldus, D. H. J. (2005). The unconscious
consumer: Effects of environment on consumer behavior. Journal of Consumer Psychology,
15(3), 193-202.

44
Dunton, G. F., Liao, Y., Intille, S. S., Spruijt-Metz, D., & Pentz, M. (2011). Investigating children's
physical activity and sedentary behavior using ecological momentary assessment with
mobile phones. Obesity (Silver Spring, Md.), 19(6), 1205-1212.
Dunton, G. F., Whalen, C. K., Jamner, L. D., & Floro, J. N. (2007). Mapping the social and
physical contexts of physical activity across adolescence using ecological momentary
assessment. Annals of Behavioral Medicine, 34(2), 144-153.
Ellis, P. D. (2010). The essential guide to effect sizes : Statistical power, meta-analysis, and the
interpretation of research results. Cambridge ; New York: Cambridge University Press.
Engel, S. G., Kahler, K. A., Lystad, C. M., Crosby, R. D., Simonich, H. K., Wonderlich, S. A., et
al. (2009). Eating behavior in obese bed, obese non-bed, and non-obese control
participants: A naturalistic study. Behaviour Research and Therapy. Jul, 47(10), 897-900.
Fedoroff, I., Polivy, J., & Herman, C. P. (2003). The specificity of restrained versus unrestrained
eaters' responses to food cues: General desire to eat, or craving for the cued food?
Appetite, 41(1), 7-13.
Freedman, D. S., Mei, Z., Srinivasan, S. R., Berenson, G. S., & Dietz, W. H. (2007).
Cardiovascular risk factors and excess adiposity among overweight children and
adolescents: The bogalusa heart study. The Journal of Pediatrics, 150(1), 12-17.e2.
Glanz, K., & Murphy, S. (2007). Dietary assessment and monitoring in real time. In A. A. Stone,
S. Shiffman, A. A. Atienza & L. Nebeling (Eds.), The science of real-time data capture: Self-
reports in health research (). Oxford: Oxford University Press.
Gollwitzer, P. M. (1999). Implementation intentions: Strong effects of simple plans. American
Psychologist, 54(7), 493-503.
Goran, M. (2001). Metabolic precursors and effects of obesity in children: A decade of progress,
1990-1999. American Journal of Clinical Nutrition, 73(2), 158-171.
45
Gorely, T., Marshall, S. J., Biddle, S. J. H., & Cameron, N. (2007). Patterns of sedentary
behaviour and physical activity among adolescents in the united kingdom: Project STIL.
Journal of Behavioral Medicine, 30(6), 521-531.
Greeno, C. G., Wing, R. R., & Shiffman, S. (2000). Binge antecedents in obese women with and
without binge eating disorder. Journal of Consulting and Clinical Psychology, 68(1), 95-102.
Gwaltney, C. J., Bartolomei, R., Colby, S. M., & Kahler, C. W. (2008). Ecological momentary
assessment of adolescent smoking cessation: A feasibility study. Nicotine & Tobacco
Research, 10(7), 1185-1190.
Harris, J. L., Bargh, J. A., & Brownell, K. D. (2009). Priming effects of television food advertising
on eating behavior. Health Psychology : Official Journal of the Division of Health
Psychology, American Psychological Association, 28(4), 404-413.
Hausenblas, H. A., Gauvin, L., Downs, D. S., & Duley, A. R. (2008). Effects of abstinence from
habitual involvement in regular exercise on feeling states: An ecological momentary
assessment study. British Journal of Health Psychology, 13(2), 237-258.
Hilbert, A., & Tuschen-Caffier, B. (2007). Maintenance of binge eating through negative mood: A
naturalistic comparison of binge eating disorder and bulimia nervosa. International Journal
of Eating Disorders, 40(6), 521-530.
Hill, J., Melanson, E., & Wyatt, H. (2000). Dietary fat intake and regulation of energy balance:
Implications for obesity. Journal of Nutrition, 130(2), 284S-288S.
Knight, J. A. (2011). Diseases and disorders associated with excess body weight. Annals of
Clinical and Laboratory Science, 41(2), 107-121.
Knowlton, B., Mangels, J., & Squire, L. (1996). A neostriatal habit learning system in humans.
Science, 273(5280), 1399-1402.
Kubiak, T., Vogele, C., Siering, M., Schiel, R., & Weber, H. (2008). Daily hassles and emotional
eating in obese adolescents under restricted dietary conditions--the role of ruminative
thinking. Appetite, 51(1), 206-209.

46
LaBar, K. S., Gitelman, D. R., Parrish, T. B., Kim, Y. H., Nobre, A. C., & Mesulam, M. M. (2001).
Hunger selectively modulates corticolimbic activation to food stimuli in humans. Behavioral
Neuroscience, 115(2), 493-500.
Lally, P., Bartle, N., & Wardle, J. (2011). Social norms and diet in adolescents. Appetite, 57(3),
623-627.
le Grange, D., Gorin, A., Catley, D., & Stone, A. A. (2001). Does momentary assessment detect
binge eating in overweight women that is denied at interview? European Eating Disorders
Review, 9(5), 309-324.
Malik, V. S., Popkin, B. M., Bray, G. A., Despres, J. P., Willett, W. C., & Hu, F. B. (2010). Sugar-
sweetened beverages and risk of metabolic syndrome and type 2 diabetes: A meta-
analysis. Diabetes Care, 33(11), 2477-2483.
Malik, V. S., Schulze, M. B., & Hu, F. B. (2006). Intake of sugar-sweetened beverages and
weight gain: A systematic review. American Journal of Clinical Nutrition, 84(2), 274-288.
McDaniel, M. A., & Scullin, M. K. (2010). Implementation intention encoding does not
automatize prospective memory responding. Memory and Cognition, 38(2), 221-232.
Mendlein, J., Baranowski, T., & Pratt, M. (2000). Physical activity and nutrition in children and
youth: Opportunities for performing assessments and conducting interventions. Preventive
Medicine, 31(2), S150-S153.
Nelson, D. L., & Goodmon, L. B. (2003). Disrupting attention: The need for retrieval cues in
working memory theories. Memory & Cognition., 31(1), 65-76.
Ogden, C. L., Carroll, M. D., Curtin, L. R., Lamb, M. M., & Flegal, K. M. (2010). Prevalence of
high body mass index in US children and adolescents, 2007-2008. JAMA : The Journal of
the American Medical Association, 303(3), 242-249.
Painter, J. E., Wansink, B., & Hieggelke, J. B. (2002). How visibility and convenience influence
candy consumption. Appetite, 38(3), 237-238.

47
Park, S., Blanck, H. M., Sherry, B., Brener, N., & O'Toole, T. (2012). Factors associated with
sugar-sweetened beverage intake among united states high school students. The Journal
of Nutrition, 142(2), 306-312.
Park, S., Sherry, B., Foti, K., & Blanck, H. M. (2012). Self-reported academic grades and other
correlates of sugar-sweetened soda intake among US adolescents. Journal of the Academy
of Nutrition and Dietetics, 112(1), 125-131.
Piernas, C., & Popkin, B. M. (2011). Increased portion sizes from energy-dense foods affect
total energy intake at eating occasions in US children and adolescents: Patterns and trends
by age group and sociodemographic characteristics, 1977-2006. The American Journal of
Clinical Nutrition, 94(5), 1324-1332.
Polivy, J., Herman, C. P., & Coelho, J. S. (2008). Caloric restriction in the presence of attractive
food cues: External cues, eating, and weight. Physiology and Behavior, 94(5), 729-733.
Prochaska, J. J., Sallis, J. F., & Long, B. (2001). A physical activity screening measure for use
with adolescents in primary care. Archives of Pediatrics & Adolescent Medicine, 155(5),
554-559.
Ryan, J. D., & Cohen, N. J. (2003). Evaluating the neuropsychological dissociation evidence for
multiple memory systems. Cognitive, Affective & Behavioral Neuroscience, 3(3), 168-85.
Shiffman, S. (1993). Smoking cessation treatment: Any progress? Journal of Consulting and
Clinical Psychology, 61(5), 718-722.
Shiffman, S. (2005). Dynamic influences on smoking relapse process. Journal of Personality,
73(6), 1715-1748.
Shiffman, S. (2009). Ecological momentary assessment (EMA) in studies of substance use.
Psychological Assessment, 21(4), 486-497.
Shiffman, S., Stone, A. A., & Hufford, M. R. (2008). Ecological momentary assessment. Annual
Review of Clinical Psychology, 4, 1-32.
48
Shiffman, S., & Waters, A. J. (2004). Negative affect and smoking lapses: A prospective
analysis. Journal of Consulting and Clinical Psychology, 72(2), 192.
Sierra-Baigrie, S., Lemos-Giráldez, S., & Fonseca-Pedrero, E. (2009). Binge eating in
adolescents: Its relation to behavioural problems and family-meal patterns. Eating
Behaviors, 10(1), 22-28.
Skatrud-Mickelson, M., Adachi-Mejia, A. M., & Sutherland, L. A. (2011). Tween sex differences
in snacking preferences during television viewing. Journal of the American Dietetic
Association, 111(9), 1385-1390.
Smyth, J. M., Wonderlich, S. A., Sliwinski, M. J., Crosby, R. D., Engel, S. G., Mitchell, J. E., et
al. (2009). Ecological momentary assessment of affect, stress, and binge-purge behaviors:
Day of week and time of day effects in the natural environment. International Journal of
Eating Disorders, 42(5), 429-436.
Stacy, A. W., Ames, S. L., Wiers, R. W., & Krank, M. D. (2010). Associative memory in
appetitive behavior: Framework and relevance to epidemiology and prevention. In P. L.
Scheier (Ed.), Handbook of drug use etiology: Theory, methods, and empirical findings. (pp.
165-182). Washington, DC US: American Psychological Association.
Stacy, A. W., & Wiers, R. W. (2010). Implicit cognition and addiction: A tool for explaining
paradoxical behavior. Annual Review of Clinical Psychology, 6, 551-575.
Stice, E., Telch, C. F., & Rizvi, S. L. (2000). Development and validation of the eating disorder
diagnostic scale: A brief self-report measure of anorexia, bulimia, and binge-eating
disorder. Psychological Assessment, 12(2), 123-131.
Stone, A. A., & Shiffman, S. (1994). Ecological momentary assessment (EMA) in behavorial
medicine. Annals of Behavioral Medicine, 16(3), 199-202.
Swinburn, B., Caterson, I., Seidell, J., & James, W. (2004). Diet, nutrition and the prevention of
excess weight gain and obesity. Public Health Nutrition, 7(1A), 123-146.

49
Thomas, J. G., Doshi, S., Crosby, R. D., & Lowe, M. R. (2011). Ecological momentary
assessment of obesogenic eating behavior: Combining person-specific and environmental
predictors. Obesity (Silver Spring, Md.), 19(8), 1574-1579.
Vader, A. M., Walters, S. T., Harris, T. R., & Hoelscher, D. M. (2009). Television viewing and
snacking behaviors of fourth- and eighth-grade schoolchildren in texas. Preventing Chronic
Disease, 6(3), http://www.cdc.gov/pcd/issues/2009/jul/08_0122.htm.-Accessed March 20,
2012.
van den Brink, M., Bandell-Hoekstra, E. N., & Abu-Saad, H. H. (2001). The occurrence of recall
bias in pediatric headache: A comparison of questionnaire and diary data. Headache, 41(1),
11-20.
Vartanian, L. R., Schwartz, M. B., & Brownell, K. D. (2007). Effects of soft drink consumption on
nutrition and health: A systematic review and meta-analysis. American Journal of Public
Health, 97(4), 667-675.
Wegner, K. E., Smyth, J. M., Crosby, R. D., Wittrock, D., Wonderlich, S. A., & Mitchell, J. E.
(2002). An evaluation of the relationship between mood and binge eating in the natural
environment using ecological momentary assessment. International Journal of Eating
Disorders, 32(3), 352-361.
Weinstein, S. M., & Mermelstein, R. (2007). Relations between daily activities and adolescent
mood: The role of autonomy. Journal of Clinical Child and Adolescent Psychology, 36(2),
182-194.
Weinstein, S. M., Mermelstein, R. J., Hankin, B. L., Hedeker, D., & Flay, B. R. (2007).
Longitudinal patterns of daily affect and global mood during adolescence. Journal of
Research on Adolescence, 17(3), 587-600.
Wood, W., & Neal, D. T. (2007). A new look at habits and the habit-goal interface. Psychological
Review, 114(4), 843-863.

50
Wood, W., Tam, L., & Witt, M. G. (2005). Changing circumstances, disrupting habits. Journal of
Personality and Social Psychology, 88(6), 918-933.
Wouters, E. J., Larsen, J. K., Kremers, S. P., Dagnelie, P. C., & Geenen, R. (2010). Peer
influence on snacking behavior in adolescence. Appetite, 55(1), 11-17.
Yin, H. H., & Knowlton, B. J. (2006a). Addiction and learning in the brain. In R. W. Wiers, & A.
W. Stacy (Eds.), Handbook of implicit cognition and addiction (pp. 167-183). Thousand
Oaks, CA: Sage.
Yin, H. H., & Knowlton, B. J. (2006b). The role of the basal ganglia in habit formation. Nature
Reviews.Neuroscience, 7(6), 464-476.
Related Documents