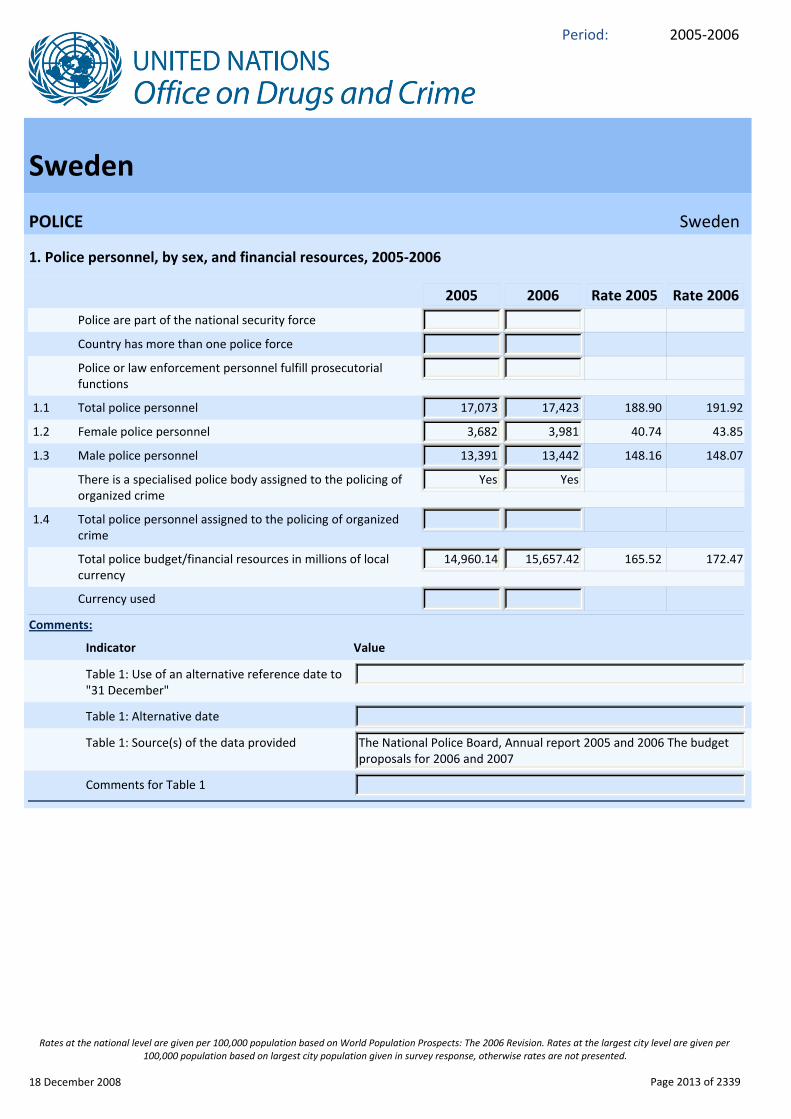
2005‐2006 Period: Sweden POLICE Sweden 1. Police personnel, by sex, and financial resources, 2005‐2006 Indicator Value Comments: 2005 2006 Rate 2005 Rate 2006 Police are part of the national security force Country has more than one police force Police or law enforcement personnel fulfill prosecutorial functions 1.1 Total police personnel 17,073 17,423 188.90 191.92 1.2 Female police personnel 3,682 3,981 40.74 43.85 1.3 Male police personnel 13,391 13,442 148.16 148.07 There is a specialised police body assigned to the policing of organized crime Yes Yes 1.4 Total police personnel assigned to the policing of organized crime Total police budget/financial resources in millions of local currency 14,960.14 15,657.42 165.52 172.47 Currency used Table 1: Use of an alternative reference date to "31 December" Table 1: Alternative date The National Police Board, Annual report 2005 and 2006 The budget proposals for 2006 and 2007 Table 1: Source(s) of the data provided Comments for Table 1 18 December 2008 Page 2013 of 2339 Rates at the national level are given per 100,000 population based on World Population Prospects: The 2006 Revision. Rates at the largest city level are given per 100,000 population based on largest city population given in survey response, otherwise rates are not presented.

Welcome message from author
This document is posted to help you gain knowledge. Please leave a comment to let me know what you think about it! Share it to your friends and learn new things together.
Transcript
2005‐2006Period:
Sweden
POLICE Sweden
1. Police personnel, by sex, and financial resources, 2005‐2006
Indicator Value
Comments:
2005 2006 Rate 2005 Rate 2006
Police are part of the national security force
Country has more than one police force
Police or law enforcement personnel fulfill prosecutorial functions
1.1 Total police personnel 17,073 17,423 188.90 191.92
1.2 Female police personnel 3,682 3,981 40.74 43.85
1.3 Male police personnel 13,391 13,442 148.16 148.07
There is a specialised police body assigned to the policing of organized crime
Yes Yes
1.4 Total police personnel assigned to the policing of organized crime
Total police budget/financial resources in millions of local currency
14,960.14 15,657.42 165.52 172.47
Currency used
Table 1: Use of an alternative reference date to "31 December"
Table 1: Alternative date
The National Police Board, Annual report 2005 and 2006 The budget proposals for 2006 and 2007
Table 1: Source(s) of the data provided
Comments for Table 1
18 December 2008 Page 2013 of 2339
Rates at the national level are given per 100,000 population based on World Population Prospects: The 2006 Revision. Rates at the largest city level are given per 100,000 population based on largest city population given in survey response, otherwise rates are not presented.

2005‐2006Period:
POLICE Sweden
2. Crimes recorded in criminal (police) statistics and persons brought into initial formal contact with the police, by type of crime, 2005‐2006
2005 2006 Rate 2005 Rate 2006
Largest City Stockholm Stockholm
City population 1,889,945 1,918,104
Definition consistent with questionnaire for "total recorded crimes"
Yes Yes
2.0 Grand total of recorded crimes 1,241,843 1,224,958 13,740.17 13,493.44
2.1 Grand total of recorded crimes in city 335,992 336,527 17,777.87 17,544.77
2.2 Grand total of suspects 106,659 109,702 1,180.11 1,208.41
Definition consistent with questionnaire for "intentional homicide"
Yes Yes
2.3 Total recorded intentional homicide, completed 127 115 1.41 1.27
2.4 Total recorded committed intentional homicides in city
2.5 Committed intentional homicide suspects 38 31 0.42 0.34
2.6 Total recorded intentional homicides committed with a firearm
2.7 Intentional homicide, completed with a firearm: Total recorded offences in the largest city
2.8 Intentional homicide committed with a firearm suspects 11 3 0.12 0.03
2.9 Total recorded intentional homicide, attempted 690 769 7.63 8.47
2.10 Total recorded attempted intentional homicides in city 215 230 11.38 11.99
2.11 Attempted intentional homicide suspects 259 355 2.87 3.91
2.12 Intentional homicide, attempted with a firearm: Total recorded offences at the national level
102 116 1.13 1.28
2.13 Intentional homicide, attempted with a firearm: Total recorded offences in the largest city
32 26 1.69 1.36
2.14 Intentional homicide, attempted with a firearm: Total persons suspected, arrested, cautioned
41 66 0.45 0.73
Definition consistent with questionnaire for "non‐intentional homicide"
Yes Yes
2.15 Total recorded non‐intentional homicides 77 88 0.85 0.97
2.16 Total recorded non‐intentional homicides in city 18 20 0.95 1.04
2.17 Total non‐intentional homicide suspects 30 33 0.33 0.36
Definition consistent with questionnaire for "assault" Yes Yes
Data on assault include threats
Data on assault include slapping/punching Yes Yes
2.18 Total recorded assaults 72,645 77,019 803.77 848.40
18 December 2008 Page 2014 of 2339
Rates at the national level are given per 100,000 population based on World Population Prospects: The 2006 Revision. Rates at the largest city level are given per 100,000 population based on largest city population given in survey response, otherwise rates are not presented.
2005‐2006Period:
POLICE Sweden
2. Crimes recorded in criminal (police) statistics and persons brought into initial formal contact with the police, by type of crime, 2005‐2006
2005 2006 Rate 2005 Rate 2006
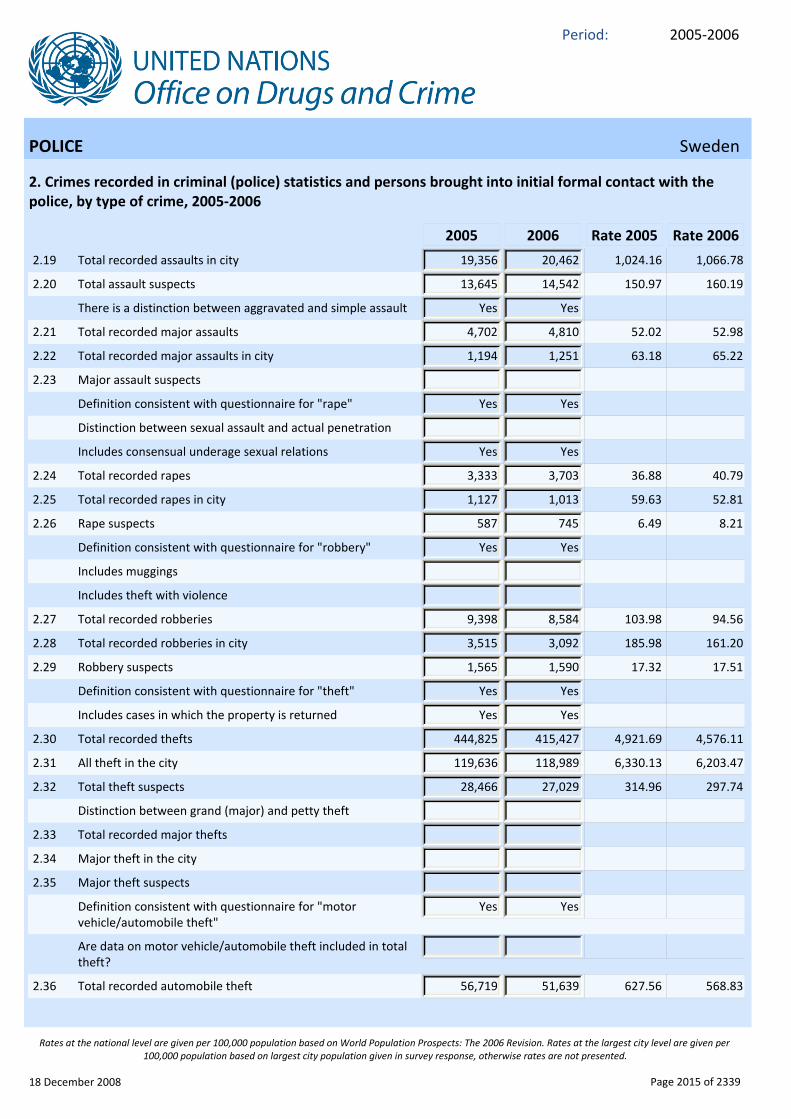
2.19 Total recorded assaults in city 19,356 20,462 1,024.16 1,066.78
2.20 Total assault suspects 13,645 14,542 150.97 160.19
There is a distinction between aggravated and simple assault Yes Yes
2.21 Total recorded major assaults 4,702 4,810 52.02 52.98
2.22 Total recorded major assaults in city 1,194 1,251 63.18 65.22
2.23 Major assault suspects
Definition consistent with questionnaire for "rape" Yes Yes
Distinction between sexual assault and actual penetration
Includes consensual underage sexual relations Yes Yes
2.24 Total recorded rapes 3,333 3,703 36.88 40.79
2.25 Total recorded rapes in city 1,127 1,013 59.63 52.81
2.26 Rape suspects 587 745 6.49 8.21
Definition consistent with questionnaire for "robbery" Yes Yes
Includes muggings
Includes theft with violence
2.27 Total recorded robberies 9,398 8,584 103.98 94.56
2.28 Total recorded robberies in city 3,515 3,092 185.98 161.20
2.29 Robbery suspects 1,565 1,590 17.32 17.51
Definition consistent with questionnaire for "theft" Yes Yes
Includes cases in which the property is returned Yes Yes
2.30 Total recorded thefts 444,825 415,427 4,921.69 4,576.11
2.31 All theft in the city 119,636 118,989 6,330.13 6,203.47
2.32 Total theft suspects 28,466 27,029 314.96 297.74
Distinction between grand (major) and petty theft
2.33 Total recorded major thefts
2.34 Major theft in the city
2.35 Major theft suspects
Definition consistent with questionnaire for "motor vehicle/automobile theft"
Yes Yes
Are data on motor vehicle/automobile theft included in total theft?
2.36 Total recorded automobile theft 56,719 51,639 627.56 568.83
18 December 2008 Page 2015 of 2339
Rates at the national level are given per 100,000 population based on World Population Prospects: The 2006 Revision. Rates at the largest city level are given per 100,000 population based on largest city population given in survey response, otherwise rates are not presented.
2005‐2006Period:
POLICE Sweden
2. Crimes recorded in criminal (police) statistics and persons brought into initial formal contact with the police, by type of crime, 2005‐2006
2005 2006 Rate 2005 Rate 2006
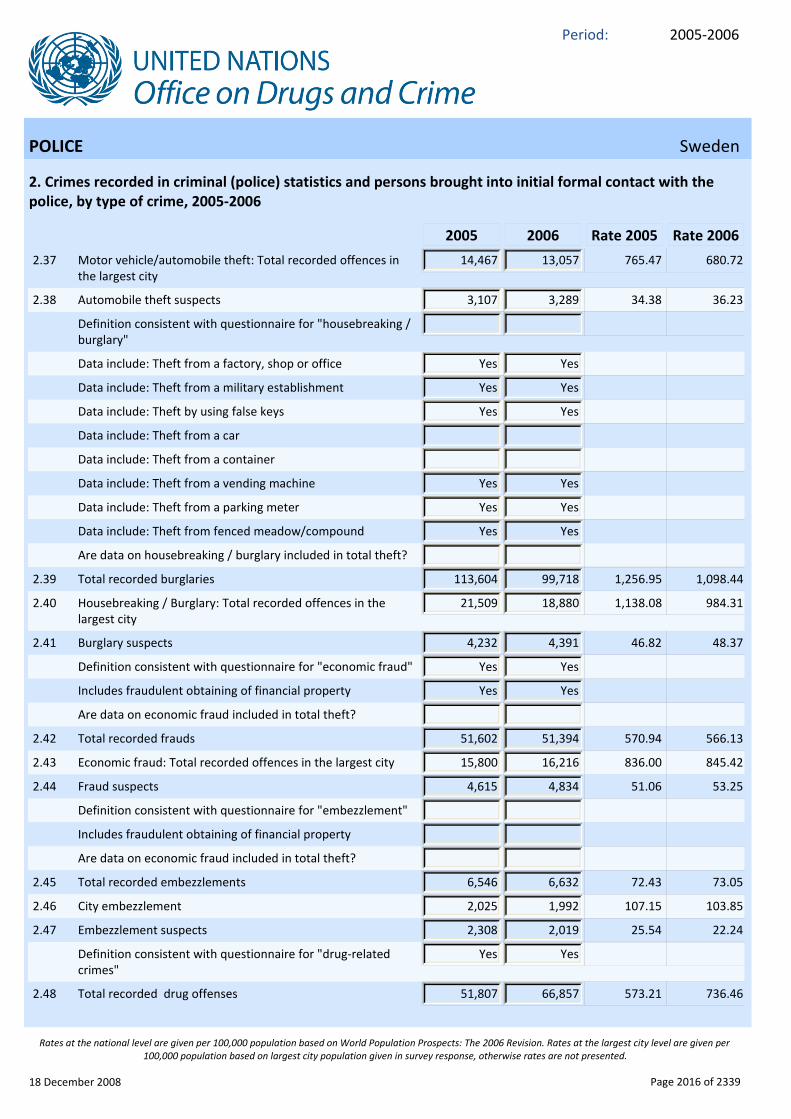
2.37 Motor vehicle/automobile theft: Total recorded offences in the largest city
14,467 13,057 765.47 680.72
2.38 Automobile theft suspects 3,107 3,289 34.38 36.23
Definition consistent with questionnaire for "housebreaking / burglary"
Data include: Theft from a factory, shop or office Yes Yes
Data include: Theft from a military establishment Yes Yes
Data include: Theft by using false keys Yes Yes
Data include: Theft from a car
Data include: Theft from a container
Data include: Theft from a vending machine Yes Yes
Data include: Theft from a parking meter Yes Yes
Data include: Theft from fenced meadow/compound Yes Yes
Are data on housebreaking / burglary included in total theft?
2.39 Total recorded burglaries 113,604 99,718 1,256.95 1,098.44
2.40 Housebreaking / Burglary: Total recorded offences in the largest city
21,509 18,880 1,138.08 984.31
2.41 Burglary suspects 4,232 4,391 46.82 48.37
Definition consistent with questionnaire for "economic fraud" Yes Yes
Includes fraudulent obtaining of financial property Yes Yes
Are data on economic fraud included in total theft?
2.42 Total recorded frauds 51,602 51,394 570.94 566.13
2.43 Economic fraud: Total recorded offences in the largest city 15,800 16,216 836.00 845.42
2.44 Fraud suspects 4,615 4,834 51.06 53.25
Definition consistent with questionnaire for "embezzlement"
Includes fraudulent obtaining of financial property
Are data on economic fraud included in total theft?
2.45 Total recorded embezzlements 6,546 6,632 72.43 73.05
2.46 City embezzlement 2,025 1,992 107.15 103.85
2.47 Embezzlement suspects 2,308 2,019 25.54 22.24
Definition consistent with questionnaire for "drug‐related crimes"
Yes Yes
2.48 Total recorded drug offenses 51,807 66,857 573.21 736.46
18 December 2008 Page 2016 of 2339
Rates at the national level are given per 100,000 population based on World Population Prospects: The 2006 Revision. Rates at the largest city level are given per 100,000 population based on largest city population given in survey response, otherwise rates are not presented.
2005‐2006Period:
POLICE Sweden
2. Crimes recorded in criminal (police) statistics and persons brought into initial formal contact with the police, by type of crime, 2005‐2006
2005 2006 Rate 2005 Rate 2006
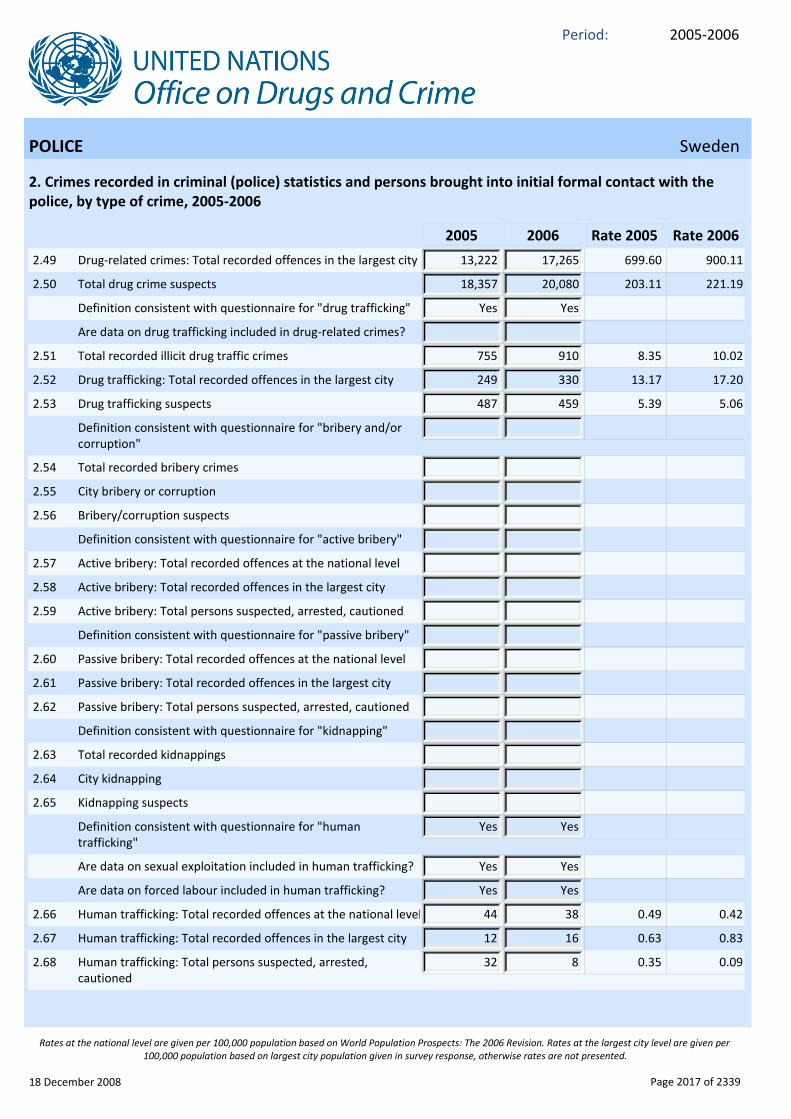
2.49 Drug‐related crimes: Total recorded offences in the largest city 13,222 17,265 699.60 900.11
2.50 Total drug crime suspects 18,357 20,080 203.11 221.19
Definition consistent with questionnaire for "drug trafficking" Yes Yes
Are data on drug trafficking included in drug‐related crimes?
2.51 Total recorded illicit drug traffic crimes 755 910 8.35 10.02
2.52 Drug trafficking: Total recorded offences in the largest city 249 330 13.17 17.20
2.53 Drug trafficking suspects 487 459 5.39 5.06
Definition consistent with questionnaire for "bribery and/or corruption"
2.54 Total recorded bribery crimes
2.55 City bribery or corruption
2.56 Bribery/corruption suspects
Definition consistent with questionnaire for "active bribery"
2.57 Active bribery: Total recorded offences at the national level
2.58 Active bribery: Total recorded offences in the largest city
2.59 Active bribery: Total persons suspected, arrested, cautioned
Definition consistent with questionnaire for "passive bribery"
2.60 Passive bribery: Total recorded offences at the national level
2.61 Passive bribery: Total recorded offences in the largest city
2.62 Passive bribery: Total persons suspected, arrested, cautioned
Definition consistent with questionnaire for "kidnapping"
2.63 Total recorded kidnappings
2.64 City kidnapping
2.65 Kidnapping suspects
Definition consistent with questionnaire for "human trafficking"
Yes Yes
Are data on sexual exploitation included in human trafficking? Yes Yes
Are data on forced labour included in human trafficking? Yes Yes
2.66 Human trafficking: Total recorded offences at the national level 44 38 0.49 0.42
2.67 Human trafficking: Total recorded offences in the largest city 12 16 0.63 0.83
2.68 Human trafficking: Total persons suspected, arrested, cautioned
32 8 0.35 0.09
18 December 2008 Page 2017 of 2339
Rates at the national level are given per 100,000 population based on World Population Prospects: The 2006 Revision. Rates at the largest city level are given per 100,000 population based on largest city population given in survey response, otherwise rates are not presented.
2005‐2006Period:
POLICE Sweden
2. Crimes recorded in criminal (police) statistics and persons brought into initial formal contact with the police, by type of crime, 2005‐2006
Indicator Value
Comments:
2005 2006 Rate 2005 Rate 2006
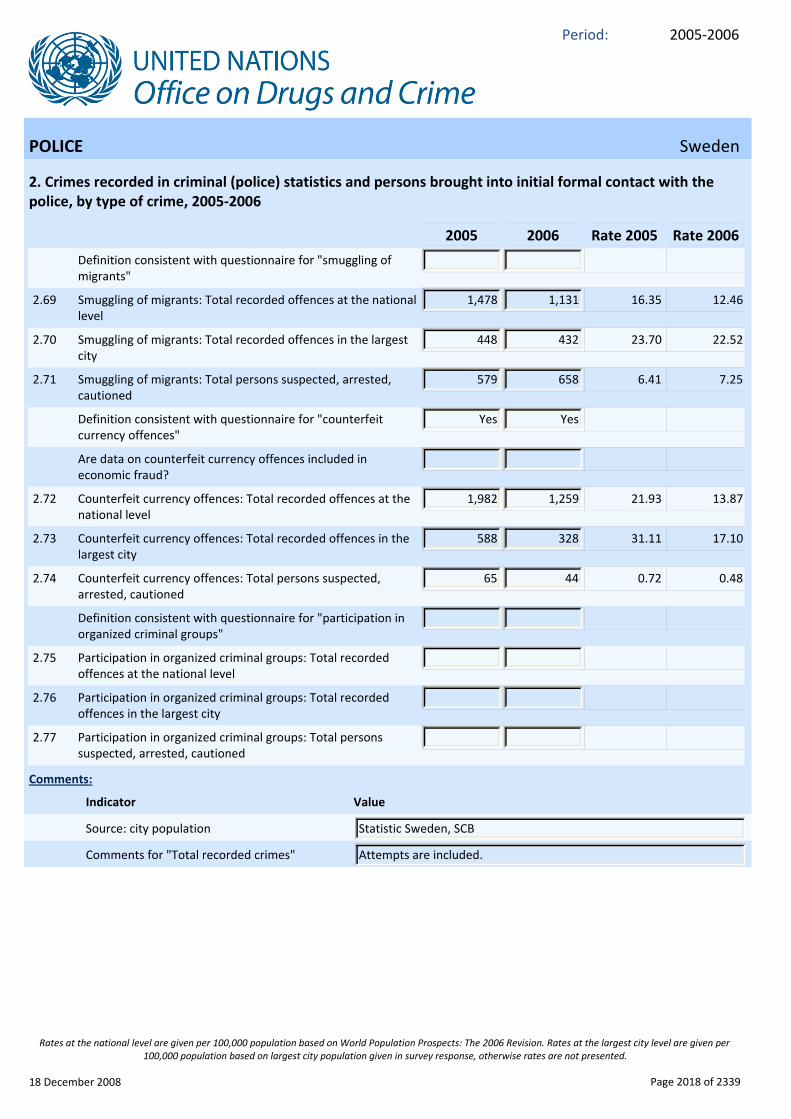
Definition consistent with questionnaire for "smuggling of migrants"
2.69 Smuggling of migrants: Total recorded offences at the national level
1,478 1,131 16.35 12.46
2.70 Smuggling of migrants: Total recorded offences in the largest city
448 432 23.70 22.52
2.71 Smuggling of migrants: Total persons suspected, arrested, cautioned
579 658 6.41 7.25
Definition consistent with questionnaire for "counterfeit currency offences"
Yes Yes
Are data on counterfeit currency offences included in economic fraud?
2.72 Counterfeit currency offences: Total recorded offences at the national level
1,982 1,259 21.93 13.87
2.73 Counterfeit currency offences: Total recorded offences in the largest city
588 328 31.11 17.10
2.74 Counterfeit currency offences: Total persons suspected, arrested, cautioned
65 44 0.72 0.48
Definition consistent with questionnaire for "participation in organized criminal groups"
2.75 Participation in organized criminal groups: Total recorded offences at the national level
2.76 Participation in organized criminal groups: Total recorded offences in the largest city
2.77 Participation in organized criminal groups: Total persons suspected, arrested, cautioned
Statistic Sweden, SCB Source: city population
Attempts are included.Comments for "Total recorded crimes"
18 December 2008 Page 2018 of 2339
Rates at the national level are given per 100,000 population based on World Population Prospects: The 2006 Revision. Rates at the largest city level are given per 100,000 population based on largest city population given in survey response, otherwise rates are not presented.

2005‐2006Period:
POLICE Sweden
2. Crimes recorded in criminal (police) statistics and persons brought into initial formal contact with the police, by type of crime, 2005‐2006
The crimes that are reported to the police and that the police report to the Council are an estimate of the actual number of cases of lethal violence. For example, there are cases that, after the police investigation, prove to be natural deaths, suicides or accidents. To obtain a clear picture of lethal violence, it is necessary instead to conduct special studies, with each individual case being compared with the National Board of Health and Welfare’s cause of death statistics. The number presented for the years 2005 and 2006 are the ones that have been obtained from a special study of lethal violence in Sweden which is yearly conducted by the National Council for Crime Prevention (statistical authority in the field of Crime Statistics).
Comments for "Intentional homicide"
Attempts are includedComments for "Non‐intentional homicide"
In assessing if the crime is gross (major/aggravated) special consideration is given to whether the act constituted a mortal danger or whether the offender inflicted grievous bodily harm or severe illness or otherwise displayed particular ruthlessness or brutality. Attempts are included.
Comments for "Assault"
Attempts are includedComments for "Rape"
Attempts are includedComments for "Robbery"
Attempts are includedComments for "Theft"
Attempts are includedComments for "Motor vehicle/automobile theft"
Attempts are includedComments for "Housebreaking / Burglary"
Attempts are includedComments for "Economic fraud"
The category includes embezzlement according to the definition as well as other breaches of trust for example: misuse of authority, unlawful use, breach of trust against a principal.
Comments for "Embezzlement"
Attempts are includedComments for "Drug‐related crimes"
Attempts are includedComments for "Drug trafficking"
The category isn’t separated in our statistics from the number of other categories. The category is therefore a part of a total number.
Comments for "Bribery and/or corruption"
The category isn’t separated in our statistics from the number of other categories. The category is therefore a part of a total number.
Comments for "Kidnapping"
Attempts are includedComments for "Human trafficking"
Attempts are includedComments for "Smuggling of migrants"
Attempts are includedComments for "Counterfeit currency offences"
Comments for "Participation in organized criminal groups"
The National Council for Crime Prevention in SwedenTable 2: Source(s) of the data provided
18 December 2008 Page 2019 of 2339
Rates at the national level are given per 100,000 population based on World Population Prospects: The 2006 Revision. Rates at the largest city level are given per 100,000 population based on largest city population given in survey response, otherwise rates are not presented.
2005‐2006Period:
POLICE Sweden
2. Crimes recorded in criminal (police) statistics and persons brought into initial formal contact with the police, by type of crime, 2005‐2006
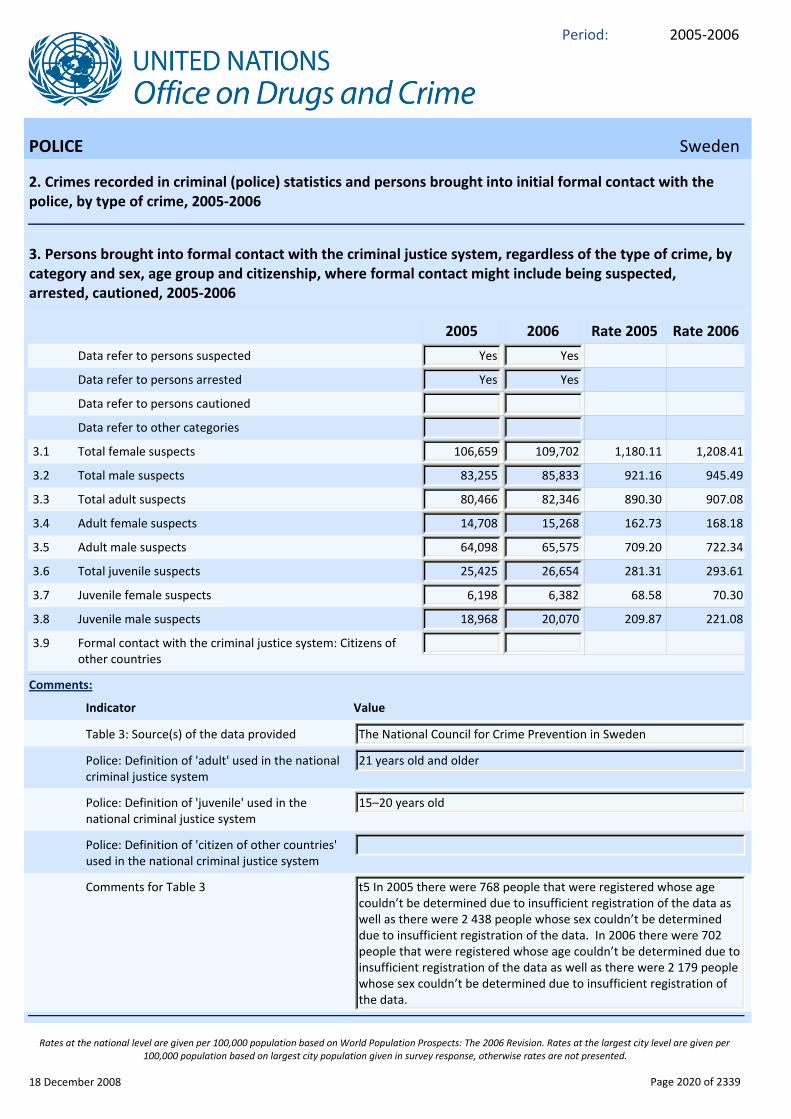
3. Persons brought into formal contact with the criminal justice system, regardless of the type of crime, by category and sex, age group and citizenship, where formal contact might include being suspected, arrested, cautioned, 2005‐2006
Indicator Value
Comments:
2005 2006 Rate 2005 Rate 2006
Data refer to persons suspected Yes Yes
Data refer to persons arrested Yes Yes
Data refer to persons cautioned
Data refer to other categories
3.1 Total female suspects 106,659 109,702 1,180.11 1,208.41
3.2 Total male suspects 83,255 85,833 921.16 945.49
3.3 Total adult suspects 80,466 82,346 890.30 907.08
3.4 Adult female suspects 14,708 15,268 162.73 168.18
3.5 Adult male suspects 64,098 65,575 709.20 722.34
3.6 Total juvenile suspects 25,425 26,654 281.31 293.61
3.7 Juvenile female suspects 6,198 6,382 68.58 70.30
3.8 Juvenile male suspects 18,968 20,070 209.87 221.08
3.9 Formal contact with the criminal justice system: Citizens of other countries
The National Council for Crime Prevention in SwedenTable 3: Source(s) of the data provided
21 years old and olderPolice: Definition of 'adult' used in the national criminal justice system
15–20 years oldPolice: Definition of 'juvenile' used in the national criminal justice system
Police: Definition of 'citizen of other countries' used in the national criminal justice system
t5 In 2005 there were 768 people that were registered whose age couldn’t be determined due to insufficient registration of the data as well as there were 2 438 people whose sex couldn’t be determined due to insufficient registration of the data. In 2006 there were 702 people that were registered whose age couldn’t be determined due to insufficient registration of the data as well as there were 2 179 people whose sex couldn’t be determined due to insufficient registration of the data.
Comments for Table 3
18 December 2008 Page 2020 of 2339
Rates at the national level are given per 100,000 population based on World Population Prospects: The 2006 Revision. Rates at the largest city level are given per 100,000 population based on largest city population given in survey response, otherwise rates are not presented.

2005‐2006Period:
POLICE Sweden
4. Supplementary information on crimes recorded in criminal (police) statistics
Indicator Value
Comments:
YesAre there written rules regulating the way in which criminal (police) data are recorded?
1Data is collected: 1‐when reported to police, 2‐before invastigation, 3‐after investigation
A principal offence rule is applied
1Multiple offences are counted as: 1‐one offence, 2‐two or more offences, 3‐uncertain
1An offence committed by more than one person is counted as : 1‐one offence, 2‐two or more offences, 3‐uncertain
Data recording methods have been substantially modified during the reporting period
The National Council for Crime Prevention in SwedenTable 4: Source(s) of the data provided
Comments for Table 4
18 December 2008 Page 2021 of 2339
Rates at the national level are given per 100,000 population based on World Population Prospects: The 2006 Revision. Rates at the largest city level are given per 100,000 population based on largest city population given in survey response, otherwise rates are not presented.

2005‐2006Period:
PROSECUTION Sweden
5. Prosecution personnel, by category, and financial resources, 2005‐2006
Indicator Value
Comments:
2005 2006 Rate 2005 Rate 2006
5.0 Total prosecution personnel 772 808 8.54 8.90
5.1 Female prosecution personnel 387 414 4.28 4.56
5.2 Male prosecution personnel 385 394 4.26 4.34
There is a specialized prosecution body dealing with organized crime
5.3 Total prosecution officials assigned to the prosecution of organized crime
33 41 0.37 0.45
Total prosecution budget/financial resources in millions of local currency
829.87 888.68 9.18 9.79
Currency used SEK SEK
The Swedish Prosecution Authority and The National Economic Crimes Bureau
Prosecutor agency
Table 5: Use of an alternative reference date to "31 December"
Table 5: Alternative date
Annual Report of The Swedish Prosecution AuthorityTable 5: Source(s) of the data provided
The numbers presented regards The Swedish Prosecution Authority as this authority is the one normally dealing with organized crimes and narcotics. At 31 December 2006 97 prosecutors worked in The National Crimes Bureau. This authority had 2006 a budget of 350 429 000 SEK.
Comments for Table 5
18 December 2008 Page 2022 of 2339
Rates at the national level are given per 100,000 population based on World Population Prospects: The 2006 Revision. Rates at the largest city level are given per 100,000 population based on largest city population given in survey response, otherwise rates are not presented.
2005‐2006Period:
PROSECUTION Sweden
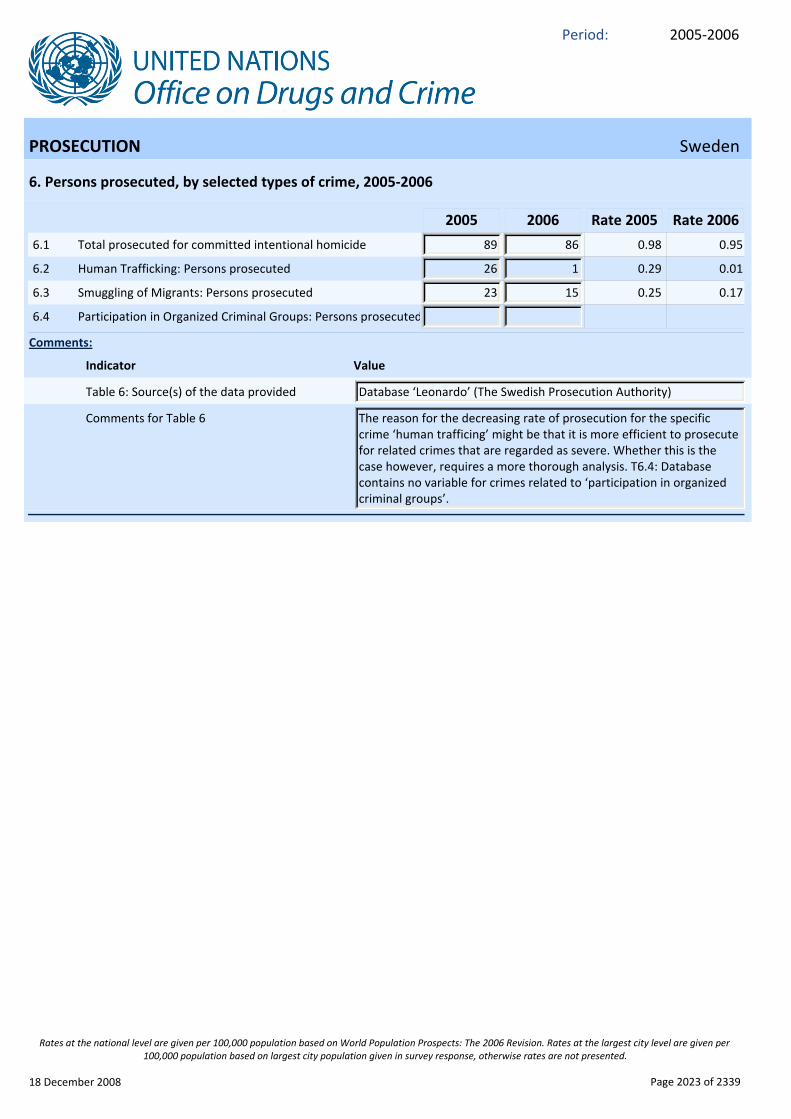
6. Persons prosecuted, by selected types of crime, 2005‐2006
Indicator Value
Comments:
2005 2006 Rate 2005 Rate 2006
6.1 Total prosecuted for committed intentional homicide 89 86 0.98 0.95
6.2 Human Trafficking: Persons prosecuted 26 1 0.29 0.01
6.3 Smuggling of Migrants: Persons prosecuted 23 15 0.25 0.17
6.4 Participation in Organized Criminal Groups: Persons prosecuted
Database ‘Leonardo’ (The Swedish Prosecution Authority)Table 6: Source(s) of the data provided
The reason for the decreasing rate of prosecution for the specific crime ‘human trafficing’ might be that it is more efficient to prosecute for related crimes that are regarded as severe. Whether this is the case however, requires a more thorough analysis. T6.4: Database contains no variable for crimes related to ‘participation in organized criminal groups’.
Comments for Table 6
18 December 2008 Page 2023 of 2339
Rates at the national level are given per 100,000 population based on World Population Prospects: The 2006 Revision. Rates at the largest city level are given per 100,000 population based on largest city population given in survey response, otherwise rates are not presented.

2005‐2006Period:
PROSECUTION Sweden
7. Persons prosecuted, regardless of the type of crime, by sex, age group, and citizenship, 2005‐2006
Indicator Value
Comments:
2005 2006 Rate 2005 Rate 2006
7.0 Total persons prosecuted 118,949 122,159 1,316.09 1,345.63
7.1 Total females prosecuted
7.2 Total males prosecuted
7.3 Total adults prosecuted
7.4 Adult females prosecuted
7.5 Adult males prosecuted
7.6 Total juveniles prosecuted 14,319 15,247 158.43 167.95
7.7 Juvenile females prosecuted
7.8 Juvenile males prosecuted
7.9 Persons prosecuted: Citizens of other countries
Are citizens of other countries included in total persons prosecuted?
Yes Yes
Database ‘Leonardo’ (The Swedish Prosecution AuthorityTable 7: Source(s) of the data provided
Age 18 yrsProsecution: Definition of 'adult' used in the national criminal justice system
Age 15‐17 yrsProsecution: Definition of 'juvenile' used in the national criminal justice system
No statistical definitionProsecution: Definition of 'citizen of other countries' used in the national criminal justice system
Database contains no variables regarding t 7.1‐7.5, 7.7‐7.9Comments for Table 7
18 December 2008 Page 2024 of 2339
Rates at the national level are given per 100,000 population based on World Population Prospects: The 2006 Revision. Rates at the largest city level are given per 100,000 population based on largest city population given in survey response, otherwise rates are not presented.

2005‐2006Period:
COURTS Sweden
8. Judges, by status and sex, and financial resources, including in appeal courts, 2005‐2006
Indicator Value
Comments:
2005 2006 Rate 2005 Rate 2006
8.0 Total number of professional judges/magistrates 1,419 1,532 15.70 16.88
8.1 Number of female professional judges/magistrates 610 735 6.75 8.10
8.2 Number of male professional judges/magistrates 809 797 8.95 8.78
8.3 Number of part time professional judges/magistrates 0 0 0.00 0.00
8.4 Professional part time judges: Females 0 0 0.00 0.00
8.5 Professional part time judges: Males 0 0 0.00 0.00
Part‐time personnel is NOT included in total professional judges or magistrates
8.6 Number of lay judges/magistrates 7,572 8,428 83.78 92.84
8.7 Number of female lay judges/magistrates 3,911 4,213 43.27 46.41
8.8 Number of male lay judges/magistrates 3,661 4,215 40.51 46.43
8.9 Number of part time lay judges/magistrates 7,572 8,428 83.78 92.84
8.10 Lay part time judges: Females 3,911 4,213 43.27 46.41
8.11 Lay part time judges: Males 3,661 4,215 40.51 46.43
Data on part‐time personnel is NOT included in total lay judges or magistrates
There is a specialised court dealing with organized crime
8.12 Total professional judges or magistrates assigned to the judging of organized crime
Total court budget/financial resources in millions of local currency
4,134 3,916 45.74 43.14
Currency used SEK SEK
Table 8: Use of an alternative reference date to "31 December"
Table 8: Alternative date
8.0‐8.11: The National Courts Administration’s Personnel system Palasso. Total court budget: The National Courts Administration’s annual reports
Table 8: Source(s) of the data provided
Question in table 8.12 is not possible to answer. Comments for Table 8
18 December 2008 Page 2025 of 2339
Rates at the national level are given per 100,000 population based on World Population Prospects: The 2006 Revision. Rates at the largest city level are given per 100,000 population based on largest city population given in survey response, otherwise rates are not presented.

2005‐2006Period:
COURTS Sweden
9. Persons brought before the criminal courts and estimates on output statistics, regardless of the type of crime, 2005‐2006
Indicator Value
Comments:
2005 2006 Rate 2005 Rate 2006
Data on total persons brought before the criminal courts (input statistics) are available
9.0 Total number of persons brought before the criminal courts
9.1 Conviction rate
9.2 Duration of criminal trials (months)
Table 9: Source(s) of the data provided
Comments for Table 9
10. Persons convicted in the criminal courts, by selected types of crime, 2005‐2006
Indicator Value
Comments:
2005 2006 Rate 2005 Rate 2006
10.1 Total convicted for committing intentional homicide 146 163 1.62 1.80
10.2 Human Trafficking: Persons convicted 7 11 0.08 0.12
10.3 Smuggling of Migrants: Persons convicted 383 435 4.24 4.79
10.4 Participation in Organized Criminal Groups: Persons convicted
The National Council fro Crime Prevention in Sweden Table 10: Source(s) of the data provided
Comments for Table 10
18 December 2008 Page 2026 of 2339
Rates at the national level are given per 100,000 population based on World Population Prospects: The 2006 Revision. Rates at the largest city level are given per 100,000 population based on largest city population given in survey response, otherwise rates are not presented.

2005‐2006Period:
COURTS Sweden
11. Persons convicted in the criminal courts, by sex, age group and citizenship, 2005‐2006
Indicator Value
Comments:
2005 2006 Rate 2005 Rate 2006
11.0 Grand total of persons convicted 115,402 119,686 1,276.85 1,318.39
11.1 Total females convicted 20,162 20,967 223.08 230.96
11.2 Total males convicted 95,240 98,719 1,053.77 1,087.43
11.3 Total adults convicted 91,526 94,295 1,012.67 1,038.70
11.4 Adult females convicted 14,582 15,104 161.34 166.38
11.5 Adult males convicted 76,944 79,191 851.33 872.32
11.6 Total juveniles convicted 23,876 25,390 264.17 279.68
11.7 Juvenile females convicted 5,580 5,863 61.74 64.58
11.8 Juvenile males convicted 18,296 19,527 202.43 215.10
11.9 Persons convicted: Citizens of other countries
Citizens of other countries are included in total persons convicted
Yes Yes
The National Council fro Crime Prevention in SwedenTable 11: Source(s) of the data provided
21 years old and older Courts: Definition of 'adult' used in the national criminal justice system
15–20 years old Courts: Definition of 'juvenile' used in the national criminal justice system
Courts: Definition of 'citizen of other countries' used in the national criminal justice system
Comments for Table 11
18 December 2008 Page 2027 of 2339
Rates at the national level are given per 100,000 population based on World Population Prospects: The 2006 Revision. Rates at the largest city level are given per 100,000 population based on largest city population given in survey response, otherwise rates are not presented.
2005‐2006Period:
PRISONS Sweden
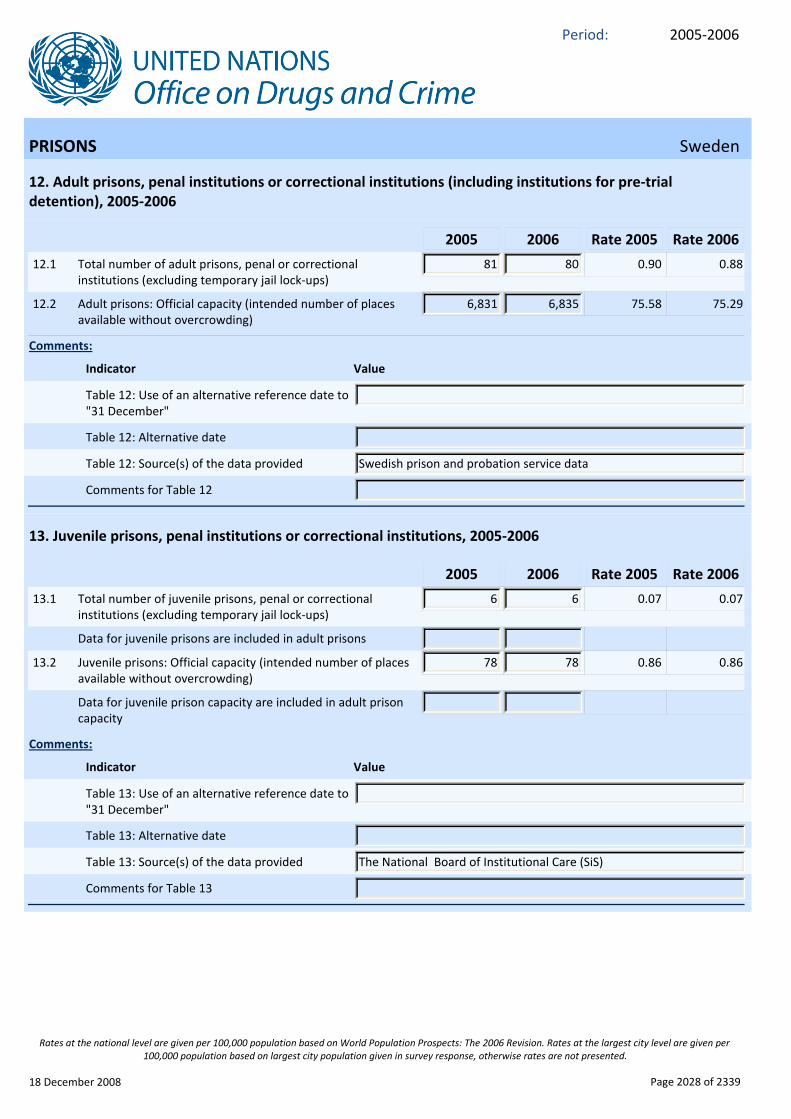
12. Adult prisons, penal institutions or correctional institutions (including institutions for pre‐trial detention), 2005‐2006
Indicator Value
Comments:
2005 2006 Rate 2005 Rate 2006
12.1 Total number of adult prisons, penal or correctional institutions (excluding temporary jail lock‐ups)
81 80 0.90 0.88
12.2 Adult prisons: Official capacity (intended number of places available without overcrowding)
6,831 6,835 75.58 75.29
Table 12: Use of an alternative reference date to "31 December"
Table 12: Alternative date
Swedish prison and probation service dataTable 12: Source(s) of the data provided
Comments for Table 12
13. Juvenile prisons, penal institutions or correctional institutions, 2005‐2006
Indicator Value
Comments:
2005 2006 Rate 2005 Rate 2006
13.1 Total number of juvenile prisons, penal or correctional institutions (excluding temporary jail lock‐ups)
6 6 0.07 0.07
Data for juvenile prisons are included in adult prisons
13.2 Juvenile prisons: Official capacity (intended number of places available without overcrowding)
78 78 0.86 0.86
Data for juvenile prison capacity are included in adult prison capacity
Table 13: Use of an alternative reference date to "31 December"
Table 13: Alternative date
The National Board of Institutional Care (SiS)Table 13: Source(s) of the data provided
Comments for Table 13
18 December 2008 Page 2028 of 2339
Rates at the national level are given per 100,000 population based on World Population Prospects: The 2006 Revision. Rates at the largest city level are given per 100,000 population based on largest city population given in survey response, otherwise rates are not presented.
2005‐2006Period:
PRISONS Sweden
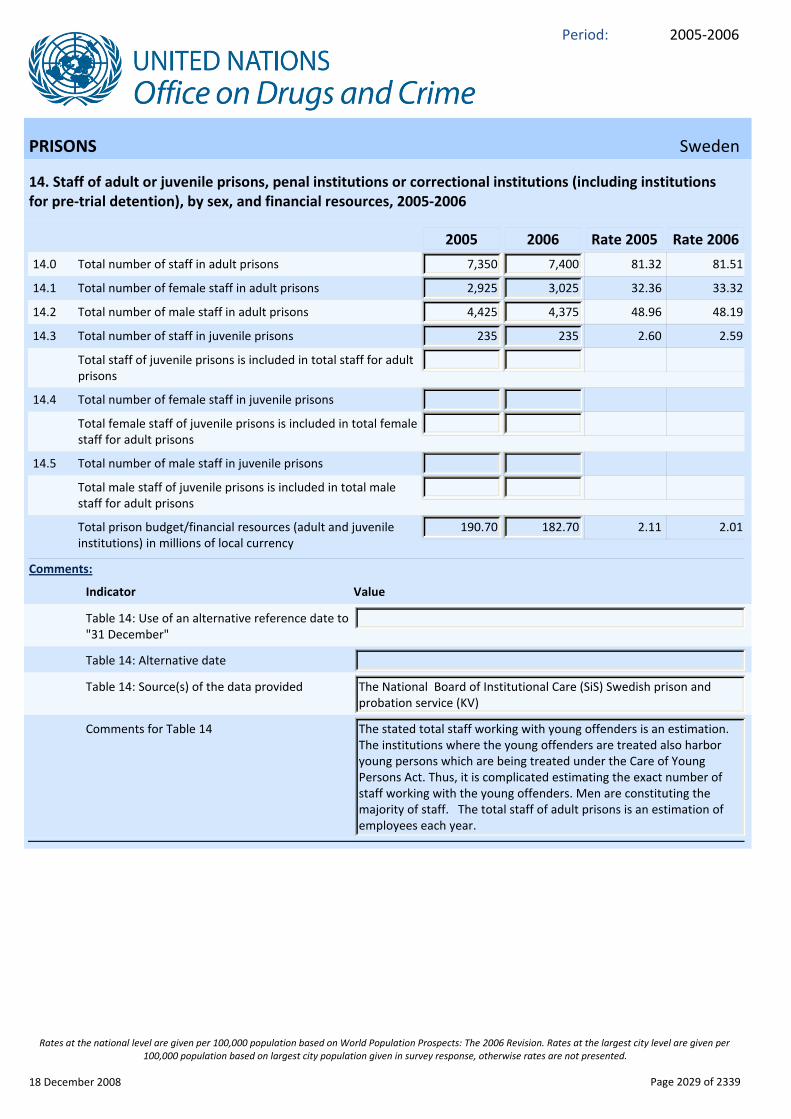
14. Staff of adult or juvenile prisons, penal institutions or correctional institutions (including institutions for pre‐trial detention), by sex, and financial resources, 2005‐2006
Indicator Value
Comments:
2005 2006 Rate 2005 Rate 2006
14.0 Total number of staff in adult prisons 7,350 7,400 81.32 81.51
14.1 Total number of female staff in adult prisons 2,925 3,025 32.36 33.32
14.2 Total number of male staff in adult prisons 4,425 4,375 48.96 48.19
14.3 Total number of staff in juvenile prisons 235 235 2.60 2.59
Total staff of juvenile prisons is included in total staff for adult prisons
14.4 Total number of female staff in juvenile prisons
Total female staff of juvenile prisons is included in total female staff for adult prisons
14.5 Total number of male staff in juvenile prisons
Total male staff of juvenile prisons is included in total male staff for adult prisons
Total prison budget/financial resources (adult and juvenile institutions) in millions of local currency
190.70 182.70 2.11 2.01
Table 14: Use of an alternative reference date to "31 December"
Table 14: Alternative date
The National Board of Institutional Care (SiS) Swedish prison and probation service (KV)
Table 14: Source(s) of the data provided
The stated total staff working with young offenders is an estimation. The institutions where the young offenders are treated also harbor young persons which are being treated under the Care of Young Persons Act. Thus, it is complicated estimating the exact number of staff working with the young offenders. Men are constituting the majority of staff. The total staff of adult prisons is an estimation of employees each year.
Comments for Table 14
18 December 2008 Page 2029 of 2339
Rates at the national level are given per 100,000 population based on World Population Prospects: The 2006 Revision. Rates at the largest city level are given per 100,000 population based on largest city population given in survey response, otherwise rates are not presented.
2005‐2006Period:
PRISONS Sweden
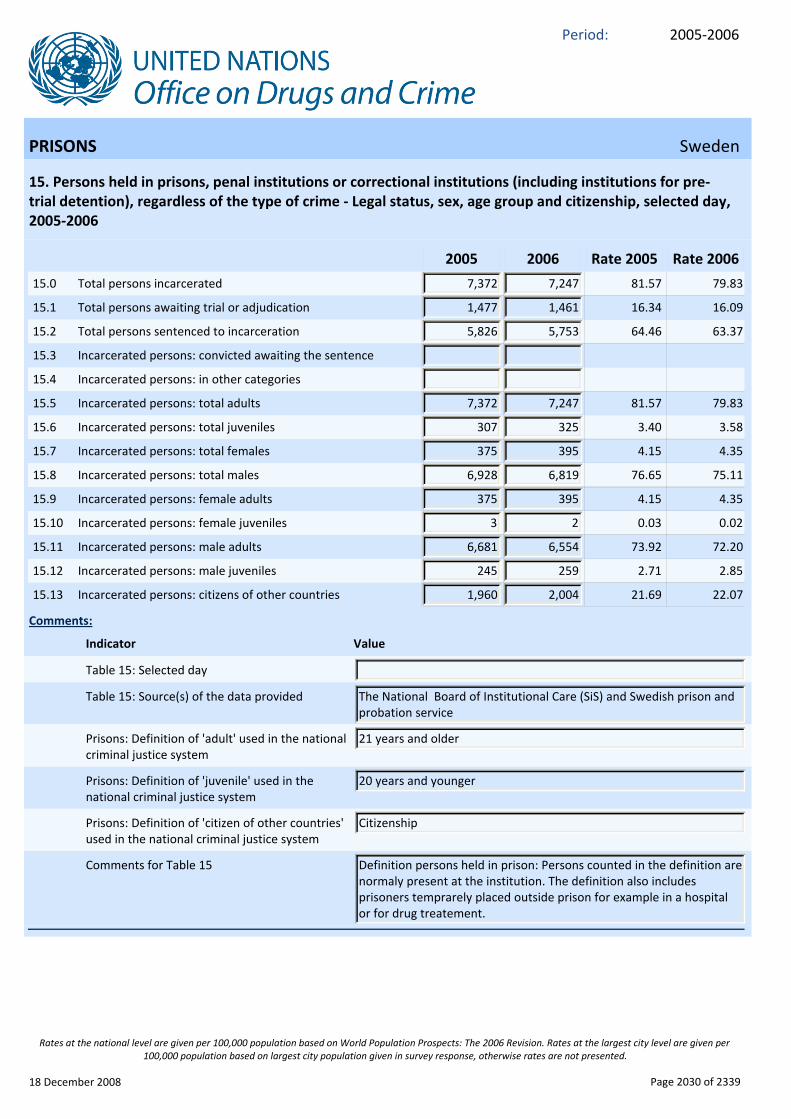
15. Persons held in prisons, penal institutions or correctional institutions (including institutions for pre‐trial detention), regardless of the type of crime ‐ Legal status, sex, age group and citizenship, selected day, 2005‐2006
Indicator Value
Comments:
2005 2006 Rate 2005 Rate 2006
15.0 Total persons incarcerated 7,372 7,247 81.57 79.83
15.1 Total persons awaiting trial or adjudication 1,477 1,461 16.34 16.09
15.2 Total persons sentenced to incarceration 5,826 5,753 64.46 63.37
15.3 Incarcerated persons: convicted awaiting the sentence
15.4 Incarcerated persons: in other categories
15.5 Incarcerated persons: total adults 7,372 7,247 81.57 79.83
15.6 Incarcerated persons: total juveniles 307 325 3.40 3.58
15.7 Incarcerated persons: total females 375 395 4.15 4.35
15.8 Incarcerated persons: total males 6,928 6,819 76.65 75.11
15.9 Incarcerated persons: female adults 375 395 4.15 4.35
15.10 Incarcerated persons: female juveniles 3 2 0.03 0.02
15.11 Incarcerated persons: male adults 6,681 6,554 73.92 72.20
15.12 Incarcerated persons: male juveniles 245 259 2.71 2.85
15.13 Incarcerated persons: citizens of other countries 1,960 2,004 21.69 22.07
Table 15: Selected day
The National Board of Institutional Care (SiS) and Swedish prison and probation service
Table 15: Source(s) of the data provided
21 years and olderPrisons: Definition of 'adult' used in the national criminal justice system
20 years and youngerPrisons: Definition of 'juvenile' used in the national criminal justice system
CitizenshipPrisons: Definition of 'citizen of other countries' used in the national criminal justice system
Definition persons held in prison: Persons counted in the definition are normaly present at the institution. The definition also includes prisoners temprarely placed outside prison for example in a hospital or for drug treatement.
Comments for Table 15
18 December 2008 Page 2030 of 2339
Rates at the national level are given per 100,000 population based on World Population Prospects: The 2006 Revision. Rates at the largest city level are given per 100,000 population based on largest city population given in survey response, otherwise rates are not presented.

2005‐2006Period:
PRISONS Sweden
16. Persons on probation or under another form of supervision in the community, selected day, 2005‐2006
Indicator Value
Comments:
2005 2006 Rate 2005 Rate 2006
Definition consistent with questionnaire for "persons on probation"
16.0 Total persons placed on probation on given day 8,436 8,537 93.34 94.04
16.1 Adults placed on probation on given day 6,808 6,915 75.33 76.17
16.2 Juveniles placed on probation on given day 1,628 1,622 18.01 17.87
Average 2005 and 2006 Table 16: Selected day
Swedish prison and probation service data Table 16: Source(s) of the data provided
Comments for Table 16
17. Persons on conditional release/parole, by age group, selected day, 2005‐2006
Indicator Value
Comments:
2005 2006 Rate 2005 Rate 2006
Definition consistent with questionnaire for "persons on conditional release/parole"
17.0 Total persons placed on release/parole on given day 4,930 4,809 54.55 52.97
17.1 Adult persons on conditional release/parole 4,718 4,569 52.20 50.33
17.2 Juvenile persons on conditional release/parole 212 240 2.35 2.64
Table 17: Selected day
Swedish prison and probation service data Table 17: Source(s) of the data provided
Comments for Table 17
18 December 2008 Page 2031 of 2339
Rates at the national level are given per 100,000 population based on World Population Prospects: The 2006 Revision. Rates at the largest city level are given per 100,000 population based on largest city population given in survey response, otherwise rates are not presented.
2005‐2006Period:
PRISONS Sweden
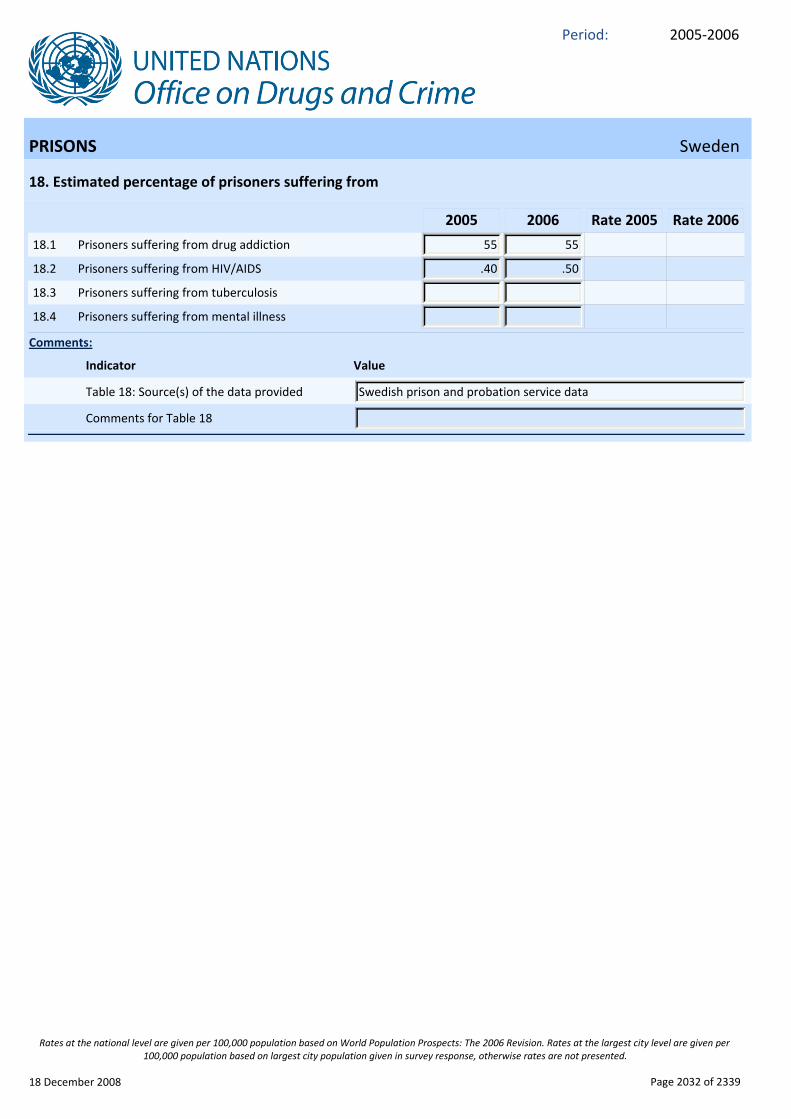
18. Estimated percentage of prisoners suffering from
Indicator Value
Comments:
2005 2006 Rate 2005 Rate 2006
18.1 Prisoners suffering from drug addiction 55 55
18.2 Prisoners suffering from HIV/AIDS .40 .50
18.3 Prisoners suffering from tuberculosis
18.4 Prisoners suffering from mental illness
Swedish prison and probation service dataTable 18: Source(s) of the data provided
Comments for Table 18
18 December 2008 Page 2032 of 2339
Rates at the national level are given per 100,000 population based on World Population Prospects: The 2006 Revision. Rates at the largest city level are given per 100,000 population based on largest city population given in survey response, otherwise rates are not presented.

2005‐2006Period:
Annex Sweden
19. Statistics on police recorded crime: homicide and other crimes leading to the death of another person, by category ‐ Metadata
Indicator Value
Comments:
1. recorded separately?
2. recorded as a group under ...
3. cons. intentional homicide
4. cons. non‐intentional homicide
5. cons. a crime, but not homicide
6. not considered a
crime
7. Wording in national language
Indicator
19.1 Attempted homicide19.2 Murder19.3 Manslaughter19.4 Infanticide19.5 Homicide related to
intimate/proximity19.6 Homicide related to family19.7 Homicide related to felony
murder/robbery/assault leading to death
19.8 Homicide related to fight19.9 Homicide related to sex19.10 Homicide related to drug19.11 Homicide related to alcohol19.12 Homicide related to arson19.13 Homicide related to
gang/organized crime19.14 Homicide related to
juvenile gang killings19.15 Homicide related to act of
terrorism19.16 Homicide related to
professional negligence19.17 Abortion19.18 Euthanasia19.19 Help with suicide19.20 Causing death by
dangerous driving19.21 Causing death by careless
driving19.22 Other
Table 19: Source(s) of the data provided The National Council for Crime Prevention in Sweden
Comments for Table 19
18 December 2008 Page 2033 of 2339
Rates at the national level are given per 100,000 population based on World Population Prospects: The 2006 Revision. Rates at the largest city level are given per 100,000 population based on largest city population given in survey response, otherwise rates are not presented.
2005‐2006Period:
Annex Sweden
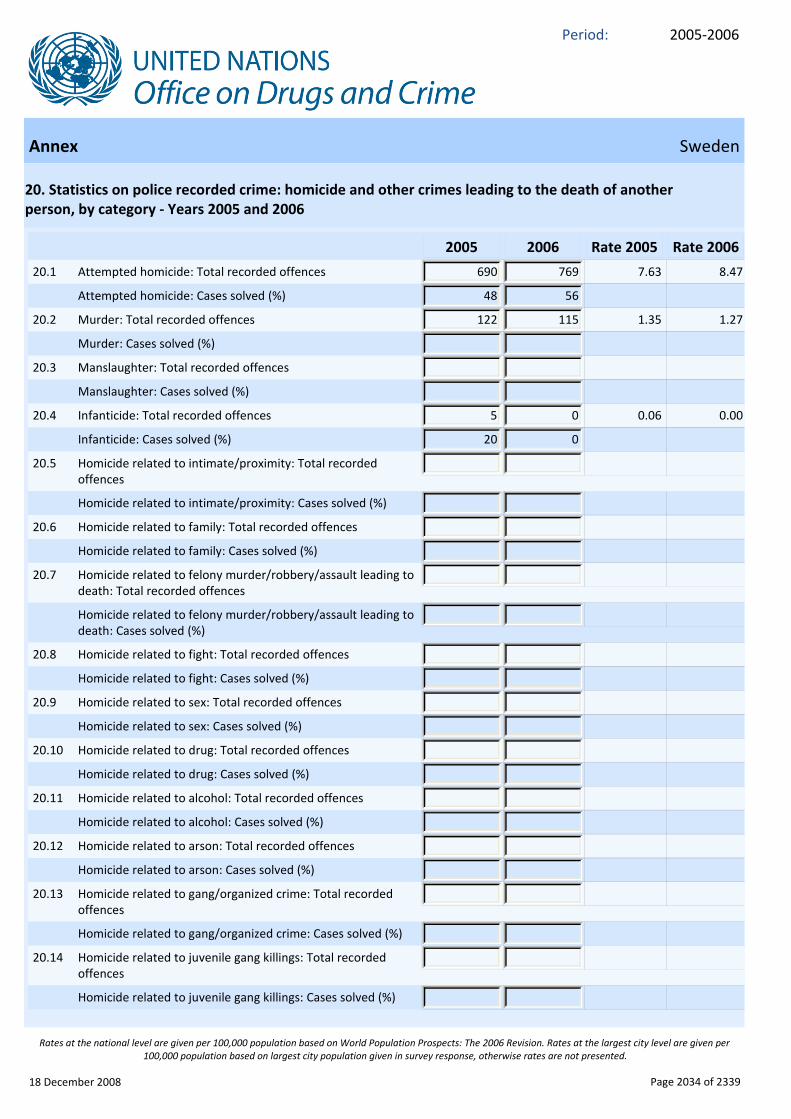
20. Statistics on police recorded crime: homicide and other crimes leading to the death of another person, by category ‐ Years 2005 and 2006
2005 2006 Rate 2005 Rate 2006
20.1 Attempted homicide: Total recorded offences 690 769 7.63 8.47
Attempted homicide: Cases solved (%) 48 56
20.2 Murder: Total recorded offences 122 115 1.35 1.27
Murder: Cases solved (%)
20.3 Manslaughter: Total recorded offences
Manslaughter: Cases solved (%)
20.4 Infanticide: Total recorded offences 5 0 0.06 0.00
Infanticide: Cases solved (%) 20 0
20.5 Homicide related to intimate/proximity: Total recorded offences
Homicide related to intimate/proximity: Cases solved (%)
20.6 Homicide related to family: Total recorded offences
Homicide related to family: Cases solved (%)
20.7 Homicide related to felony murder/robbery/assault leading to death: Total recorded offences
Homicide related to felony murder/robbery/assault leading to death: Cases solved (%)
20.8 Homicide related to fight: Total recorded offences
Homicide related to fight: Cases solved (%)
20.9 Homicide related to sex: Total recorded offences
Homicide related to sex: Cases solved (%)
20.10 Homicide related to drug: Total recorded offences
Homicide related to drug: Cases solved (%)
20.11 Homicide related to alcohol: Total recorded offences
Homicide related to alcohol: Cases solved (%)
20.12 Homicide related to arson: Total recorded offences
Homicide related to arson: Cases solved (%)
20.13 Homicide related to gang/organized crime: Total recorded offences
Homicide related to gang/organized crime: Cases solved (%)
20.14 Homicide related to juvenile gang killings: Total recorded offences
Homicide related to juvenile gang killings: Cases solved (%)
18 December 2008 Page 2034 of 2339
Rates at the national level are given per 100,000 population based on World Population Prospects: The 2006 Revision. Rates at the largest city level are given per 100,000 population based on largest city population given in survey response, otherwise rates are not presented.

2005‐2006Period:
Annex Sweden
20. Statistics on police recorded crime: homicide and other crimes leading to the death of another person, by category ‐ Years 2005 and 2006
Indicator Value
Comments:
2005 2006 Rate 2005 Rate 2006
20.15 Homicide related to act of terrorism: Total recorded offences
Homicide related to act of terrorism: Cases solved (%)
20.16 Homicide related to professional negligence: Total recorded offences
Homicide related to professional negligence: Cases solved (%)
20.17 Abortion: Total recorded offences
Abortion: Cases solved (%)
20.18 Euthanasia: Total recorded offences
Euthanasia: Cases solved (%)
20.19 Help with suicide: Total recorded offences
Help with suicide: Cases solved (%)
20.20 Causing death by dangerous driving: Total recorded offences 97 96 1.07 1.06
Causing death by dangerous driving: Cases solved (%) 74 89
20.21 Causing death by careless driving: Total recorded offences
Causing death by careless driving: Cases solved (%)
20.22 Other: Total recorded offences
Other: Cases solved (%)
Figures are checked with other sources
Details for checking with other sources
YesFigures are revised retrospectively
Whenever the information is availableDetails for retrospective revision
OffenceUsed counting unit
Explicit counting unit
The National Council for Crime Prevention in SwedenTable 20: Source(s) of the data provided
Murder and manslaughter are presented together. By the case solved it’s meant that either a person is tied to the offence as a suspect or the offence is cleared by some other means for instance Police investigations reveal that no penal offence was in fact committed.
Table 20: Comments
18 December 2008 Page 2035 of 2339
Rates at the national level are given per 100,000 population based on World Population Prospects: The 2006 Revision. Rates at the largest city level are given per 100,000 population based on largest city population given in survey response, otherwise rates are not presented.

2005‐2006Period:
Annex Sweden
21. Statistics on police recorded crime: theft of motor vehicles, by category ‐ Metadata
1. recorded separately?
2. recorded as a group under ...
3. Wording in national languageIndicator
21.1 Attempted theft of motor vehicles
21.2 Theft from motor vehicle
21.3 Handling of stolen motor vehicle
21.4 Trafficking of stolen cars/ Organized crime
21.5 Aggravated motor vehicle theft (using force against the person)/ Car hijacking
21.6 Joyriding
21.7 Theft of Cars/automobiles
21.8 Theft of taxi
21.9 Theft of vehicles for the transportation of livestock
21.10 Theft of vans/minibuses
21.11 Theft of motorcycles
21.12 Theft of scooters/mopeds
21.13 Theft of motorised miniscooters
21.14 Theft of cyclomotors
21.15 Theft of quad bikes
21.16 Theft of caravans/motor homes
21.17 Theft of buses
21.18 Theft of coaches
21.19 Theft of trains
21.20 Theft of trams
21.21 Theft of lorries
21.22 Theft of construction vehicles
21.23 Theft of agricultural vehicles
21.24 Theft of military vehicles
21.25 Theft of boats
21.26 Theft of other motorised seacrafts
21.27 Theft of snowmobiles
21.28 Theft of aeroplanes
21.29 Theft of other motorised aircrafts
21.30 Theft of other categories of vehicle not mentioned above
18 December 2008 Page 2036 of 2339
Rates at the national level are given per 100,000 population based on World Population Prospects: The 2006 Revision. Rates at the largest city level are given per 100,000 population based on largest city population given in survey response, otherwise rates are not presented.
2005‐2006Period:
Annex Sweden
21. Statistics on police recorded crime: theft of motor vehicles, by category ‐ Metadata
Indicator Value
Comments:
Table 21: Source(s) of the data provided The National Council for crime prevention in Sweden
Table 21: Comments
18 December 2008 Page 2037 of 2339
Rates at the national level are given per 100,000 population based on World Population Prospects: The 2006 Revision. Rates at the largest city level are given per 100,000 population based on largest city population given in survey response, otherwise rates are not presented.

2005‐2006Period:
Annex Sweden
22. Statistics on police recorded crime: theft of motor vehicles, by category ‐ Years 2005 and 2006
2005 2006 Rate 2005 Rate 2006
22.1 Attempted theft of motor vehicles: Total number of recorded offences
10,542 9,935 116.64 109.44
22.2 Theft from motor vehicle: Total number of recorded offences 128,901 107,152 1,426.20 1,180.33
22.3 Handling of stolen motor vehicle: Total number of recorded offences
22.4 Trafficking of stolen cars/ Organized crime: Total number of recorded offences
22.5 Aggravated motor vehicle theft (using force against the person)/ Car hijacking: Total number of recorded offences
22.6 Joyriding: Total number of recorded offences
22.7 Theft of Cars/automobiles: Total number of recorded offences 31,588 26,326 349.50 289.99
22.8 Theft of taxi: Total number of recorded offences
22.9 Theft of vehicles for the transporetation of livestock: Total number of recorded offences
22.10 Theft of vans/minibuses: Total number of recorded offences
22.11 Theft of motorcycles: Total number of recorded offences 2,988 3,105 33.06 34.20
22.12 Theft of scooters/mopeds: Total number of recorded offences 8,656 8,831 95.77 97.28
22.13 Theft of motorised miniscooters: Total number of recorded offences
22.14 Theft of cyclomotors: Total number of recorded offences
22.15 Theft of quad bikes: Total number of recorded offences
22.16 Theft of caravans/motor homes: Total number of recorded offences
22.17 Theft of buses: Total number of recorded offences
22.18 Theft of coaches: Total number of recorded offences
22.19 Theft of trains: Total number of recorded offences
22.20 Theft of trams: Total number of recorded offences
22.21 Theft of lorries: Total number of recorded offences
22.22 Theft of construction vehicles: Total number of recorded offences
22.23 Theft of agricultural vehicles: Total number of recorded offences
22.24 Theft of military vehicles: Total number of recorded offences
22.25 Theft of boats: Total number of recorded offences 1,564 1,412 17.30 15.55
22.26 Theft of other motorised seacrafts: Total number of recorded offences
18 December 2008 Page 2038 of 2339
Rates at the national level are given per 100,000 population based on World Population Prospects: The 2006 Revision. Rates at the largest city level are given per 100,000 population based on largest city population given in survey response, otherwise rates are not presented.
2005‐2006Period:
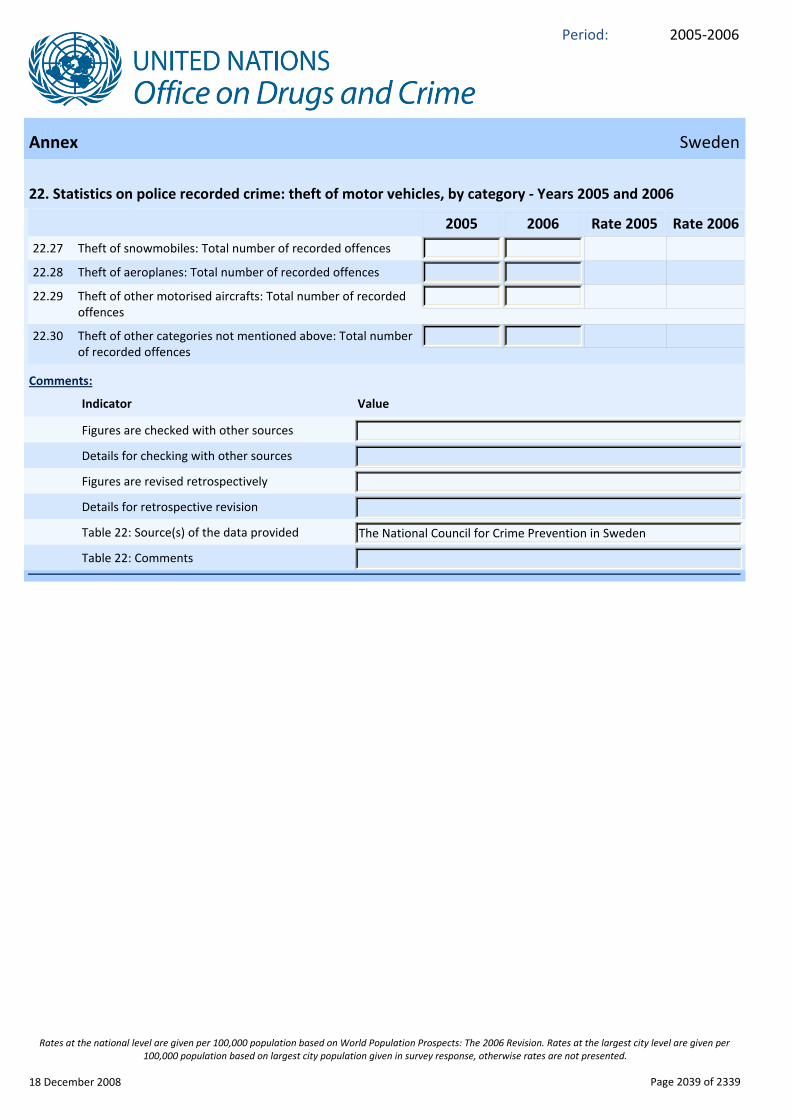
Annex Sweden
22. Statistics on police recorded crime: theft of motor vehicles, by category ‐ Years 2005 and 2006
Indicator Value
Comments:
2005 2006 Rate 2005 Rate 2006
22.27 Theft of snowmobiles: Total number of recorded offences
22.28 Theft of aeroplanes: Total number of recorded offences
22.29 Theft of other motorised aircrafts: Total number of recorded offences
22.30 Theft of other categories not mentioned above: Total number of recorded offences
Figures are checked with other sources
Details for checking with other sources
Figures are revised retrospectively
Details for retrospective revision
Table 22: Source(s) of the data provided The National Council for Crime Prevention in Sweden
Table 22: Comments
18 December 2008 Page 2039 of 2339
Rates at the national level are given per 100,000 population based on World Population Prospects: The 2006 Revision. Rates at the largest city level are given per 100,000 population based on largest city population given in survey response, otherwise rates are not presented.
Related Documents