September, 2015 Swachh Power A Glimpse of Power Quality in India

Welcome message from author
This document is posted to help you gain knowledge. Please leave a comment to let me know what you think about it! Share it to your friends and learn new things together.
Transcript
September, 2015
Swachh Power A Glimpse of Power Quality in India

i
About the Report
Economic growth of any country is directly influenced by availability of reliable and
quality power. Manufacturing sector plays an important role in industrialization and it requires
quality power for increased productivity. With the increased use of power electronics / non-
linear devices in the industrial, commercial, domestic sectors, as well as in the renewable
generation especially wind and solar generation connected through inverter or other electronic
devices; new power quality problems such as harmonics, interruptions, voltage dips, variations
in grid parameters etc. have emerged which need to be addressed suitably. Power quality has
now become an important component of service reliability to both utility and customers. It has
now become more critical due to modern industrial and commercial equipment becoming more
sensitive to minor voltage variations & quality of supply in general.
The Quality of Power Supply or ‘Power Quality’ is a new & ‘not so talked about’ term
for the Indian Power Sector. Quality of power can be measured in terms of parameters like
power frequency, supply voltage magnitude, flicker, voltage deviations (dips and swells),
voltage interruptions, transients, voltage unbalance, voltage harmonics, voltage inter-
harmonics, rapid voltage changes, under & over voltages etc. To assess the status of power
quality in the Indian Power System and plan for necessary preventive /corrective measures, the
first & foremost step is to conduct nation-wide surveys/measurements, collect the relevant data,
draw the financial aspects of maintaining Power-Quality & subsequently identify the mitigating
solutions. .
In this direction, Power Grid Corporation of India Ltd. has taken pioneering initiative
to measure the Power-Quality indices across the country at various towns/cities (at different
voltage levels), create a baseline data repository & present an analysis of Power-Quality in
Indian power system. This will enable identification of mitigating measures, its deployment
locations, industrial requirements etc. Towards this Power Quality measurement has been
carried out at about 175 towns/cities across the country covering almost all the states and union
territories through POWERGRID substations. These measurements have created a database of
more than 500 different locations in India. The observations on these measurements and
analyses have been presented in this report along with basic literature related to Power Quality,
measures to ensure Quality Power, proposed Investment requirements and International
initiatives in this direction.
ii
This report has been structured to understand the Power Quality in general and know
its baseline status across the country. It provides necessary fundamentals on power quality,
international experience and summary of field measurements at various voltage levels,
identified mitigating measures, way forward estimated investment required to address power
quality issues in Indian context. In this report an initial investment of Rs. 24,840 Cr. has been
identified towards providing quality power in India. There are seven (7) chapters in the report.
Chapter-1 describes the Power Quality concepts and their significance in power system.
Chapter-2 provides necessary fundamentals on power quality, its causes and consequences as
well as impact of power quality. Chapter-3 discusses various power quality standards
developed by IEEE, IEC, CEA, and other organizations. Some international experience on the
Power Quality Management has been presented in Chapter-4. Summary of Power quality
parameters at different voltage levels (765kV, 400kV, 220kV, 132kV, 66kV and in the LT
supplies) in the grid at different locations across the country based on field measurements along
with measurements carried out with various house hold appliances are presented in Chapter-5.
In addition to understanding power quality fundamentals and standards, it is important
to know how to solve the issues associated with various Power Quality Problems which are
deliberated in Chapter-6. Various types of power conditioning equipment addressing power
quality issues are presented, along with how they can solve the power quality problems.
Chapter-7 deals with the economics associated with power quality problem and
estimated investment required for mitigating measures to be deployed in Indian Power System.
At the end of this report, Annexure-A shows a brief analysis of Power Quality Measurements
done with various household equipment like TV, fan, CFL, mobile charger, oven, etc. An
exhaustive list of bibliography/references on Power Quality is also included to facilitate further
research/reading in this area.
This report is an initial milestone achieved in the direction of studying the Quality of
Power Supply in India; first attempt in the world to measure the Quality of Power across the
Grid, at various voltage-levels in a country. The improvement in the Quality of Power is not
just an aim but a regular process. Further periodic reviews would be required to keep a check
on the Quality of Supply at all the Voltage levels (especially Distribution Levels). Hence,
further improvements in the form of feedbacks from all the stakeholders are always solicited.
***
Swachh Power
1 | P a g e
TABLE OF CONTENTS
TABLE OF CONTENTS ..................................................................................................................... 1
LIST OF ABBREVIATIONS ............................................................................................................... I
CHAPTER-1 ................................................................................................................................... 1
1. POWER QUALITY AND ITS SIGNIFICANCE ...................................................................... 1
1.1 What is Power Quality? .......................................................................................................................... 1
1.2 Significance of Power Quality ................................................................................................................. 3
1.3 Reasons of poor power quality: .............................................................................................................. 4
1.3.1 Non-linear Loads .................................................................................................................................. 4
1.3.2 Unstable Power System ....................................................................................................................... 6
1.3.3 Large Machines / Equipment ............................................................................................................... 6
1.4 Impacts of Poor Power Quality ............................................................................................................... 6
1.4.1 Loss to Consumer ................................................................................................................................ 7
1.4.2 Loss to Utility ....................................................................................................................................... 9
1.5 Financial Losses ...................................................................................................................................... 9
1.5.1 Direct Costs .......................................................................................................................................... 9
1.5.2 Indirect Costs ..................................................................................................................................... 10
CHAPTER-2 ................................................................................................................................. 11
2 POWER QUALITY PARAMETERS ...................................................................................... 11
2.1 Harmonic Distortion ............................................................................................................................. 12
2.1.1 Sources of Harmonics ........................................................................................................................ 14
2.1.2 Problems caused by Non-linear loads ............................................................................................... 15
2.1.3 Effects of Harmonic Distortion .......................................................................................................... 16
2.2 Inter-harmonics .................................................................................................................................... 19
Swachh Power
2 | P a g e
2.2.1 Sources of Inter-harmonics ............................................................................................................... 19
2.2.2 Consequences of Inter-harmonics ..................................................................................................... 20
2.3 Power Factor ........................................................................................................................................ 20
2.3.1 Sources of Poor Power Factor ........................................................................................................... 21
2.3.2 Consequences of Poor Power Factor ................................................................................................. 21
2.4 Voltage Sag (or Dip) .............................................................................................................................. 22
2.4.1 Sources of Voltage Sag ...................................................................................................................... 22
2.4.2 Consequences of Voltage Sag ............................................................................................................ 23
2.5 Voltage Swell ........................................................................................................................................ 24
2.5.1 Sources of Voltage Swell.................................................................................................................... 24
2.5.2 Consequences of Voltage Swell ......................................................................................................... 25
2.6 Over Voltage / Under Voltage............................................................................................................... 25
2.6.1 Sources of Over / Under Voltage ....................................................................................................... 25
2.6.2 Consequences of Over / Under Voltage ............................................................................................ 26
2.7 Voltage Interruptions ........................................................................................................................... 26
2.7.1 Causes of Voltage Interruptions ........................................................................................................ 26
2.7.2 Effect of Voltage Interruptions .......................................................................................................... 27
2.8 Transient .............................................................................................................................................. 27
2.8.1 Sources of Transients......................................................................................................................... 28
2.8.2 Consequences of Transients .............................................................................................................. 29
2.9 Spike ..................................................................................................................................................... 29
2.9.1 Sources of Spikes ............................................................................................................................... 30
2.9.2 Consequences of Spikes .................................................................................................................... 30
2.10 Voltage Fluctuations & Flicker .......................................................................................................... 30
2.10.1 Sources of Voltage Fluctuation and Flicker ................................................................................... 31
2.10.2 Consequences of Voltage Fluctuation and Flicker ........................................................................ 32
2.11 Voltage Unbalance ........................................................................................................................... 32
2.11.1 Sources of Voltage Unbalance ...................................................................................................... 32
2.11.2 Consequences of Voltage Unbalance ........................................................................................... 33
2.11.3 Mitigation of Voltage Unbalance .................................................................................................. 33
2.12 DC Offset .......................................................................................................................................... 33
Swachh Power
3 | P a g e
2.13 K-Factor in Transformer ................................................................................................................... 34
2.14 Grounding for Power Quality ........................................................................................................... 35
2.15 Neutral Grounding for MV/HV/EHV Networks ................................................................................. 37
2.16 Impact of Power Quality .................................................................................................................. 39
CHAPTER-3 ................................................................................................................................. 41
3 POWER QUALITY STANDARDS ......................................................................................... 41
3.1 Standard related to various PQ phenomena ......................................................................................... 43
3.2 Standards for measurement, monitoring and mitigation ...................................................................... 45
3.3 Standards for testing procedure and equipment .................................................................................. 45
3.4 Standards regarding limitations for different PQ phenomena .............................................................. 46
3.5 Transformer overheating standards ..................................................................................................... 49
3.6 Trends in Power Quality Standards ....................................................................................................... 49
3.7 Power Quality in India .......................................................................................................................... 50
3.8 Some points to be noted: ..................................................................................................................... 53
CHAPTER-4 ................................................................................................................................. 56
4 INTERNATIONAL EXPERIENCES ON POWER QUALITY MANAGEMENT .............. 56
4.1 Power Quality Contracts ....................................................................................................................... 56
4.1.1 Power quality contracts by EdF (Électricité de France), France ........................................................ 56
4.1.2 Detroit Edison Company, USA ........................................................................................................... 58
4.1.3 National Electricity Regulator (NER), South Africa ............................................................................ 58
4.1.4 Norwegian Water Resources and Energy Directorate (NVE), Norway .............................................. 60
4.2 Extensive Measurements ...................................................................................................................... 61
4.3 Power Quality Services ......................................................................................................................... 61
4.4 Power Quality Labeling ......................................................................................................................... 62
Swachh Power
4 | P a g e
4.5 Cost of Poor Power Quality Survey: ...................................................................................................... 63
4.6 Voltage Sags in Process Industry Applications ...................................................................................... 64
4.7 The costs of Interruptions/Outages ...................................................................................................... 66
4.8 A Case Study in India: ........................................................................................................................... 69
4.9 Cost of poor Power Quality in India ...................................................................................................... 72
CHAPTER-5 ................................................................................................................................. 76
5 POWER QUALITY MONITORING ...................................................................................... 76
5.1 Where to look for Power Quality Issues? .............................................................................................. 76
5.2 Power Quality Measurement Tools ...................................................................................................... 76
5.3 Monitoring Power Quality .................................................................................................................... 77
5.4 Typical Harmonic Spectrum Signatures ................................................................................................. 79
5.5 Planning Power Quality Field Measurement ......................................................................................... 82
5.5.1 Measurement Procedure .................................................................................................................. 82
5.5.2 Set up ................................................................................................................................................. 82
5.5.3 Power Quality Data Management ..................................................................................................... 83
5.6 Field Measurement of Power Quality Parameters at EHV Grid Substations .......................................... 85
5.6.1 Power Quality Observation at 765 kV: .............................................................................................. 85
5.6.2 Power Quality Observation at 400 kV: .............................................................................................. 89
5.6.3 Power Quality Observation at 220 kV: .............................................................................................. 94
5.7 Region-Wise Summary of Power Quality Measurements in India ......................................................... 98
5.7.1 Summary of Power Quality Measurement in Eastern Region ........................................................... 98
5.7.2 Summary of Power Quality Measurement in Northern Region ...................................................... 106
5.7.3 Summary of Power Quality Measurement in Western Region ....................................................... 113
5.7.4 Summary of Power Quality Measurement in Southern Region ...................................................... 119
5.7.5 Summary of Power Quality Measurement in North-Eastern Region .............................................. 125
5.8 Power Quality Measurement in Typical Buildings ............................................................................... 132
5.9 Power Quality Measurement at a 132/33 kV Distribution substation ................................................. 135
Swachh Power
5 | P a g e
5.10 Power Quality Measurement on LT supply at various substations ................................................. 137
5.11 Power Quality Measurement of various household appliances ...................................................... 140
5.12 Broad Observation ......................................................................................................................... 142
CHAPTER-6 .............................................................................................................................. 147
6 SOLUTIONS FOR POWER QUALITY PROBLEMS ....................................................... 147
6.1 Mitigation of Power Quality Problems ................................................................................................ 147
6.1.1 Power Factor Improvement............................................................................................................. 147
6.1.2 Mitigation of Voltage Sag / Swell .................................................................................................... 149
6.1.3 Mitigation of Over / Under Voltage Conditions............................................................................... 149
6.1.4 Reduction of Voltage Interruptions ................................................................................................. 149
6.1.5 Mitigation of Transients .................................................................................................................. 149
6.1.6 Remedy for Voltage Notching ......................................................................................................... 149
6.1.7 Mitigation of Voltage Fluctuation and Flicker ................................................................................. 150
6.1.8 Mitigation of Harmonic / Inter Harmonic Distortions ..................................................................... 150
6.2 Planning for mitigation of Power Quality Issues ................................................................................. 152
6.3 Enhanced Interface Devices ................................................................................................................ 155
6.3.1 Series Capacitor ............................................................................................................................... 155
6.3.2 Shunt Capacitors .............................................................................................................................. 156
6.3.3 Static Var Compensator (SVC) ......................................................................................................... 156
6.3.4 STATCOM ......................................................................................................................................... 158
6.3.5 D-STATCOM ..................................................................................................................................... 161
6.3.6 Dynamic Voltage Restorer (DVR) ..................................................................................................... 162
6.3.7 Unified Power Quality Conditioner (UPQC) ..................................................................................... 163
6.3.8 Harmonic Filters .............................................................................................................................. 163
6.3.9 K-Factor Transformer ...................................................................................................................... 164
6.3.10 Transient Voltage Surge suppressors (TVSS) .............................................................................. 165
6.3.11 Isolation transformer .................................................................................................................. 165
6.4 Make End-use Devices Less Sensitive .................................................................................................. 166
CHAPTER-7 .............................................................................................................................. 169
7 INVESTMENTS FOR POWER QUALITY ........................................................................ 169
Swachh Power
6 | P a g e
7.1 Estimated Investments required in next 5 years ................................................................................. 169
7.2 Proposed Roles & Responsibilities of Statutory Bodies/Authorities towards ensuring Quality Supply in
the Indian Power System: ............................................................................................................................ 173
WAY FORWARD ................................................................................................................... 175
EXHIBIT A ................................................................................................................................ 179
POWER QUALITY CHARACTERISTICS OF HOUSEHOLD EQUIPMENT ....................... 179
REFERENCES ................................................................................................................................. 201
Swachh Power
7 | P a g e
List of Figures
FIGURE 1-1: TYPICAL LINEAR & NON-LINEAR CURRENT WAVEFORMS .................................................................. 5
FIGURE 1-2: DESKTOP SALES IN INDIA .................................................................................................................... 5
FIGURE 1-3: TABLET SALES IN INDIA ....................................................................................................................... 6
FIGURE 1-4: EQUIPMENT FAILURE DUE TO POOR POWER QUALITY ...................................................................... 8
FIGURE 2-1: FUNDAMENTAL WITH 3RD HARMONICS .......................................................................................... 12
FIGURE 2-2: FUNDAMENTAL WITH MULTIPLE HARMONICS ................................................................................ 13
FIGURE 2-3: DISTORTED COMPOSITE CURRENT WAVEFORM .............................................................................. 18
FIGURE 2-4: ADDITIVE THIRD HARMONICS .......................................................................................................... 18
FIGURE 2-5: POWER FACTOR RELATIONSHIP FOR LINEAR AND NON-LINEAR LOAD ............................................ 20
FIGURE 2-6: A TYPICAL VOLTAGE SAG .................................................................................................................. 22
FIGURE 2-7: TYPICAL CURRENT DRAWN BY ARC FURNACE .................................................................................. 23
FIGURE 2-8: TYPICAL VOLTAGE SWELL ................................................................................................................. 24
FIGURE 2-9: VOLTAGE SWELL OBSERVED ON A TYPICAL 400 KV LINE.................................................................. 25
FIGURE 2-10: TYPICAL VOLTAGE INTERRUPTIONS ................................................................................................ 26
FIGURE 2-11: TWO TYPES OF TRANSIENT WAVEFORMS ...................................................................................... 27
FIGURE 2-12: TYPICAL TRANSIENT DUE TO CAPACITOR SWITCHING ................................................................... 29
FIGURE 2-13: A TYPICAL SPIKE .............................................................................................................................. 29
FIGURE 2-14: VOLTAGE WAVEFORM CAUSING FLICKER ...................................................................................... 30
FIGURE 2-15: FLICKER SENSITIVITY CURVE BY GE ................................................................................................. 31
FIGURE 2-16: TYPICAL VOLTAGE UNBALANCE ...................................................................................................... 33
FIGURE 2-17: TYPICAL DC OFFSET IN VOLTAGE WAVEFORM. .............................................................................. 34
FIGURE 2-18: GROUNDING WITHOUT GROUND ROD .......................................................................................... 35
FIGURE 2-19: GROUNDING WITH GROUND ROD ................................................................................................. 36
FIGURE 3-1: POWER QUALITY STANDARDS HISTORICAL TREND .......................................................................... 50
FIGURE 3-2: TYPICAL VARIATION IN THD / TDD VS. LOAD (MW) ......................................................................... 53
FIGURE 4-1: POWER QUALITY CONTRACTS TO BE IMPLEMENTED BY THE DISTRIBUTION COMPANY ................ 59
FIGURE 4-2: COST OF POOR POWER QUALITY IN EU ............................................................................................ 63
FIGURE 4-3: COST OF POOR POWER QUALITY IN USA.......................................................................................... 64
FIGURE 4-4: CBEMA LIMITS .................................................................................................................................. 65
FIGURE 4-5: A TYPICAL COST VS. INTERRUPTION ................................................................................................. 66
FIGURE 4-6: COST OF MOMENTARY INTERRUPTIONS AND OUTAGES ................................................................. 67
FIGURE 4-7: LOSS PER VOLTAGE SAG IN DIFFERENT INDUSTRIES ........................................................................ 68
FIGURE 4-8: AVG. COST OF ELECTRICITY PER UNIT (LEFT) & AVG. MONTHLY ELECTRICITY COST (RIGHT) .......... 69
FIGURE 4-9: DISTRIBUTION OF INDUSTRIAL POWER SHORTAGE (HOURS PER WEEK) ......................................... 70
FIGURE 4-10: SHORTFALL IN PRODUCTION DUE TO POWER OUTAGES ............................................................... 70
FIGURE 4-11: COST ESCALATION DUE TO INTERRUPTIONS IN POWER SUPPLY ................................................... 71
Swachh Power
8 | P a g e
FIGURE 4-12: POWER QUALITY SOLUTIONS ......................................................................................................... 74
FIGURE 5-1: POINT OF COMMON COUPLING ....................................................................................................... 76
FIGURE 5-2: PQ DATA MANAGEMENT, REPORTING & ANALYTICS (POWER QUALITY DASHBOARD) .................. 84
FIGURE 5-3: AVERAGE VOLTAGE HARMONIC SPECTRUM AT 765 KV ACROSS INDIA ........................................... 86
FIGURE 5-4: DURATION CURVE OF VOLTAGE THD AT 765KV ACROSS INDIA ....................................................... 86
FIGURE 5-5: AVERAGE VOLTAGE THD AT 765KV LEVEL ........................................................................................ 87
FIGURE 5-6: TYPICAL AVERAGE VOLTAGE HARMONICS DAILY TREND AT 765 KV ACROSS THE COUNTRY .......... 88
FIGURE 5-7: AVERAGE THD IN PHASE VOLTAGES AT 400 KV LEVEL ..................................................................... 89
FIGURE 5-8: DURATION CURVE-400KV VOLTAGE THD ......................................................................................... 90
FIGURE 5-9: AVERAGE VOLTAGE HARMONIC SPECTRUM AT 400 KV ACROSS INDIA ........................................... 90
FIGURE 5-10: TYPICAL AVERAGE VOLTAGE HARMONICS DAILY TREND AT 400 KV ACROSS THE COUNTRY ........ 91
FIGURE 5-11: AVERAGE VOLTAGE UNBALANCE AT 400 KV .................................................................................. 92
FIGURE 5-12: AVERAGE THD IN PHASE AND NEUTRAL CURRENTS AT 400 KV SUBSTATIONS ACROSS INDIA ...... 93
FIGURE 5-13: THD IN PHASE VOLTAGES AT 220 KV LEVEL.................................................................................... 95
FIGURE 5-14: DURATION CURVE-220KV VOLTAGE THD ....................................................................................... 95
FIGURE 5-15: AVERAGE VOLTAGE HARMONIC SPECTRUM AT 220 KV ACROSS INDIA ......................................... 96
FIGURE 5-16: TYPICAL AVERAGE VOLTAGE HARMONICS DAILY TREND AT 220 KV ACROSS THE COUNTRY ........ 96
FIGURE 5-17: VOLTAGE UNBALANCE AT 220 KV .................................................................................................. 97
FIGURE 5-18: AVERAGE VOLTAGE HARMONICS MEASURED IN EASTERN REGION (AT 765KV) ........................... 98
FIGURE 5-19: AVERAGE CURRENT HARMONICS MEASURED IN EASTERN REGION (AT 765KV) ........................... 98
FIGURE 5-20: OVERALL POWER FACTOR DURATION CURVE (AT 765 KV LEVEL) .................................................. 99
FIGURE 5-21: VOLTAGE UNBALANCE DURATION CURVE (AT 765 KV LEVEL) ....................................................... 99
FIGURE 5-22: AVERAGE VOLTAGE HARMONICS MEASURED IN EASTERN REGION (400KV) .............................. 100
FIGURE 5-23: AVERAGE CURRENT HARMONICS MEASURED IN EASTERN REGION (400KV) .............................. 100
FIGURE 5-24: AVG. POWER FACTOR DURATION CURVE .................................................................................... 101
FIGURE 5-25: VOLTAGE UNBALANCE DURATION CURVE (AT 400KV) ................................................................ 101
FIGURE 5-26: AVERAGE VOLTAGE HARMONICS MEASURED IN EASTERN REGION (AT 220KV) ......................... 102
FIGURE 5-27: AVERAGE CURRENT HARMONICS MEASURED IN EASTERN REGION (AT 220KV) ......................... 102
FIGURE 5-28: OVERALL POWER FACTOR DURATION CURVE AT 220 KV LEVEL .................................................. 103
FIGURE 5-29: OVERALL VOLTAGE UNBALANCE DURATION CURVE AT 220 KV LEVEL ........................................ 103
FIGURE 5-30: AVERAGE VOLTAGE HARMONICS MEASURED IN EASTERN REGION (132KV) .............................. 104
FIGURE 5-31: AVERAGE CURRENT HARMONICS MEASURED IN EASTERN REGION (132KV) .............................. 104
FIGURE 5-32: OVERALL POWER FACTOR DURATION CURVE AT 132 KV LEVEL .................................................. 105
FIGURE 5-33: VOLTAGE UNBALANCE DURATION CURVE AT 132 KV LEVEL ........................................................ 105
FIGURE 5-34: AVERAGE VOLTAGE HARMONICS MEASURED IN EASTERN REGION (415V) ................................ 106
FIGURE 5-35: AVERAGE VOLTAGE HARMONICS AT 765 KV ................................................................................ 106
FIGURE 5-36: AVERAGE CURRENT HARMONICS AT 765 KV ................................................................................ 107
FIGURE 5-37: POWER FACTOR DURATION CURVE (AT 765KV) ........................................................................... 107

Swachh Power
9 | P a g e
FIGURE 5-38: UNBALANCE DURATION CURVE (AT 400KV) ................................................................................. 108
FIGURE 5-39: AVERAGE VOLTAGE HARMONICS (AT 400KV) .............................................................................. 108
FIGURE 5-40: AVERAGE CURRENT HARMONICS (AT 400KV) .............................................................................. 109
FIGURE 5-41 : POWER FACTOR DURATION CURVE (AT 400KV) .......................................................................... 109
FIGURE 5-42 : UNBALANCE DURATION CURVE (AT 400KV) ................................................................................ 110
FIGURE 5-43 : AVERAGE VOLTAGE HARMONICS MEASURED (AT 220KV) .......................................................... 110
FIGURE 5-44 : AVERAGE CURRENT HARMONICS MEASURED (AT 220KV) .......................................................... 111
FIGURE 5-45 : POWER FACTOR DURATION CURVE (AT 220KV) .......................................................................... 111
FIGURE 5-46 : AVG. VOLTAGE UNBALANCE DURATION CURVE (AT 220KV) ....................................................... 112
FIGURE -5-47 : AVERAGE VOLTAGE HARMONICS IN 415V LT SUPPLY ................................................................ 112
FIGURE 5-48 : AVERAGE VOLTAGE HARMONICS (AT 765KV) ............................................................................. 113
FIGURE 5-49 : AVERAGE CURRENT HARMONICS (AT 765KV) ............................................................................. 113
FIGURE 5-50: OVERALL POWER FACTOR DURATION CURVE (AT 765 KV) .......................................................... 114
FIGURE 5-51: VOLTAGE UNBALANCE DURATION CURVE (AT 765 KV) ................................................................ 114
FIGURE 5-52: AVERAGE VOLTAGE HARMONICS (AT 400KV) .............................................................................. 114
FIGURE 5-53 : AVERAGE CURRENT HARMONICS (AT 400KV) ............................................................................. 115
FIGURE 5-54 : POWER FACTOR DURATION CURVE (AT 400 KV) ......................................................................... 115
FIGURE 5-55: UNBALANCE DURATION CURVE (AT 400KV) ................................................................................. 116
FIGURE 5-56: AVERAGE VOLTAGE HARMONICS (AT 220KV) .............................................................................. 116
FIGURE 5-57 : AVERAGE CURRENT HARMONICS (AT 220KV) ............................................................................. 117
FIGURE 5-58 : POWER FACTOR DURATION CURVE (AT 220KV) .......................................................................... 117
FIGURE 5-59: UNBALANCE DURATION CURVE (AT 220 KV) ................................................................................ 118
FIGURE 5-60: AVERAGE VOLTAGE HARMONICS IN LT NETWORK ...................................................................... 118
FIGURE 5-61: AVERAGE VOLTAGE HARMONICS MEASURED (AT 765KV) ........................................................... 119
FIGURE 5-62: AVERAGE CURRENT HARMONICS MEASURED AT 765 KV ............................................................ 119
FIGURE 5-63: AVERAGE POWER FACTOR DURATION CURVE (AT 765 KV) ......................................................... 120
FIGURE 5-64: AVERAGE VOLTAGE HARMONICS MEASURED AT 400 KV ............................................................ 121
FIGURE 5-65: AVERAGE CURRENT HARMONICS MEASURED AT 400 KV ............................................................ 121
FIGURE 5-66: AVERAGE POWER FACTOR IN 400 KV ........................................................................................... 122
FIGURE 5-67: AVERAGE VOLTAGE UNBALANCE (VN%) IN 400 KV ...................................................................... 122
FIGURE 5-68: AVERAGE VOLTAGE HARMONICS MEASURED AT 220/230KV ...................................................... 123
FIGURE 5-69: AVERAGE CURRENT HARMONICS AT 220 KV ................................................................................ 123
FIGURE 5-70: POWER FACTOR DURATION CURVE (AT 220KV) ........................................................................... 124
FIGURE 5-71: UNBALANCE DURATION CURVE (AT 220 KV) ................................................................................ 124
FIGURE 5-72: AVERAGE VOLTAGE HARMONICS MEASURED AT LT NETWORK .................................................. 125
FIGURE 5-73: INDIVIDUAL VOLTAGE HARMONICS AT 400KV ............................................................................. 125
FIGURE 5-74: INDIVIDUAL CURRENT HARMONICS AT 400KV ............................................................................. 126
FIGURE 5-75: POWER FACTOR DURATION CURVE AT 400 KV ............................................................................ 126
Swachh Power
10 | P a g e
FIGURE 5-76: UNBALANCE DURATION CURVE AT 400KV ................................................................................... 127
FIGURE 5-77: INDIVIDUAL VOLTAGE HARMONICS MEASURED AT 220KV ......................................................... 127
FIGURE 5-78: INDIVIDUAL CURRENT HARMONICS AT 220KV LEVEL .................................................................. 128
FIGURE 5-79: POWER FACTOR DURATION CURVE AT 220KV ............................................................................. 128
FIGURE 5-80: VOLTAGE UNBALANCE DURATION CURVE AT 220KV ................................................................... 129
FIGURE 5-81: INDIVIDUAL VOLTAGE HARMONICS AT 132KV LEVEL .................................................................. 129
FIGURE 5-82: INDIVIDUAL CURRENT HARMONICS AT 132KV ............................................................................. 130
FIGURE 5-83 : POWER FACTOR DURATION CURVE AT 132KV ............................................................................ 130
FIGURE 5-84 : UNBALANCE DURATION CURVE AT 132KV .................................................................................. 131
FIGURE 5-85: HARMONIC SPECTRUM OF VOLTAGE AT PCC OF THE OFFICE BUILDING ..................................... 133
FIGURE 5-86: HARMONIC SPECTRUM IN UPS SUPPLY FEEDER OF A TYPICAL OFFICE BUILDING ....................... 134
FIGURE 5-87: HARMONIC SPECTRUM IN LIGHTING CURRENT OF A TYPICAL OFFICE BUILDING CONTAINING CFL,
FLUORESCENT & LED LAMPS ..................................................................................................................... 134
FIGURE 5-88: HARMONIC PROFILE &SPECTRUM IN THE CURRENT OF AIR CONDITIONING PLANT FEEDER OF A
TYPICAL OFFICE BUILDING ........................................................................................................................ 135
FIGURE 5-89: VOLTAGE & CURRENT HARMONIC SPECTRUM ON A 33 KV FEEDER. ........................................... 136
FIGURE 5-90: VOLTAGE HARMONIC SPECTRUM IN LT SUPPLY OF SUBSTATION ............................................... 137
FIGURE 5-91: OVERALL DURATION CURVE FOR TOTAL HARMONIC DISTORTION AT 415V ............................... 138
FIGURE 5-92: TYPICAL VOLTAGE AND CURRENT WAVE FORM OF A NON-LINEAR SINGLE PHASE APPLIANCE AND
HARMONIC CONTENT OF THE CURRENT DRAWN. ................................................................................... 141
FIGURE 5-93: TYPICAL VOLTAGE AND CURRENT WAVE FORM OF A LINEAR SINGLE PHASE APPLIANCE AND
HARMONIC CONTENT OF THE CURRENT DRAWN .................................................................................... 142
FIGURE 5-94: REGION-WISE POWER QUALITY PARAMETERS OBSERVED ACROSS THE COUNTRY ..................... 143
FIGURE 5-95 : POWER QUALITY MAP OF INDIA .................................................................................................. 146
FIGURE 6-1: POWER FACTOR IMPROVEMENT .................................................................................................... 148
FIGURE 6-2: PRINCIPLE OF PASSIVE HARMONIC FILTERS ................................................................................... 151
FIGURE 6-3: PRINCIPLE OF ACTIVE HARMONIC FILTERS ..................................................................................... 152
FIGURE 6-4: COST OF POWER QUALITY SOLUTION ............................................................................................ 153
FIGURE 6-5: BASIC STEPS INVOLVED IN POWER QUALITY PROBLEM EVALUATION. (COURTESY OF EPRI.) ....... 153
FIGURE 6-6: SOLUTIONS FOR POWER QUALITY PROBLEM ................................................................................. 154
FIGURE 6-7: VOLTAGE RISE DUE TO SERIES CAPACITORS ................................................................................... 155
FIGURE 6-8: STATIC VAR COMPENSATOR (SVC) ................................................................................................. 157
FIGURE 6-9: EFFECT OF STATIC VAR COMPENSATION ........................................................................................ 157
FIGURE 6-10: THYRSITOR-CONTROLLED REACTORS WITH FIXED CAPACITORS (OR SHUNT FILTERS) ................ 158
FIGURE 6-11: THYRISTOR-SWITCHED CAPACITORS (TSC) ................................................................................... 158
FIGURE 6-12: STATCOM (STATIC SYNCHRONOUS COMPENSATOR) ................................................................... 159
FIGURE 6-13: V-I CHARACTERISTICS OF STATCOM ............................................................................................. 160
FIGURE 6-14: D-STATCOM SCHEMATIC REPRESENTATION ................................................................................ 161
Swachh Power
11 | P a g e
FIGURE 6-15: DYNAMIC VOLTAGE RESTORER (DVR) SCHEMATIC DIAGRAM ..................................................... 162
FIGURE 6-16: TYPICAL HARDWARE STRUCTURE OF UPQC ................................................................................. 163
FIGURE 6-17: ISOLATION TRANSFORMER ........................................................................................................... 166
Swachh Power
12 | P a g e
Swachh Power
13 | P a g e
List of Tables
TABLE 1-1: INCONVENIENCES TO CONSUMERS DUE TO POWER QUALITY PROBLEM ........................................... 8
TABLE 2-1: POWER QUALITY PROBLEMS BASED ON PARAMETERS DEVIATED .................................................... 12
TABLE 2-2: CLASSIFICATION OF OSCILLATORY TRANSIENTS ................................................................................. 28
TABLE 2-3: SUMMARY OF POWER QUALITY PROBLEMS, THEIR CAUSES AND EFFECTS ....................................... 38
TABLE 3-1: ORGANIZATIONS PUBLISHING POWER QUALITY STANDARDS ........................................................... 42
TABLE 3-2: POWER QUALITY STANDARDS ............................................................................................................ 43
TABLE 3-3: CHARACTERIZATION OF DIFFERENT PQ PHENOMENA SPECIFIED BY IEEE 1159-1995 ....................... 44
TABLE 3-4: VOLTAGE LIMITS AS PER CEA[8] ......................................................................................................... 46
TABLE 3-5: TEMPORARY OVER VOLTAGE LIMITS AS PER CEA[8] .......................................................................... 46
TABLE 3-6: PERMISSIBLE VOLTAGE UNBALANCE AS PER CEA[8] .......................................................................... 47
TABLE 3-7: VOLTAGE HARMONICS LIMIT AS PER CEA[8] ...................................................................................... 47
TABLE 3-8: CURRENT DISTORTION LIMITS FOR HARMONICS [3] ........................................................................... 48
TABLE 3-9: K-FACTORS FOR DIFFERENT LOADS .................................................................................................... 49
TABLE 4-1: EDF’S AND CUSTOMERS' OBLIGATIONS FOR MEDIUM VOLTAGE (BASIC CONTRACT) ....................... 57
TABLE 4-2: NRS-048 COMPLIANCE LIMITS IN SOUTH AFRICA .............................................................................. 60
TABLE 4-3: NVE DIRECTORATE COMPLIANCE LIMITS ........................................................................................... 61
TABLE 4-4: VIEW OF INDUSTRIAL FIRMS ON WILLINGNESS TO PAY FOR RELIABLE SUPPLY[12] ............................ 72
TABLE 5-1: TYPICAL HARMONICS FOUND IN DIFFERENT CONVERTERS ............................................................... 79
TABLE 5-2 SUMMARY OF POWER QUALITY MEASUREMENTS ON COMMON APPLIANCES ................................. 80
TABLE 5-3: THD & INDIVIDUAL HARMONICS IN VOLTAGE AT 765 KV .................................................................. 88
TABLE 5-4: MAX THD & INDIVIDUAL HARMONICS OBSERVED IN VOLTAGE AT 400 KV ....................................... 91
TABLE 5-5: MAX THD & INDIVIDUAL HARMONICS IN VOLTAGE AT 220 KV ......................................................... 96
TABLE 5-6: VOLTAGE HARMONICS DISTRIBUTION IN A TYPICAL OFFICE BUILDING POWER SUPPLY................. 132
TABLE 5-7: CURRENT HARMONICS DISTRIBUTION IN A TYPICAL OFFICE BUILDING POWER SUPPLY ................ 132
TABLE 5-8: VOLTAGE HARMONICS DISTRIBUTION AT A TYPICAL 132/33 KV S/STN ON 33 KV SIDE .................. 136
TABLE 5-9: CURRENT HARMONICS DISTRIBUTION AT A TYPICAL 132/33 KV S/STN ON 33 KV SIDE .................. 136
TABLE 5-10: VOLTAGE HARMONICS IN LT SUPPLY OF SUBSTATION .................................................................. 137
TABLE 5-11: CURRENT HARMONICS IN LT SUPPLY OF SUBSTATION .................................................................. 137
TABLE 5-12: THD, PST & PLT MEASURED IN LT/AUXILIARY SUPPLY AT VARIOUS SUBSTATIONS ....................... 138
TABLE 5-13: OVERVIEW OF POWER QUALITY PARAMETERS OBSERVED ACROSS THE COUNTRY ...................... 142
TABLE 5-14: SUMMARY OF CRITICAL POWER QUALITY PARAMETERS ............................................................... 143
TABLE 5-15: STATE WISE POWER QUALITY SEVERITY LEVEL .............................................................................. 144
TABLE 5-16: POWER QUALITY SEVERITY INDEX CALCULATION .......................................................................... 145
TABLE 6-1: SUMMARY OF POWER QUALITY PROBLEM AND SOLUTIONS .......................................................... 167
TABLE 7-1: STATE-WISE CONNECTED LOADS IDENTIFIED FOR POWER QUALITY IMPROVEMENT* ................... 169
TABLE 7-2: TOTAL CONNECTED LOAD IDENTIFIED FOR POWER QUALITY IMPROVEMENT* .............................. 169
Swachh Power
14 | P a g e
TABLE 7-3: COST OF POWER CONDITIONING DEVICE FOR A TYPICAL DT OF 500KVA ........................................ 171
TABLE 7-4: INDUSTRIAL VFDS/ASDS IN INDIA ..................................................................................................... 171
TABLE 7-5: INITIAL INVESTMENTS FOR POWER QUALITY IMPROVEMENT ......................................................... 172
TABLE 7-6: ROLES & RESPONSIBILITY OF VARIOUS AGENCIES ........................................................................... 173
Swachh Power
i
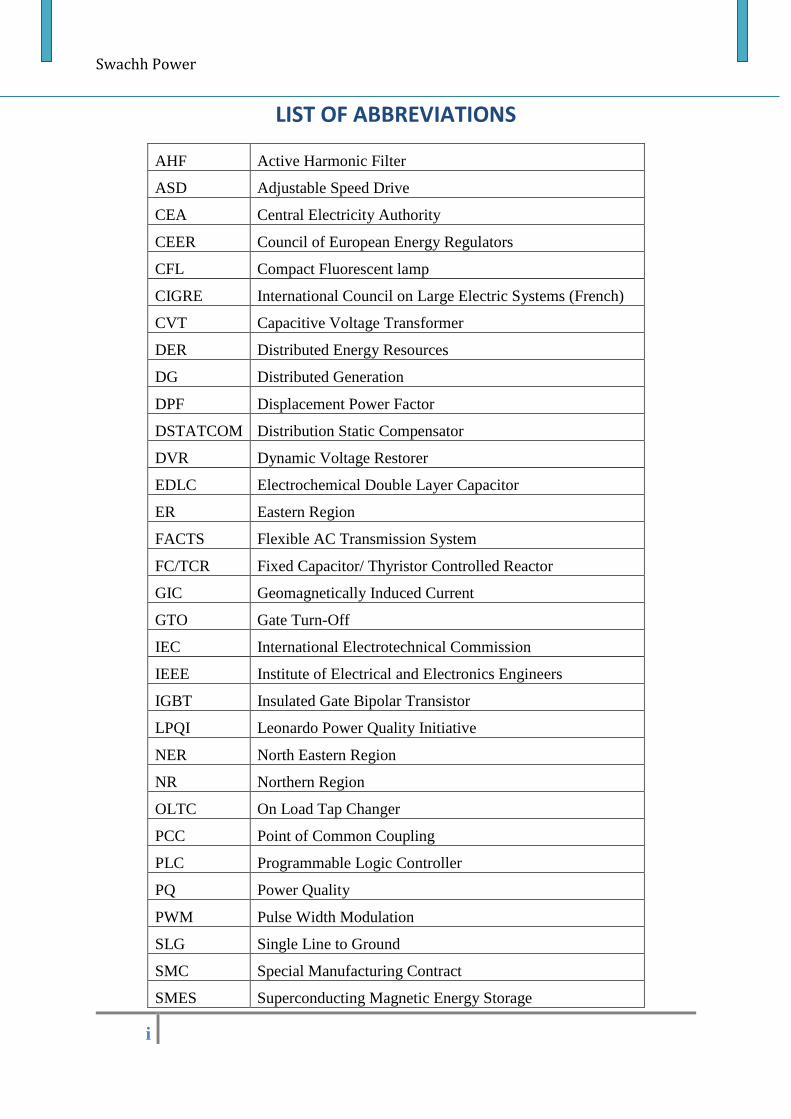
LIST OF ABBREVIATIONS
AHF Active Harmonic Filter
ASD Adjustable Speed Drive
CEA Central Electricity Authority
CEER Council of European Energy Regulators
CFL Compact Fluorescent lamp
CIGRE International Council on Large Electric Systems (French)
CVT Capacitive Voltage Transformer
DER Distributed Energy Resources
DG Distributed Generation
DPF Displacement Power Factor
DSTATCOM Distribution Static Compensator
DVR Dynamic Voltage Restorer
EDLC Electrochemical Double Layer Capacitor
ER Eastern Region
FACTS Flexible AC Transmission System
FC/TCR Fixed Capacitor/ Thyristor Controlled Reactor
GIC Geomagnetically Induced Current
GTO Gate Turn-Off
IEC International Electrotechnical Commission
IEEE Institute of Electrical and Electronics Engineers
IGBT Insulated Gate Bipolar Transistor
LPQI Leonardo Power Quality Initiative
NER North Eastern Region
NR Northern Region
OLTC On Load Tap Changer
PCC Point of Common Coupling
PLC Programmable Logic Controller
PQ Power Quality
PWM Pulse Width Modulation
SLG Single Line to Ground
SMC Special Manufacturing Contract
SMES Superconducting Magnetic Energy Storage
Swachh Power
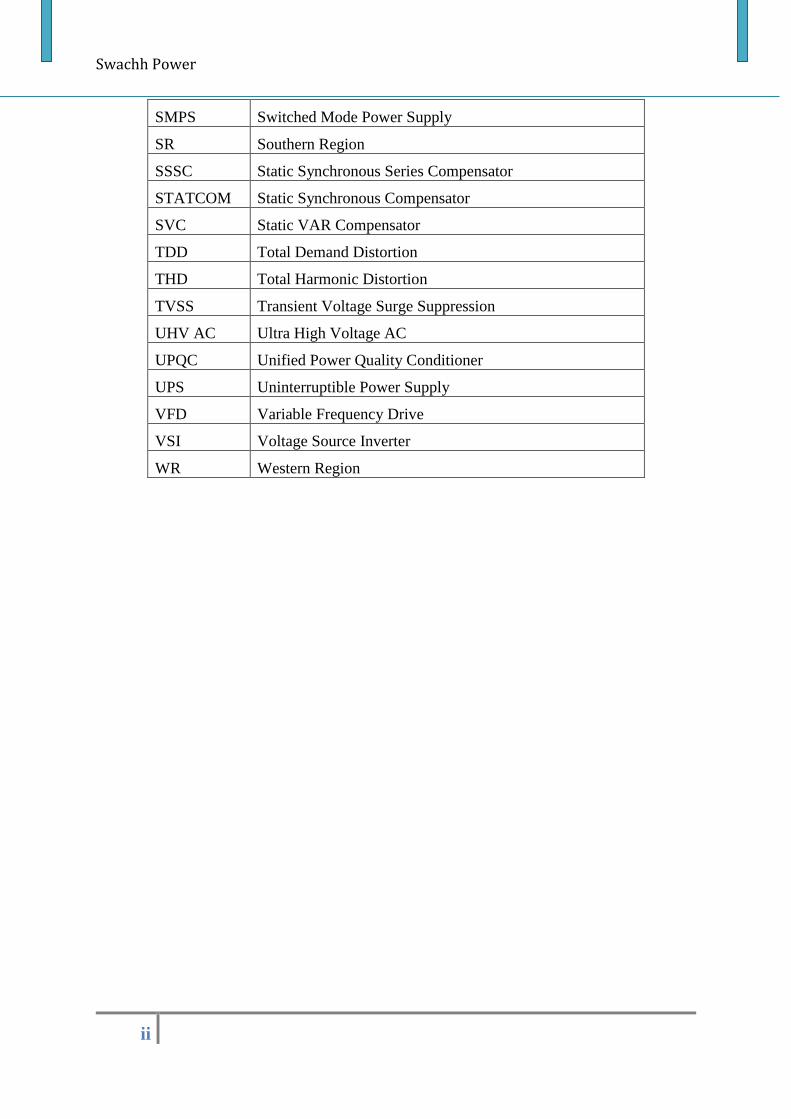
ii
SMPS Switched Mode Power Supply
SR Southern Region
SSSC Static Synchronous Series Compensator
STATCOM Static Synchronous Compensator
SVC Static VAR Compensator
TDD Total Demand Distortion
THD Total Harmonic Distortion
TVSS Transient Voltage Surge Suppression
UHV AC Ultra High Voltage AC
UPQC Unified Power Quality Conditioner
UPS Uninterruptible Power Supply
VFD Variable Frequency Drive
VSI Voltage Source Inverter
WR Western Region
i
Executive Summary
1. Power Quality and its Significance
Traditionally, the power system was simple and unidirectional, i.e. the flow of
electricity (power) used to be from source (generator) to sink (load) only. Power was
generated in bulk using conventional resources and then transmitted, distributed and
consumed by end users as load. Availability of power had more concern than the quality and
therefore the target used to be “to keep the lights on”, without taking reliability and quality of
power into account. Now the scenario is gradually changing. Modern power system has many
types of generation resources including renewable which have specific characteristics of
variability and intermittency connected to the grid through power conditioning equipment.
Transmission systems have become multifaceted with technologies like Ultra High Voltage
AC (UHVAC) / High Voltage Direct Current (HVDC) systems, power electronics based
Flexible AC Transmission Systems (FACTS) devices etc. Distributed generation and battery
storage systems are being connected with distribution system using power electronics
inverters to provide power supply including in remote areas.
Loads at consumer end have also changed their characteristics. Most of the electronic
devices being used by the consumers are non-linear type & sensitive to power quality.
Cumulatively all such changes in power system are affecting the quality of power supply. At
the same time consumers’ awareness, requirement and aspirations for quality power in terms
of continuity, sinusoidal shape and specified limits etc. are increasing.
Quality of Power Supply in any country also portrays the nation’s prosperity. With the
new initiatives like ‘Make in India’, India is already getting international attention especially
in the field of setting up new industries / manufacturing facilities. Other than the political
support, these industries certainly need Quality Power. It has been observed that International
Companies don’t have a good image of Power Supply in India. This is one of the reasons
which behold the foreign industries to set-up manufacturing facilities / plants or sophisticated
factories in India. Considering all these facts, maintaining ‘Power-Quality’ has now become
one of the major concerns for power system stakeholders.
To ensure high quality power for end consumers, it is important to identify the power
quality issues and its effects along with the locations for deployment of mitigating solutions.
In this direction, Power Grid Corporation of India Ltd. has taken pioneering initiative to
ii
measure the Power-Quality parameters across the country at various towns/cities (at different
voltage levels), create a baseline data repository & present an analysis of Power-Quality
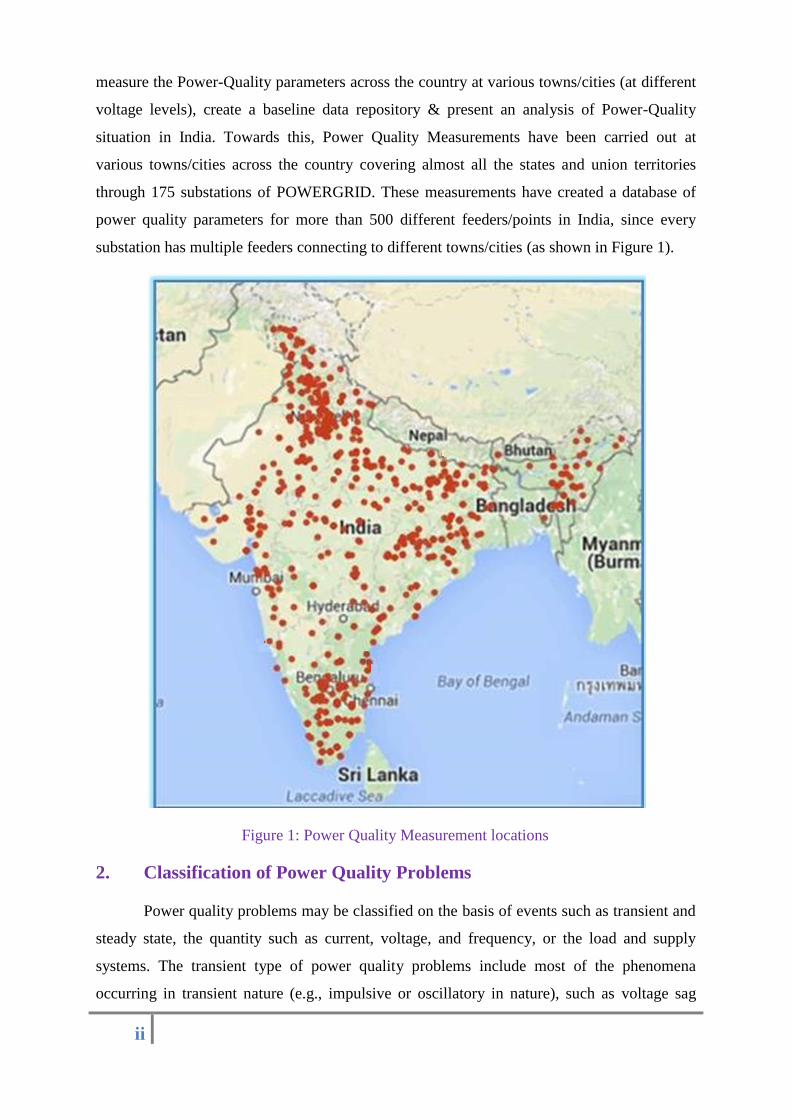
situation in India. Towards this, Power Quality Measurements have been carried out at
various towns/cities across the country covering almost all the states and union territories
through 175 substations of POWERGRID. These measurements have created a database of
power quality parameters for more than 500 different feeders/points in India, since every
substation has multiple feeders connecting to different towns/cities (as shown in Figure 1).
Figure 1: Power Quality Measurement locations
2. Classification of Power Quality Problems
Power quality problems may be classified on the basis of events such as transient and
steady state, the quantity such as current, voltage, and frequency, or the load and supply
systems. The transient type of power quality problems include most of the phenomena
occurring in transient nature (e.g., impulsive or oscillatory in nature), such as voltage sag
iii
(dip), swell, short-duration voltage variations, power frequency variations, and voltage
fluctuations. The steady-state types of power quality problems include long-duration voltage
variations, waveform distortions, unbalanced voltages, DC offset, flicker, poor power factor,
unbalanced load currents, load harmonic currents, and excessive neutral current.
The second classification can be made on the basis of quantity such as voltage,
current and frequency. Corresponding to voltage, these include voltage distortions, flicker,
sag, swell, unbalance, under-voltage/overvoltage; similarly for the current, these include
reactive power component of the current, harmonic currents, unbalanced currents, excessive
neutral current etc.
The third classification of power quality problems is based on the load or the supply
system. Normally, power quality problems due to nature of the load (e.g., fluctuating loads
such as arc furnaces) consisting of current harmonics, reactive power component of the
current, unbalanced currents, neutral current, DC offset and so on.
The power quality problems due to the supply system consist of voltage and
frequency related issues such as voltage distortion, unbalance, sag, swell & flicker. These
may also consists of combination of both voltage and current based power quality problems
in the system. The frequency-related power quality problems are frequency variation above
or below the desired value. These affect the performance of a number of loads and other
equipment such as transformers, motors, luminaire etc. in the distribution system including
reduction of their service life & increased losses.
3. Brief Description of Various Power Quality Parameters
A brief description of various power quality parameters is elucidated in the following section:
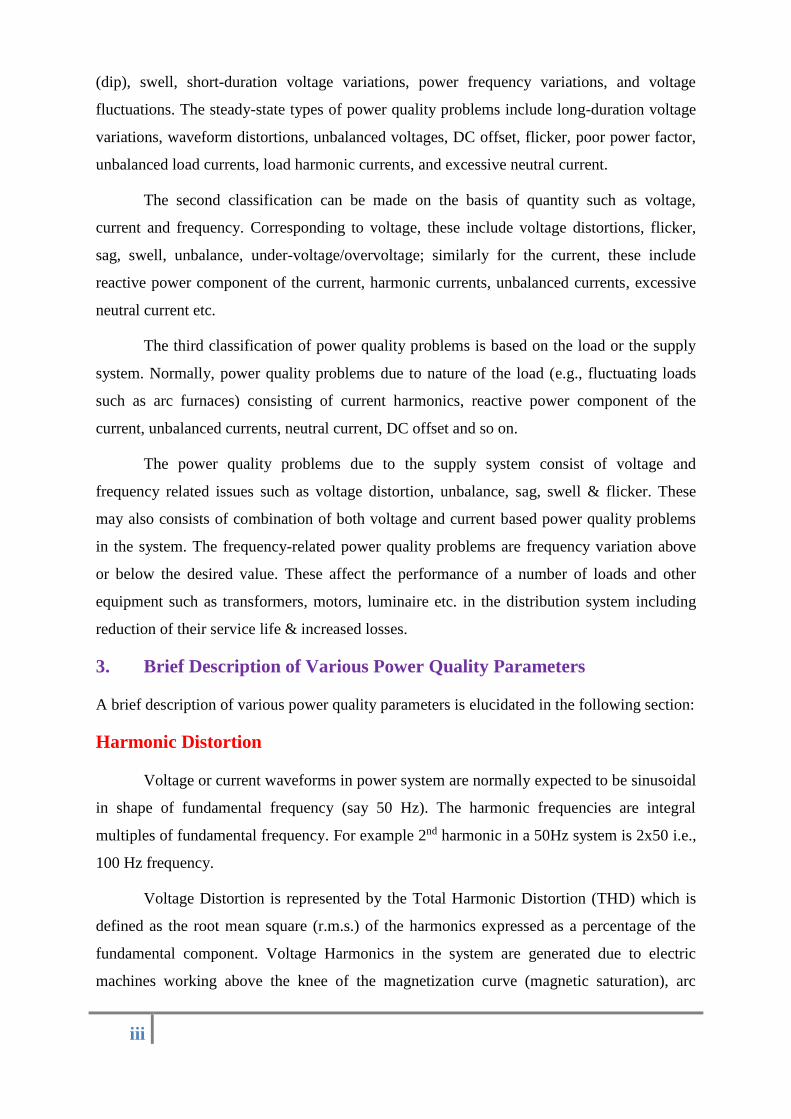
Harmonic Distortion
Voltage or current waveforms in power system are normally expected to be sinusoidal
in shape of fundamental frequency (say 50 Hz). The harmonic frequencies are integral
multiples of fundamental frequency. For example 2nd harmonic in a 50Hz system is 2x50 i.e.,
100 Hz frequency.
Voltage Distortion is represented by the Total Harmonic Distortion (THD) which is
defined as the root mean square (r.m.s.) of the harmonics expressed as a percentage of the
fundamental component. Voltage Harmonics in the system are generated due to electric
machines working above the knee of the magnetization curve (magnetic saturation), arc
iv
furnaces, welding machines, rectifiers, DC brushless motors, non-linear loads (such as power
electronics equipment including Adjustable Speed Drives (ASDs), fan regulators, Compact
Fluorescent Lamps (CFLs), televisions, Switched Mode Power Supplies (SMPS), data
processing equipment, high efficiency lighting etc. While current harmonics are injected into
the system by the non-linear loads. The amount of voltage harmonics often depends upon the
amount of harmonic current drawn by the load, and the source impedance, which includes all
the wiring and transformers back to the source of the electricity. Harmonic currents increase
the rms value of supply current, increase losses, cause poor utilization and heating of
components of the distribution system, reducing their service life, malfunction of relay i.e.
protection system thereby affecting system safety & quality of supply, interference to
communication system & other equipment etc. and also cause distortion and notching in
voltage waveforms at the point of common coupling due to voltage drop in the source
impedance.
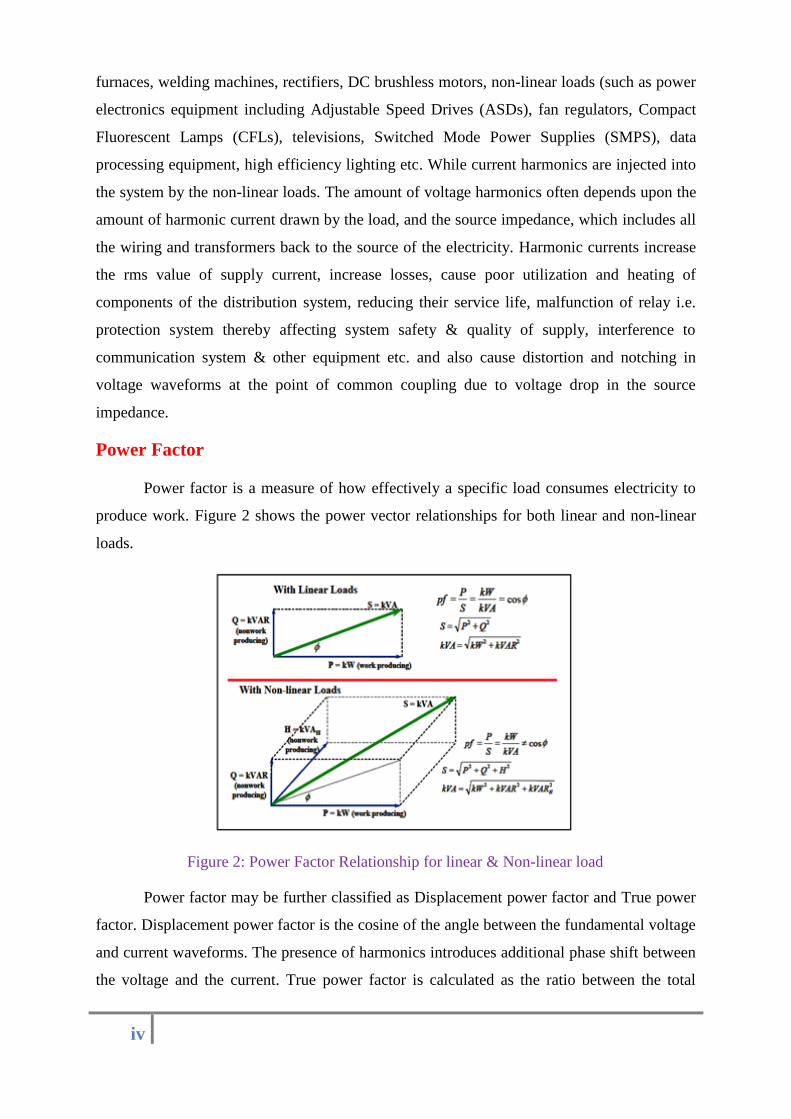
Power Factor
Power factor is a measure of how effectively a specific load consumes electricity to
produce work. Figure 2 shows the power vector relationships for both linear and non-linear
loads.
Figure 2: Power Factor Relationship for linear & Non-linear load
Power factor may be further classified as Displacement power factor and True power
factor. Displacement power factor is the cosine of the angle between the fundamental voltage
and current waveforms. The presence of harmonics introduces additional phase shift between
the voltage and the current. True power factor is calculated as the ratio between the total
v
active power used in a circuit (including harmonics) and the total apparent power (including
harmonics) supplied from the source. True power factor is always less than displacement
power factor if harmonics are present in the system.
Poor power factor results into requirement of higher apparent power and higher
current flow to do the same work against good power factor. It results into following
disadvantages:
i. Greater conductor size, hence, increased cost
ii. Higher capacity electrical equipment like generator or transformers which increases
size and cost of the system.
iii. Due to high current for low power factor, the losses increase in the conductors and
switchgear machinery
The large current at low lagging power factor causes greater voltage drops in
alternators, motors, transformers and transmission lines. This leads to decrease in voltage at
the driving end and forces the use of extra equipment to counter act the voltage drop like
voltage stabilizers.
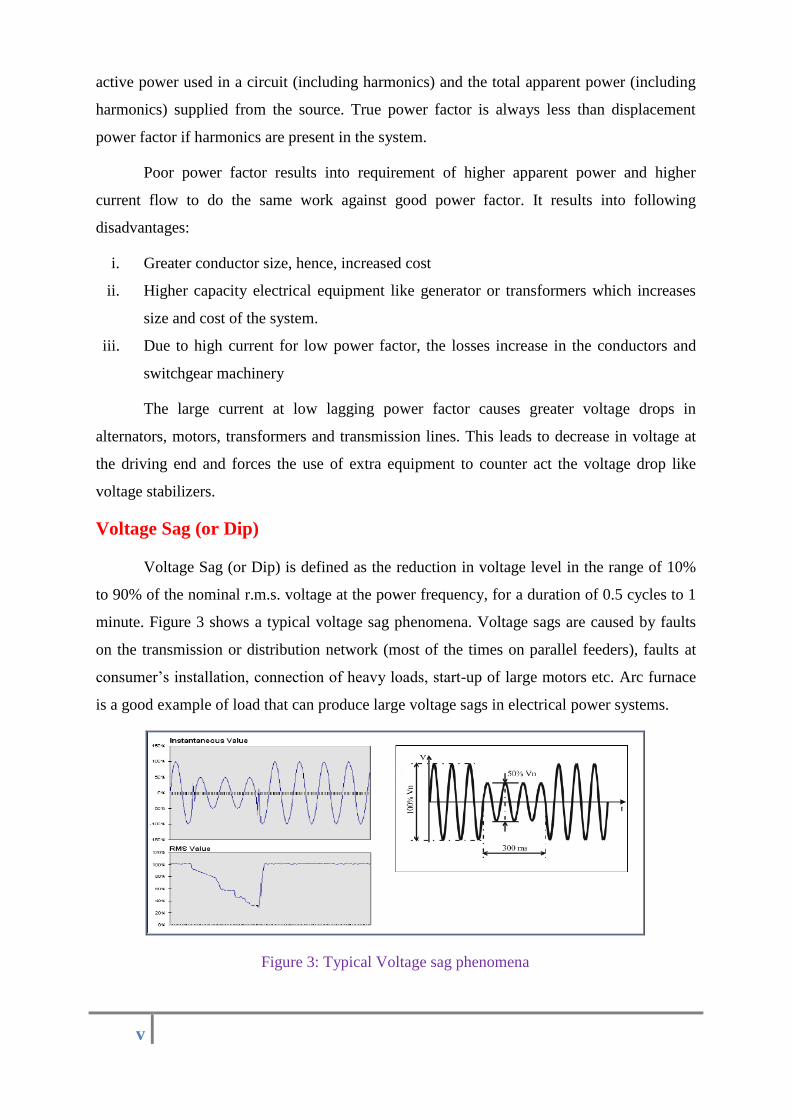
Voltage Sag (or Dip)
Voltage Sag (or Dip) is defined as the reduction in voltage level in the range of 10%
to 90% of the nominal r.m.s. voltage at the power frequency, for a duration of 0.5 cycles to 1
minute. Figure 3 shows a typical voltage sag phenomena. Voltage sags are caused by faults
on the transmission or distribution network (most of the times on parallel feeders), faults at
consumer’s installation, connection of heavy loads, start-up of large motors etc. Arc furnace
is a good example of load that can produce large voltage sags in electrical power systems.
Figure 3: Typical Voltage sag phenomena
vi
Voltage sag may result into malfunction of Information Technology (IT) equipment,
namely microprocessor-based control systems (Personal Computers, Adjustable Speed
Drives, etc.) that may lead to a process stoppage, tripping of contactors and
electromechanical relays, disconnection and loss of efficiency in electric rotating machines,
thus loss in overall production etc.
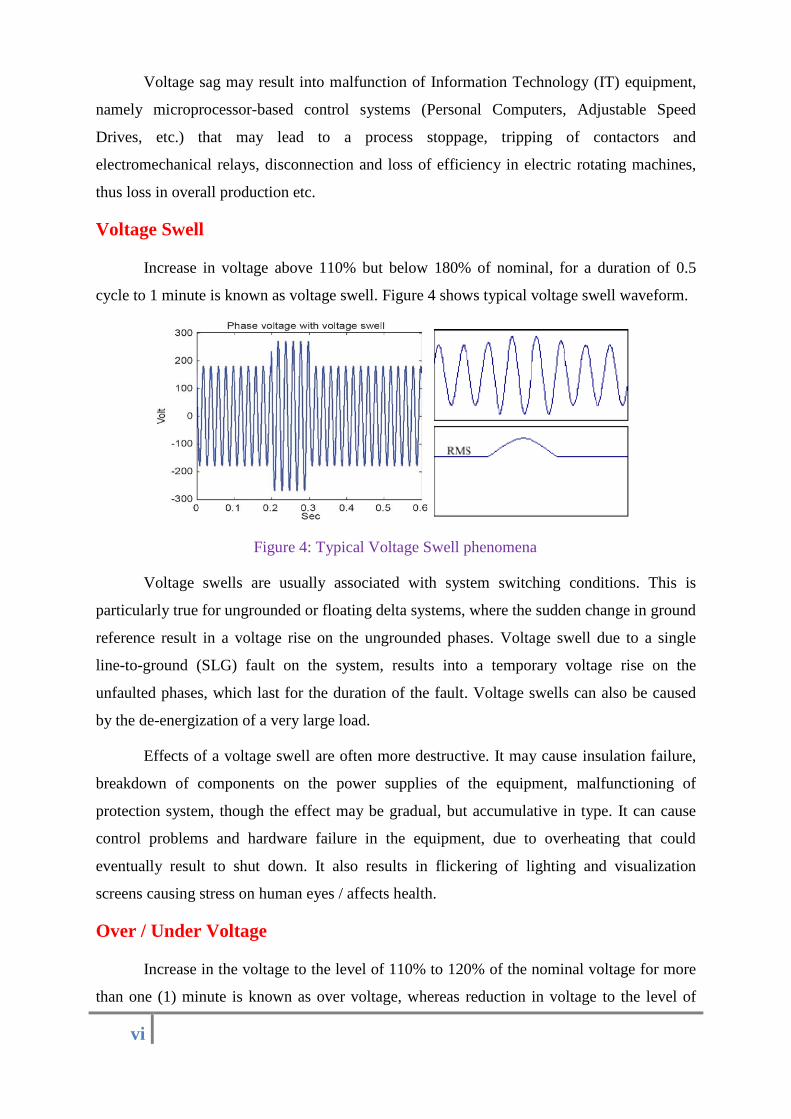
Voltage Swell
Increase in voltage above 110% but below 180% of nominal, for a duration of 0.5
cycle to 1 minute is known as voltage swell. Figure 4 shows typical voltage swell waveform.
Figure 4: Typical Voltage Swell phenomena
Voltage swells are usually associated with system switching conditions. This is
particularly true for ungrounded or floating delta systems, where the sudden change in ground
reference result in a voltage rise on the ungrounded phases. Voltage swell due to a single
line-to-ground (SLG) fault on the system, results into a temporary voltage rise on the
unfaulted phases, which last for the duration of the fault. Voltage swells can also be caused
by the de-energization of a very large load.
Effects of a voltage swell are often more destructive. It may cause insulation failure,
breakdown of components on the power supplies of the equipment, malfunctioning of
protection system, though the effect may be gradual, but accumulative in type. It can cause
control problems and hardware failure in the equipment, due to overheating that could
eventually result to shut down. It also results in flickering of lighting and visualization
screens causing stress on human eyes / affects health.
Over / Under Voltage
Increase in the voltage to the level of 110% to 120% of the nominal voltage for more
than one (1) minute is known as over voltage, whereas reduction in voltage to the level of
vii
90% to 80% of the nominal voltage for more than 1 minute is called under voltage
phenomenon.
Over / under voltage is caused due to sudden load changes, high / low load conditions,
improper operation of compensation device, outage of lines / transformers /motors etc.
Lightly loaded long lines / cables causes over voltage in the system whereas heavily loaded
lines / cables causes under voltage. Continuous over voltage may result into over stress of
equipment, increased corona, flashover of insulators etc. whereas continuous under voltage
may result into inefficient operation of devices, increased losses, high current drawl, heating
effect and mal-operation of the power system components affecting system safety & quality
of supply.
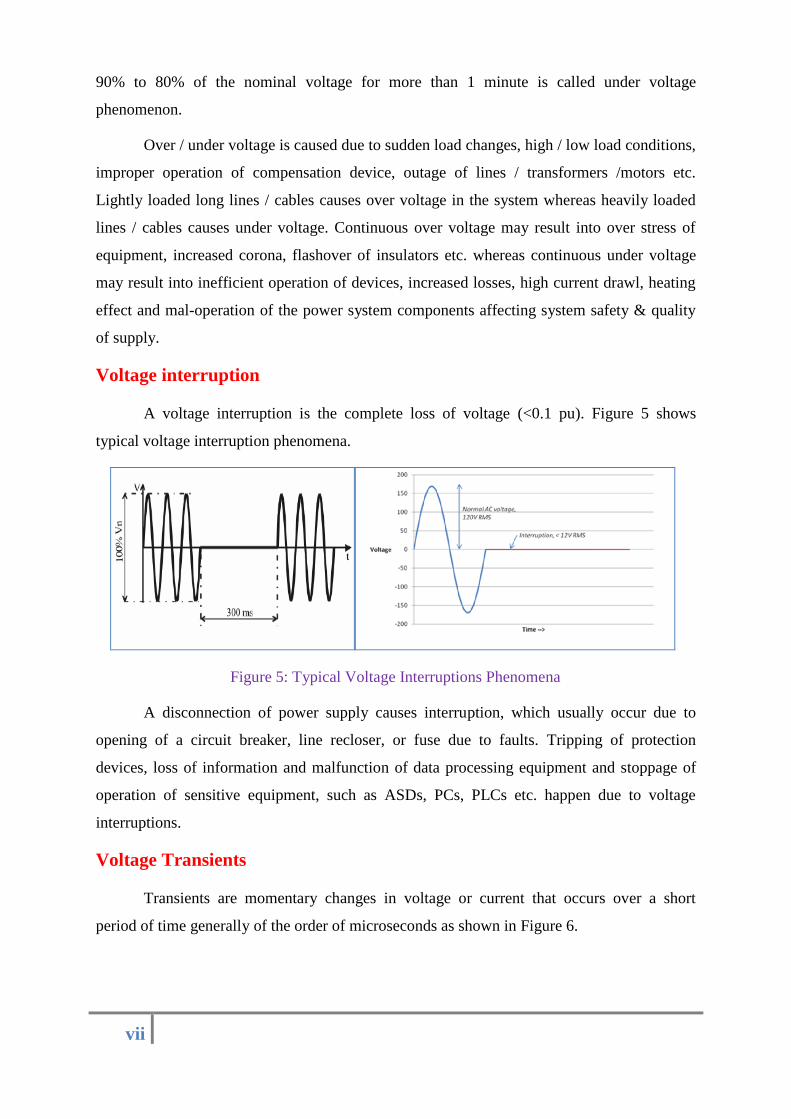
Voltage interruption
A voltage interruption is the complete loss of voltage (<0.1 pu). Figure 5 shows
typical voltage interruption phenomena.
Figure 5: Typical Voltage Interruptions Phenomena
A disconnection of power supply causes interruption, which usually occur due to
opening of a circuit breaker, line recloser, or fuse due to faults. Tripping of protection
devices, loss of information and malfunction of data processing equipment and stoppage of
operation of sensitive equipment, such as ASDs, PCs, PLCs etc. happen due to voltage
interruptions.
Voltage Transients
Transients are momentary changes in voltage or current that occurs over a short
period of time generally of the order of microseconds as shown in Figure 6.
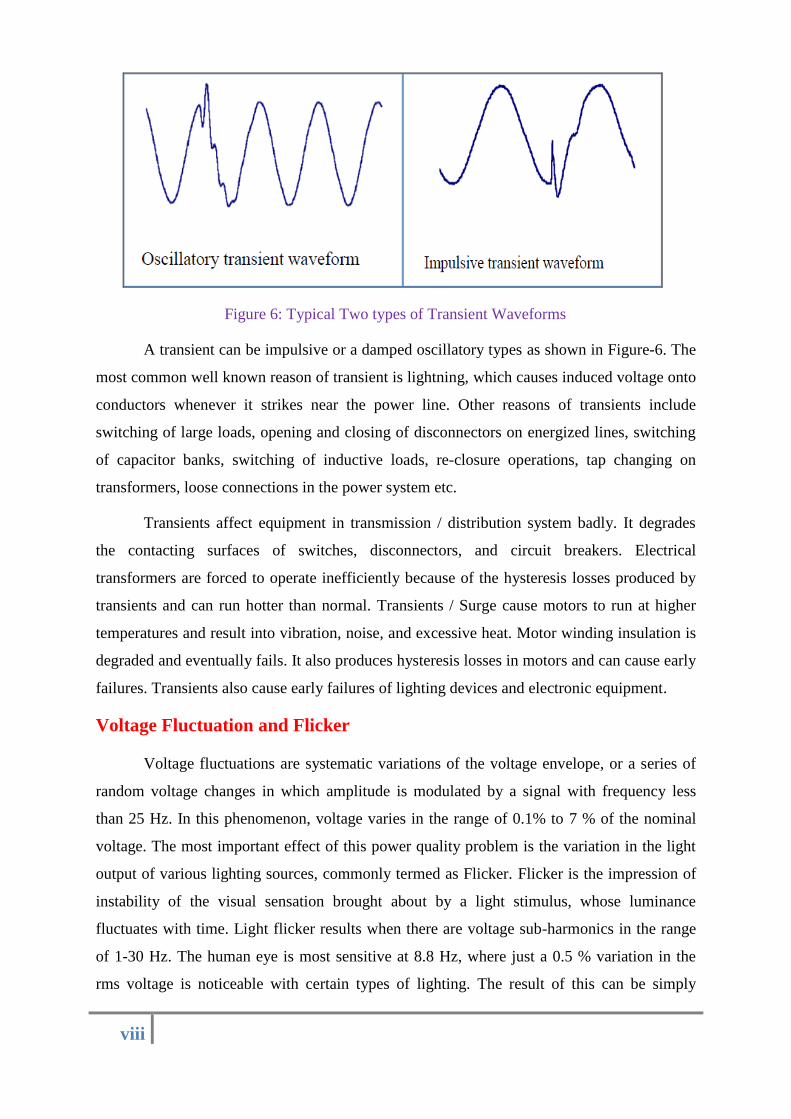
viii
Figure 6: Typical Two types of Transient Waveforms
A transient can be impulsive or a damped oscillatory types as shown in Figure-6. The
most common well known reason of transient is lightning, which causes induced voltage onto
conductors whenever it strikes near the power line. Other reasons of transients include
switching of large loads, opening and closing of disconnectors on energized lines, switching
of capacitor banks, switching of inductive loads, re-closure operations, tap changing on
transformers, loose connections in the power system etc.
Transients affect equipment in transmission / distribution system badly. It degrades
the contacting surfaces of switches, disconnectors, and circuit breakers. Electrical
transformers are forced to operate inefficiently because of the hysteresis losses produced by
transients and can run hotter than normal. Transients / Surge cause motors to run at higher
temperatures and result into vibration, noise, and excessive heat. Motor winding insulation is
degraded and eventually fails. It also produces hysteresis losses in motors and can cause early
failures. Transients also cause early failures of lighting devices and electronic equipment.
Voltage Fluctuation and Flicker
Voltage fluctuations are systematic variations of the voltage envelope, or a series of
random voltage changes in which amplitude is modulated by a signal with frequency less
than 25 Hz. In this phenomenon, voltage varies in the range of 0.1% to 7 % of the nominal
voltage. The most important effect of this power quality problem is the variation in the light
output of various lighting sources, commonly termed as Flicker. Flicker is the impression of
instability of the visual sensation brought about by a light stimulus, whose luminance
fluctuates with time. Light flicker results when there are voltage sub-harmonics in the range
of 1-30 Hz. The human eye is most sensitive at 8.8 Hz, where just a 0.5 % variation in the
rms voltage is noticeable with certain types of lighting. The result of this can be simply
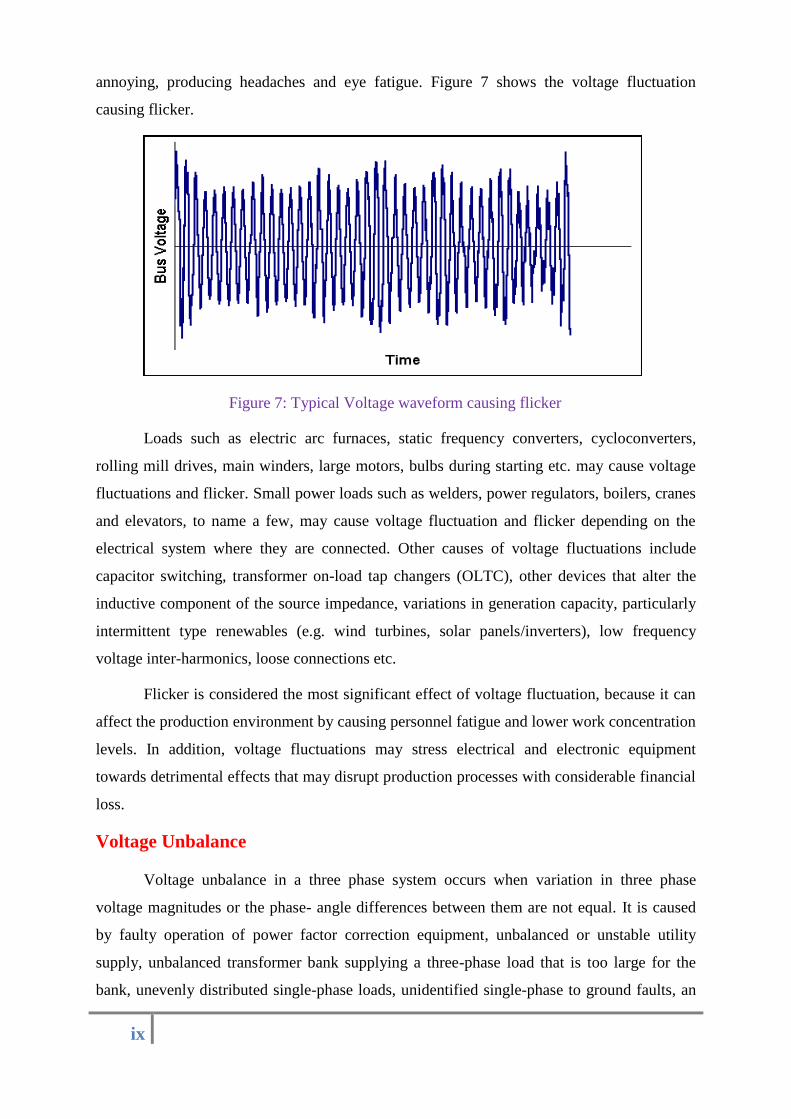
ix
annoying, producing headaches and eye fatigue. Figure 7 shows the voltage fluctuation
causing flicker.
Figure 7: Typical Voltage waveform causing flicker
Loads such as electric arc furnaces, static frequency converters, cycloconverters,
rolling mill drives, main winders, large motors, bulbs during starting etc. may cause voltage
fluctuations and flicker. Small power loads such as welders, power regulators, boilers, cranes
and elevators, to name a few, may cause voltage fluctuation and flicker depending on the
electrical system where they are connected. Other causes of voltage fluctuations include
capacitor switching, transformer on-load tap changers (OLTC), other devices that alter the
inductive component of the source impedance, variations in generation capacity, particularly
intermittent type renewables (e.g. wind turbines, solar panels/inverters), low frequency
voltage inter-harmonics, loose connections etc.
Flicker is considered the most significant effect of voltage fluctuation, because it can
affect the production environment by causing personnel fatigue and lower work concentration
levels. In addition, voltage fluctuations may stress electrical and electronic equipment
towards detrimental effects that may disrupt production processes with considerable financial
loss.
Voltage Unbalance
Voltage unbalance in a three phase system occurs when variation in three phase
voltage magnitudes or the phase- angle differences between them are not equal. It is caused
by faulty operation of power factor correction equipment, unbalanced or unstable utility
supply, unbalanced transformer bank supplying a three-phase load that is too large for the
bank, unevenly distributed single-phase loads, unidentified single-phase to ground faults, an
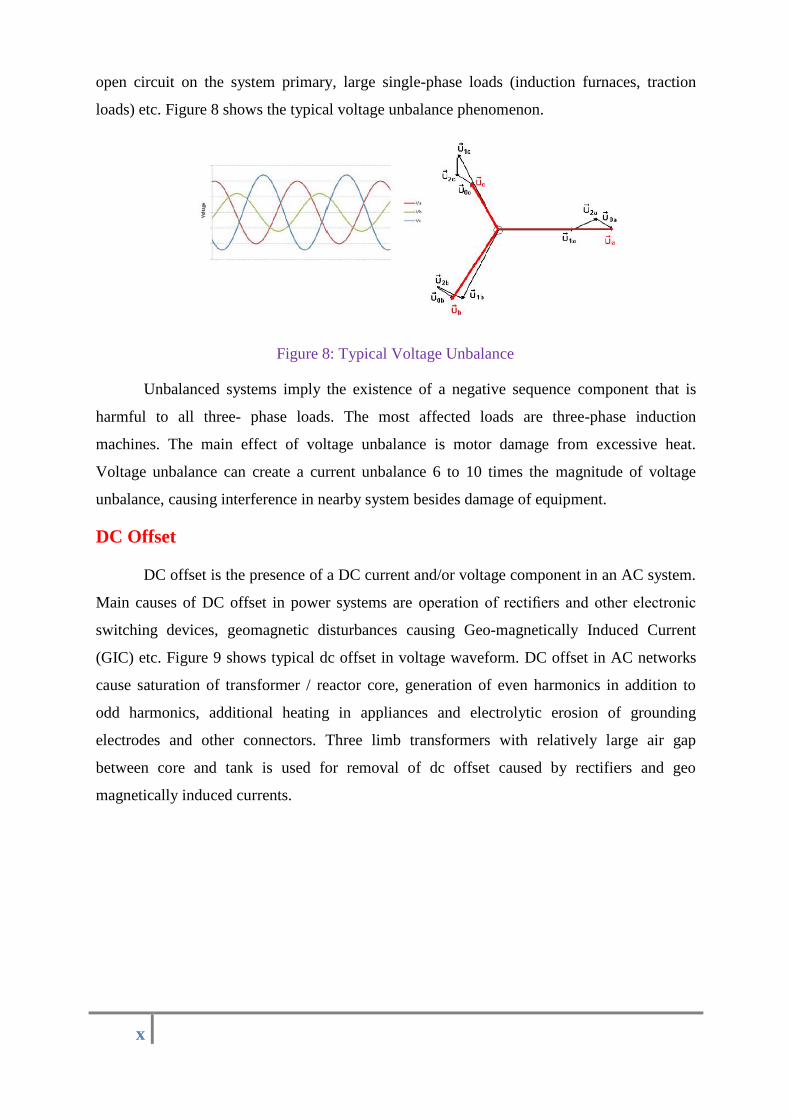
x
open circuit on the system primary, large single-phase loads (induction furnaces, traction
loads) etc. Figure 8 shows the typical voltage unbalance phenomenon.
Figure 8: Typical Voltage Unbalance
Unbalanced systems imply the existence of a negative sequence component that is
harmful to all three- phase loads. The most affected loads are three-phase induction
machines. The main effect of voltage unbalance is motor damage from excessive heat.
Voltage unbalance can create a current unbalance 6 to 10 times the magnitude of voltage
unbalance, causing interference in nearby system besides damage of equipment.
DC Offset
DC offset is the presence of a DC current and/or voltage component in an AC system.
Main causes of DC offset in power systems are operation of rectifiers and other electronic
switching devices, geomagnetic disturbances causing Geo-magnetically Induced Current
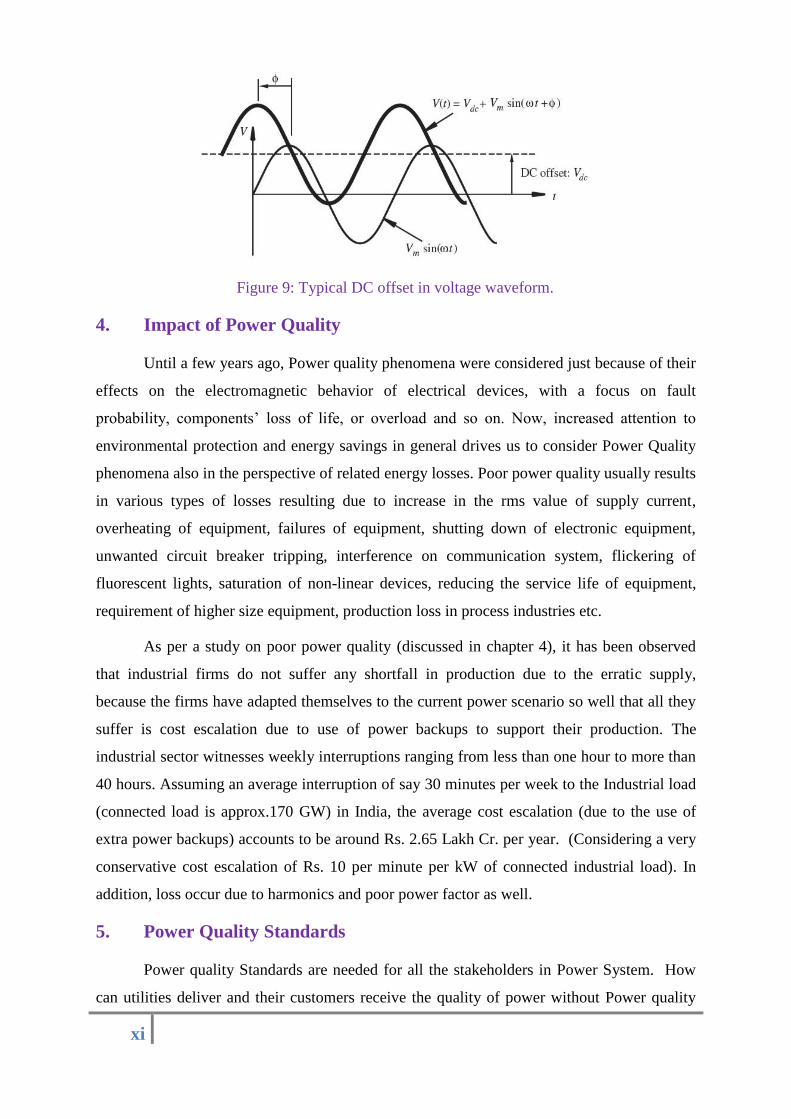
(GIC) etc. Figure 9 shows typical dc offset in voltage waveform. DC offset in AC networks
cause saturation of transformer / reactor core, generation of even harmonics in addition to
odd harmonics, additional heating in appliances and electrolytic erosion of grounding
electrodes and other connectors. Three limb transformers with relatively large air gap
between core and tank is used for removal of dc offset caused by rectifiers and geo
magnetically induced currents.
xi
Figure 9: Typical DC offset in voltage waveform.
4. Impact of Power Quality
Until a few years ago, Power quality phenomena were considered just because of their
effects on the electromagnetic behavior of electrical devices, with a focus on fault
probability, components’ loss of life, or overload and so on. Now, increased attention to
environmental protection and energy savings in general drives us to consider Power Quality
phenomena also in the perspective of related energy losses. Poor power quality usually results
in various types of losses resulting due to increase in the rms value of supply current,
overheating of equipment, failures of equipment, shutting down of electronic equipment,
unwanted circuit breaker tripping, interference on communication system, flickering of
fluorescent lights, saturation of non-linear devices, reducing the service life of equipment,
requirement of higher size equipment, production loss in process industries etc.
As per a study on poor power quality (discussed in chapter 4), it has been observed
that industrial firms do not suffer any shortfall in production due to the erratic supply,
because the firms have adapted themselves to the current power scenario so well that all they
suffer is cost escalation due to use of power backups to support their production. The
industrial sector witnesses weekly interruptions ranging from less than one hour to more than
40 hours. Assuming an average interruption of say 30 minutes per week to the Industrial load
(connected load is approx.170 GW) in India, the average cost escalation (due to the use of
extra power backups) accounts to be around Rs. 2.65 Lakh Cr. per year. (Considering a very
conservative cost escalation of Rs. 10 per minute per kW of connected industrial load). In
addition, loss occur due to harmonics and poor power factor as well.
5. Power Quality Standards
Power quality Standards are needed for all the stakeholders in Power System. How
can utilities deliver and their customers receive the quality of power without Power quality
xii
standards? How can the electronic industries produce sensitive electronic equipment without
power quality standards? How can the Power conditioning industry manufacture devices that
will protect sensitive electronic equipment without power Quality standards? They can’t.
Therefore, stakeholders in the power sector have developed power quality standards.
They realize that the increased use of sensitive electronic equipment, increased application of
non-linear devices but to reduce stress on equipment, losses and improve energy efficiency,
and the increasingly complex and interconnected power system, integration of renewables
etc. all contribute to the need of power quality standards. Utilities need standards that define
limits on the amount of voltage distortion (caused by customer’s pollution), their power
systems can tolerate. End users need standards that set limits not only on the electrical
pollution produced by utility systems, but also similar pollution generated by other end users.
There are various prevailing Industrial Power-Quality standards like IEEE 519,
CBEMA, IEEE 1159, IEC 61000, etc. along with some of the standards by Central Electricity
Authority (CEA) to measure, mitigate & limit the various indices of Power-Quality.
6. Power Quality Field measurement
Importance of Power Quality is well understood internationally and appropriate
methods have been developed and employed to ensure quality power. In India, Central
Electricity Authority have notified required standards. In this direction, to establish base line
data about Power Quality parameters in the Indian Power system, Power quality
measurement were taken up by POWERGRID at the Grid level starting from its own sub-
stations across all the five regions in the country covering all the states and union territories.
Simultaneous measurements of various power quality parameters were carried out using
portable 3-phase Power Quality Analyser. Measurements from 6 hours to 24 hours at each
HV/EHV/UHV feeder/point were recorded at secondary terminals of respective CT/PT
whereas for LT supply direct measurements in auxiliary and state supply feeders were done.
In this endeavour Power Quality measurement of various household appliances, typical office
building, and distribution substations were also carried out. Broad observations in this regard
are presented in the following section.
7. Broad Observation based on Field Measurement
Power quality measurement in 175 cities / towns at various voltage levels covering
more than 500 feeders/points indicate presence of high content of voltage harmonics at 65
cities/towns, for duration ranging up to 4% of time. Transmission system as well as LT
xiii
supply (415V) voltages (HV/EHV/UHV) and current were found to be rich in 3rd and 5th
harmonics respectively.
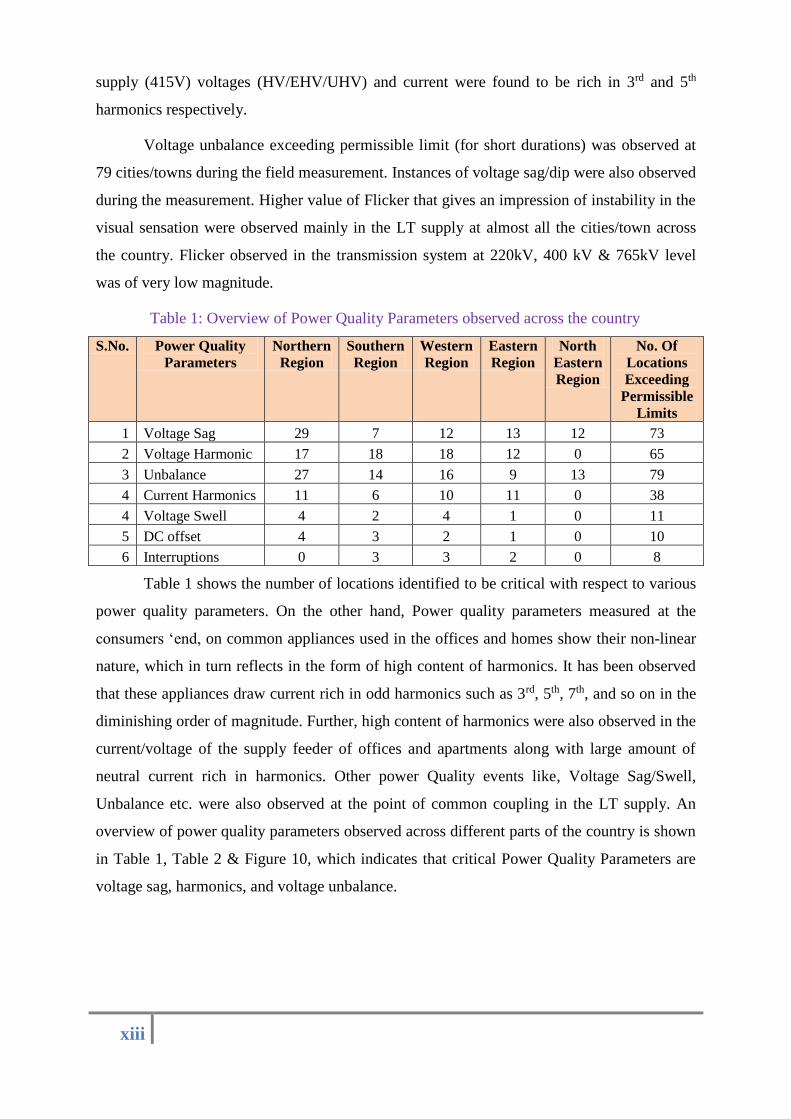
Voltage unbalance exceeding permissible limit (for short durations) was observed at
79 cities/towns during the field measurement. Instances of voltage sag/dip were also observed
during the measurement. Higher value of Flicker that gives an impression of instability in the
visual sensation were observed mainly in the LT supply at almost all the cities/town across
the country. Flicker observed in the transmission system at 220kV, 400 kV & 765kV level
was of very low magnitude.
Table 1: Overview of Power Quality Parameters observed across the country
S.No. Power Quality
Parameters
Northern
Region
Southern
Region
Western
Region
Eastern
Region
North
Eastern
Region
No. Of
Locations
Exceeding
Permissible
Limits
1 Voltage Sag 29 7 12 13 12 73
2 Voltage Harmonic 17 18 18 12 0 65
3 Unbalance 27 14 16 9 13 79
4 Current Harmonics 11 6 10 11 0 38
4 Voltage Swell 4 2 4 1 0 11
5 DC offset 4 3 2 1 0 10
6 Interruptions 0 3 3 2 0 8
Table 1 shows the number of locations identified to be critical with respect to various
power quality parameters. On the other hand, Power quality parameters measured at the
consumers ‘end, on common appliances used in the offices and homes show their non-linear
nature, which in turn reflects in the form of high content of harmonics. It has been observed
that these appliances draw current rich in odd harmonics such as 3rd, 5th, 7th, and so on in the
diminishing order of magnitude. Further, high content of harmonics were also observed in the
current/voltage of the supply feeder of offices and apartments along with large amount of
neutral current rich in harmonics. Other power Quality events like, Voltage Sag/Swell,
Unbalance etc. were also observed at the point of common coupling in the LT supply. An
overview of power quality parameters observed across different parts of the country is shown
in Table 1, Table 2 & Figure 10, which indicates that critical Power Quality Parameters are
voltage sag, harmonics, and voltage unbalance.
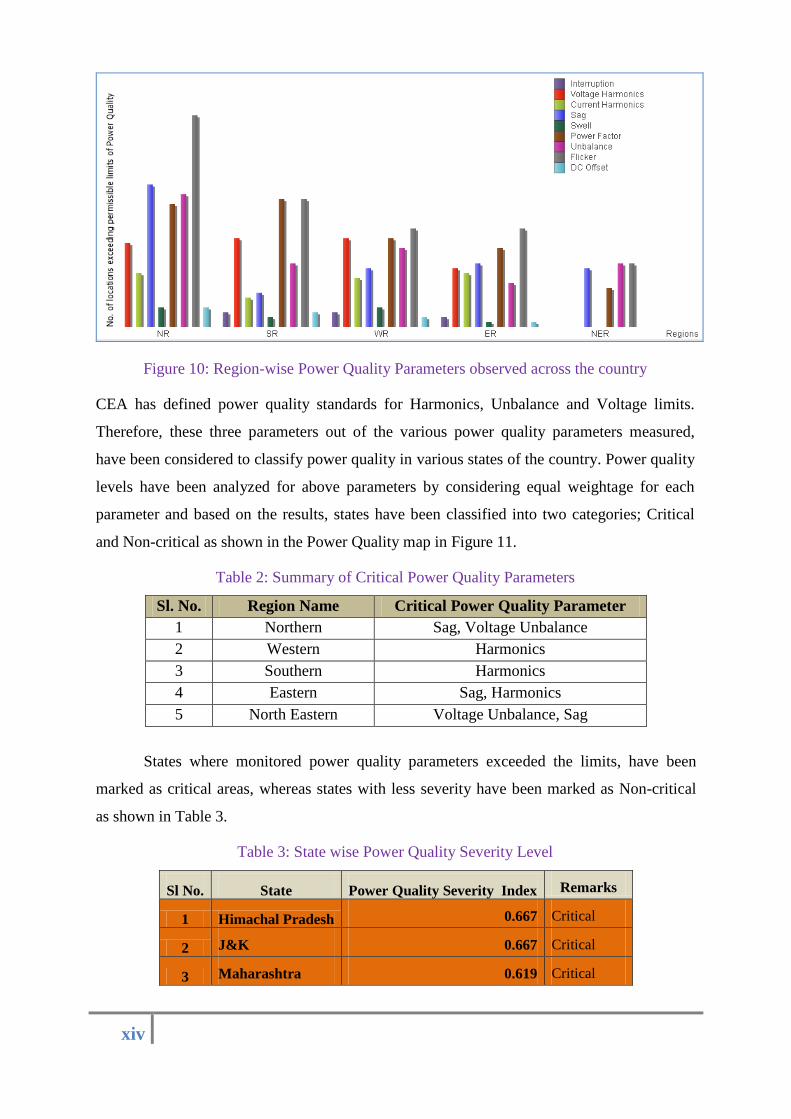
xiv
Figure 10: Region-wise Power Quality Parameters observed across the country
CEA has defined power quality standards for Harmonics, Unbalance and Voltage limits.
Therefore, these three parameters out of the various power quality parameters measured,
have been considered to classify power quality in various states of the country. Power quality
levels have been analyzed for above parameters by considering equal weightage for each
parameter and based on the results, states have been classified into two categories; Critical
and Non-critical as shown in the Power Quality map in Figure 11.
Table 2: Summary of Critical Power Quality Parameters
Sl. No. Region Name Critical Power Quality Parameter
1 Northern Sag, Voltage Unbalance
2 Western Harmonics
3 Southern Harmonics
4 Eastern Sag, Harmonics
5 North Eastern Voltage Unbalance, Sag
States where monitored power quality parameters exceeded the limits, have been
marked as critical areas, whereas states with less severity have been marked as Non-critical
as shown in Table 3.
Table 3: State wise Power Quality Severity Level
Sl No. State Power Quality Severity Index Remarks
1 Himachal Pradesh 0.667 Critical
2 J&K 0.667 Critical
3 Maharashtra 0.619 Critical
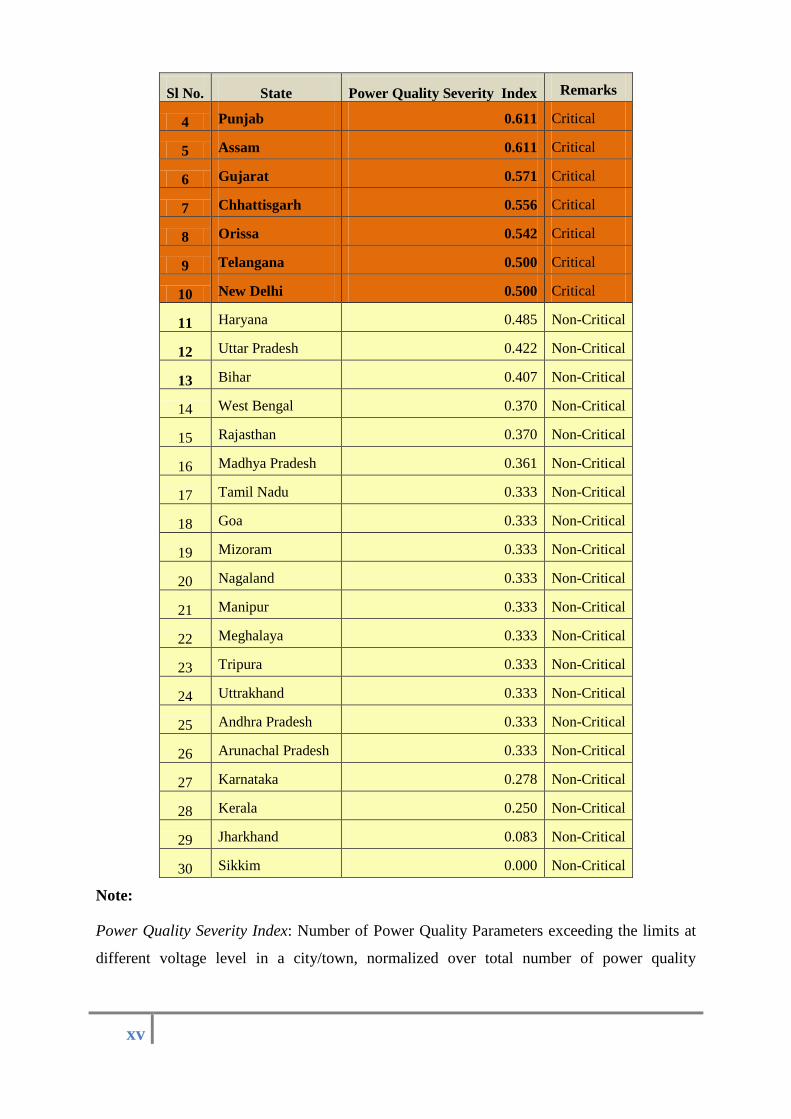
xv
Sl No. State Power Quality Severity Index Remarks
4 Punjab 0.611 Critical
5 Assam 0.611 Critical
6 Gujarat 0.571 Critical
7 Chhattisgarh 0.556 Critical
8 Orissa 0.542 Critical
9 Telangana 0.500 Critical
10 New Delhi 0.500 Critical
11 Haryana 0.485 Non-Critical
12 Uttar Pradesh 0.422 Non-Critical
13 Bihar 0.407 Non-Critical
14 West Bengal 0.370 Non-Critical
15 Rajasthan 0.370 Non-Critical
16 Madhya Pradesh 0.361 Non-Critical
17 Tamil Nadu 0.333 Non-Critical
18 Goa 0.333 Non-Critical
19 Mizoram 0.333 Non-Critical
20 Nagaland 0.333 Non-Critical
21 Manipur 0.333 Non-Critical
22 Meghalaya 0.333 Non-Critical
23 Tripura 0.333 Non-Critical
24 Uttrakhand 0.333 Non-Critical
25 Andhra Pradesh 0.333 Non-Critical
26 Arunachal Pradesh 0.333 Non-Critical
27 Karnataka 0.278 Non-Critical
28 Kerala 0.250 Non-Critical
29 Jharkhand 0.083 Non-Critical
30 Sikkim 0.000 Non-Critical
Note:
Power Quality Severity Index: Number of Power Quality Parameters exceeding the limits at
different voltage level in a city/town, normalized over total number of power quality
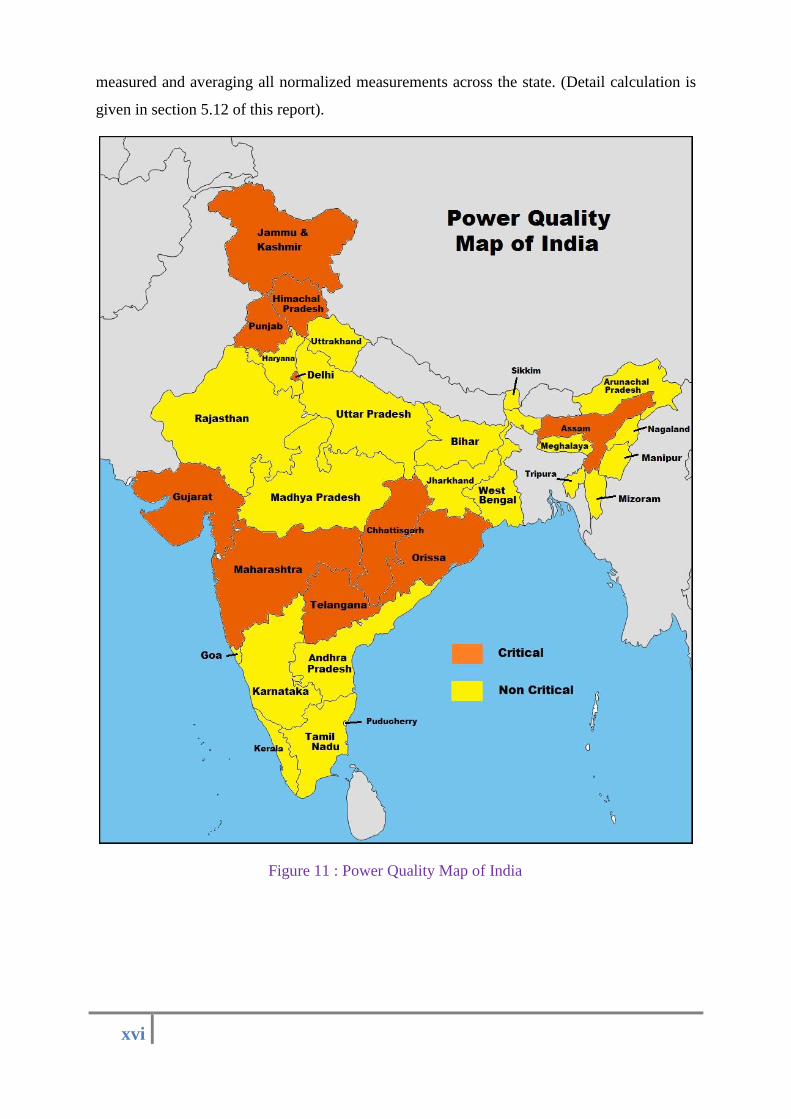
xvi
measured and averaging all normalized measurements across the state. (Detail calculation is
given in section 5.12 of this report).
Figure 11 : Power Quality Map of India
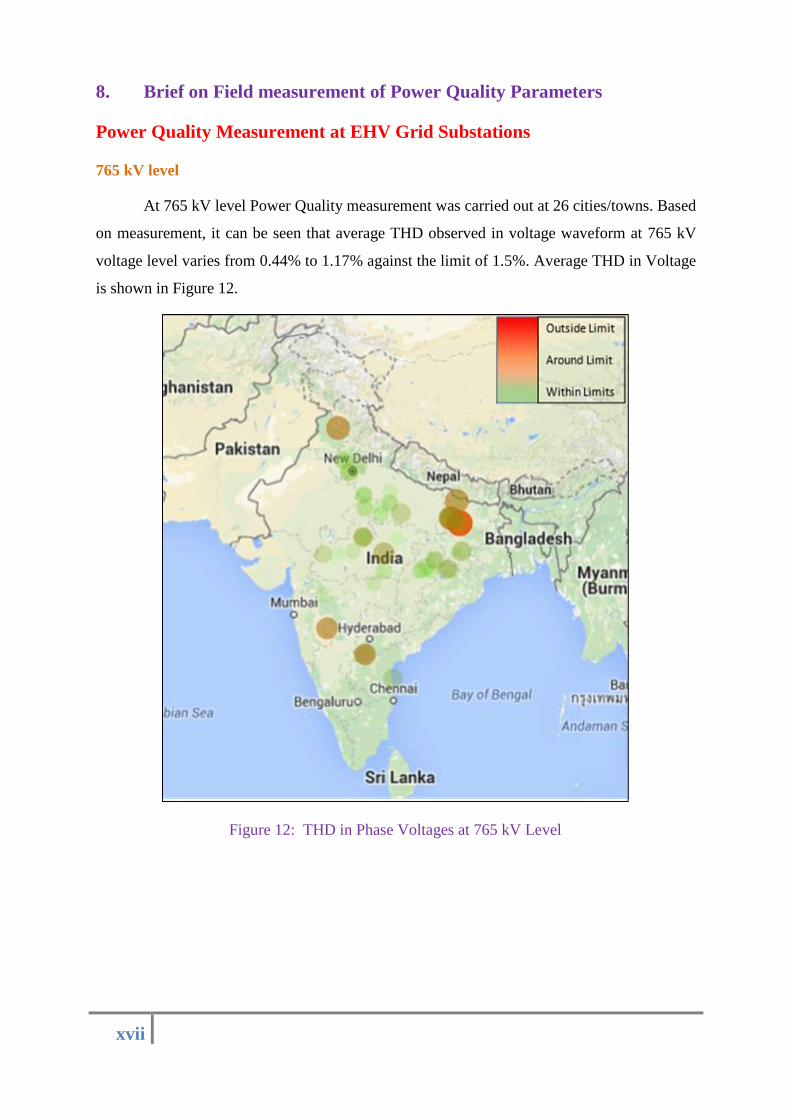
xvii
8. Brief on Field measurement of Power Quality Parameters
Power Quality Measurement at EHV Grid Substations
765 kV level
At 765 kV level Power Quality measurement was carried out at 26 cities/towns. Based
on measurement, it can be seen that average THD observed in voltage waveform at 765 kV
voltage level varies from 0.44% to 1.17% against the limit of 1.5%. Average THD in Voltage
is shown in Figure 12.
Figure 12: THD in Phase Voltages at 765 kV Level
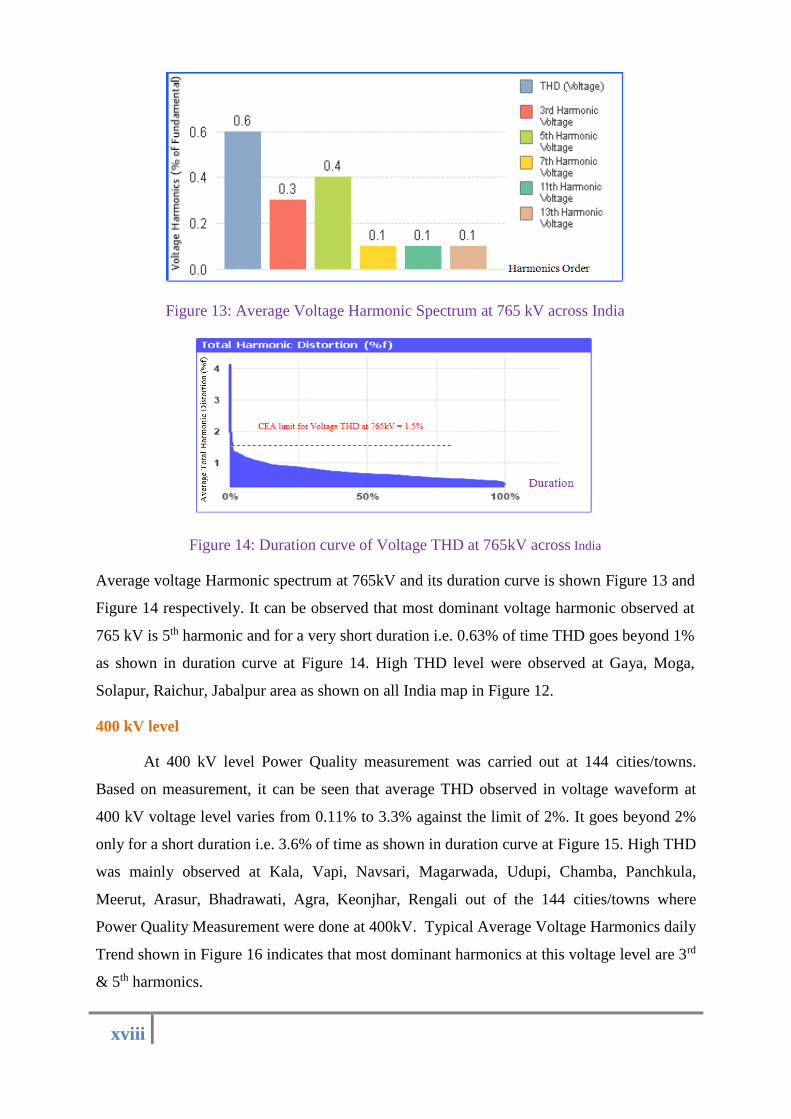
xviii
Figure 13: Average Voltage Harmonic Spectrum at 765 kV across India
Figure 14: Duration curve of Voltage THD at 765kV across India
Average voltage Harmonic spectrum at 765kV and its duration curve is shown Figure 13 and
Figure 14 respectively. It can be observed that most dominant voltage harmonic observed at
765 kV is 5th harmonic and for a very short duration i.e. 0.63% of time THD goes beyond 1%
as shown in duration curve at Figure 14. High THD level were observed at Gaya, Moga,
Solapur, Raichur, Jabalpur area as shown on all India map in Figure 12.
400 kV level
At 400 kV level Power Quality measurement was carried out at 144 cities/towns.
Based on measurement, it can be seen that average THD observed in voltage waveform at
400 kV voltage level varies from 0.11% to 3.3% against the limit of 2%. It goes beyond 2%
only for a short duration i.e. 3.6% of time as shown in duration curve at Figure 15. High THD
was mainly observed at Kala, Vapi, Navsari, Magarwada, Udupi, Chamba, Panchkula,
Meerut, Arasur, Bhadrawati, Agra, Keonjhar, Rengali out of the 144 cities/towns where
Power Quality Measurement were done at 400kV. Typical Average Voltage Harmonics daily
Trend shown in Figure 16 indicates that most dominant harmonics at this voltage level are 3rd
& 5th harmonics.
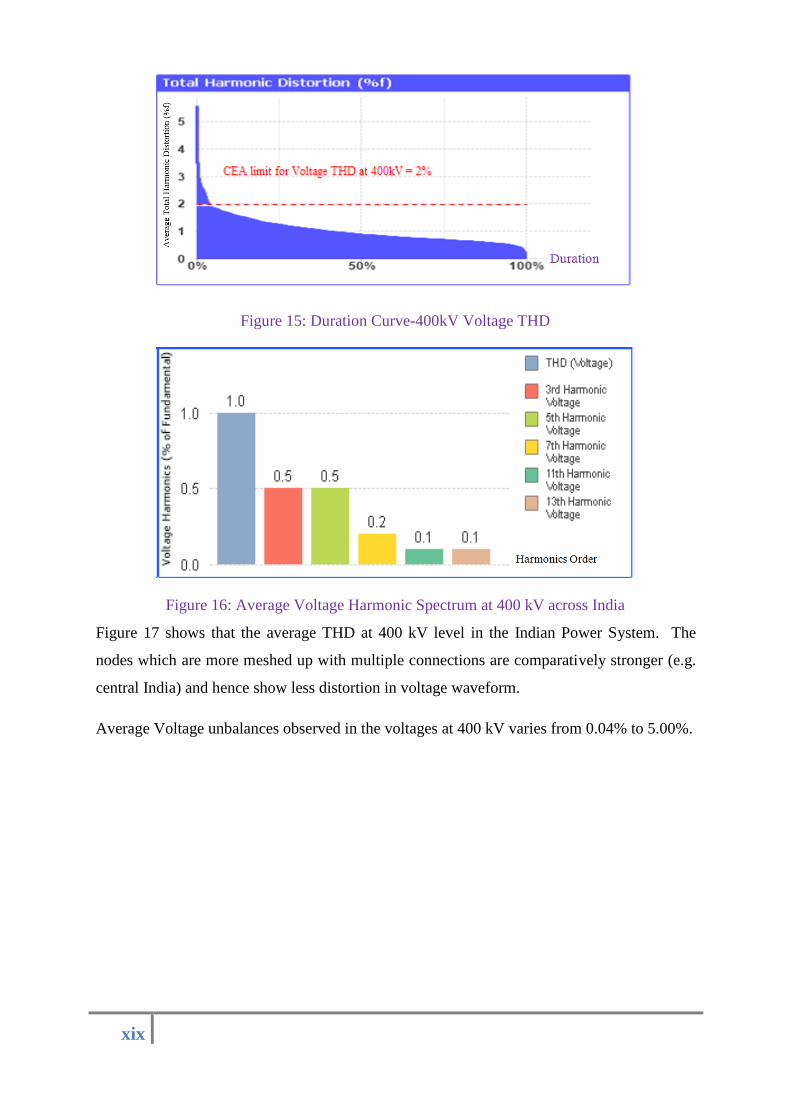
xix
Figure 15: Duration Curve-400kV Voltage THD
Figure 16: Average Voltage Harmonic Spectrum at 400 kV across India
Figure 17 shows that the average THD at 400 kV level in the Indian Power System. The
nodes which are more meshed up with multiple connections are comparatively stronger (e.g.
central India) and hence show less distortion in voltage waveform.
Average Voltage unbalances observed in the voltages at 400 kV varies from 0.04% to 5.00%.
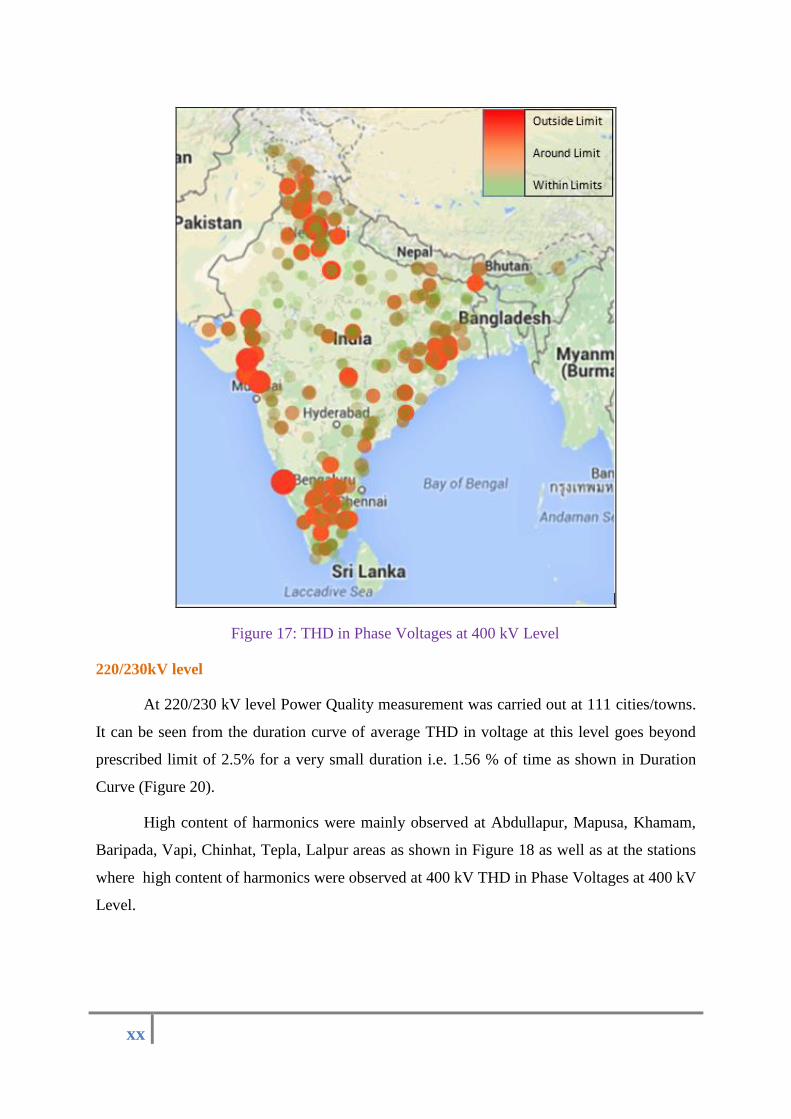
xx
Figure 17: THD in Phase Voltages at 400 kV Level
220/230kV level
At 220/230 kV level Power Quality measurement was carried out at 111 cities/towns.
It can be seen from the duration curve of average THD in voltage at this level goes beyond
prescribed limit of 2.5% for a very small duration i.e. 1.56 % of time as shown in Duration
Curve (Figure 20).
High content of harmonics were mainly observed at Abdullapur, Mapusa, Khamam,
Baripada, Vapi, Chinhat, Tepla, Lalpur areas as shown in Figure 18 as well as at the stations
where high content of harmonics were observed at 400 kV THD in Phase Voltages at 400 kV
Level.
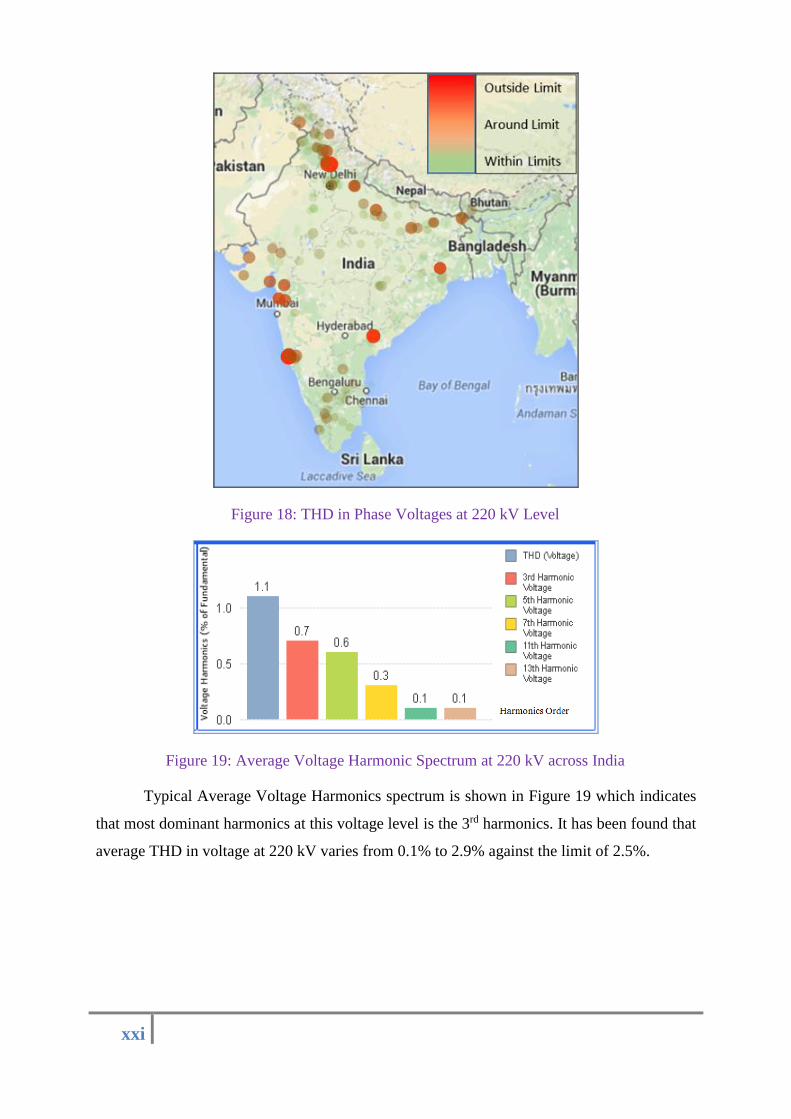
xxi
Figure 18: THD in Phase Voltages at 220 kV Level
Figure 19: Average Voltage Harmonic Spectrum at 220 kV across India
Typical Average Voltage Harmonics spectrum is shown in Figure 19 which indicates
that most dominant harmonics at this voltage level is the 3rd harmonics. It has been found that
average THD in voltage at 220 kV varies from 0.1% to 2.9% against the limit of 2.5%.
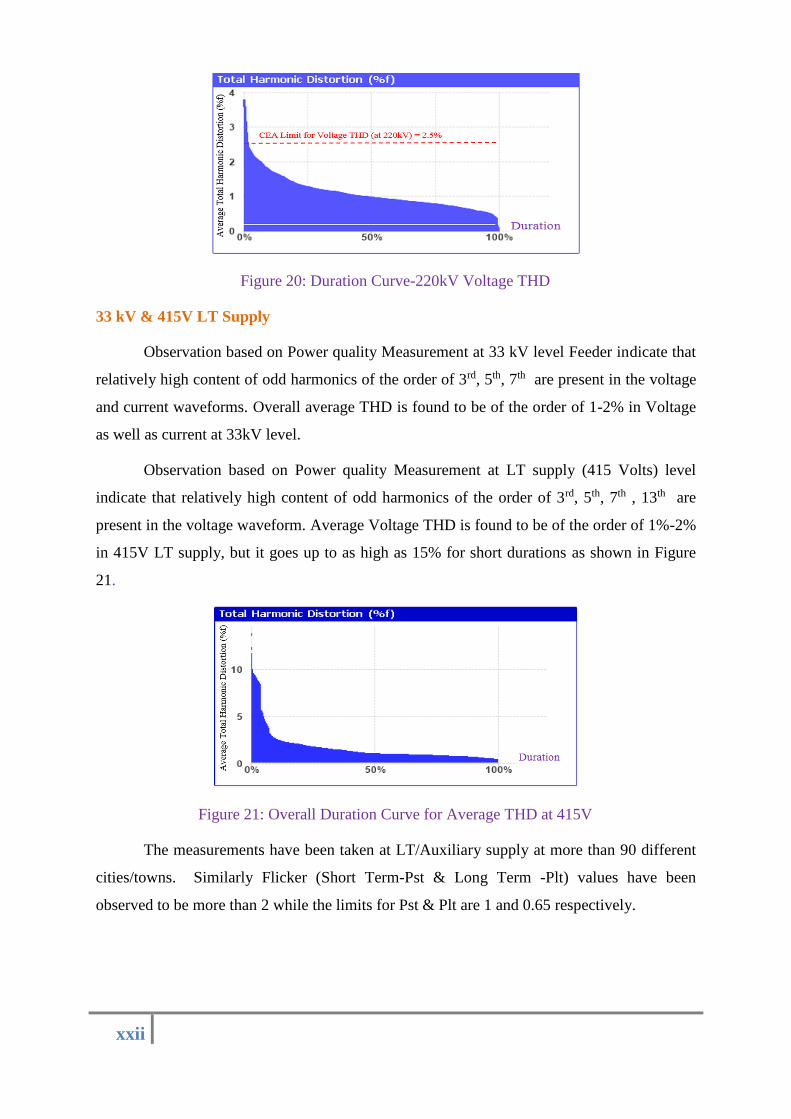
xxii
Figure 20: Duration Curve-220kV Voltage THD
33 kV & 415V LT Supply
Observation based on Power quality Measurement at 33 kV level Feeder indicate that
relatively high content of odd harmonics of the order of 3rd, 5th, 7th are present in the voltage
and current waveforms. Overall average THD is found to be of the order of 1-2% in Voltage
as well as current at 33kV level.
Observation based on Power quality Measurement at LT supply (415 Volts) level
indicate that relatively high content of odd harmonics of the order of 3rd, 5th, 7th , 13th are
present in the voltage waveform. Average Voltage THD is found to be of the order of 1%-2%
in 415V LT supply, but it goes up to as high as 15% for short durations as shown in Figure
21.
Figure 21: Overall Duration Curve for Average THD at 415V
The measurements have been taken at LT/Auxiliary supply at more than 90 different
cities/towns. Similarly Flicker (Short Term-Pst & Long Term -Plt) values have been
observed to be more than 2 while the limits for Pst & Plt are 1 and 0.65 respectively.
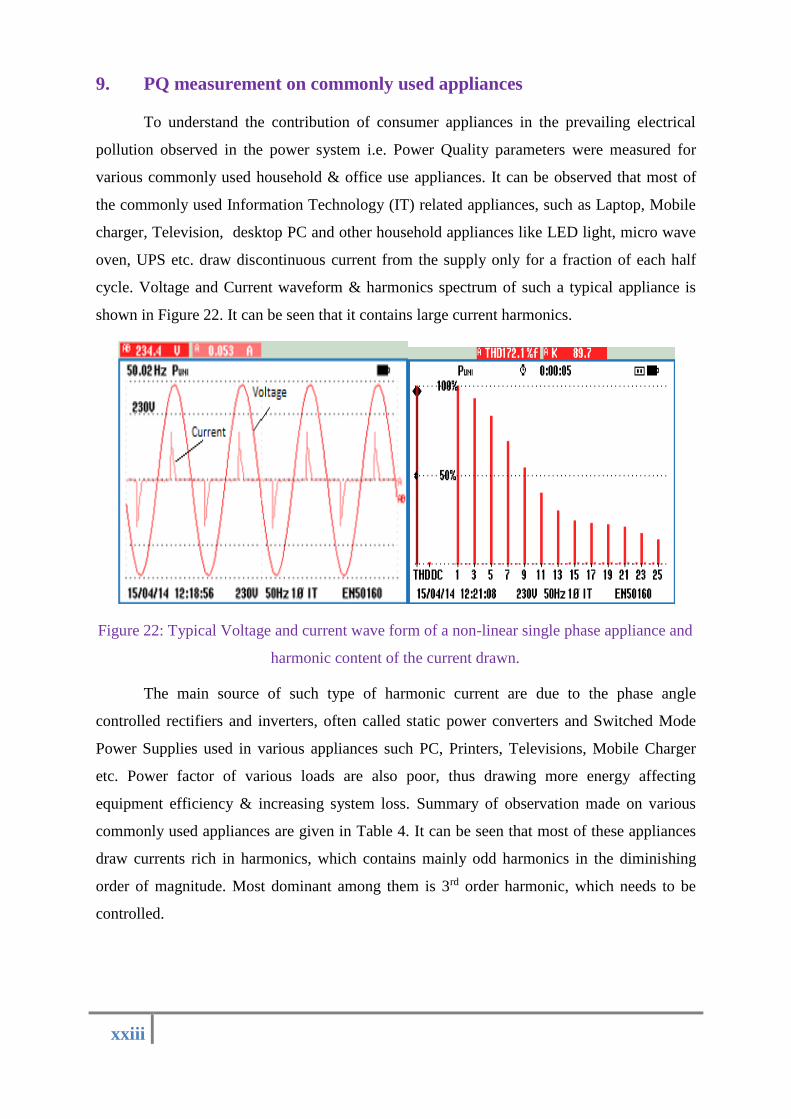
xxiii
9. PQ measurement on commonly used appliances
To understand the contribution of consumer appliances in the prevailing electrical
pollution observed in the power system i.e. Power Quality parameters were measured for
various commonly used household & office use appliances. It can be observed that most of
the commonly used Information Technology (IT) related appliances, such as Laptop, Mobile
charger, Television, desktop PC and other household appliances like LED light, micro wave
oven, UPS etc. draw discontinuous current from the supply only for a fraction of each half
cycle. Voltage and Current waveform & harmonics spectrum of such a typical appliance is
shown in Figure 22. It can be seen that it contains large current harmonics.
Figure 22: Typical Voltage and current wave form of a non-linear single phase appliance and
harmonic content of the current drawn.
The main source of such type of harmonic current are due to the phase angle
controlled rectifiers and inverters, often called static power converters and Switched Mode
Power Supplies used in various appliances such PC, Printers, Televisions, Mobile Charger
etc. Power factor of various loads are also poor, thus drawing more energy affecting
equipment efficiency & increasing system loss. Summary of observation made on various
commonly used appliances are given in Table 4. It can be seen that most of these appliances
draw currents rich in harmonics, which contains mainly odd harmonics in the diminishing
order of magnitude. Most dominant among them is 3rd order harmonic, which needs to be
controlled.
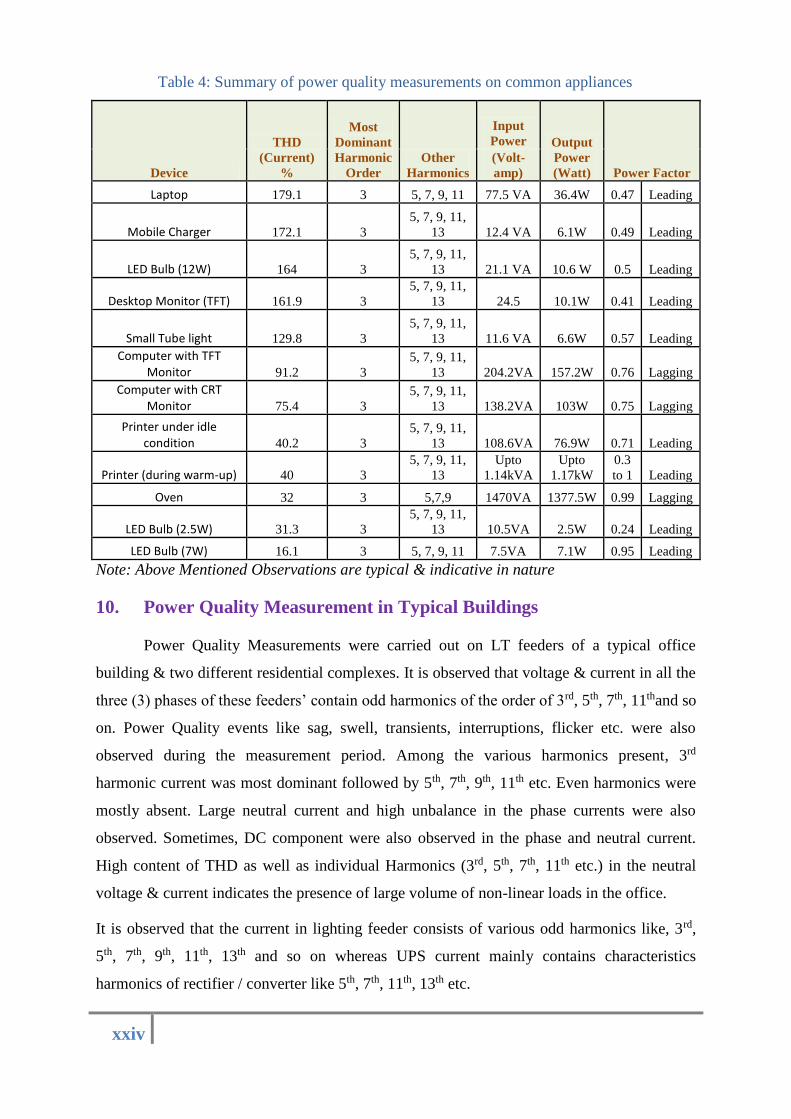
xxiv
Table 4: Summary of power quality measurements on common appliances
Device
THD
(Current)
%
Most
Dominant
Harmonic
Order
Other
Harmonics
Input
Power Output
Power
(Watt) Power Factor
(Volt-
amp)
Laptop 179.1 3 5, 7, 9, 11 77.5 VA 36.4W 0.47 Leading
Mobile Charger 172.1 3
5, 7, 9, 11,
13 12.4 VA 6.1W 0.49 Leading
LED Bulb (12W) 164 3
5, 7, 9, 11,
13 21.1 VA 10.6 W 0.5 Leading
Desktop Monitor (TFT) 161.9 3
5, 7, 9, 11,
13 24.5 10.1W 0.41 Leading
Small Tube light 129.8 3
5, 7, 9, 11,
13 11.6 VA 6.6W 0.57 Leading
Computer with TFT Monitor 91.2 3
5, 7, 9, 11,
13 204.2VA 157.2W 0.76 Lagging
Computer with CRT Monitor 75.4 3
5, 7, 9, 11,
13 138.2VA 103W 0.75 Lagging
Printer under idle condition 40.2 3
5, 7, 9, 11,
13 108.6VA 76.9W 0.71 Leading
Printer (during warm-up) 40 3
5, 7, 9, 11,
13
Upto
1.14kVA
Upto
1.17kW
0.3
to 1 Leading
Oven 32 3 5,7,9 1470VA 1377.5W 0.99 Lagging
LED Bulb (2.5W) 31.3 3
5, 7, 9, 11,
13 10.5VA 2.5W 0.24 Leading
LED Bulb (7W) 16.1 3 5, 7, 9, 11 7.5VA 7.1W 0.95 Leading
Note: Above Mentioned Observations are typical & indicative in nature
10. Power Quality Measurement in Typical Buildings
Power Quality Measurements were carried out on LT feeders of a typical office
building & two different residential complexes. It is observed that voltage & current in all the
three (3) phases of these feeders’ contain odd harmonics of the order of 3rd, 5th, 7th, 11thand so
on. Power Quality events like sag, swell, transients, interruptions, flicker etc. were also
observed during the measurement period. Among the various harmonics present, 3rd
harmonic current was most dominant followed by 5th, 7th, 9th, 11th etc. Even harmonics were
mostly absent. Large neutral current and high unbalance in the phase currents were also
observed. Sometimes, DC component were also observed in the phase and neutral current.
High content of THD as well as individual Harmonics (3rd, 5th, 7th, 11th etc.) in the neutral
voltage & current indicates the presence of large volume of non-linear loads in the office.
It is observed that the current in lighting feeder consists of various odd harmonics like, 3rd,
5th, 7th, 9th, 11th, 13th and so on whereas UPS current mainly contains characteristics
harmonics of rectifier / converter like 5th, 7th, 11th, 13th etc.
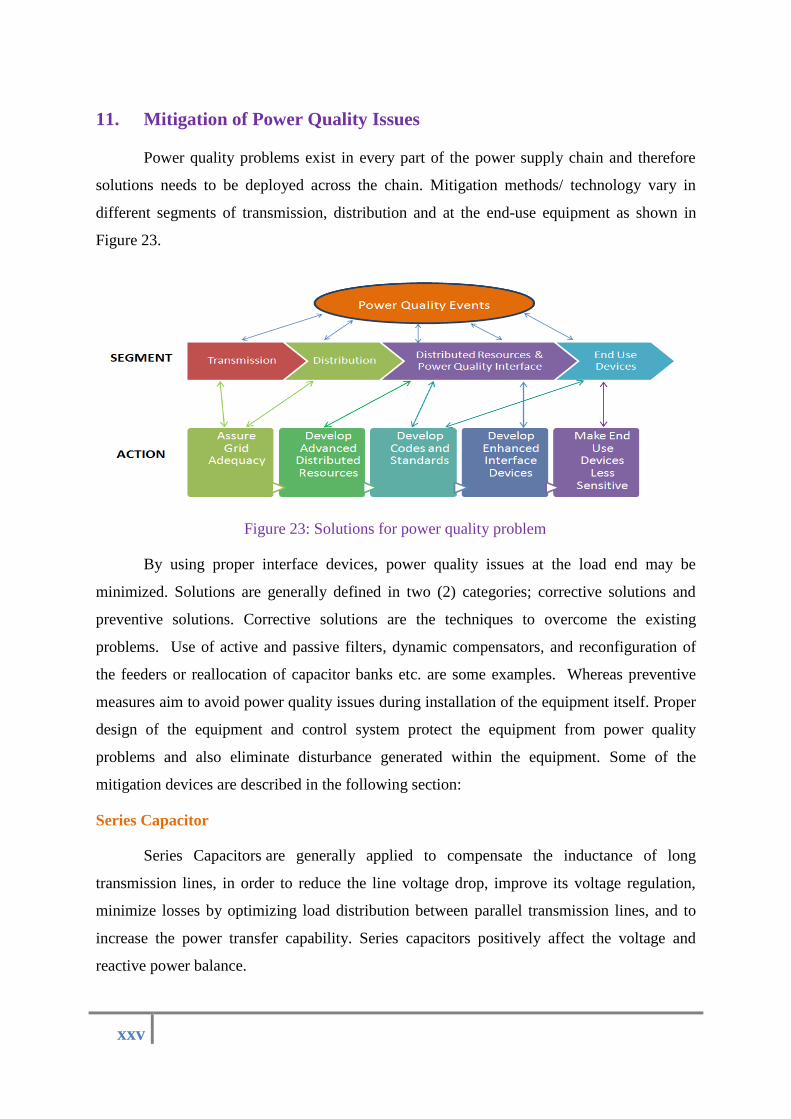
xxv
11. Mitigation of Power Quality Issues
Power quality problems exist in every part of the power supply chain and therefore
solutions needs to be deployed across the chain. Mitigation methods/ technology vary in
different segments of transmission, distribution and at the end-use equipment as shown in
Figure 23.
Figure 23: Solutions for power quality problem
By using proper interface devices, power quality issues at the load end may be
minimized. Solutions are generally defined in two (2) categories; corrective solutions and
preventive solutions. Corrective solutions are the techniques to overcome the existing
problems. Use of active and passive filters, dynamic compensators, and reconfiguration of
the feeders or reallocation of capacitor banks etc. are some examples. Whereas preventive
measures aim to avoid power quality issues during installation of the equipment itself. Proper
design of the equipment and control system protect the equipment from power quality
problems and also eliminate disturbance generated within the equipment. Some of the
mitigation devices are described in the following section:
Series Capacitor
Series Capacitors are generally applied to compensate the inductance of long
transmission lines, in order to reduce the line voltage drop, improve its voltage regulation,
minimize losses by optimizing load distribution between parallel transmission lines, and to
increase the power transfer capability. Series capacitors positively affect the voltage and
reactive power balance.
xxvi
Shunt Capacitors
Shunt capacitors are usually called “power factor correction capacitors”. They are used at all
voltage levels from end-user utilization to extra high voltages. Shunt capacitors, either at the
customer location for power factor correction or on the distribution system for voltage
control, alter the system impedance variation with frequency.
Utilities use shunt capacitors at distribution and utilization voltage levels to provide
reactive power near the inductive loads that require it. This reduces the total current flowing
on the distribution feeder, which improves the voltage profile along the feeder, release
additional feeder capacity and reduces losses.
Static Var Compensator (SVC)
Static Var Compensator (SVC) provides fast reactive power compensation in power
system using combination of capacitors and reactors to regulate the voltage. These are
primarily used to mitigate voltage fluctuation, dynamic voltage support as well as the
resulting flicker. As an automated impedance matching device, they have the added benefit of
bringing the system power factor close to unity. Therefore, SVC is usually installed near high
and rapidly varying loads, such as electric arc furnaces, welding plants and other industries
prone to voltage fluctuations and flicker.
STATCOM
STATCOM or Static Synchronous Compensator is a shunt device, which uses force-
commutated power electronics (i.e. GTO, IGBT) devices/switches to control power flow and
improve transient stability on electrical power networks. The STATCOM basically performs
the same function as the static var compensators but with additional advantages.
STATCOM is composed of the following components:
(i) Voltage-Source Converter (VSC):
(ii) DC Capacitor
(iii)Inductive Reactance (X)
(iv) Harmonic Filters
D-STATCOM
A D-STATCOM (Distribution Static Compensators) is a fast-response, solid-state
power controller that provides power quality improvements at the point of connection to the
xxvii
utility distribution feeder. It is the most important power quality controller for the distribution
networks. It has been widely used for precisely regulate the system voltage and /or for load
compensation. It can exchange both active and reactive power with the distribution system
by varying the amplitude and phase angle of the voltage of the VSC (Voltage Source
Converter) with respect to the PCC voltage, if an energy storage system is included into the
DC bus. However, a capacitor supported D-STATCOM is preferred for power quality
improvement in the currents, such as reactive power compensation for unity power factor or
voltage regulation at PCC, load balancing and neutral current compensation. These
compensating devices are also used to regulate the terminal voltage, suppress voltage flicker,
and improve voltage balance in three phase systems. One of the major factors in advancing
the D-STATCOM technology is the advent of fast, self-commutating solid-state devices.
With the introduction of IGBT (insulated gate bipolar transistor), the D-STATCOM
technology has got a real boost.
Dynamic Voltage Restorer (DVR)
To mitigate the voltage based power quality problems such as spikes, surges, flickers,
sags, swells, notches, fluctuations, voltage imbalance, waveform distortion, etc. in the
distribution system solid-state series compensators (SSC) and dynamic voltage restorer are
commonly used. These active series compensators are recently reported with some
modifications as cost-effective filters with series active power filters to eliminate harmonic
currents in voltage-fed nonlinear loads and with shunt passive filters to eliminate harmonic
currents in current fed non-linear loads. These compensators are based on the principle of
injecting a voltage in series with the supply. This compensator inserts a voltage of required
waveform so that it can protect the sensitive consumer loads from supply disturbances such
as sag, swell, spikes, notches, unbalance, harmonics, and so on in supply voltage.
UPQC (Unified Power Quality Compensators)
A UPQC, which is a combination of shunt and series compensators, is proposed as a
single solution for mitigating multiple power quality problems. The power circuit of a UPQC
consists of two VSCs connected back to back by a common DC link. The shunt devices
known as DSTATCOM provides reactive power compensation along with load balancing,
neutral current compensation, and elimination of harmonics (if required) and is positioned
parallel to consumer load. The series device known as DVR keeps the load end voltage
insensitive to supply voltage quality problems such as voltage sag/swell, surge spikes,
xxviii
notches, or unbalance. The DVR injects a compensating voltage between the supply and the
consumer load, and restores the load voltage to its reference value.
Harmonic Filters
Harmonic Filters are used to mitigate the power quality problem known as harmonic
waveform distortion. Consequently, they minimize the thermal and electrical stress on the
electrical infrastructure, eliminate the risk of harmonics-related reliability issues and allow
for long-term energy efficiency and cost savings. Harmonic filters are classified as following:
a) Passive Harmonic filters: Passive harmonic filters provide low impedance path to
the harmonic frequencies to be attenuated using passive components (inductors,
capacitors and resistors). It absorbs the harmonic current to which it is tuned and
filters it out of the system.
b) Active harmonic filters: Active Harmonic Filters monitor the non-linear load and
dynamically provide controlled current injection, which cancels out the harmonic
currents in the electrical system. They also correct poor displacement power factor by
compensating the system’s reactive current.
c) Hybrid harmonic filter: It is a combination of both passive & active harmonic
filters.
12. International Experience
The availability of sophisticated and sensitive appliances at consumer end has led
demand for higher levels of power quality across the world. To meet these needs, various
approaches have been followed by utilities worldwide. Some utilities have set up premium
power quality contracts for their customers, whereas some identify the additional costs
involved in providing the services and bill the customer for it. Experience across the world in
this regard is described in the following section:
EdF, France:
EdF, France has set up a number of electricity supply contracts and services for large
and medium customers to ensure higher level of power quality. In 1994, EdF began to use the
“Emeraude” contract as an experiment for 6,000 customers. Presently, EdF offer their
customers with customized contracts of assigned voltage quality levels. If the customer
claims for better contractual levels than the normal ones, they can avail the same by paying
extra charges. In these contracts, consumers are required to limit the maximum electrical
emission level to the system.
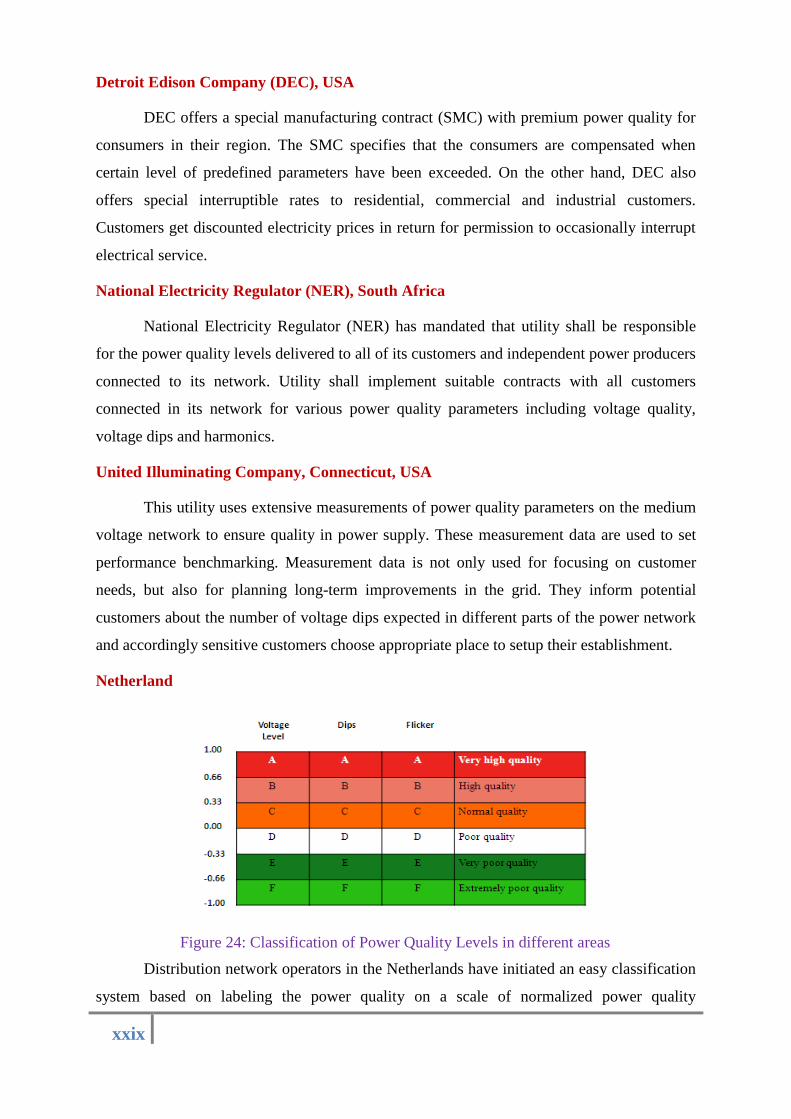
xxix
Detroit Edison Company (DEC), USA
DEC offers a special manufacturing contract (SMC) with premium power quality for
consumers in their region. The SMC specifies that the consumers are compensated when
certain level of predefined parameters have been exceeded. On the other hand, DEC also
offers special interruptible rates to residential, commercial and industrial customers.
Customers get discounted electricity prices in return for permission to occasionally interrupt
electrical service.
National Electricity Regulator (NER), South Africa
National Electricity Regulator (NER) has mandated that utility shall be responsible
for the power quality levels delivered to all of its customers and independent power producers
connected to its network. Utility shall implement suitable contracts with all customers
connected in its network for various power quality parameters including voltage quality,
voltage dips and harmonics.
United Illuminating Company, Connecticut, USA
This utility uses extensive measurements of power quality parameters on the medium
voltage network to ensure quality in power supply. These measurement data are used to set
performance benchmarking. Measurement data is not only used for focusing on customer
needs, but also for planning long-term improvements in the grid. They inform potential
customers about the number of voltage dips expected in different parts of the power network
and accordingly sensitive customers choose appropriate place to setup their establishment.
Netherland
Figure 24: Classification of Power Quality Levels in different areas
Distribution network operators in the Netherlands have initiated an easy classification
system based on labeling the power quality on a scale of normalized power quality
xxx
characteristics. To keep the labeling meaningful and transparent, aggregation of large
amounts of measured data is done to have single measure of quality as shown in Figure 24.
Areas with +ve normalized value of Power Quality are considered either normal or
high in quality depending on its value. On the other hand areas with –ve normalized value of
Power Quality are considered poor in quality.
Norway
In 1995 mandatory reporting of interruptions greater than 3 minutes was added in the
regulation of quality of supply that began in 1991 and about 179 network companies were
required to report key figures on voltage quality. Subsequently, in 2005 the Norwegian
Water Resource and Energy Directorate (NVE) put into force “Regulations relating to the
quality of supply in Norwegian power system”. This regulation applies to all network voltage
levels.
PowerGrid Ltd., Singapore
PowerGrid Ltd, a subsidiary of Singapore Power Ltd, responsible for the transmission
and distribution of electricity at 400kV, 230kV, 66kV, 22kV and 6.6kV levels has put up a
comprehensive power quality improvement plan to meet the needs of the high–tech
industries. The plan covers initiatives including Power Quality Monitoring System,
application of mitigation technologies for voltage dip ride-through, network enhancement,
cost-effective mitigation devices, condition monitoring, cable damage prevention etc.
India
The Electricity Act (EA), 2003, explicitly specifies the responsibility to supply quality
power to end consumers. The technical standards for construction of electrical plants and
electric lines and connectivity to the grid have been specified by the Central Electricity
Authority (CEA). Grid code has been notified by the Central and State electricity
Commissions for supply code and standard of performance regulations as per Electricity Act.
Some SERCs have notified distribution codes such as Gujarat Electricity Regulatory
Commission has notified ‘Gujarat Electricity Distribution Code’ and Orissa Electricity
Regulatory Commission has constituted a PQ monitoring committee to oversee the quality of
Supply.
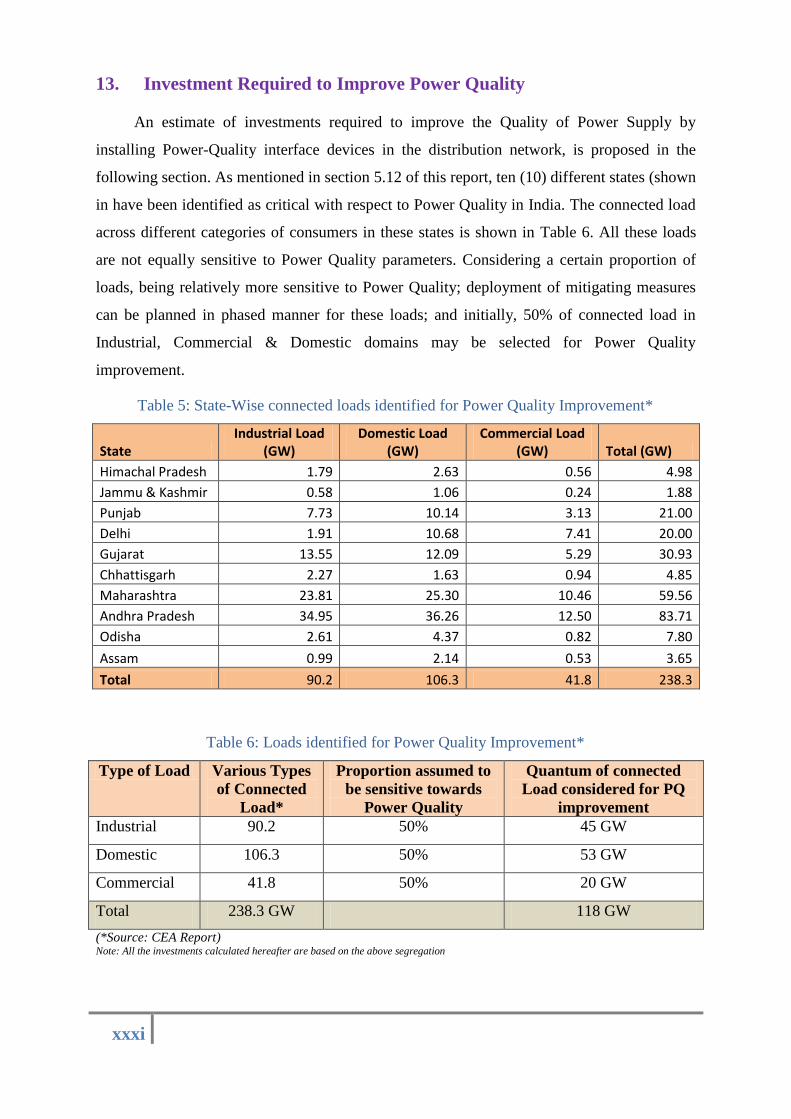
xxxi
13. Investment Required to Improve Power Quality
An estimate of investments required to improve the Quality of Power Supply by
installing Power-Quality interface devices in the distribution network, is proposed in the
following section. As mentioned in section 5.12 of this report, ten (10) different states (shown
in have been identified as critical with respect to Power Quality in India. The connected load
across different categories of consumers in these states is shown in Table 6. All these loads
are not equally sensitive to Power Quality parameters. Considering a certain proportion of
loads, being relatively more sensitive to Power Quality; deployment of mitigating measures
can be planned in phased manner for these loads; and initially, 50% of connected load in
Industrial, Commercial & Domestic domains may be selected for Power Quality
improvement.
Table 5: State-Wise connected loads identified for Power Quality Improvement*
State Industrial Load
(GW) Domestic Load
(GW) Commercial Load
(GW) Total (GW)
Himachal Pradesh 1.79 2.63 0.56 4.98
Jammu & Kashmir 0.58 1.06 0.24 1.88
Punjab 7.73 10.14 3.13 21.00
Delhi 1.91 10.68 7.41 20.00
Gujarat 13.55 12.09 5.29 30.93
Chhattisgarh 2.27 1.63 0.94 4.85
Maharashtra 23.81 25.30 10.46 59.56
Andhra Pradesh 34.95 36.26 12.50 83.71
Odisha 2.61 4.37 0.82 7.80
Assam 0.99 2.14 0.53 3.65
Total 90.2 106.3 41.8 238.3
Table 6: Loads identified for Power Quality Improvement*
(*Source: CEA Report) Note: All the investments calculated hereafter are based on the above segregation
Type of Load Various Types
of Connected
Load*
Proportion assumed to
be sensitive towards
Power Quality
Quantum of connected
Load considered for PQ
improvement
Industrial 90.2 50% 45 GW
Domestic 106.3 50% 53 GW
Commercial 41.8 50% 20 GW
Total 238.3 GW 118 GW
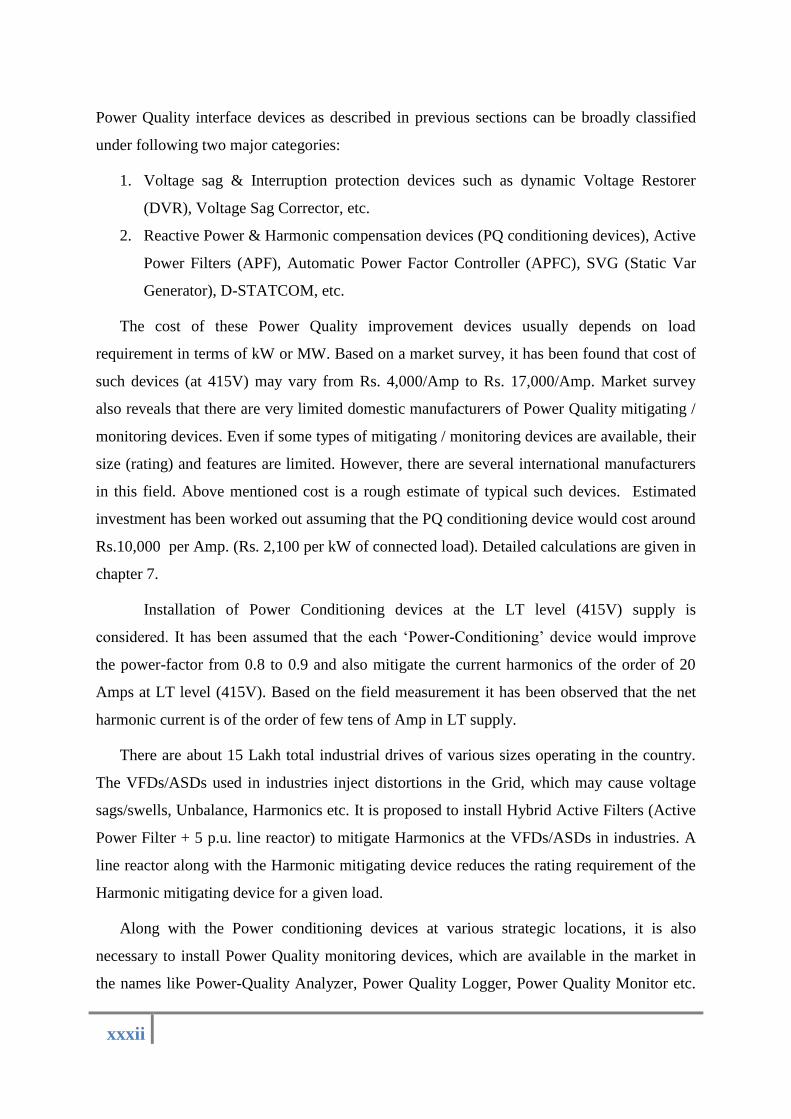
xxxii
Power Quality interface devices as described in previous sections can be broadly classified
under following two major categories:
1. Voltage sag & Interruption protection devices such as dynamic Voltage Restorer
(DVR), Voltage Sag Corrector, etc.
2. Reactive Power & Harmonic compensation devices (PQ conditioning devices), Active
Power Filters (APF), Automatic Power Factor Controller (APFC), SVG (Static Var
Generator), D-STATCOM, etc.
The cost of these Power Quality improvement devices usually depends on load
requirement in terms of kW or MW. Based on a market survey, it has been found that cost of
such devices (at 415V) may vary from Rs. 4,000/Amp to Rs. 17,000/Amp. Market survey
also reveals that there are very limited domestic manufacturers of Power Quality mitigating /
monitoring devices. Even if some types of mitigating / monitoring devices are available, their
size (rating) and features are limited. However, there are several international manufacturers
in this field. Above mentioned cost is a rough estimate of typical such devices. Estimated
investment has been worked out assuming that the PQ conditioning device would cost around
Rs.10,000 per Amp. (Rs. 2,100 per kW of connected load). Detailed calculations are given in
chapter 7.
Installation of Power Conditioning devices at the LT level (415V) supply is
considered. It has been assumed that the each ‘Power-Conditioning’ device would improve
the power-factor from 0.8 to 0.9 and also mitigate the current harmonics of the order of 20
Amps at LT level (415V). Based on the field measurement it has been observed that the net
harmonic current is of the order of few tens of Amp in LT supply.
There are about 15 Lakh total industrial drives of various sizes operating in the country.
The VFDs/ASDs used in industries inject distortions in the Grid, which may cause voltage
sags/swells, Unbalance, Harmonics etc. It is proposed to install Hybrid Active Filters (Active
Power Filter + 5 p.u. line reactor) to mitigate Harmonics at the VFDs/ASDs in industries. A
line reactor along with the Harmonic mitigating device reduces the rating requirement of the
Harmonic mitigating device for a given load.
Along with the Power conditioning devices at various strategic locations, it is also
necessary to install Power Quality monitoring devices, which are available in the market in
the names like Power-Quality Analyzer, Power Quality Logger, Power Quality Monitor etc.
xxxiii
It is proposed to install one monitoring device for every 50MW of connected load out of
118GW load identified in Table 6.
Considering all the investments mentioned above, the total estimated investment required
during initial phase for Power Quality improvement for the loads identified in Table 6 is
about Rs. 24,840 Cr. as shown in Table 7.
Table 7: Estimated Investments for Power Quality Improvement
Sl No. Load Category Load Considered for PQ
Improvement (GW)
Rate
Rs per KW
Estimated Investment
(Rs. Cr.)
A. Power Conditioning Device
(Such as DSTATCOM, SVG, APF, DVR, Active Power Filter, etc.) 1 Industrial 45
2,100 9,450
2 Domestic 53 11,130 3 Commercial 20 4,200
Sub-Total 24,780
Sl
No.
Number of Power Quality Monitoring
devices required
Rate
Rs per Device
Estimated Investment
(Rs. Cr.)
B. Power Quality Monitoring Device
(Such as Power Quality Analyzer, Power Quality Logger etc.) 1 1180 5,00,000 59
Sub-Total 59
14. Way forward: Actions required for Power Quality improvement
This report has highlighted the importance of power quality while building an insight upon
power quality standards, pan India power quality status based on primary measurement, the
ill effects of poor power quality and possible mitigating measures required for the same.
Power Quality Measurements have been done on various voltage levels ranging from
distribution (415 V) to EHV (765 kV) throughout India.
These measurements were done for 6 to 24 hours on each feeder in a non-simultaneous
manner. From the measurements, it was observed that voltage harmonics are high in certain
pockets of the country. The higher magnitude of Voltage Harmonics in these pockets
necessitates the need for corrective measures to be taken.
High current distortions have been observed invariably at all voltage levels. Various
challenges and threats posed by poor power quality including harmonics have been discussed
Total Investment (A+B) Rs. 24,840 Cr.
xxxiv
in this report. Prudent mitigating measures to address these challenges, viz. STATCOM,
passive harmonic filters, active power filters, DVR, power factor conditioners etc. have been
discussed and suggested.
Installation of these devices is to be done at locations which may be decided by extensive
system studies. Sizing of these power quality devices also need to be carried out through
meticulous data analysis and simulation studies. Further course of action imperative to ensure
a good quality power at the national level is as follows:
Identification of critical nodes with critical level of electrical pollution.
Detailed measurement of power quality for longer duration and further analysis of
data.
Development of infrastructure to periodically monitor the Power-Quality parameters
across the Grid at all the Voltage Levels, including distribution network.
Assessment of various power quality improvement devices depending upon issue,
ratings, voltage level, economic considerations etc.
Development of regulatory framework and economic model to facilitate the
deployment of mitigating solutions.
Enforcement of regulations for maintaining power quality parameters for various
stake holders.
Simulation based study for further improvement at varying voltage level.
To ensure Quality Supply in the entire Power System, any single stakeholder can’t be
made responsible. Since Power-Quality has a very broad spectrum, all the stakeholders in the
Power Supply Value chain are expected to contribute in a collaborative manner to ensure
high quality of power to end consumers. Various actions that need to be taken by different
stakeholders are enlisted below:
1. Necessary standards shall be formulated / updated under the emerging scenario of
large penetration of non-linear loads, volatile renewable generation capacity addition,
increasing inverter penetration & stringent quality requirements by various categories
of load.
2. Utilities need to strengthen/upgrade their network to ensure high quality of power.
3. Manufacturers need to produce electrical / electronic appliances/ gadgets meeting the
standards and end consumer needs.
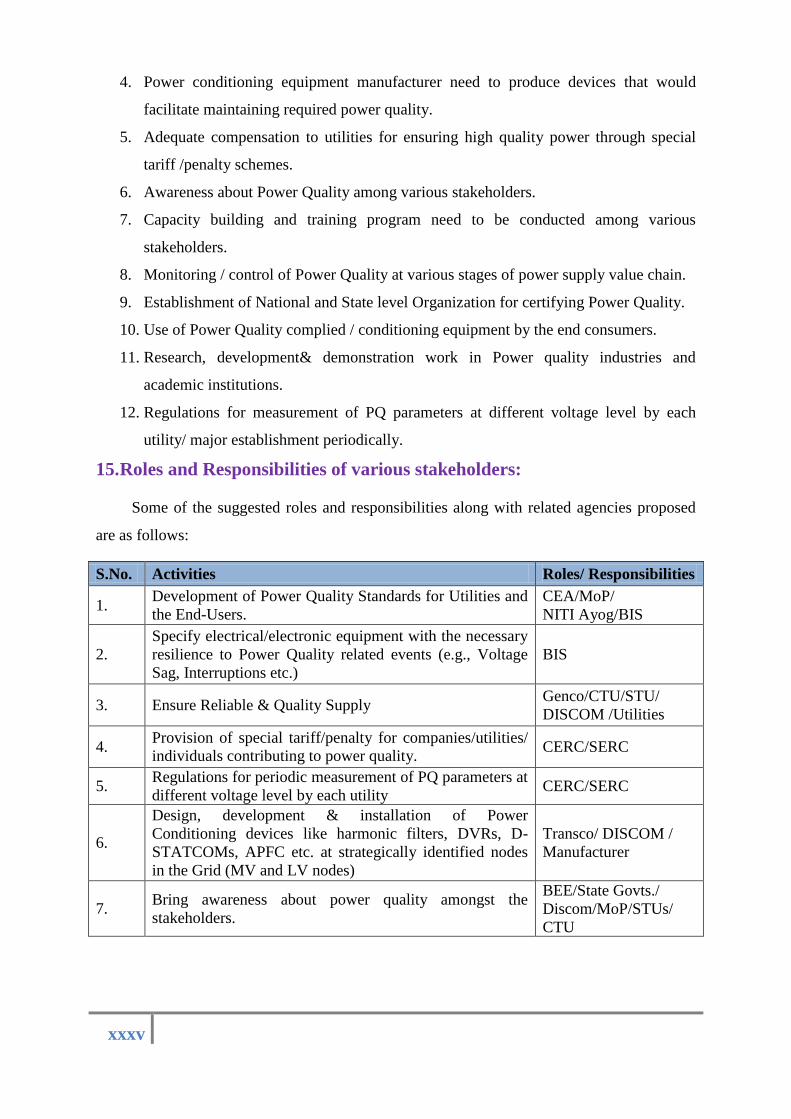
xxxv
4. Power conditioning equipment manufacturer need to produce devices that would
facilitate maintaining required power quality.
5. Adequate compensation to utilities for ensuring high quality power through special
tariff /penalty schemes.
6. Awareness about Power Quality among various stakeholders.
7. Capacity building and training program need to be conducted among various
stakeholders.
8. Monitoring / control of Power Quality at various stages of power supply value chain.
9. Establishment of National and State level Organization for certifying Power Quality.
10. Use of Power Quality complied / conditioning equipment by the end consumers.
11. Research, development& demonstration work in Power quality industries and
academic institutions.
12. Regulations for measurement of PQ parameters at different voltage level by each
utility/ major establishment periodically.
15. Roles and Responsibilities of various stakeholders:
Some of the suggested roles and responsibilities along with related agencies proposed
are as follows:
S.No. Activities Roles/ Responsibilities
1. Development of Power Quality Standards for Utilities and
the End-Users.
CEA/MoP/
NITI Ayog/BIS
2.
Specify electrical/electronic equipment with the necessary
resilience to Power Quality related events (e.g., Voltage
Sag, Interruptions etc.)
BIS
3. Ensure Reliable & Quality Supply Genco/CTU/STU/
DISCOM /Utilities
4. Provision of special tariff/penalty for companies/utilities/
individuals contributing to power quality. CERC/SERC
5. Regulations for periodic measurement of PQ parameters at
different voltage level by each utility CERC/SERC
6.
Design, development & installation of Power
Conditioning devices like harmonic filters, DVRs, D-
STATCOMs, APFC etc. at strategically identified nodes
in the Grid (MV and LV nodes)
Transco/ DISCOM /
Manufacturer
7. Bring awareness about power quality amongst the
stakeholders.
BEE/State Govts./
Discom/MoP/STUs/
CTU
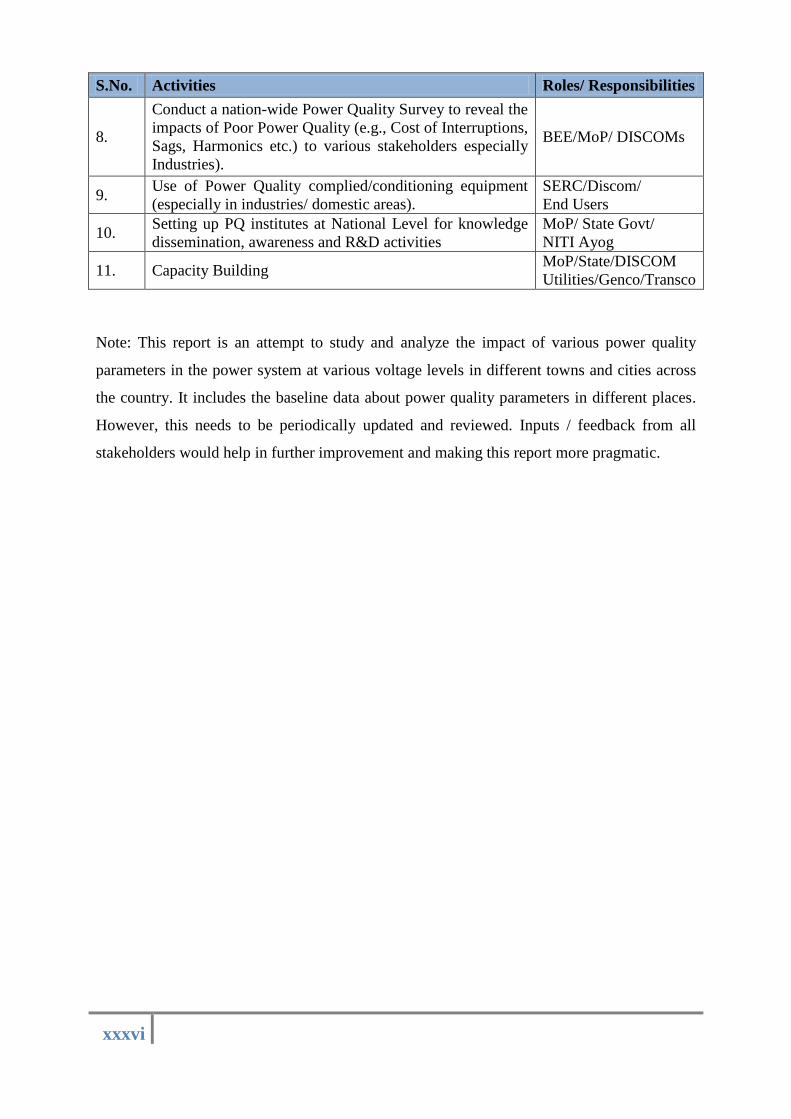
xxxvi
S.No. Activities Roles/ Responsibilities
8.
Conduct a nation-wide Power Quality Survey to reveal the
impacts of Poor Power Quality (e.g., Cost of Interruptions,
Sags, Harmonics etc.) to various stakeholders especially
Industries).
BEE/MoP/ DISCOMs
9. Use of Power Quality complied/conditioning equipment
(especially in industries/ domestic areas).
SERC/Discom/
End Users
10. Setting up PQ institutes at National Level for knowledge
dissemination, awareness and R&D activities
MoP/ State Govt/
NITI Ayog
11. Capacity Building MoP/State/DISCOM
Utilities/Genco/Transco
Discom
Note: This report is an attempt to study and analyze the impact of various power quality
parameters in the power system at various voltage levels in different towns and cities across
the country. It includes the baseline data about power quality parameters in different places.
However, this needs to be periodically updated and reviewed. Inputs / feedback from all
stakeholders would help in further improvement and making this report more pragmatic.
Swachh Power
1
Chapter-1
1. Power Quality and its
Significance Traditionally, the power system was simple and unidirectional; the flow of electricity
(power) used to be from source (generator) to sink (load) only. Power was generated in bulk
using conventional resources and then transmitted, distributed and consumed by end users as
load. Availability of power had more concern than the quality and therefore the target used to
be “to keep the lights On”, without taking reliability and quality of power into account. Now
the scenario is gradually changing.
Modern power system has many types of generation resources including renewables (which
have specific characteristics of variability and intermittency) connected to the grid through
power conditioning equipment. Transmission systems have become multifaceted with
technologies like UHVAC / HVDC systems, FACTS devices etc. Distributed generation and
battery storage systems have been connected with distribution system using inverters.
Loads at consumer end have also changed their characteristics. Most of the electronic
devices being used by the consumers are sensitive and non-linear loads. Cumulatively all such
changes in power system have affected quality of the power supply. At the same time
consumers’ awareness, requirement and aspirations for quality power in terms of continuity,
sinusoidal shape and specified limits etc. are increasing. Hence, Power Quality has now
become one of the major concerns for power system stakeholders.
1.1 What is Power Quality?
The Power Quality (PQ) aspect in the Power System is largely ignored, often not
understood and so is rarely demanded or enforced. Our industry does not readily recognise the
impacts of a poor Power Quality environment since the costs are not captured. There is a
readiness to invest in energy efficiency, where the return is more easily visible, and tendency
to ignore PQ, where the idea of losses is nebulous or non-existent. But recently the awareness
of customers towards power quality problems has increased tremendously because of the
following reasons:
Swachh Power
2
The customer’s equipment have become much more sensitive to power quality problems
than these have been earlier due to the use of digital control and power electronic
converters, which are highly sensitive to the quality of supply and other disturbances.
Moreover, the industries have also become conscious about loss of production due to power
quality issues.
The increase in use of solid-state controllers in a number of equipment with other benefits
such as decreasing the losses, increasing overall efficiency, and reducing the cost of
production has resulted in the increased harmonic level, distortion, notches, and other
power quality problems. Typical examples are adjustable speed drives (ASDs) and energy
saving electronic blasts, which have substantial energy savings and some other benefits;
however, they are the sources of waveform distortion and much more sensitive to the
number of power quality disturbances.
The awareness of power quality problems has increased among the customers due to direct
and indirect penalties enforced on them, which are caused by interruptions, loss of
production, equipment failure, standards, and so on.
The disturbances to other important appliances such as telecommunication network, TVs,
computers, metering systems, and protection systems have forced the end users to either
reduce or eliminate power quality problems or dispense the use of power polluting devices
and equipment.
Distributed generation using renewable energy and other local energy sources has increased
power quality problems as it needs, in many situations, solid-state conversion and
variations in input power, which in turn adds new problems of voltage quality.
Power quality is a measure of the fitness of electrical power fed into the consumer devices.
The term is used to describe electric power that drives an electrical load and the load's ability
to function as intended. Without the quality power, an electrical device (or load) may
malfunction, fail prematurely, become economically unviable due to losses or not operate at
all. There are various parameters which are related to quality of power and deviation in their
value from reference results into poor quality of power.
IEC 61000-4-30[5]defines power quality as “The characteristics of the electricity at a given
point on an electrical system, evaluated against a set of reference technical parameters”.
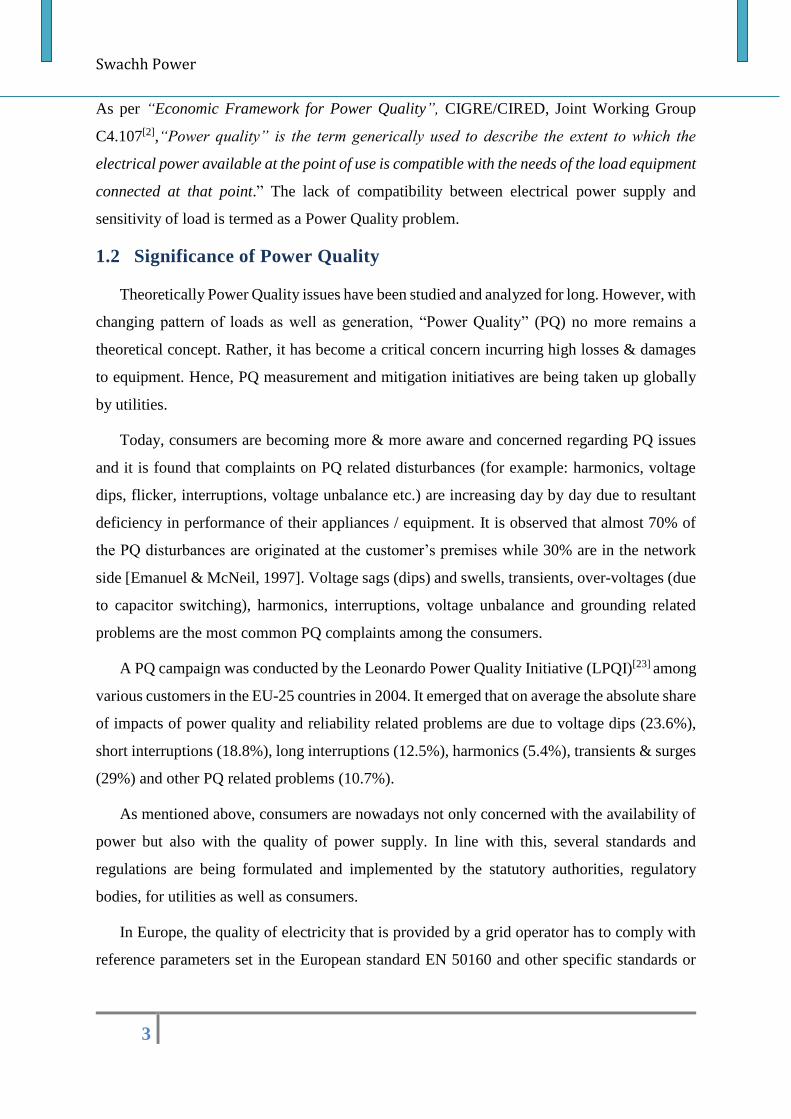
Swachh Power
3
As per “Economic Framework for Power Quality”, CIGRE/CIRED, Joint Working Group
C4.107[2],“Power quality” is the term generically used to describe the extent to which the
electrical power available at the point of use is compatible with the needs of the load equipment
connected at that point.” The lack of compatibility between electrical power supply and
sensitivity of load is termed as a Power Quality problem.
1.2 Significance of Power Quality
Theoretically Power Quality issues have been studied and analyzed for long. However, with
changing pattern of loads as well as generation, “Power Quality” (PQ) no more remains a
theoretical concept. Rather, it has become a critical concern incurring high losses & damages
to equipment. Hence, PQ measurement and mitigation initiatives are being taken up globally
by utilities.
Today, consumers are becoming more & more aware and concerned regarding PQ issues
and it is found that complaints on PQ related disturbances (for example: harmonics, voltage
dips, flicker, interruptions, voltage unbalance etc.) are increasing day by day due to resultant
deficiency in performance of their appliances / equipment. It is observed that almost 70% of
the PQ disturbances are originated at the customer’s premises while 30% are in the network
side [Emanuel & McNeil, 1997]. Voltage sags (dips) and swells, transients, over-voltages (due
to capacitor switching), harmonics, interruptions, voltage unbalance and grounding related
problems are the most common PQ complaints among the consumers.
A PQ campaign was conducted by the Leonardo Power Quality Initiative (LPQI)[23] among
various customers in the EU-25 countries in 2004. It emerged that on average the absolute share
of impacts of power quality and reliability related problems are due to voltage dips (23.6%),
short interruptions (18.8%), long interruptions (12.5%), harmonics (5.4%), transients & surges
(29%) and other PQ related problems (10.7%).
As mentioned above, consumers are nowadays not only concerned with the availability of
power but also with the quality of power supply. In line with this, several standards and
regulations are being formulated and implemented by the statutory authorities, regulatory
bodies, for utilities as well as consumers.
In Europe, the quality of electricity that is provided by a grid operator has to comply with
reference parameters set in the European standard EN 50160 and other specific standards or
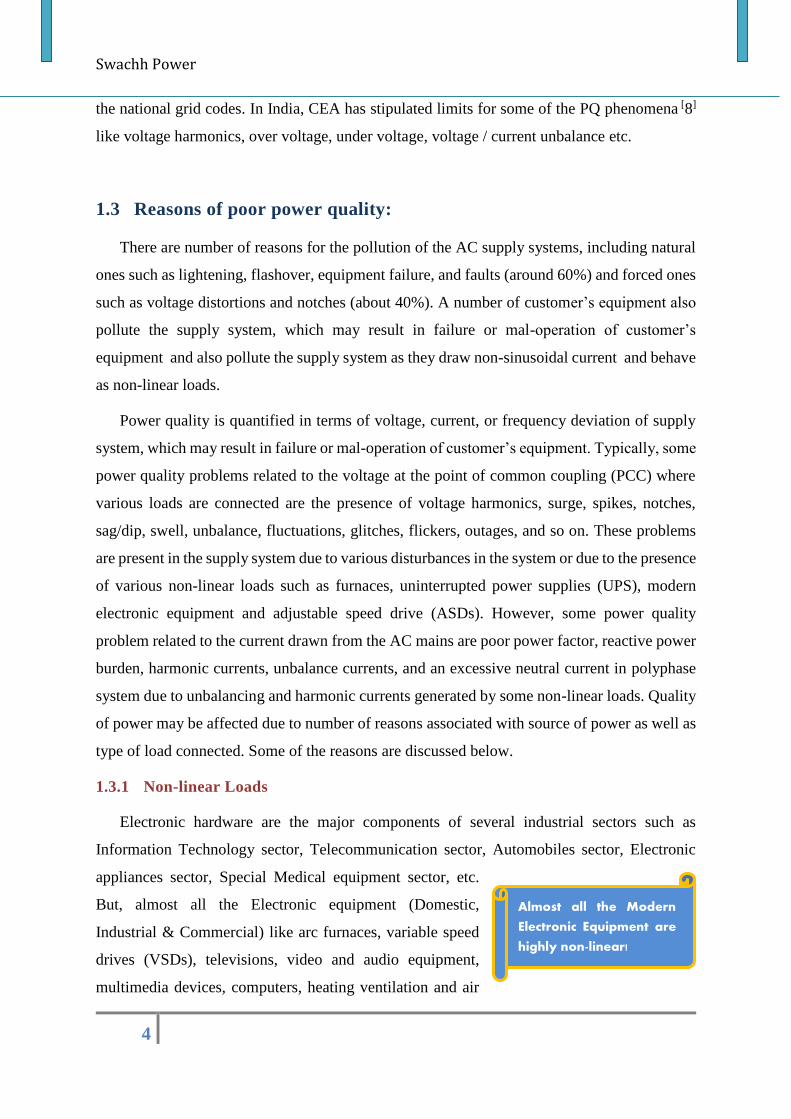
Swachh Power
4
the national grid codes. In India, CEA has stipulated limits for some of the PQ phenomena [8]
like voltage harmonics, over voltage, under voltage, voltage / current unbalance etc.
1.3 Reasons of poor power quality:
There are number of reasons for the pollution of the AC supply systems, including natural
ones such as lightening, flashover, equipment failure, and faults (around 60%) and forced ones
such as voltage distortions and notches (about 40%). A number of customer’s equipment also
pollute the supply system, which may result in failure or mal-operation of customer’s
equipment and also pollute the supply system as they draw non-sinusoidal current and behave
as non-linear loads.
Power quality is quantified in terms of voltage, current, or frequency deviation of supply
system, which may result in failure or mal-operation of customer’s equipment. Typically, some
power quality problems related to the voltage at the point of common coupling (PCC) where
various loads are connected are the presence of voltage harmonics, surge, spikes, notches,
sag/dip, swell, unbalance, fluctuations, glitches, flickers, outages, and so on. These problems
are present in the supply system due to various disturbances in the system or due to the presence
of various non-linear loads such as furnaces, uninterrupted power supplies (UPS), modern
electronic equipment and adjustable speed drive (ASDs). However, some power quality
problem related to the current drawn from the AC mains are poor power factor, reactive power
burden, harmonic currents, unbalance currents, and an excessive neutral current in polyphase
system due to unbalancing and harmonic currents generated by some non-linear loads. Quality
of power may be affected due to number of reasons associated with source of power as well as
type of load connected. Some of the reasons are discussed below.
1.3.1 Non-linear Loads
Electronic hardware are the major components of several industrial sectors such as
Information Technology sector, Telecommunication sector, Automobiles sector, Electronic
appliances sector, Special Medical equipment sector, etc.
But, almost all the Electronic equipment (Domestic,
Industrial & Commercial) like arc furnaces, variable speed
drives (VSDs), televisions, video and audio equipment,
multimedia devices, computers, heating ventilation and air
Almost all the Modern
Electronic Equipment are
highly non-linear!
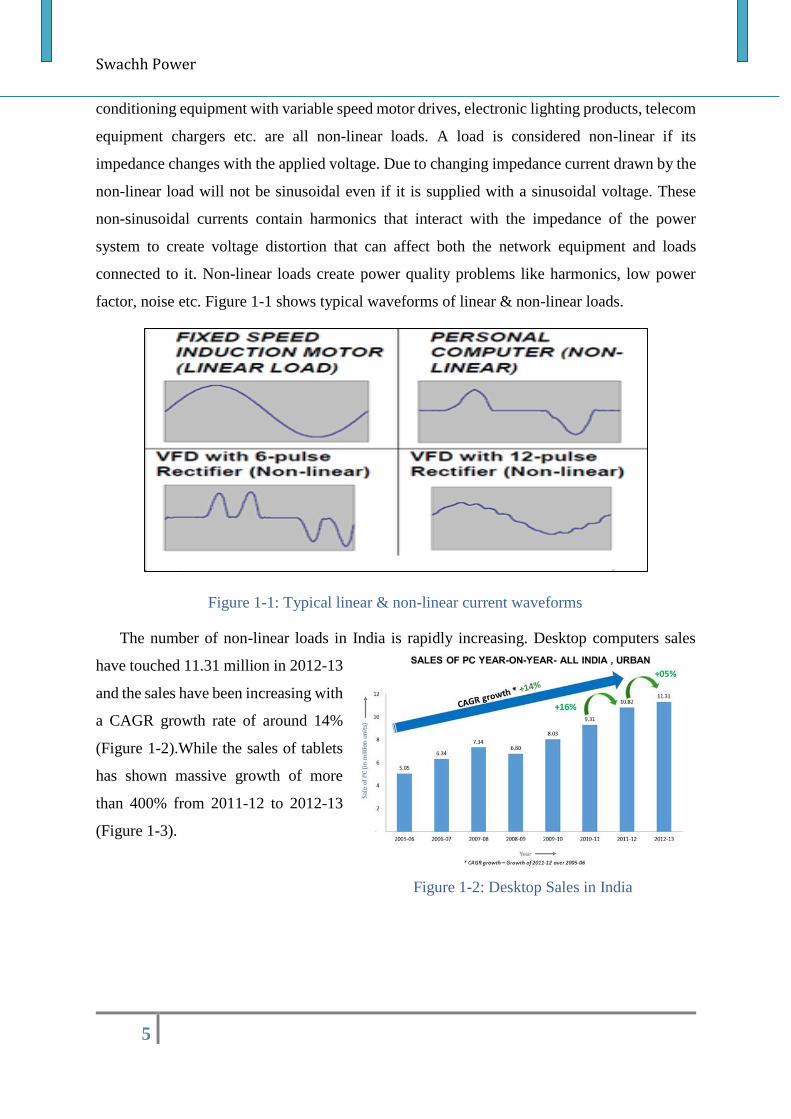
Swachh Power
5
conditioning equipment with variable speed motor drives, electronic lighting products, telecom
equipment chargers etc. are all non-linear loads. A load is considered non-linear if its
impedance changes with the applied voltage. Due to changing impedance current drawn by the
non-linear load will not be sinusoidal even if it is supplied with a sinusoidal voltage. These
non-sinusoidal currents contain harmonics that interact with the impedance of the power
system to create voltage distortion that can affect both the network equipment and loads
connected to it. Non-linear loads create power quality problems like harmonics, low power
factor, noise etc. Figure 1-1 shows typical waveforms of linear & non-linear loads.
Figure 1-1: Typical linear & non-linear current waveforms
The number of non-linear loads in India is rapidly increasing. Desktop computers sales
have touched 11.31 million in 2012-13
and the sales have been increasing with
a CAGR growth rate of around 14%
(Figure 1-2).While the sales of tablets
has shown massive growth of more
than 400% from 2011-12 to 2012-13
(Figure 1-3).
Figure 1-2: Desktop Sales in India
Swachh Power
6
The growth in telecom products demand have been breathtaking and India is adding 2
million mobile phone users every
month!
In the industrial domain, there are
more than 15 Lakh LT motors used with
VSD/ASD applications, which are
highly non-linear. Moreover, nearly 5
Lakh such motors are getting added to
the Indian industry use, each year. Most of the Industrial Energy is used by motors which are
used for various applications like pumps, fans, compressors, Mechanical Movement, etc. All
these changes in the system have been introducing more and more of non-linearity in the
system, which will keep increasing.
1.3.2 Unstable Power System
Power system instability caused by inadequate planning, improper design of protection
systems, grounding related issues, aging of transformer & other equipment, overloading of
feeders & transformers etc. may result into various power quality problems. There may be
interruptions and voltage sags due to frequent tripping of feeders / transformers, voltage
unbalance due to unmatched impedances of lines / transformers and noise due to improper
grounding or arcing in the system.
1.3.3 Large Machines / Equipment
Switching on / off of large machines / equipment may cause some of the power quality
issues like voltage dip / swell, voltage fluctuations, flicker etc. Saturation of magnetic core of
induction motors, transformers, reactors and saliency of motors / generators causes harmonics
in the system. Inter-turn faults of motors / generators results into voltage/ current unbalances.
1.4 Impacts of Poor Power Quality
Poor Power Quality not only causes reduction in performance of the appliances / consumer
equipment but also results into increased losses in system, failure of equipment, additional
capacity requirement, financial loss etc.[4]. Some of the major impacts of poor power quality
are mentioned below:
Figure 1-3: Tablet Sales in India
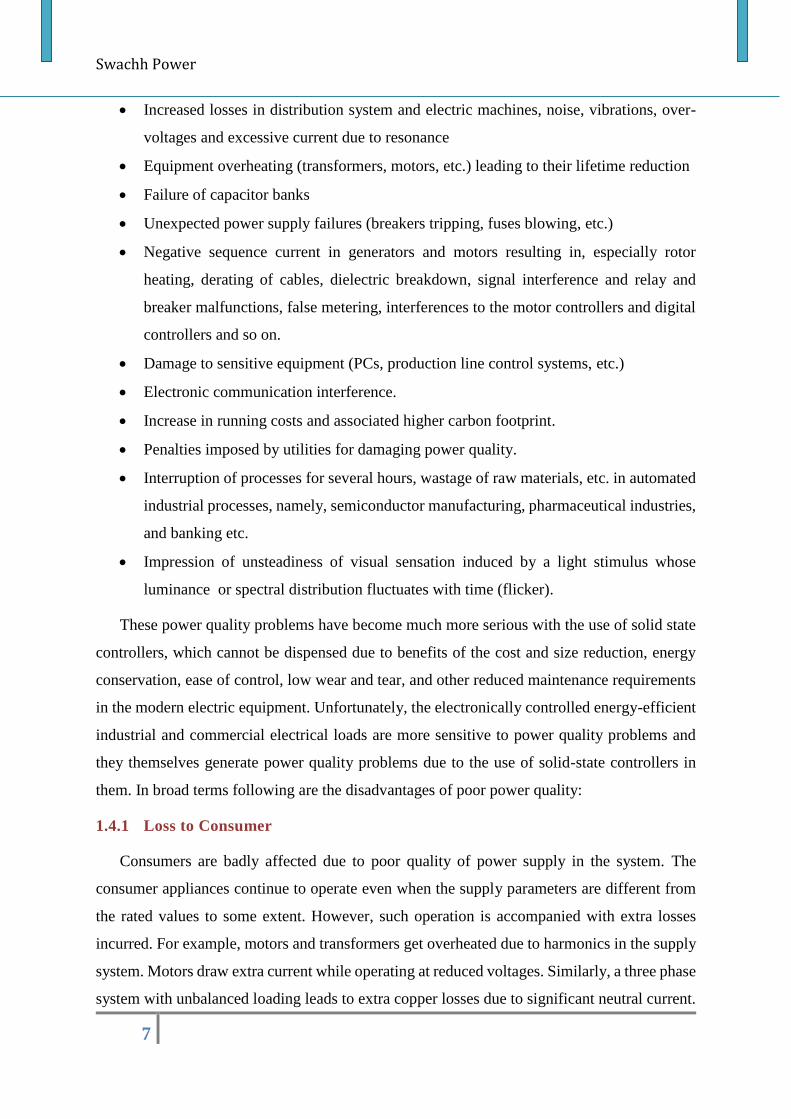
Swachh Power
7
Increased losses in distribution system and electric machines, noise, vibrations, over-
voltages and excessive current due to resonance
Equipment overheating (transformers, motors, etc.) leading to their lifetime reduction
Failure of capacitor banks
Unexpected power supply failures (breakers tripping, fuses blowing, etc.)
Negative sequence current in generators and motors resulting in, especially rotor
heating, derating of cables, dielectric breakdown, signal interference and relay and
breaker malfunctions, false metering, interferences to the motor controllers and digital
controllers and so on.
Damage to sensitive equipment (PCs, production line control systems, etc.)
Electronic communication interference.
Increase in running costs and associated higher carbon footprint.
Penalties imposed by utilities for damaging power quality.
Interruption of processes for several hours, wastage of raw materials, etc. in automated
industrial processes, namely, semiconductor manufacturing, pharmaceutical industries,
and banking etc.
Impression of unsteadiness of visual sensation induced by a light stimulus whose
luminance or spectral distribution fluctuates with time (flicker).
These power quality problems have become much more serious with the use of solid state
controllers, which cannot be dispensed due to benefits of the cost and size reduction, energy
conservation, ease of control, low wear and tear, and other reduced maintenance requirements
in the modern electric equipment. Unfortunately, the electronically controlled energy-efficient
industrial and commercial electrical loads are more sensitive to power quality problems and
they themselves generate power quality problems due to the use of solid-state controllers in
them. In broad terms following are the disadvantages of poor power quality:
1.4.1 Loss to Consumer
Consumers are badly affected due to poor quality of power supply in the system. The
consumer appliances continue to operate even when the supply parameters are different from
the rated values to some extent. However, such operation is accompanied with extra losses
incurred. For example, motors and transformers get overheated due to harmonics in the supply
system. Motors draw extra current while operating at reduced voltages. Similarly, a three phase
system with unbalanced loading leads to extra copper losses due to significant neutral current.
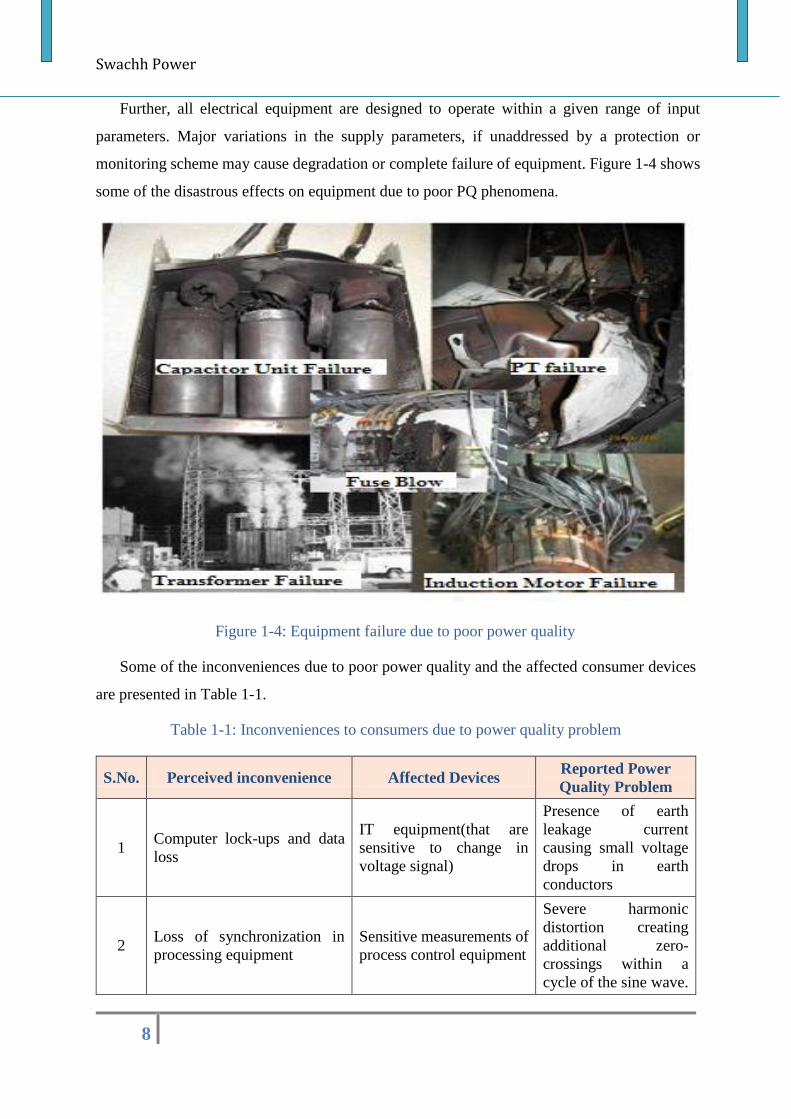
Swachh Power
8
Further, all electrical equipment are designed to operate within a given range of input
parameters. Major variations in the supply parameters, if unaddressed by a protection or
monitoring scheme may cause degradation or complete failure of equipment. Figure 1-4 shows
some of the disastrous effects on equipment due to poor PQ phenomena.
Figure 1-4: Equipment failure due to poor power quality
Some of the inconveniences due to poor power quality and the affected consumer devices
are presented in Table 1-1.
Table 1-1: Inconveniences to consumers due to power quality problem
S.No. Perceived inconvenience Affected Devices Reported Power
Quality Problem
1 Computer lock-ups and data
loss
IT equipment(that are
sensitive to change in
voltage signal)
Presence of earth
leakage current
causing small voltage
drops in earth
conductors
2 Loss of synchronization in
processing equipment
Sensitive measurements of
process control equipment
Severe harmonic
distortion creating
additional zero-
crossings within a
cycle of the sine wave.
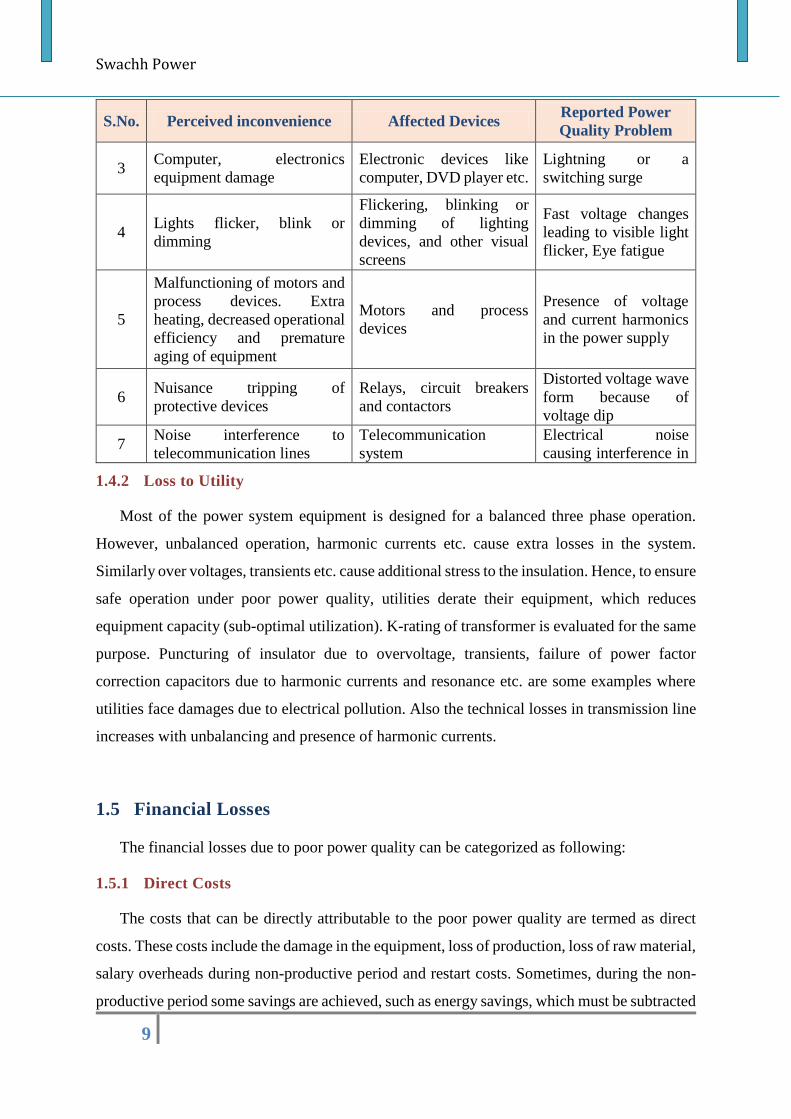
Swachh Power
9
S.No. Perceived inconvenience Affected Devices Reported Power
Quality Problem
3 Computer, electronics
equipment damage
Electronic devices like
computer, DVD player etc.
Lightning or a
switching surge
4 Lights flicker, blink or
dimming
Flickering, blinking or
dimming of lighting
devices, and other visual
screens
Fast voltage changes
leading to visible light
flicker, Eye fatigue
5
Malfunctioning of motors and
process devices. Extra
heating, decreased operational
efficiency and premature
aging of equipment
Motors and process
devices
Presence of voltage
and current harmonics
in the power supply
6 Nuisance tripping of
protective devices
Relays, circuit breakers
and contactors
Distorted voltage wave
form because of
voltage dip
7 Noise interference to
telecommunication lines
Telecommunication
system
Electrical noise
causing interference in
signals 1.4.2 Loss to Utility
Most of the power system equipment is designed for a balanced three phase operation.
However, unbalanced operation, harmonic currents etc. cause extra losses in the system.
Similarly over voltages, transients etc. cause additional stress to the insulation. Hence, to ensure
safe operation under poor power quality, utilities derate their equipment, which reduces
equipment capacity (sub-optimal utilization). K-rating of transformer is evaluated for the same
purpose. Puncturing of insulator due to overvoltage, transients, failure of power factor
correction capacitors due to harmonic currents and resonance etc. are some examples where
utilities face damages due to electrical pollution. Also the technical losses in transmission line
increases with unbalancing and presence of harmonic currents.
1.5 Financial Losses
The financial losses due to poor power quality can be categorized as following:
1.5.1 Direct Costs
The costs that can be directly attributable to the poor power quality are termed as direct
costs. These costs include the damage in the equipment, loss of production, loss of raw material,
salary overheads during non-productive period and restart costs. Sometimes, during the non-
productive period some savings are achieved, such as energy savings, which must be subtracted
Swachh Power
10
to the costs. Some power quality disturbances do not imply production stoppage, but may have
other costs associated, such as reduction of equipment efficiency and reduction of equipment
lifetime, which are also considered direct costs e.g. voltage sag, under frequency etc.
1.5.2 Indirect Costs
Due to some power quality disturbances and non-productive periods, customer may not be
able to accomplish the deadlines for some deliveries and loose future orders. Such costs
incurred are termed as ‘Indirect Costs’. Investments to safeguard equipment/facilities against
power quality problems may be considered as an indirect cost as well.
It can be summarized that power quality degradation results into enormous direct & indirect
losses. These costs are particularly huge for industries like semiconductors, electronics, steel,
paint, paper, packaging etc. and for services like financial institutions, banks, data centers, IT
services etc. Therefore improvement in power quality is utmost important for benefits of
consumers, utility and society as a whole.
***
Swachh Power
11
Chapter-2
2 Power Quality Parameters There are a number of power quality problems in the modern electrical/electronic
equipment/systems. These may be classified on the basis of events such as transient & steady
state, the quantity such as current, voltage, and frequency, or the load and supply systems. The
transient type of power quality problems include most of the phenomena occurring in transient
nature (e.g., impulsive or oscillatory in nature), such as sag(dip), swell, short-duration voltage
variations, power frequency variations, and voltage fluctuations. The steady-state types of
power quality problems include long-duration voltage variations, waveform distortions,
unbalanced voltages, notches, DC offset, flicker, poor power factor, unbalanced load currents,
load harmonic currents, and excessive neutral current.
The second classification can be made on the basis of quantity such as voltage, current
and frequency. Corresponding to voltage, these include voltage distortions, flicker, notches,
noise, sag, swell, unbalance, under-voltage and overvoltage; similarly for the current, these
include reactive power component of the current, harmonic currents, unbalanced currents, and
excessive neutral current.
The third classification of power quality problems is based on the load or the supply
system. Normally, power quality problems due to nature of the load (e.g., fluctuating loads
such as furnaces) are current harmonics, reactive power component of the current, unbalanced
currents, neutral current, DC offset and so on.
The power quality problems due to the supply system consist of voltage and frequency
related issues such as voltage distortion, unbalance, sag, swell, flicker and noise. These may
also consists of combination of both voltage-and current based power quality problems in the
system. The frequency related power quality problems are frequency variation above or below
the desired value. These affect the performance of a number of loads and other equipment such
as transformers in the distribution system[9].
Subsequently, it can be said that, “Continuous availability of balanced three phase
power supply of perfect sinusoidal shape, rated voltage and rated frequency optimized to
perform real work implies a good quality power.” Any deviation from the above statement
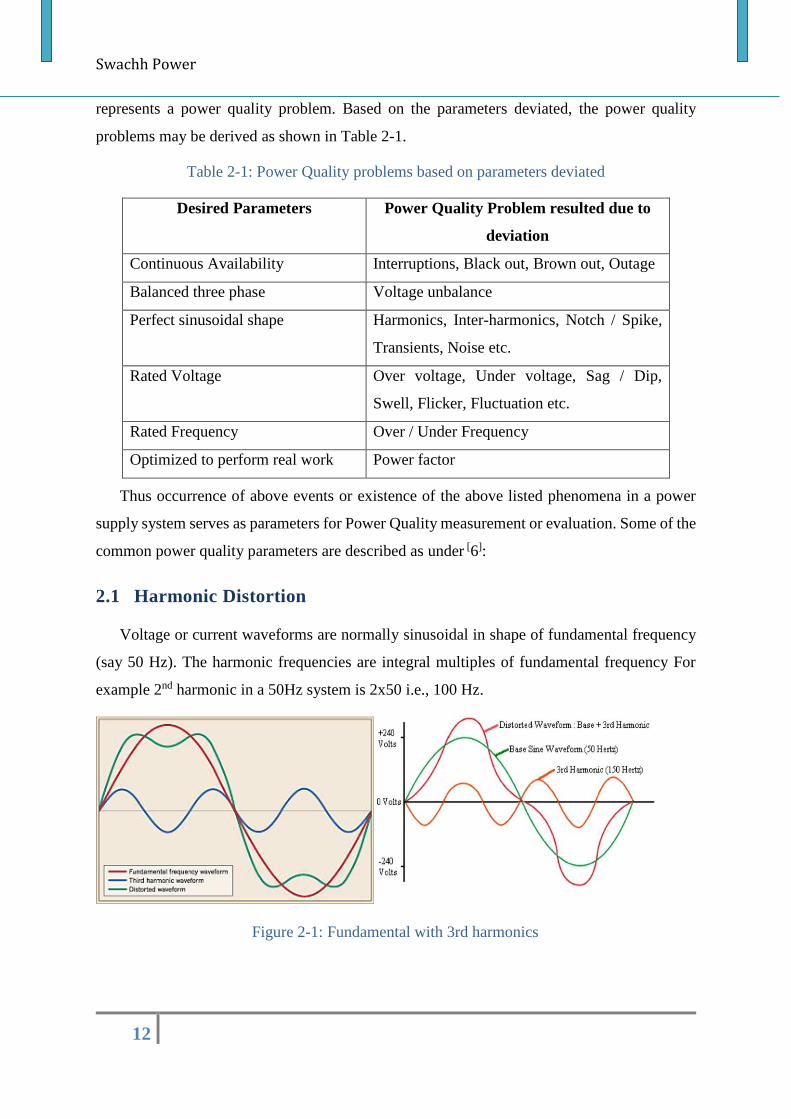
Swachh Power
12
represents a power quality problem. Based on the parameters deviated, the power quality
problems may be derived as shown in Table 2-1.
Table 2-1: Power Quality problems based on parameters deviated
Desired Parameters Power Quality Problem resulted due to
deviation
Continuous Availability Interruptions, Black out, Brown out, Outage
Balanced three phase Voltage unbalance
Perfect sinusoidal shape Harmonics, Inter-harmonics, Notch / Spike,
Transients, Noise etc.
Rated Voltage Over voltage, Under voltage, Sag / Dip,
Swell, Flicker, Fluctuation etc.
Rated Frequency Over / Under Frequency
Optimized to perform real work Power factor
Thus occurrence of above events or existence of the above listed phenomena in a power
supply system serves as parameters for Power Quality measurement or evaluation. Some of the
common power quality parameters are described as under [6]:
2.1 Harmonic Distortion
Voltage or current waveforms are normally sinusoidal in shape of fundamental frequency
(say 50 Hz). The harmonic frequencies are integral multiples of fundamental frequency For
example 2nd harmonic in a 50Hz system is 2x50 i.e., 100 Hz.
Figure 2-1: Fundamental with 3rd harmonics
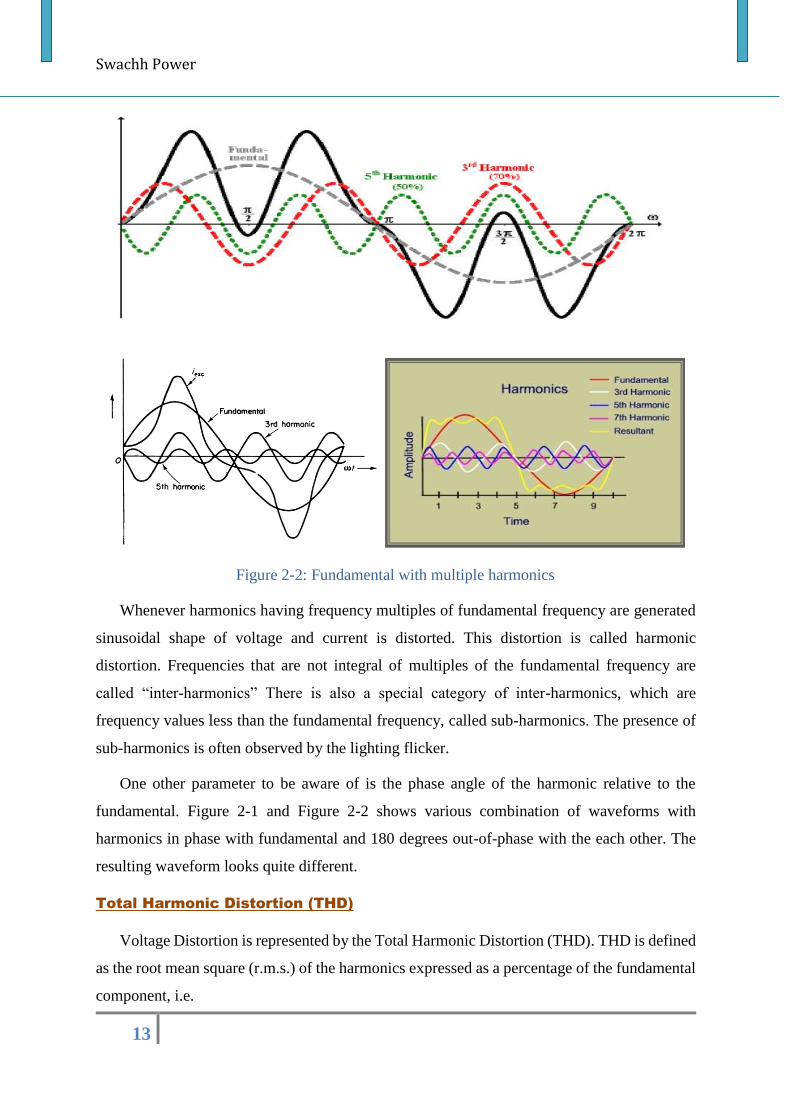
Swachh Power
13
Figure 2-2: Fundamental with multiple harmonics
Whenever harmonics having frequency multiples of fundamental frequency are generated
sinusoidal shape of voltage and current is distorted. This distortion is called harmonic
distortion. Frequencies that are not integral of multiples of the fundamental frequency are
called “inter-harmonics” There is also a special category of inter-harmonics, which are
frequency values less than the fundamental frequency, called sub-harmonics. The presence of
sub-harmonics is often observed by the lighting flicker.
One other parameter to be aware of is the phase angle of the harmonic relative to the
fundamental. Figure 2-1 and Figure 2-2 shows various combination of waveforms with
harmonics in phase with fundamental and 180 degrees out-of-phase with the each other. The
resulting waveform looks quite different.
Total Harmonic Distortion (THD)
Voltage Distortion is represented by the Total Harmonic Distortion (THD). THD is defined
as the root mean square (r.m.s.) of the harmonics expressed as a percentage of the fundamental
component, i.e.
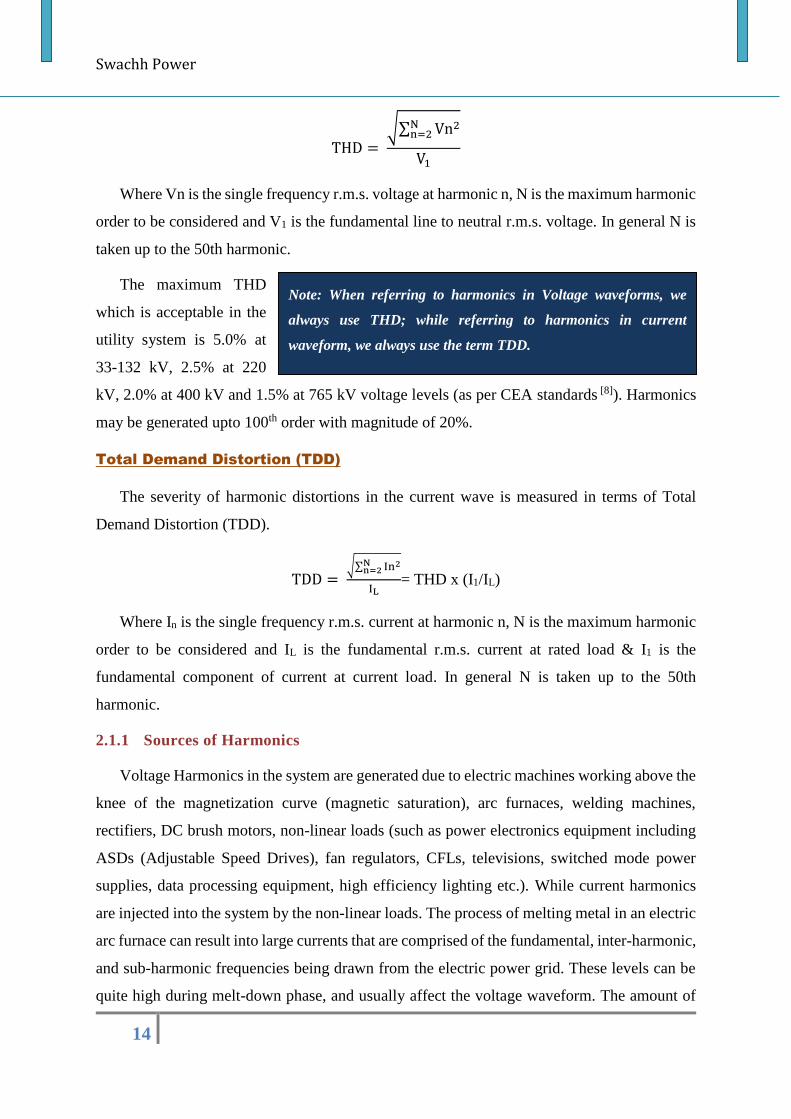
Swachh Power
14
THD = √∑ Vn2N
n=2
V1
Where Vn is the single frequency r.m.s. voltage at harmonic n, N is the maximum harmonic
order to be considered and V1 is the fundamental line to neutral r.m.s. voltage. In general N is
taken up to the 50th harmonic.
The maximum THD
which is acceptable in the
utility system is 5.0% at
33-132 kV, 2.5% at 220
kV, 2.0% at 400 kV and 1.5% at 765 kV voltage levels (as per CEA standards [8]). Harmonics
may be generated upto 100th order with magnitude of 20%.
Total Demand Distortion (TDD)
The severity of harmonic distortions in the current wave is measured in terms of Total
Demand Distortion (TDD).
TDD = √∑ In2N
n=2
IL= THD x (I1/IL)
Where In is the single frequency r.m.s. current at harmonic n, N is the maximum harmonic
order to be considered and IL is the fundamental r.m.s. current at rated load & I1 is the
fundamental component of current at current load. In general N is taken up to the 50th
harmonic.
2.1.1 Sources of Harmonics
Voltage Harmonics in the system are generated due to electric machines working above the
knee of the magnetization curve (magnetic saturation), arc furnaces, welding machines,
rectifiers, DC brush motors, non-linear loads (such as power electronics equipment including
ASDs (Adjustable Speed Drives), fan regulators, CFLs, televisions, switched mode power
supplies, data processing equipment, high efficiency lighting etc.). While current harmonics
are injected into the system by the non-linear loads. The process of melting metal in an electric
arc furnace can result into large currents that are comprised of the fundamental, inter-harmonic,
and sub-harmonic frequencies being drawn from the electric power grid. These levels can be
quite high during melt-down phase, and usually affect the voltage waveform. The amount of
Note: When referring to harmonics in Voltage waveforms, we
always use THD; while referring to harmonics in current
waveform, we always use the term TDD.
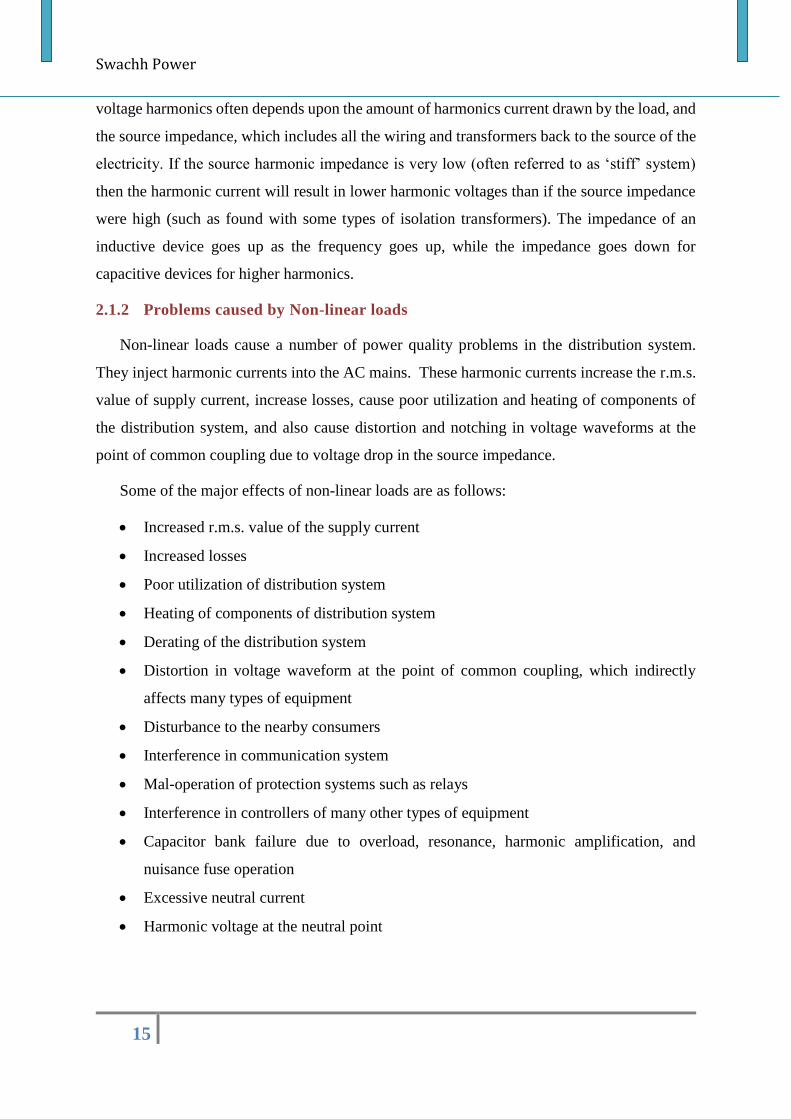
Swachh Power
15
voltage harmonics often depends upon the amount of harmonics current drawn by the load, and
the source impedance, which includes all the wiring and transformers back to the source of the
electricity. If the source harmonic impedance is very low (often referred to as ‘stiff’ system)
then the harmonic current will result in lower harmonic voltages than if the source impedance
were high (such as found with some types of isolation transformers). The impedance of an
inductive device goes up as the frequency goes up, while the impedance goes down for
capacitive devices for higher harmonics.
2.1.2 Problems caused by Non-linear loads
Non-linear loads cause a number of power quality problems in the distribution system.
They inject harmonic currents into the AC mains. These harmonic currents increase the r.m.s.
value of supply current, increase losses, cause poor utilization and heating of components of
the distribution system, and also cause distortion and notching in voltage waveforms at the
point of common coupling due to voltage drop in the source impedance.
Some of the major effects of non-linear loads are as follows:
Increased r.m.s. value of the supply current
Increased losses
Poor utilization of distribution system
Heating of components of distribution system
Derating of the distribution system
Distortion in voltage waveform at the point of common coupling, which indirectly
affects many types of equipment
Disturbance to the nearby consumers
Interference in communication system
Mal-operation of protection systems such as relays
Interference in controllers of many other types of equipment
Capacitor bank failure due to overload, resonance, harmonic amplification, and
nuisance fuse operation
Excessive neutral current
Harmonic voltage at the neutral point
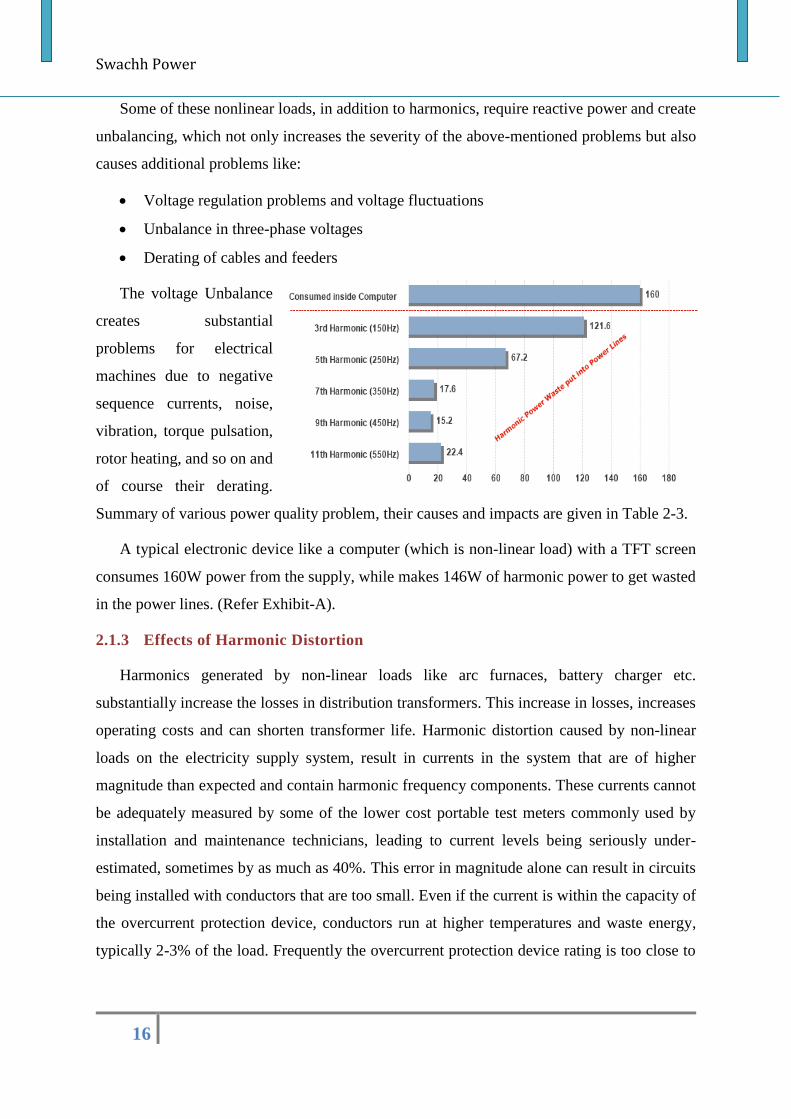
Swachh Power
16
Some of these nonlinear loads, in addition to harmonics, require reactive power and create
unbalancing, which not only increases the severity of the above-mentioned problems but also
causes additional problems like:
Voltage regulation problems and voltage fluctuations
Unbalance in three-phase voltages
Derating of cables and feeders
The voltage Unbalance
creates substantial
problems for electrical
machines due to negative
sequence currents, noise,
vibration, torque pulsation,
rotor heating, and so on and
of course their derating.
Summary of various power quality problem, their causes and impacts are given in Table 2-3.
A typical electronic device like a computer (which is non-linear load) with a TFT screen
consumes 160W power from the supply, while makes 146W of harmonic power to get wasted
in the power lines. (Refer Exhibit-A).
2.1.3 Effects of Harmonic Distortion
Harmonics generated by non-linear loads like arc furnaces, battery charger etc.
substantially increase the losses in distribution transformers. This increase in losses, increases
operating costs and can shorten transformer life. Harmonic distortion caused by non-linear
loads on the electricity supply system, result in currents in the system that are of higher
magnitude than expected and contain harmonic frequency components. These currents cannot
be adequately measured by some of the lower cost portable test meters commonly used by
installation and maintenance technicians, leading to current levels being seriously under-
estimated, sometimes by as much as 40%. This error in magnitude alone can result in circuits
being installed with conductors that are too small. Even if the current is within the capacity of
the overcurrent protection device, conductors run at higher temperatures and waste energy,
typically 2-3% of the load. Frequently the overcurrent protection device rating is too close to
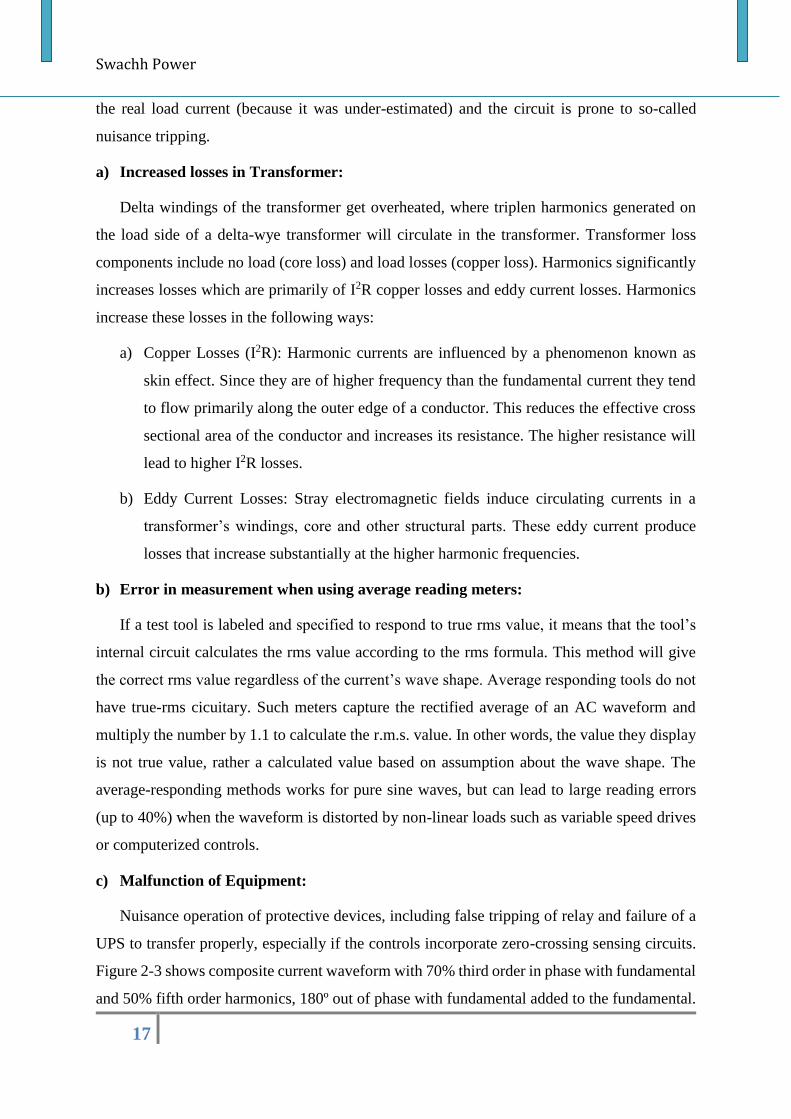
Swachh Power
17
the real load current (because it was under-estimated) and the circuit is prone to so-called
nuisance tripping.
a) Increased losses in Transformer:
Delta windings of the transformer get overheated, where triplen harmonics generated on
the load side of a delta-wye transformer will circulate in the transformer. Transformer loss
components include no load (core loss) and load losses (copper loss). Harmonics significantly
increases losses which are primarily of I2R copper losses and eddy current losses. Harmonics
increase these losses in the following ways:
a) Copper Losses (I2R): Harmonic currents are influenced by a phenomenon known as
skin effect. Since they are of higher frequency than the fundamental current they tend
to flow primarily along the outer edge of a conductor. This reduces the effective cross
sectional area of the conductor and increases its resistance. The higher resistance will
lead to higher I2R losses.
b) Eddy Current Losses: Stray electromagnetic fields induce circulating currents in a
transformer’s windings, core and other structural parts. These eddy current produce
losses that increase substantially at the higher harmonic frequencies.
b) Error in measurement when using average reading meters:
If a test tool is labeled and specified to respond to true rms value, it means that the tool’s
internal circuit calculates the rms value according to the rms formula. This method will give
the correct rms value regardless of the current’s wave shape. Average responding tools do not
have true-rms cicuitary. Such meters capture the rectified average of an AC waveform and
multiply the number by 1.1 to calculate the r.m.s. value. In other words, the value they display
is not true value, rather a calculated value based on assumption about the wave shape. The
average-responding methods works for pure sine waves, but can lead to large reading errors
(up to 40%) when the waveform is distorted by non-linear loads such as variable speed drives
or computerized controls.
c) Malfunction of Equipment:
Nuisance operation of protective devices, including false tripping of relay and failure of a
UPS to transfer properly, especially if the controls incorporate zero-crossing sensing circuits.
Figure 2-3 shows composite current waveform with 70% third order in phase with fundamental
and 50% fifth order harmonics, 180º out of phase with fundamental added to the fundamental.
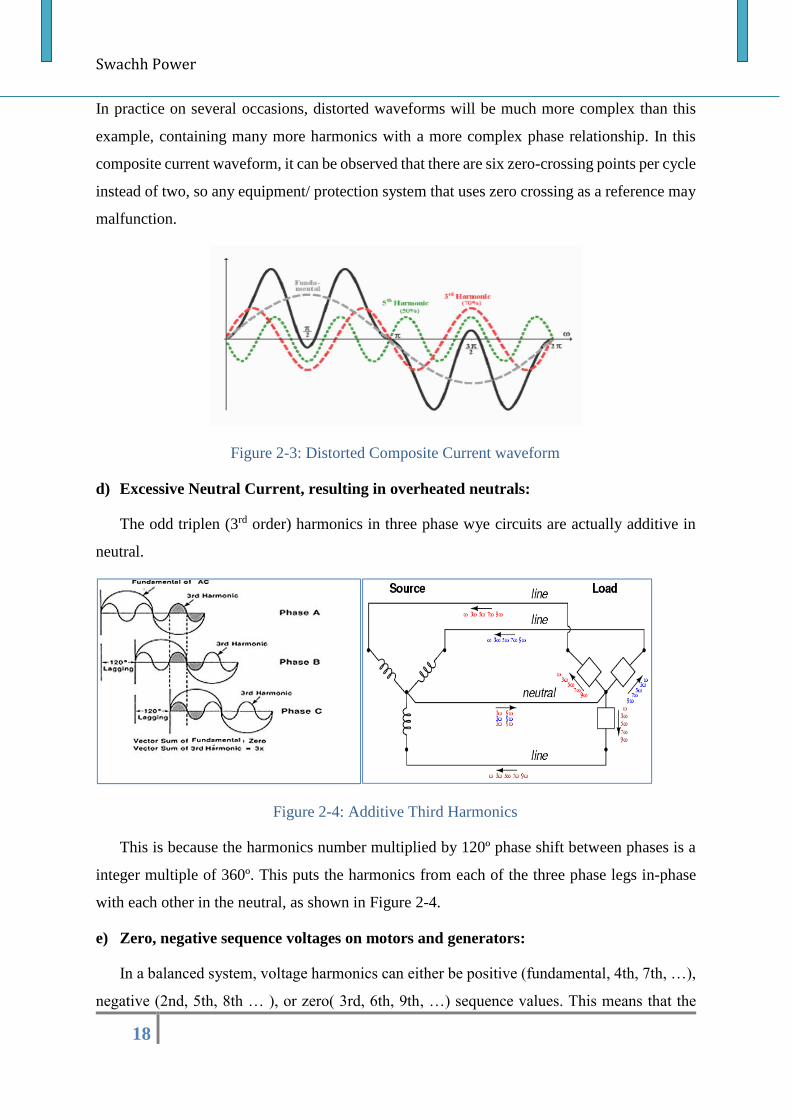
Swachh Power
18
In practice on several occasions, distorted waveforms will be much more complex than this
example, containing many more harmonics with a more complex phase relationship. In this
composite current waveform, it can be observed that there are six zero-crossing points per cycle
instead of two, so any equipment/ protection system that uses zero crossing as a reference may
malfunction.
Figure 2-3: Distorted Composite Current waveform
d) Excessive Neutral Current, resulting in overheated neutrals:
The odd triplen (3rd order) harmonics in three phase wye circuits are actually additive in
neutral.
Figure 2-4: Additive Third Harmonics
This is because the harmonics number multiplied by 120º phase shift between phases is a
integer multiple of 360º. This puts the harmonics from each of the three phase legs in-phase
with each other in the neutral, as shown in Figure 2-4.
e) Zero, negative sequence voltages on motors and generators:
In a balanced system, voltage harmonics can either be positive (fundamental, 4th, 7th, …),
negative (2nd, 5th, 8th … ), or zero( 3rd, 6th, 9th, …) sequence values. This means that the
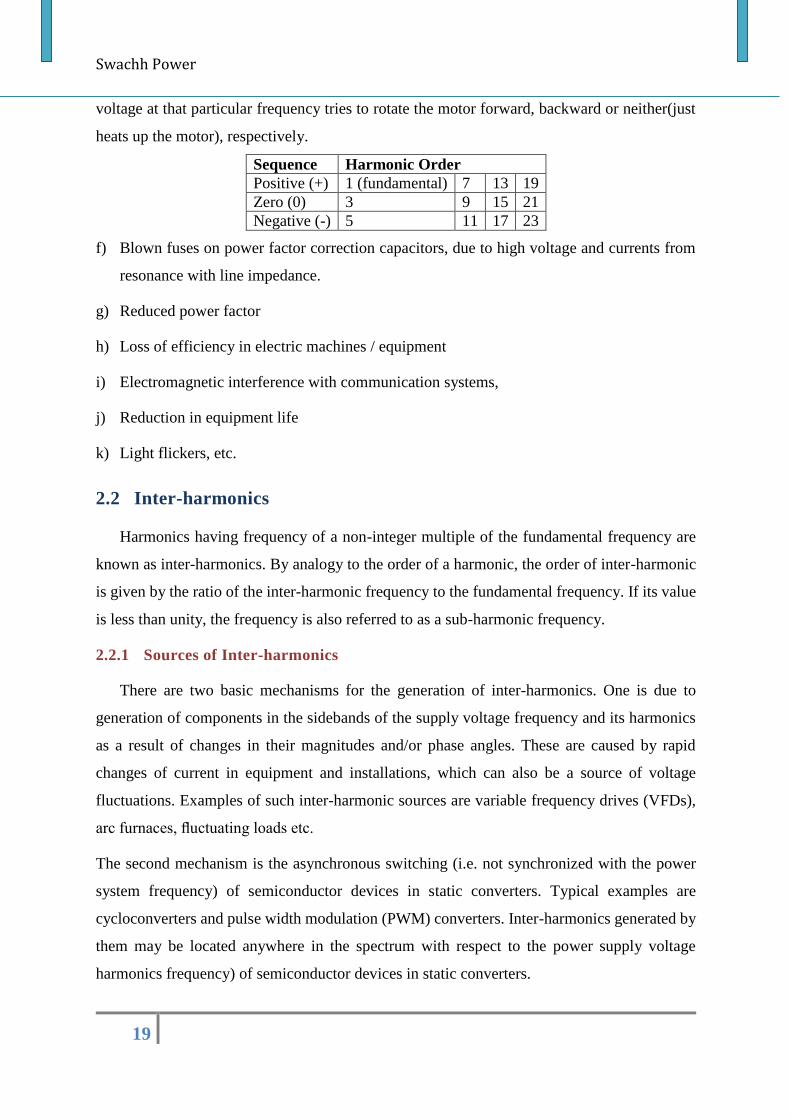
Swachh Power
19
voltage at that particular frequency tries to rotate the motor forward, backward or neither(just
heats up the motor), respectively.
Sequence Harmonic Order
Positive (+) 1 (fundamental) 7 13 19
Zero (0) 3 9 15 21
Negative (-) 5 11 17 23
f) Blown fuses on power factor correction capacitors, due to high voltage and currents from
resonance with line impedance.
g) Reduced power factor
h) Loss of efficiency in electric machines / equipment
i) Electromagnetic interference with communication systems,
j) Reduction in equipment life
k) Light flickers, etc.
2.2 Inter-harmonics
Harmonics having frequency of a non-integer multiple of the fundamental frequency are
known as inter-harmonics. By analogy to the order of a harmonic, the order of inter-harmonic
is given by the ratio of the inter-harmonic frequency to the fundamental frequency. If its value
is less than unity, the frequency is also referred to as a sub-harmonic frequency.
2.2.1 Sources of Inter-harmonics
There are two basic mechanisms for the generation of inter-harmonics. One is due to
generation of components in the sidebands of the supply voltage frequency and its harmonics
as a result of changes in their magnitudes and/or phase angles. These are caused by rapid
changes of current in equipment and installations, which can also be a source of voltage
fluctuations. Examples of such inter-harmonic sources are variable frequency drives (VFDs),
arc furnaces, fluctuating loads etc.
The second mechanism is the asynchronous switching (i.e. not synchronized with the power
system frequency) of semiconductor devices in static converters. Typical examples are
cycloconverters and pulse width modulation (PWM) converters. Inter-harmonics generated by
them may be located anywhere in the spectrum with respect to the power supply voltage
harmonics frequency) of semiconductor devices in static converters.
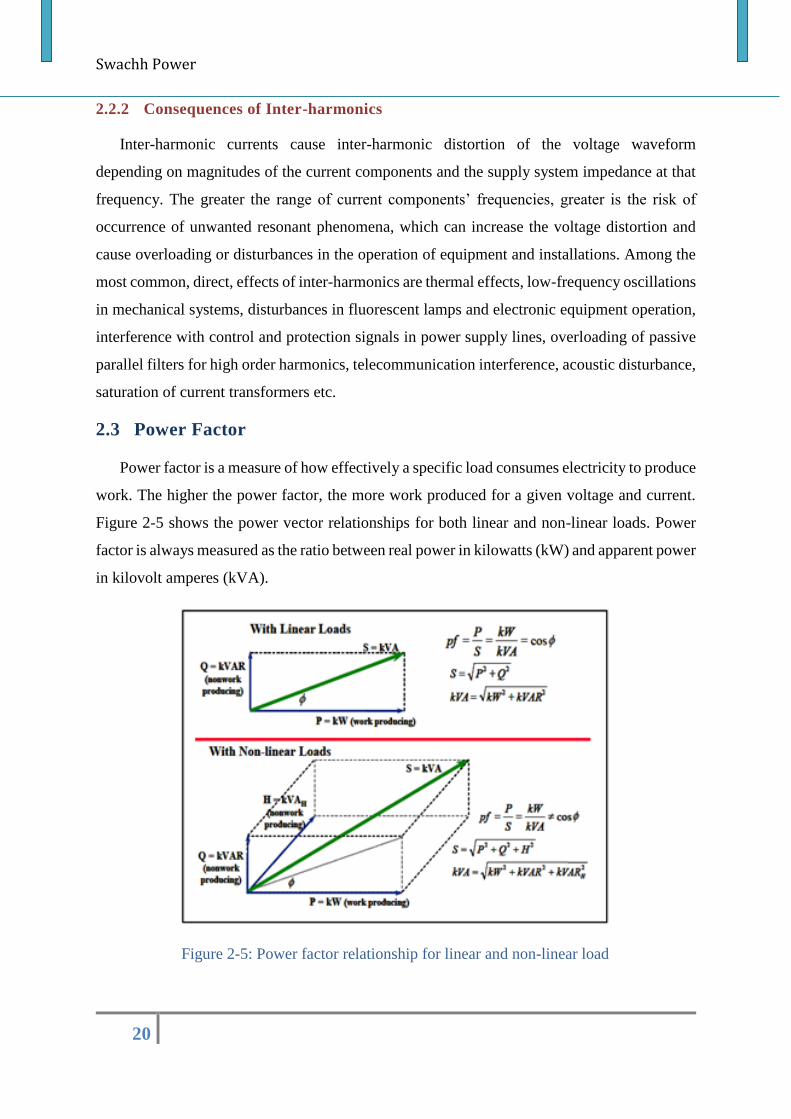
Swachh Power
20
2.2.2 Consequences of Inter-harmonics
Inter-harmonic currents cause inter-harmonic distortion of the voltage waveform
depending on magnitudes of the current components and the supply system impedance at that
frequency. The greater the range of current components’ frequencies, greater is the risk of
occurrence of unwanted resonant phenomena, which can increase the voltage distortion and
cause overloading or disturbances in the operation of equipment and installations. Among the
most common, direct, effects of inter-harmonics are thermal effects, low-frequency oscillations
in mechanical systems, disturbances in fluorescent lamps and electronic equipment operation,
interference with control and protection signals in power supply lines, overloading of passive
parallel filters for high order harmonics, telecommunication interference, acoustic disturbance,
saturation of current transformers etc.
2.3 Power Factor
Power factor is a measure of how effectively a specific load consumes electricity to produce
work. The higher the power factor, the more work produced for a given voltage and current.
Figure 2-5 shows the power vector relationships for both linear and non-linear loads. Power
factor is always measured as the ratio between real power in kilowatts (kW) and apparent power
in kilovolt amperes (kVA).
Figure 2-5: Power factor relationship for linear and non-linear load
Swachh Power
21
For linear loads, the apparent power in kVA (S = V•I) is the vector sum of the reactive power
in kVAR (Q) and the real power in kW (P). The power factor is P/S = CosΦ, where Φ is the
angle between S and P. This angle is the same as the displacement angle between the voltage
and the current for linear loads. Power factor may be lagging when current lags voltage due to
inductive loads and leading when current leads voltage in case of capacitive loads. For a given
amount of current, increasing the displacement angle will increase Q, decrease P, and lower
the power factor.
Power factor may be further classified as displacement power factor and true power factor.
Displacement power factor is the cosine of the angle between the fundamental voltage and
current waveforms. The fundamental waveforms are by definition pure sinusoids. But, if there
is waveform distortion due to harmonics, the power factor angles are different than what would
be for the fundamental waves alone. The presence of harmonics introduces additional phase
shift between the voltage and the current. True power factor is calculated as the ratio between
the total active power used in a circuit (including harmonics) and the total apparent power
(including harmonics) supplied from the source:
True power factor = Total active power/ Total apparent power
True power factor is always less than displacement power factor if harmonics are present.
2.3.1 Sources of Poor Power Factor
Main source of poor power factors are inductive loads like induction motors, arc furnaces,
electric discharge lamps, industrial heating furnace, high intensity discharge lightings etc. and
various non-linear loads. These loads draw higher reactive power resulting into drawl of more
apparent power whereas active power demand remains the same, which causes low power
factor.
2.3.2 Consequences of Poor Power Factor
Poor power factor results into requirement of higher apparent power and higher current
flow to do the same work against good pf. It results into following disadvantages:
i. Greater conductor size
ii. Higher capacity electrical machines like generator or transformers are required which
increases size and cost of the system.
iii. Due to the high current for low power factor, the losses increases in the conductors and
switchgear machinery
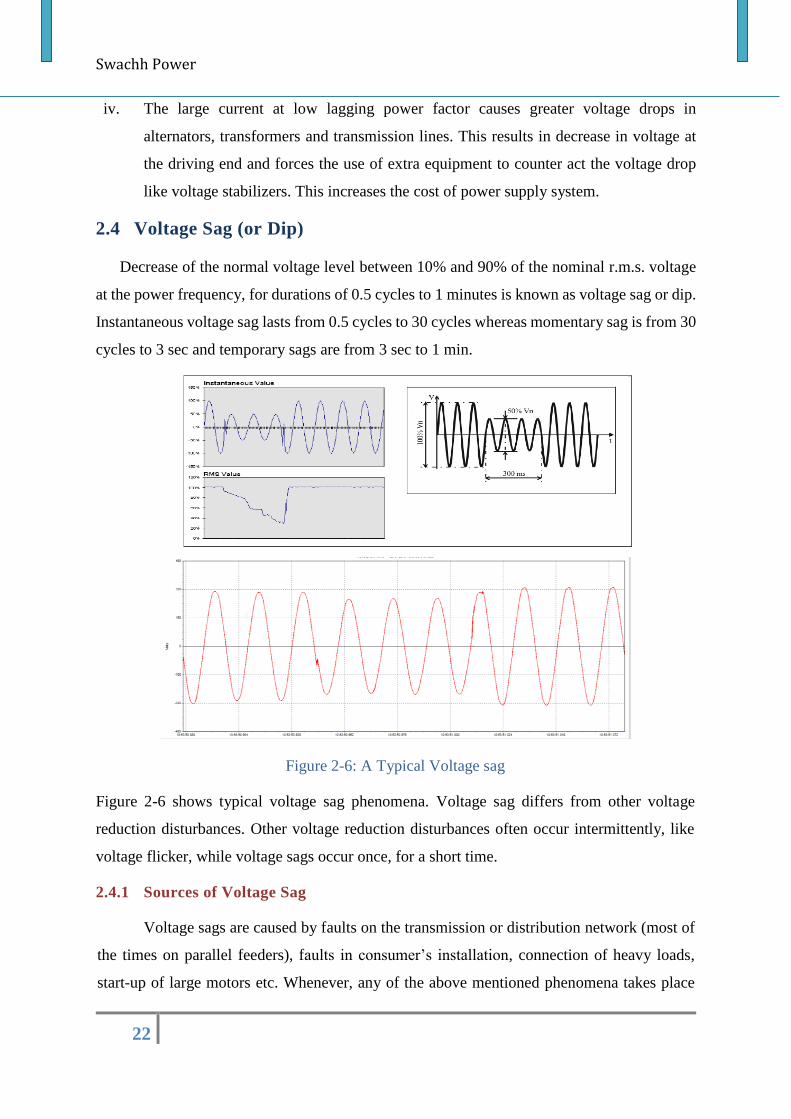
Swachh Power
22
iv. The large current at low lagging power factor causes greater voltage drops in
alternators, transformers and transmission lines. This results in decrease in voltage at
the driving end and forces the use of extra equipment to counter act the voltage drop
like voltage stabilizers. This increases the cost of power supply system.
2.4 Voltage Sag (or Dip)
Decrease of the normal voltage level between 10% and 90% of the nominal r.m.s. voltage
at the power frequency, for durations of 0.5 cycles to 1 minutes is known as voltage sag or dip.
Instantaneous voltage sag lasts from 0.5 cycles to 30 cycles whereas momentary sag is from 30
cycles to 3 sec and temporary sags are from 3 sec to 1 min.
Figure 2-6: A Typical Voltage sag
Figure 2-6 shows typical voltage sag phenomena. Voltage sag differs from other voltage
reduction disturbances. Other voltage reduction disturbances often occur intermittently, like
voltage flicker, while voltage sags occur once, for a short time.
2.4.1 Sources of Voltage Sag
Voltage sags are caused by faults on the transmission or distribution network (most of
the times on parallel feeders), faults in consumer’s installation, connection of heavy loads,
start-up of large motors etc. Whenever, any of the above mentioned phenomena takes place
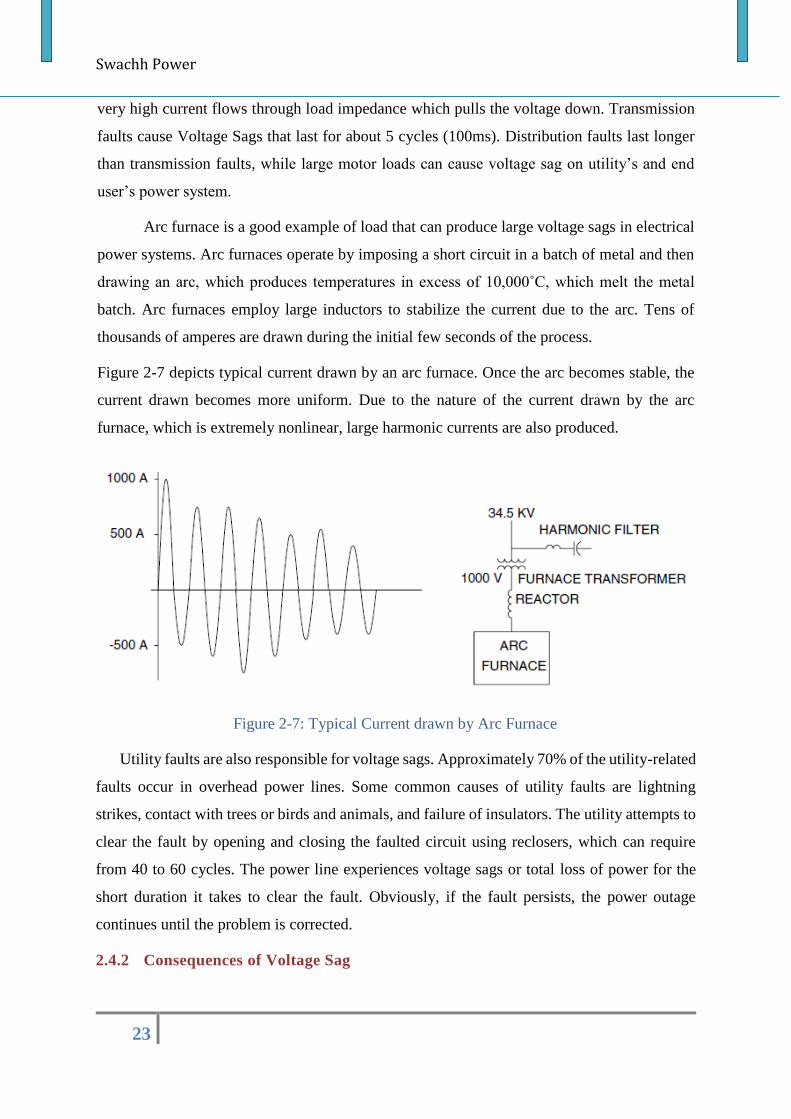
Swachh Power
23
very high current flows through load impedance which pulls the voltage down. Transmission
faults cause Voltage Sags that last for about 5 cycles (100ms). Distribution faults last longer
than transmission faults, while large motor loads can cause voltage sag on utility’s and end
user’s power system.
Arc furnace is a good example of load that can produce large voltage sags in electrical
power systems. Arc furnaces operate by imposing a short circuit in a batch of metal and then
drawing an arc, which produces temperatures in excess of 10,000˚C, which melt the metal
batch. Arc furnaces employ large inductors to stabilize the current due to the arc. Tens of
thousands of amperes are drawn during the initial few seconds of the process.
Figure 2-7 depicts typical current drawn by an arc furnace. Once the arc becomes stable, the
current drawn becomes more uniform. Due to the nature of the current drawn by the arc
furnace, which is extremely nonlinear, large harmonic currents are also produced.
Figure 2-7: Typical Current drawn by Arc Furnace
Utility faults are also responsible for voltage sags. Approximately 70% of the utility-related
faults occur in overhead power lines. Some common causes of utility faults are lightning
strikes, contact with trees or birds and animals, and failure of insulators. The utility attempts to
clear the fault by opening and closing the faulted circuit using reclosers, which can require
from 40 to 60 cycles. The power line experiences voltage sags or total loss of power for the
short duration it takes to clear the fault. Obviously, if the fault persists, the power outage
continues until the problem is corrected.
2.4.2 Consequences of Voltage Sag
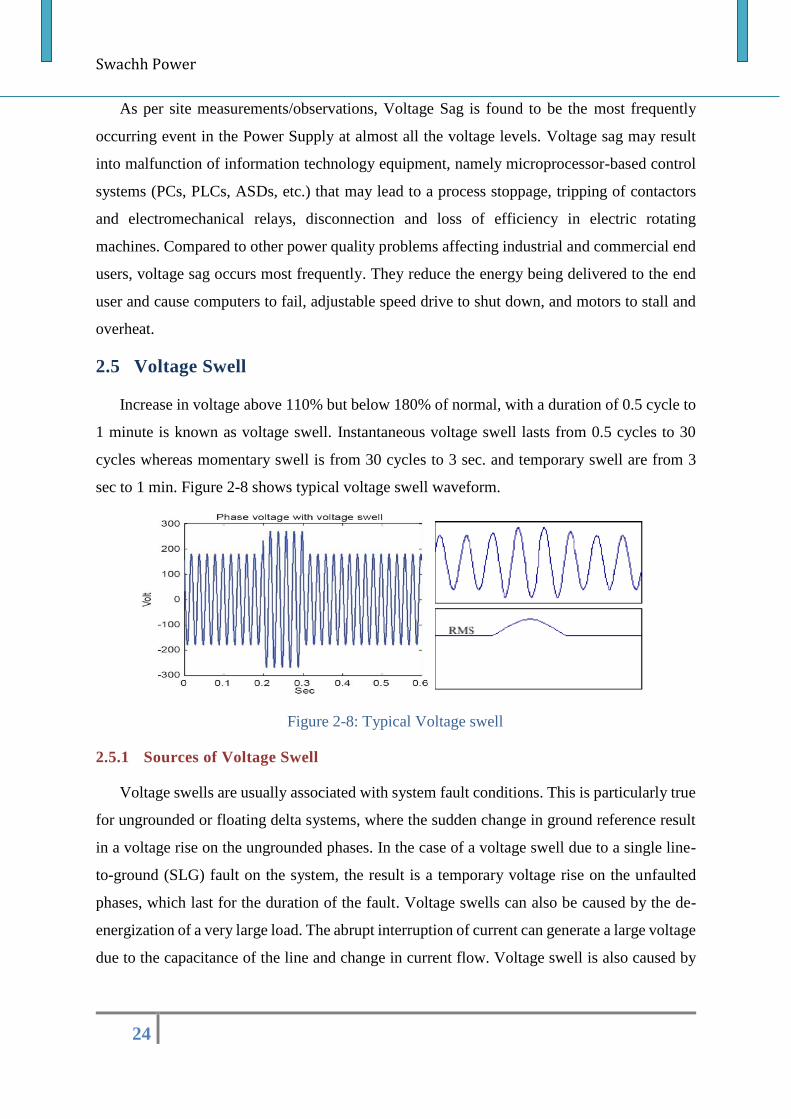
Swachh Power
24
As per site measurements/observations, Voltage Sag is found to be the most frequently
occurring event in the Power Supply at almost all the voltage levels. Voltage sag may result
into malfunction of information technology equipment, namely microprocessor-based control
systems (PCs, PLCs, ASDs, etc.) that may lead to a process stoppage, tripping of contactors
and electromechanical relays, disconnection and loss of efficiency in electric rotating
machines. Compared to other power quality problems affecting industrial and commercial end
users, voltage sag occurs most frequently. They reduce the energy being delivered to the end
user and cause computers to fail, adjustable speed drive to shut down, and motors to stall and
overheat.
2.5 Voltage Swell
Increase in voltage above 110% but below 180% of normal, with a duration of 0.5 cycle to
1 minute is known as voltage swell. Instantaneous voltage swell lasts from 0.5 cycles to 30
cycles whereas momentary swell is from 30 cycles to 3 sec. and temporary swell are from 3
sec to 1 min. Figure 2-8 shows typical voltage swell waveform.
Figure 2-8: Typical Voltage swell
2.5.1 Sources of Voltage Swell
Voltage swells are usually associated with system fault conditions. This is particularly true
for ungrounded or floating delta systems, where the sudden change in ground reference result
in a voltage rise on the ungrounded phases. In the case of a voltage swell due to a single line-
to-ground (SLG) fault on the system, the result is a temporary voltage rise on the unfaulted
phases, which last for the duration of the fault. Voltage swells can also be caused by the de-
energization of a very large load. The abrupt interruption of current can generate a large voltage
due to the capacitance of the line and change in current flow. Voltage swell is also caused by
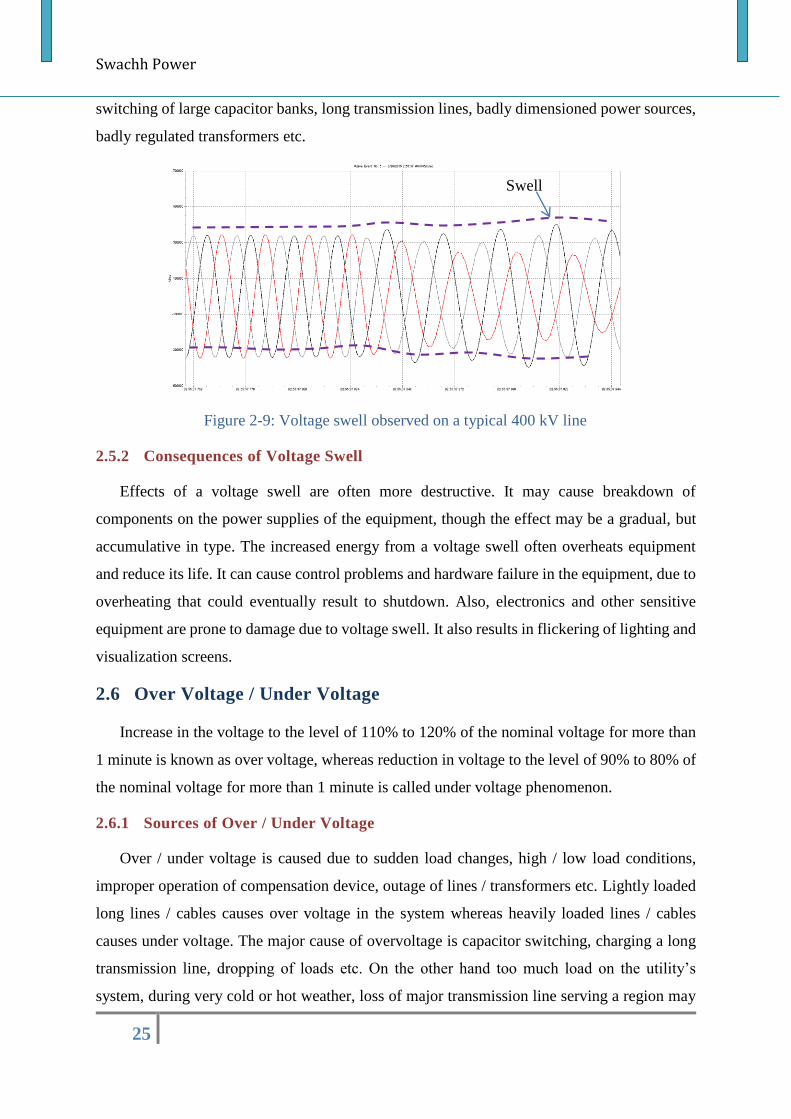
Swachh Power
25
switching of large capacitor banks, long transmission lines, badly dimensioned power sources,
badly regulated transformers etc.
Figure 2-9: Voltage swell observed on a typical 400 kV line
2.5.2 Consequences of Voltage Swell
Effects of a voltage swell are often more destructive. It may cause breakdown of
components on the power supplies of the equipment, though the effect may be a gradual, but
accumulative in type. The increased energy from a voltage swell often overheats equipment
and reduce its life. It can cause control problems and hardware failure in the equipment, due to
overheating that could eventually result to shutdown. Also, electronics and other sensitive
equipment are prone to damage due to voltage swell. It also results in flickering of lighting and
visualization screens.
2.6 Over Voltage / Under Voltage
Increase in the voltage to the level of 110% to 120% of the nominal voltage for more than
1 minute is known as over voltage, whereas reduction in voltage to the level of 90% to 80% of
the nominal voltage for more than 1 minute is called under voltage phenomenon.
2.6.1 Sources of Over / Under Voltage
Over / under voltage is caused due to sudden load changes, high / low load conditions,
improper operation of compensation device, outage of lines / transformers etc. Lightly loaded
long lines / cables causes over voltage in the system whereas heavily loaded lines / cables
causes under voltage. The major cause of overvoltage is capacitor switching, charging a long
transmission line, dropping of loads etc. On the other hand too much load on the utility’s
system, during very cold or hot weather, loss of major transmission line serving a region may
Swell
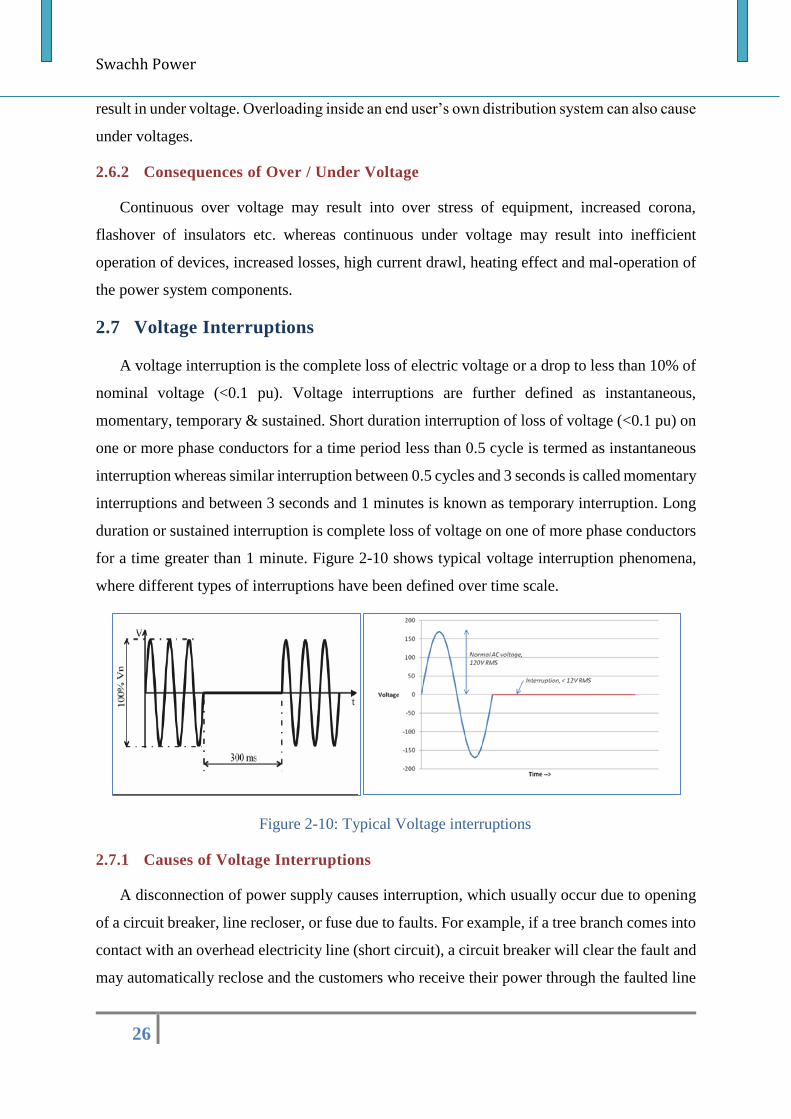
Swachh Power
26
result in under voltage. Overloading inside an end user’s own distribution system can also cause
under voltages.
2.6.2 Consequences of Over / Under Voltage
Continuous over voltage may result into over stress of equipment, increased corona,
flashover of insulators etc. whereas continuous under voltage may result into inefficient
operation of devices, increased losses, high current drawl, heating effect and mal-operation of
the power system components.
2.7 Voltage Interruptions
A voltage interruption is the complete loss of electric voltage or a drop to less than 10% of
nominal voltage (<0.1 pu). Voltage interruptions are further defined as instantaneous,
momentary, temporary & sustained. Short duration interruption of loss of voltage (<0.1 pu) on
one or more phase conductors for a time period less than 0.5 cycle is termed as instantaneous
interruption whereas similar interruption between 0.5 cycles and 3 seconds is called momentary
interruptions and between 3 seconds and 1 minutes is known as temporary interruption. Long
duration or sustained interruption is complete loss of voltage on one of more phase conductors
for a time greater than 1 minute. Figure 2-10 shows typical voltage interruption phenomena,
where different types of interruptions have been defined over time scale.
Figure 2-10: Typical Voltage interruptions
2.7.1 Causes of Voltage Interruptions
A disconnection of power supply causes interruption, which usually occur due to opening
of a circuit breaker, line recloser, or fuse due to faults. For example, if a tree branch comes into
contact with an overhead electricity line (short circuit), a circuit breaker will clear the fault and
may automatically reclose and the customers who receive their power through the faulted line
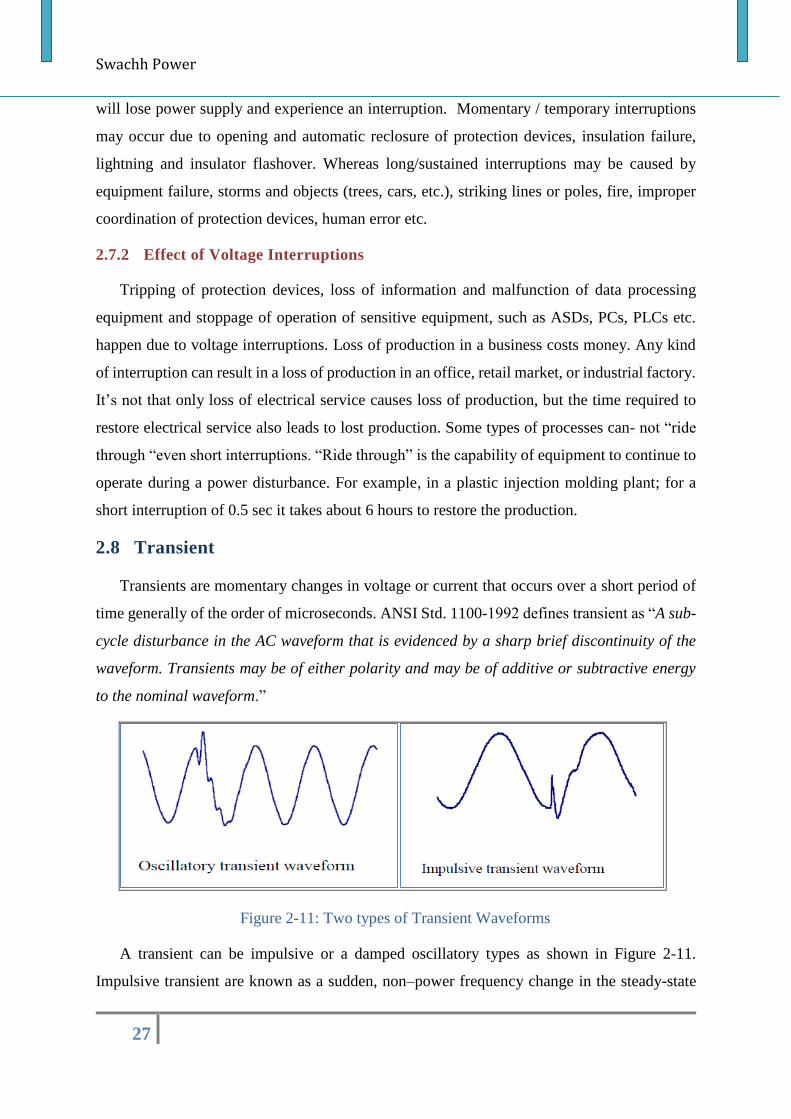
Swachh Power
27
will lose power supply and experience an interruption. Momentary / temporary interruptions
may occur due to opening and automatic reclosure of protection devices, insulation failure,
lightning and insulator flashover. Whereas long/sustained interruptions may be caused by
equipment failure, storms and objects (trees, cars, etc.), striking lines or poles, fire, improper
coordination of protection devices, human error etc.
2.7.2 Effect of Voltage Interruptions
Tripping of protection devices, loss of information and malfunction of data processing
equipment and stoppage of operation of sensitive equipment, such as ASDs, PCs, PLCs etc.
happen due to voltage interruptions. Loss of production in a business costs money. Any kind
of interruption can result in a loss of production in an office, retail market, or industrial factory.
It’s not that only loss of electrical service causes loss of production, but the time required to
restore electrical service also leads to lost production. Some types of processes can- not “ride
through “even short interruptions. “Ride through” is the capability of equipment to continue to
operate during a power disturbance. For example, in a plastic injection molding plant; for a
short interruption of 0.5 sec it takes about 6 hours to restore the production.
2.8 Transient
Transients are momentary changes in voltage or current that occurs over a short period of
time generally of the order of microseconds. ANSI Std. 1100-1992 defines transient as “A sub-
cycle disturbance in the AC waveform that is evidenced by a sharp brief discontinuity of the
waveform. Transients may be of either polarity and may be of additive or subtractive energy
to the nominal waveform.”
Figure 2-11: Two types of Transient Waveforms
A transient can be impulsive or a damped oscillatory types as shown in Figure 2-11.
Impulsive transient are known as a sudden, non–power frequency change in the steady-state
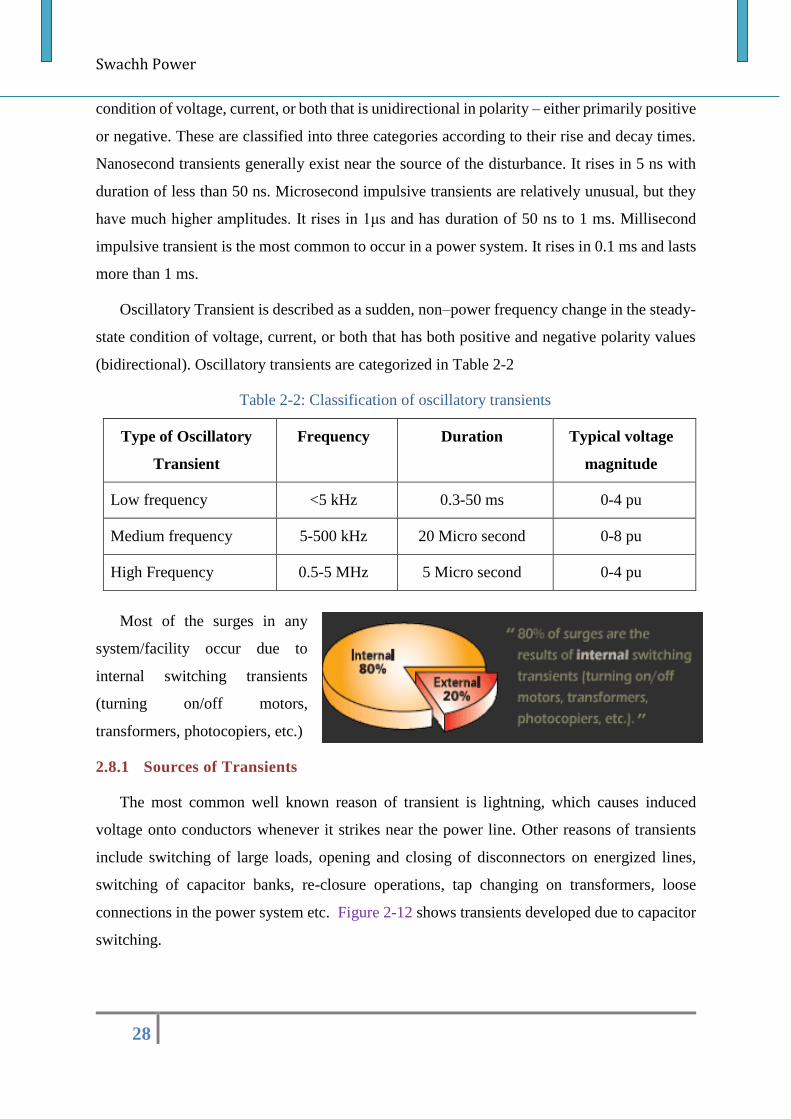
Swachh Power
28
condition of voltage, current, or both that is unidirectional in polarity – either primarily positive
or negative. These are classified into three categories according to their rise and decay times.
Nanosecond transients generally exist near the source of the disturbance. It rises in 5 ns with
duration of less than 50 ns. Microsecond impulsive transients are relatively unusual, but they
have much higher amplitudes. It rises in 1μs and has duration of 50 ns to 1 ms. Millisecond
impulsive transient is the most common to occur in a power system. It rises in 0.1 ms and lasts
more than 1 ms.
Oscillatory Transient is described as a sudden, non–power frequency change in the steady-
state condition of voltage, current, or both that has both positive and negative polarity values
(bidirectional). Oscillatory transients are categorized in Table 2-2
Table 2-2: Classification of oscillatory transients
Type of Oscillatory
Transient
Frequency Duration Typical voltage
magnitude
Low frequency <5 kHz 0.3-50 ms 0-4 pu
Medium frequency 5-500 kHz 20 Micro second 0-8 pu
High Frequency 0.5-5 MHz 5 Micro second 0-4 pu
Most of the surges in any
system/facility occur due to
internal switching transients
(turning on/off motors,
transformers, photocopiers, etc.)
2.8.1 Sources of Transients
The most common well known reason of transient is lightning, which causes induced
voltage onto conductors whenever it strikes near the power line. Other reasons of transients
include switching of large loads, opening and closing of disconnectors on energized lines,
switching of capacitor banks, re-closure operations, tap changing on transformers, loose
connections in the power system etc. Figure 2-12 shows transients developed due to capacitor
switching.
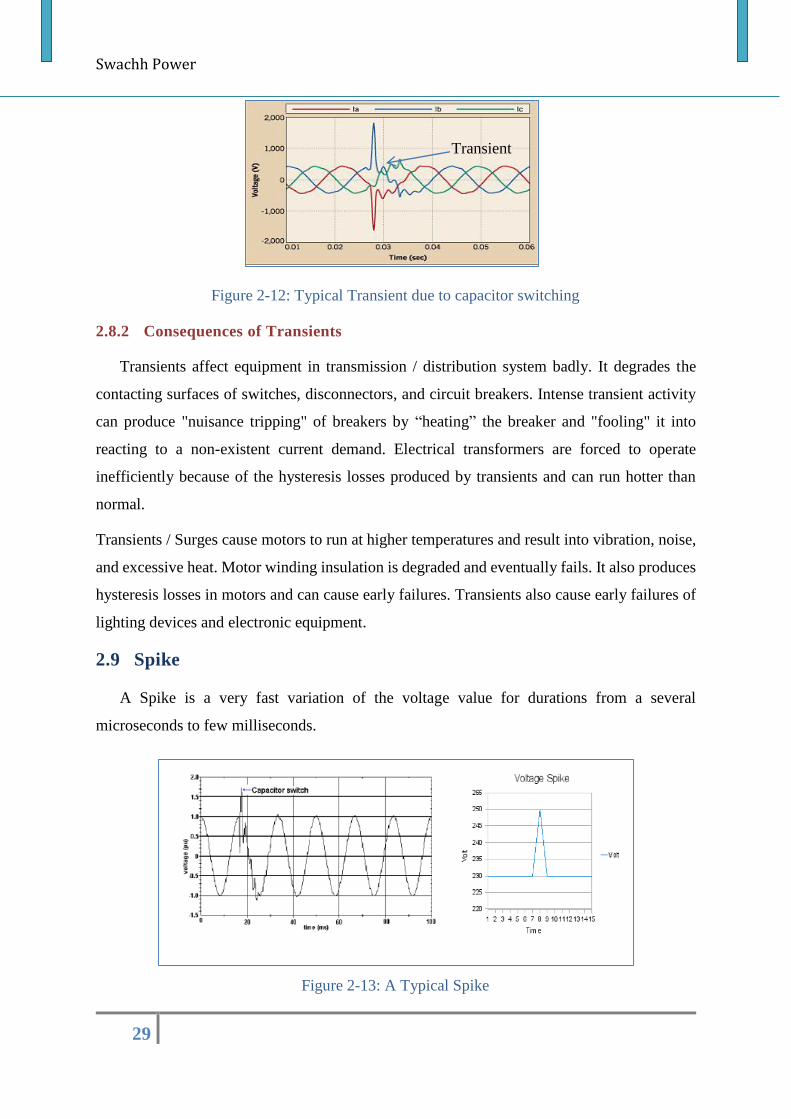
Swachh Power
29
Figure 2-12: Typical Transient due to capacitor switching
2.8.2 Consequences of Transients
Transients affect equipment in transmission / distribution system badly. It degrades the
contacting surfaces of switches, disconnectors, and circuit breakers. Intense transient activity
can produce "nuisance tripping" of breakers by “heating” the breaker and "fooling" it into
reacting to a non-existent current demand. Electrical transformers are forced to operate
inefficiently because of the hysteresis losses produced by transients and can run hotter than
normal.
Transients / Surges cause motors to run at higher temperatures and result into vibration, noise,
and excessive heat. Motor winding insulation is degraded and eventually fails. It also produces
hysteresis losses in motors and can cause early failures. Transients also cause early failures of
lighting devices and electronic equipment.
2.9 Spike
A Spike is a very fast variation of the voltage value for durations from a several
microseconds to few milliseconds.
Figure 2-13: A Typical Spike
Transient
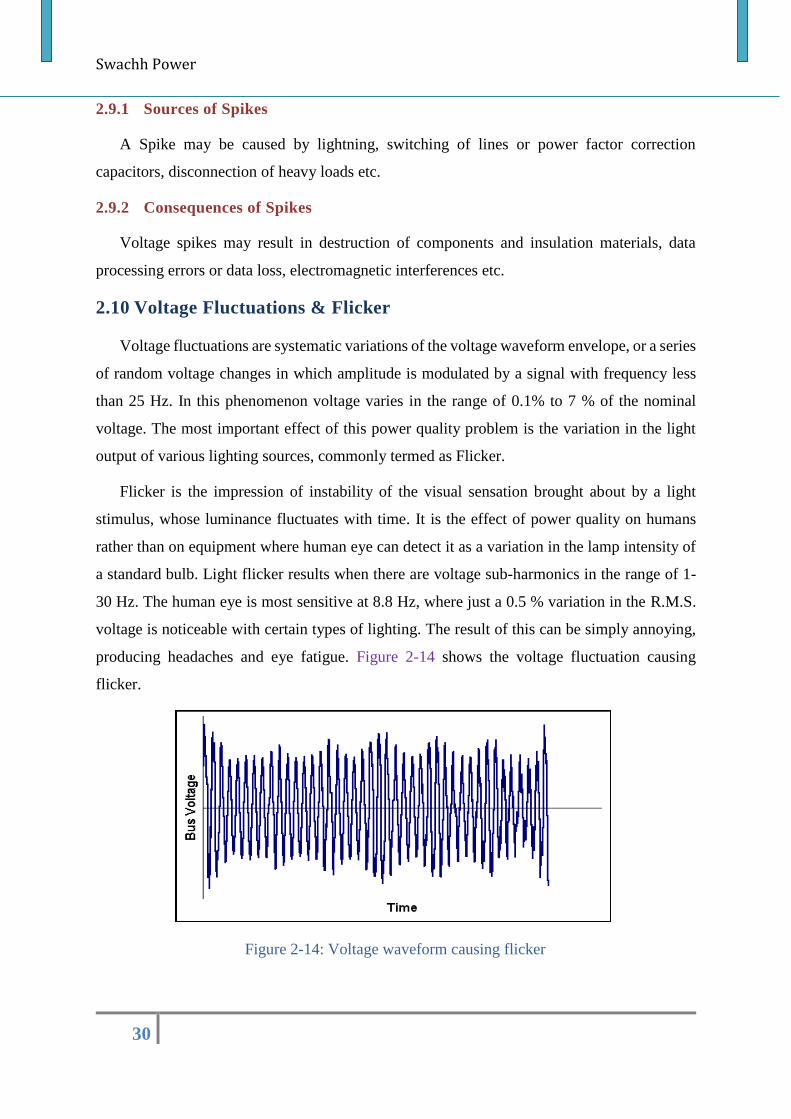
Swachh Power
30
2.9.1 Sources of Spikes
A Spike may be caused by lightning, switching of lines or power factor correction
capacitors, disconnection of heavy loads etc.
2.9.2 Consequences of Spikes
Voltage spikes may result in destruction of components and insulation materials, data
processing errors or data loss, electromagnetic interferences etc.
2.10 Voltage Fluctuations & Flicker
Voltage fluctuations are systematic variations of the voltage waveform envelope, or a series
of random voltage changes in which amplitude is modulated by a signal with frequency less
than 25 Hz. In this phenomenon voltage varies in the range of 0.1% to 7 % of the nominal
voltage. The most important effect of this power quality problem is the variation in the light
output of various lighting sources, commonly termed as Flicker.
Flicker is the impression of instability of the visual sensation brought about by a light
stimulus, whose luminance fluctuates with time. It is the effect of power quality on humans
rather than on equipment where human eye can detect it as a variation in the lamp intensity of
a standard bulb. Light flicker results when there are voltage sub-harmonics in the range of 1-
30 Hz. The human eye is most sensitive at 8.8 Hz, where just a 0.5 % variation in the R.M.S.
voltage is noticeable with certain types of lighting. The result of this can be simply annoying,
producing headaches and eye fatigue. Figure 2-14 shows the voltage fluctuation causing
flicker.
Figure 2-14: Voltage waveform causing flicker
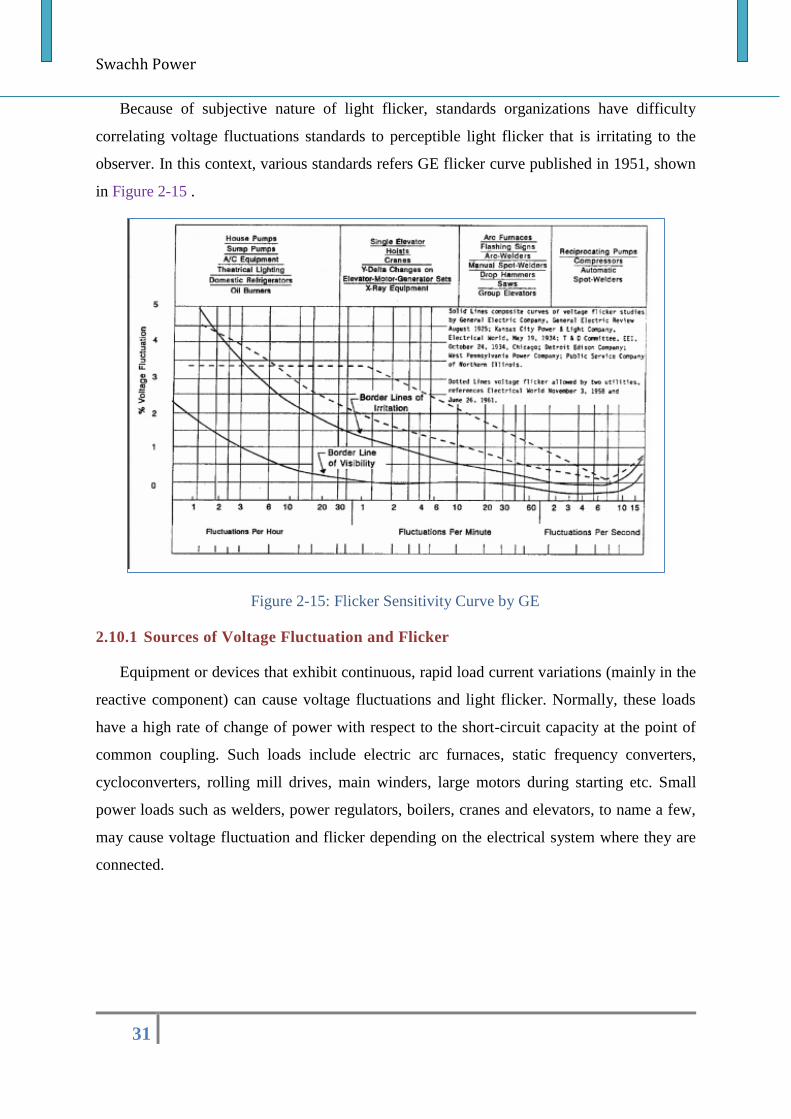
Swachh Power
31
Because of subjective nature of light flicker, standards organizations have difficulty
correlating voltage fluctuations standards to perceptible light flicker that is irritating to the
observer. In this context, various standards refers GE flicker curve published in 1951, shown
in Figure 2-15 .
Figure 2-15: Flicker Sensitivity Curve by GE
2.10.1 Sources of Voltage Fluctuation and Flicker
Equipment or devices that exhibit continuous, rapid load current variations (mainly in the
reactive component) can cause voltage fluctuations and light flicker. Normally, these loads
have a high rate of change of power with respect to the short-circuit capacity at the point of
common coupling. Such loads include electric arc furnaces, static frequency converters,
cycloconverters, rolling mill drives, main winders, large motors during starting etc. Small
power loads such as welders, power regulators, boilers, cranes and elevators, to name a few,
may cause voltage fluctuation and flicker depending on the electrical system where they are
connected.
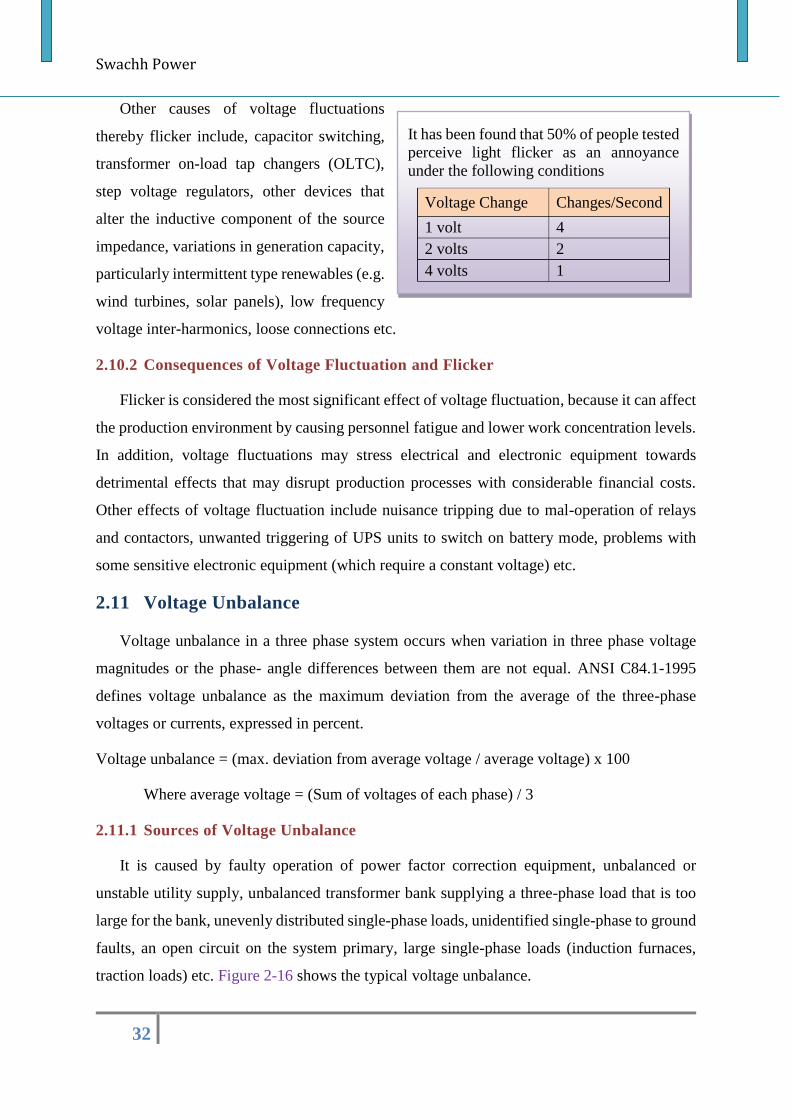
Swachh Power
32
Other causes of voltage fluctuations
thereby flicker include, capacitor switching,
transformer on-load tap changers (OLTC),
step voltage regulators, other devices that
alter the inductive component of the source
impedance, variations in generation capacity,
particularly intermittent type renewables (e.g.
wind turbines, solar panels), low frequency
voltage inter-harmonics, loose connections etc.
2.10.2 Consequences of Voltage Fluctuation and Flicker
Flicker is considered the most significant effect of voltage fluctuation, because it can affect
the production environment by causing personnel fatigue and lower work concentration levels.
In addition, voltage fluctuations may stress electrical and electronic equipment towards
detrimental effects that may disrupt production processes with considerable financial costs.
Other effects of voltage fluctuation include nuisance tripping due to mal-operation of relays
and contactors, unwanted triggering of UPS units to switch on battery mode, problems with
some sensitive electronic equipment (which require a constant voltage) etc.
2.11 Voltage Unbalance
Voltage unbalance in a three phase system occurs when variation in three phase voltage
magnitudes or the phase- angle differences between them are not equal. ANSI C84.1-1995
defines voltage unbalance as the maximum deviation from the average of the three-phase
voltages or currents, expressed in percent.
Voltage unbalance = (max. deviation from average voltage / average voltage) x 100
Where average voltage = (Sum of voltages of each phase) / 3
2.11.1 Sources of Voltage Unbalance
It is caused by faulty operation of power factor correction equipment, unbalanced or
unstable utility supply, unbalanced transformer bank supplying a three-phase load that is too
large for the bank, unevenly distributed single-phase loads, unidentified single-phase to ground
faults, an open circuit on the system primary, large single-phase loads (induction furnaces,
traction loads) etc. Figure 2-16 shows the typical voltage unbalance.
It has been found that 50% of people tested
perceive light flicker as an annoyance
under the following conditions
Voltage Change Changes/Second
1 volt 4
2 volts 2
4 volts 1
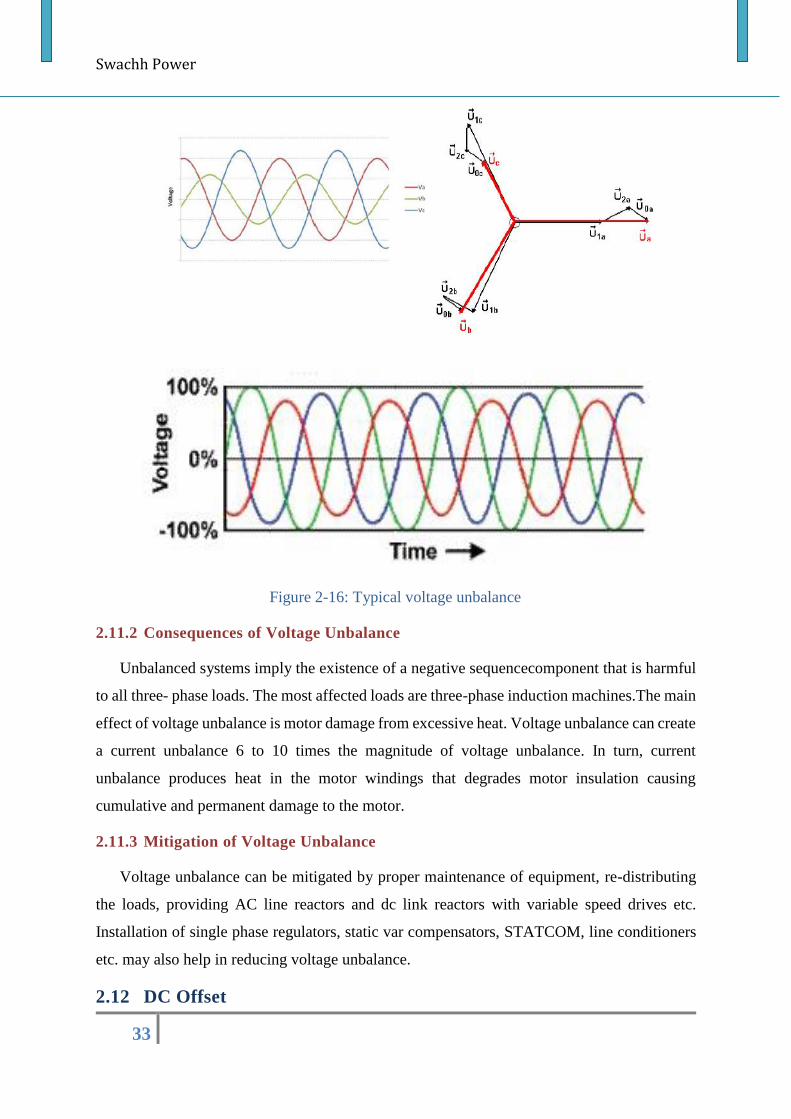
Swachh Power
33
Figure 2-16: Typical voltage unbalance
2.11.2 Consequences of Voltage Unbalance
Unbalanced systems imply the existence of a negative sequencecomponent that is harmful
to all three- phase loads. The most affected loads are three-phase induction machines.The main
effect of voltage unbalance is motor damage from excessive heat. Voltage unbalance can create
a current unbalance 6 to 10 times the magnitude of voltage unbalance. In turn, current
unbalance produces heat in the motor windings that degrades motor insulation causing
cumulative and permanent damage to the motor.
2.11.3 Mitigation of Voltage Unbalance
Voltage unbalance can be mitigated by proper maintenance of equipment, re-distributing
the loads, providing AC line reactors and dc link reactors with variable speed drives etc.
Installation of single phase regulators, static var compensators, STATCOM, line conditioners
etc. may also help in reducing voltage unbalance.
2.12 DC Offset
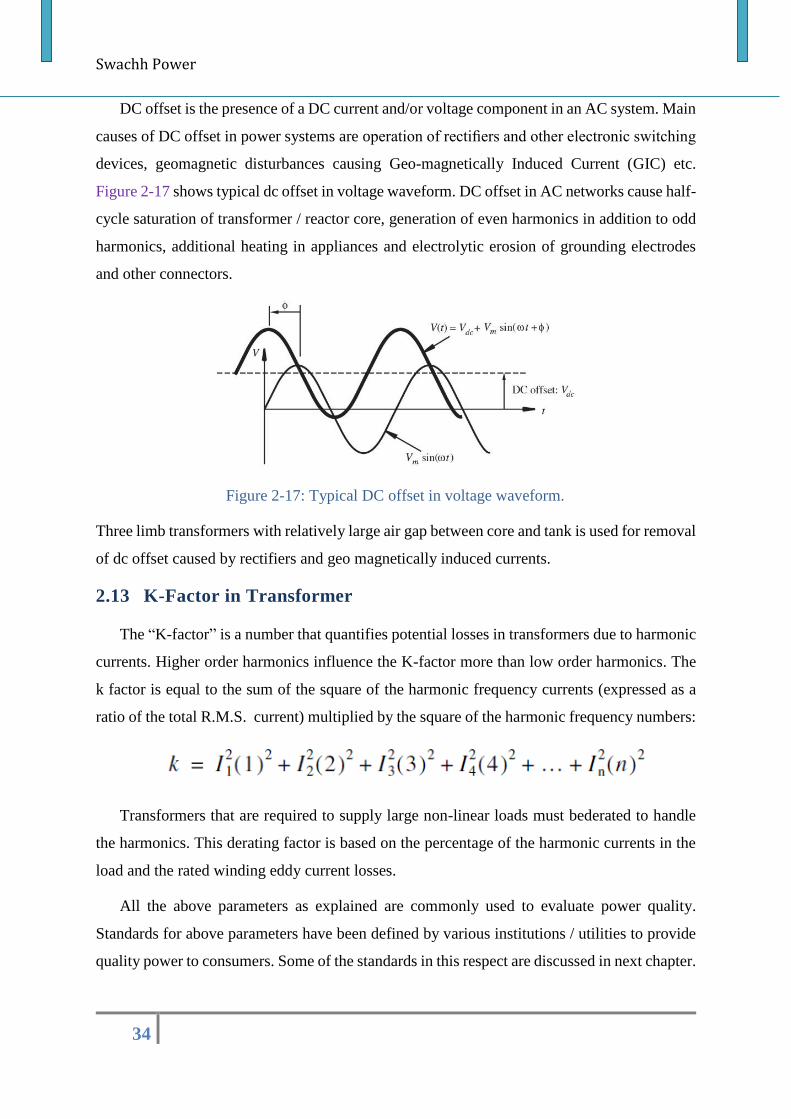
Swachh Power
34
DC offset is the presence of a DC current and/or voltage component in an AC system. Main
causes of DC offset in power systems are operation of rectifiers and other electronic switching
devices, geomagnetic disturbances causing Geo-magnetically Induced Current (GIC) etc.
Figure 2-17 shows typical dc offset in voltage waveform. DC offset in AC networks cause half-
cycle saturation of transformer / reactor core, generation of even harmonics in addition to odd
harmonics, additional heating in appliances and electrolytic erosion of grounding electrodes
and other connectors.
Figure 2-17: Typical DC offset in voltage waveform.
Three limb transformers with relatively large air gap between core and tank is used for removal
of dc offset caused by rectifiers and geo magnetically induced currents.
2.13 K-Factor in Transformer
The “K-factor” is a number that quantifies potential losses in transformers due to harmonic
currents. Higher order harmonics influence the K-factor more than low order harmonics. The
k factor is equal to the sum of the square of the harmonic frequency currents (expressed as a
ratio of the total R.M.S. current) multiplied by the square of the harmonic frequency numbers:
Transformers that are required to supply large non-linear loads must bederated to handle
the harmonics. This derating factor is based on the percentage of the harmonic currents in the
load and the rated winding eddy current losses.
All the above parameters as explained are commonly used to evaluate power quality.
Standards for above parameters have been defined by various institutions / utilities to provide
quality power to consumers. Some of the standards in this respect are discussed in next chapter.
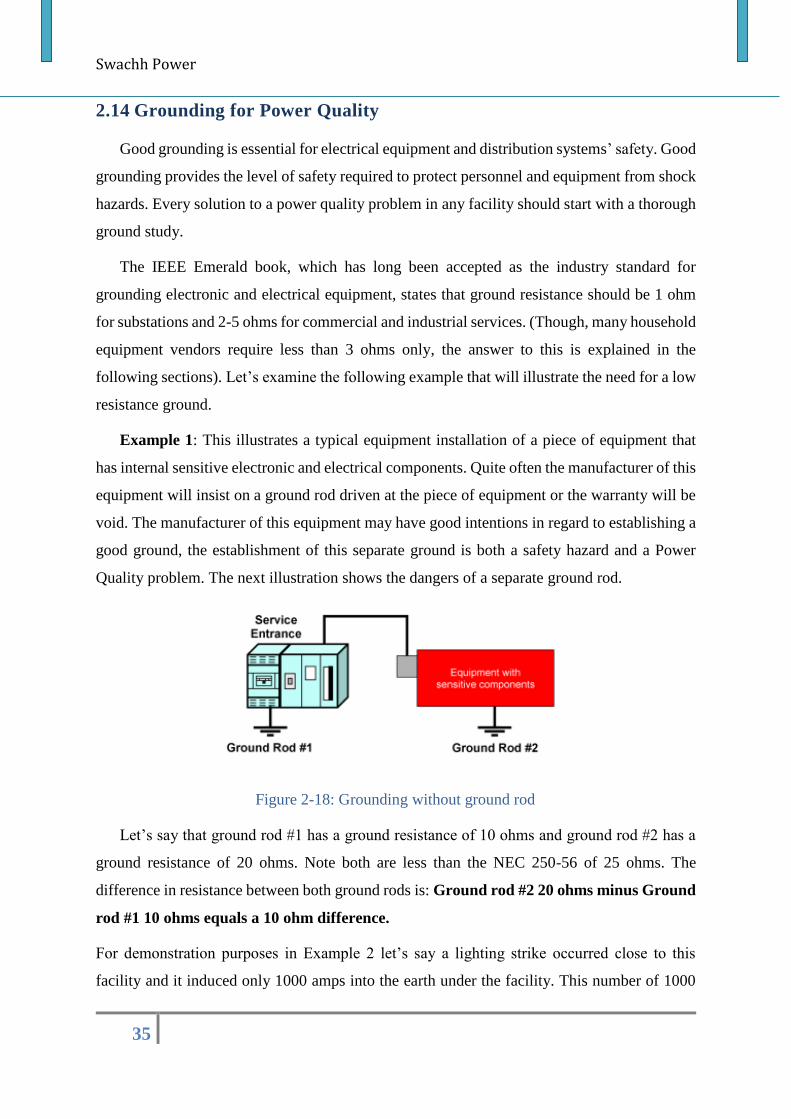
Swachh Power
35
2.14 Grounding for Power Quality
Good grounding is essential for electrical equipment and distribution systems’ safety. Good
grounding provides the level of safety required to protect personnel and equipment from shock
hazards. Every solution to a power quality problem in any facility should start with a thorough
ground study.
The IEEE Emerald book, which has long been accepted as the industry standard for
grounding electronic and electrical equipment, states that ground resistance should be 1 ohm
for substations and 2-5 ohms for commercial and industrial services. (Though, many household
equipment vendors require less than 3 ohms only, the answer to this is explained in the
following sections). Let’s examine the following example that will illustrate the need for a low
resistance ground.
Example 1: This illustrates a typical equipment installation of a piece of equipment that
has internal sensitive electronic and electrical components. Quite often the manufacturer of this
equipment will insist on a ground rod driven at the piece of equipment or the warranty will be
void. The manufacturer of this equipment may have good intentions in regard to establishing a
good ground, the establishment of this separate ground is both a safety hazard and a Power
Quality problem. The next illustration shows the dangers of a separate ground rod.
Figure 2-18: Grounding without ground rod
Let’s say that ground rod #1 has a ground resistance of 10 ohms and ground rod #2 has a
ground resistance of 20 ohms. Note both are less than the NEC 250-56 of 25 ohms. The
difference in resistance between both ground rods is: Ground rod #2 20 ohms minus Ground
rod #1 10 ohms equals a 10 ohm difference.
For demonstration purposes in Example 2 let’s say a lighting strike occurred close to this
facility and it induced only 1000 amps into the earth under the facility. This number of 1000
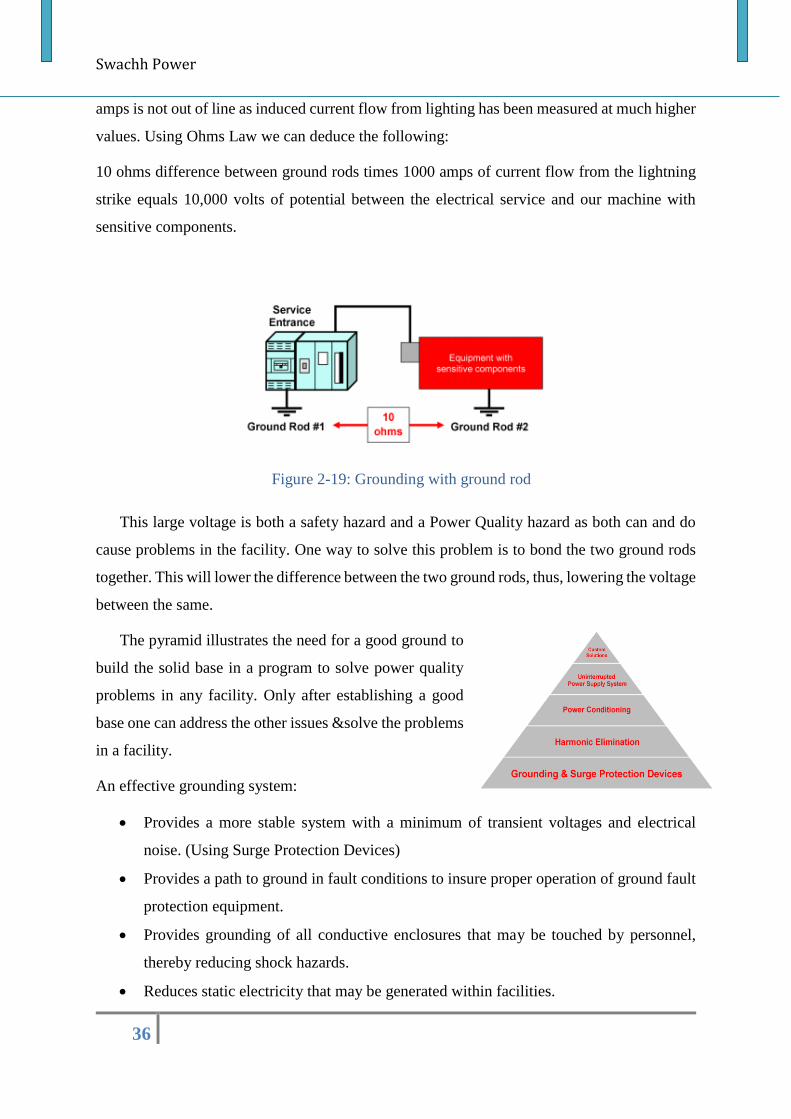
Swachh Power
36
amps is not out of line as induced current flow from lighting has been measured at much higher
values. Using Ohms Law we can deduce the following:
10 ohms difference between ground rods times 1000 amps of current flow from the lightning
strike equals 10,000 volts of potential between the electrical service and our machine with
sensitive components.
This large voltage is both a safety hazard and a Power Quality hazard as both can and do
cause problems in the facility. One way to solve this problem is to bond the two ground rods
together. This will lower the difference between the two ground rods, thus, lowering the voltage
between the same.
The pyramid illustrates the need for a good ground to
build the solid base in a program to solve power quality
problems in any facility. Only after establishing a good
base one can address the other issues &solve the problems
in a facility.
An effective grounding system:
Provides a more stable system with a minimum of transient voltages and electrical
noise. (Using Surge Protection Devices)
Provides a path to ground in fault conditions to insure proper operation of ground fault
protection equipment.
Provides grounding of all conductive enclosures that may be touched by personnel,
thereby reducing shock hazards.
Reduces static electricity that may be generated within facilities.
Figure 2-19: Grounding with ground rod
Swachh Power
37
Provides protection from large electrical disturbances (such as lighting) by creating a
low resistive path to earth.
Should be built so that it can be EASILY measured on a REGULAR basis to make sure
it is still functioning properly.
2.15 Neutral Grounding for MV/HV/EHV Networks
The different modes of grounding for the medium voltage power distribution networks
differ from country to country. The physical characteristics of the networks, such as network
extend, load density, load nature, the quality of the earthing terminals, the network type – air,
underground or mixed - led the operators of the various countries to an independent choice of
grounding in their particular networks. For the choice of the neutral grounding mode, they have
to consider the criteria of tension control during the occurrence of single-phase or multiphase
fault currents, the reliability and the sensitivity of protections, the voltage level – simple line-
to-earth or phase-to-phase during of the network voltage rise during the defect, the quality of
supply as well as the security of goods and people.
Neutrals, however, play a major role in effective grounding. A fault that occurs 16 km from
a substation can cause swells of 1.33 per unit if a broken neutral exists on any part of a system.
Even faults occurring 2.25km away can cause swells up to 1.5 per unit if a broken neutral
exists. The size of the neutral conductor appreciably reduces swells, whereas good grounding
hardly affects the voltage at all. This indicates that the neutral is more important than the
grounding.
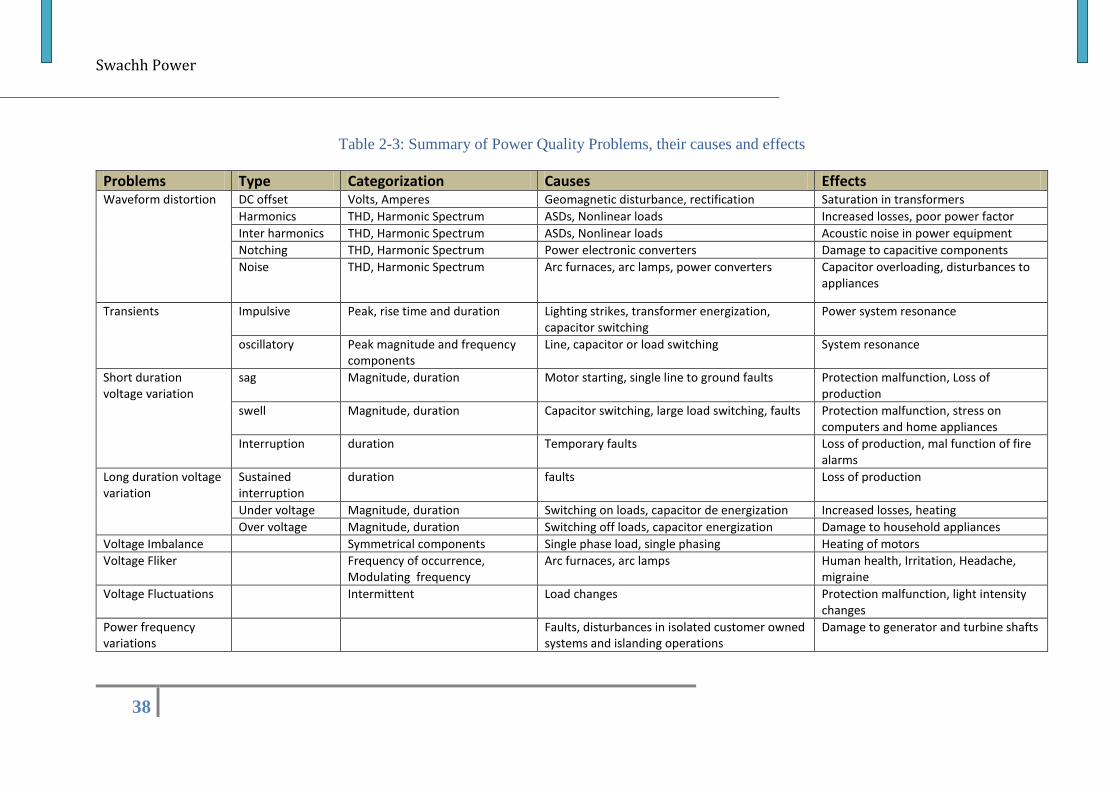
Swachh Power
38
Table 2-3: Summary of Power Quality Problems, their causes and effects
Problems Type Categorization Causes Effects Waveform distortion
DC offset Volts, Amperes Geomagnetic disturbance, rectification Saturation in transformers
Harmonics THD, Harmonic Spectrum ASDs, Nonlinear loads Increased losses, poor power factor
Inter harmonics THD, Harmonic Spectrum ASDs, Nonlinear loads Acoustic noise in power equipment
Notching THD, Harmonic Spectrum Power electronic converters Damage to capacitive components
Noise THD, Harmonic Spectrum Arc furnaces, arc lamps, power converters Capacitor overloading, disturbances to appliances
Transients Impulsive Peak, rise time and duration Lighting strikes, transformer energization, capacitor switching
Power system resonance
oscillatory Peak magnitude and frequency components
Line, capacitor or load switching System resonance
Short duration voltage variation
sag Magnitude, duration Motor starting, single line to ground faults Protection malfunction, Loss of production
swell Magnitude, duration Capacitor switching, large load switching, faults Protection malfunction, stress on computers and home appliances
Interruption duration Temporary faults Loss of production, mal function of fire alarms
Long duration voltage variation
Sustained interruption
duration faults Loss of production
Under voltage Magnitude, duration Switching on loads, capacitor de energization Increased losses, heating
Over voltage Magnitude, duration Switching off loads, capacitor energization Damage to household appliances
Voltage Imbalance Symmetrical components Single phase load, single phasing Heating of motors
Voltage Fliker Frequency of occurrence, Modulating frequency
Arc furnaces, arc lamps Human health, Irritation, Headache, migraine
Voltage Fluctuations Intermittent Load changes Protection malfunction, light intensity changes
Power frequency variations
Faults, disturbances in isolated customer owned systems and islanding operations
Damage to generator and turbine shafts
Swachh Power
39
2.16 Impact of Power Quality
Until a few years ago, Power quality phenomena were considered just because of their
effects on the electromagnetic behavior of electrical devices, with a focus on fault probability,
components’ loss of life, or overload and so on. Now, increased attention to environmental
protection and energy savings in general drives us to consider Power Quality phenomena also
in the perspective of related energy losses. Poor power quality usually results in various types
of losses resulting due to increase in the rms value of supply current, overheating heating of
equipment, failures of equipment, shutting down of electronic equipment, unwanted circuit
breaker tripping, interference on communication system, flickering of fluorescent lights,
saturation of non-linear devices, reducing the service life of equipment, requirement of higher
size equipment, production loss in process industries etc.
As per a study on poor power quality (section 3.7), it has been observed that industrial
firms do not suffer any shortfall in production due to the erratic supply, because the firms have
adapted themselves to the current power scenario so well that all they suffer is cost escalation
due to use of power backups to support their production; it is estimated that for an average
interruption of say 30 minutes per week to the Industrial load (connected load is approx.170
GW) in India, the average cost escalation accounts to be around Rs. 2.65 Lakh Cr. per year.
(Assuming a very conservative loss of Rs. 10 per minute of interruption per kW of connected
industrial load). In addition, loss occur due to harmonics and poor power factor.
Due to poor power factor transmission capacity gets reduced and it is estimated that
energy worth Rs. 5400 cr. faces a bottleneck in the Grid. This energy could be otherwise served
to the users.
***
Swachh Power
40
Swachh Power
41
Chapter-3
3 Power Quality Standards Power Quality Standards are needed for all the stakeholders in Power System. How
can utilities deliver and their customers receive the quality of power without Power quality
standards? How can the electronic industries produce sensitive electronic equipment without
power quality standards? How can the Power conditioning industry manufacture devices that
will protect sensitive electronic equipment without power Quality standards? They can’t.
Therefore, stakeholders in the power sector have developed power quality standards in
recent years. They realize that the increased use of sensitive electronic equipment, increased
application of non-linear devices to reduce stress on equipment, losses and improve energy
efficiency, and the increasingly complex and interconnected power system, integration of
renewables etc. all contribute to the need of power quality standards. Utilities need standards
that define limits on the amount of voltage distortion (caused by customer’s pollution), their
power systems can tolerate. End users need standards that set limits not only on the electrical
pollution produced by utility systems, but also similar pollution generated by other end users.
As power systems become more interconnected, contracts based on standards will be needed
to protect the offended party. Standards allow utilities to provide different levels of power
quality services.
As the issue regarding Power Quality started gaining attention worldwide, several
stakeholders like utilities, statutory authorities, regulatory bodies, generators, consumers, grid
operators, equipment manufacturers, solution providers etc. have started to come together for
standardization of power quality parameters. It has resulted in a new direction of research and
development (R&D) activities for the design and development engineers working in the field
of power electronics, power systems, electric drives, digital signal processing, and sensors. It
has changed the scenario of power electronics as most of the equipment using power converters
at the front end need modification in view of these newly visualized requirements. Moreover,
some of the well-developed converters are becoming obsolete and better substitutes are being
looked for. Apart from these issues, a number of standards and benchmarks have already been
developed by various organizations such as IEEE (Institute of Electrical and Electronics
engineers) and IEC (International Electrotechnical Commission), to determine the normal or
acceptable levels, which can be imposed onto the customers, utilities, and manufacturers to
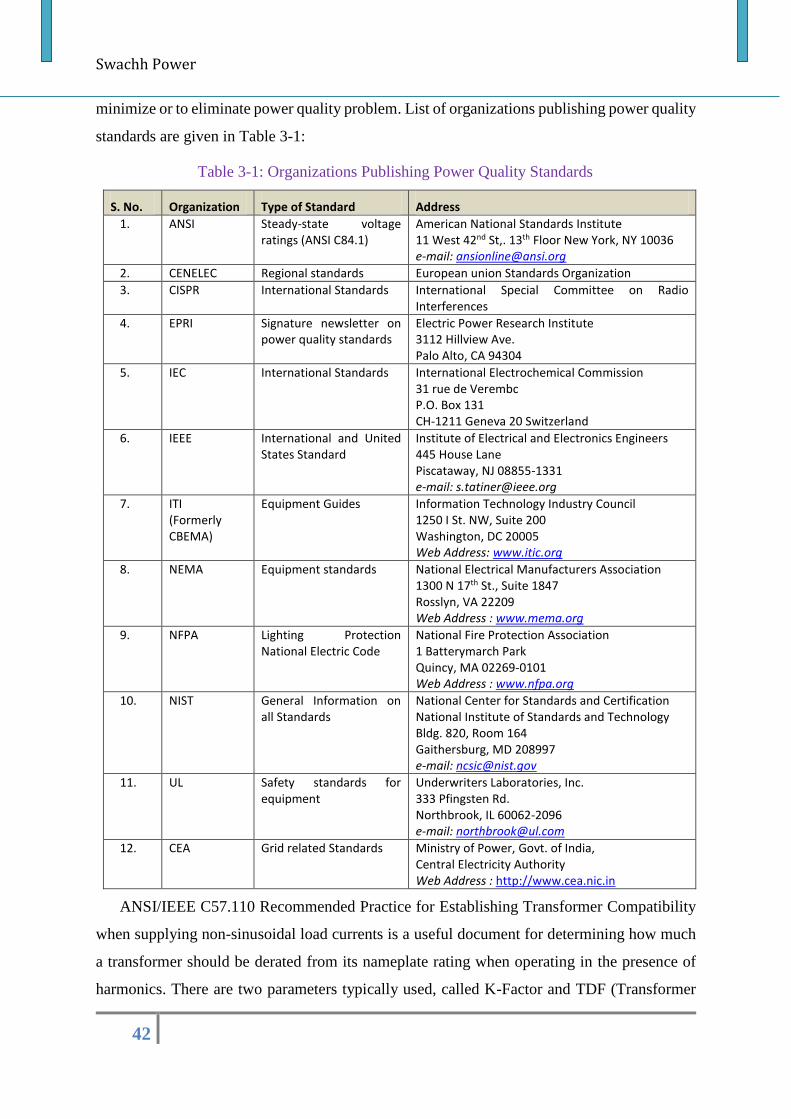
Swachh Power
42
minimize or to eliminate power quality problem. List of organizations publishing power quality
standards are given in Table 3-1:
Table 3-1: Organizations Publishing Power Quality Standards
S. No. Organization Type of Standard Address
1. ANSI Steady-state voltage ratings (ANSI C84.1)
American National Standards Institute 11 West 42nd St,. 13th Floor New York, NY 10036 e-mail: [email protected]
2. CENELEC Regional standards European union Standards Organization
3. CISPR International Standards International Special Committee on Radio Interferences
4. EPRI Signature newsletter on power quality standards
Electric Power Research Institute 3112 Hillview Ave. Palo Alto, CA 94304
5. IEC International Standards International Electrochemical Commission 31 rue de Verembc P.O. Box 131 CH-1211 Geneva 20 Switzerland
6. IEEE International and United States Standard
Institute of Electrical and Electronics Engineers 445 House Lane Piscataway, NJ 08855-1331 e-mail: [email protected]
7. ITI (Formerly CBEMA)
Equipment Guides Information Technology Industry Council 1250 I St. NW, Suite 200 Washington, DC 20005 Web Address: www.itic.org
8. NEMA Equipment standards National Electrical Manufacturers Association 1300 N 17th St., Suite 1847 Rosslyn, VA 22209 Web Address : www.mema.org
9. NFPA Lighting Protection National Electric Code
National Fire Protection Association 1 Batterymarch Park Quincy, MA 02269-0101 Web Address : www.nfpa.org
10. NIST General Information on all Standards
National Center for Standards and Certification National Institute of Standards and Technology Bldg. 820, Room 164 Gaithersburg, MD 208997 e-mail: [email protected]
11. UL Safety standards for equipment
Underwriters Laboratories, Inc. 333 Pfingsten Rd. Northbrook, IL 60062-2096 e-mail: [email protected]
12. CEA Grid related Standards Ministry of Power, Govt. of India, Central Electricity Authority Web Address : http://www.cea.nic.in
ANSI/IEEE C57.110 Recommended Practice for Establishing Transformer Compatibility
when supplying non-sinusoidal load currents is a useful document for determining how much
a transformer should be derated from its nameplate rating when operating in the presence of
harmonics. There are two parameters typically used, called K-Factor and TDF (Transformer
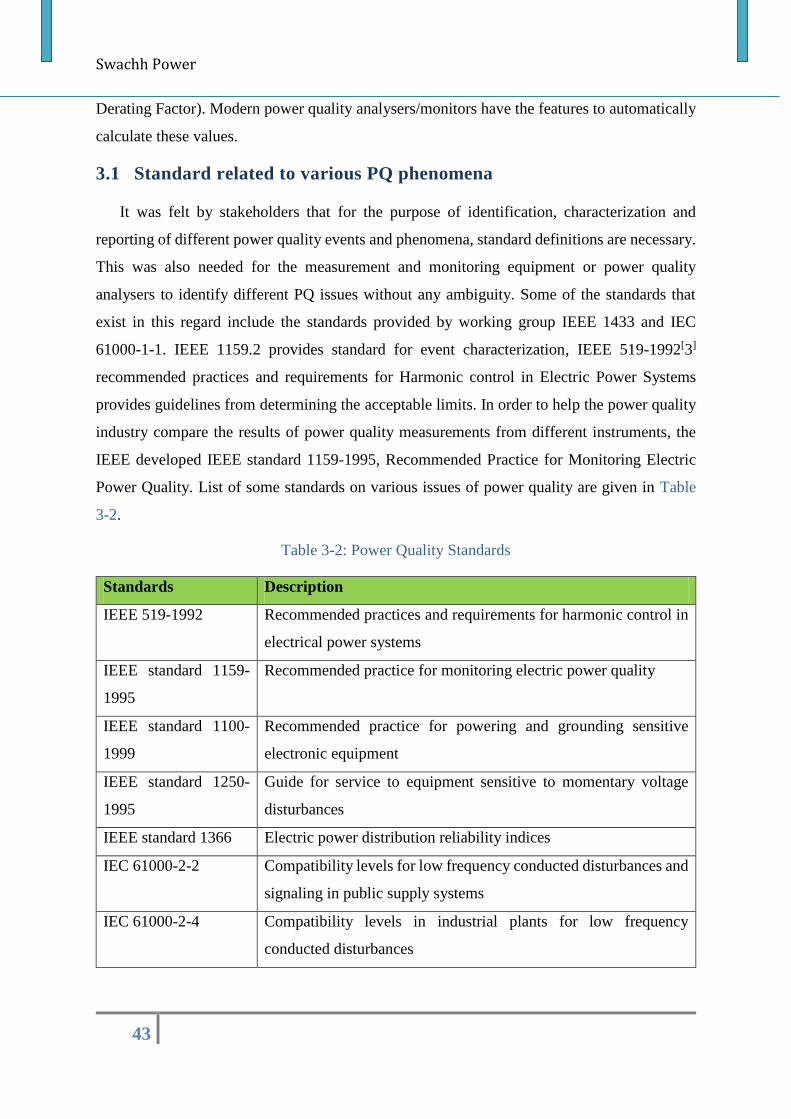
Swachh Power
43
Derating Factor). Modern power quality analysers/monitors have the features to automatically
calculate these values.
3.1 Standard related to various PQ phenomena
It was felt by stakeholders that for the purpose of identification, characterization and
reporting of different power quality events and phenomena, standard definitions are necessary.
This was also needed for the measurement and monitoring equipment or power quality
analysers to identify different PQ issues without any ambiguity. Some of the standards that
exist in this regard include the standards provided by working group IEEE 1433 and IEC
61000-1-1. IEEE 1159.2 provides standard for event characterization, IEEE 519-1992[3]
recommended practices and requirements for Harmonic control in Electric Power Systems
provides guidelines from determining the acceptable limits. In order to help the power quality
industry compare the results of power quality measurements from different instruments, the
IEEE developed IEEE standard 1159-1995, Recommended Practice for Monitoring Electric
Power Quality. List of some standards on various issues of power quality are given in Table
3-2.
Table 3-2: Power Quality Standards
Standards Description
IEEE 519-1992 Recommended practices and requirements for harmonic control in
electrical power systems
IEEE standard 1159-
1995
Recommended practice for monitoring electric power quality
IEEE standard 1100-
1999
Recommended practice for powering and grounding sensitive
electronic equipment
IEEE standard 1250-
1995
Guide for service to equipment sensitive to momentary voltage
disturbances
IEEE standard 1366 Electric power distribution reliability indices
IEC 61000-2-2 Compatibility levels for low frequency conducted disturbances and
signaling in public supply systems
IEC 61000-2-4 Compatibility levels in industrial plants for low frequency
conducted disturbances
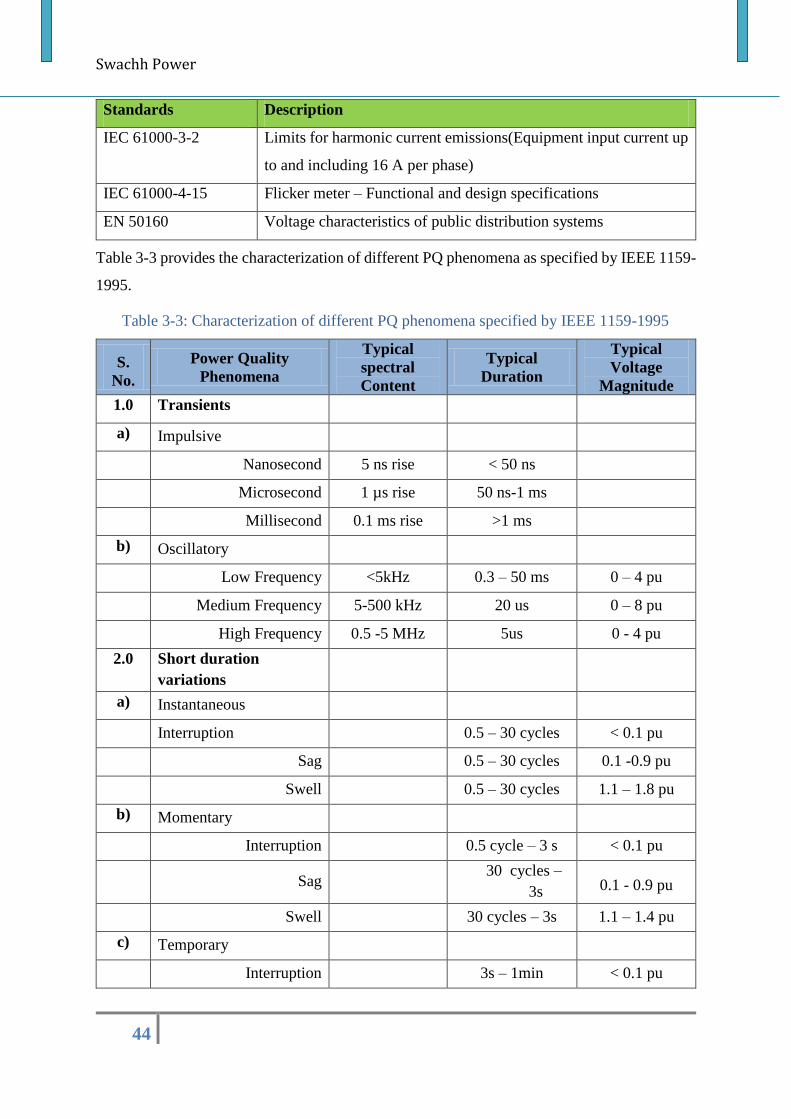
Swachh Power
44
Standards Description
IEC 61000-3-2 Limits for harmonic current emissions(Equipment input current up
to and including 16 A per phase)
IEC 61000-4-15 Flicker meter – Functional and design specifications
EN 50160 Voltage characteristics of public distribution systems
Table 3-3 provides the characterization of different PQ phenomena as specified by IEEE 1159-
1995.
Table 3-3: Characterization of different PQ phenomena specified by IEEE 1159-1995
S.
No.
Power Quality
Phenomena
Typical
spectral
Content
Typical
Duration
Typical
Voltage
Magnitude
1.0 Transients
a) Impulsive
Nanosecond 5 ns rise < 50 ns
Microsecond 1 µs rise 50 ns-1 ms
Millisecond 0.1 ms rise >1 ms
b) Oscillatory
Low Frequency <5kHz 0.3 – 50 ms 0 – 4 pu
Medium Frequency 5-500 kHz 20 us 0 – 8 pu
High Frequency 0.5 -5 MHz 5us 0 - 4 pu
2.0 Short duration
variations
a) Instantaneous
Interruption 0.5 – 30 cycles < 0.1 pu
Sag 0.5 – 30 cycles 0.1 -0.9 pu
Swell 0.5 – 30 cycles 1.1 – 1.8 pu
b) Momentary
Interruption 0.5 cycle – 3 s < 0.1 pu
Sag
30 cycles –
3s 0.1 - 0.9 pu
Swell 30 cycles – 3s 1.1 – 1.4 pu
c) Temporary
Interruption 3s – 1min < 0.1 pu
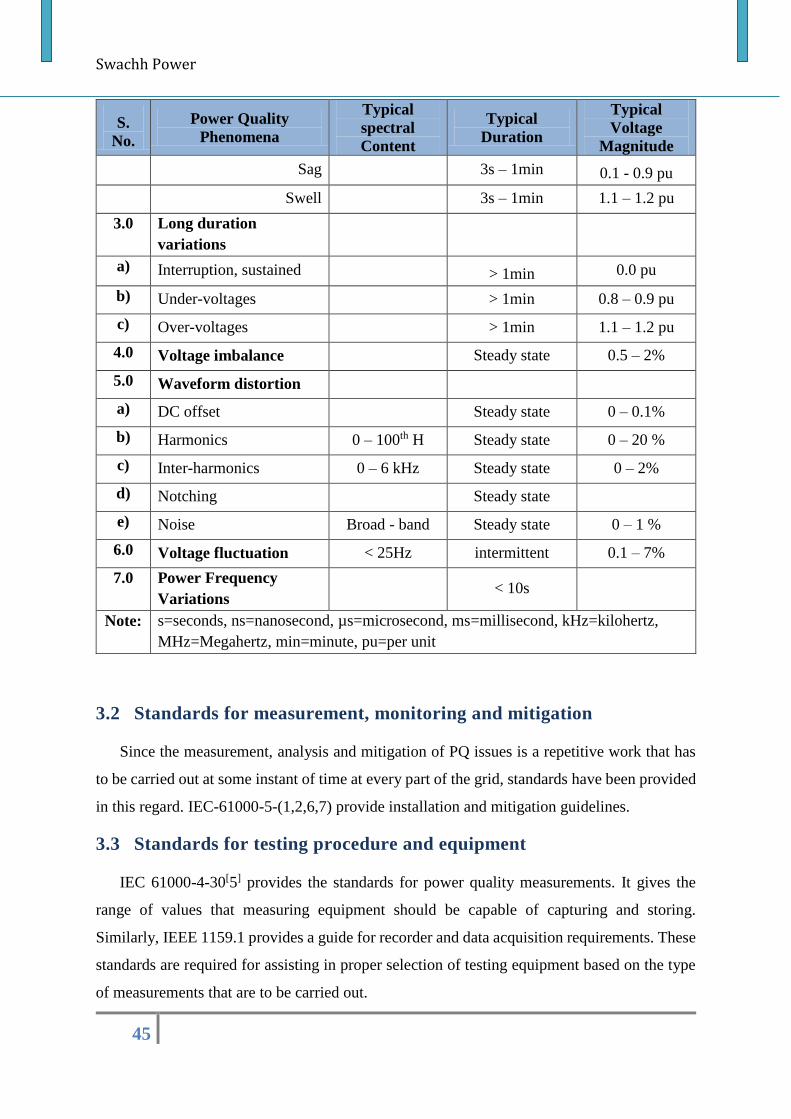
Swachh Power
45
S.
No.
Power Quality
Phenomena
Typical
spectral
Content
Typical
Duration
Typical
Voltage
Magnitude
Sag 3s – 1min 0.1 - 0.9 pu
Swell 3s – 1min 1.1 – 1.2 pu
3.0 Long duration
variations
a) Interruption, sustained > 1min 0.0 pu
b) Under-voltages > 1min 0.8 – 0.9 pu
c) Over-voltages > 1min 1.1 – 1.2 pu
4.0 Voltage imbalance Steady state 0.5 – 2%
5.0 Waveform distortion
a) DC offset Steady state 0 – 0.1%
b) Harmonics 0 – 100th H Steady state 0 – 20 %
c) Inter-harmonics 0 – 6 kHz Steady state 0 – 2%
d) Notching Steady state
e) Noise Broad - band Steady state 0 – 1 %
6.0 Voltage fluctuation < 25Hz intermittent 0.1 – 7%
7.0 Power Frequency
Variations < 10s
Note: s=seconds, ns=nanosecond, µs=microsecond, ms=millisecond, kHz=kilohertz,
MHz=Megahertz, min=minute, pu=per unit
3.2 Standards for measurement, monitoring and mitigation
Since the measurement, analysis and mitigation of PQ issues is a repetitive work that has
to be carried out at some instant of time at every part of the grid, standards have been provided
in this regard. IEC-61000-5-(1,2,6,7) provide installation and mitigation guidelines.
3.3 Standards for testing procedure and equipment
IEC 61000-4-30[5] provides the standards for power quality measurements. It gives the
range of values that measuring equipment should be capable of capturing and storing.
Similarly, IEEE 1159.1 provides a guide for recorder and data acquisition requirements. These
standards are required for assisting in proper selection of testing equipment based on the type
of measurements that are to be carried out.
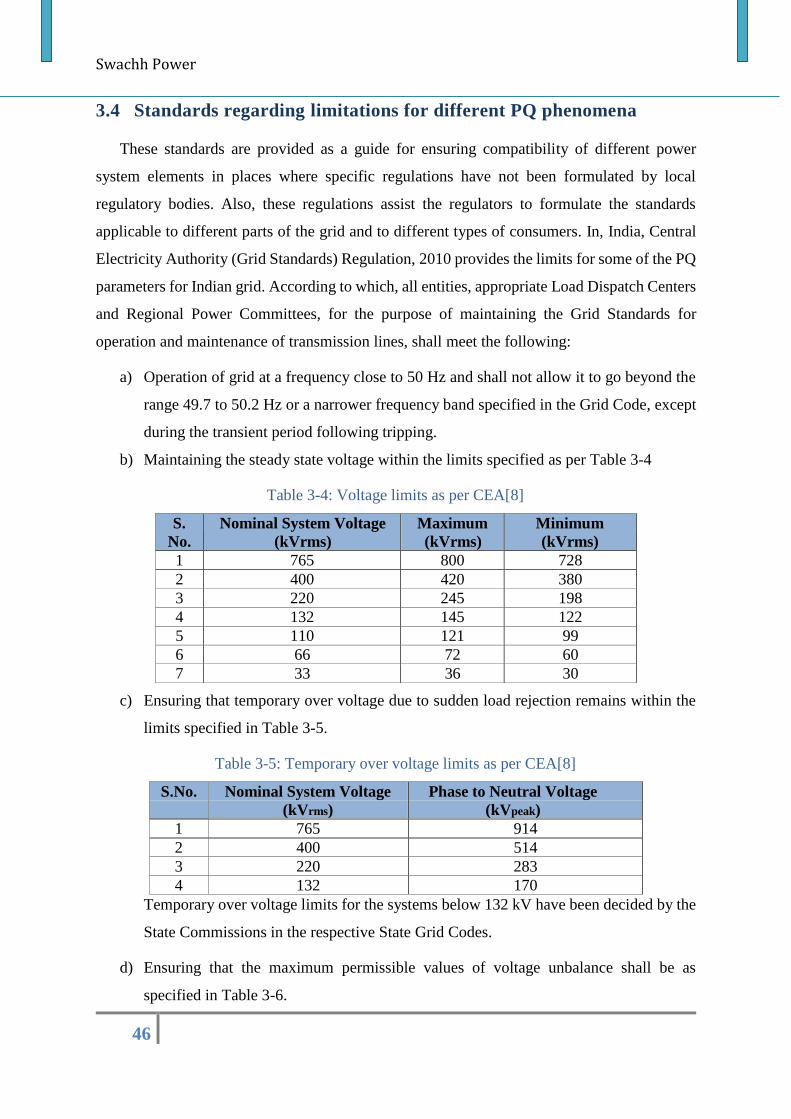
Swachh Power
46
3.4 Standards regarding limitations for different PQ phenomena
These standards are provided as a guide for ensuring compatibility of different power
system elements in places where specific regulations have not been formulated by local
regulatory bodies. Also, these regulations assist the regulators to formulate the standards
applicable to different parts of the grid and to different types of consumers. In, India, Central
Electricity Authority (Grid Standards) Regulation, 2010 provides the limits for some of the PQ
parameters for Indian grid. According to which, all entities, appropriate Load Dispatch Centers
and Regional Power Committees, for the purpose of maintaining the Grid Standards for
operation and maintenance of transmission lines, shall meet the following:
a) Operation of grid at a frequency close to 50 Hz and shall not allow it to go beyond the
range 49.7 to 50.2 Hz or a narrower frequency band specified in the Grid Code, except
during the transient period following tripping.
b) Maintaining the steady state voltage within the limits specified as per Table 3-4
Table 3-4: Voltage limits as per CEA[8]
S.
No.
Nominal System Voltage
(kVrms)
Maximum
(kVrms)
Minimum
(kVrms)
1 765 800 728
2 400 420 380
3 220 245 198
4 132 145 122
5 110 121 99
6 66 72 60
7 33 36 30
c) Ensuring that temporary over voltage due to sudden load rejection remains within the
limits specified in Table 3-5.
Table 3-5: Temporary over voltage limits as per CEA[8]
S.No. Nominal System Voltage
(kVrms)
Phase to Neutral Voltage
(kVpeak)
1 765 914
2 400 514
3 220 283
4 132 170
Temporary over voltage limits for the systems below 132 kV have been decided by the
State Commissions in the respective State Grid Codes.
d) Ensuring that the maximum permissible values of voltage unbalance shall be as
specified in Table 3-6.
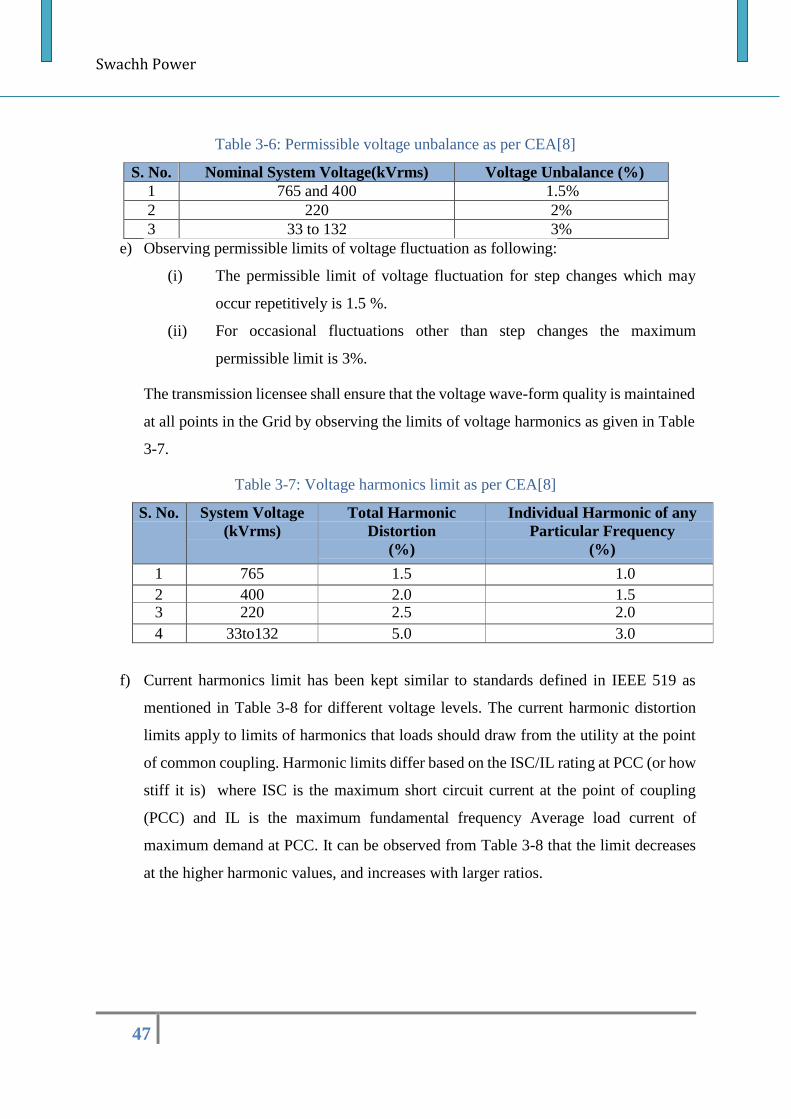
Swachh Power
47
Table 3-6: Permissible voltage unbalance as per CEA[8]
S. No. Nominal System Voltage(kVrms) Voltage Unbalance (%)
1 765 and 400 1.5%
2 220 2%
3 33 to 132 3%
e) Observing permissible limits of voltage fluctuation as following:
(i) The permissible limit of voltage fluctuation for step changes which may
occur repetitively is 1.5 %.
(ii) For occasional fluctuations other than step changes the maximum
permissible limit is 3%.
The transmission licensee shall ensure that the voltage wave-form quality is maintained
at all points in the Grid by observing the limits of voltage harmonics as given in Table
3-7.
Table 3-7: Voltage harmonics limit as per CEA[8]
S. No. System Voltage
(kVrms)
Total Harmonic
Distortion
(%)
Individual Harmonic of any
Particular Frequency
(%)
1 765 1.5 1.0
2 400 2.0 1.5 3 220 2.5 2.0
4 33to132 5.0 3.0
f) Current harmonics limit has been kept similar to standards defined in IEEE 519 as
mentioned in Table 3-8 for different voltage levels. The current harmonic distortion
limits apply to limits of harmonics that loads should draw from the utility at the point
of common coupling. Harmonic limits differ based on the ISC/IL rating at PCC (or how
stiff it is) where ISC is the maximum short circuit current at the point of coupling
(PCC) and IL is the maximum fundamental frequency Average load current of
maximum demand at PCC. It can be observed from Table 3-8 that the limit decreases
at the higher harmonic values, and increases with larger ratios.
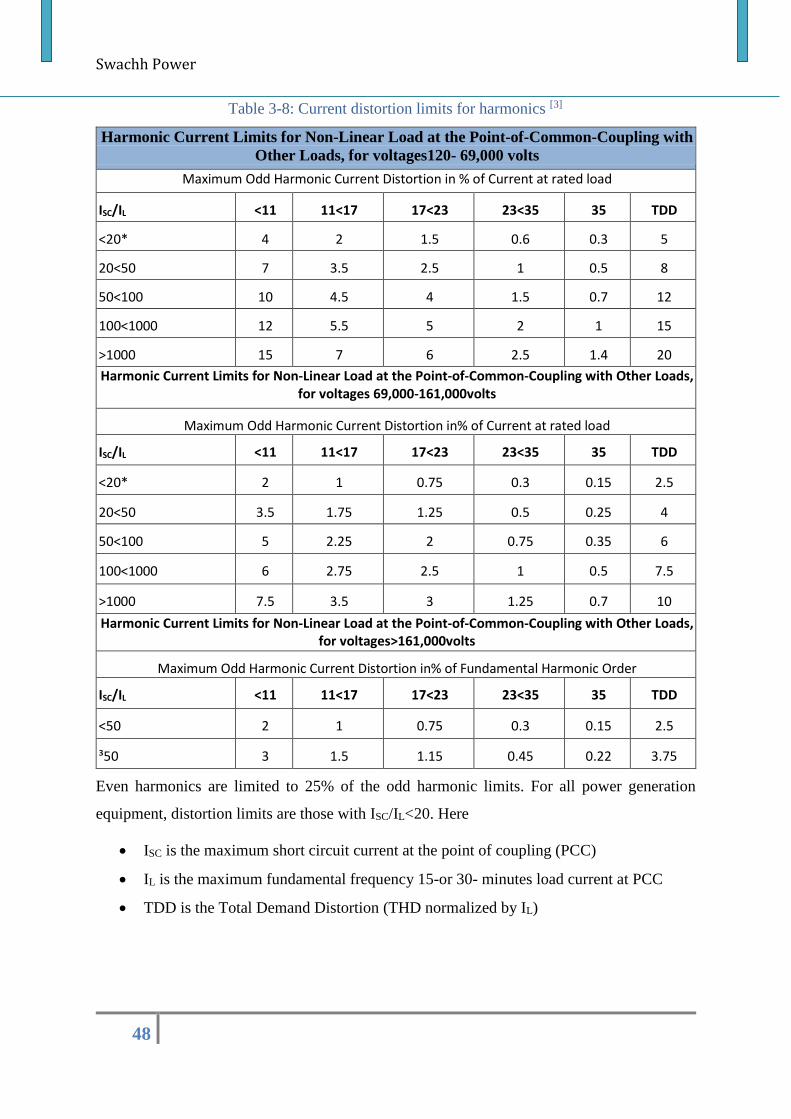
Swachh Power
48
Table 3-8: Current distortion limits for harmonics [3]
Harmonic Current Limits for Non-Linear Load at the Point-of-Common-Coupling with
Other Loads, for voltages120- 69,000 volts
Maximum Odd Harmonic Current Distortion in % of Current at rated load
ISC/IL <11 11<17 17<23 23<35 35 TDD
<20* 4 2 1.5 0.6 0.3 5
20<50 7 3.5 2.5 1 0.5 8
50<100 10 4.5 4 1.5 0.7 12
100<1000 12 5.5 5 2 1 15
>1000 15 7 6 2.5 1.4 20
Harmonic Current Limits for Non-Linear Load at the Point-of-Common-Coupling with Other Loads, for voltages 69,000-161,000volts
Maximum Odd Harmonic Current Distortion in% of Current at rated load
ISC/IL <11 11<17 17<23 23<35 35 TDD
<20* 2 1 0.75 0.3 0.15 2.5
20<50 3.5 1.75 1.25 0.5 0.25 4
50<100 5 2.25 2 0.75 0.35 6
100<1000 6 2.75 2.5 1 0.5 7.5
>1000 7.5 3.5 3 1.25 0.7 10
Harmonic Current Limits for Non-Linear Load at the Point-of-Common-Coupling with Other Loads, for voltages>161,000volts
Maximum Odd Harmonic Current Distortion in% of Fundamental Harmonic Order
ISC/IL <11 11<17 17<23 23<35 35 TDD
<50 2 1 0.75 0.3 0.15 2.5
³50 3 1.5 1.15 0.45 0.22 3.75
Even harmonics are limited to 25% of the odd harmonic limits. For all power generation
equipment, distortion limits are those with ISC/IL<20. Here
ISC is the maximum short circuit current at the point of coupling (PCC)
IL is the maximum fundamental frequency 15-or 30- minutes load current at PCC
TDD is the Total Demand Distortion (THD normalized by IL)
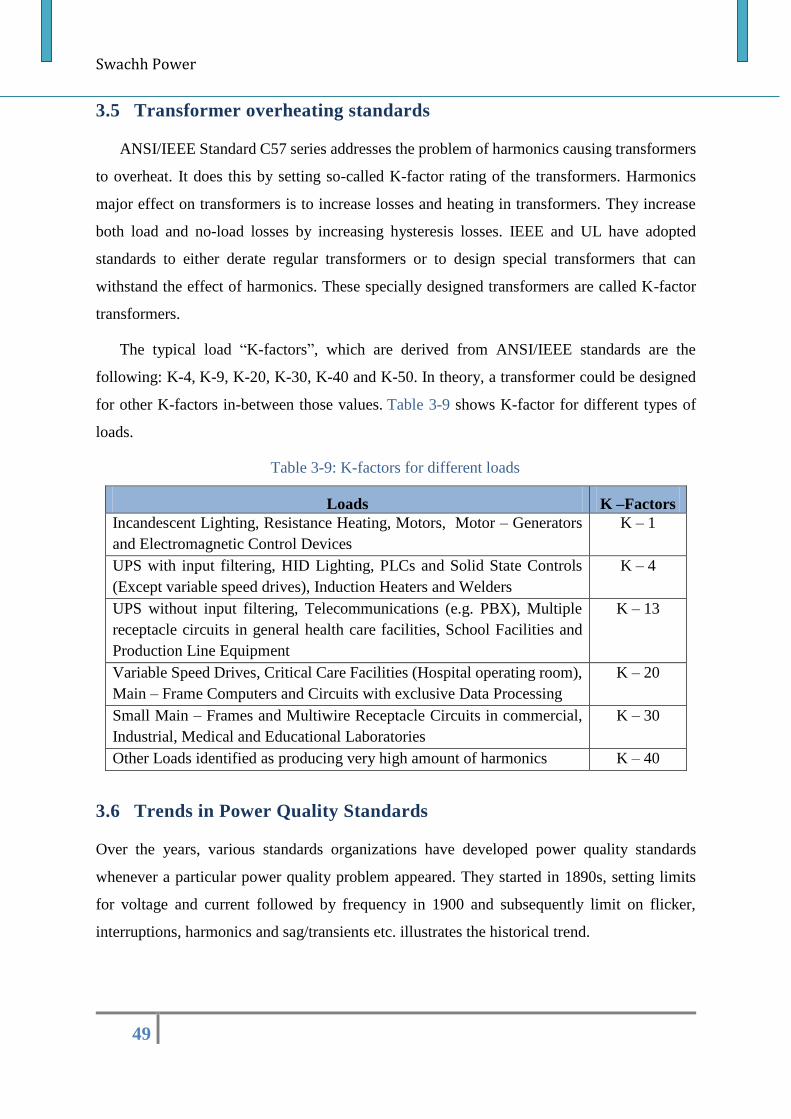
Swachh Power
49
3.5 Transformer overheating standards
ANSI/IEEE Standard C57 series addresses the problem of harmonics causing transformers
to overheat. It does this by setting so-called K-factor rating of the transformers. Harmonics
major effect on transformers is to increase losses and heating in transformers. They increase
both load and no-load losses by increasing hysteresis losses. IEEE and UL have adopted
standards to either derate regular transformers or to design special transformers that can
withstand the effect of harmonics. These specially designed transformers are called K-factor
transformers.
The typical load “K-factors”, which are derived from ANSI/IEEE standards are the
following: K-4, K-9, K-20, K-30, K-40 and K-50. In theory, a transformer could be designed
for other K-factors in-between those values. Table 3-9 shows K-factor for different types of
loads.
Table 3-9: K-factors for different loads
Loads K –Factors
Incandescent Lighting, Resistance Heating, Motors, Motor – Generators
and Electromagnetic Control Devices
K – 1
UPS with input filtering, HID Lighting, PLCs and Solid State Controls
(Except variable speed drives), Induction Heaters and Welders
K – 4
UPS without input filtering, Telecommunications (e.g. PBX), Multiple
receptacle circuits in general health care facilities, School Facilities and
Production Line Equipment
K – 13
Variable Speed Drives, Critical Care Facilities (Hospital operating room),
Main – Frame Computers and Circuits with exclusive Data Processing
K – 20
Small Main – Frames and Multiwire Receptacle Circuits in commercial,
Industrial, Medical and Educational Laboratories
K – 30
Other Loads identified as producing very high amount of harmonics K – 40
3.6 Trends in Power Quality Standards
Over the years, various standards organizations have developed power quality standards
whenever a particular power quality problem appeared. They started in 1890s, setting limits
for voltage and current followed by frequency in 1900 and subsequently limit on flicker,
interruptions, harmonics and sag/transients etc. illustrates the historical trend.
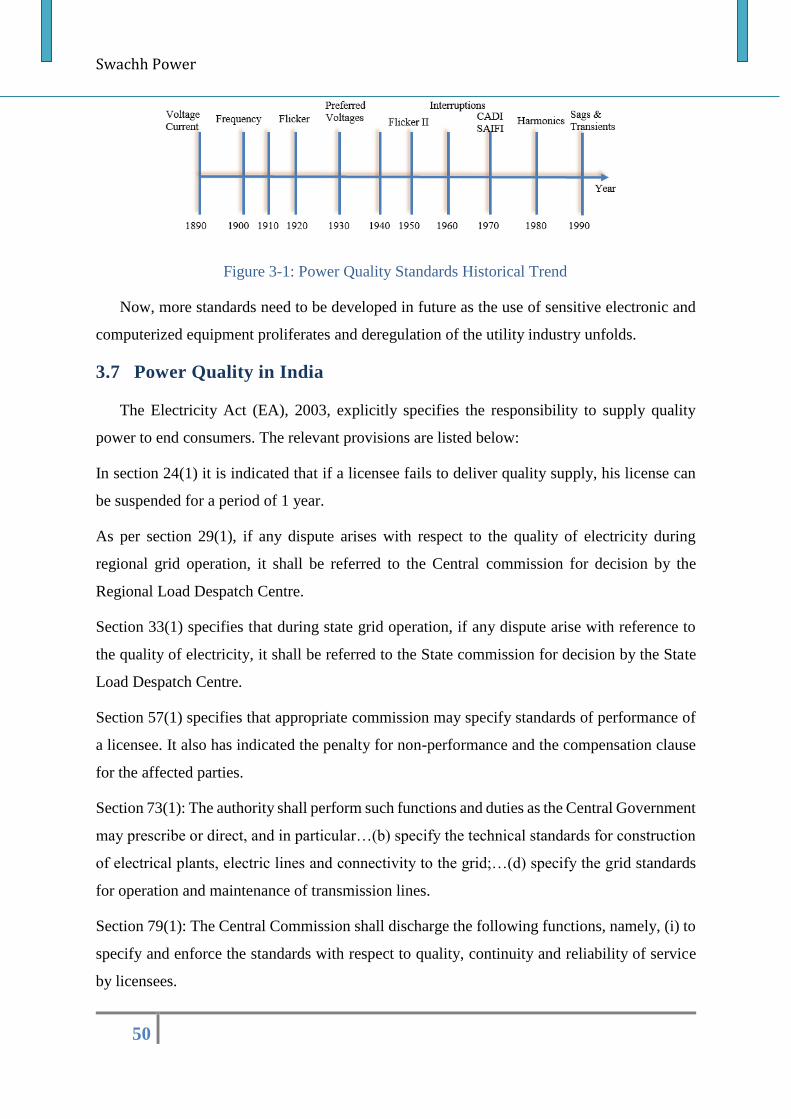
Swachh Power
50
Figure 3-1: Power Quality Standards Historical Trend
Now, more standards need to be developed in future as the use of sensitive electronic and
computerized equipment proliferates and deregulation of the utility industry unfolds.
3.7 Power Quality in India
The Electricity Act (EA), 2003, explicitly specifies the responsibility to supply quality
power to end consumers. The relevant provisions are listed below:
In section 24(1) it is indicated that if a licensee fails to deliver quality supply, his license can
be suspended for a period of 1 year.
As per section 29(1), if any dispute arises with respect to the quality of electricity during
regional grid operation, it shall be referred to the Central commission for decision by the
Regional Load Despatch Centre.
Section 33(1) specifies that during state grid operation, if any dispute arise with reference to
the quality of electricity, it shall be referred to the State commission for decision by the State
Load Despatch Centre.
Section 57(1) specifies that appropriate commission may specify standards of performance of
a licensee. It also has indicated the penalty for non-performance and the compensation clause
for the affected parties.
Section 73(1): The authority shall perform such functions and duties as the Central Government
may prescribe or direct, and in particular…(b) specify the technical standards for construction
of electrical plants, electric lines and connectivity to the grid;…(d) specify the grid standards
for operation and maintenance of transmission lines.
Section 79(1): The Central Commission shall discharge the following functions, namely, (i) to
specify and enforce the standards with respect to quality, continuity and reliability of service
by licensees.
Swachh Power
51
Section 86 (1): The State Commission shall discharge the following functions, namely, (i)
specify and enforce standards with respect to quality, continuity and reliability of service by
licensees.
Electricity supply code for distribution utilities has to be specified by the regulator, under
section 50. The technical standards for construction of electrical plants and electric lines and
connectivity to the grid under clause (b) of section 73 and the grid standards specified under
clause (d) of section 73 have to be specified by the Central Electricity Authority(CEA). Grid
code has to be specified by the Central Commission under clause (h) of sub-section (1) of
section 79 and the State Grid Code referred to under clause (h) of sub-section (1) of section 86
has to be specified by the respective State Commission.
Standards & Code: In line with EA 2003, provisions, Central Electricity Authority (Technical Standard for
Grid Connectivity) Regulations, 2007, was notified in the Gazette of India on 17th February
2007. The standard specified include limits of steady-state e, temporary overvoltage due to
sudden load rejection, maximum permissible value of voltage unbalance, maximum fault
clearance times, voltage waveform quality and so on.
Central Electricity Authority (Grid Standard) Regulations, 2010, was notified in the Gazette of
India on 26th June 2010.
Central Electricity Authority (Technical Standard for Construction of Electrical Plants and
Electrical Lines) Regulations, 2010, was notified in the official Gazette on 20th August 2010.
Central Electricity Regulatory Commission (Indian Electricity Grid Code) Regulations, 2010,
was notified on 28th April 2010.
Most of the State Electricity Regulatory Commissions (SERCs) have notified state Grid Code,
supply code and standard of performance regulations, in line with EA 2003 provisions.
Some SERCs have notified distribution codes. Gujarat Electricity Regulatory Commission has
notified ‘Gujarat Electricity Distribution Code’ on 25th August, 2004. Orissa Electricity
Regulatory Commission has constituted a PQ monitoring committee to oversee the quality of
Supply.
Though various standards and codes have specified PQ norms, monitoring mechanism is
missing or not effective. PQ implementation status needs to be reviewed by regulatory bodies.
Distribution utilities shall have to observe the norms mentioned in the standard of performance
Swachh Power
52
regulation. SERCs may have to evaluate the PQ performance index of licensees; full Return on
Equity (RoE) in the Annual revenue requirement of a licensee can be approved based on
achievement of the stipulated PQ index/norms.
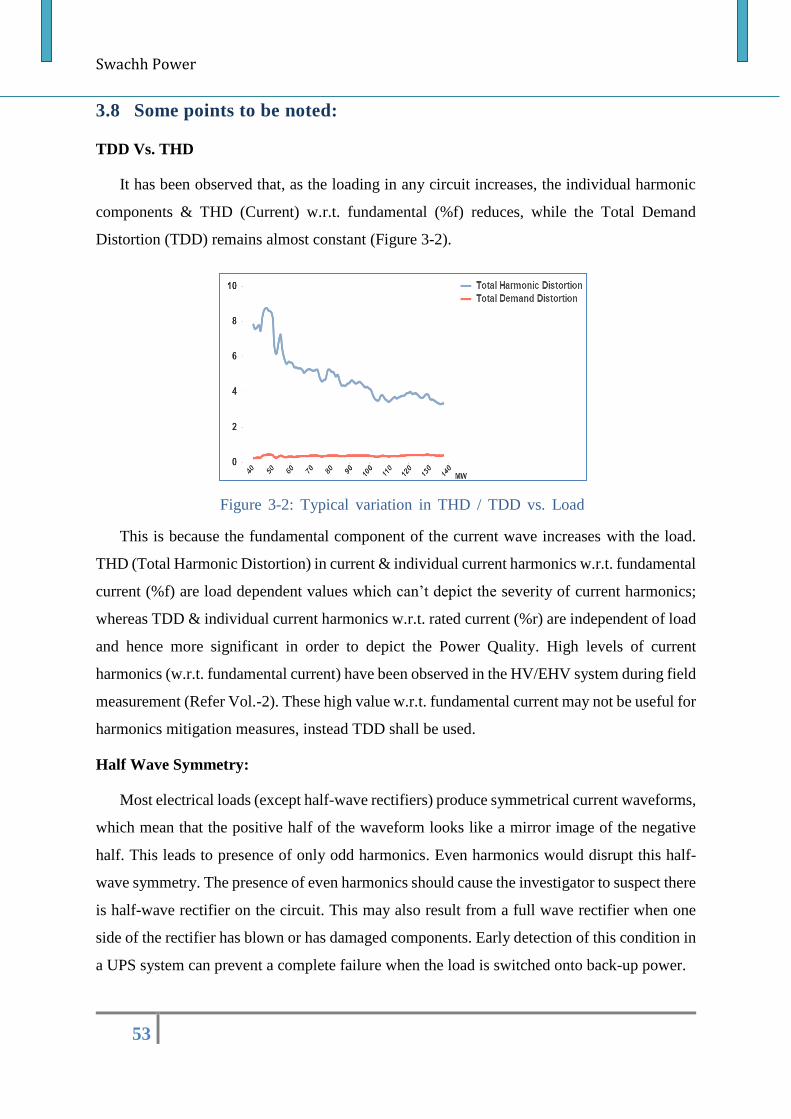
Swachh Power
53
3.8 Some points to be noted:
TDD Vs. THD
It has been observed that, as the loading in any circuit increases, the individual harmonic
components & THD (Current) w.r.t. fundamental (%f) reduces, while the Total Demand
Distortion (TDD) remains almost constant (Figure 3-2).
This is because the fundamental component of the current wave increases with the load.
THD (Total Harmonic Distortion) in current & individual current harmonics w.r.t. fundamental
current (%f) are load dependent values which can’t depict the severity of current harmonics;
whereas TDD & individual current harmonics w.r.t. rated current (%r) are independent of load
and hence more significant in order to depict the Power Quality. High levels of current
harmonics (w.r.t. fundamental current) have been observed in the HV/EHV system during field
measurement (Refer Vol.-2). These high value w.r.t. fundamental current may not be useful for
harmonics mitigation measures, instead TDD shall be used.
Half Wave Symmetry:
Most electrical loads (except half-wave rectifiers) produce symmetrical current waveforms,
which mean that the positive half of the waveform looks like a mirror image of the negative
half. This leads to presence of only odd harmonics. Even harmonics would disrupt this half-
wave symmetry. The presence of even harmonics should cause the investigator to suspect there
is half-wave rectifier on the circuit. This may also result from a full wave rectifier when one
side of the rectifier has blown or has damaged components. Early detection of this condition in
a UPS system can prevent a complete failure when the load is switched onto back-up power.
Figure 3-2: Typical variation in THD / TDD vs. Load
(MW)
Swachh Power
54
Neutral conductor loading
Single phase nonlinear electronic loads will draw current only during the peak of the
voltage waveform. These loads combined in a three phase circuit produce triplen harmonics
(multiple of third order harmonics, like third, ninth, fifteenth). Triplen harmonics do not cancel
one other but are additive and return exclusively through the neutral conductor. Thus, the
neutral current may exceed the capacity of the neutral conductor.
***

Swachh Power
55
Swachh Power
56
Chapter-4
4 International Experiences on
Power Quality Management The availability of sophisticated and sensitive technologies& appliances at consumer end
has led demand for higher levels of power quality across the world. To meet these needs,
various approaches have been followed by utilities. Some utility companies have set up
premium power quality contracts for their customers, whereas some identify the additional
costs involved in providing the services and bill the customer for it. Regulators have also played
their role in fixing standards of power quality. Council of European Energy Regulators
(CEER), in their report titled "Quality of Electricity Supply-Initial Benchmarking on Actual
Levels, Standards, and Regulatory Strategies", provides a regulatory view on power quality
and regulations as below:
“Where market competition replaces monopoly regimes, quality competition should
replace quality regulation; however complete withdrawal of the regulator is not usually
possible because, while some quality factors can be individually negotiated, others cannot”.
Some of the innovative methods and approaches for providing quality power to customer
internationally have been discussed below:
4.1 Power Quality Contracts
The utility companies in some countries around the world have set up a program for power
quality contracts. For customers, who wish premium power, are supplied through dedicated
feeder fulfilling the power quality needs of customers. Some of the programs are described
below:
4.1.1 Power quality contracts by EdF (Électricité de France), France
At the beginning of 1990, the use of increasingly sophisticated and more sensitive
electronic equipment led to EdFs customers requesting higher levels of power quality. In order
to fulfill the customers’ needs, EdF set up a number of electricity quality contracts and services
for large and medium customers. In 1994, EdF began to use the “Emeraude”contract as an
experiment for 6,000 customers. Presently, EdF offer their customers customized contracts
with assigned voltage quality levels (“engagements” or contractual levels). If the customer
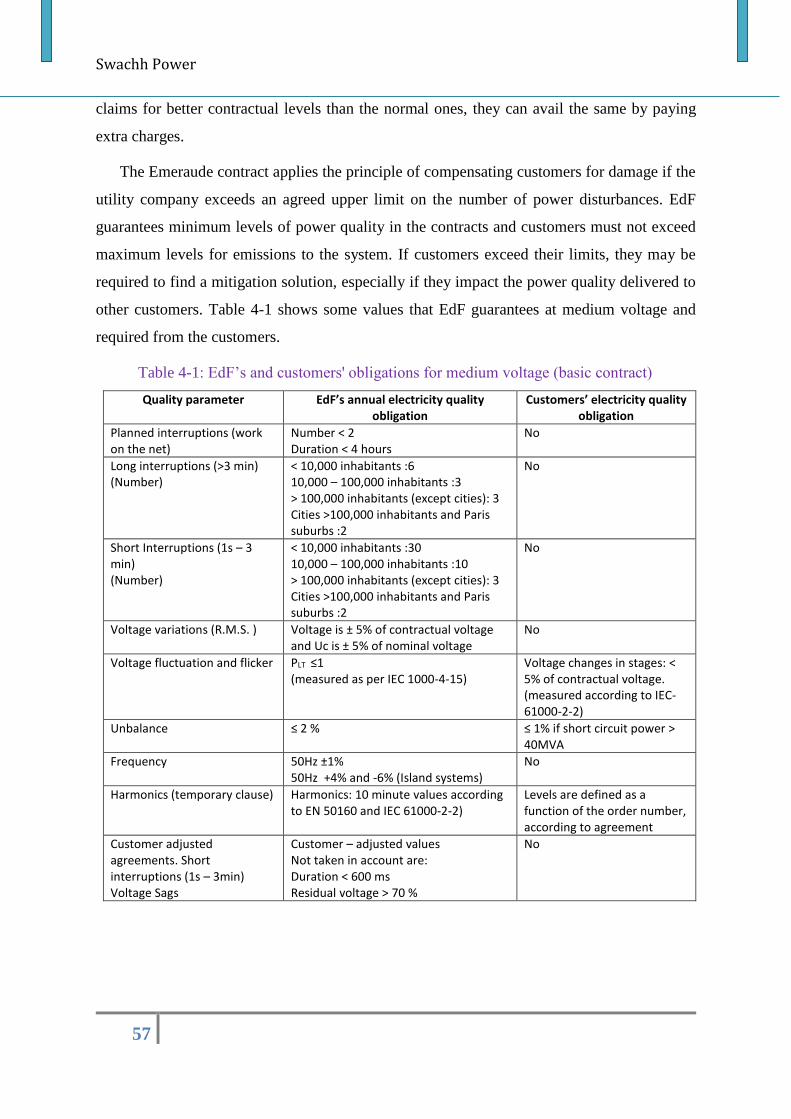
Swachh Power
57
claims for better contractual levels than the normal ones, they can avail the same by paying
extra charges.
The Emeraude contract applies the principle of compensating customers for damage if the
utility company exceeds an agreed upper limit on the number of power disturbances. EdF
guarantees minimum levels of power quality in the contracts and customers must not exceed
maximum levels for emissions to the system. If customers exceed their limits, they may be
required to find a mitigation solution, especially if they impact the power quality delivered to
other customers. Table 4-1 shows some values that EdF guarantees at medium voltage and
required from the customers.
Table 4-1: EdF’s and customers' obligations for medium voltage (basic contract)
Quality parameter EdF’s annual electricity quality obligation
Customers’ electricity quality obligation
Planned interruptions (work on the net)
Number < 2 Duration < 4 hours
No
Long interruptions (>3 min) (Number)
< 10,000 inhabitants :6 10,000 – 100,000 inhabitants :3 > 100,000 inhabitants (except cities): 3 Cities >100,000 inhabitants and Paris suburbs :2
No
Short Interruptions (1s – 3 min) (Number)
< 10,000 inhabitants :30 10,000 – 100,000 inhabitants :10 > 100,000 inhabitants (except cities): 3 Cities >100,000 inhabitants and Paris suburbs :2
No
Voltage variations (R.M.S. ) Voltage is ± 5% of contractual voltage and Uc is ± 5% of nominal voltage
No
Voltage fluctuation and flicker PLT ≤1 (measured as per IEC 1000-4-15)
Voltage changes in stages: < 5% of contractual voltage. (measured according to IEC-61000-2-2)
Unbalance ≤ 2 % ≤ 1% if short circuit power > 40MVA
Frequency 50Hz ±1% 50Hz +4% and -6% (Island systems)
No
Harmonics (temporary clause) Harmonics: 10 minute values according to EN 50160 and IEC 61000-2-2)
Levels are defined as a function of the order number, according to agreement
Customer adjusted agreements. Short interruptions (1s – 3min) Voltage Sags
Customer – adjusted values Not taken in account are: Duration < 600 ms Residual voltage > 70 %
No
Swachh Power
58
4.1.2 Detroit Edison Company, USA
The Detroit Edison Company (DEC), a subsidiary of DTE Energy, is one of the largest
electricity utility companies in the USA. It serves more than 2.2 million customers in South-
East Michigan, the America industrial heartland. DEC offers a special manufacturing contract
(SMC) with premium power quality for manufacturers (automotive industry) in their region.
On the other hand, DEC also offers special interruptible rates to residential, commercial and
industrial customers. Customers get discounted electricity prices in return for permission to
occasionally interrupt electrical service.
The DEC Special Manufacturing Contract (SMC) was introduced in 1994 for three of
DEC's largest customers: the Chrysler Corporation (after 1998, DaimlerChrysler), the Ford
Motor Company and General Motors Corporation, who wanted to decrease their cost due to
competition in automotive market. .DEC on the other hand was cautious about losing these
companies to other electricity suppliers.
Presently such contracts are offered to many customers covering offices, assembly
factories, processing plants and component delivery departments. The SMC specifies that the
manufacturers are compensated when certain levels of predefined parameters have been
exceeded.
4.1.3 National Electricity Regulator (NER), South Africa
The establishment of an Electricity Regulator in South Africa in 1995 led to the creation of
five national Quality of Supply standards (NRS-048) between 1996 and 1998. In 2004 the
National Energy Regulator Act was passed and in 2005 the National Energy Regulator of South
Africa (NERSA) was established. NERSA enforces Quality of Supply standards within South
Africa.
Regulatory framework for utilities prepared by NER, South Africa embodied power quality
directives. These directives include mechanisms to ensure information to customers about their
rights and obligations regarding power quality, establishment of accessible power quality
complaints resolution mechanisms, identification & development of appropriate standards and
codes of practice on power quality, ensuring the long-term sustainability of the supply industry
with regard to power quality and ensuring appropriate power quality performance information
is made available through measurement, data management, and statistical analysis.
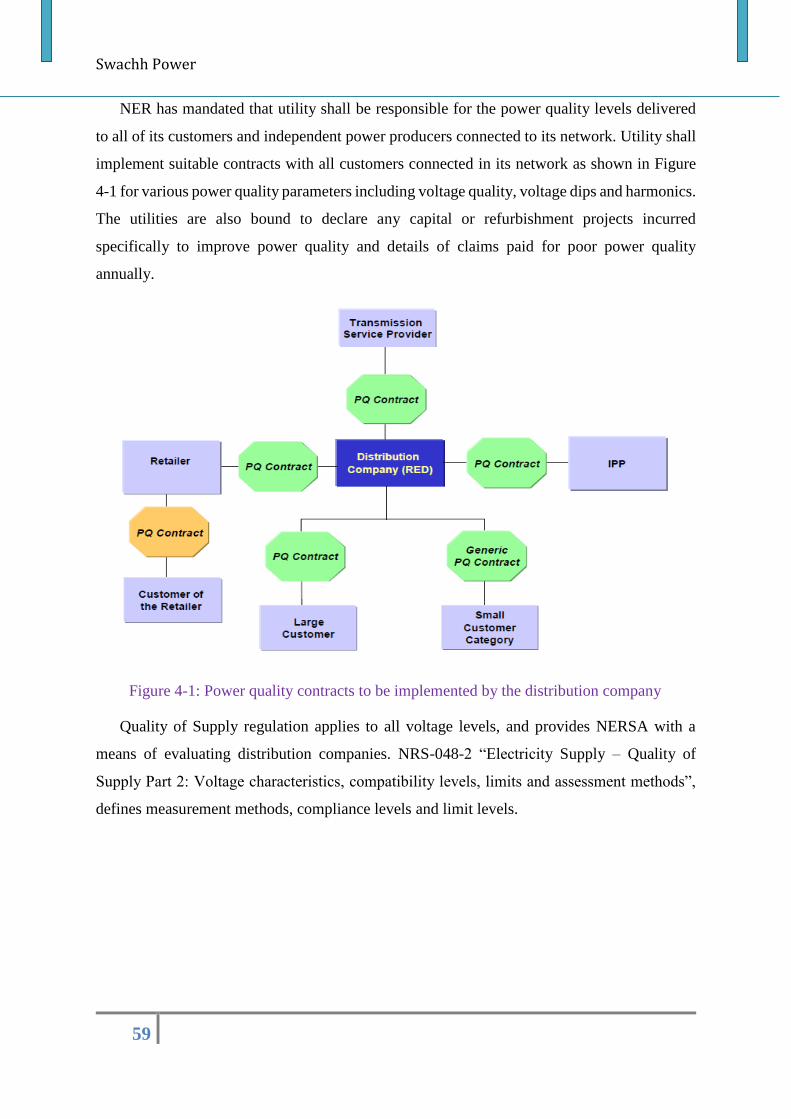
Swachh Power
59
NER has mandated that utility shall be responsible for the power quality levels delivered
to all of its customers and independent power producers connected to its network. Utility shall
implement suitable contracts with all customers connected in its network as shown in Figure
4-1 for various power quality parameters including voltage quality, voltage dips and harmonics.
The utilities are also bound to declare any capital or refurbishment projects incurred
specifically to improve power quality and details of claims paid for poor power quality
annually.
Figure 4-1: Power quality contracts to be implemented by the distribution company
Quality of Supply regulation applies to all voltage levels, and provides NERSA with a
means of evaluating distribution companies. NRS-048-2 “Electricity Supply – Quality of
Supply Part 2: Voltage characteristics, compatibility levels, limits and assessment methods”,
defines measurement methods, compliance levels and limit levels.
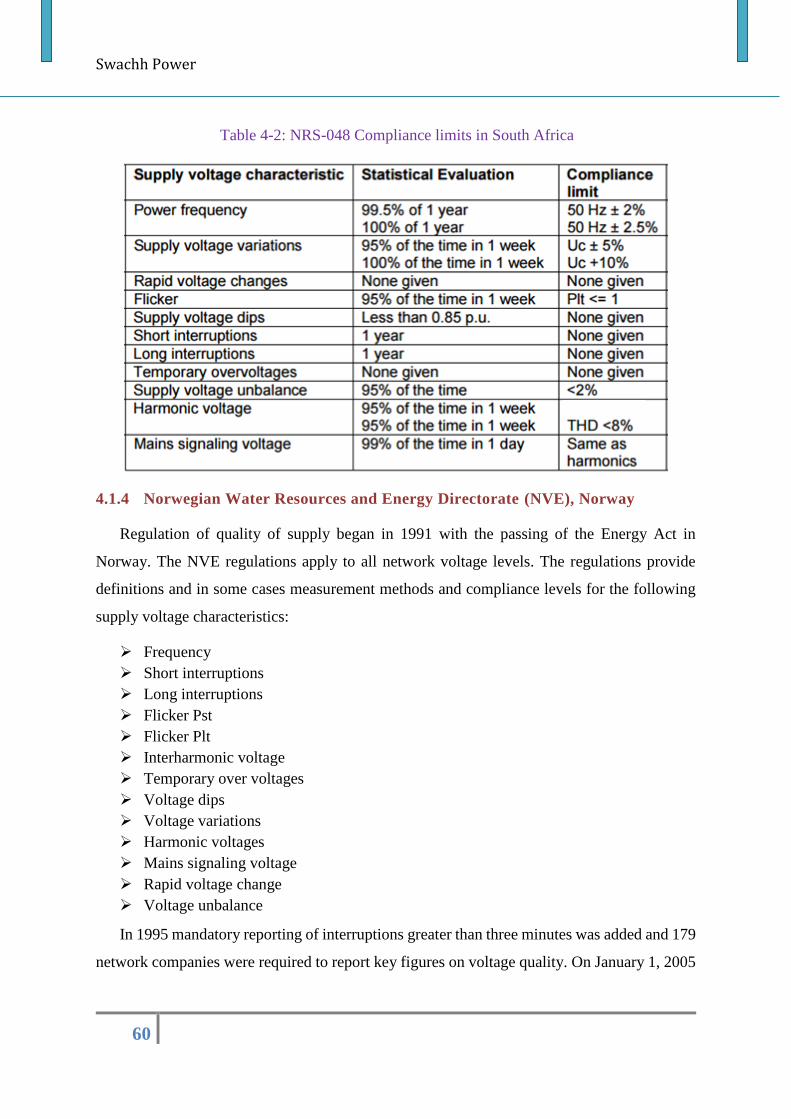
Swachh Power
60
4.1.4 Norwegian Water Resources and Energy Directorate (NVE), Norway
Regulation of quality of supply began in 1991 with the passing of the Energy Act in
Norway. The NVE regulations apply to all network voltage levels. The regulations provide
definitions and in some cases measurement methods and compliance levels for the following
supply voltage characteristics:
Frequency
Short interruptions
Long interruptions
Flicker Pst
Flicker Plt
Interharmonic voltage
Temporary over voltages
Voltage dips
Voltage variations
Harmonic voltages
Mains signaling voltage
Rapid voltage change
Voltage unbalance
In 1995 mandatory reporting of interruptions greater than three minutes was added and 179
network companies were required to report key figures on voltage quality. On January 1, 2005
Table 4-2: NRS-048 Compliance limits in South Africa
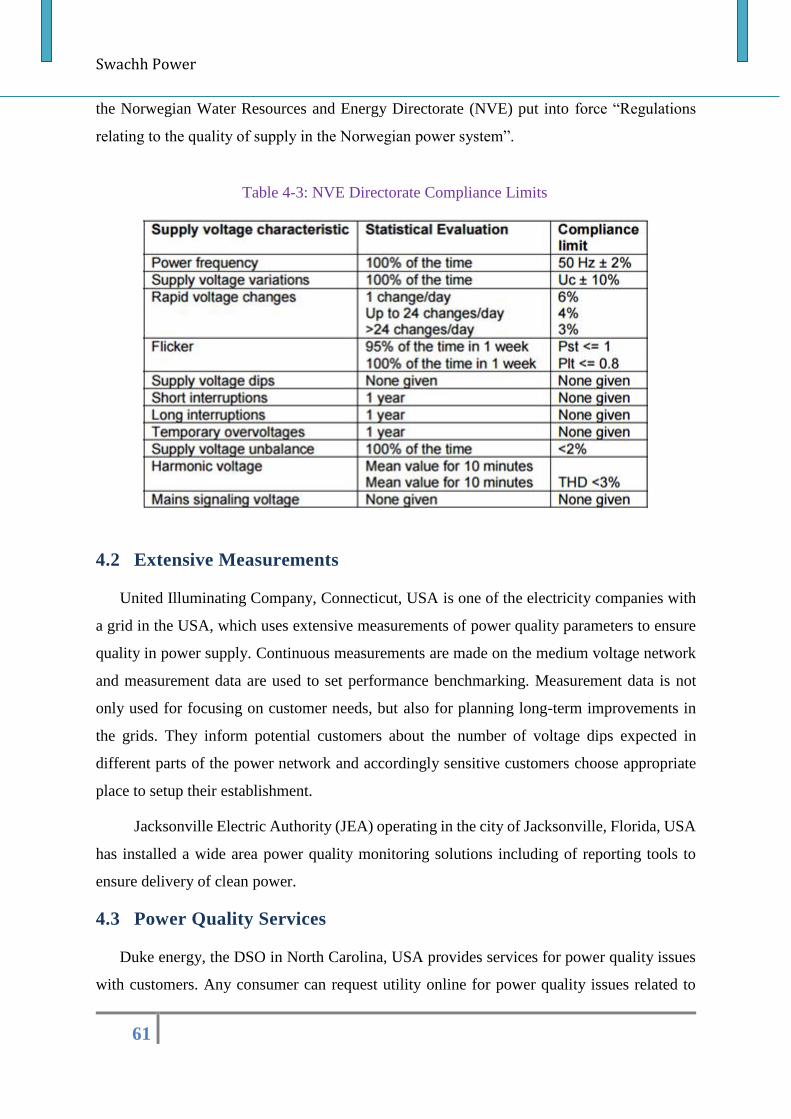
Swachh Power
61
the Norwegian Water Resources and Energy Directorate (NVE) put into force “Regulations
relating to the quality of supply in the Norwegian power system”.
4.2 Extensive Measurements
United Illuminating Company, Connecticut, USA is one of the electricity companies with
a grid in the USA, which uses extensive measurements of power quality parameters to ensure
quality in power supply. Continuous measurements are made on the medium voltage network
and measurement data are used to set performance benchmarking. Measurement data is not
only used for focusing on customer needs, but also for planning long-term improvements in
the grids. They inform potential customers about the number of voltage dips expected in
different parts of the power network and accordingly sensitive customers choose appropriate
place to setup their establishment.
Jacksonville Electric Authority (JEA) operating in the city of Jacksonville, Florida, USA
has installed a wide area power quality monitoring solutions including of reporting tools to
ensure delivery of clean power.
4.3 Power Quality Services
Duke energy, the DSO in North Carolina, USA provides services for power quality issues
with customers. Any consumer can request utility online for power quality issues related to
Table 4-3: NVE Directorate Compliance Limits
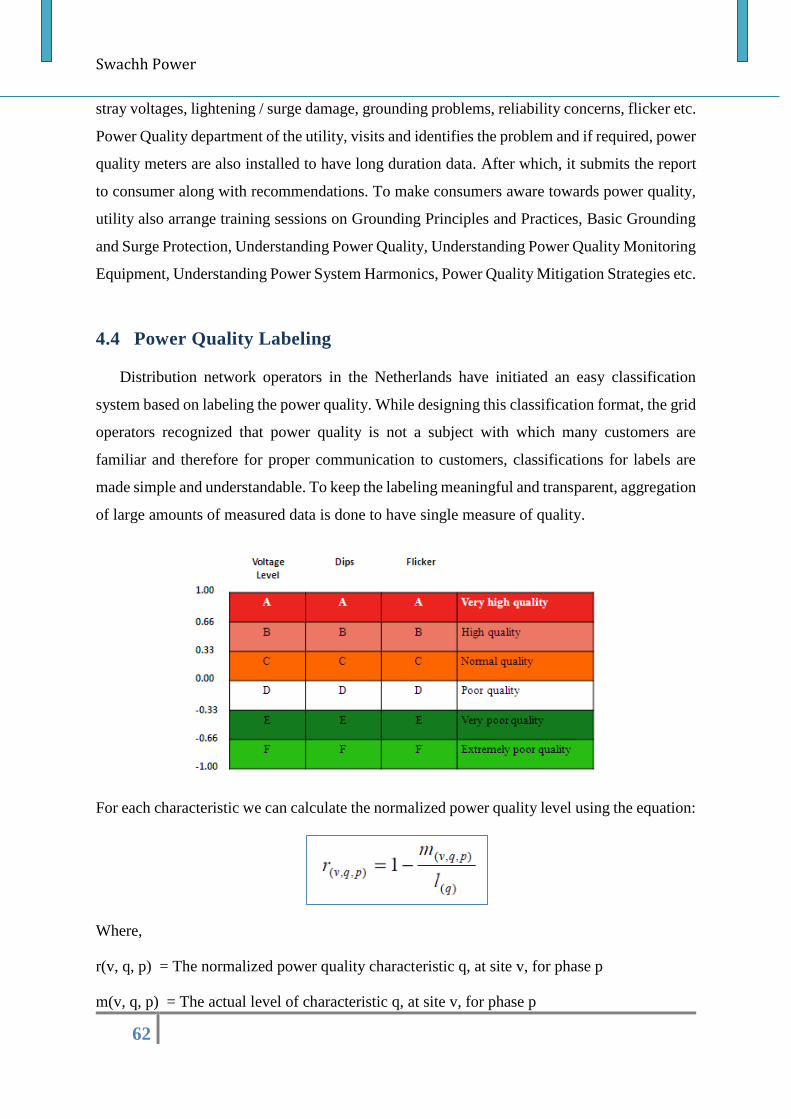
Swachh Power
62
stray voltages, lightening / surge damage, grounding problems, reliability concerns, flicker etc.
Power Quality department of the utility, visits and identifies the problem and if required, power
quality meters are also installed to have long duration data. After which, it submits the report
to consumer along with recommendations. To make consumers aware towards power quality,
utility also arrange training sessions on Grounding Principles and Practices, Basic Grounding
and Surge Protection, Understanding Power Quality, Understanding Power Quality Monitoring
Equipment, Understanding Power System Harmonics, Power Quality Mitigation Strategies etc.
4.4 Power Quality Labeling
Distribution network operators in the Netherlands have initiated an easy classification
system based on labeling the power quality. While designing this classification format, the grid
operators recognized that power quality is not a subject with which many customers are
familiar and therefore for proper communication to customers, classifications for labels are
made simple and understandable. To keep the labeling meaningful and transparent, aggregation
of large amounts of measured data is done to have single measure of quality.
For each characteristic we can calculate the normalized power quality level using the equation:
Where,
r(v, q, p) = The normalized power quality characteristic q, at site v, for phase p
m(v, q, p) = The actual level of characteristic q, at site v, for phase p
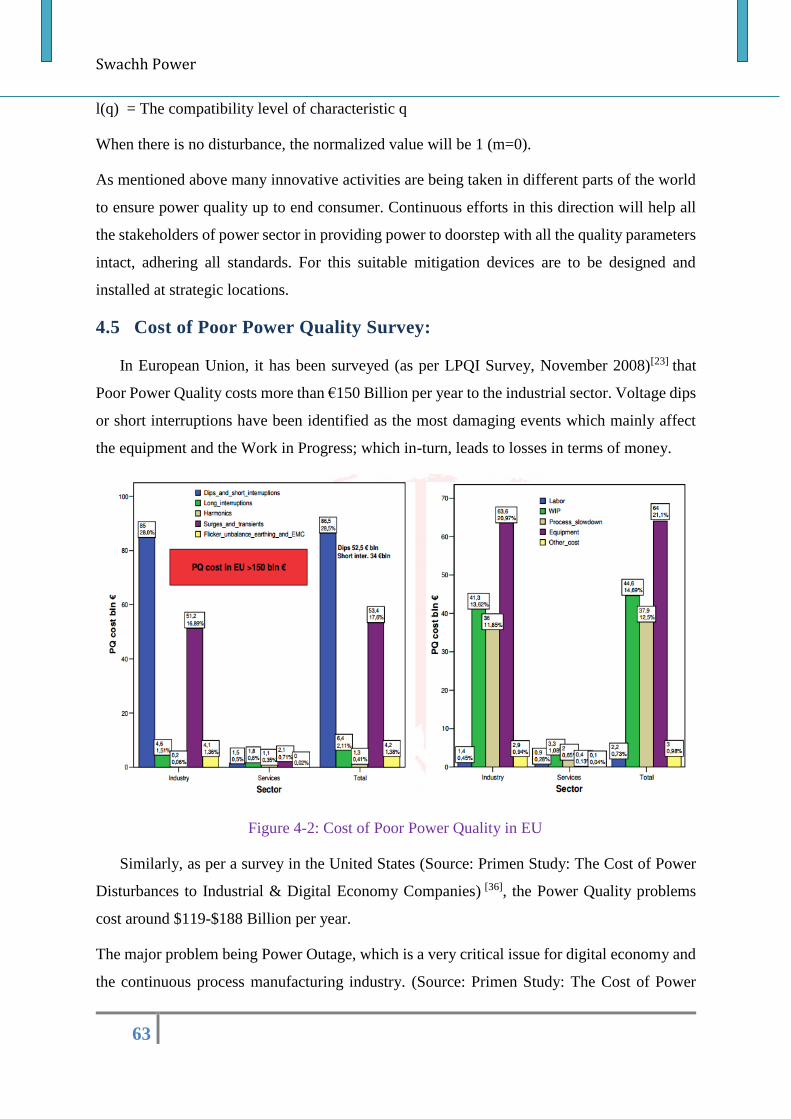
Swachh Power
63
l(q) = The compatibility level of characteristic q
When there is no disturbance, the normalized value will be 1 (m=0).
As mentioned above many innovative activities are being taken in different parts of the world
to ensure power quality up to end consumer. Continuous efforts in this direction will help all
the stakeholders of power sector in providing power to doorstep with all the quality parameters
intact, adhering all standards. For this suitable mitigation devices are to be designed and
installed at strategic locations.
4.5 Cost of Poor Power Quality Survey:
In European Union, it has been surveyed (as per LPQI Survey, November 2008)[23] that
Poor Power Quality costs more than €150 Billion per year to the industrial sector. Voltage dips
or short interruptions have been identified as the most damaging events which mainly affect
the equipment and the Work in Progress; which in-turn, leads to losses in terms of money.
Figure 4-2: Cost of Poor Power Quality in EU
Similarly, as per a survey in the United States (Source: Primen Study: The Cost of Power
Disturbances to Industrial & Digital Economy Companies) [36], the Power Quality problems
cost around $119-$188 Billion per year.
The major problem being Power Outage, which is a very critical issue for digital economy and
the continuous process manufacturing industry. (Source: Primen Study: The Cost of Power
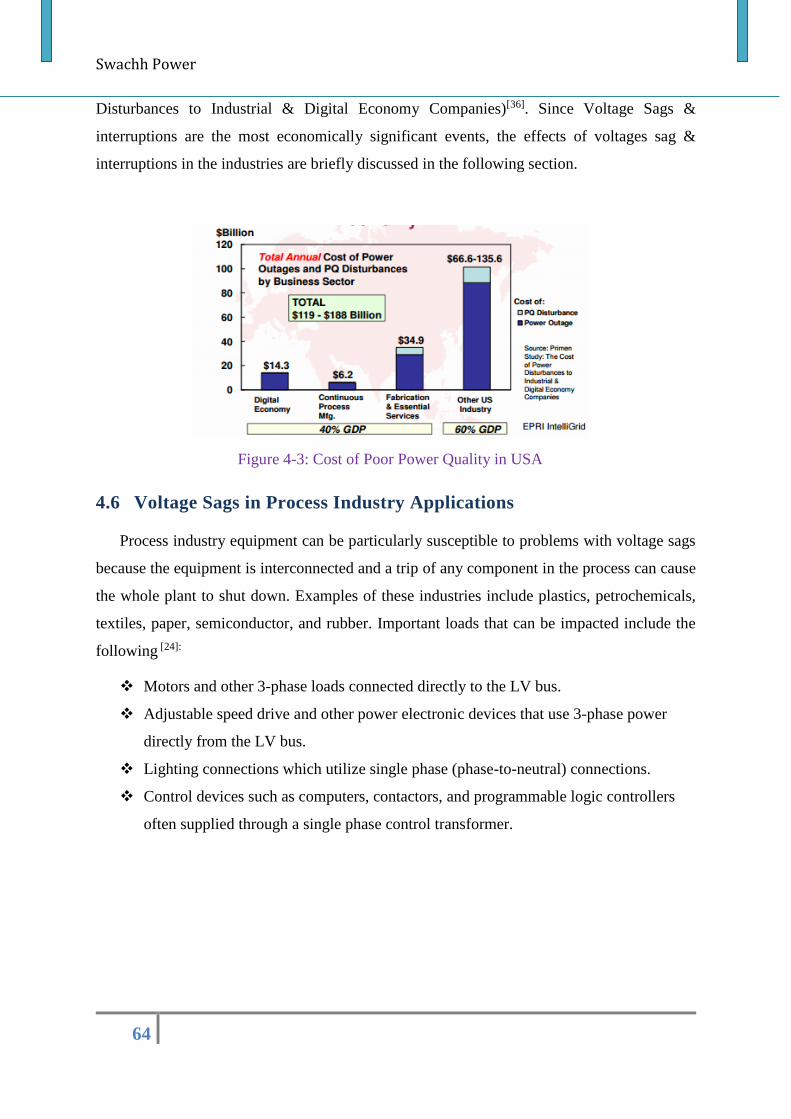
Swachh Power
64
Disturbances to Industrial & Digital Economy Companies)[36]. Since Voltage Sags &
interruptions are the most economically significant events, the effects of voltages sag &
interruptions in the industries are briefly discussed in the following section.
4.6 Voltage Sags in Process Industry Applications
Process industry equipment can be particularly susceptible to problems with voltage sags
because the equipment is interconnected and a trip of any component in the process can cause
the whole plant to shut down. Examples of these industries include plastics, petrochemicals,
textiles, paper, semiconductor, and rubber. Important loads that can be impacted include the
following [24]:
Motors and other 3-phase loads connected directly to the LV bus.
Adjustable speed drive and other power electronic devices that use 3-phase power
directly from the LV bus.
Lighting connections which utilize single phase (phase-to-neutral) connections.
Control devices such as computers, contactors, and programmable logic controllers
often supplied through a single phase control transformer.
Figure 4-3: Cost of Poor Power Quality in USA
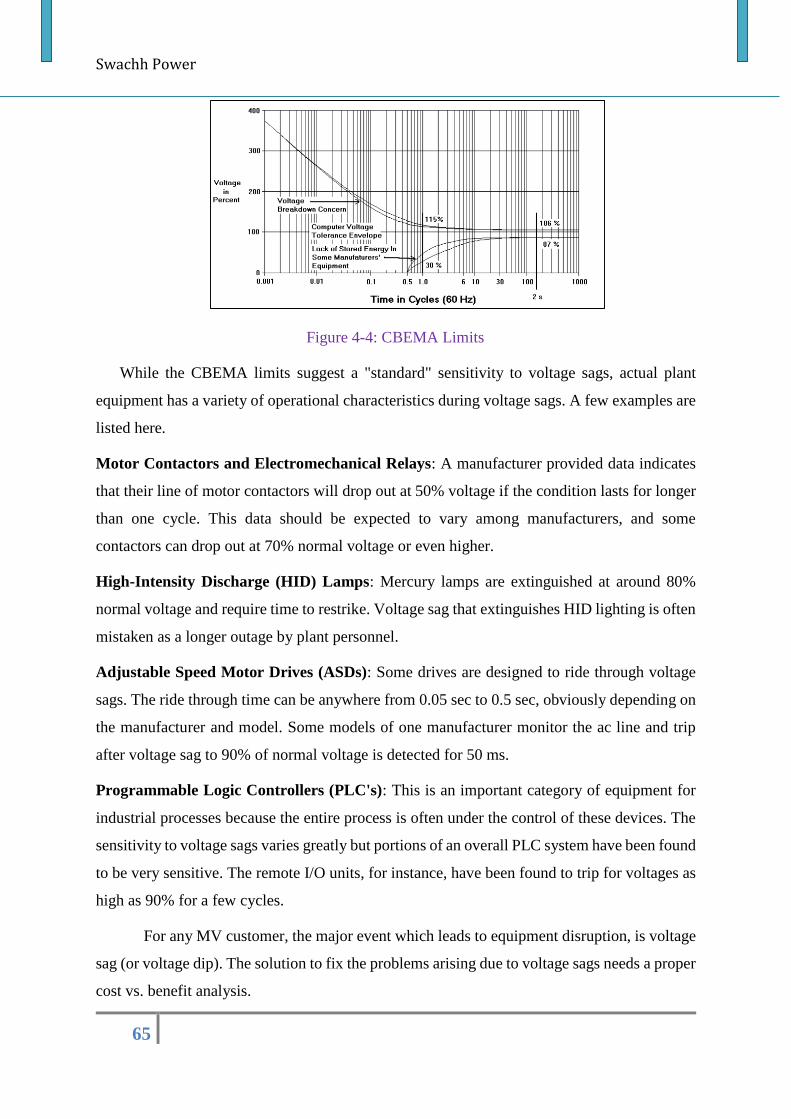
Swachh Power
65
Figure 4-4: CBEMA Limits
While the CBEMA limits suggest a "standard" sensitivity to voltage sags, actual plant
equipment has a variety of operational characteristics during voltage sags. A few examples are
listed here.
Motor Contactors and Electromechanical Relays: A manufacturer provided data indicates
that their line of motor contactors will drop out at 50% voltage if the condition lasts for longer
than one cycle. This data should be expected to vary among manufacturers, and some
contactors can drop out at 70% normal voltage or even higher.
High-Intensity Discharge (HID) Lamps: Mercury lamps are extinguished at around 80%
normal voltage and require time to restrike. Voltage sag that extinguishes HID lighting is often
mistaken as a longer outage by plant personnel.
Adjustable Speed Motor Drives (ASDs): Some drives are designed to ride through voltage
sags. The ride through time can be anywhere from 0.05 sec to 0.5 sec, obviously depending on
the manufacturer and model. Some models of one manufacturer monitor the ac line and trip
after voltage sag to 90% of normal voltage is detected for 50 ms.
Programmable Logic Controllers (PLC's): This is an important category of equipment for
industrial processes because the entire process is often under the control of these devices. The
sensitivity to voltage sags varies greatly but portions of an overall PLC system have been found
to be very sensitive. The remote I/O units, for instance, have been found to trip for voltages as
high as 90% for a few cycles.
For any MV customer, the major event which leads to equipment disruption, is voltage
sag (or voltage dip). The solution to fix the problems arising due to voltage sags needs a proper
cost vs. benefit analysis.
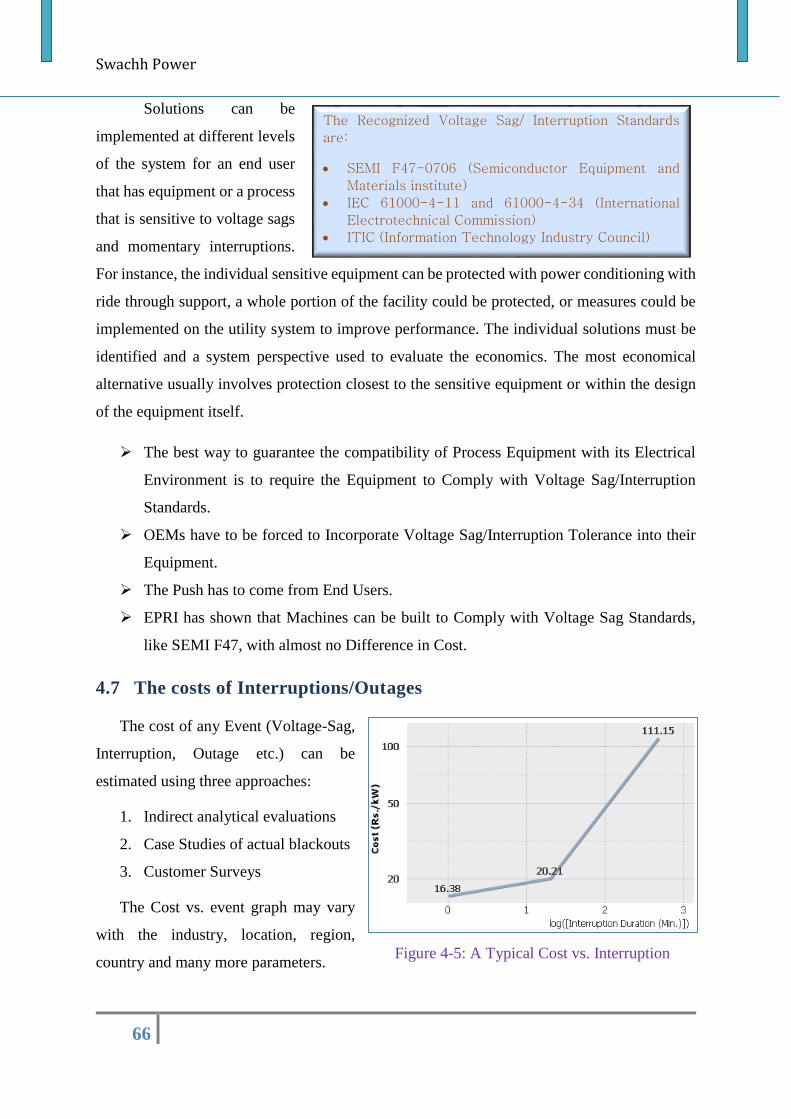
Swachh Power
66
Solutions can be
implemented at different levels
of the system for an end user
that has equipment or a process
that is sensitive to voltage sags
and momentary interruptions.
For instance, the individual sensitive equipment can be protected with power conditioning with
ride through support, a whole portion of the facility could be protected, or measures could be
implemented on the utility system to improve performance. The individual solutions must be
identified and a system perspective used to evaluate the economics. The most economical
alternative usually involves protection closest to the sensitive equipment or within the design
of the equipment itself.
The best way to guarantee the compatibility of Process Equipment with its Electrical
Environment is to require the Equipment to Comply with Voltage Sag/Interruption
Standards.
OEMs have to be forced to Incorporate Voltage Sag/Interruption Tolerance into their
Equipment.
The Push has to come from End Users.
EPRI has shown that Machines can be built to Comply with Voltage Sag Standards,
like SEMI F47, with almost no Difference in Cost.
4.7 The costs of Interruptions/Outages
The cost of any Event (Voltage-Sag,
Interruption, Outage etc.) can be
estimated using three approaches:
1. Indirect analytical evaluations
2. Case Studies of actual blackouts
3. Customer Surveys
The Cost vs. event graph may vary
with the industry, location, region,
country and many more parameters.
The Recognized Voltage Sag/ Interruption Standards
are:
SEMI F47-0706 (Semiconductor Equipment and
Materials institute)
IEC 61000-4-11 and 61000-4-34 (International
Electrotechnical Commission)
ITIC (Information Technology Industry Council)
Figure 4-5: A Typical Cost vs. Interruption
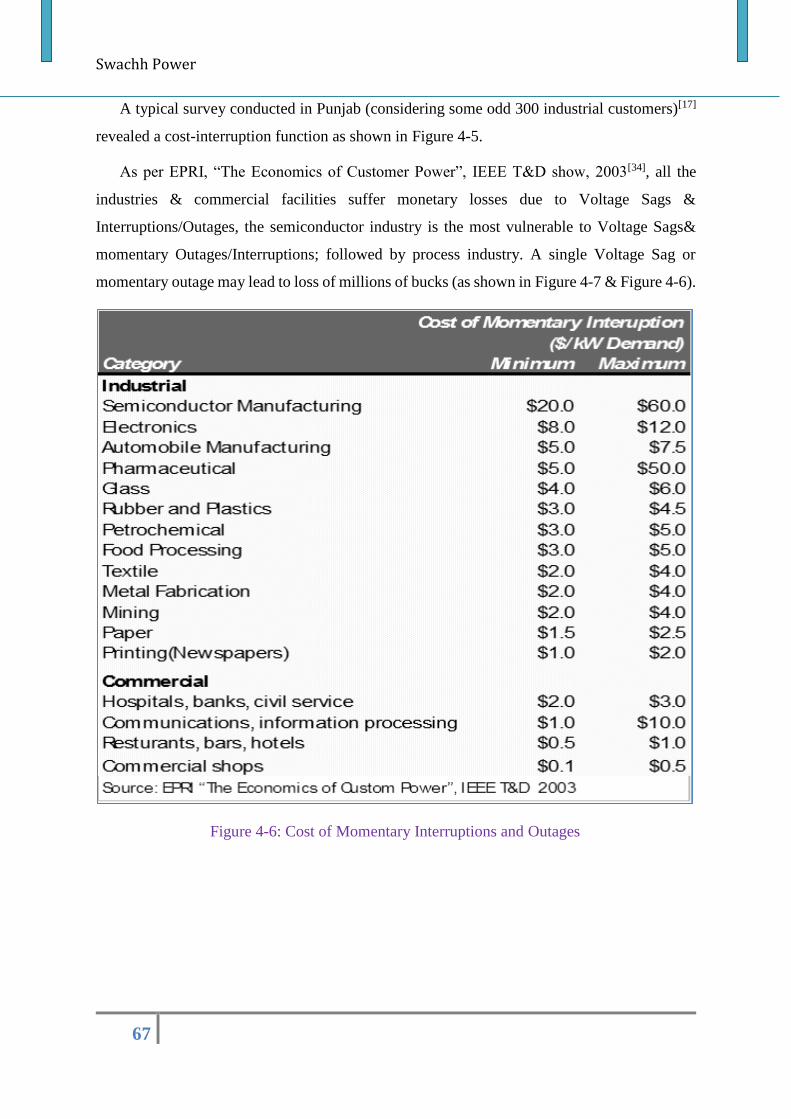
Swachh Power
67
A typical survey conducted in Punjab (considering some odd 300 industrial customers)[17]
revealed a cost-interruption function as shown in Figure 4-5.
As per EPRI, “The Economics of Customer Power”, IEEE T&D show, 2003[34], all the
industries & commercial facilities suffer monetary losses due to Voltage Sags &
Interruptions/Outages, the semiconductor industry is the most vulnerable to Voltage Sags&
momentary Outages/Interruptions; followed by process industry. A single Voltage Sag or
momentary outage may lead to loss of millions of bucks (as shown in Figure 4-7 & Figure 4-6).
Figure 4-6: Cost of Momentary Interruptions and Outages
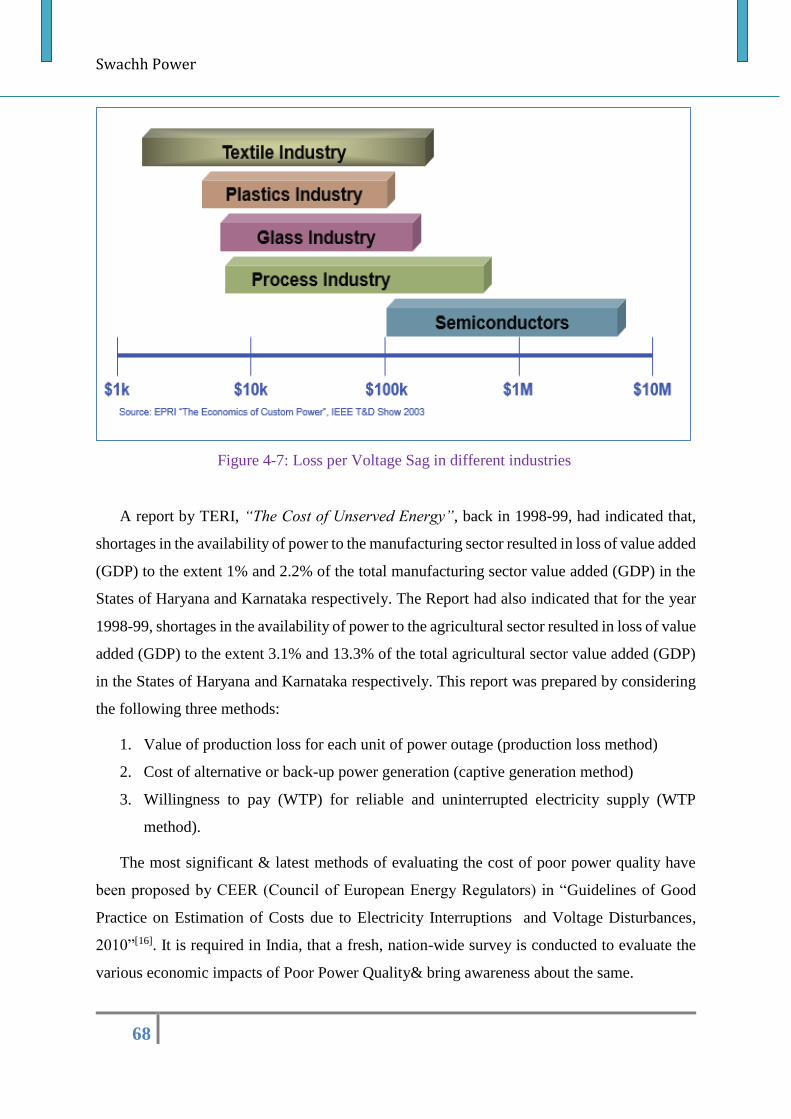
Swachh Power
68
A report by TERI, “The Cost of Unserved Energy”, back in 1998-99, had indicated that,
shortages in the availability of power to the manufacturing sector resulted in loss of value added
(GDP) to the extent 1% and 2.2% of the total manufacturing sector value added (GDP) in the
States of Haryana and Karnataka respectively. The Report had also indicated that for the year
1998-99, shortages in the availability of power to the agricultural sector resulted in loss of value
added (GDP) to the extent 3.1% and 13.3% of the total agricultural sector value added (GDP)
in the States of Haryana and Karnataka respectively. This report was prepared by considering
the following three methods:
1. Value of production loss for each unit of power outage (production loss method)
2. Cost of alternative or back-up power generation (captive generation method)
3. Willingness to pay (WTP) for reliable and uninterrupted electricity supply (WTP
method).
The most significant & latest methods of evaluating the cost of poor power quality have
been proposed by CEER (Council of European Energy Regulators) in “Guidelines of Good
Practice on Estimation of Costs due to Electricity Interruptions and Voltage Disturbances,
2010”[16]. It is required in India, that a fresh, nation-wide survey is conducted to evaluate the
various economic impacts of Poor Power Quality& bring awareness about the same.
Figure 4-7: Loss per Voltage Sag in different industries
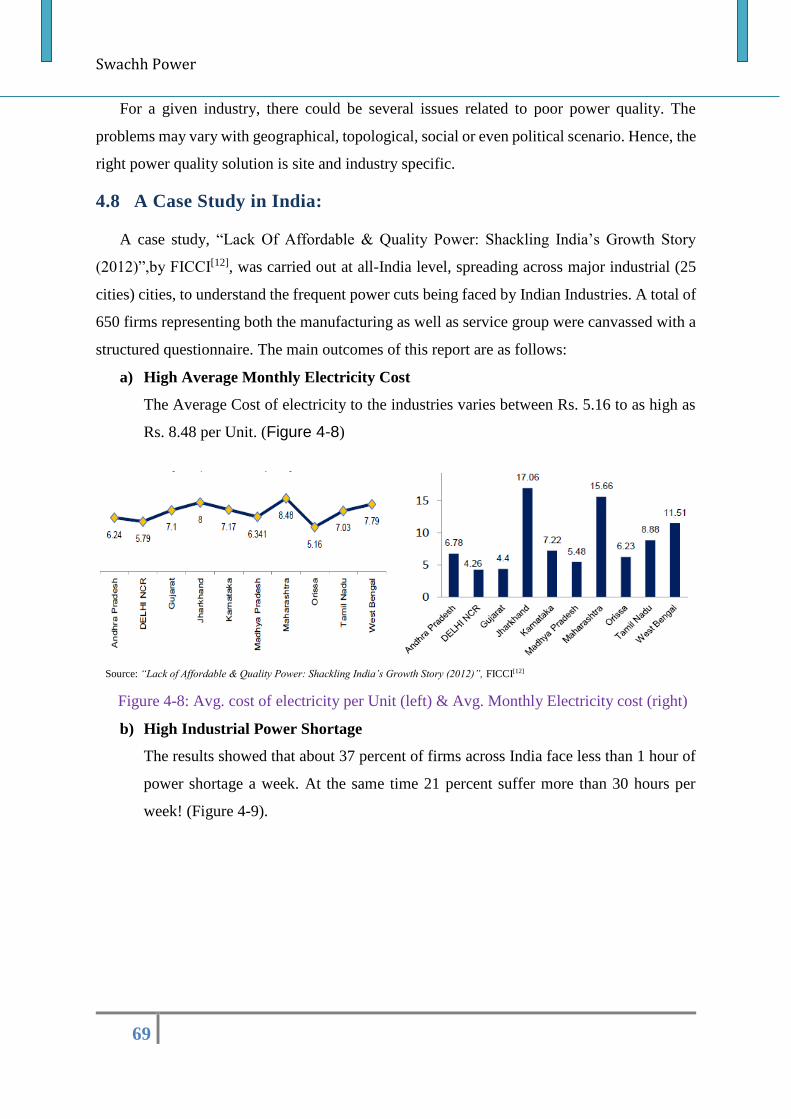
Swachh Power
69
For a given industry, there could be several issues related to poor power quality. The
problems may vary with geographical, topological, social or even political scenario. Hence, the
right power quality solution is site and industry specific.
4.8 A Case Study in India:
A case study, “Lack Of Affordable & Quality Power: Shackling India’s Growth Story
(2012)”,by FICCI[12], was carried out at all-India level, spreading across major industrial (25
cities) cities, to understand the frequent power cuts being faced by Indian Industries. A total of
650 firms representing both the manufacturing as well as service group were canvassed with a
structured questionnaire. The main outcomes of this report are as follows:
a) High Average Monthly Electricity Cost
The Average Cost of electricity to the industries varies between Rs. 5.16 to as high as
Rs. 8.48 per Unit. (Figure 4-8)
b) High Industrial Power Shortage
The results showed that about 37 percent of firms across India face less than 1 hour of
power shortage a week. At the same time 21 percent suffer more than 30 hours per
week! (Figure 4-9).
Figure 4-8: Avg. cost of electricity per Unit (left) & Avg. Monthly Electricity cost (right)
Source: “Lack of Affordable & Quality Power: Shackling India’s Growth Story (2012)”, FICCI[12]
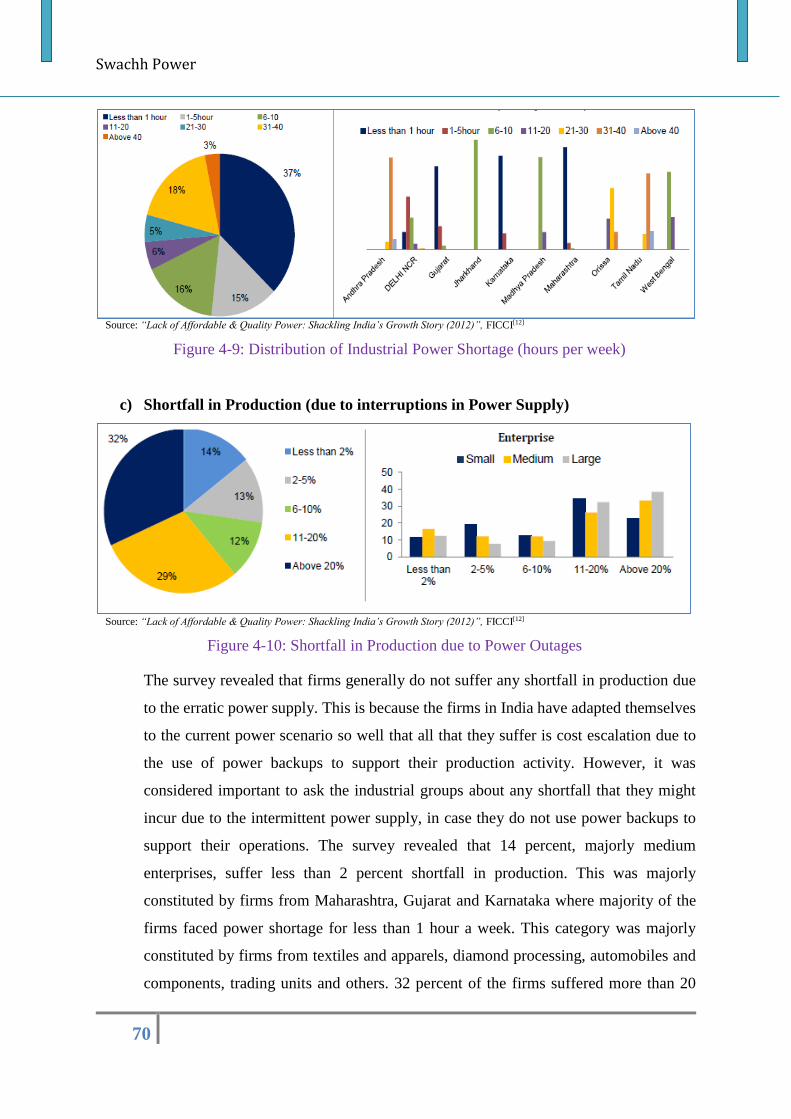
Swachh Power
70
c) Shortfall in Production (due to interruptions in Power Supply)
The survey revealed that firms generally do not suffer any shortfall in production due
to the erratic power supply. This is because the firms in India have adapted themselves
to the current power scenario so well that all that they suffer is cost escalation due to
the use of power backups to support their production activity. However, it was
considered important to ask the industrial groups about any shortfall that they might
incur due to the intermittent power supply, in case they do not use power backups to
support their operations. The survey revealed that 14 percent, majorly medium
enterprises, suffer less than 2 percent shortfall in production. This was majorly
constituted by firms from Maharashtra, Gujarat and Karnataka where majority of the
firms faced power shortage for less than 1 hour a week. This category was majorly
constituted by firms from textiles and apparels, diamond processing, automobiles and
components, trading units and others. 32 percent of the firms suffered more than 20
Figure 4-10: Shortfall in Production due to Power Outages
Source: “Lack of Affordable & Quality Power: Shackling India’s Growth Story (2012)”, FICCI[12]
Figure 4-9: Distribution of Industrial Power Shortage (hours per week)
Source: “Lack of Affordable & Quality Power: Shackling India’s Growth Story (2012)”, FICCI[12]
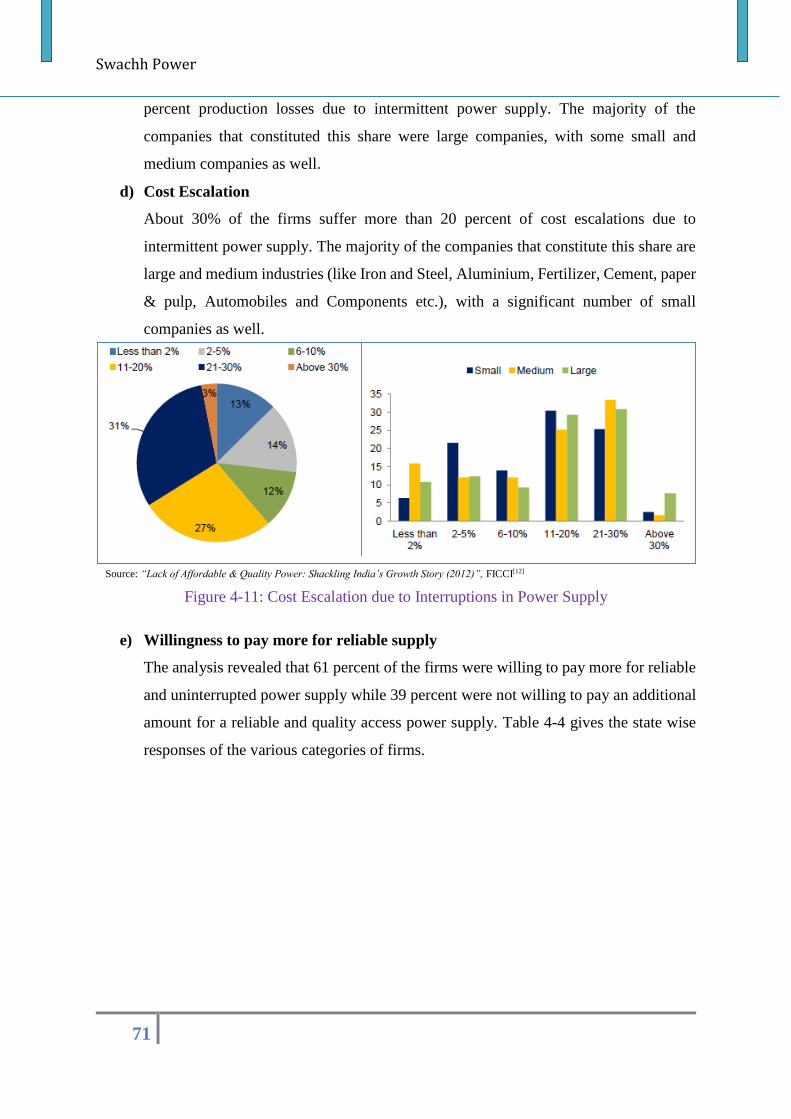
Swachh Power
71
percent production losses due to intermittent power supply. The majority of the
companies that constituted this share were large companies, with some small and
medium companies as well.
d) Cost Escalation
About 30% of the firms suffer more than 20 percent of cost escalations due to
intermittent power supply. The majority of the companies that constitute this share are
large and medium industries (like Iron and Steel, Aluminium, Fertilizer, Cement, paper
& pulp, Automobiles and Components etc.), with a significant number of small
companies as well.
e) Willingness to pay more for reliable supply
The analysis revealed that 61 percent of the firms were willing to pay more for reliable
and uninterrupted power supply while 39 percent were not willing to pay an additional
amount for a reliable and quality access power supply. Table 4-4 gives the state wise
responses of the various categories of firms.
Figure 4-11: Cost Escalation due to Interruptions in Power Supply
Source: “Lack of Affordable & Quality Power: Shackling India’s Growth Story (2012)”, FICCI[12]
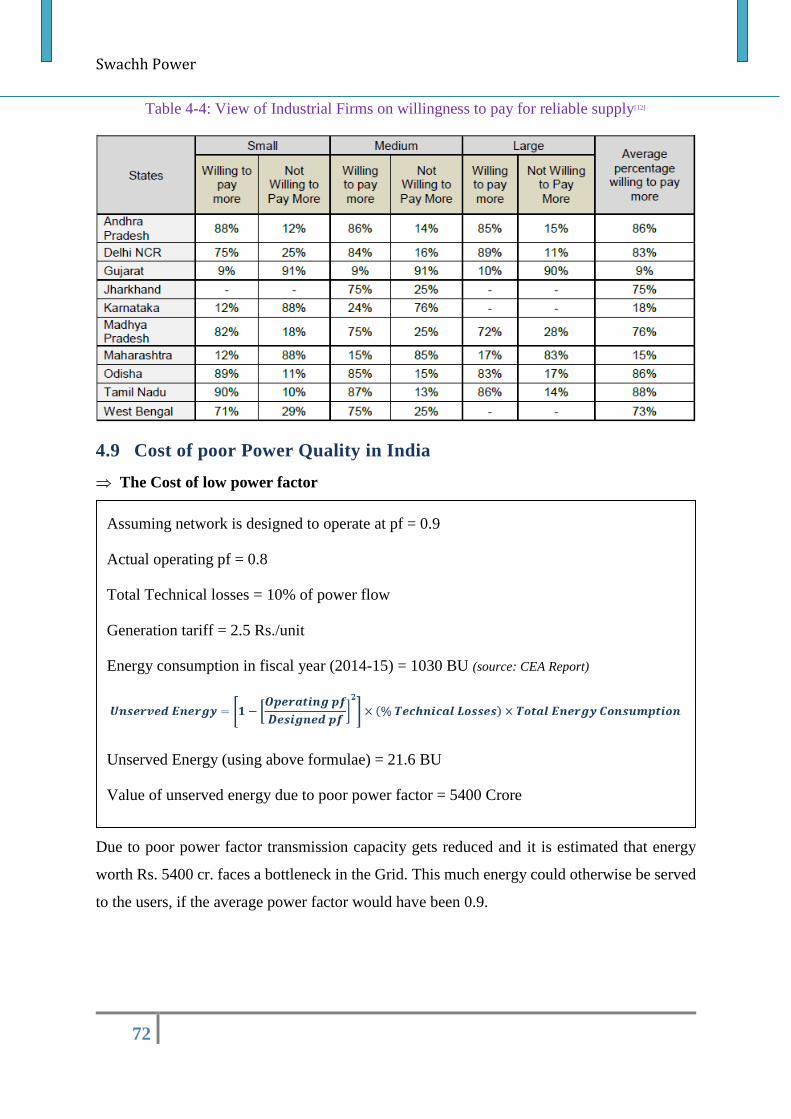
Swachh Power
72
Table 4-4: View of Industrial Firms on willingness to pay for reliable supply[12]
4.9 Cost of poor Power Quality in India
The Cost of low power factor
Due to poor power factor transmission capacity gets reduced and it is estimated that energy
worth Rs. 5400 cr. faces a bottleneck in the Grid. This much energy could otherwise be served
to the users, if the average power factor would have been 0.9.
Assuming network is designed to operate at pf = 0.9
Actual operating pf = 0.8
Total Technical losses = 10% of power flow
Generation tariff = 2.5 Rs./unit
Energy consumption in fiscal year (2014-15) = 1030 BU (source: CEA Report)
Unserved Energy (using above formulae) = 21.6 BU
Value of unserved energy due to poor power factor = 5400 Crore
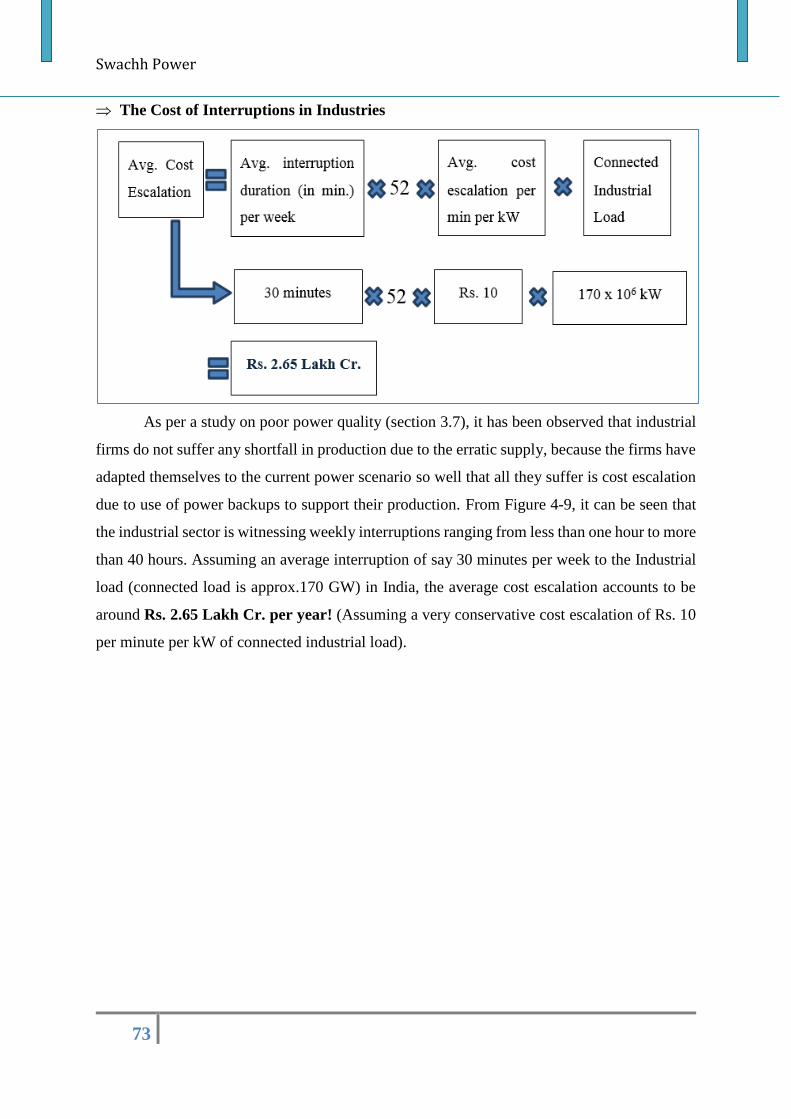
Swachh Power
73
The Cost of Interruptions in Industries
As per a study on poor power quality (section 3.7), it has been observed that industrial
firms do not suffer any shortfall in production due to the erratic supply, because the firms have
adapted themselves to the current power scenario so well that all they suffer is cost escalation
due to use of power backups to support their production. From Figure 4-9, it can be seen that
the industrial sector is witnessing weekly interruptions ranging from less than one hour to more
than 40 hours. Assuming an average interruption of say 30 minutes per week to the Industrial
load (connected load is approx.170 GW) in India, the average cost escalation accounts to be
around Rs. 2.65 Lakh Cr. per year! (Assuming a very conservative cost escalation of Rs. 10
per minute per kW of connected industrial load).
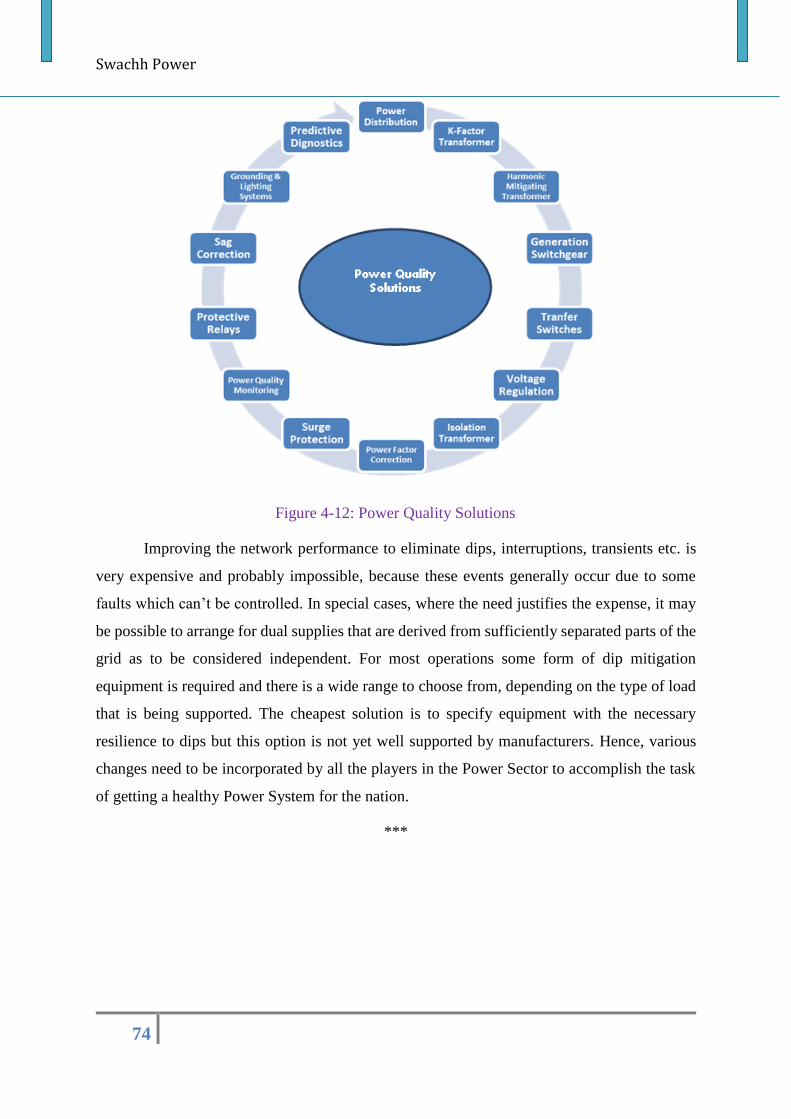
Swachh Power
74
Figure 4-12: Power Quality Solutions
Improving the network performance to eliminate dips, interruptions, transients etc. is
very expensive and probably impossible, because these events generally occur due to some
faults which can’t be controlled. In special cases, where the need justifies the expense, it may
be possible to arrange for dual supplies that are derived from sufficiently separated parts of the
grid as to be considered independent. For most operations some form of dip mitigation
equipment is required and there is a wide range to choose from, depending on the type of load
that is being supported. The cheapest solution is to specify equipment with the necessary
resilience to dips but this option is not yet well supported by manufacturers. Hence, various
changes need to be incorporated by all the players in the Power Sector to accomplish the task
of getting a healthy Power System for the nation.
***
Swachh Power
75
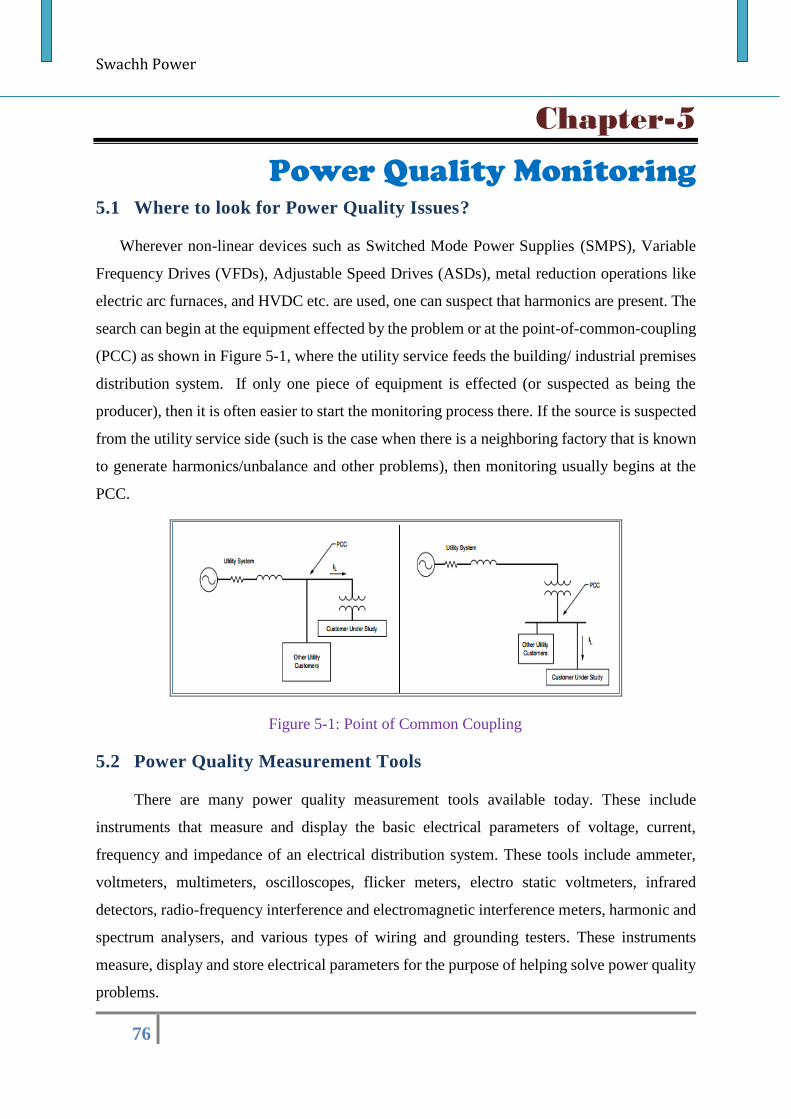
Swachh Power
76
Chapter-5
5 Power Quality Monitoring 5.1 Where to look for Power Quality Issues?
Wherever non-linear devices such as Switched Mode Power Supplies (SMPS), Variable
Frequency Drives (VFDs), Adjustable Speed Drives (ASDs), metal reduction operations like
electric arc furnaces, and HVDC etc. are used, one can suspect that harmonics are present. The
search can begin at the equipment effected by the problem or at the point-of-common-coupling
(PCC) as shown in Figure 5-1, where the utility service feeds the building/ industrial premises
distribution system. If only one piece of equipment is effected (or suspected as being the
producer), then it is often easier to start the monitoring process there. If the source is suspected
from the utility service side (such is the case when there is a neighboring factory that is known
to generate harmonics/unbalance and other problems), then monitoring usually begins at the
PCC.
Figure 5-1: Point of Common Coupling
5.2 Power Quality Measurement Tools
There are many power quality measurement tools available today. These include
instruments that measure and display the basic electrical parameters of voltage, current,
frequency and impedance of an electrical distribution system. These tools include ammeter,
voltmeters, multimeters, oscilloscopes, flicker meters, electro static voltmeters, infrared
detectors, radio-frequency interference and electromagnetic interference meters, harmonic and
spectrum analysers, and various types of wiring and grounding testers. These instruments
measure, display and store electrical parameters for the purpose of helping solve power quality
problems.
Swachh Power
77
The power quality monitoring system has evolved significantly. The old Watt-hour meter
has changed from analog to digital meter. It has acquired the features of a power quality
monitor to provide not only energy consumption information but power quality data as well.
Using microprocessors to record and store power and power quality measurements, some
manufacturers have combined the features of a wattmeter and power quality meter into one
meter. This allows the utility and utility’s customers to monitor the power use requirements of
the customer’s facilities not only for revenue purpose but for power quality measurement and
analysis purposes as well. These meters record both real and reactive power use as well. They
capture power quality parameters, like harmonics, sags and swells, power factor, waveforms,
crest factor etc. However, there are several portable power quality analyser (fixed and portable
both)also available now a days which can capture power quality parameters & also monitor
real and reactive power along with energy consumption over a period. They can perform spot
monitoring as well as record it over a period at specified interval.
5.3 Monitoring Power Quality
Hand held harmonic meters can be useful tools for making spot checks for known harmonic
problems. However, harmonic values will often change during the day, as different loads are
turned on and off within the facility or in other facilities on the same electric utility distribution
system. This requires the use of a harmonic monitor or power quality monitor with harmonic
measurement capabilities, which can record various power quality parameters over a period of
time. The phase voltages and currents, as well as the neutral-to-ground voltage and the neutral
current should be monitored. This will aid in pinpointing problems.
Measurement Cycle: Typically, power quality monitoring shall be carried out for one business
cycle. A business cycle is how long it takes for the normal operation of the plant to repeat itself.
For example, if a plant runs three identical shifts, seven days a week, then a business would be
eight hours. More typically, a business cycle is one week, as different operations take place on
different days of the week, such as on a Monday, when the plant equipment is restarted after
being off over the weekend, then on a Wednesday, or a Saturday, when only a skeleton crew
may be working.
Power Quality Analyzers: Usually, Power quality parameters are measured recorded and
analyzed using Power Quality analyzers. There are many variants available in power quality
analyzer which measure r.m.s. value of voltage/current, power, frequency, power factor,
harmonics, sag/swell, transients, THD, flicker, etc. Typically, power quality analyzers contain
Swachh Power
78
a meter with a waveform display screen, voltage leads, and current probes. Power quality
measurement instruments provide either a snapshot of the waveform and harmonic distortion
pertaining to the instant during which the measurement is made or capable of recording
snapshots as well as a continuous record of harmonic distortion over time.
Harmonic analyzers from various manufacturers tend to have different, upper-harmonic-
frequency measurement capability. Harmonic distortion levels diminish substantially with the
harmonic number. In order to accurately determine the frequency content, the sampling
frequency of the measuring instrument must be greater than twice the frequency of the highest
harmonic of interest. This rule is called the Nyquist frequency criteria. According to Nyquist
criteria, to accurately determine the frequency content of a 50-Hz fundamental frequency
waveform up to the 50th harmonic number, the harmonic measuring instrument must have a
minimum sampling rate of 5000 (50 × 50 × 2) samples per second. Of course, higher sampling
rates reflect the actual waveform more accurately.
Measurement of voltage harmonic data requires leads (probes) that can be attached to the points
at which the distortion measurements are needed. Typical voltage leads are 4 to 6 ft long. At
these lengths, cable inductance and capacitance are not a concern, as the highest frequency of
interest is in the range of 1500 to 3000 Hz (25th to 50th harmonic); therefore, no significant
attenuation or distortion should be introduced by the leads in the voltage distortion data.
Typically, a 5.0% loss in accuracy might be expected, if the waveform contains significant
levels of higher order harmonics.
Measuring current harmonic distortion data requires some special considerations. Most current
probes use an iron core transformer designed to fit around the conductors in which harmonic
measurements are needed. Iron-core current probes are susceptible to increased error at high
frequencies and saturation at currents higher than the rated values.
Power Quality Measurement Device can be broadly classified into two categories.
1. Single Phase Power Quality Analyser: Used for measurement of power quality
parameters for single phase quantity.
2. Three Phase Power Quality Analyser: Used for measurement of power quality
parameters on all the three phase simultaneously.
Continuous power quality monitoring detects, records, and leads to the prevention of power
quality problems.
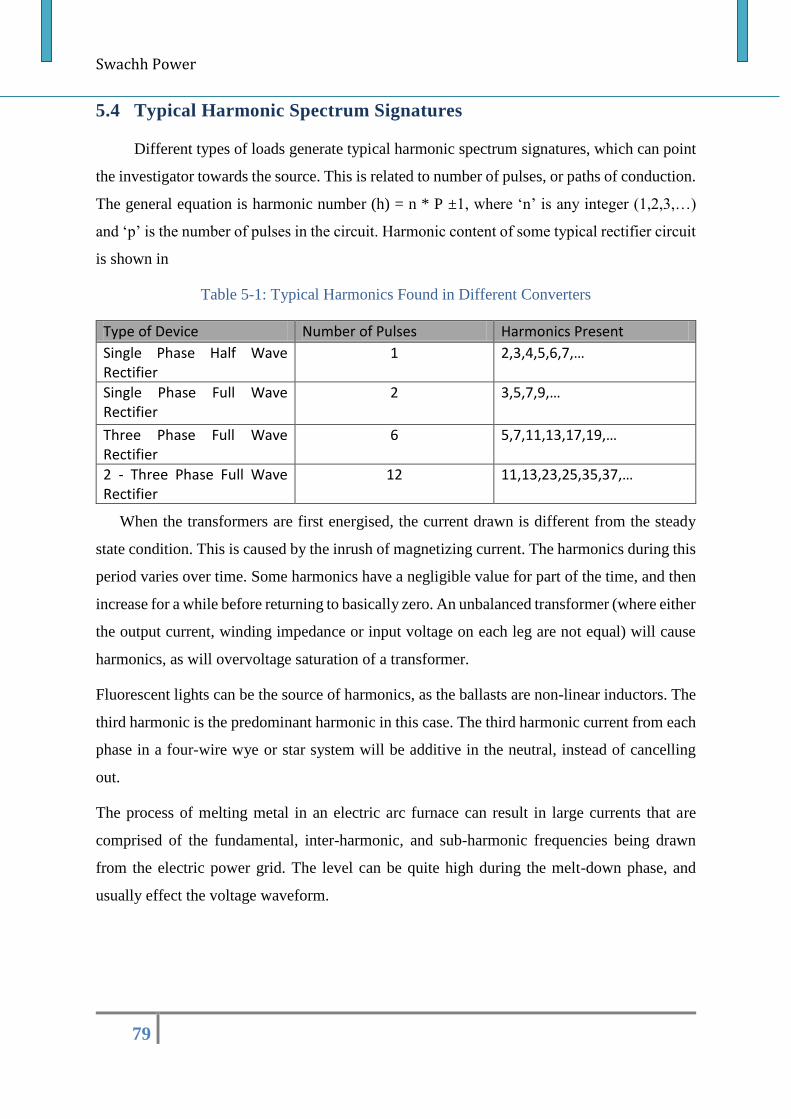
Swachh Power
79
5.4 Typical Harmonic Spectrum Signatures
Different types of loads generate typical harmonic spectrum signatures, which can point
the investigator towards the source. This is related to number of pulses, or paths of conduction.
The general equation is harmonic number (h) = n * P ±1, where ‘n’ is any integer (1,2,3,…)
and ‘p’ is the number of pulses in the circuit. Harmonic content of some typical rectifier circuit
is shown in
Table 5-1: Typical Harmonics Found in Different Converters
Type of Device Number of Pulses Harmonics Present
Single Phase Half Wave Rectifier
1 2,3,4,5,6,7,…
Single Phase Full Wave Rectifier
2 3,5,7,9,…
Three Phase Full Wave Rectifier
6 5,7,11,13,17,19,…
2 - Three Phase Full Wave Rectifier
12 11,13,23,25,35,37,…
When the transformers are first energised, the current drawn is different from the steady
state condition. This is caused by the inrush of magnetizing current. The harmonics during this
period varies over time. Some harmonics have a negligible value for part of the time, and then
increase for a while before returning to basically zero. An unbalanced transformer (where either
the output current, winding impedance or input voltage on each leg are not equal) will cause
harmonics, as will overvoltage saturation of a transformer.
Fluorescent lights can be the source of harmonics, as the ballasts are non-linear inductors. The
third harmonic is the predominant harmonic in this case. The third harmonic current from each
phase in a four-wire wye or star system will be additive in the neutral, instead of cancelling
out.
The process of melting metal in an electric arc furnace can result in large currents that are
comprised of the fundamental, inter-harmonic, and sub-harmonic frequencies being drawn
from the electric power grid. The level can be quite high during the melt-down phase, and
usually effect the voltage waveform.
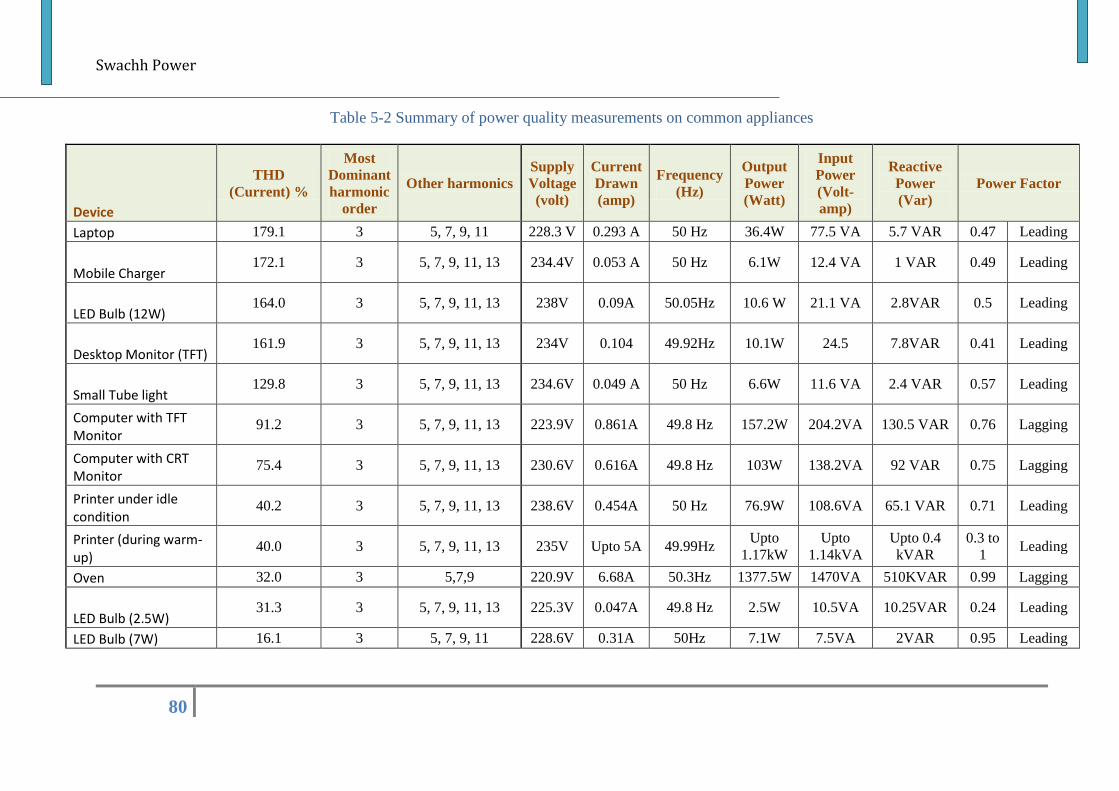
Swachh Power
80
Table 5-2 Summary of power quality measurements on common appliances
Device
THD
(Current) %
Most
Dominant
harmonic
order
Other harmonics
Supply
Voltage
(volt)
Current
Drawn
(amp)
Frequency
(Hz)
Output
Power
(Watt)
Input
Power
(Volt-
amp)
Reactive
Power
(Var)
Power Factor
Laptop 179.1 3 5, 7, 9, 11 228.3 V 0.293 A 50 Hz 36.4W 77.5 VA 5.7 VAR 0.47 Leading
Mobile Charger 172.1 3 5, 7, 9, 11, 13 234.4V 0.053 A 50 Hz 6.1W 12.4 VA 1 VAR 0.49 Leading
LED Bulb (12W) 164.0 3 5, 7, 9, 11, 13 238V 0.09A 50.05Hz 10.6 W 21.1 VA 2.8VAR 0.5 Leading
Desktop Monitor (TFT) 161.9 3 5, 7, 9, 11, 13 234V 0.104 49.92Hz 10.1W 24.5 7.8VAR 0.41 Leading
Small Tube light 129.8 3 5, 7, 9, 11, 13 234.6V 0.049 A 50 Hz 6.6W 11.6 VA 2.4 VAR 0.57 Leading
Computer with TFT Monitor
91.2 3 5, 7, 9, 11, 13 223.9V 0.861A 49.8 Hz 157.2W 204.2VA 130.5 VAR 0.76 Lagging
Computer with CRT Monitor
75.4 3 5, 7, 9, 11, 13 230.6V 0.616A 49.8 Hz 103W 138.2VA 92 VAR 0.75 Lagging
Printer under idle condition
40.2 3 5, 7, 9, 11, 13 238.6V 0.454A 50 Hz 76.9W 108.6VA 65.1 VAR 0.71 Leading
Printer (during warm-up)
40.0 3 5, 7, 9, 11, 13 235V Upto 5A 49.99Hz Upto
1.17kW
Upto
1.14kVA
Upto 0.4
kVAR
0.3 to
1 Leading
Oven 32.0 3 5,7,9 220.9V 6.68A 50.3Hz 1377.5W 1470VA 510KVAR 0.99 Lagging
LED Bulb (2.5W) 31.3 3 5, 7, 9, 11, 13 225.3V 0.047A 49.8 Hz 2.5W 10.5VA 10.25VAR 0.24 Leading
LED Bulb (7W) 16.1 3 5, 7, 9, 11 228.6V 0.31A 50Hz 7.1W 7.5VA 2VAR 0.95 Leading
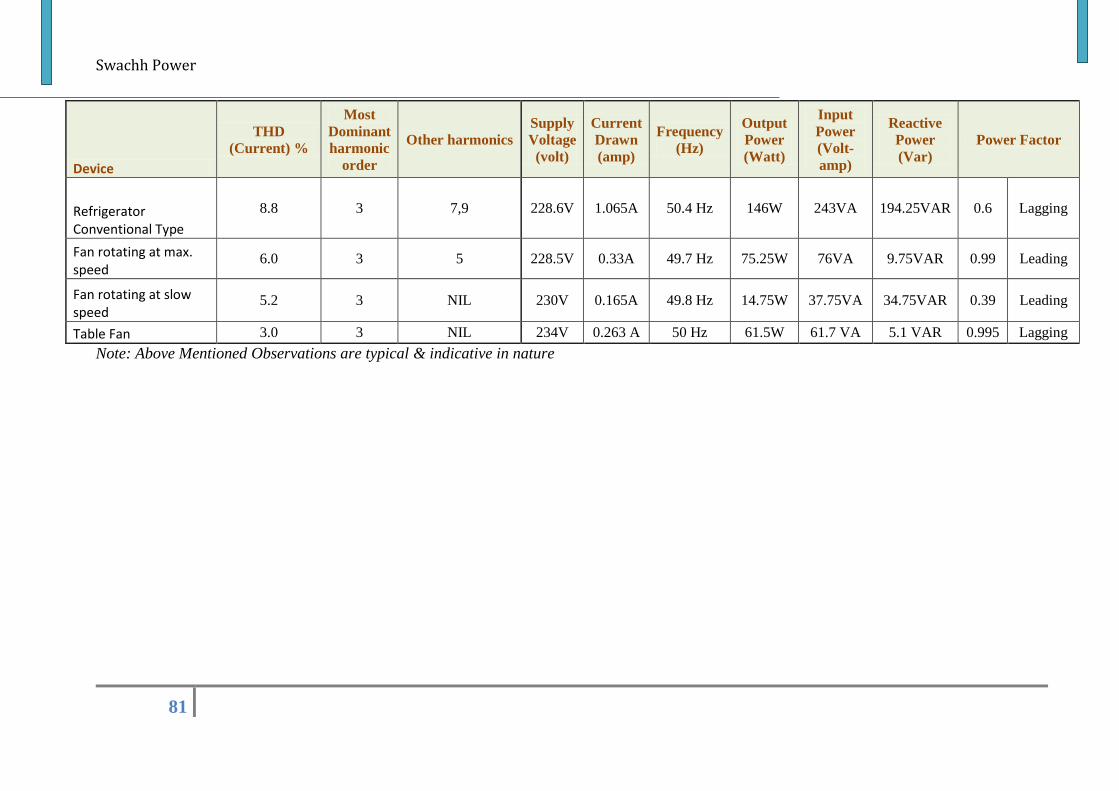
Swachh Power
81
Device
THD
(Current) %
Most
Dominant
harmonic
order
Other harmonics
Supply
Voltage
(volt)
Current
Drawn
(amp)
Frequency
(Hz)
Output
Power
(Watt)
Input
Power
(Volt-
amp)
Reactive
Power
(Var)
Power Factor
Refrigerator Conventional Type
8.8 3 7,9 228.6V 1.065A 50.4 Hz 146W 243VA 194.25VAR 0.6 Lagging
Fan rotating at max. speed
6.0 3 5 228.5V 0.33A 49.7 Hz 75.25W 76VA 9.75VAR 0.99 Leading
Fan rotating at slow speed
5.2 3 NIL 230V 0.165A 49.8 Hz 14.75W 37.75VA 34.75VAR 0.39 Leading
Table Fan 3.0 3 NIL 234V 0.263 A 50 Hz 61.5W 61.7 VA 5.1 VAR 0.995 Lagging
Note: Above Mentioned Observations are typical & indicative in nature
Swachh Power
82
5.5 Planning Power Quality Field Measurement
Importance of Power Quality is been well understood internationally and appropriate
methods have been developed and employed to ensure quality power. In India, regulatory
agencies have notified required standards and regulation. In the implementation arena, how it
is performing is yet to be assessed. In this direction, to establish base line date about Power
Quality parameters in the Indian Power system, Power quality measurement were taken up by
POWERGRID at the Grid level starting from its own sub-stations across all the five regions in
the country covering all the states and union territories. In this endeavour Power Quality
measurement of various household appliances, typical office building, and distribution
substations were also carried out. Results are presented in the following section. A brief
description of measurement procedure and necessary set-up is given in following section.
5.5.1 Measurement Procedure
In the low tension (415 Volt AC) network, to measure various power quality parameters
such as phase wise currents, voltages, harmonics, sag / swell, interruptions etc. suitable
voltages and currents probe shall be connected directly in the electrical circuits carrying load
current. However, in the high voltage (above 11 kV) network, to measure various power quality
parameters such as phase wise currents, voltages, harmonics, sag / swell, interruptions etc.
suitable voltage and current probes (according to the magnitude of current) shall be connected
in the secondary circuit i.e. to the measurement core output of CTs and PTs used for local
measurement purposes.
5.5.2 Set up
Setting up the instruments to collect power quality data is probably the most critical aspect
of measurement. Utmost care must be taken while setting up the analyser. The first step is to
make sure that all the safety rules are being followed. In the majority of cases, power to
electrical equipment cannot be turned off to allow for the instrument setup. The facility users
cannot allow any interruption. Opening the covers of electrical switchboards and distribution
panels requires diligence and patience. While removing panel covers and setting up instrument
probes it is important to have someone else present in the room. The second person may not be
trained in power quality measurement but should have some ‘know-how’ about electrical
systems and the hazards associated with it.
Swachh Power
83
When connecting voltage probes, the connections must be secure. Loose connections are prone
to intermittent contact, which can produce false indications of power quality problems. Voltage
and current probe leads should be periodically inspected. Leads with damaged insulation or
those that look suspect must be promptly replaced to avoid dangerous conditions. While
making current measurements, one of the main causes of errors is improper closing of the jaws
of the probe. Substantial errors in current measurements and phase angles can be produced due
to air gaps across the jaws of the current probes. While carrying out power quality
measurements, suitable current probes shall be selected depending upon the magnitude of
current. Power Quality Measurement can be carried out in two modes, i.e. either for real time
snapshot monitoring (spot measurement) or for recording purpose. When Power Quality
Measurement is done in recording mode, desired power quality parameters such as voltage
sag/swell, transients, percentage over / under voltage, flicker, power factor, harmonics, voltage
unbalance, inrush current shall be selected. Care must be taken to select triggers for event
detection. Also interval time for sampling and duration of measurements are to be selected.
While in the monitoring mode, voltage and current wave forms, harmonics, etc. can be directly
viewed on the PQA screen.
It is important to note that the user of the instrument must be well trained in the use and care
of the instrumentation. The engineer should be knowledgeable in the field of power quality
measurement. Most importantly, the engineer should be safety conscious. All these factors are
equally important in solving power quality problems.
5.5.3 Power Quality Data Management
The Power-Quality measurements have been done at more than 175 different cities/towns
covering all the states of India which in turn has measured the Power Quality of more than 500
different feeders/points and archived a Database of more than 100 GB. Portable Power Quality
Analysers (Class-A) were used in all these measurements. The data collected from such
measurements has been archived in the form of csv files (one file for each measurement). The
integrity of the Data has been maintained by using proper naming conventions for the csv files.
Automated Reporting template has been developed in MS-Excel to automatically pull
the data from csv files and generate a report for a given substation/location. The same Database
is also being used by Power Quality Dashboard which shows the various Power-Quality
parameters in the form of graphs, charts, maps etc. These graphs, charts, maps etc. have been
used in this report to depict the Quality of Power across India.
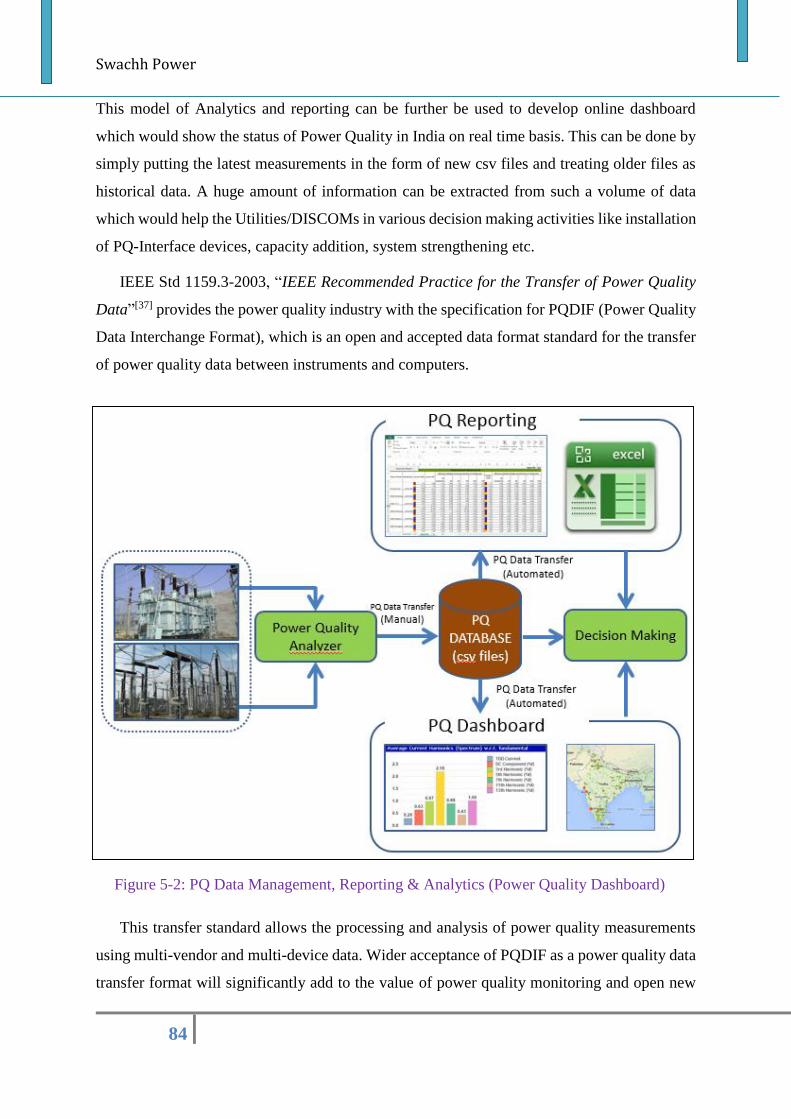
Swachh Power
84
This model of Analytics and reporting can be further be used to develop online dashboard
which would show the status of Power Quality in India on real time basis. This can be done by
simply putting the latest measurements in the form of new csv files and treating older files as
historical data. A huge amount of information can be extracted from such a volume of data
which would help the Utilities/DISCOMs in various decision making activities like installation
of PQ-Interface devices, capacity addition, system strengthening etc.
IEEE Std 1159.3-2003, “IEEE Recommended Practice for the Transfer of Power Quality
Data”[37] provides the power quality industry with the specification for PQDIF (Power Quality
Data Interchange Format), which is an open and accepted data format standard for the transfer
of power quality data between instruments and computers.
This transfer standard allows the processing and analysis of power quality measurements
using multi-vendor and multi-device data. Wider acceptance of PQDIF as a power quality data
transfer format will significantly add to the value of power quality monitoring and open new
Figure 5-2: PQ Data Management, Reporting & Analytics (Power Quality Dashboard)
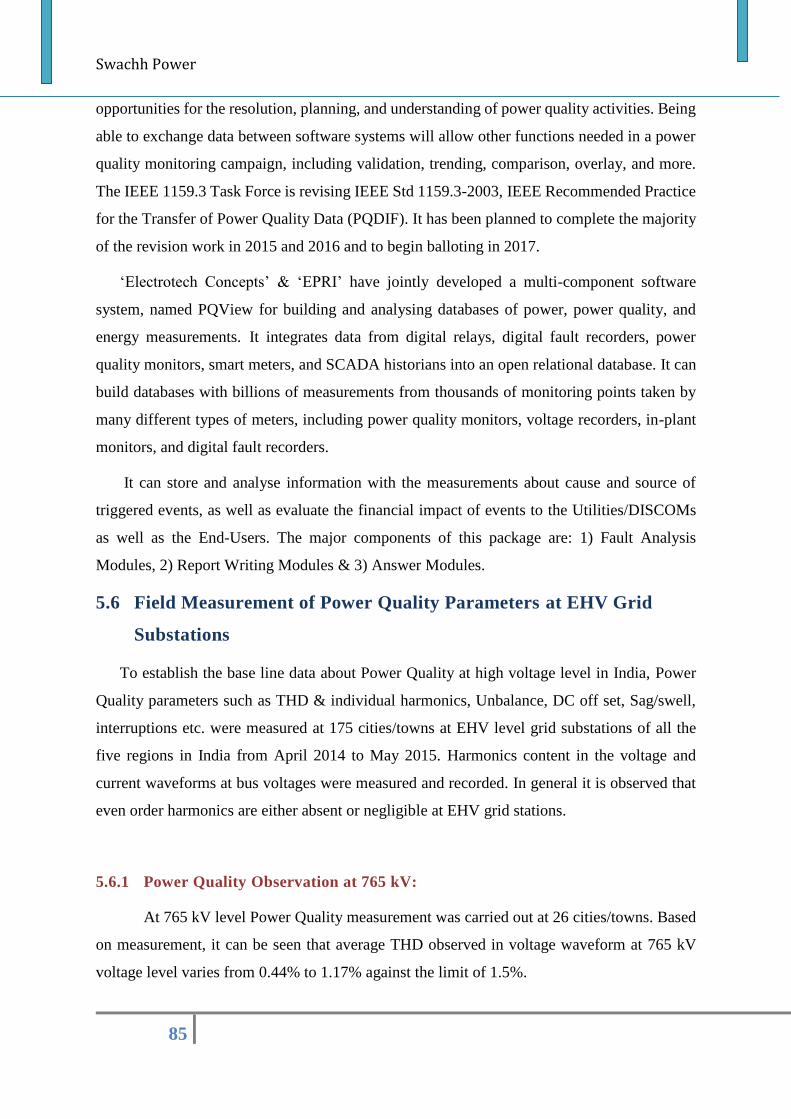
Swachh Power
85
opportunities for the resolution, planning, and understanding of power quality activities. Being
able to exchange data between software systems will allow other functions needed in a power
quality monitoring campaign, including validation, trending, comparison, overlay, and more.
The IEEE 1159.3 Task Force is revising IEEE Std 1159.3-2003, IEEE Recommended Practice
for the Transfer of Power Quality Data (PQDIF). It has been planned to complete the majority
of the revision work in 2015 and 2016 and to begin balloting in 2017.
‘Electrotech Concepts’ & ‘EPRI’ have jointly developed a multi-component software
system, named PQView for building and analysing databases of power, power quality, and
energy measurements. It integrates data from digital relays, digital fault recorders, power
quality monitors, smart meters, and SCADA historians into an open relational database. It can
build databases with billions of measurements from thousands of monitoring points taken by
many different types of meters, including power quality monitors, voltage recorders, in-plant
monitors, and digital fault recorders.
It can store and analyse information with the measurements about cause and source of
triggered events, as well as evaluate the financial impact of events to the Utilities/DISCOMs
as well as the End-Users. The major components of this package are: 1) Fault Analysis
Modules, 2) Report Writing Modules & 3) Answer Modules.
5.6 Field Measurement of Power Quality Parameters at EHV Grid
Substations
To establish the base line data about Power Quality at high voltage level in India, Power
Quality parameters such as THD & individual harmonics, Unbalance, DC off set, Sag/swell,
interruptions etc. were measured at 175 cities/towns at EHV level grid substations of all the
five regions in India from April 2014 to May 2015. Harmonics content in the voltage and
current waveforms at bus voltages were measured and recorded. In general it is observed that
even order harmonics are either absent or negligible at EHV grid stations.
5.6.1 Power Quality Observation at 765 kV:
At 765 kV level Power Quality measurement was carried out at 26 cities/towns. Based
on measurement, it can be seen that average THD observed in voltage waveform at 765 kV
voltage level varies from 0.44% to 1.17% against the limit of 1.5%.
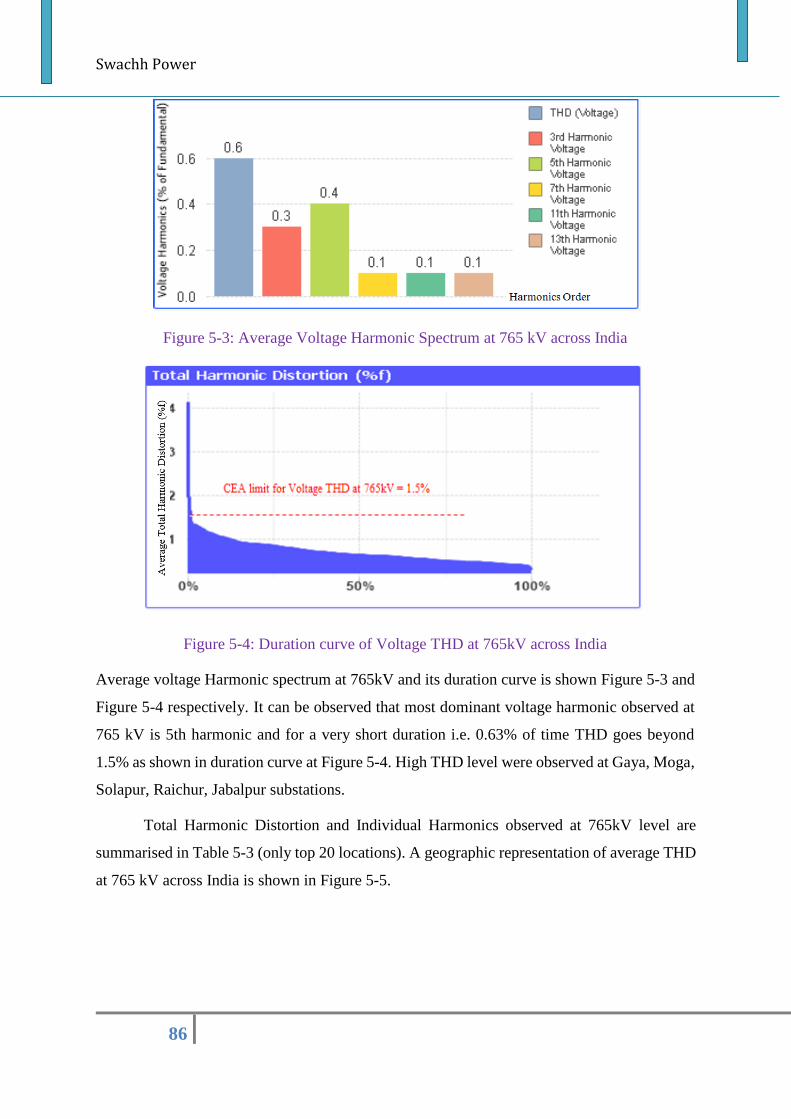
Swachh Power
86
Figure 5-3: Average Voltage Harmonic Spectrum at 765 kV across India
Figure 5-4: Duration curve of Voltage THD at 765kV across India
Average voltage Harmonic spectrum at 765kV and its duration curve is shown Figure 5-3 and
Figure 5-4 respectively. It can be observed that most dominant voltage harmonic observed at
765 kV is 5th harmonic and for a very short duration i.e. 0.63% of time THD goes beyond
1.5% as shown in duration curve at Figure 5-4. High THD level were observed at Gaya, Moga,
Solapur, Raichur, Jabalpur substations.
Total Harmonic Distortion and Individual Harmonics observed at 765kV level are
summarised in Table 5-3 (only top 20 locations). A geographic representation of average THD
at 765 kV across India is shown in Figure 5-5.
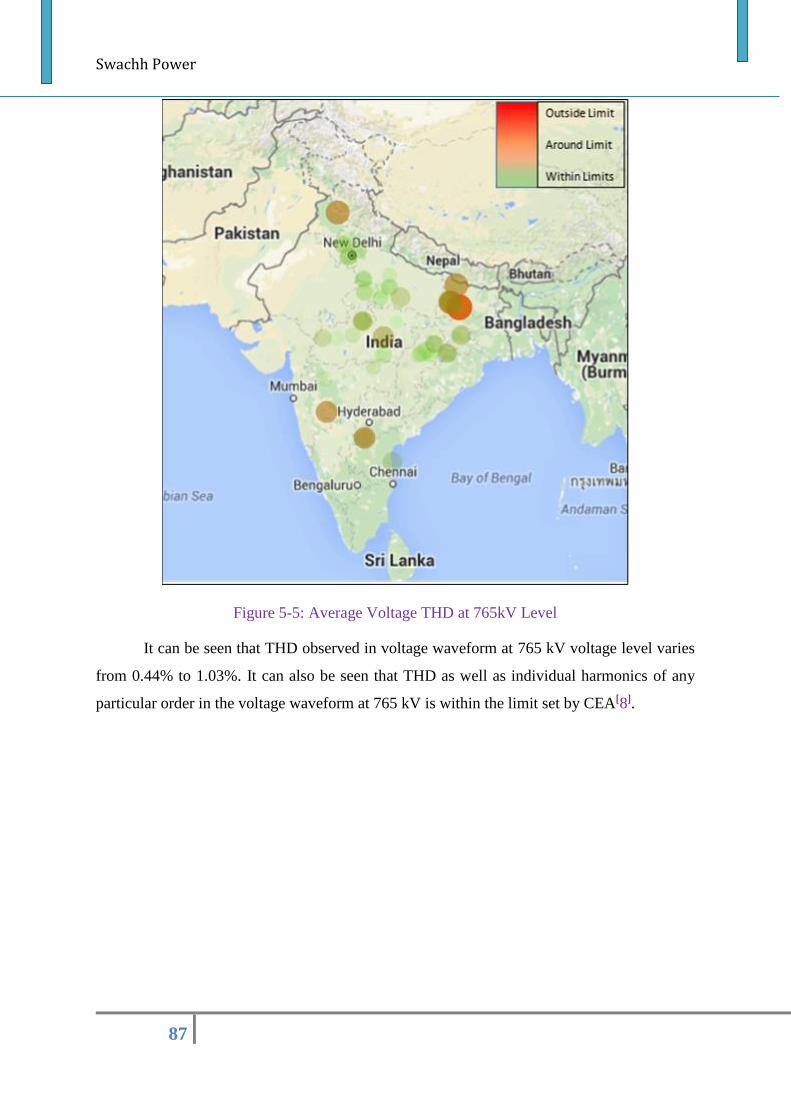
Swachh Power
87
Figure 5-5: Average Voltage THD at 765kV Level
It can be seen that THD observed in voltage waveform at 765 kV voltage level varies
from 0.44% to 1.03%. It can also be seen that THD as well as individual harmonics of any
particular order in the voltage waveform at 765 kV is within the limit set by CEA[8].
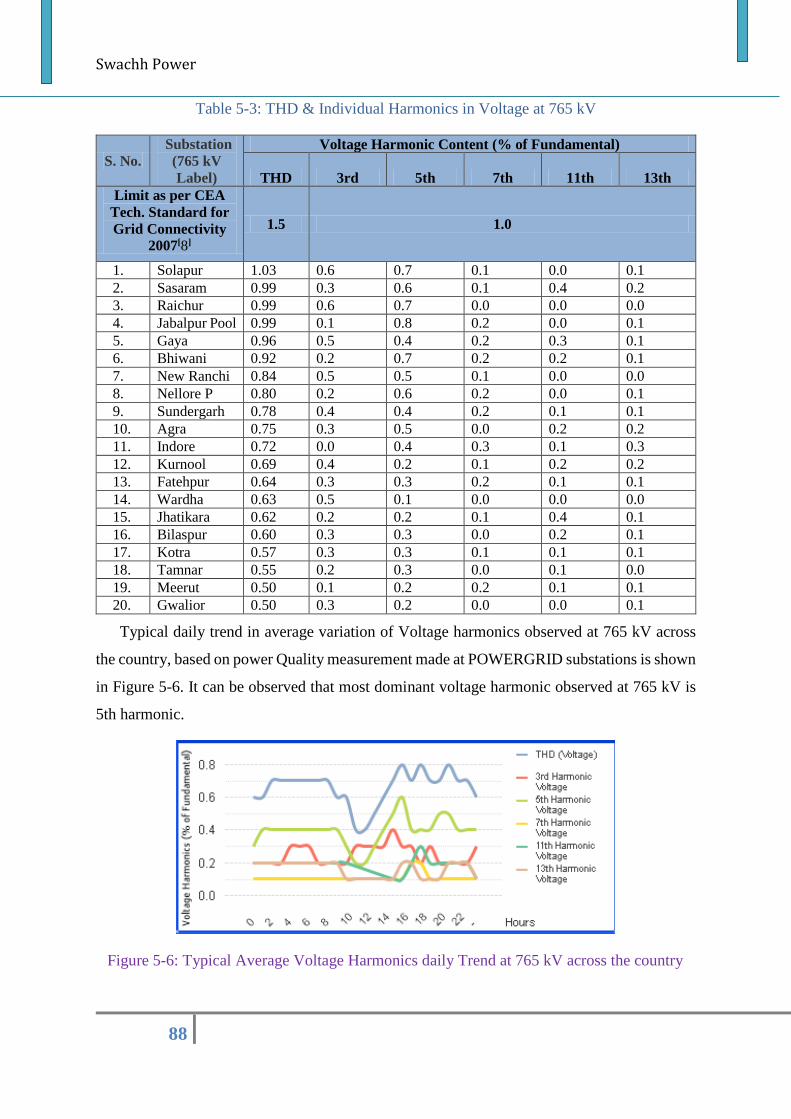
Swachh Power
88
Table 5-3: THD & Individual Harmonics in Voltage at 765 kV
S. No.
Substation
(765 kV
Label)
Voltage Harmonic Content (% of Fundamental)
THD 3rd 5th 7th 11th 13th
Limit as per CEA
Tech. Standard for
Grid Connectivity
2007[8]
1.5 1.0
1. Solapur 1.03 0.6 0.7 0.1 0.0 0.1
2. Sasaram 0.99 0.3 0.6 0.1 0.4 0.2
3. Raichur 0.99 0.6 0.7 0.0 0.0 0.0
4. Jabalpur Pool 0.99 0.1 0.8 0.2 0.0 0.1
5. Gaya 0.96 0.5 0.4 0.2 0.3 0.1
6. Bhiwani 0.92 0.2 0.7 0.2 0.2 0.1
7. New Ranchi 0.84 0.5 0.5 0.1 0.0 0.0
8. Nellore P 0.80 0.2 0.6 0.2 0.0 0.1
9. Sundergarh 0.78 0.4 0.4 0.2 0.1 0.1
10. Agra 0.75 0.3 0.5 0.0 0.2 0.2
11. Indore 0.72 0.0 0.4 0.3 0.1 0.3
12. Kurnool 0.69 0.4 0.2 0.1 0.2 0.2
13. Fatehpur 0.64 0.3 0.3 0.2 0.1 0.1
14. Wardha 0.63 0.5 0.1 0.0 0.0 0.0
15. Jhatikara 0.62 0.2 0.2 0.1 0.4 0.1
16. Bilaspur 0.60 0.3 0.3 0.0 0.2 0.1
17. Kotra 0.57 0.3 0.3 0.1 0.1 0.1
18. Tamnar 0.55 0.2 0.3 0.0 0.1 0.0
19. Meerut 0.50 0.1 0.2 0.2 0.1 0.1
20. Gwalior 0.50 0.3 0.2 0.0 0.0 0.1
Typical daily trend in average variation of Voltage harmonics observed at 765 kV across
the country, based on power Quality measurement made at POWERGRID substations is shown
in Figure 5-6. It can be observed that most dominant voltage harmonic observed at 765 kV is
5th harmonic.
Figure 5-6: Typical Average Voltage Harmonics daily Trend at 765 kV across the country
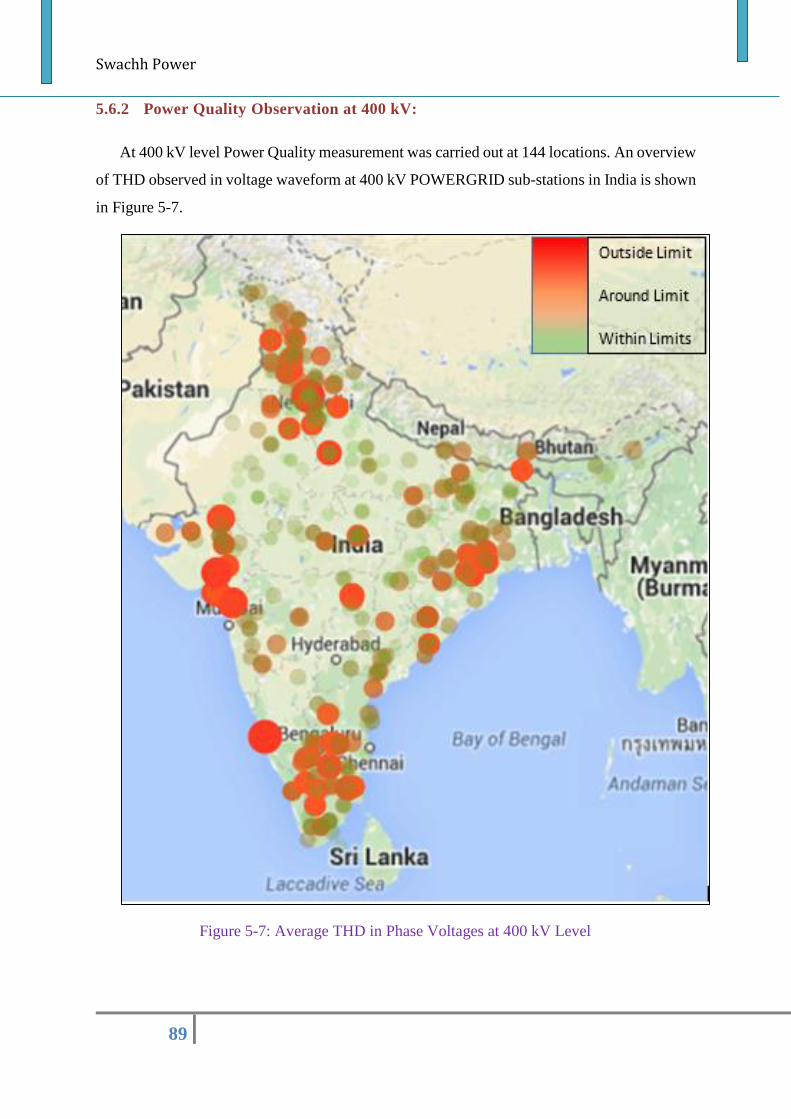
Swachh Power
89
5.6.2 Power Quality Observation at 400 kV:
At 400 kV level Power Quality measurement was carried out at 144 locations. An overview
of THD observed in voltage waveform at 400 kV POWERGRID sub-stations in India is shown
in Figure 5-7.
Figure 5-7: Average THD in Phase Voltages at 400 kV Level
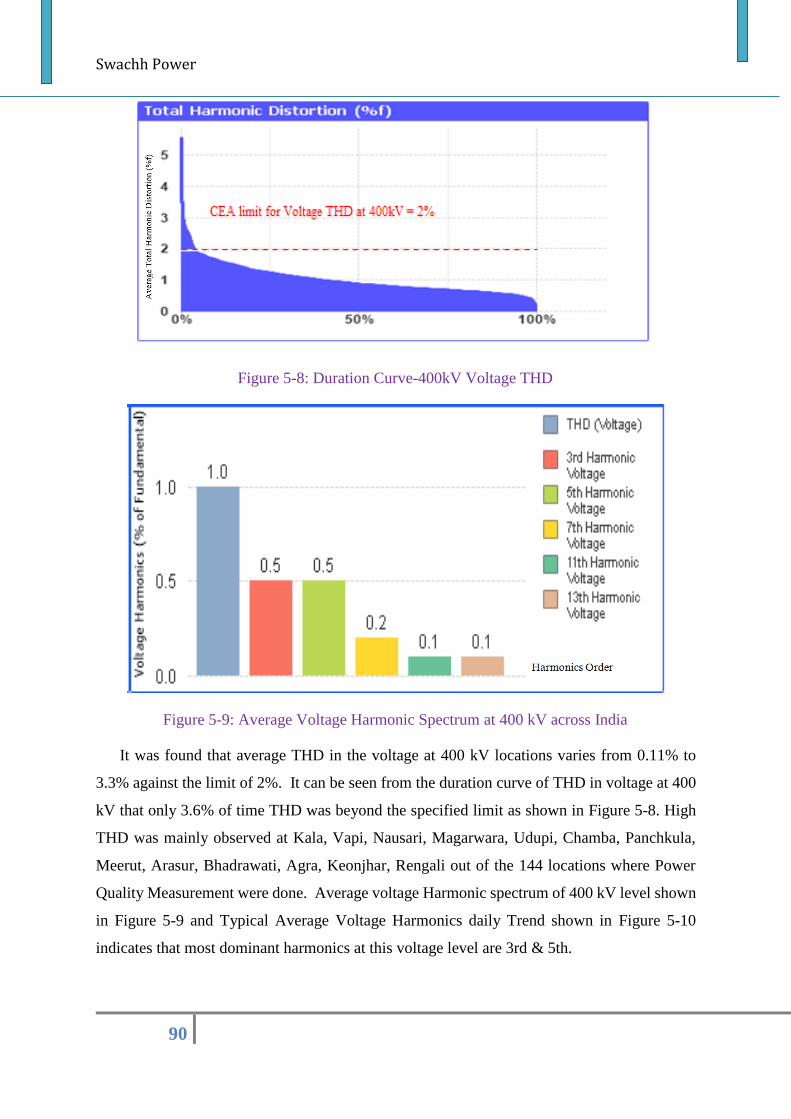
Swachh Power
90
Figure 5-8: Duration Curve-400kV Voltage THD
Figure 5-9: Average Voltage Harmonic Spectrum at 400 kV across India
It was found that average THD in the voltage at 400 kV locations varies from 0.11% to
3.3% against the limit of 2%. It can be seen from the duration curve of THD in voltage at 400
kV that only 3.6% of time THD was beyond the specified limit as shown in Figure 5-8. High
THD was mainly observed at Kala, Vapi, Nausari, Magarwara, Udupi, Chamba, Panchkula,
Meerut, Arasur, Bhadrawati, Agra, Keonjhar, Rengali out of the 144 locations where Power
Quality Measurement were done. Average voltage Harmonic spectrum of 400 kV level shown
in Figure 5-9 and Typical Average Voltage Harmonics daily Trend shown in Figure 5-10
indicates that most dominant harmonics at this voltage level are 3rd & 5th.
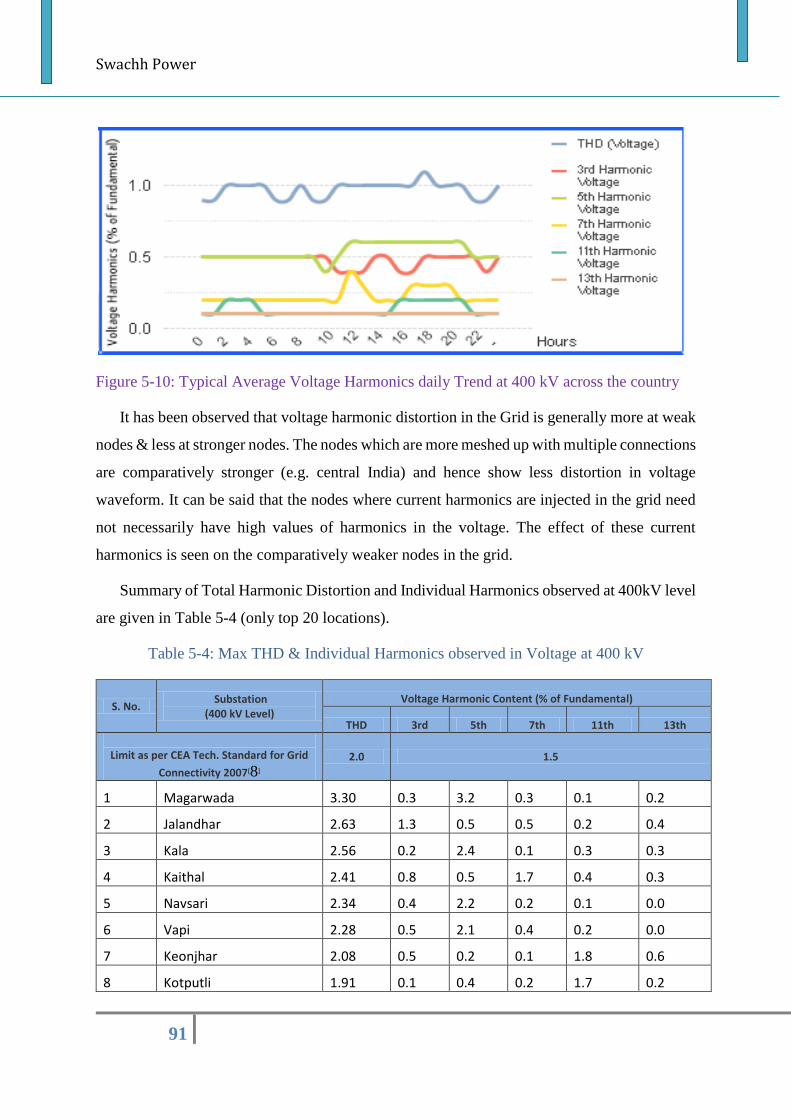
Swachh Power
91
Figure 5-10: Typical Average Voltage Harmonics daily Trend at 400 kV across the country
It has been observed that voltage harmonic distortion in the Grid is generally more at weak
nodes & less at stronger nodes. The nodes which are more meshed up with multiple connections
are comparatively stronger (e.g. central India) and hence show less distortion in voltage
waveform. It can be said that the nodes where current harmonics are injected in the grid need
not necessarily have high values of harmonics in the voltage. The effect of these current
harmonics is seen on the comparatively weaker nodes in the grid.
Summary of Total Harmonic Distortion and Individual Harmonics observed at 400kV level
are given in Table 5-4 (only top 20 locations).
Table 5-4: Max THD & Individual Harmonics observed in Voltage at 400 kV
S. No. Substation
(400 kV Level)
Voltage Harmonic Content (% of Fundamental)
THD 3rd 5th 7th 11th 13th
Limit as per CEA Tech. Standard for Grid
Connectivity 2007[8]
2.0 1.5
1 Magarwada 3.30 0.3 3.2 0.3 0.1 0.2
2 Jalandhar 2.63 1.3 0.5 0.5 0.2 0.4
3 Kala 2.56 0.2 2.4 0.1 0.3 0.3
4 Kaithal 2.41 0.8 0.5 1.7 0.4 0.3
5 Navsari 2.34 0.4 2.2 0.2 0.1 0.0
6 Vapi 2.28 0.5 2.1 0.4 0.2 0.0
7 Keonjhar 2.08 0.5 0.2 0.1 1.8 0.6
8 Kotputli 1.91 0.1 0.4 0.2 1.7 0.2
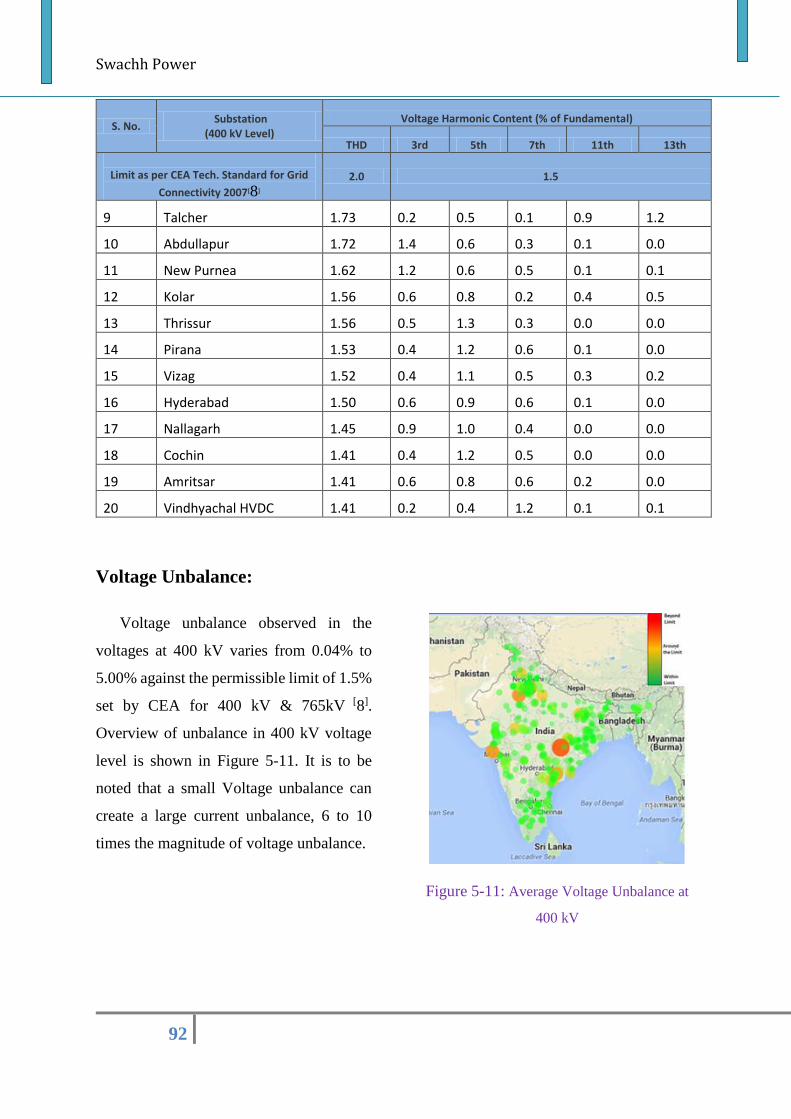
Swachh Power
92
S. No. Substation
(400 kV Level)
Voltage Harmonic Content (% of Fundamental)
THD 3rd 5th 7th 11th 13th
Limit as per CEA Tech. Standard for Grid
Connectivity 2007[8]
2.0 1.5
9 Talcher 1.73 0.2 0.5 0.1 0.9 1.2
10 Abdullapur 1.72 1.4 0.6 0.3 0.1 0.0
11 New Purnea 1.62 1.2 0.6 0.5 0.1 0.1
12 Kolar 1.56 0.6 0.8 0.2 0.4 0.5
13 Thrissur 1.56 0.5 1.3 0.3 0.0 0.0
14 Pirana 1.53 0.4 1.2 0.6 0.1 0.0
15 Vizag 1.52 0.4 1.1 0.5 0.3 0.2
16 Hyderabad 1.50 0.6 0.9 0.6 0.1 0.0
17 Nallagarh 1.45 0.9 1.0 0.4 0.0 0.0
18 Cochin 1.41 0.4 1.2 0.5 0.0 0.0
19 Amritsar 1.41 0.6 0.8 0.6 0.2 0.0
20 Vindhyachal HVDC 1.41 0.2 0.4 1.2 0.1 0.1
Voltage Unbalance:
Voltage unbalance observed in the
voltages at 400 kV varies from 0.04% to
5.00% against the permissible limit of 1.5%
set by CEA for 400 kV & 765kV [8].
Overview of unbalance in 400 kV voltage
level is shown in Figure 5-11. It is to be
noted that a small Voltage unbalance can
create a large current unbalance, 6 to 10
times the magnitude of voltage unbalance.
Figure 5-11: Average Voltage Unbalance at
400 kV
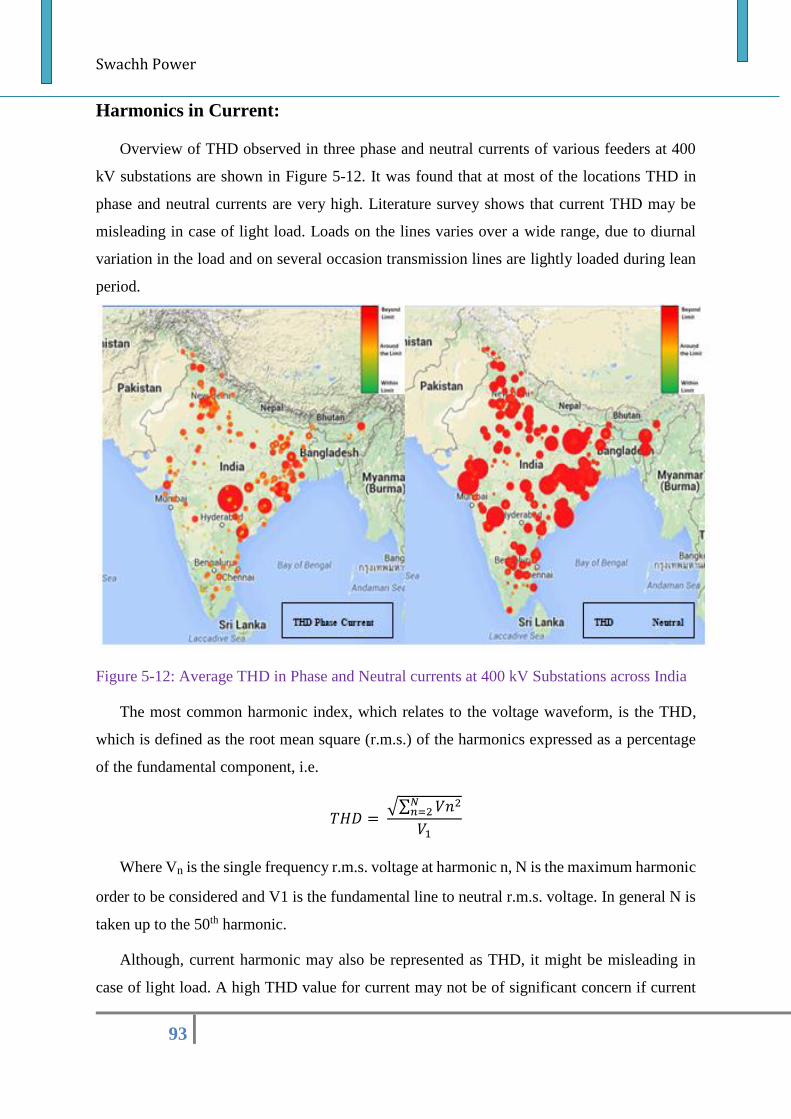
Swachh Power
93
Harmonics in Current:
Overview of THD observed in three phase and neutral currents of various feeders at 400
kV substations are shown in Figure 5-12. It was found that at most of the locations THD in
phase and neutral currents are very high. Literature survey shows that current THD may be
misleading in case of light load. Loads on the lines varies over a wide range, due to diurnal
variation in the load and on several occasion transmission lines are lightly loaded during lean
period.
Figure 5-12: Average THD in Phase and Neutral currents at 400 kV Substations across India
The most common harmonic index, which relates to the voltage waveform, is the THD,
which is defined as the root mean square (r.m.s.) of the harmonics expressed as a percentage
of the fundamental component, i.e.
𝑇𝐻𝐷 = √∑ 𝑉𝑛2𝑁
𝑛=2
𝑉1
Where Vn is the single frequency r.m.s. voltage at harmonic n, N is the maximum harmonic
order to be considered and V1 is the fundamental line to neutral r.m.s. voltage. In general N is
taken up to the 50th harmonic.
Although, current harmonic may also be represented as THD, it might be misleading in
case of light load. A high THD value for current may not be of significant concern if current
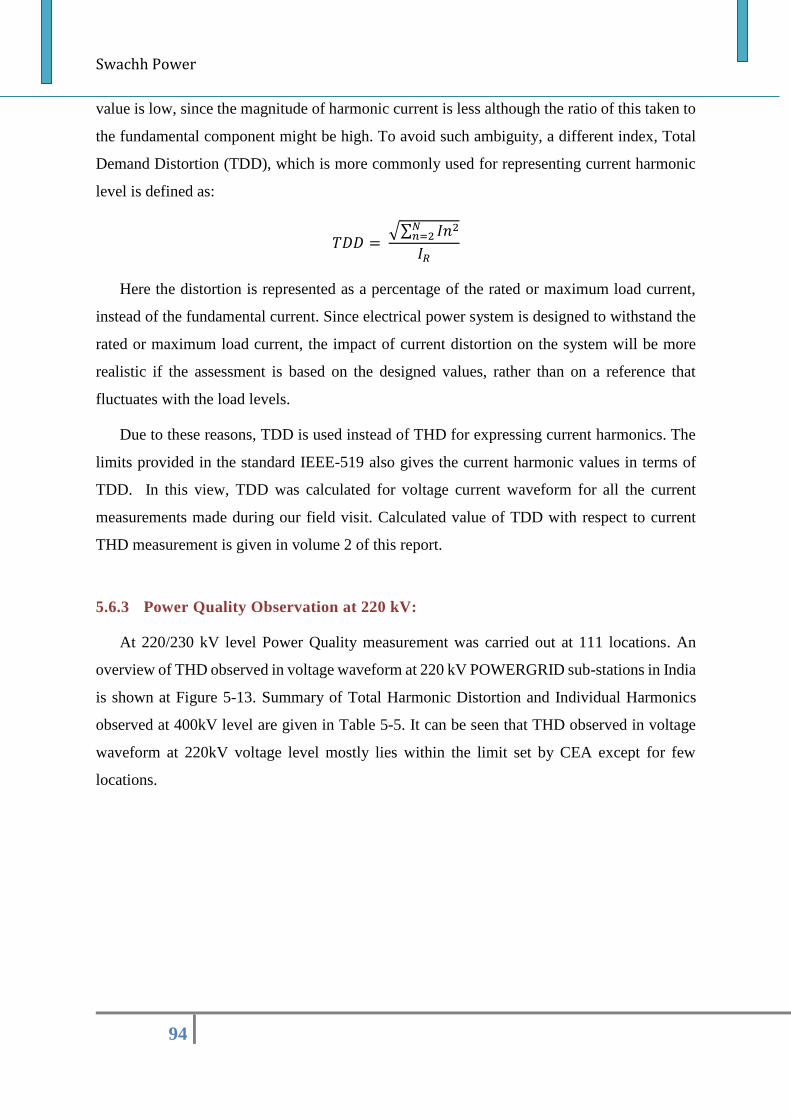
Swachh Power
94
value is low, since the magnitude of harmonic current is less although the ratio of this taken to
the fundamental component might be high. To avoid such ambiguity, a different index, Total
Demand Distortion (TDD), which is more commonly used for representing current harmonic
level is defined as:
𝑇𝐷𝐷 = √∑ 𝐼𝑛2𝑁
𝑛=2
𝐼𝑅
Here the distortion is represented as a percentage of the rated or maximum load current,
instead of the fundamental current. Since electrical power system is designed to withstand the
rated or maximum load current, the impact of current distortion on the system will be more
realistic if the assessment is based on the designed values, rather than on a reference that
fluctuates with the load levels.
Due to these reasons, TDD is used instead of THD for expressing current harmonics. The
limits provided in the standard IEEE-519 also gives the current harmonic values in terms of
TDD. In this view, TDD was calculated for voltage current waveform for all the current
measurements made during our field visit. Calculated value of TDD with respect to current
THD measurement is given in volume 2 of this report.
5.6.3 Power Quality Observation at 220 kV:
At 220/230 kV level Power Quality measurement was carried out at 111 locations. An
overview of THD observed in voltage waveform at 220 kV POWERGRID sub-stations in India
is shown at Figure 5-13. Summary of Total Harmonic Distortion and Individual Harmonics
observed at 400kV level are given in Table 5-5. It can be seen that THD observed in voltage
waveform at 220kV voltage level mostly lies within the limit set by CEA except for few
locations.
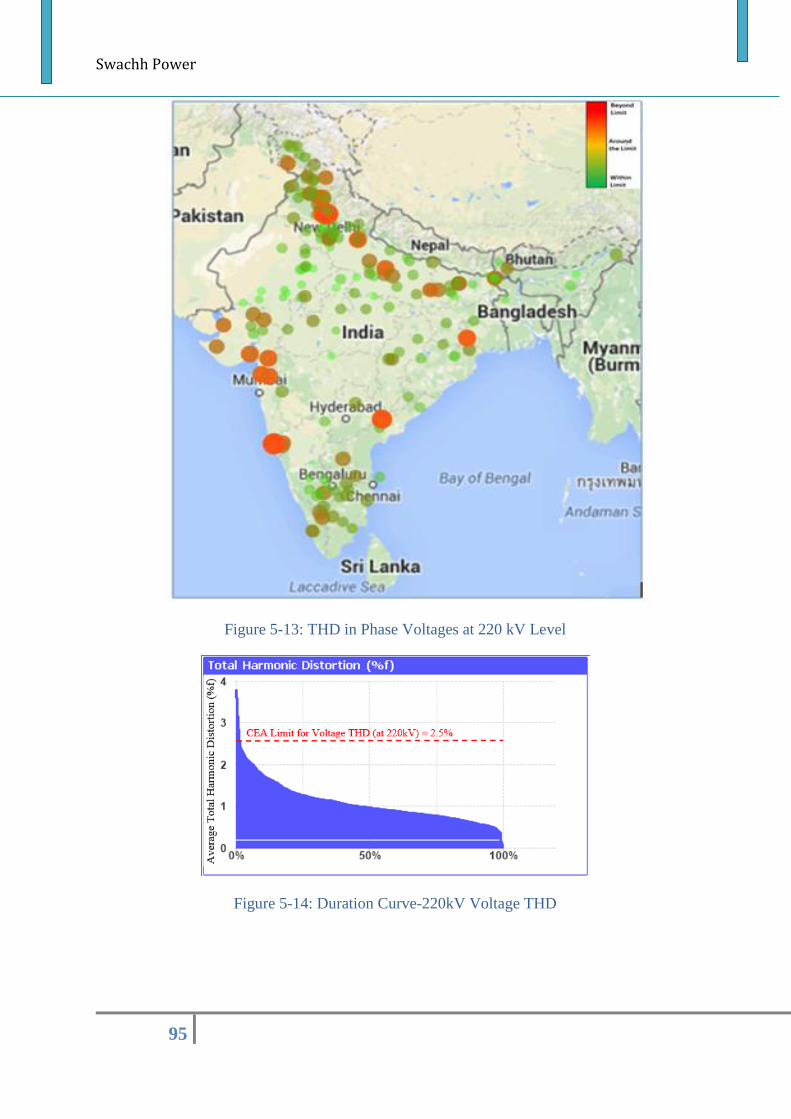
Swachh Power
95
Figure 5-13: THD in Phase Voltages at 220 kV Level
Figure 5-14: Duration Curve-220kV Voltage THD
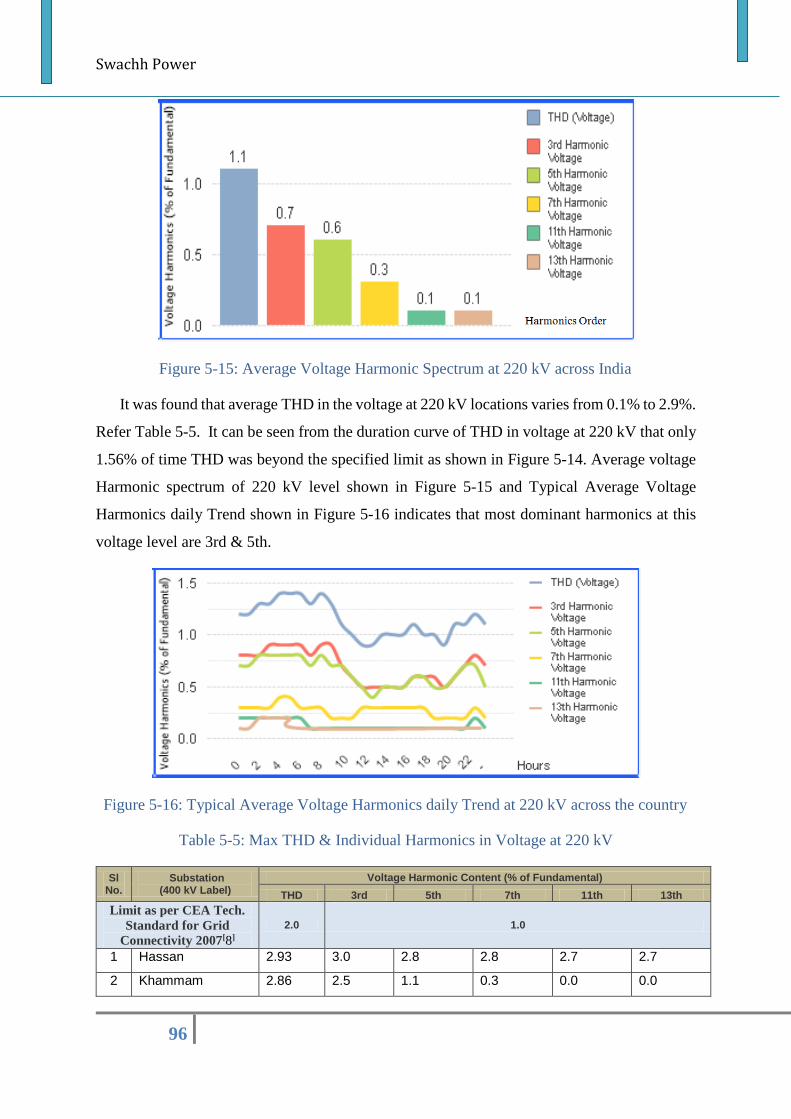
Swachh Power
96
Figure 5-15: Average Voltage Harmonic Spectrum at 220 kV across India
It was found that average THD in the voltage at 220 kV locations varies from 0.1% to 2.9%.
Refer Table 5-5. It can be seen from the duration curve of THD in voltage at 220 kV that only
1.56% of time THD was beyond the specified limit as shown in Figure 5-14. Average voltage
Harmonic spectrum of 220 kV level shown in Figure 5-15 and Typical Average Voltage
Harmonics daily Trend shown in Figure 5-16 indicates that most dominant harmonics at this
voltage level are 3rd & 5th.
Figure 5-16: Typical Average Voltage Harmonics daily Trend at 220 kV across the country
Table 5-5: Max THD & Individual Harmonics in Voltage at 220 kV
Sl No.
Substation (400 kV Label)
Voltage Harmonic Content (% of Fundamental)
THD 3rd 5th 7th 11th 13th
Limit as per CEA Tech.
Standard for Grid
Connectivity 2007[8]
2.0 1.0
1 Hassan 2.93 3.0 2.8 2.8 2.7 2.7
2 Khammam 2.86 2.5 1.1 0.3 0.0 0.0
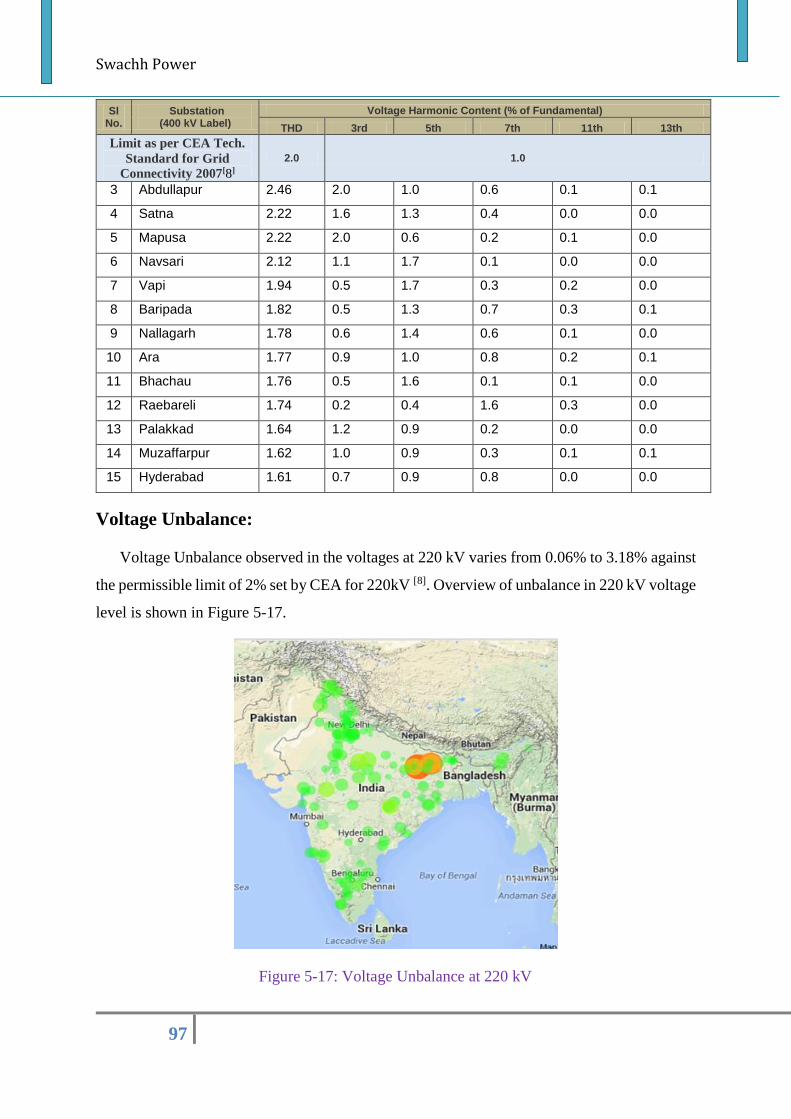
Swachh Power
97
Sl No.
Substation (400 kV Label)
Voltage Harmonic Content (% of Fundamental)
THD 3rd 5th 7th 11th 13th
Limit as per CEA Tech.
Standard for Grid
Connectivity 2007[8]
2.0 1.0
3 Abdullapur 2.46 2.0 1.0 0.6 0.1 0.1
4 Satna 2.22 1.6 1.3 0.4 0.0 0.0
5 Mapusa 2.22 2.0 0.6 0.2 0.1 0.0
6 Navsari 2.12 1.1 1.7 0.1 0.0 0.0
7 Vapi 1.94 0.5 1.7 0.3 0.2 0.0
8 Baripada 1.82 0.5 1.3 0.7 0.3 0.1
9 Nallagarh 1.78 0.6 1.4 0.6 0.1 0.0
10 Ara 1.77 0.9 1.0 0.8 0.2 0.1
11 Bhachau 1.76 0.5 1.6 0.1 0.1 0.0
12 Raebareli 1.74 0.2 0.4 1.6 0.3 0.0
13 Palakkad 1.64 1.2 0.9 0.2 0.0 0.0
14 Muzaffarpur 1.62 1.0 0.9 0.3 0.1 0.1
15 Hyderabad 1.61 0.7 0.9 0.8 0.0 0.0
Voltage Unbalance:
Voltage Unbalance observed in the voltages at 220 kV varies from 0.06% to 3.18% against
the permissible limit of 2% set by CEA for 220kV [8]. Overview of unbalance in 220 kV voltage
level is shown in Figure 5-17.
Figure 5-17: Voltage Unbalance at 220 kV
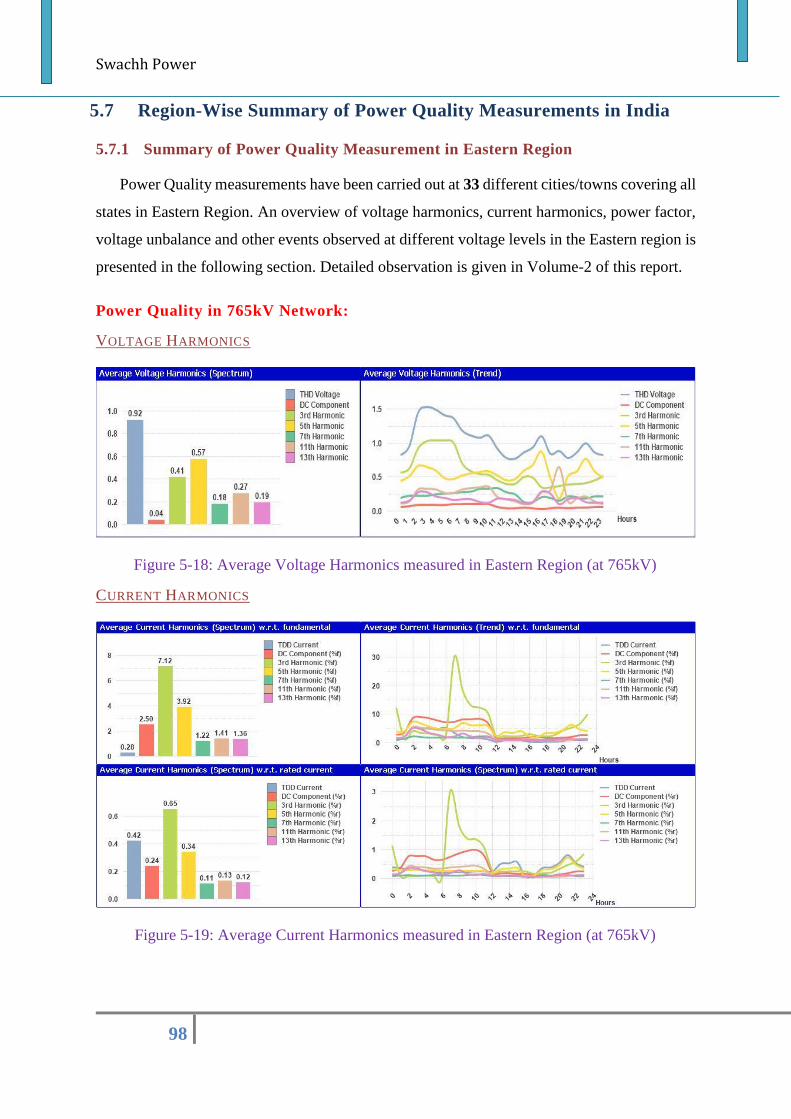
Swachh Power
98
5.7 Region-Wise Summary of Power Quality Measurements in India
5.7.1 Summary of Power Quality Measurement in Eastern Region
Power Quality measurements have been carried out at 33 different cities/towns covering all
states in Eastern Region. An overview of voltage harmonics, current harmonics, power factor,
voltage unbalance and other events observed at different voltage levels in the Eastern region is
presented in the following section. Detailed observation is given in Volume-2 of this report.
Power Quality in 765kV Network:
VOLTAGE HARMONICS
Figure 5-18: Average Voltage Harmonics measured in Eastern Region (at 765kV)
CURRENT HARMONICS
Figure 5-19: Average Current Harmonics measured in Eastern Region (at 765kV)
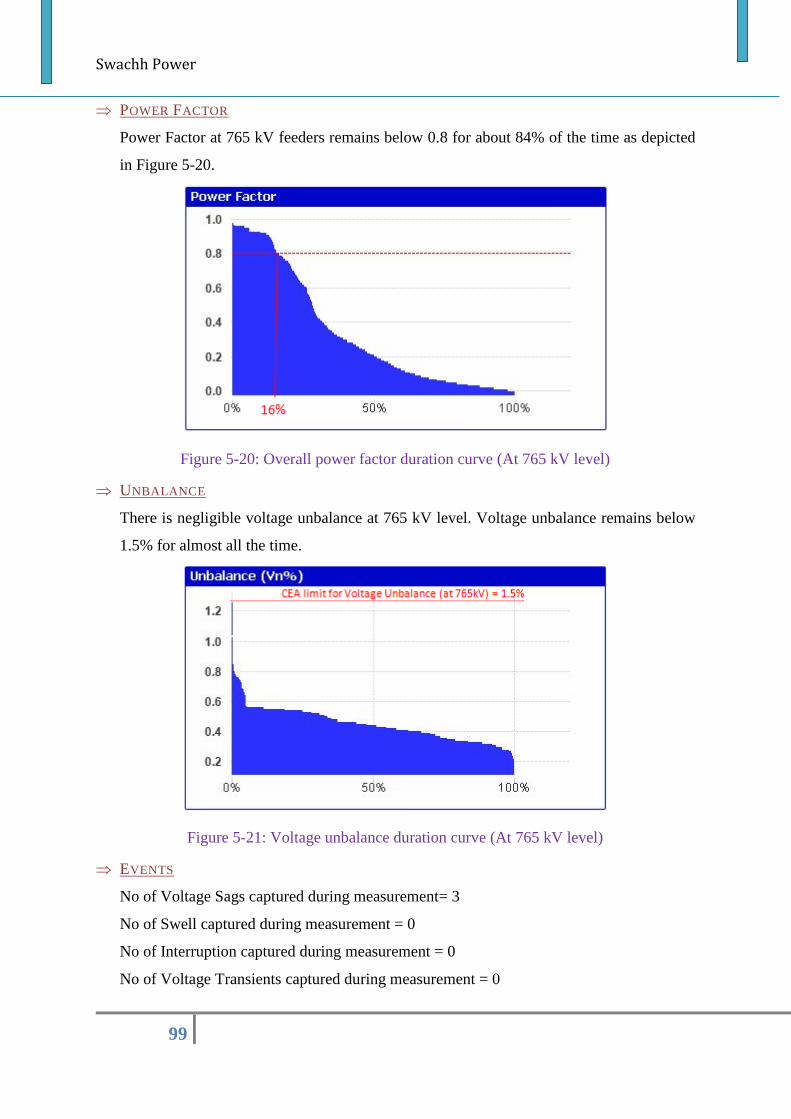
Swachh Power
99
POWER FACTOR
Power Factor at 765 kV feeders remains below 0.8 for about 84% of the time as depicted
in Figure 5-20.
Figure 5-20: Overall power factor duration curve (At 765 kV level)
UNBALANCE
There is negligible voltage unbalance at 765 kV level. Voltage unbalance remains below
1.5% for almost all the time.
Figure 5-21: Voltage unbalance duration curve (At 765 kV level)
EVENTS
No of Voltage Sags captured during measurement= 3
No of Swell captured during measurement = 0
No of Interruption captured during measurement = 0
No of Voltage Transients captured during measurement = 0
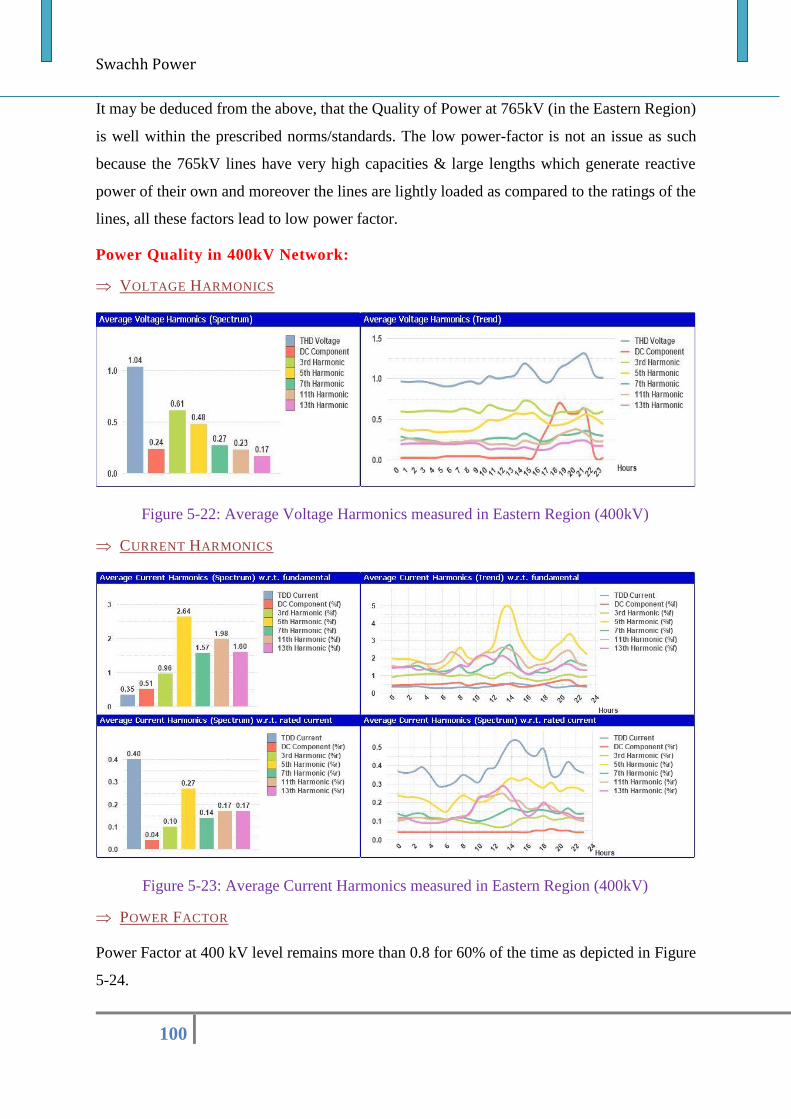
Swachh Power
100
It may be deduced from the above, that the Quality of Power at 765kV (in the Eastern Region)
is well within the prescribed norms/standards. The low power-factor is not an issue as such
because the 765kV lines have very high capacities & large lengths which generate reactive
power of their own and moreover the lines are lightly loaded as compared to the ratings of the
lines, all these factors lead to low power factor.
Power Quality in 400kV Network:
VOLTAGE HARMONICS
Figure 5-22: Average Voltage Harmonics measured in Eastern Region (400kV)
CURRENT HARMONICS
Figure 5-23: Average Current Harmonics measured in Eastern Region (400kV)
POWER FACTOR
Power Factor at 400 kV level remains more than 0.8 for 60% of the time as depicted in Figure
5-24.
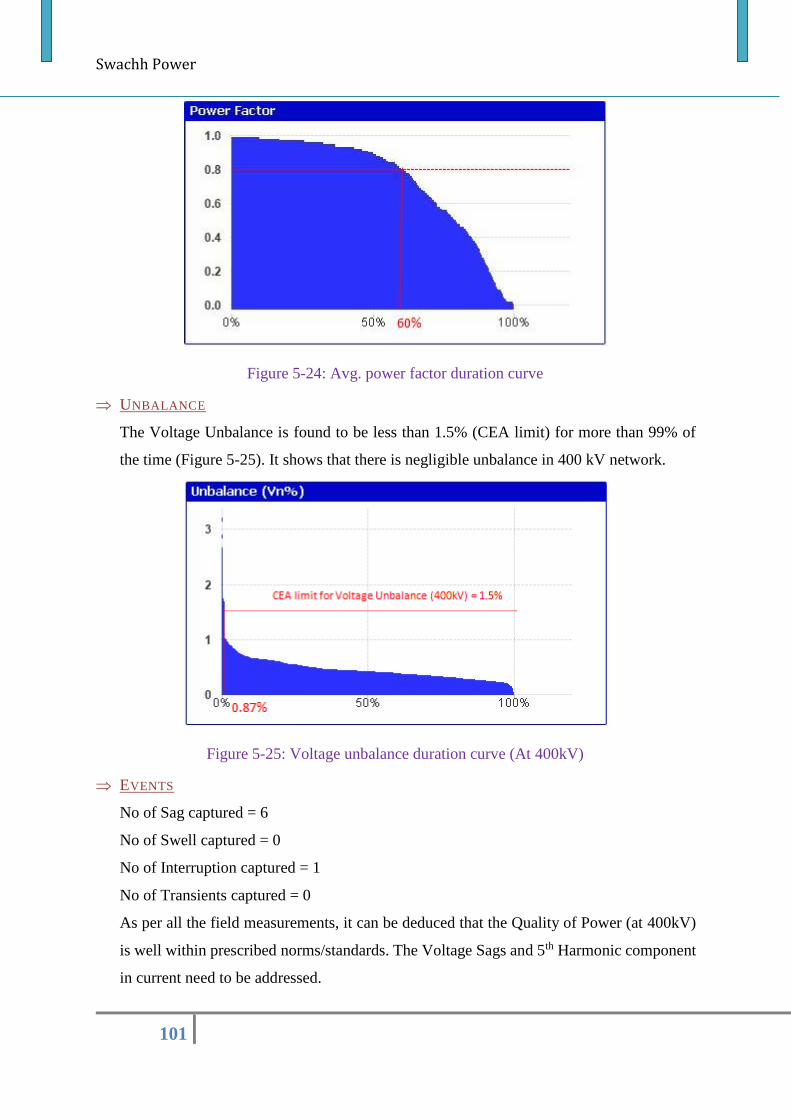
Swachh Power
101
Figure 5-24: Avg. power factor duration curve
UNBALANCE
The Voltage Unbalance is found to be less than 1.5% (CEA limit) for more than 99% of
the time (Figure 5-25). It shows that there is negligible unbalance in 400 kV network.
Figure 5-25: Voltage unbalance duration curve (At 400kV)
EVENTS
No of Sag captured = 6
No of Swell captured = 0
No of Interruption captured = 1
No of Transients captured = 0
As per all the field measurements, it can be deduced that the Quality of Power (at 400kV)
is well within prescribed norms/standards. The Voltage Sags and 5th Harmonic component
in current need to be addressed.
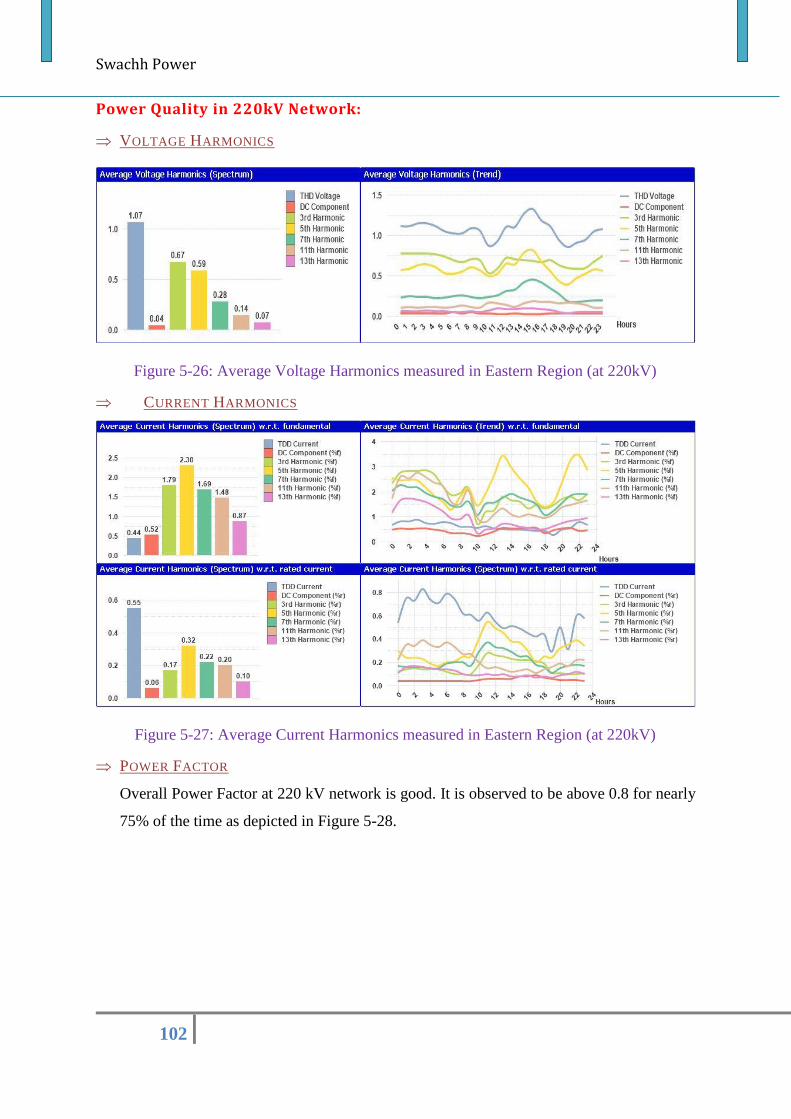
Swachh Power
102
Power Quality in 220kV Network:
VOLTAGE HARMONICS
Figure 5-26: Average Voltage Harmonics measured in Eastern Region (at 220kV)
CURRENT HARMONICS
Figure 5-27: Average Current Harmonics measured in Eastern Region (at 220kV)
POWER FACTOR
Overall Power Factor at 220 kV network is good. It is observed to be above 0.8 for nearly
75% of the time as depicted in Figure 5-28.
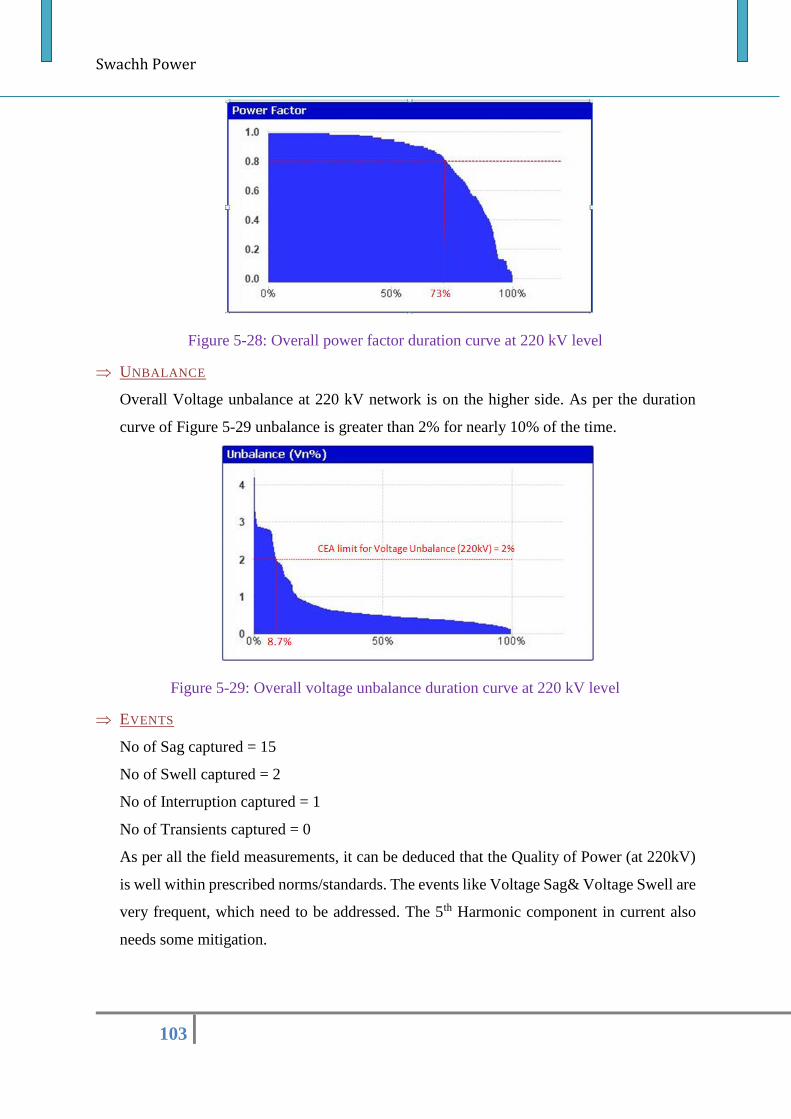
Swachh Power
103
Figure 5-28: Overall power factor duration curve at 220 kV level
UNBALANCE
Overall Voltage unbalance at 220 kV network is on the higher side. As per the duration
curve of Figure 5-29 unbalance is greater than 2% for nearly 10% of the time.
Figure 5-29: Overall voltage unbalance duration curve at 220 kV level
EVENTS
No of Sag captured = 15
No of Swell captured = 2
No of Interruption captured = 1
No of Transients captured = 0
As per all the field measurements, it can be deduced that the Quality of Power (at 220kV)
is well within prescribed norms/standards. The events like Voltage Sag& Voltage Swell are
very frequent, which need to be addressed. The 5th Harmonic component in current also
needs some mitigation.
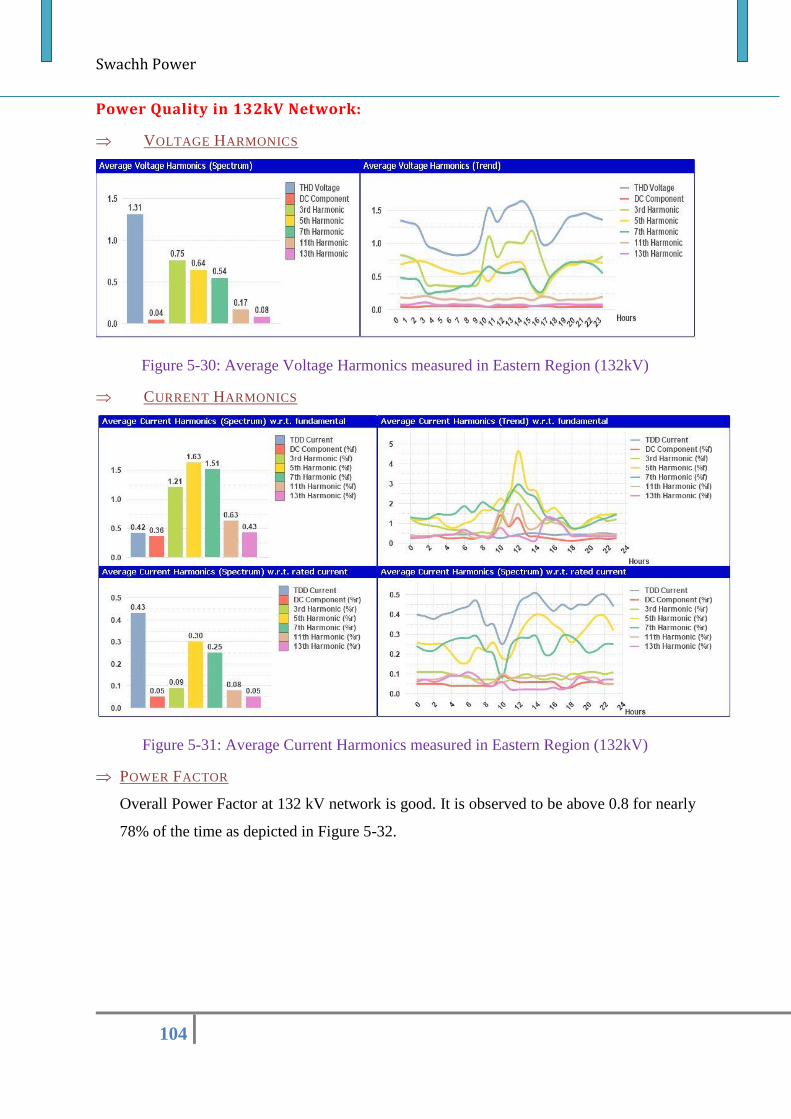
Swachh Power
104
Power Quality in 132kV Network:
VOLTAGE HARMONICS
Figure 5-30: Average Voltage Harmonics measured in Eastern Region (132kV)
CURRENT HARMONICS
Figure 5-31: Average Current Harmonics measured in Eastern Region (132kV)
POWER FACTOR
Overall Power Factor at 132 kV network is good. It is observed to be above 0.8 for nearly
78% of the time as depicted in Figure 5-32.
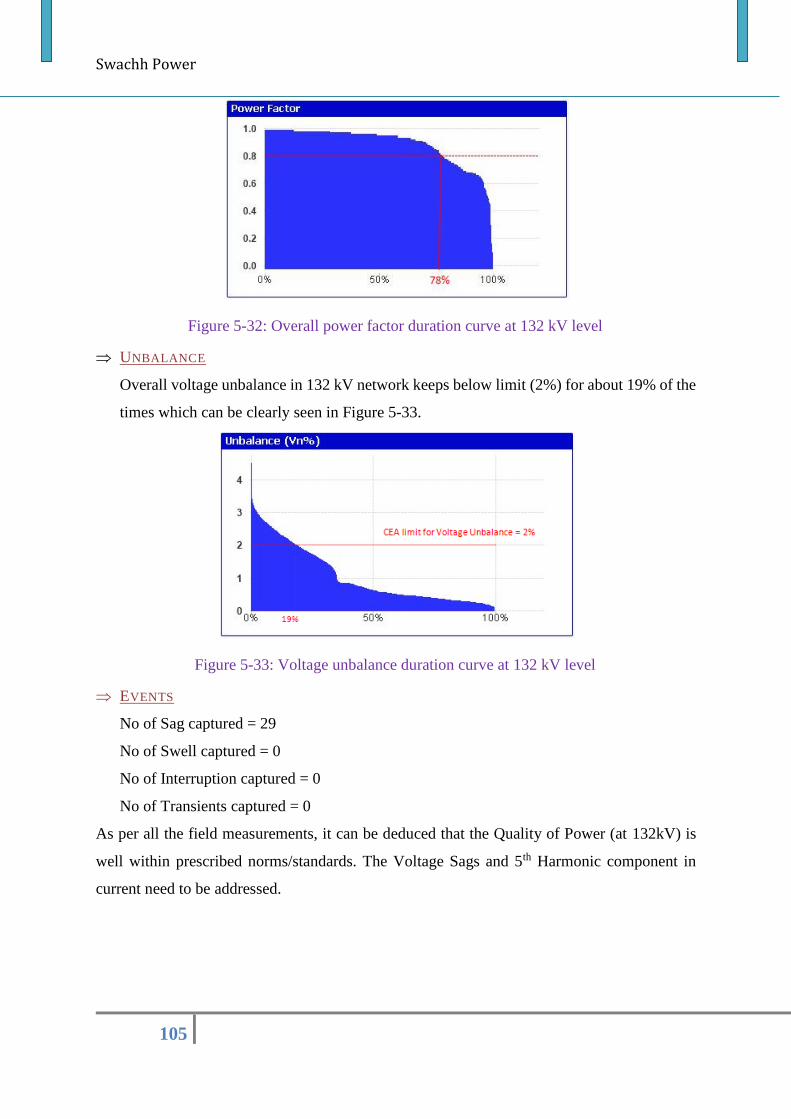
Swachh Power
105
Figure 5-32: Overall power factor duration curve at 132 kV level
UNBALANCE
Overall voltage unbalance in 132 kV network keeps below limit (2%) for about 19% of the
times which can be clearly seen in Figure 5-33.
Figure 5-33: Voltage unbalance duration curve at 132 kV level
EVENTS
No of Sag captured = 29
No of Swell captured = 0
No of Interruption captured = 0
No of Transients captured = 0
As per all the field measurements, it can be deduced that the Quality of Power (at 132kV) is
well within prescribed norms/standards. The Voltage Sags and 5th Harmonic component in
current need to be addressed.
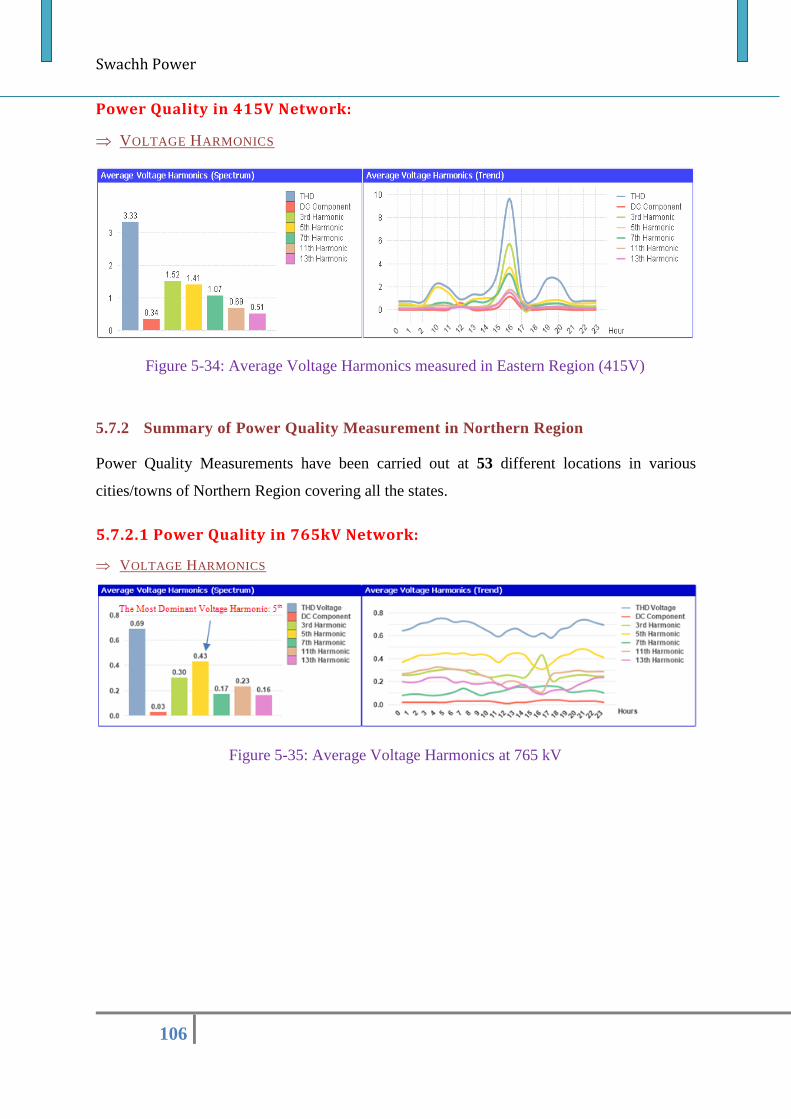
Swachh Power
106
Power Quality in 415V Network:
VOLTAGE HARMONICS
Figure 5-34: Average Voltage Harmonics measured in Eastern Region (415V)
5.7.2 Summary of Power Quality Measurement in Northern Region
Power Quality Measurements have been carried out at 53 different locations in various
cities/towns of Northern Region covering all the states.
5.7.2.1 Power Quality in 765kV Network:
VOLTAGE HARMONICS
Figure 5-35: Average Voltage Harmonics at 765 kV
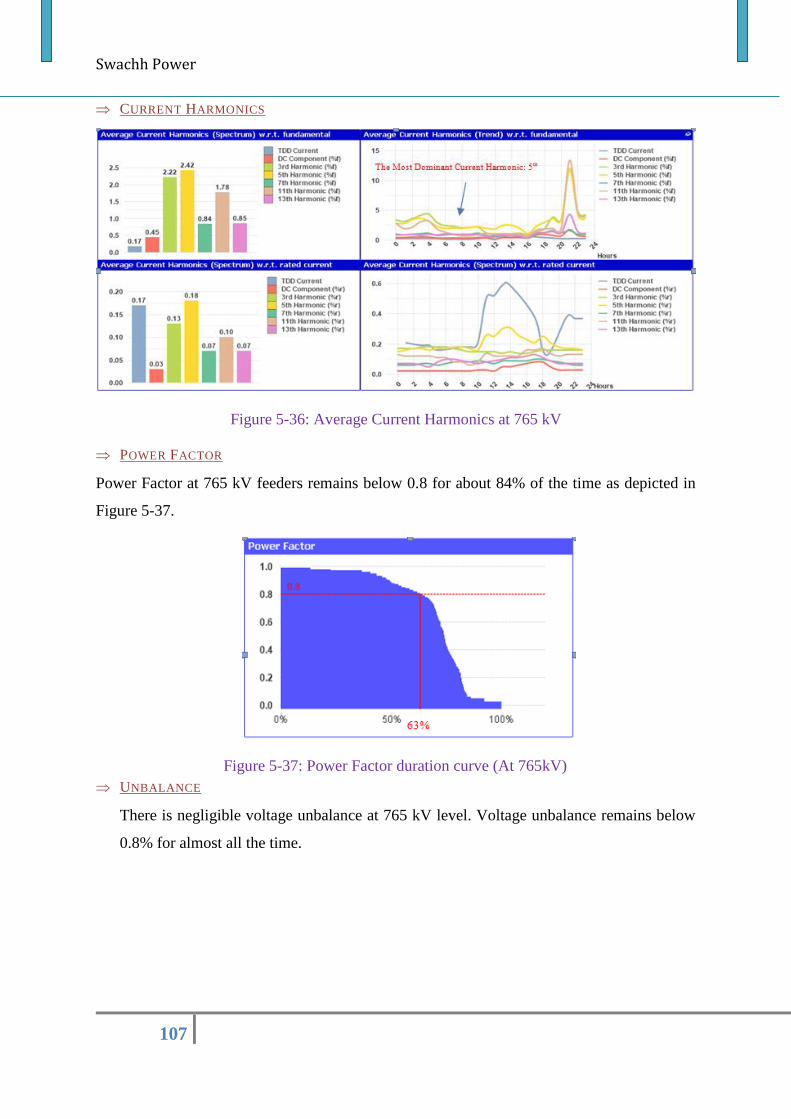
Swachh Power
107
CURRENT HARMONICS
Figure 5-36: Average Current Harmonics at 765 kV
POWER FACTOR
Power Factor at 765 kV feeders remains below 0.8 for about 84% of the time as depicted in
Figure 5-37.
Figure 5-37: Power Factor duration curve (At 765kV)
UNBALANCE
There is negligible voltage unbalance at 765 kV level. Voltage unbalance remains below
0.8% for almost all the time.
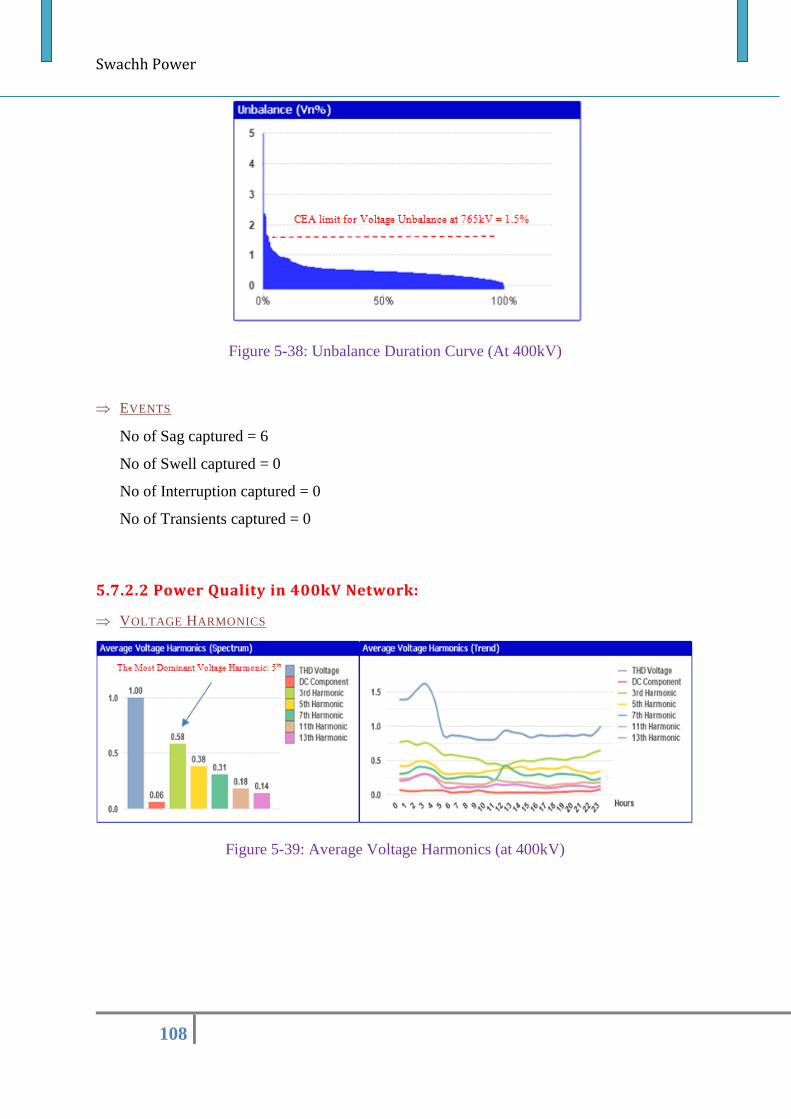
Swachh Power
108
Figure 5-38: Unbalance Duration Curve (At 400kV)
EVENTS
No of Sag captured = 6
No of Swell captured = 0
No of Interruption captured = 0
No of Transients captured = 0
5.7.2.2 Power Quality in 400kV Network:
VOLTAGE HARMONICS
Figure 5-39: Average Voltage Harmonics (at 400kV)
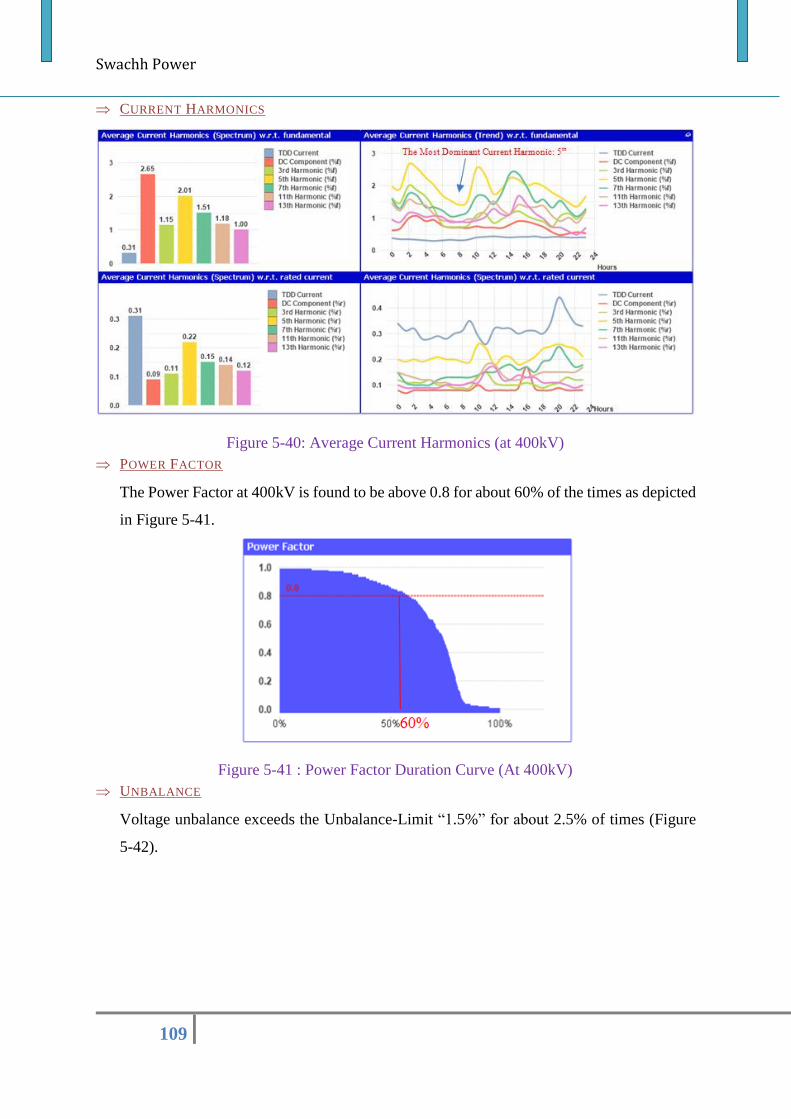
Swachh Power
109
CURRENT HARMONICS
Figure 5-40: Average Current Harmonics (at 400kV)
POWER FACTOR
The Power Factor at 400kV is found to be above 0.8 for about 60% of the times as depicted
in Figure 5-41.
Figure 5-41 : Power Factor Duration Curve (At 400kV)
UNBALANCE
Voltage unbalance exceeds the Unbalance-Limit “1.5%” for about 2.5% of times (Figure
5-42).
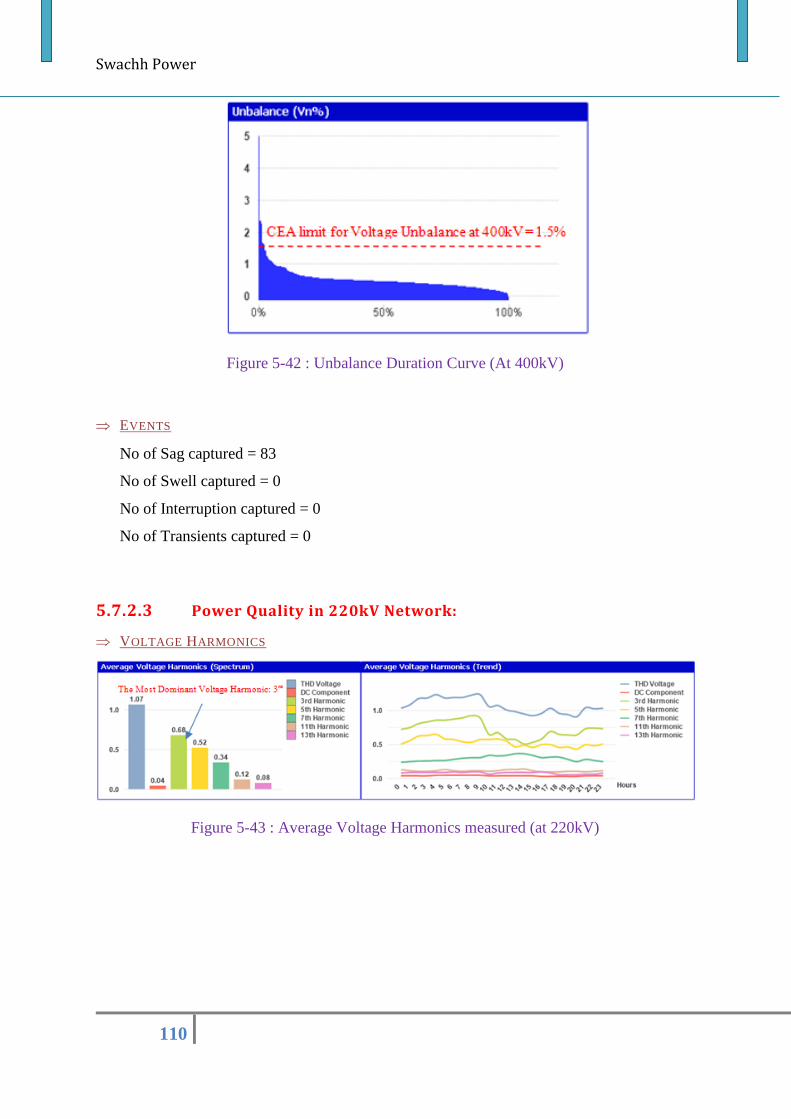
Swachh Power
110
Figure 5-42 : Unbalance Duration Curve (At 400kV)
EVENTS
No of Sag captured = 83
No of Swell captured = 0
No of Interruption captured = 0
No of Transients captured = 0
5.7.2.3 Power Quality in 220kV Network:
VOLTAGE HARMONICS
Figure 5-43 : Average Voltage Harmonics measured (at 220kV)
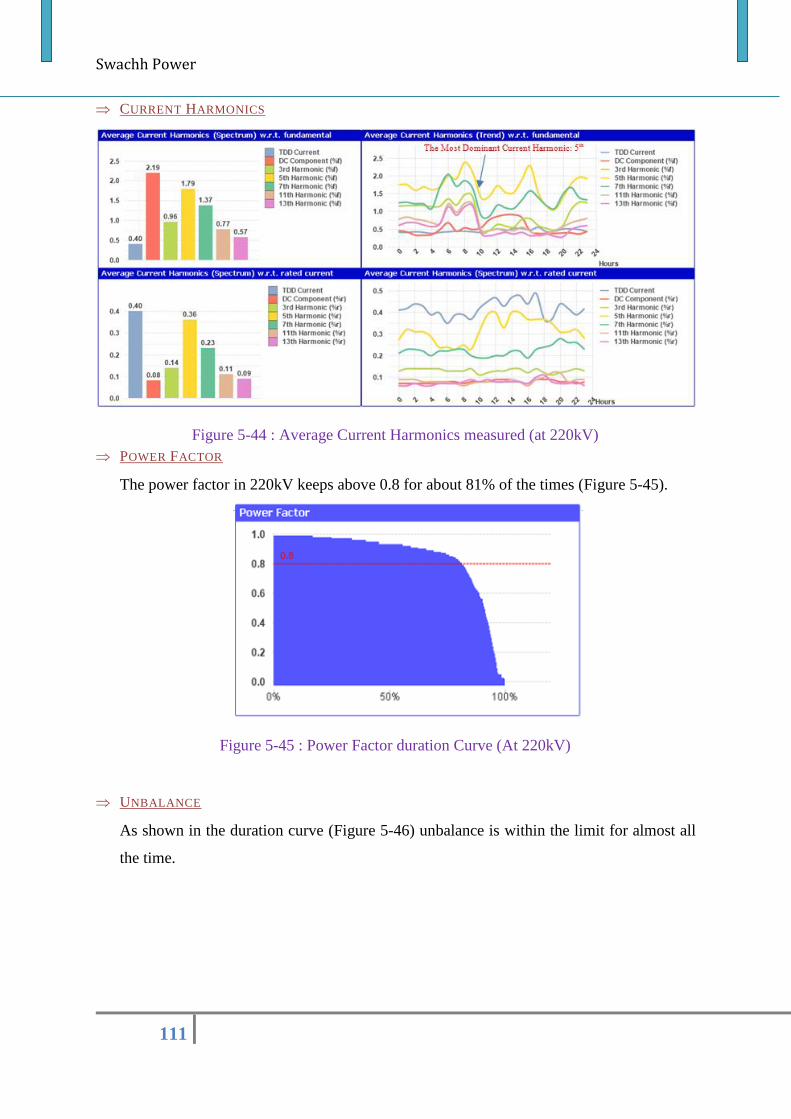
Swachh Power
111
CURRENT HARMONICS
Figure 5-44 : Average Current Harmonics measured (at 220kV)
POWER FACTOR
The power factor in 220kV keeps above 0.8 for about 81% of the times (Figure 5-45).
Figure 5-45 : Power Factor duration Curve (At 220kV)
UNBALANCE
As shown in the duration curve (Figure 5-46) unbalance is within the limit for almost all
the time.
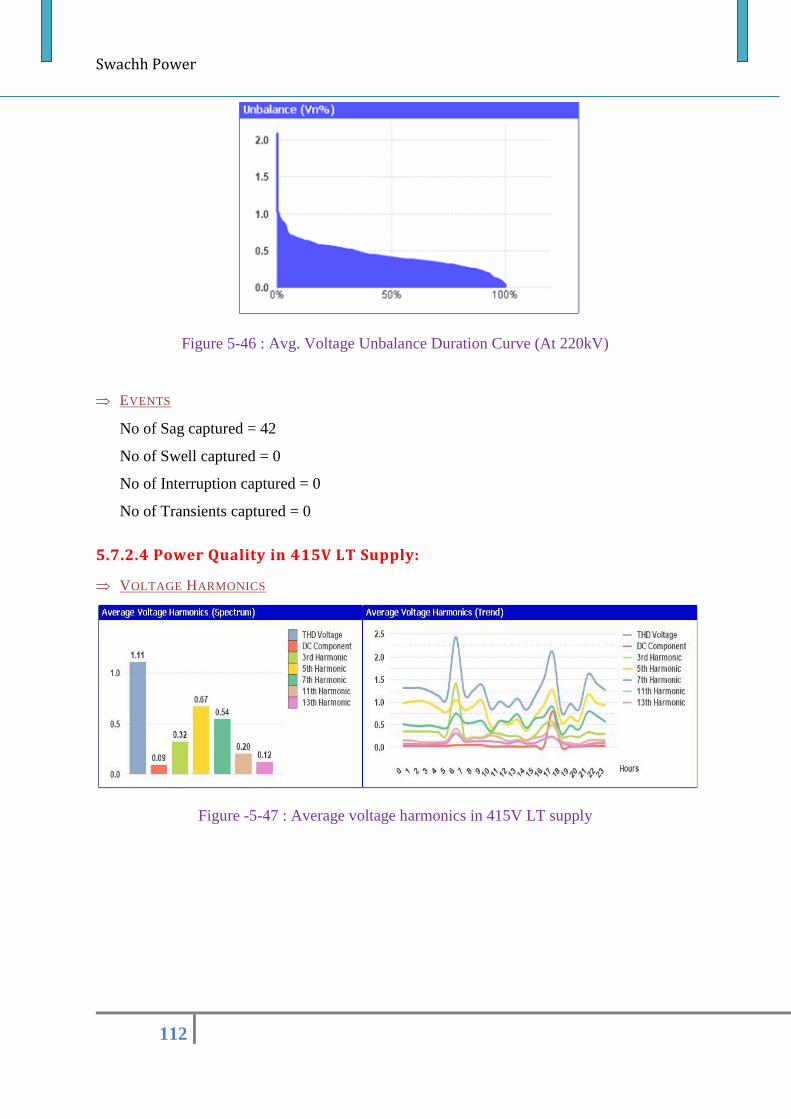
Swachh Power
112
Figure 5-46 : Avg. Voltage Unbalance Duration Curve (At 220kV)
EVENTS
No of Sag captured = 42
No of Swell captured = 0
No of Interruption captured = 0
No of Transients captured = 0
5.7.2.4 Power Quality in 415V LT Supply:
VOLTAGE HARMONICS
Figure -5-47 : Average voltage harmonics in 415V LT supply
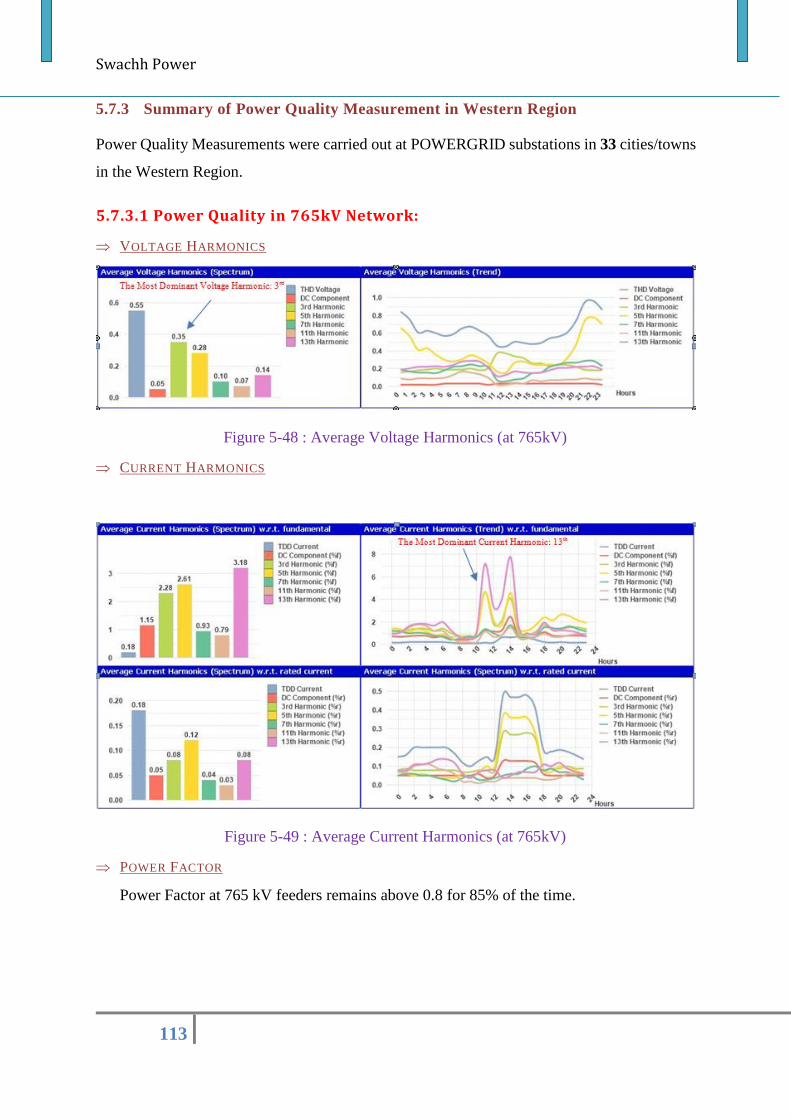
Swachh Power
113
5.7.3 Summary of Power Quality Measurement in Western Region
Power Quality Measurements were carried out at POWERGRID substations in 33 cities/towns
in the Western Region.
5.7.3.1 Power Quality in 765kV Network:
VOLTAGE HARMONICS
Figure 5-48 : Average Voltage Harmonics (at 765kV)
CURRENT HARMONICS
Figure 5-49 : Average Current Harmonics (at 765kV)
POWER FACTOR
Power Factor at 765 kV feeders remains above 0.8 for 85% of the time.
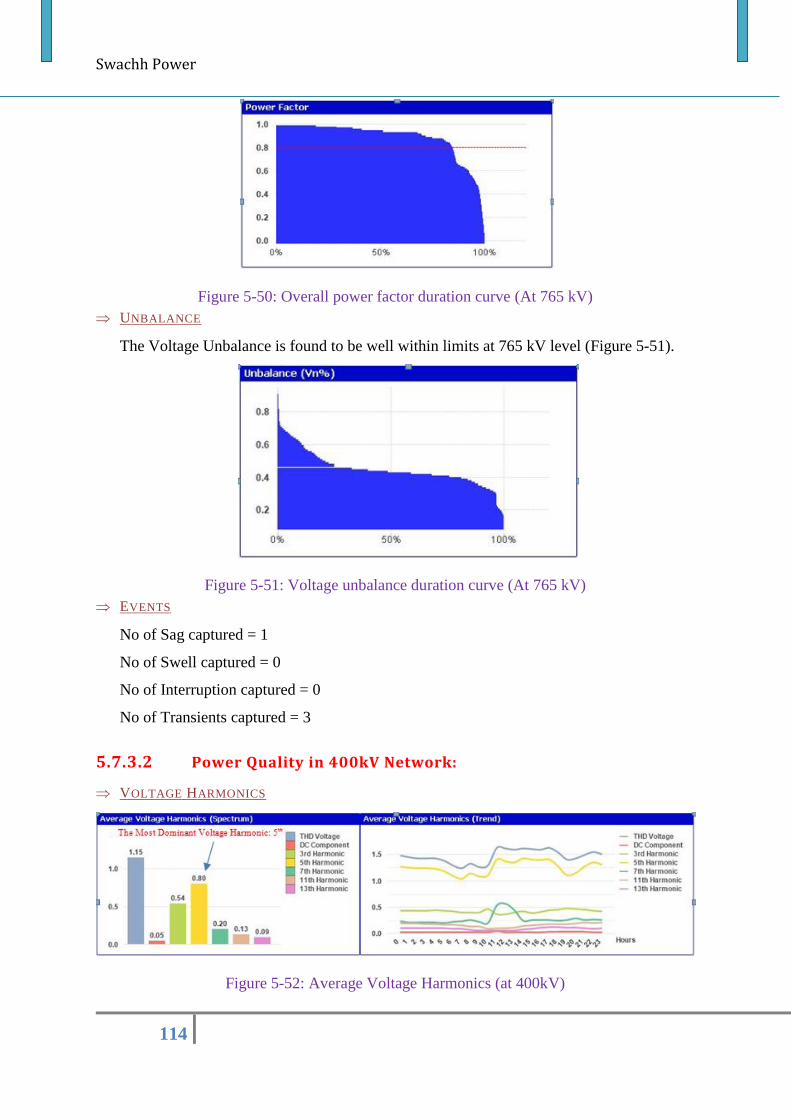
Swachh Power
114
Figure 5-50: Overall power factor duration curve (At 765 kV)
UNBALANCE
The Voltage Unbalance is found to be well within limits at 765 kV level (Figure 5-51).
Figure 5-51: Voltage unbalance duration curve (At 765 kV)
EVENTS
No of Sag captured = 1
No of Swell captured = 0
No of Interruption captured = 0
No of Transients captured = 3
5.7.3.2 Power Quality in 400kV Network:
VOLTAGE HARMONICS
Figure 5-52: Average Voltage Harmonics (at 400kV)
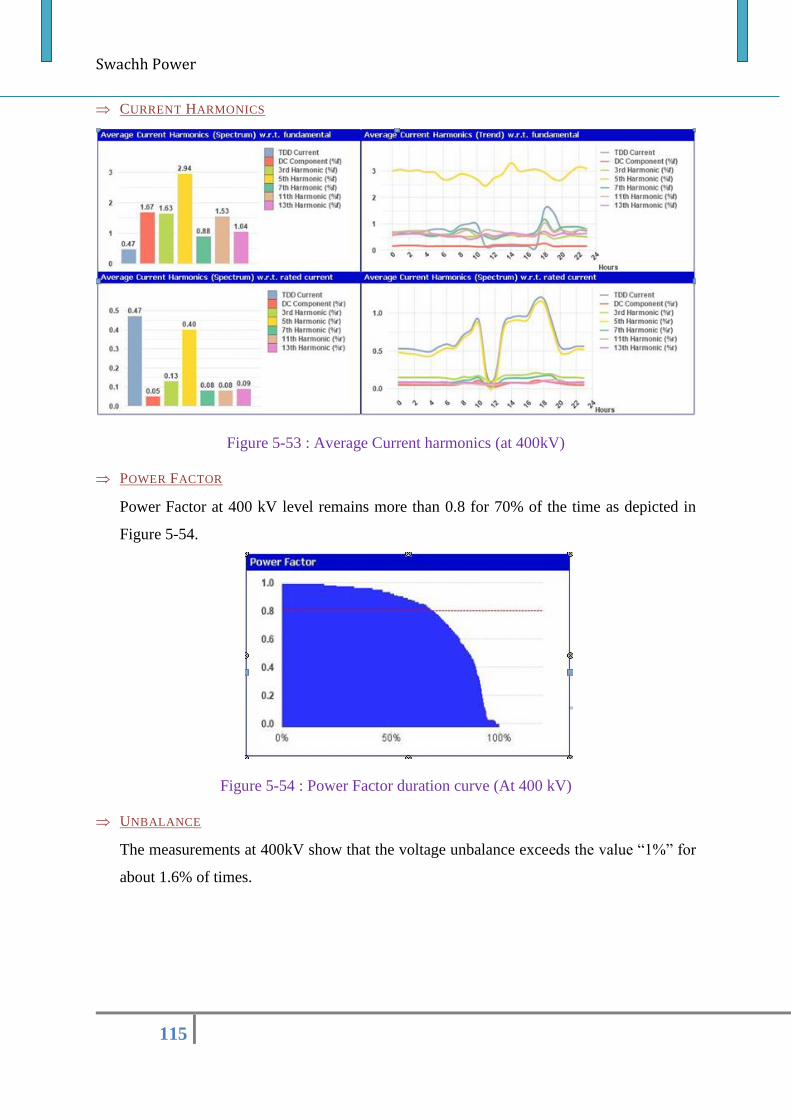
Swachh Power
115
CURRENT HARMONICS
Figure 5-53 : Average Current harmonics (at 400kV)
POWER FACTOR
Power Factor at 400 kV level remains more than 0.8 for 70% of the time as depicted in
Figure 5-54.
Figure 5-54 : Power Factor duration curve (At 400 kV)
UNBALANCE
The measurements at 400kV show that the voltage unbalance exceeds the value “1%” for
about 1.6% of times.
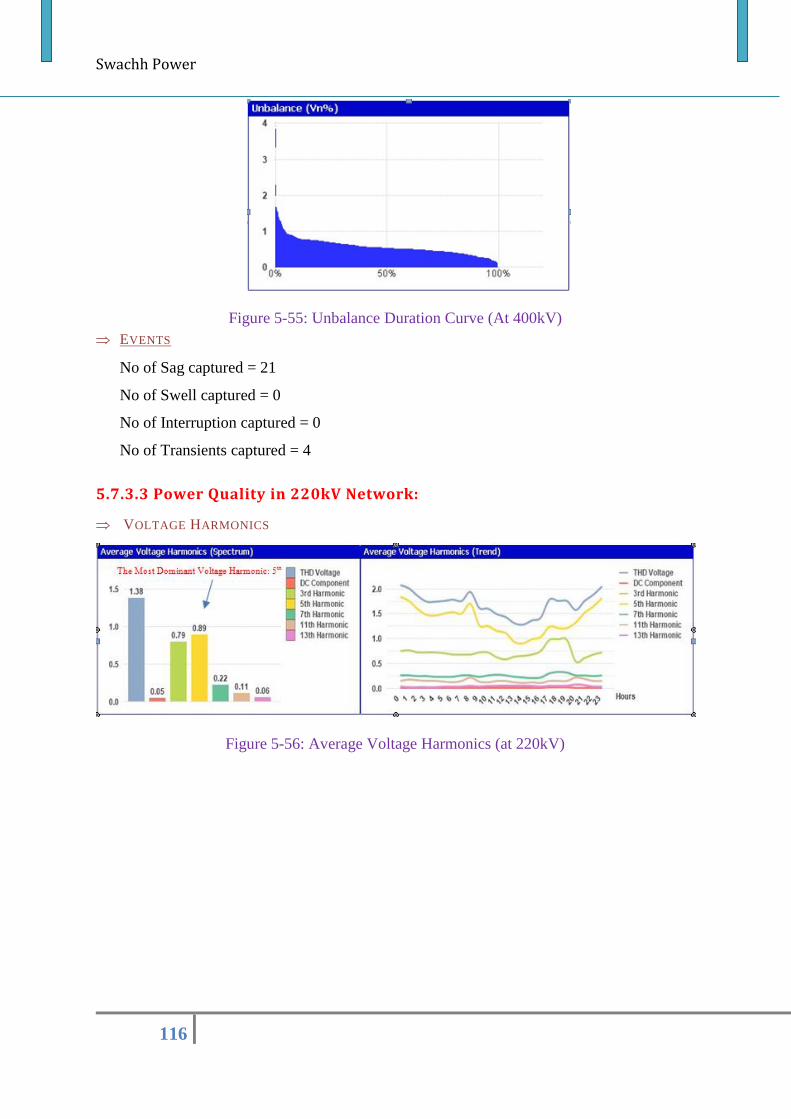
Swachh Power
116
Figure 5-55: Unbalance Duration Curve (At 400kV)
EVENTS
No of Sag captured = 21
No of Swell captured = 0
No of Interruption captured = 0
No of Transients captured = 4
5.7.3.3 Power Quality in 220kV Network:
VOLTAGE HARMONICS
Figure 5-56: Average Voltage Harmonics (at 220kV)
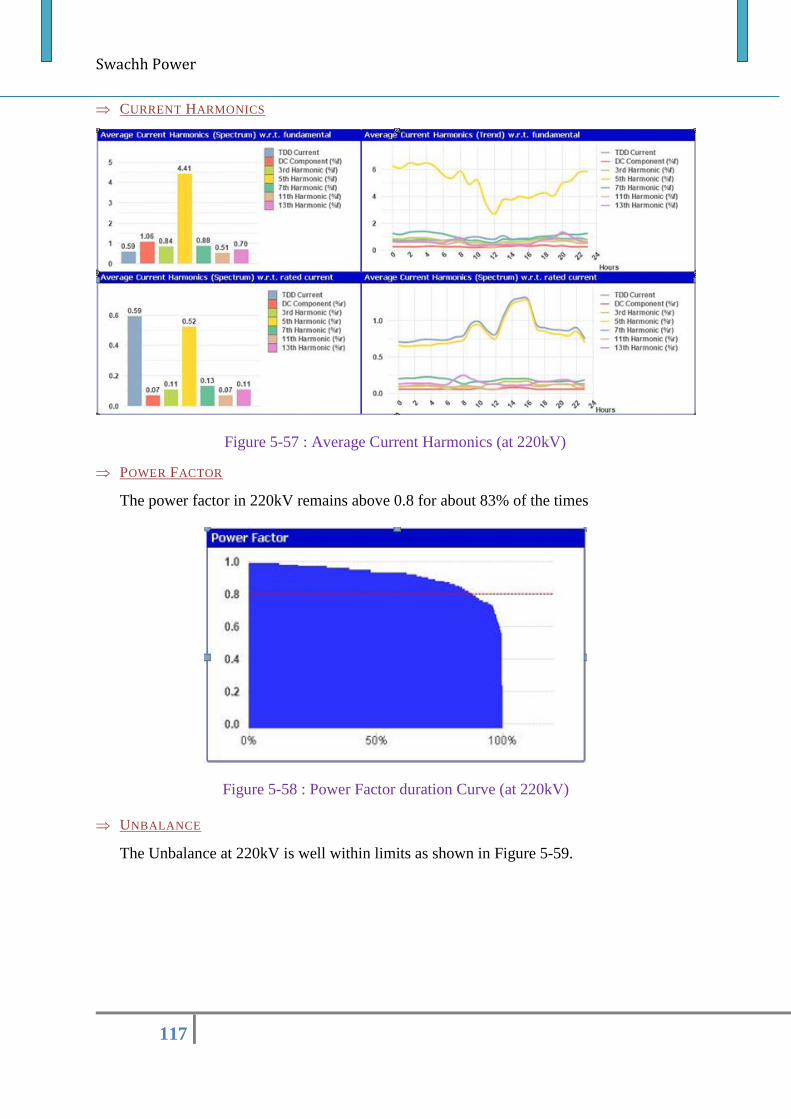
Swachh Power
117
CURRENT HARMONICS
Figure 5-57 : Average Current Harmonics (at 220kV)
POWER FACTOR
The power factor in 220kV remains above 0.8 for about 83% of the times
Figure 5-58 : Power Factor duration Curve (at 220kV)
UNBALANCE
The Unbalance at 220kV is well within limits as shown in Figure 5-59.
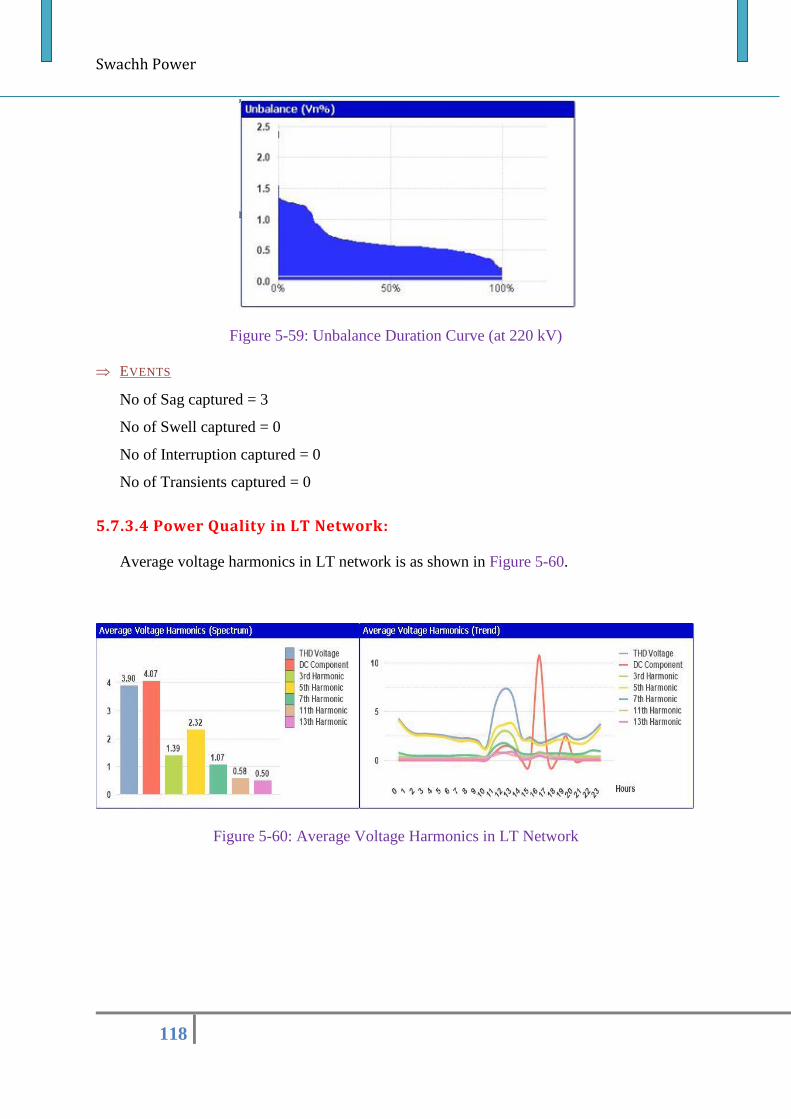
Swachh Power
118
Figure 5-59: Unbalance Duration Curve (at 220 kV)
EVENTS
No of Sag captured = 3
No of Swell captured = 0
No of Interruption captured = 0
No of Transients captured = 0
5.7.3.4 Power Quality in LT Network:
Average voltage harmonics in LT network is as shown in Figure 5-60.
Figure 5-60: Average Voltage Harmonics in LT Network
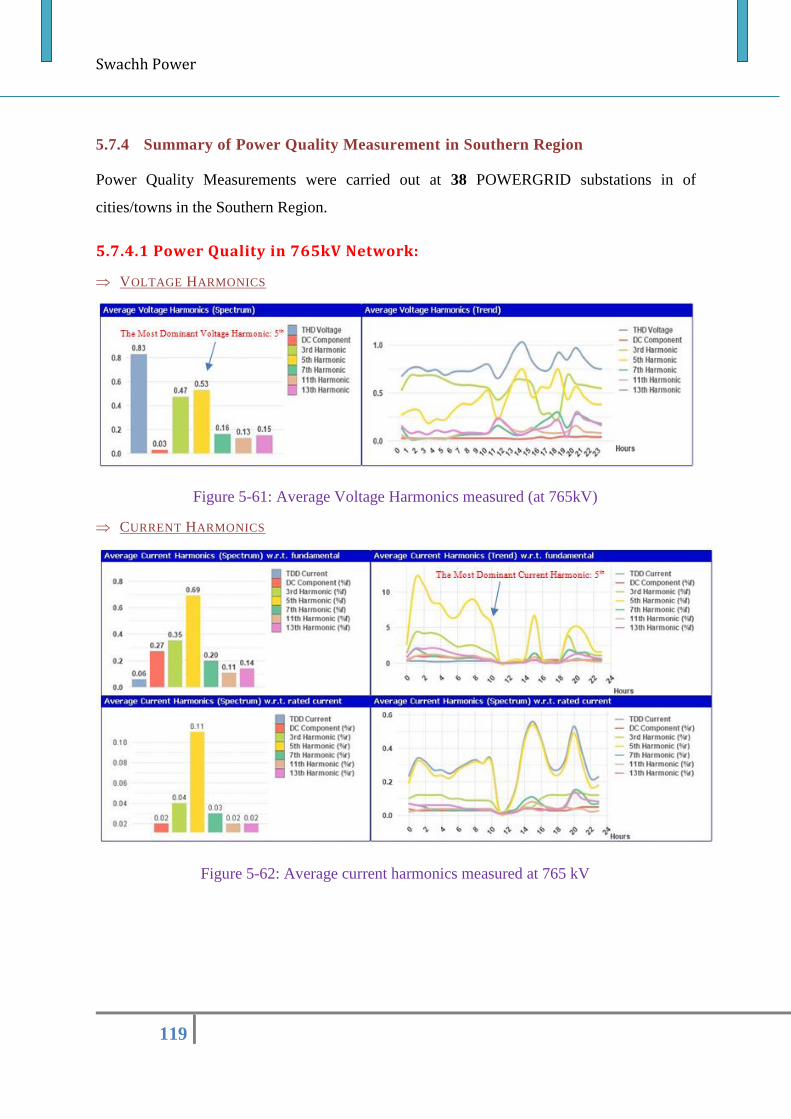
Swachh Power
119
5.7.4 Summary of Power Quality Measurement in Southern Region
Power Quality Measurements were carried out at 38 POWERGRID substations in of
cities/towns in the Southern Region.
5.7.4.1 Power Quality in 765kV Network:
VOLTAGE HARMONICS
Figure 5-61: Average Voltage Harmonics measured (at 765kV)
CURRENT HARMONICS
Figure 5-62: Average current harmonics measured at 765 kV
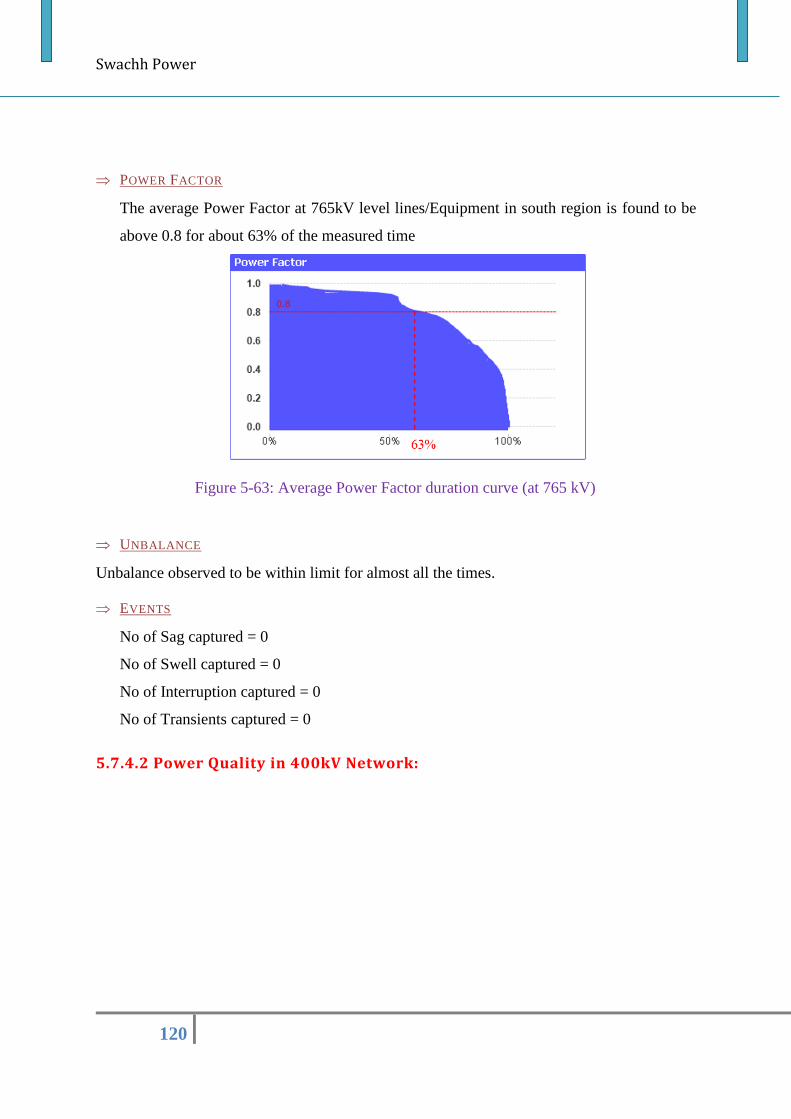
Swachh Power
120
POWER FACTOR
The average Power Factor at 765kV level lines/Equipment in south region is found to be
above 0.8 for about 63% of the measured time
Figure 5-63: Average Power Factor duration curve (at 765 kV)
UNBALANCE
Unbalance observed to be within limit for almost all the times.
EVENTS
No of Sag captured = 0
No of Swell captured = 0
No of Interruption captured = 0
No of Transients captured = 0
5.7.4.2 Power Quality in 400kV Network:
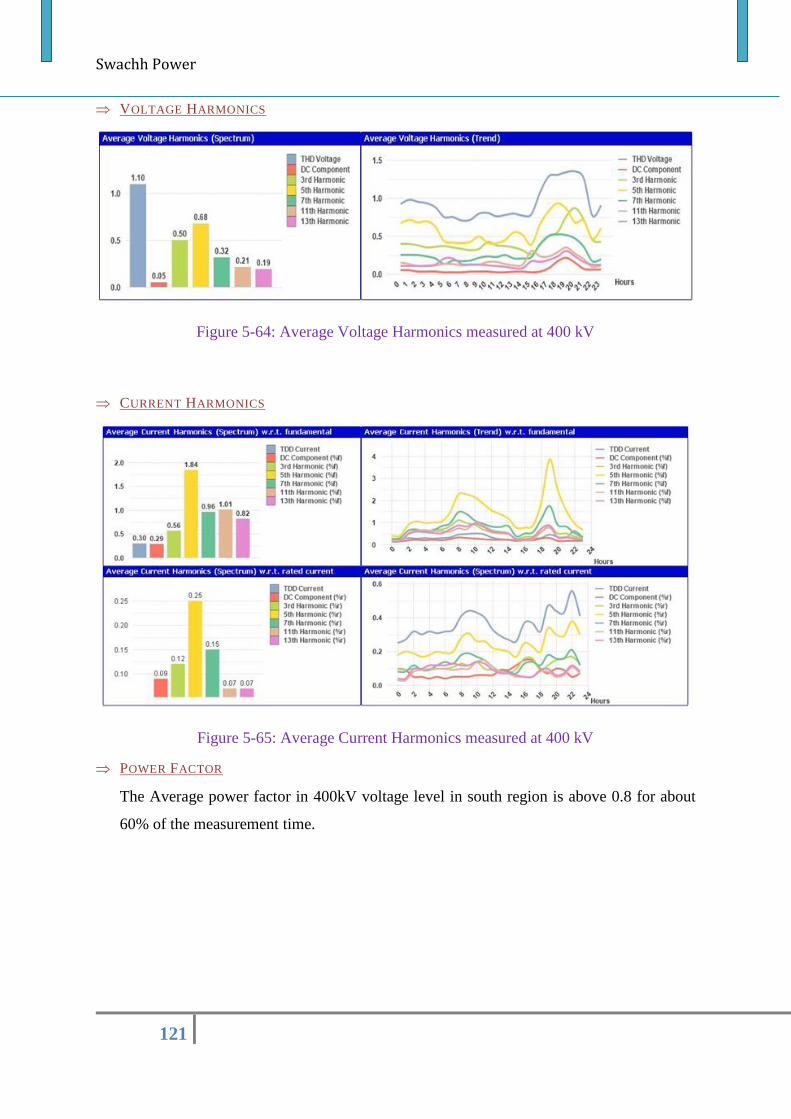
Swachh Power
121
VOLTAGE HARMONICS
Figure 5-64: Average Voltage Harmonics measured at 400 kV
CURRENT HARMONICS
Figure 5-65: Average Current Harmonics measured at 400 kV
POWER FACTOR
The Average power factor in 400kV voltage level in south region is above 0.8 for about
60% of the measurement time.
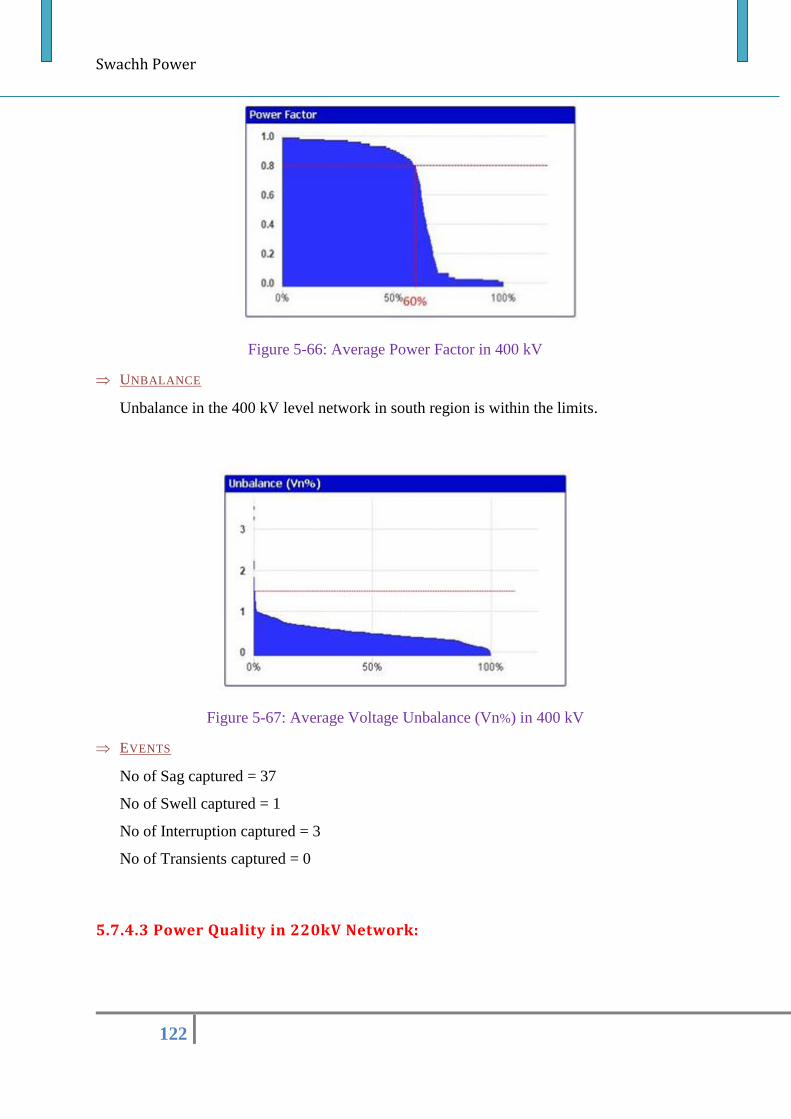
Swachh Power
122
Figure 5-66: Average Power Factor in 400 kV
UNBALANCE
Unbalance in the 400 kV level network in south region is within the limits.
Figure 5-67: Average Voltage Unbalance (Vn%) in 400 kV
EVENTS
No of Sag captured = 37
No of Swell captured = 1
No of Interruption captured = 3
No of Transients captured = 0
5.7.4.3 Power Quality in 220kV Network:
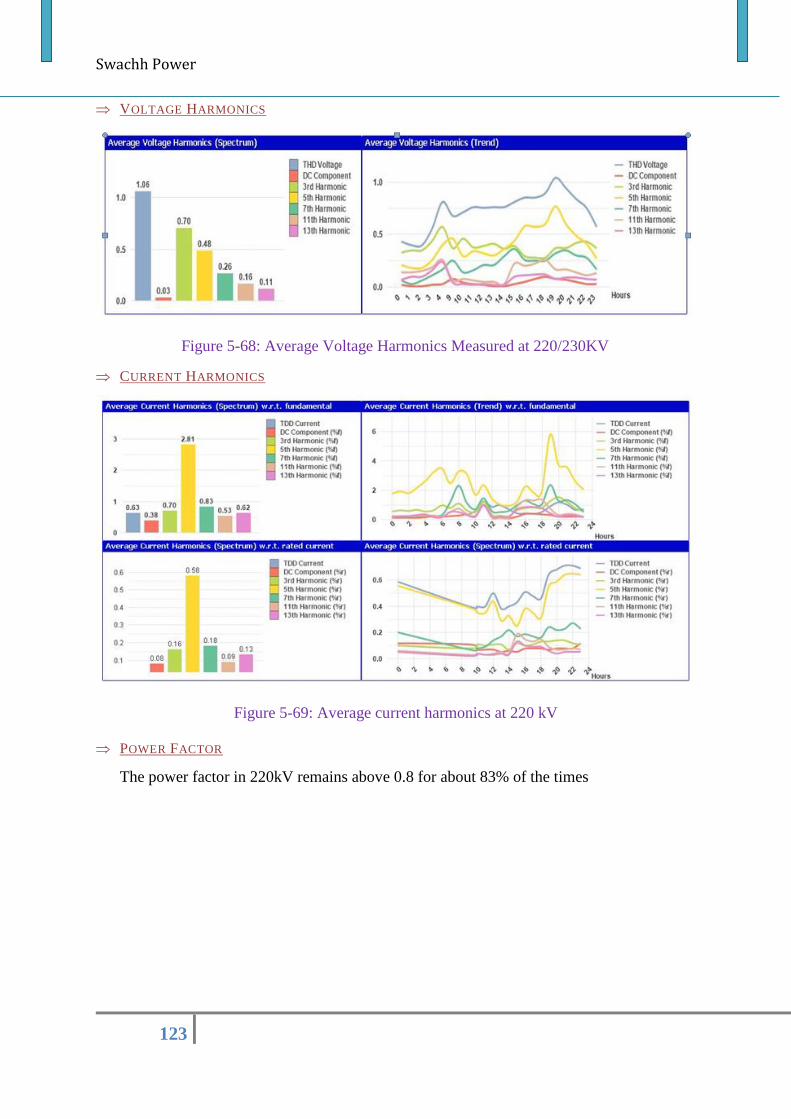
Swachh Power
123
VOLTAGE HARMONICS
Figure 5-68: Average Voltage Harmonics Measured at 220/230KV
CURRENT HARMONICS
Figure 5-69: Average current harmonics at 220 kV
POWER FACTOR
The power factor in 220kV remains above 0.8 for about 83% of the times
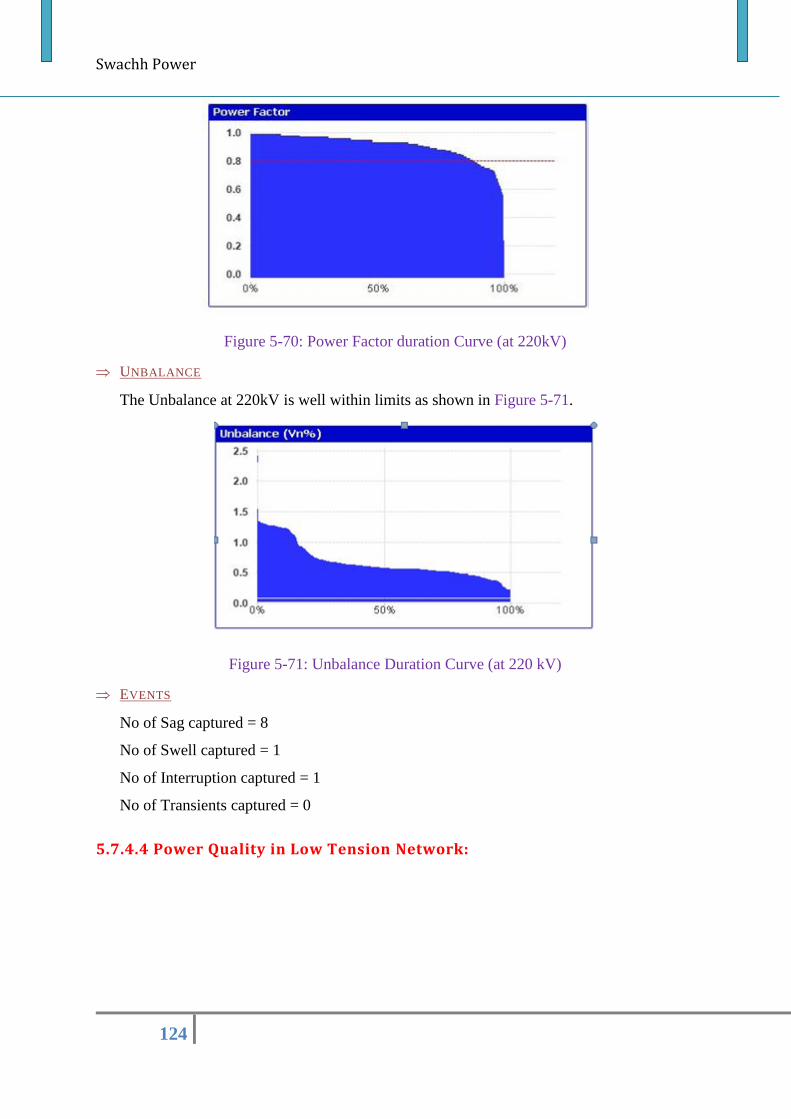
Swachh Power
124
Figure 5-70: Power Factor duration Curve (at 220kV)
UNBALANCE
The Unbalance at 220kV is well within limits as shown in Figure 5-71.
Figure 5-71: Unbalance Duration Curve (at 220 kV)
EVENTS
No of Sag captured = 8
No of Swell captured = 1
No of Interruption captured = 1
No of Transients captured = 0
5.7.4.4 Power Quality in Low Tension Network:
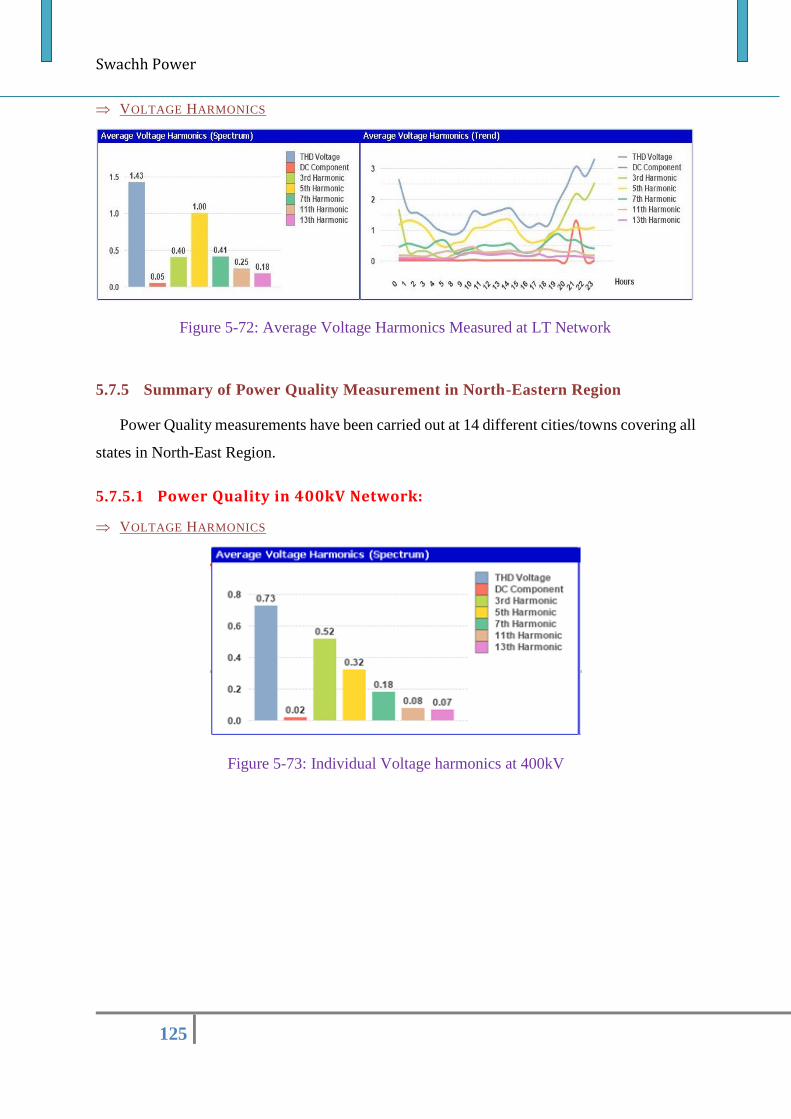
Swachh Power
125
VOLTAGE HARMONICS
Figure 5-72: Average Voltage Harmonics Measured at LT Network
5.7.5 Summary of Power Quality Measurement in North-Eastern Region
Power Quality measurements have been carried out at 14 different cities/towns covering all
states in North-East Region.
5.7.5.1 Power Quality in 400kV Network:
VOLTAGE HARMONICS
Figure 5-73: Individual Voltage harmonics at 400kV
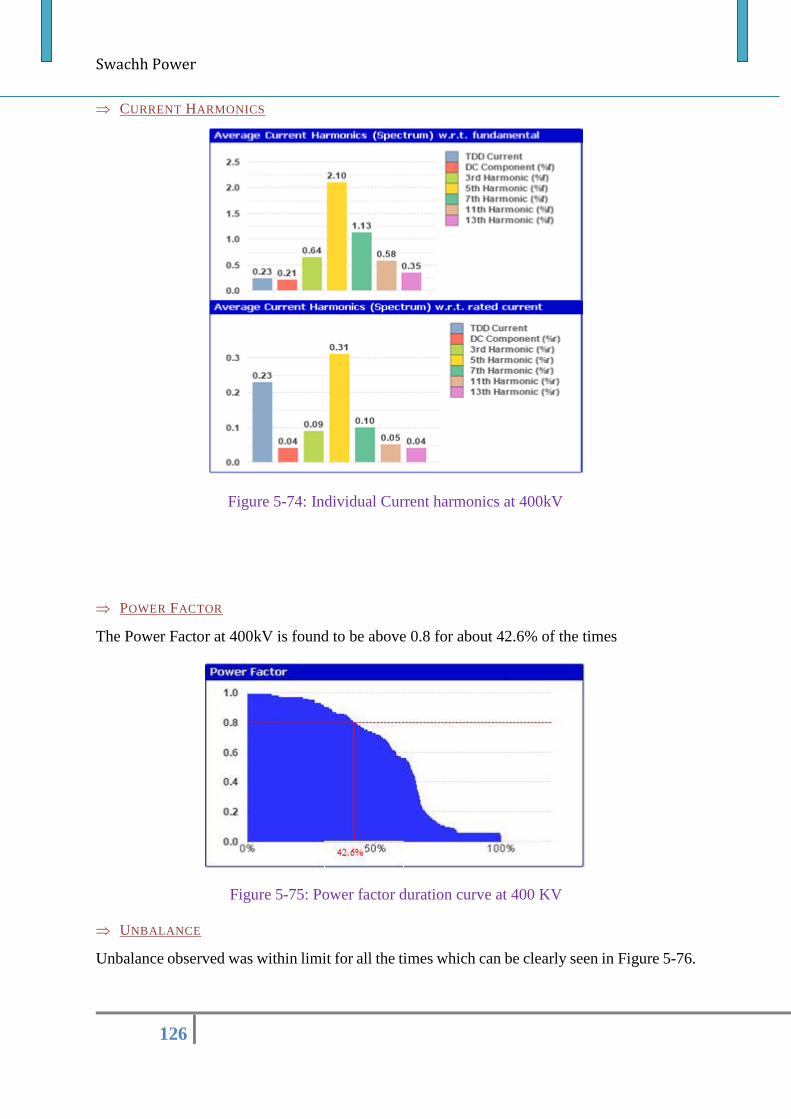
Swachh Power
126
CURRENT HARMONICS
Figure 5-74: Individual Current harmonics at 400kV
POWER FACTOR
The Power Factor at 400kV is found to be above 0.8 for about 42.6% of the times
Figure 5-75: Power factor duration curve at 400 KV
UNBALANCE
Unbalance observed was within limit for all the times which can be clearly seen in Figure 5-76.
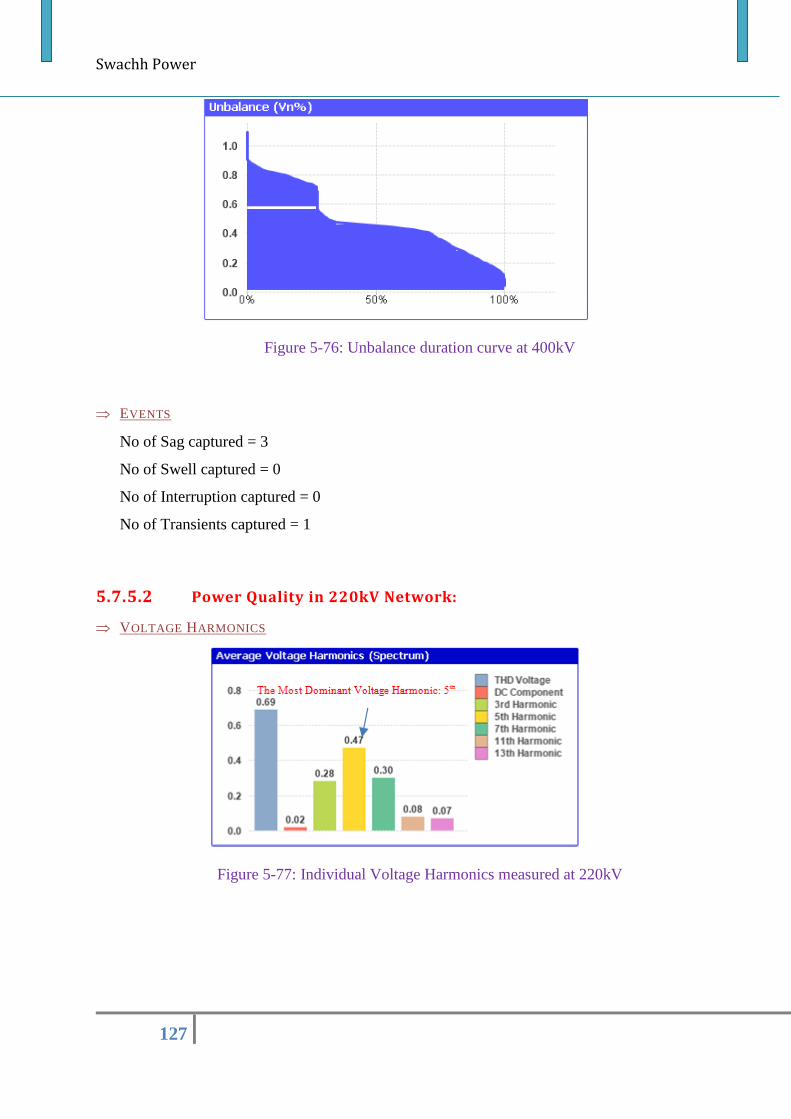
Swachh Power
127
Figure 5-76: Unbalance duration curve at 400kV
EVENTS
No of Sag captured = 3
No of Swell captured = 0
No of Interruption captured = 0
No of Transients captured = 1
5.7.5.2 Power Quality in 220kV Network:
VOLTAGE HARMONICS
Figure 5-77: Individual Voltage Harmonics measured at 220kV
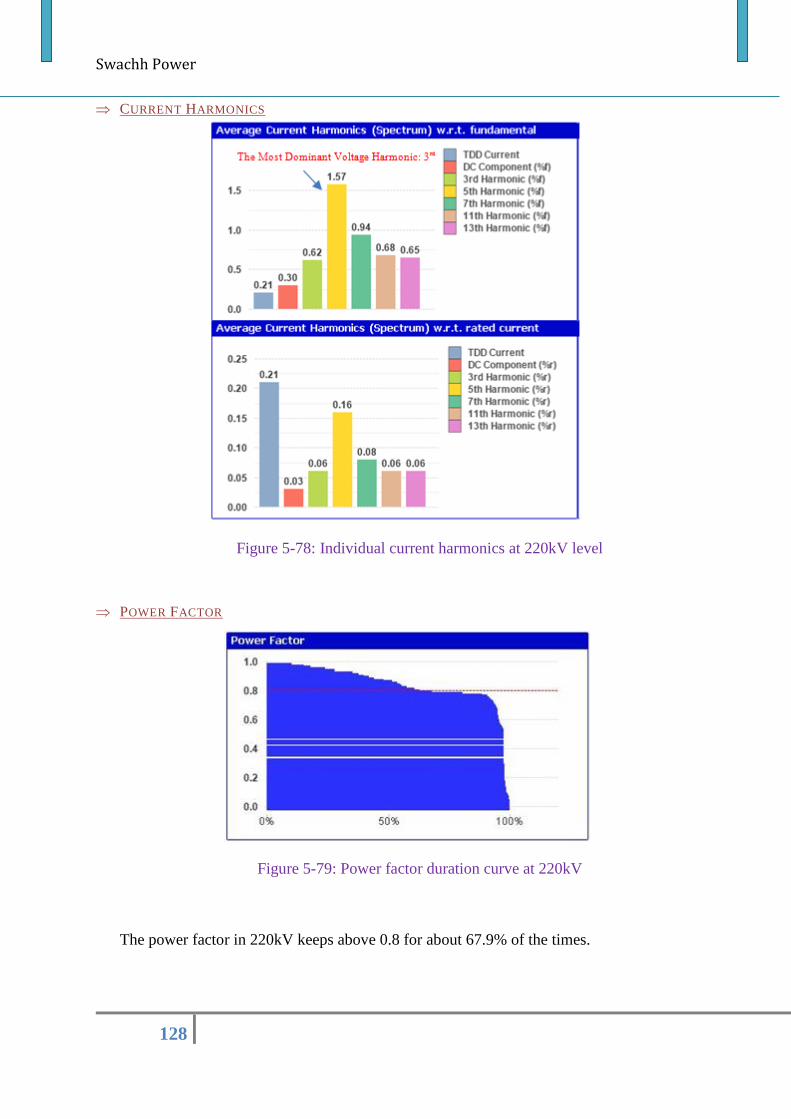
Swachh Power
128
CURRENT HARMONICS
Figure 5-78: Individual current harmonics at 220kV level
POWER FACTOR
Figure 5-79: Power factor duration curve at 220kV
The power factor in 220kV keeps above 0.8 for about 67.9% of the times.
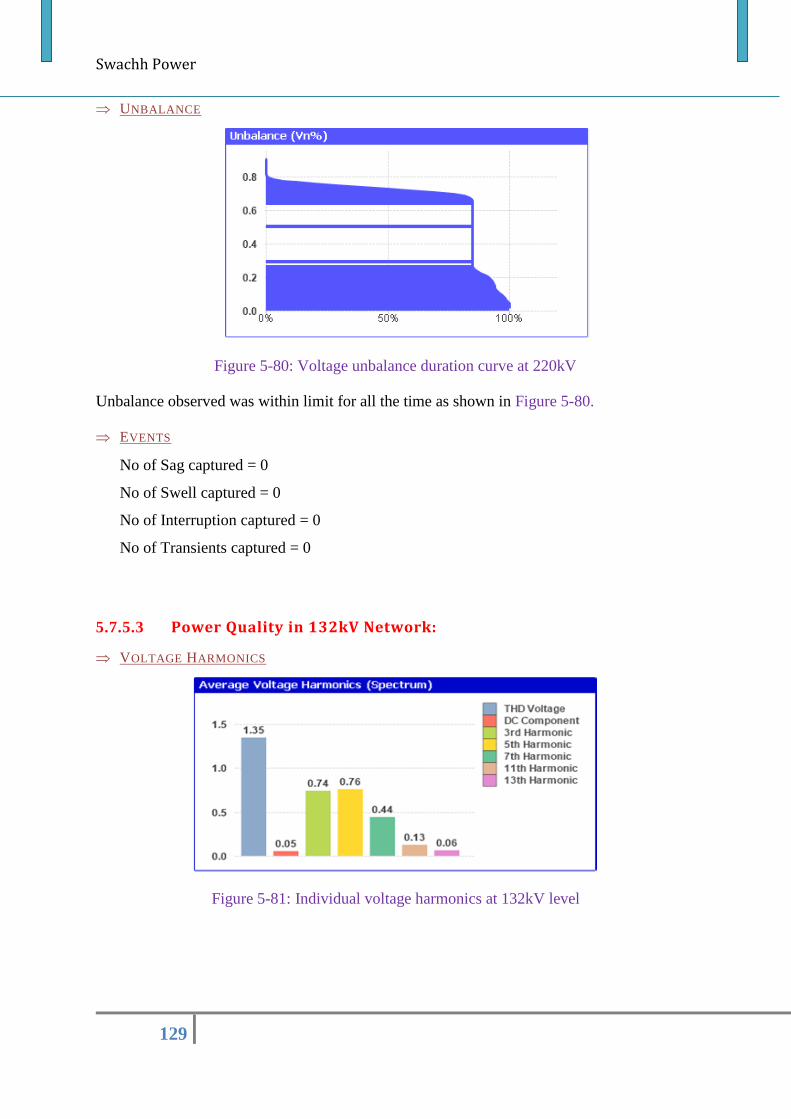
Swachh Power
129
UNBALANCE
Figure 5-80: Voltage unbalance duration curve at 220kV
Unbalance observed was within limit for all the time as shown in Figure 5-80.
EVENTS
No of Sag captured = 0
No of Swell captured = 0
No of Interruption captured = 0
No of Transients captured = 0
5.7.5.3 Power Quality in 132kV Network:
VOLTAGE HARMONICS
Figure 5-81: Individual voltage harmonics at 132kV level
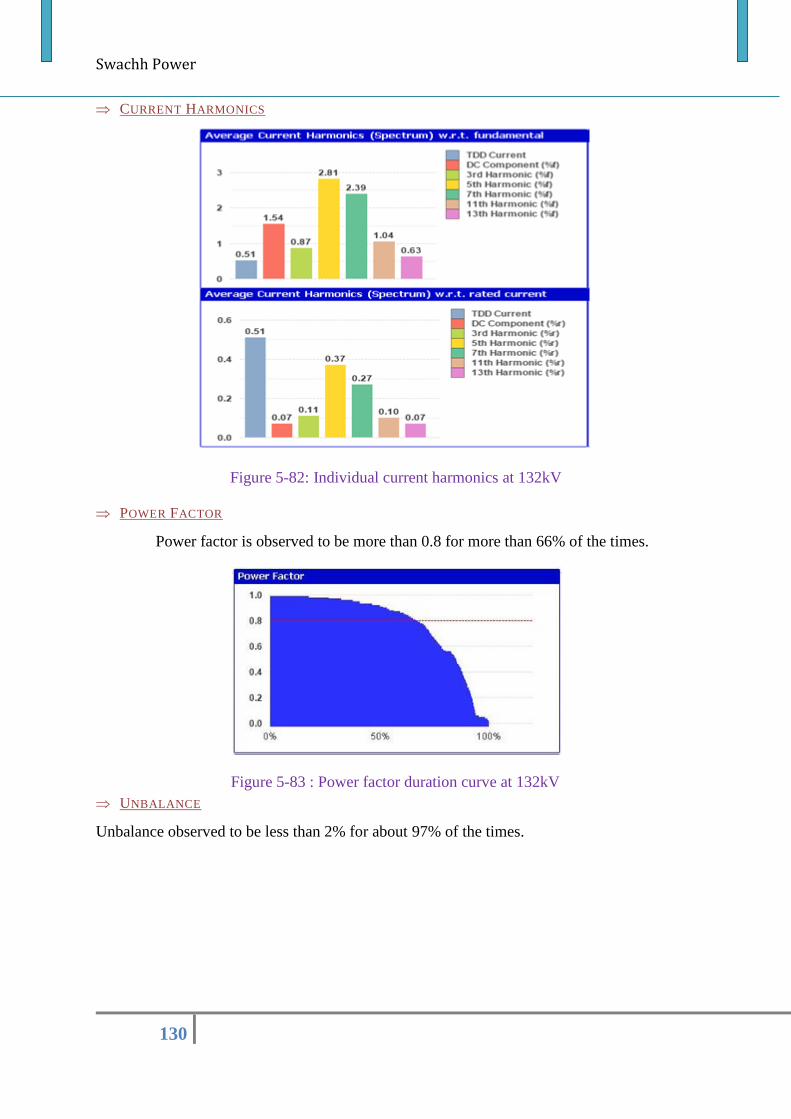
Swachh Power
130
CURRENT HARMONICS
Figure 5-82: Individual current harmonics at 132kV
POWER FACTOR
Power factor is observed to be more than 0.8 for more than 66% of the times.
Figure 5-83 : Power factor duration curve at 132kV
UNBALANCE
Unbalance observed to be less than 2% for about 97% of the times.
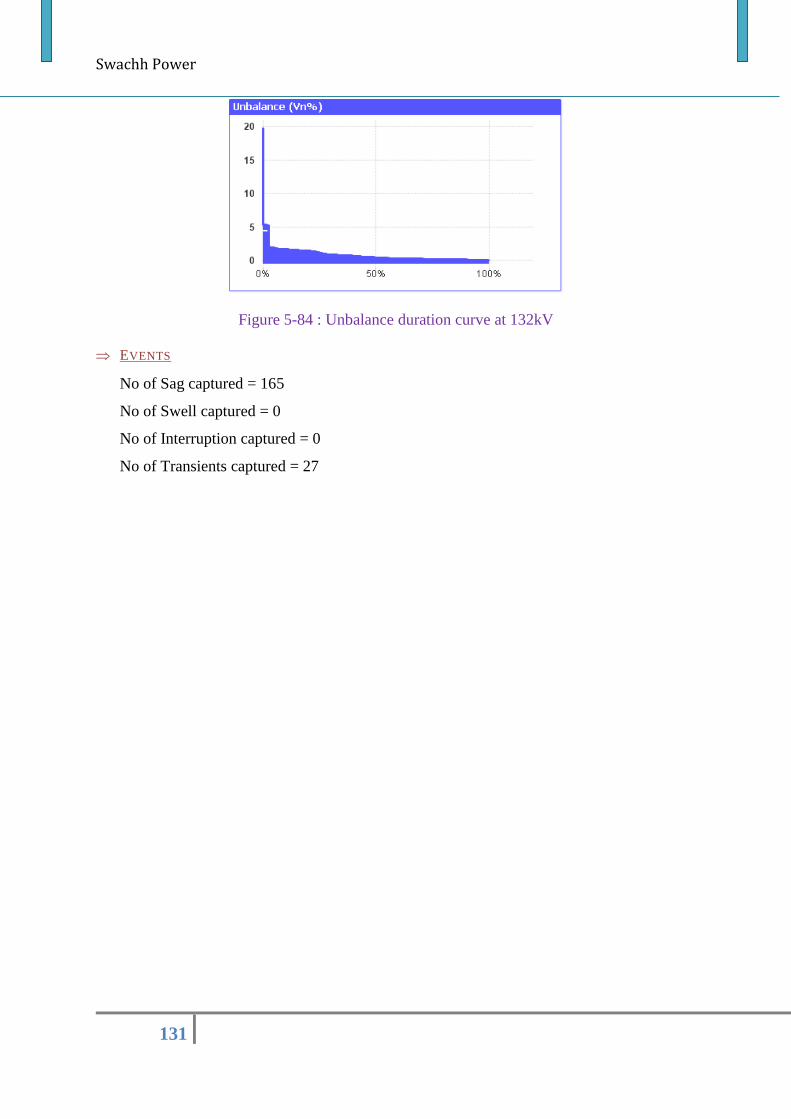
Swachh Power
131
Figure 5-84 : Unbalance duration curve at 132kV
EVENTS
No of Sag captured = 165
No of Swell captured = 0
No of Interruption captured = 0
No of Transients captured = 27
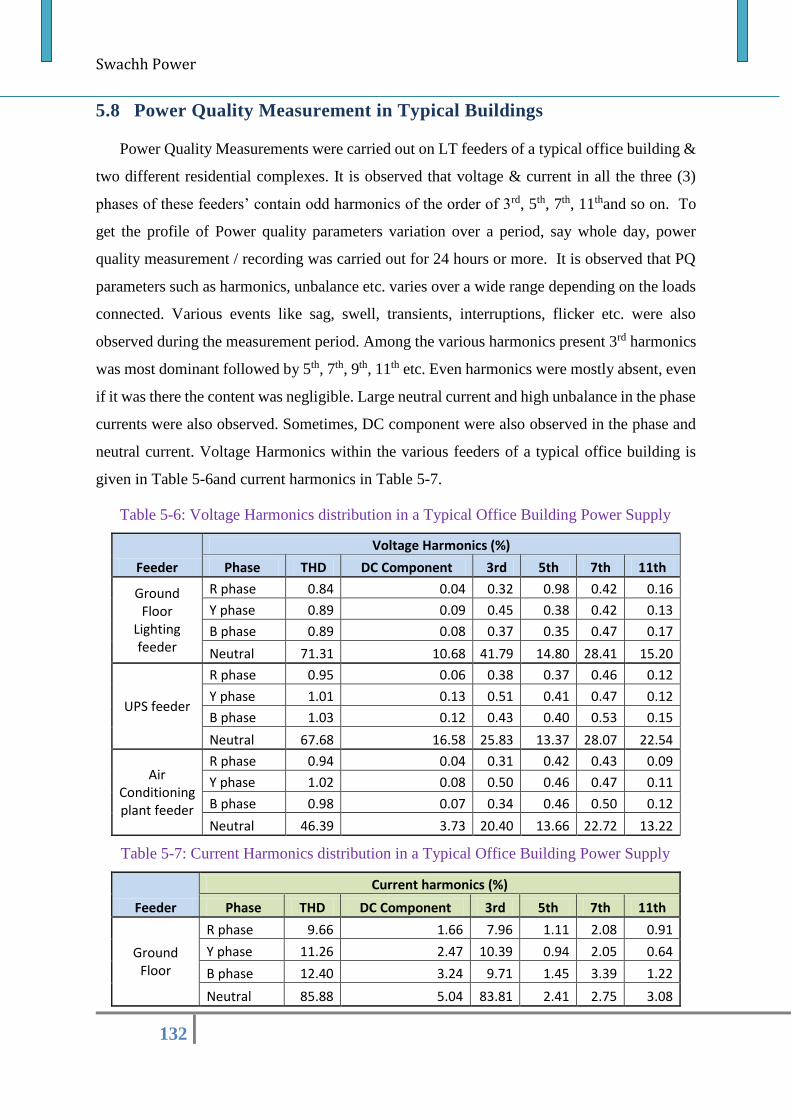
Swachh Power
132
5.8 Power Quality Measurement in Typical Buildings
Power Quality Measurements were carried out on LT feeders of a typical office building &
two different residential complexes. It is observed that voltage & current in all the three (3)
phases of these feeders’ contain odd harmonics of the order of 3rd, 5th, 7th, 11thand so on. To
get the profile of Power quality parameters variation over a period, say whole day, power
quality measurement / recording was carried out for 24 hours or more. It is observed that PQ
parameters such as harmonics, unbalance etc. varies over a wide range depending on the loads
connected. Various events like sag, swell, transients, interruptions, flicker etc. were also
observed during the measurement period. Among the various harmonics present 3rd harmonics
was most dominant followed by 5th, 7th, 9th, 11th etc. Even harmonics were mostly absent, even
if it was there the content was negligible. Large neutral current and high unbalance in the phase
currents were also observed. Sometimes, DC component were also observed in the phase and
neutral current. Voltage Harmonics within the various feeders of a typical office building is
given in Table 5-6and current harmonics in Table 5-7.
Table 5-6: Voltage Harmonics distribution in a Typical Office Building Power Supply
Feeder
Voltage Harmonics (%)
Phase THD DC Component 3rd 5th 7th 11th
Ground Floor
Lighting feeder
R phase 0.84 0.04 0.32 0.98 0.42 0.16
Y phase 0.89 0.09 0.45 0.38 0.42 0.13
B phase 0.89 0.08 0.37 0.35 0.47 0.17
Neutral 71.31 10.68 41.79 14.80 28.41 15.20
UPS feeder
R phase 0.95 0.06 0.38 0.37 0.46 0.12
Y phase 1.01 0.13 0.51 0.41 0.47 0.12
B phase 1.03 0.12 0.43 0.40 0.53 0.15
Neutral 67.68 16.58 25.83 13.37 28.07 22.54
Air Conditioning plant feeder
R phase 0.94 0.04 0.31 0.42 0.43 0.09
Y phase 1.02 0.08 0.50 0.46 0.47 0.11
B phase 0.98 0.07 0.34 0.46 0.50 0.12
Neutral 46.39 3.73 20.40 13.66 22.72 13.22
Table 5-7: Current Harmonics distribution in a Typical Office Building Power Supply
Feeder
Current harmonics (%)
Phase THD DC Component 3rd 5th 7th 11th
Ground Floor
R phase 9.66 1.66 7.96 1.11 2.08 0.91
Y phase 11.26 2.47 10.39 0.94 2.05 0.64
B phase 12.40 3.24 9.71 1.45 3.39 1.22
Neutral 85.88 5.04 83.81 2.41 2.75 3.08
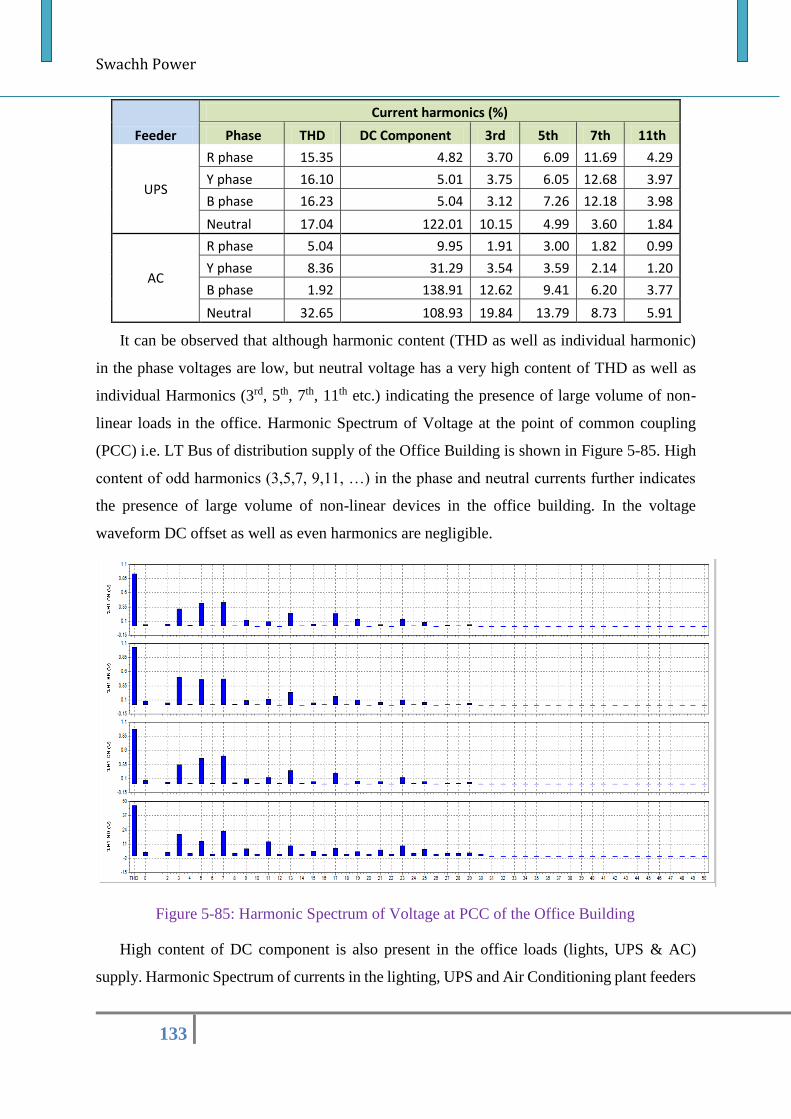
Swachh Power
133
Feeder
Current harmonics (%)
Phase THD DC Component 3rd 5th 7th 11th
UPS
R phase 15.35 4.82 3.70 6.09 11.69 4.29
Y phase 16.10 5.01 3.75 6.05 12.68 3.97
B phase 16.23 5.04 3.12 7.26 12.18 3.98
Neutral 17.04 122.01 10.15 4.99 3.60 1.84
AC
R phase 5.04 9.95 1.91 3.00 1.82 0.99
Y phase 8.36 31.29 3.54 3.59 2.14 1.20
B phase 1.92 138.91 12.62 9.41 6.20 3.77
Neutral 32.65 108.93 19.84 13.79 8.73 5.91
It can be observed that although harmonic content (THD as well as individual harmonic)
in the phase voltages are low, but neutral voltage has a very high content of THD as well as
individual Harmonics (3rd, 5th, 7th, 11th etc.) indicating the presence of large volume of non-
linear loads in the office. Harmonic Spectrum of Voltage at the point of common coupling
(PCC) i.e. LT Bus of distribution supply of the Office Building is shown in Figure 5-85. High
content of odd harmonics (3,5,7, 9,11, …) in the phase and neutral currents further indicates
the presence of large volume of non-linear devices in the office building. In the voltage
waveform DC offset as well as even harmonics are negligible.
Figure 5-85: Harmonic Spectrum of Voltage at PCC of the Office Building
High content of DC component is also present in the office loads (lights, UPS & AC)
supply. Harmonic Spectrum of currents in the lighting, UPS and Air Conditioning plant feeders
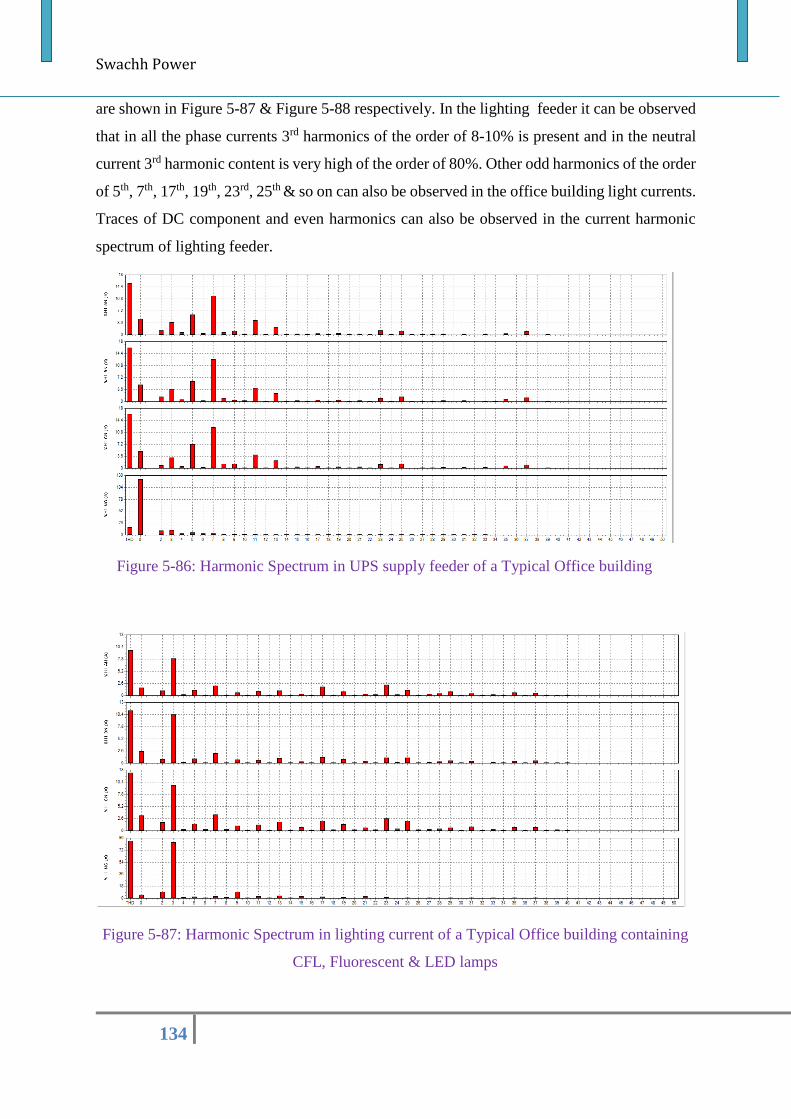
Swachh Power
134
are shown in Figure 5-87 & Figure 5-88 respectively. In the lighting feeder it can be observed
that in all the phase currents 3rd harmonics of the order of 8-10% is present and in the neutral
current 3rd harmonic content is very high of the order of 80%. Other odd harmonics of the order
of 5th, 7th, 17th, 19th, 23rd, 25th & so on can also be observed in the office building light currents.
Traces of DC component and even harmonics can also be observed in the current harmonic
spectrum of lighting feeder.
Figure 5-87: Harmonic Spectrum in lighting current of a Typical Office building containing
CFL, Fluorescent & LED lamps
Figure 5-86: Harmonic Spectrum in UPS supply feeder of a Typical Office building
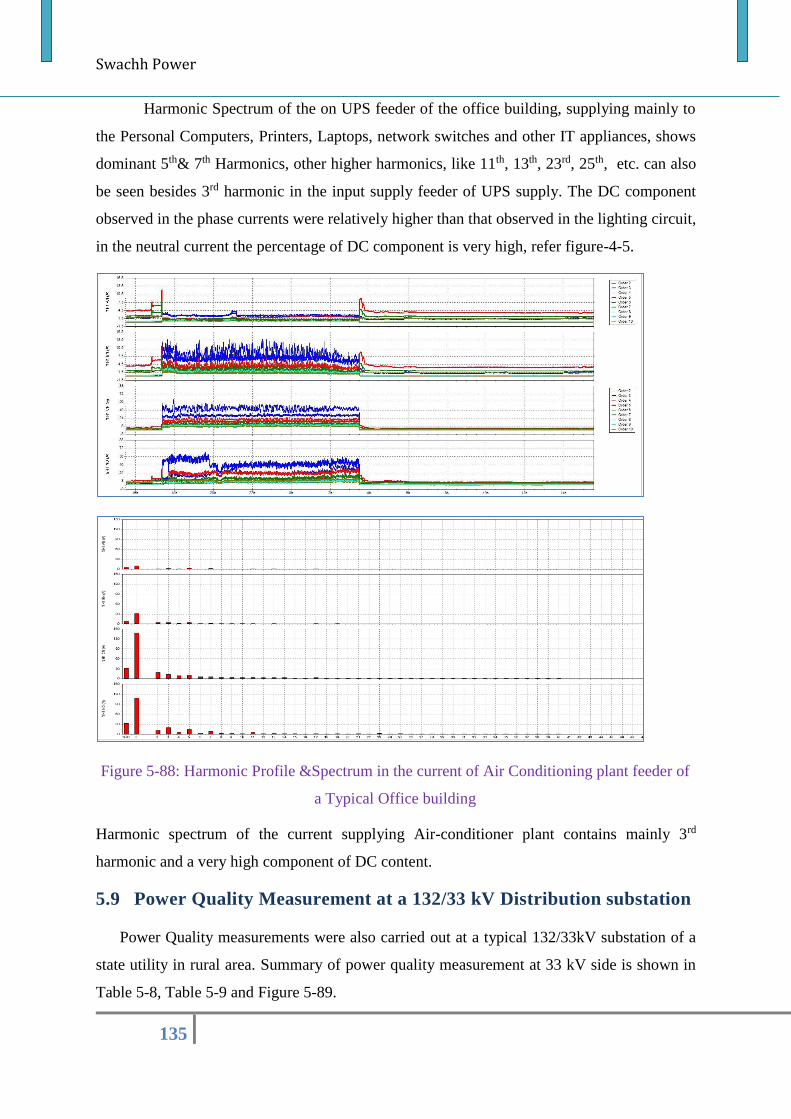
Swachh Power
135
Harmonic Spectrum of the on UPS feeder of the office building, supplying mainly to
the Personal Computers, Printers, Laptops, network switches and other IT appliances, shows
dominant 5th& 7th Harmonics, other higher harmonics, like 11th, 13th, 23rd, 25th, etc. can also
be seen besides 3rd harmonic in the input supply feeder of UPS supply. The DC component
observed in the phase currents were relatively higher than that observed in the lighting circuit,
in the neutral current the percentage of DC component is very high, refer figure-4-5.
Figure 5-88: Harmonic Profile &Spectrum in the current of Air Conditioning plant feeder of
a Typical Office building
Harmonic spectrum of the current supplying Air-conditioner plant contains mainly 3rd
harmonic and a very high component of DC content.
5.9 Power Quality Measurement at a 132/33 kV Distribution substation
Power Quality measurements were also carried out at a typical 132/33kV substation of a
state utility in rural area. Summary of power quality measurement at 33 kV side is shown in
Table 5-8, Table 5-9 and Figure 5-89.
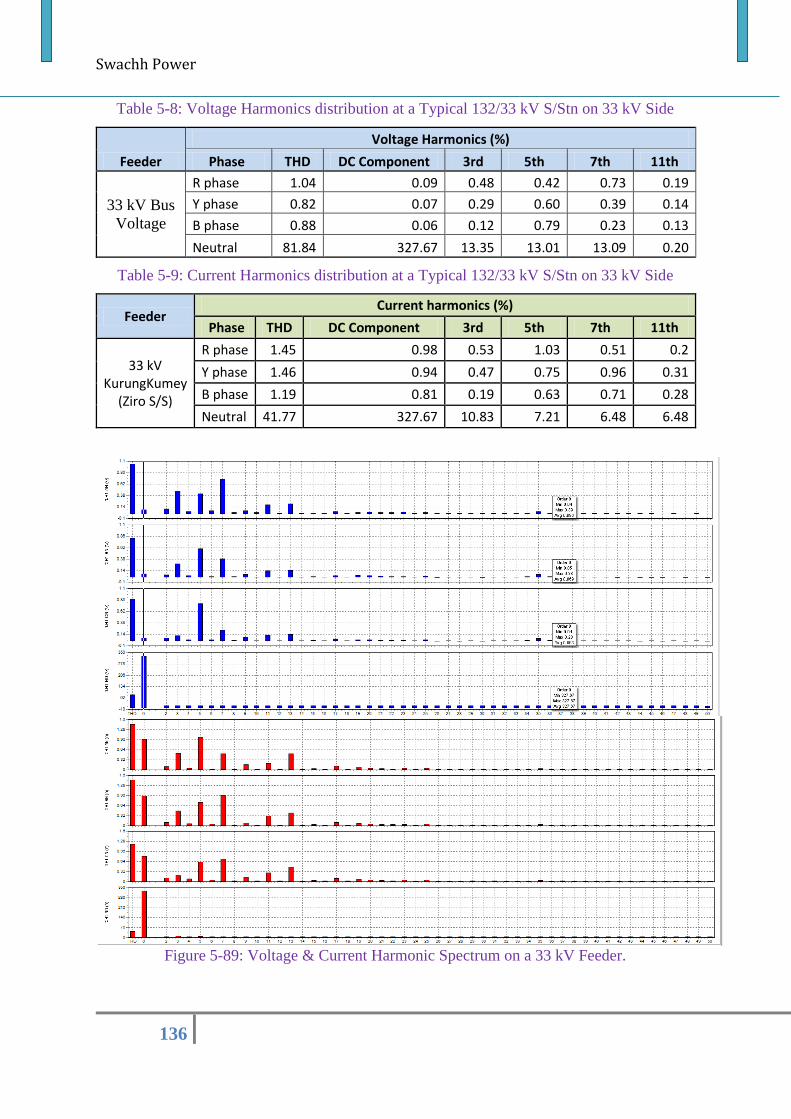
Swachh Power
136
Table 5-8: Voltage Harmonics distribution at a Typical 132/33 kV S/Stn on 33 kV Side
Feeder
Voltage Harmonics (%)
Phase THD DC Component 3rd 5th 7th 11th
33 kV Bus
Voltage
R phase 1.04 0.09 0.48 0.42 0.73 0.19
Y phase 0.82 0.07 0.29 0.60 0.39 0.14
B phase 0.88 0.06 0.12 0.79 0.23 0.13
Neutral 81.84 327.67 13.35 13.01 13.09 0.20
Table 5-9: Current Harmonics distribution at a Typical 132/33 kV S/Stn on 33 kV Side
Feeder Current harmonics (%)
Phase THD DC Component 3rd 5th 7th 11th
33 kV KurungKumey
(Ziro S/S)
R phase 1.45 0.98 0.53 1.03 0.51 0.2
Y phase 1.46 0.94 0.47 0.75 0.96 0.31
B phase 1.19 0.81 0.19 0.63 0.71 0.28
Neutral 41.77 327.67 10.83 7.21 6.48 6.48
Figure 5-89: Voltage & Current Harmonic Spectrum on a 33 kV Feeder.
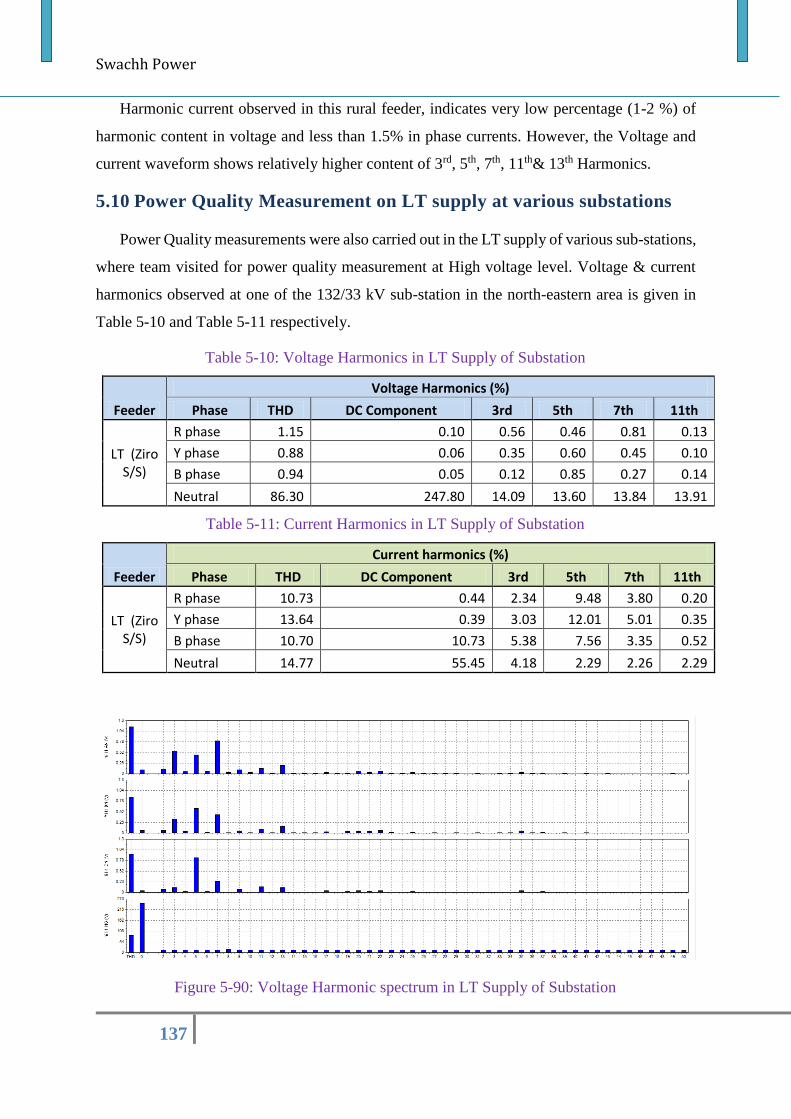
Swachh Power
137
Harmonic current observed in this rural feeder, indicates very low percentage (1-2 %) of
harmonic content in voltage and less than 1.5% in phase currents. However, the Voltage and
current waveform shows relatively higher content of 3rd, 5th, 7th, 11th& 13th Harmonics.
5.10 Power Quality Measurement on LT supply at various substations
Power Quality measurements were also carried out in the LT supply of various sub-stations,
where team visited for power quality measurement at High voltage level. Voltage & current
harmonics observed at one of the 132/33 kV sub-station in the north-eastern area is given in
Table 5-10 and Table 5-11 respectively.
Table 5-10: Voltage Harmonics in LT Supply of Substation
Feeder
Voltage Harmonics (%)
Phase THD DC Component 3rd 5th 7th 11th
LT (Ziro S/S)
R phase 1.15 0.10 0.56 0.46 0.81 0.13
Y phase 0.88 0.06 0.35 0.60 0.45 0.10
B phase 0.94 0.05 0.12 0.85 0.27 0.14
Neutral 86.30 247.80 14.09 13.60 13.84 13.91
Table 5-11: Current Harmonics in LT Supply of Substation
Feeder
Current harmonics (%)
Phase THD DC Component 3rd 5th 7th 11th
LT (Ziro S/S)
R phase 10.73 0.44 2.34 9.48 3.80 0.20
Y phase 13.64 0.39 3.03 12.01 5.01 0.35
B phase 10.70 10.73 5.38 7.56 3.35 0.52
Neutral 14.77 55.45 4.18 2.29 2.26 2.29
Figure 5-90: Voltage Harmonic spectrum in LT Supply of Substation
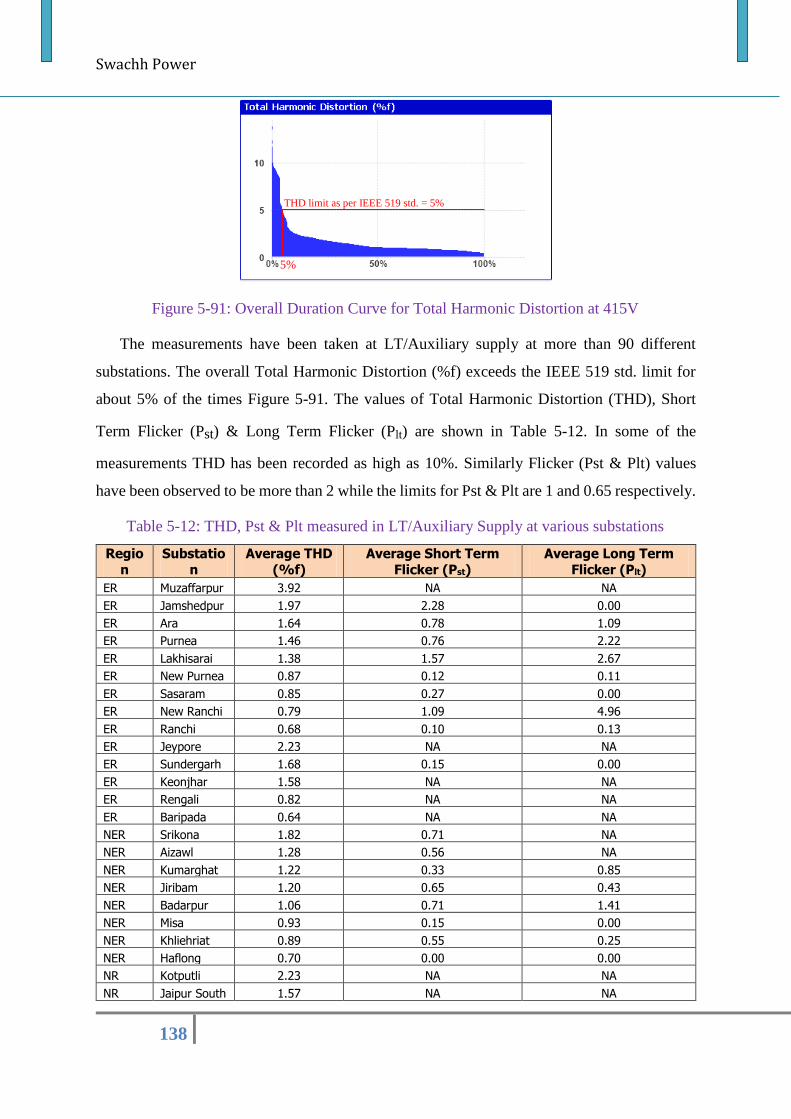
Swachh Power
138
Figure 5-91: Overall Duration Curve for Total Harmonic Distortion at 415V
The measurements have been taken at LT/Auxiliary supply at more than 90 different
substations. The overall Total Harmonic Distortion (%f) exceeds the IEEE 519 std. limit for
about 5% of the times Figure 5-91. The values of Total Harmonic Distortion (THD), Short
Term Flicker (Pst) & Long Term Flicker (Plt) are shown in Table 5-12. In some of the
measurements THD has been recorded as high as 10%. Similarly Flicker (Pst & Plt) values
have been observed to be more than 2 while the limits for Pst & Plt are 1 and 0.65 respectively.
Table 5-12: THD, Pst & Plt measured in LT/Auxiliary Supply at various substations
Regio
n
Substatio
n
Average THD
(%f)
Average Short Term
Flicker (Pst)
Average Long Term
Flicker (Plt)
ER Muzaffarpur 3.92 NA NA
ER Jamshedpur 1.97 2.28 0.00
ER Ara 1.64 0.78 1.09
ER Purnea 1.46 0.76 2.22
ER Lakhisarai 1.38 1.57 2.67
ER New Purnea 0.87 0.12 0.11
ER Sasaram 0.85 0.27 0.00
ER New Ranchi 0.79 1.09 4.96
ER Ranchi 0.68 0.10 0.13
ER Jeypore 2.23 NA NA
ER Sundergarh 1.68 0.15 0.00
ER Keonjhar 1.58 NA NA
ER Rengali 0.82 NA NA
ER Baripada 0.64 NA NA
NER Srikona 1.82 0.71 NA
NER Aizawl 1.28 0.56 NA
NER Kumarghat 1.22 0.33 0.85
NER Jiribam 1.20 0.65 0.43
NER Badarpur 1.06 0.71 1.41
NER Misa 0.93 0.15 0.00
NER Khliehriat 0.89 0.55 0.25
NER Haflong 0.70 0.00 0.00
NR Kotputli 2.23 NA NA
NR Jaipur South 1.57 NA NA
THD limit as per IEEE 519 std. = 5%
5%
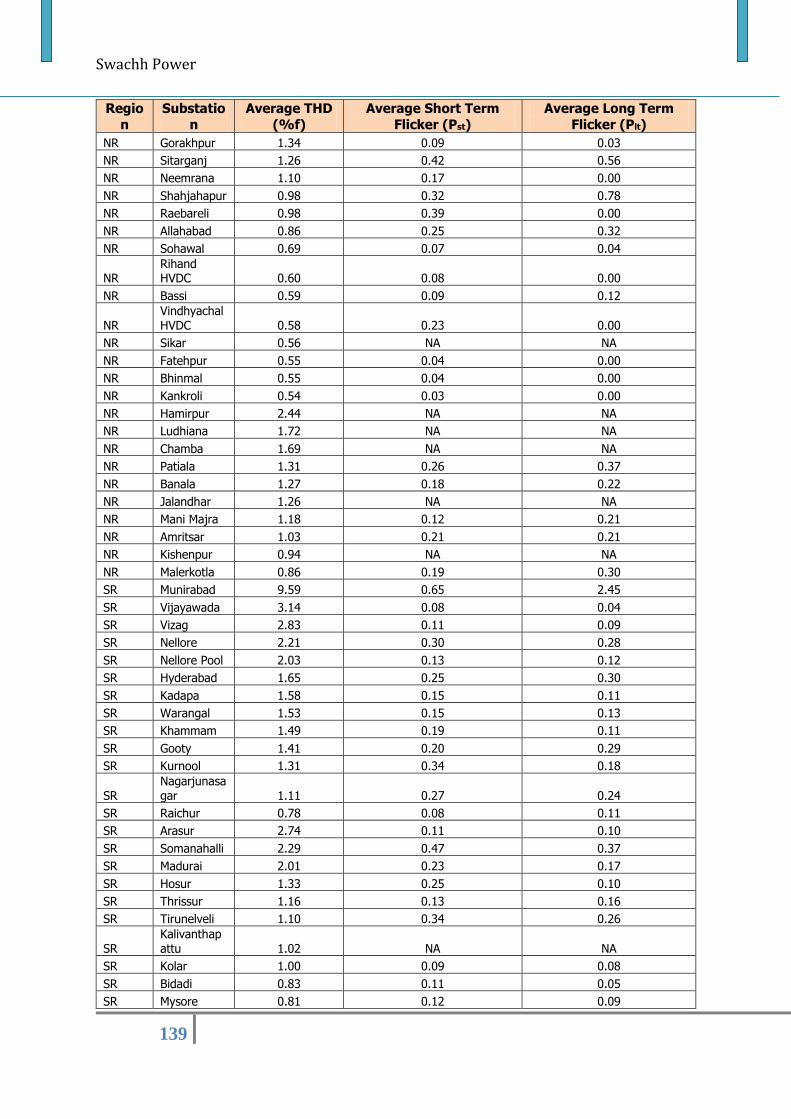
Swachh Power
139
Regio
n
Substatio
n
Average THD
(%f)
Average Short Term
Flicker (Pst)
Average Long Term
Flicker (Plt)
NR Gorakhpur 1.34 0.09 0.03
NR Sitarganj 1.26 0.42 0.56
NR Neemrana 1.10 0.17 0.00
NR Shahjahapur 0.98 0.32 0.78
NR Raebareli 0.98 0.39 0.00
NR Allahabad 0.86 0.25 0.32
NR Sohawal 0.69 0.07 0.04
NR Rihand HVDC 0.60 0.08 0.00
NR Bassi 0.59 0.09 0.12
NR Vindhyachal HVDC 0.58 0.23 0.00
NR Sikar 0.56 NA NA
NR Fatehpur 0.55 0.04 0.00
NR Bhinmal 0.55 0.04 0.00
NR Kankroli 0.54 0.03 0.00
NR Hamirpur 2.44 NA NA
NR Ludhiana 1.72 NA NA
NR Chamba 1.69 NA NA
NR Patiala 1.31 0.26 0.37
NR Banala 1.27 0.18 0.22
NR Jalandhar 1.26 NA NA
NR Mani Majra 1.18 0.12 0.21
NR Amritsar 1.03 0.21 0.21
NR Kishenpur 0.94 NA NA
NR Malerkotla 0.86 0.19 0.30
SR Munirabad 9.59 0.65 2.45
SR Vijayawada 3.14 0.08 0.04
SR Vizag 2.83 0.11 0.09
SR Nellore 2.21 0.30 0.28
SR Nellore Pool 2.03 0.13 0.12
SR Hyderabad 1.65 0.25 0.30
SR Kadapa 1.58 0.15 0.11
SR Warangal 1.53 0.15 0.13
SR Khammam 1.49 0.19 0.11
SR Gooty 1.41 0.20 0.29
SR Kurnool 1.31 0.34 0.18
SR Nagarjunasagar 1.11 0.27 0.24
SR Raichur 0.78 0.08 0.11
SR Arasur 2.74 0.11 0.10
SR Somanahalli 2.29 0.47 0.37
SR Madurai 2.01 0.23 0.17
SR Hosur 1.33 0.25 0.10
SR Thrissur 1.16 0.13 0.16
SR Tirunelveli 1.10 0.34 0.26
SR Kalivanthapattu 1.02 NA NA
SR Kolar 1.00 0.09 0.08
SR Bidadi 0.83 0.11 0.05
SR Mysore 0.81 0.12 0.09
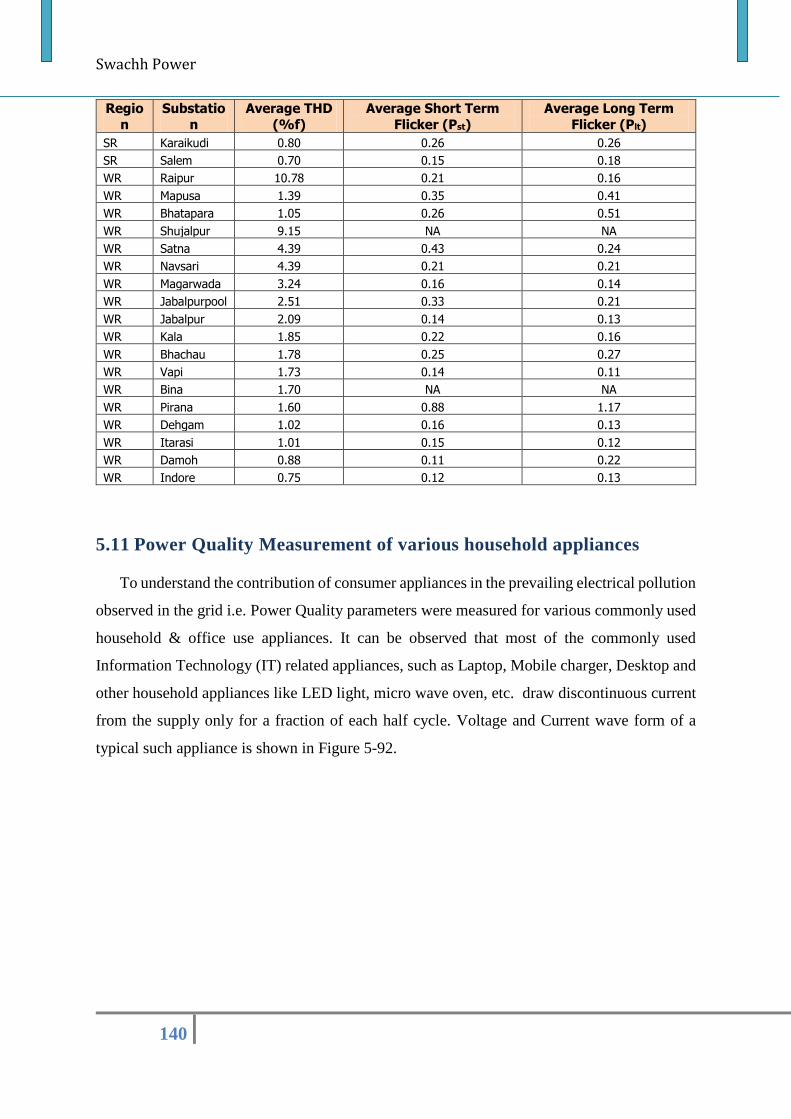
Swachh Power
140
Regio
n
Substatio
n
Average THD
(%f)
Average Short Term
Flicker (Pst)
Average Long Term
Flicker (Plt)
SR Karaikudi 0.80 0.26 0.26
SR Salem 0.70 0.15 0.18
WR Raipur 10.78 0.21 0.16
WR Mapusa 1.39 0.35 0.41
WR Bhatapara 1.05 0.26 0.51
WR Shujalpur 9.15 NA NA
WR Satna 4.39 0.43 0.24
WR Navsari 4.39 0.21 0.21
WR Magarwada 3.24 0.16 0.14
WR Jabalpurpool 2.51 0.33 0.21
WR Jabalpur 2.09 0.14 0.13
WR Kala 1.85 0.22 0.16
WR Bhachau 1.78 0.25 0.27
WR Vapi 1.73 0.14 0.11
WR Bina 1.70 NA NA
WR Pirana 1.60 0.88 1.17
WR Dehgam 1.02 0.16 0.13
WR Itarasi 1.01 0.15 0.12
WR Damoh 0.88 0.11 0.22
WR Indore 0.75 0.12 0.13
5.11 Power Quality Measurement of various household appliances
To understand the contribution of consumer appliances in the prevailing electrical pollution
observed in the grid i.e. Power Quality parameters were measured for various commonly used
household & office use appliances. It can be observed that most of the commonly used
Information Technology (IT) related appliances, such as Laptop, Mobile charger, Desktop and
other household appliances like LED light, micro wave oven, etc. draw discontinuous current
from the supply only for a fraction of each half cycle. Voltage and Current wave form of a
typical such appliance is shown in Figure 5-92.
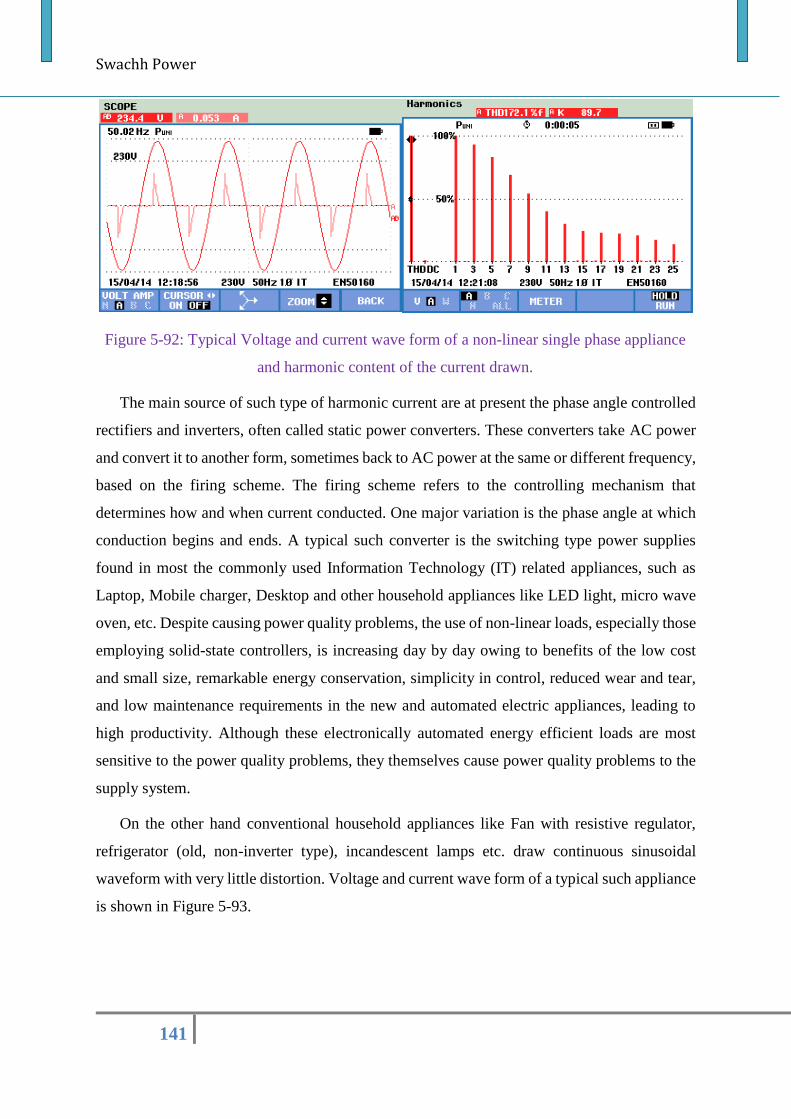
Swachh Power
141
Figure 5-92: Typical Voltage and current wave form of a non-linear single phase appliance
and harmonic content of the current drawn.
The main source of such type of harmonic current are at present the phase angle controlled
rectifiers and inverters, often called static power converters. These converters take AC power
and convert it to another form, sometimes back to AC power at the same or different frequency,
based on the firing scheme. The firing scheme refers to the controlling mechanism that
determines how and when current conducted. One major variation is the phase angle at which
conduction begins and ends. A typical such converter is the switching type power supplies
found in most the commonly used Information Technology (IT) related appliances, such as
Laptop, Mobile charger, Desktop and other household appliances like LED light, micro wave
oven, etc. Despite causing power quality problems, the use of non-linear loads, especially those
employing solid-state controllers, is increasing day by day owing to benefits of the low cost
and small size, remarkable energy conservation, simplicity in control, reduced wear and tear,
and low maintenance requirements in the new and automated electric appliances, leading to
high productivity. Although these electronically automated energy efficient loads are most
sensitive to the power quality problems, they themselves cause power quality problems to the
supply system.
On the other hand conventional household appliances like Fan with resistive regulator,
refrigerator (old, non-inverter type), incandescent lamps etc. draw continuous sinusoidal
waveform with very little distortion. Voltage and current wave form of a typical such appliance
is shown in Figure 5-93.
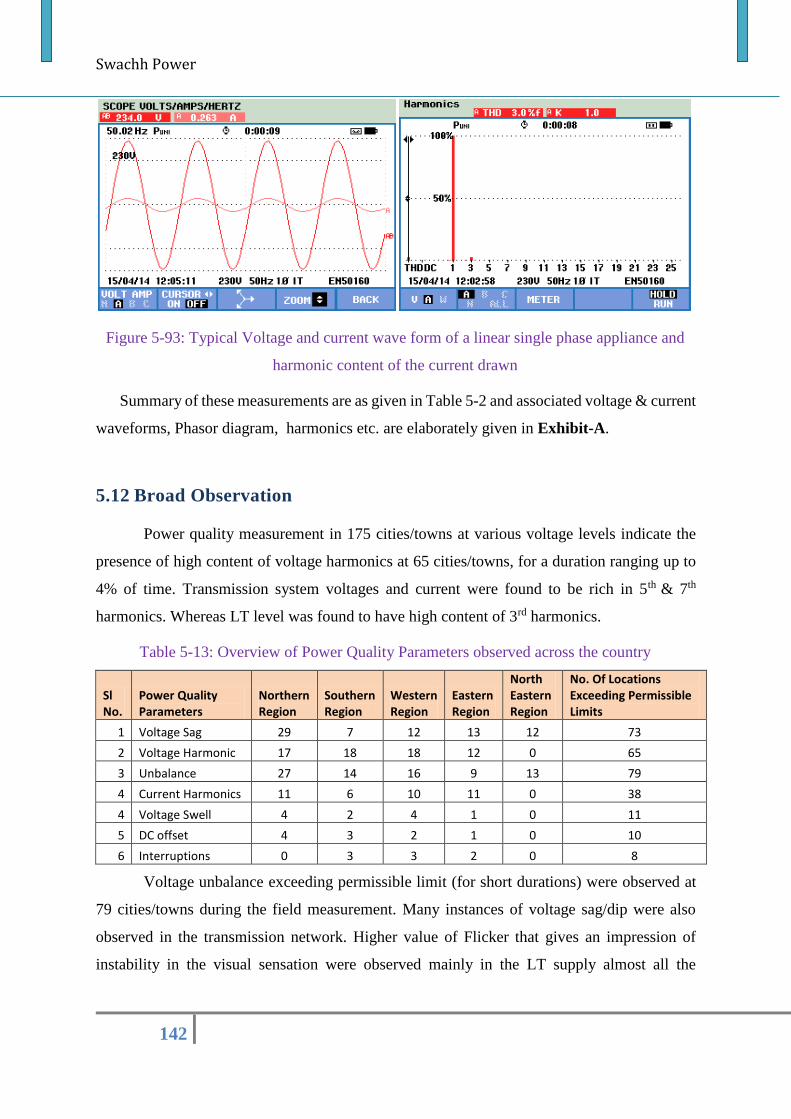
Swachh Power
142
Figure 5-93: Typical Voltage and current wave form of a linear single phase appliance and
harmonic content of the current drawn
Summary of these measurements are as given in Table 5-2 and associated voltage & current
waveforms, Phasor diagram, harmonics etc. are elaborately given in Exhibit-A.
5.12 Broad Observation
Power quality measurement in 175 cities/towns at various voltage levels indicate the
presence of high content of voltage harmonics at 65 cities/towns, for a duration ranging up to
4% of time. Transmission system voltages and current were found to be rich in 5th & 7th
harmonics. Whereas LT level was found to have high content of 3rd harmonics.
Table 5-13: Overview of Power Quality Parameters observed across the country
Sl No.
Power Quality Parameters
Northern Region
Southern Region
Western Region
Eastern Region
North Eastern Region
No. Of Locations Exceeding Permissible Limits
1 Voltage Sag 29 7 12 13 12 73
2 Voltage Harmonic 17 18 18 12 0 65
3 Unbalance 27 14 16 9 13 79
4 Current Harmonics 11 6 10 11 0 38
4 Voltage Swell 4 2 4 1 0 11
5 DC offset 4 3 2 1 0 10
6 Interruptions 0 3 3 2 0 8
Voltage unbalance exceeding permissible limit (for short durations) were observed at
79 cities/towns during the field measurement. Many instances of voltage sag/dip were also
observed in the transmission network. Higher value of Flicker that gives an impression of
instability in the visual sensation were observed mainly in the LT supply almost all the
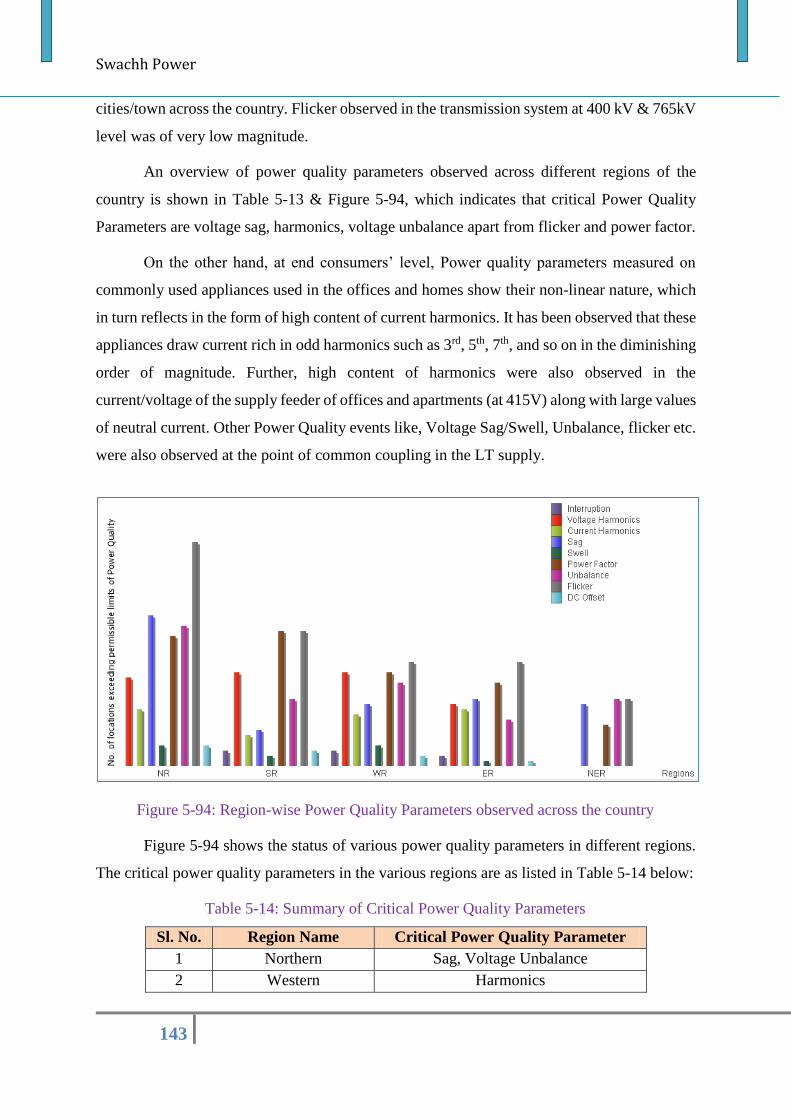
Swachh Power
143
cities/town across the country. Flicker observed in the transmission system at 400 kV & 765kV
level was of very low magnitude.
An overview of power quality parameters observed across different regions of the
country is shown in Table 5-13 & Figure 5-94, which indicates that critical Power Quality
Parameters are voltage sag, harmonics, voltage unbalance apart from flicker and power factor.
On the other hand, at end consumers’ level, Power quality parameters measured on
commonly used appliances used in the offices and homes show their non-linear nature, which
in turn reflects in the form of high content of current harmonics. It has been observed that these
appliances draw current rich in odd harmonics such as 3rd, 5th, 7th, and so on in the diminishing
order of magnitude. Further, high content of harmonics were also observed in the
current/voltage of the supply feeder of offices and apartments (at 415V) along with large values
of neutral current. Other Power Quality events like, Voltage Sag/Swell, Unbalance, flicker etc.
were also observed at the point of common coupling in the LT supply.
Figure 5-94: Region-wise Power Quality Parameters observed across the country
Figure 5-94 shows the status of various power quality parameters in different regions.
The critical power quality parameters in the various regions are as listed in Table 5-14 below:
Table 5-14: Summary of Critical Power Quality Parameters
Sl. No. Region Name Critical Power Quality Parameter
1 Northern Sag, Voltage Unbalance
2 Western Harmonics
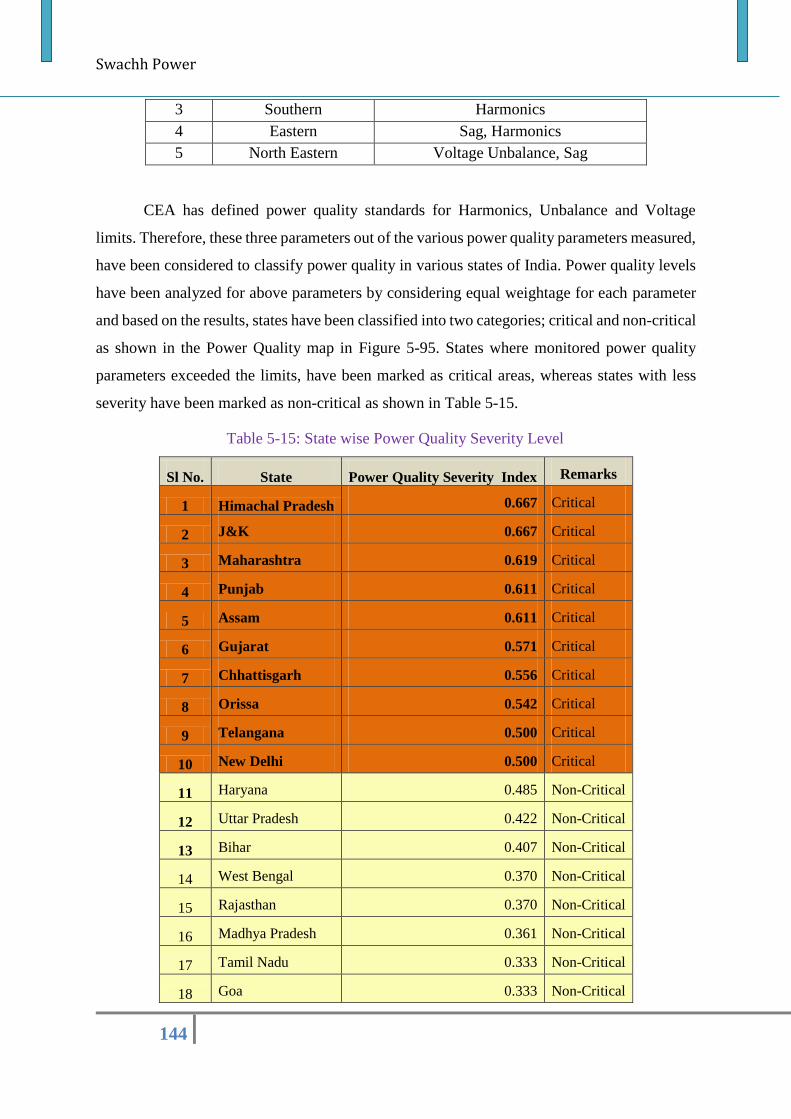
Swachh Power
144
3 Southern Harmonics
4 Eastern Sag, Harmonics
5 North Eastern Voltage Unbalance, Sag
CEA has defined power quality standards for Harmonics, Unbalance and Voltage
limits. Therefore, these three parameters out of the various power quality parameters measured,
have been considered to classify power quality in various states of India. Power quality levels
have been analyzed for above parameters by considering equal weightage for each parameter
and based on the results, states have been classified into two categories; critical and non-critical
as shown in the Power Quality map in Figure 5-95. States where monitored power quality
parameters exceeded the limits, have been marked as critical areas, whereas states with less
severity have been marked as non-critical as shown in Table 5-15.
Table 5-15: State wise Power Quality Severity Level
Sl No. State Power Quality Severity Index Remarks
1 Himachal Pradesh 0.667 Critical
2 J&K 0.667 Critical
3 Maharashtra 0.619 Critical
4 Punjab 0.611 Critical
5 Assam 0.611 Critical
6 Gujarat 0.571 Critical
7 Chhattisgarh 0.556 Critical
8 Orissa 0.542 Critical
9 Telangana 0.500 Critical
10 New Delhi 0.500 Critical
11 Haryana 0.485 Non-Critical
12 Uttar Pradesh 0.422 Non-Critical
13 Bihar 0.407 Non-Critical
14 West Bengal 0.370 Non-Critical
15 Rajasthan 0.370 Non-Critical
16 Madhya Pradesh 0.361 Non-Critical
17 Tamil Nadu 0.333 Non-Critical
18 Goa 0.333 Non-Critical
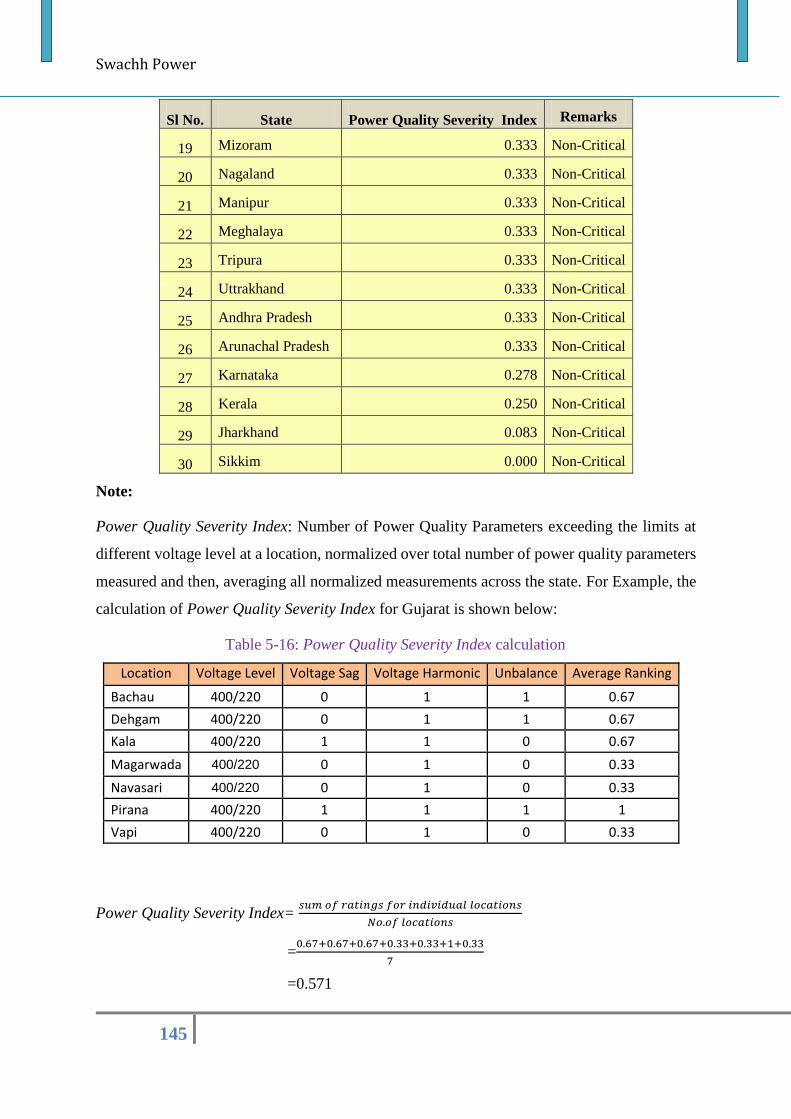
Swachh Power
145
Sl No. State Power Quality Severity Index Remarks
19 Mizoram 0.333 Non-Critical
20 Nagaland 0.333 Non-Critical
21 Manipur 0.333 Non-Critical
22 Meghalaya 0.333 Non-Critical
23 Tripura 0.333 Non-Critical
24 Uttrakhand 0.333 Non-Critical
25 Andhra Pradesh 0.333 Non-Critical
26 Arunachal Pradesh 0.333 Non-Critical
27 Karnataka 0.278 Non-Critical
28 Kerala 0.250 Non-Critical
29 Jharkhand 0.083 Non-Critical
30 Sikkim 0.000 Non-Critical
Note:
Power Quality Severity Index: Number of Power Quality Parameters exceeding the limits at
different voltage level at a location, normalized over total number of power quality parameters
measured and then, averaging all normalized measurements across the state. For Example, the
calculation of Power Quality Severity Index for Gujarat is shown below:
Table 5-16: Power Quality Severity Index calculation
Location Voltage Level Voltage Sag Voltage Harmonic Unbalance Average Ranking
Bachau 400/220 0 1 1 0.67
Dehgam 400/220 0 1 1 0.67
Kala 400/220 1 1 0 0.67
Magarwada 400/220 0 1 0 0.33
Navasari 400/220 0 1 0 0.33
Pirana 400/220 1 1 1 1
Vapi 400/220 0 1 0 0.33
Power Quality Severity Index= 𝑠𝑢𝑚 𝑜𝑓 𝑟𝑎𝑡𝑖𝑛𝑔𝑠 𝑓𝑜𝑟 𝑖𝑛𝑑𝑖𝑣𝑖𝑑𝑢𝑎𝑙 𝑙𝑜𝑐𝑎𝑡𝑖𝑜𝑛𝑠
𝑁𝑜.𝑜𝑓 𝑙𝑜𝑐𝑎𝑡𝑖𝑜𝑛𝑠
=0.67+0.67+0.67+0.33+0.33+1+0.33
7
=0.571
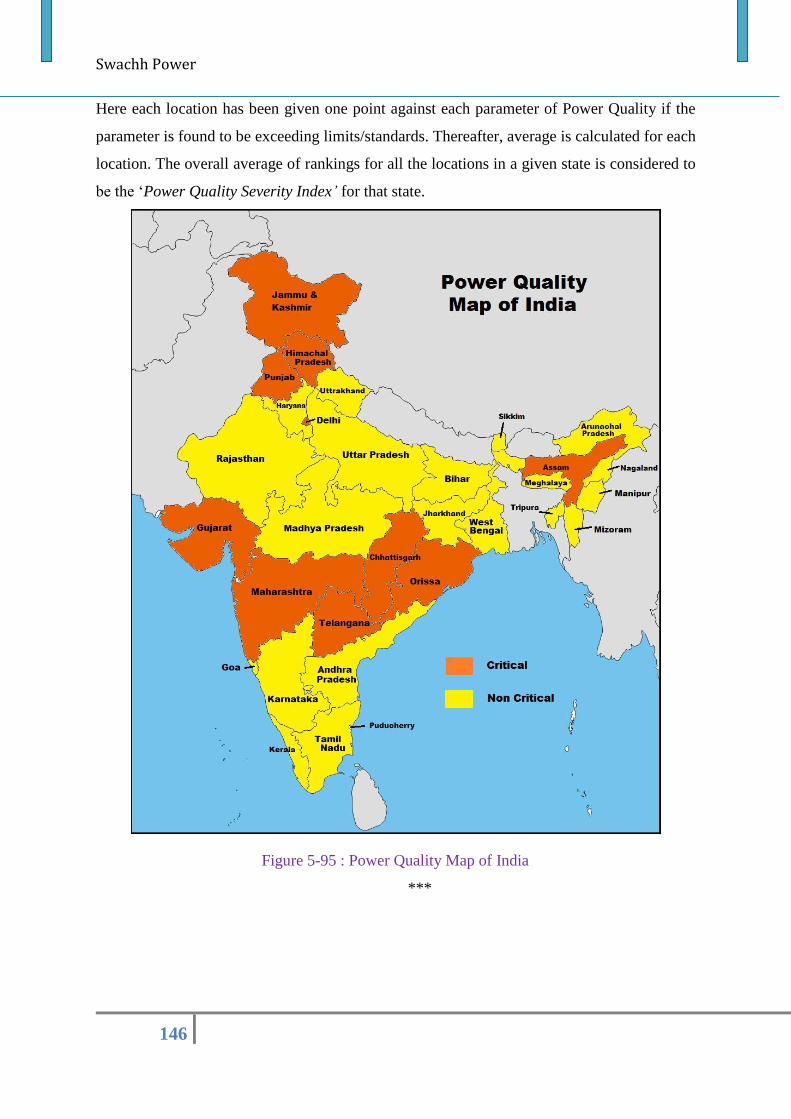
Swachh Power
146
Here each location has been given one point against each parameter of Power Quality if the
parameter is found to be exceeding limits/standards. Thereafter, average is calculated for each
location. The overall average of rankings for all the locations in a given state is considered to
be the ‘Power Quality Severity Index’ for that state.
Figure 5-95 : Power Quality Map of India
***
Swachh Power
147
Chapter-6
6 Solutions for Power Quality
Problems 6.1 Mitigation of Power Quality Problems
A number of techniques have evolved for mitigation of Power Quality problems either
in the existing systems or in equipment to be developed in the near future. The techniques
employed for power quality improvements in existing system facing power quality problems
are classified in a different manner from those used in newly designed and developed
equipment. These mitigation techniques are further sub-classified for the electrical loads and
supply system, since both of them have somewhat different kind of power quality problems.
In existing nonlinear loads, having the power quality problem of poor power factor,
harmonic currents, unbalanced currents, and an excessive neutral current, a series of power
filters of various types such as passive, active, and hybrid in shunt, series, or a combination of
both configurations are used externally depending upon the nature of loads such as voltage-fed
loads, current-fed loads, or a combination of both to mitigate PQ problems.
Power Quality Issues has resulted in a new direction of research and development
(R&D) activities for the design and development engineers working in the field of power
electronics, power systems, electric drives, digital signal processing, and sensors. It has
changed the scenario of power electronics as most of the equipment using power converters at
the front end need modification in view of these newly visualized requirements. Moreover,
some of the well-developed converters are becoming obsolete and better substitutes are
required.
A brief description of mitigating measures for various types of power quality problems are
discussed in following section.
6.1.1 Power Factor Improvement
Power factor may be improved by compensating reactive power requirement at the load. If
power factor is lagging then compensation is done in the form of capacitive reactive power by
installing capacitors banks, minimizing operation of lightly loaded induction motors, avoiding
operation of equipment above their rated voltage etc. Whereas leading power factor situations
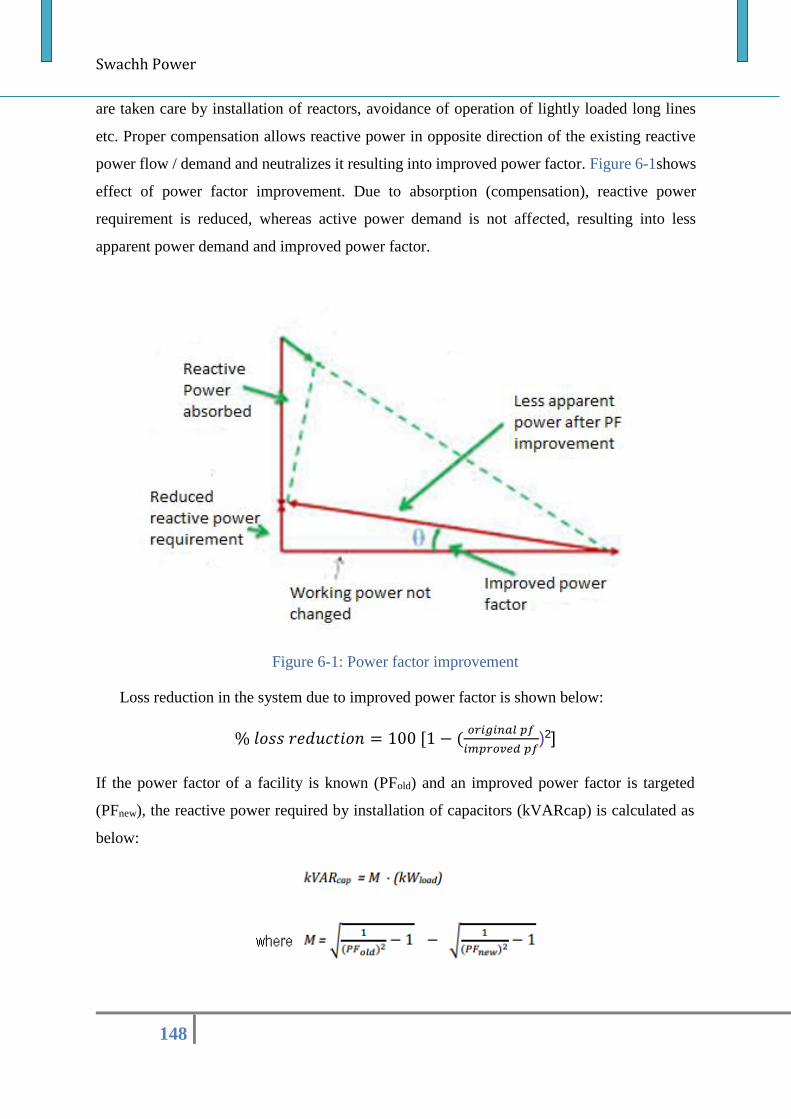
Swachh Power
148
are taken care by installation of reactors, avoidance of operation of lightly loaded long lines
etc. Proper compensation allows reactive power in opposite direction of the existing reactive
power flow / demand and neutralizes it resulting into improved power factor. Figure 6-1shows
effect of power factor improvement. Due to absorption (compensation), reactive power
requirement is reduced, whereas active power demand is not affected, resulting into less
apparent power demand and improved power factor.
Figure 6-1: Power factor improvement
Loss reduction in the system due to improved power factor is shown below:
% 𝑙𝑜𝑠𝑠 𝑟𝑒𝑑𝑢𝑐𝑡𝑖𝑜𝑛 = 100 [1 − (𝑜𝑟𝑖𝑔𝑖𝑛𝑎𝑙 𝑝𝑓
𝑖𝑚𝑝𝑟𝑜𝑣𝑒𝑑 𝑝𝑓)2]
If the power factor of a facility is known (PFold) and an improved power factor is targeted
(PFnew), the reactive power required by installation of capacitors (kVARcap) is calculated as
below:
Swachh Power
149
6.1.2 Mitigation of Voltage Sag / Swell
Modifications in the process equipment itself are the cheapest solution to mitigate voltage
sag/swell. Modifying the grid for immunization for voltage sag/swell is also an option but is
expensive. Voltage sag/swell may be mitigated by providing sources / devices in the power
system which shall be capable of providing stability in system through higher current /
maintaining voltage. Protective devices installed between the sensitive process and the grid,
are other solutions which include energy storage devices, dynamic voltage regulators / dynamic
voltage restorars, superconducting energy storage devices, flywheels, UPS, STATCOM,
ferroresonant, i.e., constant voltage transformers etc.
6.1.3 Mitigation of Over / Under Voltage Conditions
Over / under voltage may be mitigated by using shunt capacitors, shunt reactors, SVC,
STATCOM etc., which provide compensating reactive power in the system to maintain
voltage. Correctly setting the transformer taps also helps in controlling the over/under voltage
conditions. In the power system network under-voltages can be prevented by adding more
generation and transmission lines.
6.1.4 Reduction of Voltage Interruptions
Many of the causes of interruptions like faults can be mitigated by monitoring &
maintaining the power system stable so that probability of occurrence of faults is reduced. An
end user may install energy storage system, UPS etc. to prevent interruptions by providing
emergency power supply while a utility may provide an off-site source that includes two
feeders with a high speed switch that switches to the alternate feeder when one feeder fails.
6.1.5 Mitigation of Transients
To control transients, transient voltage surge suppressors (TVSS) are used. These are non-
linear resistances, which offer low resistance at voltages higher than threshold limit and
transient is directed to the ground. Surge arrestor, voltage stabilizers, voltage regulators etc. are
used for transient control.
6.1.6 Remedy for Voltage Notching
Solution for voltage notching typically involves isolation of the critical and sensitive
equipment from the source (i.e. rectifiers) of voltage notching. Other methods for reducing
notches includes provision of impedance reactor in series with source of notches, which results
Swachh Power
150
into distribution of notch voltage across the new impedance (reactance) and the pre-existing
line to source impedance.
6.1.7 Mitigation of Voltage Fluctuation and Flicker
The effects of voltage fluctuations depend on their amplitude / rate of occurrence, which
are influenced by the characteristics of the power system and type of load &its operation.
Therefore mitigation measures are targeted at actions focused on limiting the amplitude of the
voltage fluctuations. Voltage fluctuation and flicker may be reduced by:
Increasing the short circuit power (with respect to the load power) at the point of
coupling to which a fluctuating load is connected. It is done by connecting the load at
a higher nominal voltage level, supplying this category of loads from dedicated lines,
separating supplies for fluctuating loads from steady loads by using separate windings
of a three-winding transformer, increasing the rated power of the transformer supplying
the fluctuating load and installing series capacitors.
Reducing the changes of reactive power in the supply system by installing dynamic
compensators.
Dynamic voltage regulators, synchronous machines, STATCOM etc. are the devices which can
be installed in the power system to control voltage fluctuations and flicker.
6.1.8 Mitigation of Harmonic / Inter Harmonic Distortions
Harmonics may be removed from the system in two ways; Passive and Active
arrangements. In passive techniques, the undesirable harmonic currents are prevented from
flowing into the system by either installing a high series impedance to block their flow or
diverting the flow of harmonic currents by means of a low-impedance parallel path. Passive
techniques are series line reactors, tuned harmonic filters, series induction filters, parallel /
series connected resonant filters, neutral current filter, zigzag grounding filter and the use of
higher pulse number converter circuits such as 12-pulse, 18-pulse, 24-pulse rectifiers etc.
Principle of passive harmonic filter is shown in Figure 6-2, where pre-identified harmonic
current for which filter is designed is absorbed by the passive harmonic filter.
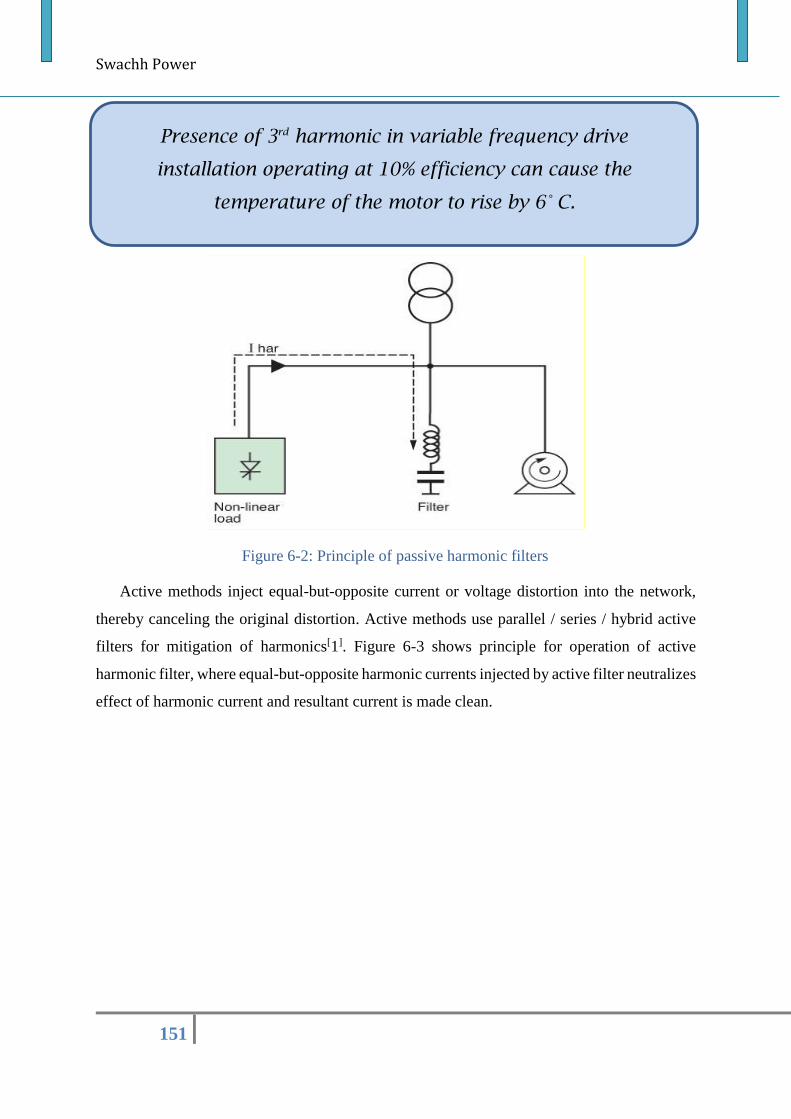
Swachh Power
151
Figure 6-2: Principle of passive harmonic filters
Active methods inject equal-but-opposite current or voltage distortion into the network,
thereby canceling the original distortion. Active methods use parallel / series / hybrid active
filters for mitigation of harmonics[1]. Figure 6-3 shows principle for operation of active
harmonic filter, where equal-but-opposite harmonic currents injected by active filter neutralizes
effect of harmonic current and resultant current is made clean.
Presence of 3rd harmonic in variable frequency drive
installation operating at 10% efficiency can cause the
temperature of the motor to rise by 6° C.
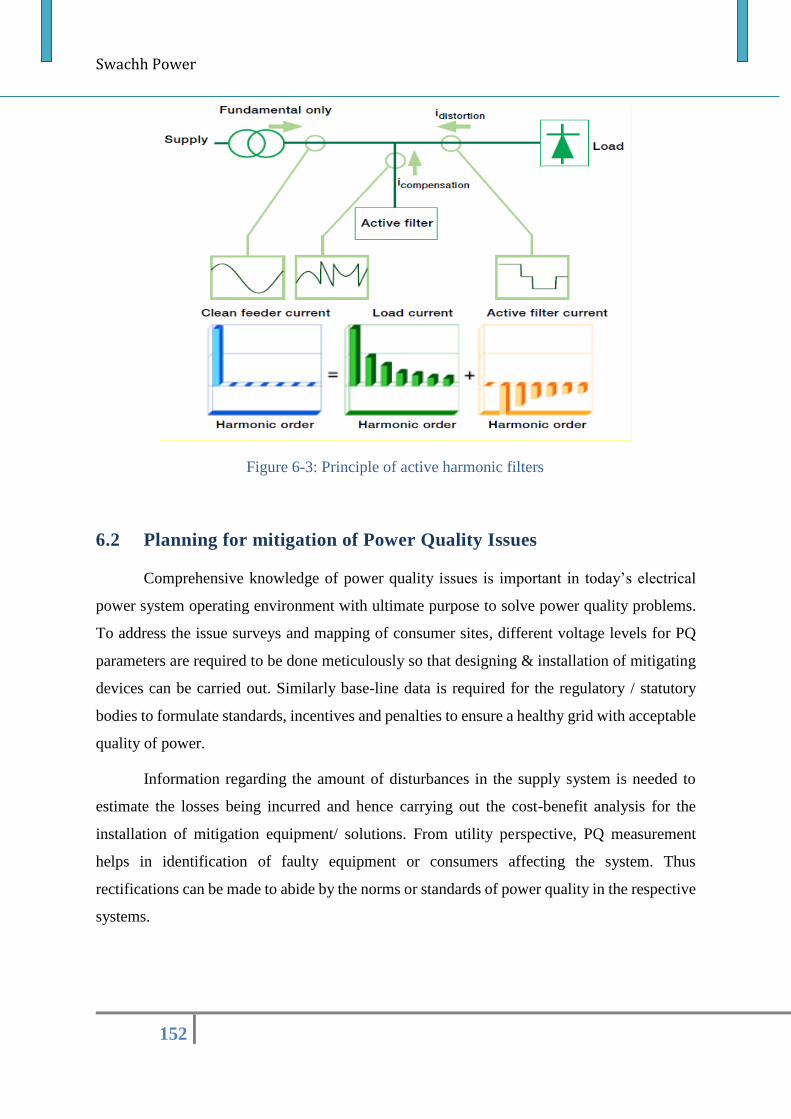
Swachh Power
152
Figure 6-3: Principle of active harmonic filters
6.2 Planning for mitigation of Power Quality Issues
Comprehensive knowledge of power quality issues is important in today’s electrical
power system operating environment with ultimate purpose to solve power quality problems.
To address the issue surveys and mapping of consumer sites, different voltage levels for PQ
parameters are required to be done meticulously so that designing & installation of mitigating
devices can be carried out. Similarly base-line data is required for the regulatory / statutory
bodies to formulate standards, incentives and penalties to ensure a healthy grid with acceptable
quality of power.
Information regarding the amount of disturbances in the supply system is needed to
estimate the losses being incurred and hence carrying out the cost-benefit analysis for the
installation of mitigation equipment/ solutions. From utility perspective, PQ measurement
helps in identification of faulty equipment or consumers affecting the system. Thus
rectifications can be made to abide by the norms or standards of power quality in the respective
systems.
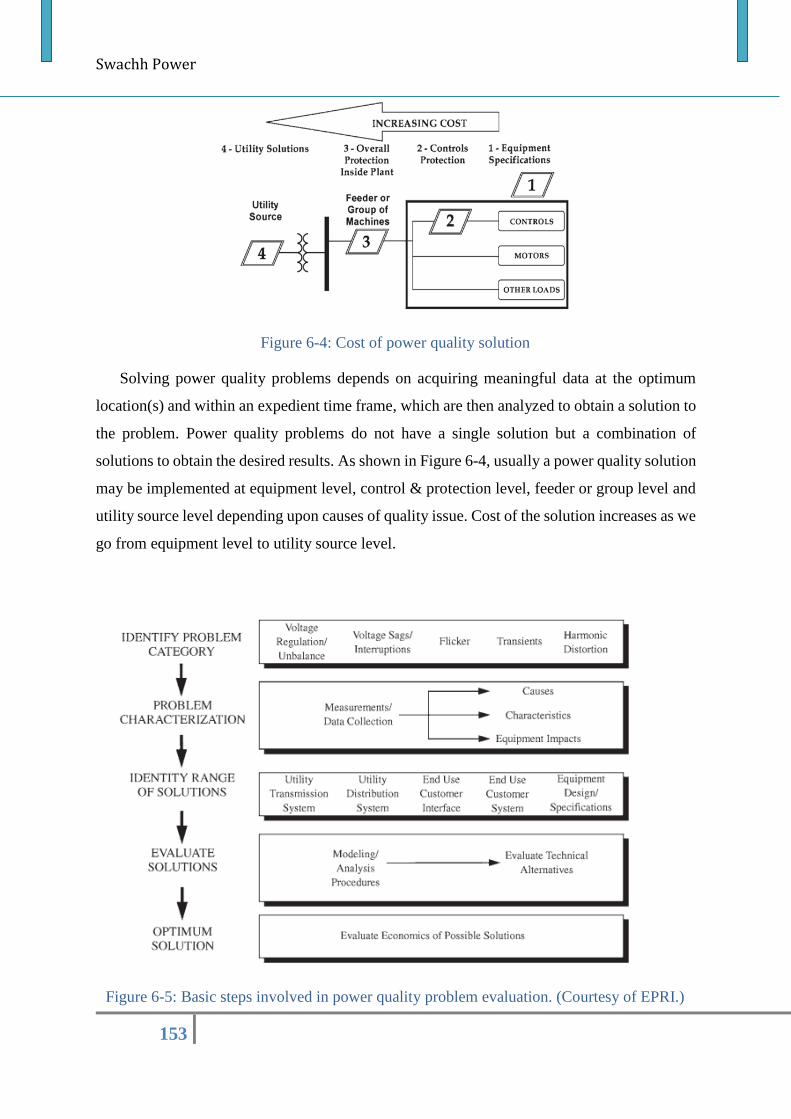
Swachh Power
153
Figure 6-4: Cost of power quality solution
Solving power quality problems depends on acquiring meaningful data at the optimum
location(s) and within an expedient time frame, which are then analyzed to obtain a solution to
the problem. Power quality problems do not have a single solution but a combination of
solutions to obtain the desired results. As shown in Figure 6-4, usually a power quality solution
may be implemented at equipment level, control & protection level, feeder or group level and
utility source level depending upon causes of quality issue. Cost of the solution increases as we
go from equipment level to utility source level.
Figure 6-5: Basic steps involved in power quality problem evaluation. (Courtesy of EPRI.)
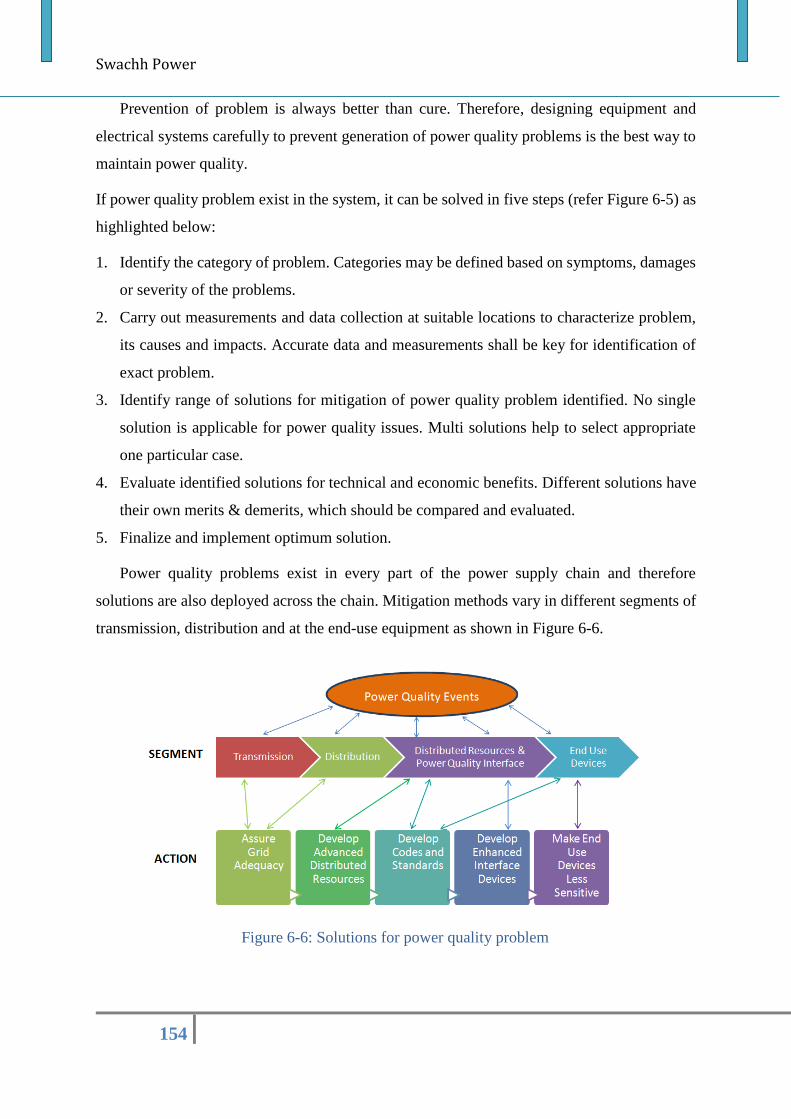
Swachh Power
154
Prevention of problem is always better than cure. Therefore, designing equipment and
electrical systems carefully to prevent generation of power quality problems is the best way to
maintain power quality.
If power quality problem exist in the system, it can be solved in five steps (refer Figure 6-5) as
highlighted below:
1. Identify the category of problem. Categories may be defined based on symptoms, damages
or severity of the problems.
2. Carry out measurements and data collection at suitable locations to characterize problem,
its causes and impacts. Accurate data and measurements shall be key for identification of
exact problem.
3. Identify range of solutions for mitigation of power quality problem identified. No single
solution is applicable for power quality issues. Multi solutions help to select appropriate
one particular case.
4. Evaluate identified solutions for technical and economic benefits. Different solutions have
their own merits & demerits, which should be compared and evaluated.
5. Finalize and implement optimum solution.
Power quality problems exist in every part of the power supply chain and therefore
solutions are also deployed across the chain. Mitigation methods vary in different segments of
transmission, distribution and at the end-use equipment as shown in Figure 6-6.
Figure 6-6: Solutions for power quality problem
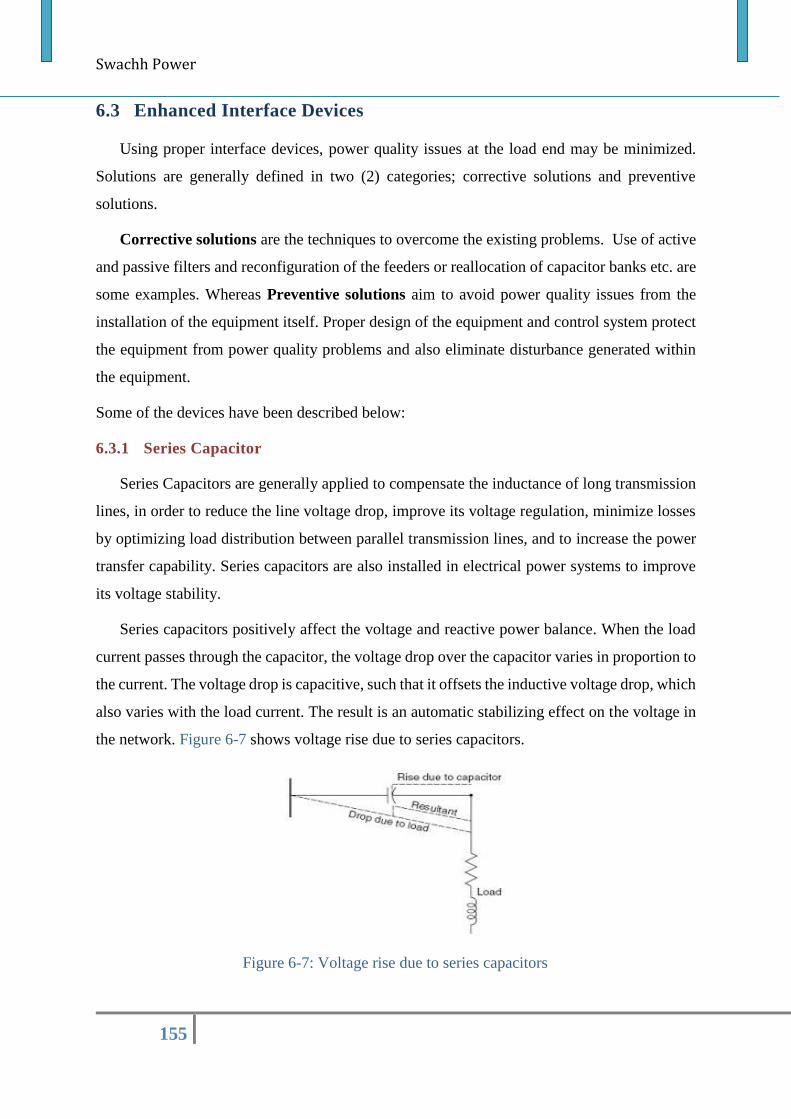
Swachh Power
155
6.3 Enhanced Interface Devices
Using proper interface devices, power quality issues at the load end may be minimized.
Solutions are generally defined in two (2) categories; corrective solutions and preventive
solutions.
Corrective solutions are the techniques to overcome the existing problems. Use of active
and passive filters and reconfiguration of the feeders or reallocation of capacitor banks etc. are
some examples. Whereas Preventive solutions aim to avoid power quality issues from the
installation of the equipment itself. Proper design of the equipment and control system protect
the equipment from power quality problems and also eliminate disturbance generated within
the equipment.
Some of the devices have been described below:
6.3.1 Series Capacitor
Series Capacitors are generally applied to compensate the inductance of long transmission
lines, in order to reduce the line voltage drop, improve its voltage regulation, minimize losses
by optimizing load distribution between parallel transmission lines, and to increase the power
transfer capability. Series capacitors are also installed in electrical power systems to improve
its voltage stability.
Series capacitors positively affect the voltage and reactive power balance. When the load
current passes through the capacitor, the voltage drop over the capacitor varies in proportion to
the current. The voltage drop is capacitive, such that it offsets the inductive voltage drop, which
also varies with the load current. The result is an automatic stabilizing effect on the voltage in
the network. Figure 6-7 shows voltage rise due to series capacitors.
Figure 6-7: Voltage rise due to series capacitors
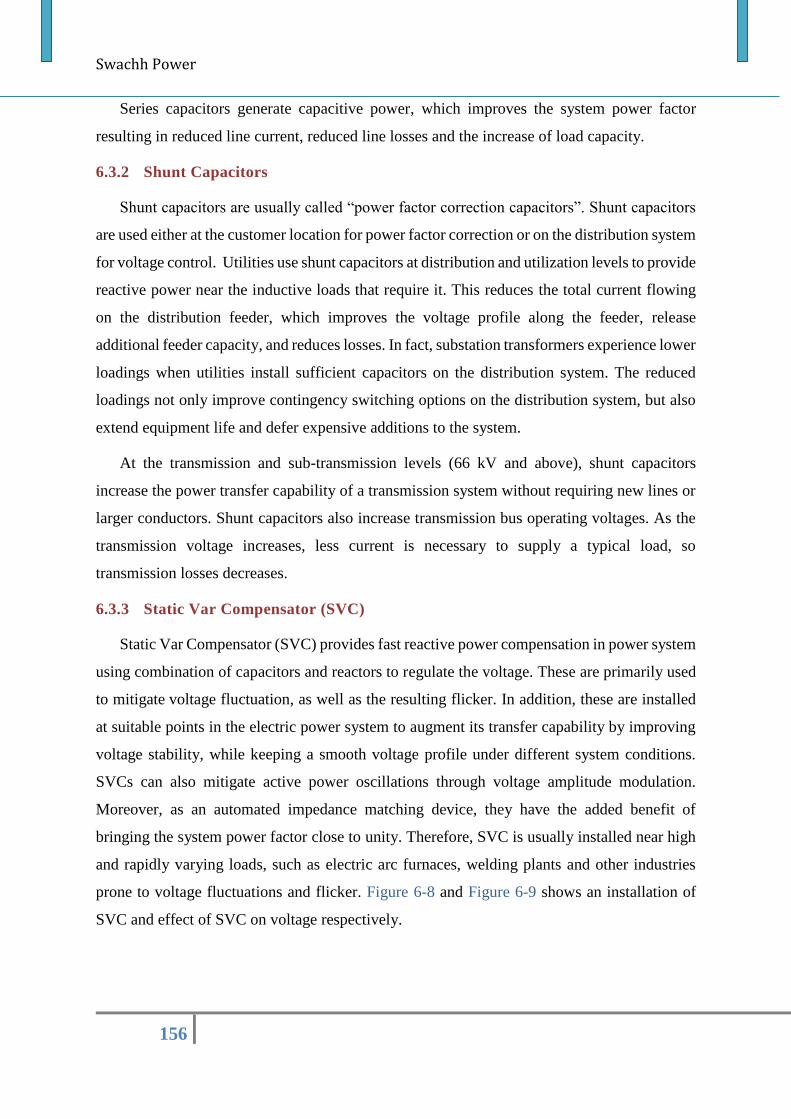
Swachh Power
156
Series capacitors generate capacitive power, which improves the system power factor
resulting in reduced line current, reduced line losses and the increase of load capacity.
6.3.2 Shunt Capacitors
Shunt capacitors are usually called “power factor correction capacitors”. Shunt capacitors
are used either at the customer location for power factor correction or on the distribution system
for voltage control. Utilities use shunt capacitors at distribution and utilization levels to provide
reactive power near the inductive loads that require it. This reduces the total current flowing
on the distribution feeder, which improves the voltage profile along the feeder, release
additional feeder capacity, and reduces losses. In fact, substation transformers experience lower
loadings when utilities install sufficient capacitors on the distribution system. The reduced
loadings not only improve contingency switching options on the distribution system, but also
extend equipment life and defer expensive additions to the system.
At the transmission and sub-transmission levels (66 kV and above), shunt capacitors
increase the power transfer capability of a transmission system without requiring new lines or
larger conductors. Shunt capacitors also increase transmission bus operating voltages. As the
transmission voltage increases, less current is necessary to supply a typical load, so
transmission losses decreases.
6.3.3 Static Var Compensator (SVC)
Static Var Compensator (SVC) provides fast reactive power compensation in power system
using combination of capacitors and reactors to regulate the voltage. These are primarily used
to mitigate voltage fluctuation, as well as the resulting flicker. In addition, these are installed
at suitable points in the electric power system to augment its transfer capability by improving
voltage stability, while keeping a smooth voltage profile under different system conditions.
SVCs can also mitigate active power oscillations through voltage amplitude modulation.
Moreover, as an automated impedance matching device, they have the added benefit of
bringing the system power factor close to unity. Therefore, SVC is usually installed near high
and rapidly varying loads, such as electric arc furnaces, welding plants and other industries
prone to voltage fluctuations and flicker. Figure 6-8 and Figure 6-9 shows an installation of
SVC and effect of SVC on voltage respectively.
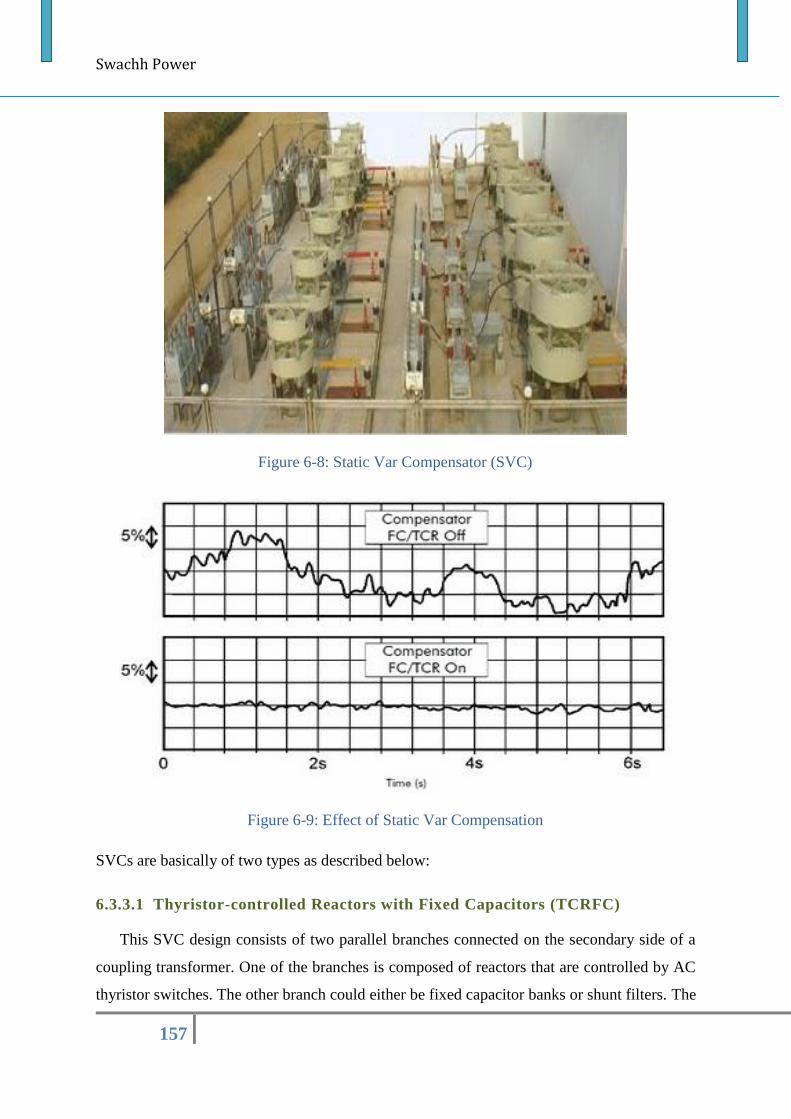
Swachh Power
157
Figure 6-8: Static Var Compensator (SVC)
Figure 6-9: Effect of Static Var Compensation
SVCs are basically of two types as described below:
6.3.3.1 Thyristor-controlled Reactors with Fixed Capacitors (TCRFC)
This SVC design consists of two parallel branches connected on the secondary side of a
coupling transformer. One of the branches is composed of reactors that are controlled by AC
thyristor switches. The other branch could either be fixed capacitor banks or shunt filters. The
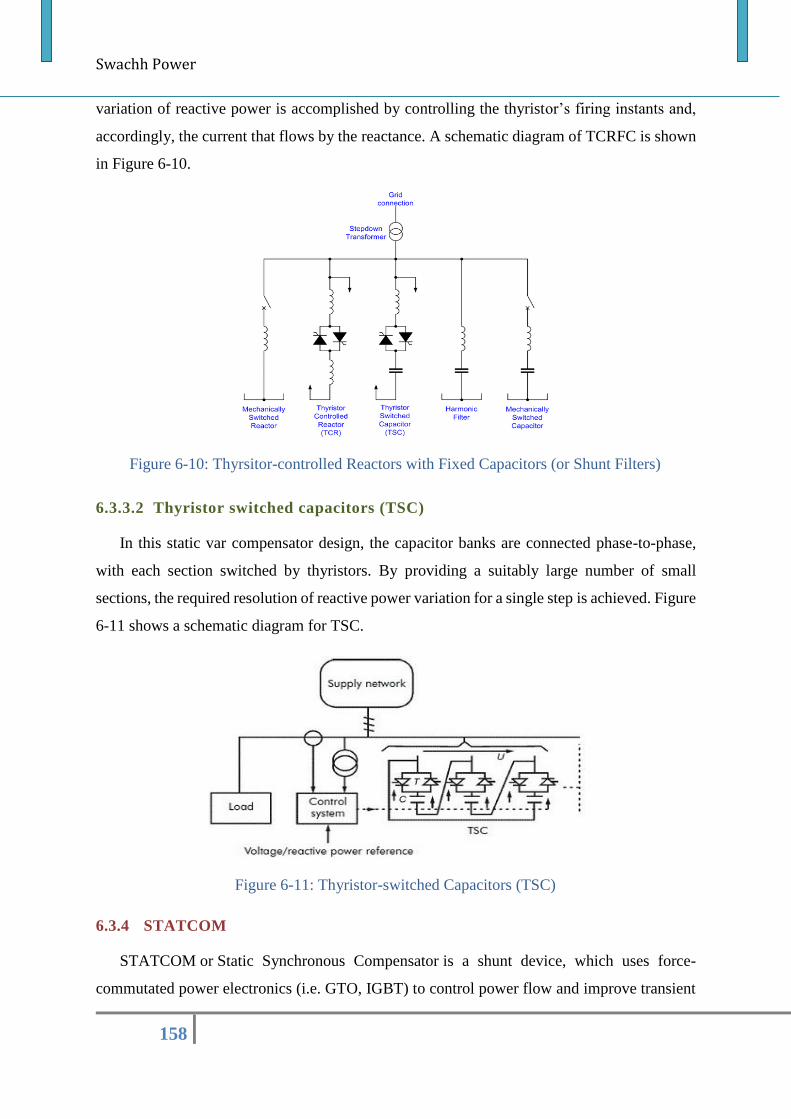
Swachh Power
158
variation of reactive power is accomplished by controlling the thyristor’s firing instants and,
accordingly, the current that flows by the reactance. A schematic diagram of TCRFC is shown
in Figure 6-10.
Figure 6-10: Thyrsitor-controlled Reactors with Fixed Capacitors (or Shunt Filters)
6.3.3.2 Thyristor switched capacitors (TSC)
In this static var compensator design, the capacitor banks are connected phase-to-phase,
with each section switched by thyristors. By providing a suitably large number of small
sections, the required resolution of reactive power variation for a single step is achieved. Figure
6-11 shows a schematic diagram for TSC.
Figure 6-11: Thyristor-switched Capacitors (TSC)
6.3.4 STATCOM
STATCOM or Static Synchronous Compensator is a shunt device, which uses force-
commutated power electronics (i.e. GTO, IGBT) to control power flow and improve transient
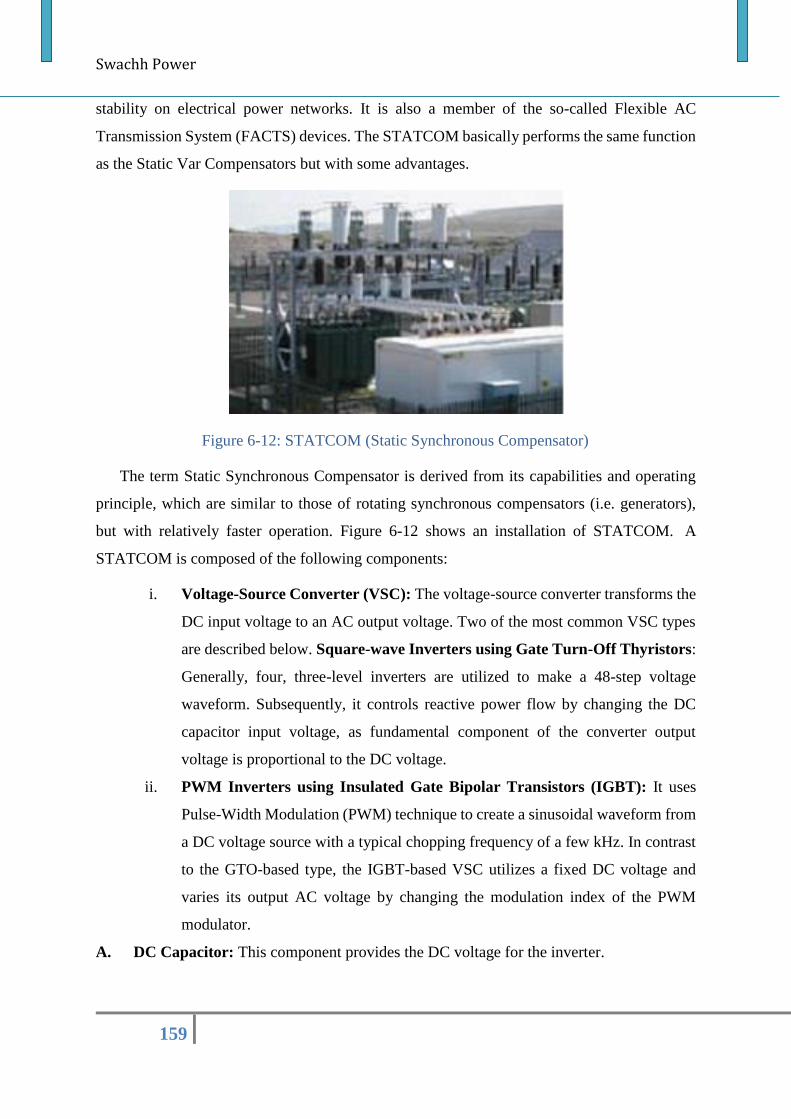
Swachh Power
159
stability on electrical power networks. It is also a member of the so-called Flexible AC
Transmission System (FACTS) devices. The STATCOM basically performs the same function
as the Static Var Compensators but with some advantages.
Figure 6-12: STATCOM (Static Synchronous Compensator)
The term Static Synchronous Compensator is derived from its capabilities and operating
principle, which are similar to those of rotating synchronous compensators (i.e. generators),
but with relatively faster operation. Figure 6-12 shows an installation of STATCOM. A
STATCOM is composed of the following components:
i. Voltage-Source Converter (VSC): The voltage-source converter transforms the
DC input voltage to an AC output voltage. Two of the most common VSC types
are described below. Square-wave Inverters using Gate Turn-Off Thyristors:
Generally, four, three-level inverters are utilized to make a 48-step voltage
waveform. Subsequently, it controls reactive power flow by changing the DC
capacitor input voltage, as fundamental component of the converter output
voltage is proportional to the DC voltage.
ii. PWM Inverters using Insulated Gate Bipolar Transistors (IGBT): It uses
Pulse-Width Modulation (PWM) technique to create a sinusoidal waveform from
a DC voltage source with a typical chopping frequency of a few kHz. In contrast
to the GTO-based type, the IGBT-based VSC utilizes a fixed DC voltage and
varies its output AC voltage by changing the modulation index of the PWM
modulator.
A. DC Capacitor: This component provides the DC voltage for the inverter.
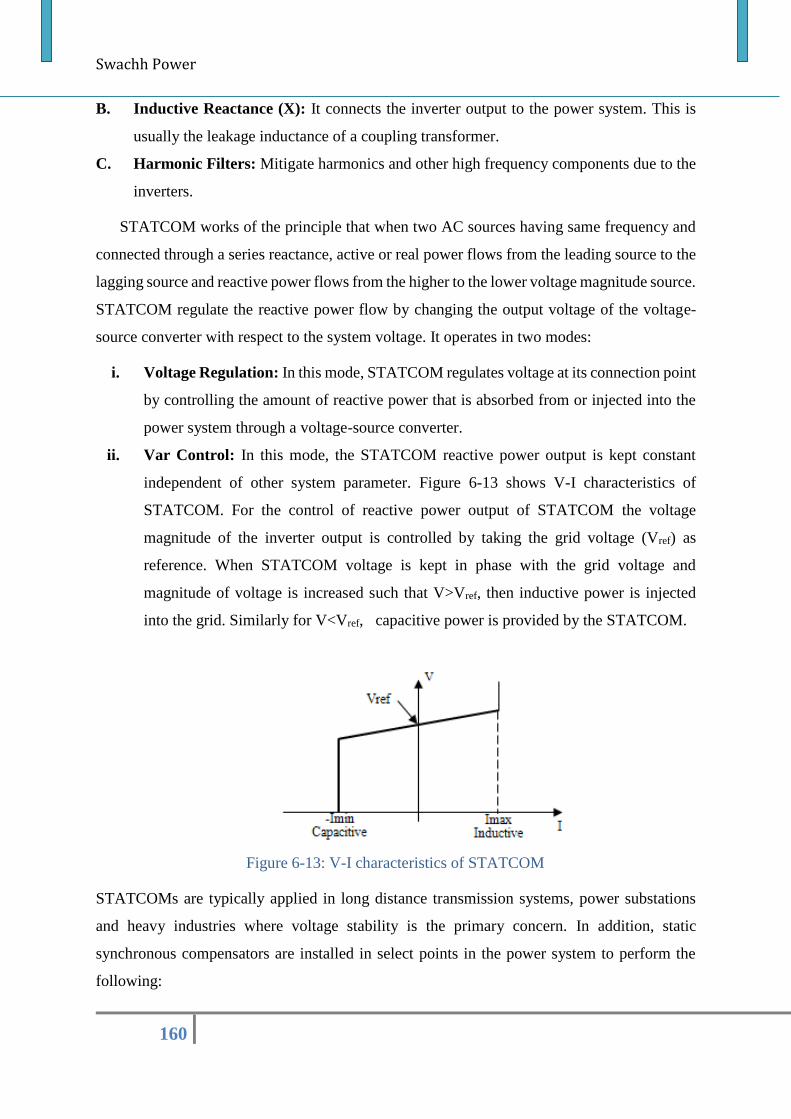
Swachh Power
160
B. Inductive Reactance (X): It connects the inverter output to the power system. This is
usually the leakage inductance of a coupling transformer.
C. Harmonic Filters: Mitigate harmonics and other high frequency components due to the
inverters.
STATCOM works of the principle that when two AC sources having same frequency and
connected through a series reactance, active or real power flows from the leading source to the
lagging source and reactive power flows from the higher to the lower voltage magnitude source.
STATCOM regulate the reactive power flow by changing the output voltage of the voltage-
source converter with respect to the system voltage. It operates in two modes:
i. Voltage Regulation: In this mode, STATCOM regulates voltage at its connection point
by controlling the amount of reactive power that is absorbed from or injected into the
power system through a voltage-source converter.
ii. Var Control: In this mode, the STATCOM reactive power output is kept constant
independent of other system parameter. Figure 6-13 shows V-I characteristics of
STATCOM. For the control of reactive power output of STATCOM the voltage
magnitude of the inverter output is controlled by taking the grid voltage (Vref) as
reference. When STATCOM voltage is kept in phase with the grid voltage and
magnitude of voltage is increased such that V>Vref, then inductive power is injected
into the grid. Similarly for V<Vref, capacitive power is provided by the STATCOM.
Figure 6-13: V-I characteristics of STATCOM
STATCOMs are typically applied in long distance transmission systems, power substations
and heavy industries where voltage stability is the primary concern. In addition, static
synchronous compensators are installed in select points in the power system to perform the
following:
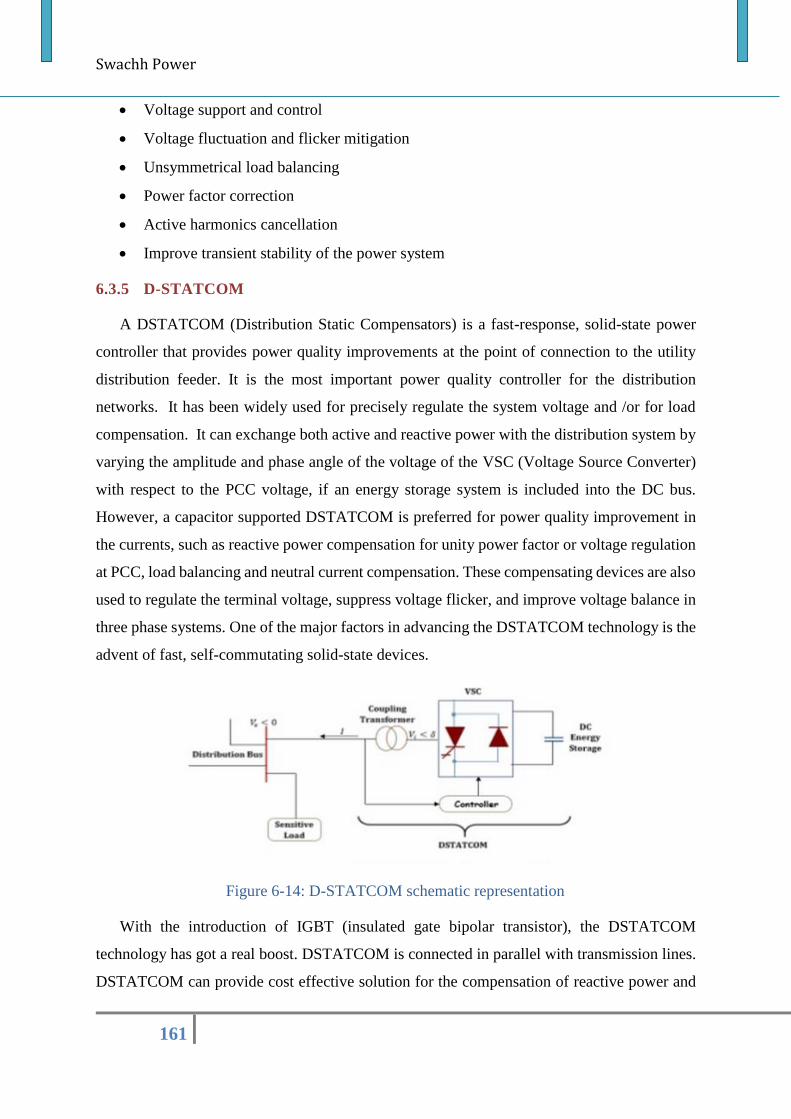
Swachh Power
161
Voltage support and control
Voltage fluctuation and flicker mitigation
Unsymmetrical load balancing
Power factor correction
Active harmonics cancellation
Improve transient stability of the power system
6.3.5 D-STATCOM
A DSTATCOM (Distribution Static Compensators) is a fast-response, solid-state power
controller that provides power quality improvements at the point of connection to the utility
distribution feeder. It is the most important power quality controller for the distribution
networks. It has been widely used for precisely regulate the system voltage and /or for load
compensation. It can exchange both active and reactive power with the distribution system by
varying the amplitude and phase angle of the voltage of the VSC (Voltage Source Converter)
with respect to the PCC voltage, if an energy storage system is included into the DC bus.
However, a capacitor supported DSTATCOM is preferred for power quality improvement in
the currents, such as reactive power compensation for unity power factor or voltage regulation
at PCC, load balancing and neutral current compensation. These compensating devices are also
used to regulate the terminal voltage, suppress voltage flicker, and improve voltage balance in
three phase systems. One of the major factors in advancing the DSTATCOM technology is the
advent of fast, self-commutating solid-state devices.
Figure 6-14: D-STATCOM schematic representation
With the introduction of IGBT (insulated gate bipolar transistor), the DSTATCOM
technology has got a real boost. DSTATCOM is connected in parallel with transmission lines.
DSTATCOM can provide cost effective solution for the compensation of reactive power and
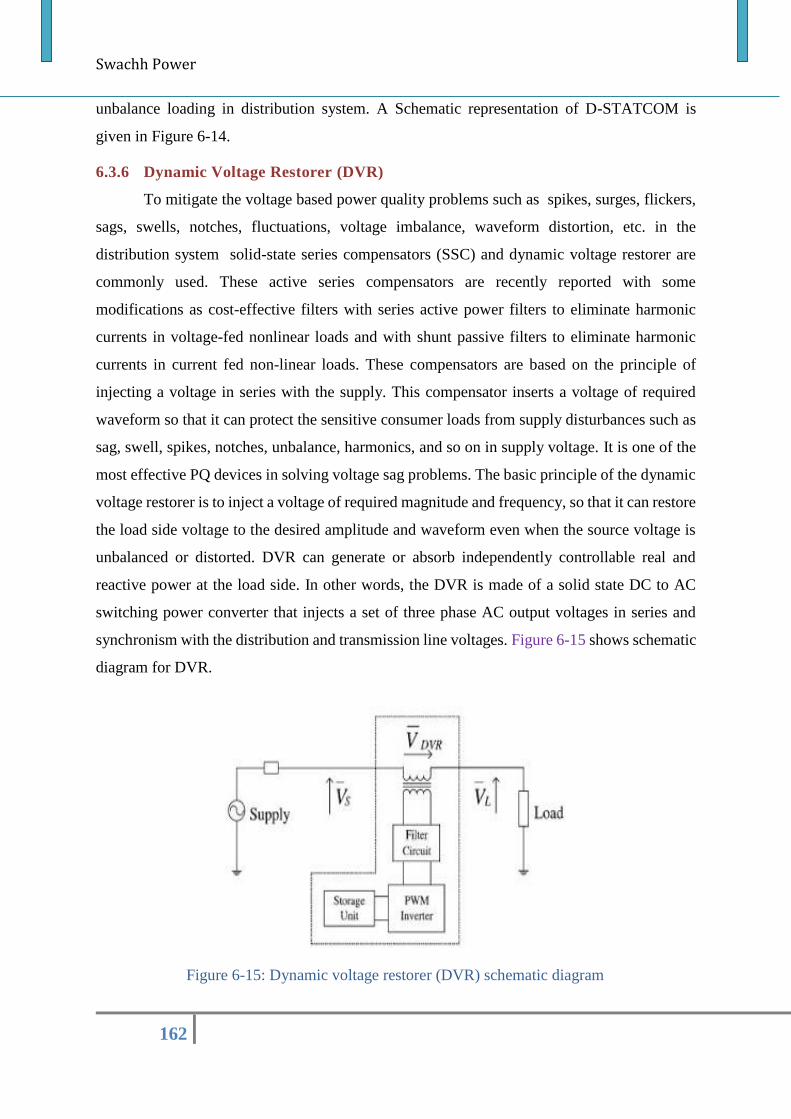
Swachh Power
162
unbalance loading in distribution system. A Schematic representation of D-STATCOM is
given in Figure 6-14.
6.3.6 Dynamic Voltage Restorer (DVR)
To mitigate the voltage based power quality problems such as spikes, surges, flickers,
sags, swells, notches, fluctuations, voltage imbalance, waveform distortion, etc. in the
distribution system solid-state series compensators (SSC) and dynamic voltage restorer are
commonly used. These active series compensators are recently reported with some
modifications as cost-effective filters with series active power filters to eliminate harmonic
currents in voltage-fed nonlinear loads and with shunt passive filters to eliminate harmonic
currents in current fed non-linear loads. These compensators are based on the principle of
injecting a voltage in series with the supply. This compensator inserts a voltage of required
waveform so that it can protect the sensitive consumer loads from supply disturbances such as
sag, swell, spikes, notches, unbalance, harmonics, and so on in supply voltage. It is one of the
most effective PQ devices in solving voltage sag problems. The basic principle of the dynamic
voltage restorer is to inject a voltage of required magnitude and frequency, so that it can restore
the load side voltage to the desired amplitude and waveform even when the source voltage is
unbalanced or distorted. DVR can generate or absorb independently controllable real and
reactive power at the load side. In other words, the DVR is made of a solid state DC to AC
switching power converter that injects a set of three phase AC output voltages in series and
synchronism with the distribution and transmission line voltages. Figure 6-15 shows schematic
diagram for DVR.
Figure 6-15: Dynamic voltage restorer (DVR) schematic diagram
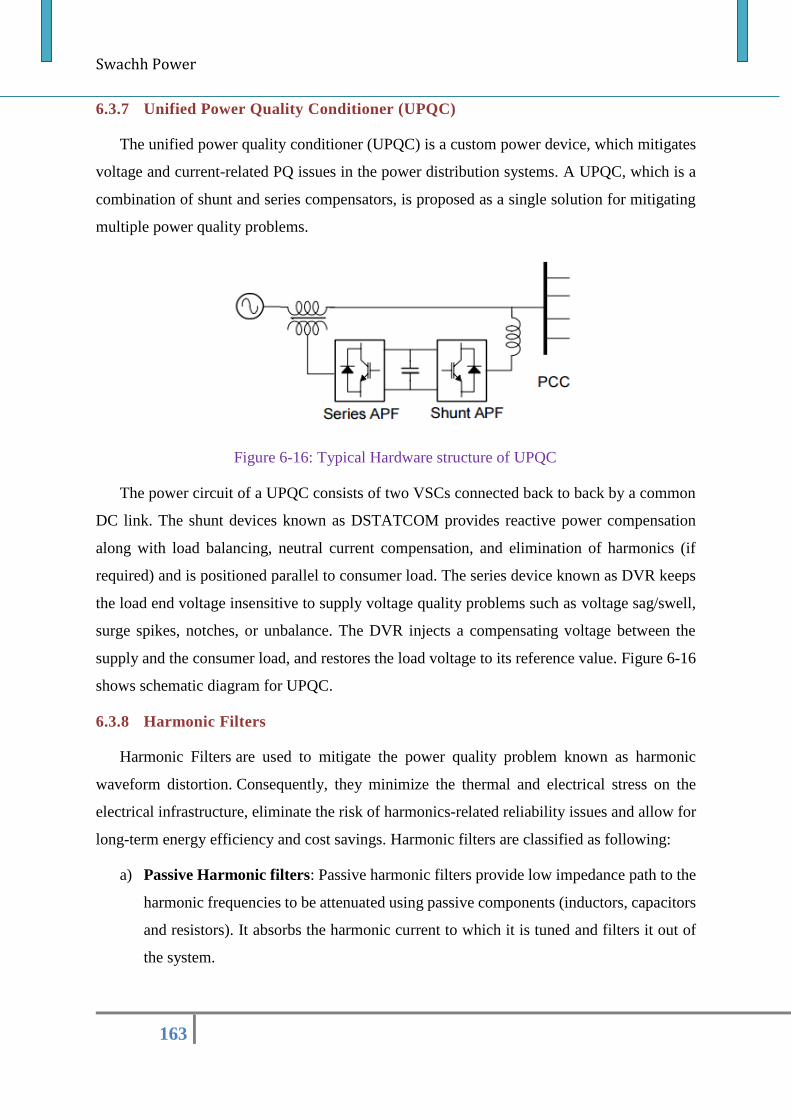
Swachh Power
163
6.3.7 Unified Power Quality Conditioner (UPQC)
The unified power quality conditioner (UPQC) is a custom power device, which mitigates
voltage and current-related PQ issues in the power distribution systems. A UPQC, which is a
combination of shunt and series compensators, is proposed as a single solution for mitigating
multiple power quality problems.
Figure 6-16: Typical Hardware structure of UPQC
The power circuit of a UPQC consists of two VSCs connected back to back by a common
DC link. The shunt devices known as DSTATCOM provides reactive power compensation
along with load balancing, neutral current compensation, and elimination of harmonics (if
required) and is positioned parallel to consumer load. The series device known as DVR keeps
the load end voltage insensitive to supply voltage quality problems such as voltage sag/swell,
surge spikes, notches, or unbalance. The DVR injects a compensating voltage between the
supply and the consumer load, and restores the load voltage to its reference value. Figure 6-16
shows schematic diagram for UPQC.
6.3.8 Harmonic Filters
Harmonic Filters are used to mitigate the power quality problem known as harmonic
waveform distortion. Consequently, they minimize the thermal and electrical stress on the
electrical infrastructure, eliminate the risk of harmonics-related reliability issues and allow for
long-term energy efficiency and cost savings. Harmonic filters are classified as following:
a) Passive Harmonic filters: Passive harmonic filters provide low impedance path to the
harmonic frequencies to be attenuated using passive components (inductors, capacitors
and resistors). It absorbs the harmonic current to which it is tuned and filters it out of
the system.
Swachh Power
164
b) Active harmonic filters: Active Harmonic Filters (AHF) monitor the non-linear load
and dynamically provide controlled current injection, which cancels out the harmonic
currents in the electrical system. They also correct poor displacement power
factor (DPF) by compensating the system’s reactive current.
c) Hybrid harmonic filter: It is combination of both passive & active harmonic filters.
A harmonic filter provides the following benefits and performs these functions:
Supplies connected loads with non-destructive current and voltage waveforms.
Increases equipment capacity by reducing losses caused by harmonics on lines and
transformers.
Reduces triplen harmonics, which increase the current flowing through the neutral.
Protects the electrical system by reducing overheating of equipment and/or fire hazards.
Improves phase current and voltage balance.
Improves the power factor of non-linear loads.
Harmonic Filters are appropriate for electrical power distribution systems that supply
significant amount of harmonic-producing loads. Some of the places where harmonic filters
are deployed are as below:
Industrial - Adjustable Speed Drives, Arc Furnaces, Arc Welders and HVAC
Commercial - SMPS, Medical Devices ,UPS Systems and Data Centers
Residential – Computer equipment, electronic devices and other appliances.
6.3.9 K-Factor Transformer
“K-Factor” (K-rated) Transformer is designed for non-linear or harmonic generating loads
that a standard transformer could not adequately handle due to overheating. K-factor
transformers are specially assembled with a double sized neutral conductor, heavier gauge
copper and either change the geometry of their conductors or use multiple conductors for the
coils. These properties allow them to endure the additional heat caused by harmonic currents
much better than a standard transformer.
A K-factor transformer has certain features that allow it to handle the extra heating of
harmonic currents. It may have a static shield between the high and low voltage windings to
reduce electrostatic noise caused by harmonics. It may use smaller than normal, transposed,
and individually insulated conductors to reduce the skin-effect and eddy-current losses. It may
also have a neutral conductor in the secondary winding large enough to carry the third harmonic
Swachh Power
165
neutral currents. It may also have a neutral conductor in the secondary winding large enough
to carry the third-harmonic neutral currents. It may have core laminations that are individually
insulated to reduce eddy currents in the core. It may have a larger core with special steel to
reduce hysteresis losses and reduce the possibility of the transformer saturating because of high
voltage peaks on the distorted bus voltage waveform. This special steel has less resistance to
the changing magnetic fields. A larger core increases the area of steel and thus reduces the flux
density and resistance to the changing magnetic fields. The K-factor transformers flux density
can also be reduced by increasing the no. of turns in the winding. These transformers may have
larger conductors than a standard transformer with the same name plate rating to reduce eddy-
current losses and decrease the flux density.
Note: A K-factor transformer may cost approximately twice as much as a standard
transformer and weigh 115 percent more than a standard transformer. It is recommended that
purchasers of transformers use K-factor transformers rather than derate a standard transformer.
This is to avoid unforeseen hotspots. A derated transformer may still contain hot spots due to
harmonics that could result in overheating and transformer loss of life. Harmonics not only
cause transformers and other equipment to overheat but also can cause cables to overheat as
well. The neutral conductor in the cable is especially susceptible to overloading due to
harmonics.
6.3.10 Transient Voltage Surge suppressors (TVSS)
TVSS devices are used to protect other equipment from dangers of potentially harmful
voltage surges caused by lightning and switching of inductive or capacitive devices. Transient
voltage surge suppressors are used as interface between the power source and sensitive loads,
so that the transient voltage is clamped by the TVSS before it reaches the load. TVSSs usually
contain a component with a non-linear resistance (a metal oxide varistor or a zener diode) that
limits excessive line voltage and conduct any excess impulse energy to ground.
6.3.11 Isolation transformer
Isolation Transformer is a special type of transformer, wherein the primary and secondary
windings are physically separated through double insulation. The leakage inductance of
isolation transformers is the primary feature that electrically isolates people and equipment
from the hazards of power quality problems such as transients and high-frequency noise. In
addition, isolation transformers can prevent transfer of DC signals from one circuit to the other,
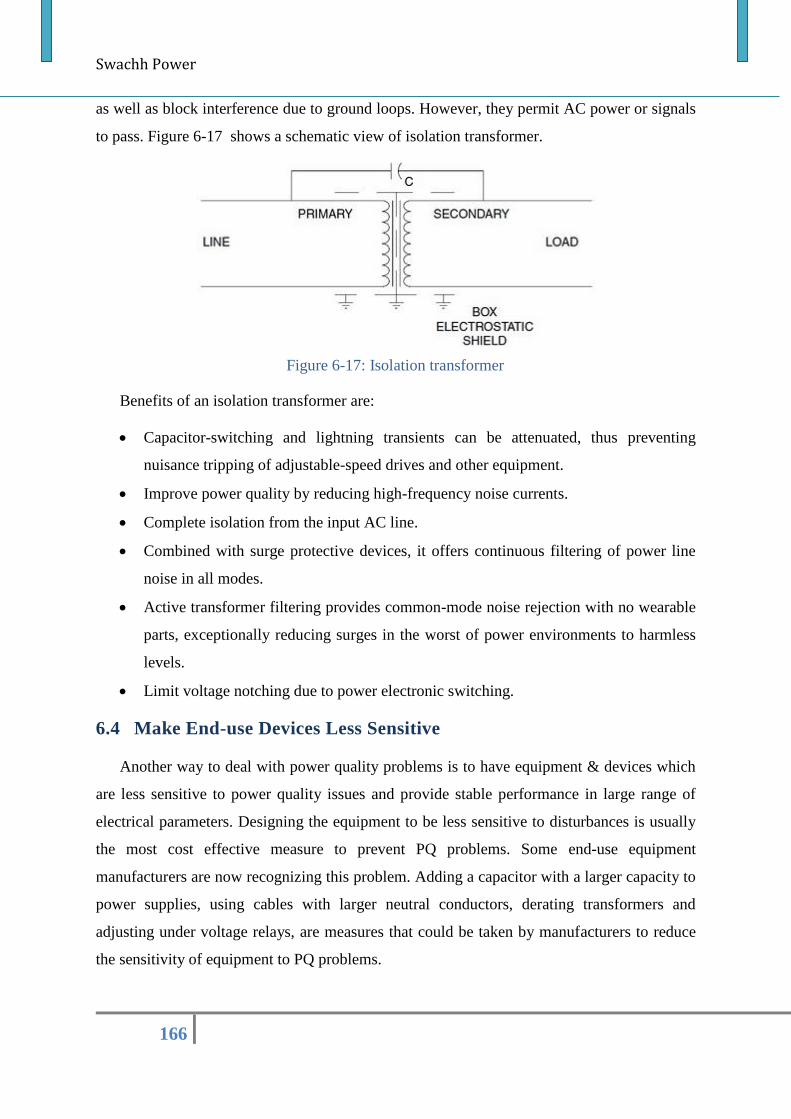
Swachh Power
166
as well as block interference due to ground loops. However, they permit AC power or signals
to pass. Figure 6-17 shows a schematic view of isolation transformer.
Figure 6-17: Isolation transformer
Benefits of an isolation transformer are:
Capacitor-switching and lightning transients can be attenuated, thus preventing
nuisance tripping of adjustable-speed drives and other equipment.
Improve power quality by reducing high-frequency noise currents.
Complete isolation from the input AC line.
Combined with surge protective devices, it offers continuous filtering of power line
noise in all modes.
Active transformer filtering provides common-mode noise rejection with no wearable
parts, exceptionally reducing surges in the worst of power environments to harmless
levels.
Limit voltage notching due to power electronic switching.
6.4 Make End-use Devices Less Sensitive
Another way to deal with power quality problems is to have equipment & devices which
are less sensitive to power quality issues and provide stable performance in large range of
electrical parameters. Designing the equipment to be less sensitive to disturbances is usually
the most cost effective measure to prevent PQ problems. Some end-use equipment
manufacturers are now recognizing this problem. Adding a capacitor with a larger capacity to
power supplies, using cables with larger neutral conductors, derating transformers and
adjusting under voltage relays, are measures that could be taken by manufacturers to reduce
the sensitivity of equipment to PQ problems.
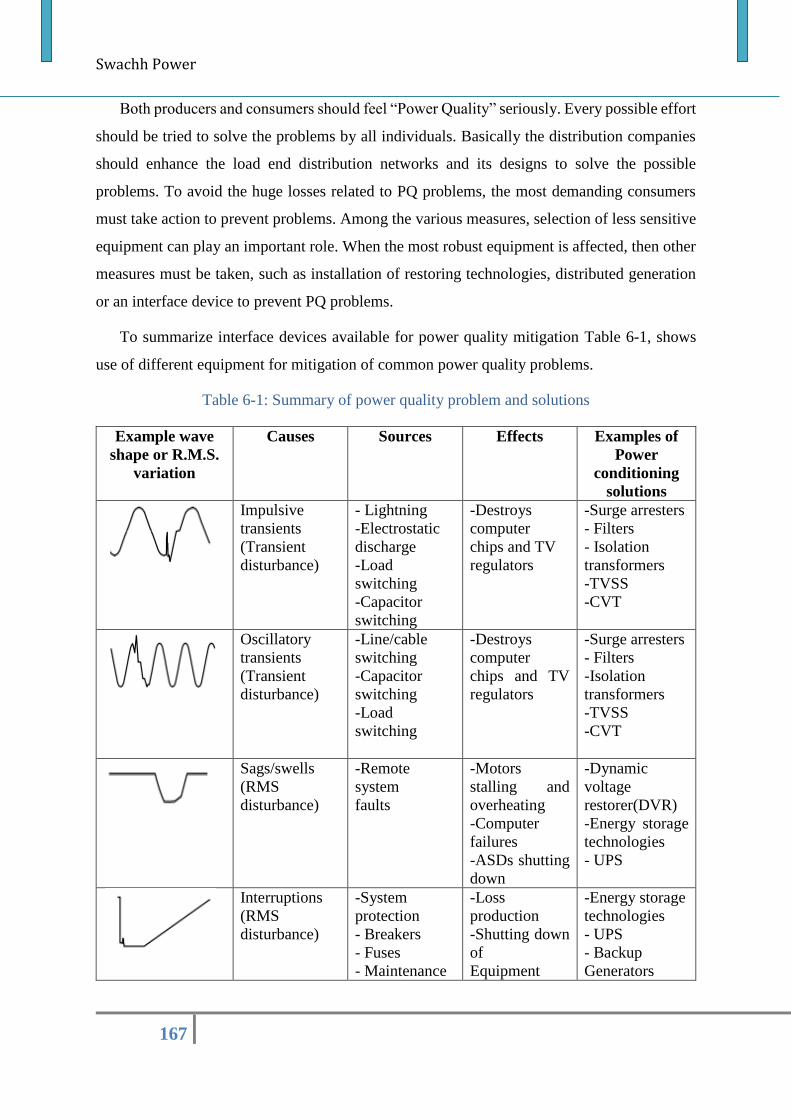
Swachh Power
167
Both producers and consumers should feel “Power Quality” seriously. Every possible effort
should be tried to solve the problems by all individuals. Basically the distribution companies
should enhance the load end distribution networks and its designs to solve the possible
problems. To avoid the huge losses related to PQ problems, the most demanding consumers
must take action to prevent problems. Among the various measures, selection of less sensitive
equipment can play an important role. When the most robust equipment is affected, then other
measures must be taken, such as installation of restoring technologies, distributed generation
or an interface device to prevent PQ problems.
To summarize interface devices available for power quality mitigation Table 6-1, shows
use of different equipment for mitigation of common power quality problems.
Table 6-1: Summary of power quality problem and solutions
Example wave
shape or R.M.S.
variation
Causes Sources Effects Examples of
Power
conditioning
solutions
Impulsive
transients
(Transient
disturbance)
- Lightning
-Electrostatic
discharge
-Load
switching
-Capacitor
switching
-Destroys
computer
chips and TV
regulators
-Surge arresters
- Filters
- Isolation
transformers
-TVSS
-CVT
Oscillatory
transients
(Transient
disturbance)
-Line/cable
switching
-Capacitor
switching
-Load
switching
-Destroys
computer
chips and TV
regulators
-Surge arresters
- Filters
-Isolation
transformers
-TVSS
-CVT
Sags/swells
(RMS
disturbance)
-Remote
system
faults
-Motors
stalling and
overheating
-Computer
failures
-ASDs shutting
down
-Dynamic
voltage
restorer(DVR)
-Energy storage
technologies
- UPS
Interruptions
(RMS
disturbance)
-System
protection
- Breakers
- Fuses
- Maintenance
-Loss
production
-Shutting down
of
Equipment
-Energy storage
technologies
- UPS
- Backup
Generators
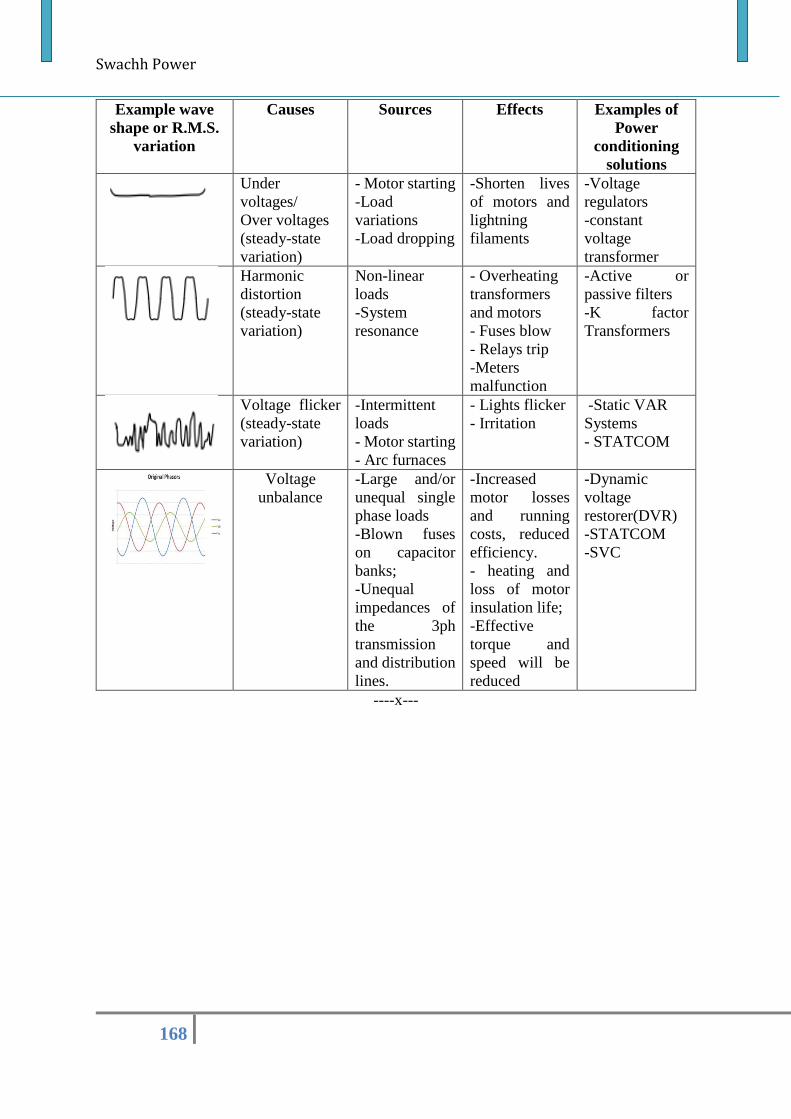
Swachh Power
168
Example wave
shape or R.M.S.
variation
Causes Sources Effects Examples of
Power
conditioning
solutions
Under
voltages/
Over voltages
(steady-state
variation)
- Motor starting
-Load
variations
-Load dropping
-Shorten lives
of motors and
lightning
filaments
-Voltage
regulators
-constant
voltage
transformer
Harmonic
distortion
(steady-state
variation)
Non-linear
loads
-System
resonance
- Overheating
transformers
and motors
- Fuses blow
- Relays trip
-Meters
malfunction
-Active or
passive filters
-K factor
Transformers
Voltage flicker
(steady-state
variation)
-Intermittent
loads
- Motor starting
- Arc furnaces
- Lights flicker
- Irritation
-Static VAR
Systems
- STATCOM
Voltage
unbalance
-Large and/or
unequal single
phase loads
-Blown fuses
on capacitor
banks;
-Unequal
impedances of
the 3ph
transmission
and distribution
lines.
-Increased
motor losses
and running
costs, reduced
efficiency.
- heating and
loss of motor
insulation life;
-Effective
torque and
speed will be
reduced
-Dynamic
voltage
restorer(DVR)
-STATCOM
-SVC
----x---
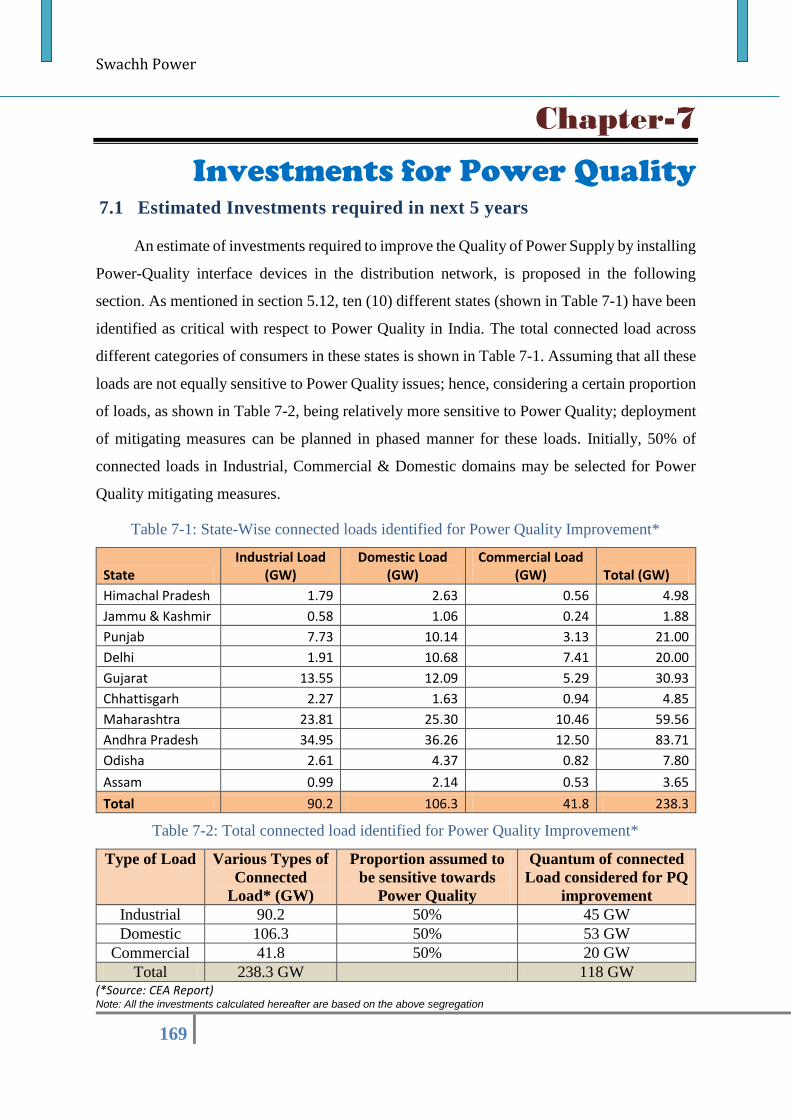
Swachh Power
169
Chapter-7
7 Investments for Power Quality 7.1 Estimated Investments required in next 5 years
An estimate of investments required to improve the Quality of Power Supply by installing
Power-Quality interface devices in the distribution network, is proposed in the following
section. As mentioned in section 5.12, ten (10) different states (shown in Table 7-1) have been
identified as critical with respect to Power Quality in India. The total connected load across
different categories of consumers in these states is shown in Table 7-1. Assuming that all these
loads are not equally sensitive to Power Quality issues; hence, considering a certain proportion
of loads, as shown in Table 7-2, being relatively more sensitive to Power Quality; deployment
of mitigating measures can be planned in phased manner for these loads. Initially, 50% of
connected loads in Industrial, Commercial & Domestic domains may be selected for Power
Quality mitigating measures.
Table 7-1: State-Wise connected loads identified for Power Quality Improvement*
State Industrial Load
(GW) Domestic Load
(GW) Commercial Load
(GW) Total (GW)
Himachal Pradesh 1.79 2.63 0.56 4.98
Jammu & Kashmir 0.58 1.06 0.24 1.88
Punjab 7.73 10.14 3.13 21.00
Delhi 1.91 10.68 7.41 20.00
Gujarat 13.55 12.09 5.29 30.93
Chhattisgarh 2.27 1.63 0.94 4.85
Maharashtra 23.81 25.30 10.46 59.56
Andhra Pradesh 34.95 36.26 12.50 83.71
Odisha 2.61 4.37 0.82 7.80
Assam 0.99 2.14 0.53 3.65
Total 90.2 106.3 41.8 238.3
Table 7-2: Total connected load identified for Power Quality Improvement*
(*Source: CEA Report) Note: All the investments calculated hereafter are based on the above segregation
Type of Load Various Types of
Connected
Load* (GW)
Proportion assumed to
be sensitive towards
Power Quality
Quantum of connected
Load considered for PQ
improvement
Industrial 90.2 50% 45 GW
Domestic 106.3 50% 53 GW
Commercial 41.8 50% 20 GW
Total 238.3 GW 118 GW
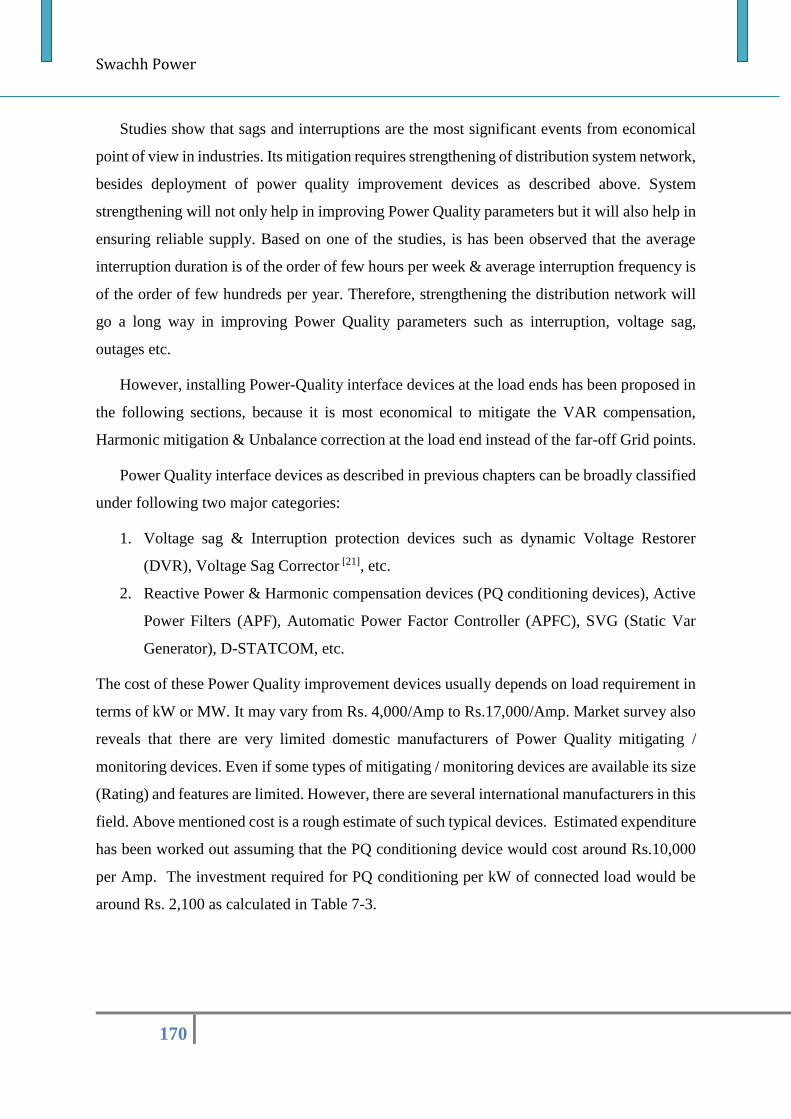
Swachh Power
170
Studies show that sags and interruptions are the most significant events from economical
point of view in industries. Its mitigation requires strengthening of distribution system network,
besides deployment of power quality improvement devices as described above. System
strengthening will not only help in improving Power Quality parameters but it will also help in
ensuring reliable supply. Based on one of the studies, is has been observed that the average
interruption duration is of the order of few hours per week & average interruption frequency is
of the order of few hundreds per year. Therefore, strengthening the distribution network will
go a long way in improving Power Quality parameters such as interruption, voltage sag,
outages etc.
However, installing Power-Quality interface devices at the load ends has been proposed in
the following sections, because it is most economical to mitigate the VAR compensation,
Harmonic mitigation & Unbalance correction at the load end instead of the far-off Grid points.
Power Quality interface devices as described in previous chapters can be broadly classified
under following two major categories:
1. Voltage sag & Interruption protection devices such as dynamic Voltage Restorer
(DVR), Voltage Sag Corrector [21], etc.
2. Reactive Power & Harmonic compensation devices (PQ conditioning devices), Active
Power Filters (APF), Automatic Power Factor Controller (APFC), SVG (Static Var
Generator), D-STATCOM, etc.
The cost of these Power Quality improvement devices usually depends on load requirement in
terms of kW or MW. It may vary from Rs. 4,000/Amp to Rs.17,000/Amp. Market survey also
reveals that there are very limited domestic manufacturers of Power Quality mitigating /
monitoring devices. Even if some types of mitigating / monitoring devices are available its size
(Rating) and features are limited. However, there are several international manufacturers in this
field. Above mentioned cost is a rough estimate of such typical devices. Estimated expenditure
has been worked out assuming that the PQ conditioning device would cost around Rs.10,000
per Amp. The investment required for PQ conditioning per kW of connected load would be
around Rs. 2,100 as calculated in Table 7-3.
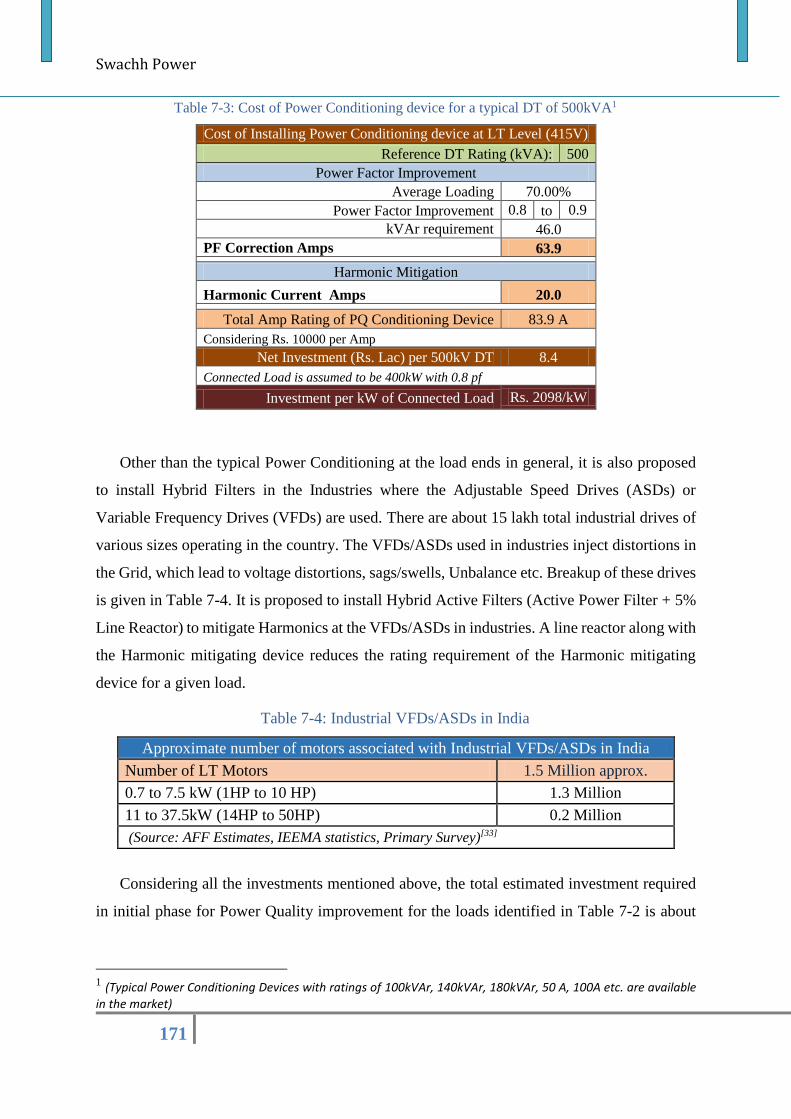
Swachh Power
171
Table 7-3: Cost of Power Conditioning device for a typical DT of 500kVA1
Cost of Installing Power Conditioning device at LT Level (415V)
Reference DT Rating (kVA): 500
Power Factor Improvement
Average Loading 70.00%
Power Factor Improvement 0.8 to 0.9
kVAr requirement 46.0
PF Correction Amps 63.9
Harmonic Mitigation
Harmonic Current Amps 20.0
Total Amp Rating of PQ Conditioning Device 83.9 A
Considering Rs. 10000 per Amp
Net Investment (Rs. Lac) per 500kV DT 8.4
Connected Load is assumed to be 400kW with 0.8 pf
Investment per kW of Connected Load Rs. 2098/kW
Other than the typical Power Conditioning at the load ends in general, it is also proposed
to install Hybrid Filters in the Industries where the Adjustable Speed Drives (ASDs) or
Variable Frequency Drives (VFDs) are used. There are about 15 lakh total industrial drives of
various sizes operating in the country. The VFDs/ASDs used in industries inject distortions in
the Grid, which lead to voltage distortions, sags/swells, Unbalance etc. Breakup of these drives
is given in Table 7-4. It is proposed to install Hybrid Active Filters (Active Power Filter + 5%
Line Reactor) to mitigate Harmonics at the VFDs/ASDs in industries. A line reactor along with
the Harmonic mitigating device reduces the rating requirement of the Harmonic mitigating
device for a given load.
Table 7-4: Industrial VFDs/ASDs in India
Approximate number of motors associated with Industrial VFDs/ASDs in India
Number of LT Motors 1.5 Million approx.
0.7 to 7.5 kW (1HP to 10 HP) 1.3 Million
11 to 37.5kW (14HP to 50HP) 0.2 Million
(Source: AFF Estimates, IEEMA statistics, Primary Survey)[33]
Considering all the investments mentioned above, the total estimated investment required
in initial phase for Power Quality improvement for the loads identified in Table 7-2 is about
1 (Typical Power Conditioning Devices with ratings of 100kVAr, 140kVAr, 180kVAr, 50 A, 100A etc. are available
in the market)
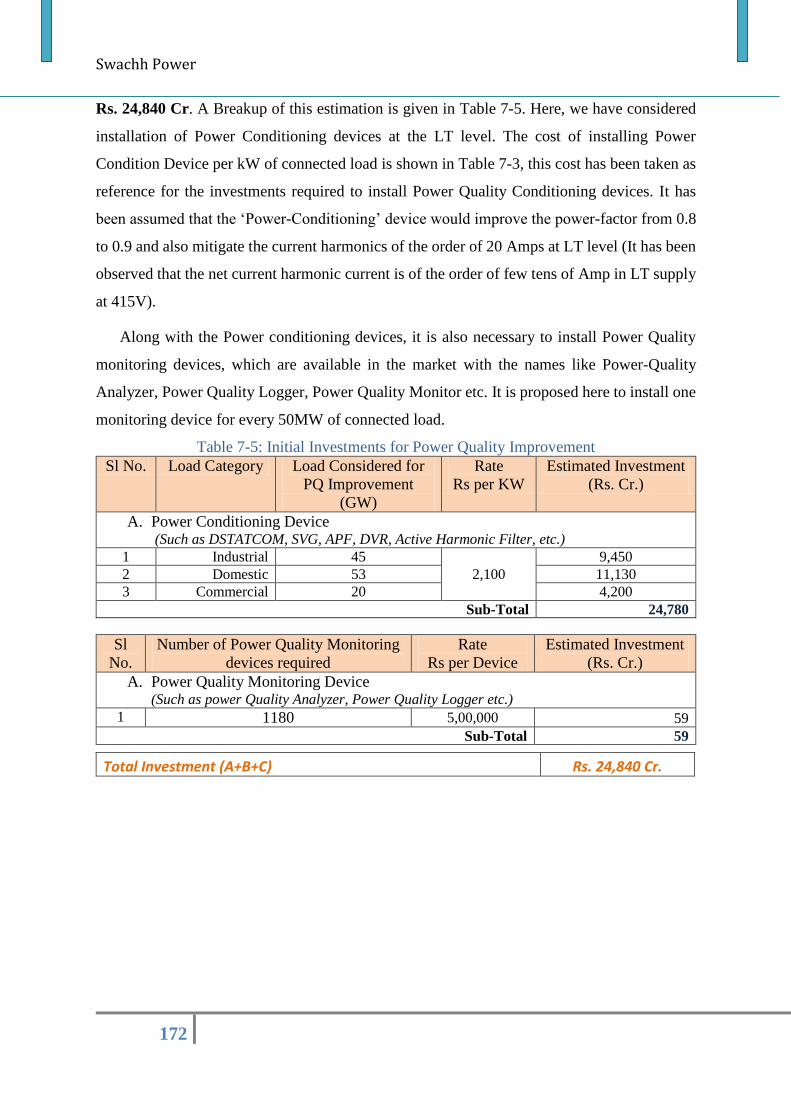
Swachh Power
172
Rs. 24,840 Cr. A Breakup of this estimation is given in Table 7-5. Here, we have considered
installation of Power Conditioning devices at the LT level. The cost of installing Power
Condition Device per kW of connected load is shown in Table 7-3, this cost has been taken as
reference for the investments required to install Power Quality Conditioning devices. It has
been assumed that the ‘Power-Conditioning’ device would improve the power-factor from 0.8
to 0.9 and also mitigate the current harmonics of the order of 20 Amps at LT level (It has been
observed that the net current harmonic current is of the order of few tens of Amp in LT supply
at 415V).
Along with the Power conditioning devices, it is also necessary to install Power Quality
monitoring devices, which are available in the market with the names like Power-Quality
Analyzer, Power Quality Logger, Power Quality Monitor etc. It is proposed here to install one
monitoring device for every 50MW of connected load.
Table 7-5: Initial Investments for Power Quality Improvement
Sl No. Load Category Load Considered for
PQ Improvement
(GW)
Rate
Rs per KW
Estimated Investment
(Rs. Cr.)
A. Power Conditioning Device (Such as DSTATCOM, SVG, APF, DVR, Active Harmonic Filter, etc.)
1 Industrial 45 2,100
9,450 2 Domestic 53 11,130 3 Commercial 20 4,200
Sub-Total 24,780
Sl
No.
Number of Power Quality Monitoring
devices required
Rate
Rs per Device
Estimated Investment
(Rs. Cr.)
A. Power Quality Monitoring Device (Such as power Quality Analyzer, Power Quality Logger etc.)
1 1180 5,00,000 59 Sub-Total 59
Total Investment (A+B+C) Rs. 24,840 Cr.
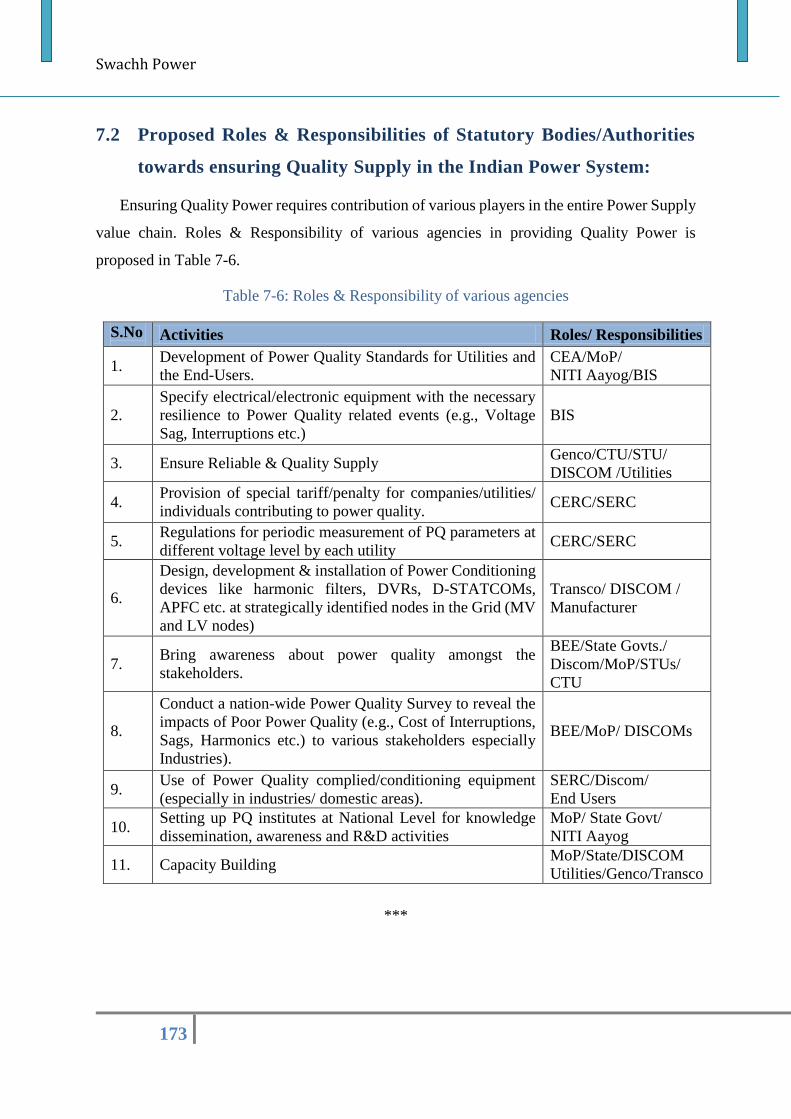
Swachh Power
173
7.2 Proposed Roles & Responsibilities of Statutory Bodies/Authorities
towards ensuring Quality Supply in the Indian Power System:
Ensuring Quality Power requires contribution of various players in the entire Power Supply
value chain. Roles & Responsibility of various agencies in providing Quality Power is
proposed in Table 7-6.
Table 7-6: Roles & Responsibility of various agencies
S.No
. Activities Roles/ Responsibilities
1. Development of Power Quality Standards for Utilities and
the End-Users.
CEA/MoP/
NITI Aayog/BIS
2.
Specify electrical/electronic equipment with the necessary
resilience to Power Quality related events (e.g., Voltage
Sag, Interruptions etc.)
BIS
3. Ensure Reliable & Quality Supply Genco/CTU/STU/
DISCOM /Utilities
4. Provision of special tariff/penalty for companies/utilities/
individuals contributing to power quality. CERC/SERC
5. Regulations for periodic measurement of PQ parameters at
different voltage level by each utility CERC/SERC
6.
Design, development & installation of Power Conditioning
devices like harmonic filters, DVRs, D-STATCOMs,
APFC etc. at strategically identified nodes in the Grid (MV
and LV nodes)
Transco/ DISCOM /
Manufacturer
7. Bring awareness about power quality amongst the
stakeholders.
BEE/State Govts./
Discom/MoP/STUs/
CTU
8.
Conduct a nation-wide Power Quality Survey to reveal the
impacts of Poor Power Quality (e.g., Cost of Interruptions,
Sags, Harmonics etc.) to various stakeholders especially
Industries).
BEE/MoP/ DISCOMs
9. Use of Power Quality complied/conditioning equipment
(especially in industries/ domestic areas).
SERC/Discom/
End Users
10. Setting up PQ institutes at National Level for knowledge
dissemination, awareness and R&D activities
MoP/ State Govt/
NITI Aayog
11. Capacity Building MoP/State/DISCOM
Utilities/Genco/Transco
Discom
***

Swachh Power
174
Swachh Power
175
Way Forward
This report has highlighted the importance of power quality while building an insight upon
power quality standards, pan India power quality status based on primary measurement, the ill
effects of poor power quality and possible mitigating measures required for the same. Power
Quality Measurements have been done on various voltage levels ranging from distribution (415
V) to EHV (765 kV) throughout India.
These measurements were done for 6 to 24 hours on each feeder in a non-simultaneous manner.
From the measurements, it was observed (Figure 1) that voltage harmonics are high in certain
pockets of northern India, Gujarat, Odisha, Tamil Nadu and Kerala. The higher magnitude of
Voltage Harmonics in these pockets necessitates the need for corrective measures to be taken.
High current distortions have been observed invariably at all voltage levels. Various challenges
and threats posed by poor power quality including harmonics have been discussed in this report.
Prudent mitigating measures to address these challenges, viz. STATCOM, passive harmonic
filters, active power filters, DVR, power factor conditioners etc. have been discussed and
suggested.
Installation of these devices is to be done at locations which may be decided by extensive
system studies. Sizing of these power quality devices also need to be carried out through
meticulous data analysis and simulation studies. Further course of action imperative to ensure
a good quality power at the national level is as follows:
Identification of critical nodes with threatening level of electrical pollution.
Detailed measurement of power quality for longer duration and further analysis of data.
Development of infrastructure to periodically monitor the Power-Quality parameters
across the Grid at all the Voltage Levels, including distribution network.
Assessment of various power quality improvement devices depending upon issue,
ratings, voltage level, economic considerations etc.
Development of regulatory framework and economic model to necessitate and
facilitate deployment of mitigating solutions.
Enforcement of regulations for power quality parameters for maintaining various stake
holders.
Swachh Power
176
Simulation based study for further improvement at varying voltage level.
To ensure Quality Supply in the entire Power System, any single stakeholder can’t be made
responsible. Since Power-Quality has a very broad spectrum, all the stakeholders in the Power
Supply Value chain are expected to contribute in a collaborative manner to ensure high quality
of power to end consumers. Various actions that need to be taken by different stakeholders are
enlisted below:
1. Necessary standards shall be formulated / updated under the emerging scenario of large
penetration of non-linear loads, volatile renewable generation capacity addition,
increasing inverter penetration & stringent quality requirements by various categories
of load.
2. Utilities need to strengthen/upgrade their network to ensure high quality of power.
3. Manufacturers need to produce electrical / electronic appliances/ gadgets meeting the
standards and end consumer needs.
4. Power conditioning equipment manufacturer need to produce devices that would
facilitate maintaining required power quality.
5. Adequate compensation to utilities for ensuring high quality power through special
tariff /penalty schemes.
6. Awareness about Power Quality among various stakeholders.
7. Capacity building and training program need to be conducted among various
stakeholders.
8. Monitoring / control of Power Quality at various stages of power supply value chain.
9. Establishment of National and State level Organization for certifying Power Quality.
10. Use of Power Quality complied / conditioning equipment by the end consumers.
11. Research, development& demonstration work in Power quality industries and academic
institutions.
12. Regulations for measurement of PQ parameters at different voltage level by each utility/
major establishment periodically.
Note: This report is an attempt to study and analyze the impact of various power quality
parameters in the power system at various voltage levels in different towns and cities across
Swachh Power
177
the country. It includes the baseline data about power quality parameters in different places.
However, this needs to be periodically updated and reviewed. Inputs / feedback from all
stakeholders would help in further improvement and making this report more pragmatic.
***
Swachh Power
178
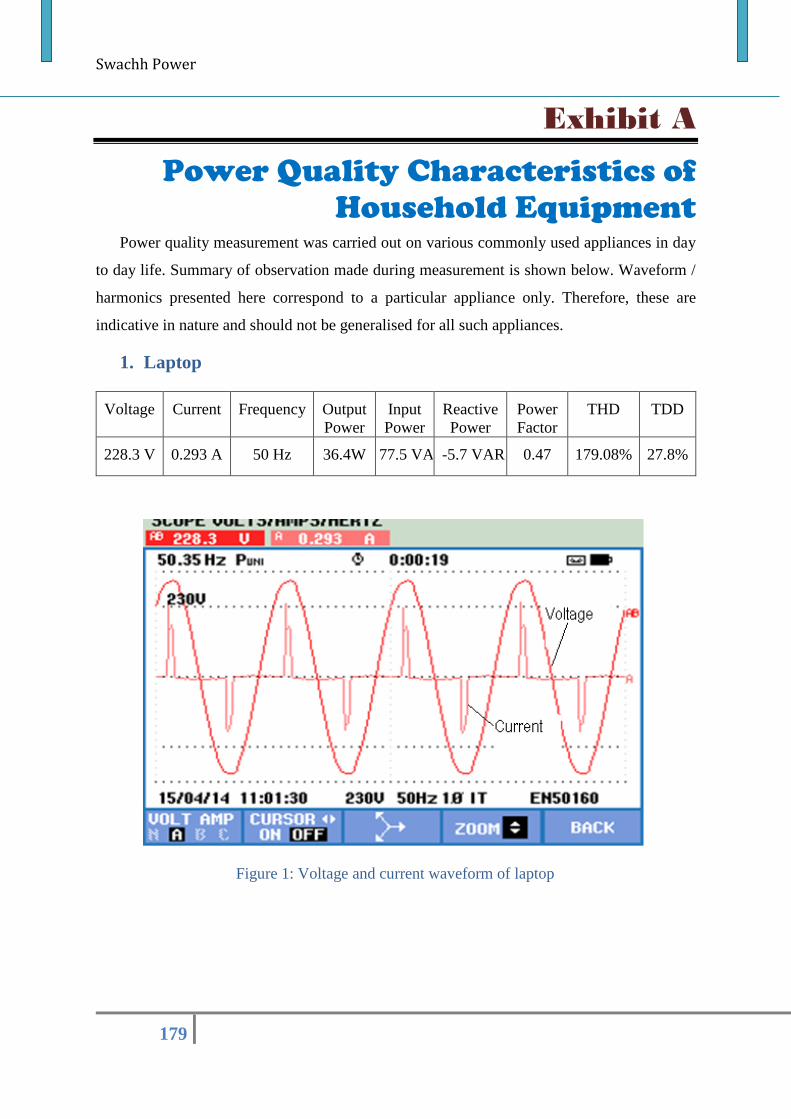
Swachh Power
179
Exhibit A
Power Quality Characteristics of
Household Equipment Power quality measurement was carried out on various commonly used appliances in day
to day life. Summary of observation made during measurement is shown below. Waveform /
harmonics presented here correspond to a particular appliance only. Therefore, these are
indicative in nature and should not be generalised for all such appliances.
1. Laptop
Voltage Current Frequency Output
Power
Input
Power
Reactive
Power
Power
Factor
THD TDD
228.3 V 0.293 A 50 Hz 36.4W 77.5 VA -5.7 VAR 0.47 179.08% 27.8%
Figure 1: Voltage and current waveform of laptop
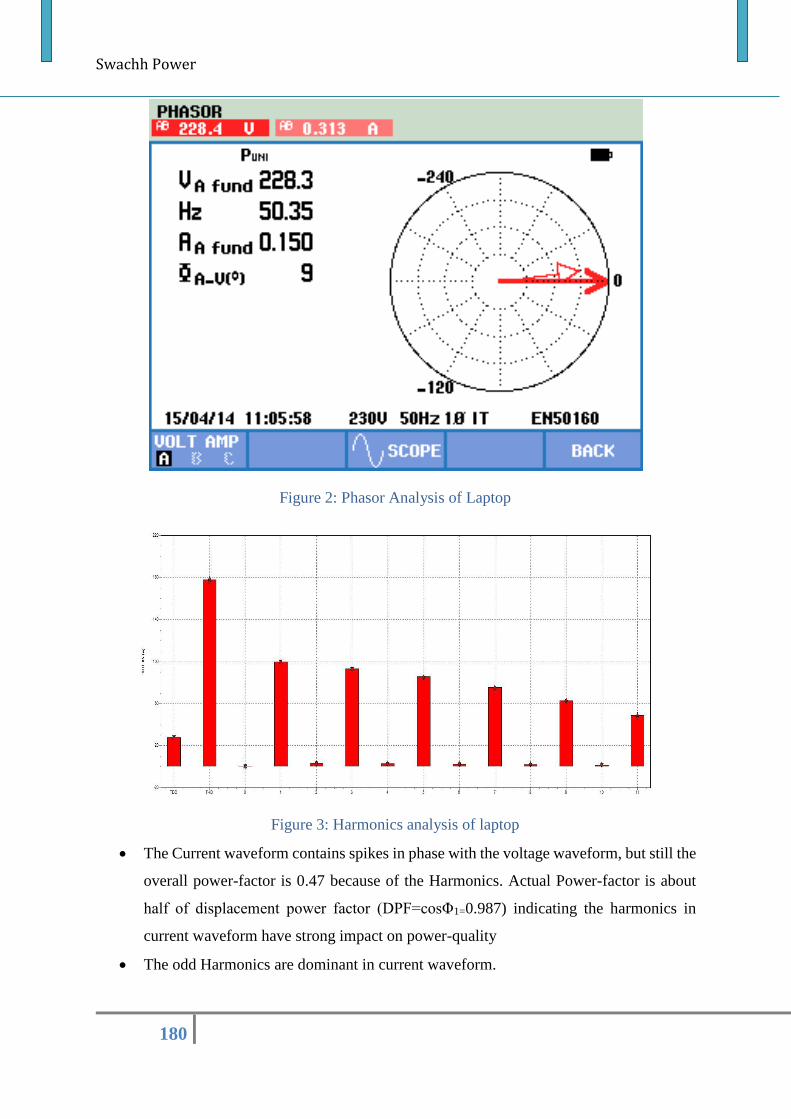
Swachh Power
180
Figure 2: Phasor Analysis of Laptop
Figure 3: Harmonics analysis of laptop
The Current waveform contains spikes in phase with the voltage waveform, but still the
overall power-factor is 0.47 because of the Harmonics. Actual Power-factor is about
half of displacement power factor (DPF=cosΦ1=0.987) indicating the harmonics in
current waveform have strong impact on power-quality
The odd Harmonics are dominant in current waveform.
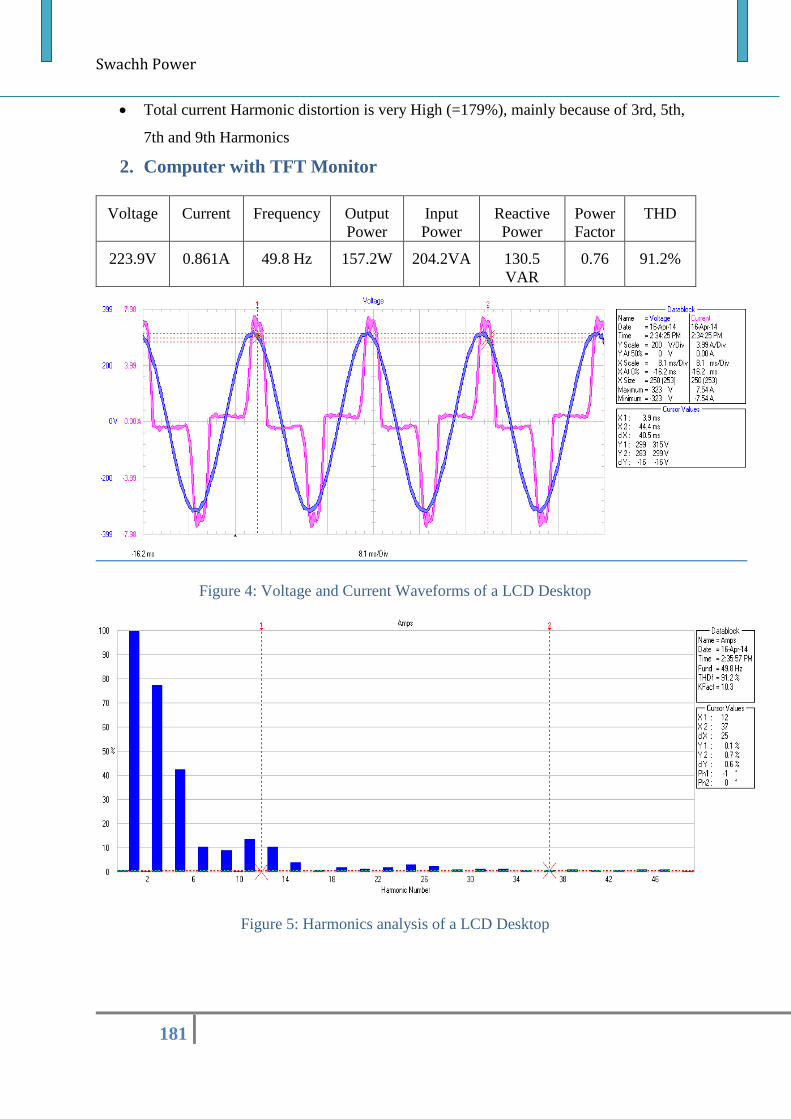
Swachh Power
181
Total current Harmonic distortion is very High (=179%), mainly because of 3rd, 5th,
7th and 9th Harmonics
2. Computer with TFT Monitor
Voltage Current Frequency Output
Power
Input
Power
Reactive
Power
Power
Factor
THD
223.9V 0.861A 49.8 Hz 157.2W 204.2VA 130.5
VAR
0.76 91.2%
Figure 4: Voltage and Current Waveforms of a LCD Desktop
Figure 5: Harmonics analysis of a LCD Desktop
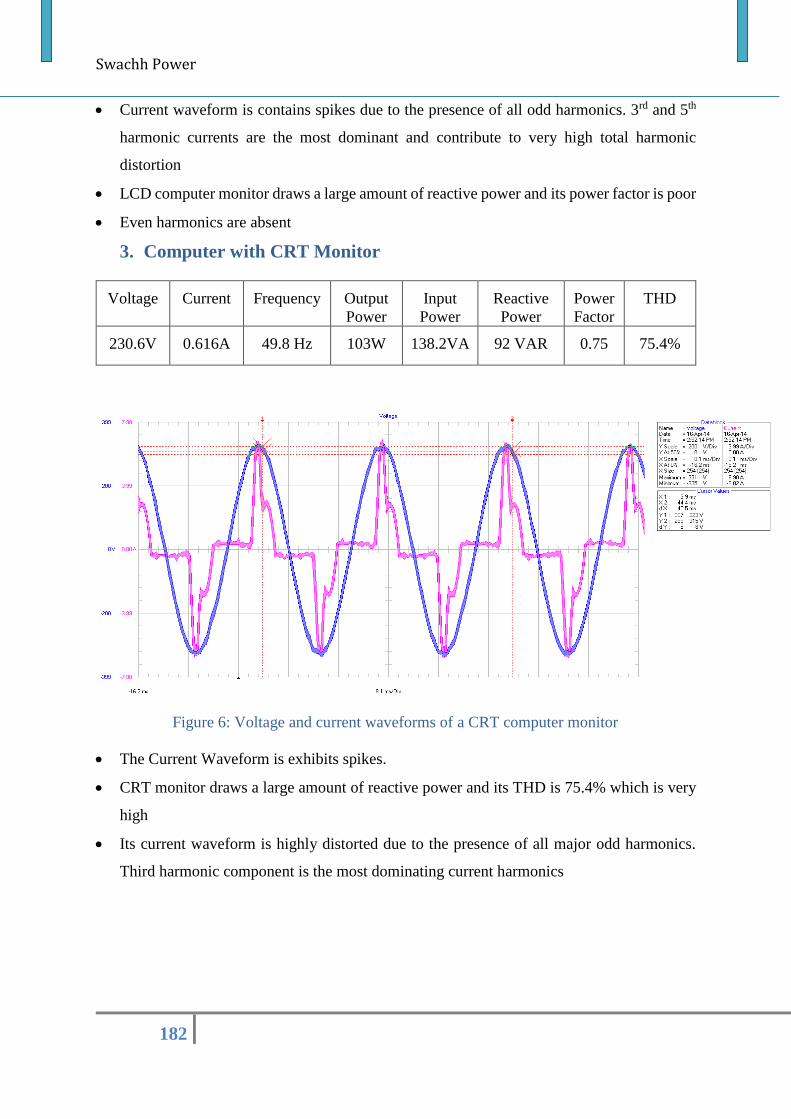
Swachh Power
182
Current waveform is contains spikes due to the presence of all odd harmonics. 3rd and 5th
harmonic currents are the most dominant and contribute to very high total harmonic
distortion
LCD computer monitor draws a large amount of reactive power and its power factor is poor
Even harmonics are absent
3. Computer with CRT Monitor
Voltage Current Frequency Output
Power
Input
Power
Reactive
Power
Power
Factor
THD
230.6V 0.616A 49.8 Hz 103W 138.2VA 92 VAR 0.75 75.4%
Figure 6: Voltage and current waveforms of a CRT computer monitor
The Current Waveform is exhibits spikes.
CRT monitor draws a large amount of reactive power and its THD is 75.4% which is very
high
Its current waveform is highly distorted due to the presence of all major odd harmonics.
Third harmonic component is the most dominating current harmonics
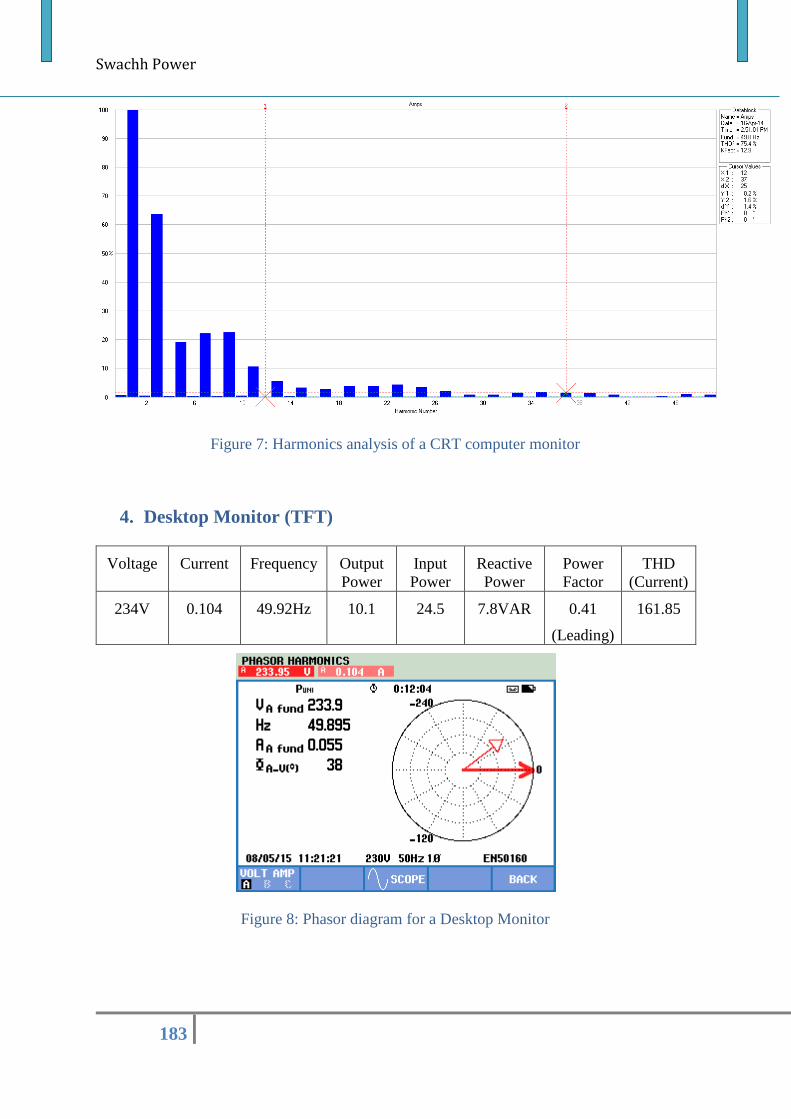
Swachh Power
183
Figure 7: Harmonics analysis of a CRT computer monitor
4. Desktop Monitor (TFT)
Voltage Current Frequency Output
Power
Input
Power
Reactive
Power
Power
Factor
THD
(Current)
234V 0.104 49.92Hz 10.1 24.5 7.8VAR 0.41
(Leading)
161.85
Figure 8: Phasor diagram for a Desktop Monitor
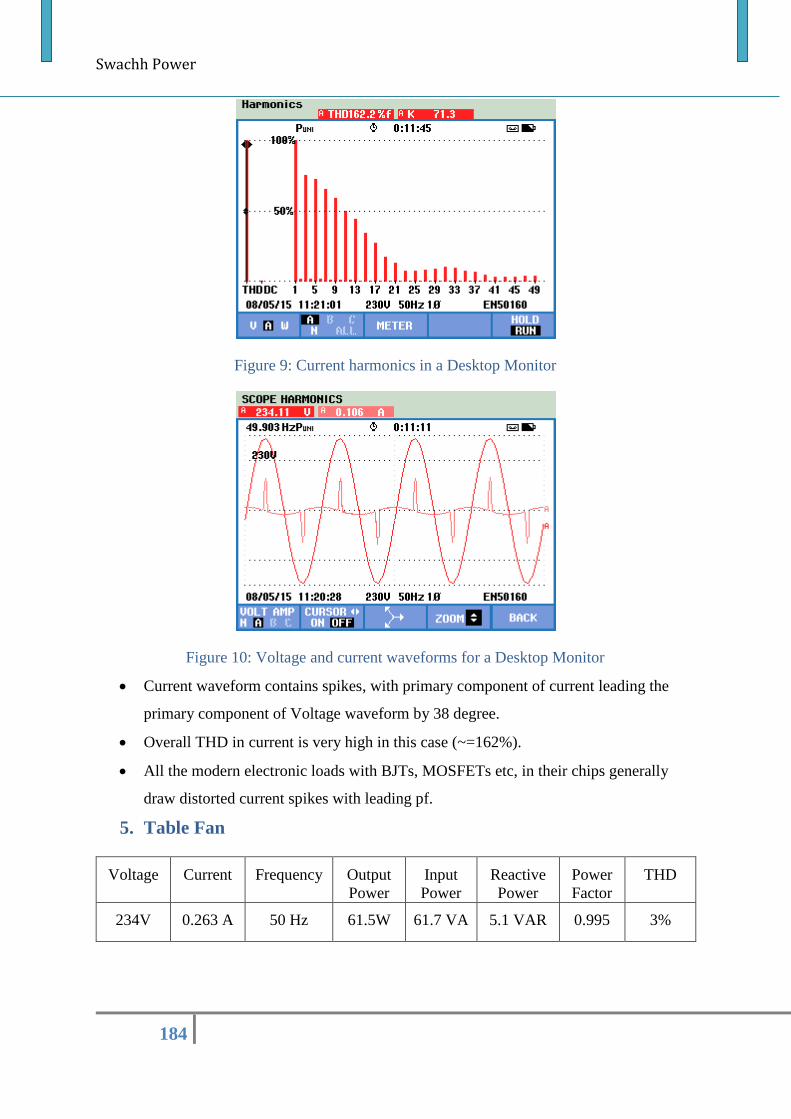
Swachh Power
184
Figure 9: Current harmonics in a Desktop Monitor
Figure 10: Voltage and current waveforms for a Desktop Monitor
Current waveform contains spikes, with primary component of current leading the
primary component of Voltage waveform by 38 degree.
Overall THD in current is very high in this case (~=162%).
All the modern electronic loads with BJTs, MOSFETs etc, in their chips generally
draw distorted current spikes with leading pf.
5. Table Fan
Voltage Current Frequency Output
Power
Input
Power
Reactive
Power
Power
Factor
THD
234V 0.263 A 50 Hz 61.5W 61.7 VA 5.1 VAR 0.995 3%
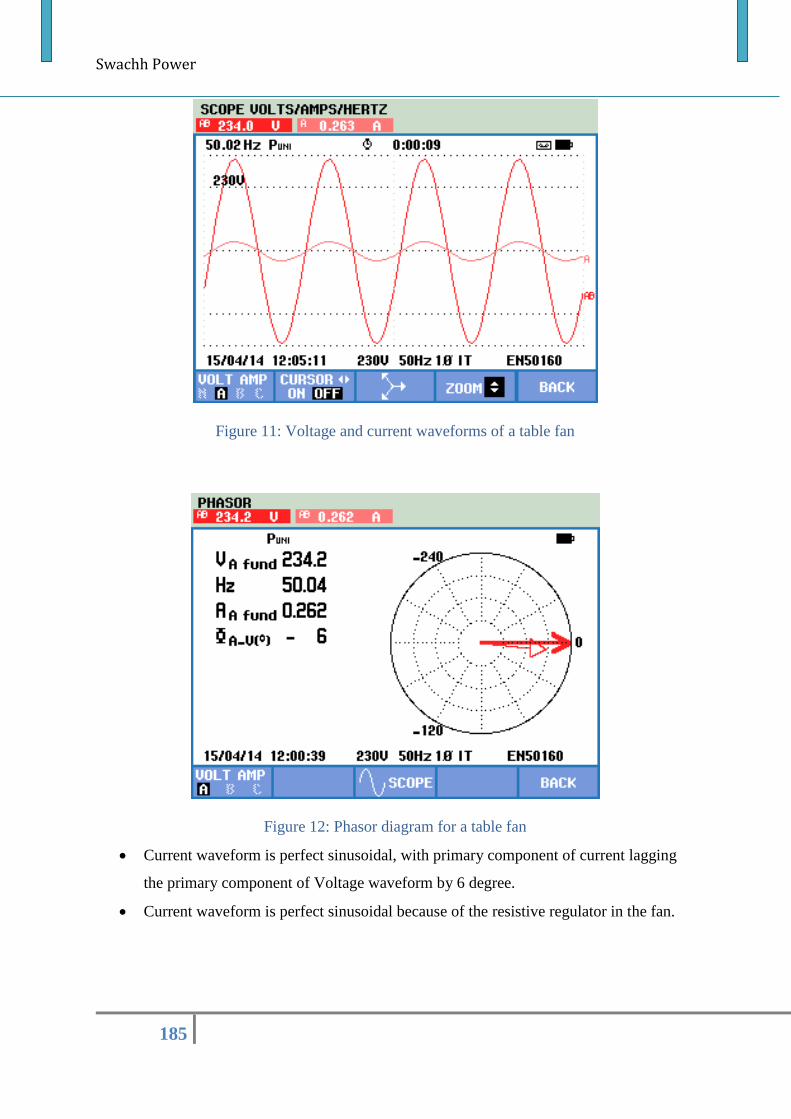
Swachh Power
185
Figure 11: Voltage and current waveforms of a table fan
Figure 12: Phasor diagram for a table fan
Current waveform is perfect sinusoidal, with primary component of current lagging
the primary component of Voltage waveform by 6 degree.
Current waveform is perfect sinusoidal because of the resistive regulator in the fan.
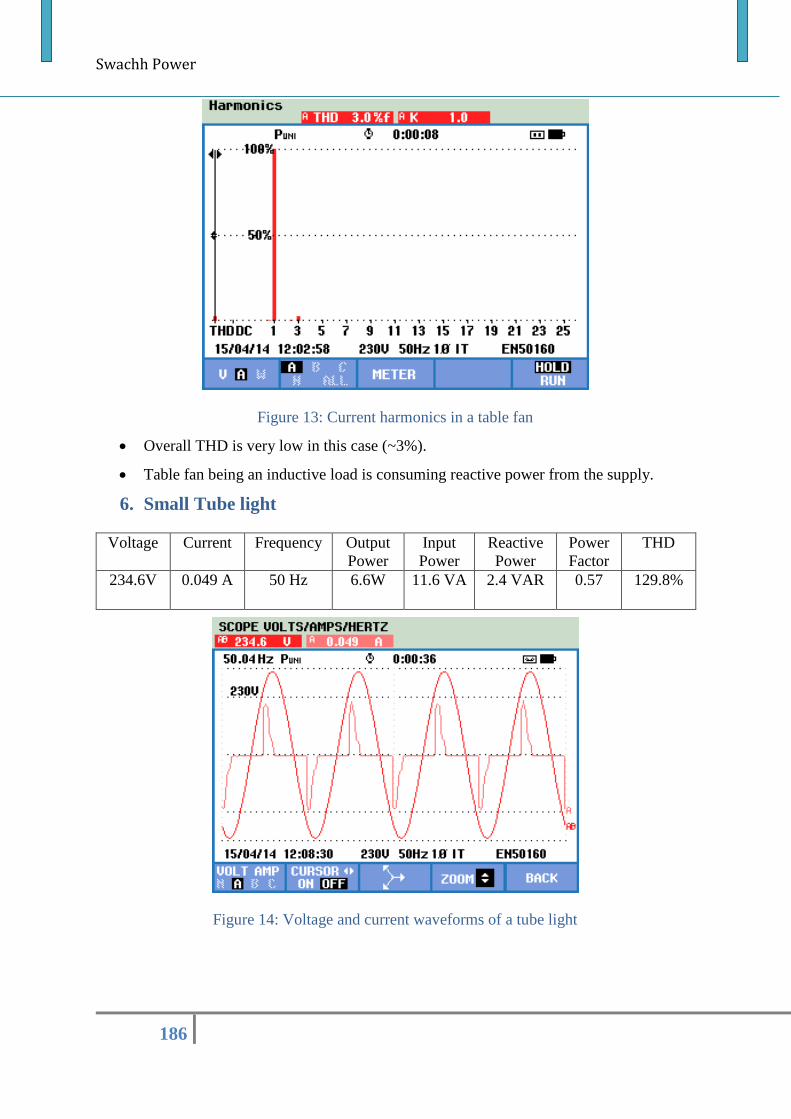
Swachh Power
186
Figure 13: Current harmonics in a table fan
Overall THD is very low in this case (~3%).
Table fan being an inductive load is consuming reactive power from the supply.
6. Small Tube light
Voltage Current Frequency Output
Power
Input
Power
Reactive
Power
Power
Factor
THD
234.6V 0.049 A 50 Hz 6.6W 11.6 VA 2.4 VAR 0.57 129.8%
Figure 14: Voltage and current waveforms of a tube light
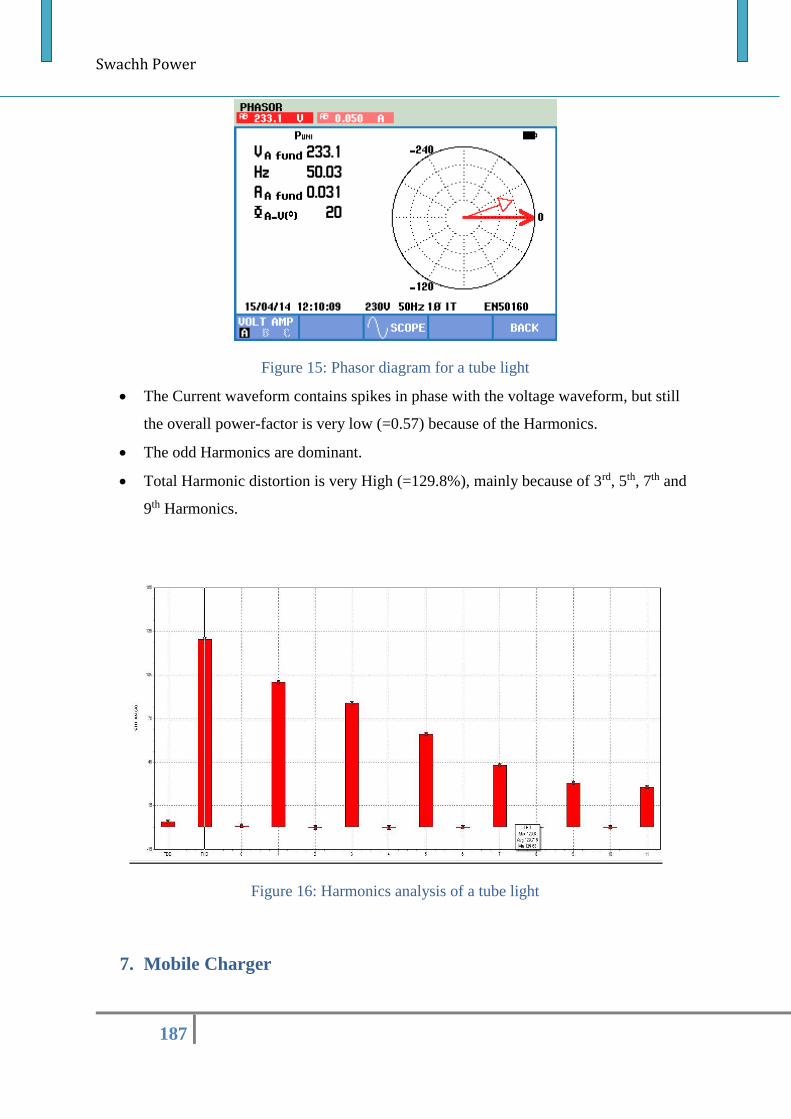
Swachh Power
187
Figure 15: Phasor diagram for a tube light
The Current waveform contains spikes in phase with the voltage waveform, but still
the overall power-factor is very low (=0.57) because of the Harmonics.
The odd Harmonics are dominant.
Total Harmonic distortion is very High (=129.8%), mainly because of 3rd, 5th, 7th and
9th Harmonics.
Figure 16: Harmonics analysis of a tube light
7. Mobile Charger
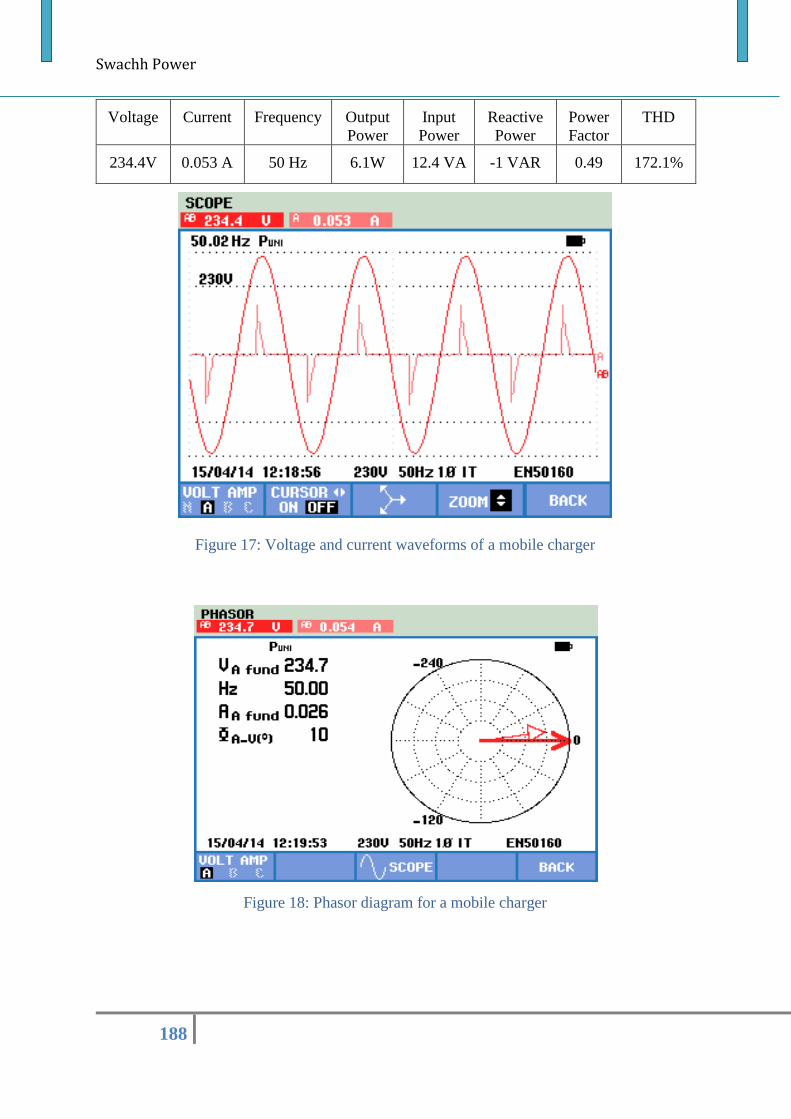
Swachh Power
188
Voltage Current Frequency Output
Power
Input
Power
Reactive
Power
Power
Factor
THD
234.4V 0.053 A 50 Hz 6.1W 12.4 VA -1 VAR 0.49 172.1%
Figure 17: Voltage and current waveforms of a mobile charger
Figure 18: Phasor diagram for a mobile charger
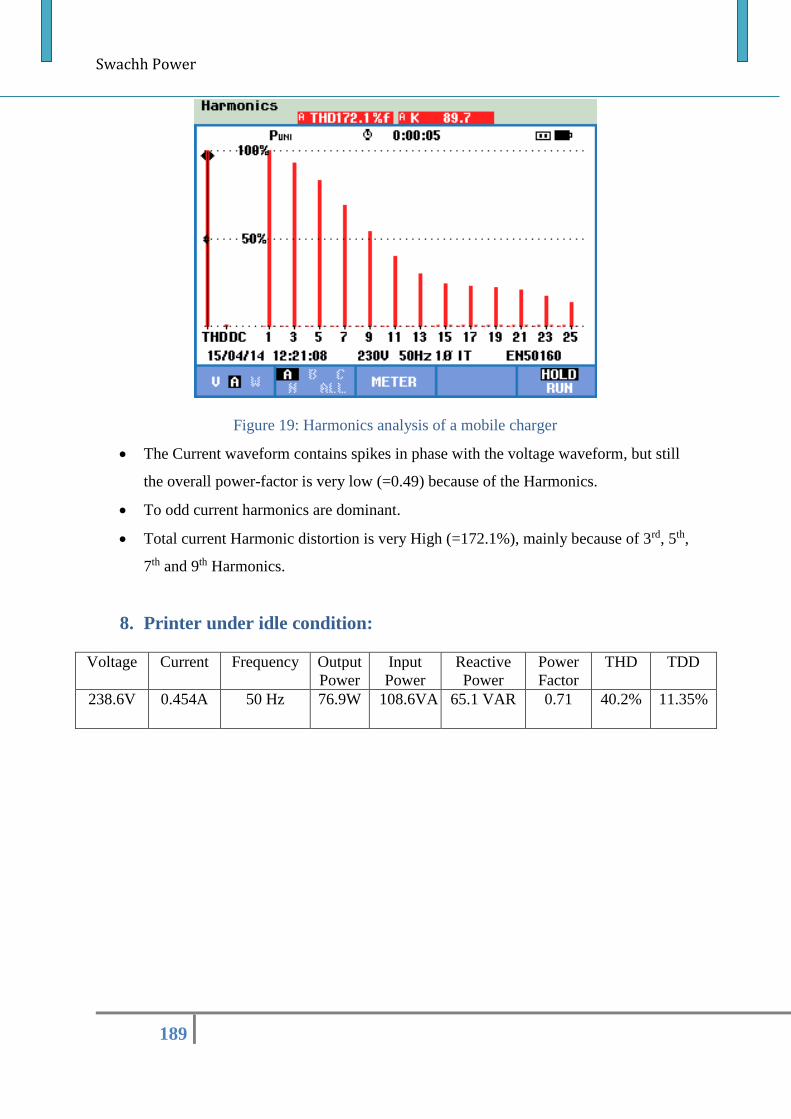
Swachh Power
189
Figure 19: Harmonics analysis of a mobile charger
The Current waveform contains spikes in phase with the voltage waveform, but still
the overall power-factor is very low (=0.49) because of the Harmonics.
To odd current harmonics are dominant.
Total current Harmonic distortion is very High (=172.1%), mainly because of 3rd, 5th,
7th and 9th Harmonics.
8. Printer under idle condition:
Voltage Current Frequency Output
Power
Input
Power
Reactive
Power
Power
Factor
THD TDD
238.6V 0.454A 50 Hz 76.9W 108.6VA 65.1 VAR 0.71 40.2% 11.35%
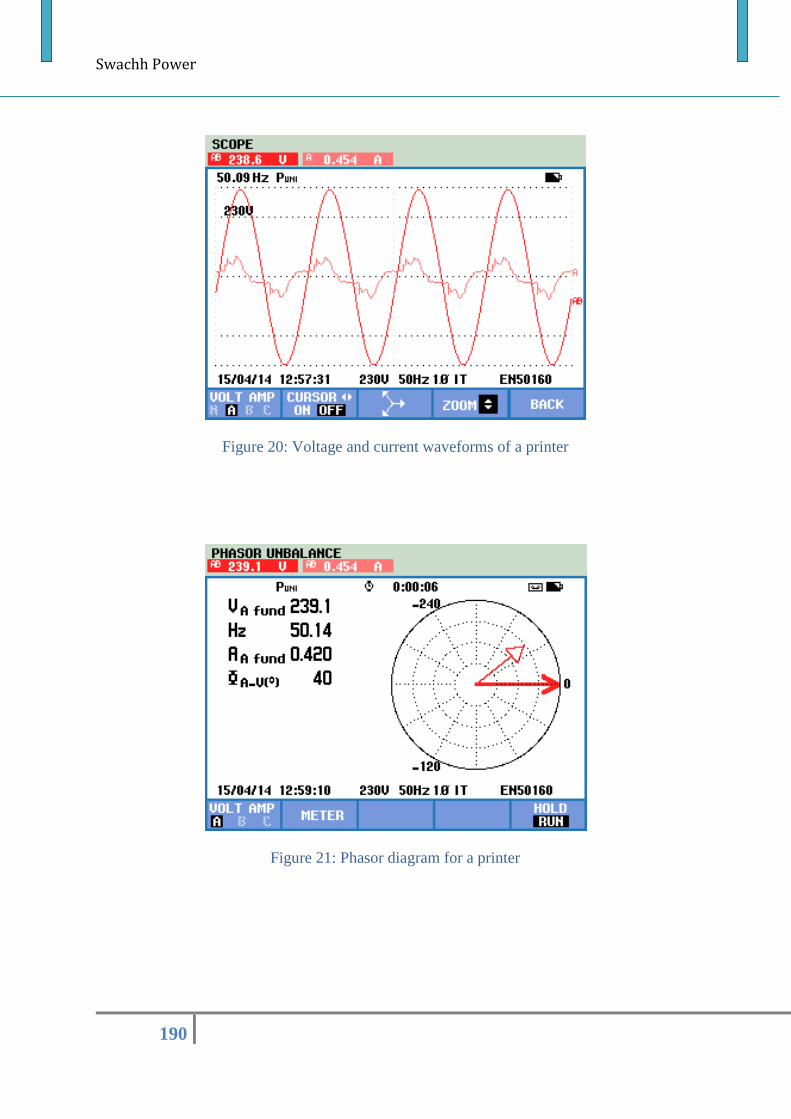
Swachh Power
190
Figure 20: Voltage and current waveforms of a printer
Figure 21: Phasor diagram for a printer
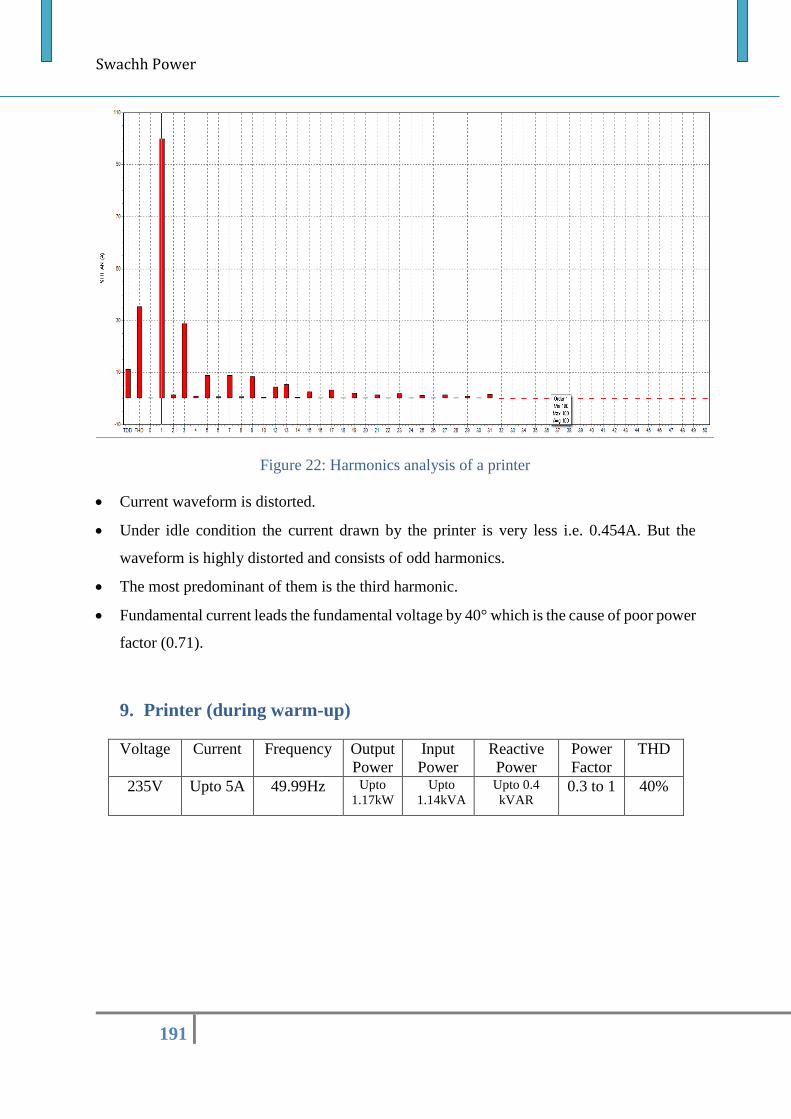
Swachh Power
191
Figure 22: Harmonics analysis of a printer
Current waveform is distorted.
Under idle condition the current drawn by the printer is very less i.e. 0.454A. But the
waveform is highly distorted and consists of odd harmonics.
The most predominant of them is the third harmonic.
Fundamental current leads the fundamental voltage by 40° which is the cause of poor power
factor (0.71).
9. Printer (during warm-up)
Voltage Current Frequency Output
Power
Input
Power
Reactive
Power
Power
Factor
THD
235V Upto 5A 49.99Hz Upto
1.17kW Upto
1.14kVA Upto 0.4
kVAR 0.3 to 1 40%
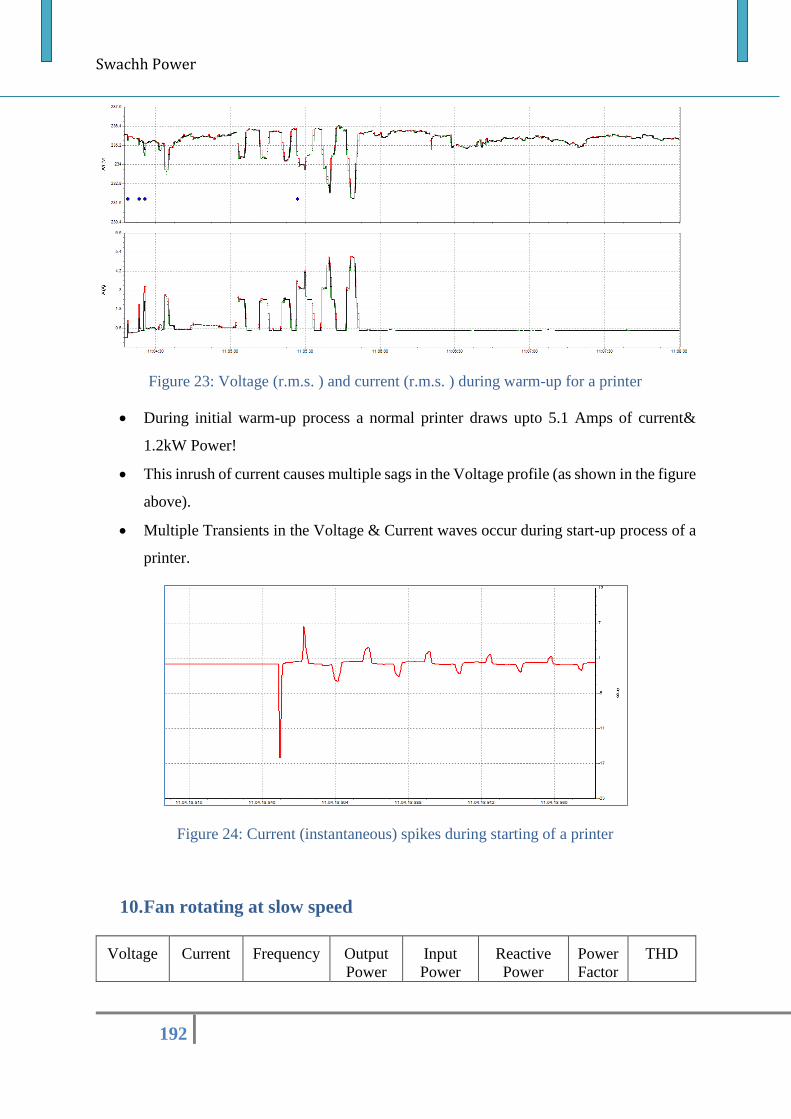
Swachh Power
192
Figure 23: Voltage (r.m.s. ) and current (r.m.s. ) during warm-up for a printer
During initial warm-up process a normal printer draws upto 5.1 Amps of current&
1.2kW Power!
This inrush of current causes multiple sags in the Voltage profile (as shown in the figure
above).
Multiple Transients in the Voltage & Current waves occur during start-up process of a
printer.
Figure 24: Current (instantaneous) spikes during starting of a printer
10. Fan rotating at slow speed
Voltage Current Frequency Output
Power
Input
Power
Reactive
Power
Power
Factor
THD
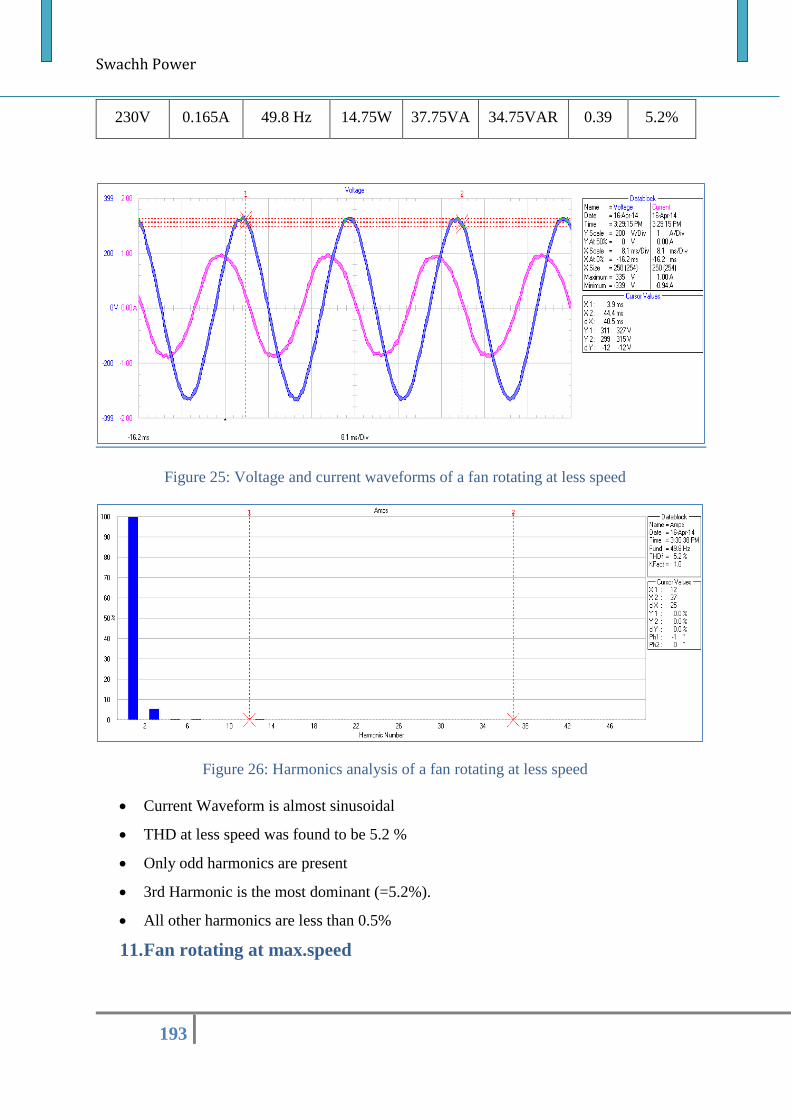
Swachh Power
193
230V 0.165A 49.8 Hz 14.75W 37.75VA 34.75VAR 0.39 5.2%
Figure 25: Voltage and current waveforms of a fan rotating at less speed
Figure 26: Harmonics analysis of a fan rotating at less speed
Current Waveform is almost sinusoidal
THD at less speed was found to be 5.2 %
Only odd harmonics are present
3rd Harmonic is the most dominant (=5.2%).
All other harmonics are less than 0.5%
11. Fan rotating at max.speed
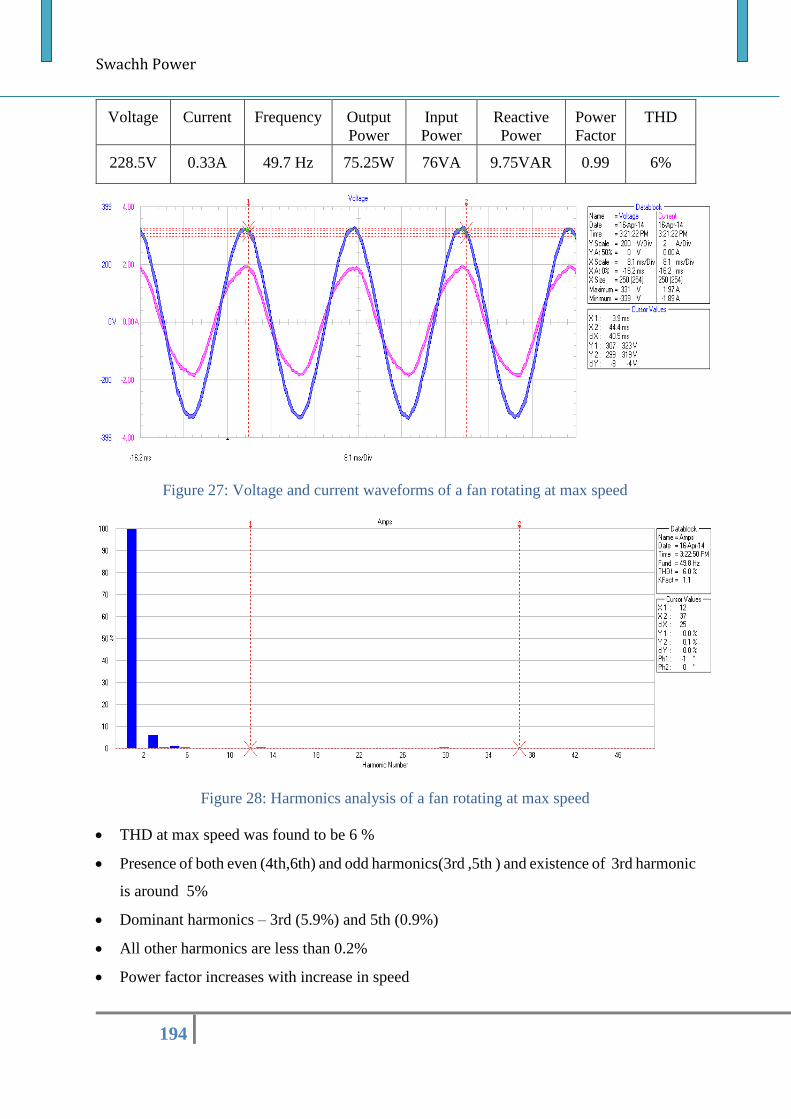
Swachh Power
194
Voltage Current Frequency Output
Power
Input
Power
Reactive
Power
Power
Factor
THD
228.5V 0.33A 49.7 Hz 75.25W 76VA 9.75VAR 0.99 6%
Figure 27: Voltage and current waveforms of a fan rotating at max speed
Figure 28: Harmonics analysis of a fan rotating at max speed
THD at max speed was found to be 6 %
Presence of both even (4th,6th) and odd harmonics(3rd ,5th ) and existence of 3rd harmonic
is around 5%
Dominant harmonics – 3rd (5.9%) and 5th (0.9%)
All other harmonics are less than 0.2%
Power factor increases with increase in speed
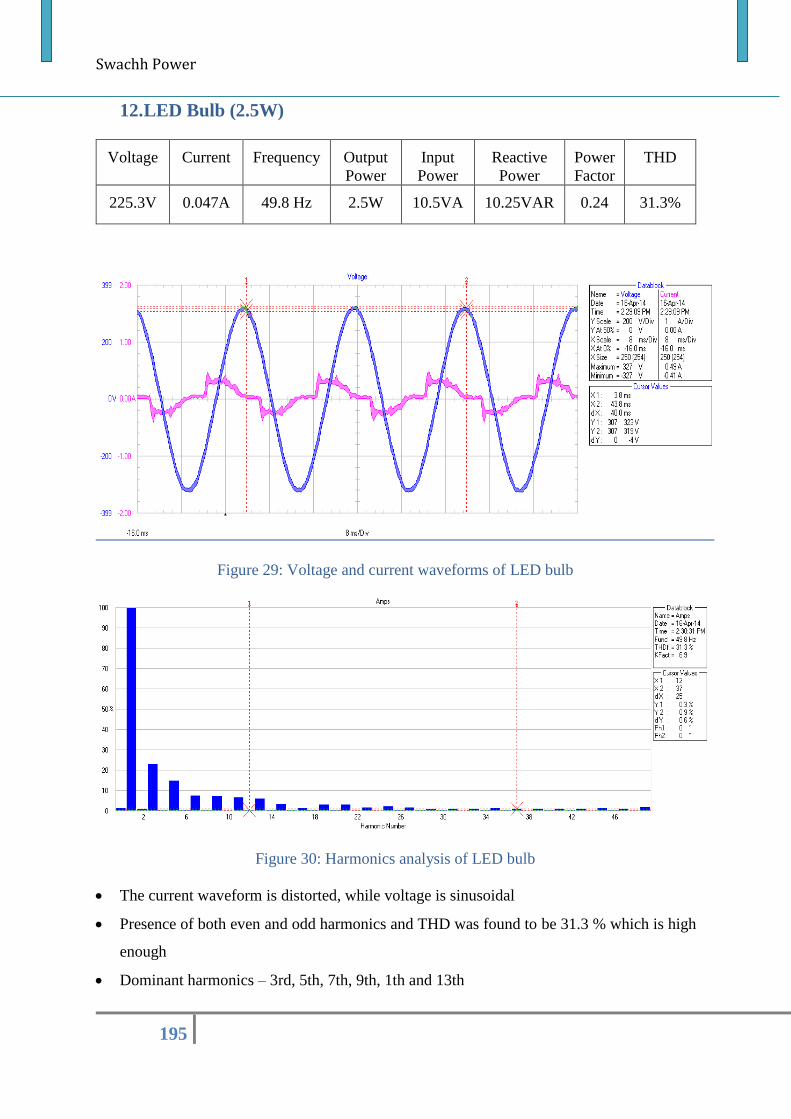
Swachh Power
195
12. LED Bulb (2.5W)
Voltage Current Frequency Output
Power
Input
Power
Reactive
Power
Power
Factor
THD
225.3V 0.047A 49.8 Hz 2.5W 10.5VA 10.25VAR 0.24 31.3%
Figure 29: Voltage and current waveforms of LED bulb
Figure 30: Harmonics analysis of LED bulb
The current waveform is distorted, while voltage is sinusoidal
Presence of both even and odd harmonics and THD was found to be 31.3 % which is high
enough
Dominant harmonics – 3rd, 5th, 7th, 9th, 1th and 13th
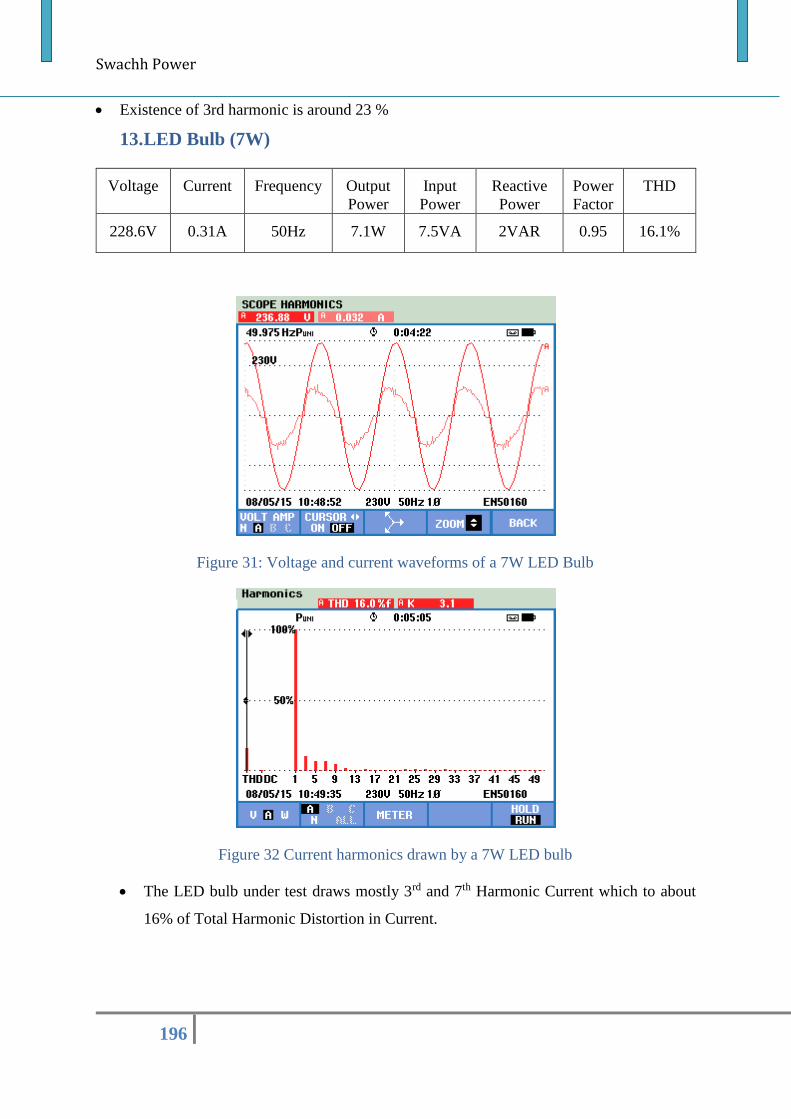
Swachh Power
196
Existence of 3rd harmonic is around 23 %
13. LED Bulb (7W)
Voltage Current Frequency Output
Power
Input
Power
Reactive
Power
Power
Factor
THD
228.6V 0.31A 50Hz 7.1W 7.5VA 2VAR 0.95 16.1%
Figure 31: Voltage and current waveforms of a 7W LED Bulb
Figure 32 Current harmonics drawn by a 7W LED bulb
The LED bulb under test draws mostly 3rd and 7th Harmonic Current which to about
16% of Total Harmonic Distortion in Current.
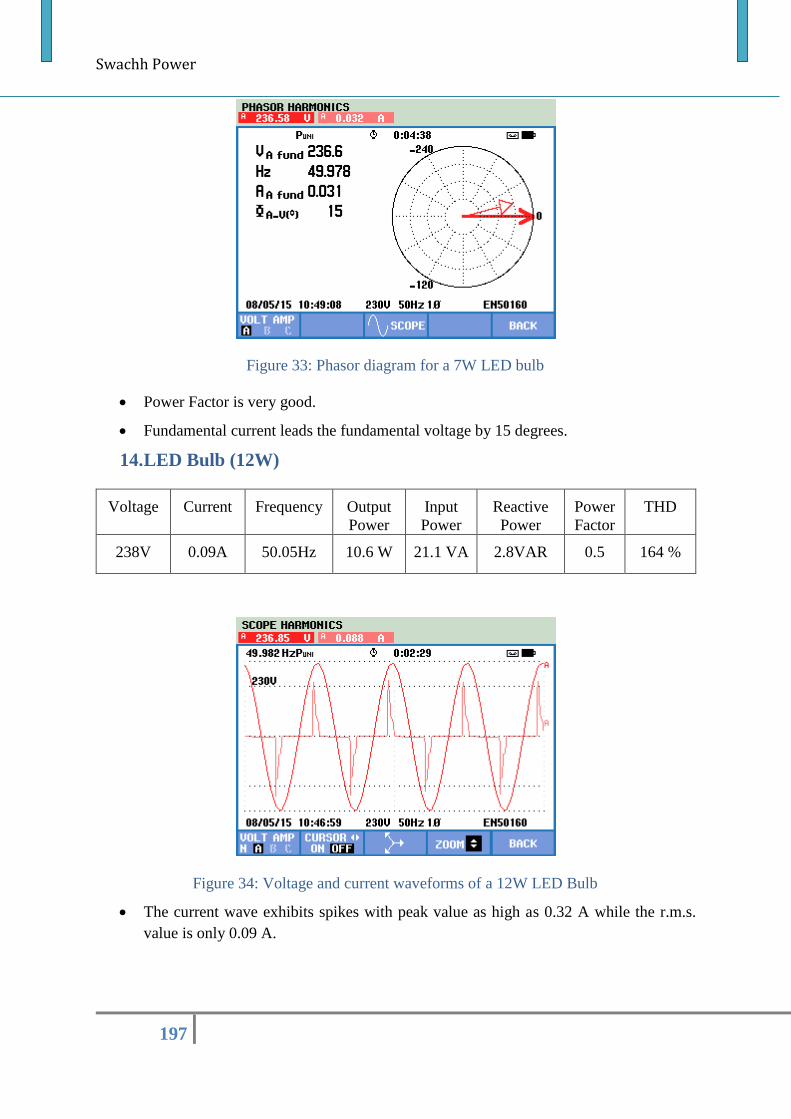
Swachh Power
197
Figure 33: Phasor diagram for a 7W LED bulb
Power Factor is very good.
Fundamental current leads the fundamental voltage by 15 degrees.
14. LED Bulb (12W)
Voltage Current Frequency Output
Power
Input
Power
Reactive
Power
Power
Factor
THD
238V 0.09A 50.05Hz 10.6 W 21.1 VA 2.8VAR 0.5 164 %
Figure 34: Voltage and current waveforms of a 12W LED Bulb
The current wave exhibits spikes with peak value as high as 0.32 A while the r.m.s.
value is only 0.09 A.
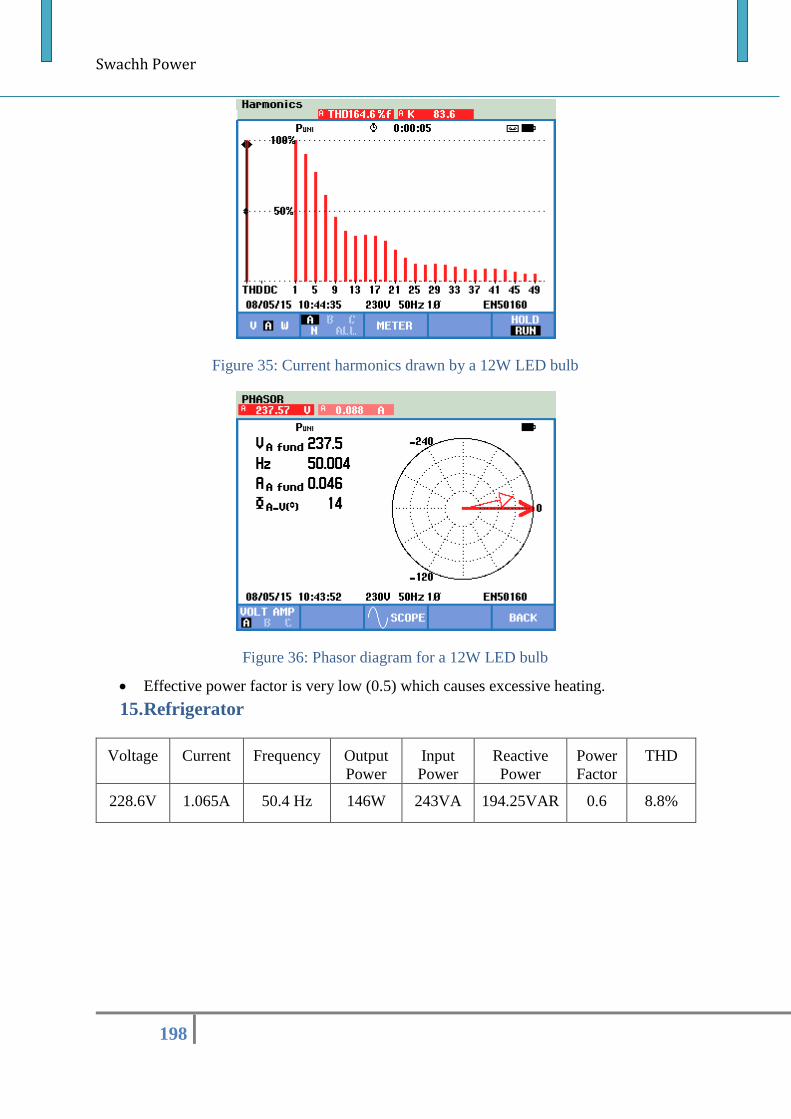
Swachh Power
198
Figure 35: Current harmonics drawn by a 12W LED bulb
Figure 36: Phasor diagram for a 12W LED bulb
Effective power factor is very low (0.5) which causes excessive heating.
15. Refrigerator
Voltage Current Frequency Output
Power
Input
Power
Reactive
Power
Power
Factor
THD
228.6V 1.065A 50.4 Hz 146W 243VA 194.25VAR 0.6 8.8%
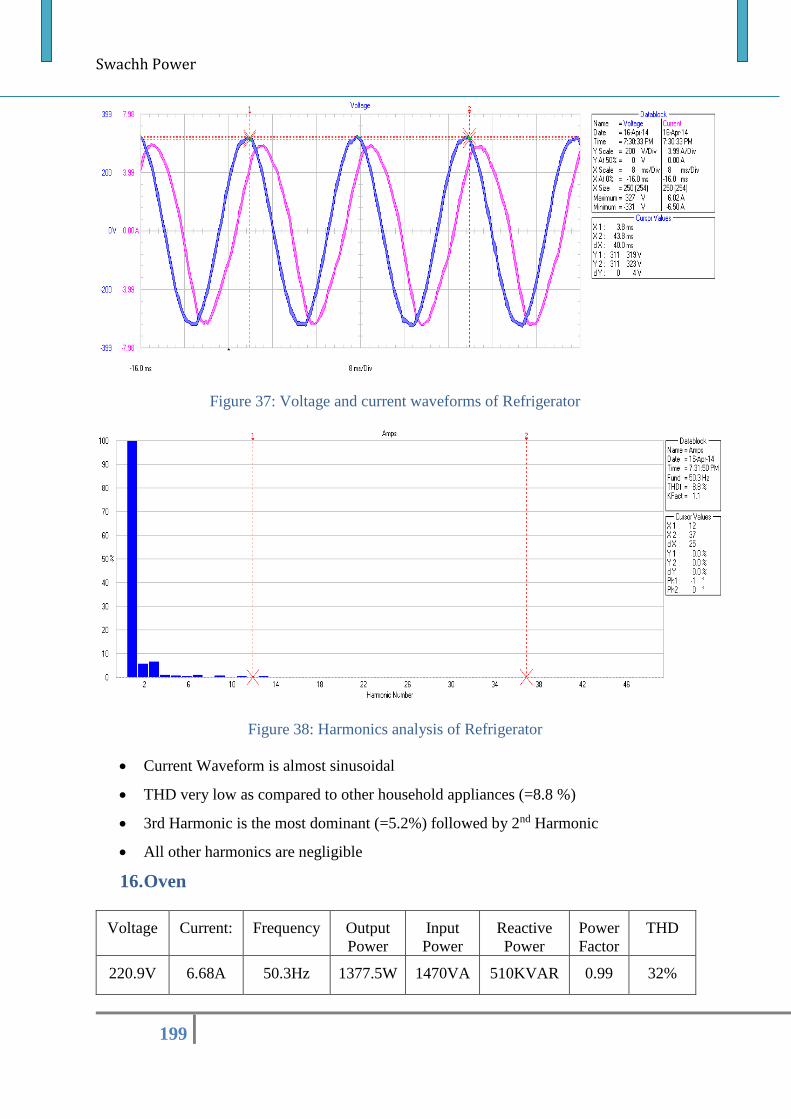
Swachh Power
199
Figure 37: Voltage and current waveforms of Refrigerator
Figure 38: Harmonics analysis of Refrigerator
Current Waveform is almost sinusoidal
THD very low as compared to other household appliances (=8.8 %)
3rd Harmonic is the most dominant (=5.2%) followed by 2nd Harmonic
All other harmonics are negligible
16. Oven
Voltage Current: Frequency Output
Power
Input
Power
Reactive
Power
Power
Factor
THD
220.9V 6.68A 50.3Hz 1377.5W 1470VA 510KVAR 0.99 32%
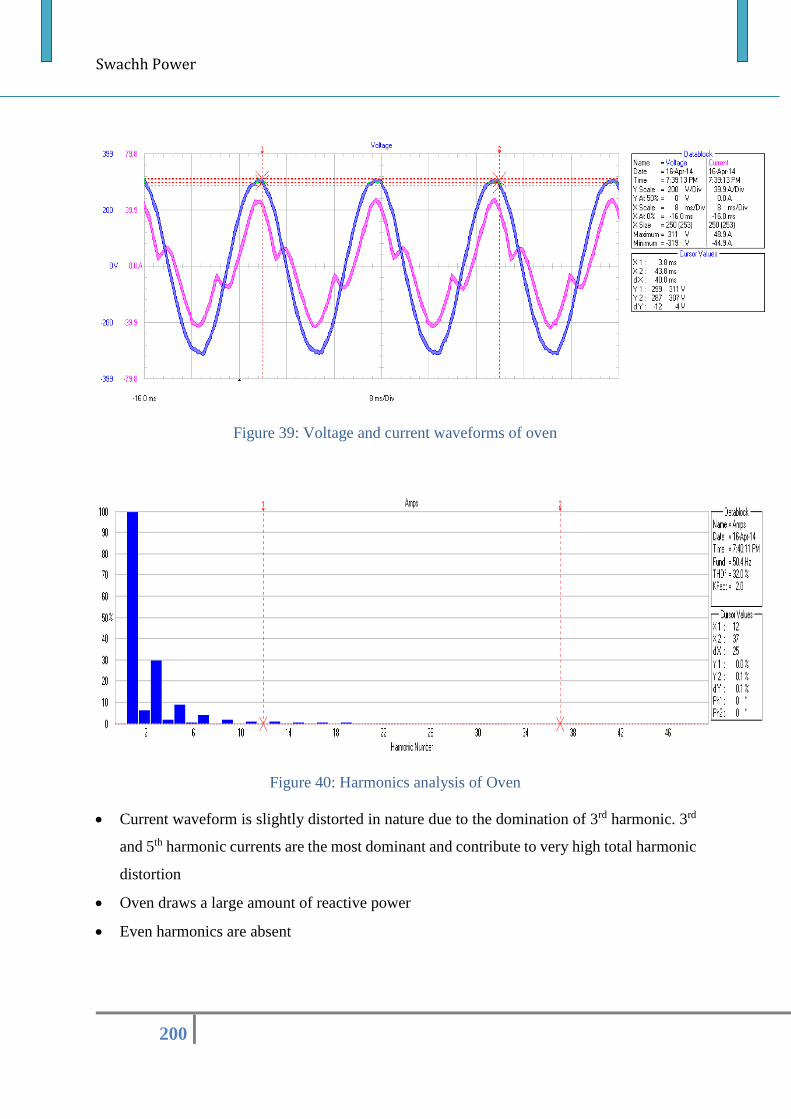
Swachh Power
200
Figure 39: Voltage and current waveforms of oven
Figure 40: Harmonics analysis of Oven
Current waveform is slightly distorted in nature due to the domination of 3rd harmonic. 3rd
and 5th harmonic currents are the most dominant and contribute to very high total harmonic
distortion
Oven draws a large amount of reactive power
Even harmonics are absent
Swachh Power
201
References 1. Bhim Singh, Kamal Al-Haddad, Ambrish Chandra, “A review of active filters for power
quality improvement”, IEEE Trans. on industrial electronics, Vol.46, No. 5, pp. 960-
971, October 1999.
2. “Economic Framework For Power Quality”, CIGRE/CIRED, Joint Working Group
C4.107.
3. IEEE, “IEEE Recommended Practices and Requirements for Harmonic Control in
Electrical Power Systems,” IEEE Std. 519-1992, revision of IEEE Std. 519-1981.
4. “Consequences of Poor Power Quality – An Overview”, Sharmistha Bhattacharyya and
Sjef Cobben, Technical University of Eindhoven, The Netherlands
5. Draft IEC 61000-4-30 Ed. 1.0): “Electromagnetic compatibility (EMC) – Part 4-30:
Testing and measurement techniques -- Power quality measurement methods”
(77A/356/CDV)
6. A. de Almeida, L. Moreira. J. Delgado ,“Power Quality Problems and New Solutions”,
ISR – Department of Electrical and Computer Engineering, University of Coimbra,
Pólo II 3030-290 Coimbra
7. “The Cost of Poor Power Quality”, David Chapman Copper Development Association
March 2001 (Version 0b November 2001)
8. Central Electricity Authority (Grid Standards) Regulations, 2006.
9. “The importance of good power quality”, Dr. Kurt Schipman, Dr. François Delincé,
ABB Power Quality Products, Belgium
10. S.Khalid, Bharti Dwivedi, “Power quality issues, problems, standards and their effects
in industry with corrective means”, International Journal of Advances in Engineering
& Technology, May 2011, Vol. 1,Issue 2,pp.1-11
11. The “The WTO, harmonization of international standards, and electric utilities”, Naoki
Kobayashi, USJP Occasional Paper 08-05, Harvard University
12. “Lack of affordable & quality power: Shackling India’s growth story”, FICCI, New
Delhi
13. Sagar Kondaveeti, M. Jaya Bharata Reddy, D. K. Mohanta, “Power Quality Analysis
on EHV Transmission line Using Modified S-Transform”
14. “A Review of Harmonic Mitigation Techniques”, Gonzalo Sandoval & John Houdek,
2005.
15. “Study on estimation of costs due to electricity interruptions and voltage disturbance”,
Matthias Hofmann, Helge Seljeseth, Gro Holst Volden, Gerd H. Kjalle, Sintef energy
research, December, 2010
16. “Guidelines of good practices on estimation of cost due to electricity interruptions and
voltage disturbances”, Council of European Energy Regulators, December 2010
17. Navjot Kaur, Gurdip Singh, M. S. Bedi, Tejpal Bhatti, “Customer interruption cost
assessment: an Indian commercial survey”, IEEE, 2002
Swachh Power
202
18. Daniel J Carnovale, Thomas J Dionise, Thomas M Blooming, “Price and performance
considerations for harmonic solutions”
19. Brahm Segal, “Costs and benefits of harmonic current and power factor reduction for
variable speed drives in an industry facility”
20. “Power quality standards: CBEMA, ITIC, SEMI F47, IEC 61000-4-11/34”, EPRI
21. William E Brumsickle, Robert S Schneider, Glen A. Luckjiff, Deepak M divan, Mark
F McGranaghan, “Dynamic sag correctors: Cost-effective industrial power line
conditioning”, IEEE, 20001, Vol 37, No 1
22. Kristina Hamachi, LaCommare, Joesph H Eto, “Cost of power interruptions to
electricity consumers in the United States”, Ernest Orlando Lawrence Berkeley national
laboratory, February, 2006
23. Jonathan Manson, Roman Targosz, “European power quality survey report”, Leonardo
Energy, November, 2008
24. Mark Mcgranaghan, Dave Mueller, “Effects of voltage sags in process industry
applications”, Electrotek Concepts.
25. Kurt Schipman, Francios Delince, “The importance of good power quality”, ABB,
Belgium
26. Bill Dabbs, Jeff Lamoree & Bob Zavadil, Marek Samotyj, “The power quality
database: software tool for utility engineers to solve problems”, IEEE
27. Liu Yu-quan, Hua Huang-Sheng, WU Guo-pei, Wang Li, “Research for the effects of
high speed electrified railway traction load on power quality”, IEEE, 2011
28. B E Khshare, A A Ghatol, T N Date, “Power quality survey of 33 kV Indian industrial:
results and remedial actions”
29. Jose Gutierrez Iglesias, Detmar Arlt et al,“Economic frame work power quality” JWG
CIGRE-CIRED C4.107, 2011.
30. Sara Nourollah, Mehdi Moallem, “A data mining method for obtaining global power
quality index” 2nd International Conference on Electric Power and Energy Conversion
Systems (EPECS), 2011.
31. Fayyaz Akram M, Mumtaz Bajwa S, “A sample power quality survey for emerging
competitive electricity market in Pakistan” Technology for the 21st Century
Proceedings, Multi Topic Conference, IEEE INMIC ,2001.
32. Ding Zejun, Zhu Yongqiang, Chen Caihong, “Comprehensive evaluation of power
quality based on meaningful classification 5th International Conference on .
33. AFF Estimates, IEEMA Statistics, Primary Survey.
34. EPRI, “The Economics of Customer Power”, IEEE T&D show, 2003.
35. B.E. Kushare, A.A. Ghatol, T.N. Date, “Power Quality Survey of 33 kV Industrial
Supply System: Results and Remedial Actions”, RPS 2007.
36. Primen Study, “The Cost of Power Disturbances to Industrial & Digital Economy
Companies”, 2001.
37. IEEE, “IEEE Recommended Practice for the Transfer of Power Quality Data”, IEEE
Std 1159.3-2003
Swachh Power
203
Books:
1. Mohan, Undeland and Robbins, Power Electronics, John Wiley and Sons, 1995.
2. R. C. Dugan, M. F. McGranaghan, S. Santosa, and H. W. Beaty, Electrical Power
Systems Quality, 2nd edition, McGraw-Hill, 2002.
3. IEC, Electromagnetic Compatibility, Part 3: Limits- Sect.2: Limits for Harmonic
Current Emission,” IEC 1000-3-2, 1st ed., 1995.
4. Mohan, Underland and Robbins, Power Electronics, John Wiley and Sons, 1995.
5. Alexander Kusko, Marc T. Thompson, “Power Quality in Electrical Systems, McGraw-
Hill, New York, 2007.
6. PQ in Switzerland. M. Levet, UCS, 1998
---x---
Swachh Power
204
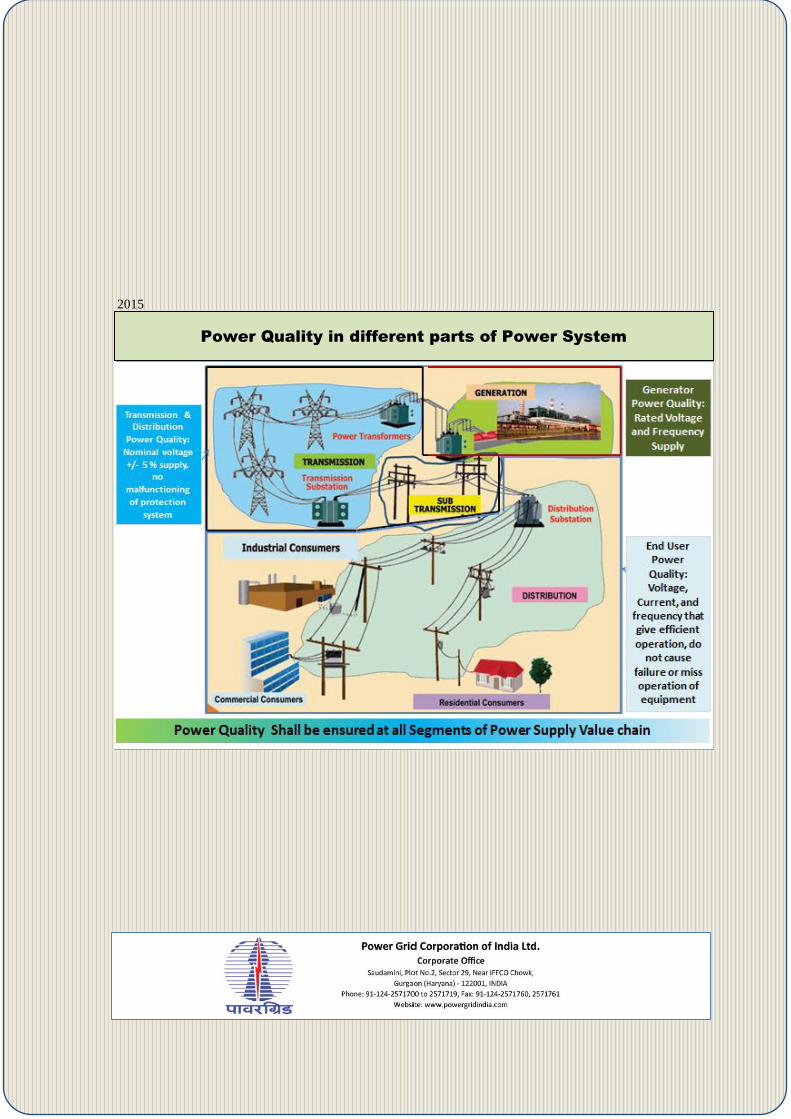
2015
Power Quality in different parts of Power System
Related Documents