Sustaining value in challenging times July 2016 Capital Markets Story

Welcome message from author
This document is posted to help you gain knowledge. Please leave a comment to let me know what you think about it! Share it to your friends and learn new things together.
Transcript

Sustaining value in challenging times July 2016
Capital Markets Story

Agenda
2
1. Investment rationale
2. Financial highlights & commitment to shareholders
3. Appendix
3.1 European Generation
3.2 Global Commodities
3.3 International Power
3.4 Top-Management incentives & Uniper Supervisory Board

What we as Uniper stand for
3
Performance Potential Portfolio

Focused portfolio with attractive assets
across Europe/Russia
4
International
Power
• Number 3 privately-owned Russian generation company
• ~30% capacity increase since 2010
• 11 GW of generation assets
Portfolio
Performance
Potential
• One of the largest European generators with 31 GW of
own, mostly dispatchable generation capacity
• Diversified base across technologies and main NWE
markets
• Strong capabilities in construction, operations and
maintenance
European
Generation
Global
Commodities
• A leading physical energy trader with global footprint
• Large gas midstream business in Europe with more than
400 TWh gas LTC portfolio, own storage capacity of
8.8 bcm and pipeline shareholdings
• Participation in giant Russian gas field
• Optimisation of European Generation portfolio
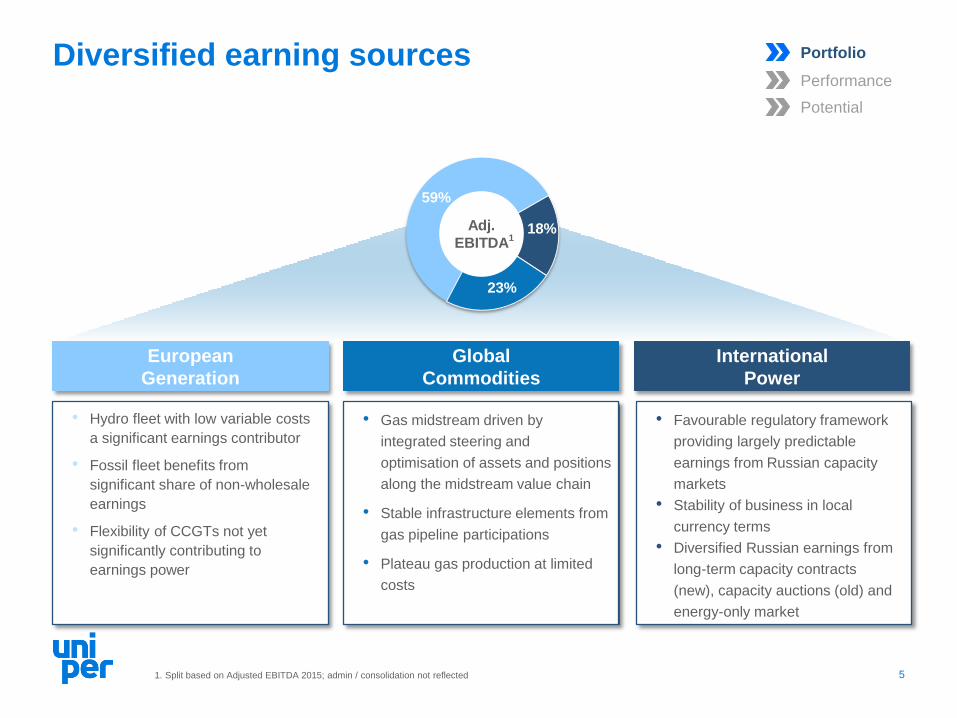
Diversified earning sources
5
• Hydro fleet with low variable costs
a significant earnings contributor
• Fossil fleet benefits from
significant share of non-wholesale
earnings
• Flexibility of CCGTs not yet
significantly contributing to
earnings power
European
Generation
International
Power
• Favourable regulatory framework
providing largely predictable
earnings from Russian capacity
markets
• Stability of business in local
currency terms
• Diversified Russian earnings from
long-term capacity contracts
(new), capacity auctions (old) and
energy-only market
• Gas midstream driven by
integrated steering and
optimisation of assets and positions
along the midstream value chain
• Stable infrastructure elements from
gas pipeline participations
• Plateau gas production at limited
costs
Global
Commodities
Adj.
EBITDA
1. Split based on Adjusted EBITDA 2015; admin / consolidation not reflected
1
Portfolio
Performance
Potential
59%
18%
23%

Radical reduction of direct and
indirect costs across the Group
Offset loss of earnings due to
commodity price collapse1
Optimisation of working capital
Ambition to reduce investments
to maintenance level
At least €2bn of potential
disposal proceeds identified
Used for deleveraging and
funding of remaining growth
projects
Commitment to cost excellence and cash
flow optimization
2015 20182015 2018 By 2018
>€2bn
Targeted total cost reductions Group investments (€bn) Disposal volume
Action plan
Cost Cash Portfolio
6
Portfolio
Performance
Potential
1. Referring to annualised foregone earnings from price declines of €8 - €10/MWh in continental Europe and the Nordics since 26/04/2015 and a total outright
volume of 25-27TWh in an unhedged scenario
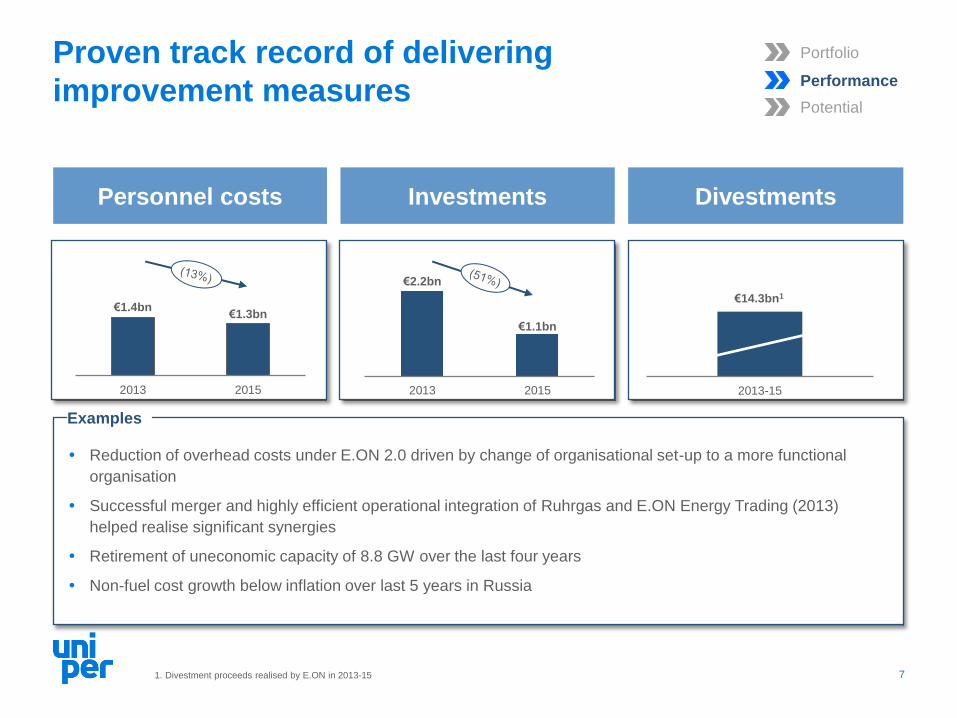
Proven track record of delivering
improvement measures
Personnel costs Investments Divestments
€2.2bn
€1.1bn
2013 2015 2013-15
Reduction of overhead costs under E.ON 2.0 driven by change of organisational set-up to a more functional
organisation
Successful merger and highly efficient operational integration of Ruhrgas and E.ON Energy Trading (2013)
helped realise significant synergies
Retirement of uneconomic capacity of 8.8 GW over the last four years
Non-fuel cost growth below inflation over last 5 years in Russia
Examples
Portfolio
Performance
Potential
€1.4bn €1.3bn
2013 2015
7 1. Divestment proceeds realised by E.ON in 2013-15
€14.3bn1
15
25
35
45
2016E 2017E 2018E 2019E 2020E
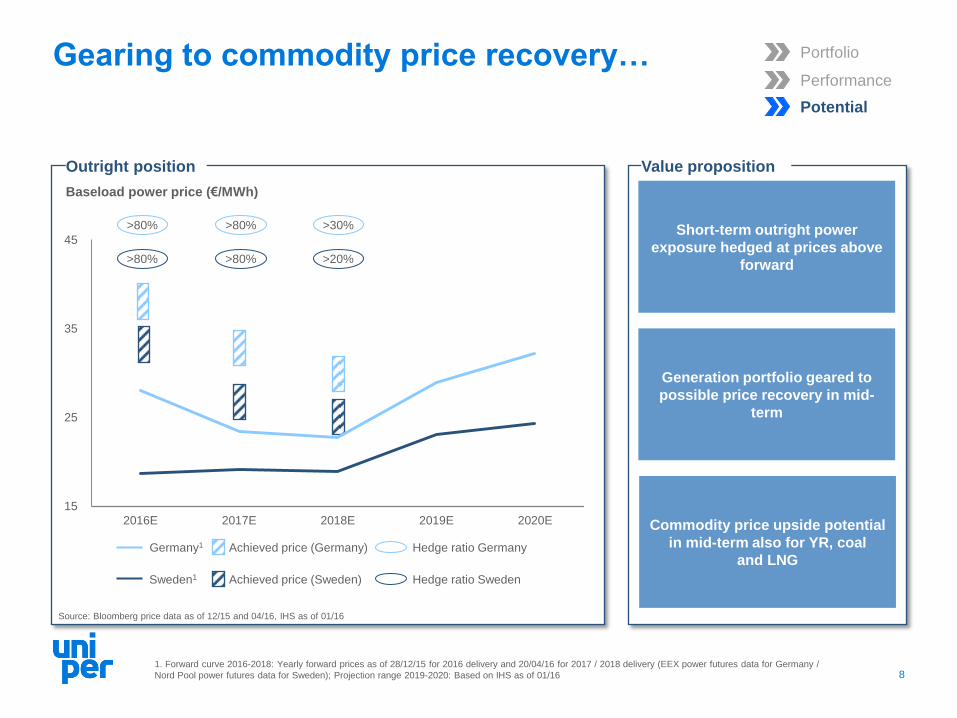
Gearing to commodity price recovery…
8
Value proposition
Source: Bloomberg price data as of 12/15 and 04/16, IHS as of 01/16
Baseload power price (€/MWh)
Germany1
Sweden1
Outright position
Achieved price (Germany)
Short-term outright power
exposure hedged at prices above
forward
Generation portfolio geared to
possible price recovery in mid-
term
Commodity price upside potential
in mid-term also for YR, coal
and LNG
1. Forward curve 2016-2018: Yearly forward prices as of 28/12/15 for 2016 delivery and 20/04/16 for 2017 / 2018 delivery (EEX power futures data for Germany /
Nord Pool power futures data for Sweden); Projection range 2019-2020: Based on IHS as of 01/16
Achieved price (Sweden)
>80% >80%
>80% >80%
>30%
>20%
Hedge ratio Sweden
Hedge ratio Germany
Portfolio
Performance
Potential

...as well as market transformation
9
Gas plant portfolio Storage portfolio
1,6
2,5
1,5
2,3
3,8
5,8
17E16E151413121110
11.7 GW gas-fired 8.8 bcm gas storage capacity
Clean spark spreads (€/MWh)1 Summer-winter spreads (€/MWh)2
Security of supply not yet adequately compensated
1. Based on nominal peak load power prices; Spark spread assumptions: Efficiency 54.53% LHV/heat rate 6,204 MMBtu per kWh 2. S/W-Spreads at Netherlands
TTF (€/MWh, nominal); in projection period IHS lower bound for 2016E and upper bound for 2017E and accordingly forward upper bound in 2016E and lower bound
for 2017E
Value proposition
Source: IHS as of 01/16 Source: IHS as of 11/15, forward as of 01/16
(15)
(5)
5
15
12 13 14 15 16E 17E
UK GER
Portfolio
Performance
Potential
CCGTs and gas storages
addressing system flexibility
needs
Upside from upcoming and
potential capacity markets
Benefits from possible industry
consolidation
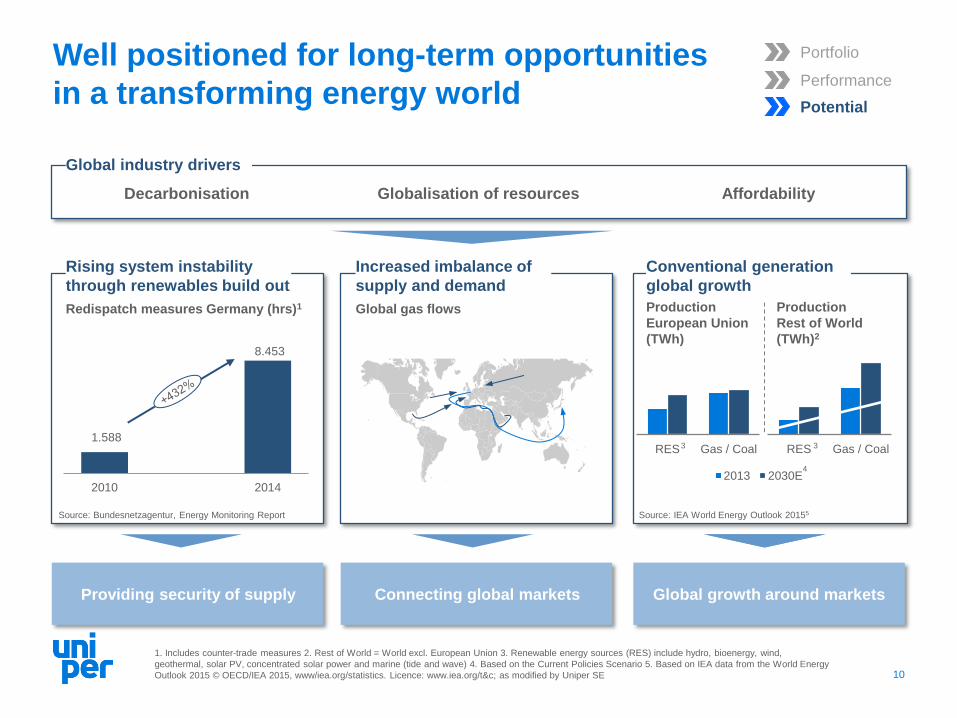
Well positioned for long-term opportunities
in a transforming energy world
10
Global industry drivers
Decarbonisation Globalisation of resources Affordability
Rising system instability
through renewables build out
Increased imbalance of
supply and demand
Conventional generation
global growth
Global gas flows
1. Includes counter-trade measures 2. Rest of World = World excl. European Union 3. Renewable energy sources (RES) include hydro, bioenergy, wind,
geothermal, solar PV, concentrated solar power and marine (tide and wave) 4. Based on the Current Policies Scenario 5. Based on IEA data from the World Energy
Outlook 2015 © OECD/IEA 2015, www/iea.org/statistics. Licence: www.iea.org/t&c; as modified by Uniper SE
Providing security of supply Connecting global markets Global growth around markets
1.588
8.453
2010 2014
Redispatch measures Germany (hrs)1
Source: Bundesnetzagentur, Energy Monitoring Report
Portfolio
Performance
Potential
7919
20402
RES Gas / Coal
2013 2030E
1353
1524
RES Gas / Coal
Production
European Union
(TWh)
Source: IEA World Energy Outlook 20155
Production
Rest of World
(TWh)2
3 3
4

Sustaining value in challenging times
11
Attractive assets across Europe/Russia
and diversified earning sources Portfolio
Commitment and track record of cost
excellence and cash flow optimization Performance
Gearing to commodity price recovery and
market transformation Potential
Agenda
12
1. Investment rationale
2. Financial highlights & commitment to shareholders
3. Appendix
3.1 European Generation
3.2 Global Commodities
3.3 International Power
3.4 Top-Management incentives & Uniper Supervisory Board

Adj. EBITDA contribution by segment 2015 (€bn) Group adj. EBITDA development (€bn)
Strong underlying earnings platform despite difficult
market environment
13
0.5
0,6
0,3
0,2
0,2
0.1
EuropeanGeneration
GlobalCommodities
InternationalPower
Admin/Consolidation
Total
Adj. EBIT D&A Adj. EBITDA
1.1
0.4
0.3
1.7
(0.2)1
2.0 1.7
2014 2015
0.8 0.8
2014 2015
Group adj. EBIT development (€bn)
1. Adj. EBITDA of €(0.2bn) and adj. EBIT of €(0.2bn)
Source: Combined Financial Statements
Source: Combined Financial Statements Source: Combined Financial Statements
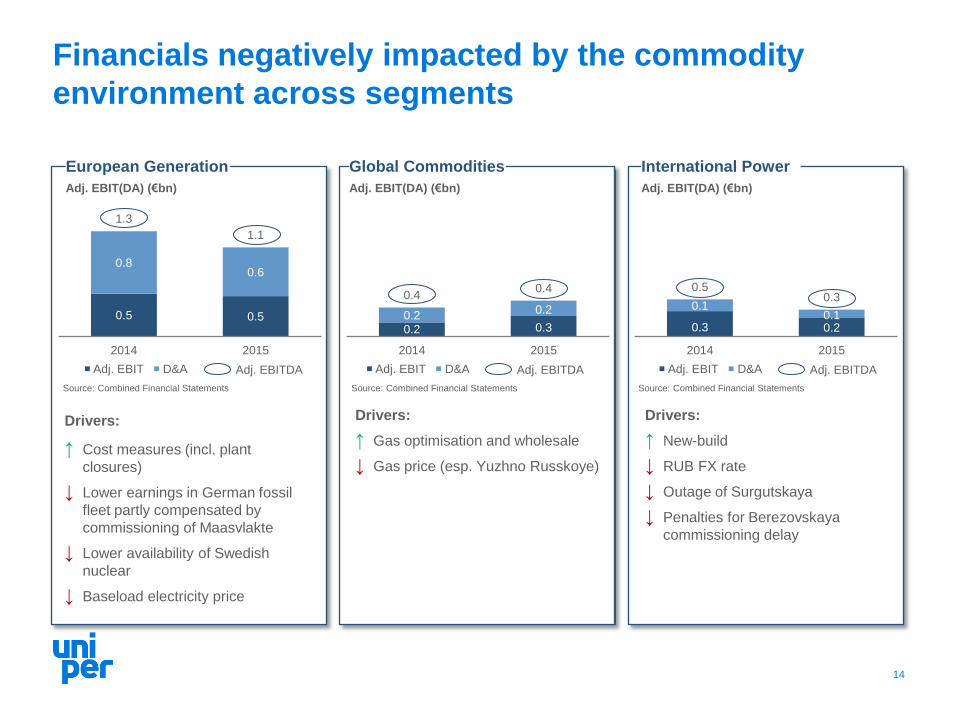
Financials negatively impacted by the commodity
environment across segments
14
European Generation Global Commodities International Power
Drivers:
↑ Cost measures (incl. plant
closures)
↓ Lower earnings in German fossil
fleet partly compensated by
commissioning of Maasvlakte
↓ Lower availability of Swedish
nuclear
↓ Baseload electricity price
Drivers:
↑ Gas optimisation and wholesale
↓ Gas price (esp. Yuzhno Russkoye)
Drivers:
↑ New-build
↓ RUB FX rate
↓ Outage of Surgutskaya
↓ Penalties for Berezovskaya
commissioning delay
0.5 0.5
0.8 0.6
1.3
1.1
2014 2015
0.2 0.3 0.2
0.2
0.4 0.4
2014 2015
0.3 0.2
0.1 0.1
0.5 0.3
2014 2015
Adj. EBIT(DA) (€bn) Adj. EBIT(DA) (€bn) Adj. EBIT(DA) (€bn)
Adj. EBIT Adj. EBITDA D&A Adj. EBIT Adj. EBITDA D&A Adj. EBIT Adj. EBITDA D&A
Source: Combined Financial Statements Source: Combined Financial Statements Source: Combined Financial Statements

OCFbIT1 and cash conversion (€bn)
Strong cash generation based on attractive cash
conversion
15 1. Group operating cash flow before interest and taxes 2. Cash conversion defined as OCFbIT / Adj. EBITDA
1,7
2,0
2014 2015
89% 118%
% Cash conversion 2
OCFbIT1 by segment and cash conversion 2015 (€bn)
0,8
0,4
(0.3)
EuropeanGeneration
GlobalCommodities
InternationalPower
Admin/Consolidation
Total
118%
% Cash conversion 2
Source: Combined Financial Statements Source: Combined Financial Statements
1.1
2.0
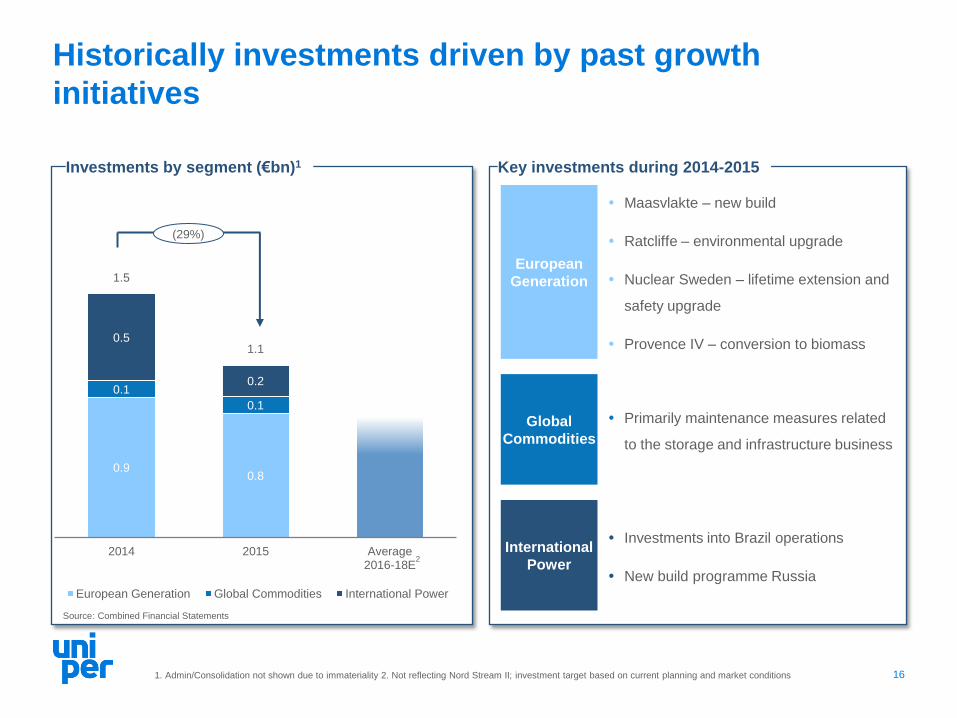
Key investments during 2014-2015 Investments by segment (€bn)1
Historically investments driven by past growth
initiatives
16
European
Generation
Maasvlakte – new build
Ratcliffe – environmental upgrade
Nuclear Sweden – lifetime extension and
safety upgrade
Provence IV – conversion to biomass
Global
Commodities
Primarily maintenance measures related
to the storage and infrastructure business
International
Power
Investments into Brazil operations
New build programme Russia
0.9 0.8
0.1
0.1
0.5
0.2
1.5
1.1
2014 2015 Average2016-18E
European Generation Global Commodities International Power
(29%)
2
1. Admin/Consolidation not shown due to immateriality 2. Not reflecting Nord Stream II; investment target based on current planning and market conditions
Source: Combined Financial Statements

Future investments focused on maintenance and
existing growth projects
17
Investment outlook1
2016-18E
European Generation Global Commodities
International Power Admin/Consolidation
65 – 75%
5 – 15%
10 – 20%
Remaining growth projects
20163
2018
2016
2016 Eu
rop
ean
Gen
era
tio
n
Datteln IV
Provence IV
Maasvlakte III
<€0.5bn2
<€0.1bn
<€0.1bn
IP
Berezovskaya <€0.1bn
< 10%
1. Not reflecting Nord Stream II; investment target based on current planning and market conditions 2. Includes c. <€0.1bn of remaining growth investments from
2019-2021 3. Last investment for completing Berezvoskaya III before incident 4. Depending on the financing structure 5. The precise cost of repairs may be
evaluated only after the full-scale examination will be finished
Investments for special projects
2019
GC
Nord Stream II €0.5-
€1.0bn4
IP
Berezovskaya At least
RUB15bn5
At least until
end 2017

Targeted deleveraging enforced by focus on investment
grade rating
18 1. Includes nuclear and other asset retirement obligations (“AROs”) as well as receivables from Swedish nuclear fund 2. Includes cash & cash equivalents, non-
current securities, financial receivables and liabilities from cash-pooling with E.ON Group 3. Reflects settlement of profit and loss sharing agreements terminated as
per FYE 2015 and the reduction of the Fortum loan
Economic net debt 2015 (€bn)
Net
financial
debt2
Safeguarding rating
Disposals
At least €2bn of potential
disposal proceeds identified
Positive FCF post dividend
Sufficient cash retained in initial
years
0.8
1.0
Economicnet debt(END)
NordStream I
CapitalRaise by
E.ON
OtherEffects
Pro-formaeconomicnet debt
AROs1
Pension
Provisions
4.9
3 Target
economicnet debt /
Adj. EBITDA
Target netfinancial
debt / Adj.EBITDA
Safeguarding necessary market
access through comfortable
investment grade rating
Comfortably
below 2.0x
Corresponding
to leverage ratio
below 1.0x
~4.7
6.7
Financial target ratios
~3.9x ~2.7x
END /
Adj.
EBITDA
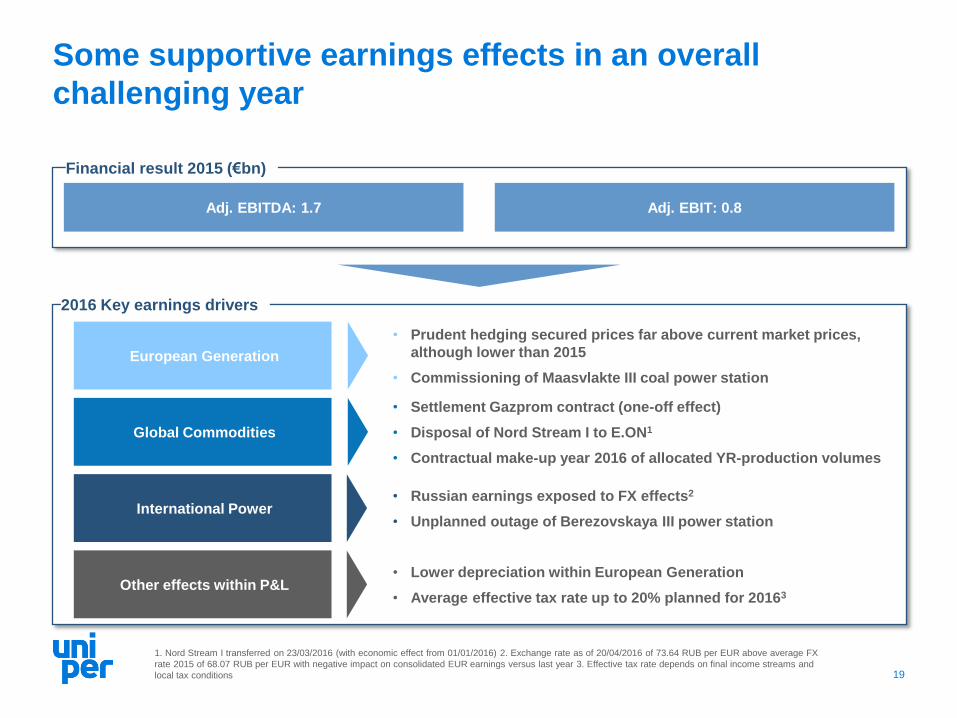
Some supportive earnings effects in an overall
challenging year
19
European Generation
• Prudent hedging secured prices far above current market prices,
although lower than 2015
• Commissioning of Maasvlakte III coal power station
Financial result 2015 (€bn)
Adj. EBITDA: 1.7 Adj. EBIT: 0.8
1. Nord Stream I transferred on 23/03/2016 (with economic effect from 01/01/2016) 2. Exchange rate as of 20/04/2016 of 73.64 RUB per EUR above average FX
rate 2015 of 68.07 RUB per EUR with negative impact on consolidated EUR earnings versus last year 3. Effective tax rate depends on final income streams and
local tax conditions
2016 Key earnings drivers
• Settlement Gazprom contract (one-off effect)
• Disposal of Nord Stream I to E.ON1
• Contractual make-up year 2016 of allocated YR-production volumes
Global Commodities
• Russian earnings exposed to FX effects2
• Unplanned outage of Berezovskaya III power station International Power
• Lower depreciation within European Generation
• Average effective tax rate up to 20% planned for 20163 Other effects within P&L
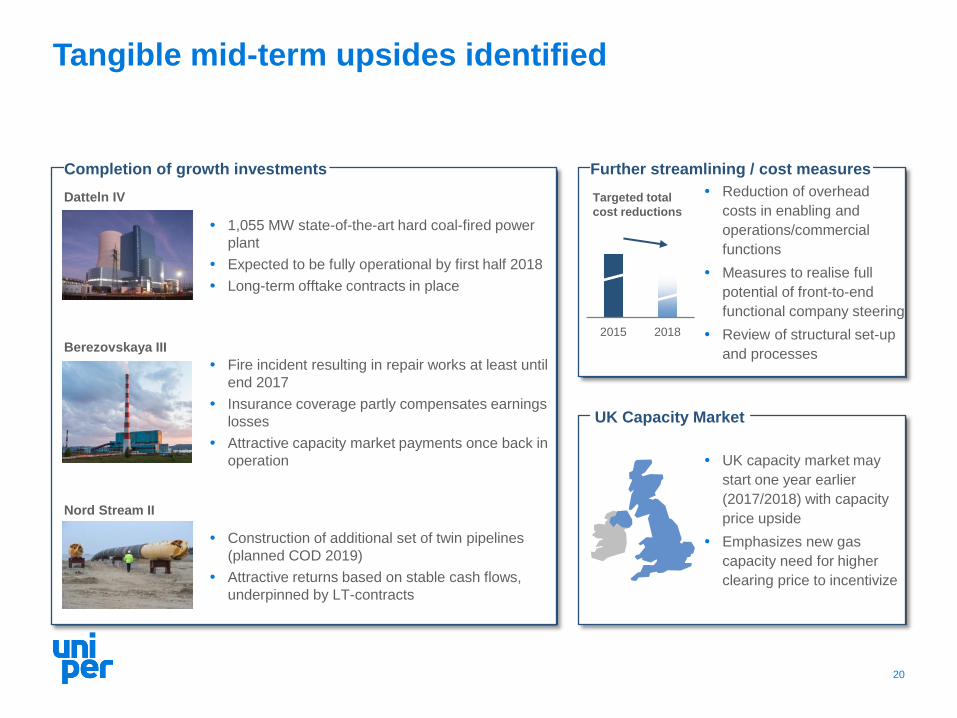
Further streamlining / cost measures
Tangible mid-term upsides identified
20
UK capacity market may
start one year earlier
(2017/2018) with capacity
price upside
Emphasizes new gas
capacity need for higher
clearing price to incentivize
UK Capacity Market
Completion of growth investments
1,055 MW state-of-the-art hard coal-fired power
plant
Expected to be fully operational by first half 2018
Long-term offtake contracts in place
Datteln IV
Fire incident resulting in repair works at least until
end 2017
Insurance coverage partly compensates earnings
losses
Attractive capacity market payments once back in
operation
Berezovskaya III
Construction of additional set of twin pipelines
(planned COD 2019)
Attractive returns based on stable cash flows,
underpinned by LT-contracts
Nord Stream II
Targeted total
cost reductions
Reduction of overhead
costs in enabling and
operations/commercial
functions
Measures to realise full
potential of front-to-end
functional company steering
Review of structural set-up
and processes
2015 2018

Adjusted Funds from Operations1 over time (€bn)
Adjusted FFO as key KPI for future dividend base
21
2013 2014 2015
From OCF to adjusted FFO
% Cash conversion 2
1. Adj. FFO 2. Defined as Adj. FFO / Adj. EBITDA 3. Changes in operating assets and liabilities and in income taxes adjusted by derivatives
In terms of conversion rate to EBITDA gas LTC situation
has to be taken into account
Reported 2013-2015 EBITDA burdened by provisions
Adj. FFO benefitted from not yet renegotiated LTC
contracts
2016 Adj. FFO also to be special year as strongly impacted
by gas LTC settlement
Putting historic FFO cash conversion into context
1.5 1.5 1.8
Operating Cash Flow
Dividends to minorities
Contributions to Swedish nuclear fund
–
–
Working capital effects3 +/–
Pension service cost contributions –
Adjusted Funds from Operations (Adj. FFO)
67% 79%
105%
Cash conversion strongly impacted by gas LTC

Our commitment to shareholders:
Attractive free cash flow based dividend policy
22
New dividend policy
1. Based on number of shares of 365,960,000 shares; dependent on distribution capacity of Uniper SE (based on German GAAP) as well as AGM and Supervisory
Board consent
Illustration of dividend base
Adjusted Funds from Operations (Adj. FFO)
Dividends
Maintenance / replacement
investments –
Free Cash from Operations (FCfO)
For subsequent years, payout based on Free
Cash from Operations
Total free cash post-dividends to be neutral
or positive
Proposed 2016 dividend payment of c.
€200m (implicit €0.55 / share)1
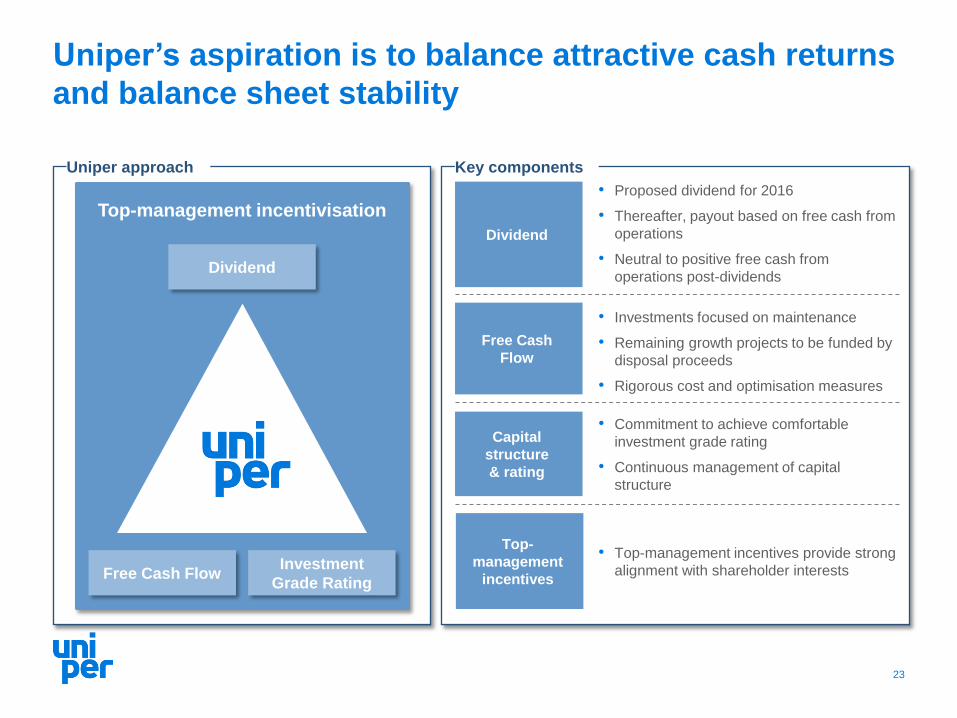
Uniper’s aspiration is to balance attractive cash returns
and balance sheet stability
Top-management incentivisation
Dividend
Free Cash Flow Investment
Grade Rating
23
Uniper approach
Dividend
Free Cash
Flow
Capital
structure
& rating
• Proposed dividend for 2016
• Thereafter, payout based on free cash from
operations
• Neutral to positive free cash from
operations post-dividends
• Investments focused on maintenance
• Remaining growth projects to be funded by
disposal proceeds
• Rigorous cost and optimisation measures
• Commitment to achieve comfortable
investment grade rating
• Continuous management of capital
structure
Top-
management
incentives
• Top-management incentives provide strong
alignment with shareholder interests
Key components

Agenda
24
1. Investment rationale
2. Financial highlights & commitment to shareholders
3. Appendix
3.1 European Generation
3.2 Global Commodities
3.3 International Power
3.4 Top-Management incentives & Uniper Supervisory Board

The investment rationale for European Generation
25
Cash generative portfolio with a
diversified earnings footprint and
the assets and services in place
to address a changing
conventional energy world
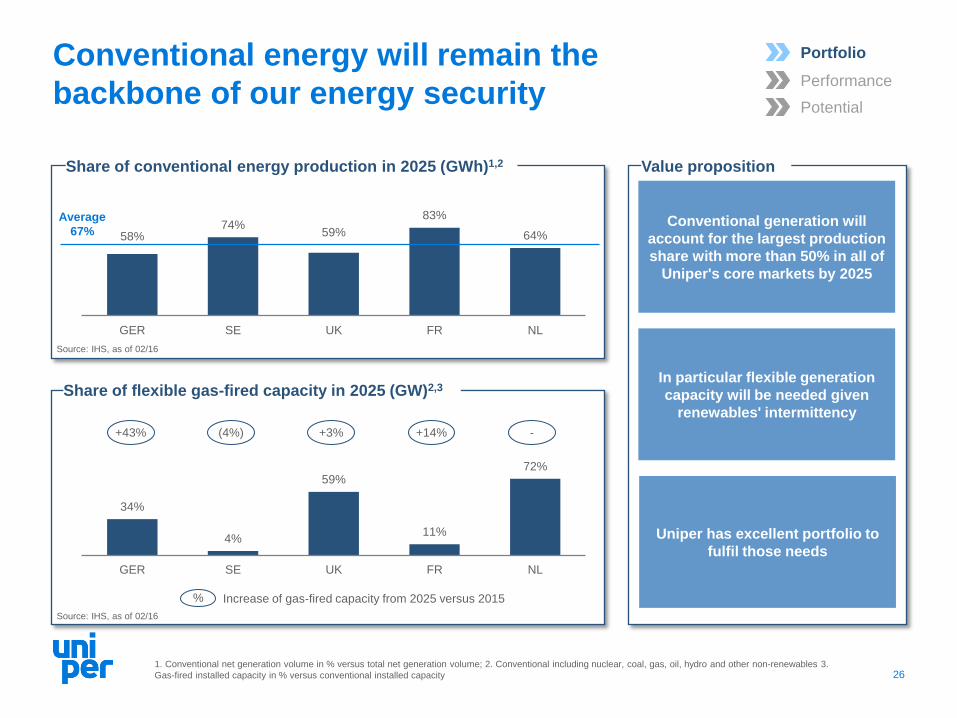
26
Value proposition
Source: IHS, as of 02/16
Share of conventional energy production in 2025 (GWh)1,2
Conventional generation will
account for the largest production
share with more than 50% in all of
Uniper's core markets by 2025
In particular flexible generation
capacity will be needed given
renewables' intermittency
Uniper has excellent portfolio to
fulfil those needs
1. Conventional net generation volume in % versus total net generation volume; 2. Conventional including nuclear, coal, gas, oil, hydro and other non-renewables 3.
Gas-fired installed capacity in % versus conventional installed capacity
58% 74%
59%
83%
64%
GER SE UK FR NL
Average
67%
Source: IHS, as of 02/16
34%
4%
59%
11%
72%
GER SE UK FR NL
Share of flexible gas-fired capacity in 2025 (GW)2,3
+43% +14% - (4%) +3%
% Increase of gas-fired capacity from 2025 versus 2015
Conventional energy will remain the
backbone of our energy security
Portfolio
Performance
Potential

Well-diversified European generation
portfolio with strong position in its markets
27
1. Net capacity for 2015 (accounting view); net generation capacity is reported for a power plant if it has been in operation within a year 2. Excluding Hydro LTCs 3.
Including Hydro LTCs with net capacities of 0.6 GW and production volume of 0.75 TWh in Austria and Switzerland 4. For Benelux: Market position for Netherlands
only 5. Market positions based on IHS figures for peers vs. actual numbers for Uniper; figures refer to 2014 (Hungary and France refer to 2013) 6. Deviation due to
rounding
Net capacity by country and fuel type (GW)1,2
Source: IHS (market position)
12.0
7.0
5.7
2.1
3.7
0.4
Germany (# 3)
Hungary (#5) France (# 3)
Benelux(# 2)4
UK (# 4)
Sweden (# 2)
# Market position5
Hydro Hard Coal Other Gas Nuclear
Net capacity by fuel type (GW)1,3
Electricity production (TWh)1,3
4,2
2,5
9,0
11,7
4,2
31.6
GW
15,3
12,2
34,0
15,2
7,3
83.8
TWh6
4.2 Hydro
2.5 Nuclear
9.0 Hard coal
11.7 Gas
4.2 Other
15.3 Hydro
12.2 Nuclear
34.0 Hard Coal
15.2 Gas
7.3 Other
Portfolio
Performance
Potential

Attractive earnings platform which is
diversified across technologies
28
Adj. EBIT(DA) contribution by sub-segment 2015 (€bn)
0.4
1.1
0.2
0.5
(0.0)
Hydro Nuclear Fossil Other Total
Vast majority of earnings related
to Germany and Sweden based
outright fleet (hydro & nuclear)
Locked-in prices above current
spot levels
Earnings from fossil segment
primarily driven by coal-fired
steam fleet located in Germany,
the UK and the Netherlands
Additional contribution to fossil
fleet earnings from integrated
product offerings in Germany and
the Netherlands: sales of power,
steam, heat, and other energy
products
Key considerations
0.4
0.5 0.1 0.0
(0.0)
Hydro Nuclear Fossil Other Total
Adj. EBITDA contribution
Adj. EBIT contribution2
1. Includes RUs of Netherlands, France, UTG and other effects 2. Differences from total versus sum of subtotals due to rounding effects
1
1
Portfolio
Performance
Potential
Source: Combined Financial Statements

Solid earnings contribution from our
Northwest European outright position
29
Electricity production volumes from
hydro and fossil assets (TWh)1
13 13 15
59 44 39
20
14 15
92
71 69
2013 2014 2015
Hydro Hard Coal / Lignite Gas
Adj. EBITDA by fuel in Germany(€bn)2,3
Value proposition
Hydro as earnings backbone of European generation fleet
based on low variable costs and regulated components
Attractive earnings contribution of fossil fleet driven by high
load factors of coal assets and integrated supply elements
CCGT fleet cash flow positive even in a difficult market
environment for gas-fired plants
Adj. EBITDA by fuel in other markets (€bn)3
0.2
0.5 0.3
Hydro Nuclear Fossil Other Total
0.2
0.6
0.2
0.2
(0.0)
Hydro Nuclear Fossil Other Total
1. Includes electricity generation volumes from Hydro LTCs from TIWAG Kaunertal, TIWAG Sillrain-Silz an Verbund Zemm-Ziller in Austria and Axpo ENAG in
Switzerland of 0.56 TWh in 2013, 0.42 TWh in 2014 and 0.75 TWh in 2015 2. Hungary allocated to Germany for reporting purposes 3. 2015 figures; Not reflecting
consolidation effects
Portfolio
Performance
Potential
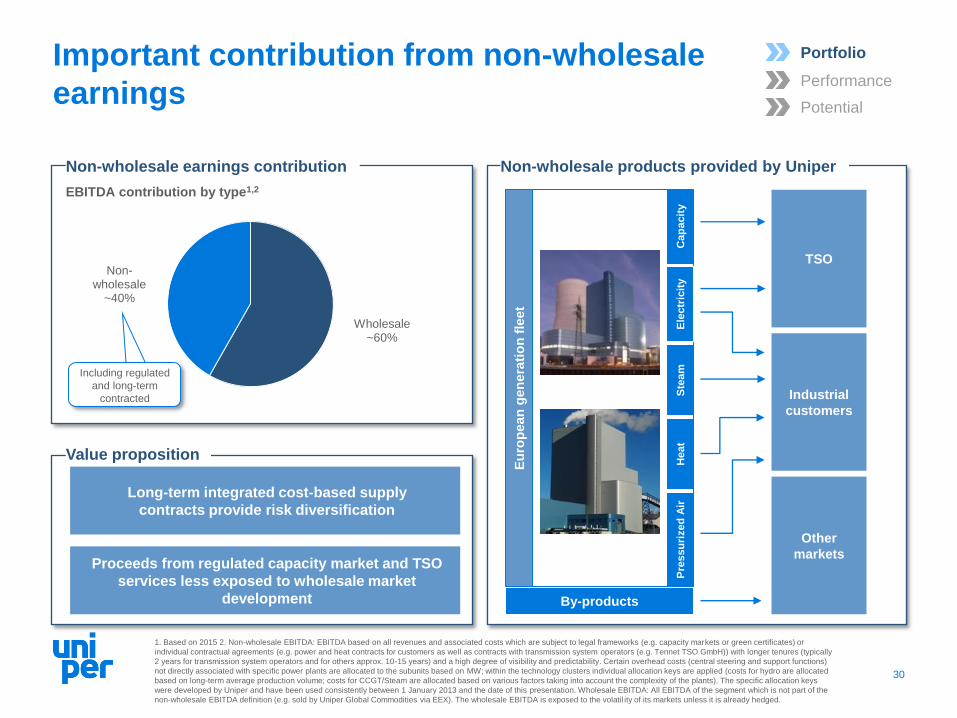
Important contribution from non-wholesale
earnings
30
Non-wholesale products provided by Uniper Non-wholesale earnings contribution
Wholesale ~60%
Non-wholesale
~40%
EBITDA contribution by type1,2
Value proposition
Long-term integrated cost-based supply
contracts provide risk diversification
Proceeds from regulated capacity market and TSO
services less exposed to wholesale market
development
Eu
rop
ean
gen
era
tio
n f
leet
TSO
Industrial
customers
Cap
acit
y
Ste
am
H
eat
Pre
ssu
rized
Air
By-products
Other
markets
1. Based on 2015 2. Non-wholesale EBITDA: EBITDA based on all revenues and associated costs which are subject to legal frameworks (e.g. capacity markets or green certificates) or
individual contractual agreements (e.g. power and heat contracts for customers as well as contracts with transmission system operators (e.g. Tennet TSO GmbH)) with longer tenures (typically
2 years for transmission system operators and for others approx. 10-15 years) and a high degree of visibility and predictability. Certain overhead costs (central steering and support functions)
not directly associated with specific power plants are allocated to the subunits based on MW; within the technology clusters individual allocation keys are applied (costs for hydro are allocated
based on long-term average production volume; costs for CCGT/Steam are allocated based on various factors taking into account the complexity of the plants). The specific allocation keys
were developed by Uniper and have been used consistently between 1 January 2013 and the date of this presentation. Wholesale EBITDA: All EBITDA of the segment which is not part of the
non-wholesale EBITDA definition (e.g. sold by Uniper Global Commodities via EEX). The wholesale EBITDA is exposed to the volatil ity of its markets unless it is already hedged.
Ele
ctr
icit
y
Portfolio
Performance
Potential
Including regulated
and long-term
contracted
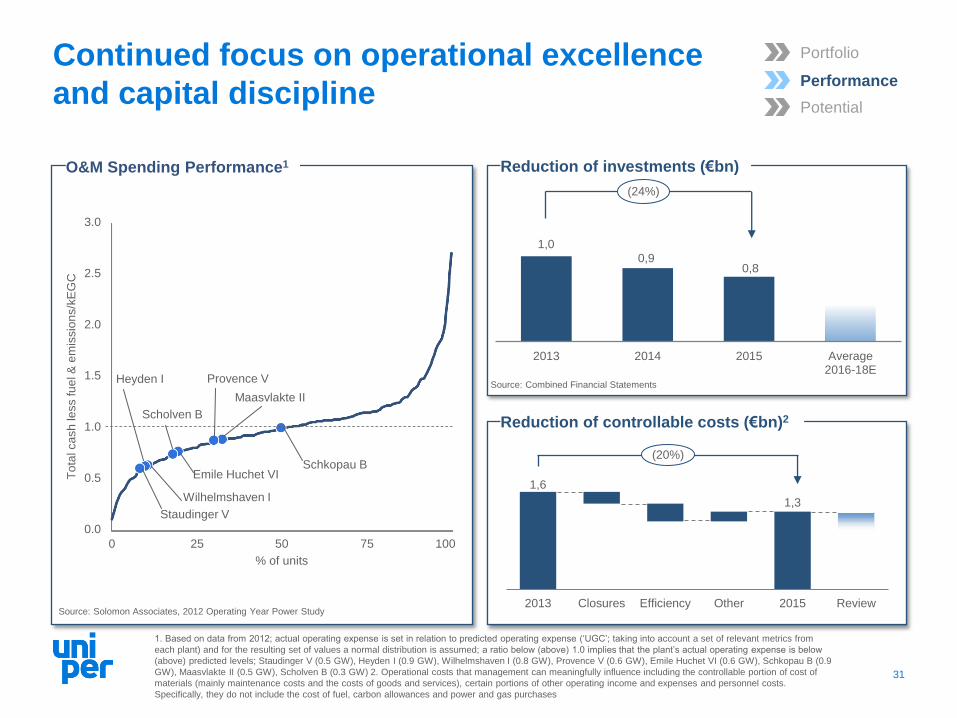
Reduction of investments (€bn)
Continued focus on operational excellence
and capital discipline
31
Source: Solomon Associates, 2012 Operating Year Power Study
1. Based on data from 2012; actual operating expense is set in relation to predicted operating expense (‘UGC’; taking into account a set of relevant metrics from
each plant) and for the resulting set of values a normal distribution is assumed; a ratio below (above) 1.0 implies that the plant’s actual operating expense is below
(above) predicted levels; Staudinger V (0.5 GW), Heyden I (0.9 GW), Wilhelmshaven I (0.8 GW), Provence V (0.6 GW), Emile Huchet VI (0.6 GW), Schkopau B (0.9
GW), Maasvlakte II (0.5 GW), Scholven B (0.3 GW) 2. Operational costs that management can meaningfully influence including the controllable portion of cost of
materials (mainly maintenance costs and the costs of goods and services), certain portions of other operating income and expenses and personnel costs.
Specifically, they do not include the cost of fuel, carbon allowances and power and gas purchases
1,0
0,9 0,8
2013 2014 2015 Average2016-18E
(24%)
Provence V
Maasvlakte II
Schkopau B
Heyden I
Scholven B
Emile Huchet VI
Wilhelmshaven I
Staudinger V
3.0
2.5
2.0
1.5
1.0
0.5 To
tal ca
sh
le
ss fu
el &
em
issio
ns/k
EG
C
0.0
0 25 50 75 100
% of units
O&M Spending Performance1
Reduction of controllable costs (€bn)2
1,6
1,3
2013 Closures Efficiency Other 2015 Review
(20%)
Portfolio
Performance
Potential
Source: Combined Financial Statements
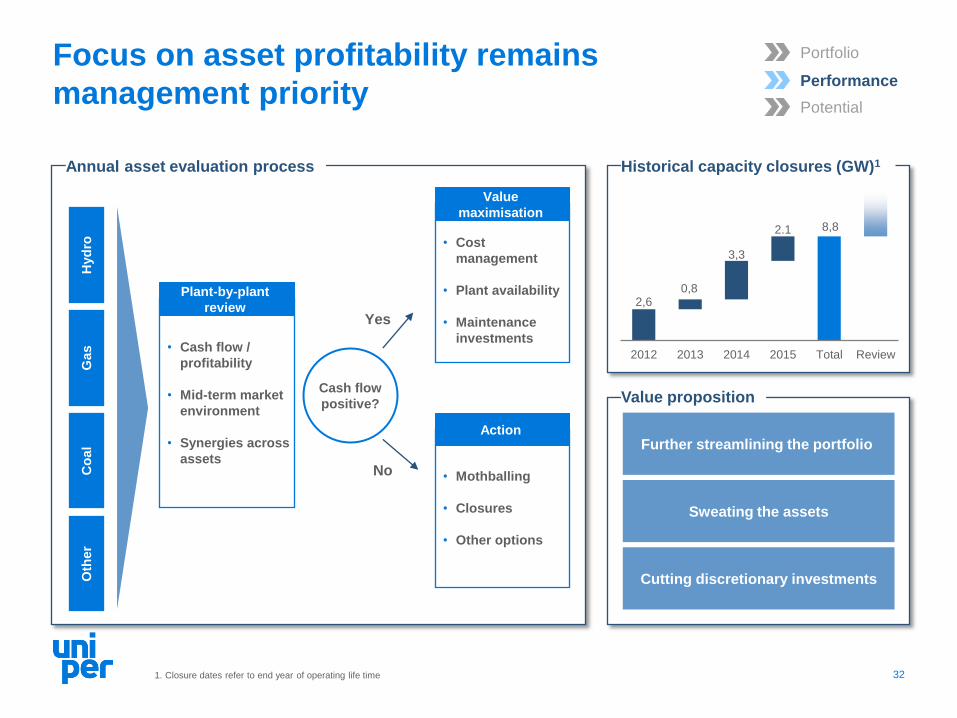
Focus on asset profitability remains
management priority
32
Annual asset evaluation process Historical capacity closures (GW)1
2,6 0,8
3,3
2.1 8,8
2012 2013 2014 2015 Total Review
Value proposition
Further streamlining the portfolio
Sweating the assets
Cutting discretionary investments
1. Closure dates refer to end year of operating life time
Portfolio
Performance
Potential
Hyd
ro
Gas
Co
al
Oth
er
• Cash flow /
profitability
• Mid-term market
environment
• Synergies across
assets
Plant-by-plant
review
Cash flow
positive?
Yes
No
• Cost
management
• Plant availability
• Maintenance
investments
Value
maximisation
• Mothballing
• Closures
• Other options
Action

Security of supply needs in
Germany
2019
100% of
Uniper’s
plants2
46
GW
107 GW
~£ 29 / kW – net CONE1 OCGT
Capacity Market auction UK capacity market launch
Source: UK DECC, Redpoint
£18 / kW clearing price
Well positioned to benefit from schemes
remunerating flexibility and back-up value
33
Need for back-up capacity
across Europe
Capacity market introduced / introduction soon
Capacity market currently not expected but
adjustments to energy-only market discussed
Capacity schemes increasingly
implemented across Europe
Entire Uniper UK fleet to benefit
from UK capacity scheme
Value proposition
Plants well placed to serve
security-of-supply product needs
of German TSO
1. Net cost of new entry based on calculation of OCGTs’ levelised costs less its expected revenues from the energy and balancing markets 2. 100% of capacity
registered in the auction (5.5 GW)
Gas-fired plant Coal-fired plant
High grid utilization
Staudinger
Berlin
Cologne
Frankfurt
Stuttgart
Hamburg
Munich Ingolstadt
Irsching
Franken
Source: Bundesnetzagentur
Oil-fired plant
Portfolio
Performance
Potential
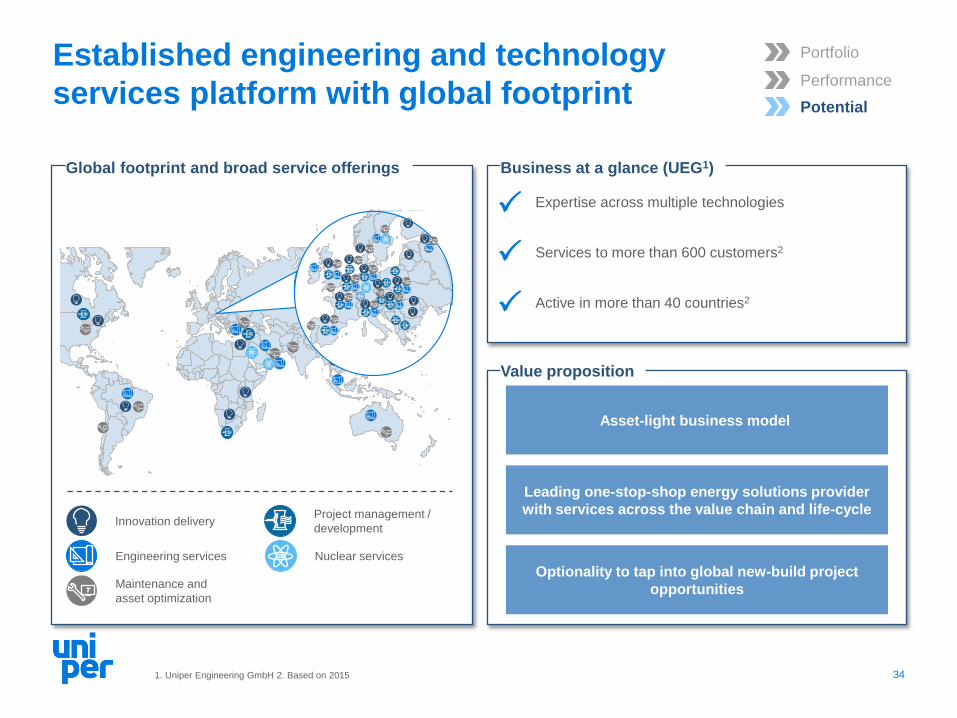
Established engineering and technology
services platform with global footprint
34
Global footprint and broad service offerings
Maintenance and
asset optimization
Innovation delivery Project management /
development
Engineering services Nuclear services
Business at a glance (UEG1)
Value proposition
Expertise across multiple technologies
Services to more than 600 customers2
Active in more than 40 countries2
1. Uniper Engineering GmbH 2. Based on 2015
Asset-light business model
Leading one-stop-shop energy solutions provider
with services across the value chain and life-cycle
Optionality to tap into global new-build project
opportunities
Portfolio
Performance
Potential

The investment rationale for European Generation
35
› Well-diversified portfolio across markets
› Solid earnings from outright and fossil fleet
› Material non-wholesale earnings contribution
› Operational excellence and capital discipline
› Asset profitability clear management priority
› Flexibility and back-up remuneration schemes
› Engineering and technology services
Portfolio
Performance
Potential
Agenda
36
1. Investment rationale
2. Financial highlights & commitment to shareholders
3. Appendix
3.1 European Generation
3.2 Global Commodities
3.3 International Power
3.4 Top-Management incentives & Uniper Supervisory Board
The investment rationale for Global Commodities
37
Attractive low investment
business model with a diversified
earnings profile across the value
chain and across commodities
based on strong people
capabilities
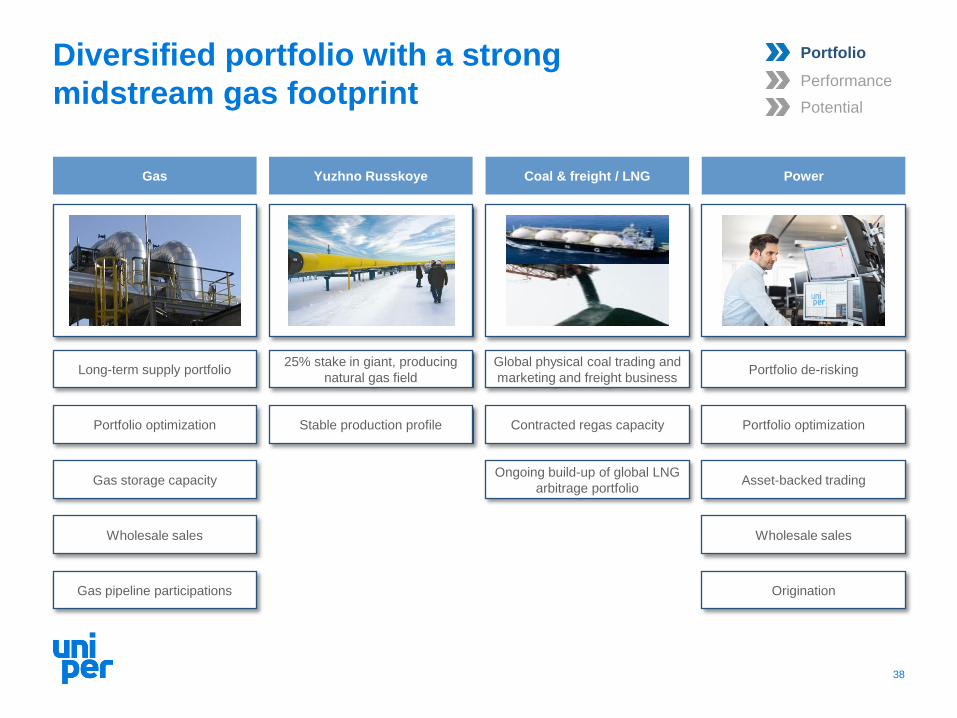
Diversified portfolio with a strong
midstream gas footprint
38
Gas Power Coal & freight / LNG
Global physical coal trading and
marketing and freight business
Contracted regas capacity
Ongoing build-up of global LNG
arbitrage portfolio
Long-term supply portfolio
Portfolio optimization
Gas storage capacity
Wholesale sales
Gas pipeline participations
Yuzhno Russkoye
25% stake in giant, producing
natural gas field Portfolio de-risking
Portfolio optimization
Asset-backed trading
Wholesale sales
Origination
Stable production profile
Portfolio
Performance
Potential
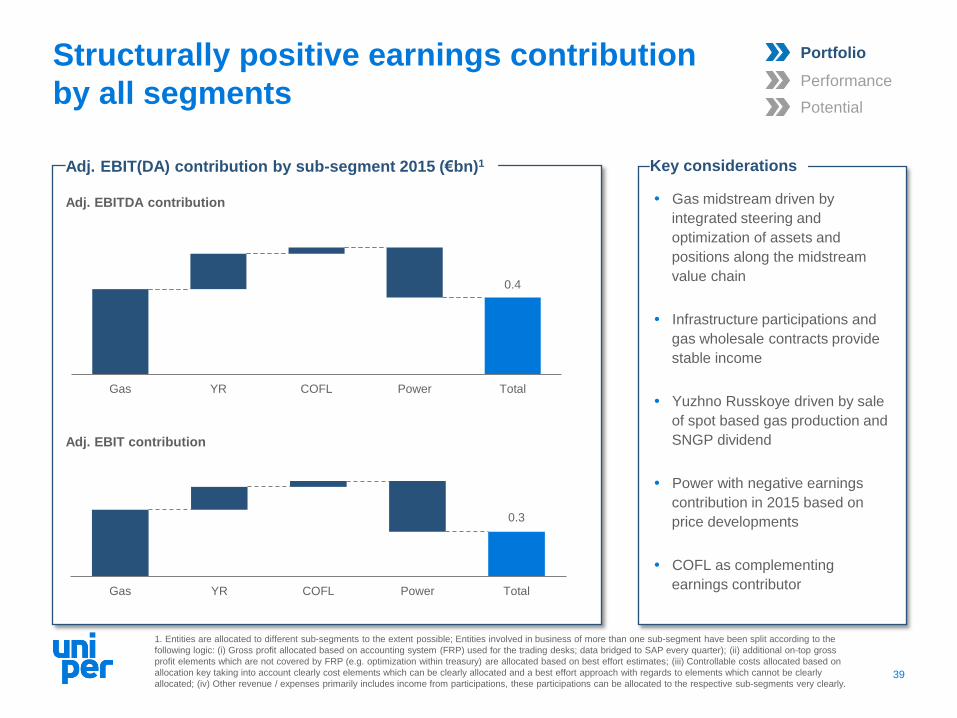
Gas midstream driven by
integrated steering and
optimization of assets and
positions along the midstream
value chain
Infrastructure participations and
gas wholesale contracts provide
stable income
Yuzhno Russkoye driven by sale
of spot based gas production and
SNGP dividend
Power with negative earnings
contribution in 2015 based on
price developments
COFL as complementing
earnings contributor
Structurally positive earnings contribution
by all segments
39
Adj. EBIT(DA) contribution by sub-segment 2015 (€bn)1 Key considerations
0.3
Gas YR COFL Power Total
Adj. EBITDA contribution
Adj. EBIT contribution
0.4
Gas YR COFL Power Total
1. Entities are allocated to different sub-segments to the extent possible; Entities involved in business of more than one sub-segment have been split according to the
following logic: (i) Gross profit allocated based on accounting system (FRP) used for the trading desks; data bridged to SAP every quarter); (ii) additional on-top gross
profit elements which are not covered by FRP (e.g. optimization within treasury) are allocated based on best effort estimates; (iii) Controllable costs allocated based on
allocation key taking into account clearly cost elements which can be clearly allocated and a best effort approach with regards to elements which cannot be clearly
allocated; (iv) Other revenue / expenses primarily includes income from participations, these participations can be allocated to the respective sub-segments very clearly.
Portfolio
Performance
Potential

Fully integrated, market-leading gas
midstream business
1. LTC = Long Term Contracts; 2. Natural gas consumption in Germany according to Arbeitsgemeinschaft Energiebilanzen e.V. (AGEB) 3. Uniper Energy Sales GmbH 40
Transport Storage Sales and optimisation
Germany, Austria, UK
Flexible, diversified
storage portfolio
78%
20%
2%
Germany Austria UK
Main participations
• 7.3 bcm in OPAL
• 3.2 bcm in BBL
Bookings
• Hub-to-hub
• Market entry-exit
• Storage entry-exit Market-reflective pricing
Volume & time flexibility
Gas portfolio optimisation
8.8 bcm
Supply (LTCs)1
TSO products
346 TWh wholesale sales
(UES3)
401 TWh
781 TWh
Uniper2015
Germandemand
2
Portfolio
Performance
Potential
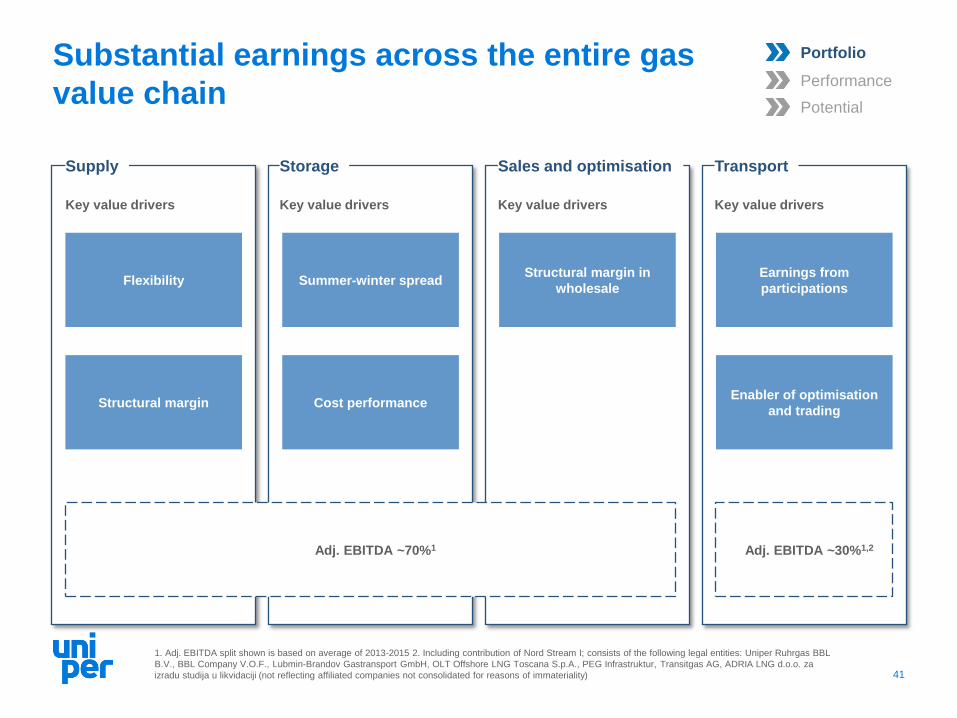
Substantial earnings across the entire gas
value chain
41
Transport Storage Sales and optimisation
Adj. EBITDA ~70%1
Supply
Key value drivers
1. Adj. EBITDA split shown is based on average of 2013-2015 2. Including contribution of Nord Stream I; consists of the following legal entities: Uniper Ruhrgas BBL
B.V., BBL Company V.O.F., Lubmin-Brandov Gastransport GmbH, OLT Offshore LNG Toscana S.p.A., PEG Infrastruktur, Transitgas AG, ADRIA LNG d.o.o. za
izradu studija u likvidaciji (not reflecting affiliated companies not consolidated for reasons of immateriality)
Key value drivers Key value drivers Key value drivers
Summer-winter spread Flexibility Earnings from
participations
Cost performance
Structural margin in
wholesale
Structural margin Enabler of optimisation
and trading
Adj. EBITDA ~30%1,2
Portfolio
Performance
Potential
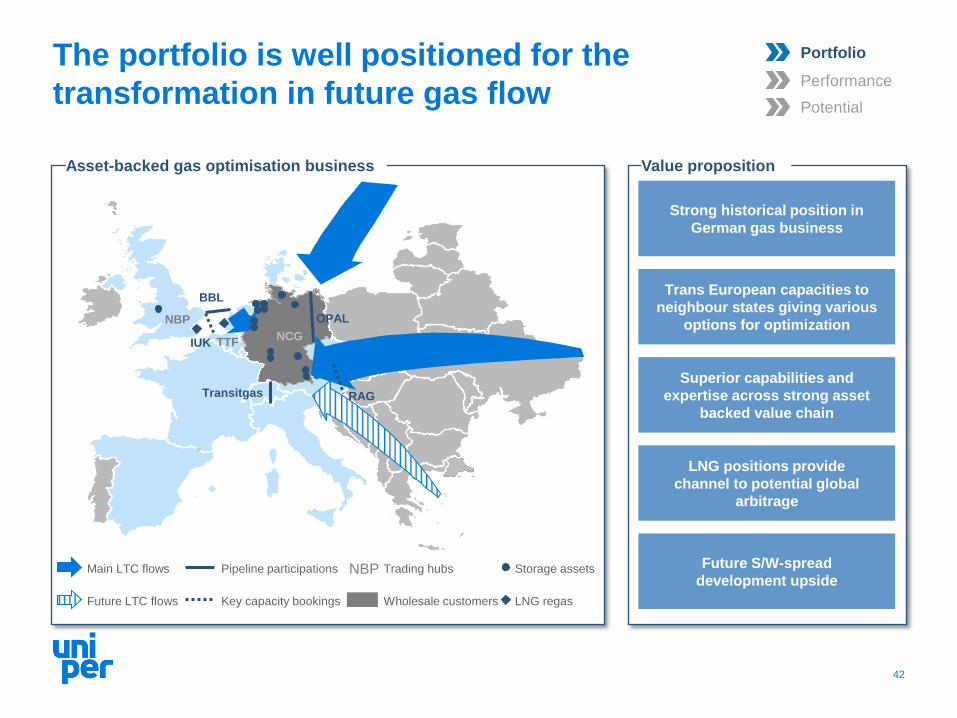
The portfolio is well positioned for the
transformation in future gas flow
42
Value proposition Asset-backed gas optimisation business
Strong historical position in
German gas business
Trans European capacities to
neighbour states giving various
options for optimization
Superior capabilities and
expertise across strong asset
backed value chain
LNG positions provide
channel to potential global
arbitrage
Future S/W-spread
development upside
IUK
NBP
TTF
BBL
OPAL
Transitgas RAG
Key capacity bookings Wholesale customers Future LTC flows LNG regas
Pipeline participations NBP Trading hubs Main LTC flows Storage assets
NCG
Portfolio
Performance
Potential
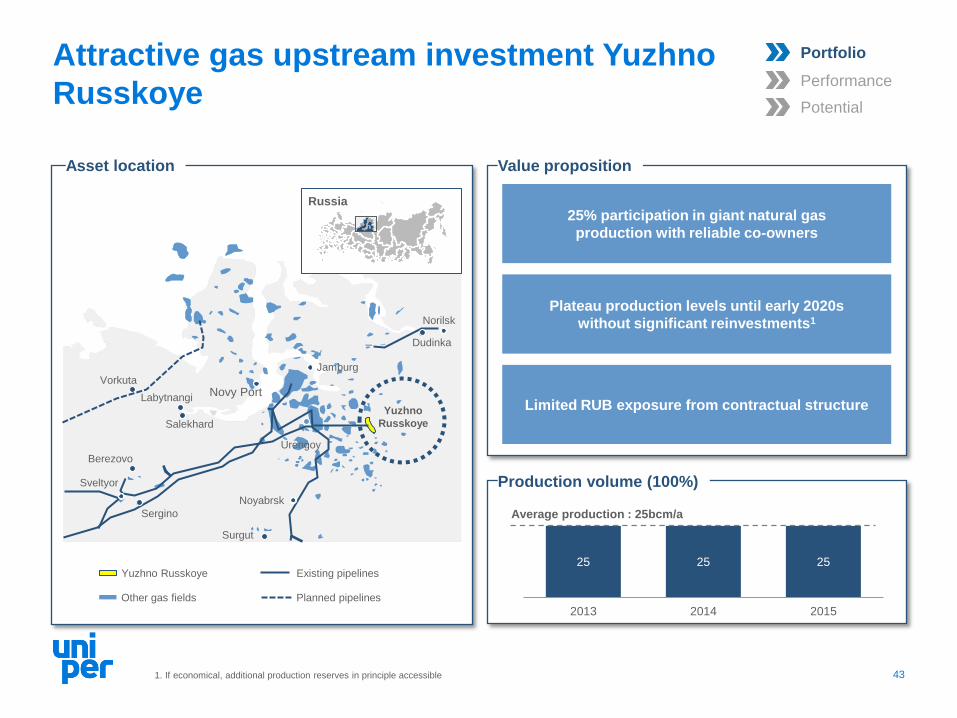
25 25 25
2013 2014 2015
Attractive gas upstream investment Yuzhno
Russkoye
43
Production volume (100%)
25% participation in giant natural gas
production with reliable co-owners
Plateau production levels until early 2020s
without significant reinvestments1
Limited RUB exposure from contractual structure
Value proposition
Average production : 25bcm/a
Existing pipelines Yuzhno Russkoye
Planned pipelines Other gas fields
Asset location
Norilsk
Dudinka
Novy Port Labytnangi
Yuzhno
Russkoye
Berezovo
Sveltyor
Noyabrsk
Sergino
Surgut
Salekhard
Vorkuta
Urengoy
Jamburg
Russia
1. If economical, additional production reserves in principle accessible
Portfolio
Performance
Potential

Physical commodity and freight business
enables global arbitrage
44
Value proposition
Physical supply of coal and LNG addressing
own and third-party commodity requirements
Monetisation of global arbitrage
opportunities based on sizeable supply portfolio
and global fleet of bulk carriers
Key drivers Coal flows
1. Excluding access to regasification capacities at Huelva and Barcelona terminals in Spain and 48% stake in 3.75 bcm OLT terminal in Italy
Established global coal arbitrage portfolio
Transition from select regas positions to global arbitrage
Main coal flows Uniper offices (across commodities)
31 30 28
2013 2014 2015
3,0 1,7
Gate Grain
Physical coal volume (mmt)
LNG regas capacity (bcm)1
Portfolio
Performance
Potential
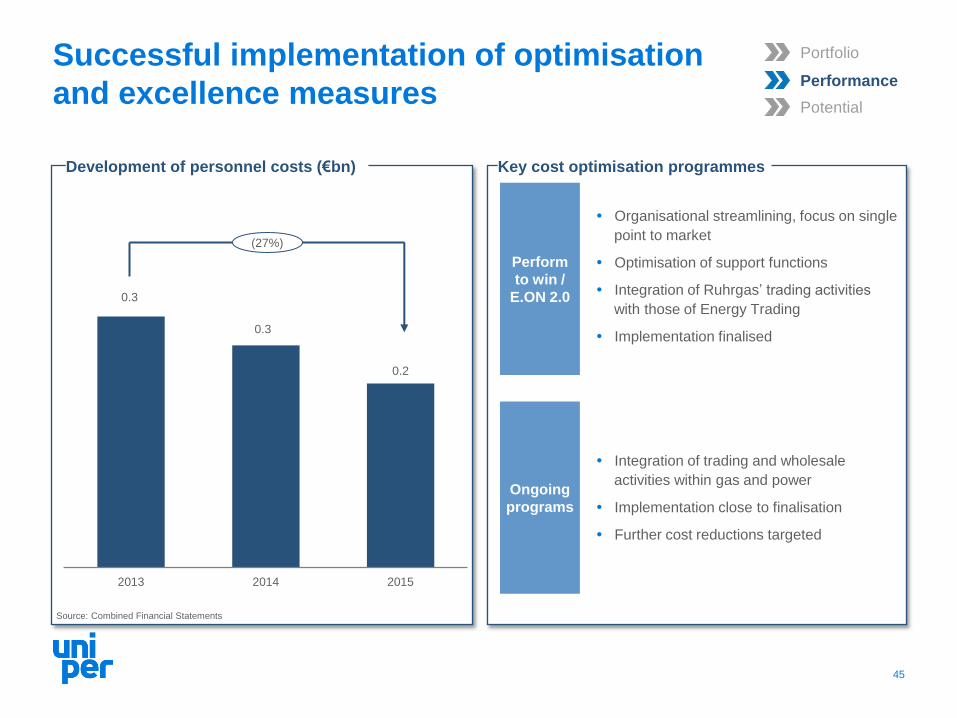
Successful implementation of optimisation
and excellence measures
45
Key cost optimisation programmes Development of personnel costs (€bn)
0.3
0.3
0.2
2013 2014 2015
(27%)
Perform
to win /
E.ON 2.0
Organisational streamlining, focus on single
point to market
Optimisation of support functions
Integration of Ruhrgas’ trading activities
with those of Energy Trading
Implementation finalised
Ongoing
programs
Integration of trading and wholesale
activities within gas and power
Implementation close to finalisation
Further cost reductions targeted
Portfolio
Performance
Potential
Source: Combined Financial Statements
`
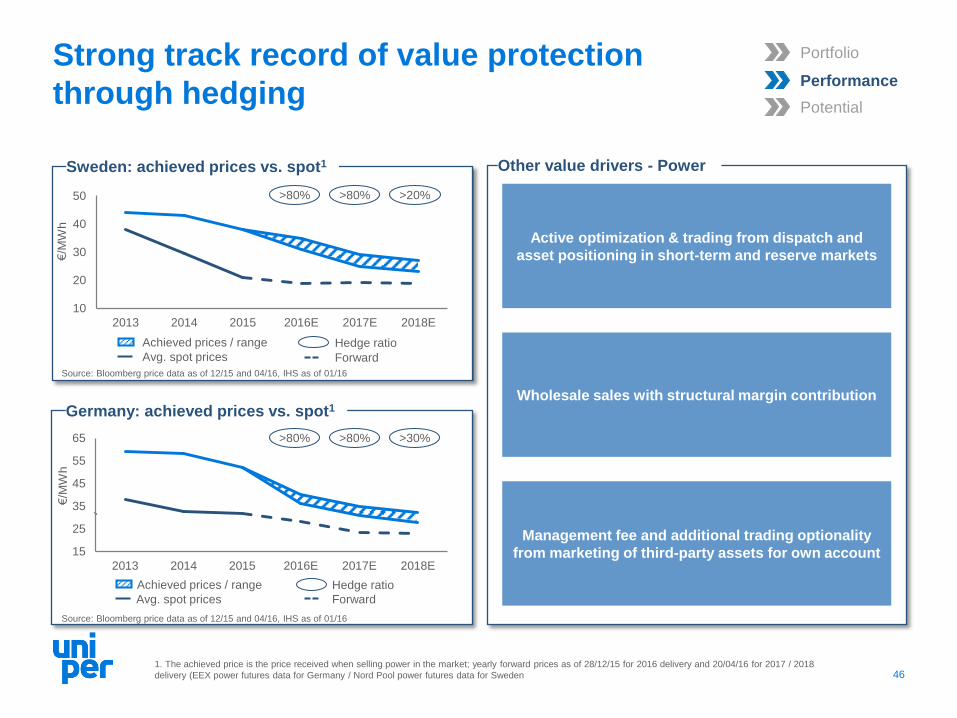
15
25
35
45
55
65
2013 2014 2015 2016E 2017E 2018E
10
20
30
40
50
2013 2014 2015 2016E 2017E 2018E
Strong track record of value protection
through hedging
46
Other value drivers - Power
Germany: achieved prices vs. spot1
1. The achieved price is the price received when selling power in the market; yearly forward prices as of 28/12/15 for 2016 delivery and 20/04/16 for 2017 / 2018
delivery (EEX power futures data for Germany / Nord Pool power futures data for Sweden
€/M
Wh
Active optimization & trading from dispatch and
asset positioning in short-term and reserve markets
Wholesale sales with structural margin contribution
Management fee and additional trading optionality
from marketing of third-party assets for own account
Sweden: achieved prices vs. spot1
€/M
Wh
Source: Bloomberg price data as of 12/15 and 04/16, IHS as of 01/16
>80% >80%
>80% >80%
>30%
>20%
Avg. spot prices
Achieved prices / range Hedge ratio
Avg. spot prices
Achieved prices / range Hedge ratio
Forward
Forward
Portfolio
Performance
Potential
Source: Bloomberg price data as of 12/15 and 04/16, IHS as of 01/16
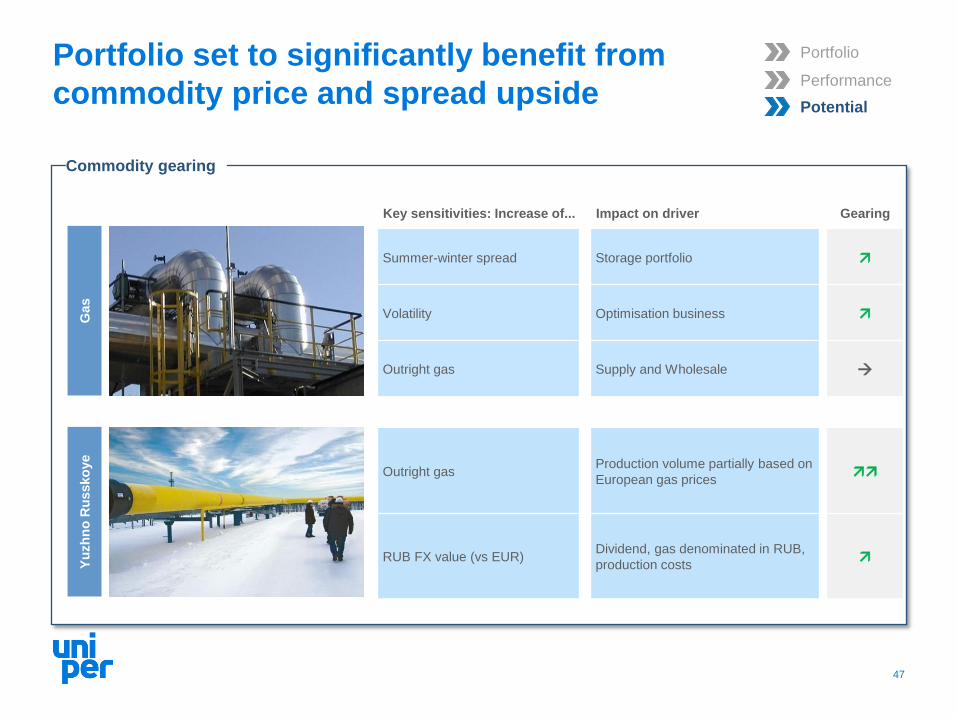
Portfolio set to significantly benefit from
commodity price and spread upside
47
Summer-winter spread Storage portfolio
Volatility Optimisation business
Outright gas Supply and Wholesale
Outright gas Production volume partially based on
European gas prices
RUB FX value (vs EUR) Dividend, gas denominated in RUB,
production costs
Gas
Yu
zh
no
Ru
ssko
ye
Key sensitivities: Increase of... Impact on driver Gearing
Commodity gearing
Portfolio
Performance
Potential

The investment rationale for Global Commodities
48
› Fully integrated, leading gas midstream business
› Attractive gas upstream investment
› Global arbitrage from physical commodity business
› Track record of cost optimization and excellence
› Value protection through hedging of asset positions
› Commodity upside
› Spread upside
Portfolio
Performance
Potential
Agenda
49
1. Investment rationale
2. Financial highlights & commitment to shareholders
3. Appendix
3.1 European Generation
3.2 Global Commodities
3.3 International Power
3.4 Top-Management incentives & Uniper Supervisory Board

The investment rationale for International Power
50
Well positioned and optimised
portfolio in a market with
favourable regulatory framework

0,6
1,0
1,4
2,3
5,5
Smolenskaya
Yaivinskaya
Shaturskaya
Berezovskaya
Surgutskaya
Old capacities New capacities
International Power driven by majority stake
in one of the leading Russian energy players
51
1. Net generation capacity for 2015 (accounting view); net generation capacity is reported for a power plant if it has been in operation within a year - excludes 20
MW of capacity in the Czech Republic which is held by E.ON Russia 2. Block 3 currently not operational after fire incident 3. Old capacities defined as capacities
commissioned prior to 2007 4. Stake in E.ON Russia JSC as of 31 December 2015
10.7 GW net capacity (GW)¹
83.7% stake4 in one of the largest private Russian generators
~5% of Russian electricity production
~30% capacity increase since 2010
Russia
Smolenskaya
Shaturskaya
Yaivinskaya
Surgutskaya Berezovskaya
3
Pricing zone 1
Pricing zone 2
2
Portfolio
Performance
Potential
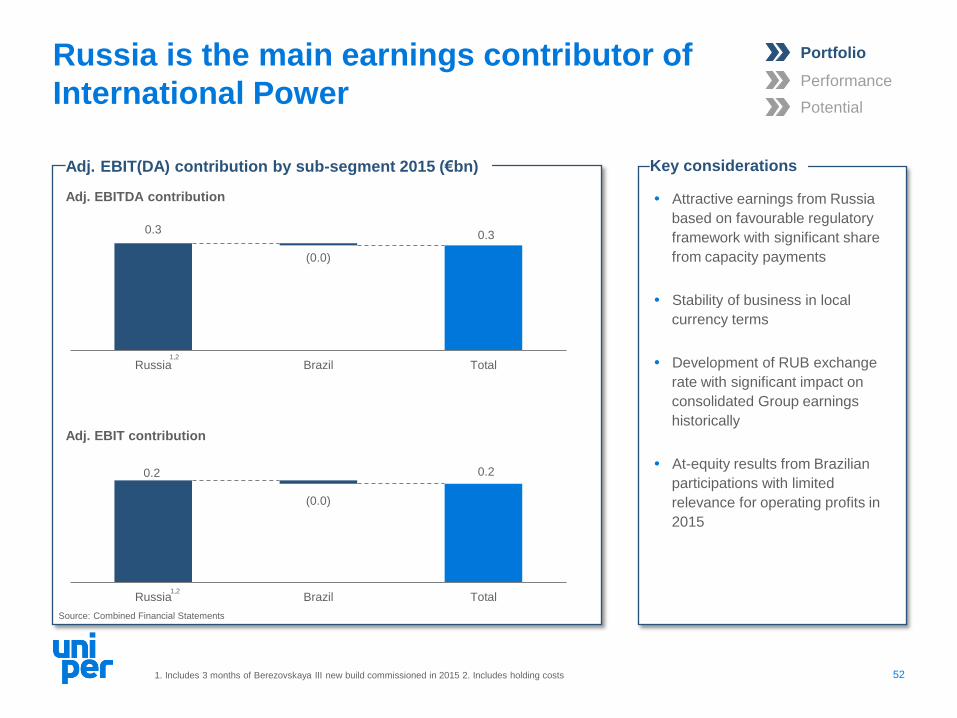
Attractive earnings from Russia
based on favourable regulatory
framework with significant share
from capacity payments
Stability of business in local
currency terms
Development of RUB exchange
rate with significant impact on
consolidated Group earnings
historically
At-equity results from Brazilian
participations with limited
relevance for operating profits in
2015
Russia is the main earnings contributor of
International Power
52
Adj. EBIT(DA) contribution by sub-segment 2015 (€bn)
0.3 0.3
(0.0)
Russia Brazil Total
Key considerations
0.2 0.2
(0.0)
Russia Brazil Total
1,2
1,2
1. Includes 3 months of Berezovskaya III new build commissioned in 2015 2. Includes holding costs
Adj. EBITDA contribution
Adj. EBIT contribution
Portfolio
Performance
Potential
Source: Combined Financial Statements

Adequate market design with significant
share of less volatile capacity payments
53
Market design
Day ahead
Regulated
Marginal cost driven
Indexed
based on historical costs
Electricity market
favourable for low-cost and
efficient assets
Capacity mechanisms
cover fixed and capital
costs
KOM
(old capacity)
CSA
(new capacity)
Auctions designed to cover fixed costs
Guaranteed return of 13–14%
Portfolio
Performance
Potential

Major market elements provide stability
and predictability of revenue streams
54
Regular gas tariff indexation¹ Attractive KOM auction design² Guaranteed return from CSA
Stability based on limiting price
fluctuations
Mid-term stability based on
recent auction results
Return on investment based on
framework securing IRR
75
100
125
150
kR
UB
/ M
W p
er
mo
nth
(re
al p
rice
s)
Source: Federal Tariff Service, ATS Source: System operator
Shaturskaya
Yaivinskaya
Surgutskaya
Berezovskaya
Number of past CSA payment years
Remaining CSA period
14 years
10 years
10 years
9 years
Electricity price Gas tariff
3
1. Rebased to 100 in 2011 2. Figures supposed to be inflated by actual inflation of the prior year minus 1% 3. Currently out of service
Indexed (%)
/ Inflation
2011 2015 2013
Portfolio
Performance
Potential
113 111 110 113
182 186 190 189
Pricing zone 1 Pricing zone 2
2016 2017 2018 2019

Strong merit order positioning of key plants
55
Hydro & Nuclear Coal & gas Hydro Coal & regional CHPs
Value proposition Strong merit order positioning
1.6 GW new state-of-the-art gas-fired
capacities
Surgutskaya and Berezovskaya with low
variable costs based on local sourcing
Assets beneficially located in high-
demand regions
Beneficial efficiency gap between
“old" portfolio and average price
setting plants in the market
Second pricing zone First pricing zone
E.ON Russia Plants
Portfolio
Performance
Potential
Source: ATS (market data) and company information (illustrative positioning of E.ON Russia plants based on management estimates)

Competitive advantage in capacity markets
from delivering on cost and excellence
Disciplined management of non-fuel costs¹
Ind
ex 1
00
in
20
10
Value proposition
Lean management and optimized overhead
Implemented operational improvements
Streamlined maintenance measures
1. Calculated as operating costs less costs for fuel, depreciation & amortization, purchase of electricity, taxes other than income tax, provisions for impairment of
receivables, raw materials and impairment of PPE 2. 2015 non-fuel costs adjusted for extraordinary expenses related to repair & maintenance works at Surgutskaya
IV and No. 7 (c.1.9 RUBbn; partly compensated by insurance, which is included in other operating income in amount of c. 1.3 RUBbn) and an accrual for delay in
delivery of capacity from Berezovskaya III (1.8 RUBbn); only 25% of capacity from Berezovskaya III reflected in 2015 56
80
100
120
140
160
2010 2011 2012 2013 2014 2015
Non-fuel costs - RUB/MW Russian CPI
2
Portfolio
Performance
Potential

100% 105%
Track record of solid financial performance
57
Dividends and payout ratio
0.5
0.3
0.3
0.2 0.1
30% 30% 30%
15%
9%
Peer A IPRussia
Peer B Peer C Peer D2
OCFbIT (€bn) Investments (€bn)
OCFbIT (RUB4; Indexed5)
FX
Cash flow performance3 EBITDA performance vs. peers¹
Source: Company information, Combined Financial Statements
EBITDA (€bn) Margin (%)
1. 2015 based and most relevant peers as per management view; EBITDA and EBITDA-Margin; for peers, EBITDA as per company reporting; because not all
companies define EBITDA in the same way, these figures may not be comparable to similarly titled measures used by those companies 2. Includes holding costs 3.
For International Power Russia 4. Illustrative RUB denominated OCFbIT based on EUR-denominated OCFbIT and an average EUR/RUB exchange rate of 50.95 in
2014 and 68.07 in 2015; minor non-RUB denominated cost elements relating to the holding structure have not been adjusted 5. Rebased to 100 in 2014 6. Proposed
7. Based on weighted average number of ordinary shares outstanding of 63,048,706,145 8. Based on Russian GAAP net income
0.3
0.2
100%
80 %
2014 2015
DPS (RUB)7 Payout ratio (%)8
23
11
5
10 19
Capacity (GW)
6
Portfolio
Performance
Potential
0.5
0.4 0.3
0.2
2014 2015

Upside from Berezovskaya III
Upside from Berezovskaya III and further
mid-term development options
58
Significant earning contribution from
Berezovskaya III
Leverage engineering know-how and
experience for third-party modernisation
business
Possible upside from further development
of the Russian power market
Value proposition
Quantification
of damage
Duration of
repair works
Insurance
coverage
Costs of repair of at least RUB15bn1
Repair works at least until end 2017
Significant compensation for business
interruption and property damage
1. The precise cost of repairs may be evaluated only after the full-scale examination will be finished
Portfolio
Performance
Potential

The investment rationale for International Power
59
› Majority in one of leading Russian energy players
› Predictability and stability from Russian market design
› Power plants well positioned in Russian merit order
› Disciplined management of costs over years
› Track record of solid financial performance
› Returning cash to shareholders is a key priority
› Focus on bringing Berezovskaya III back to service
› Development of third-party services
Portfolio
Performance
Potential
Agenda
60
1. Investment rationale
2. Financial highlights & commitment to shareholders
3. Appendix
3.1 European Generation
3.2 Global Commodities
3.3 International Power
3.4 Top-Management incentives & Uniper Supervisory Board

Top-Management incentives designed to shareholder
interest alignment and reward long-term value creation
61
Key components Uniper management
remuneration
35%
LTI
25%
STI 40%
Base Salary
Incentive
Compensation
STI
(cash)
Key KPI: Adj. FFO (year ahead)1,2
Paid in April of following year
Capped at 200%
LTI
(cash)
Key KPI: Absolute TSR3
Paid after each 4-year period4
Target TSR of 25%
Target achievement of 15% TSR must be met to trigger payout (50%)
Capped at 400% (at TSR of 80%)
1. The only exception is the transition year of 2016 where EBITDA is still used 2. Payout depending on company target achievement (Adj. FFO) x assessment of
individual performance (0.7-1.3) equals annual bonus 3. LTI target value x performance factor (driven by absolute Total Shareholder Return) = payout 4. Start in
2020 at the end of first vesting period; displayed values will be adjusted pro-rata in the first vesting period due to the date of the spin-off 5. 100% of base salary
Share
Ownership
Guidelines Board members to hold significant amount of company shares5

Split leads to reshuffling of Uniper Supervisory Board
62
Michael Sen Dr. Bernhard Reutersberg
Chairman Deputy
chairman
Jean-Francois Cirelli *
David Charles Davies * Dr. Marion Helmes * Rebecca Ranich *
Outgoing CMO,
E.ON CFO, E.ON
Member of the
supervisory board,
Vallourec
Previously GDF
Suez, Deputy CEO
CFO, OMV
Deputy chairman
of the supervisory
board, Borealis
Member of the
supervisory board,
NXP Semiconductors/
ProSiebenSat.1
Previously
Celesio, CFO
Member of the
advisory board,
Yet Analytics
Previously
Deloitte, Director
Proposed composition of shareholder representatives
* joining the Supervisory Board latest with election by the General Meeting in 2017
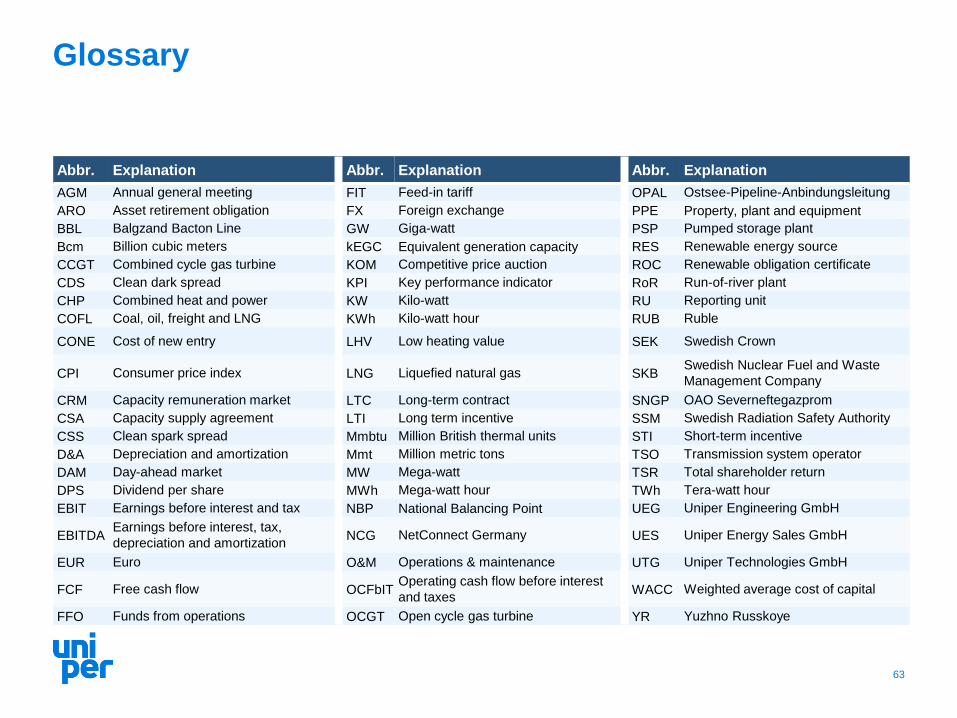
Glossary
Abbr. Explanation Abbr. Explanation Abbr. Explanation
AGM Annual general meeting FIT Feed-in tariff OPAL Ostsee-Pipeline-Anbindungsleitung
ARO Asset retirement obligation FX Foreign exchange PPE Property, plant and equipment
BBL Balgzand Bacton Line GW Giga-watt PSP Pumped storage plant
Bcm Billion cubic meters kEGC Equivalent generation capacity RES Renewable energy source
CCGT Combined cycle gas turbine KOM Competitive price auction ROC Renewable obligation certificate
CDS Clean dark spread KPI Key performance indicator RoR Run-of-river plant
CHP Combined heat and power KW Kilo-watt RU Reporting unit
COFL Coal, oil, freight and LNG KWh Kilo-watt hour RUB Ruble
CONE Cost of new entry LHV Low heating value SEK Swedish Crown
CPI Consumer price index LNG Liquefied natural gas SKB Swedish Nuclear Fuel and Waste
Management Company
CRM Capacity remuneration market LTC Long-term contract SNGP OAO Severneftegazprom
CSA Capacity supply agreement LTI Long term incentive SSM Swedish Radiation Safety Authority
CSS Clean spark spread Mmbtu Million British thermal units STI Short-term incentive
D&A Depreciation and amortization Mmt Million metric tons TSO Transmission system operator
DAM Day-ahead market MW Mega-watt TSR Total shareholder return
DPS Dividend per share MWh Mega-watt hour TWh Tera-watt hour
EBIT Earnings before interest and tax NBP National Balancing Point UEG Uniper Engineering GmbH
EBITDA Earnings before interest, tax,
depreciation and amortization NCG NetConnect Germany UES Uniper Energy Sales GmbH
EUR Euro O&M Operations & maintenance UTG Uniper Technologies GmbH
FCF Free cash flow OCFbIT Operating cash flow before interest
and taxes WACC Weighted average cost of capital
FFO Funds from operations OCGT Open cycle gas turbine YR Yuzhno Russkoye
63
Disclaimer
This document and the presentation to which it relates contains information relating to Uniper SE, ("Uniper" or the "Company"), which is a 100 % fully consolidated subsidiary of E.ON SE, that must not
be relied upon for any purpose and may not be redistributed, reproduced, published, or passed on to any other person or used in whole or in part for any other purposes. By accessing this document you
agree to abide by the limitations set out in this document.
This document is being presented solely for informational purposes and should not be treated as giving investment advice. It is not, and is not intended to be, a prospectus, is not, and should not be
construed as, an offer to sell or the solicitation of an offer to buy any securities, and should not be used as the sole basis of any analysis or other evaluation and investors should not subscribe for or
purchase any shares or other securities in the Company on the basis of or in reliance on the information in this document. The Company has not decided finally whether to proceed with any transaction.
We advise you that the financial information presented herein has been derived or recalculated from the combined financial statements or from the accounting records of Uniper which have been
prepared by Uniper and not from the financial statements of E.ON Group.
Certain information in this presentation is based on management estimates. Such estimates have been made in good faith and represent the current beliefs of applicable members of management.
Those management members believe that such estimates are founded on reasonable grounds. However, by their nature, estimates may not be correct or complete. Accordingly, no representation or
warranty (express or implied) is given that such estimates are correct or complete.
We advise you that some of the information presented herein is based on statements by third parties, and that no representation or warranty, express or implied, is made as to, and no reliance should be
placed on, the fairness, accuracy, completeness or correctness of this information or any other information or opinions contained herein, for any purpose whatsoever. Certain statements contained
herein may be statements of future expectations and other forward-looking statements that are based on the Company’s current views and assumptions and involve known and unknown risks and
uncertainties that may cause actual results, performance or events to differ materially from those expressed or implied in such statements. No one undertakes to publicly update or revise any such
forward-looking statement. Neither Uniper, E.ON SE or any of their respective officers, employees or affiliates nor any other person shall assume or accept any responsibility, obligation or liability
whatsoever (in negligence or otherwise) for any loss howsoever arising from any use of this presentation or the statements contained herein as to unverified third person statements, any statements of
future expectations and other forward-looking statements, or the fairness, accuracy, completeness or correctness of statements contained herein.
In giving this presentation, none of Uniper, E.ON SE or their respective agents undertake any obligation to provide the recipient with access to any additional information or to update this presentation or
any information or to correct any inaccuracies in any such information. Any decision to purchase shares or any other securities should be made solely on the basis of information contained in any
prospectus that may be published by the Company and which would supersede this document and information contained herein in its entirety.
This presentation is not intended to provide the basis for any evaluation or any securities and should not be considered as a recommendation that any person should subscribe for or purchase any
shares or other securities.
This presentation contains certain financial measures (including forward-looking measures) that are not calculated in accordance with IFRS and are therefore considered as "Non-IFRS financial
measures". The Management of Uniper believes that the Non-IFRS financial measures used by Uniper, when considered in conjunction with (but not in lieu of) other measures that are computed in
accordance with IFRS, enhance an understanding of Uniper's results of operations, financial position or cash flows. A number of these Non-IFRS financial measures are also commonly used by
securities analysts, credit rating agencies and investors to evaluate and compare the periodic and future operating performance and value of Uniper and other companies with which Uniper competes.
These Non-IFRS financial measures should not be considered in isolation as a measure of Uniper's profitability or liquidity, and should be considered in addition to, rather than as a substitute for, net
income and the other income or cash flow data prepared in accordance with IFRS. In particular, there are material limitations associated with our use of Non-IFRS financial measures, including the
limitations inherent in our determination of each of the relevant adjustments. The Non-IFRS financial measures used by Uniper may differ from, and not be comparable to, similarly-titled measures used
by other companies.
Certain numerical data, financial information and market data (including percentages) in this presentation have been rounded according to established commercial standards. As a result, the aggregate
amounts (sum totals or interim totals or differences or if numbers are put in relation) in this presentation may not correspond in all cases to the amounts contained in the underlying (unrounded) figures
appearing in the consolidated financial statements. Furthermore, in tables and charts, these rounded figures may not add up exactly to the totals contained in the respective tables and charts.
64
Related Documents