Sustainable Use of Natural Resources in the Context of Trade Liberalization and Export Growth in Indonesia A Study on the Use of Economic Instruments in the Pulp and Paper Industry

Welcome message from author
This document is posted to help you gain knowledge. Please leave a comment to let me know what you think about it! Share it to your friends and learn new things together.
Transcript

Sustainable Use of Natural Resources inthe Context of Trade Liberalization andExport Growth in Indonesia
A Study on the Use of Economic Instruments in the Pulp and Paper Industry


i
During Indonesia’s economic growth oriented paradigm of the 1980s – 1990s, natural resources and the
environment were regarded as free goods (or factors of production) and the costs of using natural
resources were not internalized into production costs. This approach has led to a negative situation in
which natural resources are over used and environmental services are under valued, which disturbs the
natural balance. The perception that environmental resources are free should be discontinued because this
approach creates high environmental costs and social inequities, in particular for the people who are not
using those natural resources directly. For these reasons and to achieve sustainable development, the
Indonesian Government needs to design development policies, including trade-related policies, that will
internalize the costs of pollution and environmental damage into an activity’s production costs.
Current environmental policies and the institutional framework of Indonesia’s industrial sector do not
adequately address the negative impacts of export growth resulting from trade liberalization. Environ-
mental management in Indonesia has relied on command and control approaches, which have many
limitations in addressing adverse impacts, especially in the industrial sector. The use of economic
instruments in environmental management is fast becoming an alternative approach, particularly for
pollution control and damage to the environment. This study proposes the use of economic instruments to
address and mitigate the negative impacts of pollution caused by the pulp and paper industry.
However, environmental policies are part of a complex system of existing and proposed government
actions. In competition with other government actions and objectives, economic instruments for environ-
mental protection must be able to operate effectively with other policies already in place, and the
responsible institution will need adequate capacity to carry out an additional set of highly sophisticated
activities. In other words, any proposed economic instruments must be compatible with national regulatory
objectives and existing legislation. The National Effluent Charge for the pulp and paper industry proposed
in this report should meet these criteria.
Foreword


iii
This project was initiated and supervised by Hussein Abaza at UNEP and conducted under the auspices of
the UNEP-UNCTAD Capacity Building Task Force (CBTF). A number of institutions and individuals have
been involved in the implementation of this study and contributed to its successful implementation. The
Ministry of Environment of the Republic of Indonesia has been the main national institution in Indonesia
responsible for undertaking the research. Special thanks therefore goes to the Ministry and to the technical
team (Organizing Committee) led by Mrs. Laksmi Dhewanthi. Thanks are also extended to Ms. Aristin Tri
Apriani, Mr. Denny D. Indrajaya and Mr. Arief B. Purwanto who directly participated in the project.
This study has been made possible due to the cooperation and commitment of the Government of the
Republic of Indonesia and the Minister for Environment – the Honourable Nabiel Makarim. Thanks are
also due to the members of the National Steering Committee, who represent various government and non-
governmental organizations. The Steering Committee was led by Mr. Hoetomo – Deputy Minister of
Environment and included Mr. Arie D. Djukardi of the Ministry of Environment, Mr. Dana A.
Kartakusuma of the Ministry of Environment and Mr. Ngaloken Ginting of the Ministry of Forestry.
Thanks are also extended to the individuals and institutions that responded to the questionnaires and who
actively participated in a series of discussions, with special thanks to Mr. Kahar Haryopuspito and
Mr. Soebardjo from the Indonesian Pulp and Paper Association. Since we cannot mention them all by
name, we take this opportunity to thank them all. We also thank Mr. Timothy Brown and Mr. Virza
Sasmitawidjaja from the NRM (Natural Resource Management) Programme of USAID, for their valuable
contributions during the development of the report.
At UNEP, Anja von Moltke and Sophie Forster Carbonnier coordinated and provided technical support to
the project, with the support of Minna Epps. Special thanks go to the UNEP Working Group on Economic
Instruments, which provided substantive guidance and input throughout the project. Andrea Smith was
responsible for editing the report. Désirée Leon processed the report for publication and administrative
support was provided by Rahila Mughal.
Acknowledgements


United Nations EnvironmentProgramme
v
The United Nations Environment Programme (UNEP) is the overall coordinating environmental organi-
zation of the United Nations system. Its mission is to provide leadership and encourage partnerships in
caring for the environment by inspiring, informing and enabling nations and people to improve their
quality of life without compromising that of future generations. In accordance with its mandate, UNEP
works to observe, monitor and assess the state of the global environment, improve the scientific under-
standing of how environmental change occurs, and in turn, how such change can be managed by action-
oriented national policies and international agreements. UNEP’s capacity building work thus centers on
helping countries strengthen environmental management in diverse areas that include freshwater and land
resource management, the conservation and sustainable use of biodiversity, marine and coastal ecosystem
management, and cleaner industrial production and eco-efficiency, among many others.
UNEP, which is headquartered in Nairobi, Kenya, marked its first 30 years of service in 2002. During this
time, in partnership with a global array of collaborating organizations, UNEP has achieved major advances
in the development of international environmental policy and law, environmental monitoring and
assessment, and the understanding of the science of global change. This work also supports the successful
development and implementation of the world’s major environmental conventions. In parallel, UNEP
administers several multilateral environmental agreements (MEAs) including the Vienna Convention’s
Montreal Protocol on Substances that Deplete the Ozone Layer, the Convention on International Trade in
Endangered Species of Wild Fauna and Flora (CITES), the Basel Convention on the Control of Trans-
boundary Movements of Hazardous Wastes and their Disposal (SBC), the Convention on Prior Informed
Consent Procedure for Certain Hazardous Chemicals and Pesticides in International Trade (Rotterdam
Convention, PIC) and the Cartagena Protocol on Biosafety to the Convention on Biological Diversity as
well as the Stockholm Convention on Persistent Organic Pollutants (POPs).
Division of Technology, Industry and Economics
The mission of the Division of Technology, Industry and Economics (DTIE) is to encourage decision
makers in government, local authorities and industry to develop and adopt policies, strategies and practices
that are cleaner and safer, make efficient use of natural resources, ensure environmentally sound
management of chemicals, and reduce pollution and risks for humans and the environment. In addition, it
seeks to enable implementation of conventions and international agreements and encourage the
internalization of environmental costs. UNEP DTIE’s strategy in carrying out these objectives is to
influence decision-making through partnerships with other international organizations, governmental
authorities, business and industry, and non-governmental organizations; facilitate knowledge management
through networks; support implementation of conventions; and work closely with UNEP regional offices.
The Division, with its Director and Division Office in Paris, consists of one centre and five branches
located in Paris, Geneva and Osaka.

Economics and Trade Branch
The Economics and Trade Branch (ETB) is one of the five branches of DTIE. Its mission is to enhance the
capacities of countries, especially of developing countries and countries with economies in transition, to
integrate environmental considerations into development planning and macroeconomic policies, including
trade policies. ETB helps countries to develop and use integrated assessment and incentive tools for
sustainable development and poverty reduction. The Branch further works to improve the understanding of
environmental, social and economic impacts of trade liberalization and the trade impacts of environmental
policies, and to strengthen coherence between Multilateral Environmental Agreements and the World
Trade Organization. Through its finance initiative, ETB helps enhance the role of the financial sector in
moving towards sustainability.
In the field of environmental economics, ETB aims to promote the internalization of environmental costs
and enhance the use of economic instruments to contribute to sustainable development and poverty
reduction, including in the specific context of Multilateral Environmental Agreements. The UNEP
Working Group on Economic Instruments, serves as an advisory body to UNEP-ETB’s work programme
on economics and has been instrumental in the preparation of UNEP publications on economic instruments.
For more information regarding UNEP’s work on economic instruments, please contact Anja von Moltke,
Economics Affairs Officer, Economics and Trade Branch at +41 22 917 81 37 or e-mail [email protected].
For more information on the general programme of the Economics and Trade Branch, please contact:
Hussein Abaza
Chief, Economics and Trade Branch (ETB)
Division of Technology, Industry and Economics (DTIE)
United Nations Environment Programme (UNEP)
11-13, chemin des Anémones
1219 Châtelaine/Geneva
Switzerland
Tel.: +41 22 917 81 79
Fax: +41 22 917 80 76
http://www.unep.ch/etb
vi
A Study on the Use of Economic Instruments in the Pulp and Paper Industry
vii
Foreword .............................................................................................................................................. i
Acknowledgements ............................................................................................................................ iii
Executive summary ............................................................................................................................ xi
Abbreviations and acronyms ............................................................................................................ xiii
1. Introduction and background .................................................................................................... 1
1.1 Indonesia’s industrial sector ........................................................................................................ 1
1.2 Environmental issues in Indonesia .............................................................................................. 2
1.3 Project rationale .......................................................................................................................... 3
1.4 Overview of the pulp and paper industry .................................................................................... 4
1.5 Project objectives and scope ........................................................................................................ 4
1.6 Methodology................................................................................................................................ 5
2. Impacts of trade liberalization in Indonesia ............................................................................ 7
2.1 Trade liberalization and economic growth .................................................................................. 7
2.1.1 Economic reform .............................................................................................................. 7
2.1.2 Transition to an industrial economy and growth of the private sector .............................. 8
2.2 Environmental impacts of trade liberalization ............................................................................ 8
2.2.1 Environmental impacts of trade liberalization in the pulp and paper industry .................. 9
2.3 Prospects for economic growth.................................................................................................... 10
2.3.1 Policy issues for future development of the pulp and paper industry ................................ 10
2.4 Opportunities and challenges ...................................................................................................... 11
2.4.1 Comparative advantages .................................................................................................... 11
2.4.2 Competition issues ............................................................................................................ 12
3. Indonesia’s pulp and paper industry .......................................................................................... 13
3.1 Development of the industry........................................................................................................ 13
3.2 Structure of the pulp and paper industry .................................................................................... 16
3.2.1 Supply of raw materials .................................................................................................... 16
3.2.2 The production process...................................................................................................... 18
3.2.3 Environmental impacts ...................................................................................................... 21
3.2.4 Development of improved technology and cleaner production .......................................... 22
Table of contents

viii
A Study on the Use of Economic Instruments in the Pulp and Paper Industry
3.3 Future prospects for the pulp and paper industry ........................................................................ 22
4. Review of Indonesia’s current environmental policies .......................................................... 23
4.1 National environmental policies in the industrial sector.............................................................. 24
4.1.1 Policies relevant to the pulp and paper sector .................................................................... 24
4.2 Use of economic instruments in environmental policy .............................................................. 24
4.2.1 Use of EIs in Indonesia...................................................................................................... 26
4.2.2 Use of EIs in the forestry sector ........................................................................................ 27
4.2.3 Use of EIs for pollution control: Environmental soft loan programme for pollution
control equipment .............................................................................................................. 29
4.2.4 Use of EIs for improved technology: Import duty exemption to encourage technology import 31
4.2.5 Use of EIs in the water sector ............................................................................................ 32
4.4 Summary...................................................................................................................................... 34
5. Policy proposal................................................................................................................................ 37
5.1 Basic considerations .................................................................................................................... 37
5.2 Targeting pollution: Proposal for a National Effluent Charge .................................................... 37
5.2.1 Creating a framework for a National Effluent Charge Programme .................................. 38
6. Summary and conclusions............................................................................................................ 41
6.1 Key findings ................................................................................................................................ 41
6.2 Need for further research ............................................................................................................ 42
References .......................................................................................................................................... 43
Appendices .......................................................................................................................................... 47
Appendix I .......................................................................................................................................... 47
Industry selection process............................................................................................................ 47
Table A1: Criteria, weighting factors and level of degree .......................................................... 47
Table A2: Results of selection process ........................................................................................ 48
Appendix II ........................................................................................................................................ 49
Summary of survey results .......................................................................................................... 49
Appendix III ...................................................................................................................................... 51
Preliminary identification of environmental impacts in the pulp and paper industry resulting
from trade policies and agreements ............................................................................................ 51
Appendix IV ...................................................................................................................................... 53
Eco-Labelling requirements for uncoated printing paper ............................................................ 53
Appendix V ........................................................................................................................................ 54
Lending mechanism of the environmental credit line.................................................................. 54
ix
Table of contents
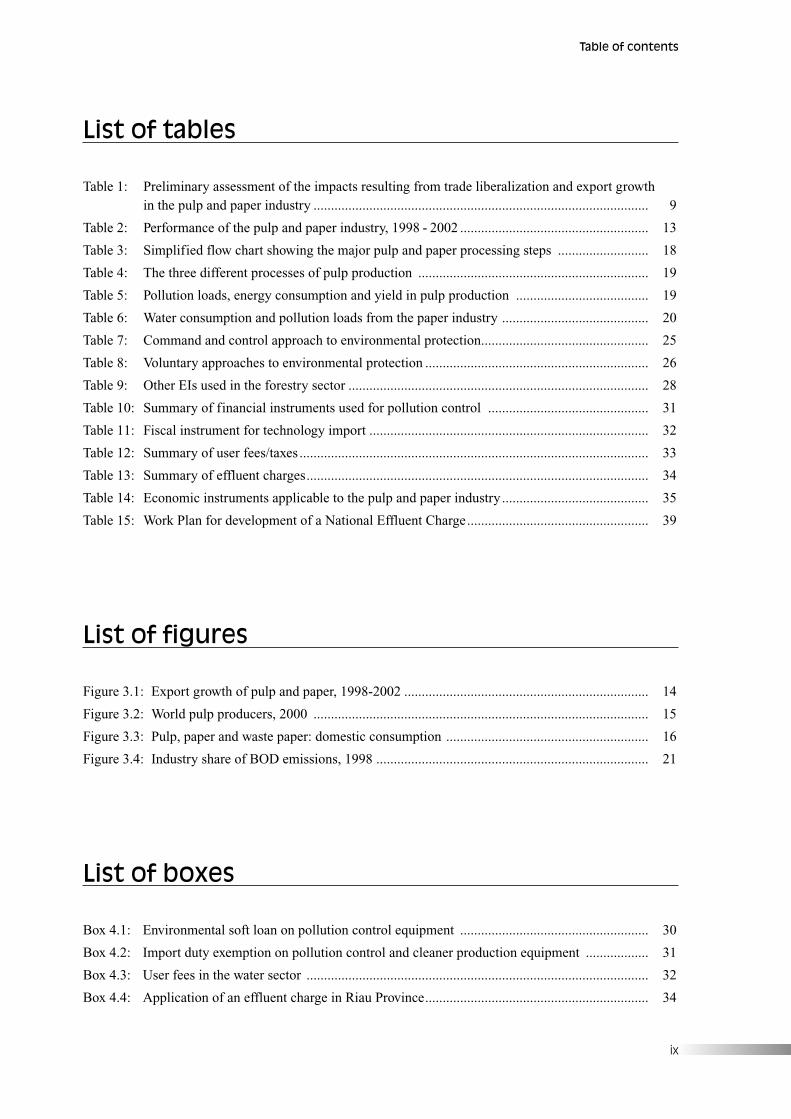
List of tables
Table 1: Preliminary assessment of the impacts resulting from trade liberalization and export growth in the pulp and paper industry ................................................................................................ 9
Table 2: Performance of the pulp and paper industry, 1998 - 2002 ...................................................... 13
Table 3: Simplified flow chart showing the major pulp and paper processing steps .......................... 18
Table 4: The three different processes of pulp production .................................................................. 19
Table 5: Pollution loads, energy consumption and yield in pulp production ...................................... 19
Table 6: Water consumption and pollution loads from the paper industry .......................................... 20
Table 7: Command and control approach to environmental protection................................................ 25
Table 8: Voluntary approaches to environmental protection ................................................................ 26
Table 9: Other EIs used in the forestry sector ...................................................................................... 28
Table 10: Summary of financial instruments used for pollution control .............................................. 31
Table 11: Fiscal instrument for technology import ................................................................................ 32
Table 12: Summary of user fees/taxes .................................................................................................... 33
Table 13: Summary of effluent charges.................................................................................................. 34
Table 14: Economic instruments applicable to the pulp and paper industry .......................................... 35
Table 15: Work Plan for development of a National Effluent Charge.................................................... 39
List of figures
Figure 3.1: Export growth of pulp and paper, 1998-2002 ...................................................................... 14
Figure 3.2: World pulp producers, 2000 ................................................................................................ 15
Figure 3.3: Pulp, paper and waste paper: domestic consumption .......................................................... 16
Figure 3.4: Industry share of BOD emissions, 1998 .............................................................................. 21
List of boxes
Box 4.1: Environmental soft loan on pollution control equipment ...................................................... 30
Box 4.2: Import duty exemption on pollution control and cleaner production equipment .................. 31
Box 4.3: User fees in the water sector .................................................................................................. 32
Box 4.4: Application of an effluent charge in Riau Province................................................................ 34

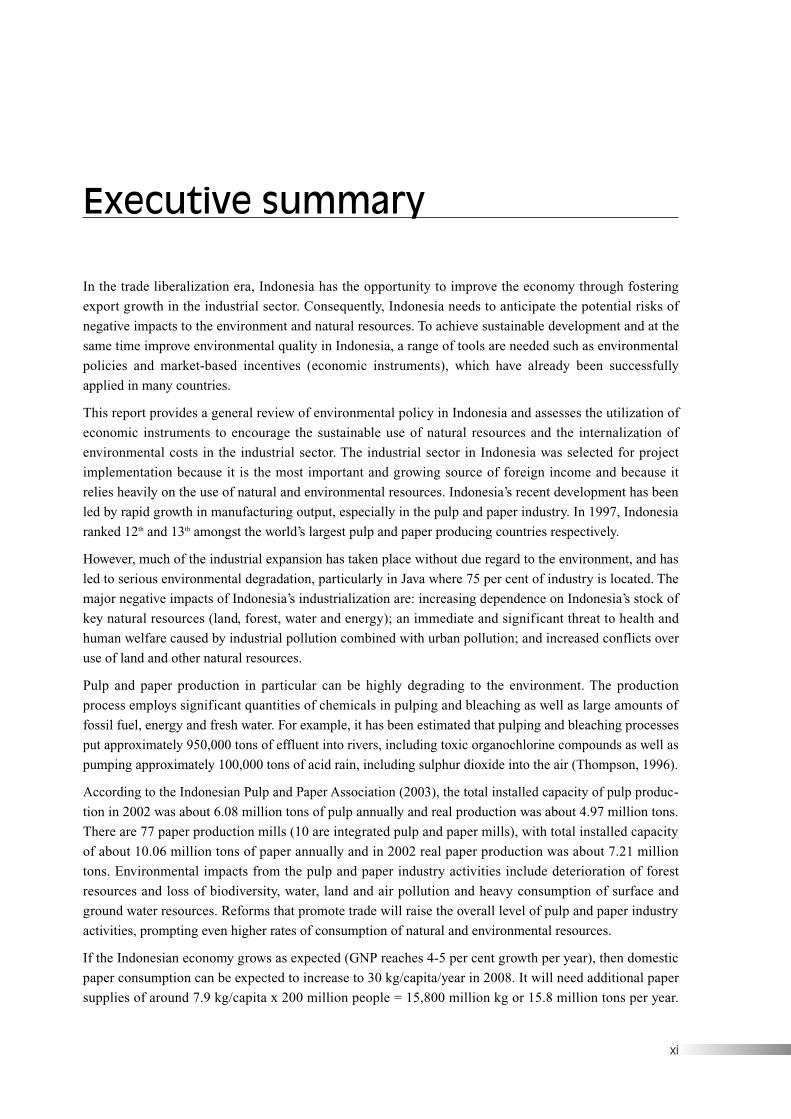
In the trade liberalization era, Indonesia has the opportunity to improve the economy through fostering
export growth in the industrial sector. Consequently, Indonesia needs to anticipate the potential risks of
negative impacts to the environment and natural resources. To achieve sustainable development and at the
same time improve environmental quality in Indonesia, a range of tools are needed such as environmental
policies and market-based incentives (economic instruments), which have already been successfully
applied in many countries.
This report provides a general review of environmental policy in Indonesia and assesses the utilization of
economic instruments to encourage the sustainable use of natural resources and the internalization of
environmental costs in the industrial sector. The industrial sector in Indonesia was selected for project
implementation because it is the most important and growing source of foreign income and because it
relies heavily on the use of natural and environmental resources. Indonesia’s recent development has been
led by rapid growth in manufacturing output, especially in the pulp and paper industry. In 1997, Indonesia
ranked 12th and 13th amongst the world’s largest pulp and paper producing countries respectively.
However, much of the industrial expansion has taken place without due regard to the environment, and has
led to serious environmental degradation, particularly in Java where 75 per cent of industry is located. The
major negative impacts of Indonesia’s industrialization are: increasing dependence on Indonesia’s stock of
key natural resources (land, forest, water and energy); an immediate and significant threat to health and
human welfare caused by industrial pollution combined with urban pollution; and increased conflicts over
use of land and other natural resources.
Pulp and paper production in particular can be highly degrading to the environment. The production
process employs significant quantities of chemicals in pulping and bleaching as well as large amounts of
fossil fuel, energy and fresh water. For example, it has been estimated that pulping and bleaching processes
put approximately 950,000 tons of effluent into rivers, including toxic organochlorine compounds as well as
pumping approximately 100,000 tons of acid rain, including sulphur dioxide into the air (Thompson, 1996).
According to the Indonesian Pulp and Paper Association (2003), the total installed capacity of pulp produc-
tion in 2002 was about 6.08 million tons of pulp annually and real production was about 4.97 million tons.
There are 77 paper production mills (10 are integrated pulp and paper mills), with total installed capacity
of about 10.06 million tons of paper annually and in 2002 real paper production was about 7.21 million
tons. Environmental impacts from the pulp and paper industry activities include deterioration of forest
resources and loss of biodiversity, water, land and air pollution and heavy consumption of surface and
ground water resources. Reforms that promote trade will raise the overall level of pulp and paper industry
activities, prompting even higher rates of consumption of natural and environmental resources.
If the Indonesian economy grows as expected (GNP reaches 4-5 per cent growth per year), then domestic
paper consumption can be expected to increase to 30 kg/capita/year in 2008. It will need additional paper
supplies of around 7.9 kg/capita x 200 million people = 15,800 million kg or 15.8 million tons per year.
Executive summary
xi
Therefore, domestic market conditions still provide good prospects for the industry to grow (CIFOR,
2002). In addition, from the economic point of view, foreign exchange revenue from the industry was
US$ 3 billion, equal to about 4.4 per cent of total GDP in the year 2000, but it declined slightly to about
US$ 2.54 billion in 2001. The expected revenue for 2002 was US$ 3.5 billion (APKI, 2001). Based on the
projected increases in production, if appropriate environmental policies are not well established, negative
environmental impacts will continue.
Indonesia’s first environmental policy was promulgated in 1982, and was revised in 1997 to introduce a
new paradigm in environmental management, replacing the earlier law. The new Act pays more attention to
promoting policies that use market based instruments (economic instruments) together with the command
and control (CAC) approach. To achieve better synergy between CAC policy and economic instruments,
partnerships among stakeholders and increased public involvement is being encouraged.
A number of market-based policies have already been adopted in several sectors with some positive
indirect impacts. However, market based approaches have made only modest inroad into national
environmental policies. The complementary nature of command and control and market-based approaches
or economic instruments needs to be better understood and then turned into better policy-making. Policy
approaches are rarely comprised of only a single tool.
In the pulp and paper industry there is currently no specific use of economic instruments, although they
have been used in the upstream activities that supply raw materials for the industry. For example, a forest
taxation system has been in use for many years. Other economic instruments that can be applied to the
main cycle of the pulp and paper production process include environmental soft loans, import duty
exemptions on environmentally sound technology, user fees and user charges. In order to identify an
appropriate type of economic instrument for specific use in a specific sector, it is necessary to determine
whether it is possible to design a measure that will also meet all the other relevant criteria. For example, a
tax must meet the criteria set out in the Statement of Intent and similar criteria will apply to other
economic instrument schemes. However, while the ideal economic instrument will tackle the environ-
mental problem identified, this is often not possible to achieve directly and proxies may need to be used.
In contrast to economic instruments, regulation often takes the form of uniform emission standards across
industry. This is because regulators lack the necessary information about firm-specific pollution
abatement costs to design a pattern of regulation whereby the marginal abatement costs between firms are
equalized. However, a well-designed economic instrument can equalize the marginal abatement costs
between polluters.
This report summarizes a number of economic instruments that have been implemented in the industrial
sector with relevance to the pulp and paper industry. Findings indicate that economic instruments do tend
to have specific purposes and have a strong potential to reduce the environmental impact identified. The
report then proposes a framework for implementing a national effluent charge in the pulp and paper
industry and presents a preliminary work plan for achieving this. An effluent charge is a viable option to
implement in Indonesia since many of the conditions required to implement such an economic instrument
programme are already in place. However, the proposal will have broad implications for the institutions
responsible for implementing and enforcing it.
Finally, the report clearly indicates that further research on environmental management strategies is
needed to provide sound guidance to decision makers and industry stakeholders to establish new policies
and select appropriate instruments for environmental protection and sustainable development of the pulp
and paper industry. It is hoped that this report will provide a useful basis from which to continue the
research and develop in-depth studies in the future.
xii
A Study on the Use of Economic Instruments in the Pulp and Paper Industry
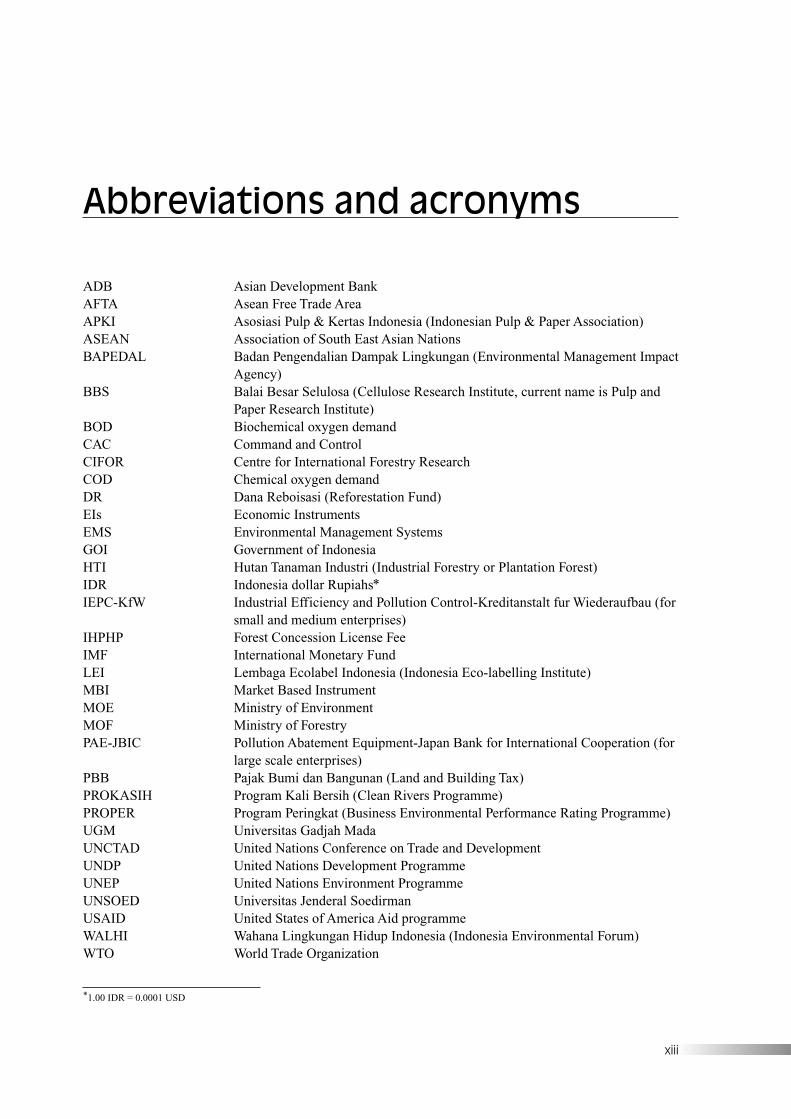
ADB Asian Development BankAFTA Asean Free Trade AreaAPKI Asosiasi Pulp & Kertas Indonesia (Indonesian Pulp & Paper Association)ASEAN Association of South East Asian NationsBAPEDAL Badan Pengendalian Dampak Lingkungan (Environmental Management Impact
Agency)BBS Balai Besar Selulosa (Cellulose Research Institute, current name is Pulp and
Paper Research Institute)BOD Biochemical oxygen demandCAC Command and ControlCIFOR Centre for International Forestry Research COD Chemical oxygen demandDR Dana Reboisasi (Reforestation Fund)EIs Economic InstrumentsEMS Environmental Management SystemsGOI Government of IndonesiaHTI Hutan Tanaman Industri (Industrial Forestry or Plantation Forest) IDR Indonesia dollar Rupiahs*IEPC-KfW Industrial Efficiency and Pollution Control-Kreditanstalt fur Wiederaufbau (for
small and medium enterprises)IHPHP Forest Concession License FeeIMF International Monetary FundLEI Lembaga Ecolabel Indonesia (Indonesia Eco-labelling Institute)MBI Market Based InstrumentMOE Ministry of EnvironmentMOF Ministry of ForestryPAE-JBIC Pollution Abatement Equipment-Japan Bank for International Cooperation (for
large scale enterprises) PBB Pajak Bumi dan Bangunan (Land and Building Tax)PROKASIH Program Kali Bersih (Clean Rivers Programme) PROPER Program Peringkat (Business Environmental Performance Rating Programme) UGM Universitas Gadjah MadaUNCTAD United Nations Conference on Trade and DevelopmentUNDP United Nations Development ProgrammeUNEP United Nations Environment ProgrammeUNSOED Universitas Jenderal SoedirmanUSAID United States of America Aid programmeWALHI Wahana Lingkungan Hidup Indonesia (Indonesia Environmental Forum)WTO World Trade Organization
Abbreviations and acronyms
*1.00 IDR = 0.0001 USD
xiii


1. Introduction and background
1
After three decades of continuous growth fostered by political, social, and macroeconomic stability, the
Asian economic crisis of 1997 catalyzed a major change in Indonesia’s economic and political system. The
crisis and the subsequent fall in GDP, the largest among ASEAN (Association of South East Asian
Nations) countries, exposed the underlying weaknesses in Indonesia’s economic and financial structures,
prompting calls for reform. Subsequently, Indonesia developed a programme aimed at stabilizing the
economy, restructuring its ailing banking system, and creating the conditions conducive to a more
efficient, market-based allocation of resources in several key sectors.
These reforms have so far been positive, as Indonesia’s economy began to stabilize in 1999, following the
sharp economic contraction and high inflation of 1998. By following a tight monetary policy, the
Government reduced inflation from over 70 per cent in 1998 to 2 per cent in 1999. Although interest rates
spiked as high as 70 per cent in response to the monetary contraction, they fell rapidly to the 10 to
15 per cent range. The free-fall of the economy stopped in the second half of 1999 as GDP showed some
growth, although GDP for the year as a whole showed no growth.
The Indonesian economy grew at an average rate of 7.1 per cent annually over the past decade
(1990-2000), and in 1996 attained a GDP of approximately US$ 157 billion (at 1993 prices). However, the
monetary crisis in mid-1997 led to a 75 per cent devaluation of the rupiah (IDR) relative to the US dollar.
The prolonged crisis weakened nearly every sector of economic activity so that economic growth was only
2 per cent in 1997 and shrank by 17 per cent in 1998. However, the World Bank and the Asian
Development Bank (ADB) expressed satisfaction with the Government of Indonesia’s efforts to implement
a wide range of economic reforms. Considering the 3.6 per cent growth of GDP in 2002, some economists
are optimistic that monetary stability will be restored and the Indonesian economy will regain its growth
momentum, starting with 3.8 per cent in 2003 (Basri, 2003).1
Indonesia’s growing industrial sector in particular was severely affected by the economic crisis. Having
previously grown at rate of 11-14 per cent annually for more than a decade, it shrank by 12 per cent in
1998. For almost five years (1997-2002), the government has had to face political, moral, social and
economic crises influencing every aspect of human life.
1.1 Indonesia’s industrial sector
Indonesia, as a developing country, has focused its recent economic development on the industrial sector.
As the government gradually simplified administrative procedures and offered a more attractive
investment policy to domestic and foreign private investors in the 1980s and early 1990s, significant
growth of industrial activities at all levels occurred.
1 As of publication, the Indonesian Research Bank predicted a 4.5-5 per cent growth of GDP in 2004 and reported that GDP reached 4.9 per cent inthe third quarter of 2004.

2
A Study on the Use of Economic Instruments in the Pulp and Paper Industry
In the first semester of 2003 the industrial sector contributed significant output to national income:
24.54 per cent of GDP, compared to 17.85 per cent for agriculture (Biro Pusat Statistik, 2003). In the
same period, the industrial sector grew by 3.67 per cent while the agricultural sector grew only 3.43 per
cent (ibid.). In addition, Basri (2003) predicts that the industrial sector will grow by 4.5 per cent in 2004,
whereas agriculture will grow by only 2.2 per cent.
In Indonesia’s economic growth oriented paradigm of the 1980s - 1990s, natural resources and the
environment were treated as free goods. This approach has led to a negative situation in which natural
resources are over used and environmental services under valued, and the environmental and social costs
are not internalized into production costs.
Expansion of industrial activity also increased the amount of industrial waste generated. Consequently,
environmental management measures must now be put in place to solve the environmental problems
associated with growth of industrial activities, including waste treatment techniques.
The perception that natural resources are free also creates high social costs, as well as inequities for the
people who are not directly benefiting from use of those natural resources. For these reasons and to
produce development that can be sustained for the long run, the government therefore needs to design
sustainable development policies and policies that internalize the costs of pollution and environmental
damage into production costs.
1.2 Environmental issues in Indonesia
Issues of environmental quality and sustainability are recent additions to government development concerns.
Development policies tended formerly to be based on economic growth rather than on sustainable
development. It is now widely recognized that much pollution and environmental damage has been caused
by the failure to include and integrate environmental wisdom into development plans and processes. Over
the last five years, there have been many changes in development policy.
The pursuit of this goal of environmental sustainability will need to be shaped by a future fundamentally
different from the past. The story of the past is one of oil, rural development and the reduction of poverty
based primarily on a natural resource intensive growth strategy. The story of the future is one of transition,
already well under way: from a dependence on oil and agriculture to reliance on rapid industrialization;
from a largely rural society to a predominantly urban one; and from a low-income to solidly middle-
income country. This is based on a development strategy that emphasizes increasing efficiency and
competitiveness of domestic production, higher productivity and greater value-added goods. The private
sector, with support from the government, is expected to be the main engine of growth.
These transitions will have major implications for the environment. The analysis of current environmental
conditions and trends, and the likely impact of future growth and development under existing policies and
practices, leads to three main conclusions.
First, future growth and development, including the process of industrialization, will depend increasingly
on Indonesia’s stock of key natural resources (land, forest, water, and energy) and the sustainability of
critical ecosystems (including groundwater aquifers in urban areas, and watersheds and coastal and marine
ecosystems throughout Indonesia). Current inefficiencies in the allocation and use of natural resources
however, and the prospects for continued degradation of critical ecosystems, call into question the
sustainability of even current levels of economic activity in a number of key sectors.
Second, industrial sector growth will continue to be concentrated in urban areas, especially on Java.
Industrial pollution, combined with pollution from urban sources (human waste, solid waste and vehicle
3
Introduction and background
emissions), poses an immediate and significant threat to health and human welfare. Growing congestion
and pollution in Indonesia’s main urban centres will erode the efficiency of public and private sector
investment, reduce Indonesia’s ability to attract foreign investment, and eventually lead to strong
community resistance to industrial expansion, particularly in urban areas, with serious implications for
growth of the economy as a whole.
Third, as a result of rapid economic growth, conflicts over the use of land (i.e., forests, since it directly
relates to the present study) and access to other natural resources are increasing. Growing numbers of
people are being exposed to environmental pollution, threatening their health and livelihoods and
jeopardizing their prospects for a higher quality of life in the future.
The emergence of these issues has led to a growing awareness in Indonesia of the need to improve the
management of natural resources, reduce the level of urban and industrial pollution, and enhance equity in
future growth and development. To deal with these issues will not be easy. The main challenge will be to
integrate environmental issues and concerns into the development process, to take maximum advantage of
the positive linkages, and deal effectively with the tradeoffs. This will require continued improvement in
development policies and creating incentives for environmentally responsible behaviour. Substantial
increase in investments for environmental protection by both the Government and the private sector, and
sustained efforts to strengthen the institutions responsible for environmental planning and management
will also be required.
In order to support the sustainable use of natural resources, the Government of Indonesia has developed
policies and laws that promote the use of economic instruments. Once implemented, most sectors will be
required to use economic instruments as a tool to internalize environmental and social externalities.
1.3 Project rationale
The industrial sector in Indonesia has been selected for project implementation because it is the most
important and growing source of foreign income in Indonesia and because it relies heavily on the use of
natural resources and environmental services. However, much of the industrial expansion has taken place
without due regard to the environment, and this has led to serious environmental degradation, particularly
in Java where 75 per cent of industry is located.
This degradation has become increasingly evident in the form of deforestation, adverse health impacts,
increased pressure on air, land and water resources, and damage to downstream activities and coastal and
marine ecosystems. In broad terms, these impacts can be traced to industrial pollutants of three major
types: water pollutants (e.g., biochemical oxygen demand (BOD) and suspended solids), air pollutants
(e.g., particulates, sulphur and nitrogen oxides, carbon dioxide and carbon monoxide), and toxic and
hazardous waste (e.g., bio-accumulative metals).
The six major industries that support the developing Indonesian economy are chemical fertilizers, pulp and
paper, cement, textiles, leather and plywood. This study will focus on the pulp and paper industry. This
sector was chosen according to the following criteria: contribution to gross domestic product (GDP);
volume of exports; number of workers; environmental impacts; and use of natural resources (for details,
see Appendix 1).
It is hoped that this report will produce a comprehensive overview of the utilization of economic
instruments to encourage the sustainable use of natural resources and internalize environmental impacts
resulting from trade liberalization and export growth in the industrial sector.

4
A Study on the Use of Economic Instruments in the Pulp and Paper Industry
1.4 Overview of the pulp and paper industry
Pulp and paper production can be highly degrading to the environment. The production process employs
significant quantities of chemicals in pulping and bleaching as well as large amounts of fossil fuel energy
and fresh water. It has been estimated that pulping and bleaching processes put approximately 950,000 tons
of effluent into rivers, including toxic organochlorine compounds as well as pumping approximately
100,000 tons of acid rain, including sulphur dioxide into the air (Thompson, 1996).
Prior to the economic crisis, Indonesia’s pulp and paper industry was characterized by rapid growth and
strong performance, at approximately 24 per cent per annum. Foreign investment has played a significant
part in increasing production capacity. Joint ventures between domestic and foreign companies have
allowed for larger investments and the establishment of greater production capacities than domestically
supported plants. By 1997, the industry employed over 75,000 workers nationwide.
In 1997, of the world’s 30 largest paper and pulp producing countries, Indonesia ranked 12th and 13th
respectively. In the past five years, the country’s pulp production went up by an average annual rate of
28.1 per cent, from 1.3 million tons in 1993 to 3.05 million tons in 1997. The paper industry continued to
expand by 17.5 per cent on average per year, yielding 2.5 million tons of paper in 1993 and 4.8 million
tons in 1997. Until the end of 1997, the paper and pulp industry was not significantly affected by the
economic crisis. In fact, the industry continued to grow since the domestic market for the first nine months
of 1997 remained strong.
In 1998, however, the continued heavy devaluation of the Indonesian dollar rupiah (IDR) against the
US dollar caused the prices of most paper types to soar by more than 100 per cent, making them
unaffordable to most domestic users. To cope with this situation, many pulp and paper manufactures
intensified exports. This has not been difficult in view of the devaluation of the IDR, making the
manufacturing costs among the lowest in the world, and creating a price advantage for Indonesian pulp and
paper. As a result, Indonesia’s export volume of pulp and paper in the first eight months of 1998 jumped
by 63.4 per cent and 60.1 per cent respectively. According to Indonesia’s Pulp and Paper Association
(APKI, 2000), the value of exports of pulp and paper products in 1998 was US$ 3.5 billion.
1.5 Project objectives and scope
Based on the considerations above, this report aims to reach the following objectives:
• to assess the environmental implications of trade liberalization and export growth of the industrialsector, focusing on the pulp and paper industry.
• to stimulate decision makers to take a proactive role in formulating country and sector-specificeconomic policy instruments to achieve sustainable use of natural resources.
• to institute a multi-stakeholder process in identifying and implementing effective economic instrumentsto address the issue of industrial pollution in Indonesia.
• to enhance cooperation between national and international institutions and experts in the use ofeconomic instruments.
• to identify economic instruments to use in environmental and natural resource management in the pulpand paper industry.
• to develop and recommend a policy proposal to use economic instruments to support the sustainable useof natural resources in the pulp and paper industry.
• to develop capacity in policy research in Indonesia.

5
Introduction and background
1.6 Methodology
With the support of UNEP, the project was implemented by the Ministry for Environment in cooperation
with the Ministry of Forestry, the Ministry of Industry and Trade, the National Agency for Export
Development (NAFED), the Ministry of Finance, and was supported by the Natural Resources
Management (NRM) and other stakeholders.
Team members and UNEP
A multidisciplinary team was established by the Minister for the Environment through Ministerial Decree
No. 30, dated 12 June 2002 comprising a Steering Committee and an Organizing Committee. The Steering
Committee was chaired by Mr. Hoetomo, Deputy Minister for Environmental Policy and Institution (MOE).
The main task of the Steering Committee was to guide the study by defining strategy and policy. The
Steering Committee was composed of members of the Ministry of Environment, the Ministry of Finance, the
Ministry of Industry and Trade, the Ministry of Forestry, and the National Agency for Export Development.
The Organizing Committee was established to direct the project and was led by Mrs. Laksmi Dhewanthi
(MOE). Team members included staff from the Ministry of Environment and resource personnel. In
addition, two consultants, Mr. Denny Indradjaja and Mr. Arief Budi Purwanto were responsible for
conducting the study. The team was also supported by experts in the use of economics instruments,
forestry management and industrial issues. The consultants, experts and resources personnel were
appointed by the Deputy Minister for Environmental Policy and Institution.2
A Launching Workshop took place on 21 February 2002 and included representatives from agencies and
relevant stakeholders related to the pulp and paper industry as well as several independent experts.
A further series of consultative meetings and discussions were also convened to develop the study. The
first Organizing Committee meeting was conducted on 26 April 2002 and the Steering Committee first
met on 10 May 2002. These meetings were organized to obtain more information and suggestions for
achieving the objectives and producing the outputs of the report. Participants included representatives
from the Ministry of Industry and Trade, the Ministry of Finance, the Ministry of Forestry, the Ministry of
Environment, the National Agency for Export Development (BPFN), the Ministry of Foreign Affairs, the
Chamber of Commerce (KADIN), the Indonesian Anti Dumping Committee (KADI), the Cellulose
Research Institute (BBS), the Indonesian Pulp and Paper Association (APKI), professional experts
from well-known universities (UGM, UNSOED), local authorities, environmental organizations and
representatives of the pulp and paper industry.
UNEP provided financial and technical support, attended the Launching Workshop and the National
Closing Workshop, and invited experts and consultants to review and make comments and suggestions on
the draft reports.
Data collection
Primary and secondary data were collected from a variety of different sources:
• Literature review
Analysis of relevant information and data from a range of research literature and previous studies
conducted by governmental agencies, UNEP, UNDP, USAID, NGOs, the Indonesian Pulp and Paper
Association (APKI), and other research organizations.
2 Letter No. B -1816/Dep.I/06/2002 dated 24 June 2002.

6
A Study on the Use of Economic Instruments in the Pulp and Paper Industry
• Consultative meetings and discussions
Several meetings were convened for specific designated purposes, such as for examining national policy
and international norms relevant to the pulp and paper industry, discussing the use of economic
instruments, and develop the final objectives of the study to map a project proposal.
• Survey
A survey was conducted to gather detailed information and primary data directly from the pulp and
paper industries as well as through interviews with key persons from relevant agencies/institutions.
(A summary of the survey results is provided in Appendix 2).
• Independent experts and stakeholders
Discussions with a variety of stakeholders were convened as required. Participants included environ-
mental economic researchers (UGM, UNSOED), forestry researchers (technology research centre),
a Base and Cellulose Industry researcher, and a Finance researcher.
The private sector such as Hutan Tanaman Industri, private organizations such as Jasa Tirta, Co, as well
as the Indonesian Pulp and Paper Association and key representatives from pulp and paper industries
also took part.

7
Trade liberalization can have both positive and negative impacts on the environment and the economy. On
the one hand, increased trade can lead to expansion of production, employment, and consumption, which is
associated with a rise in living standards and a reduction of poverty. Trade liberalization can promote the
efficient allocation of resources worldwide and therefore reduce pressure caused by over-exploitation of global
natural resources. On the other hand, without appropriate environmental policies and regulations in place,
increase in production and consumption as a result of trade can also increase demand for natural resources
and increased generation of waste and emissions. Degradation of the environment and increased pollution
will likely be hastened and can also have major implications on poverty and economic development.
As a member of WTO (since 1947 as a colony of the Netherlands), Indonesia has had to adjust its trade-
related policies in the era of trade liberalization. The Government significantly liberalized both import and
export markets after the economic crisis of 1998, under supervision and with the support of the
International Monetary Fund (IMF) and the World Bank. Many policies and regulations have been set up
and implemented, including a new tax system, trade liberalization, foreign investment, performance bonds,
and restrictions on forest conversion.
2.1 Trade liberalization and economic growth
2.1.1 Economic reform
Trade and foreign investment were at the heart of Indonesia’s economic reform policy during the 1990s,
but from 1994 – 1996, the pace of trade and investment slowed somewhat, compared with previous years.
In the face of the economic crisis, however, the Government undertook to accelerate the pace of reforms
and to remove many remaining restrictions on domestic and international trade. These reforms involved
a major review of anti-competitive practices, including monopolies, oligopolies and all other restrictive
marketing arrangements that had survived Indonesia’s trade liberalization process, with a view to
“levelling the playing field” across many sectors, and creating a more open, competitive market place.
Government policy makers have reiterated Indonesia’s commitment to stable macroeconomic policies,
have started to restructure the banking sector, and are addressing long-standing structural impediments to
growth. These impediments include the many trade distorting barriers that survived the wave of
liberalization in the 1980s and 1990s, and which have, over time, contributed to unduly high costs for the
economy as a whole. This issue of Indonesia’s competitiveness had in fact already become a concern in
1996, when growth in exports, a main economic strength, started to slow down. Certainly, as Indonesia
seeks to improve the performance of its economy and address poverty, the environment will be an
important concern.
2. Impacts of trade liberalization in Indonesia
8
A Study on the Use of Economic Instruments in the Pulp and Paper Industry
2.1.2 Transition to an industrial economy and growth of the private sector
Future development of Indonesia’s economy will be characterized by efforts to achieve a full economic
recovery and enhance free trade. Indonesia is well on its way to making a transition from an agricultural to
an industrial economy. Success in making this transition sustainable will be determined by the efforts of
both the government and the private sector. However, the government’s ability to catalyze economic
development is likely to weaken, as its control of overall expenditure and investment is decreasing due to
the increasing role of the private sector and regional governments. Also, the government budget for
subsidizing state-owned enterprises will most likely decrease. The privatization of state-owned enterprises
and the issuance of municipal bonds could be seen as an effort to ease the government budget while
attracting foreign investment.
2.2 Environmental impacts of trade liberalization
Rapid growth of Indonesia’s industrial sector to support economic and trade activities has serious
worldwide environmental implications. Increased exploitation of natural resources including high con-
sumption of water and accelerated forest conversion, increased generation of energy and deterioration of
other resources, as well as increased levels of pollution, are examples of environmental problems
happening worldwide.
The international community is making efforts to take concrete actions to protect the environment,
mitigate the negative impacts of increased trade and promote the positive impacts. One example is by
integrating environmental considerations into trade policies and international, regional and bilateral trade
agreements. However, it is important to ensure that internalizing environmental costs does not adversely
affect market access and it is important that this does not act as unfair obstacles to trade or are protec-
tionist in intent, but also that trade rules do not discourage environmental protection. Indonesia, with an
open economic system, is susceptible to international influence.
The present situation in which deterioration and degradation of the environment continues, makes
Indonesia vulnerable to such consequences – indeed Indonesia has already experienced some discrimi-
nation where export destination countries have refused certain products because of environmental issues
such as illegal logging, use of environmentally unfriendly materials, content of hazardous substances in
final products, and so on.
There are many ways of assessing environmental and sustainable development effects of trade policies and
trade liberalization. One of the most commonly used approaches in Indonesia is based on the environ-
mental assessment methodology of the OECD, which has been further developed by other practitioners of
assessment, including UNEP. This methodology qualitatively assesses the impacts of trade on the
environment and can be similarly used to assess the social impacts of trade policy. It takes into account the
full range of effects that trade reforms may have on the environment and on society (UNEP, 2002).
Ideally, an environmental assessment will consider both direct and indirect effects of trade reforms on the
environment and on society. Decision makers are then able to make decisions on trade-offs between
economic gains, environmental impacts and social effects, if those impacts can be rationally and exactly
identified or measured (UNEP, 2001).
UNEP has provided a reference manual for the integrated assessment of trade-related policies (UNEP, 2001).
It outlines five types of effect that will happen directly and/or indirectly to a range of environmental, health,
and social issues due to trade reforms. These effects include Product effects, Technology effects,
Scale effects, Structural Effects, and Regulatory effects (for details describing the effects, see Appendix 3).
Table 1 below summarizes the results of a preliminary assessment relating to the pulp and paper industry.

9
Impacts of trade liberalization in Indonesia
2.2.1 Environmental impacts of trade liberalization in the pulp and paper industry
Reforms that promote trade will raise the overall level of pulp and paper industry activities, causing a
higher rate of consumption of natural and environmental resources. Environmental impacts from the pulp
and paper industry activities include higher air, water, or land pollution, natural resource effects associated
with changes in demand for the use of natural resources, and faster resource depletion or resource
degradation. Assessment of the environmental impacts of the pulp and paper industry resulting from trade
policies and agreements were based on qualitative exercises carried out by experts and practitioners
(so-called ‘expert judgment’ method) for preliminary identification of impacts and their magnitude. The
table in Appendix 3 shows a modification of the matrix developed by UNEP (2001). This preliminary
identification needs to be further developed for more quantitative results.
However, these preliminary impacts may be mitigated when efficiency is improved, or when industry
growth allows for greater investments in environmental projects. An expansion in the level of economic
activities in the pulp and paper industry could have positive impacts on the environment by reduced
demand on natural resources through improved efficiency and less generation of polluting waste through
improved technology.
Expansion of pulp and paper production could also have negative environmental impacts when the use of
natural resources is inefficient and there is minimum investment in environmental management. In this
situation, pulp and paper production will be associated with increase in environmental degradation and
pollution and severe impacts on health and safety.
The environmental impacts are summarized as follows:
1. Deterioration of forest resources and loss of biodiversity
• increased demand for raw materials
• increased dependency on natural forests due to improper management of industrial forestry
• increase in rate of degradation and deforestation, not only to natural forests but also to cultivated/
industrial forests due to increase in illegal logging when supply of raw materials is low
• deterioration of forest ecosystems, threats to biodiversity and loss of endemic species
• social impacts due to destruction of local communities surrounding and/or within the forest.
Table 1: Preliminary assessment of the impacts resulting from trade liberalization andexport growth in the pulp and paper industry
Trade- Impact Impact Impact Impact Impact Impact Impact Impactrelated on forest on bio on water on energy on aquatic on surface & on acid on health &effects resources diversity use use resources ground water rain safety
Product effects (0) (0) (0) (0) (-) (-) (0) (0)
Technology effects (++) (++) (+++) (++) (+++) (++) (++) (+++)
Scale effects (—-) (—-) (—-) (—) (—) (—) (—) (—)
Structural effects (—) (—) (—) (—) (—) (—) (-) (-)
Regulatory effects (++) (++) (0) (0) (++) (++) (++) (++)
Source: Adapted from UNEP, 2001.Note: (0) = No significant impact(-) = Light negative impact; (- -) = Moderate; (- - -) = Significant negative impact(+) = Light positive impact; (+ +)= Moderate; (+++) = Significant positive impact

10
A Study on the Use of Economic Instruments in the Pulp and Paper Industry
2. Water and air pollution
The pulp and paper industry is energy and water intensive. Pulp industry wastewater contains high
concentrations of COD and BOD emissions. Transport vehicles, power stations and recovery boilers for
chemical pulping all emit sulphur and nitrogen oxides, gases which acidify the atmosphere have
regional environmental impacts.
3. Surface and ground water resources
An increase in pulp and paper production will create an increased demand for surface and ground
water resources.
2.3 Prospects for economic growth
The Indonesian pulp and paper industry has good prospects due to a high domestic and international
demand, and also the abundant availability of resources and raw materials. The Government has stated that
pulp and paper are priority export products (APKI, 2003). However, globally, the demand is for wood fibre
to be produced from renewable sources and is sustainable in terms of both the environment and the impact
on local and wider societies. Moreover, the average paper consumption per capita will possibly increase
with population and overall economic development.
2.3.1 Policy issues for future development of the pulp and paper industry
Trade liberalization could lead to further changes in the sectoral composition of Indonesia’s economy, as it
specializes in production of goods or services where it has comparative advantages. Since the pulp and
paper industry has good prospects, this industry could be an important source of Indonesian foreign
exchange earnings, leading to changes in policy that will create more incentives to develop the industry.
If the Indonesian economy grows as expected (reaches 3 - 4 per cent), then domestic paper consumption
could increase to 30 kg/capita/year by 2008.3 Additional paper supplies of around 7.9 kg/capita x
200 million people = 15.800 million kg or 15.8 million tons per year will be required. Thus, the domestic
market still offers a good opportunity for the industry to grow (CIFOR, 2002).
Foreign exchange revenue from the industry was US$ 3 billion – equal to about 4.4 per cent of total GDP
in the year 2000, but it declined slightly to about US$ 2.54 billion in 2001. The expected revenue for
2002 was US$ 3.5 billion (APKI, 2001). Consequently, with this potential increase in production, the
development of the pulp and paper industry is likely to increase pollution and forest exploitation unless
there are appropriate environmental policies in place.
Pulp and paper industries compete continuously between themselves and indirectly through the use of
technology. Thus the pulp and paper industry needs to:
• Encourage innovation of technology to survive and develop. Innovations can include installation of new
equipment, improvement in production efficiency and quality, or importing components in exchange for
local ones. Innovation can also be proposed in anticipation of environmental issues. Recently, the
industry has said that environmentally friendly technologies are available and being implemented. This
technology reduces the impact of environmental pollution and guides the industry to use resources more
3 In the third quarter of 2004 Indonesia’s economy was growing at a rate of 4.9 per cent GDP and domestic paper consumption was 24 kg/capita/year in 2002.

11
Impacts of trade liberalization in Indonesia
efficiently. And more open trade policies will lead to further transfer of production technologies across
borders, with a positive effect on the environment.
• Guarantee availability of basic materials. Almost all pulp and paper factories use wood-based raw
material. Any permit for expansion and new investment should be made only with a guarantee of supply
from sustainable plantations. A few producers use bamboo and recycled paper, and the use of non-wood
raw material is a challenge to be developed.
• Strengthen community development through improved forest management programmes.
• Reform trade that may have impacts on environmental regulation and standards. Trade agreements
may explicitly include measures to improve environmental standards. This regulatory reform should
have positive impacts on forest resources, biodiversity, health and safety, and surface and ground
water resources.
2.4 Opportunities and challenges
The positive implication of trade liberalization is the encouragement of rapid growth of commercial and
manufacturing sub-sectors in general, and the pulp and paper industry in particular. Trade liberalization
drives international trade activities by reducing tariff and non-tariff barriers.
In the ASEAN Free Trade Area (AFTA) in particular, there will be good opportunities for Indonesia’s pulp
and paper products, because import tariffs will be 0 per cent for pulp, between 0 – 5 per cent for paper and
10 per cent for newspaper. In addition, some final products of paper such as notebooks and shopping bags
will be more competitive and have more added value as compared to other forms of exported papers.
The effect of trade liberalization policy on the pulp and paper industry will thus be expansion of the export
market because of Indonesia’s low production costs for making pulp. However, this raises the major issue
of supply of raw material, as discussed in the following.
2.4.1 Comparative advantages
The tropical climate in Indonesia makes it easy for the environment to recover, so the cost for plantation
wood is cheap. Meanwhile, in the USA and Europe that have 4 seasons in a year, the growth of wood is
slower and the cost of recovery is more expensive also. These factors make the Indonesian pulp and paper
industry competitive with the USA, Canada and Scandinavian countries.
Indonesia’s comparative advantages are:
• Indonesia still has a considerable area for further development of industrial or plantation forestry (HTI),
with over 144 million hectares of forest (70 per cent of Indonesia’s landmass). The present allowed
exploitation of forests by the pulp and paper industry is only 2.6 million hectares or around 1.8 per cent
of Indonesia’s forests (APKI, 2003).
• Indonesia’s HTI timber can be harvested after 7-8 years, while in ‘Norscan’ countries timber for pulp
needs 30 years before harvesting. With appropriate use of technology and good management systems,
these comparative advantages can deliver competitive advantages.
The situation described above shows that Indonesia has a prospective world-class pulp and paper industry.
The industry sector has a strong structure in terms of raw material supply, quality, and technology, and the
structure of the pulp and paper industry is stronger than the other industries.

12
A Study on the Use of Economic Instruments in the Pulp and Paper Industry
These advantages should make penetration of the international market possible. In fact, this industry was
able to penetrate the world market from 1994 to 1997, especially to the Scandinavian countries, Europe,
the USA and Canada. According to data from the Indonesian Pulp and Paper Industry Association (APKI,
2001), those countries represent around 70 per cent of the world pulp and paper market.
2.4.2 Competition issues
In the trade liberalization era, Indonesia’s pulp and paper industry will face competition that could
hamper export growth and could cause the industry to reduce its production capacity. The competition
issues include:
1. Bilateral and Regional Agreements and the WTO
The temporary exemption of import tariffs on writing paper and printed paper that are exported to
Indonesia by several countries could decrease opportunities in the international market, because it
could raise the price of Indonesia’s paper for export.
2. Imported paper and ‘dumping’
With trade liberalization, there will be a lot of imported pulp and paper products entering the
Indonesian market, particularly those from Indonesia’s main competitors. This market penetration by
imported products could hamper growth of the industry and impede the growth of national income
from exports.
Data from APKI shows that the price of imported paper products was only US$ 500 - 550 per ton while
the price of Indonesian paper products exported to other countries and price in the international market
was US$ 800 to US$ 850 per ton. The Indonesian Anti Dumping Committee needs to be more
proactive in investigating the dumped paper issue to avoid loss of market momentum.
3. Eco-labelling and EMS ISO-14001 Series
Indonesia is often accused of allowing environmentally unsound and illegal logging (CIFOR, 2002).
To address this allegation, the Government and the Indonesian Pulp and Paper Industry Association
need to encourage voluntary product certification such as the eco-label ISO-14024 (for details of
eco-labelling requirements see Appendix IV).
Eco-labelling is a way to motivate the industry to adopt sound environmental management systems.
There are basic criteria to follow for achieving eco-certification in terms of life cycle analysis of a
product, from raw material procurement, processing, distribution, product utilization, and disposal. The
pulp and paper industry needs to accept responsibility for minimizing environmental destruction and
degradation, and increase energy and water efficiencies for sustainable use of natural resources in order
to avoid criticism in the future.
4. Environmental sustainability
Increased production of pulp and paper will increase pressure on natural resources and the environ-
ment, inviting concern from various parties. Since forests are the main source of raw materials for the
industry, the concept of sustainable forestry that positions forests as a long-term economic and environ-
mental resource should integrate the concept of environmental sustainability including through
internalizing environmental costs. Indonesian forests need to be properly managed to minimize
environmental degradation through increased law enforcement, better implementation of existing
regulations, including economic instruments, and wider dissemination of voluntary approaches.

13
3.1 Development of the industry
The growth of Indonesia’s pulp and paper industry over the past decade has involved an aggregate capital
investment of approximately US$ 15 billion (Barr, C, 2002). According to the Indonesian Pulp and Paper
Association (2003), total installed capacity of pulp industries was about 6.08 million tons of pulp annually
and in 2002 actual production was about 4.97 million tons. There are 77 paper production mills (10 are
integrated pulp and paper mills) with a total installed capacity of about 10.06 million tons of paper
annually. In 2002 actual paper production was about 7.21 million tons.
Table 2 shows the increased performance of Indonesia’s pulp and paper industry from 1998 to 2002. The
table also shows that production was at about 73 per cent of capacity on average. It should be noted that in
order to achieve optimum profit and to increase efficiency, production capacity could reach 90 per cent.
3. Indonesia’s pulp and paper industry
Table 2: Performance of the pulp and paper industry, 1998-2002
Commodities 1998 1999 2000 2001 2002
Installed capacity (tons per annum)Pulp 4,323,600 4,543,600 5,228,100 5,587,100 6,087,100Paper 7,479,530 9,097,180 9,116,180 9,904,080 10,065,580Waste paper (WP) 2,783,430 3,913,560 4,224,420 4,805,945 5,015,935
Production (tons)Pulp 3,430,000 3,694,630 4,089,550 4,665,920 4,969,000Paper 5,487,260 6,720,560 6,849,000 6,951,240 7,212,970Waste paper recovery 1,355,000 1,917,650 1,679,265 1,740,000 2,215,000
Utilization rate (%)Pulp 79.30 81.30 78.20 83.50 81.60Paper 73.40 73.90 75.10 70.20 71.70Waste paper 61.80 58.80 60.00 60.70 61.30Recovery rate of WP 48.70 49.00 39.80 36.20 44.20
Source: Indonesian Pulp and Paper Association, 2003.
Capacity
In relation to capacity development of the pulp and paper industry, the Ministry of Trade and Industry
stated that the demand for raw material (wood chips) from the big seven companies in the pulp and paper
industry would be 26.4 million metric tons annually. Therefore, the Ministry of Forestry needs to prioritize
the development of Industrial or Plantation Forestry (HTI) in order to support the supply of raw material.
In addition, research institutions have also encouraged utilization of other fibre sources (rather than

14
A Study on the Use of Economic Instruments in the Pulp and Paper Industry
conventional wood), such as woody wastes, non-wood fibres (e.g., abaca,4 bamboo, bagasse,5 and agricul-
tural residues), estate wastes (e.g., empty oil-palm bunches), and waste paper, which are potentially abundant.
Plantation Forestry (HTI) Investment
The cost of the HTI (Hutan Tanaman Industri) development project is less than 10 per cent of the average
pulp factory investment. Some simple calculations pertaining to estimated investment needs in pulp
production and HTI are provided below (Haryopuspito, K, 2001):
• A factory with a capacity of 1,500 tons per day needs a minimum investment of around US$ 1.5 billion
• For continuous wood supply a pulp factory needs around 100,000 hectares (of HTI), so if the HTI
operation costs US$ 1,000/ha, then the investment needed is US$ 100 million.
Hence, in this simple calculation, investment for HTI is only about 6.6 per cent of total pulp factory investment.
International and domestic markets
Export market
In the early 1990s, the country’s pulp industry grew fast. Fast growth was boosted by rising demand in
export markets and growing demand from the expanding paper industry in the country. Growth of the pulp
and paper industry in 1996-2000 indicated that the industry still had good prospects even though there
were some problems in relation to government policies and external competition. The trend of Indonesia’s
pulp and paper exports in 1998 - 2002 is shown in Figure 3.1.
The price of pulp in the international market in 2001 was high, between US$ 680-700 per ton. Even
though the price of pulp and paper in the international market fluctuates, Indonesia’s pulp and paper
industry still struggles to compete with other countries. Before the economic crisis in 1998, the cost of
pulp production in Indonesia was US$ 217 per ton and in 2001 about US$ 250. This is the same as pulp
production costs in Asia/Pacific (US$ 250), and less than in South-America (US$ 260), North America
(US$ 300), Western Europe (US$ 420) and Japan (US$ 590). Brazil and Chile are Indonesia’s main
competitors with pulp production costs at US$ 231 and US$ 241 respectively (APKI, 2002).
4 Philippine banana tree having leafstalks that yield Manila hemp used for rope and paper etc.5 Sugar cane residue.
Figure 3.1: Export growth of pulp and paper, 1998-2002
Source: Indonesian Pulp and Paper Association Directory (2003)
0
500,000
Metr
icto
ns
1,000,000
1,500,000
2,000,000
2,500,000
3,000,000
1998 1999 2000 2001 2002
Pulp
Paper
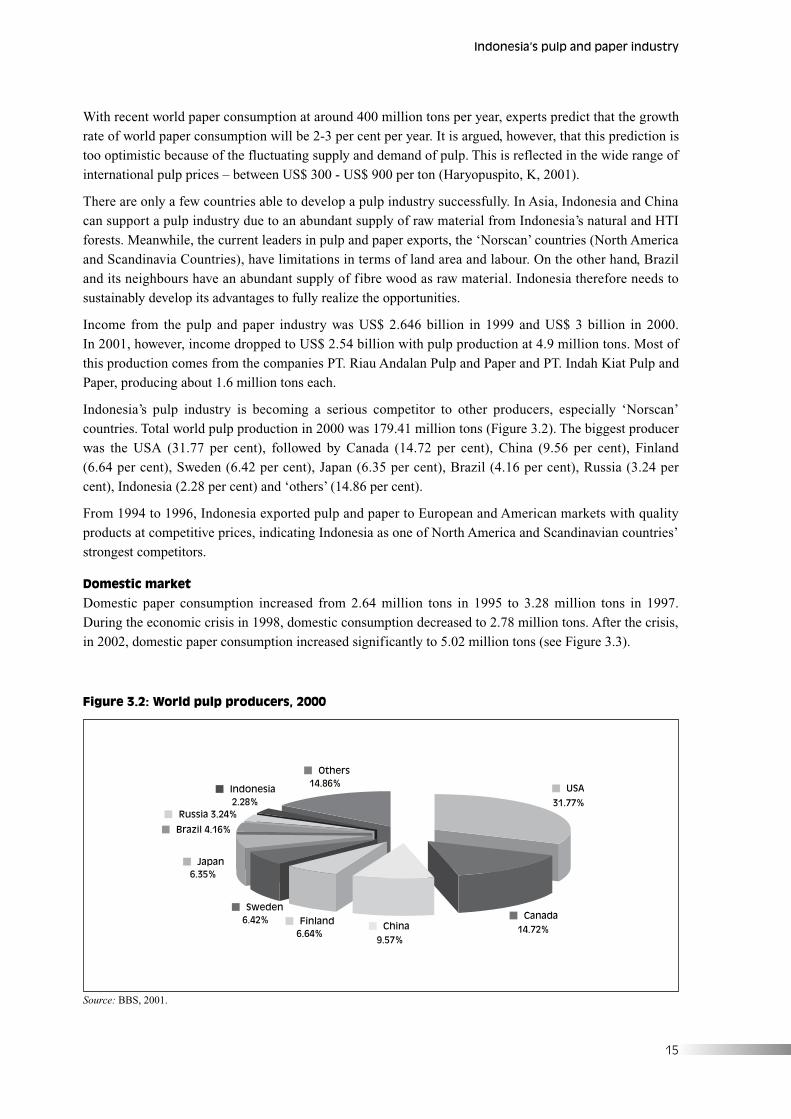
15
Indonesia’s pulp and paper industry
With recent world paper consumption at around 400 million tons per year, experts predict that the growth
rate of world paper consumption will be 2-3 per cent per year. It is argued, however, that this prediction is
too optimistic because of the fluctuating supply and demand of pulp. This is reflected in the wide range of
international pulp prices – between US$ 300 - US$ 900 per ton (Haryopuspito, K, 2001).
There are only a few countries able to develop a pulp industry successfully. In Asia, Indonesia and China
can support a pulp industry due to an abundant supply of raw material from Indonesia’s natural and HTI
forests. Meanwhile, the current leaders in pulp and paper exports, the ‘Norscan’ countries (North America
and Scandinavia Countries), have limitations in terms of land area and labour. On the other hand, Brazil
and its neighbours have an abundant supply of fibre wood as raw material. Indonesia therefore needs to
sustainably develop its advantages to fully realize the opportunities.
Income from the pulp and paper industry was US$ 2.646 billion in 1999 and US$ 3 billion in 2000.
In 2001, however, income dropped to US$ 2.54 billion with pulp production at 4.9 million tons. Most of
this production comes from the companies PT. Riau Andalan Pulp and Paper and PT. Indah Kiat Pulp and
Paper, producing about 1.6 million tons each.
Indonesia’s pulp industry is becoming a serious competitor to other producers, especially ‘Norscan’
countries. Total world pulp production in 2000 was 179.41 million tons (Figure 3.2). The biggest producer
was the USA (31.77 per cent), followed by Canada (14.72 per cent), China (9.56 per cent), Finland
(6.64 per cent), Sweden (6.42 per cent), Japan (6.35 per cent), Brazil (4.16 per cent), Russia (3.24 per
cent), Indonesia (2.28 per cent) and ‘others’ (14.86 per cent).
From 1994 to 1996, Indonesia exported pulp and paper to European and American markets with quality
products at competitive prices, indicating Indonesia as one of North America and Scandinavian countries’
strongest competitors.
Domestic market
Domestic paper consumption increased from 2.64 million tons in 1995 to 3.28 million tons in 1997.
During the economic crisis in 1998, domestic consumption decreased to 2.78 million tons. After the crisis,
in 2002, domestic paper consumption increased significantly to 5.02 million tons (see Figure 3.3).
Figure 3.2: World pulp producers, 2000
Source: BBS, 2001.
31.77%
14.72%9.57%
6.64%6.42%
6.35%
2.28%
14.86% USA
CanadaChinaFinland
Sweden
Japan
Brazil 4.16%
Russia 3.24%
Indonesia
Others
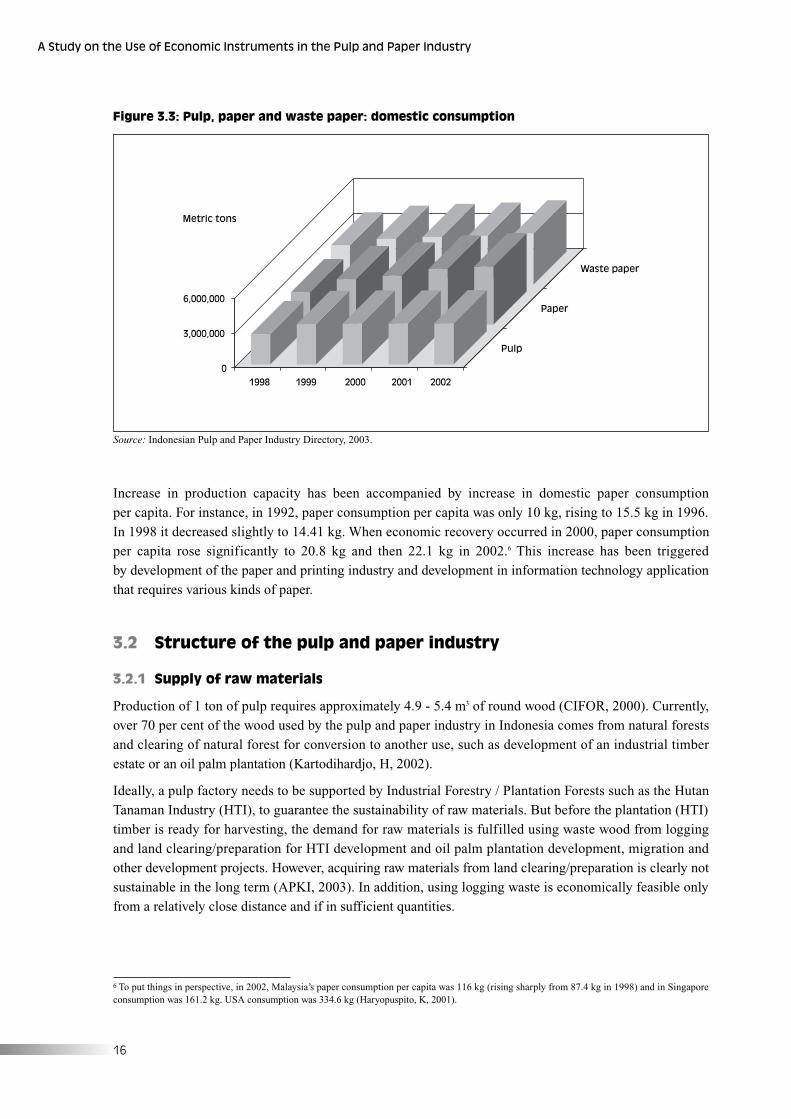
16
A Study on the Use of Economic Instruments in the Pulp and Paper Industry
Increase in production capacity has been accompanied by increase in domestic paper consumption
per capita. For instance, in 1992, paper consumption per capita was only 10 kg, rising to 15.5 kg in 1996.
In 1998 it decreased slightly to 14.41 kg. When economic recovery occurred in 2000, paper consumption
per capita rose significantly to 20.8 kg and then 22.1 kg in 2002.6 This increase has been triggered
by development of the paper and printing industry and development in information technology application
that requires various kinds of paper.
3.2 Structure of the pulp and paper industry
3.2.1 Supply of raw materials
Production of 1 ton of pulp requires approximately 4.9 - 5.4 m3 of round wood (CIFOR, 2000). Currently,
over 70 per cent of the wood used by the pulp and paper industry in Indonesia comes from natural forests
and clearing of natural forest for conversion to another use, such as development of an industrial timber
estate or an oil palm plantation (Kartodihardjo, H, 2002).
Ideally, a pulp factory needs to be supported by Industrial Forestry / Plantation Forests such as the Hutan
Tanaman Industry (HTI), to guarantee the sustainability of raw materials. But before the plantation (HTI)
timber is ready for harvesting, the demand for raw materials is fulfilled using waste wood from logging
and land clearing/preparation for HTI development and oil palm plantation development, migration and
other development projects. However, acquiring raw materials from land clearing/preparation is clearly not
sustainable in the long term (APKI, 2003). In addition, using logging waste is economically feasible only
from a relatively close distance and if in sufficient quantities.
Source: Indonesian Pulp and Paper Industry Directory, 2003.
0
3,000,000
6,000,000
1998 1999 2000 2001 2002
Pulp
Paper
Waste paper
Metric tons
Figure 3.3: Pulp, paper and waste paper: domestic consumption
6 To put things in perspective, in 2002, Malaysia’s paper consumption per capita was 116 kg (rising sharply from 87.4 kg in 1998) and in Singaporeconsumption was 161.2 kg. USA consumption was 334.6 kg (Haryopuspito, K, 2001).
17
Indonesia’s pulp and paper industry
In 1985, the Government of Indonesia launched an ambitious plan to establish vast areas of fast-growing
Industrial Forest – the Hutan Tanaman Industry, (HTI) under the Ministry of Forestry, especially in
Sumatra and the Kalimantan Islands. The programme accelerated with the issuance of a Government
Regulation in 1990. The HTI programme aimed to supplement supplies of timber from the natural forests,
rehabilitate degraded lands, and promote environmental conservation (Forest Watch Indonesia, 2002).
Every pulp mill would be required to have its own industrial forestry/plantation forest. HTI pulp is
composed of Eucalyptus spp, Accacia mangium and Gmelina arborea.
Ideally, HTI pulp production is based on principles of sustainable forest management, improved land
productivity, and adds to the overall forested area if developed from secondary degraded land or bushland
rather than from converted natural forests.
The Government has also established a regulation specifying that investors in HTI development should
also build pulp and paper factories. However, HTI production is incompletely developed and only half
have operational pulp and paper factories. The realization of HTI pulp planting until December 2000 was
around 23.5 per cent (Forest Watch Indonesia, 2002).
Social equity
One issue that generally occurs in plantation/forestry areas comes from claims from local people that the
land that belongs to them. To deal with this, local and central governments often act as mediators in any
conflict. Social conflict in forest management is becoming critical due to:
• the weaknesses of Forest Preservation and Conservation legislation
• unprofessional forest management
• unrealistic rules
• lack of understanding of the socio-economic issues and local culture
• a deep economic gap and unfair income distribution between the forestry sector and local communities
(Pratomo, H, 2002).
Use of non-wood raw materials
Non-wood fibre for pulp and paper production can come from: stubble, bagasse, bamboo, palm bunches,
abaca, and recycled paper. There are some difficulties in efforts to increase the use of alternative raw
material coming from non-wood fibres:
1. Alternative raw materials can only be supplied in limited quantities (max. 100 tons/day).
2. Supply of most of the raw materials is seasonal, fluctuates, and is not widely and equally distributed.
3. The machinery and other technical equipment to process raw materials of wood fibre are not always
suitable to process raw materials of non-wood fibre.
However, there is some opportunity to develop non-wood fibre raw material from oil palm petioles.7
The utilization of agricultural residues would make economic as well as environmental sense. The supply
of oil palm petioles is abundant, because for each 20 tons of palm oil, 200 tons of palm oil bunches are
produced. Preliminary studies on the use of oil palm petioles have been conducted (Joedodibroto, 1982).
Good pulping properties and sheets of good strength were obtained and the results compare well with the
use of commercial wood pulps. More recently, Santosa, (1998) has conducted experiments using pulp from
unbleached oil palm petioles. The handsheets of various grammage were made on a laboratory scale and
results showed that oil palm petiole pulp influences significantly the strength, sizing effect, and moisture
content of the liner paper, but does not influence the ring crush and bulk properties.
7 The stalk that joins the leaf to the stem.

18
A Study on the Use of Economic Instruments in the Pulp and Paper Industry
3.2.2 The production process
Generally, the pulp and paper production process, which employs chemical pulping and bleachings,
incorporates several steps simplified in Table 3 below.
Table 3: Simplified flow chart showing the major pulp and paper processing steps
MAIN POINT PROCESS STEPPOTENTIAL ENVIRONMENTAL
IMPACT
Raw Material HANDLING RAW MATERIALSolid Waste, Forest Degradation& Biodiversity
Chemical Energy PULPING (RECOVERY)Gaseous Material, Water Vapor,Energy Use
Water WASHINGDissolved Material, ResidualChemical, Water Use
Energy SCREENING Solid Waste, Energy Use
Chemical Energy BLEACHINGDissolved Material, ResidualChemical
Energy DRYING Energy Use
Energy, Water, Chemical PAPER MACHINESolid Waste, Dissolved Material,Residual Chemical Water Use,Energy Use
PAPER Solid Waste
Sources: Modified from UNEP, Cleaner Production at Pulp and Paper Mills: A Guidance Manual, 1996.
Pulp
Pulp can be produced using three types of pulping processes – mechanical, semi-mechanical/semi-
chemical, and chemical – to convert wood or other cellulosic materials into separated individual fibres,
called “pulp”. The processes consume a lot of water, chemicals, and energy. The three different processes
of pulp production are shown in Table 4.
In Kraft pulp,8 one of the chemical processes, a mixture of sodium hydroxide (NaOH) and sodium
sulphide (Na2S) agents are used to chemically separate lingo-cellulosic fibrous inputs into pulp through
dissolution of non-cellulosic compounds (i.e., particularly lignin).
8 A chemical pulp also called sulphate pulp, used to create Kraft paper.

Table 5: Pollution loads, energy consumption and yield in pulp production
Kind of pulp Pollution Energy consumption Yield(Kg/ton pulp) (GJ/ton) (%)
COD BOD
SGW Unbleached 15-35 8-20 5.3Bleached 20-40 – 93-98
PGW Unbleached – 9-16 5.0 85-90Bleached – 14-23 – –
RMP Unbleached 23-55 12-25 6.8 93-97Bleached
TMP Unbleached 40-45 10-30 8.5 85-95Bleached 75-80 20-40 –
CTMP Unbleached 70-140 30-60 7.6-10 85-95Bleached 80-160 40-85 –
Note: SGW: Stone Ground Wood; PGW: Pressure Ground Wood RMP: Refined Mechanical Pulp; TMP: Themo Mechanical PulpCTMP: Chemi Thermo Mechanical Pulp
Sources: Webb (1991) and Panggabean, 1995.
19
Indonesia’s pulp and paper industry
Pollution, energy consumption and yield from pulp processing
The load of potential pollutants, energy consumption, and yield of pulp are different according to the pulp
production process (see Table 5 below). According to this table, SGW (Stone Ground Wood) and PGW
(Pressure Ground Wood) discharge the lowest pollution load (COD & BOD) and also consume the lowest
energy compared to the others. SGW and RMP (Refined Mechanical Pulp) processes produce the highest
yield of pulp. Meanwhile, Silitonga (1989) stated that water consumption required in pulp processing is
about 45 - 60 cubic meters per ton of pulp.
Table 4: The three different processes of pulp production
Mechanical Semi-mechanical/ semi-chemical Chemical
The fibres are separated mainlyby mechanical force in grinders,refiners
The raw material fibre is treated withchemicals at elevated temperatureprior to atmospheric refining
The raw material fibre is treated withchemicals at elevated temperature andpressure (cooking) in pressure vessels(digester)
The type of raw material:wooden logs, wood chips (longfibres)
The type of raw material: long orshort or mixed fibres
The type of raw material: long or shortfibres
Pulp yield is around 90 per cent Pulp yield is in the range 60-75 per cent Pulp yield is in the range 45-55 per cent
The resulting pulp has lowstrength, low quality to be usedfor non-permanent uses, e.g:newspaper
The resulting pulp strengthproperties to be used for carton, box
The resulting pulp has the beststrength properties, high quality to beused for permanent uses, eg:magazine, printing paper, textbook
No chemical used Chemical used: sulphite or soda Chemicals used: soda, sulphate andsulphite
Source: Modified from UNEP (1996) and Roliadi (2003)

20
A Study on the Use of Economic Instruments in the Pulp and Paper Industry
Processing technology
Depending on the desired products, the resulting pulp can be further processed. For example, it may not be
necessary to bleach the pulp, resulting in unbleached pulp and paper products. Furthermore, after or
without the bleaching, some additive agents can be added to impart pulp/paper products with certain
characteristics and properties. For example, additives such as resin, size or wax emulsion are added to
increase water repellency of the pulp/paper product; additives such as binding/gluing agents (e.g., starch,
latex emulsion, and asphalt emulsions) are added to increase the bonding and felting network among the
fibres in the pulp/paper sheets, thereby improving their physical/mechanical strengths; and colouring can
be added.
Additives can be added internally or externally during the processing. Internal additives are added to the
pulp furnaces before being converted to paper sheets. Meanwhile, external additives are added to the
surface of the paper products after the sheet formation. In particular cases, pulp/paper processing can
proceed without any or with only a little additive treatment, for instance in the production of tissues,
napkins, and sanitary or toilet paper.
In all, the pulp/paper processing, from preparation of raw material (e.g., wood logging, chipping,
debarking), to pulping, bleaching, treating with internal additives, to the finished product (paper sheet),
besides consuming a lot of energy, water, and chemicals, can generate a substantial amount of waste that is
potentially polluting the environment.
Pollution from paper production
Pollution loads from the paper industry vary from between 1 to 5 kg/tons of BOD and 2-25 kg/tons of
SS (suspended solid), depending on the kind of paper produced. Water consumption of the paper industry
is between 10-30 m3/ton of paper (Table 6).
In 1998, BOD emissions of the pulp and paper industry contributed 7 per cent to the national total of BOD
emissions, about the same as the emissions generated by the chemical industry (see Figure 3.4). Any
increase in production and development of the pulp and paper industry should raise concern for generating
further environmental problems.
Table 6: Water consumption and pollution loads from the paper industry
Kind of paper Water consumption BOD5 SS(M3/tons) (Kg/tons) (Kg/tons)
Newsprint 20-30 2-4 8-20
Magazine paper 20-30 2-4 10-20
Wood-free printing paper 10-20 3-6 12-25
Kraft paper 10-20 1-3 8-15
Folding boxboard 20-30 2-5 2-8
Food board 20-40 2-5 2-8
Corrugating medium 10-20 1-3 10-25
Source: Eddy H., 1984.
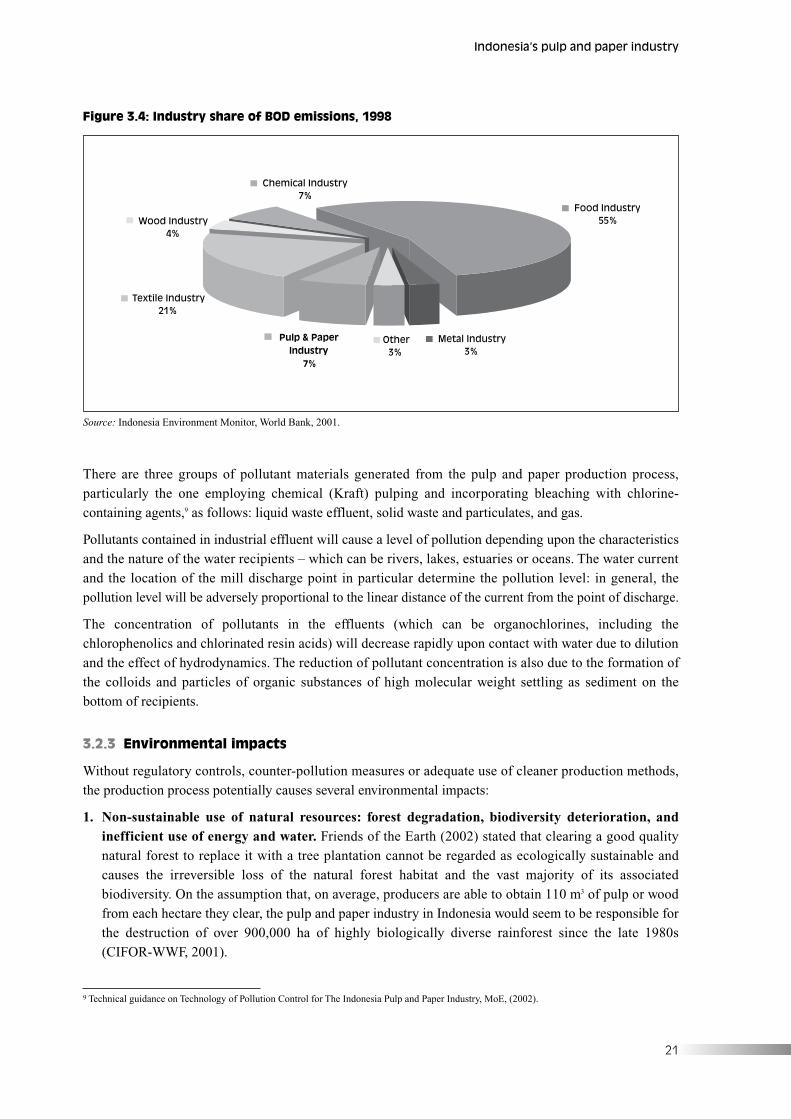
21
Indonesia’s pulp and paper industry
There are three groups of pollutant materials generated from the pulp and paper production process,
particularly the one employing chemical (Kraft) pulping and incorporating bleaching with chlorine-
containing agents,9 as follows: liquid waste effluent, solid waste and particulates, and gas.
Pollutants contained in industrial effluent will cause a level of pollution depending upon the characteristics
and the nature of the water recipients – which can be rivers, lakes, estuaries or oceans. The water current
and the location of the mill discharge point in particular determine the pollution level: in general, the
pollution level will be adversely proportional to the linear distance of the current from the point of discharge.
The concentration of pollutants in the effluents (which can be organochlorines, including the
chlorophenolics and chlorinated resin acids) will decrease rapidly upon contact with water due to dilution
and the effect of hydrodynamics. The reduction of pollutant concentration is also due to the formation of
the colloids and particles of organic substances of high molecular weight settling as sediment on the
bottom of recipients.
3.2.3 Environmental impacts
Without regulatory controls, counter-pollution measures or adequate use of cleaner production methods,
the production process potentially causes several environmental impacts:
1. Non-sustainable use of natural resources: forest degradation, biodiversity deterioration, andinefficient use of energy and water. Friends of the Earth (2002) stated that clearing a good quality
natural forest to replace it with a tree plantation cannot be regarded as ecologically sustainable and
causes the irreversible loss of the natural forest habitat and the vast majority of its associated
biodiversity. On the assumption that, on average, producers are able to obtain 110 m3 of pulp or wood
from each hectare they clear, the pulp and paper industry in Indonesia would seem to be responsible for
the destruction of over 900,000 ha of highly biologically diverse rainforest since the late 1980s
(CIFOR-WWF, 2001).
Figure 3.4: Industry share of BOD emissions, 1998
Food Industry55%
Chemical Industry7%
Wood Industry4%
Textile Industry21%
Pulp & Paper Industry
7%
Other3%
Metal Industry3%
Source: Indonesia Environment Monitor, World Bank, 2001.
9 Technical guidance on Technology of Pollution Control for The Indonesia Pulp and Paper Industry, MoE, (2002).
22
A Study on the Use of Economic Instruments in the Pulp and Paper Industry
2. Solid waste that could pollute soil, water bodies and surface and ground water. Waste is formed at
all stages of pulp and paper production. Waste from forestry consists mainly of degradable material.
Organic waste formed in production processes, such as sludge from external treatment, may cause environ-
mental impacts at disposal. Ashes, slag and other inorganic process waste usually goes to landfill.
3. Liquid waste that could cause dysfunction of photosynthesis of aquatic flora and interferencewith benthos life. Discharge of organic matter will result in oxygen consumption in the receiving
water. The environmental impacts of this will vary with the characteristics of such water bodies.
4. Gas that could poison living creatures, release particular substances carcinogenic to human andaquatic organisms, and induce acid rain which in all are harmful to human health throughinhalation. Emissions to air from the pulp and paper industry to a large extent originate from the
incineration of fuels. Volatile Organic Compounds (VOCs) are emitted from the processing, storage and
handling of raw material fibre and from all combustion processes, including transportation. VOCs consist
of various substances which can contribute to the formation of tropospheric or low-level ozone which has
a direct environmental impact on vegetation and crops. The level of air emissions is not well documented.
3.2.4 Development of improved technology and cleaner production
The pulping and bleaching processing technologies are changing and the trend of the industry to apply
closed loop operations10 will help to significantly reduce the amount of pollutants emitted to the
environment. The hydrophilic properties of the pollutants and the prospect of making them biodegradable
is being investigated (UNEP, 1996).
Changes in technology to reduce the use of chlorine in the bleaching process include pressure cooking and
oxygen delignification to reduce significant amounts of pollutant in the effluent. Bleaching process
applying ECF (Elemental Chlorine Free) technology will reduce AOX (Adsorbable Organic Halides) up to
90 per cent. Beside ETC, TCF (Total Chlorine Free) bleaching has already been applied commercially in
some Scandinavian Countries, despite not currently being very economically feasible (Sudirjo, S.T, 1998).
3.3 Future prospects for the pulp and paper industry
It is hoped that the pulp and paper industry will help to ensure sustainability in Indonesia and improve the
national economy, which has been weak for several years. In the long term, the pulp industry will be
supplied with raw materials from industrial forestry (HTI), but in the meantime, most of the raw material
is supplied from natural forests, land clearing and unused chips from the plywood and sawmill industries,
currently available in huge amounts.
Indonesia’s Government encourages the industry to use logs from land clearing for land preparation to
reduce or avoid forest fires and optimize government expenditures (such as the Reforestation Fund and the
Forest Resource Fee). Ultimately the pulp industry will use logs from 100 per cent HTI – both to produce a
better product and to reduce dependency on the available mixed woods.
In the future, the pulp and paper industry will be developed as a priority sub-sector of the forestry sector
and development of the pulp and paper industry will be encouraged. Three key aspects of development
will need to be considered: expansion, equitable distribution, and environmental sustainability.
10 The concept of a closed loop mill aims to eliminate discharges to the aquatic environment, recycle and reuse all possible solid and liquid processwastes, and reduce air emissions to the lowest possible quantity and toxicity.

23
There are three main approaches that can be used to manage environmental problems: 1) command and
control policies (CACs), 2) voluntary approaches and 3) economic instruments (EIs). These approaches
attempt to shift the costs and responsibilities associated with pollution or use of natural resources back
onto the polluter or the user (the polluter pays principle). However, in practice, no single approach is
implemented, a combination of the approaches is generally applied.
Command and control
Command and control (CAC) policies rely on regulation and law with a set of explicit requirements for
resource users and polluters to comply with. Common performance standards are applied to a large group
of firms, individuals or pollution sources (the target will depend on the exact nature of the problem). These
standards will drive needed modification either by installing new control equipment or by reducing
emissions or resource use.
Voluntary approaches
The use of voluntary approaches has increased recently due to market pressure and internal requirements
for efficiency. Most of the major pulp and paper companies have been certified to Environmental
Management System (EMS) ISO 14001 standards and are implementing cleaner production technology.
Economic instruments
The use of economic instruments in environmental management is becoming an alternative approach,
particularly for pollution control and mitigation of damage to the environment. This approach is used
because of the failure of conventional methods that tend to focus on the waste treatment process – known
as the end-of-pipe approach. Economic instruments encourage financial incentive and disincentive
mechanisms to drive effective environmental management (UNEP, 2002).
The promotion of economic instruments seems to be a good strategy for controlling pollution in many
developing countries. Although not yet fully implemented, many studies, seminars and workshops have
taken place and draft policies have been proposed. In accordance with Agenda 21, all developing countries
(including Indonesia) have considered implementing environmental economics instruments, but imple-
mentation is difficult, especially since the Asian economic crisis.
It is known, however, that selection of the most appropriate instrument requires careful consideration in
terms of environmental, social and economic conditions. Consequently, an instrument that is successfully
implemented in one country or area will not necessarily deliver the same results in other countries or areas.
Each country needs to analyse and select the most appropriate instrument according to its specific
conditions. For example, some instruments such as transferable emissions permits are especially difficult
4. Review of Indonesia’s current environmental policies

24
A Study on the Use of Economic Instruments in the Pulp and Paper Industry
to apply in developing countries because they require good infrastructure and control systems. They
also require strong law enforcement systems to enforce penalties. Effective implementation of
economic instruments in environmental management can therefore only be achieved by improving
other approaches concurrently.
4.1 National environmental policies in the industrial sector
The first set of environmental policies was promulgated in 1982 with Act Number 4 regarding Provisions
of Environmental Management. In 1997, Act Number 23 regarding Environmental Management intro-
duced a new paradigm in environmental management and replaced the earlier law. This new Act gives
more attention to policies that use Market Based Instruments (MBIs) rather than Command and Control
(CAC) only. To achieve better synergies between CAC policy and MBIs, partnerships among stakeholders
and greater public involvement is being encouraged.
A provision in the Act relevant to economic instruments is highlighted in Article 10e. The article
encourages efforts to prevent decrease in environmental supportive and carrying capacity by developing
and applying various schemes of environmental management, including pre-emptive, preventive and
proactive instruments.
Pre-emptive instruments include actions undertaken at the decision-making and planning level, such as
spatial use planning and environmental impact analysis. Preventive action takes place at the level of
implementation through compliance with waste quality standards and/or economic instruments. Proactive
action is at the level of production with application of environmental management systems such as EMS
ISO 14001.
The provisions in the Environmental Management Act are general and flexible and outline basic principles
for the management of Indonesia’s environmental and natural resources. They are also adaptable in the
context of the trade liberalization era.
4.1.1 Policies relevant to the pulp and paper sector
Some of Indonesia’s national environmental policies and regulations that are relevant to pulp and
paper production are summarized in Tables 7 and 8. Some of these policies are in the process of being
implemented.
4.2 Use of economic instruments in environmental policy
When environmental costs are fully internalized into the price of a product or activity, a reallocation of
resources in the economy occurs because price signals for both producers and consumers will reflect the
environmental costs of goods and services. Consumers will be encouraged to substitute higher priced
goods or services in favour of lower priced alternatives that are less environmentally damaging. Likewise,
businesses are encouraged to move away from using environmentally damaging production methods
and resources.
Using the tax system to address environmental externalities can also lead to an efficient level of pollution
abatement and can be an effective way of achieving behavioural change in a number of ways by creating
dynamic incentives to reduce pollution. As polluters are required to pay tax for residual emissions as well
as abatement costs, this can encourage technological developments and new processes offering greater
environmental protection. This contrasts with regulation, where there is usually no incentive to do better
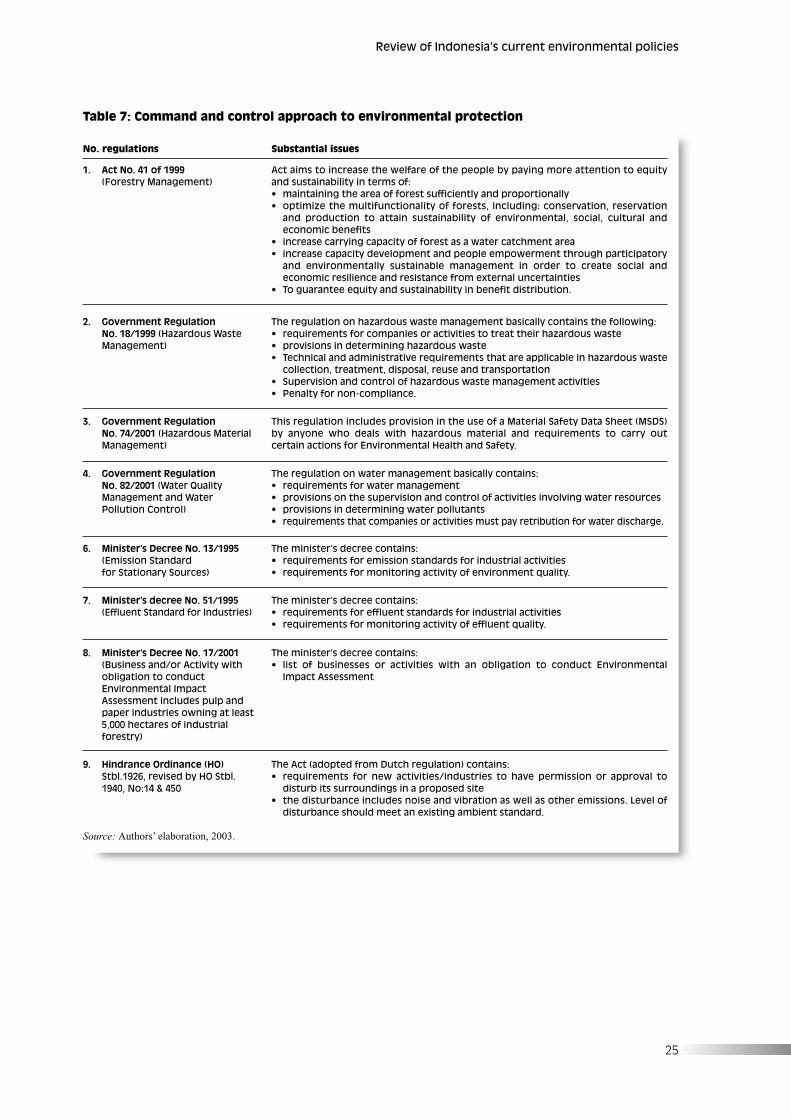
25
Review of Indonesia’s current environmental policies
Table 7: Command and control approach to environmental protection
No. regulations Substantial issues
1. Act No. 41 of 1999(Forestry Management)
Act aims to increase the welfare of the people by paying more attention to equityand sustainability in terms of: • maintaining the area of forest sufficiently and proportionally• optimize the multifunctionality of forests, including: conservation, reservation
and production to attain sustainability of environmental, social, cultural andeconomic benefits
• increase carrying capacity of forest as a water catchment area• increase capacity development and people empowerment through participatory
and environmentally sustainable management in order to create social andeconomic resilience and resistance from external uncertainties
• To guarantee equity and sustainability in benefit distribution.
2. Government Regulation No. 18/1999 (Hazardous Waste Management)
The regulation on hazardous waste management basically contains the following:• requirements for companies or activities to treat their hazardous waste • provisions in determining hazardous waste• Technical and administrative requirements that are applicable in hazardous waste
collection, treatment, disposal, reuse and transportation• Supervision and control of hazardous waste management activities• Penalty for non-compliance.
3. Government Regulation No. 74/2001 (Hazardous Material Management)
This regulation includes provision in the use of a Material Safety Data Sheet (MSDS)by anyone who deals with hazardous material and requirements to carry outcertain actions for Environmental Health and Safety.
4. Government Regulation No. 82/2001 (Water Quality Management and Water Pollution Control)
The regulation on water management basically contains:• requirements for water management• provisions on the supervision and control of activities involving water resources• provisions in determining water pollutants• requirements that companies or activities must pay retribution for water discharge.
6. Minister’s Decree No. 13/1995 (Emission Standard for Stationary Sources)
The minister’s decree contains:• requirements for emission standards for industrial activities• requirements for monitoring activity of environment quality.
7. Minister’s decree No. 51/1995 (Effluent Standard for Industries)
The minister’s decree contains:• requirements for effluent standards for industrial activities• requirements for monitoring activity of effluent quality.
8. Minister’s Decree No. 17/2001 (Business and/or Activity with obligation to conduct Environmental Impact Assessment includes pulp and paper industries owning at least 5,000 hectares of industrial forestry)
The minister’s decree contains:• list of businesses or activities with an obligation to conduct Environmental
Impact Assessment
9. Hindrance Ordinance (HO) Stbl.1926, revised by HO Stbl. 1940, No:14 & 450
The Act (adopted from Dutch regulation) contains:• requirements for new activities/industries to have permission or approval to
disturb its surroundings in a proposed site• the disturbance includes noise and vibration as well as other emissions. Level of
disturbance should meet an existing ambient standard.
Source: Authors’ elaboration, 2003.
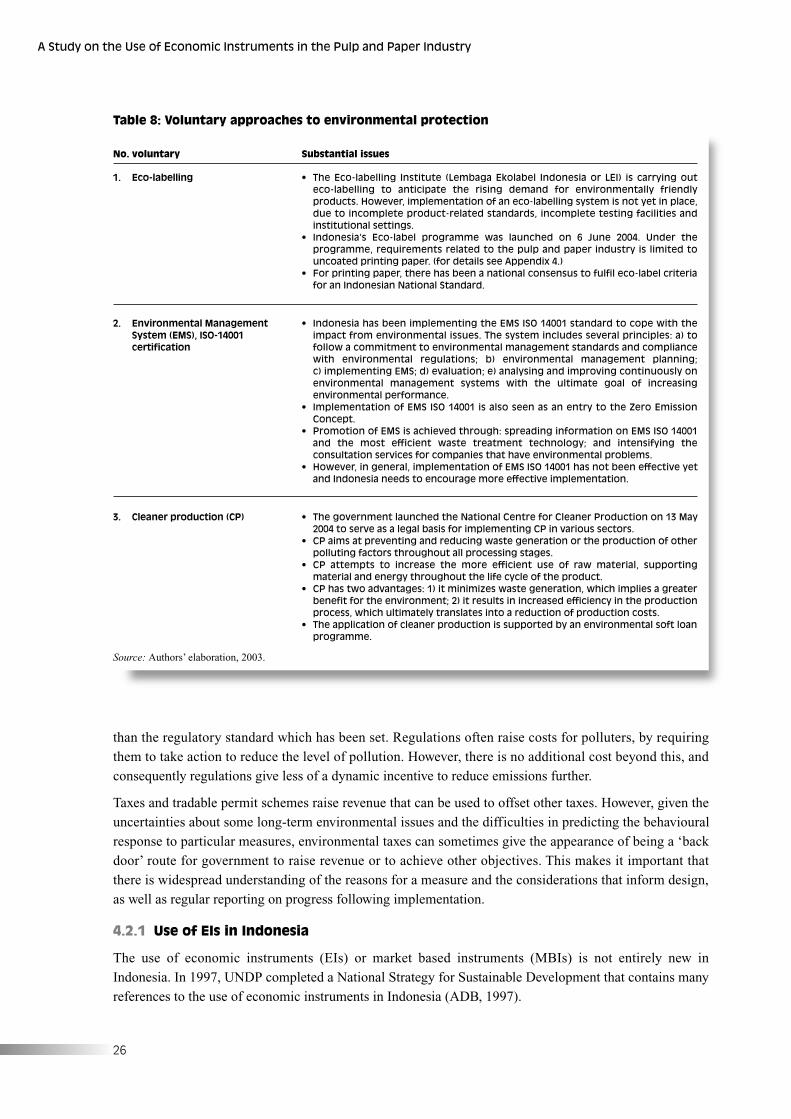
26
A Study on the Use of Economic Instruments in the Pulp and Paper Industry
Table 8: Voluntary approaches to environmental protection
No. voluntary Substantial issues
1. Eco-labelling • The Eco-labelling Institute (Lembaga Ekolabel Indonesia or LEI) is carrying outeco-labelling to anticipate the rising demand for environmentally friendlyproducts. However, implementation of an eco-labelling system is not yet in place,due to incomplete product-related standards, incomplete testing facilities andinstitutional settings.
• Indonesia’s Eco-label programme was launched on 6 June 2004. Under theprogramme, requirements related to the pulp and paper industry is limited touncoated printing paper. (for details see Appendix 4.)
• For printing paper, there has been a national consensus to fulfil eco-label criteriafor an Indonesian National Standard.
2. Environmental Management System (EMS), ISO-14001 certification
• Indonesia has been implementing the EMS ISO 14001 standard to cope with theimpact from environmental issues. The system includes several principles: a) tofollow a commitment to environmental management standards and compliancewith environmental regulations; b) environmental management planning; c) implementing EMS; d) evaluation; e) analysing and improving continuously onenvironmental management systems with the ultimate goal of increasingenvironmental performance.
• Implementation of EMS ISO 14001 is also seen as an entry to the Zero EmissionConcept.
• Promotion of EMS is achieved through: spreading information on EMS ISO 14001and the most efficient waste treatment technology; and intensifying theconsultation services for companies that have environmental problems.
• However, in general, implementation of EMS ISO 14001 has not been effective yetand Indonesia needs to encourage more effective implementation.
3. Cleaner production (CP) • The government launched the National Centre for Cleaner Production on 13 May2004 to serve as a legal basis for implementing CP in various sectors.
• CP aims at preventing and reducing waste generation or the production of otherpolluting factors throughout all processing stages.
• CP attempts to increase the more efficient use of raw material, supportingmaterial and energy throughout the life cycle of the product.
• CP has two advantages: 1) it minimizes waste generation, which implies a greaterbenefit for the environment; 2) it results in increased efficiency in the productionprocess, which ultimately translates into a reduction of production costs.
• The application of cleaner production is supported by an environmental soft loanprogramme.
than the regulatory standard which has been set. Regulations often raise costs for polluters, by requiring
them to take action to reduce the level of pollution. However, there is no additional cost beyond this, and
consequently regulations give less of a dynamic incentive to reduce emissions further.
Taxes and tradable permit schemes raise revenue that can be used to offset other taxes. However, given the
uncertainties about some long-term environmental issues and the difficulties in predicting the behavioural
response to particular measures, environmental taxes can sometimes give the appearance of being a ‘back
door’ route for government to raise revenue or to achieve other objectives. This makes it important that
there is widespread understanding of the reasons for a measure and the considerations that inform design,
as well as regular reporting on progress following implementation.
4.2.1 Use of EIs in Indonesia
The use of economic instruments (EIs) or market based instruments (MBIs) is not entirely new in
Indonesia. In 1997, UNDP completed a National Strategy for Sustainable Development that contains many
references to the use of economic instruments in Indonesia (ADB, 1997).
Source: Authors’ elaboration, 2003.

27
Review of Indonesia’s current environmental policies
A number of market-based policies have been adopted in several sectors with some positive indirect
impacts. For example, a forest taxation system has been in use for many years. Additionally, by
implementing a user fee in the water sector, consumption tends to decrease. Another example is the
application by local authorities of charges for urban solid waste (garbage) produced by households. There
are no specific EIs directly used in the pulp and paper industry.
In general, however, market based approaches have made only modest inroads into national environmental
policies and many MBI-type approaches are adopted outside the official environmental framework.
‘Institutional complexity’ is usually cited as the major obstacle to introducing market-based approaches,
especially those that are tax based. Simplification of administrative systems or jurisdictional realignment
could create the conditions more conducive to expanding MBI use (ADB, 1997). The complementary
potential of market-based and command and control approaches needs to be better understood and then
turned into better policy making. Policy approaches are rarely comprised of only a single tool.
4.2.2 Use of EIs in the forestry sector
Although command and control (CAC) instruments such as maximum allowable harvest, prescribed
practices, and different forms of licensing have dominated the approach in protecting Indonesia’s forests, a
number of economic instruments have been used in forest management. Forestry taxes, part of the
prevailing system of forest management and long regarded as only a revenue tool, were later recognized to
affect the forest concessionaires’ behaviour as well. The level and structure of forest charges and their
possible effect on forest management have since been the object of extensive examination. There is a
prevailing view that forest charges in Indonesia have been too low, making logging too profitable, and that
there has not been sufficient incentive to use the ‘standing volume’ more efficiently (ADB, 1997).
According to Indonesia’s Environmental Forum (Walhi, 1991), Indonesia’s Government gained only
17 per cent of logging rent compared to the Sabah East Malaysia Government whose revenues through
aggressive taxation was about 81.3 per cent (Reppetto, 1988). This would indicate that the Government has
earned only a small proportion of the potential rent from its seven forms of forest taxation.
Forestry taxes
The total burden of forest taxation is as follows:
1. Forest Concession License Fee (IHPHP) is paid once at the issuance of the 20 year forest concession
license. Its level reflects differences in the average quality of standing forest and local factors (US$ 4/ha
in Irian Jaya and Nusa Tenggara, US$ 7.50/ha, in Sumatra and Sulawesi, US$ 10/ha in Kalimantan and
Maluku). Since 1993, IHPHP became payable, at a somewhat lower rate, also on loggedover areas
within the concessions coming up for renewal.
2. Land and building tax (PBB), payable on the area of concession occupied by facilities and housing.
Its application is similar to that prevailing outside the forestry sector.
3. Reforestation Fund (Dana Reboisasi or DR), perhaps the most controversial component of the current
forest taxation regime for two reasons. First: the stated purpose of the tax is either to induce
environmentally desirable behaviour (reforestation) or to generate funds needed to deter any damage
that concessionaries are believed to cause. Second, the principle of earmarking the tax is considered by
many to be weak. The tariff paid at US$ 10.50 – 16.00/m3 according to province of origin and species
group on wood chips and sawn logs, and at US$ 2/m3 for pulpwood. In 1993, DR was estimated to
account for almost two thirds of the total forest taxation income. Its proceeds are to be used mainly to
provide soft loan financing for industrial forestry plantations. However, the fund has proven a relatively
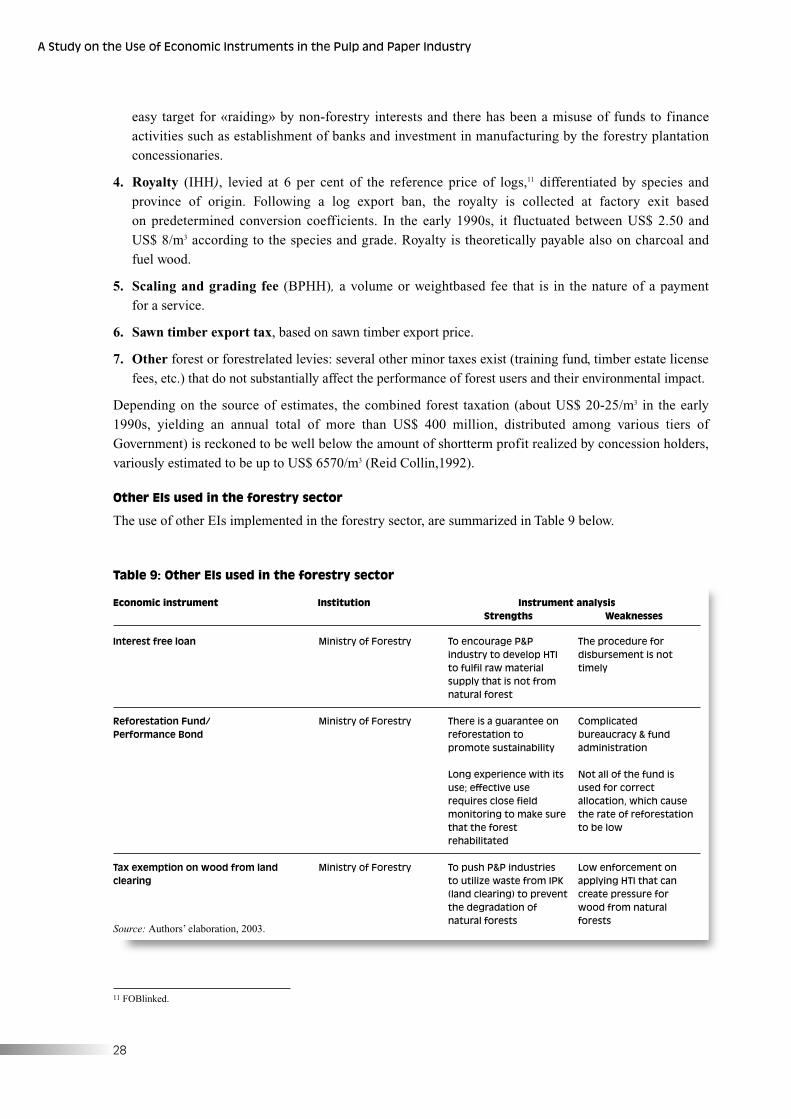
Table 9: Other EIs used in the forestry sector
Economic instrument Institution Instrument analysisStrengths Weaknesses
Interest free loan
Reforestation Fund/Performance Bond
Tax exemption on wood from landclearing
Ministry of Forestry
Ministry of Forestry
Ministry of Forestry
To encourage P&Pindustry to develop HTIto fulfil raw materialsupply that is not fromnatural forest
There is a guarantee onreforestation topromote sustainability
Long experience with itsuse; effective userequires close fieldmonitoring to make surethat the forestrehabilitated
To push P&P industriesto utilize waste from IPK(land clearing) to preventthe degradation ofnatural forests
The procedure fordisbursement is nottimely
Complicatedbureaucracy & fundadministration
Not all of the fund isused for correctallocation, which causethe rate of reforestationto be low
Low enforcement onapplying HTI that cancreate pressure forwood from naturalforests
28
A Study on the Use of Economic Instruments in the Pulp and Paper Industry
easy target for «raiding» by non-forestry interests and there has been a misuse of funds to finance
activities such as establishment of banks and investment in manufacturing by the forestry plantation
concessionaries.
4. Royalty (IHH), levied at 6 per cent of the reference price of logs,11 differentiated by species and
province of origin. Following a log export ban, the royalty is collected at factory exit based
on predetermined conversion coefficients. In the early 1990s, it fluctuated between US$ 2.50 and
US$ 8/m3 according to the species and grade. Royalty is theoretically payable also on charcoal and
fuel wood.
5. Scaling and grading fee (BPHH), a volume or weightbased fee that is in the nature of a payment
for a service.
6. Sawn timber export tax, based on sawn timber export price.
7. Other forest or forestrelated levies: several other minor taxes exist (training fund, timber estate license
fees, etc.) that do not substantially affect the performance of forest users and their environmental impact.
Depending on the source of estimates, the combined forest taxation (about US$ 20-25/m3 in the early
1990s, yielding an annual total of more than US$ 400 million, distributed among various tiers of
Government) is reckoned to be well below the amount of shortterm profit realized by concession holders,
variously estimated to be up to US$ 6570/m3 (Reid Collin,1992).
Other EIs used in the forestry sector
The use of other EIs implemented in the forestry sector, are summarized in Table 9 below.
11 FOBlinked.
Source: Authors’ elaboration, 2003.

29
Review of Indonesia’s current environmental policies
The extent of the effectiveness of existing EIs for sustainable management of forest resources is not clear
due to a lack of valid data to support analysis. However, in 2000, forest degradation took place at a rate of
2 million ha/year and was caused mainly by illegal logging (Pratomo, 2002). Some researchers believe that
this is because the forest charge is too low, while others claim that raising the forest charges alone would
not be sufficient to reduce the rate of deforestation in Indonesia.
Reforestation Fund
The Reforestation Fund of the Ministry of Forestry and Estate Crops was originally meant to operate as a
type of performance bond that was refundable if concessions were managed sustainably. Unfortunately,
‘administrative difficulties’ made it next to impossible for concessions to get their bond back. Ultimately,
this scheme was replaced by a set of command and control regulations governing allowable cut, the
harvesting system (the selective cutting system), and other aspects of concession management.
Performance Bond
The Performance Bond has the purpose of ensuring a company’s performance related to its sustainable
management of forest resources. It is regarded as more effective in comparison to the Reforestation Fund,
which is not earmarked toward repairing environmental damage. APPHI-IPB (2003) also states that the
risk to forestry ecosystem quality (the sustainability of goods and service for long term) should be
incorporated into government forestry management requirements. The requirements encompass rehabili-
tation and forest protection (forest culture). The private sector has to guarantee performance to recover the
Performance Bond. The Performance Bond is not a governmental tax income, but must be refunded to the
private sector if it has good performance. However, the Performance Bond will require several perfor-
mance standards (criteria and indicators).
There is also a deposit scheme for pulp and paper that suggests that performance bonds could successfully
reduce pollution and materials recovery. Performance bonds involve an upfront financial guarantee by
developers, pulp and paper companies or other users to ensure that, should they go bankrupt or otherwise
neglect their environmental responsibilities, there will be funding available to cover the cost of
rehabilitation. Riau province and East Java will be imposing an innovative Performance Bond system for
its pulp and paper sector. The plan contains economic incentives designed to encourage companies to
implement best practice forest management and rehabilitation processes.
4.2.3 Use of EIs for pollution control: Environmental soft loan programme forpollution control equipment
For controlling pollution in the production process, one of the biggest problems facing enterprises in
environmental compliance is a lack of finance for investment in pollution prevention and control
equipment. To address this problem, the Government (Ministry of Environment, Ministry of Finance and
the Central Bank of Indonesia) together with state/private banks provide environmental soft loans for the
following purposes:
• Investment in pollution prevention and pollution control equipment
• Improvement of production efficiency
• Technical advisory services (for small and medium enterprises)
The objective of the environmental soft loan programme is thus to improve environmental quality by
reducing pollution loads through investment in technology.

30
A Study on the Use of Economic Instruments in the Pulp and Paper Industry
This programme includes two credit schemes. Firstly, Industrial Efficiency and Pollution Control (IEPC)
for small and medium enterprises is funded by Kreditanstalt fur Wiederaufbau (IEPC-KfW). Secondly,
Pollution Abatement Equipment (PAE) for large scale enterprises is funded by the Japan Bank for
International Cooperation (PAE-JBIC). This soft loan is managed as a revolving fund, as others can use the
repayments from one end user for similar purposes. Any kind of industry with a potential to pollute the
environment can apply for this soft loan.
IEPC-KfW and PAE-JBIC are only available for these types of investments:
• Civil works and equipment for pollution prevention, pollution control (wastewater, emission and solid
waste) and recycling plants.
• Consultancy fees for designing pollution prevention and pollution control system and construction fees.
Pollution prevention equipment for the pulp and paper industry includes fibre recovery technology for
recovering fibre (sludge) from the wastewater and returning it to the production process and de-inking
plants for processing recycled waste paper.
PAE-JBIC provided 111.013 billion Indonesian rupiah (33.64 per cent of the total loan) to 7 pulp and
paper industries. This loan helped to reduce 79.52 per cent of BOD loads in 1997 (year 4 of the project),
and accounted for 12 per cent of national pollution reduction. The IEPC-KfW soft loan financed 3 small
recycling paper plants (1.6 per cent of the total loan).
Box 4.1: Environmental soft loan on pollution control equipment
PT Riau Andalan Pulp and Paper Co.
The PT Riau Andalan Pulp and Paper was granted a PAE-JBIC soft loan in June 1995 for the following equipment:
1. Primary Clarifier
2. Bar Screen
3. Surface Aerators
4. Secondary Clarifiers
5. Screw Press and Sludge dewatering
Source: Ministry of Environment, 1995.
The IEPC-KfW and PAE-JBIC programmes are categorized as financial instruments. Although a lot of
industries are satisfied with this instrument, there are some complaints about the application procedure
being too complicated. All loan applications have to be processed by the Ministry of Environment,
handling banks and the Ministry of Finance/Central Bank of Indonesia. There are only a few banks
involved in handling the loan – 2 state banks, 4 private banks and 5 regional development banks out of a
total 138 banks operating in Indonesia. (For details of the lending mechanism see Appendix 5).
The strength of this scheme is that funding is made available to promote environmentally friendly
technologies. However, the weaknesses include limited fund availability, limited number of handling
banks, and complex bureaucracy making some industries hesitate to apply (see Table 10).
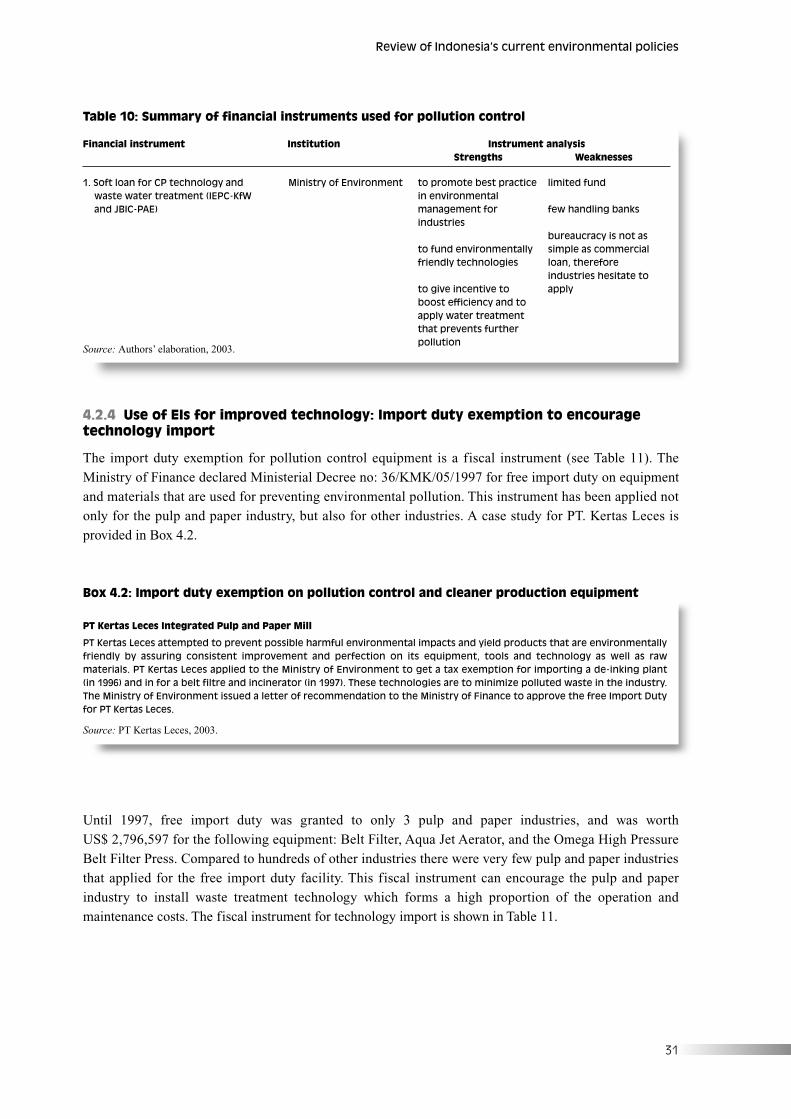
31
Review of Indonesia’s current environmental policies
4.2.4 Use of EIs for improved technology: Import duty exemption to encouragetechnology import
The import duty exemption for pollution control equipment is a fiscal instrument (see Table 11). The
Ministry of Finance declared Ministerial Decree no: 36/KMK/05/1997 for free import duty on equipment
and materials that are used for preventing environmental pollution. This instrument has been applied not
only for the pulp and paper industry, but also for other industries. A case study for PT. Kertas Leces is
provided in Box 4.2.
Table 10: Summary of financial instruments used for pollution control
Financial instrument Institution Instrument analysisStrengths Weaknesses
1. Soft loan for CP technology and waste water treatment (IEPC-KfW and JBIC-PAE)
Ministry of Environment to promote best practicein environmentalmanagement forindustries
to fund environmentallyfriendly technologies
to give incentive toboost efficiency and toapply water treatmentthat prevents furtherpollution
limited fund
few handling banks
bureaucracy is not assimple as commercialloan, thereforeindustries hesitate toapply
Box 4.2: Import duty exemption on pollution control and cleaner production equipment
PT Kertas Leces Integrated Pulp and Paper Mill
PT Kertas Leces attempted to prevent possible harmful environmental impacts and yield products that are environmentallyfriendly by assuring consistent improvement and perfection on its equipment, tools and technology as well as rawmaterials. PT Kertas Leces applied to the Ministry of Environment to get a tax exemption for importing a de-inking plant (in 1996) and in for a belt filtre and incinerator (in 1997). These technologies are to minimize polluted waste in the industry.The Ministry of Environment issued a letter of recommendation to the Ministry of Finance to approve the free Import Dutyfor PT Kertas Leces.
Source: PT Kertas Leces, 2003.
Until 1997, free import duty was granted to only 3 pulp and paper industries, and was worth
US$ 2,796,597 for the following equipment: Belt Filter, Aqua Jet Aerator, and the Omega High Pressure
Belt Filter Press. Compared to hundreds of other industries there were very few pulp and paper industries
that applied for the free import duty facility. This fiscal instrument can encourage the pulp and paper
industry to install waste treatment technology which forms a high proportion of the operation and
maintenance costs. The fiscal instrument for technology import is shown in Table 11.
Source: Authors’ elaboration, 2003.

32
A Study on the Use of Economic Instruments in the Pulp and Paper Industry
4.2.5 Use of EIs in the water sector
User fees for sustainable management of surface are imposed by by the Perum Jasa Tirta (Water Service
Company) (see Box 4.3) and deep well water tax for ground water resources by Ministry of Energy and
Minerals Resources. The main weakness of the instrument is that the tariff is too low, so it is not an
effective control over the efficient use of resources. In addition, there is no guarantee that the revenue from
the tariffs will be reinvested (no earmarked system) in managing water resources (see Table 12).
Table 11: Fiscal instrument for technology import
Existing fiscal instrument Institution Instruments analysisStrengths Weaknesses
Free import duty on waste treatmentequipment
Ministry of FinanceDecree No: 136/KMK/.05/1997 on Free Import Dutyon Equipment & Materialthat is used for preven-ting environmentalpollution
Ministry of Environment
To encourage pulpindustry to install wastetreatment that preventsfurther pollution
Not guarantee tooperate waste treatmentequipment
Operation andmaintenance cost isexpensive that makesthe industries hesitate tooperate it
Box 4.3: User fees in the water sector
River Basin ManagementRiver Basin authorities in a few regions charge a wide range of tariffs for the extraction of water from surface sources. The tablebelow shows the charge rates for the two main River Basin authorities on Java : Perum Jasa Tirta I in East Java, and Perum JasaTirta II in West Java. In both cases, all institutional users are currently charged except for irrigation schemes, and charge rates haverisen over time. Despite these increases, charges are not sufficiently high to cover the full costs of river basin management.
User/Purchaser River Basin Authority
Perum Jasa Tirta II Perum Jasa Tirta I
Water supply: – – 1991 16 rupiah/m3
PDAM 1997-1999 PAM Jaya: 35 rupiah/m3 1998 35 rupiah/m3
Other PDAM: 23 rupiah/m3
2000-2003 PAM Jaya: 65 rupiah/m3 – –Other PDAM: 48 rupiah/m3
Water supply : 1997-1999 23 rupiah/m3 1998 52 rupiah/m3
Industry 2000-2003 48 rupiah/m3 –
Irrigation Currenta 0 rupiah/m3 Currentb 0 rupiah/m3
Hydropower 1991 2.6 rupiah/kwh 1991 6 .0 rupiah/kwh 1994 3.3 rupiah/kwh – –1997 7.0 rupiah/kwh 1998 12.4 rupiah/kwh1999 8.6 rupiah/kwh – –2000 11.9 rupiah/kwh – –
a Charge likely to be introduced in 4-6 yearsb Charge likely to be introduced in 3-4 years
Irrigation schemes User fees cover less than 10 per cent of the O&M costs of the irrigation system in Indonesia (1998 Public ExpenditureReview). Recommendations included in the Water Sector Adjustment Loan (WATSAL) include the creation of private wateruser associations (WUAs), with mandatory annual payments by irrigators into audited WUA bank accounts, and paymentrates approved by a scheme-level management committee. For schemes remaining under government responsibility, itrecommended greater retention and control of user fee revenues by provincial and district irrigation agencies.
Urban water supply services Water supply services are not fully self-financing and government funds mainly subsidize capital costs. PDAMs do notreceive grants for routine expenditures and are sometimes compelled to pay advance "dividends" that local governmentshave budgeted, even if they are losing money. This practice is gradually being stopped following concerns raised by donors.
Source: Yearly Publication Book of Perum Jasa Tirta, 2001.
Source: Authors’ elaboration, 2003.
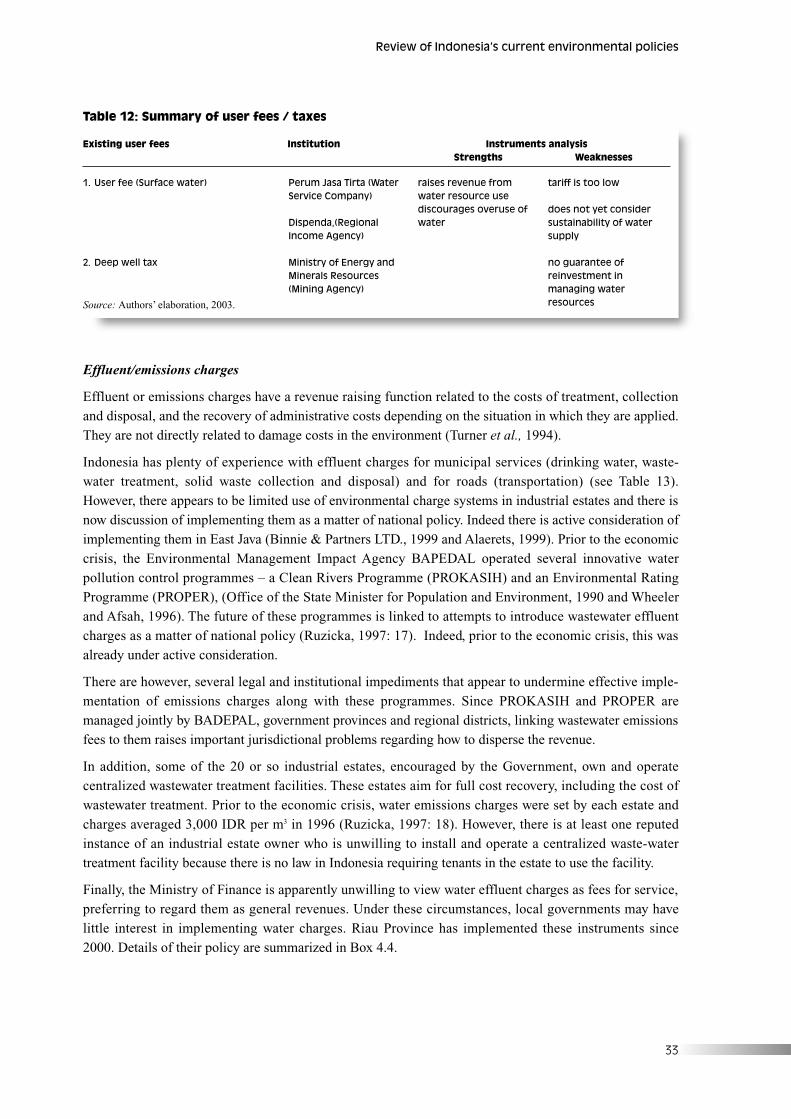
33
Review of Indonesia’s current environmental policies
Effluent/emissions charges
Effluent or emissions charges have a revenue raising function related to the costs of treatment, collection
and disposal, and the recovery of administrative costs depending on the situation in which they are applied.
They are not directly related to damage costs in the environment (Turner et al., 1994).
Indonesia has plenty of experience with effluent charges for municipal services (drinking water, waste-
water treatment, solid waste collection and disposal) and for roads (transportation) (see Table 13).
However, there appears to be limited use of environmental charge systems in industrial estates and there is
now discussion of implementing them as a matter of national policy. Indeed there is active consideration of
implementing them in East Java (Binnie & Partners LTD., 1999 and Alaerets, 1999). Prior to the economic
crisis, the Environmental Management Impact Agency BAPEDAL operated several innovative water
pollution control programmes – a Clean Rivers Programme (PROKASIH) and an Environmental Rating
Programme (PROPER), (Office of the State Minister for Population and Environment, 1990 and Wheeler
and Afsah, 1996). The future of these programmes is linked to attempts to introduce wastewater effluent
charges as a matter of national policy (Ruzicka, 1997: 17). Indeed, prior to the economic crisis, this was
already under active consideration.
There are however, several legal and institutional impediments that appear to undermine effective imple-
mentation of emissions charges along with these programmes. Since PROKASIH and PROPER are
managed jointly by BADEPAL, government provinces and regional districts, linking wastewater emissions
fees to them raises important jurisdictional problems regarding how to disperse the revenue.
In addition, some of the 20 or so industrial estates, encouraged by the Government, own and operate
centralized wastewater treatment facilities. These estates aim for full cost recovery, including the cost of
wastewater treatment. Prior to the economic crisis, water emissions charges were set by each estate and
charges averaged 3,000 IDR per m3 in 1996 (Ruzicka, 1997: 18). However, there is at least one reputed
instance of an industrial estate owner who is unwilling to install and operate a centralized waste-water
treatment facility because there is no law in Indonesia requiring tenants in the estate to use the facility.
Finally, the Ministry of Finance is apparently unwilling to view water effluent charges as fees for service,
preferring to regard them as general revenues. Under these circumstances, local governments may have
little interest in implementing water charges. Riau Province has implemented these instruments since
2000. Details of their policy are summarized in Box 4.4.
Table 12: Summary of user fees / taxes
Existing user fees Institution Instruments analysisStrengths Weaknesses
1. User fee (Surface water)
2. Deep well tax
Perum Jasa Tirta (WaterService Company)
Dispenda,(RegionalIncome Agency)
Ministry of Energy andMinerals Resources(Mining Agency)
raises revenue fromwater resource use discourages overuse ofwater
tariff is too low
does not yet considersustainability of watersupply
no guarantee ofreinvestment inmanaging waterresources Source: Authors’ elaboration, 2003.
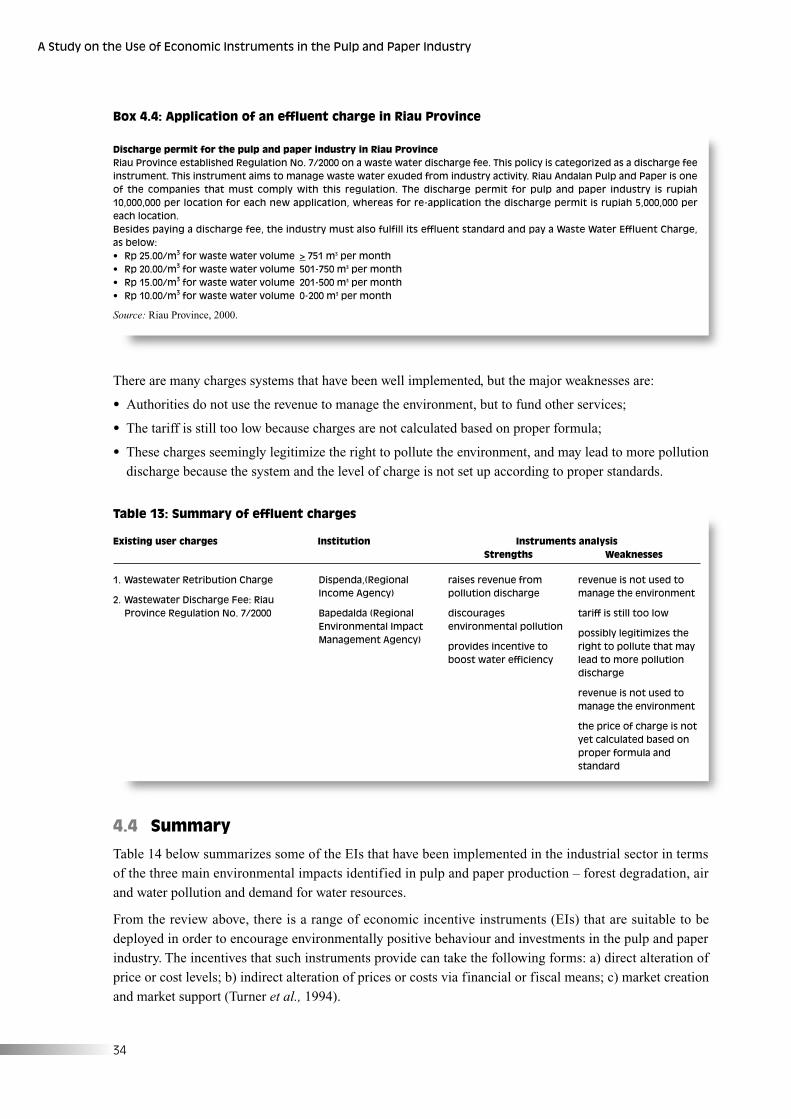
34
A Study on the Use of Economic Instruments in the Pulp and Paper Industry
There are many charges systems that have been well implemented, but the major weaknesses are:
• Authorities do not use the revenue to manage the environment, but to fund other services;
• The tariff is still too low because charges are not calculated based on proper formula;
• These charges seemingly legitimize the right to pollute the environment, and may lead to more pollution
discharge because the system and the level of charge is not set up according to proper standards.
Box 4.4: Application of an effluent charge in Riau Province
Discharge permit for the pulp and paper industry in Riau ProvinceRiau Province established Regulation No. 7/2000 on a waste water discharge fee. This policy is categorized as a discharge feeinstrument. This instrument aims to manage waste water exuded from industry activity. Riau Andalan Pulp and Paper is oneof the companies that must comply with this regulation. The discharge permit for pulp and paper industry is rupiah10,000,000 per location for each new application, whereas for re-application the discharge permit is rupiah 5,000,000 pereach location. Besides paying a discharge fee, the industry must also fulfill its effluent standard and pay a Waste Water Effluent Charge, as below:• Rp 25.00/m3 for waste water volume > 751 m3 per month• Rp 20.00/m3 for waste water volume 501-750 m3 per month• Rp 15.00/m3 for waste water volume 201-500 m3 per month• Rp 10.00/m3 for waste water volume 0-200 m3 per month
Source: Riau Province, 2000.
Table 13: Summary of effluent charges
Existing user charges Institution Instruments analysisStrengths Weaknesses
1. Wastewater Retribution Charge
2. Wastewater Discharge Fee: RiauProvince Regulation No. 7/2000
Dispenda,(RegionalIncome Agency)
Bapedalda (RegionalEnvironmental ImpactManagement Agency)
raises revenue frompollution discharge
discouragesenvironmental pollution
provides incentive toboost water efficiency
revenue is not used tomanage the environment
tariff is still too low
possibly legitimizes theright to pollute that maylead to more pollutiondischarge
revenue is not used tomanage the environment
the price of charge is notyet calculated based onproper formula andstandard
4.4 Summary
Table 14 below summarizes some of the EIs that have been implemented in the industrial sector in terms
of the three main environmental impacts identified in pulp and paper production – forest degradation, air
and water pollution and demand for water resources.
From the review above, there is a range of economic incentive instruments (EIs) that are suitable to be
deployed in order to encourage environmentally positive behaviour and investments in the pulp and paper
industry. The incentives that such instruments provide can take the following forms: a) direct alteration of
price or cost levels; b) indirect alteration of prices or costs via financial or fiscal means; c) market creation
and market support (Turner et al., 1994).
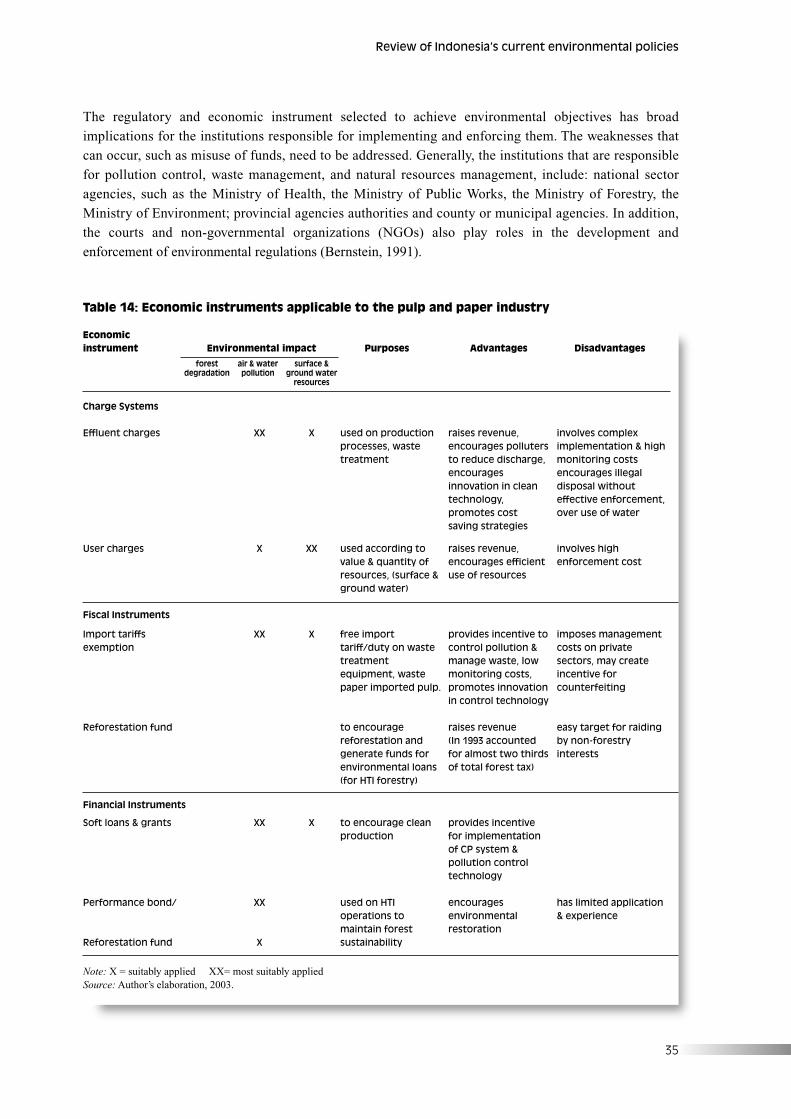
35
Review of Indonesia’s current environmental policies
Table 14: Economic instruments applicable to the pulp and paper industry
Economic instrument Environmental impact Purposes Advantages Disadvantages
forest air & water surface °radation pollution ground water
resources
Charge Systems
Effluent charges XX X used on productionprocesses, wastetreatment
raises revenue,encourages pollutersto reduce discharge,encouragesinnovation in cleantechnology,promotes costsaving strategies
involves compleximplementation & highmonitoring costsencourages illegaldisposal withouteffective enforcement,over use of water
User charges X XX used according tovalue & quantity ofresources, (surface &ground water)
raises revenue,encourages efficientuse of resources
involves highenforcement cost
Import tariffsexemption
Reforestation fund
XX X free importtariff/duty on wastetreatmentequipment, wastepaper imported pulp.
to encouragereforestation andgenerate funds forenvironmental loans(for HTI forestry)
provides incentive tocontrol pollution &manage waste, lowmonitoring costs,promotes innovationin control technology
raises revenue(In 1993 accountedfor almost two thirdsof total forest tax)
imposes managementcosts on privatesectors, may createincentive forcounterfeiting
easy target for raidingby non-forestryinterests
Fiscal Instruments
Soft loans & grants
Performance bond/
Reforestation fund
XX
XX
X
X to encourage cleanproduction
used on HTIoperations tomaintain forestsustainability
provides incentivefor implementationof CP system &pollution controltechnology
encouragesenvironmentalrestoration
has limited application& experience
Financial Instruments
Note: X = suitably applied XX= most suitably appliedSource: Author’s elaboration, 2003.
The regulatory and economic instrument selected to achieve environmental objectives has broad
implications for the institutions responsible for implementing and enforcing them. The weaknesses that
can occur, such as misuse of funds, need to be addressed. Generally, the institutions that are responsible
for pollution control, waste management, and natural resources management, include: national sector
agencies, such as the Ministry of Health, the Ministry of Public Works, the Ministry of Forestry, the
Ministry of Environment; provincial agencies authorities and county or municipal agencies. In addition,
the courts and non-governmental organizations (NGOs) also play roles in the development and
enforcement of environmental regulations (Bernstein, 1991).

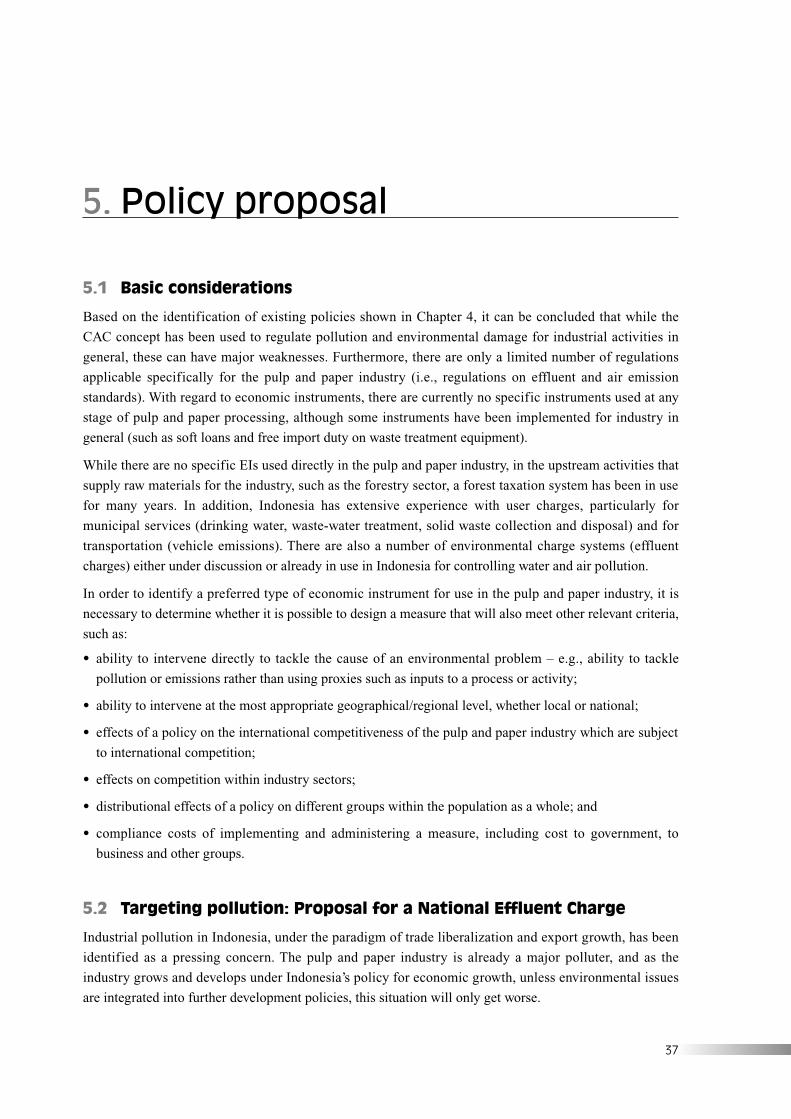
37
5.1 Basic considerations
Based on the identification of existing policies shown in Chapter 4, it can be concluded that while the
CAC concept has been used to regulate pollution and environmental damage for industrial activities in
general, these can have major weaknesses. Furthermore, there are only a limited number of regulations
applicable specifically for the pulp and paper industry (i.e., regulations on effluent and air emission
standards). With regard to economic instruments, there are currently no specific instruments used at any
stage of pulp and paper processing, although some instruments have been implemented for industry in
general (such as soft loans and free import duty on waste treatment equipment).
While there are no specific EIs used directly in the pulp and paper industry, in the upstream activities that
supply raw materials for the industry, such as the forestry sector, a forest taxation system has been in use
for many years. In addition, Indonesia has extensive experience with user charges, particularly for
municipal services (drinking water, waste-water treatment, solid waste collection and disposal) and for
transportation (vehicle emissions). There are also a number of environmental charge systems (effluent
charges) either under discussion or already in use in Indonesia for controlling water and air pollution.
In order to identify a preferred type of economic instrument for use in the pulp and paper industry, it is
necessary to determine whether it is possible to design a measure that will also meet other relevant criteria,
such as:
• ability to intervene directly to tackle the cause of an environmental problem – e.g., ability to tackle
pollution or emissions rather than using proxies such as inputs to a process or activity;
• ability to intervene at the most appropriate geographical/regional level, whether local or national;
• effects of a policy on the international competitiveness of the pulp and paper industry which are subject
to international competition;
• effects on competition within industry sectors;
• distributional effects of a policy on different groups within the population as a whole; and
• compliance costs of implementing and administering a measure, including cost to government, to
business and other groups.
5.2 Targeting pollution: Proposal for a National Effluent Charge
Industrial pollution in Indonesia, under the paradigm of trade liberalization and export growth, has been
identified as a pressing concern. The pulp and paper industry is already a major polluter, and as the
industry grows and develops under Indonesia’s policy for economic growth, unless environmental issues
are integrated into further development policies, this situation will only get worse.
5. Policy proposal
38
A Study on the Use of Economic Instruments in the Pulp and Paper Industry
The economic instrument approach has several advantages for pollution control because, when properly
implemented, it can:
• promote a cost-effective means for achieving acceptable levels of pollution;
• stimulate development of pollution control technology and expertise in the private sector;
• provide government with a source of revenue to support pollution control programs;
• provide flexibility in pollution control technologies; and
• eliminate a government’s requirement for large amounts of detailed information to determine the
feasible and appropriate level of control for each plant or product (Bernstein, 1991).
However, EIs also have some disadvantages. One significant problem is that the effects of EIs on
environmental quality are not as predictable as those under the traditional regulatory approach, since
polluters may choose their own solutions.
Effluent charges have been well studied in Indonesia. Before the economic crisis, there was some
discussion of implementing them as a matter of national policy, and there is currently active consideration
of them in East Java (Binnie & Partners LTD., 1999 and Alaerets, 1999). Prior to the economic crisis,
BAPEDAL operated several innovative water pollution control programmes – a Clean Rivers Programme
(PROKASIH) and a Business Environmental Performance Rating Programme (PROPER). The future of
these programmes is closely tied with raising revenue from an effluent charge.
An effluent charge is a viable option for the pulp and paper industry since many of the conditions required
to implement such a programme are already in place. These include the necessary legal framework to
develop a wastewater charge system and the associated permit requirements, existing programmes such as
PROKASIH and PROPER which provide waste water loading data, and a real need to improve the water
quality of Indonesia’s rivers.
However, it should be noted that the policy approach for each step of the process will need a close
assessment of existing information and baseline conditions, and also working closely with stakeholders to
ensure support for particular approaches.
5.2.1 Creating a framework for a National Effluent Charge Programme
There are three basic components that are needed to build an economic instruments programme for
wastewater management: the data provided in the permits issued, monitoring of pollutant loadings, and
application of the charge. These three components provide the framework for a system where:
1. information is first obtained from permits such as the Hindrance Ordinance (HO).
2. monitoring is conducted through self-monitoring requirements and from routine wastewater sampling
conducted by the provincial wastewater monitoring agency.
3. a fee is applied to the industry based on total pollution loading (flow and concentration) as determined
by the sampling and self-monitoring requirements (Sawyer, 1994).
Presented in Table 15 is an outline of what needs to be addressed in the development of an effluent charge
programme. Since this type of system is broad-based and as such will involve multiple government and
private sector stakeholders, the institutional arrangements will need to be determined at the beginning of
the development process. The legal basis for the charge system will also be of great importance and as
such will require attention early in the development process.
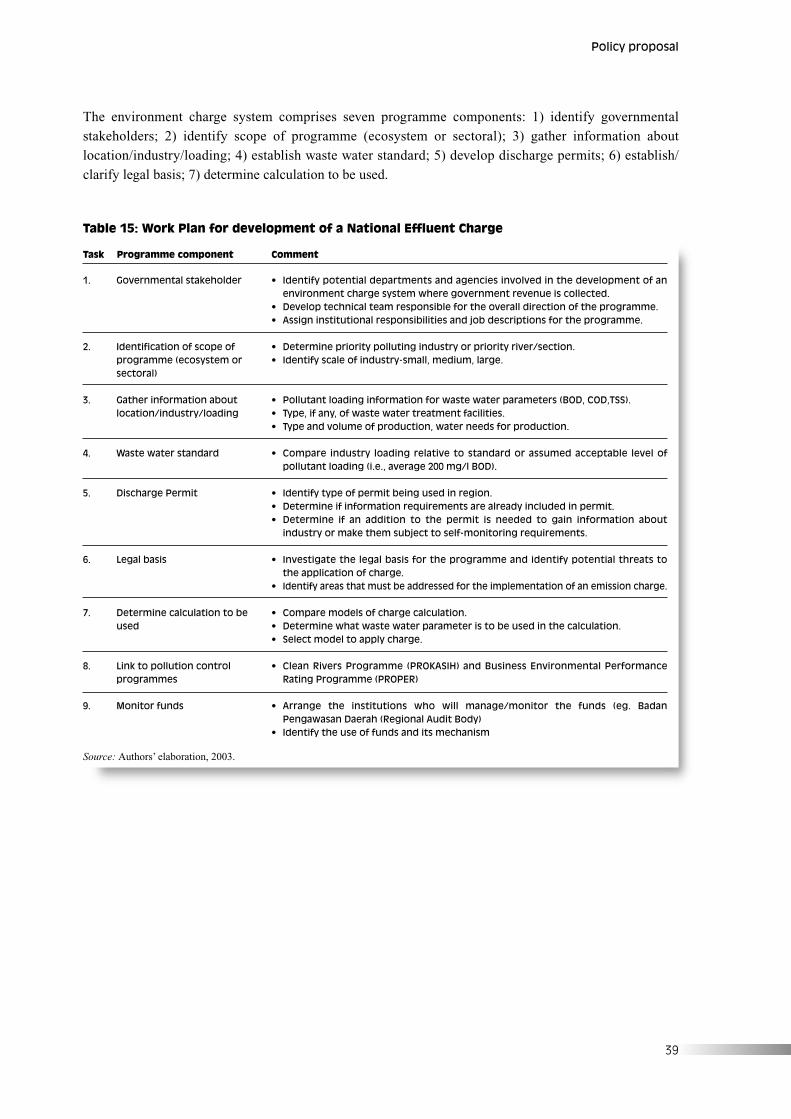
39
Policy proposal
The environment charge system comprises seven programme components: 1) identify governmental
stakeholders; 2) identify scope of programme (ecosystem or sectoral); 3) gather information about
location/industry/loading; 4) establish waste water standard; 5) develop discharge permits; 6) establish/
clarify legal basis; 7) determine calculation to be used.
Table 15: Work Plan for development of a National Effluent Charge
Task Programme component Comment
1.
2.
3.
4.
5.
6.
7.
8.
9.
Governmental stakeholder
Identification of scope ofprogramme (ecosystem orsectoral)
Gather information aboutlocation/industry/loading
Waste water standard
Discharge Permit
Legal basis
Determine calculation to beused
Link to pollution controlprogrammes
Monitor funds
• Identify potential departments and agencies involved in the development of anenvironment charge system where government revenue is collected.
• Develop technical team responsible for the overall direction of the programme.• Assign institutional responsibilities and job descriptions for the programme.
• Determine priority polluting industry or priority river/section.• Identify scale of industry-small, medium, large.
• Pollutant loading information for waste water parameters (BOD, COD,TSS).• Type, if any, of waste water treatment facilities.• Type and volume of production, water needs for production.
• Compare industry loading relative to standard or assumed acceptable level ofpollutant loading (i.e., average 200 mg/l BOD).
• Identify type of permit being used in region.• Determine if information requirements are already included in permit.• Determine if an addition to the permit is needed to gain information about
industry or make them subject to self-monitoring requirements.
• Investigate the legal basis for the programme and identify potential threats tothe application of charge.
• Identify areas that must be addressed for the implementation of an emission charge.
• Compare models of charge calculation.• Determine what waste water parameter is to be used in the calculation.• Select model to apply charge.
• Clean Rivers Programme (PROKASIH) and Business Environmental PerformanceRating Programme (PROPER)
• Arrange the institutions who will manage/monitor the funds (eg. BadanPengawasan Daerah (Regional Audit Body)
• Identify the use of funds and its mechanism
Source: Authors’ elaboration, 2003.

41
This report has provided a general overview of the implications of trade liberalization and export growth in
Indonesia, a review of Indonesia’s current environment policies relevant to the industrial sector, and
offered a preliminary assessment of the environmental implications of export growth in the pulp and paper
industry. Report findings indicate that environmental issues are a relatively new concern in Indonesia, and
there is much scope for further research and analysis.
Environmental management in Indonesia is currently based predominantly on command and control
regulation, with the use of economic instruments for sustainable development only minimally employed in
some sectors. The complementary potential of both approaches needs to be better understood so that
environmental policies can operate effectively within the existing system of current and proposed
Government actions. One of the most difficult challenges facing policy makers is choosing an effective
policy package that will both address the environmental problem they are facing and fit in with the
existing institutional capabilities and environmental policies already in place.
However, many supporting factors can help to address the problem. Among others are a high level of
awareness and participation of the community, effective law enforcement, and fund availability. Environ-
mental management in developed countries is considerably more successful because of integration of all
components into one synergistic system. In Indonesia, there are plenty of informal processes, whereas the
formal process is under discussion among stakeholders.
6.1 Key findings
A number of key issues have been raised by the report. Firstly, Indonesia’s policy of industrialization and
future growth depends heavily on exploitation of natural resources and environmental services (land,
forest, water, energy). In particular, the demand for raw materials from the pulp and paper industry
urgently needs to be addressed. The policy of sustainably managed plantation or industrial forestry (HTI)
must become operational as a matter of high priority. Opportunities for using non-wood raw materials
should also be investigated further.
Secondly, current environment policies based on the CAC and voluntary approach are generally weak,
poorly enforced and susceptible to misuse. The Government needs to continue improving its policies and
incentives for encouraging environmentally responsible behaviour as well as sustain efforts to strengthen
the institutions responsible for environmental planning and management. Substantial increase in invest-
ment in environmental protection will also be required by both the Government and the private sector.
Thirdly, as a result of economic growth, industrial pollution poses an immediate and significant threat to
health and human welfare, creating a major problem that requires urgent attention. Cleaner production
processes such as ‘closed loop production’ should be taken up as a matter of priority, and technological
innovation, particularly environmentally friendly technology should be further encouraged.
6. Summary and conclusions
42
A Study on the Use of Economic Instruments in the Pulp and Paper Industry
Finally, for economic growth to be sustainable, the costs of pollution and environmental damage must be
internalized into the costs of production and consumption as a matter of national policy, and decision
makers need to take a proactive role in formulating a wide range of economic policy instruments to
achieve the sustainable use of natural resources. This report will hopefully provide a basis on which to
move forward. The National Effluent Charge as proposed in this report is a good first step but it requires
further development, a detailed action plan for implementation and suggestions for follow-up.
6.2 Need for further research
Further research on environmental management strategies is clearly needed to build capacity and provide
sound guidance in the process of establishing new policies and selecting policy instruments aimed at
pollution control and sustainable use of natural resources and raw materials in the pulp and paper industry.
The research could include:
– In-depth studies on the effectiveness of various regulatory and economic instruments in developing
countries
– Practical aspects of implementing and operating economic instruments and circumstances under which
they can be successfully applied
– The combination of regulatory and economic instruments that are most appropriate for developing
countries
– Setting appropriate standards for developing countries
– Identifying means for building appropriate monitoring and enforcement capabilities in the pulp and
paper industry, and
– Cross-sectoral issues (for example energy consumption).
43
Anderson, M.S. 1994. Governance by Green Taxes: Making pollution prevention pay. Manchester
University Press. pp 171-195.
APHI, 2003. Peninjauan Menyeluruh terhadap Pungutan Sektor Usaha Kehutanan. Asosiasi Pengusahaan
Hutan Indonesia – Fakultas Kehutanan Institut Pertanian Bogor. p 79.
Asian Development Bank, 1997. Strategy for the Use of Market-Based Instruments in Indonesia’s Environ-
mental Management. Environmental Division, Office of Environment and Social Development,
Asian Development Bank. p 97.
BAPEDAL, 1994. Produksi Bersih di Indonesia (Cleaner Production in Indonesia). Bapedal (Environ-
mental Impact Management Agency) p 20.
Barr, C. 2002. Critical Policy Issues Facing Indonesia (Cleaner Production in Indonesia). Paper. Center for
International Forestry Research (CIFOR) Indonesia. p 3.
Basri, M.Chatib. 2003. Indonesian Economic Outlook 2002-2003. Paper. Institute for Economic and
Social Research, Faculty of Economics, University of Indonesia.
BBS, 2001. Proceeding Seminar of Celullose Technology at Panghegar Hotel, Bandung November 13,
2001. ISBN – 979-95271-1-2
Berstein J.D. 1991. Alternative Approaches to Pollution Control and Waste Management: Regulatory and
Economic Instruments. Discussion Paper for the Urban Management and Environment component
of the joint UNDP/World Bank/UNHCS Urban Management Programme (UMP). p 63.
CIFOR. 2002. Forestry Outlook and Review: Annual Report. Indonesia.
Cristoff P. 1995. Market-Based Instruments: The Australian Experience; in Eckersley R. (ed.) Market, the
State and the Environment: Towards Integration, Macmillan Education Australia PTY LTD. pp 157-
193.
Eddy H, 1984. Pollution Technology Review: Environmental Control for Pulp & Paper Mills
Forest Watch Indonesia. 2002. Dampak Pembangunan Industri Pulp & Paper terhadap Lingkungan.
Makalah tidak dipublikasikan.
Forest Watch Indonesia, 2002. The State of the Forest: Indonesia. Global Forest Watch. Washington DC.
Haryopuspito, K. 2000. The Prospect of Pulp & Paper Industry and its Challenge. Unpublished paper.
Haryopuspito, K. 2002. The Pulp & Paper Industry and the Free Trade Era. Unpublished paper.
IISD, 1994. Trade and Sustainable Development Principles. International Institute for Sustainable
Development (IISD). p 32.
References

44
A Study on the Use of Economic Instruments in the Pulp and Paper Industry
Indonesian Pulp & Paper Association. 2002. Status of Indonesian Pulp and Paper Industry in Relation to
Governmental Policies and Impact of Moratorium. Paper.
Indonesian Pulp & Paper Association. 2003. Directory 2003 Indonesian Pulp & Paper Industry. PT.
Gramedia Jakarta. pp 66.
Indonesian Research Bank. (BI). 2004. Minutes of Meeting of Board of Indonesia Bank’s Governor, 13
October 2004. www.bisnis.com
Joedodibroto, R. 1982. Palm plantation residues as an alternate source of cellulosic raw material for the
pulp and paper industry. Berita Selulosa: December 1982, Vol. XVIII, No.4. pp 95-97.
Kartodiharjo, H. 2001. Tinjauan Industri Pulp & Kertas. Makalah tidak dipublikasikan
Kartodihardjo, H. 2002. The Condition and Degradation of Indonesia’s Forest: Problems and Policy
Recommendations. INFID’s Background Paper on Forestry. p 20.
Malmsteen Arie, 2002. Pengelolaan sumberdaya Hutan dalam Rangka Otonomi Daerah (Forestry Resource
Management in Regional Autonomy Programme). Paper. Institute Teknologi Bandung. p 13.
Mathew, E and J.W. van Gelder. 2002. Paper Tiger, Hidden Dragon 2: APRIL fool. The forest destruction,
social conflict and financial crisis of Asia Pacific resources International Holdings Ltd (APRIL),
and the role of financial institutions and paper merchants. Paper. Friends of the Earth. p 20.
Ministry of Environment, 2001. Position Report & Recommendation on Environment, Small Economies,
Trade Debt, Finance, Transfer Technology, Technical Cooperation, and LDCs.
Ministry of Environment, 2002. Technical Guidance on Technology of Pollution Control for The
Indonesian Pulp & Paper Industry. Published by MoE. p 57.
Ministry of Forestry, 2001. Forestry Statistics of Indonesia 2000. Forestry Planning Agency.
Moran A., 1995. Tools of Environmental Policy: Market Instruments versus Command-and-Control; in
Eckersley R. (ed.) Market, The State and The Environment: Towards Integration, Macmillan
Education Australia PTY LTD. pp 73-85.
Panggabean, P. R., 1995. Clean Technology for the Manufacture of Papermaking Pulps from Indonesia
Hardwoods, MSc Thesis, Department of Paper Science. UMIST Manchester, United Kingdom.
Pratomo H. 2002. Application of Economic Instruments in Environmental Management in the Pulp &
Paper Industry in Indonesia. Paper for launching workshop. Jakarta, 21 February 2002.
Riau Province, 2000. Regulation No 7 Year of 2000. Regarding on Discharge Fee.
Rock, TM. 2000. Using “Green taxes” to increase revenue and improve the environment in local
government following decentralization. Technical Report. Natural Resources Management (NRM)
Programme Secretariat. p 34.
Roliadi, 2003. (Personal communication).
Ruzicka, 1997. Strategy for the Use of Market-Based Instruments in Indonesia’s Environmental Manage-
ment. Environmental Division, Office of Environment and Social Development, Asia Development.
Santosa, L, Hidayat T, Basuki TP. The Application of Oil Palm Empty Fruit Bunches (OPFEB) Pulp in
Liner Papermaking. Berita Selulosa, Vol. XXXIV. No. 1, Maret 1998, pp 2-8.

45
References
Santoso, F. and Astono B., 2002. Industri Kertas dan Pulp-Mesin Ekonomi yang Dimatikan (Pulp & Paper
Industry-Economic Engine to be Stopped). Kompas Daily News paper, Monday 30 December 2002.
Sawyer, D. 1994. The Development of an Economic Instruments Programme for Industrial Wastewater.
EMDI-BAPEDAL. p 31.
State Ministry for Environment, 2000. Indonesia Country Programme Update: For the Phase-out of Ozone
Depleting Substances Under the Montreal Protocol. p 24.
Sudirdjo, ST. 1998. The Influence of Bleached Kraft Pulp Mill Effluent to Water Recipients and the Effort
to Reduce It. Berita Selulosa, Vol. XXXIV, No.1, Maret 1998, p19-25.
Turner, R.K, Pearce D., and Bateman I., 1994. Environmental Economics. An elementary introduction.
Harvester Wheatsheaft. Maryland. p 328.
UNEP, 1996. Cleaner Production at Pulp and Paper Mills: A Guidance Manual. United Nations, Geneva.
UNEP, 1996. Environmental Management in the Pulp and Paper Industry. United Nations Publications,
France. p 231.
UNEP, 2001. Reference Manual for the Integrated Assessment of Trade-Related Policies. United Nations,
Geneva, p 83.
UNEP, 2002. Enhancing Synergies and Mutual Supportiveness of Multilateral Environmental Agreements
and the World Trade Organization. A Synthesis Report. United Nations, Geneva.
UNEP, 2002. Environmental Impact Assessment Training Resource Manual, United Nations, Geneva.
UNEP, 2004. The Use of Economic Instruments in Environmental Policy: Opportunities and Challenges.
United Nations, Geneva.
Webb, L. J., 1991. Clean production Techniques for Waste Minisation in the Pulp and Paper Industry,
Envirocell Report.
World Bank, 2001. INDONESIA: Environment and Natural Resource Management in a Time of Transition.
The World Bank, Washington DC. p 129.
World Bank, 2003. Indonesia Environment Monitor 2003: Special Focus on Reducing Pollution. World
Bank, Washington DC. p 50.
WTO, 2001. Ministerial Declaration, Doha 9-14 November 2001.


47
Appendix I
Industry selection process
1. Criteria
The experts agreed that the weighting factors are varied, from 10 for number of workers, 15 for contri-
bution to GDP, 20 for the use of natural resources, 25 for volume of export to 30 for environmental
impacts. This means that the number of workers absorbed is 10 per cent contribution to the weight
of degree of importance, contribution to GDP is 15 per cent, 20 per cent for the use of natural resources,
25 per cent for contribution in volume of export, and 30 per cent for environmental impact.
2. Selection process
Data is a key factor in the selection process. However, there are number of difficulties in compiling a
complete and comprehensive set of data and not all data are available. Since the quantitative data was
Appendices
Table A1: Criteria, weighting factors and level of degree
No. Criteria Weighting factor Level of degree Remarks
1. Contribution to GDP 15 1 Very low2 Low3 Medium4 High5 Very high
2. Volume of export 25 1 Very low2 Low3 Medium4 High5 Very high
3. Number of workers 10 1 Very low2 Low3 Medium4 High5 Very high
4. Environmental impact 30 1 Very low2 Low3 Medium4 High5 Very high
5. Use of natural resources 20 1 Very low2 Low3 Medium4 High5 Very high
Source: Inception Report, 2002.
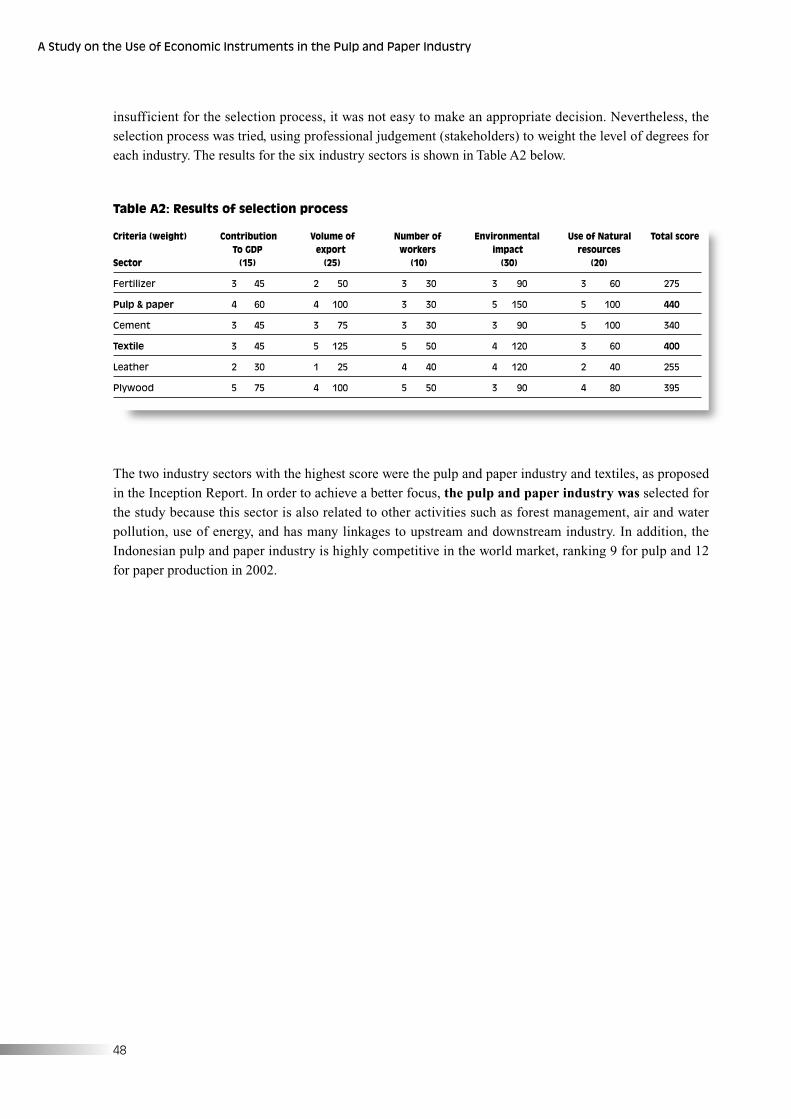
48
A Study on the Use of Economic Instruments in the Pulp and Paper Industry
insufficient for the selection process, it was not easy to make an appropriate decision. Nevertheless, the
selection process was tried, using professional judgement (stakeholders) to weight the level of degrees for
each industry. The results for the six industry sectors is shown in Table A2 below.
Table A2: Results of selection process
Criteria (weight) Contribution Volume of Number of Environmental Use of Natural Total scoreTo GDP export workers impact resources
Sector (15) (25) (10) (30) (20)
Fertilizer 3 45 2 50 3 30 3 90 3 60 275
Pulp & paper 4 60 4 100 3 30 5 150 5 100 440
Cement 3 45 3 75 3 30 3 90 5 100 340
Textile 3 45 5 125 5 50 4 120 3 60 400
Leather 2 30 1 25 4 40 4 120 2 40 255
Plywood 5 75 4 100 5 50 3 90 4 80 395
The two industry sectors with the highest score were the pulp and paper industry and textiles, as proposed
in the Inception Report. In order to achieve a better focus, the pulp and paper industry was selected for
the study because this sector is also related to other activities such as forest management, air and water
pollution, use of energy, and has many linkages to upstream and downstream industry. In addition, the
Indonesian pulp and paper industry is highly competitive in the world market, ranking 9 for pulp and 12
for paper production in 2002.
49
Appendices
Appendix II
Summary of survey results
A survey was conducted to gather detailed input from representatives of the pulp and paper industry. The
survey aimed to identify the pulp and paper production process and also to gather information about the
implications of using economic instruments.
Results:
• Simplified flow chart showing the major pulp and paper process steps which employs chemical pulping
and bleaching as shown in Table 3, page 43.
• Development of industrial forestry (HTI):
– Industrial forestry is still underdeveloped with consideration to conservation area
– Harvesting of HTI can be done after 7-8 years
– A claim from local people surrounding HTI areas about property rights of the area is argued because
of low law enforcement
– Source of bridging of raw material are chips from plywood industry, waste logging wood form land
clearing for HTI development, oil palm development, transmigration and other project
• Raw material diversification:
– A reliable long term supply of diversified raw material (such as oil palm bunches, bagasse) is
fluctuated and scattered in many regions
– Technology equipment and machinery is not always suitable for non wood materials. It requires other
investment needs
– Pulp yield of non-wood material generally is lower than wood fibres
– There is still questionable economics for non-wood materials
– There is research on use of non-wood materials for small scale capacity only
• Research institution for pulp and paper:
– The pulp and paper industry usually has communicated with research institutions both in Indonesia
and at international level (UNEP, CIDA) and disseminates the research results well
– Introduction of applicable and appropriate technology is expected to be wider
– Research institutions help pulp and paper industries in dealing with pollution control (such as a Zero
Discharge Mean), production efficiency (such as through cleaner production), applying environ-
mentally friendly technology, efficient use of natural resources
• Trade liberalization:
– The pulp and paper industry is motivated to be environmentally concerned since its products are exported
– Optimistic the industry will react properly to non-tariff barriers to trade
– In relation to dumping issue, the pulp and paper industry encourages the Indonesian Pulp and Paper
Association to cooperate closely with the Indonesian Anti Dumping Committee
• Environmental regulations:
– Need strong commitment on law enforcement

50
A Study on the Use of Economic Instruments in the Pulp and Paper Industry
– Motivate the pulp and paper industry to perform environmental management better
– Need incentives and/or disincentives as well as reward or punishment
• Economics instruments:
– Implemented economic instruments are: waste water discharge fee, waste water effluent charge, waste
water retribution, environmental soft loan programme, user fees in water sector, import tariff exemp-
tion for technology import.
– There is a good impact of the implemented economic instruments. The pulp and paper industry
intends to reduce its effluents in order to pay lower charges.
51
Appendices
Appendix III
Preliminary identification of environmental impacts in the pulp and paper industry resulting from trade policies and agreements
Product effects
These are effects related to the flow of products (or services) between countries. As trade liberalization
will likely increase the flow of products between countries, an increase in imported pulp and paper
products would have a negative impact on pollution to the aquatic, surface and ground water; primarily
caused by increasing the use of pulp and paper products in the importing country. There are no significant
direct impacts of product effect (0) on forest resource, biodiversity, water use, energy use, and health and
safety, whereas the light negative impacts (-) would occur to the groundwater and aquatic due to the used
paper that is not recycled.
Technology effects
More open trade policies may lead to the transfer of production technology across borders. There is a
positive technology effect when trade policy allows the flow of environmentally friendly technologies.
Pulp and paper production is applying cleaner production technologies. This technology tends to reduce
impact on environmental pollution and guides the industry to use resources more efficiently. The techno-
logy effects will influence a change in the quality of the environment. For instance, improvement in
technology will have very significant impacts (+++) on health and safety, water use, and aquatic, and some
moderate impacts (++) to forest resource, energy use, and acid rain.
Scale effects
Reforms that promote trade will often raise the overall level of pulp and paper industry activities,
demanding the industry to use a higher consumption rate of natural and environmental resources.
However, this may be compensated when efficiency is improved, or when industry growth makes greater
investments in environmental projects possible. An expansion in the level of economic activities in the
pulp and paper industry can have positive impacts on the environment by improving efficiency, showed by
reduced demand on natural resources and less generation of polluting waste.
However, expansion in pulp and paper production can also have negative environmental impacts when
there is no efficiency in use of natural resources and the investment in environmental management is
minimum. A higher output increases the demand for natural and environmental resources. In this situation,
pulp and paper production tends to be associated with an increase in environmental pollution, and severe
impacts on health and safety. The pulp and paper industry is complex and highly energy-and-water
intensive. In relation to forest resources, the growth of pulp and paper industry possibly causes:
• a higher pressure on natural forest sustainability
• increase in degradation and deforestation rate, not only to natural forest but also to cultivated/industrial
forest;
• increase in illegal logging and illegal supply when raw materials availability is lacking
• dependency on supply from natural forest due to improper management of industrial forestry (HTI)
52
A Study on the Use of Economic Instruments in the Pulp and Paper Industry
• Deforestation of natural forest causes poor forest ecosystem, with threats to biodiversity, the population
of endemic or threatened species, and the wilderness. Besides, deforestation may then influence social
impacts due to decreased ability of the community surrounding and/or within the forest to gain benefits
from the forest.
Structural effects
Trade liberalization could lead changes in sectoral composition of a country’s economy, as it specializes in
production of goods or services where it has comparative advantages. If the prospects for developing the
pulp and paper industry are good, this industry could be the main source of Indonesia’s income. This
potential could change the existing policy and then lead to more incentives to development of this industry.
Consequently, the development of the pulp and paper industry could increase pollution and uncontrollable
forest exploitation to fulfil raw material needs. Without appropriate environmental policies in place,
negative environmental effects may occur. Development of the pulp and paper industry will cause
moderate negative impacts (—) on forest resources, biodiversity, water use and energy use. Structural
effects will affect health and safety, and acid rain also with light negative impact (-).
Regulatory effects
Trade reforms may have impacts on environmental regulation and standards. Trade agreements may
explicitly include measures to improve environmental standards. If there are several trade-related policies
implemented to best policy and second best policy, there is a tendency for the pulp and paper industry to
produce lower impacts on pollution, consume natural resources more efficiently and adopt environ-
mentally friendly practices. Regulatory effects will have moderate positive impacts (++) on forest
resources, biodiversity, health and safety, and surface and ground water.
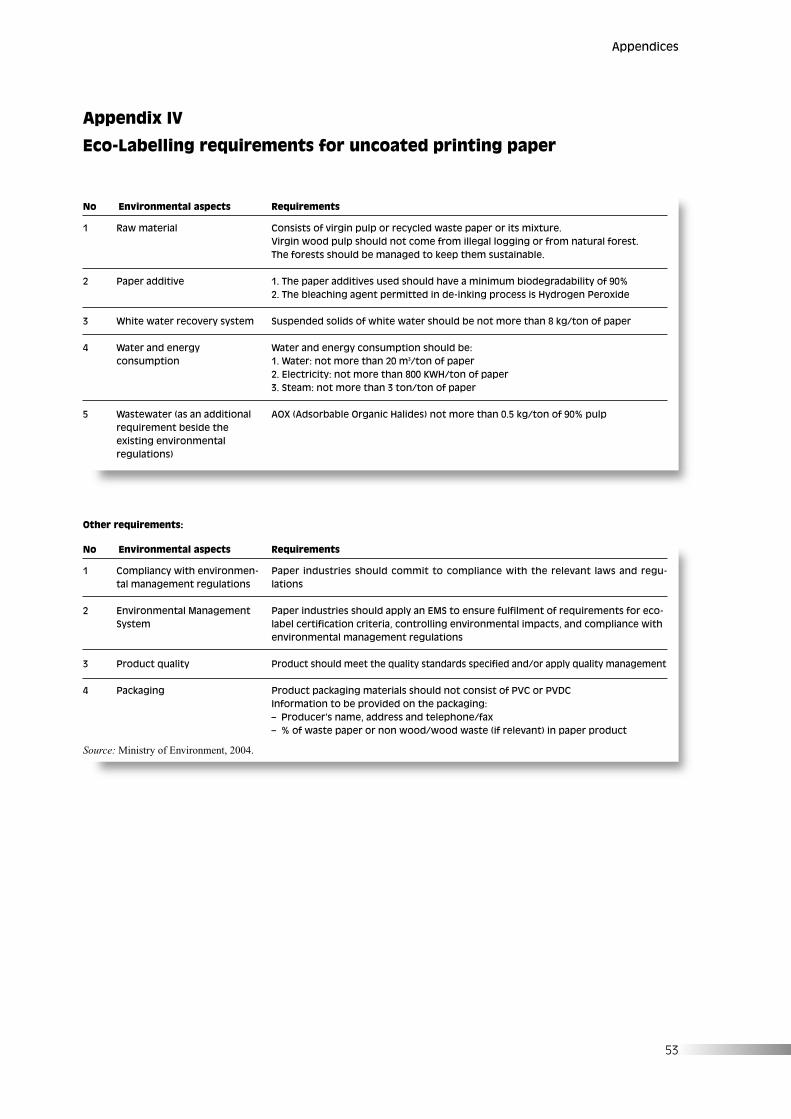
53
Appendices
Appendix IV
Eco-Labelling requirements for uncoated printing paper
No Environmental aspects Requirements
1
2
3
4
5
Raw material
Paper additive
White water recovery system
Water and energyconsumption
Wastewater (as an additionalrequirement beside theexisting environmentalregulations)
Consists of virgin pulp or recycled waste paper or its mixture. Virgin wood pulp should not come from illegal logging or from natural forest. The forests should be managed to keep them sustainable.
1. The paper additives used should have a minimum biodegradability of 90%2. The bleaching agent permitted in de-inking process is Hydrogen Peroxide
Suspended solids of white water should be not more than 8 kg/ton of paper
Water and energy consumption should be:1. Water: not more than 20 m3/ton of paper2. Electricity: not more than 800 KWH/ton of paper3. Steam: not more than 3 ton/ton of paper
AOX (Adsorbable Organic Halides) not more than 0.5 kg/ton of 90% pulp
Other requirements:
No Environmental aspects Requirements
1
2
3
4
Compliancy with environmen-tal management regulations
Environmental ManagementSystem
Product quality
Packaging
Paper industries should commit to compliance with the relevant laws and regu-lations
Paper industries should apply an EMS to ensure fulfilment of requirements for eco-label certification criteria, controlling environmental impacts, and compliance withenvironmental management regulations
Product should meet the quality standards specified and/or apply quality management
Product packaging materials should not consist of PVC or PVDCInformation to be provided on the packaging:– Producer’s name, address and telephone/fax – % of waste paper or non wood/wood waste (if relevant) in paper product
Source: Ministry of Environment, 2004.
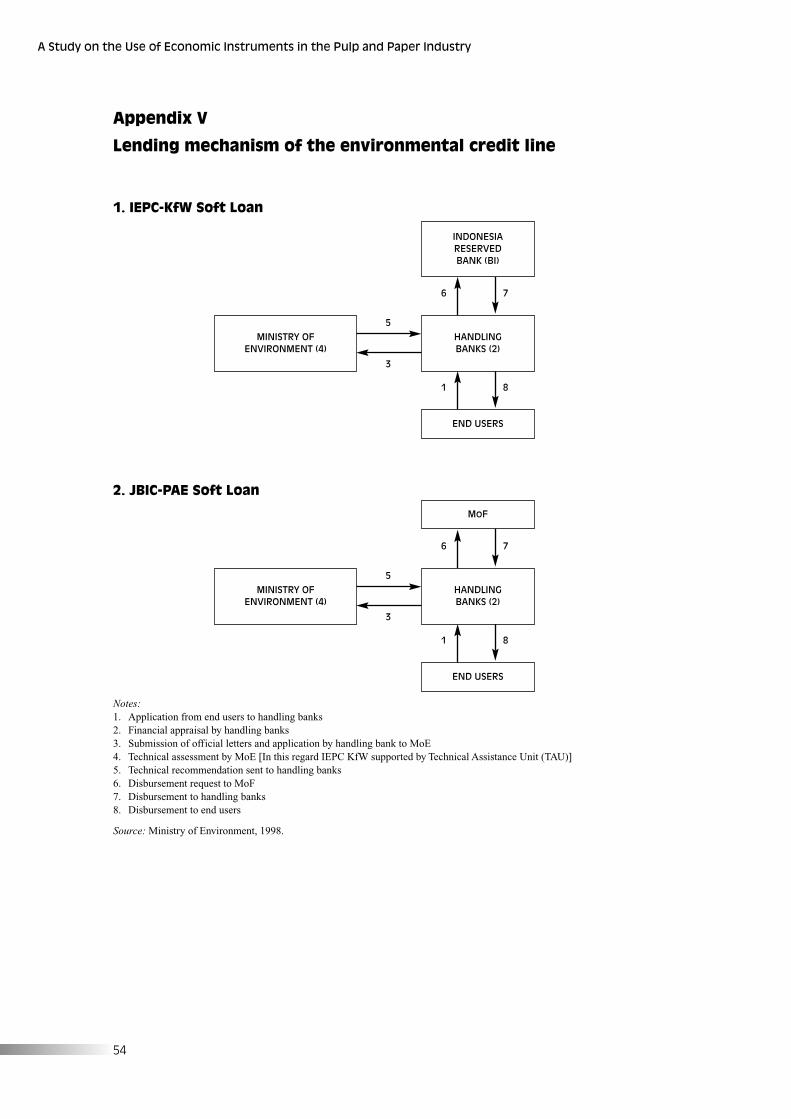
6 7
INDONESIARESERVEDBANK (BI)
1 8
HANDLINGBANKS (2)
MINISTRY OFENVIRONMENT (4)
END USERS
5
3
6 7
MoF
1 8
HANDLINGBANKS (2)
MINISTRY OFENVIRONMENT (4)
END USERS
5
3
54
A Study on the Use of Economic Instruments in the Pulp and Paper Industry
Appendix V
Lending mechanism of the environmental credit line
1. IEPC-KfW Soft Loan
2. JBIC-PAE Soft Loan
Notes:1. Application from end users to handling banks2. Financial appraisal by handling banks3. Submission of official letters and application by handling bank to MoE4. Technical assessment by MoE [In this regard IEPC KfW supported by Technical Assistance Unit (TAU)]5. Technical recommendation sent to handling banks6. Disbursement request to MoF7. Disbursement to handling banks8. Disbursement to end users
Source: Ministry of Environment, 1998.


Related Documents