ISTANBUL TECHNICAL UNIVERSITY INSTITUTE OF SCIENCE AND TECHNOLOGY PhD Thesis by Aliye Ahu GÜLÜMSER Department : Urban and Regional Planning Programme : Urban and Regional Planning NOVEMBER 2009 RURAL AREAS AS PROMISING HOT SPOTS: SUSTAINABLE RURAL DEVELOPMENT SCENARIOS

Welcome message from author
This document is posted to help you gain knowledge. Please leave a comment to let me know what you think about it! Share it to your friends and learn new things together.
Transcript
ISTANBUL TECHNICAL UNIVERSITY INSTITUTE OF SCIENCE AND TECHNOLOGY
PhD Thesis by Aliye Ahu GÜLÜMSER
Department : Urban and Regional Planning
Programme : Urban and Regional Planning
NOVEMBER 2009
RURAL AREAS AS PROMISING HOT SPOTS: SUSTAINABLE RURAL DEVELOPMENT SCENARIOS

ISTANBUL TECHNICAL UNIVERSITY INSTITUTE OF SCIENCE AND TECHNOLOGY
PhD Thesis by Aliye Ahu GÜLÜMSER
(502042910)
Date of submission : 28 July 2009 Date of defence examination: 02 November 2009
Supervisor (Chairman) : Assoc. Prof. Dr. Tüzin BAYCAN LEVENT (ITU)Co-Supervisor : Prof. Dr. Peter NIJKAMP (VUA)
Members of the Examining Committee : Prof. Dr. Fulin BÖLEN (ITU) Prof. Dr. Ümit ŞENESEN (ITU) Prof. Dr. Gülden ERKUT (ITU) Prof. Dr. Ayda ERAYDIN (METU) Prof. Dr. Gülay KIROĞLU (MSFAU)
NOVEMBER 2009
RURAL AREAS AS PROMISING HOT SPOTS: SUSTAINABLE RURAL DEVELOPMENT SCENARIOS


KASIM 2009
İSTANBUL TEKNİK ÜNİVERSİTESİ FEN BİLİMLERİ ENSTİTÜSÜ
DOKTORA TEZİ Aliye Ahu GÜLÜMSER
(502042910)
Tezin Enstitüye Verildiği Tarih : 28 Temmuz 2009 Tezin Savunulduğu Tarih : 02 Kasım 2009
Tez Danışmanı : Doç. Dr. Tüzin BAYCAN LEVENT (İTÜ) Eş Danışman : Prof. Dr. Peter NIJKAMP (VUA)
Diğer Jüri Üyeleri : Prof. Dr. Fulin BÖLEN (İTÜ) Prof. Dr. Ümit ŞENESEN (İTÜ) Prof. Dr. Gülden ERKUT (İTÜ) Prof. Dr. Ayda ERAYDIN (ODTÜ) Prof. Dr. Gülay KIROĞLU (MSGSÜ)
UMUT VEREN ÇEKİM NOKTALARI OLARAK KIRSAL ALANLAR: KIRSAL GELİŞME SENARYOLARI


v
To the real villagers:
Hatice and Hasan Gülümser

vi
vii
FOREWORD
A PhD thesis is a lifetime, and ‘life is what happens to you when you are making other plans’, as John Lennon says. I am sure most of the people think that I pushed myself too hard to come up with this work and I have missed life in a way. But I had a great reason. I started this PhD study almost 4 years ago with the inspiration of my family – especially the life story of my grandparents Hatice and Hasan Gülümser. They were two villagers and teachers who had graduated from The Village Institute. Therefore, I dedicate this manuscript to my paternal grandparents: the real villagers who were bound to the real tradition – the development of their environment. Explaining my gratitude to all of the people who had somehow contributed to this thesis in one page is difficult. Therefore, I apologise if I have not mentioned some of the names here but they know that they were part of my lifetime. First, I would like to thank my supervisors, both Assoc. Prof. Dr. Tüzin Baycan Levent and Prof. Dr. Peter Nijkamp who have become my lifesavers by sharing the most precious thing in human life, “their time” with me. If I managed to achieve such a dual work, it was also thanks to my committee members Professors Bölen and Şenesen. Even though this research completely consists of my original ideas and work in collaboration with my supervisors, the improvement of scientific value depends on the contribution of many colleagues, viz. Prof. Poot, Dr. Brons, Dr. de Dominicis, Dr. Daniels, Prof. de Groot, Dr. de Graaff, Prof. Dr. Noronha de Vaz, Prof. Torre, Mrs. Ellman, and Mrs. and Mr. Love (my sister and brother-in-law). I would like to thank Mr. Ziya Güveli and his team, and of course, Mr. Akar Apay and Mr. Bayram Bora and all the Sürat Daktilo Team for their endless help. As I was based in Istanbul Technical University, it would not have been possible without the support of my Department and my Faculty, and without the scholarship from The Scientific and Technological Council of Turkey (TUBITAK), ITU Scientific Research Projects (BAP). I am also very grateful to the Department of Spatial Economics at the VU University Amsterdam. As a result, I was blessed with an extensive and intensive social network both in Istanbul and in Amsterdam. I would like to thank all of my friends who were with me during my lifetime. Words do not come easy to thank my sister, Hande (the example in life) with my brother-in-law Mark, my mother, Gülşah, my father, Yurdagün (the village expert), and my aunt, Bülend. It is really difficult to find a way to thank them. But I am sure they do understand how much I am grateful to be their daughter and to be able to say I am a part of them. I hope with this thesis, they will be as proud of me as I am proud of them. The last but not the least, I would like to thank İlker Akgün for supporting me to put the final point. November 2009
Aliye Ahu GÜLÜMSER
Urban and Regional Planning

viii

ix
TABLE OF CONTENTS
Page
FOREWORD ............................................................................................................ vii TABLE OF CONTENTS .......................................................................................... ix ABBREVIATIONS ................................................................................................. xiii LIST OF TABLES ................................................................................................... xv LIST OF FIGURES ............................................................................................... xvii SUMMARY ............................................................................................................. xix ÖZET ...................................................................................................................... xxiii 1. INTRODUCTION: THE THINKING ON RURAL AREAS AND SUSTAINABILITY ................................................................................................... 1
1.1 The Changing Face of Rural Areas: Call for Sustainable Rural Development .. 2 1.2 The Confusion about Sustainable Rural Development ...................................... 4 1.3 Clarification of Sustainable Rural Development ............................................... 6 1.4 Tools and Facts to Explore and Analyse Sustainable Rural Development ........ 8
2. CONTEMPORANEOUS THINKING ON SUSTAINABLE RURAL DEVELOPMENT .................................................................................................... 11
2.1 The Main Concepts for a Sustainable Change in Rural Areas ......................... 11 2.1.1 The place: rural areas ................................................................................ 12 2.1.2 The actor and the action: entrepreneurs and their activities ...................... 18 2.1.3 The continuity of the place and action: sustainability ............................... 19 2.1.4 Conceptualizing sustainable rural development ....................................... 21
2.2 Finding a Theory for Sustainable Rural Development ..................................... 21 2.2.1 Theory of counterurbanization and intervening opportunities .................. 23 2.2.2 Endogenous growth theory, creative destruction, and entrepreneurship .. 27 2.2.3 Theory of social capital and embeddedness .............................................. 30 2.2.4 Selecting a theory for sustainable rural development ............................... 35
2.3 Additional Concepts of Sustainable Rural Development ................................. 36 2.3.1 Creative capacity in a rural context ........................................................... 36 2.3.2 Validity of the term ‘hot spot’ in rural discourses .................................... 47 2.3.3 Transforming rural areas using their creative capacity ............................. 49
2.4 Sustainable Rural Development in Operation .................................................. 50 2.4.1 Operational concepts ................................................................................. 50 2.4.2 Operational processes ............................................................................... 52 2.4.3 Operational thoughts on sustainable rural development ........................... 53
2.5 Concluding Remarks on Part 2 ......................................................................... 53 3. RURAL AREAS AS PROMISING HOT SPOTS IN EUROPE ...................... 57
3.1 The Evolution of Rural Areas in Europe .......................................................... 57 3.1.1 The enlargement of the european union: a powerful policy tool .............. 57 3.1.2 CAP and its reforms .................................................................................. 59 3.1.3 The effects of enlargements and the CAP on rural Europe ....................... 61

x
3.2 The Changing Trends in Rural Europe ............................................................. 63 3.2.1 Changes in rural employment ................................................................... 63 3.2.2 Changes in rural self-employment ............................................................ 67 3.2.3 Changing rural Europe .............................................................................. 72
3.3 Attractive Villages in Europe ........................................................................... 72 3.3.1 The associations of the most beautiful villages ......................................... 73 3.3.2 The associations in Europe ........................................................................ 75 3.3.3 Achieving European beauty: survey of European villages ....................... 77
3.4 Rural Areas and Their Capacity ....................................................................... 80 3.4.1 Rural creative capacity in the European villages ...................................... 80 3.4.2 Attractiveness capacity of European villages ............................................ 83 3.4.3 From appreciation to depreciation: the modern rural perception .............. 88
3.5 Rural Areas and Entrepreneurs ......................................................................... 89 3.5.1 The place of entrepreneurs in the European villages ................................ 90 3.5.2 Entrepreneurs and their impacts on the European villages ....................... 96 3.5.3 Creating and perceiving the opportunities in European villages ............. 106
3.6 New Rural Areas and Sustainable Rural Development .................................. 108 3.6.1 New rural areas: the perspective of visitors ............................................ 109 3.6.2 Sustainable rural development: perspective of the local population ....... 112 3.6.3 Sustainable rural development perception in Europe .............................. 116
3.7 Concluding Remarks on Part 3 ....................................................................... 117 4. RURAL AREAS AS PROMISING HOT SPOTS IN TURKEY ................... 123
4.1 The evolution of rural development in Turkey ............................................... 123 4.1.1 Rural development in Turkey during the unplanned period (1923-1962) .......................................................................................................................... 123 4.1.2 Rural development in Turkey during the planned period (1963-2013) .. 126 4.1.3 Development of rural Turkey: from past to present ................................ 130
4.2 The Rural Structure in Turkey ........................................................................ 131 4.2.1 Changes in Turkey’s rural structure ........................................................ 132 4.2.2 Analysis of Turkey’s rural structure ....................................................... 138 4.2.3 Mapping Turkey’s rurality: different approaches ................................... 143 4.2.4 Rural Turkey from different perspectives ............................................... 147
4.3 Rural Entrepreneurship and Successful Villages in Turkey ........................... 148 4.3.1 The attractive rural regions in Turkey ..................................................... 149 4.3.2 The successful Turkish villages .............................................................. 155 4.3.3 Breaking the closeness: the field survey in Turkish villages .................. 159
4.4 Rural Areas and Their Capacity: The Examples from Turkey ....................... 161 4.4.1 The rural creative capacity of the Turkish villages ................................. 161 4.4.2 The attractiveness of the Turkish villages ............................................... 164 4.4.3 The intensity, not the density, to measure the rural capacity .................. 168
4.5 Rural Areas and Entrepreneurs in Turkey ...................................................... 170 4.5.1 The rural entrepreneurs in Turkish villages ............................................ 170 4.5.2 The entrepreneurial effects on Turkish villages ...................................... 175 4.5.3 The entrepreneurial changes in the Turkish villages ............................... 180
4.6 New Rural Areas and Sustainable Rural Development in Turkey ................. 181 4.6.1 New rural areas: perspective of visitors in the Turkish villages ............. 182 4.6.2 Sustainable rural development: the perspective of Turkish villagers ..... 184 4.6.3 The new rural perception and sustainable rural development in Turkey 188
4.7 Concluding Remarks on Part 4 ....................................................................... 190 5. ENVISIONING PROMISING HOT SPOTS .................................................. 195

xi
5.1 Rural Areas in Europe and Turkey: Comparative Analyses .......................... 195 5.1.1 Rurality and the rural economy at the European level and Turkey......... 196 5.1.2 Changes in European and Turkish villages: a comparative approach .... 206 5.1.3 Opportunities in the European and Turkish rural areas .......................... 209 5.1.4 To exploit the opportunities in the villages ............................................. 211
5.2 The Future of Rural Areas: Sustainable Rural Development ......................... 214 5.2.1 Critical factors for sustainable rural development .................................. 215 5.2.2 Driving forces required to envision for rural areas ................................. 221 5.2.3 Sustainable development scenarios for rural hot spots ........................... 224 5.2.4 The best-fit sustainable rural development scenario ............................... 227
5.3 Concluding Remarks on Part 5 ....................................................................... 232 6. CONCLUSION: PROSPECTIVE THINKING ON SUSTAINABLE RURAL DEVELOPMENT .................................................................................................. 237
6.1 Rural Areas: The Future Hot Spots ................................................................ 237 6.2 Retrospect: Rural Areas as Promising Hot Spots ........................................... 238 6.3 Prospect: The Future of Sustainable Rural Development .............................. 241
REFERENCES ....................................................................................................... 245 APPENDICES ........................................................................................................ 267 CURRICULUM VITAE ........................................................................................ 295

xii

xiii
ABBREVIATIONS
AD : Archiving Data ANCI : Associazione Nazionale Comuni Italini CAP : Common Agricultural Policy CoE : Council of Europe EADP : East Anatolia Development Project EC : European Communities EL : Embeddedness Level entre-info : Entrepreneurial Information EU : European Union EUROSTAT : Statistical Office of European Communities FAO : The Food and Agricultural Organization FYDP : Five-Year Development Plan GATT : The General Agreement on Tariffs and Trade GDP : Gross Domestic Product GIS : Geographical Information Systems ICT : Information Communication Technologies IFAD : International Fund of Agricultural Development IMF : International Monetary Fund IPARD : Instrument for Pre-Accession Assistance for Rural Development LRA : Logistic Regression Analysis MARA : The Ministry of Agriculture and Rural Affairs MBV : The Most Beautiful Villages MCA : Multi-criteria Analysis MEDA : Mediterranean Non-member Countries MRAP : Multi-dimensional Rural Area Planning NGO : Non-Governmental Organization NRDP : The National Rural Development Plan NRDS : The National Rural Development Strategy NUTS : The Nomenclature of Territorial Units for Statistics OECD : Organisation for Economic Co-Operation and Development PCA : Principal Component Analysis pNDP : Preliminary National Development Plan pub-info : Publication Information QD : Questionnaire Data R&D : Research and Development RD : Rural Development ROSE : Rough Set Data Explorer RSDA : Rough Set Data Analysis SAPARD : Special Accession Programme for Agriculture and Rural
Development SARD : Sustainable Agricultural and Rural Development

xiv
SEAP : South Eastern Anatolia Project SME : Small and Medium-sized Enterprise SPESP : The Study Programme of the European Spatial Programme SPO : State Planning Organization SRD : Sustainable Rural Development TR : Turkey TURKSTAT : Turkish Statistical Institute UK : The United Kingdom UN : The United Nations UNCSD : The United Nations Common Supply Database UNCTAD : The United Nations Conference on Trade and Development US : The United States WB : World Bank WIPO : World Intellectual Property Organisation WTO : World Trade Organization WWII : World War Two
xv
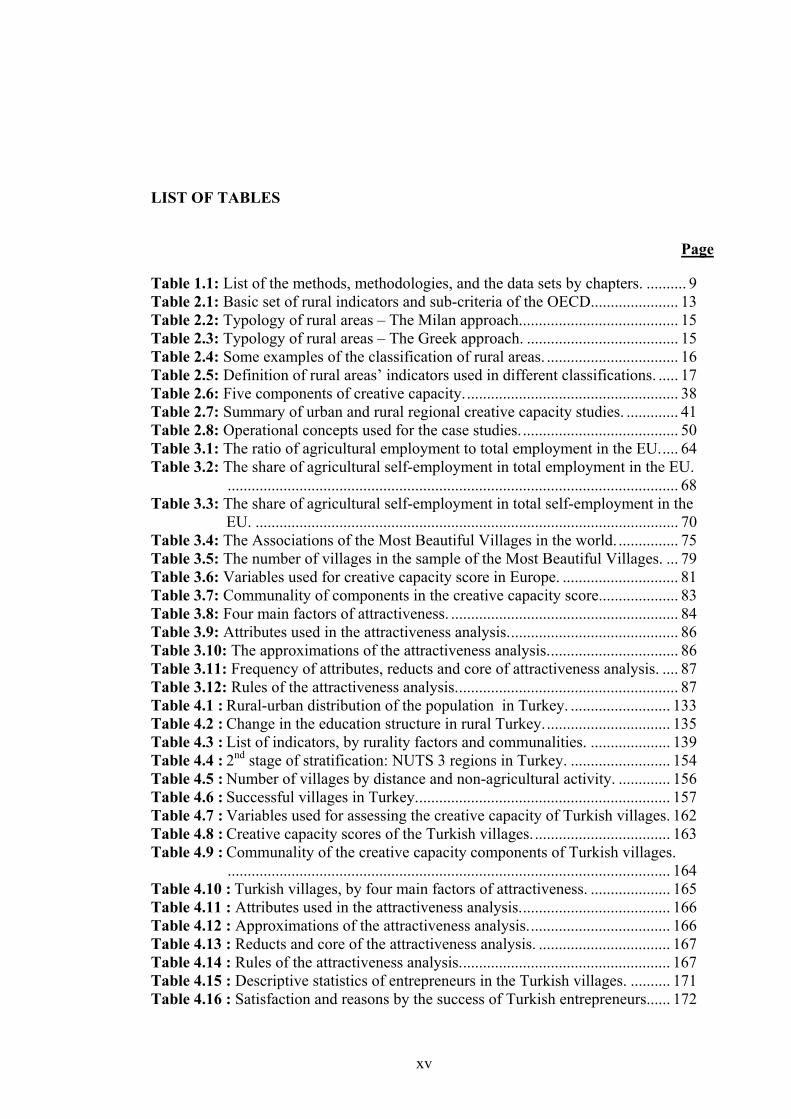
LIST OF TABLES
Page
Table 1.1: List of the methods, methodologies, and the data sets by chapters. .......... 9 Table 2.1: Basic set of rural indicators and sub-criteria of the OECD...................... 13 Table 2.2: Typology of rural areas – The Milan approach........................................ 15 Table 2.3: Typology of rural areas – The Greek approach. ...................................... 15 Table 2.4: Some examples of the classification of rural areas. ................................. 16 Table 2.5: Definition of rural areas’ indicators used in different classifications. ..... 17 Table 2.6: Five components of creative capacity. ..................................................... 38 Table 2.7: Summary of urban and rural regional creative capacity studies. ............. 41 Table 2.8: Operational concepts used for the case studies. ....................................... 50 Table 3.1: The ratio of agricultural employment to total employment in the EU. .... 64 Table 3.2: The share of agricultural self-employment in total employment in the EU.
................................................................................................................. 68 Table 3.3: The share of agricultural self-employment in total self-employment in the
EU. .......................................................................................................... 70 Table 3.4: The Associations of the Most Beautiful Villages in the world. ............... 75 Table 3.5: The number of villages in the sample of the Most Beautiful Villages. ... 79 Table 3.6: Variables used for creative capacity score in Europe. ............................. 81 Table 3.7: Communality of components in the creative capacity score.................... 83 Table 3.8: Four main factors of attractiveness. ......................................................... 84 Table 3.9: Attributes used in the attractiveness analysis. .......................................... 86 Table 3.10: The approximations of the attractiveness analysis. ................................ 86 Table 3.11: Frequency of attributes, reducts and core of attractiveness analysis. .... 87 Table 3.12: Rules of the attractiveness analysis. ....................................................... 87 Table 4.1 : Rural-urban distribution of the population in Turkey. ......................... 133 Table 4.2 : Change in the education structure in rural Turkey. ............................... 135 Table 4.3 : List of indicators, by rurality factors and communalities. .................... 139 Table 4.4 : 2nd stage of stratification: NUTS 3 regions in Turkey. ......................... 154 Table 4.5 : Number of villages by distance and non-agricultural activity. ............. 156 Table 4.6 : Successful villages in Turkey. ............................................................... 157 Table 4.7 : Variables used for assessing the creative capacity of Turkish villages. 162 Table 4.8 : Creative capacity scores of the Turkish villages. .................................. 163 Table 4.9 : Communality of the creative capacity components of Turkish villages.
............................................................................................................... 164 Table 4.10 : Turkish villages, by four main factors of attractiveness. .................... 165 Table 4.11 : Attributes used in the attractiveness analysis. ..................................... 166 Table 4.12 : Approximations of the attractiveness analysis. ................................... 166 Table 4.13 : Reducts and core of the attractiveness analysis. ................................. 167 Table 4.14 : Rules of the attractiveness analysis. .................................................... 167 Table 4.15 : Descriptive statistics of entrepreneurs in the Turkish villages. .......... 171 Table 4.16 : Satisfaction and reasons by the success of Turkish entrepreneurs...... 172
xvi
Table 4.17 : Attributes used for the embeddedness analysis. .................................. 173 Table 4.18 : Approximations for embeddedness levels. ......................................... 173 Table 4.19 : Frequency of attributes, reducts, and core of embeddedness analysis.174 Table 4.20 : Rules and their strengths in the embeddedness analysis. .................... 175 Table 4.21 : Variables used in the analysis of the impacts of entrepreneurs. ......... 177 Table 4.22 : Results of the z-tests on the origin comparison .................................. 178 Table 4.23 : Results of the logistic regression analysis on rural capital. ................ 179 Table 4.24 : Changes in the number of visits to Turkish villages. .......................... 182 Table 4.25 : Types of visitors in the Turkish villages. ............................................ 183 Table 4.26 : Variables used in the visitor analysis. ................................................. 183 Table 4.27 : Results of the logistic regression analysis of visitors. ......................... 184 Table 4.28 : Recent changes in 17 Turkish villages. ............................................... 186 Table 4.29 : Variables used in the visitor analysis. ................................................. 187 Table 4.30 : The equations in the visitor analysis. .................................................. 188 Table 5.1: Distribution of variables included in the factor analysis. ....................... 197 Table 5.2: Some rural indicators of different countries. .......................................... 203 Table 5.3: Some statistics on rural employment at the EU level and in Turkey. .... 205 Table 5.4: Opportunities from the perspective of different rural users. .................. 210 Table 5.5: Scenarios coded by the five critical factors – Impact matrix I. .............. 228 Table 5.6: Set of weights from the perspective of rural users. ................................ 229 Table 5.7: The performance indicators of the sensitivity analysis. ......................... 230 Table B.1: Database and scores of rural creative capacity – The European case ... 275 Table B.2: Data set for the attractiveness analysis– The European case ................ 276 Table B.3: Studies used in the embeddedness analysis – The European case ........ 277 Table B.4: Information table of the embeddedness analysis – The European case 277 Table B.5: Studies used in the impact analysis – The European case ..................... 278 Table B.6: Information table of the impact analysis – The European case ............. 279 Table B.7: Data set on the visitors and inhabitants – The European case ............... 280 Table C.1: Results of the factor analysis of the rural structure of Turkey .............. 281 Table C.2: NUTS 2 regions included in the 2nd stratification – The Turkish case . 282 Table C.3: NUTS 4 regions included in the 3rd stratification – The Turkish case .. 282 Table C.4: Villages included in the 4th stratification – The Turkish case ............... 283 Table C.5: Database on creativity – The Turkish case ............................................ 286 Table C.6: Database of the embeddedness analysis – The Turkish case ................ 286 Table C.7: Database of impact analysis – The Turkish case ................................... 288 Table C.8: Database on visitors and inhabitants – The Turkish case ...................... 291 Table D.1: Data and results of the rurality analysis – EU and Turkey .................... 293
xvii
LIST OF FIGURES
Page
Figure 1.1 : The structure of the study. ....................................................................... 7 Figure 2.1 : The conceptual framework of the study. ............................................... 11 Figure 2.2 : The theoretical framework of the study................................................. 22 Figure 2.3 : Changes in rural areas. .......................................................................... 26 Figure 2.4 : The effect of embeddedness on rural areas. .......................................... 33 Figure 3.1 : The distribution of agricultural employment in total employment. ...... 65 Figure 3.2 : Agricultural self-employment in total employment in the EU. ............. 69 Figure 3.3 : Agricultural self-employment in total self-employment in the EU. ...... 71 Figure 4.1 : Timeline of the main events and activities in Turkey. ........................ 124 Figure 4.2 : The Republican Village drawn and designed by Atatürk. ................... 125 Figure 4.3 : Timeline of the main events in the planned period in Turkey. ............ 127 Figure 4.4 : Milestones of rural structural changes in Turkey. ............................... 132 Figure 4.5 : Migration between settlements in Turkey. .......................................... 133 Figure 4.6 : Structural changes in age distribution in Turkey. ................................ 134 Figure 4.7 : Rural employment structure in Turkey................................................ 135 Figure 4.8 : The distribution of the rural labour force in Turkey. ........................... 136 Figure 4.9 : Change of agricultural employment in Turkey. .................................. 137 Figure 4.10 : Sectors in which employment has increased in Turkey. ................... 137 Figure 4.11 : Box plots of the results of factor analysis of rural Turkey. ............... 140 Figure 4.12 : Map of Turkey’s rurality – The OECD’s methodology. ................... 143 Figure 4.13 : Map of Turkey’s rurality – The EU’s methodology. ......................... 144 Figure 4.14 : Map of Turkey’s rurality – A traditional perspective. ....................... 145 Figure 4.15 : Map of Turkey’s rurality – A new definition. ................................... 146 Figure 4.16 : Changes in employment in Turkey.................................................... 149 Figure 4.17 : Age structure of rural entrepreneurs in Turkey. ................................ 150 Figure 4.18 : Education levels of rural entrepreneurs in Turkey. ........................... 150 Figure 4.19 : Economic activity of rural entrepreneurs in Turkey. ......................... 151 Figure 4.20 : Multi-stage sampling of the Turkish case. ........................................ 152 Figure 4.21 : The level of population flows by NUTS 2 regions in Turkey. .......... 153 Figure 4.22 : Priorities during the village selection – The Turkish case. ............... 157 Figure 5.1 : The EU-25 and Turkey by underdevelopment level. ......................... 199 Figure 5.2 : The EU-25 and Turkey by demographic level. ................................... 199 Figure 5.3 : The EU-25 and Turkey by urbanization level. .................................... 199 Figure 5.4 : The EU-25 and Turkey by higher education level. ............................. 199 Figure 5.5 : The EU-25 and Turkey by industrialization level. .............................. 199 Figure 5.6 : The EU-25 and Turkey by rurality level. ........................................... 199 Figure 5.7 : Box plots of factor scores obtained by the rurality analysis. ............... 202 Figure 5.8 : Typology of rural areas. ...................................................................... 208 Figure 5.9 : Demographic changes. ........................................................................ 208

xviii
Figure 5.10 : Causes of permanent demography changes. ...................................... 208 Figure 5.11 : Causes of seasonal demography changes. ......................................... 208 Figure 5.12 : Negative consequences of demographic changes. ............................. 208 Figure 5.13 : Positive consequences for inhabitants. .............................................. 208 Figure 5.14 : The basic pentagon prism. ................................................................. 217 Figure 5.15 : The critical factors of sustainable rural development. ....................... 220 Figure 5.16 : The driving forces required to envision for rural areas. .................... 222 Figure 5.17 : The ranking of the four Hot Spot scenarios. ...................................... 229 Figure 5.18 : The ranking of scenarios – Sensitivity analysis. ................................ 230

xix
RURAL AREAS AS PROMISING HOT SPOTS: SUSTAINABLE RURAL DEVELOPMENT SCENARIOS
SUMMARY
In recent years, rural areas are no longer seen just as places of beautiful landscapes
but also as places of diverse economies and unique social networks. In contrast to the
early transitions, which produced demographic and economic structural changes,
today rural areas are now experiencing transitions in their cultural, social and
demographic structures. These changes have both positive and negative impacts on
rural structure. The negative impacts on the cultural, social and even natural structure
in rural areas have caused governments to put rural areas towards the top of their
agenda. In addition, there were also positive impacts on the well-being of people but
which sometimes resulted in conflicting perceptions. On this basis, in this study, we
have tried to answer the question: Can rural areas be hot spots while still maintaining
their sustainability and continuity? To answer this question, this study aims to
explore and analyse the opportunities for economic diversity in rural areas and to
develop sustainable rural development scenarios. In order to reach our aim and to
clarify the conflict on sustainable rural development and the impacts of recent
changes, the study consists of: one introductory chapter; the main theoretical part;
two empirical parts on rural areas, and one empirical part on rural hot spots and
sustainable rural development scenarios; and, finally, the concluding chapter.
The first chapter provides the background and motivations of the study, while
introducing the research questions, methodologies and data sets used in this study. In
other words, in the introductory part of the study, we explain all the thinking on rural
areas and sustainability. As a result, we use a multi-method approach by applying a
wide range of analysis techniques, i.e. descriptive statistics, exploratory analysis,
meta-analysis, regime analysis, pentagon analysis, factor analysis, principal
component analysis, rough set data analysis and logistic regression analysis. The data
and information used in this study are obtained from different sources, i.e.
EUROSTAT, TURKSTAT, the World Bank, and the FAO, and also from extensive
field surveys conducted in European and Turkish villages.

xx
Part 2, in order to develop the conceptual and theoretical frameworks of the study,
offers a contemporary approach which also stresses the uniqueness and novelty of
the study by means of contemporaneous thinking on sustainable rural development.
With this approach, the study is designed to deal with the complexity of the concepts
and related theories used in the sustainable rural development phenomenon, while
adding the hot spot theory to generate an alternative perspective for rural-specific
evaluation. Later, the study provides empirical evidence from 60 European villages
and 17 Turkish villages in Part 3 and Part 4, respectively. These analyses refer to the
creative and attractiveness capacity of villages; to the entrepreneurs, their place in,
and their impacts on, rural areas; and to the new rural perception of visitors and
inhabitants. The results obtained from these two case studies are used in the last
empirical part of the study in order to show the various opportunities in rural areas,
to offer a set of critical factors for sustainable rural development, and to design
sustainable rural development scenarios for the future of rural hot spots.
Therefore, we came up with five critical factors, viz. physical systems; social
systems; economic systems; locality systems; and creative systems, which are related
to the five driving forces of sustainable rural development, viz. attractiveness;
embeddedness; continuity; competitiveness; and capacity. Through these findings,
four sustainable rural development alternatives that are called: Green Hot Spot;
Agricultural Hot Spot; Cultural Hot Spot; and Learning Hot Spot, were generated.
While generating these alternatives, our main approach was that rural areas are
promising hot spots, and therefore can be transformed from depreciated and
neglected places into appreciated and important places in the global scene, while
maintaining their sustainability. From this perspective, we assumed that innovation
and creativity are vital in rural areas to achieve sustainable rural development (SRD).
The results showed that the Learning Hot Spot scenario is ranked first followed by
the Cultural Hot Spot, the Agricultural Hot Spot and the Green Hot Spot scenario,
respectively. The rural areas are ready to be exploited and want to be a part of the
open market with a high level of participation. Therefore, to accept them only as
places of beautiful landscapes and nature or as reservoirs of natural resources will be
unfair for their future. On the other hand, their inhabitants also expect them to
continue to be the home-land of agriculture.

xxi
The results of our study show the differences between villages in Europe and Turkey
and also describe the heterogeneity of villages, even when they are in the same
geographical area. In addition, the results demonstrate the importance of social
systems and locality systems in the rural environment. According to our findings,
rural inhabitants are generally enthusiastic about innovative futures, and want to play
an active role in such futures. Furthermore, the future research agenda could be
concerned with how to operationalize and implement rural hot spot scenarios in real
terms as a joint mission of all stakeholders.

xxii
xxiii
UMUT VEREN ÇEKİM NOKTALARI OLARAK KIRSAL ALANLAR: SÜRDÜRÜLEBİLİR KIRSAL GELİŞME SENARYOLARI
ÖZET
Kırsal alanlar, son yıllarda sadece güzel manzaraların değil aynı zamanda çeşitlilik
sunan ekonomilerin ve özgün sosyal ağların mekanı olarak görülmeye başlanmıştır.
Geçmişte düşüş gösteren demografik ve ekonomik yapı gibi yapısal dönüşümlerin
aksine, günümüzde yükseliş gösteren demografik yapıları ile kırsal alanlar kültürel
ve sosyal yapısal dönüşümleri deneyimlemeye başlamışlardır. Kırsal alanlar bu
değişimlerden hem olumlu hem olumsuz biçimde etkilenmişlerdir. Kırsal alanlardaki
kültürel, sosyal ve hatta doğal yapının olumsuz yönde etkilenmesi hükümetleri kırsal
alanları gündemlerine almaları yönünde uyarıcı olmuştur. Buna ek olarak, insan
refahındaki olumlu yöndeki gelişmeler ise değişimler bağlamında bir karmaşa
yaratmıştır. Bu çalışma, kırsal alanların sürdürülebilirlik ve sürekliliklerini devam
ettirirken aynı zamanda çekici noktalar olabilirler mi? sorusuna cevap vermeye
çalışmaktadır. Bu soruya cevap verebilmek için çalışma ekonomik çeşitlilik için
kırsal alanlardaki olanakları irdelemeyi ve sürdürülebilir kırsal gelişme senaryoları
geliştirmeyi amaçlamaktadır. Bu amaca ulaşabilmek ve gerek sürdürülebilir kırsal
gelişmeye yönelik, gerekse yakın geçmişte meydana gelmiş değişimlerin yarattığı
karmaşık durumu aydınlatmaya yönelik olarak bu çalışma, bir giriş, bir kuramsal,
kırsal alanlar üzerine iki deneysel, sürdürülebilir kırsal alanlar üzerine bir deneysel
bölüm ile bir sonuç bölümü olmak üzere toplam altı bölümden oluşmaktadır.
İlk bölüm çalışmanın arka planını ve nedenlerini sunmakta, aynı zamanda çalışmada
kullanılan araştırma sorularını, yöntemleri ve veri tabanlarını tanıtmaktadır. Diğer bir
deyişle, giriş bölümü, kırsal alanları ve sürdürülebilirliği düşündüğümüzde ortaya
çıkan bulguları sunmaktadır. Konunun çok uzun bir geçmişe sahip olmaması, hala
kavramsal ve kuramsal olarak karmaşıklığı bünyesinde barındırması bizi betimleyici
ve açıklayıcı istatistik tekniklerini, meta-analizi tekniği, idare(regime) analizi, beşgen
analizi, faktör analizi, ana bileşenler analizi, taslak küme veri analizi (rough set data
analysis) ve lojistik regresyon analiz teknikleri gibi geniş bir çözümleme teknikleri
xxiv
grubu uygulayarak çoklu yöntem yaklaşımı kullanmaya yönlendirmiştir. Ayrıca,
kullanılan veri ve bilgiler de TÜİK, EUROSTAT, Dünya Bankası, ve Gıda ve Tarım
Örgütü veri bankaları gibi farklı kaynaklardan ve Türkiye ile Avrupa köylerinde
yapılan saha araştırmalarından elde edilen verilerden elde edilmiştir.
Çalışmanın A Bölümü gerek kavramsal gerekse kuramsal çerçeveyi oluşturmak için
kullanılan sürdürülebilir kırsal gelişme üzerine çağdaş düşüncelerin ortaya konduğu
ve çalışmanın özgünlüğünün ve yenilikçiliğinin çağdaş bir yaklaşım anlamında
sunulduğu bir bölümdür. Bu yaklaşıma dayanarak, çalışma sürdürülebilir kırsal
gelişme olgusuna dair kullanılan kavramların karmaşıklığı ve konu ile ilgili
kuramların üzerine kırsal odaklı değerlendirmelere bakış açısı seçeneği oluşturmak
için çekici nokta kuramını da ele alarak tasarlanmıştır. Çalışma 60 Avrupa ve 17
Türk köyünden elde edilen deneysel bulguları sırasıyla B Bölümü ve C Bölümünde
sunmaktadır. Bu bulgular köylerin yaratıcılık ve çekicilik yeteneklerine,
girişimcilerin köydeki konumlarına ve köye etkilerine, ve son olarak ziyaretçiler ile
köy sakinlerinin yeni kırsallığın algılayınış biçimlerine dayanmaktadır. Bu iki farklı
saha çalışmasından elde edilen sonuçlar son amprik bölümde kırsal alanlarda
bulunan çok çeşitli olanakları ortaya koymak, sürdürülebilir kırsal gelişmenin önemli
unsurlarını sunmak ve geleceğin kırsal çekici noktaları için sürdürülebilir kırsal
gelişme senaryoları tasarlamak için kullanılmıştır.
Bu bağlamda, fiziksel sistemler, sosyal sistemler, ekonomik sistemler, yerel sistemler
ve yaratıcı sistemler olmak üzere beş önemli unsur ve bu unsurlara bağlı olan
çekicilik, gömülülük, süreklilik, rekabetçilik ve kapasite olmak üzere sürdürülebilir
kırsal gelişmenin beş itici gücü sunulmaktadır. Bu bulgular doğrultusunda, yeşil
çekici nokta, tarımsal çekici nokta, kültürel çekici nokta ve öğrenme çekici noktası
olarak adlandırılan dört sürdürülebilir kırsal gelişme senaryo seçeneği tasarlanmıştır.
Bu seçenekler geliştirilirken, kırsal alanların umut veren çekici noktalar olduğu ve
dolayısıyla küresel ortamda sürdürülebilirliklerini korurken, değeri düşmüş ve ihmal
edilmiş alanlar olmaktan beğeni toplayan önemli alanlara dönüştürülebilir olmaları
ana yaklaşımımızdır. Bu bakış açısıyla, yenilikçilik ve yaratıcılığın kırsal alanlarda
sürdürülebilir kırsal gelişmeyi (SKG) başarmak için hayati olduğu varsayılmaktadır.
Sonuçlar göstermektedir ki; öğrenme çekici noktası senaryosu, ilk olarak sıralanırken
kültürel çekici nokta, tarımsal çekici nokta ve yeşil çekici nokta sırasıyla bu
senaryoyu takip etmektedir. Kırsal alanlar işletilmeye hazır ve yüksek düzeyde

xxv
katılımla açık pazarın bir parçası olmayı istemektedir. Dolayısıyla, onları, gelecekleri
adına sadece güzel mazaraların ve doğanın varolduğu alanlar veya doğal havza
alanları olarak kabul etmek hiç adil olmayacaktır. Öte yandan, kırsal alanlar bunlara
ek olarak, tarımın memleketi olmayı da sürdürmeyi kabul etmektedir.
Çalışmanın sonuçları, Avrupa ve Türkiye arasındaki farklılıklarla birlikte aynı
coğrafyada olsalar bile köylerin çok çeşitliliğini de göstermektedir. Sonuçlar ayrıca,
sosyal ve yerel sistemlerin kırsal çevrede ne kadar önemli olduğunu da
göstermektedir. Sonuçlara gçre, kırsal yerleşme sakinleri yenilikçi geleceklere dair
çok hevesli ve etken biçimde görev almayı istemektedirler. İleride, gelecek araştırma
gündeminin kırsal çekici nokta senaryolarının nasıl gerçekleştirilebileceği ve
işlevselleştirilebileceği yönünde olabileceğini ortaya koymaktadır.


1
1. INTRODUCTION: THE THINKING ON RURAL AREAS AND
SUSTAINABILITY
Human settlements have never had a static character but have always been in a state
of flux (Nijkamp, 1978). This dynamic pattern depends essentially on the dynamics
of population movement. Mobility seems to be today’s basic need, but the dominant
type of population mobility in the 19th century, known as rural-urban migration,
caused the decline of rural areas and emphasized the persistence of their well-known
problems, i.e. depopulation, lack of employment and other socio-economic
deficiencies. Although this was the situation in the 19th century, since then, because
of the increased mobility, the perception and cognition of people about rural places
have been transformed in the late 20th and early 21st century. The impacts of this
change can be observed in a reversal in demographic trends (‘counterurbanization’),
a search for new lifestyles, and flexible production and work (van Geenhuizen et al.,
2002). As a consequence, people and also policy makers now no longer regard rural
areas as depressed, problematic and poor areas, but rather as diverse, attractive, and
high-potential areas.
Governments have often tried to develop rural areas by giving subsidies or loans.
However, they could not limit the out-migration of the labour force from rural areas.
One of the reasons for out-migration was the pursuit of employment opportunities
that drove local people to move away from their homelands towards surrounding
towns or even further (Shucksmith, 2001). This changing pattern of the labour force
in rural areas has forced governments to create new solutions to keep employment
within the rural areas. The increasing importance and implementation of rural
development plans and the reversal in population flows raised the issue of the
‘sustainability and continuity’ of rural areas, especially where natural resources are
concerned. On this basis, rural development on its own is not enough but calls for a
sustainable approach. In this chapter, we introduce the motivations and background
of the study, and then describe the aim, structure, methodology and the data
employed for an assessment of the current state of play in rural areas.

2
1.1 The Changing Face of Rural Areas: Call for Sustainable Rural Development
The early changing demographics in rural areas due to the rural-urban migration
flows went hand in hand with the demise of agriculture as the main economic source
of rural economies (Hodge, 1997; Ilbery, 1998). To prevent latent problems in rural
areas, i.e. outflow from rural to urban, the reallocation of agricultural labour became
more important. Traditionally, agriculture was the only source of employment, but
today’s rural areas have different business opportunities not only in agriculture but
also in other sectors (Christenson and Flora, 1991). Even though agriculture is by far
the most important sector for people living in rural areas, it has begun to lose its
importance, as was expected (European Communities, 2004): the industrialization
and shrinkage of jobs in the agriculture industry are well-known (Healey and Ilbery,
1985; Gilg, 1991; Howland, 1993). Therefore, the rural economy has changed and its
restructuring has increasingly involved a number of economic, social and
employment issues other than those related directly or indirectly to agriculture
(House of Lords, 1991; OECD, 1991; Scottish Office, 1995).
Rural development has become an important topic on the policy agenda of many
countries in recent years. Its importance has mainly come from its original meaning,
i.e. sustained improvement in the well-being of people living in less developed areas.
Although, historically, rural areas were associated with their own intrinsic
characteristics, e.g. non-urbanization, nature, and agriculture, today, they are
considered in terms of their cultural, social, political, and economic aspects –
especially with regard to their future. Thus, they have attracted much attention from
many governments.
Each developed or developing country has its own definition of ‘rural’ on the basis
of specific contexts usually focused on socio-economic indicators, but these are not
globally applicable (Dinis, 2006; Politechnico di Milano, 1999). The Food and
Agricultural Organization (FAO) has combined both rural development and
sustainable development and describes sustainable agriculture and rural development
(SARD) as:
“the management and conservation of the natural resources base, and the orientation of
technological and institutional change in such a manner as to ensure the attainment and
continued satisfaction of human needs for present and future generations" (FAO, 1988).

3
In addition, the different ideas about, and approaches to, sustainability, which
embraces rural development, have influenced new rural areas. These approaches,
such as the carrying-capacity of ecosystems, improving the quality of human life
(IUCN et al., 1991), the orientation of technology (WCED, 1987), and the
maximization of the net benefits of economic development (Munasinghe and
McNeely, 1995) are also the main objectives of rural development plans.
The changing face of the countryside, increasing government interest in the potential
of rural regions, and the sustainability debate have all brought sustainable rural
development onto the world’s agenda. Therefore, governments and international
organizations such as the FAO, the European Union (EU) and the Organisation of for
Economic Co-operation and Development (OECD) have placed entrepreneurship –
related to self-employment – as the centrepiece of rural development in order to
achieve economic growth. Today, many countries evaluate entrepreneurship, which
is linked to the creation of new job opportunities, as the key element of rural
development.
The rural milieu with all its existing potential is now seen as an entrepreneurial
milieu (Stathopoulou et al., 2004). To this end, the endogenous potential of both the
environment and entrepreneurship needs to be stimulated and supported within the
rural area itself rather than from outside (Petrin and Gannon, 1997), in order to
achieve the aim of opening rural systems to the global arena. That is, rural
development should be undertaken mainly by local initiatives and be grounded
largely on local resources. Some of the early attempts to provide short-term local
solutions failed mainly because of the inability to create new income resources. This
happened because these attempts were mainly based on the industrialization of
agriculture, and innovation had been brought only into the agricultural sector itself
(van der Ploeg and Saccomandi, 1995). Therefore, to begin with, they were seen to
fail to answer the needs of the local inhabitants. What was missing was that rural
employment was in fact no longer dominated by agriculture (Ilbery, 1998). This
meant that rural life called for new challenges to create endogenous growth and
development. Thus, entrepreneurship was seen as such a challenge through which the
necessary diversification of activities could be obtained.
In addition, although people in rural areas do not necessarily want to have their own
firm, market conditions push them into self-employment, as they do not have other
4
options. However, self-employment can offer a beneficial alternative in the market
(Tervo, 2004). Because of the insufficient revenue from primary production for
making a living, farmers are now looking for extra sources of income. In the
literature, this effort in rural areas is called “innovation” or “entrepreneurship”
(Bock, 2004). Rurality and entrepreneurial processes form a dense, complex, and
dynamic system of mutual influences (Stathopoulou et al., 2004). Entrepreneurial
orientation to rural development, contrary to development based on bringing in
human capital, infrastructure and investment from outside, is based on stimulating
local entrepreneurial talent and the subsequent growth of indigenous companies
(Petrin and Gannon, 1997). Among the important attributes for successful
endogenous development are the ability of agricultural labour to engage in new
enterprises, a cultural orientation towards self-employment and a network of small
and medium-sized enterprises (SMEs) which are often strongly interdependent
(Roberts, 2002).
Given this background, in this study, we aim to explore and analyse opportunities for
economic diversity in rural areas and to develop the best-fit sustainable rural
development scenario(s). To achieve this aim, the study focuses on a sample of
European and Turkish villages, and makes a comparative evaluation of rural Europe
and rural Turkey at different scales. Rural studies conducted in different disciplines
are mainly empirical studies, so, in terms of a research contribution, providing
empirical evidence from Europe and Turkey may not seem much. Intrinsically, the
novelty of this study lies in its multi-approach in terms of its conceptual and
theoretical structure, methodological and analytical applications, and hence, in its
overall evaluation of different villages in different geographical areas, to discover a
common development path. The following sections explain in more detail the
novelty of this study.
1.2 The Confusion about Sustainable Rural Development
Many of the transformations – mainly economic ones – in rural areas are related to
social changes associated with the in-migration of particular groups such as
entrepreneurs. This new group is exerting a strong influence over the social and
physical nature of rural space (Ilbery, 1998). The increasing mobility of people,
goods and information has helped to corrode local communities and open up the

5
countryside to new uses (Munton, 1995; Murdoch and Marsden, 1995). These
changes in rural areas have both advantages, such as the improvement of traditional
and existing practices (Curran and Storey, 1993; Elbersen, 2001; Haartsen, 2002;
Heins, 2002), and disadvantages, such as traffic congestion, pressure on the natural
environment caused by the appearance of new sectors such as tourism, leisure
activities and many others (van den Berg, 1991; van den Berg et al., 1998; Bosch and
Hanemaayer, 1999).
Economic restructuring, socio-political transformation and changing relations have
influenced the position of rural areas in the world system. In the global context, the
world is facing negative changes such as climate change, global warming, and air
pollution (Sassen, 2007), and therefore rural areas are seen as the reserves of the
world’s natural resources. In contrast, locally, these changes can be also positive,
such as opportunities in terms of culture, arts, sports, innovativeness and
entrepreneurship (Nijkamp, 2008), so that rural areas can be a new flourishing
milieu.
Today’s rural areas, by destroying the dual economy (i.e. the sharp distinction
between rural and urban), are no longer merely hinterlands but are also heartlands by
offering amenities and unusual new economic activities (Brown and Grilliard, 1981;
Tarmann, 2003). These opposing views and the impacts of many forces have
generated a sense of confusion about sustainable rural development and created an
urgent need to answer the question: “Can rural areas be hot spots while
maintaining their sustainability and continuity?”
In order to answer this question, the study aims to explore and analyse opportunities
for economic diversity in rural areas and to develop sustainable development
scenarios. To better understand the opportunities in rural areas, the study focuses on
answering the following set of research questions:
― What is the capacity of rural areas to attract population flows and economic
activities?
― Who are the economic agents/entrepreneurs in rural areas?
― What are the positions of these entrepreneurs?
― What are their impacts on rural areas?
― What are the necessary conditions to maintain the continuity of economic activity
and diversity in rural areas?

6
― What are the structural changes obtained by entrepreneurs?
― What are the types of entrepreneurs and their activities which can contribute
more to the continuity of rural setting? And,
― What are the policies needed for economic diversity to be achieved without
negatively affecting the rural setting in terms of the outcome of sustainable rural
development?
The next section, in the light of the main goal of the thesis, presents the objectives
and structure of the study – the road map of the study – in order to obtain a clearer
understanding of sustainable rural development.
1.3 Clarification of Sustainable Rural Development
Both the negative and positive views have their own reasoning, and they can be
observed in practice. To combine both views is not an easy task but neither is it
impossible. In order to find a common ground for such different views on sustainable
rural development and the impacts of recent changes, the study has three objectives,
viz. (i) to investigate the changes occurring in rural areas; (ii) to investigate
entrepreneurs in rural areas; and (iii) to develop scenarios in order to derive a set of
comparative and comprehensive policy implications for rural areas. Such goals
require a comprehensive synthesis of the existing capacity of rural areas and the
identification of entrepreneurs and their relations with the environment and the
outside world. Therefore, it will be possible to derive policy lessons for sustainable
rural development. The above-mentioned aim and objectives are used to design the
structure of the study (Figure 1.1).
The study consists of six parts as follows;
1. Introcution: The Thinking on Rural Areas and Sustainability: This part is
formed by one chapter which introduces the background and motivation of
the study and also the research questions of the study, the methodologies and
the data sets used in each analysis.
2. Contemporaneous Thinking on Sustainable Rural Development: This is the
subject of Part 2 and evaluates sustainable rural development from a
theoretical perspective, while introducing a conceptual framework, a
theoretical framework and the operational concepts of the study in a group of

7
five chapters. It discusses all concepts and theories, focusing particularly on
their operationalization which forms the basis of the case studies. Therefore,
this part is very much related to the empirical parts of the study. It also offers
a contemporary approach to sustainable rural development.
Figure 1.1 : The structure of the study.
3. Rural Areas as Promising Hot Spots in Europe: This is Part 3, the first
empirical contribution of our study. Here, rural areas are evaluated in a series
of six chapters with a special focus on selected European villages. The first
two chapters descriptively explore the rural areas, related policies, and the
rural structure in Europe at macro/country level. Then, the third chapter offers
preliminary remarks on the European field survey. The last three chapters
focus on the capacity, the entrepreneurs, and the development of the
European villages in our sample.
8
4. Rural Areas as Promising Hot Spots in Turkey: This is Part 4 which has
exactly the same structure as Part 3, but this time with a special focus on rural
areas in Turkey and the selected Turkish villages.
5. Envisioning Promising Hot Spots: This Part 5 is the last empirical part and
offers a comprehensive and comparative evaluation of rural areas in Europe
and Turkey, as well as of the European and Turkish villages in our sample,
while providing lessons retrieved from the scenario analysis, which is
constructed on the results of the earlier Parts 2, 3 and 4, and Part 5 itself. This
Part comprises two chapters.
6. Conclusion: Prospective Thinking on Sustainable Rural Development: In the
course of one final chapter, the last part of this study discusses its findings
retrospectively, while prospectively proposing a future research agenda on the
promising hot spots.
Although this dissertation might seem to be a very extensive study, such extensive
and combined work is a must where rural areas are concerned. The following section
describes the methodological and analytical approaches used in the evaluations.
1.4 Tools and Facts to Explore and Analyse Sustainable Rural Development
To get an adequate view of the changing face of rural areas, to benefit from diverse
range of methodologies and perspectives, and also to be able to synthesize them
comprehensively, multi-method is used in this study. The multi-method approach is
put into operation on the basis of a series of steps (Table 1.1). In each step, using a
different approach allows us to have a multi-methodological perspective by
combining the existing literature with the existing data, and then comparing them in
order to come up with policy implications. The overall approach of the study is to
overlap the results of both previous studies undertaken by many researchers and real
life by means of case studies in order to answer the question “Can rural areas be hot
spots while maintaining their sustainability?”
To this end, in this study, there are two applications of the meta-analytic approach (in
Chapters 3.5 and 4.5), which uses two main techniques, i.e. rough set data analysis
(RSDA) to identify the most important attractiveness factors, and logistic regression
analysis (LRA) to understand the contributions of rural entrepreneurs on the basis of

9
their origin. The exploratory, comparative and multi-dimensional approaches are
used in order to conduct in-depth surveys in the European and Turkish villages. In
order to analyse the outcome of these approaches and surveys, the following methods
are used: exploratory analysis, RSDA, LRA, factor analysis, principal component
analysis (PCA), the z-test, geographical information systems (GIS) analysis, and
spider analysis. The strategic planning approach, due to its very nature, called for a
multi-criteria evaluation, therefore we first used pentagon analysis to identify the
critical factors for sustainable development, and later regime analysis, one of the
multi-criteria analysis techniques, to select the best-fit alternative sustainable rural
development scenario.
Table 1.1: List of the methods, methodologies, and the data sets by chapters. Chapter Approach Methodology and Techniques Data STEP 1: Definition of the diversity of rurality, rural areas, and rural structure Chapter 3.1 and 5.2 Exploratory Approach Exploratory Analysis Archive Chapter 3.4 and 4.4 Multidimensional Approach Principal Component Analysis Questionnaire Chapter 4.2 Mapping Approach GIS Analysis ArchiveChapter 5.1 Multidimensional Approach Factor Analysis ArchiveChapter 5.2 Comparative Approach Exploratory Analysis ArchiveSTEP 2: Identification of changes and the capacity of rural areas in terms of their opportunities for economic diversity Chapter 3.1 Exploratory Approach Rough Set Data Analysis QuestionnaireChapter 3.1 Comparative Approach Principal Component Analysis QuestionnaireChapter 4.3 Exploratory Approach Exploratory Analysis Archive Chapter 4.6 Exploratory Approach Logistic Regression Analysis Questionnaire Chapter 5.2 Multidimensional Approach Factor Analysis Archive Chapter 5.2 Comparative Approach Spider Analysis Questionnaire STEP 3: Investigation of rural entrepreneurs in terms of their position in, and their impacts on, rural areas including their firm and personal profiles, and their success/failure factors Chapter 3.5 Meta-analytic Approach Snowball Technique ArchiveChapter 3.5 Meta-analytic Approach Rough Set Data Analysis ArchiveChapter 3.5 Meta-analytic Approach Logistic Regression Analysis Archive Chapter 3.5 Comparative Approach z-test Archive Chapter 4.5 Exploratory Approach Rough Set Data Analysis QuestionnaireChapter 4.5 Exploratory Approach Logistic Regression Analysis QuestionnaireChapter 4.5 Comparative Approach z-test QuestionnaireSTEP 4: Construction of alternative sustainable rural development scenarios to derive policy implications Chapter 5.2 Multi-dimensional Approach Pentagon Analysis QuestionnaireChapter 5.2 Multi-criteria Approach Regime Analysis QuestionnaireChapter 5.2 Envisioning Approach Scenario Analysis Questionnaire
The data sets used in this study can be divided into two groups, viz. archive data
(AD), and questionnaire data (QD). The AD consist of the data retrieved from the
existing literature used for the applications of the meta-analysis and also the data sets
obtained from the several organizations, i.e. the FAO, the Statistical Office of the
European Communities (EUROSTAT), the Turkish Statistical Institute
(TURKSTAT) and the World Bank (WB). The second group of data, questionnaire
data (QD), were collected by in-depth survey questionnaires administrated in the
10
European and Turkish villages in our sample. Two types of questionnaire are
applied: the questionnaire for the village; and the questionnaire for the entrepreneurs.
The questionnaire for the village was filled in by the chief representative of the
village both in Turkey and Europe, while the questionnaire for the entrepreneur was
filled in by rural entrepreneurs from the selected Turkish villages.
Each methodology and each approach could be a thesis topic in itself, so giving
separate detailed explanations about them in the text could overload the reader.
Therefore, we give their explanation in detail in Appendix A, but we only provide a
few lines in the text about the analyses used in our study. Furthermore, in the light of
these diverse approaches and methodologies, the applications and their results enable
us to come up with relevant sustainable rural development policies. But, first the
following chapters in Part 2 explain the conceptual and theoretical background of the
study, and show the scientific way to reach our aim by means of a contemporary
approach.
11
2. CONTEMPORANEOUS THINKING ON SUSTAINABLE RURAL
DEVELOPMENT
2.1 The Main Concepts for a Sustainable Change in Rural Areas
Today, sustainable rural development has been placed high on the world’s agenda
because of the changing face of rural areas, and, hence, the increasing attention from
governments to rural areas and sustainability discourses. Governments and
international organizations, i.e. FAO, EU, OECD, are in search of a sustainable
change in rural areas. Their experiences show that a sustainable change depends on
the locality characteristics of the place, and the maintenance of their continuity by
the actors and their actions which will then lead stakeholders to obtain the continuity
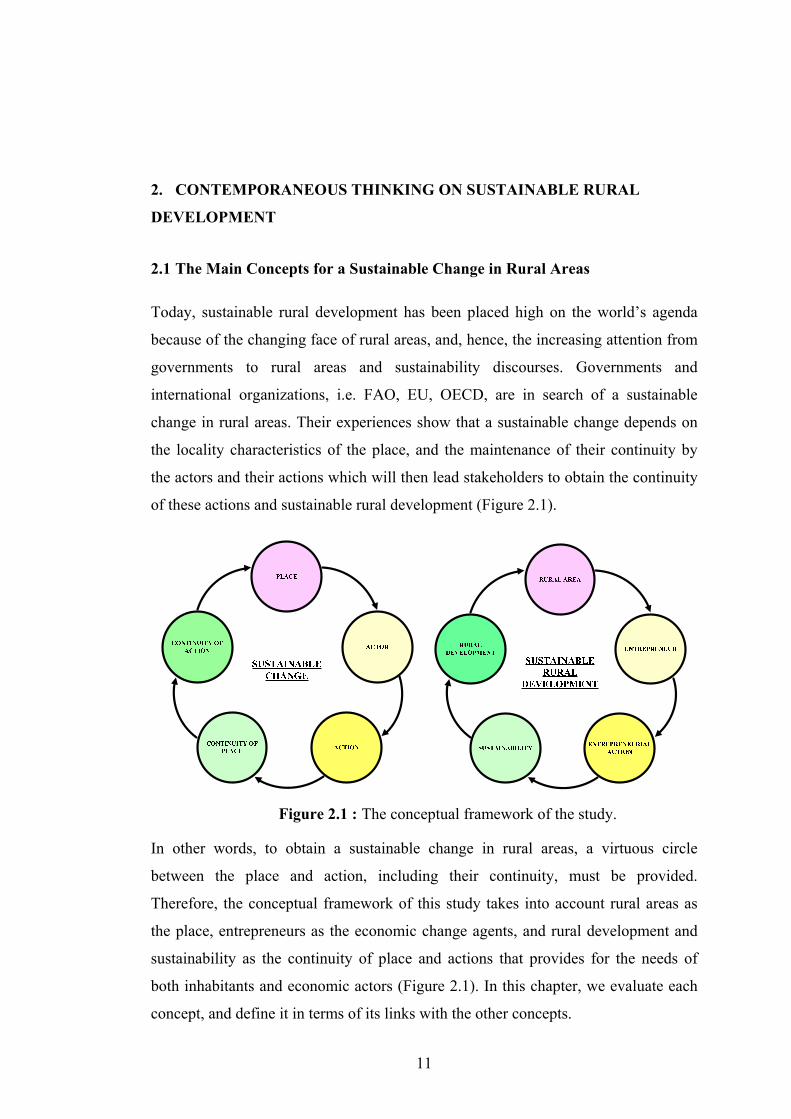
of these actions and sustainable rural development (Figure 2.1).
Figure 2.1 : The conceptual framework of the study.
In other words, to obtain a sustainable change in rural areas, a virtuous circle
between the place and action, including their continuity, must be provided.
Therefore, the conceptual framework of this study takes into account rural areas as
the place, entrepreneurs as the economic change agents, and rural development and
sustainability as the continuity of place and actions that provides for the needs of
both inhabitants and economic actors (Figure 2.1). In this chapter, we evaluate each
concept, and define it in terms of its links with the other concepts.

12
2.1.1 The place: rural areas
‘Rural’ is an easy-to-use word, so therefore its meaning depends on people’s
perception of it, and the user does not think about the meaning behind it (Bealer et
al., 1965; Cloke, 1985; Falk and Pinhey, 1978; Woods, 2005). In fact, Gilbert (1982)
stated that defining ‘rural’ had been under discussion for at least 70 years and still is.
Initially, rural areas were defined mainly by the existence of agricultural activities
and the density of the population, and were seen as declining and problematic places
by being the opposite and residual of urban areas. In the literature, there are various
definitions of the term ‘rural’. Cloke and Park (1985) attempted to classify different
definitions, while Halfacree (1993) developed their work. The conclusion of these
attempts was that the quest for any single, all-embracing definition of ‘the rural’ is
neither desirable nor feasible (Ilbery, 1998).
The fuzziness and frequent use of the concept of ‘rural’ in policy circles, as well as in
the scientific community and public debates, including the recent changes in rural
areas are controversial in terms of identifying the critical parameters of rural space
rather than actually defining it (Halfacree, 1993; Pierce, 1996; Tümertekin and
Özgüç, 1999; Westhead et al., 2004; Baum et al., 2004). This multi-criteria approach
has brought up different typologies and an endless list of criteria concerning the
diversity and uniqueness of each rural area (Gülümser et al., 2009a). The
classification of rural areas and the distinction between rural and urban areas are not
easy tasks. Each country has its own definition usually focused on socio-economic
indicators, and these are not globally applicable (Politechnico di Milano, 1999).
However, in the global context, two main perspectives of rural typologies have been
developed by the OECD and the EU.
The OECD (1994; 1996; 2003) when creating territorial and rural indicators has
aimed to be able to compare sub-national territories. According to the OECD,
territorial studies have four main indicators: population and migration; economic
structure and performance; social well-being and equity; and environment and
sustainability (Table 2.1). The OECD definition of rural areas distinguishes two
hierarchical levels of territorial unit, viz. local and regional. At the local community
level (administrative or statistical units – equivalent to NUTS 5), the OECD
identifies rural areas as communities with a population density below 150 inhabitants
per square kilometre. At the regional level (aggregated sub-national regions –

13
equivalent to NUTS 3), the OECD distinguishes larger functional or administrative
units by their degree of rurality, depending on what share of the region’s population
lives in rural communities. To facilitate the analysis, regions are clustered into three
types:
• Predominantly Rural Regions: with over 50 per cent of the population living
in rural communities;
• Significantly Rural Regions: with 15 to 50 per cent of the population living in
rural communities;
• Predominantly Urban Regions: with less than 15 per cent of the population
living in rural communities.
Table 2.1: Basic set of rural indicators and sub-criteria of the OECD. Population and Migration Social well-being and equity Density Income Change Housing Structure Education Households Health Communities Safety Economic structure and performance Environment and sustainability Labour force Topography and climate Employment Land use changes Sectoral shares Habitats and species Productivity Soils and water Investment Air quality Source: Akder (2002).
On the other hand, the EU’s rural typology is less strict and is often being
restructured by different EU initiatives. For instance, EUROSTAT focusing on the
degree of urbanization as a main indicator, developed an approach to define zones at
the NUTS 5 level. In this approach, EU regions are classified into three types:
• Densely Populated Zones: These are groups of contiguous municipalities,
each with a population density above 500 inhabitants/km² and a total
population for the zone of at least 50,000 inhabitants.
• Intermediate Zones: These are groups of municipalities, each with a density
above 100 inhabitants/km², which do not belong to a densely populated zone.
The zone’s total population must be at least 50,000 inhabitants, or it must be
adjacent to a densely-populated zone.

14
• Sparsely Populated Zones: These are groups of municipalities not classified
as either densely populated or intermediate (Politecnico Di Milano, 1999;
Ballas et al., 2003).
A second EU rural typology is the classification of territories being developed in the
European Spatial Programme. For this purpose, a specific typology of six broad
types of territories was distinguished on the basis of: urbanization rate; rural
population density; the degree of contrast in the distribution of settlement size;
average distance to any urban settlement; the primacy of the largest city; and the size
of the largest centre at the NUTS 3 Level (SPESP, 2000). These six broad types are:
regions dominated by a large metropolis; polycentric regions with high urban and
rural densities; polycentric regions with high urban densities; rural areas under
metropolitan influence; rural areas with networks of medium-sized and small towns;
and remote rural areas.
Besides these typologies of the EU and the OECD, there are also two different
typologies which utilize the EU and OECD typologies. One of these has been
developed by a group of researchers from the Politecnico di Milano, and the second
by three Greek scholars, Ballas, Labrianidis and Kalogeresis.
The Milan Approach was based on a strategic study leading to a new urban-rural
partnership in Europe, and it examined all European rural areas. The main
assumption of this approach was that, as the diversity of rural areas and their
heterogeneity is very great, it is impossible to develop a single and unequivocal
definition of a rural area. In the study, an alternative methodology to describe the
nature of rural areas based on the strengths and weaknesses of agricultural activities
in Europe was identified. Their typology depends on the presence or absence of four
major indicators, viz. productivity of agriculture; importance of agriculture;
agriculturally compatible activities; and urban sprawl, in a specific area as a
fundamental characteristic of rurality (Table 2.2).
On the other hand, the Greek approach (named so because the authors are Greek)
attempted to draw a picture of the European rural areas on the basis of a novel
database, while comparing two different approaches, those of the OECD and
EUROSTAT. The aim of this approach was to create rural typologies on the basis of
aggregative and disaggregative classification methods. They distinguished rural

15
regions by means of four main indicators: accessibility; dynamism-competitiveness;
economic performance; and role of agriculture, and they excluded all urban regions
from the analysis. As a result they reached a typology of 24 types of rural areas (see
Table 2.3).
Table 2.2: Typology of rural areas – The Milan approach. 1
High productivity of agriculture
High importance of agriculture area Strong 2 Low importance
of agriculture area
High diversification of activities
Low urban sprawl Strong
3 High urban sprawl Under pressure
4 Low diversification of activities Under pressure 5
Low productivity of agriculture
High importance of agriculture area
High diversification of activities
Low urban sprawl Weak
6 High urban sprawl Under pressure
7 Low diversification of activities Weak 8 Low importance of agricultural area Weak Source: Politechnico di Milano (1999).
Table 2.3: Typology of rural areas – The Greek approach. Accessibility Economic performance Dynamism Importance of agriculture 1
Least accessible
Relatively low Lagging Dependent
2 Not dependent 3 Advancing Dependent 4 Not dependent 5
Relatively high Low competitiveness Dependent
6 Not dependent 7 High competitiveness Dependent 8 Not dependent 9
Semi-accessible
Low Low competitiveness Dependent
10 Not dependent 11 High competitiveness Dependent 12 Not dependent 13
High Low competitiveness Dependent
14 Not dependent 15 High competitiveness Dependent 16 Not dependent 17
Most accessible
Low Low competitiveness Dependent
18 Not dependent 19 High competitiveness Dependent 20 Not dependent 21
High Low competitiveness Dependent
22 Not dependent 23 High competitiveness Dependent 24 Not dependent Source: Ballas et al. (2003).
In addition, there are also early and late attempts to make different typologies
developed by academicians and governmental departments in terms of the diversity
of rural areas between or within countries (see Table 2.4). As summarized in Table
2.4, the classification of countries developed at the NUTS 3 level has started to
reflect more the multi-dimensional context of rural areas. Unlike the classifications
of Cloke (1977), Cloke and Edwards (1986) and Leavy et al. (1999), the above-

16
mentioned classifications focused not only on rural areas but also on urban areas. In
addition to these attempts, there are also sector-specific focused typologies
developed for specific countries to be policy-based or used as a tool for development
plans or sectoral plans for transport, education, health and housing, etc. (Cloke, 1977;
Reading et al., 1994; Malinen, 1995; Blunden et al. 1998; Williams et al., 1999;
Satsangi et al., 2000; CIT, 2001; Copus et al., 2001).
Table 2.4: Some examples of the classification of rural areas.
Year Author Level No of types Area
1977 Cloke Administrative rural districts 5 England 1988 CoE EU Territories 3 EU 1994 OECD NUTS 3-5 3 OECD 1995 Malinen Municipalities 3 Finland 1997 EUROSTAT NUTS 5 3 EU 1998 Blunden LOC II LOC III 5 EU 1999 Leavy et al. Rural district 5 Ireland 1999 Politechnico di Milano NUTS 3 8 EU 2000 SPESP NUTS 3 6 EU 2003 Ballas et al. NUTS 3 25 EU
The merits and the generalization possibilities of these various typologies can be
discussed from several perspectives. The distinction between rural and urban areas
emerged as a result of policy issues or planning problems: for instance, in order to
measure differences in the degree of rurality (Cloke, 1977; SEDD, 2005).
There are numerous rural indicators used in different typologies which reflect the
diversity and heterogeneity of rural areas. It is possible to classify rural indicators
used in typologies under four main themes, viz. demography and population;
economic structure; environmental structure; and social structure (Table 2.5). The
complexity of rural areas has led to intensive efforts in order to both identify rural
indicators and classify rural areas. The evaluation of these rural classifications
demonstrates that the early negative approaches are shifting to positive, opportunistic
and multidimensional approaches with respect to the changes in economic activities,
relations, employment structure, and land use in rural areas that have led rural areas
to be more dynamic, improving and entrepreneurial (Bryant, 1989; Stathopoulou et
al., 2004).
In this study, when evaluating rural areas as a suitable place for economic
diversification, the definition of the Cork Declaration is used. This definition is:
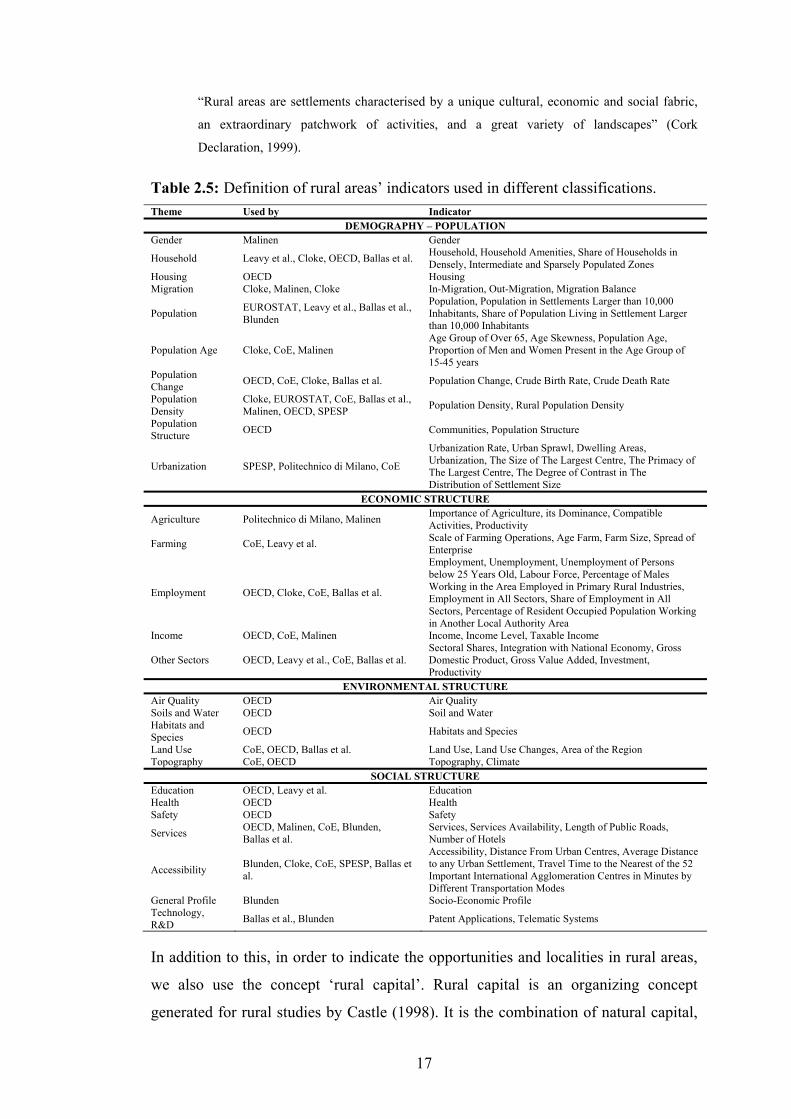
17
“Rural areas are settlements characterised by a unique cultural, economic and social fabric,
an extraordinary patchwork of activities, and a great variety of landscapes” (Cork
Declaration, 1999).
Table 2.5: Definition of rural areas’ indicators used in different classifications. Theme Used by Indicator
DEMOGRAPHY – POPULATION Gender Malinen Gender
Household Leavy et al., Cloke, OECD, Ballas et al. Household, Household Amenities, Share of Households in Densely, Intermediate and Sparsely Populated Zones
Housing OECD Housing Migration Cloke, Malinen, Cloke In-Migration, Out-Migration, Migration Balance
Population EUROSTAT, Leavy et al., Ballas et al., Blunden
Population, Population in Settlements Larger than 10,000 Inhabitants, Share of Population Living in Settlement Larger than 10,000 Inhabitants
Population Age Cloke, CoE, Malinen Age Group of Over 65, Age Skewness, Population Age, Proportion of Men and Women Present in the Age Group of 15-45 years
Population Change OECD, CoE, Cloke, Ballas et al. Population Change, Crude Birth Rate, Crude Death Rate
Population Density
Cloke, EUROSTAT, CoE, Ballas et al., Malinen, OECD, SPESP Population Density, Rural Population Density
Population Structure OECD Communities, Population Structure
Urbanization SPESP, Politechnico di Milano, CoE
Urbanization Rate, Urban Sprawl, Dwelling Areas, Urbanization, The Size of The Largest Centre, The Primacy of The Largest Centre, The Degree of Contrast in The Distribution of Settlement Size
ECONOMIC STRUCTURE
Agriculture Politechnico di Milano, Malinen Importance of Agriculture, its Dominance, Compatible Activities, Productivity
Farming CoE, Leavy et al. Scale of Farming Operations, Age Farm, Farm Size, Spread of Enterprise
Employment OECD, Cloke, CoE, Ballas et al.
Employment, Unemployment, Unemployment of Persons below 25 Years Old, Labour Force, Percentage of Males Working in the Area Employed in Primary Rural Industries, Employment in All Sectors, Share of Employment in All Sectors, Percentage of Resident Occupied Population Working in Another Local Authority Area
Income OECD, CoE, Malinen Income, Income Level, Taxable Income
Other Sectors OECD, Leavy et al., CoE, Ballas et al. Sectoral Shares, Integration with National Economy, Gross Domestic Product, Gross Value Added, Investment, Productivity
ENVIRONMENTAL STRUCTURE Air Quality OECD Air Quality Soils and Water OECD Soil and Water Habitats and Species OECD Habitats and Species
Land Use CoE, OECD, Ballas et al. Land Use, Land Use Changes, Area of the Region Topography CoE, OECD Topography, Climate
SOCIAL STRUCTURE Education OECD, Leavy et al. Education Health OECD Health Safety OECD Safety
Services OECD, Malinen, CoE, Blunden, Ballas et al.
Services, Services Availability, Length of Public Roads, Number of Hotels
Accessibility Blunden, Cloke, CoE, SPESP, Ballas et al.
Accessibility, Distance From Urban Centres, Average Distance to any Urban Settlement, Travel Time to the Nearest of the 52 Important International Agglomeration Centres in Minutes by Different Transportation Modes
General Profile Blunden Socio-Economic Profile Technology, R&D Ballas et al., Blunden Patent Applications, Telematic Systems
In addition to this, in order to indicate the opportunities and localities in rural areas,
we also use the concept ‘rural capital’. Rural capital is an organizing concept
generated for rural studies by Castle (1998). It is the combination of natural capital,

18
man-made capital, human capital, and social capital. Natural capital refers to the part
of the natural environment that is capable of contributing directly or indirectly to
human satisfaction, while man-made capital refers to the capabilities of the physical
environment. In addition, human capital reflects both the size of the working age
population (with population growth leading to the widening of human capital) and
investment in the education and training of people (which leads to the deepening of
human capital). Social capital refers to the networking, trust and relationships within
communities. The development and conservation of rural capital is of fundamental
importance to rural people as they exercise their autonomy in addressing common
concerns and pursuing their aspirations, while encouraging consideration of the
destruction of some capital, as well as the creation of other forms (Castle, 1998).
2.1.2 The actor and the action: entrepreneurs and their activities
After clarifying the meaning of the rural areas, another concept which needs a
clarification relates to economic change agents and their activities. In the literature,
there is evidence that recent changes in rural areas have been obtained by the
contributions of entrepreneurs and entrepreneurial activities. In the early economic
studies, entrepreneurship was evaluated specially and was seen as the critical success
factor of economic performance (Nijkamp, 2003). Contemporary theories have taken
entrepreneurship (which is an individual process though contributing to both the
local and the national economy) into account as the main tool to create a new
equilibrium where sustainable development will be realized. In recent years,
entrepreneurship has also been seen as the engine of rural development, on the basis
of its potential to improve rural areas as a new node in their relations while bringing
the necessities of growth such as technology and education. Although the presence
and the contribution of the phenomenon are widely discussed and seem clear, the
definition of the phenomenon largely depends on the research undertaken (Verheul et
al., 2002) and also on the circumstances of the author(s)’ own period.
For instance, researchers have defined entrepreneurship in connection with the aim
of their studies (Verheul et al., 2002). Schumpeter (1934; 1950) defined an
entrepreneur as being related to innovativeness and innovation, while Knight (1967)
and Drucker (1970) argued that entrepreneurship was about taking risks. Nijkamp
(2003) related this to Schumpeter’s view: risk is more limited to financial risks than
to the broader set of entrepreneurial challenges that a company must face, while

19
Knight (1921) put greater emphasis on risk and the distinction of different types of
risks. Naudé (2007) refers to Wennekers and Thurik (1999) who identified 13
distinct roles of an entrepreneur.
Entrepreneurship refers to the total number of employers and self-employed people
who work and/or to create job opportunities for others (Gülümser et al., 2009b).
Thus, in this study, we define rural entrepreneurs as the local inhabitants who work
as self-employed or employers in rural economic activities. Traditionally, the sole
rural economic activity was agriculture, but, today’s rural areas are characterized by
a wide range of unusual economic activities (Terluin, 2001). Thus, the notion of rural
entrepreneurship is not limited to the agriculture sector and related activities but also
to other non-agricultural activities (Christenson and Flora, 1991). Therefore, here, we
focus on the entrepreneurs working in both agricultural and non-agricultural
activities.
The economic changes in rural areas, where most of such changes are dominantly
dependent on social relations and social life, are due to the embeddedness of
entrepreneurs and their activities in the rural environment. In the literature,
embeddedness is a must for desired social and economic outcomes (Granovetter,
1985). Therefore, it also identifies the place of entrepreneurs in the rural setting and
their success. In other words, embeddedness is the identifier of links between
economic agents and the rural physical and social environment. Not only the
embeddedness but also the continuity of the rural setting and of the entrepreneurial
activity in this setting are the key concerns for the desired outcome. Therefore, the
study focuses on entrepreneurs, their activities, and their embeddedness levels while
stressing the continuity and sustainability of both their activities and environments.
2.1.3 The continuity of the place and action: sustainability
Sustainability is the third concept which is raised in this study. Like the other two
concepts, sustainability is a hard-to-define concept and is a term that everyone likes
to use (Daly, 1996). However, rural areas have been gaining in importance because
they have become the key reserve areas to achieve the sustainability of the whole
world. In other words, sustainability considers rural areas to be the natural reserves
of the world.
20
Sustainability discourses have a history of two decades that started with the
publication of ‘Our Common Future’, usually known as the Brundtland Report, in
1987. The aim of the report was to stress that environmental issues should be put on
policy agendas and to search for a common understanding of the sustainability of
nations. Therefore, the report was the basis for the future of the sustainability
phenomenon that, later on, resulted in the Earth Summit Convention in 1992 which
adopted Agenda 21, The Rio Declaration.
According to the Brundtland Report, sustainable development was development that
meets the needs of the present without compromising the ability of future generations
to meet their own needs (WCED, 1987). The concept was not limited to just
environmental issues but included other aspects, so this concept has become
multidimensional and difficult to define. Therefore, maybe not spatially but
conceptually, its multidimensionality has led international organizations and
researchers to identify their own parameters. The diversity of the necessary
conditions (WCED, 1987) and dimensions of sustainability (Sachs, 1997) has been
reflected in a complex list of indicators. In 1996, the UN produced a list of 134
indicators following the outline drawn in Agenda 21 (UN, 1996).
Despite the UN’s indicators, the EU, which decided to translate the vision of
sustainable development into an operational strategy in 2001 (EC, 2005), attempted
to develop its own sustainable development indicators in 1997, 1998, and 2001. The
EU finalized its studies in February 2005 by developing 155 indicators under 10
main themes, viz. economic development; poverty and social exclusion; ageing
society; public health; climate and energy; production and consumption patterns;
agriculture; management of natural resources; transport; good governance and global
partnership (for the list of these sustainability indicators, see EC, 2005). This set of
indicators mainly covers those of the OECD, United Nations Common Supply
Database (UNCSD) and other EU initiatives, including structural indicators (EC,
2005). However, it is also differentiated from them by referring to the development
but not to the concept itself. Nevertheless, identifying sustainable development
indicators is an ongoing process.
Besides its broader definition and sense, in this study, sustainability is taken into
consideration as the ability to maintain the newly obtained dynamism and develop
the rural capital in association with this dynamism. Therefore, sustainable rural
21
development is the development by which the continuity of rural settlements and
environments (‘rural capital’) is maintained, while increasing the well-being of their
inhabitants and offering a desirable milieu for economic activities.
2.1.4 Conceptualizing sustainable rural development
Sustainability and rurality concepts are thought of and taken into consideration
together, and thus somehow both cover each other. Their multidimensional aspects
stimulate researchers to describe both concepts from their own perspectives in
relation to the geographical area studied. The broad structure of sustainability sees
rurality as a guide to achieve its goals, while sustainability is the inevitable and
indispensable strategy of rural development plans. In this chapter, we have provided
the conceptual framework of the study while clarifying the definitions of the
concepts used in the evaluations.
There are three main concepts, viz. the rural areas, entrepreneurship, and
sustainability. There is no consensus on the definitions of all these concepts, and
each researcher and each user of the terms have their own subjective evaluation. In
this study by giving much attention to the multidimensionality of these concepts, we
prefer to narrow down their definition while operationalizing the concepts.
On this basis, the definitions mentioned in this chapter are used as a guide to conduct
our empirical analysis and also to generalize our findings for the majority of rural
areas.
The frequent use of the terms in both daily and academic life can create conflicts.
Nevertheless, our evaluation in this chapter clarifies what we mean by these
concepts. The next chapter offers insights about the theoretical framework of the
study in the light of the above-mentioned concepts.
2.2 Finding a Theory for Sustainable Rural Development
There is no universally accepted theory of rural development which can explain
existing rural development and predict its future (Singh, 1999). Rural development,
which is not even a sub-discipline of development theories, is still looking for a place
in the theoretical repertoire (Ward and Hite, 1998). Therefore, its multidisciplinary
aspect allows contributions from many disciplines and approaches (Isserman, 1998).
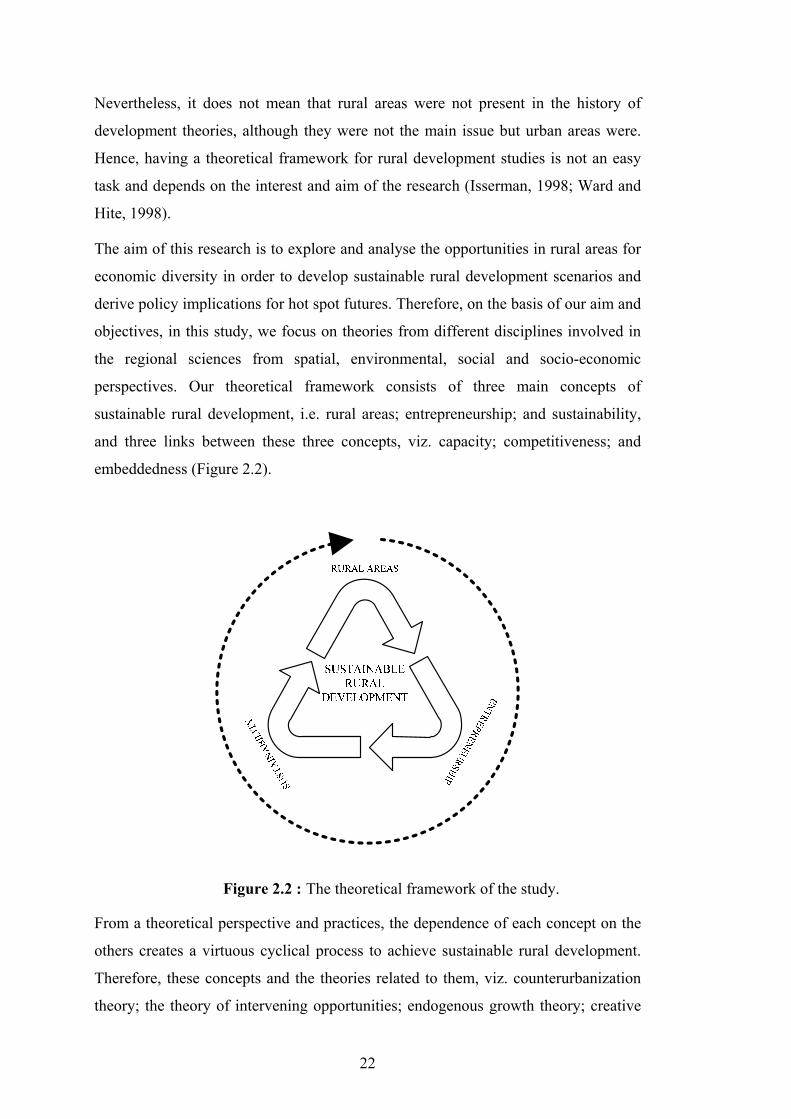
22
Nevertheless, it does not mean that rural areas were not present in the history of
development theories, although they were not the main issue but urban areas were.
Hence, having a theoretical framework for rural development studies is not an easy
task and depends on the interest and aim of the research (Isserman, 1998; Ward and
Hite, 1998).
The aim of this research is to explore and analyse the opportunities in rural areas for
economic diversity in order to develop sustainable rural development scenarios and
derive policy implications for hot spot futures. Therefore, on the basis of our aim and
objectives, in this study, we focus on theories from different disciplines involved in
the regional sciences from spatial, environmental, social and socio-economic
perspectives. Our theoretical framework consists of three main concepts of
sustainable rural development, i.e. rural areas; entrepreneurship; and sustainability,
and three links between these three concepts, viz. capacity; competitiveness; and
embeddedness (Figure 2.2).
Figure 2.2 : The theoretical framework of the study.
From a theoretical perspective and practices, the dependence of each concept on the
others creates a virtuous cyclical process to achieve sustainable rural development.
Therefore, these concepts and the theories related to them, viz. counterurbanization
theory; the theory of intervening opportunities; endogenous growth theory; creative

23
destruction and entrepreneurship; and the theory of social capital and embeddedness,
have all been the building blocks for the theoretical framework of our study. Thus, in
the following section, how this framework is constructed is explained.
2.2.1 Theory of counterurbanization and intervening opportunities
The basic motivation of this study is the recent changes occurring in rural areas –
first realized as demographic changes and later as economic, social and
environmental changes. As a result of these changes, they have become very
promising environments by opening a place for themselves in the global system.
These changes – especially the increasing trend in the population movement from
cities to villages – have attracted much attention from the researchers but not have
yet been explained clearly in the theory as a whole.
The movement of a person from one location to another (‘migration’) is usually
motivated by employment, income and housing concerns, predominantly to improve
living standards or, more broadly speaking, well-being. On this basis, net migration
tends to be from less developed to relatively more developed areas. This population
exchange, including the depopulation of some areas and the repopulation of others, is
a continuing process which has a long and notable history in which there have been
at least three milestones in terms of the redistribution of population.
The first milestone, the emergence of significant rural-urban migration, was observed
around 1850 in the United Kingdom (UK) and spread out all around the world
(Lewis, 1998; Lucas, 2007). The main reason for rural-urban migration was the
pursuit of employment opportunities (Harris and Todaro, 1970). An increasing
urbanization rate, due to immense migration flows from poor rural areas, became the
main concern of enlightened developers in the 19th century, which led them to find
solutions for the associated problems. One of the these developers’ solutions was the
suburbanization process which can be seen as the second milestone of migration
history. Suburbanization eased the migration flow to urban centres, but at that time it
generated new settlements at locations close to, and well-connected to, urban areas
(Woods, 2005). While this attempt was successful at the beginning, social life and
employment remained the key concerns in rural areas at the end of 19th century.
During this time, modernization of the sole sector ‘agriculture’ in rural areas did not
ameliorate the problems, but pushed more people to leave rural areas.

24
Although our world is still urbanizing at an increasing pace, a notable counterflow
has happened in recent years in many countries. This ‘counterurbanization’ is the
third milestone of migration history, related to modernization in the 1970s and to
globalization in the following years. Counterurbanization was first seen in the United
States (US) (Berry, 1976), and later on in the rest of the world (Beale, 1975;
Champion, 1989; Hugo and Smailes, 1985; Kontuly, 1998).
It is difficult to separate out the different forms of counterurbanization, such as back-
to-the-land migration, the pursuit of land-based lifestyles, and the creation of
ecovillages (Halfacree, 2007). In the literature, the patterns of migration flows into
rural areas are evaluated mainly by the characteristics and motivations of the various
migrant groups. Champion (1989) identified 17 different explanations for
counterurbanization based on studies of nine countries. These mainly referred to
changes occurring in urban areas, including institutional changes. According to
Champion, there are two schools of thought in the literature. The first agrees on two
or three major explanations as a basis for understanding counterurbanization (Geyer,
1996; Hugo and Smailes, 1985; Kontuly, 1998; Kontuly and Vogelsang, 1988;
Moseley, 1984), while the second school of thought disagrees on such generalization
and prefers to explain the phenomenon by referring to the specificities of the location
and the environment (Sant and Simons, 1993). It is hence not easy to formulate a
unified theory of counterurbanization, but it is clear that the phenomenon is generally
less driven by economic factors and more by quality-of-life considerations (Jones et
al., 2003; Sofranko and Williams, 1980).
Researchers define migrant groups depending on their study focus, so we find: green
migration (Jones et al., 2003); retirement migration (Cross, 1990); commuters
(Cross, 1990); or expatriate migration (Stone and Stubbs, 2007). The phenomenon is
usually evaluated as an internal, i.e. domestic, form of migration. Actually,
international migration and the internal migration of the foreign-born have also
become increasingly important in recent years. On this basis, the broadest
classification of urban-rural migration refers to the settlement of both internal and
international migrant groups in rural areas. The impact of these new migration flows
has only recently become a popular object to study in the sustainable rural
development literature.

25
Demographically, newcomers change the population composition of rural areas in
terms of age and education. In the literature, there is evidence that the newcomers are
older on average than the local population. Retirement migration is seen as one of the
main flows into rural areas as a consequence of the life course (Bures, 1997;
Stockdale et al., 2000), but, on the other hand, the recent literature provides evidence
that some older newcomers are not retired but, instead, people in employment
(Stockdale, 2005). Nonetheless, they are older than local rural entrepreneurs. The
young population born and raised in rural areas have a tendency to leave their home
territory, mainly to advance their education, and then usually remain in urban areas
where they have more opportunity to put into practice what they have learned. At the
same time, newcomers in rural areas usually have high education levels that also
change the education structure of these areas. Therefore, migration triggers human
capital accumulation in both urban and rural areas. On the other hand, it is believed
that rural people possess a strong sense of community and a marked feeling of
belonging to their village. Therefore, these strong sentiments are changed through the
impact of mobility (Milbourne, 2007). In other words, newcomers integrate their
existing relations into their new relations obtained in rural areas. This creates new
social networks and breaks the defensive locality, once the newcomers are able to
take control of local institutions (Curran and Storey, 1993; Ilbery, 1998; Munton,
1995; Murdoch and Marsden, 1995).
Empirical evidence also shows that newcomers have a better appreciation of nature
and protect the natural environment better than the local population (Anderson and
Mckain, 2005; Jones et al., 2003). In other words, as newcomers perceive rural areas
as the places where they can experience their ‘idyll’, they protect what they perceive
as such (Cloke, 1997). The main reason why they are better at protecting the
environment is related to their desire to live in a better quality-of-life environment.
Thus newcomers are also responsible for the gentrification of the heritage of the
man-made environment (Ilbery, 1998). However, this then triggers a desire among
the local population to also improve their housing situation, but they often cannot do
so without some form of subsidy because of their limited earnings. The residential
investment of newcomers increases house prices and creates a lack of low-cost
housing for the local population (Findlay et al., 2000). Similarly, commuters have a
tendency to protect the natural environment, thereby discouraging the provision of
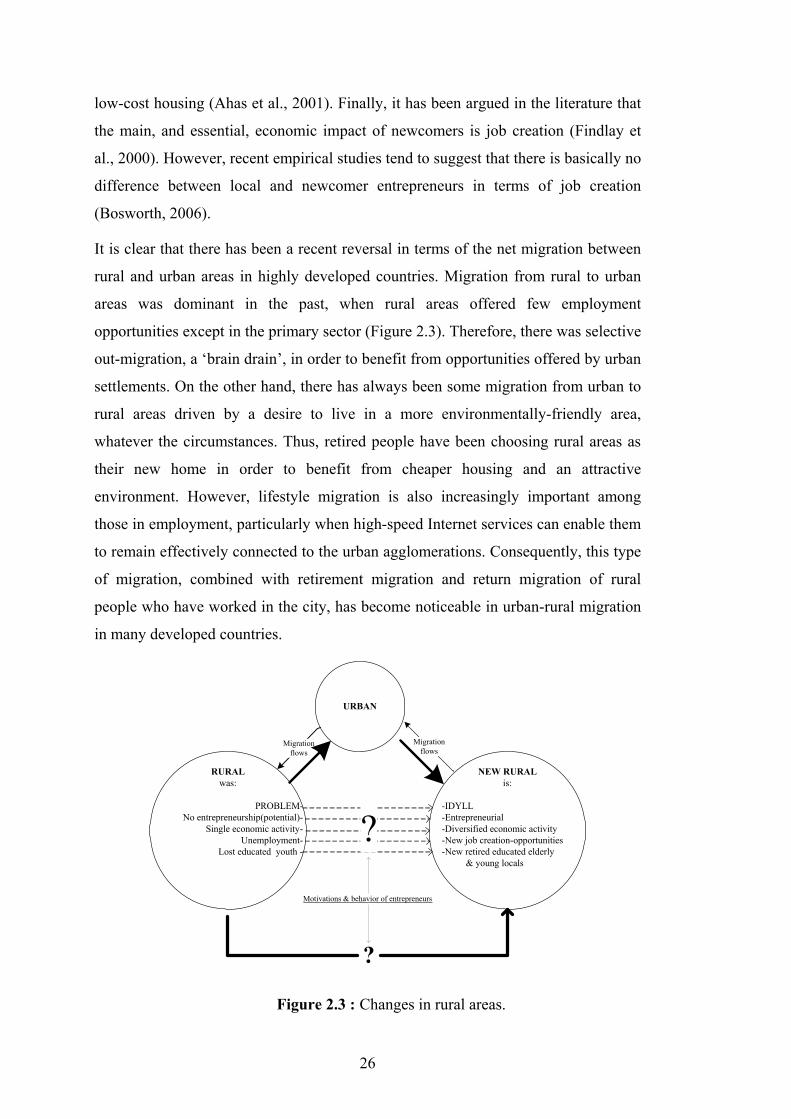
26
low-cost housing (Ahas et al., 2001). Finally, it has been argued in the literature that
the main, and essential, economic impact of newcomers is job creation (Findlay et
al., 2000). However, recent empirical studies tend to suggest that there is basically no
difference between local and newcomer entrepreneurs in terms of job creation
(Bosworth, 2006).
It is clear that there has been a recent reversal in terms of the net migration between
rural and urban areas in highly developed countries. Migration from rural to urban
areas was dominant in the past, when rural areas offered few employment
opportunities except in the primary sector (Figure 2.3). Therefore, there was selective
out-migration, a ‘brain drain’, in order to benefit from opportunities offered by urban
settlements. On the other hand, there has always been some migration from urban to
rural areas driven by a desire to live in a more environmentally-friendly area,
whatever the circumstances. Thus, retired people have been choosing rural areas as
their new home in order to benefit from cheaper housing and an attractive
environment. However, lifestyle migration is also increasingly important among
those in employment, particularly when high-speed Internet services can enable them
to remain effectively connected to the urban agglomerations. Consequently, this type
of migration, combined with retirement migration and return migration of rural
people who have worked in the city, has become noticeable in urban-rural migration
in many developed countries.
RURALwas:
PROBLEM- No entrepreneurship(potential)-
Single economic activity-Unemployment-
Lost educated youth -
URBAN
NEW RURALis:
-IDYLL -Entrepreneurial -Diversified economic activity -New job creation-opportunities -New retired educated elderly
& young locals
Migration flows
Migration flows
Motivations & behavior of entrepreneurs
?
?
Figure 2.3 : Changes in rural areas.

27
Some past studies have shown the negative influences of newcomers on rural areas,
while others have stressed their positive impacts and their role as a catalyst for the
economic regeneration of the areas. Some studies that focus on local entrepreneurs in
rural areas are claiming that the diversification of economic activities is mainly
driven by locals and not by newcomers (Stockdale, 2005). Such studies also claim
that locals have more impact on rural economic regeneration. In contrast, the new
urban-to-rural migrants perceive rural areas as a dynamic, expanding and
entrepreneurial milieu in which to invest (Bryant, 1989; Sthathopoulou et al., 2004).
Rural areas that provide an entrepreneurial milieu do not only attract such migrants
but may also encourage the local people to become more entrepreneurially-oriented.
Hence, the fostering of an entrepreneurial milieu in rural areas is increasingly seen as
an endogenous tool to create better places for people to live. However, while rural
areas may be idyllic places for newcomers, they may not remain so for the local
population. From a theoretical perspective, this movement destroys the early
developed theories on mobility, e.g. Zipf’s Law (Zipf, 1949); Ravenstein’s Law of
Migration (Ravenstein, 1989), and on place/location, e.g. Central Place Theory
(Christaller, 1913; Lösch, 1954) that cannot explain comprehensively the situation
because they neglect rural areas and the population flows through them, but rather
consider urban areas and the movement towards them.
Among these theories, only the theory of intervening opportunities raised by Stouffer
(1940) inspired us to see rural areas as the place of opportunities. In his theory,
Stouffer (1940; 1962) relates the number of people migrating to the number of
opportunities at the destination, while arguing that distance and population are less
important than the opportunities at the destination to explain the volume of
migration. In the light of his theory, the study took into consideration rural areas as
promising hot spots, as in these places there is an increase in the volume of
migration. This means that rural areas offer diverse opportunities. On the basis of this
assumption, the multidimensional structure of sustainable rural development is
evaluated from additional theoretical perspectives to draw a more comprehensive
theoretical framework.
2.2.2 Endogenous growth theory, creative destruction, and entrepreneurship
Historically, rural development has been inextricably linked with agriculture, and the
analysis of rural development cannot afford to ignore this (European Commission,

28
2004a). But the decrease in the agriculture sector in terms of employment and also in
terms of its weight during the industrialization and modernization periods has
underlined the importance and the necessity to encourage new job resources and to
create economic diversity for rural communities as key concerns (North and
Smallbone, 1996).
Rural development is produced mainly by local initiatives and grounded largely on
local resources. From an endogenous perspective, policies can have an impact on the
long-run growth rate. The transition from the information society towards the
knowledge-based economy has reshaped the evaluation of endogenous growth
strategies in both empirical research and policy making (Audrescth and Thurik,
2001). This new evaluation is simply to provide new and efficient solutions for the
disparities – mainly in terms of economic prosperity – among regions. Regional
endogenous development theory combines the three principal dimensions of
development: the ‘economic dimension’ found in the concept of economic growth,
using inputs that are at least partly available or generated locally; the ‘socio-cultural
dimension’, which reflects cultural needs and community identity; and the ‘political
dimension’, related to political decision making and the involvement of regional
groups and individuals in the policy process (Moulaert and Sekia, 2003).
Endogenous inputs can be defined in a technical-economic way, looking at the
natural resources, human resources, entrepreneurial experiences, the existence of an
industrial structure, the technical education, etc. (Coffey and Polèse, 1984; Garofoli,
1984); or they can include the wider socio-cultural fabric of growth coalitions
involving the educational system, chambers of commerce, professional associations,
etc., leading to the definition of territory in terms of ‘the clustering of social
relations, the place where local culture and other non-transferable local features are
superimposed’ (Friedmann and Weaver, 1979; Stöhr, 1984; Garofoli, 1992). In our
knowledge-based economy, the overall approach to define disparities among regions
is basically associated with capacity, innovation, knowledge and formal/informal
networks among diverse actors who, by their destructive effect, have caused
remarkable changes in the region. This effect, otherwise referred to as ‘creative
destruction’, is capable of explaining the dynamics of change in regions, and, thus,
has been the inspiration of endogenous growth theory and also of evolution
economics (Nelson and Nelson, 2002).
29
Creative destruction has brought to the fore the economic discourses by Schumpeter
(1947). It can be obtained by the innovation process, and although the cyclical
relations of the above-mentioned concepts could seem to be affecting development
negatively in the short term, they will bring success in the long run.
The uniqueness of a region is the necessary starting point of innovation in order to
exploit new ideas, by creating or transforming a form of knowledge (Fritsch, 2007)
in the quest for a sustainable competitive advantage (Santanen et al., 2000). Thus
output which is a type of knowledge (for further information on the ‘Knowledge
Production Function’, see Grilliches, 1990 and Audretsch, 2003) is ready to be
promoted in the market, or a new niche market is created for it in order to compete.
For sustained competitive advantage and economic growth, relating what rural
inhabitants know and how science can improve this knowledge is more important
than the relocation of industries and high-tech firms in rural regions which will cause
relocalization of rural inhabitants and increase the problems of rural-urban migration
which can harm cities more than could be imagined (Gülümser et al., 2008).
Having sustainable competitive advantage in the knowledge-based economy, the
road to success seems to be a cyclical rather than a linear process. The endogenous
dynamism, growth and the active mechanisms of change which are very much
concentrated in the phenomena of entrepreneurship and innovation can secure
regional competitive advantage (Scott, 2006). However, the effectiveness, quality
and performance of this process all depend on the diffusion and transmission/transfer
of its output and to obtain feedback from the users which can be only realized by
both formal and informal networks of diverse actors.
Among the actors in economic growth, much credit is given to the entrepreneurs who
are the best change agents, acting as the remarkable tailors of innovation in order to
obtain effective and sustainable vitality in regional development (Nijkamp, 2003).
The achievement of the complex route of sustainable competitive advantage towards
the success of a region seems, however, to depend mainly on the creation of an
innovative and entrepreneurial milieu: the capacity of a region is the basic identifier
to reach success in sustainable development.
On this basis, the contemporary theories have considered entrepreneurship as the
main tool to create a new equilibrium where sustainable development will be
obtained. However, this view specifically targeted urban areas, but, today in policy

30
circles, entrepreneurship is seen as an engine for sustainable ‘rural’ development, and
therefore entrepreneurial activities are supported by policies.
The classical economic development theories were usually sought to explain the
equilibrium of labour markets, costs and prices. However, they were often rejected or
did not give any space to entrepreneurship (Skuras and Stathopoulou, 2000). This
was because entrepreneurship like a spoilt child was destroying this equilibrium.
Later on, in the early economic studies, entrepreneurship was evaluated separately,
and was seen as the critical success factor of economic performance (Nijkamp,
2003). Despite the long history of entrepreneurship studies starting from 1920s, rural
entrepreneurship did not have a place in the literature until the 1980s (Wortman,
1990). Generally, rural entrepreneurs have been defined or studied in the same way
as their urban counterparts with reference to their entrepreneurial profiles and their
needs, viz. personal motivation, social environment, external business culture, and
creative milieu. But, in the recent rural entrepreneurship literature, the apparent
differences between the milieu created by rural areas and what urban areas can offer
in terms of social relations, and the effects of these relations on economic life, have
revealed the need for specific rural models.
The main strategy of recent rural development plans is to support and stimulate
entrepreneurship while exploiting the local potential of rural capital instead of
bringing it in from outside (Petrin and Gannon, 1997). Rural entrepreneurship is
fundamentally influenced by the relative abundance of each type of rural capital.
Conversely, the activities of rural entrepreneurs are the major driving force in rural
capital accumulation.
Entrepreneurship lies at the heart of innovation as the art of doing creative things for
the sake of achieving a competitive advantage (Nijkamp, 2008a). It is the driving
force of the enhancement of the innovative capacity and growth potential of a region
(Acs et al., 1999; Nijkamp, 2008a). Hence, entrepreneurship can be seen as the main
tool to promote rural development and to exploit rural capital.
2.2.3 Theory of social capital and embeddedness
The neo-classical theories, which use the production function, referring to human,
physical capital, and also natural capital, were of limited value in explaining ‘the
whole’. From a sociological perspective, the missing factor in the production

31
function was ‘social capital’ which refers to the interaction and the strength of
obtained and maintained local and external ties among agents. Thus, recent regional
endogenous theories have stressed the importance of localism and locality features
including their potential and their optimum use as the basis for the main strategies of
growth and development. In the literature, this is called ‘territorial capital’ (Camagni,
2008).
Territorial capital depends on the economic and social distance of the interacting
agents, the geographic distance, and the effectiveness of legal institutions (Camagni,
2008). Both territorial capital and rural capital stress local assets, including the
destruction of the existing, and the development of a new, socio-economic system.
Therefore, rural dwellers will each have a different perception of the formation of
new socio-economic systems, including their territorial scales. Territorial capital
refers to cities and regions, while rural capital covers only rural areas. Therefore, if
the interest of territorial capital is thought of as a ‘territory’, then the application of
the theory in rural areas becomes clearer. But to clarify the distinction between the
perceptions of the restructuration of both territorial and rural capital is not an easy
task. Territorial capital has a more optimistic connotation and considers the
destruction of some capital as leading to the enhancement of economic performance
and to the efficiency of knowledge and innovation, while the development and
conservation of rural capital takes into account both negative and positive effects,
and has a more conservative approach to the destruction of some capital, as well as to
the creation of other forms, referring to possible undesired changes in rural regions.
Despite their different perspectives, both territorial and rural capital cannot be
neglected if the aim is to achieve the desired sustainable rural development and
sustainable competitive advantage which is based on the optimum use of local
resources and their potential.
Sustainable rural development on the basis of entrepreneurship aims to achieve the
optimum use of local resources, while obtaining and maintaining social capital. In
the literature, the desired outcomes of socio-economic development rely strongly on
the contribution of social capital (Falk and Kilpatrick, 2000; Flora et al., 1996;
Woolcock, 1998). Despite traditional and social determinants, in modern theories,
social capital is measured by social cohesion, civic and economic well-being, and the
social processes, which all contribute to highly beneficial outcomes, while also
32
producing social capital itself (Falk and Kilpatrick, 2000; Flora et al., 1996). In other
words, social capital is defined as the outcomes of common values, explicit and tacit
norms, ways, and the density and the intensity of social interaction in a group that all
together increase the group’s capabilities and enhance socio-economic mechanisms.
The main idea of social capital is that social networks have value. It is also the extent
to which individuals are willing to cooperate with each other on the basis of trust.
Social capital is seen as an important element of economic performance. Granovetter
(1985) affirmed that the desired social and economic outcomes are achieved through
embeddedness, which is the interaction between social, economic, physical, and
environmental conditions.
‘Embeddedness’ is a notion developed by economic sociologists to emphasize the
social dimension of economic activities. The term ’embeddedness’ is widely used in
the literature in relation to many issues. The concept arose from Granovetter’s (1985)
interpretation and the extension of the earlier ideas of Polanyi (1944). According to
Granovetter (1985), economic activities need social relations. He assumed that social
relations have an important and significant role in terms of generating trust for
economic activities to happen. On this basis, entrepreneurs in rural areas must
achieve embeddedness in order to start-up, survive, and succeed in their businesses.
However, because of the heavy dependence of rural inhabitants on primary group
relationships and close personal ties (Frazier and Niehm, 2004), becoming embedded
is not an easy task for entrepreneurs.
Rural areas are basically social systems where social networks and ties are more
important than any other relations. Entrepreneurship, which is seen as a locally-based
economic system, is tied to the collective efforts of members of communities (Flora
et al., 1992; Kinsley, 1997; Miller and Besser, 2000). Therefore, the ties between
entrepreneurs and rural areas require local potential to link production to
consumption. On the other hand, business needs a market area in order to be present
and survive. On this basis, it is plausible to say that rural entrepreneurs, depending on
their entrepreneurial characteristics, are increasingly choosing rural areas as a living
and working environment or as a resource/input of their entrepreneurial process,
while seeing the market as a must for their business (Figure 2.4).
Thus, rural entrepreneurs must have ties with both areas: rural and market. Therefore,
the link between production (local resources) and consumption (market beyond rural
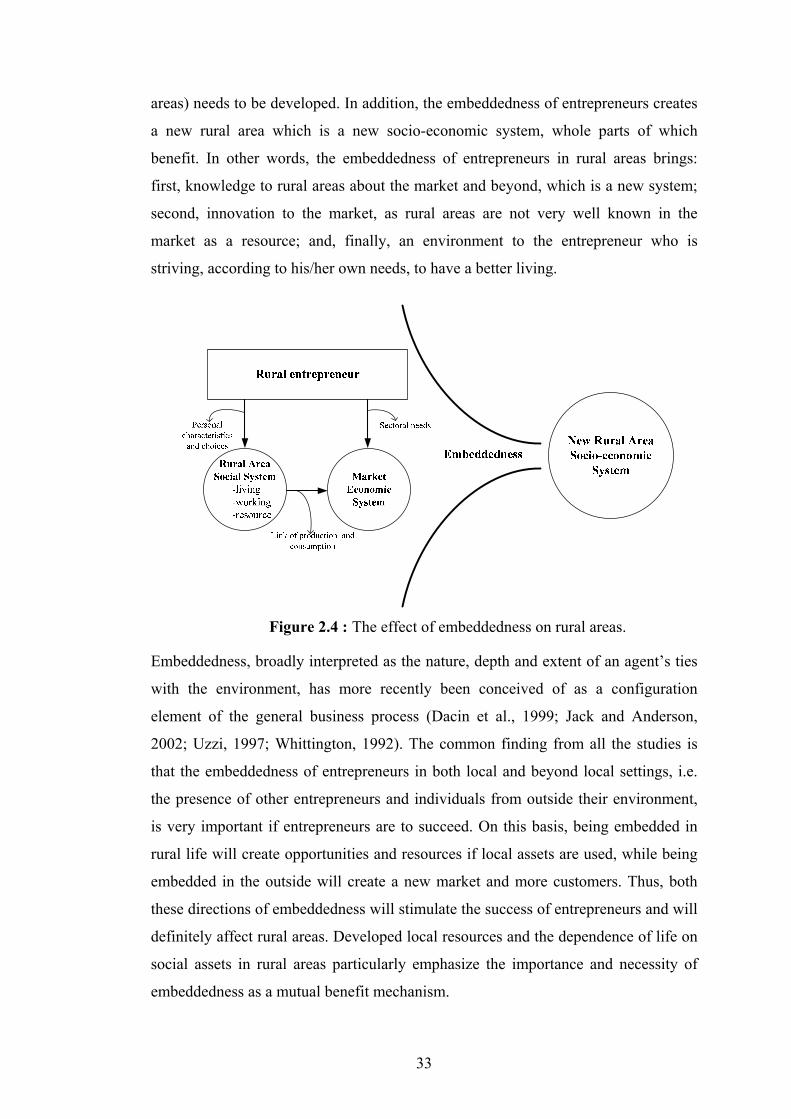
33
areas) needs to be developed. In addition, the embeddedness of entrepreneurs creates
a new rural area which is a new socio-economic system, whole parts of which
benefit. In other words, the embeddedness of entrepreneurs in rural areas brings:
first, knowledge to rural areas about the market and beyond, which is a new system;
second, innovation to the market, as rural areas are not very well known in the
market as a resource; and, finally, an environment to the entrepreneur who is
striving, according to his/her own needs, to have a better living.
Figure 2.4 : The effect of embeddedness on rural areas.
Embeddedness, broadly interpreted as the nature, depth and extent of an agent’s ties
with the environment, has more recently been conceived of as a configuration
element of the general business process (Dacin et al., 1999; Jack and Anderson,
2002; Uzzi, 1997; Whittington, 1992). The common finding from all the studies is
that the embeddedness of entrepreneurs in both local and beyond local settings, i.e.
the presence of other entrepreneurs and individuals from outside their environment,
is very important if entrepreneurs are to succeed. On this basis, being embedded in
rural life will create opportunities and resources if local assets are used, while being
embedded in the outside will create a new market and more customers. Thus, both
these directions of embeddedness will stimulate the success of entrepreneurs and will
definitely affect rural areas. Developed local resources and the dependence of life on
social assets in rural areas particularly emphasize the importance and necessity of
embeddedness as a mutual benefit mechanism.
34
In rural entrepreneurship studies, embeddedness is measured by the locality and
externality of entrepreneurs’ market and social relations, including the involvement
of rurality in the entrepreneurial process. In other words, ‘locality’ measures whether
entrepreneurs have local relations in terms of production by and for locals, while
‘external relations’ emphasize production by or for outside rural areas. In addition,
rurality shows the extent to which rural resources, i.e. environment and labour, are
added to the entrepreneurial process in rural areas. Based on the literature in our
sample, the different dimensions of embeddedness in terms of this multidimensional
structure can be grouped into four categories:
1. Disembeddedness: refers to entrepreneurs who have no economic or social
relations with the local environment but produce and sell outside of the rural
area;
2. Underembeddedness: refers to entrepreneurs who have not yet gained full trust
but are trying to have the local community as their market in order to sell their
products;
3. Embeddedness: refers to entrepreneurs who have obtained a balanced and
integrated relationship between themselves and society in the local area.
4. Overembeddedness: refers to entrepreneurs whose innovativeness is barred by
social closure, and therefore their creativity has led them to create external
relations by protecting their embeddedness in order to expand their business.
Both rural areas and entrepreneurship can be affected negatively by the defensive
localism if the local community is not engaged in the new activities (Rostow, 2002).
In addition, rurality affects entrepreneurship with regard to creating, realizing, and
operating a new economic opportunity while offering a desirable milieu
(Stathopoulou et al., 2004). This positive effect can be only realized by the creation
of new economic activities to support existing activity which is agriculture.
Therefore, bringing new economic activities can also be a threat for rural areas in
terms of the sustainability of the natural and social environment. But they, i.e. the
new economic activities, will definitely contribute to economic growth and the
development of rural areas, depending on the success of entrepreneurs in becoming
embedded and maintaining their activities.

35
2.2.4 Selecting a theory for sustainable rural development
The previous sections include a number of different theories which are related in
some way to sustainable rural development. Both sustainable rural development and
endogenous development aim to promote the locality features of rural regions, while
exploiting them in the global competitive arena by the stimulation of
entrepreneurship.
Rural regions face different changes sometimes problematic, sometimes successful,
and therefore they are becoming more dynamic and possess various intervening
opportunities, increasing their attractiveness in terms of the different flows, which
changes the position of rural areas in the global market and competitive arena. Thus,
endogenous approaches have displaced exogenous models, which conceived the
main forces of modern development as emanating from outside rural areas (van der
Ploeg, 1995); rural development should be the interplay between local and external
forces in the control of development processes. Indeed, rural areas as promising hot
spots are now important elements of the international economic scene and among the
leading investment frontiers (Clout, 1993).
Both the theories and empirical evidence show the importance of the conservation of
rural areas for global sustainability, while rural areas call for economic development.
Neglected rural areas are changing their face and becoming very important regions
which possess numerous intervening opportunities and potential. At the same time,
they are in danger, facing the possibility of disappearing. Thus, this dual situation
calls for a multi-theoretical approach while it also seems paradoxical. Intervening
opportunity theory provides us insights about the reasons for the changes in rural
areas. In addition, endogenous growth theory gives us a clue about how to obtain
sustainability and the continuity of the dynamism in rural areas, while explaining
how to benefit from their intervening opportunities and potentials. In summary, in
this study, our main theoretical framework consists of the theory of intervening
opportunities and endogenous growth. In addition, we use the theory of social capital
to investigate changes and trends in rural areas. The following chapter contains
additional concepts to the above-mentioned main sustainable rural development
concepts in order to clarify the focus of this study and to get a clear theoretical
background.
36
2.3 Additional Concepts of Sustainable Rural Development
Actually, what is related to rural is always complicated and dynamic. Due to the
planned system, when you revisit a city after several years, you may be able to find
the same shop, but perhaps run by another person. But when it comes to a village, it
can surprise you during your second visit few months later. Because of the fast
reaction of rural areas to the changes, you may be able to find the same people but
running diverse and unusual activities. Although our perception of ‘rural’ is very
much related to the nature, peace and quiet of the countryside, the dynamism in rural
areas has led us to add other concepts in order to make have a much better
understanding of our rural evaluation. Therefore, in this chapter, we talk about two
concepts, viz. ‘rural creative capacity’; and ‘hot spot’. Rural creative capacity, which
comes from the concept of creativity, has only lately been developed in the regional
sciences. The other concept, hot spot, again has been newly used in economic
discourses. In the following sections, both concepts are discussed and defined by a
literature review using a comparative approach on the basis of the urban-rural
dichotomy, related to their various components with a special focus on their possible
association with sustainable rural development.
2.3.1 Creative capacity in a rural context
Creative capacity studies have a long and outstanding history in the field of
psychology focusing on the capacity of individuals, groups and organizations –
particularly firms. But regional creative capacity is the subject of recent studies in the
field of regional sciences which focus particularly on urban and developed regions.
‘Creative capacity’ means the capability of any region to generate knowledge, and
thus to achieve innovation and the diffusion of the output of the innovative activity,
while ensuring the viability and sustainability of this process.
There are several reasons why such studies focus mainly on urban regions. One is
that the effectiveness of creative capacity can be measured over a long-term period.
It is much easier to generate theories and to develop the concept for urban regions
which have already benefitted from their creative capacity for a longer time than
rural regions. Also, the regional creativity concept was first introduced in cities and
urban areas by Florida in 2002.

37
Another reason is the limitations of the data on rural regions, i.e. the lack of such
data; the difficulty to obtain and collect accurate data; the lack of comparable data.
The concept has five components, viz. knowledge; innovation; entrepreneurship;
creativity; and networks (Table 2.6). To use these components and their indicators to
measure regional creative capacity has both advantages and disadvantages. The first
component ‘knowledge’ as an input in the success route towards obtaining sustained
competitive advantage in the knowledge-based economy is usually measured by the
values, culture, and traditions in the region. In a region, there exist different forms of
knowledge (Tovey, 2008). Knowledge which is actually a process itself can be
evaluated mainly in two types: tacit knowledge which carried out by the mind of an
individual therefore, the access is not easy, and the explicit knowledge which is the
codification of tacit knowledge and easy to communicate with (Polanyi, 1997). In the
knowledge-based economy, the knowledge in discussion is basically forms of
explicit knowledge. The forms of such knowledge in a region are:
(1) Traditional knowledge which is also called indigenous knowledge and
local knowledge which refers usually the traditions and practices transferred
for generations and is the economic resource of neo-endogenous development
(Ray, 1998) However local knowledge is usually mixed with the knowledge
in the locality which can be in another form of knowledge i.e., transferred or
expert knowledge or brought knowledge by migrants or newcomers
depending on the diversity of the region and the intensity of external ties
(Siebert et al., 2008).
(2) Transferred/Brought knowledge: is basically the knowledge beyond the
region which is brought or transferred through networks and became
knowledge of the population. It can be scientific knowledge, expert
knowledge or also learnt knowledge through education.
(3) Created knowledge: is the knowledge which is new for and generated in
the region.
Knowledge existing in the region – tacit knowledge – is one of the keys to the
success of that region (Maskell et al., 1998). The difficulty of accessing and the
possibility of misinterpreting the knowledge when retrieving it from local practices,
observations and documentation, and also the individualistic and cognitive structure

38
of knowledge can be seen as the disadvantages or the failure of this component
(Neelamegehan and Chester, 2006). In other words, knowledge which is the basic
component must be carefully investigated.
The second component is ‘innovation’. Innovation being the most discussed process
is very well-documented in the literature, but still maintains its paradoxical structure.
Innovation or its output as knowledge is measured by research and development
(R&D) structures of both private and public initiatives; its rate of return,
expenditures and employment; patents; technological parameters; productivity;
diversity of industries; characteristics of region with a special focus on specific
sectors known as innovative sectors (Grilliches, 1979; 1990; Rogers, 1998;
Audretsch, 2003).
Component Advantages Disadvantages Knowledge as an input
reflect locality creates transfer of knowledge
can be misrepresented difficult to access individualistic – personal cognitive
values culture
traditions Innovation/Knowledge as an output ease policy implementations and
investment decisions easy to interpret growth and competitiveness capacity environment is included
ignores traditional knowledge, give too much importance to scientific knowledge and biased towards technology and misinterpreted/ questionable, regional characteristics are missing especially natural and man-made environment and capital.
R&D patents
diversity of industries technology
productivity characteristics of the region
Entrepreneurship
ease the interpretations of policy and actions in regions depends on researcher’s interpretation
characteristics of entrepreneurs characteristics of business
human capital social capital
sectors social structure of the region
Creativity explains the residual missing part of the growth
open to discussion / questionable, newly developed and one-sided and biased interpretation of less developed or innovative regions
creativity indexes creative class demographics
creative industries Network
solve the complexity of running operations
difficult to understand and sometimes misrepresented in terms of social relations and informal relations
market relations market conditions
use of ICT efficiency
The dynamism of the innovation process is not easy to measure and the transition of
economies due to changing trends in the world has raised questions about the
disadvantages when using some particular parameters. One such disadvantage is the
dependence of the process on technology and R&D that does not give enough weight
to traditional knowledge. In other words, traditional knowledge is evaluated as less
important than scientific knowledge in most of the innovation studies. But this is a
Table 2.6: Five components of creative capacity.
39
biased view in the knowledge-based world, and, in fact, traditional knowledge is a
scarce and desired good providing useful insights especially for R&D (Fonte, 2008).
The third component is ‘entrepreneurship’ which was ignored in the early economic
theories, but recently became one of the key elements of competitiveness and
development. Basically, entrepreneurship refers to the entrepreneur not only as an
individual but also as a change agent in an environment, and is very much related to
the notions of social capital and networks (Noteboom, 1999; Cooke, 2002; Elfring
and Hulsink, 2003; Westlund and Bolton, 2003).
The main component of creative capacity is no doubt ‘creativity’. This notion,
having more than 60 definitions elucidated with respect to the arts, has a long history
especially in the field of psychology (Sternberg, 1998). In contrast, creativity in
regions or cities – a recently developed form of creativity – was first introduced by
Florida (2002). However, being so recently popularized, there are not many
contributions to the measurement of creativity, and Florida’s own measurement has
been criticized. Regional creativity is measured by different indexes, i.e. the
bohemian index; the gay index; the diversity index with a special focus on a group of
people called the ‘creative class’, who work in the ‘creative industries’. Factors that
attract the creative class are not just the job opportunity but the cultural supply;
tolerance; openness to new ideas, new people and new lifestyles; and also the
stimulus or inspiration of new experience. Because of the recent development of the
notion of creativity, it remains obscure and open to discussion, and therefore there
have been many criticisms on the scientific and empirical side of the study (i.e.
Glaeser, 2005; Qian and Stough, 2008), or it has been recommended that the field
must be revisited (Scott, 2006; Peck, 2007). Thus, it is accepted in the academic
arena that the field of creativity is empirically and statistically biased and
misinterpreted, including the paradoxical sometimes insufficient side of the
measurement. However, it is also evident that creativity can provide a boom in the
economy and increases the competitive advantage of a region (Scott, 2006).
The last and the most important component of regional creative capacity is
‘network’. Network, which realizes the transfer of product – particularly knowledge,
became the key parameter of obtaining success in the knowledge-based economy.
Through network(s), innovation can create a sustained competitive advantage and
thus a region can be visible.

40
The results of empirical studies show that urban areas compared with rural areas
have much more creative capacity and are able to transform this into strengths and
opportunities (Table 2.7). In addition, the strengths of urban areas are seen as
weaknesses of rural areas. However, these weaknesses are basically opportunities
that can be transformed into strengths in the future with right and clever policies.
Nevertheless, sometimes these opportunities are also seen as threats for rural areas.
For example, the increasing trend of counterurbanization, which brings diversity to
the knowledge base – tacit knowledge – in rural localities, can destroy the traditional
knowledge which has already been transformed over the generations. In addition,
with counterurbanization and the changing quality of life, rural areas are becoming
the place for experiencing the desired lifestyle of urban inhabitants thus contributing
to the displacement of the indigenous inhabitants. This does not ease but, on the
contrary, strengthens the rural-urban migration.
Empirical studies suggest that traditional knowledge can be the best input for R&D
activities, and scientific knowledge needs to respect and try to understand, instead of
ignoring it, and to assimilate such knowledge (Fonte, 2008). Although rural regions
are eager to benefit from information and communication technologies (ICT), and
rural inhabitants participate in ICT training and extension more than might be
expected, the efficient use of ICT has not yet been achieved in rural regions, as rural
inhabitants do not have enough technical infrastructure to practice their skills and
learnt knowledge.
Not only in technology but also in entrepreneurship it might be expected that there
will be less growth, and less innovative activities in rural areas. However, some
empirical evidence shows that actually rural regions are more innovative and
entrepreneurial than their urban counterparts (Keeble et al., 1992).
These results are due to the research focus and rural specific treatments, so that the
generalization of regional creative capacity for both urban and rural regions can
misrepresent the intervening opportunities of rural regions and related policies, thus,
putting their cultural heritage in danger. In other words, in terms of abilities and
capabilities, urban and rural regions are quite different. This means that comparing
‘apples’ and ‘pears’ with the same parameters can cause problems.

41
Urban Creative Capacity Studies Strength Weakness
Transferred/brought knowledge: diversified - easy to access Traditional Knowledge: transformed Created knowledge: technology based – diversified – high registered (high patent) Social Ties: mixed ties
Innovation: high – easy to achieve – high R&D – high level of productivity in all sectors
Entrepreneurship: small, medium or large size of business – high growth
Creativity: high economic success Promotion: easy access to ICT – efficient use of ICT – diverse and extensive market
Human Capital: highly skilled/educated Actors: courageous Support: diverse
Opportunity Threat Traditional Knowledge: diversity of culture Entrepreneurship: shorter establishment Innovation: low risk – based on technology – easy to adopt –fast take-ups – high technology Networks: depends on individual ties
Entrepreneurship: mixed business formation – stable business formation Human Capital: excess
Creativity: high technology use – diversified among sectors – fine arts – openness – tolerance – high technological – high artistic/cultural
Natural Capital: destroyed
Networks: high density – informal/formal networking Actors: mobile Human Capital: any labour Man-made Capital: high infrastructure – diversified Sector: diverse Actors: mobile
Rural Creative Capacity Studies Strength Weakness
Traditional knowledge: relatively protected Created knowledge:exists through needs of inhabitants – limited – usually remains as unknown (low patenting)
Entrepreneurship: longer establishment
Innovation: low rather continuity of existing – high risk – difficult to achieve – low technology – R&D exists only if government invests in it and universities exist in the immediate environment
Network: low formal network – high informal networking Entrepreneurship:small growth – less mixed business formation – unstable business formation
Social Capital: strong internal ties Creativity: very low high tech – focused on agriculture and manufacturing as the tech-user sectors – open depending on the localism – low level of tolerance – no or few technological
Natural Capital: well-protected Promotion: difficult to access
Actors :stable Network: limited density – depends on the defensive localism – low formal network, high informal networking
Human capital: shortage – family labour Man-made capital: single Sector: mainly based on agriculture and manufacturing Actors: Stable – fear Support: Limited
Opportunities Threats Traditional knowledge: Single culture Transferred/brought knowledge:difficult to access Transferred/brought knowledge: exist side-by-side in the region
Innovation: lack of technology – difficult to adopt – slow take-ups
Innovation: high level of productivity in agriculture and manufacturing Promotion : limited use of ICT – limited market
Entrepreneurship: small size of business Human capital : low skilled / less educated Creativity: inspiration for art – economic – artistic/cultural Man-made capital:shortage of infrastructure Natural Capital: well-protected Man-made capital: one form
On the basis of above-mentioned reasons and on the basis of recent empirical
evidence on regional creative capacity, evaluating rural regions using the same
approaches and measurement techniques applied to urban regions seems to fail.
These applications have usually resulted in indications of shortages and deficiencies
in rural regions, i.e. infrastructure, human capital and technology, while stressing the
Table 2.7: Summary of urban and rural regional creative capacity studies.
42
weaknesses of rural regions. Therefore, rural regions are usually seen as places
which have less creative capacity. On the contrary, rural-specific studies have proved
the high level of creative capacity in rural regions. The reason is that usually rural-
specific studies use a positive approach to evaluate rural regions. Because of these
diverse and contradictory results and the limited number of empirical studies
focusing on rural regional creative capacity, an overall argument about rural creative
capacity has not yet been provided in the literature. This calls for a systematic review
of the literature on each component of creative capacity. Therefore, on the basis of a
review of empirical studies and the literature review, we have generated three
arguments, viz. (1) rural creative capacity needs a more rural-specific approach; (2)
rural creative capacity depends on locality features; and (3) rural creative capacity
needs more suitable data than registered data.
1st Argument: ‘Rural creative capacity needs a more rural-specific approach.’
This argument is also the basis of the other two arguments on rural creative capacity.
Creative capacity which was popularized by Florida (2002) is measured as a fast rate
of employment growth, not only for urban areas but also for rural regions.
McGranahan and Wojan (2007) applied both Florida’s urban-specific approach
(Florida, 2002) and their own rural-specific approach to measure rural creative
capacity. Thus, they proved that an urban-specific approach underestimates rural
creative capacity. The reasons for this underestimation are that rurality measures, i.e.
natural amenities, rural lifestyles and quality of life, are lacking and urban-specific
parameters, i.e. low crime rates, low taxes, high-tech technologies are, not suitable as
measures for rural regions. Thus, when evaluating and investigating rural creative
capacity, a rural-specific approach, in other words an approach where rural is
considered instead of using urban-specific approaches, is needed to minimize the
underestimation.
2nd Argument: ‘Rural creative capacity depends on locality features.’
McGranahan and Wojan (2007) have already shown that rural creative capacity
depends on locality features which are the vehicles of competitiveness in rural
regions (Gülümser et al., 2009d). Locality features are diverse but, here, we focus on
four main features, viz. (i)tacit knowledge; (ii)technology; (iii)human capital; and
(iv)distance.
43
Tacit - Traditional/Local Knowledge: The existing literature on the new paradigm of
rural development has already taken into consideration local knowledge as the
development resource (Ray, 1998; Ploeg et al., 2000; Marsden, 2003; Ploeg and
Renting, 2004; Tovey, 2008). The value of traditional knowledge and the necessity to
protect it are mentioned by various international groups, viz. The United Nations
Conference on Trade and Development (UNCTAD), the World Intellectual Property
Organization (WIPO), and the World Trade Organization (WTO) (Fonte, 2008).
Usually knowledge with science and technological expertise gives little recognition
to the role of traditional knowledge in its generation and use (Koutsouris, 2008) and
this causes the destruction and loss of local knowledge. But in the national
development process, local values, and world views and understanding of
marginalized communities all need to be recognized, respected, honoured, and
adhered to by the consultants and advisors who may be educated, technologically-
advanced urban people (Neegelhamen and Chester, 2006). In fact, certain types of
technological innovation can revalue rural knowledge especially with respect to the
nutritional and medicinal uses of plants and animals (Fonte, 2008). Local knowledge
will then be reborn and will be a mixture of scientific and local knowledge. The use
of traditional knowledge will ease the adaptation and participation in rural areas
Hence, the awareness/conciousness will increase, and tolerance/openness will be
obtained. Thus, rural regions will attract the creative class and increase their creative
capacity.
Technology: The use of technology may affect local knowledge or traditional
knowledge – tacit knowledge – negatively. If this is the case, in rural regions, one
might then question the continual production of new technologies which opens up
new possibilities for material and natural resource exploitation while ushering in new
labour processes, increasing productivity and creating new products and new markets
(Tovey, 2008). Innovation plays an essential role for rural economic development
(Barkley et al., 2006). But a scientific-based technical process can often be
something alien to rural practices and institutions (Dargan and Schuksmith, 2008).
Therefore, adopting scientific knowledge by embedding, and interacting with, local
conditions is an important opportunity for rural creative capacity by easing the
adaptation and increasing the participation and the enthusiasm of rural inhabitants to
be a part of it.
44
Human capital: The explanation for high innovativeness in rural SMEs is the
importance of quality of life and residential attractiveness considerations for
professionally qualified workers, entrepreneurs and high-tech firm founders, as well
as greater availability of space and room for expansion of innovative and growing
businesses (Keeble, 1993). In other words, it is not the economic challenges and
opportunities in rural regions which attract the creative class, but rather quality-of-
life issues (Jones et al., 2003). In an innovation cycle from adoption to effective use,
from effective use to competitive advantage, a higher level of education is required
in order to translate the awareness of what is on offer into practice, but it is not
enough (Cornford et al., 1996). Human capital related to education and employment
skills in rural regions is not registered or confirmed as the experts or the highly-
educated people. The expertise of rural people depends on their local practices and
experience which make them better experts than scientific or educated ones. Thus,
respect for the tacit knowledge and experiences of local people, by consolidating it
with education, extension or training programmes, will create the human capital in
rural regions. But, neglecting the knowledge of rural populations and trying to
impose an alien type of knowledge on them will usually not attract local people to be
the source of human capital. Whether they are educated or not, the rural local
population can be seen as the human capital in terms of their various backgrounds.
Distance: in order to clarify this feature, we evaluate it in terms of three types of
‘physical distance’, which refers to the distance of rural regions to the nearest urban
centres and the innovation clusters and their geographical accessibility; ‘economic
distance’, which means the place of rural regions and their products in the global
markets; and ‘social distance’, which concerns the networks and relations of rural
people through which they become capable of transferring knowledge and accepting
the novelty. The extension of cities reaching far out into rural areas (Vaz et al.,
2006), the changing perception of quality of life and the increasing importance of
locality have together transformed a one-sided dependency in urban-rural
relationships into a more interdependent relationship. Today, apart from their
physical differences, urban and rural areas are functionally related to each other (van
den Berg et al., 1987) by exchanging diverse flows, i.e. people; goods; services;
capital and assets; waste and pollution; environmental resources; knowledge; and
social norms, values, lifestyles and identities (Davoudi, 2008).Therefore, the distance

45
of rural areas to the other settlements can be identified in different forms. Thus’ we
are taking into account these three types of distances separately.
• Physical distance: The distance of rural regions as peripheral and lagging regions
and its effect on the returns of R&D – in a broader sense on innovation and
technology – is discussed widely in the literature. Different views, i.e. the
Schumpeterian view, and the neoclassical view have led to a conflict of
perspectives (see Rodriguez-Pose, 2001). For instance, neoclassical theories
supported investing in R&D especially in peripheral and lagging rural regions
which can create economic convergence, while the Schumpeterian view – and
also the von Thünen Model and core-periphery theories – highlighted the
complexity of the connection of R&D and growth with a link to the spillover
effects from one region to the neighbouring regions. This conflict has led public
investors to doubt whether it is wise to invest in R&D in rural areas, but there is
still the need to increase their creative capacity and to improve the
competitiveness of economic actors (Rodriguez-Pose, 2001). Alston et al. (2000)
supported the importance of R&D investments and their increasing rate of return
in rural regions, stressing the paradoxical side of these effects. Rural areas are
dynamic by being involved in different networks and offering a diffusion of
knowledge, i.e. relocalization of food, culture, etc. but being more innovative
depends on location (Lundvall, 1992; Cooke et al., 1994). The employment
growth in rural regions is positively associated with innovative activity in nearby
metropolitan areas only if the metropolitan area is a highly active centre of
innovation and entrepreneurship (Barkley et al., 2006). In contrast, recent studies
have shown that the increase of the creative class does not depend on the physical
distance or R&D, but depends on the attractiveness capacity of rural regions and
the motivation of entrepreneurs. Thus, there is no single sign of the association
between physical distance and rural creative capacity, but the association
between local characteristics/features and rural creative capacity is always
positive.
• Economic Distance: The economic distance of rural regions is closely related to
the ability both to use and to adapt communication technologies to
entrepreneurship in order to succeed in the knowledge-based economy (Keeble,
1993; North and Smallbone, 2000; Malecki, 2003; Cannarella and Piccioni,
2005). However, the adaptation of rural firms and entrepreneurs to the new ICT

46
tools is not easy to achieve. Although they learn how to use these tools, they are
not able to use them in their business due to the poor provision of communication
infrastructure in rural regions (Grimes, 2000). In other words, rural regions are
not yet efficient beneficiaries of the ICT era, and therefore they are still using the
old generation of ICT, i.e. computers, but are not that involved with the new
generation technologies and e-commerce now widespread in the world. This
situation creates an unfair competitive arena in the global market for the rural
economy. Rural and small-town SMEs development is closely related to the
growth in the wide economy of new specialized niche markets, in which small
firms can supply efficiently, even though it is not more efficiently than large
firms (Keeble, 1993). Thus, when evaluating rural creative capacity, measuring
investments in technology – ICT – and the capabilities to adapt the ICT will offer
a better estimation of rural regional creative capacity.
• Social Distance: This third type of distance is a measure of the closeness between
players in a strategic interaction, and has recently been acknowledged to have a
profound influence on individual decisions (see Akerlof, 1997). There is
evidence that social distance matters more than physical distance and even more
than economic distance, in terms of cooperating and transferring knowledge
while creating knowledge externalities (Autant-Bernard et al., 2007). Reducing
social distance is also fundamental for diminishing economic distance. Rural
regions possess a very defensive localism in terms of accepting ‘the new’
(Winter, 2003). Therefore, in rural regions, the willingness to accept newcomers
as well as new economic activities that can create and increase opportunities, in
terms of increasing human capital, innovation, adaptation and economic
diversity, is one of the most important determinants of rural creative capacity
together with the continuity of the existing economic activities. Thus, instead of
measuring the extension and density of social networks, it is better to measure the
openness and tolerance of the rural inhabitants. In other words, the intensity of
social networks and the embeddedness of newcomers will provide more accurate
findings on rural creative capacity.
3rd Argument: ‘Rural creative capacity needs more suitable data than registered data.’
Rural firms in innovative sectors are underrepresented because of the use of patent
data in many research studies (North and Smallbone, 2000). On this basis, measuring
only technology-based sectors or using patent data can misrepresent the creative

47
capacity of rural regions. Therefore, instead of measuring rural creative capacity on
the basis of bureaucratic and scientific-based businesses or registered data, it is more
useful to measure the potential of business start-ups which can meet the challenges of
local communities and that of the businesses which use locality features –
particularly local knowledge and local culture – whether combined with technology
or not. In other words, rural creative capacity studies should keep in mind that those
rural creative sectors which respond to the demands of post-modern societies while
maintaining the continuity of rural characteristics are the innovative sectors in rural
regions.
To measure rural creative capacity by the capability and capacity of rural regions,
including the participation and enthusiasm of rural inhabitants, rather than with
registered data, i.e. patents, the education level of the inhabitants and the
accessibility and closeness to urban regions of rural regions, will be more accurate to
estimate the real rural capacity. The creative capacity of rural regions is different
compared with that of urban regions, and the application of urban-specific
approaches misrepresents the actual capacity of rural regions.
On the basis of the above-mentioned literature review and argumentative approach
on creative capacity, we define rural creative capacity as the changes and capabilities
of rural areas with respect to five main components of regional creative capacity. In
the next section, we explain the hot spot concept which is very much related to the
creative capacity of rural areas, and therefore a future in which they are capable of
using their full capacity may lead people to see rural areas as innovative hot spots.
2.3.2 Validity of the term ‘hot spot’ in rural discourses
The term ‘hot spot’ is widely used in ecological sciences and recently in the
innovation literature to define a region which is important for its development and
sustainability. From an ecosystem-based approach, a hot spot is the region of high
global importance for biodiversity conservation (Mittermeier et al., 1998; Beck,
2003). From an innovative approach, a hot spot is regional clusters of firms that
compete in the same industry. It begins as one or several start-up firms that as a
group grow more rapidly than other industry participants, and that have the same or
very similar immobile physical resource requirements in the long run (Pouder and St.
John, 1996). From a socio-economic approach, a hot spot indicates a geographical
area marked by the extensive political and economic activities, often resulting in very
48
intense multiple-use conflicts and political complications (Thia-Eng, 2007), or a
region with high level of land values (Alessa et al., 2008). The term ‘hot spot’ is
literally used to show the regions in danger. But, today, the term is changing its
meaning to point out regions with high importance or booming places in terms of
sustainability and development, especially with respect to innovation or economy.
Governments are making efforts to propel innovation, especially in Europe, by
creating competitive clusters centred around a specific sector, i.e. the hot spots, and
their development has not only spurred the growth of the creative classes, but has
also made competition more local, pitting cities against each other in a struggle to
earn recognition and corporate investment (Fishbein, 2008). Therefore, the hot spots
have made people who glow with energy and innovation master three main things: to
build deeply trusting and co-operative relationships with others; to extend their
networks beyond the obvious; and to be on an inner quest that ignites their own
energy and that of others (Gratton, 2007). On this basis, rural inhabitants who
already have deeply trusting and co-operative relations with others; who will extend
their networks; and who inspire others by their actions can easily transform rural
areas into hot spots. But, here, it should be kept in mind that in rural areas innovation
or the motive of the hot spot are certainly different from what they are in urban areas.
Fast-growing, geographically clustered firms within industries – sometimes also
referred to as ‘hot spots’ have become an increasingly important part of the
competitive landscape (Pouder and St. John, 1996). The concept is closely associated
with the agglomeration economies, which seem impossible to achieve in rural areas.
Nevertheless, in this study, with the help of alternative scenarios, we hope to show
how it might be possible to realize the impossible.
In this study, we used the term ‘hot spot’ in order to show that rural areas can be a
region of development, if the priorities for each village can be carefully identified. In
other words, tourism cannot be the sole saviour for rural areas to be developed, but
rather their locality characteristics and even their agricultural capacities can turn
them into hot spots. Therefore, in this study we evaluate rural areas as promising hot
spots in terms of their capabilities and intervening opportunities, and, in this
connection we come up with some scenario alternatives.
49
2.3.3 Transforming rural areas using their creative capacity
To conduct a conceptual framework for rural areas is a dynamic process, due to the
dynamism and multidimensionality of the topic itself. The orientation of the overall
aim of this study led us to use three main concepts (rural area, entrepreneur, and
sustainability) on which we generated our empirical analysis. But, there is also a
need to clarify two additional concepts often used in urban studies in order to
convert them into rural studies. On this basis, in this chapter, we have defined the
creative capacity and hot spot concepts in the rural context.
Regional creative capacity is the starting point of a region’s sustained competitive
advantage, and its success route, therefore, explains economic growth and
development. It is explained by five components, viz. (i) creativity; (ii) innovation;
(iii) tacit knowledge; (iv) entrepreneurship; and (v) networks. The notion of creative
capacity in regional sciences fostered and became a relevant way of explaining the
residual of early functions by giving much importance to knowledge, and thus its
measurement is basically related to workers having a knowledge-based job. The
interpretation in regional sciences and the findings of our argumentative approach
showed that rural creative capacity is a very important concept for sustainable rural
development evaluations. As a result, we suggested that rural creative capacity
should be measured by the changes and actual capabilities of rural areas rather than
by registered data.
Our second additional concept is related to the term ‘hot spot’. The transformation of
several rural areas from being dependent on urban areas to being interdependent with
them signalled the dynamism of such areas, and directed many researchers to think
about giving a special attention to rural areas. Therefore, rural areas by being
exposed with their capacities and capabilities – particularly with their
traditional/local knowledge – present a brilliant picture and a way to tap into the
heart of their way of innovation and economic diversity. On this basis, we used the
concept of ‘hot spot’ in order to envision the future of rural areas, and, hence, to
stress the high capacity and intervening opportunities waiting to be exploited in rural
areas. Therefore, in the following chapter, we operationalize our conceptual and
theoretical frameworks to reach our overall aim and to provide empirical evidence.
50
2.4 Sustainable Rural Development in Operation
So far, we have tried to present the challenges of our study, as well as to clarify our
conceptual and theoretical framework. The multidimensional characteristics of the
concepts involve a multi-methodological approach, and the multi-theoretical
structure of the study calls for a clear and strict operationalization. Therefore, we
define our operational concepts for each case study with the guidance of the main
conceptual definition. Here, we define our operational concepts one by one, while
explaining why we have so defined them. In addition, we give brief description of
the surveys conducted in Europe and Turkey.
2.4.1 Operational concepts
In order to conduct our research, we had to define our operational concepts. To put
each concept into operation depends heavily on the level of the evaluation. Table 2.8
summarizes each definition of operational concepts for each case study by means of
the level of the evaluation. The study, overall, is interested in the changes occurring
in rural areas and the impacts of these changes in relation to the stakeholders of the
development process. Therefore, we had three main concepts: rural areas;
entrepreneur; and sustainability.
Table 2.8: Operational concepts used for the case studies. Europe Turkey Rural Area “settlements characterized by a unique cultural, economic and social fabric, an extraordinary
patchwork of activities, and a great variety of landscapes” (Cork Declaration, 1999) Macro Definition of early applied studies (meta-
analytic approach) Regions with a population less than 20000 (TURKSTAT) (national level)
Micro Villages with a rural character, at least two registered monuments or sites
Settlements with a population less than 2000 and without a municipality
Entrepreneur “the local inhabitant who works as self-employed or employer as the owner of a local firm in a rural area”
Macro The total of self-employment and employers Micro Definition of early applied studies (meta-
analytic approach) The local inhabitant who works as self-employed or as an employer of a local firm
Sustainability “the ability to maintain the newly obtained dynamism and develop the rural capital in association with this dynamism”
Macro to obtain continuity and sustainability of the settlements while representing the villages in the global world Micro
When defining the operational concepts for each of these three concepts, we analyse
them by using different case studies because of the specific definitions used in each
case study area and also for each national and meta-analytic evaluation. Therefore, in
Table 2.8, we give each operational definition separately: as ‘macro’ to define the
national and meta-analytic evaluations at the macro-level, and as ‘micro’ to define
51
our case studies conducted in villages at a settlement level. For the macro-level
evaluations, following a meta-analytic approach, which is briefly the combination of
the results of several studies that address a set of related research hypotheses
(Rosenthal, 1984), has led us to use the definitions of the existing studies included in
the analysis. In addition, the same type of evaluations at national level directed us to
use the definitions of statistics institutes, i.e. TURKSTAT and EUROSTAT.
When it came to the micro-level evaluations, it was not very easy to define
operational concepts. In a broader sense, rural areas are unique settlements with a
patchwork of unusual diverse activities. This already accepted uniqueness and also
the extensive number of rural areas did not facilitate our operationalization. The
problematic image of rural areas was and is almost similar all around the world at
different levels of degree. Although this seems to be an exaggerated argument, rural
areas have been the suffering settlements for centuries. Therefore, we focused on
successful examples to find out their way of dealing with long-standing problems,
and how their success can be maintained in such villages and applied to others. We
were trying to find successful villages in terms of their ability to face the recent
changes occurring in the area and to convert these changes into sustainable rural
development.
To this end, in Europe we focused on the villages of a federation called ‘The Most
Beautiful Villages on Earth’ that aims to obtain sustainable rural development in its
member villages (for further explanation on the federation, see Chapter 3.3). For the
cases in Turkey, such an organization does not exist. Although there are rural
development implementation areas, which can be seen as an equivalent attempt,
many research studies have been conducted in such villages but the implementation
is not locally-based as in the European case. Especially for Turkey, in our study we
put more stress on finding out which villages were facing demographic changes
while creating economic diversity on their own. Therefore, we used a multi-
stratification sampling method, while using the definition in Village Law as the basis
(see Chapter 4.3 for further explanation concerning the Turkish case). The following
section provides information about how we conducted the surveys in the case study
areas, and how we collected our data in the field. Hence, the information about the
structure of different types of questionnaires is also given in the next section.
52
2.4.2 Operational processes
In our study, the operational processes for the case studies consist of questionnaire
surveys. The surveys are based on two types of questionnaire. In this section, we
summarize the survey process for Europe and Turkey, while explaining the structure
and content of the questionnaires. An extensive explanation of the data collection
processes is provided as separate chapters in the related empirical parts on each case.
The survey in Europe began in July 2008 and ended in August 2008 by collecting
information from 60 villages located in Belgium, France and Italy. The
questionnaires were translated into French and Italian in order to avoid any language
problems (see Appendix B for the English version of the questionnaire). The
questionnaire had four main parts, (1) general information; (2) environmental
characteristics; (3) relations and connections with the outside; and (4) changes. Part 1
and Part 2 were designed to reveal the similarities and the differences of the
characteristics of the villages, while Part 3 was designed to measure the
attractiveness of villages, and Part 4 was designed to evaluate the changes that had
occurred in the villages.
When preparing the questionnaire, the aim was to highlight the perception of relevant
experts, with a special focus on sustainable rural development. In Part 1 of the
questionnaire, we investigated the characteristics of the villages. In Part 2, we asked
questions about the natural, physical and social environment. Part 3 focused on the
diverse networks created inside the villages and built between the village and the
outside.
For the Turkish case, the survey started in April 2009 and ended in May 2009 by
collecting data from 17 villages and 255 entrepreneurs. In this case, we conducted
two questionnaires in Turkish (see Appendix C). The questionnaire is almost the
same as the one used for the European case, except the second part, which is related
to the environmental characteristics of the villages. The reason not to include this
part, related to the characteristics of the villages, was that we visited all the Turkish
villages, and thus we were able to answer these questions during the field surveys.
The questionnaires for the villages of Europe and Turkey are intrinsically the same,
but due to the operational definitions they differ in terms of partition and in terms of
some additional information needed to be collected, i.e. the data on the federation for
the European case.
53
For the Turkish case, as we had no possibility to conduct a meta-analytical analysis,
we were obliged to provide our own data to better understand entrepreneurship in the
villages. Therefore, we prepared a questionnaire called the questionnaire for the
entrepreneur, which has six parts, viz. personal profile – social relations;
entrepreneurial profile – economic relations; firm profile – market relations; success
factors; impacts on the village; needs – sustainable rural development. Parts 3 and 4
of this study evaluate the findings of these questionnaires – questionnaire data – as
well as the data and information obtained from the literature, EUROSTAT,
TURKSTAT, FAO and WB – archive data.
2.4.3 Operational thoughts on sustainable rural development
To operationalize sustainable rural development (SRD) was not an easy task because
of several issues. First of all, it was not easy because of the broadness of the concepts
in relation to SRD; second, the extensive number of villages provided a great
universe, and this did not ease our sampling process.
Therefore, we conducted our research at different levels, viz. the macro–level,
including the meta- and country analyses; the micro-level, including the settlement
analysis. For the macro-level, we used earlier applied operational definitions to
facilitate our evaluation. For the case studies, another methodological attempt was
needed. Therefore, we generated our operational concepts to reflect the successful
villages in Europe and Turkey. Hence, we conducted our questionnaire survey in the
villages themselves. The selected villages in both Europe and Turkey are the
successful examples. Thus, they provide relevant evidence – the basic material to
come up with rural hot spot scenarios – to expose the differences and similarities
between the two cases, as well as between the expectations of different rural users.
2.5 Concluding Remarks on Part 2
Everybody is subconsciously thinking about sustainability and development in their
daily life. People are working hard to maintain their current living standards, while
thinking how to ameliorate them. In recent years, the countryside has become a part
of these improvement attempts. The impacts of these individualistic personal
attempts on rural areas have started to result in exhaustion for the natural and social
environment, on the one hand, and, a boost for the man-made and economic
54
environment, on the other. These conflicting impacts, including different perceptions
of the use of the terms, pushed both researchers and policy makers to find out how to
better evaluate sustainable rural development (SRD), and how to cope with the
changes that have been occurring out of control. Taking into account these recent
attempts and efforts, in this part of the study, we created a contemporary approach
for SRD by means of conceptual, theoretical and operational frameworks for a better
SRD evaluation.
To think about SRD, especially with a contemporary perspective, has its own
conflicts and complexity. Therefore, we started to cope with it by discussing the
three main concepts of SRD thinking. Hence, we first offered a conceptual
framework which included rural areas, entrepreneurship, and sustainability. This
framework is not a novelty itself, as SRD covering rural areas and sustainability
concepts is already very much associated with the concept of entrepreneurship. Thus,
from a modern perspective there was the need to add a new approach that brought
novelty to our study. With respect to the contemporaneous perspective, we added
two new concepts, viz. the rural creative capacity concept and the hot spot concept,
which are both newly developed in the regional sciences. From this contextual point
of view, these additional concepts facilitated our explanation of where we are
positioning and evaluating SRD in our study.
A conceptual framework is not enough on its own to clarify our thoughts on SRD.
Hence, secondly, we offered a theoretical framework. The lack of a basic and
specific theory for SRD led us to provide a list of related theories with which we
described our theoretical background. The combination of theories from several
disciplines formed the complexity of our study as well as the complexity of the SRD
phenomenon.
In our modern age, there has been a huge turnaround from the exogenous to the
endogenous perspective in terms of growth and development. In addition, empirical
evidence and new generated theories on rurality and the increasing attractiveness of
rural areas have launched a huge debate on the intervening opportunities waiting to
be exploited in rural areas. Having said that, it is important not to forget ‘the rural’
itself. Rural areas are unique communities with a defensive localism linked to their
social life. Therefore, we constructed our theoretical framework using three main
theories, viz. the theory of intervening opportunities, the theory of endogenous
55
growth, and the theory of social capital. After drawing both conceptual and
theoretical frameworks what remained was to think about how to operationalize our
complete methodological structure in order to have an analytical basis. To this end,
we redefined our concepts by means of operational concepts. Therefore, we outlined
our surveys by pointing out the relevant data and the ways in which data collection
was to be put into operation our study. Furthermore, the questionnaire process was
conducted in more than 300 European villages, of which we obtained data from 60
European villages. In the case of Turkey we distributed questionnaires to 17 villages,
and this process resulted in data collected from 17 villages and 255 entrepreneurs
from these villages. In the Turkish case, the questionnaire process was followed by
in-depth interviews to better understand the structure of villages.
In conclusion, Part 2 has clarified the content of the study in order to obtain a better
understanding of the empirical parts, the challenges, and our motivations in this
study on the basis of practical and theoretical evidence from rural areas.
Contemporaneous thinking on SRD has its limitations, to some extent because of the
broadness and frequent use of related concepts, as well as the lack of an overall
theoretical evaluation. Nevertheless, Part 2 has succeeded in reflecting recent
discourses on SRD, opening-up the discussion of the new terms used in different
disciplines. Therefore, it offers a new contemporary approach to SRD. The following
parts of the study provide empirical analyses and their findings from the
contemporary perspective on SRD given in Part 2.

56

57
3. RURAL AREAS AS PROMISING HOT SPOTS IN EUROPE
3.1 The Evolution of Rural Areas in Europe
The future of rural peripheries as well as the future of rural societies has become an
important development and planning issue in Europe due to globalization, the
changing characteristics of local economy, and the enlargement of the European
Union (EU). This chapter aims to explore the main EU policy-based issues – the
enlargement and Common Agricultural Policy (CAP) that have had a great impact on
the evolution and reshaping of rural areas. The reason to start the explanation of our
survey in Europe by this exploration is to be able to understand more deeply the
policy-based concerns of the Union in the rural context, and hence to evaluate better
our empirical results by being aware of the milestones which had a great impact on
rural areas in Europe.
3.1.1 The enlargement of the european union: a powerful policy tool
The EU was set up with the aim of ending the frequent and devastating wars between
neighbouring countries which culminated in World War II (WWII) (EU, 2009).
Thus, the EU has its roots going back to 1951 with six founding members (Belgium,
France, Germany, Italy, Luxembourg and the Netherlands). The reasons behind
European integration have changed depending on the emergence of contemporary
issues. For instance, the unification of the European countries began with the
European Coal and Steel Community in order to secure lasting peace in the 1950s,
while in 1957, the European Economic Community or Common Market was created
by the Treaty of Rome in order to bring economic integration and a Single Market
for the community members. Europe, as a whole, was, however, not limited to six
countries, so there was a call for integration to be extended all over Europe. On this
basis, this section summarizes the enlargement processes, and at the same time
focuses on their impacts on rural Europe.
58
After its foundation in 1973, the EU has gone through six enlargement processes. In
1995, the number of Member States reached 15, in 2004 it rose to 25, and, today,
there are 27 Member States. The countries, which joined the EU, and the year they
joined, are as follows;
• In 1973, Denmark, Ireland and the UK;
• In 1981, Greece;
• In 1986, Spain and Portugal;
• In 1995, Austria, Finland and Sweden;
• In 2004, Czech Republic, Estonia, Cyprus, Latvia, Lithuania, Hungary, Malta, Poland, Slovakia and Slovenia;
• In 2007, Romania and Bulgaria.
Of these enlargement periods, the period in 2004 during which 10 new Member
States (Cyprus, the Czech Republic, Estonia, Hungary, Latvia, Lithuania, Malta,
Poland, Slovakia, and Slovenia) joined the EU was a historic milestone in the
remaking of Europe after centuries of destructive war. There are also three candidate
countries, viz. Croatia, the Former Yugoslav Republic of Macedonia, and Turkey.
Whilst Turkey applied for membership in 1987, the other countries applied in 2003
and 2004, respectively. These and other future enlargements will depend on each
country’s performance to meet the standards set by the EU.
Although the Union is, in principle, open to any European country, to fulfil the
democratic, political and economic criteria for membership is not an easy task for
each European country. In order to be a member, candidates need to achieve
negotiation, pre-accession, accession, and transition processes, consecutively, while
also achieving harmonization of the EU standards. One of the most important issues
of the negotiation and also the most difficult issue of the accession and transition
periods is the fulfilment of conditions concerned with rural (‘agriculture’-) related
issues which account for the highest share of the EU’s budget.
Enlargement is one of the most powerful policy tools of the Union. With a carefully
managed process, enlargement helps the transformation of the countries involved,
leading to peace, stability, prosperity, democracy, human rights, and the rule of law
across Europe (EU, 2007). Europe gains from an assured political stability and
security, as well as from the expansion of the internal EU market from 380 million to
454 million people (European Communities, 2004). This larger market offers new
59
and important opportunities for the development of European agriculture and of the
EU’s Common Agricultural Policy (CAP). Accession provides opportunities not only
to the national economies of the new Member States but also to the farmers of these
States in terms of access to the Single Market and benefit from stable prices, direct
payments and also rural development procedures. Therefore, by accession, new
Member States are able to modernize and restructure their agricultural sector, which
results in improved prosperity as a whole. The EU achieves this improvement by
creating new rural development measures focused on the specific situation of the
new Member States. The obligations and rules of EU membership are applied to the
farmers of the new Member States immediately, and sometimes even before the
accession period. Joining the EU has changed rural areas of both the Union and the
new Member States in terms of their economies and spatial uses. However, the
decline of the importance of agriculture is still an absolute reality.
The dynamism of the EU due to the enlargement and also the dynamism of rural
areas are the most important challenges for policy evaluation and evolution in the EU
and also in many of its countries. In the following section, the first EU common
policy – the CAP – and its evolution over time are explained in order to better
understand how the EU has evaluated the dynamism of rural areas and their
contemporary needs.
3.1.2 CAP and its reforms
The EU is trying to create an equal and democratic environment for its Members
under a common understanding. The EU’s first attempt to create such common views
was the Common Agricultural Policy (CAP) in the 1950s to meet the needs of
Western Europe whose various societies had been damaged by years of war, and
where agriculture had been crippled and food supplies could not be guaranteed
(European Communities, 2004). The CAP is one of the most reformist policies of the
EU policies, and also the most effective one in the budget formation and membership
process. Therefore, in this section, we evaluate the CAP over time by discussing its
impacts on rural areas in Europe.
The early aim of the CAP was to ensure that the EU had a viable agricultural sector,
and to achieve better productivity, while generating a stable supply of affordable
food. The CAP offered subsidies and guaranteed prices to farmers for the

60
restructuring of farming, providing incentives for them to produce agricultural
products. However, in contrast to its success in meeting its objective of moving the
EU towards self-sufficiency, the CAP has had to be changed several times according
to the needs of society rather than the needs of the farmers (European Communities,
2004).
The early CAP reforms were usually focused on the protection of farmers by
subsidizing them to export, store and dispose of commodity surpluses. By the 1980s,
the EU had to contend with almost permanent surpluses (e.g. the so-called ‘butter
mountains’ and ‘wine lakes’) of major farm commodities, some of which were
exported (with the help of subsidies), while others had to be stored or disposed of
within the EU. These measures distorted some world markets, did not always serve
the best interests of farmers, and became unpopular with consumers and taxpayers.
All this had a high budgetary cost, and society was concerned about the
environmental sustainability of agriculture, like the Rio Earth Summit, which was a
notable landmark for such intentions in the early 1990s. In the mid-1990s, the CAP
was facing two main constraints: the need of the EU to respect commitments made in
the Uruguay Round Agreement on Agriculture (GATT); and the prospect of the EU’s
enlargement towards Central and Eastern Europe (Buckwell, 1998). The EU’s basic
strategy was to continue with another reform in 1992, and to move towards a more
integrated rural policy. This will was expressed at the Cork Declaration in 1996 by
positioning sustainable rural development at the top of the EU’s agenda.
According to the Cork Declaration, the emphasis was on participation and a bottom-
up approach, which harnesses the creativity and solidarity of rural communities. In
2003, a further fundamental reform was agreed. The 2003 CAP reform involved a
major strengthening of rural development policy by reducing direct payments for
bigger farms and transferring the funds into rural development measures. Another
important measure was the bottom-up approach of the public/private partnership
initiative known as LEADER+, whereby local rural development projects are funded
by both the EU and the national governments, as well as by private bodies. Today,
the scope of rural development policy is much wider than traditional ‘agricultural’
activities, including measures to protect and improve the environment, and schemes
to support rural communities and develop the rural economy as a whole.

61
The current CAP is demand-driven. The series of reforms have now painted a clearer
future for the CAP, making more apparent its value to all of society. The CAP, today,
is very different from the CAP of the 1960s. According to the EU’s territorial
classification (see SPESP, 2000), over half of the population of the EU-25 live in
rural areas which cover 80 per cent of the territory shaped by human occupation and
activity, and therefore rural development is a vitally important policy area (European
Communities, 2004).
Farming and forestry are the main land uses in rural areas, and, as such, play an
important role at the heart of rural communities as the basis for a strong social fabric
and economic viability and the management of natural resources and the landscape.
Rural areas are very diverse, since their natural environments have been shaped by
various forms of farming, forestry and the crafts and industries associated with them.
Numerous opinion polls in both the EU-15 and the new Member States clearly
demonstrate that a liveable and sustainable countryside matters to European citizens
(European Communities, 2004). Agriculture and forestry, as major land uses, play a
key role in determining the health of the rural economy, as well as that of the rural
landscape. Though agriculture may be less important to the economy of rural areas
than it used to be, it still has a valuable contribution to make towards their economic
growth and environmental sustainability (European Communities, 2004). The
following section discusses the effects of the enlargements and the CAP reforms on
rural Europe with a special focus on the rural economy.
3.1.3 The effects of enlargements and the CAP on rural Europe
In recent years, significant changes have been observed in the rural areas of Europe.
These changes mostly concern the agricultural policy reforms, the reform of the EU’s
structural funds and the strengthening of its rural development policies, international
trade liberalization, and (more generally) the processes of globalization, i.e.
technological change, and localization. Within the context of these developments, the
EU has attempted to ensure an economically-efficient and environmentally-
sustainable agriculture and to stimulate the economic diversification and the
integrated development of rural areas (European Commission, 1997).
Recent developments at the agricultural policy level did not affect the agricultural
sector of the Member States equally. In the two previous sections, we briefly
62
examined the enlargement of the EU and we also evaluated the CAP and its reformist
structure in time. In this section, we discuss the effects of both the enlargement and
the CAP on rural Europe.
Recent studies have focused on and analysed the latent problems of agriculture and
the transformation in transition countries. The transition countries in the process of
accession to the EU are trying to apply the CAP and the rural development policy.
Although the European Commission aimed to facilitate the application of the CAP
with a special accession programme for agriculture and rural development
(SAPARD) programmes, countries are still having problems during the pre-accession
and accession periods. Although the differences between and within the Member
States and the transition countries were obvious, the problems of the transition
countries were similar to those of Member States. According to Arzeni et al. (2001),
the reasons for these similarities were the similar patterns of investment in rural
areas. Because of lack of investment, first, rural areas and the livelihood of rural
people have been severely affected in terms of the economic and institutional
transformation process; second, output and employment in rural areas have
experienced a significant decline; and finally, with respect to the urban areas, the
rural economy in transition countries has continued to lag behind in terms of
employment creation (Arzeni et al., 2001). However, even during the pre-accession
period, including the transition period, self-employment has been stimulated as a
result of economic deregulation, the increase in unemployment, and the decline in
the provision of social services and this can also be seen in Western European rural
areas (Arzeni et al., 2001). In recent years, the growth of new small-scale enterprises
in the peripheral regions of Western Europe such as Italy, Spain, Portugal and
Greece, has been observed (Simmons and Kalantiridis, 1996; Arzeni et al. 2001).
The flexibility of the working hours of labour has helped to facilitate the control of
the management and the organization of such enterprises. In these countries, labour
was being resourced from within the family, especially females (Dokopoulou, 1986;
Fua, 1986; Ferrao, 1987; Vasquez-Barquero, 1988). Therefore, it was easy to apply
the current policies of the EU in rural areas in Western Europe, as, at management
level, institutions and governments wanted to implement policies effectively and
consistently. On the other hand, this is still an ongoing process in the Eastern
European countries, as the implementation of new policies takes time.
63
Agricultural employment and thus rural employment are subject to the reforms and
dynamic perspectives. Especially Europe, which is trying to create a common
understanding for a dynamic enlargement and dynamic structure, is challenged by
the rural-specific issues, which are much related to the self-containment and
unemployment in the European continent, as well as in the Union. The following
chapter describes the changes in rural employment and entrepreneurship – self-
employment –by means of an exploratory analysis in order to show the dynamism of
trends in rural Europe.
3.2 The Changing Trends in Rural Europe
In this chapter, the agricultural employment and self-employment of the 27 Member
States of the EU are evaluated on the basis of data and information derived from
EUROSTAT. Exploratory analysis techniques, viz. box plot and cross-tabulation (for
further explanation, see Appendix A) have been used to highlight the changes in
agricultural employment and its structural component self-employment. The chapter,
first, investigates the agricultural employment changes; and, secondly, evaluates
agricultural self-employment within each Member States. The chapter concludes by
summarizing the employment changes and the trends in rural Europe.
3.2.1 Changes in rural employment
Modernization and globalization including new technologies have brought efficiency
in the agricultural sector in terms of providing labour productivity and reducing
labour demand. Such effects, particularly the effect on labour demand, have obliged
rural economies to face their main weakness, i.e. the high unemployment rate. In the
EU, a high unemployment rate is not a weakness for all Member States, but the latest
Member States, especially the Eastern Bloc countries, suffer from unemployment, as
the agriculture sector is losing its importance and labour, and is still dominant in
these countries. The EU gives priority to agriculture and allocates a remarkable
amount of its funds and budget to it for many reasons, e.g. the dependence of the
EU’s self-sufficiency on agriculture. Even though the EU spends the biggest share of
its budget on subsidizing rural areas and the agriculture sector, in order to respond to
the changing demands of its society, agricultural employment is still becoming less
attractive within the rural communities. Against this background, this section

64
discusses the changes in agricultural employment which occurred between the years
1995 and 2006. The decline in agricultural employment in terms of both numbers
and significance is not related to the enlargement and the CAP reforms. On the
contrary, the share of agricultural employment in total employment increased with
the enlargement. The share of agricultural employment in total employment was 5.15
in 1995 and 3.77 in 2004 before the enlargement, but, with the accession of 10 new
Member States in 2004, this share has risen to 4.99 (Table 3.1). Nevertheless the EU-
25’s agricultural employment has continued to decrease.
1995 1996 1997 1998 1999 2000 2001 2002 2003 2004 2005 2006 United Kingdom 2.04 1.94 1.85 1.71 1.55 1.54 1.39 1.39 1.25 1.27 1.38 1.35 Malta 2.03 2.37 2.35 2.49 2.26 1.95 1.77 Luxembourg 3.83 2.67 2.37 2.93 1.93 2.43 1.51 1.97 2.73 1.96 1.76 1.84 Belgium 2.68 2.75 2.66 2.24 2.39 1.91 1.38 1.79 1.72 2.22 2.04 1.95 Sweden 3.50 3.26 3.24 3.05 2.99 2.90 2.64 2.52 2.54 2.48 2.27 2.22 Germany 3.17 2.94 2.94 2.78 2.87 2.64 2.62 2.49 2.42 2.36 2.37 2.27 Denmark 4.39 3.87 3.72 3.70 3.31 3.66 3.54 3.20 3.29 3.26 3.18 3.08 Netherlands 3.71 3.56 3.49 3.32 3.04 3.08 2.95 2.66 2.94 3.15 3.18 3.14 EU-15 5.15 4.95 4.85 4.66 4.47 4.31 4.20 4.05 4.01 3.77 3.72 3.65 Czech Republic 5.79 5.55 5.31 5.21 4.87 4.89 4.51 4.45 3.98 3.76 France 4.89 4.82 4.64 4.41 4.24 4.14 4.07 4.13 4.34 3.99 3.79 3.94 Cyprus 4.65 5.41 4.85 5.26 5.20 5.11 4.74 4.25 Italy 6.58 6.13 5.88 5.77 5.42 5.23 5.21 4.93 4.71 4.20 4.20 4.27 Slovakia 8.14 7.25 6.94 6.26 6.59 5.99 5.08 4.74 4.38 Finland 7.75 7.80 7.75 7.10 6.36 6.19 5.82 5.51 5.26 4.99 4.82 4.65 EU-25 5.71 5.59 5.47 5.27 4.99 4.89 4.70 Hungary 8.22 7.81 7.34 6.95 6.46 6.19 6.12 5.38 5.26 4.87 4.77 Spain 8.99 8.36 8.04 7.70 7.21 6.69 6.55 6.03 5.71 5.48 5.27 4.78 Estonia 9.68 9.30 8.57 6.83 6.87 6.49 6.26 5.46 5.30 4.97 Austria 7.34 7.43 6.89 6.49 6.23 6.05 5.81 5.76 5.50 4.96 5.50 5.52 Ireland 11.97 11.20 10.88 9.10 8.64 7.95 7.11 7.03 6.50 6.37 5.91 5.73 EU-27 7.95 7.70 7.08 6.83 6.31 6.14 5.88 Bulgaria 13.12 9.68 10.69 11.13 10.72 8.93 8.11 Slovenia 10.22 12.11 12.02 10.81 9.53 9.83 9.59 8.38 9.67 9.07 9.54 Latvia 19.02 17.49 14.92 15.11 15.29 14.58 13.30 11.81 11.19 Portugal 11.48 12.20 13.28 13.78 12.62 12.52 13.08 12.51 12.84 12.08 11.83 11.70 Greece 20.43 20.28 19.84 17.89 17.43 17.40 16.12 15.47 15.29 12.60 12.41 11.98 Lithuania 19.56 19.99 19.24 17.58 18.64 18.71 16.32 14.04 12.45 Poland 18.67 19.20 19.63 18.20 17.60 17.37 15.79 Romania 40.87 41.98 44.01 45.20 44.43 37.71 37.68 32.57 32.29 30.60
In other words, despite the rise in agricultural employment gained with the
enlargement, the natural decrease in total agricultural employment remained the
same. Nevertheless, with the entry of two countries in 2007, the level of agricultural
employment in the EU definitely increased because of the high rates of the
agricultural employment of these latecomers. However, between the years 2000 and
2006, agricultural employment has still had a decreasing trend.
Agricultural employment is very sensitive to the CAP reforms, especially to the 2003
reform. The subsidies and opportunities of the CAP resulted in an increase of
agricultural employment, even though this acceleration did not have a long-term
Table 3.1: The ratio of agricultural employment to total employment in the EU.

65
effect. In addition, divergences between Member States are obvious, and the
agricultural share ranges from 1.35 per cent to 30.60 per cent as a result of the
different economic structures of each Member Country (Table 3.1 and Figure 3.1).
Although many countries stay below or at the level of the EU, there are still some
countries − both new and old Member States − above the average.
2006
2005
2004
2003
2002
2001
2000
1999
1998
1997
1996
1995
2006
2005
2004
2003
2002
2001
2000
1999
1998
1997
1996
1995
50403020100
50403020100
Greece
Greece
Romania
Romania
Romania
Romania
Romania
Romania
Romania
Romania
Romania
Romania
Figure 3.1 : The distribution of agricultural employment in total employment.
Between the years, 1995 and 2006, 18 Member States out of 27 could not reach the
level of the old EU Member States (EU-15) (Table 3.1) in terms of agricultural
employment. Among these old Member States, France showed a different pattern.
The share of France was below the level of the EU-15 between the years 1995 and
2001, while in 2002 and 2003, its share increased above this level. Even though
France’s share decreased after 2003, it stayed higher than the level of the EU-15.
Compared with the total share of the EU-25, there are 14 countries, which are below
this level. Among them, 3 Member States, viz. Slovakia, Finland, and Hungary have
a higher share of agricultural employment than the level of the EU-25. For instance,
Slovakia, before being accepted as a member in 2004 had a higher share, but since
then its share has become lower than that of the EU-25. In addition, another new
Member State, Hungary, had a higher share except in 2005 − the year following its
acceptance. During the years of transition, a decline of 50 per cent was observed in
the share of agricultural employment of the Czech Republic, Slovakia, Hungary and
Estonia, while the decline in Poland, Slovenia and Latvia was between 10 per cent
and 20 per cent. In contrast, Romania, Lithuania and Bulgaria compared with other
new Member States have experienced a significant increase. Apart from the countries
66
that were in the enlargement in 2004, Finland (joined in 1995) had a slower decrease
until 2002, and then its share went down dramatically starting from 2003 and came
below the level of EU-25. In other words, the CAP reform in 2003 negatively
affected Finland. In addition, only eight countries, viz. Bulgaria and Romania (both
joined in 2007), Slovenia, Latvia, Lithuania and Poland (all joined in 2004), and two
old Member States − Greece and Portugal − had a higher share of agricultural
employment than the level of the EU-27, which is already higher than the EU-15 and
the EU-25. A decrease in agricultural employment is an expected result of today’s
labour market but, in recent years, five countries, viz. Belgium, France, Italy, Austria
and Slovenia, had an increasing trend.
Between the years 1995 and 1998, the share of agricultural employment in the total
employment of many countries had an increasing trend, while from 1998 to 2006 the
share of the majority of the Member States had a decreasing trend. Among the
Member States, Greece – which joined the union in 1973 – with the highest
agricultural employment rate in 1995 and 1996 has differed significantly from the
other Member States. On the other hand, the enlargements after 2000 provided an
increase in numbers as the figures for Romania were included in the figures of the
EU, even though the country was still in the transition period. The share of
agricultural employment of Romania has differed from the others ranging between
30 and 50 per cent between the years 1995 and 2006. The share of agricultural
employment of each Member State, excluding Romania, does not exceed more than
20 per cent. The distribution of the share of agricultural employment of the Member
States was relatively balanced (Figure 3.1). The accession of the Eastern bloc
countries and later Romania and Bulgaria has disturbed the balanced distribution of
the share of agricultural employment in the EU. The distribution of the agricultural
employment of countries – excluding Romania – had the widest range in 1999 and
2002 ranging from 1.55 to 19.99 per cent and from 1.39 to 19.20 per cent,
respectively. In recent years, however, this wide range between countries has
narrowed as countries have become closer to each other, although Romania has still
remained the exception.
The changing trends and the different patterns of the European countries discussed
above show the differences in the importance and the significance of agricultural
employment in the labour market for each country. Nevertheless, despite different
67
patterns, due to the universally changing trends, the similarities can also be seen over
time. For instance, the founders of the EU and the early Member States, viz. the
Netherlands, Belgium, Sweden, Germany, Luxembourg, the UK and Denmark, have
converged towards each other in terms of agricultural employment, and so have
latecomers Latvia, Lithuania, Poland, Slovenia and Bulgaria, and early Member
States Portugal and Greece. In other words, Northern European countries and
Western European countries are following similar trends, and so are Southern and
Eastern European countries. Although the importance of agriculture for the
sustainability and self-sufficiency of a country is an obvious and absolute reality, the
changing trends in the sector, innovation, and the challenging competitiveness have
started to change the nature of traditional productivity and labour demand. Therefore,
rural employment will search for new ways of improvement. The structure of
employment is heavily dependent on self-employment in rural areas, and the next
section focuses the on changes and trends in rural self-employment in Europe.
3.2.2 Changes in rural self-employment
The dependence of rural employment on self-employment and the creative
destruction effect of self-employment (‘entrepreneurship’) point to the stimulation of
entrepreneurship as the main tool to obtain development in rural areas.
Entrepreneurship as such a development tool is usually associated with sectors other
than agriculture, such as tourism and manufacturing. But in rural areas, most of the
self-employment is still in the agricultural sector. Therefore, in this section, we
evaluate agricultural self-employment, not at a micro- but at a macro-level due to the
lack of data.
The share of agricultural self-employment in total employment shows clearly that the
agriculture sector is not an attractive sector for entrepreneurs in the EU (Table 3.2).
This share is very low and decreasing over time. The enlargements of the EU in the
last few years have led the share of agricultural self-employment to increase in terms
of numbers. Indeed, the diversity within the EU countries also exists in terms of the
share of agricultural self-employment in total employment. Within the Member
States, Greece, Portugal, Lithuania, Poland and Romania have remarkable shares
which are three times more than the level of the EU-27 (Table 3.2).

68
As exceptions to the decreasing trend of overall agricultural self-employment in the
EU, there are five Member States which have showed an increasing trend in the last
years. For instance, Luxembourg had a fluctuating trend between the 1995 and 2006
that ended with a rise in 2006, reaching the same level of the year 2004 (Table 3.2).
The other Member States, Sweden, France, Slovenia and Latvia, had an increasing
trend in 2006. Among Central Eastern European countries, Slovakia, Czech
Republic, Hungary, and Estonia had a low share. Although the share of agricultural
self-employment in these countries has increased over time (especially in their
accession year), their agricultural self-employment has still been close to the low rate
of the EU’s early Member States.
1995 1996 1997 1998 1999 2000 2001 2002 2003 2004 2005 2006 Slovakia 0.004 0.004 0.004 0.004 0.005 0.004 0.006 0.006 0.007 United Kingdom 0.010 0.010 0.009 0.009 0.008 0.007 0.007 0.006 0.006 0.007 0.007 0.007 Czech Republic 0.007 0.008 0.008 0.009 0.008 0.007 0.008 0.008 0.007 0.007 Germany 0.010 0.009 0.009 0.009 0.009 0.009 0.009 0.008 0.008 0.008 0.008 0.007 Belgium 0.017 0.018 0.016 0.014 0.013 0.011 0.008 0.009 0.010 0.013 0.012 0.012 Luxembourg 0.022 0.015 0.013 0.018 0.013 0.016 0.009 0.013 0.018 0.013 0.012 0.013 Malta 0.011 0.011 0.013 0.013 0.014 Sweden 0.021 0.019 0.019 0.019 0.020 0.017 0.015 0.014 0.015 0.014 0.012 0.012 Netherlands 0.020 0.019 0.019 0.016 0.015 0.014 0.013 0.013 0.014 0.015 0.014 0.014 Denmark 0.018 0.016 0.016 0.017 0.013 0.017 0.016 0.014 0.016 0.015 0.013 0.012 Hungary 0.035 0.032 0.028 0.029 0.026 0.023 0.022 0.016 0.018 0.016 0.015 Estonia 0.018 0.022 0.020 0.020 0.019 0.019 0.017 0.019 0.016 0.012 EU-15 0.027 0.026 0.026 0.024 0.023 0.022 0.022 0.021 0.022 0.020 0.019 0.019 Italy 0.032 0.030 0.030 0.028 0.027 0.025 0.024 0.023 0.022 0.021 0.019 0.019 France 0.028 0.026 0.026 0.025 0.024 0.022 0.022 0.023 0.026 0.022 0.022 0.023 Spain 0.046 0.044 0.040 0.038 0.035 0.032 0.031 0.028 0.025 0.024 0.022 0.020 Cyprus 0.028 0.029 0.025 0.027 0.026 0.025 0.023 0.019 EU-25 0.031 0.030 0.030 0.029 0.027 0.026 0.025 Finland 0.053 0.052 0.051 0.050 0.041 0.039 0.038 0.037 0.035 0.031 0.030 0.029 Slovenia 0.046 0.046 0.047 0.045 0.038 0.040 0.042 0.032 0.031 0.033 0.039 Austria 0.043 0.043 0.042 0.041 0.038 0.037 0.036 0.034 0.033 0.033 0.035 0.034 EU-27 0.041 0.041 0.038 0.037 0.034 0.033 0.031 Latvia 0.079 0.063 0.057 0.046 0.045 0.046 0.041 0.038 0.045 Ireland 0.088 0.083 0.079 0.067 0.063 0.059 0.053 0.052 0.048 0.049 0.045 0.043 Bulgaria 0.072 0.049 0.054 0.060 0.055 0.043 0.039 Greece 0.117 0.118 0.117 0.105 0.109 0.110 0.106 0.102 0.101 0.085 0.084 0.081 Portugal 0.089 0.094 0.105 0.099 0.095 0.087 0.096 0.097 0.101 0.094 0.093 0.092 Lithuania 0.090 0.108 0.119 0.109 0.112 0.109 0.100 0.080 0.064 Poland 0.127 0.130 0.130 0.118 0.114 0.111 0.104 Turkey 0.159 0.151 0.158 0.156 0.145 0.150 0.158 0.148 0.148 0.144 0.135 0.129 Romania 0.192 0.199 0.208 0.219 0.219 0.205 0.196 0.163 0.168 0.158
Compared with the distribution of the agricultural employment, the distribution of
agricultural self-employment among countries is more varied. The highest level of
diversity within countries can be seen in the years 2000 and 2001. The share of
agricultural self-employment in total employment increased in 1996, while from
1997 to 2003, it decreased. In 2003, however, the share increased in some countries
with the positive impact of the CAP reform. The decreasing trend between 1997 and
2003 did not change until 2006. The EU Member States have converged in terms of
Table 3.2: The share of agricultural self-employment in total employment in the EU.
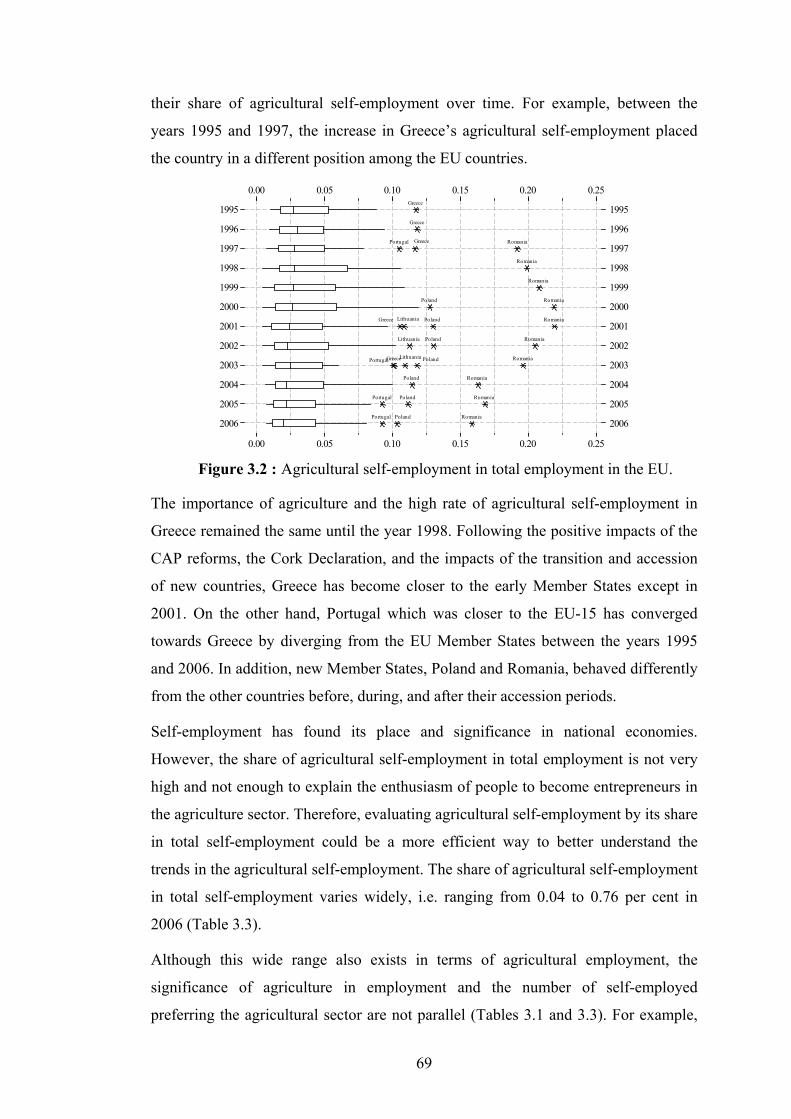
69
their share of agricultural self-employment over time. For example, between the
years 1995 and 1997, the increase in Greece’s agricultural self-employment placed
the country in a different position among the EU countries.
2006
2005
2004
2003
2002
2001
2000
1999
1998
1997
1996
1995
2006
2005
2004
2003
2002
2001
2000
1999
1998
1997
1996
1995
0.250.200.150.100.050.00
0.250.200.150.100.050.00
Greece
Greece
RomaniaPortugal Poland
RomaniaPortugal Poland
RomaniaPortugal Greece
Romania
Romania
RomaniaPoland
RomaniaPolandLithuaniaGreece
RomaniaPolandLithuania
RomaniaPortugal PolandLithuaniaGreece
RomaniaPoland
Figure 3.2 : Agricultural self-employment in total employment in the EU.
The importance of agriculture and the high rate of agricultural self-employment in
Greece remained the same until the year 1998. Following the positive impacts of the
CAP reforms, the Cork Declaration, and the impacts of the transition and accession
of new countries, Greece has become closer to the early Member States except in
2001. On the other hand, Portugal which was closer to the EU-15 has converged
towards Greece by diverging from the EU Member States between the years 1995
and 2006. In addition, new Member States, Poland and Romania, behaved differently
from the other countries before, during, and after their accession periods.
Self-employment has found its place and significance in national economies.
However, the share of agricultural self-employment in total employment is not very
high and not enough to explain the enthusiasm of people to become entrepreneurs in
the agriculture sector. Therefore, evaluating agricultural self-employment by its share
in total self-employment could be a more efficient way to better understand the
trends in the agricultural self-employment. The share of agricultural self-employment
in total self-employment varies widely, i.e. ranging from 0.04 to 0.76 per cent in
2006 (Table 3.3).
Although this wide range also exists in terms of agricultural employment, the
significance of agriculture in employment and the number of self-employed
preferring the agricultural sector are not parallel (Tables 3.1 and 3.3). For example,

70
Ireland, which has an average, even low, significance of agriculture in terms of
employment, has a high level of self-employment. On the other hand, countries like
Poland, Romania and Latvia have the highest share both in terms of self-employment
and employment in agriculture. Of the 27 Member States, only 12 countries
exceeded the average for the EU-27 (Table 3.3).
1995 1996 1997 1998 1999 2000 2001 2002 2003 2004 2005 2006 Czech Republic 0.062 0.060 0.056 0.060 0.056 0.048 0.048 0.050 0.046 0.043 United Kingdom 0.080 0.076 0.075 0.070 0.062 0.057 0.055 0.053 0.051 0.052 0.054 0.051 Slovakia 0.054 0.056 0.049 0.050 0.053 0.038 0.050 0.051 0.053 Germany 0.106 0.095 0.092 0.088 0.090 0.085 0.088 0.084 0.079 0.075 0.070 0.066 Italy 0.110 0.102 0.102 0.097 0.093 0.081 0.077 0.076 Belgium 0.108 0.114 0.110 0.090 0.086 0.075 0.059 0.064 0.073 0.096 0.088 0.087 Malta 0.087 0.090 0.088 0.093 0.097 Cyprus 0.131 0.137 0.124 0.134 0.129 0.124 0.114 0.096 Hungary 0.178 0.167 0.170 0.128 0.127 0.122 0.126 Netherlands 0.175 0.171 0.164 0.153 0.141 0.133 0.124 0.115 0.124 0.127 0.119 0.113 Spain 0.215 0.205 0.192 0.189 0.181 0.176 0.169 0.163 0.151 0.143 0.132 0.118 Sweden 0.176 0.166 0.173 0.170 0.178 0.158 0.146 0.141 0.151 0.139 0.117 0.119 EU-15 0.179 0.174 0.173 0.166 0.160 0.155 0.154 0.151 0.151 0.136 0.132 0.128 Denmark 0.213 0.188 0.190 0.201 0.156 0.202 0.203 0.174 0.185 0.190 0.159 0.145 Estonia 0.277 0.245 0.253 0.291 0.297 0.211 0.202 0.201 0.152 EU-25 0.207 0.206 0.201 0.193 0.179 0.174 0.167 Luxembourg 0.153 0.207 0.149 0.180 0.129 0.174 0.229 0.169 0.160 0.174 EU-27 0.269 0.265 0.253 0.242 0.219 0.213 0.205 France 0.220 0.226 0.234 0.257 0.225 0.226 0.225 Finland 0.372 0.347 0.352 0.354 0.314 0.301 0.306 0.301 0.285 0.258 0.247 0.236 Ireland 0.406 0.353 0.347 0.330 0.307 0.306 0.289 0.286 0.276 0.269 Greece 0.346 0.350 0.350 0.326 0.339 0.340 0.336 0.326 0.327 0.279 0.279 0.272 Austria 0.395 0.389 0.370 0.352 0.340 0.328 0.314 0.302 0.279 0.296 0.284 Bulgaria 0.493 0.358 0.405 0.436 0.405 0.345 0.328 Slovenia 0.366 0.384 0.377 0.354 0.337 0.339 0.356 0.322 0.309 0.328 0.340 Portugal 0.343 0.351 0.391 0.383 0.381 0.370 0.377 0.378 0.393 0.383 0.385 0.397 Turkey 0.530 0.520 0.530 0.530 0.500 0.500 0.520 0.660 0.500 0.490 0.450 0.440 Latvia 0.668 0.565 0.530 0.444 0.492 0.478 0.410 0.405 0.447 Lithuania 0.566 0.663 0.713 0.649 0.655 0.638 0.632 0.568 0.478 Poland 0.564 0.578 0.577 0.545 0.540 0.543 0.521 Romania 0.858 0.859 0.871 0.863 0.853 0.838 0.835 0.802 0.781 0.764
Furthermore, agricultural self-employment as a share of total self-employment has
gone down over time. However, Slovakia, Hungary, Sweden, Luxembourg, Slovenia,
Portugal, and Latvia show an increasing trend in recent years. This shows that the
EU’s efforts to improve agricultural self-employment were effective in these
countries (Table 3.3).
The number of self-employed persons who have chosen the agricultural sector is
similar among Member States. However Lithuania and Romania again rank higher
within Member States (Figure 3.3). In the case of self-employment, the structure
shows that Member States are more alike than they were in terms of agricultural
employment. In other words, the divergences in this case are less obvious than they
were in agricultural employment. This can be seen as the result of the efforts of the
Table 3.3: The share of agricultural self-employment in total self-employment in theEU.
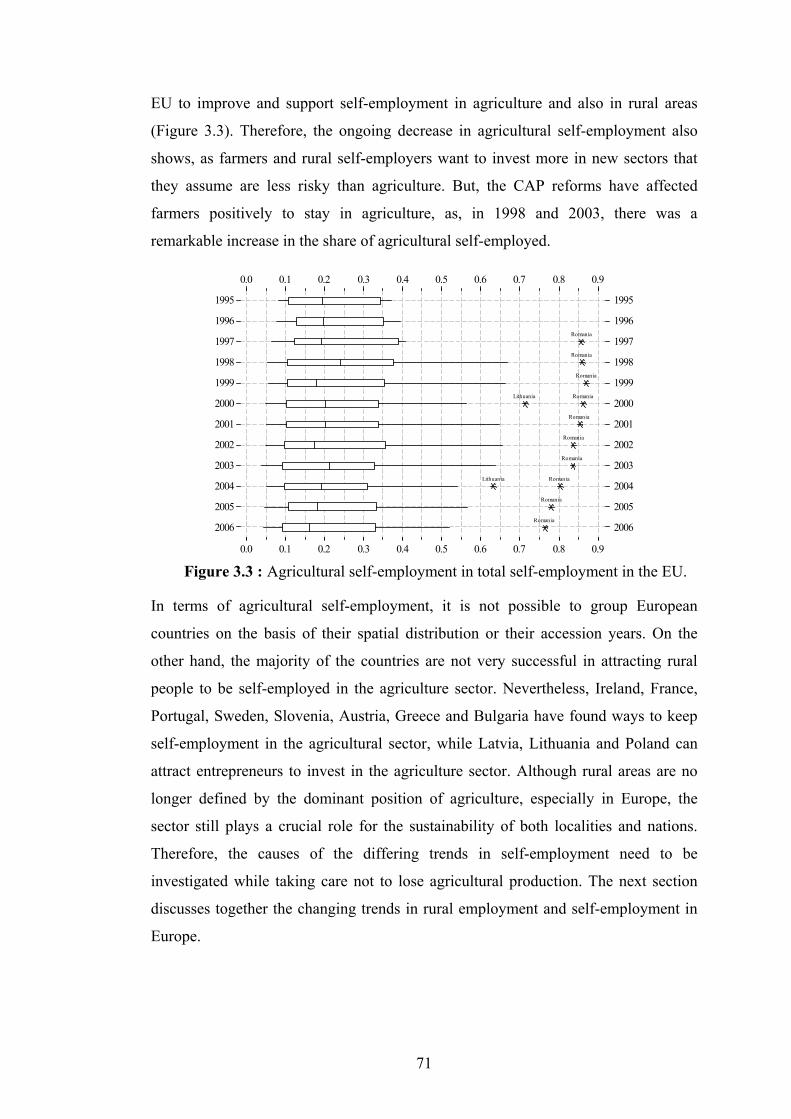
71
EU to improve and support self-employment in agriculture and also in rural areas
(Figure 3.3). Therefore, the ongoing decrease in agricultural self-employment also
shows, as farmers and rural self-employers want to invest more in new sectors that
they assume are less risky than agriculture. But, the CAP reforms have affected
farmers positively to stay in agriculture, as, in 1998 and 2003, there was a
remarkable increase in the share of agricultural self-employed.
2006
2005
2004
2003
2002
2001
2000
1999
1998
1997
1996
1995
2006
2005
2004
2003
2002
2001
2000
1999
1998
1997
1996
1995
0.90.80.70.60.50.40.30.20.10.0
0.90.80.70.60.50.40.30.20.10.0
Romania
Romania
Romania
Romania
Romania
RomaniaLithuania
Romania
Romania
Romania
RomaniaLithuania
Figure 3.3 : Agricultural self-employment in total self-employment in the EU.
In terms of agricultural self-employment, it is not possible to group European
countries on the basis of their spatial distribution or their accession years. On the
other hand, the majority of the countries are not very successful in attracting rural
people to be self-employed in the agriculture sector. Nevertheless, Ireland, France,
Portugal, Sweden, Slovenia, Austria, Greece and Bulgaria have found ways to keep
self-employment in the agricultural sector, while Latvia, Lithuania and Poland can
attract entrepreneurs to invest in the agriculture sector. Although rural areas are no
longer defined by the dominant position of agriculture, especially in Europe, the
sector still plays a crucial role for the sustainability of both localities and nations.
Therefore, the causes of the differing trends in self-employment need to be
investigated while taking care not to lose agricultural production. The next section
discusses together the changing trends in rural employment and self-employment in
Europe.
72
3.2.3 Changing rural Europe
Agriculture has lost its importance in rural areas in terms of its economic weight and
share in employment due to the changes in national and international economies, viz.
technological changes, globalization, liberalization, and localization. Although the
dependence of the rural economy and self-sufficiency on agriculture remains a well-
known reality, the loss of employment especially in agriculture has warned
governments about the need to encourage new job resources for the rural
communities, while keeping the agriculture sector alive. Within the context of these
developments, the EU has attempted to ensure economically-efficient and
environmentally-sustainable agriculture, and to stimulate economic diversification
and the integrated development of rural areas. It is not only globalization or the
changing characteristics of the local economy but also the enlargements of the EU
which have affected rural areas in Europe from many perspectives. Both the
successive enlargements of the EU and the successive CAP reforms have had a
profound impact on the structure of agricultural employment of Member States in
various ways. This chapter has aimed to evaluate rural employment and self-
employment in the EU Member States by means of a study of the agriculture sector.
The results of our explanatory evaluation show that agricultural employment and
self-employment show a slight decrease over time, and that agriculture is still a
significant sector in terms of employment for only a few Member States. Among the
EU Member States, Romania, Bulgaria, Lithuania, Latvia and Poland, and Greece,
can be easily singled out in terms of the importance of agriculture sector for each of
these countries. Countries that have recently joined the EU are quite dissimilar to the
early Member States due to the heavy dependence of their national economy on the
agriculture sector. Driving research at the national level may, however, cause the
problem of losing information, thus misrepresenting the real potential of rural areas.
Therefore, in the following chapters, we focus on the empirical evidence at the
micro-level by means of a meta-analytic approach and its survey results. The next
chapter provides insights about the sample and the survey conducted in Europe.
3.3 Attractive Villages in Europe
The extension of cities reaching far out into rural areas (Vaz et al., 2006), the
changing perception of the quality-of-life, and the increasing importance of locality

73
have together transformed the evaluation of rural areas especially in terms of their
relation with urban areas. Over the years, the one-sided dependency in urban-rural
relationships has turned into a more interdependent relationship. Today, apart from
their physical differences, urban and rural areas are functionally related to each other
(van den Berg et al., 1987) by exchanging diverse flows, i.e. people; goods; services;
capital and assets; waste and pollution; environmental resources; knowledge; and
social norms, such as values, lifestyles, and identities (Davoudi, 2008). Therefore,
small towns and villages, hitherto neglected by the urban-centric and economically-
driven approaches in the early literature (see also, Burnham and Bennett, 1909;
Christaller, 1933; Lösch, 1954; Friedmann, 1966) have now been given increased
attention in many policy documents and academic studies as a part of the complex
system and as the important spatial actors in modern economies (Ache, 2000;
Antikainen, 2005; Gonzales et al., 2006; Davoudi, 2008). From a global perspective,
these changes can be both negative in terms of sustainability and positive from an
economic perspective.
This dual impact has led local authorities and individuals to develop innovative and
creative ideas in order to ensure sustainable rural development at the local level and
to promote rural areas in the global scene. To this end, in this study, we evaluate
European villages which are part of such a creative idea. This Part 3 of the study
focuses on the member villages of the “Associations of the Most Beautiful Villages”
in France, Italy and Belgium, while also including meta-analytic samples. Therefore,
in this chapter in order to describe our sample for the European case studies, we
introduce these Associations, their aims and their membership rules, and explain the
survey process conducted in these villages.
3.3.1 The associations of the most beautiful villages
Sustainability is not only determined by the local ecological quality or the
availability of green spaces but also by a wide array of architectural and cultural
heritage parameters. Contemporary theories are based on the idea that the success of
an area in terms of sustainability depends on quality-of-life issues, creativity,
diversity of lifestyle and local decisions, in tandem with regenerating the existing
locality in all areas. Therefore, sustainable development aims to achieve the optimum
use of local resources, while obtaining and maintaining strong local and external

74
relations (‘social capital’). On this basis, rural areas, which, more than urban areas,
can offer quality of life and beautiful landscapes, with their diversified uniqueness
and preserved resources, play a crucial role in achieving sustainability and
competitiveness in the complex economic system.
It is especially those rural settlements with more local, traditional and natural values,
which are being developed in an uncontrolled way because of the lack of
administrative restrictions, that are most in need of creative ideas in order to control
and decide simultaneously about the discontinuity or sustainability of their increasing
attractiveness and the cultural heritage in the surrounding rural areas. Creative
practices are usually seen as related to the tourism sector. From the perspective of
visitors and newcomers, and also from the perspective of the local population, these
ideas have contributed to the protection and promotion of the locality, particularly its
cultural heritage and traditions, while obtaining sustainable economic development
by diversifying economic activities. One of the successful examples of such creative
practices is the foundation of the “Association of the Most Beautiful Villages of
France”, known as “L’Association des Plus Beaux Villages de France”, which
inspired first Belgium and later on Italy in Europe. The existing studies on these
Associations, i.e. Bousuet (2003) and Rieucau (2007), treated them as tourism
actions in which social capital was obtained by tourism and leisure activities. In
contrast, the past and present aims of the Associations are not only to promote
tourism but also to obtain and stimulate sustainable development – in particular with
respect to cultural heritage and the quality of life – of villages by creating economic
diversity.
With the aim of controlling changes in rural areas, publicizing them, and
transforming their localities into a trademark in the global market, in 1982, Charles
Ceyrac, the mayor of the French village Collognes-la-Rouge, decided to bring
together villages in his country, and to this end he established the Association of the
Most Beautiful Villages of France with the collaboration of 18 mayors. Ceyrac’s idea
to form a creative group of similar villages in different regions of the country in
order to improve their quality, build their reputation, and control their development
inspired municipalities and individuals from a number of other countries, i.e.
Belgium, Italy, Canada and Japan (Norman, 2006; MBVF, 2008a;b; MBVI, 2008;
MBVQ, 2008; MBVW, 2008). Although each of these organizations applied the
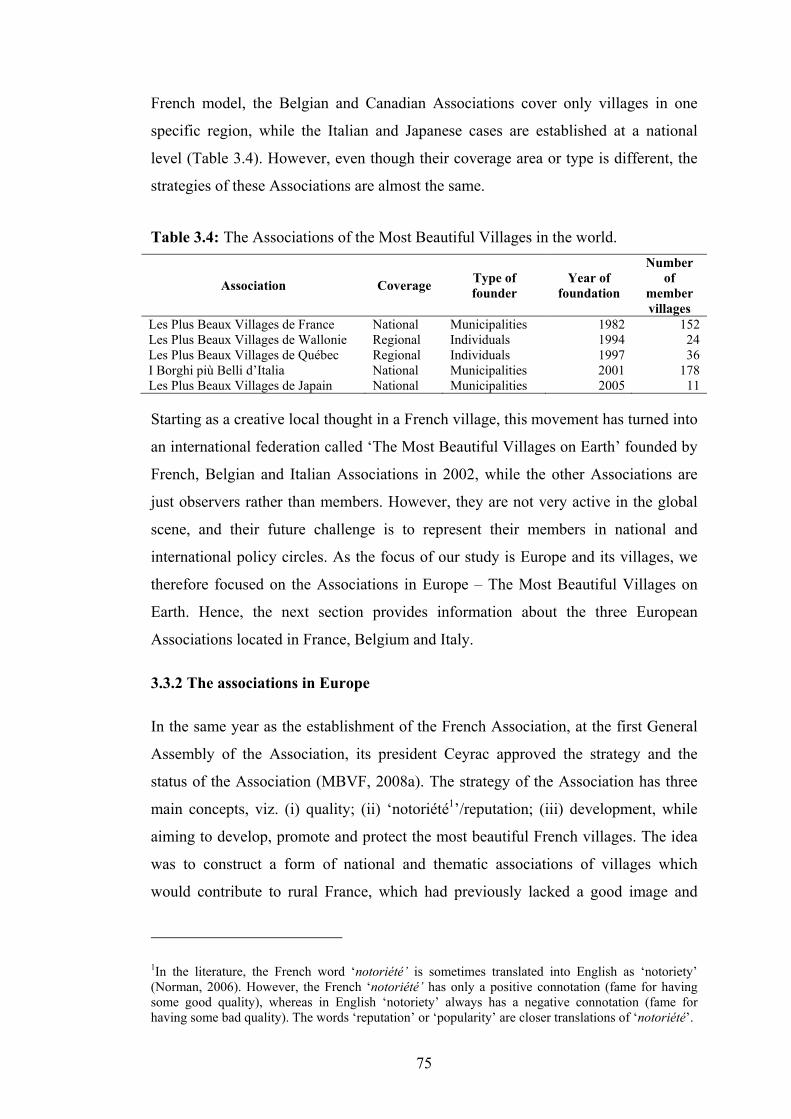
75
French model, the Belgian and Canadian Associations cover only villages in one
specific region, while the Italian and Japanese cases are established at a national
level (Table 3.4). However, even though their coverage area or type is different, the
strategies of these Associations are almost the same.
Association Coverage Type of founder
Year of foundation
Number of
member villages
Les Plus Beaux Villages de France National Municipalities 1982 152 Les Plus Beaux Villages de Wallonie Regional Individuals 1994 24 Les Plus Beaux Villages de Québec Regional Individuals 1997 36 I Borghi più Belli d’Italia National Municipalities 2001 178 Les Plus Beaux Villages de Japain National Municipalities 2005 11
Starting as a creative local thought in a French village, this movement has turned into
an international federation called ‘The Most Beautiful Villages on Earth’ founded by
French, Belgian and Italian Associations in 2002, while the other Associations are
just observers rather than members. However, they are not very active in the global
scene, and their future challenge is to represent their members in national and
international policy circles. As the focus of our study is Europe and its villages, we
therefore focused on the Associations in Europe – The Most Beautiful Villages on
Earth. Hence, the next section provides information about the three European
Associations located in France, Belgium and Italy.
3.3.2 The associations in Europe
In the same year as the establishment of the French Association, at the first General
Assembly of the Association, its president Ceyrac approved the strategy and the
status of the Association (MBVF, 2008a). The strategy of the Association has three
main concepts, viz. (i) quality; (ii) ‘notoriété1’/reputation; (iii) development, while
aiming to develop, promote and protect the most beautiful French villages. The idea
was to construct a form of national and thematic associations of villages which
would contribute to rural France, which had previously lacked a good image and
1In the literature, the French word ‘notoriété’ is sometimes translated into English as ‘notoriety’ (Norman, 2006). However, the French ‘notoriété’ has only a positive connotation (fame for having some good quality), whereas in English ‘notoriety’ always has a negative connotation (fame for having some bad quality). The words ‘reputation’ or ‘popularity’ are closer translations of ‘notoriété’.
Table 3.4: The Associations of the Most Beautiful Villages in the world.
76
were not identified correctly by the consumers. In order to achieve this aim and to
fulfil this strategy, the Association follows a strict and selective membership process.
Villages with a rural character, at least one registered monuments or sites, and the
approval of the town council may apply for membership, but this depends on their
meeting the criteria defined by the quality chart of the Association. If a village
satisfies the quality chart, its mayor will become the active member. Besides villages,
there are two other types of member: the honorary members, who are the founder
mayors; and associate members, which are the partner enterprises that provide
technical and financial support for the realization of the strategy of the Association.
Usually this organization invites the individual villages to put themselves forward as
candidates for membership, but some villages apply on their own initiative.
The Belgian Association ‘The Most Beautiful Villages of Wallonia’ came into being
in 1994, on the initiative of Alain Collin, of Chardeneux (Nap-Leuze), when the
touristic attractions of the Province of Namur were being exploited inspired by the
experience of the French Association (MBVW, 2009). This Belgian Association,
having similar objectives, succeeded in heading a network of 24 approved villages in
the Wallonia region. Since its establishment, the Association has been diffusing,
through a mosaic of villages with character and wonderful surrounding landscapes,
the image of a rural Wallonia that is to be preserved and developed by promoting
projects and activities that are as diversified as they are innovative, with the help of
the inhabitants of the member villages, the public authorities, and the local
Associations.
The most similar Association to the French model, the Association of the Most
Beautiful Villages in Italy, was founded in May 2001 by the leadership of the
Tourism Council of the National Association of Italian Municipalities (ANCI) in
order to promote the cultural heritage of history, art, culture, environment and
traditions in small Italian towns which are for the most part cut off from the flow of
visitors and tourists. Small villages in Italy risk depopulation and a consequent
decline caused by the marginalization of economic interests, and are gravitating
towards tourism and commercial activities (MBVI, 2008). Thus, the Association was
established to bring together administrators who are sensitive to the protection and
promotion of their villages, and who believe, and will participate actively, in the
activities of the Association (MBVI, 2008). Similar to the French model, the

77
membership process of the Italian Association is also a rigorous procedure, during
which villages are carefully screened by a committee in terms of their architectural
harmony, quality of buildings and quality-of-life, including the activities and services
provided for their inhabitants. Membership is not guaranteed. In fact, membership is
a reciprocal commitment between villages which show their determination to
increase the quality of their villages through concrete actions and practices and the
Association which guarantees the preservation of the heritage of monuments and
traditions. The Association ensures that they are not excluded from desirable
development and modernization, and represents and introduces villages and their
dynamics of locality in the global arena.
The Italian Association considers villages as hidden and less-known places which
represent best the history and locality of the country. According to the Association,
although there are a large number of books and a great deal of information about the
beauty of villages, the local inhabitants are the best people to describe their villages
rather than the outsiders who propose and discover the beauty of a village. So, the
Association simply tries to sell the village to the tourist and visitors, while at the
same time improving the overall quality of life in the villages to ensure that both
tourists and the people who live in their villages will be the beneficiaries. The goal of
the Association is to create an alternative to places which are anonymous and alike
everywhere, and an alternative lifestyle.
All these Associations in Europe based on the French model have been united as a
federation under the name of The Most Beautiful Villages on Earth. This federation
aims to be recognized by the EU as a player in the enhancement and protection of
rural capital. The next section, explains how we contacted these villages to conduct
our survey while giving prefatory remarks on the empirical evidence obtained as a
result of these surveys.
3.3.3 Achieving European beauty: survey of European villages
The villages approved as members of The Associations of The Most Beautiful
Villages are the subject of our research. Our survey is structured on the basis of two
extensive survey questionnaires, viz. a questionnaire for the Associations and a
questionnaire for the villages filled out by the relevant experts (Appendix B). The
survey began in June 2008 by sending emails to the Associations through their

78
websites asking them: (1) to fill out the questionnaire for the Associations with the
help of the responsible person from their organization; (2) to send the questionnaire
for the village with an invitation letter to their members directly, or (3) to provide the
contact details of the responsible person from their member villages.
The French Association immediately replied to our email, while the Italian
Association replied late as it was delayed by its General Assembly, and the Belgian
Association did not reply at all to our emails. In addition, only the Italian Association
helped with sending the questionnaire to its members. To reach the villages was not
easy, even though we conducted our survey in French and Italian in order to avoid
any language problems. In other words, the questionnaire and the emailing process
were done in the mother tongue of the Associations. For the French case, via the
website of the Association, we reached 81 French villages out of 152 members, while
in the Italian case; we were able to reach 113 members out of 178 villages. The
hardest case concerned the Belgian Association: the different structure and limited
profile of the Belgian Association caused difficulties in collecting data. Thus, we
were able to reach only 10 members (Table 3.5).
The survey was generated in three rounds and ended in August 2008. In the first
round, we sent the questionnaire to the villages to answer in three weeks’ time. As a
result 10 villages from the French Association and 22 villages from the Italian
Association replied by fax, email, or mail (Table 3.5). Thus, at the end of the first
round we obtained 32 questionnaires. For the second round, we re-sent our
questionnaire with a reminder giving two additional weeks, and we obtained 6 and
11 additional replies from the French and Italian Associations, respectively, and 2
responses from the Belgian Association. The third round was initiated spontaneously
by the villages themselves, and we received replies from 8 villages from the French
Association and 1 village from the Italian Association, even though they had gone
past the closing date to reply. In addition, we also conducted a questionnaire for the
Associations followed by a call for interview to the Associations in France and Italy
and also obtained useful documentation from the villages and Associations, which
benefitted our research and evaluations. As there were only two Associations which
filled in the questionnaire for the Association, we do not provide either the form or
its data in this study. Nevertheless, we use these two questionnaires as insights for
our evaluations.
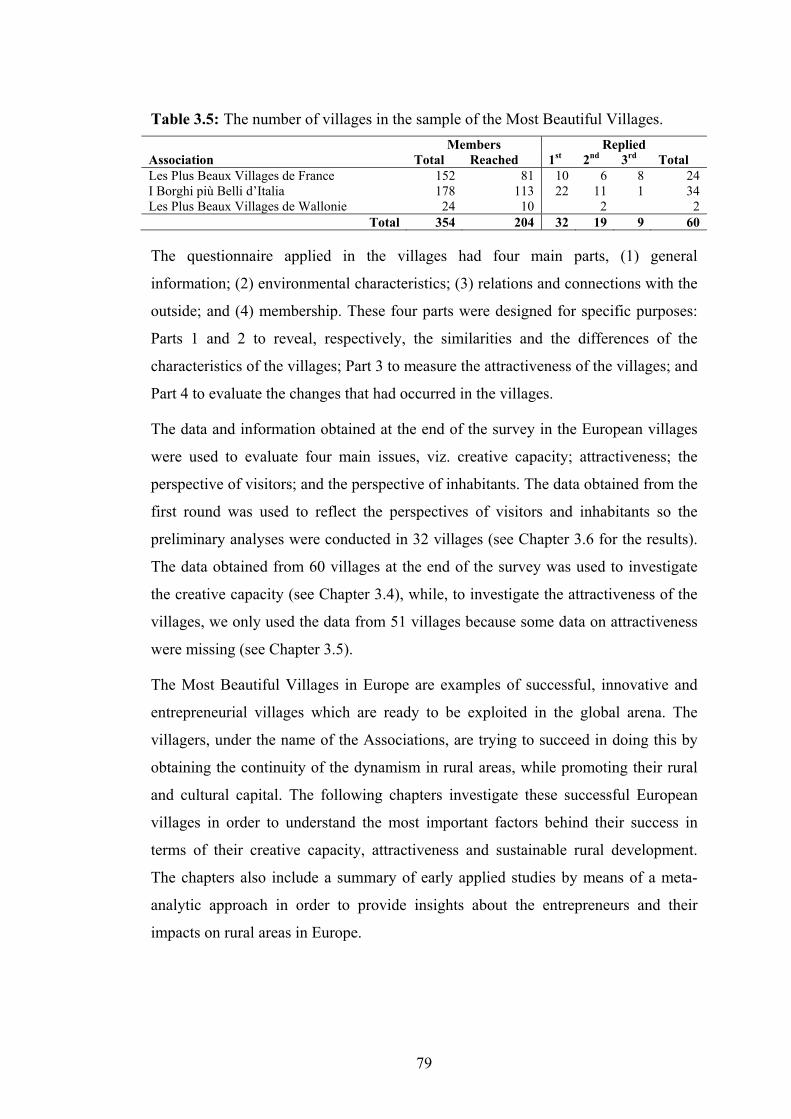
79
Association Members Replied
Total Reached 1st 2nd 3rd Total Les Plus Beaux Villages de France 152 81 10 6 8 24 I Borghi più Belli d’Italia 178 113 22 11 1 34 Les Plus Beaux Villages de Wallonie 24 10 2 2
Total 354 204 32 19 9 60
The questionnaire applied in the villages had four main parts, (1) general
information; (2) environmental characteristics; (3) relations and connections with the
outside; and (4) membership. These four parts were designed for specific purposes:
Parts 1 and 2 to reveal, respectively, the similarities and the differences of the
characteristics of the villages; Part 3 to measure the attractiveness of the villages; and
Part 4 to evaluate the changes that had occurred in the villages.
The data and information obtained at the end of the survey in the European villages
were used to evaluate four main issues, viz. creative capacity; attractiveness; the
perspective of visitors; and the perspective of inhabitants. The data obtained from the
first round was used to reflect the perspectives of visitors and inhabitants so the
preliminary analyses were conducted in 32 villages (see Chapter 3.6 for the results).
The data obtained from 60 villages at the end of the survey was used to investigate
the creative capacity (see Chapter 3.4), while, to investigate the attractiveness of the
villages, we only used the data from 51 villages because some data on attractiveness
were missing (see Chapter 3.5).
The Most Beautiful Villages in Europe are examples of successful, innovative and
entrepreneurial villages which are ready to be exploited in the global arena. The
villagers, under the name of the Associations, are trying to succeed in doing this by
obtaining the continuity of the dynamism in rural areas, while promoting their rural
and cultural capital. The following chapters investigate these successful European
villages in order to understand the most important factors behind their success in
terms of their creative capacity, attractiveness and sustainable rural development.
The chapters also include a summary of early applied studies by means of a meta-
analytic approach in order to provide insights about the entrepreneurs and their
impacts on rural areas in Europe.
Table 3.5: The number of villages in the sample of the Most Beautiful Villages.
80
3.4 Rural Areas and Their Capacity
Rural areas used to be isolated, traditional and less-developed regions in a country,
and were usually seen as the opposite of, and dependent on, urban areas (Jacobs,
1969). But, in our modern age, they have enjoyed the benefits of the ICT era and can
be distinguished less than in the past from urban areas and cities, with the exception
of their demographic and natural characteristics (Gülümser et al., 2009b). In urban
regions, the structure of life is usually based on the pursuit of jobs and opportunities,
but in rural regions the pursuit of quality of life, lifestyles, and the wishes of the
population come before jobs (Vias, 1999; Malecki, 2003; Labrianidis and
Kalogeresis, 2006). From being traditional sources of socio-economic concern, many
towns and villages have become high-potential areas where a good quality of life can
be combined with creative and often flourishing economic activities. On this basis, in
this chapter, we investigate the creative capacity and the increasing attractiveness of
rural areas on the basis of the empirical findings of the investigations in selected
villages.
3.4.1 Rural creative capacity in the European villages
Rural regions are quite different from urban regions in terms of their socio-economic
structures. Although creativity theories focus on urban regions by
misrepresenting/underestimating creativity in rural regions, rural regions show an
increasing trend to attract the creative class. This attraction is not obtained by
technology, availability of infrastructures or job opportunities, but rather by the
quality of life and locality characteristics of rural regions (Gülümser et al., 2009d).
Because of the demographic changes in rural areas, socio-economic transformations
can be sometimes problematic, sometimes successful. But these areas have certainly
become more dynamic by having various intervening opportunities. Therefore, these
transformations are also changing the position of rural areas in the global market and
competitive arena.
Rural regions have entered the arena of global competition by their sustainable and
endogenous development efforts. Both types of development aim to promote locality
features in the global arena mainly by the stimulation of entrepreneurial and R&D
activities. The five components of creative capacity: knowledge, innovation,
creativity, entrepreneurship, and networks, are seen as the real engine of economic
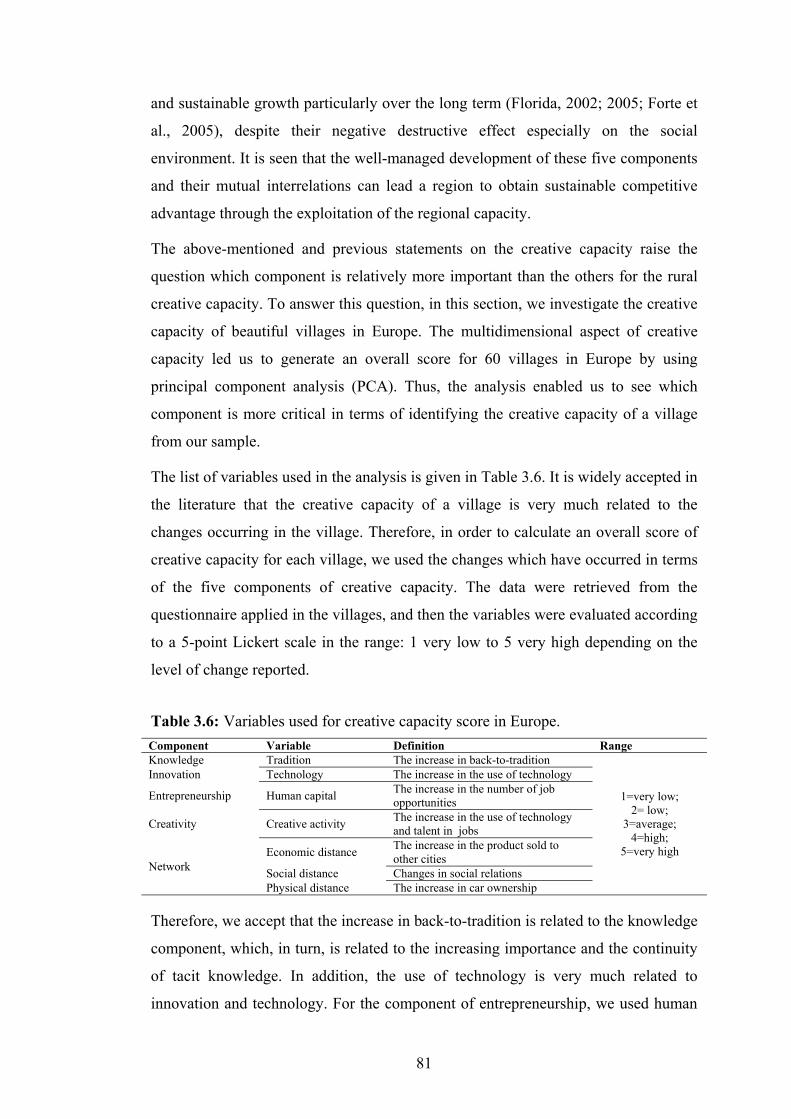
81
and sustainable growth particularly over the long term (Florida, 2002; 2005; Forte et
al., 2005), despite their negative destructive effect especially on the social
environment. It is seen that the well-managed development of these five components
and their mutual interrelations can lead a region to obtain sustainable competitive
advantage through the exploitation of the regional capacity.
The above-mentioned and previous statements on the creative capacity raise the
question which component is relatively more important than the others for the rural
creative capacity. To answer this question, in this section, we investigate the creative
capacity of beautiful villages in Europe. The multidimensional aspect of creative
capacity led us to generate an overall score for 60 villages in Europe by using
principal component analysis (PCA). Thus, the analysis enabled us to see which
component is more critical in terms of identifying the creative capacity of a village
from our sample.
The list of variables used in the analysis is given in Table 3.6. It is widely accepted in
the literature that the creative capacity of a village is very much related to the
changes occurring in the village. Therefore, in order to calculate an overall score of
creative capacity for each village, we used the changes which have occurred in terms
of the five components of creative capacity. The data were retrieved from the
questionnaire applied in the villages, and then the variables were evaluated according
to a 5-point Lickert scale in the range: 1 very low to 5 very high depending on the
level of change reported.
Component Variable Definition Range Knowledge Tradition The increase in back-to-tradition
1=very low; 2= low;
3=average; 4=high;
5=very high
Innovation Technology The increase in the use of technology
Entrepreneurship Human capital The increase in the number of job opportunities
Creativity Creative activity The increase in the use of technology and talent in jobs
Network Economic distance The increase in the product sold to
other cities Social distance Changes in social relations Physical distance The increase in car ownership
Therefore, we accept that the increase in back-to-tradition is related to the knowledge
component, which, in turn, is related to the increasing importance and the continuity
of tacit knowledge. In addition, the use of technology is very much related to
innovation and technology. For the component of entrepreneurship, we used human
Table 3.6: Variables used for creative capacity score in Europe.
82
capital, not in the sense of skills, but rather as the creation of job opportunities in
order to be able to include opportunities to create human capital accumulation in the
village. The creativity component in the literature is usually equivalent to R&D
activities or patents. But we also mentioned in Chapter 2.1 that in the countryside
most people do not register their innovative products, and also the R&D activities by
excluding local knowledge in their process may not contribute to the rural creative
capacity. Thus, here, we measured the creativity component as the increase of the
combination of technology and local talent in economic activities. The last
component, network, is a complex component itself, so for this we distinguish three
types of distance, viz. economic, social, and physical, and included in our analysis
each of these variables as a separate variable.
Therefore, we ran our PCA by seven variables for 60 European villages. PCA is a
multi-criteria analytical tool which helps to reduce the number of variables in order
to create a new component. Therefore, with one single score extracted as the result of
the PCA which we call the ‘creative capacity score’, we were able to explain 75 per
cent of the total variance. The factor scores of the 60 villages range between -2.40 to
1.70 (see Table B.1 in Appendix B). This shows that each village is unique in terms
of its creative capacity and its capacity depends on the opportunities it has.
In the application of PCA, we only use the creative capacity score in order to show
how different the capacity of each village can be. Instead of factor scores, we use the
communality of each variable to explain the rural creative capacity and its
components. In other words, we use the loadings of each variable when defining the
complex structure of creative capacity. Therefore, the results show that, in order to
explain the creative capacity of a European village, the main variables are creativity
and innovation (Table 3.7), followed by the social networks inside the village and its
tradition. Moreover, neither economic distance nor physical distance is as important
as the other components.
The results of the analysis show that the rural creative capacity in European villages
depends heavily on technology and its link with tacit knowledge. Furthermore, the
rural aspect remains intrinsically rural, with the capacity of the area reflecting its
rural uniqueness, i.e. social characteristics and traditions which are also relatively
important components of rural creative capacity.

83
According to the results of our field surveys, we can state that rural Europe which
does not suffer very much from problems associated with economic and physical
distance is looking more to provide an innovative milieu while maintaining its
powerful sense of community.
Component of Creative Capacity Variable Communality Creativity Creative Activity 0.94 Innovation Technology 0.94 Network Social Distance 0.89 Knowledge Tradition 0.88 Entrepreneurship Human Capital 0.83 Network Economic Distance 0.78 Network Physical Distance 0.76
The results also show that Chapter 2.1’s argumentative approach to the rural-specific
evaluation of creative capacity does not cause any problems about the essentials of
the creative capacity phenomenon. Thus, the results again suggest that creativity and
innovation are the main factors to estimate creative capacity. This capacity depends
basically the attractiveness capacity of a village, so the next section investigates the
most important attractiveness factors of the most beautiful villages in Europe.
3.4.2 Attractiveness capacity of European villages
The attractiveness of rural areas is very much associated with their creative capacity,
depending on the openness of the inhabitants and the use of technology in the village,
as well as on the locality, promotion, cultural heritage, and the quality of life in the
settlement.
In recent years, the maintenance and revitalization of locality have attracted much
attention as the critical success factors necessary to obtain sustainable economic
development in our modern age. The dynamics of localities, i.e. cultural heritage, the
social and physical environment, and economic opportunities, are related to the
image and identity of an area. From an economic perspective, the relationship
between locality and economic development is represented by the tourism sector, but
the attractive image of an area shapes the vision not only of tourists but also of the
people who live and invest in the area (Forte et al., 2005).
It is increasingly recognized that a mobile society incurs high social costs and
generates a variety of negative externalities, including traffic congestion, accidents
Table 3.7: Communality of components in the creative capacity score.

84
and fatalities, pollution and noise nuisance, destruction of visual landscape beauty,
waste in the use of resources, raw materials and energy, and so forth (van
Geenhuizen et al., 2002). This new awareness and the influence of the mobile society
have prompted a discussion on the future continuity and discontinuity of rural areas.
The quality of settlements is at stake in many countries. This negative development
has led local authorities and individuals to develop innovative and creative ideas in
order to ensure sustainable development at the local level and to promote it in the
global scene. On this basis, in this section, we discuss the attractiveness of villages in
Europe. The Associations of the Most Beautiful Villages in Europe are the results of
a determination to control the negative development which had occurred in the
villages. We conducted a questionnaire survey in the member villages of these
Associations. Although we received replies from 60 villages, because of missing
data, we were only able to evaluate the attractiveness of 51 villages of the
Associations in France, Italy, and Belgium (see Table B.2 in Appendix B for the data
set). Most data are qualitative in nature and call for a specific statistical treatment.
Therefore, we applied a recently developed artificial intelligence method, Rough Set
Data Analysis (RSDA) (see Appendix A), in order to identify the most important
factors which determine the attractiveness of these rural localities in our sample.
The aim of the questionnaire was to highlight the perception of relevant experts, with
a special focus on three main concerns of the Associations, viz. quality, promotion,
and protection. In Part 1 of the questionnaire, we investigated the perception of the
chief person of the village when describing the village concerned. Even though each
village needs to have at least one registered site (e.g. a monument) to be a member,
not all of them describe themselves as historic sites. Only 94 per cent of the villages
describe themselves as ‘historic’, while 45 per cent describe themselves as ‘villages’,
which are dependent only on nature (Table 3.8).
% # % # Description Promotion
Historic 94 48 Local events 92 47 Dependent on nature 45 23 National Events 41 21
Quality International Events 39 20 Infrastructure 71 36 Outside Product Sell 84 43
Cable TV 71 36 Creativity Phone 90 46 Uniqueness 63 32 Water 100 51 Technology use 90 46
Electricity 100 51 Openness 27 14 Internet 37 19
Table 3.8: Four main factors of attractiveness.
85
In Part 2, we asked questions about the natural, physical and social environment.
Therefore, we focused on another membership criterion, which is to meet the
requirements of the quality chart related to the adequacy of the local infrastructure.
However, although the villages in our sample did satisfy the chart and became
members, 71 per cent claimed that their infrastructure was not adequate (Table 3.8).
This is because, although each house had electricity and water, and 90 per cent had a
phone connection, today’s indispensable urban infrastructures, cable TV and the
Internet, exist in only 71 per cent and 37 per cent of the houses, respectively. Thus,
infrastructure is still a differentiation criterion among villages in Europe.
The description and infrastructure of the villages show that they already have both
cultural heritage and quality. In other words, they are ready to be exposed in the
global scene by having local pull factors. But, these are not yet enough for them to be
actually present in the global scene. They need to have some products which can be
promoted and some level of creative capacity to attract people. The product of the
villages is one of the tools to attract people, and all of the villages have their own
particular product, i.e. cuisine, handicrafts, agricultural products, wine, and
especially their landscape. However, the product itself is not enough if it is not
promoted in the global market. Thus, villages use two types of promotion, viz.
promotion in the village; and promotion outside the village. In the village, they
organize different types of events, i.e. local, national, and international, while in the
outside world the promotion of villages is done by selling the products. 92 per cent
of the villages organize local events, while 41 per cent and 39 per cent of the villages
organize national and international events, respectively. In the outside world, only 84
per cent of the villages sell their products on their own or with the help of the
Association (Table 3.8).
The description, quality, and promotion of the villages have accelerated the number
of visitors. But the most important thing in order to obtain continuity not only of
their attractiveness but also of their locality and rurality depends on the creative
capacity of the villages. The creative capacity of the village is measured here by the
uniqueness of the villages, their use of technology, and the openness of their
inhabitants. 32 of the villages claimed that they have uniqueness, and 90 per cent use
technology, but only 27 per cent said that their inhabitants are open to new ideas
(Table 3.8). It is a well-known reality that villages usually have a defensive localism,
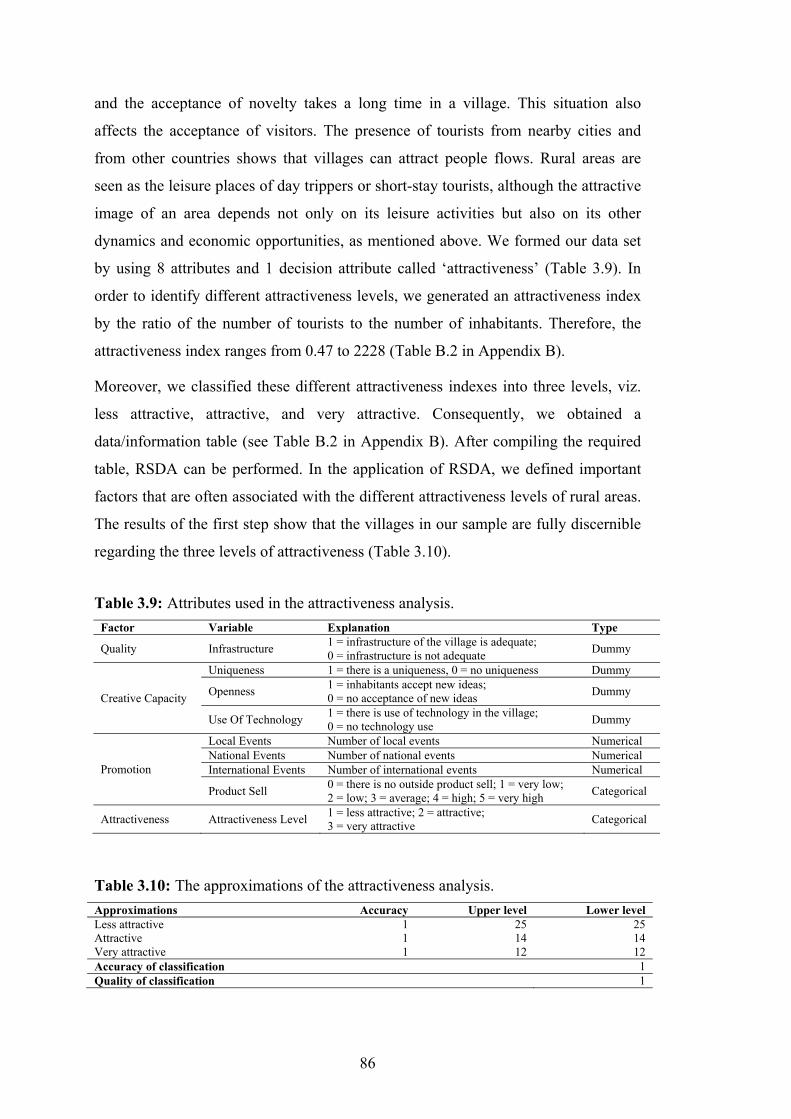
86
and the acceptance of novelty takes a long time in a village. This situation also
affects the acceptance of visitors. The presence of tourists from nearby cities and
from other countries shows that villages can attract people flows. Rural areas are
seen as the leisure places of day trippers or short-stay tourists, although the attractive
image of an area depends not only on its leisure activities but also on its other
dynamics and economic opportunities, as mentioned above. We formed our data set
by using 8 attributes and 1 decision attribute called ‘attractiveness’ (Table 3.9). In
order to identify different attractiveness levels, we generated an attractiveness index
by the ratio of the number of tourists to the number of inhabitants. Therefore, the
attractiveness index ranges from 0.47 to 2228 (Table B.2 in Appendix B).
Moreover, we classified these different attractiveness indexes into three levels, viz.
less attractive, attractive, and very attractive. Consequently, we obtained a
data/information table (see Table B.2 in Appendix B). After compiling the required
table, RSDA can be performed. In the application of RSDA, we defined important
factors that are often associated with the different attractiveness levels of rural areas.
The results of the first step show that the villages in our sample are fully discernible
regarding the three levels of attractiveness (Table 3.10).
Factor Variable Explanation Type
Quality Infrastructure 1 = infrastructure of the village is adequate; 0 = infrastructure is not adequate Dummy
Creative Capacity
Uniqueness 1 = there is a uniqueness, 0 = no uniqueness Dummy
Openness 1 = inhabitants accept new ideas; 0 = no acceptance of new ideas Dummy
Use Of Technology 1 = there is use of technology in the village; 0 = no technology use Dummy
Promotion
Local Events Number of local events Numerical National Events Number of national events Numerical International Events Number of international events Numerical
Product Sell 0 = there is no outside product sell; 1 = very low; 2 = low; 3 = average; 4 = high; 5 = very high Categorical
Attractiveness Attractiveness Level 1 = less attractive; 2 = attractive; 3 = very attractive Categorical
Approximations Accuracy Upper level Lower level Less attractive 1 25 25 Attractive 1 14 14 Very attractive 1 12 12 Accuracy of classification 1 Quality of classification 1
Table 3.9: Attributes used in the attractiveness analysis.
Table 3.10: The approximations of the attractiveness analysis.

87
According to the results, there are four combinations of condition attributes which
determine the variation in the different levels of attractiveness (Table 3.11). In
addition, two condition attributes, viz. local events, and product sell, are the core
elements which are included in each reduct. This shows that the cores are the most
important attributes to determine the different levels of attractiveness, while use of
technology and infrastructure are relatively less important.
Attribute Frequency Reducts # %
Local Events 4 100 {Local Events, Product Sell, Uniqueness, Openness, International Events, Infrastructure};
Product Sell 4 100 {Local Events, Product Sell, Uniqueness, National events, Use of Technology};
Uniqueness 3 75 {Local Events, Product Sell, Uniqueness, National Events, Openness};
National Events 3 75 {Local Events, Product Sell, Openness, International Events, Infrastructure}
Openness 3 75 Core
International Events 2 50
Use of Technology 1 25 Local Events; Product Sell
Infrastructure 1 25
In the RSDA application, we excluded rules which are supported by less than three
cases. Therefore, we have five exact rules which are supported by more than 3 cases
(Table 3.12). According to the rules, 27 per cent of the whole sample belongs to one
of the three levels of attractiveness with certainty (Table 3.12).
Strength # % Less Attractive Rule 1 (National Events=None) (Product Sell=High) (Openness=Close-defensive) 6 24 Rule 2 (Local Events=None) 4 16 Attractive Rule 3 (Product Sell=Low) (Openness=Open) 3 25 Very Attractive Rule 4 (Infrastructure=Adequate) (International Events=None) (Product Sell=Average) 3 21 Rule 5 (Uniqueness=None) (Openness=Open) (Technology=Used) 3 21
The results of the analysis show that promotion of the dynamics of locality and the
openness of the inhabitants are the two most important factors of the attractiveness of
villages. On the other hand, the results also show that the quality of life is also an
important factor, and the creative capacity of a village is becoming more important to
Table 3.11: Frequency of attributes, reducts and core of attractiveness analysis.
Table 3.12: Rules of the attractiveness analysis.
88
attract diverse people and to sustain their arrival and relations with the villages.
These results and the results of the creative capacity analysis are discussed in the
next section in order to clarify our findings on this capacity of villages.
3.4.3 From appreciation to depreciation: the modern rural perception
In our times, globalization has changed the economy from being capital-based to
information-based. This has been reflected in the direction of population flows, and
thus in people’s perception. Today, people are moving in all directions from less
developed to developed, or from developed to less developed, settlements. This
change has led to an immense reversal in the perception of rural areas. Therefore,
rural areas are no longer places from which people are running away, and which then
depreciate, but rather they are the places that people appreciate.
Of course, it is not possible to say that all rural areas are appreciated, but many rural
areas, especially those in Europe, which were able to convert their creative capacity
into attractiveness, have become some of the most attractive visiting and living
places. Although this increasing mobility towards rural regions has caused a number
of problems, i.e. air pollution or the degradation of natural areas, this new flow has
helped the economic development and growth in rural regions that is very much
related to the creative capacity of the villages.
The creative capacity of a region is measured by its capability to attract economic
change agents that is related to the newly popularized concept, i.e. creative capacity,
and also by its capability to attract visitors which, in turn, is related to the
attractiveness of the region. On this basis, in order to investigate the creative capacity
of the European villages, we aimed to investigate the relatively important
components of rural creative capacity and the most important factors behind the
attractiveness of villages in our sample.
To investigate the relatively important component(s) of rural creative capacity, we
conducted a principal component analysis on the basis of the data obtained from 60
villages in Europe. The results of the analysis showed that rural-specific approaches
of rural creative capacity succeed in measuring the creative capacity in association
with the concept in general, and that the creativity and the social networks are the
most important components when estimating innovation in the rural creative capacity
of European villages.
89
In addition, in order to identify the most important factors associated with the
attractiveness of rural areas, we applied RSDA by using data from 51 villages.
According to the results of the RSDA, the most important factors are the reputation,
the openness, and the creativity in rural areas. Hence, although the appreciation of
rural regions began with the pursuit of quality of life, today what makes a rural
region attractive depends on its will to be a part of the global system, and its will to
accept novelty in the region.
The results of both the creative capacity and the attractiveness of villages stress the
importance of the specific components of creative capacity of rural regions, viz.
creativity and social networks and, hence, their locality features and their continuity.
In addition, focusing mainly on already attractive and known villages prevents us
from developing an overall picture for all rural regions. Even so, this chapter
highlights unknown hidden knowledge in traditions existing in rural areas, and the
importance of its continuity. Hence, the knowledge-based mobile network era of
today’s world needs to expose this knowledge in order to obtain a diverse, creative
and sustainable system united with technology. In the following chapter, we focus on
entrepreneurs – the change agents and the most effective stakeholders – in rural
regions by means of a meta-analytic approach.
3.5 Rural Areas and Entrepreneurs
The rural economy is widely dependent on self-employment and small business
which are strongly linked to entrepreneurship (van Leeuwen and Nijkamp, 2006).
Entrepreneurship is the driving force for the enhancement of the innovative capacity
and growth potential of a region (Acs et al., 1999; Audretsch, 2002; Nijkamp,
2008a). Hence, entrepreneurship is also one of the driving forces of rural
development. Due to the conservative attitudes and reluctance in rural areas to
change the cultural heritage, traditions and values, in the literature, it is commonly
assumed that change agents of rural capital are mainly migrants and that changes
have happened by their integration into the rural areas.
The increasing attractiveness and the realization of the capacity of rural areas have
stimulated some entrepreneurs to act in and/or move into rural areas where they
became the economic change agents. On this basis, in this chapter, we evaluate with
90
a meta-analytic approach: first, the embeddedness of entrepreneurs in rural areas;
second, the differences and similarities of rural entrepreneurs, with a special focus on
their origin; and, third, their impacts on rural regions.
3.5.1 The place of entrepreneurs in the European villages
Rural studies including rural entrepreneurship studies are mainly based on individual
cases rather than large-scale surveys. Thus, rural entrepreneurship studies are usually
qualitative or partially quantitative. This limits the quantitative generalization of the
overall results for the population, as qualitative small-scale studies reflect only the
behaviour of the sample. While drawing attention to this gap in the literature, we are
aiming to find common and contrasting outcomes of rural entrepreneurship studies
on embeddedness.
The difficulty of working with large samples in rural areas has led researchers to use
small and focused samples and to undertake semi-quantitative or qualitative studies.
The need to combine the results of several studies which address the embeddedness
of rural entrepreneurs has led us to use a systematic comparative approach to produce
a more accurate set of results in order to accumulate existing knowledge about the
topic. The embeddedness of entrepreneurs is the subject of many fields, e.g. ethnic
entrepreneurship, food sector management, etc., while the embeddedness of rural
entrepreneurs has recently been studied under a number of different assumptions,
usually by means of the profile and nature of rural entrepreneurs.
Taking all this into account, on the basis of the qualitative structure and the
characteristics of several empirical studies on rural entrepreneurship, in this section,
in order to compare the results of different studies by means of meta-analysis, we
again used Rough Set Data Analysis (RSDA) (see Appendix A). Here, the relative
importance of selected and partially comparable indicators is investigated, in order to
identify their associations with different levels of embeddedness of entrepreneurs in
rural areas.
In order to form our database, an in-depth literature review was undertaken using
many sources, i.e. Web of Science, the Internet, and other e-sources in order to locate
studies on the embeddedness of rural entrepreneurs. The reviewed literature showed
that there are two main types of embeddedness studies focusing on rural
entrepreneurs, viz. (1) the embeddedness of enterprises usually from the agro-food
91
sector in different markets; and (2) the embeddedness of rural entrepreneurs in the
rural environment. However, although embeddedness is a matter of market networks,
its dependency on social life in rural areas led us to focus on the second type of
studies to better understand the situation of entrepreneurs in rural areas in terms of
their being integrated in the community life.
After completing the preliminary study-gathering phase, we narrowed our study
collection down by using the conceptual and theoretical framework of our study
including the comparability of variables used in the studies. We had to eliminate
some of the studies as they did not use common variables or used the same database
as other studies. For instance, two studies of Kalantaridis and Bika (2006a; 2006b)
both used the same database, so that the most suitable single paper from among these
papers is included in our study. As a result, we came up with a limited number of
studies, which led us to use the snowball technique by sending emails to the authors
of the selected applied studies, asking if they had other or forthcoming, publications
or reports. The use of the snowball technique provided us with a reasonable number
of studies through which we generated our database for the application of RSDA. We
used in total 16 applied studies published between 1997 and 2007 in order to create a
systematic information table for RSDA (Table B.3 in Appendix B). Of these studies,
only three are not journal articles. The main difference between the selected studies
is their sample size, which ranges from 2 to 513. Studies with a relatively larger
sample size usually employed questionnaires, while the other studies used face-to-
face interviews and qualitative ethnographic methods. From the 16 papers which
evaluated different embeddedness levels, we retrieved each embeddedness level
separately. This evaluation allowed us to retrieve a different number of distinct cases,
so that in total we obtained a sample of 31 cases (for an overview see Table B.4 in
Appendix B).
It should to be noted that the context and orientation of these studies may show quite
some diversity (see also Stake, 2006), but the main aim of our study was to look for
commonalities at a general conceptual – but nevertheless qualitatively measurable –
level, while the focal point of comparing these different studies was embeddedness.
Even though the aims of these studies were different, the integration and
embeddedness of entrepreneurs in the local environment was evaluated and stated in
association with the characteristics of entrepreneurs, including the nature of their
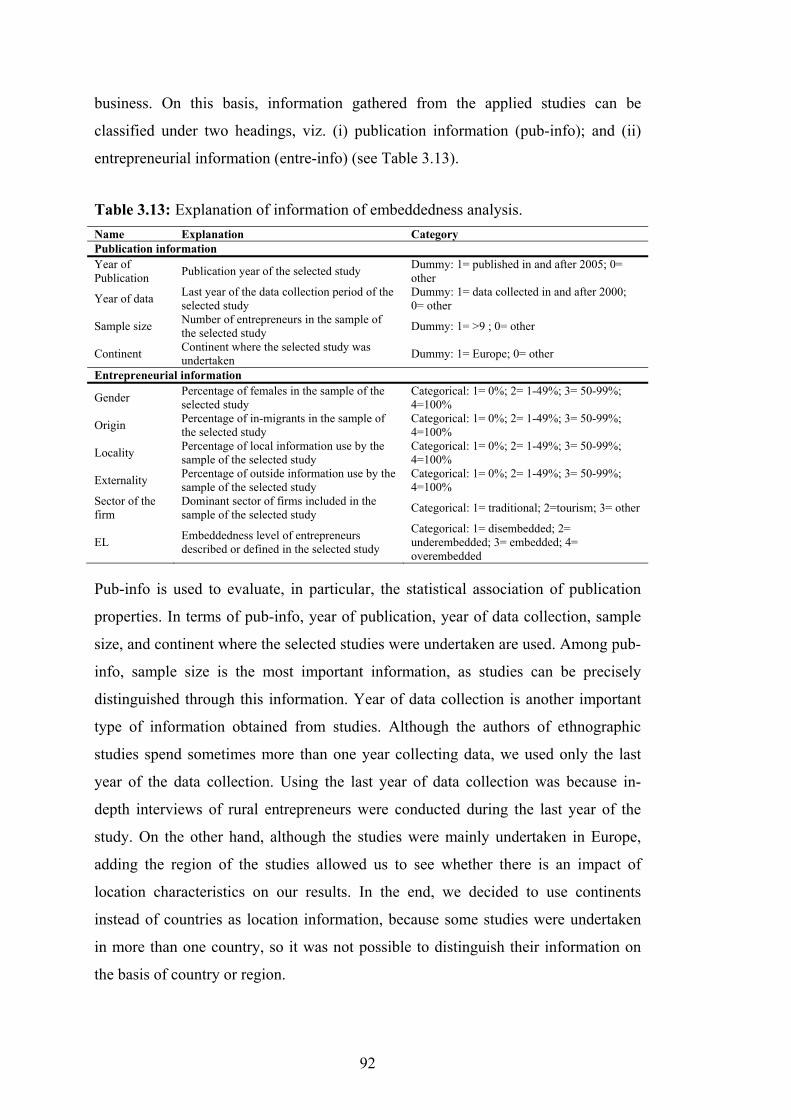
92
business. On this basis, information gathered from the applied studies can be
classified under two headings, viz. (i) publication information (pub-info); and (ii)
entrepreneurial information (entre-info) (see Table 3.13).
Name Explanation Category Publication information Year of Publication Publication year of the selected study Dummy: 1= published in and after 2005; 0=
other
Year of data Last year of the data collection period of the selected study
Dummy: 1= data collected in and after 2000; 0= other
Sample size Number of entrepreneurs in the sample of the selected study Dummy: 1= >9 ; 0= other
Continent Continent where the selected study was undertaken Dummy: 1= Europe; 0= other
Entrepreneurial information
Gender Percentage of females in the sample of the selected study
Categorical: 1= 0%; 2= 1-49%; 3= 50-99%; 4=100%
Origin Percentage of in-migrants in the sample of the selected study
Categorical: 1= 0%; 2= 1-49%; 3= 50-99%; 4=100%
Locality Percentage of local information use by the sample of the selected study
Categorical: 1= 0%; 2= 1-49%; 3= 50-99%; 4=100%
Externality Percentage of outside information use by the sample of the selected study
Categorical: 1= 0%; 2= 1-49%; 3= 50-99%; 4=100%
Sector of the firm
Dominant sector of firms included in the sample of the selected study Categorical: 1= traditional; 2=tourism; 3= other
EL Embeddedness level of entrepreneurs described or defined in the selected study
Categorical: 1= disembedded; 2= underembedded; 3= embedded; 4= overembedded
Pub-info is used to evaluate, in particular, the statistical association of publication
properties. In terms of pub-info, year of publication, year of data collection, sample
size, and continent where the selected studies were undertaken are used. Among pub-
info, sample size is the most important information, as studies can be precisely
distinguished through this information. Year of data collection is another important
type of information obtained from studies. Although the authors of ethnographic
studies spend sometimes more than one year collecting data, we used only the last
year of the data collection. Using the last year of data collection was because in-
depth interviews of rural entrepreneurs were conducted during the last year of the
study. On the other hand, although the studies were mainly undertaken in Europe,
adding the region of the studies allowed us to see whether there is an impact of
location characteristics on our results. In the end, we decided to use continents
instead of countries as location information, because some studies were undertaken
in more than one country, so it was not possible to distinguish their information on
the basis of country or region.
Table 3.13: Explanation of information of embeddedness analysis.
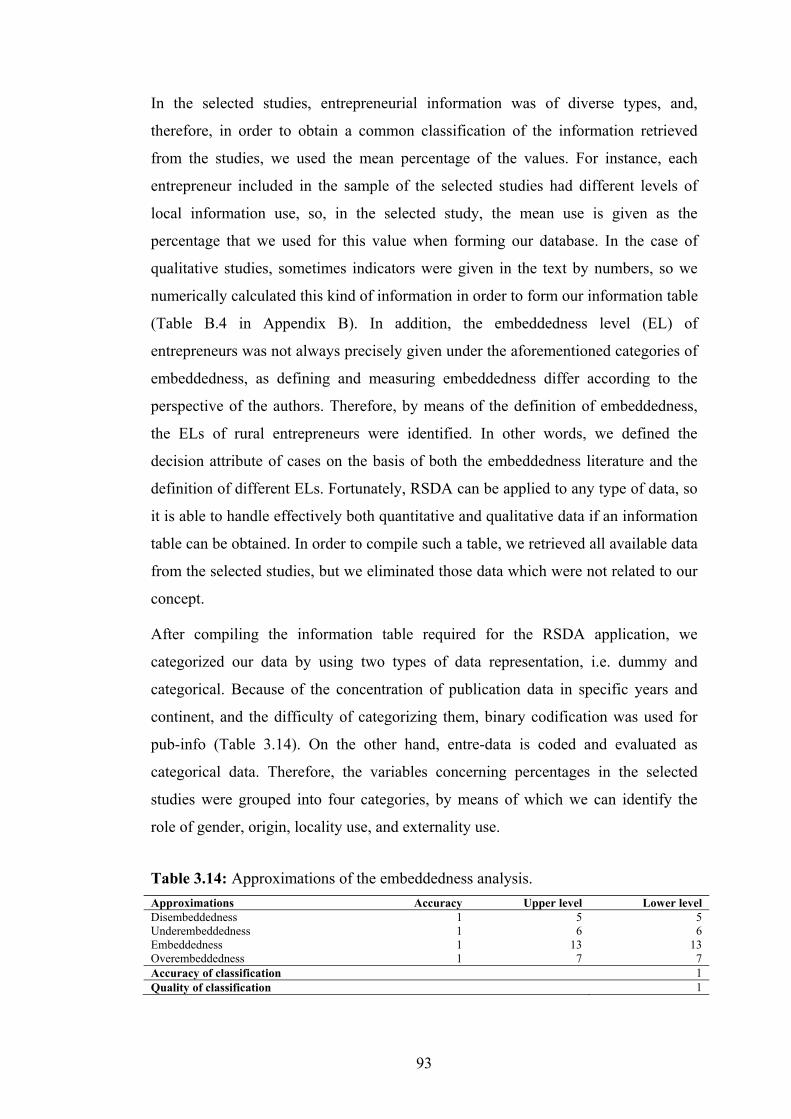
93
In the selected studies, entrepreneurial information was of diverse types, and,
therefore, in order to obtain a common classification of the information retrieved
from the studies, we used the mean percentage of the values. For instance, each
entrepreneur included in the sample of the selected studies had different levels of
local information use, so, in the selected study, the mean use is given as the
percentage that we used for this value when forming our database. In the case of
qualitative studies, sometimes indicators were given in the text by numbers, so we
numerically calculated this kind of information in order to form our information table
(Table B.4 in Appendix B). In addition, the embeddedness level (EL) of
entrepreneurs was not always precisely given under the aforementioned categories of
embeddedness, as defining and measuring embeddedness differ according to the
perspective of the authors. Therefore, by means of the definition of embeddedness,
the ELs of rural entrepreneurs were identified. In other words, we defined the
decision attribute of cases on the basis of both the embeddedness literature and the
definition of different ELs. Fortunately, RSDA can be applied to any type of data, so
it is able to handle effectively both quantitative and qualitative data if an information
table can be obtained. In order to compile such a table, we retrieved all available data
from the selected studies, but we eliminated those data which were not related to our
concept.
After compiling the information table required for the RSDA application, we
categorized our data by using two types of data representation, i.e. dummy and
categorical. Because of the concentration of publication data in specific years and
continent, and the difficulty of categorizing them, binary codification was used for
pub-info (Table 3.14). On the other hand, entre-data is coded and evaluated as
categorical data. Therefore, the variables concerning percentages in the selected
studies were grouped into four categories, by means of which we can identify the
role of gender, origin, locality use, and externality use.
Approximations Accuracy Upper level Lower level Disembeddedness 1 5 5 Underembeddedness 1 6 6 Embeddedness 1 13 13 Overembeddedness 1 7 7 Accuracy of classification 1 Quality of classification 1
Table 3.14: Approximations of the embeddedness analysis.

94
In addition, in terms of the attribute referring to the sector, two main sectors in the
rural literature are differentiated among the studies, viz. traditional sectors and the
tourism sector, while manufacturing, services and other sectors are taken into
consideration as ‘other sectors’. Thus, we obtained a table called the coded value
table. After compiling the coded value table, RSDA can be performed. By getting the
highest score 1 in both accuracy and quality of classification, on the basis of the
chosen indicators, the studies in our sample are fully discernible regarding the four
dimensions of embeddedness.
On the basis of the selected indicators, there are 3 sets of attributes which explain
different levels of embeddedness. From Table 3.15, it can be seen that each set
includes the locality level, externality level, and the sector, which are called the ‘core
elements’. The locality attribute is the most relevant indicator for the classification of
different studies together with the external relations and sector (Table 3.15). The
relative importance of two types of pub-info, i.e. sample size and continent
associated with the ELs of entrepreneurs, show that publication characteristics have
an impact on the determination of ELs.
Attributes Frequency Reducts # % Locality 3 100.00 {Locality; Externality; Sector; Sample Size} Externality 3 100.00 {Locality; Externality; Sector; Continent} Sector 3 100.00 {Locality; Externality; Sector; Gender} Gender 1 33.33 Core Continent 1 33.33 Sample size 1 33.33 Locality; Externality; Sector
In the RSDA application, 11 exact rules were generated. Among these 11 rules, 8
rules are supported by more than one case, while three rules are supported by only
one single example which had such a low strength that we excluded these rules from
our decision rules list (Table 3.16). According to the related decision rules, each EL
of entrepreneurs is explained by at least two exact rules. The application of the
RSDA shows that locality use is the attribute most associated with the embeddedness
level of entrepreneurs in rural areas, just as it is in terms of defining decision rules.
The relations of the selected indicators and the levels of embeddedness, i.e. the
decision rules, are shown in Table 3.16, which refers to data obtained through two
types of information, viz. pub-info and entre-info. Among these two types of
Table 3.15: Frequency of attributes, reducts and core of embeddedness analysis.
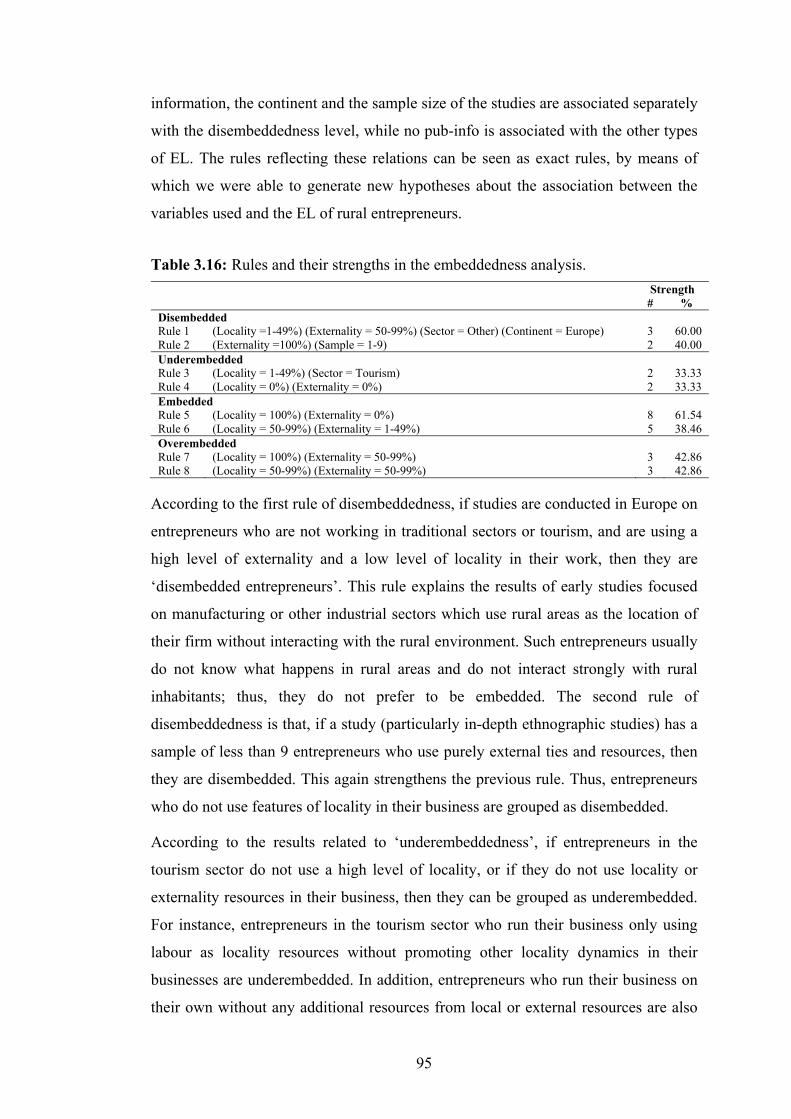
95
information, the continent and the sample size of the studies are associated separately
with the disembeddedness level, while no pub-info is associated with the other types
of EL. The rules reflecting these relations can be seen as exact rules, by means of
which we were able to generate new hypotheses about the association between the
variables used and the EL of rural entrepreneurs.
Strength # %
Disembedded Rule 1 (Locality =1-49%) (Externality = 50-99%) (Sector = Other) (Continent = Europe) 3 60.00 Rule 2 (Externality =100%) (Sample = 1-9) 2 40.00 Underembedded Rule 3 (Locality = 1-49%) (Sector = Tourism) 2 33.33 Rule 4 (Locality = 0%) (Externality = 0%) 2 33.33 Embedded Rule 5 (Locality = 100%) (Externality = 0%) 8 61.54 Rule 6 (Locality = 50-99%) (Externality = 1-49%) 5 38.46 Overembedded Rule 7 (Locality = 100%) (Externality = 50-99%) 3 42.86 Rule 8 (Locality = 50-99%) (Externality = 50-99%) 3 42.86
According to the first rule of disembeddedness, if studies are conducted in Europe on
entrepreneurs who are not working in traditional sectors or tourism, and are using a
high level of externality and a low level of locality in their work, then they are
‘disembedded entrepreneurs’. This rule explains the results of early studies focused
on manufacturing or other industrial sectors which use rural areas as the location of
their firm without interacting with the rural environment. Such entrepreneurs usually
do not know what happens in rural areas and do not interact strongly with rural
inhabitants; thus, they do not prefer to be embedded. The second rule of
disembeddedness is that, if a study (particularly in-depth ethnographic studies) has a
sample of less than 9 entrepreneurs who use purely external ties and resources, then
they are disembedded. This again strengthens the previous rule. Thus, entrepreneurs
who do not use features of locality in their business are grouped as disembedded.
According to the results related to ‘underembeddedness’, if entrepreneurs in the
tourism sector do not use a high level of locality, or if they do not use locality or
externality resources in their business, then they can be grouped as underembedded.
For instance, entrepreneurs in the tourism sector who run their business only using
labour as locality resources without promoting other locality dynamics in their
businesses are underembedded. In addition, entrepreneurs who run their business on
their own without any additional resources from local or external resources are also
Table 3.16: Rules and their strengths in the embeddedness analysis.
96
underembedded. If entrepreneurs do not make use of the local potential, they will not
be able to break the defensive localism and will stay underembedded. Entrepreneurs
at these levels of embeddedness are able to choose whether to increase their EL or to
decrease it.
The decision rules explaining the other levels of embeddedness are the composition
of different levels of locality and externality use of entrepreneurs. So, if an
entrepreneur uses 100 per cent locality without using any features of externality, or if
entrepreneurs use a high level of locality with less externality, then they become
‘embedded’. On the other hand, if entrepreneurs use 100 per cent locality or a high
level of locality with a low level of externality, then they are ‘overembedded’. These
rules completely reflect the current theory of embeddedness in rural areas.
Entrepreneurs who have the first two levels of embeddedness, i.e. disembeddedness
and underembeddedness, can both be called ‘disembedded entrepreneurs’, while
entrepreneurs who have the other two ELs, i.e. embeddedness and
overembeddedness, can be called ‘embedded entrepreneurs’. According to the results
of our analysis, in determining the EL of entrepreneurs, use of locality and
externality play an important role, although the disembeddedness of entrepreneurs
also depends on the sector or publication characteristics, i.e. sample and location.
Clearly, the existing theories on embeddedness are reflected in our empirical results.
It is also noteworthy that both the reducts and the decision rules show that, among
the characteristics of entrepreneurs, gender has a very low influence, and the origin
of entrepreneurs has no influence at all in determining the ELs of entrepreneurs in
rural areas. In the following section, using a similar meta-analytic approach, we
investigate the entrepreneurs first by their origin, and then second by their impacts on
rural capital.
3.5.2 Entrepreneurs and their impacts on the European villages
Classical theories of development have tended to ignore the role of entrepreneurship,
but new theories have highlighted the importance of this notion, especially in order
to encourage sustainable rural development by using local resources (Keeble and
Tyler, 1995; North and Smallbone, 1996; Phillipson and Raley, 2002; Renkow, 2003;
Stathopoulou et al., 2004). The local population is a potential source for rural
entrepreneurship. Locals have not always been ready to become entrepreneurial

97
agents of change, although the rural problem necessitated their – sometimes reluctant
– involvement in new enterprises and activities. Therefore, newcomer rural
entrepreneurs, who seek personal opportunities in rural areas without necessarily
taking on the role of actually fostering rural development, have become a force of
competition for the local population.
The appearance of this new group and the changes occurring in rural areas prompt
two main questions: ‘Do local and newcomer entrepreneurs in rural areas differ in
terms of their demographic and entrepreneurial characteristics?’. And, ‘Do only
newcomer entrepreneurs contribute to the development of rural capital?’ In order to
answer these questions, the aim of this section is to investigate the differences
between the characteristics and the impacts of newcomer and local rural
entrepreneurs by means of a meta-analytic approach (see Appendix A for the
explanation of meta-analysis). Data used in this study are derived from existing
applied studies in order to investigate and integrate the literature on both types of
rural entrepreneurs.
The heterogeneity and uniqueness of rural areas has often encouraged researchers to
study rural entrepreneurship by means of qualitative research drawn from small
samples of in-depth interviews. Naturally, the generalization of results may be
difficult in these cases, as such authors usually stress in their conclusions. However,
the systematic pooling of such study findings by means of meta-analytic techniques
enhances comparability and permits some generalization. In this section, we compare
the characteristics and impacts of newcomer and local rural entrepreneurs by means
of summary statistics and logistic meta-regression analysis. We first provide the
description of the database formulated by the integration and combination of 22
applied studies that cover a total of 2,802 rural entrepreneurs. This is followed by the
results of the descriptive analysis. Later, we also provide the empirical results of the
logistic meta-regression analysis.
The qualitative characteristics of rural entrepreneurship studies and the decision to
use a meta-analytic approach have led us to define two groups of variables in this
study (Table 3.17). The first group are called ‘study variables’. They are derived in
order to measure the effects of the research and publication process itself. The
second group of variables are the ‘entrepreneurial variables’.
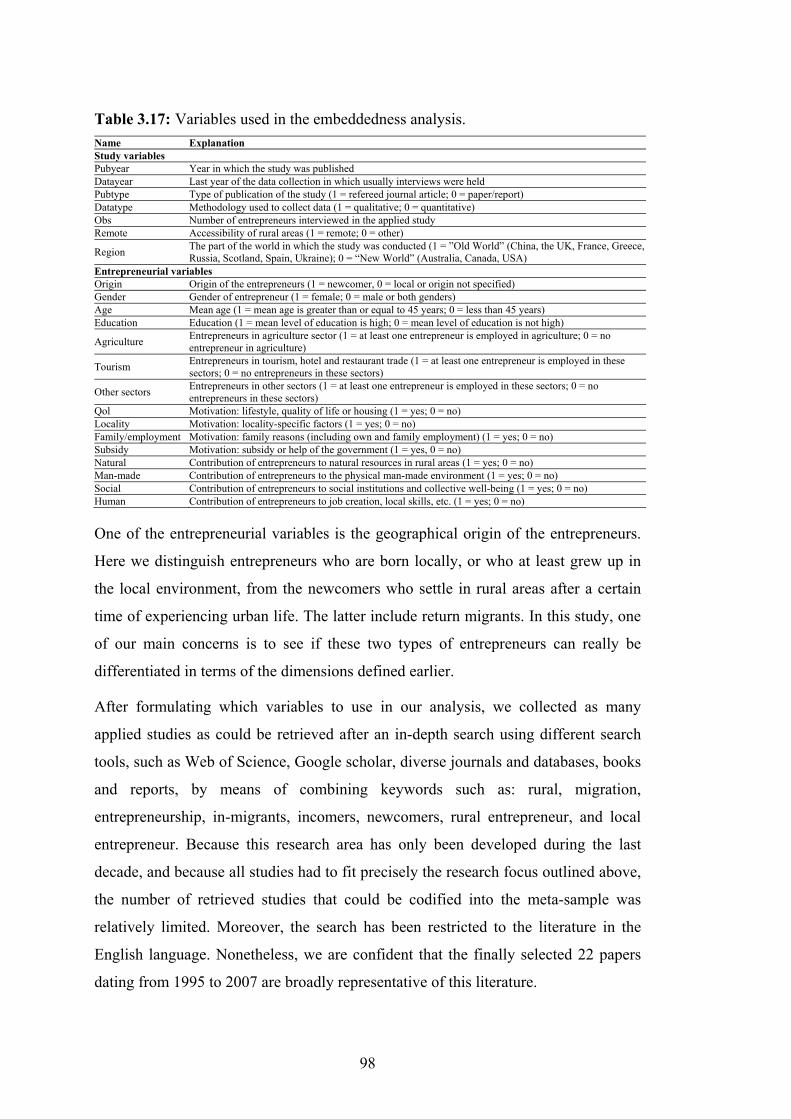
98
Name Explanation Study variables Pubyear Year in which the study was publishedDatayear Last year of the data collection in which usually interviews were heldPubtype Type of publication of the study (1 = refereed journal article; 0 = paper/report)Datatype Methodology used to collect data (1 = qualitative; 0 = quantitative)Obs Number of entrepreneurs interviewed in the applied studyRemote Accessibility of rural areas (1 = remote; 0 = other)
Region The part of the world in which the study was conducted (1 = ”Old World” (China, the UK, France, Greece, Russia, Scotland, Spain, Ukraine); 0 = “New World” (Australia, Canada, USA)
Entrepreneurial variables Origin Origin of the entrepreneurs (1 = newcomer, 0 = local or origin not specified) Gender Gender of entrepreneur (1 = female; 0 = male or both genders) Age Mean age (1 = mean age is greater than or equal to 45 years; 0 = less than 45 years) Education Education (1 = mean level of education is high; 0 = mean level of education is not high)
Agriculture Entrepreneurs in agriculture sector (1 = at least one entrepreneur is employed in agriculture; 0 = no entrepreneur in agriculture)
Tourism Entrepreneurs in tourism, hotel and restaurant trade (1 = at least one entrepreneur is employed in these sectors; 0 = no entrepreneurs in these sectors)
Other sectors Entrepreneurs in other sectors (1 = at least one entrepreneur is employed in these sectors; 0 = no entrepreneurs in these sectors)
Qol Motivation: lifestyle, quality of life or housing (1 = yes; 0 = no) Locality Motivation: locality-specific factors (1 = yes; 0 = no) Family/employment Motivation: family reasons (including own and family employment) (1 = yes; 0 = no) Subsidy Motivation: subsidy or help of the government (1 = yes, 0 = no) Natural Contribution of entrepreneurs to natural resources in rural areas (1 = yes; 0 = no) Man-made Contribution of entrepreneurs to the physical man-made environment (1 = yes; 0 = no) Social Contribution of entrepreneurs to social institutions and collective well-being (1 = yes; 0 = no) Human Contribution of entrepreneurs to job creation, local skills, etc. (1 = yes; 0 = no)
One of the entrepreneurial variables is the geographical origin of the entrepreneurs.
Here we distinguish entrepreneurs who are born locally, or who at least grew up in
the local environment, from the newcomers who settle in rural areas after a certain
time of experiencing urban life. The latter include return migrants. In this study, one
of our main concerns is to see if these two types of entrepreneurs can really be
differentiated in terms of the dimensions defined earlier.
After formulating which variables to use in our analysis, we collected as many
applied studies as could be retrieved after an in-depth search using different search
tools, such as Web of Science, Google scholar, diverse journals and databases, books
and reports, by means of combining keywords such as: rural, migration,
entrepreneurship, in-migrants, incomers, newcomers, rural entrepreneur, and local
entrepreneur. Because this research area has only been developed during the last
decade, and because all studies had to fit precisely the research focus outlined above,
the number of retrieved studies that could be codified into the meta-sample was
relatively limited. Moreover, the search has been restricted to the literature in the
English language. Nonetheless, we are confident that the finally selected 22 papers
dating from 1995 to 2007 are broadly representative of this literature.
Table 3.17: Variables used in the embeddedness analysis.
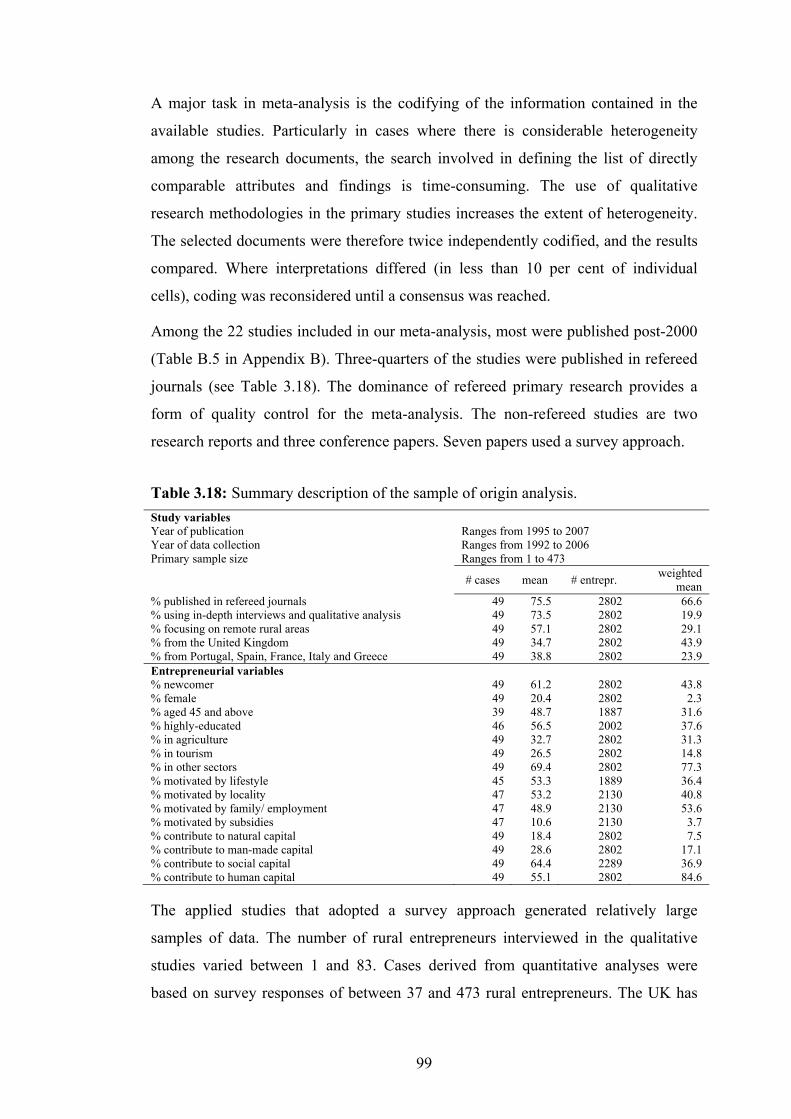
99
A major task in meta-analysis is the codifying of the information contained in the
available studies. Particularly in cases where there is considerable heterogeneity
among the research documents, the search involved in defining the list of directly
comparable attributes and findings is time-consuming. The use of qualitative
research methodologies in the primary studies increases the extent of heterogeneity.
The selected documents were therefore twice independently codified, and the results
compared. Where interpretations differed (in less than 10 per cent of individual
cells), coding was reconsidered until a consensus was reached.
Among the 22 studies included in our meta-analysis, most were published post-2000
(Table B.5 in Appendix B). Three-quarters of the studies were published in refereed
journals (see Table 3.18). The dominance of refereed primary research provides a
form of quality control for the meta-analysis. The non-refereed studies are two
research reports and three conference papers. Seven papers used a survey approach.
Study variables Year of publication Ranges from 1995 to 2007 Year of data collection Ranges from 1992 to 2006 Primary sample size Ranges from 1 to 473
# cases mean # entrepr. weighted mean
% published in refereed journals 49 75.5 2802 66.6 % using in-depth interviews and qualitative analysis 49 73.5 2802 19.9 % focusing on remote rural areas 49 57.1 2802 29.1 % from the United Kingdom 49 34.7 2802 43.9 % from Portugal, Spain, France, Italy and Greece 49 38.8 2802 23.9 Entrepreneurial variables % newcomer 49 61.2 2802 43.8 % female 49 20.4 2802 2.3 % aged 45 and above 39 48.7 1887 31.6 % highly-educated 46 56.5 2002 37.6 % in agriculture 49 32.7 2802 31.3 % in tourism 49 26.5 2802 14.8 % in other sectors 49 69.4 2802 77.3 % motivated by lifestyle 45 53.3 1889 36.4 % motivated by locality 47 53.2 2130 40.8 % motivated by family/ employment 47 48.9 2130 53.6 % motivated by subsidies 47 10.6 2130 3.7 % contribute to natural capital 49 18.4 2802 7.5 % contribute to man-made capital 49 28.6 2802 17.1 % contribute to social capital 49 64.4 2289 36.9 % contribute to human capital 49 55.1 2802 84.6
The applied studies that adopted a survey approach generated relatively large
samples of data. The number of rural entrepreneurs interviewed in the qualitative
studies varied between 1 and 83. Cases derived from quantitative analyses were
based on survey responses of between 37 and 473 rural entrepreneurs. The UK has
Table 3.18: Summary description of the sample of origin analysis.
100
been the most common country from which studies on rural entrepreneurship
originated (9 out of 22 studies). Studies from southern Europe (Portugal, Spain,
France, Italy and Greece) also make up a relatively large proportion. Among the
sample of studies, only one study focused on Russian and Ukrainian entrepreneurs in
the post-communist era. Another study focused on China, and there was also one
study from Australia. Hence, the majority of the studies were from Europe.
Most studies yielded more than one case observation, usually one on local
entrepreneurs, and one on newcomer entrepreneurs. The maximum number of cases
per study is six, originating from the article by Kalantaridis and Labrianidis 2004,
and referring to two entrepreneurial types in each of three regions. In total, the 22
studies yielded 49 cases representing 2,802 entrepreneurs (Table 3.18).
The variables are defined such that the number of missing observations is minimized.
Table 10.6 reports two types of summary statistics. The first type is the ‘unweighted
mean’, in which each of the 49 cases has equal weight. The second type is the
‘weighted mean’ in which cases are weighted by the number of rural entrepreneurs
on which the primary observation is based. The difference is large where qualitative
and quantitative research studies have different features. Thus, among the 49 cases,
36 (73.5 per cent) refer to in-depth interviews. However, the large samples of
quantitative studies imply that the qualitative studies only cover 19.9 per cent of all
researched rural entrepreneurs.
Rural areas themselves are quite heterogeneous, some are on the periphery of major
urban agglomerations, while others are geographically remote and separated from
major population centres by mountains, lakes or long roads. Of the 49 cases, 28 (57.1
per cent) concern remote rural areas. Mainly qualitative research was conducted in
such remote regions, with only 29.1 per cent of the studied rural entrepreneurs living
in such regions.
The meta-analysis permits a fairly balanced study for contrasting newcomers (61.2
per cent of the cases) with local entrepreneurs (43.8 per cent of the cases). About
one-fifth of the cases refer to female entrepreneurs, but a focus on female
entrepreneurship is much more prevalent in the qualitative studies, though females
account for only 2.3 per cent of the total number of investigated entrepreneurs.
Entrepreneurs aged 45 and above represent about half the number of cases and 31.6
per cent of the entrepreneurs. Over half of the cases (and 37.6 per cent of the

101
entrepreneurs) are highly educated persons. In terms of sectoral composition, a split
is made between agriculture, tourism, and other sectors. As a case may refer to a
mixed group of entrepreneurs covering more than one sector, these percentages do
not add up to 100. The “other sectors” category is dominant, accounting for more
than two-thirds of the employment, and covers manufacturing and all services other
than tourism. Four types of motivation for entrepreneurial activity are identified:
lifestyle (found among 36.4 per cent of entrepreneurs), locality (40.8 per cent),
family/employment (53.6 per cent) and public subsidies (3.7 per cent). No split was
made between seeking employment opportunities for the entrepreneur and for his/her
family members, because in most cases this was a joint goal.
Finally, with respect to the contribution to rural development, job creation
(‘contribution to human capital’) is clearly the most common impact. Nearly 85 per
cent of entrepreneurs made this contribution. The next most common is a
contribution to social capital (which is more often found in qualitative research),
whereas a contribution to natural capital is the least common (18.4 per cent of cases
and 7.5 per cent of the entrepreneurs). Early applied studies stressed the differences
between newcomers and local entrepreneurs, and assumed that newcomers are the
main change agents in terms of creating new rural areas. Here, we investigate
descriptively and statistically the validity of these earlier conclusions.
Table 3.19 compares the means of the data that we have on the two types of
entrepreneurs. Because all variables considered are binary, we also conduct
conventional z-tests on the statistical significance of the difference in estimated
probabilities for local entrepreneurs pl and newcomer entrepreneurs pn. With a
sample size of 49 cases, and 61 per cent of our cases referring to newcomer rural
entrepreneurs, this approach is statistically quite valid.
It is not appropriate to conduct these tests with data weighted by the number of
observations in each primary study because of the non-random split of the qualitative
research (small samples) and quantitative research (large samples) with respect to the
study attribute of interest, and because local entrepreneurs are overrepresented in the
quantitative studies. We consider the null hypothesis H0: pl − pn = 0 against both the
two-tailed alternative Ha: pl − pn ≠ 0 and the appropriate one-tailed alternative.
Because of the small sample size (n = 49), we consider a 10 per cent significance
level a reasonable criterion. On this basis, we find statistical significance of the
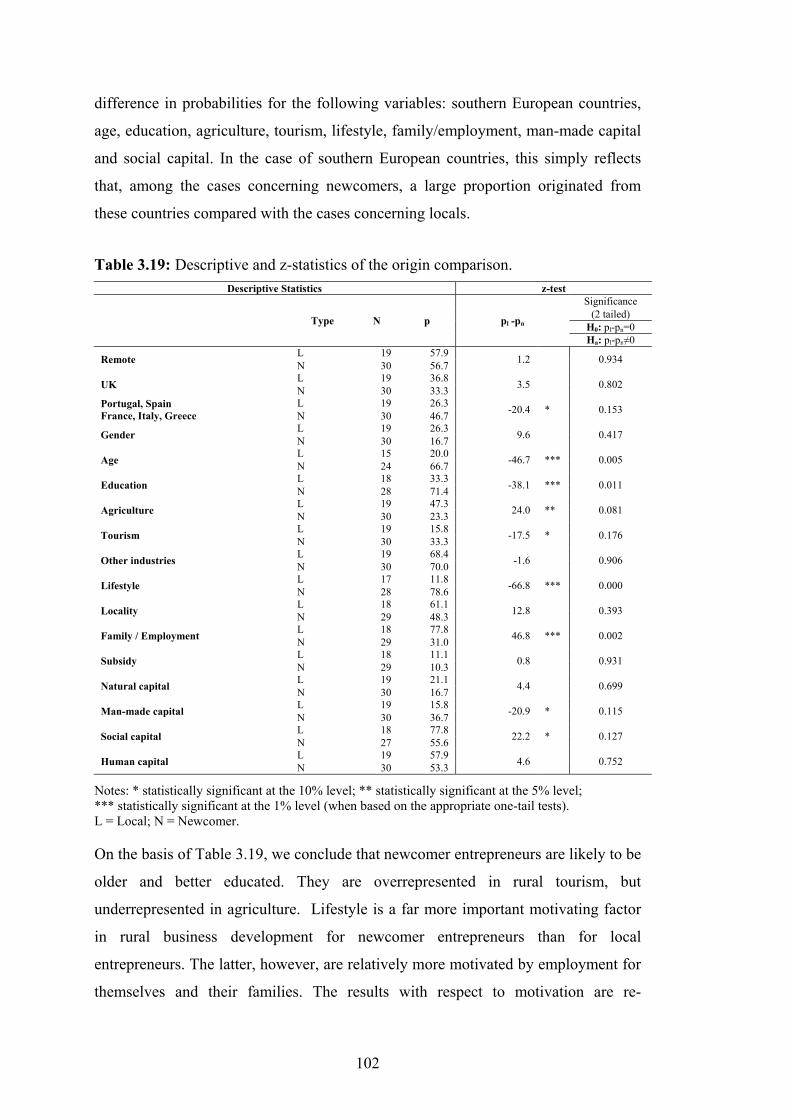
102
difference in probabilities for the following variables: southern European countries,
age, education, agriculture, tourism, lifestyle, family/employment, man-made capital
and social capital. In the case of southern European countries, this simply reflects
that, among the cases concerning newcomers, a large proportion originated from
these countries compared with the cases concerning locals.
Descriptive Statistics z-test
Type N p pl -pn
Significance (2 tailed)
H0: pl-pn=0 Ha: pl-pn≠0
Remote L 19 57.9 1.2 0.934 N 30 56.7
UK L 19 36.8 3.5 0.802 N 30 33.3 Portugal, Spain France, Italy, Greece
L 19 26.3 -20.4 * 0.153 N 30 46.7
Gender L 19 26.3 9.6 0.417 N 30 16.7
Age L 15 20.0 -46.7 *** 0.005 N 24 66.7
Education L 18 33.3 -38.1 *** 0.011 N 28 71.4
Agriculture L 19 47.3 24.0 ** 0.081 N 30 23.3
Tourism L 19 15.8 -17.5 * 0.176 N 30 33.3
Other industries L 19 68.4 -1.6 0.906 N 30 70.0
Lifestyle L 17 11.8 -66.8 *** 0.000 N 28 78.6
Locality L 18 61.1 12.8 0.393 N 29 48.3
Family / Employment L 18 77.8 46.8 *** 0.002 N 29 31.0
Subsidy L 18 11.1 0.8 0.931 N 29 10.3
Natural capital L 19 21.1 4.4 0.699 N 30 16.7
Man-made capital L 19 15.8 -20.9 * 0.115 N 30 36.7
Social capital L 18 77.8 22.2 * 0.127 N 27 55.6
Human capital L 19 57.9 4.6 0.752 N 30 53.3
Notes: * statistically significant at the 10% level; ** statistically significant at the 5% level; *** statistically significant at the 1% level (when based on the appropriate one-tail tests). L = Local; N = Newcomer.
On the basis of Table 3.19, we conclude that newcomer entrepreneurs are likely to be
older and better educated. They are overrepresented in rural tourism, but
underrepresented in agriculture. Lifestyle is a far more important motivating factor
in rural business development for newcomer entrepreneurs than for local
entrepreneurs. The latter, however, are relatively more motivated by employment for
themselves and their families. The results with respect to motivation are re-
Table 3.19: Descriptive and z-statistics of the origin comparison.
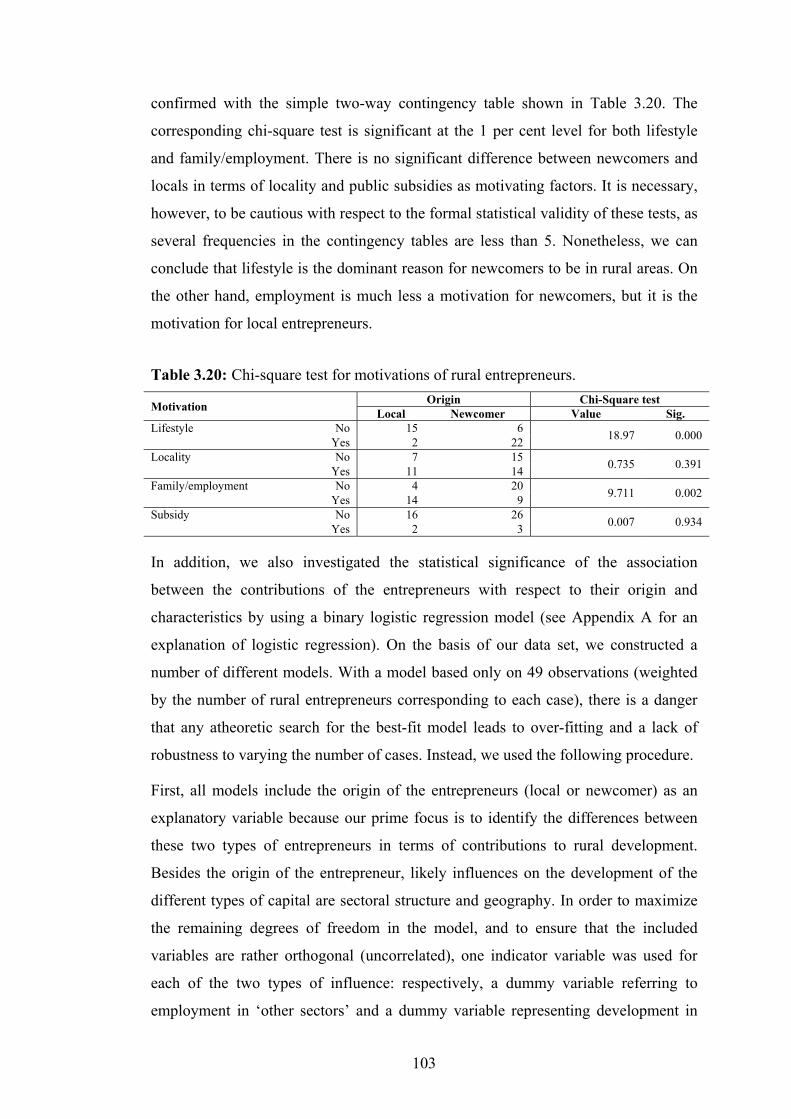
103
confirmed with the simple two-way contingency table shown in Table 3.20. The
corresponding chi-square test is significant at the 1 per cent level for both lifestyle
and family/employment. There is no significant difference between newcomers and
locals in terms of locality and public subsidies as motivating factors. It is necessary,
however, to be cautious with respect to the formal statistical validity of these tests, as
several frequencies in the contingency tables are less than 5. Nonetheless, we can
conclude that lifestyle is the dominant reason for newcomers to be in rural areas. On
the other hand, employment is much less a motivation for newcomers, but it is the
motivation for local entrepreneurs.
Motivation Origin Chi-Square test Local Newcomer Value Sig.
Lifestyle No 15 6 18.97 0.000 Yes 2 22 Locality No 7 15 0.735 0.391 Yes 11 14 Family/employment No 4 20 9.711 0.002 Yes 14 9 Subsidy No 16 26 0.007 0.934 Yes 2 3
In addition, we also investigated the statistical significance of the association
between the contributions of the entrepreneurs with respect to their origin and
characteristics by using a binary logistic regression model (see Appendix A for an
explanation of logistic regression). On the basis of our data set, we constructed a
number of different models. With a model based only on 49 observations (weighted
by the number of rural entrepreneurs corresponding to each case), there is a danger
that any atheoretic search for the best-fit model leads to over-fitting and a lack of
robustness to varying the number of cases. Instead, we used the following procedure.
First, all models include the origin of the entrepreneurs (local or newcomer) as an
explanatory variable because our prime focus is to identify the differences between
these two types of entrepreneurs in terms of contributions to rural development.
Besides the origin of the entrepreneur, likely influences on the development of the
different types of capital are sectoral structure and geography. In order to maximize
the remaining degrees of freedom in the model, and to ensure that the included
variables are rather orthogonal (uncorrelated), one indicator variable was used for
each of the two types of influence: respectively, a dummy variable referring to
employment in ‘other sectors’ and a dummy variable representing development in
Table 3.20: Chi-square test for motivations of rural entrepreneurs.
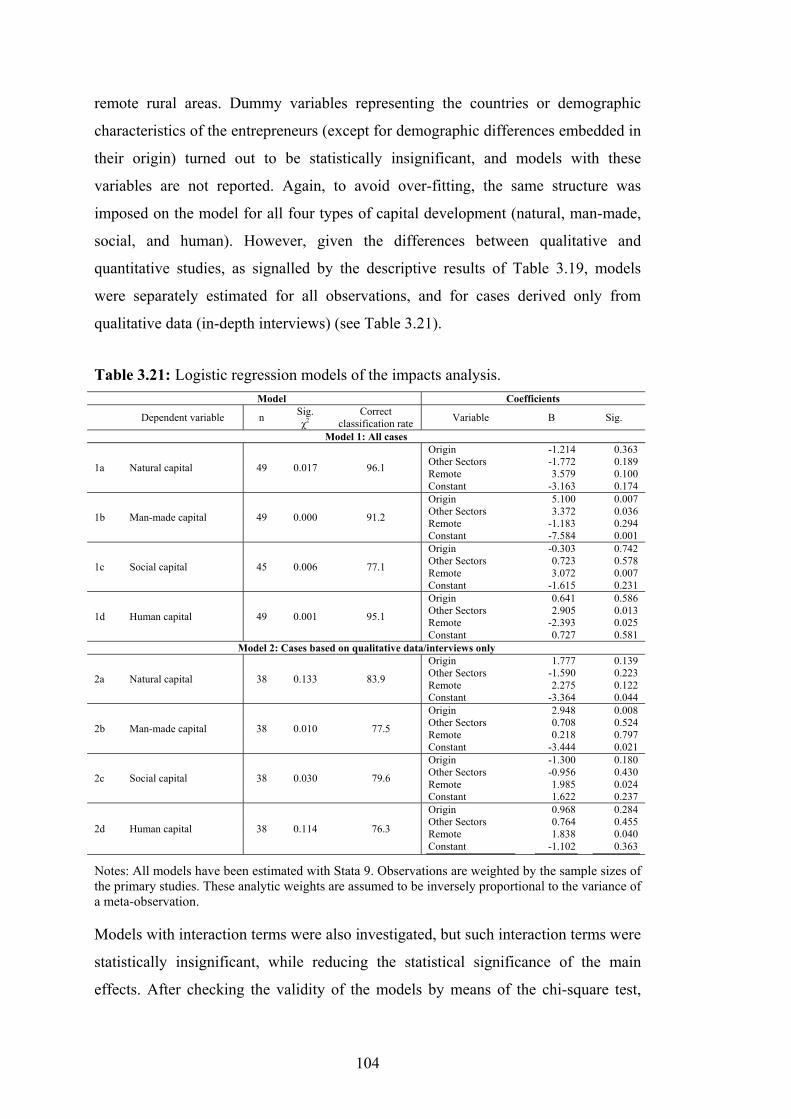
104
remote rural areas. Dummy variables representing the countries or demographic
characteristics of the entrepreneurs (except for demographic differences embedded in
their origin) turned out to be statistically insignificant, and models with these
variables are not reported. Again, to avoid over-fitting, the same structure was
imposed on the model for all four types of capital development (natural, man-made,
social, and human). However, given the differences between qualitative and
quantitative studies, as signalled by the descriptive results of Table 3.19, models
were separately estimated for all observations, and for cases derived only from
qualitative data (in-depth interviews) (see Table 3.21).
Model Coefficients
Dependent variable n Sig. χ2
Correct classification rate Variable B Sig.
Model 1: All cases
1a Natural capital 49 0.017 96.1
Origin -1.214 0.363 Other Sectors -1.772 0.189 Remote 3.579 0.100 Constant -3.163 0.174
1b Man-made capital 49 0.000 91.2
Origin 5.100 0.007 Other Sectors 3.372 0.036 Remote -1.183 0.294 Constant -7.584 0.001
1c Social capital 45 0.006 77.1
Origin -0.303 0.742 Other Sectors 0.723 0.578 Remote 3.072 0.007 Constant -1.615 0.231
1d Human capital 49 0.001 95.1
Origin 0.641 0.586 Other Sectors 2.905 0.013 Remote -2.393 0.025 Constant 0.727 0.581
Model 2: Cases based on qualitative data/interviews only
2a Natural capital 38 0.133 83.9
Origin 1.777 0.139 Other Sectors -1.590 0.223 Remote 2.275 0.122 Constant -3.364 0.044
2b Man-made capital 38 0.010 77.5
Origin 2.948 0.008 Other Sectors 0.708 0.524 Remote 0.218 0.797 Constant -3.444 0.021
2c Social capital 38 0.030 79.6
Origin -1.300 0.180 Other Sectors -0.956 0.430 Remote 1.985 0.024 Constant 1.622 0.237
2d Human capital 38 0.114 76.3
Origin 0.968 0.284 Other Sectors 0.764 0.455 Remote 1.838 0.040 Constant -1.102 0.363
Notes: All models have been estimated with Stata 9. Observations are weighted by the sample sizes of the primary studies. These analytic weights are assumed to be inversely proportional to the variance of a meta-observation.
Models with interaction terms were also investigated, but such interaction terms were
statistically insignificant, while reducing the statistical significance of the main
effects. After checking the validity of the models by means of the chi-square test,
Table 3.21: Logistic regression models of the impacts analysis.
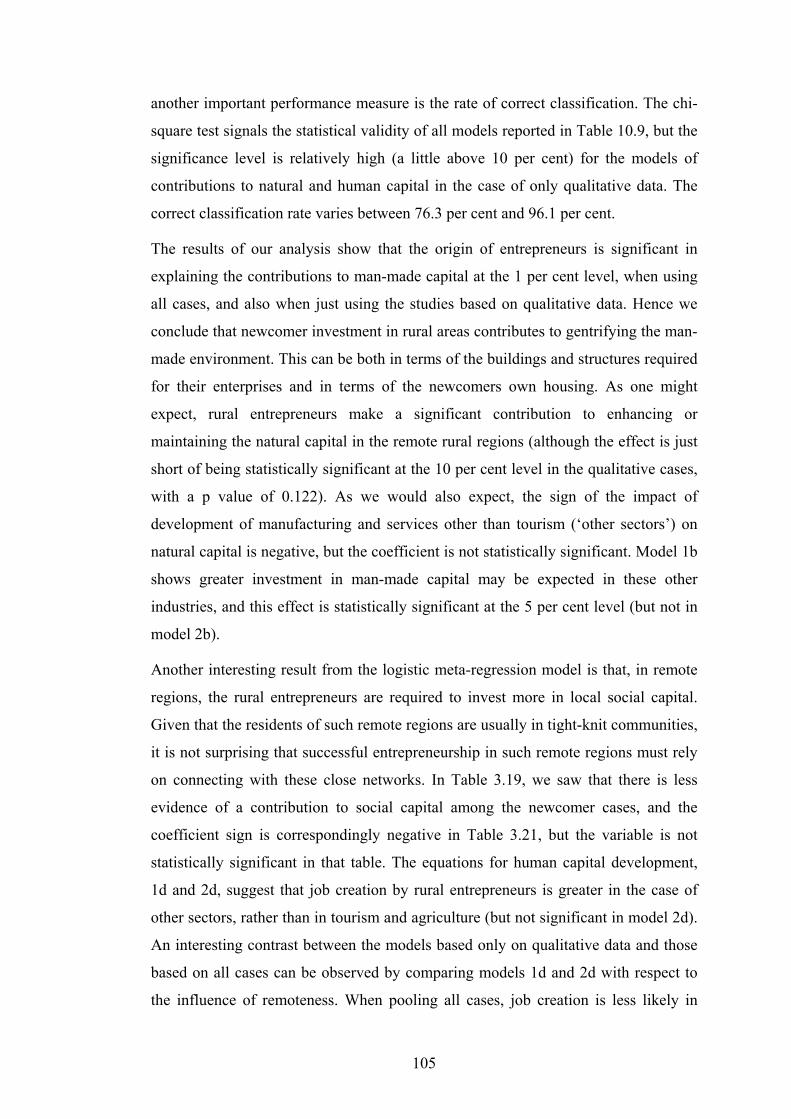
105
another important performance measure is the rate of correct classification. The chi-
square test signals the statistical validity of all models reported in Table 10.9, but the
significance level is relatively high (a little above 10 per cent) for the models of
contributions to natural and human capital in the case of only qualitative data. The
correct classification rate varies between 76.3 per cent and 96.1 per cent.
The results of our analysis show that the origin of entrepreneurs is significant in
explaining the contributions to man-made capital at the 1 per cent level, when using
all cases, and also when just using the studies based on qualitative data. Hence we
conclude that newcomer investment in rural areas contributes to gentrifying the man-
made environment. This can be both in terms of the buildings and structures required
for their enterprises and in terms of the newcomers own housing. As one might
expect, rural entrepreneurs make a significant contribution to enhancing or
maintaining the natural capital in the remote rural regions (although the effect is just
short of being statistically significant at the 10 per cent level in the qualitative cases,
with a p value of 0.122). As we would also expect, the sign of the impact of
development of manufacturing and services other than tourism (‘other sectors’) on
natural capital is negative, but the coefficient is not statistically significant. Model 1b
shows greater investment in man-made capital may be expected in these other
industries, and this effect is statistically significant at the 5 per cent level (but not in
model 2b).
Another interesting result from the logistic meta-regression model is that, in remote
regions, the rural entrepreneurs are required to invest more in local social capital.
Given that the residents of such remote regions are usually in tight-knit communities,
it is not surprising that successful entrepreneurship in such remote regions must rely
on connecting with these close networks. In Table 3.19, we saw that there is less
evidence of a contribution to social capital among the newcomer cases, and the
coefficient sign is correspondingly negative in Table 3.21, but the variable is not
statistically significant in that table. The equations for human capital development,
1d and 2d, suggest that job creation by rural entrepreneurs is greater in the case of
other sectors, rather than in tourism and agriculture (but not significant in model 2d).
An interesting contrast between the models based only on qualitative data and those
based on all cases can be observed by comparing models 1d and 2d with respect to
the influence of remoteness. When pooling all cases, job creation is less likely in

106
rural entrepreneurship if it is undertaken in remote rural regions. Those researchers
using qualitative data, however, found that in remote rural regions there was a greater
emphasis on human capital development. In both cases, the coefficient is statistically
significant at the 5 per cent level. The overall results suggest that rural areas do not
only have push factors such as a lack of jobs and low incomes but there are rural pull
factors as well, such as the natural environment, the expected lower level of stress,
and the more attractive lifestyle. On this basis, the following section discusses the
entrepreneurs and their impacts, with special focus on the intervening opportunities
in rural areas.
3.5.3 Creating and perceiving the opportunities in European villages
The goal of achieving the continuity and sustainability of rural areas calls for more
involvement of, and in, the local area and its potential. Today, both the social-
economic and the infrastructural and technical capabilities of rural areas are
changing. Many researchers have evaluated migrants settling in rural areas as the
agents of change. But, rural areas cannot be changed without the engagement of the
local population. In other words, the integration of change agents is a difficult task to
achieve because of the strong and closed social ties which have existed in rural areas
for centuries. Therefore, we aimed to find out in Section 3.5.1 what matters the most
in order to become embedded as an entrepreneur in rural areas, and in Section 3.5.2
what are the differences and similarities between local and newcomer rural
entrepreneurs in terms of their contributions to rural capital by means of a meta-
analytic approach.
The most interesting output of meta-analysis is the possibility to come up with new
theoretical propositions. The results of our analysis on embeddedness confirm that
the most common assumptions on embeddedness related to the rural environment,
while the transference of conventional urban theories transferred to the profiles of
rural entrepreneurs was rejected. In the literature, not only using the potential of rural
areas is important in achieving the goals of rural development plans, but also being
able to benefit from this potential makes the start-up process of entrepreneurs easier
and brings success faster than expected. The results of our study confirm this view,
and also show that using local information is very important for an entrepreneur to be
accepted in the rural environment. Another interesting outcome of our analysis is that
the main theories of embeddedness based on urban evidence related to the profile of

107
entrepreneurs seem to fail in the rural context. The results show that the origin of an
entrepreneur does not influence nor does it have a great importance, in determining
the embeddedness level of entrepreneurs. In addition, the results of our analysis
stress the importance of the specific sector of the enterprise in order to determine the
level of embeddedness of entrepreneurs. In the comparative approach used in this
study, publication data (pub-data) appeared to have a relative importance in terms of
determining the embeddedness level (EL), but it was not as important as the locality
level of entrepreneurs and the specific sector of enterprises.
Although the results of our first analysis show that the origin is not very associated
with the integration of change agents in rural areas, the empirical evidence in the
literature and the limited number of rural entrepreneurship studies led us to
investigate in greater detail the origin and the impacts of both local and newcomer
change agents comparatively.
According to the results of our analysis on the origin of entrepreneurs, we suggest
four main propositions. The first proposition is that newcomer and local
entrepreneurs are not really different with respect to their contributions to natural and
human capital. The second proposition is that newcomers play a crucial role in the
continuity and regeneration of the physical environment in rural areas. The third
proposition is that the search for a new lifestyle is the main motivator of
entrepreneurs moving to rural areas, but that the need to generate employment for
oneself and one’s family is the main factor driving local entrepreneurs to remain in
rural areas and start up a business there. The fourth and final proposition that is
consistent with the results of our meta-analysis is that the origin of the entrepreneur
may not be of direct importance in terms of generating additional rural capital, but
that entrepreneurs may indirectly affect the different types of rural capital differently
through their differences in preferred type of economic activity. For example,
manufacturing and services investment may be particularly beneficial for job
creation, but detrimental to the natural environment, and newcomer rural
entrepreneurs are more likely to invest in such activity than in agriculture.
As a result, we suggest that the primary role of the newcomer entrepreneur in rural
areas is not to be the person ‘responsible’ for the development in rural areas, but
instead to be the ‘catalyst’ for such development. Their interaction and integration
with the local rural population may stimulate the local people to be more

108
entrepreneurially-oriented themselves. This interaction may also lead the local
entrepreneurs to be more concerned about the problems of their rural region, while
the motivation and behaviour of newcomer entrepreneurs appears to be primarily
related to their own lives and needs. Although we came up with some very
interesting results, the way in which the recent literature has addressed the issues has
severely limited our ability to conduct comparative research in a quantitative form.
For example, we had to exclude studies in which the origin of the entrepreneurs was
not precisely given. In addition, using mainly ethnographic studies limits the
potential to obtain results that can be generalized. It must be noted that there are also
subjective judgements in the construction of meta-analytic databases that can
potentially bias the results. However, this is no different from the empirical
modelling in primary studies which also requires a mix of theory, data, and
judgement. Furthermore, our measure of the rural impact was limited to the presence
of an impact or not. The available studies did not permit us to measure the magnitude
or the efficiency of the impact. Despite these limitations, the present syntheses of
applied studies have nonetheless been successful in highlighting the rural
entrepreneurs and their impacts on rural capital. In the following chapter, we focus
on the other two rural users/stakeholders, viz. visitors and inhabitants, to reflect their
respective perspectives on new rural areas and on sustainable rural development.
3.6 New Rural Areas and Sustainable Rural Development
Despite the drastic changes in policies from a localized perspective to a global
vision, the good image and the improvement of the attractiveness of an area depend
on the conservation/continuity and promotion of the dynamics of locality,
particularly the cultural heritage (Forte et al., 2005). The different dynamics of
localities which determine the attractiveness of regions can no longer be experienced
in the old sense, as they are now being penetrated by non-local forces and goods
(Relph, 1976; Taylor, 2000). Thus, the old and bad image of rural areas which can
nevertheless generate traditional locality has changed into an attractive image, so that
both the local population and visitors can experience the rural idyll. Therefore, this
chapter discusses the new rural perception by means of the dynamics of locality and
sustainable rural development from two perspectives, viz. (i) that of the visitors; and
(ii) that of the local population.
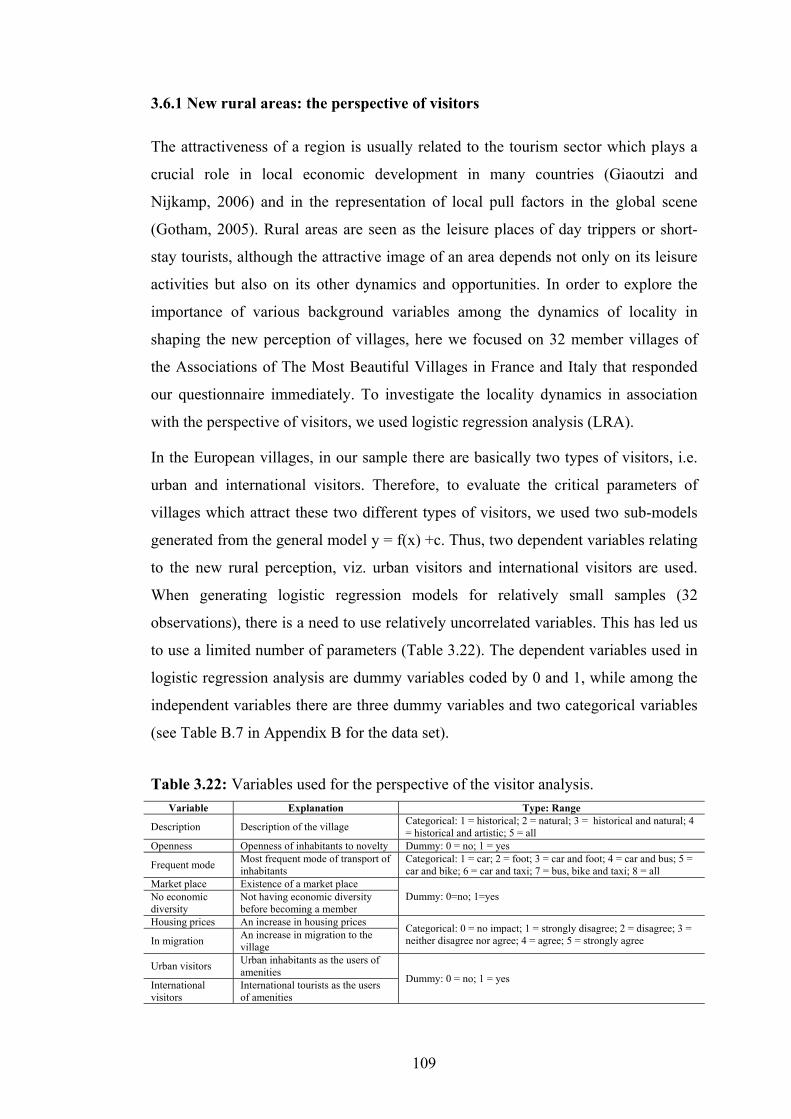
109
3.6.1 New rural areas: the perspective of visitors
The attractiveness of a region is usually related to the tourism sector which plays a
crucial role in local economic development in many countries (Giaoutzi and
Nijkamp, 2006) and in the representation of local pull factors in the global scene
(Gotham, 2005). Rural areas are seen as the leisure places of day trippers or short-
stay tourists, although the attractive image of an area depends not only on its leisure
activities but also on its other dynamics and opportunities. In order to explore the
importance of various background variables among the dynamics of locality in
shaping the new perception of villages, here we focused on 32 member villages of
the Associations of The Most Beautiful Villages in France and Italy that responded
our questionnaire immediately. To investigate the locality dynamics in association
with the perspective of visitors, we used logistic regression analysis (LRA).
In the European villages, in our sample there are basically two types of visitors, i.e.
urban and international visitors. Therefore, to evaluate the critical parameters of
villages which attract these two different types of visitors, we used two sub-models
generated from the general model y = f(x) +c. Thus, two dependent variables relating
to the new rural perception, viz. urban visitors and international visitors are used.
When generating logistic regression models for relatively small samples (32
observations), there is a need to use relatively uncorrelated variables. This has led us
to use a limited number of parameters (Table 3.22). The dependent variables used in
logistic regression analysis are dummy variables coded by 0 and 1, while among the
independent variables there are three dummy variables and two categorical variables
(see Table B.7 in Appendix B for the data set).
Variable Explanation Type: Range
Description Description of the village Categorical: 1 = historical; 2 = natural; 3 = historical and natural; 4 = historical and artistic; 5 = all
Openness Openness of inhabitants to novelty Dummy: 0 = no; 1 = yes
Frequent mode Most frequent mode of transport of inhabitants
Categorical: 1 = car; 2 = foot; 3 = car and foot; 4 = car and bus; 5 = car and bike; 6 = car and taxi; 7 = bus, bike and taxi; 8 = all
Market place Existence of a market place Dummy: 0=no; 1=yes No economic
diversity Not having economic diversity before becoming a member
Housing prices An increase in housing prices Categorical: 0 = no impact; 1 = strongly disagree; 2 = disagree; 3 = neither disagree nor agree; 4 = agree; 5 = strongly agree In migration An increase in migration to the
village
Urban visitors Urban inhabitants as the users of amenities Dummy: 0 = no; 1 = yes International
visitors International tourists as the users of amenities
Table 3.22: Variables used for the perspective of the visitor analysis.

110
Therefore, in the first model that we used to evaluate the new rural perception of
villages from the perspective of the urban inhabitants, only four parameters were
used, viz. openness; market place; housing prices; and in-migration. The second
model explaining the new rural perception from the viewpoint of international
visitors includes only three parameters, viz. description; frequent mode of
transportation; and no economic diversity. In both cases, c is the constant intercept.
According to the significance values of chi-square (Sig. χ2), the two models that
evaluate the attractiveness of villages from the perspective of different types of
visitors are valid (Table 3.23). The model explains the urban visitor’s perspective
with a 90.6 per cent explanation rate, while the second model explains the
international visitor’s perspective with an 81.3 per cent explanation rate (Table 3.23)
by the use of the ‘entre’ method. After determining relatively uncorrelated
exploratory variables, then, according to the results of the analysis, at the 10 per cent
confidence level the most important factors to attract urban visitors are: openness of
villagers; the existence of a market place; increase in housing prices; and increase in
in-migration (Table 3.23). Among these parameters, openness of villagers and
increase in housing prices are the positively associated variables, while the existence
of a market place and the increase in in-migration are negatively associated with the
new rural perception. The reason for the negative impact of the existence of a market
place is that, if a market place exists in a village, the products sold are not only local
products but products brought from other regions.
Model Variable
Sig. χ2 Correct
classification rate
Name B Sig.
Model 1: New rural perception from the perspective of urban visitors
0.002 90.6
Openness 3.333 0.10 Market place -4.061 0.06
Housing prices 1.917 0.03 In-migration -0.974 0.10
Constant -5.093 0.08 Model 2: New rural perception from the perspective of the international visitors
0.000 81.3
Description -0.985 0.05 Frequent mode 0.753 0.05
No economic diversity 3.308 0.02 Constant -0.221 0.85
Table 3.23: Statistical results of locality forces related to attractiveness.

111
In other words, even though market places that have existed since the earliest years
of the settlements are seen as the places to publicize local products, eventually, as
mentioned by Webber (1964) and Giddens (1990), these products are not purely local
but are also brought in from other settlements. In addition, the negative sign of the
increase in number of in-migrants is a parameter which shows that rural areas have
already become populated and discovered.
The results of the first model show that locality and quality are the main rural
characteristics that attract urban visitors. According to the results of the second
model which explains the new rural perception for international visitors , among the
indicators chosen on the basis of the results of the correlation table, the significant
rural characteristics at the 5 per cent confidence level are: description; frequent
mode; and no economic diversity (Table 3.23). The negative sign of the variable the
historical, natural or artistic characteristics of the villages means that the presence of
historical heritage is more associated with attracting international visitors to the
villages. Again, the results show the importance of locality, but, this time, emphasize
more the importance of cultural heritage and traditions as the attractors of
international visitors.
The results of both sub-models explained in this section show that traditional
locality, referring to cultural heritage and traditions, is the best tool to attract or to
create an attractive image for villages. Today’s modern era calls for changes and the
accumulation of spaceless products, i.e. knowledge. Villages and towns offering
traditional knowledge of the locality now seem to be more attractive than in the past
compared with cities which usually lack this kind of knowledge, and city dwellers
who visit these rural localities are curious about it.
The sustainability of traditional locality can also be called cultural heritage, which
comprises both the tangible and intangible attributes of a society that come from the
past. Cultural heritage, together with natural heritage including the countryside and
natural environment, is seen as an important component of the tourism sector,
attracting many visitors from near and far settlements both locally and globally. The
heritage in the countryside is often unique which requires its preservation. Therefore,
sustainable rural development usually covers the preservation of this heritage, as well
as the improvement of social well-being and economic development. Unlike visitors,
the local population live with this heritage without noticing its economic value. Thus,
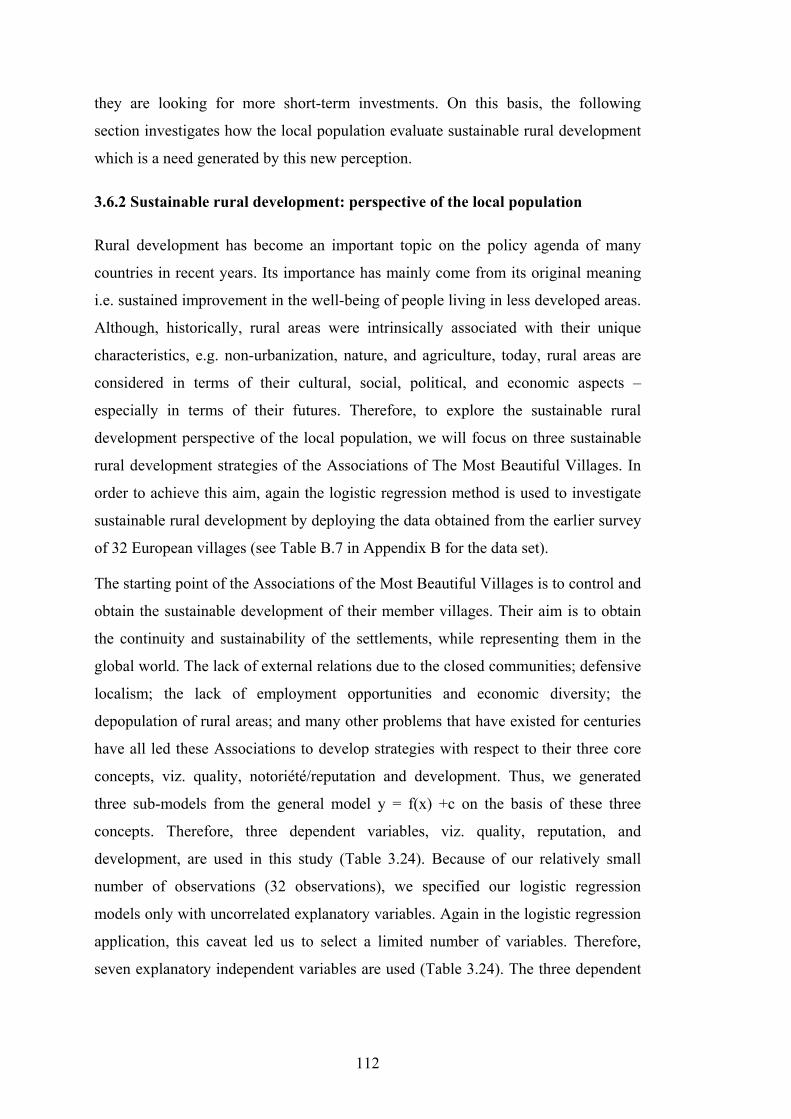
112
they are looking for more short-term investments. On this basis, the following
section investigates how the local population evaluate sustainable rural development
which is a need generated by this new perception.
3.6.2 Sustainable rural development: perspective of the local population
Rural development has become an important topic on the policy agenda of many
countries in recent years. Its importance has mainly come from its original meaning
i.e. sustained improvement in the well-being of people living in less developed areas.
Although, historically, rural areas were intrinsically associated with their unique
characteristics, e.g. non-urbanization, nature, and agriculture, today, rural areas are
considered in terms of their cultural, social, political, and economic aspects –
especially in terms of their futures. Therefore, to explore the sustainable rural
development perspective of the local population, we will focus on three sustainable
rural development strategies of the Associations of The Most Beautiful Villages. In
order to achieve this aim, again the logistic regression method is used to investigate
sustainable rural development by deploying the data obtained from the earlier survey
of 32 European villages (see Table B.7 in Appendix B for the data set).
The starting point of the Associations of the Most Beautiful Villages is to control and
obtain the sustainable development of their member villages. Their aim is to obtain
the continuity and sustainability of the settlements, while representing them in the
global world. The lack of external relations due to the closed communities; defensive
localism; the lack of employment opportunities and economic diversity; the
depopulation of rural areas; and many other problems that have existed for centuries
have all led these Associations to develop strategies with respect to their three core
concepts, viz. quality, notoriété/reputation and development. Thus, we generated
three sub-models from the general model y = f(x) +c on the basis of these three
concepts. Therefore, three dependent variables, viz. quality, reputation, and
development, are used in this study (Table 3.24). Because of our relatively small
number of observations (32 observations), we specified our logistic regression
models only with uncorrelated explanatory variables. Again in the logistic regression
application, this caveat led us to select a limited number of variables. Therefore,
seven explanatory independent variables are used (Table 3.24). The three dependent

113
variables used for evaluation are dummy variables while the seven independent
variables are composed of two dummy and five categorical variables.
The first concept called ‘quality’ is related to the protection and enhancement of the
historical and cultural heritage in the villages (MBVF, 2008a). The quality concept,
which contributes to the man-made environment including the quality of housing, is
measured in the analysis by the existence of an increase in house prices, which is
associated with three independent variables, i.e. the presence of expatriates; a
decrease in the number of farmers; and finding it easy to obtain financial support for
village projects.
Variable Explanation Type: Range Expatriates International migrant residents Dummy: 0=no; 1=yes Tourists International tourists Economic diversity An increase in the diversity of economic activities Categorical:
0=no impact; 1= strongly disagree; 2=disagree; 3=neither disagree nor agree; 4= agree; 5=strongly agree
Farmers A decrease in the number of farmers Agriculture A decrease in agricultural activities Local products An external market of local products
Support Finding it easy to obtain technical and financial support
Quality An increase in housing prices Dummy: 0=no; 1=yes Notoriété/Reputation Becoming well-known outside the village
Development A decrease in unemployment
The second concept is the ‘notoriété/reputation’ of the villages. Sustainable
development requires the exploitation of existing strong local relations, including the
creation of strong external relations so that the villages can be players in today’s
modern economic and competitive societies. Therefore, the contributions from the
representation of the villages at the national and international level are measured by
the increase in the reputation of the villages in both platforms, which is explained by:
the presence of international tourists; and the ability to sell local products outside the
villages. The last concept is the ‘development strategy’. The development is related
to the increase of the number of economic actors who can become aware of their
cultural heritage and their potential, while discovering how to benefit from their
existing resources and opportunities. Thus, we measured the development concept
by the decrease of unemployment, which is explained by three variables: obtaining
economic diversity; a decrease in agricultural activities; and sales of local products
outside the villages.
Table 3.24: Variables used for the perspective of the local population.

114
Following the same steps in the earlier application of logistic regression, the results
of the validity tests of the three models show that their chi-squares are significant,
and therefore these models are valid. Table 3.25 shows that 90.6 per cent of the
results of the quality model can be explained at the 10 per cent level by the presence
of expatriates; a decrease in the number of farmers; and finding it easy to obtain
financial support for projects in the villages.
Model Variables
Sig. χ2 Correct classification
rate B Sig.
Model 1: Quality as a strategy for sustainable development
0.001 90.6
the presence of expatriates 3.080 0.10 a decrease in the number of farmers 1.114 0.02
finding it easy to obtain financial support for projects in the villages 0.743 0.10
C -4.251 0.04 Model 2: Notoriété/reputation as a strategy for sustainable development
0.001 93.8 impact of international tourists -2.589 0.10
ability to sell local products outside the villages 1.520 0.04 C 3.098 0.45
Model 3: Development as a strategy for sustainable development
0.000 87.5
obtaining the economic diversity 3.819 0.07 a decrease in agricultural activities -3.722 0.09
ability to sell local products outside the villages 3.895 0.07 C -7.112 0.05
According to the results of the model of the first concept, the local population
considers the quality increase is associated with the presence of expatriates, the
decrease in numbers of farmers, and finding it easier to obtain financial support for
their projects. In the literature, the motivation of expatriates is shown to be related to
quality-of-life issues rather than to economic opportunities. In addition, the link
between quality and the decreasing number of farmers from the perspective of the
local population can be seen at first glance as a discontinuity rather than a
contribution, as farmers are the traditional economic actors. But, farmers who have
suffered for years from unemployment and lack of income have a tendency to sell
their farms to the expatriates in order to get money and then move to the urban areas,
believing they will find a better life there or they may start-up a new business in the
village. Therefore, although farms may continue to exist, farmers are tending to
change their economic activities from farming to other flourishing economic
activities which are now beginning to appear in their village. As a result, by
Table 3.25: The main strategies of the Associations.

115
increasing the quality in the village, the Associations may change the actors, and then
the locality may be changed. The second concept, the ‘notoriété/reputation’ of
villages is explained with a 93.8 per cent correct classification rate at the 10 per cent
confidence level by the negative impact of international tourists and the ability to sell
local products outside the villages (Table 3.25). From the perspective of the local
population, notoriété/reputation does not mean the attractiveness or the presence of
international tourists, but it is the capability to be present in both national and
international markets. It can be said immediately that the negative perception of
international tourists is a surprising result as the international tourists are seen as the
contributors of the notoriété/reputation of the areas because of their strong external
ties. But, the reason to visit rural areas is not only related to seeing the uniqueness of
these places but to escape from urban areas in order to experience ‘the traditional’.
Usually such tourists prefer to keep their discovered territory – rural areas – as
undiscovered and preserved as it used to be until their next visit. In other words, for
the local inhabitants, notoriété/reputation depends on entering and competing in the
global market with their unique and archetypal products, while creating their own
niche markets, but not on bringing or attracting people to visit their villages. This
also shows the breakdown of the closed system in rural areas and how they are now
looking forward to be an open society in the modern system.
The last concept ‘development’ is explained with an 87.5 per cent correct
classification rate at a 10 per cent significance level by: obtaining economic
diversity; maintaining the agricultural activities; and selling local products outside
the villages. According to this last model, from the perspective of the local
inhabitants, development means the protection of the traditional agricultural sector;
the diversification of economic sectors in the villages; and the promotion of local
products in the global market. From a local perspective, sustainable rural
development lies at the heart of continuity of the tradition, the economic diversity,
and the promotion of rural areas. In other words, the local population, as well as
visitors, are happy to continue to preserve the cultural heritage in the rural areas. In
the next section, we discuss the perspectives of both the visitors and the local
population.

116
3.6.3 Sustainable rural development perception in Europe
The dynamics of locality, i.e. cultural heritage and traditions, are the vehicles of
sustainability and competitiveness in our modern era. For many people, rural areas
promoting the forgotten and desired Arcadian idyll have become some of the most
attractive visiting and living places. But, this attractiveness can have both positive
and negative impacts which call for creative and innovative ideas in order to increase
the quality of life and enable economic activities to flourish, and hence obtain
sustainable rural development. In Chapter 3.6, in order to investigate the sustainable
development in rural areas while focusing on the important dynamics of locality, the
“Association of the Most Beautiful Villages in France and Italy” was used as a case
study. In order to achieve this aim, we investigated the most important dynamics of
locality from the perspective of visitors and the sustainable rural development from
the perspective of the local inhabitants in 32 member villages. The nature of the
variables, and the relatively small sample used in this investigation led us to apply a
logistic regression analysis in order to emphasize the important dynamics of locality
from different perspectives.
According to the results, from the perspective of visitors, attractiveness of villages is
associated with well-protected heritage and locality. In other words, the villages in
our sample that offer and publicize knowledge of local customs and traditions seem
to be more attractive in the modern knowledge-based society. The results show that
cultural heritage, together with natural heritage including the countryside and the
natural environment, is seen as an important component of the tourism sector,
attracting many visitors from near and far settlements, both locally and globally.
Although, in today’s modern era, locality parameters determine the attractive image
of an area, the problems faced by villages are diverse and cannot be solved only by
increasing their attractiveness. The aforementioned Associations have been
successful in bringing together similar villages in different countries and also in
dealing with the problem of the previous neglect of the member villages by obtaining
the sustainability and continuity of the heritage and dynamics of locality. The results
of the second analysis which investigates the perspective of the local inhabitants
show that they evaluate sustainable development in relation to changing the
dynamics of the economy in their village, which is closely related to the image of the
villages.
117
The small number of cases prevents us from including a wider list of variables
because of their multi-collinearity. Nevertheless, this evaluation has been successful
in investigating sustainable development, and in understanding the importance of
locality in a competitive world. The importance of locality and even the importance
of the representation of rural areas in the global arena seem very important.
However, the world is urbanizing at an increasing pace, and cities are still the most
important settlements in the world. Therefore, the importance of rural areas is
emphasized by the increasing demand of mainly urban inhabitants for the traditional
locality which is lacking in many cities and has become one of the scarce goods in
knowledge-based modern economies.
3.7 Concluding Remarks on Part 3
The world is urbanizing at an increasing pace, and cities are still the most important
settlements in the world. But today, the importance of locality and even the
importance of rural areas are emphasized by the increasing demand of outsiders –
mainly urban inhabitants – for the traditional locality which is lacking in many cities
and has become one of the scarce goods in knowledge-based modern economies.
The importance of rurality is without any doubt associated with its connections to
agriculture coming from the past. But, agriculture is losing its importance in terms of
its economic weight and share in employment because of changes in national and
international economies. This situation has alerted governments to the need for
sustainable rural development and for some precautions to be taken to achieve the
sustainability of rural areas.
Each country defines rural areas from a different perspective, and thus generates its
own policies. Against this heterogeneity, the EU is trying to unify these perspectives
in a general and common understanding. The dynamism of rurality in combination
with the reformist view of the EU due to the need to keep up with the global
dynamism have led us to investigate sustainable rural development in rural Europe.
Thus, Part 3 has focused on successful European villages which are capable of
maintaining their traditions but nevertheless continue to develop. In order to do that,
Part 3 was composed of six chapters (Chapters 3.1-3.6).
118
In Chapters 3.1 and 3.2, we focused on the EU and European countries at the macro-
level in terms of their policy-based view on rural areas and the changing trends in
rural employment over time in order to better understand the evolution of rural
Europe.
Hence, we deepened our research by considering some specific villages in Europe
that are the Members of the Associations of The Most Beautiful Villages. Chapter
3.3 presented an explanation of these Associations, our sample, and the survey
conducted in these villages. After introducing our case studies, Chapters 3.4 and 3.5
provide our empirical results concerning the capacity of villages in our sample and
the new rural areas from the perspective of visitors and the local population,
respectively. Then, due to the difficulty of data collection, and the lack of sufficient
financial resources, but benefiting from the gap in the literature, Chapter 3.5 used a
meta-analytic approach to deal with entrepreneurship in rural Europe as a first
attempt to gather different empirical findings retrieved from the literature.
The results of the exploratory approach to the EU policies – the enlargement and the
CAP, the most effective policies in rural areas – suggest that rural Europe will
remain dynamic as a result of the accession of new Member States. Therefore, the
EU needs to keep its reformist view and country-specific treatments to sustain its
basic approach. In addition, the results of the exploratory analysis on the changing
trends and patterns of rural employment in the EU Member States show the
differences in the importance and the significance of rural (‘agriculture’)
employment in the labour market. The results also show, despite the differences
between Member States, the decrease and divergences of rural employment
experienced over time because of universal trends.
Although the importance of agriculture for the sustainability and self-sufficiency of a
country is an obvious and absolute reality, the changing trends in the sector, the
innovation and the challenging competitiveness have changed the nature of the
traditional productivity and labour demand, and hence rural employment has started
to search for ways of improvement. Rural areas which are reacting very rapidly to the
external constraints and changes, today are experiencing socio-economic, technical
and infrastructural changes. In order to better understand these changes occurring in
rural areas with a special focus on the Members of the Associations of The Most
Beautiful Villages (MBV), we collected data from 60 European villages. The reason
119
to choose the MBV was to be able to investigate the reaction and adaptation to these
changes by successful villages. Hence, the MBV by gathering such villages
succeeded, at that level, to enter the global competitive arena.
The changes occurring in villages are noticed mainly in the demographic changes
which can be a sign of the village’s capability to attract different people. In the light
of the aim of this chapter and the background of this study, we, furthermore,
evaluated the capacity of villages by focusing on their creative capacity and their
attractiveness. The results of the analysis on creative capacity show that the ability to
combine the contemporary developments, i.e. technology and innovation, with local
knowledge – in other words, the creativity in the villages – is the most important
component of rural creative capacity, followed by rural social life. In addition, the
results of an attractiveness analysis showed that this creative capacity, hand in hand
with the will of local population to be a part of the global system, can lead rural areas
to sustainable rural development and sustainable competitive advantage.
Many researchers have evaluated newcomers – especially entrepreneurs – as the
agents of rural change, because rural change cannot be obtained merely at the will of
the local population. Therefore, the acceptance of these change agents is a must for
rural change. On this basis, moreover, we investigated entrepreneurs on the basis of
their embeddedness, their origin, and their impacts on rural areas by means of a
meta-analytic approach. The first application of meta-analysis on the embeddedness
of entrepreneurs suggested that the integration/embeddedness of change agents
depends heavily on the degree of the level of locality and externality involved in
their business, but not on their origin. Furthermore, the results of the comparative
meta-evaluation of entrepreneurs by their origin suggested four main propositions for
further research. The first proposition is that newcomer and local entrepreneurs are
not really different with respect to their contributions to natural and human capital.
The second proposition is that newcomers play a crucial role in the continuity and
regeneration of the physical environment in rural areas. The third proposition is that
the search for a new lifestyle is the main motivator of entrepreneurs moving to rural
areas, but that the need to generate employment for oneself and one’s family is the
main factor driving local entrepreneurs to remain in rural areas and start up a
business there. The fourth and final proposition that is consistent with the results of
our meta-analysis is that the origin of the entrepreneur may not be of direct
120
importance in terms of generating additional rural capital, but that entrepreneurs may
indirectly affect the different types of rural capital differentially through the
entrepreneurs’ differences in the preferred type of economic activity. For example,
manufacturing and services investment may be particularly beneficial for job
creation, but detrimental to the natural environment, and newcomer rural
entrepreneurs are more likely to invest in such activity than in agriculture.
As a result, we suggest that the primary role of the newcomer entrepreneur in rural
areas is not that of being the person ‘responsible’ for development in rural areas, but
instead being the ‘catalyst’ for such development. Their interaction and integration
with the local population may stimulate the local people to be more
entrepreneurially-oriented themselves. This interaction may also lead local
entrepreneurs to be more concerned about the problems of their rural region, while
the motivation and behaviour of newcomer entrepreneurs appears to be primarily
related to their own lives and needs.
Furthermore, as a last step, we tried to understand the perspective of visitors and the
local population concerning the new perception of ‘rural’. According to the results,
from the perspective of visitors, the attractiveness of villages is associated with well-
protected heritage and locality. In other words, the villages in our sample that offer
and publicize the knowledge of local customs and traditions seem to be more
attractive in the modern knowledge-based society. The results of the study show that
cultural heritage, together with natural heritage including the countryside and the
natural environment, is seen as an important component of the tourism sector,
attracting many visitors from near and far settlements, both locally and globally.
Although, in today’s modern era, locality parameters determine the attractive image
of an area, the problems faced by villages are diverse and cannot be solved only by
increasing their attractiveness as a visiting place. Therefore, the results of the
analysis on the perception of the local population suggested that sustainable rural
development lies at the heart of continuity of the tradition, the economic diversity,
and the promotion of rural areas.
Although because of our biased sample of beautiful villages and the other sample
formulated for the use of meta-analysis, we can not generalize our findings for all
rural Europe, the overall picture drawn in Part 3 at the macro- and micro-levels
shows that, in Europe, much weight is given to locality and locality-specific

121
treatments. Therefore, today, many of the rural areas, by being appreciated, are well-
developed and benefit from contemporary changes. Although they still face some
problems, the EU, national and local governments are implementing creative ideas to
deal with these problems and have brought success to the villages. Notwithstanding
all these efforts, rural areas are still alas represented in the global arena by their
urban counterparts instead of being represented by themselves, so they are searching
for ways to have a voice by means of their numerous opportunities.

122

123
4. RURAL AREAS AS PROMISING HOT SPOTS IN TURKEY
4.1 The evolution of rural development in Turkey
Due to the dominant rural characteristics of Turkey, both rural areas and rural
development were on the policy agenda of the country for many years. Although, in
the first years of the Republic, there was much interest in the development of rural
areas, later on the modernization of agriculture and industrialization leading to
increased regional disparities took precedent over rural development. However, in
recent years, it has regained its priority as a result of the changing perception of
rurality and accelerated relations with the EU. In order to better understand the
evolution of rural development in Turkey, this chapter evaluates its attempts at rural
development in two periods, viz. the unplanned period, and the planned period
including the current policies.
4.1.1 Rural development in Turkey during the unplanned period (1923-1962)
Attempts to develop rural areas and to improve the living conditions of the rural
population in Turkey go back to the foundation years of the Republic (Akşit, 2006).
Inherited problems from the Ottoman Empire in agricultural production, food safety,
defragmentation and the problems of micro- and small enterprises, and the aftermath
of The War of Independence were the main interest of the government in the first
years of the Republic. In this section, we aim to summarize the rural development of
Turkey starting from the first years of the Republic until the start of national plans.
The timeline of events and attempts related to rural areas and their development
between the years 1920 and 1962 is given in Figure 4.1. Boratav (2007) examines the
history of Turkey’s economic development in five periods, but here we focus on
rural-specific development which was also affected in these particular periods.
The beginning of the unplanned period can be traced back to the 1st Congress of
Economics which was held in Izmir between 17 February and 24 March 1923. The
Congress was held in order to emphasize the importance of economic development,
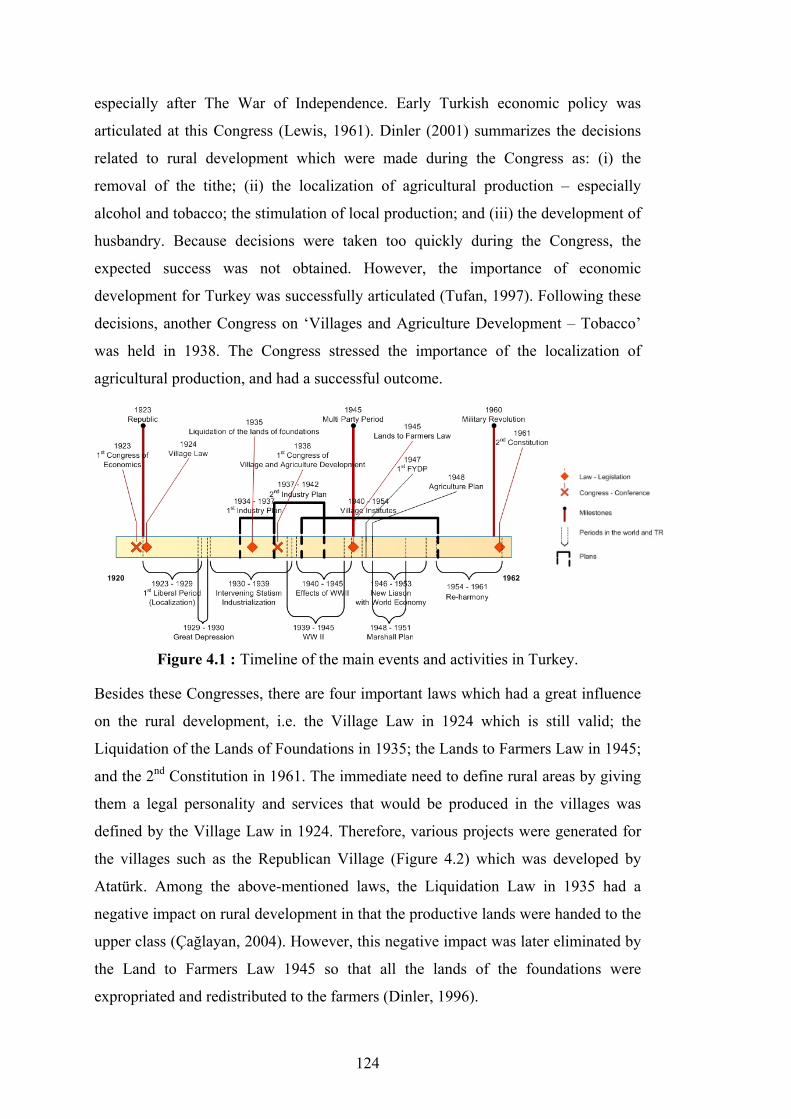
124
especially after The War of Independence. Early Turkish economic policy was
articulated at this Congress (Lewis, 1961). Dinler (2001) summarizes the decisions
related to rural development which were made during the Congress as: (i) the
removal of the tithe; (ii) the localization of agricultural production – especially
alcohol and tobacco; the stimulation of local production; and (iii) the development of
husbandry. Because decisions were taken too quickly during the Congress, the
expected success was not obtained. However, the importance of economic
development for Turkey was successfully articulated (Tufan, 1997). Following these
decisions, another Congress on ‘Villages and Agriculture Development – Tobacco’
was held in 1938. The Congress stressed the importance of the localization of
agricultural production, and had a successful outcome.
Figure 4.1 : Timeline of the main events and activities in Turkey.
Besides these Congresses, there are four important laws which had a great influence
on the rural development, i.e. the Village Law in 1924 which is still valid; the
Liquidation of the Lands of Foundations in 1935; the Lands to Farmers Law in 1945;
and the 2nd Constitution in 1961. The immediate need to define rural areas by giving
them a legal personality and services that would be produced in the villages was
defined by the Village Law in 1924. Therefore, various projects were generated for
the villages such as the Republican Village (Figure 4.2) which was developed by
Atatürk. Among the above-mentioned laws, the Liquidation Law in 1935 had a
negative impact on rural development in that the productive lands were handed to the
upper class (Çağlayan, 2004). However, this negative impact was later eliminated by
the Land to Farmers Law 1945 so that all the lands of the foundations were
expropriated and redistributed to the farmers (Dinler, 1996).
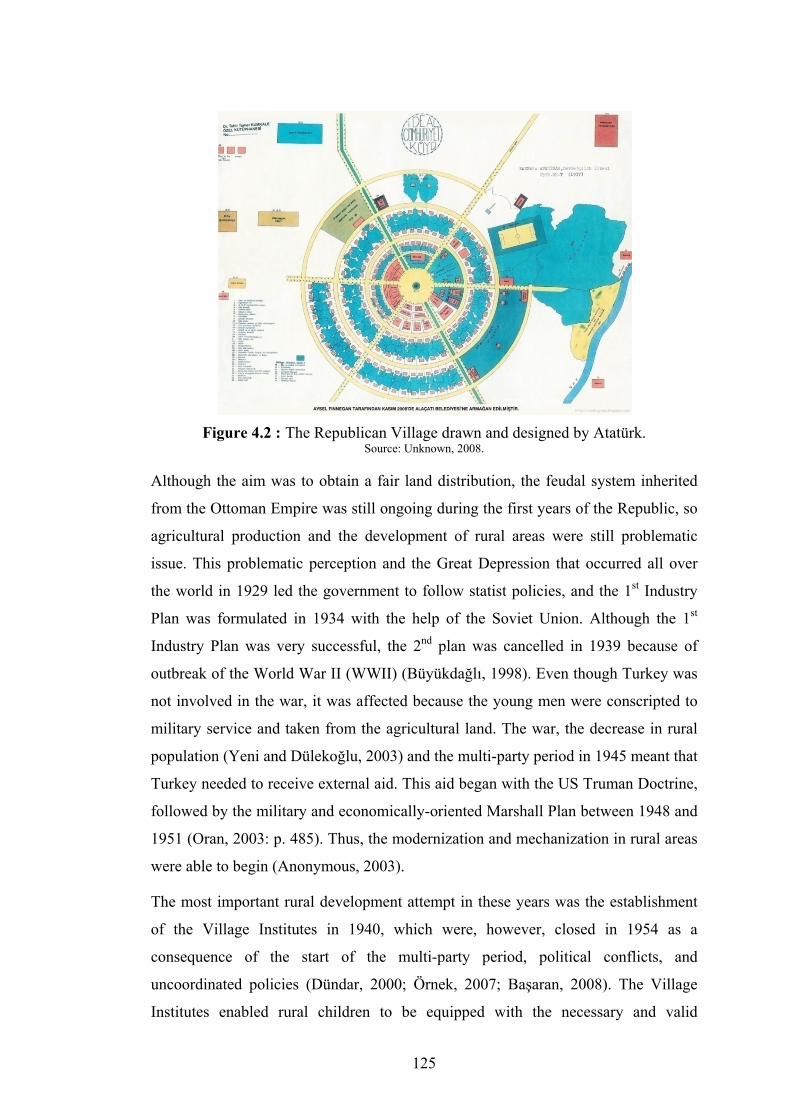
125
Figure 4.2 : The Republican Village drawn and designed by Atatürk.
Source: Unknown, 2008.
Although the aim was to obtain a fair land distribution, the feudal system inherited
from the Ottoman Empire was still ongoing during the first years of the Republic, so
agricultural production and the development of rural areas were still problematic
issue. This problematic perception and the Great Depression that occurred all over
the world in 1929 led the government to follow statist policies, and the 1st Industry
Plan was formulated in 1934 with the help of the Soviet Union. Although the 1st
Industry Plan was very successful, the 2nd plan was cancelled in 1939 because of
outbreak of the World War II (WWII) (Büyükdağlı, 1998). Even though Turkey was
not involved in the war, it was affected because the young men were conscripted to
military service and taken from the agricultural land. The war, the decrease in rural
population (Yeni and Dülekoğlu, 2003) and the multi-party period in 1945 meant that
Turkey needed to receive external aid. This aid began with the US Truman Doctrine,
followed by the military and economically-oriented Marshall Plan between 1948 and
1951 (Oran, 2003: p. 485). Thus, the modernization and mechanization in rural areas
were able to begin (Anonymous, 2003).
The most important rural development attempt in these years was the establishment
of the Village Institutes in 1940, which were, however, closed in 1954 as a
consequence of the start of the multi-party period, political conflicts, and
uncoordinated policies (Dündar, 2000; Örnek, 2007; Başaran, 2008). The Village
Institutes enabled rural children to be equipped with the necessary and valid
126
professional skills for the village, especially in teaching, as there was a lack of
teachers in village schools. This training would secure their employment in the
villages, and would contribute to socio-economic development by meeting the need
for the improvement of human resources (Dündar, 2000; SPO, 2006; Örnek, 2007;
Başaran, 2008). The start of the multi-party period and intervening statist period with
the end of liberalism had led to a political conflict not only in the policy arena but
also in the population (Boratav, 2007). This conflict ended with the Military
Revolution in 1960, and a new Constitution in 1961 which revised the socio-
economic structure of rural areas (Çağlayan, 2004).
In the unplanned period, except for the Village Institutes, most of the policies were
about agricultural production, but the idea of the localization of production was the
necessary start of rural development activities in those years. In addition, the two
attempts to produce national development plans, i.e. the 1st Five-Year Development
Plan (FYDP) in 1947 and the Agriculture Plan in 1948 were both failures. The next
section evaluates the planned period in Turkey by summarizing rural-related attempts
in each plan.
4.1.2 Rural development in Turkey during the planned period (1963-2013)
Although there were several plan attempts starting from the establishment of the
Republic, apart from the 1st Industry Plan, none of the attempts were successfully
implemented. Therefore, the early experiences and the beginning of the multi-party
period made it absolutely necessary to develop basic strategies for the development
of the country. Thus, the planned period started in 1963 with the 1st FYDP. During
the planned period, various projects were generated and implemented to develop
rural areas, basically the villages (SPO, 2006) (Figure 4.3).
The purpose of these projects or strategies was: to converge the living standards in
the rural areas to those in the urban areas; to facilitate the integration of the rural
market with the urban and national market network; to reduce the costs of services
provided to the rural areas; to raise the effectiveness of services by improving
accessibility for the wider part of the communities; and to plan and improve the
quality of rural settlements (SPO, 2006). Moreover, those aims which were not
achieved in one plan period had to be brought forward to the next plan period
because of the heterogeneity and the immense number of villages in Turkey.

127
Figure 4.3 : Timeline of the main events in the planned period in Turkey.
The 1st FYDP stressed the method of ‘Village Development’, otherwise called
‘Stated Social Development’ (SPO, 1963). The intrinsic principles of this method
were the self- and voluntary organization of the rural population in order to establish
the necessary cooperation with the public sector. The villages would own their
services, which would reduce costs. The Village Development was adopted as a
successful method in terms of education and organization in some parts of the
country but could not be extended everywhere (MARA, 2004; SPO, 2006). Another
project during the first plan was ‘Model Villages’ which were implemented between
1963 and 1965 as archetypes to ensure the coordination in services and cooperation
between actors, while eliminating the distance and remoteness of peripheral villages.
However, this attempt was also not successful and not implemented (MARA, 2004).
The failure of the Model Villages brought forward the implementation of another
project, i.e. Multidimensional Rural Area Planning (MRAP) during the 1st and 2nd
FYDP period. From 1965 to 1970, to increase the distinction between village and
city and to increase the self-sufficiency of the villages, MRAP was implemented in
six provinces, viz. Izmir; Manisa; Diyarbakır; Uşak; Şanlıurfa; and Malatya (MARA,
2004). This project was developed on the basis of previous implementations in the
Netherlands, Italy and Israel, but, due to the incorrect choice of priorities and
unsuitable structure, this was also a failure. Another project developed during the 2nd
FYDP period was the ‘Agriculture City’. The project aimed to cluster eight to ten
villages in order to share and cooperatively organize the services while constructing
agricultural industry and machinery centres in the central village (MARA, 2004).

128
However, although the project was implemented for ten years, its continuity could
not be maintained. In the period of the 3rd FYDP, another project was realized under
the name of the ‘Central Village’ policy. This policy was similar to the Agricultural
City project which had been replaced by the Village City model. The implementation
of the Village City model was interrupted after many years because of the political
diversity. However, it was resumed in 2000 at the Çavdar village of Mesudiye in
Ordu (SPO, 2006). The success of such initiatives was poor because of the limited
participation, the ignorance of the conditions of the country and localities, the lack of
coordination, the incorrect priorities, and the lack of cooperation and administrative
and technical capacity (MARA, 2004).
Rural development is the most important issue on Turkey’s agenda especially to
ensure country-wide development and to eliminate disparities among regions.
Because of the diversity in the country and the difficulty to implement general
strategies, during the planned period regional development can be seen as another
tool for rural development. Under the heading of regional development there were
also various projects (see Dinler, 2001). In contrast to rural development projects,
regional planning projects turned into actual plans and were implemented, viz. the
South Eastern Anatolia Project (SEAP) and the East Anatolia Development Project
(EADP).
As well as governmental projects and models, from the 1970s most of the rural
development projects were financed by foreign organizations (SPO, 2006). Thus, the
choice of location was governed by the priorities of the financial resource provider
and also by the development plans. Starting from 1972, the International Fund of
Agricultural Development (IFAD), the World Bank (WB), the International
Monetary Foundation (IMF), the EU, and others have financed rural development
projects. The objectives of the rural development projects completed or ongoing are
to raise income and living standards through the diversification of economic
activities in underdeveloped territories (SPO, 2006). Among the foreign financial
resource providers, the EU is the most important one for Turkey. From a policy
perspective, rural development is one of the most important challenges in EU-Turkey
relations. These relations have accelerated in the last decade with the start of
Turkey’s accession period. As a candidate country, Turkey, instead of being a part of
Special Accession Programme for Agriculture and Rural Development, (SAPARD)
129
like Romania and Bulgaria, first benefitted from the project Measures to Accompany
the Economic and Social Reforms in the Mediterranean Non-member Countries
(MEDA) in the context of regional development and cross-border cooperation
projects. Thus, Turkey has prepared a Preliminary National Development Plan for
2004-2006 (pNDP) within the framework of financial cooperation with the EU. This
was followed by the Instrument for Pre-Accession Assistance for Rural Development
(IPARD) starting from 2007.
The revision of the National Development Strategy and the Strategic Report of the
EU on Turkey were the stimulation for rural development actions and policies. Thus,
starting with the National Rural Development Strategy in 2006, both the 8th and the
9th FYDPs and agricultural strategy gave considerable space to rural development.
The 9th Plan envisages “Turkey, a country of the information society, growing in
stability, sharing more equitably, globally competitive and having fully completed
her accession to the EU” (SPO, 2007). To achieve this vision, the plan identifies five
development axes, viz. increasing competitiveness; increasing employment;
strengthening human development and social solidarity; ensuring regional
development; and increasing quality and effectiveness in public services. According
to the Plan, emphasizing the competitiveness axis includes special efforts to improve
the efficiency of the agricultural structure. Within this framework, achieving food
security and safety and the sustainable use of natural resources, and placing emphasis
on animal breeding by giving importance to animal health are all measures mainly
designed to create an agricultural structure that is highly organized and competitive.
Moreover, ensuring the regional development axis emphasizes the importance of
ensuring development in the rural areas. Within this context, the plan highlights the
creation of the necessary institutional framework for harmonization with the EU rural
development policies, and the effective use of EU pre-accession funds for rural
development by improved administrative capacity. It also highlights the priority to
prepare and implement the National Rural Development Plan (funded by national
and international resources) in line with the National Rural Development Strategy
(NRDS).
The NRDS sets out a comprehensive policy framework for rural development
policies in Turkey. It also establishes the basis for the “National Rural Development
Plan” (NRDP), currently under preparation, and provides a framework for relevant

130
stakeholders in preparing and implementing rural development programmes and
projects, both financed from national and international resources (MARA, 2004).
The NRDS identifies the main aim in rural development as “to improve and ensure
the sustainability of living and job conditions of the rural community in its territory,
in harmony with urban areas, based on the utilization of local resources and potential,
the protection of the rural environment and cultural assets”. In this context, four
strategic objectives, viz. (i) economic development and increasing job opportunities;
(ii) strengthening human resources, organization level and local development
capacity; and (iii) the protection and (iv) the improvement of the rural environment
(SPO, 2006).
The NRDS acknowledges the “Agriculture Strategy” for 2006-2010, which aims to
achieve “a competitive and sustainable structure in the agricultural sector in its
process of structural transformation”, which is a sectoral objective; while the NRDS
aims “to accelerate rural development in order to increase the welfare of rural
society”, which is a wider social objective. The harmonization and integration of
these two aims is considered important for developing the synergies between the
improvement of the agriculture sector and the protection and development of natural
resources in the framework of the sustainable environment (SPO, 2006).
From a policy perspective, the policies on rural development in Turkey seem very
comprehensive and very well-generated. However, the problems begin with the
implementation as a result of ignoring the specific characteristics and conditions of
locality which are very diverse in rural Turkey.
4.1.3 Development of rural Turkey: from past to present
The importance of rural areas and their development come from the land history and
geography, as well as from the large size of Turkey in terms of its land area. In
Chapter 4.1, we have tried to summarize the milestones and the attempts of the
Republic of Turkey in terms of rural development during two periods, viz. the
unplanned period and the planned period.
From historical perspective, Turkey, although successful in the first years of the
establishment of the Republic with its localization policies, could not implement its
projects until it started to receive external aid, especially finance. From a political
perspective, the changes in the political system and the diversity of political views

131
that created conflicts had a negative influence on rural areas and rural development,
so the continuity of projects, as well as a seamless rural policy, have not been
obtained. From an economic perspective, external forces, e.g. WWII and the Great
Depression, negatively affected the development attempts in rural Turkey. From an
institutional perspective, the lack of coordination between public organizations and
the other stakeholders has limited widespread policy implementation. The most
important outcome of our evaluation is that the failure of the rural development plans
is basically caused by the diversity of localities, which was not sufficiently taken into
account in the projects. This has been proven by the success of those projects and
plans which were shaped by local characteristics and needs.
In addition, local needs, such as economic capacity building: in other words, creating
job opportunities, diversifying economic activities, and increasing the entrepreneurial
skills are also usually not included in the projects, and instead their main focus is
often the development of the infrastructure and agricultural productivity.
The rural development issue has been newly raised comprehensively in Turkey in
recent years in connection with the acceleration of the EU membership process.
However, only a partial understanding of this can be observed in the implementations
of the Ministry of Agriculture and Rural Affairs (MARA). Although rural areas are
developing, the structural changes showed that, compared with urban areas, rural
areas are still relatively less attractive. This has been mainly caused by the inability
to generate policy for localities and by the lack of seamless rural policies. In the next
chapter, we evaluate the structural changes in rural Turkey.
4.2 The Rural Structure in Turkey
Turkey’s rural policies were never seamless, and rural areas have been suffering
from this for decades. The complexity and the spread of rural areas in this large
country make it difficult to develop uniform policies, as well as to provide a general
picture of its complexity. Against this background, to clarify this complexity,
Chapter 4.2 describes a multi-dimensional approach to rurality in Turkey, while
describing the structural changes that have occurred in rural Turkey.
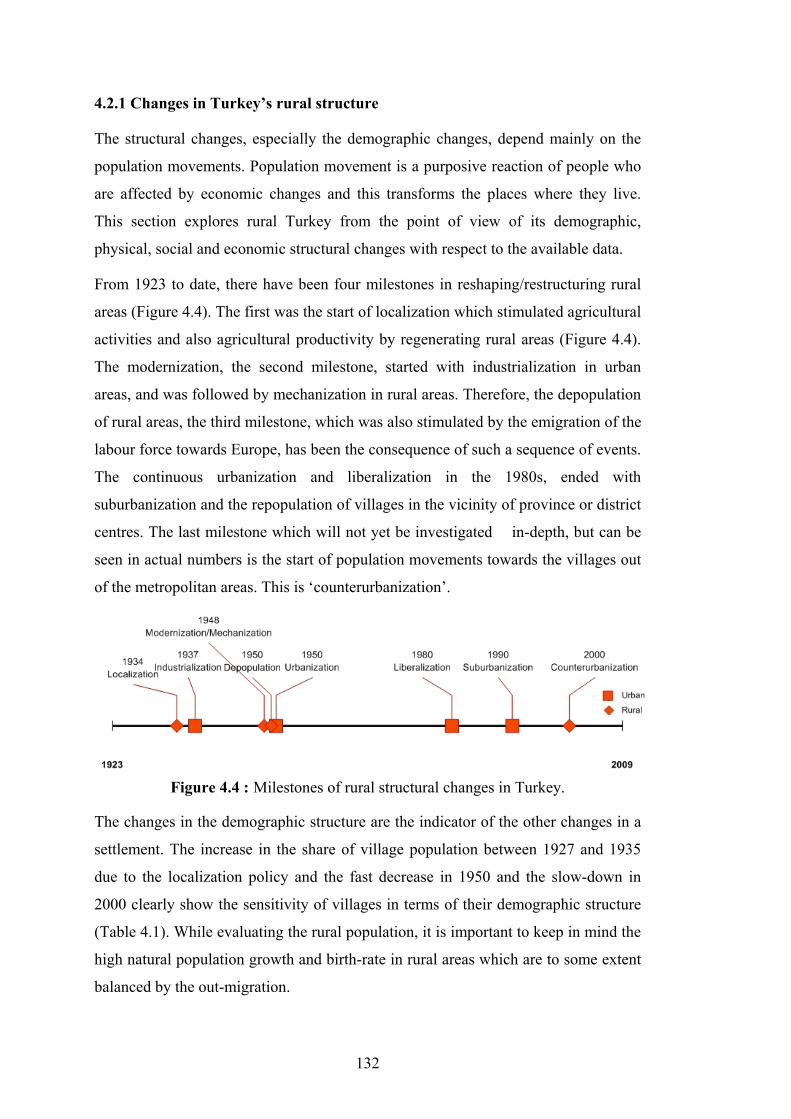
132
4.2.1 Changes in Turkey’s rural structure
The structural changes, especially the demographic changes, depend mainly on the
population movements. Population movement is a purposive reaction of people who
are affected by economic changes and this transforms the places where they live.
This section explores rural Turkey from the point of view of its demographic,
physical, social and economic structural changes with respect to the available data.
From 1923 to date, there have been four milestones in reshaping/restructuring rural
areas (Figure 4.4). The first was the start of localization which stimulated agricultural
activities and also agricultural productivity by regenerating rural areas (Figure 4.4).
The modernization, the second milestone, started with industrialization in urban
areas, and was followed by mechanization in rural areas. Therefore, the depopulation
of rural areas, the third milestone, which was also stimulated by the emigration of the
labour force towards Europe, has been the consequence of such a sequence of events.
The continuous urbanization and liberalization in the 1980s, ended with
suburbanization and the repopulation of villages in the vicinity of province or district
centres. The last milestone which will not yet be investigated in-depth, but can be
seen in actual numbers is the start of population movements towards the villages out
of the metropolitan areas. This is ‘counterurbanization’.
Figure 4.4 : Milestones of rural structural changes in Turkey.
The changes in the demographic structure are the indicator of the other changes in a
settlement. The increase in the share of village population between 1927 and 1935
due to the localization policy and the fast decrease in 1950 and the slow-down in
2000 clearly show the sensitivity of villages in terms of their demographic structure
(Table 4.1). While evaluating the rural population, it is important to keep in mind the
high natural population growth and birth-rate in rural areas which are to some extent
balanced by the out-migration.
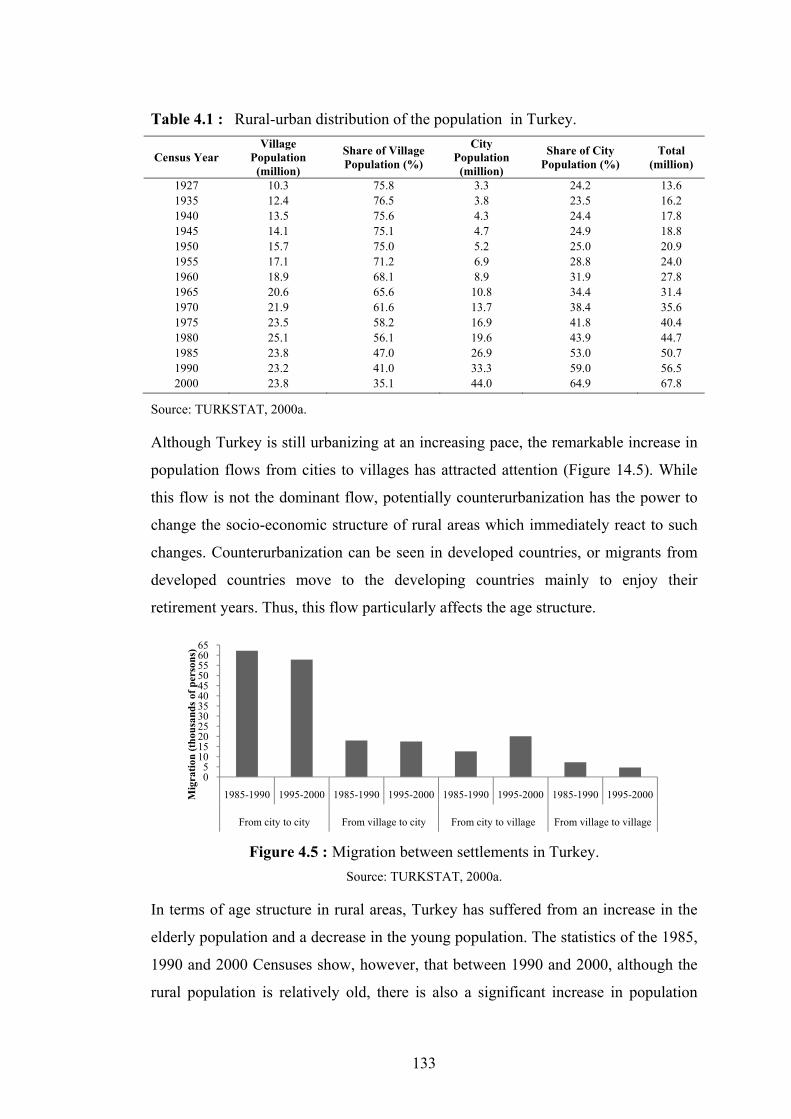
133
Census Year Village
Population (million)
Share of Village Population (%)
City Population (million)
Share of City Population (%)
Total (million)
1927 10.3 75.8 3.3 24.2 13.6 1935 12.4 76.5 3.8 23.5 16.2 1940 13.5 75.6 4.3 24.4 17.8 1945 14.1 75.1 4.7 24.9 18.8 1950 15.7 75.0 5.2 25.0 20.9 1955 17.1 71.2 6.9 28.8 24.0 1960 18.9 68.1 8.9 31.9 27.8 1965 20.6 65.6 10.8 34.4 31.4 1970 21.9 61.6 13.7 38.4 35.6 1975 23.5 58.2 16.9 41.8 40.4 1980 25.1 56.1 19.6 43.9 44.7 1985 23.8 47.0 26.9 53.0 50.7 1990 23.2 41.0 33.3 59.0 56.5 2000 23.8 35.1 44.0 64.9 67.8
Source: TURKSTAT, 2000a.
Although Turkey is still urbanizing at an increasing pace, the remarkable increase in
population flows from cities to villages has attracted attention (Figure 14.5). While
this flow is not the dominant flow, potentially counterurbanization has the power to
change the socio-economic structure of rural areas which immediately react to such
changes. Counterurbanization can be seen in developed countries, or migrants from
developed countries move to the developing countries mainly to enjoy their
retirement years. Thus, this flow particularly affects the age structure.
Figure 4.5 : Migration between settlements in Turkey.
Source: TURKSTAT, 2000a.
In terms of age structure in rural areas, Turkey has suffered from an increase in the
elderly population and a decrease in the young population. The statistics of the 1985,
1990 and 2000 Censuses show, however, that between 1990 and 2000, although the
rural population is relatively old, there is also a significant increase in population
05
101520253035404550556065
1985-1990 1995-2000 1985-1990 1995-2000 1985-1990 1995-2000 1985-1990 1995-2000
From city to city From village to city From city to village From village to village
Mig
ratio
n (t
hous
ands
of p
erso
ns)
Table 4.1 : Rural-urban distribution of the population in Turkey.

134
aged between 20 and 40 years old (Figure 4.6). This increase is first due to the return
of young people to their villages after finishing their education, and also due to the
counterurbanites who are of working age and prefer to live in rural areas.
Figure 4.6 : Structural changes in age distribution in Turkey.
Source: TURKSTAT, 1985; 1990; 2000.
In the wake of the above-mentioned demographic changes, there have been a series
of remarkable positive changes in rural Turkey. Rural Turkey has suffered not only
from depopulation but also from a low literacy rate and lack of education provision
in rural areas. But this now seems to have changed, as there has been a marked
increase between the years 1990 and 2000 in the literacy rate and the level of
education including the share of female literate population (Table 4.2). The increase
in the education level, as well as in the literacy rate, shows that human resources in
rural Turkey have been changed and increased lately. The reasons for this increase
can be ascribed to the efforts made by NGOs and local administrators, as well as to
the growing presence of highly-educated counterurbanites.
Another much discussed problem of rural areas is their economic structure. Because
of the national economic crisis, the employment rate has decreased over time,
especially in recent years all over Turkey including the rural areas (Figure 4.7), and
so has the participation rate of the rural labour force. On the other hand, the
fluctuations in the rural unemployment rate call for in-depth analysis. But, it is
possible to say that employment growth in rural areas lags slightly behind population
growth, though the young people who are students are not included in the
employment rate.
0
10
20
30
40
50
60
70
80
90
1985 1990 2000
Age
Dis
trib
utio
n (%
)
00−14 15−24 25−34 35−44 45−54 55+
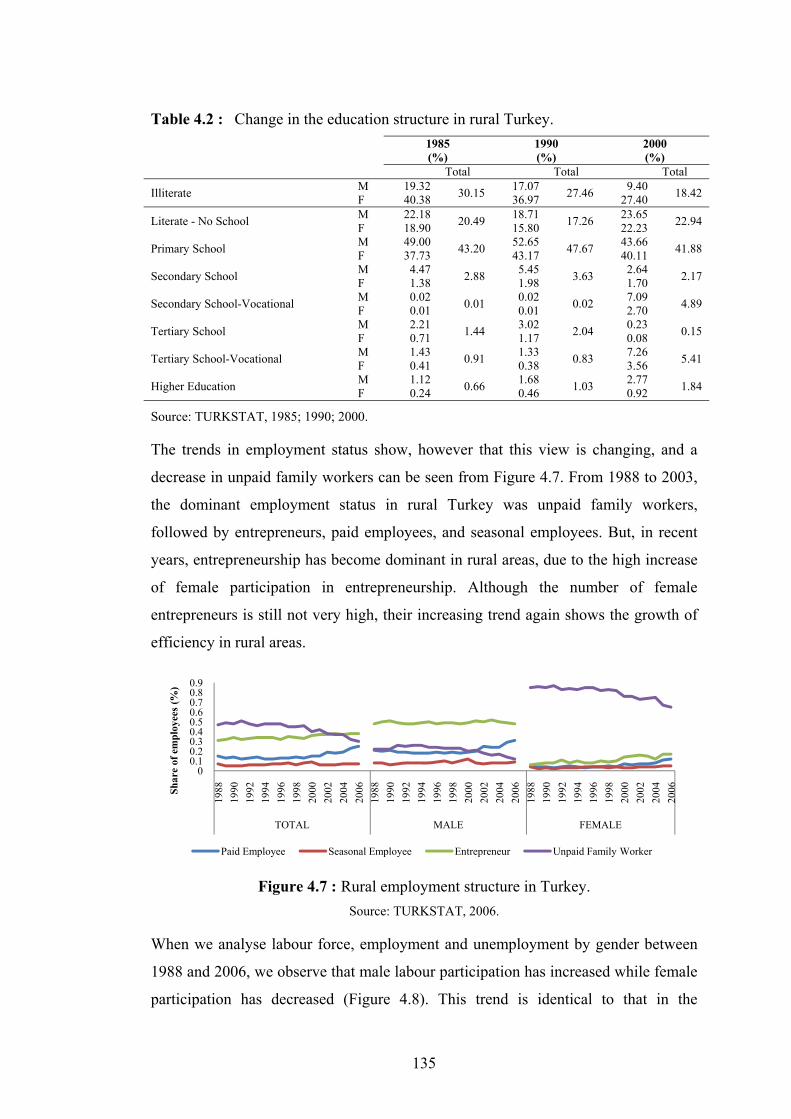
135
1985 (%)
1990 (%)
2000 (%)
Total Total Total
Illiterate M 19.32 30.15 17.07 27.46 9.40 18.42 F 40.38 36.97 27.40
Literate - No School M 22.18 20.49 18.71 17.26 23.65 22.94 F 18.90 15.80 22.23
Primary School M 49.00 43.20 52.65 47.67 43.66 41.88 F 37.73 43.17 40.11
Secondary School M 4.47 2.88 5.45 3.63 2.64 2.17 F 1.38 1.98 1.70
Secondary School-Vocational M 0.02 0.01 0.02 0.02 7.09 4.89 F 0.01 0.01 2.70
Tertiary School M 2.21 1.44 3.02 2.04 0.23 0.15 F 0.71 1.17 0.08
Tertiary School-Vocational M 1.43 0.91 1.33 0.83 7.26 5.41 F 0.41 0.38 3.56
Higher Education M 1.12 0.66 1.68 1.03 2.77 1.84 F 0.24 0.46 0.92
Source: TURKSTAT, 1985; 1990; 2000.
The trends in employment status show, however that this view is changing, and a
decrease in unpaid family workers can be seen from Figure 4.7. From 1988 to 2003,
the dominant employment status in rural Turkey was unpaid family workers,
followed by entrepreneurs, paid employees, and seasonal employees. But, in recent
years, entrepreneurship has become dominant in rural areas, due to the high increase
of female participation in entrepreneurship. Although the number of female
entrepreneurs is still not very high, their increasing trend again shows the growth of
efficiency in rural areas.
Figure 4.7 : Rural employment structure in Turkey.
Source: TURKSTAT, 2006.
When we analyse labour force, employment and unemployment by gender between
1988 and 2006, we observe that male labour participation has increased while female
participation has decreased (Figure 4.8). This trend is identical to that in the
00.10.20.30.40.50.60.70.80.9
1988
1990
1992
1994
1996
1998
2000
2002
2004
2006
1988
1990
1992
1994
1996
1998
2000
2002
2004
2006
1988
1990
1992
1994
1996
1998
2000
2002
2004
2006
TOTAL MALE FEMALE
Shar
e of
em
ploy
ees
(%)
Paid Employee Seasonal Employee Entrepreneur Unpaid Family Worker
Table 4.2 : Change in the education structure in rural Turkey.

136
employment rate, but, in terms of the unemployment rate, the female rate has
decreased while male rate has increased. Thus, although employment is still male–
dominated, in rural areas more females have started to work in recent years.
However, rural Turkey is less enthusiastic about working women than urban Turkey
(Family Survey, 2006).
Figure 4.8 : The distribution of the rural labour force in Turkey.
Source: TURKSTAT, 2006.
Such demographic and structural changes consequently provide sectoral changes.
Therefore, we also explored the sectoral changes in rural Turkey focusing on
agriculture – the dominant sector – and four sectors which show increasing trends.
All over the world, agriculture is losing its dominance and weight, but still keeps its
importance. This trend is also seen in rural Turkey (Figure 4.9). Especially in the last
few years, a dramatic decrease in agricultural employment can be seen. In addition,
according to Figure 4.9, we can state that agriculture has been affected positively by
the economic crisis. In other words, Turkey, which has faced an economic crisis
almost every five years, has nevertheless had an increasing trend in terms of
agriculture in the course of such a crisis for instance: in 1991 or in 2001 which were
the years with the most severe financial crisis in Turkey.
Moreover, although they are not dominant, four sectors, viz. manufacturing,
construction, tourism, and logistics, have been increasing rapidly in recent years.
Tourism is the fastest growing economic activity in rural Turkey (Figure 4.10). This
is an obvious result in today’s world, as more people are passionate about
experiencing the rural idyll. Tourism is followed by manufacturing. This is also not
very surprising as the experience of developed countries is the same, i.e. the
00.10.20.30.40.50.60.70.80.9
1
1988
1989
1990
1991
1992
1993
1994
1995
1996
1997
1998
1999
2000
2001
2002
2003
2004
2005
2006
1988
1989
1990
1991
1992
1993
1994
1995
1996
1997
1998
1999
2000
2001
2002
2003
2004
2005
2006
MALE FEMALE
Lab
our
Forc
e (%
)
Labour Force Participation Rate Employment Rate Unemployment Rate
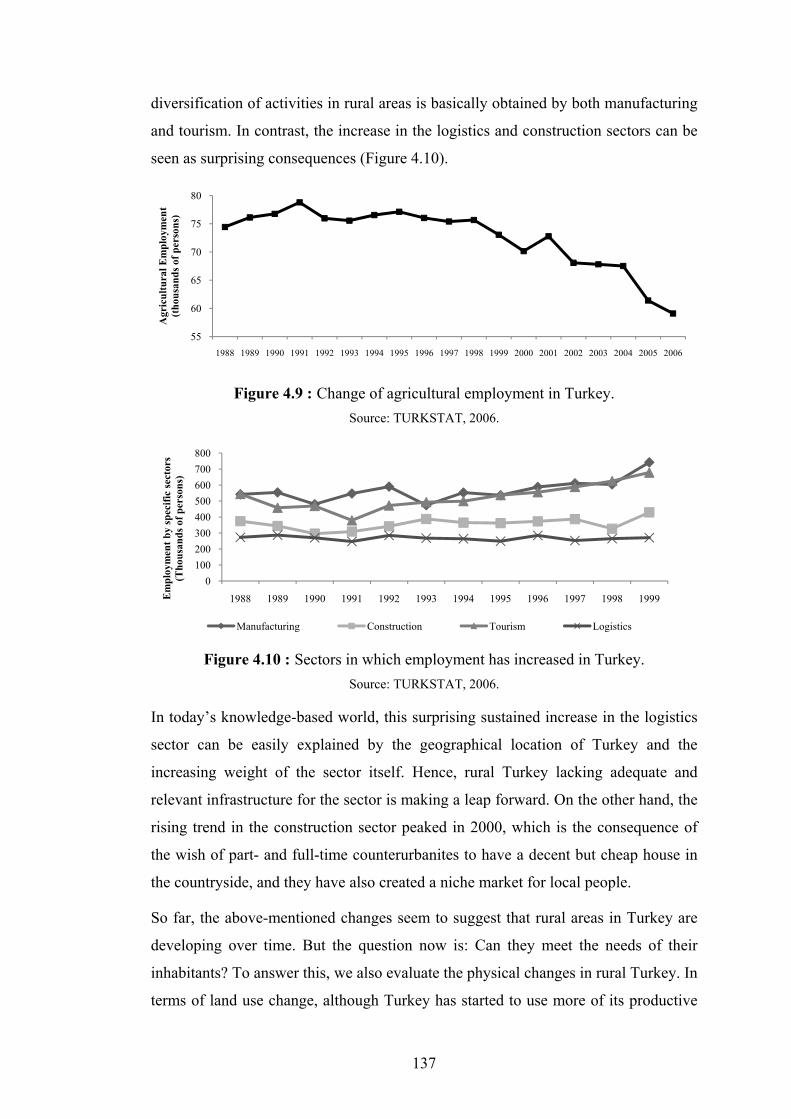
137
diversification of activities in rural areas is basically obtained by both manufacturing
and tourism. In contrast, the increase in the logistics and construction sectors can be
seen as surprising consequences (Figure 4.10).
Figure 4.9 : Change of agricultural employment in Turkey. Source: TURKSTAT, 2006.
Figure 4.10 : Sectors in which employment has increased in Turkey.
Source: TURKSTAT, 2006.
In today’s knowledge-based world, this surprising sustained increase in the logistics
sector can be easily explained by the geographical location of Turkey and the
increasing weight of the sector itself. Hence, rural Turkey lacking adequate and
relevant infrastructure for the sector is making a leap forward. On the other hand, the
rising trend in the construction sector peaked in 2000, which is the consequence of
the wish of part- and full-time counterurbanites to have a decent but cheap house in
the countryside, and they have also created a niche market for local people.
So far, the above-mentioned changes seem to suggest that rural areas in Turkey are
developing over time. But the question now is: Can they meet the needs of their
inhabitants? To answer this, we also evaluate the physical changes in rural Turkey. In
terms of land use change, although Turkey has started to use more of its productive
55
60
65
70
75
80
1988 1989 1990 1991 1992 1993 1994 1995 1996 1997 1998 1999 2000 2001 2002 2003 2004 2005 2006
Agr
icul
tura
l Em
ploy
men
t(t
hous
ands
of p
erso
ns)
0100200300400500600700800
1988 1989 1990 1991 1992 1993 1994 1995 1996 1997 1998 1999Em
ploy
men
t by
spec
ific
sect
ors
(Tho
usan
ds o
f per
sons
)
Manufacturing Construction Tourism Logistics
138
land, the continuity of natural resource areas, i.e. forest and woodland, is in danger as
the area of this kind of land is getting smaller in area each year due to fires or to the
building which is allowed in forest lands (TURKSTAT, 2001). Although there are
various infrastructure investments in rural Turkey, the rural inhabitants still suffer
from a low standard of living and quality of life. Most of the villages in Turkey do
not have the standard facilities, except electricity. For instance, 8.3 per cent of the
villages are still without water, while 15 per cent of the dwellings have access to an
adequate sewage system (SPO, 2006). In addition, only 8 and 6.1 per cent of
individuals can use computers and the Internet, respectively (SPO, 2006).
These figures show that, even though rural Turkey is converting its capacity from
potential to actual strength, the basics of the physical environment still need special
treatment even though there are a number of investments. In the following sections,
we first analyse the current rural structure of Turkey, and then we will map out
Turkey’s rural structure from different perspectives at the NUTS 3 level.
4.2.2 Analysis of Turkey’s rural structure
The modern perception of rurality refers not only to the agricultural sector but also to
the new non-traditional sectors that have recently appeared in rural areas. The
diversity and complexity of rurality and its relatively less significance compared with
other components at country level call for a multi-dimensional in-depth evaluation
including demographic, economic and social indicators (Gülümser et al., 2009c). On
this basis, in addition to country-based comparative evaluations, this section
evaluates the rural structure of Turkey at the regional level by mapping out the
current regional rural structure of Turkey. Here, we aim to analyse the rural structure
of Turkey and the rurality level of regions on the basis of selected demographic,
economic and social indicators of rurality while focusing, in particular, on regional
disparities in terms of rural development. To analyse the rural structure of Turkey,
the statistics available in the Turkish Statistical Institute (TURKSTAT) database
were used.
A multidimensional technique, factor analysis, to reduce data at the NUTS 3 level, is
used for this evaluation. The 16 indicators for 81 NUTS 3 regions used in our
analysis are shown in Table 4.3. These indicators were selected from lists of
indicators used by international organizations and various researchers in earlier
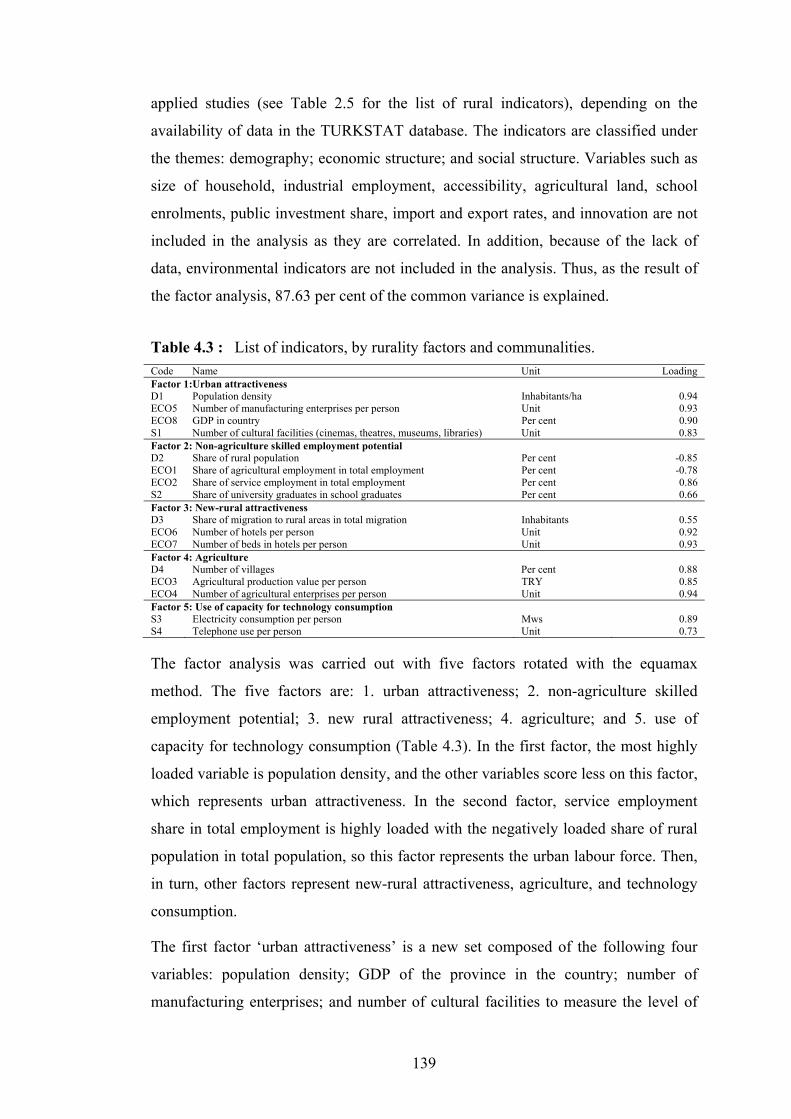
139
applied studies (see Table 2.5 for the list of rural indicators), depending on the
availability of data in the TURKSTAT database. The indicators are classified under
the themes: demography; economic structure; and social structure. Variables such as
size of household, industrial employment, accessibility, agricultural land, school
enrolments, public investment share, import and export rates, and innovation are not
included in the analysis as they are correlated. In addition, because of the lack of
data, environmental indicators are not included in the analysis. Thus, as the result of
the factor analysis, 87.63 per cent of the common variance is explained.
Code Name Unit Loading Factor 1:Urban attractiveness D1 Population density Inhabitants/ha 0.94 ECO5 Number of manufacturing enterprises per person Unit 0.93 ECO8 GDP in country Per cent 0.90 S1 Number of cultural facilities (cinemas, theatres, museums, libraries) Unit 0.83 Factor 2: Non-agriculture skilled employment potential D2 Share of rural population Per cent -0.85 ECO1 Share of agricultural employment in total employment Per cent -0.78 ECO2 Share of service employment in total employment Per cent 0.86 S2 Share of university graduates in school graduates Per cent 0.66 Factor 3: New-rural attractiveness D3 Share of migration to rural areas in total migration Inhabitants 0.55 ECO6 Number of hotels per person Unit 0.92 ECO7 Number of beds in hotels per person Unit 0.93 Factor 4: Agriculture D4 Number of villages Per cent 0.88 ECO3 Agricultural production value per person TRY 0.85 ECO4 Number of agricultural enterprises per person Unit 0.94 Factor 5: Use of capacity for technology consumption S3 Electricity consumption per person Mws 0.89 S4 Telephone use per person Unit 0.73
The factor analysis was carried out with five factors rotated with the equamax
method. The five factors are: 1. urban attractiveness; 2. non-agriculture skilled
employment potential; 3. new rural attractiveness; 4. agriculture; and 5. use of
capacity for technology consumption (Table 4.3). In the first factor, the most highly
loaded variable is population density, and the other variables score less on this factor,
which represents urban attractiveness. In the second factor, service employment
share in total employment is highly loaded with the negatively loaded share of rural
population in total population, so this factor represents the urban labour force. Then,
in turn, other factors represent new-rural attractiveness, agriculture, and technology
consumption.
The first factor ‘urban attractiveness’ is a new set composed of the following four
variables: population density; GDP of the province in the country; number of
manufacturing enterprises; and number of cultural facilities to measure the level of
Table 4.3 : List of indicators, by rurality factors and communalities.

140
attractiveness of provinces. A high number of enterprises offering job opportunities,
a good provision of cultural facilities, high GDP, and high population density
represent urban areas. According to the results of our analysis, the concentration of
population, manufacturing activities, and cultural facilities put Istanbul at the top of
each province in terms of its urban profile (Figure 4.11) (Table C.1 in Appendix C).
On the other hand, Ankara (the capital), Izmir, Bursa and Kocaeli follow Istanbul in
the ranking. The attractive provinces; Istanbul, Ankara, Izmir, Bursa and Kocaeli
house 31 per cent of the total population, and cover 7 per cent of the total land area
of Turkey. On the contrary, the South East provinces of Şırnak, Hakkari and Tunceli,
and the Southern provinces Antalya and Muğla are not attractive provinces in terms
of their urban profiles (Table C.1 in Appendix C). The first three of these provinces
are also less attractive because of safety problems associated with their recent history
of terror attacks. The results of our analysis show that there are some provinces, such
as Antalya and Muğla, which are highly developed but, surprisingly, appear less
attractive in our analysis. It is not easy to explain this situation, and this needs further
in-depth exploration.
Figure 4.11 : Box plots of the results of factor analysis of rural Turkey.
The second factor explains the non-agriculture employment potential of provinces in
Turkey by the share of rural population and agricultural employment with a negative
effect, and by the share of service employment and university graduates with a

141
positive effect. However, the share of agricultural employment and service
employment explains the employment situation, but the share of university graduates
among all school graduates covers both the population in employment and the retired
and unemployed. According to the second factor, Ankara the capital city has the
highest share of non-agriculture employment potential, followed by peripheral
provinces, such as Edirne, Şırnak, Hakkari, Kilis, Gaziantep, and other provinces
such as Tunceli, Bursa, and Izmir. Ankara’s high rate of non-agriculture employment
is connected with Ankara’s role as the capital city, where the headquarters of
administrative institutions are located. This role makes Ankara the highest ranked
city in terms of its potential for non-agricultural employment. It has always been
thought that the Eastern provinces have higher rates in terms of rural population and
agricultural employment. Yet, according to the results of our study, surprisingly,
some Eastern provinces, such as Şırnak and Hakkari, have a high level of non-
agriculture employment. Actually, the rural population rate of these provinces is not
as high as might be thought; on the contrary, it is no more than 40 per cent. In
addition, although their economy is not dominantly agriculture, nevertheless 48 per
cent of the labour force is mainly active in agriculture, and 35 per cent of the
population live in rural areas.
The third factor, ‘new rural attractiveness’ is measured by tourist facilities and
migration to rural areas. The changing definition of ‘rural’ presents rural as a part of
modern leisure activities with mass and small-scale tourism. So, from this point of
view, this factor is called ‘rural attractiveness’. According to the results, the South
and West coasts of Turkey are more attractive than the rest of the country. In terms
of rural attractiveness, this result clearly demonstrates the well-known reality that
retired people choose to settle in these coastal provinces, which are also the focal
points for tourists. According to the results, Antalya is the most attractive rural
province of Turkey, followed by Muğla and Aydın. The high ranking of Antalya,
Aydın and Muğla shows that they are main tourist-attraction focal points, but, in
addition, people migrate to these provinces after retirement. They migrate and settle
down in houses built with their retirement money. According to the results of the
urban attractiveness factor, attractive provinces like Istanbul and Izmir both have a
high rural attractiveness rate as well because of the flight of the urban population to
the peripheral rural areas of these provinces and the presence of numerous tourist

142
facilities. The beautiful landscape of Turkey is mentioned in many tourist guides or
travel books, but the general lack of tourist facilities and lack of infrastructure limit
further exploitation of Turkey’s existing rural potential.
In the fourth factor, ‘agriculture’ the number of villages, agricultural productivity,
and agricultural enterprises measure the agricultural level of provinces. In terms of
the fourth factor, Turkey is an agricultural country, as 30 provinces have a high level
of agricultural characteristics, while 17 have an average level. In other words, 47 out
of 81 provinces have the potential for agriculture and use it.
The most suitable and precious land for agriculture is found in the Eastern and
Southern parts of Turkey, and these areas benefit from and use this potential very
well compared with other provinces in Turkey. On the other hand, East and Central
Turkey are not very suitable for agriculture because of their topography and lack of
irrigation infrastructure. In addition, Konya and Sivas, topographically flat and large
provinces, are also highly agricultural provinces. In terms of the traditional
understanding of ‘rural’, this factor proves the rural potential of Turkey. But, in fact,
this reflects only Turkey’s agricultural potential and its capability for self-
sufficiency, not its broader rural potential. Actually, environmental variables like
climate, and, especially slope would be more useful to explain the reasons behind the
clustering of provinces in terms of agricultural characteristics but, because of lack of
data, environmental factors are not included in the analysis.
The last factor is the ‘capacity for technology consumption’, measured by electricity
consumption and telephone use in the different provinces of Turkey. In Turkey,
technology is not equally distributed all over the country. Especially the East part of
Turkey has less infrastructure and therefore cannot consume technology like the
West part does. Kocaeli, Bilecik, Yalova, and Tekirdağ are the provinces which use
all their technology capacity more than other provinces. The main reason is that, in
these provinces, basic industry firms are located. Not only East but also Central
Anatolia, including the capital province Ankara, do not consume their technological
capacity as much as West Turkey. This is because these provinces do not have
industrial activities like those in the West, and, moreover, their technological
consumption needs are different and less developed than in the West.
The results of our analysis have clearly pointed out the divergences and unequal
development levels of the provinces in Turkey. Some findings were also surprising:
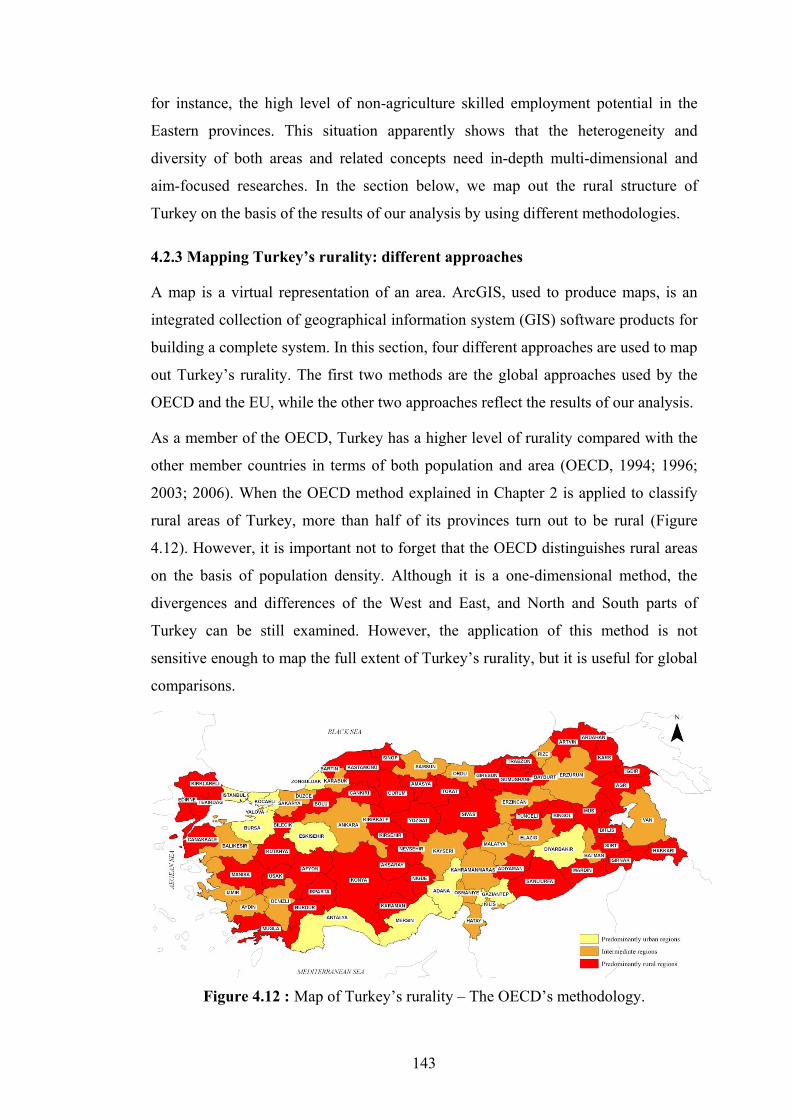
143
for instance, the high level of non-agriculture skilled employment potential in the
Eastern provinces. This situation apparently shows that the heterogeneity and
diversity of both areas and related concepts need in-depth multi-dimensional and
aim-focused researches. In the section below, we map out the rural structure of
Turkey on the basis of the results of our analysis by using different methodologies.
4.2.3 Mapping Turkey’s rurality: different approaches
A map is a virtual representation of an area. ArcGIS, used to produce maps, is an
integrated collection of geographical information system (GIS) software products for
building a complete system. In this section, four different approaches are used to map
out Turkey’s rurality. The first two methods are the global approaches used by the
OECD and the EU, while the other two approaches reflect the results of our analysis.
As a member of the OECD, Turkey has a higher level of rurality compared with the
other member countries in terms of both population and area (OECD, 1994; 1996;
2003; 2006). When the OECD method explained in Chapter 2 is applied to classify
rural areas of Turkey, more than half of its provinces turn out to be rural (Figure
4.12). However, it is important not to forget that the OECD distinguishes rural areas
on the basis of population density. Although it is a one-dimensional method, the
divergences and differences of the West and East, and North and South parts of
Turkey can be still examined. However, the application of this method is not
sensitive enough to map the full extent of Turkey’s rurality, but it is useful for global
comparisons.
Figure 4.12 : Map of Turkey’s rurality – The OECD’s methodology.

144
Besides the OECD’s classification of rural areas, Turkey’s rurality can be also
evaluated by the EU’s classification method. The application of the EU’s method
also shows the high level of rurality within Turkey (Figure 4.13). According to the
EU’s classification, the provinces of Turkey are mainly sparsely populated zones.
Compared with the OECD’s classification, the EU’s typology depends on the degree
of urbanization. Except for Istanbul, Turkey’s provinces do not have a high degree of
urbanization, mainly because of the unbalanced distribution of infrastructure and
investment opportunities within them.
Figure 4.13 : Map of Turkey’s rurality – The EU’s methodology.
Both the OECD and the EU’s methods are only helpful to understand the degree of
rurality from a one-dimensional approach, which facilitates global comparisons.
These methods are limited in terms of offering a clear picture of the heterogeneity
and complexity of rural areas. Another reason for the failure of these applications is
the diversity of land area of the statistical regions. Within each country the statistical
regions are different in size. Particularly, in Turkey there is a wide variety in the size
of regions. So, not only the application of the one-dimensional approach but also the
size of the areas in Turkey limit the application of these methods, and their results
remain too general to map Turkey’s rurality.
In contrast to these applications, mapping Turkey’s rurality on the basis of the
findings from the application of factor analysis undertaken in the previous section
provides a multi-dimensional evaluation. The results are used to obtain an overall
score by means of which Turkey’s rurality can be mapped out. To calculate an
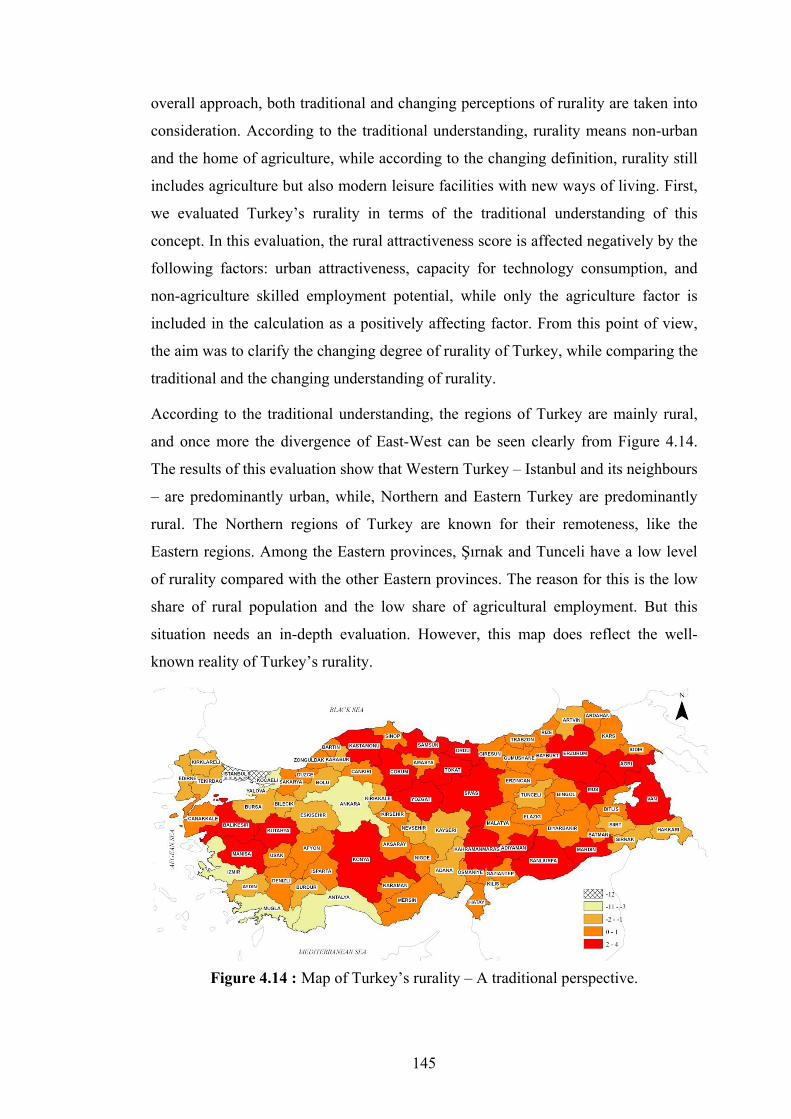
145
overall approach, both traditional and changing perceptions of rurality are taken into
consideration. According to the traditional understanding, rurality means non-urban
and the home of agriculture, while according to the changing definition, rurality still
includes agriculture but also modern leisure facilities with new ways of living. First,
we evaluated Turkey’s rurality in terms of the traditional understanding of this
concept. In this evaluation, the rural attractiveness score is affected negatively by the
following factors: urban attractiveness, capacity for technology consumption, and
non-agriculture skilled employment potential, while only the agriculture factor is
included in the calculation as a positively affecting factor. From this point of view,
the aim was to clarify the changing degree of rurality of Turkey, while comparing the
traditional and the changing understanding of rurality.
According to the traditional understanding, the regions of Turkey are mainly rural,
and once more the divergence of East-West can be seen clearly from Figure 4.14.
The results of this evaluation show that Western Turkey – Istanbul and its neighbours
– are predominantly urban, while, Northern and Eastern Turkey are predominantly
rural. The Northern regions of Turkey are known for their remoteness, like the
Eastern regions. Among the Eastern provinces, Şırnak and Tunceli have a low level
of rurality compared with the other Eastern provinces. The reason for this is the low
share of rural population and the low share of agricultural employment. But this
situation needs an in-depth evaluation. However, this map does reflect the well-
known reality of Turkey’s rurality.
Figure 4.14 : Map of Turkey’s rurality – A traditional perspective.

146
On the other hand, to map out Turkey’s rurality in terms of the new perception of
rurality, the overall score is calculated by taking urban attractiveness, non-agriculture
skilled employment, and capacity for technology consumption as negatively
affecting factors, while taking rural attractiveness and agriculture as positively
affecting factors. According to this overall score, the most rural province of Turkey
is Antalya, followed by Muğla and Aydın as significantly rural provinces (Figure
4.15). The reason for this ranking is mainly because these provinces, and especially
Antalya have been developed for tourism with their natural resources in the
countryside which partially matches the new perception of rurality. In contrast,
Istanbul still remains predominantly urban, but this time together with Kocaeli,
Yalova and Bilecik. In terms of the new definition of ‘rural’, Turkey can still be
defined as a rural country, but its rural character is not as dominant as it was in terms
of the traditional definition of rurality.
Figure 4.15 : Map of Turkey’s rurality – A new definition.
The maps produced by the application of different methods provide a clear picture of
the differences and divergences between Turkey’s provinces in terms of rurality.
Although Turkey has an essentially rural character, it has not yet been able to take
advantage of its environmental features as leisure amenities. In other words, the shift
from the traditional meaning to the new meaning of ‘rural’ has not yet been fully
realized in all of Turkey’s rural areas. In addition, mapping Turkey’s rurality also
stressed the divergence between the East and West provinces in terms of the
inequality of income and infrastructure distribution, the lack of accessibility to high
living standards, and the lack of new job opportunities.
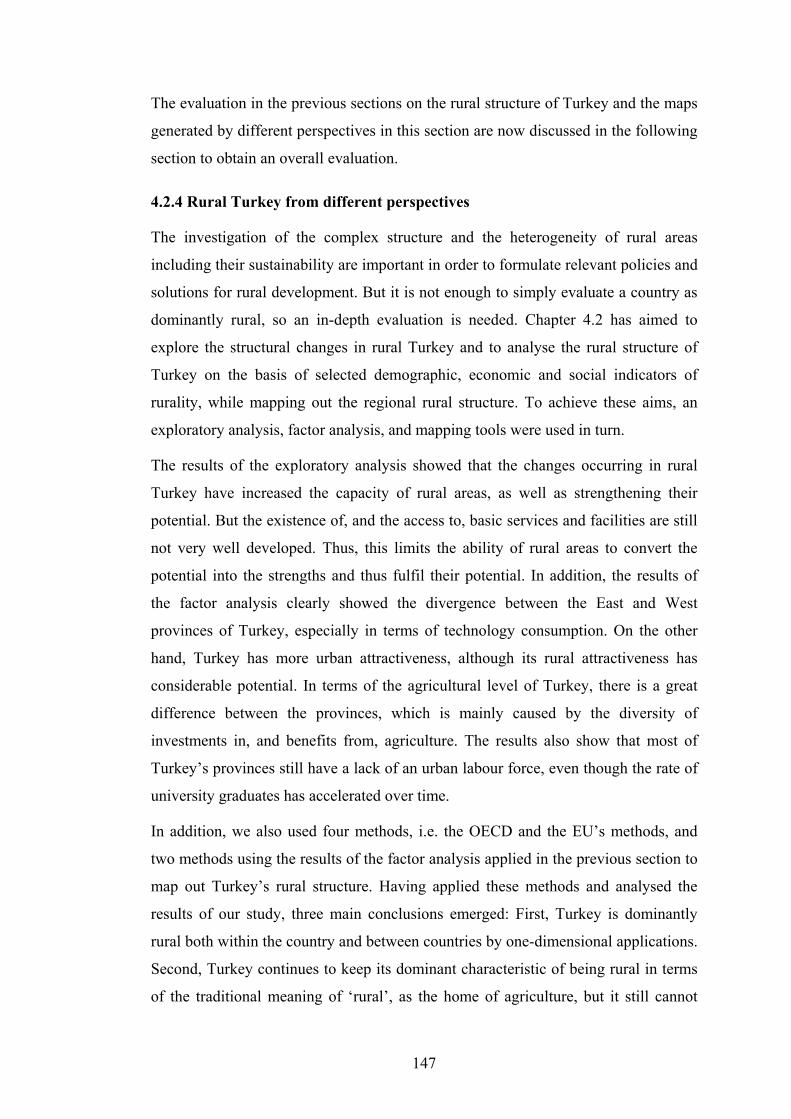
147
The evaluation in the previous sections on the rural structure of Turkey and the maps
generated by different perspectives in this section are now discussed in the following
section to obtain an overall evaluation.
4.2.4 Rural Turkey from different perspectives
The investigation of the complex structure and the heterogeneity of rural areas
including their sustainability are important in order to formulate relevant policies and
solutions for rural development. But it is not enough to simply evaluate a country as
dominantly rural, so an in-depth evaluation is needed. Chapter 4.2 has aimed to
explore the structural changes in rural Turkey and to analyse the rural structure of
Turkey on the basis of selected demographic, economic and social indicators of
rurality, while mapping out the regional rural structure. To achieve these aims, an
exploratory analysis, factor analysis, and mapping tools were used in turn.
The results of the exploratory analysis showed that the changes occurring in rural
Turkey have increased the capacity of rural areas, as well as strengthening their
potential. But the existence of, and the access to, basic services and facilities are still
not very well developed. Thus, this limits the ability of rural areas to convert the
potential into the strengths and thus fulfil their potential. In addition, the results of
the factor analysis clearly showed the divergence between the East and West
provinces of Turkey, especially in terms of technology consumption. On the other
hand, Turkey has more urban attractiveness, although its rural attractiveness has
considerable potential. In terms of the agricultural level of Turkey, there is a great
difference between the provinces, which is mainly caused by the diversity of
investments in, and benefits from, agriculture. The results also show that most of
Turkey’s provinces still have a lack of an urban labour force, even though the rate of
university graduates has accelerated over time.
In addition, we also used four methods, i.e. the OECD and the EU’s methods, and
two methods using the results of the factor analysis applied in the previous section to
map out Turkey’s rural structure. Having applied these methods and analysed the
results of our study, three main conclusions emerged: First, Turkey is dominantly
rural both within the country and between countries by one-dimensional applications.
Second, Turkey continues to keep its dominant characteristic of being rural in terms
of the traditional meaning of ‘rural’, as the home of agriculture, but it still cannot
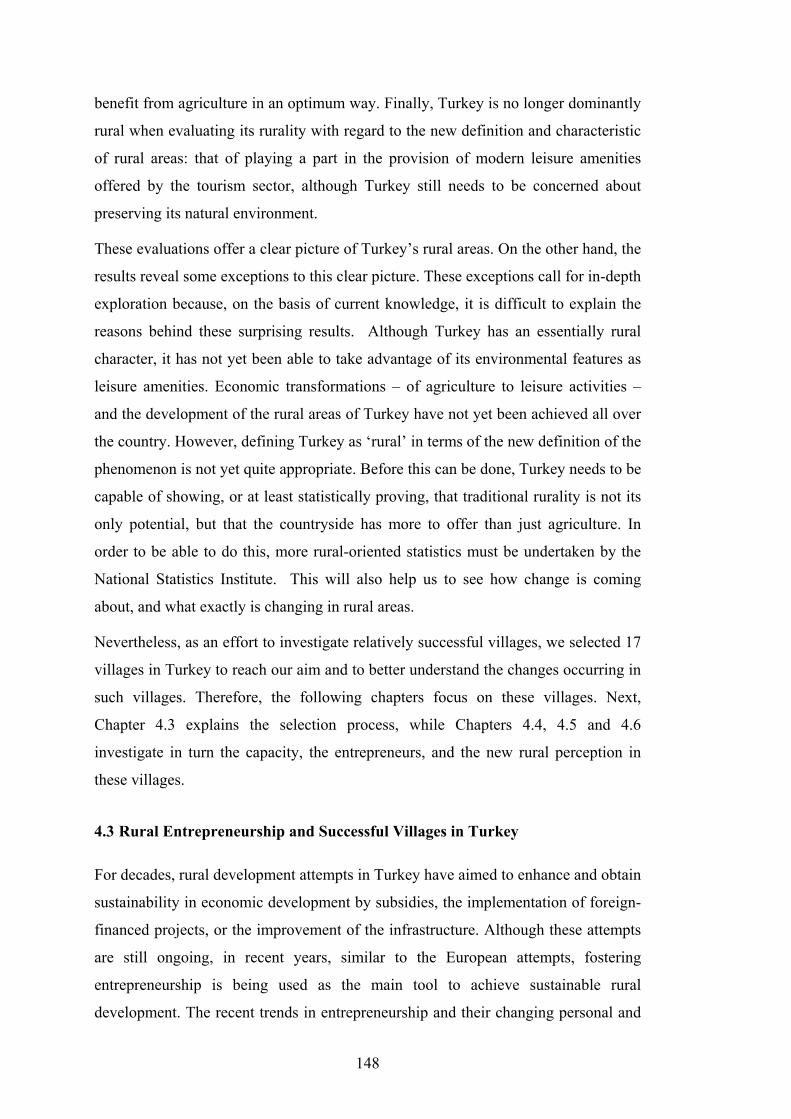
148
benefit from agriculture in an optimum way. Finally, Turkey is no longer dominantly
rural when evaluating its rurality with regard to the new definition and characteristic
of rural areas: that of playing a part in the provision of modern leisure amenities
offered by the tourism sector, although Turkey still needs to be concerned about
preserving its natural environment.
These evaluations offer a clear picture of Turkey’s rural areas. On the other hand, the
results reveal some exceptions to this clear picture. These exceptions call for in-depth
exploration because, on the basis of current knowledge, it is difficult to explain the
reasons behind these surprising results. Although Turkey has an essentially rural
character, it has not yet been able to take advantage of its environmental features as
leisure amenities. Economic transformations – of agriculture to leisure activities –
and the development of the rural areas of Turkey have not yet been achieved all over
the country. However, defining Turkey as ‘rural’ in terms of the new definition of the
phenomenon is not yet quite appropriate. Before this can be done, Turkey needs to be
capable of showing, or at least statistically proving, that traditional rurality is not its
only potential, but that the countryside has more to offer than just agriculture. In
order to be able to do this, more rural-oriented statistics must be undertaken by the
National Statistics Institute. This will also help us to see how change is coming
about, and what exactly is changing in rural areas.
Nevertheless, as an effort to investigate relatively successful villages, we selected 17
villages in Turkey to reach our aim and to better understand the changes occurring in
such villages. Therefore, the following chapters focus on these villages. Next,
Chapter 4.3 explains the selection process, while Chapters 4.4, 4.5 and 4.6
investigate in turn the capacity, the entrepreneurs, and the new rural perception in
these villages.
4.3 Rural Entrepreneurship and Successful Villages in Turkey
For decades, rural development attempts in Turkey have aimed to enhance and obtain
sustainability in economic development by subsidies, the implementation of foreign-
financed projects, or the improvement of the infrastructure. Although these attempts
are still ongoing, in recent years, similar to the European attempts, fostering
entrepreneurship is being used as the main tool to achieve sustainable rural
development. The recent trends in entrepreneurship and their changing personal and
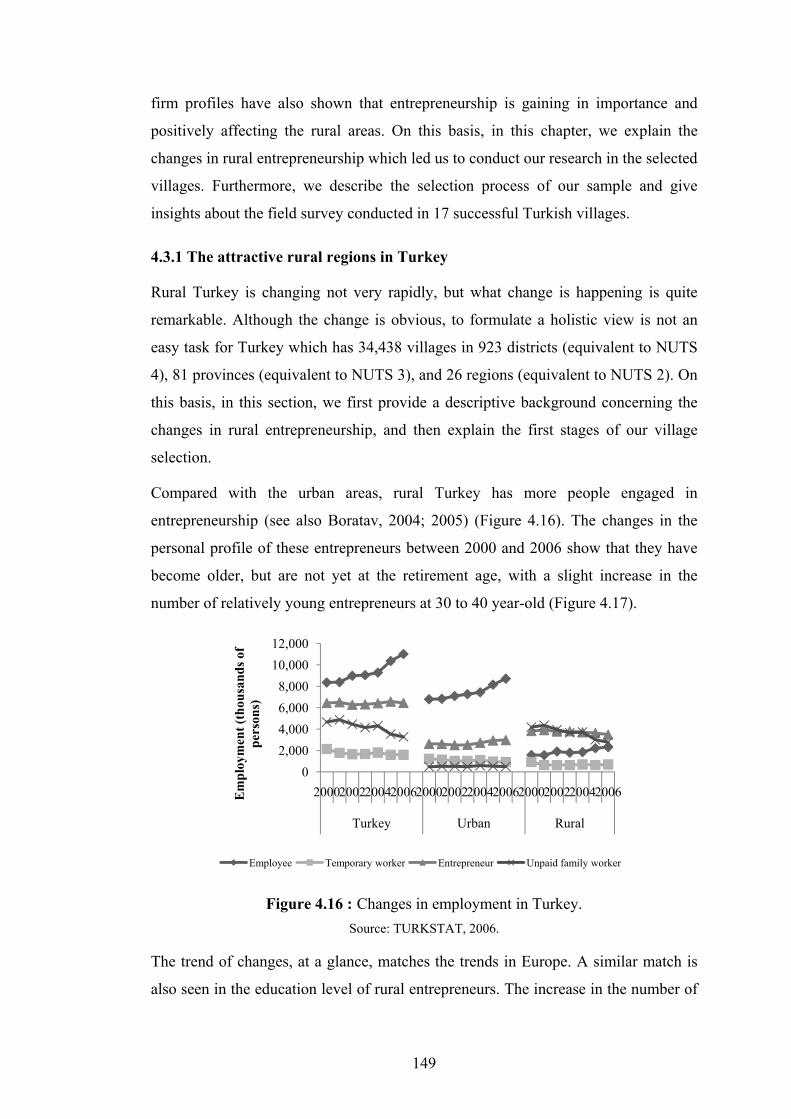
149
firm profiles have also shown that entrepreneurship is gaining in importance and
positively affecting the rural areas. On this basis, in this chapter, we explain the
changes in rural entrepreneurship which led us to conduct our research in the selected
villages. Furthermore, we describe the selection process of our sample and give
insights about the field survey conducted in 17 successful Turkish villages.
4.3.1 The attractive rural regions in Turkey
Rural Turkey is changing not very rapidly, but what change is happening is quite
remarkable. Although the change is obvious, to formulate a holistic view is not an
easy task for Turkey which has 34,438 villages in 923 districts (equivalent to NUTS
4), 81 provinces (equivalent to NUTS 3), and 26 regions (equivalent to NUTS 2). On
this basis, in this section, we first provide a descriptive background concerning the
changes in rural entrepreneurship, and then explain the first stages of our village
selection.
Compared with the urban areas, rural Turkey has more people engaged in
entrepreneurship (see also Boratav, 2004; 2005) (Figure 4.16). The changes in the
personal profile of these entrepreneurs between 2000 and 2006 show that they have
become older, but are not yet at the retirement age, with a slight increase in the
number of relatively young entrepreneurs at 30 to 40 year-old (Figure 4.17).
Figure 4.16 : Changes in employment in Turkey.
Source: TURKSTAT, 2006.
The trend of changes, at a glance, matches the trends in Europe. A similar match is
also seen in the education level of rural entrepreneurs. The increase in the number of
02,0004,0006,0008,000
10,00012,000
200020022004200620002002200420062000200220042006
Turkey Urban Rural
Em
ploy
men
t (th
ousa
nds o
f pe
rson
s)
Employee Temporary worker Entrepreneur Unpaid family worker
150
highly-educated entrepreneurs can be seen as a similar trend to the changes
experienced in rural Europe which are probably the results of counterurbanization
(Figure 4.18). In fact, not only changes in entrepreneurs’ age and education but also
changes occurring in economic activities also signal that there is a move away from
defensive localism and the traditional economy in rural Turkey.
Figure 4.17 : Age structure of rural entrepreneurs in Turkey.
Source: TURKSTAT, 2006.
Figure 4.18 : Education levels of rural entrepreneurs in Turkey.
Source: TURKSTAT, 2006.
The decrease in the traditional sectors, i.e. agriculture, husbandry, fishery and
forestry, shows that entrepreneurs can find opportunities for different economic
activities and thus diversify the economy in rural Turkey (Figure 4.19). However, the
increase in the construction sector could be a serious threat for the continuity of rural
Turkey, the increasing trend in the wholesale sector, the logistics sector and also in
the social services sector can be seen as sources of salvation for rural areas.
These trends which are similar to the European examples call for an in-depth
investigation and a comparative approach. Hence, we decided to conduct our
research in a number of Turkish villages. The overall aim of our study was to focus
on changing and successfully maintained villages. But to select such villages among
0 500 1000 1500 2000 2500 3000 3500 4000
2000200220042006
Age structure (thousands of persons)
0-15 15-30 30-40 40-50 50-60 60+
0 500 1000 1500 2000 2500 3000 3500 4000
2000200120022003200420052006
Education levels (thousands of persons)
Illiterate Literate but no school completedPrimary school Junior high school or equivalent vocational schoolHigh school Vocational school at high school level

151
more than 34,000 villages calls for a two-level: macro- and micro-level, data
evaluation. This is mainly because of the lack of data at the micro-level and also the
multi-dimensionality of the phenomenon itself.
Figure 4.19 : Economic activity of rural entrepreneurs in Turkey.
Source: TURKSTAT, 2006.
To undertake this research requirement, and to decrease the pressure due to both the
extensive number of villages and the complexity and diversity of rural Turkey, multi-
stage stratified sampling was used at two levels: the macro-level formed by two
stratifications for NUTS 2 and NUTS 3 regions, and the micro-level formed by two
stratifications for NUTS 4 regions and villages (Figure 4.20). Using only the macro-
data might limit us, and hence we may lose relevant information on villages, while
using only micro-data is not possible due to the lack of data and its inadequate
quality. Dealing with both macro- and micro-data at the same time needs careful
treatment.
In previous chapters, we mentioned that the success of a settlement or an area
depends heavily on its creative capacity. Thus, this capacity is measured by several
dimensions. We also stated that the capacity of a village changes depending on its
reaction to change; and the demography is the first aspect to change immediately.
Therefore, at the macro-level, we focus more on demographic and physical changes
including employment changes. In addition, at the micro-level, we focus again on
demographic changes but, this time, also rurality, and the two main dimensions of
the networks – as components of creative capacity – viz. economic and physical
distance which are usually at the root of problems in rural areas. Therefore, we used
four-stage stratified sampling in our study (Figure 4.20).
0 500 1000 1500 2000 2500 3000 3500 4000
2000200120022003200420052006
Economic activity (thousands of persons)Agriculture Manufacturing Construction Tourism Logistics Finance Social Services
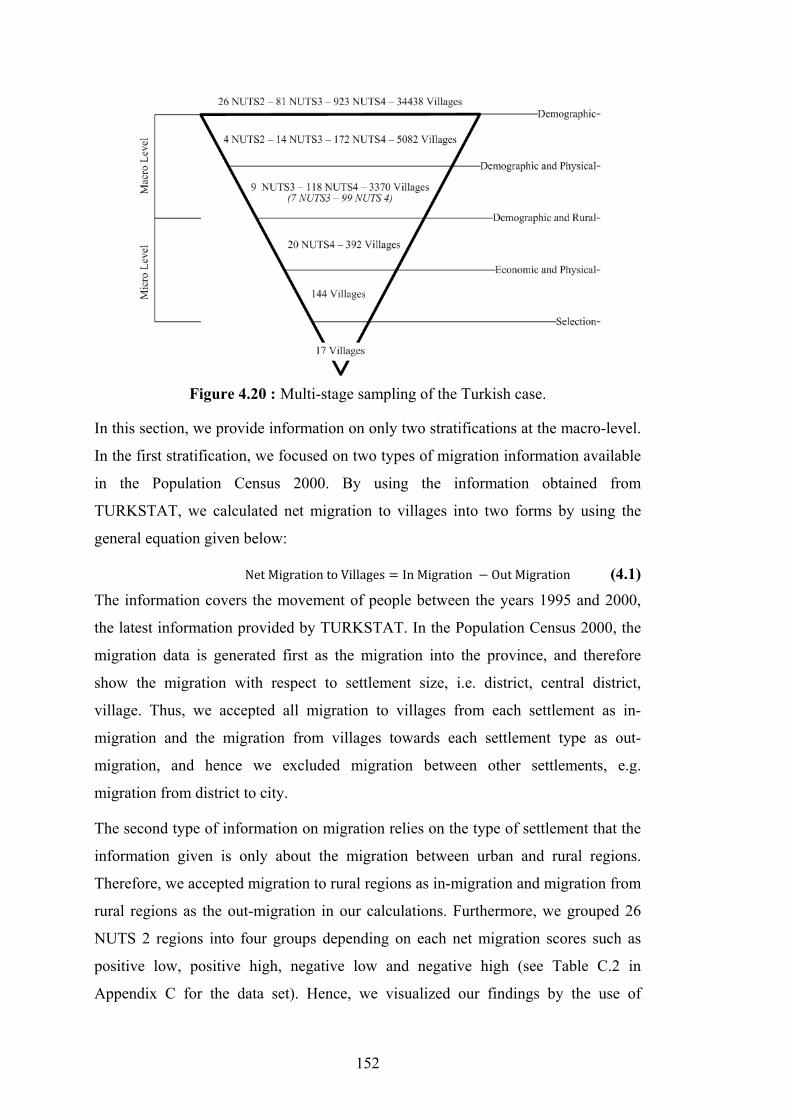
152
Figure 4.20 : Multi-stage sampling of the Turkish case.
In this section, we provide information on only two stratifications at the macro-level.
In the first stratification, we focused on two types of migration information available
in the Population Census 2000. By using the information obtained from
TURKSTAT, we calculated net migration to villages into two forms by using the
general equation given below:
Net Migration to Villages In Migration Out Migration (4.1) The information covers the movement of people between the years 1995 and 2000,
the latest information provided by TURKSTAT. In the Population Census 2000, the
migration data is generated first as the migration into the province, and therefore
show the migration with respect to settlement size, i.e. district, central district,
village. Thus, we accepted all migration to villages from each settlement as in-
migration and the migration from villages towards each settlement type as out-
migration, and hence we excluded migration between other settlements, e.g.
migration from district to city.
The second type of information on migration relies on the type of settlement that the
information given is only about the migration between urban and rural regions.
Therefore, we accepted migration to rural regions as in-migration and migration from
rural regions as the out-migration in our calculations. Furthermore, we grouped 26
NUTS 2 regions into four groups depending on each net migration scores such as
positive low, positive high, negative low and negative high (see Table C.2 in
Appendix C for the data set). Hence, we visualized our findings by the use of

153
ArcView 9.2 software for GIS applications. The map clearly shows that Turkey has
started to experience positive migration from urban to rural regions, except in its
Eastern and South-Eastern regions; additionally a counterflow inside the provinces
from cities to villages can be seen, but this time also in South-Eastern regions (Figure
4.21).
Figure 4.21 : The level of population flows by NUTS 2 regions in Turkey.
According to the results of this stratification, we observe that four NUTS 2 regions,
viz. Aydın (TR32), Bursa (TR41), Kocaeli (TR42), and Antalya (TR61) regions have
experienced major socio-economic changes in their rural areas due to migration.
Therefore, at the end of this stage of stratification at the macro-level, we selected
four NUTS 2 regions. The second stage at the macro-level focuses on the 14 NUTS 3
regions of the above-mentioned four NUTS 2 regions (Figure 4.20). The second
round of our stratification is reducing the scale one step forward to deal with NUTS 3
regions by means of demographic changes in association with employment and
physical changes. The demographic changes are measured by two indicators which
are calculated from the general equation (eq.4.1) as the net migration to villages
using the same information used in the previous stage but this time at the NUTS 3
level.
To measure the employment changes, we focused on the change in the share of
entrepreneurs in total employment. Here, we focus on entrepreneurs because, in the
literature, they are shown as the main factor responsible for socio-economic changes
in rural areas. Here, entrepreneurs refer to the total of the self-employed and

154
employers because there is no specific data on entrepreneurship in the Population
Census or Labour Force Survey. Therefore, we calculated the employment change
using the following equation:
Change in the Share of Rural Entrepreneurs R S E ER E
(4.2)
The third indicator at this stage is the physical changes which were retrieved from
the General Agricultural Census 2001. In that Census 2001, the information about
the land use changes is calculated by means of the changes in natural lands, including
agricultural land, between 1995 and 2001 in this study (for further explanation, see
TURKSTAT, 2001). After compiling the key table of indicators for 14 NUTS 3
regions (provinces), we classified each province by each of the indicators in two
classes, viz. high and low (Table 4.4). Hence, we obtained six groups for 14 regions.
Code NUTS 3 Group Land Use Entrepreneur Migration Region Province
Share Class Share Class Share Class Share Class TR611 Antalya 1 0.6 L 25.59 H 0.27 H 0.55 H TR323 Muğla 1 0.6 L 29.25 H 0.24 H 0.54 H TR322 Denizli 1 1.1 L 27.13 H 0.27 H 0.51 H TR613 Burdur 2 1.4 L 33.48 H 0.15 L 0.27 L TR321 Aydın 2 1.9 L 28.35 H 0.18 L 0.34 L TR423 Düzce 3 0.5 L 24.83 L 0.33 H 0.68 H TR422 Sakarya 3 1.2 L 24.24 L 0.25 H 0.52 H TR421 Kocaeli 3 2.5 L 18.33 L 0.29 H 0.56 H TR411 Bursa 4 1.8 L 21.33 L 0.23 H 0.35 L TR412 Eskisehir 5 0.6 L 21.23 L 0.17 L 0.31 L TR413 Bilecik 5 0.9 L 23.05 L 0.12 L 0.20 L TR424 Bolu 5 1.0 L 23.62 L 0.17 L 0.39 L TR612 Isparta 5 1.1 L 23.32 L 0.14 L 0.21 L TR425 Yalova 6 7.0 H 23.06 H 0.26 H 0.68 H
Note: ‘L’ refers to low and ‘H’ refers to high.
In order to reflect each group, we included province(s) depending on their score and
their geographical locations. The reason to add the geographical location to our
stratification is due to the divergences among regions in Turkey. For instance, in the
first group there are three provinces, but the land use change was the same in Antalya
and Muğla, and so we only included Antalya. Another example is that in the second
group we included both Aydın and Burdur due to their location. Therefore, we
included Antalya, Düzce, Sakarya, Burdur, Aydın, Yalova, Bilecik, Eskisehir and
Bursa in our sample. Therefore, we started our micro-level stratification with these
nine provinces which we ended up with at the end of our macro-level multi-stage
sampling. In summary, our stratification at the macro-level covers four NUTS 2
Table 4.4 : 2nd stage of stratification: NUTS 3 regions in Turkey.
155
regions and nine NUTS 3 regions, and the next section provides insights about how
we selected successful villages from among the ones in these regions by means of
multi-stage stratification at the micro-level.
4.3.2 The successful Turkish villages
Early studies and evaluations showed the importance of scale when focusing on the
‘rurality’ concept. Investigating rurality at the macro-level can provide useful
background for evaluation at the national or regional level, but the relatively small
size of rural areas calls for a micro-level evaluation to evaluate them at settlement
level. Thus, on the basis of the selection process explained in Section 4.3.1, this
section is interested in settlements located in the four NUTS 2 regions, viz. Aydın,
Bursa, Kocaeli, and Antalya. Now, as we start our micro-level stratification, we can
start to talk about the rurality of settlements as we deepen our investigation to NUTS
4 regions.
At this stage of our stratification indicator, which is related to the changes in the
rurality of settlements, the change in the share of rural population between 1990 and
2000 was used to eliminate NUTS 4 regions (Table C.3 in Appendix C). Thus, this
change is calculated by the equation:
Change in rural population R P T P
(4.3)
Therefore, we eliminated those districts which have a negative sign in the changes of
rural population. In other words, they are not attractive and did not experience
positive changes in their rural areas. Therefore, we focused on 20 districts in the next
stage from seven NUTS 3 regions.
Before starting on the last stage of our stratification which is the village level, we
have to remember how we have defined a village for the Turkish case. The definition
was the legal definition used in Turkey, and it is related to population, so for a
settlement to be a village it needs to have a population of less than 2,000 and also not
to have a municipality. Therefore, we eliminated settlements with a population of
more than 2,000 inhabitants and also settlements which already have a municipality.
Therefore, we continued to our micro-level stratification with 392 villages (see
Figure 4.20).

156
Another key issue to remember is that we are interested in successful villages with a
diversity of economic activities (see the definition of the Cork Declaration and
Chapter 2.1). Thus, entrepreneurs again appear as a selection indicator because they
are the most effective catalysts of change and success. In addition, diversity of
economic activities depends mainly on the non-agricultural entrepreneurial activity
in rural areas, so we used the share of non-agricultural entrepreneurship in total
employment. Therefore, at the last stage of our stratification, we used the share of
non-agricultural entrepreneurship as one of the stratification indicators. In addition,
we determined non-agricultural activity in three degrees, viz. high (more than 30 per
cent of total entrepreneurial activity); medium (between 5 to 29 per cent of total
entrepreneurial activity); low (between 0 to 4 per cent of total entrepreneurial
activity).
In addition, distance to these nearest centre is seen as the indicator of the place of
rural areas in the production system, and also the indicator of rural inhabitants’
accessibility to urban opportunities and visitors’ accessibility to rural areas. There are
three types of rural areas in terms of their distance to the nearest urban centre, viz.
‘accessible’ located at a distance of 0 to 35 km2 to the nearest settlement which has a
population of more than 10,000; ‘semi-accessible’ located between 35 and 70 km;
and ‘remote’ located beyond 70 km (The Scottish Government, 2008). Here, as the
nearest settlement, the district centre is taken into account. However, among the 20
district centres 8 of them have a population of under 10,000, so, in these cases, the
distance to the provincial centre was used. Therefore, we classified villages in nine
groups (Table 4.5).
Distance Non-agricultural activity
High Medium Low Remote - 8 20 Semi-accessible 1 26 29 Accessible 15 183 110
Based on the literature and previous findings, in order to limit the number of villages
we focused on villages which are remote or semi-accessible with a high or medium
degree of non-agricultural activities, and on accessible villages with high agricultural
activities – in other words, low non-agricultural activity (Figure 4.22). Therefore, 2 35 km is equal to a 30 minutes drive. This measure has recently been used to classify rural areas.
Table 4.5 : Number of villages by distance and non-agricultural activity.

157
from among 392 villages, we narrowed down our village selection to 144 villages
(see Table C.3 in Appendix C for the complete list of villages). From this point
onwards, the selection is more difficult as we have to choose some examples for our
research. As remote-high villages did not exist in our sample, we focused on remote-
medium and semi-high villages. Among remote-medium villages, we selected
villages which have a degree of non-agricultural activity of more than 10 per cent
and thus we focused on four types of villages (Table 4.6).
Figure 4.22 : Priorities during the village selection – The Turkish case.
NUTS 2 NUTS 3 NUTS 4 NUTS 5 Entrepreneurs Census Predicted Observed
Remote – Medium TR42 Sakarya Taraklı Alballar 36(10) 10(3) 8(4) TR42 Sakarya Taraklı Mahdumlar 92(9) 30(3) 34(6) TR41 Bilecik Yenipazar Karahasanlar 31(5) 10(2) 11(0) TR41 Bilecik Yenipazar Dereköy 10(2) 5(1) 3(0)
Semi – HighTR61 Antalya Akseki Değirmenlik 129(44) 30(15) 17(2)
Semi – MediumTR61 Antalya Alanya Başköy 43(9) 15(3) 11(1) TR61 Antalya Kemer Ovacık 41(7) 15(2) 2(1) TR61 Antalya Alanya Beldibi 55(9) 15(3) 0(0) TR61 Antalya Akseki Susuzşahap 62(10) 20(3) 0(3) TR61 Antalya Alanya Çakallar 146(20) 30(6) 26(9)
Access – LowTR32 Aydin Yenipazar Karaçakal 53(0) 15(0) 15(0) TR61 Antalya Kale Kapaklı 69(0) 20(0) 12 (2) TR32 Aydin Karpuzlu Ovapınarı 146(2) 30(0) 37(0) TR32 Aydin İncirliova Akçeşme 108(1) 30(0) 26(0) TR32 Aydin Yenipazar Alhan 55(1) 15(0) 15(0) TR32 Aydin Koçarlı Halilbeyli 107(2) 30(0) 27(0) TR61 Antalya Akseki Emiraşıklar 58(1) 20(0) 7(1) TOTAL 340(44) 255 (29)
Note: ‘(..)’ represents number of non-agricultural entrepreneurs.
Table 4.6 : Successful villages in Turkey.

158
Only one village among the 144 villages matched the group semi-high villages and
thus we included that one. In the case of semi-medium villages, we selected five
villages which have the highest degree of non-agricultural activity. In the case of
access-low villages, it was important to select the nearest villages to the urban centre
– between 0 and 5 km – with the lowest degree of non-agricultural activity between 0
and 2 per cent. Thus, we selected seven villages. In total, we examined 17 villages in
Turkey (Table 4.6).
As mentioned in Chapter 2.1, we used two types of questionnaire in our Turkish case
studies, i.e. a questionnaire for the village and a questionnaire for the entrepreneur.
Therefore, Table 4.6 also provides the total number of entrepreneurs and the number
of non-agricultural entrepreneurs in brackets in the three columns. The first column
‘Census’ is the data obtained from the Population Census 2000; the second column
shows the predicted number of entrepreneurs to be interviewed; and the last column
‘Observed’ indicates entrepreneurs with whom an in-depth analysis was conducted.
In total, we carried out our analyses in 17 villages with 255 entrepreneurs.The multi-
stage sampling applied above was based on the conceptual and theoretical framework
of the study (see Chapters 2.1 to 2.4.). Today, the changes occurring in rural areas
have attracted a great deal of attention. Especially the demographic changes and their
consequences have become the interest of both theoretical and empirical studies.
Although little has been generated in the theoretical field, much empirical evidence
has shown the impacts of changes from many perspectives. Therefore, we used these
changes as stratification indicators at the macro-level. When it comes to the micro-
level, the changes were not enough to stratify the successful villages, so we had to
add sustainable development theories on the basis of the focus of our study.
From this point, both the theoretical discussions and empirical evidence in the
literature showed that the development of rural areas depends on an endogenous
rather than exogenous approach. Today, the development trend is moving from
exogenous approaches to endogenous approaches (Stimson et al., 2009). From an
endogenous perspective, those rural areas which possess intervening opportunities
are fast developing and attractive areas especially for entrepreneurs.
The early empirical evidence showed that it is especially the remote rural areas
which are growing faster than the accessible and semi-accessible rural areas, and
even more than urban areas (Keeble and Tyler, 1995). Although classifying rural

159
areas depending on the basis of their multi-dimensional characteristics is difficult,
their heterogeneity, as well as early evidence, has led us to use distance as one of the
indicators, and non-agricultural entrepreneurs as another indicator at the micro-level,
as well as some additional rurality indicators.
Distance is an important indicator of changes as most of the population movements
depend on it. For instance, the theory of intervening opportunities and the other
theories, i.e. counterurbanization theories, central place theory etc., have looked into
the relations between distance and population movements. In addition, as well as
population movements, being close to agglomerations, e.g. urban areas, also
positively affects the development of rural areas.
Taking all these theoretical and conceptual backgrounds into consideration, the
stratification applied in this study achieved its aim. But generalizing the results of the
empirical evidence to the whole of Turkey is not possible. Nevertheless, the results
can offer a valid background for future studies and current trends of Turkish villages.
The details of the field survey are given in the next section, while noting the
similarities and differences between the macro- and the micro-data (Census and
observed data): in other words it compares facts in terms of both figures and reality.
4.3.3 Breaking the closeness: the field survey in Turkish villages
The complexity and extensive size of rural Turkey are very much known and visible
from the descriptive analysis offered in the previous chapter. But, when it comes to
employment, rural Turkey has suffered from the lack of it for many years. However,
entrepreneurship is high compared with the other structural forms of employment;
but unpaid workers are still the biggest share. As we focus on entrepreneurs in this
study, in this chapter we started by exploring entrepreneurship in rural Turkey. The
results of this exploration show that there is a slight but remarkable change going on
in rural Turkey and its employment. The number of entrepreneurs is increasing and
their profile is changing in a positive way.
Early empirical evidence showed the possible danger and many positive side effects
of this turnaround in rural areas. On this basis, while considering the overall aim of
this study, we used multi-stage stratification sampling. The stratification is generated
at two levels: the macro- and micro-levels by the use of several indicators in order to
reflect changes occurring in rural areas. After we had achieved the stratification and
160
the predicted number of questionnaires to be filled in, we were able to start our field
survey. The field survey took place between March and May 2009 in three phases. In
the first phase, with the help of Ziya Güveli and his team, the questionnaires were
filled in. The team was usually formed by two persons of opposite gender, and they
spent two to three days in the villages.
At the end of the first phase, we had to face a few problems. Among these problems
can be cited the mismatch of the Census data and the observed number of
entrepreneurs, the unwillingness of the villagers, and the emptiness of the villages.
Most of the problems occurred in the Southern regions. For instance, the village of
Beldibi was empty during our first visit due to a funeral, and, later on, we were not
able to find any entrepreneurs in the village although we were able to speak to the
chief person. Thus, the village is included in the analysis but not its entrepreneurs. In
addition, the chief person of the village of Susuzşahaplar was not at all eager to lead
our team to speak to the entrepreneurs. Another problematic example is the village of
Emiraşıklar whose the youngest entrepreneur was 62 years-old, and the village was a
village of retirees. Therefore, the number of questionnaires that could be filled in was
limited.
In the second phase of our field survey, we personally visited each village in the
company of a village expert in order to be able to break the closeness of the
communities. The expert advised us to take a packet of a well-known brand of
Turkish delight to the villages to thank them for taking part in our survey. During the
second phase, we realized another problem: that villagers had trust issues and were
thinking either we were sent by the government, or we were cheaters, in the light of
their earlier experiences. Therefore, luckily and with the help of the village expert,
we had no problem, neither to enter into the communities nor to do our in-depth
survey analysis. We were even able to persuade the chief person of the
Susuzşahaplar village to allow us to complete our questionnaires there. But, there
were not many entrepreneurs in the village because the village was supported and
financed by the remittances. Therefore, again, we did not exclude the village or its
entrepreneurs from our analyses. The third and the last phase occurred in May 2009
during a revisit to the villages where we had encountered problems to see if we could
get any additional questionnaire responses as we had from Susuzşahaplar.

161
All these three phases, the village selection and the advice of the village expert ended
up as a success story, even though we had to face some limitations like not having
up-to-date-data or lack of reliable data. Therefore, in the following chapters, the
results of our field survey are provided using a similar approach to that followed in
the European cases.
4.4 Rural Areas and Their Capacity: The Examples from Turkey
Compared with urban areas rural areas seem to have hardly any capacity at all. Early
empirical studies, (e.g. McGranahan and Wojan, 2007) showed that a village does
have capacity but it is different from that of towns and cities. The difference in rural
capacity is very much related to the intensity of its activities, rather than their
density. Therefore, although the components with which we measure capacity in
rural areas are the same as for the urban capacity, the key issue here is not the
quantity of the measurements but their quality improvement in time. Having said
that, in order to discuss the capacity of Turkish villages, in this chapter, we discuss
these villages in terms of two capacities, viz. their creative capacity and their
attractiveness capacity. 17 Turkish villages are evaluated in this chapter using a
similar approach to that used for the European villages.
4.4.1 The rural creative capacity of the Turkish villages
Creative capacity means the capability of a region to generate knowledge, in order to
achieve innovation and the diffusion of innovation output, while achieving the
viability and sustainability of this process. The creative capacity of a region is the
basic indicator of its potential for success in sustainable development. The capacity
of a region means what exists and what can exist or be absorbed by a region.
Regional creative capacity and its components are mainly measured by the returns
and output of the innovative processes, the effectiveness and efficiencies of which
depend on the creative capacity. In other words, the creative capacity of a region is
usually measured by already-existing strengths of regions rather than their
intervening opportunities. But the creative capacity of rural areas depends on the
capacity of rural areas to change.
The early literature review and argumentative approach to rural creative capacity (see
Chapter 2.1) showed that the important components to measure creative capacity are:
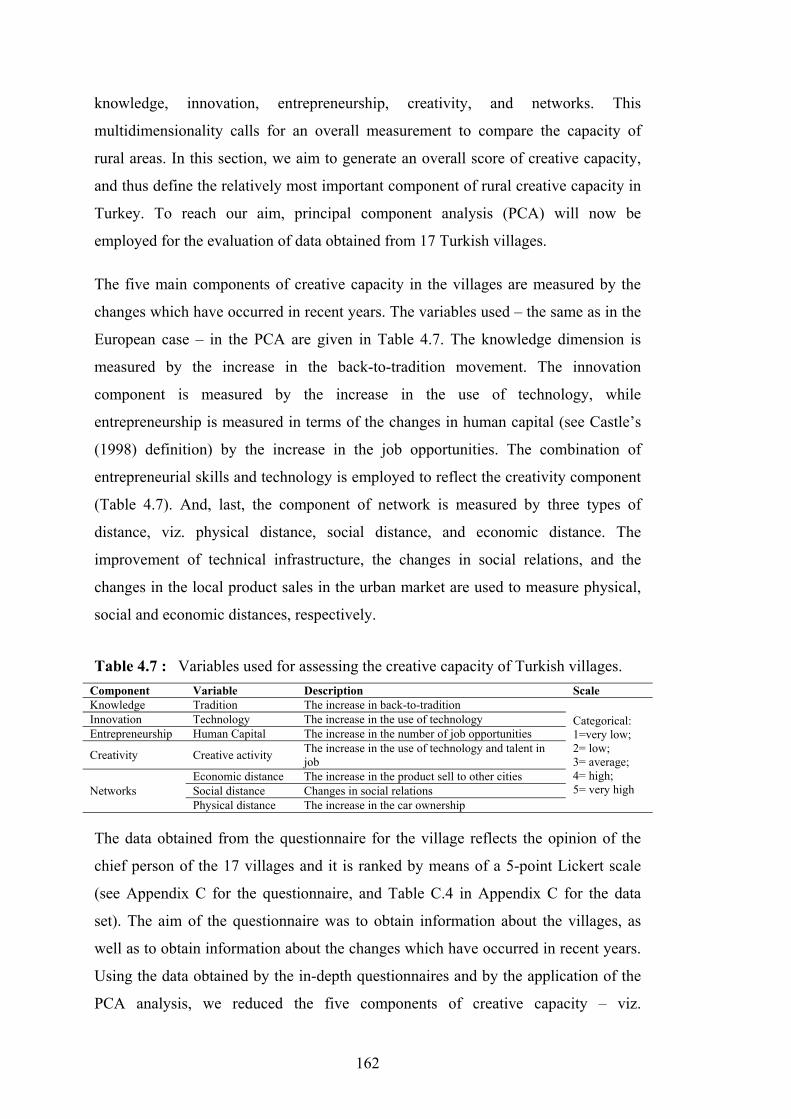
162
knowledge, innovation, entrepreneurship, creativity, and networks. This
multidimensionality calls for an overall measurement to compare the capacity of
rural areas. In this section, we aim to generate an overall score of creative capacity,
and thus define the relatively most important component of rural creative capacity in
Turkey. To reach our aim, principal component analysis (PCA) will now be
employed for the evaluation of data obtained from 17 Turkish villages.
The five main components of creative capacity in the villages are measured by the
changes which have occurred in recent years. The variables used – the same as in the
European case – in the PCA are given in Table 4.7. The knowledge dimension is
measured by the increase in the back-to-tradition movement. The innovation
component is measured by the increase in the use of technology, while
entrepreneurship is measured in terms of the changes in human capital (see Castle’s
(1998) definition) by the increase in the job opportunities. The combination of
entrepreneurial skills and technology is employed to reflect the creativity component
(Table 4.7). And, last, the component of network is measured by three types of
distance, viz. physical distance, social distance, and economic distance. The
improvement of technical infrastructure, the changes in social relations, and the
changes in the local product sales in the urban market are used to measure physical,
social and economic distances, respectively.
Component Variable Description Scale Knowledge Tradition The increase in back-to-tradition
Categorical: 1=very low; 2= low; 3= average; 4= high; 5= very high
Innovation Technology The increase in the use of technology Entrepreneurship Human Capital The increase in the number of job opportunities
Creativity Creative activity The increase in the use of technology and talent in job
Networks Economic distance The increase in the product sell to other cities Social distance Changes in social relations Physical distance The increase in the car ownership
The data obtained from the questionnaire for the village reflects the opinion of the
chief person of the 17 villages and it is ranked by means of a 5-point Lickert scale
(see Appendix C for the questionnaire, and Table C.4 in Appendix C for the data
set). The aim of the questionnaire was to obtain information about the villages, as
well as to obtain information about the changes which have occurred in recent years.
Using the data obtained by the in-depth questionnaires and by the application of the
PCA analysis, we reduced the five components of creative capacity – viz.
Table 4.7 : Variables used for assessing the creative capacity of Turkish villages.
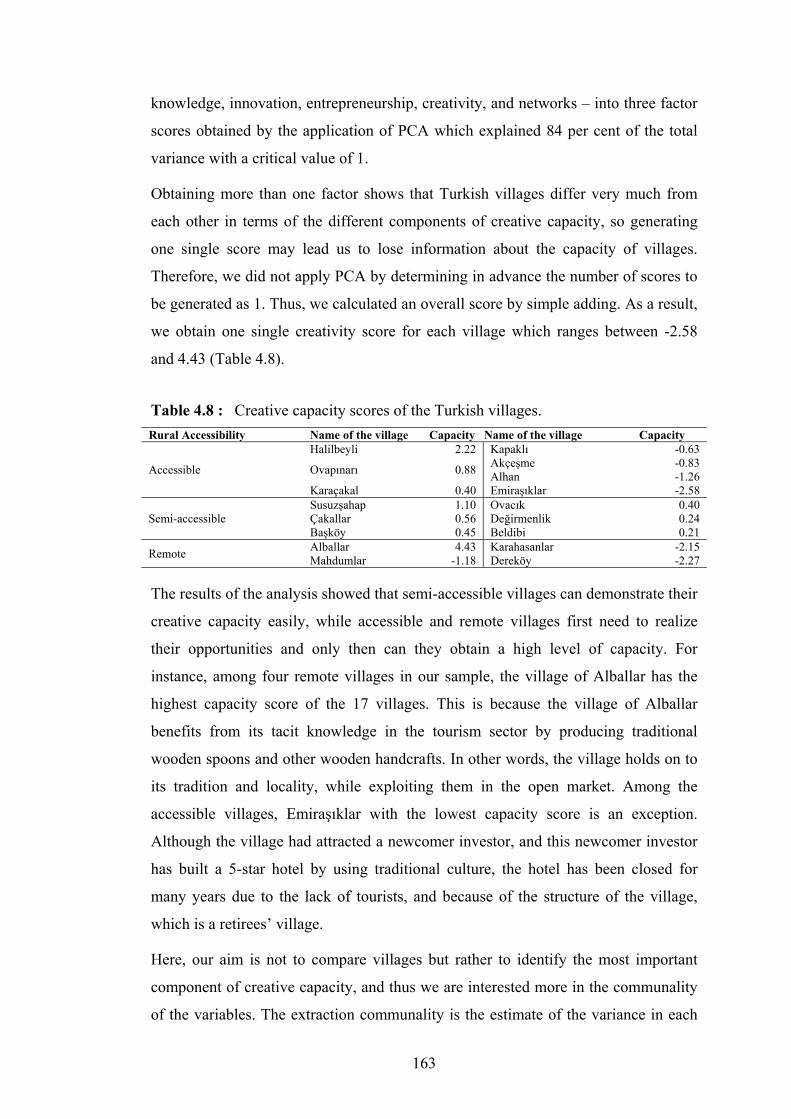
163
knowledge, innovation, entrepreneurship, creativity, and networks – into three factor
scores obtained by the application of PCA which explained 84 per cent of the total
variance with a critical value of 1.
Obtaining more than one factor shows that Turkish villages differ very much from
each other in terms of the different components of creative capacity, so generating
one single score may lead us to lose information about the capacity of villages.
Therefore, we did not apply PCA by determining in advance the number of scores to
be generated as 1. Thus, we calculated an overall score by simple adding. As a result,
we obtain one single creativity score for each village which ranges between -2.58
and 4.43 (Table 4.8).
Rural Accessibility Name of the village Capacity Name of the village Capacity
Accessible
Halilbeyli 2.22 Kapaklı -0.63
Ovapınarı 0.88 Akçeşme -0.83 Alhan -1.26
Karaçakal 0.40 Emiraşıklar -2.58
Semi-accessible Susuzşahap 1.10 Ovacık 0.40 Çakallar 0.56 Değirmenlik 0.24 Başköy 0.45 Beldibi 0.21
Remote Alballar 4.43 Karahasanlar -2.15 Mahdumlar -1.18 Dereköy -2.27
The results of the analysis showed that semi-accessible villages can demonstrate their
creative capacity easily, while accessible and remote villages first need to realize
their opportunities and only then can they obtain a high level of capacity. For
instance, among four remote villages in our sample, the village of Alballar has the
highest capacity score of the 17 villages. This is because the village of Alballar
benefits from its tacit knowledge in the tourism sector by producing traditional
wooden spoons and other wooden handcrafts. In other words, the village holds on to
its tradition and locality, while exploiting them in the open market. Among the
accessible villages, Emiraşıklar with the lowest capacity score is an exception.
Although the village had attracted a newcomer investor, and this newcomer investor
has built a 5-star hotel by using traditional culture, the hotel has been closed for
many years due to the lack of tourists, and because of the structure of the village,
which is a retirees’ village.
Here, our aim is not to compare villages but rather to identify the most important
component of creative capacity, and thus we are interested more in the communality
of the variables. The extraction communality is the estimate of the variance in each
Table 4.8 : Creative capacity scores of the Turkish villages.

164
variable accounted for by the components. The high level of communality indicates
that the extracted components represent the variables well. Table 4.9 shows the
communality of each variable calculated for the creative capacity score. In the other
words, the results show that creativity, i.e. being able to bring together technology
and the local knowledge, is the most important indicator of the rural creative capacity
in Turkish villages. This is followed by the entrepreneurship component, although
most of the Turkish villages still face the difficulty of exposing their economic
opportunities and converting them into strengths. In addition, social life, selling their
products in the outside world, and local knowledge are relatively important
indicators of rural creative capacity of Turkish villages. Physical distance with the
lowest communality suggests that neither the remoteness of a village nor shortening
the physical distance has any great effect on increasing or exploiting the creative
capacity.
Component Variable Communality Creativity Creative activity 0.90 Entrepreneurship Human Capital 0.87 Networks Social distance 0.86 Networks Economic distance 0.85 Knowledge Tradition 0.84 Innovation Technology 0.82 Networks Physical distance 0.70
The results of the analysis show that, whether Turkish villages can have intervening
opportunities or not, they have to work hard to accept change and improve the
perspective of the local population to that of the modern knowledge society. In other
words, to make the local population conscious of the opportunities available in their
villages must be the main concern of policies. The next section evaluates another
form of capacity, i.e. attractiveness in the Turkish villages.
4.4.2 The attractiveness of the Turkish villages
The old and unattractive image of rural areas, which represents traditional locality,
has changed into an attractive image, so that both the local population and
newcomers can experience the rural idyll. This new image of rural areas, closely
related to the dynamics of locality, especially to the cultural heritage and quality of
life, is explained in the literature by many factors such as counterurbanization (Berry,
Table 4.9 : Communality of the creative capacity components of Turkish villages.

165
1976), the back-to-the-land movement, land-based lifestyles (Halfacree, 2007), eco-
towns, and also green tourism. The attractiveness of a village depends on four main
factors, viz. description; quality; promotion; and creativity. But, it is not certain
which of these factors are important to identify the ability of village to attract
visitors. On this basis, in this section, in order to investigate the attractiveness
capacity of Turkish villages and to identify the most important attractiveness factor,
we examine 17 villages in our sample in terms of four attractiveness factors, by using
rough set data analysis (RSDA). The data and information used in this evaluation are
obtained from the in-depth survey analysis conducted in these villages. A
questionnaire was used during this survey with the aim of obtaining information
about the villages and the changes occurring in them. This questionnaire was filled in
by the chief person of the villages.
Table 4.10 summarizes the data on villages by the four main factors of attractiveness.
As can be seen from the Table 4.10, the majority of the Turkish villages enjoy their
history and nature. But 82 per cent of the villages suffer from insufficient
infrastructure. Although each village has water and electricity, only 41 per cent of the
villages enjoy ICT technology and only 30 per cent has Cable TV (Table 4.10). 53
per cent of the villages have increased their use of technology. 59 per cent of the
villages have uniqueness as a local product. Only 2 per cent of the villages can
expose their products in the local market, but 53 per cent do this in the urban market
(Table 4.10). Therefore, compared with the European villages, Turkish villages
although they have more advantages in terms of nature and history, do not yet have
sufficient physical and economic development.
% # % # Description Promotion
Historic 94 16 Outside Product Sell 53 9 Dependent on nature 82 14 Locality: Local Market 2 12
Quality Creativity Infrastructure 18 3 Uniqueness 59 10 Cable TV 30 5
Phone 94 16 Technology use 53 9 Water 100 17 Electricity 100 17
Openness
47
8 Internet 41 7
Table 4.10 : Turkish villages, by four main factors of attractiveness.

166
As mentioned before, in our study we have two main study areas: Europe and
Turkey, so the analysis conducted in both cases is similar. However, in the case of
the analysis on attractiveness, the Turkish case is distinct from the European case to
some extent due to the lack of data. Therefore, although while evaluating European
villages in terms of their attractiveness we were able to generate an attractiveness
index by the number of tourists and their population, to generate an index for Turkish
villages is not possible due to the lack of records of visitors. To do this here, in order
to measure their attractiveness level, we only use a dummy variable to indicate
whether these villages have visitors frequently, or not (Table 4.11). To investigate
the most important factors behind the attractiveness of Turkish villages, we used
RSDA (for an explanation, see Appendix A) because of the qualitative nature of the
attributes. To apply RSDA, six condition attributes and one decision attribute were
employed (Table 4.11). Compared with our previous analysis, we cannot include
variables related to the events because there are no such events in these villages. But
instead, we included the existence of a local market variable which can be seen as a
local event and therefore formed part of our information table (see Table C.4 in
Appendix C for the data set).
Factor Variable Explanation Type
Quality Infrastructure 1 = infrastructure of the village is adequate; 0 = infrastructure is not adequate Dummy
Creative Capacity
Uniqueness 1 = there is a uniqueness, 0=no uniqueness Dummy Openness 1 = there is a social change; 0=no social change Dummy
Use Of Technology 1 = there is use of technology in the village; 0 = no technology use Dummy
Promotion Local Market 1 = there is a local market; 0=no local market Dummy
Product Sell 0 = there is no outside product sell; 1 = very low; 2 = low; 3 = average; 4 = high; 5 = very high Categorical
Attractiveness Attractiveness Level 1 = frequently visited; 0 = no frequent visitors Dummy
According to the results of the analysis, the attractiveness of the villages is
approximated with high accuracy and quality of classification (Table 4.12). Thus, the
attractive image of the villages is fully discernible. Therefore, we can use the results
of following steps of RSDA as exact approximations.
Approximations Accuracy Upper level Lower level 1 Attractive 1 9 9 2 Not Attractive 1 8 8 Accuracy of classification 1 Quality of classification 1
Table 4.11 : Attributes used in the attractiveness analysis.
Table 4.12 : Approximations of the attractiveness analysis.
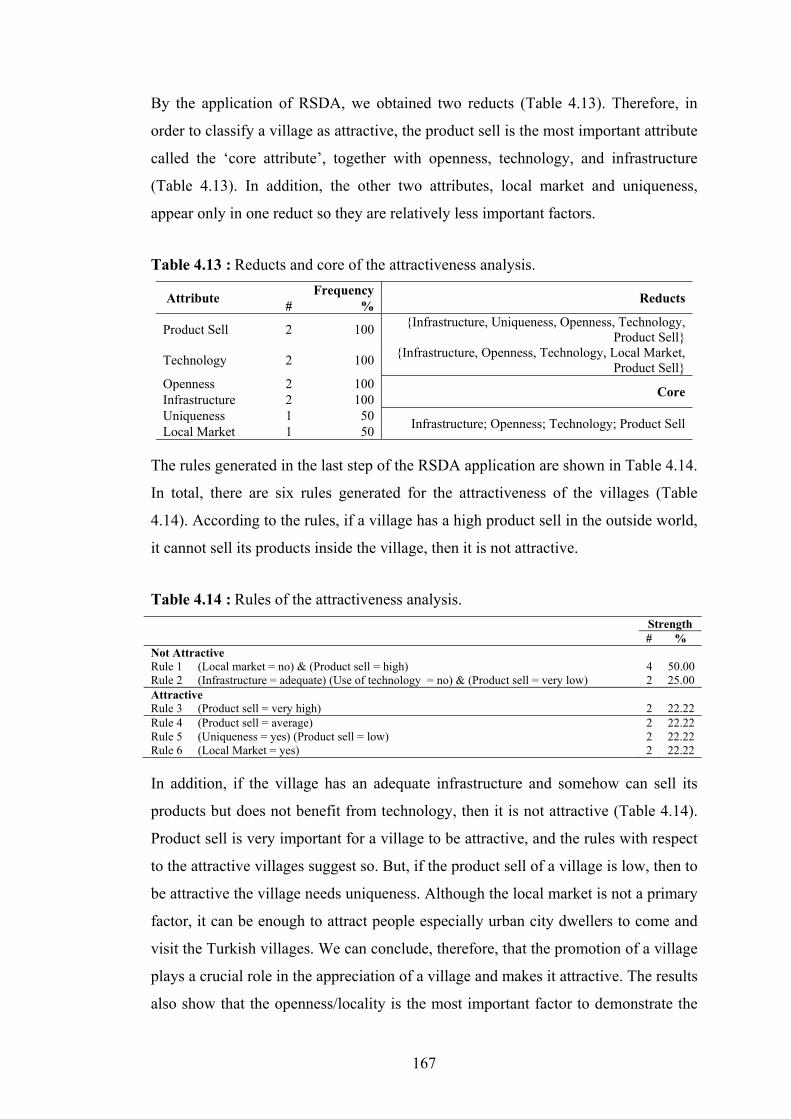
167
By the application of RSDA, we obtained two reducts (Table 4.13). Therefore, in
order to classify a village as attractive, the product sell is the most important attribute
called the ‘core attribute’, together with openness, technology, and infrastructure
(Table 4.13). In addition, the other two attributes, local market and uniqueness,
appear only in one reduct so they are relatively less important factors.
Attribute Frequency Reducts # %
Product Sell 2 100 {Infrastructure, Uniqueness, Openness, Technology, Product Sell}
Technology 2 100 {Infrastructure, Openness, Technology, Local Market, Product Sell}
Openness 2 100 Core Infrastructure 2 100 Uniqueness 1 50 Infrastructure; Openness; Technology; Product Sell Local Market 1 50
The rules generated in the last step of the RSDA application are shown in Table 4.14.
In total, there are six rules generated for the attractiveness of the villages (Table
4.14). According to the rules, if a village has a high product sell in the outside world,
it cannot sell its products inside the village, then it is not attractive.
Strength # % Not Attractive Rule 1 (Local market = no) & (Product sell = high) 4 50.00 Rule 2 (Infrastructure = adequate) (Use of technology = no) & (Product sell = very low) 2 25.00 Attractive Rule 3 (Product sell = very high) 2 22.22 Rule 4 (Product sell = average) 2 22.22 Rule 5 (Uniqueness = yes) (Product sell = low) 2 22.22 Rule 6 (Local Market = yes) 2 22.22
In addition, if the village has an adequate infrastructure and somehow can sell its
products but does not benefit from technology, then it is not attractive (Table 4.14).
Product sell is very important for a village to be attractive, and the rules with respect
to the attractive villages suggest so. But, if the product sell of a village is low, then to
be attractive the village needs uniqueness. Although the local market is not a primary
factor, it can be enough to attract people especially urban city dwellers to come and
visit the Turkish villages. We can conclude, therefore, that the promotion of a village
plays a crucial role in the appreciation of a village and makes it attractive. The results
also show that the openness/locality is the most important factor to demonstrate the
Table 4.13 : Reducts and core of the attractiveness analysis.
Table 4.14 : Rules of the attractiveness analysis.

168
attractiveness of villages. The results suggest that the quality of Turkish villages is
low despite all their attractive localities and uniqueness. Therefore, in the next
section, we discuss in-depth the capacity of Turkish villages.
4.4.3 The intensity, not the density, to measure the rural capacity
In the knowledge era, the global system calls for the sustained competitive advantage
of a region. Regions, especially rural ones, to begin to obtain sustained competitive
advantage need to increase their level of creative capacity which is the starting point
of the success route for competitive advantage. In addition, to have a place in the
global system and to strengthen their place, rural areas first need to convert their
capacity into attractiveness.
Rural areas are often ignored or neglected as they are disadvantageous in terms of
their capacity compared with urban areas. Urban areas, being the place of
agglomerations which are the incubators of innovation, have become the focus of
many researchers, in contrast to rural areas which lack such agglomerations.
Nowadays, in addition to agglomerations, ‘trust’ or ‘networks’ are also the main
incubators of the formation of economic activities. Such networks and trust exist
intensely in rural areas but not as densely as they are in urban areas. Although the
density does not exist in rural areas, they can be seen as ‘focused factories’ which are
areas specialized in the traditions and social networks that are concentrated and
developed (see Skinner, 1974 for the explanation of ‘The Focused Factory’). This
intensity and the concentration of social networks and traditions are lacking in urban
areas where their dwellers are eager to experience these in an old fashioned way.
However, the socio-geographical landscapes of rural areas are changing by attracting
new people from outside. This changing socio-geographical landscape is usually
created by the collective learning strategies which manifest themselves in two
configurations, viz. network participation and geographical agglomeration (Nijkamp,
2003). At present, the focus on knowledge which is found in the form of
traditional/tacit knowledge in rural areas ties in with the present emphasis on
endogenous growth theory which takes for granted that economic growth does not
automatically emerge from the seeds of technological innovation, but is the result of
deliberate actions and choices of various stakeholders (Nijkamp, 2003).

169
We are living in a network and knowledge-based society, so social networks play a
crucial role. Therefore, rural life which depends on social networks has a low density
in terms of networks, but creates intense networks, and, thus, rural areas with their
intense knowledge of traditions can manage the economic activities much better.
Therefore, it is not the density of these networks but rather the intensity that must be
taken into consideration when evaluating rural areas. On this basis, in this section we
discuss the capacity of 17 Turkish villages in our sample with respect to the
empirical results.
The capacity of a region is not one uni-dimensional concept but rather a multi-
dimensional concept. Given this background, Chapter 4.4 has aimed to compare the
capacity of 17 Turkish villages and to investigate the most important factors of the
rural capacity by means of creative capacity and attractiveness.
Therefore, to investigate the creative capacity, five factors: knowledge, technology,
entrepreneurship, creativity, and networks were employed, while for the
attractiveness three factors: quality, creativity, and promotion, are used. It is not easy
to measure the capacity of a region. On the other hand, the diverse and unique
locality of the rural region – i.e. the creativity – makes it difficult to decide the prior
factors necessary to become attractive.
The results of the PCA analysis of creative capacity showed that the combination of
technology and local knowledge plays an important role in improving the creative
capacity of the villages. In addition, the results of RSDA on the attractiveness,
suggest that, in order to be attractive, Turkish villages still need to increase their
quality and as well as their openness level. Not all Turkish villages but some Turkish
villages do show high potential in terms of capacity by exposing, may be not densely
but intensely, their localities in the system.
The relatively small number of villages in our sample prevented us from using a
wide list of variables/attributes when conducting our research. Nevertheless, this
evaluation provides a valid background for future development strategies. Therefore,
policies need to focus more on how to increase the quality of rural areas and how to
open societies to new ideas in order to increase both the creative capacity and the
attractiveness level of the village as the priority of sustainability. The next chapter
focuses on the entrepreneurs in Turkish villages with a special focus on their place
in, and impacts on, rural areas.
170
4.5 Rural Areas and Entrepreneurs in Turkey
The achievement of the complex route from sustainable competitive advantage to
success for regions seems to depend mainly on the creation of an innovative and
entrepreneurial milieu, but this is not enough. The entrepreneurs in rural areas play a
crucial role not only in the rural economy but also in rural life. Therefore, their
embeddedness in, and their impacts on, rural areas are both connected to rural
development. Thus, this chapter first investigates their embeddedness by their
profile, and second their impacts on rural capital, with a special focus on their origin.
4.5.1 The rural entrepreneurs in Turkish villages
The increasing attractiveness of rural areas has affected the emergence of small
firms, while influencing entrepreneurs and their behaviour (Keeble and Tyler, 1995).
Therefore, significant aspects of what entrepreneurs need for business start-ups in
rural areas differ from those of their urban counterparts. In other words, maleness,
higher education, and entrepreneurial parents are not as fundamental for business
start-ups in rural areas as they are in urban areas (Weber, 2007). In urban settings,
the entrepreneurs are heterogeneous, and have a low involvement in social networks
(Renzulli et al., 2000). In contrast, in rural areas, entrepreneurs are more
homogeneous and have an involvement in social groups (Francis et al., 1990).
Entrepreneurs in rural areas are the main economic agents. To survive in conditions
of closed social localism, even economic agents need to be accepted by the social
environment and to be a part of it. In the literature, the effect of social behaviour on
economic activities is called ‘embeddedness’. Therefore, the embeddedness of
entrepreneurs is very important for the continuity of economic activity in rural areas.
Moreover, rural entrepreneurship studies focusing on embeddedness stress gender,
the use of local resources, the origin of entrepreneurs, and the sector in which they
are operating. Early studies have found that both the personal and the firm profile of
entrepreneurs are the indicators of the embeddedness level of an entrepreneur. On
this basis, in this section, we aim to first explore the profile of entrepreneurs, and
second to identify the most important factors to define their different embeddedness
levels. To achieve our aim, we first used descriptive techniques, and later RSDA in
order to investigate 255 entrepreneurs on the basis of the data obtained from the in-
depth questionnaire interviews. The questionnaire of entrepreneurs aimed to
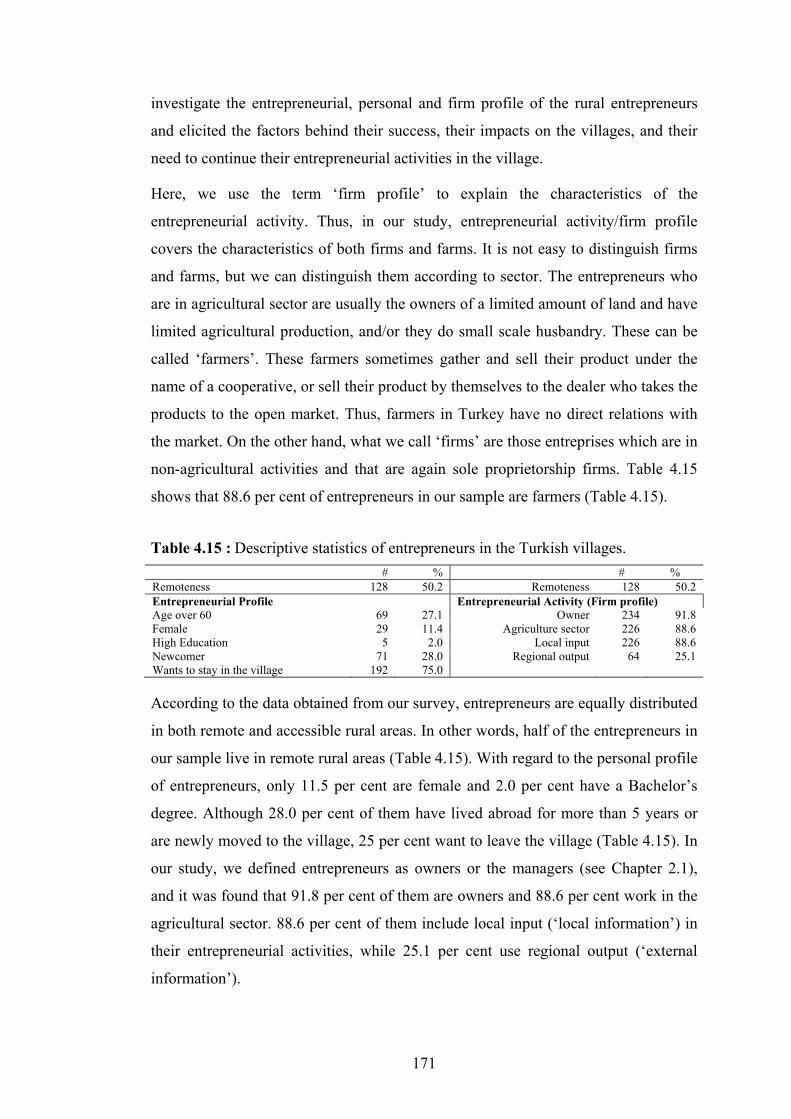
171
investigate the entrepreneurial, personal and firm profile of the rural entrepreneurs
and elicited the factors behind their success, their impacts on the villages, and their
need to continue their entrepreneurial activities in the village.
Here, we use the term ‘firm profile’ to explain the characteristics of the
entrepreneurial activity. Thus, in our study, entrepreneurial activity/firm profile
covers the characteristics of both firms and farms. It is not easy to distinguish firms
and farms, but we can distinguish them according to sector. The entrepreneurs who
are in agricultural sector are usually the owners of a limited amount of land and have
limited agricultural production, and/or they do small scale husbandry. These can be
called ‘farmers’. These farmers sometimes gather and sell their product under the
name of a cooperative, or sell their product by themselves to the dealer who takes the
products to the open market. Thus, farmers in Turkey have no direct relations with
the market. On the other hand, what we call ‘firms’ are those entreprises which are in
non-agricultural activities and that are again sole proprietorship firms. Table 4.15
shows that 88.6 per cent of entrepreneurs in our sample are farmers (Table 4.15).
# % # % Remoteness 128 50.2 Remoteness 128 50.2 Entrepreneurial Profile Entrepreneurial Activity (Firm profile) Age over 60 69 27.1 Owner 234 91.8 Female 29 11.4 Agriculture sector 226 88.6 High Education 5 2.0 Local input 226 88.6 Newcomer 71 28.0 Regional output 64 25.1 Wants to stay in the village 192 75.0
According to the data obtained from our survey, entrepreneurs are equally distributed
in both remote and accessible rural areas. In other words, half of the entrepreneurs in
our sample live in remote rural areas (Table 4.15). With regard to the personal profile
of entrepreneurs, only 11.5 per cent are female and 2.0 per cent have a Bachelor’s
degree. Although 28.0 per cent of them have lived abroad for more than 5 years or
are newly moved to the village, 25 per cent want to leave the village (Table 4.15). In
our study, we defined entrepreneurs as owners or the managers (see Chapter 2.1),
and it was found that 91.8 per cent of them are owners and 88.6 per cent work in the
agricultural sector. 88.6 per cent of them include local input (‘local information’) in
their entrepreneurial activities, while 25.1 per cent use regional output (‘external
information’).
Table 4.15 : Descriptive statistics of entrepreneurs in the Turkish villages.
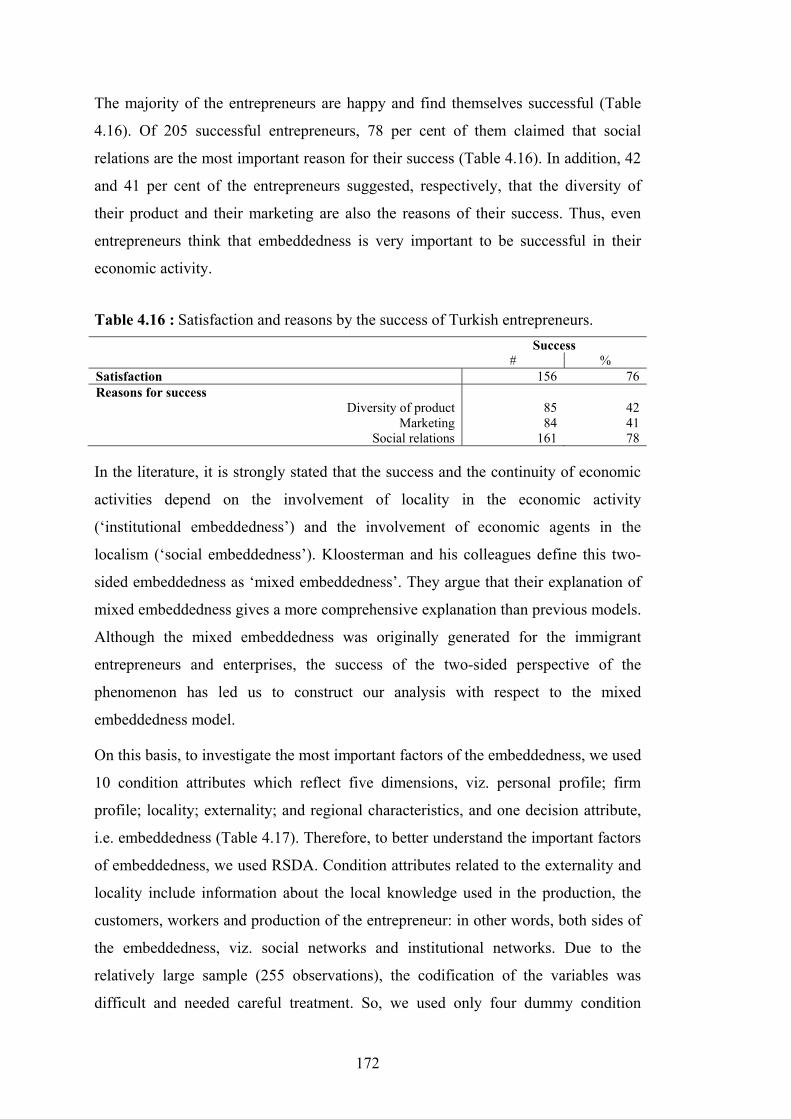
172
The majority of the entrepreneurs are happy and find themselves successful (Table
4.16). Of 205 successful entrepreneurs, 78 per cent of them claimed that social
relations are the most important reason for their success (Table 4.16). In addition, 42
and 41 per cent of the entrepreneurs suggested, respectively, that the diversity of
their product and their marketing are also the reasons of their success. Thus, even
entrepreneurs think that embeddedness is very important to be successful in their
economic activity.
Success # %
Satisfaction 156 76 Reasons for success
Diversity of product 85 42 Marketing 84 41
Social relations 161 78
In the literature, it is strongly stated that the success and the continuity of economic
activities depend on the involvement of locality in the economic activity
(‘institutional embeddedness’) and the involvement of economic agents in the
localism (‘social embeddedness’). Kloosterman and his colleagues define this two-
sided embeddedness as ‘mixed embeddedness’. They argue that their explanation of
mixed embeddedness gives a more comprehensive explanation than previous models.
Although the mixed embeddedness was originally generated for the immigrant
entrepreneurs and enterprises, the success of the two-sided perspective of the
phenomenon has led us to construct our analysis with respect to the mixed
embeddedness model.
On this basis, to investigate the most important factors of the embeddedness, we used
10 condition attributes which reflect five dimensions, viz. personal profile; firm
profile; locality; externality; and regional characteristics, and one decision attribute,
i.e. embeddedness (Table 4.17). Therefore, to better understand the important factors
of embeddedness, we used RSDA. Condition attributes related to the externality and
locality include information about the local knowledge used in the production, the
customers, workers and production of the entrepreneur: in other words, both sides of
the embeddedness, viz. social networks and institutional networks. Due to the
relatively large sample (255 observations), the codification of the variables was
difficult and needed careful treatment. So, we used only four dummy condition
Table 4.16 : Satisfaction and reasons by the success of Turkish entrepreneurs.
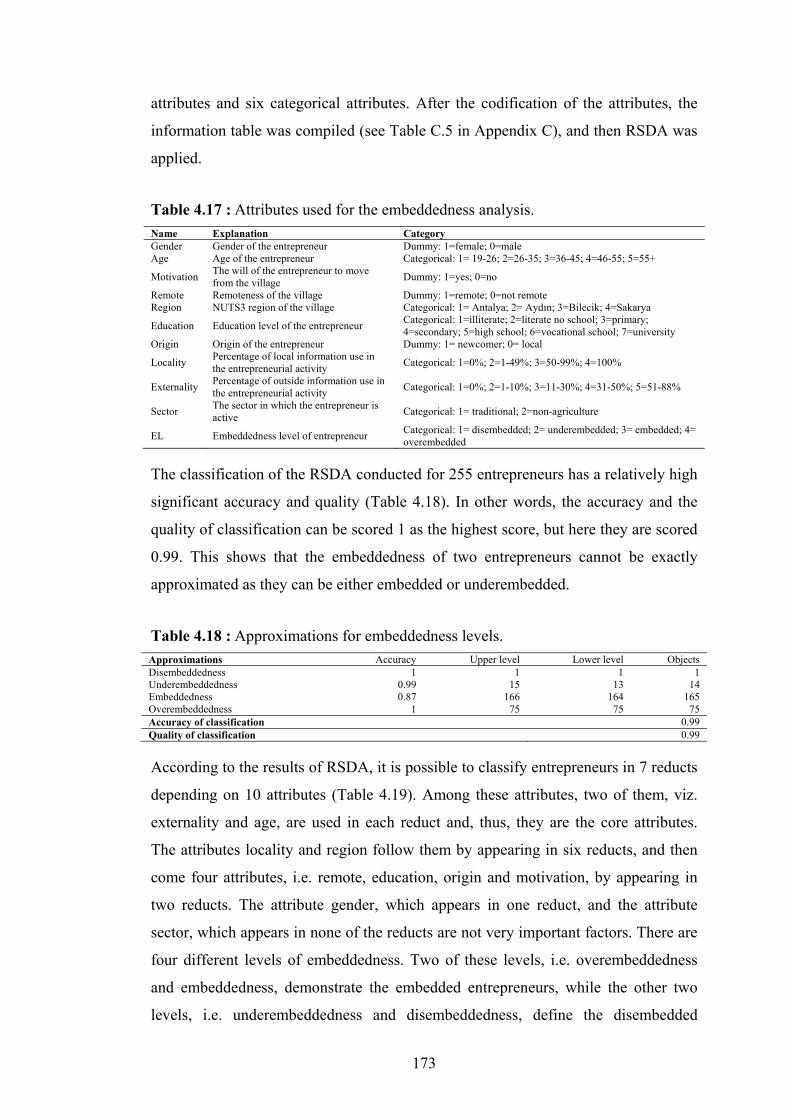
173
attributes and six categorical attributes. After the codification of the attributes, the
information table was compiled (see Table C.5 in Appendix C), and then RSDA was
applied.
Name Explanation Category Gender Gender of the entrepreneur Dummy: 1=female; 0=male Age Age of the entrepreneur Categorical: 1= 19-26; 2=26-35; 3=36-45; 4=46-55; 5=55+
Motivation The will of the entrepreneur to move from the village Dummy: 1=yes; 0=no
Remote Remoteness of the village Dummy: 1=remote; 0=not remote Region NUTS3 region of the village Categorical: 1= Antalya; 2= Aydın; 3=Bilecik; 4=Sakarya
Education Education level of the entrepreneur Categorical: 1=illiterate; 2=literate no school; 3=primary; 4=secondary; 5=high school; 6=vocational school; 7=university
Origin Origin of the entrepreneur Dummy: 1= newcomer; 0= local
Locality Percentage of local information use in the entrepreneurial activity Categorical: 1=0%; 2=1-49%; 3=50-99%; 4=100%
Externality Percentage of outside information use in the entrepreneurial activity Categorical: 1=0%; 2=1-10%; 3=11-30%; 4=31-50%; 5=51-88%
Sector The sector in which the entrepreneur is active Categorical: 1= traditional; 2=non-agriculture
EL Embeddedness level of entrepreneur Categorical: 1= disembedded; 2= underembedded; 3= embedded; 4= overembedded
The classification of the RSDA conducted for 255 entrepreneurs has a relatively high
significant accuracy and quality (Table 4.18). In other words, the accuracy and the
quality of classification can be scored 1 as the highest score, but here they are scored
0.99. This shows that the embeddedness of two entrepreneurs cannot be exactly
approximated as they can be either embedded or underembedded.
Approximations Accuracy Upper level Lower level Objects Disembeddedness 1 1 1 1 Underembeddedness 0.99 15 13 14 Embeddedness 0.87 166 164 165 Overembeddedness 1 75 75 75 Accuracy of classification 0.99 Quality of classification 0.99
According to the results of RSDA, it is possible to classify entrepreneurs in 7 reducts
depending on 10 attributes (Table 4.19). Among these attributes, two of them, viz.
externality and age, are used in each reduct and, thus, they are the core attributes.
The attributes locality and region follow them by appearing in six reducts, and then
come four attributes, i.e. remote, education, origin and motivation, by appearing in
two reducts. The attribute gender, which appears in one reduct, and the attribute
sector, which appears in none of the reducts are not very important factors. There are
four different levels of embeddedness. Two of these levels, i.e. overembeddedness
and embeddedness, demonstrate the embedded entrepreneurs, while the other two
levels, i.e. underembeddedness and disembeddedness, define the disembedded
Table 4.17 : Attributes used for the embeddedness analysis.
Table 4.18 : Approximations for embeddedness levels.
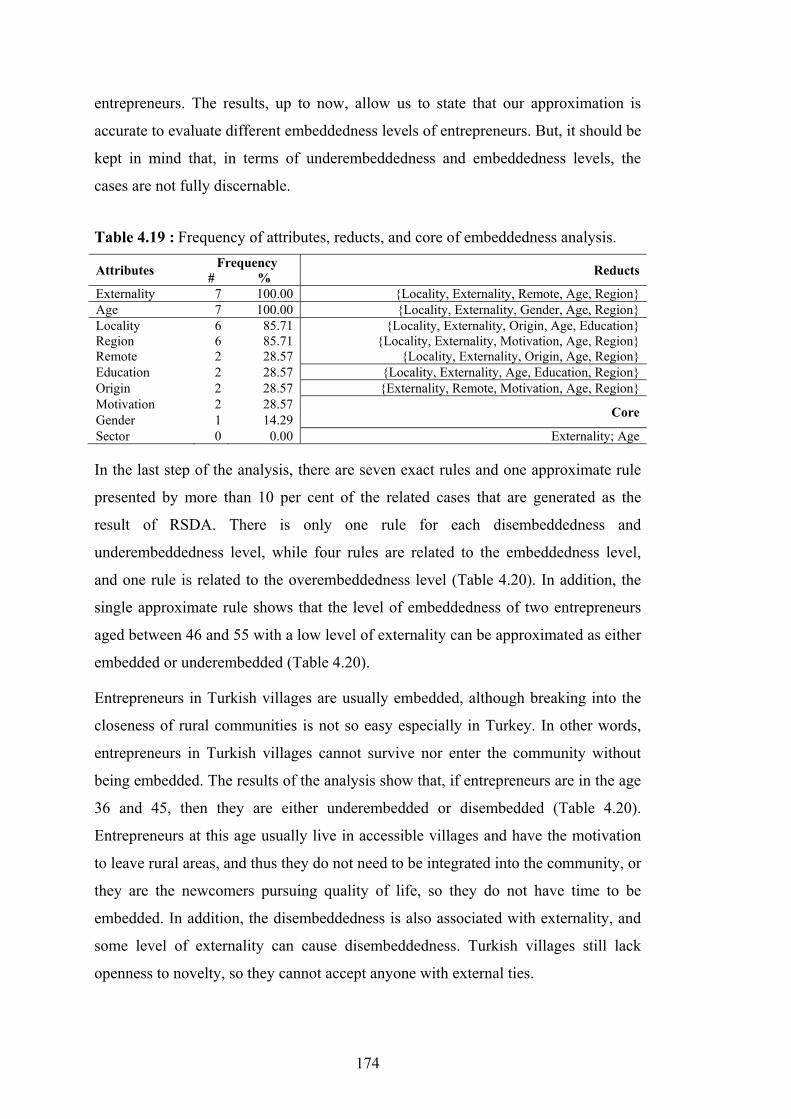
174
entrepreneurs. The results, up to now, allow us to state that our approximation is
accurate to evaluate different embeddedness levels of entrepreneurs. But, it should be
kept in mind that, in terms of underembeddedness and embeddedness levels, the
cases are not fully discernable.
Attributes Frequency Reducts # % Externality 7 100.00 {Locality, Externality, Remote, Age, Region} Age 7 100.00 {Locality, Externality, Gender, Age, Region} Locality 6 85.71 {Locality, Externality, Origin, Age, Education} Region 6 85.71 {Locality, Externality, Motivation, Age, Region} Remote 2 28.57 {Locality, Externality, Origin, Age, Region} Education 2 28.57 {Locality, Externality, Age, Education, Region} Origin 2 28.57 {Externality, Remote, Motivation, Age, Region} Motivation 2 28.57 Core Gender 1 14.29 Sector 0 0.00 Externality; Age
In the last step of the analysis, there are seven exact rules and one approximate rule
presented by more than 10 per cent of the related cases that are generated as the
result of RSDA. There is only one rule for each disembeddedness and
underembeddedness level, while four rules are related to the embeddedness level,
and one rule is related to the overembeddedness level (Table 4.20). In addition, the
single approximate rule shows that the level of embeddedness of two entrepreneurs
aged between 46 and 55 with a low level of externality can be approximated as either
embedded or underembedded (Table 4.20).
Entrepreneurs in Turkish villages are usually embedded, although breaking into the
closeness of rural communities is not so easy especially in Turkey. In other words,
entrepreneurs in Turkish villages cannot survive nor enter the community without
being embedded. The results of the analysis show that, if entrepreneurs are in the age
36 and 45, then they are either underembedded or disembedded (Table 4.20).
Entrepreneurs at this age usually live in accessible villages and have the motivation
to leave rural areas, and thus they do not need to be integrated into the community, or
they are the newcomers pursuing quality of life, so they do not have time to be
embedded. In addition, the disembeddedness is also associated with externality, and
some level of externality can cause disembeddedness. Turkish villages still lack
openness to novelty, so they cannot accept anyone with external ties.
Table 4.19 : Frequency of attributes, reducts, and core of embeddedness analysis.
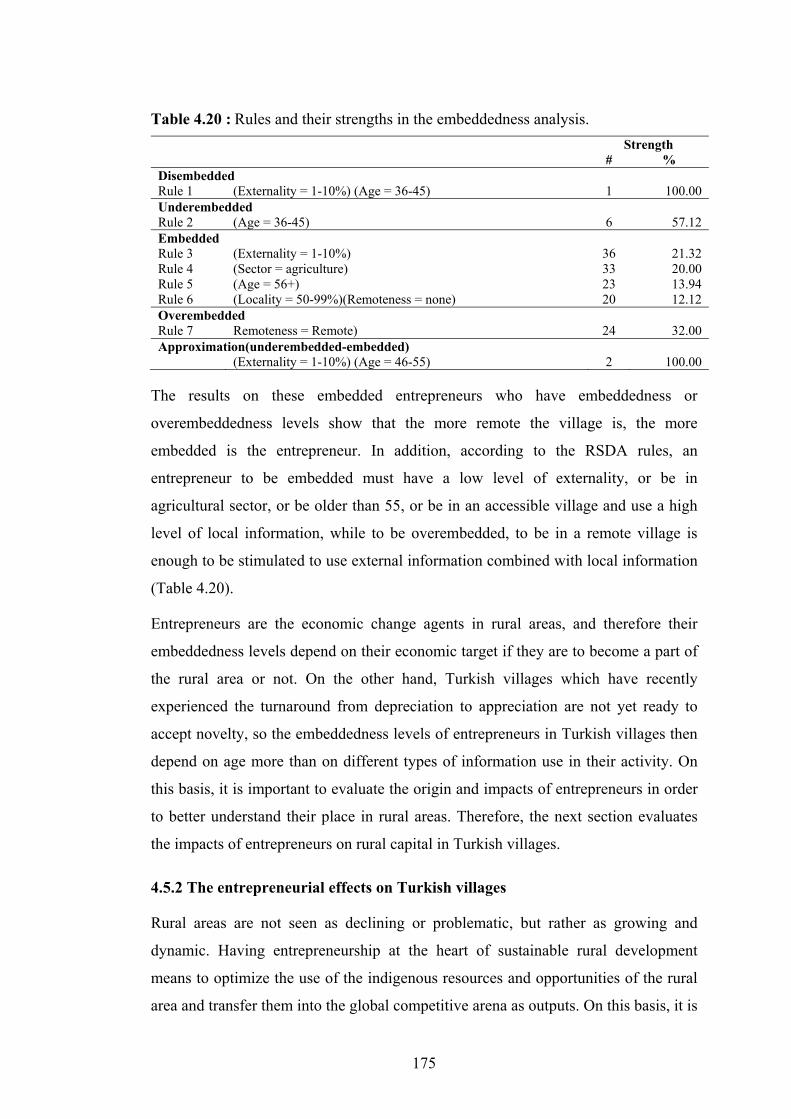
175
Strength # %
Disembedded Rule 1 (Externality = 1-10%) (Age = 36-45) 1 100.00 Underembedded Rule 2 (Age = 36-45) 6 57.12 Embedded Rule 3 (Externality = 1-10%) 36 21.32 Rule 4 (Sector = agriculture) 33 20.00 Rule 5 (Age = 56+) 23 13.94 Rule 6 (Locality = 50-99%)(Remoteness = none) 20 12.12 Overembedded Rule 7 Remoteness = Remote) 24 32.00 Approximation(underembedded-embedded) (Externality = 1-10%) (Age = 46-55) 2 100.00
The results on these embedded entrepreneurs who have embeddedness or
overembeddedness levels show that the more remote the village is, the more
embedded is the entrepreneur. In addition, according to the RSDA rules, an
entrepreneur to be embedded must have a low level of externality, or be in
agricultural sector, or be older than 55, or be in an accessible village and use a high
level of local information, while to be overembedded, to be in a remote village is
enough to be stimulated to use external information combined with local information
(Table 4.20).
Entrepreneurs are the economic change agents in rural areas, and therefore their
embeddedness levels depend on their economic target if they are to become a part of
the rural area or not. On the other hand, Turkish villages which have recently
experienced the turnaround from depreciation to appreciation are not yet ready to
accept novelty, so the embeddedness levels of entrepreneurs in Turkish villages then
depend on age more than on different types of information use in their activity. On
this basis, it is important to evaluate the origin and impacts of entrepreneurs in order
to better understand their place in rural areas. Therefore, the next section evaluates
the impacts of entrepreneurs on rural capital in Turkish villages.
4.5.2 The entrepreneurial effects on Turkish villages
Rural areas are not seen as declining or problematic, but rather as growing and
dynamic. Having entrepreneurship at the heart of sustainable rural development
means to optimize the use of the indigenous resources and opportunities of the rural
area and transfer them into the global competitive arena as outputs. On this basis, it is
Table 4.20 : Rules and their strengths in the embeddedness analysis.
176
important that entrepreneurs know what the local community needs and what the
local community has, while being able to act globally. Entrepreneurs are not only
economic change agents but also affect the physical and social environment in rural
areas. From a theoretical perspective, the economic impact of entrepreneurs was
explained by Schumpeter in 1934 as creative destruction. In other words,
entrepreneurs are destroying the current economic system, while creating a new one.
This creative destruction effect of entrepreneurs, bringing novelty to the rural areas is
also seen in the socio-economic structure. In the literature, the changes due to the
entrepreneurs are connected to their origin which is seen as the main reasons for
socio-economic changes and also for the changes in rural capital/territorial capital. In
other words, entrepreneurs change the localism and locality features including their
potential and their optimum use in rural areas.
Although rural capital and territorial capital were explained in depth in Chapter 2.1,
here it is helpful to remind the reader of these phenomena. Rural capital is a concept
first used by Castle in 1998. He divides rural capital into four types of capital, i.e.
natural capital, man-made capital, social capital and human capital. Castle uses the
concept as the simplifier of rural studies. Territorial capital is a concept first used by
Camagni in 2008 to show the importance of the economic and social distance of the
interacting agents, the geographic distance, and the effectiveness of legal institutions.
Both territorial capital and rural capital stress local assets, including the destruction
of the existing, and the development of a new, socio-economic system. Therefore,
rural dwellers will each have a different perception of the formation of new socio-
economic systems, including their territorial scales. Territorial capital refers to cities
and regions, while rural capital covers only rural areas.
Territorial capital has a more optimistic connotation and considers the destruction of
some capital as the enhancement of economic performance and efficiency of
knowledge and innovation, while the development and conservation of rural capital
takes into account both negative and positive effects, and has a more conservative
approach to the destruction of some capital, as well as to the creation of other forms,
referring to possible undesired changes in rural regions. Despite their different
perspectives, both territorial and rural capital cannot be neglected if the aim is to
achieve the desired sustainable rural development and sustainable competitive
advantage based on the optimum use of local resources and their potential. On this

177
basis, this section aims to investigate the impacts of entrepreneurs on the socio-
economic structure and the components of rural capital, with a special focus on their
origin.
To explore the impact of entrepreneurs on the socio-economic structure, we first
investigate the differences of both newcomer and local entrepreneurs by using
conventional z-tests (see Appendix A). The application of z-tests allowed us to
compare the means of the data and to test the statistical significance of the difference
in means for local and newcomer entrepreneurs. In addition, to investigate the
differences between these two types of entrepreneurs on the basis of their
contributions to rural capital, we also used logistic regression analysis.
We used the data generated from our in-depth survey of 255 entrepreneurs. To
investigate the impacts of entrepreneurs by means of their origin, 11 variables are
used (Table 4.21). These variables include the characteristics of entrepreneurs – viz.
gender; origin; age; education; motivation; sector – and four components of rural
capital – viz. natural capital; man-made capital; social capital; and human capital.
These variables are coded as dummy variables (Table 4.21).
Variable Explanation Range Remote Remoteness of the villages 1=remote; 0=not remote Origin Whether entrepreneurs lived in another place or not 1=newcomer; 0=local Gender Gender of entrepreneurs 1=female; 0=male
Age Entrepreneurs aged 45 or over 1=age equal to or more than 45; 0=lower than 45
Education Entrepreneurs with high education level 1=high educated; 0=not high educated Motivation The will of entrepreneurs to move from the village 1=yes; 0=no Sector Sector in which entrepreneurs work 1=agriculture; 2=non-agriculture Natural capital The contribution of entrepreneurs to nature 1=yes; 0=no
Man-made capital The contribution of entrepreneurs on the regeneration of the man-made environment 1=yes; 0=no
Social capital The contribution of the entrepreneurs on the diversity and depth of social networks 1=yes; 0=no
Human capital The contribution of entrepreneurs to job creation and to the education in rural areas 1=yes; 0=no
The dummy nature of the variables has led us to use conventional z-tests to compare
the means of the data on entrepreneurs. In the analysis, we consider the null
hypothesis H0:pl – pn=0 against both two-tailed alternative Ha: pl – pn ≠ 0 and the
appropriate one-tailed alternative, where pl are the estimated probabilities for local
entrepreneurs, and pn are those for newcomer entrepreneurs. The results of the z-tests
show that remoteness, sector, education, and contributions to natural capital are the
variables for which there is statistical significance of the difference in probabilities at
Table 4.21 : Variables used in the analysis of the impacts of entrepreneurs.
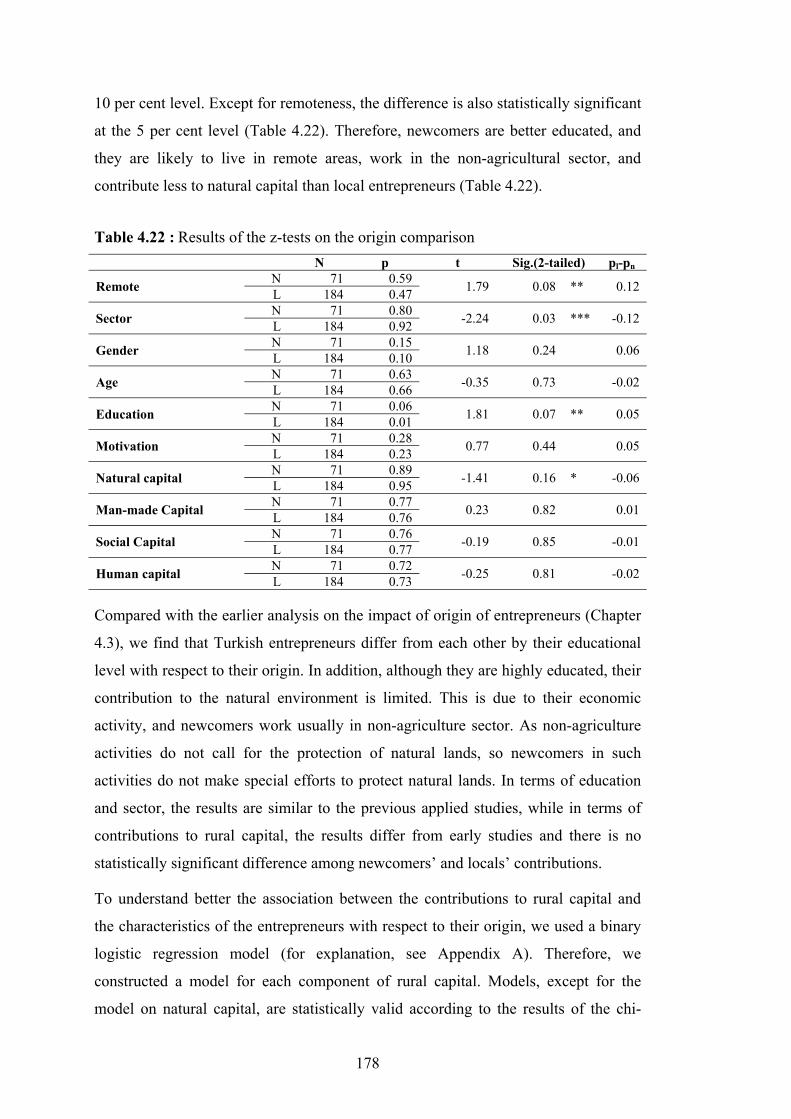
178
10 per cent level. Except for remoteness, the difference is also statistically significant
at the 5 per cent level (Table 4.22). Therefore, newcomers are better educated, and
they are likely to live in remote areas, work in the non-agricultural sector, and
contribute less to natural capital than local entrepreneurs (Table 4.22).
N p t Sig.(2-tailed) pl-pn
Remote N 71 0.59 1.79 0.08 ** 0.12 L 184 0.47
Sector N 71 0.80 -2.24 0.03 *** -0.12 L 184 0.92
Gender N 71 0.15 1.18 0.24 0.06 L 184 0.10
Age N 71 0.63 -0.35 0.73 -0.02 L 184 0.66
Education N 71 0.06 1.81 0.07 ** 0.05 L 184 0.01
Motivation N 71 0.28 0.77 0.44 0.05 L 184 0.23
Natural capital N 71 0.89 -1.41 0.16 * -0.06 L 184 0.95
Man-made Capital N 71 0.77 0.23 0.82 0.01 L 184 0.76
Social Capital N 71 0.76 -0.19 0.85 -0.01 L 184 0.77
Human capital N 71 0.72 -0.25 0.81 -0.02 L 184 0.73
Compared with the earlier analysis on the impact of origin of entrepreneurs (Chapter
4.3), we find that Turkish entrepreneurs differ from each other by their educational
level with respect to their origin. In addition, although they are highly educated, their
contribution to the natural environment is limited. This is due to their economic
activity, and newcomers work usually in non-agriculture sector. As non-agriculture
activities do not call for the protection of natural lands, so newcomers in such
activities do not make special efforts to protect natural lands. In terms of education
and sector, the results are similar to the previous applied studies, while in terms of
contributions to rural capital, the results differ from early studies and there is no
statistically significant difference among newcomers’ and locals’ contributions.
To understand better the association between the contributions to rural capital and
the characteristics of the entrepreneurs with respect to their origin, we used a binary
logistic regression model (for explanation, see Appendix A). Therefore, we
constructed a model for each component of rural capital. Models, except for the
model on natural capital, are statistically valid according to the results of the chi-
Table 4.22 : Results of the z-tests on the origin comparison
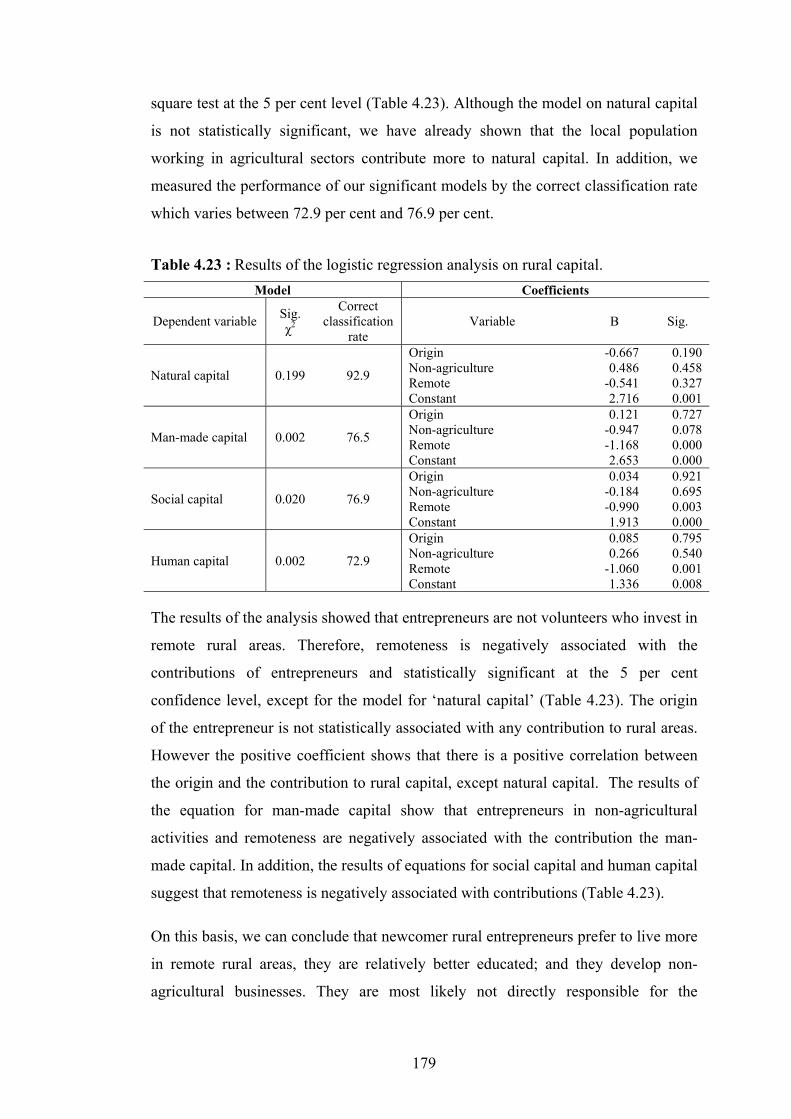
179
square test at the 5 per cent level (Table 4.23). Although the model on natural capital
is not statistically significant, we have already shown that the local population
working in agricultural sectors contribute more to natural capital. In addition, we
measured the performance of our significant models by the correct classification rate
which varies between 72.9 per cent and 76.9 per cent.
Model Coefficients
Dependent variable Sig. χ2
Correct classification
rate Variable B Sig.
Natural capital 0.199 92.9
Origin -0.667 0.190 Non-agriculture 0.486 0.458 Remote -0.541 0.327 Constant 2.716 0.001
Man-made capital 0.002 76.5
Origin 0.121 0.727 Non-agriculture -0.947 0.078 Remote -1.168 0.000 Constant 2.653 0.000
Social capital 0.020 76.9
Origin 0.034 0.921 Non-agriculture -0.184 0.695 Remote -0.990 0.003 Constant 1.913 0.000
Human capital 0.002 72.9
Origin 0.085 0.795 Non-agriculture 0.266 0.540 Remote -1.060 0.001 Constant 1.336 0.008
The results of the analysis showed that entrepreneurs are not volunteers who invest in
remote rural areas. Therefore, remoteness is negatively associated with the
contributions of entrepreneurs and statistically significant at the 5 per cent
confidence level, except for the model for ‘natural capital’ (Table 4.23). The origin
of the entrepreneur is not statistically associated with any contribution to rural areas.
However the positive coefficient shows that there is a positive correlation between
the origin and the contribution to rural capital, except natural capital. The results of
the equation for man-made capital show that entrepreneurs in non-agricultural
activities and remoteness are negatively associated with the contribution the man-
made capital. In addition, the results of equations for social capital and human capital
suggest that remoteness is negatively associated with contributions (Table 4.23).
On this basis, we can conclude that newcomer rural entrepreneurs prefer to live more
in remote rural areas, they are relatively better educated; and they develop non-
agricultural businesses. They are most likely not directly responsible for the
Table 4.23 : Results of the logistic regression analysis on rural capital.
180
development in rural areas, and their contribution to the natural environment is less
than that of locals. These results are not very surprising as rural Turkey is just at the
beginning of its turnaround so the value and opportunities in remote villages have not
yet been realized. Therefore, the majority of local entrepreneurs still prefer the
accessible villages and they are not real risk-takers.
4.5.3 The entrepreneurial changes in the Turkish villages
In earlier times, the entrepreneurs were seen as destroyers of the economy. Lately,
however, researchers and even governments have realized that the destruction of
entrepreneurs is rather creative and contributes very much to the economy.
Therefore, today, entrepreneurs are seen as the triggers of the economic
development. From this new point of view, they are seen as the saviours of rural
areas. Rural entrepreneurship studies, although not having a long history, focus on
the profile and the origin of entrepreneurs to find out the associations of
entrepreneurship with the changes occurring in rural areas. In Part 3 of our study, we
focused on the European villages with the aim to investigate the profile of
entrepreneurs, their place in, and their impacts on, rural areas with a special focus on
their origin. Against this background, in Chapter 4.5, we aimed to investigate the
entrepreneurs in Turkish villages with a similar approach to that applied in the
European case.
Descriptive statistics on entrepreneurs showed that the gender gap and the education
problem still exist in the villages, although depopulation is somewhat limited due to
the motivation of entrepreneurs. However, most of the entrepreneurs want to stay in
the villages, and they have stated that the continuity and the success of their
entrepreneurial activity are very much related to the social relations and their
involvement in the village social life.
In the field of social economy, this causality relation is called ‘embeddedness’, and is
usually evaluated by considering the profile of entrepreneurs and their locality and
externality levels. According to the results of our analysis, embeddedness and
disembeddedness of entrepreneurs are strongly associated with the remoteness of
villages, the personal profile especially their age, and the use of external information
by entrepreneurs.
181
Among the characteristics of entrepreneurs, origin is the focus of many
entrepreneurship studies, and there is evidence about the power of newcomer
entrepreneurs to change their environment. According to the results of z-tests,
newcomer entrepreneurs are better educated and younger than local entrepreneurs
and create more economic diversity in rural areas by choosing remote villages to
settle in. But, they are not directly responsible for the changes occurring in rural
areas. The results also showed that local entrepreneurs are more likely to be male-
oriented, older entrepreneurs who contribute to natural capital. Even though Turkish
female self-employment has shown a highly increasing trend in the recent years, our
results suggested that Turkish rural self-employment is still male-oriented.
In addition, to identify the association between the characteristics of entrepreneurs
and their contribution to rural capital, we conducted logistic regression models for
each component of rural capital. The results of the logistic regression analyses
suggested that the location of village is very much associated with the investments in
man-made capital, social and human capital. The small number of villages under
investigation prevented us from generalizing our findings for a large number of
Turkish villages. Nevertheless, the results signalled the start of a turnaround in
villages, while indicating the need for controlled development to obtain the
sustainability and continuity of rural areas and entrepreneurial activities and to
overcome the possible negative consequences. These results also revealed that many
intervening opportunities exist in rural areas, especially in the remote ones.
In the following chapter, we explore the changes occurring in rural areas while
investigating the perspective of visitors about the changes. In addition, we also
investigate the perspective of inhabitants in order to better understand their
perception of sustainable rural development.
4.6 New Rural Areas and Sustainable Rural Development in Turkey
Rural areas are usually perceived as depreciated areas due to their lack of visitors and
inhabitants. But the recent changing face of rural areas and the counterurbanization
movements all around the world have changed this perception. Today, people
perceive rural areas in their daily life as the ideal places to spend their time and
experience their Arcadian idyll. Moreover, this perception has increased the number
of visitors and shown the importance of the perspective of visitors. The perspective

182
of the local population is also equally important to obtain sustainable rural
development and convert policies into practice. Therefore, in this section, we aim to
evaluate these two perspectives. Section 4.6.1 evaluates the perspective of visitors
with respect to the changes in rural areas and to the characteristics of rural areas,
while Section 4.6.2 evaluates the perspective of the local population on sustainable
rural development.
4.6.1 New rural areas: perspective of visitors in the Turkish villages
Locality and its revitalization is one of the main success factors of sustainable rural
development (Gülümser et al., 2009d). Among economists, the general view is that
the relation between locality and economic development lies at the heart of the
tourism sector (Forte et al., 2005). In other words, the combination of locality and
development can be achieved by transforming the image of villages into an attractive
image. Therefore, tourism development is used as the main target of sustainable rural
development in many developed countries. Hence, the attractiveness of villages was
seen to be related to the number of visitors. In addition, the latest reorganization of
settlements and the reversal in the population movement (‘counterurbanization”) are
also associated with the changing face of villages.
Today, in many countries, villages are placed among the most attractive visiting and
living places. In Turkey, this reversal is still new, and Turkish villages are relatively
less tourism-oriented. For instance, only 27 per cent of the villages in our sample had
an increase in the number of tourist facilities, while 64 per cent do not have proper
tourist facilities but have only a kind of lodgings for seasonal workers (Table 4.24).
Therefore, the majority of the villages cannot benefit from the tourism or visitors.
Changes in visits very low low average high very high (per cent)
Tourist facilities 64.7 17.6 5.9 11.8 Visitors 47.1 5.9 5.9 23.5 17.6
Seasonal inhabitants 58.8 11.8 11.8 17.6 Migration to village 29.4 17.6 17.6 17.6 17.6
Being less-tourism oriented does not mean that villages do not have visitors. But
only 52 per cent of villages in our sample frequently have visitors. Visitors come to
the villages daily to spend a pleasant day in a natural environment. Only 78 per cent
of the villages have short stay visitors (Table 4.25). And, none of the villages have
Table 4.24 : Changes in the number of visits to Turkish villages.

183
long-stay visitors. In addition, 78 per cent of the villages have visitors from the
nearest urban areas. Besides the nearest urban areas, 44 per cent and 33 per cent of
the villages also have visitors from, respectively, other villages in Turkey and from
other countries (Table 4.25).
Type of visitors The location of residence of visitors Short-stay 78% Nearest urban area 78% Daily 100% Other villages 44% Long-stay 0% Other countries 33%
In order to understand the association between visitors and the rural areas, in other
words to understand the perspective of visitors, we applied logistic regression
analysis (LRA). Due to the relatively small sample, we used uncorrelated variables,
and in our analysis we used four independent variables, viz. easy access, no
economic diversity, housing, and immigration, and two dependent variables, viz.
urban visitors, and international visitors (Table 4.26).
Variable Explanation Type: Range Easy access The existence of access to the villages
Dummy: 0=no; 1=yes No economic diversity Not having economic diversity before
Housing prices An increase in housing prices Categorical: 0=no impact; 1= strongly disagree; 2=disagree; 3=neither disagree nor agree; 4= agree; 5=strongly agree In-migration An increase in migration to the village
Urban visitors Urban inhabitants as the users of amenitiesDummy: 0=no; 1=yes International visitors International tourists as the users of
amenities
Therefore, to investigate the perspective of both urban and international visitors, we
generated two logistic regression models (Table 4.27). Models are statistically
significant according to the chi-square test at the 10 per cent level. Although we
checked the validity of the models, their performance is also important, and the
correct classification rate shows the performance of a logistic regression model. For
Model 1 on the perspective of urban visitors, the correct classification rate is 70.6 per
cent at the 5 per cent confidence level, while for Model 2 on the perspective of
international visitors, the rate is 94.1 per cent at the 10 per cent confidence level
(Table 4.27). The first logistic model investigated the association between house
prices and in-migration and the perspective of urban visitors. According to the results
of the analysis, urban visitors associate new rural perception significantly with in-
migration to the villages. Although, the increase in house prices is not statistically
Table 4.25 : Types of visitors in the Turkish villages.
Table 4.26 : Variables used in the visitor analysis.

184
significantly associated, the negative sign of its coefficient shows that urban visitors
in Turkey are in search of a rural idyll in undiscovered ruralities.
Model Variable
Sig. χ2 Correct
classification rate
Name B Sig.
Model 1: New rural perception from the perspective of urban visitors
0.028 70.6 house prices -1.413 0.14 in-migration 1.495 0.09
Constant -0.271 0.08 Model 2: New rural perception from the perspective of the international visitors
0.068 94.1 easy access 1.328 0.26
no economic diversity -2.418 0.13 Constant -8.111 0.15
Note: Figures in bold print are significant at the 5% level in Model 1, and at the 10% level in Model 2.
In addition, although Model 2 on the perception of international visitors is
statistically significant, none of the variables are significantly reflect the perspective
of international visitors. Nevertheless, the results of this model suggest that economic
diversity is positively associated with the new rural perception.
The small number of villages, the lack of tourist records, and also the less-tourism
oriented characteristics of villages prevented us from providing a clearer picture.
Nevertheless, the results are successful in showing the importance of the quality of
villages, as well as their economic diversity. The next section investigates the
perspective of the local population on sustainable rural development, hence the new
rural perception.
4.6.2 Sustainable rural development: the perspective of Turkish villagers
The continuity of rurality and locality in a country is very much related to its self-
sufficiency and self-dependency. But globalization has put considerable pressure on
the rurality and locality of countries. In addition, these rural qualities have become
the scarce goods of today’s knowledge economy. Therefore, countries, especially the
developed ones, have put their main efforts into sustainable rural development, and
the developing countries have benefitted from these experiences.
Although there are diverse strategies and targets for sustainable rural development,
governments’ general policy has been to increase quality, to obtain economic
development, and to bring rural areas into the global system. The defensive localism
and the closed social networks in rural areas make it complicated for governments to
Table 4.27 : Results of the logistic regression analysis of visitors.

185
convert their strategies into practice. To achieve the successful implementation of
plans it is necessary to convince the local population of their validity, and thus obtain
local participation. Therefore, the perspective of the local population on sustainable
rural development is important. To this end, this section aims to identify/ascertain the
local perception of sustainable rural development. In other words, we aim to
understand which particular component of sustainability is related to sustainable
development in the local inhabitants’ minds. To do this, we used logistic regression
analysis by generating three logistic models with respect to the three components of
sustainable rural development.
In our previous analysis, we stated that Turkish villages still have a very closed
defence mechanism, which means that the local population has difficulties in
accepting new ideas, and hence the villages rarely change. Table 4.28 shows four
different changes, viz. demographic, physical, economic, and social changes which
have occurred in recent years in Turkish villages. Among the 17 villages, the
majority have experienced demographic change, and there is a back-to-the-land trend
in many of them. To be changed, villages do not only need plans but rather the
openness of the inhabitants. Therefore, social changes in Turkish villages suggest
that social relations have remained the same in many villages, strengthening our
previous results with respect to the continuing closedness of villages. In addition,
education, which is another tool to increase local awareness about possible
innovations, is improving but not as fast as other socio-economic changes.
Ahead of the locals, outsiders realized that intervening opportunities tend to create
uncontrolled development in rural areas that threatens their sustainability. Therefore,
both governments and non-profit organizations have put efforts into controlling these
changes. Turkish villages are experiencing remarkable, though not fast, changes. For
instance, 63 per cent of the villages in our sample have experienced an increase in
the number of cars, which is likely to result in traffic congestion and air pollution
(Table 4.28).
As the process of change seems to have just started in Turkish villages, to understand
the perspective of local inhabitants from the very beginning can be very useful to
generate strategies for sustainable rural development. In order to achieve this, we
focused on already successful strategies, i.e. the strategies of the Associations of the
Most Beautiful Villages (see Chapter 4.3). The first reason to use their strategy is
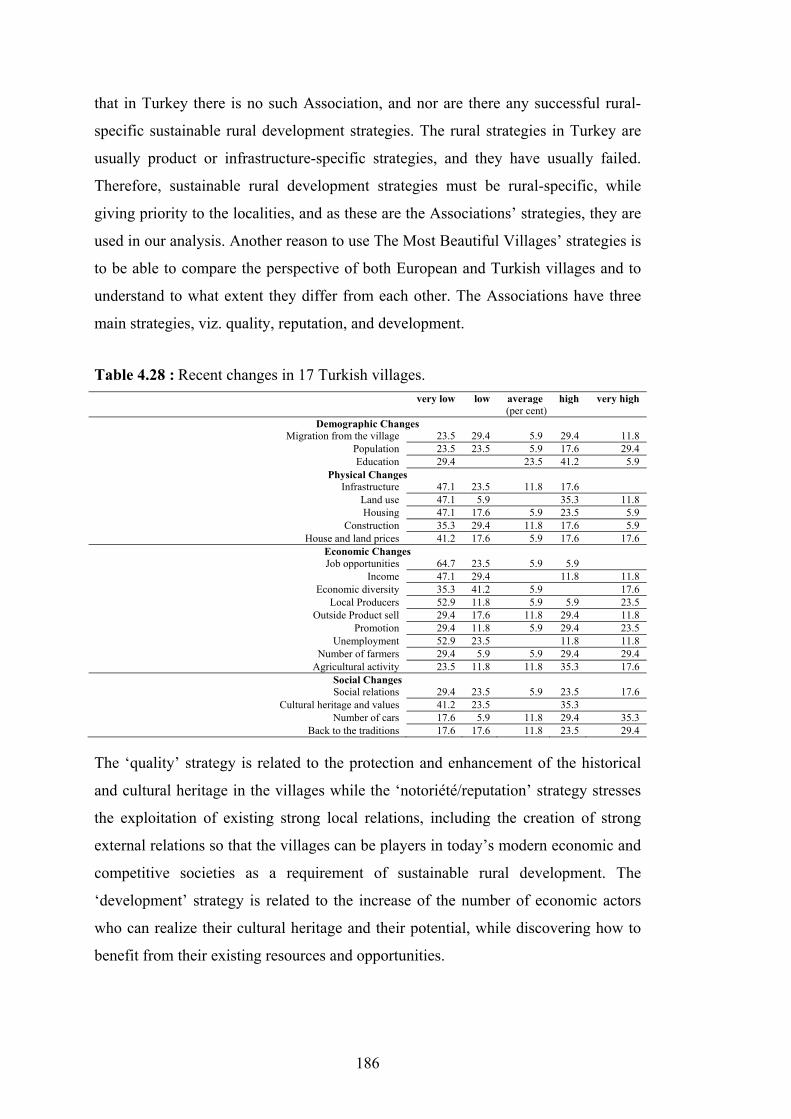
186
that in Turkey there is no such Association, and nor are there any successful rural-
specific sustainable rural development strategies. The rural strategies in Turkey are
usually product or infrastructure-specific strategies, and they have usually failed.
Therefore, sustainable rural development strategies must be rural-specific, while
giving priority to the localities, and as these are the Associations’ strategies, they are
used in our analysis. Another reason to use The Most Beautiful Villages’ strategies is
to be able to compare the perspective of both European and Turkish villages and to
understand to what extent they differ from each other. The Associations have three
main strategies, viz. quality, reputation, and development.
very low low average high very high (per cent)
Demographic Changes Migration from the village 23.5 29.4 5.9 29.4 11.8
Population 23.5 23.5 5.9 17.6 29.4 Education 29.4 23.5 41.2 5.9
Physical ChangesInfrastructure 47.1 23.5 11.8 17.6
Land use 47.1 5.9 35.3 11.8 Housing 47.1 17.6 5.9 23.5 5.9
Construction 35.3 29.4 11.8 17.6 5.9 House and land prices 41.2 17.6 5.9 17.6 17.6
Economic Changes Job opportunities 64.7 23.5 5.9 5.9
Income 47.1 29.4 11.8 11.8 Economic diversity 35.3 41.2 5.9 17.6
Local Producers 52.9 11.8 5.9 5.9 23.5 Outside Product sell 29.4 17.6 11.8 29.4 11.8
Promotion 29.4 11.8 5.9 29.4 23.5 Unemployment 52.9 23.5 11.8 11.8
Number of farmers 29.4 5.9 5.9 29.4 29.4 Agricultural activity 23.5 11.8 11.8 35.3 17.6
Social Changes Social relations 29.4 23.5 5.9 23.5 17.6
Cultural heritage and values 41.2 23.5 35.3 Number of cars 17.6 5.9 11.8 29.4 35.3
Back to the traditions 17.6 17.6 11.8 23.5 29.4
The ‘quality’ strategy is related to the protection and enhancement of the historical
and cultural heritage in the villages while the ‘notoriété/reputation’ strategy stresses
the exploitation of existing strong local relations, including the creation of strong
external relations so that the villages can be players in today’s modern economic and
competitive societies as a requirement of sustainable rural development. The
‘development’ strategy is related to the increase of the number of economic actors
who can realize their cultural heritage and their potential, while discovering how to
benefit from their existing resources and opportunities.
Table 4.28 : Recent changes in 17 Turkish villages.
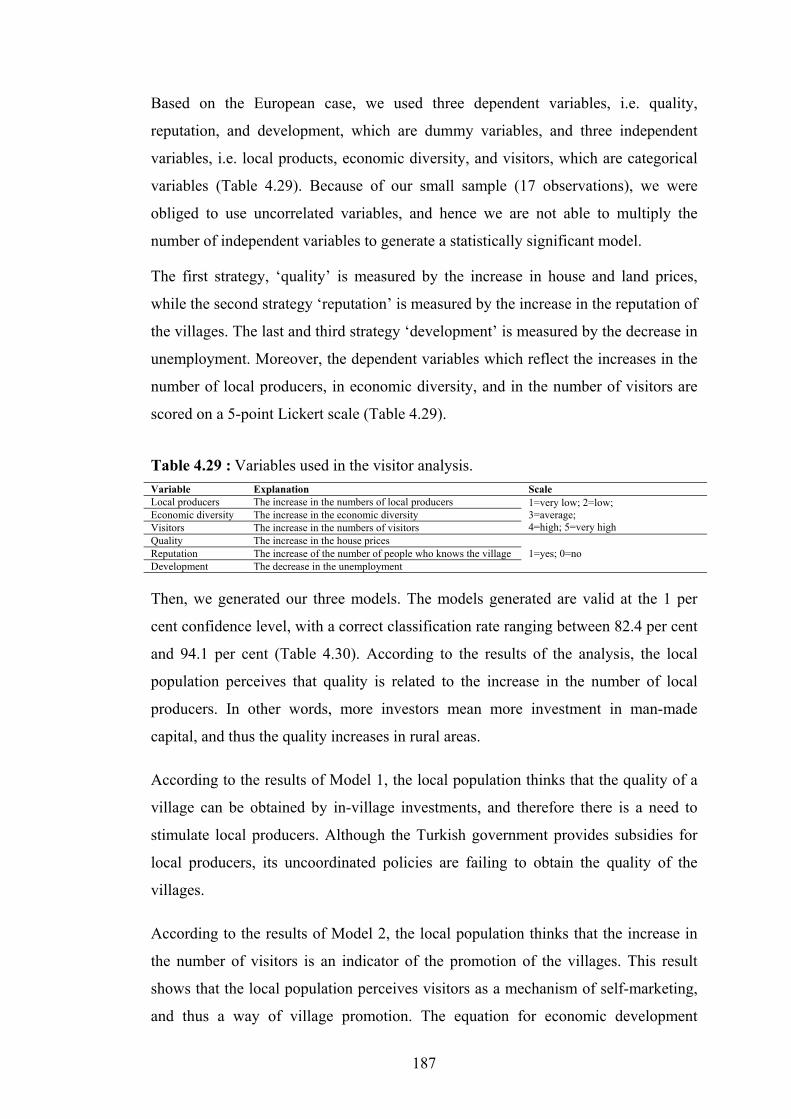
187
Based on the European case, we used three dependent variables, i.e. quality,
reputation, and development, which are dummy variables, and three independent
variables, i.e. local products, economic diversity, and visitors, which are categorical
variables (Table 4.29). Because of our small sample (17 observations), we were
obliged to use uncorrelated variables, and hence we are not able to multiply the
number of independent variables to generate a statistically significant model.
The first strategy, ‘quality’ is measured by the increase in house and land prices,
while the second strategy ‘reputation’ is measured by the increase in the reputation of
the villages. The last and third strategy ‘development’ is measured by the decrease in
unemployment. Moreover, the dependent variables which reflect the increases in the
number of local producers, in economic diversity, and in the number of visitors are
scored on a 5-point Lickert scale (Table 4.29).
Variable Explanation Scale Local producers The increase in the numbers of local producers 1=very low; 2=low;
3=average; 4=high; 5=very high
Economic diversity The increase in the economic diversity Visitors The increase in the numbers of visitors Quality The increase in the house prices
1=yes; 0=no Reputation The increase of the number of people who knows the village Development The decrease in the unemployment
Then, we generated our three models. The models generated are valid at the 1 per
cent confidence level, with a correct classification rate ranging between 82.4 per cent
and 94.1 per cent (Table 4.30). According to the results of the analysis, the local
population perceives that quality is related to the increase in the number of local
producers. In other words, more investors mean more investment in man-made
capital, and thus the quality increases in rural areas.
According to the results of Model 1, the local population thinks that the quality of a
village can be obtained by in-village investments, and therefore there is a need to
stimulate local producers. Although the Turkish government provides subsidies for
local producers, its uncoordinated policies are failing to obtain the quality of the
villages.
According to the results of Model 2, the local population thinks that the increase in
the number of visitors is an indicator of the promotion of the villages. This result
shows that the local population perceives visitors as a mechanism of self-marketing,
and thus a way of village promotion. The equation for economic development
Table 4.29 : Variables used in the visitor analysis.

188
suggests that economic development depends on economic diversity. To create
economic diversity in the villages due to the intensity, depends heavily on the
localities and cultural heritage. Although local inhabitants perceive that economic
development is associated with economic diversity, they must first realize that the
intervening opportunities are in their own hands. In these circumstances, economic
diversity can be achieved. If, however, economic diversity can only be created by
bringing resources from outside, the development strategy probably fails.
Model Variables
Sig. χ2 Correct
classification rate
B Sig.
Model 1: Quality as a strategy for sustainable development
0.009 82.4 Local Producers 0.88 0.03 C -2.46 0.026
Model 2: Notoriété/reputation as a strategy for sustainable development
0.001 82.4 Visitors 1.68 0.048 C -3.03 0.036
Model 3: Development as a strategy for sustainable development
0.004 94.1 Economic Diversity 1.32 0.031 C -4.64 0.011
The results stress the importance of economic regeneration and local investments for
sustainable rural development. The local inhabitants are ready to exploit what they
have, but they do not yet fully recognize what those opportunities can bring. The
following section discusses the new rural perception from the perspective of different
rural users, i.e. visitors and local inhabitants, on the basis of the empirical findings of
Sections 4.6.1 and 4.6.2.
4.6.3 The new rural perception and sustainable rural development in Turkey
For many years, governments have been concerned about rural areas and their
deprivation. The self-sufficiency of a country depends heavily on agriculture.
Therefore, by being the cradle of agriculture, today, rural areas are at the top of
countries’ policy agendas. Although many policies are being generated to develop
rural areas, on the one hand, due to the lack of locality-based priorities and the
difficulty to break the closed localism, many policies have failed, but on the other
hand, many rural areas, mainly in developed countries, have become extremely
attractive living and visiting places.
Table 4.30 : The equations in the visitor analysis.

189
Turkey, after facing policy failures for decades because of uncoordinated rural
policies, has begun to experience the appreciation of its rural areas in recent years.
Thus, it is very important to understand the perspective of visitors and local
inhabitants at the beginning of this restructuring, in order to obtain successful
sustainable rural development. On this basis, Chapter 4.6 has aimed to investigate the
perspective of different rural users, viz. visitors and inhabitants, concerning the new
rural perception. To achieve this aim, on the basis of the data obtained from 17
villages, logistic regression analysis was applied.
The perspective of visitors was examined from the point of view of the two types of
visitors, viz. urban visitors, and international visitors. The results of the two models
generated for each subgroup showed that there is a lack of promotion, and that
Turkish city dwellers will not go out to discover places on their own to experience
the rural idyll if the villages are not promoted. Although the model for international
visitors was not statistically significant, the results were useful to state that, in order
to exploit the opportunities in the rural areas, economic diversity is needed to attract
foreigners. Furthermore, we generated three logistic models for investigating the
villagers’ sustainable rural development perspective. These three models were based
on the three main sustainable rural development strategies applied by the
Associations of the Most Beautiful Villages in Europe. According to the results of
the analysis, Turkish villagers think that the sustainable rural development is
associated with the economic change. In other words, they believe that the villages
need economic diversity and local producers to improve the quality and to obtain
development.
The villages in Turkey definitely need to be accessible to become attractive. But,
their attractiveness is very much related to the conservation and regeneration of their
cultural heritage and local values. This situation depends on the motivations of the
local inhabitants. Therefore, sustainable rural development strategies may focus on
how to create economic diversity and how to evaluate general strategies. To obtain
such a focus is quite hard for such unique places, therefore to be successful policy
makers need to be precise when defining locality-based priorities. A summary of the
exploratory analyses and the empirical findings about the Turkish case is given in the
following section, to finalize the findings of the Turkish case.

190
4.7 Concluding Remarks on Part 4
Rurality and rural areas are now an important development and planning issue in
many countries. Their importance stems first from their complex structure and
changing definition, and second from their close relation to sustainability. Today,
rural areas are becoming an environment for living and leisure activities which is far
from their traditional task as the home of agriculture and non-urban areas. Although
this turnaround is common in rural Europe, rural Turkey has just started to
experience remarkable changes in the last few years.
Turkey offers a complex picture in terms of rurality that is neither easy to investigate
nor to explain. The widespread distribution of villages all over the country, and
hence, on the one hand, the difficulty of including them in the spatial and economic
systems, and on the other hand, being dependent on them due to the weight of
agriculture in the national economy call for a rural-specific treatment. Even though
the government has tried to change the problematic face of rural areas for many
years, only in recent years has sustainable rural development become a priority with
regard to the economic restructuration of rural Turkey. This is because of two issues
on the current agenda; first, Turkey, after more than 20 years, has been able to
achieve some acceleration in its negotiations with the EU; and, second, it has begun
to experience remarkable changes in its rural areas.
This background has challenged us to investigate the changes – if there are any – in
Turkish rural areas that are similar to the changes in rural Europe. Therefore, Part 4
has focused on what we called ‘successful’ villages in Turkey using a similar
approach to the evaluation of the European villages in Part 3. Part 4 was composed
of six chapters. The first chapter, Chapter 4.1 aimed to evaluate the rural
development attempts of Turkey in two periods, viz. the unplanned period and the
planned period from a policy perspective, while Chapter 4.2 aimed to describe the
current rural structure of Turkey by means of a multi-dimensional approach. The
following four chapters then focused on the Turkish case, covering 17 successful
villages in Turkey.
The extensive number of villages in Turkey had led us to select some ‘successful’
villages to reach our overall aim in this thesis, to facilitate our survey in Turkey, and
to come up with insights on sustainable rural development and current trends in
191
Turkish villages, Chapter 4.3 explained the field survey with a special focus on the
sample selection process. Chapters 4.4, 4.5 and 4.6 evaluated, respectively, the
capacity, the entrepreneurs, and the new rural perception in the selected Turkish
villages.
In the first chapter of Part 4, the evolutionary approach to the Turkish rural
development policies suggested that most of the policies and the implementation
attempts have failed because of the diversity of localities which were often excluded
or neglected. Furthermore, in the next chapter, we investigated the structural changes
in rural Turkey by means of an exploratory analysis, factor analysis, and mapping.
The results of the exploratory analysis, in Chapter 4.2, showed that the changes
occurring in rural Turkey have increased the capacity of rural areas, as well as
strengthened their potential. But, the lack of basic services and facilities and the
difficulty in accessing them are preventing villages from converting their potential
into strengths and freeing themselves in the open market.
In addition, the results of the factor analysis clearly showed the divergences among
the provinces of Turkey, especially in terms of their agricultural level. In addition,
we also used four different methods to map out Turkey’s rurality, i.e. the OECD’s
and EU’s methods, and two methods generated from the results of the factor analysis.
Having applied these methods, mapping the rural structure of Turkey suggested three
conclusions: (1) Turkey is dominantly rural both within the country itself and
between countries by one-dimensional applications; (2) it continues to keep its
dominant characteristic of being rural in terms of the traditional meaning of ‘rural’,
as the home of agriculture, but without benefitting from it in an optimum way; and
(3) it is no longer dominantly rural when evaluating its rurality with regard to the
new definition and characteristic of rural areas: that of playing a part in the provision
of modern leisure amenities offered by the tourism sector.
As an effort to better understand, at a smaller scale, the relative success of the
villages in Turkey, we selected 17 villages to investigate the rural changes.
Therefore, Chapter 4.3 explained the selection process and provided insights into the
field survey conducted in these villages. In the selection process, while considering
the overall aim of this study, we used multi-stage stratification sampling. The
stratification was generated at two levels: the macro-level and the micro–level, with
the use of several indicators referring to the diversity of the changes in, and the

192
capacity of, rural areas. in order to reflect changes occurring in rural areas.
According to the results of the sampling, we focused on 17 villages from four NUTS
3 and four NUTS 2 regions.
Furthermore, in Chapter 4.4, we compared the capacity of these 17 Turkish villages
and investigated the most important factors influencing the rural capacity by
analysing their creative capacity and attractiveness. The results of the principal
component analysis of creative capacity showed that creative activities are the main
identifiers of the rural creative capacity. In addition, the results of rough set data
analysis on the attractiveness, revealed that Turkish villages still need to increase
their quality, as well as their degree of openness.
In Chapter 4.5, we investigated the entrepreneurs in 17 Turkish villages. The results
of the analysis on the embeddedness levels of entrepreneurs showed that the
embeddedness and the disembeddedness of entrepreneurs are strongly associated
with the remoteness of the villages, the personal profile of entrepreneurs – especially
their age, and their use of external information. In addition, the results of the analysis
on the origin of entrepreneurs suggested that newcomer entrepreneurs are better
educated and younger than locals and create economic diversity in rural areas by
choosing remote villages to settle in. But they are not directly responsible for the
rural changes. The results also showed that local entrepreneurs are more likely to be
male-oriented, older entrepreneurs who contribute to natural capital. In addition, the
results of the logistic regression analysis suggested that the location of the village is
very much associated with the investments in man-made capital, social and human
capital.
Finally, to investigate the perspective of two rural stakeholders, viz. visitors and
inhabitants, on the new rural perception with a special focus on 17 villages, we used
logistic regression analysis. The results of Chapter 4.6 stated that, in order to exploit
the opportunities in rural areas, economic diversity is the requirement to attract
visitors. According to the results of the analysis of local inhabitants, Turkish
villagers think that sustainable rural development is associated with economic
change. In other words, they believe that the villages need the local producers and
economic diversity to improve quality and to obtain development. Currently, Turkey
is adopting strategies and a future vision related to the new rural understanding,
including the goal of restructuring rural communities within the country. In the
193
recent years, Turkey has been driving its national strategies more towards rural areas
and rural development in terms of finding ways to increase the accessibility of its
provinces to all kinds of infrastructure, such as education, cultural facilities, etc., by
encouraging its population to be entrepreneurial, innovative, and participant in the
national development process. Therefore, the heterogeneity and uniqueness of rural
areas are pushing the government to find local and short-term solutions, as national
and long-term solutions do not satisfy the impatient inhabitants of rural areas, who
have suffered a great deal in the past from being neglected, and who are not aware of
the benefits of long-term solutions.
The small number of villages under investigation prevents us from generalizing our
findings for a large number of villages. Nevertheless, the results signal the start of a
turnaround in villages, while clarifying the need for controlled development to obtain
the sustainability and continuity of rural areas and their economy. Although there
does seem to be a turnaround, at least in the investigated villages, the results of our
evaluation on the basis of 17 villages also show that Turkish villages still suffer from
low quality of life and cannot yet benefit from the ICT era effectively. Thus, the
Turkish villages are not yet as attractive as the European ones. In addition, the
Turkish villages have difficulty in reaching the open market on their own. Therefore,
in order for rural areas to develop, the following Part 5 envisions four sustainable
rural development scenarios on the basis of the findings of both the European case
and the Turkish case.

194
195
5. ENVISIONING PROMISING HOT SPOTS
5.1 Rural Areas in Europe and Turkey: Comparative Analyses
Rural areas considered in terms of their cultural, social, political, and economic
aspects – and especially in terms of their futures – have lately attracted much
attention from policy makers. Therefore, the future of rural peripheries, as well as the
future of rural societies, is becoming an important development and planning issue,
especially in Europe. In terms of land area, approximately 80 per cent of Europe is
now rural, and 25 per cent of its population live in the countryside (van Leeuwen and
Nijkamp, 2006). The European Union (EU) takes into consideration the rurality of a
candidate country often as the last negotiation issue because of its heterogeneity and
complexity. Turkey as the most discussed candidate is now in the accession period
and, during the negotiations, its rurality will certainly be addressed. The Turkish
government has started to work on bridging the political gap between Turkey and the
EU, so these attempts are called the EU harmonization process.
Some sector-specific analyses were carried out in 1987 (Akder et al., 1990) to
evaluate the situation of Turkey if it were to become a full member, including
probable consequences in the EU, but due to the subsequent Common Agricultural
Policy (CAP) reforms, the validity of these analyses is limited. Various recent
analyses of specific features of the agricultural sector in Turkey have estimated the
cost of Turkey’s application of the CAP, while emphasizing the size of Turkey in
terms of both its population and its agricultural employment rates (European
Commission, 2004; Grethe, 2004; Oskam et al., 2004; Grethe, 2005). According to
the various studies (Akder, 2002; FAO, 2006), Turkey is evaluated as highly rural.
The national and rural economy that depends on the agriculture sector is stressed.
The complexity of Turkey’s rurality is recognized by the EU and the academic
world. But the rurality of Turkey has not yet been evaluated as a whole. Therefore,
here, we aim to evaluate rurality, the rural economy and rural areas of Turkey

196
compared with those of the European countries (the ‘EU Member States’) at both the
macro- (country) level and the micro- (village) level. At the macro-level, Section
18.1 provides a multi-dimensional analysis of the rurality of European countries and
Turkey. It also provides some descriptive statistics on the rural economy, while
focusing on the changing trends of rural employment. Then, Section 18.2 continues
by describing the changes in rural areas, but this time with a special focus on the
European and Turkish villages in our sample. The last two sections discuss the
opportunities in European and Turkish villages, while investigating how they can
benefit from these changes.
5.1.1 Rurality and the rural economy at the European level and Turkey
Rurality is a multi-dimensional concept, but its importance without any doubt stems
from its connections with its agricultural past. Agriculture has generated the start of
civilization and economies. But it has lost its importance in rural areas in terms of
economic weight and share in employment because of the changes in national and
international economies, viz. technological changes, globalization, liberalization, and
localization. But the dependence of the rural economy on agriculture remains a well-
known reality, while the loss of employment, especially in the agricultural sector, as
well as in rural areas, has alerted governments to the need to encourage new job
resources for rural communities in order to limit the depopulation and the loss of
rurality, which is one of the main indicators of the socio-economic development of a
country.
In this section, first we evaluate the rurality of European countries and Turkey by
means of a multi-dimensional approach, and, then, second, we explore the rural
economy on the basis of some indicators, and, last, we discuss the agricultural
employment trends, descriptively. In order to achieve our aim, we have benefitted
from the data of the FAO, EUROSTAT, and the World Bank (WB). To show the
similarities and differences between the EU and Turkey at the macro-level, we
applied this data to use descriptive and exploratory analysis techniques, i.e. cross-
tabulation. Although we used such techniques, the multi-dimensional characteristics
of rurality also led us to use multi-variate analysis techniques, e.g. factor analysis, to
provide a better understanding of the rurality similarities and differences between
each country of the EU25 and Turkey at country level.
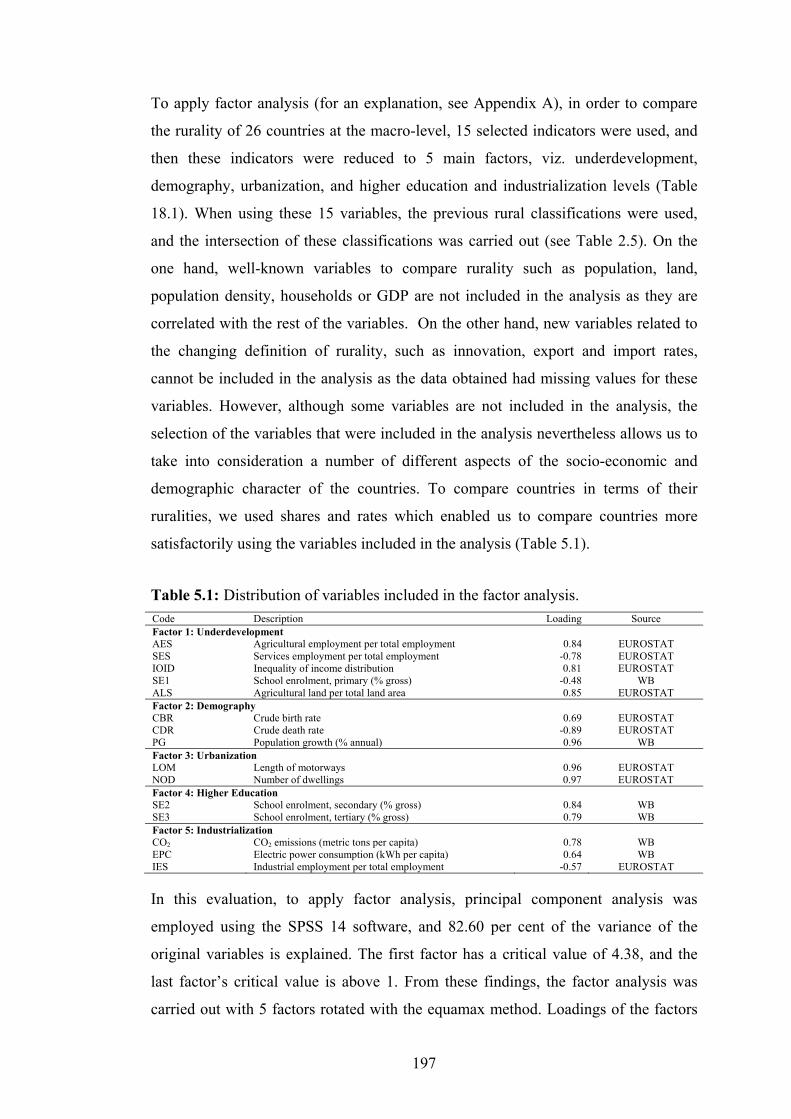
197
To apply factor analysis (for an explanation, see Appendix A), in order to compare
the rurality of 26 countries at the macro-level, 15 selected indicators were used, and
then these indicators were reduced to 5 main factors, viz. underdevelopment,
demography, urbanization, and higher education and industrialization levels (Table
18.1). When using these 15 variables, the previous rural classifications were used,
and the intersection of these classifications was carried out (see Table 2.5). On the
one hand, well-known variables to compare rurality such as population, land,
population density, households or GDP are not included in the analysis as they are
correlated with the rest of the variables. On the other hand, new variables related to
the changing definition of rurality, such as innovation, export and import rates,
cannot be included in the analysis as the data obtained had missing values for these
variables. However, although some variables are not included in the analysis, the
selection of the variables that were included in the analysis nevertheless allows us to
take into consideration a number of different aspects of the socio-economic and
demographic character of the countries. To compare countries in terms of their
ruralities, we used shares and rates which enabled us to compare countries more
satisfactorily using the variables included in the analysis (Table 5.1).
Code Description Loading Source Factor 1: Underdevelopment AES Agricultural employment per total employment 0.84 EUROSTAT SES Services employment per total employment -0.78 EUROSTAT IOID Inequality of income distribution 0.81 EUROSTAT SE1 School enrolment, primary (% gross) -0.48 WB ALS Agricultural land per total land area 0.85 EUROSTAT Factor 2: Demography CBR Crude birth rate 0.69 EUROSTAT CDR Crude death rate -0.89 EUROSTAT PG Population growth (% annual) 0.96 WB Factor 3: Urbanization LOM Length of motorways 0.96 EUROSTAT NOD Number of dwellings 0.97 EUROSTAT Factor 4: Higher Education SE2 School enrolment, secondary (% gross) 0.84 WB SE3 School enrolment, tertiary (% gross) 0.79 WB Factor 5: Industrialization CO2 CO2 emissions (metric tons per capita) 0.78 WB EPC Electric power consumption (kWh per capita) 0.64 WB IES Industrial employment per total employment -0.57 EUROSTAT
In this evaluation, to apply factor analysis, principal component analysis was
employed using the SPSS 14 software, and 82.60 per cent of the variance of the
original variables is explained. The first factor has a critical value of 4.38, and the
last factor’s critical value is above 1. From these findings, the factor analysis was
carried out with 5 factors rotated with the equamax method. Loadings of the factors
Table 5.1: Distribution of variables included in the factor analysis.
198
tend to be either high or low in absolute values. In the first component, the highly
loaded variable is agricultural land per total land area, but the other loadings are also
high so this component represents the underdevelopment level of the area (Table
5.1). On the other hand, the second component represents demographic change in the
area. Consecutively, the other factors represent the levels of the built-up
area/urbanization, higher education, and industrialization.
The first factor measures the underdevelopment level of the countries by their
agricultural employment, inequality of income distribution, agricultural land, service
employment, and primary school enrolment. According to the underdevelopment
factor, Turkey has the highest score, while Malta, Slovenia, Luxembourg, Austria,
the Czech Republic and Sweden have the lowest scores (see Table D.1 in Appendix
D). Greece, Poland, Lithuania and Latvia come after Turkey, and they all have a high
level of relative underdevelopment (Figure 5.1). Most of the European countries have
a negative score which means they are developed, but they are quite different from
each other. Moreover, the similarity within northern countries and also within
southern countries can be seen from Figure 5.1. However, Ireland and the United
Kingdom (UK) which are northern countries behave unlike to the rest of the northern
countries and have a higher value in terms of underdevelopment level.
The second component, the demography factor, is used to measure demographic
changes, with crude birth rate and population growth having a positive effect and
crude death rates having a negative effect. According to this factor, Turkey and also
Ireland have the highest scores; while Latvia, Lithuania, Estonia and Hungary have
the lowest scores. It is usually expected that developing countries have high crude
birth rates and crude death rates together with population growth, but, according to
our results, countries like Latvia, Lithuania, Estonia, and Hungary have a low score.
In other words, the crude birth rate of these countries is low, and in contrast the crude
death rate is high (see Table D.1 in Appendix D). Those countries are small countries
with regard to their land area, so their population growth is limited. An opposite
situation is seen for more developed countries like France, the Netherlands and
Luxembourg. Their high demography level is caused by their attractiveness to
immigrants which affects population growth. In addition, the two islands Malta and
Cyprus, which have limited attraction, compared with other countries, and
populations with a relatively limited life span, have a high demography level. On the

199
other hand, Germany which has a high population is in the low part of the ranking,
the reason being that Germany has a negative population growth rate. As a broad
spectrum, the results show that, while northern European countries have a low
demography level, southern European countries have a relatively high level (Figure
5.2).
Figure 5.1 : The EU-25 and Turkey by underdevelopment level.
Figure 5.2 : The EU-25 and Turkey by demographic level.
Figure 5.3 : The EU-25 and Turkey by urbanization level.
Figure 5.4 : The EU-25 and Turkey by higher education level.
Figure 5.5 : The EU-25 and Turkey by industrialization level.
Figure 5.6 : The EU-25 and Turkey by rurality level.
200
According to the third factor, the urbanization level is measured by the length of
motorways, which can be also a tool to understand accessibility, but here we used it
together with the number of dwellings to define how much built-up land exists in the
countries. From this point of view, Germany which is in the middle of Europe has the
highest score (Figure 5.3). Germany, the UK, Italy, Spain and France are the
countries which are far above the others in terms of their extreme urbanization score.
The reason is that most of the European transportation projects are being undertaken
in those areas. Therefore, most of the peripheral countries like Ireland, Lithuania,
Estonia, Latvia, and Finland and also Luxembourg, Slovenia, and Cyprus have a low
urbanization level. On the other hand, Turkey is, on average, similar to high level
countries, as it is strategically a bridge between Europe and Asia. According to these
results, the surprising finding is Luxembourg. Luxembourg has the lowest percentage
of urban area in the EU. The reason for our result is that Luxembourg has the
smallest land area but the lowest density of dwellings. The results show that southern
and western European countries have a parallel tendency in terms of urbanization
level, and so do northern European countries.
Our fourth factor is enrolment in secondary and tertiary schools, which here are
taken together and called ‘higher education’, as secondary and tertiary education are
not obligatory in all countries. The UK, Belgium and Scandinavian countries have
very high scores. This is not surprising, as these countries have the highest
percentages in terms of secondary and tertiary school enrolments (see Table D.1 in
Appendix D). On the other hand, Malta, Cyprus, Luxembourg, Slovakia, the Czech
Republic and Turkey have low higher education enrolment (Figure 5.4). The reason
for Turkey’s low score is the extreme remoteness of some areas, while at the same
time secondary, and especially tertiary, schools are not spread equally around
Turkey. The unequal spread of schools exists not only in Turkey but also around
Europe, so that most of the European countries have a different share of school
enrolment. Northern and western European countries have a similar level, and so do
eastern and southern European countries.
The fifth and last factor, the industrialization level, evaluates three components, viz.
the employment share of industry, CO2 emissions, and the electric power
consumption of the country. According to the results, Luxembourg and Finland have
the highest scores, and none of the other countries can match them. Slovenia is the

201
least industrialized country. In terms of industrialization level, Turkey comes in the
middle which means that it has an industry which is not sufficiently developed. As
can be seen in Figure 5.5, northern European countries are close in terms of having a
high industrialization level; therefore, eastern and southern European countries are
close in terms of their low industrialization level. It is a well-known reality that
technology and innovation used in the northern European countries is highly
developed compared with southern European countries where the economy is more
concentrated in the service sector, especially tourism.
In other words, according to Factor 1, northern European countries have higher
scores, as agriculture is highly important and developed in those countries. However,
the ones which are close in terms of scores to Turkey are Latvia, Lithuania and
Poland, which are new Member States, and Greece. On the other hand, in terms of
Factor 2, the demography level, southern and western countries are similar and have
higher scores. In contrast, the new Member States, viz. Latvia, Lithuania and
Estonia, are far removed from Turkey in this respect and have the lowest scores. In
this sense, Turkey is close to many of the EU founder states, viz. France, the
Netherlands, and Luxembourg. For the third factor, it is difficult to classify the
Member States spatially. However, western and southern European countries
including Turkey are the most urbanized ones. With respect to higher education
enrolment, in Factor 4, the distribution of states has a high variance. However; some
similarities between northern and western and between southern and eastern
European countries can be seen. In this sense, in terms of figures, Turkey is close to
southern and eastern countries, where higher education enrolment is low. In terms of
the industrialization factor, there are again similarities between northern and western
and between southern and eastern European countries. In summary, it can be said
that, apart from certain exceptions, northern and western and southern and eastern
countries are alike from many perspectives and so are southern and eastern countries,
and that Turkey is close to the southern countries.
On the basis of these results, we aim to calculate an overall score called a ‘rurality
score’ from all the factor scores. To calculate a rurality score is very useful in order
to come up with overall findings to reflect the multidimensional characteristics of
rural areas. The rurality of countries can be explained on the basis of different
perspectives and research focus, but an overall score can offer a holistic multi-

202
dimensional evaluation. When calculating this rurality score, underdevelopment and
demography scores had a positive effect, and urbanization, higher education and
industrialization had a negative effect. It is assumed that rural areas have fewer
dwellings and motorways; education facilities are often lacking in these areas; and
also these areas have not yet been industrialized.
In Europe, 11 countries have positive rurality levels, although they are rather
different from each other (see Table D.1 in Appendix D). According to the results of
our study, the general picture is that northern countries and western European
countries are not really rural; in contrast, southern and eastern European countries are
rural (Figure 5.6). The UK and Germany have the lowest scores, although they give
importance to their rurality. On the other hand, Turkey has the highest rurality level,
and none of the countries is anywhere near its level. Ireland follows Turkey in terms
of being rural and has the second highest rurality score together with Portugal. Rural
Poland, which is seen as similar to Turkey, also has a high score but this is much
lower than Turkey’s. Rurality is obvious on the periphery of Europe (Figure 5.6).
As can be seen from the box plots of the factors, the spread of variables is quite
different and has no equilibrium (Figure 5.7). Hence, it also shows us that each
country, even if it has similarities to others, can also have differences as it is unique.
The countries’ uniqueness and their specialization can also be seen from the box
plots, except for Turkey, which has high scores in almost every factor, while the
upper and lower outliers in the European countries vary quite considerably.
Notes: Fact = factor; TR = Turkey; UK = the United Kingdom; IT = Italy;
ES = Estonia; FR = France; DE = Denmark; SI = Slovenia; FI = Finland; LU = Lithuania
Figure 5.7 : Box plots of factor scores obtained by the rurality analysis.
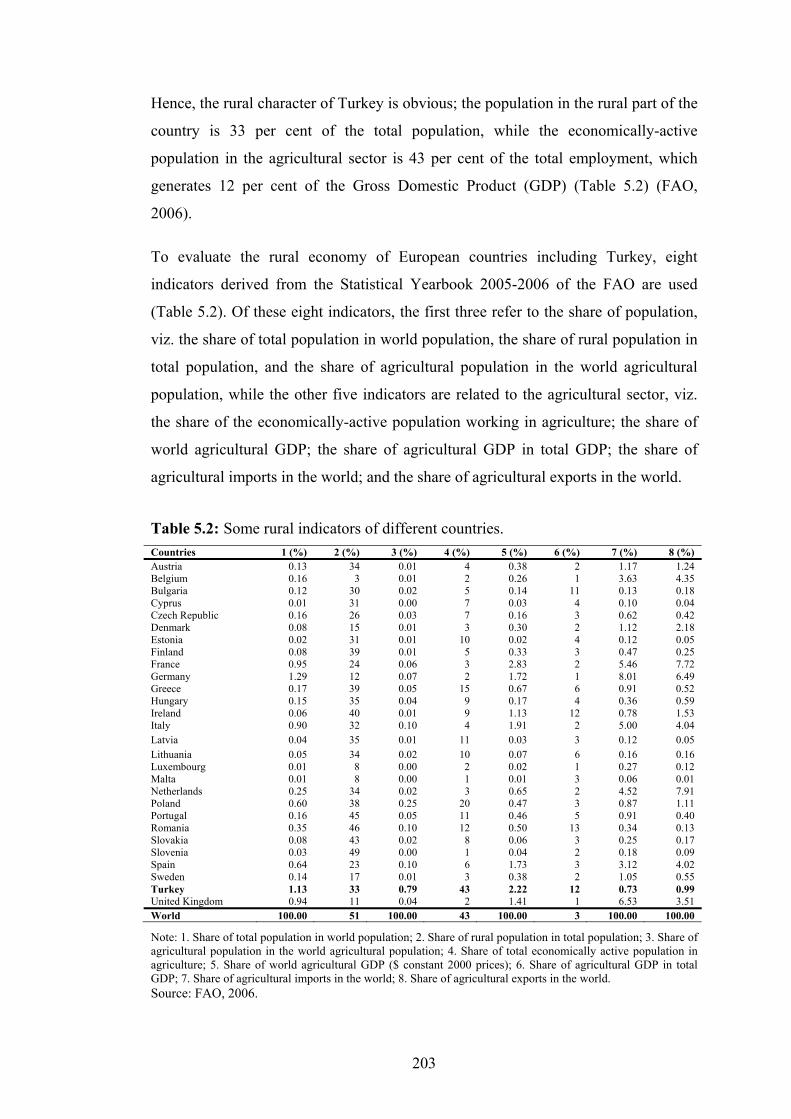
203
Hence, the rural character of Turkey is obvious; the population in the rural part of the
country is 33 per cent of the total population, while the economically-active
population in the agricultural sector is 43 per cent of the total employment, which
generates 12 per cent of the Gross Domestic Product (GDP) (Table 5.2) (FAO,
2006).
To evaluate the rural economy of European countries including Turkey, eight
indicators derived from the Statistical Yearbook 2005-2006 of the FAO are used
(Table 5.2). Of these eight indicators, the first three refer to the share of population,
viz. the share of total population in world population, the share of rural population in
total population, and the share of agricultural population in the world agricultural
population, while the other five indicators are related to the agricultural sector, viz.
the share of the economically-active population working in agriculture; the share of
world agricultural GDP; the share of agricultural GDP in total GDP; the share of
agricultural imports in the world; and the share of agricultural exports in the world.
Countries 1 (%) 2 (%) 3 (%) 4 (%) 5 (%) 6 (%) 7 (%) 8 (%) Austria 0.13 34 0.01 4 0.38 2 1.17 1.24 Belgium 0.16 3 0.01 2 0.26 1 3.63 4.35 Bulgaria 0.12 30 0.02 5 0.14 11 0.13 0.18 Cyprus 0.01 31 0.00 7 0.03 4 0.10 0.04 Czech Republic 0.16 26 0.03 7 0.16 3 0.62 0.42 Denmark 0.08 15 0.01 3 0.30 2 1.12 2.18 Estonia 0.02 31 0.01 10 0.02 4 0.12 0.05 Finland 0.08 39 0.01 5 0.33 3 0.47 0.25 France 0.95 24 0.06 3 2.83 2 5.46 7.72 Germany 1.29 12 0.07 2 1.72 1 8.01 6.49 Greece 0.17 39 0.05 15 0.67 6 0.91 0.52 Hungary 0.15 35 0.04 9 0.17 4 0.36 0.59 Ireland 0.06 40 0.01 9 1.13 12 0.78 1.53 Italy 0.90 32 0.10 4 1.91 2 5.00 4.04 Latvia 0.04 35 0.01 11 0.03 3 0.12 0.05 Lithuania 0.05 34 0.02 10 0.07 6 0.16 0.16 Luxembourg 0.01 8 0.00 2 0.02 1 0.27 0.12 Malta 0.01 8 0.00 1 0.01 3 0.06 0.01 Netherlands 0.25 34 0.02 3 0.65 2 4.52 7.91 Poland 0.60 38 0.25 20 0.47 3 0.87 1.11 Portugal 0.16 45 0.05 11 0.46 5 0.91 0.40 Romania 0.35 46 0.10 12 0.50 13 0.34 0.13 Slovakia 0.08 43 0.02 8 0.06 3 0.25 0.17 Slovenia 0.03 49 0.00 1 0.04 2 0.18 0.09 Spain 0.64 23 0.10 6 1.73 3 3.12 4.02 Sweden 0.14 17 0.01 3 0.38 2 1.05 0.55 Turkey 1.13 33 0.79 43 2.22 12 0.73 0.99 United Kingdom 0.94 11 0.04 2 1.41 1 6.53 3.51 World 100.00 51 100.00 43 100.00 3 100.00 100.00
Note: 1. Share of total population in world population; 2. Share of rural population in total population; 3. Share of agricultural population in the world agricultural population; 4. Share of total economically active population in agriculture; 5. Share of world agricultural GDP ($ constant 2000 prices); 6. Share of agricultural GDP in total GDP; 7. Share of agricultural imports in the world; 8. Share of agricultural exports in the world. Source: FAO, 2006.
Table 5.2: Some rural indicators of different countries.

204
On the basis of these indicators, the share of population living in the rural areas of
Turkey is less than that in 14 of the European countries (Table 5.2). On the other
hand, the share of the economically-active population working in agriculture is, at 43
per cent, higher in Turkey than that it is in any European countries. This implies a
different structure of economic activities than in rural Europe. When agricultural
imports and exports are evaluated, European countries may be seen as importers,
although they also act as exporters. Compared with the European countries, Turkey
exports less agricultural products, but the share of imports to Turkey is still high
compared with the potential of the economically-active population in agriculture. For
example, Ireland has more rural population and less agricultural employment
compared with Turkey, but exports more than Turkey. Thus, this shows that despite
its potential, Turkey does not have an efficient and sufficient agricultural production
for its own population. Turkey provides 2.22 per cent of the world’s agricultural
GDP, which is still higher than that of the European countries, except for France.
However, the agricultural GDP of France within that country is only 2 per cent,
while Turkey has 12 per cent agricultural GDP in its total GDP. This comparison
shows again the vast unused rural potential of Turkey. Rural economies still depend
heavily on agriculture and self-employment. In Chapter 3.1, we described the
changing trends of rural employment and rural self-employment in Europe. Here, on
the basis of this exploration, we also compare the trends in Turkey with those of the
European countries.
In the case of Turkey, the changes in agricultural employment over time are similar
to the changes in the EU-15, EU-25 and EU-27. However, the agricultural
employment rate is much higher in Turkey than it is in the EU (Table 5.3). In
addition, the share of agricultural employment in Romania is higher than it is in
Turkey (see Table 3.1). Although it is not much more than 50 per cent of the
participation in Turkey, the agricultural employment in Poland – as well as that in
Romania – is the closest to Turkey. Turkey has a decreasing trend with regard to
agricultural employment over time. There, agricultural employment dipped in the
year 2000 because of the economic crisis. It is obvious that the accession of Turkey
to the EU would increase the diversity of the European countries both spatially and
statistically, while also changing the trends in the agricultural employment of the
European countries. The share of agricultural self-employment in total self-

205
employment in Turkey is higher than it is in the EU Member States except Romania,
Lithuania, Poland and Latvia (see Table 3.2 and Table 5.3). Over the years,
agricultural self-employment has declined overall, while in the case of Turkey the
dramatic decrease began only after 2002.
1995 1996 1997 1998 1999 2000 2001 2002 2003 2004 2005 2006 Agricultural employment in total employment EU-15 5.15 4.95 4.85 4.66 4.47 4.31 4.20 4.05 4.01 3.77 3.72 3.65 EU-25 5.71 5.59 5.47 5.27 4.99 4.89 4.70 EU-27 7.95 7.70 7.08 6.83 6.31 6.14 5.88 Turkey 44.11 43.69 41.68 41.50 40.16 36.00 37.58 34.93 33.88 33.96 29.45 27.30 Agricultural self-employment in total employment EU-15 0.027 0.026 0.026 0.024 0.023 0.022 0.022 0.021 0.022 0.020 0.019 0.019 EU-25 0.031 0.030 0.030 0.029 0.027 0.026 0.025 EU-27 0.041 0.041 0.038 0.037 0.034 0.033 0.031 Turkey 0.159 0.151 0.158 0.156 0.145 0.150 0.158 0.148 0.148 0.144 0.135 0.129 Agricultural self-employment in total self-employment EU-15 0.179 0.174 0.173 0.166 0.160 0.155 0.154 0.151 0.151 0.136 0.132 0.128 EU-25 0.207 0.206 0.201 0.193 0.179 0.174 0.167 EU-27 0.269 0.265 0.253 0.242 0.219 0.213 0.205 Turkey 0.530 0.520 0.530 0.530 0.500 0.500 0.520 0.660 0.500 0.490 0.450 0.440 Male agricultural self-employment in total male self-employment EU-15 0.18 0.18 0.17 0.17 0.16 0.16 0.16 0.15 0.15 0.14 0.14 0.13 EU-25 0.20 0.20 0.19 0.19 0.18 0.17 0.17 EU-27 0.26 0.25 0.24 0.23 0.22 0.21 0.20 Turkey 0.52 0.51 0.52 0.51 0.49 0.48 0.49 0.46 0.46 0.47 0.42 0.41 Female agricultural self-employment in total female self-employment EU-15 0.17 0.17 0.17 0.16 0.15 0.15 0.15 0.15 0.15 0.13 0.12 0.12 EU-25 0.22 0.23 0.22 0.21 0.18 0.18 0.17 EU-27 0.30 0.30 0.28 0.26 0.22 0.22 0.21 Turkey 0.60 0.69 0.67 0.68 0.64 0.71 0.76 0.77 0.76 0.69 0.67 0.65
In addition, the results also show that the trends exhibited by Turkey are not similar
to the early Member States, and especially the EU-15. With the latest enlargements
(Romania, Bulgaria, Poland, Latvia and Lithuania), Turkey became much closer to
the European countries in terms of agricultural employment and its structural
components. In terms of self-employment, Turkey is successful in keeping self-
employment in agriculture and the dominance of women. This success is not the
success of the government, but rather the result of high unemployment in rural areas,
which has forced self-employed males to migrate to urban centres to work in other
sectors as employees.
The results of our study also show that the motivation of Turkish women to be self-
employed is higher than that of European women and of Turkish men. Discussions in
the past and in more recent times about the large size of Turkey’s population and
land area and on the potential of the agricultural sector have considered Turkey to be
far removed from the European Member States. Now, however, with the efforts of
the government and the support of the EU, Turkey stands side-by-side or is
Table 5.3: Some statistics on rural employment at the EU level and in Turkey.
206
becoming closer to the European countries. This changing position can be a great
challenge for Turkey’s future strategies, especially in the agricultural sector. In the
following section, we continue our comparative evaluation of European and Turkish
rural areas on the basis of our field surveys at the micro-level.
5.1.2 Changes in European and Turkish villages: a comparative approach
Starting from the Agricultural Revolution, for centuries, rural areas have been shaped
by agricultural activities. The reshaping of rural areas, especially in Europe, has
increased greatly during the last few decades, involving more and different actors.
Today, in rural areas, there is increased competition between socio-economic and
land-use activities. This competition has run the risk of environmental damage and
social unacceptability, while incurring the risk of losing cultural heritage in rural
areas. Therefore, these changes call for managed sustainable rural development. The
major causes for the changes in the rural areas are demographic changes and changes
in prosperity and mobility, and changes in technology, markets, and central
government policies (Oenema, 2005).
On this basis, in this section, we evaluate the changes in both European and Turkish
villages in our sample, while comparing them by application of the spider model in
order to visualize their comparative strengths and weaknesses. The spider model is
an appropriate analytical tool to show the relative score of various factors, while
enabling different cases to be compared (Rienstra, 1998; Baycan-Levent et al., 2007).
The spider model is not a real quantitative model but just a visualization tool.
In our sample, the typology of the villages reflects mainly accessible and historic
villages (Figure 5.8). Turkish villages are rich in terms of their diverse natural
landscapes, while suffering from lack of infrastructure, economic diversity, tourists,
and being neglected in comparison with the European villages. The latest
demographic changes occurring in the European and the Turkish villages show that
the changes in the European villages are faster and very much associated with
tourism and seasonal demographic changes compared with the Turkish villages
(Figure 5.9). Furthermore, Turkish villages which have faced out-migration for
decades have now started to enjoy a decrease in out-migration flows, while
experiencing increases in population and tourist numbers. Although both European
and Turkish villages experience seasonal demographic changes, the changes in
207
Turkey are more oriented to the population movement towards the villages being
permanent. Moreover, the villages have become attractive places to visit because of
their promotion by their outside product sell and their general promotion.
People choose to visit rural areas in search of their Arcadian idyll. Therefore, a
village needs to be a place to see the traditional way of life. The promotion of the
European villages has worked well, so that 66 per cent of the villages have become
very well known, while 36 per cent have started to sell their products outside (Figure
5.11). In addition, 59 per cent have realized the importance of tradition rather than
the urban lifestyle, and have experienced a back-to-tradition movement. These
changes and also additional external forces have worked well in the European
villages, so most of them have experienced an increase in the number of tourists.
However, more Turkish villages are selling their products outside, and though most
of them are well known, and their inhabitants live in a traditional way, they are not
very lucky in being able to benefit from the changing rural perception of urban
inhabitants. This is due to the lack of tourist facilities so, compared with 52 per cent
of the European villages, only 18 per cent of Turkish villages can offer tourist
facilities (Figure 5.11).
In addition, in terms of basic technology, both the European and the Turkish villages
have experienced technological changes. The causes and consequences of the
changes in rural areas are various. Rural areas are very sensitive to the changes and,
hence, react very quickly as they are not used to them. The consequences of these
changes can be both negative and positive. For instance, rural areas are usually under
investigation from a sociological perspective due to their dominant defensive social
character. In our sample, 41 per cent of the Turkish villages have experienced
changes in social relations compared with 25 per cent of the European villages
(Figure 5.12). This logically shows that Turkish villages are more closed
communities than the European ones as they react more. In contrast, the increase in
the car circulation in Turkish villages is much heavier than in the European villages.
In addition, house prices have increased more in the European villages. Because of
its vast land size, Turkey has not yet suffered from a lack of rural land. These
consequences can be seen as negative, as the traditional strengths of rural areas are
losing their power. But the impact of these changes on the inhabitants, especially in
terms of their economic activities, is a desired outcome. Therefore, 30 to 40 per cent
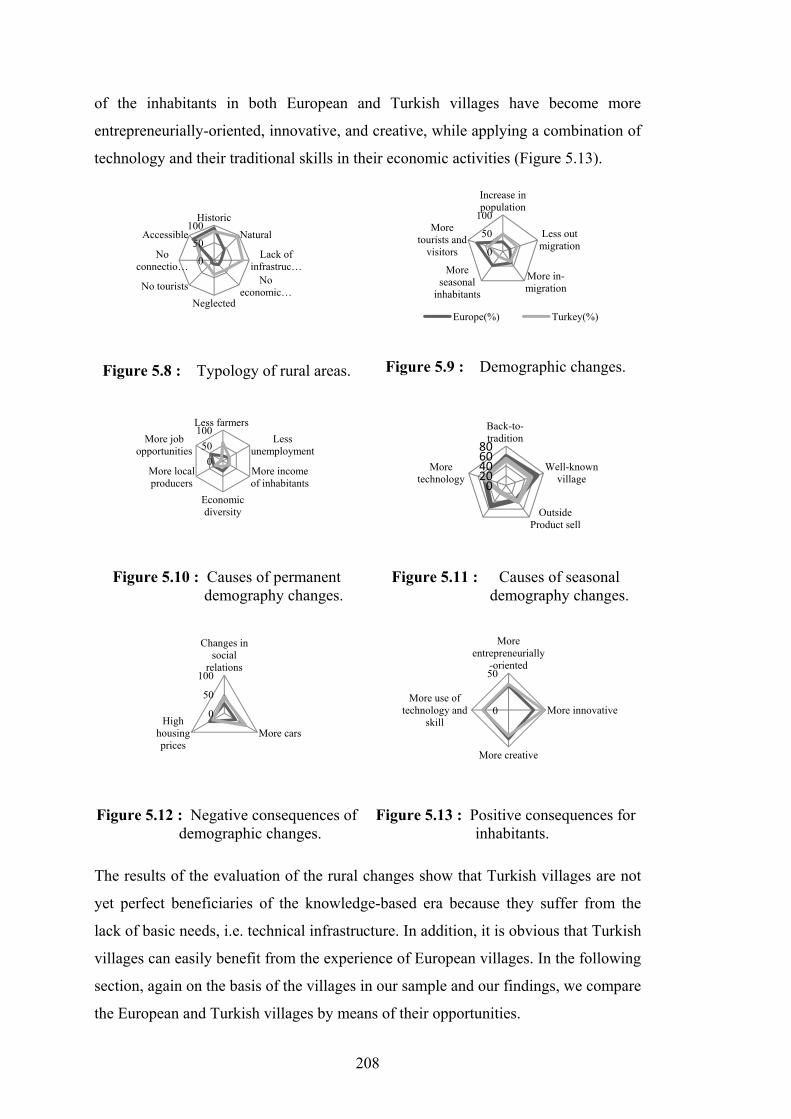
208
of the inhabitants in both European and Turkish villages have become more
entrepreneurially-oriented, innovative, and creative, while applying a combination of
technology and their traditional skills in their economic activities (Figure 5.13).
Figure 5.8 : Typology of rural areas. Figure 5.9 : Demographic changes.
Figure 5.10 : Causes of permanent
demography changes. Figure 5.11 : Causes of seasonal
demography changes.
Figure 5.12 : Negative consequences of demographic changes.
Figure 5.13 : Positive consequences for inhabitants.
The results of the evaluation of the rural changes show that Turkish villages are not
yet perfect beneficiaries of the knowledge-based era because they suffer from the
lack of basic needs, i.e. technical infrastructure. In addition, it is obvious that Turkish
villages can easily benefit from the experience of European villages. In the following
section, again on the basis of the villages in our sample and our findings, we compare
the European and Turkish villages by means of their opportunities.
0
50
100Historic
Natural
Lack of infrastruc…
No economic …
NeglectedNo tourists
No connectio…
Accessible0
50
100
Increase in population
Less out migration
More in-migration
More seasonal
inhabitants
More tourists and
visitors
Europe(%) Turkey(%)
050
100Less farmers
Less unemployment
More income of inhabitants
Economic diversity
More local producers
More job opportunities
020406080
Back-to-tradition
Well-known village
Outside Product sell
More technology
0
50
100
Changes in social
relations
More carsHigh
housing prices
0
50
More entrepreneurially
-oriented
More innovative
More creative
More use of technology and
skill

209
5.1.3 Opportunities in the European and Turkish rural areas
The changes in rural areas are very remarkable, as rural areas have been used to
experiencing depopulation and deconcentration for decades as a result of the
modernization and mechanization of the sole economic activity: agriculture. On the
other hand, the modernization in rural areas has forced more rural inhabitants to
leave their homelands, and, on the other, the realization of economic shifts has led
selective economic actors to move into rural areas (Nijkamp, 1978; Halfacree, 2008).
Therefore, rural areas can still offer intervening opportunities for economic actors,
not only in the past during the decentralization, but also, today, by means of their
rural creative capacity. Moreover, this immigration, i.e. counterurbanization, has
functioned as an intervening opportunity for the inhabitants and the rural capital
(Beryl, 1976; Stockdale and Findlay, 2008). From this point of view, in this section,
we investigate the opportunities in rural areas from the perspective of different rural
users, viz. the entrepreneurs, the visitors, and the inhabitants, and also from the
perspective of the villages (‘rural capital’), on the basis of the results of the applied
analyses. We used the seven components of creative capacity (for the explanation,
see Chapter 3) and additionally the quality of the villages in order to summarize our
findings with respect to the intervening opportunities in the villages.
The results show that the European and Turkish villages investigated in this study
have very different intervening opportunities, while the perspective of each user also
differs (Table 18.4). Among the intervening opportunities, only the ‘social network’
component seems to be similar in both European and Turkish villages. This shows
that the close localism and the importance of the social network are the indispensable
characteristics of rural areas that play an important role in attracting entrepreneurs
and visitors, as well as in improving the life of the inhabitants in the villages. In other
words, openness and tolerance in the villages are very important to attract people and
to facilitate novelty and innovation in the area, as the social networking in each of
them is unique.
The results also show that, to attract visitors, ‘quality’ plays an important role but the
Turkish villages lack such quality (Table 5.4). The built-environment in the Turkish
villages is not in good shape, and also traditional housing is in danger of becoming
lost. In addition, geographical difficulties prevent villages from benefitting from
even basic infrastructure. Even though knowledge is an opportunity for both
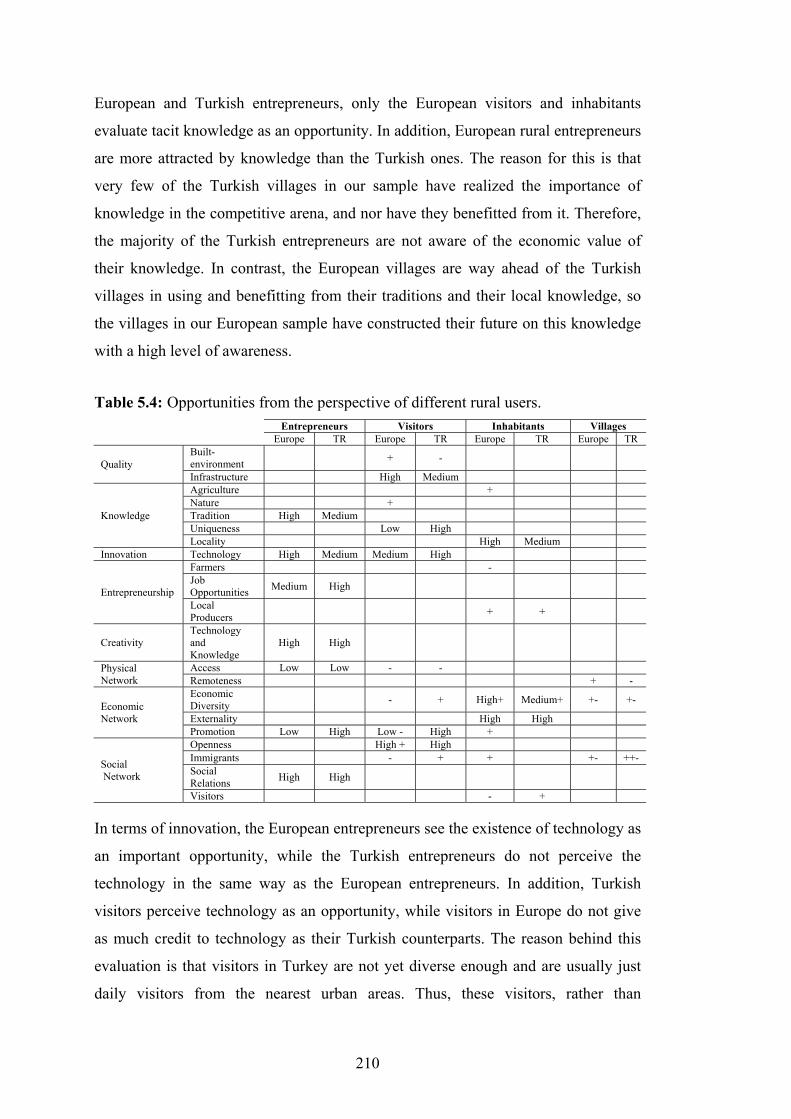
210
European and Turkish entrepreneurs, only the European visitors and inhabitants
evaluate tacit knowledge as an opportunity. In addition, European rural entrepreneurs
are more attracted by knowledge than the Turkish ones. The reason for this is that
very few of the Turkish villages in our sample have realized the importance of
knowledge in the competitive arena, and nor have they benefitted from it. Therefore,
the majority of the Turkish entrepreneurs are not aware of the economic value of
their knowledge. In contrast, the European villages are way ahead of the Turkish
villages in using and benefitting from their traditions and their local knowledge, so
the villages in our European sample have constructed their future on this knowledge
with a high level of awareness.
Entrepreneurs Visitors Inhabitants Villages Europe TR Europe TR Europe TR Europe TR
Quality Built-environment + - Infrastructure High Medium
Knowledge
Agriculture + Nature + Tradition High Medium Uniqueness Low High Locality High Medium
Innovation Technology High Medium Medium High
Entrepreneurship
Farmers - Job Opportunities Medium High Local Producers + +
Creativity Technology and Knowledge
High High
Physical Network
Access Low Low - - Remoteness + -
Economic Network
Economic Diversity - + High+ Medium+ +- +-
Externality High High Promotion Low High Low - High +
Social Network
Openness High + High Immigrants - + + +- ++- Social Relations High High Visitors - +
In terms of innovation, the European entrepreneurs see the existence of technology as
an important opportunity, while the Turkish entrepreneurs do not perceive the
technology in the same way as the European entrepreneurs. In addition, Turkish
visitors perceive technology as an opportunity, while visitors in Europe do not give
as much credit to technology as their Turkish counterparts. The reason behind this
evaluation is that visitors in Turkey are not yet diverse enough and are usually just
daily visitors from the nearest urban areas. Thus, these visitors, rather than
Table 5.4: Opportunities from the perspective of different rural users.

211
experiencing their rural idyll and enjoying only the fresh air and beautiful
landscapes, they are looking for some level of technology in the village, at least the
basic ICT features, i.e. telecommunication. On the other hand, visitors to the
European villages are more eager to find just undiscovered and untouched places
(Gülümser et al., 2009d).
Moreover, entrepreneurship has relatively less role as an intervening opportunity for
the European entrepreneurs and the villages. The reason is that unemployment or
lack of job opportunities are not serious problems in the European villages. When it
comes to creativity, it is very important for both European and Turkish
entrepreneurs. Due to the diversity of geographical areas, physical networks are
difficult to obtain in rural areas. Their evolution can create opportunities. Being away
from the agglomerations, difficulty of access is seen as a threat more than an
opportunity for the entrepreneurs and visitors, but the remoteness of the European
villages has been turned into an opportunity, while this is not the case for the Turkish
villages in our sample.
Economic networks are another most important opportunity component in rural areas
but differ slightly in the European and Turkish villages. Even though economic
diversity is an important opportunity for inhabitants, it can be both threat and an
opportunity for villages in both Europe and Turkey. In addition, the entrepreneurs
and visitors have a contrasting view: they perceive the promotion of the villages as a
threat, while the Turkish villagers perceive it as an opportunity.
The trends and changes, as well as the opportunistic perception of the different rural
users, are overlapping on the basis of our data. Rural users see whatever is missing in
their villages as an opportunity, while the ability to actually improve the existing
facilitates is not evaluated as an opportunity, especially in the Turkish villages. In the
next section, the ways to benefit from these opportunities will be discussed to
prepare the ground for the creation of sustainable rural development scenarios.
5.1.4 To exploit the opportunities in the villages
Rural areas are reshaping in an uncontrolled way mainly as a result of increasing
mobility and people’s changing perception of the ‘rural’. Due to these changes, the
definition of rurality, as well as the rural economy of countries, has also changed in
the last years. But the complexity of the phenomenon, diversity of geographies, and

212
the heterogeneity of localities has made it difficult to come up with commonalities
and a common understanding. Although the EU seems successful in creating a
common ground for rurality and rural-specific issues, the differences between
European countries have led us to compare Turkey with the European countries.
Turkey has been under investigation as a potential European Member State for years.
The long history of Turkey’s relations with the EU accelerated in recent years since
the decision of the EU Council in 2004 to start the EU accession negotiations with
Turkey in October 2005. The reason for the late evaluation of Turkey’s accession
was the continuing discussions in different fields, especially in politics and
international relations (Buzan and Diez, 1999; Axt, 2005). The political view does
not depend on Turkey’s socio-cultural differences, but rather on the political and
strategic standing of the country that may affect its full membership of the EU.
Against the above-background, this chapter has aimed to compare Turkey with the
European countries at country level and settlement level by means of various
selected variables.
In the first section of this chapter, we investigated rurality, the rural economy, and
employment of the European countries and Turkey from a comparative perspective.
The results of the factor analysis on the rurality level of countries showed that
Turkey has both lower and upper values, and sometimes even becomes an outlier in
regard to each of the chosen indicators compared with the European countries. In
terms of rurality scores, the nearest countries to Turkey are Ireland and Portugal.
Therefore, the rurality of the European countries is also different amongst
themselves. The reason for Turkey’s high rurality score is the high level of inequality
of income distribution and the presence of less favoured areas. In other words, social
and public facilities and other socio-economic facilities related to quality of life are
not spread equally around Turkey.
In addition, the results of the analysis of the rural economy and employment showed
that the rates of agricultural employment and self-employment show a slight decrease
over time, and that for only a few European countries is agriculture still a significant
sector in terms of employment. On the other hand, another important issue is the
changing aspect of agriculture from being a masculine occupation to being a more
feminine occupation in many countries. Women are becoming more courageous and
are insisting on working in agriculture, a traditionally masculine field of work.
213
In addition, the results also showed that Turkey is successful in keeping self-
employment in agriculture and the dominance of women. This success is not the
success of the government, but rather the result of high unemployment in rural areas,
which has forced self-employed males to migrate to urban centres to work in other
sectors as employees. The results of our study also showed that Turkish women are
more motivated to be self-employed than European women and Turkish men.
After these macro-level investigations, we also compared our samples of the Turkish
and the European villages in terms of the changes that have occurred there in recent
years by using a visualization tool, i.e. spider analysis. According to the results of the
spider analysis, European villages have experienced more changes in terms of
seasonal movements than Turkish villages which are changing with respect to
permanent movements. The high level of seasonal demographic changes in European
villages is the reason for the numerous tourist facilities, and, of course, because they
are tourism-oriented villages.
In addition, Turkish villages do not have one single tourist accommodation facility in
their village so that the inhabitants have to accommodate the visitors in their own
houses. In terms of permanent demographic changes, the results are very surprising
so, even though Turkish villages attract more new inhabitants than the European
ones, European villages have had more job opportunities, and local producers have
had more income, more economic diversity and less unemployment and more
farmers than the Turkish villages. This conflicting and unexpected result is the
reason why Turkey has just started to experience rural change and this is being
stimulated also by the local city councils. But, there is neither plan nor a strategy for
this counterflow.
The results also suggested that there are both negative and positive effects of these
changes. Both the European and the Turkish villages enjoy increasing land values.
This increase can prompt local owners, who have suffered for years from poverty, to
sell land and properties to the new settlers, and thus the cultural heritage can no
longer be sustainable and is in danger. In addition, the results showed that newly
growing and developing Turkish villages face more negative consequences, i.e. more
cars and social change than the European ones. It is not plausible that all these
changes are damaging and only have negative consequences: they also have positive
effects, especially for the rural local inhabitants. Their benefits are very much

214
appreciated, so the inhabitants, as a result of these changes in both European and
Turkish villages, are encouraged to demonstrate their skills, innovativeness,
entrepreneurial, and creative skills. This is essentially the result of the interaction
with the outside world and also with the newcomers. However, the European villages
are doing better than the Turkish villages and no longer face the usual problems, viz.
lack of infrastructure, economic diversity, poor job opportunities, and few tourists
and outside connections, while the Turkish villages are still suffering from these
problems.
All these changes with their causes and consequences are reshaping the opportunities
in dynamic rural areas. The results show that endogenous growth and development
with economic diversity and locality are seen as the major opportunities by all rural
users. In addition, for the entrepreneurs, the openness, technology and infrastructure
in the villages are also relatively important.
These results show only the changes and dynamism of a limited number of villages
in Europe and Turkey. Nevertheless, even though every village is unique and reacts
in a different way, the general picture is almost the same everywhere. This can also
be seen from the comparison of Europe and Turkey where the opportunistic view of
rural users is similar. In addition, as European villages are tourism-oriented and
developed in a controlled way, they are benefitting from these changes. In other
words, with a well-targeted sector depending on the local characteristics of a village,
development will certainly succeed. Next, Chapter 5.2 aims to present the critical
factors and the driving forces of sustainable rural development, using the results of
this chapter.
5.2 The Future of Rural Areas: Sustainable Rural Development
The face of rural areas is changing from being problematic to dynamic. From both
socio-economic and spatial perspectives, these changes, e.g. attracting numerous
visitors and newcomers, are uncontrolled and have become one of today’s most
pressing policy concerns, especially for European villages. The development of rural
areas is one of the long-standing policy concerns in Europe and particularly in
Turkey. The goals of states with respect to rural development are focused on
economic development, e.g. job and income creation, while fostering local economic
growth. Although these goals are particularly important for rural areas, their various

215
causes and consequences have led to competing approaches. Therefore, some of the
policies can have substantial negative effects on rural areas, especially concerning
the sustainability of nature and cultural heritage and even the continuity of economic
activities. Therefore, in this last empirical chapter of the study, we aim to develop a
set of sustainable rural development scenarios, in which the entrepreneurial activity
and the economic diversity necessary to survive will be strengthened, while
obtaining sustainability in rural areas, with a special focus on the European and
Turkish villages investigated in the previous parts of this study.
5.2.1 Critical factors for sustainable rural development
Sustainable development has been the indispensable type of development since the
Brundtland Report in 1987 produced by the UN’s World Commission on
Environment and Development. In this report, called ‘Our Common Future’,
sustainable development was defined as the “development that meets the needs of the
present without compromising the ability of future generations to meet their own
needs’. Hence, the importance of combining the development of the economy and
technology, while maintaining natural resources, has become the main policy
concern (WCED, 1987; IUCN et al., 1991; Muhansinghe and McNeely, 1995).
In the same report, the necessary conditions for sustainable development are defined
in terms of seven systems, viz. 1) a ‘political system’ that secures effective citizen
participation in decision making; 2) an ‘economic system’ that is able to generate
surpluses and technical knowledge on a self-reliant and sustained basis; 3) a ‘social
system’ that provides solutions for the tensions arising from disharmonious
development; 4) a ‘production system’ that respects the obligation to preserve the
ecological base for development; 5) a ‘technological system’ that can search
continuously for new solutions; 6) an ‘international system’ that fosters sustainable
patterns of trade and finance; and 7) an ‘administrative system’ that is flexible and
has the capacity for self-correction (WCED, 1987).
These above-mentioned systems can serve the urban systems and their needs very
well. In urban areas, sustainable development practices have been successfully
implemented, especially in specific sectors, i.e. transport and energy. However, rural
areas, which are already the natural resources of both urban areas and the world,
were not involved in these practices, but they were rather seen as merely the land
216
stock in many countries, as well as in theoretical discourses. Furthermore, recent
changes in rural areas have shown that sustainable development is also a must for
rural areas. Therefore, sustainable rural development needs to be present on the
agenda of policy makers.
The impacts of globalization and the knowledge-based era, as well as the increasing
mobility of population towards rural areas, have brought up for discussion a dual
development, as well as a dualization in the economy. The discussion on the
hinterland-heartland or the core-periphery paradigms has undergone a process of
change: the interdependence of rural areas and urban areas has been increasing, while
the urban-rural dichotomy has been decreasing over time. Today, many rural areas
have become production, as well as consumption, areas. On the one hand,
globalization is demanding competitiveness, innovation and cohesion, and, on the
other hand, the knowledge-based era is stressing the importance of rural culture and
knowledge as scarce goods in danger of being lost. To this end, this section aims to
identify critical factors of sustainable rural development by applying the ‘pentagon
model’.
The pentagon model has been applied in several policy studies in the last decade in
order to assess the critical success/failure factors of a policy (see, e.g,. Nijkamp et al.,
1994; Nijkamp and Pepping, 1998b; Capello et al., 1999; Nijkamp, 2008b).
Basically, this model aims to map out in a structured manner the various forces that
contribute to the performance of a given policy (Pepping and Nijkamp, 1998c). The
model which is used not only in policy studies but also in systematic thinking
about, and evaluation of, multidimensional complexity, has demonstrated its
methodological power and empirical validity in various studies (Nijkamp, 2008b).
On this basis, here, we need to use a pentagon prism, in order to distinguish a limited
systematized set of critical factors that exert a decisive impact on sustainable rural
development, despite the multidimensional complexity of rural areas in their struggle
for economic development and sustainability.
Normally, the pentagon model includes five distinct factors which are visualized by a
pentagon prism (Figure 5.14). These factors are:
• Hardware: the physical and technological construction works of the
infrastructure, in particular its degree of sophistication and innovation;

217
• Software: the information and communication potential of the infrastructure
provision concerned, in particular its broader network-connecting potential;
• Orgware: the degree of managerial, regulatory and organizational competence
involved, with a view to enhancing the efficiency and the satisfaction of
customers’ needs,
• Finware: the cost-effectiveness and financing aspects of the infrastructure
investment, with a particular view to the improvement of the competitive
position of the infrastructure facility,
• Ecoware: the contribution of the infrastructure concerned to an enhancement
of ecological quality conditions, in particular from the viewpoint of
sustainable development (Pepping and Nijkamp, 1998c).
Figure 5.14 : The basic pentagon prism.
The pentagon approach plays an important role as a systematic framework for
identifying success/failure factors in the search for sustainable development. In our
study, taking into consideration the systematic approach to the necessary conditions
for sustainable development, i.e. our conceptual framework and theoretical
framework, we generated our own critical conditions for sustainable rural
development by means of the pentagon approach. In the description of each factor, it
is important to identify the sub-factors/decomposition of each pentagon factor.
Therefore, our five critical factors called ‘systems’ are as follows (Figure 5.15):
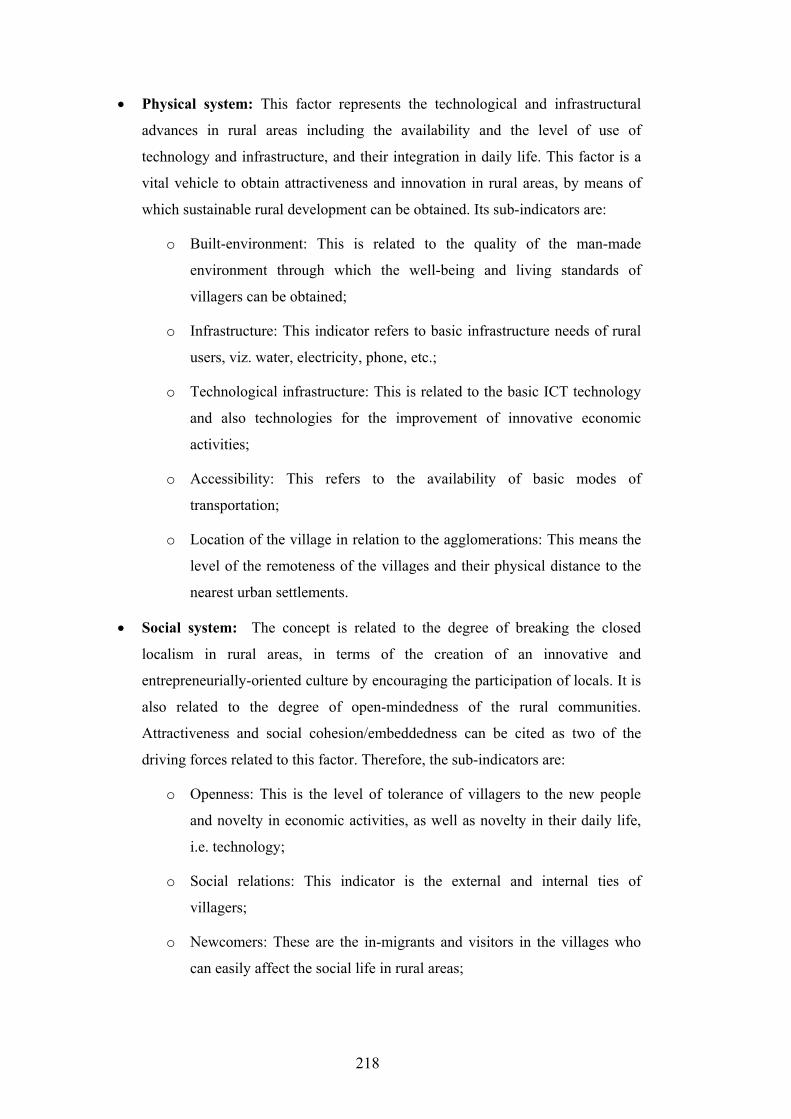
218
• Physical system: This factor represents the technological and infrastructural
advances in rural areas including the availability and the level of use of
technology and infrastructure, and their integration in daily life. This factor is a
vital vehicle to obtain attractiveness and innovation in rural areas, by means of
which sustainable rural development can be obtained. Its sub-indicators are:
o Built-environment: This is related to the quality of the man-made
environment through which the well-being and living standards of
villagers can be obtained;
o Infrastructure: This indicator refers to basic infrastructure needs of rural
users, viz. water, electricity, phone, etc.;
o Technological infrastructure: This is related to the basic ICT technology
and also technologies for the improvement of innovative economic
activities;
o Accessibility: This refers to the availability of basic modes of
transportation;
o Location of the village in relation to the agglomerations: This means the
level of the remoteness of the villages and their physical distance to the
nearest urban settlements.
• Social system: The concept is related to the degree of breaking the closed
localism in rural areas, in terms of the creation of an innovative and
entrepreneurially-oriented culture by encouraging the participation of locals. It is
also related to the degree of open-mindedness of the rural communities.
Attractiveness and social cohesion/embeddedness can be cited as two of the
driving forces related to this factor. Therefore, the sub-indicators are:
o Openness: This is the level of tolerance of villagers to the new people
and novelty in economic activities, as well as novelty in their daily life,
i.e. technology;
o Social relations: This indicator is the external and internal ties of
villagers;
o Newcomers: These are the in-migrants and visitors in the villages who
can easily affect the social life in rural areas;
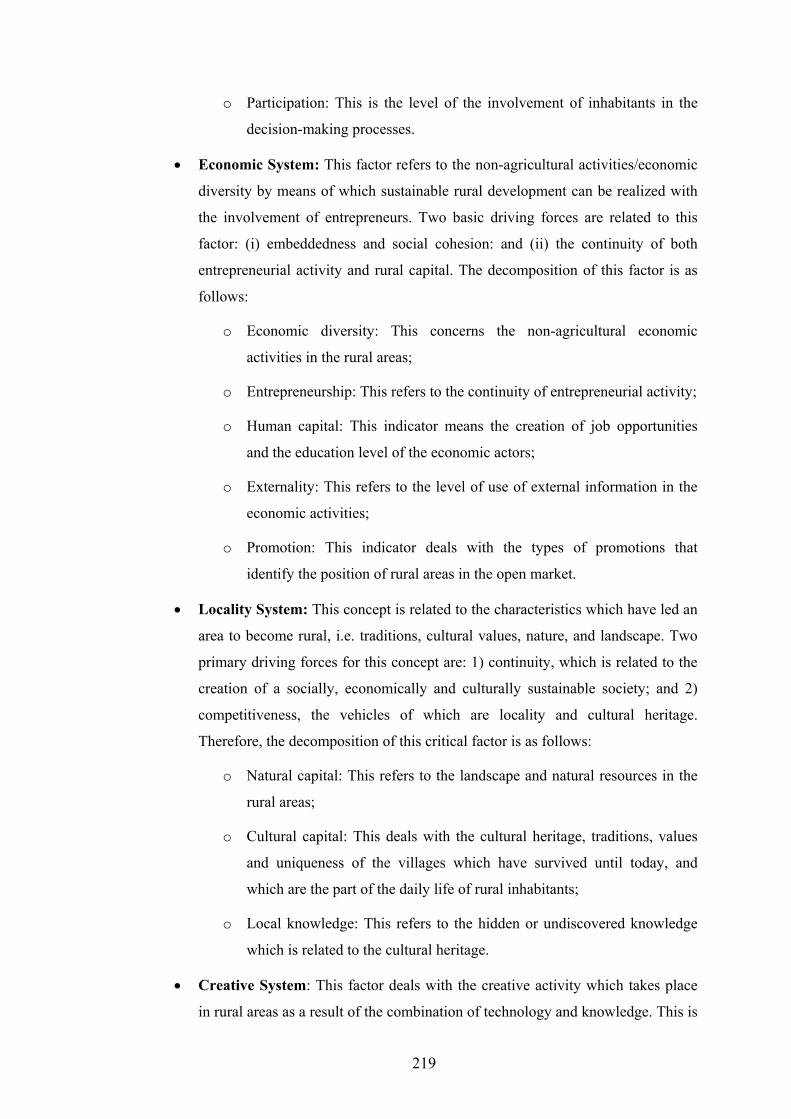
219
o Participation: This is the level of the involvement of inhabitants in the
decision-making processes.
• Economic System: This factor refers to the non-agricultural activities/economic
diversity by means of which sustainable rural development can be realized with
the involvement of entrepreneurs. Two basic driving forces are related to this
factor: (i) embeddedness and social cohesion: and (ii) the continuity of both
entrepreneurial activity and rural capital. The decomposition of this factor is as
follows:
o Economic diversity: This concerns the non-agricultural economic
activities in the rural areas;
o Entrepreneurship: This refers to the continuity of entrepreneurial activity;
o Human capital: This indicator means the creation of job opportunities
and the education level of the economic actors;
o Externality: This refers to the level of use of external information in the
economic activities;
o Promotion: This indicator deals with the types of promotions that
identify the position of rural areas in the open market.
• Locality System: This concept is related to the characteristics which have led an
area to become rural, i.e. traditions, cultural values, nature, and landscape. Two
primary driving forces for this concept are: 1) continuity, which is related to the
creation of a socially, economically and culturally sustainable society; and 2)
competitiveness, the vehicles of which are locality and cultural heritage.
Therefore, the decomposition of this critical factor is as follows:
o Natural capital: This refers to the landscape and natural resources in the
rural areas;
o Cultural capital: This deals with the cultural heritage, traditions, values
and uniqueness of the villages which have survived until today, and
which are the part of the daily life of rural inhabitants;
o Local knowledge: This refers to the hidden or undiscovered knowledge
which is related to the cultural heritage.
• Creative System: This factor deals with the creative activity which takes place
in rural areas as a result of the combination of technology and knowledge. This is
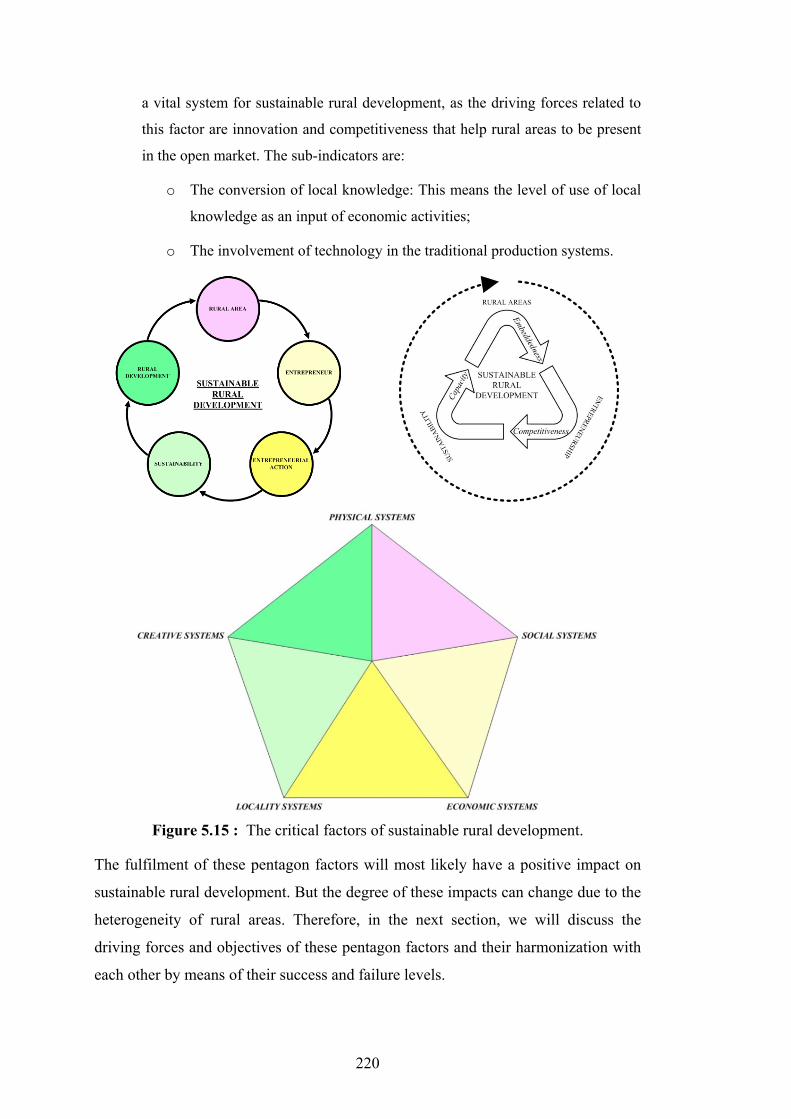
220
a vital system for sustainable rural development, as the driving forces related to
this factor are innovation and competitiveness that help rural areas to be present
in the open market. The sub-indicators are:
o The conversion of local knowledge: This means the level of use of local
knowledge as an input of economic activities;
o The involvement of technology in the traditional production systems.
Figure 5.15 : The critical factors of sustainable rural development.
The fulfilment of these pentagon factors will most likely have a positive impact on
sustainable rural development. But the degree of these impacts can change due to the
heterogeneity of rural areas. Therefore, in the next section, we will discuss the
driving forces and objectives of these pentagon factors and their harmonization with
each other by means of their success and failure levels.

221
5.2.2 Driving forces required to envision for rural areas
Sustainability was first seen in the 1980s to be concerned with the protection and
conservation of natural resources, and technology was considered vital for this type
of development (Barrow, 1995). The meaning of sustainability was related to the
improvement of people’s well-being and quality of life. Basically, sustainable
development has become a paradigm shift of a post-modern development approach
(Barrow, 1995). However, although it might seem difficult to achieve sustainable
development, it is neither impossible nor unfeasible, despite the difficulty to define
its priorities. From a cost-benefit analytical view, the benefits of sustainable
development for the future are greater than its benefits for the present, while its costs
in the present are much heavier than they are for the future. In other words,
sustainable development cannot be taken as a short-term solution, but rather as a long
term one.
Today, rural areas are ecological and cultural hot spots from many perspectives, but
many poor people live in such rich lands (Beck, 2003). To protect this inherited
culture all these people need an improvement in their well-being. However, the
general policies and their implementation have usually failed to answer such a need.
The empirical evidence shows that the catalyst in these areas is neither the policies
nor the subsidies, but in fact, the entrepreneurs – mainly the newcomers – who have
realized the opportunities in the rural areas. Therefore, to sustain the natural
resources, the continuity and the sustainability of local activities play a crucial role in
sustainable rural development, as the rural capacity heavily depends on these
attributes.
In the previous section, we defined five critical factors of sustainable rural
development on the basis of the theoretical and conceptual framework of this study
and the empirical evidence obtained from the results of the field surveys. Although
we also briefly summarized the driving forces of these factors, in this section we aim
to discuss in detail whether these critical factors are success or failure factors,
depending on the driving forces which are also discussed in detail in this section.
Hence, we can come up with a number of relevant and plausible sustainable rural
development scenarios. The success factors refer to the necessary – though not
sufficient – conditions that are to be fulfilled to meet a-priori given objectives, such
as economic performance, social cohesion, and ecological sustainability (van
222
Leeuwen et al., 2009). The failure factors are to be interpreted in a different way, and
refer to those factors that drive the performance of an economic-social-ecological
system toward levels that are unacceptable from the perspective of a-priori specified
objectives (van Leeuwen et al., 2009).
Although there can be many driving forces for sustainable rural development, here
we discuss five of them which are related to the five critical factors of sustainable
rural development (Figure 5.15). These driving forces concern both the need of rural
areas to achieve sustainable development and the needs of today. Thus, they are: (i)
attractiveness, which is the main driving force to change the face of rural areas and to
improve their economic system; (ii) embeddedness/cohesion, which is the most
difficult issue to change, but the easiest to obtain in socially-oriented communities
like rural communities; (iii) continuity, which is the main focus of sustainability; (iv)
competitiveness, which is a must for being present in the open market; and (v) the
(creative) capacity, which these days is the indispensable vehicle for competitiveness
(Figure 5.16).
Figure 5.16 : The driving forces required to envision for rural areas.
Attractiveness, the first driving force, is mainly obtained by the improvement of
physical and social systems: in other words, the quality in terms of infrastructure and
built-environment, together with the accessibility of the villages where there is a high
tolerance level to attract more visitors. Although the attractiveness of a village is a
success factor, when it exists, it can also be a failure factor because over-
223
attractiveness can limit the sustainability and the continuity of the activities.
Especially if the attractiveness turns into mass attractiveness, it will change the
motivation of population moving to villages. Therefore, for the visitors and the
villages, including the inhabitants, attractiveness can also be a failure factor, as the
social system may change in a negative way.
The second driving force, embeddedness/cohesion, is mainly related to the social
system but also to the economic system. The tolerance and the openness of
inhabitants to new economic activities and entrepreneurs, as well as to the visitors,
are very important, and the continuity of rural areas cannot be obtained without it.
But to become embedded in a rural locality, it is very important to respect the
locality features, the rural capital, and the cultural capital.
The third driving force is continuity, and this depends on three factors as was the
case with embeddedness. As it refers the continuity of the localities as well as their
economic activities, it depends on the locality and the economic systems, but,
without the inclusion of the social system, it cannot be obtained.
The fourth driving force is competitiveness, which can carry rural areas into the
global arena and give them a voice there. Rural areas, with all their localities, are, on
the one hand, very lucky to have the capital to compete, but, on the other hand, the
lack of education and awareness, as well as the lack of the knowledge of creativity
make them scared to compete, or even try to compete, in the global arena. In
addition, being small in size and having difficulty in creating agglomerations or
densities of activities can be cited as the deterrent factors for rural areas to enter in
the competing world.
Finally, the fifth and the most important driving force is the capacity, which, here,
refers to the combination of technology, localities and the high quality of life in the
villages. This driving force shows how innovative a village can be.
Here, we have defined the driving forces and their related factors. The empirical
evidence shows that, apart from attractiveness, none of the driving forces can cause
damage or failure for the villages, but attractiveness, capacity, and competitiveness
can be a failure factor for visitors. Therefore, we can conclude that, when making the
villages into attractive places, it is very important to envision suitable strategies.
Otherwise, increasing attractiveness could result in the unsustainability of the

224
villages. In addition, if attractiveness is the main goal, it is important to keep a
balanced capacity-competitiveness level because high capacity and
promotion/competitiveness can also cause depreciation. In the following section, we
offer a set of rural hot spot scenarios on the basis of the above-mentioned critical
factors and driving forces of sustainable rural development.
5.2.3 Sustainable development scenarios for rural hot spots
The term ‘hot spot’ is widely used in the ecological sciences and more recently in the
innovation literature to define a region which is important for its development and
sustainability. The term ‘hot spot’ has been used literally to show that a region is in
danger. But, today, the term is used to identify the regions with high importance or
booming places in terms of sustainability and development, especially with respect to
innovation.
In this study, we use the term ‘hot spot’ in order to show that rural areas can be
regions of development if the priorities for each village can be carefully identified. In
other words, tourism cannot be the sole saviour of the rural areas to be developed but
rather their locality features and even their agricultural capacities can transform them
into hot spots. In order to achieve our aim, by means of scenario analysis we have
developed four scenarios on the basis of our field surveys and in-depth interviews.
Scenarios have proved to be a suitable tool to manage uncertainty when formulating
strategic policy choices (Nijkamp and van Hemert, 2007). Scenario analysis judges a
set of hypothetical development alternatives for a complex system in order to
generate a consistent response to future uncertainties and backgrounds so as to ease
and optimize the learning mechanism for both decision makers and policy makers
(Finco and Nijkamp, 1997; Nijkamp and van Hemert, 2007). The hypothetical
development alternatives can lead to a feasible choice of alternatives based on a solid
empirical framework. On the basis of our empirical frameworks, we developed four
scenarios using the critical factors for sustainable rural development defined by the
results of our research in the European and Turkish villages. These four scenarios are
defined on the basis of the knowledge and locality features in rural areas. Therefore,
they are named after the locality which was articulated most. These scenarios are as
follows:
225
• Scenario 1 – Green Hot Spot: This scenario is our base scenario, as rural areas
are already the places to experience nature and green landscapes. In other words,
this scenario offers the continuity of rural areas as reservoirs of natural resources.
These villages will not need to have a high level of tolerance as they will be
attractive because of their surrounding nature. In addition, they need to keep up
their physical system, maybe not in terms of technology, but certainly in terms of
infrastructure and built-environment. On this basis, on account of their
landscapes, they will promote and thus obtain some level of the economic
system. In addition, the knowledge of inhabitants about nature and on how to
deal with nature will be used as guidance for visitors, and thus economic
diversity will be obtained, and creativity will be high. But it is necessary to
obtain the awareness of the inhabitants about the visitors and their possible needs,
as well as the consciousness of visitors about the locality and social system. This
scenario refers to those villages which benefit from their landscapes and nature,
and therefore does not ask for a high level of tolerance or economic diversity,
although both will be present ultimately. In addition, technology to overcome the
natural difficulties, i.e. telecommunication and promotion, is definitely needed.
• Scenario 2 – Agricultural Hot Spot: When we talk about a village we cannot
ignore the agriculture. This scenario accepts that a village can be an Agricultural
Hot Spot as a result of the improvement of technology and infrastructure for
agricultural production and also the strengthening of market relations, while
keeping the locality system alive. Rural areas are already the homelands of the
agricultural sector. But, basically, they do not benefit from this power on account
of the lack of marketing capabilities, as well as because of product selection
which is related to the national economy not to the geography or local
knowledge. For sustainable development, technology is absolutely vital, but, for
rural development, the impact of technology can be harsh if it is not associated
with local knowledge. Thus, technology improvement must be very well
connected to the locality system and can be transformed into real development
when it increases productivity and economic growth in rural areas, especially in
agricultural sector. Therefore, to achieve this scenario, rural areas need to be
highly creative, but do not need to exploit their locality or to change their social
networks. In addition, they need well-improved promotion and economic

226
networks, but they do not need a very well-developed economic diversity,
although a sufficient level of physical networks will be necessary for such a
future.
• Scenario 3 – Cultural Hot Spot: This scenario refers to the village which has
become a hot spot in order to expose and exploit its cultural heritage, including
its natural environment and its locality. In this scenario, it is assumed that rural
areas convert their cultural capital into economic activities without destroying
their traditional system. In order to do that, these hot spots need a high level of
open mindedness as well as a high level of locality which will ultimately result in
economic diversity. However, the idea to keep the traditional way of production
does not call for a high level of technology to answer the basic needs of rural
users, and the village will automatically attract attention. In this case, to create
some level of physical network will be enough. In other words, to make rural
areas accessible will be sufficient.
• Scenario 4 – Learning Hot Spot: This scenario has been constructed in order to
explore the high level of innovativeness in rural areas. In other words, this
scenario suggests that rural areas can also be innovative hot spots, referring to
those villages which will be the place to learn about the local knowledge,
traditions and cultural capital as the resource/input of research and development
(R&D) and innovative activities. These villages can be the places where
researchers, governments, private firms and students can be trained or experience
the local knowledge. For instance, students in related study programmes (e.g.
veterinary studies) can come to such villages to experience daily life in rural
areas, while learning how to deal with the practical problems faced in their
profession. In this way they can take advantage of experiencing how people are
used to dealing with such problems in relatively less developed areas using their
local experience and knowledge, their only resource Therefore, a mutual benefit
can be obtained. Another option can be that related institutions or NGOs could be
located in such villages and could benefit from locality systems. Thus, such
villages need highly developed physical and social systems with a high level of
creativity. Even though such villages will not need highly developed economic
systems, and they are not based on economic concerns but rather on innovative

227
and R&D concerns, innovation will bring economic development and external
networks, as well as economic diversity.
On the basis of the above-mentioned findings and explanations, in the next section
we investigate which rural users prefer what kind of future for villages, and which
future for rural areas is the best-fit scenario for sustainable rural development.
5.2.4 The best-fit sustainable rural development scenario
After defining the sustainable rural development scenario alternatives, in order to
define the best-fit sustainable rural development scenario, and to see which rural user
prefers which scenario alternative, and how they rank them through their perceptions,
we applied multi-criteria analysis (MCA). MCA comprises various classes of
decision-making approaches. There are various MCA methods, but in this study we
applied the regime method (for an explanation, see Appendix A). Regime analysis is
a discrete multi-assessment method suitable to assess projects, as well as policies
(Baycan-Levent et al., 2009).
The fundamental framework of the method is based upon two kinds of input data: an
impact matrix, and a set of weights (Nijkamp et al., 1990; Hinloopen et al., 1983).
The impact matrix is composed of elements that measure the effect of each
considered alternative in relation to each relevant criterion. The set of weights
incorporates information concerning the relative importance of the criteria in the
evaluation. The regime method presupposes a distinct set of a-priori-defined
alternatives and a distinct set of a-priori-defined evaluation criteria. For all criteria
together this then leads to a ‘regime matrix’. Then, by adding a weight vector, the
relative dominance of each alternative can be assessed in the form of a performance
(or success) indicator.
The regime method leads to an unambiguous quantitative ordering of all choice
alternatives. As the future policy-making environment is uncertain, it is necessary to
identify the key issues of policy making that are to be of importance over the
medium and long term if effective strategic decisions are to be made. Then, the first
impact matrix can be generated and used to compare the four scenarios (Table 5.5).
The four scenarios explained in the previous section are scored in Table 5.5 in terms
of the evaluation of the five pentagon factors which are the key issues in sustainable
rural development (see Section 5.2.1).

228
Green
Hot Spot Agricultural
Hot Spot Cultural Hot Spot
Learning Hot Spot
Creative Systems 4 4 3 4 Economic Systems 3 3 3 2 Locality Systems 2 2 4 3 Physical Systems 2 3 2 4 Social Systems 3 2 4 4
The scores vary between 2 and 4, depending on the level of change needed in terms
of the factor to succeed in the designed future. For instance, in the Green Hot Spot
scenario, we mentioned that the inhabitants do not need to have a high level of
tolerance, but some level is enough, as the village derives economic benefit not from
its own economic activities but rather from its green surroundings. Therefore, the
factor ‘social systems’ is scored 3. This table forms the impact matrix for our
evaluation. In the application of the regime analysis, we used the software called
BOSDA, which was designed for the SAMI project undertaken by the VU
University, Amsterdam. In order to apply regime analysis, we also need to give
weights and construct the weight matrix. As we do not use a stakeholder analysis to
determine the opinions of different stakeholders/users in rural areas, and, as each
critical factor is equally important (equally ‘weighted’) from a sustainable rural
development perspective, we used equal weights for each of the scenarios, and we
thus come up with an inductive result. On this basis, we applied our regime analysis
giving equal weights to the factors. The ranking of scenarios based on the results is
shown in Figure 5.17. This shows that the Learning Hot Spot scenario is the best-fit
scenario for rural areas to be in the open market with their localities. On the other
hand, the second best-fit alternative is the Cultural Hot Spot scenario, followed by
the Agricultural Hot Spot and the Green Hot Spot scenario, as the third and fourth
alternatives, respectively.
To increase the plausibility of our analysis and results, we also applied sensitivity
analysis in terms of our scenario selection. To apply sensitivity analysis, we
formulated a weight matrix depending on the results of our analysis conducted
separately in the European and Turkish villages (Table 5.6). On this basis, we
evaluated the four scenarios from the perspective of different rural users, viz. the
inhabitants, the entrepreneurs, and the visitors, including the village itself again by
means of the regime method.
Table 5.5: Scenarios coded by the five critical factors – Impact matrix I.

229
Figure 5.17 : The ranking of the four Hot Spot scenarios.
Inhabitants Villages Visitors Entrepreneur
s Europe
Physical Systems 0 1 2 2 Social Systems 1 2 2 1 Economic Systems 1 2 3 3 Locality Systems 0 1 1 2 Creative Systems 0 0 0 1
Turkey Physical Systems 2 3 2 3 Social Systems 3 1 1 1 Economic Systems 1 2 1 1 Locality Systems 0 3 2 2 Creative Systems 0 0 0 1
According to the results of the analysis, the views of the future envisaged by rural
users and the villages in both Europe and Turkey are diverse (Table 5.7). Although
there is diversity in Europe in terms of the future preferences, what villages need and
what visitors prefer for the future rural areas seem similar, while in the case of
Turkey, villages and entrepreneurs’ preferences also show some similarities. These
differences are more likely to depend on the diverse perception of intervening
opportunities, the motivations, and the priorities of different rural users.
But it can be said that more users in European villages are eager to have the scenario
Learning Hot Spot as their first choice, although the inhabitants are not so
enthusiastic. A Cultural Hot Spot future clearly comes second. However, the choice
between Green and Agricultural Hot Spot futures for third and fourth place is not so
clear. For the case of the Turkish villages, we cannot say what the users want as their
first choice, but we can state that in general they do not want an agricultural future,
although the inhabitants do want this kind of future. However, although we can see
the separate choices of different actors in different places, we still do not know which
0.00
0.20
0.40
0.60
0.80
1.00
1.20
Green Hot Spot
Agricultural Hot Spot
Cultural Hot Spot
Learning Hot Spot
Table 5.6: Set of weights from the perspective of rural users.
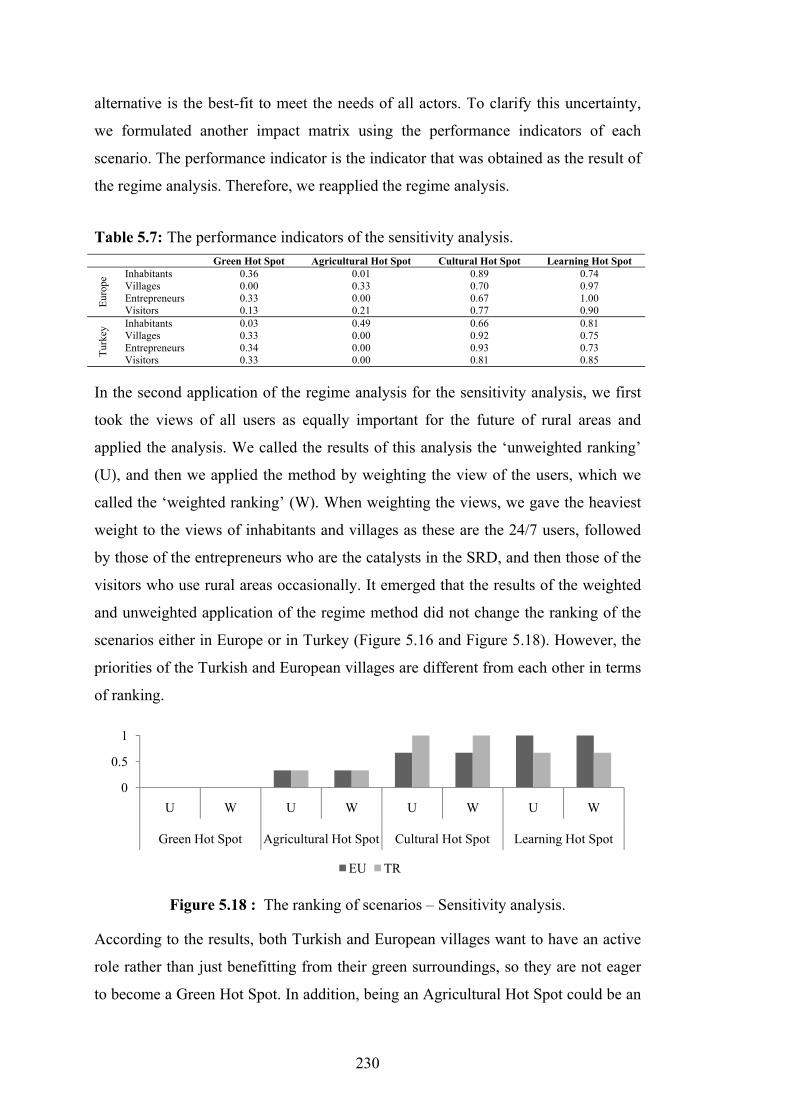
230
alternative is the best-fit to meet the needs of all actors. To clarify this uncertainty,
we formulated another impact matrix using the performance indicators of each
scenario. The performance indicator is the indicator that was obtained as the result of
the regime analysis. Therefore, we reapplied the regime analysis.
Green Hot Spot Agricultural Hot Spot Cultural Hot Spot Learning Hot Spot
Euro
pe Inhabitants 0.36 0.01 0.89 0.74
Villages 0.00 0.33 0.70 0.97 Entrepreneurs 0.33 0.00 0.67 1.00 Visitors 0.13 0.21 0.77 0.90
Turk
ey Inhabitants 0.03 0.49 0.66 0.81
Villages 0.33 0.00 0.92 0.75 Entrepreneurs 0.34 0.00 0.93 0.73 Visitors 0.33 0.00 0.81 0.85
In the second application of the regime analysis for the sensitivity analysis, we first
took the views of all users as equally important for the future of rural areas and
applied the analysis. We called the results of this analysis the ‘unweighted ranking’
(U), and then we applied the method by weighting the view of the users, which we
called the ‘weighted ranking’ (W). When weighting the views, we gave the heaviest
weight to the views of inhabitants and villages as these are the 24/7 users, followed
by those of the entrepreneurs who are the catalysts in the SRD, and then those of the
visitors who use rural areas occasionally. It emerged that the results of the weighted
and unweighted application of the regime method did not change the ranking of the
scenarios either in Europe or in Turkey (Figure 5.16 and Figure 5.18). However, the
priorities of the Turkish and European villages are different from each other in terms
of ranking.
Figure 5.18 : The ranking of scenarios – Sensitivity analysis.
According to the results, both Turkish and European villages want to have an active
role rather than just benefitting from their green surroundings, so they are not eager
to become a Green Hot Spot. In addition, being an Agricultural Hot Spot could be an
0
0.5
1
U W U W U W U W
Green Hot Spot Agricultural Hot Spot Cultural Hot Spot Learning Hot Spot
EU TR
Table 5.7: The performance indicators of the sensitivity analysis.

231
option for both Turkish and European villages, but it is not the most preferred one.
The overall opinion of users in European and Turkish villages differs on the most
preferred scenario and its alternative. Turkish villages are looking forward to being
Cultural Hot Spots, while the European villages would prefer to be Learning Hot
Spots. Therefore, we can conclude that the European villages are ready to be the
promising rural innovative hot spots, while the Turkish villages, which have not yet
benefitted from tourism and their culture, are eager a priori to exploit their cultural
capital.
Both the applications of the sensitivity analysis showed that the Learning Hot Spot
scenario is the best-fit scenario for an innovative, sustainable and developed future
for rural areas. The differences in the ranking of rural users also suggest that each
stakeholder has its own perception. According to the results of this ranking, the
outsiders’ perception and the perception of economic agents do not match that of the
insiders who actually live in rural areas.
Although our scenarios are limited to the villages inspected during our field surveys,
the theoretical and conceptual frameworks, as well as the meta-analytical evaluations
allow us to derive some generalized lessons to achieve success in sustainable rural
development. These lessons are:
- To make the sustainability useable for the rural development, importance
should be given to rural-specific evaluation.
- Sustainable rural development should be constructed by an endogenous rather
than an exogenous approach, which is related to bringing in, and benefitting
from, the world outside rural areas.
- The objectives of sustainable rural development plans should first be
concerned with the locality features, and then with the global and national
needs.
- The benefits from the existing intensity of social relationships in rural
systems can bring more sustainable competitive advantage to the rural areas
than creating density of activities.
- The increase and the improvement of the awareness of inhabitants can result
in an innovative and sustainably developed rural area.
232
- The definition of an active role for each stakeholder in rural areas can prevent
the decline of rural areas, as well as their depopulation.
- Economic development cannot be thought of independently of the social
systems in rural areas.
- Social development should be the main component of sustainable rural
development rather than economic development which is only a tool to
improve the well-being of villagers, but not their main purpose in life.
- Innovative activity (‘R&D’) can be obtained and survive in rural areas if it is
firmly based on local knowledge.
- Even though tourism is associated with creating job opportunities and
economic diversity, if only tourism is brought to the villages without the
involvement of the settlements and the cultural capital provided by the
inhabitants, then sustainable rural development as a whole could fail.
Although these lessons seem clichéd, and can be seen separately in many
publications and reports, their novelty will be discussed more detail in the concluding
part of this dissertation: ‘Prospective Thinking on Sustainable Rural Development’.
Now, however, in the next section we provide the concluding remarks of Part 5.
5.3 Concluding Remarks on Part 5
The sustainable future of rural areas is one of today’s hot policy issues. The policies
related to rural areas have usually been focused on agriculture-related issues, i.e.
agricultural productivity, and also on the amelioration of rural well-being. Lately,
this has turned into a tourism-oriented focus, and thus rural areas have changed.
Economic growth and globalization have put pressure on human and natural
resources. Thus, their protection and maintenance depends on the achievement of
sustainable development. Although there seems to be great interest in sustainable
rural development, the latest changes have exposed a lack of attention. Today, rural
areas are experiencing deep structural changes in their economy that are most likely
to accelerate. However, these changes are not the only ones occurring in the rural
economy: there are also major demographic, social and cultural transitions.
The usual perception of rural areas by urban dwellers is that they represent the
Arcadian idyll consisting of beautiful landscapes and agricultural activities. But,
233
actually, rural areas, besides their diverse landscapes, are characterized by diverse
economic activities, a unique social life, and a rich cultural heritage. Although the
perception of urban inhabitants can lead us to think that rural areas with such a
beautiful image do not have serious problems, in reality they do have many
problems, viz. the changing role of agriculture, the environmental and natural
protection and sustainability of rural landscapes, the ageing, impoverishment and
depopulation of rural areas, the almost complete disappearance of the traditional
peasant society and lifestyle, and different effects and problems originating from the
above-mentioned changes (Varga and Varga, 2008). Several models are competing
today to deal with such problems. Especially since the release of the Brundtland
Report and the complex concept of ‘sustainability’, governments, researchers, and
many other stakeholders have been trying to make the sustainability concept useable
for the development of rural areas.
To this end, in the last part of the study, Part 5, we aimed to envision a series of
futures for rural areas which are considered to be promising hot spots, in an attempt
to make the concept of sustainability useable for the future of rural areas in an
innovative way. To achieve our aim, first we focused on the changes and
opportunities in both the European and Turkish cases by means of a comparative
approach. Furthermore, the results of these comparative analyses enabled us to
evaluate alternative sustainable rural development scenarios in turn.
The comparative analyses were constructed on two different levels, viz. macro-
country level, and micro-settlement level. The results of the analyses at the macro-
level showed Turkey to have a dominant rural character compared with the European
countries, but it suffers from not being able to exploit the potential of its rurality and
not obtaining as much profit as the European countries do. In addition, the results of
the comparative analyses that focused on the information obtained from the field
surveys strengthened the findings about the difference between Turkish and
European rural areas. However, the results also suggested that the dominant social
character of villages is the same in every rural area, as well as the earliest changes.
The changes in rural areas can have both negative and positive effects in each rural
area. But, these changes are perceived differently by different rural users. Moreover,
the comparative evaluation of the results of each field survey suggests that, today,

234
rural areas have diverse intervening opportunities while benefitting from them in a
varied way.
After comparing the European countries and Turkey at the macro- and micro-level,
the diversity and the heterogeneity of rural areas under investigation led us to discuss
the future of rural areas from a sustainable rural development point of view.
Therefore, by means of the pentagon approach, we defined the critical factors for
sustainable rural development on the basis of the theoretical and conceptual
frameworks of our study, as well as the empirical evidence obtained from our field
surveys. At the end of the pentagon analysis, we came up with five critical factors,
viz. physical systems; social systems; economic systems; locality systems, and
creative systems, which are related to the five driving forces of sustainable rural
development, viz. attractiveness; embeddedness; continuity; competitiveness; and
capacity. Through these findings, we came up with four sustainable rural
development alternatives that we called: Green Hot Spot; Agricultural Hot Spot;
Cultural Hot Spot; and Learning Hot Spot. When generating these alternatives, our
main approach was that rural areas are the promising hot spots, and therefore can be
transformed from unappreciated and neglected places into appreciated and important
places in the global scene, while maintaining their sustainability. In this connection,
we assumed that innovation and creativity are vital in rural areas to achieve
sustainable rural development (SRD).
In order to be able to rank the generated SRD scenario alternatives, we applied multi-
criteria analysis (MCA) and, from among several MCA methods, we decided to
apply the regime method in our evaluation. The application of regime analysis was to
identify the performance of each scenario depending on the priorities given to each
critical factor.
In addition, to strengthen our findings, we also applied a sensitivity analysis: first, on
the basis of the priority given to the critical factors from the perspective of each user;
and, secondly, on the basis of the priority of rural users in the future of rural areas.
The results of the application of the regime method showed that the Learning Hot
Spot scenario was ranked the first, followed by the Cultural Hot Spot, the
Agricultural Hot Spot, and the Green Hot Spot scenarios. These results are powerful,
as the results of the first sensitivity analysis showed that most of the rankings of each
user was the same. But as the perception of individuals are unique to themselves,

235
some users, viz. the European villagers, the Turkish entrepreneurs and also the
Turkish villages gave priority to the Cultural Hot Spot future more than to the
Learning Hot Spot future. The results of the second sensitivity analysis showed again
that, for the European case, our ranking of scenarios is powerful, while, for the
Turkish case, the first-ranked scenario is again the Cultural Hot Spot.
The rural areas are ready to be exploited and want to be a part of the open market
with a high level of participation. Therefore, to accept them only as places where
there are beautiful landscapes and nature or merely as reservoirs of natural resources
will be unfair for their future. On the other hand, it is also accepted that they will
continue to be the homeland of agriculture. The results showed that the European and
the Turkish villages in our sample differ very much from each other in terms not only
of their appearance but also of the mentality of their users. In addition, the
preferences of users also differ among the villages in Europe and Turkey quite
clearly.
Furthermore, the results suggested that the European villages are more innovatively-
oriented than Turkish villages, and have already gone beyond the stage of promoting
tourism and the protection of environment. Therefore, they are now eager to share
their experiences as learning Hot Spots. On the other hand, Turkish villages and
Turkish rural users suffer from a lack of participation and a lack of awareness, and so
they are more enthusiastic about becoming Cultural Hot Spots rather than learning
Hot Spots.
Our envisioning a series of futures for rural areas is limited to the villages in our
sample. Nevertheless, the results of the analyses and the scenarios enabled us to
come up with ten lessons. Therefore, we suggest that rural dwellers, who are the
most productive and hardworking people, need dynamic sustainable rural
development solutions in which they can have an active role. They are innovative
and entrepreneurially-oriented, but they need to be stimulated, not by general
subsidies or financial support, but rather by locally-based subsidies that are more
focused on the increase of awareness in rural areas. In other words, solutions created
for the development of rural areas on the basis of national, economic, global or
urban-oriented approaches can misdirect the future of rural areas. Each rural area
must be taken into consideration in a unique way, while anticipating an innovative
future for all of them, and giving them their real share in this future and in the global

236
arena, instead of keeping them in reserve. In order to conclude our study, the
following chapter will first summarize the findings of the research, and secondly
suggest a list of possible topics for a future research agenda on sustainable rural
development and rural hot spots.
237
6. CONCLUSION: PROSPECTIVE THINKING ON SUSTAINABLE RURAL
DEVELOPMENT
In this chapter, in order to present the success of our research, as well as its
limitations and its future agenda, we will recall the challenges for a hot spot future
for rural areas, and then provide the conclusions of our research. Finally, we suggest
a future research agenda.
6.1 Rural Areas: The Future Hot Spots
Our world is changing at an increasing pace. Although this is normal, the dual effects
of these changes cause people to think and to be concerned about the future. On the
one hand, these changes refer to an improved and developed future, while, on the
other, the future of natural environment is threatened with loss and degradation.
Change is inevitable, development is the real tradition, and both the change and the
development have highlighted ‘sustainability’ as the vital solution to meet the needs
of future generations.
Even though this duality has been relatively solved in urban areas, the escape of
people in pursuit of new lifestyles from urban areas towards rural areas – the
environmental and cultural resources of our planet – has started to change these
formerly neglected areas. Rural areas are usually the neglected ones in both
theoretical and policy discourses. The early changes which negatively affected the
sustainability of the world have attracted much attention, especially from the policy
makers. The uncontrolled development that has occurred in rural areas, on the one
hand, was very successful in improving the well-being of local inhabitants, but, on
the other, has eroded, to some extent, the cultural heritage and the social life in rural
areas. Therefore, the newly appeared duality in rural areas has taken the place of the
traditional urban-rural dichotomy, while signalling the need to use sustainability as
guiding principle for rural development. But how will rural areas, already suffering
238
from lack of economic development, social well-being, living standards,
depopulation and many other problems, be able to face new additional problems?
Can they be attractive, innovative and developed (‘hot spots’), while maintaining
their sustainability and continuity? This question was our challenge in conducting
our research. Therefore, we aimed to explore and analyse the opportunities for
economic diversity in rural areas and to develop a set of alternative sustainable
development scenarios. To combine different views on the impacts of recent changes
is not an easy task when you have to work with fuzzy concepts but neither is it
impossible. Therefore, our research has succeeded in this respect. The next section
offers a summary of the overall conclusions of our research.
6.2 Retrospect: Rural Areas as Promising Hot Spots
The dichotomous nature of the impacts of the changes in rural areas including the
different perceptions concerning the use of the terms ‘rurality’ and ‘sustainability’
have led both scholars and policy makers to come up with competing models and
solutions to better evaluate sustainable rural development (SRD) and to cope with the
changes that have been occurring out of control in rural areas. In addition to the
complexity of concepts, the heterogeneity of rural geographies calls for an extensive
and comprehensive synthesis. Hopefully, policy lessons for sustainable rural
development can be derived.
This research had three objectives which should contribute to producing such a
synthesis. These objectives are (i) to investigate the changes occurring in rural areas;
(ii) to investigate entrepreneurs in rural areas; and (iii) to develop scenarios to build
up comparative and comprehensive policy implications for rural areas. To exploit our
aim and objectives, we constructed our research in six main parts. In the first, the
introductory chapter ‘Thinking on Rural Areas and Sustainability’, we offered the
challenges and the structure of our research. Our research is structured as a multi-
method approach including various methodologies and data sets. Although our
research seems extensive and broad, the diverse approaches and methodologies, as
well as the various applications and their empirical results have led us to come up
with a set of relevant SRD scenarios, and thus, to envisage the future of rural areas as
promising hot spots.

239
Secondly, in Part 2 ‘Contemporaneous Thinking on Sustainable Rural Development’,
we aimed to offer the current scientific discourses on sustainable rural development,
while synthesizing different theoretical and empirical evidence. From this, we
generated a contemporary approach for sustainable rural development by means of
conceptual, theoretical and operational frameworks in order to make a better
evaluation of sustainable rural development. Although this approach has its
limitations because of the broadness and complexity of related concepts, as well as
the lack of an overall theory, our approach succeeds in reflecting current SRD
discourses in combination with the new terminology, i.e. hot spot.
In the light of the introductory part and the contemporary approach offered in Part 2,
we then provided empirical evidence from examples of European and Turkish
villages, in Parts 3 and 4, respectively. While conducting our questionnaire field
surveys, we focused on answering our research questions, viz. What is the capacity
of rural areas to attract population flows and economic activities? Who are the
economic agents/entrepreneurs in rural areas? What are the positions of these
entrepreneurs? What are their impacts on rural areas? What are the necessary
conditions to maintain the continuity of the economic activity and diversity in rural
areas? What are the structural changes obtained by entrepreneurs? And, finally: What
are the types of entrepreneurs and their activities that contribute more to the
continuity of the rural setting?
Among these questions, the ones related to entrepreneurs are answered by means of a
meta-analytic approach for the European case, while for the Turkish case, we used
the data retrieved from our questionnaire surveys. The empirical evidence and the
results of our survey in both these case study areas helped to answer our research
questions. In addition, the results showed the uniqueness of each village and the
diversity of both people’s and policy makers’ perceptions. As we focused on a
limited number of villages both in Europe and Turkey, we cannot generalize our
findings for a large number of villages. However, the results of both cases show that
rural areas are in transition and are facing having to lose their cultural capital, as well
as their rural capital. Therefore, the loss of cultural capital and unique social life of
even one single village needs attention. To this end, in the last empirical part of our
study, we offered a comparative and comprehensive evaluation of both the European
and the Turkish case to provide policy lessons by means of an SRD approach.

240
For the European case, these changes are not new, but the solutions have been
focused more on tourism-related activities and are attractiveness-oriented. In
contrast, for the Turkish case these changes are new. Even though SRD is now on the
policy agenda, this is not as a result of these changes but rather due to the EU
harmonization process. In the last stage of the empirical part of the study, we
evaluated four SRD scenario alternatives, and we ranked them to offer the best-fit
scenario for promising hot spots. In other words, to answer our last research
question: What are the policies needed for economic diversity to be achieved without
negatively affecting the rural setting in rural areas as the outcome of sustainable rural
development? By taking into consideration the empirical results of the case studies
and our contemporary approach to sustainable rural development, we offered a
comprehensive evaluation by means of which we could envision the future for rural
hot spots.
Even though these scenarios are based on case studies and can not be generalized,
because we provided some level of heterogeneity of villages and their diverse
localities, we were able to derive 11 basic lessons. These lessons showed that to
transform rural areas into hot spots is neither impossible nor difficult. On the
contrary, rural areas and their inhabitants are ready to achieve such a future, but the
policies concerning the rural areas need to be restructured. Therefore, as the general
outcome of our study, our main policy recommendations for a hot spot future are as
follows:
- To use proper measurements and indicators to identify the capacity, the
locality, and the opportunities of rural areas, as well as the rurality itself.
- To avoid the adoption of urban-specific policies.
- To identify local- and rural-specific goals and objectives, rather than national
and economically-based ones.
- To subsidize local knowledge-based economic activities and R&D activities.
- To facilitate the promotion of rural and cultural capital in the market.
- To stimulate local entrepreneurs to adopt technology.
- To improve the awareness and consciousness of rural people while trying to
avoid imposing novelty and innovation on the local community.
241
- To focus on social development, which will bring economic development.
- To provide a place to rural areas to represent themselves in the global system
particularly in the policy arena.
- To educate all citizens in how to benefit from and how to use the rural areas.
- To be seamless in essence and reformist in practice.
The topic and its decomposition are already so broad and complex that even this
extensive and comprehensive study can not encompass sustainable rural development
as a whole. Nevertheless, this study has succeeded in bringing an innovative
perspective to sustainable rural development. From a conceptual perspective, the
study evaluates rural areas using early and lately-related concepts of sustainable rural
development, while including a new concept – the hot spot – in the sustainable rural
development literature. Therefore, the general evaluation of rural areas and the
contemporary approach used in this thesis is specific to this study. From a theoretical
perspective, although the study combines several theories used in different
disciplines without offering a new theory, it does provide some theoretical
propositions as the result of meta-analysis applications as first attempts in the topic-
specific literature. From a methodological perspective, the multi-method approach at
different scales using different data sets has strengthened the overall results of our
study. In addition, with its results, our research has also thrown up new research
questions and thus a possible future research agenda to continue our evaluation,
which we outline in the next section.
6.3 Prospect: The Future of Sustainable Rural Development
After taking care of urban areas and giving all their attention to sustainable urban
development, scientists and policy makers then remembered the plight of the rural
areas. This shift of attention was not immediate and nor was it altogether helpful, as
the uncontrolled change had already started, and had affected rural areas both
positively and negatively. In order to highlight the priorities of rural areas, as well as
their users, and to provide policy background for a challenging and innovative future
for rural areas, this research has envisaged rural areas as promising hot spots, and has
managed to show the willingness of rural users to realize such a future by means of a
contempory SRD approach.
242
Although we revealed the enthusiasm of rural users to see the rural areas as
innovative hot spots, it is indeed very important to be able to implement this.
Therefore, the future agenda of this research is based on how to operationalize these
scenarios. To do this, we suggest three main steps:
Step 1: Rural inventory: There have been several attempts to collect data about rural
areas, but rural areas must be classified by their capacity and opportunities, as well as
by their characteristics.
Step 2: Creative thinking on SRD: SRD in operation needs to come up with creative
ideas, whereby inhabitants and all other rural users must have an active role in the
implementation. In other words, rural areas which are becoming the most
consumerized places of today can also continue to be the production places.
Step 3: Ways to raise rural awareness: Although there are several training and
education programmes, workshops and seminars, they seem to be ineffective. The
reasons for this ineffectiveness can be the lack of such attempts or the inability to
attract the attention of rural people. So, what could be a better solution to increase the
consciousness of villagers? Perhaps it is to work with them and, simultaneously train
them. This could be one option. But, is it the consciousness of villagers or that of
each rural user that needs to be improved? Thus, this step should be to investigate the
localities, the needs of inhabitants, and their ways of doing things rather than just
applying theoretical knowledge and neglecting the essential ruralities. Both rural and
urban inhabitants have a lot to learn from each other, and hence mutual and
reciprocal exchange must be obtained.
Therefore, the future research agenda may contain several components of the
sustainable rural development phenomenon. However, the success of a sustainable
rural development plan in implementation can only be achieved by the identification
of rural- and local-specific priorities and objectives. This has already been proved by
the failure of providing only financial subsidies and also by the attempts to introduce
uniformity into both the policy and the theoretical arena.
Although this is our future research agenda to realize successful sustainable rural
development, the future research questions raised as the result of this study have not
yet been asked. Therefore, we now list few of them which may lead to future
sustainable rural development evaluations:
243
1. Are rural areas becoming the new destination only because of the quality of
life they offer, or are there any other motivations?
2. Does being small mean being neglected?
3. Is it right to ignore rural areas because of their lack of weight in the economic
and policy arena?
4. Can the dynamism be generalized and theorized?
5. Does being small mean being afraid of competing?
6. What are accurate rural creative capacity indicators?
7. Who are the newcomers besides entrepreneurs? How do they survive
economically?
8. Why are some rural areas not tolerant to incomers, while some are? Is there a
hidden secret?
9. Are we sure that rural areas cannot benefit from the ICT era?
The lack of theoretical background on population movements towards rural areas
(‘counterurbanization’) and the need to provide evidence rather than general
theoretical outcomes led us to ask Question 1 above, and challenges us to search for
the relations between such movements and the other types of motivation, i.e.
employment. In addition, this lack of a theoretical basis due to the neglect of rural
areas challenges us to ask Question 2. Even though rural areas on their own are very
small, the number of rural areas is so huge that neglecting them means neglecting
most of the country. So are they really too small and neglected in theoretical
evaluations, or do they need a new kind of evaluation approach? Thus, this is also
related to Questions 3 and 4. We also ask Question 5 to see if there is any possibility
for these areas to enter the competitive arena despite their size? Rural areas are small
but contain a concentrated amount of today’s scarce goods, so there should be a way
for them to compete without having to engage in mass production. The next two
questions, even though related to the rural areas, are more focused questions.
Question 6 concerns the newly-introduced concept of creative capacity and the
misrepresentation of the rural creative capacity, and calls for a clear list of relevant
indicators to measure rural creative capacity. It is very important to answer this
question in order to be able to generate a rural hot spot future.
244
Question 7 is asked on the basis of diverse empirical evidence in the literature.
Although we suggested theoretical propositions for the entrepreneurs, newcomers
are not only entrepreneurs, so there is a need to clarify who are the rest of the
newcomers. During our field survey in Turkey, we had difficulty in entering one
of the villages. Although we did eventually succeed, later on, we learnt that the
village was mostly empty during the cold season but very rich as it depends on
the remittances. Therefore, villagers wanted to keep us away from their village in
order not to show their situation and showed highly intolerant behaviour. So we
also asked Question 8. Concerning our last Question 9, we are now in the age of
technology and communication, so it is pertinent to ask: What can be the reasons
behind the lack of ICT in rural areas? Who does not want ICT in rural areas, or is
it not possible for ICT to reach the rural area? Will bringing the ICT to rural
areas be sustainable?
The neglect of the rural areas in innovation discourses and their dynamism could
multiply the questions that need to be asked. But these nine questions will form
the basis of our search for a theoretical basis including the search for a way to
operationalize rural hot spot scenarios for our future sustainable rural
development research. In this way, we can provide relatively more solid policies
for the future hot research topic – sustainable rural development.

245
REFERENCES
Ache, P., 2000: Vision and creativity – challenge for city regions. Futures. 32, 435–449.
Acs, Z.J., Carlsson, B. and Karlsson, C., 1999: The Linkages Among Entrepreneurship, SMEs and the Macroeconomy, in Entrepreneurship, Small and Medium-Sized Enterprises, and the Macroeconomy, p. 3-42, eds. Acs, Z.J., Carlsson, B. and Karlsson, C., Cambridge University Press, Cambridge.
Ahas, R., Mark, Ü., Albre, N. and Link, L., 2001: Dispercity - new development approach for Estonian rural peripheries. 41st Congress of the European Regional Science Association on European Regional Development Issues in the New Millennium and Their Impact on Economic Policy, Zagreb, Croatia, August 29 – September 1.
Aitken, K., 2006: Young Entrepreneurs in Rural Northumberland and County Durham. Research Report, Centre for Rural Economy, Newcastle upon Tyne, UK.
Akder, A.H., 2002: Linking agricultural statistics to other data sources for analyzing rural indicators of social well being and equity. The 8th IWG.AGRI Seminar on Perspectives for Agriculture and Rural Indicators and Sustainability, Château de la Muette, Paris, France, Novembre 21-22.
Akder, A.H., Buckwell, A. and Kasnakoğlu, H., 1990: Turkish Agriculture and European Community Policies, Issues, Strategies and Institutional Adaptation. 2241-AETB:25. SPO, Ankara.
Akerlof, G.A., 1997: Social Distance and Social Decisions. Econometrica, 65(5), 1005-1027.
Akşit, B. 2006. Köy, Kırsal Kalkınma ve Kırsal Hanehalkı/Aile Araştırmaları: 1923-2002 Yılları Arası Eleştirel Bir Yazın Taraması, in Değişen Mekan: Mekansal Süreçlere İlişkin Tartışma ve Araştırmalara Toplu Bakış: 1923-2003, A. Eraydın (ed.) Dost Kitabevi Yayınları, Ankara. pp. 123-163.
Alesaa, N.L., Kliskey, A.A. and Brown, G. 2008: Social-ecological hotspots mapping: A spatial approach for identifying coupled social-ecological space. Landscape and Urban Planning. 85(1), 27-39.
Alston, J.M., Marra, M.C., Pardey, P.G. and Wyatt, T.J., 2000. Research returns redux: a meta-analysis of the returns to agricultural R&D. The Australian Journal of Agricultural and Resource Economics. 44(2), 185-215.

246
Anderson, A.R. and McKain, R., 2005: Rural entrepreneurship: perspectives of values in the rural environment. Journal of Rural Research and Policy, 12(4), 71-83.
Anderson, A.R., 2000a: Paradox in the periphery: an entrepreneurial reconstruction?. Entrepreneurship and Regional Development, 12(2), 91-109.
Anderson, A.R., 2000b: The protean entrepreneur: the entrepreneurial process as fitting self and circumstance. Journal of Enterprising Culture, 8(3), 201-234.
Anonymous, 2003: Rakamlarla ve Tablolarla Dünden Bugüne Türk Tarımı, TZOB Yayınları, Ankara.
Antikainen, J., 2005: The concept of functional urban area, in Metropolitan Regions, IZR 7.2005. Bonn: BBR, pp. 447-452, Ed. Göddecke-Stellmann, J., The Federal Institute for Research on Building, Urban Affairs and Spatial Development, Germany.
Arzeni, A., Esposti, R., and Sotte, F., 2001: Agriculture in transition countries and the European model of agriculture: entrepreneurship and multifunctionality. Report for the World Bank Project "Šibenik-Knin and Zadar Counties: Framework for a Regional Development Vision, University of Ancona, Octobre 2001.
Audretsch, D.B., 2002: Entrepreneurship: Determinants and Policy in a European-US Comparison. Springer, Boston, USA.
Audretsch, D.B., 2003: Innovation and Spatial Externalities. International Regional Science Review, 26(2), 167-174.
Audretsch, D.B., and Thurik, A.R., 2001: What is New about the New Economy? Industrial and Corporate Change, 10(1), 267-315.
Autant-Bernard, C., Billand P., Frachisse, D. and Massard, N., 2007: Social distance versus spatial distance in R&D cooperation: empirical evidence from European collaboration choices in micro and nanotechnologies, Papers in Regional Science, 86(3), 495-520.
Axt, H.J., 2005: Relations with Turkey and Their Impact on the European Union. Southeast European and Black Sea Studies, 5(3), 365-378.
Baaijens, S. and Nijkamp, P., 2000: Meta-analytic methods for comparative and exploratory policy research: an application to the assessment of regional tourist multipliers. Journal of Policy Modelling, 22(7), 821-858.
Ballas, D., Kalogeresis, T., and Labrianidis, L., 2003. A comparative study of typologies for rural areas in Europe. In 43rd Congress of European Regional Sciences Association on Peripheries, Centers, and Spatial Development in the New Europe. Jyvaskyla, Finland, August 27-30.
Barkley, D.L., Henry, M.S. and Lee, D., 2006: Innovative activity in rural areas: the importance of local and regional characteritics. Community Development Investment Review, 2(3), 1-14.
247
Barrow, C.J., 1995: Sustainable Development: Concept, Value and Practice. Third World Planning Review, 17(4), 369-386.
Başaran, M., 2008. Özgürleşme Eylemi: Köy Enstitüleri. Cumhuriyet Kitapları. İstanbul. pp. 25-26.
Baum, S., Frohberg, K., Hartmann, M., Matthews, A., and Weingarten, P., 2004: The future of rural areas in the CEE new member states. Report of Network of independent agricultural experts in the CEE candidate countries, Germany.
Baycan-Levent, T., Bruinsma, F. and Nijkamp, P. 2007. Urban spiders: a comparative framework for evaluation and scenario analysis, In Sustainable Urban Development: The environmental assessment methods, M. Deakin, S.R. Curwell, G. Mitchell, P. Nijkamp, M. Symes, R. Vreeker (eds). Taylor & Francis, London. pp. 236-263.
Baycan-Levent, T., Vreeker, R. and Nijkamp, P. 2009. A Multi-Criteria Evaluation of Green Spaces in European Cities. European Urban and Regional Studies, 16(2), 193-213.
Beale, C.L., 1975: The revival of population growth in nonmetropolitan America, economic development division. Economic Research Service, U.S. Department of Agriculture. ERS-065, Washington D.C.
Bealer, R.C., Willits, F.K. and Kuvlesky, W.P., 1965. The Meaning of Rurality in American Society. Some Implications of Alternative Definitions. Rural Sociology, 30, 255-66.
Beck, J.P., 2003. Poor People in Rich Lands: A First Look at the Socioeconomic State of Biodiversity Hotspots. Scholarly Paper. Sustainable Development and Conservation Biology Program, University of Maryland, College Park, Spring 2003.
Berg, L.M. van den, 1991: Quasi-agricultural Land: hidden urbanization, hobby farming or what else? In The International Conference organized by the 'Commission on Changing Rural Systems' of the IGU on Limits to rural land use, Amsterdam, August 21-25.
Berg, L.M. van den, Burns, L.S. and Klaassen, L.H., 1987: Spatial Cycles. Gower, Aldershot.
Berg, L.M. van den, Goetgeluk, R. and Windt, N.P. van Der, 1998: Nieuwe Economische Dragers in het 'Zonnetje'gezet. Wageningen/Den Haag: SC-DLO and LEI-DLO. Retrieved in Daalhuizen et al. 2003.
Bergh, J.C.J.M. van Den, Button, K., Nijkamp, P. and Pepping, G., 1997. Meta-analysis in environmental economics. Kluwer Academic Publishers, Dordrecht.
Berry, B.J.L., 1976: The counterurbanization process: urban America since 1970. In Urbanization and Counterurbanization, B. J. L Berry (ed), pp. 17-30. Sage Publications, California, USA.
Beryl, N. 1976. Local Migration as a Component of Rural Population Change. An Example from North Norway. Paper presented at the 4th World Congress of Rural Sociology, Torun, Poland. August.
248
Blunden, J.R., Pryce, W.T.R. and Dreyer, P., 1998: The classification of Rural Areas in the European Context: An Exploration of a Typology Using Neural Network Applications. Regional Studies, 32, 149-160.
Bock, B.B., 2004: Fitting in and multi-tasking: Dutch farm women’s strategies in rural entrepreneurship. Sociologia Ruralis, 44(3), 245-260.
Boratav, K. 2004. İstanbul ve Anadolu’dan Sınıf Profilleri. 2nd Edition. İmge Kitabevi, İstanbul.
Boratav, K. 2005. 1980’li Yıllarda Türkiye’de Sosyal Sınıflar ve Bölüşüm. 2nd Edition. İmge Kitabevi, İstanbul.
Boratav, K. 2007. Türkiye İktisat Tarihi 1908-2005. 11th Edition. İmge Kitabevi, İstanbul. pp. 93-94.
Bosch, N. and Hanemaayer, D., 1999: Beleidswijzer Hergebruik Voormalige Agrarische Complexen. Den Haag: BandA Groep Beleidsonderzoek en -Advies bv. Retrieved in Daalhuizen et al., 2003.
Bosuet, L., 2003. Habiter le patrimoine au quotidien, selon quelles conceptions et pour quels usage ? In Université Européenne d’été on Habiter le patrimoine. Saumur, France. 13-16 Octobre.
Bosworth, G., 2006. Counterurbanization and Job Creation: Entrepreneurial In-Migration and Rural Economic Development. Discussion Paper No.4, Centre for Rural Economy, Newcastle upon Tyne, UK.
Brown, L. and Grilliard, R.S. 1981. On the Interrelationship between Development and Migration Processes. In Geographic Research On Latin America: Benchmark 1980, T.L. Martinson and G.S. Elbow (eds). CLAG, US. pp. 357-373.
Bryant, C.R., 1989. Entrepreneurs in the rural environment. Journal of Rural Studies, 5(4), 337-348.
Buckwell, A. 1998. Agenda 2000 and beyond: towards a new common agricultural a rural policy for Europe – CARPE. Associazione Alessandro Bartola, Collana Appunti n. 3. Italy.
Bures, R.M., 1997: Migration and the life course: is there a retirement transition?. International Journal of Population Geography. 3(2), 109-119.
Burnham, D. and Bennett, E., 1909. Plan of Chicago. Commercial Club, Chicago. USA.
Buzan, B. and Diez, T., 1999. The European Union and Turkey. Survival, 41(1), 41-57.
Büyükdağlı, Y., 1998. Kemalist Devletcilik ve Ilk Sanayi Planlari, Teori Dergisi, August, 1- 25.
Camagni, R.P., 2008: Regional Competitiveness: Towards a Concept of Territorial Capital. In Modelling Regional Scenarios for the Enlarged Europe, R. Capello, R. Camagni, B. Chizzolini, and U. Fratesi (eds). Springer, Berlin.
249
Cannarella, C. and Piccioni, V. 2005. Knowledge Building in Rural Areas: Experiences From A Research Centre–Rural SME Scientific Partnership In Central Italy. International Journal of Rural Management, 1(1), 1-25.
Capello, R., Nijkamp, P. and Pepping, G. 1999. Sustainable Cities and Energy Policies. Springer, Verlag Berlin, Heidelberg. pp. 43-47.
Castle, E.N., 1998: A Conceptual Framework for the Study of Rural Places. American Journal of Agricultural Economics, 80(3), 621-631.
Champion, A.G., 1989: Counterurbanization: The Changing Pace and Nature of Population Deconcentration, Edward Arnold, England.
Christaller, W., 1933: Central Places in Southern Germany. Prentice-Hall, New Jersey, US.
Christenson, J.A. and Flora, C.B., 1991: Rural Policies for the 1990s. Westview Press, Boulder, Co. Retrieved in R.W. Mcquaid, 1997.
Cloke, P., 1977: An index of rurality for England and Wales. Regional Studies, 11, 31-46.
Cloke, P., 1985: Editorial: Whither rural studies? Journal of Rural Studies. 1(1). 1-9.
Cloke, P., 1997: Country backwater to virtual village? Rural studies and ‘the cultural turn’. Journal of Rural Studies, 13(4), 367-375.
Cloke P. and Edwards, G., 1986. Rurality in England and Wales: A replication of the 1971 index. Regional Studies, 20, 289-306.
Cloke, P. and Park, C.C., 1985. Rural resource management. Croom Helm, London, UK.
Clout, H.D., 1993: European Experience of Rural Development, Rural Development Commission, London.
Coffey, W.J. and Polèse, M., 1984. The concept of local development: a stages model of endogenous regional growth. Papers in Regional Science, 55(1), 1-12.
Commission for Integrated Transport (CIT), 2001: Rural Transport: An Overview of Key Issues. [online]. CIT, Aberdeen (Published 2001).
Cooke, P. 2002: Knowledge Economies: Clusters, Learning and Cooperative Advantage, Routledge, London
Cooke, P., Morgan, K. Dodgson, M. and Rothwell, R., 1994: The creative milieu: A regional perspective on innovation. The Handbook of Industrial Innovation. Edward Elgar , Aldershot. pp. 25-32.
Copus, A., Petrie, S., Shucksmith, J., Shucksmith, M., Still, M., and Watt, J., 2001: Pre-School Educational Provision in Rural Areas: A Report to the Scottish Executive Education Department, Reproduced as an Arkleton Occasional Report No.1, Aberdeen.
Cork Declaration, 1996. The Cork Declaration - A living countryside. In The European Conference on Rural Development. Cork, Ireland. 7-9 November, 1996.

250
Cornford, J., Gillespie, A. and Richardson, R., 1996: Regional Development in the Information Society: A Review and Analysis Centre for Urban and Regional Development, University of Newcastle upon Tyne, Newcastle upon Tyne.
Cross, D.F.W. 1990: Counterurbanization in England and Wales, Avebury, Aldershot.
Curran, J. and Storey, D., 1993. Small Firms in Urban and Rural Locations. Routledge, London.
Çağlayan, T., 2004. Osmanlı’dan Günümüze Tarım Ve Tarıma Hizmet Veren Kurumların Teşkilatlanma Süreçleri, T.C. Tarım ve Köyişleri Bakanlığı, Mayıs 2004. http://www.tarim.gov.tr/arayuz/9/icerik.asp? efl=sanal_kutuphane2/tarim_tarihi/tarim_tarihi.htm&curdi=\sanal_kutuphane2\tarim_tarihi&fl=index.htm, Retrieved in 03.04.2005.
Daalhuizen, F., Dam, F. van, and Goetgeluk, R., 2003. New Firms in Former Farms: A Process with Two Faces. Tijdschrift voor Economische en Sociale Geografie, 94(5), 606–615.
Dacin, M.T., Ventresca, M.J., and Beal, B.D., 1999. The Embeddedness of Organizations: Dialogue and Directions. Journal of Management, 25(3), 317-356.
Dalhuisen, J., 2002: The Economics of Sustainable Water Use: Comparisons and Lessons From Urban Areas. PhD Thesis, Vrije Universiteit, Amsterdam.
Daly, H. 1996. Beyond growth: the economics of sustainable development. Boston, MA: Beacon Press. p. 7.
Dargan, L. and Shucksmith, M., 2008. LEADER and Innovation. Sociologia Ruralis. 48(3), 274-291.
Davoudi, S., 2008. Conceptions of the city-region: a critical review. Journal of Urban Design and Planning. 161(2), 51-60.
Dinis, A., 2006: Rural Entrepreneurship: an innovation and marketing perspective. In The New European Rurality: Strategies for Small Firms, T.N. Vaz, E.J. Morgan and P. Nijkamp (eds). Ashgate, England. pp. 157-178.
Dinler, Z., 1996. Tarım Ekonomisi IV. Basım, Ekin Yayınları, Bursa.
Dinler, Z., 2001. Bölgesel İktisat, Ekin Kitabevi Yayınları, Ankara.
Dokopoulou, E. 1986. Small manufacturing firms and regional development in Greece: Pattern and change. In New Firms and Regional Development in Europe, D. Keeble and E. Wever (eds). pp. 299-318.
Drucker P., 1970. Entrepreneurship in Business Enterprise, Journal of Business Policy, 1(1), 3-12.
Dündar, C., 2000. Köy Enstitüleri. İmge Kitabevi. 7. Baskı. İstanbul. p. 17.
Elbersen, B., 2001. Nature on the Doorstep. The Relationship Between Protected Natural Areas and Residential Activity in the European Countryside, PhD. thesis, Utrecht University. Retrieved in Daalhuizen et al., 2003.

251
Elfring, T. and Hulsink, W., 2003. Networks in entrepreneurship: the case of high-technology firms. Small Business Economics, 21(4), 409-422.
European Commission (EC), 1997. CAP 2000 Working Document: Rural Developments. July, 1997.
European Commission (EC), 1999. ESDP-European Spatial Development Perspective: Towards Balanced and Sustainable Development of the territory of the European Union, May. pp, 23.
European Commission (EC), 2004. Rural development: the impact of eu research 1998-2004. Report, Luxembourg.
European Commission (EC), 2005. Measuring progress towards a more sustainable Europe: sustainable development indicators for the European Union. EC, Luxembourg.
European Communities, 2004: The Common Agricultural Policy. Germany.
European Union (EU), 2007. Official website of the EU on enlargement, accessed in December 2007. http://ec.europa.eu/enlargement/enlargement_pro cess /index_en.htm
European Union (EU), 2009. Official website of the EU, accessed in May 2009. http://ec.europa.eu/
Falk, I. and Kilpatrick, S., 2000: What is Social Capital? A Study of Interaction in a Rural Community. Sociologia Ruralis, 40(1), 87-110.
Falk, W.W. and Pinhey, T.K., 1978: Making Sense of the Concept Rural and Doing Rural Sociology: An Interpretive Perspective. Rural Sociology. 43(4). 547-558.
Ferrao, J., 1987: Social structures, labour markets and spatial configuration in modern Portugal. Antipode, 19(2), 99-118.
Finco, A. and Nijkamp, P., 1997: Sustainable land use: methodology and application, Serie Research Memoranda 0064, VU University Amsterdam, Faculty of Economics, Business Administration and Econometrics.
Findlay, A.M., Short, D. and Stockdale, A., 2000. The labour-market impact of migration to rural areas. Applied Geography, 20(4), 333-348.
Fishbein, J. 2008: Europe’s Innovation Hot Spots. Businessweek, Special Report 28 April.
Flora, C.B., Flora, J. and Wade, K. 1996. Measuring success and empowerment. In Community Strategic Visionning Programs, N. Waltzer (ed). Praeger, London.
Flora, C.B., Flora, J., Spears, J., and Swanson, L., 1992. Rural Communities: Legacy and Change. Westview Press, Oxford.
Florida, R., 2002. The Rise of the Creative Class. Basic Books, New York.
Florida, R., 2005. Cities and the Creative Class. Routledge. New York.
Fonte, M., 2008: Knowledge, Food and Place. A Way of Producing, a Way of Knowing. Sociologia Ruralis. 48(3). 200-222.
252
Food and Agricultural Organization (FAO), 1988. Aspects of FAOs policies, programmes, budget and activities aimed at contributing to sustainable development. In the 94th Session of the FAO Council, Rome, CL94/6. Rome. 15-25 November 1988
Food and Agricultural Organization (FAO), 2006. FAO Statistical Yearbook 2005-2006 Volume 2 Issue 1. FAO Publishing.
Forte, F., Fusco Girard, L. and Nijkamp, P., 2005. Smart policy, creative strategy and urban development. Studies in Regional Science, 35(4), 497-963.
Francis, C.A., Flora, C.B., and King, L.D., 1990: Sustainable Agriculture in Temperate Zones. John Wiley and Sons, London.
Frazier, B.J. and Niehm, L.S., 2004. Exploring Business Information Netwroks of Small Retailers in Rural Communities. Journal of Developmental Entrepreneurship, 9(1), 23-42.
Friedmann, J. 1966. Regional development policy: a case study of Venezuela. Cambridge, MA and London: MIT Press.
Friedmann, J. and Weaver, C. 1979. Territory and Function: The Evolution of Regional Planning. Edward Arnold, London.
Fritsch, M., 2007. The Geography and the Effect of Creative People in Germany. Jena Economic Research Paper No. 2007-001. University of Jena - School of Economics and Business Administration, Germany.
Galloway, L. and Mochrie, R., 2005. The use of ICT in rural firms: a policy-oriented literature review. Info, 7(3), 33-46.
Garcia-Ramon, M.D., Canoves, G. and Valdovinos, N., 1995: Farm tourism, gender and the environment in Spain. Annals of Tourism Research, 22(2), 267-282.
Garofoli, G., 1984. Diffuse industrialisation and small firms: the Italian pattern in the 70s, in Hudson R. (Ed) Small Firms and Regional Development, Institute For Transport, Tourism and Regional Economy, Publication No. 39, Copenhagen School of Economics and Business Administration, Copenhagen.
Garofoli, G., 1992. Endogenous Development and Southern Europe. Avebury, Aldershot. Pp. 4.
Geenhuizen, M., Nijkamp P. and Black W., 2002. Social Change and Sustainable Transport: A Manifesto on Transatlantic Research Opportunities. In Social Change and Sustainable Transport, W. Black and P. Nijkamp (Eds.). Indiana University Press, USA, pp. 3.
Geyer, H., 1996. Expanding the theoretical foundation of differential urbanization. Tijdschrift voor economische en sociale geografie, 87(1), 44-59.
Giaoutzi, M. and Nijkamp, P. 2006. Emerging Trends in Tourism Development in an Open World, in M. Giaoutzi and P. Nijkamp (Eds), Tourism and Regional Development: New Pathways, Ashgate: Aldershot, 1-12.
Giddens, A. 1990. The Consequences of Modernity, Polity Press, Oxford.
253
Gilbert, J., 1982: Rural theory: the grounding of rural sociology. Rural Sociology. 47. 609–633.
Gilg, A.W., 1991: Countryside Planning Policies for the 1990s. CAB International, Wallingford. Retrieved in Mcquaid, R. W. 1997.
Glaeser, E.L., 2005. Review of Richard Florida’s The Rise of the Creative Class. Regional Science and Urban Economics, 35(5), 471-596.
Gomez-Velasco, M. and Saleilles, S.S. 2007: The Local Embeddedness of Lifestyle Entrepreneur: an Explorative Study, 5th IECER Conference on Enterpreneurship and the region. February 28- March 2. Montpelier Business School, France.
Gonzales, S., Tomaney, J. and Ward, N., 2006. Faith in the city-region? Town and Country Planning, Novembre, 315-17.
Gotham, K.F., 2005. Tourism from Above and Below: Globalization, Localization and New Orleans’s Mardi Gras. International Journal of Urban and Regional Research, 29(2), 309–26.
Granovetter, M., 1985. Economic action and social structure: the problem of embeddedness. American Journal of Sociology, 91(3), 481-510.
Gratton, L. 2007. Hot spots: why some teams, workplaces, and organizations buzz with energy and others don't. Berrett-Koehler Publishers, UK. Pp.146-147.
Grethe, H. 2004. Turkey’s Accession to the EU: What Will the Common Agricultural Policy Cost? Working Paper No. 70/2004. Institut für Wirtschafts- und Sozialwissenschaften des Landbaus, Humboldt-Universität zu Berlin. In: http://www.agrar.hu-berlin.de/wisola/va/w p70 .pdf.
Grethe, H. 2005. Turkey’s accession to the EU: what will the Common Agricultural Policy cost? Agrarwirtschaft, 54(2), 128-136.
Grilliches, Z., 1990. Patent Statistics as Economic Indicators: A Survey. Journal of Economic Literature, 28(4), 1661-1707.
Grimes, S. 2000. Rural areas in the information society: diminishing distance or increasing learning capacity? Journal of Rural Studies, 16, 13-21.
Gülümser, A.A., Baycan-Levent, T. and Nijkamp, P. 2009a: Mapping rurality: analysis of rural structure in Turkey. International Journal of Agricultural Resources, Governance and Ecology. 8(2-3). 130-157.
Gülümser, A.A., Baycan-Levent, T. and Nijkamp, P. 2009b: Changing Trends in Rural Self-employment in Europe and Turkey. In Territorial Governance, Rural Areas and Agrofood Systems, Torre, A. and Traversac, J.B. (Eds). Forthcoming.
Gülümser, A.A., Baycan-Levent, T., and Nijkamp, P. 2009c. Turkey’s Rurality: A Comparative Analysis at the EU Level. In T.N. Vaz, P. Nijkamp and J.L. Rastoin (eds.) Traditional Food Production and Rural Sustainable Development. Ashgate, England.

254
Gülümser, A.A., Baycan-Levent, T., and Nijkamp, P. 2009d. Beauty is on the eyes of beholder: A Logistic Regression Analysis of Sustainability and Locality as Competitive Vehicles for Human Settlements, International Journal of Sustainainable Development, 12(1), 95-110.
Gülümser, A.A., Baycan-Levent, T., Nijkamp, P., and Poot, J. de 2008. Indigenous and Newcomer rural entrepreneurs: a comparative study, paper presented at Regional Studies Association Conference. Regions: The Dilemmas of Integration and Competition?, 27 – 29 May. Prague, Czech Republic.
Haartsen, T. 2002. Platteland: Boerenland, Natuurterrein of Beleidsveld? Een Onderzoek naar Veranderingen in Functies, Eigendom en Representaties van het Nederlandse Platteland. PhD. thesis, University of Groningen. Retrieved in Daalhuizen et al. 2003.
Hair, J.F., Anderson, R.E., Tatham, R.L., and Black, W.C., 1998. Multivariate Data Analysis. Prentice-Hall International, London.
Halfacree, K.H., 1993. Locality and social representation: space, discourse and alternative definitions of the rural. Journal of Rural Studies, 9, 23-37.
Halfacree, K.H., 2007. Back-to-the-land in the twenty first century making connections with rurality. Tijdschrift voor Economische en Sociale Geografie, 98(1), 3-8.
Halfacree, K.H., 2008. To Revitalise Counterurbanization Research? Recognising an International and Fuller Picture. Population, Space and Place, 14, 479-495.
Harris, J.R. and Todaro, M.P. 1970: Migration, unemployment and development: a two-sector analysis. The American Economic Review, 60(1), 126-142.
Healey, M.J. and Ilbery, B.W., 1985: The lndustnalisation of the Countryside. GEO Books, Norwich. Retrieved in Mcquaid, R. W. 1997.
Heins, S., 2002. Rurale Woonmilieus in Stad en Land. PhD thesis, Utrecht University. Retrieved in Daalhuizen et al. 2003.
Hinloopen, E., Nijkamp, P. and Rietveld, P. 1982: The Regime Method: A New Multicriteria Method. In: Hansen P (ed) Essays and Surveys on Multiple Criteria Decision Making. Springer, Berlin.
Hinloopen, E., Nijkamp, P. and Rietveld, P., 1983. Qualitative discrete multiple criteria choice models in regional planning. Regional Science and Urban Economics, 13, 77-102.
Hodge, I., 1997. The integration of the rural economy. Built Environment, 3(3), 192-201.
Hosmer, D. and Lemeshow, S. 1989: Applied logistic regression, Wiley & Sons, New York.
House of Lords, 1991: Select Committee on the European Communmes - The Future of Rural Society. HMSO, London. Retrieved in Mcquaid, R. W. 1997.
255
Howland, M., 1993: Applying theory to practice in rural economies. In Theories of Local Economic Development: perspecttves from across the disciphnes. Bingham, R.D. and Meir, R. (Eds) Sage, London. Retrieved in Mcquaid, R. W. 1997.
Hugo, G.J. and Smailes, P.J. 1985: Urban-rural migration in Australia: a process view of the turnaround, Journal of Rural Studies, 1(1), 11-30.
Ilbery, B., 1998. The geography of rural change. Longman, London.
Isserman, A.M., 1998. Conclusion: What do we want from, theory in rural development?. Growth and Change. 29(3), 344-351.
IUCN, UNEP, and WWF, 1991: Caring for the Earth, A Strategy for Sustainable Living. Gland, Switzerland: Earthscan.
IWG.AgRI, 2005. The Wye Group Handbook: Rural Households’ Livelihood and Well-being-Statistics on Rural Development and Agriculture Household Income. United Nations, 2005.
Jack, S.L. and Anderson, A.R. 2002. The effects of embeddedness on the entrepreneurial process. Journal of Business Venturing, 17(5), 467-487.
Jacobs, J., 1969. The economy of cities. New York: Vintage Books.
Jones, R.E., Fly, J.M., Talley, J. and Cordell, H.K., 2003. Green Migration into Rural America: The New Frontier of Environmentalism? Society and Natural Resources, 16(3), 221-238.
Kalantaridis, C., 2007. Embeddedness and In-Migrant Entrepreneurship on the Rural Fringe of a City-Region: The Case of East Cleveland, North East England, European Planning Studies Forthcoming.
Kalantaridis, C. and Bika, Z., 2006a: In-migrant entrepreneurship in rural England: beyond local embeddedness. Entrepreneurship and Regional Development, 18(2), 109-131.
Kalantaridis, C. and Bika, Z., 2006b: Local embeddedness and rural entrepreneurship: case-study evidence from Cumbria, England. Environment and Planning A, 38(8), 1561-1579.
Kalantaridis, C. and Labrianidis, L., 2004. Rural Entrepreneurs in Russia and the Ukraine: Origins, Motivations, and Institutional Change. Journal of Economic Issues, 38(3), 659-682.
Keeble, D., 1993. Small firm creation, innovation and growth and the urban-rural shift. In Curran J. and Storey D. (eds) Small firms in urban and rural locations. Routledge; London.
Keeble, D. and Tyler, P., 1995: Enterprising Behaviour and the Urban-Rural Shift. Urban Studies, 32(6), 975-997.
Keeble, D., Tyler, P., Broom, G. and Lewis, J. 1992: Business Success in the Countryside: the Performance of Rural Enterprise. London: HMSO.
Kinsley, M.J. 1997: Economic Renewal Guide: A Collaborative Process for Sustainable Community Development, Rocky Mountain Institute, Colorado.

256
Kloosterman, R., Leun, J. van der, and Rath, J., 1999. Mixed Embeddedness: (In)formal Economic Activities and Immigrant Businesses in the Netherlands. International Journal of Urban and Regional Research, 23(2), 252-266.
Knight, F.H., 1921: Risk, Uncertainty and Profit, Houghton Mifflin Company, New York.
Knight, F.H., 1967. Laissez Faire: Pro and Con. The Journal of Political Economy. 75(6), 782-795.
Kontuly, T., 1998: Contrasting the counterurbanization experience in European nations, in Migration into rural areas, Boyle, P. and Halfacree, K. H., pp. 61-78. Wiley, Chester.
Kontuly, T. and Vogelsang, R., 1988. Explanations for the intensification of counterurbanization in the Federal Republic of Germany. The Professional Geographer, 40(1), 42-54.
Koutsouris, A., 2008: The Battlefield for (Sustainable) Rural Development: The Case of Lake Plastiras, Greece. Sociologia Ruralis. 48(3), 240-256.
Labrianidis, L., 2006a. Fostering Entrepreneurship as a Means to Overcome Barriers to Development of Rural Peripheral Areas in Europe. European Planning Studies. 14(1), 3-8.
Labrianidis, L. and Kalogeresis, T., 2006: The digital divide in Europe’s rural enterprises. European Planning Studies. 14(1). 23-39.
Leavy, A., McDonagh, P. and Commins, P., 1999: Public Policy Trends: Some Regional Impacts, Teagasc, Rural Economy Research Series No. 6. Agricultural and Food Development Authority (Teagasc), Dublin.
Leeuwen, E.S. and Nijkamp, P., 2006: The Embeddedness of Small Enterprises in the Rural Local Economy of Small and Medium-sized Towns. In: The New Rurality: Strategies for Small Firms. Vaz, T.N., Morgan, E.J. and Nijkamp, P. Eds. Ashgate, England.
Lewis, B. 1961: The Emergence of Modern Turkey. Oxford University Press. London. p.460.
Lewis, G., 1998. Rural migration and demographic change. In The geography of rural change, Ilbery, B. (Ed) Longman, London. pp. 131-160.
Lösch, A., 1954. The Economics of Location. New Haven: Yale University Press.
Lucas, R.E.B., 2007: Migration and rural development. Electronic Journal of Agricultural and Development Economics, 4(1), 99-122.
Lundvall, B., 1992: National Systems of Innovation-Towards a Theory of Innovation and Interactive Learning, Pinter Publishers , London.
Mailfert, K., 2007: New Farmers and Networks: How Beginning Farmers Build Social Connections in France. Tijdschrift voor economische en sociale geografie. 98(1), 21-31.
Malecki, E.J., 2003: Digital development in rural areas: Potentials and pitfalls. Journal of Rural Studies. 19, 201–214.
257
Malinen, P., 1995. Rural area typologies in Finland. In LEADER, Workshop of Typology of European rural areas. Luxembourg 2-5 November. LEADER: Luxembourg.
Mankelow, G. and Merrilees, B., 2001: Towards a model of entrepreneurial marketing for rural women: a case study approach. Journal of Development Entrepreneurship. 6(3), 221-235.
Marsden, T. and Smith, E. 2005: Ecological entrepreneurship: sustainable development in local communities through quality food production and local branding. Geoforum. 36(4), 440-451.
Maskell, P., Eskelinen, H. and Hannibalsson, I., 1998. Competitiveness, Localised Learning and Regional Development: Specialisation and Prosperity in Small Open Economies. Routledge.
McGranahan, D. and Wojan, T., 2007: Recasting the Creative Class to Examine Growth Processes in Rural and Urban Counties. Regional Studies. 41(2). 197-216.
Mcquaid, R.W. 1997: Local Entreprise Companies and Rural Development. Journal of Rural Studies. 13(2), 197-212.
Milbourne, P., 2007: Re-populating rural studies: Migrations, movements and mobilities. Journal of Rural Studies. 23(3), 381-386.
Miller, N.L. and Besser, T.L., 2000: The importance of community values in small business strategy formation: evidence from rural Iowa. Journal of Small Business Management. 38(1), 68-85.
Ministry of Agriculture and Rural Affairs (MARA), 2004: II. Tarim Surasi, Kirsal Kalkinma Politikalari Komisyon Raporu. Ankara.
Mittermeier, R., Myers, N., Thomsen, J., da Fonseca, G. and Olivieri, S., 1998. Biodiversity Hotspots and major tropical wilderness areas: Approaches to Setting Conservation Priorities. Conservation Biology, 12. 516-520.
Moseley, M.J., 1984: The revival of rural areas in advanced economies: a review of some causes and consequences. Geoforum, 15, 447-456.
Most Beautiful Villages of France (MBVF), 2008a. Vivons L’exception!. The presentation file of the association Les Plus Beaux Villages de France.
Most Beautiful Villages of France (MBVF), 2008b. The official website: http://www.les-plus-beaux-villages-de-france.org/
Most Beautiful Villages of Italy (MBVI), 2008. The official website: http://www.borghitalia.it/
Most Beautiful Villages of Quebec (MBVQ), 2008. The official website: http://www.beauxvillages.qc.ca/
Most Beautiful Villages of Wallonia (MBVW), 2008. The official website: http://www.beauxvillages.be/
Most Beautiful Villages of Wallonia (MBVW), 2009. The official website: http://www.beauxvillages.be/
258
Mouleart, F. and Sekia, F., 2003. Territorial Innovation Models: A Critical Survey, Regional Studies, 37(3), 289-302.
Munasinghe, M. and McNeely, J., 1995: Key Concepts and Terminology of Sustainable Development. In Defining and Measuring Sustainability, Munasinghe, M. and Shearer, W. eds. New York: The United Nations University & The World Bank, pp. 19-56.
Munton, R., 1995: Regulating rural change: Property rights, economy and environment: a case study from Cumbria, UK. Journal of Rural Studies, 11(3), 269-284.
Murdoch, J. and Marsden, T., 1995: The Spatialization of Politics: Local and National Actor-Spaces in Environmental Conflict. Transactions of the Institute of British Geographers, 20(3), 368-380.
Naudé, W. 2007: Peace, Prosperity, and Pro-Growth Entrepreneurship, Wider Discussion Paper, 2007/2, UNU-WIDER, Finland.
Neelameghan, A. and Chester, G. 2006. Environmental Knowledge and Marginalized Communities: The Last Mile Connectivity. Webology, 3 (1). 24.
Nelson, R.R. and Nelson, K., 2002: Technology, institutions and innovation systems. Research Policy, 31, 265-272.
Nijkamp, P., 1978: A spatial complex analysis of agglomeration and settlement patterns. Research Memorandum. RM-78-9. VU Univeristy, Amsterdam.
Nijkamp, P. 2003. Entrepreneurship in a Modern Network Economy. Regional Studies, 37(4), 395-405.
Nijkamp, P., 2008a: Regional development as self-organized converging growth, in Kochendorfer-Lucius, G. and Pleskovic, B. (Eds), Berlin Workshop Series 2008: Disparities and development policy, World Bank, Washington DC. Forthcoming.
Nijkamp, P. 2008b. XXQ factors for sustainable urban development: a system economics view, Romanian Journal of Regional Science, 2(1), 1-34.
Nijkamp, P. and Pepping, G. 1998a: A Meta-Analytic Exploration of the Effectiveness of Pesticide Price Policies in Agriculture. Journal of Environmental Systems, 26(1), 1-25.
Nijkamp, P. and Pepping, G., 1998b: A Meta-analytical Evaluation of Sustainable City Initiatives. Urban Studies, 35(9), 1481-1500.
Nijkamp, P. and Rietveld, P. 1999: Classification techniques in quantitative comparative research: a meta-comparison, Research Memorandum, Vrije Universiteit, Amsterdam.
Nijkamp, P. and van Hemert, P., 2007: Going for Growth; a Theoretical and Policy Framework, Papers DYNREG14, Economic and Social Research Institute (ESRI).
Nijkamp. P., Rietveld, P., and Voogd, H. 1990: Multicriteria Analysis for Physical Planning. Elsevier, Amsterdam.

259
Nijkamp, P., Vleugel, J., Maggi, R. and Masser, I. 1994. Missing Transport Networks in Europe. Aldershot: Avebury.
Norman, J., 2006. The strategy of cultivating Lifestyle entrepreneurs and amenity movers through most beautiful village associations, Kumamto University studies in social and cultural sciences, 4, 357-377.
North, D. and Smallbone, D. 1996. Small Business Development in Remote Rural Areas: the Example of Mature Manufacturing Firms in Northern England. Journal of Rural Studies, 12(2), 151-167.
North, D. and Smallbone, D. 2000. The Innovativeness and Growth of Rural SMEs During the 1990s. Regional Studies. 34(2), 145-157.
Noteboom, B. 1999. Innovation, Learning and Industrial Organization. Cambridge Journal of Economics, 23, 127-150.
Oenema, O. 2005. How to manage changes in rural areas in desired directions?, Werk Document 7, Wettelijke Onderzoekstaken Natuur and Milieu, Wageningen, September, 2005.
Oltmer, K., 2003: Agriculture Policy Land Use and Environment Effects: Studies in Quantitative Research Synthesis. PhD Thesis, Vrije Universiteit, Amsterdam.
Oran, B. 2003: Türk Dış Politikası 1 'Kurtuluş Savaşından Bugüne Olgular, Belgeler, Yorumlar / Cilt 1: 1919–1980, İletişim Yayınları, İstanbul.
Organisation for Economic Co-operation and Development (OECD), 1991: Partnership for Rural Development. OECD, Paris. Retrieved in Mcquaid, R. W. 1997.
Organisation for Economic Co-operation and Development (OECD), 1994. Creating rural indicators for shaping territorial policy. OECD, Paris, France.
Organisation for Economic Co-operation and Development (OECD), 1996. Territorial Indicators of Employment; Focusing on Rural Development, OECD, Paris, France.
Organisation for Economic Co-operation and Development (OECD), 2003. Territorial indicators of socio-economic patterns and dynamics, Working Paper 30. Septembre.
Organization for Economic Cooperation and Development (OECD), 2006. Economic surveys: Turkey Volume 2006 Issue 15. OECD Publishing.
Oskam, A., Burrell, A., Temel, T., van Berkum, S., Vilchez, I. M. and Longworth, N. 2004. Turkey in the European Union? Exploring the Consequences for Agricultural, Food, Rural Areas and Structural Policy. December. Retrieved in Simmons and Kalantiridis, 1996.
Örnek, A., 2007. Kırsal Kalkınma El Kitabı. Henrich Böll Stiftung Derneği Türkiye Temsilciliği, İstanbul. pp. 36.
Paniagua, A., 2002: Urban-rural migration, tourism entrepreneurs and rural restructuring in Spain. Tourism Geographies, 4(4), 349-371.
260
Pawlak, Z., 1982: Rough sets [J]. International Journal of Computer and Information Sciences. 11(5), 341-356.
Pawlak, Z., 1991: Rough Sets: Theoretical Aspects of Reasoning about Data. Kluwer Academic Publishers, Dordrecht.
Peck, J. 2007. The cult of urban creativity. In Keil R and Mahon R (eds) The political economy of scale, University of British Columbia Press, Vancouver.
Petrin, T. and Gannon, A. 1997: Rural Development through entrepreneurship. FAO, Rome.
Phillipson, J. and Raley, M. 2002: The impacts of foot and mouth on non-farming businesses, in Confronting the Rural Shutdown: Foot and Mouth Disease and the North East Rural Economy, J Phillipson, P Lowe , T Carroll (eds) Centre for Rural Economy, University of Newcastle upon Tyne, Newcastle upon Tyne, pp 42-72.
Pierce, J., 1996. The conversation challenge in sustaining rural environments. Journal of Rural Studies, 12, 215-219.
Ploeg, J.D. van der, 1995. From structural development involution: the impact of new development in Dutch agriculture. In Beyond Modernization: The Impact of Endogenous Rural Development, Ploeg, J.D. van der and Dijk, G. van eds. Uitgeverij Van Gorcum, Assen. pp. 109-146.
Ploeg, J.D. van der and Saccomandi, V., 1995: On the Impact of Endogenous Development in Agriculture. In Beyond Modernization: The Impact of Endogenous Rural Development, Ploeg, J.D. van der and Dijk, G. van eds. Uitgeverij Van Gorcum, Assen. pp. 10-27.
Polanyi, K. 1944. The great transformation: Economic and political origins of our time, Rinehart, New York.
Politechnico di Milano, 1999: A typology of rural areas in Europe. ESDP Summary Report, Milan.
Pouder R. and St. John C.H., 1996: Hot Spots and Blind Spots: Geographical Clusters of Firms and Innovation, Academy of Management Review 21(4), 1192-1225.
Predki, B., Slowinski, R., Stefanowski, J., Susmaga, R. and Wilk, S., 1998: ROSE: Software Implementation of the Rough Set Theory, Rough Sets and Current Trends in Computing. Lecture Notes in Artificial Intelligence, 1424, 605-608.
Psaltopoulos, D., Stathopoulou, S. and Skuras, D. 2005: The Location of Markets, Perceived Entrepreneurial Risk, and Start-up Capital of Micro Rural Firms. Small Business Economics, 25(2), 147-158.
Qian, H. and Stough, R. 2008. Social Diversity and Creative Capital: A Regional Perspective, paper presented in International Workshop On Human Capital, Social Capital and Creative Capital as Sources of Regional Growth, 30 June-1 July, Tinbergen Institute and VU University, Amsterdam.

261
Ravenstein, E., 1889: The Laws of Migration: Second Paper. Journal of the Royal Statistical Society, 52, 241-305.
Reading, R., Openshaw, S. and Jarvis, S., 1994: Are multidimensional Social Classifications of Areas Useful in UK Health-Service Research? Journal of Epidemiology and Community Health, 48(2), 192-200.
Relph, E. 1976. Place and Placelessness. London: Pion.
Renkow, M., 2003: Employment Growth, Worker Mobility, and Rural economic Development. American Journal of Agricultural Economics, 85(2), 503-513.
Renzulli, L.A., Aldrich, H. and Moody, J., 2000: Family Matters: Gender, Networks, and Entrepreneurial Outcomes. Social Forces, 79(2), 523-546.
Rienstra, S.A. 1998. Options and barriers for sustainable transport policies, PhD Thesis, Vrije Universiteit, Amsterdam.
Rieucau, J. 2007. Marques et labels, nouveaux maîtres des territoires touristiques ? Paper prensented at 6e Rencontres de Mâcon, «Tourismes et territoire», 13-15 Septembre, Pré-actes.
Roberts, S., 2002: Key Drivers of Economic Development and Inclusion in Rural Areas, Initial scoping study for the socio-economic evidence base for DEFRA. DEFRA, London.
Rodriguez-Pose, A., 2001: Is R&D investment in lagging areas of Europe worthwhile? Theory and empirical evidence. Papers in Regional Science. 80, 275-295.
Rogers, M. 1998. The Definition and Measurement of Innovation. Melbourne Institute Working Paper No. 10/98. Australia.
Rosenthal, R. 1984. Meta-analytic procedures for social research. Revised edition. California: Sage Publications, Inc.
Rostow, W.W., 1959. The Stages of Economic Growth. The Economic History Review, 12(1), 1-16.
Rupp, T. 2005: Rough set methodology in meta-analysis-a comparative and exploratory analysis, Discussion Papers in Economics, Instituts fur Volkswirthschaftslehre, Technische Universitat, Darmstadt.
Sachs, I., 1997. L'écodéveloppement/Stratégies pour le XXIe siecle, Paris:Syros.
Sant, M. and Simons, P., 1993: The conceptual basis of counterurbanization: critique and development. Australian Geographical Studies, 31(2), 113-126.
Santanen E, Briggs, R. O. and Vreede de, G.J. 2000. A Cognitive Network model of creativity: a renewed focus on brainstorming methodology. Proceedings of the 33rd Hawaii International Conference on System Sciences. pp.489-494.
Satsangi, M., Bramley, G., and Storey, C., 2000. Selling and Developing Land and Buildings for Rent and Low Cost Home Ownership: the Views of Landowners. Edinburgh: Scottish Homes/Landowners Federation.

262
Schumpeter, J.A., 1934. The Theory of Economic Development. Translated by R. Opie form the second German edition. Cambridge: Harvard University Press.
Schumpeter, J.A., 1947. Capitalism, Socialism, and Democracy, 2nd Edition. Harper cop. New York.
Schumpeter, J.A., 1950. Capitalism, Socialism, and Democracy, 3rd edition, Harper and Row, New York
Scott, A. 2006. Entrepreneurship, Innovation and Industrial Development: Geography and the Creative Field Revisited. Journal Small Business Economics. 26(1). 1-24 .
Scottish Executive Development Department (SEDD), 2005. Rural planning typologies report. February. Edinburgh.
Scottish Government, 2008. Urban rural classification 2007-2008. Scottish Goverment, Edinburgh.
Scottish Office, 1995. Rural Scotland: People Prosperity and Partnership. Scottish Office, Edinburgh. Retrieved in Mcquaid, R. W. 1997.
Shucksmith, M., 2001: Development and ruralities in Europe: Processes of change and social exclusion in rural areas. In the National Meeting of the Portuguese Association for Regional Development. Vila Real, June.
Siemens, L. 2006: Operational Challenges Of Rural/Remote Businesses: An Exploratory Study On Vancouver Island, in Reaching New Heights, H. Kelley, ed., Association des science administrative du Canada, Calgary.
Simmons, C. and Kalantiridis, C. 1996. Making garments in Southern Europe: Entrepreneurship and labour in rural Greece. Journal of Rural Studies, 12(2), 169-185.
Singh, K., 1999. Rural development: principles, policies, and management, Sage Publications India. New Delhi. 2nd edition. p. 91.
Skinner, W. 1974: The Focused Factory, Harvard Business Review, May-June, 113–121.
Skuras, D. and Stathopoulou, S. 2000: Rural Entrepreneurship and Regional Development, 40th Congress of European Regional Science Association on European Monetary Union and Regional Policy, 29 August-1 September, Barcelona.
Skuras, D., Meccheri, N., Moreira, M.B., Rosell, J. and Stathopoulou, S., 2005: Entrepreneurial human capital accumulation and the growth of rural businesses: a four-country survey in mountainous and lagging areas of the European union. Journal of Rural Studies, 21(1), 67-79.
Slowinski, R., 1992: Intelligent Decision Support: Handbook of Applications and Advances of the Rough Sets Theory. Kluwer Academic Publishers, Dordrecht.
Smith, M.S., Findeis, J.L., Kraybill, D.B. and Nolt, S.M., 1997: Nonagricultural micro-enterprise development among the Pennsylvania Amish: A new phenomenon. Journal of Rural Studies, 13(3), 237-251.
263
Sofranko, A.J. and Williams, J.D., 1980, Characteristics of migrants and residents, in Rebirth of rural America: Rural migration in the Midwest, Ames, Iowa, Iowa State University, North Central Regional Center for Rural Development, pp. 19-31.
Stake, R.E. 2006: Multiple Case Study Analysis, Guildford Press, New York.
State Planning Organization (SPO), 1963. I. Beş Yıllık Kalkınma Planı, Ankara.
State Planning Organization (SPO), 2006. National Rural Development Strategy. Ankara: SPO.
State Planning Organization (SPO), 2007. IX. Beş Yıllık Kalkınma Planı, Ankara.
Stathopoulou, S., Psatopoulos, D., and Skuras, D., 2004: Rural entrepreneurship in Europe. International Journal of Entrepreneurial Behaviour and Research, 10(6), 404-425.
Sternberg, R. J. 1998. Handbook of Creativity. Cambridge University Press; New York.
Stimson, R., Stough, R. And Nijkamp, P. 2009. An Endogenous Perspective on Regional Development and Growth. Creative, Intellectual and Entrepreneurial Resources for Regional Development: Analysis and Policy, paper presented in International Workshop On Human Capital, Social Capital and Creative Capital as Sources of Regional Growth, 15-16 June, 2009, Tinbergen Institute and VU University, Amsterdam.
Stockdale, A. 2005: Incomers: offering economic potential in rural England, RASE, 166.
Stockdale, A. and Findlay, A.M., 2008: Rural in-migration: a catalyst for economic regeneration, RuSource rural information network, Briefing 171.
Stockdale, A., Findlay, A.M., and Short, D., 2000: The repopulation of rural Scotland: opportunity and threat. Journal of Rural Studies, 16(2), 243-257.
Stone, I.A. and Stubbs, C., 2007. Enterprising expatriates: lifestyle migration and entrepreneurship in rural southern Europe. Entrepreneurship and Regional Development, 19(5), 433-450.
Stouffer, S.A. 1940. Intervening Opportunities: A Theory Relating to Mobility and Distance. American Sociological Review, 5(6), 845-867.
Stouffer, S.A. 1962. Social Research to Test Ideas. NY: Free Press. pp. 8-14
Stöhr, W B. 1984. La Crise Economique Demande-t-Elle de Nouvells Strategies de Developpement Regional? P. Aydalot (Ed). Crise et Espace. Economica. Paris.
Study Programme of the European Spatial Programme (SPESP), 2000. Final Report. 31 March. Brussels, Stockholm.
Şenesen, Ü. 2004. İstatistik: Sayıların Arkasını Anlamak. Literatür. Istanbul.
Tarmann, A., 2003: Revival of U.S. Rural Areas Signals Heartland No Longer a Hinterland. Population reference Bureau, January. USA.

264
Taxgloss, 2005. http://www.taxgloss.com/Tax-Professions_E_-_F-/Entrepreneur.htm Retrieved in October 2005.
Taylor, N. 2000. Eco-villages: Dream and Reality. In Barton, H. (ed) Sustainable Communities. Earthscan: UK. pp.19-28.
Terluin, I.J., 2001. Rural regions in the EU: exploring differences in economic development. Faculteit der Ruimtelijke Wetenschappen, Groningen.
Tervo, H., 2004. Self-employment dynamics in rural and urban labour markets. In 44th Conference of European Regional Science Association, 25-29 August. Porto, Portugal.
Thia-Eng, C., 2007: Development and Implementation of the Sustainable Development Strategy for the Seas of East Asia. Paper presented at the Seminar on Maritime Policies and Globalisation, 9-10 July, Azores, Portugal.
Tovey, H., 2008: Introduction: Rural Sustainable Development in the Era of Knowledge Society. Sociologia Ruralis, 48(3), 185-189.
Tufan, A., 1997, Türkiye Ekonomisi, Ankara Üniversitesi Ziraat Fakültesi Yayınları, Yayın No:1487, Ankara.
Turkish Statistical Institute (TURKSTAT), 1985. General Population Census 1985. SPO, Ankara.
Turkish Statistical Institute (TURKSTAT), 1990. General Population Census 1990. SPO, Ankara.
Turkish Statistical Institute (TURKSTAT), 2000. General Population Census 2000. SPO, Ankara.
Turkish Statistical Institute (TURKSTAT), 2001. General Agricultural Census, 2001. SPO, Ankara.
Turkish Statistical Institute (TURKSTAT), 2006. Household Labor Force Questionnaire. SPO, Ankara.
Tümertekin, E. and Özgüç, N. 1999. Beşeri Coğrafya. Çantay Kitabevi. İstanbul.
United Nations (UN), 1996. Indicators of sustainable development: framework and methodologies. UN, New York.
Unknown, 2008. As an email attachement from Chamber of Architects, İstanbul.
Uzzi, B., 1997. Social Structure and Competition in Interfirm Networks: The Paradox of Embeddedness. Administrative Science Quarterly, 42(1), 35-67.
Varga, L.Sz. and Varga, E., 2008: The Challenges of Sustainable Rural Development towards Engineering Education. Paper presented at ICEE 2008, International Conference on Engineering Education. "New Challanges in Engineering Education and Research in the 21st Century", 27-31 July. Pécs-Budapest, Hungary.
Vasquez-Barquero, A., 1986. Small scale industry in rural areas: The Spanish experience since the beginning of the Century. In The Balance between Industry and Agriculture in Economic Development, Arrow, K. (ed.). New Delhi, Macmillan.

265
Vaz, de Noronha T., Morgan, E. J., and Nijkamp, P., 2006. The New European Rurality: Strategies for Small Firms. Ashgate Publishing, Aldershot.
Verheul, I., Risseeuw, P. and Bartelse, G., 2002: Gender Differences in Strategy and Human Resource Management: The Case of Dutch Real Estate Brokerage. International Small Business Journal, 20(4), 443-476.
Vias, A., 1999. Jobs follow people in the rural Rocky Mountain West. Rural Development Perspectives, 14(2), 14–23.
Vollet, D. and Bousset, J.P. 2002: Use of Meta-analysis for the Comparison and Transfer of Economic Base Multipliers. Regional Studies, 36(5), 481-494.
Ward, A.W. and Hite J. 1998. Theory in rural development: an introduction and overview. Growth and Change. 29(3), 245-258.
Webber, M., 1964. The urban place and the non-place urban realm. In Webber, M., Dyckman, J. W., Foley, L. D., Guttenberg, A. Z., Wheaton, W.L.C., Wurster, C.B. (eds), Explorations into urban structure, University of Pennsylvania Press, Philadelphia.
Weber, S.S., 2007. Saving St. James: A case study of farmwomen entrepreneurs. Agriculture and Human Values, 24(4), 425-434.
Wennekers, S. and Thurik, R., 1999. Linking Entrepreneurship and Economic Growth. Small Business Economics, 13(1), 27-56.
Westhead, P., Ucbasaran, D., and Binks, M., 2004: Internationalization strategies selected by established rural and urban SMEs. Journal of Small Business and Entreprise Development, 11(1), 8-22.
Westlund, H. and Bolton, R. 2003. Local Social Capital and Entrepreneurship, Small Business Economics, 21, 77-113.
Whitehead, J.C., 1999. An Introduction to Logistic Regression, http://personal.ecu. edu/whiteheadj/data/logit/ Retrieved in 27/11/2004.
Whittington, R., 1992: Putting Giddens into Action: Social Systems and Managerial Agency. Journal of Management Studies, 29(6), 693-712.
Wikipedia, 2009. Z-Test. http://en.wikipedia.org/wiki/Z-test. Retrieved in 20/06/2009.
Williams, N., Shucksmith, M., Edmond, H. and Gemmell, A., 1999. Scottish Rural Life Update: A Revised Socio-Economic Profile of Rural Scotland. The Scottish Office, Edinburgh.
Winter, M., 2003. Embeddedness, the new food economy and defensive localism. Journal of Rural Studies, 19(1), 23-32.
Woods, M., 2005. Rural geography: processes, responses and experiences in rural restructuring. Sage Publications, London.
Woolcock, M., 1998. Social capital and economic development: Toward a theoretical synthesis and policy framework. Theory and Society. 27(2), 151-208.
World Commission on Environment and Development (WCED), 1987. Our Common Future. Oxford University Press, Oxford.
266
Wortman, M.S.Jr., 1990. Rural Entrepreneurship Research: An Integration into the Entrepreneurship Field. Agribusiness, 6(4), 329-344.
Wu, C., Yue, Y., Li, M., and Adjei, O., 2004. The rough set theory and applications. Engineering Computations, 21(5), 488-511.
Yeni, R., and Dölekoğlu, C.Ö., 2003: Tarımsal Destekleme Politikasında Süreçler ve Üretici Transferleri, Yayın No:98, TEAE Yayınları, Ankara.
Zhang, J., Zhang, L., Rozelle, S., and Boucher, S., 2006. Self-Employment with Chinese Characteristics: The Forgotten Engine of Rural China's Growth. Contemporary Economic Policy, 24(3). 446-458.
Zipf, G.K., 1949: Human Behaviour and the Principle of Least-Effort. Addison-Wesley, Cambridge.
Zontanos, G. and Anderson, A.R., 2004. The nurturing and harvesting of a rural Greek network. International Journal of Entrepreneurial Behaviour and Research, 10(4), 260-276.

267
APPENDICES
APPENDIX A : Methodologies used in the study APPENDIX B : Data and information on the European case APPENDIX C : Data and information on the Turkish case APPENDIX D : Data and information used in the comparative analyses

268
269
APPENDIX A : Methodologies used in the Study
Box plot A box plot is a graphical visualization of numerical data by means of five-number summaries that is used in descriptive statistics. A box plot, besides the five number summaries, viz. the minimum, lower quartile, median, upper quartile and the maximum, also indicates the outliers – if there are any – (Şenesen, 2004). This graph is very useful to display differences between the data, to indicate the degree of spread and skewness in the data.
Cross-tabulation One of the well-known visualization technique in descriptive and exploratory statistics is the cross-tabulation (‘cross tab’). It is a form of a contingency table in a matrix format that is able to provide the distribution of more than one variable simultaneously. This technique is frequently used because of its practicality, and its applicability to all type of data.
Factor Analysis (FA) Factor analysis (FA) is one of the well-known multidimensional techniques that can be used to analyse interrelationships between a large number of variables and to explain them in terms of their common underlying dimensions. Factor analysis is an interdependence technique in which all variables are considered, as each relates to all others, and where the concept of the variate, the linear composite of variables, is employed (Hair et al., 1998). When applying FA, several analyses can be used to reduce the data. Among these analyses in this thesis, principal component analysis (PCA) is used to transform the set of originally mutually correlated variables into a new set of independent variables. It is a non-stochastic approach and it only deals with the common variance of the original variables. It first derives the first factor or the first principal component, which is supposed to account for the greatest part of the common variance. The second factor is supposed to account for the next greatest part of the common variance, and so on. A minimum part of the common variance is set, and factors below this critical level must be eliminated. The relative lengths of the lines that express the different variable combinations are called eigenvalues.
Logistic Regression Analysis (LRA) The (binary) logistic regression model is simply a non-linear transformation of the linear regression model. Logistic regression is a type of regression analysis in which the dependent variable is a binary dummy variable and the independent variables can be of any type (Whitehead, 1999). Since the logistic model is a non-linear type of regression, the statistic which is suggestive of model validity is the chi-square statistic (Hosmer and Lemeshow, 1989). After checking the validity of the models by means of the chi-square test, another important performance measure is the rate of correct classification.
Regime Analysis (RA) Regime analysis is a discrete multicriteria method which is able to cope with both qualitative and quantitative effect information (Hinloopen et al., 1982; Nijkamp et al. 1990). It uses pairwise comparisons to assess the performance of alternatives and the outranking relationships are built between the alternatives (Nikamp et al., 1990). The fundamental framework of the method is based upon two kinds of input data: an impact matrix and a set of (politically-determined) weights (for a detailed

270
explanation, see Nijkamp et al., 1990, and Hinloopen et al., 1983). The impact matrix is composed of elements that measure the effect of each considered alternative in relation to each policy-relevant criterion. The set of weights incorporates information concerning the relative importance of the criteria in the evaluation. If there is no prioritisation of criteria in the evaluation process, all criteria will be assigned the same numerical weight value.
Rough Set Data Analysis (RSDA) In principal, rough set data analysis (RSDA) is a non-parametric classification technique (Nijkamp and Rietveld, 1999) which has been developed as an artificial intelligence method for the multidimensional classification of categorical data. It was introduced by Pawlak (1982) in the early 1980s and developed by Pawlak (1991) and Slowinski (1992). In recent years, RSDA has become popular in the social and economic sciences not only because of the advantage arising from its non-parametric character but also because of its ability to handle imprecise and qualitative data (Baaijens and Nijkamp, 2000; Dalhuisen, 2002; Vollet and Bousset, 2002; Nijkamp and Pepping, 1998a; Nijkamp and Pepping, 1998b; Oltmer, 2003; Wu et al., 2004).
RSDA serves to pinpoint regularities in classified data, in order to identify the relative importance of some specific data attributes, and to eliminate less relevant ones, and to discover possible cause-effect relationships by logical deterministic inference rules (van den Bergh et al., 1997). The basic idea in RSDA is to describe the data with rough sets (Rupp, 2005). A rough set can be characterized as a set for which the classification of a group of certain objects is uncertain (Dalhuisen, 2002). Using early applied studies, it can be assumed that there exist a certain finite set of objects to be classified. To perform RSDA, a modular software system Rough Set Data Explorer (ROSE) is used in order to implement basic elements of rough set theory and rule discovery techniques. This software was created at the Laboratory of Intelligent Decision Support Systems of the Institute of Computing Science in Poznan by Predki, Slowinski and Stefanowski in 1998 (Predki et al., 1998; Wu et al., 2004). There have been also other attempts to create software for the application of RSDA, e.g. ROSETTA, but ROSE is the most user-friendly software to apply RSDA. In the application of RSDA, three main steps based on rough set theory must be carried out, viz. pre-processing, attribute reduction, and rule induction. The first step is pre-processing. This step enables the researcher to see the quality of classification and the accuracy of each of the categories of the decision attribute by dividing the lower approximation by the upper approximation of each category. In other words, if quality and accuracy of classification is lower than 1, then the chosen data and examples in the sample are not fully unambiguous concerning their allocation to the categories of decision attribute. This step strengthens the conclusions made on the basis of the other steps of the rough set analysis. The second step of RSDA – the reduction – is used to form all combinations of condition attributes that can completely determine the variation in the decision attribute without needing another condition. In other words, in this step, minimal sets of attributes are found, and these are called reducts. While finding reducts, RSDA can also find the frequency of appearance of all condition attributes in the reducts. If among them, one or more attributes has a frequency of 100%, this is called the core. The third and last step is rule induction. This provides rules which explain both the exact and the approximate relations between the decision and the condition attributes. An exact rule guarantees that the values of the decision attributes correspond to the same values of the condition attributes. Therefore, only in this case
271
is it always possible to state with certainty whether an object belongs to a certain class of the decision attribute. In addition, if a rule is supported by more objects, then it is more important, for instance, in summarizing the different single study results. This is generally considered as an “if…then…”clause. A rule can be both deterministic and non-deterministic. A deterministic rule guarantees correspondence of the same categories of a decision attribute with the same condition attributes. In other words, a non-deterministic rule offers possibilities of correspondence of the same categories of a condition attribute with more than one decision attribute category. Another indicator can be the strength and support of the rules by cases. If a rule is supported by more objects, and it has a high percentage frequency, then it is more significant and important when summarizing different study results.
Z-Test3 A Z-test is any statistical test for which the distribution of the test statistic under the null hypothesis can be approximated by a normal distribution. Due to the central limit theorem, many test statistics are approximately normally distributed for large samples. Therefore, many statistical tests can be performed as approximate Z-tests if the sample size is not too small. In addition, some statistical tests, such as comparisons of means between two samples, or a comparison of the mean of one sample to a given constant, are exact Z-tests under certain assumptions. The most general way to obtain a Z-test is to define a numerical test statistic that can be calculated from a collection of data, such that the sampling distribution of the statistic is approximately normal under the null hypothesis. Statistics that are averages (or approximate averages) of approximately independent data values are generally well-approximated by a normal distribution.
3 Wikipedia, 2009.

272
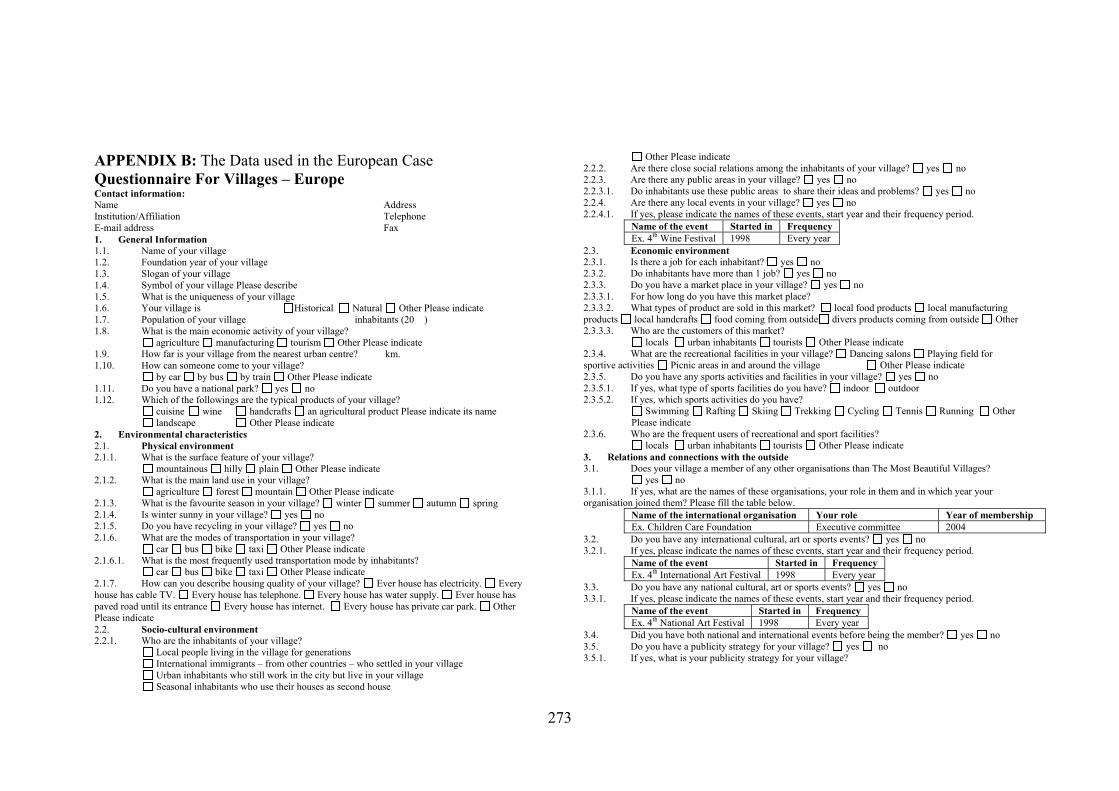
273
APPENDIX B: The Data used in the European Case Questionnaire For Villages – Europe Contact information: Name Address Institution/Affiliation Telephone E-mail address Fax 1. General Information 1.1. Name of your village 1.2. Foundation year of your village 1.3. Slogan of your village 1.4. Symbol of your village Please describe 1.5. What is the uniqueness of your village 1.6. Your village is Historical Natural Other Please indicate 1.7. Population of your village inhabitants (20 ) 1.8. What is the main economic activity of your village?
agriculture manufacturing tourism Other Please indicate 1.9. How far is your village from the nearest urban centre? km. 1.10. How can someone come to your village?
by car by bus by train Other Please indicate 1.11. Do you have a national park? yes no 1.12. Which of the followings are the typical products of your village?
cuisine wine handcrafts an agricultural product Please indicate its name landscape Other Please indicate
2. Environmental characteristics 2.1. Physical environment 2.1.1. What is the surface feature of your village?
mountainous hilly plain Other Please indicate 2.1.2. What is the main land use in your village?
agriculture forest mountain Other Please indicate 2.1.3. What is the favourite season in your village? winter summer autumn spring 2.1.4. Is winter sunny in your village? yes no 2.1.5. Do you have recycling in your village? yes no 2.1.6. What are the modes of transportation in your village?
car bus bike taxi Other Please indicate 2.1.6.1. What is the most frequently used transportation mode by inhabitants?
car bus bike taxi Other Please indicate 2.1.7. How can you describe housing quality of your village? Ever house has electricity. Every house has cable TV. Every house has telephone. Every house has water supply. Ever house has paved road until its entrance Every house has internet. Every house has private car park. Other Please indicate 2.2. Socio-cultural environment 2.2.1. Who are the inhabitants of your village?
Local people living in the village for generations International immigrants – from other countries – who settled in your village Urban inhabitants who still work in the city but live in your village Seasonal inhabitants who use their houses as second house
Other Please indicate 2.2.2. Are there close social relations among the inhabitants of your village? yes no 2.2.3. Are there any public areas in your village? yes no 2.2.3.1. Do inhabitants use these public areas to share their ideas and problems? yes no 2.2.4. Are there any local events in your village? yes no 2.2.4.1. If yes, please indicate the names of these events, start year and their frequency period.
Name of the event Started in Frequency Ex. 4th Wine Festival 1998 Every year
2.3. Economic environment 2.3.1. Is there a job for each inhabitant? yes no 2.3.2. Do inhabitants have more than 1 job? yes no 2.3.3. Do you have a market place in your village? yes no 2.3.3.1. For how long do you have this market place? 2.3.3.2. What types of product are sold in this market? local food products local manufacturing products local handcrafts food coming from outside divers products coming from outside Other 2.3.3.3. Who are the customers of this market?
locals urban inhabitants tourists Other Please indicate 2.3.4. What are the recreational facilities in your village? Dancing salons Playing field for sportive activities Picnic areas in and around the village Other Please indicate 2.3.5. Do you have any sports activities and facilities in your village? yes no 2.3.5.1. If yes, what type of sports facilities do you have? indoor outdoor 2.3.5.2. If yes, which sports activities do you have?
Swimming Rafting Skiing Trekking Cycling Tennis Running Other Please indicate
2.3.6. Who are the frequent users of recreational and sport facilities? locals urban inhabitants tourists Other Please indicate
3. Relations and connections with the outside 3.1. Does your village a member of any other organisations than The Most Beautiful Villages?
yes no 3.1.1. If yes, what are the names of these organisations, your role in them and in which year your organisation joined them? Please fill the table below.
Name of the international organisation Your role Year of membership Ex. Children Care Foundation Executive committee 2004
3.2. Do you have any international cultural, art or sports events? yes no 3.2.1. If yes, please indicate the names of these events, start year and their frequency period.
Name of the event Started in Frequency Ex. 4th International Art Festival 1998 Every year
3.3. Do you have any national cultural, art or sports events? yes no 3.3.1. If yes, please indicate the names of these events, start year and their frequency period.
Name of the event Started in Frequency Ex. 4th National Art Festival 1998 Every year
3.4. Did you have both national and international events before being the member? yes no 3.5. Do you have a publicity strategy for your village? yes no 3.5.1. If yes, what is your publicity strategy for your village?
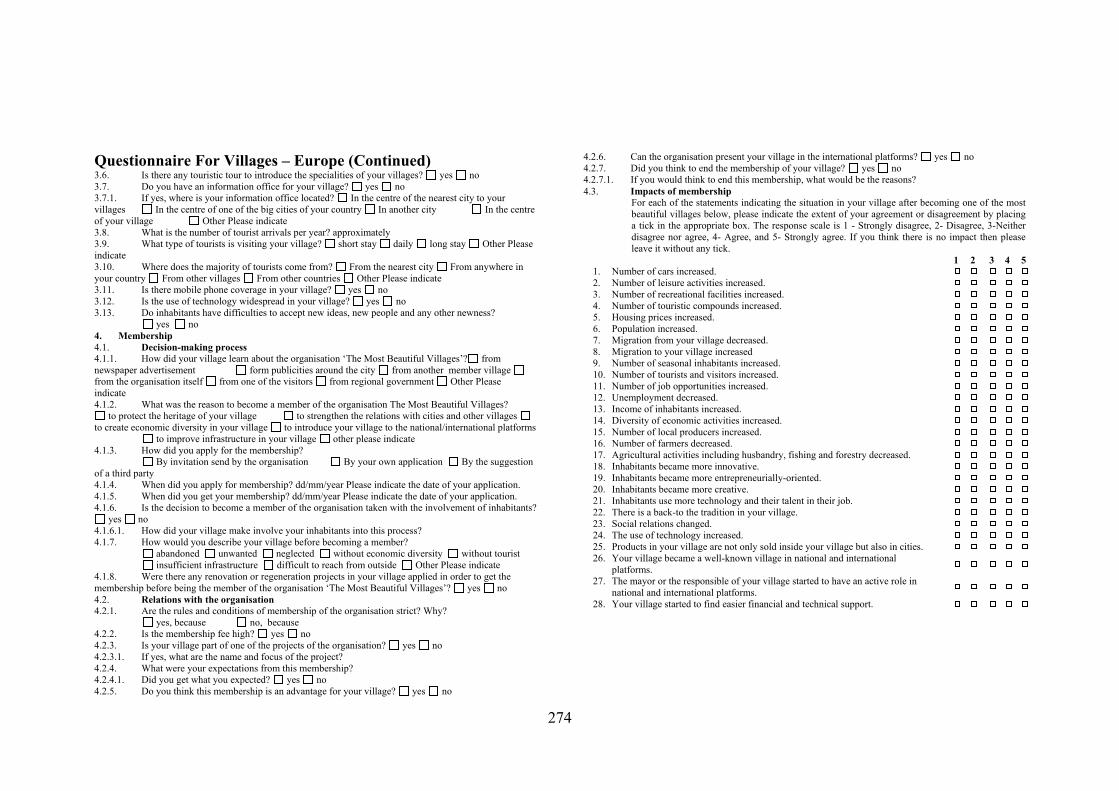
274
Questionnaire For Villages – Europe (Continued) 3.6. Is there any touristic tour to introduce the specialities of your villages? yes no 3.7. Do you have an information office for your village? yes no 3.7.1. If yes, where is your information office located? In the centre of the nearest city to your villages In the centre of one of the big cities of your country In another city In the centre of your village Other Please indicate 3.8. What is the number of tourist arrivals per year? approximately 3.9. What type of tourists is visiting your village? short stay daily long stay Other Please indicate 3.10. Where does the majority of tourists come from? From the nearest city From anywhere in your country From other villages From other countries Other Please indicate 3.11. Is there mobile phone coverage in your village? yes no 3.12. Is the use of technology widespread in your village? yes no 3.13. Do inhabitants have difficulties to accept new ideas, new people and any other newness?
yes no 4. Membership 4.1. Decision-making process 4.1.1. How did your village learn about the organisation ‘The Most Beautiful Villages’? from newspaper advertisement form publicities around the city from another member village from the organisation itself from one of the visitors from regional government Other Please indicate 4.1.2. What was the reason to become a member of the organisation The Most Beautiful Villages?
to protect the heritage of your village to strengthen the relations with cities and other villages to create economic diversity in your village to introduce your village to the national/international platforms
to improve infrastructure in your village other please indicate 4.1.3. How did you apply for the membership?
By invitation send by the organisation By your own application By the suggestion of a third party 4.1.4. When did you apply for membership? dd/mm/year Please indicate the date of your application. 4.1.5. When did you get your membership? dd/mm/year Please indicate the date of your application. 4.1.6. Is the decision to become a member of the organisation taken with the involvement of inhabitants?
yes no 4.1.6.1. How did your village make involve your inhabitants into this process? 4.1.7. How would you describe your village before becoming a member?
abandoned unwanted neglected without economic diversity without tourist insufficient infrastructure difficult to reach from outside Other Please indicate
4.1.8. Were there any renovation or regeneration projects in your village applied in order to get the membership before being the member of the organisation ‘The Most Beautiful Villages’? yes no 4.2. Relations with the organisation 4.2.1. Are the rules and conditions of membership of the organisation strict? Why?
yes, because no, because 4.2.2. Is the membership fee high? yes no 4.2.3. Is your village part of one of the projects of the organisation? yes no 4.2.3.1. If yes, what are the name and focus of the project? 4.2.4. What were your expectations from this membership? 4.2.4.1. Did you get what you expected? yes no 4.2.5. Do you think this membership is an advantage for your village? yes no
4.2.6. Can the organisation present your village in the international platforms? yes no 4.2.7. Did you think to end the membership of your village? yes no 4.2.7.1. If you would think to end this membership, what would be the reasons? 4.3. Impacts of membership
For each of the statements indicating the situation in your village after becoming one of the most beautiful villages below, please indicate the extent of your agreement or disagreement by placing a tick in the appropriate box. The response scale is 1 - Strongly disagree, 2- Disagree, 3-Neither disagree nor agree, 4- Agree, and 5- Strongly agree. If you think there is no impact then please leave it without any tick.
1 2 3 4 5 1. Number of cars increased.
2. Number of leisure activities increased.
3. Number of recreational facilities increased.
4. Number of touristic compounds increased.
5. Housing prices increased.
6. Population increased.
7. Migration from your village decreased.
8. Migration to your village increased
9. Number of seasonal inhabitants increased.
10. Number of tourists and visitors increased.
11. Number of job opportunities increased.
12. Unemployment decreased.
13. Income of inhabitants increased.
14. Diversity of economic activities increased.
15. Number of local producers increased.
16. Number of farmers decreased.
17. Agricultural activities including husbandry, fishing and forestry decreased.
18. Inhabitants became more innovative.
19. Inhabitants became more entrepreneurially-oriented.
20. Inhabitants became more creative.
21. Inhabitants use more technology and their talent in their job.
22. There is a back-to the tradition in your village.
23. Social relations changed.
24. The use of technology increased.
25. Products in your village are not only sold inside your village but also in cities.
26. Your village became a well-known village in national and international platforms.
27. The mayor or the responsible of your village started to have an active role in national and international platforms.
28. Your village started to find easier financial and technical support.

275
Table B.1: Database and scores of rural creative capacity – The European case
Village Country Creative Capacity
Tra
ditio
n
Tec
hnol
ogy
Hum
an
Cap
ital
Cre
ativ
e
Act
ivity
Eco
nom
ic
Dis
tanc
e
Soci
al
Dis
tanc
e
Phys
ical
D
ista
nce
Lagrasse France 0.50 3 4 4 3 4 3 4 San Donato Val di Comino Italy 0.53 4 4 4 4 3 2 4 Gordes France -2.40 0 0 0 0 0 0 0 Morano Calabro Italy 0.00 5 2 3 4 0 3 3 Saint Lizier France -0.86 2 2 2 2 0 2 3 Fources France -0.16 2 3 2 3 3 3 3 Novara di Sicilia Italy 0.06 4 3 2 2 2 4 4 La Flotte-en-Re France 0.76 4 4 5 4 4 3 3 Gourdon France 0.59 3 4 3 3 5 3 5 Bova Italy 0.31 4 4 3 3 3 3 3 Bienno Italy 0.42 4 4 4 3 3 3 3 Volpedo Italy 0.42 4 4 4 3 4 3 2 Neive Italy 0.62 4 3 4 4 4 3 4 Zavattarello Italy -1.36 2 1 1 1 1 1 2 Fagagna Italy 0.11 4 4 3 3 2 3 2 Castel di Tora Italy 1.21 5 5 5 5 0 5 5 Geraci Siculo Italy 1.00 5 4 4 4 4 4 4 Civita di Bagnoregio Italy -0.99 2 3 1 1 1 1 3 Gradara Italy 0.32 4 3 3 4 3 3 3 Cusano Mutri Italy 0.46 4 4 4 4 2 3 3 Mombaldone Italy -0.29 4 3 2 2 3 2 2 Borgio Verezzi Italy -2.40 0 0 0 0 0 0 0 Castel del Monte Italy 0.96 4 4 5 4 4 3 5 Furore Italy 0.91 5 4 5 4 5 4 1 Saint Quirin France -1.96 0 0 4 0 0 0 0 Orvinio Italy 0.23 4 4 2 3 2 4 3 Tourtour France -0.17 3 3 3 2 1 3 4 Giglio Castello Italy 0.04 5 4 3 2 3 1 3 Stilo Italy -0.55 3 2 1 2 3 2 3 Sauveterre de Rouergue France 1.70 5 5 5 5 5 5 5 Oramala Italy -2.40 0 0 0 0 0 0 0 Sainte Agnes France 1.70 5 5 5 5 5 5 5 Vernazza Italy 0.71 4 4 4 4 4 5 1 Cutigliano Italy -0.52 2 2 2 3 3 2 2 La Roche-Guyon France -1.58 1 1 1 1 1 1 1 La Bastide Clairence France 0.54 4 4 2 4 4 3 4 Asolo Italy -0.26 4 4 2 2 2 2 2 Moresco Italy 0.80 5 4 4 4 4 4 2 Montsoreau France 0.29 4 3 4 3 3 3 3 Pettorano sul Gizio L'Aqu Italy 0.47 5 4 2 3 4 5 1 Bettona Italy -2.40 0 0 0 0 0 0 0 Le Bec Hellouin France 0.18 4 3 3 3 2 3 4 Saint Benoit du Sault France 0.19 3 3 3 3 3 4 3 Ars en Re France 0.39 4 3 4 3 4 3 3 Crupet Belgium 0.07 3 3 4 3 2 3 3 Chardeneux Belgium 0.14 4 2 4 2 2 4 4 Pietracamela Italy 0.65 4 4 3 4 4 3 4 Campo Ligure Italy -2.40 0 0 0 0 0 0 0 Navelli Italy -0.19 3 3 3 3 3 1 3 Mirmande France 0.79 4 4 5 4 2 4 4 Belves France 0.98 3 5 5 4 4 3 5 Montefioralle Italy 0.04 3 3 1 3 4 3 4 Canale Italy -0.76 2 2 2 2 2 2 2 Chiusa Italy 0.30 5 3 3 3 3 3 3 Roussillon France 0.86 3 4 4 4 4 4 5 Brisighella Italy 0.40 3 4 4 3 4 3 3 Massa Martana Italy -0.49 4 3 2 2 2 2 1 Ricetto di Candelo Italy 0.99 4 4 5 4 4 4 4 Buonconvento Italy 0.28 4 3 3 3 3 3 4 Offida Italy 0.21 3 3 4 4 4 3 1
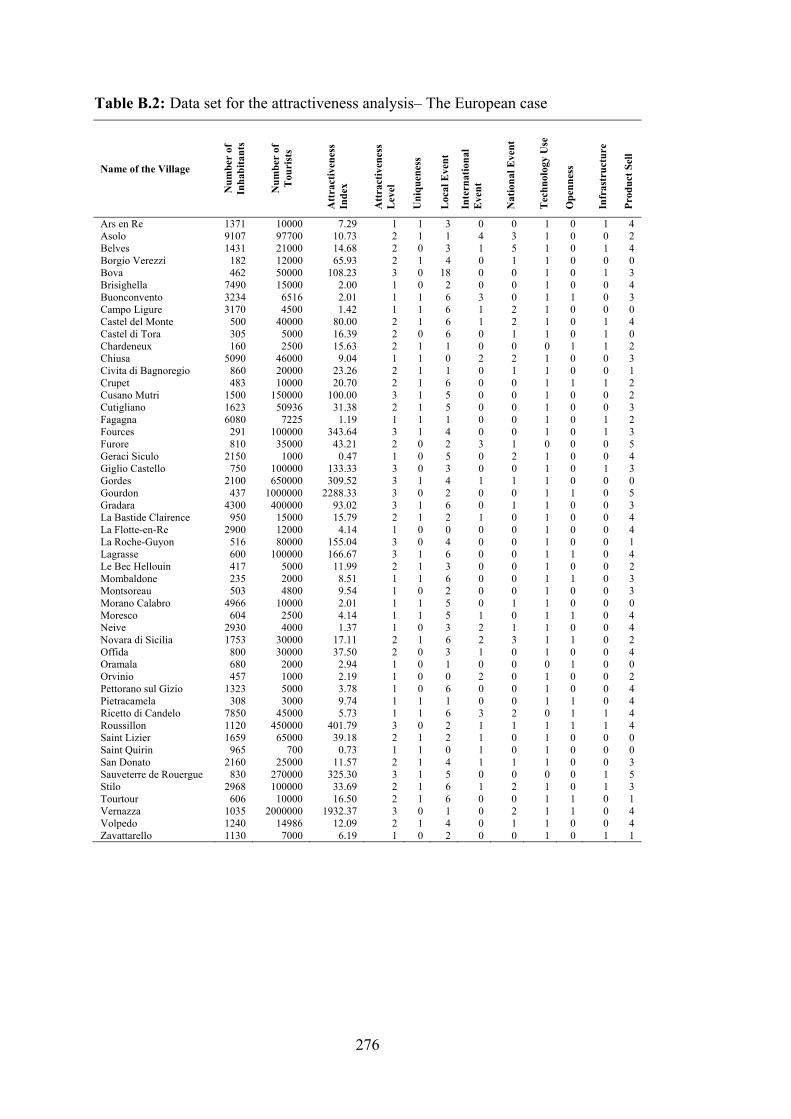
276
Table B.2: Data set for the attractiveness analysis– The European case
Name of the Village
Num
ber
of
Inha
bita
nts
Num
ber
of
Tou
rist
s
Att
ract
iven
ess
Inde
x
Att
ract
iven
ess
Lev
el
Uni
quen
ess
Loc
al E
vent
Inte
rnat
iona
l E
vent
Nat
iona
l Eve
nt
Tec
hnol
ogy
Use
Ope
nnes
s
Infr
astr
uctu
re
Prod
uct S
ell
Ars en Re 1371 10000 7.29 1 1 3 0 0 1 0 1 4 Asolo 9107 97700 10.73 2 1 1 4 3 1 0 0 2 Belves 1431 21000 14.68 2 0 3 1 5 1 0 1 4 Borgio Verezzi 182 12000 65.93 2 1 4 0 1 1 0 0 0 Bova 462 50000 108.23 3 0 18 0 0 1 0 1 3 Brisighella 7490 15000 2.00 1 0 2 0 0 1 0 0 4 Buonconvento 3234 6516 2.01 1 1 6 3 0 1 1 0 3 Campo Ligure 3170 4500 1.42 1 1 6 1 2 1 0 0 0 Castel del Monte 500 40000 80.00 2 1 6 1 2 1 0 1 4 Castel di Tora 305 5000 16.39 2 0 6 0 1 1 0 1 0 Chardeneux 160 2500 15.63 2 1 1 0 0 0 1 1 2 Chiusa 5090 46000 9.04 1 1 0 2 2 1 0 0 3 Civita di Bagnoregio 860 20000 23.26 2 1 1 0 1 1 0 0 1 Crupet 483 10000 20.70 2 1 6 0 0 1 1 1 2 Cusano Mutri 1500 150000 100.00 3 1 5 0 0 1 0 0 2 Cutigliano 1623 50936 31.38 2 1 5 0 0 1 0 0 3 Fagagna 6080 7225 1.19 1 1 1 0 0 1 0 1 2 Fources 291 100000 343.64 3 1 4 0 0 1 0 1 3 Furore 810 35000 43.21 2 0 2 3 1 0 0 0 5 Geraci Siculo 2150 1000 0.47 1 0 5 0 2 1 0 0 4 Giglio Castello 750 100000 133.33 3 0 3 0 0 1 0 1 3 Gordes 2100 650000 309.52 3 1 4 1 1 1 0 0 0 Gourdon 437 1000000 2288.33 3 0 2 0 0 1 1 0 5 Gradara 4300 400000 93.02 3 1 6 0 1 1 0 0 3 La Bastide Clairence 950 15000 15.79 2 1 2 1 0 1 0 0 4 La Flotte-en-Re 2900 12000 4.14 1 0 0 0 0 1 0 0 4 La Roche-Guyon 516 80000 155.04 3 0 4 0 0 1 0 0 1 Lagrasse 600 100000 166.67 3 1 6 0 0 1 1 0 4 Le Bec Hellouin 417 5000 11.99 2 1 3 0 0 1 0 0 2 Mombaldone 235 2000 8.51 1 1 6 0 0 1 1 0 3 Montsoreau 503 4800 9.54 1 0 2 0 0 1 0 0 3 Morano Calabro 4966 10000 2.01 1 1 5 0 1 1 0 0 0 Moresco 604 2500 4.14 1 1 5 1 0 1 1 0 4 Neive 2930 4000 1.37 1 0 3 2 1 1 0 0 4 Novara di Sicilia 1753 30000 17.11 2 1 6 2 3 1 1 0 2 Offida 800 30000 37.50 2 0 3 1 0 1 0 0 4 Oramala 680 2000 2.94 1 0 1 0 0 0 1 0 0 Orvinio 457 1000 2.19 1 0 0 2 0 1 0 0 2 Pettorano sul Gizio 1323 5000 3.78 1 0 6 0 0 1 0 0 4 Pietracamela 308 3000 9.74 1 1 1 0 0 1 1 0 4 Ricetto di Candelo 7850 45000 5.73 1 1 6 3 2 0 1 1 4 Roussillon 1120 450000 401.79 3 0 2 1 1 1 1 1 4 Saint Lizier 1659 65000 39.18 2 1 2 1 0 1 0 0 0 Saint Quirin 965 700 0.73 1 1 0 1 0 1 0 0 0 San Donato 2160 25000 11.57 2 1 4 1 1 1 0 0 3 Sauveterre de Rouergue 830 270000 325.30 3 1 5 0 0 0 0 1 5 Stilo 2968 100000 33.69 2 1 6 1 2 1 0 1 3 Tourtour 606 10000 16.50 2 1 6 0 0 1 1 0 1 Vernazza 1035 2000000 1932.37 3 0 1 0 2 1 1 0 4 Volpedo 1240 14986 12.09 2 1 4 0 1 1 0 0 4 Zavattarello 1130 7000 6.19 1 0 2 0 0 1 0 1 1

277
Table B.3: Studies used in the embeddedness analysis – The European case
Table B.4: Information table of the embeddedness analysis – The European case
ID Year of publication
Year of data
Sample size Continent Gender Origin Locality Externality Sector EL
01A 1997 1993 118 Other 81 0 92.7 35.4 other 3 02A 2000 1995 2 Europe 0 100 100 0 tourism 3 03A 2000 1995 8 Europe 50 100 50 87.5 other 4 03B 2000 1995 6 Europe 0 0 66 17 other 3 04A 2001 2000 1 Other 100 100 100 0 other 3 04B 2001 2000 1 Other 100 100 0 0 other 2 04C 2001 2000 1 Other 100 100 50 50 other 4 04D 2001 2000 1 Other 100 0 100 50 other 4 05A 2002 2001 1 Europe 100 100 100 0 other 3 05B 2002 2001 1 Europe 0 100 0 0 tourism 2 05C 2002 2001 5 Europe 40 60 100 80 other 4 06A 2004 1999 2 Europe 0 50 100 0 traditional 3 07A 2005 2000 127 Europe 20 52 88.8 8.39 tourism 3 07B 2005 2000 215 Europe 20 52 12.49 10.33 tourism 2 07C 2005 2000 58 Europe 20 52 88.36 84.24 tourism 4 07D 2005 2000 113 Europe 20 52 16.81 90.3 other 1 08A 2005 1999 96 Europe NA 65.6 54.6 40.7 other 3 09A 2006 2001 56 Europe 48 30 62.9 40 traditional 3 09B 2006 2001 20 Europe 55 100 39.2 64.4 other 1 09C 2006 2001 24 Europe 20 80 35.5 55.6 other 1 10A 2006 2000 16 Europe 31.25 0 100 0 other 3 10B 2006 2000 34 Europe 38.23 100 50 100 other 4 11A 2006 2000 486 Other 38 0 100 0 other 3 12A 2006 2003 5 Europe 40 0 100 0 traditional 3 12B 2006 2003 7 Europe 43 15 less 0 other 2 12C 2006 2003 6 Europe 50 100 very low 100 other 1 13A 2006 2005 2 Other 0 50 <50 over 50 other 2 14A 2006 2002 5 Other 100 100 100 0 traditional 3 15A 2007 2005 27 Europe > 50 100 100 60 tourism 4 15B 2007 2005 31 Europe > 50 100 39 83 tourism 2 16A 2007 2005 4 Other 25 100 0 100 other 1
ID Author(s) name Year of publication
Type of publication Continent Sample
size
Number of cases
retrieved 1 Smith S M et al. 1997 Journal America 118 1 2 Anderson A R (a) 2000 Journal Europe 2 1 3 Anderson A R (b) 2000 Journal Europe 14 2 4 Mankelow G and Merrilees B 2001 Journal Oceania 4 4 5 Jack S L and Anderson A R 2002 Journal Europe 7 3 6 Zontanos G and Anderson A R 2004 Journal Europe 2 1 7 Skuras D et al. 2005 Journal Europe 513 4 8 Psatopoulos D et al. 2005 Journal Europe 96 1 9 Anderson A R and McKain R 2005 Journal Europe 50 2
10 Kalantaridis C and Bika Z(b) 2006 Journal Europe 100 3 11 Zhang J et al. 2006 Journal Asia 486 1 12 Aitken K 2006 Report Europe 18 3 13 Siemens L 2006 Paper America 2 1 14 Weber S S 2007 Journal America 5 1 15 Stone I and Stubbs C 2007 Journal Europe 58 2 16 Gomez Velasco M and Saleilles S 2007 Paper Europe 4 1
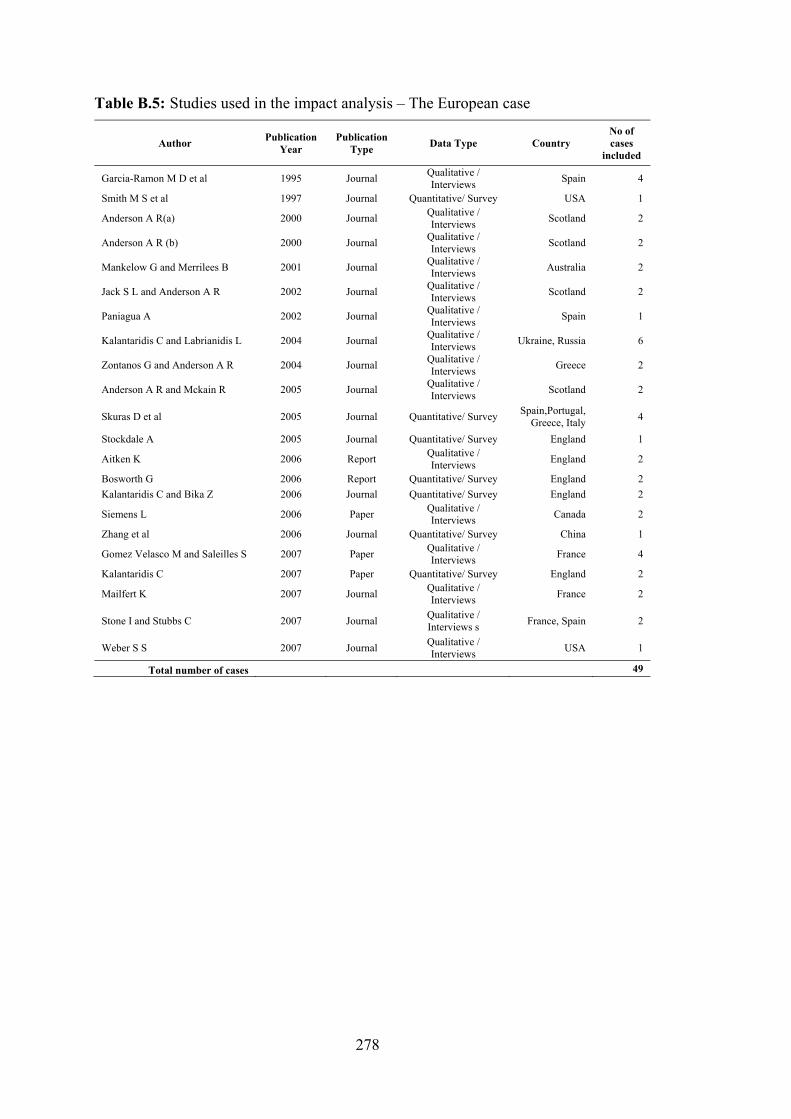
278
Table B.5: Studies used in the impact analysis – The European case
Author Publication Year
Publication Type Data Type Country
No of cases
included
Garcia-Ramon M D et al 1995 Journal Qualitative / Interviews Spain 4
Smith M S et al 1997 Journal Quantitative/ Survey USA 1
Anderson A R(a) 2000 Journal Qualitative / Interviews Scotland 2
Anderson A R (b) 2000 Journal Qualitative / Interviews Scotland 2
Mankelow G and Merrilees B 2001 Journal Qualitative / Interviews Australia 2
Jack S L and Anderson A R 2002 Journal Qualitative / Interviews Scotland 2
Paniagua A 2002 Journal Qualitative / Interviews Spain 1
Kalantaridis C and Labrianidis L 2004 Journal Qualitative / Interviews Ukraine, Russia 6
Zontanos G and Anderson A R 2004 Journal Qualitative / Interviews Greece 2
Anderson A R and Mckain R 2005 Journal Qualitative / Interviews Scotland 2
Skuras D et al 2005 Journal Quantitative/ Survey Spain,Portugal, Greece, Italy 4
Stockdale A 2005 Journal Quantitative/ Survey England 1
Aitken K 2006 Report Qualitative / Interviews England 2
Bosworth G 2006 Report Quantitative/ Survey England 2 Kalantaridis C and Bika Z 2006 Journal Quantitative/ Survey England 2
Siemens L 2006 Paper Qualitative / Interviews Canada 2
Zhang et al 2006 Journal Quantitative/ Survey China 1
Gomez Velasco M and Saleilles S 2007 Paper Qualitative / Interviews France 4
Kalantaridis C 2007 Paper Quantitative/ Survey England 2
Mailfert K 2007 Journal Qualitative / Interviews France 2
Stone I and Stubbs C 2007 Journal Qualitative / Interviews s France, Spain 2
Weber S S 2007 Journal Qualitative / Interviews USA 1
Total number of cases 49

279
Table B.6: Information table of the impact analysis – The European case
AUTHORS
Dat
ayea
r
Reg
ion
Obs
Rem
ote
Ori
gin
Gen
der
Age
Edu
catio
n
Agr
icul
ture
Tou
rism
Oth
erse
ctor
s
Qol
Loc
ality
Fam
ily/e
mpl
oym
ent
Subs
idy
Nat
ural
Man
mad
e
Soci
al
Hum
an
Garcia-Ramon et al. 1992 1 7 0 0 1 0 1 1 1 0 0 1 1 0 1 1 0 0Garcia-Ramon et al. 1992 1 7 0 1 1 0 1 0 1 0 1 1 0 0 1 1 0 1Garcia-Ramon et al. 1992 1 7 1 0 1 1 0 0 1 0 0 1 1 1 1 1 1 0Garcia-Ramon et al. 1992 1 7 1 1 1 1 0 0 1 0 1 1 0 1 1 1 1 0Smith et al. 1993 0 118 0 0 0 0 0 0 0 1 0 1 0 0 0 0 1 1Anderson - a 1995 1 1 1 1 0 0 1 0 1 0 1 1 0 0 0 1 0 0Anderson - a 1995 1 1 1 1 1 1 0 0 1 0 0 1 1 0 0 0 1 0Anderson - b 1995 1 9 1 1 0 . 1 1 1 1 1 1 0 0 1 1 0 1Anderson - b 1995 1 5 1 0 0 . 0 1 0 1 0 1 1 0 1 1 1 1Mankelow and Merrilees 2000 0 3 1 0 1 1 1 0 0 1 1 0 0 0 0 0 1 1Mankelow and Merrilees 2000 0 1 1 1 1 1 1 0 0 1 0 0 1 0 0 0 1 0Jack and Anderson 1998 1 5 1 1 0 . 1 0 1 1 1 1 1 0 0 0 1 0Jack and Anderson 1998 1 2 1 0 0 . 0 0 0 1 1 1 1 0 0 0 1 0Paniagua 2001 1 44 0 1 0 . 1 0 1 0 1 1 1 1 0 0 1 1Kalantaridis and Labrianidis 2001 1 17 1 1 0 1 1 0 0 1 1 0 0 0 0 1 1 0Kalantaridis and Labrianidis 2001 1 83 1 0 0 0 0 1 0 1 0 0 0 0 0 0 1 1Kalantaridis and Labrianidis 2001 1 74 0 1 0 1 1 1 0 1 1 1 0 0 0 1 0 1Kalantaridis and Labrianidis 2001 1 26 0 0 1 0 1 0 0 1 0 0 1 0 0 0 0 0Kalantaridis and Labrianidis 2001 1 34 1 1 0 1 1 1 0 1 1 0 0 0 0 1 0 1Kalantaridis and Labrianidis 2001 1 66 1 0 0 0 0 1 0 1 0 0 1 0 0 0 1 1Zontanos and Anderson 1999 1 1 1 0 0 1 0 1 0 0 0 1 1 0 0 0 1 1Zontanos and Anderson 1999 1 1 1 1 0 0 0 1 0 0 1 1 1 0 0 0 1 1Anderson and McCain 2000 1 16 0 0 0 . 0 0 1 1 0 1 1 0 0 0 1 0Anderson and McCain 2000 1 34 0 1 0 . 1 0 1 1 1 1 0 0 0 0 1 0Skuras et al. 2000 1 111 1 0 0 0 1 1 0 0 0 0 1 0 1 0 . 0Skuras et al. 2000 1 123 1 1 0 1 1 0 1 1 1 1 1 0 0 0 . 1Skuras et al. 2000 1 154 1 1 0 1 0 1 1 0 0 0 0 0 0 0 . 0Skuras et al. 2000 1 125 0 1 0 0 1 0 0 1 1 1 1 0 0 1 . 1Stockdale 1997 1 128 0 1 0 . . 0 0 1 1 0 0 0 0 1 0 1Aitken K 2006 1 12 0 0 0 0 1 0 0 1 0 1 1 0 0 0 1 0Aitken K 2006 1 6 0 1 0 0 1 0 0 1 0 1 0 0 0 0 1 0Bosworth 2002 1 269 0 1 0 . . 1 0 0 . . . . 0 0 0 1Bosworth 2002 1 403 0 0 0 . . 0 0 1 . . . . 0 0 0 1Kalantaridis and Bika 2001 1 62 1 1 0 1 1 0 0 1 0 0 1 0 0 0 1 1Kalantaridis and Bika 2001 1 37 1 0 0 0 0 1 0 1 0 1 1 0 0 0 1 1Siemens 2005 0 1 1 1 0 0 1 0 0 1 1 0 0 0 0 0 1 1Siemens 2005 0 1 1 1 0 1 1 0 0 1 1 0 0 0 0 0 1 1Zhang et 2000 1 473 0 0 0 0 0 0 0 1 0 0 1 0 0 0 0 1Gomez Velasco and Saleilles 2005 1 1 0 1 0 0 0 0 0 1 1 0 1 0 0 0 0 0Gomez Velasco and Saleilles 2005 1 1 0 1 0 1 1 0 0 1 0 0 0 0 0 0 0 0Gomez Velasco and Saleilles 2005 1 1 0 1 1 1 1 0 0 1 1 0 0 0 0 0 0 0Gomez Velasco and Saleilles 2005 1 1 0 1 0 1 0 0 0 1 1 0 0 0 0 0 0 0Kalantaridis 2006 1 191 0 0 0 0 0 0 0 1 . 1 0 0 0 0 1 1Kalantaridis 2006 1 50 0 1 0 1 0 0 0 1 . 0 0 0 0 0 1 1Mailfert 2006 1 10 1 1 0 0 1 1 0 0 1 0 0 1 0 0 0 0Mailfert 2006 1 10 1 0 0 0 1 1 0 0 0 1 1 1 0 0 1 0Stone and Stubbs 2005 1 27 1 1 0 1 1 0 0 1 1 1 0 0 1 1 1 1Stone and Stubbs 2005 1 31 1 1 0 1 0 0 0 1 1 0 0 0 1 1 1 1Weber 2002 0 5 1 0 1 0 0 1 0 0 0 0 1 0 0 0 1 1
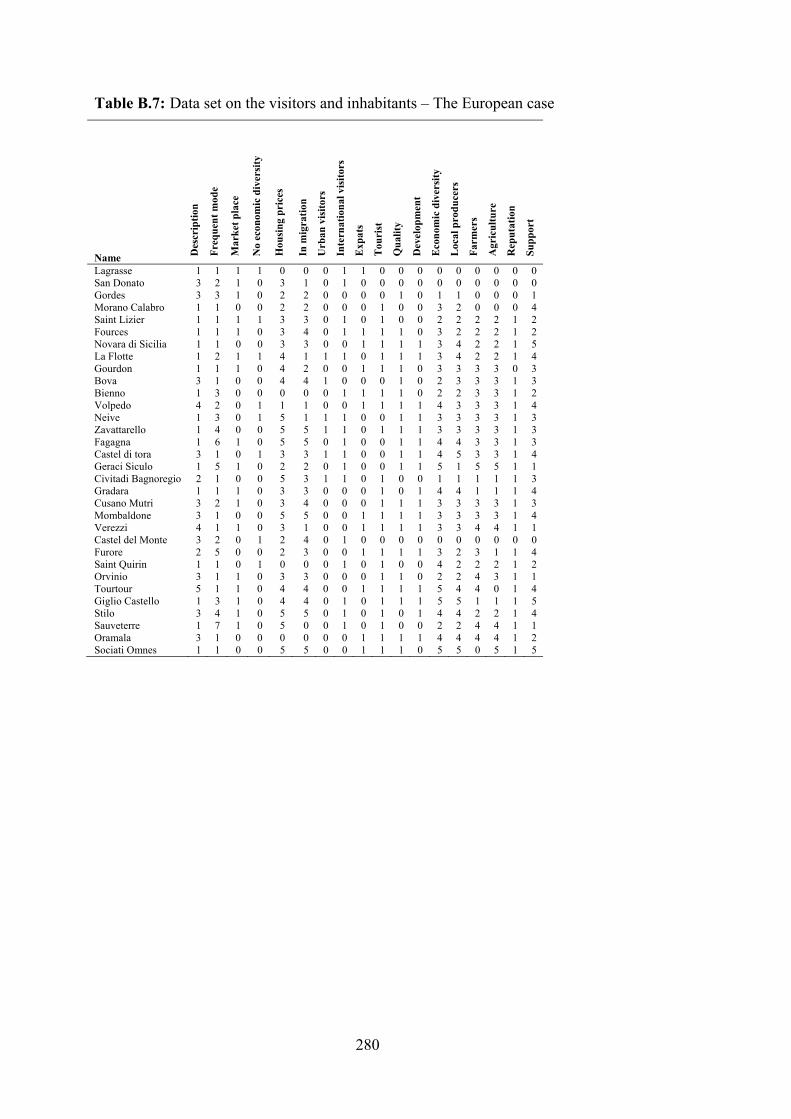
280
Table B.7: Data set on the visitors and inhabitants – The European case
Name Des
crip
tion
Freq
uent
mod
e
Mar
ket p
lace
No
econ
omic
div
ersi
ty
Hou
sing
pri
ces
In m
igra
tion
Urb
an v
isito
rs
Inte
rnat
iona
l vis
itors
Exp
ats
Tou
rist
Qua
lity
Dev
elop
men
t
Eco
nom
ic d
iver
sity
Loc
al p
rodu
cers
Farm
ers
Agr
icul
ture
Rep
utat
ion
Supp
ort
Lagrasse 1 1 1 1 0 0 0 1 1 0 0 0 0 0 0 0 0 0 San Donato 3 2 1 0 3 1 0 1 0 0 0 0 0 0 0 0 0 0 Gordes 3 3 1 0 2 2 0 0 0 0 1 0 1 1 0 0 0 1 Morano Calabro 1 1 0 0 2 2 0 0 0 1 0 0 3 2 0 0 0 4 Saint Lizier 1 1 1 1 3 3 0 1 0 1 0 0 2 2 2 2 1 2 Fources 1 1 1 0 3 4 0 1 1 1 1 0 3 2 2 2 1 2 Novara di Sicilia 1 1 0 0 3 3 0 0 1 1 1 1 3 4 2 2 1 5 La Flotte 1 2 1 1 4 1 1 1 0 1 1 1 3 4 2 2 1 4 Gourdon 1 1 1 0 4 2 0 0 1 1 1 0 3 3 3 3 0 3 Bova 3 1 0 0 4 4 1 0 0 0 1 0 2 3 3 3 1 3 Bienno 1 3 0 0 0 0 0 1 1 1 1 0 2 2 3 3 1 2 Volpedo 4 2 0 1 1 1 0 0 1 1 1 1 4 3 3 3 1 4 Neive 1 3 0 1 5 1 1 1 0 0 1 1 3 3 3 3 1 3 Zavattarello 1 4 0 0 5 5 1 1 0 1 1 1 3 3 3 3 1 3 Fagagna 1 6 1 0 5 5 0 1 0 0 1 1 4 4 3 3 1 3 Castel di tora 3 1 0 1 3 3 1 1 0 0 1 1 4 5 3 3 1 4 Geraci Siculo 1 5 1 0 2 2 0 1 0 0 1 1 5 1 5 5 1 1 Civitadi Bagnoregio 2 1 0 0 5 3 1 1 0 1 0 0 1 1 1 1 1 3 Gradara 1 1 1 0 3 3 0 0 0 1 0 1 4 4 1 1 1 4 Cusano Mutri 3 2 1 0 3 4 0 0 0 1 1 1 3 3 3 3 1 3 Mombaldone 3 1 0 0 5 5 0 0 1 1 1 1 3 3 3 3 1 4 Verezzi 4 1 1 0 3 1 0 0 1 1 1 1 3 3 4 4 1 1 Castel del Monte 3 2 0 1 2 4 0 1 0 0 0 0 0 0 0 0 0 0 Furore 2 5 0 0 2 3 0 0 1 1 1 1 3 2 3 1 1 4 Saint Quirin 1 1 0 1 0 0 0 1 0 1 0 0 4 2 2 2 1 2 Orvinio 3 1 1 0 3 3 0 0 0 1 1 0 2 2 4 3 1 1 Tourtour 5 1 1 0 4 4 0 0 1 1 1 1 5 4 4 0 1 4 Giglio Castello 1 3 1 0 4 4 0 1 0 1 1 1 5 5 1 1 1 5 Stilo 3 4 1 0 5 5 0 1 0 1 0 1 4 4 2 2 1 4 Sauveterre 1 7 1 0 5 0 0 1 0 1 0 0 2 2 4 4 1 1 Oramala 3 1 0 0 0 0 0 0 1 1 1 1 4 4 4 4 1 2 Sociati Omnes 1 1 0 0 5 5 0 0 1 1 1 0 5 5 0 5 1 5

281
APPENDIX C : The Data and Information used for the Turkish Case Table C.1: Results of the factor analysis of the rural structure of Turkey PROVINCE F1 F2 F3 F4 F5 R1 R2 PROVINCE F1 F2 F3 F4 F5 R1 R2 Adana -0.03 1.30 -0.39 0.80 0.52 -0.60 -1.38 Izmir 1.08 1.86 0.41 1.94 1.56 -2.97 -2.16 Adiyaman 0.07 -0.45 -0.50 -0.03 -0.84 1.70 0.70 Kahramanmaras 0.01 -0.43 -0.29 0.61 -0.36 1.68 1.09 Afyon 0.19 -0.78 -0.09 0.44 -0.37 1.49 1.32 Karabuk -0.63 1.29 -0.47 -1.00 0.47 -1.66 -2.59 Agri 0.05 -0.53 -0.50 0.05 -1.14 2.18 1.18 Karaman -0.14 -0.11 -0.32 -0.66 -0.29 0.20 -0.45 Aksaray 0.00 -0.62 -0.10 -0.69 -0.39 0.43 0.23 Kars -0.20 -0.36 -0.15 -0.47 -0.40 0.64 0.34 Amasya -0.24 0.37 -0.29 -0.39 -0.42 0.19 -0.38 Kastamonu 0.00 -0.84 -0.52 1.17 -0.78 3.31 2.27 Ankara 0.82 4.45 0.20 1.08 -1.18 -3.22 -2.81 Kayseri -0.19 0.94 -0.23 -0.13 0.02 -0.67 -1.13 Antalya -0.92 0.93 6.65 0.82 -0.68 -5.16 8.14 Kilis -0.41 0.85 -0.40 -1.30 -0.51 -0.84 -1.64 Ardahan 0.09 -1.33 0.11 -0.98 -0.74 0.89 1.11 Kirikkale -0.37 1.09 -0.35 -1.08 -0.34 -1.12 -1.81 Artvin -0.28 -0.39 0.34 -0.83 0.16 -0.65 0.02 Kirklareli -0.49 0.53 -0.40 -0.70 1.30 -1.64 -2.43 Aydin -0.21 -0.39 2.15 0.58 -0.08 -0.88 3.42 Kirsehir -0.18 0.14 -0.29 -0.77 -0.45 0.01 -0.57 Balikesir -0.23 -0.08 0.28 2.41 0.65 1.80 2.36 Kocaeli 0.55 -0.27 -0.36 -0.60 3.11 -3.64 -4.35 Bartin 0.17 -1.86 0.31 -0.97 0.17 0.23 0.85 Konya 0.24 0.22 -0.52 2.86 -0.75 3.68 2.63 Batman -0.12 0.50 -0.63 -0.90 -0.98 0.33 -0.94 Kutahya 0.03 -0.72 -0.34 0.35 -0.17 1.55 0.87 Bayburt -0.01 -1.02 0.10 -1.27 -0.58 0.24 0.43 Malatya -0.18 0.26 -0.14 0.13 -0.32 0.51 0.23 Bilecik -0.93 0.71 -1.48 -0.51 2.98 -1.80 -4.76 Manisa 0.25 -0.51 -0.51 2.28 0.12 2.92 1.91 Bingöl -0.08 -0.33 -0.10 -0.80 -1.05 0.76 0.56 Mardin -0.04 -0.37 -0.52 0.10 -0.53 1.55 0.51 Bitlis -0.05 0.07 -0.34 -0.65 -1.41 1.08 0.41 Mugla -0.78 -0.33 4.15 -0.04 0.83 -3.91 4.39 Bolu -0.35 -0.23 -0.18 0.06 1.48 -0.66 -1.02 Mus 0.31 -1.83 -0.01 -0.37 -1.01 2.16 2.15 Burdur -0.26 0.13 -0.06 -0.76 -0.01 -0.55 -0.68 Nevsehir 0.07 -0.98 0.47 -0.80 0.14 -0.50 0.44 Bursa 0.48 1.10 -0.51 1.48 1.38 -0.97 -2.00 Nigde 0.05 -1.31 0.24 -0.58 0.04 0.40 0.88 Canakkale -0.41 -0.20 0.23 0.52 0.92 -0.02 0.43 Ordu 0.34 -1.24 -0.33 0.85 -0.17 2.26 1.59 Cankiri -0.08 -0.34 -0.01 -0.73 -0.83 0.52 0.51 Osmaniye -0.09 0.90 -0.36 -0.89 -1.24 -0.10 -0.82 Corum 0.16 -0.37 -0.73 0.84 -0.55 2.33 0.87 Rize 0.03 -0.50 -0.06 -0.14 0.03 0.35 0.24 Denizli 0.16 -0.64 0.03 0.51 1.10 -0.14 -0.09 Sakarya 0.03 -0.22 -0.02 0.57 0.58 0.21 0.16 Diyarbakir -0.06 -0.14 -0.15 0.90 -0.22 1.46 1.17 Samsun 0.15 -0.37 -0.35 2.08 0.13 2.52 1.82 Duzce -0.01 -1.26 0.40 -0.59 0.15 0.13 0.93 Sanliurfa 0.04 -0.56 -0.76 1.68 -0.47 3.42 1.91 Edirne -0.50 1.01 0.07 -0.42 0.30 -1.31 -1.16 Siirt -0.47 0.63 -0.15 -0.97 -0.48 -0.51 -0.81 Elazig -0.48 0.60 -0.34 -0.02 0.29 -0.10 -0.78 Sinop -0.05 -1.04 0.07 -0.35 0.05 0.62 0.75 Erzincan -0.28 0.00 0.31 -0.50 -0.53 0.00 0.62 Sirnak -0.70 0.85 0.20 -1.31 -0.01 -1.66 -1.25 Erzurum -0.25 0.54 -0.45 1.15 -0.62 1.93 1.04 Sivas -0.06 -0.21 -0.67 2.02 -0.50 3.46 2.12 Eskisehir -0.60 2.38 -0.30 -0.31 -0.83 -0.96 -1.55 Tekirdag -0.41 0.45 -0.42 -0.26 2.37 -2.25 -3.08 Gaziantep -0.03 1.62 -1.11 -0.02 -0.11 -0.38 -2.61 Tokat 0.25 -0.87 -0.26 0.81 -0.93 2.62 2.11 Giresun 0.02 -0.77 -0.28 0.39 -0.04 1.45 0.89 Trabzon 0.19 -0.61 0.50 0.54 0.13 0.33 1.34 Gumushane 0.12 -1.30 0.16 -0.84 -0.79 0.97 1.29 Tunceli -0.94 1.60 0.19 -1.17 0.18 -2.19 -1.82 Hakkari -0.54 1.52 -0.21 -1.43 -1.42 -0.77 -1.19 Usak -0.15 -0.01 -0.60 -0.55 0.27 -0.06 -1.26 Hatay 0.14 -0.67 -0.04 0.42 0.20 0.79 0.71 Van 0.00 0.13 -0.43 0.11 -1.41 1.82 0.96 Icel 0.02 -0.08 0.67 1.36 0.52 0.23 1.57 Yalova -0.66 -0.16 0.44 -1.60 3.83 -5.05 -4.17 Igdir -0.14 -0.49 0.32 -1.33 -0.68 -0.36 0.29 Yozgat 0.13 -1.19 -0.33 0.59 -0.41 2.39 1.74 Isparta -0.29 0.84 -0.14 -0.35 -0.42 -0.34 -0.61 Zonguldak -0.03 -1.19 -0.42 0.06 2.04 -0.33 -1.17 Istanbul 8.33 0.68 0.90 -1.48 0.42 -11.81 -10.00 Notes: F1: Urban attractiveness; F2: Non-agriculture skilled employment potential; F3: New-rural attractiveness; F4: Agriculture; F5: Use of capacity for technology consumption; R1: Traditional rurality; R2: New-perspective of rurality.

282
Table C.2: NUTS 2 regions included in the 2nd stratification – The Turkish case Migration
NUTS2 City-village To village NUTS2 City-village To village TR10 -71388 94086 TR71 8764 -6168 TR21 15040 -6983 TR72 4224 -8720 TR22 13384 -7503 TR81 -3146 -2528 TR31 -3030 7285 TR82 7511 -7756 TR32 42984 8839 TR83 -5650 -19925 TR33 2115 -13441 TR90 20744 -17457 TR41 1749 1703 TRA1 -1556 -9271 TR42 19338 41835 TRA2 -3449 -10423 TR51 -25446 12674 TRB1 2233 -7033 TR52 -2572 -12755 TRB2 -6309 -15975 TR61 26171 10411 TRC1 -13506 -12186 TR62 -36 14001 TRC2 -18687 1080 TR63 -5156 -1859 TRC3 -4398 -8790
Table C.3: NUTS 4 regions included in the 3rd stratification – The Turkish case
Code Name Density Rural Population Code Name Density Rural
Population TR32105 Germencik 0 1,45 TR41111 Keles -5 -4,08 TR32106 İncirliova 26 1,95 TR41202 Beylikova -5 -4,34 TR32108 Karpuzlu -4 1,01 TR42307 Yýðýlca -2 -4,39 TR32109 Koçarlý -4 1,83 TR42205 Hendek 6 -4,93 TR32111 Kuþadasý 99 0,66 TR61304 Çavdýr 0 -5 TR32112 Kuyucak -3 0,45 TR41212 Sivrihisar -2 -5,05 TR32116 Yenipazar -11 0,6 TR41115 Orhaneli 0 -5,07 TR41207 Mahmudiye -2 0,57 TR32103 Çine -1 -5,18 TR41307 Yenipazar -3 0,39 TR61309 Tefenni -3 -5,27 TR42211 Sapanca 81 2,23 TR41209 Mihalýççýk -3 -6,03 TR42212 Taraklý -5 2,61 TR42204 Geyve 5 -6,07 TR42503 Çýnarcýk 23 2,77 TR61310 Yeþilova -2 -6,22 TR42504 Çiftlikköy 86 0,37 TR32113 Nazilli 36 -6,46 TR42505 Termal 24 10,25 TR41203 Çifteler -2 -6,59 TR61101 Akseki 5 5,63 TR32110 Köþk 17 -6,61 TR61102 Alanya 80 6,25 TR42210 Pamukova 9 -6,85 TR61108 Kale 3 3,36 TR41113 Mudanya 46 -6,94 TR61110 Kemer 68 4,99 TR41210 Sarýcakaya 19 -7,14 TR61301 Aðlasun 0 4,06 TR42208 Kaynarca 1 -7,29 TR61303 Bucak 2 0,21 TR41117 Yeniþehir 3 -7,31 TR41103 Yýldýrým 2410 -0,03 TR41201 Alpu -2 -7,36 TR32115 Sultanhisar 1 -0,08 TR41116 Orhangazi -4 -7,97 TR42202 Söðütlü 10 -0,11 TR41114 Mustafakemalpaþa 1 -8,25 TR32101 Bozdoðan 1 -0,26 TR41106 Gürsu 86 -8,47 TR42501 Altýnova 84 -0,3 TR61306 Gölhisar 2 -8,52 TR41108 Ýnegöl 59 -0,45 TR41206 Ýnönü 0 -8,6 TR42502 Armutlu 8 -0,51 TR41110 Karacabey 4 -8,82 TR61114 Serik 18 -0,7 TR41107 Harmancýk -6 -9,28 TR61106 Gündoðmuþ 1 -0,7 TR42209 Kocaali 7 -9,29 TR41104 Büyükorhan -6 -0,87 TR41301 Bozüyük 14 -9,53 TR61103 Elmalý 3 -1,31 TR41208 Mihalgazi 38 -9,94 TR61307 Karamanlý -2 -1,4 TR41305 Pazaryeri -8 -10,3 TR42203 Akyazý 16 -1,51 TR41302 Gölpazarý -3 -11,24 TR61109 Kaþ 3 -2,06 TR42306 Kaynaþlý 16 -11,51 TR41211 Seyitgazi -2 -2,1 TR61107 Ýbradý 3 -12,23 TR61308 Kemer -1 -2,28 TR42302 Cumayeri -70 -12,28 TR61305 Çeltikçi -8 -2,36 TR41303 Ýnhisar -1 -12,43 TR41105 Gemlik 43 -2,41 TR41304 Osmaneli 6 -12,78 TR61112 Kumluca 13 -2,58 TR42207 Karasu 20 -12,8 TR61302 Altýnyayla 0 -2,7 TR41205 Han -3 -14,24 TR32102 Buharkent 18 -2,73 TR41112 Kestel 28 -14,29 TR41204 Günyüzü 1 -2,79 TR32104 Didim 48 -15,13 TR32114 Söke 19 -2,81 TR41306 Söðüt 0 -15,25 TR61111 Korkuteli 2 -2,84 TR42201 Ferizli 36 -16,71 TR42206 Karapürçek 11 -3,22 TR42301 Akçakoca 25 -16,87 TR61113 Manavgat 36 -3,57 TR42303 Çilimli 14 -18,33 TR61105 Gazipaþa 4 -3,59 TR41101 Nilüfer 227 -20,21 TR32107 Karacasu -1 -3,74 TR42304 Gölyaka 0 -22,14 TR61104 Finike 11 -3,78 TR42305 Gümüþova 46 -32,33 TR41109 Ýznik 4 -3,96
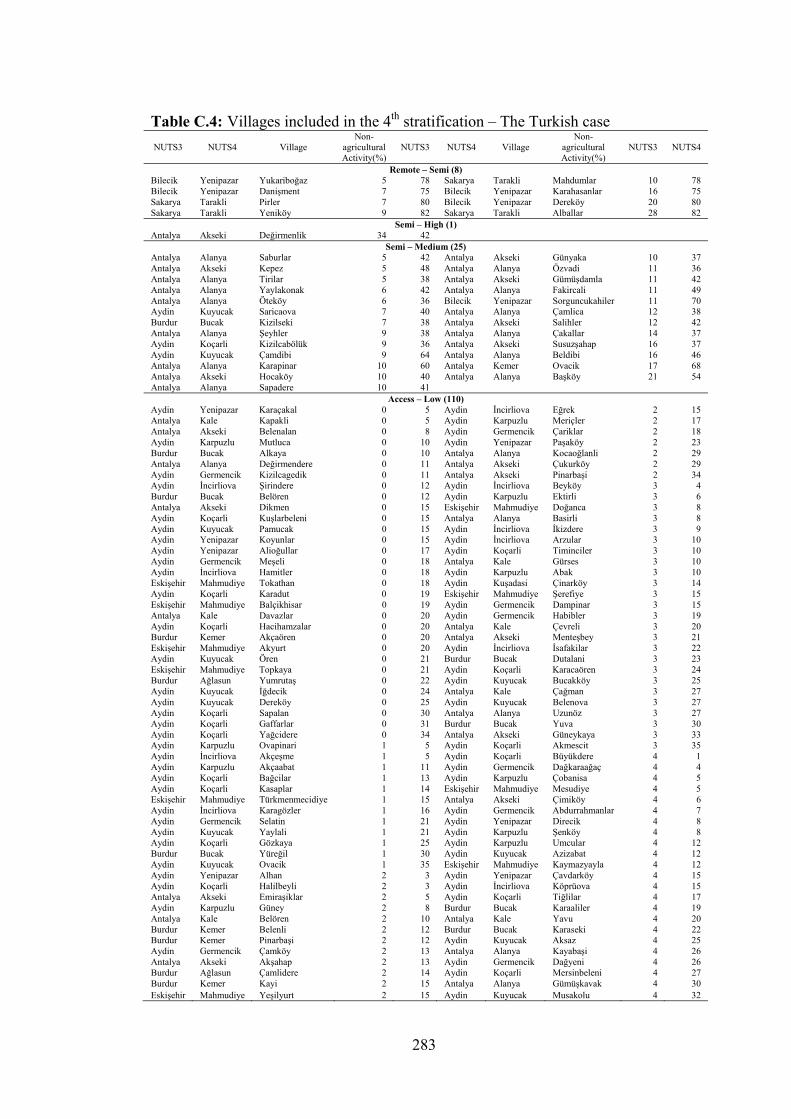
283
Table C.4: Villages included in the 4th stratification – The Turkish case NUTS3 NUTS4 Village
Non- agricultural Activity(%)
NUTS3 NUTS4 Village Non-
agricultural Activity(%)
NUTS3 NUTS4
Remote – Semi (8) Bilecik Yenipazar Yukariboğaz 5 78 Sakarya Tarakli Mahdumlar 10 78 Bilecik Yenipazar Danişment 7 75 Bilecik Yenipazar Karahasanlar 16 75 Sakarya Tarakli Pirler 7 80 Bilecik Yenipazar Dereköy 20 80 Sakarya Tarakli Yeniköy 9 82 Sakarya Tarakli Alballar 28 82
Semi – High (1) Antalya Akseki Değirmenlik 34 42
Semi – Medium (25) Antalya Alanya Saburlar 5 42 Antalya Akseki Günyaka 10 37 Antalya Akseki Kepez 5 48 Antalya Alanya Özvadi 11 36 Antalya Alanya Tirilar 5 38 Antalya Akseki Gümüşdamla 11 42 Antalya Alanya Yaylakonak 6 42 Antalya Alanya Fakircali 11 49 Antalya Alanya Öteköy 6 36 Bilecik Yenipazar Sorguncukahiler 11 70 Aydin Kuyucak Saricaova 7 40 Antalya Alanya Çamlica 12 38 Burdur Bucak Kizilseki 7 38 Antalya Akseki Salihler 12 42 Antalya Alanya Şeyhler 9 38 Antalya Alanya Çakallar 14 37 Aydin Koçarli Kizilcabölük 9 36 Antalya Akseki Susuzşahap 16 37 Aydin Kuyucak Çamdibi 9 64 Antalya Alanya Beldibi 16 46 Antalya Alanya Karapinar 10 60 Antalya Kemer Ovacik 17 68 Antalya Akseki Hocaköy 10 40 Antalya Alanya Başköy 21 54 Antalya Alanya Sapadere 10 41
Access – Low (110) Aydin Yenipazar Karaçakal 0 5 Aydin İncirliova Eğrek 2 15 Antalya Kale Kapakli 0 5 Aydin Karpuzlu Meriçler 2 17 Antalya Akseki Belenalan 0 8 Aydin Germencik Çariklar 2 18 Aydin Karpuzlu Mutluca 0 10 Aydin Yenipazar Paşaköy 2 23 Burdur Bucak Alkaya 0 10 Antalya Alanya Kocaoğlanli 2 29 Antalya Alanya Değirmendere 0 11 Antalya Akseki Çukurköy 2 29 Aydin Germencik Kizilcagedik 0 11 Antalya Akseki Pinarbaşi 2 34 Aydin İncirliova Şirindere 0 12 Aydin İncirliova Beyköy 3 4 Burdur Bucak Belören 0 12 Aydin Karpuzlu Ektirli 3 6 Antalya Akseki Dikmen 0 15 Eskişehir Mahmudiye Doğanca 3 8 Aydin Koçarli Kuşlarbeleni 0 15 Antalya Alanya Basirli 3 8 Aydin Kuyucak Pamucak 0 15 Aydin İncirliova İkizdere 3 9 Aydin Yenipazar Koyunlar 0 15 Aydin İncirliova Arzular 3 10 Aydin Yenipazar Alioğullar 0 17 Aydin Koçarli Timinciler 3 10 Aydin Germencik Meşeli 0 18 Antalya Kale Gürses 3 10 Aydin İncirliova Hamitler 0 18 Aydin Karpuzlu Abak 3 10 Eskişehir Mahmudiye Tokathan 0 18 Aydin Kuşadasi Çinarköy 3 14 Aydin Koçarli Karadut 0 19 Eskişehir Mahmudiye Şerefiye 3 15 Eskişehir Mahmudiye Balçikhisar 0 19 Aydin Germencik Dampinar 3 15 Antalya Kale Davazlar 0 20 Aydin Germencik Habibler 3 19 Aydin Koçarli Hacihamzalar 0 20 Antalya Kale Çevreli 3 20 Burdur Kemer Akçaören 0 20 Antalya Akseki Menteşbey 3 21 Eskişehir Mahmudiye Akyurt 0 20 Aydin İncirliova İsafakilar 3 22 Aydin Kuyucak Ören 0 21 Burdur Bucak Dutalani 3 23 Eskişehir Mahmudiye Topkaya 0 21 Aydin Koçarli Karacaören 3 24 Burdur Ağlasun Yumrutaş 0 22 Aydin Kuyucak Bucakköy 3 25 Aydin Kuyucak İğdecik 0 24 Antalya Kale Çağman 3 27 Aydin Kuyucak Dereköy 0 25 Aydin Kuyucak Belenova 3 27 Aydin Koçarli Sapalan 0 30 Antalya Alanya Uzunöz 3 27 Aydin Koçarli Gaffarlar 0 31 Burdur Bucak Yuva 3 30 Aydin Koçarli Yağcidere 0 34 Antalya Akseki Güneykaya 3 33 Aydin Karpuzlu Ovapinari 1 5 Aydin Koçarli Akmescit 3 35 Aydin İncirliova Akçeşme 1 5 Aydin Koçarli Büyükdere 4 1 Aydin Karpuzlu Akçaabat 1 11 Aydin Germencik Dağkaraağaç 4 4 Aydin Koçarli Bağcilar 1 13 Aydin Karpuzlu Çobanisa 4 5 Aydin Koçarli Kasaplar 1 14 Eskişehir Mahmudiye Mesudiye 4 5 Eskişehir Mahmudiye Türkmenmecidiye 1 15 Antalya Akseki Çimiköy 4 6 Aydin İncirliova Karagözler 1 16 Aydin Germencik Abdurrahmanlar 4 7 Aydin Germencik Selatin 1 21 Aydin Yenipazar Direcik 4 8 Aydin Kuyucak Yaylali 1 21 Aydin Karpuzlu Şenköy 4 8 Aydin Koçarli Gözkaya 1 25 Aydin Karpuzlu Umcular 4 12 Burdur Bucak Yüreğil 1 30 Aydin Kuyucak Azizabat 4 12 Aydin Kuyucak Ovacik 1 35 Eskişehir Mahmudiye Kaymazyayla 4 12 Aydin Yenipazar Alhan 2 3 Aydin Yenipazar Çavdarköy 4 15 Aydin Koçarli Halilbeyli 2 3 Aydin İncirliova Köprüova 4 15 Antalya Akseki Emiraşiklar 2 5 Aydin Koçarli Tiğlilar 4 17 Aydin Karpuzlu Güney 2 8 Burdur Bucak Karaaliler 4 19 Antalya Kale Belören 2 10 Antalya Kale Yavu 4 20 Burdur Kemer Belenli 2 12 Burdur Bucak Karaseki 4 22 Burdur Kemer Pinarbaşi 2 12 Aydin Kuyucak Aksaz 4 25 Aydin Germencik Çamköy 2 13 Antalya Alanya Kayabaşi 4 26 Antalya Akseki Akşahap 2 13 Aydin Germencik Dağyeni 4 26 Burdur Ağlasun Çamlidere 2 14 Aydin Koçarli Mersinbeleni 4 27 Burdur Kemer Kayi 2 15 Antalya Alanya Gümüşkavak 4 30 Eskişehir Mahmudiye Yeşilyurt 2 15 Aydin Kuyucak Musakolu 4 32

284
Questionnaire For Villages: Turkey İl: İlçe: Köy: Adı Soyadı: Köydeki Görevi: Adres: Telefon: 1 Köyünüzü aşağıdakilerden hangisi veya hangileri en iyi tanımlamaktadır? terkedilmiş istenmeyen
önemsenmeyen ekonomik çeşitliliği olmayan ziyaretçisi olmayan altyapısı yetersiz zor erişilebilen doğal ve/veya tarihi çekici güzel
2 Köyünüzün en ayırt edici özelliği nedir? yerel ürünleri yemekleri/mutfağı elişleri tarımsal ürün peyzajı/doğası Diğer ........................
3 Köyünüzün sakinleri kimlerdir? Nesillerdir yaşayan yerel halk Diğer ülkelerden gelen yabancilar Kentte çalışıp köyde ikamet edenler Mevsimlik oturanlar/yazlıkçılar Diğer
4 Köyünüzde sıklıkla ziyaretçi olur mu? evet hayır 4.1 Evet ise, bu ziyaretçiler kimlerdir?
kısa süreli ziyaretçi günü birlik turist uzun süreli/dönemlik turist Diğer 4.2 Ziyaretçilerin çoğunluğu nerden geliyorlar?
en yakın kentten ülke sınırlarında bir yerden diğer köylerden diğer ülkelerden 5 Köyde Pazar yeri var mı? Evet Hayır 5.1 Evet ise, Pazarda hangi ürünler satılıyor? yerel gıda ürünleri çeşitli yerel ürünler yerel elişleri
dışardan gelen gıda ürünleri dışardan gelen çeşitli ürünler diğer 5.2 Bu pazardan kimler alışveriş yapıyor? köy sakinleri kent sakinleri ziyaretçiler diğer 5.3 Ne sıklıkla bu Pazar kuruluyor? her gün haftada bir her ay diğer..................... 6 Aşağıdakilerden hangisi köydeki evlerde mevcut? Elektrik Kablolu yayın/Televizyon Telefon
Su Yol Internet Otopark Diğer 7 Köyde son beş yılda meydana gelen değişiklikleri lütfen sıralayınız. (1- kesinlikle katılmıyorum; 2-
katılmıyorum; 3- ne katılmıyorum ne katılıyorum; 4- katılıyorum; 5- kesinlikle katılıyorum) 1 2 3 4 5 7.1 Araba sayısı arttı. 7.2 Turistik tesis sayısı arttı. 7.3 Ev ve arsa fiyatları arttı. 7.4 Nüfus arttı. 7.5 Köyden göç azaldı. 7.6 Köye göç arttı. 7.7 Yazlıkçı sayısı arttı. 7.8 Ziyaretçi sayısı arttı. 7.9 İş imkanı arttı. 7.10 İşsizlik azaldı. 7.11 Gelir düzeyi yükseldi. 7.12 Ekonomik çeşitlilik sağlandı. 7.13 Yerel üretici sayısı arttı. 7.14 Çiftçi sayısı azaldı. 7.15 Tarımsal faaliyetler düştü. 7.16 Köy sakinleri daha yenilikçi oldu. 7.17 Köy sakinleri daha girişimci oldu. 7.18 Köy sakinleri daha yaratıcı oldu. 7.19 Köy sakinleri becerilerini ve teknolojiyi daha çok kullanmaya başladı.
7.20 Köy sakinleri anane ve törelerine geri dönmeye başladı. 7.21 Sosyal ilişkiler değişti. 7.22 Teknoloji kullanımı arttı. 7.23 Köyde üretilenler diğer kentlere de satılmaya başlandı. 7.24 Köy diğer insanlar tarafından daha çok tanınır oldu. 7.25 Altyapı gelişti. 7.26 Kültür ve tarih daha önemli oldu. 7.27 Arazi kullanımı değişti. Questionnaire For Entrepreneurs: Turkey İl: İlçe Köy Girişimcinin Adı Soyadı: İşyeri adı: Adres: Girişimdeki yeri: Mal Sahibi Yönetici Sektör: Tarım Tarım dışı Telefon: 1 Kişisel Kimlik / Sosyal ilişkiler 1.1 Cinsiyetiniz : K E 1.2 Tabiiyetiniz: Türk Diğer 1.3 Doğum yeriniz: Bu köy Diğer 1.4 Doğum Tarihiniz (gün/ay/yıl): / / 1.5 Eğitim düzeyiniz: Okuma yazma yok Okuma yazma var İlkokul mezunu Ortaokul mezunu
Lise mezunu Teknik lise mezunu Üniversite mezunu 1.6 Hane içindeki yeri: Aile reisi Çocuk Diğer 1.7 Bu köye ilk olarak ailenizden kim geldi? Nerden geldi? Kaç yılında geldi? 1.7.1 Neden bu köy tercih edilmiş? İş Yaşam Kalitesi Aile Diğer 1.8 Köyden başka bir yerde yaşadınız mı? Evet Hayır 1.8.1 Evet ise, Nerde? Kaç yıl? 1.9 Başka bir yerde yaşamak ister misiniz? Evet Hayır 1.10 Komşularınızla toplanıp buluşuyor musunuz? Evet Hayır 1.10.1 Komşularınızla ne kadar sıklıkta buluşuyorsunuz? hergün hafta bir kere fırsat buldukça 1.11 Köy halkıyla ilişkilerinizi nasıl tanımlıyorsunuz? yakın mesafeli diğer 1.12 Köydeki konumunuzu nasıl tanımlarsınız? Aşırı derecede bütünleşmiş bütünleşmiş az
bütünleşmiş bütünleşememiş 2 Girişimci Kimliği / Ekonomik İlişkiler 2.1 İlk girişimci olarak işe başladığınızda kaç yaşındaydınız? 2.2 Neden girişimci olmayı tercih ettiniz? Aile şirketinin devamlılığı Fazladan gelir sağlamak
İşsizlik Daha önceki işten memnuniyetsizlik Diğer 2.3 Bu işe başlamadan önceki iş durumunuz neydi? İşsiz İşçi Girişimci Öğrenci 2.3.1 Hangi sektörde çalışıyordunuz? Tarım Sanayi Turizm Maden İnşaat Diğer
2.3.2 Son işinizi değiştirme nedeniniz neydi? Finansal/iş problemleri İş teklifi Eğitime devam
etmek Kişisel/Ailevi sebepler Diğer 2.4 Bu sizin tek ekonomik faaliyetiniz mi? Evet Hayır, başka ne ekonomik faaliyetiniz var? 2.5 Şu anki işinizi yapmayı nasıl öğrendiniz? Aileden öğrendim teknik eğitim aldım staj yaptım
Diğer 3 İşyeri Kimliği / Pazar ilişkileri 3.1 Sermaye: tek sermaye sahibi hissedar
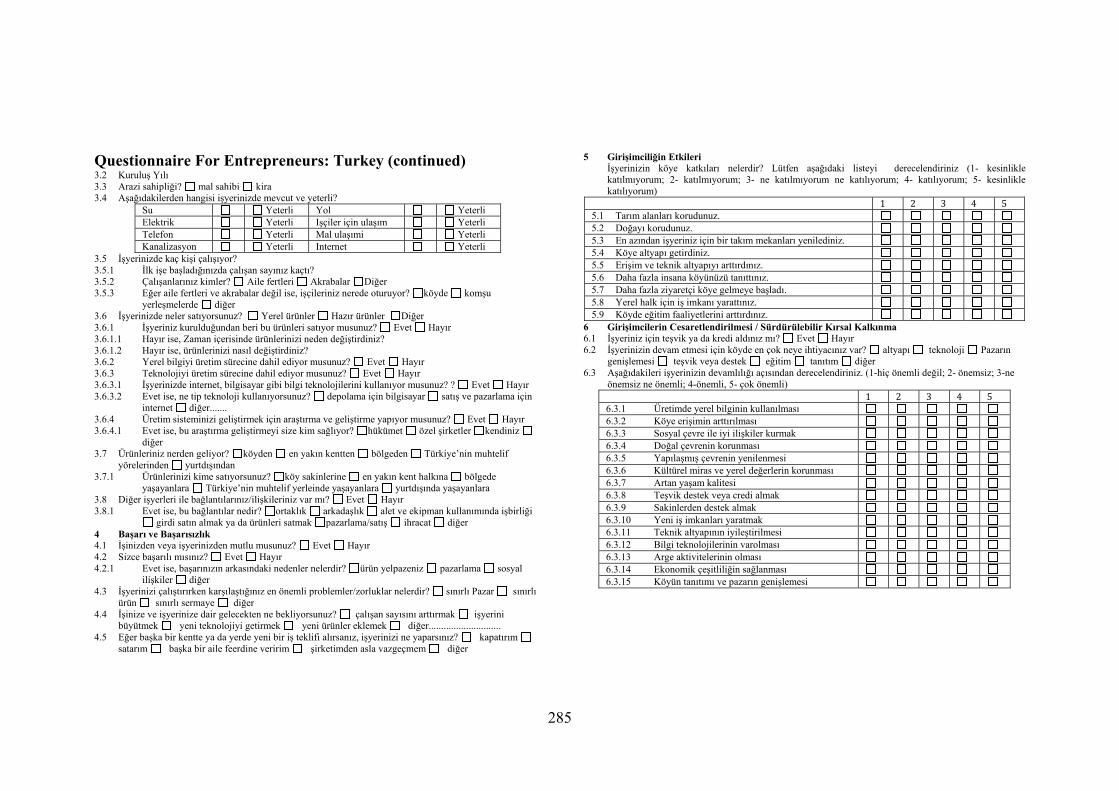
285
Questionnaire For Entrepreneurs: Turkey (continued) 3.2 Kuruluş Yılı 3.3 Arazi sahipliği? mal sahibi kira 3.4 Aşağıdakilerden hangisi işyerinizde mevcut ve yeterli?
Su Yeterli Yol Yeterli Elektrik Yeterli Işçiler için ulaşım Yeterli Telefon Yeterli Mal ulaşımi Yeterli Kanalizasyon Yeterli Internet Yeterli
3.5 İşyerinizde kaç kişi çalışıyor? 3.5.1 İlk işe başladığınızda çalışan sayınız kaçtı? 3.5.2 Çalışanlarınız kimler? Aile fertleri Akrabalar Diğer 3.5.3 Eğer aile fertleri ve akrabalar değil ise, işçileriniz nerede oturuyor? köyde komşu
yerleşmelerde diğer 3.6 İşyerinizde neler satıyorsunuz? Yerel ürünler Hazır ürünler Diğer 3.6.1 İşyeriniz kurulduğundan beri bu ürünleri satıyor musunuz? Evet Hayır 3.6.1.1 Hayır ise, Zaman içerisinde ürünlerinizi neden değiştirdiniz? 3.6.1.2 Hayır ise, ürünlerinizi nasıl değiştirdiniz? 3.6.2 Yerel bilgiyi üretim sürecine dahil ediyor musunuz? Evet Hayır 3.6.3 Teknolojiyi üretim sürecine dahil ediyor musunuz? Evet Hayır 3.6.3.1 İşyerinizde internet, bilgisayar gibi bilgi teknolojilerini kullanıyor musunuz? ? Evet Hayır 3.6.3.2 Evet ise, ne tip teknoloji kullanıyorsunuz? depolama için bilgisayar satış ve pazarlama için
internet diğer....... 3.6.4 Üretim sisteminizi geliştirmek için araştırma ve geliştirme yapıyor musunuz? Evet Hayır 3.6.4.1 Evet ise, bu araştırma geliştirmeyi size kim sağlıyor? hükümet özel şirketler kendiniz
diğer 3.7 Ürünleriniz nerden geliyor? köyden en yakın kentten bölgeden Türkiye’nin muhtelif
yörelerinden yurtdışından 3.7.1 Ürünlerinizi kime satıyorsunuz? köy sakinlerine en yakın kent halkına bölgede
yaşayanlara Türkiye’nin muhtelif yerleinde yaşayanlara yurtdışında yaşayanlara 3.8 Diğer işyerleri ile bağlantılarınız/ilişkileriniz var mı? Evet Hayır 3.8.1 Evet ise, bu bağlantılar nedir? ortaklık arkadaşlık alet ve ekipman kullanımında işbirliği
girdi satın almak ya da ürünleri satmak pazarlama/satış ihracat diğer 4 Başarı ve Başarısızlık 4.1 İşinizden veya işyerinizden mutlu musunuz? Evet Hayır 4.2 Sizce başarılı mısınız? Evet Hayır 4.2.1 Evet ise, başarınızın arkasındaki nedenler nelerdir? ürün yelpazeniz pazarlama sosyal
ilişkiler diğer 4.3 İşyerinizi çalıştırırken karşılaştığınız en önemli problemler/zorluklar nelerdir? sınırlı Pazar sınırlı
ürün sınırlı sermaye diğer 4.4 İşinize ve işyerinize dair gelecekten ne bekliyorsunuz? çalışan sayısını arttırmak işyerini
büyütmek yeni teknolojiyi getirmek yeni ürünler eklemek diğer............................. 4.5 Eğer başka bir kentte ya da yerde yeni bir iş teklifi alırsanız, işyerinizi ne yaparsınız? kapatırım
satarım başka bir aile feerdine veririm şirketimden asla vazgeçmem diğer
5 Girişimciliğin Etkileri İşyerinizin köye katkıları nelerdir? Lütfen aşağıdaki listeyi derecelendiriniz (1- kesinlikle katılmıyorum; 2- katılmıyorum; 3- ne katılmıyorum ne katılıyorum; 4- katılıyorum; 5- kesinlikle katılıyorum)
1 2 3 4 5 5.1 Tarım alanları korudunuz. 5.2 Doğayı korudunuz. 5.3 En azından işyeriniz için bir takım mekanları yenilediniz. 5.4 Köye altyapı getirdiniz. 5.5 Erişim ve teknik altyapıyı arttırdınız. 5.6 Daha fazla insana köyünüzü tanıttınız. 5.7 Daha fazla ziyaretçi köye gelmeye başladı. 5.8 Yerel halk için iş imkanı yarattınız. 5.9 Köyde eğitim faaliyetlerini arttırdınız.
6 Girişimcilerin Cesaretlendirilmesi / Sürdürülebilir Kırsal Kalkınma 6.1 İşyeriniz için teşvik ya da kredi aldınız mı? Evet Hayır 6.2 İşyerinizin devam etmesi için köyde en çok neye ihtiyacınız var? altyapı teknoloji Pazarın
genişlemesi teşvik veya destek eğitim tanıtım diğer 6.3 Aşağıdakileri işyerinizin devamlılığı açısından derecelendiriniz. (1-hiç önemli değil; 2- önemsiz; 3-ne
önemsiz ne önemli; 4-önemli, 5- çok önemli) 1 2 3 4 5
6.3.1 Üretimde yerel bilginin kullanılması 6.3.2 Köye erişimin arttırılması 6.3.3 Sosyal çevre ile iyi ilişkiler kurmak 6.3.4 Doğal çevrenin korunması 6.3.5 Yapılaşmış çevrenin yenilenmesi 6.3.6 Kültürel miras ve yerel değerlerin korunması 6.3.7 Artan yaşam kalitesi 6.3.8 Teşvik destek veya credi almak 6.3.9 Sakinlerden destek almak 6.3.10 Yeni iş imkanları yaratmak 6.3.11 Teknik altyapının iyileştirilmesi 6.3.12 Bilgi teknolojilerinin varolması 6.3.13 Arge aktivitelerinin olması 6.3.14 Ekonomik çeşitliliğin sağlanması 6.3.15 Köyün tanıtımı ve pazarın genişlemesi
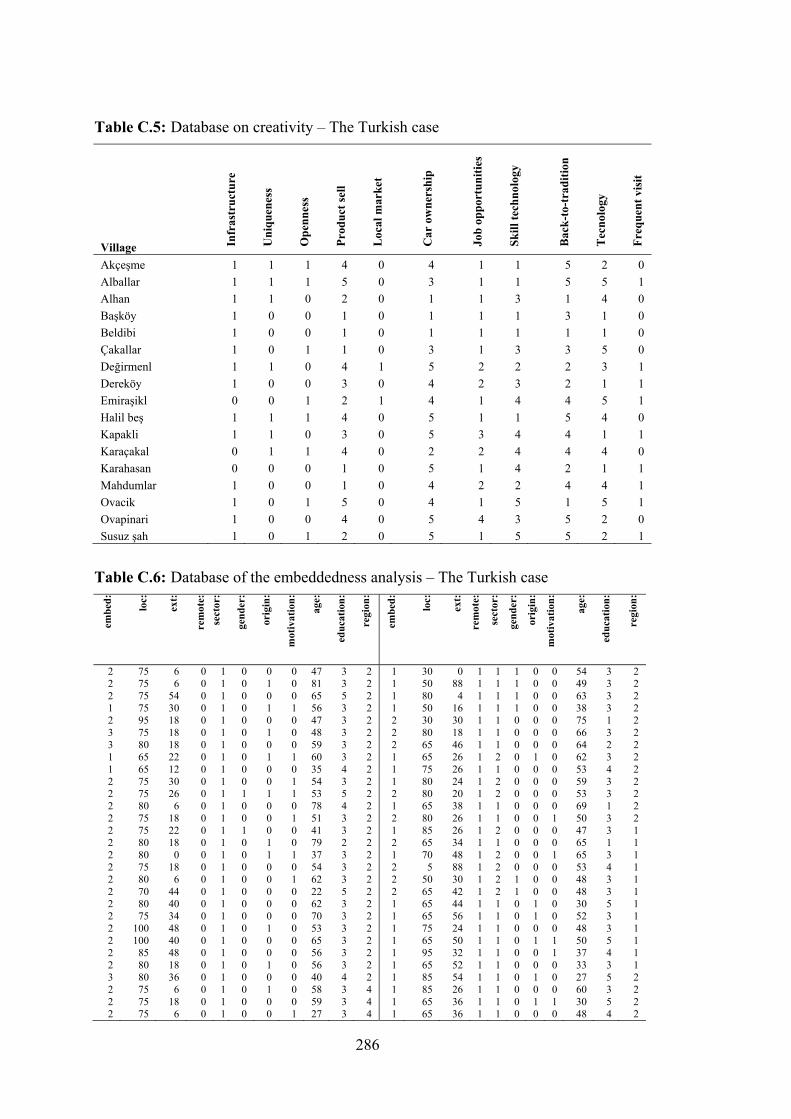
286
Table C.5: Database on creativity – The Turkish case
Village Infr
astr
uctu
re
Uni
quen
ess
Ope
nnes
s
Prod
uct s
ell
Loc
al m
arke
t
Car
ow
ners
hip
Job
oppo
rtun
ities
Skill
tech
nolo
gy
Bac
k-to
-tra
ditio
n
Tec
nolo
gy
Freq
uent
vis
it
Akçeşme 1 1 1 4 0 4 1 1 5 2 0 Alballar 1 1 1 5 0 3 1 1 5 5 1 Alhan 1 1 0 2 0 1 1 3 1 4 0 Başköy 1 0 0 1 0 1 1 1 3 1 0 Beldibi 1 0 0 1 0 1 1 1 1 1 0 Çakallar 1 0 1 1 0 3 1 3 3 5 0 Değirmenl 1 1 0 4 1 5 2 2 2 3 1 Dereköy 1 0 0 3 0 4 2 3 2 1 1 Emiraşikl 0 0 1 2 1 4 1 4 4 5 1 Halil beş 1 1 1 4 0 5 1 1 5 4 0 Kapakli 1 1 0 3 0 5 3 4 4 1 1 Karaçakal 0 1 1 4 0 2 2 4 4 4 0 Karahasan 0 0 0 1 0 5 1 4 2 1 1 Mahdumlar 1 0 0 1 0 4 2 2 4 4 1 Ovacik 1 0 1 5 0 4 1 5 1 5 1 Ovapinari 1 0 0 4 0 5 4 3 5 2 0 Susuz şah 1 0 1 2 0 5 1 5 5 2 1
Table C.6: Database of the embeddedness analysis – The Turkish case
embe
d:
loc:
ext:
rem
ote:
sect
or:
gend
er:
orig
in:
mot
ivat
ion:
age:
educ
atio
n:
regi
on:
embe
d:
loc:
ext:
rem
ote:
sect
or:
gend
er:
orig
in:
mot
ivat
ion:
age:
educ
atio
n:
regi
on:
2 75 6 0 1 0 0 0 47 3 2 1 30 0 1 1 1 0 0 54 3 2 2 75 6 0 1 0 1 0 81 3 2 1 50 88 1 1 1 0 0 49 3 2 2 75 54 0 1 0 0 0 65 5 2 1 80 4 1 1 1 0 0 63 3 2 1 75 30 0 1 0 1 1 56 3 2 1 50 16 1 1 1 0 0 38 3 2 2 95 18 0 1 0 0 0 47 3 2 2 30 30 1 1 0 0 0 75 1 2 3 75 18 0 1 0 1 0 48 3 2 2 80 18 1 1 0 0 0 66 3 2 3 80 18 0 1 0 0 0 59 3 2 2 65 46 1 1 0 0 0 64 2 2 1 65 22 0 1 0 1 1 60 3 2 1 65 26 1 2 0 1 0 62 3 2 1 65 12 0 1 0 0 0 35 4 2 1 75 26 1 1 0 0 0 53 4 2 2 75 30 0 1 0 0 1 54 3 2 1 80 24 1 2 0 0 0 59 3 2 2 75 26 0 1 1 1 1 53 5 2 2 80 20 1 2 0 0 0 53 3 2 2 80 6 0 1 0 0 0 78 4 2 1 65 38 1 1 0 0 0 69 1 2 2 75 18 0 1 0 0 1 51 3 2 2 80 26 1 1 0 0 1 50 3 2 2 75 22 0 1 1 0 0 41 3 2 1 85 26 1 2 0 0 0 47 3 1 2 80 18 0 1 0 1 0 79 2 2 2 65 34 1 1 0 0 0 65 1 1 2 80 0 0 1 0 1 1 37 3 2 1 70 48 1 2 0 0 1 65 3 1 2 75 18 0 1 0 0 0 54 3 2 2 5 88 1 2 0 0 0 53 4 1 2 80 6 0 1 0 0 1 62 3 2 2 50 30 1 2 1 0 0 48 3 1 2 70 44 0 1 0 0 0 22 5 2 2 65 42 1 2 1 0 0 48 3 1 2 80 40 0 1 0 0 0 62 3 2 1 65 44 1 1 0 1 0 30 5 1 2 75 34 0 1 0 0 0 70 3 2 1 65 56 1 1 0 1 0 52 3 1 2 100 48 0 1 0 1 0 53 3 2 1 75 24 1 1 0 0 0 48 3 1 2 100 40 0 1 0 0 0 65 3 2 1 65 50 1 1 0 1 1 50 5 1 2 85 48 0 1 0 0 0 56 3 2 1 95 32 1 1 0 0 1 37 4 1 2 80 18 0 1 0 1 0 56 3 2 1 65 52 1 1 0 0 0 33 3 1 3 80 36 0 1 0 0 0 40 4 2 1 85 54 1 1 0 1 0 27 5 2 2 75 6 0 1 0 1 0 58 3 4 1 85 26 1 1 0 0 0 60 3 2 2 75 18 0 1 0 0 0 59 3 4 1 65 36 1 1 0 1 1 30 5 2 2 75 6 0 1 0 0 1 27 3 4 1 65 36 1 1 0 0 0 48 4 2
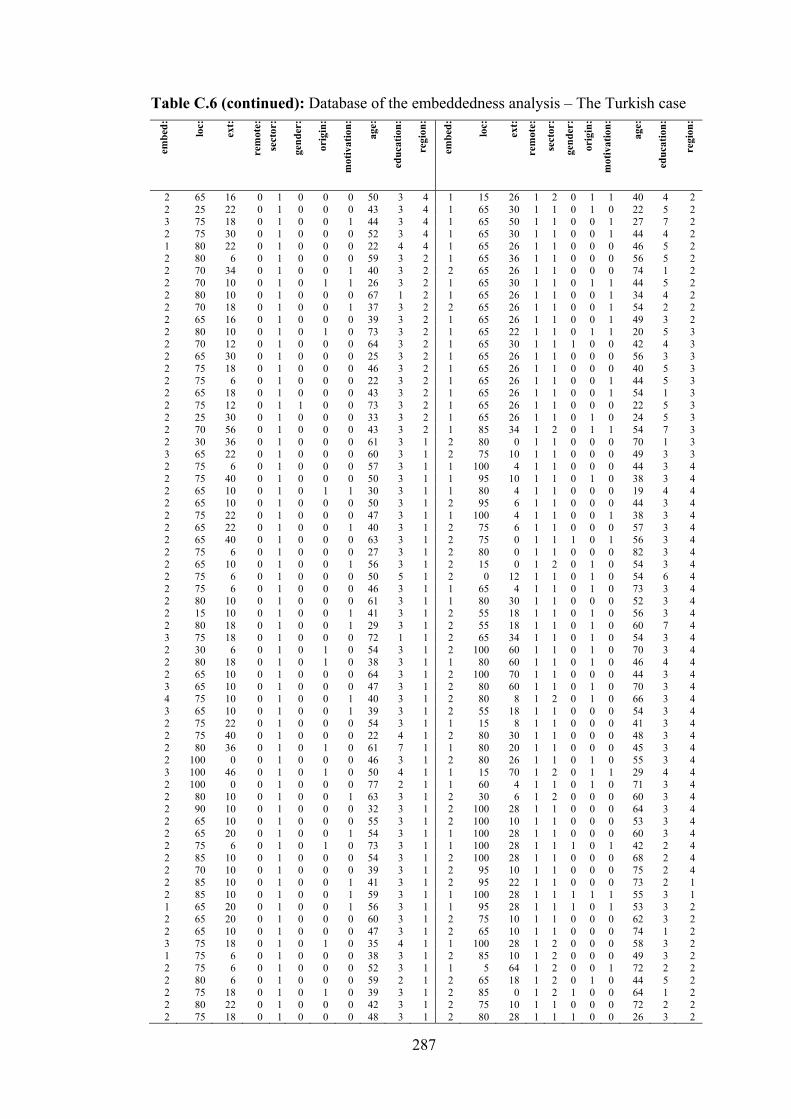
287
Table C.6 (continued): Database of the embeddedness analysis – The Turkish case
embe
d:
loc:
ext:
rem
ote:
se
c tor
:
gend
er:
orig
in:
mot
ivat
ion:
age:
educ
atio
n:
regi
on:
embe
d:
loc:
ext:
rem
ote:
sect
or:
gend
er:
orig
in:
mot
ivat
ion:
age:
educ
atio
n:
regi
on:
2 65 16 0 1 0 0 0 50 3 4 1 15 26 1 2 0 1 1 40 4 2 2 25 22 0 1 0 0 0 43 3 4 1 65 30 1 1 0 1 0 22 5 2 3 75 18 0 1 0 0 1 44 3 4 1 65 50 1 1 0 0 1 27 7 2 2 75 30 0 1 0 0 0 52 3 4 1 65 30 1 1 0 0 1 44 4 2 1 80 22 0 1 0 0 0 22 4 4 1 65 26 1 1 0 0 0 46 5 2 2 80 6 0 1 0 0 0 59 3 2 1 65 36 1 1 0 0 0 56 5 2 2 70 34 0 1 0 0 1 40 3 2 2 65 26 1 1 0 0 0 74 1 2 2 70 10 0 1 0 1 1 26 3 2 1 65 30 1 1 0 1 1 44 5 2 2 80 10 0 1 0 0 0 67 1 2 1 65 26 1 1 0 0 1 34 4 2 2 70 18 0 1 0 0 1 37 3 2 2 65 26 1 1 0 0 1 54 2 2 2 65 16 0 1 0 0 0 39 3 2 1 65 26 1 1 0 0 1 49 3 2 2 80 10 0 1 0 1 0 73 3 2 1 65 22 1 1 0 1 1 20 5 3 2 70 12 0 1 0 0 0 64 3 2 1 65 30 1 1 1 0 0 42 4 3 2 65 30 0 1 0 0 0 25 3 2 1 65 26 1 1 0 0 0 56 3 3 2 75 18 0 1 0 0 0 46 3 2 1 65 26 1 1 0 0 0 40 5 3 2 75 6 0 1 0 0 0 22 3 2 1 65 26 1 1 0 0 1 44 5 3 2 65 18 0 1 0 0 0 43 3 2 1 65 26 1 1 0 0 1 54 1 3 2 75 12 0 1 1 0 0 73 3 2 1 65 26 1 1 0 0 0 22 5 3 2 25 30 0 1 0 0 0 33 3 2 1 65 26 1 1 0 1 0 24 5 3 2 70 56 0 1 0 0 0 43 3 2 1 85 34 1 2 0 1 1 54 7 3 2 30 36 0 1 0 0 0 61 3 1 2 80 0 1 1 0 0 0 70 1 3 3 65 22 0 1 0 0 0 60 3 1 2 75 10 1 1 0 0 0 49 3 3 2 75 6 0 1 0 0 0 57 3 1 1 100 4 1 1 0 0 0 44 3 4 2 75 40 0 1 0 0 0 50 3 1 1 95 10 1 1 0 1 0 38 3 4 2 65 10 0 1 0 1 1 30 3 1 1 80 4 1 1 0 0 0 19 4 4 2 65 10 0 1 0 0 0 50 3 1 2 95 6 1 1 0 0 0 44 3 4 2 75 22 0 1 0 0 0 47 3 1 1 100 4 1 1 0 0 1 38 3 4 2 65 22 0 1 0 0 1 40 3 1 2 75 6 1 1 0 0 0 57 3 4 2 65 40 0 1 0 0 0 63 3 1 2 75 0 1 1 1 0 1 56 3 4 2 75 6 0 1 0 0 0 27 3 1 2 80 0 1 1 0 0 0 82 3 4 2 65 10 0 1 0 0 1 56 3 1 2 15 0 1 2 0 1 0 54 3 4 2 75 6 0 1 0 0 0 50 5 1 2 0 12 1 1 0 1 0 54 6 4 2 75 6 0 1 0 0 0 46 3 1 1 65 4 1 1 0 1 0 73 3 4 2 80 10 0 1 0 0 0 61 3 1 1 80 30 1 1 0 0 0 52 3 4 2 15 10 0 1 0 0 1 41 3 1 2 55 18 1 1 0 1 0 56 3 4 2 80 18 0 1 0 0 1 29 3 1 2 55 18 1 1 0 1 0 60 7 4 3 75 18 0 1 0 0 0 72 1 1 2 65 34 1 1 0 1 0 54 3 4 2 30 6 0 1 0 1 0 54 3 1 2 100 60 1 1 0 1 0 70 3 4 2 80 18 0 1 0 1 0 38 3 1 1 80 60 1 1 0 1 0 46 4 4 2 65 10 0 1 0 0 0 64 3 1 2 100 70 1 1 0 0 0 44 3 4 3 65 10 0 1 0 0 0 47 3 1 2 80 60 1 1 0 1 0 70 3 4 4 75 10 0 1 0 0 1 40 3 1 2 80 8 1 2 0 1 0 66 3 4 3 65 10 0 1 0 0 1 39 3 1 2 55 18 1 1 0 0 0 54 3 4 2 75 22 0 1 0 0 0 54 3 1 1 15 8 1 1 0 0 0 41 3 4 2 75 40 0 1 0 0 0 22 4 1 2 80 30 1 1 0 0 0 48 3 4 2 80 36 0 1 0 1 0 61 7 1 1 80 20 1 1 0 0 0 45 3 4 2 100 0 0 1 0 0 0 46 3 1 2 80 26 1 1 0 1 0 55 3 4 3 100 46 0 1 0 1 0 50 4 1 1 15 70 1 2 0 1 1 29 4 4 2 100 0 0 1 0 0 0 77 2 1 1 60 4 1 1 0 1 0 71 3 4 2 80 10 0 1 0 0 1 63 3 1 2 30 6 1 2 0 0 0 60 3 4 2 90 10 0 1 0 0 0 32 3 1 2 100 28 1 1 0 0 0 64 3 4 2 65 10 0 1 0 0 0 55 3 1 2 100 10 1 1 0 0 0 53 3 4 2 65 20 0 1 0 0 1 54 3 1 1 100 28 1 1 0 0 0 60 3 4 2 75 6 0 1 0 1 0 73 3 1 1 100 28 1 1 1 0 1 42 2 4 2 85 10 0 1 0 0 0 54 3 1 2 100 28 1 1 0 0 0 68 2 4 2 70 10 0 1 0 0 0 39 3 1 2 95 10 1 1 0 0 0 75 2 4 2 85 10 0 1 0 0 1 41 3 1 2 95 22 1 1 0 0 0 73 2 1 2 85 10 0 1 0 0 1 59 3 1 1 100 28 1 1 1 1 1 55 3 1 1 65 20 0 1 0 0 1 56 3 1 1 95 28 1 1 1 0 1 53 3 2 2 65 20 0 1 0 0 0 60 3 1 2 75 10 1 1 0 0 0 62 3 2 2 65 10 0 1 0 0 0 47 3 1 2 65 10 1 1 0 0 0 74 1 2 3 75 18 0 1 0 1 0 35 4 1 1 100 28 1 2 0 0 0 58 3 2 1 75 6 0 1 0 0 0 38 3 1 2 85 10 1 2 0 0 0 49 3 2 2 75 6 0 1 0 0 0 52 3 1 1 5 64 1 2 0 0 1 72 2 2 2 80 6 0 1 0 0 0 59 2 1 2 65 18 1 2 0 1 0 44 5 2 2 75 18 0 1 0 1 0 39 3 1 2 85 0 1 2 1 0 0 64 1 2 2 80 22 0 1 0 0 0 42 3 1 2 75 10 1 1 0 0 0 72 2 2 2 75 18 0 1 0 0 0 48 3 1 2 80 28 1 1 1 0 0 26 3 2
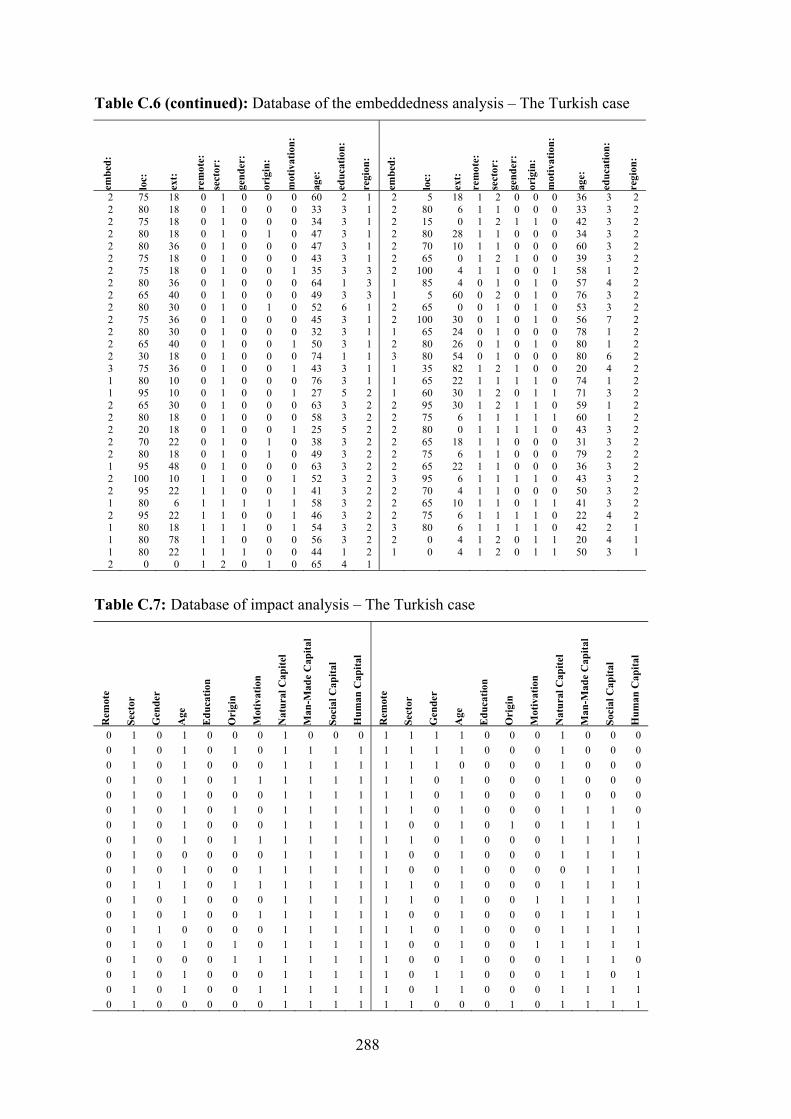
288
Table C.6 (continued): Database of the embeddedness analysis – The Turkish case em
bed:
loc:
ext:
rem
ote:
se
ctor
:
gend
er:
orig
in:
mot
ivat
ion:
age:
educ
atio
n:
regi
on:
embe
d:
loc:
ext:
rem
ote:
sect
or:
gend
er:
orig
in:
mot
ivat
ion:
age:
educ
atio
n:
regi
on:
2 75 18 0 1 0 0 0 60 2 1 2 5 18 1 2 0 0 0 36 3 2 2 80 18 0 1 0 0 0 33 3 1 2 80 6 1 1 0 0 0 33 3 2 2 75 18 0 1 0 0 0 34 3 1 2 15 0 1 2 1 1 0 42 3 2 2 80 18 0 1 0 1 0 47 3 1 2 80 28 1 1 0 0 0 34 3 2 2 80 36 0 1 0 0 0 47 3 1 2 70 10 1 1 0 0 0 60 3 2 2 75 18 0 1 0 0 0 43 3 1 2 65 0 1 2 1 0 0 39 3 2 2 75 18 0 1 0 0 1 35 3 3 2 100 4 1 1 0 0 1 58 1 2 2 80 36 0 1 0 0 0 64 1 3 1 85 4 0 1 0 1 0 57 4 2 2 65 40 0 1 0 0 0 49 3 3 1 5 60 0 2 0 1 0 76 3 2 2 80 30 0 1 0 1 0 52 6 1 2 65 0 0 1 0 1 0 53 3 2 2 75 36 0 1 0 0 0 45 3 1 2 100 30 0 1 0 1 0 56 7 2 2 80 30 0 1 0 0 0 32 3 1 1 65 24 0 1 0 0 0 78 1 2 2 65 40 0 1 0 0 1 50 3 1 2 80 26 0 1 0 1 0 80 1 2 2 30 18 0 1 0 0 0 74 1 1 3 80 54 0 1 0 0 0 80 6 2 3 75 36 0 1 0 0 1 43 3 1 1 35 82 1 2 1 0 0 20 4 2 1 80 10 0 1 0 0 0 76 3 1 1 65 22 1 1 1 1 0 74 1 2 1 95 10 0 1 0 0 1 27 5 2 1 60 30 1 2 0 1 1 71 3 2 2 65 30 0 1 0 0 0 63 3 2 2 95 30 1 2 1 1 0 59 1 2 2 80 18 0 1 0 0 0 58 3 2 2 75 6 1 1 1 1 1 60 1 2 2 20 18 0 1 0 0 1 25 5 2 2 80 0 1 1 1 1 0 43 3 2 2 70 22 0 1 0 1 0 38 3 2 2 65 18 1 1 0 0 0 31 3 2 2 80 18 0 1 0 1 0 49 3 2 2 75 6 1 1 0 0 0 79 2 2 1 95 48 0 1 0 0 0 63 3 2 2 65 22 1 1 0 0 0 36 3 2 2 100 10 1 1 0 0 1 52 3 2 3 95 6 1 1 1 1 0 43 3 2 2 95 22 1 1 0 0 1 41 3 2 2 70 4 1 1 0 0 0 50 3 2 1 80 6 1 1 1 1 1 58 3 2 2 65 10 1 1 0 1 1 41 3 2 2 95 22 1 1 0 0 1 46 3 2 2 75 6 1 1 1 1 0 22 4 2 1 80 18 1 1 1 0 1 54 3 2 3 80 6 1 1 1 1 0 42 2 1 1 80 78 1 1 0 0 0 56 3 2 2 0 4 1 2 0 1 1 20 4 1 1 80 22 1 1 1 0 0 44 1 2 1 0 4 1 2 0 1 1 50 3 1 2 0 0 1 2 0 1 0 65 4 1
Table C.7: Database of impact analysis – The Turkish case
Rem
ote
Sect
or
Gen
der
Age
Edu
catio
n
Ori
gin
Mot
ivat
ion
Nat
ural
Cap
itel
Man
-Mad
e C
apita
l
Soci
al C
apita
l
Hum
an C
apita
l
Rem
ote
Sect
or
Gen
der
Age
Edu
catio
n
Ori
gin
Mot
ivat
ion
Nat
ural
Cap
itel
Man
-Mad
e C
apita
l
Soci
al C
apita
l
Hum
an C
apita
l
0 1 0 1 0 0 0 1 0 0 0 1 1 1 1 0 0 0 1 0 0 0 0 1 0 1 0 1 0 1 1 1 1 1 1 1 1 0 0 0 1 0 0 0 0 1 0 1 0 0 0 1 1 1 1 1 1 1 0 0 0 0 1 0 0 0 0 1 0 1 0 1 1 1 1 1 1 1 1 0 1 0 0 0 1 0 0 0 0 1 0 1 0 0 0 1 1 1 1 1 1 0 1 0 0 0 1 0 0 0 0 1 0 1 0 1 0 1 1 1 1 1 1 0 1 0 0 0 1 1 1 0 0 1 0 1 0 0 0 1 1 1 1 1 0 0 1 0 1 0 1 1 1 1 0 1 0 1 0 1 1 1 1 1 1 1 1 0 1 0 0 0 1 1 1 1 0 1 0 0 0 0 0 1 1 1 1 1 0 0 1 0 0 0 1 1 1 1 0 1 0 1 0 0 1 1 1 1 1 1 0 0 1 0 0 0 0 1 1 1 0 1 1 1 0 1 1 1 1 1 1 1 1 0 1 0 0 0 1 1 1 1 0 1 0 1 0 0 0 1 1 1 1 1 1 0 1 0 0 1 1 1 1 1 0 1 0 1 0 0 1 1 1 1 1 1 0 0 1 0 0 0 1 1 1 1 0 1 1 0 0 0 0 1 1 1 1 1 1 0 1 0 0 0 1 1 1 1 0 1 0 1 0 1 0 1 1 1 1 1 0 0 1 0 0 1 1 1 1 1 0 1 0 0 0 1 1 1 1 1 1 1 0 0 1 0 0 0 1 1 1 0 0 1 0 1 0 0 0 1 1 1 1 1 0 1 1 0 0 0 1 1 0 1 0 1 0 1 0 0 1 1 1 1 1 1 0 1 1 0 0 0 1 1 1 1 0 1 0 0 0 0 0 1 1 1 1 1 1 0 0 0 1 0 1 1 1 1

289
Table C.7 (continued): Database of impact analysis – The Turkish case
Rem
ote
Sect
or
Gen
der
Age
Edu
catio
n
Ori
gin
Mot
ivat
ion
Nat
ural
Cap
itel
Man
-Mad
e C
apita
l
Soci
al C
apita
l
Hum
an C
apita
l
Rem
ote
Sect
or
Gen
der
Age
Edu
catio
n
Ori
gin
Mot
ivat
ion
Nat
ural
Cap
itel
Man
-Mad
e C
apita
l
Soci
al C
apita
l
Hum
an C
apita
l
0 1 0 1 0 0 0 1 1 1 1 1 1 0 1 0 1 0 1 1 1 1 0 1 0 1 0 0 0 1 1 1 1 1 1 0 1 0 0 0 1 1 1 1 0 1 0 1 0 1 0 1 1 1 1 1 1 0 1 0 1 1 1 1 1 1 0 1 0 1 0 0 0 1 1 1 1 1 1 0 0 0 0 1 1 1 1 1 0 1 0 1 0 0 0 1 1 1 1 1 1 0 0 0 0 0 1 1 1 1 0 1 0 1 0 1 0 1 1 1 1 1 1 0 0 0 1 0 1 1 1 1 0 1 0 0 0 0 0 1 1 1 1 1 1 0 1 0 0 0 1 1 1 1 0 1 0 1 0 1 0 0 1 0 0 1 1 0 0 0 1 1 1 1 1 1 0 1 0 1 0 0 0 1 1 1 1 1 1 0 1 0 0 0 1 1 1 1 0 1 0 0 0 0 1 1 1 1 1 1 0 0 0 0 1 1 1 1 1 1 0 1 0 1 0 0 0 1 1 1 1 1 1 0 0 0 1 0 1 1 1 1 0 1 0 0 0 0 0 1 1 1 1 1 1 0 0 1 0 1 1 1 1 1 0 1 0 0 0 0 1 1 1 1 1 1 1 0 0 0 0 1 1 1 1 1 0 1 0 1 0 0 0 1 1 1 1 1 1 0 1 0 0 0 1 1 1 1 0 1 0 0 0 0 0 1 1 1 0 1 1 0 1 0 0 0 1 1 1 1 0 1 0 1 0 0 0 1 1 1 1 1 1 0 1 0 0 0 1 1 1 1 0 1 0 0 0 0 1 1 1 0 1 1 1 0 0 0 1 1 1 1 0 1 0 1 0 0 0 1 1 0 1 1 1 1 1 0 0 0 0 1 1 1 1 1 0 1 0 1 0 0 0 1 1 1 1 1 1 0 1 0 0 1 1 1 0 0 0 1 0 0 0 0 1 1 1 1 1 1 1 0 1 0 0 1 1 1 1 1 0 1 0 0 0 0 0 1 1 1 1 1 1 0 0 0 1 1 1 1 1 1 0 1 0 1 0 1 0 1 1 1 1 1 1 1 0 0 0 0 1 1 1 1 0 1 0 1 0 0 0 1 1 1 1 1 1 0 1 0 0 0 1 1 1 1 0 1 0 0 0 0 0 1 1 1 0 1 1 0 0 0 0 0 1 1 1 1 0 1 0 1 0 0 0 1 1 1 1 1 1 0 0 0 0 1 1 1 1 1 0 1 0 0 0 0 0 1 1 1 1 1 1 0 1 0 0 1 1 1 1 1 0 1 0 0 0 0 0 1 1 1 1 1 1 0 0 0 0 0 1 1 1 1 0 1 1 1 0 0 0 1 1 1 1 1 1 0 0 0 1 0 1 1 1 1 0 1 0 0 0 0 0 0 1 1 0 1 0 0 1 1 1 1 1 1 1 1 0 1 0 0 0 0 0 1 1 1 1 1 1 0 1 0 0 0 1 0 0 0 0 1 0 1 0 0 0 1 1 1 1 1 1 0 1 0 0 0 0 0 0 0 0 1 0 1 0 0 0 1 0 0 0 1 1 0 0 0 0 0 1 1 1 1 0 1 0 1 0 0 0 1 1 1 1 1 1 0 0 0 1 0 1 1 1 1 0 1 0 1 0 0 0 1 1 1 1 1 1 0 0 0 0 0 1 1 1 1 0 1 0 0 0 1 1 1 1 1 1 1 1 0 0 0 0 0 1 1 1 1 0 1 0 1 0 0 0 1 1 1 1 1 1 0 0 0 0 1 1 0 0 0 0 1 0 1 0 0 0 1 1 1 1 1 1 0 1 0 0 0 1 1 1 1 0 1 0 0 0 0 1 1 1 1 1 1 1 1 1 0 0 1 1 1 1 1 0 1 0 1 0 0 0 1 0 1 1 1 1 0 1 0 0 0 1 1 1 1 0 1 0 0 0 0 0 1 1 1 1 1 0 0 0 0 1 0 1 1 1 1 0 1 0 1 0 0 1 1 1 0 0 1 1 0 1 0 1 0 1 1 1 1 0 1 0 1 0 0 0 1 1 1 1 1 1 0 1 0 1 0 1 1 1 1 0 1 0 1 0 0 0 1 1 1 1 1 1 0 1 0 0 0 1 1 1 0 0 1 0 1 0 0 0 1 1 1 1 1 1 0 1 0 1 0 1 1 1 1 0 1 0 0 0 0 1 1 0 1 1 1 1 0 1 1 1 0 1 1 1 1 0 1 0 0 0 0 1 1 1 1 1 1 1 0 1 0 1 0 1 1 1 1 0 1 0 1 0 0 0 1 1 1 1 1 1 0 1 0 1 0 1 1 1 1 0 1 0 1 0 1 0 1 1 1 1 1 1 0 1 0 1 0 1 1 1 1 0 1 0 0 0 1 0 1 1 1 1 1 1 0 0 0 0 0 1 1 1 1 0 1 0 1 0 0 0 1 0 0 0 1 1 0 1 0 1 0 1 1 1 1 0 1 0 1 0 0 0 0 0 1 1 1 0 0 1 0 1 0 1 1 1 0 0 1 0 0 0 0 1 1 1 1 1 1 1 0 1 0 0 0 1 1 1 1 0 1 0 0 0 0 1 1 1 0 1 1 1 0 0 0 0 0 1 0 1 1

290
Table C.7 (continued): Database of impact analysis – The Turkish case R
emot
e
Sect
or
Gen
der
Age
Edu
catio
n
Ori
gin
Mot
ivat
ion
Nat
ural
Cap
itel
Man
-Mad
e C
apita
l
Soci
al C
apita
l
Hum
an C
apita
l
Rem
ote
Sect
or
Gen
der
Age
Edu
catio
n
Ori
gin
Mot
ivat
ion
Nat
ural
Cap
itel
Man
-Mad
e C
apita
l
Soci
al C
apita
l
Hum
an C
apita
l
0 1 0 1 0 0 0 1 1 1 1 1 1 0 1 0 0 0 1 0 1 0 0 1 0 0 0 0 0 1 1 1 1 1 1 0 1 0 0 0 1 1 1 1 0 1 0 1 1 1 0 1 1 1 1 1 1 0 1 0 1 0 1 0 1 1 0 1 0 1 0 0 0 1 1 1 0 1 0 0 0 0 1 1 1 0 1 0 0 1 0 1 0 1 0 1 0 0 0 1 1 0 1 0 1 0 1 1 1 1 0 1 0 1 0 0 0 1 1 1 1 1 0 0 1 0 0 0 1 1 1 1 0 1 0 1 0 0 1 1 1 1 1 1 1 0 1 0 0 0 0 0 0 0 0 1 0 0 0 0 0 1 0 1 1 1 1 0 1 0 0 0 1 0 0 0 0 1 0 1 0 0 0 1 1 1 1 1 1 0 1 0 0 0 1 0 0 0 0 1 0 1 0 0 1 1 1 0 1 1 1 1 0 0 0 1 1 0 0 0 0 1 0 1 0 1 0 1 1 1 1 1 1 0 1 0 0 0 1 0 0 0 0 1 0 1 0 0 0 1 1 1 1 1 1 0 1 0 0 0 1 0 1 1 0 1 0 0 0 0 0 1 1 1 1 1 1 0 1 0 0 0 1 1 1 1 0 1 0 0 0 0 1 1 1 1 1 1 1 1 1 0 1 1 1 0 0 0 0 1 0 1 0 0 1 1 1 1 1 1 1 1 1 0 0 1 1 0 0 0 0 1 0 1 0 0 1 1 1 0 1 1 1 0 1 0 0 0 1 0 0 0 0 1 0 1 0 0 0 1 1 1 1 1 1 0 1 0 0 0 0 0 0 0 0 1 0 1 0 0 0 1 1 1 1 1 0 0 1 0 0 0 1 1 1 1 0 1 0 0 0 1 0 1 1 1 1 1 0 0 1 0 0 0 0 0 0 0 0 1 0 0 0 0 0 1 1 1 1 1 0 0 1 0 0 1 0 0 0 0 0 1 0 1 0 0 0 1 0 1 1 1 0 0 0 0 1 0 1 1 0 0 0 1 0 1 0 0 0 1 0 1 1 1 0 1 1 0 0 0 1 1 0 0 0 1 0 0 0 1 0 1 1 1 1 1 1 0 1 0 0 0 1 0 0 0 0 1 0 0 0 0 0 1 0 0 0 1 1 1 0 0 0 0 1 0 0 0 0 1 0 1 0 0 0 1 0 0 0 1 0 0 0 0 0 0 1 1 1 1 0 1 0 1 0 0 0 1 1 1 0 1 1 0 0 0 0 0 1 1 1 1 0 1 0 0 0 0 0 1 1 1 1 1 0 1 0 0 1 0 1 1 1 1 0 1 0 0 0 0 0 1 1 1 1 1 1 0 0 0 0 0 1 0 0 0 0 1 0 1 0 1 0 0 0 0 0 1 1 0 1 0 0 0 1 1 1 1 0 1 0 1 0 0 0 1 1 1 0 1 0 1 0 0 0 0 1 1 1 1 0 1 0 0 0 0 0 1 0 0 1 1 1 0 1 0 0 1 1 0 0 0 0 1 0 0 0 0 1 1 1 1 1 0 1 0 1 0 1 0 1 0 1 1 0 1 0 1 0 0 0 1 1 1 1 0 0 0 1 0 1 0 1 1 1 1 0 1 0 1 0 0 0 1 1 1 1 0 1 0 1 0 1 0 1 1 0 0 0 1 0 1 0 1 0 1 0 0 0 0 1 0 1 1 1 0 1 0 0 0 0 1 0 1 0 0 0 1 1 1 1 0 1 0 1 0 0 0 1 1 1 0 0 1 0 0 0 0 0 1 1 1 1 0 1 0 1 0 1 0 1 0 0 1 0 1 0 1 0 0 1 1 1 1 1 0 1 0 1 0 0 0 1 1 1 0 0 1 0 1 0 0 0 1 1 1 1 1 0 1 0 0 0 0 1 1 1 1 0 1 0 0 0 0 1 0 0 0 0 1 1 1 1 0 1 0 1 1 1 1 0 1 0 1 0 0 0 1 1 1 1 1 0 0 1 0 1 1 1 1 0 0 0 1 0 0 0 0 1 1 1 1 1 1 0 1 1 0 1 0 1 0 0 0 0 1 0 1 0 0 0 1 1 1 1 1 1 1 1 0 1 1 0 0 0 0 0 1 0 1 0 0 0 1 1 1 1 1 1 1 0 0 1 0 1 1 1 1 0 1 0 0 0 0 1 1 1 1 1 1 1 0 0 0 0 0 1 0 0 0 0 1 0 0 0 1 0 1 1 1 1 1 1 0 1 0 0 0 0 0 0 0 0 1 0 1 0 1 0 1 1 1 1 1 1 0 0 0 0 0 1 0 1 1 0 1 0 1 0 0 0 1 1 1 1 1 1 1 0 0 1 0 0 0 0 0 1 1 0 1 0 0 1 1 0 0 0 1 1 0 1 0 0 0 1 0 0 0 1 1 0 0 0 0 1 1 1 1 1 1 1 0 0 0 1 1 1 0 0 0 1 1 1 1 0 1 1 1 1 1 0 1 1 1 0 0 1 0 0 0 0 0 1 1 0 1 0 0 1 1 1 1 1 1 1 1 0 0 1 0 0 0 1 1 1 1 1 1 0 0 1 1 1 1 0 1 0 0 0 0 1 1 1 1 1 0 1 1 0 1 0 0 0 1 0 0 0 1 0 0 1 0 1 1 1 1 1 0 1 1 1 0 0 0 0 1 1 1 1 1 0 0 1 0 1 0 0 0 0 0 1 1 1 1 0 0 0 1 1 1 1
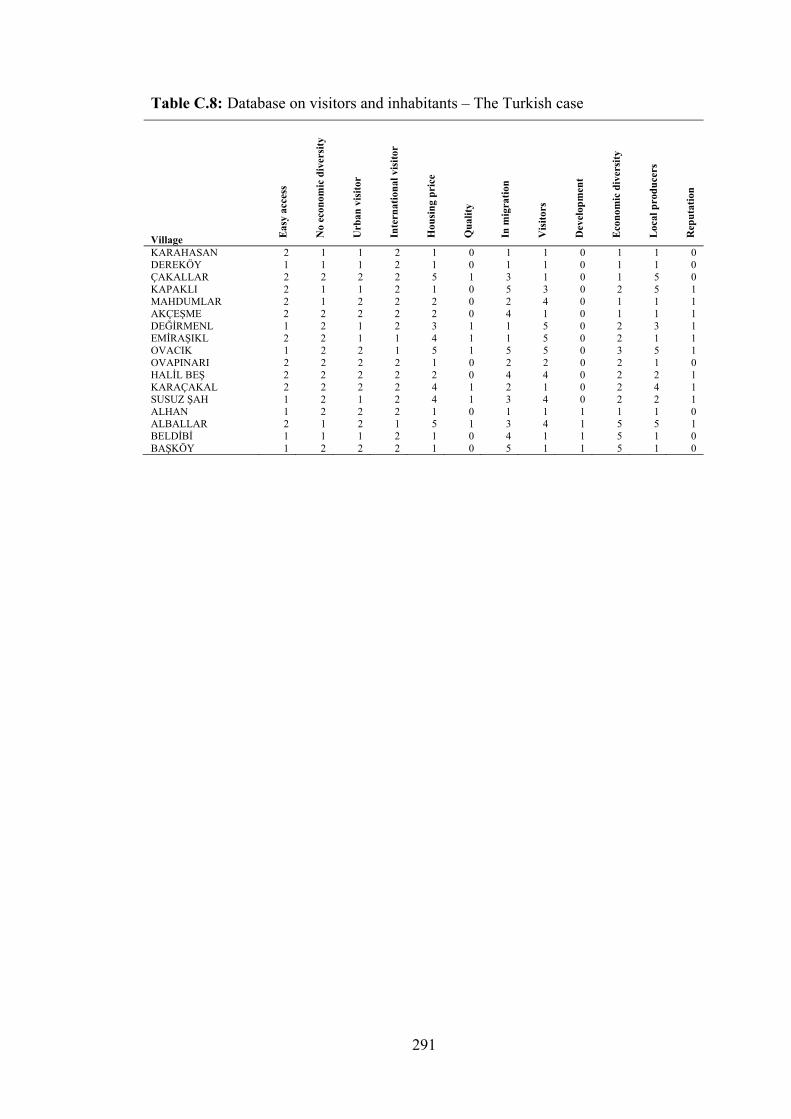
291
Table C.8: Database on visitors and inhabitants – The Turkish case
Village Eas
y ac
cess
No
econ
omic
div
ersi
ty
Urb
an v
isito
r
Inte
rnat
iona
l vis
itor
Hou
sing
pri
ce
Qua
lity
In m
igra
tion
Vis
itors
Dev
elop
men
t
Eco
nom
ic d
iver
sity
Loc
al p
rodu
cers
Rep
utat
ion
KARAHASAN 2 1 1 2 1 0 1 1 0 1 1 0 DEREKÖY 1 1 1 2 1 0 1 1 0 1 1 0 ÇAKALLAR 2 2 2 2 5 1 3 1 0 1 5 0 KAPAKLI 2 1 1 2 1 0 5 3 0 2 5 1 MAHDUMLAR 2 1 2 2 2 0 2 4 0 1 1 1 AKÇEŞME 2 2 2 2 2 0 4 1 0 1 1 1 DEĞİRMENL 1 2 1 2 3 1 1 5 0 2 3 1 EMİRAŞIKL 2 2 1 1 4 1 1 5 0 2 1 1 OVACIK 1 2 2 1 5 1 5 5 0 3 5 1 OVAPINARI 2 2 2 2 1 0 2 2 0 2 1 0 HALİL BEŞ 2 2 2 2 2 0 4 4 0 2 2 1 KARAÇAKAL 2 2 2 2 4 1 2 1 0 2 4 1 SUSUZ ŞAH 1 2 1 2 4 1 3 4 0 2 2 1 ALHAN 1 2 2 2 1 0 1 1 1 1 1 0 ALBALLAR 2 1 2 1 5 1 3 4 1 5 5 1 BELDİBİ 1 1 1 2 1 0 4 1 1 5 1 0 BAŞKÖY 1 2 2 2 1 0 5 1 1 5 1 0

292

293
APPENDIX D : Data and information used in the comparative analyses
Table D.1: Data and results of the rurality analysis – EU and Turkey Country AES SES IOID SE1 ALS CBR CDR PG LOM NOD SE2 SE3 CO2 EPC IES F1 F2 F3 F4 F5 R Austria 0.05 0.67 3.80 104.72 40.20 9.70 9.10 0.64 1670.00 3888821 100.35 48.71 1.07 8104.42 0.20 -0,71 0,45 -0,36 -0,40 -0,33 0,82 Belgium 0.02 0.73 4.00 104.90 45.70 11.10 9.80 0.43 1729.00 4745503 160.15 60.67 1.08 8411.94 0.18 -0,37 0,31 -0,26 1,54 0,12 -1,45 Cyprus 0.05 0.71 4.10 97.61 14.70 11.20 7.00 1.01 268.00 323828 98.42 31.96 1.08 4758.63 0.13 -0,33 1,07 -0,65 -0,78 0,34 1,83 Czech Republic 0.04 0.56 3.40 102.15 46.00 9.60 10.50 0.14 517.76 4344178 96.89 36.88 1.11 6070.08 0.30 -0,75 -0,38 -0,41 -1,27 -0,76 1,32 Denmark 0.03 0.73 3.40 102.63 61.80 12.00 10.30 0.32 1010.00 2780658 127.31 66.83 1.08 6602.32 0.17 -0,19 0,00 -0,48 1,02 0,21 -0,94 Estonia 0.06 0.59 5.90 100.37 17.00 10.40 13.20 -0.33 98.00 646764 95.91 64.49 1.11 5224.16 0.27 0,32 -1,43 -0,59 -0,16 -0,34 -0,02 Finland 0.05 0.69 3.50 101.66 6.70 11.00 9.10 0.29 653.00 2624474 127.39 86.90 12.03 16426.83 0.19 -0,16 -0,32 -0,63 1,13 1,83 -2,81 France 0.04 0.00 4.20 105.21 53.70 12.70 8.40 0.59 10379.00 29600012 109.99 55.35 1.06 7816.45 0.00 -0,34 0,67 2,07 0,30 -0,02 -2,01 Germany 0.02 0.66 4.40 99.39 47.70 8.60 9.90 -0.03 12037.00 38628607 100.07 50.10 10.03 6896.33 0.24 -0,50 -1,04 3,00 -1,04 0,73 -4,22 Greece 0.13 0.65 6.00 99.98 29.50 9.40 9.40 0.22 280.00 5709281 95.58 72.24 1.08 5040.51 0.14 0,67 -0,41 -0,44 0,36 0,12 0,22 Hungary 0.05 0.62 3.30 98.55 63.00 9.40 13.10 -0.22 542.00 4120551 103.41 51.89 1.05 3637.28 0.25 -0,13 -1,41 -0,37 -0,39 -0,13 -0,65 Ireland 0.06 0.66 5.00 105.57 61.30 15.20 6.90 1.08 176.00 1424565 109.02 55.29 1.10 6098.00 0.16 -0,03 1,72 -0,78 0,31 -0,35 2,50 Italy 0.04 0.65 5.60 100.97 50.70 9.70 9.40 -0.13 6478.00 26681151 99.09 59.02 1.07 5619.84 0.22 -0,03 -0,66 1,59 -0,31 -0,22 -1,74 Latvia 0.13 0.59 6.00 95.13 25.40 8.80 13.80 -0.54 0.00 1026168 94.70 70.98 1.02 2455.55 0.19 1,13 -2,15 -0,59 0,21 0,30 -0,94 Lithuania 0.16 0.56 4.50 99.71 39.90 8.90 12.00 -0.54 417.00 1423463 102.52 68.99 1.03 3055.09 0.20 0,74 -1,58 -0,65 0,24 -0,17 -0,26 Luxembourg 0.02 0.78 3.70 99.18 49.50 12.00 7.90 0.74 115.00 217427 96.01 1.12 21.26 15935.21 0.10 -0,77 0,77 -0,75 -1,75 3,56 -1,07 Malta 0.02 0.68 4.60 102.59 30.40 9.70 7.20 0.57 2262.00 161658 93.93 29.92 1.07 4867.17 0.22 -0,95 0,78 -0,26 -1,39 -0,61 2,09 Netherlands 0.03 0.73 4.00 107.92 51.50 11.90 8.40 0.35 2289.00 6882317 121.94 58.00 1.09 6747.81 0.13 -0,42 0,73 -0,14 0,80 -0,08 -0,26 Poland 0.18 0.53 5.00 99.51 52.20 9.30 9.50 -0.04 405.00 12566780 104.51 59.47 1.07 3329.14 0.23 0,69 -0,75 -0,14 -0,24 -0,49 0,82 Portugal 0.12 0.57 7.20 118.48 41.50 10.40 9.70 0.58 1835.00 4152943 109.04 55.53 6.00 4383.18 0.20 -0,21 0,95 -0,41 0,05 -1,41 2,50 Slovakia 0.05 0.56 5.80 100.25 45.60 10.00 9.60 0.05 312.80 1907196 91.73 33.99 1.06 5009.81 0.30 -0,31 -0,32 -0,44 -1,51 -0,76 2,09 Slovenia 0.10 0.53 3.00 111.32 24.20 9.00 9.30 0.07 477.00 776965 111.80 70.12 1.07 6816.66 0.31 -0,82 -0,02 -0,76 -0,08 -1,69 1,69 Spain 0.06 0.64 5.10 107.45 49.80 10.60 8.70 1.01 9739.00 21093061 116.52 63.55 1.07 5701.08 0.18 -0,35 0,87 1,61 0,36 -0,82 -0,62 Sweden 0.02 0.75 3.30 109.11 7.70 11.20 10.10 0.40 1591.00 4336297 137.03 81.78 1.05 15402.63 0.17 -0,62 0,31 -0,50 1,87 0,36 -2,05 Turkey 0.28 0.16 10.00 94.69 53.10 19.10 6.20 1.01 1775.00 17631782 85.30 28.01 1.02 1656.00 0.15 4,16 1,69 0,26 -0,85 0,04 6,41 United Kingdom 0.01 0.76 5.30 100.82 67.20 12.00 9.70 0.48 3609.00 25957376 170.12 62.76 1.09 6209.24 0.15 0,27 0,13 1,10 1,96 0,56 -3,21
Notes: AES = Agricultural employment per total employment; SES = Services employment per total employment; IOID = Inequality of income distribution; SE1 = School enrolment, primary (% gross); ALS = Agricultural land per total land area ; CBR = Crude birth rate; CDR = Crude death rate; PG = Population growth (% annual); LOM = Length of motorways; NOD = Number of dwellings; SE2 = School enrolment, secondary (% gross) ; SE3 = School enrolment, tertiary (% gross); CO2 = CO2 emissions (metric tons per capita); EPC = Electric power consumption (kWh per capita); IES = Industrial employment per total employment.

294
295
CURRICULUM VITAE
Candidate’s full name: Aliye Ahu GÜLÜMSER
Place and date of birth: Istanbul, 26 November 1979
Universities and Colleges attended:
Undergraduate, Urban and Regional Planning, Istanbul Technical University, Fall 1998-Spring 2003
Graduate, Regional Planning Master’s Programme, Istanbul Technical University, Fall 2003-Fall 2004
Selected Publications: Gülümser, A.A., Baycan-Levent, T., Nijkamp, P. and Brons, M. 2010.
Embeddedness of Entrepreneurs in Rural Areas: A Comparative Rough Set Data Analysis, Tijdschrift voor Economische en Sociale Geografie. 101(5).
Gülümser, A.A., Baycan-Levent, T. and Nijkamp, P. 2009. Changing Trends in Rural Self-employment in Europe and Turkey. In A. Torre and J.B. Traversac (eds), Territorial Governance, Rural Areas and Agrofood Systems. Springer. forthcoming.
Gülümser, A. A., Baycan-Levent, T. and Nijkamp, P. 2009. Beauty is in the Eyes of the Beholder: A Logistic Regression Analysis of Sustainability and Locality as Competitive Vehicles for Human Settlements. International Journal of Sustainainable Development, 12(1), 95-110.
Gülümser, A.A., Baycan-Levent, T. and Nijkamp, P. 2009. Mapping rurality: analysis of rural structure in Turkey. International Journal of Agricultural Resources, Governance and Ecology. 8(2-3), 130-157.
Gülümser, A.A., Baycan-Levent, T. and Nijkamp, P. 2008. Turkey’s Rurality: A Comparative Analysis at EU Level. In M.T. de Noronha Vaz, P. Nijkamp and J.L. Rastoin (eds), Traditional Food Production Facing Sustainability: A European Challenge, Ashgate, Aldershot, pp. 57-80.
Baycan-Levent, T., Kundak, S. and Gülümser, A.A. 2008. City-to-city Linkages in a Mobile Society: Eurocities and Sister Cities. International Journal of Services Technology and Management, 10(1), 83-109.
Baycan-Levent, T., Kundak, S. and Gülümser, A.A., 2008. Migration experience of Turkey: A historical and geographical perspective, Mondi Migranti, 2, 55-81.
Related Documents