Sustainable Remediation of Contaminated Sites GEOTECHNICAL ENGINEERING COLLECTION Hiroshan Hettiarachchi, Editor Krishna R. Reddy Jeffrey A. Adams

Welcome message from author
This document is posted to help you gain knowledge. Please leave a comment to let me know what you think about it! Share it to your friends and learn new things together.
Transcript
Sustainable R
emed
iation o
f Co
ntaminated
SitesR
ED
DY
• AD
AM
S
Sustainable Remediation of Contaminated SitesKrishna R. Reddy • Jeffrey A. AdamsThis book presents a holistic approach to remediation that considers ancillary environmental impacts and aims to optimize net effects to the environment. It addresses a broad range of environmental, social, and economic impacts during all remediation phases, and achieves remedial goals through more efficient, sustainable strategies that conserve resources and protect air, water, and soil quality through reduced emissions and other waste burdens.
Inside, the authors simultaneously encourage the reuse of remediated land and enhanced long-term financial returns for investments. Though the potential benefits are enormous, many environmental professionals and project stakeholders do not utilize green and sustainable technologies because they are unaware of methods for selection and implementation. This book describes the decision framework, presents qualitative and quantitative assessment tools, including multi-disciplinary metrics, to assess sustainability, and reviews potential new technologies.
Krishna R. Reddy, PhD, PE, is a professor of civil and environmental engineering and the director of Sustainable Engineering Research Laboratory and Geotechnical and Geoenvironmental Engineering Laboratory at the University of Illinois at Chicago (UIC). Dr. Reddy received his PhD from the Illinois Institute of Technology in Chicago, and he is a licensed professional engineer in Illinois. Dr. Reddy has over 25 years of research, consulting and teaching experience. He has published over 300 technical publications on various topics on pollution control and remediation.
Jeffrey A. Adams, PhD, PE, is an associate with San Ramon, California-based ENGEO Incorporated. He provides development-related consulting services for a variety of public and private clients, including applications in geotechnical and environmental engineering. Dr. Adams is a licensed professional engineer in California and a certified environmental manager in Nevada. He received his BS, MS, and PhD degrees in civil engineering from the University of Illinois at Chicago. Additionally, he received his MBA with concentrations in finance and real estate from the University of Washington.
Sustainable Remediation of Contaminated Sites
GEOTECHNICAL ENGINEERING COLLECTIONHiroshan Hettiarachchi, Editor
Krishna R. ReddyJeffrey A. Adams
ISBN: 978-1-60650-520-5
EBOOKS FOR THE ENGINEERING LIBRARYCreate your own Customized Content Bundle — the more books you buy, the higher your discount!
THE CONTENT• Manufacturing
Engineering• Mechanical
& Chemical Engineering
• Materials Science & Engineering
• Civil & Environmental Engineering
• Electrical Engineering
THE TERMS• Perpetual access for
a one time fee• No subscriptions or
access fees• Unlimited
concurrent usage• Downloadable PDFs• Free MARC records
For further information, a free trial, or to order, contact: [email protected]

SUSTAINABLE REMEDIATION OF CONTAMINATED
SITES

SUSTAINABLE REMEDIATION OF CONTAMINATED
SITES
KRISHNA R. REDDY JEFFREY A. ADAMS
MOMENTUM PRESS, LLC, NEW YORK
Sustainable Remediation of Contaminated SitesCopyright © Momentum Press®, LLC, 2015.
All rights reserved. No part of this publication may be reproduced, stored in a retrieval system, or transmitted in any form or by any means— electronic, mechanical, photocopy, recording, or any other—except for brief quotations, not to exceed 400 words, without the prior permission of the publisher.
First published by Momentum Press®, LLC222 East 46th Street, New York, NY 10017www.momentumpress.net
ISBN-13: 978-1-60650-520-5 (print)ISBN-13: 978-1-60650-521-2 (e-book)
Momentum Press Geotechnical Engineering Collection
Cover and interior design by Exeter Premedia Services Private Ltd., Chennai, India
10 9 8 7 6 5 4 3 2 1
Printed in the United States of America
AbstrAct
Traditional site remediation approaches typically focus on the reduction of contaminant concentrations to meet cleanup goals or risk-based corrective levels, with a primary emphasis on remediation program cost and time-frame. Such an approach, however, may result in ancillary impacts to the environment that, when considered in totality with the remediation activity, result in a net negative impact to the environment. In contrast to a traditional remediation approach, this book presents a holistic approach to remediation that considers ancillary environmental impacts and aims to optimize net effects to the environment. It addresses a broad range of environmental, social, and economic impacts during all remediation phases, and achieves remedial goals through more efficient, sustainable strategies that conserve resources and protect air, water, and soil quality through reduced emissions and other waste burdens. Inside, the authors simultaneously encourage the reuse of remediated land and enhanced long-term financial returns for investments. Though the potential benefits are enormous, many environmental professionals and project stakeholders do not utilize green and sustainable technologies because they are unaware of the methods for selection and implementation. This book describes the decision framework, presents qualitative and quantitative assessment tools, including multidisciplinary metrics, to assess sustainability, and reviews potential new technologies. It presents several case studies that include sustainable remediation solutions, and will also highlight the challenges in promoting this practice.
KEY WORDS
brownfields, environment, land contamination, life cycle assessment (LCA), remediation, remediation technologies, sustainability, sustain-ability development, sustainability framework, sustainability metrics, sustainability tools

contents
List of figures ix
List of tabLes xi
acknowLedgments xiii
chapter 1 introduction 1
chapter 2 contaminated site remediation: generaL approach 27
chapter 3 contaminated site remediation technoLogies 39
chapter 4 sustainabLe remediation frameworks 59
chapter 5 sustainabLe remediation indicators, metrics, and tooLs 141
chapter 6 case studies 193
chapter 7 chaLLenges and opportunities 225
references 237
bibLiography 241
index 243

List of figures
Figure 1.1. Sources of subsurface contamination. 15Figure 1.2. Estimated number of contaminated sites in the United
States (Cleanup horizon: 2004–2033). 15Figure 2.1. General approach for contaminated site assessment and
remediation. 29Figure 2.2. Graphical CSM. 32Figure 3.1. Vadose zone (soil) remediation technologies. 41Figure 3.2. Containment technologies: (a) cap, vertical barrier,
and bottom barrier; (b) pumping well systems; and (c) subsurface drain system. 52
Figure 4.1. Core elements of the U.S. EPA green remediation framework. 61
Figure 4.2. ITRC GSR framework. 64Figure 4.3. ASTM greener cleanup overview. 69Figure 4.4. ASTM sustainability framework: Relationship between
the sustainable aspects (center), core elements (spokes), and some example BMPs (outer rim of wheel). 109
Figure 5.1. Illinois EPA greener cleanups matrix. 155Figure 5.2. Minnesota pollution control board sustainability
evaluation tool. 156Figure 6.1. Soil profile at the site. 194Figure 6.2. Map showing the areas where the contaminant
concentrations exceeded the threshold levels based on (a) human and ecological risk for PAHs, (b) human and ecological risk for pesticides, and (c) human and ecological risk for metals. 196
x • LiSt Of figuRES
Figure 6.3. GREM analysis for soil and groundwater remediation technologies. 201
Figure 6.4. Typical SRTTM results: emission comparison for groundwater remediation technologies. 203
Figure 6.5. Typical SiteWiseTM results: GHG emission comparison for soil remediation technologies. 203
Figure 6.6. Area map showing three wetlands slated for restoration as part of the Millennium Reserve, proposed as part of the GLRI. Inset map shows AOCs identified at IRM. 207
Figure 6.7. Select output from SRT analyses among active remedial alternatives for groundwater treatment at Area F. The table and graph show the estimated emissions of CO2 and other criteria air pollutants (NOx, SOx, PM10). 209
Figure 6.8. SSEM results for IRM site. 211Figure 6.9. LCA comparing excavation and hauling to
solidification and stabilization. 219Figure 6.10. LCA for excavation and hauling. 219Figure 6.11. LCA for solidification and stabilization. 220Figure 6.12. LCA comparing excavation and hauling and
stabilization and solidification with onsite landfill. 220Figure 6.13. LCA comparing excavation and hauling and stabilization
and solidification with similar sand mining. 221Figure 6.14. SSEM results for Matthiessen and Hegeler zinc
superfund site. 222
List of tAbLes
Table 1.1. Typical subsurface contaminants 17Table 3.1. Comparative assessment of ex situ soil remedial
technologies 42Table 3.2. Comparative assessment of in situ soil remediation
technologies 43Table 3.3. Comparative assessment of groundwater remedial
technologies 48Table 4.1. ASTM Greener Cleanup BMPs 70Table 4.2. ASTM sustainable remediation BMPs 111Table 5.1. UN sustainability indicators 144Table 5.2. California GREM 159Table 5.3. Social dimensions and key theme areas included
in the SSEM 161Table 5.4. Scoring system for SSEM 165Table 5.5. Summary of quantitative assessment tools 167Table 6.1. Risk assessment 195Table 6.2. GREM for stabilization and solidification 199Table 6.3. Comparison of BMPs for different remedial options 202Table 6.4. Relative impacts of soil remediation technologies
based on SiteWise 204Table 6.5. Relative impacts of groundwater remediation
technologies based on SiteWise 204Table 6.6. Summary of SiteWise comparison of sustainability
metrics between phytoremediation with enhanced biostimulation (Phyto-EB) and excavation at Area C 204
Table 6.7. Input materials and processes for SimaPro analysis 218

Acknowledgments
The authors are thankful to Professor Hiroshan Hettiarachchi, United Nations University, Institute for Integrated Management of Material Fluxes and of Resources, Dresden, Germany, for his encouragement to prepare this book. The authors are thankful to Ms. Rebecca A. Bourdon, PG, Hydrologist, Petroleum Remediation Program, Minnesota Pollution Control Agency, for her constructive comments. The authors also gratefully acknowledge the assistance received from both Ms. Shoshanna Goldberg and Ms. Sheri Dean of Momentum Press, New York, at various stages of preparation of this book. Finally, the support of the University of Illinois at Chicago and ENGEO Incorporated during this endeavor is highly appreciated.

CHAPtER 1
introduction
1.1 EMERgENCE Of ENViRONMENtAL CONCERNS
From the 1940s through the 1960s, very little if any collective energy was focused on environmental issues. The U.S. economy and population were both growing at an unprecedented pace, and individual, private sec-tor, and public sector goals and initiatives were directed toward provid-ing housing, consumer, and durable goods to growing families within an expanding middle class. Additionally, the United States was engaged in an expanding Cold War and space race with the Soviet Union. Americans were aware of the environment; however, the slogan “dilution is the solu-tion to pollution” indicated where environmental issues registered within the American psyche.
During this time, disposal practices of liquids and solids were quite rudimentary. Solids and liquids were often placed in uncontrolled dumps without any provisions for secondary containment, or in many cases, pri-mary containment. Liquid wastes and solid wastes were also dumped into waterways without regard for chemical or thermal effects to the receiving waters. Despite some initial evolving legislation in the 1950s, air emissions from point or mobile sources were often unregulated or unchecked. As a result, the rapidly increasing pollutant loads to air, water, and soil were overwhelming the environment’s ability to absorb these releases without manifested side effects. Additionally, numerous chemicals released to the environment could not be degraded through natural processes within a reasonable amount of time.
Air pollution was becoming increasingly prevalent, and notable smog outbreaks in Donora, Pennsylvania (1948), London, UK (1952), New York (1953), and Los Angeles (1954) resulted in appreciable loss of life and significant disruptions to daily activities. In response, the Air Pollution Control Act was passed in 1955. This initial legislation acknowledged that
2 • SuStAiNABLE REMEDiAtiON Of CONtAMiNAtED SitES
air pollution was a growing hazard to public health; however, it deferred the responsibility of combating air pollution to the individual states and did not contain enforcement provisions to sanction or hold air polluters responsible for their actions.
Water pollution was gaining notoriety with spectacular images and events. In 1969, the Cuyahoga River in Cleveland caught on fire. In fact, the river had reportedly caught fire several times prior to the 1969 event. Further, studies of the river had reported extensive visible observations of oily sheens and the absence of animal life and most other forms of aquatic life. Downstream from the Cuyahoga River, its receiving water, Lake Erie, was declared biologically dead in the 1960s. Yet, Ohio was by far not the only source of impacted water bodies—they were found in every state, and the impacts were increasing.
Buffalo, New York, exhibited significant water pollution (Niagara River, Lake Erie); however, it became even more synonymous with soil pollution. A previously abandoned canal in Niagara Falls, New York, was used as a dumping ground for thousands of tons of waste from the Hooker Chemical Company. Once the canal had been filled with waste, it was reportedly capped with clay and closed. Over time, a neighborhood was built over the canal (Love Canal). The resulting development and infrastructure construction pierced the clay-lined canal. Later, in the early 1950s, the local Board of Education constructed an elementary school on the canal. Over time, noxious odors were observed, and significant acute and chronic health problems were reported by the citizens. Eventually, follow-up testing and analysis determined the presence of widespread soil and groundwater contamination, and the U.S. federal government paid for the relocation of hundreds from the Love Canal area.
Several other notable environmental impacts entered the public con-sciousness. Among several large-scale oil platform and tanker disasters, in 1969, an offshore well accident resulted in crude oil washing ashore onto beaches along the Santa Barbara Channel in California. Additionally, nuclear fallout from above-ground nuclear weapons testing, first in the deserts of the western United States, and later in the Pacific Ocean, results in health impacts among those exposed.
These high-profile events as well as the everyday observations of ordinary citizens in their lives gave rise to a grass-roots environ-mental movement. Of the milestone occurrences associated with this movement, the first has been traditionally credited to the publishing of Rachel Carson’s Silent Spring in late 1962. Ms. Carson’s book observed the death of song birds, ostensibly from the uncontrolled use of pesti-cides for vector abatement, most notably mosquitoes. Other evidence of
iNtRODuCtiON • 3
dichlorodiphenyltrichloroethane (DDT) use and its deleterious impact on the environment began to emerge—declining bald eagle populations in the United States were attributed to bioaccumulation of DDT, resulting in adverse effects to their eggs. Public outrage increased, and eventually DDT use was banned in the United States in 1972.
The 1969 Santa Barbara Channel oil spill also helped inspire the first observance of Earth Day in April 1970. Following the spill and federal government inaction, leaders of the political, business, and activist worlds conceived of an environmental teach-in to raise environmental aware-ness. The idea was well received by a wide range of audiences and inter-est groups, and millions took part in seminars, conferences, rallies, and demonstrations. Earth Day continues to this day and is celebrated in an ever-increasing number of countries by hundreds of millions of people.
Not to be discounted, the space race and the resulting ambitious scientific and engineering programs sometimes linked to environmen-tal impacts actually inspired a growing environmental consciousness. In December 1968, while in lunar orbit, the Apollo 8 command module broadcast live images of an earthrise to a worldwide television audience. Given the unprecedented distance that the Apollo 8 mission traveled and the equally unprecedented images transmitted back to an enthralled audi-ence, the images of the blue marble earth against the black emptiness of deep space and the starkness of the lunar surface inspired millions to real-ize that the earth is a fragile, discrete world worthy of protection in ways that had not been communicated or possible before the mission. Subse-quent images generated during lunar missions, space station visits, and spacewalks have enforced these feelings with equally powerful images.
1.2 EMERgENCE Of ENViRONMENtAL REguLAtiONS
The major environmental events as well as the evolving public interest in environmental protection began to coalesce in the 1960s and 1970s, and the federal government began to take notice. Beginning in the 1960s and well into the 1970s, the federal government began to enact legislation designed to protect the environment. Some of these legislative acts and regulations include the following (Sharma and Reddy 2004):
• Solid Waste Disposal Act (SWDA) (1965, 1970)—the first federal legislation attempting to regulate municipal solid waste. Provisions of the law included:
4 • SuStAiNABLE REMEDiAtiON Of CONtAMiNAtED SitES
{{ An emphasis on the reduction of solid waste volumes to protect human health and the environment.
{{ An emphasis on the improvement of waste disposal practices.{{ Provisions of funds to individual states to better manage their
solid wastes.{{ Amendments in 1970 encouraged further waste reduction and
waste recovery as well as the creation of a system of national disposal sites for hazardous wastes.
• National Environmental Policy Act (NEPA) (1969)—major legis-lation affirming the U.S. commitment to protect and maintain envi-ronmental quality. Provisions of the law included:{{ The creation of the Council of Environmental Quality, a new
executive branch agency. Eventually, the Environmental Protec-tion Agency (EPA) was created through a subsequent presiden-tial action.
{{ Requirement of the preparation of an Environmental Impact Statement (EIS) for any federal project that may have a sig-nificant effect on the environment. An EIS is a comprehensive document that assesses a wide range of potential impacts to the environment as well as social and economic impacts.
• Marine Protection, Research and Sanctuaries Act (MPRSA) (1972)—this law was passed to limit ocean dumping of wastes that would affect human health or the marine environment. Provisions of the law included:{{ Regulation of runoff, including those from rivers, streams,
atmospheric fallout, point-source discharges, dredged materi-als, discharges from ships and offshore platforms, and acciden-tal spills.
{{ Prohibition of dumping of certain wastes, including high-level radioactive wastes, biological, chemical, or radiological warfare materials, and persistent inert materials that float or are sus-pended in the water column.
{{ Permitting for all wastes to be dumped at sea.{{ Prohibition of states from enacting regulations relating to the
marine environment as covered under MPRSA.• Federal Insecticide, Fungicide, and Rodenticide Act (FIFRA)
(1972, 1982, and 1988)—the law was created to regulate the stor-age and disposal of these products. Provisions of the law included:{{ Labeling requirements for these products.{{ Registration and demonstration of usage proficiency by users of
these products.
iNtRODuCtiON • 5
{{ Registration of all pesticides with the U.S. EPA to confirm appro-priate labeling and that the materials will not harm the environment.
{{ Specific tolerance levels to prevent unreasonable hazards.• Clean Air Act (CAA) (1970, 1977, and 1990)—following previous
attempts at air pollution-related legislation, the CAA represented the first comprehensive law that regulated air emissions from area, stationary, and mobile sources. Provisions of the law included:{{ The establishment of National Ambient Air Quality Standards
(NAAQSs) for criteria pollutants.{{ Development of standards for other hazardous air pollutants,
including asbestos, volatile compounds, metals, and radionu-clides where NAAQSs have not been specified.
{{ Establishment of air quality regions within the United States for the purposes of regional monitoring toward the attainment or nonattainment of quality goals.
{{ Later amendments established a comprehensive permitting sys-tem for various emission sources toward the regulation of several common pollutants.
• Clean Water Act (CWA) (1977, 1981, and 1987)—this law estab-lished a basic structure for the regulation of discharge of pollutants into U.S. waters. Provisions of the law included:{{ A total of 129 priority pollutants were identified as hazardous
wastes.{{ Wastewater discharge treatment requirements mandating best
available technologies.{{ Prohibition of discharge from point sources unless a National Pol-
lutant Discharge Elimination System (NPDES) has been obtained.{{ Discharge of dredged material into U.S. waters is only allowed if
a permit has been obtained.{{ Discharges from Publicly Owned Treatment Works (POTWs)
must meet pretreatment standards.• Safe Drinking Water Act (SDWA) (1974, 1977, and 1986)—the act
was passed to protect the quality of drinking water in the United States, whether obtained from above-ground or groundwater sources. Provisions of the law included:{{ Establishment of drinking water standards, including maximum
contaminant levels, primary goals, and secondary goals that pro-vide protection of health and aesthetic standards.
{{ Protection of groundwater through the regulation of hazardous waste injections.
{{ Designation and protection of aquifers.
6 • SuStAiNABLE REMEDiAtiON Of CONtAMiNAtED SitES
• Toxic Substances Control Act (TSCA) (1976)—TSCA was enacted to regulation and use of hazardous chemicals. Provisions of the law included:{{ Requirement of industries to report or test chemicals that may
pose an environmental or human health threat.{{ Prohibition of the manufacture and import of chemicals that pose
an unreasonable risk.{{ Requirement of premanufacture notifications to the U.S. EPA.{{ Prohibition of polychlorinated biphenyls (PCBs).{{ The management of asbestos is also regulated under this law.
Despite these regulatory advances, several drawbacks and limitations still existed. First, with regard to solid waste disposal, a comprehensive framework was still not in place. Preliminary efforts had been reached to classify types of wastes as well as means to properly handle and dispose of these wastes; however, the concept of engineered landfill still had not replaced the concept of a dump. Further, although the regulatory frame-work had been developed to address the production, storage, and use of hazardous materials, as well as regulations for controlled emissions and releases, a framework had not been developed for handling and remedi-ating spills and other unauthorized releases of hazardous materials and petroleum products to the environment. As the 1970s wore on, incidents like Love Canal were continuing to draw the public’s attention to the need for remediation of contaminated sites—and additional sweeping legisla-tion was not far behind.
While many of the previously cited statutes and regulations were well-intended, in many cases they lacked strong enforcement or sanction-ing abilities. In other cases, these regulatory frameworks induced unin-tended and unfavorable behaviors and actions as various entities sought to skirt regulations with newly created loopholes or exclusions. For instance, it became increasingly common for unauthorized disposal of waste to occur in ditches, vacant lots, abandoned buildings, and abandoned indus-trial facilities. Additionally, few regulations were in place for landfills, and other disposal methods, such as deep groundwater injection, became increasingly common (Sharma and Reddy 2004). Of course, these prac-tices accelerated degradation of air, soil, surface water, and groundwater.
To counteract these ill-conceived and dangerous practices, the Resource Conservation and Recovery Act (RCRA) was passed in 1976. The intention of this act was to manage and regulate both hazardous and nonhazardous wastes, as well as underground storage tanks (USTs). In addition to regulations pertaining to disposal, RCRA placed an emphasis
iNtRODuCtiON • 7
on the recovery and reuse of materials through recycling (Sharma and Reddy 2004). RCRA served as a guideline for the development of sev-eral comprehensive regulatory frameworks for the storage, generation, and disposal of wastes. Some of these regulations include the following (U.S. EPA 2011):
• Subtitle C was developed to manage hazardous wastes for its entire existence to ensure that hazardous waste is handled in a manner that protects human health and the environment (i.e., cradle to grave). U.S. EPA established a regulatory framework for the generation, transportation, storage, and disposal of hazardous waste, as well as technical standards for the design and operation of treatment, storage, and disposal facilities.
• Subtitle D addresses nonhazardous solid wastes, including certain hazardous wastes that are exempted from the Subtitle C regula-tions, including hazardous wastes from households and from condi-tionally exempt small quantity generators. Subtitle D also includes general household waste; nonrecycled household appliances; non-hazardous scrap and debris, such as metal scrap, wallboard, and empty containers; and sludge from industrial and municipal waste-water and water treatment plants.
• Subtitle I regulates USTs used to store hazardous substances or petroleum. Subtitle I requires owners or operators or both to notify appropriate agencies about the presence of USTs, provide a method of release detection, ensure that the tanks and piping are properly designed, constructed, and protected from corrosion, and ensure that compatibility and other performance standards are met. Requirements for reporting, recordkeeping, and financial responsibility were also established. Corrective actions pertaining to releases from USTs are also regulated under Subtitle I. Numer-ous exceptions are provided in Subtitle I, including small tanks or tanks used for heating oil or agricultural use, as well as sep-tic tanks. USTs containing hazardous wastes are regulated under Subtitle C.
Additional statutes were passed in 1984 in the Hazardous and Solid Waste Amendments (HSWA). Much of the focus of these amendments was to protect groundwater, including the following (Sharma and Reddy 2004):
• Restrictions were placed on the disposal of liquids, including free liquids and specific chemicals or concentrations of chemicals.
8 • SuStAiNABLE REMEDiAtiON Of CONtAMiNAtED SitES
• Requirements for the management and treatment of small amounts of hazardous wastes.
• Regulations for USTs in urban areas, including leak detection sys-tems, inventory controls, and testing requirements. Importantly, owners of tanks were deemed liable for damages to third parties resulting from leakage.
• New standards were established for landfill facilities, including liner systems, leachate collection systems, groundwater monitor-ing, and leak detection.
• Specific requirements for treatment, storage, or disposal facilities (TSDF), including corrective action procedures, spill mitigation procedures, disposal bans, and five-year permit reviews. These are also applicable to inactive, formal hazardous waste disposal facili-ties located within RCRA facilities.
• The U.S. EPA was authorized to inspect and enforce these regula-tions as well as penalize violations.
While RCRA and the subsequent HSWA regulations were focused on the generation and disposal of hazardous and nonhazardous wastes, they did not address already contaminated sites. As described, many contaminated sites were emerging nationwide as a result of poor disposal and storage practices. Many of these sites posed a significant threat to human health or the environment. As a result, in 1980, the Comprehensive Environmental Response, Compensation, and Liabilities Act (CERCLA), or popularly known as Superfund, was passed to address cleanup of these hazardous sites. This extensive regulatory framework specifically addressed funding, liability, and prioritization of hazardous and abandoned waste sites. Some key provisions of CERCLA include the following (Sharma and Reddy 2004):
• A $1.6 billion fund was created from taxes levied on chemical and petroleum industries; this fund was set aside to finance the cleanup of hazardous waste sites. Additionally, funds were used to cover litigation costs associated with legal actions brought against poten-tially responsible parties (PRPs).
• In order to establish priority with respect to the relative hazards presented by contaminated sites, a hazard ranking system (HRS) was developed. Points were assigned and tallied related to fac-tors and risks associated with contaminated sites. Once a threshold score was exceeded, a site could be placed on the National Prior-ities List (NPL).
iNtRODuCtiON • 9
• A framework was developed to outline site characterization and assessment of remedial alternatives. A remedial investigation (RI) is performed to provide a thorough assessment of site conditions. Once completed, a feasibility study (FS) is prepared to assess potential remedial alternatives against a range of criteria.
There are nine existing criteria that pertain to remediation under CERCLA. The nine criteria include two threshold criteria: (1) the overall protection of human health and the environment and (2) compliance with applicable, relevant, and appropriate requirements; five balancing criteria: (3) long-term effectiveness and permanence, (4) reduction in toxicity, mobility, and volume, (5) short-term effectiveness, (6) implementability, and (7) cost; and two modifying criteria: (8) state acceptance and (9) com-munity acceptance.
At the time of CERCLA passage, the $1.6 billion fund was consid-ered substantial and was believed to be adequate to fund the cleanup of all contaminated sites within five years; however, this fund soon proved to be woefully inadequate to address the contaminated sites that were identi-fied nationwide in subsequent years. Additional funds ($8.5 billion) were appropriated in 1986 with the passage of the Superfund Amendments and Reauthorization Act (SARA). A $500 million fund was also appropriated for the remediation of leaking USTs. Additionally, community right-to-know provisions were adopted.
Most controversially, SARA specified that cleanups were required to meet applicable or relevant and appropriate requirements (ARARs). While ARARs established method for determining cleanup goals (something that was not explicitly clear in the original CERCLA statues), provisions for clean-up-related legal and financial liability were established. Disclosure require-ments related to annual releases of hazardous substances were also included.
Because of explicit liability provisions directed at current landowners and related innocent landowner provisions, liability became a paramount concern for all entities associated with land transactions. As a result, stan-dards were developed to assess the potential of contamination at prop-erties. Three phases of environmental site assessments were developed. These include the following:
• Phase I assessments are associated with a preliminary assessment to determine the potential for environmental impact at a site. These include a site reconnaissance, historic literature review, and review of government databases to ascertain if past property uses or nearby uses may have resulted in impacts.
10 • SuStAiNABLE REMEDiAtiON Of CONtAMiNAtED SitES
• Phase II assessments include actual sampling of soil, groundwater, and soil vapor to determine the extent (if any) of environmental impact at a site.
• Phase III assessments include actual environmental remediation of impacts confirmed during previous phases of study.
As with CERCLA, SARA significantly underestimated the potential costs and timing associated with environmental cleanups. When CERCLA was first enacted, approximately 36,000 contaminated sites were identi-fied; of these, 1,200 were placed on the NPL. At the end of Fiscal Year 2010, 1,627 sites remained on the NPL, and 475 sites had been closed (OSWER 2011). However, these closures consumed a significant amount of resources; on average, $40 million was expended per site (Gamper-Rabindran, Mastromonaco, and Timmins 2011) requiring an average of 11 years to achieve closure. Further, $6 billion held in trust in 1996 had been exhausted by 2003.
Environmental statutes for many years deterred investors from acquir-ing properties with either confirmed or suspected environmental impact. The deterrents were three-fold. First, entering into a purchase agree-ment in most cases exposed a buyer or owner to significant legal liabil-ity. Second, in the absence of a defined cleanup program with regulatory oversight, it was very difficult to predict costs associated with cleanups. Third, and almost as perilous to a prospective property purchaser, in many jurisdictions, low-risk contaminated sites were not assigned priority, and therefore, were very difficult to procure agency oversight to gain closure. Because very few, if any, sources of capital will invest in properties with open cases, unknown variables with respect to agency direction or timing deterred even the most aggressive investors.
As a result, in many cases, impacted properties with significant reuse potential remained idle and sat contaminated for long periods of time. Many of these sites became known as Brownfields. A Brownfield is an abandoned, idled, or underutilized industrial or commercial site where expansion or redevelopment is complicated by actual or perceived environmental con-tamination (Reddy, Adams, and Richardson 1999). The real or perceived contamination can range from minor surface debris to widespread soil and groundwater contamination. Despite the extent of the real or perceived impact at a site, because of the unknowns that existed, many property own-ers chose not to assess potential contamination at their property because of fears associated with legal and financial exposure. Potential investors also avoided these properties for the same fears. In many cases, these sites were located in decaying urban neighborhoods and contributed to overall
iNtRODuCtiON • 11
neighborhood blight while exacerbating other social problems. Ironically, a percentage of these sites were located in areas undergoing extensive urban renewal, yet their potential as productive land remained unfulfilled.
Much of this apprehension was the result of CERCLA law. When passed, clear statutory provisions were developed to assign responsibil-ity and liability to all owners of a property, even those who acquired the property after the contamination occurred. Liability was also assigned even if contamination resulted from previously legal activities and practices. Because of the collective liability of all entities that appear on a chain-of-title, there has been clear motivation to avoid potentially impacted properties, as the deep pocket often incurs much or all of the financial liability when contamination could be uncovered.
With time, many stakeholders and regulatory agencies associated with contaminated sites realized that CERCLA-induced liability was a signif-icant deterrent to site remediation or redevelopment. In the early 1990s, the federal government took action to provide inducements to encourage Brownfield redevelopment. In 1993, the U.S. EPA launched a Brownfields pilot program with a $200,000 grant used for a contaminated site in Cleveland, Ohio. The purpose of the grant and the program was to develop a model for Brownfield redevelopment that could be duplicated through-out the United States (Reddy, Adams, and Richardson 1999). Since then, millions of dollars in grants have been awarded to states, cities, counties, and tribes (Reddy, Adams, and Richardson 1999).
In addition to inducements to pursue the redevelopment of Brown-fields, the U.S. EPA also took measures to clarify liability provisions as well as provide for indemnity for prospective purchasers. In 2002, amendments were passed to the CERCLA law requiring the U.S. EPA to promulgate reg-ulations that established standards and practices for conducting all appropri-ate inquiries (U.S. Federal Register 2005). In 2005, the U.S. EPA established the All Appropriate Inquiries (AAI) requirements, which became law on November 1, 2006. The purpose of AAI was to establish liability protection under CERCLA for innocent landowners, contiguous property owners, or bona fide prospective purchasers. To establish this protection, prospective property owners must do the following (U.S. EPA 2009):
• Conduct AAI in compliance with 40 CFR Part 312, prior to acquir-ing the property;
• Comply with all continuing obligations after acquiring the property (CERCLA §§101(40)(C–G) and §§107(q)(A) (iii–viii)); and
• Not be affiliated with any liable party through any familial relation-ship or any contractual, corporate, or financial relationship (other
12 • SuStAiNABLE REMEDiAtiON Of CONtAMiNAtED SitES
than a relationship created by the instrument by which the title to the property is conveyed or financed).
The AAI reporting requirements and timing are formalized in two American Society for Testing and Materials (ASTM) standards; ASTM E1527-05 “Standard Practice for Environmental Site Assessments: Phase I Environmental Site Assessment Process” and ASTM E2247-08 “Standard Practice for Environmental Site Assessments: Phase I Environmental Site Assessment Process for Forestland and Rural Property.” These documents provide specific guidelines as to who may make the inquiries and stud-ies, the specific activities that must be performed, and the shelf life of the resulting inquiry.
AAI has been a very important milestone in encouraging land acqui-sition and development. By establishing a framework, prospective land purchasers have a discrete set of actions they must perform to avoid open-ended liability and costs. In this manner, they can help eliminate the unknowns associated with a potential redevelopment project, which facil-itates a return to productive use for many impacted properties.
Although financial and legal protections have been useful for larger projects or those that, in many cases, may have more acute environmental impacts, many more sites are impacted with low-level contamination that, while not posing a significant risk to human health or the environment, still prevent site redevelopment. In these cases, the financial implications of cleanup may be understood; however, timing issues become prohibitive factors. In many jurisdictions, regulatory agencies have opened cases for numerous low-risk properties. Often, these cases need to be closed with no further action (NFA) or similar status before redevelopment can proceed. Unfortunately, state agencies with increasingly limited resources did not have the time to devote to low-risk cases. As a result, even when motivated landowners or prospective purchasers had the best of intentions with respect to remediation, cases could not attract regulatory oversight and could not be remediated with the end goal of case closure. Further, in many cases where oversight could be made available, regulators and landowners often engaged in contentious relationships with respect to cleanup timelines, costs, and goals. In these cases, the lack of a positive relationship added unnecessary delays, expenditures, and problems for sites that may have been considered low-risk or straightforward with respect to remediation.
Having identified this trend, many states began to establish voluntary site cleanup or remediation programs. The goal was to create a framework in which regulatory agencies and property owners and purchasers could collaborate on a remediation program. Both parties were often motivated
iNtRODuCtiON • 13
to achieve cleanup and closure, and a framework was needed to create action and efficiency based on this shared motivation. Although the states’ programs are typically administered on an individual basis, they feature common objectives and characteristics. Commonly, the owner and pur-chaser and the regulatory agency enter into a formal agreement. Often the agency is reimbursed for their oversight activities. The agency and the owner and purchaser work together to establish a timeline and cleanup goals and to identify reasonable remedial system alternatives. Once the remediation has occurred, the regulatory agency issues a case closure through NFA status or similar finding.
In California, a model Brownfields program was established in late 1993. The Voluntary Cleanup Program (VCP) induces volunteer cleanup actions (the volunteer parties may or may not be responsible parties, or RPs) at eligible sites under the oversight of the California Department of Toxic Substances Control (DTSC). Prior to initiation of the VCP, DTSC focused their resources on the cleanup of state- equivalent superfund sites, impacted properties that presented a grave threat to public health or the environment (California EPA: DTSC 2008). A framework was not avail-able for the formal closure of lower-risk or low-priority contaminated sites. As a result, these sites remained open, implicitly preventing the cleanup and restoration of these impacted properties to productive use. Project proponents enter into Voluntary Cleanup Agreements, which include reimbursement to DTSC for their oversight costs. Proponents develop a detailed scope of work, project schedule, and services to be provided by DTSC. Importantly, project proponents do not admit legal liability for site remediation upon entering into a VCP agreement. Further, a 30-day grace period exists where either party (the Proponent or DTSC) may terminate the project with written notice (California EPA: DTSC 1995).
Sites must be remediated to the same cleanup standards as those under DTSC jurisdiction but not within the VCP; however, the program allows for flexibility with respect to project timing and phasing (California EPA: DTSC 1995). The use of initial studies, site-specific risk assessments, and consideration of end land-use restrictions and controls are encouraged in the program to expedite the remedial process and to facilitate a remedi-ation that is appropriate, given the envisioned future land use scenario.
Following remediation activities and the achievement of remedial action goals, DTSC may issue an NFA letter or certification of completion, depending on the project circumstances. In either case, the issuance of this finding confirms that DTSC has determined that the site does not pose a significant risk to public health or the environment. While neither consti-tutes a release or covenant not to sue, both significantly minimize future
14 • SuStAiNABLE REMEDiAtiON Of CONtAMiNAtED SitES
liability concerns. Additionally, because response actions conducted under the VCP are consistent with the National Contingency Plan, project propo-nents may seek cost recovery from other RPs under CERCLA (California EPA: DTSC 1995).
The California plan is similar to programs that exist in other states. Specifically, through the collaborative process, the project stakeholders can collectively assess and identify appropriate, efficient remedial alter-natives. Many states require a cost-benefit analysis to study how proposed alternatives compare with respect to overall associated costs and remedi-ation times. These programs have proven to be useful to all project stake-holders in facilitating site cleanups and restoring land to productive uses.
The move to voluntary site cleanups helped lead to the adoption of innovative site characterization and remedial technologies. The motiva-tion was simple—with a focus on expedited, self-funded cleanups, a pre-mium has been placed on reduced timelines and costs.
1.3 CONtAMiNAtED SitES: SOuRCES AND tYPES Of CONtAMiNAtiON
1.3.1 EXTENT OF THE PROBLEM
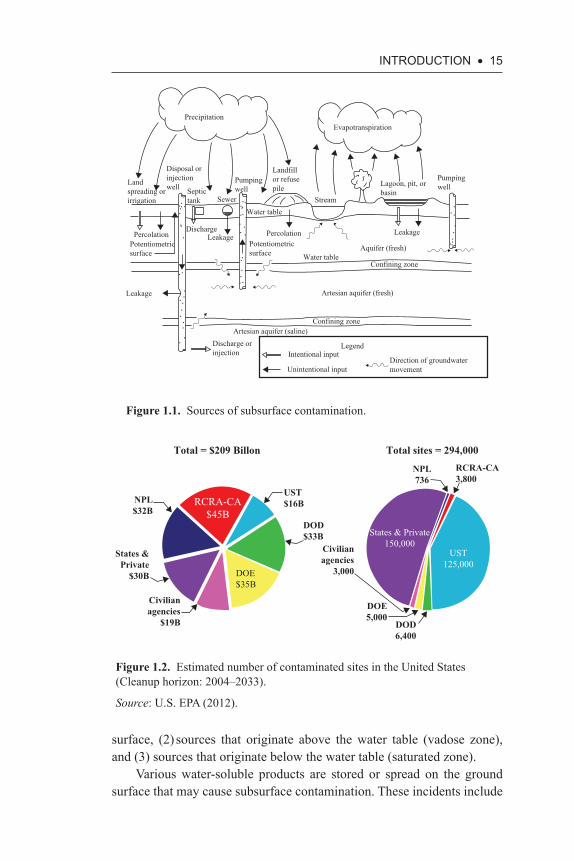
U.S. EPA estimated that there are thousands of sites that have been contam-inated in the United States, and over 294,000 of these sites require urgent remedial action (Figure 1.1). The contaminated sites are often categorized by the U.S. EPA as: (1) NPL (superfund) sites, (2) RCRA corrective action sites, (3) USTs sites, (4) Department of Energy (DOE) sites, (5) Depart-ment of Defense (DOD) sites, (6) Various Civilian Federal Agencies sites, and (7) State and Private Parties (including brownfields) sites. Contami-nation of groundwater and soils has been a major concern at these sites. The contaminants encountered include organic compounds, heavy metals, and radionuclides. DOE sites contain mixed wastes, including radioac-tive wastes, while DOD sites contain explosives and unexploded ord-nance. The cost to cleanup these sites is estimated to exceed $209 billion (U.S. dollars) (U.S. EPA 2012).
1.3.2 SOURCES OF CONTAMINATION
A variety of sources can cause the subsurface contamination, as depicted in Figure 1.2, and these sources of contamination may be divided into the following three groups: (1) sources that originate on the ground
iNtRODuCtiON • 15
surface, (2) sources that originate above the water table (vadose zone), and (3) sources that originate below the water table (saturated zone).
Various water-soluble products are stored or spread on the ground surface that may cause subsurface contamination. These incidents include
Figure 1.1. Sources of subsurface contamination.
Legend
Precipitation
Landspreading orirrigation
Disposal orinjectionwell Septic
tank Sewer
Pumpingwell
Landfillor refusepile Lagoon, pit, or
basin
Pumpingwell
Leakage
Aquifer (fresh)Water table
Water tableStream
Confining zone
Confining zoneArtesian aquifer (saline)
Discharge orinjection Intentional input
Unintentional inputDirection of groundwatermovement
PercolationDischarge
Leakage
Leakage
PercolationPotentiometricsurface
Potentiometricsurface
Artesian aquifer (fresh)
Evapotranspiration
RCRA-CA$45B
States & Private150,000
Total = $209 Billon Total sites = 294,000
NPL736
Civilianagencies
3,000
DOE5,000
DOD6,400
RCRA-CA3,800
NPL$32B
States &Private
$30B
Civilianagencies
$19B
UST$16B
DOD$33B
UST125,000
DOE$35B
Figure 1.2. Estimated number of contaminated sites in the United States (Cleanup horizon: 2004–2033).
Source: U.S. EPA (2012).
16 • SuStAiNABLE REMEDiAtiON Of CONtAMiNAtED SitES
(1) infiltration of contaminated surface waters, (2) land disposal of solid and liquid wastes, (3) accidental spills, (4) fertilizers and pesticides, (5) disposal of sewage and water treatment plant sludge, (6) salt storage and spreading on roads, (7) animal feedlots, and (8) particulate matter from airborne sources.
A variety of substances are deposited or stored in the subsurface soils above the water table (vadose zone) that may lead to subsurface contamination. Typical events include (1) waste disposal in excavations (such as unregulated dumps), (2) landfills, (3) leachate (generated from waste decomposition and infiltration of precipitation and surface runoff), (4) surface impoundments, (5) leakage from USTs, (6) leakage from underground pipelines, and (7) septic tanks.
Numerous situations exist where hazardous materials are stored or disposed of below the water table (saturated zone) that can lead to serious groundwater contamination problems. These situations include (1) waste disposal in wet excavations (excavations, such as abandoned mines, often serve as dumps for both solid and liquid wastes), (2) mining operations (leaching of the spoil material, milling wastes, etc., below the water table), (3) deep well injection, (4) agricultural drainage wells and tiles (field tiles and drainage wells are used to drain water into deeper, more permeable soils), and (5) abandoned or improperly constructed wells.
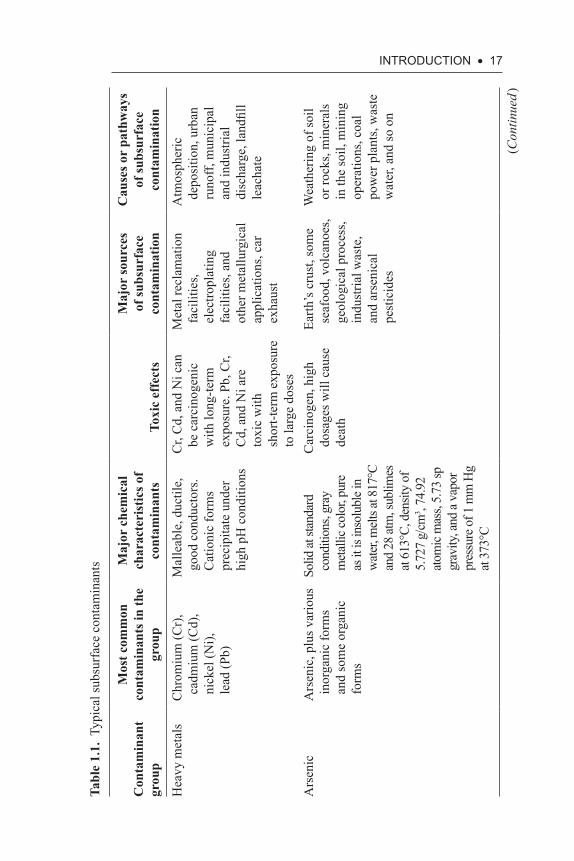
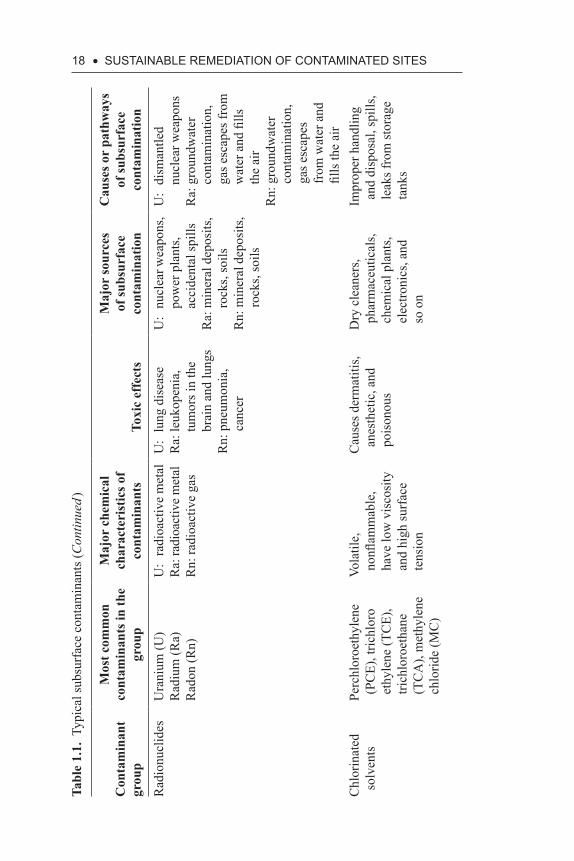
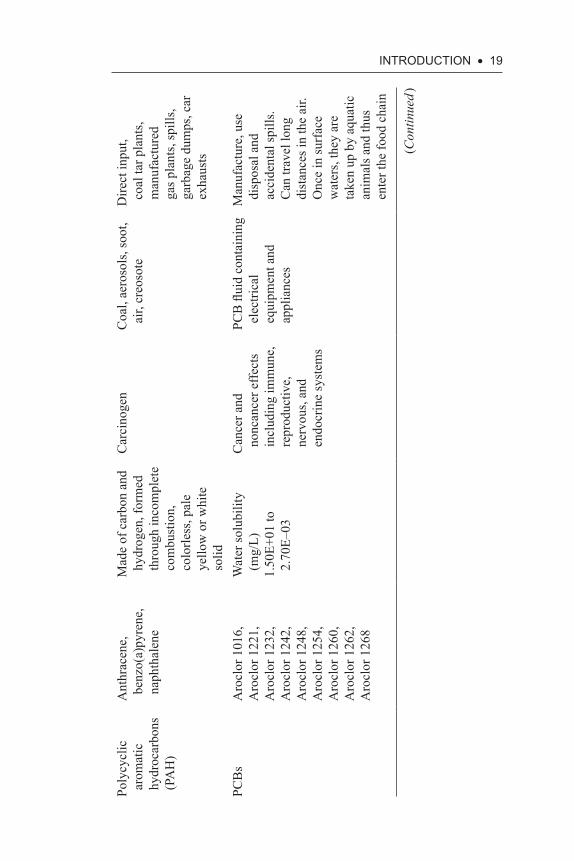
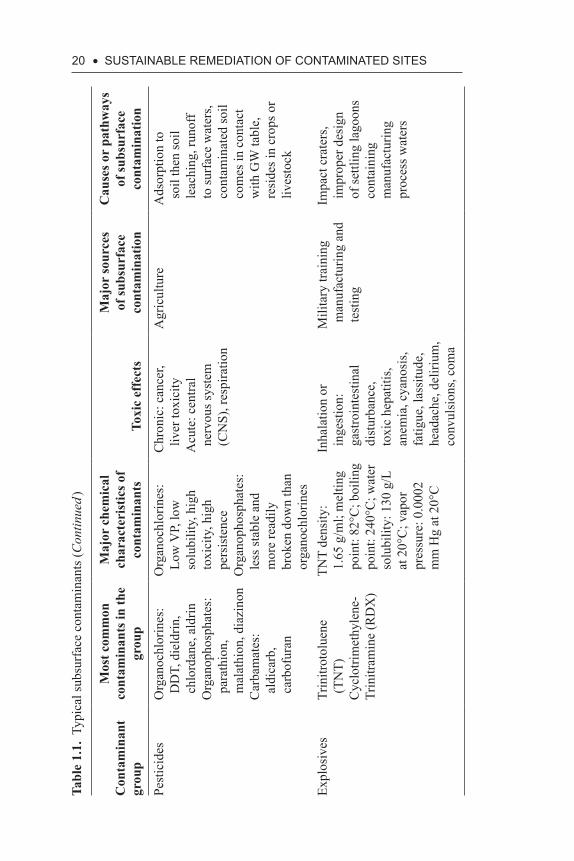
1.3.3 TYPES OF CONTAMINANTS
Table 1.1 summarizes the most common contaminants found at the con-taminated sites. This table also shows the chemical characteristics and toxicity of the contaminants as well as the major sources and pathways leading to subsurface contamination. Because of the distinctly different properties as well as the complex distribution and behavior of the contam-inants in the subsurface, the remediation of contaminated sites has been a daunting task to many environmental professionals. For example, when heavy metals are present in soils, they may be distributed in one or more of the following forms: (1) dissolved in soil solution (pore water), (2) occu-pying exchange sites on inorganic soil constituents, (3) specifically adsorbed on inorganic soil constituents, (4) associated with insoluble soil organic matter, (5) precipitated as pure or mixed solids, and (6) present in the structure of the minerals. The amount of metals present in these dif-ferent phases are controlled by the interdependent geochemical processes such as (1) adsorption and desorption, (2) redox reactions, (3) complex formations, (4) precipitation and dissolution of solids, and (5) acid-base
iNtRODuCtiON • 17
Tabl
e 1.
1. T
ypic
al su
bsur
face
con
tam
inan
ts
Con
tam
inan
t gr
oup
Mos
t com
mon
co
ntam
inan
ts in
the
grou
p
Maj
or c
hem
ical
ch
arac
teri
stic
s of
cont
amin
ants
Toxi
c ef
fect
s
Maj
or so
urce
s of
subs
urfa
ce
cont
amin
atio
n
Cau
ses o
r pa
thw
ays
of su
bsur
face
co
ntam
inat
ion
Hea
vy m
etal
sC
hrom
ium
(Cr)
, ca
dmiu
m (C
d),
nick
el (N
i),
lead
(Pb)
Mal
leab
le, d
uctil
e,
good
con
duct
ors.
Cat
ioni
c fo
rms
prec
ipita
te u
nder
hi
gh p
H c
ondi
tions
Cr,
Cd,
and
Ni c
an
be c
arci
noge
nic
with
long
-term
ex
posu
re. P
b, C
r, C
d, a
nd N
i are
to
xic
with
sh
ort-t
erm
exp
osur
e to
larg
e do
ses
Met
al re
clam
atio
n fa
cilit
ies,
elec
tropl
atin
g fa
cilit
ies,
and
othe
r met
allu
rgic
al
appl
icat
ions
, car
ex
haus
t
Atm
osph
eric
de
posi
tion,
urb
an
runo
ff, m
unic
ipal
an
d in
dust
rial
disc
harg
e, la
ndfil
l le
acha
te
Ars
enic
Ars
enic
, plu
s var
ious
in
orga
nic
form
s an
d so
me
orga
nic
form
s
Solid
at st
anda
rd
cond
ition
s, gr
ay
met
allic
colo
r, pu
re
as it
is in
solu
ble i
n w
ater
, mel
ts at
817
°C
and
28 at
m, s
ublim
es
at 6
13°C
, den
sity
of
5.72
7 g/
cm3 ,
74.9
2 at
omic
mas
s, 5.
73 sp
gr
avity
, and
a va
por
pres
sure
of 1
mm
Hg
at 3
73°C
Car
cino
gen,
hig
h do
sage
s will
cau
se
deat
h
Earth
’s c
rust
, som
e se
afoo
d, v
olca
noes
, ge
olog
ical
pro
cess
, in
dust
rial w
aste
, an
d ar
seni
cal
pest
icid
es
Wea
ther
ing
of so
il or
rock
s, m
iner
als
in th
e so
il, m
inin
g op
erat
ions
, coa
l po
wer
pla
nts,
was
te
wat
er, a
nd so
on
(Con
tinue
d )
18 • SuStAiNABLE REMEDiAtiON Of CONtAMiNAtED SitESTa
ble
1.1.
Typ
ical
subs
urfa
ce c
onta
min
ants
(Con
tinue
d )
Con
tam
inan
t gr
oup
Mos
t com
mon
co
ntam
inan
ts in
the
grou
p
Maj
or c
hem
ical
ch
arac
teri
stic
s of
cont
amin
ants
Toxi
c ef
fect
s
Maj
or so
urce
s of
subs
urfa
ce
cont
amin
atio
n
Cau
ses o
r pa
thw
ays
of su
bsur
face
co
ntam
inat
ion
Rad
ionu
clid
esU
rani
um (U
)R
adiu
m (R
a)R
adon
(Rn)
U:
radi
oact
ive
met
alRa
: rad
ioac
tive
met
alR
n: ra
dioa
ctiv
e ga
s
U:
lung
dis
ease
Ra:
leuk
open
ia,
tum
ors i
n th
e br
ain
and
lung
sR
n: p
neum
onia
, ca
ncer
U:
nucl
ear w
eapo
ns,
pow
er p
lant
s, ac
cide
ntal
spill
sR
a: m
iner
al d
epos
its,
rock
s, so
ilsR
n: m
iner
al d
epos
its,
rock
s, so
ils
U:
dism
antle
d nu
clea
r wea
pons
Ra:
gro
undw
ater
co
ntam
inat
ion,
ga
s esc
apes
from
w
ater
and
fills
th
e ai
rR
n: g
roun
dwat
er
cont
amin
atio
n,
gas e
scap
es
from
wat
er a
nd
fills
the
air
Chl
orin
ated
so
lven
tsPe
rchl
oroe
thyl
ene
(PC
E), t
richl
oro
ethy
lene
(TC
E),
trich
loro
etha
ne
(TC
A),
met
hyle
ne
chlo
ride
(MC
)
Vola
tile,
no
nflam
mab
le,
have
low
vis
cosi
ty
and
high
surf
ace
tens
ion
Cau
ses d
erm
atiti
s, an
esth
etic
, and
po
ison
ous
Dry
cle
aner
s, ph
arm
aceu
tical
s, ch
emic
al p
lant
s, el
ectro
nics
, and
so
on
Impr
oper
han
dlin
g an
d di
spos
al, s
pills
, le
aks f
rom
stor
age
tank
s
iNtRODuCtiON • 19
Poly
cycl
ic
arom
atic
hy
droc
arbo
ns
(PA
H)
Ant
hrac
ene,
be
nzo(
a)py
rene
, na
phth
alen
e
Mad
e of
car
bon
and
hydr
ogen
, for
med
th
roug
h in
com
plet
e co
mbu
stio
n,
colo
rless
, pal
e ye
llow
or w
hite
so
lid
Car
cino
gen
Coa
l, ae
roso
ls, s
oot,
air,
creo
sote
Dire
ct in
put,
coal
tar p
lant
s, m
anuf
actu
red
gas p
lant
s, sp
ills,
garb
age
dum
ps, c
ar
exha
usts
PCB
sA
rocl
or 1
016,
Aro
clor
122
1,A
rocl
or 1
232,
Aro
clor
124
2,A
rocl
or 1
248,
Aro
clor
125
4,A
rocl
or 1
260,
Aro
clor
126
2,A
rocl
or 1
268
Wat
er so
lubi
lity
(mg/
L)1.
50E+
01 to
2.
70E–
03
Can
cer a
nd
nonc
ance
r effe
cts
incl
udin
g im
mun
e,
repr
oduc
tive,
ne
rvou
s, an
d en
docr
ine
syst
ems
PCB
flui
d co
ntai
ning
el
ectri
cal
equi
pmen
t and
ap
plia
nces
Man
ufac
ture
, use
di
spos
al a
nd
acci
dent
al sp
ills.
Can
trav
el lo
ng
dist
ance
s in
the
air.
Onc
e in
surf
ace
wat
ers,
they
are
ta
ken
up b
y aq
uatic
an
imal
s and
thus
en
ter t
he fo
od c
hain
(Con
tinue
d )
20 • SuStAiNABLE REMEDiAtiON Of CONtAMiNAtED SitESTa
ble
1.1.
Typ
ical
subs
urfa
ce c
onta
min
ants
(Con
tinue
d )
Con
tam
inan
t gr
oup
Mos
t com
mon
co
ntam
inan
ts in
the
grou
p
Maj
or c
hem
ical
ch
arac
teri
stic
s of
cont
amin
ants
Toxi
c ef
fect
s
Maj
or so
urce
s of
subs
urfa
ce
cont
amin
atio
n
Cau
ses o
r pa
thw
ays
of su
bsur
face
co
ntam
inat
ion
Pest
icid
esO
rgan
ochl
orin
es:
DD
T, d
ield
rin,
chlo
rdan
e, a
ldrin
Org
anop
hosp
hate
s:
para
thio
n,
mal
athi
on, d
iazi
non
Car
bam
ates
: al
dica
rb,
carb
ofur
an
Org
anoc
hlor
ines
: Lo
w V
P, lo
w
solu
bilit
y, h
igh
toxi
city
, hig
h pe
rsis
tenc
eO
rgan
opho
spha
tes:
le
ss st
able
and
m
ore
read
ily
brok
en d
own
than
or
gano
chlo
rines
Chr
onic
: can
cer,
liver
toxi
city
Acu
te: c
entra
l ne
rvou
s sys
tem
(C
NS)
, res
pira
tion
Agr
icul
ture
Ads
orpt
ion
to
soil
then
soil
leac
hing
, run
off
to su
rfac
e w
ater
s, co
ntam
inat
ed so
il co
mes
in c
onta
ct
with
GW
tabl
e,
resi
des i
n cr
ops o
r liv
esto
ck
Expl
osiv
esTr
initr
otol
uene
(T
NT)
Cyc
lotri
met
hyle
ne-
Trin
itram
ine
(RD
X)
TNT
dens
ity:
1.65
g/m
l; m
eltin
g po
int:
82°C
; boi
ling
poin
t: 24
0°C
; wat
er
solu
bilit
y: 1
30 g
/L
at 2
0°C
; vap
or
pres
sure
: 0.0
002
mm
Hg
at 2
0°C
Inha
latio
n or
in
gest
ion:
ga
stro
inte
stin
al
dist
urba
nce,
to
xic
hepa
titis
, an
emia
, cya
nosi
s, fa
tigue
, las
situ
de,
head
ache
, del
irium
, co
nvul
sion
s, co
ma
Mili
tary
trai
ning
m
anuf
actu
ring
and
test
ing
Impa
ct c
rate
rs,
impr
oper
des
ign
of se
ttlin
g la
goon
s co
ntai
ning
m
anuf
actu
ring
proc
ess w
ater
s
iNtRODuCtiON • 21
reactions. On the other hand, organic compounds may exist in four phases in soils: (1) dissolved phase, (2) adsorbed phase, (3) gaseous phase, and (4) free or pure phase. The organic compounds may change from one phase to another phase depending on the following processes: (1) vol-atilization, (2) dissolution, (3) adsorption, and (4) biodegradation. An in-depth understanding of the various geochemical processes that control the phase distribution of the contaminants in soils is critical for the assess-ment and remediation of contaminated sites.
1.4 tRADitiONAL REMEDiAtiON MEtHODS AND POtENtiAL NEgAtiVE EffECtS
When soil or groundwater contamination or both are present, a number of remediation options may be considered. With respect to soil con-tamination, the most common traditional practice has been excavation. Impacted soils are removed from the subsurface, at which point they are commonly transported from the contaminated site, where they may be appropriately disposed. With respect to groundwater, pump-and-treat has been traditionally applied as a remediation measure. Contam-inated groundwater is extracted from the subsurface, and following treatment, it is either discharged to a sewer system, applied at the sur-face, or reinjected into the subsurface. More details regarding these methods as well as several evolving and innovative technologies are presented in Chapter 3.
Although excavation and pump-and-treat may be effectively applied when considering a range of variables and circumstances, they do have technical limitations. With excavation, impacted soil often cannot feasi-bly be reached, either due to depth or the presence of surface obstructions. Pump-and-treat, while typically effective at removing free-phase con-tamination, often becomes less effective, and commonly cost-prohibitive, at later stages when removal efficiency decreases. Further, both remedia-tion techniques exhibit unfavorable side effects during application. When considering excavation, the heavy equipment utilized during application generates significant air emissions from fuel combustion, increases wear on roadways during transport, and consumes landfill capacity during disposal. Pump-and-treat consumes energy during pumping operations, often generates excessive volumes of extracted groundwater that is often disposed via sewer facilities, and depending on the treatment alternative, may result in air emissions of the generation of solid waste requiring off-site disposal.
22 • SuStAiNABLE REMEDiAtiON Of CONtAMiNAtED SitES
The side effects associated with both excavation and pump-and-treat and their impact to the environment may be quantified. It should be noted that such side effects are not limited to only these two remediation meth-ods. All remediation technologies also result in intended or unintended side effects. Under a range of conditions and applications, these technol-ogies may result in side effects and negative impacts to the environment that outweigh the positive aspects of their application. In essence, if not applied appropriately, the environmental harm can outweigh the good.
1.5 WHAt iS SuStAiNABLE REMEDiAtiON?
During the Brownfields era, significant innovative technological advances were achieved, and the new collaboration between regulatory agencies and project proponents, combined with numerous redevelopment pro-grams and fiscal or tax incentives tied to redevelopment, led to remark-able projects that satisfied the dual goals of productive land reuse and protection of the environment. However, while these benefits were being realized, a range of project stakeholders began to take notice of some of the drawbacks that commonly occur during site remediation. Many of the remedial programs were resulting in problems beyond the fence; while sites were being remediated, many technologies relied upon contaminant partitioning into another phase.
Often the contamination was not being destroyed or degraded into less harmful components; rather, it was being driven from soils and groundwa-ter but conserved as a gas, liquid, or solid. This resulted in unfavorable air emissions, contaminated extracted groundwater, or appreciable quantities of impacted soils. If uncontrolled, these materials would again impact the environment; otherwise, expensive additional treatment or disposal alter-natives would have to be considered.
Additionally, secondary (but significant) effects were occurring. In many cases, significant energy or virgin material inputs have been required to facilitate site remediation, resulting in significant greenhouse gas (GHG) emissions or the diversion of limited resources from other potential uses. In many cases, protracted remediation programs could result in appreciable traffic loading, automotive emissions, and wear and tear to arterial roadways from personnel and materials transportation. These unintended side effects reduced the overall net environmental ben-efit when considering the overall effects of a site remediation program. In rare instances, these activities produced a negative overall environmental effect. Nevertheless, in an era where increased attention has been paid to
iNtRODuCtiON • 23
carbon footprints, resource use, and emissions, many project stakeholders have begun to look for remedial alternatives that incorporate green and sustainable technologies.
Traditional risk-based site remedial approaches have not always been sustainable because they often do not account for broader environmental impacts such as extraction and the use of natural resources, wastes cre-ated, and energy use and related GHG emissions for on- and off-site oper-ations and transportation of equipment and materials. These approaches do not explicitly account for the net environmental benefit when all rele-vant environmental parameters are considered. To address this, principles of green remediation and sustainable remediation have emerged. There is no industrywide consensus on the definitions of these terms. In general, there are many definitions for sustainability, and a U.S. Federal Executive Order under NEPA defined it as “to create and maintain conditions, under which humans and nature can exist in productive harmony, that permit ful-filling the social, economic, and other requirements of present and future generations” (E.O.13514 2009; NEPA 1969). Sustainable remediation is defined as a remedy or combination of remedies whose net benefit on human health and the environment is maximized through the judicious use of limited resources (Ellis and Hadley 2009). On the other hand, green remediation is defined as the practice of considering all environmental effects of remedy implementation and incorporating options to maximize the net environmental benefit of cleanup actions (U.S. EPA 2008). Green remediation generally implies being friendly or beneficial to the environ-ment, whereas the term sustainable remediation reflects a broader and more holistic approach aimed at balancing the impacts and influences of the triple bottom line of sustainability (i.e., environmental, societal, and economic) while protecting human health and the environment.
To emphasize the use of green technologies to achieve sustainabil-ity, the term green and sustainable remediation (GSR) is also used. GSR is defined as a remedy or combination of remedies whose net benefit to human health and the environment is maximized through the judicious use of resources and the selection of remedies that consider how the commu-nity, global society, and the environment would benefit, or be adversely affected by, RI and corrective actions (ITRC 2011). GSR is a holistic approach that protects human health and the environment while minimiz-ing environmental side effects. The goals of GSR include (1) minimizing total energy use and promoting the use of renewable energy for operations and transportation, (2) preserving natural resources, (3) minimizing waste generation while maximizing materials recycling, and (4) maximizing future reuse options for remediated land (U.S. EPA 2008; Ellis and Hadley
24 • SuStAiNABLE REMEDiAtiON Of CONtAMiNAtED SitES
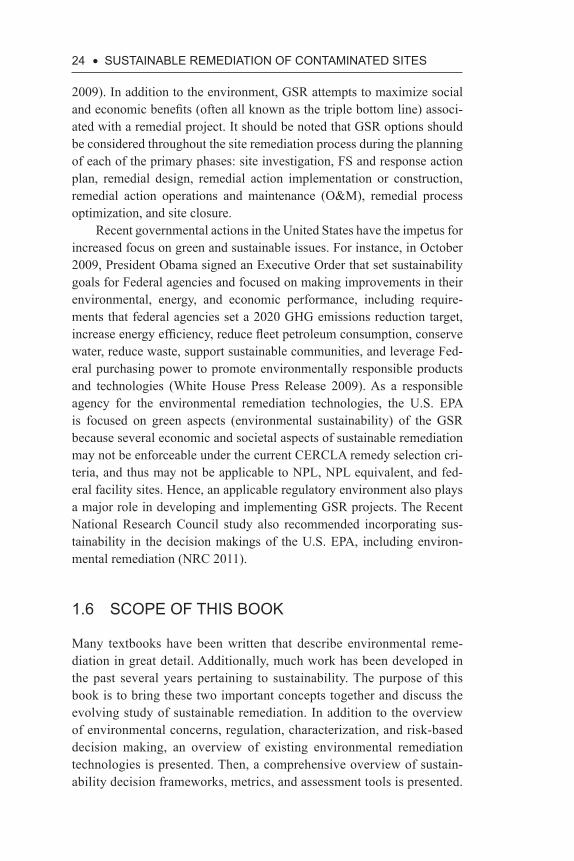
2009). In addition to the environment, GSR attempts to maximize social and economic benefits (often all known as the triple bottom line) associ-ated with a remedial project. It should be noted that GSR options should be considered throughout the site remediation process during the planning of each of the primary phases: site investigation, FS and response action plan, remedial design, remedial action implementation or construction, remedial action operations and maintenance (O&M), remedial process optimization, and site closure.
Recent governmental actions in the United States have the impetus for increased focus on green and sustainable issues. For instance, in October 2009, President Obama signed an Executive Order that set sustainability goals for Federal agencies and focused on making improvements in their environmental, energy, and economic performance, including require-ments that federal agencies set a 2020 GHG emissions reduction target, increase energy efficiency, reduce fleet petroleum consumption, conserve water, reduce waste, support sustainable communities, and leverage Fed-eral purchasing power to promote environmentally responsible products and technologies (White House Press Release 2009). As a responsible agency for the environmental remediation technologies, the U.S. EPA is focused on green aspects (environmental sustainability) of the GSR because several economic and societal aspects of sustainable remediation may not be enforceable under the current CERCLA remedy selection cri-teria, and thus may not be applicable to NPL, NPL equivalent, and fed-eral facility sites. Hence, an applicable regulatory environment also plays a major role in developing and implementing GSR projects. The Recent National Research Council study also recommended incorporating sus-tainability in the decision makings of the U.S. EPA, including environ-mental remediation (NRC 2011).
1.6 SCOPE Of tHiS BOOK
Many textbooks have been written that describe environmental reme-diation in great detail. Additionally, much work has been developed in the past several years pertaining to sustainability. The purpose of this book is to bring these two important concepts together and discuss the evolving study of sustainable remediation. In addition to the overview of environmental concerns, regulation, characterization, and risk-based decision making, an overview of existing environmental remediation technologies is presented. Then, a comprehensive overview of sustain-ability decision frameworks, metrics, and assessment tools is presented.

iNtRODuCtiON • 25
This is followed by discussion and analysis of several field applications and case studies with respect to sustainability and the degree of success achieved with each of the respective studies. Finally, an outlook for the future evolution of this innovative approach to environmental remedia-tion is presented.

CHAPtER 2
contAminAted site remediAtion:
generAL ApproAch
2.1 EVOLutiON Of CONtAMiNAtED SitE REMEDiAtiON
As explained in Chapter 1, the Comprehensive Environmental Response, Compensation, and Liabilities Act (CERCLA) and the Resource Conser-vation and Recovery Act (RCRA) significantly changed the environmen-tal regulatory landscape. For the first time, these landmark regulations induced compliance with intended waste disposal objectives. Addition-ally, responsible parties and landowners were compelled to remediate contaminated sites that posed a threat to human health and the environ-ment. However, with such rapid change came significant drawbacks and problems. The regulatory frameworks did not fully address indemnifica-tion to truly innocent parties. As such, perceptions about potential liability with respect to properties became a significant barrier to land transactions involving properties with confirmed or perceived contamination issues. Further, cleanup standards had not evolved with the passage of the legis-lation. Cleanup standards were motivated by an objective to restore con-taminated soils and groundwater to a pristine condition. These cleanup objectives greatly affected the magnitude of cleanup effort required for site closure—with the same effect on related costs and time to closure.
Further complicating the situation, the cleanup objectives were often misguided. In many cases, these desired end goals were unnecessary, and the restored soil and water resources could not be functionally used. For instance, it is impractical to remediate groundwater such that contami-nants of concern (COCs) are reduced to drinking water standards in areas
28 • SuStAiNABLE REMEDiAtiON Of CONtAMiNAtED SitES
where groundwater is not considered potable due to naturally occurring conditions. Additionally, it is equally misguided to mitigate contaminant concentrations within soils to nondetectable concentrations at ongoing industrial facilities. As a result, significant resources and time were often expended with little incremental benefit. While CERCLA and RCRA were significantly beneficial in protecting and remediating the environment, a better approach was needed to more efficiently remedy these issues.
As human health and ecological risk assessments became important in feasibility evaluations, the U.S. Environmental Protection Agency (U.S. EPA) developed comprehensive methods to perform these assessments for superfund sites (U.S. EPA 1997). As a result, remediation programs are commonly based on the findings of a risk assessment. The use of a risk-based remedial approach allows for a realistic consideration of exposure pathways, the characteristics of the contamination present at a site as well as the profile of likely future land users, and considerations of the long-term productive development potential of a site. For instance, an aban-doned industrial facility would be remediated differently if the site zoning were to remain industrial than if it were to be rezoned for a residential use. In the case of a residential setting, cleanup goals would likely be far more restrictive than if the site were intended to remain for industrial use. As a result, an appropriate site-specific remediation program can be developed and implemented following this risk-based approach to achieve cleanup goals compatible and appropriate for future land use.
A systematic approach is necessary for the characterization and reme-diation of contamination in order to facilitate the land redevelopment and reutilization process and avoid undue delays. The most important tasks of such a systematic approach include: (1) site characterization, (2) risk assessment, and (3) the selection of an effective remedial action. Figure 2.1 outlines one such systematic approach. Innovative integration of various tasks can often lead to a faster, cost-effective remedial program.
2.2 SitE CHARACtERiZAtiON
Site characterization is often the first step in leading to a contaminated site remediation strategy. It consists of the collection and assessment of data representing the contaminant type and distribution at a site under investigation. The results of a site characterization form the basis for risk assessment and decisions concerning the requirements of remedial action. Additionally, the results serve as a guide for design, implementation, and monitoring of the remedial system.
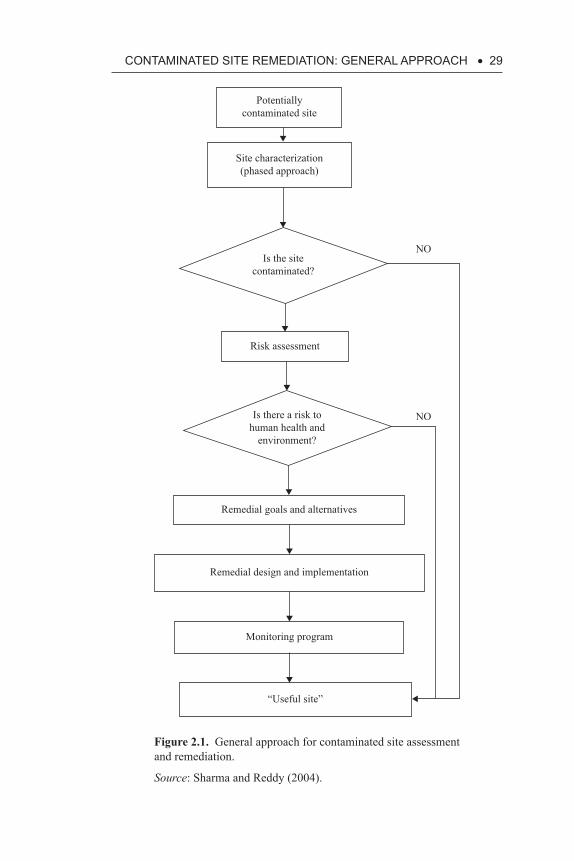
CONtAMiNAtED SitE REMEDiAtiON: gENERAL APPROACH • 29
Potentiallycontaminated site
Site characterization(phased approach)
Is the sitecontaminated?
Risk assessment
Remedial goals and alternatives
Remedial design and implementation
Monitoring program
“Useful site”
Is there a risk tohuman health and
environment?
NO
NO
Figure 2.1. General approach for contaminated site assessment and remediation.
Source: Sharma and Reddy (2004).
30 • SuStAiNABLE REMEDiAtiON Of CONtAMiNAtED SitES
Each site is unique; therefore, site characterization must be tailored to meet site-specific requirements. An inadequate site characterization may lead to the collection of unnecessary or misleading data, technical misjudgment affecting the cost and duration of possible remedial action, or extensive contamination problems resulting from inadequate or inap-propriate remedial action. If not designed and implemented correctly, site characterization can evolve into an expensive and lengthy process, so it is advantageous to follow an effective site characterization strategy to opti-mize efficiency and cost.
An effective site characterization includes the collection of data per-taining to (1) site geologic data, including site stratigraphy and important geologic formations; (2) hydrogeologic data, including major water- bearing formations and their hydraulic properties; and (3) site contami-nation data, including type, concentration, phase, and distribution, which include the lateral and vertical extent. Additionally, surface conditions both at and around the site must be taken into consideration.
Because little information regarding a particular site is often known at the beginning of an investigation, it is often advantageous to follow a phased approach for site characterization. A phased approach may also minimize the financial impact by improving the planning of the investiga-tion and ensuring the collection of relevant data. The first phase consists of the definition of investigation purpose and the performance of a prelim-inary site assessment. This may include a formal phase I environmental site assessment. The purpose of a phase I site assessment, which typically is performed in accordance with the American Society for Testing and Materials (ASTM) Standard 1527 as well as the U.S. EPA All Appropri-ate Inquiry (AAI) rule, is to determine if recognized environmental con-ditions (RECs) may exist at the site. In essence, an REC is the potential or confirmed condition or presence of environmental contamination at a site that would affect future beneficial land use. A phase I environmental site assessment includes a review of past practices; historic information; geographical location; regional geologic, hydrogeologic, and topographic information; a review of potential on-site and off-site sources of contam-ination pertaining to the site; interviews of key site managers and others with knowledge of past and present activities and conditions at the site as well as those who commissioned the study; reconnaissance of the site and adjacent properties; site ownership history; a review of legal deed and titles, including any deed restrictions or activity use limitations (AULs); and other key information that may be useful in determining if RECs exist at the site. Additionally, the phase I assessment may be coupled with other activities, including limited surface and subsurface sampling of potentially
CONtAMiNAtED SitE REMEDiAtiON: gENERAL APPROACH • 31
affected media. With the exception of limited environmental sampling, the activities associated with a phase I environmental site assessment are noninvasive and would be mostly classified as literature review activities.
Based on the results of the phase I site assessment activities, and with the assumption that the phase I assessment has identified the potential presence of RECs at the site, the purpose and scope of the phase II assess-ment may be developed. While a phase I environmental site assessment is mostly noninvasive, a phase II assessment generally consists of invasive exploration activities. It typically consists of exploratory subsurface inves-tigations, which commonly include a combination of sampling and testing of soil, groundwater, and soil gas. If contamination was detected at the site during the course of limited sampling that may have been performed during the phase I assessment, the phase II assessment would consist of more extensive sampling and testing to confirm the nature and extent of environmental contamination at the site. This may include sampling of the same media (e.g., soil), or other media (groundwater and soil gas) if more extensive impact has been hypothesized. If the phase I assessment did not include sampling but RECs are suspected, an exploratory program would be developed based on the findings and the suspected type of contamina-tion and impacted media. In either case, a detailed work plan should be prepared for the site investigations describing the scope of related field and laboratory testing. The work plan should provide details about sam-pling and testing procedures, sampling locations and frequency, a quality assurance and quality control (QA/QC) plan, a safety and health (S&H) plan, a work schedule, and a cost assessment.
Depending on the logistics of the project, site characterization may require regulatory compliance and approval or both at different stages of the investigation. Thus, it is important to review the applicable regulations during the preliminary site assessment (phase I). Meetings with regulatory officials may also be beneficial to insure that investiga-tion procedures and results conform to regulatory standards. This proac-tive approach may prevent delays in obtaining the required regulatory permits and approvals.
Based on the findings of the phase II assessment, additional exploration work may be necessary. Depending on the size, accessibility, and proposed future purpose of the site, this investigation may last anywhere from a few weeks to a few years. Because of the time and effort required, this phase of the investigation is very costly. Additional phases of site characterization must be performed until all pertinent data has been collected.
Ultimately, the goal of the phase II assessment is to develop a compre-hensive, meaningful conceptual site model (CSM). Figure 2.2 shows an
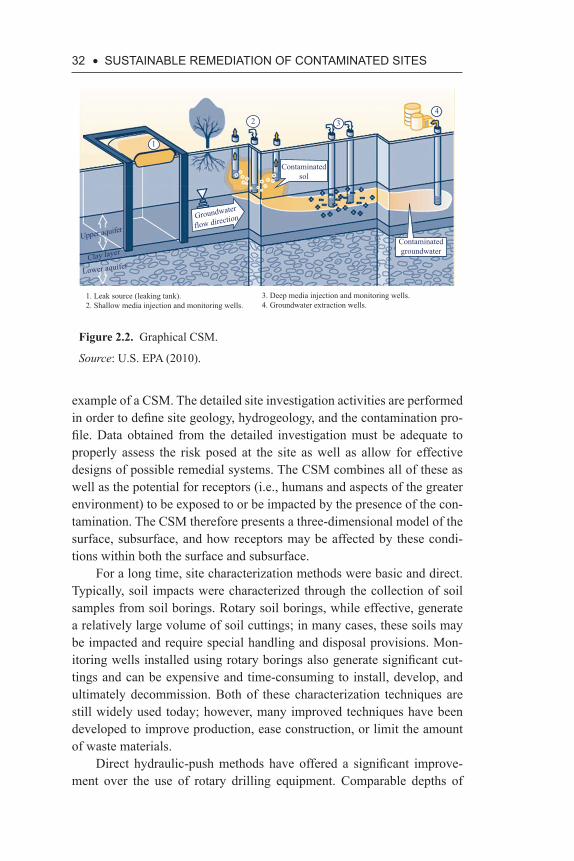
32 • SuStAiNABLE REMEDiAtiON Of CONtAMiNAtED SitES
example of a CSM. The detailed site investigation activities are performed in order to define site geology, hydrogeology, and the contamination pro-file. Data obtained from the detailed investigation must be adequate to properly assess the risk posed at the site as well as allow for effective designs of possible remedial systems. The CSM combines all of these as well as the potential for receptors (i.e., humans and aspects of the greater environment) to be exposed to or be impacted by the presence of the con-tamination. The CSM therefore presents a three-dimensional model of the surface, subsurface, and how receptors may be affected by these condi-tions within both the surface and subsurface.
For a long time, site characterization methods were basic and direct. Typically, soil impacts were characterized through the collection of soil samples from soil borings. Rotary soil borings, while effective, generate a relatively large volume of soil cuttings; in many cases, these soils may be impacted and require special handling and disposal provisions. Mon-itoring wells installed using rotary borings also generate significant cut-tings and can be expensive and time-consuming to install, develop, and ultimately decommission. Both of these characterization techniques are still widely used today; however, many improved techniques have been developed to improve production, ease construction, or limit the amount of waste materials.
Direct hydraulic-push methods have offered a significant improve-ment over the use of rotary drilling equipment. Comparable depths of
Groundwater
flow direction
Contaminatedsol
Contaminatedgroundwater
Upper aquifer
Clay layer
Lower aquifer
1. Leak source (leaking tank).2. Shallow media injection and monitoring wells.
3. Deep media injection and monitoring wells.4. Groundwater extraction wells.
2 34
1
Figure 2.2. Graphical CSM.
Source: U.S. EPA (2010).
CONtAMiNAtED SitE REMEDiAtiON: gENERAL APPROACH • 33
exploration may be reached in most soil conditions. The direct-push tech-nologies commonly utilize small-diameter sampling equipment, greatly reducing the volume of investigation-derived waste (IDW). Additionally, many of these technologies also allow for the recovery of continuous soil cores, which allow for a comprehensive visual viewing of soil lithology and allows for better in-field decisions regarding sample collection for laboratory analysis.
Direct-push technologies have also been useful for groundwater sam-ple collection. Prepacked wells or screened casing may be easily driven to the desired sampling depth, allowing for quality groundwater sam-ple recovery in a cost-effective and time-effective manner as compared to traditional well installation. Well points and casing can also easily be extracted, and the resulting boreholes can be backfilled efficiently follow-ing sampling.
Yet another advance has been the rapid evolution and adoption of soil vapor sampling technology. The use of soil vapor sampling has increased dramatically in the past few years, due to both the introduction of more robust sampling technologies and procedures as well as increased favor of the use of soil vapor data in risk assessment.
Previous estimates of soil vapor exposure were calculated using models to estimate volatilization, attenuation, and intrusion into enclosed spaces (e.g., the Johnson and Ettinger Model [1991]). Additionally, ambi-ent air sampling using passive collection vessels were commonly used. However, some began to question the application of various factors and their appropriateness in numerical modeling, and passive sampling has also been questioned because of difficulties in eliminating background sources of interference. Additionally, the increased incremental improve-ments of sampling equipment (soil vapor wells, direct push equipment, air-tight sampling collection equipment and vessels), and leak detection procedures (e.g., positive pressure sampling environments using inert tracer gases) continue to facilitate the improved quality and reliability of soil vapor data.
Innovative site characterization techniques are increasingly being used to collect relevant data in an efficient and cost-effective manner. Recent advances in cone penetrometer and sensor technology have enabled con-taminated sites to be rapidly characterized using vehicle-mounted direct push probes. Probes are available for directly measuring contaminant con-centrations in situ, in addition to measuring standard stratigraphic data, to provide flexible, real-time analysis. The probes can also be reconfigured to expedite the collection of soil, groundwater, and soil gas samples for subsequent laboratory analysis.
34 • SuStAiNABLE REMEDiAtiON Of CONtAMiNAtED SitES
The membrane interface probe (MIP) is a semiquantitative, field- screening device that can detect volatile organic compounds (VOCs) in soil and sediment (U.S. EPA CLU-IN 2011b). It is used in conjunction with a direct push platform (DPP), such as a cone penetrometer testing (CPT) rig or a rig that uses a hydraulic or pneumatic hammer to drive the MIP to the depth of interest to collect samples of vaporized compounds. The probe captures the vapor sample, and a carrier gas transports the sample to the surface for analysis by a variety of field or laboratory analytical methods. Additional sensors may be added to the probe to facilitate soil logging and identify contaminant concentrations (U.S. EPA CLU-IN 2011b, 2011c).
MIP technology is capable of sampling VOC and some semivolatile organic compounds from subsurface soil in the vadose and saturated zones. It is typically used to characterize hydrocarbon or solvent contamination. Essentially, it provides real-time, semiquantitative data of subsurface con-ditions, reducing the need to collect soil and groundwater samples as well as the costs and lead times associated with sampling and analysis. It is especially efficient at locating source zones or hot spots associated with dense nonaqueous phase liquid (DNAPL) and light nonaqueous phase liq-uid (LNAPL); this allows for targeted follow-up sampling to precisely determine the contamination constituency and concentration.
Noninvasive, geophysical techniques such as ground-penetrating radar, cross-well radar, electrical resistance tomography, vertical induc-tion profiling, and high-resolution seismic reflection produce computer- generated images of subsurface geological conditions and are qualitative at best. Other approaches such as chemical tracers are used to identify and quantify contaminated zones, based on their affinity for a particular con-taminant and the measured change in tracer concentration between wells employing a combination of conservative and partitioning tracers.
Another continuing innovation is the use of mobile analytical labo-ratories. Although off-site, fixed-base laboratories continue to be popular and necessary for a range of analyses, mobile laboratories are also becom-ing increasingly popular. With the lab inside the fence, confirmation sam-pling can be conducted in real-time as remediation activities are taking place. This allows the technical professional to make decisions in the field as the activity is occurring, eliminating the need for downtime awaiting results as well as costly remobilization of equipment.
As important as the development of characterization techniques was the development of sampling and analytical methods for soil and water samples. The U.S. EPA developed publication SW-846, Test Methods for Evaluating Solid Waste, Physical/Chemical Methods. This guide com-piled analytical and sampling methods evaluated and approved for use
CONtAMiNAtED SitE REMEDiAtiON: gENERAL APPROACH • 35
in complying with RCRA regulations. SW-846 functions primarily as a guidance document that establishes acceptable sampling and analysis methods. SW-846 was first issued by U.S. EPA in 1980. New editions have been issued to accommodate advances in analytical instrumentation and techniques.
2.3 RiSK ASSESSMENt
Once site contamination has been confirmed through the course of a thor-ough site characterization, a risk assessment is performed. A risk assess-ment, also known as an impact assessment, is a systematic evaluation used to determine the potential risk posed by the detected contamination to human health and the environment under the present and possible future conditions. If the risk assessment reveals that an unacceptable risk exists due to the contamination, a remedial strategy is developed to assess the problem. If corrective action is deemed necessary, the risk assessment will assist in the development of remedial strategies and goals necessary to reduce the potential risks posed at the site.
The U.S. EPA and the ASTM have developed comprehensive risk assessment procedures. The U.S. EPA procedure was originally developed by the U.S. Academy of Sciences in 1983. It was adopted with modifica-tions by the U.S. EPA for use in superfund feasibility studies and RCRA corrective measure studies (U.S. EPA 1989). This procedure provides a general, comprehensive approach for performing risk assessments at contaminated sites. It consists of four steps: (1) hazard identification, (2) exposure assessment, (3) toxicity assessment, and (4) risk characteri-zation. The most critical aspect of such assessment is developing the CSM, identifying receptors and exposure pathways, and determining exposure dosages under existing and potential remedial conditions. Knowing the toxicology data, risk is quantified, and risk less than 1 × 10⁻⁶ (one in one million) is generally considered acceptable. Unfortunately, this assess-ment is cumbersome and requires a large set of input data or necessity to make assumptions.
The ASTM Standard E1739-95, known as the Guide for Risk-Based Corrective Action (RBCA), is a tiered assessment originally developed to help assess sites that contained leaking underground storage tanks contain-ing petroleum (ASTM 2010). Although the standard is geared toward such sites, many regulatory agencies use a slightly modified version for non-UST sites. This approach integrates risk and exposure assessment prac-tices with site assessment activities and the selection of the remediation
36 • SuStAiNABLE REMEDiAtiON Of CONtAMiNAtED SitES
technique. The RBCA process allows corrective action activities to be tailored for site-specific conditions and risks and assures that the chosen course of action will protect both human health and the environment.
Different risk assessment methodologies have been developed by various state agencies that are based on tiered approach but applicable to any type of contamination (Sharma and Reddy 2004). The state reg-ulatory agency should be contacted for additional information on such methodologies.
2.4 REMEDiAL ACtiON
When the results of a risk assessment reveal that a site does not pose risks to human health or the environment, no remedial action is required. In some cases, however, monitoring of a site may be required to validate the results of the risk assessment. Corrective action is required when risks posed by the site are deemed unacceptable. When action is required, a remedial strategy must be developed to insure that the intended reme-dial method complies with all technological, economic, and regulatory considerations.
The costs and benefits of various remedial alternatives are often weighed by comparing the flexibility, compatibility, speed, and cost of each method. A remedial method must be flexible in its application to ensure that it is adaptable to site-specific soil and groundwater characteris-tics. The selected method must be able to address site contamination while offering compatibility with the geology and hydrogeology of the site.
Many other interrelated factors affect the selection and implementa-tion of remedial action, including the following:
• End-use of the site: The proposed future use of the site after the site has been remediated will dictate the need for remediation and the cleanup levels.
• Cost of cleanup: The cost of remediation depends on the site con-ditions and applicable regulations. The more stringent the regula-tions, the higher the cost of the remediation.
• Health and safety: Federal regulations require stringent safety mea-sures at contaminated sites. These regulations include Occupational Health and Safety Administration (OSHA) requirements stipulated in 29 CFR 1910.120: Protection of Workers in Hazardous Waste Operations. State regulations also require stringent safety mea-sures. A site-specific health and safety plan is prepared and strictly
CONtAMiNAtED SitE REMEDiAtiON: gENERAL APPROACH • 37
followed. All persons who work at the site or who visit the site are required to follow the safety measures.
• Environmental liability: Who is responsible for contamination and who will pay for the remediation are contentious questions to answer. CERCLA uses the court system to assign specific liabil-ity for the cleanup of contaminated sites. CERCLA defines four classes of potentially responsible parties: (1) the current owner or operator of the site, (2) any person who formerly owned or operated the site at the time of disposal of any hazardous waste, (3) any per-son who arranged for disposal or treatment of hazardous waste at the site, and (4) any transporter of hazardous waste to the site. This implies that almost anyone involved with the site is a potentially responsible party and liable for the cost of cleanup.
Generally, remediation methods are divided into two categories: in situ remediation methods and ex situ remediation methods. In situ methods treat contaminated soils and groundwater in place, eliminating the need to excavate the contaminated soils and extract groundwater. In situ methods are advantageous because they are less expensive, cause less site disturbance, and they provide increased safety to both the on-site workers and the general public within the vicinity of the remedial project. Successful implementation of in situ methods requires a thorough understanding of the subsurface conditions. In situ containment, using bottom barriers, vertical walls, and caps, may be a feasible strategy to minimize the risk posed by the contamination at some sites. Ex situ methods are used to treat excavated soils and extracted groundwater. Surface treatment may be performed either on-site or off-site, depending on site-specific conditions. Ex situ treatment methods are attractive because consideration does not need be given to subsurface conditions. Ex situ treatment also offers easier control and monitoring during remedial activity implementation. Specific remediation technologies are discussed in detail in Chapter 3.
2.5 SuMMARY
Many sites have been contaminated due to improper waste disposal prac-tices and accidental spills. Due to a lack of environmental laws and reg-ulations, such contaminated sites continued to increase. However, after the promulgation of RCRA and CERCLA, the number of contaminated sites has reduced and efforts have been initiated to clean up all of the contaminated sites. An earlier remedial approach aimed to restore the sites

38 • SuStAiNABLE REMEDiAtiON Of CONtAMiNAtED SitES
to pristine conditions, which was realized to be impractical. So much time and resources have been expended, yet the problem of contaminated sites persisted.
New and rational approach to the remediation of contaminated sites was then developed. It includes site characterization, followed by risk assessment. If the risk to human health or surrounding ecology is unac-ceptable, remedial action is required. Several options exist for the reme-diation of contaminated soils and groundwater, ranging from ex situ and in situ technologies and in situ containment. Remedial action is selected based on the site-specific conditions and remedial goals.
CHAPtER 3
contAminAted site remediAtion technoLogies
3.1 iNtRODuCtiON
Remedial technologies are classified into two groups based on their scope of application: (1) vadose zone or soil remediation technologies and (2) saturated zone or groundwater remediation technologies. The vadose zone is the geological profile extending from the ground surface to the upper surface of the principal water-bearing formation. In very general terms, it is often simpler to remove the vadose zone impact as compared to saturated zone impacts, and the financial impact of the remediation program may be substantially reduced if the source of pol-lution is identified and remediated while it is still in the vadose zone, before the onset of groundwater contamination. A number of remedial technologies are suitable for vadose zone (or soil) treatment; how-ever, many of these options are not capable of treating contaminated groundwater. In the case of saturated zone (groundwater) contamina-tion, other technologies must be considered for possible implementa-tion. In some situations, containment technologies may be considered as an interim remedial measure or as the only choice of remediation. To properly remediate subsurface contamination, it is essential to under-stand the operation, applicability, advantages, and drawbacks of avail-able subsurface remedial and containment technologies. Having this background, one can identify potential sustainable technologies. This chapter provides a brief description of various soil and groundwater remediation technologies and pollution containment technologies and finally identifies which technologies have the potential to be sustainable technologies.
40 • SuStAiNABLE REMEDiAtiON Of CONtAMiNAtED SitES
3.2 VADOSE ZONE (SOiL) REMEDiAtiON tECHNOLOgiES
A major concern at contaminated sites is the possibility of vadose zone con-tamination that has the potential to infiltrate the underlying groundwater resources. Fortunately, remediation may be implemented within the vadose zone before the onset of contaminant migration into the saturated soil profile and groundwater. The most common practice used to remedi-ate vadose zone contamination is excavation. Simply stated, contaminated soils are removed from the subsurface until clean excavation bases and sidewalls have been established. Impacted soil is typically characterized through subsequent testing, allowing for appropriate transportation and disposal measures, commonly involving landfill disposal. Following exca-vation activities, clean fill materials are used to backfill the resulting exca-vation. The contaminated soil may either be treated or untreated before disposal. This approach is simple, easy to perform, fast, and cost effective for small sites. Additionally, it is an applicable method for a wide range of contaminant conditions. Regulatory approval and permits are relatively easy to obtain for excavation. However, the cost effectiveness of excava-tion diminishes when applied to larger contaminated sites. Additionally, when the contamination extends deeper into the soil profile, excavation becomes very expensive. Because of the costs associated with the excava-tion, transportation, treatment, and disposal of contaminated soil, excava-tion is best applied to small, shallow contaminated soils.
When the excavation of contaminated soils is not a feasible option, a number of conventional and innovative treatment methods may be utilized. These methods may either be in situ or ex situ methods. Com-mon remedial methods are summarized in Figure 3.1. Table 3.1 offers a comparative assessment of the different ex situ remedial methods, while Table 3.2 compares several in situ technologies. A brief description of the most popular remedial technologies is provided in the following sections, and the reader should refer to Sharma and Reddy (2004) for more detailed information.
3.2.1 SOIL VAPOR EXTRACTION
Soil vapor extraction (SVE) has proven to be a popular and successful innovative treatment technique for the remediation of vadose zone con-tamination, particularly volatile organic compounds (VOCs) and motor fuels. An SVE system consists of three basic components: an extraction system, an air flow system, and an off-gas treatment system. By applying
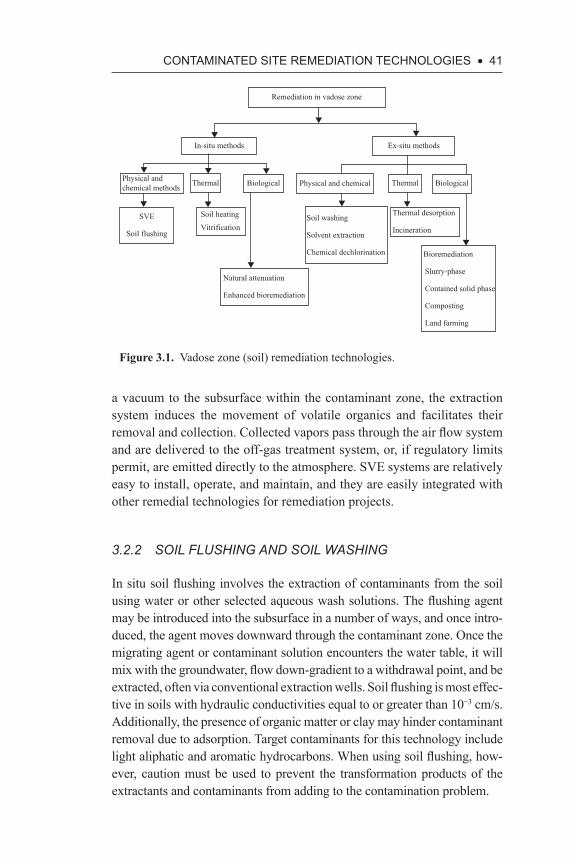
CONtAMiNAtED SitE REMEDiAtiON tECHNOLOgiES • 41
a vacuum to the subsurface within the contaminant zone, the extraction system induces the movement of volatile organics and facilitates their removal and collection. Collected vapors pass through the air flow system and are delivered to the off-gas treatment system, or, if regulatory limits permit, are emitted directly to the atmosphere. SVE systems are relatively easy to install, operate, and maintain, and they are easily integrated with other remedial technologies for remediation projects.
3.2.2 SOIL FLUSHING AND SOIL WASHING
In situ soil flushing involves the extraction of contaminants from the soil using water or other selected aqueous wash solutions. The flushing agent may be introduced into the subsurface in a number of ways, and once intro-duced, the agent moves downward through the contaminant zone. Once the migrating agent or contaminant solution encounters the water table, it will mix with the groundwater, flow down-gradient to a withdrawal point, and be extracted, often via conventional extraction wells. Soil flushing is most effec-tive in soils with hydraulic conductivities equal to or greater than 10−3 cm/s. Additionally, the presence of organic matter or clay may hinder contaminant removal due to adsorption. Target contaminants for this technology include light aliphatic and aromatic hydrocarbons. When using soil flushing, how-ever, caution must be used to prevent the transformation products of the extractants and contaminants from adding to the contamination problem.
Remediation in vadose zone
In-situ methods
Physical and chemical methods Thermal Biological
Ex-situ methods
SVE
Soil flushing
Soil heating
Vitrification
Natural attenuation
Enhanced bioremediation
Soil washing
Solvent extraction
Chemical dechlorination
Thermal desorption
Incineration
Bioremediation
Slurry-phase
Contained solid phase
Composting
Land farming
Physical and chemical Thermal Biological
Figure 3.1. Vadose zone (soil) remediation technologies.
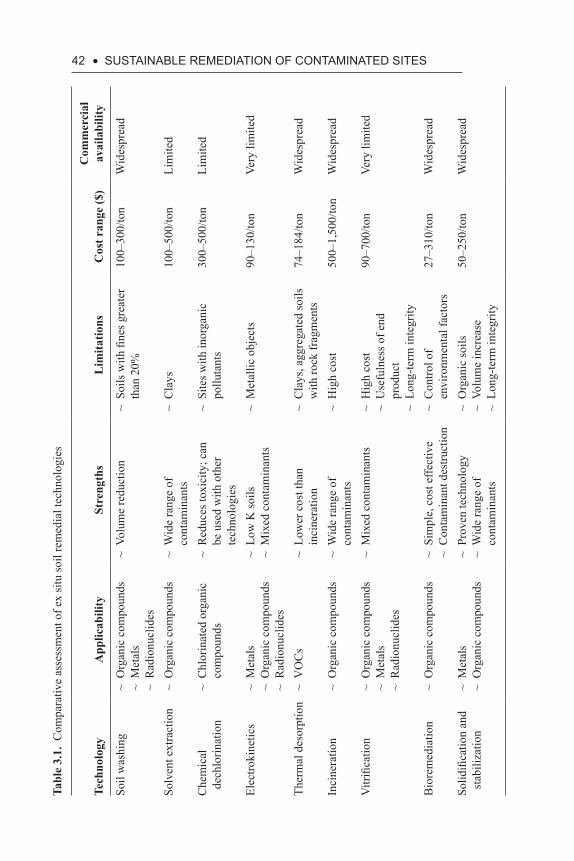
42 • SuStAiNABLE REMEDiAtiON Of CONtAMiNAtED SitESTa
ble
3.1.
Com
para
tive
asse
ssm
ent o
f ex
situ
soil
rem
edia
l tec
hnol
ogie
s
Tech
nolo
gyA
pplic
abili
tySt
reng
ths
Lim
itatio
nsC
ost r
ange
($)
Com
mer
cial
av
aila
bilit
y
Soil
was
hing
~ O
rgan
ic c
ompo
unds
~ M
etal
s~
Rad
ionu
clid
es
~ Vo
lum
e re
duct
ion
~ So
ils w
ith fi
nes g
reat
er
than
20%
100–
300/
ton
Wid
espr
ead
Solv
ent e
xtra
ctio
n~
Org
anic
com
poun
ds~
Wid
e ra
nge
of
cont
amin
ants
~ C
lays
100–
500/
ton
Lim
ited
Che
mic
al
dech
lorin
atio
n~
Chl
orin
ated
org
anic
co
mpo
unds
~ R
educ
es to
xici
ty; c
an
be u
sed
with
oth
er
tech
nolo
gies
~ Si
tes w
ith in
orga
nic
pollu
tant
s30
0–50
0/to
nLi
mite
d
Elec
troki
netic
s~
Met
als
~ O
rgan
ic c
ompo
unds
~ R
adio
nucl
ides
~ Lo
w K
soils
~ M
ixed
con
tam
inan
ts~
Met
allic
obj
ects
90–1
30/to
nVe
ry li
mite
d
Ther
mal
des
orpt
ion
~ V
OC
s~
Low
er c
ost t
han
inci
nera
tion
~ C
lays
, agg
rega
ted
soils
w
ith ro
ck fr
agm
ents
74–1
84/to
nW
ides
prea
d
Inci
nera
tion
~ O
rgan
ic c
ompo
unds
~ W
ide
rang
e of
co
ntam
inan
ts~
Hig
h co
st50
0–1,
500/
ton
Wid
espr
ead
Vitr
ifica
tion
~ O
rgan
ic c
ompo
unds
~ M
etal
s~
Rad
ionu
clid
es
~ M
ixed
con
tam
inan
ts~
Hig
h co
st~
Use
fuln
ess o
f end
pr
oduc
t~
Long
-term
inte
grity
90–7
00/to
nVe
ry li
mite
d
Bio
rem
edia
tion
~ O
rgan
ic c
ompo
unds
~ Si
mpl
e, c
ost e
ffect
ive
~ C
onta
min
ant d
estru
ctio
n~
Con
trol o
f en
viro
nmen
tal f
acto
rs27
–310
/ton
Wid
espr
ead
Solid
ifica
tion
and
stab
iliza
tion
~ M
etal
s ~
Org
anic
com
poun
ds~
Prov
en te
chno
logy
~ W
ide
rang
e of
co
ntam
inan
ts
~ O
rgan
ic so
ils~
Volu
me
incr
ease
~ Lo
ng-te
rm in
tegr
ity
50–2
50/to
nW
ides
prea
d
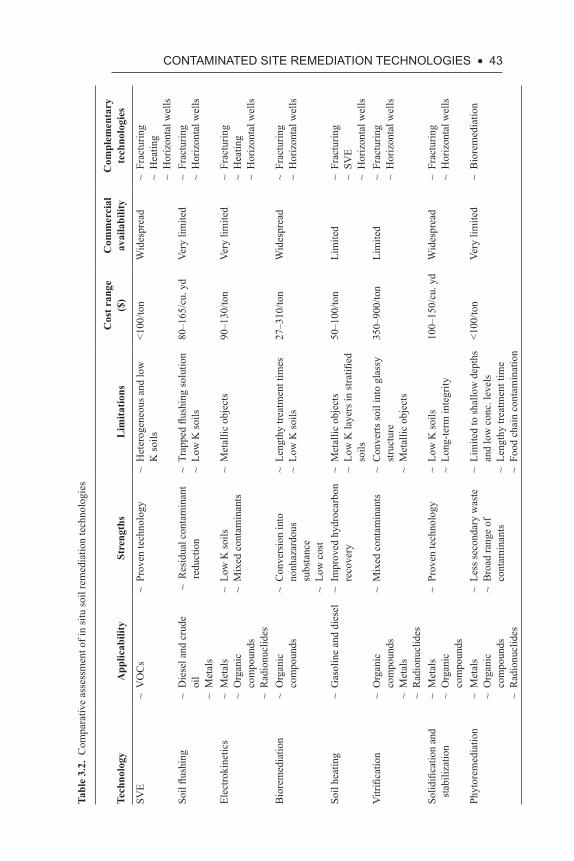
CONtAMiNAtED SitE REMEDiAtiON tECHNOLOgiES • 43Ta
ble
3.2.
Com
para
tive
asse
ssm
ent o
f in
situ
soil
rem
edia
tion
tech
nolo
gies
Tech
nolo
gyA
pplic
abili
tySt
reng
ths
Lim
itatio
nsC
ost r
ange
($
)C
omm
erci
al
avai
labi
lity
Com
plem
enta
ry
tech
nolo
gies
SVE
~ V
OC
s
~ Pr
oven
tech
nolo
gy
~ H
eter
ogen
eous
and
low
K
soils
<100
/ton
W
ides
prea
d~
Frac
turin
g~
Hea
ting
~ H
oriz
onta
l wel
lsSo
il flu
shin
g~
Die
sel a
nd c
rude
oi
l~
Met
als
~ R
esid
ual c
onta
min
ant
redu
ctio
n~
Trap
ped
flush
ing
solu
tion
~ Lo
w K
soils
80–1
65/c
u. y
dVe
ry li
mite
d~
Frac
turin
g~
Hor
izon
tal w
ells
Elec
troki
netic
s~
Met
als
~ O
rgan
ic
com
poun
ds~
Rad
ionu
clid
es
~ Lo
w K
soils
~ M
ixed
con
tam
inan
ts
~ M
etal
lic o
bjec
ts90
–130
/ton
Ve
ry li
mite
d
~ Fr
actu
ring
~ H
eatin
g~
Hor
izon
tal w
ells
Bio
rem
edia
tion
~ O
rgan
ic
com
poun
ds
~ C
onve
rsio
n in
to
nonh
azar
dous
su
bsta
nce
~ Lo
w c
ost
~ Le
ngth
y tre
atm
ent t
imes
~ Lo
w K
soils
27–3
10/to
n
Wid
espr
ead
~
Frac
turin
g~
Hor
izon
tal w
ells
Soil
heat
ing
~ G
asol
ine
and
dies
el
~ Im
prov
ed h
ydro
carb
on
reco
very
~ M
etal
lic o
bjec
ts~
Low
K la
yers
in st
ratifi
ed
soils
50–1
00/to
n
Lim
ited
~ Fr
actu
ring
~ SV
E~
Hor
izon
tal w
ells
Vitr
ifica
tion
~ O
rgan
ic
com
poun
ds~
Met
als
~ R
adio
nucl
ides
~ M
ixed
con
tam
inan
ts
~ C
onve
rts so
il in
to g
lass
y st
ruct
ure
~ M
etal
lic o
bjec
ts
350–
900/
ton
Li
mite
d
~ Fr
actu
ring
~ H
oriz
onta
l wel
ls
Solid
ifica
tion
and
stab
iliza
tion
~ M
etal
s ~
Org
anic
co
mpo
unds
~ Pr
oven
tech
nolo
gy
~ Lo
w K
soils
~ Lo
ng-te
rm in
tegr
ity10
0–15
0/cu
. yd
Wid
espr
ead
~
Frac
turin
g~
Hor
izon
tal w
ells
Phyt
orem
edia
tion
~
Met
als
~ O
rgan
ic
com
poun
ds~
Rad
ionu
clid
es
~ Le
ss se
cond
ary
was
te~
Bro
ad ra
nge
of
cont
amin
ants
~ Li
mite
d to
shal
low
dep
ths
and
low
con
c. le
vels
~ Le
ngth
y tre
atm
ent t
ime
~ Fo
od c
hain
con
tam
inat
ion
<100
/ton
Very
lim
ited
~
Bio
rem
edia
tion
44 • SuStAiNABLE REMEDiAtiON Of CONtAMiNAtED SitES
While soil flushing is an in situ technique, soil washing is an ex situ technique. Used in the same manner as its in situ counterpart, soil washing is effective in treating both organic and inorganic compounds, yet it may not be successful in treating clayey or silty soils.
3.2.3 CHEMICAL OXIDATION
Chemical oxidation technologies have also evolved as a preferred reme-dial alternative for in situ or ex situ remediation of soils and groundwater. With this technology, an oxidizing agent is introduced and mixed into the subsurface. Chemical oxidation typically involves reduction– oxidation (redox) reactions that chemically convert hazardous contaminants to non-hazardous or less toxic compounds that are more stable, less mobile, or inert. Redox reactions involve the transfer of electrons from one com-pound to another. Specifically, one reactant is oxidized (loses electrons) and one is reduced (gains electrons). The oxidizing agents most com-monly used for the treatment of hazardous contaminants in soil are ozone, hydrogen peroxide, hypochlorites, chlorine, chlorine dioxide, potassium per-manganate, persulfate, and Fenton’s reagent (hydrogen peroxide and iron) (U.S. EPA CLU-IN 2011a). The effectiveness of some of these oxidants can be enhanced through activation (Fenton’s reagent, activated persul-fate) and used in conjunction with other oxidants (perozone) (ITRC 2005).
3.2.4 SOLIDIFICATION AND STABILIZATION
Another rapid technology is soil stabilization and solidification. With this method, additives or processes are applied to contaminated soil to chem-ically bind and immobilize contaminants, preventing mobility. This pro-cess aims to physically bind contaminants to a stabilized mass. A mixing reagent, commonly Portland cement, is mixed with moist soil and allowed to harden. The final product is a stable mass with very low permeability and good erosion resistance. It is applicable to both heavy metals and to high-molecular-weight organics. The process may be applied in situ or ex situ. When performed ex situ, the treated soil mass may be replaced into the subsurface or off-hauled for disposal at an appropriate landfilling facility. In either in situ or ex situ, it is critical to assure that the reagent has been thoroughly mixed with the soil mass.
Stabilization and solidification has several benefits, including low costs due to the wide availability of inexpensive reagents and additives, a wide range of applicability to varying soil types and contaminant
CONtAMiNAtED SitE REMEDiAtiON tECHNOLOgiES • 45
conditions, use of readily available equipment, and rapid application and production rates. Alternatively, some of the drawbacks include the ongoing presence of contamination (although fixated and immobilized), increased volume of impacted material due to the introduction of addi-tives or reagents, potential emissions, especially when VOCs are present in the subsurface, assurance of proper delivery and mixing, and long-term presence may affect potential future site use. Additionally, long-term per-formance issues have not been fully explored.
3.2.5 ELECTROKINETICS
Electrokinetics, a remediation technique that involves the application of a low electric potential gradient across a contaminated soil zone in order to induce contaminant movement, offers significant potential for the in situ remediation of fine-grained soils. The mass flux of contaminants transported during electrokinetics depends upon the transient geochem-istry that takes place under the influence of the induced electrical field. Electrode conditioning procedures are sometimes necessary to induce favorable geochemistry, resulting in greater remediation efficiency. Elec-trokinetics is suitable for treating clays contaminated with heavy metals, radionuclides, and organic contaminants; often, these contaminants may be removed with efficiencies from 75 to 95 percent.
3.2.6 BIOREMEDIATION
Bioremediation is an increasingly popular technique during which micro-organisms are utilized to biologically degrade contaminants into harmless end products. Bioremediation offers flexibility because it may be per-formed in an in situ or an ex situ manner to address either vadose zone or saturated zone contamination. There are two approaches to bioremedia-tion: one associated with natural attenuation processes (when monitored, this is called monitored natural attenuation [MNA]) and enhanced biore-mediation. MNA utilizes naturally occurring microorganisms commonly present within vadose zone soils to degrade organic contaminants. When natural subsurface biological and nutrient conditions are not conducive for remediation, the subsurface may be enhanced to allow degradation to occur through the addition of nutrients, electron donors and acceptors, or suitable microorganisms (bioaugmentation). Whether natural or enhanced bioreme-diation is utilized, the effectiveness of treatment depends upon the type of contaminant(s), the microbial population, and the physical and chemical
46 • SuStAiNABLE REMEDiAtiON Of CONtAMiNAtED SitES
conditions in the subsurface. Thus, a careful assessment regarding bio-logical, nutrient, and other environmental conditions (e.g., pH, moisture, temperature) must be performed. Additionally, full mineralization of the contaminants must be assured, as incomplete degradation may often lead to end products that are more harmful than the original contaminants.
3.2.7 THERMAL METHODS
Various thermal methods may be employed to accomplish contaminant remediation. In situ vitrification (ISV) employs electrical power to heat and melt contaminated soil. Organic contaminants are destroyed through pyrolysis, while volatile metals may evolve in off-gases, necessitating off-gas treatment. Vitrification is applicable for soils contaminated with heavy metals, organic contaminants with high sorption coefficients, and radioactive materials. However, effectiveness is reduced in soils with high organic matter, high moisture content, or soils containing large metallic objects (e.g., pipes or drums).
As an alternative, in situ soil heating decontaminates soils through vaporization, steam distillation, and stripping, and may be performed through powerline frequency heating (PLH) or radiofrequency heating (RFH). In situ soil heating is applicable to both organic and semiorganic contamination; however, it may become cost-prohibitive when applied to deep-contaminated sites.
A number of ex situ thermal methods are also effective in treating a variety of contaminants. In addition to ex situ vitrification, incineration is also an ex situ remedial option. Incineration accomplishes destruction through combustion. Incineration may be used to treat all types of organic contaminants at a very high level of efficiency, but the extreme tempera-tures required for incineration makes it a very expensive technique. When the remedial goal is to increase contaminant removal through volatilization instead of destruction, thermal desorption may be used. During the use of this technique, volatized contaminants, most suitably VOCs or chlorinated solvents, are transported out of the soil. This method is effective in treating volatile contaminants over a wide range of moisture contents, but it may become cost-prohibitive for treating large volumes of contaminated soil.
3.3 SAtuRAtED ZONE (gROuNDWAtER) REMEDiAtiON tECHNOLOgiES
If groundwater contamination is confirmed and corrective action is deemed necessary following a thorough site characterization and risk
CONtAMiNAtED SitE REMEDiAtiON tECHNOLOgiES • 47
assessment, one of many remedial technologies may be utilized for corrective action. Some of the aforementioned remedial technologies may be applied to saturated soils, including soil flushing, electrokinetics, and bioremediation. In addition, other popular remedial methods that can be used include: (1) pump-and-treat, (2) air sparging, (3) dual phase extraction, and (4) permeable reactive barriers (PRBs). Actual remedial methods are varied in their applications and their limitations; thus, it is essential to evaluate the benefits, drawbacks, and economic impact of each method, as well as the site-specific soil, hydrogeologic, and contaminant conditions. A comparative assessment of several remedial technologies applicable for saturated zone contamination is shown in Table 3.3.
3.3.1 PUMP-AND-TREAT
Until recently, the most conventional method for groundwater remedi-ation has been the pump-and-treat method. With pump-and-treat, free-phase contaminants and contaminated groundwater are pumped directly out of the subsurface. Treatment occurs above ground, and the cleaned groundwater is either discharged into sewer systems or reinjected into the subsurface. As the groundwater is extracted, dissolved contaminant mass is removed, which induces subsequent dissolution of nonaqueous phase liquid (NAPL) contaminant from free-phase sources or those adsorbed to the soil matrix. Pump-and-treat systems have been operated at numer-ous sites for many years. Unfortunately, data collected from these sites reveals that although pump-and-treat may be successful during the initial stages of implementation, performance drastically decreases at later times. As a result, significant amounts of residual contamination can remain, unaffected by continued treatment. Due to these limitations, the pump-and-treat method is now primarily used for free product recovery and to control contaminant plume migration.
3.3.2 AIR SPARGING
Air sparging, also known as biosparging, is an established remediation technology useful in the treatment of volatile organic contaminants. During the implementation of air sparging, a gas, usually air, is injected into the saturated soil zone below the lowest known level of contami-nation. Due to the effect of buoyancy, the injected air will rise toward the surface. As the air comes into contact with the contamination, it will, through a variety of mechanisms, strip the contaminant away or assist in situ degradation. Eventually, the contaminant-laden air encounters the
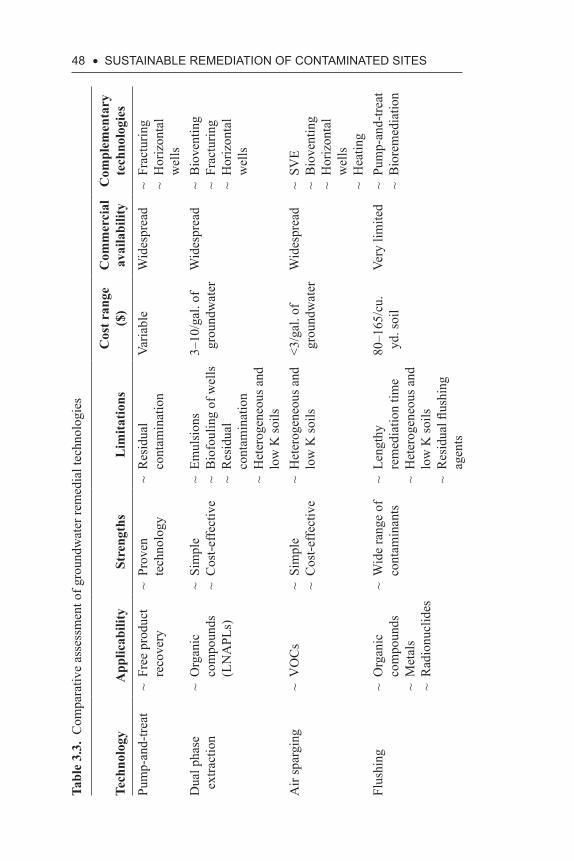
48 • SuStAiNABLE REMEDiAtiON Of CONtAMiNAtED SitESTa
ble
3.3.
Com
para
tive
asse
ssm
ent o
f gro
undw
ater
rem
edia
l tec
hnol
ogie
s
Tech
nolo
gyA
pplic
abili
tySt
reng
ths
Lim
itatio
nsC
ost r
ange
($
)C
omm
erci
al
avai
labi
lity
Com
plem
enta
ry
tech
nolo
gies
Pum
p-an
d-tre
at~
Free
pro
duct
re
cove
ry~
Prov
en
tech
nolo
gy~
Res
idua
l co
ntam
inat
ion
Varia
ble
Wid
espr
ead
~ Fr
actu
ring
~ H
oriz
onta
l w
ells
Dua
l pha
se
extra
ctio
n~
Org
anic
co
mpo
unds
(L
NA
PLs)
~ Si
mpl
e~
Cos
t-effe
ctiv
e~
Emul
sion
s~
Bio
foul
ing
of w
ells
~ R
esid
ual
cont
amin
atio
n~
Het
erog
eneo
us a
nd
low
K so
ils
3–10
/gal
. of
grou
ndw
ater
Wid
espr
ead
~ B
iove
ntin
g~
Frac
turin
g~
Hor
izon
tal
wel
ls
Air
spar
ging
~ V
OC
s~
Sim
ple
~ C
ost-e
ffect
ive
~ H
eter
ogen
eous
and
lo
w K
soils
<3/g
al. o
f gr
ound
wat
erW
ides
prea
d~
SVE
~ B
iove
ntin
g~
Hor
izon
tal
wel
ls~
Hea
ting
Flus
hing
~ O
rgan
ic
com
poun
ds~
Met
als
~ R
adio
nucl
ides
~ W
ide
rang
e of
co
ntam
inan
ts
~ Le
ngth
y re
med
iatio
n tim
e~
Het
erog
eneo
us a
nd
low
K so
ils~
Res
idua
l flus
hing
ag
ents
80–1
65/c
u.
yd. s
oil
Very
lim
ited
~ Pu
mp-
and-
treat
~ B
iore
med
iatio
n
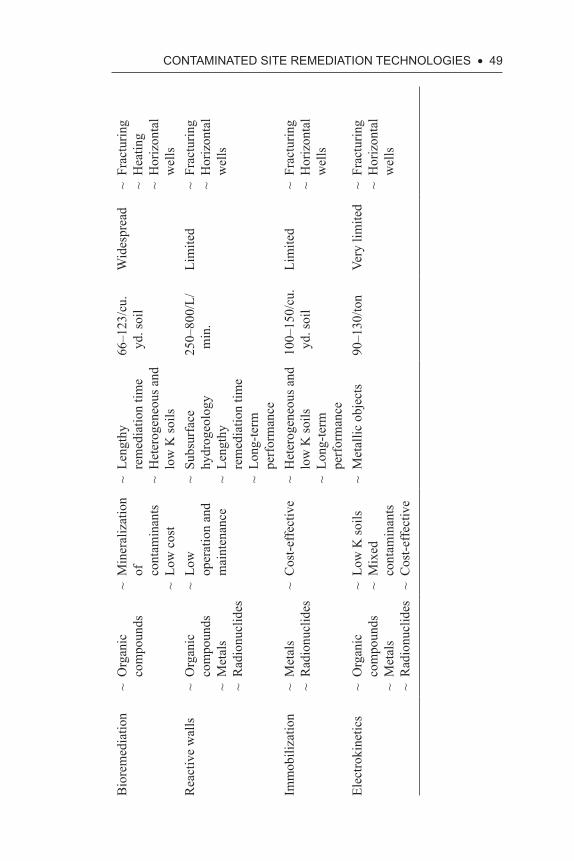
CONtAMiNAtED SitE REMEDiAtiON tECHNOLOgiES • 49
Bio
rem
edia
tion
~ O
rgan
ic
com
poun
ds
~ M
iner
aliz
atio
n of
co
ntam
inan
ts~
Low
cos
t
~ Le
ngth
y re
med
iatio
n tim
e~
Het
erog
eneo
us a
nd
low
K so
ils
66–1
23/c
u.
yd. s
oil
Wid
espr
ead
~ Fr
actu
ring
~ H
eatin
g~
Hor
izon
tal
wel
lsR
eact
ive
wal
ls
~ O
rgan
ic
com
poun
ds~
Met
als
~ R
adio
nucl
ides
~ Lo
w
oper
atio
n an
d m
aint
enan
ce
~ Su
bsur
face
hy
drog
eolo
gy~
Leng
thy
rem
edia
tion
time
~ Lo
ng-te
rm
perf
orm
ance
250–
800/
L/m
in.
Lim
ited
~ Fr
actu
ring
~ H
oriz
onta
l w
ells
Imm
obili
zatio
n
~ M
etal
s~
Rad
ionu
clid
es~
Cos
t-effe
ctiv
e
~ H
eter
ogen
eous
and
lo
w K
soils
~ Lo
ng-te
rm
perf
orm
ance
100–
150/
cu.
yd. s
oil
Lim
ited
~
Frac
turin
g~
Hor
izon
tal
wel
ls
Elec
troki
netic
s
~ O
rgan
ic
com
poun
ds~
Met
als
~ R
adio
nucl
ides
~ Lo
w K
soils
~ M
ixed
co
ntam
inan
ts~
Cos
t-effe
ctiv
e
~ M
etal
lic o
bjec
ts
90–1
30/to
n
Very
lim
ited
~ Fr
actu
ring
~ H
oriz
onta
l w
ells
50 • SuStAiNABLE REMEDiAtiON Of CONtAMiNAtED SitES
vadose zone, where it is often collected using a SVE system and treated on-site. Air sparging offers the best results when it is applied to relatively permeable and homogeneous soils. Impermeable soils as well as heteroge-neity impact air flow patterns and thus may adversely affect performance. Remediation times using air sparging are much lower than those achieved using other methods. Additionally, since the required equipment is readily available, air sparging is often an economically attractive remedial choice.
3.3.3 DUAL-PHASE EXTRACTION
Dual-phase extraction, also known as vacuum-enhanced recovery, is a hybrid remediation technique that combines technology from pump-and-treat and SVE. During implementation, groundwater is extracted to ground level through the application of a vacuum, allowing for the removal of the dissolved contaminants within the extracted groundwa-ter as well as the contaminant vapors due to the applied vacuum. Both the dissolved and vaporized contaminant may be treated on-site. The cleaned water may be discharged into sewer systems, streams, or rein-jected into the subsurface, while the clean air is generally emitted into the atmosphere. Two types of dual-phase extraction are commonly used: single-pump systems and double-pump systems. Dual-phase extraction systems are simple to implement, inexpensive, and well-suited for aqui-fers with low permeability.
3.3.4 PERMEABLE REACTIVE BARRIERS
PRBs incorporate a reactive media to adsorb, degrade, or destroy con-tamination within groundwater as it passes through the barrier. Com-mon reactants include zero-valent iron, zeolites, organobentonites, and hydroxyapatite. PRBs may be continuously installed perpendicular to a migrating plume, or they may consist of a funnel-and-gate design that diverts water flow through a treatment zone. PRBs must be monitored closely to ensure that suitable reactant mass is present as well as confirm that flow has not been lessened by clogging.
PRBs are also a technology where a mass flux and discharge anal-ysis approach can be an effective analysis alternative. In contrast to the point approach utilized with numerous characterization and remediation technologies, the mass flux and discharge approach assesses the trans-port of contaminant mass across a monitoring interface over a period of time. It can be applied with pumping tests, in-well meters, or integrative
CONtAMiNAtED SitE REMEDiAtiON tECHNOLOgiES • 51
approaches, such as the transect method. It can be especially useful in addressing plume stability and fate and transport assessment.
3.4 CONtAiNMENt tECHNOLOgiES
In some cases, it may be impractical or undesirable to actively remediate contamination in soils and groundwater via in situ methods. This can be due to the presence of surface obstructions, such as structures or utilities, or the presence of contamination with extent and depth that cannot be readily addressed. In such situations, containment systems may be con-sidered (Figure 3.2). Often times, these are used with institutional con-trols, such as deed restrictions or activity use limitations (AULs) that can formally notify property stakeholders of the presence of contamination and conditions in which the containment strategies need to be preserved. Containment methods may also be used as interim measures prior to the final selection and implementation of a remedial method.
3.4.1 SURFACE CAPPING
Surface capping involves the installation of a surface barrier that prevents or limits the ability of underlying contaminated subsurface media to be encountered (Figure 3.2a). This may consist of hardscape paving, a syn-thetic membrane, or natural material soil liner (i.e., a clay liner). In some cases, the presence of a structure may be utilized in that contamination is limited to within a building footprint. Warning devices, such as geogrid, metallic mesh, fabric, or other similar material may be incorporated into the underlying soil to alert future excavations from advancing in these areas of prohibited or limited excavation activity.
3.4.2 SOIL VAPOR MITIGATION SYSTEMS
When soil and groundwater are impacted with volatile contaminants, such as solvents or lighter-phase petroleum hydrocarbons, land users can be threatened by exposure to contaminated indoor air emanating from the subsurface. This potential exposure can be mitigated through the use of a soil vapor barrier and venting system. A vapor barrier consists of a mem-brane placed immediately below foundation elements and floor slabs. The membrane, often some type of polymer and either placed in sheeting or sprayed in place, provides a nearly impermeable break that minimizes the
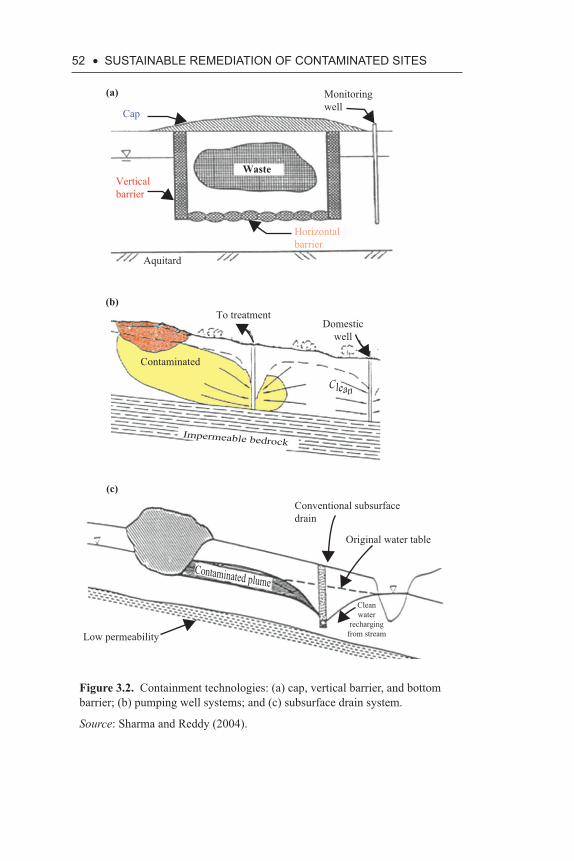
52 • SuStAiNABLE REMEDiAtiON Of CONtAMiNAtED SitES
Cap
WasteVerticalbarrier
Horizontalbarrier
Monitoringwell
Aquitard
To treatment
Contaminated
Conventional subsurfacedrain
Original water table
Cleanwater
rechargingfrom streamLow permeability
Contaminated plume
Impermeable bedrock
Domesticwell
Clean
(a)
(b)
(c)
Figure 3.2. Containment technologies: (a) cap, vertical barrier, and bottom barrier; (b) pumping well systems; and (c) subsurface drain system.
Source: Sharma and Reddy (2004).
CONtAMiNAtED SitE REMEDiAtiON tECHNOLOgiES • 53
potential for contaminant vapors from migrating into a structure. Often times, these systems are combined with passive or active ventilation sys-tems. Passive ventilation systems typically consist of a low-profile intake pipe network connected to a manifold system, which is in turn vented to the atmosphere. The slight induced pressure gradient due to atmospheric venting will induce the flow of the collected vapors for harmless discharge to the atmosphere. In some cases, the systems are outfitted with active controls, such as compressors or fans, to induce greater venting and flow.
3.4.3 VERTICAL AND BOTTOM BARRIERS
Vertical barriers are also known as vertical cutoff barriers, vertical cutoff walls, or simply barrier walls, and they function in the subsurface to con-tain contaminants (Figure 3.2a). Usually vertical barriers are embedded or keyed into a low permeability formation. Horizontal configuration can be circumferential, down-gradient, or up-gradient. With circumferential con-figuration, the vertical barrier completely surrounds the contamination, hence considered to be the most effective option. Different types of ver-tical barriers have been developed and the most common ones are: slurry trench barriers, grouted barriers, mixed-in-place barriers, and steel sheet pile barriers. Slurry trench barriers are extensively used and they are con-structed by excavating a narrow trench (two to four feet wide). As exca-vation proceeds, the trench is filled with slurry that stabilizes the walls of the trench, thereby preventing collapse. The trench is finally backfilled with soil-bentonite backfill or cement-bentonite backfill. The backfill may be amended with selected materials such as activated carbon or zeolite to improve contaminant containment.
If the vertical barrier is keyed into the low permeability formation, there is no need for providing a bottom barrier. If the low permeability formation is at very deep depth, providing a bottom barrier may become an economical option. The bottom barriers are constructed by using grout-ing techniques or employing a combination of tunneling, installation of geomembranes, and grout or slurry mix.
3.4.4 PUMPING WELLS AND DRAINS
Groundwater pumping well systems are active containment systems used to manipulate and manage groundwater for the purpose of removing, diverting, and containing a contaminated plume or for adjusting ground-water levels to prevent plume movement (Figure 3.2b). Groundwater
54 • SuStAiNABLE REMEDiAtiON Of CONtAMiNAtED SitES
pumping wells are frequently used in combination with vertical barriers to prevent groundwater from overtopping the barrier and to minimize the contact of the contaminants with the barrier to prevent barrier degradation. Combinations of extraction of injection wells with appropriate pumping or injection rates are used depending on the site-specific conditions.
Subsurface drains are an alternative to pumping wells for the contain-ment of contaminated groundwater (Figure 3.2c). They consist of drain pipe surrounded by filter and backfill to intercept a plume hydraulically down-gradient and then divert to manholes to collect flow and pump the discharge to a treatment plant. Subsurface drains are best suited for sites where the groundwater table is relatively shallow and the contaminants are near the water table. Unlike pumping systems, operation and mainte-nance costs associated with subsurface drains are low.
3.5 iNtEgRAtED REMEDiAtiON tECHNOLOgiES
Using just one technology may not be adequate to remediate some con-taminated sites when different types of contaminants exist (e.g., heavy metals combined with VOCs) or when the contaminants are present within a complex geological environment (e.g., a heterogeneous soil profile consisting of lenses or layers of low permeability zones sur-rounded by high permeability soils). Under these situations, different remediation technologies can be used sequentially to achieve the reme-dial goals. The use of such multiple remediation technologies is often referred to as treatment trains. Typical treatment trains used at con-taminated sites include soil flushing followed by bioremediation, SVE followed by soil flushing, SVE followed by stabilization and solidifi-cation, and thermal desorption followed by solidification and stabili-zation, which is then followed by soil flushing. Alternatively, different remediation technologies can be used concurrently, such as SVE and air sparging, electrokinetics and bioremediation, and soil flushing and bioremediation.
3.6 POtENtiAL SuStAiNABLE REMEDiAtiON tECHNOLOgiES
When analyzing potential remedial technologies for a remedial pro-gram, the key principles and factors of sustainable remediation should be incorporated at all phases, including (1) site investigation; (2) remediation system selection, design, construction, and operation; (3) monitoring; and
CONtAMiNAtED SitE REMEDiAtiON tECHNOLOgiES • 55
(4) site closure and determination of appropriate future land use. The use of the U.S. EPA’s Triad decision-making approach is highly recommended for site investigations (U.S. EPA 2001). This method consists of three interrelated components: (1) systematic project planning, (2) dynamic work strategies, and (3) real-time measurement technologies to reduce decision uncertainty and increase project efficiency. Appropriate sustain-ability principles can be incorporated into site characterization activities. For example, direct push technologies, geophysical techniques, and pas-sive sampling and monitoring techniques can reduce waste generation, consume less energy, and minimize land and ecosystem disturbance.
It can be challenging to incorporate sustainability parameters into the process of selecting remedial technologies. A wide range of ex situ and in situ remediation technologies have been developed and implemented at contam-inated sites (Sharma and Reddy 2004). Some technologies, such as pump-and-treat operations and incineration, are known to be energy-intensive and may not meet sustainable remediation criteria. An ideal remediation technol-ogy (and all associated on-site or off-site actions) should aim to:
• Minimize the risk to public health and the environment in a cost- effective manner and in a reasonable time period;
• Minimize the potential for secondary waste and prevent uncon-trolled contaminant mass transfer from one phase to another;
• Provide an effective, long-term solution;• Minimize the impacts to land and ecosystem;• Facilitate appropriate and beneficial land use;• Minimize or eliminate energy input; if required, renewable energy
sources (e.g., solar, wind, etc.) should be used;• Minimize the emissions of air pollutants and greenhouse gases
(GHGs);• Eliminate fresh water usage while encouraging the use of recycled,
reclaimed, and storm water. Further, the remedial action should minimize impact to natural water bodies; and
• Minimize material use while facilitating recycling and the use of recycled materials.
Technologies that encourage uncontrolled contaminant partitioning between media (i.e., from soil to liquid or from liquid to air) or those that generate significant secondary wastes or effluents are not sustainable. Rather, technologies that destroy the contaminants (such as bioremedi-ation, chemical oxidation–reduction), minimize energy input, and min-imize air emissions and wastes are preferred. In situ systems are often
56 • SuStAiNABLE REMEDiAtiON Of CONtAMiNAtED SitES
attractive, as they typically minimize GHG emissions and limit distur-bance to ground surface and the overlying soils.
A variety of remedial technologies satisfy core sustainable reme-diation criteria; however, the project life cycle for a specific technol-ogy should be considered to determine if it is appropriate for use at a given site. For example, ex situ biological soil treatment is considered a promising sustainable remediation technology; however, the impacts of transporting soil (if off site treatment is required) should be evaluated. Similarly, enhanced in situ bioremediation is also considered an attractive sustainable remediation technology, but the cumulative impacts that occur during its characteristically long treatment duration should be compared to those of other active remediation that require less time. In general, pas-sive containment systems such as phytoremediation and PRBs utilize little mechanical equipment and minimize energy input while resulting in min-imal waste or effluent.
A single remediation technology often cannot cost-effectively address the technical challenges posed by contamination at a particular site. Based on the site-specific conditions, multiple technologies may be sequentially or concurrently used for remediation. Further, technologies not typically considered sustainable may be combined with other technologies to develop multicomponent remedial programs that are sustainable.
Some popular technologies used to treat residual contaminant concen-trations are not considered effective in treating source remediation. Ground-water plumes with moderate to high dissolved contaminant concentrations may require a brief implementation of active remediation technologies to expedite contaminant mass reduction. Alternatively, many technologies appropriate for source removal are often ineffective in treating residual or lower concentrations that result from reduced contaminant diffusion and dissolution. Under such conditions, GHG emissions and energy usage associated with aggressive technologies may outweigh further contaminant mass removal and destruction, and a technology with lower energy require-ments and emissions may be used to treat residual contamination. Large dilute groundwater plumes may be treated using lower-energy passive technologies; this may extend the duration of the remediation program, but it will reduce overall net impacts to the environment.
The duration of the remediation program can itself be a major govern-ing factor in remediation system selection. Remediation technologies such as bioremediation may require lower energy input, but they require longer treatment time. Further, given the duration of the remediation, cumula-tive energy use can often be greater as compared to a shorter but energy- intensive remediation program. Other anticipated or unanticipated side
CONtAMiNAtED SitE REMEDiAtiON tECHNOLOgiES • 57
effects, such as incomplete mineralization, can render these as ineffective alternatives. Further, even energy-intensive aggressive technologies, such as thermally enhanced remediation, may become attractive from a sustain-ability standpoint if renewable energy sources are used.
Opportunities exist for reducing energy and carbon footprints from existing remediation systems. In particular, energy efficiency can be maximized by optimizing existing treatment systems, critically evalu-ating design, and upgrading equipment. In addition, alternative sources of energy, including solar, wind, landfill gas, biomass, geothermal, tidal or wave, and cogeneration can be incorporated into existing systems. A growing number of existing projects have started to use solar or wind energy sources.
3.7 SuMMARY
Over the past two decades, several technologies have been developed to remediate contaminated soils and groundwater. These technologies can be ex situ or in situ technologies, and the applicability and limitations of these technologies should be kept in mind while selecting a remedial option for a contaminated site. These technologies are based on the manip-ulation of physicochemical, thermal, electrical, and biological processes in the subsurface. In addition to the treatment technologies, containment technologies are also available to serve as interim remedial measures or as sole remedy option. Often, one technology may not be adequate to address the site contamination or economical option; hence, combinations of tech-nologies may be used to address the site contamination in an effective and economical manner. In dealing with sustainable remediation, sustain-ability principles should be incorporated at all phases of site remediation, starting with site investigation to remedial implementation to site closure. Often, in situ passive and contaminant degradation technologies are con-sidered sustainable technologies, but a combination of active and passive removal and degradation technologies may be needed to achieve the net environmental benefit of site remediation. However, the site-specific con-ditions and project-specific goals will dictate the selection of remedial technologies.

CHAPtER 4
sustAinAbLe remediAtion frAmeworks
4.1 iNtRODuCtiON
Chapter 1 introduces the concept of sustainable remediation. As discussed, a sustainable remediation approach serves to address environmental con-tamination in a manner that provides the best net overall benefit to the proj-ect with respect to environmental, economic, and societal dimensions. This is accomplished through the minimization of inputs and energy, preserva-tion of natural resources, minimization of waste generation and by-products for the betterment of the community, and a maximization of future reuse options for the specific land being addressed by the remediation program. Nevertheless, while these parameters should be quantitative and objective, there are subjective concerns that are incorporated into an analysis of the degree of success in addressing these concepts. To address this, several frameworks have been developed to provide methods in which to assess the degree of sustainability with respect to remediation alternatives.
A sustainability framework is a systematic basis by which the sus-tainability of a remediation project may be assessed with respect to envi-ronmental, social, and economic factors. This assists in decision making to evaluate the sustainability metrics of a remediation project. Although a universally acceptable standardized frame has not yet been developed, several agencies and organizations in the United States and other countries have been active in developing frameworks for measuring and facilitating sustainability in remediation of contaminated sites. The frameworks devel-oped by U.S. Environmental Protection Agency (U.S. EPA), Sustainable Remediation Forum (SURF), Interstate Technology & Regulatory Coun-cil (ITRC), and American Society of Testing and Materials (ASTM) are explained in this chapter.
60 • SuStAiNABLE REMEDiAtiON Of CONtAMiNAtED SitES
4.2 u.S. EPA fRAMEWORK
In 2008, the U.S. EPA developed a framework for incorporating sustain-able environmental practices into the remediation of contaminated sites. The framework emphasizes green remediation concepts and techniques that take into consideration a range of environmental effects. In empha-sizing green remediation, the goal of the framework is to evaluate and select remediation alternative and options that achieve maximum net envi-ronmental benefit during all phases of site characterization, remediation system implementation and operation, and postremediation monitoring.
This framework emphasizes only environmental aspects with respect to sustainability without explicit consideration of social and economic aspects. Therefore, this framework is generally considered a means to achieve green remediation as opposed to sustainable remediation. Green remediation differs from sustainable remediation in that environmen-tal effects and means to maximize net environmental benefit of cleanup actions are solely emphasized. Common concepts of emphasis that are included with the typical remediation goals of protecting public health include consideration of project-generated or secondary impacts such as air pollution, greenhouse gas (GHG) emissions, water consumption, and ecological damage. Other concepts included in the framework are goals to reduce energy consumption and waste generation, and ultimately these contribute to climate change.
The green remediation framework has incorporated five core ele-ments in order to achieve green remediation as shown in Figure 4.1. These core elements are as follows:
1. Minimization of total energy use with the maximization of renew-able energy use: Remediation alternatives are assessed with respect to their ability to maximize the use of renewable energy while simultaneously minimizing overall energy consumption. To achieve this, project alternatives that use energy-efficient equip-ment, incorporate onsite renewable resources (e.g., wind, solar), and purchase commercial energy derived from renewable resources are encouraged. Additionally, emphasis is placed on the use of passive-energy technologies and the means to use waste-to-energy techniques.
2. Minimization of air pollutants and GHG emissions: Remediation alternatives that reduce total air emissions, including emissions of air pollutants and GHG in all phases of operation, are favored. Acti-vities that emphasize this include equipment operation techniques
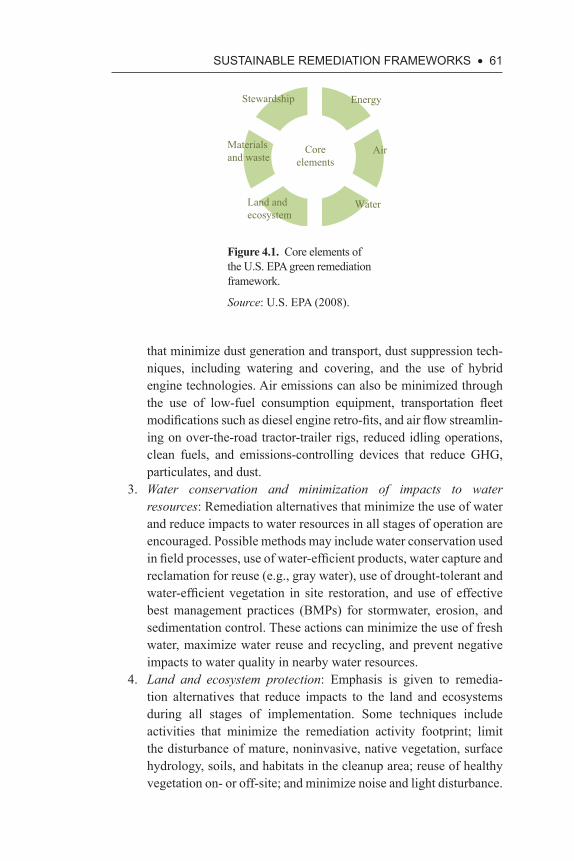
SuStAiNABLE REMEDiAtiON fRAMEWORKS • 61
that minimize dust generation and transport, dust suppression tech-niques, including watering and covering, and the use of hybrid engine technologies. Air emissions can also be minimized through the use of low-fuel consumption equipment, transportation fleet modifications such as diesel engine retro-fits, and air flow streamlin-ing on over-the-road tractor-trailer rigs, reduced idling operations, clean fuels, and emissions-controlling devices that reduce GHG, particulates, and dust.
3. Water conservation and minimization of impacts to water resources: Remediation alternatives that minimize the use of water and reduce impacts to water resources in all stages of operation are encouraged. Possible methods may include water conservation used in field processes, use of water-efficient products, water capture and reclamation for reuse (e.g., gray water), use of drought-tolerant and water- efficient vegetation in site restoration, and use of effective best management practices (BMPs) for stormwater, erosion, and sedimentation control. These actions can minimize the use of fresh water, maximize water reuse and recycling, and prevent negative impacts to water quality in nearby water resources.
4. Land and ecosystem protection: Emphasis is given to remedia-tion alternatives that reduce impacts to the land and ecosystems during all stages of implementation. Some techniques include activities that minimize the remediation activity footprint; limit the disturbance of mature, noninvasive, native vegetation, surface hydrology, soils, and habitats in the cleanup area; reuse of healthy vegetation on- or off-site; and minimize noise and light disturbance.
Stewardship Energy
Air
WaterLand andecosystem
Materialsand waste
Coreelements
Figure 4.1. Core elements of the U.S. EPA green remediation framework.
Source: U.S. EPA (2008).
62 • SuStAiNABLE REMEDiAtiON Of CONtAMiNAtED SitES
Impacts can be minimized by incorporating noninvasive, passive, and less-energy intense in situ technologies (e.g., monitored natural attenuation, bioremediation, phytoremediation, evapotranspiration covers, and permeable reactive barriers) and the use of deed restric-tions or activity use limitations that promote contaminant avoid-ance instead of lengthy remediation.
5. Reduce, reuse, and recycle materials and waste reduction and reusing and recycling of materials: Emphasis is placed on remedi-ation alternatives that minimize the use of virgin materials and the generation of waste during all stages of implementation as well as maximization of the use of recycled materials. Possible methods may include the use of recycled and locally generated or sourced materials, reusing waste materials (e.g., concrete made with coal combustion products such as fly ash or bottom ash), diversion of construction and demolition debris from disposal using recycling or recovery programs, and the use of rapidly renewable materials.
In addition to the five core elements, the framework also emphasizes actions that promote long-term environmental stewardship. Such goals in advancing large-scale environmental stewardship aim to reduce GHG contributing to climate change, encourage the use of renewable energy systems, incorporate adaptive management approaches for long-term site control, and solicit community involvement from a wide range of proj-ect stakeholders (Figure 4.1). Although the stewardship component of the U.S. EPA’s initial six core elements was removed during refinement, it remains an encouraged concept through the use of identified actions within EPA programs such as the Office of Solid Waste and Emergency Response (OSWER) Community Engagement Initiative.
The five core elements presented earlier can be quantitatively assessed through the use of environmental footprint analysis. The U.S. EPA has developed a methodology for evaluation; the details of this methodology are presented in Chapter 5.
4.3 SuRf fRAMEWORK
In 2009, the SURF published a White Paper that presented the status of sustainable remediation practices and highlighted the need for developing a well-defined framework for incorporating sustainability into remediation projects (Ellis and Hadley 2009). Subsequently in 2011, SURF published a framework that provided a systematic, process-based, holistic approach that practicing professionals can follow for integrating sustainability in all
SuStAiNABLE REMEDiAtiON fRAMEWORKS • 63
phases of a remediation project, from the project inception to the end use or future use of the site (Holland et al. 2011). The framework does not compromise the need to protect human health through remediation cleanup goals; rather, the framework emphasizes that remediation cleanup and sus-tainability-based objectives are to be simultaneously pursued and achieved.
The framework consists of a tiered decision-making process that con-siders each phase of a remediation project: site characterization, remedi-ation alternative analysis and selection, remediation system design and construction, operations and maintenance, postmonitoring, and closure. It allows the use of qualitative and quantitative assessments, ongoing revision of the conceptual site model (CSM) based on assessment results, identification and implementation of sustainability impact measures, and decision making throughout the remediation project to address sustain-ability. The framework also encourages communication among the project stakeholders who may be affected by the remediation project.
The framework consists of three tiers, similar to that of the ASTM RBCA approach (as explained in Chapter 1):
• Tier 1 consists of standardized, nonproject specific, qualitative evaluations that utilize checklists, lookup tables, guidelines, results from past project experience, rating systems, and matrices to iden-tify BMPs that maximize positive sustainability impacts. Limited stakeholder involvement, if any, is expected in this tier. This tier may especially be emphasized on smaller-scale sites that have time, budget, and resource constraints and in situations where higher-tiered evaluation is not likely to provide appreciable benefit.
• Tier 2 consists of a semiquantitative approach using project-specific and nonproject-specific information as well as greater stakeholder involvement. The project-specific information can be evaluated using various assessment tools such as emission calculations, expo-sure calculations, scoring and weighing systems, spreadsheet-based tools, and simple cost-benefit analyses. This tier evaluation is best suited for sites that are moderately complex and requires greater involvement of stakeholders.
• Tier 3 is the most comprehensive, detailed, quantitative evalua-tion for sustainability based on detailed project-specific informa-tion. This tier requires a large quantity of project-specific data and utilizes sophisticated tools such as life-cycle assessment (LCA). A greater stakeholder involvement is required in this approach. This tier evaluation is most appropriate for large-scale, long-term remediation projects with a wide range of stakeholders.
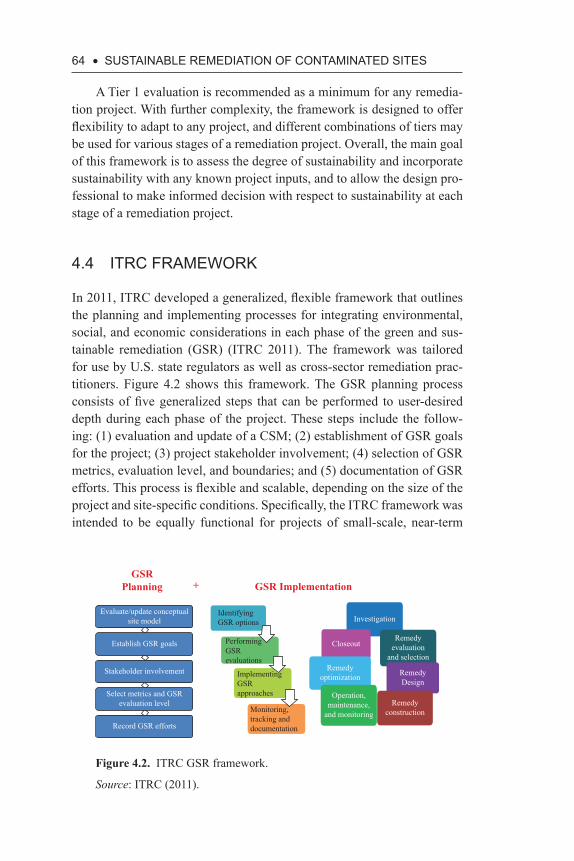
64 • SuStAiNABLE REMEDiAtiON Of CONtAMiNAtED SitES
A Tier 1 evaluation is recommended as a minimum for any remedia-tion project. With further complexity, the framework is designed to offer flexibility to adapt to any project, and different combinations of tiers may be used for various stages of a remediation project. Overall, the main goal of this framework is to assess the degree of sustainability and incorporate sustainability with any known project inputs, and to allow the design pro-fessional to make informed decision with respect to sustainability at each stage of a remediation project.
4.4 itRC fRAMEWORK
In 2011, ITRC developed a generalized, flexible framework that outlines the planning and implementing processes for integrating environmental, social, and economic considerations in each phase of the green and sus-tainable remediation (GSR) (ITRC 2011). The framework was tailored for use by U.S. state regulators as well as cross-sector remediation prac-titioners. Figure 4.2 shows this framework. The GSR planning process consists of five generalized steps that can be performed to user-desired depth during each phase of the project. These steps include the follow-ing: (1) evaluation and update of a CSM; (2) establishment of GSR goals for the project; (3) project stakeholder involvement; (4) selection of GSR metrics, evaluation level, and boundaries; and (5) documentation of GSR efforts. This process is flexible and scalable, depending on the size of the project and site-specific conditions. Specifically, the ITRC framework was intended to be equally functional for projects of small-scale, near-term
GSRPlanning + GSR Implementation
Evaluate/update conceptualsite model
IdentifyingGSR options Investigation
Remedyevaluation
and selectionRemedy
optimization RemedyDesign
Operation,maintenance,
and monitoringRemedy
construction
CloseoutPerformingGSRevaluations
ImplementingGSRapproaches
Monitoring,tracking anddocumentation
Establish GSR goals
Stakeholder involvement
Select metrics and GSRevaluation level
Record GSR efforts
Figure 4.2. ITRC GSR framework.
Source: ITRC (2011).
SuStAiNABLE REMEDiAtiON fRAMEWORKS • 65
timeframes and low-budget constraints as well as projects of large-scale, long-term timeframes and high-budget complexity.
As discussed in this book, the CSM incorporates a wide range of sur-face and subsurface information and facilitates decision making that is required for executing the remediation project. The CSM assesses how contamination has been dispersed within the environment and how soil and groundwater conditions may impact its fate and transport. The CSM also incorporates the built environment and allows for consideration of potential human and ecological receptors as well as the likely exposure scenarios for these receptors. Because the CSM forms the basis for defin-ing and implementing an effective overall strategy for the site, it should evolve throughout the life cycle of the cleanup project. Some examples of relevant GSR information that may be incorporated include on-site or nearby areas of ecological significance, on-site beneficial reuse of ground-water, air emissions and pollutant sources, on-site renewable energy, community assets on or adjacent to the site (e.g., green space), and non-impacted soil reuse.
Establishing goals is a key element of GSR planning, and GSR goals should be developed early during the planning process. GSR goals can be influenced by a number of factors, including corporate and regulatory sus-tainability objectives, stakeholder requirements, responses to a regulatory policy, or stakeholder response to a desire to lower the potential impacts from a project and make it more sustainable. The GSR goals may include the five core elements of U.S. EPA green remediation. Additionally, a wide range of project-specific criteria may be incorporated, including technol-ogies that minimize energy consumption, alternatives that emphasize returns with respect to social and economic considerations, incorporation of renewable energy sources or recycled or repurposed materials, char-acterization and postremediation monitoring activities that minimize the generation of investigation-derived waste, and optimization of construc-tion and remediation system operation that enhances aesthetic consider-ations such as noise and dust.
Stakeholder involvement begins with identifying all applicable stake-holders. Stakeholders can be identified by mapping a project’s area of influence or impact to determine what groups, areas, or activities could be affected by the planned work. Stakeholders may include federal, state, or local regulators, local governments, future site owners or site users, the site owner or operator, responsible parties, local residents affected by a site, the general community, local businesses that may benefit directly or indirectly from the remediation project, and site contractors. While GSR measurables and goals can serve to optimize potential collateral impacts,
66 • SuStAiNABLE REMEDiAtiON Of CONtAMiNAtED SitES
such as GHG emissions, water consumption, waste generation, traffic, and noise, it is essential that all project stakeholders acknowledge that the overarching objective of the cleanup action is to protect human health and the environment. At no point in the GSR framework application should the practitioner preclude the onus of cleanup with any aspect of the GSR evaluation and implementation. In short, the GSR evaluation and imple-mentation are not reasons for doing nothing.
For each of the GSR goals identified, appropriate metrics are consid-ered and selected to assess, track, or evaluate those goals. Metrics may be objective or subjective. Objective GSR metrics may include GHG emissions, energy consumption, recycling and waste minimization, and resource consumption. Subjective metrics may include beneficial reuse of property, job creation and preservation, and creation of community assets (e.g., parkland or open space created, habitat created, or preserved). A three-level approach is recommended for evaluating and selecting GSR metrics:
• Level 1 consists of common-sense-based BMPs. These are selected to promote resource conservation and process efficiency. The net impact on the environment, community, or economics is not eval-uated with this approach. Although quantitative results may be tracked to demonstrate a monetary return on investment for the employment of certain BMPs (e.g., simple documentation of dollar and fuel savings for efficient trip routing and anti-idling policies).
• Level 2 consists of the selection and implementation of BMPs at a minimum, plus some degree of qualitative and semiquanti-tative evaluation. Qualitative evaluations may reflect trade-offs associated with different remedial strategies or use value judgments for different GSR goals to determine the best way to proceed. Semiquantitative evaluations are those that can be completed by use of simple mathematical calculations or intui-tive tools (e.g., conversion factors, online calculators, and spread-sheet-based programs).
• Level 3 consists of selection and implementation of BMPs plus a comprehensive quantitative evaluation. The evaluation may employ LCA or detailed footprint analysis techniques and tools. Requiring more time and expertise, this level is intended for use by remediation professionals prepared to conduct and document a detailed evaluation. This level of evaluation is likely to be reserved for the mature project site with high stakeholder engagement stan-dards (e.g., a stakeholder charrette).
SuStAiNABLE REMEDiAtiON fRAMEWORKS • 67
GSR boundaries should be identified for each GSR evaluation. The GSR boundaries may be defined as the degree to which the GSR evalua-tion is conducted. A variety of factors influence the boundaries of a GSR evaluation, such as the physical site boundaries to be assessed within the project budgetary constraints and whether life-cycle considerations are to be addressed. The assessment of boundaries considers all the phases of the project, data availability, stakeholder considerations, timing, and bud-get. The most rigorous (Level 3) approach is to consider a comprehensive cradle-to-grave analysis for all materials used; such an analysis considers all inputs and outputs associated with the materials beginning with the mining or extraction of raw materials to the ultimate disposal or reuse of residuals. In some instances, a less rigorous approach may be appropri-ately considered; for instance, an analysis may incorporate the direct man-ufacture of the products consumed during a remediation project but would not consider the impacts of transporting raw materials or energy inputs to the manufacturer. An even less rigorous approach might consider only the impacts of direct inputs and outputs that occur on the site.
The documentation of GSR efforts is a critical part of determining whether or not GSR goals are being achieved at a site. Effective documen-tation also provides an appropriate and useful means of communicating ongoing benefits and accomplishments to stakeholders. When document-ing GSR evaluations, information would ideally include all assumptions, tools, resources, boundary conditions, and other key principles that have been incorporated into the analysis. A greater richness of detail of these aspects is desirable so that the overall approach can be understood and the results can be reproduced and verified. Any constraints or barriers encoun-tered should also be clearly documented.
4.5 AStM fRAMEWORK
ASTM has developed a standard guide for sustainable remediation specif-ically focused on greener cleanups, in their ASTM E2893 standard. The standard describes a process for identifying, evaluating, and incorporating BMPs and, as appropriate, integrating a quantitative evaluation that facil-itates an overall net reduction in environmental impact associated with remediation projects. This guide addresses the five core elements outlined in the U.S. EPA green remediation framework as described in Section 4.2. The standard provides detailed guidance on planning and scoping a reme-diation project, implementing appropriate BMPs, employing a quanti-tative evaluation when appropriate, and documenting and reporting of sustainability-related performance.
68 • SuStAiNABLE REMEDiAtiON Of CONtAMiNAtED SitES
The BMP evaluation process describes steps for identifying, priori-tizing, selecting, and implementing BMPs, whereas the quantitative eval-uation describes a more detailed assessment process, which may include an environmental footprint analysis or LCA. The BMP evaluation process relies on professional judgment to prioritize and select activities that will likely reduce the environmental footprint. The quantitative evaluation relies on appropriately selected system boundaries and estimated data inputs to quantify anticipated environmental footprint reductions prior to imple-menting BMPs. The BMP evaluation process, quantitative evaluation, or a combination of the two may be implemented over the entire remediation project cycle or at one or more project phases as shown in Figure 4.3.
The E2893 standard provides a comprehensive list of greener cleanup BMPs as shown in Table 4.1. Applicable BMPs to a specific proj-ect should be organized and prioritized to optimize appropriate selection and implementation for a project with due consideration of cost and ben-efits associated with the remediation project. These BMPs are organized into the following categories: (1) project planning and team management, (2) sampling and analysis, (3) materials, (4) vehicles and equipment, (5) site preparation and land restoration, (6) buildings, (7) power and fuel, (8) surface water and stormwater, (9) residual solid and liquid waste, and (10) wastewater. Additional BMPs, if deemed necessary, can also be identified and implemented, depending on the site conditions, to further reduce the environmental footprint of the remediation project.
A quantitative evaluation may also be performed to assist in the selec-tion of appropriate BMPs. This evaluation calculates the environmental footprint at each phase of the remediation project with consideration of the five U.S. EPA core elements. Similar to LCA-type evaluations, this evaluation should consist of seven steps:
1. Goal and scope definition: Identification of the scope of the evalu-ation and the desired parameters to be addressed.
2. Boundary definition: Establishment of the physical and time- related boundaries to be incorporated into the study, including the specific activity or activities to be assessed.
3. Core elements and contributors to the core elements: Identification of the core elements that will be evaluated in the study, as well as the key contributors to the core elements.
4. Collection and organization of information: Development of a methodical system in which pertinent data and information will be collected and organized such that it may be appropriately evaluated.
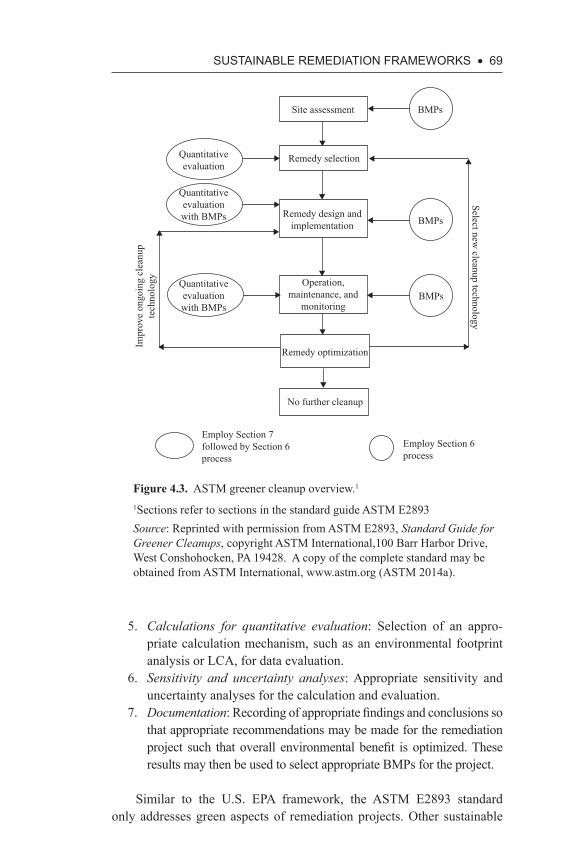
SuStAiNABLE REMEDiAtiON fRAMEWORKS • 69
5. Calculations for quantitative evaluation: Selection of an appro-priate calculation mechanism, such as an environmental footprint analysis or LCA, for data evaluation.
6. Sensitivity and uncertainty analyses: Appropriate sensitivity and uncertainty analyses for the calculation and evaluation.
7. Documentation: Recording of appropriate findings and conclusions so that appropriate recommendations may be made for the remediation project such that overall environmental benefit is optimized. These results may then be used to select appropriate BMPs for the project.
Similar to the U.S. EPA framework, the ASTM E2893 standard only addresses green aspects of remediation projects. Other sustainable
Site assessment
Quantitativeevaluation
Quantitativeevaluationwith BMPs
Quantitativeevaluationwith BMPs
BMPs
BMPs
BMPs
Select new cleanup technology
Remedy selection
Remedy design andimplementation
Operation,maintenance, and
monitoring
Remedy optimization
No further cleanup
Impr
ove
ongo
ing
clea
nup
tech
nolo
gy
Employ Section 6process
Employ Section 7followed by Section 6process
Figure 4.3. ASTM greener cleanup overview.1
1Sections refer to sections in the standard guide ASTM E2893 Source: Reprinted with permission from ASTM E2893, Standard Guide for Greener Cleanups, copyright ASTM International,100 Barr Harbor Drive, West Conshohocken, PA 19428. A copy of the complete standard may be obtained from ASTM International, www.astm.org (ASTM 2014a).
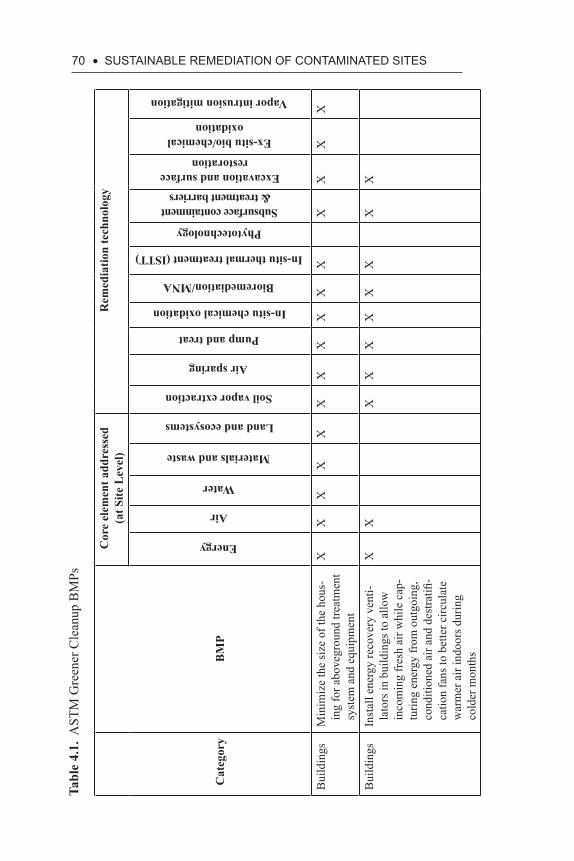
70 • SuStAiNABLE REMEDiAtiON Of CONtAMiNAtED SitESTa
ble
4.1.
AST
M G
reen
er C
lean
up B
MPs
Cor
e el
emen
t add
ress
ed
(at S
ite L
evel
)R
emed
iatio
n te
chno
logy
Cat
egor
yB
MP
Energy
Air
Water
Materials and waste
Land and ecosystems
Soil vapor extraction
Air sparing
Pump and treat
In-situ chemical oxidation
Bioremediation/MNA
In-situ thermal treatment (ISTT)
Phytotechnology
Subsurface containment & treatment barriers
Excavation and surface restoration
Ex-situ bio/chemical oxidation
Vapor intrusion mitigation
Bui
ldin
gsM
inim
ize
the
size
of t
he h
ous-
ing
for a
bove
grou
nd tr
eatm
ent
syst
em a
nd e
quip
men
t
XX
XX
XX
XX
XX
XX
XX
X
Bui
ldin
gsIn
stal
l ene
rgy
reco
very
ven
ti-la
tors
in b
uild
ings
to a
llow
in
com
ing
fres
h ai
r whi
le c
ap-
turin
g en
ergy
from
out
goin
g,
cond
ition
ed a
ir an
d de
stra
tifi-
catio
n fa
ns to
bet
ter c
ircul
ate
war
mer
air
indo
ors d
urin
g co
lder
mon
ths
XX
XX
XX
XX
XX
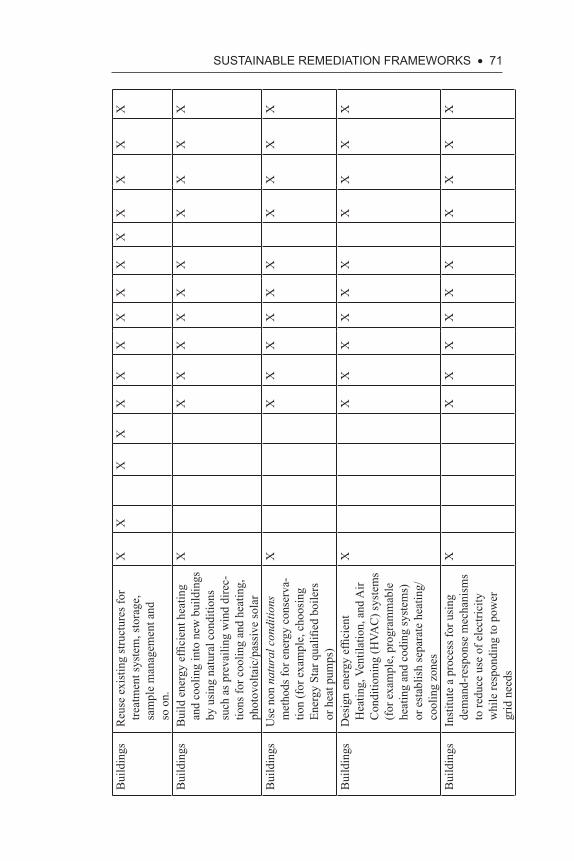
SuStAiNABLE REMEDiAtiON fRAMEWORKS • 71
Bui
ldin
gsR
euse
exi
stin
g st
ruct
ures
for
treat
men
t sys
tem
, sto
rage
, sa
mpl
e m
anag
emen
t and
so
on.
XX
XX
XX
XX
XX
XX
XX
X
Bui
ldin
gsB
uild
ene
rgy
effic
ient
hea
ting
and
cool
ing
into
new
bui
ldin
gs
by u
sing
nat
ural
con
ditio
ns
such
as p
reva
iling
win
d di
rec-
tions
for c
oolin
g an
d he
atin
g,
phot
ovol
taic
/pas
sive
sola
r
XX
XX
XX
XX
XX
X
Bui
ldin
gsU
se n
on n
atur
al c
ondi
tions
m
etho
ds fo
r ene
rgy
cons
erva
-tio
n (f
or e
xam
ple,
cho
osin
g En
ergy
Sta
r qua
lified
boi
lers
or
hea
t pum
ps)
XX
XX
XX
XX
XX
X
Bui
ldin
gsD
esig
n en
ergy
effi
cien
t H
eatin
g, V
entil
atio
n, a
nd A
ir C
ondi
tioni
ng (H
VAC
) sys
tem
s (f
or e
xam
ple,
pro
gram
mab
le
heat
ing
and
codi
ng sy
stem
s)
or e
stab
lish
sepa
rate
hea
ting/
cool
ing
zone
s
XX
XX
XX
XX
XX
X
Bui
ldin
gsIn
stitu
te a
pro
cess
for u
sing
de
man
d-re
spon
se m
echa
nism
s to
redu
ce u
se o
f ele
ctric
ity
whi
le re
spon
ding
to p
ower
gr
id n
eeds
XX
XX
XX
XX
XX
X
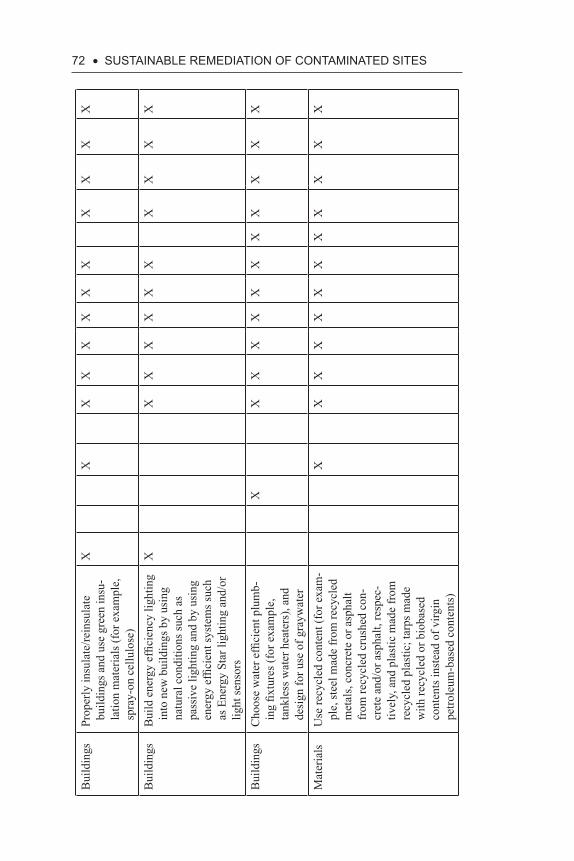
72 • SuStAiNABLE REMEDiAtiON Of CONtAMiNAtED SitES
Bui
ldin
gsPr
oper
ly in
sula
te/re
insu
late
bu
ildin
gs a
nd u
se g
reen
insu
-la
tion
mat
eria
ls (f
or e
xam
ple,
sp
ray-
on c
ellu
lose
)
XX
XX
XX
XX
XX
XX
Bui
ldin
gsB
uild
ene
rgy
effic
ienc
y lig
htin
g in
to n
ew b
uild
ings
by
usin
g na
tura
l con
ditio
ns su
ch a
s pa
ssiv
e lig
htin
g an
d by
usi
ng
ener
gy e
ffici
ent s
yste
ms s
uch
as E
nerg
y St
ar li
ghtin
g an
d/or
lig
ht se
nsor
s
XX
XX
XX
XX
XX
X
Bui
ldin
gsC
hoos
e w
ater
effi
cien
t plu
mb-
ing
fixtu
res (
for e
xam
ple,
ta
nkle
ss w
ater
hea
ters
), an
d de
sign
for u
se o
f gra
ywat
er
XX
XX
XX
XX
XX
XX
Mat
eria
lsU
se re
cycl
ed c
onte
nt (f
or e
xam
-pl
e, st
eel m
ade
from
recy
cled
m
etal
s, co
ncre
te o
r asp
halt
from
recy
cled
cru
shed
con
-cr
ete
and/
or a
spha
lt, re
spec
-tiv
ely,
and
pla
stic
mad
e fr
om
recy
cled
pla
stic
; tar
ps m
ade
with
recy
cled
or b
ioba
sed
cont
ents
inst
ead
of v
irgin
pe
trole
um-b
ased
con
tent
s)
XX
XX
XX
XX
XX
XX
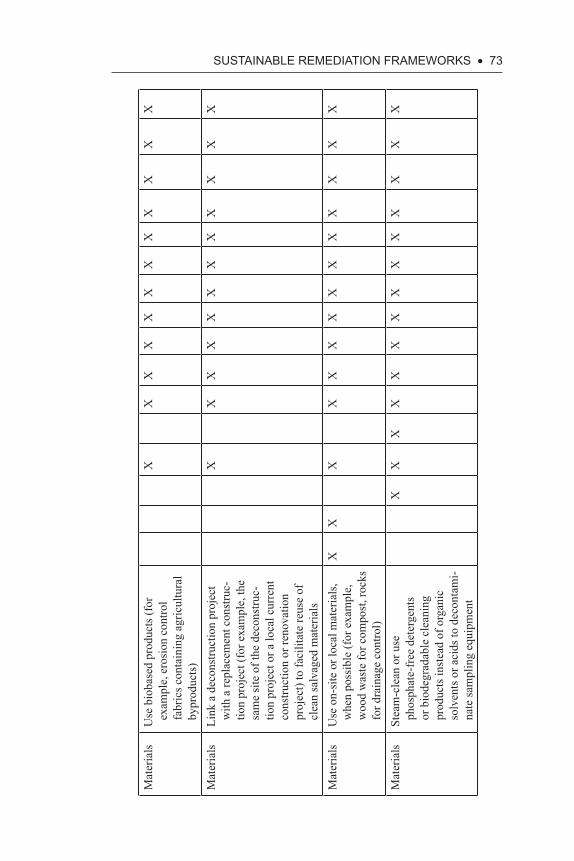
SuStAiNABLE REMEDiAtiON fRAMEWORKS • 73
Mat
eria
lsU
se b
ioba
sed
prod
ucts
(for
ex
ampl
e, e
rosi
on c
ontro
l fa
bric
s con
tain
ing
agric
ultu
ral
bypr
oduc
ts)
XX
XX
XX
XX
XX
XX
Mat
eria
lsLi
nk a
dec
onst
ruct
ion
proj
ect
with
a re
plac
emen
t con
stru
c-tio
n pr
ojec
t (fo
r exa
mpl
e, th
e sa
me
site
of t
he d
econ
stru
c-tio
n pr
ojec
t or a
loca
l cur
rent
co
nstru
ctio
n or
reno
vatio
n pr
ojec
t) to
faci
litat
e re
use
of
clea
n sa
lvag
ed m
ater
ials
XX
XX
XX
XX
XX
XX
Mat
eria
lsU
se o
n-si
te o
r loc
al m
ater
ials
, w
hen
poss
ible
(for
exa
mpl
e,
woo
d w
aste
for c
ompo
st, r
ocks
fo
r dra
inag
e co
ntro
l)
XX
XX
XX
XX
XX
XX
XX
Mat
eria
lsSt
eam
-cle
an o
r use
ph
osph
ate-
free
det
erge
nts
or b
iode
grad
able
cle
anin
g pr
oduc
ts in
stea
d of
org
anic
so
lven
ts o
r aci
ds to
dec
onta
mi-
nate
sam
plin
g eq
uipm
ent
XX
XX
XX
XX
XX
XX
XX
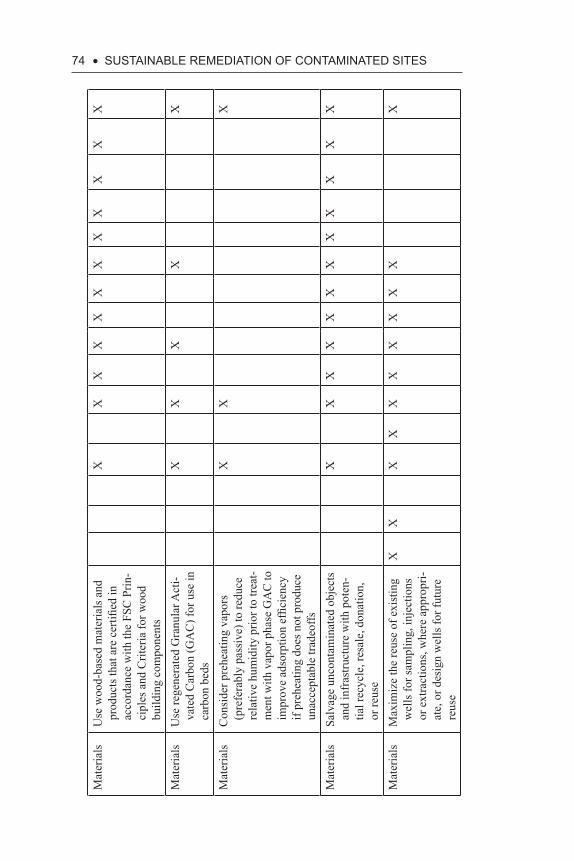
74 • SuStAiNABLE REMEDiAtiON Of CONtAMiNAtED SitES
Mat
eria
lsU
se w
ood-
base
d m
ater
ials
and
pr
oduc
ts th
at a
re c
ertifi
ed in
ac
cord
ance
with
the
FSC
Prin
-ci
ples
and
Crit
eria
for w
ood
build
ing
com
pone
nts
XX
XX
XX
XX
XX
XX
Mat
eria
lsU
se re
gene
rate
d G
ranu
lar A
cti-
vate
d C
arbo
n (G
AC
) for
use
in
carb
on b
eds
XX
XX
X
Mat
eria
lsC
onsi
der p
rehe
atin
g va
pors
(p
refe
rabl
y pa
ssiv
e) to
redu
ce
rela
tive
hum
idity
prio
r to
treat
-m
ent w
ith v
apor
pha
se G
AC
to
impr
ove
adso
rptio
n ef
ficie
ncy
if pr
ehea
ting
does
not
pro
duce
un
acce
ptab
le tr
adeo
ffs
XX
X
Mat
eria
lsSa
lvag
e un
cont
amin
ated
obj
ects
an
d in
fras
truct
ure
with
pot
en-
tial r
ecyc
le, r
esal
e, d
onat
ion,
or
reus
e
XX
XX
XX
XX
XX
XX
Mat
eria
lsM
axim
ize
the
reus
e of
exi
stin
g w
ells
for s
ampl
ing,
inje
ctio
ns
or e
xtra
ctio
ns, w
here
app
ropr
i-at
e, o
r des
ign
wel
ls fo
r fut
ure
reus
e
XX
XX
XX
XX
XX
X
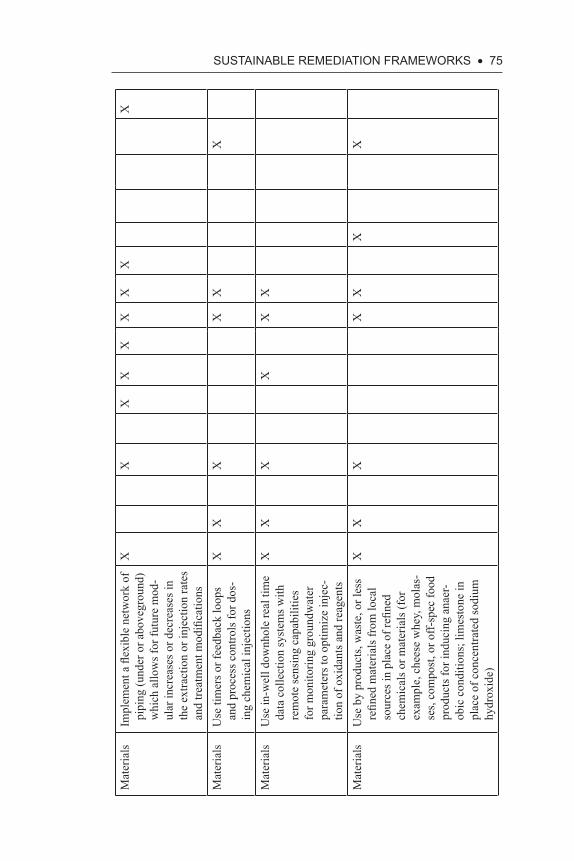
SuStAiNABLE REMEDiAtiON fRAMEWORKS • 75
Mat
eria
lsIm
plem
ent a
flex
ible
net
wor
k of
pi
ping
(und
er o
r abo
vegr
ound
) w
hich
allo
ws f
or fu
ture
mod
-ul
ar in
crea
ses o
r dec
reas
es in
th
e ex
tract
ion
or in
ject
ion
rate
s an
d tre
atm
ent m
odifi
catio
ns
XX
XX
XX
XX
X
Mat
eria
lsU
se ti
mer
s or f
eedb
ack
loop
s an
d pr
oces
s con
trols
for d
os-
ing
chem
ical
inje
ctio
ns
XX
XX
XX
Mat
eria
lsU
se in
-wel
l dow
nhol
e re
al ti
me
data
col
lect
ion
syst
ems w
ith
rem
ote
sens
ing
capa
bilit
ies
for m
onito
ring
grou
ndw
ater
pa
ram
eter
s to
optim
ize
inje
c-tio
n of
oxi
dant
s and
reag
ents
XX
XX
XX
Mat
eria
lsU
se b
y pr
oduc
ts, w
aste
, or l
ess
refin
ed m
ater
ials
from
loca
l so
urce
s in
plac
e of
refin
ed
chem
ical
s or m
ater
ials
(for
ex
ampl
e, c
hees
e w
hey,
mol
as-
ses,
com
post
, or o
ff-sp
ec fo
od
prod
ucts
for i
nduc
ing
anae
r-ob
ic c
ondi
tions
; lim
esto
ne in
pl
ace
of c
once
ntra
ted
sodi
um
hydr
oxid
e)
XX
XX
XX
X
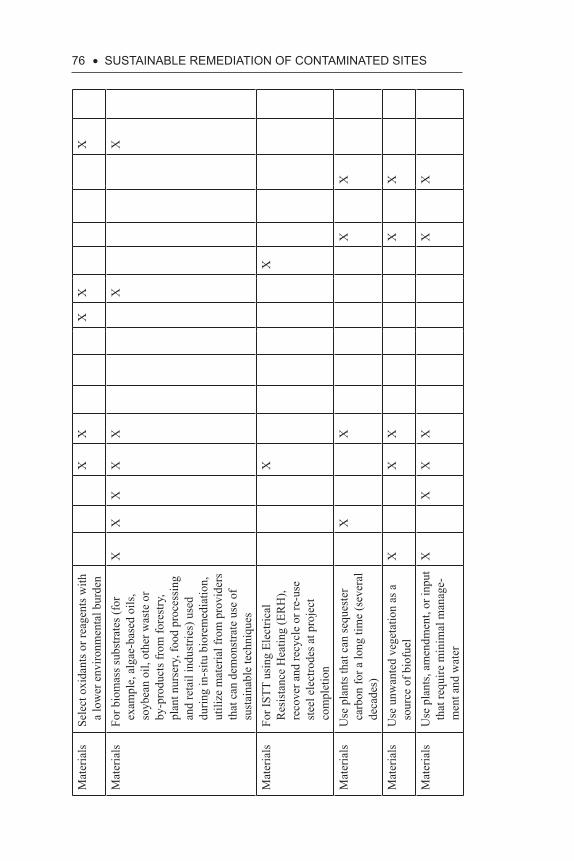
76 • SuStAiNABLE REMEDiAtiON Of CONtAMiNAtED SitES
Mat
eria
lsSe
lect
oxi
dant
s or r
eage
nts w
ith
a lo
wer
env
ironm
enta
l bur
den
XX
XX
X
Mat
eria
lsFo
r bio
mas
s sub
stra
tes (
for
exam
ple,
alg
ae-b
ased
oils
, so
ybea
n oi
l, ot
her w
aste
or
by-p
rodu
cts f
rom
fore
stry
, pl
ant n
urse
ry, f
ood
proc
essi
ng
and
reta
il in
dust
ries)
use
d du
ring
in-s
itu b
iore
med
iatio
n,
utili
ze m
ater
ial f
rom
pro
vide
rs
that
can
dem
onst
rate
use
of
sust
aina
ble
tech
niqu
es
XX
XX
XX
X
Mat
eria
lsFo
r IST
T us
ing
Elec
trica
l R
esis
tanc
e H
eatin
g (E
RH
), re
cove
r and
recy
cle
or re
-use
st
eel e
lect
rode
s at p
roje
ct
com
plet
ion
XX
Mat
eria
lsU
se p
lant
s tha
t can
sequ
este
r ca
rbon
for a
long
tim
e (s
ever
al
deca
des)
XX
XX
Mat
eria
lsU
se u
nwan
ted
vege
tatio
n as
a
sour
ce o
f bio
fuel
XX
XX
X
Mat
eria
lsU
se p
lant
s, am
endm
ent,
or in
put
that
requ
ire m
inim
al m
anag
e-m
ent a
nd w
ater
XX
XX
XX
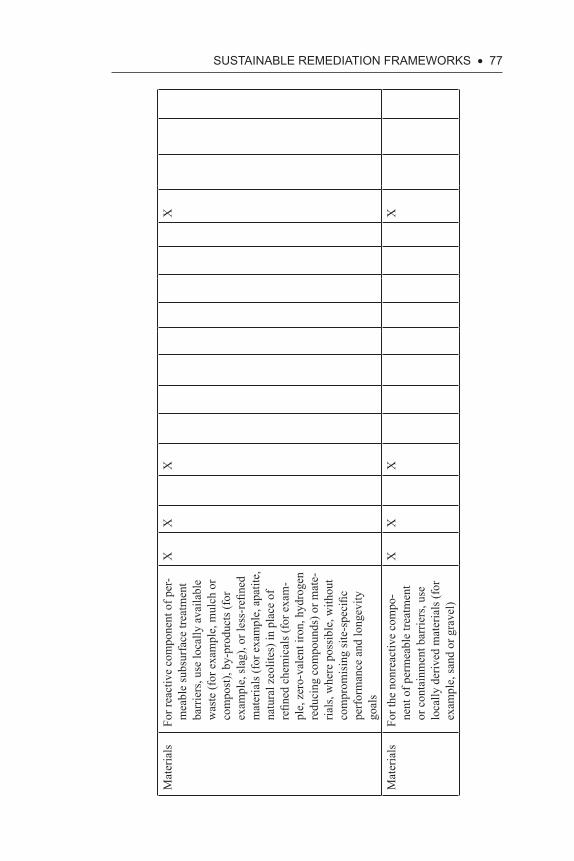
SuStAiNABLE REMEDiAtiON fRAMEWORKS • 77
Mat
eria
lsFo
r rea
ctiv
e co
mpo
nent
of p
er-
mea
ble
subs
urfa
ce tr
eatm
ent
barr
iers
, use
loca
lly a
vaila
ble
was
te (f
or e
xam
ple,
mul
ch o
r co
mpo
st),
by-p
rodu
cts (
for
exam
ple,
slag
), or
less
-refi
ned
mat
eria
ls (f
or e
xam
ple,
apa
tite,
na
tura
l zeo
lites
) in
plac
e of
re
fined
che
mic
als (
for e
xam
-pl
e, z
ero-
vale
nt ir
on, h
ydro
gen
redu
cing
com
poun
ds) o
r mat
e-ria
ls, w
here
pos
sibl
e, w
ithou
t co
mpr
omis
ing
site
-spe
cific
pe
rfor
man
ce a
nd lo
ngev
ity
goal
s
XX
XX
Mat
eria
lsFo
r the
non
reac
tive
com
po-
nent
of p
erm
eabl
e tre
atm
ent
or c
onta
inm
ent b
arrie
rs, u
se
loca
lly d
eriv
ed m
ater
ials
(for
ex
ampl
e, sa
nd o
r gra
vel)
XX
XX
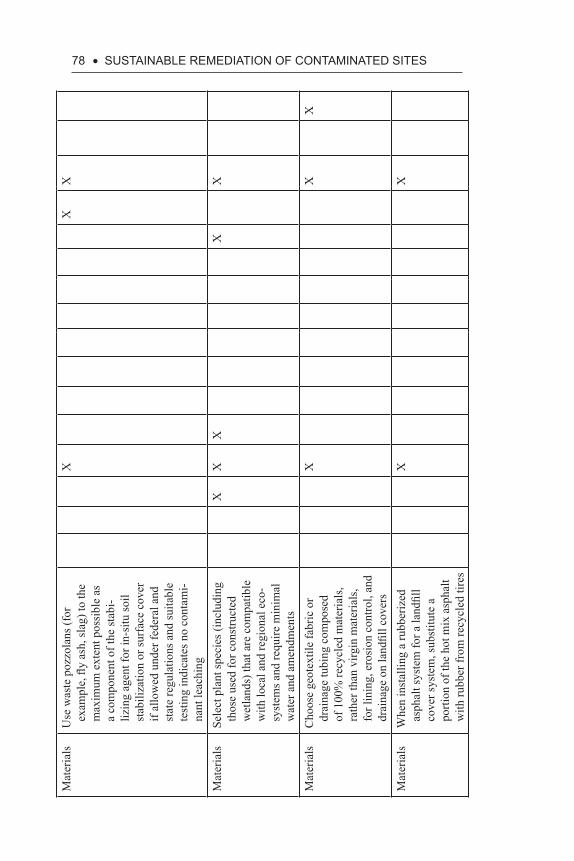
78 • SuStAiNABLE REMEDiAtiON Of CONtAMiNAtED SitESM
ater
ials
Use
was
te p
ozzo
lans
(for
ex
ampl
e, fl
y as
h, sl
ag) t
o th
e m
axim
um e
xten
t pos
sibl
e as
a
com
pone
nt o
f the
stab
i-liz
ing
agen
t for
in-s
itu so
il st
abili
zatio
n or
surf
ace
cove
r if
allo
wed
und
er fe
dera
l and
st
ate
regu
latio
ns a
nd su
itabl
e te
stin
g in
dica
tes n
o co
ntam
i-na
nt le
achi
ng
XX
X
Mat
eria
lsSe
lect
pla
nt sp
ecie
s (in
clud
ing
thos
e us
ed fo
r con
stru
cted
w
etla
nds)
that
are
com
patib
le
with
loca
l and
regi
onal
eco
-sy
stem
s and
requ
ire m
inim
al
wat
er a
nd a
men
dmen
ts
XX
XX
X
Mat
eria
lsC
hoos
e ge
otex
tile
fabr
ic o
r dr
aina
ge tu
bing
com
pose
d of
100
% re
cycl
ed m
ater
ials
, ra
ther
than
virg
in m
ater
ials
, fo
r lin
ing,
ero
sion
con
trol,
and
drai
nage
on
land
fill c
over
s
XX
X
Mat
eria
lsW
hen
inst
allin
g a
rubb
eriz
ed
asph
alt s
yste
m fo
r a la
ndfil
l co
ver s
yste
m, s
ubst
itute
a
porti
on o
f the
hot
mix
asp
halt
with
rubb
er fr
om re
cycl
ed ti
res
XX
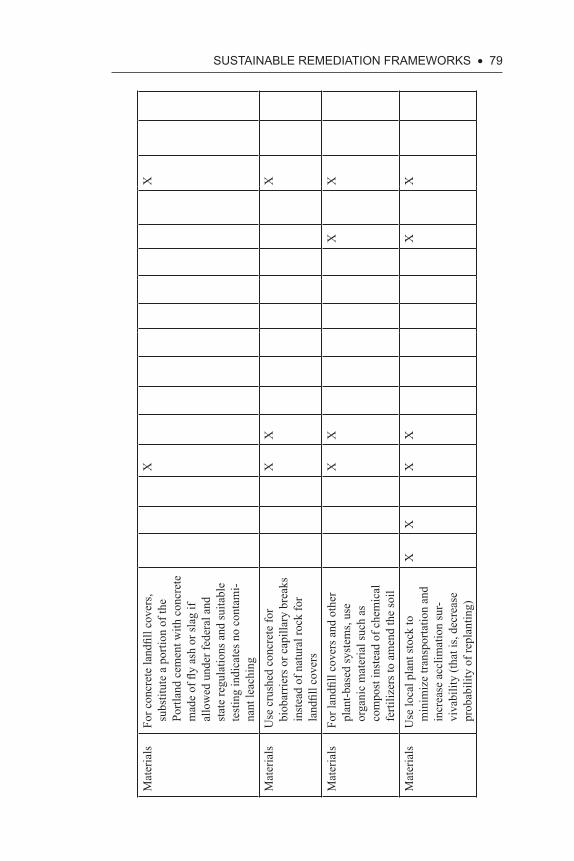
SuStAiNABLE REMEDiAtiON fRAMEWORKS • 79
Mat
eria
lsFo
r con
cret
e la
ndfil
l cov
ers,
subs
titut
e a
porti
on o
f the
Po
rtlan
d ce
men
t with
con
cret
e m
ade
of fl
y as
h or
slag
if
allo
wed
und
er fe
dera
l and
st
ate
regu
latio
ns a
nd su
itabl
e te
stin
g in
dica
tes n
o co
ntam
i-na
nt le
achi
ng
XX
Mat
eria
lsU
se c
rush
ed c
oncr
ete
for
biob
arrie
rs o
r cap
illar
y br
eaks
in
stea
d of
nat
ural
rock
for
land
fill c
over
s
XX
X
Mat
eria
lsFo
r lan
dfill
cove
rs a
nd o
ther
pl
ant-b
ased
syst
ems,
use
orga
nic
mat
eria
l suc
h as
co
mpo
st in
stea
d of
che
mic
al
ferti
lizer
s to
amen
d th
e so
il
XX
XX
Mat
eria
lsU
se lo
cal p
lant
stoc
k to
m
inim
ize
trans
porta
tion
and
incr
ease
acc
limat
ion
sur-
viva
bilit
y (th
at is
, dec
reas
e pr
obab
ility
of r
epla
ntin
g)
XX
XX
XX
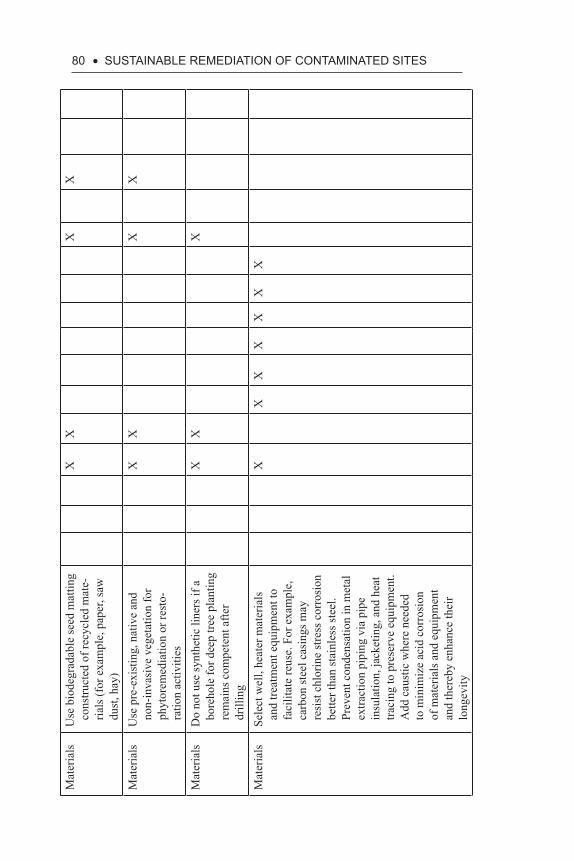
80 • SuStAiNABLE REMEDiAtiON Of CONtAMiNAtED SitESM
ater
ials
Use
bio
degr
adab
le se
ed m
attin
g co
nstru
cted
of r
ecyc
led
mat
e-ria
ls (f
or e
xam
ple,
pap
er, s
aw
dust
, hay
)
XX
XX
Mat
eria
lsU
se p
re-e
xist
ing,
nat
ive
and
non-
inva
sive
veg
etat
ion
for
phyt
orem
edia
tion
or re
sto-
ratio
n ac
tiviti
es
XX
XX
Mat
eria
lsD
o no
t use
synt
hetic
line
rs if
a
bore
hole
for d
eep
tree
plan
ting
rem
ains
com
pete
nt a
fter
drill
ing
XX
X
Mat
eria
lsSe
lect
wel
l, he
ater
mat
eria
ls
and
treat
men
t equ
ipm
ent t
o fa
cilit
ate
reus
e. F
or e
xam
ple,
ca
rbon
stee
l cas
ings
may
re
sist
chl
orin
e st
ress
cor
rosi
on
bette
r tha
n st
ainl
ess s
teel
. Pr
even
t con
dens
atio
n in
met
al
extra
ctio
n pi
ping
via
pip
e in
sula
tion,
jack
etin
g, a
nd h
eat
traci
ng to
pre
serv
e eq
uipm
ent.
Add
cau
stic
whe
re n
eede
d to
min
imiz
e ac
id c
orro
sion
of
mat
eria
ls a
nd e
quip
men
t an
d th
ereb
y en
hanc
e th
eir
long
evity
XX
XX
XX
X
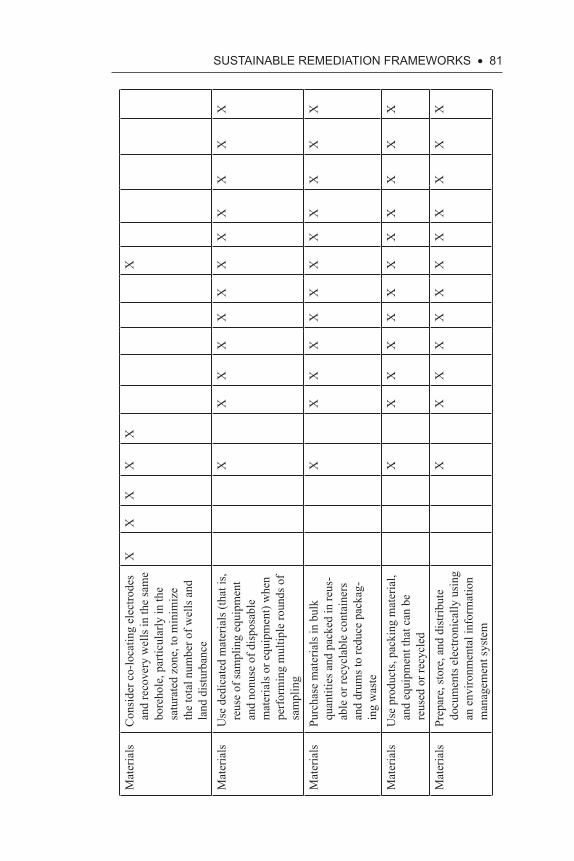
SuStAiNABLE REMEDiAtiON fRAMEWORKS • 81
Mat
eria
lsC
onsi
der c
o-lo
catin
g el
ectro
des
and
reco
very
wel
ls in
the
sam
e bo
reho
le, p
artic
ular
ly in
the
satu
rate
d zo
ne, t
o m
inim
ize
the
tota
l num
ber o
f wel
ls a
nd
land
dis
turb
ance
XX
XX
XX
Mat
eria
lsU
se d
edic
ated
mat
eria
ls (t
hat i
s, re
use
of sa
mpl
ing
equi
pmen
t an
d no
nuse
of d
ispo
sabl
e m
ater
ials
or e
quip
men
t) w
hen
perf
orm
ing
mul
tiple
roun
ds o
f sa
mpl
ing
XX
XX
XX
XX
XX
XX
Mat
eria
lsPu
rcha
se m
ater
ials
in b
ulk
quan
titie
s and
pac
ked
in re
us-
able
or r
ecyc
labl
e co
ntai
ners
an
d dr
ums t
o re
duce
pac
kag-
ing
was
te
XX
XX
XX
XX
XX
XX
Mat
eria
lsU
se p
rodu
cts,
pack
ing
mat
eria
l, an
d eq
uipm
ent t
hat c
an b
e re
used
or r
ecyc
led
XX
XX
XX
XX
XX
XX
Mat
eria
lsPr
epar
e, st
ore,
and
dis
tribu
te
docu
men
ts e
lect
roni
cally
usi
ng
an e
nviro
nmen
tal i
nfor
mat
ion
man
agem
ent s
yste
m
XX
XX
XX
XX
XX
XX
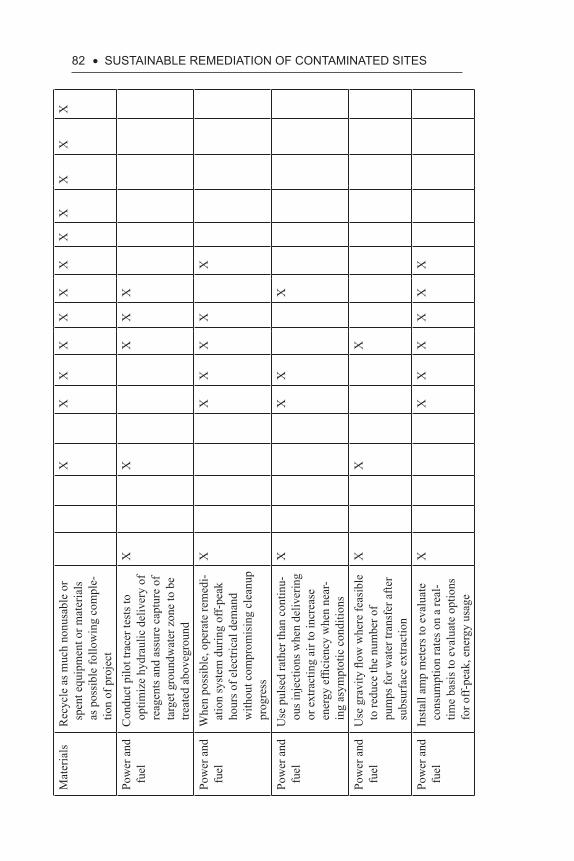
82 • SuStAiNABLE REMEDiAtiON Of CONtAMiNAtED SitESM
ater
ials
Rec
ycle
as m
uch
nonu
sabl
e or
sp
ent e
quip
men
t or m
ater
ials
as
pos
sibl
e fo
llow
ing
com
ple-
tion
of p
roje
ct
XX
XX
XX
XX
XX
XX
Pow
er a
nd
fuel
Con
duct
pilo
t tra
cer t
ests
to
optim
ize
hydr
aulic
del
iver
y of
re
agen
ts a
nd a
ssur
e ca
ptur
e of
ta
rget
gro
undw
ater
zon
e to
be
treat
ed a
bove
grou
nd
XX
XX
X
Pow
er a
nd
fuel
Whe
n po
ssib
le, o
pera
te re
med
i-at
ion
syst
em d
urin
g of
f-pe
ak
hour
s of e
lect
rical
dem
and
with
out c
ompr
omis
ing
clea
nup
prog
ress
XX
XX
XX
Pow
er a
nd
fuel
Use
pul
sed
rath
er th
an c
ontin
u-ou
s inj
ectio
ns w
hen
deliv
erin
g or
ext
ract
ing
air t
o in
crea
se
ener
gy e
ffici
ency
whe
n ne
ar-
ing
asym
ptot
ic c
ondi
tions
XX
XX
Pow
er a
nd
fuel
Use
gra
vity
flow
whe
re fe
asib
le
to re
duce
the
num
ber o
f pu
mps
for w
ater
tran
sfer
afte
r su
bsur
face
ext
ract
ion
XX
X
Pow
er a
nd
fuel
Inst
all a
mp
met
ers t
o ev
alua
te
cons
umpt
ion
rate
s on
a re
al-
time
basi
s to
eval
uate
opt
ions
fo
r off-
peak
, ene
rgy
usag
e
XX
XX
XX
X
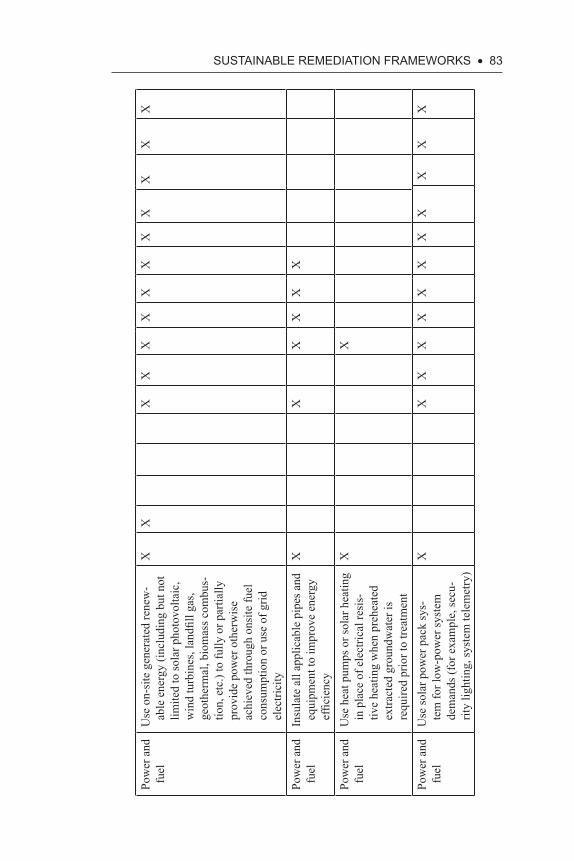
SuStAiNABLE REMEDiAtiON fRAMEWORKS • 83
Pow
er a
nd
fuel
Use
on-
site
gen
erat
ed re
new
-ab
le e
nerg
y (in
clud
ing
but n
ot
limite
d to
sola
r pho
tovo
ltaic
, w
ind
turb
ines
, lan
dfill
gas,
geot
herm
al, b
iom
ass c
ombu
s-tio
n, e
tc.)
to fu
lly o
r par
tially
pr
ovid
e po
wer
oth
erw
ise
achi
eved
thro
ugh
onsi
te fu
el
cons
umpt
ion
or u
se o
f grid
el
ectri
city
XX
XX
XX
XX
XX
XX
X
Pow
er a
nd
fuel
Insu
late
all
appl
icab
le p
ipes
and
eq
uipm
ent t
o im
prov
e en
ergy
ef
ficie
ncy
XX
XX
XX
Pow
er a
nd
fuel
Use
hea
t pum
ps o
r sol
ar h
eatin
g in
pla
ce o
f ele
ctric
al re
sis-
tive
heat
ing
whe
n pr
ehea
ted
extra
cted
gro
undw
ater
is
requ
ired
prio
r to
treat
men
t
XX
Pow
er a
nd
fuel
Use
sola
r pow
er p
ack
sys-
tem
for l
ow-p
ower
syst
em
dem
ands
(for
exa
mpl
e, se
cu-
rity
light
ing,
syst
em te
lem
etry
)
XX
XX
XX
XX
XX
XX
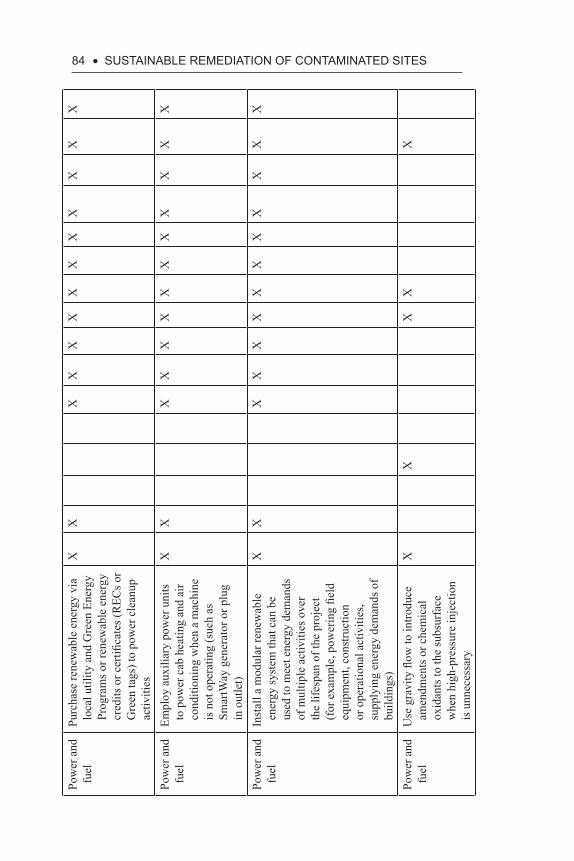
84 • SuStAiNABLE REMEDiAtiON Of CONtAMiNAtED SitESPo
wer
and
fu
elPu
rcha
se re
new
able
ene
rgy
via
loca
l util
ity a
nd G
reen
Ene
rgy
Prog
ram
s or r
enew
able
ene
rgy
cred
its o
r cer
tifica
tes (
REC
s or
Gre
en ta
gs) t
o po
wer
cle
anup
ac
tiviti
es
XX
XX
XX
XX
XX
XX
X
Pow
er a
nd
fuel
Empl
oy a
uxili
ary
pow
er u
nits
to
pow
er c
ab h
eatin
g an
d ai
r co
nditi
onin
g w
hen
a m
achi
ne
is n
ot o
pera
ting
(suc
h as
Sm
artW
ay g
ener
ator
or p
lug
in o
utle
t)
XX
XX
XX
XX
XX
XX
X
Pow
er a
nd
fuel
Inst
all a
mod
ular
rene
wab
le
ener
gy sy
stem
that
can
be
used
to m
eet e
nerg
y de
man
ds
of m
ultip
le a
ctiv
ities
ove
r th
e lif
espa
n of
the
proj
ect
(for
exa
mpl
e, p
ower
ing
field
eq
uipm
ent,
cons
truct
ion
or o
pera
tiona
l act
iviti
es,
supp
lyin
g en
ergy
dem
ands
of
build
ings
)
XX
XX
XX
XX
XX
XX
X
Pow
er a
nd
fuel
Use
gra
vity
flow
to in
trodu
ce
amen
dmen
ts o
r che
mic
al
oxid
ants
to th
e su
bsur
face
w
hen
high
-pre
ssur
e in
ject
ion
is u
nnec
essa
ry
XX
XX
X
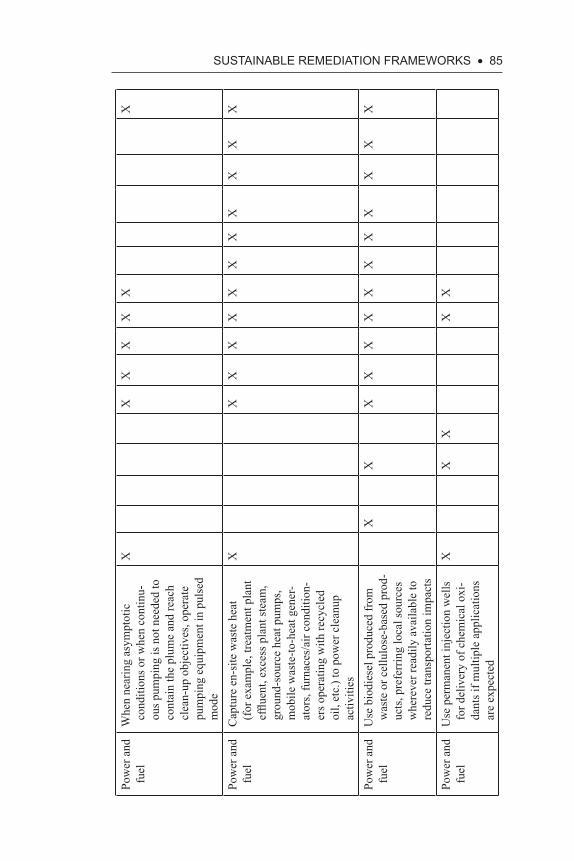
SuStAiNABLE REMEDiAtiON fRAMEWORKS • 85
Pow
er a
nd
fuel
Whe
n ne
arin
g as
ympt
otic
co
nditi
ons o
r whe
n co
ntin
u-ou
s pum
ping
is n
ot n
eede
d to
co
ntai
n th
e pl
ume
and
reac
h cl
ean-
up o
bjec
tives
, ope
rate
pu
mpi
ng e
quip
men
t in
puls
ed
mod
e
XX
XX
XX
X
Pow
er a
nd
fuel
Cap
ture
en-
site
was
te h
eat
(for
exa
mpl
e, tr
eatm
ent p
lant
ef
fluen
t, ex
cess
pla
nt st
eam
, gr
ound
-sou
rce
heat
pum
ps,
mob
ile w
aste
-to-h
eat g
ener
-at
ors,
furn
aces
/air
cond
ition
-er
s ope
ratin
g w
ith re
cycl
ed
oil,
etc.
) to
pow
er c
lean
up
activ
ities
XX
XX
XX
XX
XX
XX
Pow
er a
nd
fuel
Use
bio
dies
el p
rodu
ced
from
w
aste
or c
ellu
lose
-bas
ed p
rod-
ucts
, pre
ferr
ing
loca
l sou
rces
w
here
ver r
eadi
ly a
vaila
ble
to
redu
ce tr
ansp
orta
tion
impa
cts
XX
XX
XX
XX
XX
XX
X
Pow
er a
nd
fuel
Use
per
man
ent i
njec
tion
wel
ls
for d
eliv
ery
of c
hem
ical
oxi
-da
nts i
f mul
tiple
app
licat
ions
ar
e ex
pect
ed
XX
XX
X
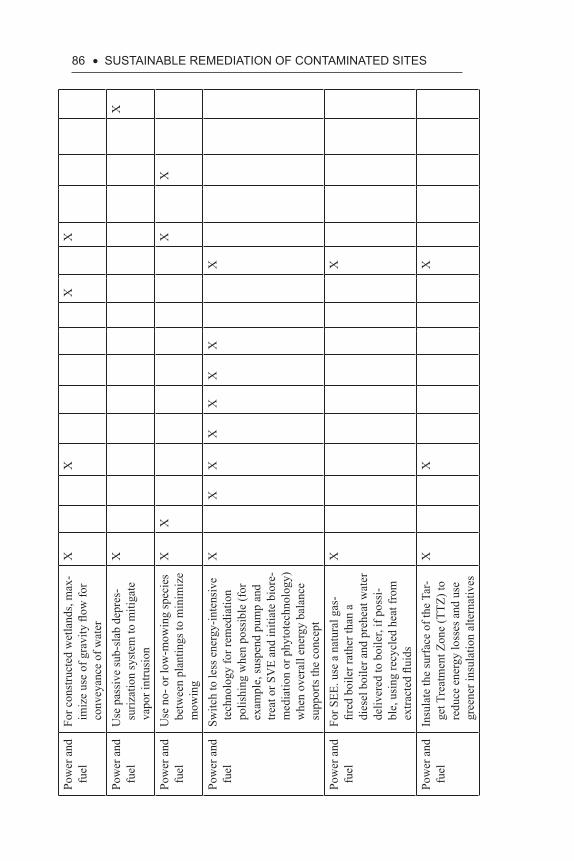
86 • SuStAiNABLE REMEDiAtiON Of CONtAMiNAtED SitESPo
wer
and
fu
elFo
r con
stru
cted
wet
land
s, m
ax-
imiz
e us
e of
gra
vity
flow
for
conv
eyan
ce o
f wat
er
XX
XX
Pow
er a
nd
fuel
Use
pas
sive
sub-
slab
dep
res-
suriz
atio
n sy
stem
to m
itiga
te
vapo
r int
rusi
on
XX
Pow
er a
nd
fuel
Use
no-
or l
ow-m
owin
g sp
ecie
s be
twee
n pl
antin
gs to
min
imiz
e m
owin
g
XX
XX
Pow
er a
nd
fuel
Switc
h to
less
ene
rgy-
inte
nsiv
e te
chno
logy
for r
emed
iatio
n po
lishi
ng w
hen
poss
ible
(for
ex
ampl
e, su
spen
d pu
mp
and
treat
or S
VE
and
initi
ate
bior
e-m
edia
tion
or p
hyto
tech
nolo
gy)
whe
n ov
eral
l ene
rgy
bala
nce
supp
orts
the
conc
ept
XX
XX
XX
XX
Pow
er a
nd
fuel
For S
EE. u
se a
nat
ural
gas
-fir
ed b
oile
r rat
her t
han
a di
esel
boi
ler a
nd p
rehe
at w
ater
de
liver
ed to
boi
ler,
if po
ssi-
ble,
usi
ng re
cycl
ed h
eat f
rom
ex
tract
ed fl
uids
XX
Pow
er a
nd
fuel
Insu
late
the
surf
ace
of th
e Ta
r-ge
t Tre
atm
ent Z
one
(TTZ
) to
redu
ce e
nerg
y lo
sses
and
use
gr
eene
r ins
ulat
ion
alte
rnat
ives
XX
X
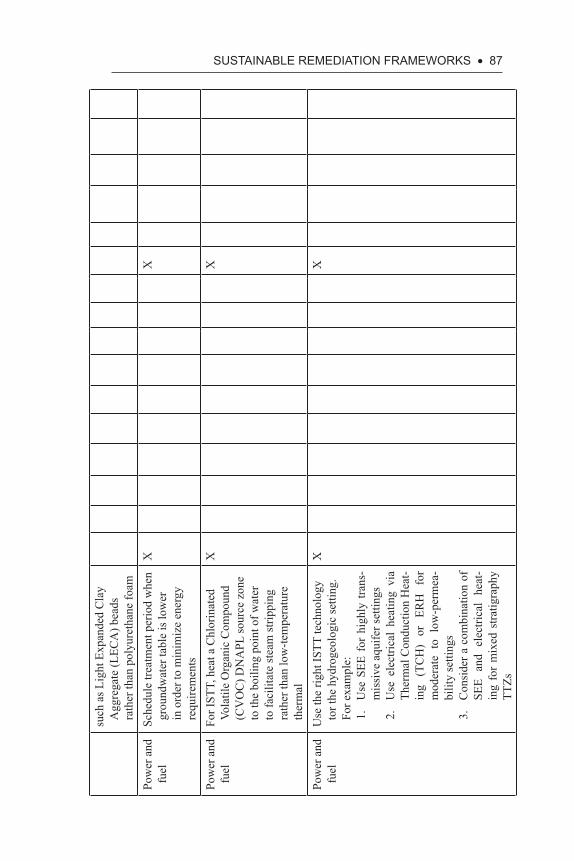
SuStAiNABLE REMEDiAtiON fRAMEWORKS • 87
such
as L
ight
Exp
ande
d C
lay
Agg
rega
te (L
ECA
) bea
ds
rath
er th
an p
olyu
reth
ane
foam
Pow
er a
nd
fuel
Sche
dule
trea
tmen
t per
iod
whe
n gr
ound
wat
er ta
ble
is lo
wer
in
ord
er to
min
imiz
e en
ergy
re
quire
men
ts
XX
Pow
er a
nd
fuel
For I
STT,
hea
t a C
hlor
inat
ed
Vola
tile
Org
anic
Com
poun
d (C
VO
C) D
NA
PL so
urce
zon
e to
the
boili
ng p
oint
of w
ater
to
faci
litat
e st
eam
strip
ping
ra
ther
than
low
-tem
pera
ture
th
erm
al
XX
Pow
er a
nd
fuel
Use
the
right
ISTT
tech
nolo
gy
tor t
he h
ydro
geol
ogic
setti
ng.
For e
xam
ple:
1.
Use
SEE
for
hig
hly
trans
-m
issi
ve a
quife
r set
tings
2.
Use
ele
ctric
al h
eatin
g vi
a Th
erm
al C
ondu
ctio
n H
eat-
ing
(TC
H)
or
ERH
fo
r m
oder
ate
to l
ow-p
erm
ea-
bilit
y se
tting
s3.
C
onsi
der a
com
bina
tion
of
SEE
and
elec
trica
l he
at-
ing
for
mix
ed s
tratig
raph
y TT
Zs
XX
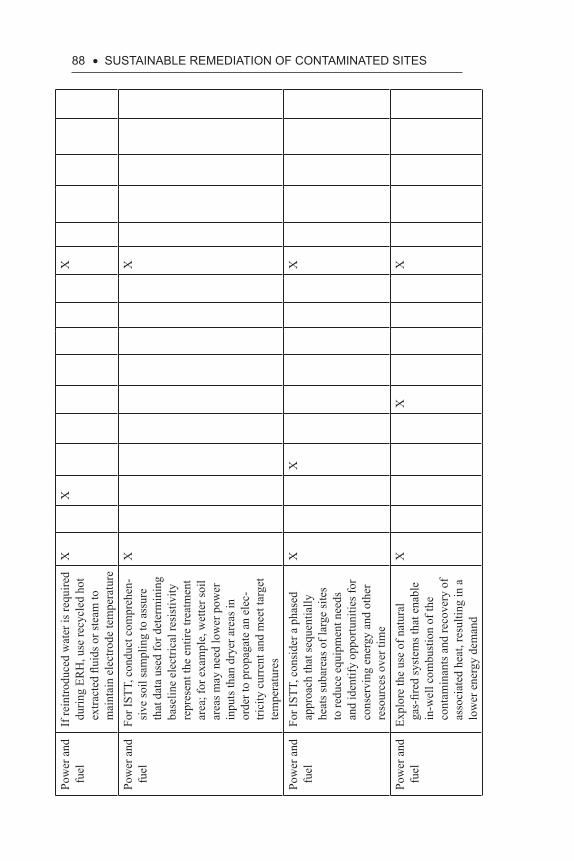
88 • SuStAiNABLE REMEDiAtiON Of CONtAMiNAtED SitESPo
wer
and
fu
elIf
rein
trodu
ced
wat
er is
requ
ired
durin
g ER
H, u
se re
cycl
ed h
ot
extra
cted
flui
ds o
r ste
am to
m
aint
ain
elec
trode
tem
pera
ture
XX
X
Pow
er a
nd
fuel
For I
STT,
con
duct
com
preh
en-
sive
soil
sam
plin
g to
ass
ure
that
dat
a us
ed fo
r det
erm
inin
g ba
selin
e el
ectri
cal r
esis
tivity
re
pres
ent t
he e
ntire
trea
tmen
t ar
ea; f
or e
xam
ple,
wet
ter s
oil
area
s may
nee
d lo
wer
pow
er
inpu
ts th
an d
ryer
are
as in
or
der t
o pr
opag
ate
an e
lec-
trici
ty c
urre
nt a
nd m
eet t
arge
t te
mpe
ratu
res
XX
Pow
er a
nd
fuel
For I
STT,
con
side
r a p
hase
d ap
proa
ch th
at se
quen
tially
he
ats s
ubar
eas o
f lar
ge si
tes
to re
duce
equ
ipm
ent n
eeds
an
d id
entif
y op
portu
nitie
s for
co
nser
ving
ene
rgy
and
othe
r re
sour
ces o
ver t
ime
XX
X
Pow
er a
nd
fuel
Expl
ore
the
use
of n
atur
al
gas-
fired
syst
ems t
hat e
nabl
e in
-wel
l com
bust
ion
of th
e co
ntam
inan
ts a
nd re
cove
ry o
f as
soci
ated
hea
t, re
sulti
ng in
a
low
er e
nerg
y de
man
d
XX
X
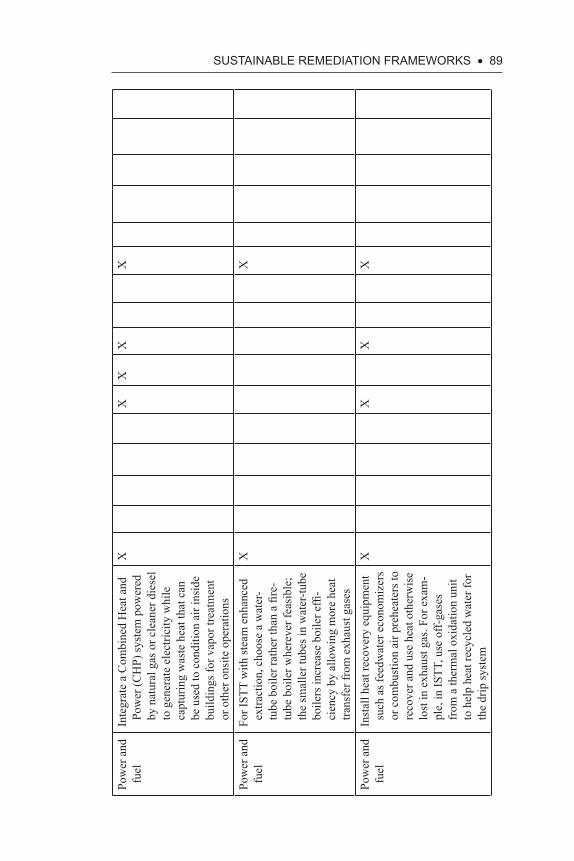
SuStAiNABLE REMEDiAtiON fRAMEWORKS • 89
Pow
er a
nd
fuel
Inte
grat
e a
Com
bine
d H
eat a
nd
Pow
er (C
HP)
syst
em p
ower
ed
by n
atur
al g
as o
r cle
aner
die
sel
to g
ener
ate
elec
trici
ty w
hile
ca
ptur
ing
was
te h
eat t
hat c
an
be u
sed
to c
ondi
tion
air i
nsid
e bu
ildin
gs fo
r vap
or tr
eatm
ent
or o
ther
ons
ite o
pera
tions
XX
XX
X
Pow
er a
nd
fuel
For I
STT
with
stea
m e
nhan
ced
extra
ctio
n, c
hoos
e a
wat
er-
tube
boi
ler r
athe
r tha
n a
fire-
tube
boi
ler w
here
ver f
easi
ble;
th
e sm
alle
r tub
es in
wat
er-tu
be
boile
rs in
crea
se b
oile
r effi
-ci
ency
by
allo
win
g m
ore
heat
tra
nsfe
r fro
m e
xhau
st g
ases
XX
Pow
er a
nd
fuel
Inst
all h
eat r
ecov
ery
equi
pmen
t su
ch a
s fee
dwat
er e
cono
miz
ers
or c
ombu
stio
n ai
r pre
heat
ers t
o re
cove
r and
use
hea
t oth
erw
ise
lost
in e
xhau
st g
as. F
or e
xam
-pl
e, in
ISTT
, use
off-
gase
s fr
om a
ther
mal
oxi
datio
n un
it to
hel
p he
at re
cycl
ed w
ater
for
the
drip
syst
em
XX
XX
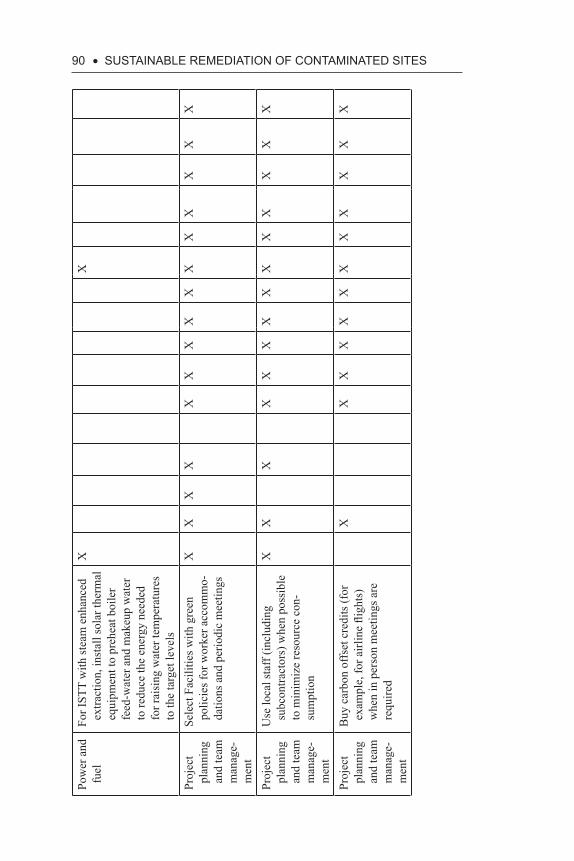
90 • SuStAiNABLE REMEDiAtiON Of CONtAMiNAtED SitES
Pow
er a
nd
fuel
For I
STT
with
stea
m e
nhan
ced
extra
ctio
n, in
stal
l sol
ar th
erm
al
equi
pmen
t to
preh
eat b
oile
r fe
ed-w
ater
and
mak
eup
wat
er
to re
duce
the
ener
gy n
eede
d fo
r rai
sing
wat
er te
mpe
ratu
res
to th
e ta
rget
leve
ls
XX
Proj
ect
plan
ning
an
d te
am
man
age-
men
t
Sele
ct F
acili
ties w
ith g
reen
po
licie
s for
wor
ker a
ccom
mo-
datio
ns a
nd p
erio
dic
mee
tings
XX
XX
XX
XX
XX
XX
XX
X
Proj
ect
plan
ning
an
d te
am
man
age-
men
t
Use
loca
l sta
ff (in
clud
ing
subc
ontra
ctor
s) w
hen
poss
ible
to
min
imiz
e re
sour
ce c
on-
sum
ptio
n
XX
XX
XX
XX
XX
XX
XX
Proj
ect
plan
ning
an
d te
am
man
age-
men
t
Buy
car
bon
offs
et c
redi
ts (f
or
exam
ple,
for a
irlin
e fli
ghts
) w
hen
in p
erso
n m
eetin
gs a
re
requ
ired
XX
XX
XX
XX
XX
XX
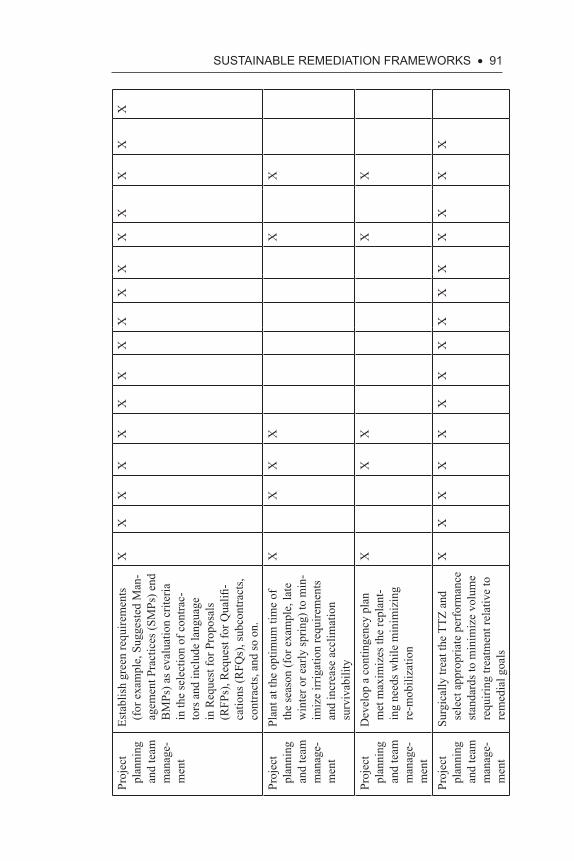
SuStAiNABLE REMEDiAtiON fRAMEWORKS • 91
Proj
ect
plan
ning
an
d te
am
man
age-
men
t
Esta
blis
h gr
een
requ
irem
ents
(f
or e
xam
ple,
Sug
gest
ed M
an-
agem
ent P
ract
ices
(SM
Ps) e
nd
BM
Ps) a
s eva
luat
ion
crite
ria
in th
e se
lect
ion
of c
ontra
c-to
rs a
nd in
clud
e la
ngua
ge
in R
eque
st fo
r Pro
posa
ls
(RFP
s), R
eque
st fo
r Qua
lifi-
catio
ns (R
FQs)
, sub
cont
ract
s, co
ntra
cts,
and
so o
n.
XX
XX
XX
XX
XX
XX
XX
XX
Proj
ect
plan
ning
an
d te
am
man
age-
men
t
Plan
t at t
he o
ptim
um ti
me
of
the
seas
on (f
or e
xam
ple,
late
w
inte
r or e
arly
sprin
g) to
min
-im
ize
irrig
atio
n re
quire
men
ts
and
incr
ease
acc
limat
ion
surv
ivab
ility
XX
XX
XX
Proj
ect
plan
ning
an
d te
am
man
age-
men
t
Dev
elop
a c
ontin
genc
y pl
an
met
max
imiz
es th
e re
plan
t-in
g ne
eds w
hile
min
imiz
ing
re-m
obili
zatio
n
XX
XX
X
Proj
ect
plan
ning
an
d te
am
man
age-
men
t
Surg
ical
ly tr
eat t
he T
TZ a
nd
sele
ct a
ppro
pria
te p
erfo
rman
ce
stan
dard
s to
min
imiz
e vo
lum
e re
quiri
ng tr
eatm
ent r
elat
ive
to
rem
edia
l goa
ls
XX
XX
XX
XX
XX
XX
XX
X
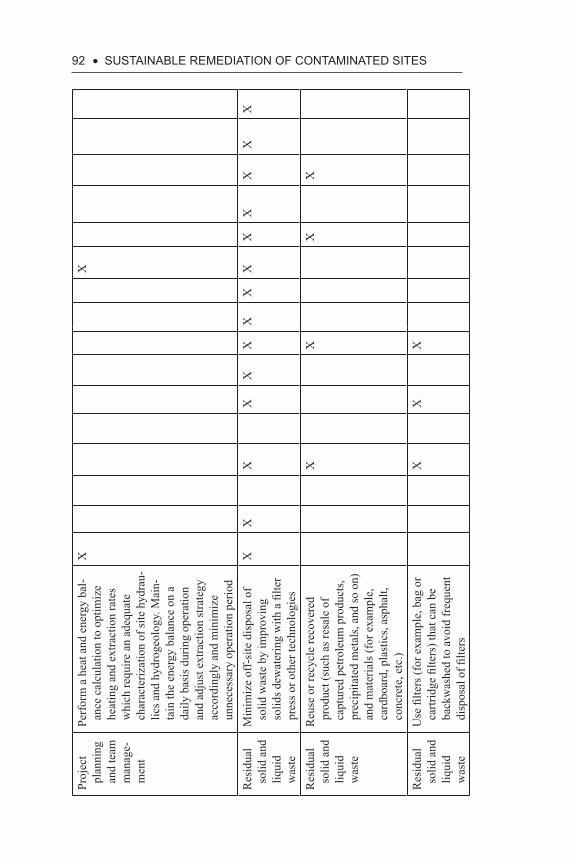
92 • SuStAiNABLE REMEDiAtiON Of CONtAMiNAtED SitES
Proj
ect
plan
ning
an
d te
am
man
age-
men
t
Perf
orm
a h
eat a
nd e
nerg
y ba
l-an
ce c
alcu
latio
n to
opt
imiz
e he
atin
g an
d ex
tract
ion
rate
s w
hich
requ
ire a
n ad
equa
te
char
acte
rizat
ion
of si
te h
ydra
u-lic
s and
hyd
roge
olog
y. M
ain-
tain
the
ener
gy b
alan
ce o
n a
daily
bas
is d
urin
g op
erat
ion
and
adju
st e
xtra
ctio
n st
rate
gy
acco
rdin
gly
and
min
imiz
e un
nece
ssar
y op
erat
ion
perio
d
XX
Res
idua
l so
lid a
nd
liqui
d w
aste
Min
imiz
e of
f-si
te d
ispo
sal o
f so
lid w
aste
by
impr
ovin
g so
lids d
ewat
erin
g w
ith a
filte
r pr
ess o
r oth
er te
chno
logi
es
XX
XX
XX
XX
XX
XX
XX
Res
idua
l so
lid a
nd
liqui
d w
aste
Reu
se o
r rec
ycle
reco
vere
d pr
oduc
t (su
ch a
s res
ale
of
capt
ured
pet
role
um p
rodu
cts,
prec
ipita
ted
met
als,
and
so o
n)
and
mat
eria
ls (f
or e
xam
ple,
ca
rdbo
ard,
pla
stic
s, as
phal
t, co
ncre
te, e
tc.)
XX
XX
Res
idua
l so
lid a
nd
liqui
d w
aste
Use
filte
rs (f
or e
xam
ple,
bag
or
cartr
idge
filte
rs) t
hat c
an b
e ba
ckw
ashe
d to
avo
id fr
eque
nt
disp
osal
of fi
lters
XX
X
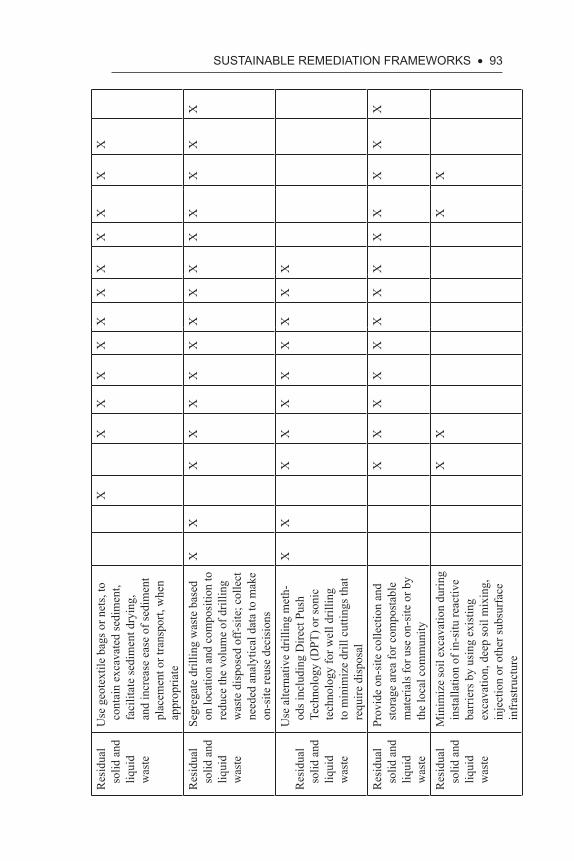
SuStAiNABLE REMEDiAtiON fRAMEWORKS • 93
Res
idua
l so
lid a
nd
liqui
d w
aste
Use
geo
text
ile b
ags o
r net
s, to
co
ntai
n ex
cava
ted
sedi
men
t, fa
cilit
ate
sedi
men
t dry
ing,
an
d in
crea
se e
ase
of se
dim
ent
plac
emen
t or t
rans
port,
whe
n ap
prop
riate
XX
XX
XX
XX
XX
XX
Res
idua
l so
lid a
nd
liqui
d w
aste
Segr
egat
e dr
illin
g w
aste
bas
ed
on lo
catio
n an
d co
mpo
sitio
n to
re
duce
the
volu
me
of d
rillin
g w
aste
dis
pose
d of
f-si
te; c
olle
ct
need
ed a
naly
tical
dat
a to
mak
e on
-site
reus
e de
cisi
ons
XX
XX
XX
XX
XX
XX
XX
X
Res
idua
l so
lid a
nd
liqui
d w
aste
Use
alte
rnat
ive
drill
ing
met
h-od
s inc
ludi
ng D
irect
Pus
h Te
chno
logy
(DPT
) or s
onic
te
chno
logy
for w
ell d
rillin
g to
min
imiz
e dr
ill c
uttin
gs th
at
requ
ire d
ispo
sal
XX
XX
XX
XX
XX
Res
idua
l so
lid a
nd
liqui
d w
aste
Prov
ide
on-s
ite c
olle
ctio
n an
d st
orag
e ar
ea fo
r com
post
able
m
ater
ials
for u
se o
n-si
te o
r by
the
loca
l com
mun
ity
XX
XX
XX
XX
XX
XX
X
Res
idua
l so
lid a
nd
liqui
d w
aste
Min
imiz
e so
il ex
cava
tion
durin
g in
stal
latio
n of
in-s
itu re
activ
e ba
rrie
rs b
y us
ing
exis
ting
exca
vatio
n, d
eep
soil
mix
ing,
in
ject
ion
or o
ther
subs
urfa
ce
infr
astru
ctur
e
XX
XX
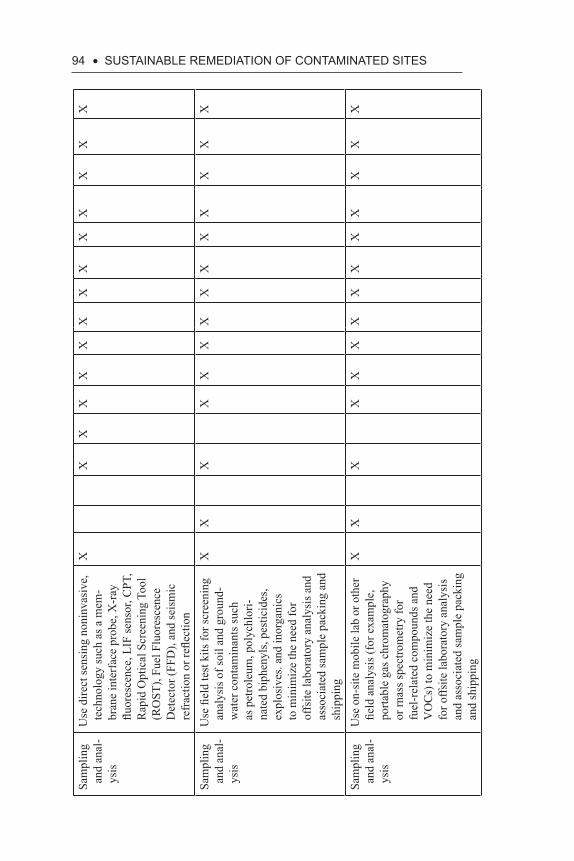
94 • SuStAiNABLE REMEDiAtiON Of CONtAMiNAtED SitES
Sam
plin
g an
d an
al-
ysis
Use
dire
ct se
nsin
g no
ninv
asiv
e,
tech
nolo
gy su
ch a
s a m
em-
bran
e in
terf
ace
prob
e, X
-ray
flu
ores
cenc
e, L
IF se
nsor
, CPT
, R
apid
Opt
ical
Scr
eeni
ng T
ool
(RO
ST),
Fuel
Flu
ores
cenc
e D
etec
tor (
FFD
), an
d se
ism
ic
refr
actio
n or
refle
ctio
n
XX
XX
XX
XX
XX
XX
XX
Sam
plin
g an
d an
al-
ysis
Use
fiel
d te
st k
its fo
r scr
eeni
ng
anal
ysis
of s
oil a
nd g
roun
d-w
ater
con
tam
inan
ts su
ch
as p
etro
leum
, pol
ychl
ori-
nate
d bi
phen
yls,
pest
icid
es,
expl
osiv
es. a
nd in
orga
nics
to
min
imiz
e th
e ne
ed fo
r of
fsite
labo
rato
ry a
naly
sis a
nd
asso
ciat
ed sa
mpl
e pa
ckin
g an
d sh
ippi
ng
XX
XX
XX
XX
XX
XX
XX
Sam
plin
g an
d an
al-
ysis
Use
on-
site
mob
ile la
b or
oth
er
field
ana
lysi
s (fo
r exa
mpl
e,
porta
ble
gas c
hrom
atog
raph
y or
rnas
s spe
ctro
met
ry fo
r fu
el-r
elat
ed c
ompo
unds
and
V
OC
s) to
min
imiz
e th
e ne
ed
for o
ffsite
labo
rato
ry a
naly
sis
and
asso
ciat
ed sa
mpl
e pa
ckin
g an
d sh
ippi
ng
XX
XX
XX
XX
XX
XX
XX
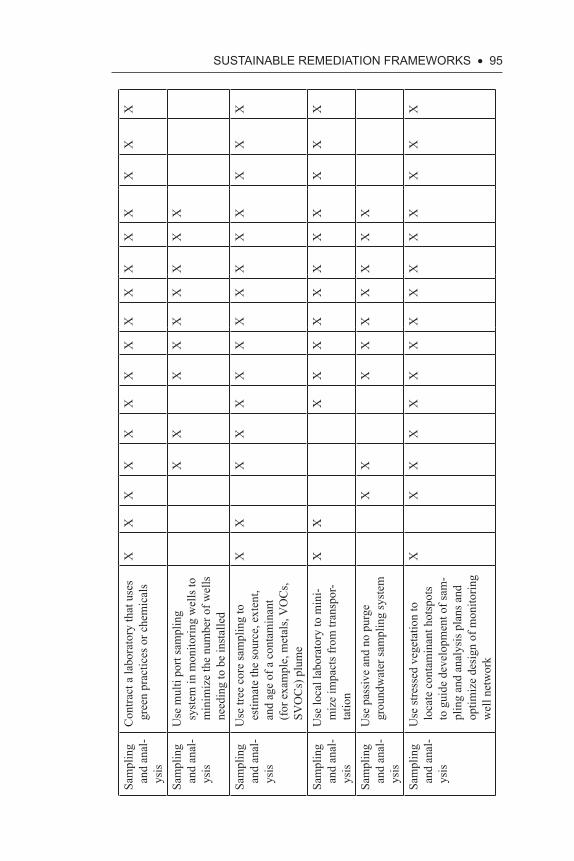
SuStAiNABLE REMEDiAtiON fRAMEWORKS • 95
Sam
plin
g an
d an
al-
ysis
Con
tract
a la
bora
tory
that
use
s gr
een
prac
tices
or c
hem
ical
sX
XX
XX
XX
XX
XX
XX
XX
X
Sam
plin
g an
d an
al-
ysis
Use
mul
ti po
rt sa
mpl
ing
syst
em in
mon
itorin
g w
ells
to
min
imiz
e th
e nu
mbe
r of w
ells
ne
edin
g to
be
inst
alle
d
XX
XX
XX
XX
X
Sam
plin
g an
d an
al-
ysis
Use
tree
cor
e sa
mpl
ing
to
estim
ate
the
sour
ce, e
xten
t, an
d ag
e of
a c
onta
min
ant
(for
exa
mpl
e, m
etal
s, V
OC
s, SV
OC
s) p
lum
e
XX
XX
XX
XX
XX
XX
XX
X
Sam
plin
g an
d an
al-
ysis
Use
loca
l lab
orat
ory
to m
ini-
miz
e im
pact
s fro
m tr
ansp
or-
tatio
n
XX
XX
XX
XX
XX
XX
X
Sam
plin
g an
d an
al-
ysis
Use
pas
sive
and
no
purg
e gr
ound
wat
er sa
mpl
ing
syst
emX
XX
XX
XX
XX
Sam
plin
g an
d an
al-
ysis
Use
stre
ssed
veg
etat
ion
to
loca
te c
onta
min
ant h
otsp
ots
to g
uide
dev
elop
men
t of s
am-
plin
g an
d an
alys
is p
lans
and
op
timiz
e de
sign
of m
onito
ring
wel
l net
wor
k
XX
XX
XX
XX
XX
XX
XX
X
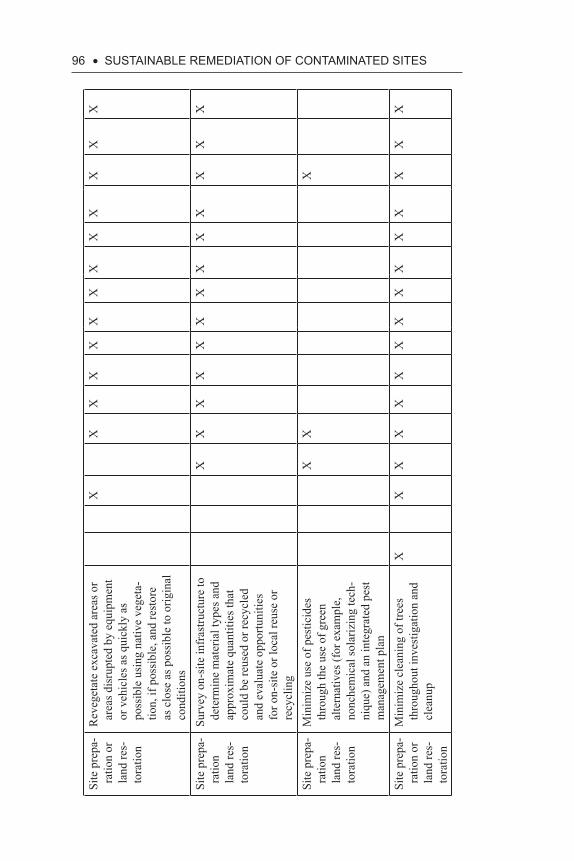
96 • SuStAiNABLE REMEDiAtiON Of CONtAMiNAtED SitES
Site
pre
pa-
ratio
n or
la
nd re
s-to
ratio
n
Rev
eget
ate
exca
vate
d ar
eas o
r ar
eas d
isru
pted
by
equi
pmen
t or
veh
icle
s as q
uick
ly a
s po
ssib
le u
sing
nat
ive
vege
ta-
tion,
if p
ossi
ble,
and
rest
ore
as c
lose
as p
ossi
ble
to o
rigin
al
cond
ition
s
XX
XX
XX
XX
XX
XX
X
Site
pre
pa-
ratio
n la
nd re
s-to
ratio
n
Surv
ey o
n-si
te in
fras
truct
ure
to
dete
rmin
e m
ater
ial t
ypes
and
ap
prox
imat
e qu
antit
ies t
hat
coul
d be
reus
ed o
r rec
ycle
d an
d ev
alua
te o
ppor
tuni
ties
for o
n-si
te o
r loc
al re
use
or
recy
clin
g
XX
XX
XX
XX
XX
XX
X
Site
pre
pa-
ratio
n la
nd re
s-to
ratio
n
Min
imiz
e us
e of
pes
ticid
es
thro
ugh
the
use
of g
reen
al
tern
ativ
es (f
or e
xam
ple,
no
nche
mic
al so
lariz
ing
tech
-ni
que)
and
an
inte
grat
ed p
est
man
agem
ent p
lan
XX
X
Site
pre
pa-
ratio
n or
la
nd re
s-to
ratio
n
Min
imiz
e cl
eani
ng o
f tre
es
thro
ugho
ut in
vest
igat
ion
and
clea
nup
XX
XX
XX
XX
XX
XX
XX
X
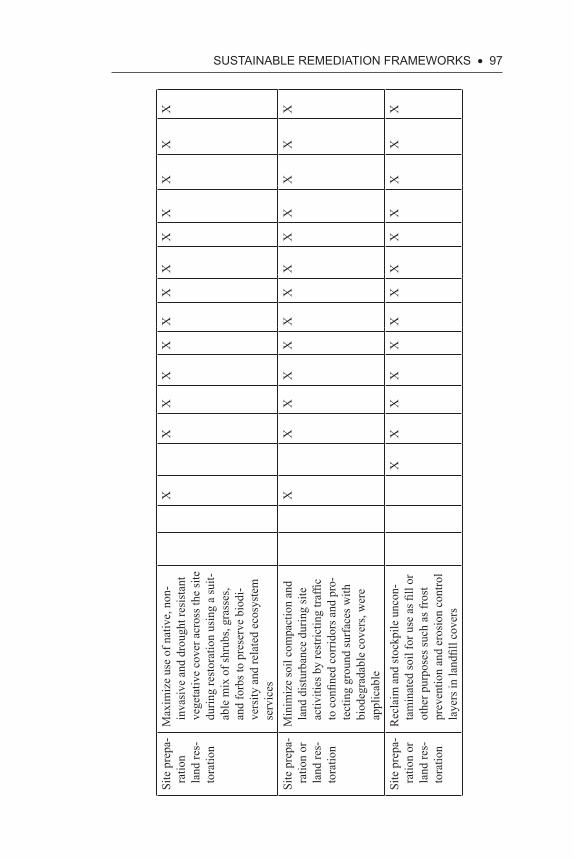
SuStAiNABLE REMEDiAtiON fRAMEWORKS • 97
Site
pre
pa-
ratio
n la
nd re
s-to
ratio
n
Max
imiz
e us
e of
nat
ive,
non
-in
vasi
ve a
nd d
roug
ht re
sist
ant
vege
tativ
e co
ver a
cros
s the
site
du
ring
rest
orat
ion
usin
g a
suit-
able
mix
of s
hrub
s, gr
asse
s, an
d fo
rbs t
o pr
eser
ve b
iodi
-ve
rsity
and
rela
ted
ecos
yste
m
serv
ices
XX
XX
XX
XX
XX
XX
X
Site
pre
pa-
ratio
n or
la
nd re
s-to
ratio
n
Min
imiz
e so
il co
mpa
ctio
n an
d la
nd d
istu
rban
ce d
urin
g si
te
activ
ities
by
rest
rictin
g tra
ffic
to c
onfin
ed c
orrid
ors a
nd p
ro-
tect
ing
grou
nd su
rfac
es w
ith
biod
egra
dabl
e co
vers
, wer
e ap
plic
able
XX
XX
XX
XX
XX
XX
X
Site
pre
pa-
ratio
n or
la
nd re
s-to
ratio
n
Rec
laim
and
stoc
kpile
unc
on-
tam
inat
ed so
il fo
r use
as fi
ll or
ot
her p
urpo
ses s
uch
as fr
ost
prev
entio
n an
d er
osio
n co
ntro
l la
yers
in la
ndfil
l cov
ers
XX
XX
XX
XX
XX
XX
X
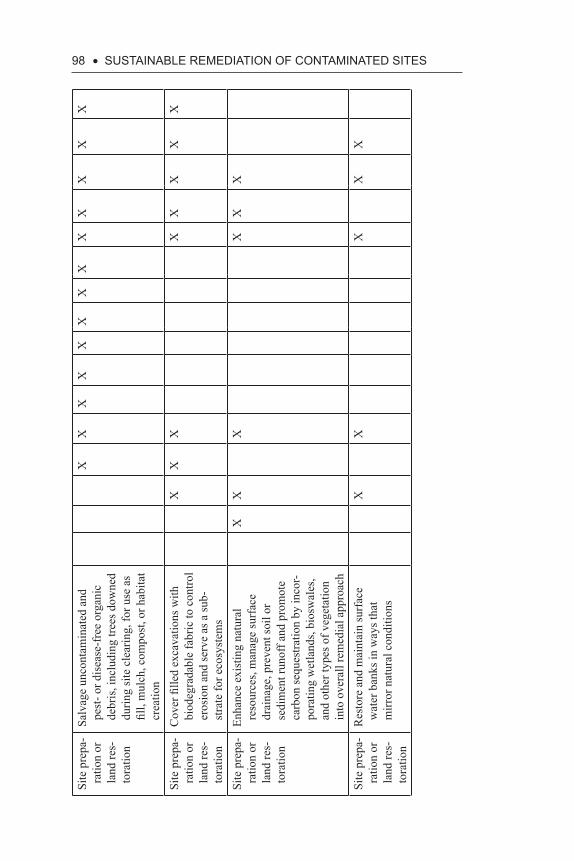
98 • SuStAiNABLE REMEDiAtiON Of CONtAMiNAtED SitES
Site
pre
pa-
ratio
n or
la
nd re
s-to
ratio
n
Salv
age
unco
ntam
inat
ed a
nd
pest
- or d
isea
se-f
ree
orga
nic
debr
is, i
nclu
ding
tree
s dow
ned
durin
g si
te c
lear
ing,
for u
se a
s fil
l, m
ulch
, com
post
, or h
abita
t cr
eatio
n
XX
XX
XX
XX
XX
XX
X
Site
pre
pa-
ratio
n or
la
nd re
s-to
ratio
n
Cov
er fi
lled
exca
vatio
ns w
ith
biod
egra
dabl
e fa
bric
to c
ontro
l er
osio
n an
d se
rve
as a
sub-
stra
te fo
r eco
syst
ems
XX
XX
XX
XX
Site
pre
pa-
ratio
n or
la
nd re
s-to
ratio
n
Enha
nce
exis
ting
natu
ral
reso
urce
s, m
anag
e su
rfac
e dr
aina
ge, p
reve
nt so
il or
se
dim
ent r
unof
f and
pro
mot
e ca
rbon
sequ
estra
tion
by in
cor-
pora
ting
wet
land
s, bi
osw
ales
, an
d ot
her t
ypes
of v
eget
atio
n in
to o
vera
ll re
med
ial a
ppro
ach
XX
XX
XX
Site
pre
pa-
ratio
n or
la
nd re
s-to
ratio
n
Res
tore
and
mai
ntai
n su
rfac
e w
ater
ban
ks in
way
s tha
t m
irror
nat
ural
con
ditio
ns
XX
XX
X
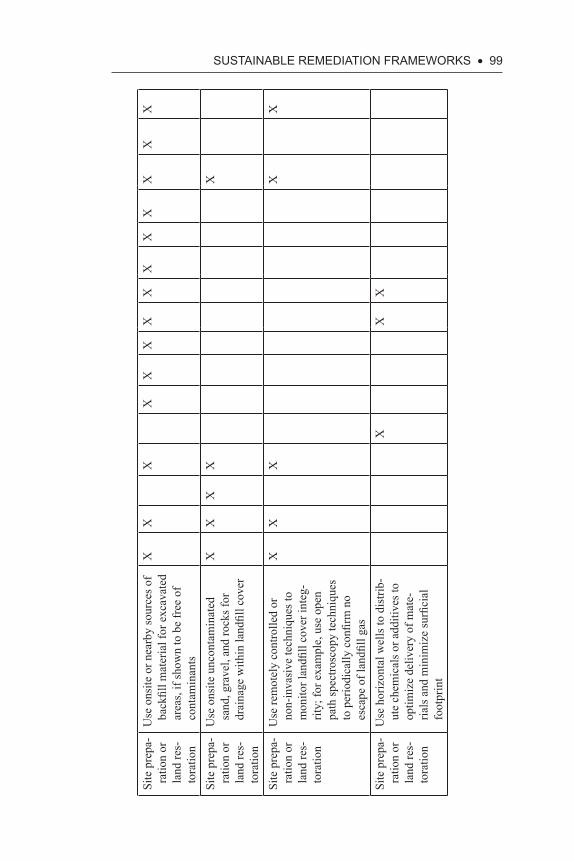
SuStAiNABLE REMEDiAtiON fRAMEWORKS • 99
Site
pre
pa-
ratio
n or
la
nd re
s-to
ratio
n
Use
ons
ite o
r nea
rby
sour
ces o
f ba
ckfil
l mat
eria
l for
exc
avat
ed
area
s, if
show
n to
be
free
of
cont
amin
ants
XX
XX
XX
XX
XX
XX
XX
Site
pre
pa-
ratio
n or
la
nd re
s-to
ratio
n
Use
ons
ite u
ncon
tam
inat
ed
sand
, gra
vel,
and
rock
s for
dr
aina
ge w
ithin
land
fill c
over
XX
XX
X
Site
pre
pa-
ratio
n or
la
nd re
s-to
ratio
n
Use
rem
otel
y co
ntro
lled
or
non-
inva
sive
tech
niqu
es to
m
onito
r lan
dfill
cove
r int
eg-
rity;
for e
xam
ple,
use
ope
n pa
th sp
ectro
scop
y te
chni
ques
to
per
iodi
cally
con
firm
no
esca
pe o
f lan
dfill
gas
XX
XX
X
Site
pre
pa-
ratio
n or
la
nd re
s-to
ratio
n
Use
hor
izon
tal w
ells
to d
istri
b-ut
e ch
emic
als o
r add
itive
s to
optim
ize
deliv
ery
of m
ate-
rials
and
min
imiz
e su
rfici
al
foot
prin
t
XX
X
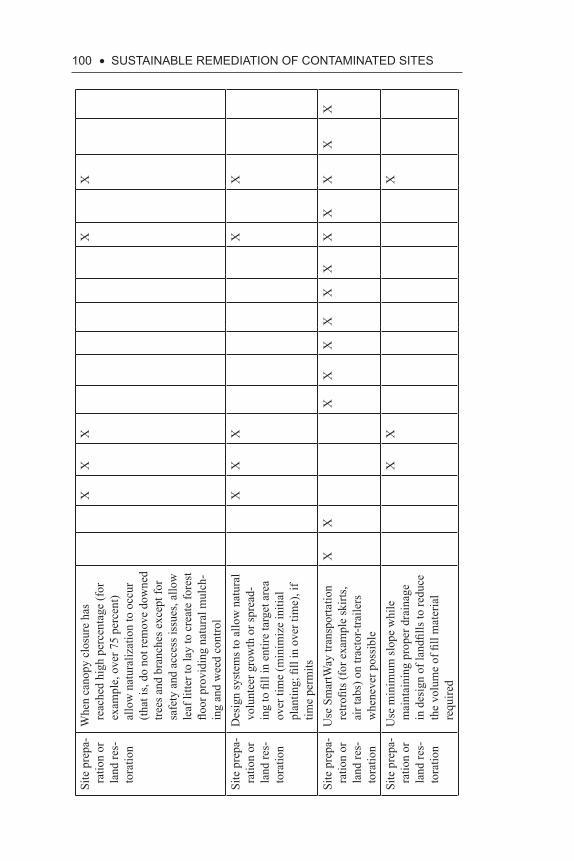
100 • SuStAiNABLE REMEDiAtiON Of CONtAMiNAtED SitES
Site
pre
pa-
ratio
n or
la
nd re
s-to
ratio
n
Whe
n ca
nopy
clo
sure
has
re
ache
d hi
gh p
erce
ntag
e (f
or
exam
ple,
ove
r 75
perc
ent)
allo
w n
atur
aliz
atio
n to
occ
ur
(that
is, d
o no
t rem
ove
dow
ned
trees
and
bra
nche
s exc
ept f
or
safe
ty a
nd a
cces
s iss
ues,
allo
w
leaf
litte
r to
lay
to c
reat
e fo
rest
flo
or p
rovi
ding
nat
ural
mul
ch-
ing
and
wee
d co
ntro
l
XX
XX
X
Site
pre
pa-
ratio
n or
la
nd re
s-to
ratio
n
Des
ign
syst
ems t
o al
low
nat
ural
vo
lunt
eer g
row
th o
r spr
ead-
ing
to fi
ll in
ent
ire ta
rget
are
a ov
er ti
me
(min
imiz
e in
itial
pl
antin
g; fi
ll in
ove
r tim
e), i
f tim
e pe
rmits
XX
XX
X
Site
pre
pa-
ratio
n or
la
nd re
s-to
ratio
n
Use
Sm
artW
ay tr
ansp
orta
tion
retro
fits (
for e
xam
ple
skirt
s, ai
r tab
s) o
n tra
ctor
-trai
lers
w
hene
ver p
ossi
ble
XX
XX
XX
XX
XX
XX
X
Site
pre
pa-
ratio
n or
la
nd re
s-to
ratio
n
Use
min
imum
slop
e w
hile
m
aint
aini
ng p
rope
r dra
inag
e in
des
ign
of la
ndfil
ls to
redu
ce
the
volu
me
of fi
ll m
ater
ial
requ
ired
XX
X
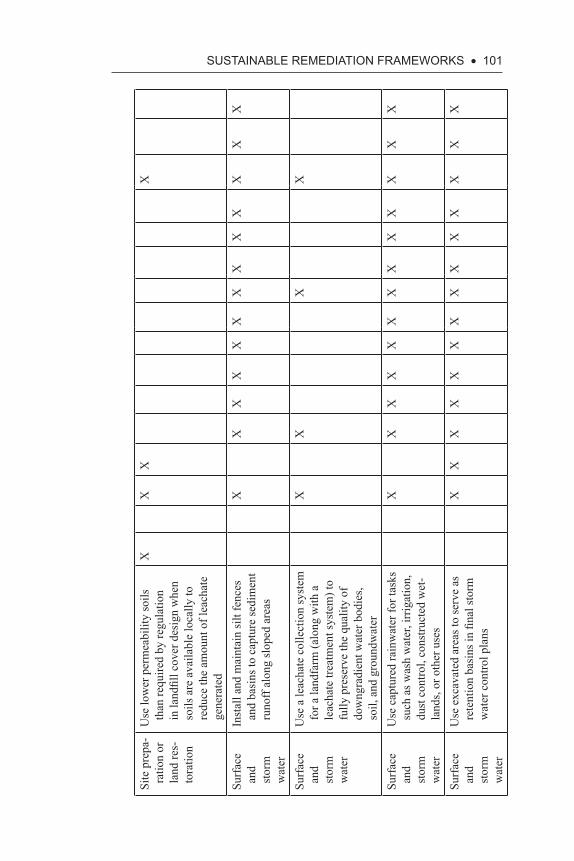
SuStAiNABLE REMEDiAtiON fRAMEWORKS • 101
Site
pre
pa-
ratio
n or
la
nd re
s-to
ratio
n
Use
low
er p
erm
eabi
lity
soils
th
an re
quire
d by
regu
latio
n in
land
fill c
over
des
ign
whe
n so
ils a
re a
vaila
ble
loca
lly to
re
duce
the
amou
nt o
f lea
chat
e ge
nera
ted
XX
XX
Surf
ace
and
stor
m
wat
er
Inst
all a
nd m
aint
ain
silt
fenc
es
and
basi
ns to
cap
ture
sedi
men
t ru
noff
alon
g sl
oped
are
as
XX
XX
XX
XX
XX
XX
X
Surf
ace
and
stor
m
wat
er
Use
a le
acha
te c
olle
ctio
n sy
stem
fo
r a la
ndfa
rm (a
long
with
a
leac
hate
trea
tmen
t sys
tem
) to
fully
pre
serv
e th
e qu
ality
of
dow
ngra
dien
t wat
er b
odie
s, so
il, a
nd g
roun
dwat
er
XX
XX
Surf
ace
and
stor
m
wat
er
Use
cap
ture
d ra
inw
ater
for t
asks
su
ch a
s was
h w
ater
, irr
igat
ion,
du
st c
ontro
l, co
nstru
cted
wet
-la
nds,
or o
ther
use
s
XX
XX
XX
XX
XX
XX
X
Surf
ace
and
stor
m
wat
er
Use
exc
avat
ed a
reas
to se
rve
as
rete
ntio
n ba
sins
in fi
nal s
torm
w
ater
con
trol p
lans
XX
XX
XX
XX
XX
XX
XX
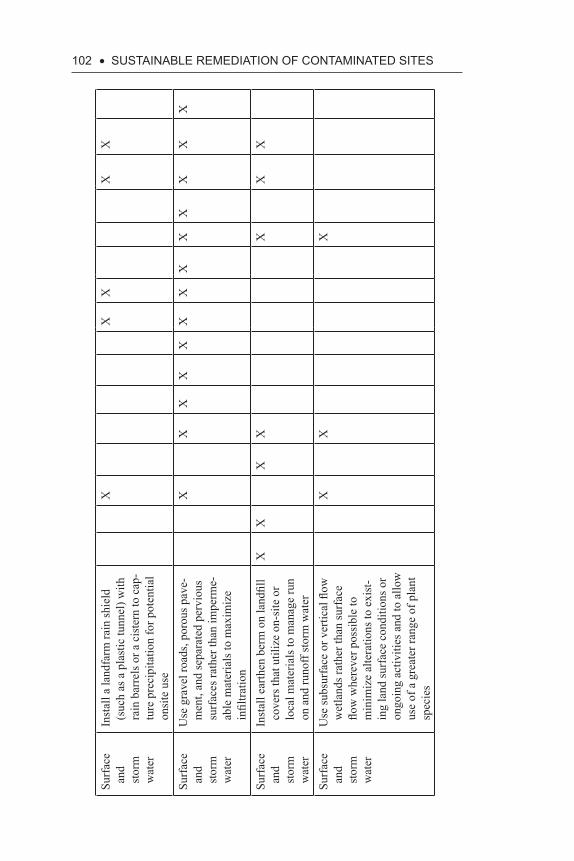
102 • SuStAiNABLE REMEDiAtiON Of CONtAMiNAtED SitES
Surf
ace
and
stor
m
wat
er
Inst
all a
land
farm
rain
shie
ld
(suc
h as
a p
last
ic tu
nnel
) with
ra
in b
arre
ls o
r a c
iste
rn to
cap
-tu
re p
reci
pita
tion
for p
oten
tial
onsi
te u
se
XX
XX
X
Surf
ace
and
stor
m
wat
er
Use
gra
vel r
oads
, por
ous p
ave-
men
t, an
d se
para
ted
perv
ious
su
rfac
es ra
ther
than
impe
rme-
able
mat
eria
ls to
max
imiz
e in
filtra
tion
XX
XX
XX
XX
XX
XX
X
Surf
ace
and
stor
m
wat
er
Inst
all e
arth
en b
erm
on
land
fill
cove
rs th
at u
tiliz
e on
-site
or
loca
l mat
eria
ls to
man
age
run
on a
nd ru
noff
stor
m w
ater
XX
XX
XX
X
Surf
ace
and
stor
m
wat
er
Use
subs
urfa
ce o
r ver
tical
flow
w
etla
nds r
athe
r tha
n su
rfac
e flo
w w
here
ver p
ossi
ble
to
min
imiz
e al
tera
tions
to e
xist
-in
g la
nd su
rfac
e co
nditi
ons o
r on
goin
g ac
tiviti
es a
nd to
allo
w
use
of a
gre
ater
rang
e of
pla
nt
spec
ies
XX
X
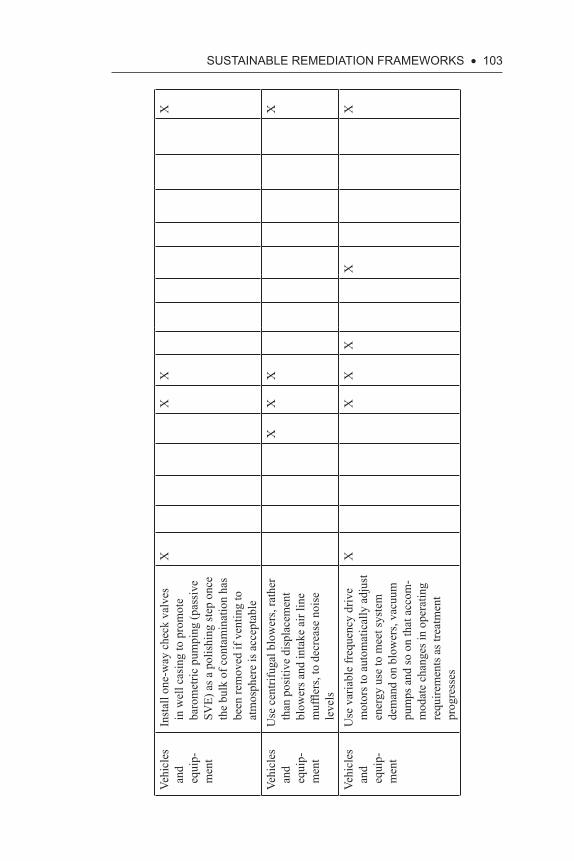
SuStAiNABLE REMEDiAtiON fRAMEWORKS • 103
Vehi
cles
an
d eq
uip-
men
t
Inst
all o
ne-w
ay c
heck
val
ves
in w
ell c
asin
g to
pro
mot
e ba
rom
etric
pum
ping
(pas
sive
SV
E) a
s a p
olis
hing
step
onc
e th
e bu
lk o
f con
tam
inat
ion
has
been
rem
oved
if v
entin
g to
at
mos
pher
e is
acc
epta
ble
XX
XX
Vehi
cles
an
d eq
uip-
men
t
Use
cen
trifu
gal b
low
ers,
rath
er
than
pos
itive
dis
plac
emen
t bl
ower
s and
inta
ke a
ir lin
e m
uffle
rs, t
o de
crea
se n
oise
le
vels
XX
XX
Vehi
cles
an
d eq
uip-
men
t
Use
var
iabl
e fr
eque
ncy
driv
e m
otor
s to
auto
mat
ical
ly a
djus
t en
ergy
use
to m
eet s
yste
m
dem
and
on b
low
ers,
vacu
um
pum
ps a
nd so
on
that
acc
om-
mod
ate
chan
ges i
n op
erat
ing
requ
irem
ents
as t
reat
men
t pr
ogre
sses
XX
XX
XX
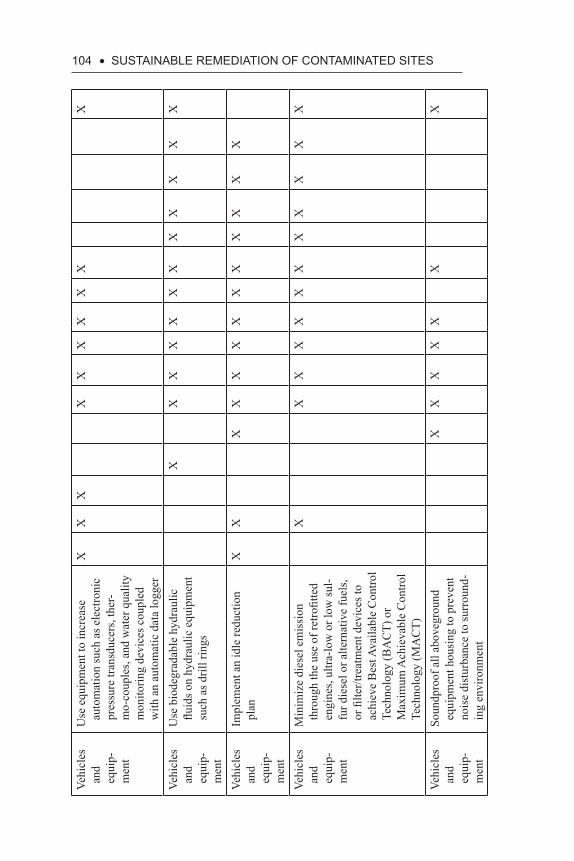
104 • SuStAiNABLE REMEDiAtiON Of CONtAMiNAtED SitESVe
hicl
es
and
equi
p-m
ent
Use
equ
ipm
ent t
o in
crea
se
auto
mat
ion
such
as e
lect
roni
c pr
essu
re tr
ansd
ucer
s, th
er-
mo-
coup
les,
and
wat
er q
ualit
y m
onito
ring
devi
ces c
oupl
ed
with
an
auto
mat
ic d
ata
logg
er
XX
XX
XX
XX
XX
Vehi
cles
an
d eq
uip-
men
t
Use
bio
degr
adab
le h
ydra
ulic
flu
ids o
n hy
drau
lic e
quip
men
t su
ch a
s dril
l rin
gs
XX
XX
XX
XX
XX
XX
Vehi
cles
an
d eq
uip-
men
t
Impl
emen
t an
idle
redu
ctio
n pl
anX
XX
XX
XX
XX
XX
XX
Vehi
cles
an
d eq
uip-
men
t
Min
imiz
e di
esel
em
issi
on
thro
ugh
the
use
of re
trofit
ted
engi
nes,
ultra
-low
or l
ow su
l-fu
r die
sel o
r alte
rnat
ive
fuel
s, or
filte
r/tre
atm
ent d
evic
es to
ac
hiev
e B
est A
vaila
ble
Con
trol
Tech
nolo
gy (B
AC
T) o
r M
axim
um A
chie
vabl
e C
ontro
l Te
chno
logy
(MA
CT)
XX
XX
XX
XX
XX
XX
Vehi
cles
an
d eq
uip-
men
t
Soun
dpro
of a
ll ab
oveg
roun
d eq
uipm
ent h
ousi
ng to
pre
vent
no
ise
dist
urba
nce
to su
rrou
nd-
ing
envi
ronm
ent
XX
XX
XX
X
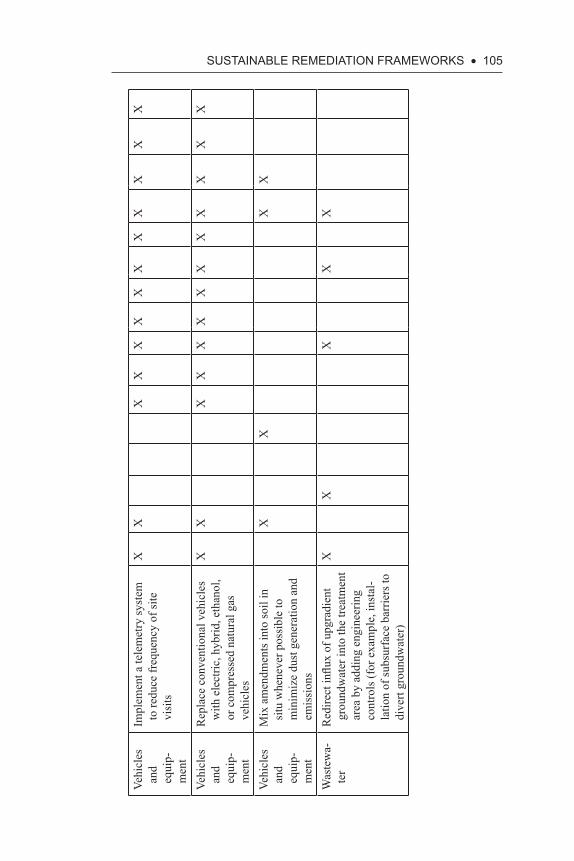
SuStAiNABLE REMEDiAtiON fRAMEWORKS • 105
Vehi
cles
an
d eq
uip-
men
t
Impl
emen
t a te
lem
etry
syst
em
to re
duce
freq
uenc
y of
site
vi
sits
XX
XX
XX
XX
XX
XX
X
Vehi
cles
an
d eq
uip-
men
t
Rep
lace
con
vent
iona
l veh
icle
s w
ith e
lect
ric, h
ybrid
, eth
anol
, or
com
pres
sed
natu
ral g
as
vehi
cles
XX
XX
XX
XX
XX
XX
X
Vehi
cles
an
d eq
uip-
men
t
Mix
am
endm
ents
into
soil
in
situ
whe
neve
r pos
sibl
e to
m
inim
ize
dust
gen
erat
ion
and
emis
sion
s
XX
XX
Was
tew
a-te
rR
edire
ct in
flux
of u
pgra
dien
t gr
ound
wat
er in
to th
e tre
atm
ent
area
by
addi
ng e
ngin
eerin
g co
ntro
ls (f
or e
xam
ple,
inst
al-
latio
n of
subs
urfa
ce b
arrie
rs to
di
vert
grou
ndw
ater
)
XX
XX
X
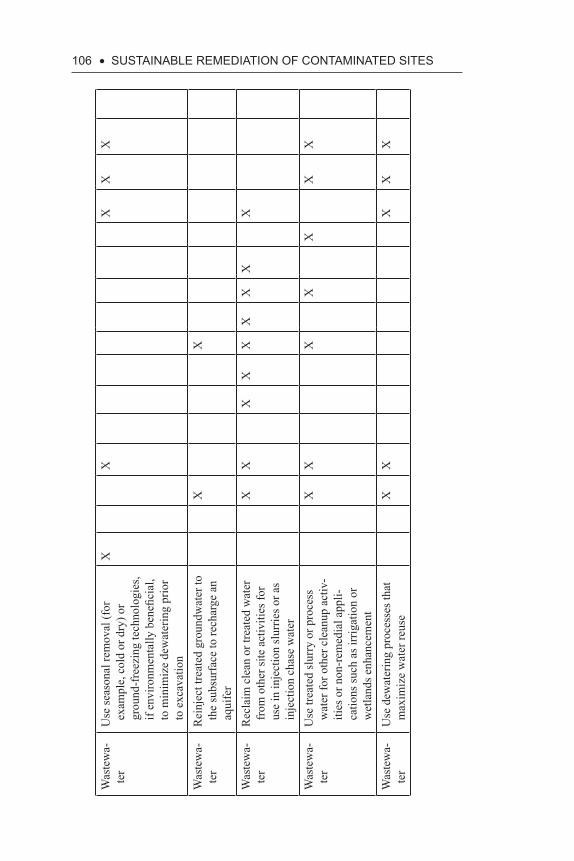
106 • SuStAiNABLE REMEDiAtiON Of CONtAMiNAtED SitES
Was
tew
a-te
rU
se se
ason
al re
mov
al (f
or
exam
ple,
col
d or
dry
) or
grou
nd-f
reez
ing
tech
nolo
gies
, if
envi
ronm
enta
lly b
enefi
cial
, to
min
imiz
e de
wat
erin
g pr
ior
to e
xcav
atio
n
XX
XX
X
Was
tew
a-te
rR
einj
ect t
reat
ed g
roun
dwat
er to
th
e su
bsur
face
to re
char
ge a
n aq
uife
r
XX
Was
tew
a-te
rR
ecla
im c
lean
or t
reat
ed w
ater
fr
om o
ther
site
act
iviti
es fo
r us
e in
inje
ctio
n sl
urrie
s or a
s in
ject
ion
chas
e w
ater
XX
XX
XX
XX
X
Was
tew
a-te
rU
se tr
eate
d sl
urry
or p
roce
ss
wat
er fo
r oth
er c
lean
up a
ctiv
-iti
es o
r non
-rem
edia
l app
li-ca
tions
such
as i
rrig
atio
n or
w
etla
nds e
nhan
cem
ent
XX
XX
XX
X
Was
tew
a-te
rU
se d
ewat
erin
g pr
oces
ses t
hat
max
imiz
e w
ater
reus
eX
XX
XX
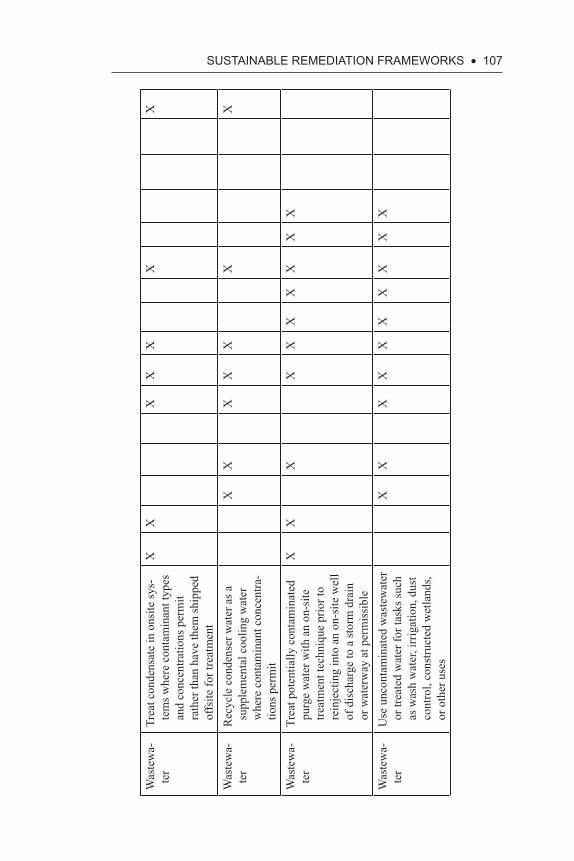
SuStAiNABLE REMEDiAtiON fRAMEWORKS • 107
Was
tew
a-te
rTr
eat c
onde
nsat
e in
ons
ite sy
s-te
ms w
here
con
tam
inan
t typ
es
and
conc
entra
tions
per
mit
rath
er th
an h
ave
them
ship
ped
offs
ite fo
r tre
atm
ent
XX
XX
XX
X
Was
tew
a-te
rR
ecyc
le c
onde
nser
wat
er a
s a
supp
lem
enta
l coo
ling
wat
er
whe
re c
onta
min
ant c
once
ntra
-tio
ns p
erm
it
XX
XX
XX
X
Was
tew
a-te
rTr
eat p
oten
tially
con
tam
inat
ed
purg
e w
ater
with
an
on-s
ite
treat
men
t tec
hniq
ue p
rior t
o re
inje
ctin
g in
to a
n on
-site
wel
l of
dis
char
ge to
a st
orm
dra
in
or w
ater
way
at p
erm
issi
ble
XX
XX
XX
XX
XX
Was
tew
a-te
rU
se u
ncon
tam
inat
ed w
aste
wat
er
or tr
eate
d w
ater
for t
asks
such
as
was
h w
ater
, irr
igat
ion,
dus
t co
ntro
l, co
nstru
cted
wet
land
s, or
oth
er u
ses
XX
XX
XX
XX
XX
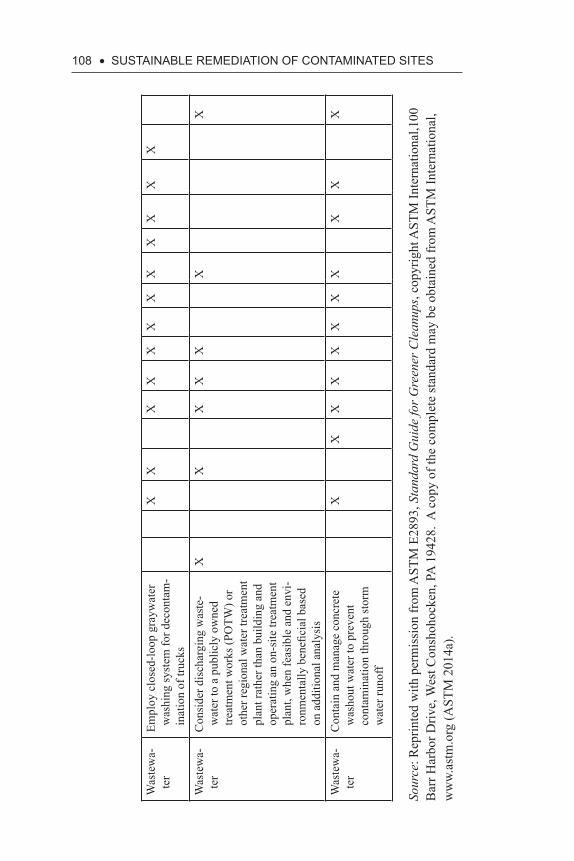
108 • SuStAiNABLE REMEDiAtiON Of CONtAMiNAtED SitES
Was
tew
a-te
rEm
ploy
clo
sed-
loop
gra
ywat
er
was
hing
syst
em fo
r dec
onta
m-
inat
ion
of tr
ucks
XX
XX
XX
XX
XX
XX
Was
tew
a-te
rC
onsi
der d
isch
argi
ng w
aste
-w
ater
to a
pub
licly
ow
ned
treat
men
t wor
ks (P
OTW
) or
othe
r reg
iona
l wat
er tr
eatm
ent
plan
t rat
her t
han
build
ing
and
oper
atin
g an
on-
site
trea
tmen
t pl
ant,
whe
n fe
asib
le a
nd e
nvi-
ronm
enta
lly b
enefi
cial
bas
ed
on a
dditi
onal
ana
lysi
s
XX
XX
XX
X
Was
tew
a-te
rC
onta
in a
nd m
anag
e co
ncre
te
was
hout
wat
er to
pre
vent
co
ntam
inat
ion
thro
ugh
stor
m
wat
er ru
noff
XX
XX
XX
XX
XX
X
Sour
ce: R
eprin
ted
with
per
mis
sion
from
AST
M E
2893
, Sta
ndar
d G
uide
for G
reen
er C
lean
ups,
copy
right
AST
M In
tern
atio
nal,1
00
Bar
r Har
bor D
rive,
Wes
t Con
shoh
ocke
n, P
A 1
9428
. A
cop
y of
the
com
plet
e st
anda
rd m
ay b
e ob
tain
ed fr
om A
STM
Inte
rnat
iona
l, w
ww
.ast
m.o
rg (A
STM
201
4a).
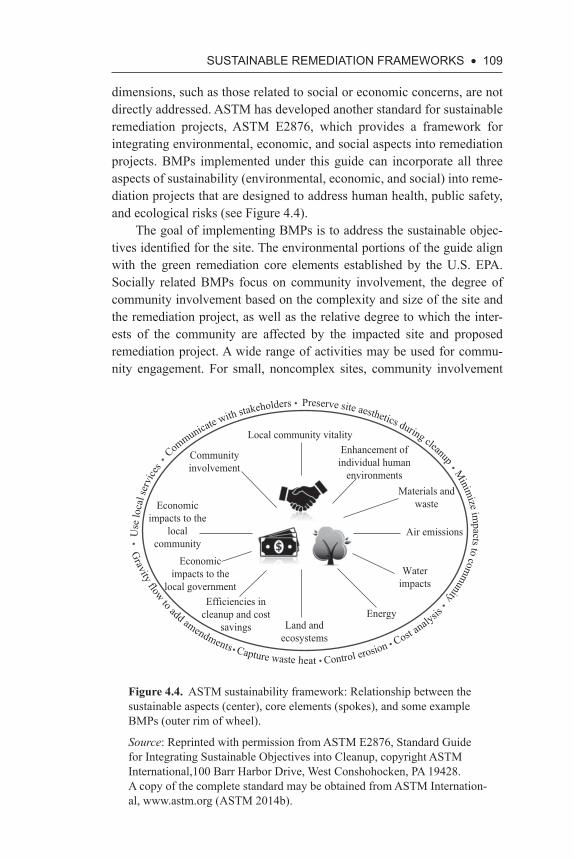
SuStAiNABLE REMEDiAtiON fRAMEWORKS • 109
dimensions, such as those related to social or economic concerns, are not directly addressed. ASTM has developed another standard for sustainable remediation projects, ASTM E2876, which provides a framework for integrating environmental, economic, and social aspects into remediation projects. BMPs implemented under this guide can incorporate all three aspects of sustainability (environmental, economic, and social) into reme-diation projects that are designed to address human health, public safety, and ecological risks (see Figure 4.4).
The goal of implementing BMPs is to address the sustainable objec-tives identified for the site. The environmental portions of the guide align with the green remediation core elements established by the U.S. EPA. Socially related BMPs focus on community involvement, the degree of community involvement based on the complexity and size of the site and the remediation project, as well as the relative degree to which the inter-ests of the community are affected by the impacted site and proposed remediation project. A wide range of activities may be used for commu-nity engagement. For small, noncomplex sites, community involvement
Communicate with stakeholders Preserve site aesthetics during cleanup M
inimize im
pacts to comm
unity
Gravity flow to add amendments Capture waste heat Control erosion Cost a
nalysis
U
se lo
cal s
ervi
ces
Local community vitality
Communityinvolvement
Economicimpacts to the
localcommunity
Economicimpacts to the
local governmentEfficiencies in
cleanup and costsavings Land and
ecosystems
Energy
Waterimpacts
Air emissions
Materials andwaste
Enhancement ofindividual human
environments
Figure 4.4. ASTM sustainability framework: Relationship between the sustainable aspects (center), core elements (spokes), and some example BMPs (outer rim of wheel).
Source: Reprinted with permission from ASTM E2876, Standard Guide for Integrating Sustainable Objectives into Cleanup, copyright ASTM International,100 Barr Harbor Drive, West Conshohocken, PA 19428. A copy of the complete standard may be obtained from ASTM Internation-al, www.astm.org (ASTM 2014b).
110 • SuStAiNABLE REMEDiAtiON Of CONtAMiNAtED SitES
activities may include public notices (both electronic and paper mail), site signage, website information, community meetings, radio or television announcements, or distribution of fact sheets about the selection and imple-mentation of sustainable BMPs. At sites with complex activities, or where there is a high level of interest on the part of the community, the level of involvement should be increased. In these circumstances, the user should identify and recruit representatives of key stakeholder groups via local community groups, civic associations, chambers of commerce, homeown-ers associations, park associations, and clubs. Community leaders may be solicited for involvement through personal invitations, door-to-door com-munications or introductions, letters, or phone calls. Community leaders and representatives should be encouraged to participate in discussions and decision- making processes. Common goals should be sought between proj-ect proponents and stakeholders and directed toward outcomes reflective of the interests of each constituent group and of the community as a whole.
With respect to the economic sustainability dimension, potential eco-nomic impacts to the local community, local government should be consid-ered in parallel with potential costs and benefits directly associated with the remediation project, including an emphasis on the maximization of positive public economic impacts to the local community. One means to enhance overall economic impact is through consideration of the economic multi-plier effect. The concept is focused on direct local investment that will, in turn, foster secondary economic benefits to the community. For example, the project proponent may choose to utilize local contractors and materials suppliers for the remediation project. In turn, these local businesses will often utilize a significant portion of their benefit into other local businesses, such as service providers (restaurants, gas stations, etc.), as well as local labor pools for temporary or long-term employment. This element could also benefit social aspects by reducing unemployment and increasing on-the-job training and experience. Additionally, other public economic and local government programs may be available, including job training, economic development areas, and increased grant and loan opportunities that can have a positive financial effect directly to the project as well as to the greater community.
Direct costs of remediation alternatives and activities are often com-pared during the cost-benefit evaluation process. The comparison and follow-up documentation of these cost-benefit analyses can provide a solid economic justification for sustainable methodologies and the value of sus-tainable business practices. While this element is primarily economic, it could benefit social and environmental aspects as well.
Several example BMPs associated with sustainable objectives that may be considered for a remediation project are presented in Table 4.2. To the extent feasible, as many BMPs as possible should be selected and implemented to address the sustainable objectives in a given remediation
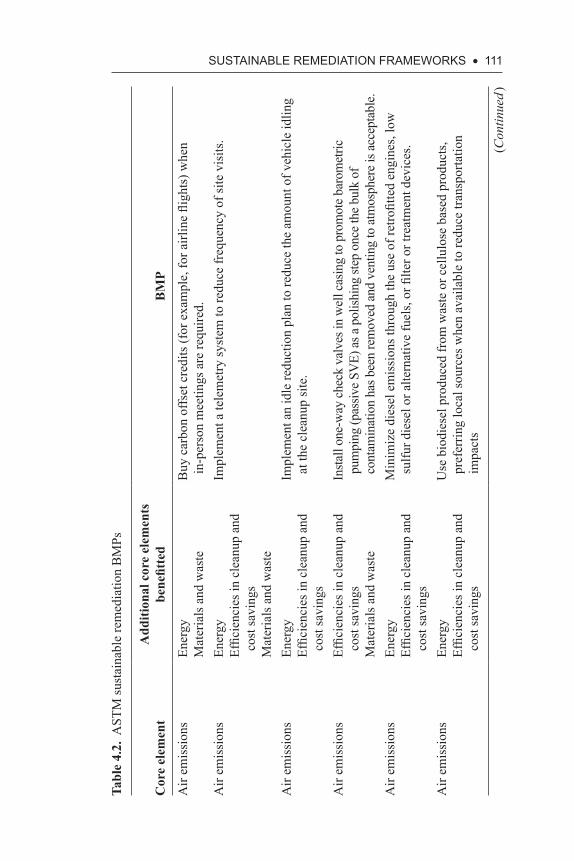
SuStAiNABLE REMEDiAtiON fRAMEWORKS • 111
Tabl
e 4.
2. A
STM
sust
aina
ble
rem
edia
tion
BM
Ps
Cor
e el
emen
tA
dditi
onal
cor
e el
emen
ts
bene
fitte
dB
MP
Air
emis
sion
sEn
ergy
Mat
eria
ls a
nd w
aste
Buy
car
bon
offs
et c
redi
ts (f
or e
xam
ple,
for a
irlin
e fli
ghts
) whe
n in
-per
son
mee
tings
are
requ
ired.
Air
emis
sion
sEn
ergy
Effic
ienc
ies i
n cl
eanu
p an
d co
st sa
ving
sM
ater
ials
and
was
te
Impl
emen
t a te
lem
etry
syst
em to
redu
ce fr
eque
ncy
of si
te v
isits
.
Air
emis
sion
sEn
ergy
Effic
ienc
ies i
n cl
eanu
p an
d co
st sa
ving
s
Impl
emen
t an
idle
redu
ctio
n pl
an to
redu
ce th
e am
ount
of v
ehic
le id
ling
at th
e cl
eanu
p si
te.
Air
emis
sion
sEf
ficie
ncie
s in
clea
nup
and
cost
savi
ngs
Mat
eria
ls a
nd w
aste
Insta
ll on
e-w
ay c
heck
val
ves i
n w
ell c
asin
g to
pro
mot
e ba
rom
etric
pu
mpi
ng (p
assiv
e SV
E) a
s a p
olish
ing
step
once
the
bulk
of
cont
amin
atio
n ha
s bee
n re
mov
ed a
nd v
entin
g to
atm
osph
ere
is ac
cept
able
.A
ir em
issi
ons
Ener
gyEf
ficie
ncie
s in
clea
nup
and
cost
savi
ngs
Min
imiz
e di
esel
em
issi
ons t
hrou
gh th
e us
e of
retro
fitte
d en
gine
s, lo
w
sulfu
r die
sel o
r alte
rnat
ive
fuel
s, or
filte
r or t
reat
men
t dev
ices
.
Air
emis
sion
sEn
ergy
Effic
ienc
ies i
n cl
eanu
p an
d co
st sa
ving
s
Use
bio
dies
el p
rodu
ced
from
was
te o
r cel
lulo
se b
ased
pro
duct
s, pr
efer
ring
loca
l sou
rces
whe
n av
aila
ble
to re
duce
tran
spor
tatio
n im
pact
s
(Con
tinue
d )
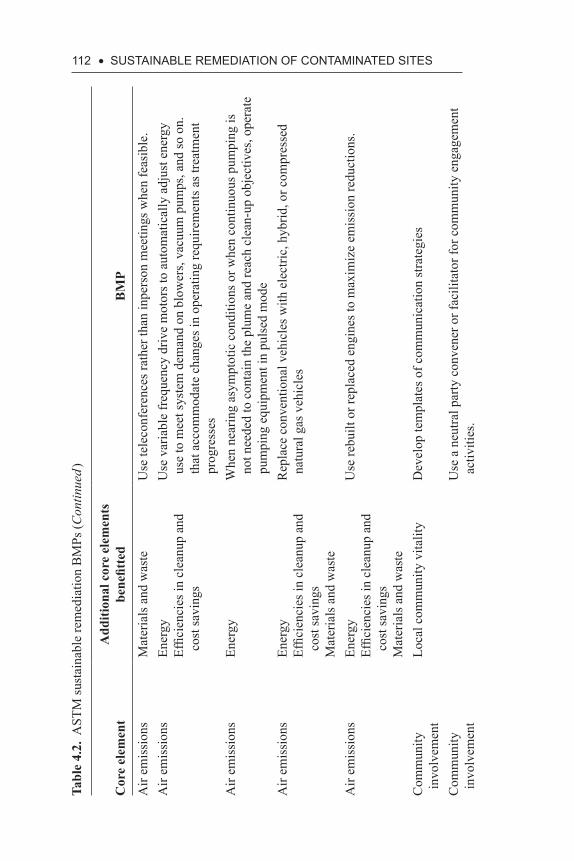
112 • SuStAiNABLE REMEDiAtiON Of CONtAMiNAtED SitESTa
ble
4.2.
AST
M su
stai
nabl
e re
med
iatio
n B
MPs
(Con
tinue
d )
Cor
e el
emen
tA
dditi
onal
cor
e el
emen
ts
bene
fitte
dB
MP
Air
emis
sion
sM
ater
ials
and
was
teU
se te
leco
nfer
ence
s rat
her t
han
inpe
rson
mee
tings
whe
n fe
asib
le.
Air
emis
sion
sEn
ergy
Effic
ienc
ies i
n cl
eanu
p an
d co
st sa
ving
s
Use
var
iabl
e fr
eque
ncy
driv
e m
otor
s to
auto
mat
ical
ly a
djus
t ene
rgy
use
to m
eet s
yste
m d
eman
d on
blo
wer
s, va
cuum
pum
ps, a
nd so
on.
th
at a
ccom
mod
ate
chan
ges i
n op
erat
ing
requ
irem
ents
as t
reat
men
t pr
ogre
sses
Air
emis
sion
sEn
ergy
Whe
n ne
arin
g as
ympt
otic
con
ditio
ns o
r whe
n co
ntin
uous
pum
ping
is
not n
eede
d to
con
tain
the
plum
e an
d re
ach
clea
n-up
obj
ectiv
es, o
pera
te
pum
ping
equ
ipm
ent i
n pu
lsed
mod
eA
ir em
issi
ons
Ener
gyEf
ficie
ncie
s in
clea
nup
and
cost
savi
ngs
Mat
eria
ls a
nd w
aste
Rep
lace
con
vent
iona
l veh
icle
s with
ele
ctric
, hyb
rid, o
r com
pres
sed
natu
ral g
as v
ehic
les
Air
emis
sion
sEn
ergy
Effic
ienc
ies i
n cl
eanu
p an
d co
st sa
ving
sM
ater
ials
and
was
te
Use
rebu
ilt o
r rep
lace
d en
gine
s to
max
imiz
e em
issi
on re
duct
ions
.
Com
mun
ity
invo
lvem
ent
Loca
l com
mun
ity v
italit
yD
evel
op te
mpl
ates
of c
omm
unic
atio
n st
rate
gies
Com
mun
ity
invo
lvem
ent
Use
a n
eutra
l par
ty c
onve
ner o
r fac
ilita
tor f
or c
omm
unity
eng
agem
ent
activ
ities
.
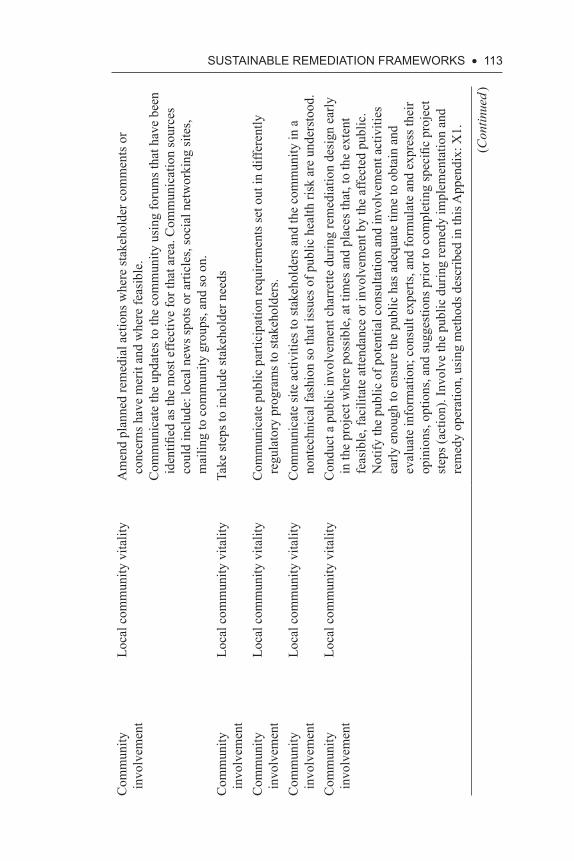
SuStAiNABLE REMEDiAtiON fRAMEWORKS • 113
Com
mun
ity
invo
lvem
ent
Loca
l com
mun
ity v
italit
yA
men
d pl
anne
d re
med
ial a
ctio
ns w
here
stak
ehol
der c
omm
ents
or
conc
erns
hav
e m
erit
and
whe
re fe
asib
le.
Com
mun
icat
e th
e up
date
s to
the
com
mun
ity u
sing
foru
ms t
hat h
ave
been
id
entifi
ed a
s the
mos
t effe
ctiv
e fo
r tha
t are
a. C
omm
unic
atio
n so
urce
s co
uld
incl
ude:
loca
l new
s spo
ts o
r arti
cles
, soc
ial n
etw
orki
ng si
tes,
mai
ling
to c
omm
unity
gro
ups,
and
so o
n.C
omm
unity
in
volv
emen
tLo
cal c
omm
unity
vita
lity
Take
step
s to
incl
ude
stak
ehol
der n
eeds
Com
mun
ity
invo
lvem
ent
Loca
l com
mun
ity v
italit
yC
omm
unic
ate
publ
ic p
artic
ipat
ion
requ
irem
ents
set o
ut in
diff
eren
tly
regu
lato
ry p
rogr
ams t
o st
akeh
olde
rs.
Com
mun
ity
invo
lvem
ent
Loca
l com
mun
ity v
italit
yC
omm
unic
ate
site
act
iviti
es to
stak
ehol
ders
and
the
com
mun
ity in
a
nont
echn
ical
fash
ion
so th
at is
sues
of p
ublic
hea
lth ri
sk a
re u
nder
stoo
d.C
omm
unity
in
volv
emen
tLo
cal c
omm
unity
vita
lity
Con
duct
a p
ublic
invo
lvem
ent c
harr
ette
dur
ing
rem
edia
tion
desi
gn e
arly
in
the
proj
ect w
here
pos
sibl
e, a
t tim
es a
nd p
lace
s tha
t, to
the
exte
nt
feas
ible
, fac
ilita
te a
ttend
ance
or i
nvol
vem
ent b
y th
e af
fect
ed p
ublic
. N
otify
the
publ
ic o
f pot
entia
l con
sulta
tion
and
invo
lvem
ent a
ctiv
ities
ea
rly e
noug
h to
ens
ure
the
publ
ic h
as a
dequ
ate
time
to o
btai
n an
d ev
alua
te in
form
atio
n; c
onsu
lt ex
perts
, and
form
ulat
e an
d ex
pres
s the
ir op
inio
ns, o
ptio
ns, a
nd su
gges
tions
prio
r to
com
plet
ing
spec
ific
proj
ect
step
s (ac
tion)
. Inv
olve
the
publ
ic d
urin
g re
med
y im
plem
enta
tion
and
rem
edy
oper
atio
n, u
sing
met
hods
des
crib
ed in
this
App
endi
x: X
1.
(Con
tinue
d )
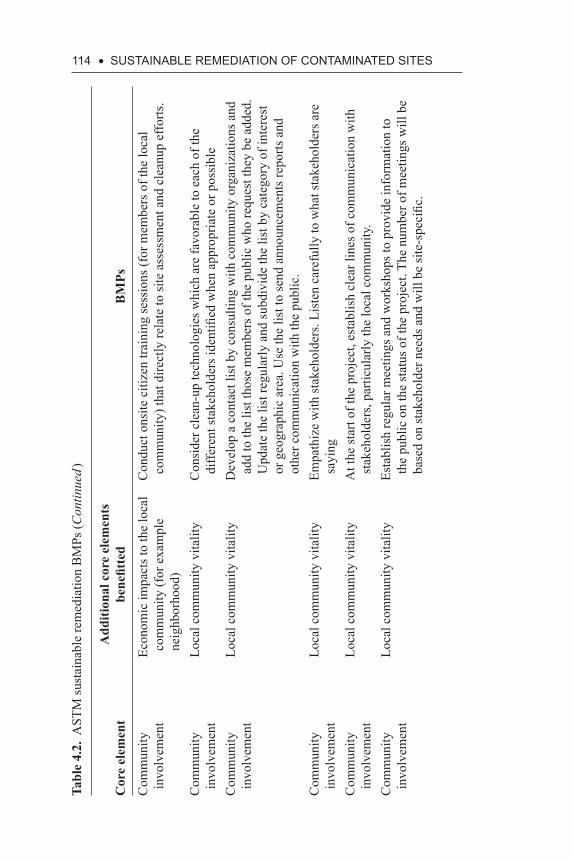
114 • SuStAiNABLE REMEDiAtiON Of CONtAMiNAtED SitESTa
ble
4.2.
AST
M su
stai
nabl
e re
med
iatio
n B
MPs
(Con
tinue
d )
Cor
e el
emen
tA
dditi
onal
cor
e el
emen
ts
bene
fitte
dB
MPs
Com
mun
ity
invo
lvem
ent
Econ
omic
impa
cts t
o th
e lo
cal
com
mun
ity (f
or e
xam
ple
neig
hbor
hood
)
Con
duct
ons
ite c
itize
n tra
inin
g se
ssio
ns (f
or m
embe
rs o
f the
loca
l co
mm
unity
) tha
t dire
ctly
rela
te to
site
ass
essm
ent a
nd c
lean
up e
fforts
.
Com
mun
ity
invo
lvem
ent
Loca
l com
mun
ity v
italit
yC
onsi
der c
lean
-up
tech
nolo
gies
whi
ch a
re fa
vora
ble
to e
ach
of th
e di
ffere
nt st
akeh
olde
rs id
entifi
ed w
hen
appr
opria
te o
r pos
sibl
eC
omm
unity
in
volv
emen
tLo
cal c
omm
unity
vita
lity
Dev
elop
a c
onta
ct li
st b
y co
nsul
ting
with
com
mun
ity o
rgan
izat
ions
and
ad
d to
the
list t
hose
mem
bers
of t
he p
ublic
who
requ
est t
hey
be a
dded
. U
pdat
e th
e lis
t reg
ular
ly a
nd su
bdiv
ide
the
list b
y ca
tego
ry o
f int
eres
t or
geo
grap
hic
area
. Use
the
list t
o se
nd a
nnou
ncem
ents
repo
rts a
nd
othe
r com
mun
icat
ion
with
the
publ
ic.
Com
mun
ity
invo
lvem
ent
Loca
l com
mun
ity v
italit
yEm
path
ize
with
stak
ehol
ders
. Lis
ten
care
fully
to w
hat s
take
hold
ers a
re
sayi
ngC
omm
unity
in
volv
emen
tLo
cal c
omm
unity
vita
lity
At t
he st
art o
f the
pro
ject
, est
ablis
h cl
ear l
ines
of c
omm
unic
atio
n w
ith
stak
ehol
ders
, par
ticul
arly
the
loca
l com
mun
ity.
Com
mun
ity
invo
lvem
ent
Loca
l com
mun
ity v
italit
yEs
tabl
ish
regu
lar m
eetin
gs a
nd w
orks
hops
to p
rovi
de in
form
atio
n to
th
e pu
blic
on
the
stat
us o
f the
pro
ject
. The
num
ber o
f mee
tings
will
be
base
d on
stak
ehol
der n
eeds
and
will
be
site
-spe
cific
.
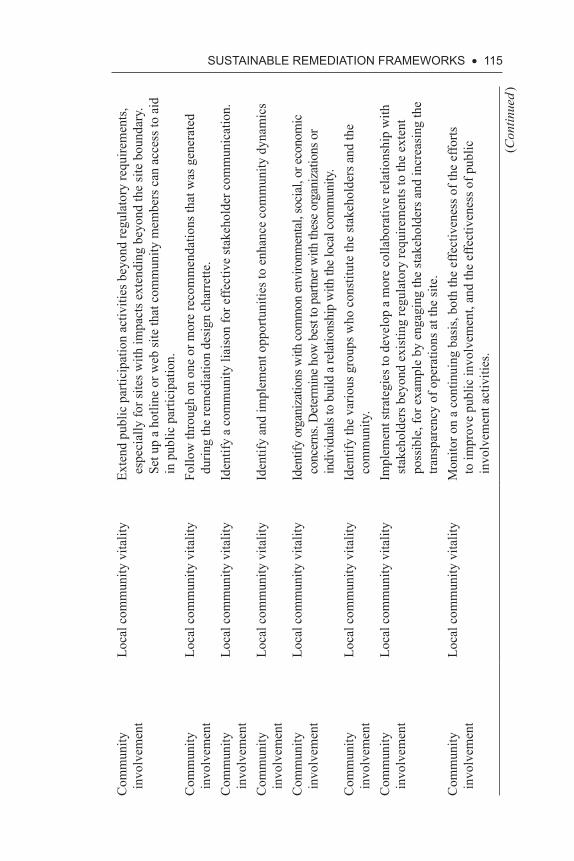
SuStAiNABLE REMEDiAtiON fRAMEWORKS • 115
Com
mun
ity
invo
lvem
ent
Loca
l com
mun
ity v
italit
yEx
tend
pub
lic p
artic
ipat
ion
activ
ities
bey
ond
regu
lato
ry re
quire
men
ts,
espe
cial
ly fo
r site
s with
impa
cts e
xten
ding
bey
ond
the
site
bou
ndar
y.
Set u
p a
hotli
ne o
r web
site
that
com
mun
ity m
embe
rs c
an a
cces
s to
aid
in p
ublic
par
ticip
atio
n.C
omm
unity
in
volv
emen
tLo
cal c
omm
unity
vita
lity
Follo
w th
roug
h on
one
or m
ore
reco
mm
enda
tions
that
was
gen
erat
ed
durin
g th
e re
med
iatio
n de
sign
cha
rret
te.
Com
mun
ity
invo
lvem
ent
Loca
l com
mun
ity v
italit
yId
entif
y a
com
mun
ity li
aiso
n fo
r effe
ctiv
e st
akeh
olde
r com
mun
icat
ion.
Com
mun
ity
invo
lvem
ent
Loca
l com
mun
ity v
italit
yId
entif
y an
d im
plem
ent o
ppor
tuni
ties t
o en
hanc
e co
mm
unity
dyn
amic
s
Com
mun
ity
invo
lvem
ent
Loca
l com
mun
ity v
italit
yId
entif
y or
gani
zatio
ns w
ith co
mm
on en
viro
nmen
tal,
soci
al, o
r eco
nom
ic
conc
erns
. Det
erm
ine h
ow b
est t
o pa
rtner
with
thes
e org
aniz
atio
ns o
r in
divi
dual
s to
build
a re
latio
nshi
p w
ith th
e loc
al co
mm
unity
.C
omm
unity
in
volv
emen
tLo
cal c
omm
unity
vita
lity
Iden
tify
the
vario
us g
roup
s who
con
stitu
te th
e st
akeh
olde
rs a
nd th
e co
mm
unity
.C
omm
unity
in
volv
emen
tLo
cal c
omm
unity
vita
lity
Impl
emen
t stra
tegi
es to
dev
elop
a m
ore
colla
bora
tive
rela
tions
hip
with
st
akeh
olde
rs b
eyon
d ex
istin
g re
gula
tory
requ
irem
ents
to th
e ex
tent
po
ssib
le, f
or e
xam
ple
by e
ngag
ing
the
stak
ehol
ders
and
incr
easi
ng th
e tra
nspa
renc
y of
ope
ratio
ns a
t the
site
.C
omm
unity
in
volv
emen
tLo
cal c
omm
unity
vita
lity
Mon
itor o
n a
cont
inui
ng b
asis
, bot
h th
e ef
fect
iven
ess o
f the
effo
rts
to im
prov
e pu
blic
invo
lvem
ent,
and
the
effe
ctiv
enes
s of p
ublic
in
volv
emen
t act
iviti
es.
(Con
tinue
d )
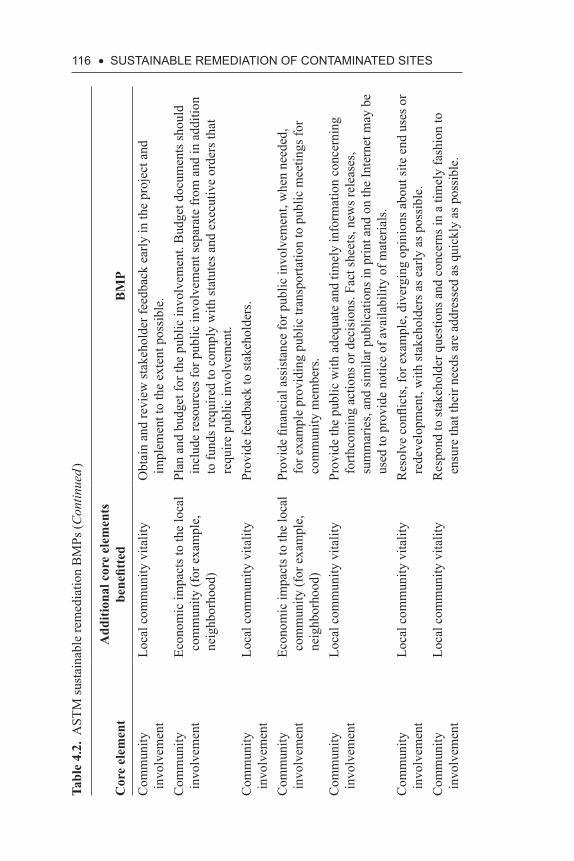
116 • SuStAiNABLE REMEDiAtiON Of CONtAMiNAtED SitESTa
ble
4.2.
AST
M su
stai
nabl
e re
med
iatio
n B
MPs
(Con
tinue
d )
Cor
e el
emen
tA
dditi
onal
cor
e el
emen
ts
bene
fitte
dB
MP
Com
mun
ity
invo
lvem
ent
Loca
l com
mun
ity v
italit
yO
btai
n an
d re
view
stak
ehol
der f
eedb
ack
early
in th
e pr
ojec
t and
im
plem
ent t
o th
e ex
tent
pos
sibl
e.C
omm
unity
in
volv
emen
tEc
onom
ic im
pact
s to
the
loca
l co
mm
unity
(for
exa
mpl
e,
neig
hbor
hood
)
Plan
and
bud
get f
or th
e pu
blic
invo
lvem
ent.
Bud
get d
ocum
ents
shou
ld
incl
ude
reso
urce
s for
pub
lic in
volv
emen
t sep
arat
e fr
om a
nd in
add
ition
to
fund
s req
uire
d to
com
ply
with
stat
utes
and
exe
cutiv
e or
ders
that
re
quire
pub
lic in
volv
emen
t.C
omm
unity
in
volv
emen
tLo
cal c
omm
unity
vita
lity
Prov
ide
feed
back
to st
akeh
olde
rs.
Com
mun
ity
invo
lvem
ent
Econ
omic
impa
cts t
o th
e lo
cal
com
mun
ity (f
or e
xam
ple,
ne
ighb
orho
od)
Prov
ide
finan
cial
ass
ista
nce
for p
ublic
invo
lvem
ent,
whe
n ne
eded
, fo
r exa
mpl
e pr
ovid
ing
publ
ic tr
ansp
orta
tion
to p
ublic
mee
tings
for
com
mun
ity m
embe
rs.
Com
mun
ity
invo
lvem
ent
Loca
l com
mun
ity v
italit
yPr
ovid
e th
e pu
blic
with
ade
quat
e an
d tim
ely
info
rmat
ion
conc
erni
ng
forth
com
ing
actio
ns o
r dec
isio
ns. F
act s
heet
s, ne
ws r
elea
ses,
sum
mar
ies,
and
sim
ilar p
ublic
atio
ns in
prin
t and
on
the
Inte
rnet
may
be
used
to p
rovi
de n
otic
e of
ava
ilabi
lity
of m
ater
ials
.C
omm
unity
in
volv
emen
tLo
cal c
omm
unity
vita
lity
Res
olve
con
flict
s, fo
r exa
mpl
e, d
iver
ging
opi
nion
s abo
ut si
te e
nd u
ses o
r re
deve
lopm
ent,
with
stak
ehol
ders
as e
arly
as p
ossi
ble.
Com
mun
ity
invo
lvem
ent
Loca
l com
mun
ity v
italit
yR
espo
nd to
stak
ehol
der q
uest
ions
and
con
cern
s in
a tim
ely
fash
ion
to
ensu
re th
at th
eir n
eeds
are
add
ress
ed a
s qui
ckly
as p
ossi
ble.
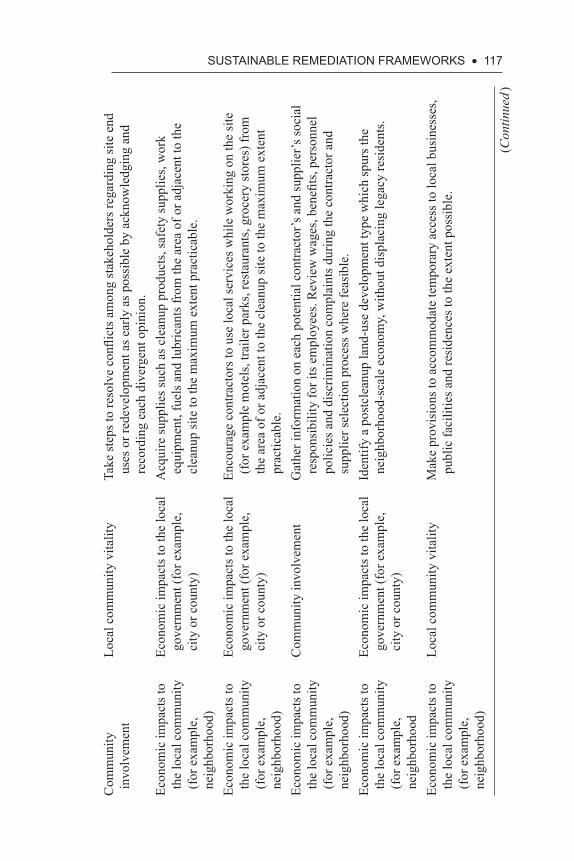
SuStAiNABLE REMEDiAtiON fRAMEWORKS • 117
Com
mun
ity
invo
lvem
ent
Loca
l com
mun
ity v
italit
yTa
ke st
eps t
o re
solv
e co
nflic
ts a
mon
g st
akeh
olde
rs re
gard
ing
site
end
us
es o
r red
evel
opm
ent a
s ear
ly a
s pos
sibl
e by
ack
now
ledg
ing
and
reco
rdin
g ea
ch d
iver
gent
opi
nion
.Ec
onom
ic im
pact
s to
the
loca
l com
mun
ity
(for
exa
mpl
e,
neig
hbor
hood
)
Econ
omic
impa
cts t
o th
e lo
cal
gove
rnm
ent (
for e
xam
ple,
ci
ty o
r cou
nty)
Acq
uire
supp
lies s
uch
as c
lean
up p
rodu
cts,
safe
ty su
pplie
s, w
ork
equi
pmen
t, fu
els a
nd lu
bric
ants
from
the
area
of o
r adj
acen
t to
the
clea
nup
site
to th
e m
axim
um e
xten
t pra
ctic
able
.
Econ
omic
impa
cts t
o th
e lo
cal c
omm
unity
(f
or e
xam
ple,
ne
ighb
orho
od)
Econ
omic
impa
cts t
o th
e lo
cal
gove
rnm
ent (
for e
xam
ple,
ci
ty o
r cou
nty)
Enco
urag
e co
ntra
ctor
s to
use
loca
l ser
vice
s whi
le w
orki
ng o
n th
e si
te
(for
exa
mpl
e m
otel
s, tra
iler p
arks
, res
taur
ants
, gro
cery
stor
es) f
rom
th
e ar
ea o
f or a
djac
ent t
o th
e cl
eanu
p si
te to
the
max
imum
ext
ent
prac
ticab
le.
Econ
omic
impa
cts t
o th
e lo
cal c
omm
unity
(f
or e
xam
ple,
ne
ighb
orho
od)
Com
mun
ity in
volv
emen
tG
athe
r inf
orm
atio
n on
eac
h po
tent
ial c
ontra
ctor
’s a
nd su
pplie
r’s so
cial
re
spon
sibi
lity
for i
ts e
mpl
oyee
s. R
evie
w w
ages
, ben
efits
, per
sonn
el
polic
ies a
nd d
iscr
imin
atio
n co
mpl
aint
s dur
ing
the
cont
ract
or a
nd
supp
lier s
elec
tion
proc
ess w
here
feas
ible
.Ec
onom
ic im
pact
s to
the
loca
l com
mun
ity
(for
exa
mpl
e,
neig
hbor
hood
Econ
omic
impa
cts t
o th
e lo
cal
gove
rnm
ent (
for e
xam
ple,
ci
ty o
r cou
nty)
Iden
tify
a po
stcl
eanu
p la
nd-u
se d
evel
opm
ent t
ype
whi
ch sp
urs t
he
neig
hbor
hood
-sca
le e
cono
my,
with
out d
ispl
acin
g le
gacy
resi
dent
s.
Econ
omic
impa
cts t
o th
e lo
cal c
omm
unity
(f
or e
xam
ple,
ne
ighb
orho
od)
Loca
l com
mun
ity v
italit
yM
ake
prov
isio
ns to
acc
omm
odat
e te
mpo
rary
acc
ess t
o lo
cal b
usin
esse
s, pu
blic
faci
litie
s and
resi
denc
es to
the
exte
nt p
ossi
ble.
(Con
tinue
d )
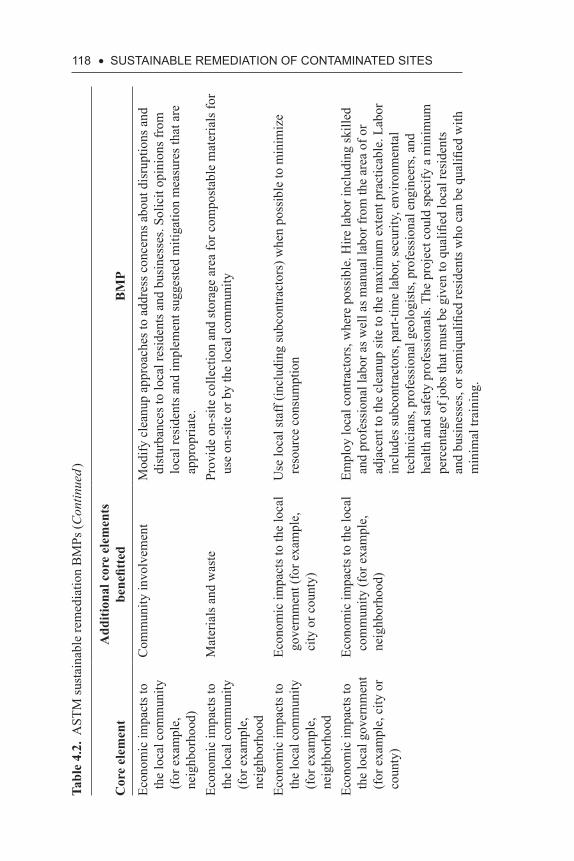
118 • SuStAiNABLE REMEDiAtiON Of CONtAMiNAtED SitESTa
ble
4.2.
AST
M su
stai
nabl
e re
med
iatio
n B
MPs
(Con
tinue
d )
Cor
e el
emen
tA
dditi
onal
cor
e el
emen
ts
bene
fitte
dB
MP
Econ
omic
impa
cts t
o th
e lo
cal c
omm
unity
(f
or e
xam
ple,
ne
ighb
orho
od)
Com
mun
ity in
volv
emen
tM
odify
cle
anup
app
roac
hes t
o ad
dres
s con
cern
s abo
ut d
isru
ptio
ns a
nd
dist
urba
nces
to lo
cal r
esid
ents
and
bus
ines
ses.
Solic
it op
inio
ns fr
om
loca
l res
iden
ts a
nd im
plem
ent s
ugge
sted
miti
gatio
n m
easu
res t
hat a
re
appr
opria
te.
Econ
omic
impa
cts t
o th
e lo
cal c
omm
unity
(f
or e
xam
ple,
ne
ighb
orho
od
Mat
eria
ls a
nd w
aste
Prov
ide
on-s
ite c
olle
ctio
n an
d st
orag
e ar
ea fo
r com
post
able
mat
eria
ls fo
r us
e on
-site
or b
y th
e lo
cal c
omm
unity
Econ
omic
impa
cts t
o th
e lo
cal c
omm
unity
(f
or e
xam
ple,
ne
ighb
orho
od
Econ
omic
impa
cts t
o th
e lo
cal
gove
rnm
ent (
for e
xam
ple,
ci
ty o
r cou
nty)
Use
loca
l sta
ff (in
clud
ing
subc
ontra
ctor
s) w
hen
poss
ible
to m
inim
ize
reso
urce
con
sum
ptio
n
Econ
omic
impa
cts t
o th
e lo
cal g
over
nmen
t (f
or e
xam
ple,
city
or
coun
ty)
Econ
omic
impa
cts t
o th
e lo
cal
com
mun
ity (f
or e
xam
ple,
ne
ighb
orho
od)
Empl
oy lo
cal c
ontra
ctor
s, w
here
pos
sibl
e. H
ire la
bor i
nclu
ding
skill
ed
and
prof
essi
onal
labo
r as w
ell a
s man
ual l
abor
from
the
area
of o
r ad
jace
nt to
the
clea
nup
site
to th
e m
axim
um e
xten
t pra
ctic
able
. Lab
or
incl
udes
subc
ontra
ctor
s, pa
rt-tim
e la
bor,
secu
rity,
env
ironm
enta
l te
chni
cian
s, pr
ofes
sion
al g
eolo
gist
s, pr
ofes
sion
al e
ngin
eers
, and
he
alth
and
safe
ty p
rofe
ssio
nals
. The
pro
ject
cou
ld sp
ecify
a m
inim
um
perc
enta
ge o
f job
s tha
t mus
t be
give
n to
qua
lified
loca
l res
iden
ts
and
busi
ness
es, o
r sem
iqua
lified
resi
dent
s who
can
be
qual
ified
with
m
inim
al tr
aini
ng.
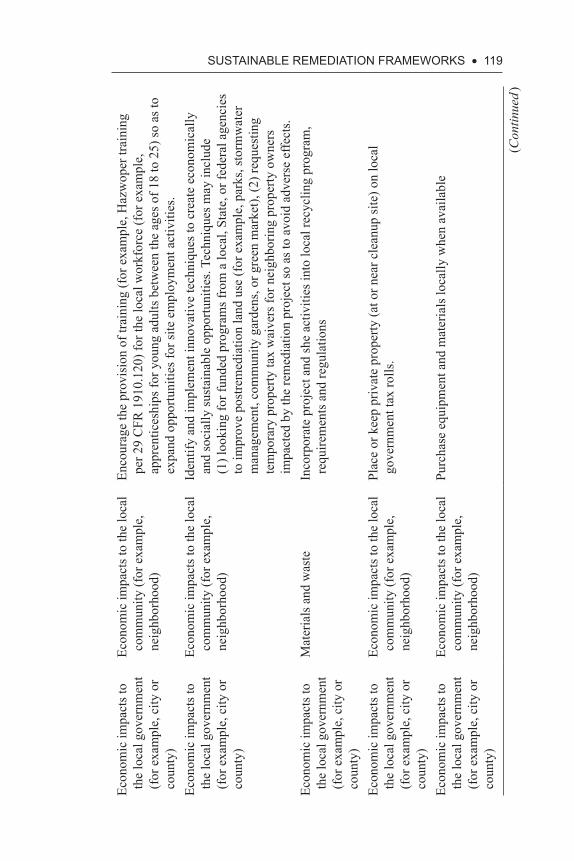
SuStAiNABLE REMEDiAtiON fRAMEWORKS • 119
Econ
omic
impa
cts t
o th
e lo
cal g
over
nmen
t (f
or e
xam
ple,
city
or
coun
ty)
Econ
omic
impa
cts t
o th
e lo
cal
com
mun
ity (f
or e
xam
ple,
ne
ighb
orho
od)
Enco
urag
e th
e pr
ovis
ion
of tr
aini
ng (f
or e
xam
ple,
Haz
wop
er tr
aini
ng
per 2
9 C
FR 1
910.
120)
for t
he lo
cal w
orkf
orce
(for
exa
mpl
e,
appr
entic
eshi
ps fo
r you
ng a
dults
bet
wee
n th
e ag
es o
f 18
to 2
5) so
as t
o ex
pand
opp
ortu
nitie
s for
site
em
ploy
men
t act
iviti
es.
Econ
omic
impa
cts t
o th
e lo
cal g
over
nmen
t (f
or e
xam
ple,
city
or
coun
ty)
Econ
omic
impa
cts t
o th
e lo
cal
com
mun
ity (f
or e
xam
ple,
ne
ighb
orho
od)
Iden
tify
and
impl
emen
t inn
ovat
ive
tech
niqu
es to
cre
ate
econ
omic
ally
an
d so
cial
ly su
stai
nabl
e op
portu
nitie
s. Te
chni
ques
may
incl
ude
(1
) loo
king
for f
unde
d pr
ogra
ms f
rom
a lo
cal,
Stat
e, o
r fed
eral
age
ncie
s to
impr
ove
post
rem
edia
tion
land
use
(for
exa
mpl
e, p
arks
, sto
rmw
ater
m
anag
emen
t, co
mm
unity
gar
dens
, or g
reen
mar
ket),
(2) r
eque
stin
g te
mpo
rary
pro
perty
tax
wai
vers
for n
eigh
borin
g pr
oper
ty o
wne
rs
impa
cted
by
the
rem
edia
tion
proj
ect s
o as
to a
void
adv
erse
effe
cts.
Econ
omic
impa
cts t
o th
e lo
cal g
over
nmen
t (f
or e
xam
ple,
city
or
coun
ty)
Mat
eria
ls a
nd w
aste
Inco
rpor
ate
proj
ect a
nd sh
e ac
tiviti
es in
to lo
cal r
ecyc
ling
prog
ram
, re
quire
men
ts a
nd re
gula
tions
Econ
omic
impa
cts t
o th
e lo
cal g
over
nmen
t (f
or e
xam
ple,
city
or
coun
ty)
Econ
omic
impa
cts t
o th
e lo
cal
com
mun
ity (f
or e
xam
ple,
ne
ighb
orho
od)
Plac
e or
kee
p pr
ivat
e pr
oper
ty (a
t or n
ear c
lean
up si
te) o
n lo
cal
gove
rnm
ent t
ax ro
lls.
Econ
omic
impa
cts t
o th
e lo
cal g
over
nmen
t (f
or e
xam
ple,
city
or
coun
ty)
Econ
omic
impa
cts t
o th
e lo
cal
com
mun
ity (f
or e
xam
ple,
ne
ighb
orho
od)
Purc
hase
equ
ipm
ent a
nd m
ater
ials
loca
lly w
hen
avai
labl
e
(Con
tinue
d )
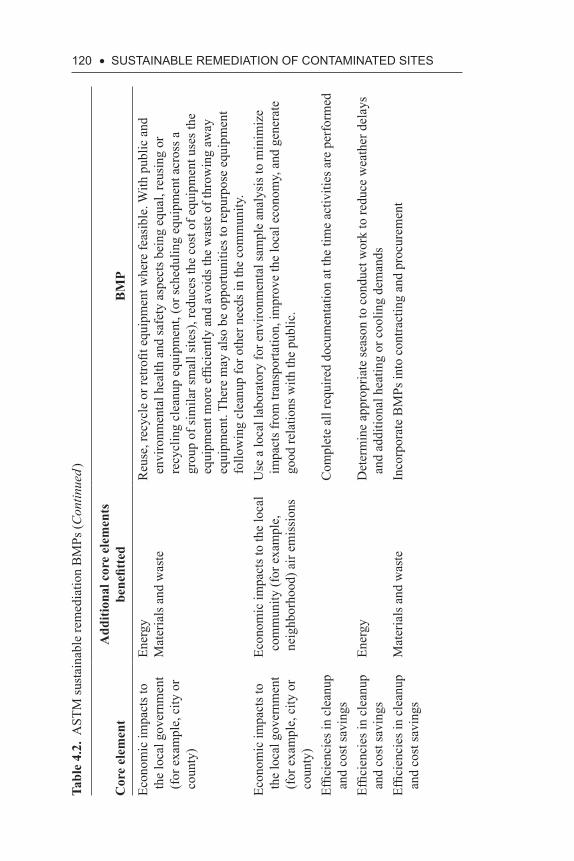
120 • SuStAiNABLE REMEDiAtiON Of CONtAMiNAtED SitESTa
ble
4.2.
AST
M su
stai
nabl
e re
med
iatio
n B
MPs
(Con
tinue
d )
Cor
e el
emen
tA
dditi
onal
cor
e el
emen
ts
bene
fitte
dB
MP
Econ
omic
impa
cts t
o th
e lo
cal g
over
nmen
t (f
or e
xam
ple,
city
or
coun
ty)
Ener
gyM
ater
ials
and
was
teR
euse
, rec
ycle
or r
etro
fit e
quip
men
t whe
re fe
asib
le. W
ith p
ublic
and
en
viro
nmen
tal h
ealth
and
safe
ty a
spec
ts b
eing
equ
al, r
eusi
ng o
r re
cycl
ing
clea
nup
equi
pmen
t, (o
r sch
edul
ing
equi
pmen
t acr
oss a
gr
oup
of si
mila
r sm
all s
ites)
, red
uces
the
cost
of e
quip
men
t use
s the
eq
uipm
ent m
ore
effic
ient
ly a
nd a
void
s the
was
te o
f thr
owin
g aw
ay
equi
pmen
t. Th
ere
may
als
o be
opp
ortu
nitie
s to
repu
rpos
e eq
uipm
ent
follo
win
g cl
eanu
p fo
r oth
er n
eeds
in th
e co
mm
unity
.Ec
onom
ic im
pact
s to
the
loca
l gov
ernm
ent
(for
exa
mpl
e, c
ity o
r co
unty
)
Econ
omic
impa
cts t
o th
e lo
cal
com
mun
ity (f
or e
xam
ple,
ne
ighb
orho
od) a
ir em
issi
ons
Use
a lo
cal l
abor
ator
y fo
r env
ironm
enta
l sam
ple
anal
ysis
to m
inim
ize
impa
cts f
rom
tran
spor
tatio
n, im
prov
e th
e lo
cal e
cono
my,
and
gen
erat
e go
od re
latio
ns w
ith th
e pu
blic
.
Effic
ienc
ies i
n cl
eanu
p an
d co
st sa
ving
sC
ompl
ete
all r
equi
red
docu
men
tatio
n at
the
time
activ
ities
are
per
form
ed
Effic
ienc
ies i
n cl
eanu
p an
d co
st sa
ving
sEn
ergy
Det
erm
ine
appr
opria
te se
ason
to c
ondu
ct w
ork
to re
duce
wea
ther
del
ays
and
addi
tiona
l hea
ting
or c
oolin
g de
man
dsEf
ficie
ncie
s in
clea
nup
and
cost
savi
ngs
Mat
eria
ls a
nd w
aste
Inco
rpor
ate
BM
Ps in
to c
ontra
ctin
g an
d pr
ocur
emen
t
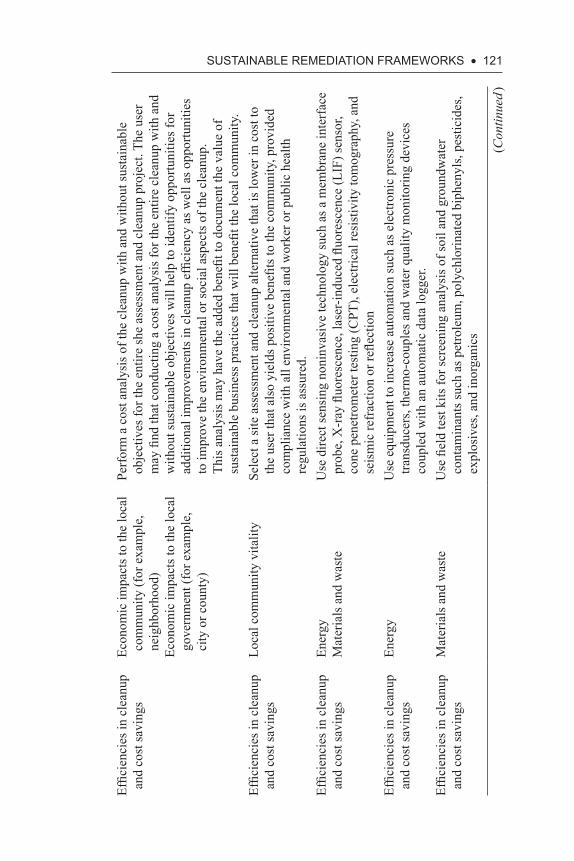
SuStAiNABLE REMEDiAtiON fRAMEWORKS • 121
Effic
ienc
ies i
n cl
eanu
p an
d co
st sa
ving
sEc
onom
ic im
pact
s to
the
loca
l co
mm
unity
(for
exa
mpl
e,
neig
hbor
hood
)Ec
onom
ic im
pact
s to
the
loca
l go
vern
men
t (fo
r exa
mpl
e,
city
or c
ount
y)
Perf
orm
a c
ost a
naly
sis o
f the
cle
anup
with
and
with
out s
usta
inab
le
obje
ctiv
es fo
r the
ent
ire sh
e as
sess
men
t and
cle
anup
pro
ject
. The
use
r m
ay fi
nd th
at c
ondu
ctin
g a
cost
ana
lysi
s for
the
entir
e cl
eanu
p w
ith a
nd
with
out s
usta
inab
le o
bjec
tives
will
hel
p to
iden
tify
oppo
rtuni
ties f
or
addi
tiona
l im
prov
emen
ts in
cle
anup
effi
cien
cy a
s wel
l as o
ppor
tuni
ties
to im
prov
e th
e en
viro
nmen
tal o
r soc
ial a
spec
ts o
f the
cle
anup
. Th
is a
naly
sis m
ay h
ave
the
adde
d be
nefit
to d
ocum
ent t
he v
alue
of
sust
aina
ble
busi
ness
pra
ctic
es th
at w
ill b
enefi
t the
loca
l com
mun
ity.
Effic
ienc
ies i
n cl
eanu
p an
d co
st sa
ving
sLo
cal c
omm
unity
vita
lity
Sele
ct a
site
ass
essm
ent a
nd c
lean
up a
ltern
ativ
e th
at is
low
er in
cos
t to
the
user
that
als
o yi
elds
pos
itive
ben
efits
to th
e co
mm
unity
, pro
vide
d co
mpl
ianc
e w
ith a
ll en
viro
nmen
tal a
nd w
orke
r or p
ublic
hea
lth
regu
latio
ns is
ass
ured
.Ef
ficie
ncie
s in
clea
nup
and
cost
savi
ngs
Ener
gyM
ater
ials
and
was
teU
se d
irect
sens
ing
noni
nvas
ive
tech
nolo
gy su
ch a
s a m
embr
ane
inte
rfac
e pr
obe,
X-r
ay fl
uore
scen
ce, l
aser
-indu
ced
fluor
esce
nce
(LIF
) sen
sor,
cone
pen
etro
met
er te
stin
g (C
PT),
elec
trica
l res
istiv
ity to
mog
raph
y, a
nd
seis
mic
refr
actio
n or
refle
ctio
nEf
ficie
ncie
s in
clea
nup
and
cost
savi
ngs
Ener
gyU
se e
quip
men
t to
incr
ease
aut
omat
ion
such
as e
lect
roni
c pr
essu
re
trans
duce
rs, t
herm
o-co
uple
s and
wat
er q
ualit
y m
onito
ring
devi
ces
coup
led
with
an
auto
mat
ic d
ata
logg
er.
Effic
ienc
ies i
n cl
eanu
p an
d co
st sa
ving
sM
ater
ials
and
was
teU
se fi
eld
test
kits
for s
cree
ning
ana
lysi
s of s
oil a
nd g
roun
dwat
er
cont
amin
ants
such
as p
etro
leum
, pol
ychl
orin
ated
bip
heny
ls, p
estic
ides
, ex
plos
ives
, and
inor
gani
cs
(Con
tinue
d )
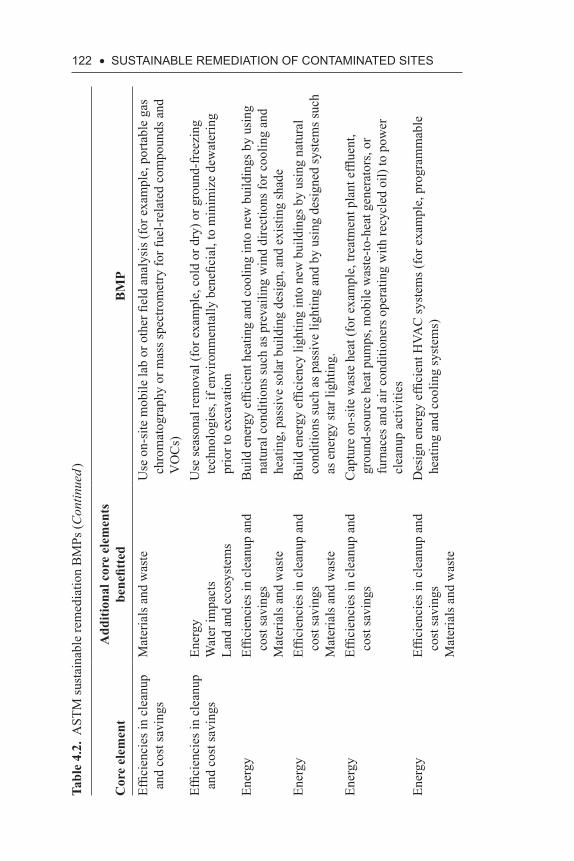
122 • SuStAiNABLE REMEDiAtiON Of CONtAMiNAtED SitESTa
ble
4.2.
AST
M su
stai
nabl
e re
med
iatio
n B
MPs
(Con
tinue
d )
Cor
e el
emen
tA
dditi
onal
cor
e el
emen
ts
bene
fitte
dB
MP
Effic
ienc
ies i
n cl
eanu
p an
d co
st sa
ving
sM
ater
ials
and
was
teU
se o
n-si
te m
obile
lab
or o
ther
fiel
d an
alys
is (f
or e
xam
ple,
por
tabl
e ga
s ch
rom
atog
raph
y or
mas
s spe
ctro
met
ry fo
r fue
l-rel
ated
com
poun
ds a
nd
VO
Cs)
Effic
ienc
ies i
n cl
eanu
p an
d co
st sa
ving
sEn
ergy
Wat
er im
pact
sLa
nd a
nd e
cosy
stem
s
Use
seas
onal
rem
oval
(for
exa
mpl
e, c
old
or d
ry) o
r gro
und-
free
zing
te
chno
logi
es, i
f env
ironm
enta
lly b
enefi
cial
, to
min
imiz
e de
wat
erin
g pr
ior t
o ex
cava
tion
Ener
gyEf
ficie
ncie
s in
clea
nup
and
cost
savi
ngs
Mat
eria
ls a
nd w
aste
Bui
ld e
nerg
y ef
ficie
nt h
eatin
g an
d co
olin
g in
to n
ew b
uild
ings
by
usin
g na
tura
l con
ditio
ns su
ch a
s pre
vaili
ng w
ind
dire
ctio
ns fo
r coo
ling
and
heat
ing,
pas
sive
sola
r bui
ldin
g de
sign
, and
exi
stin
g sh
ade
Ener
gyEf
ficie
ncie
s in
clea
nup
and
cost
savi
ngs
Mat
eria
ls a
nd w
aste
Bui
ld e
nerg
y ef
ficie
ncy
light
ing
into
new
bui
ldin
gs b
y us
ing
natu
ral
cond
ition
s suc
h as
pas
sive
ligh
ting
and
by u
sing
des
igne
d sy
stem
s suc
h as
ene
rgy
star
ligh
ting.
Ener
gyEf
ficie
ncie
s in
clea
nup
and
cost
savi
ngs
Cap
ture
on-
site
was
te h
eat (
for e
xam
ple,
trea
tmen
t pla
nt e
fflue
nt,
grou
nd-s
ourc
e he
at p
umps
, mob
ile w
aste
-to-h
eat g
ener
ator
s, or
fu
rnac
es a
nd a
ir co
nditi
oner
s ope
ratin
g w
ith re
cycl
ed o
il) to
pow
er
clea
nup
activ
ities
Ener
gyEf
ficie
ncie
s in
clea
nup
and
cost
savi
ngs
Mat
eria
ls a
nd w
aste
Des
ign
ener
gy e
ffici
ent H
VAC
syst
ems (
for e
xam
ple,
pro
gram
mab
le
heat
ing
and
cool
ing
syst
ems)
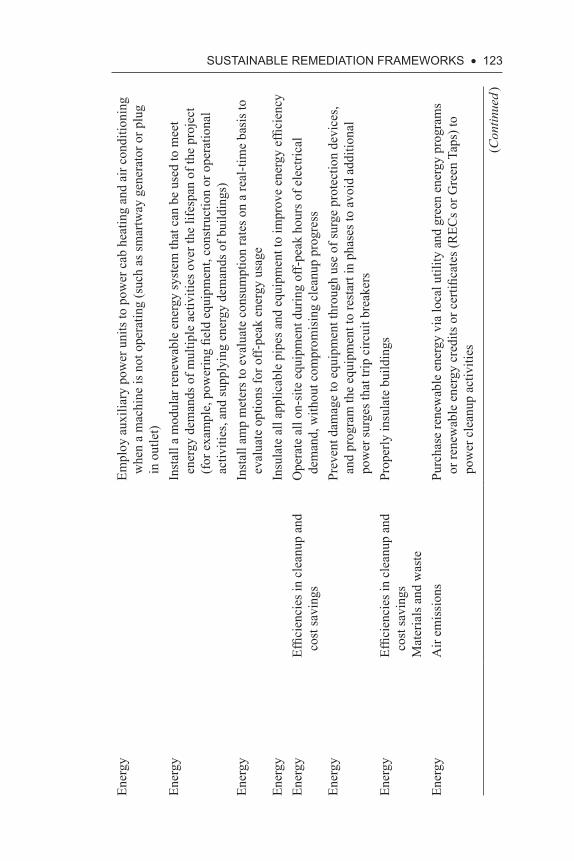
SuStAiNABLE REMEDiAtiON fRAMEWORKS • 123
Ener
gyEm
ploy
aux
iliar
y po
wer
uni
ts to
pow
er c
ab h
eatin
g an
d ai
r con
ditio
ning
w
hen
a m
achi
ne is
not
ope
ratin
g (s
uch
as sm
artw
ay g
ener
ator
or p
lug
in o
utle
t)En
ergy
Inst
all a
mod
ular
rene
wab
le e
nerg
y sy
stem
that
can
be
used
to m
eet
ener
gy d
eman
ds o
f mul
tiple
act
iviti
es o
ver t
he li
fesp
an o
f the
pro
ject
(f
or e
xam
ple,
pow
erin
g fie
ld e
quip
men
t, co
nstru
ctio
n or
ope
ratio
nal
activ
ities
, and
supp
lyin
g en
ergy
dem
ands
of b
uild
ings
)En
ergy
Inst
all a
mp
met
ers t
o ev
alua
te c
onsu
mpt
ion
rate
s on
a re
al-ti
me
basi
s to
eval
uate
opt
ions
for o
ff-pe
ak e
nerg
y us
age
Ener
gyIn
sula
te a
ll ap
plic
able
pip
es a
nd e
quip
men
t to
impr
ove
ener
gy e
ffici
ency
Ener
gyEf
ficie
ncie
s in
clea
nup
and
cost
savi
ngs
Ope
rate
all
on-s
ite e
quip
men
t dur
ing
off-
peak
hou
rs o
f ele
ctric
al
dem
and,
with
out c
ompr
omis
ing
clea
nup
prog
ress
Ener
gyPr
even
t dam
age
to e
quip
men
t thr
ough
use
of s
urge
pro
tect
ion
devi
ces,
and
prog
ram
the
equi
pmen
t to
rest
art i
n ph
ases
to a
void
add
ition
al
pow
er su
rges
that
trip
circ
uit b
reak
ers
Ener
gyEf
ficie
ncie
s in
clea
nup
and
cost
savi
ngs
Mat
eria
ls a
nd w
aste
Prop
erly
insu
late
bui
ldin
gs
Ener
gyA
ir em
issi
ons
Purc
hase
rene
wab
le e
nerg
y vi
a lo
cal u
tility
and
gre
en e
nerg
y pr
ogra
ms
or re
new
able
ene
rgy
cred
its o
r cer
tifica
tes (
REC
s or G
reen
Tap
s) to
po
wer
cle
anup
act
iviti
es
(Con
tinue
d )
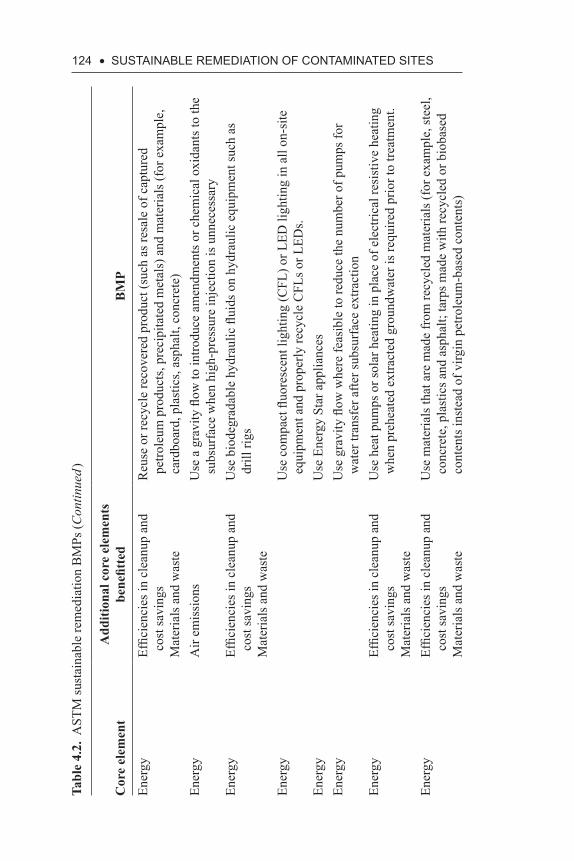
124 • SuStAiNABLE REMEDiAtiON Of CONtAMiNAtED SitESTa
ble
4.2.
AST
M su
stai
nabl
e re
med
iatio
n B
MPs
(Con
tinue
d )
Cor
e el
emen
tA
dditi
onal
cor
e el
emen
ts
bene
fitte
dB
MP
Ener
gyEf
ficie
ncie
s in
clea
nup
and
cost
savi
ngs
Mat
eria
ls a
nd w
aste
Reu
se o
r rec
ycle
reco
vere
d pr
oduc
t (su
ch a
s res
ale
of c
aptu
red
petro
leum
pro
duct
s, pr
ecip
itate
d m
etal
s) a
nd m
ater
ials
(for
exa
mpl
e,
card
boar
d, p
last
ics,
asph
alt,
conc
rete
)En
ergy
Air
emis
sion
sU
se a
gra
vity
flow
to in
trodu
ce a
men
dmen
ts o
r che
mic
al o
xida
nts t
o th
e su
bsur
face
whe
n hi
gh-p
ress
ure
inje
ctio
n is
unn
eces
sary
Ener
gyEf
ficie
ncie
s in
clea
nup
and
cost
savi
ngs
Mat
eria
ls a
nd w
aste
Use
bio
degr
adab
le h
ydra
ulic
flui
ds o
n hy
drau
lic e
quip
men
t suc
h as
dr
ill ri
gs
Ener
gyU
se c
ompa
ct fl
uore
scen
t lig
htin
g (C
FL) o
r LED
ligh
ting
in a
ll on
-site
eq
uipm
ent a
nd p
rope
rly re
cycl
e C
FLs o
r LED
s.En
ergy
Use
Ene
rgy
Star
app
lianc
esEn
ergy
Use
gra
vity
flow
whe
re fe
asib
le to
redu
ce th
e nu
mbe
r of p
umps
for
wat
er tr
ansf
er a
fter s
ubsu
rfac
e ex
tract
ion
Ener
gyEf
ficie
ncie
s in
clea
nup
and
cost
savi
ngs
Mat
eria
ls a
nd w
aste
Use
hea
t pum
ps o
r sol
ar h
eatin
g in
pla
ce o
f ele
ctric
al re
sist
ive
heat
ing
whe
n pr
ehea
ted
extra
cted
gro
undw
ater
is re
quire
d pr
ior t
o tre
atm
ent.
Ener
gyEf
ficie
ncie
s in
clea
nup
and
cost
savi
ngs
Mat
eria
ls a
nd w
aste
Use
mat
eria
ls th
at a
re m
ade
from
recy
cled
mat
eria
ls (f
or e
xam
ple,
stee
l, co
ncre
te, p
last
ics a
nd a
spha
lt; ta
rps m
ade
with
recy
cled
or b
ioba
sed
cont
ents
inst
ead
of v
irgin
pet
role
um-b
ased
con
tent
s)
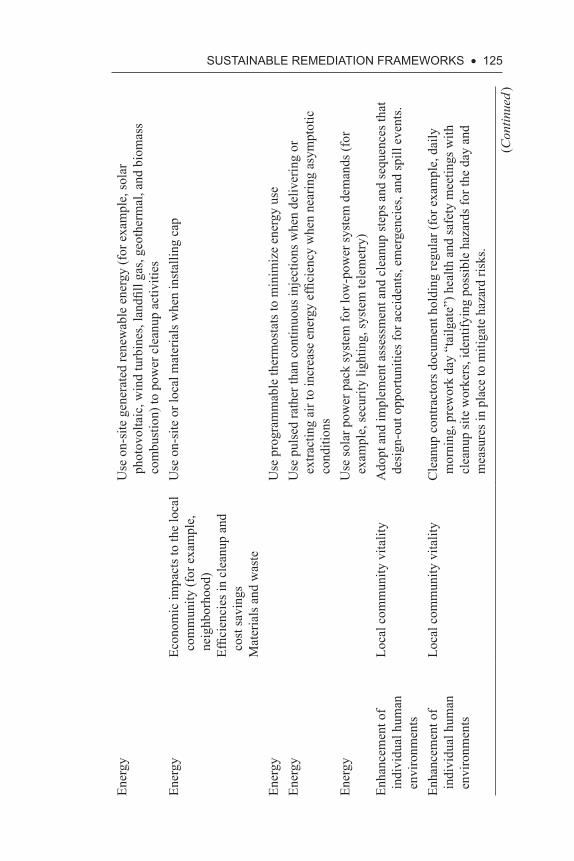
SuStAiNABLE REMEDiAtiON fRAMEWORKS • 125
Ener
gyU
se o
n-si
te g
ener
ated
rene
wab
le e
nerg
y (f
or e
xam
ple,
sola
r ph
otov
olta
ic, w
ind
turb
ines
, lan
dfill
gas,
geot
herm
al, a
nd b
iom
ass
com
bust
ion)
to p
ower
cle
anup
act
iviti
esEn
ergy
Econ
omic
impa
cts t
o th
e lo
cal
com
mun
ity (f
or e
xam
ple,
ne
ighb
orho
od)
Effic
ienc
ies i
n cl
eanu
p an
d co
st sa
ving
s M
ater
ials
and
was
te
Use
on-
site
or l
ocal
mat
eria
ls w
hen
inst
allin
g ca
p
Ener
gyU
se p
rogr
amm
able
ther
mos
tats
to m
inim
ize
ener
gy u
seEn
ergy
Use
pul
sed
rath
er th
an c
ontin
uous
inje
ctio
ns w
hen
deliv
erin
g or
ex
tract
ing
air t
o in
crea
se e
nerg
y ef
ficie
ncy
whe
n ne
arin
g as
ympt
otic
co
nditi
ons
Ener
gyU
se so
lar p
ower
pac
k sy
stem
for l
ow-p
ower
syst
em d
eman
ds (f
or
exam
ple,
secu
rity
light
ing,
syst
em te
lem
etry
)En
hanc
emen
t of
indi
vidu
al h
uman
en
viro
nmen
ts
Loca
l com
mun
ity v
italit
yA
dopt
and
impl
emen
t ass
essm
ent a
nd c
lean
up st
eps a
nd se
quen
ces t
hat
desi
gn-o
ut o
ppor
tuni
ties f
or a
ccid
ents
, em
erge
ncie
s, an
d sp
ill e
vent
s.
Enha
ncem
ent o
f in
divi
dual
hum
an
envi
ronm
ents
Loca
l com
mun
ity v
italit
yC
lean
up c
ontra
ctor
s doc
umen
t hol
ding
regu
lar (
for e
xam
ple,
dai
ly
mor
ning
, pre
wor
k da
y “t
ailg
ate”
) hea
lth a
nd sa
fety
mee
tings
with
cl
eanu
p si
te w
orke
rs, i
dent
ifyin
g po
ssib
le h
azar
ds fo
r the
day
and
m
easu
res i
n pl
ace
to m
itiga
te h
azar
d ris
ks.
(Con
tinue
d )
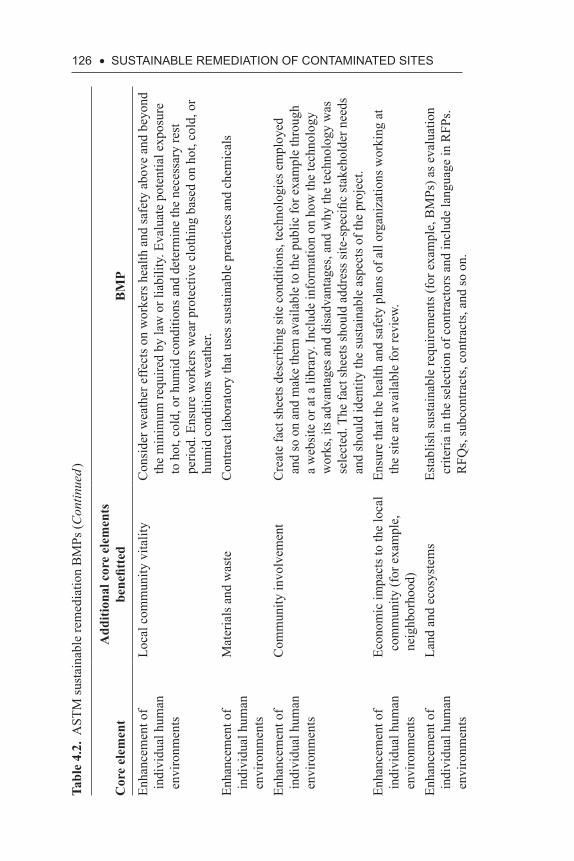
126 • SuStAiNABLE REMEDiAtiON Of CONtAMiNAtED SitESTa
ble
4.2.
AST
M su
stai
nabl
e re
med
iatio
n B
MPs
(Con
tinue
d )
Cor
e el
emen
tA
dditi
onal
cor
e el
emen
ts
bene
fitte
dB
MP
Enha
ncem
ent o
f in
divi
dual
hum
an
envi
ronm
ents
Loca
l com
mun
ity v
italit
yC
onsi
der w
eath
er e
ffect
s on
wor
kers
hea
lth a
nd sa
fety
abo
ve a
nd b
eyon
d th
e m
inim
um re
quire
d by
law
or l
iabi
lity.
Eva
luat
e po
tent
ial e
xpos
ure
to h
ot, c
old,
or h
umid
con
ditio
ns a
nd d
eter
min
e th
e ne
cess
ary
rest
pe
riod.
Ens
ure
wor
kers
wea
r pro
tect
ive
clot
hing
bas
ed o
n ho
t, co
ld, o
r hu
mid
con
ditio
ns w
eath
er.
Enha
ncem
ent o
f in
divi
dual
hum
an
envi
ronm
ents
Mat
eria
ls a
nd w
aste
Con
tract
labo
rato
ry th
at u
ses s
usta
inab
le p
ract
ices
and
che
mic
als
Enha
ncem
ent o
f in
divi
dual
hum
an
envi
ronm
ents
Com
mun
ity in
volv
emen
tC
reat
e fa
ct sh
eets
des
crib
ing
site
con
ditio
ns, t
echn
olog
ies e
mpl
oyed
an
d so
on
and
mak
e th
em a
vaila
ble
to th
e pu
blic
for e
xam
ple
thro
ugh
a w
ebsi
te o
r at a
libr
ary.
Incl
ude
info
rmat
ion
on h
ow th
e te
chno
logy
w
orks
, its
adv
anta
ges a
nd d
isad
vant
ages
, and
why
the
tech
nolo
gy w
as
sele
cted
. The
fact
shee
ts sh
ould
add
ress
site
-spe
cific
stak
ehol
der n
eeds
an
d sh
ould
iden
tity
the
sust
aina
ble
aspe
cts o
f the
pro
ject
.En
hanc
emen
t of
indi
vidu
al h
uman
en
viro
nmen
ts
Econ
omic
impa
cts t
o th
e lo
cal
com
mun
ity (f
or e
xam
ple,
ne
ighb
orho
od)
Ensu
re th
at th
e he
alth
and
safe
ty p
lans
of a
ll or
gani
zatio
ns w
orki
ng a
t th
e si
te a
re a
vaila
ble
for r
evie
w.
Enha
ncem
ent o
f in
divi
dual
hum
an
envi
ronm
ents
Land
and
eco
syst
ems
Esta
blis
h su
stai
nabl
e re
quire
men
ts (f
or e
xam
ple,
BM
Ps) a
s eva
luat
ion
crite
ria in
the
sele
ctio
n of
con
tract
ors a
nd in
clud
e la
ngua
ge in
RFP
s. R
FQs,
subc
ontra
cts,
cont
ract
s, an
d so
on.
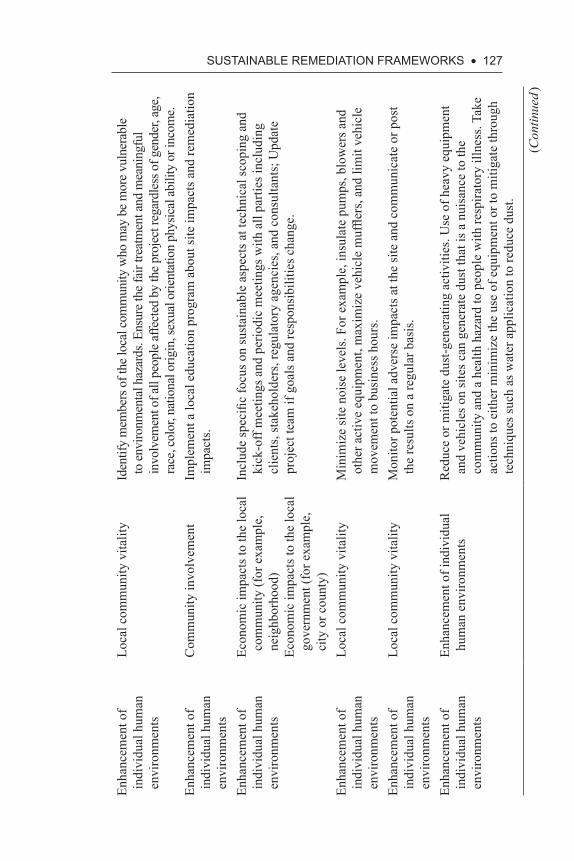
SuStAiNABLE REMEDiAtiON fRAMEWORKS • 127
Enha
ncem
ent o
f in
divi
dual
hum
an
envi
ronm
ents
Loca
l com
mun
ity v
italit
yId
entif
y m
embe
rs o
f the
loca
l com
mun
ity w
ho m
ay b
e mor
e vul
nera
ble
to en
viro
nmen
tal h
azar
ds. E
nsur
e the
fair
treat
men
t and
mea
ning
ful
invo
lvem
ent o
f all
peop
le af
fect
ed b
y th
e pro
ject
rega
rdle
ss o
f gen
der,
age,
ra
ce, c
olor
, nat
iona
l orig
in, s
exua
l orie
ntat
ion
phys
ical
abili
ty o
r inc
ome.
Enha
ncem
ent o
f in
divi
dual
hum
an
envi
ronm
ents
Com
mun
ity in
volv
emen
tIm
plem
ent a
loca
l edu
catio
n pr
ogra
m a
bout
site
impa
cts a
nd re
med
iatio
n im
pact
s.
Enha
ncem
ent o
f in
divi
dual
hum
an
envi
ronm
ents
Econ
omic
impa
cts t
o th
e lo
cal
com
mun
ity (f
or e
xam
ple,
ne
ighb
orho
od)
Econ
omic
impa
cts t
o th
e lo
cal
gove
rnm
ent (
for e
xam
ple,
ci
ty o
r cou
nty)
Incl
ude
spec
ific
focu
s on
sust
aina
ble
aspe
cts a
t tec
hnic
al sc
opin
g an
d ki
ck-o
ff m
eetin
gs a
nd p
erio
dic
mee
tings
with
all
parti
es in
clud
ing
clie
nts,
stak
ehol
ders
, reg
ulat
ory
agen
cies
, and
con
sulta
nts;
Upd
ate
proj
ect t
eam
if g
oals
and
resp
onsi
bilit
ies c
hang
e.
Enha
ncem
ent o
f in
divi
dual
hum
an
envi
ronm
ents
Loca
l com
mun
ity v
italit
yM
inim
ize
site
noi
se le
vels
. For
exa
mpl
e, in
sula
te p
umps
, blo
wer
s and
ot
her a
ctiv
e eq
uipm
ent,
max
imiz
e ve
hicl
e m
uffle
rs, a
nd li
mit
vehi
cle
mov
emen
t to
busi
ness
hou
rs.
Enha
ncem
ent o
f in
divi
dual
hum
an
envi
ronm
ents
Loca
l com
mun
ity v
italit
yM
onito
r pot
entia
l adv
erse
impa
cts a
t the
site
and
com
mun
icat
e or
pos
t th
e re
sults
on
a re
gula
r bas
is.
Enha
ncem
ent o
f in
divi
dual
hum
an
envi
ronm
ents
Enha
ncem
ent o
f ind
ivid
ual
hum
an e
nviro
nmen
tsR
educ
e or
miti
gate
dus
t-gen
erat
ing
activ
ities
. Use
of h
eavy
equ
ipm
ent
and
vehi
cles
on
site
s can
gen
erat
e du
st th
at is
a n
uisa
nce
to th
e co
mm
unity
and
a h
ealth
haz
ard
to p
eopl
e w
ith re
spira
tory
illn
ess.
Take
ac
tions
to e
ither
min
imiz
e th
e us
e of
equ
ipm
ent o
r to
miti
gate
thro
ugh
tech
niqu
es su
ch a
s wat
er a
pplic
atio
n to
redu
ce d
ust.
(Con
tinue
d )
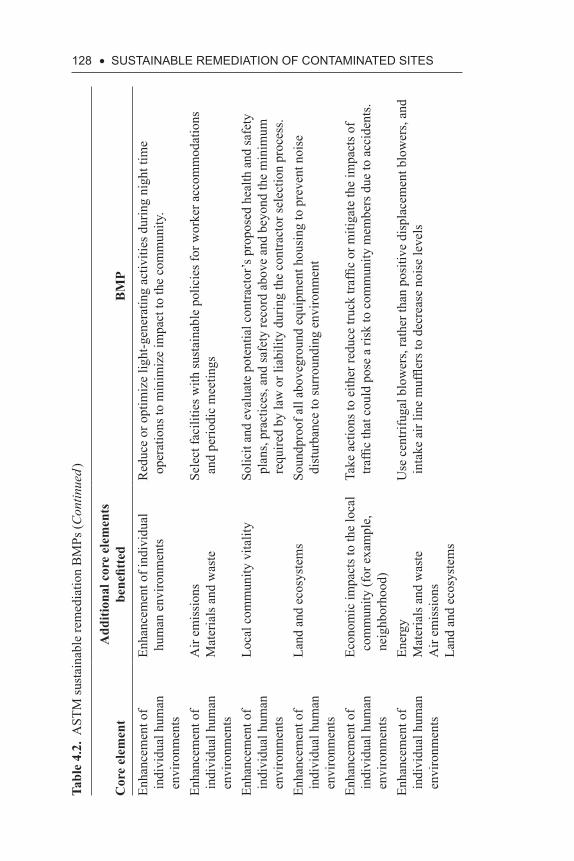
128 • SuStAiNABLE REMEDiAtiON Of CONtAMiNAtED SitESTa
ble
4.2.
AST
M su
stai
nabl
e re
med
iatio
n B
MPs
(Con
tinue
d )
Cor
e el
emen
tA
dditi
onal
cor
e el
emen
ts
bene
fitte
dB
MP
Enha
ncem
ent o
f in
divi
dual
hum
an
envi
ronm
ents
Enha
ncem
ent o
f ind
ivid
ual
hum
an e
nviro
nmen
tsR
educ
e or
opt
imiz
e lig
ht-g
ener
atin
g ac
tiviti
es d
urin
g ni
ght t
ime
oper
atio
ns to
min
imiz
e im
pact
to th
e co
mm
unity
.
Enha
ncem
ent o
f in
divi
dual
hum
an
envi
ronm
ents
Air
emis
sion
s M
ater
ials
and
was
teSe
lect
faci
litie
s with
sust
aina
ble
polic
ies f
or w
orke
r acc
omm
odat
ions
an
d pe
riodi
c m
eetin
gs
Enha
ncem
ent o
f in
divi
dual
hum
an
envi
ronm
ents
Loca
l com
mun
ity v
italit
ySo
licit
and
eval
uate
pot
entia
l con
tract
or’s
pro
pose
d he
alth
and
safe
ty
plan
s, pr
actic
es, a
nd sa
fety
reco
rd a
bove
and
bey
ond
the
min
imum
re
quire
d by
law
or l
iabi
lity
durin
g th
e co
ntra
ctor
sele
ctio
n pr
oces
s.En
hanc
emen
t of
indi
vidu
al h
uman
en
viro
nmen
ts
Land
and
eco
syst
ems
Soun
dpro
of a
ll ab
oveg
roun
d eq
uipm
ent h
ousi
ng to
pre
vent
noi
se
dist
urba
nce
to su
rrou
ndin
g en
viro
nmen
t
Enha
ncem
ent o
f in
divi
dual
hum
an
envi
ronm
ents
Econ
omic
impa
cts t
o th
e lo
cal
com
mun
ity (f
or e
xam
ple,
ne
ighb
orho
od)
Take
act
ions
to e
ither
redu
ce tr
uck
traffi
c or
miti
gate
the
impa
cts o
f tra
ffic
that
cou
ld p
ose
a ris
k to
com
mun
ity m
embe
rs d
ue to
acc
iden
ts.
Enha
ncem
ent o
f in
divi
dual
hum
an
envi
ronm
ents
Ener
gyM
ater
ials
and
was
teA
ir em
issi
ons
Land
and
eco
syst
ems
Use
cen
trifu
gal b
low
ers,
rath
er th
an p
ositi
ve d
ispl
acem
ent b
low
ers,
and
inta
ke a
ir lin
e m
uffle
rs to
dec
reas
e no
ise
leve
ls
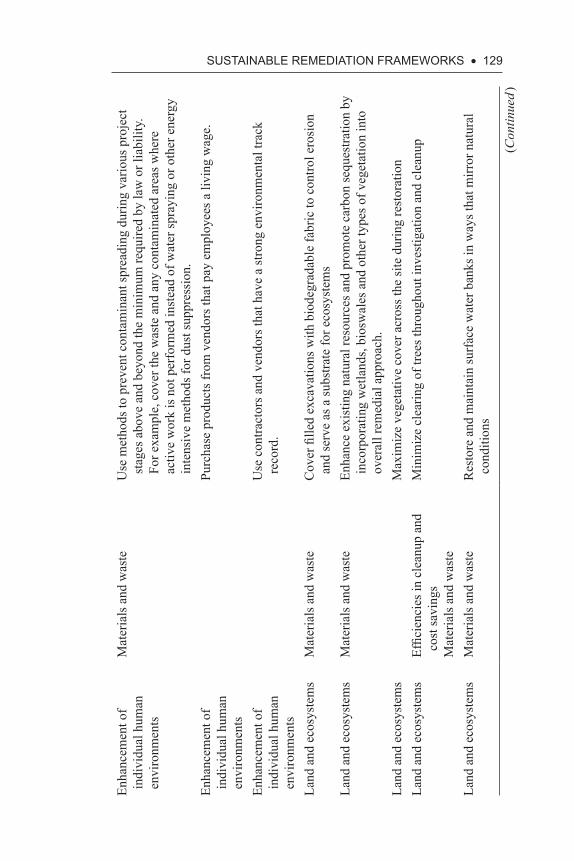
SuStAiNABLE REMEDiAtiON fRAMEWORKS • 129
Enha
ncem
ent o
f in
divi
dual
hum
an
envi
ronm
ents
Mat
eria
ls a
nd w
aste
Use
met
hods
to p
reve
nt c
onta
min
ant s
prea
ding
dur
ing
vario
us p
roje
ct
stag
es a
bove
and
bey
ond
the
min
imum
requ
ired
by la
w o
r lia
bilit
y.
For e
xam
ple,
cov
er th
e w
aste
and
any
con
tam
inat
ed a
reas
whe
re
activ
e w
ork
is n
ot p
erfo
rmed
inst
ead
of w
ater
spra
ying
or o
ther
ene
rgy
inte
nsiv
e m
etho
ds fo
r dus
t sup
pres
sion
.En
hanc
emen
t of
indi
vidu
al h
uman
en
viro
nmen
ts
Purc
hase
pro
duct
s fro
m v
endo
rs th
at p
ay e
mpl
oyee
s a li
ving
wag
e.
Enha
ncem
ent o
f in
divi
dual
hum
an
envi
ronm
ents
Use
con
tract
ors a
nd v
endo
rs th
at h
ave
a st
rong
env
ironm
enta
l tra
ck
reco
rd.
Land
and
eco
syst
ems
Mat
eria
ls a
nd w
aste
Cov
er fi
lled
exca
vatio
ns w
ith b
iode
grad
able
fabr
ic to
con
trol e
rosi
on
and
serv
e as
a su
bstra
te fo
r eco
syst
ems
Land
and
eco
syst
ems
Mat
eria
ls a
nd w
aste
Enha
nce
exis
ting
natu
ral r
esou
rces
and
pro
mot
e ca
rbon
sequ
estra
tion
by
inco
rpor
atin
g w
etla
nds,
bios
wal
es a
nd o
ther
type
s of v
eget
atio
n in
to
over
all r
emed
ial a
ppro
ach.
Land
and
eco
syst
ems
Max
imiz
e ve
geta
tive
cove
r acr
oss t
he si
te d
urin
g re
stor
atio
nLa
nd a
nd e
cosy
stem
sEf
ficie
ncie
s in
clea
nup
and
cost
savi
ngs
Mat
eria
ls a
nd w
aste
Min
imiz
e cl
earin
g of
tree
s thr
ough
out i
nves
tigat
ion
and
clea
nup
Land
and
eco
syst
ems
Mat
eria
ls a
nd w
aste
Res
tore
and
mai
ntai
n su
rfac
e w
ater
ban
ks in
way
s tha
t mirr
or n
atur
al
cond
ition
s
(Con
tinue
d )
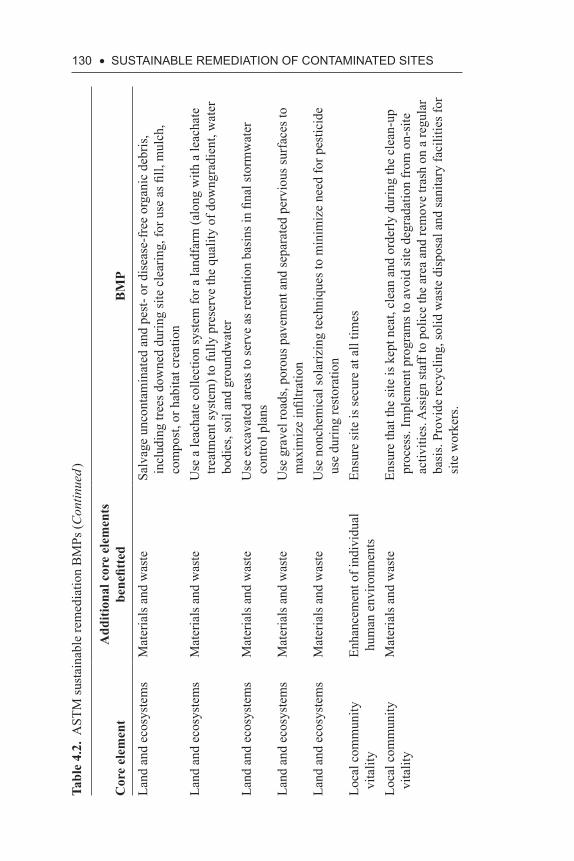
130 • SuStAiNABLE REMEDiAtiON Of CONtAMiNAtED SitESTa
ble
4.2.
AST
M su
stai
nabl
e re
med
iatio
n B
MPs
(Con
tinue
d )
Cor
e el
emen
tA
dditi
onal
cor
e el
emen
ts
bene
fitte
dB
MP
Land
and
eco
syst
ems
Mat
eria
ls a
nd w
aste
Salv
age
unco
ntam
inat
ed a
nd p
est-
or d
isea
se-f
ree
orga
nic
debr
is,
incl
udin
g tre
es d
owne
d du
ring
site
cle
arin
g, fo
r use
as fi
ll, m
ulch
, co
mpo
st, o
r hab
itat c
reat
ion
Land
and
eco
syst
ems
Mat
eria
ls a
nd w
aste
Use
a le
acha
te c
olle
ctio
n sy
stem
for a
land
farm
(alo
ng w
ith a
leac
hate
tre
atm
ent s
yste
m) t
o fu
lly p
rese
rve
the
qual
ity o
f dow
ngra
dien
t, w
ater
bo
dies
, soi
l and
gro
undw
ater
Land
and
eco
syst
ems
Mat
eria
ls a
nd w
aste
Use
exc
avat
ed a
reas
to se
rve
as re
tent
ion
basi
ns in
fina
l sto
rmw
ater
co
ntro
l pla
nsLa
nd a
nd e
cosy
stem
sM
ater
ials
and
was
teU
se g
rave
l roa
ds, p
orou
s pav
emen
t and
sepa
rate
d pe
rvio
us su
rfac
es to
m
axim
ize
infil
tratio
nLa
nd a
nd e
cosy
stem
sM
ater
ials
and
was
teU
se n
onch
emic
al so
lariz
ing
tech
niqu
es to
min
imiz
e ne
ed fo
r pes
ticid
e us
e du
ring
rest
orat
ion
Loca
l com
mun
ity
vita
lity
Enha
ncem
ent o
f ind
ivid
ual
hum
an e
nviro
nmen
tsEn
sure
site
is se
cure
at a
ll tim
es
Loca
l com
mun
ity
vita
lity
Mat
eria
ls a
nd w
aste
Ensu
re th
at th
e si
te is
kep
t nea
t, cl
ean
and
orde
rly d
urin
g th
e cl
ean-
up
proc
ess.
Impl
emen
t pro
gram
s to
avoi
d si
te d
egra
datio
n fr
om o
n-si
te
activ
ities
. Ass
ign
staf
f to
polic
e th
e ar
ea a
nd re
mov
e tra
sh o
n a
regu
lar
basi
s. Pr
ovid
e re
cycl
ing,
solid
was
te d
ispo
sal a
nd sa
nita
ry fa
cilit
ies f
or
site
wor
kers
.
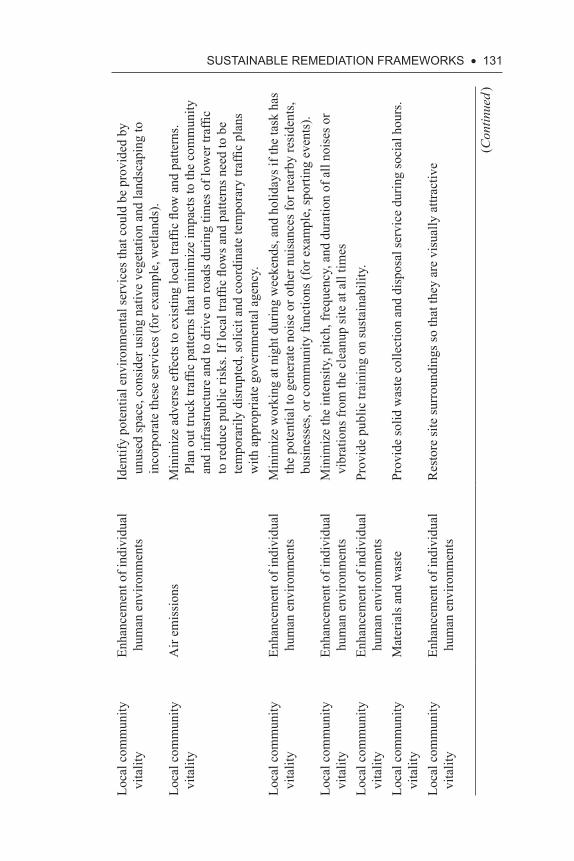
SuStAiNABLE REMEDiAtiON fRAMEWORKS • 131
Loca
l com
mun
ity
vita
lity
Enha
ncem
ent o
f ind
ivid
ual
hum
an e
nviro
nmen
tsId
entif
y po
tent
ial e
nviro
nmen
tal s
ervi
ces t
hat c
ould
be
prov
ided
by
unus
ed sp
ace,
con
side
r usi
ng n
ativ
e ve
geta
tion
and
land
scap
ing
to
inco
rpor
ate
thes
e se
rvic
es (f
or e
xam
ple,
wet
land
s).
Loca
l com
mun
ity
vita
lity
Air
emis
sion
sM
inim
ize
adve
rse
effe
cts t
o ex
istin
g lo
cal t
raffi
c flo
w a
nd p
atte
rns.
Plan
out
truc
k tra
ffic
patte
rns t
hat m
inim
ize
impa
cts t
o th
e co
mm
unity
an
d in
fras
truct
ure
and
to d
rive
on ro
ads d
urin
g tim
es o
f low
er tr
affic
to
redu
ce p
ublic
risk
s. If
loca
l tra
ffic
flow
s and
pat
tern
s nee
d to
be
tem
pora
rily
disr
upte
d, so
licit
and
coor
dina
te te
mpo
rary
traf
fic p
lans
w
ith a
ppro
pria
te g
over
nmen
tal a
genc
y.Lo
cal c
omm
unity
vi
talit
yEn
hanc
emen
t of i
ndiv
idua
l hu
man
env
ironm
ents
Min
imiz
e w
orki
ng a
t nig
ht d
urin
g w
eeke
nds,
and
holid
ays i
f the
task
has
th
e po
tent
ial t
o ge
nera
te n
oise
or o
ther
nui
sanc
es fo
r nea
rby
resi
dent
s, bu
sine
sses
, or c
omm
unity
func
tions
(for
exa
mpl
e, sp
ortin
g ev
ents
).Lo
cal c
omm
unity
vi
talit
yEn
hanc
emen
t of i
ndiv
idua
l hu
man
env
ironm
ents
Min
imiz
e th
e in
tens
ity, p
itch,
freq
uenc
y, a
nd d
urat
ion
of a
ll no
ises
or
vibr
atio
ns fr
om th
e cl
eanu
p si
te a
t all
times
Loca
l com
mun
ity
vita
lity
Enha
ncem
ent o
f ind
ivid
ual
hum
an e
nviro
nmen
tsPr
ovid
e pu
blic
trai
ning
on
sust
aina
bilit
y.
Loca
l com
mun
ity
vita
lity
Mat
eria
ls a
nd w
aste
Prov
ide
solid
was
te c
olle
ctio
n an
d di
spos
al se
rvic
e du
ring
soci
al h
ours
.
Loca
l com
mun
ity
vita
lity
Enha
ncem
ent o
f ind
ivid
ual
hum
an e
nviro
nmen
tsR
esto
re si
te su
rrou
ndin
gs so
that
they
are
vis
ually
attr
activ
e
(Con
tinue
d )
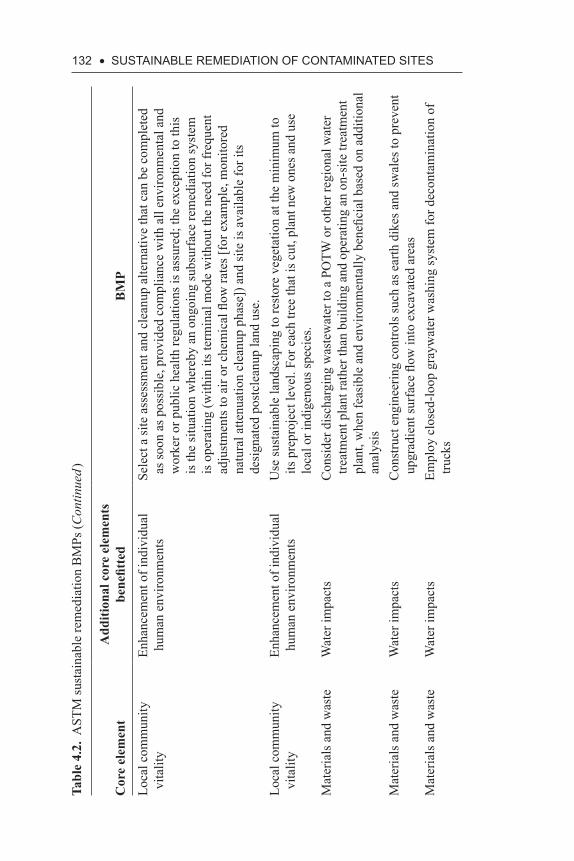
132 • SuStAiNABLE REMEDiAtiON Of CONtAMiNAtED SitESTa
ble
4.2.
AST
M su
stai
nabl
e re
med
iatio
n B
MPs
(Con
tinue
d )
Cor
e el
emen
tA
dditi
onal
cor
e el
emen
ts
bene
fitte
dB
MP
Loca
l com
mun
ity
vita
lity
Enha
ncem
ent o
f ind
ivid
ual
hum
an e
nviro
nmen
tsSe
lect
a si
te a
sses
smen
t and
cle
anup
alte
rnat
ive
that
can
be
com
plet
ed
as so
on a
s pos
sibl
e, p
rovi
ded
com
plia
nce
with
all
envi
ronm
enta
l and
w
orke
r or p
ublic
hea
lth re
gula
tions
is a
ssur
ed; t
he e
xcep
tion
to th
is
is th
e si
tuat
ion
whe
reby
an
ongo
ing
subs
urfa
ce re
med
iatio
n sy
stem
is
ope
ratin
g (w
ithin
its t
erm
inal
mod
e w
ithou
t the
nee
d fo
r fre
quen
t ad
just
men
ts to
air
or c
hem
ical
flow
rate
s [fo
r exa
mpl
e, m
onito
red
natu
ral a
ttenu
atio
n cl
eanu
p ph
ase]
) and
site
is a
vaila
ble
for i
ts
desi
gnat
ed p
ostc
lean
up la
nd u
se.
Loca
l com
mun
ity
vita
lity
Enha
ncem
ent o
f ind
ivid
ual
hum
an e
nviro
nmen
tsU
se su
stai
nabl
e la
ndsc
apin
g to
rest
ore
vege
tatio
n at
the
min
imum
to
its p
repr
ojec
t lev
el. F
or e
ach
tree
that
is c
ut, p
lant
new
one
s and
use
lo
cal o
r ind
igen
ous s
peci
es.
Mat
eria
ls a
nd w
aste
Wat
er im
pact
sC
onsi
der d
isch
argi
ng w
aste
wat
er to
a P
OTW
or o
ther
regi
onal
wat
er
treat
men
t pla
nt ra
ther
than
bui
ldin
g an
d op
erat
ing
an o
n-si
te tr
eatm
ent
plan
t, w
hen
feas
ible
and
env
ironm
enta
lly b
enefi
cial
bas
ed o
n ad
ditio
nal
anal
ysis
Mat
eria
ls a
nd w
aste
Wat
er im
pact
sC
onst
ruct
eng
inee
ring
cont
rols
such
as e
arth
dik
es a
nd sw
ales
to p
reve
nt
upgr
adie
nt su
rfac
e flo
w in
to e
xcav
ated
are
asM
ater
ials
and
was
teW
ater
impa
cts
Empl
oy c
lose
d-lo
op g
rayw
ater
was
hing
syst
em fo
r dec
onta
min
atio
n of
tru
cks
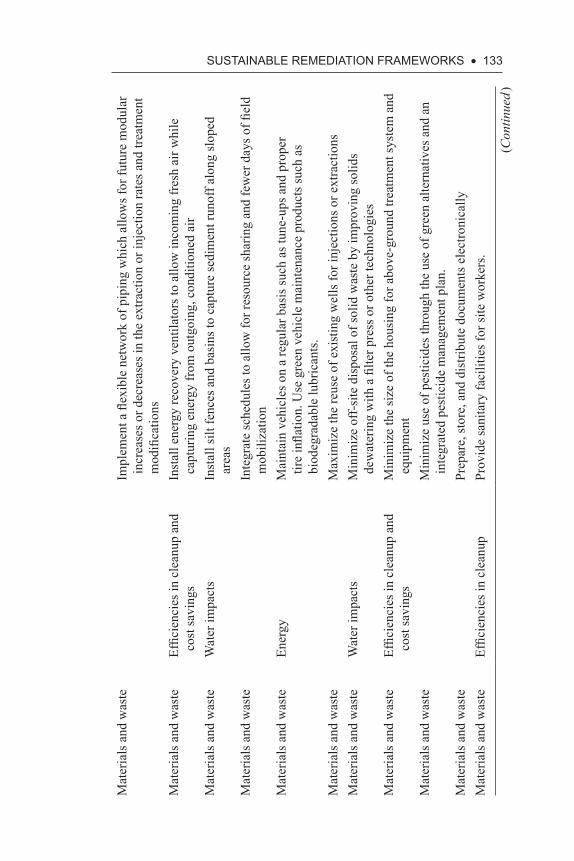
SuStAiNABLE REMEDiAtiON fRAMEWORKS • 133
Mat
eria
ls a
nd w
aste
Impl
emen
t a fl
exib
le n
etw
ork
of p
ipin
g w
hich
allo
ws f
or fu
ture
mod
ular
in
crea
ses o
r dec
reas
es in
the
extra
ctio
n or
inje
ctio
n ra
tes a
nd tr
eatm
ent
mod
ifica
tions
Mat
eria
ls a
nd w
aste
Effic
ienc
ies i
n cl
eanu
p an
d co
st sa
ving
sIn
stal
l ene
rgy
reco
very
ven
tilat
ors t
o al
low
inco
min
g fr
esh
air w
hile
ca
ptur
ing
ener
gy fr
om o
utgo
ing,
con
ditio
ned
air
Mat
eria
ls a
nd w
aste
Wat
er im
pact
sIn
stal
l silt
fenc
es a
nd b
asin
s to
capt
ure
sedi
men
t run
off a
long
slop
ed
area
sM
ater
ials
and
was
teIn
tegr
ate
sche
dule
s to
allo
w fo
r res
ourc
e sh
arin
g an
d fe
wer
day
s of fi
eld
mob
iliza
tion
Mat
eria
ls a
nd w
aste
Ener
gyM
aint
ain
vehi
cles
on
a re
gula
r bas
is su
ch a
s tun
e-up
s and
pro
per
tire
infla
tion.
Use
gre
en v
ehic
le m
aint
enan
ce p
rodu
cts s
uch
as
biod
egra
dabl
e lu
bric
ants
.M
ater
ials
and
was
teM
axim
ize
the
reus
e of
exi
stin
g w
ells
for i
njec
tions
or e
xtra
ctio
nsM
ater
ials
and
was
teW
ater
impa
cts
Min
imiz
e of
f-si
te d
ispo
sal o
f sol
id w
aste
by
impr
ovin
g so
lids
dew
ater
ing
with
a fi
lter p
ress
or o
ther
tech
nolo
gies
Mat
eria
ls a
nd w
aste
Effic
ienc
ies i
n cl
eanu
p an
d co
st sa
ving
sM
inim
ize
the
size
of t
he h
ousi
ng fo
r abo
ve-g
roun
d tre
atm
ent s
yste
m a
nd
equi
pmen
tM
ater
ials
and
was
teM
inim
ize
use
of p
estic
ides
thro
ugh
the
use
of g
reen
alte
rnat
ives
and
an
inte
grat
ed p
estic
ide
man
agem
ent p
lan.
Mat
eria
ls a
nd w
aste
Prep
are,
stor
e, a
nd d
istri
bute
doc
umen
ts e
lect
roni
cally
Mat
eria
ls a
nd w
aste
Effic
ienc
ies i
n cl
eanu
pPr
ovid
e sa
nita
ry fa
cilit
ies f
or si
te w
orke
rs.
(Con
tinue
d )
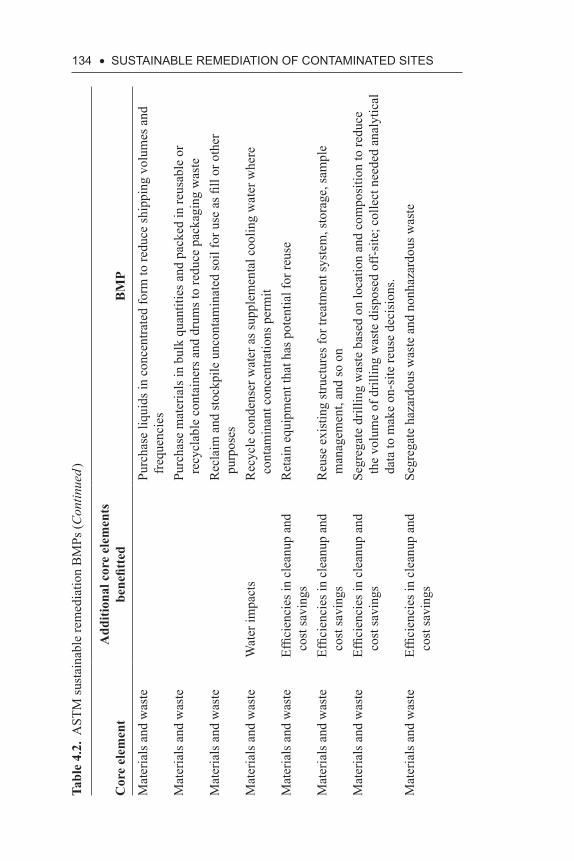
134 • SuStAiNABLE REMEDiAtiON Of CONtAMiNAtED SitESTa
ble
4.2.
AST
M su
stai
nabl
e re
med
iatio
n B
MPs
(Con
tinue
d )
Cor
e el
emen
tA
dditi
onal
cor
e el
emen
ts
bene
fitte
dB
MP
Mat
eria
ls a
nd w
aste
Purc
hase
liqu
ids i
n co
ncen
trate
d fo
rm to
redu
ce sh
ippi
ng v
olum
es a
nd
freq
uenc
ies
Mat
eria
ls a
nd w
aste
Purc
hase
mat
eria
ls in
bul
k qu
antit
ies a
nd p
acke
d in
reus
able
or
recy
clab
le c
onta
iner
s and
dru
ms t
o re
duce
pac
kagi
ng w
aste
Mat
eria
ls a
nd w
aste
Rec
laim
and
stoc
kpile
unc
onta
min
ated
soil
for u
se a
s fill
or o
ther
pu
rpos
esM
ater
ials
and
was
teW
ater
impa
cts
Rec
ycle
con
dens
er w
ater
as s
uppl
emen
tal c
oolin
g w
ater
whe
re
cont
amin
ant c
once
ntra
tions
per
mit
Mat
eria
ls a
nd w
aste
Effic
ienc
ies i
n cl
eanu
p an
d co
st sa
ving
sR
etai
n eq
uipm
ent t
hat h
as p
oten
tial f
or re
use
Mat
eria
ls a
nd w
aste
Effic
ienc
ies i
n cl
eanu
p an
d co
st sa
ving
sR
euse
exi
stin
g st
ruct
ures
for t
reat
men
t sys
tem
, sto
rage
, sam
ple
man
agem
ent,
and
so o
nM
ater
ials
and
was
teEf
ficie
ncie
s in
clea
nup
and
cost
savi
ngs
Segr
egat
e dr
illin
g w
aste
bas
ed o
n lo
catio
n an
d co
mpo
sitio
n to
redu
ce
the
volu
me
of d
rillin
g w
aste
dis
pose
d of
f-si
te; c
olle
ct n
eede
d an
alyt
ical
da
ta to
mak
e on
-site
reus
e de
cisi
ons.
Mat
eria
ls a
nd w
aste
Effic
ienc
ies i
n cl
eanu
p an
d co
st sa
ving
sSe
greg
ate
haza
rdou
s was
te a
nd n
onha
zard
ous w
aste
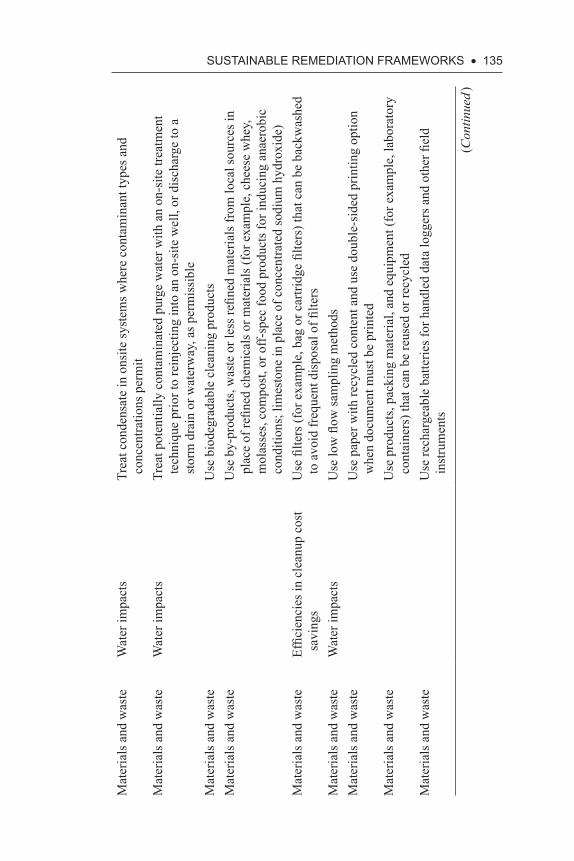
SuStAiNABLE REMEDiAtiON fRAMEWORKS • 135
Mat
eria
ls a
nd w
aste
Wat
er im
pact
sTr
eat c
onde
nsat
e in
ons
ite sy
stem
s whe
re c
onta
min
ant t
ypes
and
co
ncen
tratio
ns p
erm
itM
ater
ials
and
was
teW
ater
impa
cts
Trea
t pot
entia
lly c
onta
min
ated
pur
ge w
ater
with
an
on-s
ite tr
eatm
ent
tech
niqu
e pr
ior t
o re
inje
ctin
g in
to a
n on
-site
wel
l, or
dis
char
ge to
a
stor
m d
rain
or w
ater
way
, as p
erm
issi
ble
Mat
eria
ls a
nd w
aste
Use
bio
degr
adab
le c
lean
ing
prod
ucts
Mat
eria
ls a
nd w
aste
Use
by-
prod
ucts
, was
te o
r les
s refi
ned
mat
eria
ls fr
om lo
cal s
ourc
es in
pl
ace
of re
fined
che
mic
als o
r mat
eria
ls (f
or e
xam
ple,
che
ese
whe
y,
mol
asse
s, co
mpo
st, o
r off-
spec
food
pro
duct
s for
indu
cing
ana
erob
ic
cond
ition
s; li
mes
tone
in p
lace
of c
once
ntra
ted
sodi
um h
ydro
xide
)M
ater
ials
and
was
teEf
ficie
ncie
s in
clea
nup
cost
sa
ving
sU
se fi
lters
(for
exa
mpl
e, b
ag o
r car
tridg
e fil
ters
) tha
t can
be
back
was
hed
to a
void
freq
uent
dis
posa
l of fi
lters
Mat
eria
ls a
nd w
aste
Wat
er im
pact
sU
se lo
w fl
ow sa
mpl
ing
met
hods
Mat
eria
ls a
nd w
aste
Use
pap
er w
ith re
cycl
ed c
onte
nt a
nd u
se d
oubl
e-si
ded
prin
ting
optio
n w
hen
docu
men
t mus
t be
prin
ted
Mat
eria
ls a
nd w
aste
Use
pro
duct
s, pa
ckin
g m
ater
ial,
and
equi
pmen
t (fo
r exa
mpl
e, la
bora
tory
co
ntai
ners
) tha
t can
be
reus
ed o
r rec
ycle
dM
ater
ials
and
was
teU
se re
char
geab
le b
atte
ries f
or h
andl
ed d
ata
logg
ers a
nd o
ther
fiel
d in
stru
men
ts
(Con
tinue
d )
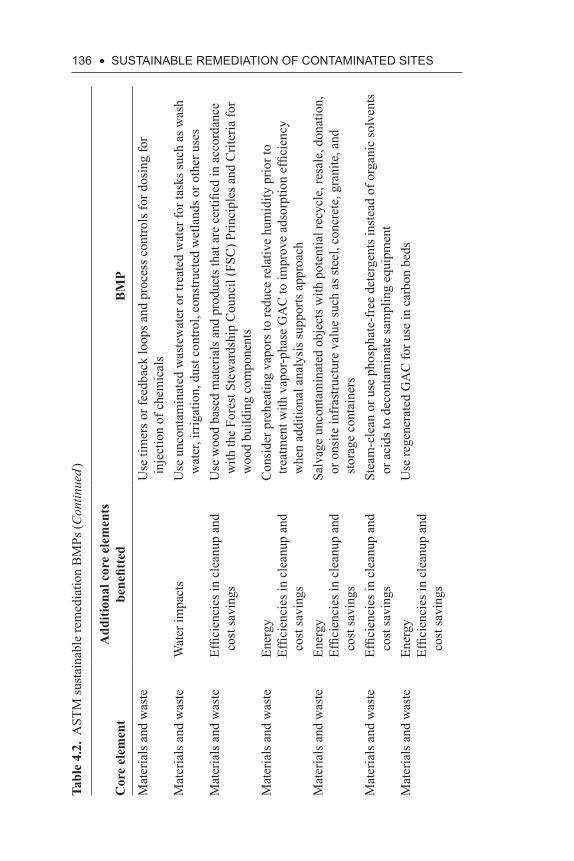
136 • SuStAiNABLE REMEDiAtiON Of CONtAMiNAtED SitESTa
ble
4.2.
AST
M su
stai
nabl
e re
med
iatio
n B
MPs
(Con
tinue
d )
Cor
e el
emen
tA
dditi
onal
cor
e el
emen
ts
bene
fitte
dB
MP
Mat
eria
ls a
nd w
aste
Use
tim
ers o
r fee
dbac
k lo
ops a
nd p
roce
ss c
ontro
ls fo
r dos
ing
for
inje
ctio
n of
che
mic
als
Mat
eria
ls a
nd w
aste
Wat
er im
pact
sU
se u
ncon
tam
inat
ed w
aste
wat
er o
r tre
ated
wat
er fo
r tas
ks su
ch a
s was
h w
ater
, irr
igat
ion,
dus
t con
trol,
cons
truct
ed w
etla
nds o
r oth
er u
ses
Mat
eria
ls a
nd w
aste
Effic
ienc
ies i
n cl
eanu
p an
d co
st sa
ving
sU
se w
ood
base
d m
ater
ials
and
pro
duct
s tha
t are
cer
tified
in a
ccor
danc
e w
ith th
e Fo
rest
Ste
war
dshi
p C
ounc
il (F
SC) P
rinci
ples
and
Crit
eria
for
woo
d bu
ildin
g co
mpo
nent
sM
ater
ials
and
was
teEn
ergy
Effic
ienc
ies i
n cl
eanu
p an
d co
st sa
ving
s
Con
side
r pre
heat
ing
vapo
rs to
redu
ce re
lativ
e hu
mid
ity p
rior t
o tre
atm
ent w
ith v
apor
-pha
se G
AC
to im
prov
e ad
sorp
tion
effic
ienc
y w
hen
addi
tiona
l ana
lysi
s sup
ports
app
roac
hM
ater
ials
and
was
teEn
ergy
Effic
ienc
ies i
n cl
eanu
p an
d co
st sa
ving
s
Salv
age
unco
ntam
inat
ed o
bjec
ts w
ith p
oten
tial r
ecyc
le, r
esal
e, d
onat
ion,
or
ons
ite in
fras
truct
ure
valu
e su
ch a
s ste
el, c
oncr
ete,
gra
nite
, and
st
orag
e co
ntai
ners
Mat
eria
ls a
nd w
aste
Effic
ienc
ies i
n cl
eanu
p an
d co
st sa
ving
sSt
eam
-cle
an o
r use
pho
spha
te-f
ree
dete
rgen
ts in
stea
d of
org
anic
solv
ents
or
aci
ds to
dec
onta
min
ate
sam
plin
g eq
uipm
ent
Mat
eria
ls a
nd w
aste
Ener
gyEf
ficie
ncie
s in
clea
nup
and
cost
savi
ngs
Use
rege
nera
ted
GA
C fo
r use
in c
arbo
n be
ds
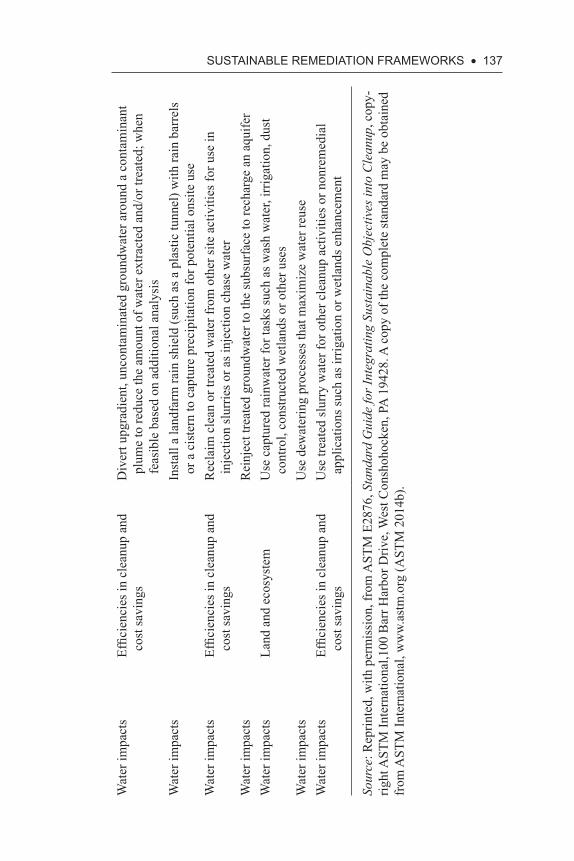
SuStAiNABLE REMEDiAtiON fRAMEWORKS • 137
Wat
er im
pact
sEf
ficie
ncie
s in
clea
nup
and
cost
savi
ngs
Div
ert u
pgra
dien
t, un
cont
amin
ated
gro
undw
ater
aro
und
a co
ntam
inan
t pl
ume
to re
duce
the
amou
nt o
f wat
er e
xtra
cted
and
/or t
reat
ed; w
hen
feas
ible
bas
ed o
n ad
ditio
nal a
naly
sis
Wat
er im
pact
sIn
stal
l a la
ndfa
rm ra
in sh
ield
(suc
h as
a p
last
ic tu
nnel
) with
rain
bar
rels
or
a c
iste
rn to
cap
ture
pre
cipi
tatio
n fo
r pot
entia
l ons
ite u
seW
ater
impa
cts
Effic
ienc
ies i
n cl
eanu
p an
d co
st sa
ving
sR
ecla
im c
lean
or t
reat
ed w
ater
from
oth
er si
te a
ctiv
ities
for u
se in
in
ject
ion
slur
ries o
r as i
njec
tion
chas
e w
ater
Wat
er im
pact
sR
einj
ect t
reat
ed g
roun
dwat
er to
the
subs
urfa
ce to
rech
arge
an
aqui
fer
Wat
er im
pact
sLa
nd a
nd e
cosy
stem
Use
cap
ture
d ra
inw
ater
for t
asks
such
as w
ash
wat
er, i
rrig
atio
n, d
ust
cont
rol,
cons
truct
ed w
etla
nds o
r oth
er u
ses
Wat
er im
pact
sU
se d
ewat
erin
g pr
oces
ses t
hat m
axim
ize
wat
er re
use
Wat
er im
pact
sEf
ficie
ncie
s in
clea
nup
and
cost
savi
ngs
Use
trea
ted
slur
ry w
ater
for o
ther
cle
anup
act
iviti
es o
r non
rem
edia
l ap
plic
atio
ns su
ch a
s irr
igat
ion
or w
etla
nds e
nhan
cem
ent
Sour
ce: R
eprin
ted,
with
per
mis
sion
, fro
m A
STM
E28
76, S
tand
ard
Gui
de fo
r Int
egra
ting
Sust
aina
ble
Obj
ectiv
es in
to C
lean
up, c
opy-
right
AST
M In
tern
atio
nal,1
00 B
arr H
arbo
r Driv
e, W
est C
onsh
ohoc
ken,
PA
194
28. A
cop
y of
the
com
plet
e st
anda
rd m
ay b
e ob
tain
ed
from
AST
M In
tern
atio
nal,
ww
w.as
tm.o
rg (A
STM
201
4b).
138 • SuStAiNABLE REMEDiAtiON Of CONtAMiNAtED SitES
project. The BMPs should be selected across the environmental, economic, and social dimensions to provide the greatest net sustainable benefit associ-ated with the proposed remediation project. Additionally, the impacts of the implemented BMPs may be quantified for a remediation alternative consid-ered for the specific site under consideration. Some BMPs may not include quantifiable attributes and therefore quantification may not be possible. Nevertheless, many of the BMPs may be easily and accurately quantified to determine contribution to benefits associated with project sustainability.
4.6 SELECtED iNtERNAtiONAL fRAMEWORKS
The United Kingdom’s Sustainable Remediation Forum (SuRF-UK) pub-lished a framework for assessing the sustainability of soil and groundwa-ter remediation (SuRF-UK 2009). This framework provided a connection between the principles of sustainable development and criteria (environ-mental, social, and economic) for selecting optimum land use design with sustainable remediation strategies and treatments. In developing their framework, the SuRF-UK engaged with a wide range of stakeholders across a broad range of organizations working in contaminated land and brownfield management. As with the other frameworks developed and presented in this chapter, the SuRF-UK framework emphasizes the impor-tance of considering sustainability issues throughout all key stages of a remediation project and identifies opportunities for considering sustain-ability at a number of milestones or decision points when considering the redevelopment potential of a site or related risk management activities.
The Network for Industrially Contaminated Land in Europe (NICOLE) is a European forum that focuses on contaminated land man-agement and promotes cooperation between industry, academia, and service providers on the development and application of sustainable technologies. NICOLE published Sustainable Remediation Road Map (NICOLE 2010), which is intended to provide users, including owners and operators of contaminated land and related stakeholders, with a single, structured process to facilitate cooperation and the implementation of best practices in sustainable remediation across a wide range of regulatory and policy frameworks.
4.7 SuMMARY
There is no universally accepted framework for evaluating the sustainabil-ity of remediation projects. Fortunately, several frameworks have been
SuStAiNABLE REMEDiAtiON fRAMEWORKS • 139
developed by a range of organizations that can be used to effectively assess sustainability-related parameters of remediation projects. The frameworks presented in this chapter are varied in their depth and breadth of anal-ysis of these parameters. Fortunately, this allows for the opportunity to select a framework of appropriate applicability and complexity based on the characteristics of the remediation project under consideration. In some cases, only environmental, or green, related aspects are desired for characterization. In these instances, the U.S. EPA framework and its core elements of green remediation are appropriate for consideration. In other cases, more direct measurement of social and economic parameters are desired; in these instances, one or more of the other frameworks presented in this chapter may be selected and utilized. In virtually all instances, these frameworks generally emphasize or aim toward the U.S. EPA-based core elements.
• Reduced energy consumption associated with site remediation, the manufacture of consumables, and the management of residual soil and groundwater impacts. Additionally, renewable energy sources should be incorporated when possible.
• Minimized GHG emissions should be undertaken through the use of BMPs, including in situ GHG sequestration within soils and vegetation.
• The use of remedial technologies that do not require on-site or off-site waste disposal and reduce water consumption and utilize recy-cled and reclaimed water sources. Additionally, technologies that promote the reuse and recycling of by-product materials should be incorporated.
• When appropriate, the use of remedial technologies or strategies that do not restrict the potential future land use of a site.
The economic and social aspects can be complex and may be best addressed through BMPs, but due to their equal importance in considering sustainability aspects of remediation projects, there is a rapidly increas-ing emphasis on accurate incorporation, assessment, and documentation of these aspects. Continued efforts are warranted for their quantitative evaluation.

CHAPtER 5
sustAinAbLe remediAtion indicAtors, metrics,
And tooLs
5.1 iNtRODuCtiON
In the previous chapter, several frameworks were presented that may be used to evaluate the sustainability of a remediation project across one or more of the dimensions of sustainability, including those associated with environmental, economic, and social aspects. When performing a sustainability analysis of remediation project alternatives or best man-agement practices (BMPs) that may be considered for inclusion into a project, it is important to identify key indicators that may be used to assess the project. These indicators, in turn, may be expressed with a numerical value, or metric. When expressed on a relative or absolute scale, these metrics may be used to determine the degree of success and progress that a particular project or alternative may realize with respect to sustainability dimensions. Numerous indicators and met-rics have been developed to measure the sustainability of remediation projects. Further, several qualitative and quantitative tools have been developed to calculate and amass these metrics toward providing an objective evaluation.
As with the case of the sustainability frameworks that were presented in the previous chapter, there is no consensus regarding key indicators and metrics, nor have there been any legitimate or accepted efforts toward standardization of the process. As a result, a wide range of indi-cators and metrics are often selected and incorporated into analyzes, and some confusion regarding terminology persists. This adds an additional
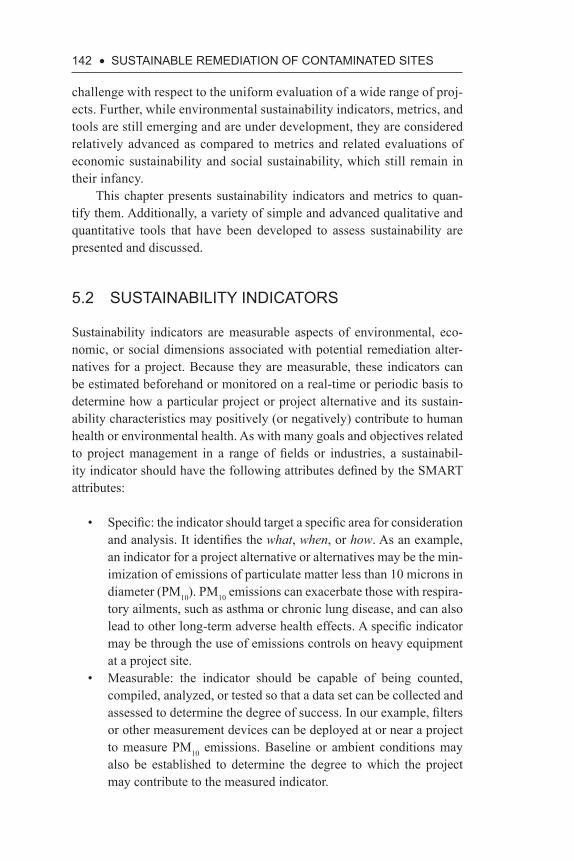
142 • SuStAiNABLE REMEDiAtiON Of CONtAMiNAtED SitES
challenge with respect to the uniform evaluation of a wide range of proj-ects. Further, while environmental sustainability indicators, metrics, and tools are still emerging and are under development, they are considered relatively advanced as compared to metrics and related evaluations of economic sustainability and social sustainability, which still remain in their infancy.
This chapter presents sustainability indicators and metrics to quan-tify them. Additionally, a variety of simple and advanced qualitative and quantitative tools that have been developed to assess sustainability are presented and discussed.
5.2 SuStAiNABiLitY iNDiCAtORS
Sustainability indicators are measurable aspects of environmental, eco-nomic, or social dimensions associated with potential remediation alter-natives for a project. Because they are measurable, these indicators can be estimated beforehand or monitored on a real-time or periodic basis to determine how a particular project or project alternative and its sustain-ability characteristics may positively (or negatively) contribute to human health or environmental health. As with many goals and objectives related to project management in a range of fields or industries, a sustainabil-ity indicator should have the following attributes defined by the SMART attributes:
• Specific: the indicator should target a specific area for consideration and analysis. It identifies the what, when, or how. As an example, an indicator for a project alternative or alternatives may be the min-imization of emissions of particulate matter less than 10 microns in diameter (PM10). PM10 emissions can exacerbate those with respira-tory ailments, such as asthma or chronic lung disease, and can also lead to other long-term adverse health effects. A specific indicator may be through the use of emissions controls on heavy equipment at a project site.
• Measurable: the indicator should be capable of being counted, compiled, analyzed, or tested so that a data set can be collected and assessed to determine the degree of success. In our example, filters or other measurement devices can be deployed at or near a project to measure PM10 emissions. Baseline or ambient conditions may also be established to determine the degree to which the project may contribute to the measured indicator.
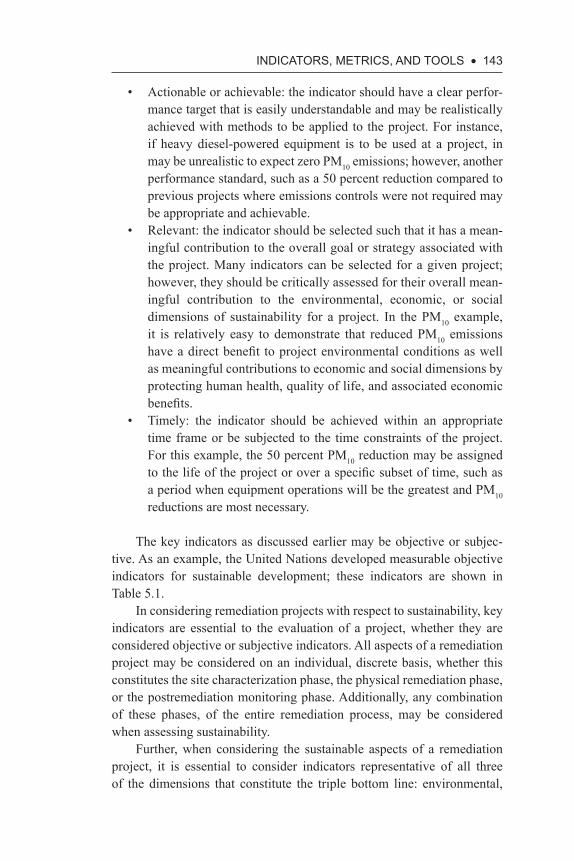
iNDiCAtORS, MEtRiCS, AND tOOLS • 143
• Actionable or achievable: the indicator should have a clear perfor-mance target that is easily understandable and may be realistically achieved with methods to be applied to the project. For instance, if heavy diesel-powered equipment is to be used at a project, in may be unrealistic to expect zero PM10 emissions; however, another performance standard, such as a 50 percent reduction compared to previous projects where emissions controls were not required may be appropriate and achievable.
• Relevant: the indicator should be selected such that it has a mean-ingful contribution to the overall goal or strategy associated with the project. Many indicators can be selected for a given project; however, they should be critically assessed for their overall mean-ingful contribution to the environmental, economic, or social dimensions of sustainability for a project. In the PM10 example, it is relatively easy to demonstrate that reduced PM10 emissions have a direct benefit to project environmental conditions as well as meaningful contributions to economic and social dimensions by protecting human health, quality of life, and associated economic benefits.
• Timely: the indicator should be achieved within an appropriate time frame or be subjected to the time constraints of the project. For this example, the 50 percent PM10 reduction may be assigned to the life of the project or over a specific subset of time, such as a period when equipment operations will be the greatest and PM10 reductions are most necessary.
The key indicators as discussed earlier may be objective or subjec-tive. As an example, the United Nations developed measurable objective indicators for sustainable development; these indicators are shown in Table 5.1.
In considering remediation projects with respect to sustainability, key indicators are essential to the evaluation of a project, whether they are considered objective or subjective indicators. All aspects of a remediation project may be considered on an individual, discrete basis, whether this constitutes the site characterization phase, the physical remediation phase, or the postremediation monitoring phase. Additionally, any combination of these phases, of the entire remediation process, may be considered when assessing sustainability.
Further, when considering the sustainable aspects of a remediation project, it is essential to consider indicators representative of all three of the dimensions that constitute the triple bottom line: environmental,
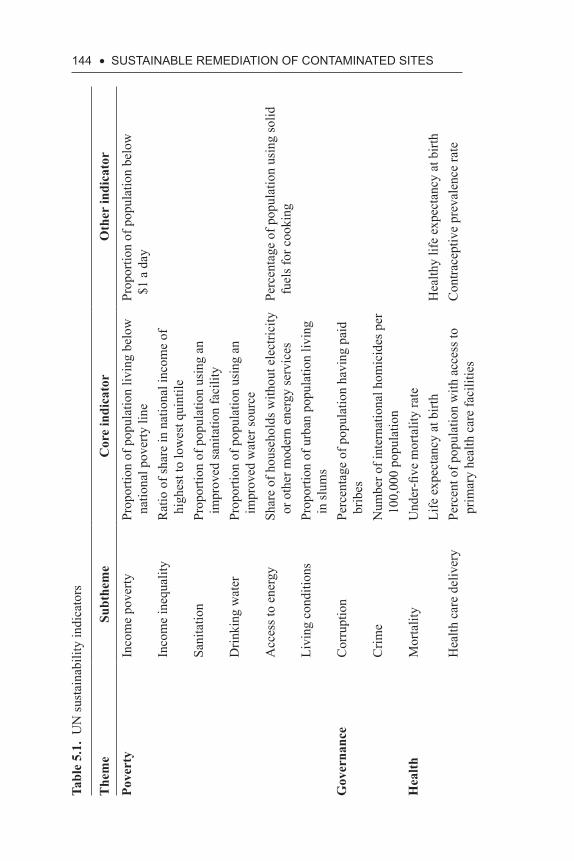
144 • SuStAiNABLE REMEDiAtiON Of CONtAMiNAtED SitESTa
ble
5.1.
UN
sust
aina
bilit
y in
dica
tors
The
me
Subt
hem
eC
ore
indi
cato
rO
ther
indi
cato
r
Pove
rty
Inco
me
pove
rtyPr
opor
tion
of p
opul
atio
n liv
ing
belo
w
natio
nal p
over
ty li
nePr
opor
tion
of p
opul
atio
n be
low
$1
a d
ayIn
com
e in
equa
lity
Rat
io o
f sha
re in
nat
iona
l inc
ome
of
high
est t
o lo
wes
t qui
ntile
Sani
tatio
nPr
opor
tion
of p
opul
atio
n us
ing
an
impr
oved
sani
tatio
n fa
cilit
yD
rinki
ng w
ater
Prop
ortio
n of
pop
ulat
ion
usin
g an
im
prov
ed w
ater
sour
ceA
cces
s to
ener
gySh
are
of h
ouse
hold
s with
out e
lect
ricity
or
oth
er m
oder
n en
ergy
serv
ices
Perc
enta
ge o
f pop
ulat
ion
usin
g so
lid
fuel
s for
coo
king
Livi
ng c
ondi
tions
Prop
ortio
n of
urb
an p
opul
atio
n liv
ing
in sl
ums
Gov
erna
nce
Cor
rupt
ion
Perc
enta
ge o
f pop
ulat
ion
havi
ng p
aid
brib
esC
rime
Num
ber o
f int
erna
tiona
l hom
icid
es p
er
100,
000
popu
latio
nH
ealth
Mor
talit
yU
nder
-five
mor
talit
y ra
teLi
fe e
xpec
tanc
y at
birt
hH
ealth
y lif
e ex
pect
ancy
at b
irth
Hea
lth c
are
deliv
ery
Perc
ent o
f pop
ulat
ion
with
acc
ess t
o pr
imar
y he
alth
car
e fa
cilit
ies
Con
trace
ptiv
e pr
eval
ence
rate
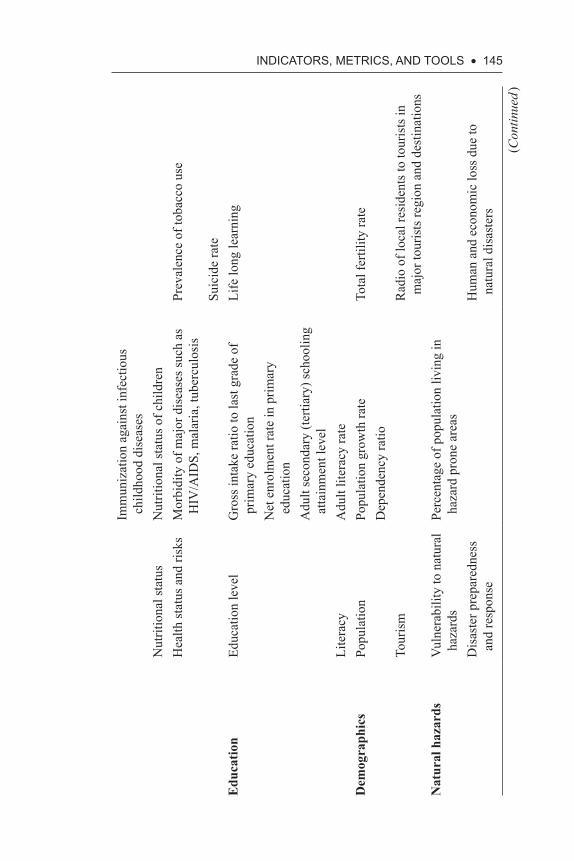
iNDiCAtORS, MEtRiCS, AND tOOLS • 145
Imm
uniz
atio
n ag
ains
t inf
ectio
us
child
hood
dis
ease
sN
utrit
iona
l sta
tus
Nut
ritio
nal s
tatu
s of c
hild
ren
Hea
lth st
atus
and
risk
sM
orbi
dity
of m
ajor
dis
ease
s suc
h as
H
IV/A
IDS,
mal
aria
, tub
ercu
losi
sPr
eval
ence
of t
obac
co u
se
Suic
ide
rate
Edu
catio
nEd
ucat
ion
leve
lG
ross
inta
ke ra
tio to
last
gra
de o
f pr
imar
y ed
ucat
ion
Life
long
lear
ning
Net
enr
olm
ent r
ate
in p
rimar
y ed
ucat
ion
Adu
lt se
cond
ary
(terti
ary)
scho
olin
g at
tain
men
t lev
elLi
tera
cyA
dult
liter
acy
rate
Dem
ogra
phic
sPo
pula
tion
Popu
latio
n gr
owth
rate
Tota
l fer
tility
rate
Dep
ende
ncy
ratio
Tour
ism
Rad
io o
f loc
al re
side
nts t
o to
uris
ts in
m
ajor
tour
ists
regi
on a
nd d
estin
atio
nsN
atur
al h
azar
dsV
ulne
rabi
lity
to n
atur
al
haza
rds
Perc
enta
ge o
f pop
ulat
ion
livin
g in
ha
zard
pro
ne a
reas
Dis
aste
r pre
pare
dnes
s an
d re
spon
seH
uman
and
eco
nom
ic lo
ss d
ue to
na
tura
l dis
aste
rs
(Con
tinue
d )
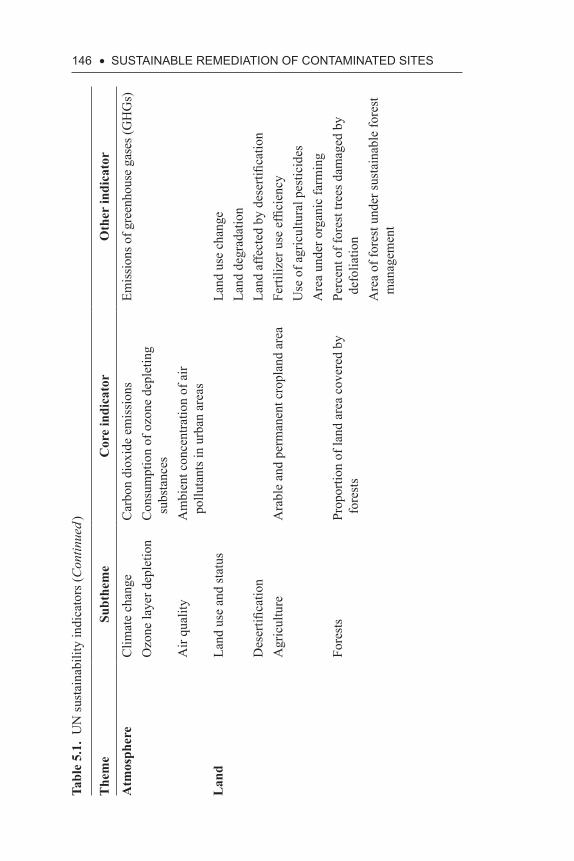
146 • SuStAiNABLE REMEDiAtiON Of CONtAMiNAtED SitESTa
ble
5.1.
UN
sust
aina
bilit
y in
dica
tors
(Con
tinue
d )
The
me
Subt
hem
eC
ore
indi
cato
rO
ther
indi
cato
r
Atm
osph
ere
Clim
ate
chan
geC
arbo
n di
oxid
e em
issi
ons
Emiss
ions
of g
reen
hous
e ga
ses (
GH
Gs)
Ozo
ne la
yer d
eple
tion
Con
sum
ptio
n of
ozo
ne d
eple
ting
subs
tanc
esA
ir qu
ality
Am
bien
t con
cent
ratio
n of
air
pollu
tant
s in
urba
n ar
eas
Lan
dLa
nd u
se a
nd st
atus
Land
use
cha
nge
Land
deg
rada
tion
Des
ertifi
catio
nLa
nd a
ffect
ed b
y de
serti
ficat
ion
Agr
icul
ture
Ara
ble
and
perm
anen
t cro
plan
d ar
eaFe
rtiliz
er u
se e
ffici
ency
Use
of a
gric
ultu
ral p
estic
ides
Are
a un
der o
rgan
ic fa
rmin
gFo
rest
sPr
opor
tion
of la
nd a
rea
cove
red
by
fore
sts
Perc
ent o
f for
est t
rees
dam
aged
by
defo
liatio
nA
rea
of fo
rest
und
er su
stai
nabl
e fo
rest
m
anag
emen
t
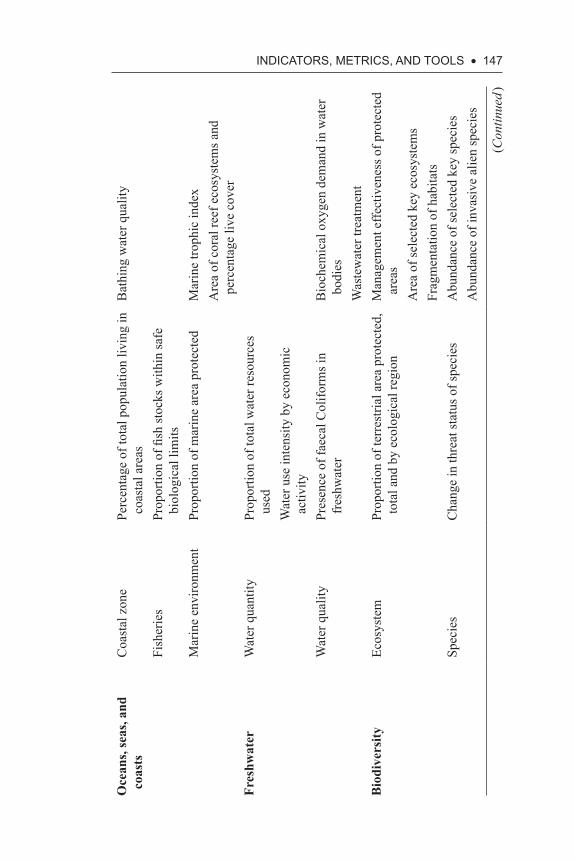
iNDiCAtORS, MEtRiCS, AND tOOLS • 147
Oce
ans,
seas
, and
co
asts
Coa
stal
zon
ePe
rcen
tage
of t
otal
pop
ulat
ion
livin
g in
co
asta
l are
asB
athi
ng w
ater
qua
lity
Fish
erie
sPr
opor
tion
of fi
sh st
ocks
with
in sa
fe
biol
ogic
al li
mits
Mar
ine
envi
ronm
ent
Prop
ortio
n of
mar
ine
area
pro
tect
edM
arin
e tro
phic
inde
xA
rea
of c
oral
reef
eco
syst
ems a
nd
perc
enta
ge li
ve c
over
Fres
hwat
erW
ater
qua
ntity
Prop
ortio
n of
tota
l wat
er re
sour
ces
used
Wat
er u
se in
tens
ity b
y ec
onom
ic
activ
ityW
ater
qua
lity
Pres
ence
of f
aeca
l Col
iform
s in
fres
hwat
erB
ioch
emic
al o
xyge
n de
man
d in
wat
er
bodi
esW
aste
wat
er tr
eatm
ent
Bio
dive
rsity
Ecos
yste
mPr
opor
tion
of te
rres
trial
are
a pr
otec
ted,
to
tal a
nd b
y ec
olog
ical
regi
onM
anag
emen
t effe
ctiv
enes
s of p
rote
cted
ar
eas
Are
a of
sele
cted
key
eco
syst
ems
Frag
men
tatio
n of
hab
itats
Spec
ies
Cha
nge
in th
reat
stat
us o
f spe
cies
Abu
ndan
ce o
f sel
ecte
d ke
y sp
ecie
sA
bund
ance
of i
nvas
ive
alie
n sp
ecie
s
(Con
tinue
d )
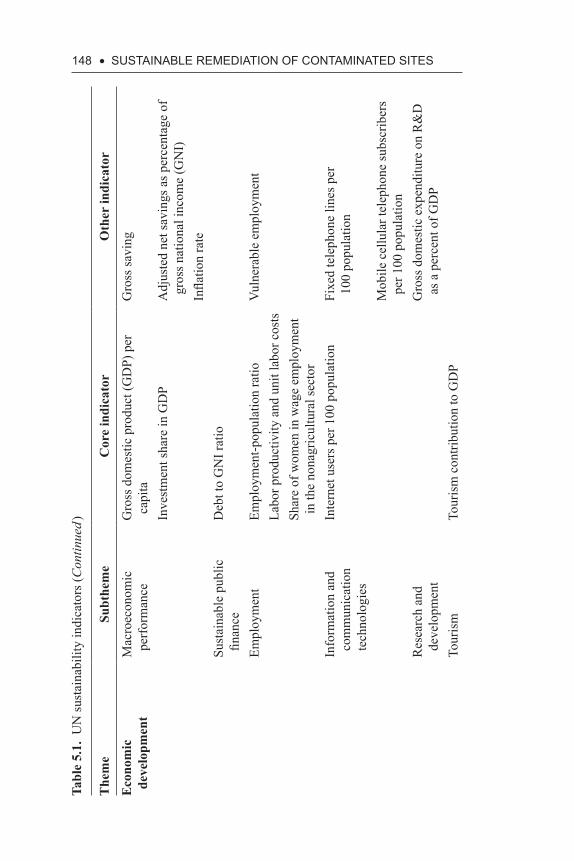
148 • SuStAiNABLE REMEDiAtiON Of CONtAMiNAtED SitESTa
ble
5.1.
UN
sust
aina
bilit
y in
dica
tors
(Con
tinue
d )
The
me
Subt
hem
eC
ore
indi
cato
rO
ther
indi
cato
r
Eco
nom
ic
deve
lopm
ent
Mac
roec
onom
ic
perf
orm
ance
Gro
ss d
omes
tic p
rodu
ct (G
DP)
per
ca
pita
Gro
ss sa
ving
Inve
stm
ent s
hare
in G
DP
Adj
uste
d ne
t sav
ings
as p
erce
ntag
e of
gr
oss n
atio
nal i
ncom
e (G
NI)
Infla
tion
rate
Sust
aina
ble
publ
ic
finan
ceD
ebt t
o G
NI r
atio
Empl
oym
ent
Empl
oym
ent-p
opul
atio
n ra
tioV
ulne
rabl
e em
ploy
men
tLa
bor p
rodu
ctiv
ity a
nd u
nit l
abor
cos
tsSh
are
of w
omen
in w
age
empl
oym
ent
in th
e no
nagr
icul
tura
l sec
tor
Info
rmat
ion
and
com
mun
icat
ion
tech
nolo
gies
Inte
rnet
use
rs p
er 1
00 p
opul
atio
nFi
xed
tele
phon
e lin
es p
er
100
popu
latio
n
Mob
ile c
ellu
lar t
elep
hone
subs
crib
ers
per 1
00 p
opul
atio
nR
esea
rch
and
deve
lopm
ent
Gro
ss d
omes
tic e
xpen
ditu
re o
n R
&D
as
a p
erce
nt o
f GD
PTo
uris
mTo
uris
m c
ontri
butio
n to
GD
P
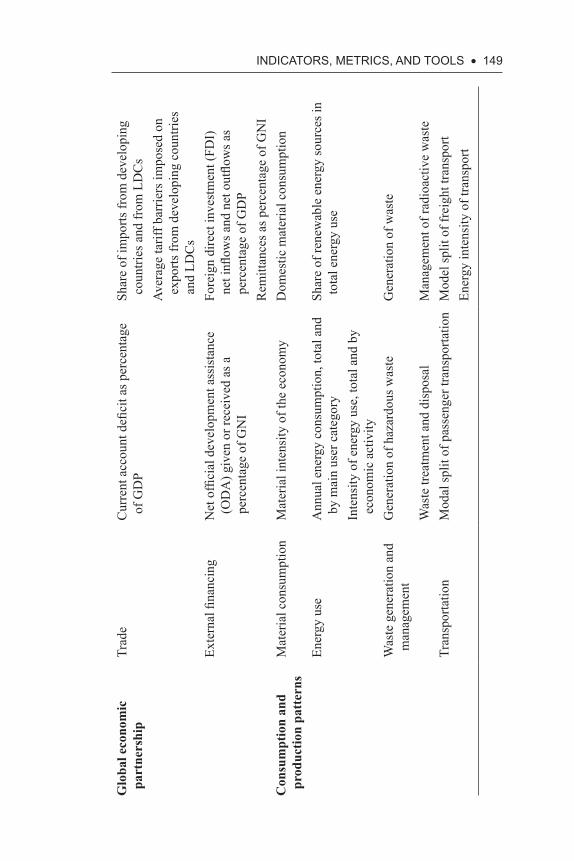
iNDiCAtORS, MEtRiCS, AND tOOLS • 149
Glo
bal e
cono
mic
pa
rtne
rshi
pTr
ade
Cur
rent
acc
ount
defi
cit a
s per
cent
age
of G
DP
Shar
e of
impo
rts fr
om d
evel
opin
g co
untri
es a
nd fr
om L
DC
sAv
erag
e ta
riff b
arrie
rs im
pose
d on
ex
ports
from
dev
elop
ing
coun
tries
an
d LD
Cs
Exte
rnal
fina
ncin
gN
et o
ffici
al d
evel
opm
ent a
ssis
tanc
e (O
DA
) giv
en o
r rec
eive
d as
a
perc
enta
ge o
f GN
I
Fore
ign
dire
ct in
vest
men
t (FD
I)
net i
nflow
s and
net
out
flow
s as
perc
enta
ge o
f GD
PR
emitt
ance
s as p
erce
ntag
e of
GN
IC
onsu
mpt
ion
and
prod
uctio
n pa
tter
nsM
ater
ial c
onsu
mpt
ion
Mat
eria
l int
ensi
ty o
f the
eco
nom
yD
omes
tic m
ater
ial c
onsu
mpt
ion
Ener
gy u
seA
nnua
l ene
rgy
cons
umpt
ion,
tota
l and
by
mai
n us
er c
ateg
ory
Shar
e of
rene
wab
le e
nerg
y so
urce
s in
tota
l ene
rgy
use
Inte
nsity
of e
nerg
y us
e, to
tal a
nd b
y ec
onom
ic a
ctiv
ityW
aste
gen
erat
ion
and
man
agem
ent
Gen
erat
ion
of h
azar
dous
was
teG
ener
atio
n of
was
te
Was
te tr
eatm
ent a
nd d
ispo
sal
Man
agem
ent o
f rad
ioac
tive
was
teTr
ansp
orta
tion
Mod
al sp
lit o
f pas
seng
er tr
ansp
orta
tion
Mod
el sp
lit o
f fre
ight
tran
spor
tEn
ergy
inte
nsity
of t
rans
port
150 • SuStAiNABLE REMEDiAtiON Of CONtAMiNAtED SitES
economic, and social dimensions. Environmental indicators may include the following:
• GHG and other air emissions• Contributions to climate change• Use of fresh water resources• Impacts to soil• Utilization of raw natural resources• Impacts on surface water or groundwater• Use of recycled or repurposed materials• Overall waste generation• Diversion of waste materials from or to landfill facilities
Economic sustainability indicators that may be considered for the remediation project include the following:
• Direct and indirect job creation within the community• Direct and indirect investment within the community• Facilitation of government grants for the project and community
as a whole• Long-term tax and revenue generation within the enhanced
community• Degree of highest and best use (HBU) achieved by the remediated
property• Potential to upzone the property and nearby properties due to reme-
diation activity
When compared to environmental and economic dimensions, social sustainability indicators have not been incorporated as extensively, nor have they been as developed or refined. In general, social sustainability is focused on the impacts of remediation activity on society as a whole, including dimensions related to quality-of-life, diversity, cultural aware-ness, and social cohesion and harmony. Some key indicators of social sus-tainability include the following:
• Enhancement of community aesthetics• Enhancement of quality-of-life features (e.g., improved transporta-
tion opportunities or recreational facilities)• Public participation in decision making• Educational and job training opportunities• Interaction between community groups
iNDiCAtORS, MEtRiCS, AND tOOLS • 151
• Emotional ownership of the community in a remediation project• Improved physical and mental health and well-being of members
of the community• Enhanced social opportunities for members of the community• Strengthening or enhancement of existing community institutions
(e.g., recreational organizations, charitable foundations, and houses of worship)
5.3 SuStAiNABiLitY MEtRiCS
The indicators presented earlier provide key variables that may be assessed when evaluating the degree of sustainability for a particular remediation project or alternative. The indicators as presented earlier may not be easily measurable. However, numerical values or characteristics may be inte-grated with the indicators so that they may be objectively and accurately assessed. As a result, metrics may be connected to the indicators. Sus-tainability metrics are numerical values that may be used to assess spe-cific indicators related to sustainability, and they are vitally important to objective analysis with respect to remediation project sustainability. These metrics are relatively easy to incorporate into a range of sustainability measurement tools, which are discussed in greater detail in subsequent sections of this chapter.
The metrics that may be used to assess the sustainability of environ-mental remediation are, in many cases, fairly straightforward and even tra-ditional forms of measurement that are used for other purposes. As a result, their ability to be accurately measured in many cases is well established. This is especially the case for economic and environmental sustainabil-ity dimensions. As mentioned, social sustainability indicators and metrics have not been as extensively defined or developed. Further, several of the social metrics can be evaluated only qualitatively, which can make the determination of social impacts difficult. However, new tools (including the Social Sustainability Evaluation Matrix [SSEM]) are being developed with respect to the measurement of the social sustainability indicators related to remediation projects, and as a result, metrics are increasingly being applied to their analysis with increasing accuracy.
Before some common metrics are presented, it is important to note that there is no standard established regarding an appropriate set of param-eters to be used for the sustainability evaluation of remediation projects, nor is there consensus on what constitutes green remediation. Additionally, there is a wide range of opinion regarding the degree to which individual
152 • SuStAiNABLE REMEDiAtiON Of CONtAMiNAtED SitES
metrics contribute to or affect sustainability. This is further reflected in the relatively wide range of scope inherent in several sustainability assess-ment tools that are presented in later sections of this chapter. Further, there is no commonly accepted set of metrics used by remediation practitioners to evaluate whether site cleanup activities are green and sustainable.
Traditional metrics associated with site remediation include the vol-ume of remediated soil or groundwater (cubic feet and gallons or m3 and liters), removed contaminant mass (lbs. or kg), mass of treated soil (tons or kg), or remediated area (square feet or m2). Commonly, these metrics may also be computed based per unit time or per monetary unit basis to determine the relative time efficiency or cost efficiency of the remediation alternative.
Similar physical metrics may be used to assess the physical inputs and outputs of a remediation project alternative, including those focused or tai-lored for positive or negative contributions with respect to sustainability.
• Energy consumption (kWh or BTU)• Renewable energy consumption (kWh or BTU or as a percentage of
total energy consumption)• Fresh water or recycled or reclaimed water consumption (gallons
or liters)• Air emissions (tons or kg)• GHG emissions (tons or kg)• Carbon emission offset (tons or kg or a percentage of GHG
emissions)• Solid waste generation (tons or kg)• Use of recycled solid materials (tons or kg)
Several of these may be combined on a per unit basis, including energy (nonrenewable or renewable), water (fresh or reclaimed), or air emissions per treated unit mass and volume of soil or water. Of course, these may further be coupled with time or monetary unit to determine these metrics on a unit time or unit cost basis. Further, other actions may be quantitatively assessed, include credits and offsets of ecological resto-ration, increased real estate value on a unit basis following remediation, and preservation or restoration of natural resources or significant cultural resources or historically significant built environment.
Because the potential list of sustainability metrics for environmental remediation projects is enormous, and because there is a lack of a con-sensus or standard regarding key indicators and related metrics, there has been a growing dialogue between a number of sustainability-focused
iNDiCAtORS, MEtRiCS, AND tOOLS • 153
organizations and regulatory agencies regarding potential efforts for stan-dardization. These organizations, including Sustainable Remediation Forum (SURF), The United Kingdom’s Sustainable Remediation Forum (SuRF-UK), Association of State and Territorial Solid Waste Manage-ment Officials (ASTSWMO), and Naval Facilities Engineering Command (NAVFAC), have issued white papers and other documents to further these efforts.
For instance, SuRF-UK evaluated the application of currently avail-able sustainability indicators to remediation in their document A Review of Published Sustainability Indicator Sets. It evaluated potential metrics for six indicator categories across the respective environmental, economic, and social sustainability dimensions. NAVFAC issued a fact sheet in 2009 that listed eight metrics that are applicable for use in remediation projects at contaminated sites under the jurisdiction of the U.S. Navy. These met-rics include the following: energy consumption, GHG emissions, criteria pollutant emissions, water impacts, ecological impacts, resources con-sumption, worker safety, and community impacts. Battelle’s SiteWise™ tool incorporates five metrics for the evaluation of sustainable remedi-ation projects, including the following: consumption, GHG emissions, criteria pollutant emissions, water impacts, and worker safety. The Sus-tainable Remediation Tool (SRT™), developed by the Air Force Center for Engineering and the Environment (AFCEE), incorporates five metrics, including GHG emissions, energy consumed, technology cost, safety and accident risk, and natural resources services.
5.4 SuStAiNABiLitY ASSESSMENt tOOLS
Once key indicators and related metrics have been devised for sustainabil-ity analyses, they may be formally evaluated using a sustainability assess-ment tool. A wide range of tools has been developed; each associated with a certain level of complexity and rigor associated with the analysis. The respective assessment tools may provide a relatively simple qualitative analysis of BMPs, a semiquantitative analysis, or a more complex quanti-tative analysis of multiple sustainability metrics. As mentioned in the pre-vious chapter, BMPs are relatively simple to identify and implement, and qualitative analyses provide a straightforward evaluation of the benefits and drawbacks among alternatives under consideration for use. Semiquan-titative and quantitative tools provide more detailed, complex evaluations of sustainability impacts. In some cases, assessment tools are in the pub-lic domain and are easily available and implemented, while other tools
154 • SuStAiNABLE REMEDiAtiON Of CONtAMiNAtED SitES
may be for sale and proprietarily follow a traditional software licensing platform and may be quite expensive. In some instances, not-for-profit or for-profit organizations, whether public or private, have developed assess-ment tools for their in-house use only. These tools can range from simple decision trees or spreadsheets to full life-cycle assessments (LCAs). Sev-eral qualitative, semiquantitative, and quantitative tools are summarized in the following sections.
5.4.1 QUALITATIVE ASSESSMENT TOOLS
The purpose of qualitative assessment tools is to screen remediation tech-nology and BMP alternatives based on anticipated impacts across the environmental, economic, and societal dimensions of sustainability. These commonly consist of guidance documents or advisory manuals that outline an appropriate selection process, including relevant criteria. Two examples of qualitative tools have been developed by public regulatory agencies, including the Illinois Environmental Protection Agency (Illinois EPA) Greener Cleanup Matrix and the Minnesota Pollution Control Agency (MPCA) Toolkit for Greener Practices.
5.4.1.1 Illinois EPA Greener Cleanups Matrix
The Illinois EPA developed the Greener Cleanups Matrix to allow for an assessment of and to facilitate technology selection to optimize the direct and indirect benefit of remediation alternatives for the environment. The Matrix is based on five key principles: (1) ensuring every cleanup protects human health and the environment; (2) the integration of site reuse plans into the cleanup strategy, including project sequencing and appropriate inclusion of engineering and engineering controls into project design; (3) the conserva-tion of raw materials such as soil and water and the salvage of building mate-rials and other resources, with the goal of reducing waste disposal, reducing the use of virgin material inputs, and the use of existing infrastructure; (4) the conservation of energy, with an emphasis on the use of energy from renew-able resources; and (5) the consideration of environmental effects associated with remediation alternatives, including contaminant fate and long-term stewardship responsibilities and consequences.
Using a multitiered approach that includes a simple matrix and a com-plex matrix, actions are identified that may be implemented during differ-ent phases of site remediation. The matrix assesses the relative impacts on air, water, land, and energy. It assesses the beneficial effect of BMPs
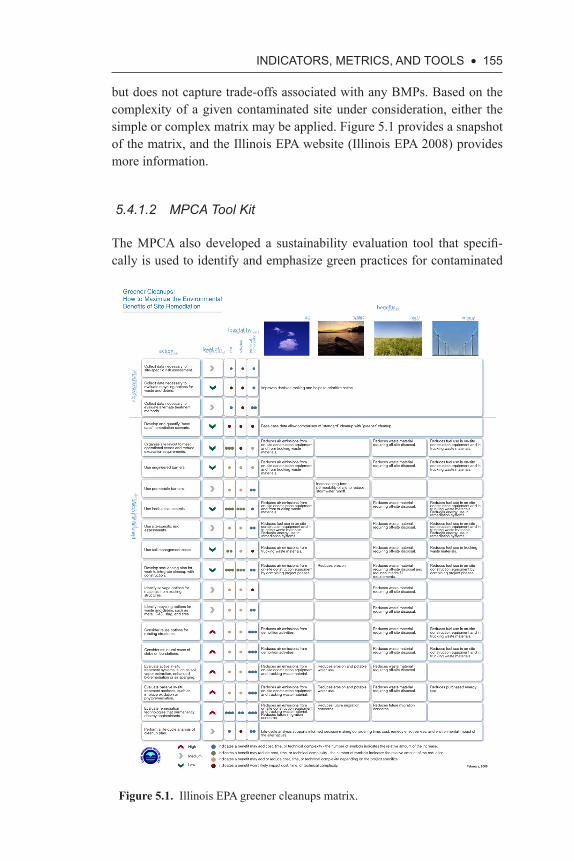
iNDiCAtORS, MEtRiCS, AND tOOLS • 155
but does not capture trade-offs associated with any BMPs. Based on the complexity of a given contaminated site under consideration, either the simple or complex matrix may be applied. Figure 5.1 provides a snapshot of the matrix, and the Illinois EPA website (Illinois EPA 2008) provides more information.
5.4.1.2 MPCA Tool Kit
The MPCA also developed a sustainability evaluation tool that specifi-cally is used to identify and emphasize green practices for contaminated
Figure 5.1. Illinois EPA greener cleanups matrix.
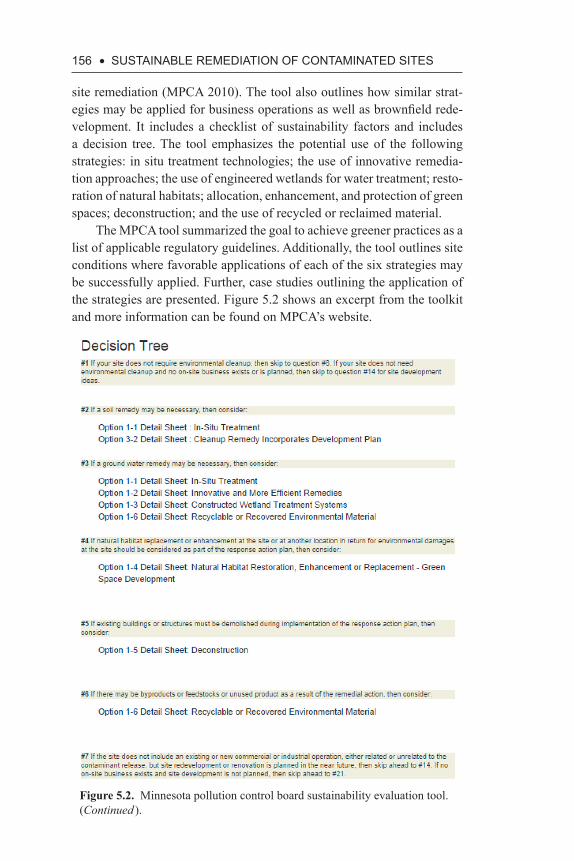
156 • SuStAiNABLE REMEDiAtiON Of CONtAMiNAtED SitES
site remediation (MPCA 2010). The tool also outlines how similar strat-egies may be applied for business operations as well as brownfield rede-velopment. It includes a checklist of sustainability factors and includes a decision tree. The tool emphasizes the potential use of the following strategies: in situ treatment technologies; the use of innovative remedia-tion approaches; the use of engineered wetlands for water treatment; resto-ration of natural habitats; allocation, enhancement, and protection of green spaces; deconstruction; and the use of recycled or reclaimed material.
The MPCA tool summarized the goal to achieve greener practices as a list of applicable regulatory guidelines. Additionally, the tool outlines site conditions where favorable applications of each of the six strategies may be successfully applied. Further, case studies outlining the application of the strategies are presented. Figure 5.2 shows an excerpt from the toolkit and more information can be found on MPCA’s website.
Figure 5.2. Minnesota pollution control board sustainability evaluation tool. (Continued ).
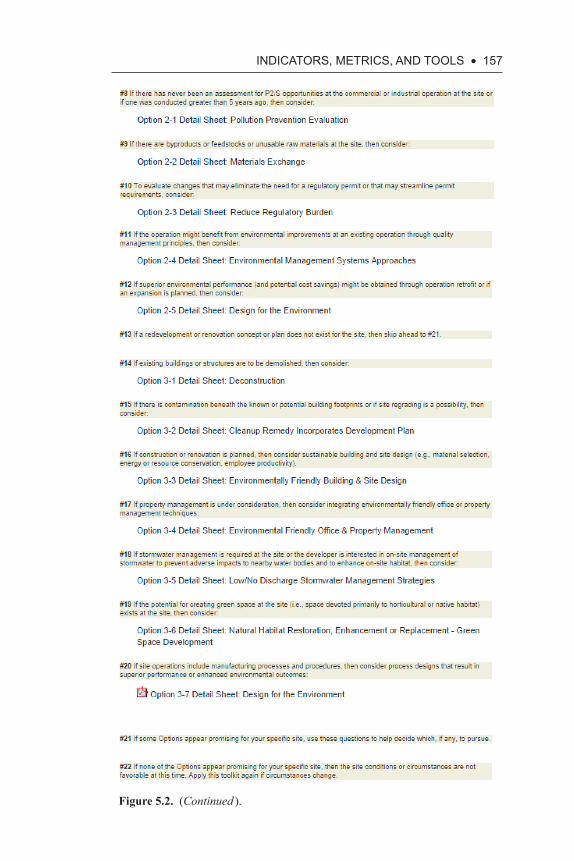
iNDiCAtORS, MEtRiCS, AND tOOLS • 157
Figure 5.2. (Continued ).
158 • SuStAiNABLE REMEDiAtiON Of CONtAMiNAtED SitES
5.4.2 SEMIQUANTITATIVE ASSESSMENT TOOLS
While qualitative tools offer a screening tool of BMPs or other remediation-related factors, semiquantitative tools offer a greater degree of rigor and analysis. Typically, these tools will offer a scorecard-like approach in which potential quantitative factors may be ranked and scored, resulting in a weighted average or cumulative score that allows for a direct numer-ical comparison among several potential remediation alternative. These semiquantitative tools are typically straightforward and do not incorporate advanced numerical modeling; rather, they may be used for screening or feasibility assessment when considering remediation alternatives for a proj-ect as well as alternative applications for the design of a particular reme-diation technology that may have been selected for a project. Examples of semiquantitative assessment tools are presented in the following text.
5.4.2.1 California Green Remediation Evaluation Matrix
To encourage the use and incorporation of technologies and strategies that promote green remediation, the California Department of Toxic Substances Control (DTSC) created a semiquantitative assessment tool called the Green Remediation Evaluation Matrix (GREM). As shown in Table 5.2, it is a straightforward assessment tool based on an Excel plat-form that is used to comparatively assess remediation alternatives. The basic application of GREM is a qualitative matrix that is developed for a project site to be assessed. The matrix incorporates several site-specific parameters, including the extent and magnitude of contamination at the site, the potential existing and generated waste (including air pollutants and GHG emissions), potential physical disturbances and disruptions to the site and its vicinity, such as noise and traffic, and the consumption or restoration of resources. Additionally, several resources may be applied to the qualitative matrix such that it functions in a semiquantitative manner, including calculators for GHG emissions and energy consumption. LCA tools may also be applied to the GREM qualitative matrix. The tool may be applied to any or all activities across the life cycle associated with a remediation project.
5.4.2.2 Social Sustainability Evaluation Matrix
Using a similar matrix approach to GREM, Reddy, Sadasivam, and Adams (2014) developed a matrix for assessing the social dimensions of sustain-
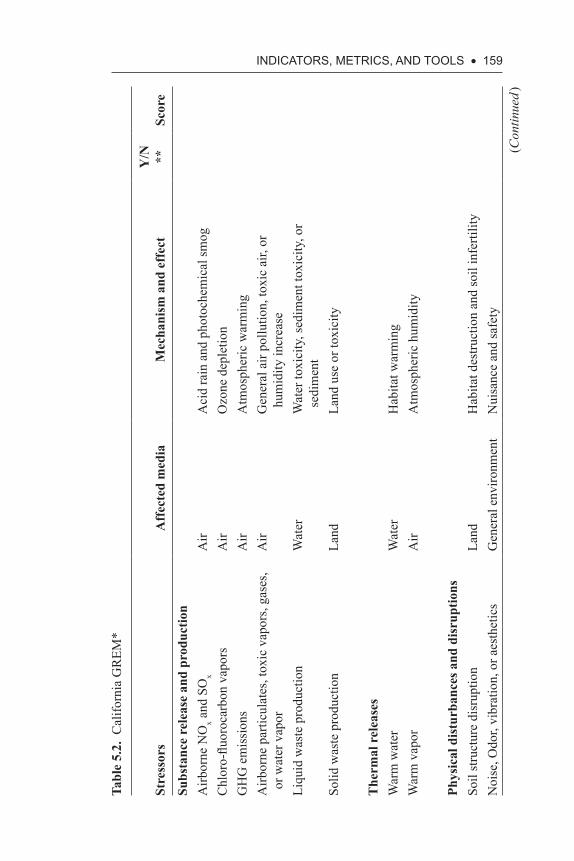
iNDiCAtORS, MEtRiCS, AND tOOLS • 159
Tabl
e 5.
2. C
alifo
rnia
GR
EM*
Stre
ssor
sA
ffec
ted
med
iaM
echa
nism
and
eff
ect
Y/N
**
Scor
e
Subs
tanc
e re
leas
e an
d pr
oduc
tion
Airb
orne
NO
x and
SO
xA
irA
cid
rain
and
pho
toch
emic
al sm
ogC
hlor
o-flu
oroc
arbo
n va
pors
Air
Ozo
ne d
eple
tion
GH
G e
mis
sion
sA
irA
tmos
pher
ic w
arm
ing
Airb
orne
par
ticul
ates
, tox
ic v
apor
s, ga
ses,
or w
ater
vap
orA
irG
ener
al a
ir po
llutio
n, to
xic
air,
or
hum
idity
incr
ease
Liqu
id w
aste
pro
duct
ion
Wat
erW
ater
toxi
city
, sed
imen
t tox
icity
, or
sedi
men
tSo
lid w
aste
pro
duct
ion
Land
Land
use
or t
oxic
ity
The
rmal
rel
ease
sW
arm
wat
erW
ater
Hab
itat w
arm
ing
War
m v
apor
Air
Atm
osph
eric
hum
idity
Phys
ical
dis
turb
ance
s and
dis
rupt
ions
Soil
stru
ctur
e di
srup
tion
Land
Hab
itat d
estru
ctio
n an
d so
il in
ferti
lity
Noi
se, O
dor,
vibr
atio
n, o
r aes
thet
ics
Gen
eral
env
ironm
ent
Nui
sanc
e an
d sa
fety
(Con
tinue
d )
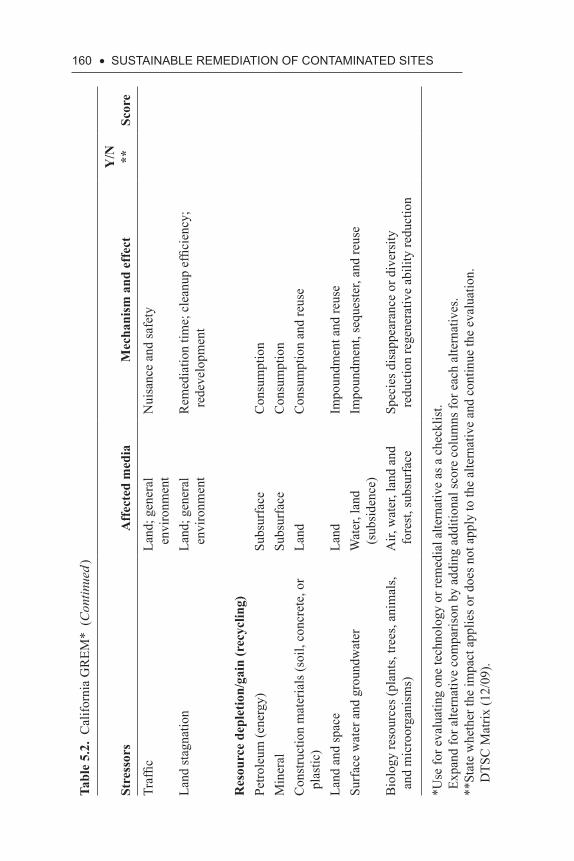
160 • SuStAiNABLE REMEDiAtiON Of CONtAMiNAtED SitES
Tabl
e 5.
2. C
alifo
rnia
GR
EM*
(Con
tinue
d )
Stre
ssor
sA
ffec
ted
med
iaM
echa
nism
and
eff
ect
Y/N
**
Scor
e
Traf
ficLa
nd; g
ener
al
envi
ronm
ent
Nui
sanc
e an
d sa
fety
Land
stag
natio
nLa
nd; g
ener
al
envi
ronm
ent
Rem
edia
tion
time;
cle
anup
effi
cien
cy;
rede
velo
pmen
t
Res
ourc
e de
plet
ion/
gain
(rec
yclin
g)Pe
trole
um (e
nerg
y)Su
bsur
face
Con
sum
ptio
nM
iner
alSu
bsur
face
Con
sum
ptio
nC
onst
ruct
ion
mat
eria
ls (s
oil,
conc
rete
, or
plas
tic)
Land
Con
sum
ptio
n an
d re
use
Land
and
spac
eLa
ndIm
poun
dmen
t and
reus
eSu
rfac
e w
ater
and
gro
undw
ater
Wat
er, l
and
(sub
side
nce)
Impo
undm
ent,
sequ
este
r, an
d re
use
Bio
logy
reso
urce
s (pl
ants
, tre
es, a
nim
als,
and
mic
roor
gani
sms)
Air,
wat
er, l
and
and
fore
st, s
ubsu
rfac
eSp
ecie
s dis
appe
aran
ce o
r div
ersi
ty
redu
ctio
n re
gene
rativ
e ab
ility
redu
ctio
n
*Use
for e
valu
atin
g on
e te
chno
logy
or r
emed
ial a
ltern
ativ
e as
a c
heck
list.
Exp
and
for a
ltern
ativ
e co
mpa
rison
by
addi
ng a
dditi
onal
scor
e co
lum
ns fo
r eac
h al
tern
ativ
es.
**St
ate
whe
ther
the
impa
ct a
pplie
s or d
oes n
ot a
pply
to th
e al
tern
ativ
e an
d co
ntin
ue th
e ev
alua
tion.
D
TSC
Mat
rix (1
2/09
).
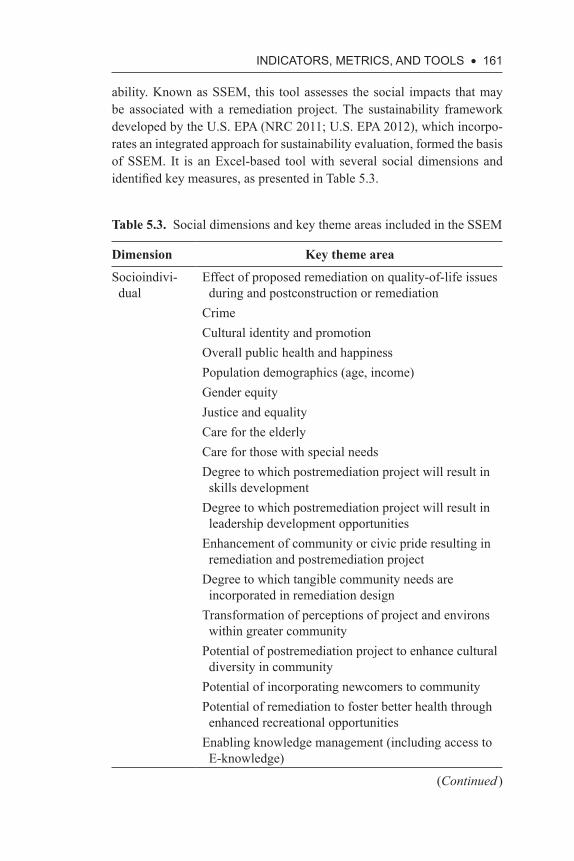
iNDiCAtORS, MEtRiCS, AND tOOLS • 161
ability. Known as SSEM, this tool assesses the social impacts that may be associated with a remediation project. The sustainability framework developed by the U.S. EPA (NRC 2011; U.S. EPA 2012), which incorpo-rates an integrated approach for sustainability evaluation, formed the basis of SSEM. It is an Excel-based tool with several social dimensions and identified key measures, as presented in Table 5.3.
Table 5.3. Social dimensions and key theme areas included in the SSEM
Dimension Key theme area
Socioindivi-dual
Effect of proposed remediation on quality-of-life issues during and postconstruction or remediation
CrimeCultural identity and promotionOverall public health and happinessPopulation demographics (age, income)Gender equityJustice and equalityCare for the elderlyCare for those with special needsDegree to which postremediation project will result in skills development
Degree to which postremediation project will result in leadership development opportunities
Enhancement of community or civic pride resulting in remediation and postremediation project
Degree to which tangible community needs are incorporated in remediation design
Transformation of perceptions of project and environs within greater community
Potential of postremediation project to enhance cultural diversity in community
Potential of incorporating newcomers to communityPotential of remediation to foster better health through enhanced recreational opportunities
Enabling knowledge management (including access to E-knowledge)
(Continued )
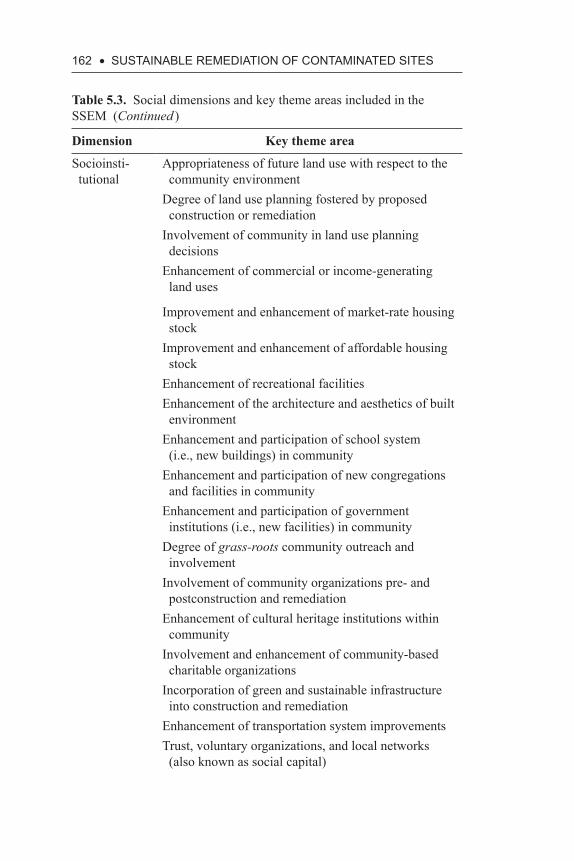
162 • SuStAiNABLE REMEDiAtiON Of CONtAMiNAtED SitES
Table 5.3. Social dimensions and key theme areas included in the SSEM (Continued )
Dimension Key theme area
Socioinsti-tutional
Appropriateness of future land use with respect to the community environment
Degree of land use planning fostered by proposed construction or remediation
Involvement of community in land use planning decisions
Enhancement of commercial or income-generating land uses
Improvement and enhancement of market-rate housing stock
Improvement and enhancement of affordable housing stock
Enhancement of recreational facilitiesEnhancement of the architecture and aesthetics of built environment
Enhancement and participation of school system (i.e., new buildings) in community
Enhancement and participation of new congregations and facilities in community
Enhancement and participation of government institutions (i.e., new facilities) in community
Degree of grass-roots community outreach and involvement
Involvement of community organizations pre- and postconstruction and remediation
Enhancement of cultural heritage institutions within community
Involvement and enhancement of community-based charitable organizations
Incorporation of green and sustainable infrastructure into construction and remediation
Enhancement of transportation system improvementsTrust, voluntary organizations, and local networks (also known as social capital)
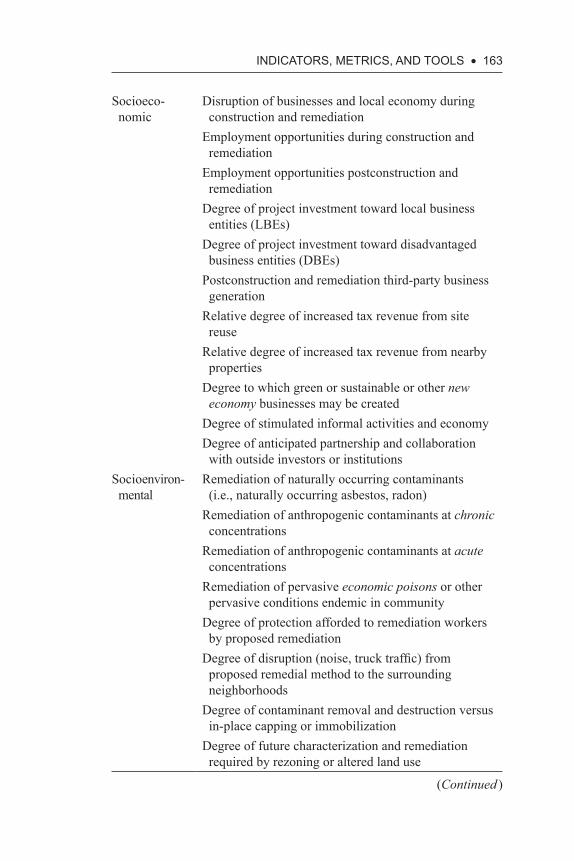
iNDiCAtORS, MEtRiCS, AND tOOLS • 163
Socioeco-nomic
Disruption of businesses and local economy during construction and remediation
Employment opportunities during construction and remediation
Employment opportunities postconstruction and remediation
Degree of project investment toward local business entities (LBEs)
Degree of project investment toward disadvantaged business entities (DBEs)
Postconstruction and remediation third-party business generation
Relative degree of increased tax revenue from site reuse
Relative degree of increased tax revenue from nearby properties
Degree to which green or sustainable or other new economy businesses may be created
Degree of stimulated informal activities and economy Degree of anticipated partnership and collaboration with outside investors or institutions
Socioenviron-mental
Remediation of naturally occurring contaminants (i.e., naturally occurring asbestos, radon)
Remediation of anthropogenic contaminants at chronic concentrations
Remediation of anthropogenic contaminants at acute concentrations
Remediation of pervasive economic poisons or other pervasive conditions endemic in community
Degree of protection afforded to remediation workers by proposed remediation
Degree of disruption (noise, truck traffic) from proposed remedial method to the surrounding neighborhoods
Degree of contaminant removal and destruction versus in-place capping or immobilization
Degree of future characterization and remediation required by rezoning or altered land use
(Continued )
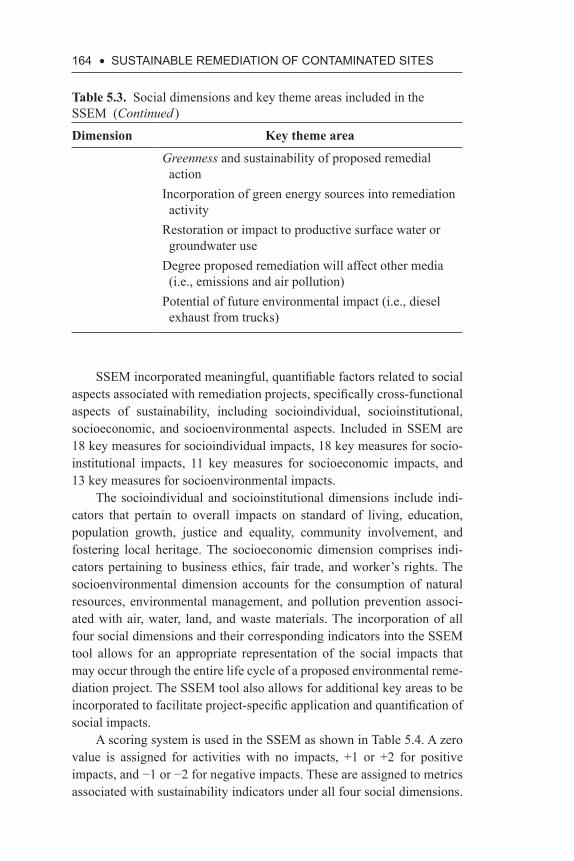
164 • SuStAiNABLE REMEDiAtiON Of CONtAMiNAtED SitES
SSEM incorporated meaningful, quantifiable factors related to social aspects associated with remediation projects, specifically cross-functional aspects of sustainability, including socioindividual, socioinstitutional, socioeconomic, and socioenvironmental aspects. Included in SSEM are 18 key measures for socioindividual impacts, 18 key measures for socio-institutional impacts, 11 key measures for socioeconomic impacts, and 13 key measures for socioenvironmental impacts.
The socioindividual and socioinstitutional dimensions include indi-cators that pertain to overall impacts on standard of living, education, population growth, justice and equality, community involvement, and fostering local heritage. The socioeconomic dimension comprises indi-cators pertaining to business ethics, fair trade, and worker’s rights. The socioenvironmental dimension accounts for the consumption of natural resources, environmental management, and pollution prevention associ-ated with air, water, land, and waste materials. The incorporation of all four social dimensions and their corresponding indicators into the SSEM tool allows for an appropriate representation of the social impacts that may occur through the entire life cycle of a proposed environmental reme-diation project. The SSEM tool also allows for additional key areas to be incorporated to facilitate project-specific application and quantification of social impacts.
A scoring system is used in the SSEM as shown in Table 5.4. A zero value is assigned for activities with no impacts, +1 or +2 for positive impacts, and −1 or −2 for negative impacts. These are assigned to metrics associated with sustainability indicators under all four social dimensions.
Table 5.3. Social dimensions and key theme areas included in the SSEM (Continued )
Dimension Key theme area
Greenness and sustainability of proposed remedial action
Incorporation of green energy sources into remediation activity
Restoration or impact to productive surface water or groundwater use
Degree proposed remediation will affect other media (i.e., emissions and air pollution)
Potential of future environmental impact (i.e., diesel exhaust from trucks)
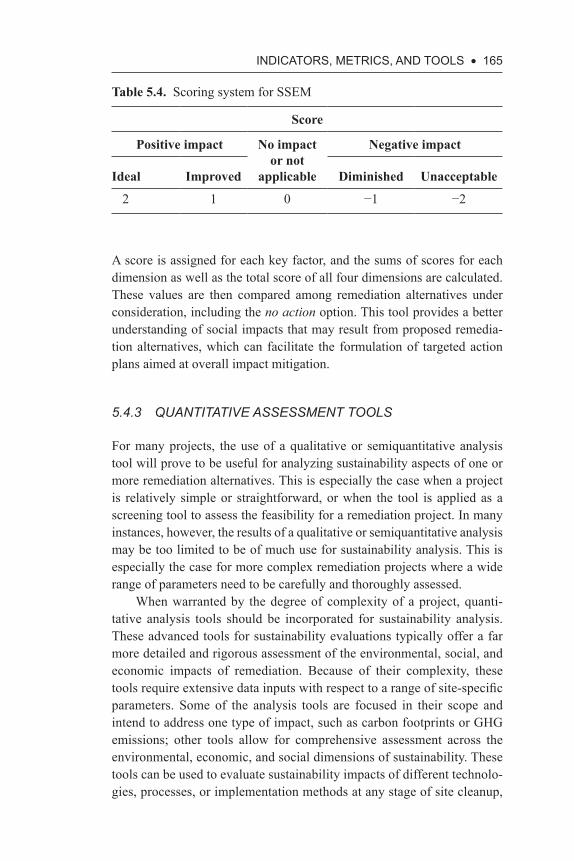
iNDiCAtORS, MEtRiCS, AND tOOLS • 165
Table 5.4. Scoring system for SSEM
Score
Positive impact No impact or not
applicable
Negative impact
Ideal Improved Diminished Unacceptable
2 1 0 −1 −2
A score is assigned for each key factor, and the sums of scores for each dimension as well as the total score of all four dimensions are calculated. These values are then compared among remediation alternatives under consideration, including the no action option. This tool provides a better understanding of social impacts that may result from proposed remedia-tion alternatives, which can facilitate the formulation of targeted action plans aimed at overall impact mitigation.
5.4.3 QUANTITATIVE ASSESSMENT TOOLS
For many projects, the use of a qualitative or semiquantitative analysis tool will prove to be useful for analyzing sustainability aspects of one or more remediation alternatives. This is especially the case when a project is relatively simple or straightforward, or when the tool is applied as a screening tool to assess the feasibility for a remediation project. In many instances, however, the results of a qualitative or semiquantitative analysis may be too limited to be of much use for sustainability analysis. This is especially the case for more complex remediation projects where a wide range of parameters need to be carefully and thoroughly assessed.
When warranted by the degree of complexity of a project, quanti-tative analysis tools should be incorporated for sustainability analysis. These advanced tools for sustainability evaluations typically offer a far more detailed and rigorous assessment of the environmental, social, and economic impacts of remediation. Because of their complexity, these tools require extensive data inputs with respect to a range of site-specific parameters. Some of the analysis tools are focused in their scope and intend to address one type of impact, such as carbon footprints or GHG emissions; other tools allow for comprehensive assessment across the environmental, economic, and social dimensions of sustainability. These tools can be used to evaluate sustainability impacts of different technolo-gies, processes, or implementation methods at any stage of site cleanup,
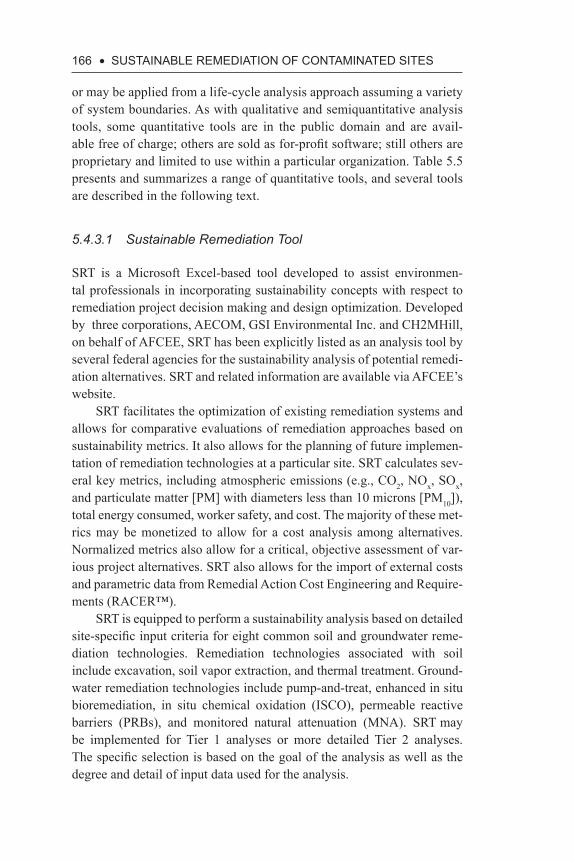
166 • SuStAiNABLE REMEDiAtiON Of CONtAMiNAtED SitES
or may be applied from a life-cycle analysis approach assuming a variety of system boundaries. As with qualitative and semiquantitative analysis tools, some quantitative tools are in the public domain and are avail-able free of charge; others are sold as for-profit software; still others are proprietary and limited to use within a particular organization. Table 5.5 presents and summarizes a range of quantitative tools, and several tools are described in the following text.
5.4.3.1 Sustainable Remediation Tool
SRT is a Microsoft Excel-based tool developed to assist environmen-tal professionals in incorporating sustainability concepts with respect to remediation project decision making and design optimization. Developed by three corporations, AECOM, GSI Environmental Inc. and CH2MHill, on behalf of AFCEE, SRT has been explicitly listed as an analysis tool by several federal agencies for the sustainability analysis of potential remedi-ation alternatives. SRT and related information are available via AFCEE’s website.
SRT facilitates the optimization of existing remediation systems and allows for comparative evaluations of remediation approaches based on sustainability metrics. It also allows for the planning of future implemen-tation of remediation technologies at a particular site. SRT calculates sev-eral key metrics, including atmospheric emissions (e.g., CO2, NOx, SOx, and particulate matter [PM] with diameters less than 10 microns [PM10]), total energy consumed, worker safety, and cost. The majority of these met-rics may be monetized to allow for a cost analysis among alternatives. Normalized metrics also allow for a critical, objective assessment of var-ious project alternatives. SRT also allows for the import of external costs and parametric data from Remedial Action Cost Engineering and Require-ments (RACER™).
SRT is equipped to perform a sustainability analysis based on detailed site-specific input criteria for eight common soil and groundwater reme-diation technologies. Remediation technologies associated with soil include excavation, soil vapor extraction, and thermal treatment. Ground-water remediation technologies include pump-and-treat, enhanced in situ bioremediation, in situ chemical oxidation (ISCO), permeable reactive barriers (PRBs), and monitored natural attenuation (MNA). SRT may be implemented for Tier 1 analyses or more detailed Tier 2 analyses. The specific selection is based on the goal of the analysis as well as the degree and detail of input data used for the analysis.
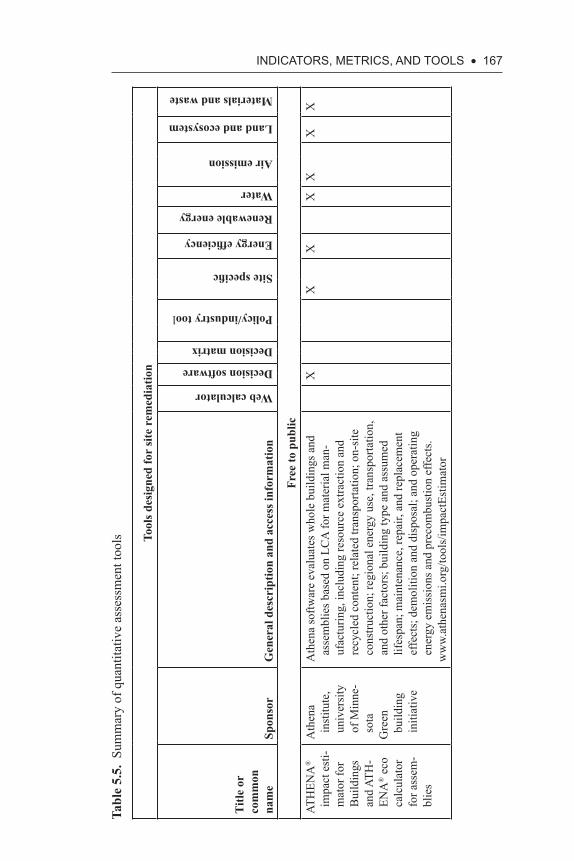
iNDiCAtORS, MEtRiCS, AND tOOLS • 167
Tabl
e 5.
5. S
umm
ary
of q
uant
itativ
e as
sess
men
t too
ls Tool
s des
igne
d fo
r si
te r
emed
iatio
n
Title
or
com
mon
na
me
Spon
sor
Gen
eral
des
crip
tion
and
acce
ss in
form
atio
n
Web calculator
Decision software
Decision matrix
Policy/industry tool
Site specific
Energy efficiency
Renewable energy
Water
Air emission
Land and ecosystem
Materials and waste
Free
to p
ublic
ATH
ENA
®
impa
ct e
sti-
mat
or fo
r B
uild
ings
an
d AT
H-
ENA
® e
co
calc
ulat
or
for a
ssem
-bl
ies
Ath
ena
inst
itute
, un
iver
sity
of
Min
ne-
sota
Gre
en
build
ing
initi
ativ
e
Ath
ena
softw
are
eval
uate
s who
le b
uild
ings
and
as
sem
blie
s bas
ed o
n LC
A fo
r mat
eria
l man
-uf
actu
ring,
incl
udin
g re
sour
ce e
xtra
ctio
n an
d re
cycl
ed c
onte
nt; r
elat
ed tr
ansp
orta
tion;
on-
site
co
nstru
ctio
n; re
gion
al e
nerg
y us
e, tr
ansp
orta
tion,
an
d ot
her f
acto
rs; b
uild
ing
type
and
ass
umed
lif
espa
n; m
aint
enan
ce, r
epai
r, an
d re
plac
emen
t ef
fect
s; d
emol
ition
and
dis
posa
l; an
d op
erat
ing
ener
gy e
mis
sion
s and
pre
com
bust
ion
effe
cts.
ww
w.a
then
asm
i.org
/tool
s/im
pact
Estim
ator
XX
XX
XX
X
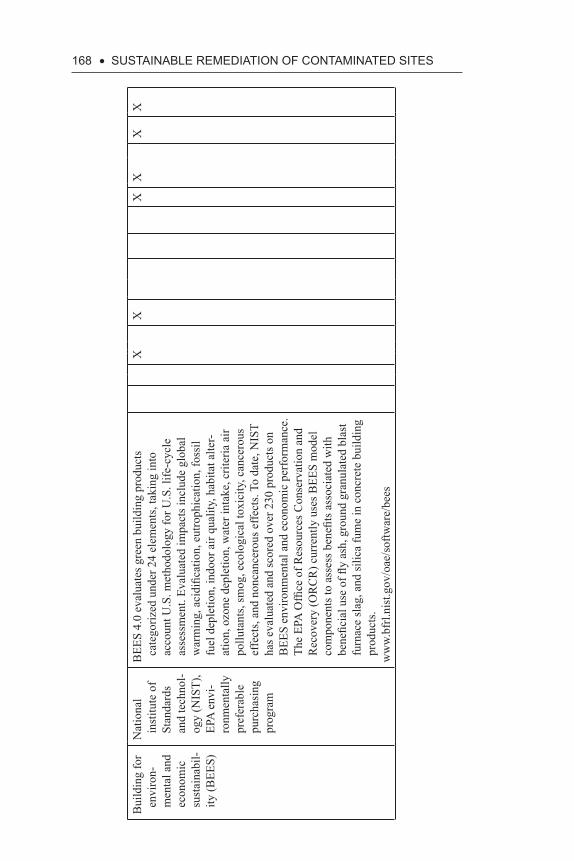
168 • SuStAiNABLE REMEDiAtiON Of CONtAMiNAtED SitES
Bui
ldin
g fo
r en
viro
n-m
enta
l and
ec
onom
ic
sust
aina
bil-
ity (B
EES)
Nat
iona
l in
stitu
te o
f St
anda
rds
and
tech
nol-
ogy
(NIS
T),
EPA
env
i-ro
nmen
tally
pr
efer
able
pu
rcha
sing
pr
ogra
m
BEE
S 4.
0 ev
alua
tes g
reen
bui
ldin
g pr
oduc
ts
cate
goriz
ed u
nder
24
elem
ents
, tak
ing
into
ac
coun
t U.S
. met
hodo
logy
for U
.S. l
ife-c
ycle
as
sess
men
t. Ev
alua
ted
impa
cts i
nclu
de g
loba
l w
arm
ing,
aci
dific
atio
n, e
utro
phic
atio
n, fo
ssil
fuel
dep
letio
n, in
door
air
qual
ity, h
abita
t alte
r-at
ion,
ozo
ne d
eple
tion,
wat
er in
take
, crit
eria
air
pollu
tant
s, sm
og, e
colo
gica
l tox
icity
, can
cero
us
effe
cts,
and
nonc
ance
rous
effe
cts.
To d
ate,
NIS
T ha
s eva
luat
ed a
nd sc
ored
ove
r 230
pro
duct
s on
BEE
S en
viro
nmen
tal a
nd e
cono
mic
per
form
ance
. Th
e EP
A O
ffice
of R
esou
rces
Con
serv
atio
n an
d R
ecov
ery
(OR
CR
) cur
rent
ly u
ses B
EES
mod
el
com
pone
nts t
o as
sess
ben
efits
ass
ocia
ted
with
be
nefic
ial u
se o
f fly
ash,
gro
und
gran
ulat
ed b
last
fu
rnac
e sl
ag, a
nd si
lica
fum
e in
con
cret
e bu
ildin
g pr
oduc
ts.
ww
w.b
frl.n
ist.g
ov/o
ae/s
oftw
are/
bees
XX
XX
XX
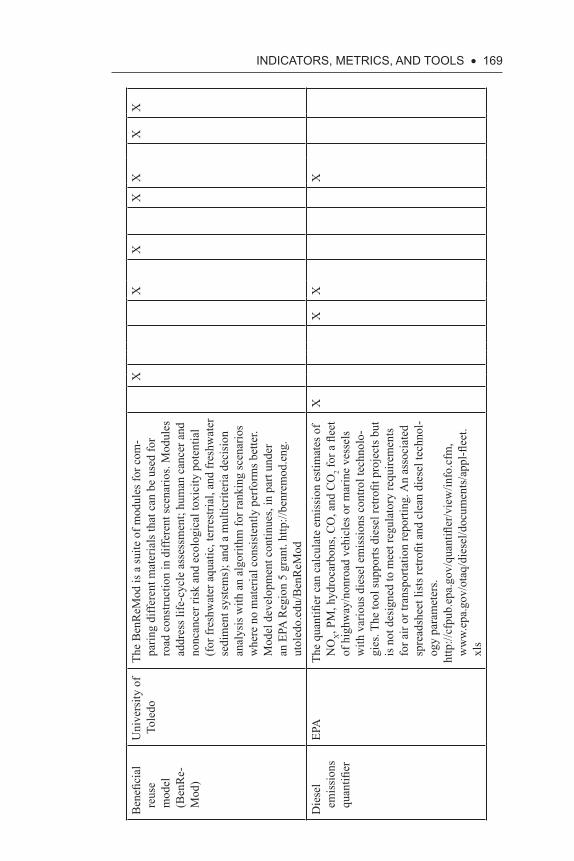
iNDiCAtORS, MEtRiCS, AND tOOLS • 169
Ben
efici
al
reus
e m
odel
(B
enR
e-M
od)
Uni
vers
ity o
f To
ledo
The
Ben
ReM
od is
a su
ite o
f mod
ules
for c
om-
parin
g di
ffere
nt m
ater
ials
that
can
be
used
for
road
con
stru
ctio
n in
diff
eren
t sce
nario
s. M
odul
es
addr
ess l
ife-c
ycle
ass
essm
ent;
hum
an c
ance
r and
no
ncan
cer r
isk
and
ecol
ogic
al to
xici
ty p
oten
tial
(for
fres
hwat
er a
quat
ic, t
erre
stria
l, an
d fr
eshw
ater
se
dim
ent s
yste
ms)
; and
a m
ultic
riter
ia d
ecis
ion
anal
ysis
with
an
algo
rithm
for r
anki
ng sc
enar
ios
whe
re n
o m
ater
ial c
onsi
sten
tly p
erfo
rms b
ette
r. M
odel
dev
elop
men
t con
tinue
s, in
par
t und
er
an E
PA R
egio
n 5
gran
t. ht
tp://
benr
emod
.eng
.ut
oled
o.ed
u/B
enR
eMod
XX
XX
XX
X
Die
sel
emis
sion
s qu
antifi
er
EPA
The
quan
tifier
can
cal
cula
te e
mis
sion
est
imat
es o
f N
OX, P
M, h
ydro
carb
ons,
CO
, and
CO
2 for
a fl
eet
of h
ighw
ay/n
onro
ad v
ehic
les o
r mar
ine
vess
els
with
var
ious
die
sel e
mis
sion
s con
trol t
echn
olo-
gies
. The
tool
supp
orts
die
sel r
etro
fit p
roje
cts b
ut
is n
ot d
esig
ned
to m
eet r
egul
ator
y re
quire
men
ts
for a
ir or
tran
spor
tatio
n re
porti
ng. A
n as
soci
ated
sp
read
shee
t lis
ts re
trofit
and
cle
an d
iese
l tec
hnol
-og
y pa
ram
eter
s.ht
tp://
cfpu
b.ep
a.go
v/qu
antifl
er/v
iew
/info
.cfm
, w
ww
.epa
.gov
/ota
q/di
esel
/doc
umen
ts/a
ppl-fl
eet.
xls
XX
XX
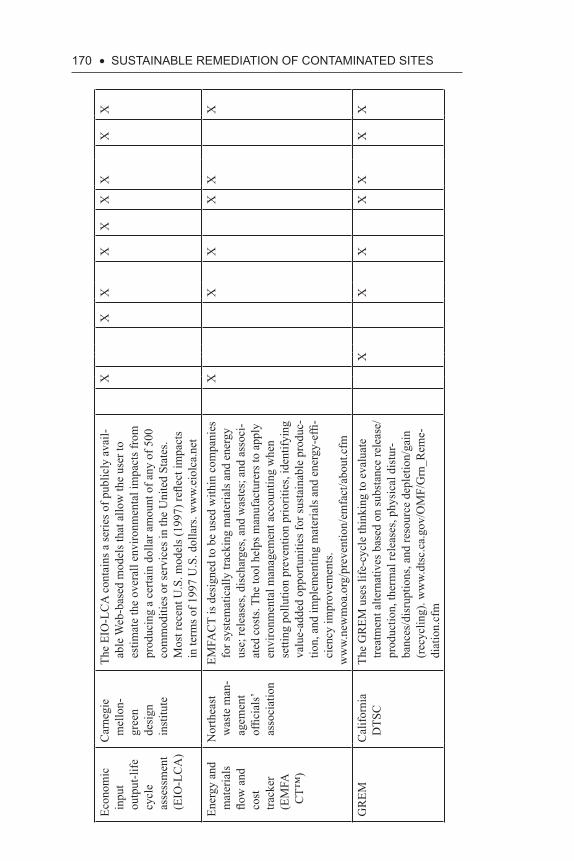
170 • SuStAiNABLE REMEDiAtiON Of CONtAMiNAtED SitES
Econ
omic
in
put
outp
ut-li
fe
cycl
e as
sess
men
t (E
IO-L
CA
)
Car
negi
e m
ello
n-
gree
n de
sign
in
stitu
te
The
EIO
-LC
A c
onta
ins a
serie
s of p
ublic
ly a
vail-
able
Web
-bas
ed m
odel
s tha
t allo
w th
e us
er to
es
timat
e th
e ov
eral
l env
ironm
enta
l im
pact
s fro
m
prod
ucin
g a
certa
in d
olla
r am
ount
of a
ny o
f 500
co
mm
oditi
es o
r ser
vice
s in
the
Uni
ted
Stat
es.
Mos
t rec
ent U
.S. m
odel
s (19
97) r
eflec
t im
pact
s in
term
s of 1
997
U.S
. dol
lars
. ww
w.e
iolc
a.ne
t
XX
XX
XX
XX
X
Ener
gy a
nd
mat
eria
ls
flow
and
co
st
track
er
(EM
FA
CT™
)
Nor
thea
st
was
te m
an-
agem
ent
offic
ials
’ as
soci
atio
n
EMFA
CT
is d
esig
ned
to b
e us
ed w
ithin
com
pani
es
for s
yste
mat
ical
ly tr
acki
ng m
ater
ials
and
ene
rgy
use;
rele
ases
, dis
char
ges,
and
was
tes;
and
ass
oci-
ated
cos
ts. T
he to
ol h
elps
man
ufac
ture
rs to
app
ly
envi
ronm
enta
l man
agem
ent a
ccou
ntin
g w
hen
setti
ng p
ollu
tion
prev
entio
n pr
iorit
ies,
iden
tifyi
ng
valu
e-ad
ded
oppo
rtuni
ties f
or su
stai
nabl
e pr
oduc
-tio
n, a
nd im
plem
entin
g m
ater
ials
and
ene
rgy-
effi-
cien
cy im
prov
emen
ts.
ww
w.n
ewm
oa.o
rg/p
reve
ntio
n/em
fact
/abo
ut.c
fm
XX
XX
XX
GR
EMC
alifo
rnia
D
TSC
The
GR
EM u
ses l
ife-c
ycle
thin
king
to e
valu
ate
treat
men
t alte
rnat
ives
bas
ed o
n su
bsta
nce
rele
ase/
prod
uctio
n, th
erm
al re
leas
es, p
hysi
cal d
istu
r-ba
nces
/dis
rupt
ions
, and
reso
urce
dep
letio
n/ga
in
(rec
yclin
g). w
ww.
dtsc
.ca.
gov/
OM
F/G
rn_R
eme-
diat
ion.
cfm
XX
XX
XX
X
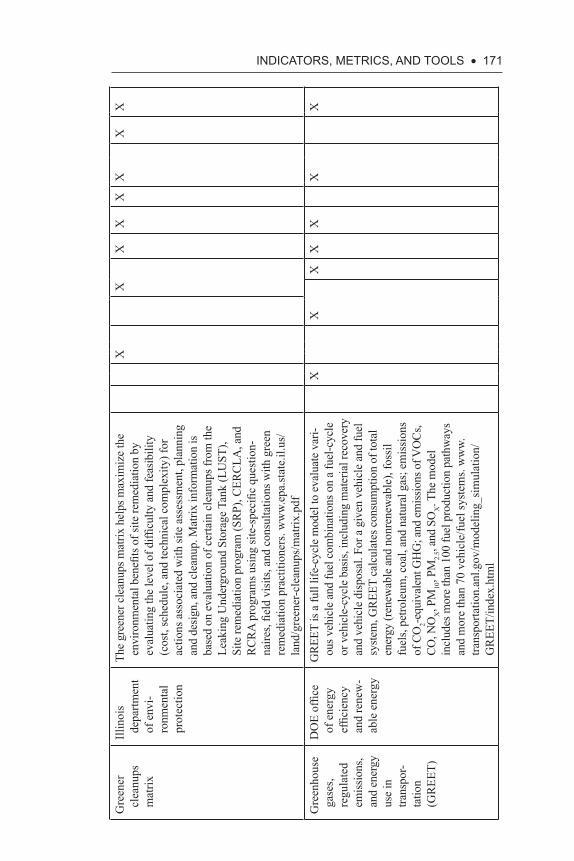
iNDiCAtORS, MEtRiCS, AND tOOLS • 171
Gre
ener
cl
eanu
ps
mat
rix
Illin
ois
depa
rtmen
t of
env
i-ro
nmen
tal
prot
ectio
n
The
gree
ner c
lean
ups m
atrix
hel
ps m
axim
ize
the
envi
ronm
enta
l ben
efits
of si
te re
med
iatio
n by
ev
alua
ting
the
leve
l of d
ifficu
lty a
nd fe
asib
ility
(c
ost,
sche
dule
, and
tech
nica
l com
plex
ity) f
or
actio
ns a
ssoc
iate
d w
ith si
te a
sses
smen
t, pl
anni
ng
and
desig
n, a
nd c
lean
up. M
atrix
info
rmat
ion
is
base
d on
eva
luat
ion
of c
erta
in c
lean
ups f
rom
the
Leak
ing
Und
ergr
ound
Sto
rage
Tan
k (L
UST
), Si
te re
med
iatio
n pr
ogra
m (S
RP)
, CER
CLA
, and
R
CR
A p
rogr
ams u
sing
site
-spe
cific
que
stio
n-na
ires,
field
vis
its, a
nd c
onsu
ltatio
ns w
ith g
reen
re
med
iatio
n pr
actit
ione
rs. w
ww
.epa
.stat
e.il.
us/
land
/gre
ener
-cle
anup
s/m
atrix
XX
XX
XX
XX
Gre
enho
use
gase
s, re
gula
ted
emiss
ions
, an
d en
ergy
us
e in
tra
nspo
r-ta
tion
(GR
EET)
DO
E of
fice
of e
nerg
y ef
ficie
ncy
and
rene
w-
able
ene
rgy
GR
EET
is a
full
life-
cycl
e m
odel
to e
valu
ate
vari-
ous v
ehic
le a
nd fu
el c
ombi
natio
ns o
n a
fuel
-cyc
le
or v
ehic
le-c
ycle
bas
is, in
clud
ing
mat
eria
l rec
over
y an
d ve
hicl
e di
spos
al. F
or a
giv
en v
ehic
le a
nd fu
el
syste
m, G
REE
T ca
lcul
ates
con
sum
ptio
n of
tota
l en
ergy
(ren
ewab
le a
nd n
onre
new
able
), fo
ssil
fuel
s, pe
trole
um, c
oal,
and
natu
ral g
as; e
mis
sion
s of
CO
2-equ
ival
ent G
HG
; and
em
issio
ns o
f VO
Cs,
CO, N
OX, P
M10
, PM
2.5,
and
SOX. T
he m
odel
in
clud
es m
ore
than
100
fuel
pro
duct
ion
path
way
s an
d m
ore
than
70
vehi
cle/
fuel
syst
ems.
ww
w.tra
nspo
rtatio
n.an
l.gov
/mod
elin
g_si
mul
atio
n/G
REE
T/in
dex.
htm
l
XX
XX
XX
X
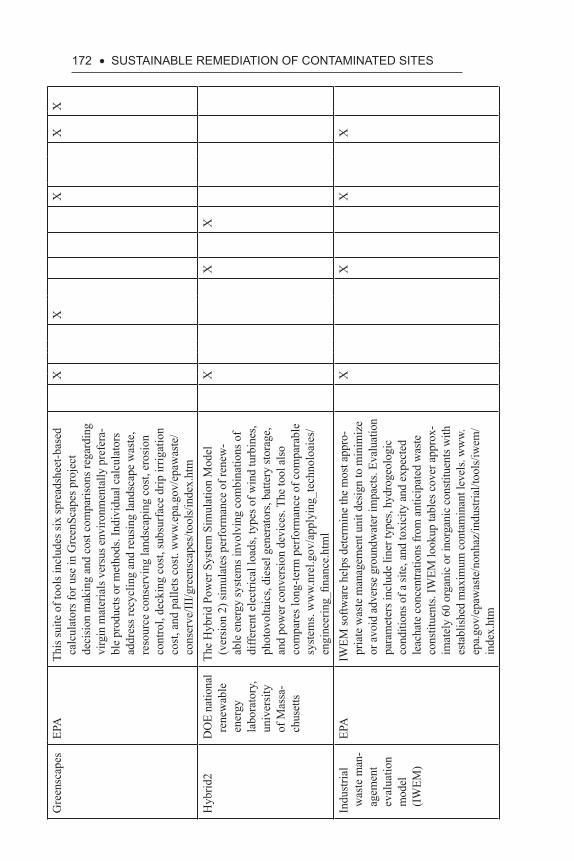
172 • SuStAiNABLE REMEDiAtiON Of CONtAMiNAtED SitESG
reen
scap
esEP
ATh
is su
ite o
f too
ls in
clud
es si
x sp
read
shee
t-bas
ed
calc
ulat
ors f
or u
se in
Gre
enSc
apes
pro
ject
de
cisi
on m
akin
g an
d co
st c
ompa
rison
s reg
ardi
ng
virg
in m
ater
ials
vers
us e
nviro
nmen
tally
pre
fera
-bl
e pr
oduc
ts or
met
hods
. Ind
ivid
ual c
alcu
lato
rs
addr
ess r
ecyc
ling
and
reus
ing
land
scap
e w
aste
, re
sour
ce c
onse
rvin
g la
ndsc
apin
g co
st, e
rosi
on
cont
rol,
deck
ing
cost
, sub
surf
ace
drip
irrig
atio
n co
st, a
nd p
alle
ts c
ost.
ww
w.ep
a.go
v/ep
awas
te/
cons
erve
/III/g
reen
scap
es/to
ols/
inde
x.ht
m
XX
XX
X
Hyb
rid2
DO
E na
tiona
l re
new
able
en
ergy
la
bora
tory
, un
iver
sity
of
Mas
sa-
chus
etts
The
Hyb
rid P
ower
Sys
tem
Sim
ulat
ion
Mod
el
(ver
sion
2) s
imul
ates
per
form
ance
of r
enew
-ab
le e
nerg
y sy
stem
s inv
olvi
ng c
ombi
natio
ns o
f di
ffere
nt e
lect
rical
load
s, ty
pes o
f win
d tu
rbin
es,
phot
ovol
taic
s, di
esel
gen
erat
ors,
batte
ry st
orag
e,
and
pow
er c
onve
rsio
n de
vice
s. Th
e to
ol a
lso
com
pare
s lon
g-te
rm p
erfo
rman
ce o
f com
para
ble
syst
ems.
ww
w.n
rel.g
ov/a
pply
ing_
tech
nolo
aies
/en
gine
erin
g_fin
ance
.htm
l
XX
X
Indu
stria
l w
aste
man
-ag
emen
t ev
alua
tion
mod
el
(IWEM
)
EPA
IWEM
softw
are
help
s det
erm
ine
the
mos
t app
ro-
pria
te w
aste
man
agem
ent u
nit d
esig
n to
min
imiz
e or
avo
id a
dver
se g
roun
dwat
er im
pact
s. Ev
alua
tion
para
met
ers i
nclu
de li
ner t
ypes
, hyd
roge
olog
ic
cond
ition
s of a
site
, and
toxi
city
and
exp
ecte
d le
acha
te c
once
ntra
tions
from
ant
icip
ated
was
te
cons
titue
nts.
IWEM
look
up ta
bles
cov
er a
ppro
x-im
atel
y 60
org
anic
or i
norg
anic
con
stitu
ents
with
es
tabl
ished
max
imum
con
tam
inan
t lev
els.
ww
w.ep
a.go
v/ep
awas
te/n
onha
z/in
dustr
ial/t
ools/
iwem
/in
dex.
htm
XX
XX
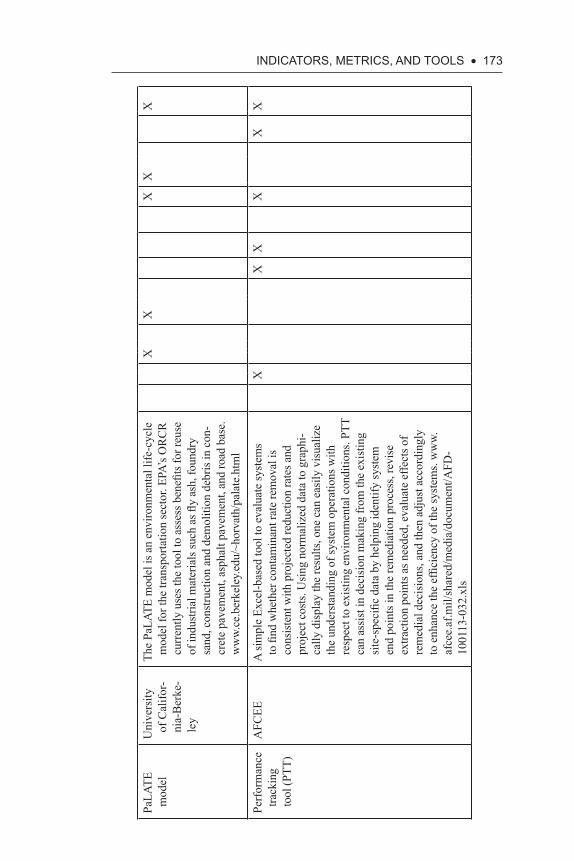
iNDiCAtORS, MEtRiCS, AND tOOLS • 173
PaLA
TE
mod
elU
nive
rsity
of
Cal
ifor-
nia-
Ber
ke-
ley
The
PaLA
TE m
odel
is a
n en
viro
nmen
tal l
ife-c
ycle
m
odel
for t
he tr
ansp
orta
tion
sect
or. E
PA’s
OR
CR
cu
rren
tly u
ses t
he to
ol to
ass
ess b
enefi
ts fo
r reu
se
of in
dustr
ial m
ater
ials
such
as fl
y as
h, fo
undr
y sa
nd, c
onst
ruct
ion
and
dem
oliti
on d
ebris
in c
on-
cret
e pa
vem
ent,
asph
alt p
avem
ent,
and
road
bas
e.
ww
w.ce
.ber
kele
y.ed
u/~h
orva
th/p
alat
e.ht
ml
XX
XX
X
Perf
orm
ance
tra
ckin
g to
ol (P
TT)
AFC
EEA
sim
ple
Exce
l-bas
ed to
ol to
eva
luat
e sy
stem
s to
find
whe
ther
con
tam
inan
t rat
e re
mov
al is
co
nsist
ent w
ith p
roje
cted
redu
ctio
n ra
tes a
nd
proj
ect c
osts.
Usi
ng n
orm
aliz
ed d
ata
to g
raph
i-ca
lly d
ispl
ay th
e re
sults
, one
can
eas
ily v
isua
lize
the
unde
rsta
ndin
g of
syst
em o
pera
tions
with
re
spec
t to
exis
ting
envi
ronm
enta
l con
ditio
ns. P
TT
can
assi
st in
dec
isio
n m
akin
g fr
om th
e ex
istin
g si
te-s
peci
fic d
ata
by h
elpi
ng id
entif
y sy
stem
en
d po
ints
in th
e re
med
iatio
n pr
oces
s, re
vise
ex
tract
ion
poin
ts as
nee
ded,
eva
luat
e ef
fect
s of
rem
edia
l dec
isio
ns, a
nd th
en a
djus
t acc
ordi
ngly
to
enh
ance
the
effic
ienc
y of
the
syst
ems.
ww
w.af
cee.
af.m
il/sh
ared
/med
ia/d
ocum
ent/A
FD-
1001
13-0
32.x
ls
XX
XX
XX
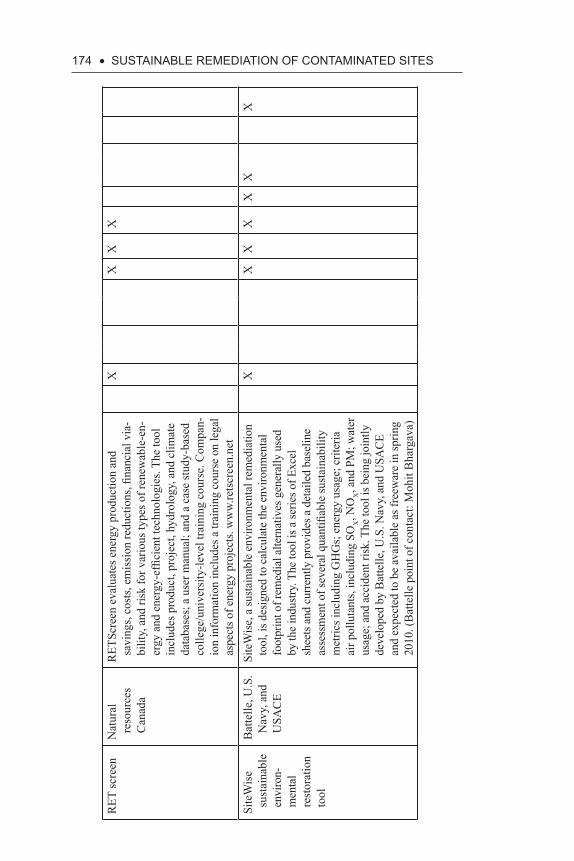
174 • SuStAiNABLE REMEDiAtiON Of CONtAMiNAtED SitES
RET
scre
enN
atur
al
reso
urce
s C
anad
a
RET
Scre
en e
valu
ates
ene
rgy
prod
uctio
n an
d sa
ving
s, co
sts,
emis
sion
redu
ctio
ns, fi
nanc
ial v
ia-
bilit
y, a
nd ri
sk fo
r var
ious
type
s of r
enew
able
-en-
ergy
and
ene
rgy-
effic
ient
tech
nolo
gies
. The
tool
in
clud
es p
rodu
ct, p
roje
ct, h
ydro
logy
, and
clim
ate
data
base
s; a
use
r man
ual;
and
a ca
se st
udy-
base
d co
llege
/uni
vers
ity-le
vel t
rain
ing
cour
se. C
ompa
n-io
n in
form
atio
n in
clud
es a
trai
ning
cou
rse
on le
gal
aspe
cts o
f ene
rgy
proj
ects.
ww
w.re
tscr
een.
net
XX
XX
Site
Wis
e su
stai
nabl
e en
viro
n-m
enta
l re
stor
atio
n to
ol
Bat
telle
, U.S
. N
avy,
and
U
SAC
E
Site
Wise
, a su
stain
able
env
ironm
enta
l rem
edia
tion
tool
, is d
esig
ned
to c
alcu
late
the
envi
ronm
enta
l fo
otpr
int o
f rem
edia
l alte
rnat
ives
gen
eral
ly u
sed
by th
e in
dustr
y. T
he to
ol is
a se
ries o
f Exc
el
shee
ts an
d cu
rrent
ly p
rovi
des a
det
aile
d ba
selin
e as
sess
men
t of s
ever
al q
uant
ifiab
le su
stai
nabi
lity
met
rics i
nclu
ding
GH
Gs;
ene
rgy
usag
e; c
riter
ia
air p
ollu
tant
s, in
clud
ing
SOX, N
OX, a
nd P
M; w
ater
us
age;
and
acc
iden
t risk
. The
tool
is b
eing
join
tly
deve
lope
d by
Bat
telle
, U.S
. Nav
y, a
nd U
SAC
E an
d ex
pect
ed to
be
avai
labl
e as
free
war
e in
sprin
g 20
10. (
Bat
telle
poi
nt o
f con
tact
: Moh
it B
harg
ava)
XX
XX
XX
X
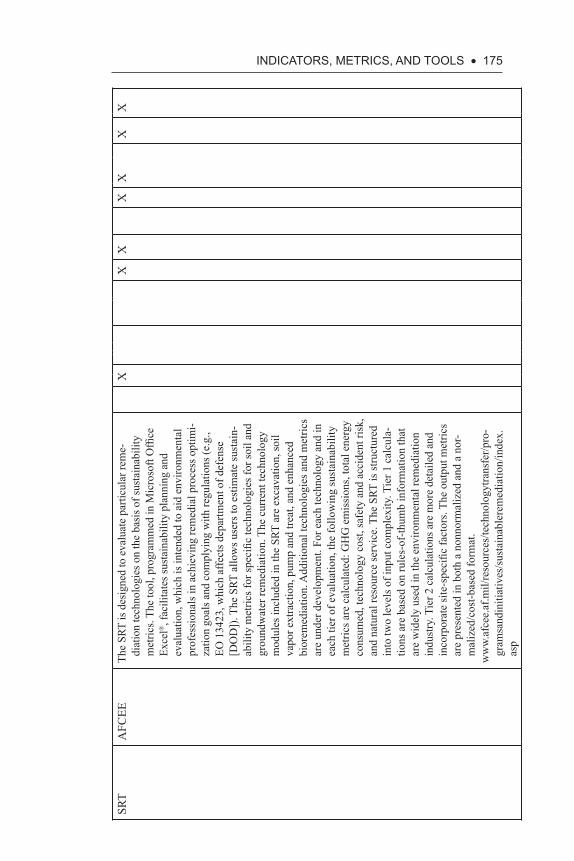
iNDiCAtORS, MEtRiCS, AND tOOLS • 175
SRT
AFC
EETh
e SR
T is
des
igne
d to
eva
luat
e pa
rticu
lar r
eme-
diat
ion
tech
nolo
gies
on
the
basi
s of s
usta
inab
ility
m
etric
s. Th
e to
ol, p
rogr
amm
ed in
Mic
roso
ft O
ffice
Ex
cel®
, fac
ilita
tes s
usta
inab
ility
pla
nnin
g an
d ev
alua
tion,
whi
ch is
inte
nded
to a
id e
nviro
nmen
tal
prof
essi
onal
s in
achi
evin
g re
med
ial p
roce
ss o
ptim
i-za
tion
goal
s and
com
plyi
ng w
ith re
gula
tions
(e.g
., EO
134
23, w
hich
affe
cts d
epar
tmen
t of d
efen
se
[DO
D])
. The
SRT
allo
ws u
sers
to e
stim
ate
sust
ain-
abili
ty m
etric
s for
spec
ific
tech
nolo
gies
for s
oil a
nd
grou
ndw
ater
rem
edia
tion.
The
cur
rent
tech
nolo
gy
mod
ules
incl
uded
in th
e SR
T ar
e ex
cava
tion,
soil
vapo
r ext
ract
ion,
pum
p an
d tre
at, a
nd e
nhan
ced
bior
emed
iatio
n. A
dditi
onal
tech
nolo
gies
and
met
rics
are
unde
r dev
elop
men
t. Fo
r eac
h te
chno
logy
and
in
each
tier
of e
valu
atio
n, th
e fo
llow
ing
sust
aina
bilit
y m
etric
s are
cal
cula
ted:
GH
G e
mis
sion
s, to
tal e
nerg
y co
nsum
ed, t
echn
olog
y co
st, s
afet
y an
d ac
cide
nt ri
sk,
and
natu
ral r
esou
rce
serv
ice.
The
SRT
is st
ruct
ured
in
to tw
o le
vels
of i
nput
com
plex
ity. T
ier 1
cal
cula
-tio
ns a
re b
ased
on
rule
s-of
-thum
b in
form
atio
n th
at
are
wid
ely
used
in th
e en
viro
nmen
tal r
emed
iatio
n in
dust
ry. T
ier 2
cal
cula
tions
are
mor
e de
taile
d an
d in
corp
orat
e si
te-s
peci
fic fa
ctor
s. Th
e ou
tput
met
rics
are
pres
ente
d in
bot
h a
nonn
orm
aliz
ed a
nd a
nor
-m
aliz
ed/c
ost-b
ased
form
at.
ww
w.af
cee.
af.m
il/re
sour
ces/
tech
nolo
gytra
nsfe
r/pro
-gr
amsa
ndin
itiat
ives
/sus
tain
able
rem
edia
tion/
inde
x.as
p
XX
XX
XX
X
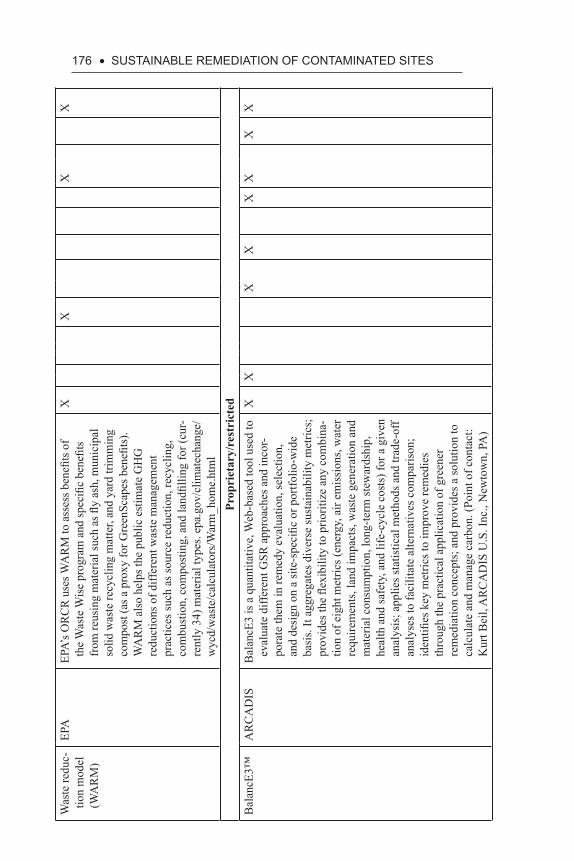
176 • SuStAiNABLE REMEDiAtiON Of CONtAMiNAtED SitESW
aste
redu
c-tio
n m
odel
(W
AR
M)
EPA
EPA’
s OR
CR
use
s WA
RM
to a
sses
s ben
efits
of
the
Was
te W
ise
prog
ram
and
spec
ific
bene
fits
from
reus
ing
mat
eria
l suc
h as
fly
ash,
mun
icip
al
solid
was
te re
cycl
ing
mat
ter,
and
yard
trim
min
g co
mpo
st (a
s a p
roxy
for G
reen
Scap
es b
enefi
ts).
WA
RM
als
o he
lps t
he p
ublic
est
imat
e G
HG
re
duct
ions
of d
iffer
ent w
aste
man
agem
ent
prac
tices
such
as s
ourc
e re
duct
ion,
recy
clin
g,
com
bust
ion,
com
post
ing,
and
land
fillin
g fo
r (cu
r-re
ntly
34)
mat
eria
l typ
es. e
pa.g
ov/c
limat
echa
nge/
wyc
d/w
aste
/cal
cula
tors
/War
m_h
ome.
htm
l
XX
XX
Prop
riet
ary/
rest
rict
edB
alan
cE3™
AR
CA
DIS
Bal
ancE
3 is
a q
uant
itativ
e, W
eb-b
ased
tool
use
d to
ev
alua
te d
iffer
ent G
SR a
ppro
ache
s and
inco
r-po
rate
them
in re
med
y ev
alua
tion,
sele
ctio
n,
and
desi
gn o
n a
site
-spe
cific
or p
ortfo
lio-w
ide
basi
s. It
aggr
egat
es d
iver
se su
stai
nabi
lity
met
rics;
pr
ovid
es th
e fle
xibi
lity
to p
riorit
ize
any
com
bina
-tio
n of
eig
ht m
etric
s (en
ergy
, air
emis
sion
s, w
ater
re
quire
men
ts, l
and
impa
cts,
was
te g
ener
atio
n an
d m
ater
ial c
onsu
mpt
ion,
long
-term
stew
ards
hip,
he
alth
and
safe
ty, a
nd li
fe-c
ycle
cos
ts) f
or a
giv
en
anal
ysis
; app
lies s
tatis
tical
met
hods
and
trad
e-of
f an
alys
es to
faci
litat
e al
tern
ativ
es c
ompa
rison
; id
entifi
es k
ey m
etric
s to
impr
ove
rem
edie
s th
roug
h th
e pr
actic
al a
pplic
atio
n of
gre
ener
re
med
iatio
n co
ncep
ts; a
nd p
rovi
des a
solu
tion
to
calc
ulat
e an
d m
anag
e ca
rbon
. (Po
int o
f con
tact
: K
urt B
eil,
AR
CA
DIS
U.S
. Inc
., N
ewto
wn,
PA
)
XX
XX
XX
XX
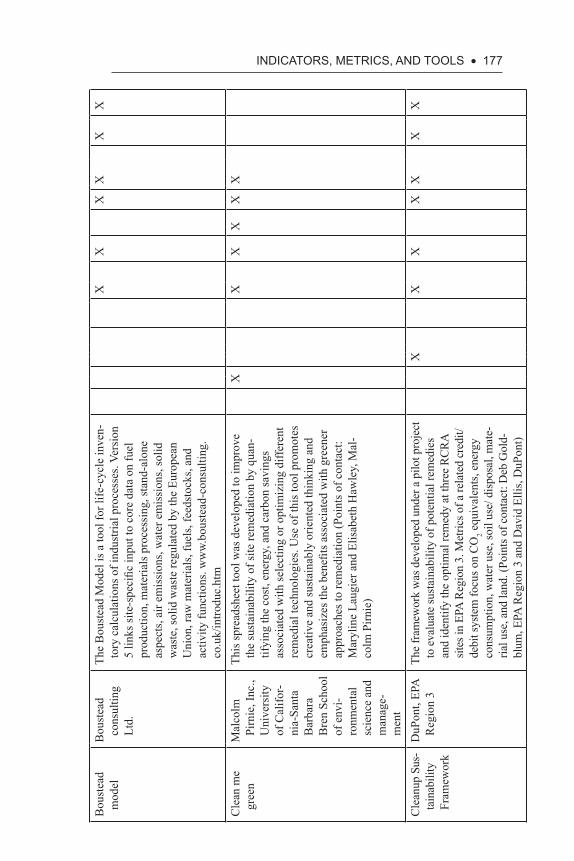
iNDiCAtORS, MEtRiCS, AND tOOLS • 177
Bou
stea
d m
odel
Bou
stea
d co
nsul
ting
Ltd.
The
Bou
stea
d M
odel
is a
tool
for l
ife-c
ycle
inve
n-to
ry c
alcu
latio
ns o
f ind
ustri
al p
roce
sses
. Ver
sion
5
links
site
-spe
cific
inpu
t to
core
dat
a on
fuel
pr
oduc
tion,
mat
eria
ls p
roce
ssin
g, st
and-
alon
e as
pect
s, ai
r em
issi
ons,
wat
er e
mis
sion
s, so
lid
was
te, s
olid
was
te re
gula
ted
by th
e Eu
rope
an
Uni
on, r
aw m
ater
ials
, fue
ls, f
eeds
tock
s, an
d ac
tivity
func
tions
. ww
w.bo
uste
ad-c
onsu
lting
.co
.uk/
intro
duc.
htm
XX
XX
XX
Cle
an m
e gr
een
Mal
colm
Pi
rnie
, Inc
., U
nive
rsity
of
Cal
ifor-
nia-
Sant
a B
arba
ra
Bre
n Sc
hool
of
env
i-ro
nmen
tal
scie
nce
and
man
age-
men
t
This
spre
adsh
eet t
ool w
as d
evel
oped
to im
prov
e th
e su
stai
nabi
lity
of si
te re
med
iatio
n by
qua
n-tif
ying
the
cost
, ene
rgy,
and
car
bon
savi
ngs
asso
ciat
ed w
ith se
lect
ing
or o
ptim
izin
g di
ffere
nt
rem
edia
l tec
hnol
ogie
s. U
se o
f thi
s too
l pro
mot
es
crea
tive
and
sust
aina
bly
orie
nted
thin
king
and
em
phas
izes
the
bene
fits a
ssoc
iate
d w
ith g
reen
er
appr
oach
es to
rem
edia
tion
(Poi
nts o
f con
tact
: M
aryl
ine
Laug
ier a
nd E
lisab
eth
Haw
ley,
Mal
-co
lm P
irnie
)
XX
XX
XX
Cle
anup
Sus
-ta
inab
ility
Fr
amew
ork
DuP
ont,
EPA
R
egio
n 3
The
fram
ewor
k w
as d
evel
oped
und
er a
pilo
t pro
ject
to
eva
luat
e su
stai
nabi
lity
of p
oten
tial r
emed
ies
and
iden
tify
the
optim
al re
med
y at
thre
e RC
RA
sites
in E
PA R
egio
n 3.
Met
rics o
f a re
late
d cr
edit/
debi
t sys
tem
focu
s on
CO
2 equ
ival
ents
, ene
rgy
cons
umpt
ion,
wat
er u
se, s
oil u
se/ d
ispos
al, m
ate-
rial u
se, a
nd la
nd. (
Poin
ts of
con
tact
: Deb
Gol
d-bl
um, E
PA R
egio
n 3
and
Dav
id E
llis,
DuP
ont)
XX
XX
XX
X
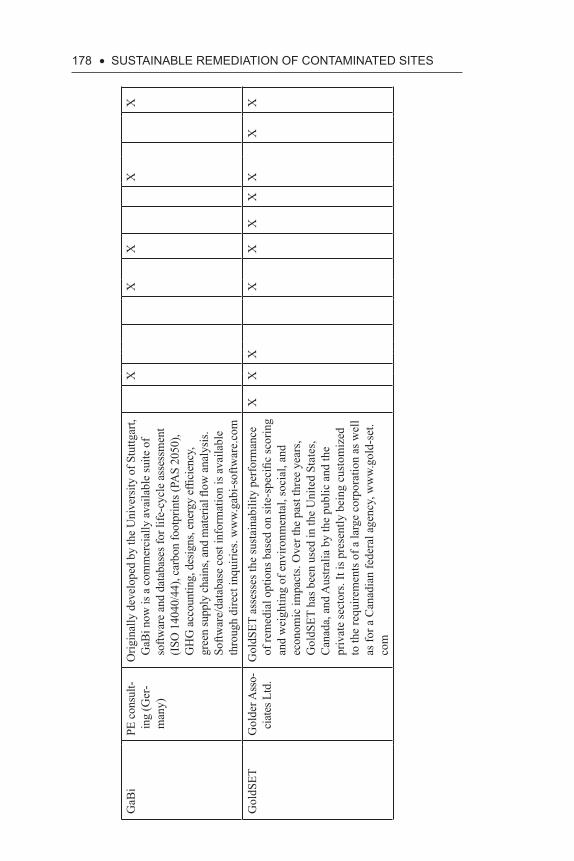
178 • SuStAiNABLE REMEDiAtiON Of CONtAMiNAtED SitES
GaB
iPE
con
sult-
ing
(Ger
-m
any)
Orig
inal
ly d
evel
oped
by
the
Uni
vers
ity o
f Stu
ttgar
t, G
aBi n
ow is
a c
omm
erci
ally
ava
ilabl
e su
ite o
f so
ftwar
e an
d da
taba
ses f
or li
fe-c
ycle
ass
essm
ent
(ISO
140
40/4
4), c
arbo
n fo
otpr
ints
(PA
S 20
50),
GH
G a
ccou
ntin
g, d
esig
ns, e
nerg
y ef
ficie
ncy,
gr
een
supp
ly c
hain
s, an
d m
ater
ial fl
ow a
naly
sis.
Softw
are/
data
base
cos
t inf
orm
atio
n is
ava
ilabl
e th
roug
h di
rect
inqu
iries
. ww
w.ga
bi-s
oftw
are.
com
XX
XX
X
Gol
dSET
Gol
der A
sso-
ciat
es L
td.
Gol
dSET
ass
esse
s the
sust
aina
bilit
y pe
rfor
man
ce
of re
med
ial o
ptio
ns b
ased
on
site
-spe
cific
scor
ing
and
wei
ghtin
g of
env
ironm
enta
l, so
cial
, and
ec
onom
ic im
pact
s. O
ver t
he p
ast t
hree
yea
rs,
Gol
dSET
has
bee
n us
ed in
the
Uni
ted
Stat
es,
Can
ada,
and
Aus
tralia
by
the
publ
ic a
nd th
e pr
ivat
e se
ctor
s. It
is p
rese
ntly
bei
ng c
usto
miz
ed
to th
e re
quire
men
ts o
f a la
rge
corp
orat
ion
as w
ell
as fo
r a C
anad
ian
fede
ral a
genc
y, w
ww
.gol
d-se
t.co
m
XX
XX
XX
XX
XX
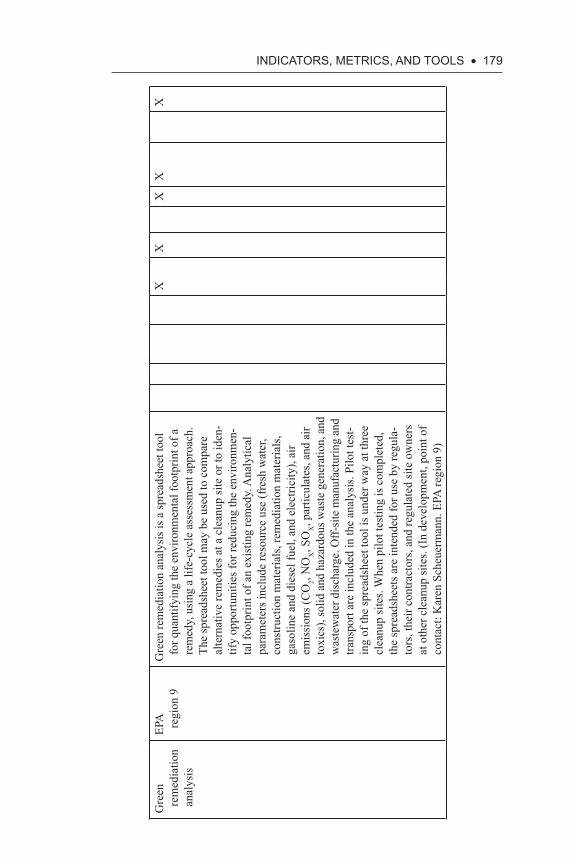
iNDiCAtORS, MEtRiCS, AND tOOLS • 179
Gre
en
rem
edia
tion
anal
ysis
EPA
re
gion
9G
reen
rem
edia
tion
anal
ysis
is a
spre
adsh
eet t
ool
for q
uant
ifyin
g th
e en
viro
nmen
tal f
ootp
rint o
f a
rem
edy,
usi
ng a
life
-cyc
le a
sses
smen
t app
roac
h.
The
spre
adsh
eet t
ool m
ay b
e us
ed to
com
pare
al
tern
ativ
e re
med
ies a
t a c
lean
up si
te o
r to
iden
-tif
y op
portu
nitie
s for
redu
cing
the
envi
ronm
en-
tal f
ootp
rint o
f an
exis
ting
rem
edy.
Ana
lytic
al
para
met
ers i
nclu
de re
sour
ce u
se (f
resh
wat
er,
cons
truct
ion
mat
eria
ls, r
emed
iatio
n m
ater
ials
, ga
solin
e an
d di
esel
fuel
, and
ele
ctric
ity),
air
emis
sion
s (C
O2,
NO
X, S
OX, p
artic
ulat
es, a
nd a
ir to
xics
), so
lid a
nd h
azar
dous
was
te g
ener
atio
n, a
nd
was
tew
ater
dis
char
ge. O
ff-si
te m
anuf
actu
ring
and
trans
port
are
incl
uded
in th
e an
alys
is. P
ilot t
est-
ing
of th
e sp
read
shee
t too
l is u
nder
way
at t
hree
cl
eanu
p si
tes.
Whe
n pi
lot t
estin
g is
com
plet
ed,
the
spre
adsh
eets
are
inte
nded
for u
se b
y re
gula
-to
rs, t
heir
cont
ract
ors,
and
regu
late
d si
te o
wne
rs
at o
ther
cle
anup
site
s. (I
n de
velo
pmen
t, po
int o
f co
ntac
t: K
aren
Sch
euer
man
n. E
PA re
gion
9)
XX
XX
X
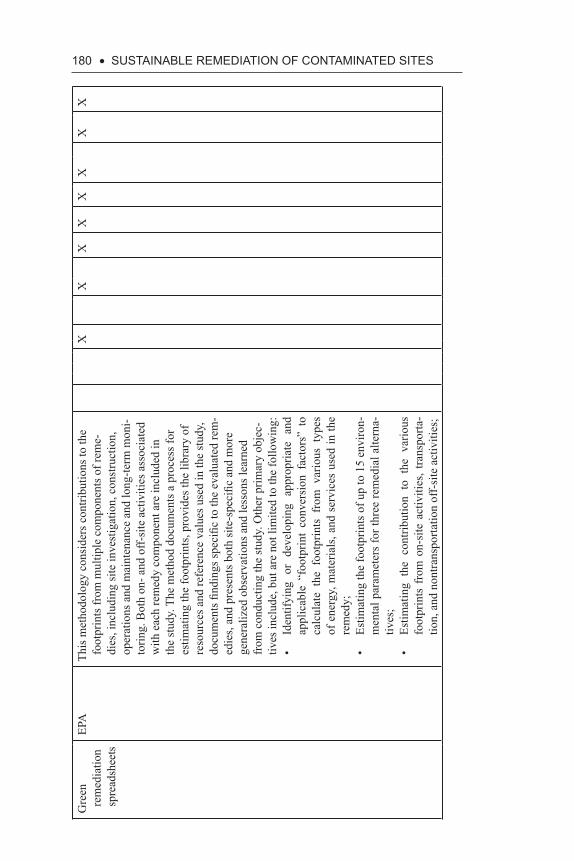
180 • SuStAiNABLE REMEDiAtiON Of CONtAMiNAtED SitES
Gre
en
rem
edia
tion
spre
adsh
eets
EPA
This
met
hodo
logy
con
side
rs c
ontri
butio
ns to
the
foot
prin
ts fr
om m
ultip
le c
ompo
nent
s of r
eme-
dies
, inc
ludi
ng si
te in
vest
igat
ion,
con
stru
ctio
n,
oper
atio
ns a
nd m
aint
enan
ce a
nd lo
ng-te
rm m
oni-
torin
g. B
oth
on- a
nd o
ff-si
te a
ctiv
ities
ass
ocia
ted
with
eac
h re
med
y co
mpo
nent
are
incl
uded
in
the
stud
y. T
he m
etho
d do
cum
ents
a p
roce
ss fo
r es
timat
ing
the
foot
prin
ts, p
rovi
des t
he li
brar
y of
re
sour
ces a
nd re
fere
nce
valu
es u
sed
in th
e st
udy,
do
cum
ents
find
ings
spec
ific
to th
e ev
alua
ted
rem
-ed
ies,
and
pres
ents
bot
h si
te-s
peci
fic a
nd m
ore
gene
raliz
ed o
bser
vatio
ns a
nd le
sson
s lea
rned
fr
om c
ondu
ctin
g th
e st
udy.
Oth
er p
rimar
y ob
jec-
tives
incl
ude,
but
are
not
lim
ited
to th
e fo
llow
ing:
• Id
entif
ying
or
deve
lopi
ng a
ppro
pria
te a
nd
appl
icab
le “
foot
prin
t co
nver
sion
fac
tors
” to
ca
lcul
ate
the
foot
prin
ts f
rom
var
ious
typ
es
of e
nerg
y, m
ater
ials
, and
ser
vice
s us
ed in
the
rem
edy;
• Es
timat
ing
the
foot
prin
ts o
f up
to 1
5 en
viro
n-m
enta
l par
amet
ers
for t
hree
rem
edia
l alte
rna-
tives
;•
Estim
atin
g th
e co
ntrib
utio
n to
the
var
ious
fo
otpr
ints
fro
m o
n-si
te a
ctiv
ities
, tra
nspo
rta-
tion,
and
non
trans
porta
tion
off-
site
act
iviti
es;
XX
XX
XX
XX
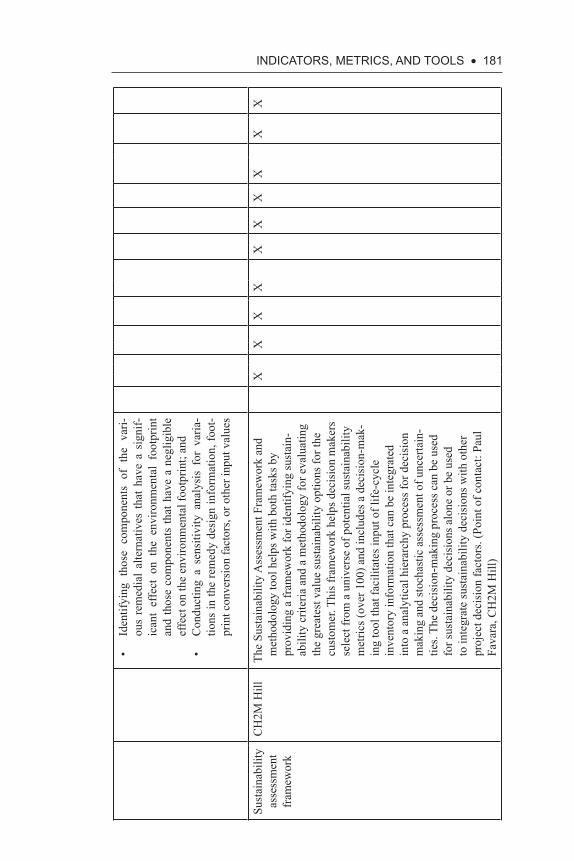
iNDiCAtORS, MEtRiCS, AND tOOLS • 181
• Id
entif
ying
tho
se c
ompo
nent
s of
the
var
i-ou
s re
med
ial
alte
rnat
ives
tha
t ha
ve a
sig
nif-
ican
t ef
fect
on
the
envi
ronm
enta
l fo
otpr
int
and
thos
e co
mpo
nent
s th
at h
ave
a ne
glig
ible
ef
fect
on
the
envi
ronm
enta
l foo
tprin
t; an
d •
Con
duct
ing
a se
nsiti
vity
ana
lysi
s fo
r va
ria-
tions
in th
e re
med
y de
sign
info
rmat
ion,
foot
-pr
int c
onve
rsio
n fa
ctor
s, or
oth
er in
put v
alue
s
Sust
aina
bilit
y as
sess
men
t fr
amew
ork
CH
2M H
illTh
e Su
stai
nabi
lity
Ass
essm
ent F
ram
ewor
k an
d m
etho
dolo
gy to
ol h
elps
with
bot
h ta
sks b
y pr
ovid
ing
a fr
amew
ork
for i
dent
ifyin
g su
stai
n-ab
ility
crit
eria
and
a m
etho
dolo
gy fo
r eva
luat
ing
the
grea
test
val
ue su
stai
nabi
lity
optio
ns fo
r the
cu
stom
er. T
his f
ram
ewor
k he
lps d
ecis
ion
mak
ers
sele
ct fr
om a
uni
vers
e of
pot
entia
l sus
tain
abili
ty
met
rics (
over
100
) and
incl
udes
a d
ecis
ion-
mak
-in
g to
ol th
at fa
cilit
ates
inpu
t of l
ife-c
ycle
in
vent
ory
info
rmat
ion
that
can
be
inte
grat
ed
into
a a
naly
tical
hie
rarc
hy p
roce
ss fo
r dec
isio
n m
akin
g an
d st
ocha
stic
ass
essm
ent o
f unc
erta
in-
ties.
The
deci
sion
-mak
ing
proc
ess c
an b
e us
ed
for s
usta
inab
ility
dec
isio
ns a
lone
or b
e us
ed
to in
tegr
ate
sust
aina
bilit
y de
cisi
ons w
ith o
ther
pr
ojec
t dec
isio
n fa
ctor
s. (P
oint
of c
onta
ct: P
aul
Fava
ra, C
H2M
Hill
)
XX
XX
XX
XX
XX
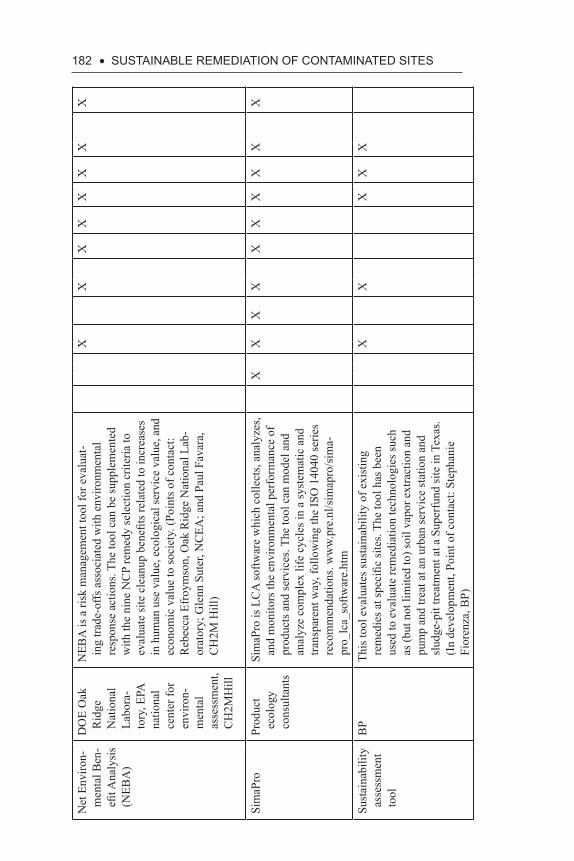
182 • SuStAiNABLE REMEDiAtiON Of CONtAMiNAtED SitES
Net
Env
iron-
men
tal B
en-
efit A
naly
sis
(NEB
A)
DO
E O
ak
Rid
ge
Nat
iona
l La
bora
-to
ry, E
PA
natio
nal
cent
er fo
r en
viro
n-m
enta
l as
sess
men
t, C
H2M
Hill
NEB
A is
a ri
sk m
anag
emen
t too
l for
eva
luat
-in
g tra
de-o
ffs a
ssoc
iate
d w
ith e
nviro
nmen
tal
resp
onse
act
ions
. The
tool
can
be
supp
lem
ente
d w
ith th
e ni
ne N
CP
rem
edy
sele
ctio
n cr
iteria
to
eval
uate
site
cle
anup
ben
efits
rela
ted
to in
crea
ses
in h
uman
use
val
ue, e
colo
gica
l ser
vice
val
ue, a
nd
econ
omic
val
ue to
soci
ety.
(Poi
nts o
f con
tact
: R
ebec
ca E
froy
mso
n, O
ak R
idge
Nat
iona
l Lab
-or
ator
y; G
lenn
Sut
er, N
CEA
; and
Pau
l Fav
ara,
C
H2M
Hill
)
XX
XX
XX
XX
Sim
aPro
Prod
uct
ecol
ogy
cons
ulta
nts
Sim
aPro
is L
CA
softw
are
whi
ch c
olle
cts,
anal
yzes
, an
d m
onito
rs th
e en
viro
nmen
tal p
erfo
rman
ce o
f pr
oduc
ts a
nd se
rvic
es. T
he to
ol c
an m
odel
and
an
alyz
e co
mpl
ex li
fe c
ycle
s in
a sy
stem
atic
and
tra
nspa
rent
way
, fol
low
ing
the
ISO
140
40 se
ries
reco
mm
enda
tions
. ww
w.pr
e.nl
/sim
apro
/sim
a-pr
o_lc
a_so
ftwar
e.ht
m
XX
XX
XX
XX
XX
Sust
aina
bilit
y as
sess
men
t to
ol
BP
This
tool
eva
luat
es su
stai
nabi
lity
of e
xist
ing
rem
edie
s at s
peci
fic si
tes.
The
tool
has
bee
n us
ed to
eva
luat
e re
med
iatio
n te
chno
logi
es su
ch
as (b
ut n
ot li
mite
d to
) soi
l vap
or e
xtra
ctio
n an
d pu
mp
and
treat
at a
n ur
ban
serv
ice
stat
ion
and
slud
ge-p
it tre
atm
ent a
t a S
uper
fund
site
in T
exas
. (I
n de
velo
pmen
t, Po
int o
f con
tact
: Ste
phan
ie
Fior
enza
, BP)
XX
XX
X
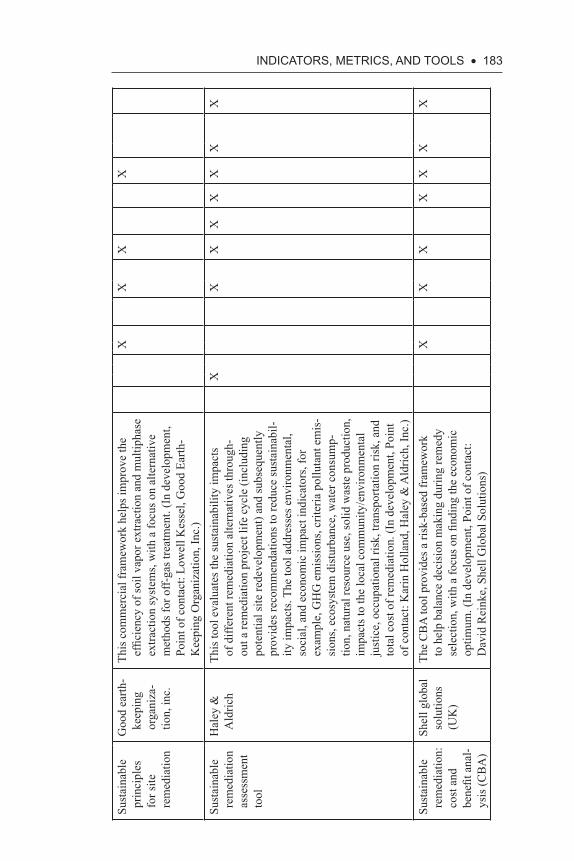
iNDiCAtORS, MEtRiCS, AND tOOLS • 183
Sust
aina
ble
prin
cipl
es
for s
ite
rem
edia
tion
Goo
d ea
rth-
keep
ing
orga
niza
-tio
n, in
c.
This
com
mer
cial
fram
ewor
k he
lps i
mpr
ove
the
effic
ienc
y of
soil
vapo
r ext
ract
ion
and
mul
tipha
se
extra
ctio
n sy
stem
s, w
ith a
focu
s on
alte
rnat
ive
met
hods
for o
ff-ga
s tre
atm
ent.
(In
deve
lopm
ent,
Poin
t of c
onta
ct: L
owel
l Kes
sel,
Goo
d Ea
rth-
Kee
ping
Org
aniz
atio
n, In
c.)
XX
XX
Sust
aina
ble
rem
edia
tion
asse
ssm
ent
tool
Hal
ey &
A
ldric
hTh
is to
ol e
valu
ates
the
sust
aina
bilit
y im
pact
s of
diff
eren
t rem
edia
tion
alte
rnat
ives
thro
ugh-
out a
rem
edia
tion
proj
ect l
ife c
ycle
(inc
ludi
ng
pote
ntia
l site
rede
velo
pmen
t) an
d su
bseq
uent
ly
prov
ides
reco
mm
enda
tions
to re
duce
sust
aina
bil-
ity im
pact
s. Th
e to
ol a
ddre
sses
env
ironm
enta
l, so
cial
, and
eco
nom
ic im
pact
indi
cato
rs, f
or
exam
ple,
GH
G e
mis
sion
s, cr
iteria
pol
luta
nt e
mis
-si
ons,
ecos
yste
m d
istu
rban
ce, w
ater
con
sum
p-tio
n, n
atur
al re
sour
ce u
se, s
olid
was
te p
rodu
ctio
n,
impa
cts t
o th
e lo
cal c
omm
unity
/env
ironm
enta
l ju
stic
e, o
ccup
atio
nal r
isk,
tran
spor
tatio
n ris
k, a
nd
tota
l cos
t of r
emed
iatio
n. (I
n de
velo
pmen
t, Po
int
of c
onta
ct: K
arin
Hol
land
, Hal
ey &
Ald
rich,
Inc.
)
XX
XX
XX
XX
Sust
aina
ble
rem
edia
tion:
co
st a
nd
bene
fit a
nal-
ysis
(CB
A)
Shel
l glo
bal
solu
tions
(U
K)
The
CB
A to
ol p
rovi
des a
risk
-bas
ed fr
amew
ork
to h
elp
bala
nce
deci
sion
mak
ing
durin
g re
med
y se
lect
ion,
with
a fo
cus o
n fin
ding
the
econ
omic
op
timum
. (In
dev
elop
men
t, Po
int o
f con
tact
: D
avid
Rei
nke,
She
ll G
loba
l Sol
utio
ns)
XX
XX
XX
X
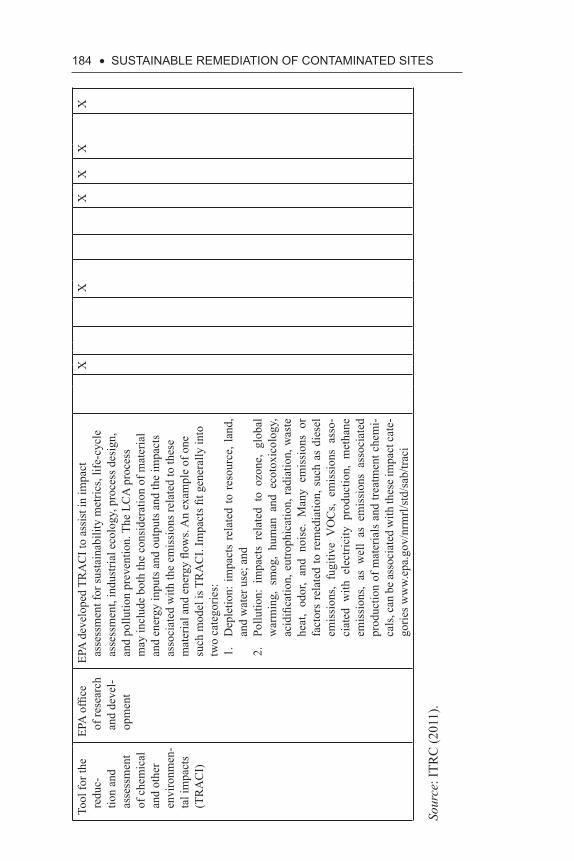
184 • SuStAiNABLE REMEDiAtiON Of CONtAMiNAtED SitES
Tool
for t
he
redu
c-tio
n an
d as
sess
men
t of
che
mic
al
and
othe
r en
viro
nmen
-ta
l im
pact
s (T
RA
CI)
EPA
offi
ce
of re
sear
ch
and
deve
l-op
men
t
EPA
dev
elop
ed T
RA
CI t
o as
sist
in im
pact
as
sess
men
t for
sust
aina
bilit
y m
etric
s, lif
e-cy
cle
asse
ssm
ent,
indu
stria
l eco
logy
, pro
cess
des
ign,
an
d po
llutio
n pr
even
tion.
The
LC
A p
roce
ss
may
incl
ude
both
the
cons
ider
atio
n of
mat
eria
l an
d en
ergy
inpu
ts a
nd o
utpu
ts a
nd th
e im
pact
s as
soci
ated
with
the
emis
sion
s rel
ated
to th
ese
mat
eria
l and
ene
rgy
flow
s. A
n ex
ampl
e of
one
su
ch m
odel
is T
RA
CI.
Impa
cts fi
t gen
eral
ly in
to
two
cate
gorie
s:1.
D
eple
tion:
impa
cts
rela
ted
to r
esou
rce,
land
, an
d w
ater
use
; and
2.
Pollu
tion:
im
pact
s re
late
d to
ozo
ne,
glob
al
war
min
g, s
mog
, hu
man
and
eco
toxi
colo
gy,
acid
ifica
tion,
eut
roph
icat
ion,
radi
atio
n, w
aste
he
at,
odor
, an
d no
ise.
Man
y em
issi
ons
or
fact
ors
rela
ted
to r
emed
iatio
n, s
uch
as d
iese
l em
issi
ons,
fugi
tive
VO
Cs,
emis
sion
s as
so-
ciat
ed w
ith e
lect
ricity
pro
duct
ion,
met
hane
em
issi
ons,
as w
ell
as e
mis
sion
s as
soci
ated
pr
oduc
tion
of m
ater
ials
and
trea
tmen
t che
mi-
cals
, can
be a
ssoc
iate
d w
ith th
ese i
mpa
ct ca
te-
gorie
s ww
w.e
pa.g
ov/n
rmrl/
std/
sab/
traci
XX
XX
XX
Sour
ce: I
TRC
(201
1).
iNDiCAtORS, MEtRiCS, AND tOOLS • 185
5.4.3.2 CleanSWEEP
AFCEE has also developed a tool called CleanSWEEP (Clean Solar and Wind Energy in Environmental Programs) for assessing alternative energy use at remediation sites. As with SRT, CleanSWEEP is an Excel-based analysis tool available for free via AFCEE’s website. CleanSWEEP evalu-ates the two most common forms of renewable energy, photovoltaic-solar panel systems and wind energy systems, and uses existing Department of Energy (DOE) data to estimate solar and wind potential and related efficiency or efficacy in applying renewable energy systems. Remediation systems with low energy requirements over long periods as well as those systems that do not require continuous operation, remediation applications in remote locations, and remediation systems with power requirements of 1 kW to 20 kW are appropriately analyzed using CleanSWEEP. It is best applied to inform design-related decisions of small- to mid-sized reme-diation systems, but may also be used as a screening tool for large and complex systems as well as an analysis alternative to sustainability eval-uation tools.
5.4.3.3 SiteWise
Similar to SRT and CleanSWEEP, SiteWise is an Excel-based sustainabil-ity assessment tool used for the sustainability analysis of remediation proj-ect alternatives. It provides an assessment of several quantitative metrics, including CO2, NOx, SOx, and PM10 emissions; energy consumption, water consumption, and resource consumption; and worker safety. Developed by the U.S. Navy in partnership with the U.S. Army, the U.S. Army Corps of Engineers, and Battelle Memorial Institute, SiteWise is available via the Green and Sustainable Remediation portal on the U.S. Navy’s website (NAVFAC 2011).
Analyses are performed on SiteWise by dividing each project remedi-ation alternative under consideration into four phases: (1) remedial inves-tigation, (2) remedial action construction, (3) remedial action operations, and (4) long-term monitoring and maintenance. Activities associated with each phase that may have an effect on the environment are incorporated into the analysis as inputs. Some activities include but are not limited to transportation of material and labor, material production, equipment oper-ation, and waste management.
The quantitative impacts associated with the user-provided inputs are derived from publically available tables and databases. Additionally, Site-Wise identifies potential technologies, such as renewable energy sources
186 • SuStAiNABLE REMEDiAtiON Of CONtAMiNAtED SitES
or energy-saving equipment that may be incorporated into a remediation alternative. It also allows for a cost-benefit analysis of such considerations.
Once each project remediation alternative is broken down into the four phases described earlier, the environmental impact of each phase may be calculated. The impacts may be grouped for cumulative impacts by one or more phases or across the entire remediation project cycle. Ultimately, the total cumulative impacts are calculated, allowing for an objective comparison among remediation project alternatives under consideration.
This phase-based analysis approach allows for easier identification of phases or entire remediation alternatives that result in greater relative impacts. This allows for optimized design on a phase-by-phase basis, or the potential to implement hybrid approaches that reduce impacts. It may also reduce redundancy with respect to the sustainability analysis process in multiple alternatives that have identical phases or subphases.
5.4.3.4 U.S. EPA Environmental Footprint Analysis Tools
Within its green remediation framework, the U.S. EPA has developed an environmental footprint assessment tool. The purpose of this tool is to quantify environment-related impacts (environmental footprint) associated with remediation projects undertaken to meet regulatory cleanup goals and requirements such that actions may be undertaken to lessen or minimize environmental impacts. The dual goals of the environmental footprint tool are to identify meaningful environmental metrics for quantification while concurrently establishing a methodology for the quantification of these metrics. The metrics identified and incorporated into this tool are aligned with U.S. EPA’s five core elements of green remediation (U.S. EPA 2011). The tool focuses on a project’s carbon footprint (i.e., the quantification of CO2 emissions associated with a project), but it may also be used to calculate the environmental impacts associated with other parameters, including NOx, SOx, and PM10 emissions, energy use, water use, and land use. The tool may be used to design and optimize a particular remediation alternative or comparison and selection of an alternative among several remediation alternatives under consideration.
With specific respect to carbon footprint analysis, several tools have been developed with different emphasis on a range of factors and system boundary implementation. The U.S. EPA has also developed a tool specifi-cally used to calculate GHG emissions associated with waste management practices. The WARM (U.S. EPA 2010) may be used to calculate GHG emissions associated with various waste management practices across
iNDiCAtORS, MEtRiCS, AND tOOLS • 187
a wide range of municipal solid waste materials. Some applicable prac-tices include source reduction, recycling, composting, combustion, and landfilling.
WARM calculates reduced GHG emissions resulting from the appli-cations of several activities or technologies, including the following:
• Energy conservation or use reduction measures• The incorporation of renewable energy sources• Reductions in fuel use• The use of greener energy sources when zero emission sources can-
not be used• Green chemistry measures, including materials substitution• Water conservation or reduced water use• Management of material inputs and waste streams
WARM applies emission factors from the Climate Registry (The Cli-mate Registry 2009), from U.S. EPA’s Climate Leaders GHG Inventory Protocol Core Module Guidance, and from published reports. These fac-tors are used to derive energy and CO2 equivalent units for a variety of material inputs and outputs.
5.4.3.5 Life-Cycle Assessment
As mentioned previously, when considering the most appropriate sus-tainability tool for a given project, it is important to consider the degree of complexity regarding the project with respect to its parameters across the various sustainability dimensions. When a complex project is under consideration, or when a comprehensive analysis is desired, an LCA is often a useful and desirable assessment tool. The International Organi-zation for Standards (ISO) developed a standard for performing LCA. It defines LCA as the “compilation and evaluation of the inputs, outputs, and the potential environmental impacts of a product system throughout its life cycle.” The ISO’s definition of product also includes services; therefore, remediation (a service) may be incorporated into an LCA analysis.
An LCA is most appropriate when a project under consideration will utilize a wide range of material, capital, and labor inputs, has the potential to generate significant or wide-ranging outputs with associated impacts, or when metrics are desired or required to be measured across a wide range of indicators. It provides a method for evaluating the total
188 • SuStAiNABLE REMEDiAtiON Of CONtAMiNAtED SitES
impacts a product (or service) may cause to the environment over its entire existence, or cradle to grave, beginning with initial manufacturing processes and ending with disposal or final disposition. When applied to a remediation project, LCA may analyze and incorporate the effects of manufacturing, transportation, use, and disposal of different materials and products associated with that activity. This includes accounting for energy and resource inputs as well as emissions and waste generations that affect land, water, and air. LCA can take into account direct and indirect impacts during all phases of a remediation project, including site characterization, system installation and optimization, system operation, maintenance, monitoring, postremediation monitoring, and impacts asso-ciated with subsequent productive land use. In assessing and optimizing a remediation alternative with respect to sustainability, LCA can be used to identify the best approach for minimizing natural resource use, means to incorporate renewable or reclaimed materials and energy sources, reha-bilitation of land for productive use, natural habitat protection or resto-ration, and cost-benefit analysis with respect to financial and temporal dimensions. An LCA analysis may be used to assess existing remediation systems, identify opportunities to decrease impacts in future remediation applications, identify optimal conditions where a specific remediation system may be applied, or compare and evaluate different remediation alternatives.
In general, an LCA follows a framework that includes the following steps:
• Definition of analysis scope, goals, and key assumptions to be incorporated;
• Performance of an inventory analysis, which includes the devel-opment of a process flow chart, system boundary definition, data collection, and data processing;
• Assessment of impact, including classification, characterization, and valuation;
• Interpretation of assessment results; and• Identification of means of improvement for the remediation proj-
ect alternative under consideration with respect to sustainability- related metrics and indicators.
Several resources have been developed that provide guidance with respect to LCA use; some of these include ISO 14044 (ISO 2006), SURF Guidance for Footprint Assessments and LCAs (Favara et al. 2011), U.S.
iNDiCAtORS, MEtRiCS, AND tOOLS • 189
EPA’s LCA: Principles and Practice (U.S. EPA 2006), and U.S. EPA’s Methodology for Understanding and Reducing a Project’s Environmental Footprint (U.S. EPA 2012).
When performing an LCA, it is essential to carefully consider the system boundary. It should be selected in a way that parameters that have a negligible or immaterial effect on overall impacts may be eliminated, but it is important to use a boundary that captures enough impacts such that the assessment may be meaningful and provide useful detail. For example, the complex extreme would assume a cradle-to-grave scenario in which all related activities from initial raw material extraction to final disposal would be accounted. Of course, this may be useful for some assessment scenarios but unnecessarily complex for many other analyses. As a simpler example, the system boundary may account only for the physical imple-mentation of a remediation project and look only at inputs and outputs that are directly applied and emanate at the project site during operation. Additionally, data used for an LCA analysis may be complex, expensive, or difficult to acquire.
Regardless of the selected boundary and processes under consider-ation of the analysis, the following should be included:
• Equipment• Consumable materials• Personnel• Natural resources• Energy inputs used during implementation, operation, monitoring,
and so forth; both directly by the remediation system as well as that consumed by the other categories listed
Several LCA analysis tools have been reported, but two LCA tools in particular are in widespread use. SimaPro is a for-sale application devel-oped by Product Ecology (Pré) Consultants. It may be used to calculate carbon footprint and other environmental impacts as well as key processes that may drive performance improvement with respect to sustainability. Several emissions inventory sources, both based on U.S. and international data, may be utilized during application. Additionally, SimaPro utilizes numerous impact assessment methods that may be used to group impacts into receptor-specific categories.
GaBi Software® (PE International 2011) is an LCA software package developed by PE International. A Free version of GaBi (GaBi Education) is available for selective academic use. GaBi offers functionality similar
190 • SuStAiNABLE REMEDiAtiON Of CONtAMiNAtED SitES
to SimaPro and may be used to perform evaluations similar to those gen-erated by SimaPro.
When conducting an LCA, data is compiled and inventoried. The resulting life-cycle inventory and associated parameter(s) are assigned to one or more impact categories and are typically reported following con-version into equivalent unit, generally by multiplying by a normalization factor. The specific impact categories that may be used during an analysis are specific and dependent on the tool being used for the analysis. One example is the U.S. EPA’s TRACI. This assessment inventory tool, uti-lized by several LCA tools, includes the following nine impact categories (from EPA’s TRACI website and Bare [2011]):
• Global Climate Change impact category—reported as carbon diox-ide (CO2) equivalents
• Acidification impact category—reported as sulfur dioxide (SO2) equivalents
• Eutrophication impact category—reported as nitrogen (N) equivalents• Ozone depletion impact category—reported as trichlorofluoro-
methane (CFC-11) equivalents• Photochemical smog formation impact category—reported as
ozone (O3) equivalents• Human health particulate matter (PM) impact category—reported
as fine particulate matter (PM2.5) equivalents• Human health cancer impact category—reported as comparative
toxicity unit cancer (CTU cancer) equivalents• Human health noncancer impact category—reported as compara-
tive toxicity unit noncancer (CTU noncancer) equivalents• Ecotoxicity impact category—reported as comparative toxicity unit
ecotoxicity (CTU eco) equivalents
Other impact categories, such as those associated with renewable energy and nonrenewable energy use, may also be incorporated into an assessment when permissible by the LCA tool that is being used for an analysis.
The resulting converted parameters are added for each respective impact category, and results are presented in terms of indicator equiva-lents. Once the cleanup’s impact assessment is complete and results are presented for each of the impact categories, the impact categories can be mapped to a related core element or elements. As an example, particulate matter may be mapped to a human health core element as well as a surface soil core element (due to aerial deposition).
iNDiCAtORS, MEtRiCS, AND tOOLS • 191
5.5 SELECtiON Of tOOLS fOR SuStAiNABiLitY EVALuAtiONS
The tools presented are applicable to projects with a wide range of scope and complexity. No single tool option can cover every type of project. Rather, it is important to assess several key aspects of a project, which can then be used to select the most appropriate tool for analysis. First, in some cases, a tool may be recommended or required by the specific regulatory agency that is providing oversight for the remediation proj-ect. Sometimes the agency has developed a tool, in other cases there is a formal or informal agency endorsement, and in still other cases a specific case officer may have a familiarity or preference for a specific tool. Also, the size, scope, and relative degree of complexity are a major factor to consider during tool selection. Generally speaking, smaller, less complex remediation projects will often focus on the incorporation of BMPs. The desired phase or phases of a remediation project that warrant analysis can also influence tool selection; some tools are more appropriate for certain aspects of a given remediation project. Larger, more complex projects will often necessitate the use of increasingly powerful but complex tools. Additionally, the desired sustainability metrics to be measured can influ-ence tool decision. Prior to selection, a list of important or relevant metrics should be identified, and then tools that are able to provide an assessment of these desired metrics may be selected. Finally, some tools offer detailed analyses for specific remediation-related technologies. While these analy-sis tools are very powerful and offer great detail, their application is lim-ited to the specific remediation technologies for which they have been developed. Obviously, the analysis tool can only be selected if the corre-sponding remediation technology will be implemented.
Once one or more potential analysis tools have been identified, there are several operational practices that should be considered when perform-ing the analysis. First, the analysis should be kept as simple as possible, but it should, of course, provide the appropriate level of detail to be mean-ingful and useful. This includes selection of the tool, which, as mentioned earlier, generally follows that simpler tools may be applied to simpler projects, while more complex projects require more complex tools. Sec-ond, it is important to maintain objectivity and transparency during tool application. This includes justification for inputs and parameters. Simply stated, objectivity and transparency make it easier to achieve buy-in and concurrence for a particular study from a range of project stakeholders. Finally, it is good practice to perform sensitivity analyses of the analy-sis process and the results of the analyses. The sensitivity analysis can
192 • SuStAiNABLE REMEDiAtiON Of CONtAMiNAtED SitES
provide insight regarding the relative weight of key inputs and parameters and how deviations associated with uncertainty may affect results. Several analysis tools actually have sensitivity analysis capabilities.
5.6 SuMMARY
Several frameworks may be used to evaluate the sustainability of a reme-diation project across one or more of the dimensions of sustainability: environmental, economic, and social aspects. However, key indicators also should be identified, and each indicator should be expressed by a metric to measure the sustainability of remediation projects. Several tools have been developed to compute the metrics and provide a means for objective evaluation.
Sustainability metrics may be grouped in the order of increasing diffi-culty for application: (1) number of BMPs, (2) semiquantitative tools, and (3) quantitative tools. The key considerations for selecting the appropriate tool include the following: the regulatory agency involved in a cleanup program, the size of the remediation project, the site remediation phase, selected sustainable remediation metrics, and available technologies.
There are several best practices to keep in mind during any sustain-able remediation evaluation, including the following: the use of the sim-plest level of sustainable remediation evaluation that is needed to meet sustainable remediation goals, transparency during the sustainable reme-diation process, and the benefit of uncertainty analysis of sustainable remediation results.
CHAPtER 6
cAse studies
6.1 CASE StuDY 1: CHiCAgO iNDuStRiAL SitE
6.1.1 PROJECT BACKGROUND
The project site measures approximately 117 acres and consists of a vacant and wooded marshland. Slag or fill materials and fly ash associated with past illegal dumping activities have been identified at the site. The prop-erties surrounding the site have been heavily industrialized since the late 1800s; current and historic land uses near the site include heavy manu-facturing, underground storage tank usage, landfills, and illegal dumping. The site is planned to be used as an ecological open space reserve with public hiking trails (City of Chicago 2005).
The site investigations revealed that site geology consists of nonnative vegetative soil cover (loamy soil consisting of a mixture of sand, silt, and clay), sandy blue-green fill (solid waste facility fill material consisting of sand and slag), native soils (well-sorted sand and silty clay), and a bedrock layer of dolomite and limestone at depths greater than 30 feet below the ground surface. Figure 6.1 depicts the typical soil profile of the site. The site has a surficial silty sand aquifer underlain by silty clay glacial till of low permeability serving as an aquitard. Estimated depth to the first occurrence of groundwater is approximately one to five feet below ground surface. Based on the topographical gradient, the hydrological gradient is inferred to be directed toward the east, although the groundwater flow direction and the depth to shallow, unconfined groundwater would likely vary depending upon seasonal variations in rainfall and other hydrological features.
Soil, surface water, sediment, and groundwater samples at various locations throughout the site were analyzed for the presence of volatile organic compounds (VOCs), polynuclear aromatic hydrocarbons (PAHs), pesticides, metals, total organic content, and pH. Contamination was
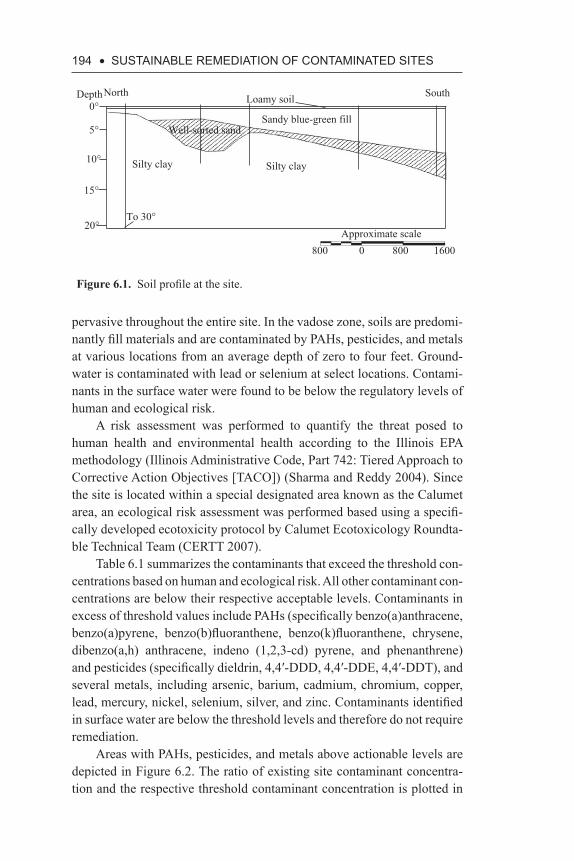
194 • SuStAiNABLE REMEDiAtiON Of CONtAMiNAtED SitES
pervasive throughout the entire site. In the vadose zone, soils are predomi-nantly fill materials and are contaminated by PAHs, pesticides, and metals at various locations from an average depth of zero to four feet. Ground-water is contaminated with lead or selenium at select locations. Contami-nants in the surface water were found to be below the regulatory levels of human and ecological risk.
A risk assessment was performed to quantify the threat posed to human health and environmental health according to the Illinois EPA methodology (Illinois Administrative Code, Part 742: Tiered Approach to Corrective Action Objectives [TACO]) (Sharma and Reddy 2004). Since the site is located within a special designated area known as the Calumet area, an ecological risk assessment was performed based using a specifi-cally developed ecotoxicity protocol by Calumet Ecotoxicology Roundta-ble Technical Team (CERTT 2007).
Table 6.1 summarizes the contaminants that exceed the threshold con-centrations based on human and ecological risk. All other contaminant con-centrations are below their respective acceptable levels. Contaminants in excess of threshold values include PAHs (specifically benzo(a)anthracene, benzo(a)pyrene, benzo(b)fluoranthene, benzo(k)fluoranthene, chrysene, dibenzo(a,h) anthracene, indeno (1,2,3-cd) pyrene, and phenanthrene) and pesticides (specifically dieldrin, 4,4′-DDD, 4,4′-DDE, 4,4′-DDT), and several metals, including arsenic, barium, cadmium, chromium, copper, lead, mercury, nickel, selenium, silver, and zinc. Contaminants identified in surface water are below the threshold levels and therefore do not require remediation.
Areas with PAHs, pesticides, and metals above actionable levels are depicted in Figure 6.2. The ratio of existing site contaminant concentra-tion and the respective threshold contaminant concentration is plotted in
SouthLoamy soilNorthDepth0°
Silty clay Silty clay
Well-sorted sand
To 30°
Sandy blue-green fill5°
10°
15°
20°Approximate scale
800 800 16000
Figure 6.1. Soil profile at the site.
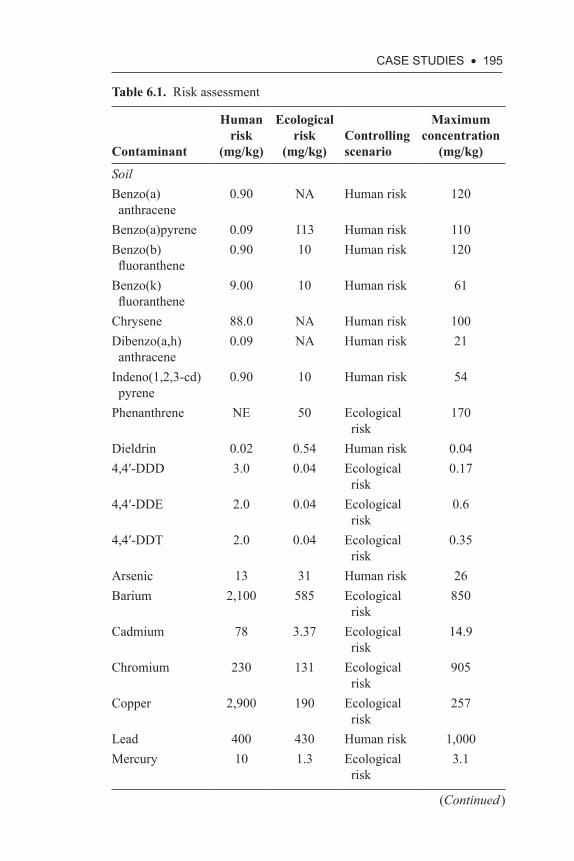
CASE StuDiES • 195
Table 6.1. Risk assessment
Contaminant
Human risk
(mg/kg)
Ecological risk
(mg/kg)Controlling scenario
Maximum concentration
(mg/kg)
SoilBenzo(a)anthracene
0.90 NA Human risk 120
Benzo(a)pyrene 0.09 113 Human risk 110Benzo(b)fluoranthene
0.90 10 Human risk 120
Benzo(k)fluoranthene
9.00 10 Human risk 61
Chrysene 88.0 NA Human risk 100Dibenzo(a,h)anthracene
0.09 NA Human risk 21
Indeno(1,2,3-cd)pyrene
0.90 10 Human risk 54
Phenanthrene NE 50 Ecological risk
170
Dieldrin 0.02 0.54 Human risk 0.044,4′-DDD 3.0 0.04 Ecological
risk0.17
4,4′-DDE 2.0 0.04 Ecological risk
0.6
4,4′-DDT 2.0 0.04 Ecological risk
0.35
Arsenic 13 31 Human risk 26Barium 2,100 585 Ecological
risk850
Cadmium 78 3.37 Ecological risk
14.9
Chromium 230 131 Ecological risk
905
Copper 2,900 190 Ecological risk
257
Lead 400 430 Human risk 1,000Mercury 10 1.3 Ecological
risk3.1
(Continued )
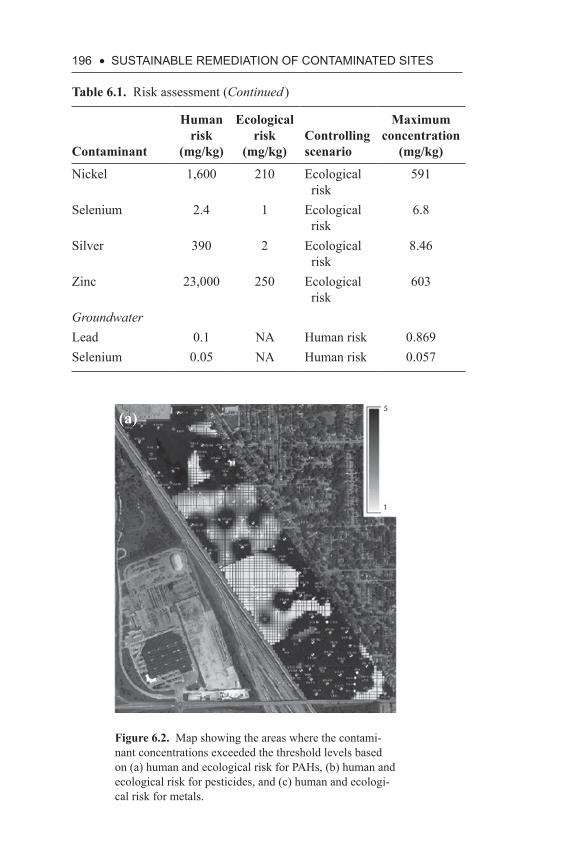
196 • SuStAiNABLE REMEDiAtiON Of CONtAMiNAtED SitES
Table 6.1. Risk assessment (Continued )
Contaminant
Human risk
(mg/kg)
Ecological risk
(mg/kg)Controlling scenario
Maximum concentration
(mg/kg)
Nickel 1,600 210 Ecological risk
591
Selenium 2.4 1 Ecological risk
6.8
Silver 390 2 Ecological risk
8.46
Zinc 23,000 250 Ecological risk
603
GroundwaterLead 0.1 NA Human risk 0.869Selenium 0.05 NA Human risk 0.057
(a)
(b)
(c)
Figure 6.2. Map showing the areas where the contami-nant concentrations exceeded the threshold levels based on (a) human and ecological risk for PAHs, (b) human and ecological risk for pesticides, and (c) human and ecologi-cal risk for metals.
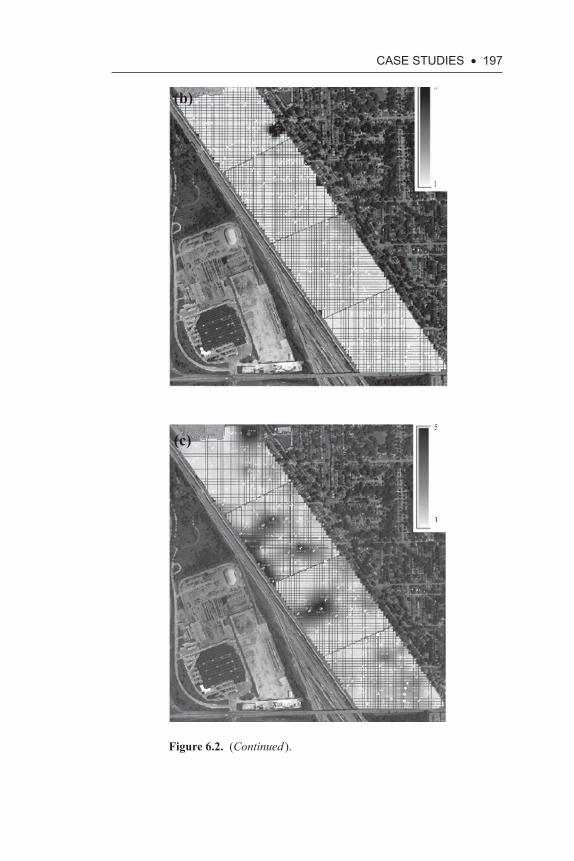
CASE StuDiES • 197
Figure 6.2. (Continued ).
(a)
(b)
(c)
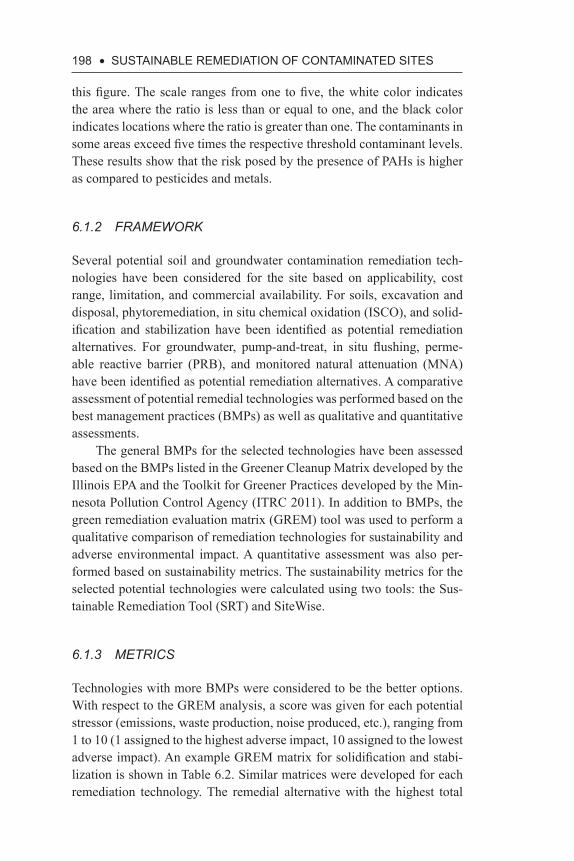
198 • SuStAiNABLE REMEDiAtiON Of CONtAMiNAtED SitES
this figure. The scale ranges from one to five, the white color indicates the area where the ratio is less than or equal to one, and the black color indicates locations where the ratio is greater than one. The contaminants in some areas exceed five times the respective threshold contaminant levels. These results show that the risk posed by the presence of PAHs is higher as compared to pesticides and metals.
6.1.2 FRAMEWORK
Several potential soil and groundwater contamination remediation tech-nologies have been considered for the site based on applicability, cost range, limitation, and commercial availability. For soils, excavation and disposal, phytoremediation, in situ chemical oxidation (ISCO), and solid-ification and stabilization have been identified as potential remediation alternatives. For groundwater, pump-and-treat, in situ flushing, perme-able reactive barrier (PRB), and monitored natural attenuation (MNA) have been identified as potential remediation alternatives. A comparative assessment of potential remedial technologies was performed based on the best management practices (BMPs) as well as qualitative and quantitative assessments.
The general BMPs for the selected technologies have been assessed based on the BMPs listed in the Greener Cleanup Matrix developed by the Illinois EPA and the Toolkit for Greener Practices developed by the Min-nesota Pollution Control Agency (ITRC 2011). In addition to BMPs, the green remediation evaluation matrix (GREM) tool was used to perform a qualitative comparison of remediation technologies for sustainability and adverse environmental impact. A quantitative assessment was also per-formed based on sustainability metrics. The sustainability metrics for the selected potential technologies were calculated using two tools: the Sus-tainable Remediation Tool (SRT) and SiteWise.
6.1.3 METRICS
Technologies with more BMPs were considered to be the better options. With respect to the GREM analysis, a score was given for each potential stressor (emissions, waste production, noise produced, etc.), ranging from 1 to 10 (1 assigned to the highest adverse impact, 10 assigned to the lowest adverse impact). An example GREM matrix for solidification and stabi-lization is shown in Table 6.2. Similar matrices were developed for each remediation technology. The remedial alternative with the highest total
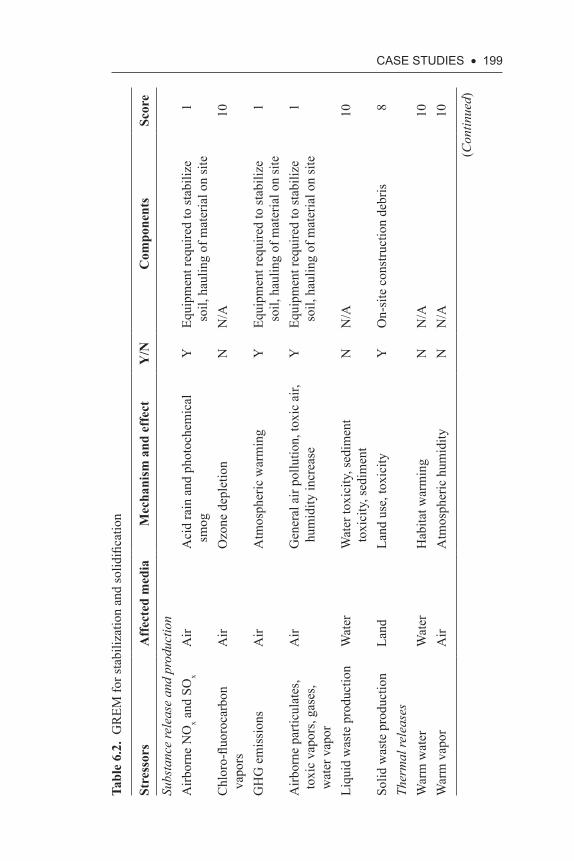
CASE StuDiES • 199
Tabl
e 6.
2. G
REM
for s
tabi
lizat
ion
and
solid
ifica
tion
Stre
ssor
sA
ffec
ted
med
iaM
echa
nism
and
eff
ect
Y/N
Com
pone
nts
Scor
e
Subs
tanc
e re
leas
e an
d pr
oduc
tion
Airb
orne
NO
x and
SO
xA
irA
cid
rain
and
pho
toch
emic
al
smog
YEq
uipm
ent r
equi
red
to st
abili
ze
soil,
hau
ling
of m
ater
ial o
n si
te 1
Chl
oro-
fluor
ocar
bon
vapo
rsA
irO
zone
dep
letio
nN
N/A
10
GH
G e
mis
sion
sA
irA
tmos
pher
ic w
arm
ing
YEq
uipm
ent r
equi
red
to st
abili
ze
soil,
hau
ling
of m
ater
ial o
n si
te 1
Airb
orne
par
ticul
ates
, to
xic
vapo
rs, g
ases
, w
ater
vap
or
Air
Gen
eral
air
pollu
tion,
toxi
c ai
r, hu
mid
ity in
crea
seY
Equi
pmen
t req
uire
d to
stab
ilize
so
il, h
aulin
g of
mat
eria
l on
site
1
Liqu
id w
aste
pro
duct
ion
Wat
erW
ater
toxi
city
, sed
imen
t to
xici
ty, s
edim
ent
NN
/A10
Solid
was
te p
rodu
ctio
nLa
ndLa
nd u
se, t
oxic
ityY
On-
site
con
stru
ctio
n de
bris
8Th
erm
al re
leas
esW
arm
wat
erW
ater
Hab
itat w
arm
ing
NN
/A10
War
m v
apor
Air
Atm
osph
eric
hum
idity
NN
/A10
(Con
tinue
d)
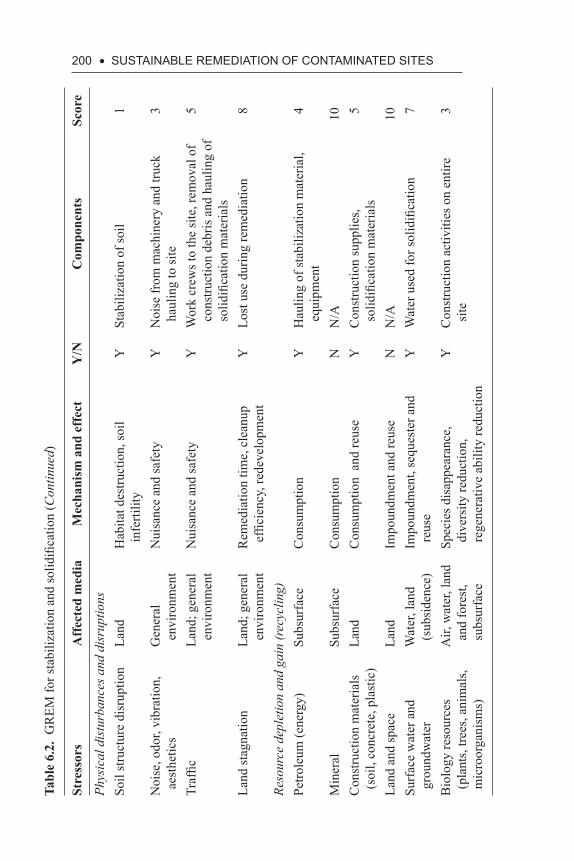
200 • SuStAiNABLE REMEDiAtiON Of CONtAMiNAtED SitESTa
ble
6.2.
GR
EM fo
r sta
biliz
atio
n an
d so
lidifi
catio
n (C
ontin
ued)
Stre
ssor
sA
ffec
ted
med
iaM
echa
nism
and
eff
ect
Y/N
Com
pone
nts
Scor
e
Phys
ical
dis
turb
ance
s and
dis
rupt
ions
Soil
stru
ctur
e di
srup
tion
Land
Hab
itat d
estru
ctio
n, so
il in
ferti
lity
YSt
abili
zatio
n of
soil
1
Noi
se, o
dor,
vibr
atio
n,
aest
hetic
sG
ener
al
envi
ronm
ent
Nui
sanc
e an
d sa
fety
YN
oise
from
mac
hine
ry a
nd tr
uck
haul
ing
to si
te3
Traf
ficLa
nd; g
ener
al
envi
ronm
ent
Nui
sanc
e an
d sa
fety
YW
ork
crew
s to
the
site
, rem
oval
of
cons
truct
ion
debr
is a
nd h
aulin
g of
so
lidifi
catio
n m
ater
ials
5
Land
stag
natio
nLa
nd; g
ener
al
envi
ronm
ent
Rem
edia
tion
time,
cle
anup
ef
ficie
ncy,
rede
velo
pmen
tY
Lost
use
dur
ing
rem
edia
tion
8
Reso
urce
dep
letio
n an
d ga
in (r
ecyc
ling)
Petro
leum
(ene
rgy)
Subs
urfa
ceC
onsu
mpt
ion
YH
aulin
g of
stab
iliza
tion
mat
eria
l, eq
uipm
ent
4
Min
eral
Subs
urfa
ceC
onsu
mpt
ion
NN
/A10
Con
stru
ctio
n m
ater
ials
(s
oil,
conc
rete
, pla
stic
)La
ndC
onsu
mpt
ion
and
reus
eY
Con
stru
ctio
n su
pplie
s, so
lidifi
catio
n m
ater
ials
5
Land
and
spac
eLa
ndIm
poun
dmen
t and
reus
eN
N/A
10Su
rfac
e w
ater
and
gr
ound
wat
erW
ater
, lan
d (s
ubsi
denc
e)Im
poun
dmen
t, se
ques
ter a
nd
reus
eY
Wat
er u
sed
for s
olid
ifica
tion
7
Bio
logy
reso
urce
s (p
lant
s, tre
es, a
nim
als,
mic
roor
gani
sms)
Air,
wat
er, l
and
and
fore
st,
subs
urfa
ce
Spec
ies d
isap
pear
ance
, di
vers
ity re
duct
ion,
re
gene
rativ
e ab
ility
redu
ctio
n
YC
onst
ruct
ion
activ
ities
on
entir
e si
te3
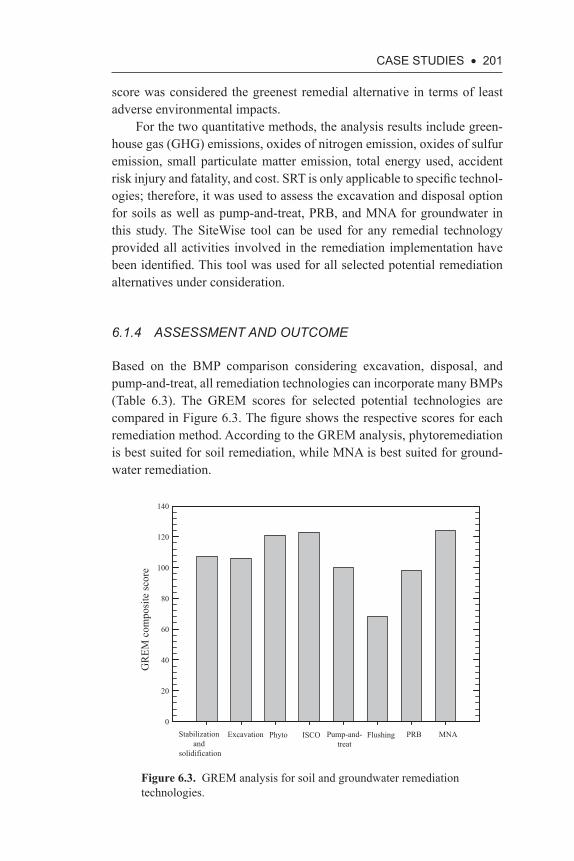
CASE StuDiES • 201
score was considered the greenest remedial alternative in terms of least adverse environmental impacts.
For the two quantitative methods, the analysis results include green-house gas (GHG) emissions, oxides of nitrogen emission, oxides of sulfur emission, small particulate matter emission, total energy used, accident risk injury and fatality, and cost. SRT is only applicable to specific technol-ogies; therefore, it was used to assess the excavation and disposal option for soils as well as pump-and-treat, PRB, and MNA for groundwater in this study. The SiteWise tool can be used for any remedial technology provided all activities involved in the remediation implementation have been identified. This tool was used for all selected potential remediation alternatives under consideration.
6.1.4 ASSESSMENT AND OUTCOME
Based on the BMP comparison considering excavation, disposal, and pump-and-treat, all remediation technologies can incorporate many BMPs (Table 6.3). The GREM scores for selected potential technologies are compared in Figure 6.3. The figure shows the respective scores for each remediation method. According to the GREM analysis, phytoremediation is best suited for soil remediation, while MNA is best suited for ground-water remediation.
Stabilization and
solidification
Excavation Phyto ISCO Pump-and-treat
Flushing PRB MNA
GR
EM c
ompo
site
scor
e
0
20
40
60
80
100
120
140
Figure 6.3. GREM analysis for soil and groundwater remediation technologies.
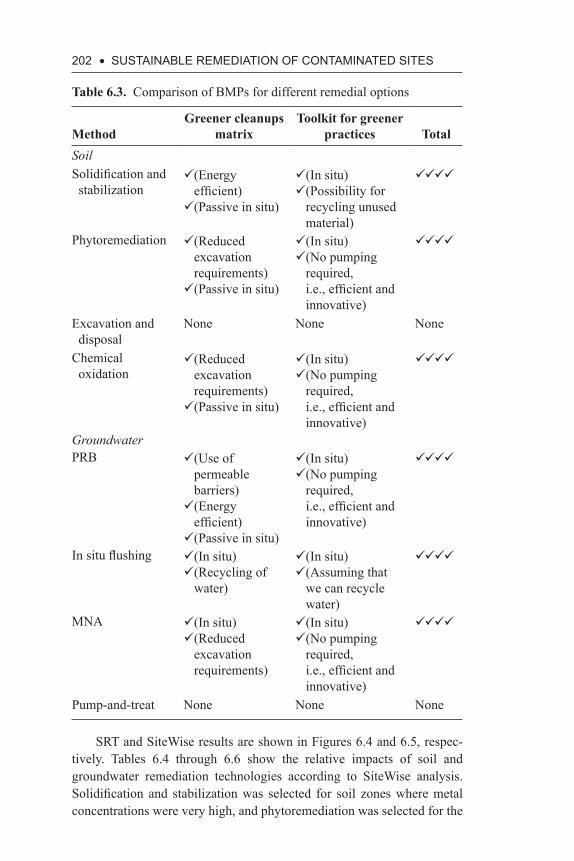
202 • SuStAiNABLE REMEDiAtiON Of CONtAMiNAtED SitES
Table 6.3. Comparison of BMPs for different remedial options
MethodGreener cleanups
matrixToolkit for greener
practices TotalSoilSolidification and stabilization
�(Energy efficient)(Passive in situ)
(In situ)�(Possibility for
recycling unused material)
Phytoremediation �(Reduced excavation requirements)(Passive in situ)
(In situ)�(No pumping
required, i.e., efficient and innovative)
Excavation and disposal
None None None
Chemical oxidation
�(Reduced excavation requirements)(Passive in situ)
(In situ)�(No pumping
required, i.e., efficient and innovative)
GroundwaterPRB �(Use of
permeable barriers)�(Energy
efficient)(Passive in situ)
(In situ)�(No pumping
required, i.e., efficient and innovative)
In situ flushing (In situ)�(Recycling of
water)
(In situ)�(Assuming that
we can recycle water)
MNA (In situ)�(Reduced
excavation requirements)
(In situ)�(No pumping
required, i.e., efficient and innovative)
Pump-and-treat None None None
SRT and SiteWise results are shown in Figures 6.4 and 6.5, respec-tively. Tables 6.4 through 6.6 show the relative impacts of soil and groundwater remediation technologies according to SiteWise analysis. Solidification and stabilization was selected for soil zones where metal concentrations were very high, and phytoremediation was selected for the
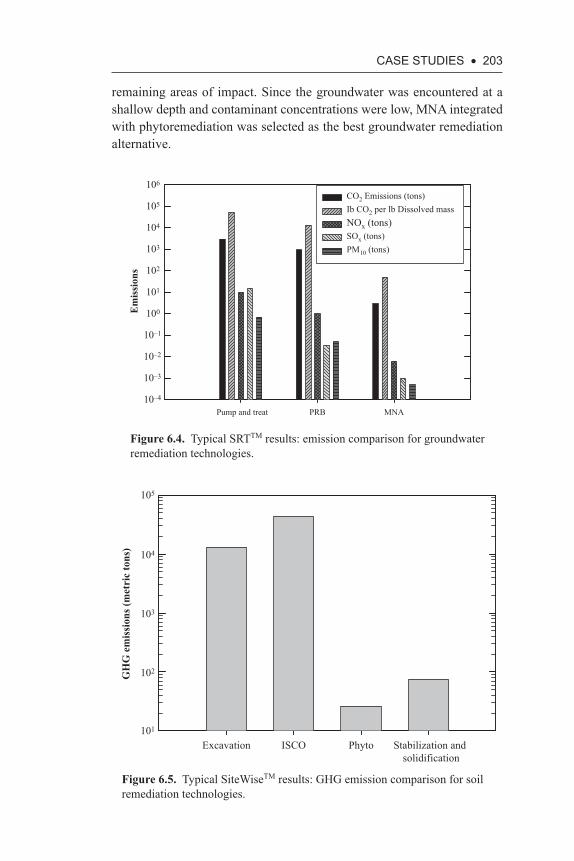
CASE StuDiES • 203
remaining areas of impact. Since the groundwater was encountered at a shallow depth and contaminant concentrations were low, MNA integrated with phytoremediation was selected as the best groundwater remediation alternative.
Pump and treat PRB MNA
Em
issi
ons
10–4
10–3
10–2
10–1
100
101
102
103
104
105
106
CO2 Emissions (tons)Ib CO2 per lb Dissolved massNOx (tons)SOx (tons)PM10 (tons)
Figure 6.4. Typical SRTTM results: emission comparison for groundwater remediation technologies.
Figure 6.5. Typical SiteWiseTM results: GHG emission comparison for soil remediation technologies.
Excavation ISCO Phyto Stabilization and solidification
GH
G e
mis
sion
s (m
etri
c to
ns)
101
102
103
104
105
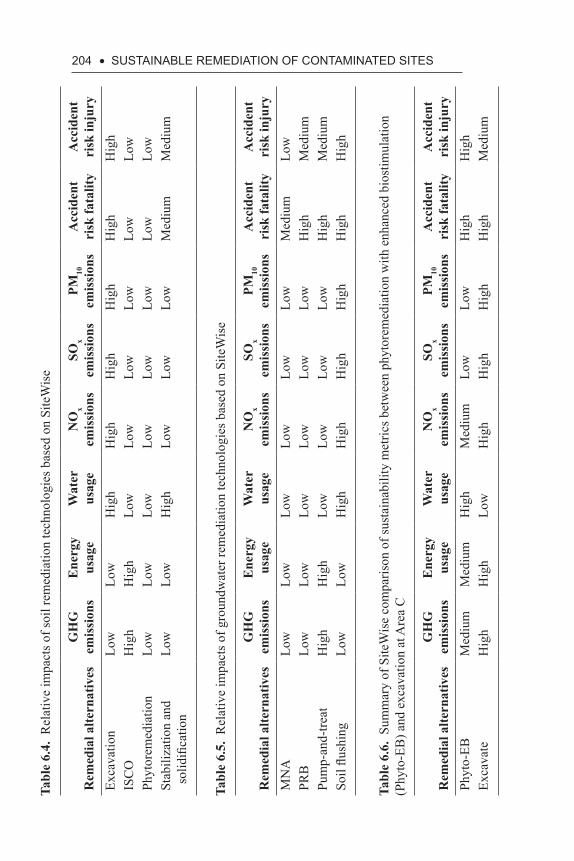
204 • SuStAiNABLE REMEDiAtiON Of CONtAMiNAtED SitESTa
ble
6.4.
Rel
ativ
e im
pact
s of s
oil r
emed
iatio
n te
chno
logi
es b
ased
on
Site
Wis
e
Rem
edia
l alte
rnat
ives
GH
G
emis
sion
sE
nerg
y us
age
Wat
er
usag
eN
Ox
emis
sion
sSO
x em
issi
ons
PM10
em
issi
ons
Acc
iden
t ri
sk fa
talit
yA
ccid
ent
risk
inju
ryEx
cava
tion
Low
Low
Hig
hH
igh
Hig
hH
igh
Hig
hH
igh
ISC
OH
igh
Hig
hLo
wLo
wLo
wLo
wLo
wLo
wPh
ytor
emed
iatio
nLo
wLo
wLo
wLo
wLo
wLo
wLo
wLo
wSt
abili
zatio
n an
d so
lidifi
catio
n Lo
wLo
wH
igh
Low
Low
Low
Med
ium
Med
ium
Tabl
e 6.
5. R
elat
ive
impa
cts o
f gro
undw
ater
rem
edia
tion
tech
nolo
gies
bas
ed o
n Si
teW
ise
Rem
edia
l alte
rnat
ives
GH
G
emis
sion
sE
nerg
y us
age
Wat
er
usag
eN
Ox
emis
sion
sSO
x em
issi
ons
PM10
em
issi
ons
Acc
iden
t ri
sk fa
talit
yA
ccid
ent
risk
inju
ryM
NA
Low
Low
Low
Low
Low
Low
Med
ium
Low
PRB
Low
Low
Low
Low
Low
Low
Hig
hM
ediu
mPu
mp-
and-
treat
Hig
hH
igh
Low
Low
Low
Low
Hig
hM
ediu
mSo
il flu
shin
gLo
wLo
wH
igh
Hig
hH
igh
Hig
hH
igh
Hig
h
Tabl
e 6.
6. S
umm
ary
of S
iteW
ise
com
paris
on o
f sus
tain
abili
ty m
etric
s bet
wee
n ph
ytor
emed
iatio
n w
ith e
nhan
ced
bios
timul
atio
n (P
hyto
-EB
) and
exc
avat
ion
at A
rea
C
Rem
edia
l alte
rnat
ives
GH
G
emis
sion
sE
nerg
y us
age
Wat
erus
age
NO
x em
issi
ons
SOx
emis
sion
sPM
10
emis
sion
sA
ccid
ent
risk
fata
lity
Acc
iden
t ri
sk in
jury
Phyt
o-EB
Med
ium
Med
ium
Hig
hM
ediu
mLo
wLo
wH
igh
Hig
hEx
cava
teH
igh
Hig
hLo
wH
igh
Hig
hH
igh
Hig
hM
ediu
m
CASE StuDiES • 205
6.1.5 REMEDIATION ALTERNATIVE SELECTION
Phytoremediation has been selected to treat the majority of the site, and solidification and stabilization has been selected for selected areas exhib-iting relatively high metal concentrations. Solidification and stabilization is proposed for implementation in approximately 7.5 acres of the site, and phytoremediation is proposed for 95 acres of the site. Considering the dif-ferent remedial options, solidification and stabilization was initially iden-tified as a feasible alternative for areas on the site where multiple types of contamination exist. Further assessment determined that while solidifica-tion and stabilization is highly effective for contaminants on the site, it is also expensive. Therefore, solidification and stabilization was determined to be best applied in areas with high contaminant concentrations that pose a threat of groundwater contamination. A cement-based solidification and stabilization mix design has been proposed to treat these impacted soils and minimize the potential for groundwater impact.
Phytoremediation involves the removal, stabilization, or degradation of contaminants in soils by plants (ITRC 2009). The majority of plant installation would consist of grasses with trees at specific locations to address existing groundwater impacts. Sunflower plantings may be used in appropriate locations to address lead, arsenic, and silver, and cattails may be planted in areas to address lead and zinc. Rye grass and tall fescue may be used in appropriate locations for the degradation of PAHs at iden-tified areas. Hybrid poplars may be used in the extreme northeast corner of the site where larger and deeper contamination of heavy metals have been identified as well as in locations where groundwater contamination has been identified.
Groundwater contamination is not as great a concern at the site as soil contamination; further, there is no complete groundwater exposure pathway at the site. A combination of MNA and phytoremediation is rec-ommended to address groundwater remediation.
Periodic groundwater monitoring is recommended to study the cumu-lative effect of the recommended phytoremediation and MNA alterna-tives. Phytoremediation monitoring will also be performed through testing of the leaves and cuttings of the plants.
6.1.6 CONCLUSIONS
As a result of past illegal dumping activities, soils and groundwater at a large vacant and wooded marshland site (117 acres) have been contami-nated with heavy metals, PAHs, and pesticides. Conversion of the site into
206 • SuStAiNABLE REMEDiAtiON Of CONtAMiNAtED SitES
an ecological open space reserve has been proposed. Some of the contam-inants, particularly PAHs and heavy metals, have been identified at lev-els that pose a risk to human health and ecology; therefore, remediation action is warranted. Following qualitative and quantitative assessments, remediation alternatives have been recommended to address contami-nated soil and groundwater. The assessments described earlier considered sustainability-related metrics to assess potential impacts on the environ-ment. A combination of remediation methods were identified as the best alternatives for the site. Solidification and stabilization (to be applied in areas of high contaminant concentrations) and phytoremediation (to be applied in other contaminated areas) have been recommended for the reme-diation of soils with PAHs and heavy metals, while MNA and phytoremedi-ation have been recommended for the treatment of impacted groundwater.
6.2 CASE StuDY 2: iNDiAN RiDgE MARSH SitE
6.2.1 PROJECT BACKGROUND
Recent efforts by the City of Chicago and the Illinois Department of Natural Resources to restore historically industrialized wetlands and prairies in the Calumet region (southeast Chicago) have prompted the evaluation of potential remedial options for several tracts of land slated for redevelopment as part of the Great Lakes Restoration Initiative (GLRI), a multiagency effort to increase funding for remediation and protection of the Great Lakes ecosystems. The Indian Ridge Marsh (IRM) has sig-nificant and widespread historic contamination, including documented impacts to soil, sediments, surface water, and groundwater. The resto-ration of wetland and prairie habitats at IRM holds significant ecological value, especially for several endangered birds (e.g., black crowned night heron) that nest seasonally in these areas (Kamins et al. 2002). Multiple contaminant classes are present on-site, heavy metals, pesticides, VOCs, PAHs, pesticides, and one observed instance of a light nonaqueous phase liquid (LNAPL) plume containing petroleum hydrocarbons.
The contaminated areas that posed the greatest risk to human and eco-logical health were identified through the comparison of measured sam-ple concentrations to risk-based screening levels (RBSLs), TACO, and the Calumet Area Ecotoxicological Protocol (CAEP). Six areas of con-cern (AOCs), identified as Areas A, B, C, D, E, and F, were established based on the geographic distribution of samples with contaminant lev-els exceeding established RBSLs (Figure 6.6). The AOCs were targeted for direct remediation, and data regarding contaminant distribution in the
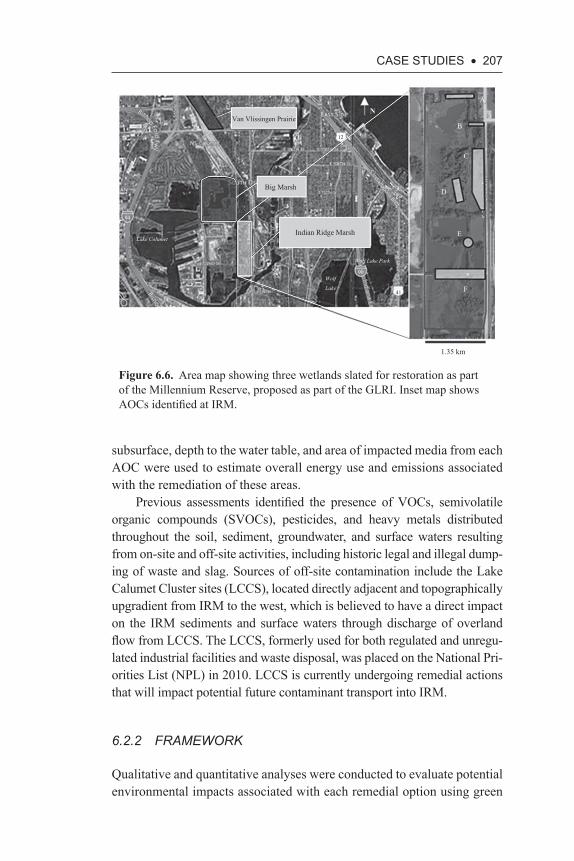
CASE StuDiES • 207
subsurface, depth to the water table, and area of impacted media from each AOC were used to estimate overall energy use and emissions associated with the remediation of these areas.
Previous assessments identified the presence of VOCs, semivolatile organic compounds (SVOCs), pesticides, and heavy metals distributed throughout the soil, sediment, groundwater, and surface waters resulting from on-site and off-site activities, including historic legal and illegal dump-ing of waste and slag. Sources of off-site contamination include the Lake Calumet Cluster sites (LCCS), located directly adjacent and topographically upgradient from IRM to the west, which is believed to have a direct impact on the IRM sediments and surface waters through discharge of overland flow from LCCS. The LCCS, formerly used for both regulated and unregu-lated industrial facilities and waste disposal, was placed on the National Pri-orities List (NPL) in 2010. LCCS is currently undergoing remedial actions that will impact potential future contaminant transport into IRM.
6.2.2 FRAMEWORK
Qualitative and quantitative analyses were conducted to evaluate potential environmental impacts associated with each remedial option using green
Van Vlissingen Prairie
Indian Ridge Marsh
1.35 km
FWolf
Lake
Wolf Lake Park
Lake Columet
D
E
90
94
41
12
C
B
NA
Big Marsh
Figure 6.6. Area map showing three wetlands slated for restoration as part of the Millennium Reserve, proposed as part of the GLRI. Inset map shows AOCs identified at IRM.
208 • SuStAiNABLE REMEDiAtiON Of CONtAMiNAtED SitES
and sustainable remediation (GSR) tools such as the GREM, SiteWise, and the SRT. Following a qualitative evaluation of sustainability metrics using GREM (i.e., noise, worker safety, and aesthetics), a quantitative evaluation of energy and resource consumption was conducted using both SRT and SiteWise considering several project phases, including the reme-dial investigation, remedial action construction, operations and mainte-nance, and long-term monitoring. Additionally, the Social Sustainability Evaluation Matrix (SSEM) tool was applied to the IRM project to evaluate the social impacts of both remedial alternatives.
6.2.3 METRICS
Estimates of material and labor needs, treatment time, volume of affected soil or groundwater to be treated (based on the surface area and depth of contamination in each AOC), and assumptions specific to certain treatments were made for each remedial alternative and input into SiteWise and SRT. Output from these models included estimates of project energy and water consumption, GHG emissions (CO2, N2O, NOX, SOX), and accident and injury risk to workers. The SiteWise and SRT user manuals present specific equations and conversion factors employed by the software to generate the reported estimates (AFCEE 2010; Bhargava and Sirabian 2011).
6.2.4 ASSESSMENT AND OUTCOME
Several treatment types were deemed inappropriate for the site conditions and contaminant chemistries and were excluded from extensive sustain-ability assessments. Several site-specific considerations narrowed the range of feasible remedies, including the following:
• The shallow water table (3 to 15 feet below the ground surface), the presence of numerous surface ponds, and extensive wetlands limited the use of technologies that were restricted for use in the vadose zone or those that required extensive dewatering of the soils.
• The widespread distribution of shallow subsurface contamination poses logistical difficulties for treating or removing large volumes of soil. In situ remediation alternatives are preferable to ex situ technologies.
• The presence of mixed contaminant types (heavy metals, PAHs, VOCs, SVOCs) requires a remediation alternative that can be applied to a variety of chemical compounds.
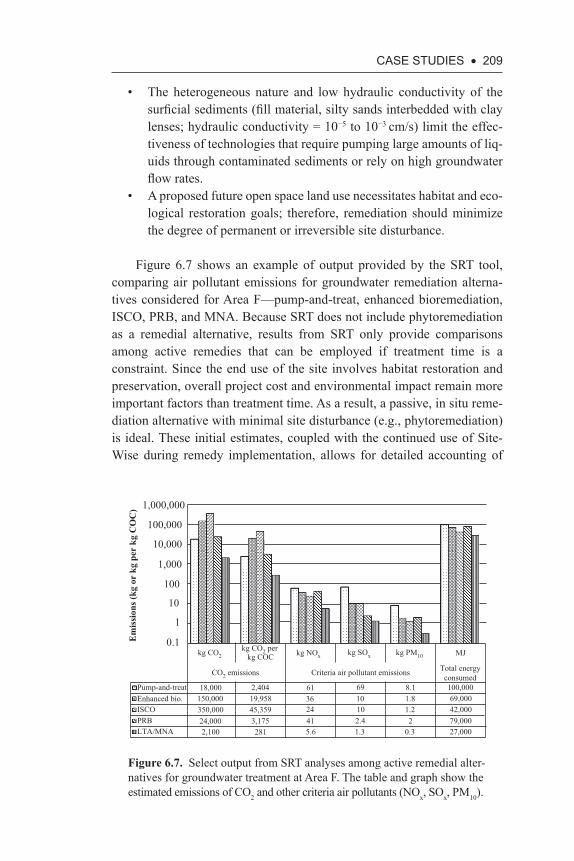
CASE StuDiES • 209
• The heterogeneous nature and low hydraulic conductivity of the surficial sediments (fill material, silty sands interbedded with clay lenses; hydraulic conductivity = 10−5 to 10−3 cm/s) limit the effec-tiveness of technologies that require pumping large amounts of liq-uids through contaminated sediments or rely on high groundwater flow rates.
• A proposed future open space land use necessitates habitat and eco-logical restoration goals; therefore, remediation should minimize the degree of permanent or irreversible site disturbance.
Figure 6.7 shows an example of output provided by the SRT tool, comparing air pollutant emissions for groundwater remediation alterna-tives considered for Area F—pump-and-treat, enhanced bioremediation, ISCO, PRB, and MNA. Because SRT does not include phytoremediation as a remedial alternative, results from SRT only provide comparisons among active remedies that can be employed if treatment time is a constraint. Since the end use of the site involves habitat restoration and preservation, overall project cost and environmental impact remain more important factors than treatment time. As a result, a passive, in situ reme-diation alternative with minimal site disturbance (e.g., phytoremediation) is ideal. These initial estimates, coupled with the continued use of Site-Wise during remedy implementation, allows for detailed accounting of
Em
issi
ons (
kg o
r kg
per
kg
CO
C)
kg CO2
CO2 emissions Criteria air pollutant emissions Total energyconsumed
Pump-and-treatEnhanced bio.ISCOPRBLTA/MNA 2,100
24,000350,000150,00018,000 2,404
19,95845,3593,175281
613624415.6
69
1010
2.41.3
8.11.81.22
0.3 27,00079,00042,00069,000
100,000
kg CO2 perkg COC kg NOx kg SOx kg PM10 MJ
0.1
1
10
100
1,000
10,000
100,000
1,000,000
Figure 6.7. Select output from SRT analyses among active remedial alter-natives for groundwater treatment at Area F. The table and graph show the estimated emissions of CO2 and other criteria air pollutants (NOx, SOx, PM10).
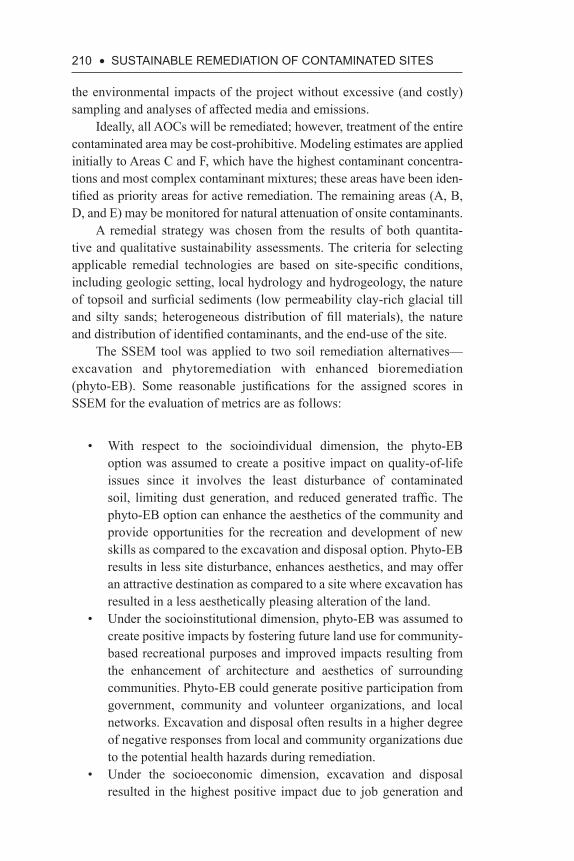
210 • SuStAiNABLE REMEDiAtiON Of CONtAMiNAtED SitES
the environmental impacts of the project without excessive (and costly) sampling and analyses of affected media and emissions.
Ideally, all AOCs will be remediated; however, treatment of the entire contaminated area may be cost-prohibitive. Modeling estimates are applied initially to Areas C and F, which have the highest contaminant concentra-tions and most complex contaminant mixtures; these areas have been iden-tified as priority areas for active remediation. The remaining areas (A, B, D, and E) may be monitored for natural attenuation of onsite contaminants.
A remedial strategy was chosen from the results of both quantita-tive and qualitative sustainability assessments. The criteria for selecting applicable remedial technologies are based on site-specific conditions, including geologic setting, local hydrology and hydrogeology, the nature of topsoil and surficial sediments (low permeability clay-rich glacial till and silty sands; heterogeneous distribution of fill materials), the nature and distribution of identified contaminants, and the end-use of the site.
The SSEM tool was applied to two soil remediation alternatives—excavation and phytoremediation with enhanced bioremediation (phyto-EB). Some reasonable justifications for the assigned scores in SSEM for the evaluation of metrics are as follows:
• With respect to the socioindividual dimension, the phyto-EB option was assumed to create a positive impact on quality-of-life issues since it involves the least disturbance of contaminated soil, limiting dust generation, and reduced generated traffic. The phyto-EB option can enhance the aesthetics of the community and provide opportunities for the recreation and development of new skills as compared to the excavation and disposal option. Phyto-EB results in less site disturbance, enhances aesthetics, and may offer an attractive destination as compared to a site where excavation has resulted in a less aesthetically pleasing alteration of the land.
• Under the socioinstitutional dimension, phyto-EB was assumed to create positive impacts by fostering future land use for community- based recreational purposes and improved impacts resulting from the enhancement of architecture and aesthetics of surrounding communities. Phyto-EB could generate positive participation from government, community and volunteer organizations, and local networks. Excavation and disposal often results in a higher degree of negative responses from local and community organizations due to the potential health hazards during remediation.
• Under the socioeconomic dimension, excavation and disposal resulted in the highest positive impact due to job generation and
CASE StuDiES • 211
employment potential, both directly (employment directly associ-ated with the remedial activity) and indirectly (enhanced economic activity in the community due to patronage of local businesses). Both impacts result in increased economic development of the surrounding community.
Under the socioenvironmental dimension, phyto-EB has higher posi-tive impacts due to a higher degree of protection to workers during reme-diation and postremediation activity. Phyto-EB is an in situ technology that avoids future impacts from emissions and roadway wear generated by large trucking loads during excavation and disposal; phyto-EB exhibits a greater degree of greenness. However, the downside is that the plants require a minimum of five growing seasons to effectively remediate the contaminant levels, while excavation and disposal is a much quicker alternative.
Results of the social sustainability assessment are shown in Figure 6.8. Overall, SSEM results indicate that the phyto-EB remedial option has the highest positive impact on the surrounding community as compared to the excavation and disposal option. It is also evident that if no remedial action were taken, there would be a negative impact on the surrounding commu-nity and is considered to be the worst-case scenario.
6.2.5 REMEDIATION ALTERNATIVE SELECTION
The recommended strategy for remediation of IRM consists of the phyto-EB option. This alternative will act to stimulate existing soil
–40–36–32–28–24–20–16–12–8–4
048
12162024283236404448
No remedy
Phyto-EB
Excavate and dispose
Social
Socio-
institu
tiona
l
Socio-
econo
mic
Socio-
envir
onmen
tal
Grand s
core
Figure 6.8. SSEM results for IRM site.
212 • SuStAiNABLE REMEDiAtiON Of CONtAMiNAtED SitES
microorganisms to enhance the degradation of organic contaminants at all identified AOCs. Native tree species with high growth and transpira-tion rates, deep rooting depths, and the ability to accumulate and seques-ter contaminants of concern will be employed. Trees will be planted in stands and spaced approximately 10 feet apart to achieve maximum growth density and remedial efficiency. In areas with both groundwa-ter and soil contamination (B, C, E, and F), approximately 50 percent of the trees will be placed in lined trenches to encourage root growth toward the contaminated aquifer. The liners will be modeled after the proprietary ANS TTTS® TreeWell system used successfully at Argonne National Laboratory with the same tree species (willows, cottonwoods, and poplars). This technique also allows for greater tree densities in the stands, as root systems will not grow as wide, reducing the lateral extent of each tree in the root zone.
All treated areas will receive soil amendments in the form of organic compost and an initial application of balanced NPK (10-10-10) fertilizer to stimulate new root growth. Oxygen reactive compounds (ORCs) will be mixed into tilled soils during planting. This form of oxygen additive is preferred over direct oxygen injection because it is less energy-intensive, less costly, does not require the installation of injection wells, and releases oxygen in the soil over time rather than in pulses, improving the long-term performance of the plants. One drawback of ORCs is the potential to raise the local soil pH, which will be counteracted by the addition of acidifying soil amendments (e.g., granular S, gypsum or Al2(SO4)3, leaf litter) (Rentz et al. 2003). The addition of oxygen to the soil is intended to stimulate microbial activity in the rhizosphere, enhancing rhizodegrada-tion processes associated with the plants as well as microbial degradation processes that occur in natural soils when sufficient nutrients and oxygen are available (Rentz et al. 2003). Regular applications (two to three times per growing season) of organic compost will provide ample nutrients for biostimulation processes and maintain overall soil quality and pH.
A vegetative cover of grasses (Lotus corniculatus) and legumes (Lolium perenne and Phalaris arundinacea) will be put in place in between treated areas to help stabilize soils, maximize total water use, minimize erosion, and keep shallow soils dry to promote deeper rooting depths of the phreatophytic trees (ITRC 2009; U.S. EPA 2003). The vege-tative cover also serves to reduce the flow of contaminated surface waters to the nearby Calumet River or other offsite waterways by increasing infiltration into shallow soils. This will also serve to minimize the pro-duction of leachate as precipitation flows through contaminated soils and groundwater. Additionally, the grasses and legumes will help remediate
CASE StuDiES • 213
contaminants in shallow subsurface soils that have less contact with the deeper root systems of the willows, poplars, and cottonwoods.
To minimize cross-contamination of surface waters with contami-nated sediments and soils, a riparian buffer zone (5 to 10 feet in width) will be installed around surface water reservoirs in close proximity to AOCs. The riparian buffer will slow water transport between surface and groundwater, limiting erosion of surficial sediments and helping to con-tain existing contamination within the site boundaries. The buffer zone will consist of cattails, small duckweed, and common reed already present onsite; additional plants will be added in areas that lack sufficient native vegetation to serve this purpose.
The remedial progress of each AOC will need to be evaluated after every five years, the approximate length of one growth cycle for the selected trees. This cycle refers to the four to six years that the trees require to grow from saplings to mature trees, at which point growth rates and phytoremediation efficiency decrease. At the end of each cycle, mature trees will be replaced in order for new saplings to be planted. It is projected that a minimum of three growing cycles (up to 15 years) will be required to reduce the contamination levels to an acceptable amount (ITRC 2009). Areas with higher contaminant concentrations (i.e., Areas C and F) will require more growth cycles than areas that have lower levels of contamination, which may be remediated within the first growth cycle. The number of cycles needed at each AOC will be determined as remedial progress is monitored and overall uptake and degradation rates can be quantified at the site.
Another major source of GHG emissions in phytoremediation is till-ing of the land prior to planting tree stands. The use of ORCs can reduce the depth and frequency of tilling required for sufficient soil aeration, though some tilling will be required initially to incorporate the ORCs with the soil. Proper management of the phytoremediation application will require regular monitoring of plant health to assess the need for additional soil amendments. This will ensure that only the necessary amount of fer-tilizer is applied to ensure ready plant growth.
6.2.6 CONCLUSIONS
Based on the site conditions and history of widespread, low-level con-tamination on- and off-site, a passive remedial strategy with minimal site disturbance is recommended. Due to the mixed contaminant chemistries present, shallow water table and heterogeneous subsurface hydrology,
214 • SuStAiNABLE REMEDiAtiON Of CONtAMiNAtED SitES
other remedial technologies were disqualified as appropriate treatments for all contaminants of concern at IRM. In terms of compatibility with future site use and sustainability metrics, phytoremediation coupled with enhanced bioremediation is the ideal technology for the remediation of IRM. This technology is in line with future site use goals as part of the Calumet Open Space Reserve (COSR) that includes the preservation of wetland habitats; improvement of existing habitat, which will be addressed as overall soil quality and vegetative health is improved over the course of treatment; and creation of new habitats, which can be incorporated into planting schemes after high levels of contamination are reduced in the early cycles of tree growth and replacement. It is recommended that an initial survey of existing vegetation on-site be conducted to determine applicability to phytoremediation processes. Further sampling of affected media in under-represented areas will be necessary to better constrain the spatial extent of areas of high-level contamination. This will allow the proposed design to be tailored to current conditions and optimized to utilize existing vegetation with minimal site disturbance. Further benefits from this remedial alternative extend from educational and public out-reach opportunities that can be incorporated into the remediation and hab-itat rehabilitation process. Information on native vegetation and wildlife at IRM can be disseminated throughout community bulletins and through posted signs onsite that inform the public of ongoing remedial activities and what steps are being taken to ensure that sensitive habitats are being protected. This will improve public acceptance of the remedial activities at IRM and garner support for habitat restoration goals and improvement of degraded sites and wetlands throughout the Calumet region.
6.3 CASE StuDY 3: fORMER MAttHiESSEN AND HEgELER ZiNC fACiLitY
6.3.1 PROJECT BACKGROUND
The Matthiessen and Hegeler Zinc facility, located in LaSalle, Illinois, was originally used for zinc smelting operations, which began in 1907. In addition to zinc smelting, the site was mined for coal; and zinc sheet and sulfuric acid were produced and cadmium was processed. In 1954, Hegeler dissolved and the site was then used for filling containers with insecticides, shaving products, and other materials by Peterson Filing and Packaging. In 1956, the Illinois Fireworks Company purchased the remainder of the land from National Distillers, the sole stockholder
CASE StuDiES • 215
of the land, for the purpose of manufacturing fireworks. A recent part-owner, Millennium Petrochemicals (formerly known as National Dis-tillers), filed for bankruptcy in 2009. Geographically, the approximately 100-acre site is located west of the village of Hegeler. The area is rural and bordered by farmland. A residential community is located less than 0.25 miles to the east of the site. Another residential area is located approximately 0.5 miles to the northeast in Tilton, Illinois. The site is directly bordered by agricultural land on the north, west, and south. Four separate impoundments are located on the site. Additionally, a large slag pile occupies 5.9 acres on the western portion of the site. The pile reaches 53 feet above grade. The slag is a result of smelting operations and con-tains unburned residues and metals such as lead, arsenic, cadmium, and zinc, as well as wood, brick, and concrete debris from buildings that were previously on-site.
The surface geology of Vermilion County is composed mainly of Wisconsin-aged glacial drift deposits, which consist of clay-rich till, with some deposits of sand and gravel. The uppermost layer consists of a fill with a typical thickness between one to three feet. The fill is composed mainly of slag. The first aquifer in the region is shallow and unconfined, between one and six feet. The surficial hydrogeology at the site consists of a silty, sandy, and gravely clay till.
The Illinois EPA and Weston Solutions collected on-site soil, slag, sed-iment, and groundwater samples during investigations conducted between 2000 and 2006. Samples were taken on-site as well as the neighboring residential area. Residential soil sample tests found that lead, arsenic, and copper concentrations were greater than levels established within Illinois EPA TACO regulations for protection of residential exposure. Residen-tial soils were above regulatory limits; however, the concentrations were not as high as the on-site soils. Soil and waste samples collected on-site were compared to TACO regulatory limits for industrial and commercial properties. This analysis strictly focused on remediating the site soils. The majority of screening level exceedances were due to elevated arsenic, cadmium, lead, and zinc concentrations, with the highest metal concen-trations in the north-central portions of the site as well as within the slag pile. The general extent of metals contamination in site soils extends to the site’s boundaries. PAHs were detected in site soils above screening levels. The areas of PAH contamination appear to coincide with areas of elevated metals, which are the main contaminants and are associated with the slag. The underlying clay soil exhibited significantly lower concentrations of metals, indicating that the majority of the elevated metal concentrations are concentrated within the fill material.
216 • SuStAiNABLE REMEDiAtiON Of CONtAMiNAtED SitES
To prevent trespassers from coming into contact with the contami-nated soil and waste material, the Illinois EPA installed a six-foot-high chain link fence around the site. In 2005, the site was officially added to the NPL due to the risk potential of human contact with the site contami-nation levels.
6.3.2 FRAMEWORK
The focus of this study and analysis is specifically contaminated on-site soils. It is assumed that the slag pile, surface water, and contaminated groundwater will be treated separately. A significant challenge with reme-diating the site is its large contaminated surface area. SimaPro software has been used to evaluate the life-cycle impact of two common methods of treatment for environmental impact: landfilling (excavation and hauling) and in situ treatment by solidification and stabilization.
The SimaPro software was used to assess the life cycle of the reme-diation alternatives for environmental impacts. While this may include all portions of the life cycle, from raw material extraction through mate-rial processing, manufacture, distribution, use, repair and maintenance, and disposal or recycling, a more limited approach was used. The system boundary is discussed in the next section.
Beyond human health and environmental impacts, economic and social impacts also contribute to the decision to use one method over another. From a social perspective, it is important to consider the nearby communities and the impact attributed to disruptive truck traffic and the resulting emissions. The SSEM tool described in the previous case study has also been applied here to assess socioinstitutional, socioeconomic, and socioenvironmental factors.
6.3.3 METRICS
Prior to performing a life-cycle assessment (LCA) on the two treatment methods, it is important to set the system boundaries. For instance, while excavation and hauling requires the use of excavators and haul trucks, this analysis will not trace all of the inputs and outputs associated with pro-ducing the equipment needed to perform the construction. This analysis will not include mobilization and demobilization of equipment to the site. Additionally, it will not include impacts associated with constructing the landfill that the contaminated waste would be disposed in. This analysis will trace the following inputs and outputs.
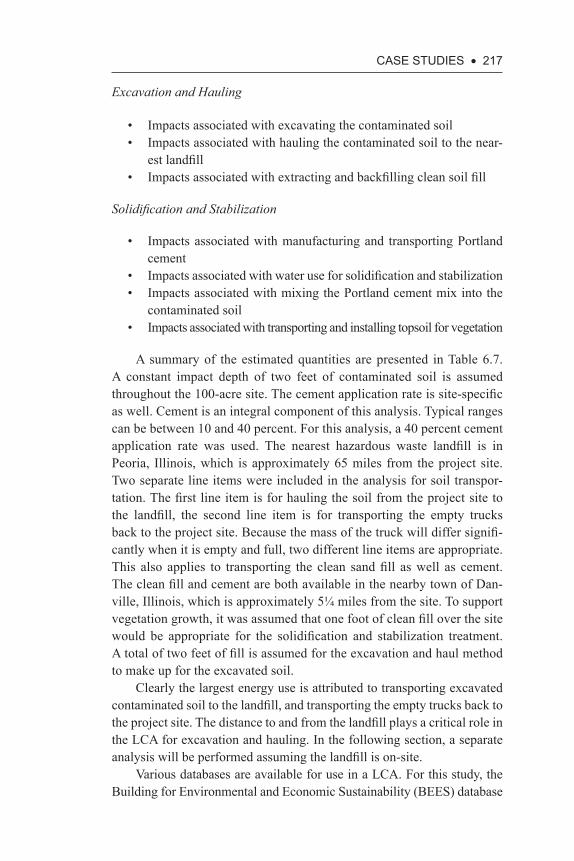
CASE StuDiES • 217
Excavation and Hauling
• Impacts associated with excavating the contaminated soil• Impacts associated with hauling the contaminated soil to the near-
est landfill• Impacts associated with extracting and backfilling clean soil fill
Solidification and Stabilization
• Impacts associated with manufacturing and transporting Portland cement
• Impacts associated with water use for solidification and stabilization• Impacts associated with mixing the Portland cement mix into the
contaminated soil• Impacts associated with transporting and installing topsoil for vegetation
A summary of the estimated quantities are presented in Table 6.7. A constant impact depth of two feet of contaminated soil is assumed throughout the 100-acre site. The cement application rate is site- specific as well. Cement is an integral component of this analysis. Typical ranges can be between 10 and 40 percent. For this analysis, a 40 percent cement application rate was used. The nearest hazardous waste landfill is in Peoria, Illinois, which is approximately 65 miles from the project site. Two separate line items were included in the analysis for soil transpor-tation. The first line item is for hauling the soil from the project site to the landfill, the second line item is for transporting the empty trucks back to the project site. Because the mass of the truck will differ signifi-cantly when it is empty and full, two different line items are appropriate. This also applies to transporting the clean sand fill as well as cement. The clean fill and cement are both available in the nearby town of Dan-ville, Illinois, which is approximately 5¼ miles from the site. To support vegetation growth, it was assumed that one foot of clean fill over the site would be appropriate for the solidification and stabilization treatment. A total of two feet of fill is assumed for the excavation and haul method to make up for the excavated soil.
Clearly the largest energy use is attributed to transporting excavated contaminated soil to the landfill, and transporting the empty trucks back to the project site. The distance to and from the landfill plays a critical role in the LCA for excavation and hauling. In the following section, a separate analysis will be performed assuming the landfill is on-site.
Various databases are available for use in a LCA. For this study, the Building for Environmental and Economic Sustainability (BEES) database
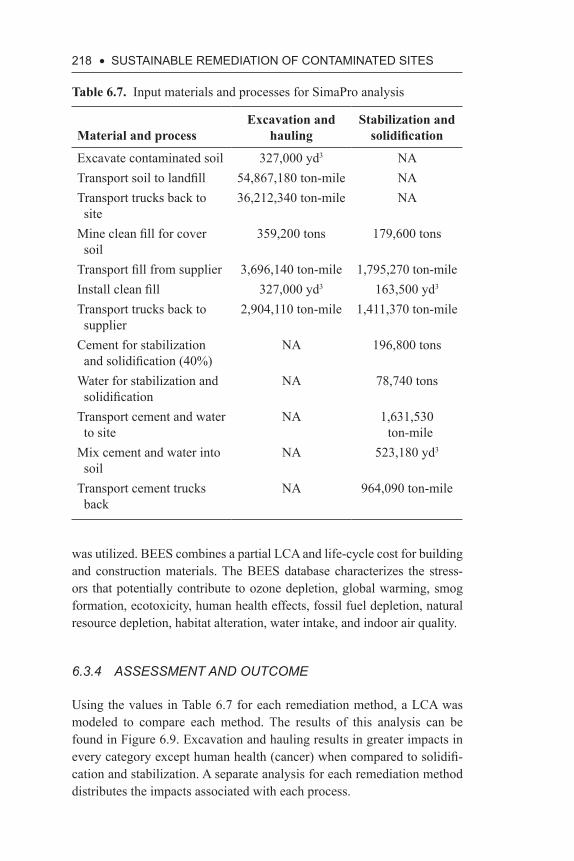
218 • SuStAiNABLE REMEDiAtiON Of CONtAMiNAtED SitES
was utilized. BEES combines a partial LCA and life-cycle cost for building and construction materials. The BEES database characterizes the stress-ors that potentially contribute to ozone depletion, global warming, smog formation, ecotoxicity, human health effects, fossil fuel depletion, natural resource depletion, habitat alteration, water intake, and indoor air quality.
6.3.4 ASSESSMENT AND OUTCOME
Using the values in Table 6.7 for each remediation method, a LCA was modeled to compare each method. The results of this analysis can be found in Figure 6.9. Excavation and hauling results in greater impacts in every category except human health (cancer) when compared to solidifi-cation and stabilization. A separate analysis for each remediation method distributes the impacts associated with each process.
Table 6.7. Input materials and processes for SimaPro analysis
Material and processExcavation and
haulingStabilization and
solidification
Excavate contaminated soil 327,000 yd3 NATransport soil to landfill 54,867,180 ton-mile NATransport trucks back to site
36,212,340 ton-mile NA
Mine clean fill for cover soil
359,200 tons 179,600 tons
Transport fill from supplier 3,696,140 ton-mile 1,795,270 ton-mileInstall clean fill 327,000 yd3 163,500 yd3
Transport trucks back to supplier
2,904,110 ton-mile 1,411,370 ton-mile
Cement for stabilization and solidification (40%)
NA 196,800 tons
Water for stabilization and solidification
NA 78,740 tons
Transport cement and water to site
NA 1,631,530 ton-mile
Mix cement and water into soil
NA 523,180 yd3
Transport cement trucks back
NA 964,090 ton-mile
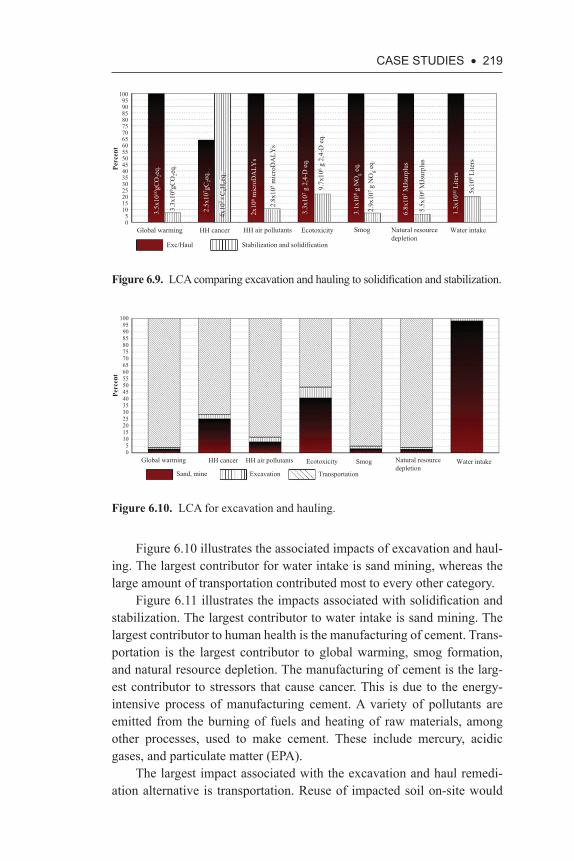
CASE StuDiES • 219
Figure 6.10 illustrates the associated impacts of excavation and haul-ing. The largest contributor for water intake is sand mining, whereas the large amount of transportation contributed most to every other category.
Figure 6.11 illustrates the impacts associated with solidification and stabilization. The largest contributor to water intake is sand mining. The largest contributor to human health is the manufacturing of cement. Trans-portation is the largest contributor to global warming, smog formation, and natural resource depletion. The manufacturing of cement is the larg-est contributor to stressors that cause cancer. This is due to the energy- intensive process of manufacturing cement. A variety of pollutants are emitted from the burning of fuels and heating of raw materials, among other processes, used to make cement. These include mercury, acidic gases, and particulate matter (EPA).
The largest impact associated with the excavation and haul remedi-ation alternative is transportation. Reuse of impacted soil on-site would
10095908580757065605550454035302520151050
Global warming
3.5x
1010
gCO
2eq.
2.5x
107 g
C2e
q.
2x10
6 mic
roD
ALY
s
3.3x
107 g
2,4
-D e
q.
3.1x
108 g
NO
g eq.
6.8x
107 M
Jsur
plus
1.3x
1010
Lite
rs
3.3x
109 g
CO
2eq.
4x10
7 g
C6H
6eq.
2.8x
105 m
icro
DA
LYs
9.7x
106 g
2,4
-D e
q.
2.9x
107 g
NO
g eq.
5.5x
106 M
Jsur
plus
5x10
9 Lite
rs
HH cancer HH air pollutants Ecotoxicity Smog Natural resourcedepletion
Water intake
Exc/Haul Stabilization and solidification
Percent
Figure 6.9. LCA comparing excavation and hauling to solidification and stabilization.
Figure 6.10. LCA for excavation and hauling.
10095908580757065605550454035302520151050
Global warming
Sand, mine Excavation Transportation
HH cancer HH air pollutants Ecotoxicity Smog Natural resourcedepletion
Water intake
Perc
ent
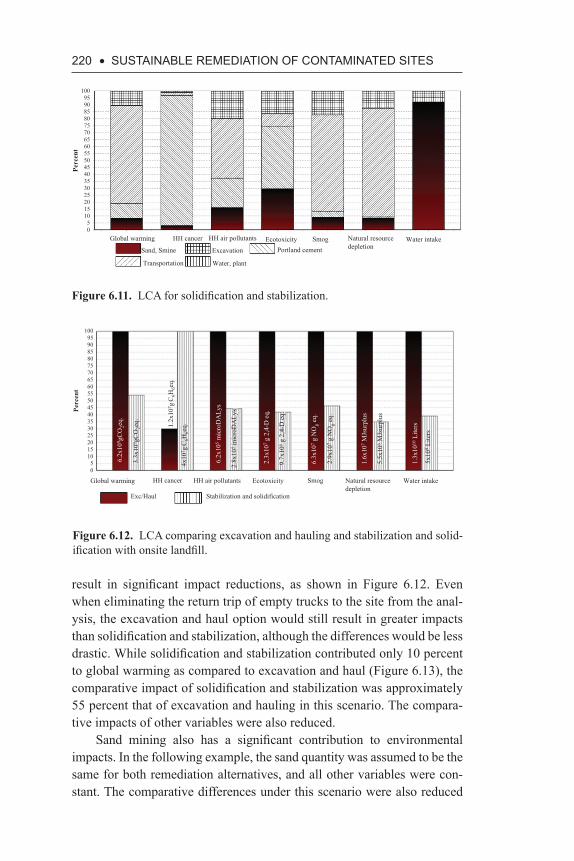
220 • SuStAiNABLE REMEDiAtiON Of CONtAMiNAtED SitES
result in significant impact reductions, as shown in Figure 6.12. Even when eliminating the return trip of empty trucks to the site from the anal-ysis, the excavation and haul option would still result in greater impacts than solidification and stabilization, although the differences would be less drastic. While solidification and stabilization contributed only 10 percent to global warming as compared to excavation and haul (Figure 6.13), the comparative impact of solidification and stabilization was approximately 55 percent that of excavation and hauling in this scenario. The compara-tive impacts of other variables were also reduced.
Sand mining also has a significant contribution to environmental impacts. In the following example, the sand quantity was assumed to be the same for both remediation alternatives, and all other variables were con-stant. The comparative differences under this scenario were also reduced
Figure 6.11. LCA for solidification and stabilization.
Global warming
Sand, Smine Excavation
Transportation Water, plant
Portland cement
HH cancer HH air pollutants Ecotoxicity Smog Natural resourcedepletion
Water intake
10095908580757065605550454035302520151050
Perc
ent
Figure 6.12. LCA comparing excavation and hauling and stabilization and solid-ification with onsite landfill.
10095908580757065605550454035302520151050
Global warming
6.2x
109 g
CO
2eq.
6.2x
105 m
icro
DA
Lys
2.3x
107 g
2,4
-D e
q.
6.3x
107 g
NO
g eq.
1.6x
107 M
Jsur
plus
1.3x
1010
Lite
rs
3.3x
109 g
CO
2eq. 1.2x
107 g
C6H
6eq.
4x10
7 g C
6H6e
q.
2.8x
105 m
icro
DA
Lys
9.7x
106 g
2,4
-D e
q.
2.9x
107 g
NO
g eq.
5.5x
106 M
Jsur
plus
5x10
9 Lite
rs
HH cancer HH air pollutants Ecotoxicity Smog Natural resourcedepletion
Water intake
Exc/Haul
Perc
ent
Stabilization and solidification
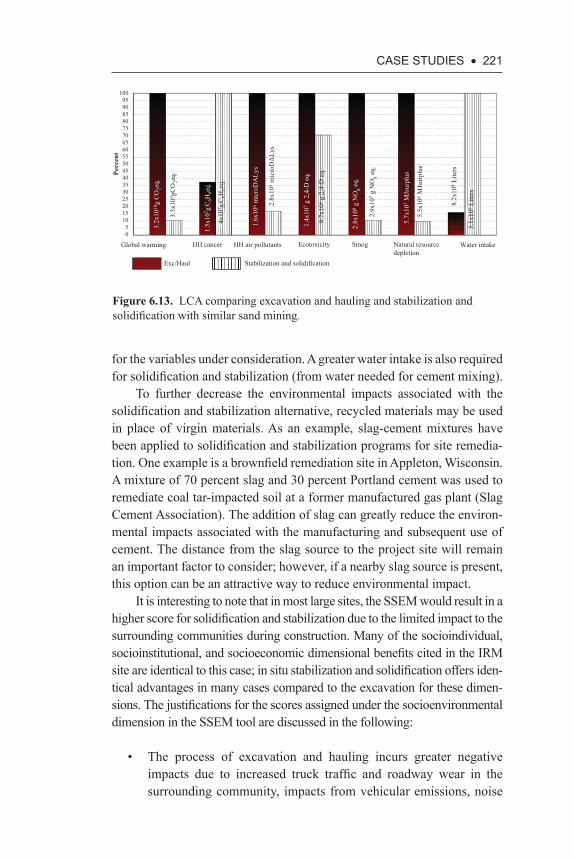
CASE StuDiES • 221
for the variables under consideration. A greater water intake is also required for solidification and stabilization (from water needed for cement mixing).
To further decrease the environmental impacts associated with the solidification and stabilization alternative, recycled materials may be used in place of virgin materials. As an example, slag-cement mixtures have been applied to solidification and stabilization programs for site remedia-tion. One example is a brownfield remediation site in Appleton, Wisconsin. A mixture of 70 percent slag and 30 percent Portland cement was used to remediate coal tar-impacted soil at a former manufactured gas plant (Slag Cement Association). The addition of slag can greatly reduce the environ-mental impacts associated with the manufacturing and subsequent use of cement. The distance from the slag source to the project site will remain an important factor to consider; however, if a nearby slag source is present, this option can be an attractive way to reduce environmental impact.
It is interesting to note that in most large sites, the SSEM would result in a higher score for solidification and stabilization due to the limited impact to the surrounding communities during construction. Many of the socioindividual, socioinstitutional, and socioeconomic dimensional benefits cited in the IRM site are identical to this case; in situ stabilization and solidification offers iden-tical advantages in many cases compared to the excavation for these dimen-sions. The justifications for the scores assigned under the socioenvironmental dimension in the SSEM tool are discussed in the following:
• The process of excavation and hauling incurs greater negative impacts due to increased truck traffic and roadway wear in the surrounding community, impacts from vehicular emissions, noise
Figure 6.13. LCA comparing excavation and hauling and stabilization and solidification with similar sand mining.
10095908580757065605550454035302520151050
Global warming
3.2x
1010
g C
O2e
q.
1.6x
106 m
icro
DA
Lys
1.4x
107 g
2,4
-D e
q.
2.8x
108 g
NO
g eq.
5.7x
107 M
Jsur
plus
8.2x
108 L
iters
3.3x
109 g
CO
2eq.
1.5x
107 g
C6H
6eq.
4x10
7 g C
6H6e
q.
2.8x
105 m
icro
DA
Lys
9.7x
106 g
2,4
-D e
q.
2.9x
107 g
NO
g eq.
5.5x
106 M
Jsur
plus
5.1x
109 L
iters
HH cancer HH air pollutants Ecotoxicity Smog Natural resourcedepletion
Water intake
Exc/Haul
Perc
ent
Stabilization and solidification
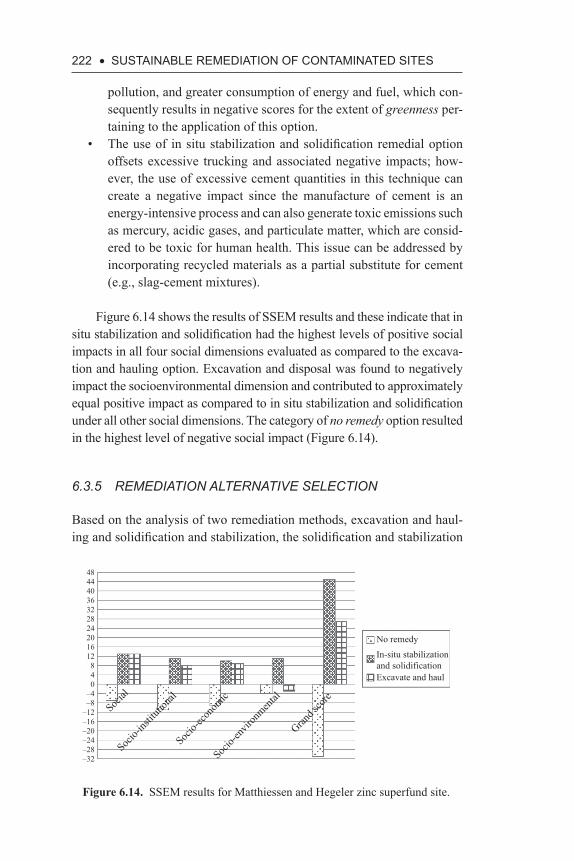
222 • SuStAiNABLE REMEDiAtiON Of CONtAMiNAtED SitES
pollution, and greater consumption of energy and fuel, which con-sequently results in negative scores for the extent of greenness per-taining to the application of this option.
• The use of in situ stabilization and solidification remedial option offsets excessive trucking and associated negative impacts; how-ever, the use of excessive cement quantities in this technique can create a negative impact since the manufacture of cement is an energy-intensive process and can also generate toxic emissions such as mercury, acidic gases, and particulate matter, which are consid-ered to be toxic for human health. This issue can be addressed by incorporating recycled materials as a partial substitute for cement (e.g., slag-cement mixtures).
Figure 6.14 shows the results of SSEM results and these indicate that in situ stabilization and solidification had the highest levels of positive social impacts in all four social dimensions evaluated as compared to the excava-tion and hauling option. Excavation and disposal was found to negatively impact the socioenvironmental dimension and contributed to approximately equal positive impact as compared to in situ stabilization and solidification under all other social dimensions. The category of no remedy option resulted in the highest level of negative social impact (Figure 6.14).
6.3.5 REMEDIATION ALTERNATIVE SELECTION
Based on the analysis of two remediation methods, excavation and haul-ing and solidification and stabilization, the solidification and stabilization
–32–28–24–20–16–12–8–4
048
12162024283236404448
No remedyIn-situ stabilization and solidificationExcavate and haul
Social
Socio-
institu
tiona
l
Socio-
econo
mic
Socio-
envir
onmen
tal
Grand s
core
Figure 6.14. SSEM results for Matthiessen and Hegeler zinc superfund site.
CASE StuDiES • 223
method was selected as the superior alternative with respect to sustainabil-ity. Largely due to the energy required to transport contaminated waste to a landfill, and also in part to additional clean fill material that would be needed, the excavation and haul option resulted in more environmental impact compared to solidification and stabilization. Excavation and haul did better with respect to potential stressors for cancer-causing agents to human health, largely due to the toxins emitted from the manufacturing of cement.
Several assumptions were used for this particular analysis. Decreas-ing the distance required to haul waste for instance would yield a lower environmental impact caused by excavation and hauling. At the same time, decreasing the cement application rate or using recycled materials would decrease the environmental impacts associated with solidification and sta-bilization. Social and economic impacts should be evaluated as well. In this scenario, the large costs and disturbances associated with excavation and hauling would favor solidification and stabilization
6.3.6 CONCLUSIONS
In this application, SimaPro software was used to evaluate the environ-mental and human health impacts attributed from two possible remediation methods for the Matthiessen and Hegeler zinc smelting site. The site has a long history of production and mining that resulted in large concentrations of heavy metal contamination. In this example, two remediation methods were evaluated using a life-cycle analysis—excavation and hauling, and solidification and stabilization. Solidification and stabilization was identi-fied as a better alternative with respect to sustainability metrics primarily due to energy requirements associated with transport and disposal as well as the transport and placement of clean fill needed to re-establish grades. The excavation option scored better when considering potential stressors of cancer-causing agents to human health, largely due to the toxins emit-ted from the manufacturing of cement. Ultimately, this analysis indicated that given the large costs and disturbances associated with excavation and hauling, the solidification and stabilization is the more attractive remedi-ation option.
6.4 SuMMARY
Three field applications are presented to document the approach followed to select sustainable remediation technology. Specifically, the sustainability

224 • SuStAiNABLE REMEDiAtiON Of CONtAMiNAtED SitES
framework, metrics, and tools used for these applications are presented. Of course, some aspects such as social sustainability are not yet fully developed and are subjective. Many field applications and case studies are being published and in a few years, we should have a number of such studies that can help identify the most applicable and useful approaches in selecting the sustainable remediation for given site-specific conditions.
CHAPtER 7
chALLenges And opportunities
7.1 iNtRODuCtiON
This book has presented a wide range of topics regarding sustainable approaches to environmental remediation. Several challenges associ-ated with the incorporation of sustainability principles to environmental remediation are presented in this chapter. These challenges are focused primarily on a lack of understanding of stakeholders, including project proponents, practitioners, and the general public of the importance of sustainability-based measures with respect to environmental remediation. It is believed that the challenges that exist may be overcome with thought-ful work and contributions from industry, academia, and governmental bodies. With this work, an understanding of these important concepts will surely spark greater interest and implementation.
Because of its innovative nature, its multidisciplinary effects and con-cepts, and the wide range of stakeholders that are affected, sustainable remediation represents an exciting area of focus for those in the regu-latory realm, among practitioners, and those in academia. With the aim of achieving remedial goals through more efficient, sustainable strategies that conserve resources and protect air, water, and soil quality through reduced emissions and other waste burdens, and with an emphasis on con-ducting such activities in a cost-effective and socially acceptable manner, sustainable remediation offers those with a wide range of perspectives, skills, and experience to participate actively. The continued development of sustainable remediation frameworks, metrics, and assessment tools, including many presented in this book, will further positive benefits to the environment, society, and economy.
226 • SuStAiNABLE REMEDiAtiON Of CONtAMiNAtED SitES
7.2 tHE BACKLASH Of “gREENWASHiNg”
As specifically applied to remediation, greenwashing refers to situa-tions where sustainable remediation options have not been evaluated and backup documentation is lacking but claims exist that sustainable remedi-ation approaches have been implemented. Greenwashing in a larger sense is commonly associated with a wide range of approaches, from consumer product marketing to legislative initiatives in which suspect green or sus-tainable claims are made. These claims may be misleading or outright false. Specific to the remediation industry, greenwashing is frequently encountered in the marketing of a single, specific remediation technology as greener than other remedy options.
Greenwashing claims often serve to erode the confidence of the gen-eral public or make the public loath to believe or trust claims of any green or environmentally focused virtue, whether true or false. Similar to gre-enwashing, misuse of the terms sustainable or sustainability may hamper the integration and acceptance of sustainable remediation concepts into the environmental industry.
In the future, the potential for greenwashing may be lessened through the development of certification processes modeled after existing pro-cesses and systems such as the U.S. Green Building Council’s (U.S. GBC) Leadership in Energy and Environmental Design (LEED) certification process (U.S. GBC 2011) or the Institute for Sustainable Infrastructure’s (ISI) Envision™ rating system. The sustainable remediation concept is likely to gain acceptance, use, and credibility through the development of such a certification.
7.3 LACK Of fiNANCiAL iNCENtiVES Of SuStAiNABLE REMEDiAtiON
While there is growing general interest in sustainability concepts, there may be resistance in incorporating a greater degree of sustainability among select potential stakeholders. In many cases, it is associated with cost and timing considerations. With limited exceptions, few financial incentives exist for stakeholders (especially project proponents) to incor-porate sustainability principles. As an example, outside of the realm of remediation, there has been a growing general interest in LEED accred-itation with respect to building design and construction. However, the interest in the overall goals in LEED and the specific measures that may be employed have not been universally adopted or pursed. Higher levels
CHALLENgES AND OPPORtuNitiES • 227
of LEED accreditation are often pursued and achieved in the design of public or government buildings. A perception exists among many taxpay-ing citizens that only publicly funded projects are capable of absorbing the additional cost burden associated with incorporating such measures. Defenders will counter that many design features implemented to achieve LEED status result in reduced operational costs that are easily recoverable during the design life of the structure. Critics will further counter that the hold period of many for-profit structures does not provide an adequate time horizon for the original owner to recognize the operational cost sav-ings to justify their use. Further, the general consumer, while valuing gen-eral sustainable principles, may not stay true to their beliefs with high-cost purchases or investments like a house when lower-cost alternatives that do not try to achieve a degree of sustainability through design and construc-tion are available in the marketplace.
Adoption of sustainable remediation concepts can face the same resis-tance. In many locales, project entitlement and approvals can be lengthy, such that when the time comes for a developer to implement a remediation project, timing can often be the major driver in selecting a remediation alternative. This is often the case even if a more sustainable remediation alternative is available for a lower cost. In the absence of the right incen-tives, project proponents will often select based on remediation dura-tion or cost while accepting the detrimental effects to the environment. A simple solution to a redevelopment green and sustainable remediation (GSR) challenge such as this is the incorporation of GSR evaluations or approaches in the credit and application process for redevelopment grant funders. Local redevelopment authorities have the opportunity to incorpo-rate GSR processes into their grant applications and give credit to those projects willing to evaluate and implement the GSR aspects of remedia-tion on redevelopment sites.
A powerful means to overcome this decision-making inertia is through the use of financial incentives that may be available to a project proponent to use if a remediation alternative is selected based on their strong per-formance with respect to sustainability metrics. One framework may be through the use of tax-related deductions, credits, or incentives related to environmental or social dimension-related benefits. Another potential framework could be based on the former U.S. Environmental Protection Agency (U.S. EPA) Brownfields Tax incentive program that expired in December 2011. With the program, certain remediation activities asso-ciated with brownfield redevelopment could be expensed in the year that remediation activities occurred as opposed to the standard tax treatment of capitalizing the remediation-related costs. By allowing these costs to be
228 • SuStAiNABLE REMEDiAtiON Of CONtAMiNAtED SitES
treated as expenses, project proponents were able to significantly reduce their tax burden in the year in which they were applied to the proponent’s financial statements. Although it is unfortunate that the U.S. government allowed such a valuable financial incentive to expire, a similar framework could be revived that would allow for sustainability-related actions to have a favorable tax effect.
An additional and poignant opportunity for overcoming the challenge of incentivizing sustainable remediation practices lies in the authority of the reimbursement funds common to many state petroleum cleanup programs. These reimbursement fund organizations hold the ability to incorporate the reimbursement of expenses related to sustainable reme-diation work into their allowable and reimbursable expenses. Often the reimbursement fund organizations may be capable of reaching across the aisle to their constituency to assist in achieving corporate sustainability objectives and at the same time provide financial assurance to the reme-diation practitioner that the effort put forth in a sustainable remediation evaluation and implementation would be eligible for reimbursement. This type of financial incentive displaces the presumed up-front cost apprehen-sion and perception. At the same time, this authority would negate the pol-icy change necessity within regulatory bodies for sustainable remediation requirements.
7.4 LACK Of A REguLAtORY MANDAtE
In contrast to many for-profit project proponents, many local, state, and federal agencies are quite enthusiastic and receptive regarding the incorpo-ration of sustainability-based principles into site remediation. First, social-based dimensions are heavily emphasized in many government-sponsored projects. Often this takes the form of hiring goals for disadvantaged business enterprises (DBEs) for direct and indirect project roles. Second, federally funded projects that require the preparation of environmental impact statement (EIS) reports must analyze a given project’s effects on the social and economic dimension. Further, as demonstrated throughout this book, several state and federal regulatory agencies have developed sustainability tools, databases, and frameworks to be used to assess var-ious sustainability metrics and dimensions associated with remediation projects. These efforts offer clear evidence regarding a growing interest and emphasis in sustainability principles among these agencies.
While these agencies encourage sustainability-focused activities and efforts, no clear mechanism requiring the incorporation of such measures
CHALLENgES AND OPPORtuNitiES • 229
exists as applied to many remediation projects. Incorporation of best man-agement practices (BMPs) and other activities that enhance the dimen-sions of sustainability in many cases are optional. With many agencies, the use of such measures may be encouraged, but in many cases these activities are not required.
One consideration to encourage sustainability-focused practices would be through regulatory requirements or mandates. Of course, such efforts would be viewed as controversial and would meet resistance among many potential project stakeholders; however, governmental regulatory activity is present in many aspects of environmental protection. Regulatory agen-cies oversee the operation of landfill facilities and are intimately involved in the protection of air, land, and water quality. Because the remediation of contaminated properties will invariably have side effects on all these physical media, and in many cases add to the waste stream that eventually affects wastewater and landfill loading, it is appropriate for these govern-mental agencies to have a say in how remediation and the related waste generation may affect these resources and associated facilities.
7.5 LACK Of PuBLiC AWARENESS
Government mandates requiring specific actions associated with any type of activity or behavior are by their very nature controversial. In a free society, such mandates are almost assuredly met with pushback or protest solely on the basis of governmental requirement. However, in a free soci-ety, the government is vested with power from and wields power on behalf of the citizenry. Stated another way, if a particular ideal is the will of the people, it will be encouraged by government.
Despite the virtues of government-based incentives or mandates (the proverbial carrot or stick) that would encourage the application of sustainability-focused activities or practices for site remediation, the gov-ernment will not act in such a manner if it is not the will of the public. In many ways, the general public is as aware as ever of environmental issues. These issues may be on a local level—growing interest in local environmentally focused activities like recycling of household waste, to the largest, most complex global environmental issues, such as climate change and its various physical manifestations on the physical environ-ment. However, with respect to remediation, much of the general public is unaware of general remediation activities, let alone the virtues of incor-porating sustainability-based practices into site remediation. However, with educational outreach, the public could undoubtedly see the benefit of
230 • SuStAiNABLE REMEDiAtiON Of CONtAMiNAtED SitES
such practices—reduced use of landfills, less wear and tear on transpor-tation infrastructure, less air emissions, a greater use of renewable energy sources and reclaimed water with reduced reliance, and use of fossil fuels and fresh water sources, to name a few. Once the connection is made for the public of the overall holistic benefit of these practices, it would be reasonable to expect that the public would expect their elected lawmakers and related governmental agencies to put incentive programs and statutory mandates in place to encourage and require such beneficial activity.
7.6 LACK Of SPECiALtY tRAiNiNg ON LCA, CARBON BALANCE, AND OtHER ASSESSMENt tOOLS fOR PROfESSiONALS
For many reasons, it is understandable that the general public is not famil-iar or aware of traditional or sustainability-related remediation activities. Despite their enthusiasm, regulatory agencies currently lack encouragement of the use of remediation methods that incorporate sustainability principles. Environmental remediation professionals clearly and obviously could play the greatest role in advancing the uses of these remediation practices and activities. However, in many ways, they are unaware of the best means by which to do so. By many measures, they are well aware of the benefits of sustainability practices, but they either are unable to synthesize a remedia-tion project that can utilize these practices, or far more commonly, they lack the knowledge or ability to demonstrate to project stakeholders the benefits of incorporating such principles and practices into remediation projects.
Many remediation professionals do have a desire to incorporate sus-tainable measures into remediation projects; however, in many cases, they lack the skill set or knowledge of assessment tools to demon-strate the related benefits. With the continued evolution and innovation of these tools, it is necessary for design professionals to seek out and learn these tools so they may be able to apply them on remediation projects. Importantly, as regulatory agencies, public–private partnership entities and academia develop sustainability assessment tools, they need to find better methods to promulgate their tools so that they may be adopted and implemented on a wide scale. A clear understanding of the tools that are available as well as their best-case applicability and limitations is neces-sary for their widespread use among remediation design professionals. In doing so, it is reasonable to expect that such tool utilization would result in a rapid acceleration in the incorporation of sustainability principles in remediation projects.
CHALLENgES AND OPPORtuNitiES • 231
It is a natural question to ask how best to encourage awareness, learn-ing, and adoption and use of sustainability assessment tools. There is a wide range of acceptable means. Of course, it may begin with traditional classroom work in the form of college courses or continuing education short courses. Utilizing the technical realm, webinars and webcasts, online videos, social media platforms for idea exchange, and other similar chan-nels can reach a wide audience and offer an approachable and convenient means to promulgate the assessment toll concepts. Similarly, case studies and success stories (as well as less desirable lessons learned) may be shared via a wide range of electronic communications and social media outlets.
Beyond the need for trained regulatory professionals is the need for demonstrable returns from case studies showing the use of the sustain-able remediation concepts and tools. Currently, the previously named U.S. organizations active in the sustainable remediation realm continue their efforts to gather adequate success stories and disseminate the information across a broad but segmented industry. While many case studies are in development at the state or federal agency level, the private sector appears to have surpassed the waiting game for policy requirement change and in doing so it has created a number of proprietary sustainable remediation tools and methodologies for their own clientele base in the meanwhile. This has resulted in further dissolution of consistent, standardized, and transparent case study sharing across the industry. Frequent sharing of case study results are demonstrated across the country at various sym-posia, but equal to the number of presentations is the ambiguity of the background data and tool development. These proprietary tools and case studies gain experience for the consulting professional and responsible party but do little to aid in industrywide use and acceptance of sustain-able remediation tools and processes and, at worst, increase the distrust of the regulatory community to embrace the data provided. Simply put, the regulator has nowhere to put and no way to process individualized data. Therefore, many of these case studies will remain exercises in futility for the public and entire stakeholder group.
7.7 gREAtER ACADEMiC fOCuS
Many innovative remediation technologies that are commonly employed by remediation professionals were conceived of and developed in aca-demia. In this setting, potential technologies can be developed in bench-scale settings with refined mathematical and physical modeling. This naturally feeds into pilot field-scale testing to determine the efficacy of
232 • SuStAiNABLE REMEDiAtiON Of CONtAMiNAtED SitES
evolving technologies in real-world conditions, and the continued col-laboration of academia allows for a deeper understanding of the inherent processes and physical phenomena at work, leading to faster optimization and further development.
This academic and practitioner model has worked for countless technological advances and will continue to advance the applications of environmental remediation. With a greater emphasis of sustainability as a common interest between academia and practitioners, sustainability-related applications would also be expected to evolve at an accelerated pace. First, practitioners and academics do need to identify research needs for sustainable technologies. This could take many forms and areas of interest, from actual remediation applications, material development, or advances in reagent or substrate delivery to means of measurement, com-putation, modeling, and assessment. Once these common areas of inter-est are identified, academics and practitioners should closely collaborate on scoping research projects. This would serve the dual goal of targeting specific areas that could benefit most directly from research and lead to related improvements in practice applications as well as facilitate research funding via grants from industry and government. By identifying specific common areas of interest, practitioners and academics can work together to more efficiently devote financial resources to such areas that will yield improvements in sustainable technology deployment and operation.
7.8 fuRtHER REfiNEMENt AND DEVELOPMENt Of ASSESSMENt tOOLS AND fRAMEWORKS
As discussed earlier, continued and expanded research partnerships between academia and practitioners in industry would result in accel-erated advances in remediation technological development and a dual advancement of the state-of-the-art and the state-of-the-practice. Fur-ther, such research collaboration could also advance another key concept related to sustainability—the means to accurately measure and assess sustainability-related principles and practices associated with environ-mental remediation.
As presented throughout this book, numerous assessment frameworks and tools are available for use, both in the public domain and as propri-etary, fee-based software. Frameworks have been developed by a number of private and public entities that can provide feasibility-level screening, alternatives analysis, or BMP selection. The range and scope of tools are wide—some are quite simple to use, but do provide limited output.
CHALLENgES AND OPPORtuNitiES • 233
Other tools are quite complex and can incorporate significant computa-tional capabilities. However, in many cases, these software applications do require a level of expertise to properly use—or at least have an appre-ciable learning curve that must be overcome in order to yield accurate, actionable results.
The wide range of tools should be viewed as beneficial; because such a range exists, those performing analysis of remediation project sustain-ability have a wide range of tools at their disposal and may match up the right application for the task at hand. Simple tools may be selected for simple projects or optimization and screening tasks that may be minor in scope. Comprehensive tools may be selected and implemented for more complex projects, when a wider range of analysis is necessary to satisfy project stakeholders on high-visibility projects, or when project impacts can have significant environmental, economic, or social consequences. However, with the wide range of tools, there is significant variation among the actual assessment methods, algorithms, or computational procedures among the range of assessment tools. It is obvious that this would be the case when comparing simple qualitative assessment tools with the most complex life-cycle assessment (LCA) tools; however, even those tools that are used to analyze similar projects in scope can vary significantly.
This variation exists for several reasons. First, different methods place a varied emphasis on parameters associated with different sustain-ability indicators and metrics under consideration. Some indicators and metrics are heavily emphasized in some tools, while others may be omit-ted or downplayed. This may extend to the depth and detail required for a given parameter at the input stage or the manner in which related output is reported. Some tools allow for virtually every remediation method to be incorporated into an analysis as long as related activities can be defined and metrics can be quantified, while other assessment tools have been hard wired to provide the detailed analysis of a select group of remedia-tion methods. Further, when computations are made during the analysis, equivalent reporting units for associated impacts vary among assessment tools, leading to difficultly in attempting to make a direct comparison of output generated during analyses of identical activities using different assessment tools.
A move toward standardization, at least among similar assessment tools and frameworks would be beneficial to the environmental remedia-tion practice. Even if differences among computational processes within different tools remained, increased standardization in terms of reported output units, indicators and metrics considered, and greater agreement on the range of remediation activities that could be handled by different
234 • SuStAiNABLE REMEDiAtiON Of CONtAMiNAtED SitES
remediation tools would eliminate confusion. Practitioners would likely feel more comfortable if a common language or feel regarding sustainabil-ity analysis could be developed; the greater ability for direct comparison among different assessment methods could foster greater interest, trust, and reliance in the tools and the resulting analysis conclusions. It would also enhance innovation and increased accuracy in assessment tools, as increased familiarity of the inputs and outputs would likely result in a greater focus on interest in refinement and enhancement, with an empha-sis on identifying new metrics or subanalyses while purging unnecessary data and computations. This move toward uniformity or standardization could be jointly undertaken by practitioners and academia to identify needs, develop solutions, and continuously improve the quality of analysis frameworks and tools.
7.9 iMPROVED ASSESSMENt Of iNDiRECt CONSEQuENCES
The lack of uniformity among assessment frameworks and tools presents difficulties when attempting to assess direct project impacts and related benefits or adverse consequences. However, in many cases, it is as prob-lematic or even more difficult to account for indirect benefits or impacts associated with a remediation project. These indirect consequences, whether beneficial or detrimental to the environmental, economic, and social dimensions associated with a remediation project, can be quite extensive and significantly wider in scope than more easily definable direct consequences.
The difficultly in accounting for these indirect benefits exists for two primary reasons. First, system boundary selection will invariably affect the number of indirect consequences that are accounted for in an analysis. While reflexively one might say that a wider system boundary would be more useful because a greater number of impacts could be determined from an analysis, system boundary expansion leads to a significant increase in the complexity and difficultly of an analysis, in terms of both time and cost associated with the analysis. It is not always evident or obvious where to draw a boundary such that diminishing returns associated with increased impact analysis can be readily determined such that they may be excluded from an analysis.
The second reason is that indirect consequences are not often prop-erly accounted for by existing assessment tools, regardless of the choice of system boundary. Straightforward benefits such as reduced emissions,
CHALLENgES AND OPPORtuNitiES • 235
resource utilization, or construction jobs created by a remediation project would be considered typical and easily handled by a comprehensive anal-ysis tool. However, benefits such as increased neighborhood tax receipts, increased life expectancy for residents near a project site, or increased number of species present in a rehabilitated natural habitat can be diffi-cult to quantify with existing tools. As is the case with enhanced assess-ment tools, practitioners and academia could successfully collaborate to identify key indicators and metrics of indirect benefits resulting from sustainability-focused remediation projects as well as ways to incorporate and quantify into existing and future assessment tools.
7.10 iMPROVED MEtRiCS AND tOOLS tO ADDRESS SOCiAL iSSuES
Regardless of the accuracy or completeness of their scope, inputs, and computation, existing frameworks and assessment tools have mostly been focused on environmental and economic dimensions. As a result, social dimensions have not received much attention. Many assessment frameworks and assessment tools have been developed by economists or environmentally focused entities, such as regulatory agencies. It is natu-ral that the focus of these developments was directed toward economic and environmental dimensions, as these served as the initial impetus for the development of tools and frameworks by these entities. Additionally, as assessment frameworks and tools evolved, the focus was primarily placed on environmental and economic dimensions because metrics asso-ciated with these dimensions were relatively easy to quantify and ana-lyze. Further, whether associated on costs or physical units, economic and environmental metrics are relatively easy to objectively compare among remediation project alternatives.
While there has been a general interest in the measurement of social- related sustainability impacts, tools and frameworks other than those cited in this book have been lagging behind the development of other more eco-nomically and environmentally focused tools. Metrics for social aspects have been more difficult to develop, as have related units of measurement. However, with increasing interest in these metrics, a greater awareness within the general public of the potential socially related enhancements of site remediation, and increased attention from governmental bodies, academic institutions, and among practitioners in industry, it is reasonable to assume that increased attention and effort will be directed toward the development of social metrics and assessment tools in the near future.

references
AFCEE (Air Force Center for Environmental Excellence). 2010. Sustainable Remediation Tool User Guide. U.S. Air Force.
ASTM (American Society for Testing and Materials). 2010. Standard Guide for Risk-Based Corrective Action Applied at Petroleum Release Sites, E1739-95(2010)e1. West Conshohocken, PA: ASTM International. www.astm.org
ASTM. 2014a. Standard Guide for Greener Cleanups, E2893-13e1. West Consho-hocken, PA: ASTM International. www.astm.org
ASTM. 2014b. Standard Guide for Integrating Sustainable Objectives into Cleanup, E2876-13. West Conshohocken, PA: ASTM International. www.astm.org
Bare, J. 2011. “TRACI 2.0: The Tool for the Reduction and Assessment of Chemical and Other Environmental Impacts 2.0.” Clean Technologies and Environmental Policy, 13, no. 5.
Bhargava, M., and R. Sirabian. 2011. SiteWise™ Version 2 User Guide. NAVFAC Engineering Service Center, Port Hueneme, CA.
California EPA: DTSC (Environmental Protection Agency: Department of Toxic Substances Control). 1995. Redevelopment and Revitalization of Brown-fields, Department of Toxic Substances Control Initiatives.
California EPA: DTSC. 2008. The Voluntary Cleanup Program.CERTT (Calumet Ecotoxicology Roundtable Technical Team). 2007. Calumet
Ecotoxicology Protocol: Protecting Calumet’s Plants and Animals.City of Chicago. 2005. Calumet Open Space Reserve Plan. Chicago Department
of Planning and Development.Ellis, D.E., and P.W. Hadley. 2009. “Integrating Sustainable Principles, Practices,
and Metrics into Remediation Projects.” Remediation Journal 19, no. 3, pp. 5–114. doi: http://dx.doi.org/10.1002/rem.20210
Favara, P.J., T.M. Krieger, B. Boughton, A.S. Fisher, and M. Bhargava. 2011. “Guidance for Performing Footprint Analyses and Life-Cycle Assessments for the Remediation Industry.” Remediation Journal 21, no. 3, pp. 39–79. doi: http://dx.doi.org/10.1002/rem.20289
Gamper-Rabindran, S., R. Mastromonaco, and C. Timmins. 2011. “Valuing the Benefits of Superfund Site Remediation: Three Approaches to Measuring Localized Externalitites.” Triangle RDC.
Holland, K.S., R.E. Lewis, K. Tipton, S. Karnis, C. Dona, E. Petrovskis, L.P. Bull, D. Taege, and C. Hook. 2011. “Framework for Integrating Sustainability into Remediation Projects.” Remediation Journal 21, no. 3, pp. 5–114.
238 • REfERENCES
Illinois EPA (Illinois Environmental Protection Agency). February, 2008. Greener Cleanups: How to Maximize the Environmental Benefits of Site Remediation. http://www.epa.state.il.us/land/greener-cleanups/matrix.pdf
ISO (International Organization for Standardization). 2006. “Environmental Management: Life Cycle Assessment—Principles and Framework.” ISO 14040:2006. www.iso.org/iso/catalogue_detail?csnumber=37456
ITRC (Interstate Technology & Regulatory Council). 2005. Technical and Reg-ulatory Guidance for In Situ Chemical Oxidation of Contaminated Soil and Groundwater. Washington, D.C.: Interstate Technology & Regulatory Coun-cil, In Situ Chemical Oxidation Team.
ITRC. 2009. Phytotechnology Technical and Regulatory Guidance and Decision Trees. Revised, Washington, D.C.: Interstate Technology & Regulatory Coun-cil, Phytotechnologies Team, Tech Reg Update. www.itrcweb.org
ITRC. 2011. Green and Sustainable Remediation: State of the Science and Prac-tice. GSR-1. Washington, D.C.: Interstate Technology & Regulatory Council, Green and Sustainable Remediation Team. www.itrcweb.org
Kamins, N., S. Malec, L. Westphal, and C. LeBlanc. 2002. Calumet Ecological Management Strategy (EMS). City of Chicago, Dept. of Environment, Natural Resources Division.
MPCA (Minnesota Pollution Control Agency). 2010. “Greener Practices for Business, Site Development, and Site Cleanups: A Toolkit.” http://www.pca.state.mn.us/index.php/topics/preventing-waste-and-pollution/sustainability/greener-practices-toolkit/greener-practices-for-business-site-development-and-site-cleanups-a-toolkit.html
NAVFAC (Naval Facilities Engineering Command). 2011. “Green and Sustainable Remediation.” http://www.navfac.navy.mil/navfac_worldwide/ specialty_ centers/exwc/products_and_services/ev/erb/gsr.html
NICOLE (Network for Industrially Contaminated Land in Europe). September, 2010. Sustainable Remediation Road Map. www.nicole.org
NRC (National Research Council). 2011. Sustainability and the U.S. EPA. Com-mittee on Incorporating Sustainability in the U.S. Environmental Protection Agency and Science and Technology for Sustainability Program, Policy and Global Affairs Division. http://www.nap.edu/catalog.php?record_id=13152
OSWER (Office of Solid Waste and Emergency Response). 2011. Fiscal Year 2010 End of Year Report. Washington, DC: U.S. EPA.
PE International. 2011. GaBi software. www.pe-international.comReddy, K.R., B.Y. Sadasivam, and J.A. Adams. 2014. Social Sustainability Evalu-
ation Matrix (SSEM) to Quantify Social Aspects of Sustainable Remediation. Proceedings of International Conference on Sustainable Infrastructure, Long Beach, CA, November 6–8, Reston, VA: ASCE.
Reddy, K.R., J.A. Adams, and C. Richardson. 1999. “Potential Technologies for Remediation of Brownfields.” Practice Periodical of Hazardous, Toxic, and Radioactive Waste Management, ASCE 3, no. 2, pp. 61–68. doi: http://dx.doi .org/10.1061/(asce)1090-025x(1999)3:2(61)
REfERENCES • 239
Rentz, J.A., B. Chapman, P.J.J. Alvarez, and J.L. Schnoor. 2003. “Stim-ulation of Hybrid Poplar Growth in Petroleum-Contaminated Soils through Oxygen Addition and Soil Nutrient Amendments.” Interna-tional Journal of Phytoremediation 5, no. 1, pp. 57–72. doi: http://dx.doi .org/10.1080/16226510390856475
Sharma, H.D., and K.R. Reddy. 2004. Geoenvironmental Engineering: Site Reme-diation, Waste Containment, and Emerging Waste Management Technologies. Hoboken, NJ: John Wiley.
SuRF-UK (Sustainable Remediation Forum—United Kingdom). 2009. “A Frame-work for Assessing the Sustainability of Soil and Groundwater Remedia-tion.” www.claire.co.uk/index.php?option=com_phocadownload&view= file&id=61:initiatives&It mid=78
The Climate Registry. 2009. www.theclimateregistry.orgU.S. EPA (Environmental Protection Agency). 1989. Risk Assessment Guide for
Superfund, Vol. I., Human Health Evaluation Manual, Part A, EPA/540/ 1-89/002. Washington, DC: OSWER.
U.S. EPA 1997. Expedited Site Assessment Tools for Underground Storage Tank Sites: A Guide for Regulators, EPA/510-B-97-001, Washington, D.C.
U.S. EPA. 2001. “Using the Triad Approach to Improve the Cost-Effectiveness of Hazardous Waste Site Cleanups.” Current Perspectives in Site Remediation and Monitoring, EPA 542-R-01-016. Washington, DC: OSWER.
U.S. EPA. 2003. Deployment of Phytotechnology in the 317/319 Area at Argonne National Laboratory-East: Innovative Technology Evaluation Report. National Risk Management Research Laboratory, Office of Research and Development, Cincinnati, Ohio.
U.S. EPA. 2006. Life Cycle Assessment: Principles and Practice. EPA/600/ R-06/060, National Risk Management Research Laboratory, Office of Research and Development, Cincinnati, Ohio, May 2006.
U.S. EPA. 2008. Green Remediation: Incorporating Sustainable Environmental Practices into Remediation of Contaminated Sites. EPA 542-R-08-002, Office of Solid Waste and Emergency Response, Washington, D.C.
U.S. EPA. 2009. Brownfields Fact Sheet, EPA Brownfields Grants, CERCLA Lia-bility, and All Appropriate Inquiries. EPA 560-F-09-026, Washington, D.C.
U.S. EPA. 2010. “Green Remediation.” www.clu-in.org/greenremediationU.S. EPA. 2011. “RCRA Laws and Regulations.” www.epa.gov/waste/laws-regs/
index/htmU.S. EPA. 2012. “Air Emissions from the Portland Cement Industry.” http://www
.epa.gov/airquality/cement/basic.htmlU.S. EPA CLU-IN. 2011a. “In-situ Chemical Oxidation Overview.” www.clu-in.orgU.S. EPA CLU-IN. 2011b. “Membrane Interface Probe Overview.” www.clu-in.orgU.S. EPA CLU-IN. 2011c. “X-Ray Fluorescence Overview.” www.clu-in.orgU.S. Federal Register. 2005. Environmental Protection Agency, 40 CFR Part 312,
“Standards and Practices for All Appropriate Inquiries,” Vol. 70, No. 210, November 1, 2005.

240 • REfERENCES
U.S. GBC (U.S. Green Building Council). 2011. “LEED Certification Process Manual.” www.leedonline.com/irj/go/km/docs/documents/usgbc/leed/config/ terms/Legal_Documents_Download/rating_system_doc_june_20_2011/June2011_Cert_Policy_Manual.pdf
White House Press Release. 2009. President Obama Signs an Executive Order Focused on Federal Leadership in Environmental, Energy, and Economic Performance, October 5.
bibLiogrAphy
Adams, J.A., K.R. Reddy, and L. Tekola. 2011. “Remediation of Chlorinated Solvent Plumes Using In-Situ Air Sparging.” International Journal of Environmental Research and Public Health 8, no. 6, pp. 2226–39. doi: http://dx.doi.org/10.3390/ijerph8062226
Bosko, M.T. 1998a. Phase 1 Ecological Reclamation Study, Lake Calumet Cluster Site. Roy F. Weston, Inc., Chicago, IL.
Bosko, M.T. 1998b. Lake Calumet Area Ecological Analysis. Roy F. Weston, Inc., Chicago, IL.
“Calumet Open Space Reserve Plan.” 2005. Chicago Department of Planning and Development.
Chinthamreddy, S., and K.R. Reddy. 1999. “Oxidation and Mobility of Trivalent Chromium in Manganese Enriched Clays During Electrokinetic Remedia-tion.” Journal of Soil Contamination 8, no. 2, pp. 197–216. doi: http://dx.doi .org/10.1080/10588339991339306
DTSC (California Department of Toxic Substances Control). 2007. “Green Reme-diation.” www.dtsc.ca.gov/OMF/Grn_Remediation.cfm
Electric Power Research Institute. 2003. Evaluation of the Effectiveness of In Situ Solidification/Stabilization at the Columbus, Georgia Manufacturing Gas Plant Site, Palo Alto, CA: EPRI, 1009095, pp. 8–1 and 8–2.
Goedkoop, M., A. De Schryver, M. Oele, D. de Roest, M. Vieira, and S. Durksz. 2010. SimaPro 7 Tutorial, Version 3.5. Netherlands: Pre Consultants.
Hinchman, R.R., M.C. Negri, and E.G. Gatliff. 1997. “Phytoremediation: Using Green Plants to Clean Up Contaminated Soil, Groundwater, and Wastewater.” Submitted to the U.S. Department of Energy, Assistant Secretary for Energy Efficient and Renewable Energy under Contract W-31-109-Eng-38.
ITRC (Interstate Technology & Regulatory Council). 2011. Green and Sustainable Remediation: A Practical Framework, GSR-2. Washington, D.C.
NAVFAC (Naval Facilities Engineering Command). 2009. Sustainable Environ-mental Remediation Fact Sheet.
Newman, L.A., S.E. Strand, N. Choe, J. Duffy, G. Ekuan, M. Ruszaj, B.B. Shur-tleff, J. Wilmoth, P. Heilman, and M.P. Gordon. 1997b. “Uptake and Biotrans-formation of Trichloroethylene by Hybrid Poplars.” Environmental Science and Technology 31, pp. 1062–67. doi: http://dx.doi.org/10.1021/es960564w
Reddy, K.R., and J.A. Adams. 2001. “Cleanup of Chemical Spills Using Air Sparging.” In Handbook of Chemical Spill Technologies, ed. M. Fingas. New York: McGraw-Hill.
242 • BiBLiOgRAPHY
Reddy, K.R., and M.R. Karri. 2008. Removal and Degradation of Pentachloro-phenol in Clayey Soil Using Nanoscale Iron Particles. Geotechnics of Waste Management and Remediation (GSP 177), ASCE, pp. 463–69. Reston, VA.
Roadcap, G.S., M.B. Wentzel, S.D. Lin, E.E. Herricks, R.K. Raman, R.L. Locke, and D.L. Hullinger. 1999. An Assessment of the Hydrology and Water Quality of Indian Ridge Marsh and the Potential Effects of Wetland Rehabilitation on the Diversity of Wetland Plant Communities. University of Illinois. Prepared for EPA. November.
Slag Cement Association. 2005. “Waste Solidification/Stabilization Using Slag Cement.” SCIC #26, Farmington Hills/MI. http://www.slagcement.org/Publi-cations/pdf/no26%20Wast%20Solidification%20Using%20Slag%20Cement.pdf
U.S. EPA (Environmental Protection Agency). 1996. Soil Vapor Extraction Imple-mentation Experiences, Engineering Forum Issue Paper, EPA/540/F-95/030, Washington, D.C.
U.S. EPA: OSWER (Office of Solid Waste and Emergency Response). 2010. Fis-cal Year 2010 End of Year Report. United States Environmental Protection Agency, Washington, D.C.
“U.S. Life Cycle Inventory Database.” 2012. National Renewable Energy Lab-oratory. https://www.lcacommons.gov/nrel/search (accessed November 19, 2012).
WESTON (Weston Solutions, Inc.). 2007. Final Remedial Investigation Report Hegeler Zinc Site. Work Assignment No. 250-RICO-B54T, Document Con-trol No. RFW250-2A-AWOO.
Westphal, L.M., and J.G. Isebrands. 2006. “Phytoremediation of Chicago’s Brownfields: Consideration of Ecological Approaches and Social Issues.” USDA Forest Service, North Central Research Station.
Wilk, C.M. 1997. Stabilization of Heavy Metals with Portland Cement: Research Synopsis, IS007. Skokie, IL: Portland Cement Association.
Wilk, C.M. 2004. Solidification/Stabilization Treatment and Examples of Use at Port Facilities. Ports 2004: Port Development in the Changing World. ASCE Conference Proceedings, p. 10.
Wood, P.A. 1997. “Remediation Methods for Contaminated Sites.” In Contami-nated Land and Its Reclamation, eds. R. Hester and R. Harrison, 47. Cam-bridge: The Royal Society of Chemistry.
Zalesny, R.S., Jr., and E.O. Bauer. 2007. “Selecting and Utilizing Populus and Salix for Landfill Covers: Implications for Leachate Irrigation.” International Journal of Phytoremediation 9, no. 6, pp. 497–511. doi: http://dx.doi .org/10.1080/15226510701709689
index
AAAI. See All Appropriate Inquiries
(AAI)Air pollution, 1–2Air sparging, 47, 50All Appropriate Inquiries (AAI)
benefits, 12property owners’ obligations,
11–12shortfalls, 12
American Society of Testing and Materials (ASTM)
core elements, 67evaluation, 68–69greener cleanup BMPs, 68,
70–108standards, 12sustainability framework, 109sustainable remediation BMPs,
110–138Assessment tools, sustainability
California Green Remediation Evaluation Matrix, 156, 158–160
Illinois EPA Greener Cleanups Matrix, 154–155
MPCA tool kit, 155–157quantitative (see Quantitative
assessment tools)selection, 190–191SSEM, 160–164
ASTM. See American Society of Testing and Materials (ASTM)
ASTM sustainable remediation BMPs
air emissions, 111–112cleanup efficiency and cost
savings, 120–122community involvement,
112–117community vitality, 130–132economic impacts, local,
117–120energy, 122–125environment enhancement,
125–129land and ecosystems, 129–130materials and waste, 132–136water impacts, 137
BBest management practices
(BMPs), 61, 141greener cleanup, 68, 70–108remedial options, comparison,
202sustainable remediation, 110–138
Bioremediation, 45–46Biosparging. See Air spargingBMPs. See Best management
practices (BMPs)
CCAA. See Clean Air Act (CAA)California Green Remediation
Evaluation Matrix (GREM), 156
244 • iNDEx
physical disturbances and disruptions, 158–159
resource depletion/gain, 159substance release and production,
158thermal releases, 158
CERCLA. See Comprehensive Environmental Response, Compensation, and Liabilities Act (CERCLA)
Challenges and opportunitiesassessment tools and
frameworks, refinement and development, 232–234
financial incentives, 226–228greater academic focus, 231–232greenwashing, 226improved metrics and tools, 235indirect consequences improved
assessment, 234–235professionals specialty training,
230–231public awareness, 229–230regulatory mandate, 228–229
Chemical oxidation, 44Chicago industrial site
background, 193BMPs comparison, 201–202contaminant concentrations, 194,
196–198framework, 198GREM analysis, 201metrics, 198–201remediation alternative selection,
205risk assessment, 194–196soil profile, 193–194SRT and SiteWise results,
202–204Clean Air Act (CAA), 5CleanSWEEP, 184Clean Water Act (CWA), 5Comprehensive Environmental
Response, Compensation, and Liabilities Act (CERCLA)
All Appropriate Inquiries (AAI), 11–12
Brownfield redevelopment, 10–11
key provisions, 8–9remediation criteria, 9SARA, 9–10Voluntary Cleanup Program
(VCP), 13–14Conceptual site model (CSM),
31–32Containment technologies
soil vapor mitigation systems, 51, 53
surface capping, 51–52vertical and bottom barriers, 53wells and drains, 53–54
Contaminated site characterizationadditional explorations, 31conceptual site model (CSM),
31–32data collection, 30general approach, 28–29invasive assessment, 31methods employed, 32modern techniques, 32–34regulatory compliance, 31sampling and analytical methods,
34–35site assessment, 30–31
Contaminated site remediationcontaminant types, 16–21contamination sources, 14–16CSM, 31–32data collection, 30direct hydraulic-push methods,
32–33evolution, 27–28MIP, 34phased approach, 30–31remedial action, 36–37risk assessment, 35–36site characterization, 27–34soil vapor sampling technology,
33
iNDEx • 245
sustainable remediation, 22–24SW-846, 34–35traditional methods and negative
effects, 21–22Contaminated site remediation
technologiesclassification, 39containment (see Containment
technologies)integrated, 54saturated zone (see Saturated
zone remediation technologies)sustainable (see Sustainable
remediation technologies)vadose zone (see Vadose zone
remediation technologies)Contaminated site risk assessment,
35–36CSM. See Conceptual site model
(CSM)CWA. See Clean Water Act (CWA)
DDDT. See Dichlorodiphenyltrichlo-
roethane (DDT)Department of Toxic Substances
Control (DTSC), 13Dichlorodiphenyltrichloroethane
(DDT), 3Direct hydraulic-push methods,
32–33DTSC. See Department of Toxic
Substances Control (DTSC)Dual-phase extraction, 50
EElectrokinetics, 45Environmental concerns
air pollution, 1–2Carson’s Silent Spring, 2–3oil spill disasters, 2–3space race impacts, 3water pollution, 2
Environmental Protection Agency (EPA), US
carbon footprint analysis, 186core elements, 60–62environment footprint tool, 185long-term stewardship, 62WARM, 185
Environmental regulationsCERCLA (see Comprehensive
Environmental Response, Compensation, and Liabilities Act (CERCLA))
Clean Air Act (CAA), 5Clean Water Act (CWA), 5drawbacks and limitations, 6Federal Insecticide, Fungicide,
and Rodenticide Act (FIFRA), 4–5
Hazardous and Solid Waste Amendments (HSWA), 7–8
Marine Protection, Research and Sanctuaries Act (MPRSA), 4
National Environmental Policy Act (NEPA), 4
Resource Conservation and Recovery Act (RCRA), 6–7
Safe Drinking Water Act (SDWA), 5
Solid Waste Disposal Act (SWDA), 3–4
Toxic Substances Control Act (TSCA), 6
Ex situ soil remediation technologies, 40, 42
FFederal Insecticide, Fungicide and
Rodenticide Act (FIFRA), 4–5FIFRA. See Federal Insecticide,
Fungicide, and Rodenticide Act (FIFRA)
GGaBi Software®, 189Green and sustainable remediation
(GSR), 23–24, 59CSM evaluation and updation, 65
246 • iNDEx
documentation, 67framework, 64goals establishment, 65metrics, evaluation level and
boundaries selection, 66–67project stakeholder involvement,
65–66Greener cleanup BMPs
buildings, 70–72evaluation process, 68materials, 72–82power and fuel, 82–90project planning and team
management, 90–92residual solid and liquid waste,
92–93sampling and analysis, 94–95site preparation, 96–101surface and storm water, 101–
102vehicles and equipment, 103–105wastewater, 105–108
Green Remediation Evaluation Matrix (GREM)
California GREM, 156California GREM stressors,
158–159Chicago industrial site, 198–201quantitative assessment tools,
169Greenwashing, 226GREM. See Green Remediation
Evaluation Matrix (GREM)Groundwater remediation
technologies. See Saturated zone remediation technologies
GSR. See Green and sustainable remediation (GSR)
HHazardous and Solid Waste
Amendments (HSWA), 7–8HSWA. See Hazardous and Solid
Waste Amendments (HSWA)
IIllinois EPA Greener Cleanups
Matrix, 154–155Indian ridge marsh (IRM) site
framework, 207–208metrics, 208project background, 206–207remediation alternative selection,
211–213site-specific considerations,
208–209SRT analyses output, 209SSEM results, 210–211
Indicators, sustainabilityeconomic and environmental, 150social, 150–151United Nations, 143–149
In situ soil remediation technologies, 40, 43
In situ vitrification (ISV), 46Integrated remediation
technologies, 54International Organization for
Standards (ISO), 186Interstate Technology &
Regulatory Council (ITRC)framework, 64GSR (See Green and sustainable
remediation (GSR))IRM. See Indian ridge marsh
(IRM) siteISO. See International
Organization for Standards (ISO)
ISV. See In situ vitrification (ISV)ITRC. See Interstate Technology &
Regulatory Council (ITRC)
LLCAs. See Life-cycle assessments
(LCAs)Leadership in Energy and
Environmental Design (LEED), 226–227
iNDEx • 247
LEED. See Leadership in Energy and Environmental Design (LEED)
Life-cycle assessment (LCA) analysis
Former Matthiessen and Hegeler zinc facility, 218–221
professionals specialty training, 230–231
Life-cycle assessments (LCAs), 154
considerations, 188impact categories, 189–190ISO’s definition, 186steps involved, 187
MMarine Protection, Research and
Sanctuaries Act (MPRSA), 4Matthiessen and Hegeler zinc
facilityframework, 216LCA analysis, 218–221metrics, 216–218project background, 214–216remediation alternative selection,
222–223SimaPro analysis, 218SSEM results, 221–222
Membrane interface probe (MIP), 34
Metrics, sustainability, 151–153Minnesota Pollution Control
Agency (MPCA) Toolkit, 155–157
MIP. See Membrane interface probe (MIP)
MNA. See Monitored natural attenuation (MNA)
Monitored natural attenuation (MNA), 45
MPCA. See Minnesota Pollution Control Agency (MPCA) Toolkit
MPRSA. See Marine Protection, Research and Sanctuaries Act (MPRSA)
NNational Environmental Policy Act
(NEPA), 4Naval Facilities Engineering
Command (NAVFAC), 153NAVFAC. See Naval Facilities
Engineering Command (NAVFAC)
NEPA. See National Environmental Policy Act (NEPA)
Network for Industrially Contaminated Land in Europe (NICOLE), 138
NICOLE. See Network for Industrially Contaminated Land in Europe (NICOLE)
OOccupational Health and Safety
Administration (OSHA), 36OSHA. See Occupational Health
and Safety Administration (OSHA)
PPAHs. See Polynuclear aromatic
hydrocarbons (PAHs)Permeable reactive barriers
(PRBs), 50–51Polynuclear aromatic
hydrocarbons (PAHs), 193–194PRBs. See Permeable reactive
barriers (PRBs)Pump-and-treat method, 47
QQualitative assessment tools
Illinois EPA Greener Cleanups Matrix, 154–155
248 • iNDEx
MPCA tool kit, 155–157Quantitative assessment tools
ATHENA, 166BalancE3TM, 175BEES, 167BenReMod, 168Boustead model, 176Clean me green, 176CleanSWEEP, 184Cleanup sustainability
framework, 176Diesel emissions quantifier, 168EIO-LCA, 169EMFACTTM, 169GoldSET, 177Greener cleanups matrix, 170Green remediation analysis, 178Green remediation spreadsheets,
179–180Greenscapes, 171GREET, 170GREM, 169Hybrid2, 171IPaLATE model, 172IWEM, 171LCA (see Life-cycle assessments
(LCAs))NEBA, 181PTT, 172RET screen, 173SimaPro, 181SiteWise, 173, 184–185SRT, 165, 184sustainability assessment
framework, 180sustainability assessment tool,
181sustainable principles, site
remediation, 182sustainable remediation cost/
benefit analysis, 182TRACI, 183U.S. EPA environmental
footprint analysis tools, 185–186
WARM, 175
RRBCA. See Risk-Based Corrective
Action (RBCA)RCRA. See Resource
Conservation and Recovery Act (RCRA)
Recognized environmental conditions (RECs), 30–31
RECs. See Recognized environmental conditions (RECs)
Remediation methodslimitations, 21–22traditional methods, 21
Resource Conservation and Recovery Act (RCRA), 6–7
Risk-Based Corrective Action (RBCA), 35–36
SSafe Drinking Water Act (SDWA),
5SARA. See Superfund
Amendments and Reauthorization Act (SARA)
Saturated zone remediation technologies
air sparging, 47, 48, 50bioremediation, 49comparative assessment, 47–49dual-phase extraction, 48, 50electrokinetics, 49flushing, 48immobilization, 49permeable reactive barriers,
50–51pump-and-treat method, 47, 48reactive walls, 49
SDWA. See Safe Drinking Water Act (SDWA)
Selected international frameworks, 138
Semiquantitative assessment toolsCalifornia Green Remediation
Evaluation Matrix, 156, 158–160
iNDEx • 249
SSEM, 160–164Silent Spring, 2SimaPro, 181, 188SiteWise
quantitative assessment tools, 184–185
Chicago industrial site, 202–204Social Sustainability Evaluation
Matrix (SSEM), 151Former Matthiessen and Hegeler
zinc facility, 221–222IRM site, 210–211socioeconomic dimension,
162–163socioenvironmental dimension,
163socioindividual dimension, 161socioinstitutional dimension,
161–162Soil flushing and soil washing, 41,
44Soil remediation technologies.
See Vadose zone remediation technologies
Soil vapor extraction (SVE), 40–41
Soil vapor mitigation systems, 51, 53
Soil vapor sampling technology, 33Solidification and stabilization,
44–45Solid Waste Disposal Act
(SWDA), 3–4SRT, 202–203. See Sustainable
Remediation Tool™ (SRT)SSEM. See Social Sustainability
Evaluation Matrix (SSEM)Subsurface contaminants
arsenic, 17chlorinated solvents, 18explosives, 20heavy metal distribution, 17heavy metals, 17organic compounds distribution,
21PCBs, 19
pesticides, 20polycyclic aromatic
hydrocarbons (PAH), 19radionuclides, 18
Superfund Amendments and Reauthorization Act (SARA), 9–10
SURF. See Sustainable Remediation Forum (SURF)
Surface capping, 51–52SuRF-UK. See United Kingdom’s
Sustainable Remediation Forum (SuRF-UK)
Sustainability indicatorsatmosphere, 146biodiversity, 147consumption and production
patterns, 149demographics, 145economic development, 148education, 145freshwater, 147global economic partnership, 149governance, 144health, 144land, 146natural hazards, 145oceans seas and coasts, 147poverty, 144SMART attributes, 142–143
Sustainable remediationassessment tools (see Assessment
tools, sustainability)disadvantages of traditional
approaches, 22–23early efforts, 22green technology, 23–24indicators (see Sustainability
indicators)metrics, 151–153
Sustainable Remediation Forum (SURF), 59, 62–64
Sustainable remediation frameworks
ASTM (see American Society of Testing and Materials (ASTM))
250 • iNDEx
ITRC (see Interstate Technology & Regulatory Council (ITRC))
objectives, 139selected international, 138SURF, 62–64U.S. EPA, 59–62
Sustainable remediation technologies
components and objectives, 55governing factors, 56–57groundwater plumes, 56key principles and factors, 54–55
Sustainable Remediation Tool™ (SRT), 165, 184
SVE. See Soil vapor extraction (SVE)
SWDA. See Solid Waste Disposal Act (SWDA)
TThe Beneficial Reuse Model
(BenReMod), 168Tool for the Reduction and
Assessment of Chemical and Other Environmental Impacts (TRACI), 189
Toxic Substances Control Act (TSCA), 6
TRACI. See Tool for the Reduction and Assessment of Chemical and Other Environmental Impacts (TRACI)
TSCA. See Toxic Substances Control Act (TSCA)
UUnderground storage tanks
(USTs), 6–7United Kingdom’s Sustainable
Remediation Forum (SuRF-UK), 138
U.S. EPA. See U.S. Environmental Protection Agency (U.S. EPA)
U.S. EPA environmental footprint analysis tools, 185–186
USTs. See Underground storage tanks (USTs)
VVadose zone remediation
technologiesbioremediation, 45–46chemical oxidation, 44electrokinetics, 45ex situ, 40, 42in situ, 40, 43soil flushing and soil washing,
41, 44solidification and stabilization,
44–45SVE, 40–41thermal methods, 46
VCP. See Voluntary Cleanup Program (VCP)
Vertical and bottom barriers, 53Voluntary Cleanup Program
(VCP), 13–14
WWARM. See Waste Reduction
Model (WARM)Waste Reduction Model (WARM),
186Water pollution, 2Wells and drains pumping, 53–54
FORTHCOMING TITLES IN OUR GEOTECHNICAL ENGINEERING COLLECTION
Hiroshan Hettiarachchi, Lawrence technological university, Editor
Geotechnical Aspects of Pavement Engineering by Nishantha Bandara and Manjriker gunaratne
Geotechnical Site Characterization by Anirban De
Momentum Press is one of the leading book publishers in the field of engineering, mathematics, health, and applied sciences. Momentum Press offers over 30 collections,
including Aerospace, Biomedical, Civil, Environmental, Nanomaterials, geotechnical, and many others.
Momentum Press is actively seeking collection editors as well as authors. For more information about becoming an MP author or collection editor, please visit
http://www.momentumpress.net/contact
Announcing Digital Content Crafted by Librarians
Momentum Press offers digital content as authoritative treatments of advanced engineering top-ics by leaders in their field. Hosted on ebrary, MP provides practitioners, researchers, faculty, and students in engineering, science, and industry with innovative electronic content in sensors and controls engineering, advanced energy engineering, manufacturing, and materials science.
Momentum Press offers library-friendly terms:
• perpetual access for a one-time fee• no subscriptions or access fees required• unlimited concurrent usage permitted• downloadable PDFs provided• free MARC records included• free trials
The Momentum Press digital library is very affordable, with no obligation to buy in future years.
For more information, please visit www.momentumpress.net/library or to set up a trial in the US, please contact [email protected].

Sustainable R
emed
iation o
f Co
ntaminated
SitesR
ED
DY
• AD
AM
S
Sustainable Remediation of Contaminated SitesKrishna R. Reddy • Jeffrey A. AdamsThis book presents a holistic approach to remediation that considers ancillary environmental impacts and aims to optimize net effects to the environment. It addresses a broad range of environmental, social, and economic impacts during all remediation phases, and achieves remedial goals through more efficient, sustainable strategies that conserve resources and protect air, water, and soil quality through reduced emissions and other waste burdens.
Inside, the authors simultaneously encourage the reuse of remediated land and enhanced long-term financial returns for investments. Though the potential benefits are enormous, many environmental professionals and project stakeholders do not utilize green and sustainable technologies because they are unaware of methods for selection and implementation. This book describes the decision framework, presents qualitative and quantitative assessment tools, including multi-disciplinary metrics, to assess sustainability, and reviews potential new technologies.
Krishna R. Reddy, PhD, PE, is a professor of civil and environmental engineering and the director of Sustainable Engineering Research Laboratory and Geotechnical and Geoenvironmental Engineering Laboratory at the University of Illinois at Chicago (UIC). Dr. Reddy received his PhD from the Illinois Institute of Technology in Chicago, and he is a licensed professional engineer in Illinois. Dr. Reddy has over 25 years of research, consulting and teaching experience. He has published over 300 technical publications on various topics on pollution control and remediation.
Jeffrey A. Adams, PhD, PE, is an associate with San Ramon, California-based ENGEO Incorporated. He provides development-related consulting services for a variety of public and private clients, including applications in geotechnical and environmental engineering. Dr. Adams is a licensed professional engineer in California and a certified environmental manager in Nevada. He received his BS, MS, and PhD degrees in civil engineering from the University of Illinois at Chicago. Additionally, he received his MBA with concentrations in finance and real estate from the University of Washington.
Sustainable Remediation of Contaminated Sites
GEOTECHNICAL ENGINEERING COLLECTIONHiroshan Hettiarachchi, Editor
Krishna R. ReddyJeffrey A. Adams
ISBN: 978-1-60650-520-5
EBOOKS FOR THE ENGINEERING LIBRARYCreate your own Customized Content Bundle — the more books you buy, the higher your discount!
THE CONTENT• Manufacturing
Engineering• Mechanical
& Chemical Engineering
• Materials Science & Engineering
• Civil & Environmental Engineering
• Electrical Engineering
THE TERMS• Perpetual access for
a one time fee• No subscriptions or
access fees• Unlimited
concurrent usage• Downloadable PDFs• Free MARC records
For further information, a free trial, or to order, contact: [email protected]
Related Documents