Clemson University TigerPrints All Dissertations Dissertations 12-2018 Sustainable Manufacturing of Natural Fiber Reinforced Green Composite Kousaalya Bakthavatchalam Clemson University, [email protected] Follow this and additional works at: hps://tigerprints.clemson.edu/all_dissertations is Dissertation is brought to you for free and open access by the Dissertations at TigerPrints. It has been accepted for inclusion in All Dissertations by an authorized administrator of TigerPrints. For more information, please contact [email protected]. Recommended Citation Bakthavatchalam, Kousaalya, "Sustainable Manufacturing of Natural Fiber Reinforced Green Composite" (2018). All Dissertations. 2239. hps://tigerprints.clemson.edu/all_dissertations/2239

Welcome message from author
This document is posted to help you gain knowledge. Please leave a comment to let me know what you think about it! Share it to your friends and learn new things together.
Transcript
Clemson UniversityTigerPrints
All Dissertations Dissertations
12-2018
Sustainable Manufacturing of Natural FiberReinforced Green CompositeKousaalya BakthavatchalamClemson University, [email protected]
Follow this and additional works at: https://tigerprints.clemson.edu/all_dissertations
This Dissertation is brought to you for free and open access by the Dissertations at TigerPrints. It has been accepted for inclusion in All Dissertations byan authorized administrator of TigerPrints. For more information, please contact [email protected].
Recommended CitationBakthavatchalam, Kousaalya, "Sustainable Manufacturing of Natural Fiber Reinforced Green Composite" (2018). All Dissertations.2239.https://tigerprints.clemson.edu/all_dissertations/2239

SUSTAINABLE MANUFACTURING OF NATURAL FIBER REINFORCED
GREEN COMPOSITE
A Dissertation
Presented to
the Graduate School of
Clemson University
In Partial Fulfillment
of the Requirements for the Degree
Doctor of Philosophy
Automotive Engineering
by
Kousaalya Bakthavatchalam
December 2018
Accepted by:
Dr. Srikanth Pilla, Committee Chair
Dr. Beshah Ayalew, Co-Chair
Dr. Igor Luzinov
Dr. Philip Brown

ii
ABSTRACT
Amidst growing concerns about environmental sustainability, the renewed push
towards adoption of circular economy has increased focus among several manufacturing
sectors on using renewable resources and improving process efficiencies. From the
materials standpoint, use of bio-based polymers and natural fibers as sustainable
reinforcements are increasingly gaining market share. However, conventional processing
methods for fiber reinforced composites are usually energy-intensive and often involve
long processing times, which may lead to detrimental environmental impacts. In this
context, a holistic attainment of sustainability makes it imperative to adapt sustainable
practices not only for raw materials but at every stage of the product. Hence, this work
provides a detailed exploration of the potential power of photons for sustainable processing
of natural fiber-reinforced bio-polymer composites.
To select a more sustainable matrix material, a comprehensive life-cycle
assessment of existing bio-epoxies was carried out. The assessment demonstrated that
triglyceride-based epoxies possess the potential to be highly sustainable epoxies if their
epoxy equivalent weight is reduced to values of conventional Diglycidyl ether of
Bisphenol-A. Hence, triglycerides sourced from perilla oil that possess higher functionality
were selected and epoxidized. To obtain epoxidized triglyceride with minimal oxirane
cleavage, epoxidation kinetics was systematically studied, and optimal synthesis
conditions were determined. A pseudo two-phase model was developed that would
demonstrate the variation in reactivity of individual double bonds based on their position
iii
as the reaction proceeds. Synthesized epoxidized perilla oil exhibited epoxy equivalent
weight of ~164 g/eq which was comparable to Diglycidyl ether of Bisphenol-A.
Photo-curing was explored as potential sustainable manufacturing technique due to
its fast cure; however, UV attenuation is a major hurdle in curing thicker parts (> 1 mm).
Since free-radical mechanism was traditionally studied in photo-cure literature, acrylated
epoxidized triglyceride was selected to cure thicker parts. Initially, cure kinetics was
studied via photo-calorimetry and appropriate process parameters were selected to cure
acrylated triglyceride. In order to process natural fiber-reinforced composite, three
different natural fibers, possessing diversified composition of cellulose, hemi-cellulose and
lignin content, were selected to understand the effect of fiber constituent on photo-
curability. Acrylated epoxidized soybean oil was chosen as matrix material and processed
via both thermal- and photo-curing, and their thermal and mechanical performance was
evaluated. Photo-curability of natural fiber-reinforced composites was demonstrated for
the first time.

iv
ACKNOWLEDGMENTS
I would like to express my deep sense of gratitude and sincere thanks to my research
advisor, Dr. Srikanth Pilla, and co-advisor, Dr. Beshah Ayalew, for providing their
valuable and inspiring guidance throughout the duration of my research at CU-ICAR.
Furthermore, I am grateful to both of them for the motivation and encouragement they have
shown towards me at every step of my research, without which this work would not have
been possible. I would also like to sincerely thank my committee members, Dr. Igor
Luzinov and Dr. Philip Brown, for their research insights, support and encouragement
provided to me throughout the entirety of my research.
As I complete this thesis, I would also like to extend my sincere thanks to the National
Science Foundation (NSF) Award #CMMI-1537756 as well as to the Southern Automotive
Women’s Scholarship (SAWF) for financially supporting my research and studies at
Clemson University, without which it would not have been possible to pursue my research.
Special thanks are also reserved in particular to Rakesh K. Iyer and Sai Aditya Pradeep,
my research group colleagues who have been an immense source of support as friends and
colleagues. Additionally, I am also grateful to my teachers, particularly Dr. Terry Tritt
(formerly from Department of Physics at Clemson University), for having trusted me,
constantly motivated me and helped me to build a strong foundation for my future. I am
also grateful to Ms. Kimberly Ivey of the Material Science and Engineering Department
for having helped me in characterizing samples and giving useful insights on my research.

v
Last, and probably the most important, I also wish to take this opportunity to acknowledge
my deepest sense of gratitude to those without whom this would not have been possible:
my family that is currently in India. I am indebted in particular to my father who made me
realize the importance of education at a very young age, the good fruits of which I have
continued to bear even as I complete this thesis, and hopefully will continue to bear them
later in my life.

vi
LIST OF ABBREVATIONS
Abbreviation Full form
AELO Acrylated epoxidized linseed oil
AESO Acrylated epoxidized soybean oil
AIER Acidic ion-exchange resins
BPA Bisphenol-A
DGEBA Diglycidyl ether of bisphenol-a
DMPA 2,2-dimethoxy -2- phenylacetophenone
DSC Differential Scanning Calorimetry
ECH Epichlorohydrin
EEW Epoxy equivalent weight
ELO Epoxidized linseed oil
ENLO Epoxynorbornene linseed oil
EPeO Epoxidized perilla oil
EPO Epoxidized palm oil
ESO Epoxidized soybean oil
EV Epoxy value
EVO Epoxidized vegetable oil
FE Freshwater ecotoxicity
FPM Fine particulate matter formation
FRS Fossil resource scarcity
vii
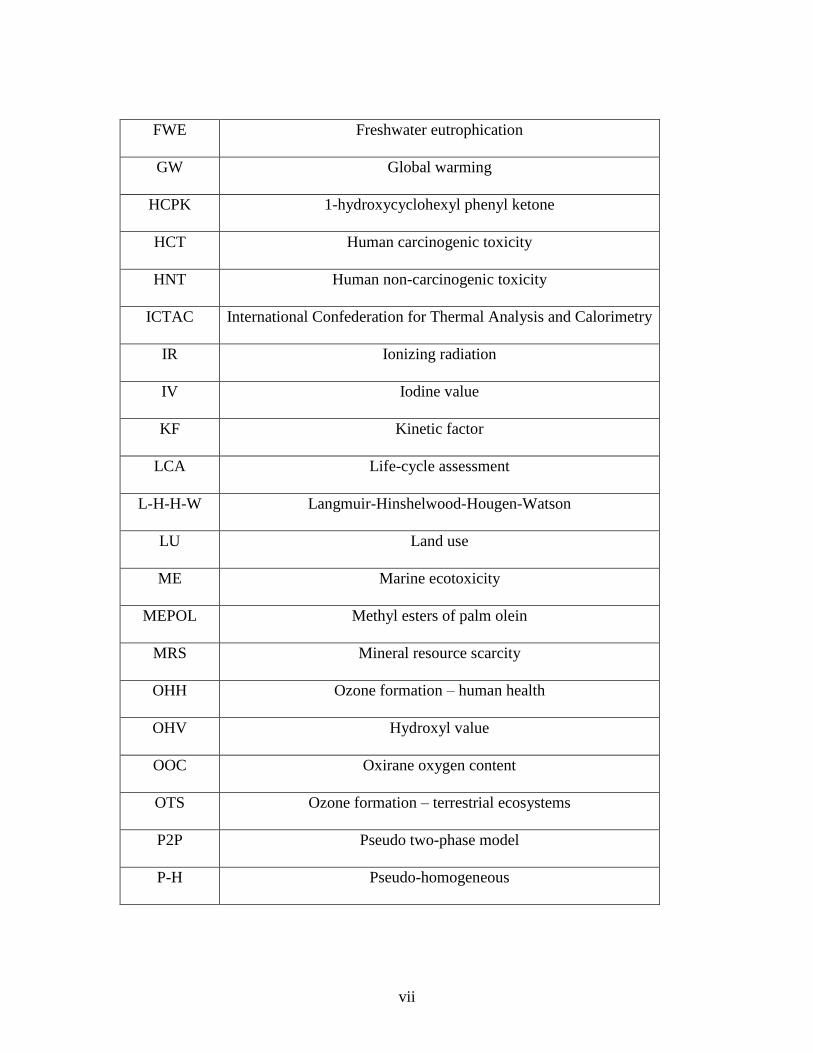
FWE Freshwater eutrophication
GW Global warming
HCPK 1-hydroxycyclohexyl phenyl ketone
HCT Human carcinogenic toxicity
HNT Human non-carcinogenic toxicity
ICTAC International Confederation for Thermal Analysis and Calorimetry
IR Ionizing radiation
IV Iodine value
KF Kinetic factor
LCA Life-cycle assessment
L-H-H-W Langmuir-Hinshelwood-Hougen-Watson
LU Land use
ME Marine ecotoxicity
MEPOL Methyl esters of palm olein
MRS Mineral resource scarcity
OHH Ozone formation – human health
OHV Hydroxyl value
OOC Oxirane oxygen content
OTS Ozone formation – terrestrial ecosystems
P2P Pseudo two-phase model
P-H Pseudo-homogeneous

viii
PI Photo-initiator
RMS Root mean square
ROC Relative oxirane conversion
RSS Residual sum of least squares
RT Room temperature
RT-FTIR Real time Fourier Transform Infra-red spectroscopy
SCC Stepped-concurrent curing
SOD Stratospheric ozone depletion
TA Terrestrial acidification
TBPB Tert-butyl perbenzoate
TE Terrestrial ecotoxicity
TEAB Tetraethyl ammonium bromide
TGA Thermogravimetry analysis
UV Ultra-violet
WC Water consumption
ix
TABLE OF CONTENTS
ABSTRACT ......................................................................................................................... i
ACKNOWLEDGMENTS ................................................................................................. iv
LIST OF ABBREVATIONS ............................................................................................. vi
TABLE OF CONTENTS ................................................................................................... ix
LIST OF TABLES ........................................................................................................... xiii
LIST OF FIGURES ......................................................................................................... xiv
I INTRODUCTION .............................................................................................. 1
1. Sustainable Composites: Challenges and Opportunities ...................... 1
1.1. Organization of Thesis ...................................................................... 6
1.2. Sustainable Epoxy: Panoramic View ................................................ 7
1.3. Photo Curing as Alternate Sustainable Manufacturing for Acrylated
Epoxidized Triglycerides .......................................................................... 12
II EXPERIMENTAL ............................................................................................ 18
2. Experimental Methods ....................................................................... 18
2.1. Life Cycle Assessment of Bio-epoxies ........................................... 18
2.1.1. Goal Scope and Functional Unit .................................................. 18
2.1.2. LCA Inventory and Impact Assessment....................................... 20
2.2. Synthesis of Sustainable Epoxy from Triglyceride Molecule ......... 23
2.2.1. Epoxidation Kinetics .................................................................... 23
2.2.2. Oxirane Ring Cleavage Kinetics .................................................. 24
2.2.3. Characterization ........................................................................... 25
2.2.3.1. Iodine Value .............................................................................. 25
2.2.3.2. Epoxy Content (Oxirane Oxygen Content) ............................... 25
2.2.3.3. α-Glycol Content ....................................................................... 26
2.3. Sustainable Manufacturing .............................................................. 27
2.3.1. Processing of Acrylated Epoxidized Soybean Oil ....................... 27
2.3.2. Natural Fiber Mat and Composite ................................................ 28
2.3.2.1. Photo-curing of Resin and Fiber-Reinforced Composite .......... 30
2.3.2.2. Thermal Curing of Resin and Fiber Reinforced Composite ..... 31
x
2.3.3. Characterization ........................................................................... 31
2.3.3.1. Photo Calorimetry ..................................................................... 31
2.3.3.2. Differential Scanning Calorimetry ............................................ 32
2.3.3.3. Background on Cure Kinetics ................................................... 33
2.3.3.4. Photo-DSC: Model-fitting Method .............................................. 35
2.3.3.5. Photo-DSC: Model-free Isoconversional Method ....................... 38
2.3.3.6. Thermal DSC: Model-free Isoconversional Method ................... 38
2.3.3.7. Thermogravimetry Analysis ...................................................... 40
2.3.3.8. UV Transmission Measurement ................................................ 41
2.3.3.9. Tensile Testing .......................................................................... 41
III LIFE CYCLE ASSESSMENT ......................................................................... 42
3. Life Cycle Inventory .......................................................................... 42
3.1. Life Cycle Impact Assessment – Results ........................................ 45
3.2. Life Cycle Impact Assessment – Discussion .................................. 48
IV SYNTHESIS OF SUSTAINABLE EPOXY FROM A TRIGLYCERIDE
MOLECULE ..................................................................................................... 51
4. Epoxidation Reaction and Conditions ................................................ 51
4.1. Results and Discussion .................................................................... 53
4.1.1. Rate of Epoxidation ...................................................................... 53
4.1.2. Epoxy Equivalent Weight (𝑾𝒆𝒆𝒘 or EEW) ............................... 57
4.2. Kinetics and Thermodynamics ........................................................ 59
4.2.1. Epoxidation Kinetics .................................................................... 59
4.2.2. Oxirane Cleavage during In-situ Epoxidation .............................. 62
4.2.3. Post-oxirane Cleavage Kinetics ................................................... 63
4.2.4. Epoxidation Thermodynamics ..................................................... 66
V INFLUENCE OF DOUBLE BOND POSITION ON EPOXIDATION
KINETICS ........................................................................................................ 69
5. Kinetic Model ..................................................................................... 69
5.1. Parameter Estimation and Model Validation .................................. 75
5.2. Results and Discussion .................................................................... 76
5.2.1. Influence of Double Bond Position on its Reactivity ................... 76
5.2.2. Reactivity of Double Bond and Epoxy Groups at Different Bond
Positions – Scenario S1 ............................................................................. 79

xi
5.2.3. Reactivity of Double Bond and Epoxy Groups at Different Bond
Positions – Scenario S2 ............................................................................. 80
VI PHOTO-CURE KINETICS OF ACRYLATED EPOXIDIZED SOYBEAN
OIL .................................................................................................................... 84
6. Results and Discussion ....................................................................... 84
6.1. Change in Enthalpy and Reaction Time Under Different Process
Conditions ................................................................................................. 84
6.2. Theoretical Heat of Reaction........................................................... 87
6.3. Effect of Photo-Initiator Type and Concentration on Extent of Cure
88
6.4. Kinetic Analysis .............................................................................. 90
6.4.1. Model-fitting Method ................................................................... 90
6.4.2. Model-free Isoconversional Method ............................................ 92
6.5. Light Intensity Exponent – Termination Mechanism ..................... 94
6.6. Discussion ....................................................................................... 95
6.6.1. Vitrification and Steric Hinderance on Extent of Cure ................ 95
6.7. Activation Energy Dependence on Conversion .............................. 98
VII THERMAL CURE KINETICS OF ACRYLATED EPOXIDIZED SOYBEAN
OIL .................................................................................................................. 100
7. Results and Discussion ..................................................................... 100
7.1. Effect of Thermal-initiator Concentration on Heat Flow .............. 100
7.2. Extent of Cure ............................................................................... 102
7.3. Cure Kinetics ................................................................................. 104
7.4. Effect of Initiator Concentration on Activation Energy ................ 105
VIII PHOTO CURABILITY OF NATURAL FIBER-REINFORCED
ACRYLATED EPOXIDIZED SOYBEAN OIL ............................................ 109
8. Results and Discussion ..................................................................... 109
8.1. Photo-curing of Thicker Parts ....................................................... 109
8.2. Photo-curing of Natural Fiber-Reinforced Composite .................. 111
8.3. Mechanical Performance of AESO ............................................... 112
8.4. Mechanical and Thermal Performance of Natural Fiber-Reinforced
Composites .............................................................................................. 115
IX THERMAL CURING OF NATURAL FIBER REINFORCED ACRYLATED
EPOXIDIZED SOYBEAN OIL ..................................................................... 117

xii
9. Results and Discussion ..................................................................... 117
9.1. Mechanical and Thermal Performance of AESO and Composites 117
9.2. Effect of Interface on Mechanical Performance ........................... 120
X SUMMARY AND FUTURE WORK ............................................................ 121
10. Conclusions .................................................................................... 121
10.1. Life Cycle Assessment ................................................................ 121
10.2. Synthesis of Sustainable Epoxy .................................................. 122
10.3. Cure Kinetics of Acrylated Triglycerides ................................... 124
10.4. Mechanical Properties of Acrylated Triglycerides ...................... 125
10.5. Future Work ................................................................................ 126
REFERENCES ............................................................................................................... 129

xiii
LIST OF TABLES
Table 1-1: Theoretical and experimentally-determined parameters for triglyceride-based
EVOs studied in literature ................................................................................................... 9 Table 1-2: Various acrylated or epoxidized triglycerides that were tested for photo-
curability ........................................................................................................................... 17 Table 2-1: Various bio-epoxies selected in this LCA study along with their advantages
and disadvantages, mechanical properties, density, epoxy equivalent weight. ................ 22 Table 2-2: Chemical composition of various natural fibers .............................................. 29 Table 3-1: Environmental impacts of vegetable oil-based epoxy and petroleum-based
epoxy ................................................................................................................................. 47
Table 4-1: Kinetic rate constant (𝒌) of epoxidation reaction at different synthesis
temperatures ...................................................................................................................... 61
Table 4-2: Rate constant (𝒌) and pseudo-rate constant (𝒌′) for oxirane cleavage at
different synthesis temperatures ....................................................................................... 65 Table 4-3: Thermodynamic parameters for epoxidation and post-oxirane cleavage
reaction .............................................................................................................................. 67 Table 6-1: Enthalpy of reaction and peak time for photo curing of AESO at different
photo-initiator concentration, intensity and temperature obtained from Photo-DSC for
low-intensity regime. ........................................................................................................ 85 Table 6-2: Enthalpy of reaction and peak time for photo curing of AESO at different
photo-initiator concentration, medium-light intensity and temperature obtained from
Photo-DSC ........................................................................................................................ 86 Table 6-3: Rate constant and reaction order predicted by modified Kamal’s model ....... 92 Table 7-1: Heat flow values for AESO samples at varying initiator concentration ....... 104
Table 8-1: Strength, Young’s modulus and Tensile toughness of AESO with varying
photo-initiator concentration (1, 2 and 4 wt. %) ............................................................. 114 Table 8-2: Mechanical properties and heat-resistant index of UV-cured natural fiber-
reinforced composites ..................................................................................................... 116
Table 9-1: Heat resistant index/temperature (𝑇𝑠) and other important temperatures (𝑇5,
𝑇30) for chosen fibers (flax, areca and coir) .................................................................. 117 Table 9-2: Strength, Young’s modulus and tensile toughness of AESO with varying
photo-initiator concentration (1, 2 and 4 wt. %) ............................................................. 118
Table 9-3: Mechanical properties and heat resistant index/temperature (𝑇𝑠) of fiber-
reinforced composites ..................................................................................................... 119
xiv
LIST OF FIGURES
Figure 1-1: Challenges that exist in both state-of-the-art and alternative paradigms in
selection of matrix material and manufacturing technique for processing natural fiber-
reinforced composites. ........................................................................................................ 3 Figure 1-2: Key aspects of sustainable manufacturing ....................................................... 3 Figure 1-3: Various research gaps and the proposed tasks to address them ....................... 6
Figure 1-4: Variation in (a) tensile strength and (b) tensile modulus with acrylate
functionality (no. of acrylate groups per triglyceride molecule) for polymers containing
87.5 mol. % styrene (filled symbols) and no styrene (open symbols)65 ........................... 14 Figure 1-5: Number of acrylate groups reportedly lost on account of intramolecular
cyclization of triglycerides for polymers that were copolymerized with styrene65 .......... 15 Figure 2-1: System boundary considered in this LCA study ............................................ 19
Figure 2-2: Step-by-step manufacturing of randomly oriented areca and coir mats ........ 29 Figure 2-3: Step-by-step procedure for processing of composite ..................................... 30 Figure 3-1: Step-by-step procedure for synthesis of bark-based epoxy (B-Epoxy) ......... 43
Figure 3-2: Step-by-step process for lignin-based epoxy (L-Epoxy) ............................... 44 Figure 3-3: Comparison of environmental performance of the three bio-epoxy systems
(B-epoxy, L-epoxy and V-epoxy) on 17 impact categories under the hierarchist
perspective of ReCiPe midpoint method .......................................................................... 46 Figure 3-4: Comparison of the environmental performance of vegetable oil-based epoxy
(V-epoxy) and petroleum-based epoxy (P-epoxy) on 17 impact categories under the
hierarchist perspective of ReCiPe midpoint method ........................................................ 46
Figure 4-1: Schematic of epoxy formation and side-reactions during epoxidation of
vegetable oils (VOs) ......................................................................................................... 52
Figure 4-2: a) Iodine Value b) Relative Oxirane Conversion c) α-Glycol content of EPeO
as a function of synthesis temperature and reaction duration. .......................................... 55
Figure 4-3: Epoxy equivalent weight (EEW) of EPeO as a function of synthesis
temperature and reaction duration .................................................................................... 58 Figure 4-4: a) Plot of vs time {ln (H2O2]0-[EP])} for epoxidation of perilla oil by
performic acid b) Arrhenius plot for epoxidation reaction and c) Arrhenius plot for post-
oxirane ring cleavage reaction .......................................................................................... 60
Figure 5-1: (a) Major reactions occurring during the epoxidation of triglyceride: (i)
Reaction I: Acid-catalyzed formation of performic acid; (ii) Reaction II: Formation of
epoxy groups via reaction between performic acid and double bond; and (iii) Reaction
III: Ring-opening reaction due to attack of formic acid on epoxy groups; and (b)
Triglyceride molecule that indicates the position of double bonds in different fatty acids.
........................................................................................................................................... 70 Figure 5-2: Experimentally obtained and model-predicted (for all four scenarios): a)
Iodine values and b) Epoxy values at reaction temperature of 40°C; c) Iodine values and
d) Epoxy values at reaction temperature of 60°C; e) Iodine values and f) Epoxy values
during model validation at reaction temperature of 50°C; and g) Optimized cost function

xv
(RMS value) of the developed model for all four scenarios at the three reaction
temperatures ...................................................................................................................... 77
Figure 5-3: (a to f) Variation in the reactivity of the double bond and epoxy groups, based
on their position at different reaction temperatures and reaction durations, for scenario S1
........................................................................................................................................... 81 Figure 5-4: (a to d) Variation in the reactivity of the double bond and epoxy groups,
based on their position at different reaction temperatures and durations, for scenario S2 82
Figure 6-1: Extent of conversion (𝛼) as a function of time during photo curing of AESO
at varying photo-initiator concentration, intensity and temperature for two different
photo-initiators in the low-intensity regime. ..................................................................... 89
Figure 6-2: Extent of conversion (𝛼) as a function of time during photo curing of AESO
at varying photo-initiator concentration, intensity and temperature for two different
photo-initiators in the medium-intensity regime............................................................... 90
Figure 6-3: Experimental and model-fitted (Kamal-Sourour model) values of dα/dt as a
function of α for AESO containing 2 wt. % DMPA photo-cured at 25°C and UV intensity
of 30 mW/cm2. .................................................................................................................. 91 Figure 6-4: Experimental data for dα/dt as a function of α at 25, 50 and 75°C, fitted with
the modified Kamal’s model, for two photo-initiators: (a) DMPA and (b) HCPK. ......... 91 Figure 6-5: Isoconversional plots of the extent of conversion in the range of 0.05-0.50 for
AESO containing 2 wt. % of DMPA as photo-initiator.................................................... 93 Figure 6-6: Variation in effective activation energy with extent of conversion for AESO
samples photo-cured using two different photo-initiators (DMPA and HCPK)............... 93
Figure 7-1: Heat flow as a function of temperature for AESO samples containing (a) 1 wt.
% and (b) 2 wt. % of thermal initiator at different heating rates .................................... 101
Figure 7-2: Variation in the extent of curing (𝛼) as a function of time for AESO resin
precursors containing 1 wt. % of initiator concentration at different heating rates ........ 103 Figure 7-3: Plots for application of (a) Kissinger and (b) Starink methods to evaluate
reaction kinetics for curing of AESO at initiator concentration of 1 wt. % .................... 106
Figure 7-4: Variation in effective activation energy (𝐸𝛼) as a function of the extent of
conversion (𝛼) for thermally cured AESO at different initiator concentrations ............. 108 Figure 8-1: Representative photo cured tensile specimens both prior to and after the
tensile test........................................................................................................................ 110
Figure 8-2: Intensity variation at the bottom of the layer (or 3 mm thick) ..................... 111 Figure 8-3: Challenges encountered with respect to fiber wettability during the
impregnation of fiber with resin precursor ..................................................................... 113 Figure 8-4: Influence of the trapped initiator radicals on the mechanical performance of
the material...................................................................................................................... 114
Figure 8-5: Thermo-gravimetry analysis of natural fiber-reinforced composites cured via
UV radiation.................................................................................................................... 116
Figure 9-1: Thermogravimetry analysis of fiber-reinforced composites processed via
thermal curing. ................................................................................................................ 119

1
CHAPTER ONE
INTRODUCTION
1. Sustainable Composites: Challenges and Opportunities
The rise in public awareness has strengthened the hands of policymakers and
governments to formulate stringent regulations for monitoring and protecting our
environment. This has pushed organizations, industries and institutions across multiple
sectors towards implementing measures to enhance the environmental sustainability of
their products and services at each step1. In particular, the aerospace and automotive sectors
have been working towards the use of natural fiber-reinforced composites as alternatives
to existing materials in order to achieve the twin goals of superior performance (through
lightweight) and enhanced ecological sustainability2,3. Among the different choices that
exist for the matrix material of such composites, thermosets are preferred for their
combination of superior mechanical properties and high thermal and chemical resistance
that they offer. However, several critical challenges exist with regard to obtaining a truly
sustainable high-performance thermoset composite, beginning with material selection and
extending to its manufacturing, as shown in Figure 1-1.
From the standpoint of selection of matrix material, epoxies have a major stake
among all thermosets due to their versatility and an optimal balance of mechanical and
thermal properties4–6. However, conventional epoxies suffer from two issues that impact
their ecological sustainability. First, these are usually petroleum-derived epoxies, i.e., they
are dependent on a non-renewable resource. Second, such epoxies, e.g. Diglycidyl ether of
2
bisphenol-A (DGEBA) – the most commonly used epoxy chemistry4 – involve the use of
most hazardous and toxic chemicals such as Bisphenol-A (BPA) and Epichlorohydrin
(ECH)7–9, making them hazardous for both human health and environment10. To address
these issues, a plethora of research initiatives have been undertaken in recent years towards
elucidating the synthesis of bio-based epoxies as alternatives to conventional epoxies5,11,12.
However, these initiatives have remained confined to the development of eco-friendly
replacements solely for BPA4–6, while neglecting the need to address the toxicity of ECH,
which has been classified as class 1B carcinogen7. Hence, there exists a need to synthesize
epoxies derived from biological resources that are completely free of toxic chemicals10,13,
yet also exhibit properties comparable to those of DGEBA-based epoxies. While there are
several different chemical moieties that can be sourced from various biological sources,
triglycerides are increasingly being used as potential alternative for different polymers14,15.
Conventionally, triglycerides can be categorized as non-drying oils, semi-drying oils and
drying oils based on the number of unsaturated groups present in their respective fatty acid
chains16. Among these, non-drying and semi-drying oils do not exhibit auto-oxidation
behavior. In contrast, drying oils are conventionally used in paints and coating applications
due to their auto-oxidation behavior (formation of three-dimensional crosslinked network
when exposed to oxygen and/or sunlight)17, but the poor reactivity of internal double bonds
in these oils renders them unsuitable (due to inferior properties) for any application. Hence,
chemical modification of these double bonds with a highly reactive functional group (such
as epoxies and acrylates) has been traditionally carried out to utilize these triglycerides as
potential alternatives to conventional petroleum-based polymers18,19.
3
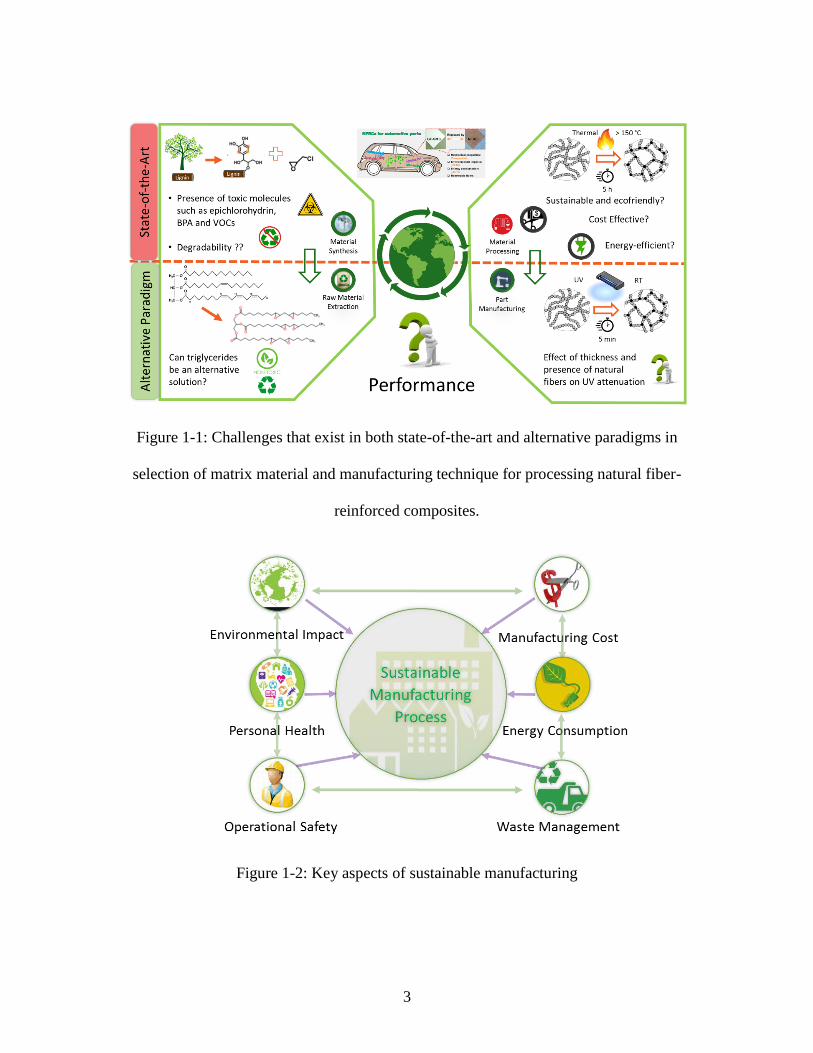
Figure 1-1: Challenges that exist in both state-of-the-art and alternative paradigms in
selection of matrix material and manufacturing technique for processing natural fiber-
reinforced composites.
Figure 1-2: Key aspects of sustainable manufacturing
4
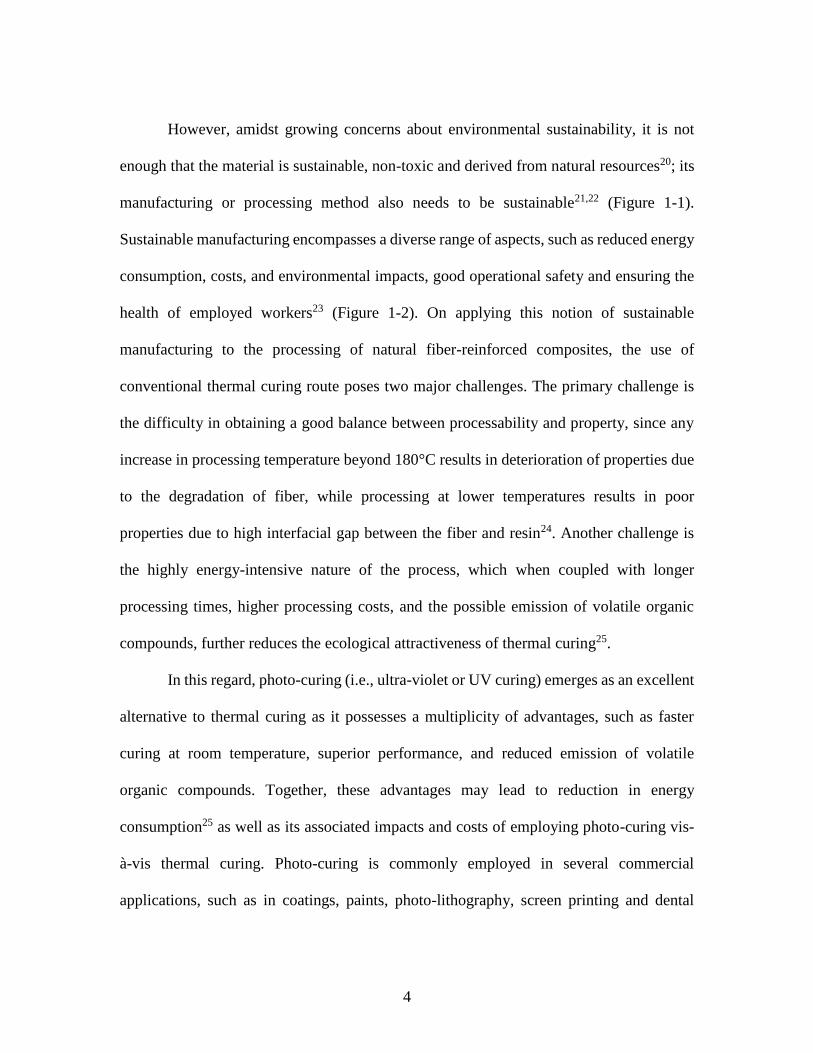
However, amidst growing concerns about environmental sustainability, it is not
enough that the material is sustainable, non-toxic and derived from natural resources20; its
manufacturing or processing method also needs to be sustainable21,22 (Figure 1-1).
Sustainable manufacturing encompasses a diverse range of aspects, such as reduced energy
consumption, costs, and environmental impacts, good operational safety and ensuring the
health of employed workers23 (Figure 1-2). On applying this notion of sustainable
manufacturing to the processing of natural fiber-reinforced composites, the use of
conventional thermal curing route poses two major challenges. The primary challenge is
the difficulty in obtaining a good balance between processability and property, since any
increase in processing temperature beyond 180°C results in deterioration of properties due
to the degradation of fiber, while processing at lower temperatures results in poor
properties due to high interfacial gap between the fiber and resin24. Another challenge is
the highly energy-intensive nature of the process, which when coupled with longer
processing times, higher processing costs, and the possible emission of volatile organic
compounds, further reduces the ecological attractiveness of thermal curing25.
In this regard, photo-curing (i.e., ultra-violet or UV curing) emerges as an excellent
alternative to thermal curing as it possesses a multiplicity of advantages, such as faster
curing at room temperature, superior performance, and reduced emission of volatile
organic compounds. Together, these advantages may lead to reduction in energy
consumption25 as well as its associated impacts and costs of employing photo-curing vis-
à-vis thermal curing. Photo-curing is commonly employed in several commercial
applications, such as in coatings, paints, photo-lithography, screen printing and dental
5
filings, but in all these cases, this technique is used only for thin specimens (< 1 mm)26.
This is because UV attenuation constitutes a major hurdle in using photo-curing for
manufacturing composites with higher thickness (> 1 mm)25, thereby hampering its
application for processing thick natural fiber-reinforced composites. Moreover, the
addition of natural fibers (mainly containing lignin) that are not UV-transparent can
accelerate UV attenuation, thereby reducing the extent of photo-curing. To address the
aforementioned concerns, novel techniques such as stepped-concurrent curing (SCC)25
have been developed in recent times. Yet, while the SCC technique has demonstrated the
capability to process 10 mm-thick glass fiber-reinforced unsaturated polyester composite25,
its applicability for their natural fiber-reinforced counterparts remains unknown.
Consequently, despite its potential as an alternative to thermal curing, existing knowledge
on photo-curing cannot be directly applied towards processing thicker (i.e., > 1 mm) natural
fiber-reinforced composites for structural applications.
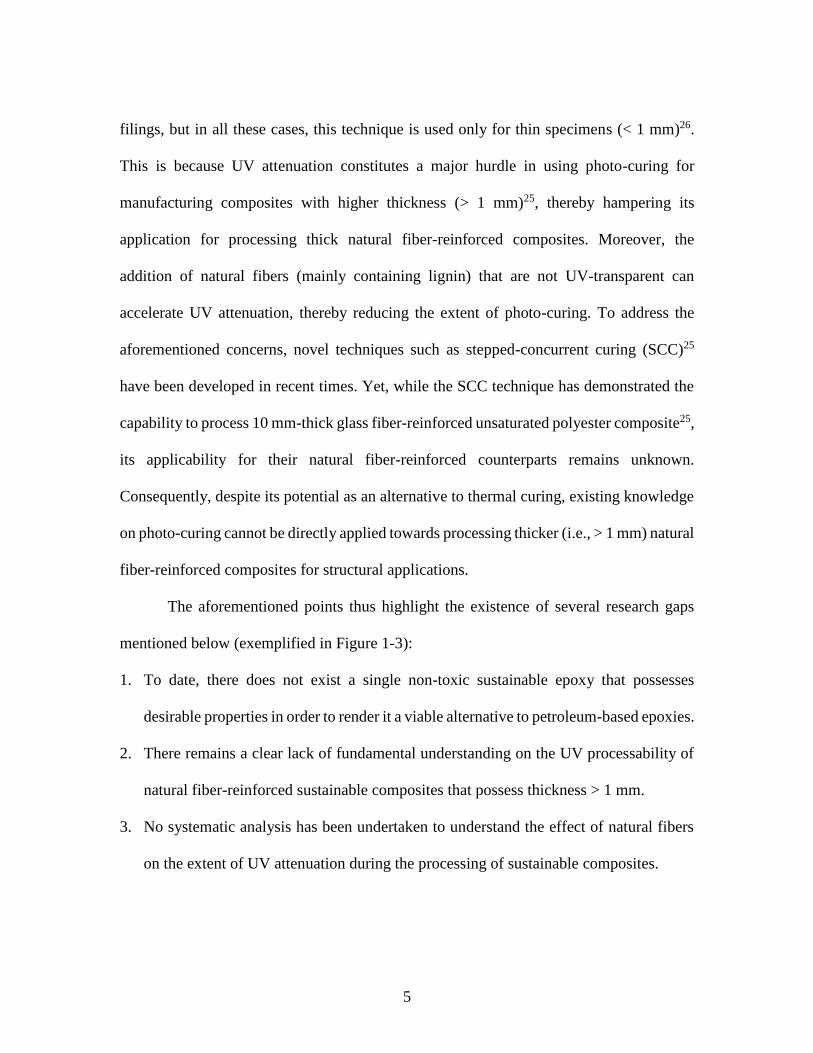
The aforementioned points thus highlight the existence of several research gaps
mentioned below (exemplified in Figure 1-3):
1. To date, there does not exist a single non-toxic sustainable epoxy that possesses
desirable properties in order to render it a viable alternative to petroleum-based epoxies.
2. There remains a clear lack of fundamental understanding on the UV processability of
natural fiber-reinforced sustainable composites that possess thickness > 1 mm.
3. No systematic analysis has been undertaken to understand the effect of natural fibers
on the extent of UV attenuation during the processing of sustainable composites.

6
4. Finally, no study has focused on comparing the impact of the nature of curing process
– thermal or UV – on the properties of natural fiber-reinforced sustainable composites.
Figure 1-3: Various research gaps and the proposed tasks to address them
Hence, this study seeks to address the aforementioned research gaps via the primary
objective of “Processing natural fiber-reinforced triglyceride-based green composites via
sustainable manufacturing method” via several tasks as outlined in Figure 1-3.
1.1. Organization of Thesis
The remainder of this chapter comprehends the current state-of-the-art with regard
to both the synthesis of sustainable epoxy as well as photo-curing as a potential sustainable
manufacturing technique, while the rest of this thesis is organized as described henceforth.
Chapter 2 provides the details of experimental plan carried out in this work. Chapter 3
describes the life-cycle assessment (LCA) of epoxies that are sourced from different bio-
derived materials and compares their performance on several environmental impact
7
categories. This LCA study demonstrates the potential of triglycerides as sustainable
epoxies that can be an alternative to conventional DGEBA.
However, in order to compete with DGEBA, existing triglyceride-based epoxies
also need significant improvement in their functionality. Hence, Chapters 4 and 5 detail the
epoxidation kinetics of triglycerides that possess higher functionality and can thereby
exhibit superior performance. Subsequently, Chapters 6 and 7 respectively describe the
photo-cure and thermal-cure kinetics of acrylated epoxidized triglycerides cured via free
radical mechanism. Further, Chapter 8 details the potential of photons in processing natural
fiber-reinforced green composites and demonstrates the mechanical and thermal
performance of the processed composites. Chapter 9 describes the performance of
thermally cured natural fiber-reinforced green composites. Various natural fibers,
containing varying amounts of chemical constituents (such as cellulose, hemi-cellulose,
and lignin), were selected in order to understand the effect of each chemical constituent on
the curing technique. Finally, Chapter 10 provides a brief summary of the entire work and
also sheds light on the directions in which future research can be undertaken.
1.2. Sustainable Epoxy: Panoramic View
In the endeavor towards developing sustainable ecofriendly alternatives to
petroleum-based epoxies, epoxidized triglycerides or epoxidized vegetable oils (EVOs) –
synthesized via Prilezhaev reaction27–30 – have gained significant attention over the past
two decades31,32. Their potential is buttressed by the commercialization of epoxidized
soybean oil (ESO) and epoxidized linseed oil (ELO) as the only two fully bio-based
epoxies (i.e., 100 % bio-epoxy) that are currently available33,34. Regrettably, such epoxies

8
are characterized by poor mechanical properties due to the presence of fewer chemically
modifiable groups, resulting in higher values of epoxy equivalent weight (EEW > 250 g/eq)
(Table 1-1) (lower crosslinking density), and longer aliphatic chains35. Since EEW of
epoxies is directly related to their mechanical properties, such high EEW values hinder the
use of EVOs as sustainable alternatives to conventional petroleum-based epoxies in
structural applications33,34,36.
One way to address this issue is through increasing the number of epoxy groups in
EVOs by selecting triglyceride molecules with high unsaturation content in order to reduce
the EEW of EVOs to < 175 g/eq. Such reduction can be achieved by selecting triglyceride
molecules with larger proportion (> 90 %) of chemically modifiable groups – namely, oleic
(C18:1), linoleic (C18:2) and linolenic (C18:3) acids. However, the occurrence of oxirane
cleavage in the presence of acids during Prilezhaev reaction – a commonly used reaction
in industries for synthesizing EVOs37–39 – makes it impossible to obtain theoretically
predicted EEW values for any EVO (Table 1-1). Hence, a comprehensive knowledge on
reaction kinetics of epoxidation of triglycerides is vital for selecting the appropriate
reaction conditions that would help obtain EVOs with the maximum number of epoxy
groups and minimal occurrence of side reactions.
Further, even though epoxidation kinetics of EVOs synthesized via Prilezhaev
reaction27,28 have been extensively studied in the past, all these studies involve vegetable
oils with no linolenic acid (C18:3) and negligible linoleic acid (C18:2) content – barring
one on soybean oil (5-11 wt. % linolenic acid)39–48. Also, it is well known that double bonds
in linolenic acid (C18:3) are three times more reactive than those in the other two acid

9
groups (oleic and linoleic) of a triglyceride molecule due to the elimination of both steric
and electronic effects49. Hence, it is necessary to understand the epoxidation reaction
kinetics of oils with significant amount (> 50 %) of highly-reactive linolenic acid groups.
Also, most studies on epoxidation kinetics of EVOs have focused either solely on oxirane
ring formation41,43,50 or on oxirane cleavage51, while it is imperative to focus on both types
of reactions given the occurrence of oxirane cleavage as a side reaction.
Table 1-1: Theoretical and experimentally-determined parameters for triglyceride-based
EVOs studied in literature
Vegetable Oil
Iodine Value
(g/100 g)
Theoretically Possible Experimentally Attained
Oxirane Oxygen
(Wt. %)
EEW
(g/Eq)
Oxirane Oxygen
(Wt. %)
EEW
(g/Eq)
Mahua43 88.0 5.26 304.41 3.80 421.05
Castor44 81.5 4.89 327.41 3.83 417.75
Rubber seed45 155.6 8.93 179.15 4.00 400.00
Karanja48 89.0 5.31 301.17 4.21 380.05
Jatropha46 105.0 6.21 257.71 4.50 355.56
Cotton seed41 105.0 6.21 257.71 4.78 334.69
Hemp47 133 7.74 206.83 6.81 235.03
Perilla
(this study)
197.0 11.05 144.83 9.71 164.78
10
Hence, the epoxidation kinetics of perilla oil – a vegetable oil with high linolenic
acid (> 65 %) content – in the presence of homogeneous catalyst (i.e., inorganic acid) via
Prilezhaev reaction was studied to address the aforementioned gap, while also focusing on
both oxirane formation and cleavage reactions during epoxidation to minimize the
occurrence of side reactions. Rate constants of both these reactions during epoxidation
were determined under different reaction conditions to analyze the effect of reaction
temperature and time. Further details on the entire experiment, as well as a detailed
discussion of the results obtained have been provided in Chapters 2 and 4 respectively.
Interestingly, among the studies undertaken on epoxidation kinetics of triglycerides
via Prilezhaev reaction, such research has been widely studied in the presence of inorganic
acids (Sulfuric, nitric, hydrochloric acids) as catalyst39–48. However, these studies are often
critiqued for the role of acid in causing extensive oxirane cleavage observed during the
reaction52. This has led to a shift in recent years towards the use of solid acidic ion-
exchange resins (AIER) as alternatives to liquid inorganic acids53. AIER possesses the
ability to trap various reactants that can react with epoxy, such as formic acid and hydrogen
peroxide, thus allowing the obtainment of EVOs with minimal oxirane cleavage53–55. Yet,
such a shift is marked by enhanced complexity in epoxidation reaction kinetics due to the
occurrence of chemical reactions in three phases: oil, water and solid catalyst56.
In order to understand reaction kinetics amidst such complexity, epoxidation
kinetics of triglyceride (obtained from fish oil) in the presence of ion-exchange resin as
catalyst was first studied by Wisniak and Navarrete57. However, their model failed to
adequately explain epoxidation reaction kinetics on account of its simplistic assumption of
11
the reaction being homogeneous, thereby neglecting the effect of various reactants on
epoxy formation and cleavage44,58. Since then, numerous kinetic models have been
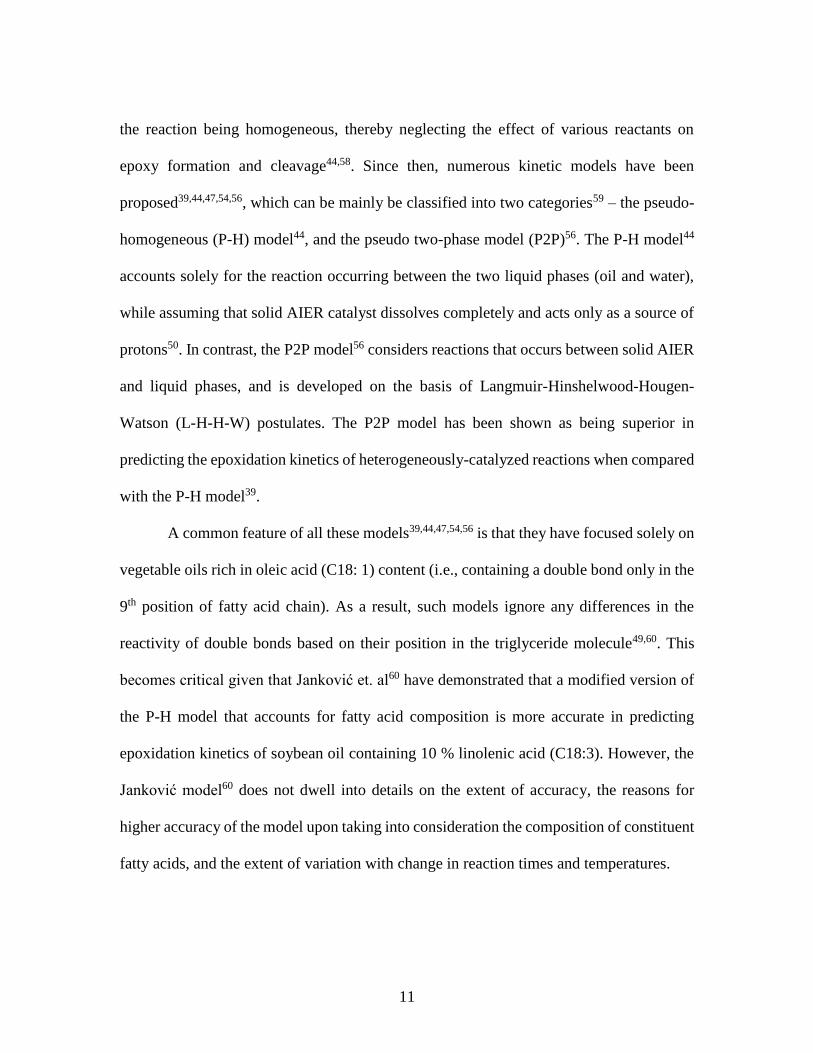
proposed39,44,47,54,56, which can be mainly be classified into two categories59 – the pseudo-
homogeneous (P-H) model44, and the pseudo two-phase model (P2P)56. The P-H model44
accounts solely for the reaction occurring between the two liquid phases (oil and water),
while assuming that solid AIER catalyst dissolves completely and acts only as a source of
protons50. In contrast, the P2P model56 considers reactions that occurs between solid AIER
and liquid phases, and is developed on the basis of Langmuir-Hinshelwood-Hougen-
Watson (L-H-H-W) postulates. The P2P model has been shown as being superior in
predicting the epoxidation kinetics of heterogeneously-catalyzed reactions when compared
with the P-H model39.
A common feature of all these models39,44,47,54,56 is that they have focused solely on
vegetable oils rich in oleic acid (C18: 1) content (i.e., containing a double bond only in the
9th position of fatty acid chain). As a result, such models ignore any differences in the
reactivity of double bonds based on their position in the triglyceride molecule49,60. This
becomes critical given that Janković et. al60 have demonstrated that a modified version of
the P-H model that accounts for fatty acid composition is more accurate in predicting
epoxidation kinetics of soybean oil containing 10 % linolenic acid (C18:3). However, the
Janković model60 does not dwell into details on the extent of accuracy, the reasons for
higher accuracy of the model upon taking into consideration the composition of constituent
fatty acids, and the extent of variation with change in reaction times and temperatures.
12
Hence, Chapter 5 of this thesis details a pseudo two-phase model that considers the
variation in reactivity of double bonds based on their position during both epoxy formation
(main reaction) and cleavage (side reaction due to attack by formic acid). High-linolenic
perilla oil, containing > 65 wt. % linolenic acid, was epoxidized via Prilezhaev reaction28
in the presence of a heterogeneous catalyst (AIER). Reaction kinetics was constantly
monitored by experimentally determining the variation in iodine and epoxy values at
regular time intervals. Various reaction kinetic parameters were determined by fitting
experimentally obtained data using genetic algorithm, which was selected given the
flexibility and simplicity it offers in optimization61. A good fit was observed between
experimentally obtained results and values predicted by the model, indicating good
accuracy of the proposed model. Together, the outcome of the work on both
homogeneously- and heterogeneously-catalyzed epoxidation of triglycerides with high
linolenic content can enable the synthesis of triglyceride-based sustainable epoxies that are
superior to conventional DGEBA chemistry in the future.
1.3. Photo Curing as Alternate Sustainable Manufacturing for Acrylated
Epoxidized Triglycerides
Photo-curing can take place either via free radical or cationic mechanisms62.
Thermosets such as acrylates and vinyl ethers cure via free radical mechanism, while
epoxies on the other hand cure via cationic mechanism63. Traditionally, the lack of suitable
photo-initiators for curing materials via cationic mechanism has led to enhanced focus on
free radical-based curing64. Hence, acrylated epoxidized vegetable oil – that can be cured
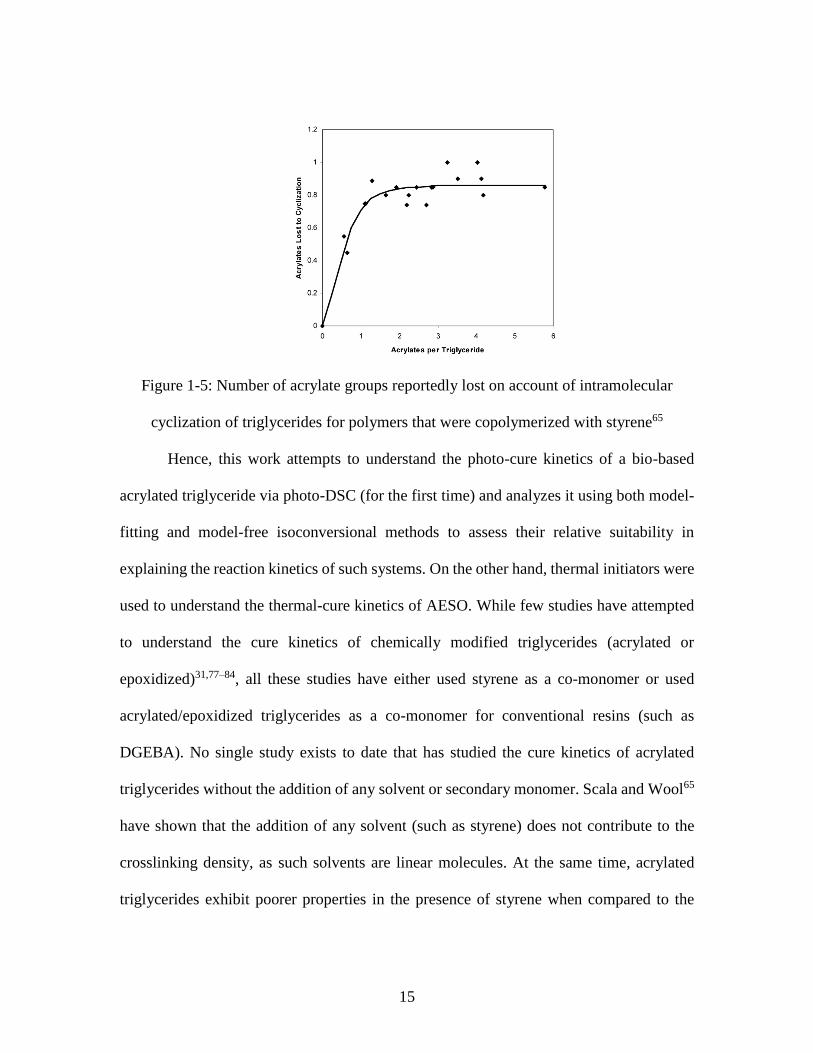
via free radical mechanism – was selected for this work. Previously, Scala and Wool65 have

13
shown that mechanical properties of acrylated triglycerides tend to level-off (i.e., remain
constant) beyond 3 acrylate groups per triglyceride molecule (Figure 1-4) due to the
occurrence of intermolecular cyclization (Figure 1-5). Theoretically, acrylated epoxidized
perilla oil will possess ~ 9 acrylate groups per triglyceride molecule. Since acrylated
epoxidized soybean oil is commercially available and possesses 4.2 acrylate groups per
triglyceride molecule, and its cure behavior is not expected to differ significantly from that
of its perilla oil acrylated (or triglyceride) counterpart, acrylated epoxidized soybean oil
was chosen to understand the cure kinetics of acrylated triglycerides.
While DSC (Differential Scanning Calorimetry) is commonly used to understand
cure kinetics of thermally activated processes, both photo-DSC and RT-FTIR (Real time
Fourier Transform Infra-red spectroscopy) have been commonly used to study photo-cure
kinetics66,67. Cure kinetics is generally monitored using DSC (both photo- and thermal-
DSC) by measuring the change in enthalpy during curing, while RT-FTIR monitors the
change in intensity of IR absorption spectra of a specific functional group68. DSC (photo-
DSC or thermal-DSC) remains the oldest technique available for analyzing the photo-cure
kinetics of any reaction in a more reliable and robust manner69,70. In addition, photo-DSC
also helps us obtain the average degree of cure for the material as a whole.
However, a true study of reaction kinetics necessitates the marriage of experimental
observation of cure behavior with its analysis using kinetic models. Typically, any reaction
kinetics is studied either via model-fitting method and/or model-free isoconversional
method71. Among the two types of methods, model-free isoconversional methods are well
known for being more realistic and accurate in predicting reaction kinetics as they are free

14
from any assumptions and determine the variation in effective activation energy with the
progression of the reaction72–74. Nevertheless, since their inception, such isoconversional
methods have been mainly used to understand non-isothermal reaction kinetics, with
model-fitting methods used predominantly in case of their isothermal counterparts72,75.
This can be ascribed to the premise of isoconversional methods being inaccurate for
isothermal reaction kinetics vis-à-vis their relatively higher accuracy for non-isothermal
reactions – an outcome of the initial application of isoconversional methods for thermal
degradation reactions72,75. However, isothermal curing of any thermoset may lead to
gelation and vitrification of the polymer – an isoconversional phenomenon76. This suggests
that determining the photo-cure reaction kinetics via isoconversional methods may provide
useful insights about the reaction that may otherwise not be obtained via use of model-
fitting methods.
Figure 1-4: Variation in (a) tensile strength and (b) tensile modulus with acrylate
functionality (no. of acrylate groups per triglyceride molecule) for polymers containing
87.5 mol. % styrene (filled symbols) and no styrene (open symbols)65
15
Figure 1-5: Number of acrylate groups reportedly lost on account of intramolecular
cyclization of triglycerides for polymers that were copolymerized with styrene65
Hence, this work attempts to understand the photo-cure kinetics of a bio-based
acrylated triglyceride via photo-DSC (for the first time) and analyzes it using both model-
fitting and model-free isoconversional methods to assess their relative suitability in
explaining the reaction kinetics of such systems. On the other hand, thermal initiators were
used to understand the thermal-cure kinetics of AESO. While few studies have attempted
to understand the cure kinetics of chemically modified triglycerides (acrylated or
epoxidized)31,77–84, all these studies have either used styrene as a co-monomer or used
acrylated/epoxidized triglycerides as a co-monomer for conventional resins (such as
DGEBA). No single study exists to date that has studied the cure kinetics of acrylated
triglycerides without the addition of any solvent or secondary monomer. Scala and Wool65
have shown that the addition of any solvent (such as styrene) does not contribute to the
crosslinking density, as such solvents are linear molecules. At the same time, acrylated
triglycerides exhibit poorer properties in the presence of styrene when compared to the

16
properties of such triglycerides without styrene (Figure 1-4). Hence, this study aims at
understanding the cure kinetics of acrylated epoxidized soybean oil (AESO) without the
presence of any solvent or co-monomer.
The curing kinetics of unsaturated polyester resin was studied earlier via photo-
DSC in the presence of 2,2-dimethoxy phenylacetophenone (DMPA) as photoinitator25. In
this study, AESO was chosen as the acrylated triglyceride, while two different photo-
initiators (PIs) belonging to the Norish Type-I category (that can undergo unimolecular
bond cleavage or α-Cleavage), namely, DMPA and 1-hydroxycyclohexyl phenyl ketone
(HCPK) were used85. While DMPA possesses a short-lived excited triplet state with a
yellowing character86, HCPK is a non-yellowing PI that is widely used for curing acrylate
monomers87. Photo-cure kinetics of AESO was monitored via photo-DSC under different
conditions by varying PI concentration, temperature and light intensity. For thermal curing,
tert-butyl perbenzoate (TBPB) was used as thermal initiator and varying concentration was
used to study thermal-cure kinetics under dynamic cure conditions. Hence, Chapters 6 and
7 of this thesis detail the photo and thermal cure kinetics of AESO respectively.
Table 1-2 lists the various photo-cured acrylated triglycerides that have been
employed in coatings to date. As can be seen, all these studies have restricted coating
thickness to less than 1 mm. At the same time, in case of fiber-reinforced composites, only
one study88 exists that has attempted to cure thicker (i.e., > 2 mm) glass fiber-reinforced
composites. Interestingly, this study reports that samples had to be cured on both sides due
to poor curing of the bottom layer. Unfortunately, no similar study has been undertaken to
date on the UV curability of natural-fiber reinforced green composites. Hence, Chapter 8

17
describes the processing of natural-fiber reinforced green composites via harnessing the
potential power of photons (for the first time), while Chapter 9 details the performance of
natural-fiber reinforced green composites processed via thermal curing.
Table 1-2: Various acrylated or epoxidized triglycerides that were tested for photo-
curability
Material Curing Mechanism Sample Thickness Tensile Properties
AESO89 Free radical 35 µm
AELO81 Free radical 60 µm
AESO90 Free radical 35 µm
ESO79 Cationic 0.2 mm
ESO91 Cationic 25 µm
EPO92 Cationic 50 µm
ENLO93 Cationic 28 µm ✓
18
CHAPTER TWO
EXPERIMENTAL
2. Experimental Methods
2.1. Life Cycle Assessment of Bio-epoxies
2.1.1. Goal Scope and Functional Unit
The goal of this life-cycle assessment (LCA) study is to evaluate the ecological
performance of bio-epoxies sourced from different biological sources and compare their
impacts with those of conventional petroleum-based epoxy. All these epoxies were
evaluated from cradle-to-factory gate, i.e., sourcing of raw material and its subsequent
extraction, processing and purification of epoxy, followed by the final manufacture of
epoxy panel along with all the input chemicals/materials used. LCA work was undertaken
based on the methodology defined in ISO 14040 and ISO 14044 standards94,95. Both the
use and end-of-life stages of these epoxies have been excluded from this study (Figure 2-1)
– while the use phase is assumed to have no difference on environmental impacts, the end-
of-life stage is neglected due to lack of data availability.
Since any LCA involves a like-for-like comparison, the functional unit of this study
was chosen as a rectangular panel that has length and width of 1 m each and is designed to
withstand a uniform load of 250 N while undergoing a maximum deflection of only 1.5
mm. The choice of this functional unit stemmed from the fact that the idea behind this LCA
study was to identify the most ecofriendly type of bio-epoxy among currently available
bio-derived epoxies. However, the thickness of rectangular panel will vary based on

19
mechanical properties of the selected epoxy. Therefore, to design the panel and estimate
the desired thickness values for each epoxy panel, its corresponding modulus values – as
reported in existing literature13,96–98 – were considered and have been shown in Table 2-1.
Here, each epoxy has been re-named as per the following convention: bark-based epoxy is
B-epoxy; vanillin-based epoxy is actually derived from lignin and is named as L-epoxy;
epoxy derived from vegetable oil or triglyceride is termed V-epoxy; and conventional
petroleum-based epoxy is termed P-epoxy.
Figure 2-1: System boundary considered in this LCA study
20
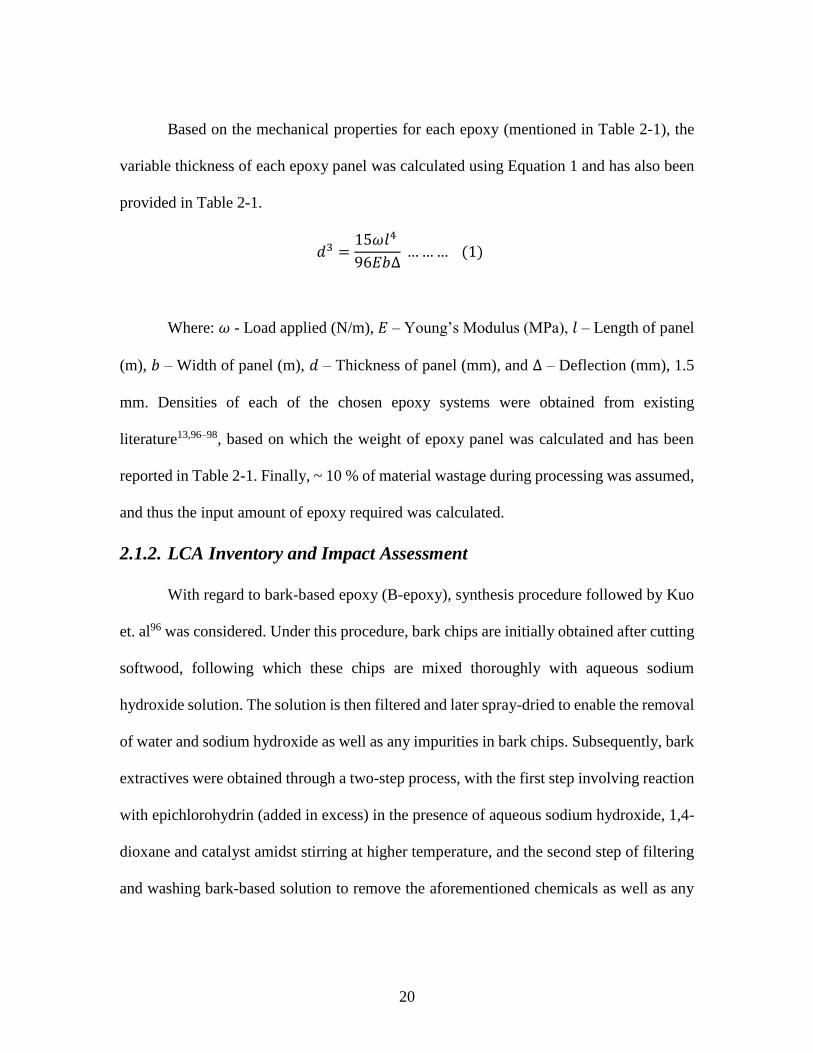
Based on the mechanical properties for each epoxy (mentioned in Table 2-1), the
variable thickness of each epoxy panel was calculated using Equation 1 and has also been
provided in Table 2-1.
𝑑3 =15𝜔𝑙4
96𝐸𝑏∆ … … … (1)
Where: 𝜔 - Load applied (N/m), 𝐸 – Young’s Modulus (MPa), 𝑙 – Length of panel
(m), 𝑏 – Width of panel (m), 𝑑 – Thickness of panel (mm), and ∆ – Deflection (mm), 1.5
mm. Densities of each of the chosen epoxy systems were obtained from existing
literature13,96–98, based on which the weight of epoxy panel was calculated and has been
reported in Table 2-1. Finally, ~ 10 % of material wastage during processing was assumed,
and thus the input amount of epoxy required was calculated.
2.1.2. LCA Inventory and Impact Assessment
With regard to bark-based epoxy (B-epoxy), synthesis procedure followed by Kuo
et. al96 was considered. Under this procedure, bark chips are initially obtained after cutting
softwood, following which these chips are mixed thoroughly with aqueous sodium
hydroxide solution. The solution is then filtered and later spray-dried to enable the removal
of water and sodium hydroxide as well as any impurities in bark chips. Subsequently, bark
extractives were obtained through a two-step process, with the first step involving reaction
with epichlorohydrin (added in excess) in the presence of aqueous sodium hydroxide, 1,4-
dioxane and catalyst amidst stirring at higher temperature, and the second step of filtering
and washing bark-based solution to remove the aforementioned chemicals as well as any

21
salt formed in the process. Finally, rotary evaporation was undertaken to remove any
chemical present in bark epoxy, which was subsequently mixed with petroleum-based
epoxy and hardener and then cured to obtain the final epoxy panel.
Inventory data containing the material and energy flow was developed based on the
synthesis procedure described in literature13,96–98. Based on the developed inventory data
(and use of Ecoinvent 3.4 database), the environmental impacts of all bio-epoxy panels as
well as of the conventional epoxy panel were quantified by applying the hierarchist
perspective of ReCiPe midpoint method99. Environmental impacts were investigated on all
17 midpoint impact categories, namely: GW (Global warming); stratospheric ozone
depletion (SOD); ionizing radiation (IR); ozone formation – human health (OHH); ozone
formation – terrestrial ecosystems (OTS); fine particulate matter formation (FPM);
terrestrial acidification (TA); freshwater eutrophication (FWE); terrestrial ecotoxicity
(TE); freshwater ecotoxicity (FE); marine ecotoxicity (ME); human carcinogenic toxicity
(HCT); human non-carcinogenic toxicity (HNT); land use (LU); mineral resource scarcity
(MRS); fossil resource scarcity (FRS); and water consumption (WC). For each impact
category, the prominent contributing reasons were identified and have been briefly
described. A termination criterion of 1 % was used in this work to determine the significant
contributing reasons for each epoxy.
22
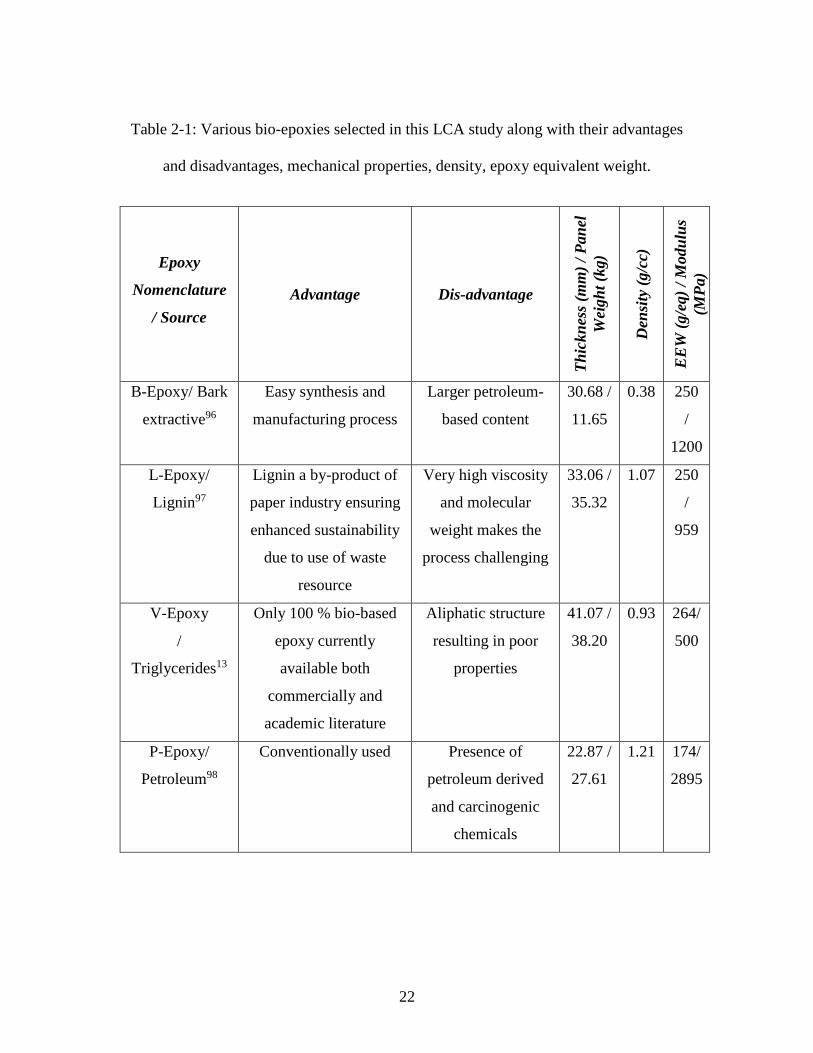
Table 2-1: Various bio-epoxies selected in this LCA study along with their advantages
and disadvantages, mechanical properties, density, epoxy equivalent weight.
Epoxy
Nomenclature
/ Source
Advantage Dis-advantage
Th
ickn
ess
(mm
) /
Pan
el
Wei
gh
t (k
g)
Den
sity
(g/c
c)
EE
W (
g/e
q)
/ M
odu
lus
(MP
a)
B-Epoxy/ Bark
extractive96
Easy synthesis and
manufacturing process
Larger petroleum-
based content
30.68 /
11.65
0.38 250
/
1200
L-Epoxy/
Lignin97
Lignin a by-product of
paper industry ensuring
enhanced sustainability
due to use of waste
resource
Very high viscosity
and molecular
weight makes the
process challenging
33.06 /
35.32
1.07 250
/
959
V-Epoxy
/
Triglycerides13
Only 100 % bio-based
epoxy currently
available both
commercially and
academic literature
Aliphatic structure
resulting in poor
properties
41.07 /
38.20
0.93 264/
500
P-Epoxy/
Petroleum98
Conventionally used Presence of
petroleum derived
and carcinogenic
chemicals
22.87 /
27.61
1.21 174/
2895

23
2.2. Synthesis of Sustainable Epoxy from Triglyceride Molecule
Non-edible perilla oil – extracted from non-edible seeds of Perilla frutescens – was
chosen due to its higher linolenic acid content (~ 62-65 %) compared to other vegetable
oils (VOs), along with linoleic acid (~ 13-15 %) and oleic acid (~ 12-15 %)100,101.
Epoxidation of perilla oil was carried out via Prilezhaev reaction using performic acid
(HCOOOH) generated in-situ as explained by Swern28 by maintaining the molar ratio of
perilla oil, formic acid (HCOOH) and hydrogen peroxide (H2O2) as 1.0:3.4:10.3. Two types
of catalysts were used, namely: (a) Inorganic acid (sulfuric acid or H2SO4) as homogeneous
catalyst, taken at 2 wt. % of (HCOOH + H2O2) combination; and (b) Acidic Ion-Exchange
resin (AIER) as heterogeneous catalyst, taken at 20 wt. % of perilla oil. Epoxidation was
carried out at three different temperatures – 40, 50 and 60°C – for 8 h each.
200 ml of perilla oil was initially taken in a 1000 ml three-neck round-bottom flask
and equilibrated to synthesis temperature, followed by the addition of HCOOH and
catalyst. The solution was stirred at constant speed of 500 rpm for 30 min using an overhead
stirrer. Subsequently, 30% (w/w) H2O2 solution was added drop-wise to the afore-
described solution under constant stirring. System temperature was maintained below
110°C during the entire reaction duration, as any further increase in temperature due to
heat evolution during the formation of performic acid and epoxy – both of which are highly
exothermic reactions – would lead to significant amount of water loss via evaporation.
2.2.1. Epoxidation Kinetics
To determine epoxidation reaction kinetics, the time at which H2O2 addition was
completed was assumed to be time zero (t = 0). Aliquot samples were removed from the

24
solution at intervals of 30 min for the first two hours (0.5, 1, 1.5 and 2 h), followed by
removal at intervals of 2 h for the next six hours (4, 6 and 8 h). Extracted epoxidized perilla
oil (EPeO) was dissolved in toluene and subjected to several cycles of washing with
distilled water until the aqueous phase showed pH of 7. Subsequently, washed EPeO was
dried using anhydrous sodium sulfate (Na2SO4) – to remove the presence of water (small
amount) – and then filtered. The filtrate was finally vacuum dried at 40°C to ensure
complete evaporation of any solvent present. Iodine, epoxy and α-glycol values of
extracted and dried EPeO was determined to understand the progression of epoxidation
and in-situ oxirane cleavage reaction.
2.2.2. Oxirane Ring Cleavage Kinetics
In order to determine post-oxirane ring cleavage kinetics, initially 100 ml of perilla
oil was used to synthesize EPeO, while maintaining the same ratio of other chemical
constituents used in epoxidation reaction. Epoxidation was initially carried out for 8 h at
three synthesis temperatures (40, 50 and 60°C) while being simultaneously stirred at 500
rpm. EPeO obtained via this step was washed several times using distilled water, then dried
and introduced in a round-bottom flask and mixed with HCOOH in weight ratio of 1:3
(dried EPeO: HCOOH) and reacted at the same temperature as that of epoxidation reaction.
Aliquot samples were removed from the flask at different intervals (0.5, 1, 1.5, 2, 4, 6, and
8 h) and immediately titrated for determination of epoxy content.

25
2.2.3. Characterization
2.2.3.1. Iodine Value
Iodine value of a substance refers to the mass of iodine (I2, in grams) consumed by
100 g of that substance, and is calculated to determine the extent of unsaturation (i.e.,
double bonds) in fatty acids102. Iodine value is determined via use of Wijs solution that
reacts with double bonds, leading to the evolution of I2 that is detected using sodium
thiosulfate (Na2S2O3). Iodine values for both perilla oil and EPeO (withdrawn at different
time intervals) were determined as per ASTM D5768 standard and calculated using
Equation 2.
𝐼𝑉 =[(𝐵 − 𝑉) × 𝑁 × 12.69]
𝑆 … … … … … … (2)
Where:
𝐼𝑉 : Iodine value of the specimen
𝐵 : Volume of Na2S2O3 required for titration of blank solution (Wijs solution) (ml)
𝑉 : Volume of Na2S2O3 required for titration of sample (Perilla oil/EPeO) (ml)
𝑁 : Normality of Na2S2O3 solution (0.1 N)
𝑆 : Mass of sample used (g)
2.2.3.2. Epoxy Content (Oxirane Oxygen Content)
Epoxy content of a material is measured as per ASTM D1652-11 standard. EPeO
was dissolved in dichloromethane (CH2Cl2) and tetraethyl ammonium bromide (TEAB/
(C2H5)4N)+Br-), followed by titration against 0.1 N perchloric acid reagent (HClO4).

26
Reaction between TEAB and HClO4 results in in-situ generation of HBr, as shown in
Equation 3. HBr reacts subsequently with the epoxy group present in EPeO, resulting in
the cleavage of oxirane ring, as shown in Equation 4. Epoxy content in EPeO was
calculated using Equation 5103.
((𝐶2𝐻5)4𝑁)+𝐵𝑟− + 𝐻𝐶𝑙𝑂4 → ((𝐶2𝐻5)4𝑁)+𝐶𝑙𝑂4− + 𝐻𝐵𝑟 … … … … . . (3)
…………..(4)
𝐸 = 4.3 × 𝑉 × (𝑁
𝑊) … … … (5)
With regard to Equation 5:
𝑉 refers to the volume of HClO4 required for titration (ml),
𝑁 refers to the normality of HClO4 (0.1 N), and
𝑊 refers to the mass of EPeO used for titration (g).
However, experimentally obtained oxirane oxygen (𝑂𝑂𝑒) can be estimated using
Equation 6103.
𝑂𝑂𝑒 = (16
43) × 𝐸 … … … . . (6)
2.2.3.3. α-Glycol Content
Ring opening (cleavage) of epoxy groups in EVOs results in the generation of α–
glycol during epoxidation (as side reaction). α-glycol content in this study was determined
via the method reported by May104 and Stenmark105. This method is based on the oxidation
of glycol via benzylmethylammonium periodate in a non-aqueous medium, whereby
excess periodic acid is reacted with potassium iodide (KI), leading to the liberation of I2
27
that is titrated against Na2S2O3. To determine α-glycol content, EPeO samples (containing
< 0.3 meq. of α-glycol) were mixed with 25 ml of chloroform in a stoppered bottle and
placed in an ice-bath. Subsequently, 25 ml of oxidation reagent was added to the afore-
described solution, mixed thoroughly, and allowed to stand for 2.5 h in ice-bath. After this,
100 ml of ice water was added and shaken vigorously for 60 s. Finally, 5 ml of (20 %)
H2SO4 and 15 ml of KI solution were added, after which the solution was titrated against
0.1 N Na2S2O3 to the starch end-point. Experimental α-glycol content was calculated via
Equation 7104, where:
𝛼 − 𝑔𝑙𝑦𝑐𝑜𝑙 𝑐𝑜𝑛𝑡𝑒𝑛𝑡 (𝑚𝑜𝑙𝑒𝑠
100 𝑔) =
(𝐵 − 𝑆) × 𝑁
20 × 𝑊 … … … . . (7)
Where 𝐵 refers to the volume of Na2S2O3 required for titration of blank solution (ml)
𝑆 refers to the volume of Na2S2O3 required for titration of the sample (ml)
𝑁 refers to the normality of Na2S2O3 solution (N)
𝑊 refers to the weight of the sample (oil) used (g)
2.3. Sustainable Manufacturing
2.3.1. Processing of Acrylated Epoxidized Soybean Oil
Acrylated epoxidized soybean oil, containing 4000 ppm of monomethyl ether
hydroquinone as inhibitor and purchased from Sigma Aldrich, was cured in the presence
of photo-initiator or thermal initiator, as the case may be. While 2,2-dimethoxy
phenylacetophenone (DMPA) and 1-hydroxycyclohexyl phenyl ketone (HCPK) were
selected as photo-initiators, tert-butyl perbenzoate (TBPB) was used as thermal initiator in
this work. Varying wt. % of free radical initiators were used and cure kinetics of AESO in

28
their presence was studied. Subsequently, their mechanical performance and thermal
behavior was also evaluated.
2.3.2. Natural Fiber Mat and Composite
Acrylated epoxidized soybean oil (AESO) – of the same kind as that described in
Section 2.3.1 – was selected as the matrix material, while three different natural fibers –
namely, flax, areca and coir – were selected as reinforcement materials. Unidirectional flax
fiber (UD flax tape, 110 gsm that is 15.75″ wide) was purchased from Lingrove LLC, USA,
while areca and coir fibers were purchased from India. The chemical composition of all
three fibers is reported in Table 2-2. Areca and coir fibers were observed to be short as they
were directly extracted from the seed, while flax fibers were obtained from the bast. Hence,
randomly oriented areca and coir fiber mats were prepared by measuring ~ 15 g of fibers
and placing these fibers between two aluminum plates in a randomly oriented manner in
dimensions of 25 cm × 15 cm. These randomly arranged fibers were then subjected to
simultaneous heat and pressure using a Wabash Press (shown in Figure 2-2). Care was
taken to ensure that porosity, density and thickness (~ 1 mm) of these mats were consistent
across different samples. In order to maintain uniformity, as-purchased flax fibers were
also compressed under the same conditions. The varying chemical composition of these
fibers helped understand the effect of different constituents, such as cellulose,
hemicellulose and lignin, on the processability of these composites.
29
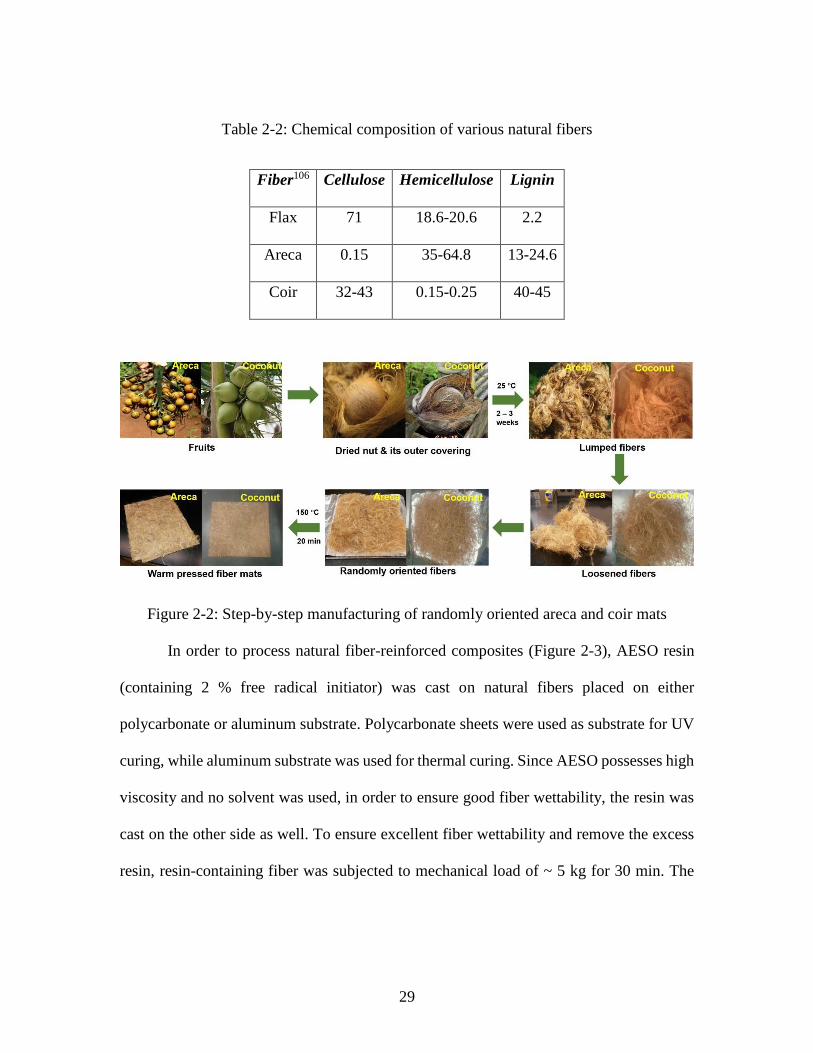
Table 2-2: Chemical composition of various natural fibers
Fiber106 Cellulose Hemicellulose Lignin
Flax 71 18.6-20.6 2.2
Areca 0.15 35-64.8 13-24.6
Coir 32-43 0.15-0.25 40-45
Figure 2-2: Step-by-step manufacturing of randomly oriented areca and coir mats
In order to process natural fiber-reinforced composites (Figure 2-3), AESO resin
(containing 2 % free radical initiator) was cast on natural fibers placed on either
polycarbonate or aluminum substrate. Polycarbonate sheets were used as substrate for UV
curing, while aluminum substrate was used for thermal curing. Since AESO possesses high
viscosity and no solvent was used, in order to ensure good fiber wettability, the resin was
cast on the other side as well. To ensure excellent fiber wettability and remove the excess
resin, resin-containing fiber was subjected to mechanical load of ~ 5 kg for 30 min. The

30
excess resin was squeezed out during this process, and the composite was cured in
appropriate manner (photo/thermal curing) under inert atmosphere.
Figure 2-3: Step-by-step procedure for processing of composite
2.3.2.1. Photo-curing of Resin and Fiber-Reinforced Composite
Photo-curing of both virgin resin and fiber-reinforced composite was carried out
using ELC-4001 UV flood system (Electrolite Corporation, Bethel, CT, USA) that has UV
output of 125 mW/cm2. The lamp had a peak output in the UV wavelength range of 365
nm coupled with an enclosure. Since the exposure area in this equipment was 7.5″ wide
and 9″ long, ASTM D638 Type 1 specimen were prepared via photo-curing to test their
mechanical performance. Photo-curing of pure resin was carried out for 5 min, while for
fiber-reinforced composites, curing took place in 10 min with both sides of the composite
exposed to UV radiation for 5 min each.
31
2.3.2.2. Thermal Curing of Resin and Fiber Reinforced Composite
Thermal curing of both AESO resin and fiber-reinforced composites was carried
out at 160°C for 3 h in an atmosphere-controlled oven (Across International, USA). The
oven was heated from room temperature (RT) to 160°C in 3 h, and it took more than 6 h
for the oven to cool down to RT, thereby ensuring that the total processing time for both
pure resin as well as its composite was ~ 12 h. Any sample that was taken out of the oven
prior to this duration (12 h) was observed to crack due to high temperature differential.
Despite the half-life of TBPB being 1 min at 165°C, curing was carried out for 3 h at 160°C,
mainly to ensure complete curing.
2.3.3. Characterization
2.3.3.1. Photo Calorimetry
NETZSCH Photo-DSC 204 F1 Differential Scanning Calorimeter (DSC), equipped
with a UV lamp (Omnicure S2000) with a single light guide, was used to monitor the photo-
cure kinetics of AESO under nitrogen atmosphere with a flow rate of 40 ml/min.
Approximately 2-5 mg of samples were taken in an open aluminum pan for each DSC
test/experiment. Both the reference pan and sample pan were exposed to UV radiation in
the wavelength region of 320-500 nm for 120 s with a delay of 5 s. The influence of photo-
initiator concentration (0.5, 1, 2 and 4 wt. %), temperature (25, 50 and 75°C), and light
intensity on photo-cure kinetics of AESO was studied. Light intensity was monitored at the
end of the light guide and was varied in two batches, namely, a low-intensity batch/regime
of 50, 100 and 150 mW/cm2, and a medium-intensity batch/ regime of 1500, 2500 and 3500
mW/cm2, where the intensity experienced by the sample was ~ 50 times107 lower in case
32
of both the regimes/batches. To monitor the occurrence of any chemical reaction solely
due to thermal energy (i.e., temperature), for each DSC experiment, samples were held in
isothermal condition (at their respective temperature profile) for 5 min prior to exposure to
UV radiation. Further, for each experiment, the samples were subjected to a second UV
irradiation cycle to monitor the occurrence of any residual reaction. No peaks were
observed in the second irradiation cycle for any DSC experiment, indicating that the
reaction was complete in the first irradiation cycle itself.
2.3.3.2. Differential Scanning Calorimetry
Thermally initiated cure kinetics of acrylated epoxidized soybean oil (AESO) in the
presence of Tert-butyl peroxybenzoate (TBPB) as thermal initiator was monitored via
differential scanning calorimetry (DSC, Q20, TA instruments). Non-isothermal DSC runs
were conducted from 25°C to 220°C at varying heating rates (5, 7.5, 10, 15, and 20°C/min)
under nitrogen atmosphere (flow rate: 50 ml/min). Approximately 3-8 mg of AESO,
containing varying concentration of initiator (1, 2, 4 and 6 wt. %), was measured in an
Tzero Aluminum hermetic pan. The samples were subjected to a second heating cycle at
the same heating rate (as first heating cycle) after cooling to 20°C at a cooling rate of
20°C/min in order to verify the completion of curing in the first cycle. The absence of
exothermic peak during second heating cycle for all samples indicated the completion of
reaction during the first cycle. In order to obtain reproducible results, DSC runs were
obtained in triplicates.

33
2.3.3.3. Background on Cure Kinetics
For any chemical reaction that is a thermally activated process, Equation 8
represents the general kinetic equation, where 𝛼 is the extent of conversion (or curing in
this case) while 𝑓(𝛼) is a function of 𝛼, 𝑇 refers to temperature, 𝑘(𝑇) refers to the rate
constant as a function of temperature or 𝑇, and 𝑑𝛼/𝑑𝑡 is the rate of curing.
𝑑𝛼
𝑑𝑡= 𝑘 (𝑇)𝑓(𝛼) … … … . (8)
Further, the rate constant 𝑘(𝑇) is in turn calculated using Equation 9, where 𝐴 is
pre-exponential factor, 𝐸𝑎 refers to effective activation energy (in kJ/mol) and 𝑅 is
universal gas constant (8.314 J/mol K).
𝑘(𝑇) = 𝐴𝑒−𝐸𝑎𝑅𝑇
… . . (9)
However, any understanding of reaction kinetics – i.e., obtaining values of rate
constants (𝑘) and effective activation energy (𝐸𝑎) – is typically studied either using model-
fitting method and/or model-free isoconversional method71. With regard to model-fitting
methods, several phenomenological and mechanistic models have been reviewed in
literature, all of which assume that the reaction is a single-step reaction and has a single
value of activation energy for the entire duration of the reaction. However, such model-
fitting methods may be unreliable when the reactant material undergoes a multi-step
complex kinetics reaction.
On the other hand, model-free isoconversional methods are well known for being
more realistic and accurate in predicting reaction kinetics, as these methods are free from
any assumptions and determine the variation in effective activation energy with the
34
progression of the reaction. Nevertheless, since their inception, such isoconversional
methods have been primarily used to understand non-isothermal reaction kinetics, with
model-fitting methods used predominantly in case of their isothermal counterparts72,75.
This can be ascribed to the premise of isoconversional methods being inaccurate for
isothermal reaction kinetics vis-à-vis their relatively higher accuracy for non-isothermal
reactions – an outcome of the initial application of isoconversional methods for thermal
degradation reaction72,75.
This study focuses on analyzing both photo-cure and thermal cure kinetics of an
acrylated triglyceride system – specifically, acrylate epoxidized soybean oil (AESO).
Typically, the isothermal curing of any thermoset leads to gelation and vitrification of the
polymer – an isoconversional phenomenon76. This suggests that determining the photo-
cure reaction kinetics of AESO via isoconversional methods may provide useful insights
about the cure reaction that may otherwise not be obtained via use of model-fitting
methods. Further, the possibility of change in effective activation energy with further
progress of the reaction retains a significant probability in case of reactions such as
isothermal curing of thermosets. It is for such cases that the recent ICTAC Review
Committee has recommended the use of model-free isoconversional methods in order to
determine reaction kinetics71. At the same time, a definite claim of these methods being
superior over model-fitting methods for isothermal reaction kinetics – as experienced by
AESO under photo-curing – cannot be made with a high degree of certainty. Contrastingly,
thermal curing of AESO represents non-isothermal reaction kinetics, enhancing the

35
suitability of model fitting methods vis-à-vis model-free methods for understanding
thermal curing of acrylated triglyceride systems.
Hence, this study chooses two different procedures with regard to modeling both
photo-cure and thermal cure kinetics of AESO. While both the model-fitting and
isoconversional methods are used to fit experimentally obtained data for photo-cure
kinetics (from photo-DSC), only isoconversional methods are used to analyze experimental
data obtained for thermal cure kinetics of AESO. While the choice of both sets of methods
for photo-DSC stems from the need to ascertain the relative suitability of both methods
when compared against each other, the use of only isoconversional methods for thermal
curing is based on its definite suitability for non-isothermal reaction kinetics as established
in literature71. In addition, model-free isoconversional methods also help in gaging and
predicting the nature or mechanism of curing reaction – be it chemical reaction controlled,
or diffusion controlled.
2.3.3.4. Photo-DSC: Model-fitting Method
In general, heat flow – measured using photo-DSC – is assumed to be occurring
solely due to one reaction, namely, the crosslinking of acrylate groups that are present in
the AESO molecule. This assumption is valid in this study due to the absence of any solvent
and/or co-monomer. Hence, the rate of conversion (or crosslinking) (𝑅𝑝 or 𝑑𝛼/𝑑𝑡) is
calculated using Equation 10108, where ∆𝐻𝑡𝑜𝑡𝑎𝑙 is the total enthalpy of the reaction at 100
% crosslinking, and 𝑑𝐻/𝑑𝑡 is the heat flow measured under isothermal DSC condition.
𝑅𝑝 = 𝑑𝛼
𝑑𝑡=
1
∆𝐻𝑡𝑜𝑡𝑎𝑙(
𝑑𝐻
𝑑𝑡)
𝑇… … … . . (10)

36
Upon integrating Equation 10, the degree of conversion (𝛼) can be obtained from
Equation 11, where ∆𝐻𝑡𝑜𝑡𝑎𝑙 is the total enthalpy of a reaction at 100 % crosslinking (i.e.,
𝛼 = 1)108,109.
𝛼 =1
∆𝐻𝑡𝑜𝑡𝑎𝑙∫ (
𝑑𝐻
𝑑𝑡)
𝑡
0 𝑇
… … … . . (11)
In order to understand the variation in 𝛼 with time, i.e., the progression of the
reaction (or its kinetics), several cure kinetics models – both phenomenological as well as
mechanistic ones – have been proposed and well discussed in literature71,78,110. These
models can be primarily categorized into two groups: nth order models that can be further
sub-classified into accelerating and decelerating reaction models, and autocatalytic
reaction models75. However, according to the ICTAC Review Committee
recommendations71, for a cure kinetics model to be reliable and robust, it is necessary that
the model is capable of taking into account the variation in extent of conversion (𝛼) via
both the nth order and autocatalytic reaction models71. One such model which has been
widely used for understanding the cure kinetics of various systems is the Kamal-Sourour110
model that is expressed using Equation 12. Here, 𝑑𝛼/𝑑𝑡 is the rate of crosslinking, 𝑘1 and
𝑘2 are rate constants that correspond to the nth order and autocatalytic reaction models
respectively, while 𝑚 and 𝑛 are the orders of crosslinking reaction and monomer
consumption reaction respectively.
𝑑𝛼
𝑑𝑡= (𝑘1 + 𝑘2𝛼𝑚)(1 − 𝛼)𝑛 … . . (12)
However, it is widely known that thermosets exhibit vitrification behavior – a
phenomenon that refers to the ceasing of curing reaction due to the formation of glassy
37
phase and prevents the curing reaction from reaching its completion (i.e., 𝛼 ≠ 1).
Henceforth, the Kamal-Sourour110 model was modified to capture this vitrification
phenomenon (as expressed in Equation 13), where the term “1” in Equation 12 is replaced
by 𝛼𝑚𝑎𝑥, which refers to the maximum degree of conversion that can occur (such that 𝛼𝑚𝑎𝑥
< 1) during the reaction.
𝑑𝛼
𝑑𝑡 (𝑜𝑟 𝑅𝑝) = (𝑘1 + 𝑘2𝛼𝑚)(𝛼𝑚𝑎𝑥 − 𝛼)𝑛 … . . (13)
The objective of this study – with regard to photo-cure kinetics – is to determine
the optimal values of the four parameters of curing reaction, i.e., reaction rate constants
(𝑘1, 𝑘2) and reaction orders (𝑚, 𝑛), such that the model-predicted 𝑑𝛼/𝑑𝑡 (defined by
Equation 13) matches the experimentally measured 𝑑𝛼/𝑑𝑡 as closely as possible through
curve-fitting. Mathematically, this is defined using the cost function (Equation 14) as
shown below, where 𝑅𝑆𝑆 is the residual sum of least squares, 𝑁 is the total number of data
samples, 𝑖 is the time index, 𝑅𝑝𝑒𝑥𝑝 is the experimentally measured rate of curing reaction,
and 𝑅𝑝𝑐𝑎𝑙𝑐is the model-predicted rate of curing reaction.
𝑅𝑆𝑆 = min𝑘1,𝑘2,𝑚.𝑛
∑ (𝑅𝑝𝑒𝑥𝑝(𝑖) − 𝑅𝑝𝑐𝑎𝑙𝑐
(𝑖))
2
… . .
𝑁
𝑖=1
(14)
Upon determining the values of (𝑘1, 𝑘2), effective activation energy (𝐸𝑎) of the
curing reaction can be calculated using the Arrhenius equation (Equation 15) – similar to
Equation 9 – where 𝐴 is pre-exponential factor, 𝑅 is universal gas constant (8.314 J/mol.K),
and 𝑇 is temperature (K).
𝑘1 𝑜𝑟 𝑘2 = 𝐴𝑒−𝐸𝑎𝑅𝑇
… . . (15)
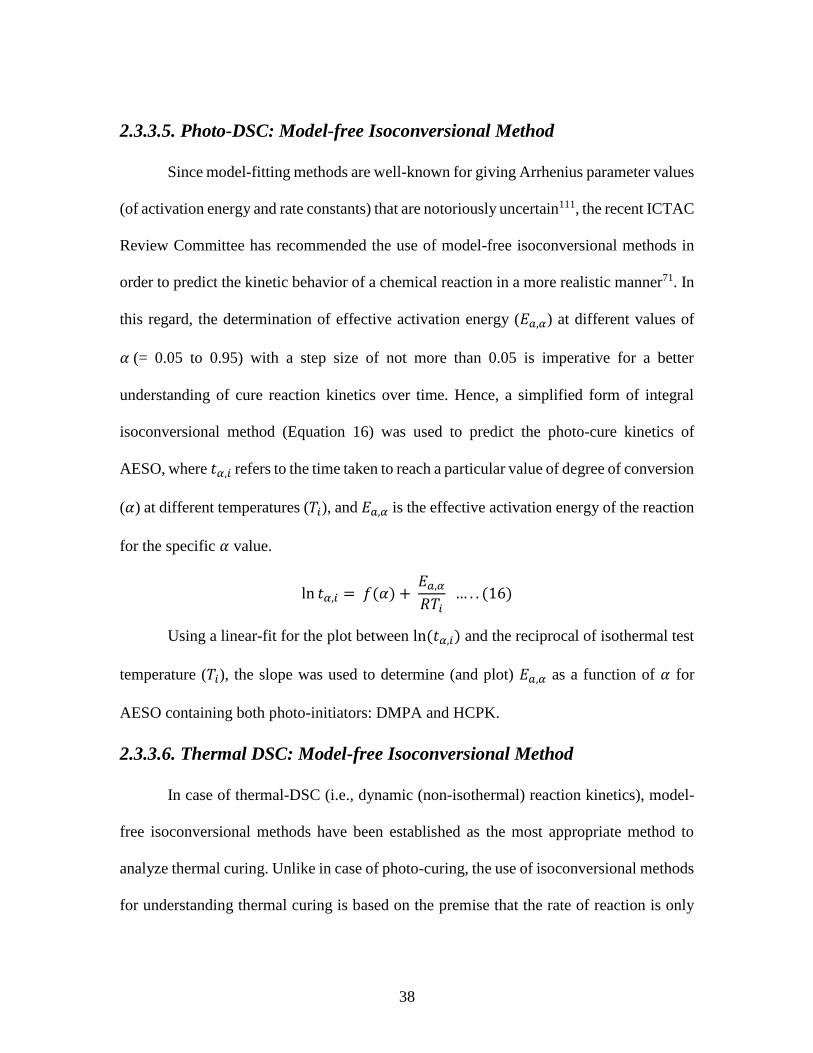
38
2.3.3.5. Photo-DSC: Model-free Isoconversional Method
Since model-fitting methods are well-known for giving Arrhenius parameter values
(of activation energy and rate constants) that are notoriously uncertain111, the recent ICTAC
Review Committee has recommended the use of model-free isoconversional methods in
order to predict the kinetic behavior of a chemical reaction in a more realistic manner71. In
this regard, the determination of effective activation energy (𝐸𝑎,𝛼) at different values of
𝛼 (= 0.05 to 0.95) with a step size of not more than 0.05 is imperative for a better
understanding of cure reaction kinetics over time. Hence, a simplified form of integral
isoconversional method (Equation 16) was used to predict the photo-cure kinetics of
AESO, where 𝑡𝛼,𝑖 refers to the time taken to reach a particular value of degree of conversion
(𝛼) at different temperatures (𝑇𝑖), and 𝐸𝑎,𝛼 is the effective activation energy of the reaction
for the specific 𝛼 value.
ln 𝑡𝛼,𝑖 = 𝑓(𝛼) + 𝐸𝑎,𝛼
𝑅𝑇𝑖 … . . (16)
Using a linear-fit for the plot between ln(𝑡𝛼,𝑖) and the reciprocal of isothermal test
temperature (𝑇𝑖), the slope was used to determine (and plot) 𝐸𝑎,𝛼 as a function of 𝛼 for
AESO containing both photo-initiators: DMPA and HCPK.
2.3.3.6. Thermal DSC: Model-free Isoconversional Method
In case of thermal-DSC (i.e., dynamic (non-isothermal) reaction kinetics), model-
free isoconversional methods have been established as the most appropriate method to
analyze thermal curing. Unlike in case of photo-curing, the use of isoconversional methods
for understanding thermal curing is based on the premise that the rate of reaction is only
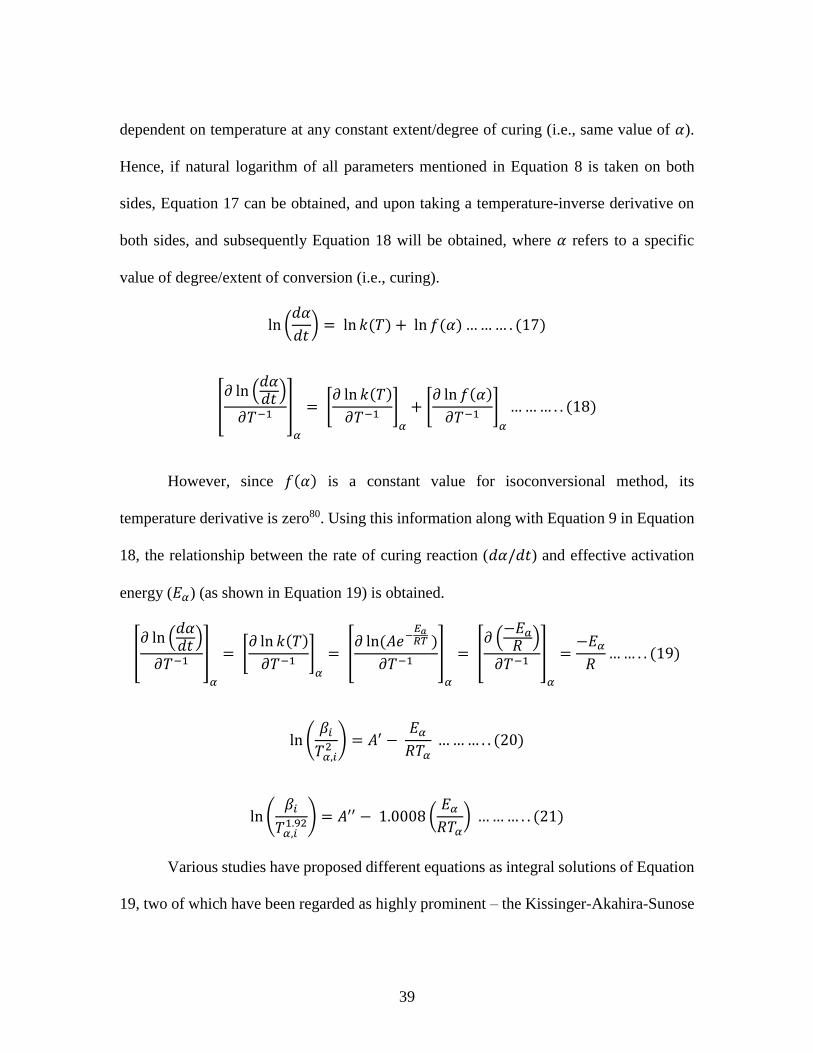
39
dependent on temperature at any constant extent/degree of curing (i.e., same value of 𝛼).
Hence, if natural logarithm of all parameters mentioned in Equation 8 is taken on both
sides, Equation 17 can be obtained, and upon taking a temperature-inverse derivative on
both sides, and subsequently Equation 18 will be obtained, where 𝛼 refers to a specific
value of degree/extent of conversion (i.e., curing).
ln (𝑑𝛼
𝑑𝑡) = ln 𝑘(𝑇) + ln 𝑓(𝛼) … … … . (17)
[𝜕 ln (
𝑑𝛼𝑑𝑡
)
𝜕𝑇−1]
𝛼
= [𝜕 ln 𝑘(𝑇)
𝜕𝑇−1]
𝛼
+ [𝜕 ln 𝑓(𝛼)
𝜕𝑇−1]
𝛼
… … … . . (18)
However, since 𝑓(𝛼) is a constant value for isoconversional method, its
temperature derivative is zero80. Using this information along with Equation 9 in Equation
18, the relationship between the rate of curing reaction (𝑑𝛼/𝑑𝑡) and effective activation
energy (𝐸𝛼) (as shown in Equation 19) is obtained.
[𝜕 ln (
𝑑𝛼𝑑𝑡
)
𝜕𝑇−1]
𝛼
= [𝜕 ln 𝑘(𝑇)
𝜕𝑇−1]
𝛼
= [𝜕 ln(𝐴𝑒−
𝐸𝑎𝑅𝑇
)
𝜕𝑇−1]
𝛼
= [𝜕 (
−𝐸𝑎
𝑅 )
𝜕𝑇−1]
𝛼
=−𝐸𝛼
𝑅… … . . (19)
ln (𝛽𝑖
𝑇𝛼,𝑖2 ) = 𝐴′ −
𝐸𝛼
𝑅𝑇𝛼 … … … . . (20)
ln (𝛽𝑖
𝑇𝛼,𝑖1.92) = 𝐴′′ − 1.0008 (
𝐸𝛼
𝑅𝑇𝛼) … … … . . (21)
Various studies have proposed different equations as integral solutions of Equation
19, two of which have been regarded as highly prominent – the Kissinger-Akahira-Sunose

40
equation (Equation 20), and Starink equation (Equation 21) – due to their higher accuracy
vis-à-vis other alternative methods. For these equations, 𝛽 refers to the heating rate used,
𝛼 is the degree/extent of curing (and has a specific value at each data point), 𝑇𝛼,𝑖 is the
temperature at the specific value of 𝛼 for each time step 𝑖, 𝐴′ and 𝐴′′ are constants, 𝐸𝛼 is
the effective activation energy of curing reaction when the degree of curing is 𝛼, and 𝑅 is
universal gas constant (8.314 J/mol K). Essentially, Equations 20 and 21 express the idea
that when samples of same chemical composition are subjected to different heating rates
(𝛽) under thermal-DSC, they exhibit the same extent of curing (𝛼) at different temperatures
(𝑇𝛼,𝑖), but all these temperatures are related to the heating rate used by the kinetic parameter
of effective activation energy (𝐸𝛼) that remains constant for a specific value of extent of
curing (𝛼). Based on this, effective activation energy was determined for AESO mixed
with thermal initiator at different concentrations (1, 2, 4 and 6 wt. %) with change in the
degree or extent of curing – in line with the model-free method used for photo-DSC.
2.3.3.7. Thermogravimetry Analysis
Both pure resin and fiber-reinforced composite – cured via photo-curing and/or
thermal curing – were subjected to thermogravimetry analysis (TGA) from RT to 800°C
(at heating rate of 5 °C/min) in order to determine their respective thermal stability and
heat resistant temperatures. TGA was carried out using TGA‐2950 (TA Instruments, New
Castle, DE) in nitrogen atmosphere at a flow rate of 25 mL/min.

41
2.3.3.8. UV Transmission Measurement
The variation in UV intensity with the progression of the reaction was measured
using Solarmeter model 5 that has a resolution of 0.1 mW/cm2. Variation in intensity was
measured both with and without the photo-initiator.
2.3.3.9. Tensile Testing
Tensile testing of AESO was carried out at a strain rate of 5 mm/min as per the
ASTM D638 standard, while similar testing for fiber-reinforced composite samples was
carried out at strain rate of 2 mm/min as per ASTM D3039 standard. Prior to testing, fiber-
reinforced composite samples were cut to dimensions of 14 cm × 2 cm, following which
tabs were placed based on the procedure recommended by the ASTM D3039 standard.
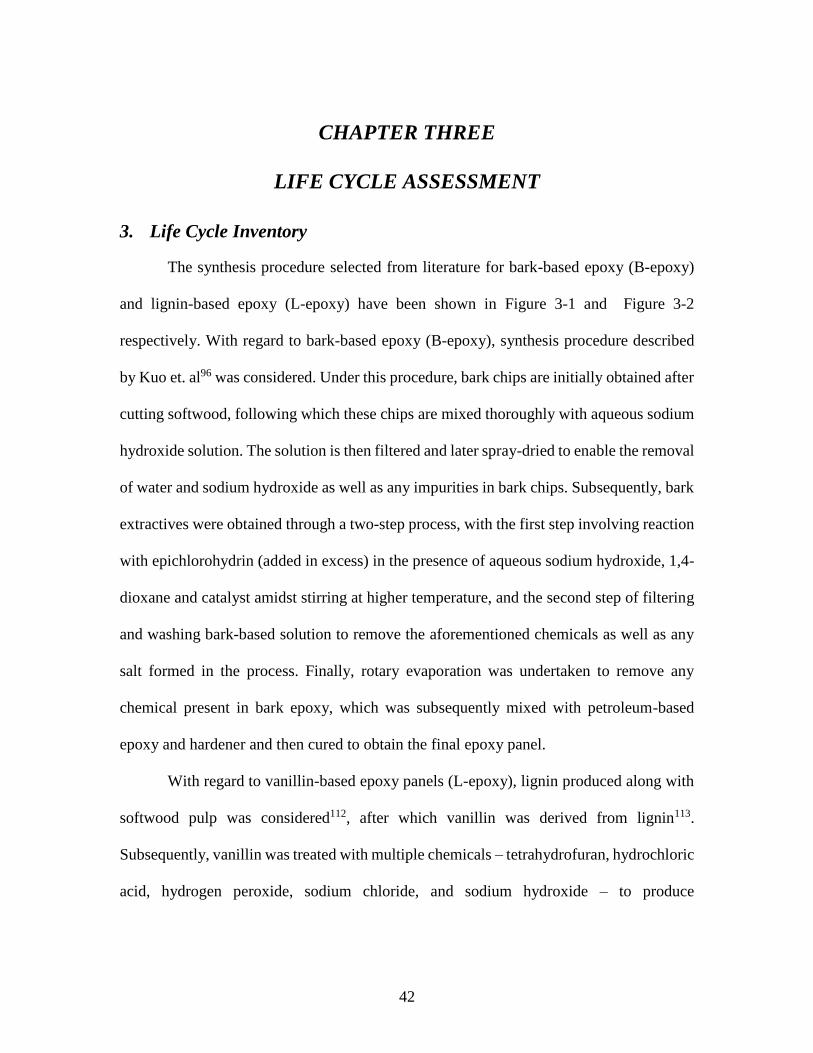
42
CHAPTER THREE
LIFE CYCLE ASSESSMENT
3. Life Cycle Inventory
The synthesis procedure selected from literature for bark-based epoxy (B-epoxy)
and lignin-based epoxy (L-epoxy) have been shown in Figure 3-1 and Figure 3-2
respectively. With regard to bark-based epoxy (B-epoxy), synthesis procedure described
by Kuo et. al96 was considered. Under this procedure, bark chips are initially obtained after
cutting softwood, following which these chips are mixed thoroughly with aqueous sodium
hydroxide solution. The solution is then filtered and later spray-dried to enable the removal
of water and sodium hydroxide as well as any impurities in bark chips. Subsequently, bark
extractives were obtained through a two-step process, with the first step involving reaction
with epichlorohydrin (added in excess) in the presence of aqueous sodium hydroxide, 1,4-
dioxane and catalyst amidst stirring at higher temperature, and the second step of filtering
and washing bark-based solution to remove the aforementioned chemicals as well as any
salt formed in the process. Finally, rotary evaporation was undertaken to remove any
chemical present in bark epoxy, which was subsequently mixed with petroleum-based
epoxy and hardener and then cured to obtain the final epoxy panel.
With regard to vanillin-based epoxy panels (L-epoxy), lignin produced along with
softwood pulp was considered112, after which vanillin was derived from lignin113.
Subsequently, vanillin was treated with multiple chemicals – tetrahydrofuran, hydrochloric
acid, hydrogen peroxide, sodium chloride, and sodium hydroxide – to produce
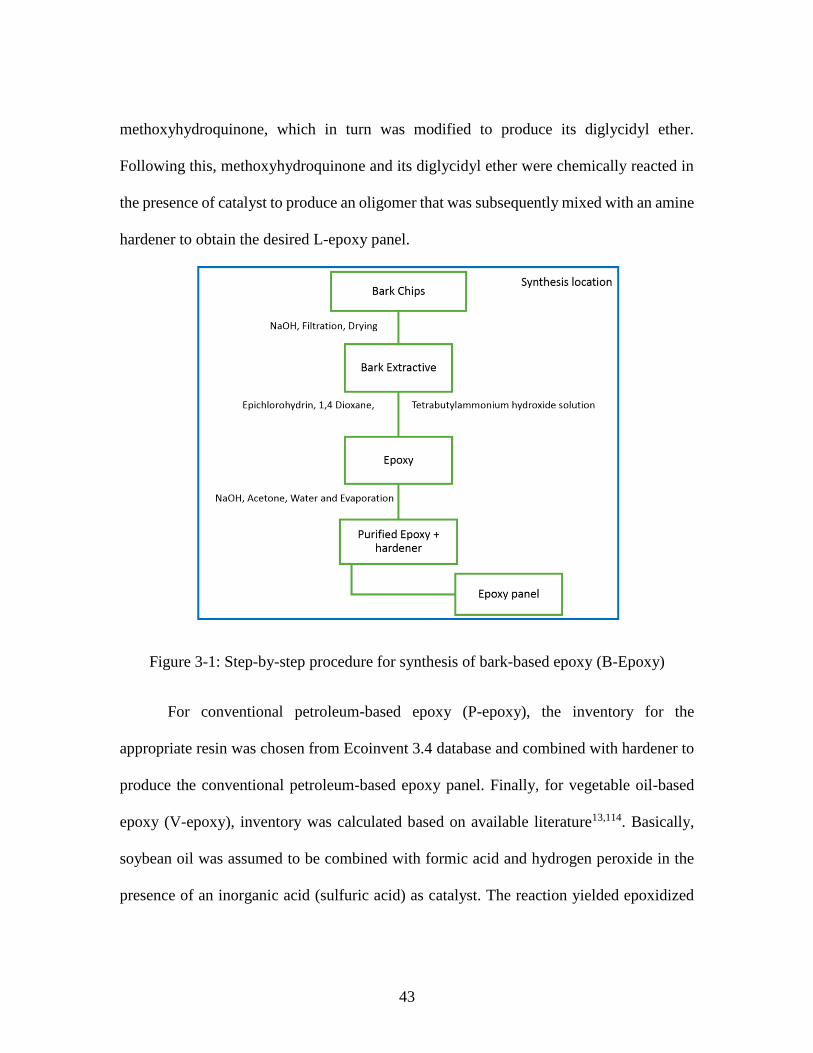
43
methoxyhydroquinone, which in turn was modified to produce its diglycidyl ether.
Following this, methoxyhydroquinone and its diglycidyl ether were chemically reacted in
the presence of catalyst to produce an oligomer that was subsequently mixed with an amine
hardener to obtain the desired L-epoxy panel.
Figure 3-1: Step-by-step procedure for synthesis of bark-based epoxy (B-Epoxy)
For conventional petroleum-based epoxy (P-epoxy), the inventory for the
appropriate resin was chosen from Ecoinvent 3.4 database and combined with hardener to
produce the conventional petroleum-based epoxy panel. Finally, for vegetable oil-based
epoxy (V-epoxy), inventory was calculated based on available literature13,114. Basically,
soybean oil was assumed to be combined with formic acid and hydrogen peroxide in the
presence of an inorganic acid (sulfuric acid) as catalyst. The reaction yielded epoxidized
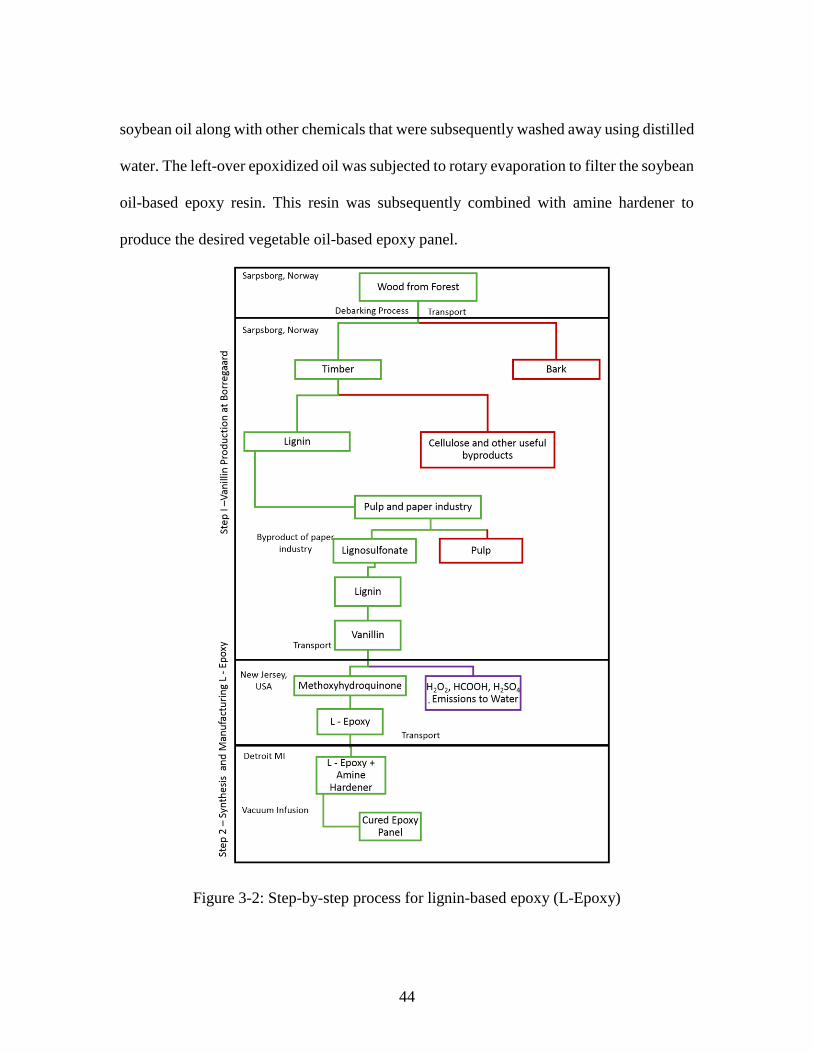
44
soybean oil along with other chemicals that were subsequently washed away using distilled
water. The left-over epoxidized oil was subjected to rotary evaporation to filter the soybean
oil-based epoxy resin. This resin was subsequently combined with amine hardener to
produce the desired vegetable oil-based epoxy panel.
Figure 3-2: Step-by-step process for lignin-based epoxy (L-Epoxy)

45
3.1. Life Cycle Impact Assessment – Results
Figure 3-3 (a and b) compare the environmental impacts of all the three bio-epoxy
panels considered in this study (B-epoxy, L-epoxy and V-epoxy) on 17 midpoint impact
categories. As can be seen, across all environmental impact categories barring two (SOD
and LU), V-epoxy (i.e., vegetable oil-based epoxy) exhibits the least amount of impact vis-
à-vis the other two bio-epoxies. In contrast, lignin-based epoxy or L-epoxy shows the worst
environmental performance among the three systems by exhibiting the highest impact on
12 categories (i.e., except SOD, TE, FE, ME and LU), while B-epoxy shows the highest
impact on only 3 categories (TE, FE and ME).
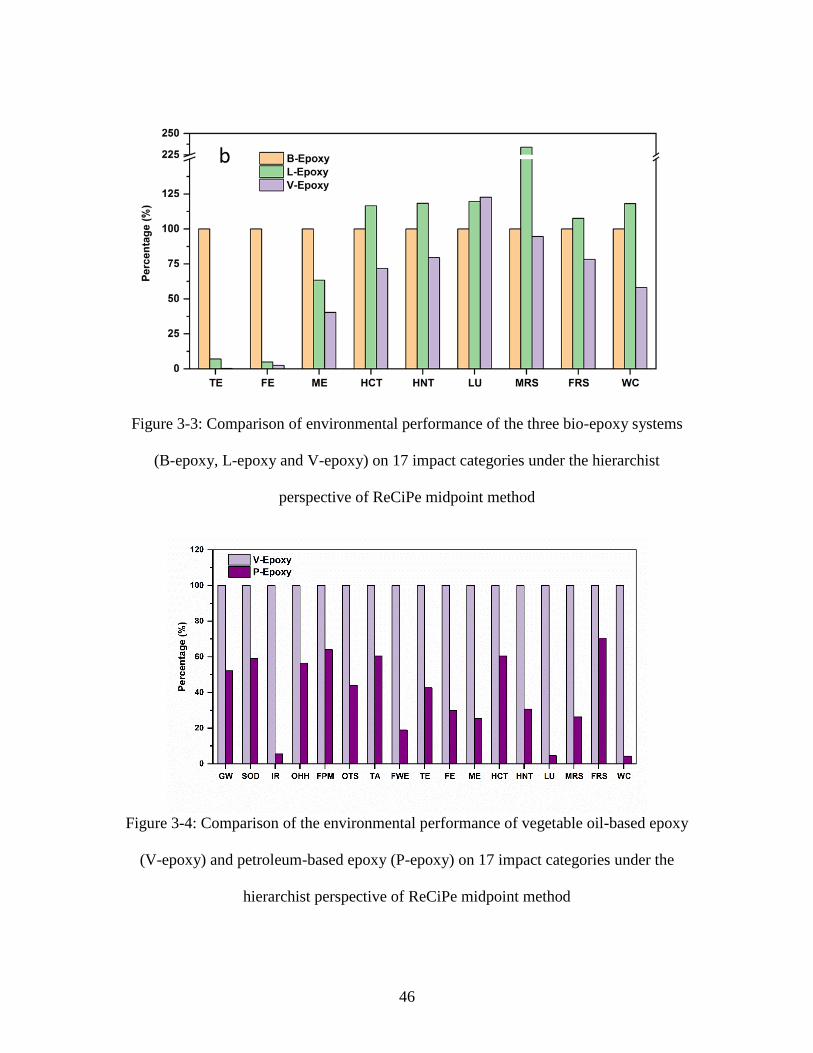
46
Figure 3-3: Comparison of environmental performance of the three bio-epoxy systems
(B-epoxy, L-epoxy and V-epoxy) on 17 impact categories under the hierarchist
perspective of ReCiPe midpoint method
Figure 3-4: Comparison of the environmental performance of vegetable oil-based epoxy
(V-epoxy) and petroleum-based epoxy (P-epoxy) on 17 impact categories under the
hierarchist perspective of ReCiPe midpoint method

47
Table 3-1: Environmental impacts of vegetable oil-based epoxy and petroleum-based
epoxy
Impact category Unit V-Epoxy P-Epoxy
Global warming kg CO2 eq 83.29 43.51
Stratospheric ozone depletion kg CFC11 eq 280.80 165.81
Ionizing radiation kBq Co-60 eq 59.48 3.26
Ozone formation, Human health kg NOx eq 65.66 37.05
Fine particulate matter formation kg PM2.5 eq 88.39 56.56
Ozone formation, Terrestrial
ecosystems
kg NOx eq 63.84 28.03
Terrestrial acidification kg SO2 eq 81.46 49.26
Freshwater eutrophication kg P eq 76.93 14.56
Terrestrial ecotoxicity kg 1,4-DCB eq 0.28 0.12
Freshwater ecotoxicity kg 1,4-DCB eq 2.51 0.75
Marine ecotoxicity kg 1,4-DBC eq 40.32 10.21
Human carcinogenic toxicity kg 1,4-DBC eq 71.74 43.40
Human non-carcinogenic toxicity kg 1,4-DBC eq 79.54 24.36
Land use m2a crop eq 122.73 5.56
Mineral resource scarcity kg Cu eq 94.55 24.86
Fossil resource scarcity kg oil eq 78.27 55.21
Water consumption m3 58.08 2.46
Overall, it can be clearly seen that in terms of holistic environmental performance,
V-epoxy is superior than the other two bio-epoxy systems considered in this study.
Subsequently, ecological performance of V-epoxy was compared with its conventional
epoxy counterpart or P-epoxy, as can be seen in Figure 3-4 and Table 3-1. As the figure
shows, P-epoxy panel performs superior than V-epoxy on all impact categories, albeit by

48
differing amounts. Since the inventory was developed beginning with the extraction of raw
materials to the manufacture of the panel for all the considered epoxies, energy consumed
during agriculture (in case of V-epoxy), deforestation (in case of B-epoxy and L-epoxy)
and extraction of raw materials from petroleum sources (for P-epoxy) were also considered.
3.2. Life Cycle Impact Assessment – Discussion
The most interesting finding from this work is that vegetable oil-based epoxy (V-
epoxy) has lower environmental impacts when compared with bio-epoxies derived from
other biological sources (such as bark or lignin) (Figure 3-3). It is an interesting finding
given that V-epoxy has significantly poorer mechanical properties compared to B-epoxy
or L-epoxy (i.e., more amount of V-epoxy is required in the panel compared to the other
two bio-epoxies) (Table 2-1). However, these higher impacts of B-epoxy and L-epoxy
(over V-epoxy) can be ascribed to two key factors. The first is the use of epichlorohydrin
(ECH) – a highly toxic and carcinogenic chemical – in large quantities, with a larger
quantity of usage in B-epoxy vis-à-vis L-epoxy (almost twice that of L-epoxy in B-epoxy),
which explains the higher toxicity-related impacts in particular for both these bio-epoxies
vis-à-vis vegetable oil-based epoxy. The second factor is the larger amount of electricity
consumed (during the entire process starting from raw material extraction) to process both
B- and L-epoxy when compared to V-epoxy (~ 10315 MJ for B-epoxy and ~ 11406 MJ for
L-epoxy vis-à-vis ~ 7577 MJ for V-epoxy). Since this electricity is mostly produced from
fossil fuels (coal and natural gas), fossil-based electricity accounts for a significant share
of the impacts of these epoxies.
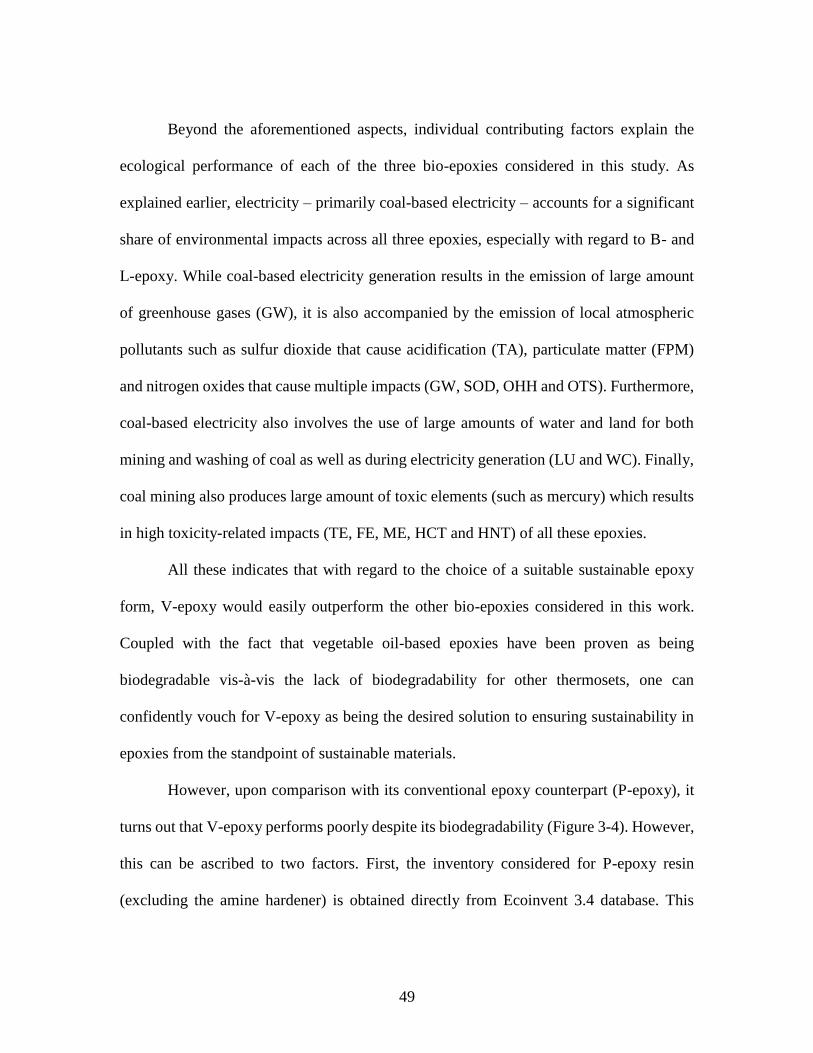
49
Beyond the aforementioned aspects, individual contributing factors explain the
ecological performance of each of the three bio-epoxies considered in this study. As
explained earlier, electricity – primarily coal-based electricity – accounts for a significant
share of environmental impacts across all three epoxies, especially with regard to B- and
L-epoxy. While coal-based electricity generation results in the emission of large amount
of greenhouse gases (GW), it is also accompanied by the emission of local atmospheric
pollutants such as sulfur dioxide that cause acidification (TA), particulate matter (FPM)
and nitrogen oxides that cause multiple impacts (GW, SOD, OHH and OTS). Furthermore,
coal-based electricity also involves the use of large amounts of water and land for both
mining and washing of coal as well as during electricity generation (LU and WC). Finally,
coal mining also produces large amount of toxic elements (such as mercury) which results
in high toxicity-related impacts (TE, FE, ME, HCT and HNT) of all these epoxies.
All these indicates that with regard to the choice of a suitable sustainable epoxy
form, V-epoxy would easily outperform the other bio-epoxies considered in this work.
Coupled with the fact that vegetable oil-based epoxies have been proven as being
biodegradable vis-à-vis the lack of biodegradability for other thermosets, one can
confidently vouch for V-epoxy as being the desired solution to ensuring sustainability in
epoxies from the standpoint of sustainable materials.
However, upon comparison with its conventional epoxy counterpart (P-epoxy), it
turns out that V-epoxy performs poorly despite its biodegradability (Figure 3-4). However,
this can be ascribed to two factors. First, the inventory considered for P-epoxy resin
(excluding the amine hardener) is obtained directly from Ecoinvent 3.4 database. This
50
inventory is built upon the use of optimum process conditions and material requirements
for producing such resin, for it is produced in large quantities on commercial scale. In
contrast, the inventory for V-epoxy (or for that matter, all the bio-epoxies considered in
this study) is based upon its synthesis at laboratory-scale conditions. Since input chemicals
(such as hydrogen peroxide and formic acid) are often required in larger quantities for
laboratory-scale synthesis vis-à-vis production on an industrial scale, the inventory for V-
epoxy is based on an over-estimate of chemical requirement that may offer possibilities for
reduction in case of industrial-scale production. Second, in addition to the challenge with
inventory, vegetable oil-based epoxies suffer from the issue of higher epoxy equivalent
weight (EEW) vis-à-vis their conventional epoxy counterparts. Higher EEW values result
in poorer mechanical properties of V-epoxy compared to P-epoxy, necessitating the use of
larger amount of V-epoxy for producing the desired panel and further exacerbating its
environmental impacts. Thus, the combination of lack of industrial-scale inventory and
poorer mechanical properties (an outcome of higher EEW) lead to V-epoxy panels
performing poorly vis-à-vis P-epoxy panels. Hence, the following part of this work focuses
on the use of triglycerides as sustainable materials by improving their performance via
lowering EEW.

51
CHAPTER FOUR
SYNTHESIS OF SUSTAINABLE EPOXY FROM A
TRIGLYCERIDE MOLECULE
4. Epoxidation Reaction and Conditions
In-situ epoxidation via Prilezhaev reaction is a two-step process: (i) Performic acid
formation; and (ii) Conversion of double bond to epoxy, with these steps occurring
simultaneously in both oil and aqueous phases48,115–117 along with several side reactions.
During these reactions, H2O2, H2O and H2SO4 remain in the aqueous phase, while perilla
oil and EPeO remains in the oil phase. Only HCOOH and HCOOOH are transferred
between the aqueous and oil phase116,117. Hence, oxirane ring cleavage can take place at
the oil phase and at the oil/aqueous phase interface115 due to the attack of HCOOH,
HCOOOH, H2O2 or H2O. In addition to oxirane ring cleavage, several other side-reactions
occur simultaneously, as shown in Figure 4-1. Hence, the extent of both epoxidation and
oxirane ring cleavage reactions is dependent on reaction conditions, such as the molar ratio
of H2O2-to-organic acid-to-double bond and the amount of catalyst (H2SO4)
used41,43,48,50,115,117,118.
High molar ratio of H2O2-to-organic acid-to-double bond can result in significant
oxirane cleavage, while low molar ratio of these entities can cause incomplete epoxidation.
Hence, these parameters were carefully chosen based on available literature to synthesize
EPeO with minimal in-situ oxirane cleavage. Various studies have shown the optimal
amount of HCOOH to be in the range of 0.25-0.5 and H2O2 to be in the range of 1.5-2.0

52
for one mole of C=C bonds32. Hence, in this work, molar ratio of H2O2-to-HCOOH-to-
ethylenic unsaturation was maintained at 1.5:0.5:1.0.
Figure 4-1: Schematic of epoxy formation and side-reactions during epoxidation of
vegetable oils (VOs)
Among different organic acids, formic acid (HCOOH) and acetic acid (CH3COOH)
are the most widely used due to their high reactivity32,39,40,117. HCOOH is also
advantageous as it does not require any catalyst for the occurrence of epoxidation reaction
and is the most preferred in industrial epoxidation process119. However, the absence of
53
catalyst is generally accompanied by rapid increase in reaction temperature to > 100°C,
leading to the explosion of performic acid at > 80-85°C28,32. Hence, an inorganic acid had
to be used as a catalyst to control the reaction rate and inhibit the detonation of performic
acid. Among the four commonly used inorganic acids: sulfuric acid (H2SO4), phosphoric
acid (H3PO4), nitric acid (HNO3) and hydrochloric acid (HCl), H2SO4 results in the highest
level of oxirane content, followed by H3PO4 > HNO3 > HCl. Hence, H2SO4 was chosen as
the inorganic acid catalyst with an optimal concentration of H2SO4 as 2 wt. % of (HCOOH
+ H2O2) combination41,43.
Another critical factor, stirring speed, was observed to play a determining role43,48,54
in the reaction rate upto 1500 rpm beyond which its effect on epoxidation kinetics becomes
insignificant. However, the stirring speed has significant effect in epoxidation based on the
initial volume of oil selected120, as the objective was to eliminate both heat and mass
transfer during the reaction. Hence to avoid uncontrolled turbulence and chemical spillage
associated with high stirring speeds, 500 rpm was chosen for this study.
4.1. Results and Discussion
4.1.1. Rate of Epoxidation
Iodine value (𝐼𝑉) of perilla oil was estimated to be 196.9 g/100 g (of oil), indicating
the double bond concentration to be 0.77 moles per 100 g of oil, while the average
molecular weight of perilla oil was calculated as ~ 871 g/mole. Rate of progression of
epoxidation reaction was determined by estimating the iodine, epoxy, and α-glycol content
values of extracted EPeO (Figure 4-2). The results presented in Figure 4-2 were within the
statistical error of ± 5 %. Figure 4-2 (a) exemplifies the variation in iodine value, while
54
Figure 4-2 (b) shows the rate of relative oxirane conversion (𝑅𝑂𝐶), as estimated using
Equation 2146,48.
𝑅𝑂𝐶 =𝑂𝑂𝑒
𝑂𝑂𝑡… … … . (21)
Where 𝑂𝑂𝑡 (theoretical oxirane oxygen) was calculated from Equation 2246,48.
𝑂𝑂𝑡 = {(
𝐼𝑉𝑜
2𝐴𝑖)
[100 + (𝐼𝑉𝑜
2𝐴𝑖) 𝐴𝑜]
} × 𝐴𝑜 × 100 … … … . . (22)
Where 𝐼𝑉𝑜 is iodine value of perilla oil = 196.9 g/100 g oil
𝐴𝑖 is atomic mass of iodine = 126.9 amu, and
𝐴𝑜 is atomic mass of oxygen = 16 amu
Based on Equation 22, 𝑂𝑂𝑡 was estimated as 11.04 wt. % and 𝑂𝑂𝑒 was
experimentally determined and calculated from Equation 6. Figure 4-2 (c) shows the
variation in α-glycol content with change in temperature and time.
From Figure 4-2 (a,b), it is evident that increase in reaction temperature (from 40
to 60°C) led to increase in 𝑅𝑂𝐶 (from 58 % to 88 %). This can be attributed to the enhanced
rate of formation of peroxyformic acid, along with its enhanced activation, at higher
temperatures121. On the other hand, increase in reaction time at constant temperature was
observed to be accompanied by the conversion of a significant fraction of double bonds
(35-50 %) to epoxy groups in the first 30 minutes, with the extent of conversion dependent
on reaction temperature. This is in contrast to the observation of < 30 % conversion in other
EVOs, such as epoxidized mahua oil43 and epoxidized karanja oil48. Such higher
epoxidation rate – in the initial 30 minutes – can be attributed to the higher reactivity of
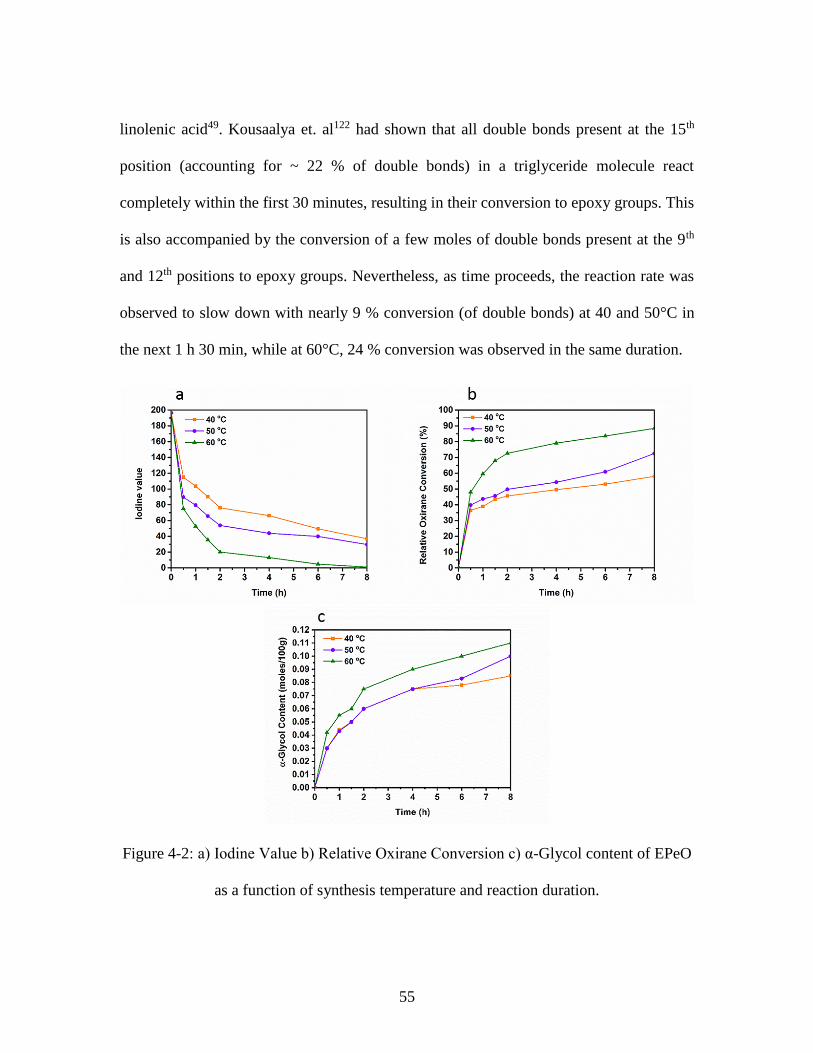
55
linolenic acid49. Kousaalya et. al122 had shown that all double bonds present at the 15th
position (accounting for ~ 22 % of double bonds) in a triglyceride molecule react
completely within the first 30 minutes, resulting in their conversion to epoxy groups. This
is also accompanied by the conversion of a few moles of double bonds present at the 9th
and 12th positions to epoxy groups. Nevertheless, as time proceeds, the reaction rate was
observed to slow down with nearly 9 % conversion (of double bonds) at 40 and 50°C in
the next 1 h 30 min, while at 60°C, 24 % conversion was observed in the same duration.
Figure 4-2: a) Iodine Value b) Relative Oxirane Conversion c) α-Glycol content of EPeO
as a function of synthesis temperature and reaction duration.
56
Further, it can also be seen that the slope of the reaction curve changes at 2 h for all
reaction temperatures, indicating a reduction in reaction rate from this point onwards. This
can be ascribed to the fact that during the first 2 h, the observed initial increase in system
temperature – due to the highly exothermic nature of performic acid formation – led to
vigorous epoxidation for 2 h. Subsequently, significant reduction in epoxidation reaction
rate was observed beyond 2 h, which is observed via ~ 15-20 % conversion over a span of
6 h. This reduction in rate of reaction with time can be attributed to two factors: (a)
Decomposition of formic acid (HCOOH), performic acid (HCOOOH), and hydrogen
peroxide (H2O2) with time, resulting in loss of their quantity123; and (b) Stabilization in
system temperature back to original reaction temperatures after 2 h.
From Figure 4-2 (c), it is clear that with increase in both reaction time and/or
temperature, along with the epoxidation reaction, a small-yet-significant amount of oxirane
ring cleavage reaction was also observed. While α-glycol values were observed to be
similar at reaction temperatures of 40 and 50°C, they were found to undergo a substantial
increase at 60°C, indicating the ease of oxirane cleavage at higher temperature. Relative
glycol conversion (𝑅𝐺𝐶) can be calculated from Equation 2346,48.
𝑅𝐺𝐶 =𝐺𝑒𝑥𝑝
𝐺𝑡ℎ𝑒… … … . . (23)
Where theoretical α-glycol content (𝐺𝑡ℎ𝑒) was calculated using Equation 2446,48.
𝐺𝑡ℎ𝑒 (𝑚𝑜𝑙𝑒𝑠
100 𝑔) = {
(𝐼𝑉𝑜
2𝐴𝑖)
[100 + (𝐼𝑉𝑜
2𝐴𝑖) 2𝐴𝑂𝐻]
} × 100 … … … . . (24)
Where 𝐴𝑂𝐻 is the atomic mass of -OH group = 17.0 amu.
57
Hence, 𝐺𝑡ℎ𝑒 was obtained through calculations as 0.61 moles/100 g (of oil). From
Equation 24, the maximum α-glycol content was obtained to be in the range of 6-18 %.
This is in stark difference to the observation by Goud et. al43,48 of minimal oxirane cleavage
for many EVOs (< 10 %). However, linolenic acid group – a highly-reactive group present
in perilla oil – is likely to undergo ring opening at a faster rate than the other two acid
groups (linolenic and oleic) present in a triglyceride molecule. Kousaalya et. al122 had
shown that the epoxy group formed at 15th position underwent cleavage to form α-glycol
in a triglyceride molecule due to the higher reactivity of a chemical group that is farther
away from the glycerol center. Also, it should be noted that in spite of high oxirane ring
cleavage, epoxidized perilla oil possessed higher number of epoxy groups compared to
epoxies from other vegetable oils.
4.1.2. Epoxy Equivalent Weight (𝑾𝒆𝒆𝒘 or EEW)
𝑊𝑒𝑒𝑤 or EEW refers to the weight of resin (in grams) that contains 1 mole of epoxy,
and is directly related to the crosslinking density (number of crosslinks per unit volume)
which dictates the structural performance of epoxies13. 𝑊𝑒𝑒𝑤 of synthesized EPeO was
calculated using Equation 25103 and plotted in Figure 4-3.
𝑊𝑒𝑒𝑤 = 43 × (100
𝐸) … … … … . (25)
Where:
𝑊𝑒𝑒𝑤 represents epoxy equivalent weight (g/eq),
“43” is the molecular weight of an epoxy ring, and
𝐸 represents weight percent of epoxy groups or epoxide (wt. %) as determined via titration.
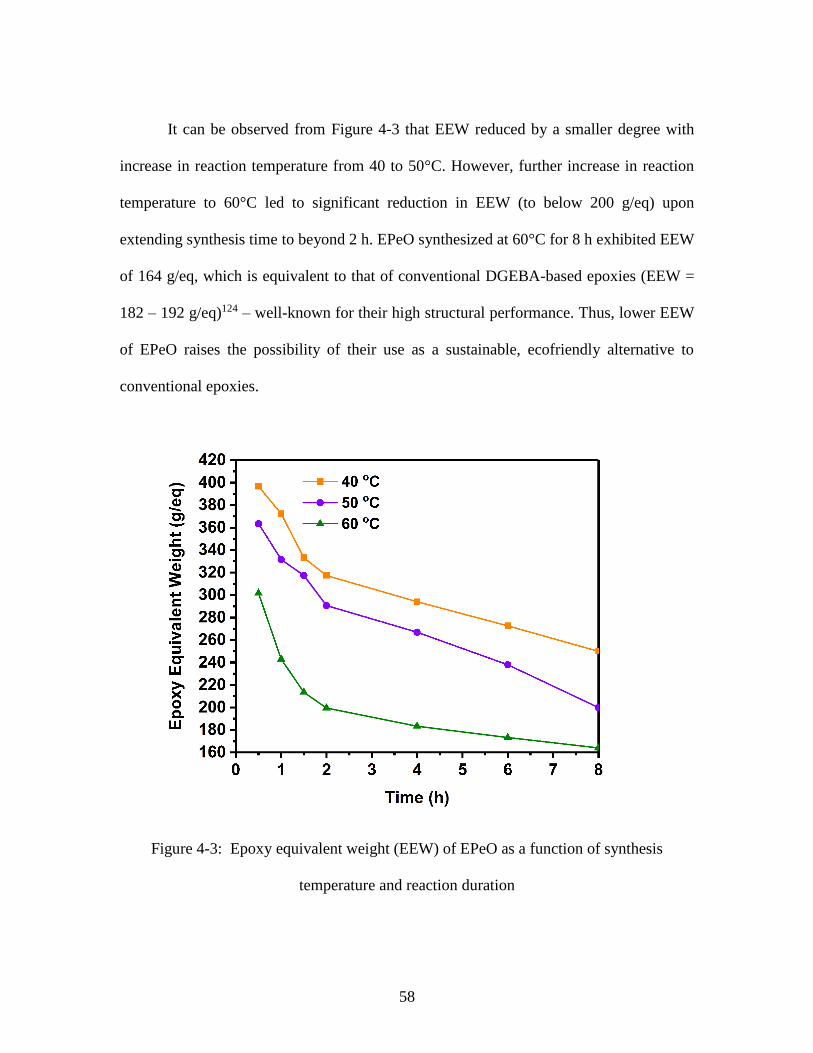
58
It can be observed from Figure 4-3 that EEW reduced by a smaller degree with
increase in reaction temperature from 40 to 50°C. However, further increase in reaction
temperature to 60°C led to significant reduction in EEW (to below 200 g/eq) upon
extending synthesis time to beyond 2 h. EPeO synthesized at 60°C for 8 h exhibited EEW
of 164 g/eq, which is equivalent to that of conventional DGEBA-based epoxies (EEW =
182 – 192 g/eq)124 – well-known for their high structural performance. Thus, lower EEW
of EPeO raises the possibility of their use as a sustainable, ecofriendly alternative to
conventional epoxies.
Figure 4-3: Epoxy equivalent weight (EEW) of EPeO as a function of synthesis
temperature and reaction duration
59
4.2. Kinetics and Thermodynamics
4.2.1. Epoxidation Kinetics
Several studies43,118 have shown that among the various reactions in
homogeneously catalyzed two-step epoxidation reaction, the first step – formation of
HCOOOH – is the rate-determining step, assuming the concentration of performic acid (i.e.
peroxyformic acid) to be constant throughout the entire reaction. Based on this hypothesis,
Equation 26 shows the applicable rate law, where 𝑘 is the rate constant (Lmol-1s-1), [𝐸𝑃]
is the molarity of epoxy groups formed during the reaction (mol/L) at any given time, and
[𝐻2𝑂2]0 and [𝐻𝐶𝑂𝑂𝐻]0 refer to molarity of H2O2 and HCOOH respectively at zero
time43,118. On integration, Equation 26 changes to Equation 27, indicating that this reaction
is possibly a first-order reaction40,117.
𝑑[𝐸𝑃]
𝑑𝑡= 𝑘{[𝐻2𝑂2]0 − [𝐸𝑃]} . [𝐻𝐶𝑂𝑂𝐻]0 … … … … (26)
ln{[𝐻2𝑂2]0 − [𝐸𝑃]} = −𝑘[𝐻𝐶𝑂𝑂𝐻]0𝑡 + ln[𝐻2𝑂2]0 … … … … … (27)
As per Equation 27, any graph between ln{[𝐻2𝑂2]0 − [𝐸𝑃]} and time (𝑡) is
expected to be a straight line for the first step of epoxidation reaction, assuming that a
negligible amount of oxirane undergoes cleavage. However, the graph between these two
variables (Figure 4-4 (a)) shows deviation from the expected linear relationship, indicating
that a fraction of epoxy rings underwent cleavage as observed from Figure 4-2 (c).
Kinetic rate constants (𝑘) were calculated for the epoxidation reaction (first-step)
based on the initial slopes of the curve as the reaction showed first-order nature in this
region. Table 4-1 shows rate constants (𝑘) of the epoxidation reaction at different synthesis
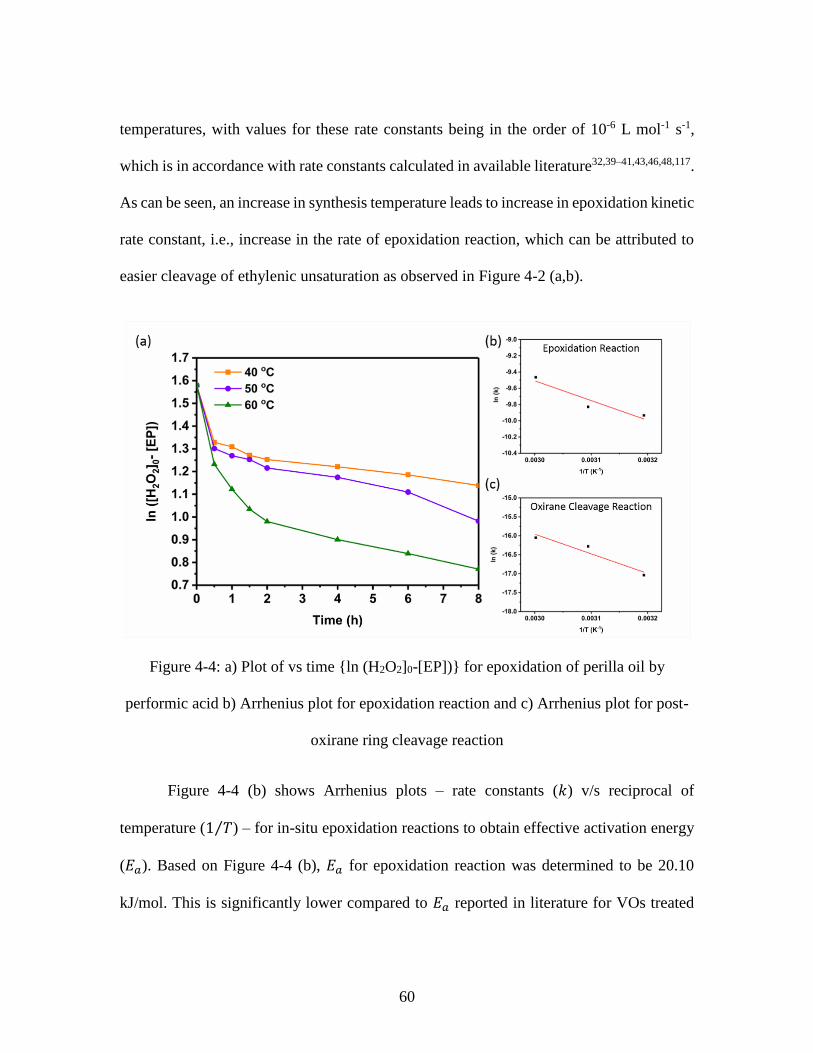
60
temperatures, with values for these rate constants being in the order of 10-6 L mol-1 s-1,
which is in accordance with rate constants calculated in available literature32,39–41,43,46,48,117.
As can be seen, an increase in synthesis temperature leads to increase in epoxidation kinetic
rate constant, i.e., increase in the rate of epoxidation reaction, which can be attributed to
easier cleavage of ethylenic unsaturation as observed in Figure 4-2 (a,b).
Figure 4-4: a) Plot of vs time {ln (H2O2]0-[EP])} for epoxidation of perilla oil by
performic acid b) Arrhenius plot for epoxidation reaction and c) Arrhenius plot for post-
oxirane ring cleavage reaction
Figure 4-4 (b) shows Arrhenius plots – rate constants (𝑘) v/s reciprocal of
temperature (1 𝑇⁄ ) – for in-situ epoxidation reactions to obtain effective activation energy
(𝐸𝑎). Based on Figure 4-4 (b), 𝐸𝑎 for epoxidation reaction was determined to be 20.10
kJ/mol. This is significantly lower compared to 𝐸𝑎 reported in literature for VOs treated
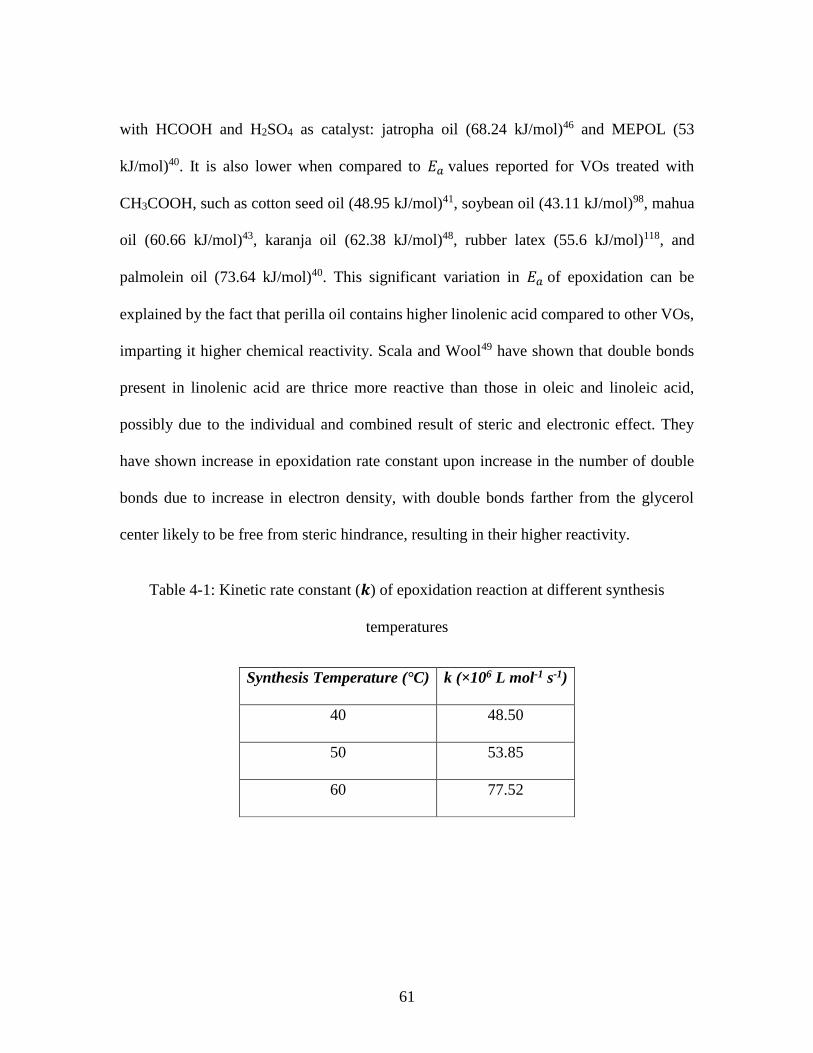
61
with HCOOH and H2SO4 as catalyst: jatropha oil (68.24 kJ/mol)46 and MEPOL (53
kJ/mol)40. It is also lower when compared to 𝐸𝑎 values reported for VOs treated with
CH3COOH, such as cotton seed oil (48.95 kJ/mol)41, soybean oil (43.11 kJ/mol)98, mahua
oil (60.66 kJ/mol)43, karanja oil (62.38 kJ/mol)48, rubber latex (55.6 kJ/mol)118, and
palmolein oil (73.64 kJ/mol)40. This significant variation in 𝐸𝑎 of epoxidation can be
explained by the fact that perilla oil contains higher linolenic acid compared to other VOs,
imparting it higher chemical reactivity. Scala and Wool49 have shown that double bonds
present in linolenic acid are thrice more reactive than those in oleic and linoleic acid,
possibly due to the individual and combined result of steric and electronic effect. They
have shown increase in epoxidation rate constant upon increase in the number of double
bonds due to increase in electron density, with double bonds farther from the glycerol
center likely to be free from steric hindrance, resulting in their higher reactivity.
Table 4-1: Kinetic rate constant (𝒌) of epoxidation reaction at different synthesis
temperatures
Synthesis Temperature (°C) k (×106 L mol-1 s-1)
40 48.50
50 53.85
60 77.52

62
4.2.2. Oxirane Cleavage during In-situ Epoxidation
Kinetic rate equations used to describe in-situ epoxidation assume that epoxy
groups formed during epoxidation remain completely stable, without any ring cleavage
reactions taking place. However, this is an ideal case, and in reality, epoxy rings present in
oil phase are reactive and can cleave. To determine the extent to which epoxy ring cleavage
may have happened via this route, two kinds of tests can be generally undertaken: α-glycol
test and hydroxyl test (OHV)32,41. Hydroxyl test is used to detect the presence of -OH
groups that form during side-reaction between epoxy phase and HCOOH (Figure 4-2 (c)).
However, due to the low concentration of HCOOH used in this study, theoretical
calculation shows negligible concentration of hydroxylated-formiated products (< 0.01 wt.
%) thereby confirming negligible epoxy ring cleavage via this route. However, presence of
excess H2O due to several reasons – such as high amount of H2O in initially used H2O2
solution and generation of H2O during epoxidation reaction as a result of various side-
reactions – is likely to have resulted in the occurrence of epoxy ring cleavage. Hence, only
α-glycol test was undertaken to understand the degree of epoxy ring cleavage.
The α-glycol content of EPeO (Figure 4-2 (c)) was higher than values observed in
literature54 by a factor of ~ 10, even as less than 20 % of theoretical α-glycol limit was
achieved at reaction temperature of 60°C and duration of 8 h. This indicates that a small-
yet-significant fraction of epoxy groups was not stable, with increase in this fraction upon
increase in reaction temperature/duration. This can be attributed to mainly two reasons: (1)
Higher reactivity of functional groups that are further away from the glycerol group13, and

63
(2) Higher degradation of H2O2 at higher temperature, resulting in the formation of excess
amount of H2O that reacts with epoxy to form α-glycol32,125.
4.2.3. Post-oxirane Cleavage Kinetics
Unlike epoxidation that involves both oxirane formation (a two-step reaction) and
oxirane cleavage (a side-reaction) simultaneously, post-oxirane cleavage kinetics is
significantly different. The reaction of oxirane groups with excess HCOOH – resulting in
the ring opening of epoxy groups40,51.
The general form of the kinetic rate law equation for oxirane ring cleavage is
described in Equation 28, where [𝐸𝑃] refers to the molarity of epoxy in EPeO (mol/L),
[𝐹𝐶] refers to molarity of HCOOH (mol/L), 𝑡 is reaction duration (s), 𝑘 is the kinetic rate
constant for ring cleavage reaction, −𝑑[𝐸𝑃]/𝑑𝑡 is the rate of oxirane ring cleavage, and 𝑎
and 𝑏 refer to the order of the reaction with respect to epoxy groups (in EPeO) and HCOOH
respectively40,51.
−𝑑[𝐸𝑃]
𝑑𝑡= 𝑘[𝐸𝑃]𝑎[𝐹𝐶]𝑏 … … … … … (28)
When excess HCOOH is used – i.e., molar ratio of epoxy groups-to-HCOOH is 1:3
– Equation 28 can be re-written as Equation 29, where 𝑘′ is a pseudo first-order kinetic
rate constant defined as per Equation 30. Previous studies40,51 have shown that
experimental data on plots of ln[[𝐸𝑃]0 [𝐸𝑃]𝑡⁄ ] against reaction time (𝑡) at various reaction
temperatures leads to the obtainment of linear curves51. This indicates that 𝑎 = 1, meaning
that the ring opening reaction is first-order with respect to epoxy group concentration, and
that 𝑘′ is a pseudo first-order rate constant.
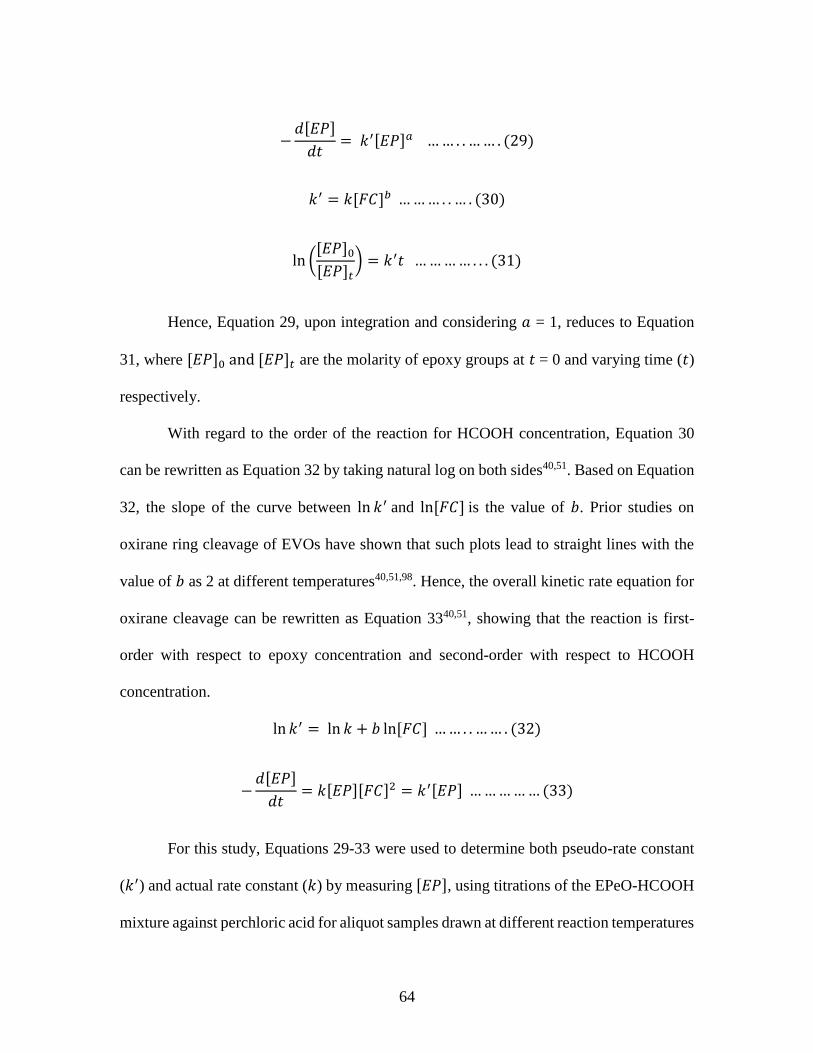
64
−𝑑[𝐸𝑃]
𝑑𝑡= 𝑘′[𝐸𝑃]𝑎 … … . . … … . (29)
𝑘′ = 𝑘[𝐹𝐶]𝑏 … … … . . … . (30)
ln ([𝐸𝑃]0
[𝐸𝑃]𝑡) = 𝑘′𝑡 … … … … . . . (31)
Hence, Equation 29, upon integration and considering 𝑎 = 1, reduces to Equation
31, where [𝐸𝑃]0 and [𝐸𝑃]𝑡 are the molarity of epoxy groups at 𝑡 = 0 and varying time (𝑡)
respectively.
With regard to the order of the reaction for HCOOH concentration, Equation 30
can be rewritten as Equation 32 by taking natural log on both sides40,51. Based on Equation
32, the slope of the curve between ln 𝑘′ and ln[𝐹𝐶] is the value of 𝑏. Prior studies on
oxirane ring cleavage of EVOs have shown that such plots lead to straight lines with the
value of 𝑏 as 2 at different temperatures40,51,98. Hence, the overall kinetic rate equation for
oxirane cleavage can be rewritten as Equation 3340,51, showing that the reaction is first-
order with respect to epoxy concentration and second-order with respect to HCOOH
concentration.
ln 𝑘′ = ln 𝑘 + 𝑏 ln[𝐹𝐶] … … . . … … . (32)
−𝑑[𝐸𝑃]
𝑑𝑡= 𝑘[𝐸𝑃][𝐹𝐶]2 = 𝑘′[𝐸𝑃] … … … … … (33)
For this study, Equations 29-33 were used to determine both pseudo-rate constant
(𝑘′) and actual rate constant (𝑘) by measuring [𝐸𝑃], using titrations of the EPeO-HCOOH
mixture against perchloric acid for aliquot samples drawn at different reaction temperatures

65
and time intervals. Table 4-2 shows the values of 𝑘′ and 𝑘 at different reaction
temperatures, with the values for 𝑘 being in the order of 10-8 L2 mol-2 s-1, which is in
accordance with literature40,51. As can be seen from Table 4-2, both rate constants – pseudo
first-order kinetic rate constant (𝑘′) as well as kinetic rate constant for oxirane cleavage (𝑘)
– show an increase with increase in reaction temperature, indicating a reduction in oxirane
ring stability with increase in reaction temperature40,51.
Table 4-2: Rate constant (𝒌) and pseudo-rate constant (𝒌′) for oxirane cleavage at
different synthesis temperatures
Synthesis Temperature (°C) k' (× 10-6 L mol-1 s-1) k (× 10-6 L2 mol-2 s-1)
40 15.71 0.04
50 33.64 0.09
60 42.24 0.11
Figure 4-4 (c) shows Arrhenius plots – rate constants (𝑘) v/s reciprocal of
temperature (1 𝑇⁄ ) – for oxirane cleavage reactions. These plots were used to obtain
activation energy (𝐸𝑎) of oxirane cleavage reactions and assess the stability of epoxy
groups formed during epoxidation. Based on Figure 4-4 (c), 𝐸𝑎 for oxirane ring cleavage
was obtained through calculations as 43.11 kJ/mol. This is significantly lower than 𝐸𝑎
values reported for palm olein oil (73.5 kJ/mol)40 and soybean oil (66.27 kJ/mol)51.
However, it should be noted that the cleavage reaction mentioned in these studies was the
reaction between CH3COOH and EVO. Hence, the lower 𝐸𝑎 value for oxirane cleavage of
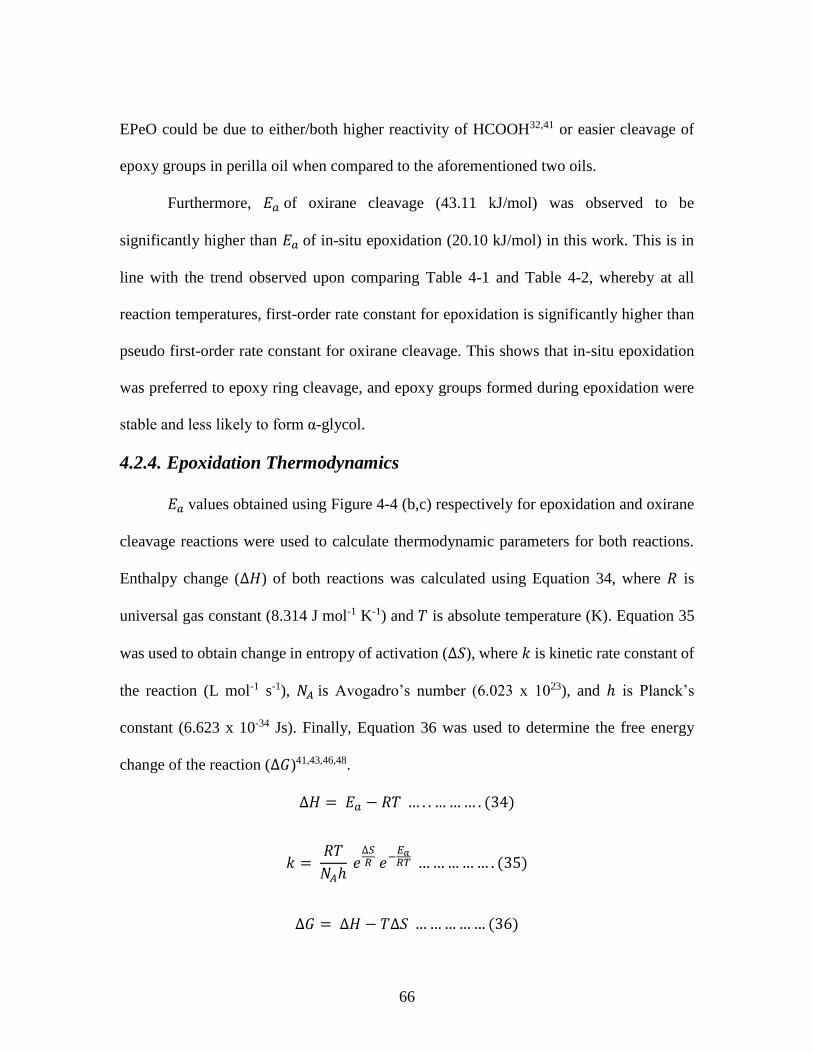
66
EPeO could be due to either/both higher reactivity of HCOOH32,41 or easier cleavage of
epoxy groups in perilla oil when compared to the aforementioned two oils.
Furthermore, 𝐸𝑎 of oxirane cleavage (43.11 kJ/mol) was observed to be
significantly higher than 𝐸𝑎 of in-situ epoxidation (20.10 kJ/mol) in this work. This is in
line with the trend observed upon comparing Table 4-1 and Table 4-2, whereby at all
reaction temperatures, first-order rate constant for epoxidation is significantly higher than
pseudo first-order rate constant for oxirane cleavage. This shows that in-situ epoxidation
was preferred to epoxy ring cleavage, and epoxy groups formed during epoxidation were
stable and less likely to form α-glycol.
4.2.4. Epoxidation Thermodynamics
𝐸𝑎 values obtained using Figure 4-4 (b,c) respectively for epoxidation and oxirane
cleavage reactions were used to calculate thermodynamic parameters for both reactions.
Enthalpy change (∆𝐻) of both reactions was calculated using Equation 34, where 𝑅 is
universal gas constant (8.314 J mol-1 K-1) and 𝑇 is absolute temperature (K). Equation 35
was used to obtain change in entropy of activation (∆𝑆), where 𝑘 is kinetic rate constant of
the reaction (L mol-1 s-1), 𝑁𝐴 is Avogadro’s number (6.023 x 10²³), and ℎ is Planck’s
constant (6.623 x 10⁻³⁴ Js). Finally, Equation 36 was used to determine the free energy
change of the reaction (∆𝐺)41,43,46,48.
∆𝐻 = 𝐸𝑎 − 𝑅𝑇 … . . … … … . (34)
𝑘 = 𝑅𝑇
𝑁𝐴ℎ 𝑒
∆𝑆𝑅 𝑒−
𝐸𝑎𝑅𝑇 … … … … … . (35)
∆𝐺 = ∆𝐻 − 𝑇∆𝑆 … … … … … (36)

67
Table 4-3: Thermodynamic parameters for epoxidation and post-oxirane cleavage
reaction
Thermodynamic Parameters Epoxidation Reaction
Post-oxirane Cleavage
Reaction
Synthesis temperature (°C) 40 50 60 40 50 60
Enthalpy of activation (ΔH,
kJ/mol)
17.98 17.89 17.81 56.37 56.29 56.20
Entropy of activation (ΔS, J/
mol.K)
-262.18 -263.61 -262.75 -194.72 -198.60 -202.33
Gibbs free energy of
activation (ΔG, kJ/mol)
100.08 103.08 105.34 117.35 120.46 123.61
Table 4-3 shows the thermodynamic parameters – activation enthalpy, activation
entropy and activation free energy – for epoxidation reaction and oxirane ring cleavage
reaction respectively – at all reaction temperatures (40, 50 and 60°C). As can be observed
from the values for different thermodynamic parameters mentioned in Table 4-3, both
epoxidation and ring opening reactions are endothermic40,41,48, and are also non-
spontaneous as Gibbs’ free energy change (∆𝐺) for both reactions is positive41,43,48,50. It
can also be seen that increase in synthesis temperature leads to an increase in non-
spontaneous nature of both reactions41,50, thereby reducing the possibility of their
occurrence. However, sections on kinetics (epoxidation and oxirane cleavage) show the
very opposite of this trend – increase in reaction rates for both epoxidation and oxirane
68
cleavage reactions with increase in synthesis temperature. This can be attributed to the
external heat supplied for occurrence of both reactions, as well as excess heat generated
due to the formation of performic acid during epoxidation reaction. However, since the
Gibbs’ free energy of activation (∆𝐺) is lower for epoxidation over oxirane cleavage,
reaction rates are higher for epoxidation compared to those for oxirane cleavage, as has
been seen in the section on oxirane cleavage kinetics. ∆𝐺 values for epoxidation reaction
were also observed to be significantly lower compared to values reported in other literature:
jatropha oil (126 -133 kJ/mol)50, karanja oil (130 kJ/mol)48, and cottonseed oil (117.5
kJ/mol)41. This indicates easier formation of oxirane groups for perilla oil compared to
other VOs studied in literature, which can be explained by the presence of higher linolenic
acid content and its higher reactivity and can be correlated with results presented in other
sections of this study.
69
CHAPTER FIVE
INFLUENCE OF DOUBLE BOND POSITION ON
EPOXIDATION KINETICS
5. Kinetic Model
Epoxidation of triglycerides via Prilezhaev reaction is a two-step process: (a)
Performic acid formation (via acid catalysis, Scheme I, Figure 5-1 (a)), and (b) Epoxidation
reaction (Scheme II, Figure 5-1 (a))27. These two steps are accompanied by the
simultaneous occurrence of multiple side reactions such as the cleavage of epoxy rings and
decomposition of reactant molecules. Among these side reactions, the most predominant
is epoxy cleavage due to the attack of formic acid, resulting in the formation of
hydroxylated-formiated products (Scheme III, Figure 5-1 (a))56. Reaction kinetics of these
reactions (shown in) is expressed by multiple first-order differential equations (Equations
37-40), assuming negligible mass and heat transfer resistance due to intense stirring.
𝑑[𝐹]
𝑑𝑡=
𝑑[𝐻]
𝑑𝑡+
𝑑[𝐸]
𝑑𝑡… … … … (37)
𝑑[𝑃]
𝑑𝑡=
−𝑑[𝐻]
𝑑𝑡+
𝑑[𝐷]
𝑑𝑡… … … … … . (38)
𝑑[𝑊]
𝑑𝑡=
−𝑑[𝐻]
𝑑𝑡 … … … … . (39)
𝑑[𝐻𝐴]
𝑑𝑡= − (
𝑑[𝐸]
𝑑𝑡+
𝑑[𝐷]
𝑑𝑡) … … … … . (40)

70
Figure 5-1: (a) Major reactions occurring during the epoxidation of triglyceride: (i)
Reaction I: Acid-catalyzed formation of performic acid; (ii) Reaction II: Formation of
epoxy groups via reaction between performic acid and double bond; and (iii) Reaction
III: Ring-opening reaction due to attack of formic acid on epoxy groups; and (b)
Triglyceride molecule that indicates the position of double bonds in different fatty acids.

71
Here, square bracket “[]” denotes the concentration of a particular chemical species
(in moles per 100 g of oil). Thus, formic acid [𝐹], performic acid [𝑃], water [𝑊], hydrogen
peroxide [𝐻], hydroxyl acetate [𝐻𝐴], double bond [𝐷] and epoxy [𝐸] are denoted
respectively.
To understand the influence of the position of double bond on its reactivity, four
scenarios (S1, S2, S3 and S4) were considered in the proposed model (Figure 5-1 (b)), each
of which assumes the reactivity of double bond and epoxy at any position to be the same.
For the aforementioned kinetic equations (Equations 37-40), double bond concentration
(𝑑[𝐷]/𝑑𝑡) and epoxy concentration (𝑑[𝐸]/𝑑𝑡) were expanded for different scenarios as
explained below:
a) Scenario 1 (S1) considers the reactivity of double bonds to be highly influenced by
their position, i.e., double bonds at various positions exhibit differences in their
reactivity. Hence:
𝑑[𝐷]
𝑑𝑡= −𝑘2𝑎
[𝑃][𝑂1] − 𝑘2𝑏[𝑃][𝑂2] − 𝑘2𝑐
[𝑃][𝑂3]
𝑑[𝐸]
𝑑𝑡= {𝑘2𝑎
[𝑃][𝑂1] − 𝑘3𝑎[𝐸𝑂1][𝐹]2} + {𝑘2𝑏
[𝑃][𝑂2] − 𝑘3𝑏[𝐸𝑂2][𝐹]2}
+ {𝑘2𝑐[𝑃][𝑂3] − 𝑘3𝑐
[𝐸𝑂3][𝐹]2}
b) Scenario 2 (S2) considers the reactivity of double bonds at positions 9 and 12 to be
equal, while assuming the reactivity of double bond at the 15th position to be different
from those at the 9th and 12th positions. Hence:
𝑑[𝐷]
𝑑𝑡= −𝑘2𝑑
[𝑃][𝑂4] − 𝑘2𝑐[𝑃][𝑂3]

72
𝑑[𝐸]
𝑑𝑡= {𝑘2𝑑
[𝑃][𝑂4] − 𝑘3𝑑[𝐸𝑂4][𝐹]2} + {𝑘2𝑐
[𝑃][𝑂3] − 𝑘3𝑐[𝐸𝑂3][𝐹]2}
c) Scenario 3 (S3) considers the reactivity of double bonds at positions 12 and 15 to be
the same, and that of double bond at the 9th position to be different from those at the
12th and 15th positions. Hence:
𝑑[𝐷]
𝑑𝑡= −𝑘2𝑎
[𝑃][𝑂1] − 𝑘2𝑒[𝑃][𝑂5]
𝑑[𝐸]
𝑑𝑡= {𝑘2𝑎
[𝑃][𝑂1] − 𝑘3𝑎[𝐸𝑂1][𝐹]2} + {𝑘2𝑒
[𝑃][𝑂5] − 𝑘3𝑒[𝐸𝑂5][𝐹]2}
d) Scenario 4 (S4) considers the reactivity of double bonds at all positions (9, 12 and 15)
to be equal. Hence:
𝑑[𝐷]
𝑑𝑡= −𝑘2𝑓
[𝑃][𝑂6]
𝑑[𝐸]
𝑑𝑡= {𝑘2𝑓
[𝑃][𝑂6] − 𝑘3𝑓[𝐸𝑂6][𝐹]2}
Here, 𝑘2𝑎, 𝑘2𝑏, 𝑘2𝑐,
𝑘2𝑑, 𝑘2𝑒,
𝑘2𝑓 are the rate constants that correspond to epoxy
formation, while 𝑘3𝑎, 𝑘3𝑏, 𝑘3𝑐,
𝑘3𝑑, 𝑘3𝑒,
𝑘3𝑓 are the rate constants that correspond to epoxy
cleavage reaction, at different bond positions for different scenarios.
The following initial conditions (@ time, t = 0) were used in model computations
(where total double bond concentration [𝐷] is 0.77 moles/100 g of oil):
Scenario S1: [𝐷] = [𝑂1] +[𝑂2] + [𝑂3] = 46.5% of [𝐷] + 30.7% of [𝐷] + 22.8% of [𝐷]
Scenario S2: [𝐷] = [𝑂4] + [𝑂3] = 77.2% of [𝐷] + 22.8% of [𝐷]
Scenario S3: [𝐷] = [𝑂1] + [𝑂5] = 46.5% of [𝐷] + 53.5% of [𝐷]
Scenario S4: [𝐷] = [𝑂6] = 100% of [D]
73
Among the three reactions mentioned in Figure 5-1 (a), formation of performic acid
(Scheme I) occurs in three steps amidst the presence of AIER catalyst: (a) Adsorption of
chemicals onto the surface of solid catalyst; (b) Reaction between these adsorbed chemicals
on the catalytic surface; and (c) Desorption of products from the surface of the catalyst39,54.
Also, unlike homogeneous catalyst-based reactions where performic acid formation is the
rate-determining step, either of these three steps (adsorption, surface reaction or
desorption) can be the rate-determining step in case of heterogeneous catalyst-based
reaction39.
Hence, the kinetic rate equation for such a complex reaction (performic acid
formation) was developed based on the L-H-H-W postulates. The general form of this
equation is shown in Equation 41, where 𝑘 is kinetic rate constant, 𝐾𝐹 is kinetic factor,
𝐷𝐹 is driving force group, and 𝐴𝐺 is the adsorption group. While the rate coefficient of
rate-determining reaction is included in 𝐾𝐹, displacement from chemical equilibrium is
explained by 𝐷𝐹. Further, variation in the rate of reaction is explained by variation in the
number of active catalytic sites.
𝑘 = 𝐾𝐹 ∗ 𝐷𝐹
𝐴𝐺 … … … … . (41)
Hence, it is assumed that during chemisorption mechanism, all chemicals in the
aqueous phase (formic and performic acids, hydrogen peroxide, and water) were adsorbed
onto the surface of the catalyst. Among these chemicals, adsorption of formic acid was
assumed to be the rate-determining step for reasons explained by Janković et. al39. Based
on these assumptions and the L-H-H-W postulates, rate of consumption of hydrogen
peroxide during the formation of performic acid was obtained from Equation 4239, where,

74
𝑀 is the mass of catalyst (in grams), and 𝐶𝑠 is the number of moles of active catalytic sites
per gram of catalyst.
𝑑[𝐻]
𝑑𝑡=
− {𝑀𝐶𝑠𝑘𝑎,𝐹 ( [𝐹] − [𝑃][𝑊]𝐾1[𝐻]
)}
1 +𝐾𝐹[𝑃][𝑊]
𝐾1[𝐻]+ 𝐾𝐻[𝐻] + 𝐾𝑃[𝑃] + 𝐾𝑤[𝑊]
… … … … … . (42)
Here, 𝐾𝐹, 𝐾𝐻, 𝐾𝑃, 𝐾𝑤 are the respective adsorption equilibrium constants for formic
acid, hydrogen peroxide, performic acid and water, while 𝑘𝑎,𝐹 refers to the adsorption rate
constant for formic acid. 𝐾1 refers to the chemical equilibrium constant for performic acid
formation, and is obtained from Equation 43 as described by Santacesaria et.al123.
𝐾1 = 1.6 exp [−10000
𝑅 (
1
298−
1
𝑇)] … … … … … . (43)
Schwaab et.al61,126 had shown the existence of strong correlation of kinetic
parameters in mathematical models containing more than one temperature-dependent
kinetic constant. Such correlation makes the task of precise estimation of different kinetic
parameters more onerous127,128. In such cases, re-parametrized form of Arrhenius equation
is known to significantly reduce computational effort by reducing the correlation between
parameters129. Hence, temperature-dependency of various kinetic rate coefficients and
adsorption equilibrium constants in the proposed model was determined using the re-
parametrized form of Arrhenius equation (Equation 44). In Equation 44, 𝐾𝑖 refers to the
rate coefficient of reaction 𝑖, 𝐾𝑖,0 is the constant related to frequency coefficient, 𝐾𝑖,𝐸𝑎 is
the constant related to activation energy of a reaction, 𝑅 is universal gas constant (8.314
J/mol. K), and 𝑇 is temperature (in Kelvin).

75
𝑘𝑖 = exp [𝑘𝑖,0 − 𝑘𝑖,𝐸𝑎
𝑅 (
1
𝑇−
1
323)] … … … … . (44)
5.1. Parameter Estimation and Model Validation
To determine the various rate constants, experimentally determined [𝐷] and [𝐸]
values were used as input parameters in the proposed model for all four scenarios (S1, S2,
S3 and S4). First-order differential equations (Equations 37-40) were integrated using
Forward-Euler method with a step size of 1 s. Genetic algorithm was used to minimize the
cost function (𝐽) (Equation 45) by running 1000 iterations that had the same boundary
conditions for all kinetic parameters in all scenarios. Initially, various rate constants were
determined for the epoxidation reaction at 40, 50 and 60°C for all four scenarios.
𝐽 = √1
𝑛∑ (
([𝐷]𝑒𝑥𝑝 − [𝐷]𝑚𝑜𝑑𝑒𝑙)2
[𝐷]𝑒𝑥𝑝,𝑚𝑎𝑥2 ) +
1
𝑛∑ (
([𝐸]𝑒𝑥𝑝 − [𝐸]𝑚𝑜𝑑𝑒𝑙)2
[𝐸]𝑒𝑥𝑝,𝑚𝑎𝑥2 ) … … . (45)
Where [𝐷]𝑒𝑥𝑝 = IV/(2*126.9), mol/100 g of oil and [𝐸]𝑒𝑥𝑝 = EV/16, mol/100 g of oil,
and n = 8.
To estimate the robustness of the proposed model and obtain a clear understanding
of the influence of double bond position on its reactivity, all scenarios were validated.
Under the model validation process, pre-calculated rate constants were used as input
parameters and the model was allowed to predict [𝐷] and [𝐸] values, which were then
compared with their corresponding experimentally determined values.
Model predicted rate constants at 40 and 60°C for various reactions in each scenario
were used to obtain the pre-exponential factor and activation energy of the generalized
76
Arrhenius equation (Equation 46). From this, rate constants at 50°C were calculated and
used as inputs for model validation.
𝑘 = 𝐴𝑒−𝐸𝑎𝑅𝑇 … … … . (46)
Where 𝑘 – rate constant, 𝐴 – pre-exponential factor and 𝐸𝑎 – activation energy.
Error percentage (%) between experimentally determined and model-predicted
iodine value (IV) and epoxy value (EV) was calculated using Equations 47 and 48.
% 𝐷 𝐸𝑟𝑟𝑜𝑟 = 𝑅𝑀𝑆 (𝐷𝑒𝑥𝑝 − 𝐷𝑚𝑜𝑑𝑒𝑙) × 100
𝑀𝑒𝑎𝑛(𝐷𝑒𝑥𝑝)… … … . (47)
% 𝐸 𝐸𝑟𝑟𝑜𝑟 = 𝑅𝑀𝑆 (𝐸𝑒𝑥𝑝 − 𝐸𝑚𝑜𝑑𝑒𝑙) × 100
𝑀𝑒𝑎𝑛(𝐸𝑒𝑥𝑝)… . . … … . (48)
5.2. Results and Discussion
Figure 5-1 (b) shows the chemical composition of perilla oil130,131. While the
average molecular weight of triglyceride (perilla oil) was estimated to be ~ 871 g/mol, its
double bond functionality (i.e., average no. of double bonds per mole of triglyceride) was
calculated as ~ 7. Iodine value of perilla oil was experimentally determined to be 196.6
g/100 g of oil, (i.e 0.775 mol/100 g of oil)132.
5.2.1. Influence of Double Bond Position on its Reactivity
Experimentally determined (shown as points) and model-predicted (shown as lines
for all scenarios) IV and EV, along with their respective error % (using Equations 47 and
48) are shown for 40°C (Figure 5-2 (a,b)) and 60°C (Figure 5-2 (c,d)) respectively. Further,
Figure 5-2 (e,f) show IV and EV predicted at 50°C during the validation of the proposed
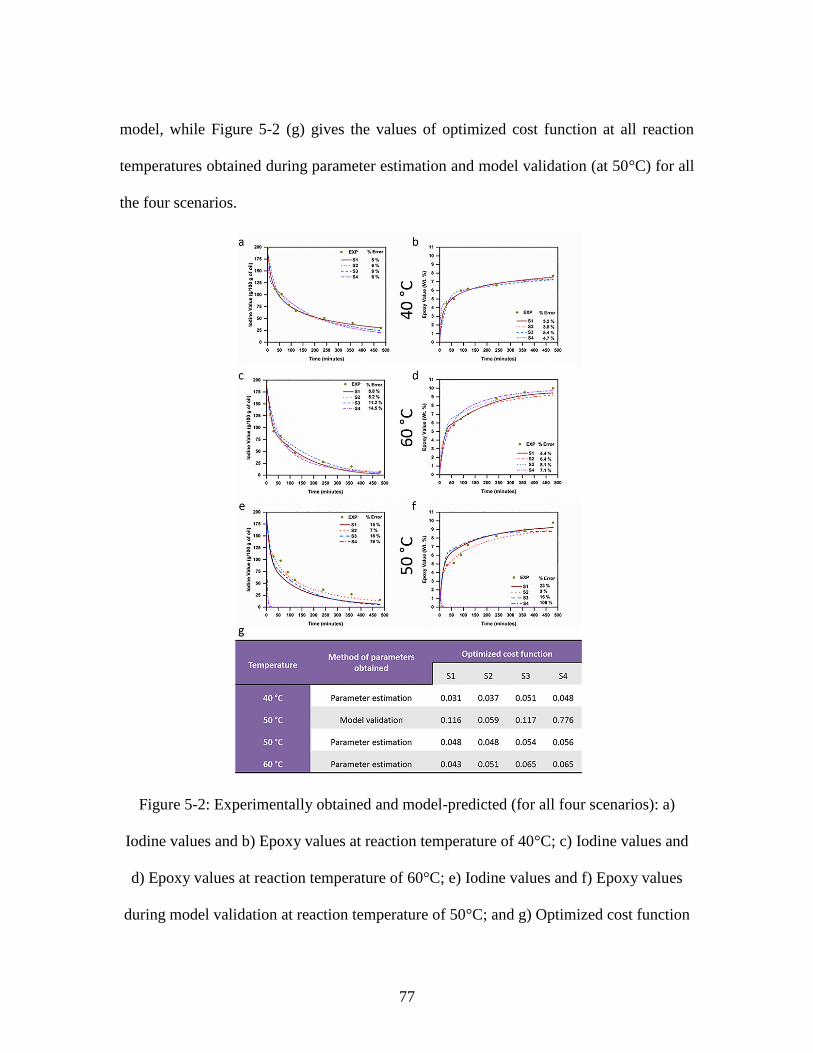
77
model, while Figure 5-2 (g) gives the values of optimized cost function at all reaction
temperatures obtained during parameter estimation and model validation (at 50°C) for all
the four scenarios.
Figure 5-2: Experimentally obtained and model-predicted (for all four scenarios): a)
Iodine values and b) Epoxy values at reaction temperature of 40°C; c) Iodine values and
d) Epoxy values at reaction temperature of 60°C; e) Iodine values and f) Epoxy values
during model validation at reaction temperature of 50°C; and g) Optimized cost function

78
(RMS value) of the developed model for all four scenarios at the three reaction
temperatures
As can be seen (Figure 5-2 (a-d, g)), both error % and optimized cost function
obtained during parameter estimation were observed to be higher for scenarios S3 and S4
at all three temperatures. In contrast, scenarios S1 and S2 showed the least error and cost
function values, with S1 predicting experimental observations more accurately when
compared to S2 during parameter estimation. However, upon the validation of the model
(Figure 5-2 (e-g)), scenario S2 was observed to predict experimental observations
accurately with least error (< 10%) and cost function (0.06). Conversely, scenario S4
exhibited very high error (> 50%) and cost function (0.776), thereby failing completely in
validating itself as a likely scenario, while scenarios S1 and S3 had higher error (≥ 15%)
compared to S2, even though their predicted values were close to those observed
experimentally when compared to S4.
Based on these observations (from Figure 5-2 (a-g)), the model indicates that the
assumptions made in scenario S2 are the most likely to explain experimentally observed
epoxidation behavior. In other words, the reactivity of double bonds at the 9th and 12th
positions are the same, while that of double bond at the 15th position is different. This is in
line with similar findings reported earlier by Scala and Wool49. They attributed this to the
high influence of steric and electronic effects of glycerol center on double bonds closer to
them (i.e., 9th and 12th positions), with no influence of such effects on double bonds that
are farther from the glycerol center (i.e., 15th position).

79
Conventionally, epoxidation kinetics of various triglycerides has been modelled
using scenario S4 in existing literature39,44,47,50,54,56, indicating that models based on this
scenario are highly robust and accurately predict epoxidation of different triglycerides.
However, the model indicates that scenario S4 is the least likely to explain experimentally
observed epoxidation behavior of high-linolenic perilla oil. This stark contrast is due to the
absence of linolenic acid (C18:3) – that possesses double bond in the 15th position – in
triglycerides used in aforementioned studies, while perilla oil has high linolenic content (>
50 %). This means that scenarios S2 (the most accurate) and S4 (the least accurate) in this
study are same for high-oleic triglycerides that have been studied to date.
Together, these explanations highlight the vital need for developing a model that
robustly captures the variation in reactivity of double bonds for synthesizing EVOs with
higher oxirane content – an aspect achieved by the model. In addition to capturing this
variation, the model also provides further insights into their epoxidation behavior. An
explanation of some such insights for two scenarios (S1 and S2) is provided henceforth.
5.2.2. Reactivity of Double Bond and Epoxy Groups at Different Bond
Positions – Scenario S1
Figure 5-3 shows the variation in double bond and epoxy concentration – based on
their bond position – as predicted by the proposed model for scenario S1 at all three reaction
temperatures. Figure 5-3 (a) indicates sluggish reactivity of the double bond present at the
9th position. Nevertheless, almost all double bonds at this position are predicted to
participate in epoxidation reaction at both 50 and 60°C. On the other hand, significant
amount of residual double bond content is predicted to exist at 40°C, indicating that the

80
epoxidation reaction is incomplete even after 8 h. Conversely, Figure 5-3 (c,e) indicate
high reactivity of double bonds present at the 12th and 15th positions at reaction
temperatures of 50 and 60°C, showing that they get consumed within the first 50 minutes
of the reaction. However, at 40°C, the double bond at 12th position is predicted to react
slowly when compared to the double bond at the 15th position. Contrastingly, the reactivity
of epoxy group – which indicates its stability or the probability of cleavage of epoxy groups
– is shown in Figure 5-3 (b,d,f) (corresponding to the 9th, 12th and 15th positions
respectively). As can be seen, at all reaction temperatures, epoxy groups formed at the 15th
position (Figure 5-3 (f)) are predicted by the proposed model to have undergone cleavage.
However, epoxy groups formed at the 9th and 12th positions (Figure 5-3 (b,d)) are predicted
to have not participated in the ring-opening reaction.
Nonetheless, as mentioned earlier, scenario S1 shows a higher error when compared
to S2 during model validation (at 50°C), indicating that it is not the most accurate scenario
for explaining the experimentally observed epoxidation behavior. Hence, variation in the
reactivity of double bond and epoxy groups at different positions, as predicted in scenario
S2, is explained in the subsequent section.
5.2.3. Reactivity of Double Bond and Epoxy Groups at Different Bond
Positions – Scenario S2
Figure 5-4 (a-d) highlight the variation in double bond and epoxy concentration
with increasing reaction duration at all three reaction temperatures, as predicted by scenario
S2. As can be seen (Figure 5-4 (a)), double bonds at the 9th and 12th positions exhibit
sluggish reactivity at 40°C, resulting in a significant number of un-reacted double bonds.
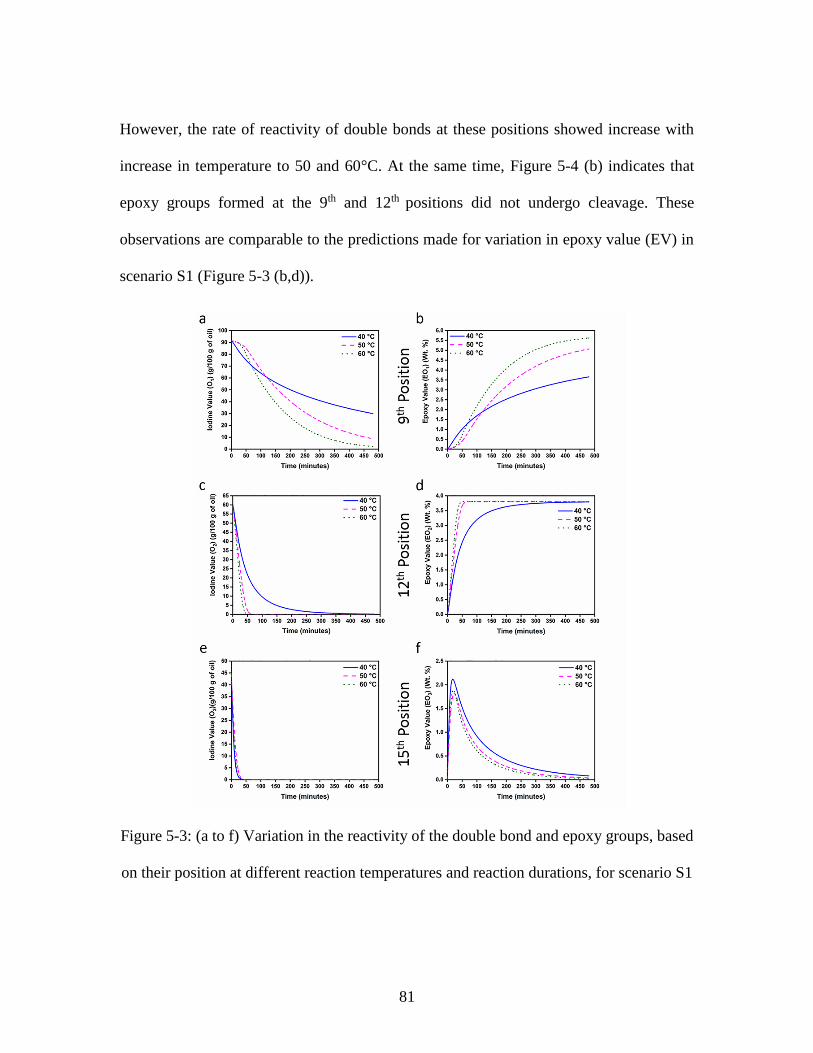
81
However, the rate of reactivity of double bonds at these positions showed increase with
increase in temperature to 50 and 60°C. At the same time, Figure 5-4 (b) indicates that
epoxy groups formed at the 9th and 12th positions did not undergo cleavage. These
observations are comparable to the predictions made for variation in epoxy value (EV) in
scenario S1 (Figure 5-3 (b,d)).
Figure 5-3: (a to f) Variation in the reactivity of the double bond and epoxy groups, based
on their position at different reaction temperatures and reaction durations, for scenario S1
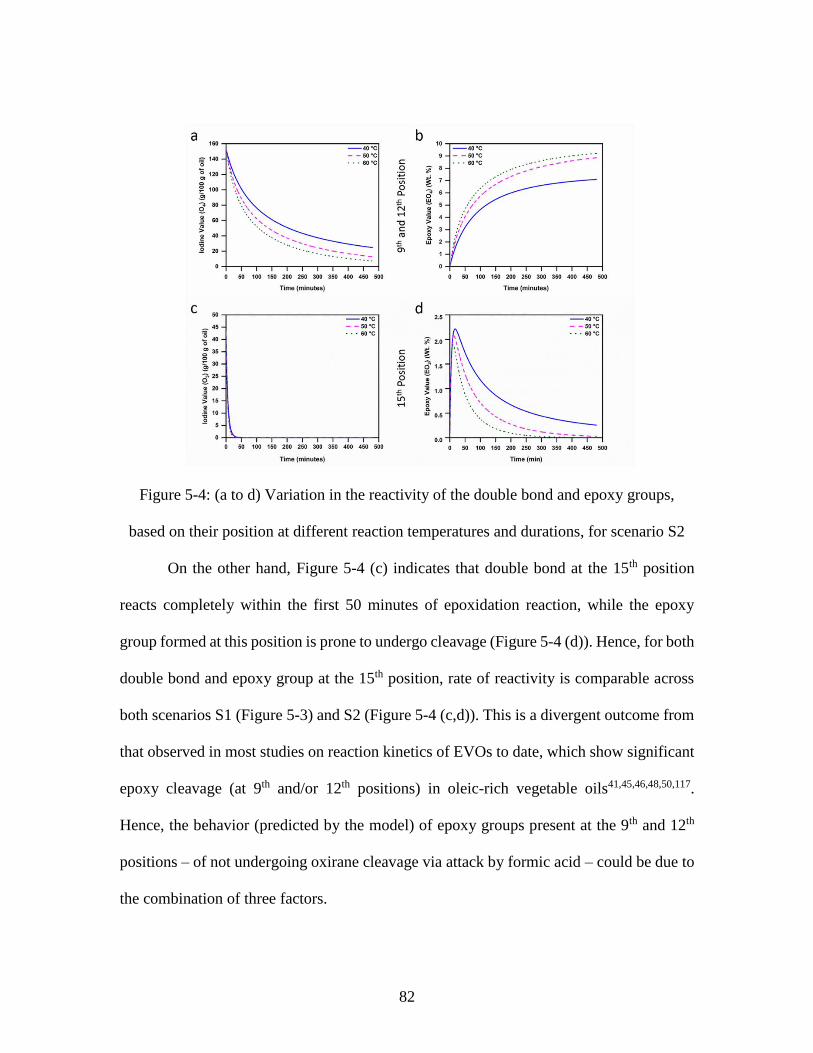
82
Figure 5-4: (a to d) Variation in the reactivity of the double bond and epoxy groups,
based on their position at different reaction temperatures and durations, for scenario S2
On the other hand, Figure 5-4 (c) indicates that double bond at the 15th position
reacts completely within the first 50 minutes of epoxidation reaction, while the epoxy
group formed at this position is prone to undergo cleavage (Figure 5-4 (d)). Hence, for both
double bond and epoxy group at the 15th position, rate of reactivity is comparable across
both scenarios S1 (Figure 5-3) and S2 (Figure 5-4 (c,d)). This is a divergent outcome from
that observed in most studies on reaction kinetics of EVOs to date, which show significant
epoxy cleavage (at 9th and/or 12th positions) in oleic-rich vegetable oils41,45,46,48,50,117.
Hence, the behavior (predicted by the model) of epoxy groups present at the 9th and 12th
positions – of not undergoing oxirane cleavage via attack by formic acid – could be due to
the combination of three factors.
83
The first factor is the possible steric effect of the hydroxylated group present at the
15th position (formed due to oxirane cleavage) on incoming formic acid. This effect is
hypothesized to prevent any interaction between formic acid and the epoxy groups present
at the 9th and 12th positions, thereby preventing their cleavage.
The second contributing factor is the combination of steric and electronic effects as
reported by Scala and Wool125 in their study on reaction kinetics of acylation reaction (i.e.,
cleavage of epoxy groups and formation of acrylic group) of EVOs. They observed that
oleic-rich vegetable oils exhibited higher reaction rates for acylation reaction when
compared to oils containing higher amount of linoleic (C18:2) and linolenic acid (C18:3)
groups, a finding they attributed to steric and electronic effects. Steric effect was generated
by the presence of multiple epoxy groups in the same fatty acid chain that hindered other
chemical species from attacking these groups. Simultaneously, electronic effect generated
due to the glycerol center was considered responsible for preventing the cleavage of epoxy
group present at the 9th position in fatty acids.
A third interesting factor that explains the low levels of oxirane cleavage, as
observed via decrease in kinetic rate constant for oxirane cleavage (at 9th and 12th positions)
with increase in reaction temperature (Table 4-1 and Table 4-2), is the degradation of
formic acid at higher temperatures due to the higher reactivity of hydrogen peroxide32,133.
Such degradation is likely to reduce the possibility of oxirane cleavage via attack by formic
acid on epoxy groups, especially for epoxy groups at relatively less-accessible positions
(i.e., 9th and 12th positions).
84
CHAPTER SIX
PHOTO-CURE KINETICS OF ACRYLATED EPOXIDIZED
SOYBEAN OIL
6. Results and Discussion
6.1. Change in Enthalpy and Reaction Time Under Different Process
Conditions
Table 6-1 and Table 6-2 provide the respective reaction enthalpies and peak times
for photo-curing of AESO under different processing conditions (varying PI concentration,
UV light intensity, and temperatures), as obtained from photo-DSC, for the low-intensity
batch (50, 100 and 150 mW/cm2) and medium-intensity batch (1500, 2500 and 3500
mW/cm2). As can be seen from both the tables, increase in intensity from the low-intensity
(50-150 mW/cm2) to medium-intensity (1500-3500 mW/cm2) regime resulted in an
increase in reaction enthalpy along with significant reduction in reaction time. This
observation was consistent, irrespective of the type of PI, UV light intensity and/or
temperature used. Since a broadband lamp with a wide UV wavelength ranging from 320-
500 nm was used in photo-DSC, the effect of UV wavelength on the extent of curing was
not studied. Further, the reaction time for HCPK-initiated reaction was higher than for
DMPA-initiated reaction at lower PI concentration and temperature in both low- and
medium-intensity regimes. In order to determine the extent of conversion (𝛼) under all
conditions, Equation 11 was employed.

85
Table 6-1: Enthalpy of reaction and peak time for photo curing of AESO at different
photo-initiator concentration, intensity and temperature obtained from Photo-DSC for
low-intensity regime.
Intensity
(mW/cm2)
Temp
(°C)
Concentration of PI
(%)
Enthalpy (J/g) Peak Time (s)
DMPA HCPK DMPA HCPK
50
25
0.5 -89.85 -59.8 25 67
1 -113.2 -87.24 19 31
2 -121.2 -116.5 13 13
4 -127 -124.7 7 13
50
2
-143 -124.3 7 13
75 -155.7 -128.3 7 7
100
25
-134.4 -133.8 7 13
150 -139.2 -141 7 7
In case of photo-cure kinetics, for Equation 11, the general practice is to consider
the enthalpy value of a reaction obtained at the highest reaction temperature as its total
enthalpy value (∆𝐻𝑡𝑜𝑡𝑎𝑙), in order to calculate the extent of the reaction (i.e., conversion or
crosslinking in this study)108,109. From Table 6-1, it is evident that by this logic, the highest
enthalpy value of crosslinking reaction (-155.7 J/g) was obtained at the highest temperature
(75°C) for AESO sample containing DMPA (2 wt. %) as photo-initiator (negative sign
indicates that the reaction is exothermic). On the contrary, for AESO samples containing
HCPK as photo-initiator (Table 6-1), increase in UV radiation intensity (from 50 to 150
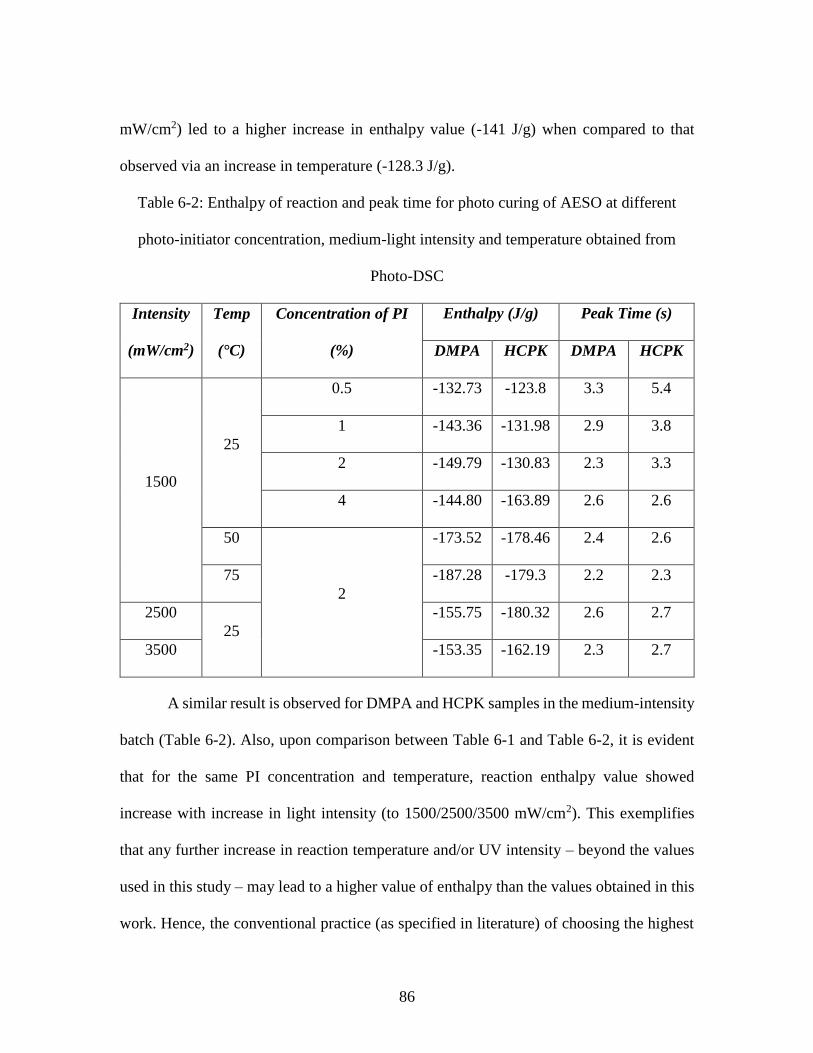
86
mW/cm2) led to a higher increase in enthalpy value (-141 J/g) when compared to that
observed via an increase in temperature (-128.3 J/g).
Table 6-2: Enthalpy of reaction and peak time for photo curing of AESO at different
photo-initiator concentration, medium-light intensity and temperature obtained from
Photo-DSC
Intensity
(mW/cm2)
Temp
(°C)
Concentration of PI
(%)
Enthalpy (J/g) Peak Time (s)
DMPA HCPK DMPA HCPK
1500
25
0.5 -132.73 -123.8 3.3 5.4
1 -143.36 -131.98 2.9 3.8
2 -149.79 -130.83 2.3 3.3
4 -144.80 -163.89 2.6 2.6
50
2
-173.52 -178.46 2.4 2.6
75 -187.28 -179.3 2.2 2.3
2500
25
-155.75 -180.32 2.6 2.7
3500 -153.35 -162.19 2.3 2.7
A similar result is observed for DMPA and HCPK samples in the medium-intensity
batch (Table 6-2). Also, upon comparison between Table 6-1 and Table 6-2, it is evident
that for the same PI concentration and temperature, reaction enthalpy value showed
increase with increase in light intensity (to 1500/2500/3500 mW/cm2). This exemplifies
that any further increase in reaction temperature and/or UV intensity – beyond the values
used in this study – may lead to a higher value of enthalpy than the values obtained in this
work. Hence, the conventional practice (as specified in literature) of choosing the highest
87
enthalpy value obtained as the total enthalpy value (∆𝐻𝑡𝑜𝑡𝑎𝑙) of the reaction can lead to
unrealistic conclusions about the kinetics of curing reaction. Therefore, to obtain a more
realistic understanding of the extent of conversion (𝛼), it is critical to calculate the reaction
enthalpy value at 100 % conversion using a theoretical method.
6.2. Theoretical Heat of Reaction
While the theoretical heat of reaction has been previously calculated in literature
for simple molecules such as acrylates and diepoxies134, there still exists lack of clarity on
determining the theoretical heat of reaction for complex molecules such as triglycerides.
Typically, Equation 49 can be used to calculate the theoretical heat of reaction
(∆𝐻𝑡ℎ𝑒𝑜𝑟𝑒𝑡𝑖𝑐𝑎𝑙) for a complex molecule (such as triglyceride), where 𝑓 is the number of
sites per mole of monomer, 𝐶 is the fraction of monomer used in the chemical composition,
𝐻 is the energy (in Joules) per mole of reactive site, and 𝑀𝑊 is the molecular weight of
the monomer (in grams/mole).
∆𝐻𝑡ℎ𝑒𝑜𝑟𝑒𝑡𝑖𝑐𝑎𝑙 =𝑓 ∗ 𝐶 ∗ 𝐻
𝑀𝑊… … … … (49)
In case of acrylated epoxidized soybean oil (AESO), there can only be a maximum
of 4.2 acrylate groups in the molecule65 (i.e., 𝑓 = 4.2), resulting in the total molecular
weight (𝑀𝑊) of the monomer being 1290 g/mol135. Enthalpy of the reaction (∆𝐻) was
considered to be -86.2 kJ per acrylate double bond134,136, while the value of 𝐶 (fraction of
monomer) was assumed to be 1 as no solvents or co-monomers were used in this study.
Based on these details, the theoretical heat of reaction (∆𝐻𝑡ℎ𝑒𝑜𝑟𝑒𝑡𝑖𝑐𝑎𝑙) for 100 % conversion
of double bond in AESO was calculated to be -280.65 J/g. Using this value as ∆𝐻𝑡𝑜𝑡𝑎𝑙, the

88
degree or extent of conversion (𝛼) was calculated using Equation 11 for all the test
conditions and has been plotted for the low-intensity and medium-intensity batches in
Figure 6-1 (a-f) and Figure 6-2 (a-f) respectively.
6.3. Effect of Photo-Initiator Type and Concentration on Extent of Cure
From Figure 6-1 and Figure 6-2, it is evident that the extent of crosslinking did not
reach unity (𝛼 ≠ 1) under any DSC condition. Upon comparing these two figures, it is
clear that the reaction reached completion within 40 s for the medium-intensity regime,
while it continued beyond 120 s in the low-intensity regime despite the UV irradiation on
sample for only 120 s under both scenarios. As can be seen from Figure 6-1 (for low-
intensity regime), the extent of cure is observed to increase with increase in PI
concentration (be it DMPA or HCPK), UV intensity, and/or temperature. However, in case
of the medium-intensity regime/batch (Figure 6-2 (a,b)), it can be seen that while increase
in DMPA concentration did not alter the extent of curing (𝛼), significant increase in 𝛼 was
observed with increase in HCPK concentration. On the other hand, Figure 6-2 (c,f) show
that 𝛼 increased with increase in DSC temperature – irrespective of the PI used. This can
be attributed to the probable reduction in viscosity of the resin precursor (AESO), thereby
enabling increased diffusivity of the PI that in turn would result in increased conversion137.
Further, the rate of reaction was also observed to differ in both intensity regimes, being
slower in the low-intensity regime vis-à-vis the medium-intensity regime (Figure 6-1 and
Figure 6-2). Additionally, for both the low- and medium-intensity regimes, DMPA-
containing samples exhibited a higher reaction rate (i.e., faster reaction) when compared to

89
HCPK-containing samples. In contrast, for both the PIs, increase in intensity beyond 1500
mW/cm2 did not influence either the curing rate (𝑑𝛼/𝑑𝑡) or the extent of curing (𝛼).
Figure 6-1: Extent of conversion (𝛼) as a function of time during photo curing of AESO
at varying photo-initiator concentration, intensity and temperature for two different
photo-initiators in the low-intensity regime.
Figure 6-2: Extent of conversion (𝛼) as a function of time during photo curing of AESO
at varying photo-initiator concentration, intensity and temperature for two different
photo-initiators in the medium-intensity regime.
90
6.4. Kinetic Analysis
6.4.1. Model-fitting Method
In order to determine the cure kinetics of acrylated epoxidized soybean oil (AESO),
experimentally obtained 𝑑𝛼/𝑑𝑡 values were fitted using Equation 12 (Kamal-Sourour
model) as a function of 𝛼 (Figure 6-3). As can be seen from the figure, model-predicted
values did not show a good fit for experimentally obtained values, indicating that this
model cannot accurately predict the experimental observations for curing of AESO. This
is due to the assumption made by the Kamal-Sourour model that 𝛼 always reaches unity
(i.e., complete crosslinking)138,139, while Figure 6-1 and Figure 6-2 clearly show that
crosslinking of AESO was not completed under any cure condition – largely as a result of
vitrification. Hence, to account for the vitrification that occurs in AESO upon photo-curing,
the modified Kamal’s model (Equation 13) was used to fit experimentally obtained 𝑑𝛼/𝑑𝑡
values and determine the reaction rate constants and activation energy. Figure 6-4 shows
the model-predicted and experimentally obtained 𝑑𝛼/𝑑𝑡 values as a function of 𝛼. As can
be seen, the model shows a good fit with experimental values, indicating that the modified
Kamal’s model can well explain experimental observations during the photo-curing of
AESO. Based upon this fitting, the values of rate constants (𝑘1, 𝑘2) and reaction orders (𝑚
and 𝑛) were obtained and have been reported in Table 6-3.
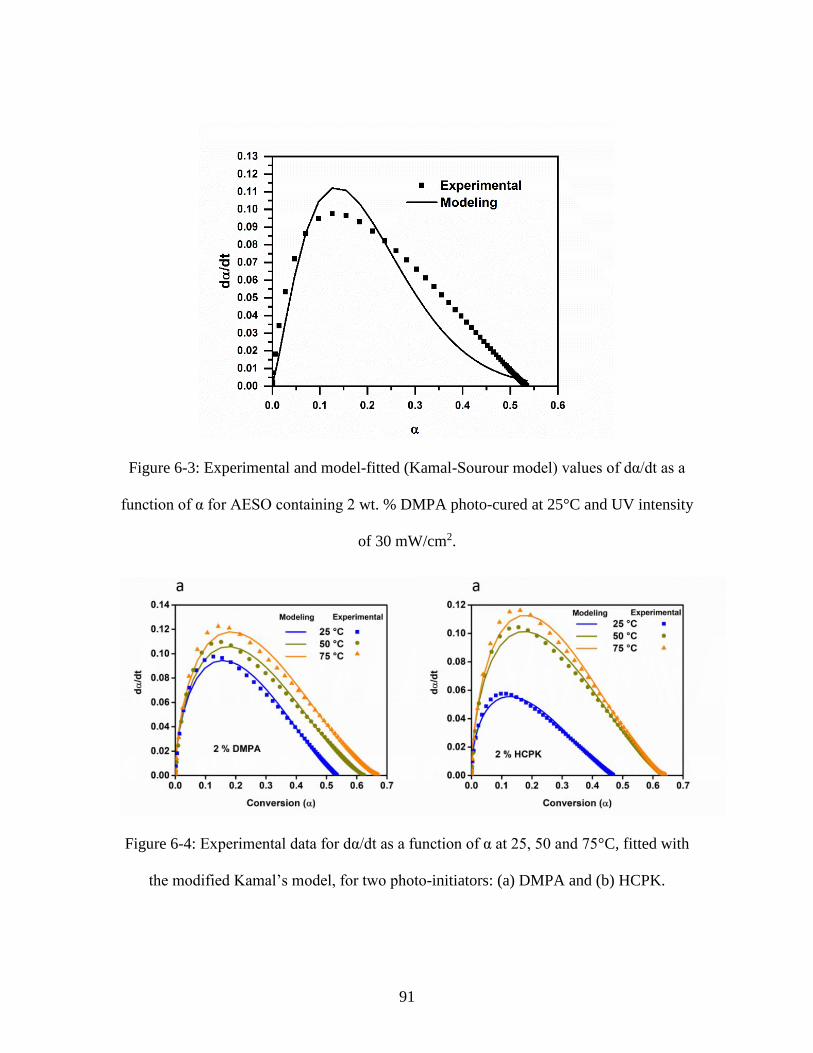
91
Figure 6-3: Experimental and model-fitted (Kamal-Sourour model) values of dα/dt as a
function of α for AESO containing 2 wt. % DMPA photo-cured at 25°C and UV intensity
of 30 mW/cm2.
Figure 6-4: Experimental data for dα/dt as a function of α at 25, 50 and 75°C, fitted with
the modified Kamal’s model, for two photo-initiators: (a) DMPA and (b) HCPK.
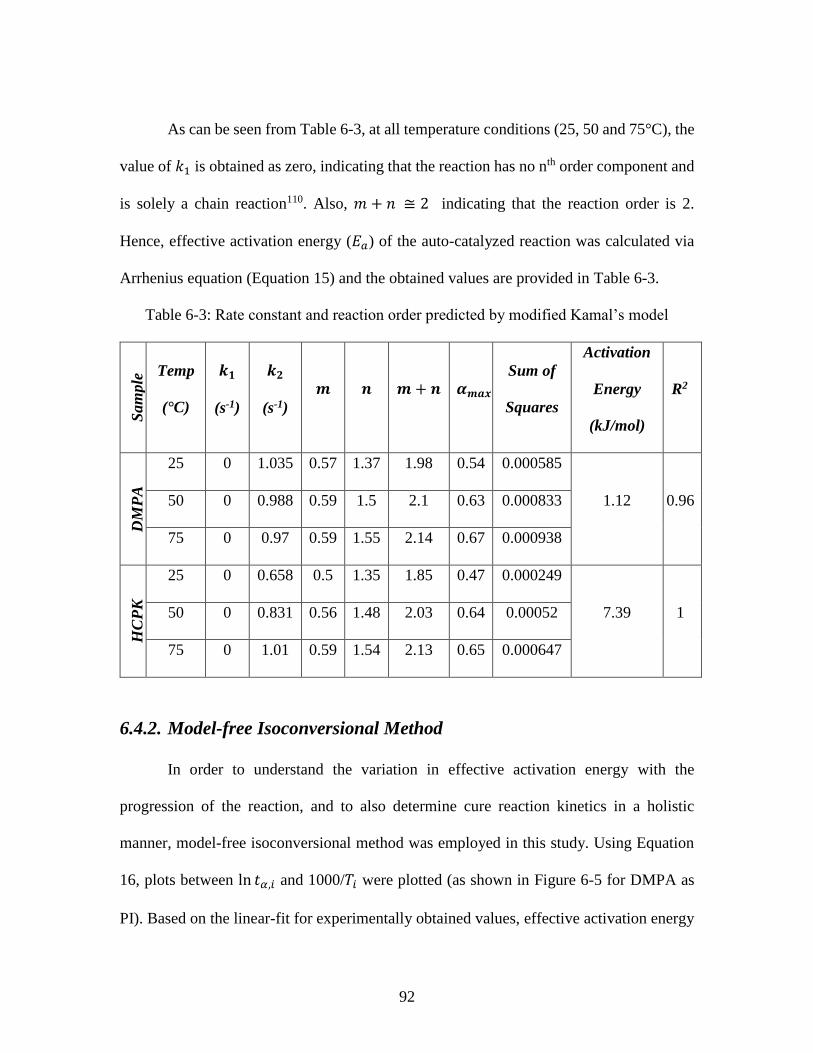
92
As can be seen from Table 6-3, at all temperature conditions (25, 50 and 75°C), the
value of 𝑘1 is obtained as zero, indicating that the reaction has no nth order component and
is solely a chain reaction110. Also, 𝑚 + 𝑛 ≅ 2 indicating that the reaction order is 2.
Hence, effective activation energy (𝐸𝑎) of the auto-catalyzed reaction was calculated via
Arrhenius equation (Equation 15) and the obtained values are provided in Table 6-3.
Table 6-3: Rate constant and reaction order predicted by modified Kamal’s model
Sam
ple
Temp
(°C)
𝒌𝟏
(s-1)
𝒌𝟐
(s-1)
𝒎 𝒏 𝒎 + 𝒏 𝜶𝒎𝒂𝒙
Sum of
Squares
Activation
Energy
(kJ/mol)
R2
DM
PA
25 0 1.035 0.57 1.37 1.98 0.54 0.000585
1.12 0.96 50 0 0.988 0.59 1.5 2.1 0.63 0.000833
75 0 0.97 0.59 1.55 2.14 0.67 0.000938
HC
PK
25 0 0.658 0.5 1.35 1.85 0.47 0.000249
7.39 1 50 0 0.831 0.56 1.48 2.03 0.64 0.00052
75 0 1.01 0.59 1.54 2.13 0.65 0.000647
6.4.2. Model-free Isoconversional Method
In order to understand the variation in effective activation energy with the
progression of the reaction, and to also determine cure reaction kinetics in a holistic
manner, model-free isoconversional method was employed in this study. Using Equation
16, plots between ln 𝑡𝛼,𝑖 and 1000/𝑇𝑖 were plotted (as shown in Figure 6-5 for DMPA as
PI). Based on the linear-fit for experimentally obtained values, effective activation energy
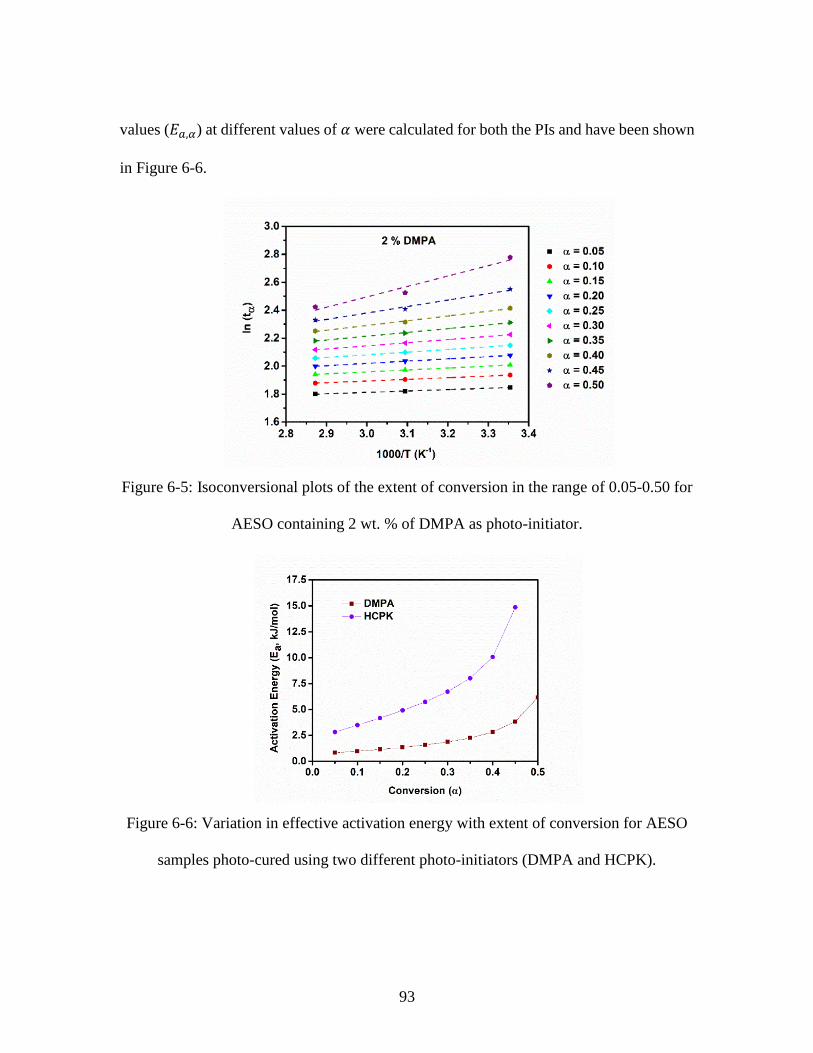
93
values (𝐸𝑎,𝛼) at different values of 𝛼 were calculated for both the PIs and have been shown
in Figure 6-6.
Figure 6-5: Isoconversional plots of the extent of conversion in the range of 0.05-0.50 for
AESO containing 2 wt. % of DMPA as photo-initiator.
Figure 6-6: Variation in effective activation energy with extent of conversion for AESO
samples photo-cured using two different photo-initiators (DMPA and HCPK).
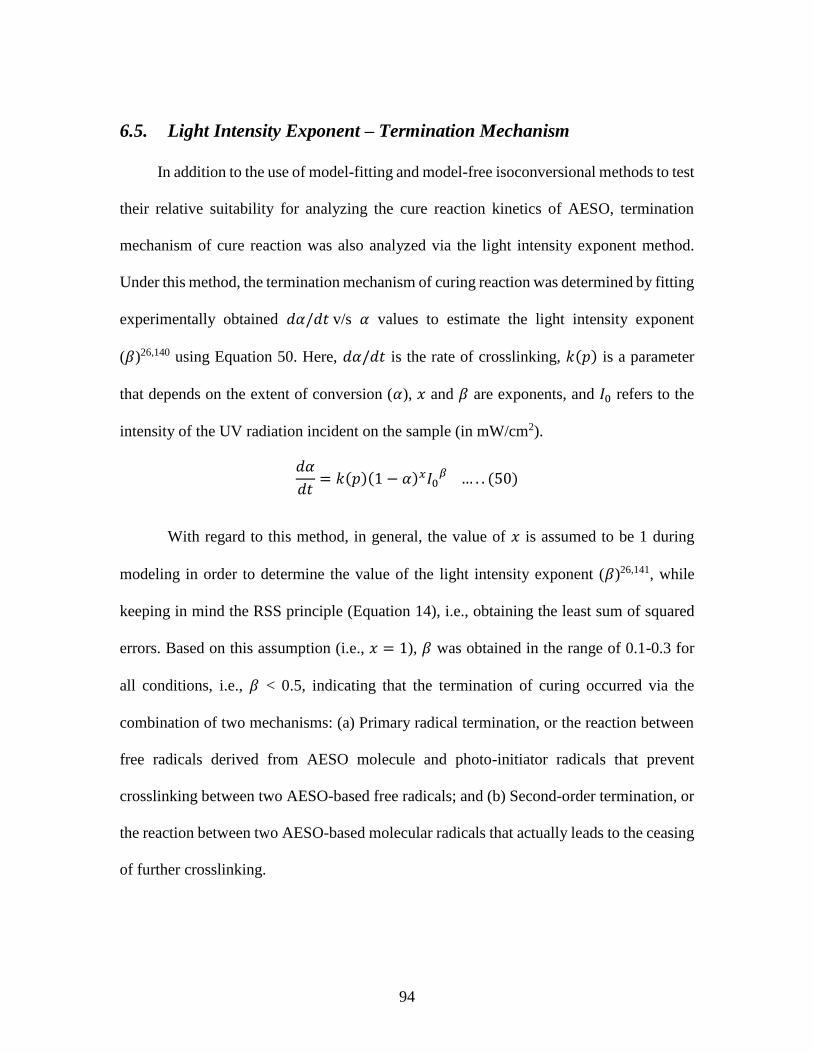
94
6.5. Light Intensity Exponent – Termination Mechanism
In addition to the use of model-fitting and model-free isoconversional methods to test
their relative suitability for analyzing the cure reaction kinetics of AESO, termination
mechanism of cure reaction was also analyzed via the light intensity exponent method.
Under this method, the termination mechanism of curing reaction was determined by fitting
experimentally obtained 𝑑𝛼/𝑑𝑡 v/s 𝛼 values to estimate the light intensity exponent
(𝛽)26,140 using Equation 50. Here, 𝑑𝛼/𝑑𝑡 is the rate of crosslinking, 𝑘(𝑝) is a parameter
that depends on the extent of conversion (𝛼), 𝑥 and 𝛽 are exponents, and 𝐼0 refers to the
intensity of the UV radiation incident on the sample (in mW/cm2).
𝑑𝛼
𝑑𝑡= 𝑘(𝑝)(1 − 𝛼)𝑥𝐼0
𝛽 … . . (50)
With regard to this method, in general, the value of 𝑥 is assumed to be 1 during
modeling in order to determine the value of the light intensity exponent (𝛽)26,141, while
keeping in mind the RSS principle (Equation 14), i.e., obtaining the least sum of squared
errors. Based on this assumption (i.e., 𝑥 = 1), 𝛽 was obtained in the range of 0.1-0.3 for
all conditions, i.e., 𝛽 < 0.5, indicating that the termination of curing occurred via the
combination of two mechanisms: (a) Primary radical termination, or the reaction between
free radicals derived from AESO molecule and photo-initiator radicals that prevent
crosslinking between two AESO-based free radicals; and (b) Second-order termination, or
the reaction between two AESO-based molecular radicals that actually leads to the ceasing
of further crosslinking.

95
6.6. Discussion
6.6.1. Vitrification and Steric Hinderance on Extent of Cure
Multiple studies have reported incomplete curing (i.e., 𝛼 ≠ 1) during isothermal
cure conditions, irrespective of the material used and/or the cure mechanism78,86,109,142.
Such behavior is commonly known as “vitrification”, which refers to the transformation of
a polymer from its liquid/rubbery state to its glassy state. Vitrification occurs due to
increase in the molecular weight of the polymer – an outcome of its crosslinking – and is
typically accompanied by an increase in polymeric viscosity, leading to a drastic decrease
in the rate of crosslinking reaction due to the reduced mobility of both PI and AESO
species. As a result, the reaction stops prior to reaching the maximum degree of conversion
theoretically possible (𝛼𝑚𝑎𝑥 < 1), with the remaining functional groups left behind as
unreacted groups143. In addition, steric hindrance experienced by the free radicals – due to
the presence of glycerol group in triglycerides – also hinders their segmental mobility and
ceases the curing reaction, thereby preventing 𝛼 from reaching unity. Thus, the
simultaneous occurrence of vitrification and steric hindrance experienced by free radicals
explains the lack of completion of the curing reaction (𝛼 ≠ 1).
It is widely known and understood that for any photo-curing reaction, increase in
any one of the three processing parameters – light (UV) intensity, photo-initiator (PI)
concentration, temperature – will increase the rate and extent of curing (𝑑𝛼/𝑑𝑡 and 𝛼)
due to the increase in number of free radicals available for reaction propagation. However,
for the medium-intensity batch in this study, DMPA (PI) concentration is observed to be
ineffective in causing any change in either the cure rate or the extent of curing (Figure 6-1
96
(a) and Figure 6-2 (a)). Similar observations have also been reported by Mucci and Vallo144
in their work on analyzing the photopolymerization of methacrylate monomers using
DMPA as PI. They attributed this behavior to the screening effect on account of increase
in UV absorbance in samples containing ≥ 0.25 wt. % of DMPA. In other words, at higher
UV intensities (similar to those in the medium-intensity batch in this study), the optimum
PI concentration for obtaining the maximum extent of curing is 0.25 wt. % for DMPA,
beyond which any further increase in PI concentration will accelerate the termination
process and not contribute towards the propagation reaction (i.e., curing). Since this study
employs DMPA at higher concentrations (0.5, 1, 2 and 4 wt. %) than this limit (0.25 wt.
%), change in DMPA concentration is observed to have a negligible effect on crosslinking-
related parameters for the medium-intensity batch.
In contrast with the non-influence of DMPA concentration, temperature is observed
to play a determining role with regard to the curing rate and extent of cure for the medium-
intensity batch (Figure 6-2 (c)). This can be explained by the fact that increase in
temperature enhances the rate of reaction by increasing the mobility of both PI (photo-
initiator) and AESO species that have hitherto remained unreacted at lower temperatures.
This in turn improves the ability of PI molecules to cause photo-curing of AESO. On the
other hand, for the low-intensity batch, the curing reaction is observed to occur beyond 120
s (Figure 6-1), indicating that the AESO molecule had undergone dark-polymerization
despite its slower rate of curing. This demonstration of the existence of dark
polymerization, albeit at retarded rates, is at odds with conventional thought that considers
free radical polymerization to cease upon switching off the UV light. However, such dark
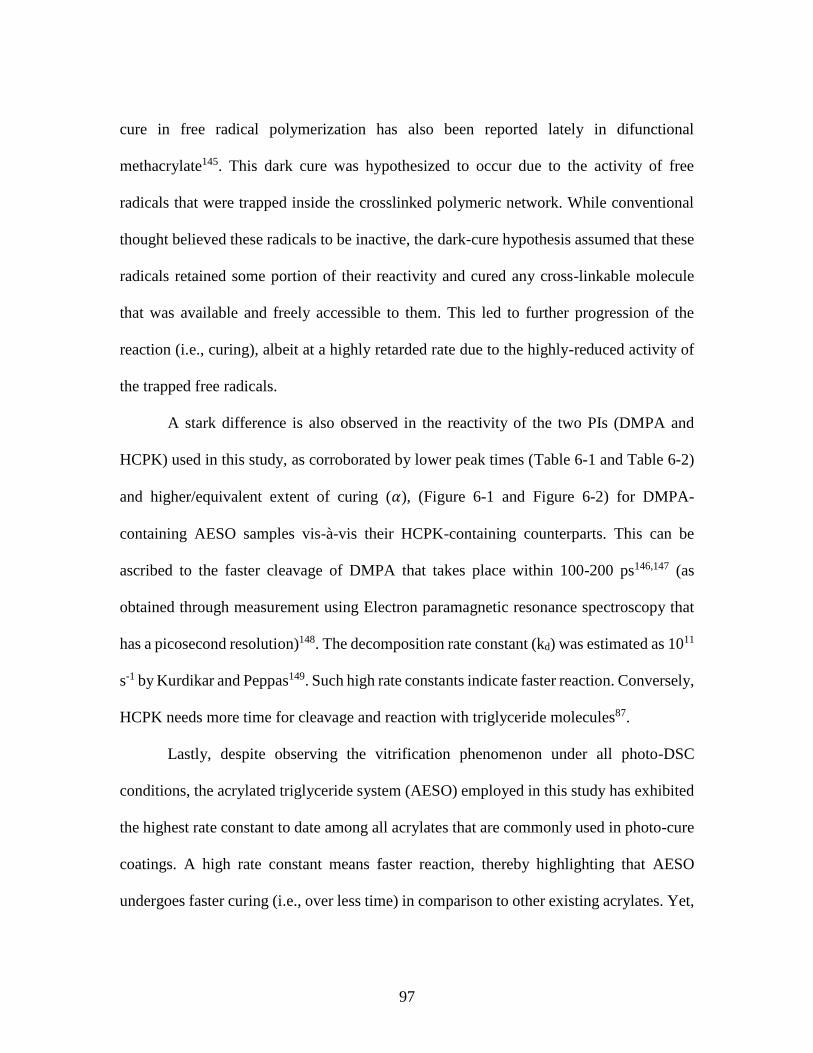
97
cure in free radical polymerization has also been reported lately in difunctional
methacrylate145. This dark cure was hypothesized to occur due to the activity of free
radicals that were trapped inside the crosslinked polymeric network. While conventional
thought believed these radicals to be inactive, the dark-cure hypothesis assumed that these
radicals retained some portion of their reactivity and cured any cross-linkable molecule
that was available and freely accessible to them. This led to further progression of the
reaction (i.e., curing), albeit at a highly retarded rate due to the highly-reduced activity of
the trapped free radicals.
A stark difference is also observed in the reactivity of the two PIs (DMPA and
HCPK) used in this study, as corroborated by lower peak times (Table 6-1 and Table 6-2)
and higher/equivalent extent of curing (𝛼), (Figure 6-1 and Figure 6-2) for DMPA-
containing AESO samples vis-à-vis their HCPK-containing counterparts. This can be
ascribed to the faster cleavage of DMPA that takes place within 100-200 ps146,147 (as
obtained through measurement using Electron paramagnetic resonance spectroscopy that
has a picosecond resolution)148. The decomposition rate constant (kd) was estimated as 1011
s-1 by Kurdikar and Peppas149. Such high rate constants indicate faster reaction. Conversely,
HCPK needs more time for cleavage and reaction with triglyceride molecules87.
Lastly, despite observing the vitrification phenomenon under all photo-DSC
conditions, the acrylated triglyceride system (AESO) employed in this study has exhibited
the highest rate constant to date among all acrylates that are commonly used in photo-cure
coatings. A high rate constant means faster reaction, thereby highlighting that AESO
undergoes faster curing (i.e., over less time) in comparison to other existing acrylates. Yet,

98
at the same time, no AESO sample showed complete curing under any condition, which
can be explained by the sole major limiting factor with such systems – their higher
functionality (𝑓 = 4.2). This is also in line with existing literature150 which shows the
inversely proportional relationship between the functionality of an acrylate (𝑓) and its
extent of conversion (or curing, 𝛼). This can be understood as the logical outcome of the
combination of increase in total enthalpy (∆𝐻𝑡𝑜𝑡𝑎𝑙) of the acrylate due to its higher
functionality (Equation 49) and the occurrence of vitrification phenomenon in the acrylate
system upon its curing.
6.7. Activation Energy Dependence on Conversion
Based on the model-free isoconversional method used in this work (Figure 6-6),
effective activation energy (𝐸𝑎,𝛼) of the curing reaction was initially observed to increase
linearly with 𝛼, but subsequently showed a drastic increase during the later stages of the
reaction. This increase was observed irrespective of the PI used (DMPA or HCPK) and can
be entirely attributed to the occurrence of vitrification in AESO due to its curing. An
additional complementing factor is the trapping of primary radical into the molecular
network of AESO which inhibits its availability for further curing, thereby ceasing the
entire cure reaction. Interestingly, effective activation energy is observed to be higher for
HCPK-containing samples in comparison to DMPA-containing samples when determined
from both model-fitting and model-free techniques. This can be ascribed to the fact that
since the photolysis product of HCPK is bulkier than that of DMPA, HCPK molecules may
experience severe steric hindrance from the glycerol center upon migrating to acrylate
groups for undergoing crosslinking reaction. Hence, HCPK-containing samples find it

99
difficult to undergo crosslinking at higher 𝛼 values vis-à-vis their DMPA-containing
counterparts, which explains the difference in their respective activation energies at higher
𝛼. The variation in effective activation energy with increase in the extent of crosslinking
(𝛼) also highlights the high complexity of the crosslinking reaction – as reported
elsewhere71 – from the point of view of cure kinetics, for it means that a single rate equation
cannot be used to explain or describe the cure kinetics of AESO. This is because
vitrification of a polymer is accompanied by a shift in the reaction mechanism (from
chemical- to diffusion-controlled) on account of change in its effective activation energy71.
Hence, the combination of vitrification, primary radical trapping, and the subsequent
transformation in the nature of cure reaction leads to significant differences in the effective
activation energy (𝐸𝑎,𝛼) values obtained at different degrees of conversion (𝛼) vis-à-vis the
effective activation energy (𝐸𝑎) value obtained using the modified Kamal’s model
(reported in Table 6-3). Further, it also establishes that the model-free isoconversional
method is more accurate and realistic in predicting cure reaction kinetics of AESO in
comparison to the model-fitting method, as it can capture the complexity of the entire
curing process. Thus, this study establishes the relatively higher suitability of
isoconversional methods over model-fitting methods with regard to analyzing the cure
phenomenon of acrylated triglycerides.

100
CHAPTER SEVEN
THERMAL CURE KINETICS OF ACRYLATED EPOXIDIZED
SOYBEAN OIL
7. Results and Discussion
7.1. Effect of Thermal-initiator Concentration on Heat Flow
Figure 7-1 (a,b) shows the heat flow recorded under dynamic conditions at varying
heating rates for two different thermal initiator concentrations – 1 wt. % and 2 wt. % of
TBPB – as a representative image of thermal DSC curves obtained in this study. As can be
seen, at higher initiator concentration (i.e., 2 wt. % and above), two peaks were observed
irrespective of the heating rate employed. In contrast, at lower initiator concentration (1
wt. %), two peaks (in the heat flow curve) are only observed for samples that were heated
at higher heating rates (15°C/min or more), while samples heated at lower heating rates (<
15°C/min) exhibited a single peak.
Conventionally, a single peak is observed during thermoset curing, but the presence
of two peaks in Figure 7-1 (a,b) indicates the occurrence of secondary reaction. A similar
observation has been made by various other researchers upon the use of tert-butyl
perbenzoate (TBPB) as free radical initiator151,152, irrespective of the material system used.
TBPB possesses half-life of 10 h at 104°C and of 1 min at 165°C153. However, the second
peak in this study is consistently observed at temperatures > 150°C, while conventionally,
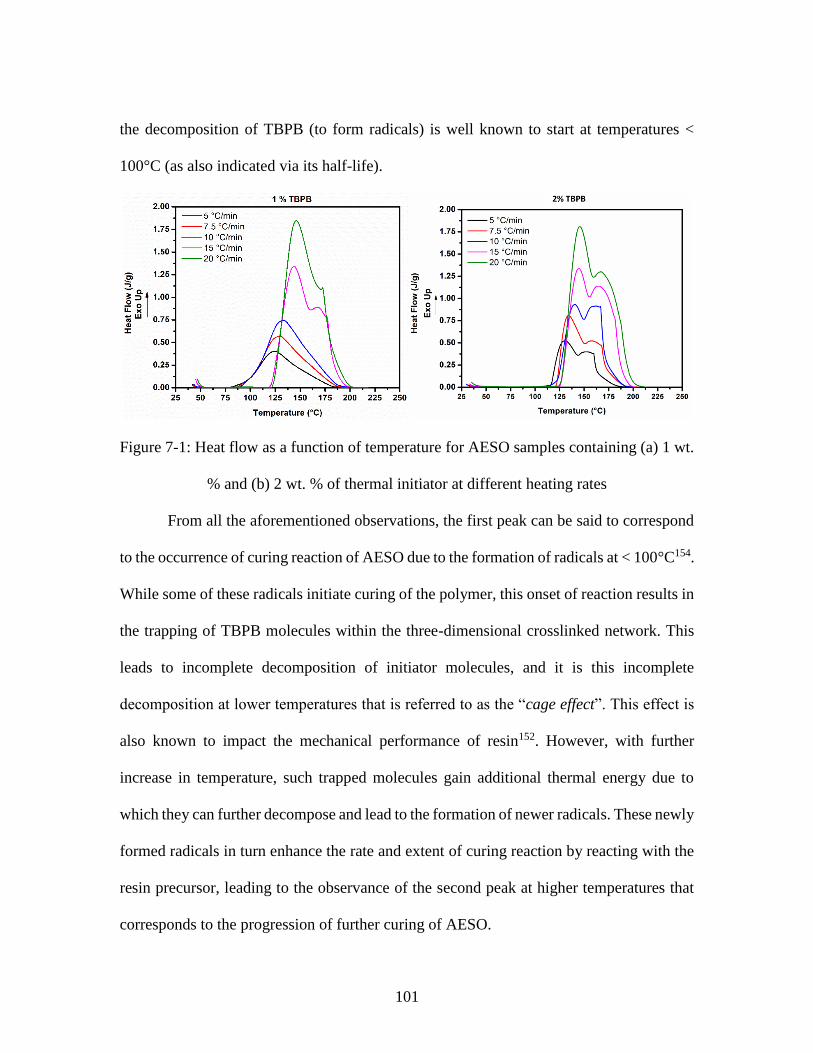
101
the decomposition of TBPB (to form radicals) is well known to start at temperatures <
100°C (as also indicated via its half-life).
Figure 7-1: Heat flow as a function of temperature for AESO samples containing (a) 1 wt.
% and (b) 2 wt. % of thermal initiator at different heating rates
From all the aforementioned observations, the first peak can be said to correspond
to the occurrence of curing reaction of AESO due to the formation of radicals at < 100°C154.
While some of these radicals initiate curing of the polymer, this onset of reaction results in
the trapping of TBPB molecules within the three-dimensional crosslinked network. This
leads to incomplete decomposition of initiator molecules, and it is this incomplete
decomposition at lower temperatures that is referred to as the “cage effect”. This effect is
also known to impact the mechanical performance of resin152. However, with further
increase in temperature, such trapped molecules gain additional thermal energy due to
which they can further decompose and lead to the formation of newer radicals. These newly
formed radicals in turn enhance the rate and extent of curing reaction by reacting with the
resin precursor, leading to the observance of the second peak at higher temperatures that
corresponds to the progression of further curing of AESO.

102
At the same time, a comparison of Figure 7-1 (a,b) shows that the second peak is
prominent at higher initiator concentration but is less prominent (or even absent) at lower
initiator concentration. The prominence of second peak for higher initiator concentration
can be explained by the availability of significant number of radicals for curing of AESO
upon the receipt of thermal energy (i.e., higher temperatures). In contrast, at lower initiator
concentration and slower heating rate, initiator molecules may not undergo “cage effect”
due to the simultaneous occurrence of decomposition to form radicals that in turn react
with AESO and lead to its curing. However, at lower initiator concentrations and
faster/higher heating rates, the increased supply of thermal energy means that curing occurs
at a faster rate and leads to the trapping of initiator molecules, which can then escape this
‘cage’ to cause curing at higher temperatures. The lower prominence of second peak in this
scenario can be explained by the low content of trapped radicals in the cured network.
7.2. Extent of Cure
Figure 7-2 shows the variation in extent of conversion (i.e., curing or 𝛼) with time
for AESO samples containing 1 wt. % of thermal initiator (TBPB) at different heating rates.
The extent of curing was calculated using Equation 11 that has been described earlier. With
regard to 𝛼, ∆𝐻𝑡𝑜𝑡𝑎𝑙 was calculated as the average value of heat flow/enthalpy for all
samples corresponding to the same chemical composition (i.e., initiator concentration) but
subjected to different heating rates. This is at variance with the methodology used for UV-
cured samples, where ∆𝐻𝑡𝑜𝑡𝑎𝑙 was calculated as the theoretical maximum value of enthalpy
possible (for 𝛼 = 1, based on Equation 49). However, this variation is mainly due to the
assumption that in photo-curing, photolysis of initiator (i.e., photo-decomposition of

103
initiator) does not result in any heat generation. In contrast, it is well known that
decomposition of the thermal initiator used in this study – TBPB – results in heat evolution
of ~ -1300 J/g154. While, decomposition or breakage of bond is an endothermic reaction,
TBPB exhibits an self-accelerating decomposition behavior at 65.8°C resulting in an highly
exothermic thermal run-away reaction155. Given the occurrence of both exothermic curing
of AESO and exothermic decomposition of TBPB (to form radicals), it is practically
difficult to calculate ∆𝐻𝑡𝑜𝑡𝑎𝑙 theoretically. This is also evident from Table 7-1 which shows
the heat of reaction (enthalpy or heat flow) obtained (through calculations) for AESO at
different initiator concentrations. As can be seen from this Table 7-1, the total heat of
reaction shows increase with increase in initiator concentration, further confirming the
evolution of heat due to thermal decomposition of initiator molecules.
Figure 7-2: Variation in the extent of curing (𝛼) as a function of time for AESO resin
precursors containing 1 wt. % of initiator concentration at different heating rates

104
Furthermore, as can be seen in Figure 7-2, increase in heating rate also causes
significant shift in the time required for initiation of curing of AESO as well as in the rate
of this reaction. This can be ascribed to the fact that at same initiator concentration,
increases in heating rate enhances the rate of radical formation, thereby enhancing the
probability of its (radical’s) subsequent reaction with the resin precursor to increase its
degree of cure. Similar results were also observed for other AESO samples containing
higher levels of thermal initiator concentration.
Table 7-1: Heat flow values for AESO samples at varying initiator concentration
Heating Rate (°C/min) 1 % TBPB 2 % TBPB 4 % TBPB 6 % TBPB
5 -204.4 -239.0 -255.4 -296.7
7.5 -206.2 -235.0 -266.1 -283.4
10 -196.5 -234.6 -262.8 -289.3
15 -188.2 -233.4 -258.8 -286.5
20 -213.9 -233.5 -267.7 -290.4
Average -201.84 -235.12 -262.16 -289.26
7.3. Cure Kinetics
Figure 7-3 (a&b) shows the plots for both Kissinger and Starink methods used to
evaluate the reaction kinetics of thermal curing of AESO at low initiator concentration (1
wt. %). As is well understood, time (𝑡) and temperature (𝑇) in thermal-DSC are related to
each other via the use of constant heating rate (𝛽). Thus, for thermal curing, plots between
the extent of conversion (𝛼) and time (𝑡) were used to obtain temperatures corresponding

105
to the different degrees of curing (𝛼 = 0.05 to 0.95) in step of 0.05, based on the
recommendations of the ICTAC Review Committee71. Subsequently, these temperatures
were used to generate plots between ln (𝛽𝑖
𝑇𝛼,𝑖2 ) or ln (
𝛽𝑖
𝑇𝛼,𝑖1.92) and the reciprocal of temperature
(Figure 7-3) for AESO resin containing different levels of thermal initiator concentration.
Linear curve-fitting was undertaken on the aforementioned plots and the slope was used to
calculate effective activation energy (𝐸𝛼) at different values of 𝛼.
7.4. Effect of Initiator Concentration on Activation Energy
Based on Figure 7-3, effective activation energy (𝐸𝛼) of thermal curing reaction
was calculated at different degrees of conversion (𝛼) using the Kissinger method (Equation
20), as described earlier. Subsequently, these effective activation energy values were
plotted as a function of 𝛼 for different levels of initiator concentration from 1 to 6 wt. %
(Figure 7-4). Effective activation energy values (𝐸𝛼) obtained using Starink method
(Equation 21) were observed to be nearly the same as those obtained using Kissinger
method – with a variation of less than 5 %. Interestingly, 𝐸𝛼 values obtained for thermal
curing were observed to be ~ 2-3 times higher than those obtained for UV curing,
irrespective of the amount of thermal initiator concentration used. As can be seen in Figure
7-4, effective activation energy (𝐸𝛼) does not show a consistent trend with 𝛼 at all levels
of initiator concentration. At lower initiator concentrations (1 wt. % or less), 𝐸𝛼 shows
increase with increase in 𝛼 – a behavior also observed for photo-cured samples (Chapter
6). In the case of thermal curing though, this behavior can be ascribed to the lower
likelihood of trapping of initiator-derived free radicals in the cured AESO network. This
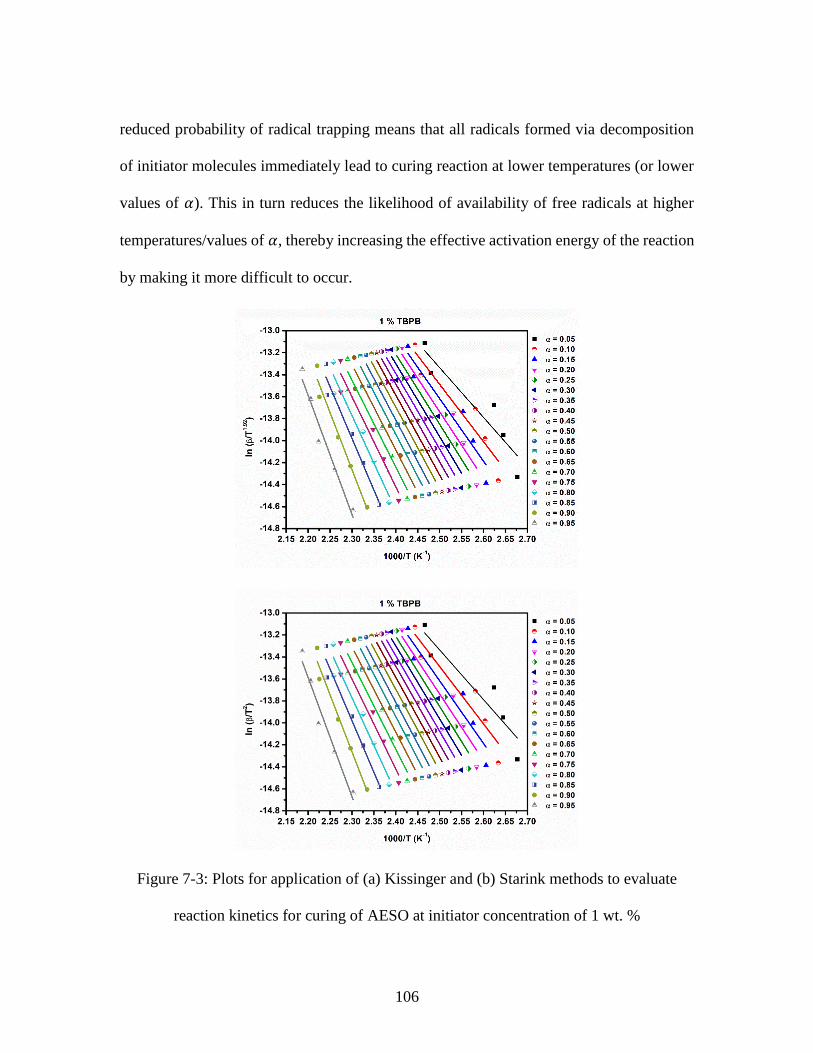
106
reduced probability of radical trapping means that all radicals formed via decomposition
of initiator molecules immediately lead to curing reaction at lower temperatures (or lower
values of 𝛼). This in turn reduces the likelihood of availability of free radicals at higher
temperatures/values of 𝛼, thereby increasing the effective activation energy of the reaction
by making it more difficult to occur.
Figure 7-3: Plots for application of (a) Kissinger and (b) Starink methods to evaluate
reaction kinetics for curing of AESO at initiator concentration of 1 wt. %

107
However, at higher initiator concentration (2 wt. % and above), effective activation
energy was higher, indicating that the reaction is very difficult to occur despite the presence
of larger number of free radicals. This can be ascribed to the possible recombination of
radicals resulting in the killing of free radicals. Also, a clear and consistent trend was not
observed for 𝐸𝛼 as a function of 𝛼. This is because at higher initiator concentration, the
previously described cage effect has a pronounced influence on the curing reaction.
Initially, high initiator concentration translates to a higher concentration of free radical
formation via thermal decomposition of initiator molecules, resulting in the initiation of
curing of AESO. However, the cage effect delays a prominent chunk of curing reaction
from occurring by trapping initiator-derived radicals within the cured AESO network, as
mentioned earlier. Upon further increase in temperature, these radicals receive higher
amount of energy, upon which they either lead to curing of AESO within the trapped region
or zone or escape out of this zone to cause the curing of resin precursor. These two events
– curing within trapped zone vis-à-vis curing outside the trapped zone – may not have the
same probability of occurrence due to a variety of factors, such as the lack of bonds in the
trapped zone for curing to occur, or the inability of radicals to escape out of this trapped
zone. In addition, the effect of either of these events on effective activation energy is not
monotonous, for their effect on the rate of curing reaction depends on the probability of the
trapped radical obtaining a favorable reaction site on the AESO molecule. Hence,
depending on the nature of curing reaction through overcoming the cage effect at higher
temperatures, the rate of curing may enhance or reduce at higher values of 𝛼, leading to
inconsistent variation in effective activation energy as a function of the extent of curing.
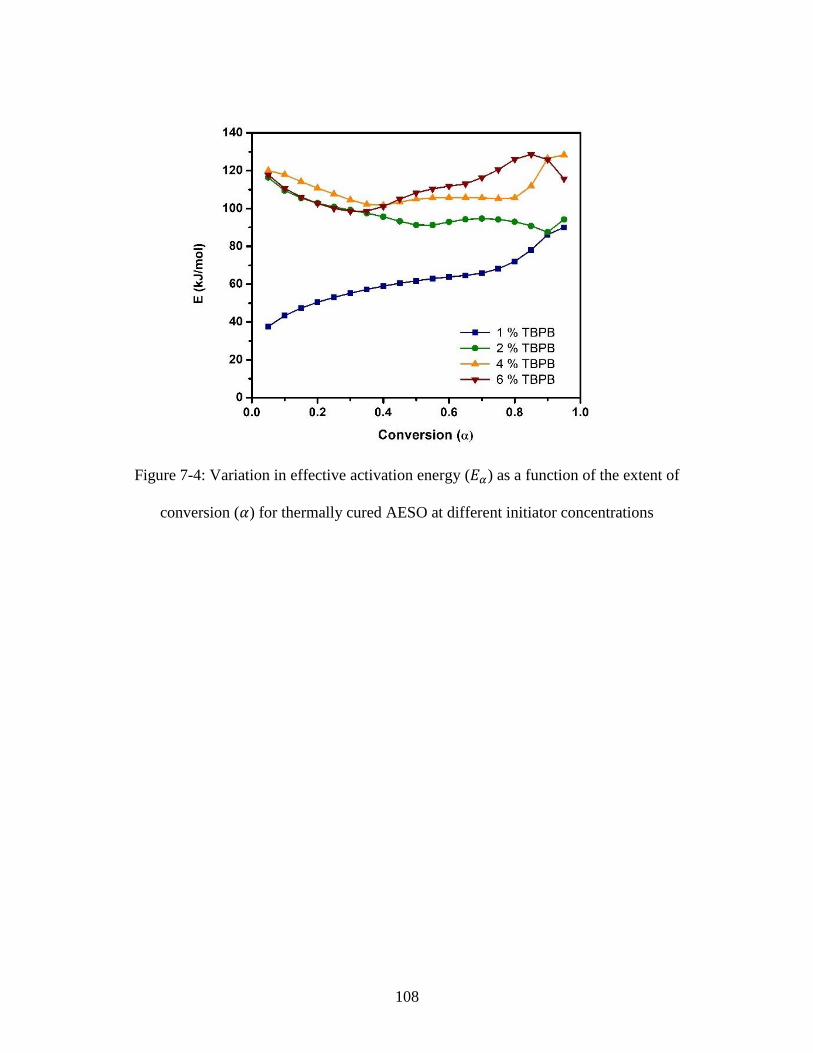
108
Figure 7-4: Variation in effective activation energy (𝐸𝛼) as a function of the extent of
conversion (𝛼) for thermally cured AESO at different initiator concentrations

109
CHAPTER EIGHT
PHOTO CURABILITY OF NATURAL FIBER-REINFORCED
ACRYLATED EPOXIDIZED SOYBEAN OIL
8. Results and Discussion
8.1. Photo-curing of Thicker Parts
Figure 8-1 shows tensile specimen (thickness > 3 mm) processed via photo-curing.
Photo-curing has been traditionally known to be restricted to use in coatings (thickness <
1 mm) due to the attenuation of UV light25,81,146,156. In this work, unreinforced AESO
samples of thickness > 3 mm were cured via Photo-curing. Conventional UV curing
formulation contains 1-3 % of photo-initiator, 25-90 % of oligomer/monomer, and 15-60
% of diluent or solvent that is added to adjust the viscosity of coating formulation157.
However, no diluent/solvent was used in this study, and casting formulation was instead
maintained as 96-99 % of acrylated epoxidized soybean oil (AESO) and 1-4 % of photo-
initiator.
Further, it is well known that aromatic hydrocarbon compounds – such as benzene
and styrene – tend to absorb more UV radiation compared to aliphatic hydrocarbons158.
Also, in conventional photo curing, the presence of styrene molecule (or similar molecules)
will lead to absorption of incident UV radiation on the sample, thereby accelerating the
cure reaction and resulting in the formation of a highly cured surface layer that further
screens UV from penetrating deeper144. On the other hand, in the absence of aromatic
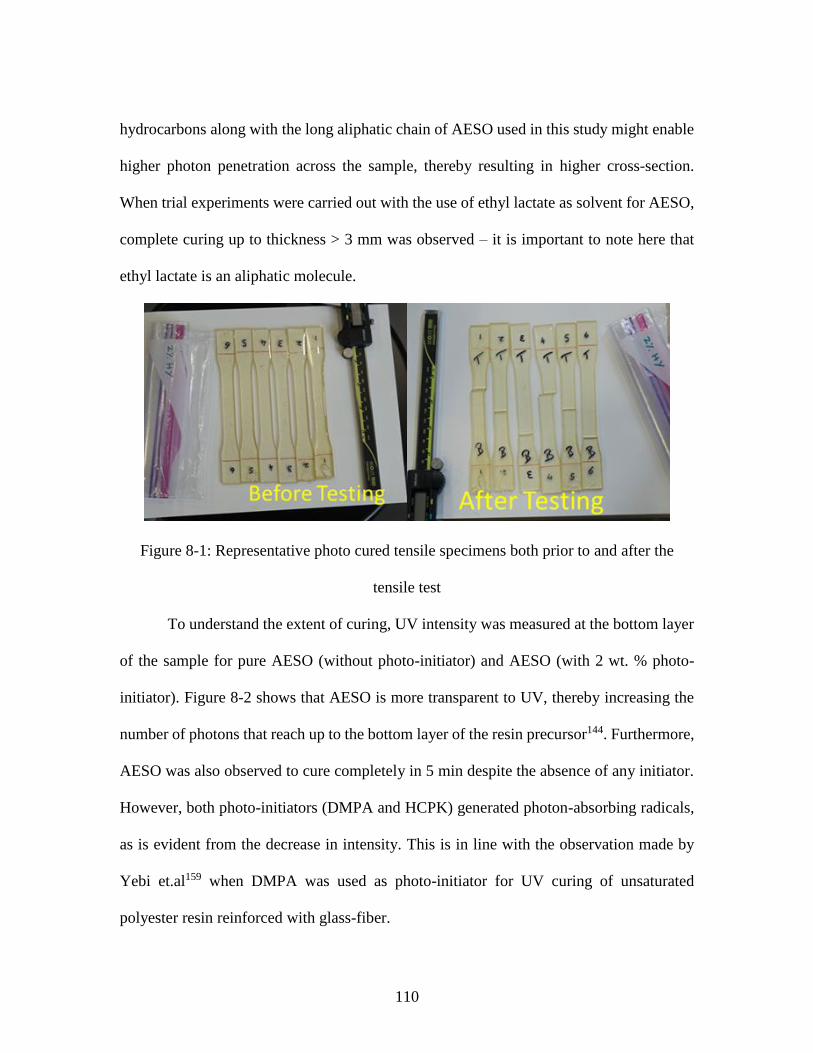
110
hydrocarbons along with the long aliphatic chain of AESO used in this study might enable
higher photon penetration across the sample, thereby resulting in higher cross-section.
When trial experiments were carried out with the use of ethyl lactate as solvent for AESO,
complete curing up to thickness > 3 mm was observed – it is important to note here that
ethyl lactate is an aliphatic molecule.
Figure 8-1: Representative photo cured tensile specimens both prior to and after the
tensile test
To understand the extent of curing, UV intensity was measured at the bottom layer
of the sample for pure AESO (without photo-initiator) and AESO (with 2 wt. % photo-
initiator). Figure 8-2 shows that AESO is more transparent to UV, thereby increasing the
number of photons that reach up to the bottom layer of the resin precursor144. Furthermore,
AESO was also observed to cure completely in 5 min despite the absence of any initiator.
However, both photo-initiators (DMPA and HCPK) generated photon-absorbing radicals,
as is evident from the decrease in intensity. This is in line with the observation made by
Yebi et.al159 when DMPA was used as photo-initiator for UV curing of unsaturated
polyester resin reinforced with glass-fiber.
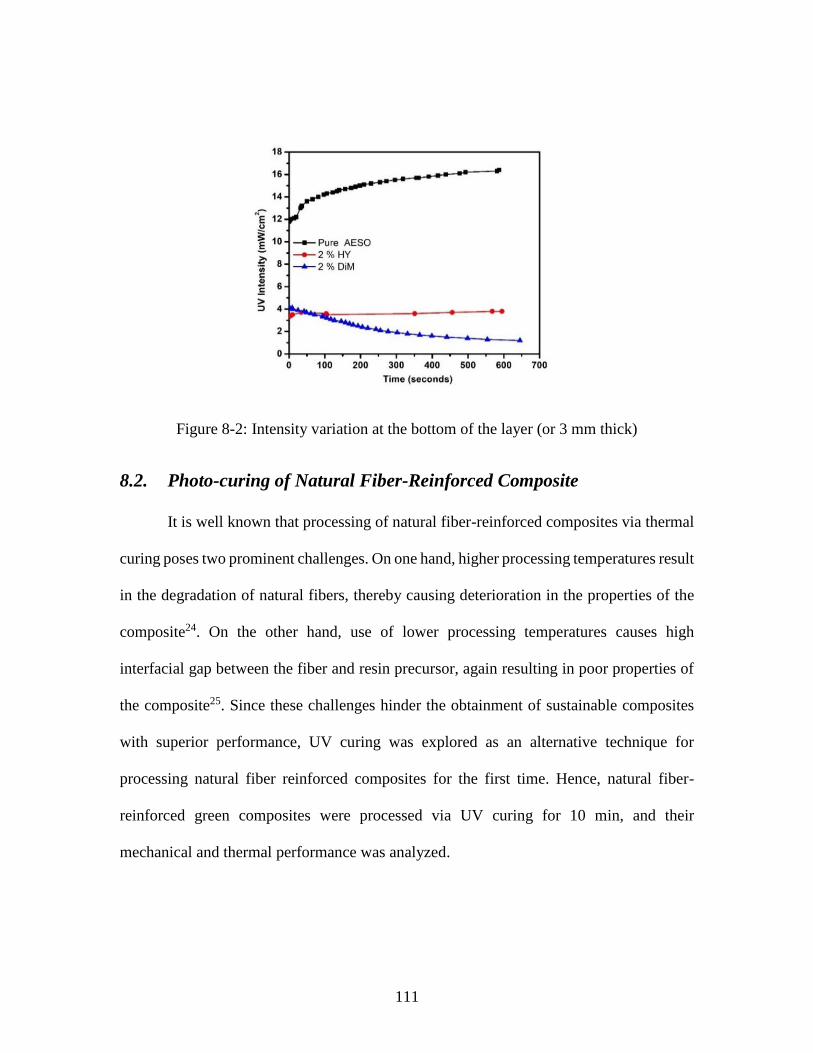
111
Figure 8-2: Intensity variation at the bottom of the layer (or 3 mm thick)
8.2. Photo-curing of Natural Fiber-Reinforced Composite
It is well known that processing of natural fiber-reinforced composites via thermal
curing poses two prominent challenges. On one hand, higher processing temperatures result
in the degradation of natural fibers, thereby causing deterioration in the properties of the
composite24. On the other hand, use of lower processing temperatures causes high
interfacial gap between the fiber and resin precursor, again resulting in poor properties of
the composite25. Since these challenges hinder the obtainment of sustainable composites
with superior performance, UV curing was explored as an alternative technique for
processing natural fiber reinforced composites for the first time. Hence, natural fiber-
reinforced green composites were processed via UV curing for 10 min, and their
mechanical and thermal performance was analyzed.
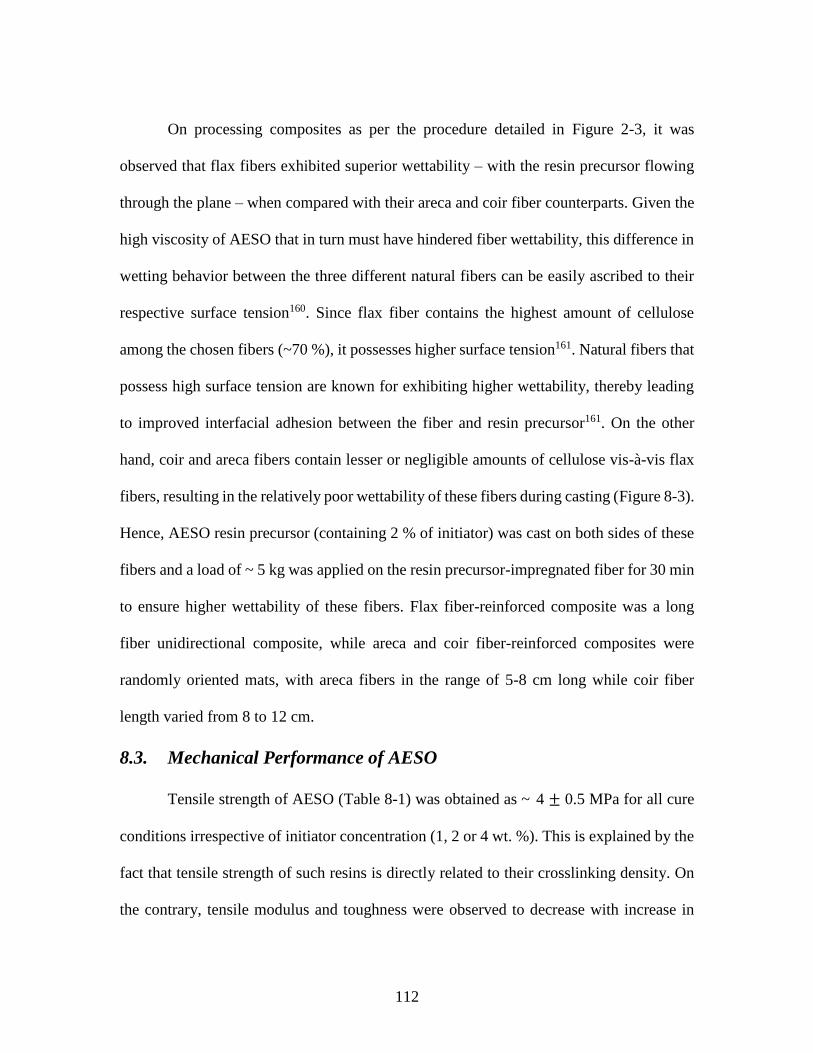
112
On processing composites as per the procedure detailed in Figure 2-3, it was
observed that flax fibers exhibited superior wettability – with the resin precursor flowing
through the plane – when compared with their areca and coir fiber counterparts. Given the
high viscosity of AESO that in turn must have hindered fiber wettability, this difference in
wetting behavior between the three different natural fibers can be easily ascribed to their
respective surface tension160. Since flax fiber contains the highest amount of cellulose
among the chosen fibers (~70 %), it possesses higher surface tension161. Natural fibers that
possess high surface tension are known for exhibiting higher wettability, thereby leading
to improved interfacial adhesion between the fiber and resin precursor161. On the other
hand, coir and areca fibers contain lesser or negligible amounts of cellulose vis-à-vis flax
fibers, resulting in the relatively poor wettability of these fibers during casting (Figure 8-3).
Hence, AESO resin precursor (containing 2 % of initiator) was cast on both sides of these
fibers and a load of ~ 5 kg was applied on the resin precursor-impregnated fiber for 30 min
to ensure higher wettability of these fibers. Flax fiber-reinforced composite was a long
fiber unidirectional composite, while areca and coir fiber-reinforced composites were
randomly oriented mats, with areca fibers in the range of 5-8 cm long while coir fiber
length varied from 8 to 12 cm.
8.3. Mechanical Performance of AESO
Tensile strength of AESO (Table 8-1) was obtained as ~ 4 ± 0.5 MPa for all cure
conditions irrespective of initiator concentration (1, 2 or 4 wt. %). This is explained by the
fact that tensile strength of such resins is directly related to their crosslinking density. On
the contrary, tensile modulus and toughness were observed to decrease with increase in

113
initiator concentration, when DMPA was used as photo initiator. When HCPK was used as
photo initiator, varying concentration did not alter the modulus or toughness.
Under isothermal processing conditions, thermosets (such as AESO) exhibit
vitrification or transition from liquid to glassy state. Hence, as curing reaction proceeds the
bulkier initiator molecules and/or initiator-derived radicals get trapped within the vitrified
polymeric network resulting in a cage effect. In turn, these molecules/radicals alter the
local bonding structure and might create higher void/free volume due to steric hindrance.
Figure 8-4 depicts the aforementioned explanation.
Figure 8-3: Challenges encountered with respect to fiber wettability during the
impregnation of fiber with resin precursor
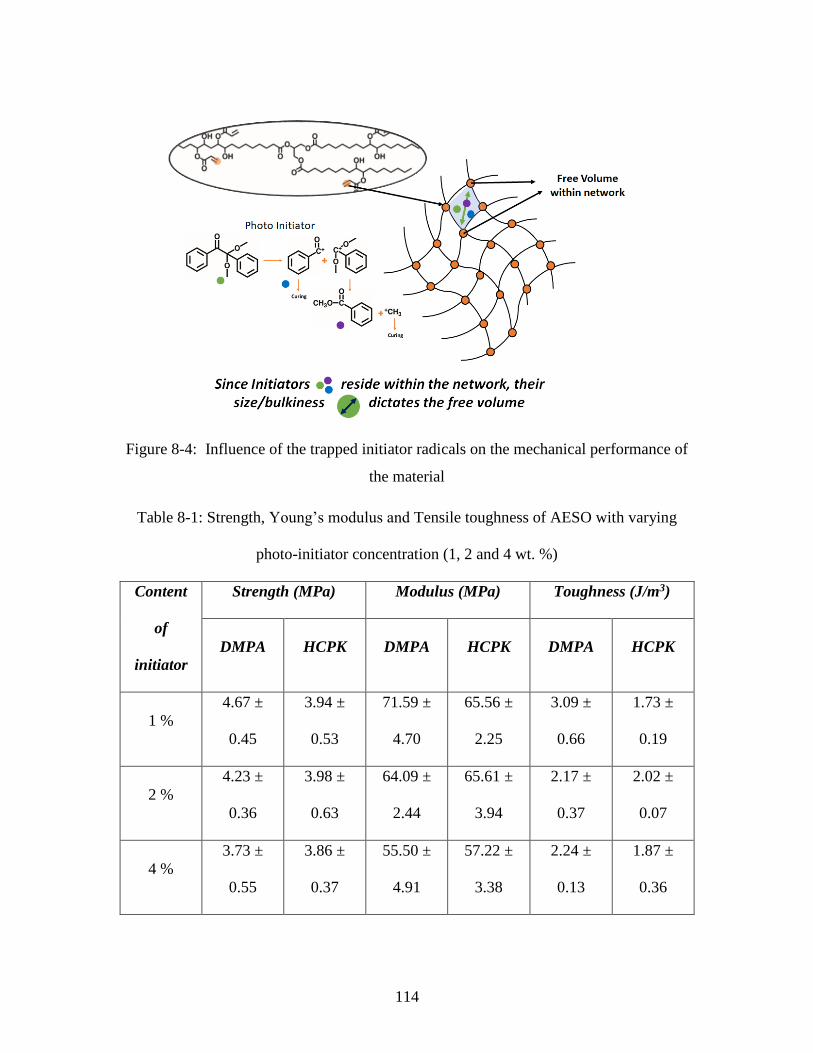
114
Figure 8-4: Influence of the trapped initiator radicals on the mechanical performance of
the material
Table 8-1: Strength, Young’s modulus and Tensile toughness of AESO with varying
photo-initiator concentration (1, 2 and 4 wt. %)
Content
of
initiator
Strength (MPa) Modulus (MPa) Toughness (J/m3)
DMPA HCPK DMPA HCPK DMPA HCPK
1 %
4.67 ±
0.45
3.94 ±
0.53
71.59 ±
4.70
65.56 ±
2.25
3.09 ±
0.66
1.73 ±
0.19
2 %
4.23 ±
0.36
3.98 ±
0.63
64.09 ±
2.44
65.61 ±
3.94
2.17 ±
0.37
2.02 ±
0.07
4 %
3.73 ±
0.55
3.86 ±
0.37
55.50 ±
4.91
57.22 ±
3.38
2.24 ±
0.13
1.87 ±
0.36
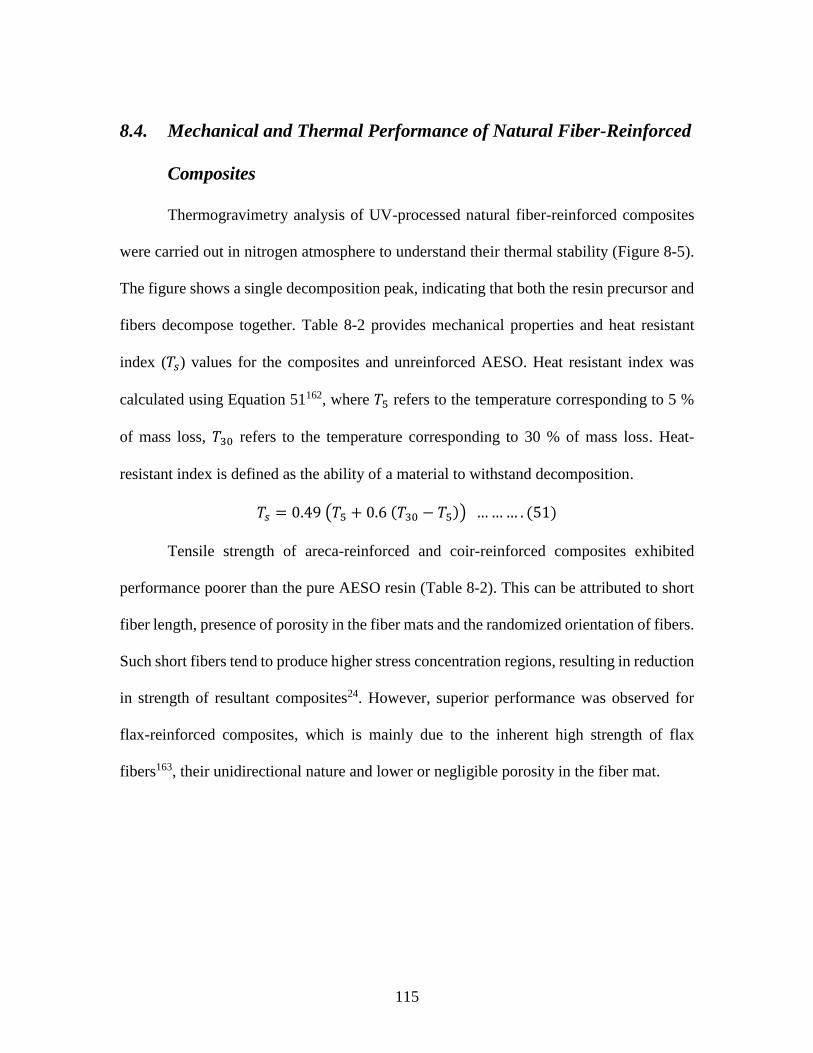
115
8.4. Mechanical and Thermal Performance of Natural Fiber-Reinforced
Composites
Thermogravimetry analysis of UV-processed natural fiber-reinforced composites
were carried out in nitrogen atmosphere to understand their thermal stability (Figure 8-5).
The figure shows a single decomposition peak, indicating that both the resin precursor and
fibers decompose together. Table 8-2 provides mechanical properties and heat resistant
index (𝑇𝑠) values for the composites and unreinforced AESO. Heat resistant index was
calculated using Equation 51162, where 𝑇5 refers to the temperature corresponding to 5 %
of mass loss, 𝑇30 refers to the temperature corresponding to 30 % of mass loss. Heat-
resistant index is defined as the ability of a material to withstand decomposition.
𝑇𝑠 = 0.49 (𝑇5 + 0.6 (𝑇30 − 𝑇5)) … … … . (51)
Tensile strength of areca-reinforced and coir-reinforced composites exhibited
performance poorer than the pure AESO resin (Table 8-2). This can be attributed to short
fiber length, presence of porosity in the fiber mats and the randomized orientation of fibers.
Such short fibers tend to produce higher stress concentration regions, resulting in reduction
in strength of resultant composites24. However, superior performance was observed for
flax-reinforced composites, which is mainly due to the inherent high strength of flax
fibers163, their unidirectional nature and lower or negligible porosity in the fiber mat.
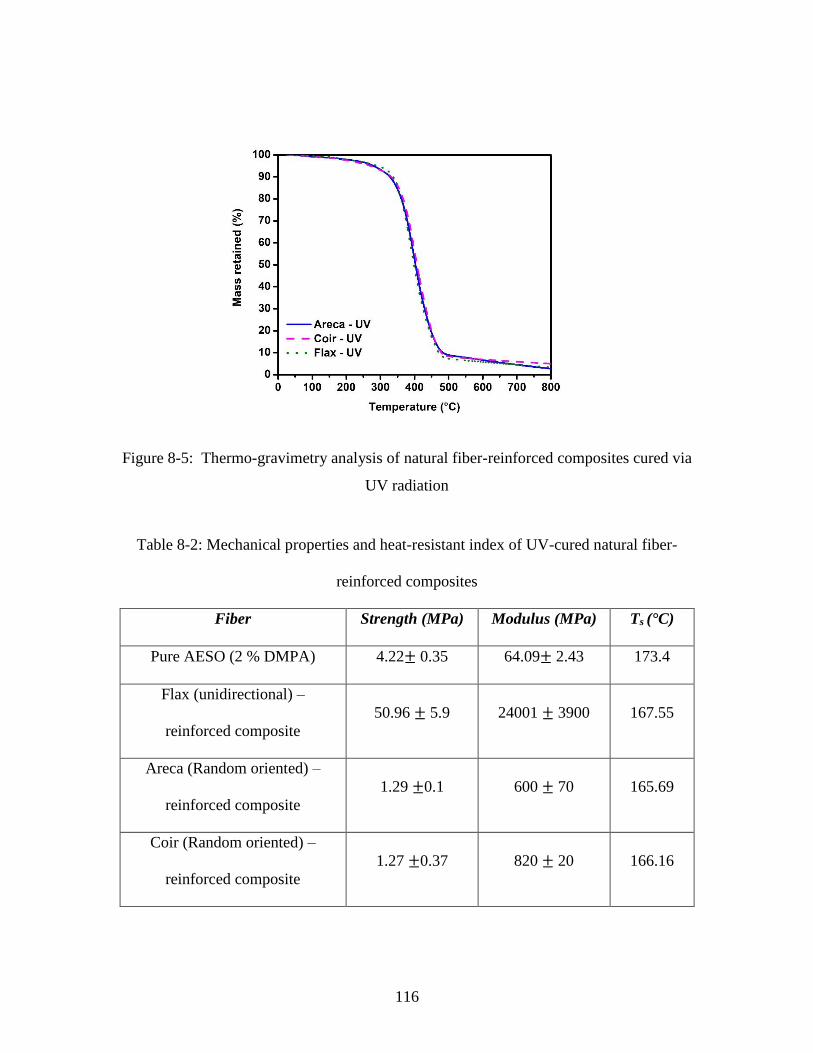
116
Figure 8-5: Thermo-gravimetry analysis of natural fiber-reinforced composites cured via
UV radiation
Table 8-2: Mechanical properties and heat-resistant index of UV-cured natural fiber-
reinforced composites
Fiber Strength (MPa) Modulus (MPa) Ts (°C)
Pure AESO (2 % DMPA) 4.22± 0.35 64.09± 2.43 173.4
Flax (unidirectional) –
reinforced composite
50.96 ± 5.9 24001 ± 3900 167.55
Areca (Random oriented) –
reinforced composite
1.29 ±0.1 600 ± 70 165.69
Coir (Random oriented) –
reinforced composite
1.27 ±0.37 820 ± 20 166.16
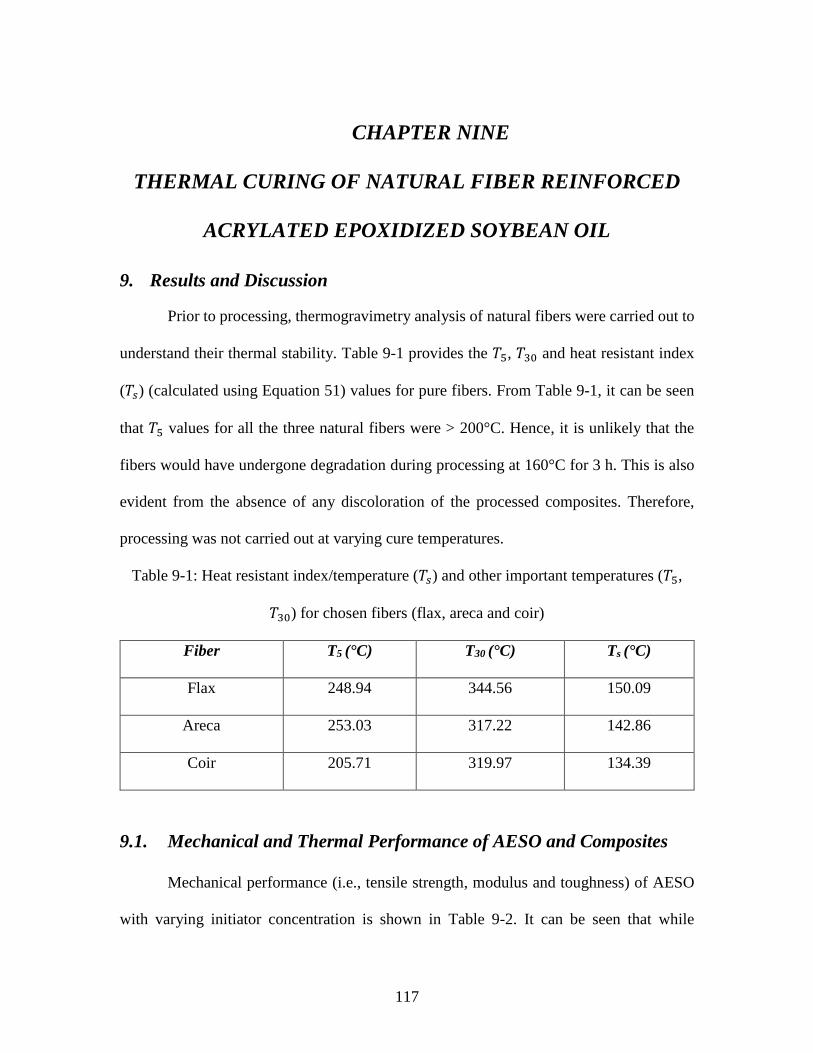
117
CHAPTER NINE
THERMAL CURING OF NATURAL FIBER REINFORCED
ACRYLATED EPOXIDIZED SOYBEAN OIL
9. Results and Discussion
Prior to processing, thermogravimetry analysis of natural fibers were carried out to
understand their thermal stability. Table 9-1 provides the 𝑇5, 𝑇30 and heat resistant index
(𝑇𝑠) (calculated using Equation 51) values for pure fibers. From Table 9-1, it can be seen
that 𝑇5 values for all the three natural fibers were > 200°C. Hence, it is unlikely that the
fibers would have undergone degradation during processing at 160°C for 3 h. This is also
evident from the absence of any discoloration of the processed composites. Therefore,
processing was not carried out at varying cure temperatures.
Table 9-1: Heat resistant index/temperature (𝑇𝑠) and other important temperatures (𝑇5,
𝑇30) for chosen fibers (flax, areca and coir)
Fiber T5 (°C) T30 (°C) Ts (°C)
Flax 248.94 344.56 150.09
Areca 253.03 317.22 142.86
Coir 205.71 319.97 134.39
9.1. Mechanical and Thermal Performance of AESO and Composites
Mechanical performance (i.e., tensile strength, modulus and toughness) of AESO
with varying initiator concentration is shown in Table 9-2. It can be seen that while

118
increasing initiator concentration did not alter strength and toughness, modulus was
observed to increase. Table 9-3 provides the mechanical properties and heat resistant index
of fiber-reinforced composites. It can be seen that the tensile strength of areca and coir
fiber-reinforced composites was inferior compared to pure AESO, which was in line with
the observation made in UV-cured composites. However, the modulus of natural fiber-
reinforced composite was observed to be higher than that of pure AESO. This can be
attributed to the higher modulus of natural fibers (modulus of coir is ~ 6000 MPa and that
of flax is 60000 MPa163) than pure AESO. Figure 9-1 shows thermogravimetry analysis
(TGA) of fiber-reinforced composites processed via thermal curing. Similar to photo-cured
composites, thermally cured composites also exhibited single decomposition peak,
indicating that both the resin and fibers decompose together. Also, it can be seen from
Table 9-3 that thermal resistance or heat resistance index of composites did not alter
irrespective of the natural fiber used or the processing method employed.
Table 9-2: Strength, Young’s modulus and Tensile Toughness of AESO with varying
photo-initiator concentration (1, 2 and 4 wt. %)
Content of initiator
(Benzo)
Strength (MPa) Modulus (MPa) Toughness (J/m3)
1 % 3.71 ± 0.10 67.05 ± 3.62 1.95 ± 0.18
2 % 4.01 ± 0.32 87.88 ± 4.43 1.54 ± 0.39
4 % 4.04 ± 0.41 110.05 ± 3.79 1.32 ± 0.32
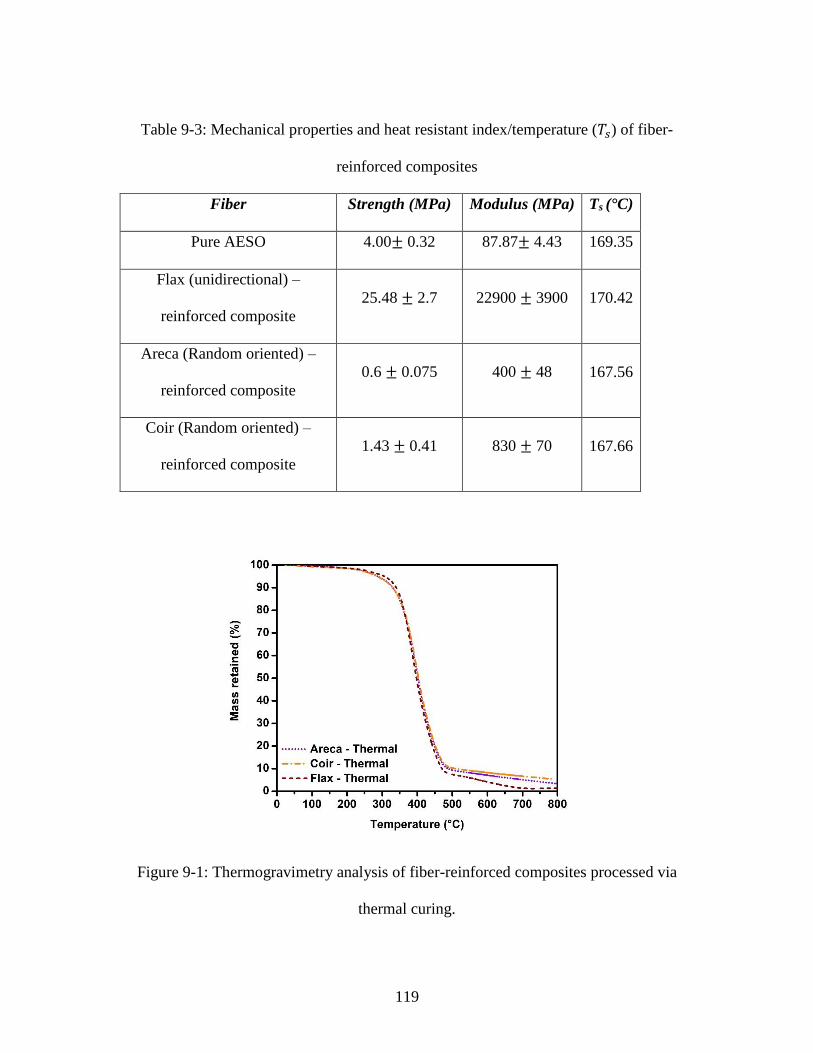
119
Table 9-3: Mechanical properties and heat resistant index/temperature (𝑇𝑠) of fiber-
reinforced composites
Fiber Strength (MPa) Modulus (MPa) Ts (°C)
Pure AESO 4.00± 0.32 87.87± 4.43 169.35
Flax (unidirectional) –
reinforced composite
25.48 ± 2.7 22900 ± 3900 170.42
Areca (Random oriented) –
reinforced composite
0.6 ± 0.075 400 ± 48 167.56
Coir (Random oriented) –
reinforced composite
1.43 ± 0.41 830 ± 70 167.66
Figure 9-1: Thermogravimetry analysis of fiber-reinforced composites processed via
thermal curing.
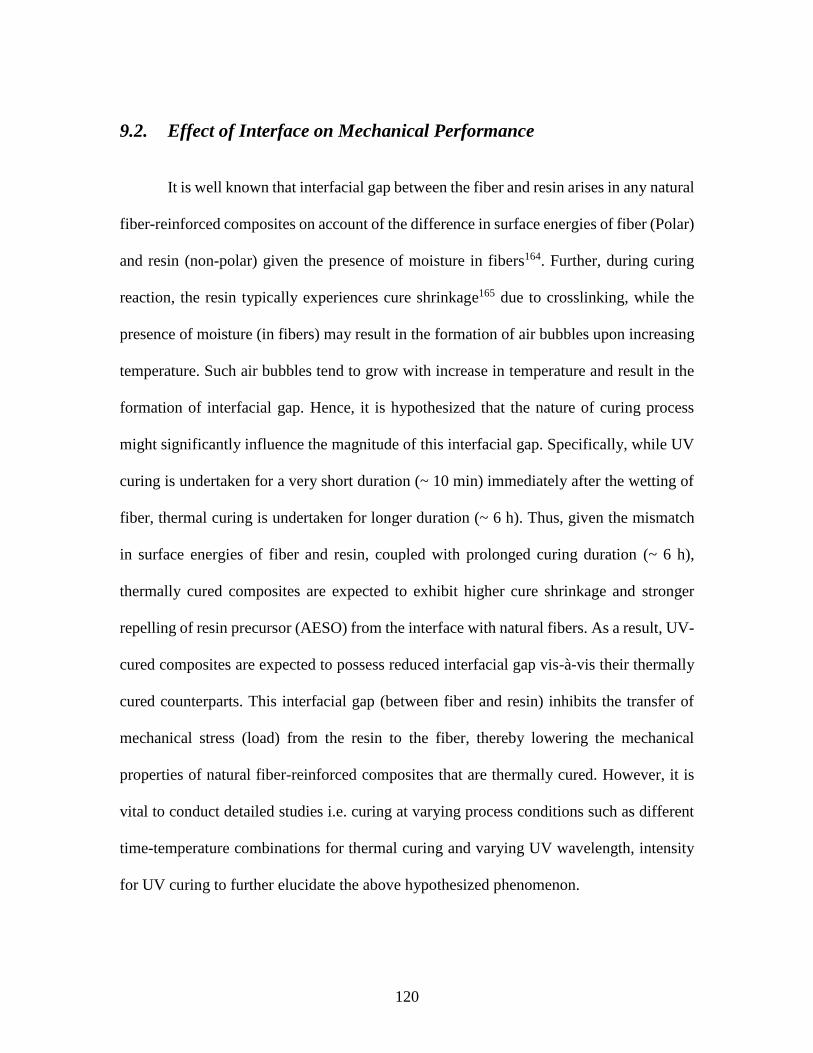
120
9.2. Effect of Interface on Mechanical Performance
It is well known that interfacial gap between the fiber and resin arises in any natural
fiber-reinforced composites on account of the difference in surface energies of fiber (Polar)
and resin (non-polar) given the presence of moisture in fibers164. Further, during curing
reaction, the resin typically experiences cure shrinkage165 due to crosslinking, while the
presence of moisture (in fibers) may result in the formation of air bubbles upon increasing
temperature. Such air bubbles tend to grow with increase in temperature and result in the
formation of interfacial gap. Hence, it is hypothesized that the nature of curing process
might significantly influence the magnitude of this interfacial gap. Specifically, while UV
curing is undertaken for a very short duration (~ 10 min) immediately after the wetting of
fiber, thermal curing is undertaken for longer duration (~ 6 h). Thus, given the mismatch
in surface energies of fiber and resin, coupled with prolonged curing duration (~ 6 h),
thermally cured composites are expected to exhibit higher cure shrinkage and stronger
repelling of resin precursor (AESO) from the interface with natural fibers. As a result, UV-
cured composites are expected to possess reduced interfacial gap vis-à-vis their thermally
cured counterparts. This interfacial gap (between fiber and resin) inhibits the transfer of
mechanical stress (load) from the resin to the fiber, thereby lowering the mechanical
properties of natural fiber-reinforced composites that are thermally cured. However, it is
vital to conduct detailed studies i.e. curing at varying process conditions such as different
time-temperature combinations for thermal curing and varying UV wavelength, intensity
for UV curing to further elucidate the above hypothesized phenomenon.

121
CHAPTER TEN
SUMMARY AND FUTURE WORK
10. Conclusions
10.1. Life Cycle Assessment
Vegetable oil-based epoxy was compared with two other bio-derived epoxies (bark-
based and lignin-based) as well as conventional petroleum-derived epoxy via cradle-to-
factory gate LCA to assess the extent of their eco-friendliness and assess the best material
from the perspective of sustainability. The results of this work showed that across most
impact categories, vegetable oil-based epoxy showed the best ecological performance
among all the three bio-epoxies on account of two factors: significantly higher electricity
consumption during the processing of B- and L-epoxy vis-à-vis V-epoxy, and the use of
epichlorohydrin in producing other bio-epoxies except V-epoxy. Further, a comparative
evaluation of the impacts of vegetable oil-based epoxy vis-à-vis conventional epoxy
showed its poor performance, which was ascribed to the use of laboratory-scale inventory
for V-epoxy that utilizes chemicals in larger proportions when compared to the optimized
industrial-scale inventory used for P-epoxy. This is further compounded by poorer
mechanical properties of V-epoxy when compared to P-epoxy. In sum, this work highlights
the potential for vegetable oil-based epoxy to constitute the base for synthesis of
sustainable epoxies for structural applications. Simultaneously, it also shows the need for
optimizing the synthesis of such epoxies to reduce the input chemical requirement as well
122
as reducing their epoxy equivalent weight in order to enhance their resultant mechanical
properties so as to make them competitive with respect to petroleum-based epoxies.
10.2. Synthesis of Sustainable Epoxy
This work witnesses the first-ever successful synthesis of green epoxy with high
epoxy content and low EEW (< 175 g/eq) – comparable to that of DGEBA-based epoxies,
thereby raising the possibility of EPeO as being an ecofriendly and sustainable alternative
to conventional epoxies. With regard to homogeneously-catalyzed epoxidation of perilla
oil produced via in-situ generation of performic acid in the presence of H2SO4 as catalyst,
higher epoxy content (relative oxirane conversion of ~ 88 %) was observed. This was
mainly due to higher unsaturation content in perilla oil (i.e., higher double bond content)
as confirmed by its high iodine value (196 g per 100 g of oil), thereby enhancing its
reactivity when compared with other vegetable oils. Reaction kinetics for epoxidation and
ring opening reactions under homogeneously-catalyzed scenario showed activation
energies of 20.10 kJ/mol (for epoxidation) and 43.11 kJ/mol (for ring opening) reactions
respectively. This indicates higher stability of epoxy groups and lower probability of α-
glycol formation, as confirmed by results obtained using the α-glycol content test that
showed its molar concentration at < 20 % of epoxy molar concentration. Thermodynamic
parameters – obtained through calculations – further confirmed higher stability of oxirane
groups compared to α-glycol given the lower free activation energy for epoxidation vis-à-
vis oxirane cleavage reactions.
In contrast, for the heterogeneously-catalyzed reaction, a pseudo two-phase model
that captures the variation in reactivity of chemical groups based on their position was
123
developed to study epoxidation kinetics of perilla oil under such condition. Four different
scenarios were considered to understand the reactivity of chemical species at different
positions in the triglyceride molecule. The results clearly indicated that chemical groups
present at the 9th and 12th position in the triglyceride molecule exhibit the same reactivity
that was significantly different from that exhibited by groups present at the 15th position.
Further, the robustness of the model was validated by calculating different kinetic
parameters (rate constant and activation energy) as well as predicting the iodine and epoxy
values of EPeO at 50°C under the heterogeneously-catalyzed reaction.
Upon combining both homogeneously- and heterogeneously-catalyzed reactions,
this study can be said to bring novelty in at least three respects. One, it is the first attempt
at analyzing the effect of high linolenic acid content – both via presence of larger number
of double bonds and their enhanced reactivity compared to those in other acid moieties –
of VOs on their epoxidation reaction through a detailed understanding of reaction kinetics
and thermodynamics. Second, it also remains the first and only attempt to date to have
focused on all three critical aspects related to EVOs – epoxidation, in-situ ring cleavage
(side-reaction during epoxidation), and ex-situ ring cleavage – while analyzing the stability
of epoxy groups during both epoxidation and ring cleavage reactions for the same EVO
through data on reaction kinetics and thermodynamics parameters. Finally, this study also
sheds light on the synthesis of EVOs with EEW equivalent to that of conventional epoxy.
Together, the combination of these three aspects is expected to help advance vigorous
research with regard to multiple aspects, including on the use of homogeneous and
heterogeneous catalysts, accounting for the rates of side-reactions in different phases, and

124
also contribute towards a better understanding on the relation of stability of epoxy groups
with the nature and content of different acid moieties present in the initially chosen VOs.
10.3. Cure Kinetics of Acrylated Triglycerides
Beyond epoxidation kinetics, this study also involved comparing the cure kinetics
of acrylated epoxidized soybean oil processed via different curing methods (photo-curing
and thermal curing). Photo-cure kinetics of AESO – a bio-based acrylated triglyceride –
was studied via photo-DSC by using two different photo-initiators (DMPA and HCPK).
Irrespective of the photo-initiator used, AESO exhibited chain reaction behavior with the
reaction order obtained as ~ 2, while under no condition was the extent of curing observed
to be complete (i.e., 𝛼 ≠ 1). For the medium-intensity regime, DMPA-containing samples
showed increase in reaction enthalpy with increase in UV intensity and/or temperature,
with their HCPK-containing counterparts exhibiting similar behavior for increase in photo-
initiator concentration and/or UV intensity. Modified Kamal’s model that takes
vitrification into account was observed to well-fit experimentally obtained values for the
extent of curing (𝛼) and was therefore used to determine the average activation energy (𝐸𝑎)
of cure reaction. On the other hand, model-free isoconversional plots were developed to
study the variation in effective activation energy (𝐸𝑎,𝛼) as the reaction proceeds, showing
increase in 𝐸𝑎,𝛼 with increase in 𝛼 for AESO samples containing either of the two photo-
initiators. Given its ability to highlight change in effective activation energy as a function
of the extent of curing (𝛼) on account of vitrification of the triglyceride, the isoconversional
method was considered more apt vis-à-vis model-fitting method for understanding the
photo-cure kinetics of acrylated triglycerides. Finally, light intensity exponent method

125
indicated that termination of curing reaction occurred via the combination of primary
radical termination and second-order termination mechanisms.
Simultaneously, thermal cure kinetics of the same resin precursor (AESO) was also
studied using tert-butyl perbenzoate as thermal initiator (in varying concentrations). Heat
flow curves obtained using thermal DSC were used to calculate the extent of curing (𝛼) at
different heating rates. Subsequently, two methods – Kissinger and Starink – were used to
determine the variation in effective activation energy (𝐸𝑎,𝛼) of curing reaction as a function
of 𝛼 using the isoconversional method. Both methods gave similar values of 𝐸𝑎,𝛼 at each
𝛼 with a difference of less than 5 %, indicating the robustness of both models. Further,
AESO samples showed irregular behavior with regard to their effective activation energy
as a function of thermal initiator concentration. While lower initiator concentration was
observed to result in enhancement of effective activation energy with increase in the extent
of curing, higher initiator concentration showed inconsistency in effective activation
energy behavior as a function of 𝛼 due to the pronounced influence of the cage effect.
10.4. Mechanical Properties of Acrylated Triglycerides
Mechanical properties – tensile strength, Young’s modulus and toughness – were
measured for both thermally cured and UV-cured AESO, as well as for their respective
composites (reinforced with natural fibers – flax, areca and coir). Regarding properties of
AESO-based composites, three natural fibers – flax, coir and areca – were chosen to
evaluate the impact of chemical composition of fibers on mechanical and thermal
properties of their respective composites. Among the three fibers, flax fiber exhibited the
best wettability of resins, followed by areca fibers with the coir fiber showing the least

126
amount of wettability. Tensile strength of areca and coir reinforced composites exhibited
inferior performance compared to pure AESO irrespective of the curing method employed.
However, the tensile modulus of the fiber reinforced composite was higher than the pure
AESO irrespective of the type of fiber and the curing method. However, the curability and
performance of natural fiber reinforced composite cured via two different techniques need
to be studied to a greater extent by varying the various process parameters. In case of UV
curing, varying UV wavelength and in case of thermal curing, varying the curing
temperature and time may impact the performance of the composites. Further, semi-
empirical models could be used to determine mechanical properties
10.5. Future Work
This work began with epoxidation and oxirane cleavage kinetics of triglyceride-
based epoxies, but then shifted towards analyzing the cure kinetics along with thermal and
mechanical behavior of acrylated triglycerides. This shift was undertaken in light of limited
information availability for cure kinetics of triglyceride-based epoxies and their associated
composites. However, any subsequent attempt towards improving the potential of
vegetable oils, specifically perilla oil, as sustainable sources for alternatives to
conventional epoxies would necessitate a whole host of studies on diverse research fronts.
The first immediate task would have to be the measurement of mechanical
properties of epoxidized perilla oil (EPeO) in order to assess its performance vis-à-vis
conventional DGEBA, since this study has restricted itself to comparing only their epoxy
equivalent weights (EEW). Further studies would also be required with regard to selecting
novel triglycerides that can help achieve lower EEW values than those exhibited by perilla

127
oil, followed by measurement of their mechanical properties. This would potentially yield
sustainable epoxies with superior mechanical properties.
The second task would focus on understanding cure kinetics of epoxies derived
from biological precursors (e.g. vegetable oils) – one immediate example in this regard can
be EPeO. This task is especially relevant in light of the difference in curing mechanism of
epoxies (via cationic mechanism) when compared to acrylated triglycerides (free radical
mechanism). In particular, photo-cure kinetics of such epoxies would need an exhaustive
study given the lack of sufficient literature on this domain.
The third task would involve in analyzing the effects of sizing and/or treating
natural fibers on both cure kinetics as well as thermal and mechanical properties of such
composites. Also, it is important to determine the UV curability by varying UV wavelength
and in case of thermal curing, varying the curing temperature and time and evaluate the
impact of process conditions on the performance of composites. Also, it was hypothesized
that there exists some interfacial gap between the fiber and matrix. Hence, such surface
modification (sizing) of these fibers may further reduce this interfacial gap and thereby
enhance the mechanical properties of such composites. However, the effect of such
modification on UV attenuation and curability remains to be understood. Additionally,
experimentally obtained properties for such composites should also be modeled using
semi-empirical models (such as Halpin-Tsai model) to enable better prediction of
mechanical properties vis-à-vis fiber loading.
As stated in Chapter 1, the stepped concurrent curing (SCC) technique remains key
to developing thicker composites (i.e., > 1 mm thick). However, this work did not dwell

128
further on the relevance of SCC technique for developing thicker UV-cured natural fiber
reinforced composite. The fifth task emanating from this study would evaluate the
suitability of SCC technique, since any possibility for use of bio-derived composites
requires its commercial applicability, that can be used in structural applications. Finally,
even as this study highlighted the superior ecological performance of vegetable oil-based
epoxy systems, it has not shed light on the ecological performance of the two curing
methodologies (photo and thermal curing). This can be the sixth task that emerges from
this work, given the need to establish the ecological credentials of UV curing prior to
declaring it as a sustainable manufacturing technique in its truest sense.
In sum, while this work demonstrates the potential power of photons towards
processing natural fiber-reinforced sustainable thermoset composites, it also highlights the
need for several key steps that must be undertaken to advance this effort towards the
commercial application of such composites for futuristic products. These efforts are
required at every life-cycle stage of such composites to enhance their true sustainability.
To begin with, novel polymers need to be synthesized in an eco-friendlier manner while
adhering to the 12 principles of green chemistry. Subsequently, it must be understood that
most commercially used components have highly complex shapes, and hence the UV
curability of such complex-shaped parts needs to be evaluated. Such understanding would
hasten the manufacturing of composites at reduced cycle times and costs, while also
fostering the culture of environmental benchmarking in industrial production, thus making
our world truly sustainable.
129
REFERENCES
1. Geissdoerfer, M., Savaget, P., Bocken, N. M. P. & Hultink, E. J. The Circular
Economy – A new sustainability paradigm? J. Clean. Prod. 143, 757–768 (2017).
2. Holbery, J. & Houston, D. Natural-fiber-reinforced polymer composites in
automotive applications. J. Miner. Met. Mater. Soc. 58, 80–86 (2006).
3. Ayrilmis, N., Jarusombuti, S., Fueangvivat, V., Bauchongkol, P. & White, R. H.
Coir fiber reinforced polypropylene composite panel for automotive interior
applications. Fibers Polym. 12, 919–926 (2011).
4. Maiorana, A., Spinella, S. & Gross, R. A. Bio-Based Alternative to the Diglycidyl
Ether of Bisphenol A with Controlled Materials Properties. Biomacromolecules
16, 1021–1031 (2015).
5. Auvergne, R., Caillol, S., David, G., Boutevin, B. & Pascault, J.-P. Biobased
Thermosetting Epoxy: Present and Future. Chem. Rev. 114, 1082–1115 (2014).
6. Nikafshar, S. et al. A renewable bio-based epoxy resin with improved mechanical
performance that can compete with DGEBA. RSC Adv. 7, 8694–8701 (2017).
7. Lawrence, W. H., Malik, M., Turner, J. E. & Autian, J. Toxicity Profile of
Epichlorohydrin. J. Pharm. Sci. 61, 1712–1717 (1972).
8. Vandenberg, L. N., Hauser, R., Marcus, M., Olea, N. & Welshons, W. V. Human
exposure to bisphenol A (BPA). Reprod. Toxicol. 24, 139–177 (2007).
9. Giulivo, M., Lopez de Alda, M., Capri, E. & Barceló, D. Human exposure to
endocrine disrupting compounds: Their role in reproductive systems, metabolic
syndrome and breast cancer. A review. Environ. Res. 151, 251–264 (2016).
130
10. Lithner, D., Larsson, Å. & Dave, G. Environmental and health hazard ranking and
assessment of plastic polymers based on chemical composition. Sci. Total Environ.
409, 3309–3324 (2011).
11. Ng, F. et al. Bio-Based Aromatic Epoxy Monomers for Thermoset Materials.
Molecules 22, 149 (2017).
12. Raquez, J.-M., Deléglise, M., Lacrampe, M.-F. & Krawczak, P. Thermosetting
(bio)materials derived from renewable resources: A critical review. Prog. Polym.
Sci. 35, 487–509 (2010).
13. Kim, J. R. & Sharma, S. The development and comparison of bio-thermoset
plastics from epoxidized plant oils. Ind. Crops Prod. 36, 485–499 (2012).
14. Ronda, J. C., Lligadas, G., Galià, M. & Cádiz, V. Vegetable oils as platform
chemicals for polymer synthesis. Eur. J. Lipid Sci. Technol. 113, 46–58 (2011).
15. Lligadas, G., Ronda, J. C., Galià, M. & Cádiz, V. Renewable polymeric materials
from vegetable oils: a perspective. Mater. Today 16, 337–343 (2013).
16. Xia, Y. & Larock, R. C. Vegetable oil-based polymeric materials: synthesis,
properties, and applications. Green Chem. 12, 1893 (2010).
17. Cosgrove, J. P., Church, D. F. & Pryor, W. A. The kinetics of the autoxidation of
polyunsaturated fatty acids. Lipids 22, 299–304 (1987).
18. Galià, M., de Espinosa, L. M., Ronda, J. C., Lligadas, G. & Cádiz, V. Vegetable
oil-based thermosetting polymers. Eur. J. Lipid Sci. Technol. 112, 87–96 (2010).
19. Seniha Güner, F., Yağcı, Y. & Tuncer Erciyes, A. Polymers from triglyceride oils.
Prog. Polym. Sci. 31, 633–670 (2006).

131
20. Llevot, A. & Meier, M. A. R. Renewability – a principle of utmost importance!
Green Chem. 18, 4800–4803 (2016).
21. Sheldon, R. A. Green and sustainable manufacture of chemicals from biomass:
state of the art. Green Chem. 16, 950–963 (2014).
22. Llevot, A. et al. Renewability is not Enough: Recent Advances in the Sustainable
Synthesis of Biomass-Derived Monomers and Polymers. Chem. - A Eur. J. 22,
11510–11521 (2016).
23. Haapala, K. R. et al. A Review of Engineering Research in Sustainable
Manufacturing. J. Manuf. Sci. Eng. 135, 041013 (2013).
24. Kousaalya, A. B., Biddappa, B. I., Krumm, K., Pradeep, S. A. & Pilla, S.
Poly(lactic acid)/areca fiber laminate composites processed via film stacking
technique. J. Appl. Polym. Sci. 45795 (2017). doi:10.1002/app.45795
25. Yebi, A., Ayalew, B., Pilla, S. & Yu, X. Model-Based Robust Optimal Control for
Layer-By-Layer Ultraviolet Processing of Composite Laminates. J. Dyn. Syst.
Meas. Control 139, 021008 (2016).
26. Andrzejewska, E. Photopolymerization kinetics of multifunctional monomers.
Prog. Polym. Sci. 26, 605–665 (2001).
27. Prileschajew, N. Oxydation ungesättigter Verbindungen mittels organischer
Superoxyde. Berichte der Dtsch. Chem. Gesellschaft 42, 4811–4815 (1909).
28. Swern, D. Organic Peracids. Chem. Rev. 45, 1–68 (1949).
29. Frias, C. F., Serra, A. C., Ramalho, A., Coelho, J. F. J. & Fonseca, A. C.
Preparation of fully biobased epoxy resins from soybean oil based amine

132
hardeners. Ind. Crops Prod. 109, 434–444 (2017).
30. Pawar, M., Kadam, A., Yemul, O., Thamke, V. & Kodam, K. Biodegradable
bioepoxy resins based on epoxidized natural oil (cottonseed & algae) cured with
citric and tartaric acids through solution polymerization: A renewable approach.
Ind. Crops Prod. 89, 434–447 (2016).
31. Crivello, J. V. & Narayan, R. Epoxidized triglycerides as renewable monomers in
photoinitiated cationic polymerization. Chem. Mater. 4, 692–699 (1992).
32. Omonov, T. S., Kharraz, E. & Curtis, J. M. The epoxidation of canola oil and its
derivatives. RSC Adv. 6, 92874–92886 (2016).
33. Brodin, M., Vallejos, M., Opedal, M. T., Area, M. C. & Chinga-Carrasco, G.
Lignocellulosics as sustainable resources for production of bioplastics – A review.
J. Clean. Prod. 162, 646–664 (2017).
34. Carbonell-Verdu, A., Samper, M. D., Garcia-Garcia, D., Sanchez-Nacher, L. &
Balart, R. Plasticization effect of epoxidized cottonseed oil (ECSO) on poly(lactic
acid). Ind. Crops Prod. 104, 278–286 (2017).
35. Wang, R. & Schuman, T. P. Vegetable oil-derived epoxy monomers and polymer
blends: A comparative study with review. Express Polym. Lett. 7, 272–292 (2012).
36. Orue, A., Eceiza, A. & Arbelaiz, A. Preparation and characterization of poly(lactic
acid) plasticized with vegetable oils and reinforced with sisal fibers. Ind. Crops
Prod. 112, 170–180 (2018).
37. Barcena, H., Tuachi, A. & Zhang, Y. Teaching Green Chemistry with Epoxidized
Soybean Oil. J. Chem. Educ. 94, 1314–1318 (2017).
133
38. Sienkiewicz, A. M. & Czub, P. The unique activity of catalyst in the epoxidation
of soybean oil and following reaction of epoxidized product with bisphenol A. Ind.
Crops Prod. 83, 755–773 (2016).
39. Janković, M. R., Sinadinović-Fišer, S. V. & Govedarica, O. M. Kinetics of the
Epoxidation of Castor Oil with Peracetic Acid Formed in Situ in the Presence of an
Ion-Exchange Resin. Ind. Eng. Chem. Res. 53, 9357–9364 (2014).
40. Gan, L. H., Goh, S. H. & Ooi, K. S. Kinetic studies of epoxidation and oxirane
cleavage of palm olein methyl esters. J. Am. Oil Chem. Soc. 69, 347–351 (1992).
41. Dinda, S., Patwardhan, A. V., Goud, V. V. & Pradhan, N. C. Epoxidation of
cottonseed oil by aqueous hydrogen peroxide catalysed by liquid inorganic acids.
Bioresour. Technol. 99, 3737–3744 (2008).
42. Park, S.-J., Jin, F.-L. & Lee, J.-R. Effect of Biodegradable Epoxidized Castor Oil
on Physicochemical and Mechanical Properties of Epoxy Resins. Macromol.
Chem. Phys. 205, 2048–2054 (2004).
43. Goud, V. V., Patwardhan, A. V. & Pradhan, N. C. Studies on the epoxidation of
mahua oil (Madhumica indica) by hydrogen peroxide. Bioresour. Technol. 97,
1365–1371 (2006).
44. Sinadinović-Fišer, S., Janković, M. & Borota, O. Epoxidation of castor oil with
peracetic acid formed in situ in the presence of an ion exchange resin. Chem. Eng.
Process. Process Intensif. 62, 106–113 (2012).
45. Okieimen, F. ., Bakare, O. . & Okieimen, C. . Studies on the epoxidation of rubber
seed oil. Ind. Crops Prod. 15, 139–144 (2002).

134
46. Goud, V. V., Dinda, S., Patwardhan, A. V. & Pradhan, N. C. Epoxidation of
Jatropha (Jatropha curcas) oil by peroxyacids. Asia-Pacific J. Chem. Eng. 5, 346–
354 (2010).
47. Mungroo, R., Pradhan, N. C., Goud, V. V. & Dalai, A. K. Epoxidation of Canola
Oil with Hydrogen Peroxide Catalyzed by Acidic Ion Exchange Resin. J. Am. Oil
Chem. Soc. 85, 887–896 (2008).
48. Goud, V. V., Pradhan, N. C. & Patwardhan, A. V. Epoxidation of karanja
(Pongamia glabra) oil by H2O2. J. Am. Oil Chem. Soc. 83, 635–640 (2006).
49. Scala, J. La & Wool, R. P. Effect of FA composition on epoxidation kinetics of
TAG. J. Am. Oil Chem. Soc. 79, 373–378 (2002).
50. Goud, V. V., Patwardhan, A. V., Dinda, S. & Pradhan, N. C. Kinetics of
epoxidation of jatropha oil with peroxyacetic and peroxyformic acid catalysed by
acidic ion exchange resin. Chem. Eng. Sci. 62, 4065–4076 (2007).
51. Zaher, F. A., El-Mallah, M. H. & El-Hefnawy, M. M. Kinetics of oxirane cleavage
in epoxidized soybean oil. J. Am. Oil Chem. Soc. 66, 698–700 (1989).
52. Tan, S. G. & Chow, W. S. Biobased Epoxidized Vegetable Oils and Its Greener
Epoxy Blends: A Review. Polym. Plast. Technol. Eng. 49, 1581–1590 (2010).
53. Alexandratos, S. D. Ion-Exchange Resins: A Retrospective from Industrial and
Engineering Chemistry Research. Ind. Eng. Chem. Res. 48, 388–398 (2009).
54. Goud, V. V, Patwardhan, A. V & Pradhan, N. C. Kinetics of in situ Epoxidation of
Natural Unsaturated Triglycerides Catalyzed by Acidic Ion Exchange Resin. Ind.
Eng. Chem. Res. 46, 3078–3085 (2007).

135
55. Gelbard, G. Organic Synthesis by Catalysis with Ion-Exchange Resins. Ind. Eng.
Chem. Res 44, 8468–8498 (2005).
56. Sinadinović-Fišer, S., Janković, M. & Petrović, Z. S. Kinetics of in situ
epoxidation of soybean oil in bulk catalyzed by ion exchange resin. J. Am. Oil
Chem. Soc. 78, 725–731 (2001).
57. Wisniak, J. & Navarrete, E. Epoxidation of Fish Oil, Kinetic and Optimization
Model. Ind. Eng. Chem. Prod. Res. Dev. 9, 33–41 (1970).
58. Jankovic, M. & Sinadinovic-Fiser, S. Kinetic models of reaction systems for the in
situ epoxidation of unsaturated fatty acid esters and triglycerides. Hem. Ind. 58,
569–576 (2004).
59. Nugrahani, R. A. et al. Study Effect of Temperature and Reaction Kinetics Model
Selection Epoxidation against Rice Bran Oil Methyl Ester with Catalyst Amberlite
IR-120. ARPN J. Eng. Appl. Sci. 12, (2017).
60. Janković, M. et al. A pseudo-homogeneous model describing soybean oil
epoxidation with peracetic acid based on the fatty acid composition. in 13th
International Conference on Fundamental and Applied Aspects of Physical
Chemistry 677–680 (2016).
61. Marcio Schwaab, Lívia P.Lemos & José CarlosPinto. Optimum reference
temperature for reparameterization of the Arrhenius equation. Part 1: Problems
involving one kinetic constant. Chem. Eng. Sci. 63, 2750–2764 (2007).
62. Scott, T. F., Cook, W. D. & Forsythe, J. S. Photo-DSC cure kinetics of vinyl ester
resins. I. Influence of temperature. Polymer (Guildf). 43, 5839–5845 (2002).
136
63. Hoyle, C. E., Kinstle, J. F., American Chemical Society. Division of Polymeric
Materials: Science and Engineering. & American Chemical Society. Meeting
(197th : 1989 : Dallas, T. . Radiation curing of polymeric materials : developed
from a symposium sponsored by the Division of Polymeric Materials: Science and
Engineering at the 197th National Meeting of the American Chemical Society,
Dallas, Texas, April 9-14, 1989. (American Chemical Society, 1990).
64. Sangermano, M. et al. New Horizons in Cationic Photopolymerization. Polymers
(Basel). 10, 136 (2018).
65. La Scala, J. & Wool, R. P. Property analysis of triglyceride-based thermosets.
Polymer (Guildf). 46, 61–69 (2005).
66. Esen, D. S., Karasu, F. & Arsu, N. The investigation of photoinitiated
polymerization of multifunctional acrylates with TX-BT by Photo-DSC and RT-
FTIR. Prog. Org. Coatings 70, 102–107 (2011).
67. Esposito Corcione, C., Frigione, M., Maffezzoli, A. & Malucelli, G. Photo – DSC
and real time – FT-IR kinetic study of a UV curable epoxy resin containing o-
Boehmites. Eur. Polym. J. 44, 2010–2023 (2008).
68. Saito, H. et al. Real-Time Kinetic Study of Laser-Induced Polymerization. Annu.
Rep. NMR Spectrosc 107, (1985).
69. Scherzer, T. & Decker, U. Real-time FTIR–ATR spectroscopy to study the
kinetics of ultrafast photopolymerization reactions induced by monochromatic UV
light. Vib. Spectrosc. 19, 385–398 (1999).
70. Castell, P., Wouters, M., Fischer, H. & de With, G. Kinetic studies of a UV-

137
curable powder coating using photo-DSC, real-time FTIR and rheology. J.
Coatings Technol. Res. 4, 411–423 (2007).
71. Vyazovkin, S. et al. ICTAC Kinetics Committee recommendations for performing
kinetic computations on thermal analysis data. Thermochim. Acta 520, 1–19
(2011).
72. Vyazovkin, S. in Isoconversional Kinetics of Thermally Stimulated Processes 27–
62 (Springer International Publishing, 2015). doi:10.1007/978-3-319-14175-6_2
73. Šimon, P. ISOCONVERSIONAL METHODS Fundamentals, meaning and
application. J. Therm. Anal. Calorim. 76, 123–132 (2004).
74. Wanjun, T. & Donghua, C. An integral method to determine variation in activation
energy with extent of conversion. Thermochim. Acta 433, 72–76 (2005).
75. Salla, J. M., Cadenato, A., Ramis, X. & Morancho, J. M. Thermoset Cure Kinetics
by Isoconversional Methods. J. Therm. Anal. Calorim. 56, 771–781 (1999).
76. Ramis, X., Cadenato, A., Morancho, J. . & Salla, J. . Curing of a thermosetting
powder coating by means of DMTA, TMA and DSC. Polymer (Guildf). 44, 2067–
2079 (2003).
77. Pelletier, H., Belgacem, N. & Gandini, A. Acrylated vegetable oils as
photocrosslinkable materials. J. Appl. Polym. Sci. 99, 3218–3221 (2006).
78. Francucci, G., Cardona, F. & Manthey, N. W. Cure kinetics of an acrylated
epoxidized hemp oil-based bioresin system. J. Appl. Polym. Sci. 128, 2030–2037
(2012).
79. Thames, S. F. & Yu, H. Cationic UV-cured coatings of epoxide-containing

138
vegetable oils. Surf. Coatings Technol. 115, 208–214 (1999).
80. Mashouf Roudsari, G., Mohanty, A. K. & Misra, M. Study of the Curing Kinetics
of Epoxy Resins with Biobased Hardener and Epoxidized Soybean Oil. ACS
Sustain. Chem. Eng. 2, 2111–2116 (2014).
81. Wuzella, G., Mahendran, A. R., Müller, U., Kandelbauer, A. & Teischinger, A.
Photocrosslinking of an Acrylated Epoxidized Linseed Oil: Kinetics and its
Application for Optimized Wood Coatings. J. Polym. Environ. 20, 1063–1074
(2012).
82. Fertier, L. et al. The use of renewable feedstock in UV-curable materials – A new
age for polymers and green chemistry. Prog. Polym. Sci. 38, 932–962 (2013).
83. Mahendran, A. R., Wuzella, G., Aust, N., Kandelbauer, A. & Müller, U.
Photocrosslinkable modified vegetable oil based resin for wood surface coating
application. Prog. Org. Coatings 74, 697–704 (2012).
84. Palanisamy, A. & Rao, B. S. Photo-DSC and dynamic mechanical studies on UV
curable compositions containing diacrylate of ricinoleic acid amide derived from
castor oil. Prog. Org. Coatings 60, 161–169 (2007).
85. Allen, N. S. Photoinitiators for UV and visible curing of coatings: Mechanisms
and properties. J. Photochem. Photobiol. A Chem. 100, 101–107 (1996).
86. Gruber, H. F. Photoinitiators for free radical polymerization. Prog. Polym. Sci. 17,
953–1044 (1992).
87. Glockner, P. & National Paint and Coatings Association. Radiation curing :
coatings and printing inks : technical basics, applications and trouble shooting.
139
(Vincentz Network, 2008).
88. Crivello, J. V., Narayan, R. & Sternstein, S. S. Fabrication and mechanical
characterization of glass fiber reinforced UV-cured composites from epoxidized
vegetable oils. J. Appl. Polym. Sci. 64, 2073–2087 (1997).
89. Habib, F. & Bajpai, M. Synthesis and characterization of acrylated epoxidized
soybean oil for UV cured coatings. Chem. Chem. Technol. 5, 317–326 (2011).
90. Liu, H., Lu, W. & Liu, S. Development of acrylated soybean oil-based UV-curable
coatings with high impact strength from low viscosity oligomer. J. Appl. Polym.
Sci. 135, 45698 (2018).
91. Gu, H., Ren, K., Martin, D., Marino, T. & Neckers, D. C. Cationic UV-cured
coatings containing epoxidized soybean oil initiated by new onium salts containing
tetrakis(pentafluorophenyl)gallate anion. J. Coatings Technol. 74, 49–52 (2002).
92. Wan Rosli, W. ., Kumar, R. ., Mek Zah, S. & Hilmi, M. M. UV radiation curing of
epoxidized palm oil–cycloaliphatic diepoxide system induced by cationic
photoinitiators for surface coatings. Eur. Polym. J. 39, 593–600 (2003).
93. Zong, Z., He, J. & Soucek, M. D. UV-curable organic–inorganic hybrid films
based on epoxynorbornene linseed oils. Prog. Org. Coatings 53, 83–90 (2005).
94. ISO. ISO 14040:2006 - Environmental management - Life cycle assessment -
Principles and framework. (2006).
95. ISO. ISO 14044:2006 - Environmental management - Life cycle assessment -
Requirements and guidelines. (2006).
96. Kuo, P.-Y., Sain, M. & Yan, N. Synthesis and characterization of an extractive-

140
based bio-epoxy resin from beetle infested Pinus contorta bark. Green Chem. 16,
3483 (2014).
97. Fache, M., Viola, A., Auvergne, R., Boutevin, B. & Caillol, S. Biobased epoxy
thermosets from vanillin-derived oligomers. Eur. Polym. J. 68, 526–535 (2015).
98. Cai, C. et al. Studies on the kinetics ofin situ epoxidation of vegetable oils. Eur. J.
Lipid Sci. Technol. 110, 341–346 (2008).
99. a.J. Huijbregts, M. et al. ReCiPe 2016: A harmonized life cycle impact assessment
method at midpoint and enpoint level - Report 1 : characterization. Natl. Inst.
Public Heal. Environ. 194 (2016). doi:10.1007/s11367-016-1246-y
100. Jung, D. M., Yoon, S. H. & Jung, M. Y. Chemical Properties and Oxidative
Stability of Perilla Oils Obtained From Roasted Perilla Seeds As Affected by
Extraction Methods. J. Food Sci. 77, C1249–C1255 (2012).
101. Derksen, J. T. P., Cuperus, F. P. & Kolster, P. Paints and coatings from renewable
resources. Ind. Crops Prod. 3, 225–236 (1995).
102. ASTM International. Standard Test Method for Determination of Iodine Value of
Tall Oil Fatty Acids. 1–3 (ASTM International, 2014). doi:10.1520/D5768-02R14
103. ASTM International. Standard Test Method for Epoxy Content of Epoxy Resins. 1–
3 (ASTM International, 2012).
104. May, C. A. Epoxy resins : chemistry and technology. (M. Dekker, 1988).
105. Stenmark, G. A. Determination of Alpha-Glycol Content of Epoxy Resins. Anal.
Chem. 30, 381–383 (1958).
106. Faruk, O., Bledzki, A. K., Fink, H.-P. & Sain, M. Biocomposites reinforced with

141
natural fibers: 2000–2010. Prog. Polym. Sci. 37, 1552–1596 (2012).
107. Steindl, J., Koch, T., Moszner, N. & Gorsche, C. Silane−Acrylate Chemistry for
Regulating Network Formation in Radical Photopolymerization. Macromolecules
50, 7448–7457 (2017).
108. Cho, J.-D., Ju, H.-T. & Hong, J.-W. Photocuring kinetics of UV-initiated free-
radical photopolymerizations with and without silica nanoparticles. J. Polym. Sci.
Part A Polym. Chem. 43, 658–670 (2005).
109. Rusu, M. C., Block, C., Van Assche, G. & Van Mele, B. Influence of temperature
and UV intensity on photo-polymerization reaction studied by photo-DSC. J.
Therm. Anal. Calorim. 110, 287–294 (2012).
110. Abliz, D., Artys, T. & Ziegmann, G. Influence of model parameter estimation
methods and regression algorithms on curing kinetics and rheological modelling. J.
Appl. Polym. Sci. 134, 45137 (2017).
111. Vyazovkin, S. & Wight, C. A. Isothermal and non-isothermal kinetics of thermally
stimulated reactions of solids. Int. Rev. Phys. Chem. 17, 407–433 (1998).
112. Culbertson, C., Treasure, T., Venditti, R., Jameel, H. & Gonzalez, R. Life Cycle
Assessment of lignin extraction in a softwood kraft pulp mill. Nord. Pulp Pap.
Res. J. 31, 030–040 (2016).
113. Fache, M. et al. Vanillin, a promising biobased building-block for monomer
synthesis. Green Chem. 16, 1987 (2014).
114. Deng, Y. et al. Life cycle assessment of flax-fibre reinforced epoxidized linseed
oil composite with a flame retardant for electronic applications. J. Clean. Prod.
142
133, 427–438 (2016).
115. Wu, Z. et al. Mass transfer and reaction kinetics of soybean oil epoxidation in a
formic acid-autocatalyzed reaction system. Can. J. Chem. Eng. 94, 1576–1582
(2016).
116. Campanella, A., Fontanini, C. & Baltanás, M. A. High yield epoxidation of fatty
acid methyl esters with performic acid generated in situ. Chem. Eng. J. 144, 466–
475 (2008).
117. Rangarajan, B., Havey, A., Grulke, E. A. & Culnan, P. D. Kinetic parameters of a
two-phase model forin situ epoxidation of soybean oil. J. Am. Oil Chem. Soc. 72,
1161–1169 (1995).
118. Gan, L.-H. & Ng, S.-C. Kinetic studies of the performic acid epoxidation of
natural rubber latex stabilized by cationic surfactant. Eur. Polym. J. 22, 573–576
(1986).
119. Cortese, B., de Croon, M. H. J. M. & Hessel, V. High-Temperature Epoxidation of
Soybean Oil in Flow—Speeding up Elemental Reactions Wanted and Unwanted.
Ind. Eng. Chem. Res. 51, 1680–1689 (2012).
120. Monono, E. M., Haagenson, D. M. & Wiesenborn, D. P. Characterizing the
epoxidation process conditions of canola oil for reactor scale-up. Ind. Crops Prod.
67, 364–372 (2015).
121. Sun, X., Zhao, X., Du, W. & Liu, D. Kinetics of Formic Acid-autocatalyzed
Preparation of Performic Acid in Aqueous Phase. Chinese J. Chem. Eng. 19, 964–
971 (2011).

143
122. Kousaalya, A. B., Pilla, S., Beyene, S. D. & Ayalew, B. Epoxidation Kinetics of
High-Linolenic Triglyceride Catalyzed by Solid Acidic-Ion Exchange Resin.
Unpubl. results
123. Santacesaria, E. et al. Kinetics of Performic Acid Synthesis and Decomposition.
Ind. Eng. Chem. Res. acs.iecr.7b00593 (2017). doi:10.1021/acs.iecr.7b00593
124. Garcia, F. G. & Soares, B. G. Determination of the epoxide equivalent weight of
epoxy resins based on diglycidyl ether of bisphenol A (DGEBA) by proton nuclear
magnetic resonance. Polym. Test. 22, 51–56 (2003).
125. Scala, J. La & Wool, R. P. The effect of fatty acid composition on the acrylation
kinetics of epoxidized triacylglycerols. J. Am. Oil Chem. Soc. 79, 59–63 (2002).
126. Marcio Schwaab, Lívia P.Lemos & José CarlosPinto. Optimum reference
temperature for reparameterization of the Arrhenius equation. Part 2: Problems
involving multiple reparameterizations. Chem. Eng. Sci. 63, 2895–2906 (2008).
127. Santos, T. J. & Pinto, J. C. Taking Variable Correlation into Consideration during
Parameter Estimation. Brazilian J. Chem. Eng. 15, 1–20 (1998).
128. Li, P. & Vu, Q. D. A simple method for identifying parameter correlations in
partially observed linear dynamic models. BMC Syst. Biol. 9, 92 (2015).
129. Agarwal, A. K. & Brisk, M. L. Sequential experimental design for precise
parameter estimation. 1. Use of reparameterization. Ind. Eng. Chem. Process Des.
Dev. 24, 203–207 (1985).
130. Lee, S., Lee, Y.-J., Sung, J.-S. & Shin, H.-S. Influence of roasting conditions on
the chemical properties and antioxidant activity of perilla oils. J. Korean Soc.
144
Appl. Biol. Chem. 58, 325–334 (2015).
131. Chempro. Fatty Acid Composition of Some Major Oils. (2015). Available at:
https://www.chempro.in/fattyacid.htm. (Accessed: 30th October 2017)
132. Kousaalya, A. B., Beyene, S. D., Gopal, V., Ayalew, B. & Pilla, S. Green epoxy
synthesized from Perilla frutescens: A study on epoxidation and oxirane cleavage
kinetics of high-linolenic oil. Ind. Crops Prod. 123, 25–34 (2018).
133. Catalytic Oxidations with Hydrogen Peroxide as Oxidant. 9, (Springer
Netherlands, 1992).
134. Kurdikar, D. L. & Peppas, N. A. A kinetic study of diacrylate
photopolymerizations. Polymer (Guildf). 35, 1004–1011 (1994).
135. La Scala, J. & Wool, R. P. Fundamental thermo-mechanical property modeling of
triglyceride-based thermosetting resins. J. Appl. Polym. Sci. 127, 1812–1826
(2013).
136. Kardar, P., Ebrahimi, M. & Bastani, S. Influence of temperature and light intensity
on the photocuring process and kinetics parameters of a pigmented UV curable
system. J. Therm. Anal. Calorim. 118, 541–549 (2014).
137. Macarie, L. & Ilia, G. The influence of temperature and photoinitiator
concentration on photoinitiated polymerization of diacrylate monomer. Open
Chem. 3, 721–730 (2005).
138. Kamal, M. R. Thermoset characterization for moldability analysis. Polym. Eng.
Sci. 14, 231–239 (1974).
139. Kamal, M. R. & Sourour, S. Kinetics and Thermal Characterization of Thermoset

145
Cure. Polym. Eng. Sci. 13, 59–64 (1973).
140. Andrzejewska, E. Effect of the sulfide group on photopolymerization kinetics of
di(meth)acrylates. Polym. Bull. 37, 199–206 (1996).
141. Timpe, H.-J. & Strehmel, B. Lichtinduzierte polymer- und
polymerisationsreaktionen, 44. Zur kinetik der radikalischen photopolymerisation
mehrfunktioneller acrylate in polymeren bindemitteln. Die Makromol. Chemie
192, 779–791 (1991).
142. Maffezzoli, A. & Terzi, R. Effect of irradiation intensity on the isothermal
photopolymerization kinetics of acrylic resins for stereolithography. Thermochim.
Acta 321, 111–121 (1998).
143. Scherzer, T. & Decker, U. The effect of temperature on the kinetics of diacrylate
photopolymerizations studied by Real-time FTIR spectroscopy. Polymer (Guildf).
41, 7681–7690 (2000).
144. Mucci, V. & Vallo, C. Efficiency of 2,2-dimethoxy-2-phenylacetophenone for the
photopolymerization of methacrylate monomers in thick sections. J. Appl. Polym.
Sci. 123, 418–425 (2012).
145. Pavlinec, J. & Moszner, N. Dark reactions of free radicals trapped in densely
crosslinked polymer networks after photopolymerization. J. Appl. Polym. Sci. 89,
579–588 (2003).
146. Shi, S., Croutxé-Barghorn, C. & Allonas, X. Photoinitiating systems for cationic
photopolymerization: Ongoing push toward long wavelengths and low light
intensities. Prog. Polym. Sci. 65, 1–41 (2017).
146
147. Fischer, H., Baer, R., Hany, R., Verhoolen, I. & Walbiner, M. 2,2-Dimethoxy-2-
phenylacetophenone: photochemistry and free radical photofragmentation. J.
Chem. Soc. Perkin Trans. 2 0, 787 (1990).
148. Hirota, N. & Yamauchi, S. Short-lived excited triplet states studied by time-
resolved EPR spectroscopy. J. Photochem. Photobiol. C Photochem. Rev. 4, 109–
124 (2003).
149. Kurdikar, D. L. & Peppas, N. A. Method of determination of initiator efficiency:
application to UV polymerizations using 2,2-dimethoxy-2-phenylacetophenone.
Macromolecules 27, 733–738 (1994).
150. Igor V. Khudyakov, Jodi C. Legg, Michael B. Purvis, A. & Overton, B. J. Kinetics
of Photopolymerization of Acrylates with Functionality of 1−6. (1999).
doi:10.1021/IE990306I
151. Hosur, M., Tcherbi-Narteh, A., Meadows, S. S., Hosur, M. V & Jeelani, S. CAMX-
The Composites and Advanced Materials Expo.
152. Li, P., Yu, Y. & Yang, X. Effects of initiators on the cure kinetics and mechanical
properties of vinyl ester resins. J. Appl. Polym. Sci. 109, 2539–2545 (2008).
153. Yu, Q. & Zhu, S. Peroxide crosslinking of isotactic and syndiotactic
polypropylene. Polymer (Guildf). 40, 2961–2968 (1999).
154. Cheng, S.-Y., Tseng, J.-M., Lin, S.-Y., Gupta, J. P. & Shu, C.-M. Runaway
reaction on tert-butyl peroxybenzoate by DSC tests. J. Therm. Anal. Calorim. 93,
121–126 (2008).
155. Lin, C.-P. et al. Green thermal analysis for predicting thermal hazard of storage

147
and transportation safety for tert-butyl peroxybenzoate. J. Loss Prev. Process Ind.
25, 1–7 (2012).
156. Crivello, J. V. & Reichmanis, E. Photopolymer Materials and Processes for
Advanced Technologies. Chem. Mater. 26, 533–548 (2014).
157. Hoyle, C. E. Radiation Curing of Polymeric Materials. (2018).
158. Jones, R. N. The Ultraviolet Absorption Spectra of Aromatic Hydrocarbons.
Chem. Rev. 32, 1–46 (1943).
159. Yebi, A., Ayalew, B. & Pilla, S. CONTROL-ORIENTED MODEL
VERIFICATION FOR UV PROCESSING OF COMPOSITE LAMINATE. in
Society for the Advancement of Material and Process Engineering(SAMPE)
(2015).
160. Van de Velde, K. & Kiekens, P. Wettability of natural fibres used as reinforcement
for composites. Die Angew. Makromol. Chemie 272, 87–93 (1999).
161. Heng, J. Y. Y., Pearse, D. F., Thielmann, F., Lampke, T. & Bismarck, A. Methods
to determine surface energies of natural fibres: a review. Compos. Interfaces 14,
581–604 (2007).
162. Shao, L. et al. The Synergy of Double Cross-linking Agents on the Properties of
Styrene Butadiene Rubber Foams. Sci. Rep. 6, 36931 (2016).
163. Komuraiah, A., Kumar, N. S. & Prasad, B. D. Chemical Composition of Natural
Fibers and its Influence on their Mechanical Properties. Mech. Compos. Mater. 50,
359–376 (2014).
164. George, J., Sreekala, M. S. & Thomas, S. A review on interface modification and

148
characterization of natural fiber reinforced plastic composites. Polym. Eng. Sci. 41,
1471–1485 (2001).
165. Shah, D. U. & Schubel, P. J. Evaluation of cure shrinkage measurement techniques
for thermosetting resins. Polym. Test. 29, 629–639 (2010).
Related Documents


