SUSTAINABLE LIVELIHOOD GENERATION THROUGH PRODUCTION AND MARKETING OF SABAI GRASS AND CRAFTS IN PASCHIM MEDINIPUR DISTRICT, WEST BENGAL Thesis Submitted for the Award of the Degree of Doctor of Philosophy (Ph.D.) By KOUSIK PAIK Department of Economics with Rural Development VIDYASAGAR UNIVERSITY Midnapore, West Bengal, INDIA-721102 2017 © Copyright by Kousik Paik 2017 All rights reserved

Welcome message from author
This document is posted to help you gain knowledge. Please leave a comment to let me know what you think about it! Share it to your friends and learn new things together.
Transcript

SUSTAINABLE LIVELIHOOD GENERATION
THROUGH PRODUCTION AND MARKETING OF
SABAI GRASS AND CRAFTS
IN PASCHIM MEDINIPUR DISTRICT, WEST BENGAL
Thesis Submitted for the Award of the Degree of
Doctor of Philosophy (Ph.D.)
By
KOUSIK PAIK
Department of Economics with Rural Development VIDYASAGAR UNIVERSITY
Midnapore, West Bengal, INDIA-721102
2017
© Copyright by Kousik Paik 2017
All rights reserved
Dedication
To those Sabai growers and artisans of
Paschim Medinipur who are toiling hard, days and nights, to
attain a minimum sustainable living.


[ii]
ACKNOWLEDGEMENT
To complete the Ph.D. dissertation is a challenging academic pursuit which requires
sincerest support, advice and exchange of knowledge and facts from the academicians,
entrepreneurs, social workers, artisans, industry professionals and of course institutions.
Such collective support and assistance enabled me to complete this dissertation.
I wish to express my gratitude to Prof. Sebak Kumar Jana, Professor & Head, Department
of Economics with Rural Development, Vidyasagar University, whose constant guidance,
encouragement and academic support was crucial to complete the research work.
I wish to record my profound and heartfelt indebtedness and gratitude to
Prof. R.N. Chattopadhyay, Emeritus Professor, Department of Architecture and Regional
Planning, IIT, Kharagpur. It is his valuable advice, guidance and critical scrutiny of the
manuscript that brought this investigation into the present form and shape my thinking
into a thesis.
I should acknowledge the authorities and officials of the Vidyasagar University for
providing me with necessary support and timely processing of necessary documents to
complete the research work and submission of Ph.D thesis document.
I express sincere regards to my parents for their encouragement, good wishes and constant
support at every stage of the study, which has been a great source of spiritual and moral
inspiration to me.
I take this opportunity to acknowledge with thanks the help and support given by
Dr. Malabendu Jana, Scientist, Rush University,USA, Dr. Tapati Dasgupta, RPMU, IIT
Kharagpur and Mrs. Debrani Chatterjee, eminent vocalist and National Awardee, during
the period of my research work.
I would also like to thank Shri Sanjib Mondal, Ph.D Scholar of Calcutta University; Mr.
Ramhari Barik, PhD Scholar of Vidyasagar University; Mr. Netai Chandra Karak, Social
Worker, Mr. Pradip Singh, Social Worker, Mr. Biswajit Ganguly, IDO, Mr. Mahadeb
Soren, IDO, Mr. Muchiram Tudu, Master Craftsmen, Mrs. Manju Rani Mahati, Artisan,
Mr. Surja Dolai, Mr. Subrata Routh of Nayagram, Mr. Harish Das of Gopiballavpur,
Mr. Rashbihari Pal of Belpahari.

[iii]
I would like to pay my sincere gratitude to all the authors of the papers I have gone
through in the course of my research. I am immensely benefitted from their papers to
conceptualize my framework of study. Some of their papers have been mentioned in the
reference list.
I acknowledge and thank the authorities of Haldia Institute of Management for giving me
the academic support to complete the research work successfully and also I thank to the
faculty members and staff of Haldia Institute of Management for their moral support.
I am also grateful to the officials of the Department of Statistics & Programme
Implementation and Rural Development Cell of Department of Panchayat and Rural
Development, Paschim Medinipur for their help, support and supply of essential data
required for my research work.
I am grateful to my Nephew Mr. Avishek. Patra for his whole hearted assistance and
support to complete my research work.
I cannot forget friends who went through hard times together, cheered me on, and
celebrated each accomplishment: Soumya, Sonali, Kiran, Soma, Sumalya, Buddha, Anita,
Bobita.
I would like to thank all survey respondents of Nyagram, Gopiballavpur-I and Binpur-II
blocks for their active participation, cooperation and help at different stages of my
research work.
Last but not least I would like to thank with love to Mousumi and Pranjal, my wife and
son for their great companion and patience during the past few years. Mousumi has been
my best friend and supported, encouraged, entertained, and helped me to get through this
agonizing period in the most positive way.
Above all, I thank and praise the God for His blessings and kindness which have
bestowed on me to complete the research work.
Kousik Paik
Vidyasagar University
February 2017

Synopsis
of Ph.D. Thesis
on
SUSTAINABLE LIVELIHOOD GENERATION
THROUGH PRODUCTION AND MARKETING OF SABAI GRASS AND CRAFTS
IN PASCHIM MEDINIPUR DISTRICT, WEST BENGAL
Eulaliopsis binata, a tufted perennial natural fibre is commonly known as Sabai or Babui
grass in West Bengal, Jharkhand, Bihar and Odisha and as Bhabbar grass in Punjab, Haryana,
Himachal Pradesh and Uttaranchal. It is grown extensively on marginal and sub-marginal
rainfed uplands as a commercial grass crop which is principally used for pulp making in paper
industry and the rest for processing into rope and crafts. In West Bengal it is abundantly
cultivated in Paschim Medinipur, Bankura and Purulia Districts along the flanks of
Chotonagpur plateau. The indeginious and backward caste community groups of these areas
depend on this grass for their livelihood by converting this grass fibre into rope, plait and
variety of crafts belonging to items of decorative, utility and fashion goods. The rope and
grass are converted into various value added craft items like chair, doormats, hats, carpets,
flower vass, tea containers, bottle holders, sofa set, litter bins, wall mats besides bags of
different varieties and styles.
In West Bengal Pachim Medinipur stands on top in terms of coverage of area, production and
also marketing. It covers 21,000 ha of marginal and waste land under Sabai cultivation; it
grows 38,000 tons of Sabai per year of which 12.17% are converted into ropes, crafts and
other processed materials. The district supports 48,000 households involved in cultivation of
grass, rope making and processing of crafts. The three Blocks of Paschim Medinipur where
Sabai cultivation, rope twisting and crafts making mainly concentrate are Nayagram,
Gopiballavpur-I and Binpur-II. These three Blocks share 85% of the district’s total Sabai
growing area, and involve 81% of the working families in its cultivation, rope making and
craft processing. These three Blocks are taken in this research as Study Area where 42% of
the households depend fully or partially on Sabai based activities for their livelihood.
The present study probes into the problems of Sabai cultivation in the Background of the
Socio-economic conditions of the Sabai farmers and agro-technical attainments besides
impact of marketing on production and productivity of crop raising. It also studies the
constraints of production and productivity rise in respect to rope making and craft production.
Problems and prospects of craft making have been studied in detail and analysis of
productivity and profitability of rope and craft making has been given a through economic
and management treatment for understanding the basic reasons of low earning level in these

processing activities. The role of technology development and transfer has been studied and
based of the lacuna existed there, the necessary steps of improvement of the status have been
recommended. The role of institutions involved in production, processing and marketing of
the crop and its processed products like rope, plait and variety craft items has been brought
out from the analysis and necessary suggestions for improving their roles for effective
services have been prescribed in this study. For this analysis, the existing marketing structure,
marketing mix and market channel effectiveness have been dealt with in detail. With
improved marketing system the value addition and entrepreneurs’ net earning could be
improved to attain sustainable level of livelihood by the workers of the Sabai based
enterprises. For this, different on-going and proposed schemes of Government are suggested
with necessary investment-income analysis to indicate the possible paths of livelihood
improvement in this sector of the rural economy. Based on the above treatments on the
subject a set of recommendations are put forward for faster progress of the Sabai economy
vis-à-vis better livelihood to the Sabai cultivators and processors.
This research should not be taken as the point of culmination in the path of development of
Sabai economy. It indicates many other directions of research for future researchers to follow.
Such directions may be on development of agro-technology for productivity rise and quality
improvement of the fibre, technology for production, quality and productivity rise in rope and
craft production, identification of new and improved marketing system and channels, methods
of reduction of ergonomic adverses through technology modification etc.
[vi]
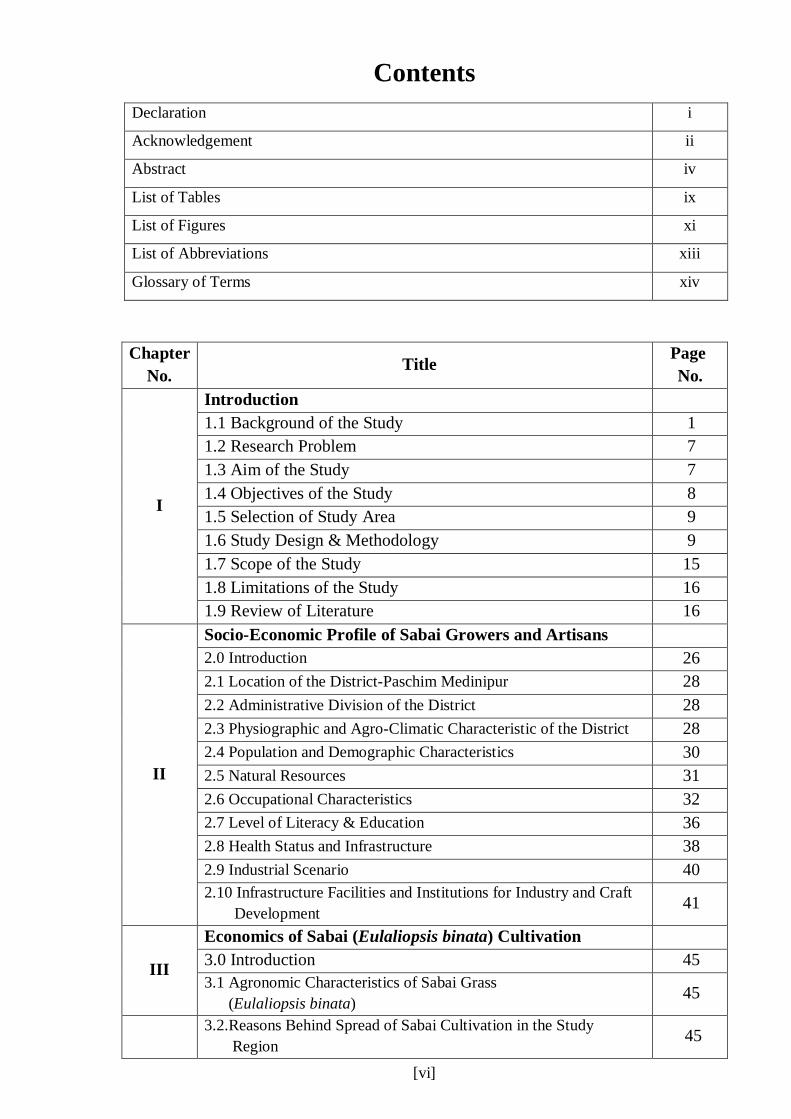
Contents Declaration i
Acknowledgement ii
Abstract iv
List of Tables ix
List of Figures xi
List of Abbreviations xiii
Glossary of Terms xiv
Chapter
No. Title Page
No.
I
Introduction 1.1 Background of the Study 1 1.2 Research Problem 7 1.3 Aim of the Study 7 1.4 Objectives of the Study 8 1.5 Selection of Study Area 9 1.6 Study Design & Methodology 9 1.7 Scope of the Study 15 1.8 Limitations of the Study 16 1.9 Review of Literature 16
II
Socio-Economic Profile of Sabai Growers and Artisans 2.0 Introduction 26 2.1 Location of the District-Paschim Medinipur 28 2.2 Administrative Division of the District 28 2.3 Physiographic and Agro-Climatic Characteristic of the District 28 2.4 Population and Demographic Characteristics 30 2.5 Natural Resources 31 2.6 Occupational Characteristics 32 2.7 Level of Literacy & Education 36 2.8 Health Status and Infrastructure 38 2.9 Industrial Scenario 40 2.10 Infrastructure Facilities and Institutions for Industry and Craft
Development 41
III
Economics of Sabai (Eulaliopsis binata) Cultivation 3.0 Introduction 45 3.1 Agronomic Characteristics of Sabai Grass (Eulaliopsis binata) 45
3.2.Reasons Behind Spread of Sabai Cultivation in the Study Region
45

[vii]
3.3 Sabai Grass and its Use 52 3.4 Process of Sabai Cultivation 53 3.5 Analysis of Cost of Various Inputs Use in Sabai Cultivation 58 3.6 Economic Evaluation of Sabai Cultivation 70
IV Rope Production: Costs, Benefits and Profitability
4.0 Introduction 75 4.1 Quality-wise Use of Sabai Rope in Rural and Urban Setting 75 4.2 Rope Making as Primary Processing from Sabai. 77 4.3 Characteristics and Productivity of Sabai Rope Making Household Units 81
4.4 Economics of Rope Production 87 4.5 Earnings from Rope Making Household Venture 89
4.6 Prospect of Rope Making by Sabai Raising Family 91
V Crafts Making: Value Addition and Contribution to Household Economy
5.0 Introduction 93 5.1 Crafts making a traditional practice: Issue and Importance 95 5.2 Changing Craft Making Practices and Introduction of New Items in the Market. 96
5.3 Technological intervention for production of Market Driven Crafts 97
5.4 Cost of Production and value addition in respect of selected Items. 102
5.5 Contribution to Household Economy from Crafts Making. 104
VI Marketing and Market Centres of Sabai Grass and Grass Based Crafts
6.0 Introduction 105
6.1 Marketing Channels and Channel Intermediaries 106
6.2 Operational Characteristics of Grass, Rope and Crafts Markets 113
6.3 Markets and Market Centers 119
6.4 Pricing Method of Sabai Grass, Rope and Crafts 123
6.5 Analysis of Price Spread and Channel Efficiency. 136
VII Problems of Sabai Cultivation and Processing
7.0 Introduction 159
7.1 Problems Related to Cultivation of Sabai Grass in Paschim Medinipur District
160
7.2 Problems Associated with Sabai Rope Production in Paschim Medinipur District
162
7.3 Problems in the Context of Sabai Crafts Making and Weaving 163
7.4 Problems Associated with Marketing of Sabai Grass, Rope and Crafts
166
[viii]
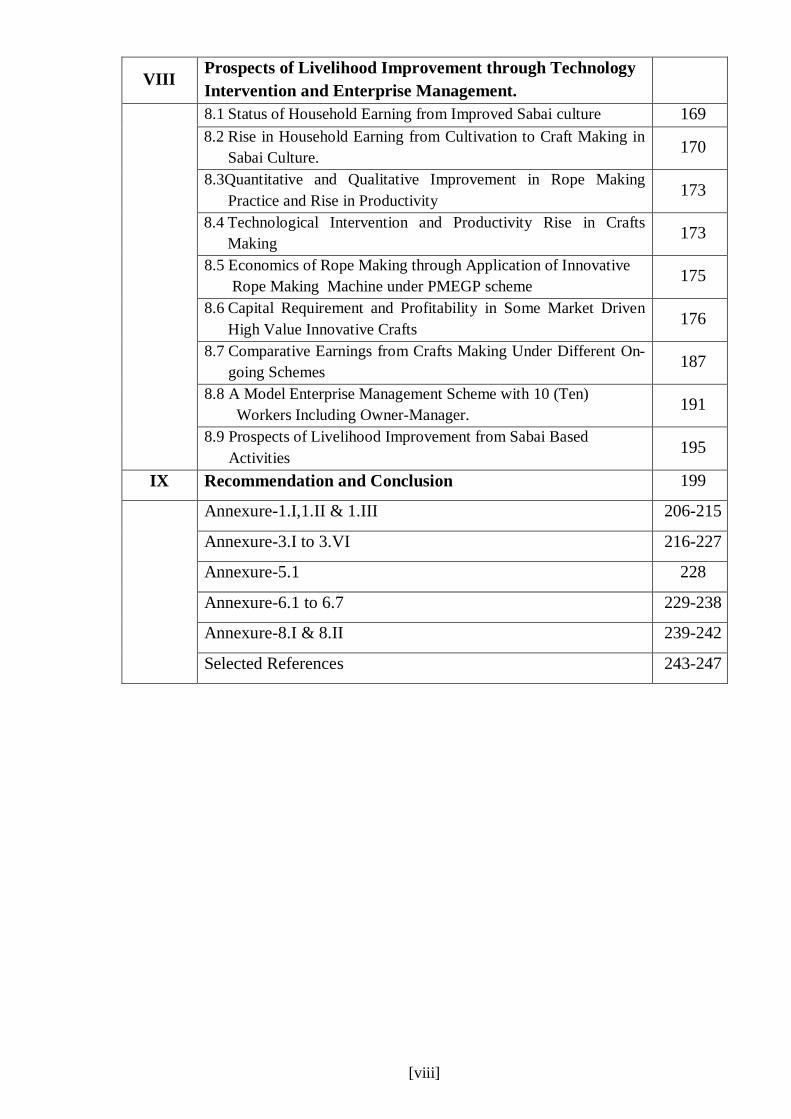
VIII Prospects of Livelihood Improvement through Technology Intervention and Enterprise Management.
8.1 Status of Household Earning from Improved Sabai culture 169 8.2 Rise in Household Earning from Cultivation to Craft Making in
Sabai Culture. 170
8.3Quantitative and Qualitative Improvement in Rope Making Practice and Rise in Productivity 173
8.4 Technological Intervention and Productivity Rise in Crafts Making 173
8.5 Economics of Rope Making through Application of Innovative Rope Making Machine under PMEGP scheme 175
8.6 Capital Requirement and Profitability in Some Market Driven High Value Innovative Crafts 176
8.7 Comparative Earnings from Crafts Making Under Different On-going Schemes 187
8.8 A Model Enterprise Management Scheme with 10 (Ten) Workers Including Owner-Manager. 191
8.9 Prospects of Livelihood Improvement from Sabai Based Activities 195
IX Recommendation and Conclusion 199
Annexure-1.I,1.II & 1.III 206-215
Annexure-3.I to 3.VI 216-227
Annexure-5.1 228
Annexure-6.1 to 6.7 229-238
Annexure-8.I & 8.II 239-242
Selected References 243-247

[ix]
List of Tables
Table No. Title Page No. Chapter-II
2.1 Administrative Structure of Paschim Medinipur District 29 2.2 Demographic features of Paschim Medinipur District 31 2.3 Principal Occupation of the Households. 33 2.4 Distribution of Seasonal Occupation 35
Chapter-III 3.1 Agronomic Characteristics of Sabai Grass (Eulaliopsis binata). 46
3.2.a Average Cost of Establishment of Sabai in one hectare of Land in First year by the Selected Farmers in Nayagrm & Gopiballavpur-I Block
60
3.2.b Average cost of establishment of Sabai in one hectare of land in first year by the selected farmers in Binpur-II Block
61
3.3 The Structure of Different Cost and their Components in a Hectare of Sabai Cultivation
65
3.4 Average Number of Labour-Days Generated from One Hectare of Sabai Cultivation in Twelve Years Tenure.
68
3.5 Average Annual Productivity and Per Unit Cost of Production 69
3.6 Financial Feasibility of Investment in Sabai cultivation/ha. in Study area.
72
Chapter-IV
4.1 Productivity and Employment Situation of Rope Making Households
77
4.2 Process of Rope Making 79 4.3 Nature of Work Participation in Sabai based Activities 82 4.4 Productivity of Household /Year in Rope Production 84 4.5 Time Spent by the Rope Makers in Sabai Activities in a Day 84 4.6 Average Man-days Involvement in Rope Making Activity in a Year 85 4.7 Busy and Lean Period of Rope Making Activity 85 4.8 Fixed Cost/kg in Sabai Rope Making Unit 87
4.9 Cost of Production of 10kg Rope (Medium Grade) by Non Sabai Growing Families (Unit-I)
88
4.10 4.10 Cost of Production of 10kg Rope by Sabai Growing Families (Unit-II)
89
4.11 Earnings from Rope Making and Associated Activities 90
4.12 Input-Output Ratio of rope production in 5 years interval Starting from the year 2000 (* Taking 1.10 kg of grass for making 1.00 kg of rope)
91
Chapter-V 5.1 List of Sabai Handicrafts 97 5.2 Economics of Sabai Crafts Production 103

[x]
Chapter-VI Page no.
6.1 Most Preferred First Line Intermediaries by the Producers 115
6.2 Quantity of Sabai Rope Turnover through Local Periodic Markets (Hats) in the Study Region
120
6.3 Primary Sabai Market Centres in the Study Region 121
6.4 Important Transit Market Centers of Sabai Products in Different States
121
6.5 Seasonal Pricing of Crop in the Farm-gate and in the Distant Market
125
6.6 Highest and Lowest Grass Price vs. Rope Price between the Year 2011 to 2015
129
6.7 Cost Based Pricing Method of Artisans (Ex Factory Price) 133 6.8 Analysis of Producers’ Share on Consumer Price. 140
6.9 Marketing Efficiency Analysis using Acharya’s & Agarwals Method
143
6.10 Marketing efficient analysis using Composite Index method 143 6.11 Price Spread Analysis of Sabai Rope Marketing Channels 148 6.12 Marketing Efficiency Analysis using Acharya & Agarwal’s Method 150
6.13 Marketing efficiency of rope supply chain (Intra-State) under Composite Index Method
151
6.14 Marketing efficiency of rope supply chain (Inter-State) under Composite Index Method
151
6.15 Producers Share on Consumer Price of Handicrafts (Sabai Hat) Marketing Channels
153
6.16 Producers Share on Consumer Price of Handicrafts Marketing Channels (Door Mat)
154
6.17 Producers Share on Consumer Price of Handicrafts Marketing Channels (Hand Bag)
155
6.18 Marketing Efficiency Analysis of Indirect Marketing Channels using Acharya and Agarwal’s Modified Measures of Marketing Efficiency (MME) Method
156
Chapter-VIII 8.1 Sabai based Occupational Status and Household Earnings 170
8.2 Higher Value Addition with Conversion of Grass into Rope and other Utility Items (Produces based on 1 dc. Land)
171
8.3 Percentage (%) Change in H/H Earnings with Changing Sabai based Activity
172
8.4 Rope Making through Use of New Technology (Innovative Rope Making Machine)
175
8.5 Sabai Hats Making Scheme 177 8.6 Shoulder Bags Making Scheme 179 8.7 Sabai made Carpets (25 sq. m.) Making Scheme 182 8.8 Furniture (Sofa Set) Making Scheme 185
8.9 Projected Profitability Scenario (1st Year) of Sabai Hand Bag Making Under Different Schemes.
188

[xi]
8.10 Projected Profitability Scenario (1st year) of Sabai Carpet Making Under Different Schemes
190
8.11 Enterprise Development Model with 10 workers Producing High Value Market Sensitive Products (Hat, Shoulder Bag, Carpet and Sofa Sets)
192
8.12 Estimated number of households in the study Area by subgroup of Sabai Based Activities.
196
8.13 Proposed Distribution Of Households Involved in the Sub-groups Of Sabai Based Activities in the Coming Decades.
198
List of Figures
Figure no. Title Page no.
1.1 Map of Important Blocks of Paschim Medinipur District for Sabai Cultivation and Processing
4
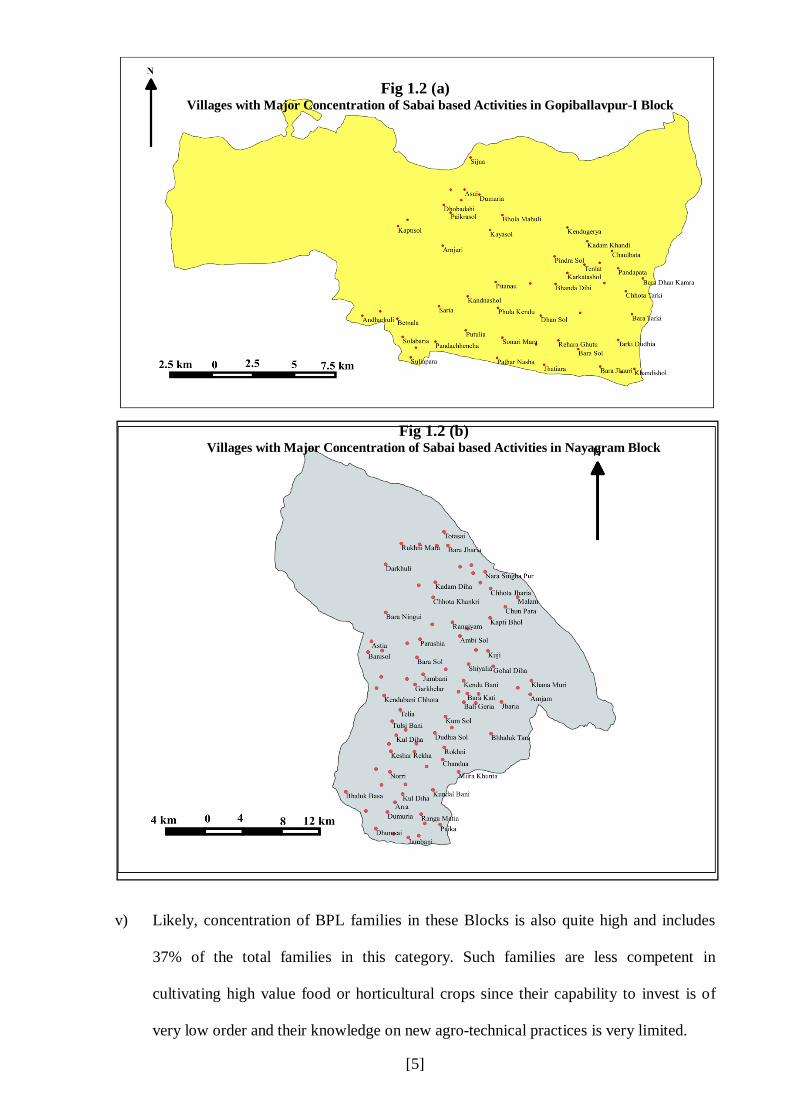
1.2.a Villages with Major Concentration of Sabai based Activities in Gopiballavpur-I Block
5
1.2.b Villages with Major Concentration of Sabai based Activities in Nayagram Block
5
1.2.c Villages with Major Concentration of Sabai based Activities in Binpur-II Block
6
1.3 Map of Intensive Study Blocks in Paschim Medinipur District 10 2.1 Different administrative units of Paschim Medinipur district 29
2.2 Distribution of Households According to their Principal Occupations
34
2.3 Road and Railway Map of Jhargram Sub-Division 43 3.1 Year-wise Average Yield of Sabai Grass in 12 Yrs. Crop Tenure 66 3.2 Proportion of Various Input Cost of Sabai Cultivation. 67 3.3 Annual Cash Flow for Sabai cultivation (Avg. of three Blocks) 71
6.1 Map of Village Markets (Haat) Dealing with Sabai Grass and Ropes in Nayagram Block 122
6.2 Map ofVillage Markets (Haat) Dealing with Sabai Grass and Ropes in Gopiballavpur-I Block
122
6.3 Map of Village Markets (Haat) Dealing with Sabai Grass and Ropes in Binpur-II Block 123
6.4 Distribution of marketing cost, margin and producers share on consumer price in hand bag marketing 155
[xii]
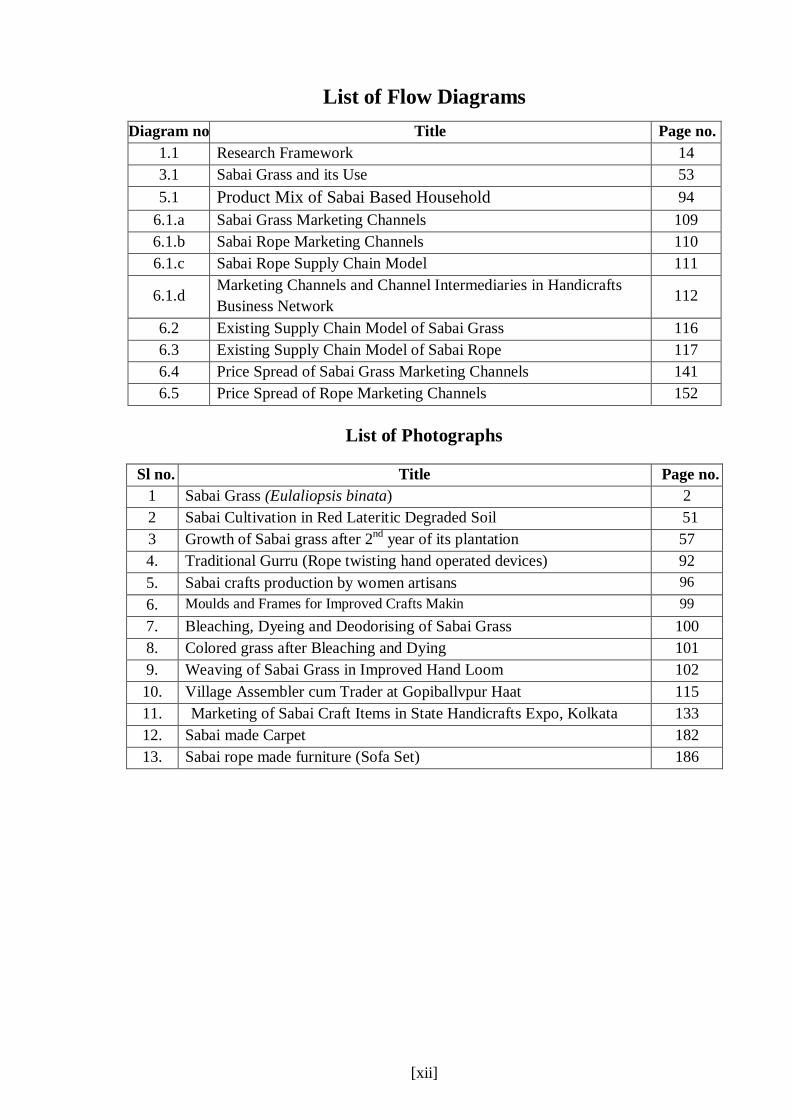
List of Flow Diagrams Diagram no Title Page no.
1.1 Research Framework 14 3.1 Sabai Grass and its Use 53 5.1 Product Mix of Sabai Based Household 94
6.1.a Sabai Grass Marketing Channels 109 6.1.b Sabai Rope Marketing Channels 110 6.1.c Sabai Rope Supply Chain Model 111
6.1.d Marketing Channels and Channel Intermediaries in Handicrafts Business Network
112
6.2 Existing Supply Chain Model of Sabai Grass 116 6.3 Existing Supply Chain Model of Sabai Rope 117 6.4 Price Spread of Sabai Grass Marketing Channels 141 6.5 Price Spread of Rope Marketing Channels 152
List of Photographs
Sl no. Title Page no.
1 Sabai Grass (Eulaliopsis binata) 2 2 Sabai Cultivation in Red Lateritic Degraded Soil 51 3 Growth of Sabai grass after 2nd year of its plantation 57 4. Traditional Gurru (Rope twisting hand operated devices) 92 5. Sabai crafts production by women artisans 96 6. Moulds and Frames for Improved Crafts Makin 99 7. Bleaching, Dyeing and Deodorising of Sabai Grass 100 8. Colored grass after Bleaching and Dying 101 9. Weaving of Sabai Grass in Improved Hand Loom 102 10. Village Assembler cum Trader at Gopiballvpur Haat 115 11. Marketing of Sabai Craft Items in State Handicrafts Expo, Kolkata 133 12. Sabai made Carpet 182 13. Sabai rope made furniture (Sofa Set) 186

[xiii]
List of Abbreviations
APL Above Poverty Level BPL Below Poverty Level BPHC Block Primary Health Centres BASE Bureau of Applied Statistics and Economics CAPART Council for Advancement of People’s Action and Rural Technology DPRD Department of Panchayats and Rural Development DHDR District Human Development Report EDII Entrepreneurship Development Institute of India FPSE For Profit Social Enterprises FPC Forest Protection Committee FWC Family Welfare Centre FYM Farm Yard Manure HRMS Hill Resource Management Societies HYV High yielding variety IIT Indian Institute of Technology (Kharagpur) ITI Industrial Training Institute ITC Industrial Training Centre IMR Infant Mortality Rate IDO Industrial Development Officer ICAR Indian Council of Agricultural Research KVIB Khadi and Village Industry Board KGP Kharagpur LAMP Large Area Multipurpose Societies L & LRD Land and Land Reforms Department LSS Lifestyle Shop LEB Life Expectancy at Birth MMR Maternal Mortality Rate NTBRBS Nayagram Thana Babui Rope Babsaye Samity NFM Natural Fibre Mission NTFP Non Timber Forest Produce NGO Non Government Organisation NH National Highway NID National Institute of Design OUAT Orissa University of Agriculture & Technology PFM Participatory Forest Management (Project) PHC Primary Health Centre P&RD Panchayat and Rural Development RCS Retail Chain Store RDC Rural Development Centre RBI Reserve Bank of India RHS Rural Household Survey Rs. Indian Rupees SHG Self Help Group WB West Bengal WBTDCC West Bengal Tribal Development Cooperative Corporation Ltd.
[xiv]
Glossary of Terms Acre Equivalent to 0.00405 sq. km or 0.405 ha. or 100 Decimals
Aratder They are actually stockist and whole sellers and function as large scale stockist.
Block Administrative Sub-Division of a District comprising several Mouzas and/or villages.
Bhai Phonta The local function or festival celebrated in a particular auspicious day of the year with sisters praying for welfare of brothers.
Bigha 20 Kathas of land make a ‘Bigha’. It consists of 33.33 decimel of land & 3 bighas make an acre.
Bhatua Bonded labour
Char Paya/ Charpoy
This is a wooden furniture consisting of four legs weaved with sabai ropes or synthetic ropes. It is used for sitting, relaxing and sleepping in the household, hotel, restaurant etc.
De or Decimal It is equal to 435.6 sqft. area or 1/100th of an acre. Durga Puja/ Kali Puja
These are two most auspicious Bengali festivals celebrated with prayers and offerings to goddess Durga or Kali
Ghurru This is a locally made traditional rope twisting device mainly used by rope makers.
Haat Periodic rural market
Jangal Mahal Jangal Mahal indicates the forest clad rolling tracts with mixed barren and cultivated areas of Pschim Medinipur, Bankura and Purulia District.
Kaccha House The house wall is constructed by mud and thatched with straw, leaves,tin or asbestos. The floor may be made of with pressed mud.
Katha/Cottah This is a Regional Bengali term which is equal to 720 sq.ft. area.
Kendu This is one kind of perennial tree found in the forest area. The young green leaves are mainly used for Bidi or local cigarettes making.
Lodha-Sabbar A particular Primitive Tribal Group
Mouza An area defined, surveyed and recorded as lowest unit of area for the purpose of public notification and for specifying a village (the lowest administrative unit)
Mahajans Professional business men and unauthorised money lenders who charge high rate of monthly interest from the loanees.
Panchayat A Unit of local Self Government functioning at 3 levels (Zilla Parishad, Panchayat Samity and Gram Panchayat) for rural development, planning and administration.
Paschimachal Region
It is an identified backward region of West Bengal along its western margin and constituted of 55 Blocks of 5 districts of the west.
Patta Agricultural land vested under the provisions of West Bengal Land Reforms Act 1955.
Phoria Buying and Selling Agents Paikar Traders for wholesale purchase directly linked with producers at village level
Rayati Land This is one of the classifications of land which has the absolute ownership of the immoveable property.
Root Slips Root Slips are the only planting materials of Sabai cultivation other than plantation by seed sowing.
Sabala Mela Fair organised by the Ministry of Rural Development, Govt of West Bengal for women entrepreneurs of SHG groups. The entrepreneurs, NGOs, SHGs, Institutions etc. participate with their craft items in this assembly.
Ton Equivalent to 0.90718 metric ton (MT) or 1000 kilograms VIP Rope Fine quality first grade rope
Zila Khudra Kutir Shilpa Mela
District level fair organised by the District Industries Centre, Govt. of West Bengal for the entrepreneurs of micro and small scale units.

[1]
Chapter-I
Introduction
1.1 Background of the Study
Eulaliopsis binata syn. Ischaemun augustfolium is a tufted perennial natural fibre
belonging to family Gramineae. It is commonly known as ‘Sabai’ or ‘Babui’ in West Bengal
and Odisha, ‘Baib’ or ‘Babiyo’ in Uttar Pradesh and ‘Bhaabar’ in Panjab, Haryana and
Uttaranchal. It is also popular in folk language as ‘Bhaabar’. In Ayurvedic term it is known as
‘Balvaja’. Sabai is found to grow extensively on marginal and sub marginal rain fed uplands
as a commercial crop. The environmental tolerance rate of Sabai plant is high and it is mostly
grown in tropical region. It prefers hot and dry climate and can also grow in the frost affected
weather in the mid- Himalayas. It is grown in the poor and degraded soil areas but does not
survive in water logged condition. In fact Sabai grass is a draught resistant dry-land crop.
In India it is grown naturally in the Siwalik Hills of Himachal Pradesh, Haryana and
Uttaranchal and also in Chotonagpur plateau of Jharkhand State. Apart from that Sabai is also
available in West Bengal, Odisha, Madhya Pradesh, Uttar Pradesh and Jammu & Kashmir
States of India. In West Bengal it is cultivated in waste-land areas and is naturally grown in
hilly slopes of Paschim Medinipur, Bankura and Purulia Districts. Sabai is cultivated both in
private lands and vested lands. It is also grown in encroached forest lands inside coppice
forests and plantation areas. In Paschim Medinipur, it is grown in the Blocks of Nayagram,
Gopiballavpur-I, Binpur-II, Jamboni, Jhargram and in limited areas of few other adjacent
Blocks (Photograph-1).
Traditionally Sabai grass has been treated as an important cash crop which has high
economic value. It is locally considered to be “The Money Plant” which ensures cash receipt
throughout the year (Hathy et al.,2010). This grass once planted can give yield for about

[2]
twelve years. The indigenous and backward caste community groups of these areas who
from the lowest economic strata, depend on this grass for their livelihood by converting it
into ropes of various grades. Sabai rope is popular for its strength, durability and flexibility
and is used as principal raw material for making baskets, mats, stools and traditional cots or
‘Charpoy’ or ‘Manja’ etc.. Rope is traditionally made by hand twisting techniques and
thereby Sabai rope is treated as handicraft. This hand crafted rope is known to be used for
decades for tying of bamboo and wood in construction industry. The grass itself is popularly
used as the rural building material for thatching of roofs. Rural households use this rope for
tying of cattle and other domestic animals too.
Photograph 1: Sabai Grass (Eulaliopsis binata)
Since the middle of eighties, Sabai grass and ropes are converted into various value
added materials, like chair, door mats, carpets, flower vass, tea containers, bottle holders, sofa
sets, besides bags of different varieties and styles. Apart from craft items, Sabai is second
only to bamboo in importance as a raw-material for pulp and paper manufacturing in India
since 1870 (Khandual et al., 2016). It also prevents soil runoff and hence has been planted on
the road sides, river banks and railway embankment etc. (Dutt et al., 2004). Its quick deep
root establishment capacity in one hand retains surface run-off and on the other, controls
subsurface runoff (Huang et al.,2002). Sabai grass plays a pivotal role in tribal household
economies in some regions of India.

[3]
In West Bengal the major Districts which are raising Sabai as cash crop are Paschim
Medinipur, Bankura, and Purulia. Of these three Districts, Paschim Medinipur stands on top
in terms of coverage of area under Sabai, its production and also marketing. Besides, the
number of households involved combinedly in production, processing and marketing in this
district is also highest in the State. This district covers about 21,000 ha. of land under Sabai
cultivation which is considered mostly marginal as well as waste lands. However the actual
land coverage under Sabai is significantly more than the above since a large part of Sabai
covered area falls under degraded forest areas in forest territories and vested lands. The
District grows more than 38,000 tons of Sabai per year of which about 12.17% are converted
into ropes, crafts, and other processed materials. It supports more than 48000 families
through cultivation, rope making and processing of crafts.
The Blocks of Paschim Medinipur where Sabai cultivation, rope twisting and crafts
making are concentrated are Nayagram, Gopiballavpur-I and Binpur-II. Though Jamboni,
Jhargram and few other adjacent Blocks grow grass on smaller areas, their share in rope and
crafts making is limited (Fig.1.1). In Paschim Medinipur District, three Blocks namely
Nayagram, Gopiballavpur-I and Binpur-II share 85% of the total Sabai growing area and 81%
of the total working families involved with its cultivation and processing. Figs. 1.2 (a), 1.2
(b), 1.2 (c) show the Blocks of the intensive study area including the major concerned
villages producing Sabai and Sabai based ropes and crafts. In the said three Blocks about
46% of total families depend on Sabai based activities totally or partially for their livelihood.
The above information clearly indicates that Sabai cultivation and processing are
concentrated in the said three Blocks and hence Studies on Sabai production, processing and
marketing have been principally focused through analysis and interpretation of primary and
secondary information that are collected from these three Blocks.
Concentration of Sabai cultivation and processing has taken place in the above
mentioned areas of Jhargram Sub-Division due to the following reasons:

[4]
i) Geographically these Blocks are less fertile due to rugged terrains, infertile soil and low
water retention capacities.
ii) Concentration of marginal lands and waste lands is of high proportions.
iii) Though climatologically these Blocks are suitable for good cultivation with more than
1500 mm rainfall, the high degree of surface and subsurface runoff has created the state
of draught prone environment, thereby making these Blocks less suitable for cultivation
of normal cereals, pulses, oil seeds and other horticultural products as is found in many
other Blocks of Paschim Medinipur.
Figure-1.1: Map of Important Blocks of Paschim Medinipur District for Sabai Cultivation and Processing
iv) These Blocks have been the abode of 26.18% tribals while the District shares 14.88%
of its population as ST population. Special mention may be made of Lodha-Sabar
communities who have high concentration in these Blocks and who are quite
accustomed with culture of Sabai needing low order of investment and technological
inputs. The Sabai cultivation and culture here is deeply rooted in the activities of these
tribal families traditionally unlike other Blocks of the District.
[5]
Fig 1.2 (a) Villages with Major Concentration of Sabai based Activities in Gopiballavpur-I Block
Fig 1.2 (b) Villages with Major Concentration of Sabai based Activities in Nayagram Block
v) Likely, concentration of BPL families in these Blocks is also quite high and includes
37% of the total families in this category. Such families are less competent in
cultivating high value food or horticultural crops since their capability to invest is of
very low order and their knowledge on new agro-technical practices is very limited.

[6]
vi) The major areas of these Blocks are remote and the markets are of traditional status
with facilities of very poor transportation and communication. The institutional services
available for progressive agricultural growth and trade are quite inadequate.
Fig 1.2 (c) Villages with Major Concentration of Sabai based Activities in Binpur-II Block
In view of the above agro-climatic factors and cultural compatibilities Sabai cultivation
and processing have been taken today a sound foot-step in the economy and culture of people
particularly in the above Blocks vis-a-vi Paschim Medinipur District in general. The situation
has now taken a shape that in these areas the culture and cultivation of Sabai cannot be
avoided neither the livelihood of the people involved could be improved with the operation
and management as are in practice today. Alternative opportunities of sustainable livelihood
generation of the people in these areas with their existing capabilities and constraints are not
so promising. This calls for a thorough study on the pros and cons of Sabai cultivation,
processing and marketing including transfer of appropriate technologies for growth and
development of Sabai industry in general and improvement of livelihood of the Sabai
growers and processors in particular.
[7]
1.2 Research Problem
From literature survey and preliminary field investigation it becomes clear that there
are ample opportunities for extension of land under Sabai cultivation and limited scope of
intensification through productivity rise with application of improved agronomic methods. It
has also been observed that rope making as first hand processing could be further extended
and increasing number of villagers could be involved. But neither extension of Sabai area nor
increasing participation in rope making could assure sustainable livelihood to the people
involved. Rope making however, indicated improved livelihood through productivity rise by
means of application of new innovative technologies.
Crafts making, though offers better earnings, it suffers from marketability due to
qualitative inferiority of the products which need improved technologies and market driven
design that are largely lacking. Besides appropriate intervention on modern marketing and
promotional practices of both rope and craft items had been missing till date. In fact, this had
also restricted opportunities of higher income from the venture thereby providing very limited
opportunities of livelihood improvement. It may also be mentioned here that the areas of
Sabai culture are backward and actors are mostly from disadvantaged communities. It is felt
that there are enough opportunities to generate better income and improved livelihood to
most of the participants through operationalising an effective enterprise and organised system
of production, processing and marketing which the present research desires to probe into.
1.3 Aim of the Study
Thus the aim of the present study is to highlight the issues and forward development
strategies on i) Raising productivity and production of Sabai with application of appropriate
agro-technical practices, ii) processing of the commodity through bleaching, drying,
deodorising, dyeing etc., iii) making rope and plaits and manufacturing variety of crafts,
utility items, furniture and a host of market driven other products, iv) efficient marketing of
[8]
raw and processed products, besides organisation building and institutionalisation of the
entire system and thus assuring better and promising livelihood to the people involved.
1.4 Objectives of the Study
In view of above, the objectives of this research are:
i. To study the socio-economic status and livelihood features of cultivators, artisans and
workers engaged in Sabai based household industry.
ii. To study the economics of Sabai cultivation, processing, value addition and its
feasibility in this ecological set up.
iii. To study the present marketing structure and marketing-mix of Sabai based handicrafts
industry.
iv. To probe into the state of technology development and transfer for promoting quality
and quantity of Sabai crafts for raising productivity and value addition.
v. To analyse the role of institutions involved in production, processing and marketing of
Sabai.
vi. To locate and categorise the problems faced by the producers and lower order traders in
disposing of the products to appropriate targets.
vii. To develop enterprise management schemes at household and group of artisans level
for promotion of market linked livelihood.
It is envisaged that given proper attention in systematic production and development of
sustainable business network, the Sabai economy can experience a faster take-off, which is
expected to generate significant income to the poor and thus placing many of them living
above the poverty level.

[9]
1.5 Selection of Study Area
The Sabai producing areas are distributed in the western peripheral Blocks falling under
Jhargram Subdivision of Paschim Medinipur District. Topographic situation, soil structure
and climatic condition in these areas are production friendly for this grass which generates
certain income to the family every year throughout its life span. High concentrations of
artisans are found in seven out of twelve Gram Panchayats of Nayagram Block. Besides,
Kendugari Gram Panchayat of Gopiballavpur-I Block and Banshpahari Gram Panchayat of
Binpur-II Block are the principal areas of Sabai cultivation, though some cultivators and
artisans are residing in other Gram Panchayats also. The villages have been chosen
purposively from the said artisan concentrated Blocks and Gram Panchayats only.
1.6 Study Design and Methodology 1.6.1 Sampling Design
Universe
Growers, collectors, craftsmen, traders, formal and informal
organisations, and finally consumers associated with Sabai based
household industry.
Sample
Unit
Households engaged in Sabai grass cultivation, rope and crafts making.
Traders or Middlemen involved in Sabai grass and grass based products
marketing from Nayagram, Gopiballavpur-I and Binpur-II Block of
Paschim Medinipur District.
Sample
Frame
Listing of participating households in selected village clusters associated
with Sabai based activities.
Size of
Sample
Minimum 10% of the listed households from selected villages. Villages
are purposively selected for the study
Parameters
of Interest
i. Nature of participation of household members in Sabai based
household industry.
ii. Proportion of earnings from Sabai based activity to total earnings.
iii. Contribution of Sabai grass and grass based products to promote status
of livelihood of people.
Sampling
Procedure
The method of stratified random sampling is used for selection of
households.

[10]
WEST BENGAL
Figure-1.3: Map of Intensive Study Blocks in Paschim Medinipur District

[11]
1.6.2 Data Collection Methods and Sampling Technique
The population of the study includes stakeholders associated with production and
marketing of Sabai grass and grass based crafts as well as end customers. The study includes
both primary and secondary data. Household level and market level field surveys were
conducted to collect the relevant data from the artisan-producers and market functionaries.
Relevant primary data have been obtained from the 330 artisans representing their households
and 25 traders during the year 2011 to 2015. Telephonic interview has also been done with
the distant wholesalers and retailers from different States like Uttar Pradesh, Jharkhand,
Bihar, Rajasthan, Haryana etc. The required secondary data have been collected from the
Block Development Offices, District Industries Centres (DIC), Offices of the Asst. Director
of Agriculture, Forest offices, Gram Panchayat Offices, LAMP offices and District office of
Department. of Economics and Applied Statistics, Government of West Bengal. The details
about general socio-economic characteristics of growers, rope makers and artisans, land
holding size, cropping pattern, yield, cost of production, return, pricing strategy, and other
aspects related to the objectives of the study were collected from the sample growers and
artisans. The farmers did not maintain any record and accounts on their investment,
production, income-expenditure etc. due to their reluctance and low level of attachment. To
minimise recall bias, cross checks were done with the alternate producers.
The population of the study includes stakeholders associated with production and
marketing of Sabai grass and grass based crafts as well as end customers. Household level
field survey has been conducted to collect the relevant data from the artisan-producers to
work on the core objectives of the study. The artisans-producers are classified in two groups,
one is traditional common or semi skilled artisans and the other is high skilled artisans
equipped with modern handicrafts production techniques. Artisans are selected from the
target villages in the study area through simple random sampling technique. Intermediaries
and traders are selected from different levels of marketing channels (Photograph-2). Two

[12]
different Interview schedules, containing a set of predetermined questions in each are used to
collect the primary data from the artisans and traders (Annexure 1.I &1.II). Apart from this,
an in depth one to one interaction, a semi-structured focus group discussion, case studies and
personal observation have been made in different village clusters and periodic markets to
record the responses and views of the artisans and traders.
1.6.3 Sample Frame
Selection of Study Area
Criteria for Selection Final Sample
Selection of District
Sabai growing areas with major concentration on rope and value-added crafts making
Paschim Medinipur
Selection of Blocks
A significant dependence of people on Sabai cultivation,
processing and its value addition.
Nayagram, Gopiballavpur-I and Binpur-II
Selection of Gram
Panchayats
Purposively Selected on the basis of
concentration of artisan villages
Name of Blocks Name of Panchayats
Nayagram
Arrah, Baligeria,
Chandrarekha, Kharikamathani
Gopiballavpur-I Kendugari
Binpur-II Banshpahari
Selection of Villages
Villages with major concentration on Sabai based
activities. Minimum 40% Households of the Villages are engaged in Sabai industry (List
of study villages attached in Annexure 1.III)
Name of Blocks No of Villages
Nayagram 19
Gopiballavpur-I 6
Binpur-II 5
Selection of Households
from Sampled Villages
Stratified Random Sampling
Name of Blocks No of Sampled Households
Nayagram 191 Gopiballavpur-I 82
Binpur-II 57 Selection of
Traders Simple Random Sampling
Method in the market place. 25
1.6.3 Tools Used for Data Analysis
For analysis the primary and secondary data, the statistical tools such as analysis of
central tendency, scaling and weighted ranking, cost benefit analysis, internal rate of return
method, payback period technique, mean score ranking, analysis of variance, Acharya and
[13]
Agarwal (2011) method of determining marketing efficiency, composite index building
method by scoring and ranking etc. have been used in the study. To analyse socio-economic
data the percentage analysis, mean and weighed ranking techniques have been applied. To
evaluate the economic viability of Sabai cultivation, the financial analysis which includes
cost benefit analysis, Internal Rate of Return analysis, and Pay-Back period have been used.
The input-output ratio analysis has been applied to understand the economics of rope and
rope based crafts production. Price spread analysis has been done to evaluate producer’s
share on consumer price in different marketing channels. Acharya and Agarwal’s Modified
Method (2011) of determining marketing efficiency and Composite Index Method have been
used to evaluate the efficiency of different marketing channels functioning in the grass, rope
and crafts markets.
1.6.4 Research Framework
The Research Framework of this study begins with the study of existing state of
production and marketing of Sabai and Sabai based products at different stages and ends with
formulation of strategies for raising production and marketing of Sabai grass, rope and crafts
through improvement of micro-enterprise linked business network. This is followed by
looking for new areas of enterprise management and recommendation thereof, for promotion
of sustainable livelihood. This entire research framework is outlined and illustrated with the
help of the flow diagram-1.1 given below.

[14]
Flow Diagram 1.1: Research Framework
Study and Analysis of Existing Production and Marketing System.
Product Place People Price Promotion
Product mix. Processing techniques &
technology. Processing features. Design development
techniques Production economics
Socio-economic condition of growers and producers. People’s livelihood Trader’s characteristics Value chain participants Consumer analysis.
Promotional practice of artisans & traders. Existing Govt. & Non
Govt. promotional events. Schemes & policy for
promotion of handicrafts
Pricing mix Pricing strategy of
market functionaries Credit facility and
financial support.
Market segment
Supply chain network. Channel margin Channel efficiency Market
Identification of Different Production & Marketing Problems.
Formulation of Strategies to Improve Micro Enterprise Linked Business Network
Future Opportunities
Govt. policy for development of handicrafts industry. Development &
transfer of technology Market driven design &
product diversification Skill development
Local resource utilisation Employment generation Enterprise Management Socioeconomic
development perspectives. Export potentiality Livelihood promotion Institution Building
Recommendation for Promotion of Sustainable Livelihood and Scope of Enterprise Development
Policy Inputs

[15]
1.7 Scope of the Study
The scope of this research work is elaborated as:
i. Sabai is widely grown beyond West Bengal in other States and other countries. The
scope of this research goes with the quality and productivity of fibre grown only in
Paschim Medinipur and adjacent Districts of West Bengal, Jharkhand and Orissa.
ii. It is known that ICAR and few other institutions have done certain research work on
agronomic aspects of Sabai cultivation and uses of this product. The present study
however does not treat with the agronomic improvements made elsewhere, neither
conducts experiments on changing usability of this grass in other areas.
iii. Sabai is known to have many other uses besides rope and crafts produced here. The scope
of production, processing and marketing is however restricted to the products of the
present study area only.
iv. The socio-economic study is done in the context of actors and beneficiaries of Paschim
Medinipur only though the scope for performing the same analysis for the other areas
also exists.
v. The cost benefit ratio is done with current prices only since information collected from
different sources, villages and respondents vary randomly over temporal and spatial scale
while collecting the information.
vi. The current research has the scope to suggest livelihood prospects of this area only since
the skill, technology and cultural aspects are varying largely over different regions.
[16]
1.8 Limitations of the Study
This study suffers from the following limitations in a large way:
i. It is limited to one district of West Bengal and its concerned Blocks only which cannot
avoid the risk of changing situation when study areas are changed over to other Districts,
States and countries.
ii. Data on Sabai cultivation and processing available from the Agricultural Development
Offices, Panchayat Office and other District level offices are limited and varying from
each other. This has forced the scholar to collect own relevant information directly
through primary survey wherever possible.
iii. Information obtained from primary sources are often conspicuous since the respondents
are often illiterate and subjected to limited awareness.
iv. Language barriers and communication limitations have often prompted them to
communicate improper and incorrect information.
v. Lastly, non-compatibility of information collected from the different sources and places
sometimes leads to absurdness.
1.9 Review of Existing Literature
The literature related to works on Sabai processing and marketing seems to be limited
though substantial literature is available on the botanical and agronomic treatments on Sabai
and associated herbages. The following are the available literatures on Sabai focusing the
subject area of the present research:
Arora, et al. (1993) had undertaken a study to assess and compare the yield of Bhabbar
(Eulaliopsis binata) and other grasses from the forest areas leased to different agencies.
Economics of the Bhabbar extraction and marketing mechanisms being practiced by the two
agencies i) Ballapur Paper Mill and ii) Hill Resource Management Societies have also been
[17]
worked out. The conclusion shows that when the Department leases its forest areas to the
societies, the lease amount is based on a proper estimation of the actual/potential production
from that particular area, whereas when the paper mill is the lessee, a per quintal rate is agreed
upon by the department and the mill does not find it economical to harvest the entire produce.
This, in turn, leads to a proportionate loss in revenue to the department.
Bhattacharya, et al. (1994) deals with the various aspects of socio cultural and
economic life of the people of Nayagram in the District of Midnapore of West Bengal. Socio-
economic aspects of Forest Protection Committees (FPCs) have also been highlighted in detail.
It is meant especially for network circulation, with the purpose of transmitting up-to-date
information and experiences amongst all who are involved in the movement (JFM), especially
the West Bengal Forest Department who are the initiators of the programme in the eastern
region.
Bishop, (1994) examines the economics of basket making and beer production in two
sites on the western edge of the Okavango delta in Ngamiland, Botswana. Using Participatory
Rural Appraisal methods, the study focuses on the priority concerns expressed by villagers, and
explores women villagers’ use of wild species. Income generating activities based on the use of
wild resources are evaluated in a total livelihood context. Resource management and control
issues are addressed by examining harvesting practice and resource tenure issues. The next
section examines the costs and benefits of basket making and contrasts the economics of using
wild and cultivated palm.
Barik, (2002) had done a field experiment for 3 consecutive years from 1992–1994 to
evaluate productivity and economic returns from Sabai grass {Eulaliopsis binata (Retz.) CE
Hubb}-based intercropping systems on submarginal rainfed uplands. Intercropping of either
greengram (Phaseolus radiatus L.) or cowpea (Vigna unguiculata (L.) Walp) or blackgram
(Phaseolus mungo L.) in the initial 2–3 years of establishment with sabai grass proved superior

[18]
to the sole crop of sabai grass both in total productivity, crude fibre content and net return.
However, intercropping of arhar {Cajanus cajan (L.) Millsp.} with Sabai grass proved to be
incompatible. Sabai grass + greengram recorded highest sabai grass equivalent yield (36.42
a/ha) and net return (Rs.10,052/ha) followed by Sabai grass+cowpea (35.78 q/ha, Rs.8,925/ha)
respectively. Intercropping with greengram also led to an increase in crude fibre content
(42.95%) and crude fibre yield (13.74 q/ha) of Sabai grass.
According to Bismarck et al. (2005), common types of plant fibres are abaca, flax,
ramie, cotton, coir, jute, straw, sisal, grass etc. Different parts of the plants are used as fibre
material. Fibre can be extracted from the bark (Kenaf, Banana, Hemp, Jute), stem (Palm,
Bamboo), leaf (Banana, Palm, Screw Pine, Sisal, Agave, Pineapple), Husk (coir), Seeds
(Cotton, Kapok) and grass and reed (Wheat, Corn, Rice, Sikki, Madhurkathi, Bennakati,
Munj). Continual development of fibres is influenced by climates. Vegetable fibres were
developed first in hot climate. Wool, hair, fur fibres were developed in cold countries. Wood,
bast, hemp, grass, leaf, husk or fruits are the important cellulosic fibres. Sabai grass, Espato
grass, cereal straw, rice straw and wheat straw etc are the main source of cellulose.
Clark, (1969); Mc Govern, et al., 1987 studied that in 1952 Sabai grass comprised 22%
of the fibrous material pulp in India. The quality of the pulps was considered by the Indian
Papermakers to be roughly equivalent to Esparto grass. The use of this materiel decreased
considerably in recent years due to difficulties in procurement. Some plantations have been
established to provide a more consistent supply of the raw-material. Many small mills in India
continue to use Sabai garss for production of warping, writing and printing papers.
Chakraborty, (2005) indicates that Marketing costs are the actual expenses incurred in
the marketing process. They include not only the cost of performing the various marketing
functions, but different levies as well. The costs of performing the marketing function include
transportation cost, labour charges, packaging, storing processing etc. Marketing margins are

[19]
actual amounts received by the marketing agencies in the marketing process. The marketing
margin between the cultivator and the consumer may be taken as an index of the soundness of
the marketing set up of any produce.
Chattopadhyay, et al. (2007) discussed about gender problem which is a vibrant issue of
the world today. The very sensitive factor that women can act as co-partners of men and even
act as singular actors in all fields of science and technology is a gorgeous truth. The gender
anguish of the yester- years has come to a halt. Women, particularly, the rural women are now
in a position to appropriate modern technologies in order to raise the socio-economic status of
their families and for larger benefits of the society. The Afro-Asian women, who had been the
victims of long-drawn exploitation and humiliation, are now striding forward for a better
destiny.
Dasgupta, et al. (2007) studied that Sabai grass (Eulaliopsis binata), locally known as
Babui is grown in abundance in the districts of Midnapore, Bankura, Purulia, Singbhum (East),
Mayurbhanj, Balasore etc. in Eastern India. Traditionally, the people of this region used to
grow and sell grass for paper industry or convert grass into rope for increasing profit margin.
Technological intervention was felt necessary for multiplying value addition and hence
livelihood generation among the people associated with Sabai culture was taken up with a new
zeal. Successful experiments have been made in making Chairs, Tables, Sofa Sets, Ottomans,
Door-Mats, Table-Mats, Carpets, Hand-Bags, Shopping-Bags, Hats, Chappals, Fruit-Bowls,
Flower-Baskets, Laundry-Boxes, Bottle-Holders and a host of other utility and interior
decorative items which have not only intervened the national market but also targeted the
export market. The success at this technological venture has been established with the
multiplication of value addition that is in the range of five to ten times that of rope-making and
10 to 20 times that of grass-trading. It is a surprising fact that women in this region have shown
extraordinary skill, aptitude and acumen in developing this craft and today 90% of the artisan
are women in Nayagram Block.

[20]
According to Dagar, et al.( 2014), basket making community locally known as Bhanjdas
and Banjaras( Those who make ropes from a grass locally known as Bhabar) of the Shivalik
region of Himalaya tract of Northern India are directly depending on availability of NTFP such
as bamboo and ‘Bhabbar’ (Eulaliopsis binata) grass. Hill Resource Management Societies
(HRMS) of Haryana Shivaliks participates in the management of forest resource in 55 villages
in the two forest division with close collaboration of local forest officials. Plots of forest were
leased out to HRMS for harvesting of ‘Bhabbar’ grass and other fodder grasses for general
economic development of the local communities. “The internal rate of return (IRR) worked out
to approximately 80%, when ‘Bahabbar’ grass was leased out to the community; when sold to
the contractor, the rate was as low as 17%. The maximum average yield of ‘Bhabbar’ grass
was 850 kg /ha under 6 years of community protection.” Leasing out of forest areas to HRMS
contributed to development of the village infrastructure and economic wellbeing of the
‘Banjara’ communities.
Ghosh, et al. (2011) wrote in their book that Sabai Grass belt comprising of traditional
Jangalmahal which includes Mayurbhanj District of Orissa, part of Midnapore District,
Bankura, Purulia, of West Bengal besides adjoining areas of Bihar like Santhal Parganas,
Singhbhum etc. Comparatively Sabai economy could grow well in Mayurbhanj due to royal
patronage and later due to interest of Orissa State Government. In Mayurbhanj a good number
of weekly markets of Sabai grass exist of which Dantiamuha is the largest. In the said market
farmers come with raw Sabai grass which is purchased by artisan who come back to same
market to sell the ropes. Production is done entirely by women folk. Normally three types of
ropes are produced. The coarser and loosely twisted ropes are meant for packing or tying
bamboo for paper mills. The second variety is medium type which is used for making
“Charpais” or country cots. The third or fine ropes are used for different value added products.
A handmade paper unit was setup in Dantimuhan to produce paper out of Sabai grass or Sabai
waste. However Sabai grass trade is totally controlled by a particular trading community settled

[21]
either in Betonoti or in Baripada who are the root cause for the miseries of artisans. Sabai is
also grown around Saharanpur belt of Uttar Pradesh.
Ghosal, (2010) in his PhD thesis mentioned that a considerable quantity of Sabai grass is
cultivated in the dry-deciduous forests of South-western part of West Bengal. Different forest
fringe people make rope from Sabai (Babui) grass and sell it to the market. The marketing of
rope however is largely controlled by mobile agents or middlemen. The lack of knowledge
about the production, collection and storage of Babui grass is largely affecting its marketing.
The limited storage facilities compared to the total quantity of grass collected have created an
opportunity for mobile agents to exploit the collectors.
Huang, et al. (2004) told about Eulaliopsis binata which is a perennial fibre producing
plant, which has a growing market in southern China and also has favourable effects on soil
and water conservation. In the present study, three land use treatments, Eulaliopsis binata (EB),
undisturbed natural grassland (NG) and orange grove (OG) were compared in respect to their
effects upon a red soil after 20 years.
Hathy, et al. (2010) discussed that Sabai grass industry plays a predominant role in
shaping the economic destiny of the rural people in the district. The objective of this paper has
been to analyse the innovative schemes and the role of Sabai grass industry for the economic
developments of growers of the district. Results show that the tribals of Mayurbhanj district
generate the Sabai grass product marketing demand in national and international markets that
can develop their economic status.
Jayasingam, (1991) describes some problems related to use of Sabai grass in Paper & Pulp
industry.
1. High cost of harvesting, collection, transportation, and storage of the material by hand
operated traditional method.
2. High cost compared to straw and other agricultural residue.

[22]
3. High cost compared to bamboo. Local bamboo is a denser material and therefore more
economical to harvest, handle and transport.
According to Liu (1988), Eulaliopsis binata is a perennial grass, which belongs to the
subtribe Apocopidinae in Gramineae, widely distributed in the south part of Qinling moutain in
China and has been used in the conservation of water and soil for its thriving roots.
Lepcha, et al. (2005) defines as Bhabar grass is a traditional resource utilized by the
poorest of the poor, the Buxa tribe, which is heavily dependent on the grass economy for a
major part of the year. The Buxas extract the bhabar in small quantities for conversion into
ropes. In Nayagaon village, Laldhang, District Haridwar, today it is common practice that the
contractors distribute the raw material to the Buxa villagers, who convert the raw fibre into
rope and sell it back to the contractors for a going rate of upto Rs. 50 per Dhari (approx. 5 kgs).
In Laldhang, District Haridwar, the Buxas were provided with rope making machines a few
years back at the intervention of CAPART. These machines are able to reduce the drudgery
involved in conversion of the raw material to rope. On an average, between their other
household activities, the villagers use this foot pedal operated rotary mechanism combined with
a feeding hopper to produce up till 3-5 kg of rope per day. Assuming an income of Rs. 50 per
day, on an average, a family can earn uptill 1500 per month during the harvest season.
Report of the working group on forests (MoEF, 2006) estimated that more than 40
percent of the country’s poor are living in the forest fringe villages. There are around seven
crore tribal and more than 20 crore non tribal rural population in India linked with forest based
livelihood. Around four crore population are living in 1.73 lakhs villages in or around the forest
in India. Forest products play a crucial role in rural tribal economy since many of the non-
timber forest products including grass provide sustenance to the rural poor. Forest related
activities provide the primary source of income to many landless families and marginal
farmers.

[23]
Mahapatra, et al. (1994) identified five areas for appropriate technology transfer which
are based on the studies on NTFPs and human resources. These are Sabai grass and Sabai rope-
based utility and decorative items manufacturing; collection, cultivation and processing of
edible mushrooms; sal leaf plate and bowl making; collection and processing of forest-based
medicinal plants; and development of agro-forestry. This report is meant for network
circulation with the purpose of transmitting information and experiences amongst all who are
involved in the movement, especially the West Bengal forest department, who are the initiators
of the programme in the eastern region.
The report of Singh, (1993) examines the effects of clipping juvenile foliage (in July,
August, September) on the yield of mature fibre of Bhabbar grass and hay production of fodder
grasses (in November). The results show that clipping of young grasses for fodder during the
active growth period of July to September is harmful for the overall vigour, basal cover, clump
size and biomass production. Therefore it recommends that the harvesting of grasses for fodder
should be avoided during their active period of growth in July- August.
According to Swamy (2005), use of natural fibre in the building Industry can save
energy, conserve scare resources, protect environment, and solve housing problem there by
enhancing infrastructure facilities in the country
Thapa, et al. (1995) described that traders and middleman are cheating farmers by taking
advantage of their lack of knowledge of market prices, poverty and weak bargaining power
arising from illiteracy and low social status, on the one side and monopsony or oligopsony
types of marketing system, on the other. Due to poor road infrastructure and financial
constraints, they often cannot transport their produce to distant markets. Traders and
middlemen visit the farmers at their home and local markets and make purchase there. In most
cases, farmers negotiate based on the price proposed by the traders or middlemen. Traders and
[24]
middlemen are cheating farmers by taking advantage of their limited accessibility to wholesale
market centres.
Varalakshmi,(1993). The Haryana Forest Department awards Bhabbar leases to
Ballarpur paper mill to Hill Resource Management Societies formed under the Joint
Participatory Forest Management Programme, and to local contractors. There are significant
variations in the way these lessees harvest Bhabbar grass and channel it to its end use. Broadly,
there are six different combinations of agents and channels through which Bhabbar ultimately
finds its end use. The report is based on a study which aims to follow closely these six
management systems and to assess the economics of each. The flow of Bhabbar grass from the
lessee to the final consumers is also been traced, and the value addition at each level computed
and compared.
UNIDO (2006): Its diagnostic report mentioned that the most widely collected grass
species in the Baripada Block cluster of Mayurbhanj District of Orissa State is Sabai grass
which is most commonly known as ‘Baboi’ in local language. It is a perennial species
cultivated in upland tracts and lasts for 25 to 30 years. A number of Handicraft industries use it
for making furniture such as sofas, beds and chairs. Sabai grass is the raw-material for rope
making. Majority of the family income comes from either Sal or sabai depending upon the
land availability. The landless families earn more from Sal and landholders from Sabai.
Vijh,(1993). This report is based on a study undertaken in the Prempura village of
Haryana. Information was collected through interviews and discussions with the contractors
etc. A cost-benefit analysis of the entire operation was done under the systems of management.
It looks into the economics of rope making by the Bhanjara community and the economic
benefits accruing to them as a result of Joint Participatory Forest Management. The study also
compares the economics of rope making by machine with that of making rope by hand, and
analyses why the bhanjaras take to a certain option under a given set of conditions.
[25]
Wayman, (1973) discussed that the availability and supply of Sabai grass was 60,000
tons per year and it is used for printing and writing papers. The average fibre length is 2.08 m.
with a width ranging upto 4.90 mm. He concluded that due to the increase of cost of harvesting
and transportation, Sabai grass for paper making becoming economically doubtful.
According to Wiersum, et al. (2005), the contribution of wild plant resources to rural
livelihoods and to poverty alleviation is receiving increased attention. Village studies in
southern Africa indicate that the harvesting of wild plant products may in some communities
amount to as much as 50 per cent of the total net income. Traditionally, most of these products
were used for subsistence.
According to Wickens, 2011, natural fibres are of three types. These are vegetable fibres,
animal fibres and mineral fibres. Vegetable fibres are derived from plants. Botanically
vegetable fibres are of four types. These are hairs fibres, bast fibres, leaf fibres and wood
fibres.

[26]
Chapter-II
Socio-economic Status of Sabai Growers and Artisans
2.0 Introduction:
The present study area falling in Paschim Medinipur District, forms part of the
“Jungalmahal” area under the Paschimachal Region of West Bengal State. Traditionally a
significant portion of the rural households of this region remain engaged with subsistence
farming and collection, processing, production and marketing of natural and forest based
products like Sabai grass, Tasar, honey, Sal leaf plate and bowl, Kendu leaf etc. Based on the
accessibility of these local resources and existing ecological, physical and social
environment, the local inhabitants use to prefer and select their convenient livelihood and
ways of living. On the basis of these local resources a distinct professional and occupational
culture has emerged and spreaded among the inhabitants of this region for their sustenance.
Besides the multiple seasonal occupational practices of the inhabitants, their distinct
participation in Sabai based activities has been found in the local area. The major participants
of Sabai based farm and artisanal activities constitute Schedule Tribe and Schedule Caste
population in different Blocks of this District.
Informal household activities of ST and SC communities has been influenced by
several social, economic, cultural and psychological factors. In fact people shape their
behaviours towards entrepreneurship (Sajilan et al., 2015) based on their demographic
characteristics also. Many studies have highlighted the role of demographic characteristics
such as age, religion, gender, experience and education of the entrepreneurs towards their
entrepreneurial behaviours and farm performance (Welmilla et al., 2011; Ahmed, 2007 and
Davidson, 1995).
[27]
To investigate into the comprehensive profile and in-depth insight on the potential
capability of the Sabai growers and artisans, a thorough account of their demographic base is
necessary. In addition to demographic enquiry, an analysis of socioeconomic background of
the participants is required to be understood before interpretation of the major production and
marketing related features of the industry. Thus to understand the status, structure,
functioning of Sabai based industry, the analysis of socioeconomic characteristics of Sabai
growers and craft workers are necessary.
According to 2011 Census data, the intensive study area (Nayagram, Gopiballavpur-I
and Binpur-II Blocks) shares 2.39% of the District population and 14.53% of its geographical
area. The total population of three study Blocks is around 4.15 lakhs of which 38.42% and
20.31% are ST and SC population respectively. It indicates that nearly 60% inhabitants of the
study region belong to the disadvantage groups of the society. Predominantly these groups
are majorly distributed in difficult terrain and hilly areas of the study region. Low population
density of 305 persons/sq. km. has been found in the study area compared to 631 for the
District as a whole which indicates its lower capacity to support human habitation.
The Paschim Medinipur District had been created on 1st January 2002 after bifurcation
of erstwhile Medinipur District. It is situated in the Southern most part of Bardhaman Sub
division of West Bengal. It covers a large area of 9368.00 sq. k.m. which forms the second
largest district in the State. According to Census Report of 2011 the total population of this
District is 59, 13,457 with 13, 01,610 number of households. Around 32.88% of the total
households of the District comes under Below Poverty Level (BPL) category (P&RD, Govt.
of W.B., 2002). Total forest area of the District is 18.52% of its geographical area. Western
and South-Western part under Jhargram Subdivision of the District consists of 8 Blocks
mostly covered by the dry deciduous forest. According to 2011 Census, 87.78% of the total
population of the district reside in the villages. The rural economy of Paschim Medinipur
District mainly depends on agriculture and agro based small and micro industry. But the
[28]
economy of the Western and South Western part of the district is mainly based on forest
resources as well as forest based household or cottage industry.
2.1 Location of the District:
Paschim Medinipur is situated in the South Western part of West Bengal. The district is
bounded by Bankura from North side and Purba Medinipur from the South Western side. The
Southern side boundary is merged with the boundaries of Balasore and Mayurbhanj district of
Odisha and Western side boundary is merged with the boundaries of East Singhbhum district
of Jharkhand and Eastern side is bounded by Hoogly district in the north and Purba
Medinipur in the South. The headquarters of this district is situated at Midnapore town of
Midnapore Sadar Subdivision. It is basically an agrarian district of West Bengal. The
geographical area is 9295.28 sq. km which occupies 2nd highest position in the State. The
district is located geographically between 22057′ 10″ and 21036′35″ north latitude and
between 88012′40″ and 86033′5″ east longitude. The yearly rainfall is around 1400 to 1500
mm. with erratically varying in nature.
2.2 Administrative Divisions of the District:
The district comprises of four sub-divisions namely Midnapur Sadar, Kharagpur,
Ghatal and Jhargram. It has 29 Community Development Blocks, 28 Police Stations, 8
Municipalities, 11 non municipal towns and 8695 villages. The District constitutes of 1094
uninhabited villages (DSH, 2011). Different administrative units and their numbers are listed
in table 2.1 and their locations are shown in the map below (Fig.2.1)
2.3 Physiographic and Agro-Climatic Characteristic of the District:
In terms of geomorphological characteristic of the District it represents margin of
Chotonagpur plateau with mounds, and rolling lands in the Western part, Rahr plain with
lateritic uplands in the middle and alluvial plain land in the East. It has two distinct
physiographic divisions, one is red, lateritic rolling and undulating Zone of the west and the

[29]
other is plane alluvial zone of the east. Dry deciduous dense forest with Sal, Piasal, Kusum,
Mahua, Tamarind etc. trees are found in the South West and North Western part of the
District.
Table 2.1: Administrative Structure of Paschim Medinipur District
Sl no Particulars Numbers 1. Geographical Area 9295.28 sq. km 2. No of Subdivisions 4 3. No of Blocks 29 4. Pancahyat Samity 29 5. No of Municipality 8 6. No of Gram Pancahyat 290 7. Gram Sansad 3491 8. No of Police Station 28 9. Total no of Mouza 8735 10. Inhabited Mouza 7498 11. Electrified Mouza 4657 12. No of ITDP Block 19
Source: Panchayat & Rural Development, Government of West Bengal, 2002.District Statistical Handbook, Paschim Medinipur, Dept. of Statistics, Govt. of West Bengal, 2011
Fig.-2.1: Administrative Blocks
High productive lands with semi aquatic vegetation are found in the central and Eastern
part of the district. The Western part of the District is inhabited by Tribes and Primitive
Tribes and in other areas by all other caste of the society. The cultural diversity has also

[30]
been found across the Blocks. The District consists of the courses and valleys of River
Rupnarayan, Kangsabati, Subarnarekhs, Dulung etc.. Subarnarekha enters the District from
Singhbhum of Jharkhand State and falls in the Bay of Bengal passing through Balasore
District of Odisha. Ghatal and part of Kharagpur Subdivision are flood prone area and often
cause damages to crops in Sabag, Ghatal, Pingla, Daspur, and Narayangarh Blocks. Many
areas of Jhargram subdivision are having undulating topography with red lateritic acidic soil
not suitable for food crop cultivation. The entire division is drought prone; consequently the
population suffers from food security due to frequent loss of standing crops. Altogether 637
villages have been declared by Govt. of West Bengal as backward villages mostly
concentrated in draught prone area of Jhargram Subdivision (DHDR-2011). The study
villages of Nayagram, Gopiballvpur-I and Binpur-II Blocks under this subdivision are
severely draught affected in both Kharif and Rabi season of the crop year mainly due to high
surface and sub-surface runoff. Though the district produces excess quantity of paddy,
vegetables and potato, it is crawling in production of oilseeds, pulses and wheat.
2.4 Population and Demographic Characteristics:
The present population of the district is 59 lakhs with 18.05 percent Schedule Caste and
14.67 percent Schedule Tribes. Paschim Medinipur District rank 5th position in term of adult
population and child (0-6 yrs) population in the State. The Schedule Caste Population of this
District is 11, 28,269 which occupies 9th position in the State and Schedule Tribe population
is 8, 80,015 which is highest in number in the State. As a whole the sex ratio of the District is
966 females per 1000 males and ranks 2nd in the State. But the sex ratio of Schedule Tribe
population is 1,001females to 1000 males and occupies 5th position in the State. The sex ratio
of Schedule Caste population is 979female to 1000 males which is highest in the State along
with Bankura District. The highest SC population have been found in the Keshpur Block and
ST population in Binpur-II Block of the district. The major SC sub community constitutes of
‘Bagdi’ and ST sub community constitutes of ‘Santal’, In terms of literacy, the District

[31]
occupies 7th position in the State which is 78% (DSH, 2011). Important demographic features
of the District are presented in table no 2.2
Table 2.2: Demographic features of Paschim Medinipur District
Sl no Particulars Numbers Study
Area 1. No of Households 13,01,610 93,698 2. No of rural households 8,35,345 92,441 3. Actual population 59,13,457 4,14,975 4. Total Rural Population 51,90,771 4,09,251 5. Population Density (per sq. km.) 631 6. Schedule Caste 11, 28,269(20.04%) 84,269 7. Schedule Tribe 8, 80,015(14.01%) 1,59,428 8. Sex Ratio 966 972 9. Literacy rate 78.00% 56.19% a) Male 86.66% 76.65% b) Female 71.11% 56.19% c) Rural 78.80% 66.4% d) Urban 85.53% 81.37% 10. Total no of Inhabited villages 7601 894 11. Electrified Mouzas 7386 761 13.. No of BPL households (DHDR,2011) 5,09,494 41,615 14. % of BPL households to total
households (RHS 2005) 43.79 57.29
Nayagram 69.26 Gopiballavpur-I 42.45 Binpur-II 68.59
Source: Census of India, 2011 Note: Sex Ratio: Sex ratio has been defined here as the number of females per 1000 male 2.5 Natural Resources:
Forest Resources of Paschim Medinipur remain as the most important natural resource
of the District. Other important resources are sand deposition in its river beds and lateritic
blocks and muroms available form degraded lateritised land surfaces. Only important mineral
of the district is steatite of Belpahari Block. Besides, aquatic shells available from river beds
at their lower courses also form an important natural resource of the district.
The district consists of four forest divisions viz. Midnapur Forest Division, Jhargram
Forest Division, Kharagpur Forest Division and Rupnarayanpur Planning and Survey
Division. Jhargram Forest Division is one of the oldest divisions of West Bengal while
Kharagpur Forest Division is primarily a social forestry division for implementing social

[32]
forestry schemes. The activities of Rupnarayanpur Forest Divisions are principally concerned
with soil conservation and social forestry activity. The forest under each division is managed
with active cooperation of the forest protection committees (FPCs). Jhargram forest division
occupies the largest forest area of 80743 hectares while the smallest area of 14957 hectares is
spread over in Kharagpur Social Forestry Division.
Nayagram, Gopiballavpur-I and Binpur-II Blocks of Jhargram Sub- division cover a big
chunk of forest land under Jhargram Forest Division. The area is part of Junglemahal area
which is largely covered with dry deciduous tropical forest species. The forest areas of
Nayagram, Gopiballavpur-I and Binpur-II Blocks are 13600, 5449, 20220 hectares
respectively. Majority of the forest fringe people depend largely on forest produces to meet
their needs of food, fodder and fuel. Forests of this area also provide raw-materials for natural
fibre and wood based crafts making. A large number of edible non timber forest produces
(NTFP) have the potential as quality organic food items with prospect of marketability. Many
medicinal species, fruits, oil seeds, nuts, mushroom, green fruits, few flowers are available in
the forest in these blocks for consumption, processing and also for marketing as a part of
value addition.
2.6 Occupational Characteristics In Paschim Medinipur District the total numbers of workers are 25.09 lakhs which is
42.43% of the total population. Of this 25.54% are main workers while marginal workers’
share is 16.89%. The total workers of the district are classified by their occupations as
cultivators (22.81%), Agricultural Labourers (44.05%), Household Industry workers (5.68%)
and other workers (27.46%).
Among the total workers females share 29.96% while that for male workers is 70.04%.
Females constitute only 17.09% of the main workers while male workers’ share remains as
82.91%. Considering marginal workers the shares of females and males are 49.45% and
50.55% respectively.

[33]
The occupation of the households depends on household asset base, local resources,
indigenous skills and knowledge, available technology, market accessibility, infrastructures,
organisational support etc.. On the basis of the economic contribution from various livelihood
sources, the occupation has been classified in two categories such as principal occupation and
subsidiary occupation.
Table: 2.3 Principal Occupation of the Households.
Sl no.
Occupational Dimension
Principal Occupation of the HHs
Total no of HHs with
Principal or Subsidiary Occupation
Avg. no of Days of
Engagement per year in Principal
Occupation No.
%
1 Sabai based activities 221 66.97 330 113 2 Wage labour 25 7.98 328 40 3 Agriculture
(Other than Sabai) 12 3.64 164 13
4 Small business 13 3.94 42 95 5 Collection & sale of Sal leaf 13 3.94 251 56 6 Collection and sale of fuel wood 6 1.82 244 108 7 Collection and sale of other NTFP 21 6.36 141 61 8 Other skill based work 7 2.12 16 119 9 Livestock rearing 6 1.82 265 All days
10 Salaried and pensioners 6 1.82 9 All days Total 330 100
(Source-Sample survey)
Based on the household survey the principal and subsidiary occupation of the
households have been classified into 10 groups and presented in table no.2.3. It is observed
that Sabai based activities remains as the principal occupation of 66.97% households. Shares
of all other activities as principal occupation are applicable for less than 10% of the households
(Fig.2.2). The average number of days of engagement (full time or part time) in a year is
highest for other skill based works which in 119 days/ year followed by Sabai based activities
(113 days/year), collection and sale of fuel wood (108 days/year), small business (95
days/year), etc.. The Most unexpected fact in this regard is only 13 days of engagement per
year in respect of activities of agriculture (other than Sabai raising).

[34]
66.97%
7.98%
3.64%
3.94%
3.94%
1.82% 6.36%
2.12%
1.82% 1.82% Sabai based activities
Wage labour
Agriculture (Other than Sabai)Small business
Collection & sale of Sal leaf
Collection and sale of fuel woodCollection and sale of other NTFPOther skill based work
Livestock rearing
Salaried and pensioners
Fig- 2.2: Distribution of Households According to their Principal Occupations
Source: Sample Survey The intensity of involvement of the households in different activities varies over the
seasons and months in a year. Table no.2.4 shows the yearly engagement pattern and nature of
involvement of the households in different occupations. This however does not include
salaried job holders and pensioners.
Household Earnings and Expenditure Pattern: Earnings of family members is an
important variable to evaluate the economic status and standard of living of the households.
In the absence of any information on household income and household expenditure from
authorised sources, this study has been based on the information collected from Household
Socio-economic Survey conducted by the Scholar on selected sample respondents. Almost all
surveyed households are engaged in Sabai based activities and their average gross income per
family per year is Rs. 10340. Around 38% of the total gross family income is generated from
Sabai related economic activities. The survey reported that the households earn about 22% of
their total income from wage labour related activities. The yearly mean gross income of the
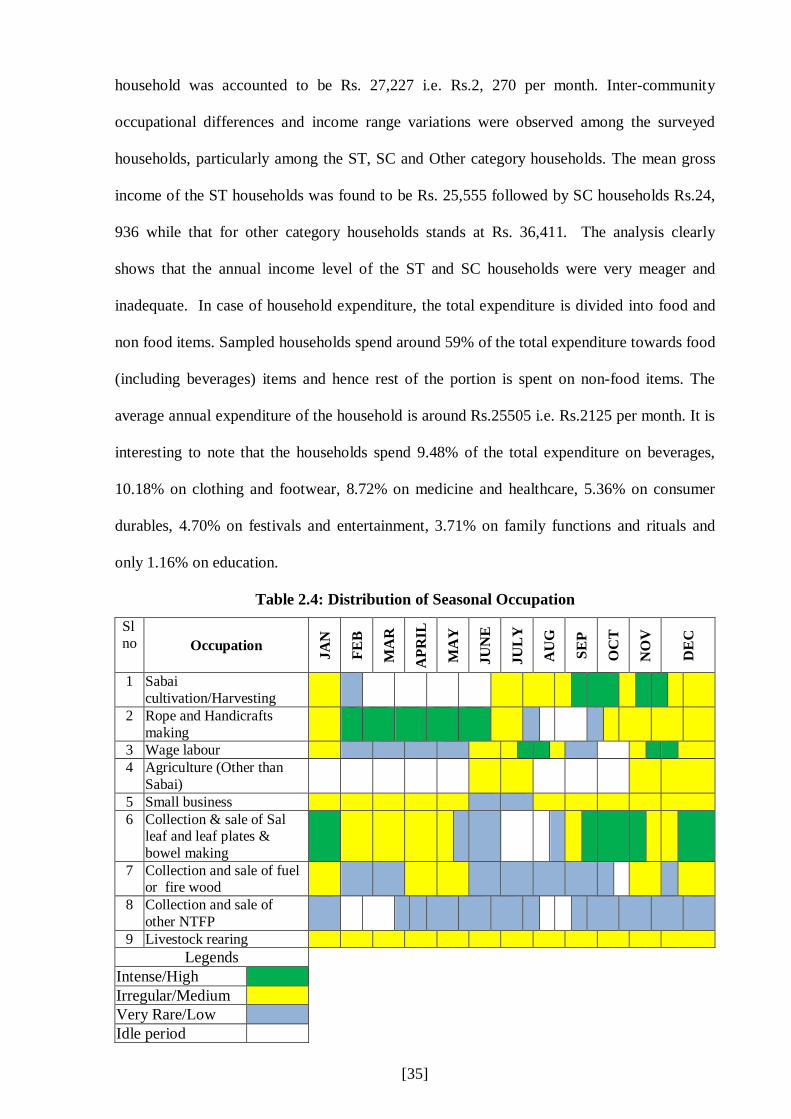
[35]
household was accounted to be Rs. 27,227 i.e. Rs.2, 270 per month. Inter-community
occupational differences and income range variations were observed among the surveyed
households, particularly among the ST, SC and Other category households. The mean gross
income of the ST households was found to be Rs. 25,555 followed by SC households Rs.24,
936 while that for other category households stands at Rs. 36,411. The analysis clearly
shows that the annual income level of the ST and SC households were very meager and
inadequate. In case of household expenditure, the total expenditure is divided into food and
non food items. Sampled households spend around 59% of the total expenditure towards food
(including beverages) items and hence rest of the portion is spent on non-food items. The
average annual expenditure of the household is around Rs.25505 i.e. Rs.2125 per month. It is
interesting to note that the households spend 9.48% of the total expenditure on beverages,
10.18% on clothing and footwear, 8.72% on medicine and healthcare, 5.36% on consumer
durables, 4.70% on festivals and entertainment, 3.71% on family functions and rituals and
only 1.16% on education.
Table 2.4: Distribution of Seasonal Occupation
Sl no Occupation JA
N
FEB
MA
R
APR
IL
MA
Y
JUN
E
JUL
Y
AU
G
SEP
OC
T
NO
V
DE
C
1 Sabai cultivation/Harvesting
2 Rope and Handicrafts making
3 Wage labour 4 Agriculture (Other than
Sabai)
5 Small business 6 Collection & sale of Sal
leaf and leaf plates & bowel making
7 Collection and sale of fuel or fire wood
8 Collection and sale of other NTFP
9 Livestock rearing Legends
Intense/High Irregular/Medium Very Rare/Low Idle period

[36]
2.7 Level of Literacy & Education The total literacy of Paschim Medinipur is 78.00% which is higher than the rural
literacy rate of 76.87%. The female literacy rate of the district is 70.50% which comes down
to 68.94% for rural areas. The literacy rate of the intensive study Blocks are 63.90% for
Nayagram, 65.44% for Gopiballavpur-I and 70.06% for Binpur-II. The female literacy rates
of the said three Blocks are significantly lower than their total as well as male literacy rates.
From the household survey conducted in the study Blocks, it is observed that only 36%
respondents are either literate or presently continuing with their school or college level
studies. The rest 64% respondents are illiterate. This indicates that majority of the
respondents engaged with Sabai based activities in the study Blocks are illiterate. Compared
to other two Blocks of the study area, Nayagram has higher proportion of literate craftsmen.
Binpur-II Block has highest percentage of illiterate workers involved in Sabai based
activities. To remove illiteracy from the district vis-à-vis the study Blocks, Government has
opened 42 Mass Literacy Centres (MLC) in Paschim Medinipur. These centres are
conducting Continuing Education Programmes. In 2012-13 the Study Area had 281 MLCs of
which 82 were in Nayagram, 68 in Gopiballavpur-I and 131 in Binpur-II Blocks.
State Government is also attempting to promote educational status among the neo-
literates and drop-outs from schools through running Sishu Siksha Kendra (SSK) and
Madhyamik Siksha Kendra (MSK) which are known as special and non-formal educational
institutions. The district has altogether 2459 MSKs and 232 SSKs. Anganwadi (Education)
Centres under Integrated Child Development Scheme (ICDS) and Jana Shikshan Sansthan
(JSS) are also important centres for non formal education of children and elderly uneducated
persons. The district runs 9009 Anganwadi Centres and 42 JSS units which have created
some positive impact on the Sabai growers, craftsmen and their family members.
Though literacy rates of both males and females are yet to be improved further,
Paschim Medinipur has significant opportunities for improving the educational status through

[37]
its existing general recognised schools and colleges. It has 4692 Primary Schools, 300
Middle Schools, 288 High Schools and 471 Higher Secondary Schools. For providing higher
education opportunities it is running 24 general colleges, 1 General University and 3 Open
University Centres. Among the responding rope-makers and craftsmen only 4.24% had
secondary level educational status and only 1.52% had reached the level of Higher Secondary
or above. These achievements do not reflect the existing educational infrastructures in the
study area.
The household survey shows that the annual expenditure on education per household is
as low as Rs.263.00 which shares only 1.16% of the total expenditure on different food and
non-food items of the household. This is quite low compared to other items like Medicine
and Health (8.72%), Beverages (9.48%), Entertainment (4.70%), Rituals (3.71%) etc. The
above household expenditure pattern clarifies that education for knowledge and skill
upliftment has not been paid due importance among these artisan families. Some of them
have lamented that with higher education and skill followed by jobs in other sectors the
young members neither participate in crafts making nor stay in the village.
For technical education and training the District has 21 Technical Schools of which 2
are Industrial Training Institutes (ITI) and 3 are Industrial Training Centres (ITC). There are
other 21 technical and Professional Colleges in the district which include Teachers’ Training,
Engineering Education and other institutions for Art, Law, Health Science etc. Paschim
Medinipur has one Medical College, two Homeopathic Medical Colleges and few Para-
medical training institutions.
Considering the Study Area, it has 385 Primary Schools, 1 High School and 52 Higher
Secondary Schools. The 3 Blocks under study area possesses one general college each. For
technical and professional training facilities the Study Area has 2 such Institutions at
Nayagram and Gopiballavpur. For technical trainings in the area of Sabai Craft making, the

[38]
district or Study Area does not have any specific centre or institution. Only occasional short-
term trainings are conducted in the Blocks or at District Headquarter by District Industries
Centre or Panchayats or local NGOs which are not so effective in the skill formation among
the local artisans.
2.8 Health Status and Infrastructures The status of health in Paschim Medinipur vis-a-vis the study area is known to be better
than or similar to that of India and West Bengal State. This could be asserted with the help of
common health indicators given in National Health Profile, 2011 by the Central Bureau of
Health Intelligence, Government of India. These indicator values for Paschim Medinipur
which is taken to be close to the values of Study Area are obtained from the District Human
Development Report (DHDR) of Paschim Medinipur, 2011. The indicators chosen for
comparative analysis of health status are Birth Rate, Death Rate, Infant Mortality Rate (IMR),
Maternal Mortality rate (MMR), and Life Expectancy at Birth (LEB).
In the context of Birth Rate, the indicator values per 1000 population for India and West
Bengal are 22.1 and 11.5 respectively while that for Paschim Medinipur is 10.0. The Death
Rate per 1000 population of India is 7.2, for West Bengal it is 6.0 and for Paschim Medinipur
it is 6.30. The IMR indicator values per thousand birth of the Nation, State and the District are
47.00, 31.00 and 27.94 respectively. The MMR per 1, 00,000 birth is 212.00 for the Nation,
145.00 for the State and that for the Study District is 94.41. The Life Expectancy at Birth
(LEB) index in years of age well reflects the general health status and its values are 67.30 for
males and 69.60 for females of India. The respective figures for the State are 69.20 for males
and 72.10 for females while the overall LEB measure for males and females of Paschim
Medinipur is 67.50. The institutional Delivery depicting health consciousness of the household
counts 74.60% for the State and 79.76% for the Nation in 2012-13 while that for the District
and Study Area recorded to be 83.50% and 45.00% respectively.

[39]
From the above analysis it is observed that Paschim Medinipur District as well as the
Study area has the similar health status which is often better than the State or the Nation in
terms of certain indicators. The villagers degraded health status is directly linked with their
poverty, illiteracy and deficiencies in health awareness. Besides, the availability and
accessibility to health infrastructures and facilities are responsible for bringing up the health
status of the villagers in general and Sabai craftsmen in particular. The accessibility to the
health facilities and infrastructures depends on their awareness of health and hygiene on one
hand and knowledge about the location and particulars of facility centres and services installed
on the other.
Regarding availability of health facilities and infrastructures the district of Paschim
Medinipur is endowed with several medical institutions and service centres. It has 3 medical
colleges of which 2 are homeopathic medical colleges. It has 6 Hospitals including two Central
Government run hospitals. In the 29 Blocks of the district there are 23 Rural Hospitals and 6
Block Primary Health Centres (BPHE). The district possesses 82 Primary Health Centres
(PHC) and 5 other Government run medical institutions. In the entire district 858 Health Sub-
Centres and 40 Family Welfare Centres are located. All the hospitals and health centre have
altogether 5480 beds and 790 doctors. This means that there are 93 beds per lakh population
and 13 doctors per lakh population to extend health facilities and service to entire rural and
urban population of the District.
Each of the three study Blocks has 1 rural hospital and 3 Primary Health Centres and
thus the total health centres in the study area are 12 units. The total number of beds in the study
area is 188 and the total number of doctors is 20 together. Thus the study area extends the
health facilities to the extent of 45 beds per lakh population and 5 doctors per lakh population.
It has 3 Family Welfare Centres (FWC) which indicates that each FWC extends service to 1.38
lakh population. From the above analysis it may be conclude that the district of Paschim
Medinipur as a whole has all forms of health facilities and services. But spatially they are not

[40]
well distributed and the number of persons to the attended by a unit of facility is too huge to
the served. The number of service facility in the Study Area is too meagre compared to number
of persons. The households involved with Sabai based activities thus cannot expect good
health facilities and services at present. They usually belong to the lower brackets of earning
scale and naturally cannot afford to get the services from privately run institutions and facility
centres.
2.9 Industrial Scenario: Though the district is endowed with rich agriculture and forest resources, its industrial
development has not been matching. It had 393 registered factories in 2012 which could
provide daily employment to 45838 workers (BAES-2013). Paschim Medinipur possessed
only 11 large scale industries including South Eastern Railway workshop at Kharagpur and
RBI Mint at Salboni. Its 8 service enterprises include mostly cold storages for preservation of
potato, fruits and other vegetables. None of the Blocks in the Study Area has any large industry
located within its territory. Similarly out of 24 Medium Scale Industries of the district none is
located in the Study Area. The district had 4088 micro and small scale enterprises which
provide employment to 25848 workers. During the last 4 years ending 2012-13 the district
recorded 53% growth of Micro and Small Units per year while their employment grew at the
rate of 35% per year. To promote medium and small enterprises, the District has created 7
Industrial Areas in important growth points like Kharagpur, Nimpura, Midnapore, Salboni,
Godapiasal etc. However, the study Blocks do not have any such area for specially promoting
industrial enterprises with extended facilities.
Other than Sabai cultivation, the rope and craft making from Sabai constitute the major
part of rural non-agricultural establishments of the district, specially in the Blocks of the Study
Area. In these Blocks the agricultural establishments are principally involved with Sabai grass
cultivation while non-agricultural establishments are majorly concerned with Sabai rope and
crafts making. In the district, the total number of persons working in rural agricultural and non-
[41]
agricultural establishments in 2005 were 0.47 lakhs and 3.31 lakhs respectively. Of them 24%
and 48% were hired working persons in agricultural and non-agricultural establishments
respectively.
Though registered factories and small scale enterprises are almost non-existent in the
Study Area, it has a good number of Self Help Groups (SHGs) which constitute its major
industrial establishments. These SHGs are a sort of assembly of households dealing with Sabai
rope or craft making or with some other processing activities. Most of the SHGs in these areas
are formed by individual women entrepreneurs whose major asset remains with their skill and
working time. Since their capacity to invest fund for enterprise development is very limited,
they can jointly accrue a workable fund through formation of SHGs and this helps them to
realise the advanced fund and at the same time earning their livelihood. Working jointly in a
cluster also promotes mutual skill transfers and development. The total number of SHGs
formed in the Study Area is 2,652 which is 9.39% of 28,249 SHGs in the District. It may be
compared with the share of households in the three study Blocks which is 7.92% of the
households in the district. The total number of members of SHGs in the study area is 27297
which constitute 9.76% of the members of the entire district. The micro establishments dealing
with Sabai processing and crafts making form major component of the industrial activities in
the study Blocks.
2.10 Infrastructure Facilities and Institutions for Industry and Craft
Development
For development of industries and crafts any region must have good railway and road
connections. Paschim Medinipur district is well divided into four distinct segments by
Kolkata-Mumbai route (North-South divide) and Asansol–Chennai route (East-West) of Indian
railways though it has wide unserved areas in all the four quadrants. These four quadrants are
served by roads to a certain extent with the services of long route express and local buses.
Though movement of labour, daily commuters and petty commodities could be noticed to a
[42]
certain extent, there remain wide deficiencies in the services in terms of frequencies and
comfort level. In some isolated tracts the ferry services are available for movement of
passengers and local commodities across the rivers and streams. The study Blocks are quite far
off from the railway routes and national highways though their demands for passengers and
commodity movement are met by local buses, trucks, tractors and even by bullock carts. The
nearest railway station from the study Blocks are 25 kms, 45 kms and 25 kms from Nayagram,
Gopiballavpur-I and Binpur-II Blocks respectively. Most of the markets of the District
including the rural Haats are connected with district or state level markets and urban centres by
State Highways and District roads. Among the important Sabai wholesale markets only
Fekoghat Market is located on the National Highway No-6. Important State Highways passing
through the Study Blocks are however connected with major Sabai markets in the adjacent
districts and those in States of Odisha and Jharkhand. The transportation network of the Study
Blocks and adjacent areas is presented in Fig no 2.3 (Road & Railway Map).
For rural industrialisation and development of crafts, it is essential to provide power
supply in the villages. For introduction of new technology and creation of productive
environment in the households and village level production units the villages need steady
supply of power for domestic uses and industrial purposes. In Paschim Medinipur District out
of total 7582 Mouzas (villages) 7386 Mouzas are electrified. This means that 97.41% villages
are electrified which can assure supply of power for meeting the domestic and industrial needs.
For promoting rural industrialisation and craft development in the villages, institutional
supports for financing and management are considered as essential back-ups. The district has
272 branches of Commercial Banks which can provide essential financial support to the rural
enterprises including those linked with various Governmental Schemes of industrial promotion
in the rural areas. In the study area, Nayagram, Gopiballavpur-I and Binpur-II Blocks have 9, 6
and 10 Bank Branches respectively to provide various industrial promotional assistance.

[43]
Sankrail
Fig no 2.3 ( Road & Railway Map of Jhargram Sub-Division)
In rural industrial development the Cooperative Societies are also taken as important
support institutions in the villages of Paschim Medinipur. The district has 2057 units of
Cooperative Societies located in different villages. The study area has 149 units of which 36
are in Nayagram, 44 are in Gopiballavpur-I and other 69 are located in Binpur-II Block. The
industry and craft workers receive financial benefits and other aids from these institutions as
their members. They often get the dividends for their own investments also. Both Commercial
Banks and Cooperative play very important roles not only for financial supports but also for

[44]
technology introduction, product marketing and sometimes creating provisions for rawmaterial
supply.
Successful marketing of products is another pillar of achievement of rural industries
and crafts. While wholesale marketing may be performed in the regional and State level
markets, the disposal of day to day products and mass production based utility items are
normally done through local primary markets (Haats) and Mandies (organised urban markets)
in the nodal centres of transaction. The district has 195 markets and Haats where as the Study
Area has 37 such Haats and markets. In the entire district there are only 2 Regulated Markets
under Midnapore Sadar town & Ghatal town. For Sabai grass, rope and craft the most
important markets are Balegeria, Belpahari and Fekoghat of which first two markets are
located within the Study Area.

[45]
Chapter: III
Economics of Sabai (Eulaliopsis binata) Cultivation
3.0 Introduction
Agricultural production and cultivation practice depend on the geographical and
social environment which includes climate, soil structure, knowledge and skill, capacity to
utilise local resources, land holding structure, cultural pattern of the locality, professional
dimension, adoption of technology etc.. An effort has been made to understand the
environmental consequences of the study area, whether it is favourable for Sabai cultivation
or not. This chapter aims at analysing the cost and return, value addition, and economic
viability of Sabai cultivation in Paschim Medinipur District. Benefit-cost analysis of Sabai
cultivation has been calculated on the basis of collected information from the field during the
period 2010 to 2015. Sabai fields were selected in the study area where crops were planted
from the year 2004 onwards. Before coming to the discussion of crop production; a precise
insight on agronomic characteristic of Sabai grass is necessary.
3.1 Agronomic Characteristics of Sabai Grass (Eulaliopsis binata) Eulaliopsis binata is a perennial grass belonging to the family Poaceae or Gramineae
(Table-3.1). The cellulosic fibres of this plant are found on leaves. The fibres are eco-
friendly, low cost and possess good strength with light weight and lower density compared to
synthetic fibres.
3.2 Reasons behind Spread of Sabai Cultivation in the Study Region
To understand the reasons behind spread of Sabai culture and high rate of
participation of local people in Sabai based livelihood activity, the geographical
characteristics, physical and topographic situations, soil structure, climatic condition of the
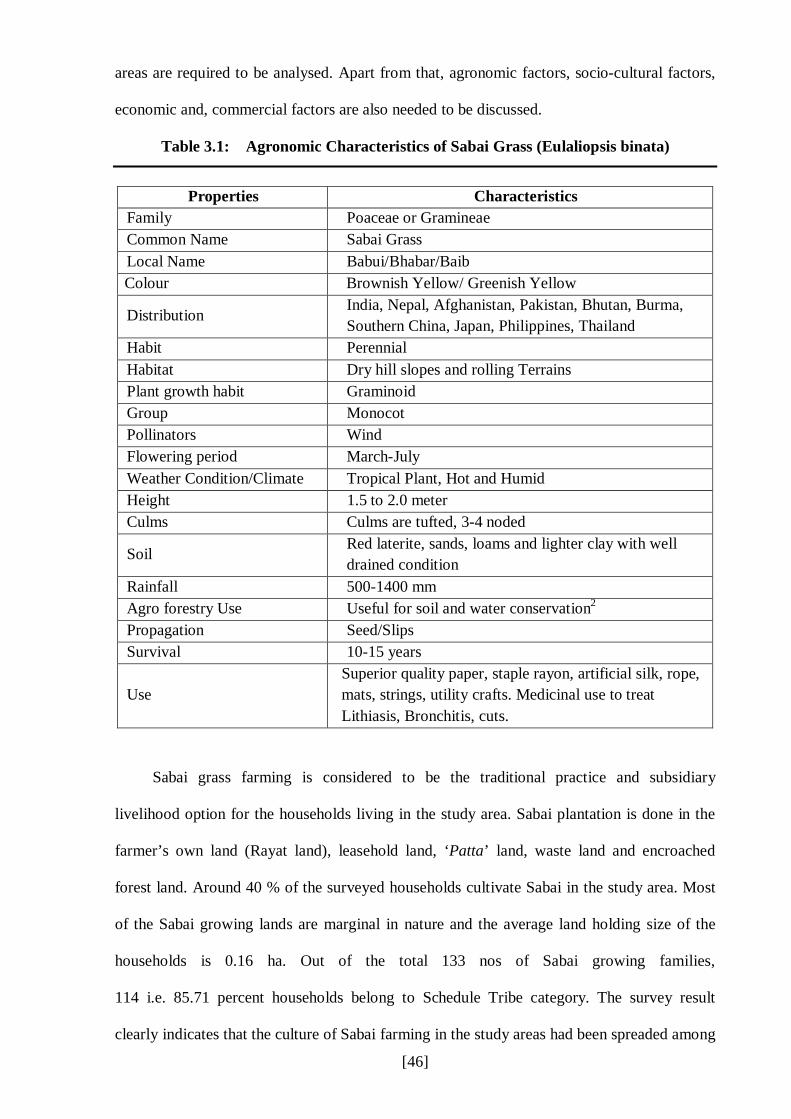
[46]
areas are required to be analysed. Apart from that, agronomic factors, socio-cultural factors,
economic and, commercial factors are also needed to be discussed.
Table 3.1: Agronomic Characteristics of Sabai Grass (Eulaliopsis binata)
Properties Characteristics
Family Poaceae or Gramineae Common Name Sabai Grass Local Name Babui/Bhabar/Baib Colour Brownish Yellow/ Greenish Yellow
Distribution India, Nepal, Afghanistan, Pakistan, Bhutan, Burma, Southern China, Japan, Philippines, Thailand
Habit Perennial Habitat Dry hill slopes and rolling Terrains Plant growth habit Graminoid Group Monocot Pollinators Wind Flowering period March-July Weather Condition/Climate Tropical Plant, Hot and Humid Height 1.5 to 2.0 meter Culms Culms are tufted, 3-4 noded
Soil Red laterite, sands, loams and lighter clay with well drained condition
Rainfall 500-1400 mm Agro forestry Use Useful for soil and water conservation2
Propagation Seed/Slips Survival 10-15 years
Use Superior quality paper, staple rayon, artificial silk, rope, mats, strings, utility crafts. Medicinal use to treat Lithiasis, Bronchitis, cuts.
Sabai grass farming is considered to be the traditional practice and subsidiary
livelihood option for the households living in the study area. Sabai plantation is done in the
farmer’s own land (Rayat land), leasehold land, ‘Patta’ land, waste land and encroached
forest land. Around 40 % of the surveyed households cultivate Sabai in the study area. Most
of the Sabai growing lands are marginal in nature and the average land holding size of the
households is 0.16 ha. Out of the total 133 nos of Sabai growing families,
114 i.e. 85.71 percent households belong to Schedule Tribe category. The survey result
clearly indicates that the culture of Sabai farming in the study areas had been spreaded among

[47]
the primitive people. Despite of manual propagation from Slips or Stumps, Sabai is also
naturally grown in the forest areas and in hill slopes through seeds. Geographically isolated
people in and around the forest territory collect Sabai grass as an important Non Timber
Forest Produce (NTFP) for subsistence livelihood. Harvesting of Sabai from forest areas
contributes significant portion of their household earnings. Sabai plantation starts at the
beginning of monsoon and collection and harvesting is done during the month of September-
October and January-February.
Western part of West Bengal falls in the Chotonagpur Plateau Region which is one of
the sub-divisions of National Agro Climatic Zones. The entire study region is characterized
by rolling lands with occasional rugged and hilly terrains and formed of red acid laterite soil.
The region has an undulating topography with rocky, red lateritic soil, which is not suitable
for large scale agricultural production. These soils are poor in basic nutrients and suffer from
lack of inherent fertility. The red and lateritic soil constitutes low contents of phosphorus,
potassium, calcium, magnesium, Nitrogen and lime. Because of high acidity and low
moisture retention capacity, manuring and other activities are required to increase the fertility
of the crop like paddy, sugar cane, oil seeds, wheat, ragi etc. In addition to this the other
problem of this topography constitutes surface and subsurface water runs off resulting to soil
erosion. The climate of this region is humid and sub humid and characterised by hot summers
and cool winters.
The economy of this regions depends on Sabai grass and grass based crafts and other
minor forest resources like Sal leaf, Kendu leaf, Mohua flower, fuel wood etc.. It has become
the main source of earnings for nearly half of the populations who are generally poor and
belong to scheduled caste and scheduled tribe communities. Sabai crop is cultivated by the
marginal and small farmers due to the following factors and reasons:

[48]
a) Agronomic Factors
i. Sabai crop is draught resistant.
ii. Characterised by low cost and easy method of cultivation.
iii. Limited plant protection measures are required.
iv. The crop withstands in porous red lateritic acid soil under upland and rain fed
condition where no other crop could be grown.
v. Two to three crop cuttings could be taken in a year if grown under irrigated
condition with good cultivation practice and manuring.
vi. Landless people utilise hardcore waste land for cultivation of Sabai.
vii. Cereal food crops do not give yield year after year but Sabai gives yield regularly
for about 10-12 years.
b) Socio-Cultural Factors
i) Ethnic communities developed their own distinctive culture, languages and
profession. A section of this group especially belonging to Lodha, Santhal,
Munda, Pouran, Shavara communities seems to be alcoholic, improvident and
lazy in nature. They traditionally fulfil their basic needs from the trees and plants
of the forest. They are also involved in fishing and hunting for their livelihood.
Apart from that they possess a unique skill in making of ropes, baskets, mats out
the plants etc.. A major part of the Tribal population is landless and by profession
they are not agriculturist.
ii. Around 36% (Sample survey) Sabai growing households grow Sabai in the
encroached forest area without taking any permission from the Forest
Department.
iii. Tribal people follow a traditional system in collection, cultivation and marketing
practice of Sabai in the local area. Sabai is a perennial grass and sometimes
naturally grown in the forest and upland areas of the selected Blocks. Tribal
[49]
people are habituated to collect these grasses from forest areas, transferred it into
rope and sell it to the village market (Haat).
iv. Due to traditional professional practice, less physical and mental effort and
laziness the tribal people intend to produce Sabai grass than any other food crops.
Because the cereal food crops do not give yield year after year while Sabai gives
yield for around 10-12 years they prefer this sabai cultivation. Sometimes no
physical labour is required for crop management and care except harvesting of
crops.
c) Economic Factors:
i. Investing in Sabai cultivation and package of practice gives good remunerative
return which continues upto twelve years.
ii. Sabai based activity provides employment especially to women folk and is treated
as main livelihood source for the landless and marginal agricultural labourers in
the region.
iii. On an average a Sabai producing household harvests around four quintal (4.2qtl.)
of sun dried grass every year from average 0.40 acres (0.16 ha.) of land.
iv. A household can earn Rs. 7,500.00 every year from sale of Sabai grass in the
village market when the average market price of the grass is considered to be
Rs.18/kg. at the harvesting season.
v. Value addition could be done with this crop by utilising family labour for
production of rope and other crafts.
vi. On an average a family produces 3.75 qtls. of rope which generates gross family
income of Rs. 11,000.00 per year.
d) Commercial Factors
i. Sabai rope is highly demanded as construction material as well as widely used
for weaving of traditional cots locally known as ‘Khatiya’ or ‘Charpai’. The
demand of the Sabai rope and rope made cots becomes high in the summer

[50]
months throughout northern and eastern India to sleep in the open space or
veranda at night.
ii. Mayurbhanj District of Odisha and South Western part of Paschim Medinipur
District of West Bengal is a popular Sabai grass and string producing zone. The
inter-state marketing channels have been found functioning in this Sabai
producing zone. Some of the local periodic markets located at ‘Negui’ ‘Baligeria,
Fekoghat, and ‘Belpahari’ etc. are popularly known as “Babui Haat” in the
region.
iii. The demand of eco-friendly natural fibre based crafts has been increasing day by
day in India as well as Western and European countries in contemporary days.
e) Topography & Agro Climatic Condition
Sabai is a common crop cultivated in the red laterite zone of West Bengal which falls
under Jhargram Sub-division of Paschim Medinipur District. This area falls in the
Chotonagpur Plateau Region which is constituted of the Southern and Eastern plateau of
Jharkhand and boarder Districts of Odisha, West Bengal, Bihar and Chhattisgarh.
Administratively it comprises all the southern Districts of Jharkhand, Districts of Purulia and
part of Bankura and south western part of Paschim Medinipur District of West Bengal and
the Mayurbhanj and Sundargarh Districts of Odisha. The entire area is characterized by
rolling lands with occasional rugged and hilly terrains and formed of red acid laterite soil.
Nayagram, Gopiballvpur-I and Binpur-II Development Blocks of Jhargram Sub-Division of
Paschim Medinipur District come in the core of this region.
The target areas under study have an undulating topography with rocky, red lateritic
soil, which is not suitable for large scale agricultural production (Photograph-2). These soils
are poor in basic nutrients and suffer from lack of inherent fertility. The red and lateritic soil
constitutes low contents of phosphorus, potassium, calcium, magnesium, Nitrogen and lime.
Lateritic soils in elevated areas receive high rainfall and as a result, top soil gets washed

[51]
away. This process is called leaching and the soil loses its fertility to a great extent. This soil
has low moisture retentive capacity and is not fertile. Because of low nutrient content , high
acidity and low moisture retentive capacity the crops like paddy, sugar cane, oil seeds, pulses,
wheat, etc could not be grown with happy harvest. In addition to this the other problems of
the topography constitutes surface and subsurface water runoff resulting in severe soil
erosion.
Photograph-2: Sabai Cultivation in Red Lateritic Degraded Soil
The climate of this region is humid and sub humid, characterised by hot summer and
cold winter. Basically the climate is tropical monsoon type with three distinct seasons:
Summer, Monsoon and Winter. May is the hottest month when the temperature raises up to
430 c. The yearly rainfall estimated is on an average 1400 millimetre. January is the coldest
month with temperature ranging from 70 c to 240 c. Though there is sufficient yearly rainfall
(1400 -1450 mm.), no significant agricultural developments have been made possible in this
area due to the following reasons:
i. Most of the inhabitant’s economic condition is poor and they fall in the BPL
category. Except a very few high or middle class farmers, no improved scientific
package of practices on high yield varieties of different crops have been adopted
by the poor, small and marginal farmers of the area.

[52]
ii. Mostly the agricultural community is constituted of marginal and landless
labourers. Majority of them belong to ethnic communities and some of them are
inherently habituated in the profession like hunting, leaf plate, rope and basket
making etc.
iii. There is also considerable area under of Sal forest cover in whole Jhargram
Subdivision. Forest fringe people accustomed with the culture of collecting
various minor forest produces or NTFPs like Sabai grass, Mahua flower, Sal
seeds, Sal leaf, Kendu leaf etc. free of cost as a part of their livelihood.
iv. Neither adequate soil conservation measures nor development of ground water
resources have been made in this area.
v. Lack of irrigation facility except in some areas of Subarnarekha river bank has
restricted the efforts of modern agricultural practices.
Under the above circumstances and the prevailing agro-climatic condition does not
favour cultivation of common crops of Bengal delta like rice, jute, potato, wheat, vegetables
etc. But this climate favors cultivation of Sabai abundantly. Lack of irrigation facilities,
scarcity of fertile land and dominance of wasteland have made the people accepting
cultivation of Sabai as one of the principal crop in this region. Sabai industry provides part-
time as well as full-time employment to the farmers and agricultural labourers in the off-crop
season and thus generate employment to the landless and marginal households during the
month of November to next June. The workforce of Sabai grass based cottage industry is
usually limited to family labour.
3.3 Sabai Grass and its Use
Cultivation of Sabai grass is useful as soil conservation measure and it improves the
physical characteristics of the soil. It is used to check soil erosion by planting along contour.
It can also be grown as protective partitions in terraced land and helps maintaining soil
moister and withstand even in draught condition. The use of Sabai is explained below with
the help of a flow Diagram (No. -3.1).
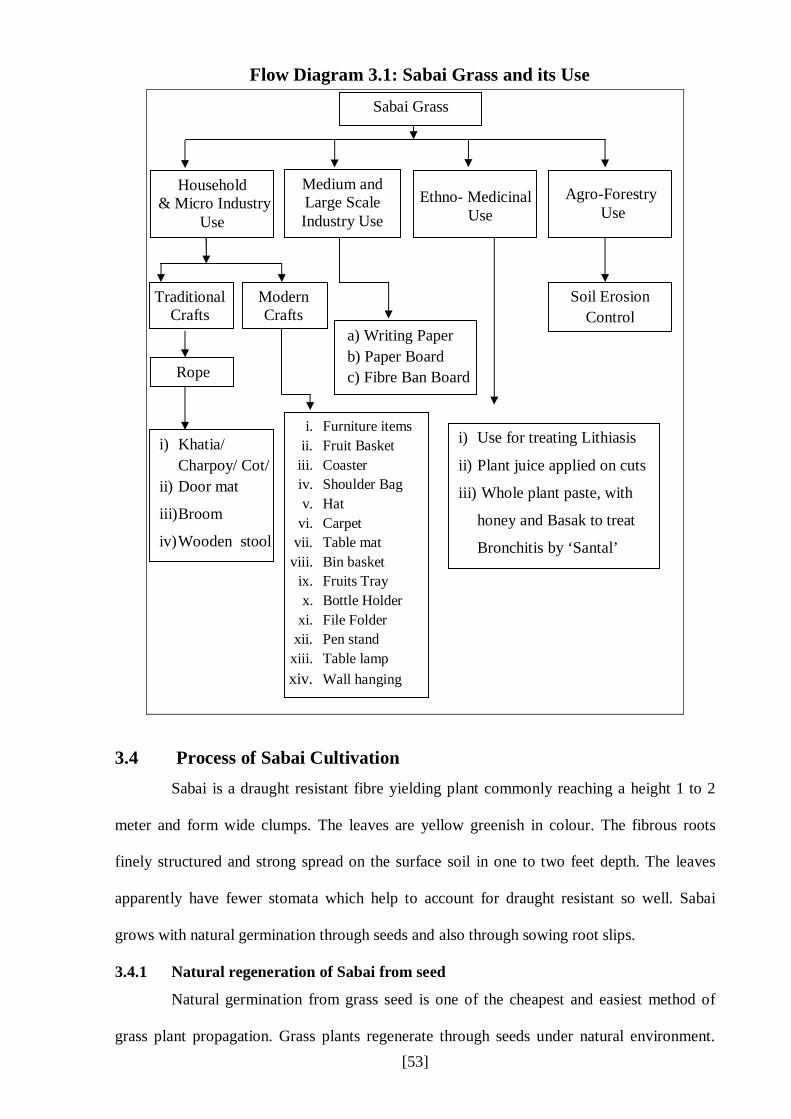
[53]
Flow Diagram 3.1: Sabai Grass and its Use
3.4 Process of Sabai Cultivation Sabai is a draught resistant fibre yielding plant commonly reaching a height 1 to 2
meter and form wide clumps. The leaves are yellow greenish in colour. The fibrous roots
finely structured and strong spread on the surface soil in one to two feet depth. The leaves
apparently have fewer stomata which help to account for draught resistant so well. Sabai
grows with natural germination through seeds and also through sowing root slips.
3.4.1 Natural regeneration of Sabai from seed
Natural germination from grass seed is one of the cheapest and easiest method of
grass plant propagation. Grass plants regenerate through seeds under natural environment.
Sabai Grass
Household & Micro Industry
Use
Medium and Large Scale Industry Use
Ethno- Medicinal
Use
Agro-Forestry Use
Traditional Crafts
Modern Crafts
a) Writing Paper b) Paper Board c) Fibre Ban Board Rope
i. Furniture items ii. Fruit Basket
iii. Coaster iv. Shoulder Bag v. Hat
vi. Carpet vii. Table mat
viii. Bin basket ix. Fruits Tray x. Bottle Holder
xi. File Folder xii. Pen stand
xiii. Table lamp xiv. Wall hanging
i) Khatia/ Charpoy/ Cot/
ii) Door mat
iii) Broom
iv) Wooden stool
i) Use for treating Lithiasis
ii) Plant juice applied on cuts
iii) Whole plant paste, with
honey and Basak to treat
Bronchitis by ‘Santal’
Soil Erosion Control
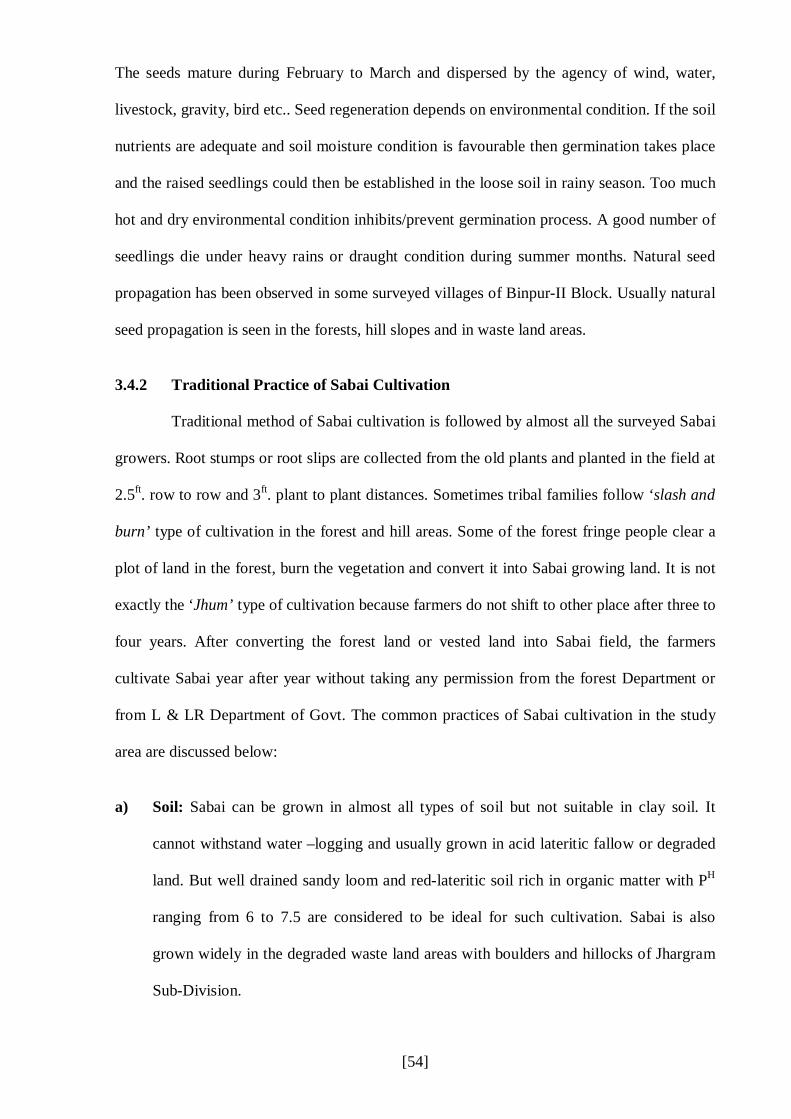
[54]
The seeds mature during February to March and dispersed by the agency of wind, water,
livestock, gravity, bird etc.. Seed regeneration depends on environmental condition. If the soil
nutrients are adequate and soil moisture condition is favourable then germination takes place
and the raised seedlings could then be established in the loose soil in rainy season. Too much
hot and dry environmental condition inhibits/prevent germination process. A good number of
seedlings die under heavy rains or draught condition during summer months. Natural seed
propagation has been observed in some surveyed villages of Binpur-II Block. Usually natural
seed propagation is seen in the forests, hill slopes and in waste land areas.
3.4.2 Traditional Practice of Sabai Cultivation
Traditional method of Sabai cultivation is followed by almost all the surveyed Sabai
growers. Root stumps or root slips are collected from the old plants and planted in the field at
2.5ft. row to row and 3ft. plant to plant distances. Sometimes tribal families follow ‘slash and
burn’ type of cultivation in the forest and hill areas. Some of the forest fringe people clear a
plot of land in the forest, burn the vegetation and convert it into Sabai growing land. It is not
exactly the ‘Jhum’ type of cultivation because farmers do not shift to other place after three to
four years. After converting the forest land or vested land into Sabai field, the farmers
cultivate Sabai year after year without taking any permission from the forest Department or
from L & LR Department of Govt. The common practices of Sabai cultivation in the study
area are discussed below:
a) Soil: Sabai can be grown in almost all types of soil but not suitable in clay soil. It
cannot withstand water –logging and usually grown in acid lateritic fallow or degraded
land. But well drained sandy loom and red-lateritic soil rich in organic matter with PH
ranging from 6 to 7.5 are considered to be ideal for such cultivation. Sabai is also
grown widely in the degraded waste land areas with boulders and hillocks of Jhargram
Sub-Division.

[55]
b) Climate: The crop can tolerate to a wide range of temperature, depending on the
location of the growing region. The crop grows luxuriantly under moderately humid
climate with annual rainfall 1000 to 1500 mm. The crops give higher yield under
irrigated condition in scanty rainfall area. The growth of the crop affects under shading
condition though grows under partial shading condition in forest encroached land with
reduced yield rate.
c) Propagation: Sabai can be propagated by both seeds and slips. But sowing of seeds is
not usually practiced for cultivation in the study area. Only slips are commonly used for
plantation. In the process of vegetative propagation slips are separated from the clumps
of previous crops keeping root portion intact and 15 to 20 cm aerial portion. The Slips,
after collection, are kept under moist shaded condition. But before transplantation dry
leaves are removed from the slips as a preventive plant protection measure.
d) Planting Time: The optimum planting period starts with the onset of monsoon
i.e. between late June to early August depending on the rainfall.
e) Land Preparation: Tillage operation is done with the first shower of rain of monsoon
season. Two to three ploughings with country plough are given for land preparation.
Farm Yard Manure (FYM) is applied at the time of last tillage operation. In case of
hard lateritic soil pit methods are followed at a spacing of 60x30 cm, 60x45 cm,
60x60 cm based on land size, soil fertility, soil type, topography, texture, water source
etc.
f) Planting: The clumps of previous crops are separated into small pieces to have many
numbers of slips. Fibrous roots and leaves are trimmed off before plantation. The
healthy slips are planted at different spacing as mentioned above during June to August.
Slips are planted vertically with 10 to 12 cm deep sub-surface cover. Late planting may
be resulting in inadequate growth, inferior quality of grass and low yield of the crop.

[56]
Plantation of crop is done under optimum soil moisture condition. But heavy rain
during plantation may affect proper establishment of root slips.
g) Fertilisation: Organic manure like farm yard manure (FYM) or compost is given
during tillage operation. Nitrogen in the form of urea in small quantity is applied as top
dressing during interculture operation like weeding, mulching, earthing up etc.
h) Irrigation: In most of the cases no irrigation is given on Sabai crops. It grows as
rainfed crop under residual moisture condition. However the optimum yield could be
obtained if irrigation is given in dry periods. Second time crop cutting may be taken
during February-March if irrigation is given after first cutting of crop in September -
October.
i) Intercultural Operation: In the first year of plantation weeding, mulching and
earthing up operation are done for proper establishment and growth of the crop. Once
the crop is established, weeds are kept under check due to thick and dense shoot cover
in the field. From the second year onwards single weeding as interculture operation
may be needed for proper growth of the perennial raton crop.
j) Plant Protection: Sabai is remarkably a disease free crop. Infestation of pests and
diseases are not so occurred. The Sabai growers of study Blocks usually do not adopt
any plant protection measure. Termites sometimes attack Sabai grass in arid region. It is
reported that leaves spot disease attacks standing crop in rainy season with little effect
on plant itself.
k) Harvesting: One crop cutting is done during September –October, when the crop is
grown under rainfed condition. But two crop cuttings may be done if the grass is grown
under irrigated condition. The perennial crops continue to give yield upto 10 to 12 years
of plantation though yield diminishes gradually from the seventh year of its plantation.
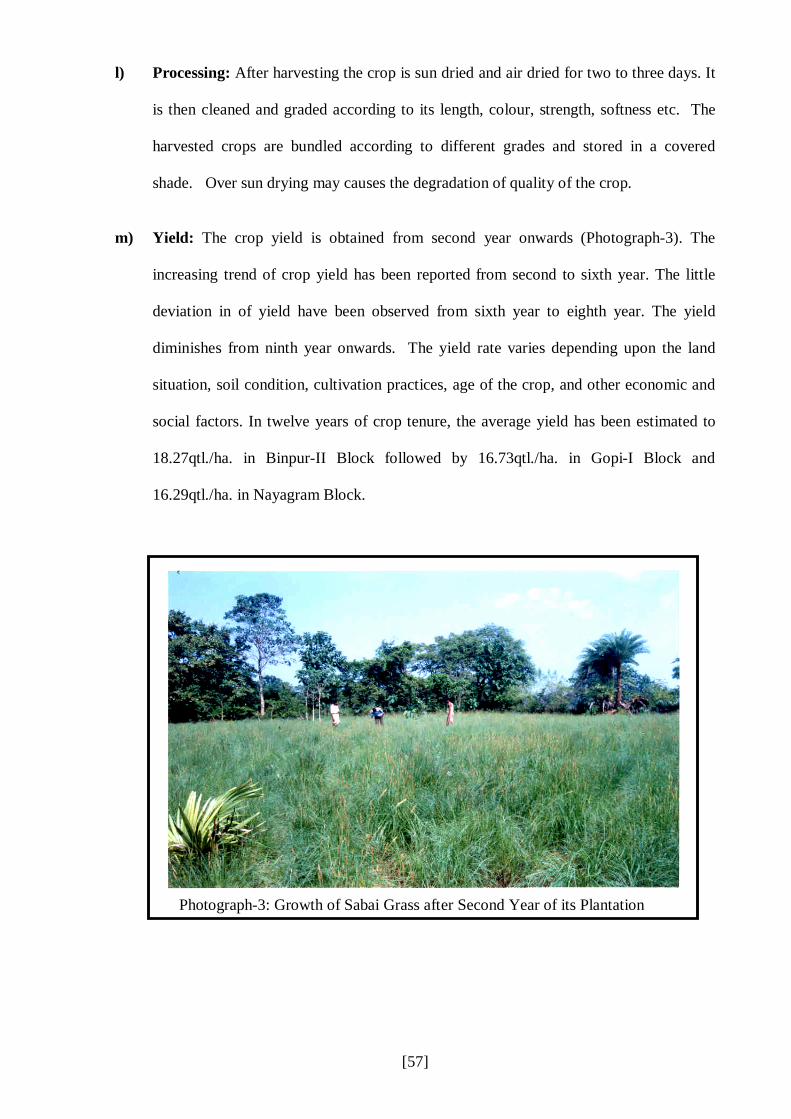
[57]
l) Processing: After harvesting the crop is sun dried and air dried for two to three days. It
is then cleaned and graded according to its length, colour, strength, softness etc. The
harvested crops are bundled according to different grades and stored in a covered
shade. Over sun drying may causes the degradation of quality of the crop.
m) Yield: The crop yield is obtained from second year onwards (Photograph-3). The
increasing trend of crop yield has been reported from second to sixth year. The little
deviation in of yield have been observed from sixth year to eighth year. The yield
diminishes from ninth year onwards. The yield rate varies depending upon the land
situation, soil condition, cultivation practices, age of the crop, and other economic and
social factors. In twelve years of crop tenure, the average yield has been estimated to
18.27qtl./ha. in Binpur-II Block followed by 16.73qtl./ha. in Gopi-I Block and
16.29qtl./ha. in Nayagram Block.
Photograph-3: Growth of Sabai Grass 2nd Year of its Plantation Photograph-3: Growth of Sabai Grass after Second Year of its Plantation

[58]
3.5. Detail Analysis of Cost of Various Inputs Used in Sabai Cultivation
After having feedback from the farmers in three different Blocks and on personal
observation at the time of field survey, it is accounted that the growth rate or yield varies
from one Block to other and from one year to other year basis. But assessment of the actual
per year yield is very difficult to estimate. Some of the framers are unable to remember the
particular year of plantation. When the questions are asked about the cost of plantation, some
of respondents were not able to response properly because the plantation was done by his
father or grandfather long years back.
Remembrance of actual cost of plantation of old established crop was not possible for
most of the respondents. But on the basis of feedback received from some of the growers an
attempt had been made to find out the average per year cost of production per hectare. The
cost of establishment of crop varies depending upon the kind of inputs used in cultivation.
Since it is a long term crop, the cost of cultivation, post harvest expenses and yield etc. are
seen to be varied in different crop years. To assess the economic viability of cultivation of
Sabai, the cost and return calculation has been done for 12 (twelve) years since its plantation.
The cost of Sabai cultivation is mostly influenced by utilisation of number of hired
labour, unpaid family labour and exchanged labour. The cost of establishment of crop in the
first year includes different input costs like root slips, manure (FYM), fertiliser, manpower,
tillage operation and tools & tackles etc. According to the physical inputs used by the
growers, the costs are divided into different categories. The actual per hectare direct cost or
cash cost and imputed value of non cash cost, mainly family labour cost over a period of
twelve years have been calculated and discussed here.
Sabai cultivation is mainly labour oriented work. This section contains the detail
investigation of average labour requirement and the cost of employment of male and female
labours in various activities from the period of plantation to maintenance and harvesting in

[59]
twelve years crop tenure. Two types of labour engagement have been found in Sabai
cultivation. First one, is the hired labour and other one is the family labour. Due to inadequate
employment opportunities in agriculture sector on regular basis in the study areas, in most of
the cases, the family members utilise their idle man days in Sabai cultivation and as such the
family labour-input in Sabai cultivation may be treated as non-cash implicit cost. Most of the
poor and marginal farmers utilise their family labour for cultivation, harvesting, post harvest
management and transport instead of hired labours.
The family labour engagement in cultivation and harvesting work is treated as value
addition which in another sense is the existing wage earning of the family members. So here
value addition of the family having one hectare of land is the total value of family labour cost
incurred for entire twelve years. The hired labour charge varies from place to place and year
to year and consequently influences the cost of production. Input wise analysis indicates that
the manual labour cost accounts for major share of cost cultivation. To understand the
dimension of labour employment and the cost incurred on cultivation activities, the labour
cost was broadly classified under six heads namely a) labour cost for fencing of grass field, b)
labour cost for land preparation, ploughing and weeding, c) labour cost for digging of pits, d)
cost of planting, e) cost of maintenance and intercultural operation and f) cost of harvesting.
Average per hectare labour employment over a period of twelve years is around 54.4 man
days.
The average per hectare cost of establishment of Sabai crop grown by selected farmers
has been workout and presented in Table 3.2.a for Nayagram, Gopiballavpur-I Block and in
Table 3.2.b. for Binpur-II Block. It is observed that the average total cost of establishment in
first year is accounted to be Rs.9,650.00/ha. in case of Nayagram and Gopi-I Block and
Rs.8,115.00/ha. in Binpur-II Block. The total fixed cost is worked out to be Rs.4, 590.00 for
Nayagram and Gopi-I and Rs.3, 990.00 for Binpur-II Block. In other words the total fixed
cost is amounted to be 47.56 percent to total establishment cost in Nayagram and Gopi-I

[60]
Block and 49.17 percent in Binpur-II Block. The share of variable cost (manual labour cost)
to the total establishment cost is worked out to be Rs.5, 060.00 in Nayagram and Gopi-I
Block and Rs.4, 125.00 in Binpur-II Block.
Table 3.2. (a):Average Cost of Establishment of Sabai in one hectare of Land in
First year by the Selected Farmers in Nayagrm & Gopiballavpur-I Block
(A) Fixed Cost: Amount
(in Rs.)
% to Total
Cost
i) Root slips (15,000 nos. @ Rs. 0.15 each*) 2,250.00 23.32
ii) Farm Yard Manures (FYM) (in cart load)
(8 cart load @ Rs. 90.00* each) 720.00 7.46
iii) NPK-Fertiliser (in kg.) (50kg @ Rs.3.00/kg*) 150.00 1.55
iv) Simple Tools & Tackles (in nos.)
a) Hand Hoes (4 nos. @ Rs. 120.00* each) 480.00 4.97
b) Grass Sickles (6 nos. @ Rs. 15.00* each) 90.00 0.93
v) Country Plough (15 hired bullock labour @ Rs.60.00*
each) 900.00 9.33
Total-A 4,590.00 47.56
Variable Cost: (Labour Charges)
vi) Fencing of Sabai field
(20 Family labour days @ Rs.40.00*/day) 800.00 8.29
vii) Land Preparation: Weeding, Cleaning and Sowing
(15 Family labour days @ Rs.40.00*/day) 600.00 6.22
viii) Digging of Pits/Root-bed (18 Hired labour days &
32 family labour days @ Rs.40.00*/day) 2000.00 20.73
ix) Planting (28 Hired labour days @ Rs.45.00*/day) 1260.00 13.06
x) 2nd Weeding (10 Family labour days @ Rs.40.00*/day) 400.00 4.15
Total-B 5,060.00 52.44
Total Cost (A+B) 9,650.00 100.00
Source: Primary Survey (*at 2004 Price)

[61]
Out of the total establishment cost in Nayagram and Gopi-I Block, manual labour
(variable cost) constitutes maximum share of 52.44 percent followed by planting materials
(root slips) 23.32 percent, manure 7.46 percent, fertiliser 1.55 percent, tools and tackles 5.91
percent and country plough operation cost 9.33 percent. In case of Binpur-II Block out of
total establishment cost of first year crop raising, the manual labour cost (variable cost)
constitute maximum share of 50.83 percent followed by planting materials (root slips) 22.18
percent, manure 8.87 percent, fertiliser 1.85 percent, tools and tackles 7.02 percent and
country plough 9.24 percent. The detail cost of cultivation is discussed below.
Table 3.2.(b):Average cost of establishment of Sabai in one hectare of land in First year by the selected farmers in Binpur-II Block
Sl. no. (A)Fixed Cost: Amount (in Rs.)
% to Total Cost
i) Planting Materials (Slips in nos.) (15000 nos. @ Rs. 0.12* each)
1800.00 22.18
ii) Farm Yard Manures (FYM) (in cart load) (8 cart load @ Rs. 90.00* each)
720.00 8.87
iii) NPK-Fertiliser (in kg.) (50kg @ Rs.3.00/kg*) 150.00 1.85 iv) Simple Tools & Tackles (in nos.)
a) Hand Hoes (4 nos. @ Rs. 120.00* each) 480.00 5.91 b) Grass Sickles (6 nos. @ Rs. 15.00* each) 90.00 1.11
v) Country Plough (15 hired bullock labour @ Rs.50.00* each)
750.00 9.24
Total-A 3,990.00 49.17 (B)Variable Cost: (Labour Charges)
vi) Fencing of Field (20 Family labour @ Rs.35.00*/Day)
700.00 8.63
vii) 1st Weeding and Cleaning (15 Family labour @ Rs.35.00*/Day)
525.00 6.47
viii) Digging of Pits/Root-bed (18 hired labour and 32 family labour @ Rs.35.00*/Day)
1750.00 21.57
ix) Planting (20 hired labour @ Rs.40*/Day) 800.00 9.86 x) 2nd Weeding (10 Family labour @ Rs.35.00*/Day) 350.00 4.31
Total-B 4,125.00 50.83 Total Cost (A+B) 8,115.00 100.00
Source: Primary Survey (*at 2004-2005 Price)

[62]
a) Cost of Land Preparation-Ploughing and Weeding
For first year of plantation, certain land preparation procedures are followed to ensure
long term benefit of the crop. The land preparation is done before transplantation of
root slips. Land preparation includes ploughing, levelling, weeding, manuring, etc.
Weed control is important in Sabai cultivation because the unwanted weeds reduce the
yield. Land preparation is done by own or hired country plough and 6″ x 9″ pits are dug
at a distance of 3ft row to row and 2.5ft plant to plant. In improved cultivation practice
very few middle and big farmers use farm machinery and equipments like Tractors or
Power-tillers in land preparation. It is important to note that 15 nos. of country plough
are employed per hectare of land @ Rs. 60.00 and Rs.50.00 per ploughing with an
amount of Rs. 900.00 and Rs.750.00 per hectare in Nayagram, Gopi-I (Table3.2.a, sl.
no. v.) and Binpur-II Block (Table 3.2.b, sl. no. v.) respectively.
After ploughing and levelling, the weeding and pit makings operations are done by own
or hired labour. The second weeding is done after 2 to 3 months of plantation. Normally
the weeding is done by female members of the family. Fifteen (15) nos. of family
labour days are required to be employed for weeding, cleaning, and sowing of one
hectare of land. One weeding is given during intercultural operation in July –August,
normally after rainfall and in moist condition of soil. The cost of labour per hectare of
weeding is accounted to be Rs. 600.00 in Nayagram and Gopiballavpur-I (Table 3.2.a,
sl. no. vii.). and Rs. 525.00 in Binpur-II Blocks (Table 3.2.b, sl. no. vii.). The average
casual labour charge was Rs.40.00/day in Nayagram and Gopiballavpur-I and
Rs.35.00/day in Binpur-II Block. The productivity of labour was more or less same in
the above mentioned three Blocks but the rate of labour wage changes year to year due
to the local demand and increased market price.

[63]
b) Cost of Fencing
Fencing is most commonly done by using bamboos and wood collected from the forest
area. The cost of temporary vegetative fencing with wood and bamboo sticks is almost
zero when home labour is engaged. Labour cost has been accounted only for
calculating the cost of cultivation. About twenty (20) family man days were employed
for fencing about 1 ha of crop land. The total imputed cost of family labour for this
purpose is accounted to be Rs.800.00 for Nayagram and Gopiballavpur-I (Table 3.2.a,
sl. no. vi.) and Rs.700.00 for Binpur-II Block (Table 3.2.b, sl. no. vi).
c) Cost of Digging of Pits
Diggings of pits are done after land preparation and weeding of field. One labour could
dig 300 pits a day i.e. 50 man days are required for digging of 15000 pits for one
hectare of land. Out of total 50 nos. of labour days, about 18 are hired labour and rest
32 are considered home labour. Slips are planted into 12cm to 15cm deep in the pits.
After planting, the moist soil around the slips is pressed gently by hand and made
levelled. Total cost of digging the pits by employing 18 hired labours and 32 family
labours was accounted to be Rs. 2000.00 in Nayagram and Gopiballavpur-I Blocks
(Table 3.2.a, sl. no. viii.). and Rs. 1750.00 in Binpur-II Block (Table 3.2.b, sl. no. viii.).
d) Cost of manure and fertiliser:
Farm yard manure (FYM) is applied in the pits before plantation. Every pit is filled up
with average 0.4 kg of FYM to increase the soil fertility vis-a-vis plant nutrients.
Approximate 8 cart-loads or 12 quintals of FYM are required for one hectare of land.
Taking price of one cart load of FYM to be Rs.90.00 the cost of manual for 1 hectare of
land i.e. Rs. 720.00 was incurred towards purchase of FYM. Split doses nitrogenous
fertiliser like urea is applied two times in the field, one as top dressing after 40-45 days
of plantation and another after 80 to 90 days in first year of plantation. The price is
taken as of urea Rs. 3/kg. So the total cost of 50 kg fertiliser is estimated to be around
Rs. 150.00/ha. (Table3.2.a & Table3.2.b, sl. no. iii).

[64]
e) Cost of root slips and planting:
The planting material or root slips, locally known as ‘Mura’ are collected or purchased
from the old Sabai grass land. The slips are planted in pits which are 12- 15 cm deep.
The row to row and plant to plant spacing is maintained approximately 90cm.x60cm.
Approximately 3000‘Murah’@ Rs. 0.75/‘Murah’ i.e. Rs.2, 250.00 is required to plant
in 10000 sqm. (1 ha.) area. One ‘Murah’ is splited into 5 root slips and so 300 ‘Murah’
is required for planting in 15000 pits. In Nayagram and Gopiballavpur-I Block, the
price of one ‘Murah’ is around Rs. 0.75 and so the cost of one root slip per pit is
Rs.0.15. But in Binpur-II Block, rate of slips is found to be comparatively cheaper than
other Blocks and the cost is around Rs.0.12 for one root slip per pit and the total cost of
planting material comes to Rs.1800/ha. Planting of Slips is the most important phase in
the new establishment of crop land. Mistakes at this stage may lead to a poor survival
rate of plants, regardless of the effort given during the land preparation phase.
Reasonable care and management after planting increase the survival rate of newly
established Slips. Skilled and experienced labour is required to be engaged in planting
of new root-slips in the field. On an average 28 nos. and 20 nos. of man-days were
engaged in Nayagram, Gopi-I Blocks and Binpur-II Block respectively with an average
per day labour rate of Rs.45.00 in Nayagram and Gopiballavpur-I and Rs. 40.00 in
Binpur-II Block. The total planting cost is calculated to be Rs.1260.00 per ha in
Nayagram and Gopiballavpur-I (Table3.2.a, sl.no.ix) and Rs.800.00 per ha in Binpur-II
Block (Table3.2.b, sl. no.ix) at the initial stage.
f) Maintenance
The regular and timely maintenance of crop is required in first two years of plantation
but from the third year onwards nominal maintenance cost may be accounted for.
Mainly weeding is done in the monsoon season. From the second year to eleventh
year, on an average two labours are required to be engaged for weeding operation in
one hectare of land. Average per year cost of weeding is around Rs. 219.50/ha. in

[65]
Nayagram and Gopiballavpur-I and Rs.205.50/ha. in Binpur-II Block (Table 3.3, sl no
viii.b.).
Table 3.3: The Structure of Different Cost and their Components in a Hectare of Sabai Cultivation
Sl no. A-Explicit Cost (Cash Cost)
Nayagram Amount (in Rs.)
Gopi-I Amount (in Rs.)
Binpur-II Amount (in Rs.)
Average of three Blocks (in Rs.)
% to total cost
i) Value of Root Slips 2250.00 2250.00 1800.00 2100.00 5.30
ii) Value of Manures (FYM) 720.00 720.00 720.00 720.00 1.82
iii) Value of fertiliser 150.00 150.00 150.00 150.00 0.38
iv) Value of tools and tackles 570.00 570.00 570.00 570.00 1.44
v) Value of hired manual labour in plantation
1980.00 1980.00 1430.00 1830.00 4.62
vi) Value of hired Country Plough 900.00 900.00 750.00 850.00 2.15
vii) Transport expenses 2037.00 2037.00 2037.00 2037.00 5.15
Total-A 8607.00 8607.00 7457.00 8257.00 20.86 B-Implicit Cost (Non Cash Cost)
viii) Imputed value of family labour
a) Crop Plantation (1st Year) 3,080.00 3,080.00 2,695.00 2,952.00 7.46
b) Maintenance for 10 years 2195.00 2195.00 2055.00 2148.00 5.43
ix) Harvesting cost for 11 years 33,662.00 34,250.00 35,894.00 26,230.00 66.26
Total-B 38,937.00 39,525.00 40,644.00 31,330.00 79.14 Total Cost (A+B) 47,544.00 48,132.00 48,101.00 47936.00 100
Source: Computed from Primary Data
g) Cost of Harvesting:
Sabai is not usually harvested in the first year of plantation due to its negligible yield
and shorter length. The first harvesting is usually done from the end of August to
September of 2nd crop year. First harvesting in any year is done generally after
monsoon and second harvest is done in late Winter depending upon the types of land
and soil, crop management system and rain fall. Generally the 70% of the yield is

[66]
0
5.468.45
14.85
20.83
31.06 29.77 28.67
21.96
17.1314.43
12.53
0
5
10
15
20
25
30
35
1st yr 2nd yr 3rd yr 4th yr 5th yr 6th yr 7th yr 8th yr 9th yr 10th yr 11th yr 12th yrYield (in Qtl.)
obtained from the first harvest in monsoon season. From second to fourth year of
plantation, generally cutting is done once a year and from the fifth year onwards two
cuttings are done. On the basis of information collected from local farmers and
personal enquiry, the highest quantity of yield is obtained in the 6th crop year and this
continues till the 8th crop year. After that the yield decreases gradually over the years.
The trend of changing yield over 12 years period is presented in fig. 3.1
Figure 3.1: Year-Wise Average Yield of Sabai Grass in 12 yrs. of Crop Tenure
Source: Primary Data
In the 6th year the yield has been estimated to be 31 qtls./ha. More or less
same yield is obtained in respect of 7th and 8th year’s crop. But from the ninth year
onwards yield of grass decreases. As per the information collected from the farmers
confirms that yield goes down by 5% to 15% every year starting from the ninth year
onwards. The crop survives for a prolonged period upto 18-20 years. Some of the
grass lands of the study areas were found very old. The cultivators are often not able
to remember the actual age of the crop or in which year the plantation was actually
done. The annual average yield of crop is estimated to be 18.65 quintals/ha. Out of
493 nos. of manual labour for cultivation, 342 nos. (i.e. 69.37 percent) of the total
manual labours are required for harvesting, drying, cleaning and processing of grass
for the total period of eleven years. One labour can harvest, dry and clean around
0.60 quintal of grass in a day. In harvesting activity, farmers generally employ home

[67]
labour or sometimes they hire labours from their neighbours or nearby areas. In such
cases the farmers pay the labour charges in exchange of harvested crop. Due to
scarcity of ready cash, labour charges are paid through crop exchange. 25% of the
total harvested crop is normally taken by the hired labours as the labour charges. The
average cost of such exchanged labour for harvesting is estimated to be
Rs. 2,190.00/ha per year (Annexure-3.I). Farmers utilise hired labour mainly for
plantation purpose in the first year. From the second year onwards, family labour is
engaged for crop maintenance and the exchanged labours are engaged for harvesting
purposes. Being a rain fed crop, no irrigation charges have been added against sabai
cultivation at the time of cost calculation. Sabai growers are to spend on an average
Rs. 33,662.00/ha, Rs.34,250.00/ha. and Rs.35,894/ha in Nayagram (Annexure-3.II.a),
Gopiballavpur-I (Annexure-3.II.b) and Binpur-II Blocks (Annexure-3.II.c)
respectively in eleven years as labour cost for the purpose of harvesting. The farmers
of Binpur-II Block have had the advantage of cheaper labour rate. On an average the
selected Sabai growers incurred Rs.3,146.00/ha. towards harvesting on an of average
205 qtl. Sabai grass per year. The calculation of home labour costs in the three
selected Blocks are shown in the annexures. The average costs of cultivation of the 3
Blocks for crop plantation, crop maintenance and crop harvesting are represented in
the figure no. 3.2.
Fig. 3.2: Proportion of Various Input Cost of Sabai Cultivation.
Cost of Crop PlantationRs.9,138
20%Cost of
MaintenanceRs.2,148
5%
Cost of HarvestingRs.34,588
75%
[68]
3.5.1 Status of Wage Employment and Value Addition by way of Employing Family Labour:
On an average 493 man days are generated from one hectare of Sabai cultivation over
the total period of 12 years. Out of these labour days 123 nos. i.e. around 25 percent is
utilised for crop establishment, 28 nos. i.e. around 6 percent for crop maintenance during the
yielding years and rest of the 342 nos. i.e. around 69 percent labour days are utilised for
harvesting and post harvest management purposes. Sabai growers engage about 455 nos. of
home labour and 38 nos. of hired labour when specialised skills are required to be employed.
It is may be observed from the table no: 3.4 that around 92 percent of the total labour force
are supplied from farmers family. On an average about 41 man-days of employment per year
are generated from one hectare Sabai cultivation.
Table 3.4:Average Number of Labour-Days Generated from One Hectare of Sabai Cultivation in Twelve Years Tenure.
Particulars
Labour Days Total
Labour Days
(in nos.)
Hired Labour (in nos.)
Home Labour (in nos.)
i. Fencing of Grass Field - 20 20 ii. Land Preparation- Weeding, Cleaning &
Sowing: - 25 25
iii. Digging of pits: 18 32 50 iv. Slips Planting: 20 8 28 v. Weeding & Crop Maintenance (for 11 Years): - 28 28 vi. Harvesting, Drying & Cleaning (Average for
11 years for 3 Blocks): Nayagram: 326 Labour Days Gopi-I: 335 Labour Days Binpur-II: 365 Labour days
- 342 342
Total 38(8%) 455(92%) 493(100%) Source: Primary Survey
It is already mentioned earlier that family members utilised their idle man days in
Sabai cultivation and other Sabai based activities. The average gross value added is estimated
to be Rs. 3,255.00/ha., Rs.3, 420.00/ha. and Rs.3, 617.00/ha. per annum in Nayagram, Gopi-I

[69]
and Binpur-II Block respectively. The Block wise and year wise specific number of Home
Labour Days engaged and corresponding value addition from 1.0 ha of Sabai growing land
are presented in Table no. 3.4.a. So a family having one hectare of Sabai cultivation can be
able to earn an estimated amount of Rs. 3,500.00 per annum employing them on their own
Sabai land. In other sense it is the value of self labour employment in cultivation purpose.
3.5.2 Annual Productivity and Per Unit Cost of Cultivation
The Sabai plant started yielding from second year onwards. Yield and plant growth
also depends on reasonable monsoon, weed control and soil management. From the fourth
year, the plant becomes mature enough and start giving higher yield. The highest grass yield
has been obtained from sixth year to eighth year. From the ninth year, the yields gradually
decrease and consequently return from sale of the crop decreases. The quantity of production
and gross return from crop has been calculated for three different Blocks (Annexure-3.III).
It is reported by the farmers, that the plants can give yield till sixteen to seventeen
years, but for better economic viability, new plantation is preferred after twelfth crop year.
From the 13th crop year onwards extraction is not economically viable because yield of grass
significantly decrease. Detailed undiscounted and discounted cost and return of Sabai
cultivation are worked out and presented in the Annexure: 3.IV.a to 3.IV.f. The result of the
cost analysis indicates that the total cost of cultivation of Sabai ranges between
Rs.47,000.00/ha. to Rs.48,500.00/ha.(Table3.3). The average cost of production per quintal of
Sabai is calculated to be Rs.243.25, Rs.239.75, Rs.219.46 in Nayagram, Gopi-I and Binpur-II
Block respectively (Table 3.5).
Table 3.5: Average Annual Productivity and Per Unit Cost of Production
Sl no Particulars Nayagram Gopi-I Binpur-II
i. Total Cost of Cultivation/ha. (in Rs.) 47,544.00 48,132.00 48,101.00 ii. Total Yield in 12 years/ha. (in Qtl.) 195.45 200.76 219.18 iii. Average Yield Per Year/ha. (in Qtl.) 16.29 16.73 18.27 iv. Cost of Cultivation Per Quintal (in Rs./ha.) 243.25 239.75 219.46
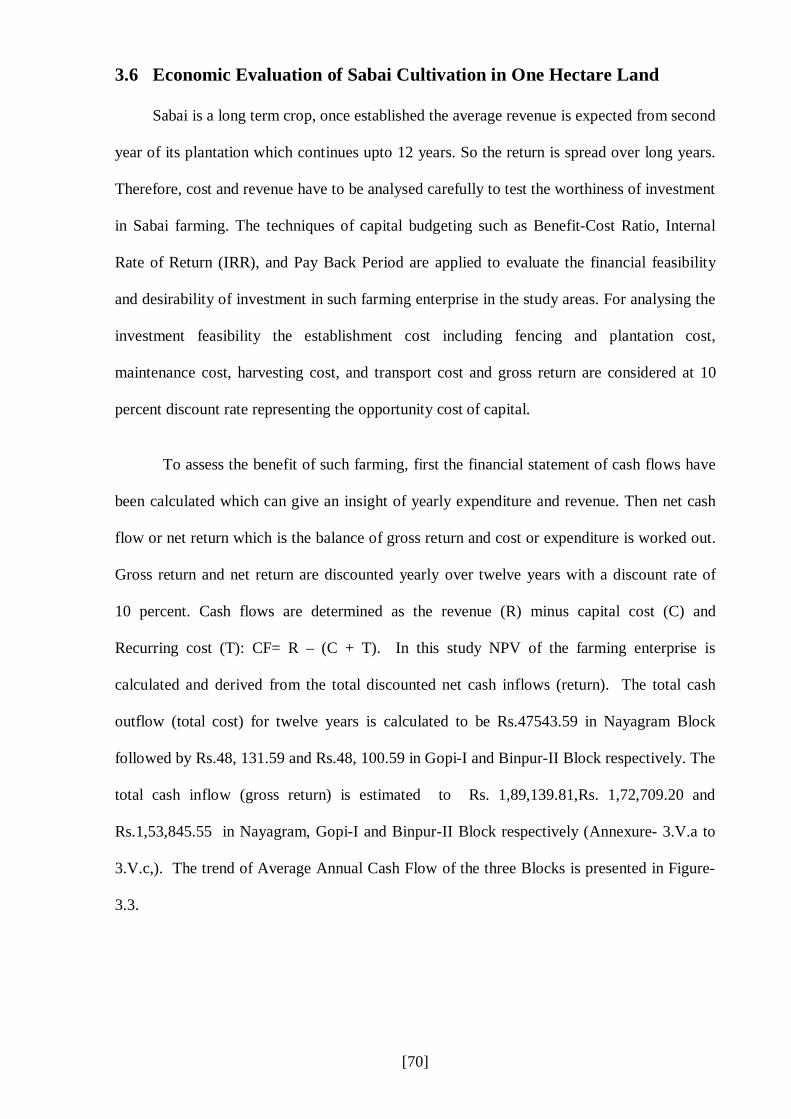
[70]
3.6 Economic Evaluation of Sabai Cultivation in One Hectare Land Sabai is a long term crop, once established the average revenue is expected from second
year of its plantation which continues upto 12 years. So the return is spread over long years.
Therefore, cost and revenue have to be analysed carefully to test the worthiness of investment
in Sabai farming. The techniques of capital budgeting such as Benefit-Cost Ratio, Internal
Rate of Return (IRR), and Pay Back Period are applied to evaluate the financial feasibility
and desirability of investment in such farming enterprise in the study areas. For analysing the
investment feasibility the establishment cost including fencing and plantation cost,
maintenance cost, harvesting cost, and transport cost and gross return are considered at 10
percent discount rate representing the opportunity cost of capital.
To assess the benefit of such farming, first the financial statement of cash flows have
been calculated which can give an insight of yearly expenditure and revenue. Then net cash
flow or net return which is the balance of gross return and cost or expenditure is worked out.
Gross return and net return are discounted yearly over twelve years with a discount rate of
10 percent. Cash flows are determined as the revenue (R) minus capital cost (C) and
Recurring cost (T): CF= R – (C + T). In this study NPV of the farming enterprise is
calculated and derived from the total discounted net cash inflows (return). The total cash
outflow (total cost) for twelve years is calculated to be Rs.47543.59 in Nayagram Block
followed by Rs.48, 131.59 and Rs.48, 100.59 in Gopi-I and Binpur-II Block respectively. The
total cash inflow (gross return) is estimated to Rs. 1,89,139.81,Rs. 1,72,709.20 and
Rs.1,53,845.55 in Nayagram, Gopi-I and Binpur-II Block respectively (Annexure- 3.V.a to
3.V.c,). The trend of Average Annual Cash Flow of the three Blocks is presented in Figure-
3.3.

[71]
-12000-10000
-8000-6000-4000-2000
02000400060008000
10000
1 2 3 4 5 6 7 8 9 10 11 12Rs.
Fig.3.3: Annual Cash Flow for Sabai Cultivation (Average of three Blocks)
Discounted Cost (in Rs.) Discounted Return (in Rs.)
The differences in net return among the three Blocks have been caused due to variation
in yield and market price of the crop. Though the crop yield in Binpur-II Block is higher than
other two Blocks, the quality of the grass is not better in than other Block and hence the price
of the grass here is comparatively lower than Nayagram and Gopiballavpur-I Blocks. Inter
Block cost-return compression indicates that the per quintal grass gives return to the farmers
of Nayagram Block is around Rs.724.46, Gopiballavpur-I Rs.620.53 and Binpur-II
Rs. 482.46. The undiscounted average net return per hector per year on the basis of 12 years
cultivation has been found to be Rs.11, 800.00 in Nayagram, Rs.10, 382.00 in Gopiballavpur-
I and Rs. 8,812.00 in Binpur-II Block.
The discounted cost of plantation is found to be Rs.29, 730.30, Rs.30, 110.07 and
Rs.29, 145.00 in Nayagram, Gopi-I and Binpur-II Block respectively (Annexure-3.VI). The
discounted benefits realised in 12 years is Rs.94,864.00, Rs.87,480.50 and Rs.76,025.07 with
a discounted net return of Rs.65,133.71, Rs.57,370.42 and Rs.46,879.3 in Nayagram, Gopi-I
and Binpur-II Block respectively. To test the profitability and economic viability of Sabai
cultivation, the input-output ratio or benefit-cost ratio have been worked out. The ratio
indicates that in one rupee investment over the whole crop tenure, farmers get return of Rs.
3.19, Rs.2.91 and Rs.2.61 in Nayagram, Gopi-I and Binpur-II Block respectively. Sabai
cultivation is found to be profitable and economically viable in 12 years tenure. Farmers of

[72]
Nayagram could realise good return than Gopi-I and Binpur-II. This remarkable difference is
observed due to lower profit margin and lower market price of the crop in the latter two
Blocks.
The Net Present Value (NPV) is used to determine the overall financial performance of
Sabai cultivation. The NPV of Sabai cultivation of a hectare of land is estimated to be
Rs. 65,133.71, Rs.57, 370.42 and Rs.46, 879.38 in Nayagram, Gopi-I and Binpur-II Block
respectively. Since the net present value is positive it is inferred that there is higher
possibility of generating significant return from one hectare of Sabai cultivation. So Sabai
farming in one hectare of land with existing state of cost and return structure is economically
viable and effective.
Payback period is the amount of time required to recover the original investment in the
project. The cut-off period for 10 percent cost of capital is 8 years. It is inferred from the
Table 3.8 that the Pay-Back period of Sabai cultivation was 3.3 yrs in Nayagram Block and
3.4 yrs and 3.6 yrs in Gopi-I and Binpur-II Block respectively. As the pay-back period is less
than the assumed cut-off period of 5 years, it is decided that Sabai cultivation is economically
viable.
Table 3.8: Financial Feasibility of Investment in Sabai cultivation/ha. in Study area
Particulars Nayagram Gopi-I Binpur-II Average i) Undiscounted Cost (in Rs.) 47,543.59 48,131.59 48,100.59 47,925.26 ii) Undiscounted Gross
Return (in Rs.) 1,89,139.81 1,72,709.20 1,53,845.55 171,898.19
iii) Undiscounted Net Return 1,41,596.22 1,24,577.61 1,05,744.96 123,972.93 iv) Discount Rate 10% 10% 10% 10% v) Discounted Cost (in Rs.)* 29,730.30 30,110.07 29,145.87 29,662.08 vi) Discounted Gross Return*
(in Rs.) 94,864.01 87,480.50 76,025.25 86,123.25
vii) NPV of Cash Flows* (Discounted Net Cash Flow) (in Rs.)
65,133.71 57,370.42 46,879.38 56,461.17
viii) Internal Rate of Return(IRR) 54% 52% 49% -
ix)Pay Back Period 3.3 Yrs 3.4 Yrs 3.6 Yrs - x) Benefit Cost Ratio 3.19 2.91 2.61 -
Source: Calculated from Primary Data

[73]
Internal rate of return is an estimate of the rate of return of the project. If the IRR of a
project is greater than or equals to the project cost of capital, the investment in the project is
acceptable. In this study the cost of capital has been taken as 10 percent. It is evident from
the table 3.8 that the IRR is 54 percent in Nayagram Block and 52 percent and 49 percent in
Gopi-I and Binpur-II Block respectively. These are the maximum rate of interest which a
farming system affords to pay on the capital invested. So the investment in Sabai farming is
economically viable and can lead to an acceptable project because IRR is greater than
opportunity cost of capital i.e. 10 percent in all the study Blocks.
Nayagram and Gopiballavpur are adjacent Blocks and inter Block marketing network
has been developed through rural periodic markets and local wholesalers and agents. The
growers, agents, middlemen of Gopiballavpur-I transact business with Negui and Baligeria
market of Nayagram Block to have better price. Better crop price is offered in the Baligeria
market than any other markets of study area. The growers of Saria Gram Panchyat of
Gopiballavpur-I often cross the West Bengal Border and enter into the Baripada District of
Odisha State to sale their produce to get better price than West Bengal. It is reported by the
growers that market price of grass is always higher in markets of Odisha than any other rural
market of rural West Bengal due to market demand and better marketing linkage.
It is observed that value addition from Sabai cultivation remains in the range of
Rs.12,000.0 to Rs.15,000.00 per year per hectare approximately (including the value added in
the form of home labour engagement) which indicates that majority of cultivators are living
below poverty level. Though some of them might attain the APL category with their
additional labour in rope making and craft making for raising their income at- least to the
extent of Rs.30,000 per family per year. Productivity analysis of Sabai cultivation confirms
that the above level of value addition could be reached when the holding size of the farm is
above 2.5 ha. which is never attainable. It may be recalled here that the average land holding
of the families under Sabai cultivation is 0.16 ha. on an average in the entire study area. Thus
[74]
it is clear that cultivation alone as a separate activity cannot help sustaining the livelihood of
the Sabai dependent families as is the situation now. It is also indicative that Sabai culture
with its multi-directional activities like cultivation, rope making, processing, craft making
and fabricating other utility items including marketing, organisation building and
institutionalisation of the entire effort only can bring a bright future in this venture.
[75]
Chapter-IV
Rope Production: Costs, Benefits and Profitability
4.0 Introduction:
The study area being identified as hot dry sub humid rain fed area with constrained
soil characteristics, the agro based cereal crop farming has not been developed yet upto the
desire level. Scanty irrigation facilities have further restricted the scope of raising
horticultural and floricultural crops. Rampant deforestation due to anthropogenic factors and
large scale extraction of muram, laterite, boulders and stones have further caused degradation
of landscape and made the areas unfavourable for normal crop cultivation and allied
activities. As such employment and income generation through agro based farming and
allied activities have been remarkably restricted. Due to the existing ecological situation and
lack of agro-based employment opportunities, the inhabitants are inclined to participate in
other self employment based activities like Sabai rope and crafts making, pottery, stone
carving, carpentry, moulding of leaf plates, bamboo crafts, etc. Among these various
household level activities, Sabai rope making, occupy a major part in livelihood generation.
Inhabitants from economically marginalised segment of the society of ‘Junglemahal’ area of
Paschim Medinipur District, especially those from the adjacent areas of Odisha and
Jharkhand States are traditionally skilled with Sabai rope twisting techniques. Thus Sabai
Rope Making has remained as an important source of livelihood generation, though not
always sustainable, for a large section of rural households over decades.
4.1 Quality-wise Use of Sabai Rope in Rural and Urban Setting:
In the study region Sabai Ropes are available in varied quality and standards. Mainly
the strength of the rope depends on the quality of grass and the twisting skill of workers.
Ropes have been categorised on the basis of thickness, color and strength. Artisan produce
rope mainly in three types, these are thin, medium and rough but the local traders after

[76]
collecting different categories of ropes from the producers, grade those into four quality
standards, viz. Grade-A, Grade-B, Grade-C and Grade-D. Thinner quality i.e. Grade-A rope
with yellow greenish color is treated as superior quality and locally popular as ‘VIP’ rope.
The next quality (Grade-B) of ropes is comparatively thicker than the previous one and
termed as Super Medium. According to the local traders and middlemen, Grade-A and
Grade-B quality of rope is quite similar in strength but only varies in colour and thickness. In
terms of quality and color, ‘VIP’ quality rope is more costly than other available standard.
The price varies between Rs.2000.00 to Rs.3000.00 per qtl. of first two grade of rope in the
local market. ‘VIP’ grade is used for weaving of traditional cot or ‘Charpoy’ and for
manufacturing furnitures and other modern decorative and utility craft items.
Grade-C quality of rope is commonly used as construction material in rural and urban
housing sector especially for the economically backward communities of the villages of
eastern and northern India. From time immemorial Sabai grass is used for thatching of roofs
and Sabai rope for binding of wood pools and tying of bamboo for construction of traditional
type of houses. Sabai rope is utilised to make a strong knot between bamboo splits and
thatched grass. Rural households treat Sabai rope as strong and long lasting binder when less
exposed to wet condition. Sabai grass is also mixed with mud to make it stronger and gripper
to construct mud plastered Katchha wall of the traditional houses. From the earlier days to the
present time Sabai grass is used as the supporting roof covering material along with straw,
palm leaf, burnt tiles, etc.
Sabai rope is used for weaving of ethnic cot or Charpoy/Manji which is treated as
popular furniture from ancient times and villagers are still inclined to use it today. The
Charpoy, derived from the word “Char Paya” in Persian meaning four footed portable bed
(Khan, 2011). In West Bengal Charpoy is called as ‘Khatiya’. In India wooden framed cot is
knitted with rope, made of from plant fibres like Sabai, Bhabar, Jute, Sisal etc. This cot is
used as seat as well as for bed to relax and sleep at night in the traditional society. This cot

[77]
can be moved to any place by a person easily because it has light weight and movable
features. The hand weaven bed is cheap, affordable and an important item in the lives of the
rural folk. The Charpoy are also placed in the road side hotels or ‘Dhabas’ where the truck
drivers used it to seat, take food and even to relax and sleep under the open shed and pay rent
to the hotel owners for this Charpoy. But now a days wooden framed Charpoy is converted
to iron frame and knitted with colourful nylon ropes though cheaper but not long lasting and
eco-friendly compared to those made of Sabai ropes. The local artisans made this cot from
locally available wood of the forest and weave it with good quality Sabai rope. It is reported
that 2kg to 3kg rope is required to weave a normal size cot. Two man days are required to
make the frame and one man day for knitting.
4.2 Rope Making as Primary Processing from Sabai.
Among several local resources which are cultivated or collected from the forest by the
surveyed population of the study region, Sabai grass has a leading position. Artisans from
tribal as well as from other backward caste communities use this grass for rope and utility
based crafts production. There are numerous expressions of craftsmanship found among these
artisans. The skill involved in creating Sabai objects are classified in two distinct forms. One
is common skill based crafts and another is high skill based technology driven crafts. The low
skilled based common artisans are primarily engaged in rope making while the semi skilled
artisans remain engaged in manufacturing common household utility products like traditional
cot (Charpoy), door mat, table mat, coaster etc. But the high skilled artisans manufacture
modern and high priced craft items like carpet, sofa set, shoulder bag, hat, fruit basket, food
basket etc.. Involvement of surveyed households in rope making is shown in table no-4.1.
Table 4.1: Productivity and Employment Situation of Rope Making Households
Sl no. Particulars Unit 1 No of surveyed HHs 330 2 No of HHs associated with rope making activity 286 3 Average Production /HH/Year (in qtl) 3.86 4 Average no of HH members engaged in rope making 3.46

[78]
Out of 330 nos of surveyed households, 13 are Sabai cultivator, 15
craftsmen, 141 are solely engaged in rope making, 109 both Sabai cultivation cum
rope making, 16 Sabai cultivator cum craftsmen, 15 rope maker cum craftsmen, 10 rope
maker cum trader and other 11 households remain engaged in cultivation cum rope making
cum crafts making. Out of the total 317 rope and crafts making households around 68 percent
belongs to Schedule Tribe community, 17 percent come from Schedule Caste Communities
and the rest 15 percent from Other categories. Rope twisting practices exclusively remained
with the tribal artisan groups like ‘Puran’, ‘Munda’, ‘Santhal’, ‘Lodha’, ‘Sabbar’ etc. Among
these ethnic groups, the artisans from the ‘Puran’ group are highly efficient and skilled in
making of thinner quality ropes which are locally popular as ‘VIP’ ropes. Rope makers of
Dolgram, Kurmipathra, Nagripada villages of Nayagram are famous for thinner quality rope
making. The average production of rope by a household is about 3.86 qtl. a year.
Workers of the home based rope making units are household members and the
average strength of the workers are on an average 3.44 nos. per family including fulltime and
part-time workers. Most of the family members actively participate in this household activity
during the off season of agricultural work though the same is carried out more or less
throughout the year. Rope making activity provides employment to about 87 percent of the
sampled households which indicates the largest sector of employment for the working group
irrespective of gender. Out of 534 sampled children surveyed, around 62 percent participate
in rope making activity.
Home based rope making activity is mainly dominated by women folk of the family.
This activity remains located in the house premises or in the places of congregations of
villagers. This activity involves entirely physical labour most commonly by family members.
It needs initial treatment of grass like drying, screening, grading etc. The rope is shaped and
made by hand twisting and thus it is treated as handcrafted products and producers are called
artisans. It is usually a hereditary practice and the skills of the workers are transferred from

[79]
parents to son or daughter or from the master to new learner. The rope making process is
discussed in nutshell with pictorial illustrations below.
Table 4.2: Process of Rope Making
Step
-1:
Moistening the grass
The grass is moistened to make it soft before hand
twisting of rope
Step
-2: 1st
twisting by
hand
Four to six grass strings are usually taken to
convert the grass into semi-finished rope using traditional hand twisting
technique.

[80]
Step
-3:
1st Drying
The ropes made by this process are dried in
sunlight by stretching it on paved floor or on
bitumen/moram road tying it on two ends with sticks
or on stone
St
ep-4
: 2nd Twisting
by “Gurru”
This semi-finished rope is further twisted by using traditional hand machine “Gurru” to make the rope
more tightened and stronger. This hand twister
is made out of old cycle ring and is priced at about
Rs.400.00 per piece.
Step
-5:
2nd Drying in Sunlight
This rope is dried once again in sunlight for 5-6
hrs
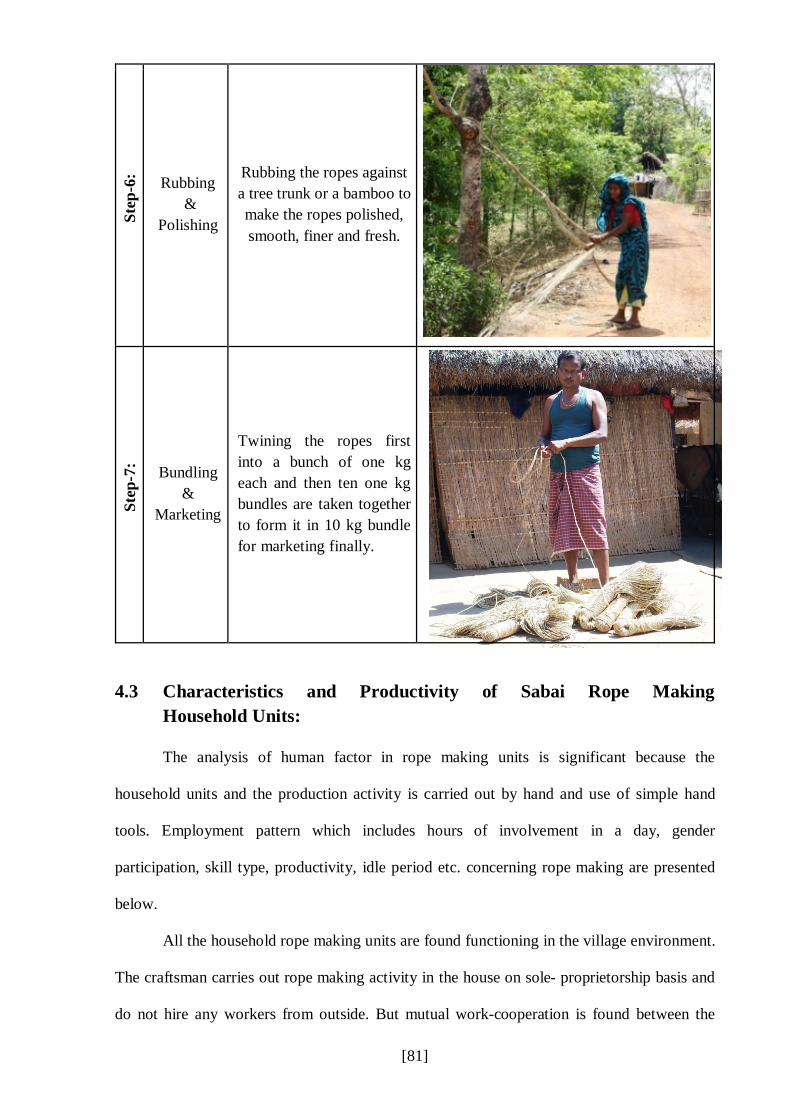
[81]
Step
-6: Rubbing
& Polishing
Rubbing the ropes against a tree trunk or a bamboo to make the ropes polished, smooth, finer and fresh.
Step
-7: Bundling
& Marketing
Twining the ropes first into a bunch of one kg each and then ten one kg bundles are taken together to form it in 10 kg bundle for marketing finally.
4.3 Characteristics and Productivity of Sabai Rope Making
Household Units:
The analysis of human factor in rope making units is significant because the
household units and the production activity is carried out by hand and use of simple hand
tools. Employment pattern which includes hours of involvement in a day, gender
participation, skill type, productivity, idle period etc. concerning rope making are presented
below.
All the household rope making units are found functioning in the village environment.
The craftsman carries out rope making activity in the house on sole- proprietorship basis and
do not hire any workers from outside. But mutual work-cooperation is found between the

[82]
families or processing units in the study area. The rope making process requires combination
of skills from hand twisting to ‘Gurru’ twisting, rubbing and smoothening, bundling and
marketing of products etc.. In the production process, family members assist each other to
give final shape from raw grass to finished rope. Full time craft workers are hardly found or
very meagre in number in some families. Maximum workers are part-time workers and it is
very difficult to find out the actual hours of working in a day due to their multiple
occupational structure. Women members work after performing their domestic
responsibilities. Rope makers residing near forests, collect forest resources in the morning
and remain engaged in rope making in the afternoon or in the evening. Out of the total 330
artisans, 317 are associated with rope making activity, of which 6.67 percent artisans (sl
no.3,5, 6 & 8 in table 4.3) are found working as full time workers and the rest are part-time
workers. The full-time workers are mainly high skilled artisans and they produce mostly
utility craft items and also rope only at times of high market demands of quality ropes.
Table No: 4.3 Nature of Work Participation in Sabai based Activities
Sl no Nature of Participation in Sabai Activities No of Artisan/Cultivator
Full-Time Part-Time 1 Sabai Cultivator - 13 2 Rope Maker - 141 3 Craftsmen 4 11 4 Sabai Cultivator cum Rope Maker - 109 5 Sabai Cultivator cum Craftsmen 4 12 6 Rope Maker and Craftsmen 6 9 7 Rope Maker cum Trader - 10 8 Sabai Cultivator, Rope Maker and Craftsmen 8 3 Total 22 308
Raw-material for rope making units is usually sourced locally or from neighbouring
villages. Sabai grass is one and only raw-material used in rope manufacturing units. It is
purchased from the local Haat or can be sourced from own farm or collect it from the
Government barren land or from the forest land as minor forest produces free of cost. But
none of the units had been found to be self dependent for meeting their full requirement of

[83]
raw-material (Sabai grass) for rope production. The average consumption of raw-material per
unit is around 4.23 qtls. per year. Around 28 percent raw grass is sourced from producer’s
own farm and rest 72 percent material is procured from the market.
Use of some simple hand tools like small knife, scissors, knitting hooks and pins etc.
are used in the production unit. Besides, ‘Gurru’ or locally fabricated Twister is used by
processors, which is usually available with a cluster of villagers used at each other’s
convenience. Rope which remains moisturised during twisting is usually sun-dried on open
roads or premises and before bundling it is rubbed against tree trunks for smoothening. Quite
small amount of fixed capital is required in the Sabai rope making units at domestic level.
Majority of the units arrange their nominal fixed and working capitals from their own
sources. Though traditionally such capitals used to be taken often from moneylenders or
advance purchasers, the practice is gradually fading out due to interventions by Panchayats,
NGOs, financial institution, local leaders etc. However a few cases of debt-traps are believed
to be occurring where money taken for craft making are known to be used for other purposes.
It is surprising to see that still now the system of ‘Bhatua’ is ongoing as a consequence of
such debt trap cases.
Quantity-wise rope production of households depicts that around 11 percent
households produce less than 2.0 qtl, around 51 percent produce between 2.1 to 4.0 qtl,
25.87 percent household produce between 4.1 to 6.0 qtl, 8.04% households produce 6.1 to
8.0qtl, only 3.49 percent produce more than 8.0 qtl rope per household per year (table 4.4).
In the three study Blocks as well as in the District the average production of rope per
household unit is 3.86 qtls. per year. In respect of surveyed Blocks, the average production is
3.99 qtls. in Nayagram, 4.33 qtls in Gopi-I Block and 2.85 qtls in Binpur-II. So the
productivity of rope making per household unit is found highest in Gopi-I Block. Overall
each working household member produces around 1.09 qtls. of rope per year.

[84]
Table 4.4: Productivity of Household /Year in Rope Production
Quantity of Production
(in qtl.) No of HHs* (Percentage)
Mean Production (in qtl.)
< 2.0 32 (11.19) 1.59 2.1-4.0 147 (51.40) 2.93
4.1-6.0 74 (25.87) 4.96 6.1-8.0 23 (8.04) 6.90 > 8.0 10 (3.49) 9.36 Total 286 (100)
Source: Field Survey * HHs-Households
The average production of rope by Schedule Caste households is around 4.53 qtl. and
Schedule Tribe households are 3.88 qtl. per year. Rope making units generate subsidiary or
part-time employment and provide supplementary income to the family workers. Women
constitute the main workforce in the manufacturing units. Around 38 percent female workers
devote on an average 2 to 4 hours, 57 percent devote more than 5 hours and rest 5 percent
devote less than 2 hours in a day (Table-4.5). So majority of female workers devote more
than 5 hours a day in rope making activity where as only 3.33 percent male workers devote
more than 5 hours a day. Around 51 percent of the male workers remain engaged for less than
2 hours a day.
Table 4.5: Time Spent by the Rope Makers in Sabai Activities in a Day
Hours of Work No of Female Respondents (%)
No of Male Respondents (%)
Less than 2 Hrs. 4 (5.26) 108 (51.43) 2 to 4 Hrs. 29 (38.16) 95 (45.24)
More than 5 Hrs 43 (56.58) 7 (3.33) Total 76 (100) 210 (100)
Source: Field Survey March to middle of June is the peak season and July to middle of September is the
lean season for Sabai rope making activity. Weekly each family unit produces on an average
10 to 12 kg of rope in the lean season and 20 to 25 kg in the peak season. Each high skilled
and experienced worker produces on an average 3 to 4 kg while semi skilled worker produces
2 to 3 kg of finished rope in 6 to 7 hours of work a day. The data from sample survey depicts

[85]
that on an average 97 man days of 8 hours duration have been generated by each
manufacturing unit (household) per year since most of them are also remain involved as
cultivator of marginal holdings or agricultural labourer for wage earning (Table-4.6). Family
members of 11 percent households engage less than 50 man-days per year followed by 51
percent engage between 50 to 100 days, 26 percent 101 to 150 days and 12 percent above 150
days per year.
Table 4.6: Average Man-days Involvement in Rope Making Activity in a Year
Days of working No of HHs (% to total) Avg. No of Man-Days
Less than 50 32 (11.19) 40 50 to 100 days 147 (51.40) 73
101 to 150 days 74 (25.87) 124 Above 150 days 33 (11.54) 191
Total 286 (100) 97 Source: Field Survey
The engagements of workers in Sabai rope making are matched with the craftsmen’s
involvement in agricultural operations and other activities in the family. Usually lean months
in agricultural operations are considered as busiest periods in Sabai rope making in a year
(Table-4.7)
Table 4.7: Busy and Lean Period of Rope Making Activity
Work Involvement Jan
Feb
Mar
Apr
May
Jun
July
Aug
Sep
Oct
N
ov
Dec
High level of Engagement
Medium level of Engagement
Lean Period
More than 50 percent household remain engaged on and average 73 man-days per year
in rope production. Productivity of the units and participation of workers are linked with the
location and distance of the market. It has been observed that majority of the artisans of
Binpur-II Block spend full working day for collection of input materials and marketing of
outputs whereas artisans of Nayagram and Gopiballavpur-I spend more or less half working

[86]
day for these purposes. The reasons for such constraints at Binpur-II may be due to location
of very few market centres, inconvenient communication network and terrain conditions.
Sao et al. (2002) remarked how productivity in Sabai based household industrial
sector was influenced by economic and behavioural factors. The productivity in Sabai based
household industry may be determined by some important factors. One of this is efficiency
and experience of workers. The other factors relate to the extent of utilisation and
employment of main and par-time workers – e.g. number of man-days worked, percentage
share of part-time workers, capacity of utilisation of all workers etc. However, these
relationships mainly depend on the characteristics of labour though exhaustive. The other
factors like capital, mainly the fixed assets, play an important role in determining the
productivity. The availability of required tools facilitates workers in realising improved
production both qualitatively and quantitatively. The raw material collected from distant
areas may be due to procurement of good quality raw-material at cheaper rate which help in
enhancing the net profit and labour productivity.
The rope making household units are linked with forward and backward marketing
channels in an unorganised way for input supply, distribution of outputs, information source,
monetary exchange etc.. Except LAMP under West Bengal Tribal Development Cooperative
Corporation, no other organised institution is found functioning as forward and backward
linking channels in Sabai economy. Middlemen, wholesalers, village assemblers or peddlers,
are the main disposal channel functionaries found working in supply chain network. In most
cases they also play the role of financial institution with the motive of higher margins in their
favour.

[87]
4.4 Economics of Rope Production
To find out the economic benefit in rope production, cost of raw-material and other
expenses are required to be analysed. The cost of production is categorised into two types. In
the absence of Sabai growing land in possession, first type of production unit functions by
entirely purchasing raw-material from the market. In such case the cost of production
becomes higher than other types of production units where the entire raw-material is sourced
from their own farm land. It is already mentioned that rope twisting by hand is a labour
intensive work. But economic valuation of labour hour is a difficult task since the
respondents are mainly utilising their idle time in the manufacturing unit.
Very simple tools like knife and cutter and hand operated ‘Ghurru’ are used in the
household units. The fixed cost of these tools is workout per kg of rope production assuming
the self life of the tools as 5 years and average rope production of the units as 350 kg/year.
The fixed cost is thus estimated to be Rs.0.30/kg (Table-4.8). Working capital includes raw-
material cost and marketing expenses only. On an average one family produces around 10 to
12 kg of rope per week in favourable seasons.
Table 4.8: Fixed Cost/kg in Sabai Rope Making Unit
Sl no. Particulars Amount
(in Rs.) i. Cost of Traditional ‘Ghurru’ 400.00
ii. Cost of 1Knife and Cutter 120.00 iii. Total 520.00 iv. Total rope production in 5 yrs (350 kg x 5yrs)=1750 kg v. Cost/kg (iii/iv) (Assuming self life of the Ghurru 5 yrs) 0.30
The Table 4.9 shows that total cost of production of 10 kg rope is around Rs. 316.00,
which includes fixed cost of Rs. 3.00, raw-material cost of Rs.308.00 and meagre marketing
cost of Rs.5.00. From the table it is clear that the marketing cost accounts for 1.58% and the
material cost of accounts for 97.47% of total cost. Due to scarcity or non availability of
alternative job opportunity in other sectors the artisans are compelled to depend on home
labour and hence the labour input in rope manufacturing unit may be treated here as non-cash

[88]
implicit cost and thus the opportunity cost of idle man-days is also zero. In fact the value
addition from such a household level rope making venture should be taken as Rs.204.00
which in another sense is the existing wage earning for the family unit per week. For Sabai
growing families the aggregate value addition from rope making is considered to be
Rs.270.00 from 10 kg of rope production.
Table: 4.9 Cost of Production of 10kg Rope (Medium Grade) by Non Sabai Growing Families (Unit-I)
Particulars Unit-I
Rate Amount (in Rs.)
% to total cost
i. Fixed Cost/10 kg @ Rs.0.30/kg 3.00 0.95
ii. Raw-material cost/10 kg 11 kg @ Rs.28.00/kg* 308.00 97.47
iii. Marketing cost/ 10 kg @ Rs.0.50/kg 5.00 1.58 iv. Labour cost (Home labour) 0.00 v. Total Cost/10 kg (i+ii+iii+iv) 316.00 100.00
vi. Sale value/10 kg 10 kg @ Rs.52.00/kg* 520.00
vii. Value Addition/10 kg ( Actual Labour Earning) (vi-v) 204.00
Source: Field survey *Market Price in Baligeria Haat, Nayagram Block, March, 2015.
From the above discussion it is clear that out of the total production expenses the raw-
material cost occupies the maximum percentage. But the Sabai growing households gets
more advantage in terms of material cost. It is clear that the aggregate value addition of
manufacturing Unit-II (Table-4.10) with Sabai growing lands is around Rs.270, which is
Rs.66.00 higher than Unit-I (Table-4.9). Such type of unit earn nearly to Rs.1000 from
production of 40 kg rope in a month. But the value addition including self labour, amounts to
nearly Rs.1000 can not support the sustainable livelihood for a family. This indicates that
these artisan families are required to adopt with this activity some other additional value
adding activity like higher production of ropes by using new innovative machine or higher
value added crafts making for assuring sustainable livelihood.
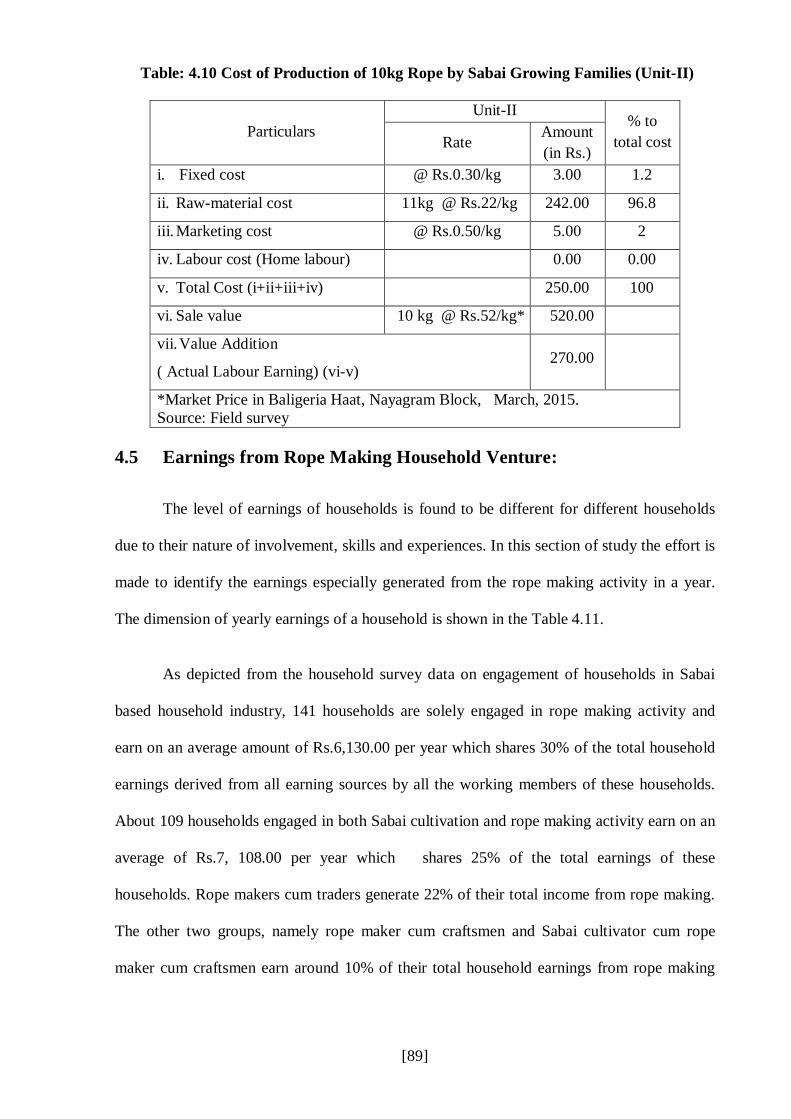
[89]
Table: 4.10 Cost of Production of 10kg Rope by Sabai Growing Families (Unit-II)
Particulars Unit-II
% to total cost Rate
Amount (in Rs.)
i. Fixed cost @ Rs.0.30/kg 3.00 1.2
ii. Raw-material cost 11kg @ Rs.22/kg 242.00 96.8
iii. Marketing cost @ Rs.0.50/kg 5.00 2
iv. Labour cost (Home labour) 0.00 0.00
v. Total Cost (i+ii+iii+iv) 250.00 100
vi. Sale value 10 kg @ Rs.52/kg* 520.00
vii. Value Addition
( Actual Labour Earning) (vi-v) 270.00
*Market Price in Baligeria Haat, Nayagram Block, March, 2015. Source: Field survey
4.5 Earnings from Rope Making Household Venture:
The level of earnings of households is found to be different for different households
due to their nature of involvement, skills and experiences. In this section of study the effort is
made to identify the earnings especially generated from the rope making activity in a year.
The dimension of yearly earnings of a household is shown in the Table 4.11.
As depicted from the household survey data on engagement of households in Sabai
based household industry, 141 households are solely engaged in rope making activity and
earn on an average amount of Rs.6,130.00 per year which shares 30% of the total household
earnings derived from all earning sources by all the working members of these households.
About 109 households engaged in both Sabai cultivation and rope making activity earn on an
average of Rs.7, 108.00 per year which shares 25% of the total earnings of these
households. Rope makers cum traders generate 22% of their total income from rope making.
The other two groups, namely rope maker cum craftsmen and Sabai cultivator cum rope
maker cum craftsmen earn around 10% of their total household earnings from rope making
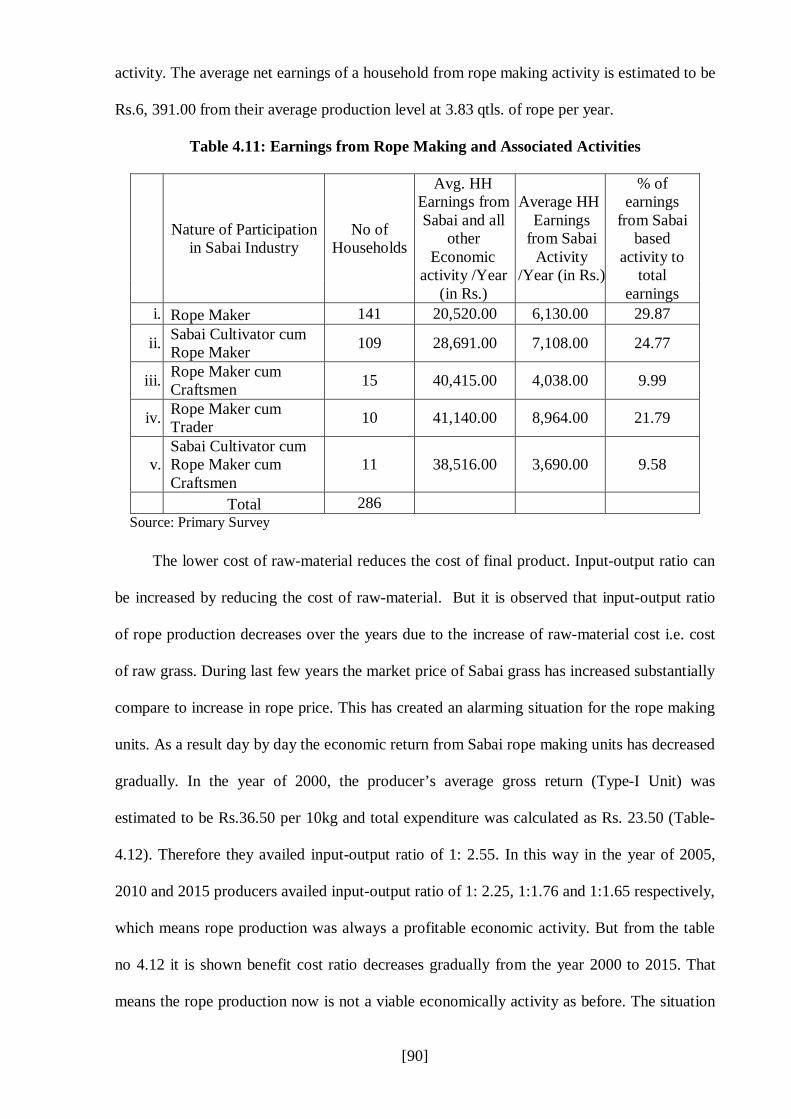
[90]
activity. The average net earnings of a household from rope making activity is estimated to be
Rs.6, 391.00 from their average production level at 3.83 qtls. of rope per year.
Table 4.11: Earnings from Rope Making and Associated Activities
Nature of Participation in Sabai Industry
No of Households
Avg. HH Earnings from Sabai and all
other Economic
activity /Year (in Rs.)
Average HH Earnings
from Sabai Activity
/Year (in Rs.)
% of earnings
from Sabai based
activity to total
earnings i. Rope Maker 141 20,520.00 6,130.00 29.87
ii. Sabai Cultivator cum Rope Maker 109 28,691.00 7,108.00 24.77
iii. Rope Maker cum Craftsmen 15 40,415.00 4,038.00 9.99
iv. Rope Maker cum Trader 10 41,140.00 8,964.00 21.79
v. Sabai Cultivator cum Rope Maker cum Craftsmen
11 38,516.00 3,690.00 9.58
Total 286 Source: Primary Survey
The lower cost of raw-material reduces the cost of final product. Input-output ratio can
be increased by reducing the cost of raw-material. But it is observed that input-output ratio
of rope production decreases over the years due to the increase of raw-material cost i.e. cost
of raw grass. During last few years the market price of Sabai grass has increased substantially
compare to increase in rope price. This has created an alarming situation for the rope making
units. As a result day by day the economic return from Sabai rope making units has decreased
gradually. In the year of 2000, the producer’s average gross return (Type-I Unit) was
estimated to be Rs.36.50 per 10kg and total expenditure was calculated as Rs. 23.50 (Table-
4.12). Therefore they availed input-output ratio of 1: 2.55. In this way in the year of 2005,
2010 and 2015 producers availed input-output ratio of 1: 2.25, 1:1.76 and 1:1.65 respectively,
which means rope production was always a profitable economic activity. But from the table
no 4.12 it is shown benefit cost ratio decreases gradually from the year 2000 to 2015. That
means the rope production now is not a viable economically activity as before. The situation
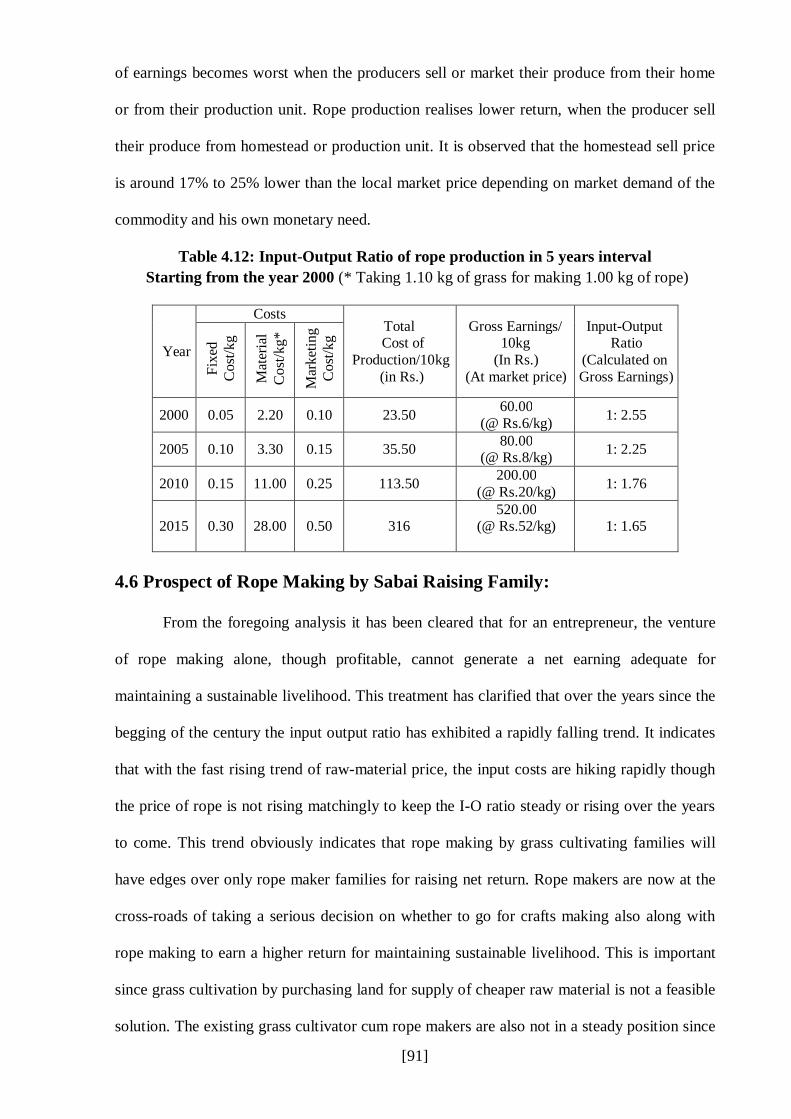
[91]
of earnings becomes worst when the producers sell or market their produce from their home
or from their production unit. Rope production realises lower return, when the producer sell
their produce from homestead or production unit. It is observed that the homestead sell price
is around 17% to 25% lower than the local market price depending on market demand of the
commodity and his own monetary need.
Table 4.12: Input-Output Ratio of rope production in 5 years interval Starting from the year 2000 (* Taking 1.10 kg of grass for making 1.00 kg of rope)
Year
Costs Total
Cost of Production/10kg
(in Rs.)
Gross Earnings/ 10kg
(In Rs.) (At market price)
Input-Output Ratio
(Calculated on Gross Earnings) Fi
xed
C
ost/k
g
Mat
eria
l C
ost/k
g*
Mar
ketin
g
Cos
t/kg
2000 0.05 2.20 0.10 23.50 60.00 (@ Rs.6/kg) 1: 2.55
2005 0.10 3.30 0.15 35.50 80.00 (@ Rs.8/kg) 1: 2.25
2010 0.15 11.00 0.25 113.50 200.00 (@ Rs.20/kg) 1: 1.76
2015 0.30 28.00 0.50 316 520.00
(@ Rs.52/kg)
1: 1.65
4.6 Prospect of Rope Making by Sabai Raising Family:
From the foregoing analysis it has been cleared that for an entrepreneur, the venture
of rope making alone, though profitable, cannot generate a net earning adequate for
maintaining a sustainable livelihood. This treatment has clarified that over the years since the
begging of the century the input output ratio has exhibited a rapidly falling trend. It indicates
that with the fast rising trend of raw-material price, the input costs are hiking rapidly though
the price of rope is not rising matchingly to keep the I-O ratio steady or rising over the years
to come. This trend obviously indicates that rope making by grass cultivating families will
have edges over only rope maker families for raising net return. Rope makers are now at the
cross-roads of taking a serious decision on whether to go for crafts making also along with
rope making to earn a higher return for maintaining sustainable livelihood. This is important
since grass cultivation by purchasing land for supply of cheaper raw material is not a feasible
solution. The existing grass cultivator cum rope makers are also not in a steady position since

[92]
their holding size is quite small compared to demand of grass. Another important alternative
for them is raising production and productivity through use of innovative technologies. The
newly introduced Rope Making Machine has the capacity to produce 110 kg rope per week
instead of only 10 kg by hand twisting. Besides, the new twisters of rope can twist the
handmade rope 7 times faster than that made by using traditional Ghurru. In this case of
productivity rise, also the net return will be multiplied but investment on procurement of
machine etc. will need both institutional investment and higher margin money as self
investment.
Photograph 4: Traditional Gurru (Rope twisting hand operated devices)
[93]
Chapter-V
Crafts Making:
Value Addition and Contribution to Household Economy
5.0 Introduction
Natural fibres are used to manufacture a wide range of traditional and novel products
like textile, ropes, nets, brushes, carpets, mats, mattresses, paper and board materials, etc.
(Jan E. G.,2009). Artisans from Tribal as well as from other backward caste communities use
this natural fibre not only to produce rope but also to manufacture beautiful decorative and
utility based craft items. There are numerous expression of craftsmanship found among these
artisans. It is already discussed in the previous chapter that the skill involved in creating
Sabai objects are categorised in two distinct forms. One is traditional skill based crafts and
another is modern technology driven market sensitive crafts. Now it is important to know the
extent of craft practice and production economics within the frame work of cottage or
household industry. The main two categories of products of this cottage industry are rope or
string and modern value added crafts. Under value added crafts three product lines are
identified viz. i) home furnishing /decorative crafts, ii) lifestyle/aesthetic crafts and iii)
household utility crafts. Under each of these broad product lines various crafts have been
identified based on market surveys and household surveys. These are listed in the flow
diagram 5.1 below.

[94]
Flow Diagram 5.1: Product Mix of Sabai Based Household
Handmade Ropes
Modern Value Added Crafts
Home Furnishing/ Decorative
Crafts (Product Line-I)
Life Style/ Aesthetic
Crafts (Product Line-II)
Household Utility Crafts
for Daily Use
(Product Line-III)
Table Mat
Floor Mat
Door Mat
Carpet
Flower Vass
Plant/Flower Pot
Sofa Set
Chair
Stool
Cot/Charpoy
VIP
Super Medium
Medium
Vanity Bag/ Purse
Shopping Bag
Clutch/ Wallet
Picnic Bag
Tissue Paper Box
Wall Hanging
Super
Medium
Table Lamp
Sinduk Box
Chest of Drawers
Water Bottle Holder
Fruit Basket
Food Basket
Coaster
Spoon Stand
Magazine Stand
Chapatti/Roti Tray
Prod
uct L
ine
Leng
th
Grass
Litter Bin

[95]
5.1 Crafts making a traditional practice: Issue and Importance
Since the beginning of human civilisation man has created variety of useful craft
items. Traditional handicrafts have got special feelings and fragrance of human touch which
the machine made mass scale produced commodity cannot serve. Sabai grass is a versatile
material which finds use in a variety of applications due to its intrinsic morphological and
eco-friendly characteristics (Chakrabarty, K. S., 2006). The high cellulosic and pectin
contents of the plants ensure the durability and strength of the finished products. Its lignin
content supports rigidity. Its colour absorbing capacity and strength characteristics is suited
for manufacturing of various decorative and household utility items (Khandual, A., et.al,
2016). The traditional utility crafts of the study region include door mats, hats, grain baskets,
mats, cots etc. Out of 330 sample households 17.27 percent are found associated with crafts
making activity. Each of this craft making activities are carried out in a household scale and
dispose of through local ‘Hats’ or through middlemen. Out of this 17.27 percent craft
producing households 26.32 percent exclusively engaged in handicrafts production and trade
where as 28.07 percent engaged in both Sabai cultivation as well as crafts production
followed by 19.30 percent associated with Sabai cultivation cum rope making cum crafts
production and 26.32 percent engaged both ropes as well as crafts production activities.
The importance of producing these handicrafts to rural economy lies in its employment
potential and export earnings. The Sabai craft making industry provides employment to over
two thousand high skilled artisans of this district which include a significant number of
people in the disadvantaged section of the society. In addition to its high potential for
employment, the sector is economically important from the point of low capital investment
and high ratio of value addition besides minimisation of rural-urban migration. Due to the
increasing domestic and export demand of green handicrafts, this industry is perceived as a
potential business opportunity and thereby important source of income and thus this sector is
gradually attracting younger artisans, traders, social entrepreneurs and exporters.

[96]
5.2 Changing Craft Making Practices and Introduction of New Items in the Market
In earlier days the artisans used to be largely involved in traditional rope making
practice and fabricating a few household utility items for their own purpose or for trading the
commodity through barter system. Sometimes artisans followed direct marketing system to
sale these household utility items in the local markets to the end users. Gradually they have
understood through Government and Non Government Agencies and traders about the
present market demand of stylish handicrafts. A few artisans have shifted to fabrication of
decorative and fancy items making activity for better earnings (Photograph-5).
Photograph-5: Sabai crafts production by women artisans
Of late, modern utility and aesthetic craft items have started penetrating in the lifestyle
market and among the new generation buyers specially women of urban India. Consumer’s
interest on natural fibre based environment friendly products has been increasing day by day
and that has created aspiration among the new generation of Sabai artisans. Rope made table
mats, door mats, carpets, purse, vanity bags, sofa set, coasters, fruit basket, wall hangings,
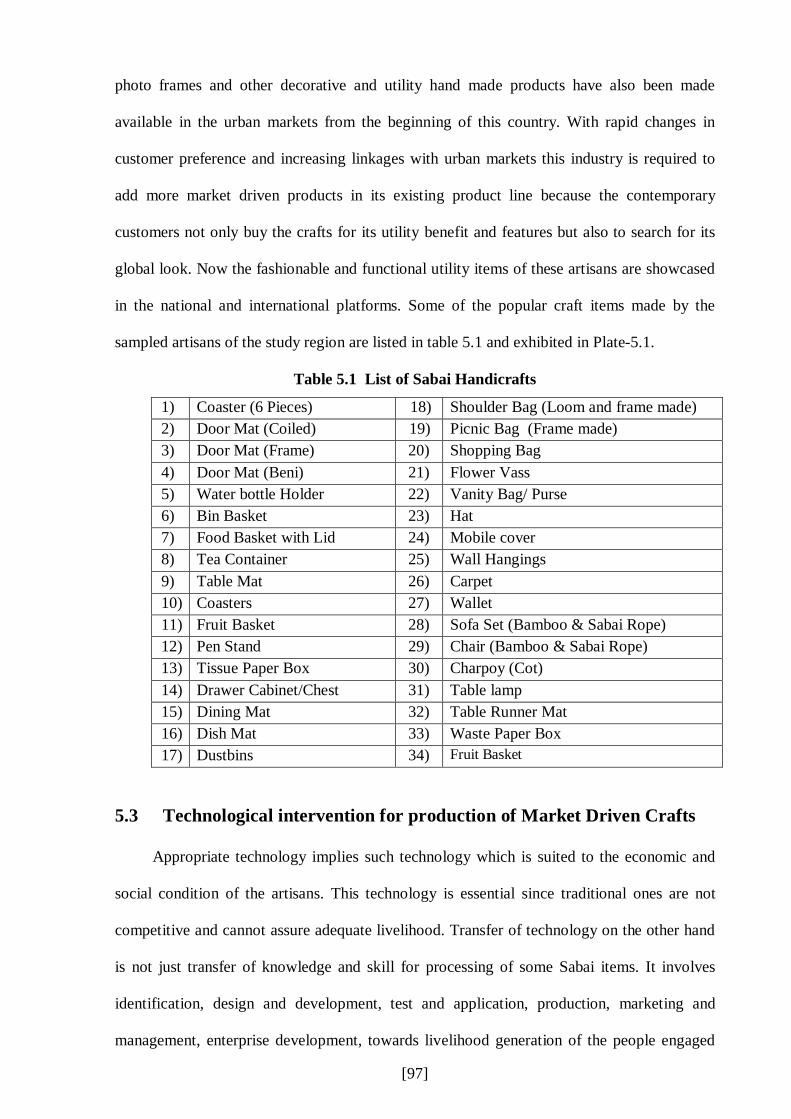
[97]
photo frames and other decorative and utility hand made products have also been made
available in the urban markets from the beginning of this country. With rapid changes in
customer preference and increasing linkages with urban markets this industry is required to
add more market driven products in its existing product line because the contemporary
customers not only buy the crafts for its utility benefit and features but also to search for its
global look. Now the fashionable and functional utility items of these artisans are showcased
in the national and international platforms. Some of the popular craft items made by the
sampled artisans of the study region are listed in table 5.1 and exhibited in Plate-5.1.
Table 5.1 List of Sabai Handicrafts
1) Coaster (6 Pieces) 18) Shoulder Bag (Loom and frame made) 2) Door Mat (Coiled) 19) Picnic Bag (Frame made) 3) Door Mat (Frame) 20) Shopping Bag 4) Door Mat (Beni) 21) Flower Vass 5) Water bottle Holder 22) Vanity Bag/ Purse 6) Bin Basket 23) Hat 7) Food Basket with Lid 24) Mobile cover 8) Tea Container 25) Wall Hangings 9) Table Mat 26) Carpet 10) Coasters 27) Wallet 11) Fruit Basket 28) Sofa Set (Bamboo & Sabai Rope) 12) Pen Stand 29) Chair (Bamboo & Sabai Rope) 13) Tissue Paper Box 30) Charpoy (Cot) 14) Drawer Cabinet/Chest 31) Table lamp 15) Dining Mat 32) Table Runner Mat 16) Dish Mat 33) Waste Paper Box 17) Dustbins 34) Fruit Basket
5.3 Technological intervention for production of Market Driven Crafts Appropriate technology implies such technology which is suited to the economic and
social condition of the artisans. This technology is essential since traditional ones are not
competitive and cannot assure adequate livelihood. Transfer of technology on the other hand
is not just transfer of knowledge and skill for processing of some Sabai items. It involves
identification, design and development, test and application, production, marketing and
management, enterprise development, towards livelihood generation of the people engaged

[98]
with Sabai based activities (Chattopadhyay R. N., et al., 1995). Technological intervention on
Sabai crafts initiated for first time in this region by IIT, Kharagpur, W.B. through pilot
programme of PFM Project sponsored by the Ford Foundation (1993-2004). The major
contribution to this effect includes training for skill formation, design development for
production of market driven crafts, treatment of raw materials like grass and bamboo for
protecting them from insects and pests and also making the product more durable. These
tasks are discussed below.
5.3.1 Design-Development Training for Skill Formation
Modern decorative and utility crafts are made of by high skilled artisans of the study
region. The artisans are given design development training for production of high value
items. Results of the discussion with artisan, Mrs. Manjurani Mahata of Kurmipathra village
of Nayagram Block depicts that the first skill development training on Sabai crafts was
conducted in this Block by Rural development Center of IIT, Kharagpur in the year of 1995-
1996. Later the design experts from NID and IIT, Kharagpur had given trainings to many
artisans. To some extent this skill development trainings help to enhance their traditional
skills into modernised form. The application of mixed (traditional and modern) skills,
supports the artisans to explore the hidden possibilities prevailing in this craft sector. The
support has been given by some Non Government Organisation but Government Agencies
have not yet come forward so much for the purpose. In certain cases some design changes
and integration of different supportive material has been done with the existing products for
changing of its looks and make it more customer friendly. Support of the Institutions and Non
Governmental organisations in this regards is also praise worthy. Some of the frames and
moulds which are used for making improved new design crafts are shown below
(Photographs -6).

[99]
Photographs 6: Moulds and Frames for Improved Crafts Making
5.3.2 Bleaching Dyeing and Deodorising The processes of bleaching, dyeing and deodorising are done to protect Sabai grass
from the attack of insect, pest and fungus (Photographs 7 & 8). It will increase the shelf-life
of the grass and products. Standardization of eco-friendly processing technique is required for
quality of craft items. The bleaching, Dyeing and deodorising technique have been followed
to reach the exportable standard of the craft items. As per consumer’s preferences for
coloured craft items both natural straw colour and selected other synthetic colours, are in use.
The following operational steps are involved in processing of the raw material, irrespective of
sun dried grass.
Step-1: Selective better quality and little bit costlier grasses which are required for crafts
making in natural shade / colour.
Steps-2: After procurement of raw grass the over matured unsuitable dry and spotted leaves,
small hardy basal leaves etc are rejected which attracts 10% loss in weight of the
raw material .
Step-3: The procured grass bundles normally weighing 10 kg are converted to smaller
bundles of 250 gms. each.

[100]
Step-4: Boiling operation of grasses / ropes is done for 2 hours in Aluminum Vessel / Pan of
50-60 liters capacity to process about 7 kg of sundried grasses/ropes in 45 liters of
water mixed with 50 ml of softener (High power Micro Amino Silicon), 50gms
Bleaching Powder and 50gms of fungicide (carbandazim + Mancozeb).
Photographs 7: Bleaching, Dyeing and Deodorising of Sabai Grass Step-5: Thorough washing after boiling repeatedly for 2-3 times is required to remove the
excess chemical residue / deposits.
Step-6 The treated grasses are dried under sun uniformly for 1-2 days and thus made ready
to use for craft items Natural colour / shade is subjected to Dyeing for portraying
other shades / colours.
Step-7 For Dyeing operation, all the aforesaid steps (1 to 6) are essential as pre- requisites.
Dyeing involves boiling 7 kg. grass bundles/ ropes at a time for second time for 3
hours in 45 liters of water mixed with 50 g. of binder (Saponin K.t.) and 100 gms.
of eco-friendly Azo free textile dye. The cost of Dyeing operation is Rs 20.75/kg.
which makes the commodity 35.8% higher than the un-dyed materials
(Rs.15.30/Kg.). (Step 6).
Step-8 Thorough washing as practised in step 5. Step-9. Sun-drying as done in step 6.

[101]
Photographs 8 : Coloured Grass after Bleaching and Dying 5.3.3 Weaving of grass mat through improved hand loom Sabai grass mat weaving techniques through improved looms have been adopted by the
artisans of Nayagram Block (Photograpg-9). The artisans of Kurmipathra village of
Nayagram Block under the financial assistance of KVIB. of India under NFM Project,
installed few looms for weaving purpose (Plate 5.3). Sabai grasses are generally weaved with
cotton warp. This weaved material is further used to make different kinds of bags, mats, and
other value added items. IIT, Kharagpur has developed an innovative loom for Sabai Mat
making with various aesthetic designs on surface. These design development has been made
possible by fabricating and using some innovative jacquards operated by paddles and
operation. The sale price of designed mats is usually 70%-80% higher than that of normal
weaved mats.

[102]
Photograph-9: Artisans Weaving on Improved Hand Loom at Kurmipathra Village, Nayagram Block
5.4 Cost of Production and Value Addition in Respect of Selected Items.
For to assessing the production cost, gross return and value addition in crafts
production activities, some selected crafts have been chosen. The sampled Sabai crop
growers produce on an average 8 kg of raw grass per year from 1 decimal of land. Thus a
Sabai Cultivator can grow about 42 kg. of grass for 5 decimal of land. If this quantity of grass
is sold in the market at the price of Rs. 28/kg, the producer earns Rs.1176.00 as gross value of
the crop. But when a family with two artisans produce 40 kg finished rope from 42kg. grass
in a month the value of output is Rs. 2,080.00, considering the rate of rope as Rs.52.00 per
kg. Thus the aggregate value addition by a family will be Rs.904.00/month i.e. Rs.22.60 per
kg. of rope.

[103]
Table 5.2 -Economics of Sabai Crafts Production
Products/ Items
No of units to be
produced per
month by a family
Labour hrs. required/
piece
Per Unit Cost
(Excluding labour cost)
(in Rs.)
Per unit selling price
(In Rs.)
Total value
of sale in Rs.
Economic Value added
per family/month (Net Earnings)
(Rs./Unit)
Sabai Rope (in kg.)
40 kg 2hr/kg 31.00 52 2080 840.00
(Rs.21/unit) Bottle Holder (in pc.)
110 Pc 2.75 man hrs/piece
10.00 60 6600 Rs. 5,500.00
(Rs.50.00/Unit)
Coaster 10″ Set of 6pcs.
dyeied (in pc.)
60 Pc 4 man
hrs/piece 42.50 260 15,600
Rs.13,050.00 (Rs.217.50/unit)
Framed Fruit
Basket (Natural)
100 pc 3 man
hrs/piece 75.00 220 22000
Rs.14,500 (Rs.145.00/Unit)
Loom Bag (Medium) 100 pc
3 man hrs./piece
84.00 300 30,000 Rs. 21,600
(Rs.216.00/Unit)
But when rope is converted to bottle holder then about 110 no of bottle holders could
be made by a family in a month (Table-5.2). The sale value of these bottle holders will be of
Rs.6600.00 considering sale price per bottle holder to be Rs.60. Thus the total value addition
becomes Rs.5500 per family per month considering net return of Rs.50 per bottle holder. In
case of production of 10” Coaster set (Coaster of 6/set) from rope, as many as 60 sets of
Coasters could be made by a family in a month with sale value of Rs.15,600 considering per
unit selling price of Coaster to be Rs.260. Two skilled workers can produce 3 set of Coasters
a day from which gross earnings is Rs.652.50 and as such net value addition per unit comes
to Rs.217.50.
Framed fruit baskets are manufactured from Sabai rope or Sabai plait which has good
market demands and this seems to be a profitable venture for the craftsmen. About 100 pieces
sizeable fruit basket could be manufactured by a family in a month and its total sale value is
estimated to Rs.22,000.00 approximately when sold @ Rs.220.00 per basket. A family with

[104]
two skilled craft workers can earn Rs.580 per day for production of four baskets. Hand loom
weaved bag is also another value adding product and it generates employment opportunities
to many skilled workers there by help utilising idle man days. The sale value of 100 no bags
is estimated to be Rs.30, 000 taking its sale price to be Rs.300/bag. The net value addition of
this craft comes to Rs.216.00 per piece of bag. One craft making family can earn Rs.864 per
day for production of 4 pieces of bags in a day which may be produced by self or family
labourers. From the analysis it is clear that an artisan family can earn a net margin of Rs.5,
500 from bottle holder making, in almost in a month. On the contrary, if the family remains
engaged in coaster making to the extent of 60 coasters set per month, their net earning comes
to Rs.13, 050.00. Similarly the net family earning per month will be Rs.14, 500.00 from
producing 100 fruit basket and Rs.21, 600.00 from 100 loom weaved bags in the same period.
5.5 Contribution to Household Economy from Crafts Making.
It is observed from the survey that economic performance of the artisans associated
with crafts making activities are better compared to other working groups associated with this
industry. It is evident from the survey and analysis that out of 193 BPL category households
only 3.63 percent are crafts producing households where as the rest 96.37 percent are from
non-crafts making households. So it is clear that maximum BPL category families are
engaged with non craft related activities like Sabai cultivation and rope making. It is quite
interesting to note that the households engaged with Sabai cultivation cum craft production
activities are the most promising artisan group where almost 68 percent of their household
earnings are generated from these two Sabai related activities. Sabai cultivators cum rope
maker cum craftsmen also contribute almost 73 percent of their total household earnings from
Sabai related activities. However, the percentage of households under this category is very
less.

[105]
Photo Plates 10: Selected Craft Items Made of from Sabai Rope/Plait

[105]
Chapter: VI
Marketing and Market Centres of Sabai Grass and Crafts. 6.0 Introduction
An enterprise or business organisation delivers its products from its production unit to
end customers through a chain of activities. This chain of activities includes production,
marketing, financing, human resource management, customer service etc. Among these
activities marketing is an important function through which any industry can achieve its
predetermined goal and objectives. Marketing functions include some other sub functions like
sales management, product management, pricing management, distribution channel
management, advertising and public relation, market research and industry analysis, customer
service etc.. To achieve the firm’s objectives, the coordination of these different activities is
important. Production without marketing becomes useless for the organisation and marketing
without production is also impossible. The business unit gets the money back when the
products are sold out in the market. Besides production, marketing functions and processes
are very important for the industry (Ling, 2007).
In the previous three chapters the discussion has been made on different aspects of
production of Sabai grass, rope and rope based handicrafts, their costs and returns,
employment characteristics and finally socio-economic importance. In addition to all these
organisational functions, marketing is one of the key important aspects. The marketing effort
bridges the gap between what the growers and artisans are producing and what the market or
final consumer want. But due to ineffective and unorganised marketing practice, the ethnic
design, aesthetics and feelings of the artisans are not able to reach and spread out to the
willing customers in a desired level. A gap between the consumer’s needs and wants and
artisans expectation and potentiality still exists in the handicrafts sector. Now to have an
overall picture on existing marketing process and structure of Sabai industry, a detailed

[106]
analysis is required. An attempt has been made in this chapter to analyse the existing
operational characteristics of the farm and non-farm units, channels, nodes and actors
involved in the distribution system, pricing method and lastly promotional activities
undertaken by the local artisans in the light of the marketing mix concept of Professor Jerom
McCarthy. To understand the factors and situations which influence the marketing process
and marketing decision, certain marketing related questions had been included in the survey
schedule. Marketing mix is a crucial tool which help to understand what the product or
service can offer and how the total process is executed. Marketing mix elements of Sabai
industry include analysis of product mix structure, pricing strategy of the different products,
its distribution channels and promotional mix. This has been also analysed in this chapter.
6.1 Marketing Channels and Channel Intermediaries
A key element of 4Ps1 of marketing is distribution. Distribution is the process by which
product or services are made available to the target customers. Principal aim of distribution
is to link up between the producers and customers. Distribution involves activities that make
products available to customers in right time, right place and in right way. It involves a
transfer of an item of exchange from one place to another, bringing it to the customers at
market place. Without market distribution system customers would have to travel to the place
of production or supply source. Distribution is to put the product or services in a position that
gives people easy access to it (Forsyth, 2009).
Through an effective marketing network the producers get the remunerative price
thereby increases the earnings level, and consumers are able to get the product with right
price, in right time, in right place and in right quantity. The efficient marketing system not
only motivates the producers to stimulate production but also accelerate the pace of economic
development. Efficient marketing system restricts the unorganised intermediaries to enter into
1 4Ps: Product, Price, Place and Promotion

[107]
a channel. The small length or level of channels increases the producer’s share, minimise the
price spread between producer and consumer and reduces the marketing expenses.
Sabai growers, rope makers and crafts producers can make available their products to
the consumers through multiple distribution channels. One of the important features of these
marketing networks are numerous number of intermediaries who function between the
producers and consumers. Channel members or intermediaries play crucial role for bridging
the gap between producers and end-users. Channel intermediaries not only provide exchange
services but also provide different supportive services to the producers such as assembling,
grading, packaging, transportation, financing, information supply etc. Channel members or
intermediaries act at local, regional, national and international market on the basis of product
mix, objectivity, financial ability, connectivity and product handling capacity.
To understand the volume of operation, profitability, network of flow, extent of market
coverage, a traders level survey in the local market have been done through the use of
interview schedule. Eight big wholesalers, fifteen middlemen, nine village assemblers, five
fellow producers cum selling agents, five village level stores and three NGOs have been
contacted to collect the relevant marketing information.
6.1.1 Marketing Channels of Sabai Grass and Ropes
Sabai products are distributed through different channels or supply chain network.
More or less in all product lines of Sabai industry, various channel functionaries like village
assemblers/peddlers, fellow producer cum selling agents, middlemen, wholesalers, and
commission agents are engaged in distribution function. Channel functionaries engage
themselves for distribution of Sabai products through diverse network. Most of the Sabai
products are sold through multilevel or hybrid types of channel where two to five levels of
intermediaries are functioning to reach the products to ultimate consumers. The heterogeneity
of this network creates complex channel structure and flow of goods.

[108]
Few big traders control the entire local markets through their diversified marketing
networks. Wholesalers or Aratdars spread their network to the remote villages where
communication facility is very poor. The existing traders of local market are found working
in the supply chain in various forms. Some traders are sitting in the Hat under the temporary
or permanent shed having godowns, weighing scale, own transport vehicles etc.. Someone
collects the produce from producer’s house, and some others are waiting in the connecting
roads nearer to the weekly Hats to capture the artisan-producer’s, not having any physical
trading facilities like weighing scale, godowns, permanent or temporary shades etc. First one
is called big, medium and small size wholesaler or ‘Aratdars’, second one is the village
assembler or pedlar, and third one is the commission agent or ‘Phoria’. These traders or
intermediaries play crucial role in Rope supply chain. Without their involvement, the artisan-
producers would not be able to make available these natural and environment friendly
products to the household and industrial consumers of different states of India.
Altogether seven marketing channels are found functioning in the distribution of Sabai
grass from growers level to consumers level. Zero level channel is also identified in grass and
rope marketing network where producers directly sell their produces to the village
consumers. For both the products, the channels are spread out to the regional and national
level markets. In case of rope marketing channels two distinct categories of channels have
been clearly found which are firstly inter-state channels and secondly intra-state channel. Of
these, the channels-I, II, III and IV are connected and function within the State network while
the other four channels i.e. channel-V, VI, VII and VIII are connected with inter-state
network.
The operations of intra-state channels are spread over normally within the State of West
Bengal. But few Kolkata based wholesalers are found connected with national level
distributors who are linked mainly with paper and construction industries for supply of Sabai
grass and ropes. Sabai growers/collectors sell through seven distinct channels (flow diagram
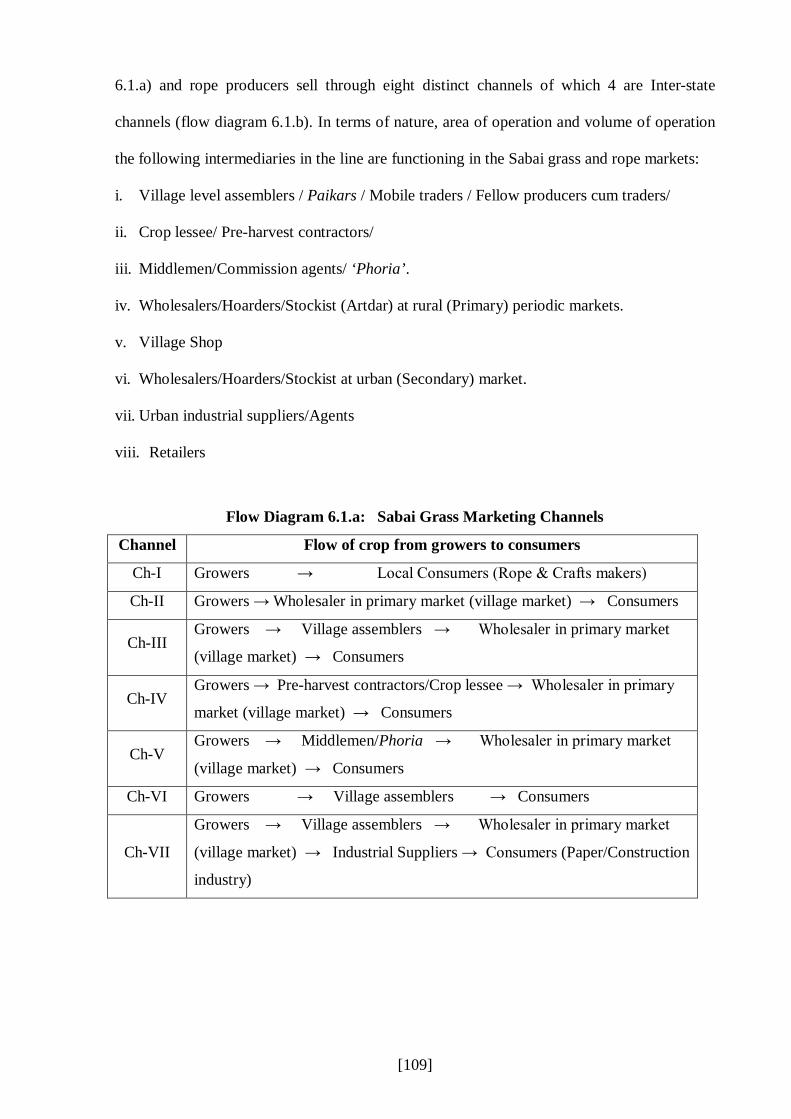
[109]
6.1.a) and rope producers sell through eight distinct channels of which 4 are Inter-state
channels (flow diagram 6.1.b). In terms of nature, area of operation and volume of operation
the following intermediaries in the line are functioning in the Sabai grass and rope markets:
i. Village level assemblers / Paikars / Mobile traders / Fellow producers cum traders/
ii. Crop lessee/ Pre-harvest contractors/
iii. Middlemen/Commission agents/ ‘Phoria’.
iv. Wholesalers/Hoarders/Stockist (Artdar) at rural (Primary) periodic markets.
v. Village Shop
vi. Wholesalers/Hoarders/Stockist at urban (Secondary) market.
vii. Urban industrial suppliers/Agents
viii. Retailers
Flow Diagram 6.1.a: Sabai Grass Marketing Channels
Channel Flow of crop from growers to consumers
Ch-I Growers → Local Consumers (Rope & Crafts makers)
Ch-II Growers → Wholesaler in primary market (village market) → Consumers
Ch-III Growers → Village assemblers → Wholesaler in primary market
(village market) → Consumers
Ch-IV Growers → Pre-harvest contractors/Crop lessee → Wholesaler in primary
market (village market) → Consumers
Ch-V Growers → Middlemen/Phoria → Wholesaler in primary market
(village market) → Consumers
Ch-VI Growers → Village assemblers → Consumers
Ch-VII
Growers → Village assemblers → Wholesaler in primary market
(village market) → Industrial Suppliers → Consumers (Paper/Construction
industry)

[110]
Flow Diagram 6.1.b: Sabai Rope Marketing Channels
Channel Intra-State Rope Marketing Channels
(Flow of rope from producers to consumers) Ch-I Rope maker (producer) → Consumers
Ch-II Rope maker → Wholesaler in primary market (village market) → Retailers
(within District) → Consumers
Ch-III
Rope maker → Village assembler → Wholesaler in primary market (village
market) → Wholesaler in secondary market (within West Bengal) →
Retailers → Consumers
Ch-IV
Rope maker → Middlemen/Phoria → Wholesaler in primary market
(village market) → Wholesaler in secondary market (within West Bengal) →
Retailers → Consumers
Inter-State Rope Marketing Channels
Ch-V
Rope maker → Village assembler → Wholesaler in primary market (village
market) → Wholesaler in secondary market (other States) → Retailers →
Consumers
Ch-VI
Rope maker → Village assembler → Wholesaler in primary market (local
market) → Wholesaler in secondary market (other States) → Retailers →
Consumers
Ch-VII
Rope maker → Middlemen/Phoria → Wholesaler in primary market
(local market) → Wholesaler in secondary market (other States) → Retailers
→ Consumers
Ch-VIII
Rope maker → Village shop → Middlemen → Wholesaler in primary
market (local market) → Wholesaler in secondary market (other States) →
Retailers → Consumers
Based on the information collected from market survey interrogation of the traders the
mapping of Sabai rope supply chain has been done and presented in the form of a model in
Flow Diagram-6.1.c. This may be designated as Sabai Rope Supply Chain model. Though all
the channel are distinct and finally reaching the end consumers. Some of them are subjected
to lateral transaction among them at the intermediate state of flow. The flow diagram explains
how price level changes in the routes along with changing actors of marketing in the routes.
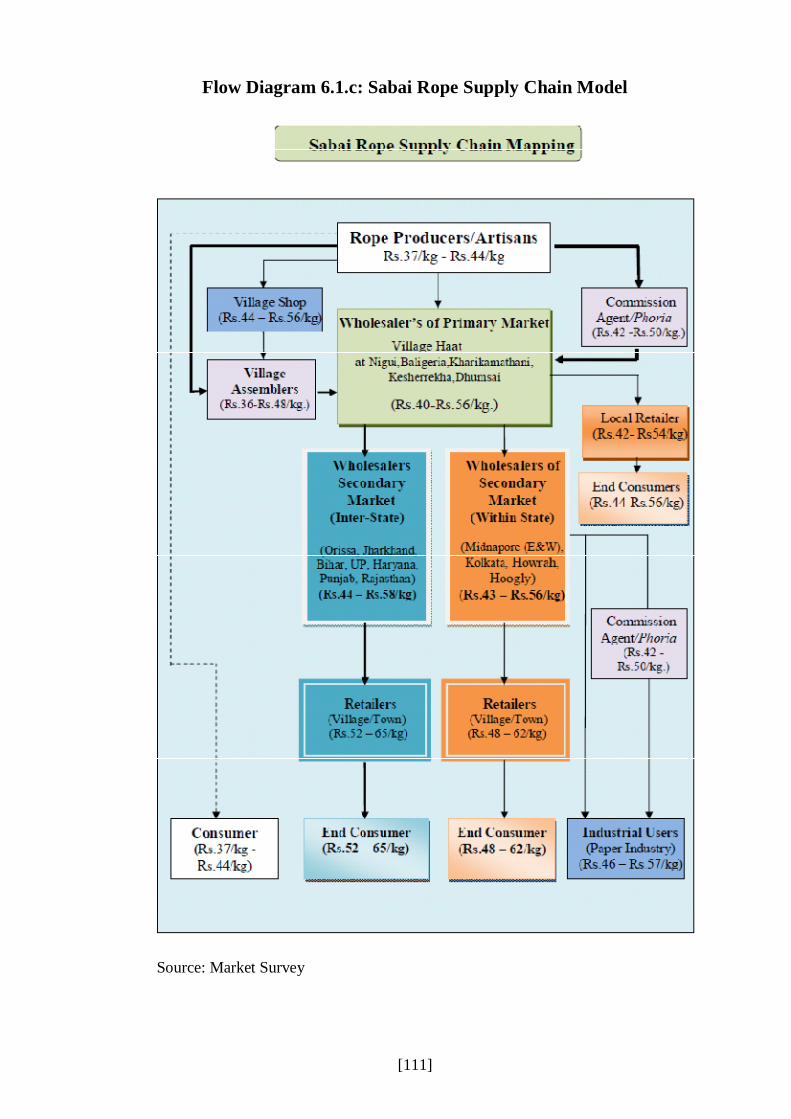
[111]
Flow Diagram 6.1.c: Sabai Rope Supply Chain Model
Source: Market Survey

[112]
6.1.2. Marketing Channels of Sabai Crafts
Sabai crafts are marketed directly by the artisans or indirectly through shops, galleries,
lifestyle stores, departmental stores and through e-commerce platform. Many social
entrepreneurs as well as big commercial houses are now showing their interest to bring these
crafts from the hinterlands to the global market place. Among these marketing platforms,
ecommerce plays a pivotal role in distribution and promotion of Sabai handicrafts across the
global markets.
Flow Diagram 6.1.d Marketing Channels and Channel Intermediaries
in Handicrafts Business Network
Channel no
Flow of Crafts from Artisans to Consumers
Ch-I Artisan → End-Consumers
Ch-II Artisan→ Local Middleman → For Profit Social Enterprise/ Wholesalers →
End-Consumer
Ch-III Artisan→ Local Middleman → For Profit Social Enterprise/ Wholesalers
→ Lifestyle Shop/Craft Store/ Retail Chain Store → End-Consumer
Ch-IV Artisan→ Local Middleman → For Profit Social Enterprise /Wholesalers →
e-marketers/online marketers → End-Consumer
There are four distinct supply chains (Flow diagram 6.1.d) prevailing in the existing
handicrafts marketing network. These channels are categories in direct and indirect form. In
direct distribution, artisans sell their produce to the ultimate consumers through direct
marketing and promotional events like trade fairs, melas, expo, etc. In indirect distribution
several intermediaries functioned in distribution network such as wholesalers, retailers, etc.
Few Non Government Organisations have come forward to promote these crafts in national
and global level. It is known that a few Kolkata based NGOs are promoting Sabai handicrafts
collaborating with profit based enterprises. The main aim of this social business model is to
return back the profit to the mother NGO for craft based livelihood promotion. For Profit
Social Enterprise (FPSE) works as the frontier marketing agency of the NGOs because their

[113]
initiative is only confined to non profit platform. The Government departments and agencies
have taken few initiatives in skill development but not satisfactorily in market development.
So far from the discussion made with Block level functionaries, it has been realised that no
marketing or promotion related training has so far been offered to the Sabai artisans. Formal
market linkages have not been developed in the study region except seasonal promotion of
SHG products through fairs and exhibitions. Government has taken initiative to conduct these
promotional events where the artisans get the opportunity to meet their buyers. But these
events are seasonal and conducted for a very short duration. Four supply chains are
functioning in distribution network (Flow diagram 6.1.d) and five types of channel
intermediaries re also engaged in this network of flow. These intermediaries are i) Local
middlemen, ii) For Profit Social Enterprises, iii) Wholesalers, iv) Retailers and v) e-
marketers. For Profit Social Enterprise is a business unit where in one side it serves the
society through a unique product/ service and also simultaneously earns profit from the
operation. Their working is not similar to that of NGOs. Although NGOs take up social
service, they mainly depend on grants from Govt. and donor agencies.
6.2 Operational Characteristics of Grass, Rope and Crafts Markets Sabai based farm and non-farm (Rope and Handicrafts) units are mostly run by the
household members with sole proprietorship form of venture. The marketing function is
carried out by the household members under the supervision of head of household. Mainly
male members of the family take the responsibility of marketing function because of holding
the monetary power with them.
6.2.1 Operational Characteristics of Grass and Rope Markets
Marketing of Sabai grass and rope is carried out mainly by informal agents or
intermediaries who bring these products from village level to primary periodic markets (Hat).
These intermediaries are locally known as ‘Paikars’ and ‘Phorias’. They are familiar with
[114]
other names such as village level paddlers, collectors, assemblers, fellow producers cum
traders etc. In every village or for a cluster of villages these types of channel intermediaries
are found involved in distribution network. Village level assemblers are mainly independent
informal business owners who collect grass and ropes from different village households.
These types of intermediaries have an important role in linking with the remote villages, in
spite of existence of very poor transport, road and communication facilities in the total
network. Such villages are usually located in the hinterland and mainly situated in the
forested or hilly and other difficult terrain areas. The average lifting of rope by this type of
intermediaries varies from 2 qtl. to 8 qtl. per week. There are around 225 to 250 number of
village level assemblers who are engaged with the Sabai marketing chain in the study region.
It has been realised from the market survey that many producers follow selective type
of distribution to sell Sabai based products. The producers follow such type of distribution
because they want to sell their product to the previously known persons, who may be
commission agents, village assemblers, wholesalers or any other known intermediary. Under
this distribution strategy the producer selects specific market centres and chooses selective
intermediaries within a geographical setting. Most of the grass and rope producers sell on an
average 20-30 kg grass or/and 10-15 kg of rope per week at their doorstep or at the rural
periodic market place. Large growers of Sabai grass with yearly production of 20 to 25
quintals, sell their crop to fellow producers cum traders or pre-harvest contractors or
wholesalers in a bulk volume. It has been found from the survey that, different producers
show their preference in choosing different first line traders (Table 6.1). On the basis of their
response, an attempt has been made to understand their preference level on trader selection.
Among the intermediaries the ‘Phorias’ or commission agents are the most preferred first
line traders.

[115]
Table 6.1: Most Preferred First Line Intermediaries by the Producers
Sl no Types of first line intermediary No of Respondents (%) 1. ‘Phoria’/ Commission agents 159 (48.18) 2. Wholesalers/Aratdar 62 (18.79) 3. Village assemblers/Paikar 86 (26.06) 4. Village shop 23 (6.97)
Total 330 (100) Source: Sample Survey
An attempt has been made to find out the average lifting of Sabai grass by a
household in a year through various channel intermediaries (Flow diagram 6.2). It is clear
from this flow diagram that the average production of Sabai grass by a grower is around 417
qtls./year. The growers sell their produce not only to different intermediaries but also directly
to rope producers. The maximum quantity of Sabai is initially sold through village
assemblers or fellow growers cum traders. In this category the average turnover of Sabai has
been identified as 242 qtls./ year, which is the 58.03% of the total production of the family
(Photograph-10). The next dominating first-line intermediaries are pre harvest contractors or
crop lessee. On an average 55 qtls./year of Sabai are sold through these intermediaries.
Growers directly sell 18qtls. Sabai per year to the rural consumers or rope makers. So, it is
evident from the discussion that village assemblers are the most dominating first-line
intermediary in the Sabai grass marketing channel.
Photograph-10: Village Assembler cum Trader at Gopiballvpur Haat

[116]
Flow Diagram 6.2: Existing Supply Chain Model of Sabai Grass
Source: Sample Survey
The total production of rope by 330 surveyed households is around 1236.85tons/year
(Flow diagram 6.3). Rope producers initially sell their product to the grass root level
intermediaries who are technically termed as first line buyers. It is clear from the Flow
Diagrm that out of the total rope production only 626.15 tons i.e. 50.63% rope is primarily
sold through commission agents or ‘Phorias’, followed by 344.89 tons i.e. 27.88% and 39.58
tons i.e. 3.20% are sold through village assemblers and village shops respectively. Producers
directly sell 214.23 tons i.e. 17.32% of the total production to the primary level wholesalers
or ‘Mahajans’ in village Hat while only 12 tons i.e. 0.97% to the local end consumers.

[117]
Flow Diagram 6.3: Existing Supply Chain Model of Sabai Rope
Source: Primary Survey
It has been observed from the field survey that the price which is offered to the rope
producers by the village assemblers is lower than that of local market rate and the price range
differs from Rs.4 per kg to Rs.8 per kg. The craftsmen get little benefit when the price of the
product increases in the peak season or when the demand of product is high in the market.
The middlemen traders prevent the flow of price information from local market to producer’s
level. Wholesale traders or ‘Mahajans’ are the independent business owners. These traders
are the main market linking actors who connect the local market with the urban external
market. This type of traders has good contact with the regional and national level traders. It
has been realised from the survey that ‘Mahajans’ or big traders dominate the entire local
level market chain and control the demand –supply condition through unauthorised holding
and financial power.
[118]
6.2.2 Operational Characteristics of Crafts Markets
Though more than twenty Sabai based crafts are manufactured in the study area for
the purpose of price spread analysis a few selected items are treated to get insight into the
process of transaction, nodes and channels, marketing margins of dealers and intermediaries
and end customers etc.. The selected crafts in this case are (i) Hats and Caps, (ii) Door Mats,
(iii) Designed Shoulder Bags and (iv) Floor Carpets. For making these items, the input
materials are mostly semi-processed like treated grass, rope, plaits etc.. For majority of these
value adding crafts the principal materials are usually subjected to treatments like bleaching,
drying, dyeing, deodorising etc. and finally packaging when needed. All the above processing
steps incur certain costs. Besides, the technological inputs in processing, decorating and
packaging with moulds and frames, knitting and weaving arrangements, integration with
external finishing materials like wood, bamboo, steel, silk and tasar, skin, animal horns,
conch and shells etc. also add to the quality and price of final product as well. In all the four
selected items such possibilities of quality improvement and fixing high price are quite wide
and make the products often market sensitive.
Marketing systems and channels in crafts are much more advanced than grass and rope
dealing. In fact, the number of intermediaries are four namely a) Local Middlemen, b) For
Profit Social Enterprises(FPSE) or Wholesalers, c) Lifestyle Shops (LSS) or Retail Chain
Store (RCS), and d) E-marketers or exporters. In this area, the local middlemen have limited
direct role though often they purposively get linked with the FPSE or wholesalers. They play
the role of suppliers of raw-materials, decorating accessories and finishing items to get the
opportunities of middlemanship to transfer the final product to FPSE and Wholesalers. They
often advance money and finishing materials to the craftsmen to get a margin of profit from
the FPSE or wholesalers. In fact the urban based large dealers or FPSEs are not much linked
directly with the artisans or their SHGs. Actually the local middlemen keep them apprised of
all the related information on quality, skills, financial capability of the artisans, their

[119]
marketing knowledge and strengths, accessibility to urban wholesale markets etc. In other
words weaknesses of the large dealers or FPSEs are the strengths of these middlemen.
Lifestyle Shops and Retail Chain Stores most commonly act as buyers and sellers of
Green Products. They play as promoters of rural crafts by creating buyers preferences on eco-
friendly products though their trading style is of high profit motive rather than concern for the
poor craftsmen. It may be said that the Government Sales Emporium, though some of them
have shown interests, are not effective in promoting Sabai crafts since their system of
procurement and payment are too slow and subjected to unusual delays in clearing.
E-marketing is a new channel for marketing of Sabai crafts. These e-marketers play as
true distributors or men to provide marketing services to the sellers in exchange of sales
commission. In fact they operate through websites and give advertisement through print and
electronic media. They operate with couriers or logistics service providers and earn selling
commissions as well as receive processing fees for connecting sellers with end customers.
6.3 Markets and Market Centres
Sabai grass and rope are primarily disposed of through rural periodic market centres,
locally known as Haat. Baligeria Haat, Kaharikamathanai Haat, Baranegui Haat and
Dhumsai Haat of Nayagram Block, Gopiballavpur Haat of Gopiballavpur-I Block, Belpahari
Haat of Binpur-II Block and Fekoghat Haat of Gopiballvpur-II Block are the seven major
market centres in the study region (Table- 6.2). The total turnover of Sabai grass and rope in
Nayagram Block, as estimated through a study in the local hats, are around 6000 qtl. and
5000 qtl. per month respectively in the peak season(November-May). About 40% of these
turnovers are products of Orissa and Gopiballavpur –I Block2. Around 30% (1800 qtls.) of
the total turnover from the market sale is made through big and medium size wholesalers.
2 PFM Study Series-4, Rural Development Centre, IIT Kharagpur, 1995

[120]
Table 6.2: Quantity of Sabai Rope Turnover through Local Periodic Markets (Haats) in the Study Region
Nam
e of
th
e B
lock
s Name of the Hat/
Periodic markets
Quantity of Turnover (in Qtls.)
% to total
turnover Oct
,12
Nov
,12
Dec
,12
Jan,
13
Feb,
13
Mar
,13
Apr
il,13
May
,13
Jun,
13 Total
Turn-over
Nay
agra
m Baligeria 287 333 473 735 875 1015 1200 1300 1000 7218 25.47
Kharika- mathani 164 190 338 420 500 580 640 700 550 4082 14.41
Negui 246 285 405 630 750 870 1000 1100 950 6236 22.01 Others
Markets 123 143 203 315 375 435 500 550 425 3069 10.83
Total Nayagram Block 820 951 1419 2100 2500 2900 3340 3650 2925 20,605 72.72
G
opi-I
Gopiballavpur 205 300 360 490 585 670 740 800 550 4700 16.59
Bin
pur-I
I
Belpahari 110 130 255 325 390 410 420 480 510 3030 10.69
Total 1,135 1,381 2,034 2,915 3,475 3,980 4,500 4,930 3,985 28,335 100.00
(Source: Market survey Year- 2012-13)
To estimate the present turnover of Sabai rope, a study of local Haats had been done
during Oct, 2012 to June, 2013. The study reveals that the total turnover of Sabai rope is
around 28,335 qtls./ year in the study region of which Nayagram Block alone generates
around 73% of total production of the region. The average regional rope transaction through
local Haats amounts to 3000 to 4000 qtls. Per month in the peak season and 1800/2500 qtl. in
the lean season. The monthly monetary transaction of Sabai rope is estimated to be around
Rs. 2.5cr. in the peak season and 1cr. in the lean season, considering the average price of rope
as Rs. 4500/qtl. It is known that about 20 to 30 percent of the total produce of Gopi-I Block is
sold in the rural markets of bordering State of Odisha. The same condition is also noticed in
Binpur-II Block from where about 40% of the grass product is transported to Purulia District
of West Bengal and East Singhbhum District of Jharkhand State. The important market
centres of the study region with their locations and days of seating are given table no-6.3 &
(Fig.6.1,6.2 & 6.3) map showing Sabai markets in the Study Areas.

[121]
Table: 6.3 Primary Sabai Market Centres in the Study Region
Sl no
Name of the Market
Centres (Haat)
Name of the Blocks
Days of Seating
Name of the Sub-Division
Name of the District
1. Baligeria Nayagram Friday Jhargram Paschim Medinipur 2. Kharikamathani Nayagram Wednesday Jhargram Paschim Medinipur 3. Bara-Negui Nayagram Tuesday Jhargram Paschim Medinipur
4. Dhumsai Nayagram Tuesday/ Saturday Jhargram Paschim Medinipur
5. Kesherrekha Nayagram Thursday Jhargram Paschim Medinipur 6. Gopiballavpur Gopiballavpur-I Sunday Jhargram Paschim Medinipur 7. Belpahari Binpur-II Wednesday Jhargram Paschim Medinipur 8. Chakadoba Binpur-II Sunday Jhargram Paschim Medinipur 9. Fekoghat Gopiballvpur-II Tuesday Jhargram Paschim Medinipur
The main processed product, Sabai rope collected from the local Haats by ‘Majahjans’
or whole sellers is sent to different markets of other States like Orissa, Bihar, Jharkhand,
Uttar Pradesh, Rajasthan etc. Sabai grass is sold through identified seven major disposal
channels whereas Sabai rope is sold through eight marketing channels. An important feature
of Sabai rope marketing channel is that the commodity moves to selected towns and market
centres of Northern, Eastern and Central regions of India and subsequently distributed to rural
retailers through medium size semi-urban or District level market centres. The district level
wholesale market centres act as transit point and thus play an important role in the entire
marketing network. Some important District level market centres of Sabai rope in other States
are mentioned in table- 6.4.
Table: 6.4 Important Transit Market Centers of Sabai Products in Different States
Sl no Name of the places
Name of the States Sl no Name of the
places Name of the
States i. Balia Uttar Pradesh x. Muzzafarpur Bihar
ii. Gajipur Uttar Pradesh xi. Darbhanga Bihar
iii. Yousufpur Uttar Pradesh xii. Patna Bihar iv. Kanpur Uttar Pradesh xiii. Gopalgunge Bihar v. Agra Uttar Pradesh xiv. Jaipur Rajasthan
vi. Allahabd Uttar Pradesh xv. Baripada Orissa vii. Lucknow Uttar Pradesh xvi. Raigarh Madhya Pradesh
viii. Daltongunge Jharkhand xvii. Biharsarif Bihar ix. Chapra Bihar

[122]
Nayagram Block
Fig.6.1: Map of Village Markets (Haat) Dealing with Sabai Grass and Ropes in Nayagram Block Gopiballavpur-I Block
Fig.6.2: Map ofVillage Markets (Haat) Dealing with Sabai Grass and Ropes in Gopiballavpur-I Block

[123]
Binpur-II Block
Fig.6.3: Map of Village Markets (Haat) Dealing with Sabai Grass and Ropes in Binpur-II Block
To understand the volume of operation, profitability, network of flow, extent of market
coverage and characteristics of marketing channels a Traders Level Survey was conducted
through questionnaire schedule and interview method. Sabai growers as well as rope and
crafts producers make available their products to the end consumers through various
distribution channels. Channel actors or intermediaries play crucial roles for creating multi-
nodal links between producers and end-users. Producers of Sabai industry depend on
conventional distribution system which forms a fragmented marketing network in which the
channel functionaries are connected with each other in an unorganised way.
6.4 Pricing Method of Sabai Grass, Ropes and Crafts
The price decision is very crucial and for that special care is to be taken so that the
artisans get competitive edge due to price decision. Price is the monetary expression of value
and as such occupies a central role in competitive exchange. Price is the only marketing mix
variables which generates revenue. The importance of price as a competitive weapon has
grown significantly since 1970’s (Simon, 1989). Typically, a producer will set the level of
price between the product cost and the perceived value of the product; the product cost sets a

[124]
floor to the price and the product’s perceived value sets the top (Kotler & Armstrong, 2014).
So the producer must consider cost, demand, and competition to determine the best price.
6.4.1 Pricing Management of Sabai Growers
Price analysis of the Sabai crop includes identification of monetary valuation,
procedures and underlying factors that causes differences in prices across location and time
and between producers and consumers. An in-depth analysis is required to understand the
pricing mix structures followed by the growers for different market intermediaries. An
attempt has been made in this part to examine the various pricing decision taken by the local
or grass-root level growers. Pricing decision varies according to the product category,
features, nature of intermediaries and category of customers. To understand the method of
valuation and the pricing behaviour, a farmer’s level survey and market survey have been
done in three study Blocks. It has been observed during the household and market survey that
Sabai growers and collectors have taken pricing decisions on the basis of few pricing
parameters. These are discussed below.
i. Time/seasonal pricing
Price of Sabai varies on the basis of place of sale and time of sale. The fluctuations of
price have been recorded in different seasons of the crop year. The places of sale transactions
have been divided in two categories, first at farm-gate sale and second at distant market sale.
Farm-gate sale is normally done during the harvesting season (August-September). The
distant market sale usually starts from the month of October-November and continues till
June or before the on-set of monsoon rain. It has been found from the sample survey that
6.52% growers in the study area sell Sabai from their farm-gates during the harvesting time
(Table-6.5). Majority of them accepts the price offered by the grass collectors or commission
agents. The reasons for preferring sale of grass from farm-gates are: (i) reduction of risks of
any damage to the crop due to heavy rain, (ii) intermediaries taking the risk of selling or

[125]
marketing upward along the channels, (iii) costs of transportation, market fees etc are borne
by the intermediaries and finally (iv) cheating and non payment for taking the commodity
could be avoided since the buyers are fellow producers or previously known persons. Often
payment is made with partial credit which is paid after few weeks when they receive money
from wholesale traders. The table-6.5 also shows the proportion of sellers in distant markets
in different seasons after harvest.
Table 6.5: Seasonal Pricing of Crop in the Farm-gate and in the Distant Market
Particulars No of growers (%) Average Price* In Rs./kg
1. Farm-gate sale during harvest (Aug -Sep) 9 (6.52) 9.88 2. Distant market sale during Oct-Nov-Dec 55 (36.23) 12.44 3. Distant market sale during Jan-Feb-March 48 (34.78) 14.94 4. Distant market sale during April-June 26 (18.84) 18.46
( *Price during the period Aug 2012 to June 2013)
The traditional culture of inhabitants of the study area is to visit the rural market centre
once in a week to purchase commodities for daily needs which includes both food and non-
food items. At the same time Sabai growers bring their crop to the road side markets to sell it
in a better price. Around 36% growers sell Sabai at an average rate of Rs.12/kg in the road
side weekly markets centre during month of October to December. It is evident from the table
6.5 that majority of the growers sell their produce during October – November -Decembers
period because the growers can sell Sabai on cash at the road-head markets and their local
festivals like Durgapuja, Diwali, Bhaiphonta etc are held in this period which need cash
money at hand to celebrate their festivals.
Most of the Sabai growers in the study region are marginal growers or agricultural
labourers. After harvesting of the sole Kharif crop, the main earners of the family migrate
seasonally to agriculturally advanced districts for wage earning. For the time being women
folk of the family handle the financial crisis of the family by selling Sabai grass and rope in
the road side weekly markets at higher prices. Actually rope making becomes the principal
occupation of the non-migrant workers of the family during this period. Sabai grass is treated

[126]
as the liquid asset or cash in hand assets of the family, because it can be converted into cash
in a simple commercial transaction with little effort.
The differences in market price between the growers and the traders have been recorded
to minimum Rs.2.00 and maximum Rs.5.00 per kg. The peak season of Sabai rope business
starts from the month of April and continues till the June middle. The demand of grass and
ropes gradually increase other than the previous months and maximum price hike have been
recorded during summer months. During this season around 19% Sabai growers sell Sabai
with an average price of Rs.18.46/kg. It is obvious from data that this value of Sabai riches on
the highest pick in the price curve. The next parameter is completely based on the market
location or place of sitting of periodic markets. Road side market centres obviously avail of
the advantage of better connectivity with the urban and regional wholesale market hubs.
ii. Going rate pricing
Illiterate and low educated growers do not have sufficient proficiency and knowledge to
calculate the exact price of their produce. In such position going rate pricing is commonly
followed by the Sabai growers. This pricing strategy is suitable when the farmer’s crop
quality is same with the other competitor’s crop quality. Growers do not take the risk of using
differentiated pricing strategy when the quality and features of the crops are equivalent to
others. In going-rate pricing strategy growers follow existing price rate that is used by other
growers in the same market place. The advantage of going rate pricing is that growers give
little effort or no effort in deciding product cost and selling price. They just follow the
existing market going rate.
iii. Area pricing
Sabai growers and collectors sell their produce in different periodic markets. They
charge different prices for the same quality crop in different market places. A farmer, Mr.
Biswanath Tudu of Kesher Rekha village of Nayagram Block charges different prices of the
crop when he visits to different weekly markets. Producer charges Rs.15 per kg in the

[127]
Kesher Rekha Haat but when the same producer sell it in the Negui Haat he/she could have
charges Rs. 17 and Rs. 18 per kg in the Baligeria Haat. So, here price varies depending on the
geographic location of the Haat. Kesher Rekha Haat is sitting in the remote area but
Baligeria Haat and Negui Haat are well connected with metal roads. Producers prefer to visit
these two Haats to have handsome price of the crop.
iv. Channel Pricing
Channel pricing strategy has been observed on the basis of distribution channels or
intermediaries. Different categories of channel functionaries viz. village collectors or
peddlers, commission agents, middlemen, wholesalers and suppliers undertake business
dealings with the growers. These channel functionaries offer various kinds of services to the
growers such as credit facility, health and medicine support, food supply etc. Among these
above mention channel intermediaries village level peddlers and middlemen traders provide
door-step services and maintain homely relationship with the growers throughout the year.
But a hidden interest of the intermediaries has been identified behind these services. Few
growers are aware of about the intention of intermediaries they offer different prices to
different channel functionaries on the basis of personal relation and keeping in mind the
service received from them. Village level peddlers or commission agents get the maximum
advantage, and purchase it an unreasonable price which is lower than the prevailing market
rate.
v. Discount pricing
Growers sometimes follow discounted pricing method for the bulk buyers. Producers
prefer to save their time in the process of selling more quantity of produce to a single buyer
and as a result; higher discounts are offered to the bulk buyers. The other intention of bulk
selling is to earn instant liquid cash. It is evident from the survey that growers also
considered discounted price to the buyers in case of advance purchase of crop. The advance
sale transaction has been made by the producers due to the requirement of the advance credit

[128]
in their financial crisis period. It is observed that buyers financially exploit growers by giving
them advance credit at their emergency period. In the advance purchase process buyer’s
intention is to snatch the farmer’s produce by giving them a nominal price which is lower
than their market price. The growers also bound to give them price discounts because of the
preceding indebtedness. Indebted growers sacrifice more in price negotiation and sometimes
it is found half of the normal market price.
vi. Segmented pricing
The use of segmented pricing is the practice of charging different prices to different
buyers. Sabai grass producers offer price to different buyer segment on the basis of their
characteristics. Buyer segments are middlemen traders, village level peddlers, commission
agent, wholesalers and very few consumers those who are local or outsiders. Producers give
first preference to local buyers those who are familiar to them earlier. Sabai growers offer
comparatively lower price to the local buyers than the outsiders, because the local buyers also
give marketing services throughout the year for selling out their handmade product like ropes
which are the main cottage industry products. Hece producer’s segment is dependent on
buyer’s familiarity and regular doorstep marketing services.
6.4.2 Pricing Management of Rope Producers
In case of pricing of handmade products, the market always has the significant problem
of covering the costs of materials and labour while staying under the limit of what a
consumer might be expected to pay for an item. The individual craft person usually
undervalued or some time not assesses the value for their labour involvement and attached no
monetary value of extra process or task performed by them and their family. In addition the
craftsperson usually ignore the overhead of workplace and equipment required for production
(Alvic, 2003).

[129]
a) Price Based on Production Cost
Price of rope depends majorly on material cost. Two other cost like fixed cost and
marketing cost is also added with the production cost. But these costs are very nominal. After
having personal interaction with the producers, it is understood that generally rope producers
follow and give more attention on the cost based pricing method. When asked to a Sabai
grower cum rope maker cum trader, Susen Bhui of Bara Jhauri village of Kendugari Gram
Panchayat under Gopiballavpur-I Block about their rope pricing strategy, he replied “we do
not calculate labour cost as per present market rate. People engage in rope twisting activity
because no other work is available. Price of rope mainly calculated on raw-material cost.”
b) Price Based on Changes in Raw-material Cost
A price trend has been recorded on the basis of rural market survey. The below table
indicates that in most of the time, price of the rope are found to be almost double than the
price of the grass in the local market. Price of the rope is greatly influenced by changes in
raw-material cost than the changes in labour cost. Because they do not consider home labour
in the production cost. If the raw-material cost increases, price of the rope will increase
subsequently. All the surveyed households who are engaged in rope production activity use
their family labour instead of hired labour. Due to the involvement of family labour, changes
in labour cost does not affect much in price level.
Table 6.6: Highest and Lowest Grass Price vs. Rope Price between the Year 2011 to 2015
Year
Price of Sabai Grass (principal raw-material)
(In Rs./kg)
Price of Sabai Rope (In Rs./kg)
Grade-I Grade-II Mean VIP Super Medium Medium Mean
2011 14 12 13 30 28 24 27.33
2012 16 14 15 35 33 27 31.67
2013 22 18 20 44 42 36 40.67
2014 30 26 28 50 48 42 46.67
2015 34 28 31 56 54 47 52.33
Source: Market survey at Baligeria & Nigui periodic market (Haat), Nayagrm Block

[130]
c) Price Based on Seasonal Demand
Seasonality factors influence the demand of the market and there by influence the price
of the products. Demand of rope become increases in the summer season. Whereas demand
of decorative and household utility items rise in the winter season. Direct selling of rope
become increases in the summer season due to increasing trend in use of rope by the local
household. Local households use this rope for construction and repair of thatched roof or
‘Kachha’ house. Another purpose is weaving of cot or ‘Charpoy’ which is popularly used in
the rural households for sitting or sleeping purpose specially during hot summer month. Price
of ropes and traditional weaving cots has been found comparatively high in the summer than
any other season.
According to the Secretary of traders association namely “Nayagram Thana Babui
Rope Babsaye Samity (NTBRBS)”, the demand of Sabai rope increases in the summer
throughout the north and north eastern zones because agriculture based poor households build
and repair thatched houses as well as fencing before starting of monsoon.
d) Price Based on Middlemen’s Decision
In this regard it is remarkable that sometimes middlemen traders fix up the price of
rope when the producers depend on them for marketing of such products. In such case the
sale price of rope barely covers only the cost of raw-material without any profit margin. High
degree of competition has been found among the middlemen traders and commission agents
locally known as ‘Phoria’ in the market. ‘Phorias’ usually wait at the road side or gate of the
periodic markets to purchase the produces. ‘Phorias’ capture the producers before their
entering in the market. The main intention is to make them unaware about the ongoing
market price of the product. Before envisaging the market situation, ‘Phoria’ pressurises
them to complete the deal. But the producer’s price decision and business deal capacity
depend on their bargaining power.

[131]
6.4.3 Pricing Management of Artisans Producing Value Added Handicrafts
Decorative and aesthetic crafts are usually purchased by the premium class aiming of
gifting to others or use in their house to enhance the natural beauty. Generally they do not
consider price rate in buying. Considering the unique features of the crafts, aesthetic skills
and different tests and spending mentality of the consumers, adoption and implementation of
uniform pricing strategy in a standardise way is a complex task. The uniqueness of natural
fibre based handicrafts provides flexibility and freedom to adopt differentiated pricing
approaches for different market segments. Some of the artisans due to absence of immediate
substitute enjoyed a monopoly in their sale.
Sabai handicrafts producers do not able to follow systematic pricing strategy like
corporate or big business groups. Most of the high skilled craft producers are trying to follow
cost based pricing approach. Besides cost based pricing, few high skill artisans follow other
pricing approaches. But artisans are not aware of or not having any knowledge about the
marketing theories and practices. Attempt has been made to give a shape of their pricing
practices under a systematic and strategic manner with the help of pricing approaches and
these are cost-plus pricing, mark-up pricing, fair value pricing, perceived value pricing etc.
But it has been observed that pricing decision of the artisans varies according to their
marketing experiences, educational standard and knowledge about the customers.
i. Cost based pricing strategy:
On the basis of personal interaction with the artisans, it appears that in most of the time
artisans usually consider cost based pricing method. The cost based pricing normally includes
variable costs (which include cost of raw-materials and labours), fixed cost (which includes
cost of tools and equipments) and certain amount of profit. Cost based pricing methods is
likely to set up the price based on what the market is willing to pay which could result in a
substantially different margin than the standard margin.
[132]
Deciding the actual labour cost, it is little bit challenging when artisans himself
laboured on the product. The labour cost has been calculated on the basis of hourly rate and
also as per prevailing market rate. But most of the cases they are compelted to underestimate
it due to unwanted pressure from middlemen or wholesale buyers. Except fair-trade business,
buyers, and other traders indirectly impose their predetermined labour rate which is quite
lower than the existing market rate. The detail cost structure is shown in Annexure -5.1.
Except pre-order, artisans do not go for bulk production. Sometimes traders or wholesale
buyers supply a part of raw-material. In such condition, it is very complicated to find out the
actual production cost of handicrafts.
The supporting input materials which are needed to give a complete shape of the
customer driven products, include, carrying handles of the fashionable bags, dyeing colours,
threads, needle etc. Some of the supporting input materials also come from the specialist
artisan groups like wood carvers, bamboo craft producers, blacksmiths etc. Price of these
input materials is unknown to the producers because suppliers do not disclose the actual cost.
So, fixing up the exact price of the input materials is very difficult. The extensive efforts have
been given to collect the information about the cost of these supporting materials, without
which the monetary value of these materials, cost calculation would not have been possible.
Variably artisans add very small amount of profit with its production cost. The
percentage of profit is not fixed and have not been followed with any pricing model. It is
mostly on the basis of their mind set, order quantity, and regularity in purchase. Craft
producers sell their products at retail prices to consumers and allow wholesale prices to the
NGOs, social entrepreneurs or exporters those who place order regularly. Craft producers
also sell their products at retail price in handicraft and entertainment fairs. Some social
entrepreneurs and NGOs keep regular connection with the artisans. Most of the sampled high
skill artisans are found tied-up with these organisations for training, product development and
marketing and promotional support. Now in the below table an attempt has been made to

[133]
find out the price of the crafts on the basis of feedback received from the artisans. The cost
plus pricing method is analysed in table 6.7.
Table 6.7: Cost Based Pricing Method of Artisans (Ex Factory Price)
Sl. no. Household Utility Items
Total Production
Cost (in Rs/pc.)
Cost Plus Profit (Wholesale price)
Cost Plus Profit
(Retail Price) B-C Ratio
(on Retail Price) Mar-up
(in Rs/pc)
Wholesale
Price (in Rs./pc)
Mark-up (in
Rs/pc)
Retail Price (in
Rs/pc)
i. Coaster- Natural Size-10″ (1 set consists of 6 Pieces) 108 42 150 72 180 1.39
(1.67)
ii. Coaster Dyed,Size-10″ (1 set consists of 6 Pieces) 119 46 165 97 200 1.39
(1.68)
iii. Door Mat (Coiled) Natural 135 65 200 115 250 1.48 (1.85)
iv. Door Mat (Frame)- Dyed 104 48 152 71 175 1.46 (1.68)
v. Door Mat (Beni)- Natural 57 23 80 43 100 1.40 (1.75)
vi. Water bottle Holder-Dyed 45 20 65 35 80 1.44 (1.78)
vii. Bin Basket-Dyed (in plywood frame) 142 33 175 58 200 1.23
(1.41)
viii. Food Basket with Lid Natural 125 40 165 75 200 1.32
( 1.6)
ix. Tea Container (3 in 1) (with bamboo Handle) 115 65 180 105 220 1.56
(1.91)
ii. Segmented Pricing
Very few producers get the opportunity to sell their products directly to the consumers
through various trade fairs like ‘Sabala Mela’, ‘Paschim Banga Rajya Hastasilpa Mela’, ‘Jila
Kutir Silpa Mela’ etc. which are installed either in the towns or in the city (Photograph-11).
Photograph-11: Marketing of Sabai Craft Items in State Handicrafts Expo, Kolkata

[134]
Segmented pricing method has been observed by the artisans in the above mentioned
fairs where they get the opportunity of direct marketing. Under this pricing method price
decision has been taken by the artisan on the basis of geographic segment of buyers. Artisans
normally charges lower prices for the customers located in the small towns compare to
customers located in the metro city. According to Mrs. Mitali Mahato of Kurmipathra village
of Nayagrm Block:
“From the past years experience we realise that customers want to spend on
fashionable products. Ladies bags are one of them. Now we try to produce
variety of fashionable bags for new generation people”.
iii. Price Discrimination/differentiation
Price discrimination is setting of different prices for different buyers. Under this
strategy prices are normally charges on the basis of buyer’s willingness to pay for the
products. The producer’s goal is to generate revenue by selling more products with minimum
prices to the people who are not willing to pay much amount. They are middleclass people
and high price sensitive people. But there is a significant relationship between the willingness
to pay and ability to pay. Buying habits of the handicrafts are generally driven by two
discriminate indicators: one is ‘ability to pay’ and “willingness to pay”. In direct marketing,
the Sabai artisans follow “willingness to pay” indicators. The great advantage of this strategy
is that people paying demanded prices because they feel pride in preserving the ethnic
artefacts of Bengal.
“Maximum time, customers of the small towns do not show their interest on handicrafts even
if we sell it on cost price but foreign visitors or buyers of Kolkata or Delhi fair buy our
products on demanded price” (Focus group Discussion with the Artisans, Kurmipathra
Village, Baligeria Gram panchayat, Nayagrm Block.

[135]
6.4.4 Price of Sabai handicrafts in e-commerce platform
Today India is one of the fastest growing e-commerce markets in Asia-Pacific along
with china. Increasing internet penetration, growing adoption of smart phones and increased
market awareness shall further accelerate the growth of ecommerce in India. In the year 2014,
India had around 281 million internet users, and the number is expected to increase to 640
million by 2019 (FICCI-KPMG, 2015). The main advantage of e-commerce users is that, it
reduces the geographic boundaries. Internet transcends all geographic boundaries and
provides an opportunity to connect with various buyers and sellers across geographies. The
handicraft players are able to reach out the newer markets or uncovered markets in a cost
effective manner. Rajesh Kumar Jain, Vice Chairman, Export Promotion council for
Handicrafts told to PTI on Feb 17, 2015:
“There is a huge demand of handicraft products in India and e-commerce portals are the
best medium to tap those consumers. Several of the handicraft players are joining hands
with e-commerce companies.”
Many e-commerce portals promote Sabai based crafts throughout the world. The main
aim of these e-commerce sites is to bridge the gap between handicraft producers/designers
and global consumers. With the help of these e-commerce portals, now consumers buy
products of the tribal people in few clicks. In recent days buyers need not wait for any crafts
fairs or ‘Mela’ which is seasonal in nature. These craft items can be purchased any time from
the online stores with cash on delivery facility.
[136]
6.5 Analysis of Price Spread and Channel Efficiency In this section attempt has been made to study marketing costs and margins and
channel efficiencies in respect of Sabai grass, rope and crafts marketing.
6.5.1 Marketing Cost of Sabai Grass and Channels of Distribution
The performance of marketing channels and series of activities are greatly influenced
by the marketing cost and the marketing margin. Marketing cost and marketing margin varies
from channel to channel and are related directly to the length of the channel. More
intermediary levels increase the channel length which raises the marketing cost and
marketing margin of the channels. Channel wise analysis of marketing cost, marketing
margin, price spread and net price received by farmer producer of Sabai grass is presented in
the table below.
Marketing cost includes all the costs that are involved in transferring or transacting the
goods from the producer point to consumers point. Marketing cost of Sabai grass and ropes
consists of assembling cost, carrying cost, binding cost, grading cost, loading -unloading cost,
transport cost, labour charges/wages, interest on loan etc.. Marketing cost varying from
product to product, place to place; region to region and time to time depending upon the
factors like self-life of the product, availability, nature of consumption and time of
consumption.
The cost components of Sabai growers include Haat fees or market fees and nominal
repairs and maintenance charges, where as the cost component of village assemblers includes
loading-unloading and godown charges, transport cost, charity or subscription to different
interest groups. Marketing Cost incurred by the fellow producer (FP) or crop lessee includes
all these previous expenses which village collectors spend but some time FP collect loan from
the financial institutions, in such case interest on loan has to be added with the marketing
cost. The major components of marketing cost of wholesalers are sorting, grading, carrying,

[137]
and loading-unloading charges, inventory, handling loss, godown rent, Haat fees,
wages/salary to staff, opportunity cost of capital, and other charges which include charity or
subscription etc. Since most of the Sabai growers live in the remote villages which are long
away from the road side markets (Haats), so far some of the growers use their bicycle for
carrying their produce from home to the market for sell. Poor road infrastructure and
financial condition of the growers compel them to use their bicycle as major transport
medium. So bicycle repairing and maintenance cost of Rs. 5.00/qtl. have been added with the
marketing cost incurred by the growers. On the basis of the feedback of wholesalers, the
interest on loan of Rs.5/qtl. has been added with the marketing expenses.
Channel-wise marketing cost structure of growers and traders have been shown in
Annexure 6.1 Channel-VII obtained the highest marketing cost of Rs. 515.50/q followed by
Channel-IV Rs. 443.83/q, Channel-III Rs.276.63/q, Channel-V Rs.229.00/q, Channel-II Rs.
60.50/q and Channel-VI Rs. 36.00/q where as Channel-I obtained the lowest marketing cost
of Rs. 15.00/q because producer directly sell to the consumers without any involvement of
intermediaries. Marketing cost of Ch-VII is high because of its longer length with
involvement of four numbers of intermediaries. In this channel growers sell Sabai through
village assemblers who then take the produce to the wholesalers and then wholesalers pass
the produce to industrial suppliers or commission agents. But if the producers sell their
produce directly to the consumers, by ignoring the intermediaries then marketing cost of the
channel become lowest among other channels. Maximum number of intermediaries increase
the marketing cost and increases the price of the product. Total marketing cost incurred by
farmer-producers is Rs 15/q in Ch-I, where as village assemblers incurred, Rs.231.13/qtl,
Rs.36.00 and Rs.62.50/qtl in Ch-III, VI and VII respectively. Middlemen (Phoria) though
involved in the distribution process, no expenses have been found incurred by them. Because
they are mainly the frontier agents of the wholesalers earning commission for carrying and
forwarding the products.

[138]
The longest and most expensive, channel-VII comprises of three intermediaries, which
are village assemblers, wholesalers of weekly Haat, and industrial suppliers or commission
agents. Paper mills normally buy Sabai through this channel. Only two grass suppliers are
found supplying Sabai to the paper mills. Decreasing trend of use of Sabai grass in the paper
mills mitigate the function of this channel. It is clear from the above discussion that
expanding channel length increases the marketing cost, decline producer’s share in
consumer’s rupee; expand the gap between producer’s price and consumer’s price
subsequently.
6.5.2 Marketing Margin, Price Spread and Producer’s Share in Consumer Rupee in
Sabai Grass Marketing Channel
The details of marketing margin and farmer-producer’s share on consumer price have
been summarised in table below. The differences between purchase price and selling price are
called marketing margin. In other words marketing margin is a price of all value adding
activities and functions performed at each stage of the marketing chain. In Ch-V commission
received by the middlemen or ‘Phoria’ from the wholesalers is considered as marketing cost,
because middlemen neither take the title of the product nor take any financial and inventory
risk. Some of them act as a frontier negotiators of wholesalers.
To calculate marketing margin of different channels, sell price of the sample growers to
different intermediaries have been taken into account. The detail calculation of marketing
margin of different intermediaries has been workout in the Annexure 6.2 Growers sell from
the grass field or from the house or taken it to the rural periodic markets. In channel-I, II & V,
farmer-producers have taken their produce to the market for sell in the market price. But in
channel-VII, growers sell to the village assemblers or fellow growers cum traders from the
field and in channel-III & VI growers sell it from their homestead. Growers realize 28 percent
to 32 percent loss when sell it from the field. The marketing cost to bring the product from

[139]
home to market is crucial in price fixasation. Due to this reason channel wise growers’s sell
price is found different from one channel to other. In channel-I & II net price received by the
growers after deducting the marketing cost is Rs. 1785/q, and in channel-V it is Rs. 1685/q
respectively. But for channel-III, IV, VI & VII growers need not spend any marketing
expenses. These channels save farmer’s time and money but knowingly they loose extra
profit. Some of the growers are not able to bargain due to unavailability of information on
ongoing market price. In this regard respondents of Kandnasol village of Gopiballavpur-I
Block remarked:
Distance of road side periodic market (Haat) from our village is around 12-15 km.
Cost of transport has become expensive. For this reason we sell Sabai from the house
itself. We do not have the actual information about the market demand and price of
the crop. “Paikar amaderke anddhakare rakhe”. If more ‘Paikars’ visit the village
then only we try to guess the present market rate. But ‘Paikars’ are also tied-up with
each other. They fix up their price in consultation with each other before visit to our
house. More or less all ‘Paikars’ offered same price. Among them those who provide
quite better price and offer immediate cash we preferably sell to them. (Group
Discussion, January 2015, medium of conversation in Bengali)
The highest marketing margin of Rs.1056.17/qtl is obtained by the intermediaries of
Ch-IV followed by Rs.723.37/qtl, Rs.606.50/q, Rs.446.00/qtl, Rs.354.5/qtl and Rs.286.00/qtl
in Ch-III, VII, VI, II and Ch-V respectively. The highest marketing margin is realized by Ch-
IV due to its larger differences between grower’s price and consumer price. The price spread
is found to Rs. 1500/q which is the highest among other channels. The farmer’s percentage of
share on consumer’s rupee is 31.82 % which is the lowest even then any other channel
functioning in Sabai marketing chain. So it is evident from the above discussion that
intermediaries functioning in channel-IV receive highest marketing margin and growers get

[140]
lowest share on consumer’s price. The lowest marketing margin is realised by the
intermediaries in channel-V. In this channel, middlemen works as the linking pin between the
producers and wholesalers in return they earn commission. Wholesalers treat this commission
as the marketing cost. Combining all channels the average marketing cost of the wholesalers
is Rs.12.70/qtl. and marketing margin is Rs.339.37/q. Village assemblers are functioned in
three marketing channels. The average marketing cost incurred by the village assemblers is
Rs.109.88/q and average marketing margin is Rs. 327.46/q.
Table 6.8: Analysis of Producers’ Share on Consumer Price.
Particulars Marketing Channels
I II III IV V VI VII Marketing cost (in Rs/qtl) 15 60.5 276.63 443.83 229 36 515.5 Marketing margin (in Rs/qtl)
354.5 723.37 1056.17 286 464 606.5
Net price received by producers (in Rs/qtl) (at 2012-13 price)
1785 1785 1200 700 1685 1600 700
Consumers’ price (in Rs/qtl) (at 212-13 Price)
1800 2200 2200 2200 2200 2100 1822
Price spread (in Rs./qtl) 15 415 1000 1500 515 500 1122 Producers’ share in consumer price (%)
99.16 81.14 54.55 31.81 76.59 76.19 38.42
It is found from the above table 6.8 that the producers share on consumer price is
highest in Ch-I because here growers directly sell to the consumers. No intermediaries
involved in this channel. The second highest producer’s share on consumer price is found to
be 81.14% in Ch-II, followed by 76.59%, 76.19%, 54.55% and 38.4% in Ch-V, VI, III and
Ch-VII respectively.
From a simple price spread analysis (Flow diagram 6.4) it is observed that at the
starting point, the growers get a normal price of Rs.7.00 to Rs.18.00 per kg when traded at
local periodic market (at 2013-14 prices). Often drastic shifts in prices with 50% to 60%
downward drifts are noted when distress sell through advance purchase is made. This
happens due to advance receipt of money to meet some unavoidable difficult situation faced

[141]
by the family or self. Sometimes due to inconveniences in marketing, the growers sell the
commodity at door step to opportunist village assemblers who pay 30% to 40% lower price
than current market rate. Landless local rope producers or craft makers procure this raw-
material from nearby periodic market at the rate of Rs.20.00 to Rs.22.00 per kg (at 2013-14
prices) sold by the local traders or village assemblers who earn nearly 25%-50% profit
margin on grass trade.
Flow Diagram 6.4: Price Spread of Sabai Grass Marketing Channels
Source: Market Survey in Local Periodic Markets (Haats), 2012-2013
A notable feature of marketing with price spread accounts show that crop leasee as
well as pre-harvest contractors exploit the growers by paying remarkably low price compared
to market price. Generally they advance a part of contract price before the crop is matured by
taking opportunities of financial crisis or emergency needs of the grower much before harvest
operation. This trap leads to selling the crop at Rs.2, 200.00 per qtl to final consumer through
the grower receives the sale price of Rs.700.00 per qtl (Channel-IV). Had the growers sold
the crop to the wholesaler in primary market by himself he would have sold the crop at

[142]
Rs.1800.00 per qtl. and thus receiving a margin of Rs. 1000.00 per qtl. Even if Rs.100.00 per
qtl. be paid towards transportation and other miscellaneous costs, his addition earning could
have been Rs.900.00 per qtl. In fact, his gross earnings could have been Rs.1600.00 per qtl.
These practices of advance sale or pre-harvest contract thus cause the farmer loosing
significant earning in grass cultivation.
6.5.3 Marketing Efficiency Analysis of Sabai Grass Marketing Channels
Marketing efficiency is defined as the ratio of output (consumer’s price) to the
marketing input (marketing cost). An increase in ratio represents improved efficiency and
decrease denotes low efficiency. An efficient marketing system provides a sound network of
flow of farm produce from farm-get to consumer’s purchase point. Effective network of flow,
remunerative sell price and increasing grower’s share on consumer rupee motivate them to
increase the production quantity. Efficient marketing channels reduce the transaction cost and
share the benefit to both the parties, growers and consumers.
To understand the channel efficiency the Acharya and Agarwal (1998) method and
Composite Index Construction method have been applied to calculate the degree of efficiency
of different channels. The Acharya and Agarwal’s modified marketing efficiency formula
(MME) focuses on net price received by the growers, farmer’s share on consumer’s price,
total marketing cost and marketing margin of the channels. The first calculation method of
marketing efficiency is given in table 6.9 which advocates that an increase in the marketing
efficiency ratio would improve the efficiency and vice versa. On the basis of this concept,
channel-I is most efficient channel with efficiency score of 119.00 followed by channel-II,
VI, V, III, VII and IV with marketing efficiency scores as 4.12, 3.20, 3.15, 1.2 and 0.62
respectively. The highest marketing efficiency in channel-I is influenced by elimination of
market intermediaries. The least efficient channel is channel-IV with marketing efficiency
score 0.47. This channel is inefficient because of high price spread and marketing margin.

[143]
Table 6.9: Marketing Efficiency Analysis using Acharya’s & Agarwals Method
Market Channel
Net price received by producers
(in Rs/qtl)
Total marketing cost +
Total marketing margin (in Rs./Qtl)
Marketing Efficiency
Channel Performance
Rank
Ch-I 1785 15 119.00 1
Ch-II 1785 415 4.30 2
Ch-III 1200 1000 1.20 5
Ch-IV 700 1500 0.47 7
Ch-V 1685 515 3.27 3
Ch-VI 1600 500 3.20 4
Ch-VII 700 1122 0.62 6
Composite Index Method
Under Composite Index Method three performance indicators are used for measuring
the efficiency of different marketing channels (Table 6.10). These indicators are i) Marketing
cost of the channel members, ii) Marketing margin of the intermediaries and iii) Producer’s
share on consumer price.
Table: 6.10: Marketing efficient analysis using Composite Index method
Particulars
Marketing Channels I II III IV V VI VII
Marketing cost Rank (in Rs./qtl)
15 1
60.50 3
276.63 5
443.83 6
229 4
36 2
515.50 7
Marketing margin (in Rs./Qtl) Rank
0 1
354.50 3
723.37 6
1056.74 7
286 2
464 4
606.50 5
Producers’ share in consumer price (%)
Rank
99.16 1
81.14
2
54.55 5
31.81 7
76.59 3
76.19 4
38.42
6 Total of Rank 3 8 16 20 9 10 18
Mean 1 2.67 5.33 6.67 3 3.33 6 Channel Performance Rank 1 2 5 7 3 4 6
The efficiency of marketing channels is determined on the basis of mean score of
different performance indicators. Lowest score indicates higher marketing efficiency and on
the basis of mean score from lowest to highest, the rank has been given to each channel.
According to the composite index score , channel-I and II are the most efficient and desirable
channel because marketing margin and marketing cost is very low in these channels and
[144]
producer’s share on consumer’s rupee is higher than other channels. If the growers sell their
produce through channel-I and II then possibility of getting profit is more than any other
channels.
So both the method equally prove that channel- I is the most efficient channel followed
by channel-II, VI, V,III, VII, and IV. Channel-I is most efficient because of absence of any
intermediary while low efficiency is found in channel-IV because of huge marketing margin
pocketed by the crop leasee or pre-harvest contractors and wholesalers. Out of total
marketing margin of Rs.1,056.74, crop-lease or pre-harvest contractors grab 57.69% and rest
is pocketed by the wholesalers. Undue advantages have been taken by these pre-harvest
contractors by providing advance money or credit to the producers at their financial crisis
period. The most financial crisis have been found in the households at the time of medical
emergency or in any family function like marriage etc.. The condition of the credit or
advances lies on crop transfer. In this way the intermediaries made pre-harvest agreement
with the growers and loot the extra profit. Performance of the channel-II is the second highest
compared to other marketing chain.
6.5.4 Analysis of Costs, Margins and Marketing Channels of Sabai Rope.
Hand twisted ropes are available in various grades in the local markets. Few big traders
control the entire local markets through their diversified marketing network. Wholesalers or
‘Artdars’ spread their network to the remote villages where communication facility is even
poor. The nature of business and business establishment of the local traders vary from traders
to trader and volume of business. Some traders sit in the Haat under the temporary shed. Big
traders have permanent sheds with godowns, weighing scale, transport vehicles etc. within or
near the market or at other places. Some traders collect the products from producer’s house
while other wait at the roadside nearer to weekly Haats to capture the rope makers, without
having any weighing scale, godowns, permanent or temporary shades etc. First category of

[145]
traders called big, medium or small size wholesalers or ‘Aratdars’, second one is village
assembler or pedlar, and third one is commission agent or ‘Phoria’
The above traders or intermediaries play crucial role in rope supply chain. Without their
involvement, the craft-producers would not be able to market these natural and environment
friendly products to the households or industrial consumers of different states of India. There
are eight types of channels identified in rope trading network. Of these, channels-I, II, III and
IV are connected to and functioned within the State network. Other four types i.e. channel-V,
VI, VII and VIII are connected with the traders of other States through inter-state network.
6.5.4.1Marketing Cost:
Channel functionaries spend money as marketing expenses to deliver the product from
producer’s house to consumer’s house. The various costs incurred in the marketing of ropes
include transport cost of hired vehicle, assembling, cleaning and grading costs, labour
charges, commission charges and other miscellaneous expenses including charity,
subscription, staff salary/wages, godown rent, Haat fees, interest on loan, repair and
maintenance charges of own transport vehicle etc.. These costs are recorded on the basis of
market survey. Other related information are collected from the traders as well as craftsmen.
Detailed cost structure has been analysed in Annexures-6.3. and 6.4
In channel-I the producers directly sell their stock of rope to the consumers in the rural
Haat. This type of channel is called direct marketing channel. The producers spend repairing
and maintenance cost of Rs.6/qtl. for their bicycle which is used as transport media and some
other marketing related expenses of Rs.4/qtl.
In channel-II, the producers sell rope to the wholesalers in the rural Haat and in turn
these wholesalers sell it to the retailers and retailers sell to the ultimate consumers. There are
two intermediaries functioning between producer and consumers in this channels. The
average total marketing cost incurred by the channel member is Rs.90/qtl. of which producer

[146]
incurred Rs.10/qtl (11.12% of total cost), wholesaler and retailer incurred Rs. 40/qtl. (44.44%
of total cost) each.
Channel-III is the longest channel, involved with three intermediaries from producers
to consumers. Here producers sell rope directly to the village collectors or assemblers at
doorstep. Few village collectors play a dual role. In one hand they are village level traders
and on the other they are producers. So, village assemblers are also functioning as producers
cum traders. The average total marketing cost incurred by the channel intermediaries is
Rs.293/qtl of which Rs.42/qtl, Rs.33/qtl, Rs.168/qtl and Rs.50/qtl incurred by village
assemblers, wholesaler of primary market, wholesaler of secondary market and retailers
respectively. Out of the total marketing cost village assemblers occupy 14.33%, wholesalers’
of primary market occupy 11.26%, wholesalers’ of secondary market occupy 57.34% and
retailers occupy 17.06%. Major share of marketing cost is incurred on transportation
expenses.
The channel-IV is the most expensive channel in terms of marketing cost. In this
channel producers sell through commission agents or phoria. Poor and educationally
backward small scale producers feel hesitate to make deal with big wholesalers due to fear
factor. Taking this opportunity, Phorias capture them before entering the Haat and perform
business deal on behalf of the wholesalers. Total expense borne by the channel members is
Rs.436/qtl. Average expense borne by the producers is Rs.10/qtl, wholesalers of village
(primary) market is Rs.208/qtl, wholesalers of urban (secondary) market is Rs.168/qtl and
retailers Rs.50/qtl. Out of the total marketing cost borne by primary level wholesalers,
commission charges occupy major share which is Rs. 170/qtl. i.e. 81.73%.
The channel-V, VI, VII and VIII are connected with inter-state marketing network.
Local wholesalers are connected with urban traders located at district towns of different
States of India, viz. Orissa, Jharkhand, Bihar, Uttar Pradesh, Punjab, Haryana, Rajasthan etc.
Among the inter-Sate marketing channels, Channel-V is the low cost channel with existence

[147]
of three channel intermediaries. The average total marketing cost of this channel is Rs.380/qtl
of which producers incur Rs.10/qtl, wholesalers of village (primary) market incurred
Rs.50/qtl, wholesalers of secondary market (outside state) incurred Rs.270/qtl. and retailers
incurred Rs.50/qtl. According to the wholesaler’s view business transaction is made with the
wholesalers of the secondary market on the basis of fifty percent credit and in fifty percent
cash. In maximum cases fifty percent payment is made through bank transfer and rest of the
fifty percent payment is made after delivery of product at their business place. Normally 15 to
30 days credit have been given by the local wholesalers. The wholesaler charges the amount
of Rs.10/qtl. as the fixed expenses for the of interest on loan.
Average total marketing cost incurred by the channel members of Channel-VI, VII and
VIII are Rs.408/qtl, Rs, 550/qtl and Rs.525/qtl respectively. Channel-VII is the highest
expensive channel in terms of marketing cost, followed by channel-VIII, channel-VI and
channel-V. In channel-VII, the cost of commission amounted to Rs. 170/qtl is paid to the
middlemen or agents by primary level wholesalers. In every inter-state supply chain network,
average transportation cost borne by the wholesalers of secondary market is Rs.270/qtl. To
carry out the business transaction, most of the village assemblers receive loan from money
lenders or wholesalers. Sometimes these village collectors lend money to the rope producers
and in return they purchase rope from them with very minimum price.
6.5.4.2 Price Spread, Marketing Margin and Producer’s Share on Consumer Price:
No formal channel has been found functioning in the study area. The channels which
are identified through a market survey show informal in nature. The IDO of Binpur-II Block
remarked:
“Sabai grass and rope marketing is fully controlled by few local wholesalers. Wholesalers
are well connected with mobile traders those who collect rope from the village producers.
Government does not have any price fixation mechanism neither yet declared any
minimum support price for the producers. Few years’ back LAMPS, a cooperative under
WBTDCC provided loan to the local producers and could buyback their products on
remunerative price”. (Interview with IDO, Binpur-II Block).

[148]
Among the intra- State channel, channel-III is identified as the longest channel with
four functional intermediaries and among the inter-state supply chain network, channel-VIII
is identified as longest channel with existence of five functional intermediaries. Presence of
maximum number of intermediaries increases the price spread between the producers and
consumers and ultimately decreases the producer’s share.
The analysis of price spread of rope marketing channels are summarised in
Annexure-6.5 and 6.6 It is clear from the analysis that channel-I is more efficient because of
absence of any other channel intermediary. The price spread is Rs.10/qtl which is, lowest
among all the channels. In this channel the producer’s share on consumer rupee is 99.77%
which is the highest percentage among all the marketing channels. Low price spread and
high percentage of producer’s share on consumer rupee have made this channel more
effective.
It is evident from the table 6.11 below that the percentage share of producers in the
consumer’s rupee decreases with the involvement of more intermediaries which in effect
increase price spread. The elimination of market intermediaries resulted to in an increase in
producers share from 80.94% in channel-IV to 99.77% in channel-I.
Table 6.11: Price Spread Analysis of Sabai Rope Marketing Channels
Particulars Intra- State Inter-State Channel Ch-I Ch-II Ch-III Ch-IV Ch-V Ch-VI Ch-VII Ch-VIII
Amount (in Rs./qtl) (Amount in Rs./qtl) Marketing cost (in Rs./qtl)
10 90 293 436 380 408 550 525
Marketing margin (in Rs./qtl)
- 530 1207 584 880 1542 920 1825
Net price received by producers(in Rs./qtl)
4290 4390 3700 4290 4390 3700 4190 3300
Consumers’ price (in Rs./qtl)
4300 5000 5200 5300 5650 5650 5650 5650
Price spread(in Rs./qtl) 10 610 1500 1010 1260 1950 1460 2350 Producers’ share in consumer price (%)
99.77 87.80 71.15 80.94 77.70 65.49 74.16 58.41
Source: Primary market survey, Price at 2013-14

[149]
The same situation has been observed in case of Inter-Sate marketing channels.
Increase in price spread from Rs.1260/qtl. in channel-V to Rs.2350/qtl. in channel-VIII,
results in decreases in percentage of producer’s share in consumer rupee from 77.70% in
channel-V to 58.41% in channel-VIII.
Rope marketing channels functioning within the State network show that highest
marketing margin of Rs.1207/qtl. is gained by the intermediaries of channel-III followed by
Rs.584/qtl. and Rs.530/qtl. in channel-IV and in channel-II respectively. Out of the total
margin of Rs.1207/qtl. in channel-III, village assemblers or mobile traders gain more
percentage of margins than any other intermediaries engaged in this channel. The percentage
share of marketing margin on total margin (Rs.1207.00) is 46.23% (highest in the channel)
where as the marketing expenses (Rs.42.00) incurred by the middleman is only l4.33% of the
total channel marketing cost ((Rs.293.00). From this percentage it can be assumed that
producers are exploited more by these intermediaries.
6.5.4.3 Marketing Efficiency
Marketing efficiency is directly related to the cost of transaction of goods or services.
The improvement of marketing efficiency means the reduction of marketing cost and margin
without affecting the customer satisfaction. Efficient marketing plays an important role in
increasing the producers share in consumer’s rupee, which in turn helps in increasing the
production (Kumar,2014).
The results of marketing efficiency analysis using Acharya & Agarwal’s method is
presented in table 6.12. It reveals that channel-I is the highest efficient channel with
maximum marketing efficiency (MME) value 429 followed by channel-II with marketing
efficiency 7.08, channel-IV with marketing efficiency 4.21 and channel-III with marketing
efficiency 2.47. According to Acharya & Agarwal highest score leads to highest efficiency of
the channel and vice versa. In supply chain-I, no intermediaries have been functioned

[150]
between producer and consumer. It is a direct marketing channel. The marketing efficiency of
channel-III is very poor because of its higher marketing margin. Among Inter-Sate marketing
network, channel-V is the most efficient channel with efficiency score 3.48 followed by 2.85,
1.90 and 1.40 for channel-VII, VI and VIII. respectively. The performance of the channel-
VIII is very poor due to its longer distance and high marketing margin. This method does not
take producer’s share on consumer price which is the important component of marketing
efficiency. Composite Index method covers this factor.
Table 6.12: Marketing Efficiency Analysis using Acharya & Agarwal’s Method
Intra-State Channels (within the State of West Bengal)
Sl no.
Marketing Channel
Net price received
by producers
(A) (in
Rs./qtl)
Total marketing cost
+ Total marketing
margin (B)
(in Rs./qtl)
Modified Marketing
Efficiency(MME) (A/B)
Channel efficiency
rank
1 I 4290 10 429 1 2 II 4390 620 7.08 2 3 III 3700 1500 2.47 4 4 IV 4290 1020 4.21 3 Inter-State network 5 V 4382 1268 3.48 1 6 VI 3700 1950 1.90 3 7 VII 4182 1468 2.85 2 8 VIII 3300 2350 1.40 4
Composite Index Method
As per Composite Index Method (with mean and rank), the producers share on
consumer price, marketing cost and marketing margin of the channels per quintal is
calculated and ranked. Total scores are found by adding the respective ranks in each channel
and after that the mean score is calculated. The lowest mean score denotes efficient channel.

[151]
Table 6.13: Marketing efficiency of rope supply chain (Intra-State) under Composite Index Method
Particulars
Intra-State channels (within the State of West
Bengal) I II III IV
Marketing cost (in Rs./qtl) 10 90 293 436 Rank 1 2 3 4 Marketing margin (in Rs./qtl) 0 530 1207 584 Rank 1 2 4 3 Producers’ share in consumer price (%) 99.77 87.80 71.15 80.94 Rank 1 2 4 3 Total Score 3 6 11 10 Mean Score 1 2 3.67 3.33 Channel Efficiency rank 1 2 4 3
It is evident from the table 6.13 that among the intra-state channel the channel-I is the most
efficient and shorter channel than that of other channels. Channel-II is the next efficient
channel involving less number of intermediaries. Among the inter-state marketing network
(table 6.14), channel-V is having minimum score which shows the higher marketing
efficiency than channel-VI, VII and VIII.
Table 6.14 Marketing efficiency of rope supply chain (Inter-State)
under Composite Index Method
Particulars Inter-State Channels V VI VII VIII
Marketing cost (in Rs./qtl) 406.5 435.7 576.5 548 Rank 1 2 4 3 Marketing margin (in Rs./qtl) 861.5 1514.3 891.5 1802 Rank 1 3 2 4 Producers’ share in consumer price (%) 77.56 65.49 74.02 58.41
Rank 1 3 2 4 Total Score 3 8 8 11 Mean Score 1 2.67 2.67 3.67 Channel efficiency rank 1 3 2 4
For both category of networks (Intra-Sate and Inter-Sate) Channel-I and II appear to
be highly efficient channels in terms of producer’s share on consumer price though their
turnovers remain at very low level. In the intra-state marketing network, except channel-I

[152]
and II, all other channels are found to be of low efficiency. Channel-IV appears to be the
most dominating channel for raising turnover and increasing producer’s share on consumer
price.
Flow Diagram 6.5: Price Spread of Rope Marketing Channels
From the above discussion and the price spread analysis as documented in Flow
Diagram no. 6.5 it may be concluded that rope makers sell to the first line intermediaries in
the price ranges between Rs.37/kg to Rs.44/kg. thus fetching the value addition on an
average Rs.16/Kg., which cause production loss to the extent of 10% of the raw-material. The
local level wholesaler or ‘Mahajans’ on the other hand dispose of their stock at the price
range of Rs.43 to Rs.49 per kg. Thus their approximate weekly earnings come to Rs.1.50 to
Rs.2.50 per kg. excluding marketing cost. On an average such market actors transact about
15,000 to 20,000 kg. of rope per week thus gain a total earnings of Rs.30,000.00 to
Rs.40,000.00 per week.
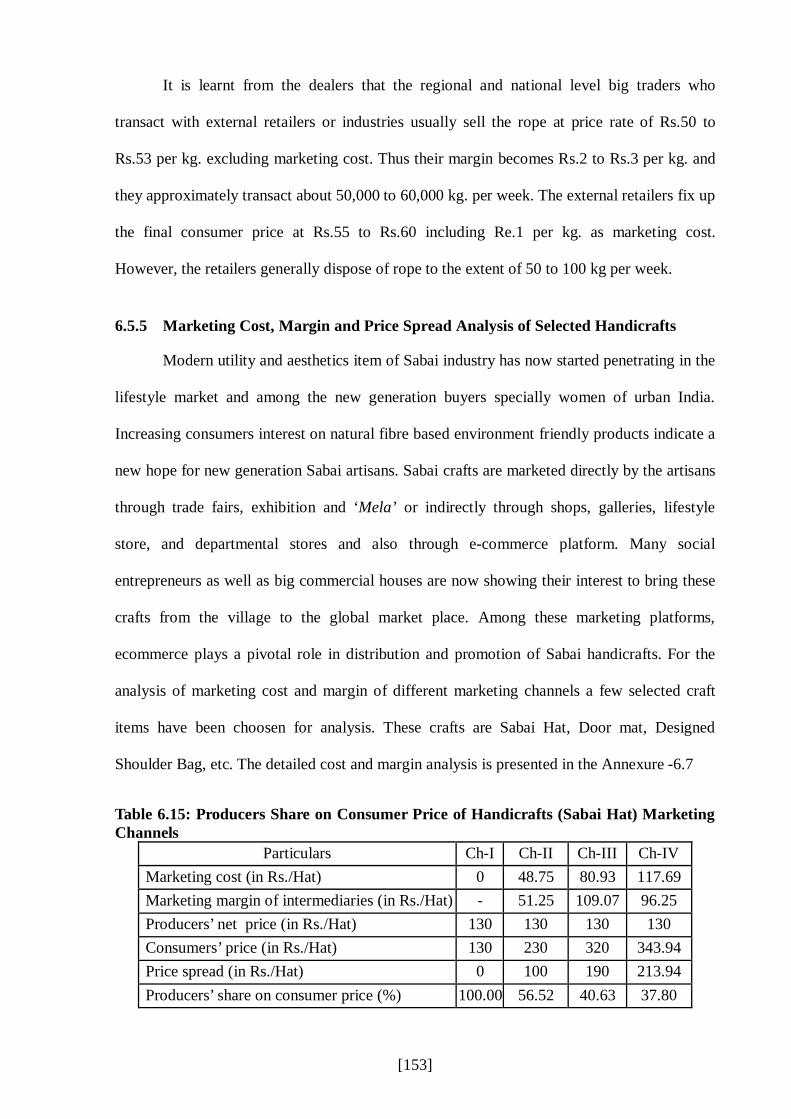
[153]
It is learnt from the dealers that the regional and national level big traders who
transact with external retailers or industries usually sell the rope at price rate of Rs.50 to
Rs.53 per kg. excluding marketing cost. Thus their margin becomes Rs.2 to Rs.3 per kg. and
they approximately transact about 50,000 to 60,000 kg. per week. The external retailers fix up
the final consumer price at Rs.55 to Rs.60 including Re.1 per kg. as marketing cost.
However, the retailers generally dispose of rope to the extent of 50 to 100 kg per week.
6.5.5 Marketing Cost, Margin and Price Spread Analysis of Selected Handicrafts
Modern utility and aesthetics item of Sabai industry has now started penetrating in the
lifestyle market and among the new generation buyers specially women of urban India.
Increasing consumers interest on natural fibre based environment friendly products indicate a
new hope for new generation Sabai artisans. Sabai crafts are marketed directly by the artisans
through trade fairs, exhibition and ‘Mela’ or indirectly through shops, galleries, lifestyle
store, and departmental stores and also through e-commerce platform. Many social
entrepreneurs as well as big commercial houses are now showing their interest to bring these
crafts from the village to the global market place. Among these marketing platforms,
ecommerce plays a pivotal role in distribution and promotion of Sabai handicrafts. For the
analysis of marketing cost and margin of different marketing channels a few selected craft
items have been choosen for analysis. These crafts are Sabai Hat, Door mat, Designed
Shoulder Bag, etc. The detailed cost and margin analysis is presented in the Annexure -6.7
Table 6.15: Producers Share on Consumer Price of Handicrafts (Sabai Hat) Marketing Channels
Particulars Ch-I Ch-II Ch-III Ch-IV Marketing cost (in Rs./Hat) 0 48.75 80.93 117.69 Marketing margin of intermediaries (in Rs./Hat) - 51.25 109.07 96.25 Producers’ net price (in Rs./Hat) 130 130 130 130 Consumers’ price (in Rs./Hat) 130 230 320 343.94 Price spread (in Rs./Hat) 0 100 190 213.94 Producers’ share on consumer price (%) 100.00 56.52 40.63 37.80

[154]
Analysis of price spread and producer’s share on consumer price in the context of
Sabai Hat marketing indicates that by selling a hat directly to the end customers (Channel-I)
the artisan receives, a net earning of Rs.130 (Table 6.15). When the same item is sold through
middlemen and For Profit Social Enterprise (FPSE) which may be designated as channel-II,
the price of the commodity goes to Rs.230.00 though the craftsmen receives the same amount
of profit. Alternatively when it is disposed of through 3 intermediaries namely local
middlemen, FPSE and Lifestyle Shop (LSS) or Retail Chain Store (RCS) which may be
identified as channel-III, the final sale value reaches to Rs.320.00, thereby giving an
opportunity of earning Rs.109.07 to the intermediaries. The craftsmen however receive the
same net earnings of Rs. 130.00 which giving near to same earning of intermediaries. The
IVth alternative channel through middlemen, FPSE and E-marketers in sequence provides
intermediaries a final sale price of Rs.344.00 and a total margin of Rs.96.25, though the
artisan receives the same net earning of Rs.130. Thus through the IVth channel the
intermediaries get an earning which is 0.74 times the earnings of the craftsman.
Table 6.16: Producers Share on Consumer Price of Handicrafts Marketing Channels (Door Mat)
Particulars Ch-I Ch-II Ch-III Ch-IV Marketing cost (in Rs./Mat) 0 56.25 93.38 126.96 Marketing margin of intermediaries (in Rs./Mat) - 93.75 156.62 145.75 Producers’ net price (in Rs./Mat) 150 150 150 150 Consumers’ price (in Rs./Mat) 150 300 400 422.71 Price spread (in Rs./Mat) 0 150 250 272.71 Producers’ share on consumer price (%) 100.00 50.00 37.50 35.49
In case of Oval Door Mat making the direct sale by artisan i.e through channel-I
provides him a net earnings of Rs.150.00 (Table 6.16). The same item if disposed of through
Channel-II, it is sold at Rs.300.00 with a marketing margin of Rs.93.75 or 0.63% of artisan’s
margin. Similarly through the IIIrd channel the total marketing margin goes to Rs.156.62
when sold at Rs.400.00 to final consumers. In case of trading through IVth channel the final
consumer price goes to Rs.422.71 thus giving a total marketing margin of Rs.145.75. This is
1.03 times the margin of the artisan.

[155]
Table 6.17: Producers Share on Consumer Price of Handicrafts Marketing Channels (Hand Bag)
Particulars Ch-I Ch-II Ch-III Ch-IV Marketing cost (in Rs./Bag) 0 112.50 186.75 193.13 Marketing margin of intermediaries (in Rs./Bag) - 237.5 363.25 412.5 Producers’ net price (in Rs./Bag) 300 300 300 300 Consumers’ price (in Rs./Bag) 300 650 850 905.63 Price spread (in Rs./Bag) 0 350 550 605.63 Producers’ share in on consumer price (%) 100.00 46.15 35.29 33.13
When the case of production of Hand Bag is considered, a net earning of Rs.300 is
incurred in favour of the artisan for selling a bag through channel-I. This item if sold through
channel-II, the marketing margin to the FPSE goes upto Rs.237.50 with a final consumer
price of Rs.650.00 (Table 6.17). This margin is 0.79% of the artisan’s margin. Taking
channel-III i.e. marketing through middlemen, FPSE and LSS or RCS, the total margin is
further raised to Rs.363.25 with final sale value of Rs.850.00. Thus the intermediaries gain
1.21 times margin of the artisan’s margin. When routed through middlemen, FPSE and E-
marketers the total margin further goes up to Rs.412.50 for selling the bag finally at
Rs.905.63. This indicates that intermediaries in the channel-IV receive the net margin which
is 2.20 times the margin that the craftsmen earn. In the case of Hand Bag marketing the
channels I & II seems to be most effective since the producer’s share in final consumer’s
price is quite high compared to other channels (Fig-6.4).
Channel-II
Channel-III
Channel-IV
Channel-I
17.31
21.97
21.33
36.54
30.97
45.55
46.15
35.29
33.13
100
Figure 6.4 : % Distribution of Marketing Cost, Margin and Producer's Share on Consumer Price in Hand Bag Marketing
% of Marketing Cost (MC) to Consumer Price% of Marketing Margin (MM) to Consumer Price% of Producer's Share on Consumer Price
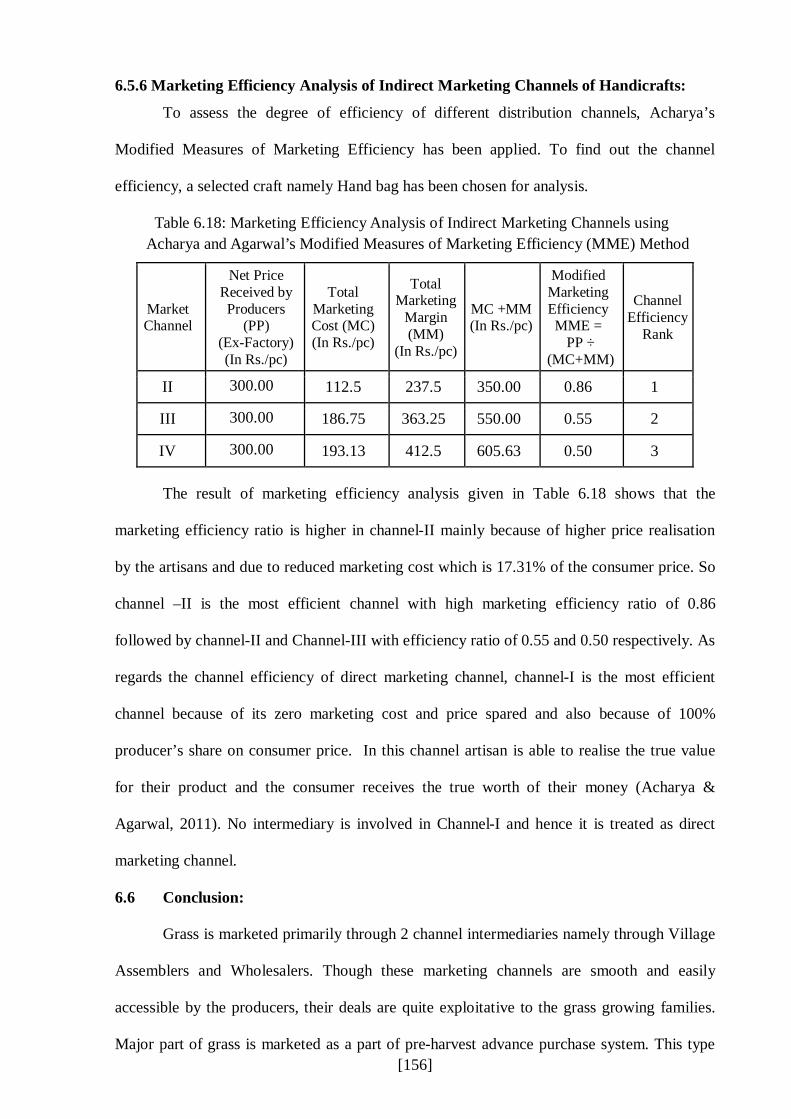
[156]
6.5.6 Marketing Efficiency Analysis of Indirect Marketing Channels of Handicrafts:
To assess the degree of efficiency of different distribution channels, Acharya’s
Modified Measures of Marketing Efficiency has been applied. To find out the channel
efficiency, a selected craft namely Hand bag has been chosen for analysis.
Table 6.18: Marketing Efficiency Analysis of Indirect Marketing Channels using Acharya and Agarwal’s Modified Measures of Marketing Efficiency (MME) Method
Market Channel
Net Price Received by Producers
(PP) (Ex-Factory) (In Rs./pc)
Total Marketing Cost (MC) (In Rs./pc)
Total Marketing
Margin (MM)
(In Rs./pc)
MC +MM (In Rs./pc)
Modified Marketing Efficiency MME =
PP ÷ (MC+MM)
Channel Efficiency
Rank
II 300.00 112.5 237.5 350.00 0.86 1
III 300.00 186.75 363.25 550.00 0.55 2
IV 300.00 193.13 412.5 605.63 0.50 3 The result of marketing efficiency analysis given in Table 6.18 shows that the
marketing efficiency ratio is higher in channel-II mainly because of higher price realisation
by the artisans and due to reduced marketing cost which is 17.31% of the consumer price. So
channel –II is the most efficient channel with high marketing efficiency ratio of 0.86
followed by channel-II and Channel-III with efficiency ratio of 0.55 and 0.50 respectively. As
regards the channel efficiency of direct marketing channel, channel-I is the most efficient
channel because of its zero marketing cost and price spared and also because of 100%
producer’s share on consumer price. In this channel artisan is able to realise the true value
for their product and the consumer receives the true worth of their money (Acharya &
Agarwal, 2011). No intermediary is involved in Channel-I and hence it is treated as direct
marketing channel.
6.6 Conclusion:
Grass is marketed primarily through 2 channel intermediaries namely through Village
Assemblers and Wholesalers. Though these marketing channels are smooth and easily
accessible by the producers, their deals are quite exploitative to the grass growing families.
Major part of grass is marketed as a part of pre-harvest advance purchase system. This type

[157]
of distress sale results in lowering the sale price and hence much lower value of output. Often
the village assemblers act as pre-harvest contractors to wholesalers. The growers subjected to
distress sale could be helped by village co-operatives or producer’s own organisation like SHGs or
their similar informal association. Inter-State trading is primarily related to paper industry for
pulp making. In this sector the wholesalers remain as the principal actors with either
transacting directly to the paper mills or through the commission agents. Smooth
channelization of grass from collection point to markets can best be operationalized through
creation of SHGs of the growers or establishment of village cooperatives with cultivators as
its members.
In case of rope marketing Village Assemblers play the key role in reaching the
product to wholesalers. In fact an artisan to village assemblers to wholesalers to retailers
seems to be the most efficient channel for disposing of the major rope products. Though
direct transaction from artisans to consumers appears to be very efficient since producers
share on consumer price remains at 100%.
Pricing of rope is usually dictated by wholesalers or hoarders since their capacity to
transact is very high and village assemblers are linked with them in business. In inter-state
marketing the channels linking Artisans to Primary Market Wholesalers to Secondary Market
Wholesalers to Retailers to Consumer is seen to be most efficient since producer’s share in
consumer’s price remains highest among all the currently operating channels. However, in
the rope marketing, Phoria are most preferred to many artisans since they are easily
accessible and provide scope of advance purchase. However the artisans are often facilitated
with supply of grass (raw-material) as advance purchase which is realised through supply of
rope to the Phorias at much lower prices. In such situation the artisans can be saved from
exploitation by creation of their SHGs or establishment of village cooperatives dealing with
rope and rope based products.

[158]
Governmental Promotional activity in craft marketing particularly for high-value
items to foreign countries is almost unknown. at home some Fairs or Melas are seasonally
promoted but their effects are not impressive at all. Middlemen linked FPSEs are the key
beneficiaries in the export market. They are the main beneficiaries though artisan’s share to
end consumers’ price is alarmingly low. In this case export linked with Governmental
intervention should be the target to realise artisans’ welfare.
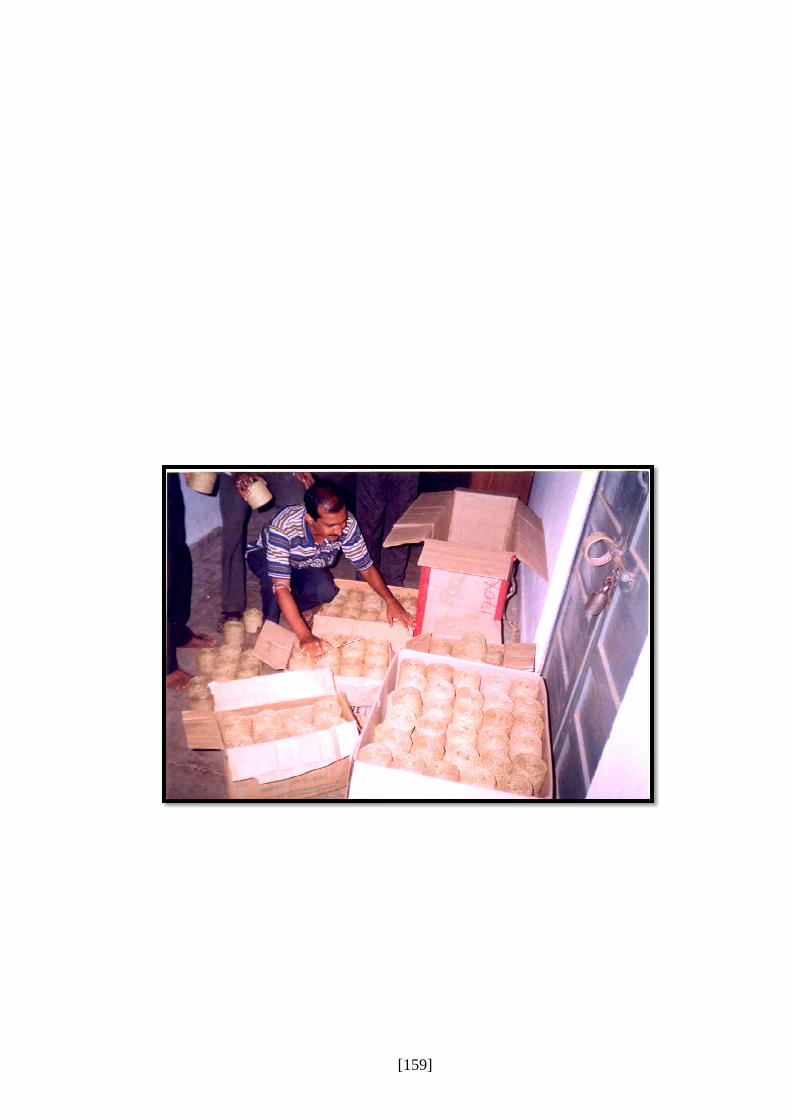
[159]

[159]
Chapter-VII
Problems of Sabai Cultivation and Processing
7.0 Introduction Sabai cultivation followed by rope making and crafts making are subjected to various
economic, social and management problems. The cultivation problems are related to
production, productivity, quality and finally pricing as well as profitability. Problems are
generally agronomic and agro-economic in nature. Another set of problems appear with
marketing of grass where final use, price, transportation cost etc appear. Distress sale of
commodities and advance purchase are serious problems of Sabai cultivation.
The first step of processing of Sabai involves rope and plait making. Its major problems
concern smooth supply of inputs, quality of raw-materials, productivity, pricing, advance
purchase, etc.. Technological attainments for productivity rise and quality improvement are
important issues in this context. In rope making the most important problem concerns
production per household unit and value addition which are not adequate to assure
sustainable livelihood.
In the domain of craft making the major problem is linked with production of market
driven quality goods. Two important issues appearing in this direction are excellence in skill
and financial solvency of the households involved in craft making. Skill improvement and
capability to invest remain in core of development of high value crafts making. Marketing
through innovative channels may result in higher margin for the producer craftsman. This
needs a thorough price-spread account involving all actors from primary level producer
craftsmen to final consumer at the end.
In case of marketing of grass and processed products the principal problems relate to
middlemanship in the entire trading process of the commodities. Market places and market
infrastructure are too inadequate and the system of market administration as well as control

[160]
are totally absent. There are several channels through which the commodities are transferred
but in most of the cases the intermediaries earn a lot of margins though the producers share
an unimpressive part of consumers’ price.
7.1 Problems Related to Cultivation of Sabai Grass in Paschim
Medinipur: The problems in this section are related to agronomic or agro-economic issues. These are: i) Most of the Sabai crop growers in this District as well as in the region are marginal
farmers who possess less than 50 decimals of land and their annual production ranges from 4
to 8 quintals. Their gross value of output may vary from Rs10, 000 to Rs.25,000 depending
on the process of marketing. This clearly indicates that dependency on cultivation of Sabai
cannot assure sustainable earning even with development of home labour for entire operation
of cultivation. It is estimated that Sabai cultivation with hired labour can provide sustainable
earning only when the land under cultivation goes above 2 hectares. And this is not feasible
since the frequency of holding size above 2 ha. is too low to support this proposition.
ii) Among several anthropogenic factors, the natural grazing of livestock like cattle,
goats, pigs etc. cause significant damage to the standing Sabai crop specially during dry
seasons when the crop suffers from draught and it is an unirrigated crop.
iii) Fencing of land under Sabai crop is not done in the entire district since it is costly
compared to return from sale of the crop. Moreover the financial condition of majority
marginal and small farmers do not encourage crop farming in the case of Sabai farming. This
lacuna often causes significant damage to crop and thus brings down the yield level.
iv) Use of high yielding Sabai variety is almost unknown to most of the Sabai growers
interviewed. HYV root slips or seeds are not available to them and they grow only traditional
variety of crop. Though good harvest from HYV crop is possible, it is yet to be confirmed
that quality of crop will be so good as the traditional crop is. That this new crop is good and
suitable for rope and crafts making and there by assure durability and utility of the product is

[161]
yet to be established. In the absence of appropriate and sufficient research in this direction
the farmers are not convinced about the tensile strength and life span of the crop.
v) Some research work on HYV Sabai raising and using it for rope making had been
done by ICAR station at Chenaduha, Baripada, Mayurbhanj District, Odisha in collaboration
with Orissa University of Agriculture & Technology (OUAT). Though developing an
improved package of practice for raising HYV Sabai has been attempted in this venture, no
effort has yet been made to present the results of the research for adoption by the Sabai
growing farmers and users of Sabai made commodities. Naturally no follow-up action for
rope and craft making through use of HYV Sabai has been made till today.
vi) Plant protection measures against pest and insect attacks to Sabai crop is not known
by farmers. It appropriate and timely actions with application of pesticides and insecticides
are taken then damage to crop could be restricted. Often termites also damage Sabai crop to a
large extent. In fact, this type of damage is not much in the knowledge of the cultivators.
That soil treatment with pesticides before plantation can save the crop in these cases, is not
known to most of the cultivators.
vii) In October-November and sometime in February –March, heavy rain and storm occur
due to Western Disturbance or Advancing Monsoon and damage the crops due to water
logging and crop fall on ground. Usually in such cases the plant roots are affected and
growth of the crop is severely stunted. Sometimes such damages are extended over the large
part of the district thus creating heavy damage to the Sabai economy of the district.
viii) Marginal and small farmers growing Sabai are not much interested in Sabai
cultivation in which they are often exploited by intermediaries, Phorias and Village
Assemblers. Instead of extending this activity they are concentrating on other rural activities
lured by higher wage earning opportunities. Sometimes they become seasonal migrants to
other regions for higher earnings and thus neglect or totally leave the practice of Sabai

[162]
cultivation. They often lease out their Sabai growing field to village assemblers, middlemen
and pre-harvest contractors against a nominal charge.
ix) Sabai cultivators, in general, with small and marginal holding size, low productivity,
low income and stereotyped activities, have lost all expectations and ambitions from
cultivation as means of life and living. Their state of hopelessness in farming activities have
made them lazy and often addicted to alcoholic drinks.
x) The younger generation of cultivator families with certain school and college level
education are not interested in grass cultivation or rope making by themselves. They are
interested in jobs with assured monthly income, preferably from salaried jobs. They often
migrate to other areas for higher wage earning. Besides, Govt. assurance of 100 days of work
under MGNREGA programme has been more attractive to them than labour earning from
Sabai based works which is uncertain and more laborious. This has created a situation of
total neglect of Sabai cultivation and rope making by the younger generation in this region.
7.2. Problems Associated with Sabai Rope Production in Paschim
Medinipur. i) The primary problem with rope making in Paschim Medinipur is linked with
availability of rawmaterial. Though Sabai grass is grown abundently in the study area as a
whole, the quality of grass varies from Block to Block and even from GP to GP. It is
changing over agro-climatic conditions across the micro level agro-climatic regions. Sabai
grass grown in Nayagram Block is considered to be excellent for rope and craft making
while the grass produced in Binpur-II Block is not so good for such activities. In fact the
grass of Binpur-II Block is often treated with muddy water for softening the grass, though
this action changes its colour and thus reduces the price level. This problem calls for
appropriate agronomic research for changing this type of declining qualities of rope.
ii) In the rope making households the members are required to work continuously over
long time for raising production and productivity. Such continuous work over long time

[163]
without changing the participants’ physical position and posture often results in typical
ergonomic problems. Insensitivity of the palms is a common problem with rope makers
above 50 years of age.
iii) Rope making with same schedule for months and years make the job monotonous to
many participants, particularly to younger ones. This has adverse impacts on the physical and
mental growth of the participant rope makers and craftsmen.
iv) With the present level of production which is 10 to 12 kg. per household per week,
the household earning cannot assure sustainable livelihood to the rope makers. This remains
as the main cause of the artisans to refuse rope making as a profession. Thus rope making has
become a pass-time work instead of full time activity to many rural households in Paschim
Medinipur.
v) New technologies like innovative Rope Making Machine, new Cycle-ream Rope
Twister, new tools etc. are yet to be adopted though such technologies can improve the rope
making quantitatively and qualitatively. In fact, production level of 10 to 12kg of rope per
week by a family can be raised to 110 to 115kg per week when such technologies are
adopted.
vi) Rope making artisans are endowed with the traditional skills which they have adopted
from hereditary sources. They lack the new skills of using new machines, tools and tackles,
dyeing and deodorising techniques etc. which they cannot acquire without opportunities of
appropriate skill trainings.
vii) New demands in the market are plait-making along with rope making and plait
makers can earn good income when they acquire the skill. This demands special trainings on
plait making and plait using for craft development.
7.3 Problems in the Context of Sabai Crafts Making and Weaving:
i) Crafts making with varying designs to shape up a range of utility, decorative and
fashion items have opened a new direction of productivity rise and income generation in the
[164]
field of Sabai culture. In this direction, a major problem is linked with quality raw materials
i.e. appropriate quality of grass and integration materials. Thus grading the stock of grass for
craft making and selection of matching integration materials are of serious concerns to the
craft makers and traders. In the International market Sabai has to compete with other quality
fibres like Abaca, Sisal etc. and naturally quality of grass remains as an important factor for
successful craft marketing.
ii) Knowledge on design development is yet to be made impressive in the national and
international markets. In fact appropriate moulds, frames and fixtures are required for
improvement of designs. Sabai craftsmen need to learn these techniques, may be from
renowned institutions like National Institute of Design (NID), Ahmedabad, Karukrit, Kolkata
etc.
iii) For majority of the craftsmen the skill attained is not up to the mark and is very
stereotyped. Both in national and international markets this skill level reflected through final
products is very fast changing. Naturally the craftsmen of the study area are back-benchers in
exposing their creation and creativity level in the context of Sabai crafts.
iv) Skill acquired by most of the craftsmen are hereditary and the opportunities of
upgrading and updating their skills through training, demonstration and workshop had been
rare.
v) Often trainings for skill formation among the crafts making artisans are imparted by
Government and Non-Government organizations. But after the training no contact is made
with the trained artisans, neither any evaluation is made for assessing the degree of skill
upgraded due to such trainings. Thus in most cases the total investment and efforts on
training remain ineffective. Rather this type of utilization of fund becomes an indirect
funding for sustenance of many NGOs or such other institutions. This calls for developing a
mechanism of measuring the effective output of such trainings.

[165]
vi) Acceptability of new technologies are yet to be proved. Though adoption of new tools
and tackles are confirmed from some craftsmen, the use of machines, new frames and
moulds, wearing looms etc. are yet to be seen with them. Weaved Sabai items are rare in the
market and design development on weaved products are almost unknown there. Loom
development for continuous design development is an untouched area till date.
vii) In spite of immense scope of product diversification through design development and
use of integration materials, this area has not been properly explored. Sabai has the potential
to replace a large number of utility and fashion items when the aims of product
diversification are accurately and properly implemented.
viii) Unlike Sabai cultivation and rope making, the crafts making units need some
essential infrastructures and facilities for success of such ventures. Such infrastructure
includes worksheds, storage space, transportation, dyeing unit, packaging facilities, etc.
Craftsmen are mostly incapable to accumulate these from their own sources and naturally
need good investible capital from institutional or other external sources.
ix) The said financial responsibility remains with the entrepreneur over the years as a big
liability. To come out of this liability the entrepreneur has to acquire proper management
capability which he has to mature and develop.
x) Promotional activities for such entrepreneurs are rare and not so effective. Often they
are in the clutches of middlemen for supply of raw-materials or disposal of produced craft
items.
xi) Constituted organizations of the group of craftsmen are almost non-existent. This has
strengthened the process of exploitation of the craftsmen by the middlemen as well other
intermediaries. It indicates the need for building their own forum for production, marketing
and management.
[166]
xii) Craft making is neither a monotonous nor a laborious work. With changing items of
crafts the job is usually of interests to craftsmen. However, weaving of grass for designed
mat production by using traditional weaving frame is laborious. Continuous and long period
of work on such frames may cause ergonomic adverses. Of course newly designed looms for
Sabai weaving have the advantages of proper sitting arrangement and hence ergonomic
problems may not occur in this case.
7.4 Problems Associated with Marketing of Sabai Grass, Rope and
Crafts. i) The entire grass, rope and crafts produced in Paschim Medinipur are marketed
through few rural unorganized periodic markets called ‘Haats’. Except some open spaces,
these Hats do not have any infrastructure or facility like shades, drinking water, toilets,
weighing platform and others.
ii) Sabai Market is not controlled by any regulatory marketing authority, neither there is
any system of recording of arrival, sale and dispatch, pricing system, auctioning etc.
iii) The agricultural Marketing Department of the State of West Bengal and its Marketing
Board which act in controlling the market and monitoring the sales and purchases of all the
major agricultural crops are in no way concerned with this important cash crop raised on the
marginal lands and wastelands of the district.
iv) The bare minimum marketing infrastructures related to grass, rope and crafts are not
available in these ‘Haats’, neither there is any section of Sabai on the market premises,
though it remains as one of the main traded product transacted through these rural markets.
v) No hierarchy of dealers or intermediaries are observed in the market. Village
Assemblers or Phorias often deal with the sellers outside the Hat on roadways and
wholesalers receive the product indirectly through middlemen and thus the producer is

[167]
deprived of higher price which he could have got if sold the product directly to the
wholesaler.
vi) There is no policy of fixing prices with seasonal fluctuations in demand and supply.
Panchayat, the principal and sole rural institution for rural development is in no way
concerned with marketing of this important commodity and thus remains indifferent to such
benefits to these small and marginal Sabai framers.
vii) From rural level to urban level the supply chain intermediaries are engaged in value
addition activities through design development, quality control, packaging, branding, and
promotion. The major intermediaries in Sabai craft trading are (a) Local Middlemen, (b) For
Profit Social Enterprises (FPSE) or wholesalers, (c) Lifestyle Shop (LSS) or Retail Chain
Store (RCS) and (d) E-marketers or exporters. Price changes are observed to be considerably
higher when the product crosses the rural boundary to reach urban territory and gradually
increases when it crosses the state boundary and reach in the national boundary and then to
international market. This changing scenario along the marketing channels has no impact on
the producer artisan’s benefit.
viii) Market information is totally missing at producer level, though local traders or ‘Phorias’
are aware of that and they transact information among themselves verbally to keep their
control on the selling price offered by them.
ix) In the case of variety new crafts, these markets are not much concerned since the
products directly reach the market or traders’ premises through the middlemen. There is no
local consumer except for low priced doormats and hats which are mostly sold from
producer’s houses or occasionally from some periodic markets and ‘Melas’ (Fairs). As a
consequence, the producers or craftsmen remain unaware about the customer’s choice and
preference and obviously about the settled prices between the middlemen and urban traders.
x) Non-Government Organisation (NGO) who work with non-profit motive for
promotion of the craftsmen, try to channelize the products to the lifestyle shops, E-marketers

[168]
and exporters in urban markets. They make efforts to propagate the information on these
crafts and craftsmen to knowledgeable societies, press and media which in turn promote the
use of and benefits from these craft items. They often go for training, demonstration,
marketing and promotion of these products for which they earn substantial funds from
Government, Corporate and other national and international foundations. Often they pose
sympathizers of the artisans to the public and play as saviours to the poor craftsmen families.
xi) NGOs can not make direct profit through business on craft items. But understanding
the scope of business opportunities and profit earnings some NGOs have created the FPSEs
in order to grab the market opportunities. The NGOs remain as the mother organization
while the FPSEs act as defacto the trading agents and there by earn huge amount of profit by
exploiting the craftsmen. Actually the major volume of business is conducted by these
FPSCs who may have also export licenses, though the total control of the trade remains with
the mother NGOs holding FCRA (Foreign Contribution Regulatory Act) certificates.
The problems stated above are of serious concern to the decision makers,
academicians, planners, and NGOs. Only after resolving the problems to the extent possible
one can assure better days in Sabai economy and welfare of the Sabai cultivators, rope
makers and craftsmen of Paschim Medinipur. An insight into those problems invites certain
recommendations towards promotion of Sabai economy. Those are presented in the
following chapter.

[169]
Chapter –VIII
Prospects of Livelihood Improvement through Technology
Intervention and Enterprise Management
8.1: Status of Household Earning from Improved Sabai culture
Though Paschim Medinipur District has shown in the recent decades remarkable
progress in agriculture and allied activities over a large part of its area, the status of household
earnings of the District has not been so pleasing. Infact, 43.79 % of its households live below
poverty level (DPRD, Govt of W.B.,2005). The situation becomes worse when one finds that
as high as 57.29% households of the three major Sabai growing Blocks of Nayagram,
Gopiballavpur-I and Binpur –II fall in BPL category. Accepting the union Cabinet-Decision
of 2005 on rural poverty level for average 5 persons/HH at Rs 2250.00 per month1, the
situation of the surveyed households has been examined. This indicates that –as high as
58.48% of the households involved in Sabai culture are living below poverty level. However,
for most of the households, the earnings earned from Sabai based activities are lower than that
earned from other economic activities. The table no. - 8.1 shows the share of earnings from
Sabai based activities generated in respect of eight categories of Sabai related activities.
It is observed that highest share of 67.87% of total income is earned by Sabai
cultivator cum craftsmen category of participants. The Sabai cultivator cum rope maker
group of workers earn 44.67% of their total earning from Sabai based activities. The rope
maker cum craftsmen group of rural workers also earn 43.35% of total income from Sabai
based activities. The households which are involved with Sabai cultivation only, earn the
lowest share of their total earning (16.59%) from Sabai based activities. This shows that share
1 Union Cabinet Decision on Rural Poverty Level,2011

[170]
of earnings of families from Sabai related activities vary in a large way depending on
quantity, quality and productivity of Sabai based products.
Table 8.1: Sabai based Occupational Status and Household Earnings
Sl. No.
Activity No of
HHs#
Avg. HH# Earnings
from Sabai and all other Economic
activity /Year
(in Rs.)
Average HH
Earnings from Sabai
Activity /Year
(in Rs.)
% of earnings
from Sabai based
activity to total earnings
Present status of Earnings of HHs
(taking poverty level of HH earnings below
Rs.27,000/Year*)
BPL APL
1 Sabai Cultivator 13 53,111.00 8,813.00 16.59 2 11 2 Rope Maker 141 20,520.00 6,130.00 29.87 123 18 3 Craftsmen 15 59,352.00 10,883.00 18.34 2 13
4 Sabai Cultivator cum Rope Maker
109 28,691.00 12,816.00 44.67 61 48
5 Sabai Cultivator cum Craftsmen
16 71,147.00 48,284.00 67.87 4 12
6 Rope Maker cum Craftsmen
15 40,415.00 17,518.00 43.35 1 14
7 Rope Maker cum Trader
10 41,140.00 8,964.00 21.79 0 10
8 Sabai Cultivator cum Rope Maker cum Craftsmen
11 38,516.00 28,000.00 72.70 0 11
Total 330
193 (58.48%)
137 (41.52)
#HHs: Households *Source: Union Cabinet Decision on Rural Poverty Level for average 5 persons/HH @ Rs.2,250.00/per month as Published in The Hindu, New Delhi dt. 21.05.2011
8.2: Rise in Household Earning from Cultivation to Craft Making in Sabai Culture.
In Sabai culture the practice of Sabai cultivation is considered as the primary activity
while rope making is taken as the next phase of processing and technology. Though
application of agronomic technology is not much known, the processing and rope making has
gone much ahead with introduction of rope making machine, faster twister etc. Besides,
improving quality of rope also has gone much ahead with rope processing through bleaching,
dyeing, deodorising etc for producing quality rope. All these steps add to productivity rise as
well as rise in household earnings.

[171]
In the same way, when rope, plait or grass itself is converted to different crafts, the
value addition goes up and naturally the household earning also rises. However, the rate of
increase in value addition and hence household earning varies from product to product and
also from primary product (say, grass or rope) to final product (say, hand bag or carpet). In
fact, the output of first product goes as input to the second product where output is the
marketable final product. In this way, this type of change from one product to another can go
ahead with three or four steps of transformation and with every step of forward product the
price of the product increases. Obviously such transformation leads to addition of value of
product and hence addition of earning of the respective producer.
These transformation steps can better be explained by taking grass product from 1dc.
of land to step by step transformation into forward products. In fact cultivation of grass over 1
dc. of land can produce 8 kg sundried grass which when transformed into rope it will be
converted to 7.5 kg rope. In the next stages of production this rope can be transformed into 30
Hats or 15 Doormats or 19 Hand Bags or even into 6 sq.m. of Floor Carpet. Considering the
prices of these different products at market rates the value addition will be significantly higher
and higher with forwarding steps of produces. The table no. 8.2 shows these streams of
produces, prices, costs, values of output and finally value additions.
Table 8.2: Higher Value Addition with Conversion of Grass into Rope and other Utility Items
(Produces based on 1 dc. Land) Sl.
No.
Product Quantity
Of
Output
Cost of
Production/Unit
(in Rs.)
Price
(in Rs.)
Value of
Output
(in Rs.)
Value
Addition
(in Rs.)
1. Grass 8kg 2.00 28.00/kg 224.00 208.00
2. Rope 7.5kg 31.00 52.00/kg 390.00 158.00
3. Hat 30 nos. 12.00 130.00/each 3900.00 3540.00
4. Door Mat 15 nos. 28.00 150.00/each 2250.00 1830.00
5. Hand Bag 19 nos. 40.00 300.00/each 5700.00 4940.00
6. Carpet 6 sq. m. 108.00 450.00/sq. m. 2700.00 2052.00
Source: Sample Survey
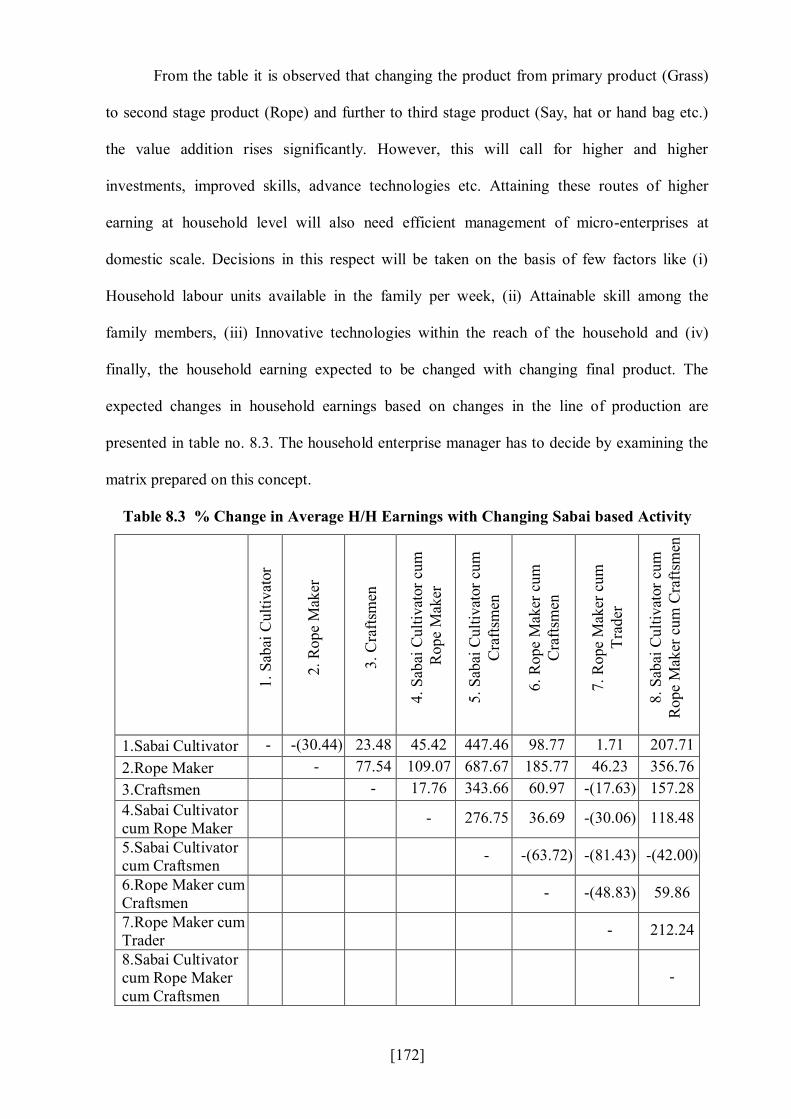
[172]
From the table it is observed that changing the product from primary product (Grass)
to second stage product (Rope) and further to third stage product (Say, hat or hand bag etc.)
the value addition rises significantly. However, this will call for higher and higher
investments, improved skills, advance technologies etc. Attaining these routes of higher
earning at household level will also need efficient management of micro-enterprises at
domestic scale. Decisions in this respect will be taken on the basis of few factors like (i)
Household labour units available in the family per week, (ii) Attainable skill among the
family members, (iii) Innovative technologies within the reach of the household and (iv)
finally, the household earning expected to be changed with changing final product. The
expected changes in household earnings based on changes in the line of production are
presented in table no. 8.3. The household enterprise manager has to decide by examining the
matrix prepared on this concept.
Table 8.3 % Change in Average H/H Earnings with Changing Sabai based Activity
1. S
abai
Cul
tivat
or
2. R
ope
Mak
er
3. C
rafts
men
4. S
abai
Cul
tivat
or c
um
Rop
e M
aker
5. S
abai
Cul
tivat
or c
um
Cra
ftsm
en
6. R
ope
Mak
er c
um
Cra
ftsm
en
7. R
ope
Mak
er c
um
Trad
er
8. S
abai
Cul
tivat
or c
um
Rop
e M
aker
cum
Cra
ftsm
en
1.Sabai Cultivator - -(30.44) 23.48 45.42 447.46 98.77 1.71 207.71 2.Rope Maker
- 77.54 109.07 687.67 185.77 46.23 356.76 3.Craftsmen
- 17.76 343.66 60.97 -(17.63) 157.28 4.Sabai Cultivator cum Rope Maker
- 276.75 36.69 -(30.06) 118.48
5.Sabai Cultivator cum Craftsmen
- -(63.72) -(81.43) -(42.00)
6.Rope Maker cum Craftsmen
- -(48.83) 59.86
7.Rope Maker cum Trader
- 212.24
8.Sabai Cultivator cum Rope Maker cum Craftsmen
-

[173]
8.3: Quantitative and Qualitative Improvement in Rope Making Practice and Rise in
Productivity.
Skill and quality of raw material remain as the key factors of productivity rise. An
entrepreneur with higher skill can produce quantitatively higher and qualitatively better
products. Rise in productivity can thus be achieved through better quality of products and
higher quantity of products provided the raw material is qualitatively appropriate. In this way
quantitatively higher and qualitatively better final product could be produced from grass to
rope, rope to bag or hat, plait to bag, rope to furniture etc and all these will lead to rise in
productivity. Similarly for the same product or transformation higher order skill can produce
qualitatively better product with higher prices and thus productivity can be raised with
adoption of higher order skills in Sabai crafts making from rope or plait or grass.
8.4 Technological Intervention and Productivity Rise in Rope and Crafts Making.
Sabai cultivation and Sabai based processing activities is remained mostly in
traditional form till recently. Technological intervention was very rare and neither
productivity rise nor quality improvement was in the target of technologists and scientists for
development. In the absence of proper innovative technologies the Sabai craftsmen had been
doing the essential jobs by applying the traditional methods of production and processing.
Many such methods are not ergonomically suitable neither their rate of production is
economically encouraging.
In the domain of rising rate of production or yield a few innovative technologies
developed by IIT, Kharagpur are:
i. Sabai rope making Machine,
ii. Ream Twisting Machine, and
iii. Sabai Grass weaving loom.
Similarly for generating high value quality products and new designs the technologies
developed so far are:

[174]
i. Bleaching, Dyeing and Deodorising technology.
ii. Development of Frames and Moulds.
iii. Design Development.
iv. Use of Integration Materials for Decorative items like NTFP materials, leather, sea
shells, wood, skin, bone, vegetative fibres etc.
In the list while the first group is for raising rate of production or yield, the second
group is aimed at quality upgradation and hence price rise. Such technologies are evolved
mostly with production of market driven items.
These Technologies are not known to most of the rural entrepreneurs and use of them
needs investible capitals which are usually beyond the reach of their self investment
capabilities. Neither these entrepreneurs have acquired the technological skill and
management expertise necessary to organise and run such enterprises. It is understood that
without the necessary capital, skill and management drive these technologies cannot be
adopted by many promising entrepreneurs. To eliminate such obstacles and to promote the
growth and spread of Sabai craft units for sustainable livelihood to thousands of artisans some
steps have been taken by Ministry of Micro-Small and Medium Enterprises (MSME) of Govt.
of India and also by the Department of Micro- Small and Medium Enterprises and Textiles
(MSMET) of Govt. of West Bengal. Attempts are taken to promote these programmes of
productivity rise through technology introduction and efficient management. For this purpose
several ongoing schemes of rural development may be considered since suitable and adequate
provisions are there for investment in such activities. Some such effective schemes are:
I. Prime Minister’s Employment Guarantee Programme (PMEGP),
II. Udiyaman Swanirbhar Karmasansthan Prakalpa (USKP),
III. Swami Vivekananda Swanirbhar Karmasansthan Prakalpa (SVSKP),
IV. West Bengal Minorities Development & Finance Corporation (WBMDFC),
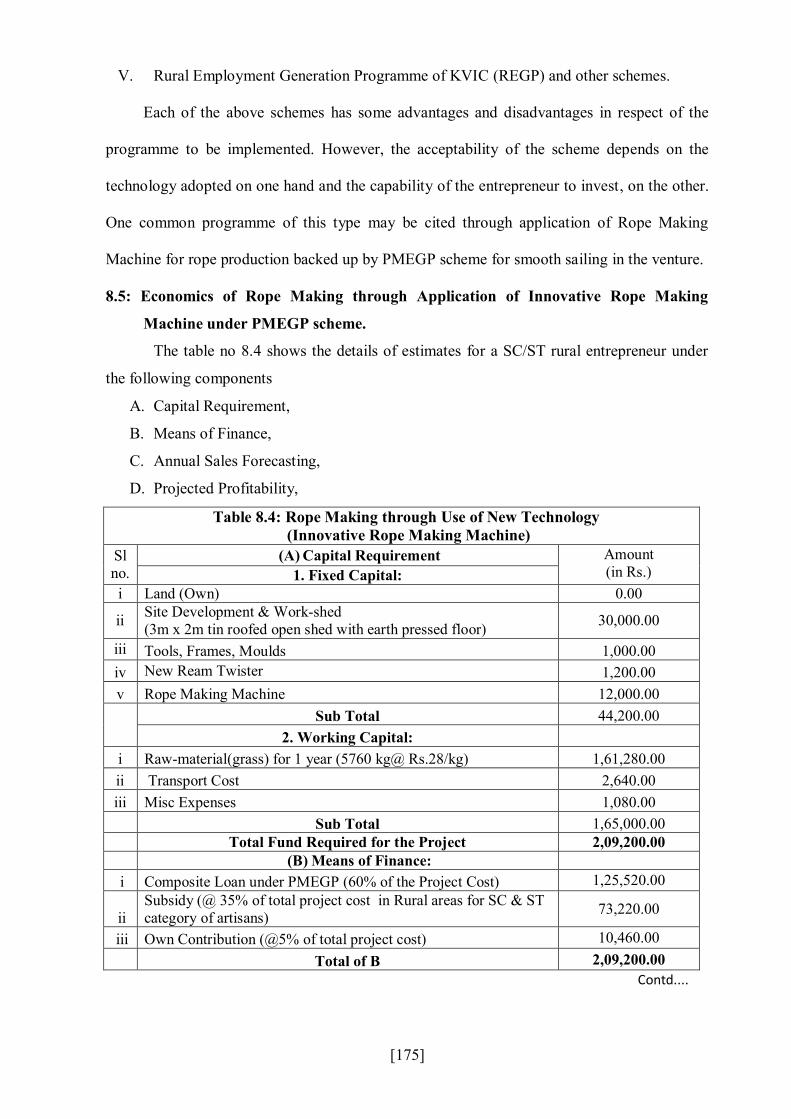
[175]
V. Rural Employment Generation Programme of KVIC (REGP) and other schemes.
Each of the above schemes has some advantages and disadvantages in respect of the
programme to be implemented. However, the acceptability of the scheme depends on the
technology adopted on one hand and the capability of the entrepreneur to invest, on the other.
One common programme of this type may be cited through application of Rope Making
Machine for rope production backed up by PMEGP scheme for smooth sailing in the venture.
8.5: Economics of Rope Making through Application of Innovative Rope Making
Machine under PMEGP scheme.
The table no 8.4 shows the details of estimates for a SC/ST rural entrepreneur under
the following components
A. Capital Requirement,
B. Means of Finance,
C. Annual Sales Forecasting,
D. Projected Profitability,
Table 8.4: Rope Making through Use of New Technology (Innovative Rope Making Machine)
Sl no.
(A) Capital Requirement Amount (in Rs.) 1. Fixed Capital:
i Land (Own) 0.00
ii Site Development & Work-shed (3m x 2m tin roofed open shed with earth pressed floor) 30,000.00
iii Tools, Frames, Moulds 1,000.00 iv New Ream Twister 1,200.00 v Rope Making Machine 12,000.00
Sub Total 44,200.00 2. Working Capital:
i Raw-material(grass) for 1 year (5760 kg@ Rs.28/kg) 1,61,280.00 ii Transport Cost 2,640.00 iii Misc Expenses 1,080.00
Sub Total 1,65,000.00 Total Fund Required for the Project 2,09,200.00
(B) Means of Finance: i Composite Loan under PMEGP (60% of the Project Cost) 1,25,520.00
ii Subsidy (@ 35% of total project cost in Rural areas for SC & ST category of artisans) 73,220.00
iii Own Contribution (@5% of total project cost) 10,460.00 Total of B 2,09,200.00
Contd....
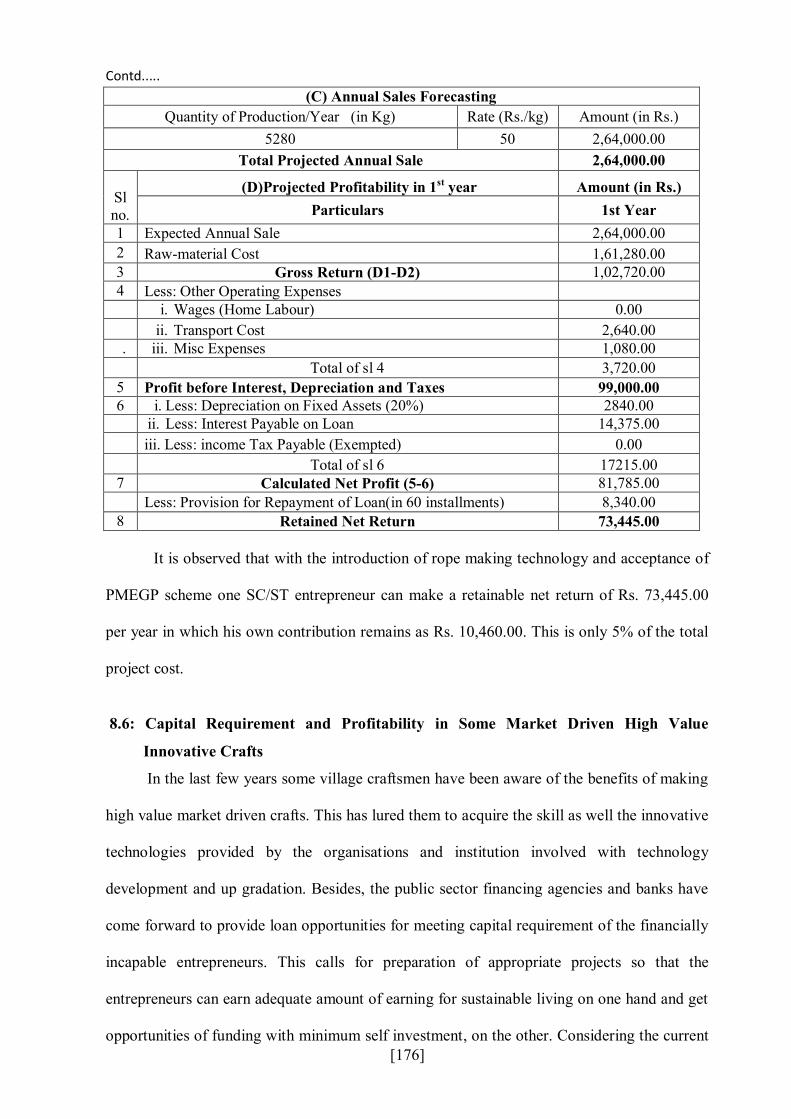
[176]
Contd..... (C) Annual Sales Forecasting
Quantity of Production/Year (in Kg) Rate (Rs./kg) Amount (in Rs.) 5280 50 2,64,000.00
Total Projected Annual Sale 2,64,000.00
Sl no.
(D)Projected Profitability in 1st year Amount (in Rs.) Particulars 1st Year
1 Expected Annual Sale 2,64,000.00 2 Raw-material Cost 1,61,280.00 3 Gross Return (D1-D2) 1,02,720.00 4 Less: Other Operating Expenses
i. Wages (Home Labour) 0.00
ii. Transport Cost 2,640.00 . iii. Misc Expenses 1,080.00
Total of sl 4 3,720.00 5 Profit before Interest, Depreciation and Taxes 99,000.00 6 i. Less: Depreciation on Fixed Assets (20%) 2840.00
ii. Less: Interest Payable on Loan 14,375.00
iii. Less: income Tax Payable (Exempted) 0.00 Total of sl 6 17215.00 7 Calculated Net Profit (5-6) 81,785.00 Less: Provision for Repayment of Loan(in 60 installments) 8,340.00 8 Retained Net Return 73,445.00
It is observed that with the introduction of rope making technology and acceptance of
PMEGP scheme one SC/ST entrepreneur can make a retainable net return of Rs. 73,445.00
per year in which his own contribution remains as Rs. 10,460.00. This is only 5% of the total
project cost.
8.6: Capital Requirement and Profitability in Some Market Driven High Value
Innovative Crafts
In the last few years some village craftsmen have been aware of the benefits of making
high value market driven crafts. This has lured them to acquire the skill as well the innovative
technologies provided by the organisations and institution involved with technology
development and up gradation. Besides, the public sector financing agencies and banks have
come forward to provide loan opportunities for meeting capital requirement of the financially
incapable entrepreneurs. This calls for preparation of appropriate projects so that the
entrepreneurs can earn adequate amount of earning for sustainable living on one hand and get
opportunities of funding with minimum self investment, on the other. Considering the current

[177]
trends of production of market driven products, and their significance in offering sustainable
livelihood to the craftsmen, the present study has projected four products for analysing their
capital requirement, means of finance, sales forecasting and finally profitability. Those are (I)
Sabai Hats, (II) Shoulder Bags or Hand Bags, (III) Sabai Made Carpets and (IV) Sabai
Furniture (Sofa Set). The estimates confirm that net returns from the above ventures to be
taken up by the craftsmen are significant and adequate for their drive for sustainable
livelihood. PMEGP scheme of financing appears to be very much suitable since 84% of the
households engaged in Sabai based activities belong to SC & ST communities.
8.6.1 Making Sabai Hats from Sabai grass appear to be a feasible programme of Sabai craft
making. For this, PMEGP scheme as the source of finance seems to be effective. A household
with average one skilled and two semiskilled workers produce 500 hats per year on an
average. Table no. 8.5 shows that the capital requirement for this purpose is Rs. 41,400.00 of
which Rs. 24,840.00 (60% of the project cost) may be made available from PMEGP scheme.
The household’s own contribution will be only 5% of the total capital amounting Rs.2070.00.
Subsidy of 35% project cost amounting Rs.14,490.00 will be available to the household
entrepreneur on repayment of 60% of project cost or composite loan amount under PMEGP.
Table 8.5: Sabai Hats Making Scheme Sl no.
(A) Capital Requirement Amount (in Rs.) 1. Fixed Capital:
i Land (Own) 0.00
ii Site Development & Work-shed (3m x 2m tin roofed open shed with earth pressed floor) 30,000.00
iii Tools, Frames, Moulds 1,000.00 iv Ghudru/Ream Twister 1,200.00 v Dyeing Unit (Dekchi, Bucket, Mug, Karai etc.) 2,000.00 vi Tool Box 500.00
Sub Total 34,700.00
2. Working Capital: (for 12 months) i Raw-material (12 month)
a) Grass (120 kg@ Rs.30/kg) 3,600.00
b) Bleaching & Dyeing Material (120 kg @ Rs.5.00/kg) 600.00 ii. Electricity & Maintenance 360.00 iii Rent 0.00 iv Transport Cost 500.00
contd....

[178]
Contd..... v Consumables (Packaging & other consumables) 600.00 vi Marketing Cost 750.00 vii Misc Expenses 290.00
Sub Total 6,700.00 Total Fund Required for the Project 41,400.00 (B) Means of Finance: i Composite Loan under PMEGP (60% of project cost) 24,840.00
ii Subsidy (@ 35% of total project cost in Rural areas for SC &ST) 14,490.00 iii Own Contribution (@5% of total project cost) 2,070.00
Total 41,400.00 (C) Annual Sales Forecasting
Quantity of Production/Year (pcs.) Rate(in Rs./Pc) Amount (in Rs.)
500 130 65,000.00 Total Projected Annual Sale 65,000.00
(D)Projected Profitability in 1st year
sl no Particulars
1st Year Amount (in
Rs.) 1 Expected Annual Sale 65,000.00 2 Raw-material Cost 3,600.00 3 Gross Return (1-2) 61,400.00 4 Less: Other Operating Expenses i. Wages (Home Labour) 0.00 ii. Electricity & Maintenance 360.00 iii. Rent 0.00 iv. Transport Cost 500.00 v. Consumables (Packaging & other consumables) 600.00 vi. Marketing Cost 750.00 vii. Misc Expenses 290.00 Total of sl 4 9,240.00 5 Profit before Interest, Depreciation and Taxes 52,160.00
6 i. Less: Depreciation on Fixed Assets (20%) Other than land and building 940.00
ii. Interest Payable on Loan 2,856.00 iii. Less: income Tax Payable (Exempted) 0.00 Total of sl 6 3,796.00 7 Calculated Net Profit (5-6) 48,364.00 Less: Provision for Repayment of Loan (in 5 installments) 4,968.00 8 Retained Net Return Per Year 43,396.00
In this programme the annual sale will be amounting to Rs. 65,000.00 from which Rs.
61,400.00 will be gross return. The calculated net profit after deduction of operating costs,
interest on capital, depreciation, taxes and repayment of loan installment will be Rs.

[179]
43,396.00 (Table-8.5).This indicates that the household involved with Sabai Hats making can
earn a net monthly income of about Rs. 3,600.00. Though earning does not assure sustainable
livelihood to a family of 5 members, it implies that sustainability could be attained if the work
programme of the household is integrated with Sabai cultivation and rope making. Even if the
household is landless, the rope making with Purchased grass stock can also serve the same
purpose.
8.6.2 Shoulder Bag from Sabai rope or plait has already been taken as a market sensitive
product among the national and international level traders. For production of a variety of
Sabai made bags with satisfactory value addition the PMEGP scheme remains as an obvious
choice for production, value addition and adequate net return to participant families. A
household with good skilled and semi-skilled working members can manufacture on an
average 30 shoulder bags per month or 360 such bags in a year. From the details of such a
scheme as shown in table no. 8.6 it is observed that the gross capital requirement for the
purpose will stand at Rs. 60,340.00. If the project is implemented under PMEGP scheme, the
capital availability for investment will be Rs. 36,204.00 or 60% of the total project cost. In
this case the own contribution of the craft family will be only Rs. 3,017.00 which is 5% of the
project cost. The subsidy component of 35% of the project cost is Rs, 21,119.00 which will be
provided to the craftsman on repayment of the loan component of Rs. 36,204.00.
Table 8.6: Shoulder/Hand Bags Making Scheme (A) Capital Requirement Amount (in Rs.) 1. Fixed Capital: i Land (Own) 0.00
ii Site Development & Work-shed (3m x 2m tin roofed open shed with earth pressed floor) 30,000.00
iii Tools, Frames, Moulds 1,000.00 iv Ghudrru/Ream Twister 1,200.00 v Wooden Weaving Frame 2,000.00 vi Dying Unit (Dekchi, Bucket, Mug, Karai etc.) 2,000.00 Tool Box 500.00 Sub Total 36,700.00
Contd...

[180]
Contd......
2. Working Capital: (for 12 months) i Raw-material (12 month) a) Grass (144 kg@ Rs.30/kg) 4,320.00 b) Bleaching & Dying Material (144 kg @ Rs.20.00/kg) 2,880.00 c) Integration Material (360 Bags @ Rs.20) 7,200.00
ii. Electricity & Maintenance 1,800.00 iii Rent 0.00 iv Transport Cost 2,400.00 v Consumables (Packaging & other consumables) 1,200.00 vi Marketing Cost 1,800.00 vii Misc Expenses 2,040.00 Sub Total 23,640.00 Total Fund Required for the Project 60,340.00 sl no (B) Means of Finance:
i Composite Loan under PMEGP (60% of Project Cost) 36,204.00
ii Subsidy (@ 35% of total project cost in Rural areas for SC &ST) 21,119.00
iii Margin Money-Own Contribution (@5% of total project cost) 3,017.00 Total 60,340.00
Annual Sales Forecasting sl no Quantity of Production/Year (pcs.) Rate (Rs./Pc) 1 360 350 1,26,000.00 Total Projected Annual Sale 1,26,000.00
(C)Projected Profitability in 1st year
Particulars 1st Year
Amount (in Rs.) 1 Expected Sale 1,26,000.00 2 Raw-material Cost 15,120.00 3 Gross Return (1-2) 1,10,880.00 4 Less: Other Operating Expenses i. Wages (Home Labour) 0.00 ii. Electricity & Maintenance 1,800.00 iii. Rent 0.00 iii. Transport Cost 2,400.00 iv. Consumables (Packaging & other consumables) 1,200.00 v. Marketing Cost 1,800.00 vi. Misc Expenses 2,040.00 Total of sl 4 9,240.00 5 Profit before Interest, Depreciation and Taxes 1,01,640.00
6 i. Less: Depreciation on Fixed Assets (20%) other than land & building 1,340.00
ii. Interest Payable on Loan 4,163.00 iii. Less: income Tax Payable (Exempted) 0.00
Contd...

[181]
Contd...... Total of sl 6 5,503.00 7 Calculated Net Profit (5-6) 96,137.00
Less: Provision for Repayment of Loan (in 5 installments ) 7,241.00
8 Retained Net Return 88,896.00 The whole sale market rate of the good quality shoulder bag is Rs. 350.00 per bag at
the minimum and thus the total sale value will be Rs. 1, 26,000.00 of which Rs. 1,10,880.00
will be gross return. Deducting operating expenses, interest on borrowed capital, depreciation
and taxes the net profit to the entrepreneur will stand at Rs. 96,107.00. From this the provision
for repayment of loan per year (5 installments) amounting Rs. 7,241.00 will be deducted to
provide the Retained Net Return from the enterprise to be Rs. 88,896.00 per year. Thus the
crafts man family involved in Sabai based shoulder bag or hand bag making can earn a
monthly net return of Rs. 7,408.00 which may be considered as just adequate to manage
sustainable living. Along with this venture of shoulder bag or hand bag making the members
of the family may go for rope making or even Sabai cultivation, if they own such suitable
land. Such families will definitely maintain sustainable livelihood smoothly and comfortably.
Of course they will have to attain higher skill in the areas of dyeing, designing, integration
with non Sabai material, weaving etc.
8.6.3 Large size Sabai Made Carpet has been found to be a market demanded useful item
specially for built up spaces of assembly like lounges, banquet halls, auditoriums, large
stages, corridors etc in hotels, academic institution, banks, theatres, ceremonial pandals etc.
(Photograph-14). In this case of Sabai craft making the PMEGP scheme seems to be a good
choice for production of carpets with adequate value addition and thereby attractive net return
to the participant families. It is estimated to know that a family with one skilled and two
semiskilled members can produce in a month one carpet of 5 m. x 5 m. dimension i.e. 12
carpets a year. The gross capital requirement for the venture as elaborated in table no. 8.7 has
been estimated to be Rs. 69,500.00. When such a project is taken up to be implemented under

[182]
PMEGP scheme, the possible capital availability for investment will be Rs.41, 700.00 which
is 60% of the total project cost. In this case only Rs. 3,475.00 or 5 % of project cost will have
to be the contribution of the family. The rest 35 % of the capital i.e. Rs. 24,325.00 will be the
subsidy which will be received by the craftsman when the loan component of Rs. 41,700.00 is
paid back in 5 years or 60 monthly installments.
Photograph-12: Sabai made Carpet
Table 8.7: Sabai made Carpets (25 sq. m.) Making Scheme
(A)Capital Requirement
1. Fixed Capital: Amount (in Rs.)
i Land (Own)
ii Site Development & Work-shed (3m x 2m tin roofed open shed with earth pressed floor) 30,000.00
iii Tools, Frames, Moulds 1,000.00 iv Ghudru/Ream Twister 1,200.00 v Wooden Weaving Frame 2,000.00 vi Dyeing Unit (Dekchi,Bucket, Mug, Karai etc.) 2,000.00 Tool Box 500.00 Sub Total 36,700.00
2. Working Capital: (for 12 months) i Raw-material (12 month) a) Grass (540 kg@ Rs.30/kg) 16200
b) Bleaching & Dyeing Material (144 kg @ Rs.20.00/kg) 10800 c) Integration Material 0
ii. Electricity & Maintenance 1,000.00 iii Rent 0.00 iv Transport Cost 2,000.00 v Consumables (Packaging & other consumables) 600.00 vi Marketing Cost 1,200.00 vii Misc Expenses 1,000.00
Contd...

[183]
Contd.... Sub Total 32800
sl no
Total Fund Required for the Project 69,500.00 (B)Means of Finance:
i Composite Loan under PMEGP (60% of project cost) 41,700.00 ii Subsidy (@ 35% of total project cost in Rural areas for SC &ST) 24,325.00 iii Margin Money-Own Contribution (@5% of total project cost) 3,475.00 Total 69,500.00 (B)Annual Sales Forecasting
sl no Quantity of Production/Year (pcs.) Rate (in
Rs./Pc) Amount (in
Rs.)
1 12 11,250 1,35,000.00 Total Projected Annual Sale 1,35,000.00
(C)Projected Profitability sl no
1st Year Particulars Amount (in Rs.)
1 Expected Sale 1,35,000.00 2 Raw-material Cost 27,000.00 3 Gross Return (1-2) 1,08,000.00 4 Less: Other Operating Expenses i.Wages (Home Labour) 0.00 ii.Electricity & Maintanance 1,000.00 iii.Rent 0.00 iv.Transport Cost 2,000.00 v.Consumables (Packaging & other consumables) 600.00 vi.Marketing Cost 1,200.00 vii.Misc Expenses 1,000.00 Total of sl 4 5,800.00 5 Profit before Interest, Depreciation and Taxes 1,02,200.00
6 i. Less: Depreciation on Fixed Assets (20%) other than land & building 1,340.00
ii. Interest Payable on Loan 4,796.00 iii. Less: income Tax Payable (Exempted) 0.00 Total of sl 6 6,136.00 7 Calculated Net Profit (5-6) 96,064.00
Less: Provision for Repayment of Loan (in 5 installments) 8,340.00
8 Retained Net Return 87,724.00 The market price for sale of carpet is Rs. 450.00 per sq.m. and hence sale value of
each carpet of 25 sqm will be Rs. 11,250.00. The total sale in year for 12 carpets will thus be
Rs. 1, 35,000.00. Taking out the cost of raw material from this, the gross return to the
entrepreneur will be Rs. 1, 08,000.00. Deducting from this the operating expenses, interest
[184]
payable on loan, depreciation and taxes the net profit from this carpet making craft unit will
be Rs. 96,064.00 .From this amount the craft making family will have to pay back 5 loan
installments in 5 years amounting Rs. 8,340.00 in a year. Thus the retained net return from
carpet making will be Rs. 87,724.00 per year. This means that the net earnings of this craft
making family per month will be Rs. 7,310.00. The family will attain definitely the status of
APL category and will be able to manage a sustainable livelihood. Such craftsman families
can earn additional income through rope and plait making. Besides, they have the prospects of
earning still higher income through improvement of their skill since good quality carpet price
per sq.m. may go up to Rs. 800.00 .In this case also design development besides dyeing,
weaving and also integration with non-Sabai eco-friendly materials can be the basis of
raising price per unit.
8.6.4 Sabai based furniture (Sofa Set) making is another high value demanding craft in the
market. The structure of the Sofa Set is however made of bamboo and hence needs additional
skill on structure designing and fabricating. The bamboo used for this is of special variety.
Paschim Medinipur District specially Paschimanchal area is endowed with the typical species
known as ‘Kathi Bans’ (Dendrocalamus Strictus) which is a deciduous densely tufted bamboo
with solid inter nodes. This variety of bamboo is specially suitable for Sofa-Set structure. For
production of sofa sets by household level enterprises the PMEGP scheme appears to quite
feasible and profit worthy. A family with 3 household labours of which one should be
specially skilled for bamboo structure making is capable of producing two sofa-Sets a month
comfortably and thus can manufacture 24 sofa sets per year. Based on PMEGP format the
scheme of Sofa Set making for producing 24 sets per year has been prepared and shown in
table no. 8.8. For this project the gross capital requirement has been estimated to be Rs.91,
000.00 of which Rs.54, 600.00 or 60% of the total project cost will be made available to the
entrepreneur as loan component to be paid back with interests in 5 equal yearly installments.
The entrepreneur’s own contribution will be Rs.4550.00 which is 5% of the total project cost.
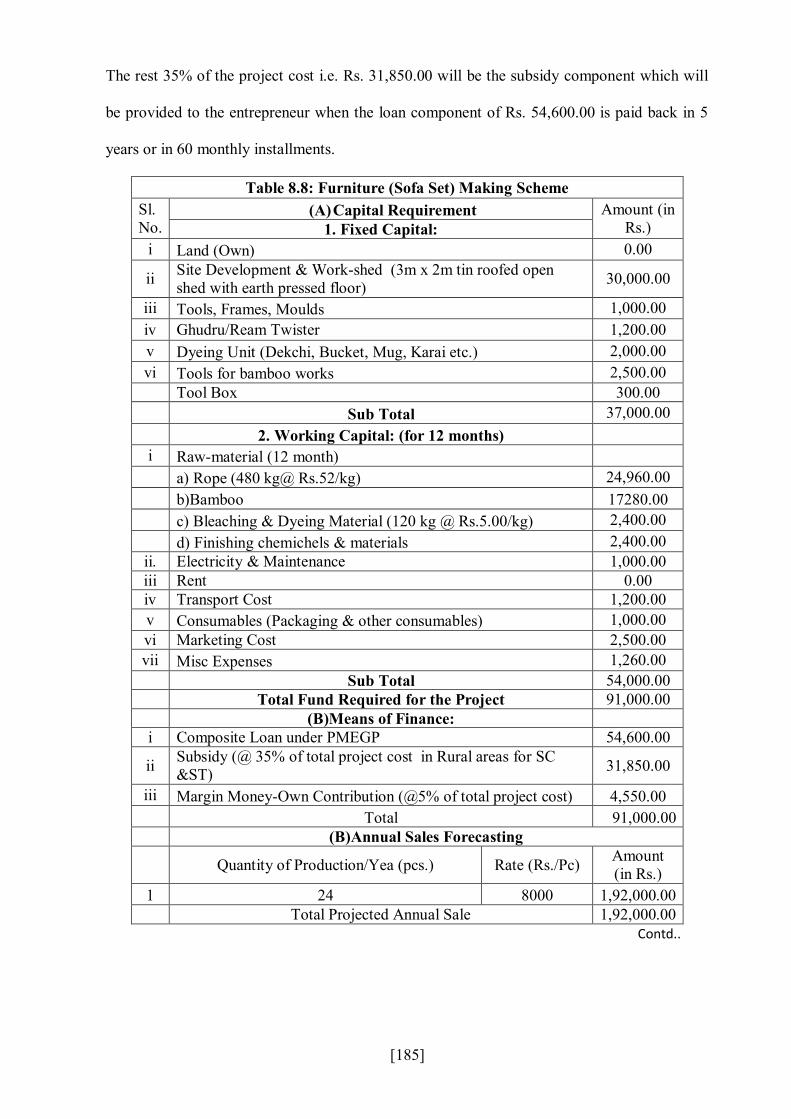
[185]
The rest 35% of the project cost i.e. Rs. 31,850.00 will be the subsidy component which will
be provided to the entrepreneur when the loan component of Rs. 54,600.00 is paid back in 5
years or in 60 monthly installments.
Table 8.8: Furniture (Sofa Set) Making Scheme Sl. No.
(A) Capital Requirement Amount (in Rs.) 1. Fixed Capital:
i Land (Own) 0.00
ii Site Development & Work-shed (3m x 2m tin roofed open shed with earth pressed floor) 30,000.00
iii Tools, Frames, Moulds 1,000.00 iv Ghudru/Ream Twister 1,200.00 v Dyeing Unit (Dekchi, Bucket, Mug, Karai etc.) 2,000.00 vi Tools for bamboo works 2,500.00 Tool Box 300.00 Sub Total 37,000.00
2. Working Capital: (for 12 months) i Raw-material (12 month) a) Rope (480 kg@ Rs.52/kg) 24,960.00 b)Bamboo 17280.00 c) Bleaching & Dyeing Material (120 kg @ Rs.5.00/kg) 2,400.00
d) Finishing chemichels & materials 2,400.00 ii. Electricity & Maintenance 1,000.00 iii Rent 0.00 iv Transport Cost 1,200.00 v Consumables (Packaging & other consumables) 1,000.00 vi Marketing Cost 2,500.00 vii Misc Expenses 1,260.00 Sub Total 54,000.00
Total Fund Required for the Project 91,000.00
(B)Means of Finance: i Composite Loan under PMEGP 54,600.00
ii Subsidy (@ 35% of total project cost in Rural areas for SC &ST) 31,850.00
iii Margin Money-Own Contribution (@5% of total project cost) 4,550.00 Total 91,000.00
(B)Annual Sales Forecasting
Quantity of Production/Yea (pcs.) Rate (Rs./Pc) Amount (in Rs.)
1 24 8000 1,92,000.00 Total Projected Annual Sale 1,92,000.00
Contd..

[186]
Contd..
(C)Projected Profitability in 1st year
Particulars Amount 1 Expected Sale 1,92,000.00 2 Raw-material Cost 47,040.00 3 Gross Return (1-2) 1,44,960.00 4 Less: Other Operating Expenses i. Wages (Home Labour) 0.00 ii. Electricity & Maintenance 1,000.00 iii. Rent 0.00 iii. Transport Cost 1,200.00 iv. Consumables (Packaging & other consumables) 1,000.00 v. Marketing Cost 2,500.00 vi. Misc Expenses 1,260.00 Total of sl 4 6,960.00 5 Profit before Interest, Depreciation and Taxes 1,38,000.00
6 i. Less: Depreciation on Fixed Assets (20%) Other than land and building 1,400.00
ii. Interest Payable on Loan 6,279.00 iii. Less: income Tax Payable (Exempted) 0.00 Total of sl 6 7,679.00 7 Calculated Net Profit (5-6) 1,30,321.00 Less: Provision for Repayment of Loan (in 5 instalments) 10,920.00 8 Retained Net Return Per Year 1,19,401.00
Photograph-13: Sabai rope made furniture (Sofa Set)
The estimated sale value of each sofa set is Rs.8000.00 in wholesale market and hence
the estimated sale value of 24 sofa sets in a year will be Rs. 1, 92,000.00. The gross return to
the entrepreneur after deduction of raw-martial cost of Rs. 47,040.00 will be Rs.1, 44,960.00.
[187]
The calculated net profit to the entrepreneur after deduction of operating expenses, interest
payable on loan amount and taxes will be Rs. 1, 30,321.00 from Sofa set making. Thus the
retained net return after paying back the loan amount of 5 yearly installments of Rs.10, 920.00
will be amounting to Rs. 1, 19,401.00 in a year. This means that the average monthly retained
net return to the entrepreneur family will be Rs.9, 950.00 (say 10,000.00). This will definitely
place the family in the APL category and will certainly make it capable to manage sustainable
livelihood. Though manufacture of two Sofa Sets per month will keep the artisan members
busy with the job, there will still remain opportunities for additional rope making and crafts
making for selling in local markets for additional earnings. Design development in sofa
making and use of materials of integration can further help in hiking the sale price and hence
hire earning to the family.
8.7: Comparative Earnings from Crafts Making Under Different On-going Schemes
In this approach information on two commonly demanded items namely Sabai Hand
Bags and Sabai Carpets are collected for analyses. For each item, the source of required
capital or loan component has been considered to be obtained from different on-going
schemes. In this analysis the on-going schemes considered are (i) PMEGP (ii) USKP (iii)
SVSKP (iv) WBMDFC (v) REGP
8.7.1 Taking Sabai Shoulder/Hand Bag as the selected craft the estimated fixed and working
capital together or the total fund required for such craft unit will be Rs. 60,340.00 (Table No.
8.6). For meeting this capital requirement both the loan component and subsidy will vary
from scheme to scheme and accordingly the entrepreneur’s contribution will differ. Annexure
8.I shows capital requirement, means of finance, subsidy contribution of the entrepreneur,
interest on loan, loan terms etc for Sabai Hand Bag making in respect of all the five schemes.
The projected profitability after one year for production of Sabai Hand Bags by a family with
3 skilled/ semi skilled labour are shown against five separate schemes in table no. 8.9. The

[188]
table clearly demonstrates that and entrepreneur may be indifferent to any of the five schemes
for hand bag making since the retained net return from the venture after one year varies from
Rs. 86,361.00 to Rs. 91,568.00. This clarifies that the net return fluctuates maximum within a
range of Rs. 5,207.00. It may be said that by shifting the entrepreneur’s choice from one
scheme to another can help increasing the net return by 6.03% only from the minimum in
REGP scheme to maximum in USKP scheme. But for this, the entrepreneur’s own
contribution will have to be raised to Rs. 10,340.00 in USKP scheme from Rs. 3,017.00 for all
other schemes. Hence the artisans may choose any of the schemes depending on his capability
to pay the self contribution which is more than 3 times for accepting USKP scheme compared
to other four schemes.
Table 8.9: Projected Profitability Scenario (1st Year) of Sabai Hand Bag Making Under Different Schemes.
Govt Approved Schemes
PMEGP USKP SVSKP WBMDFC REGP sl no Particulars Amount
(in Rs.) Amount (in Rs.)
Amount (in Rs.)
Amount (in Rs.)
Amount (in Rs.)
1 Expected Sale 1,26,000.00 1,26,000.00 1,26,000.00 1,26,000.00 1,26,000.00 2 Raw-material Cost 15,120.00 15,120.00 15,120.00 15,120.00 15,120.00 3 Gross Return (1-2) 1,10,880.00 1,10,880.00 1,10,880.00 1,10,880.00 1,10,880.00
4 Less: Other Operating Expenses
i.Wages (Home Labour) 0.00 0.00 0.00 0.00 0.00
ii.Electricity & Maintenance 1,800.00 1,800.00 1,800.00 1,800.00 1,800.00
iii.Rent 0.00 0.00 0.00 0.00 0.00
iv.Transport Cost 2,400.00 2,400.00 2,400.00 2,400.00 2,400.00
v.Consumables (Packaging & other consumables)
1,200.00 1,200.00 1,200.00 1,200.00 1,200.00
vi.Marketing Cost 1,800.00 1,800.00 1,800.00 1,800.00 1,800.00
vii.Misc Expenses 2,040.00 2,040.00 2,040.00 2,040.00 2,040.00
Total of sl 4 9,240.00 9,240.00 9,240.00 9,240.00 9,240.00
5 Profit before Interest, Depreciation and Taxes 1,01,640.00 1,01,640.00 1,01,640.00 1,01,640.00 1,01,640.00
6 i.Less: Depreciation on Fixed Assets (20%) other than land & building
1,340.00 1,340.00 1,340.00 1,340.00 1,340.00
Contd..

[189]
Contd.
ii.Less:Interest on Loan PMEGP:@11.5% on Rs.36,204, USKP: @9% on Rs. 37,500, SVSKP:@9% on Rs. 39,221 WBMFDC:@7.5% on Rs. 57,323, REGP-13% on Rs. 42238
4,163.00 3,375.00 3,530.00 4,299.00 5491
iii.Less: Income Tax Payble (Exempted) 0.00 0.00 0.00 0.00 0.00
Total of sl 6 5,503.00 4,715.00 4,870.00 5,639.00 6,831.00
7 Calculated Net Profit (5-6) 96,137.00 96,925.00 96,770.00 96,001.00 94,809.00
Less: Provision for Repayment of Loan Loan Term PMEGP:5 Yrs USKP:7 Yrs SVSKP:7Yrs WBMDFC:7 Yrs REGP: 5 yrs
7,241.00 5,357.00 5,603.00 8189.00 8,448
8 Retained Net Return 88,896.00 91,568.00 91,167.00 87,812.00 86,361.00
8.7.2 Considering Sabai Carpet making as another craft the estimated fixed and working
capital together or the total fund required for such a craft making unit at household level will
be Rs. 69,500.00 (Table No. 8.8). In this case also for meeting this capital requirement both
the loan component and subsidy will vary from scheme to scheme and this will lead to
differences in entrepreneur’s contribution accross the schemes. Annexure 8.II exhibits the
capital requirement, means of finance, subsidy amount, entrepreneur’s contribution, interest
on loan, loan terms etc for Sabai carpet making at household level in respect of all the five
schemes. The projected profitability after one year for production and marketing of Sabai
Carpet by an artisan family with three skilled/ semiskilled labours have been worked out in
respect of five different schemes and presented in table no. 8.10. From the table it is observed
that the maximum retained net return of Rs. 88,672.00 will be accrued in the case of accepting
USKP scheme while the minimum retained net return of Rs. 84,268.00 could be obtained if
the PMEGP scheme is taken up. This means that an additional net return of Rs. 4,404.00
(5.23%) will be available if USKP schemes are considered in place of PMEGP scheme. But

[190]
this additional net return will call for entrepreneur’s contribution of Rs. 19,500.00 for USKP
in place of Rs. 3,475.00 for PMEGP scheme. This means that an additional self investment of
Rs. 16,025.00 in the form of own contribution will be necessary for additional net return of
Rs. 4,404.00 from PMEGP or similar other schemes. In this case the entrepreneur has the
choice of getting higher net return provided he or she is capable of providing higher self
contribution. Taking an overall view it may be concluded that the artisan may choose any of
the schemes for Sabai Carpet making depending on his self contribution ability.
Table 8.10: Projected Profitability Scenario (1st year) of Sabai Carpet Making Under Different Schemes
Govt. Approved Schemes
Sl no Particulars
PMEGP USKP SVSKP WBMDFC REGP Amount (in Rs.)
Amount (in Rs.)
Amount (in Rs.)
Amount (in Rs.)
Amount (in Rs.)
1. Expected Sale 135,000.00 135,000.00 135,000.00 135,000.00 135,000.00 2. Rawmaterail Cost 27,000.00 27,000.00 27,000.00 27,000.00 27,000.00 3. Gross Return (1-2) 108,000.00 108,000.00 108,000.00 108,000.00 108,000.00
4. Less: Other Operating Expenses
i.Wages (Home Labour) 0.00 0.00 0.00 0.00 0.00 ii.Electricity & Maintanance 1,000.00 1,000.00 1,000.00 1,000.00 1,000.00
iii.Rent 0.00 0.00 0.00 0.00 0.00 iv.Transport Cost 2,000.00 2,000.00 2,000.00 2,000.00 2,000.00 v.Consumables (Packaging & other consumables)
600.00 600.00 600.00 600.00 600.00
vi.Marketing Cost 1,200.00 1,200.00 1,200.00 1,200.00 1,200.00 vii.Misc Expenses 1,000.00 1,000.00 1,000.00 1,000.00 1,000.00
Total of sl 4 5,800.00 5,800.00 5,800.00 5,800.00 5,800.00
5 Profit before Interest, Depreciation and Taxes 102,200.00 102,200.00 102,200.00 102,200.00 102,200.00
6. i. Depreciation on fixed assets 20% 1340.00 1340.00 1340.00 1340.00 1340.00
ii.Interest on Loan PMEGP:@11.5% on Rs.41700, USKP: @9% on Rs. 37,500, SVSKP:@9% on Rs. 45,175, WBMFDC:@7.5% on Rs. 57,323, REGP 13% on 48650
4,796.00 3,375.00 4,067.00 4,299.00 6325.00
iii.Less: income Tax Payble (Exempted) 0.00 0.00 0.00 0.00 0.00
Total of sl 6 6,136.00 4,715.00 5,407 5,639.00 7,665.00 Contd....

[191]
Contd..
7 Calculated Net Profit (5-6) 92,608.00 94,029.00 93,337.00 93,105.00 94,535.00
Less: Provision for Repayment of Loan 1st Year Loan Term PMEGP:5 Yrs USKP:7 Yrs SVSKP:7Yrs WBMDFC:7 Yrs REGP: 5 yrs
8,340.00 5,357.00 6,454.00 8,189.00 9,730.00
Retained Net Return 84,268.00 88,672.00 86,883.00 84,916.00 84,805.00
8.8. A Model Enterprise Management Scheme with 10 (Ten) Workers Including
Owner-Manager.
From the sample survey it is observed that 58.48% households involved in Sabai
based activities fall under BPL Category. This share goes as high as 83.00% when only SC &
ST households are considered. The Profitability analysis done in the previous sections with all
the five schemes indicates that the loan component and own contribution for household level
enterprises in all the schemes appear to be quite high compared to their existing earnings and
durable assets. Besides a large section of the households are headed by persons who are
neither educated to the extent desired for the purpose nor they have the capability to manage
any household level enterprise dealing with Sabai processing, marketing and profit making.
However, all of them are competent to participate as a worker with wages in any firm
managed by any competent villager as owner-manager. Such an enterprise may have several
workers and the production will be decided by the assembly of worker villagers who can offer
a range of products jointly. The greatest economic and social advantages of this type of
organisation building are:
(i) villagers with low level of skill can take part and earn,
(ii) the cross section of workers represent a combination of skilled and semi-skilled works
with varying wages,
(iii) the semi-skilled or lower skilled workers can gradually improve their skill and hence
wage level by working jointly with the fully skilled workers,

[192]
(iv) unlike a factory, they jointly work together in a household environment and
(v) in the case of indisposition of any worker, the replacement of worker from the family is
quite possible and thus the loss in wage earning to the family in one hand and the failure to
supply the product in time, on the other, are saved. Since these villagers work together and the
enterprise produces several products, they will have the opportunity to shift worker from the
line of production of a commodity with falling demand to another with hiking demand level.
Table 8.11: Enterprise Development Model with 10 workers Producing High Value Market Sensitive Products (Shoulder Bag, Carpet and Sofa Sets)
(A) Capital Requirement Sl. No. 1. Fixed Capital: Amount
(in Rs.) i Land: (Own) (Adjacent to residential cluster of artisans) 0.00
ii Site Development & Workshed with closed storage space (Workshed:6m x 3m within which the storage space of 3m x 2m is available)
a) Cost of storage space: 10 sq m. x Rs.5000 50,000.00
b) Cost of open shed: 12 sq m x Rs. 4000 48,000.00 iii Tools, Frames, Moulds 10,000.00 iv Ghudru/Ream Twister 1,200.00 v Dyeing Unit (Dekchi,Bucket, Mug, Karai etc.) 4,000.00 vi Tools box 1,500.00
Sub Total 1,14,700.00
2. Working Capital: i Raw-material (12 month)
a) Grass (Furniture section:480kg, Carpet section:540kg, Bag section 450 kg) Total:1470kg @ Rs.28.00/kg 41,160.00
b) Bamboo: 288 pcs. x Rs.60.00 17,280.00
c) Bleaching & Dyeing Material (700 kg @ Rs.15.00/kg) 10,500.00
d) Finishing chemichels & materials 1,200.00
e) Integration material (1080 bags x Rs.20.00) 21,600.00
f) Wages to worker artisan 5,70,000.00 ii. Electricity & Maintenance 5,000.00 iii Rent 0 iv Transport Cost 11,200.00 v Consumables (Packaging & other consumables) 5,500.00 vi Marketing Cost 11,400.00 vii Misc Expenses 2,460.00
Sub Total 6,97,300.00 Contd....
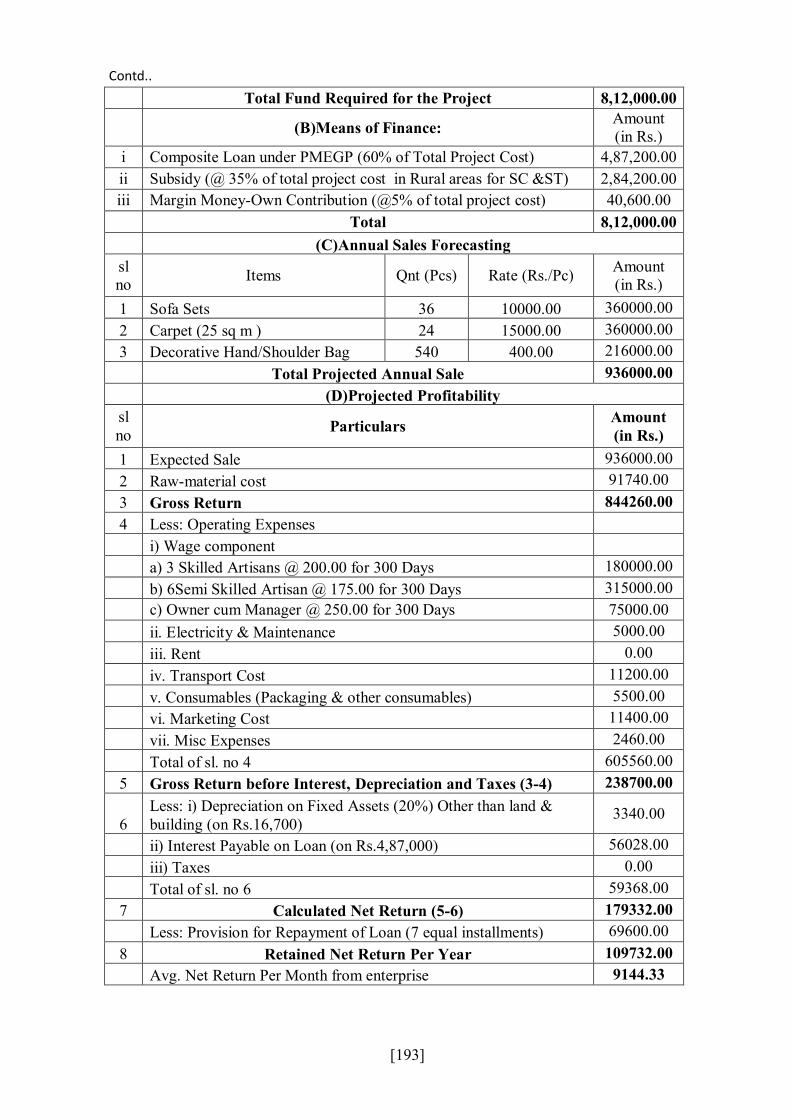
[193]
Contd..
Total Fund Required for the Project 8,12,000.00
(B)Means of Finance: Amount (in Rs.)
i Composite Loan under PMEGP (60% of Total Project Cost) 4,87,200.00 ii Subsidy (@ 35% of total project cost in Rural areas for SC &ST) 2,84,200.00 iii Margin Money-Own Contribution (@5% of total project cost) 40,600.00
Total 8,12,000.00 (C)Annual Sales Forecasting sl no Items Qnt (Pcs) Rate (Rs./Pc) Amount
(in Rs.) 1 Sofa Sets 36 10000.00 360000.00 2 Carpet (25 sq m ) 24 15000.00 360000.00 3 Decorative Hand/Shoulder Bag 540 400.00 216000.00 Total Projected Annual Sale 936000.00 (D)Projected Profitability sl no Particulars Amount
(in Rs.) 1 Expected Sale 936000.00 2 Raw-material cost 91740.00 3 Gross Return 844260.00 4 Less: Operating Expenses
i) Wage component a) 3 Skilled Artisans @ 200.00 for 300 Days 180000.00 b) 6Semi Skilled Artisan @ 175.00 for 300 Days 315000.00 c) Owner cum Manager @ 250.00 for 300 Days 75000.00 ii. Electricity & Maintenance 5000.00 iii. Rent 0.00 iv. Transport Cost 11200.00 v. Consumables (Packaging & other consumables) 5500.00 vi. Marketing Cost 11400.00 vii. Misc Expenses 2460.00 Total of sl. no 4 605560.00 5 Gross Return before Interest, Depreciation and Taxes (3-4) 238700.00
6 Less: i) Depreciation on Fixed Assets (20%) Other than land & building (on Rs.16,700)
3340.00
ii) Interest Payable on Loan (on Rs.4,87,000) 56028.00 iii) Taxes 0.00 Total of sl. no 6 59368.00 7 Calculated Net Return (5-6) 179332.00
Less: Provision for Repayment of Loan (7 equal installments) 69600.00 8 Retained Net Return Per Year 109732.00 Avg. Net Return Per Month from enterprise 9144.33

[194]
Taking the above concept in view, a model enterprise development programme has
been understood to be effective towards involvement of both BPL and APL category villagers
in promoting Sabai crafts making for improvement of their livelihood status. This basic
concept presents formation of a village level enterprise with 10 skilled and semi-skilled
workers. Craftsmen from the locality including one owner-manager who is capable accepting
a PMEGP scheme in which all the workers are expected to attain a sustainable livelihood. The
scheme is elaborated in Table 8.11. In this model other schemes are not considered because
except PMEGP, the allowable loan amount for other schemes are below 5.00 lakhs with
which such a project cannot be implemented. Taking the expected skill and capability of 10
skilled and semi-skilled workers including one owner-manager, the project will have 3 worker
groups of 2 semi-skilled and 1 skilled members. The three groups are expected to produce
three items namely (i) Handbags / Shoulder bags, (ii) Sabai Carpet and (iii) Sofa Sets. Their
monthly attainable targets of production have been taken as 45 hand / shoulder bags, 2 carpets
of 25 sq.m. dimension and 3 Sofa Sets. Thus their annual sales of products will be 540 bags,
24 carpets and 36 sofa sets. As shown in Table no. 8.11, the gross capital requirement will be
Rs. 8, 12,000.00 of which Rs. 4, 87,200 or 60% of the project cost will be available to the
entrepreneur as loan component under PMEGP scheme. This loan will be paid back with
interest (11.5%) in maximum 70 installments. The entrepreneur’s own contribution or margin
money (5% of the total project cost) will be Rs. 40,600.00. The balance 35% of the project
cost amounting Rs. 2, 84,200.00 will be the subsidy component under PMEGP scheme which
will be given to the entrepreneur when the loan component of Rs. 4.87 lakhs is paid back in 7
yearly installments.
The estimated sale value of 540 hand / shoulder bags @ Rs. 400.00 per bag, 24 carpets
(25 sqm.) @ Rs. 15,000.00 each and 36 sofa sets @ Rs. 10,000.00 per set will be Rs. 9,
36,000.00. The gross return to the firm after deduction of Rs. 91,740.00 as raw material cost
is expected to be Rs. 8, 44,260.00. The calculated net return after deduction of operating

[195]
expenses, depreciation, interest on loan component and taxes will be Rs. 1,79,332.00.
Deducting from this the annual repayment of loan (in Seven years) amounting Rs. 69,600.00,
the retained net return after one year will be Rs. 1, 09,722.00. Hence the average net return
per month from the enterprise will be Rs. 9,144.00.
The above project is considered as a model enterprise generation scheme for a group
of workers since it has the scope to generate sustainable livelihood to all the participants. It is
also the ideal one since 63.64% of the households involved with Sabai based activities in the
three Blocks under study live below poverty level. The present project provides opportunities
to raise their earnings to reach the standard of APL category. The project has clarified that
each semi-skilled worker can earn a monthly earning of Rs. 4,375.00 for 25 days of work
while each skilled worker will earn Rs. 5,000.00 for 25 days of work in a month. The
enterprise is quite lucrative to any entrepreneur since the owner-manager has the provision for
wage earning amounting to Rs. 6,250.00 for 25 days of work in a month. This is in addition to
his average retained net return of Rs. 9,144.00 per month. Thus his total earning form the
enterprise stands at Rs. 15,394.00 which is quite inspiring to any functionary in the craft
sector.
8.9: Prospects of Livelihood Improvement from Sabai Based Activities
In the intensive Study area of 3 blocks of Paschim Medinipur the total number of
households in 2011 was 93698 which indicates an average household size of 4.42 person per
family in the year. From the sample survey it has been found that 41.70% of the total
households had been engaged in the Sabai based activities. Based on this, the Sabai dependent
households in the study area has been estimated to be 39,069 in 2011.Growth in the number
of total households during 2001-2011 i.e. during last 10 years has been recorded as 28.99%
and that during 1991-2011 i.e. during last 20 years has been found to be 52.69%. Assuming
that the growth in the number of households involved with Sabai based activities will follow

[196]
this trend during the next two decades, the number of household participants in different Sabai
related activities is expected to be 50,395 in 2021 and 59654 in 2031.
As has been discussed earlier the Sabai related households are divided into 8 distinct
activity groups by taking grass cultivation, rope making and craft activities or their
combinations. From the sample survey the shares of each of the 8 Subgroups of Sabai based
activities are calculated. Accepting the same shares for the study Blocks the total number of
households in each subgroup has been estimated and presented in Table 8.12.
Table 8.12: Estimated number of households in the study Area by subgroup of Sabai Based Activities.
Sl no Subgroup Of Sabai Based Activities
Percentage of Total Households
(%)
Number of Households
1. Grass Cultivator 0.91 356 2. Rope Maker 48.19 18827 3. Craftsman 2.73 1067 4. Cultivator cum Rope Maker 37.58 14682 5. Cultivator cum Craftsman 1.21 473 6. Rope Maker cum Craftsman 4.54 1774 7. Rope Maker cum Trader 2.42 945 8. Cultivator cum Rope Maker cum
Craftsman 2.42 945
Sabai group Total (All Sabai based activities).
100.00 39,069
Source: Estimated on the basis of sample Household Survey date
The table shows that majority of the Sabai related workers (48.19%) are involved in
rope making. Another group of workers who are rope maker as well as cultivator, constitute
37.58% of the Sabai based workers. However, grass cultivation shares less than 1% of the
workers. Craftsmen alone form 2.73% and rope maker cum craftsman group shares 4.54% of
the total Sabai related workers.
Focus Group Discussion in the rope and crafts making villages and discussion with
concerned experts from micro and small industries sectors have confirmed that Sabai grass or
rope as a commodity for industrial use and export is not so bright. The trend shows that the

[197]
proportion of such uses are gradually diminishing. On the contrary the use of Sabai as
handicraft particularly making Crafts by using rope and plait has been steadily growing.
Labour productivity and net return retained from activities like rope cum crafts making as
well as only crafts making show promising future. Though shares of rope maker and
cultivator cum rope maker are expected to hold the major shares of workers for the next one
or two decades, they show all signs of going down in sharing Sabai workers though slowly
over the next few years. All other groups of Sabai based workers expected to keep their shares
almost at the same level or with marginally changing upward. Thus broadly these Sabai based
activities can be classified into three groups based on their future prospects, growth,
development and possibilities of sharing Sabai workers in the coming few decades. These
groups are:
(A) Prospective Activities:
1) Rope Makers and Craftsmen
2) Craftsmen
(B) Moderately Progressing Activities with slowly falling shares:
1) Rope Maker
2) Cultivator cum Rope maker
(C) Activities with Meagre Prospects and Low Shares:
1) Sabai Cultivator
2) Cultivator cum Craftsman
3) Rope Maker cum Trader
4) Cultivator cum Rope maker cum Craftsman
In the coming few decades it is expected that all the Sabai-groups will continue to
share the workers with changing emphasis on the group of Prospective Activities. The
Moderately Progressing Group of Activities will show downward trend in their share since
their productivity level will not be so dynamic like subgroups of Prospective Activities. The

[198]
third group of activities i.e. Activities with Meagre Prospects are expected to keep their shares
in the neighbourhood of their current shares. Table No.-8.13 shows a tentative distribution of
Sabai based working households among the sub-groups of activities in the next two decades.
Table 8.13: Proposed Distribution of Households Involved in the Sub-groups Of Sabai
Based Activities in the Coming Decades. Sl. No.
Sub groups of Sabai Based Activities 2011 2021 2031
Share in %
No. of Households % No.of
HH % No of HH.
(A) Prospective Activities Group
1 Rope Maker Cum Craftsman 4.54 1774 10 5040 20 11931
2 Craftsman 2.73 1067 6 3024 10 5965 (B) Moderately Progressing Activity Group
1 Rope Maker 48.18 18827 42 21166 32 19089
2 Cultivator cum Rope maker 37.58 14682 35 17638 30 17896
(C)
Activities With Meagre Prospects 1 Sabai cultivator
6.97 2723 7 3527 8 4772
2 Cultivator cum Craftsman
3 Rope Maker cum Trader
4 Cultivator cum Rope Maker cum Trader
Total of All Sabai Based Activities 100 39,067 100 50,395 100 59,634
Based on the merits and demerits of household level schemes discussed above it may
be said that most of them are suitable to workers of various sub-groups of Sabai based
activities. However, the prospective activities are more promising since marketability of the
new craft products are more than the traditional products like grass, rope and common crafts
locally used. The profit margin and retainable net returns are higher for prospective activities.
The model enterprise management scheme with 10 workers have the merit of involving larger
number of households and the prospective activities of rope making cum crafts making or
crafts making alone can make Sabai economy progressing at faster rate.

[199]
Chapter-IX
Recommendations and Conclusion
9.1 One of the major objectives of this research has been to analyse the production and
marketing of Sabai grass, rope and craft items and accordingly build capacities of artisan
beneficiaries. For supply of grass as raw material a significant part of 20,000 ha. of waste
land of the district can be brought under Sabai cultivation. However efforts of yield increase
and quality improvement of grass are to be targeted through further agronomic research in
labrotories and fields. Similarly participation in rope making may be further increased since
the demand for rope in regional and national markets have shown steady growth over the
last two decades. Introduction of Rope Making Machine and use of modern twister have
helped promoting production level. In craft making the progress is amazing both
quantitatively and qualitatively during the last decade. The export of craft materials has
increased significantly due to progress in design development and use of variety integration
materials to make the final product market sensitive.
At the end of this study it has been found that marketing remains to be the weakest
point amongst all other activities that are to be taken up. The reasons of failure to attain the
stage of smooth and profit worthy marketing have been a) paucity of order for supply
throughout the year, b) frequent failure on part of the artisans to meet the requirement in
time, c) lack of uniformity in style, pattern and quality of product, d) varying capacity and
skill from one artisan to another resulting in differences in qualitative standards and e)
failure to squeeze the benefits of division of labour for raising productivity, though artisans
are working in united fashion as groups. At the other end marketing depends very much on
the conveniences and whims of the buyers and agents. They are rather too selective and
fussy in their choice and often use to cancel big orders in the midway since the craft
business always remained in the unorganized informal sector trade. This type of treatment
brings frustration among the artisans and local traders and thus degenerate the very

[200]
atmosphere of craft marketing. Some concrete measures have already been suggested like
setting up of Artisans Cooperative, arrangements for production oriented loans for micro
and small enterprises dealing with Sabai crafts, exposure of artisans to different Melas,
Expos, Exhibitions, Competitions etc. and above all creation of self-managed production
units. Both male and female artisans had not been fully self-confident and possibly
remained incompetent to handle all business matters independently. The greatest loophole in
the marketing sphere is that the artisans (both males and females) are not much in touch
with the string of the outer world. Majority of them are incapable of travelling alone to
distant corners of the country and making contacts with the export agents. So they fail to
receive fresh orders directly from the agents and also fail to supply the crafts and ropes
directly to them. A salient hindrance in this process is that these artisans are mostly illiterate
or little educated which of course, creates communication barrier between the rural
craftspersons and the urban entrepreneurs. Though these male and female artisans have
definitely come out of their age long inhibitive notions, they are not yet ready to face the
competitive world of market entrepreneurship. This situation has posed a challenge to
concerned beneficiaries, facilitators, Government Departments, financial institutions and
technology providers to promote the causes of the artisans through increase in production
and market demand based output including export component. Keeping the above in view a
set of recommendations are forward herewith:
9.2 Key Recommendations
9.2.1 Grass Cultivation and Marketing:
In Sabai grass cultivation the holding size of the farmers have been found to
be small and marginal. For farming operation mostly the home labours are engaged
and labour payment is not done as cash payment. The major suggestions put forward
for this activity are:
i. Cluster farming approach with use of exchangeable home labour should be
considered as ideal for marginal and small land holders.
[201]
ii. Additional wasteland proposed to be brought under Sabai cultivation and may be
given as Patta holding to the landless and marginal villagers after formation of
appropriate clusters of Patta holders.
iii. Productivity rise should be attempted through yield increase and price sensitive
marketing. In the initial years the system of inter-cropping with agronomically
suitable crops may be taken up for aggregate productivity rise.
iv. Advance grass sale at low prices from producer’s door steps, distress sale for
relief against different adverses and other difficult odds at family level should be
totally stopped for raising net earnings of the cultivators.
v. Quality improvement of grass for fetching higher prices should be attempted
through timely field maintenance and manuring besides application of relevant
agro-technological operations.
9.2.2 Rope Making and Marketing:
i. Productivity rise could be made a reality with technological intervention in one
hand and skill training on the other.
ii. Higher production target could be attained by poor rope makers by making
available adequate institutional finance and other inputs to them.
iii. In the said effort Artisan’s organisation at cluster level will be quite effective.
iv. Quality improvement of rope with drying, screening and machine twisting is the
call of the day.
v. The innovative rope making machine should be made available to the rope
makers and SHGs for productivity rise, higher net earning and reduction of
ergonomic adverses.
vi. Grade specific price fixation and setting floor price (support price) by
cultivators, rope makers and regulatory marketing authority, if any, are important
steps for Sabai rope marketing.

[202]
9.2.3 Crafts Making and Marketing:
i. Diversified product addition in the existing product line on all Utility,
Decorative and Fashion items should be made on the basis of modern
consumer’s taste, demand and market trend.
ii. Market driven designs should be targeted through design development trainings
under skill improvement programmes.
iii. Promotional Trainings for revival of languishing craft items and for
diversification and quality upgradation of potential craft items including those
with integrated materials should be organized by the DIC of Paschim Medinipur
every year. State Government should provide grants for meeting all such costs
including honorarium to master craftsmen and stipend to trainee craftsmen.
iv. Government sponsored or self organized trainings for skill promotion remain
majorly ineffective. For all such trainings appropriate evaluation or impact
assessment must be performed by competent agencies.
v. Buyers-Sellers Meet is totally absent which may be taken as essential task to be
done at grassroot level.
vi. Introduction of available and innovative technologies at all levels should be
done for productivity rise as well as quality improvement.
vii. Organisation building and institutional financing must be given prime
importance in promoting rope and crafts making efforts.
viii. Scope of financial assistance and subsidy for craftsmen and craft making NGOs
need to be updated and upgraded by the Ministry of MSME, Government
Agencies, Panchayats and other financial Institutions. Programmes of BSAI,
PMEGP, USKP and all other Schemes should be recast in respect of their
programmes, terms and conditions, subsidy amount etc. in the interests of craft
development, promotion and value addition in Sabai growing and processing
areas.

[203]
9.2.4 Marketing Strategies:
i. Considering number, locations and functions of existing markets, the operation
of marketing of Sabai and Sabai based products seem to be quite inadequate and
incomplete. It is necessary to create and operate appropriate number of old and
new markets at suitable locations with necessary infrastructures, facilities and
information supports.
ii. Market infrastructures and networks need to be effectively developed for healthy
marketing operations which incur direct benefit to both producers and sellers.
iii. Promoting formal marketing agencies and organisations of the producers cum
sellers are essential to promote proper channelization of the products and
accruing reasonable returns.
iv. Building much developed integrated network in the value chain by taking 1st
level producers and last level consumers is imperative for understanding their
demand –supply chains, monetary transaction levels, gaps in information flow at
different stratas etc..
v. Government does not have any comprehensive marketing promotion policy or
programme related to Sabai products. Except encouraging and partially funding
some “Melas” or Fairs in a year no specific rope or craft marketing scheme
exists. Government sales emporia like Manjusha and others do not procure crafts
on payment rather payment is made any time in future when it is sold. This type
of “Consignment Purchase” is not acceptable to the artisans and they demand
payment against receipt of commodity from the craftsmen instantly.
vi. E-marketing is of little effect to rural craftsmen of the Study Area who are
neither acquainted with the technology nor they have the facilities to handle the
job. Most of the villages are on an average 15-20 kms away from the nearest
bank branches and rarely go for cashless transaction. For avoiding this

[204]
difficulties local agencies with appropriate skill and knowledge are to be
promoted by Government or Panchayat.
vii. Taking an overall view, Sabai markets need to be updated, improved and
physically developed for larger benefit to the cultivators, processors and
craftsmen since this district alone handles and transacts an important commodity
resource which produces Sabai grass to the extent of more than 50,000 tons per
year and transacts over Rs.160.00 crores annually and thus involves nearly
48,000 households in this process of Sabai culture and cultivation.
viii. Proposal for developing a few well organised Mandis with all facilities and
services at certain Central Places in the Sabai growing region of Eastern India is
taken to be one of the key decisions in Sabai marketing. Considering the regional
transport nodes and network as well as the existing markets and facility centres
of this study area, Lodhasuli or Feko-Ghat of Paschim Medinipur District
appears to be one of the ideal locations for the proposed Mandi.
9.3 Conclusion Analysis of production processes, economies, marketing structure and functions has
firmly established a fact that the Sabai artisan families cannot earn a considerable net
earnings for sustainable livelihood when remain engaged with cultivation or rope making
only. For that they are required to be involved in production of rope as well as customer
centric diversified crafts. This type of grass based production efforts of diverse items can
fetch considerable net monthly earning to support sustainable livelihood. Depending on
number of family members (male and female), composite skills available with the family
members, their capacity to afford time per week and also capacity to invest from family or
institutional sources, the household level production units could be promoted. This however
does not deny the availability and applicability of updated technological inputs. In fact,
taking the suitability and appropriateness of the above factors in one hand and analysing the
market demand and marketability of the products on the other, necessary actions should be

[205]
taken to prepare village specific as well as household specific packages of production and
marketing thereby assuring livelihood to the craft making households in the villages.
In the study area 46% households i.e. 43,101 households are connected with Sabai
based activities. Of these, 42.73% Sabai connected households i.e. 18,417 households are
rope makers. But 87.23% rope maker households i.e. 16,068 households are falling in BPL
category. Again in the study area 33% households i.e. 14,223 households fall under Sabai
cultivator cum rope maker group. About 55.76% of these cultivators cum rope maker i.e.
7,959 households fall under BPL category. Thus total BPL households involved with Sabai
based activities (i.e. rope maker and also cultivator cum rope maker) comes to 24,027
households which may be designated as target households for attaining sustainable
livelihood.
In-spite of all the loopholes and lacuna in the existing programs of development of
Sabai based activities in the Study Area as well as in the district, the people involved in
Sabai cultivation, rope making and crafts making still aspire for betterment of their
livelihood pattern which should be sustainable. They want to change their style, programme
and mechanism of working with Sabai which they believe that Government and Non-
Government Agencies will throw open to them in the form of Schemes with material inputs,
technology, financial assistance etc.. These poverty striken entrepreneurs are still looking
forward for brighter future in the form of increased output, higher value addition and finally
a sustainable livelihood. Given the will of the Government and Panchayat, determination of
the Sabai growers and processors, transfer of updated technology by technical institutions
and allocation of investment from public and private sources, the Sabai economy will
definitely prosper tomorrow with thousands of contented beneficiaries.

Annexure-1.I: Questionnaires
Household Survey Schedule for the Study on Production and Marketing of Sabai Grass and Grass Based Crafts
for Sustainable Livelihood in Paschim Medinipur District, West Bengal by
Kousik Paik Dept. Of Economics with Rural Development, Vidyasagar University
___________________________________________________________________________________
1. Identification of Sample village and household Household Id No.:
Name of the Village
Name of the Habitant area
Name of the Gram
Pancahyat
Caste of the Family Religion Household Size
Male(≥16 Yrs): Female(≥16 Yrs: Children(< 16 Yrs):
2. General Household Characteristics:
2.1 2.2 2.3 2.4 2.5 2.6 2.7 2.8 Name of the Household Members, Starting with
the Respondents first and Head of Household
Second
Gender Age Education Marital Status
Relation with Head
of Household
Main Occupation
Subsidiary Occupation
1. 2. 3. 4. 5. 6. 7. 8.
3. Occupation and Earnings from Various Economic Activity of the Household
3.1 3.2 3.3 3.4 3.5
Rank-wise important economic source of your family.
Full time/ Part-time No of
Days/ Year
Cash Earnings/ Yearly
Level of Economic Dependency on Different Livelihood Source
≥6 Months
≥3 but ≤5 Months <3 Months
Rank Name High Medium Low 1 2 3 4 5 6
[206]
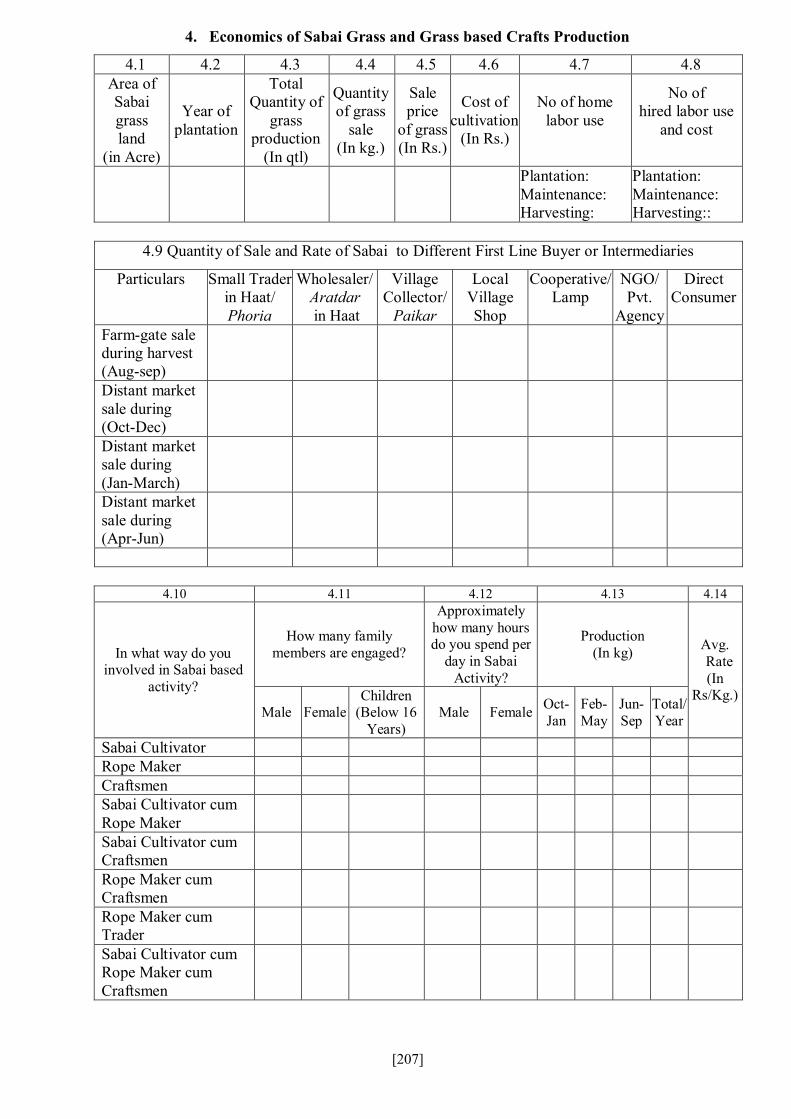
4. Economics of Sabai Grass and Grass based Crafts Production
4.1 4.2 4.3 4.4 4.5 4.6 4.7 4.8 Area of Sabai grass land
(in Acre)
Year of plantation
Total Quantity of
grass production
(In qtl)
Quantity of grass
sale (In kg.)
Sale price
of grass (In Rs.)
Cost of cultivation
(In Rs.)
No of home labor use
No of hired labor use
and cost
Plantation: Maintenance: Harvesting:
Plantation: Maintenance: Harvesting::
4.9 Quantity of Sale and Rate of Sabai to Different First Line Buyer or Intermediaries
Particulars Small Trader in Haat/ Phoria
Wholesaler/ Aratdar in Haat
Village Collector/
Paikar
Local Village Shop
Cooperative/ Lamp
NGO/ Pvt.
Agency
Direct Consumer
Farm-gate sale during harvest (Aug-sep)
Distant market sale during (Oct-Dec)
Distant market sale during (Jan-March)
Distant market sale during (Apr-Jun)
4.10 4.11 4.12 4.13 4.14
In what way do you involved in Sabai based
activity?
How many family members are engaged?
Approximately how many hours do you spend per
day in Sabai Activity?
Production (In kg) Avg.
Rate (In
Rs/Kg.) Male Female
Children (Below 16
Years) Male Female Oct-
Jan Feb-May
Jun-Sep
Total/ Year
Sabai Cultivator Rope Maker Craftsmen Sabai Cultivator cum Rope Maker
Sabai Cultivator cum Craftsmen
Rope Maker cum Craftsmen
Rope Maker cum Trader
Sabai Cultivator cum Rope Maker cum Craftsmen
[207]

4.15 4.16 4.17 4.18 4.19 4.20 4.21
Type of Sabai Crafts
Quantity of raw-material required (Sabai) (In Kg.)
Rate of Sabai
Purchased from Mkt. (Kg/in Rs.)
Cost of Other
integrating material (In Rs.)
Marketing Cost no. of man hrs. involved
Total Value of
Sale (In Rs.) Quantity x Price)
Own Source
Purchase from Mkt.
Transport Cost
Market Fees Others
4.22 4.23 4.24 4.25 Rank three different rope
buyers/traders/intermediaries in order to your preference:
The price offered by the middleman/
trader is
Do you want to Continue with the
Sabai based activity?
If the answer of sl no 3.24 is
Definitely not, then why?
Types of Intermediary Rank Definitely will
Undecided
Definitely not
1 Outstanding
Better than expected Meets expectations Unremarkable Poor
2
3
4.26 4.27 4.28 4.29 4.30
Where do you sale rope? ( Name of the Haat/Market)
Distance of market
(In k.m.)
Mode of transport
Who (Intermediary) gave you maximum price
for Sabai rope?
Who fixes the price of rope and
grass?
4.31 4.32 4.33 4.34 4.35 In your opinion
what type of activity/ work can
improve the livelihood situation
of your family?
Level of sufferings from any occupational
health/ergonomic related diseases?
Type of occupational diseases and
tenure of suffering.
Have any of your family members taken any Sabai
related skill development
training?
If, yes, then who gave the training
and when the training was conducted?
Never Suffer Rarely Suffer
Sometimes but infrequently Suffer
Usually Suffer Always Suffer
Yes
No
[208]

5. Details of Agricultural Production
5.1 5.2 5.3 5.4 5.5 5.6 5.7 Type of Land ownership Area of
Cultivable Land
Area of Sabai Grass
Land
Types of Agri Crop Cultivation
Quantity of Production
Quantity of Sale In kg.
Rate/kg
i. Rayati ii. Bargadar iii. Pattaholder iv. Share Crop/Rent in v. Rent out vi. Govt. Vested Land vii. Encroached Forest Land vii Land Less
6. Details of Sal Leaf Plate & Other NTFP Collection (Including Kendu Leaf):
6.1 6.2 6.3 Collection and Production of Sal Leaf Plate NTFP Collection
Month Quantity of production/
Month
Rate/’000(In Rs.)
Total Amount
of Sale (In Rs.)
Quantity of Collection of Sal leaf per month
Name of other NTFP
collected
Month of collection Quantity Sale
Price
7. Details of Yearly Household expenditure & food sufficiency:
7.1 7.2 7.3 7.4 7.5
Type of Expenditure Expenditure
(In Rs.)
Total Household
Requirement (In kg.)
Cost of Food Grains How many days have you gone hungry because
there was no enough food in last one
year?
Quantity of rice received through PDS (in kg.): Quantity of own production (in Kg.):
Quantity of Purchased from open market and rate (in Rs/kg.)
Months No of Days
Food Grains June Grocery & Vegetables July Non veg., Fruits & other food items.
August
Health & Medicine: September Education October Cloths November Family Function December Asset Purchase Jan Beverages/Liquor Feb Entertainment/festival March Lifestyle April Others May Total
[209]

8. Details of Loan/Credit
8.1 8.2 8.3 8.4 8.5 8.6 Dou you take any
loan/ credit? Yes/No
If yes, How much amount have you
taken credit or loan?
If yes, who gave you loan or
credit?
Purpose of taking
loan/credit?
Terms & condition of loan/credit.
Duration of credit
9. Household Living condition:
9.1 9.2 9.3 9.4 9.5 9.6 9.7 9.8 9.9 9.10 9.11
Types of Dwelling
unit
Condition of
Dwelling Unit
Construction material
used in roof
Construction material used
in wall
Material used in floor
No of Living Rooms
Toilet & Bathroom Facility (Yes/No
Source of
Lighting
Fuel used for
cooking
Separate Kitchen facility Yes/No
Source of
drinking water
a)Katcha b)Pucca
c)Mixed
Good Moderate Dilapidate
d
a)Tali b) Iron sheets/Asbestos c.)Thatched by straw or grass d)Tarpaulin
a)Mud b)Mud with Bamboo c) Mud with Bricks d)Bricks (e) Others
10. What type of constrains do you faced in Production and Marketing of Sabai Grass and
Grass based Products?
Sl Constrains in Opinion
i. Constrains in Sabai grass cultivation
ii. Constrains in Sabai grass marketing
iii Constraints in rope production
iv. Constraints in rope marketing
v. Constrains in craft production
vi. Constrains in craft marketing
11. Please indicate your views/ suggestion for the improvement/ development of Sabai based Livelihood.
1.
2.
[210]

Annexure- 1.II Traders Schedule
for the Study on Production and Marketing of Sabai Grass and Grass Based Crafts for Sustainable Livelihood in Paschim Medinipur District. by
Kousik Paik Dept. Of Economics with Rural Development, Vidyasagar University
1. Personal Information:
a) Name of trader: b) Address c) Name of the Firm/Business: d) Educational qualification: e) Main Occupation: f) Subsidiary Occupation: g) Age: h) Sex: i) Caste: SC/ST/ General j) Do you have trade license? 0.No 1.Yes k) How many years do you involve in this business?
2. Details of Sabai Rope Turnover in Different Periodic markets (Haat)
Month/Year
Name of the Haat: Quantity of turnover & Purchase Price
Sale Price (in Rs. per kg.)
Purchase from Different Intermediaries
1st Grade VIP
2nd grade VIP
Medium Fine Medium 1st Grade VIP
2nd Grade VIP
Medium Fine
Medium Producer Phoria/ Agent
Village collector
Quantity in Qtl
Price/ kg in Rs.
Quantity in Qtl.
Price/kg in Rs.
Quantity In Qtl
Price/ kg in Rs.
Quantity
in Qtl
Price/ kg in Rs.
Price/kg In Rs.
Price/kg In Rs.
Price/kg In Rs.
Price/kg In Rs.
Price/kg In Rs.
Price/kg In Rs.
Price/kg In Rs.
Oct. Nov. Dec. Jan. Feb.
March April May June
July-Sept
[211]

3. Details of Sabai Grass Turnover in Different Periodic markets (Haat)
Month/Year
Name of the Haat: Quantity of turnover & Purchase Price
Name of the Haat: Quantity of turnover & Purchase Price
Sale Price (In Rs. per kg.)
Purchase Price of grass from Different Intermediaries
Super Medium Super Medium Super Medium Producer Phoria/ Agent
Village collector
Quantity in Qtl
Price/ kg in Rs.
Quantity in Qtl
Price/kg In Rs.
Quantity in Qtl
Price/kg in Rs.
Quantity in Qtl
Price/kg in Rs.
Price/kg in Rs.
Price/kg in Rs.
Price/kg in Rs.
Price/kg in Rs.
Price/kg in Rs.
Oct. Nov. Dec. Jan. Feb.
March April May June
July/Aug Sept
4. Details of Crafts Turnover
Month/Year
Purchase Price Sale Price (In Rs. per pc)
Name of Craft Name of Craft Name of Craft Name of Craft Quantity
in pcs Price/ Pc in Rs.
Quantity in pcs
Price/ Pc in Rs.
Quantity in pcs
Price/ Pc in Rs.
Quantity in pcs
Price/ Pc in Rs.
Price/ Pc in Rs
Price/ Pc in Rs
Price/ Pc in Rs
Price/ Pc in Rs
Price/ Pc in Rs
[212]

5. Whom do you sale the product and what is the quantity and price?
6. Marketing Cost 7. What are the criteria that you considered to determine the quality of the product?
8. What are the factors that determine price fixation of the
product at the different markets?
Months Type of buyer Quantity Price/Qtl Type of Cost Rate
Per Qtl. Criteria Rank For rope For grass
Oct-Nov Carrying Cost Thickness
Dec-Jan Shorting ,Grading & Cleaning and binding Charges Colour
Feb-Mar Rent for Godown Strength Apr-May Local Haat Fees/Admin Charge Other-I Jun-July Loading & Unloading Charges Other-II
Aug-Sep Transport Charges (Area-wise) Other-III
Oct-Nov Any other charges
9. 10. 11. 12. 13. According to you, do you think the quality of rope can be different from one are to another area (region)?
14. If yes where does the best quality come from?
Does the price vary from one seller to another
seller?
If yes then why? Does the price vary from one buyer to
another buyer?
If yes then why?
Yes………… No………….
Yes………… No………….
Yes …………….
No………………
15. Do you have
any preference on choosing of rope sellers?
16. If yes, from which seller do you like to
buy?
17. Give Reason for
your answer
18. Do you give loan to the
producers/sellers?
19. If yes, when do you give loans?
20. Do you ask any interest?
21. If yes, what is the
interest rate?
0. No I. Yes
I. Producer. II. Phoria III. Village collector
IV. Others (Pls. mention)
0. No I. Yes 0. No I. Yes 0. No I. Yes
[213]

22. Do you belong to any
federation/association of traders?
23. If yes for how long are
you a member?
24. Do these organizations play any role in your
trading activities?
25. What problems do you face in marketing of
products?
26. How do you sell the product?
(Locally)
27. Overall how satisfied are you with
rope trading?
28. From which
market do you get
maximum profit?
I) Yes 0) No A. Cash ( %) B. Credit ( %)
i. Very Satisfied ii. Satisfied
iii. Neither satisfied nor dissatisfied
iv. Dissatisfied v. Very dissatisfied
28. Assets Holding By the Traders 29. Access to credit 30. 31.
Name of the Assets Do you take any
Loan/Credit?
Yes………….
No…………
If yes, from where do you
take loan?
How much
loan do you
take?
Do you have cash
credit account?
What is the credit limit in the cash credit
account?
Business Transaction with your buyer? (National Level) Cash……. In %........... Credit……. In %...........
Any forfeited amount by the buyer.
Mobile/Landline Motorbike Motor van/Pickup van/Lorry Own Godown Rented Godown Office Space/Permanent shop Electronic weighing scale Manual Dari-Palla Cycle Radio TV Private Car AC Fridge Electricity Trolley Van/Cycle van 32. What are the constraints do you faced in marketing of products?
………………………………………………………………………………………………………………………………………………………………. [214]

Annexure-1.III: Blockwise List of Study Villages
Sl no.
Name of the Study Blocks
Name of the Study Villages No of Sampled Households
1. Nayagram
i) Satpatiya 13 ii) Kesharrekha 16
iii) Biswanathpur 12 iv) Norri 12 v) Mohanpur 12
vi) Bhalukchuha 12 vii) Baramara 13
viii) Jambani 10 ix) Nagripada 14 x) Marapada 10
xi) Amjam 10 xii) Baradhansola 10
xiii) Kurmipathra 14 xiv) Birkada 12 xv) Sialia 10
xvi) Jugisol 11
2. Gopiballavpur-I
xvii) Bara Jhauri 14 xviii) Choto Jhauri 13
xix) Khadinasol 12 xx) Putulia 16
xxi) Kandnasol 16 xxii) Pandisol 11
3. Binpur-II
xxiii) Kakrajhore 10 xxiv) Amlasole 10 xxv) Banshpahari 18
xxvi) Deshmul 19 Total 330
[215]

Annexure-3.I:
Harvesting Cost through Labour Exchange/ha.
Crop Year
Avg. Yield (in Qtl)
25% of Yield (in Qtl)
Avg. Rate of Crop/Qtl
(in Rs.)
Harvesting Cost
(in Rs.)
Avg. Labour Rate/Day (in Rs.)
No of Exchanged Labour
2004 0.00 0.00 - - - - 2005 5.46 1.37 150.00 204.75 46.67 4.39 2006 8.45 2.11 200.00 422.50 51.67 8.18 2007 14.85 3.71 250.00 928.125 52.67 17.62 2008 20.83 5.21 300.00 1562.25 61.67 25.33 2009 31.06 7.77 400.00 3106.00 81.67 38.03 2010 29.77 7.44 450.00 3349.125 106.67 31.40 2011 28.67 7.17 500.00 3583.75 113.33 31.62 2012 21.96 5.49 550.00 3019.5. 113.33 26.64 2013 17.13 4.28 600.00 2569.50 133.33 19.27 2014 14.43 3.61 700.00 2525.25 148.33 17.02 2015 12.53 3.13 900.00 2819.25 158.33 17.81 Total 205.14 51.29 24,090 237.31
Annexure-3.II.a:
Harvesting Cost by Use of Home Labour in Nayagram Block
Crop Year
Yield (in Qtl)
No of labour days engaged
Labour charge/Day (in Rs.)
Cost of labour (in Rs.)
2004 0.00 0 40.00 0.00 2005 5.00 8 50.00 416.67 2006 7.90 13 55.00 724.17 2007 14.20 24 55.00 1301.67 2008 18.00 30 65.00 1950.00 2009 30.22 50 85.00 4281.17 2010 29.00 48 110.00 5316.67 2011 28.4.00 47 115.00 5443.33 2012 21.10 35 115.00 4044.17 2013 16.25 27 135.00 3656.25 2014 14.38 24 150.00 3595.00 2015 11.00 18 160.00 2933.33
Total 195.45 326 33,662.42
[216]
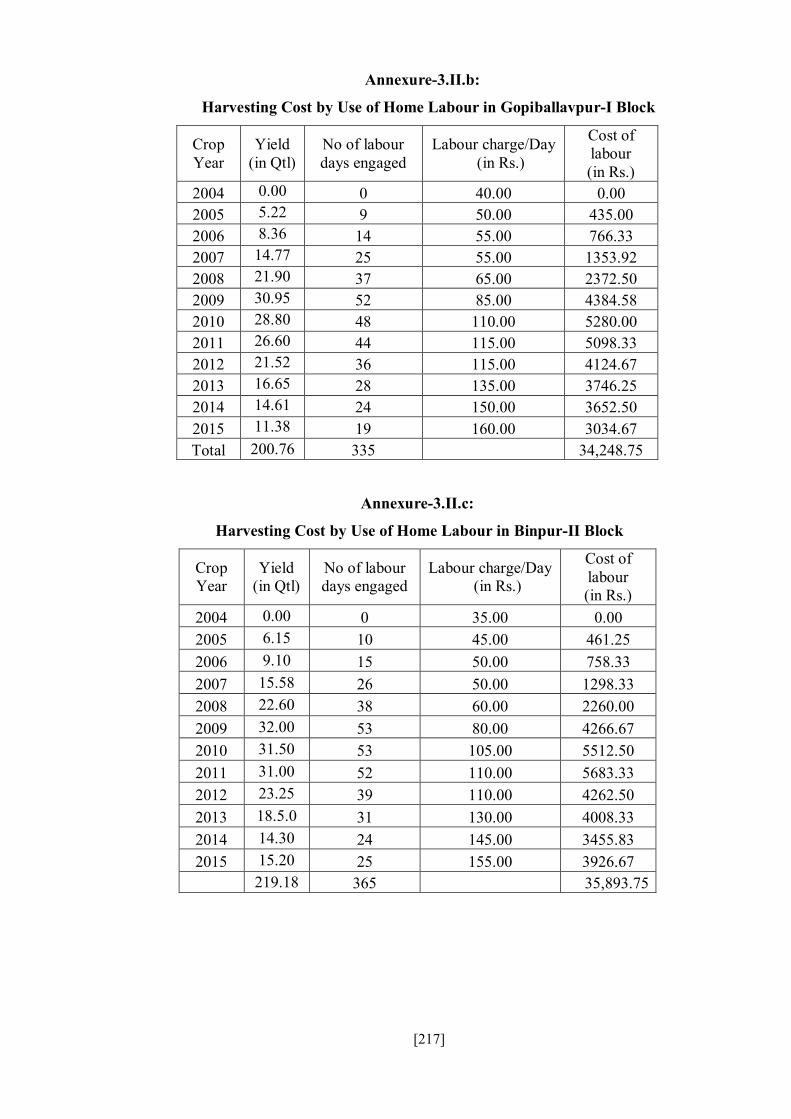
Annexure-3.II.b:
Harvesting Cost by Use of Home Labour in Gopiballavpur-I Block
Crop Year
Yield (in Qtl)
No of labour days engaged
Labour charge/Day (in Rs.)
Cost of labour (in Rs.)
2004 0.00 0 40.00 0.00 2005 5.22 9 50.00 435.00 2006 8.36 14 55.00 766.33 2007 14.77 25 55.00 1353.92 2008 21.90 37 65.00 2372.50 2009 30.95 52 85.00 4384.58 2010 28.80 48 110.00 5280.00 2011 26.60 44 115.00 5098.33 2012 21.52 36 115.00 4124.67 2013 16.65 28 135.00 3746.25 2014 14.61 24 150.00 3652.50 2015 11.38 19 160.00 3034.67 Total 200.76 335 34,248.75
Annexure-3.II.c:
Harvesting Cost by Use of Home Labour in Binpur-II Block
Crop Year
Yield (in Qtl)
No of labour days engaged
Labour charge/Day (in Rs.)
Cost of labour (in Rs.)
2004 0.00 0 35.00 0.00 2005 6.15 10 45.00 461.25 2006 9.10 15 50.00 758.33 2007 15.58 26 50.00 1298.33 2008 22.60 38 60.00 2260.00 2009 32.00 53 80.00 4266.67 2010 31.50 53 105.00 5512.50 2011 31.00 52 110.00 5683.33 2012 23.25 39 110.00 4262.50 2013 18.5.0 31 130.00 4008.33 2014 14.30 24 145.00 3455.83 2015 15.20 25 155.00 3926.67
219.18 365 35,893.75
[217]
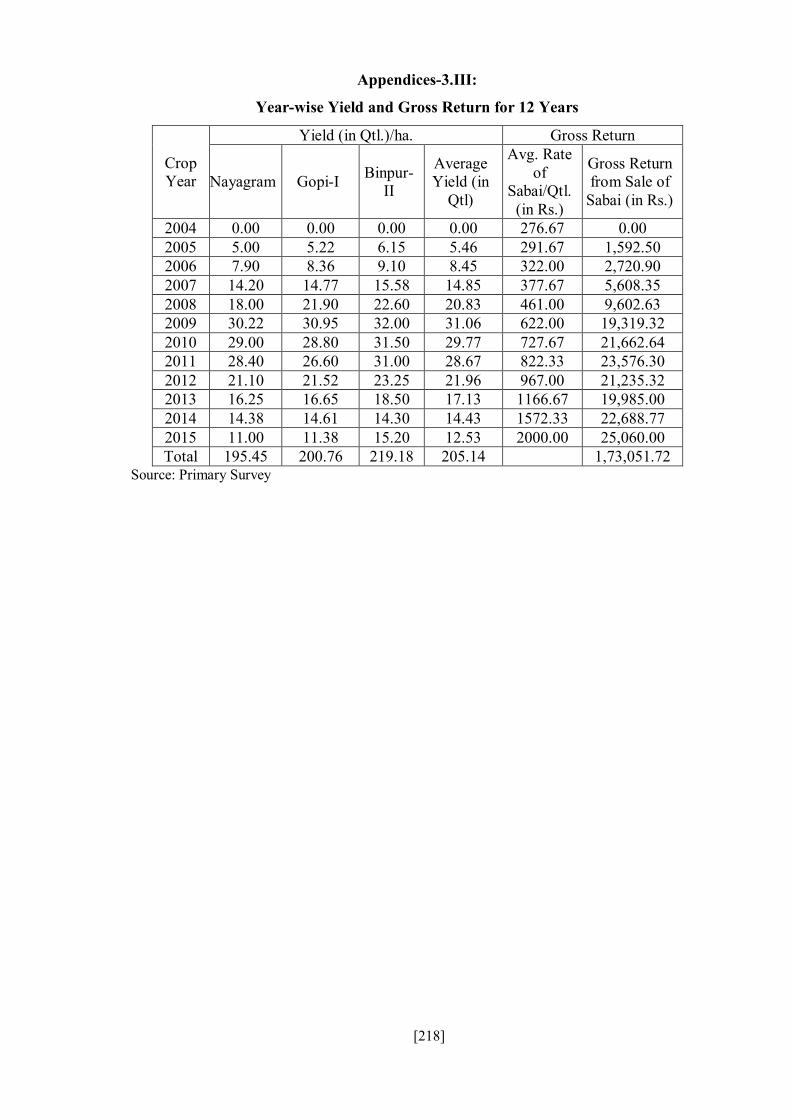
Appendices-3.III:
Year-wise Yield and Gross Return for 12 Years
Crop Year
Yield (in Qtl.)/ha. Gross Return
Nayagram Gopi-I Binpur-II
Average Yield (in
Qtl)
Avg. Rate of
Sabai/Qtl. (in Rs.)
Gross Return from Sale of
Sabai (in Rs.)
2004 0.00 0.00 0.00 0.00 276.67 0.00 2005 5.00 5.22 6.15 5.46 291.67 1,592.50 2006 7.90 8.36 9.10 8.45 322.00 2,720.90 2007 14.20 14.77 15.58 14.85 377.67 5,608.35 2008 18.00 21.90 22.60 20.83 461.00 9,602.63 2009 30.22 30.95 32.00 31.06 622.00 19,319.32 2010 29.00 28.80 31.50 29.77 727.67 21,662.64 2011 28.40 26.60 31.00 28.67 822.33 23,576.30 2012 21.10 21.52 23.25 21.96 967.00 21,235.32 2013 16.25 16.65 18.50 17.13 1166.67 19,985.00 2014 14.38 14.61 14.30 14.43 1572.33 22,688.77 2015 11.00 11.38 15.20 12.53 2000.00 25,060.00 Total 195.45 200.76 219.18 205.14 1,73,051.72
Source: Primary Survey
[218]

Appendices- 3.IV.a: Undiscounted Cost & Return of Sabai Cultivation in Nayagram Block
Crop Year
Cost of Plantation in 1st Year (In
Rs.)
Cost of Maintenance
(In Rs.)
Cost of Harvesting, Drying & Cleaning (In Rs.)
Average Transport
Cost (in Rs.)
Total Cost (in Rs.)
Avg. Yield
(in qtl.)
Avg. Rate of Sabai
(In Rs/Qtl)
Gross Return (in Rs.)
Net Return (in Rs.)
2004 9,650.00 0.00 0.00 0.00 9,650.00 0.00 0.00 0.00 -9,650.00 2005 0.00 300.00 417.00 31.32 748.32 5.00 350.00 1,750.00 1,001.68 2006 0.00 275.00 724.00 56.43 1,055.43 7.90 383.00 3,025.70 1,970.27 2007 0.00 220.00 1,302.00 147.70 1,669.70 14.20 450.00 6,390.00 4,720.30 2008 0.00 130.00 1,950.00 180.68 2,260.68 18.00 533.00 9,594.00 7,333.32 2009 0.00 170.00 4,281.00 278.55 4,729.55 30.22 700.00 21,154.00 16,424.45 2010 0.00 220.00 5,317.00 280.80 5,817.80 29.00 800.00 23,200.00 17,382.20 2011 0.00 230.00 5,443.00 279.30 5,952.30 28.40 933.00 26,497.20 20,544.90 2012 0.00 230.00 4,044.00 242.10 4,516.10 21.10 1,167.00 24,623.70 20,107.60 2013 0.00 270.00 3,656.00 199.80 4,125.80 16.25 1,367.00 22,213.75 18,087.95 2014 0.00 150.00 3,595.00 186.28 3,931.28 14.38 1,817.00 26,128.46 22,197.18 2015 0.00 0.00 2,933.00 153.63 3,086.63 11.00 2,233.00 24,563.00 21,476.37 Total 9,650.00 2,195.00 33,662.00 2,036.59 47,543.59 195.45 1,89,139.81 1,41,596.22
[219]

Annexure-3.IV.b:
Discounted Cost & Return of Sabai Cultivation in Nayagram Block
Year
Cost of Plantation 1st Year (In Rs.)
PV of Maintenance
Cost (in Rs.)
PV of Harvesting, Drying & Cleaning
Cost (in Rs.)
PV of Transport
Cost (in Rs.)
PV of Total Cost
(in Rs.)
Avg. Yield of
Sabai/Year
Avg. Price (In
Rs/Qtl)
Gross Return (in Rs.)
PV of Gross Return (in Rs.)
Net Return (in Rs.)
PV of Net Return (in Rs.)
2004 9,650.00 0.00 0.00 0.00 9,650.00 0.00 0.00 0.00 0.00 -9,650.00 -9,650.00 2005 0.00 272.73 379.09 28.47 680.29 5.00 350.00 1,750.00 1,590.91 1,001.68 910.62 2006 0.00 227.27 598.35 46.64 872.26 7.90 383.00 3,025.70 2,500.58 1,970.27 1,628.32 2007 0.00 165.29 978.21 110.97 1,254.47 14.20 450.00 6,390.00 4,800.90 4,720.30 3,546.43 2008 0.00 88.79 1,331.88 123.41 1,544.08 18.00 533.00 9,594.00 6,552.83 7,333.32 5,008.76 2009 0.00 105.56 2,658.16 172.96 2,936.68 30.22 700.00 21,154.00 13,134.97 16,424.45 10,198.29 2010 0.00 124.18 3,001.31 158.50 3,284.00 29.00 800.00 23,200.00 13,095.80 17,382.20 9,811.80 2011 0.00 118.03 2,793.12 143.33 3,054.47 28.40 933.00 26,497.20 13,597.25 20,544.90 10,542.78 2012 0.00 107.30 1,886.56 112.94 2,106.79 21.10 1,167.00 24,623.70 11,487.14 20,107.60 9,380.34 2013 0.00 114.51 1,550.50 84.73 1,749.74 16.25 1,367.00 22,213.75 9,420.80 18,087.95 7,671.06 2014 0.00 57.83 1,386.03 71.82 1,515.68 14.38 1,817.00 26,128.46 10,073.65 22,197.18 8,557.97 2015 0.00 0.00 1,028.00 53.85 1,081.85 11.00 2,233.00 24,563.00 8,609.18 21,476.37 7,527.34 Total 9,650.00 1,381.48 17,591.20 1,107.61 29,730.30 195.45 1,89,139.81 94,864.01 1,41,596.22 65,133.71
(Discount Factor at 10%)
[220]

Annexure-3.IV.c
Undiscounted Cost & Return of Sabai Cultivation in Gopiballavpur-I Block
Crop Year
Cost of Plantation
in 1st Year (In Rs.)
Cost of Maintenance
(In Rs.)
Cost of Harvesting, Drying & Cleaning (In Rs.)
Average Transport
Cost (in Rs.)
Total Cost (in Rs.)
Avg. Yield of Sabai/ Year
(in qtl.)
Avg. Price of Sabai
(In Rs./qtl.)
Gross Return (in Rs.)
Net Return (in Rs.)
2004 9,650.00 0.00 0.00 0.00 9,650.00 0.00 0.00 0.00 -9,650.00 2005 0.00 300.00 435.00 31.32 766.32 5.22 283.00 1,477.26 710.94 2006 0.00 275.00 766.00 56.43 1,097.43 8.36 333.00 2,783.88 1,686.45 2007 0.00 220.00 1,354.00 147.70 1,721.70 14.77 383.00 5,656.91 3,935.21 2008 0.00 130.00 2,373.00 180.68 2,683.68 21.90 500.00 10,950.00 8,266.32 2009 0.00 170.00 4,385.00 278.55 4,833.55 30.95 666.00 20,612.70 15,779.15 2010 0.00 220.00 5,280.00 280.80 5,780.80 28.80 783.00 22,550.40 16,769.60 2011 0.00 230.00 5,098.00 279.30 5,607.30 26.60 867.00 23,062.20 17,454.90 2012 0.00 230.00 4,125.00 242.10 4,597.10 21.52 1,017.00 21,885.84 17,288.74 2013 0.00 270.00 3,746.00 199.80 4,215.80 16.65 1,167.00 19,430.55 15,214.75 2014 0.00 150.00 3,653.00 186.28 3,989.28 14.61 1,500.00 21,915.00 17,925.72 2015 0.00 0.00 3,035.00 153.63 3,188.63 11.38 1,967.00 22,384.46 19,195.83 Total 9,650.00 2,195.00 34,250.00 2,036.59 48,131.59 200.76 1,72,709.20 1,24,577.61
[221]

Annexure-3.IV.d:
Discounted Cost & Return of Sabai Cultivation in Gopiballavpur-I Block
Year
Cost of Plantation 1st Year (In Rs.)
PV of Maintenance
Cost (in Rs.)
PV of Harvesting, Drying & Cleaning
Cost (in Rs.)
PV of Transport
Cost (in Rs.)
PV of Total Cost
(in Rs.)
Avg. Yield
of Sabai
(in qtl.)
Avg. Price of Sabai
(In Rs/qtl.)
Gross Return (in Rs.)
PV of Gross Return (in Rs.)
Net Return (in Rs.)
PV of Net Return (in Rs.)
2004 9,650.00 0.00 0.00 0.00 9,650.00 0.00 0.00 0.00 0.00 -9,650.00 -9,650.00 2005 0.00 272.73 395.45 28.47 696.65 5.22 283.00 1,477.26 1,342.96 710.94 646.31 2006 0.00 227.27 633.06 46.64 906.97 8.36 333.00 2,783.88 2,300.73 1,686.45 1,393.76 2007 0.00 165.29 1,017.28 110.97 1,293.54 14.77 383.00 5,656.91 4,250.12 3,935.21 2,956.58 2008 0.00 88.79 1,620.79 123.41 1,832.99 21.90 500.00 10,950.00 7,479.00 8,266.32 5,646.01 2009 0.00 105.56 2,722.74 172.96 3,001.25 30.95 666.00 20,612.70 12,798.87 15,779.15 9,797.61 2010 0.00 124.18 2,980.42 158.50 3,263.11 28.80 783.00 22,550.40 12,729.11 16,769.60 9,466.00 2011 0.00 118.03 2,616.08 143.33 2,877.43 26.60 867.00 23,062.20 11,834.56 17,454.90 8,957.12 2012 0.00 107.30 1,924.34 112.94 2,144.58 21.52 1,017.00 21,885.84 10,209.91 17,288.74 8,065.32 2013 0.00 114.51 1,588.67 84.73 1,787.91 16.65 1,167.00 19,430.55 8,240.45 15,214.75 6,452.54 2014 0.00 57.83 1,408.39 71.82 1,538.04 14.61 1,500.00 21,915.00 8,449.18 17,925.72 6,911.14 2015 0.00 0.00 1,063.75 53.85 1,117.60 11.38 1,967.00 22,384.46 7,845.62 19,195.83 6,728.02
Total 9,650.00 1,381.48 17,970.98 1,107.61 30,110.07 200.76 1,72,709.20 87,480.50 1,24,577.61 57,370.42 (Discount factor-10%)
[222]

Annexure-3. IV.e :
Undiscounted Cost & Return of Sabai Cultivation in Binpur-II Block
Crop Year
Cost of Plantation and Package of
practice in 1st Year (In Rs.)
Cost of Maintenance
(In Rs.)
Cost of Harvesting, Drying & Cleaning (In Rs.)
Average Transport
Cost (in Rs.)
Total Cost
(in Rs.)
Yield (in qtl.)
Avg. Rate of Sabai
(In Rs/qtl.)
Gross Return (in Rs.)
Net Return (in Rs.)
2004 8,115.00 0.00 0.00 0.00 8,115.00 0.00 0.00 0.00 -8,115.00 2005 0.00 270.00 461.00 31.32 762.32 6.15 242.00 1,488.30 725.98 2006 0.00 250.00 758.00 56.43 1,064.43 9.10 250.00 2,275.00 1,210.57 2007 0.00 200.00 1,298.00 147.70 1,645.70 15.58 300.00 4,674.00 3,028.30 2008 0.00 120.00 2,260.00 180.68 2,560.68 22.60 350.00 7,910.00 5,349.32 2009 0.00 160.00 4,267.00 278.55 4,705.55 32.00 500.00 16,000.00 11,294.45 2010 0.00 210.00 5,513.00 280.80 6,003.80 31.50 600.00 18,900.00 12,896.20 2011 0.00 220.00 5,683.00 279.30 6,182.30 31.00 667.00 20,677.00 14,494.70 2012 0.00 220.00 4,263.00 242.10 4,725.10 23.25 717.00 16,670.25 11,945.15 2013 0.00 260.00 4,008.00 199.80 4,467.80 18.50 966.00 17,871.00 13,403.20 2014 0.00 145.00 3,456.00 186.28 3,787.28 14.30 1,400.00 20,020.00 16,232.72 2015 0.00 0.00 3,927.00 153.63 4,080.63 15.20 1,800.00 27,360.00 23,279.37 Total 8,115.00 2,055.00 35,894.00 2,036.59 48,100.59 219.18 1,53,845.55 1,05,744.96
[223]

Annexure-3.IV.f:
Discounted Cost & Return of Sabai Cultivation in Binpur-II Block
Crop Year
Cost of Plantation
and Package of practice in
1st Year (In Rs.)
PV of Maintenance
Cost (in Rs.)
PV of Harvesting, Drying & Cleaning
Cost (in Rs.)
PV of Transport
Cost (in Rs.)
PV of Total Cost
(in Rs.)
Yield (in qtl.)
Avg. Price (In Rs/Qtl)
Gross Return (in Rs.)
PV of Gross Return (in Rs.)
Net Return (in Rs.)
PV of Net Return (in Rs.)
2004 8,115.00 0.00 0.00 0.00 8,115.00 0.00 0.00 0.00 0.00 -8,115.00 -8,115.00 2005 0.00 245.45 419.09 28.47 693.02 6.15 242.00 1,488.30 1,353.00 725.98 659.98 2006 0.00 206.61 626.45 46.64 879.69 9.10 250.00 2,275.00 1,880.17 1,210.57 1,000.47 2007 0.00 150.26 975.21 110.97 1,236.44 15.58 300.00 4,674.00 3,511.65 3,028.30 2,275.21 2008 0.00 81.96 1,543.61 123.41 1,748.98 22.60 350.00 7,910.00 5,402.64 5,349.32 3,653.66 2009 0.00 99.35 2,649.47 172.96 2,921.78 32.00 500.00 16,000.00 9,934.74 11,294.45 7,012.97 2010 0.00 118.54 3,111.94 158.50 3,388.99 31.50 600.00 18,900.00 10,668.56 12,896.20 7,279.57 2011 0.00 112.89 2,916.28 143.33 3,172.50 31.00 667.00 20,677.00 10,610.57 14,494.70 7,438.07 2012 0.00 102.63 1,988.72 112.94 2,204.29 23.25 717.00 16,670.25 7,776.80 11,945.15 5,572.50 2013 0.00 110.27 1,699.78 84.73 1,894.78 18.50 966.00 17,871.00 7,579.05 13,403.20 5,684.27 2014 0.00 55.90 1,332.44 71.82 1,460.16 14.30 1,400.00 20,020.00 7,718.58 16,232.72 6,258.42 2015 0.00 0.00 1,376.39 53.85 1,430.24 15.20 1,800.00 27,360.00 9,589.51 23,279.37 8,159.28 Total 8,115.00 1,283.87 18,639.38 1,107.61 29,145.87 219.18 1,53,846.00 76,025.25 1,05,744.96 46,879.38
(Discount factor-10%)
[224]

Annexure-3.V.a:
Cash Flow Analysis of Sabai Cultivation/ha. in Nayagram Block
Crop Year
Cash Outflow (Cost)
(in Rs.)
Cash Inflow (Gross Return) (in Rs.)
Net Cash flow
(Net Return) (in Rs.)
Discounted Net Cash
Flow (in Rs.)
2004 9,650.00 0.00 -9,650.00 -9,650.00 2005 748.32 1,750.00 1,001.68 910.62 2006 1,055.43 3,025.70 1,970.27 1,628.32 2007 1,669.70 6,390.00 4,720.30 3,546.43 2008 2,260.68 9,594.00 7,333.32 5,008.76 2009 4,729.55 21,154.00 16,424.45 10,198.29 2010 5,817.80 23,200.00 17,382.20 9,811.80 2011 5,952.30 26,497.20 20,544.90 10,542.78 2012 4,516.10 24,623.70 20,107.60 9,380.34 2013 4,125.80 22,213.75 18,087.95 7,671.06 2014 3,931.28 26,128.46 22,197.18 8,557.97 2015 3,086.63 24,563.00 21,476.37 7,527.34 Total 47,543.59 1,89,139.81 1,41,596.22 65,133.71
(Discount factor-10%)
Annexure-3.V.b:
Cash Flow Analysis of Sabai Cultivation/ha. in Gopi-I Block
Crop Year
Cash Outflow (Cost)
(in Rs.)
Cash Inflow (Gross Return) (in Rs.)
Net Cash flow
(Net Return) (in Rs.)
Discounted Net Cash
Flow (in Rs.)
2004 9,650.00 0.00 -9,650.00 -9,650.00 2005 766.32 1,477.26 710.94 646.31 2006 1,097.43 2,783.88 1,686.45 1,393.76 2007 1,721.70 5,656.91 3,935.21 2,956.58 2008 2,683.68 10,950.00 8,266.32 5,646.01 2009 4,833.55 20,612.70 15,779.15 9,797.61 2010 5,780.80 22,550.40 16,769.60 9,466.00 2011 5,607.30 23,062.20 17,454.90 8,957.12 2012 4,597.10 21,885.84 17,288.74 8,065.32 2013 4,215.80 19,430.55 15,214.75 6,452.54 2014 3,989.28 21,915.00 17,925.72 6,911.14 2015 3,188.63 22,384.46 19,195.83 6,728.02 Total 48,131.59 1,72,709.20 1,24,577.61 57,370.42
(Discount factor-10%)
[225]
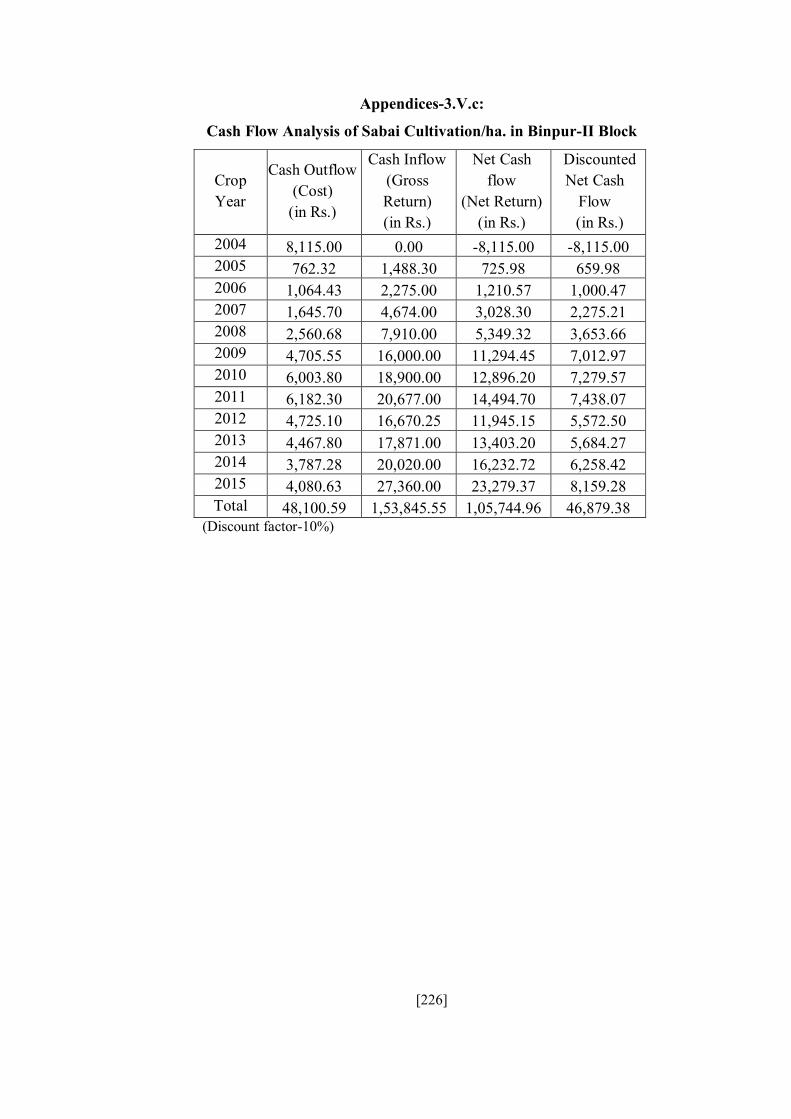
Appendices-3.V.c:
Cash Flow Analysis of Sabai Cultivation/ha. in Binpur-II Block
Crop Year
Cash Outflow (Cost)
(in Rs.)
Cash Inflow (Gross Return) (in Rs.)
Net Cash flow
(Net Return) (in Rs.)
Discounted Net Cash
Flow (in Rs.)
2004 8,115.00 0.00 -8,115.00 -8,115.00 2005 762.32 1,488.30 725.98 659.98 2006 1,064.43 2,275.00 1,210.57 1,000.47 2007 1,645.70 4,674.00 3,028.30 2,275.21 2008 2,560.68 7,910.00 5,349.32 3,653.66 2009 4,705.55 16,000.00 11,294.45 7,012.97 2010 6,003.80 18,900.00 12,896.20 7,279.57 2011 6,182.30 20,677.00 14,494.70 7,438.07 2012 4,725.10 16,670.25 11,945.15 5,572.50 2013 4,467.80 17,871.00 13,403.20 5,684.27 2014 3,787.28 20,020.00 16,232.72 6,258.42 2015 4,080.63 27,360.00 23,279.37 8,159.28 Total 48,100.59 1,53,845.55 1,05,744.96 46,879.38
(Discount factor-10%)
[226]
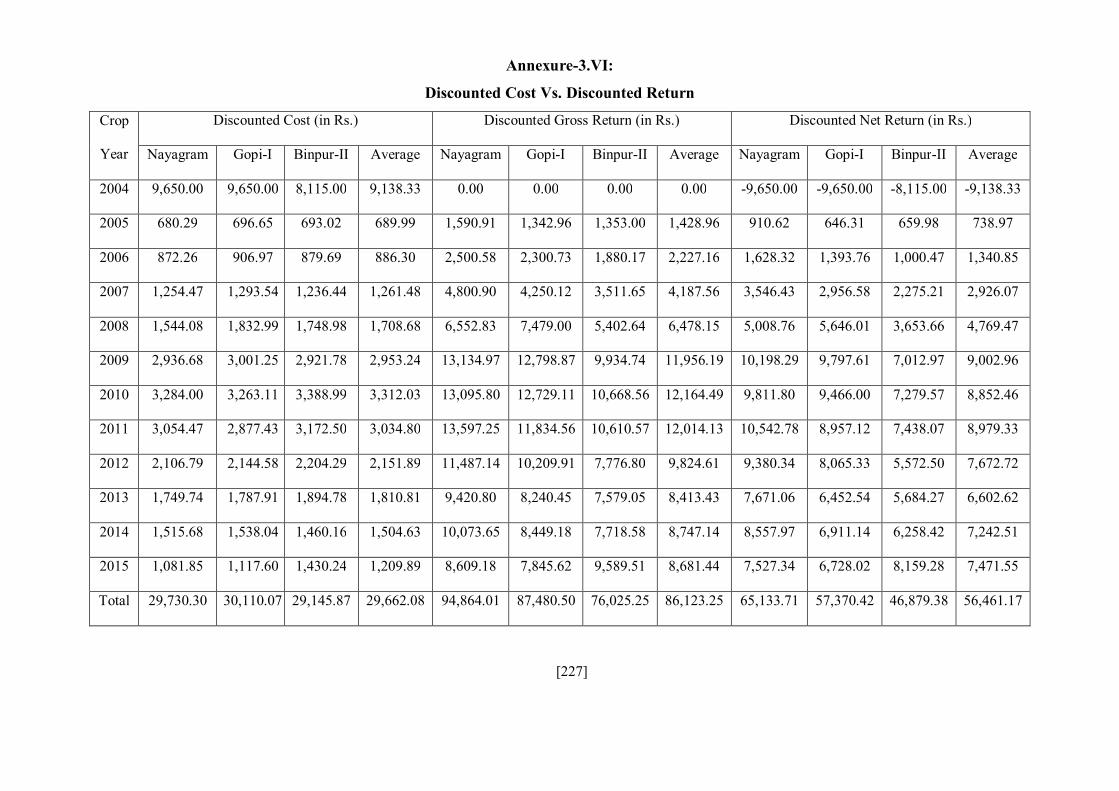
Annexure-3.VI:
Discounted Cost Vs. Discounted Return
Crop
Year
Discounted Cost (in Rs.) Discounted Gross Return (in Rs.) Discounted Net Return (in Rs.)
Nayagram Gopi-I Binpur-II Average Nayagram Gopi-I Binpur-II Average Nayagram Gopi-I Binpur-II Average
2004 9,650.00 9,650.00 8,115.00 9,138.33 0.00 0.00 0.00 0.00 -9,650.00 -9,650.00 -8,115.00 -9,138.33
2005 680.29 696.65 693.02 689.99 1,590.91 1,342.96 1,353.00 1,428.96 910.62 646.31 659.98 738.97
2006 872.26 906.97 879.69 886.30 2,500.58 2,300.73 1,880.17 2,227.16 1,628.32 1,393.76 1,000.47 1,340.85
2007 1,254.47 1,293.54 1,236.44 1,261.48 4,800.90 4,250.12 3,511.65 4,187.56 3,546.43 2,956.58 2,275.21 2,926.07
2008 1,544.08 1,832.99 1,748.98 1,708.68 6,552.83 7,479.00 5,402.64 6,478.15 5,008.76 5,646.01 3,653.66 4,769.47
2009 2,936.68 3,001.25 2,921.78 2,953.24 13,134.97 12,798.87 9,934.74 11,956.19 10,198.29 9,797.61 7,012.97 9,002.96
2010 3,284.00 3,263.11 3,388.99 3,312.03 13,095.80 12,729.11 10,668.56 12,164.49 9,811.80 9,466.00 7,279.57 8,852.46
2011 3,054.47 2,877.43 3,172.50 3,034.80 13,597.25 11,834.56 10,610.57 12,014.13 10,542.78 8,957.12 7,438.07 8,979.33
2012 2,106.79 2,144.58 2,204.29 2,151.89 11,487.14 10,209.91 7,776.80 9,824.61 9,380.34 8,065.33 5,572.50 7,672.72
2013 1,749.74 1,787.91 1,894.78 1,810.81 9,420.80 8,240.45 7,579.05 8,413.43 7,671.06 6,452.54 5,684.27 6,602.62
2014 1,515.68 1,538.04 1,460.16 1,504.63 10,073.65 8,449.18 7,718.58 8,747.14 8,557.97 6,911.14 6,258.42 7,242.51
2015 1,081.85 1,117.60 1,430.24 1,209.89 8,609.18 7,845.62 9,589.51 8,681.44 7,527.34 6,728.02 8,159.28 7,471.55
Total 29,730.30 30,110.07 29,145.87 29,662.08 94,864.01 87,480.50 76,025.25 86,123.25 65,133.71 57,370.42 46,879.38 56,461.17
[227]
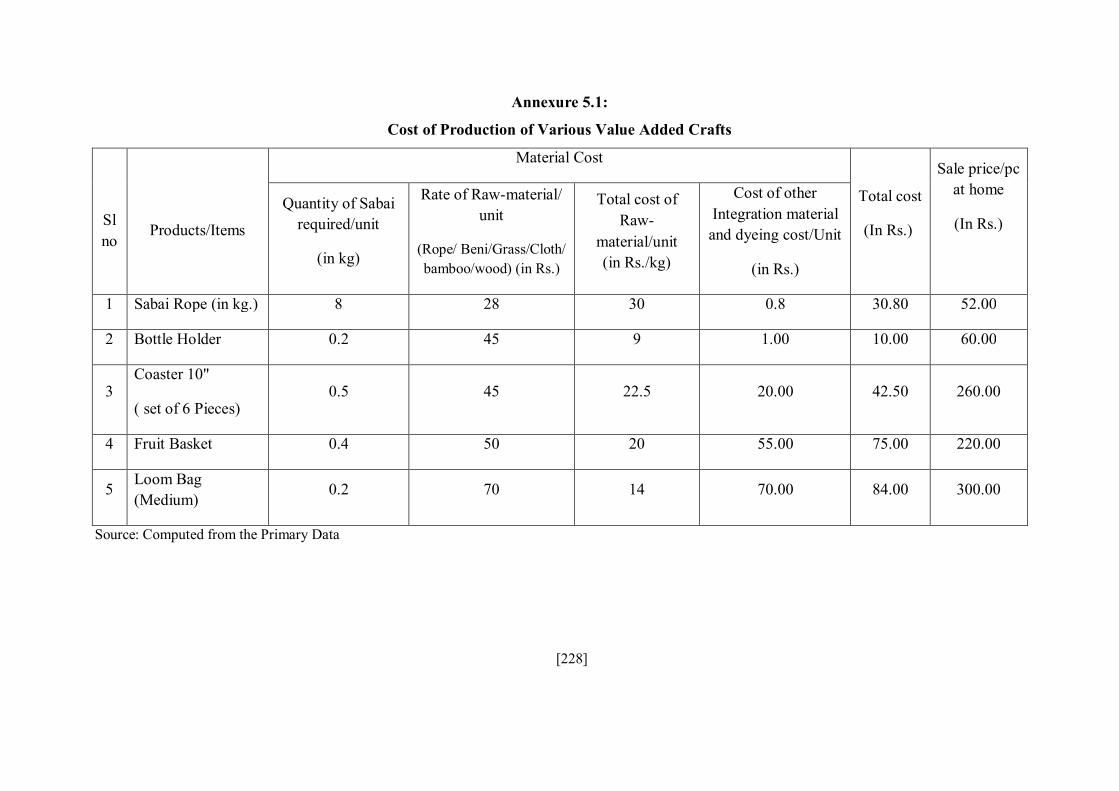
Annexure 5.1:
Cost of Production of Various Value Added Crafts
Sl no
Products/Items
Material Cost
Total cost
(In Rs.)
Sale price/pc at home
(In Rs.)
Quantity of Sabai required/unit
(in kg)
Rate of Raw-material/ unit
(Rope/ Beni/Grass/Cloth/ bamboo/wood) (in Rs.)
Total cost of Raw-
material/unit (in Rs./kg)
Cost of other Integration material and dyeing cost/Unit
(in Rs.)
1 Sabai Rope (in kg.) 8 28 30 0.8 30.80 52.00
2 Bottle Holder 0.2 45 9 1.00 10.00 60.00
3 Coaster 10"
( set of 6 Pieces) 0.5 45 22.5 20.00 42.50 260.00
4 Fruit Basket 0.4 50 20 55.00 75.00 220.00
5 Loom Bag (Medium)
0.2 70 14 70.00 84.00 300.00
Source: Computed from the Primary Data
[228]

Annexure: 6.1
Marketing Expenses Incurred by Different Supply Chain Functionaries in Sabai Grass Marketing Channel (Cost in Rs./qtl)
Sl no Particulars Ch-I Ch-II Ch-III Ch-IV Ch-V Ch-VI Ch-VII
1 Farmers / Collectors Amount (in Rs./Qtl) i Hat Fees/Market Fees 10.00 10.00 10.00 ii Repair & maintenance 5.00 5.00 5.00
Sub Total 15.00 15.00 - - 15.00 - -
2 Village Assemblers/ Fellow farmers cum traders
i.
Labour charges for assembling, loading & unloading(from field to godown)
37.50 10.00 37.50
ii. Cost of transport(Hired vehicle)
158.33 -
iii. Godown Rent 20.00 10.00
iv.
Cost of transport (use own vehicle)Depreciation charges
6.00
Repair & maintenance 10.00 v. Hat Fee/Market Fee 10.00
vi. Other charges (Charity/Subscription/personal expenses)
10.00
15.00
Interest on loan - -
Sub Total 231.13 36.00 62.50
3 Crop lessee / Pre harvest contractors
i
Labour charges for harvesting, drying, bundling, assembling, loading & unloading
170
ii Cost of transport (Hired vehicle)
158.33
iii Godown Rent 15
iv Other charges (Charity/Subscription/)
40
v Interest on loan 5
Sub Total 388.33 Contd.
[229]

Contd.. 4 Commission Agents
(Phoria)
i. Commission charge Sub Total 5 Wholesalers/Aratdar
in Primary Market
i. Cost of transport(Hired vehicle)
165.00
ii.
Cost of assembling, carrying loading & unloading.(from Hat to Godown)
8.00 8.00 8 8.00 8.00
iii. Cost of cleaning, sorting, grading & inventory handling loss
5.00 5.00 10 5.00 0.00
iv. Godown Rent 5.00 5.00 15 5.00 5.00 v. Commission charges 183.00 vi. Hat Fees/Market Fee 10.00 10.00 10 10.00 10.00 vii Wages/Salary to staff 10.00 10.00 10 0.00 10.00 ix. Interest on loan 5.00 5.00 - - 5.00 x. Other charges
(Charity/Subscription/) 2.50 2.50 2.5 3.00
Sub Total 45.50 45.50 55.5 214.00 203.00 5 Industrial Suppliers/
Commission Agents
i. Cost of transport (Hired vehicle)
250.00
Sub Total 250.00 Total Marketing Cost 15.00 60.50 276.63 443.83 229.00 36.00 515.50
[230]

Annexure 6.2:
Price Spread Analysis of Different Grass Marketing Channels (Amount in Rs./qtl)
Sl no Particulars
Channels I II III IV V VI VII
1 Growers/ Collectors Rs./qtl Rs./qtl Rs./qtl Rs./qtl Rs./qtl Rs./qtl Rs./qtl
Farmers/Collectors sale price 1800 1800 1200 700 1700 1600 700
Marketing cost 15 15 0 0 15 0 0 Net price received by the Farmers/Collectors
1785 1785 1200 700 1685 1600 700
2
Village Assemblers/ Fellow farmers cum traders
Purchase price 1200 1600 700 Marketing cost 231.13 36 62.5 Marketing margin 318.87 464 199.5 Sale price 1750 2100 962
3 Crop lessee / Pre Harvest Contractors
Purchase price 700 Marketing cost 388.33 Marketing margin 611.67 Sale price 1700
4 Middlemen (Phoria)
Purchase price Marketing cost (Personal expenses)
Marketing margin (Commission)
Sale price Contd..
[231]
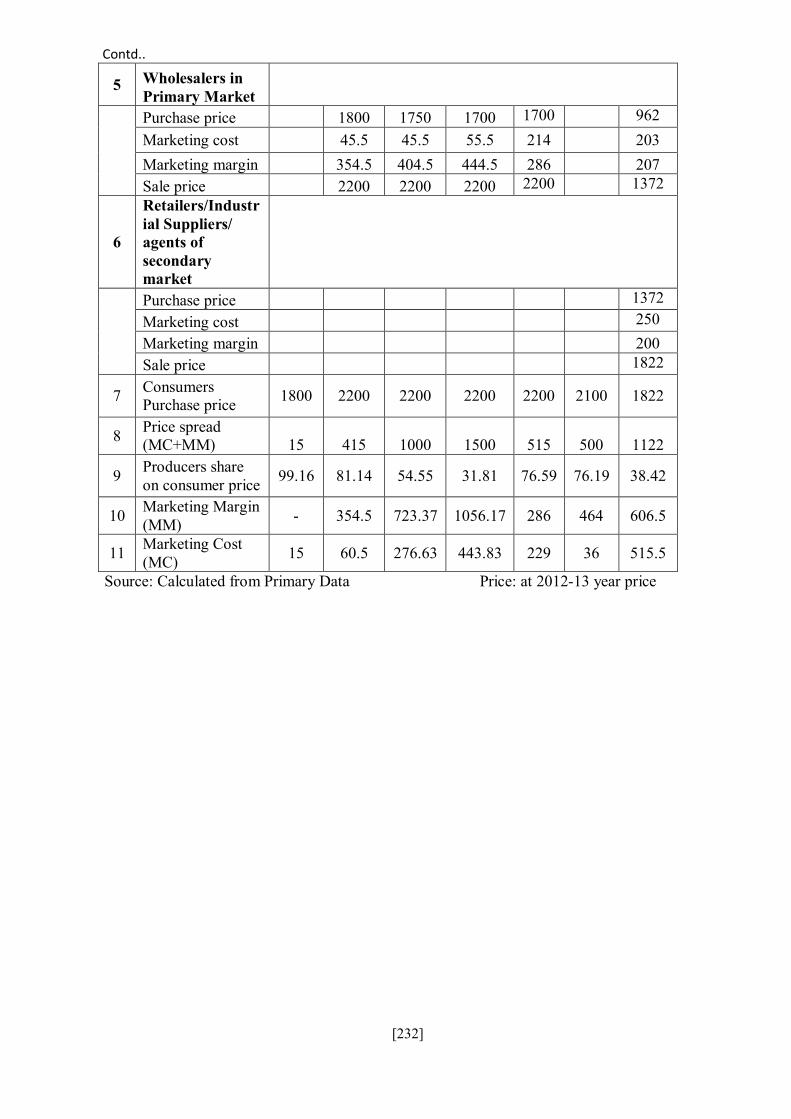
Contd..
5 Wholesalers in Primary Market
Purchase price 1800 1750 1700 1700 962 Marketing cost 45.5 45.5 55.5 214 203 Marketing margin 354.5 404.5 444.5 286 207 Sale price 2200 2200 2200 2200 1372
6
Retailers/Industrial Suppliers/ agents of secondary market
Purchase price 1372 Marketing cost 250 Marketing margin 200 Sale price 1822
7 Consumers Purchase price 1800 2200 2200 2200 2200 2100 1822
8 Price spread (MC+MM) 15 415 1000 1500 515 500 1122
9 Producers share on consumer price 99.16 81.14 54.55 31.81 76.59 76.19 38.42
10 Marketing Margin (MM) - 354.5 723.37 1056.17 286 464 606.5
11 Marketing Cost (MC) 15 60.5 276.63 443.83 229 36 515.5
Source: Calculated from Primary Data Price: at 2012-13 year price
[232]

Annexure 6.3
Marketing Costs of Rope Marketing Channels (Intra State) Cost/Qtl. (in Rs.)
Sl no
Cost Structures
Within State- Channel I II III IV
1 Rope Producers Amount (in Rs./qtl) i Repair & maintenance of By cycle/ Cycle van 6 6 6 ii Other marketing expenses (Personal expenses) 4 4 4 Sub Total 10 10 0 10 2 Village Assemblers/ Fellow producers cum traders i. Cost of transport (use own vehicle)Depreciation charges 10
Repair & maintenance 12 ii. Other charges (Charity/Subscription/personal expenses) 10 iii. Interest on loan 10 - Sub Total 42 3 Commission Agents (Phoria) i. Misc. expenses Sub Total 4 Wholesalers/Aratdar in Primary Market i. Cost of transport(Hired vehicle) 0 0 0 ii. Cost of assembling, carrying loading & unloading.(from Hat to
Godown) 10 8 8 iii. Cost of cleaning, sorting, grading & inventory handling loss 10 5 10 iv. Godown Rent 5 5 5 v. Commission charges 0 0 170 vi. Hat Fees/Market Fee 2 2 2 vii. Wages/Salary to staff 10 10 10 viii Interest on loan 0 - ix Other charges (Charity/Subscription/) 3 3 3 Sub Total 40 33 208 5 Wholesalers/Aratdar in Secondary Market i. Cost of transport(Hired vehicle) 143 143 ii Wages/Salary to staff 10 10
iii. Other charges (Charity/Subscription/) 15 15 Sub Total 168 168 6 Retailers Cost of transport 40 50 50 Sub Total 40 50 50 Total 10 90 293 436
[233]

Annexure 6.4
Marketing Costs of Rope Marketing Channels (Inter-State Channel)
Sl no
Cost Structures Inter-State Channel
Ch-V
Ch-VI
Ch-VII
Ch-VIII
1 Rope Producers Amount (in Rs./qtl) i Repair & maintenance of own Bi-Cycle/Van 6 6 ii Other marketing expenses (Personal expenses) 4 4 Sub Total 10 0 10 0 2 Village shop/General store Handling cost 50 Sub Total 50 2 Village Assemblers/ Fellow producers cum traders i. Hired Transport Charges 0 60 ii Cost of transport (use own vehicle)Depreciation charges 10 0
iii. Repair & maintenance 12 0 iv Labour charges 0 20 v Other charges (Charity/Subscription/personal expenses) 10 10 vi Interest on loan 10 10 Sub Total 42 100 3 Commission Agents (Phoria) i. Misc. expenses Sub Total 4 Wholesalers/Aratdar in Primary Market
i Cost of assembling, carrying loading & unloading.(from Hat to Godown) 10 8 10 10
ii Cost of cleaning, sorting, grading & inventory handling loss 10 8 10 10
iii. Godown Rent 5 5 5 5 iv Commission charges 0 0 170 0 v Hat Fees/Market Fee 2 2 2 2 vi Wages/Salary to staff 10 10 10 10
viii Interest on loan 10 10 10 10 ix Other charges (Charity/Subscription/) 3 3 3 3 Sub Total 50 46 220 50 5 Wholesalers/Aratdar in Secondary Market i. Cost of transport(Hired vehicle) 250 250 250 250 ii Wages/Salary to staff 10 10 10 10
iii. Other charges (Charity/Subscription/) 10 10 10 15 Sub Total 270 270 270 275 6 Retailers Cost of transport 50 50 50 50 Sub Total 50 50 50 50 Total 380 408 550 525
[234]

Annexure 6.5
Price Spread Analysis of Rope Marketing Channels (Intra- State)
Sl no Particulars Channels
Ch-I Ch-II Ch-III Ch-IV 1 Artisan-Producers Amount (in Rs./qtl) Farmers/Collectors sale price/qtl 4300 4400 3700 4300 Marketing cost/qtl 10 10 0 10 Net price received by the Farmers/Collectors /qtl 4290 4390 3700 4290 2 Village Shop/General store Purchase price Marketing cost Marketing margin Sale price 3 Village Assemblers/ Fellow producers cum traders Purchase price 3700 Marketing cost 42 Marketing margin 558 Sale price 4300 5 Middlemen (Phoria) Purchase price Marketing cost (Personal expenses)
Marketing margin (Commission) (-170) Sale price 6 Wholesalers in Primary Market Purchase price 4390 4300 4290 Marketing cost (including middlemen commission) 40 33 208 Marketing margin 220 167 152 Sale price 4650 4500 4650 7 Wholesalers in Secondary Market (Within state) Purchase price 4500 4650 Marketing cost 168 168 Marketing margin 182 132 Sale price 4850 4950 8 Retailers Purchase price 4650 4850 4950 Marketing cost 40 50 50 Marketing margin 310 300 300 Sale price 5000 5200 5300 7 Consumers Purchase price 4300 5000 5200 5300 8 Price spread 10 610 1500 1010 9 Producers share on consumer price 99.77 87.80 71.15 80.94
10 Marketing Margin (MM) 530 1207 584 11 Marketing Cost (MC) 10 90 293 436 12 MM + MC 10 620 2100 1020
[235]

Annexure 6.6
Price Spread Analysis of Rope Marketing Channels (Inter- State)
Sl no Particulars
Inter-State Channels V VI VII VIII
1 Artisan-Producers Amount (in Rs./qtl) Farmers/Collectors sale price 4400 3700 4200 3300 Marketing cost 10 10 Net price received by the Farmers/Collectors 4390 3700 4190 3300 2 Village Shop/General store Purchase price 3300 Marketing cost 50 Marketing margin 150 Sale price 3500 3 Village Assemblers/ Fellow producers cum traders Purchase price 3700 3500 Marketing cost 42 100 Marketing margin 658 800 Sale price 4400 4400 5 Middlemen (Phoria) Purchase price Marketing cost (Personal expenses)
Marketing margin (Commission)
Sale price 6 Wholesalers in Primary Market Purchase price 4400 4400 4190 4400 Marketing cost (including middlemen commission) 50 46 220 50 Marketing margin 350 204 240 200 Sale price 4800 4650 4650 4650 7 Wholesalers in Secondary Market (Outside state) Purchase price 4800 4650 4650 4650 Marketing cost 270 270 270 275 Marketing margin 280 380 280 275 Sale price 5350 5300 5200 5200 8 Retailers (Outside Sate) Purchase price 5350 5300 5200 5200 Marketing cost 50 50 50 50 Marketing margin 250 300 400 400 Sale price 5650 5650 5650 5650 7 Consumers Purchase price 5650 5650 5650 5650 8 Price spread 1260 1950 1460 2350 9 Producers share on consumer price 77.70 65.49 74.16 58.41 Marketing Margin (MM) 880 1542 920 1825 Marketing Cost (MC) 380 408 550 525 MM+MC 1260 1950 1470 2350
[226]

nnexure-6.7 Marketing Cost and Margin Analysis of Handicrafts Marketing Channels
Sl no Particulars
Sabai Hat/Cap Door Mat Shoulder Bag I II III IV I II III IV I II III IV
1 Artisan-Producers Ex factory Selling Price 130 130 130 130 150 150 150 150 300 300 300 300
Marketing cost
Net Price received by
the Artisan 130 130 130 130 150 150 150 150 300 300 300 300 2 Local Middleman Purchase price 130 130 130 150 150 150 300 300 300
Marketing cost
13 13 13
15 15 15
30 30 30
Marketing Margin
17 17 17
15 15 15
20 20 20
Sale price 160 160 160 180 180 180 350 350 350
Sub Total
3 For Profit Social
Enterprise/ Wholesalers
Purchase price 160 160 160 180 180 180 350 350 350
Marketing cost
35.75 35.75 35.75
41.25 41.25 41.25
82.5 82.5 82.5
Marketing margin
34.25 34.25 54.25
78.75 78.75 98.75
217.5 167.5 317.5
Sale price
230 230 250
300 300 320
650 600 750
4 Lifestyle Shop/Craft Store/ Retail Chain
Store
Purchase price
230
300
600 Marketing cost
32.18
37.13
74.25
Marketing margin
57.82
62.87
175.75 Sale price
320
400
850
Contd..
[237]

Contd..
Sabai Hat/Cap Door Mat Shoulder Bag
I II III IV I II III IV I II III IV
5 E-marketers/Exporters
Purchase price
250
320
750
Marketing cost 68.94 70.71 80.63
Selling Comission (Marketing margin)
10% 25 32 75
Sale price
343.94
422.71
905.63
7 Consumers Purchase price 130 230 320 343.94 150 300 400 422.71 300 650 850 905.63
8 Price spread 0 100 190 213.94 0 150 250 272.71 0 350 550 605.63
9 Producers share on consumer price (%) 100.00 56.52 40.63 37.80 100.00 50.00 37.50 35.49 100.00 46.15 35.29 33.13
10 Marketing Cost (MC) 0 48.75 80.93 117.69 0 56.25 93.38 126.96 0 112.5 186.75 193.13
11 Marketing Margin (MM) - 51.25 109.07 96.25 - 93.75 156.62 145.75 - 237.5 363.25 412.5
MC + MM 100 190 213.94 150 250 272.71 350 550 605.63
[238]

Annexure-8.I
Comparative Analysis of Project Terms and Conditions for Hand Bag Making Under Different Schemes
(A) Capital Requirement
Sl no 1. Fixed Capital: Amount (in Rs.)
i Land (Own) 0.00
ii Site Development & Workshed (3m x 2m tin roofed open shed with earth pressed floor) 30,000.00
iii Tools, Frames, Moulds 1,000.00 iv Ghudru/Ream Twister 1,200.00 v Wooden Weaving Frame 2,000.00
vi Dying Unit (Dekchi,Bucket, Mug, Karai etc.) 2,000.00 Tool Box 500.00 Sub Total 36,700.00
2. Working Capital: i Raw material (12 month) a) Grass (144 kg@ Rs.30/kg) 4,320.00 b) Bleaching & Dying Material (144 kg @ Rs.20.00/kg) 2,880.00 c) Integration Material (360 Bags @ Rs.20) 7,200.00
ii. Electricity & Maintenance 1,800.00 iii Rent 0.00 iv Transport Cost 2,400.00 v Consumables (Packaging & other consumables) 1,200.00 vi Marketing Cost 1,800.00 vii Misc Expenses 2,040.00 Sub Total 23,640.00 Total Fund Required for the Project 60,340.00
(B)Means of Finance in Different Schemes
(a) PMEGP Implementing Agency: At the State level the scheme will be implemented through state KVIC Directorates, State Khadi and Village Industries Boards (KVIBS) and District Industries Centers (DICs) and banks
sl no Means of Finance: Amount (in Rs.)
i Composite Loan under PMEGP 36,204.00
ii Subsidy (@ 35% of total project cost in Rural areas for SC &ST) 21,119.00
iii Margin Money-Own Contribution (@5% of total project cost) 3,017.00
Total 60,340.00
[239]
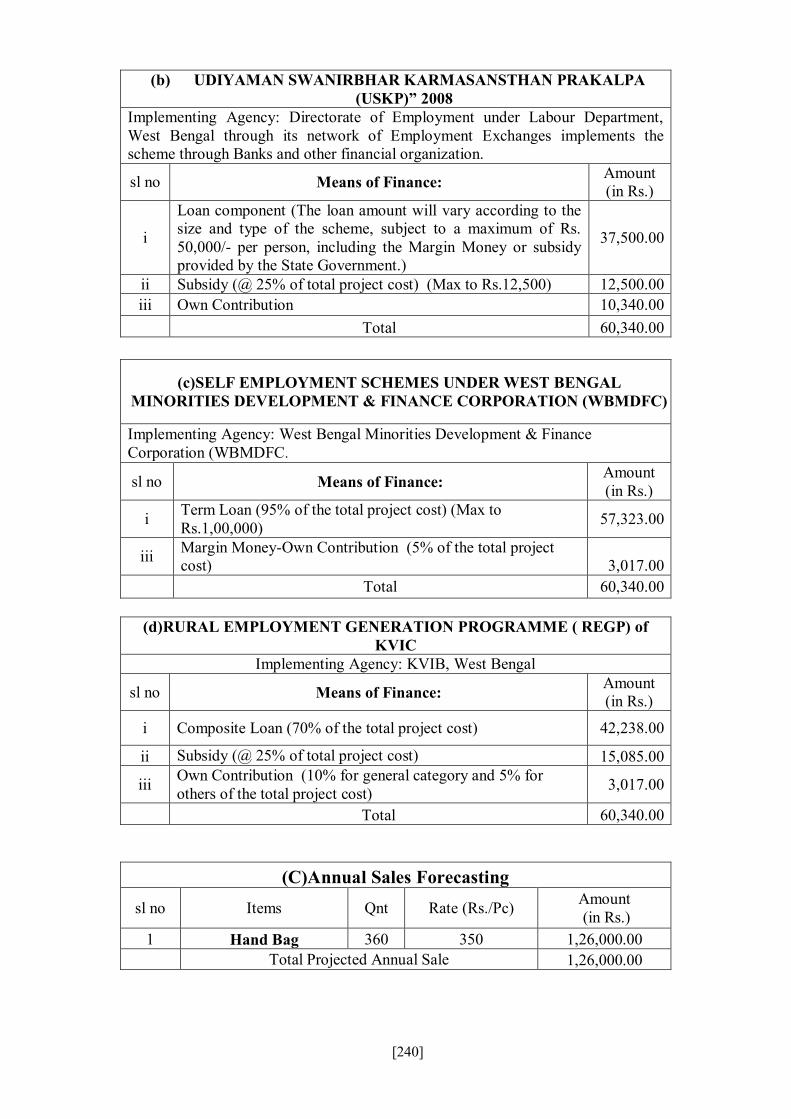
(b) UDIYAMAN SWANIRBHAR KARMASANSTHAN PRAKALPA (USKP)” 2008
Implementing Agency: Directorate of Employment under Labour Department, West Bengal through its network of Employment Exchanges implements the scheme through Banks and other financial organization.
sl no Means of Finance: Amount (in Rs.)
i
Loan component (The loan amount will vary according to the size and type of the scheme, subject to a maximum of Rs. 50,000/- per person, including the Margin Money or subsidy provided by the State Government.)
37,500.00
ii Subsidy (@ 25% of total project cost) (Max to Rs.12,500) 12,500.00 iii Own Contribution 10,340.00 Total 60,340.00
(c)SELF EMPLOYMENT SCHEMES UNDER WEST BENGAL MINORITIES DEVELOPMENT & FINANCE CORPORATION (WBMDFC)
Implementing Agency: West Bengal Minorities Development & Finance Corporation (WBMDFC.
sl no Means of Finance: Amount (in Rs.)
i Term Loan (95% of the total project cost) (Max to Rs.1,00,000) 57,323.00
iii Margin Money-Own Contribution (5% of the total project cost) 3,017.00
Total 60,340.00
(d)RURAL EMPLOYMENT GENERATION PROGRAMME ( REGP) of KVIC
Implementing Agency: KVIB, West Bengal
sl no Means of Finance: Amount (in Rs.)
i Composite Loan (70% of the total project cost) 42,238.00
ii Subsidy (@ 25% of total project cost) 15,085.00
iii Own Contribution (10% for general category and 5% for others of the total project cost) 3,017.00
Total 60,340.00
(C)Annual Sales Forecasting
sl no Items Qnt Rate (Rs./Pc) Amount (in Rs.)
1 Hand Bag 360 350 1,26,000.00 Total Projected Annual Sale 1,26,000.00
[240]

Annexure-8.II Comparative Analysis of Project Terms and Conditions for Carpet Making
Under Different Schemes (A)Capital Requirement
1. Fixed Capital: Amount (in Rs.)
i Land (Own)
ii Site Development & Workshed (3m x 2m tin roofed open shed with earth pressed floor) 30,000.00
iii Tools, Frames, Moulds 1,000.00 iv Ghurru/Ream Twister 1,200.00 v Wooden Weaving Frame 2,000.00 vi Dying Unit (Dekchi,Bucket, Mug, Karai etc.) 2,000.00 Tool Box 500.00 Sub Total 36,700.00
2. Working Capital: i Rawmaterial (12 month) a) Grass (540 kg@ Rs.30/kg) 16200.00 b) Bleaching & Dying Material (144 kg @ Rs.20.00/kg) 10800.00 c) Integration Material 0.00
ii. Electricity & Maintanance 1,000.00 iii Rent 0.00 iv Transport Cost 2,000.00 v Consumables (Packaging & other consumables) 600.00 vi Marketing Cost 1,200.00 vii Misc Expenses 1,000.00 Sub Total 32800 Total Fund Required for the Project 69,500.00
(B) Means of Finance under Different Schemes sl no (a)PMEGP Amount
(in Rs.) i Composite Loan under PMEGP 41,700.00 ii Subsidy (@ 35% of total project cost in Rural areas for SC &ST) 24,325.00 iii Margin Money-Own Contribution (@5% of total project cost) 3,475.00 Total 69,500.00
sl no (b)Udiyaman Swanirbhar Karmasansthan Prakalpa (USKP)2008 Amount
(in Rs.)
i
Loan component (The loan amount will vary according to the size and type of the scheme, subject to a maximum of Rs. 50,000/- per person, including the Margin Money or subsidy provided by the State Government.)
37,500.00
ii Subsidy (@ 25% of total project cost) (Max to Rs.12,500) 12,500.00 iii Own Contribution 19,500.00 Total 69,500.00 sl no (c)Bangla Swanirbhar Karmasansthan Prakalpa (BSKP) Amount
(in Rs.) i Term Loan (65% of the total project cost) 45,175.00 ii Subsidy (@ 30% of total project cost) (Max to Rs.1,50,000) 20,850.00 iii Margin Money-Own Contribution (5% of the total project cost) 3,475.00 Total 69,500.00
[241]

sl no
(d)Self Employment Schemes under West Bengal Minorities Development & Finance Corporation (WBMDFC.)
Amount (in Rs.)
i Term Loan (95% of the total project cost) (Max to Rs.1,00,000) 57,323.00 iii Margin Money-Own Contribution (5% of the total project cost) 3,017.00 Total 60,340.00
sl no
(e)Rural Employment Generation Programme ( REGP) of KVIC
Amount (in Rs.)
i Composite Loan (70% of the total project cost) 48,650.00 ii Subsidy (@ 25% of total project cost) 17,375.00
iii Own Contribution (10% for general category and 5% for others of the total project cost) 3,475.00
Total 69,500.00
(C)Annual Sales Forecasting sl no Items Qnt Rate (Rs./Pc) Amount
(in Rs.) 1 Carpet 12 of 25 sq.m. dimension 11,250.00 1,35,000.00 Total Projected Annual Sale 1,35,000.00
[242]

[243]
Selected References Arora, S.S.,Vijh, R.(1993). Economics of Rope Making Under Participatory Forest Management. Joint forest management series, (Vol.9,pp. 2-8).New Delhi: Tata Energy Research Institute.
Alvic, P. (2003).Weavers of the Southern Highlands. Kentucky,USA: The University Press of Kentucky,USA Acharya,S. S. & Agarwal, N. L. (2011). Agricultural Marketing in India. 5th Edition. New Delhi: Oxford and IBH Publishing Company Pvt. Ltd. Actision, J. E. & McGovern, M.C. (1987). History of paper and the importance of non-wood plant fibres. In Hamilton F., Kocurek, M. J. and Leopold B. (Eds.), Secondary fibers and non-wood pulping (Vol.3). TAPPI:Atlanta. Bishop,J. & Scoones, I.(1994).Beer and Baskets:The economics of women's livelihoods in Ngamiland (Vol.3-1). Botswana:IIED Sustainable Agriculture Programme. Bismarck, A., Mishra, S., Lampke,T.(2005) Plant fibers as reinforcement for green composites. In: A. K. Mohanty, M. Misra, L. Drzal, (Eds.), Natural Fibers, Biopolymers and Biocomposites, Boca Raton: CRC Press. Barik K. C.(1998). Performance of Sabai grass (Eulaliopsis binata) germplasm. Indian Journal of Agricultural Science,68(6),326-327. Bhattacharya, D.,Das, N., Das, C., Chattopadhyay, R. N., Dasgupta, T.(1995). PFM Study Series: Vol 2.Socio-Economic Profile of Forest Protection Committee’s of Nayagram, West Midnapur, West Bengal. Kharagpur: Rural Development Centre (RDC), IIT Kharagpur Clark,T.F.(1969). Annual Crop Fibres and the bamboos,pulp and.In R.G MacDonald., J.N.Franklin (Eds.), Pulp and Paper Manufacturer, 2nd ed. (Vol.2.p.222) McGraw- Hill: New York. Chattopadhyay, R. N., Dasgupta, T. and Roy, A.K.: Appropriate technology for upliftment of rural women: A case-study from Nayagram Block of South-West Midnapore,West Bengal, Paper presented in National Conference on Emerging Technologies & Women ( ETWOM – 02 ) at Indore, October 25 to 26, 2002.Raja Rammohan Centre for Advanced Technology Chakraborty, K. S. (2005). Marketing Costs and Margins of Agricultural Produce in Tripura. Agricultural Marketing, XLVIII (1), 4-8 Chattopadhyay, R. N., Mahapatra, S. C., Das, N., Dasgupta, T., Das, C., Bhattacharya, D. (1995). Technology Introduction in NTFP for Livelihood Generation, PFM Study Series-5(p.2), IIT Kharagpur: Rural Development Center, IIT Kharagpur Dasgupta, T., Chattopadhyay, R. N. (2003). Technology and Work Pattern of Women in the Midnapore Region of West Bengal. Science, Technology & Society, 8(1), 113-125
Dasgupta,T.,Chattopadhyay, R. N.,(2007). Gender, Rural Planning and Management: A Review. Anthropology Today: Trends, Scope and Applications (Special Issue).Anthropologist, 3, 151-159
[244]
Dagar, J.C.(2014).Greening salty and waterlogged lands through agro forestry systems for livelihood security and better environment. In: Dagar, J.C.,Singh, A.K.and Arunachalam, A. (Eds.).Agroforestry systems in India: livelihood security & ecosystem service (pp. 273-332).New Delhi, India: Springer India District Statistical Handbook, Paschim Medinipur.(2011).Bureau of Applied Statistics. Department of Statistics & Programme Implementation. Government of West Bengal. District Human Development Report, Paschim Medinipur (2011). Development and Planning Department. Government of West Bengal. Dutt, D., Upadhyaya, J. S., Tyagi, C. H., Malik, R. S. (2004). Studies on pulp and paper making characteristics of some Indian woody fibrous raw- materials-Part-II. Journal Of Scientific and & Industrial Research, 63(01), 58-67 Dharm, D., Tiwari, K. N., Upadhyaya, M. K. (1995). R & D project report (Star Paper Mills Ltd, Saharanpur, India), Nos 5(11). Ellis,F.(1998).Household Strategies and Rural Livelihood Diversification. Journal of Development Studies, 35(1), 1-38. Forsyth, P. (2009). The Economist: Marketing: A Guide to the Fundamentals. London: Profile Books Ltd. Gupta, B. N. (2006). Non-Wood Forest Products in Asia. Bangkok: RAPA Publication. Ghoshal, S. (2010). Non Timber forest products in West Bengal: knowledge, livelihood and policy (Unpublished doctoral dissertation). University of Nottingham.UK. Ghosh, G. K. & Ghosh S.(2011). Indian Textiles: Past and Present.New Delhi:APH Publishing Corporation. p.137 Hathy, P. R.,Sahu, U. N.,Satpathy, A. R. (2010). Marketing of Sabai Grass in Socio-Economic Development of Tribals in Mayurbhanj District, Orissa (India). International Journal of Business and management, 5(2),149-158. Huang, Y., Wang, H. , Zou, D.S. , Wang, S.L. (2004). Effects of planting Eulaliopsis binata on soil quality in the red soil region of southern Chin. Soil Use and Management, 20(2),150 - 155 Huang, Y., Wilcox, B. P., Stern, L., Perotto-Baldivieso, H. (2006), Springs on rangelands: Runoff dynamics and influence of woody plant cover, Hydrological Processes, 20(15), 3277–3288. Jeyasingam, J. T. (1992). Applying the correct raw material preparation methods for straw pulping. Proceedings of TAPPI Pulping Conference, Nov. 1-5, 1992, Boston, MA, USA. TAPPI Press Atlanta, GA, USA. Jan, E., Dam, G. V.(2009) Environmental Benefits of Natural Fibre production & Use, Discover natural fibres Proceedings of the Symposium on natural fibres, Technical paper no 56, FAO, Rome, p.29
[245]
Kotler, P. (1982). Marketing for nonprofit organizations. University of Michigan: Prentice Hall Khare, C. P. (2007). Indian Meditional Plants: An Illustrative Dictionary.USA: Springer + Business Media LCC, New York, USA, Kundu, S. (2016, April 11), Sabai grass industry reinvents itself. The Telegraph, Kolkata. Retrieved from http://www.telegraphindia.com/1160411/jsp/odisha/story_79457.jsp Kotler, P., Armstrong, G. (2014). Principles of Marketing (16th Edition). Pearson:England. Kumar, S. (2014). Marketing efficiency analysis: A case of broiler marketing in Anand district of Gujarat. International Journal of Commerce and Business Management, 7(1),186-190 Khandual, A., Sahu, S. (2016). Sabai Grass Possibility of Becoming A Potential Textile. In Muthu, S. S., Gardetti, M. A. (eds.), Sustainable Fibres for Fashion Industry, vol.2(pp. 44-59).Singapore: Springer Singapore Khan, S. (2011,November 17). “The Modern Day Charpoy”. Retrieved from http://www.dawn.com/news/673878 Liu, L. (1988). Study on classification and evolution of Gramineae subfamily Panicoideae. Acta Phytotax Sin, 26:11-28. Ling, L (2007). Supply Chain Management: Concept, Techniques and Practices, World Scientific Publishing, Singapore. p.289 Lepcha, S.T.S., Bahti,S. & Kumar,A.(2009). Common fibre yielding plants of North-West Himalayas – with special reference to Uttarakhand, Uttarakhand Bambooand Fibre Development Board (UBFDB), Dehradun McCarthy, E. J. (1960).Basic marketing: a managerial approach. Homewood,IL:Richard D. Irwin. Inc., 1979McCarthyBasic Marketing: A Managerial Approach1979. McGovern, J. N., Coeffelt, D. E., Hurten, A. M., Ahuja, N. K., Wiedermann, A. (1987). Other Fibres, Pulp and Paper Manufacturer, Secondary Fibres and Non-wood Pulping (vol.3.p.110). Atlanta: TAPPI Press. Mitra,S., Mukherjee, S. K. (2009). Ethnobotany of Some Grasses of West Bengal (India),Advances in Plant Biology(Debidas Bhattacharya Birth Centenary Commemorative Volume), Visva-Bharati University, Santiniketan, p.235
Ministry of Environment and Forests. (2006). Report of the National Forest Commission. New Delhi: Ministry of Environment and Forests, Government of India.
National Health Profile (2011).Central Bureau of Health Intelligence. Directorate General of Health Service. Ministry of Health and Family Welfare. Government of India N. H. Consulting. (2011). Study on Socio-Economic Impact of Agro Residue Mills. Indian Agro and Recycled Paper Mills Association,New Delhi:Author. Retrieved from http://www.dcpulppaper.org/gifs/report31.pdf
[246]
Paik, K., Jana, S.K., Chattopadhyay, R. N. (2016). Prospects of Developing Rural Economy through Production and Marketing of Sabai Grass (Eulaliopsis binata) and Rope in Paschim Medinipur District, West Bengal. Modern Research Studie, 3(4), 973-992. Paik. K. (2016). Grass for Grassroots Artisan - A Study on Artisan’s Economic Dependency on Sabai Grass (Eulaliopsis Binata) in the Backward Region of West Bengal. International Journal Advances in Social Science and Humanities, 4(12), 41-48. Sarkar, S. K.,Chattopadhyay, R. N. (2001).Role of Sabai Grass(Eulaliopsis binata) for Sustenance of Forest Protection Committee Members, Indian Forester,127(7), 737-742. Retrieved from http://www.indianforester.co.in/index.php/indianforester/article/view/2884 Sao, S., Mishra, S. K. (1985). A Model of Tribal Industrial Growth: Case study of Rope-Making, Man & Life, 11(3&4). Sharma, S., Khera, A., Bhullar, B. (1988). Study of some Agronomic Aspects of Sabai Grass (Eulaliapsis binata Retz.). Indian Forester, 114(6), 335-338. Retrieved from http://www.indianforester.co.in/index.php/indianforester/article/view/9 Simon H. (1989). Price Management, 2nd ed., North Holland: Springer, Amsterdam. Simon, H. (1992).Pricing opportunities and how to exploit them. Sloan Management Review.33(2), 52-62. Singh, B. (1993). Effect of juvenile grass cutting on fibre yield of bhabbar and hay yield of fodder grasses in Shivalik hills of Haryana, Joint Forest Management series,(no.8,p.17).New Delhi: Tata Energy Research Institute. Sarkar, S.K. (1995). State Forestry Action Plan. West Bengal (1996–2015). Department of Forests: Government of West Bengal, Kolkata. Swamy, R. N. (2005). Vegetable Fibre Reinforced Cement Composites- A False Dream or a Potential Reality, Sobral H.S. (Ed.), Vegetables Plants and their Fibres as Building Materials. London: Chapman and Hall Sajilan, S., Hadi, N. U., Tehseen, S.(2015)Impact of Entrepreneur’s Demographic Characteristics and Personal Characteristics on Firm’s Performance Under the Mediating Role of Entrepreneur Orientation. Society of Interdisciplinary Business Research.4(2)36-47. Thakur, V.,Thakur, M.,Gupta, R.(2013).Eulaliopsis binata utilisation of waste biomass in green composites, In Green Composites from Natural Resources,CRC Press, p.386 Thapa, G.B., Koirala, G.P., Gill, G.J., Thapa, M.B. (1995). Constraints on Agricultural Marketing in Nepal. Kathmandu: Winrock International. Tripathy, S.K. (1998). Effect of cutting management and nitrogen fertilization on yield and economics of sabai grass (Eulaliopsis binata). Proceedings of the National Seminar on Strategy for Maximization of Forage Production by 2000 AD, May 5-7, 1998, W.B. India, pp: 113-116. Vijh, R. & Arora, S. S. (1993).Economics of rope making under participatory forest management. New Delhi: Tata Energy Research Institute

[247]
Wiersum, K. F., and Shackleton, C. (2005). Rural dynamics and biodiversity conservation in southern Africa. In Ros-Tonen, A. F., and Dietz, T. (eds.), Linking Global Conservation Objectives and Local Livelihood Needs:Lessons from Africa (pp.67-92). U.K.: Edwin Mellen Press. Wickens, G.E. (2001). Economic Botany Principles and Practices. New York: Springer Science+Business Media. Wayman, M. (1973).Guide for planning pulp and paper enterprises. Rome: FAO.p.260-261 United Nation Industrial Development Organisation.(July-Sep, 2008).Rural livelihood and poverty alleviation, 2(2), 2-8. Varalakshmi V., R Vijh, and Arora S.S. (1993). Systems of bhabbar grass lease management in Haryana. Joint forest management series,(vol.7). New Delhi: Tata Energy Research Institute. Welmilla, I., Weerakkody, W. A. S., & Ediriweera, A. N. (2011). The Impact of Demographic Factors of Entrepreneurs on Development of SMEs in Tourism Industry in Sri Lanka. Faculty of Commerce and Management Studies, University of Kelaniya, Sri Lanka. Retrieved from http://www.kln.ac.lk/uokr/ICBI2011/SME%20322.pdf Young, R. A. (1997). Processing of agro-based resources into pulp and paper. In Rowell, R. M. and Rowell, J. (Eds.), Paper and Composites from Agro-Based Resources (P.221).New York,USA:CRC Press.
Related Documents