Sustainable Sustainable Growth: Growth: Where Margin and Mission Meet Where Margin and Mission Meet Strategies for Increasing Access & Strategies for Increasing Access & Maintaining Financial Stability Maintaining Financial Stability Facilitator: Cynthia L. Prorok Facilitator: Cynthia L. Prorok October 2010 October 2010 KENTUCKY PRIMARY CARE ASSOCIATION KENTUCKY PRIMARY CARE ASSOCIATION ANNUAL MEETING ANNUAL MEETING HRSA: Bureau of Primary Health Care

Welcome message from author
This document is posted to help you gain knowledge. Please leave a comment to let me know what you think about it! Share it to your friends and learn new things together.
Transcript

Sustainable Growth:Sustainable Growth:
Where Margin and Mission Meet Where Margin and Mission Meet Strategies for Increasing Access & Strategies for Increasing Access &
Maintaining Financial StabilityMaintaining Financial Stability
Facilitator: Cynthia L. ProrokFacilitator: Cynthia L. ProrokOctober 2010October 2010
KENTUCKY PRIMARY CARE ASSOCIATIONKENTUCKY PRIMARY CARE ASSOCIATION
ANNUAL MEETINGANNUAL MEETINGHRSA: Bureau of Primary Health Care

Goals of Learning Session:Goals of Learning Session:
Maintaining Financial StabilityStrategically Planning for GrowthForecasting – Contribution MarginKey Measures and StatisticsPreparation for OpportunityGroup Exercises
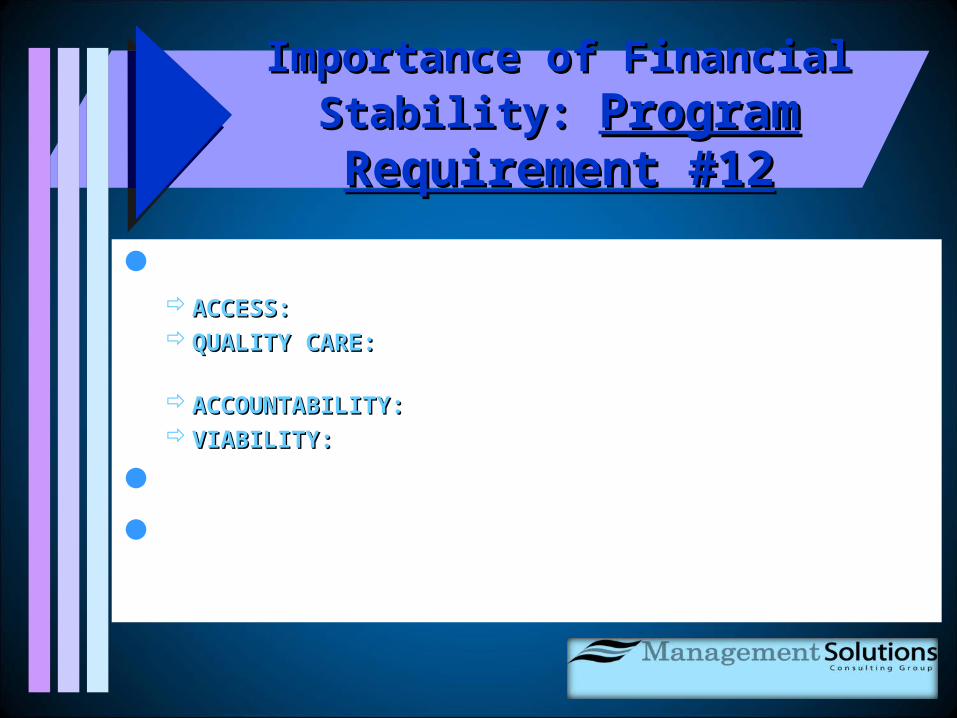
Importance of Financial Stability: Importance of Financial Stability: Program Requirement #12Program Requirement #12
To provide for: ACCESS:ACCESS: Maximize capacity to serve patients QUALITY CARE: QUALITY CARE: Sufficient resources for service delivery ACCOUNTABILITY: ACCOUNTABILITY: Stewardship of federal grant funds VIABILITY: VIABILITY: Pay staff, vendors, and creditors on time
To ‘Remain a good credit risk’Maintain/Advance health center
MISSION

Strategically Planning for Strategically Planning for Financially Sustainable Growth:Financially Sustainable Growth:
CASH CASH IS IS
KINGKING
Provider Provider RecruitmenRecruitmen
t & t & RetentionRetention
Payer MixPayer MixContributiContribution Marginon Margin
Estimating Estimating Demand – Demand –
Community Community Need/MarketplaNeed/Marketpla
cece

Cash Flow - Liquidity:Cash Flow - Liquidity:
Current Payroll/Obligations Paid Timely?Average Days of Cash on Hand?Working Capital to Monthly Expense Ratio? 2 mos.Operating Reserve?Do you have a Line of Credit?What are the Start-up Cash Flow Needs for the
Growth Opportunity?Can you Manage the Cash Flow?

Working Capital to Monthly Expense RatioWorking Capital to Monthly Expense RatioMeasures Financial Liquidity
Minimum of 1 month - with 2 months preferred
Calculation:
Working Capital (Audited Balance Sheet)
- divided by -
Average Monthly Expense (Audited Stmt Activities)
(Total Expense - divided by 12 Months)
This measure can be calculated for month -to-date & year-to-date results utilizing the Interim Statement of Activities.
If Working Capital is negative then current liabilities exceed current assets, liquidity is very tight, and financial stability is in question.

National average GoodImproving
National Average Trend Working Capital to Monthly Expense Ratio
2004 2005 2006 2007 2008Working Capital to Monthly Expense Ratio 1.86 1.95 2.10 2.25 2.35
2.35
2.25
2.11.95
1.86
1.6
1.8
2
2.2
2.4
2.6
2004 2005 2006 2007 2008
Working Capital to Monthly Expense Ratio
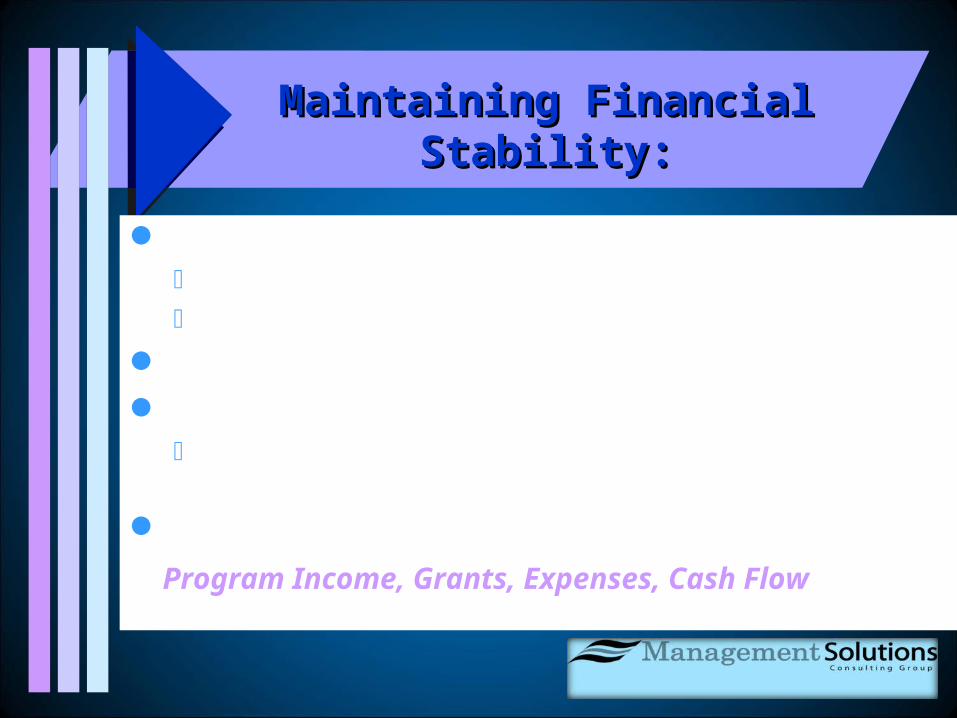
Maintaining Financial Stability:Maintaining Financial Stability:
Current and Past Financial Trends? $ Change in Net Assets on Operations? Change in Net Assets as a % of Expense? 5%
One Time versus On-Going Funding?Debt Load?
Debt Mgmt Ratio? < 50% Long-term Debt to Equity Ratio? Debt Capacity Ratio?
Financial Forecast - Growth Opportunity?
Program Income, Grants, Expenses, Cash Flow

Change in Net Assets as a Percent of ExpenseChange in Net Assets as a Percent of Expense
Measures Financial Results in Relationship to Expense
Calculation:
Change in Net Assets (Audited Stmt of Activities)
- divided by -
Total Expenses (Audited Stmt Activities)
The Change in Net Assets can be positive (a net surplus) or negative (a net loss) for the period being measured. The measure includes non-operating changes to net assets. This measure can be calculated for month -to-date & year-to-date results utilizing the Interim Statement of Activities.
A breakeven or better performance is needed for financial stability. If the trend shows decreases in net assets, particularly when the balance sheet reports a weak financial condition, there is cause for concern.

National average PositiveStableReasonable
National Average Trend Change in Net Assets as a % of Expense
2004 2005 2006 2007 2008Change in Net Assets as a Percent of Expense 4.99 4.80 4.95 5.71 4.21
4.21
5.714.954.84.99
4
5
6
7
2004 2005 2006 2007 2008
Change in Net Assets as a % of Expense

Long-term Debt to Equity Ratio:Long-term Debt to Equity Ratio:Measures Long-term Debt Leverage - Long-term Financial Condition
Calculation:
Long-term Liabilities (Audited Balance Sheet) - Divided by -
Net Assets (Audited Balance Sheet)
The preference is a Long-term Debt to Equity Ratio below 0.50 (or less than 50% of Total Assets tied up in Long-term Debt).
A Long-term Debt to Equity Ratio in excess of 0.80 (80%) indicates excessive long-term debt, the organization may not be able to borrow funds, and is an indicator financial viability may be in question.

National Average Trend:Long-term Debt to Equity Ratio
National average AcceptableImproving
2004 2005 2006 2007 2008Long-Term Debt to Equity Ratio 0.49 0.62 0.30 0.42 0.46
0.460.42
0.3
0.62
0.49
0.2
0.4
0.6
0.8
2004 2005 2006 2007 2008
Long-Term Debt to Equity Ratio
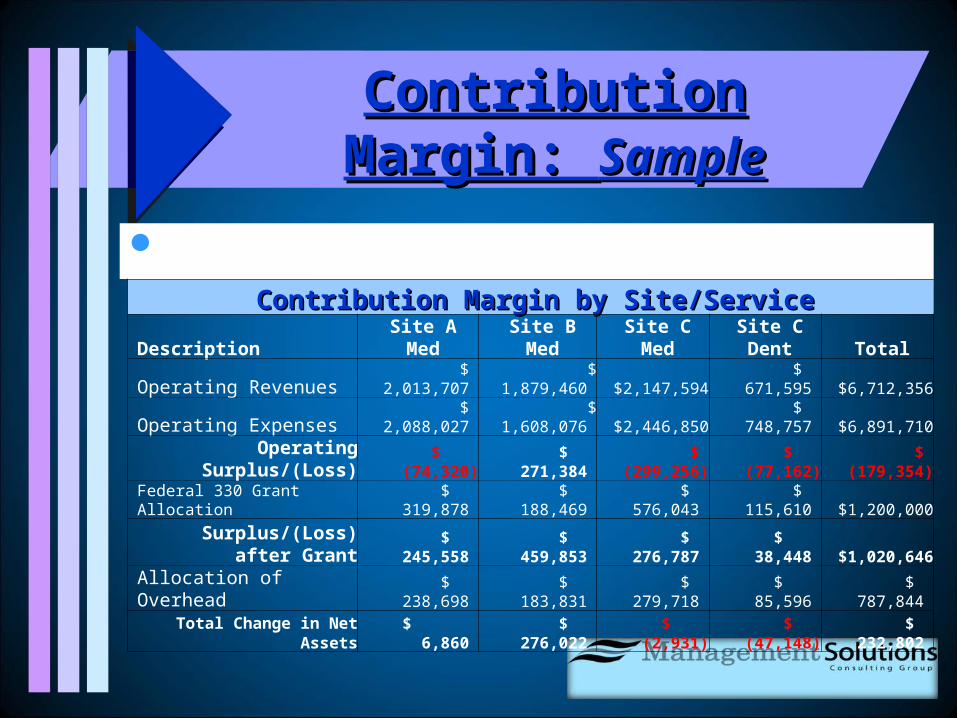
Contribution Margin: Contribution Margin: SampleSample
Evaluating Financial Impact of OpportunityContribution Margin by Site/ServiceContribution Margin by Site/Service
Description Site A Med Site B Med Site C Med Site C Dent Total
Operating Revenues $ 2,013,707 $ 1,879,460 $2,147,594 $ 671,595 $6,712,356
Operating Expenses $ 2,088,027 $ 1,608,076 $2,446,850 $ 748,757 $6,891,710 Operating
Surplus/(Loss) $ (74,320) $ 271,384 $ (299,256) $ (77,162) $ (179,354)
Federal 330 Grant Allocation $ 319,878 $ 188,469 $ 576,043 $ 115,610 $1,200,000
Surplus/(Loss) after Grant $ 245,558 $ 459,853 $ 276,787 $ 38,448 $1,020,646
Allocation of Overhead $ 238,698 $ 183,831 $ 279,718 $ 85,596 $ 787,844
Total Change in Net Assets $ 6,860 $ 276,022 $ (2,931) $ (47,148) $ 232,802

Estimating Demand:Estimating Demand:
Unmet Community Need? How Many? Where? Demographics? Health Disparities?
Market Place Consideration? Types of Private Practices? Services Provided? Hospital Clinics? Urgent Care/Minute Clinics? FQHCs, Look-Alike, Free Clinic?
Average Patient Utilization Rates by Service? 3.2 medical visits per medical user
Patient Satisfaction?

Payer Mix:Payer Mix:
Uninsured Patients? Trend of Current Operations?
Estimate for Growth Opportunities?
Medicaid and Other Public Programs? Trends? Financial Screening? Enrollment Assistance?
Medicare? Managed Care? Market Trends?
Private Insurance? Trend? Productivity Rate Needed to Break-Even?
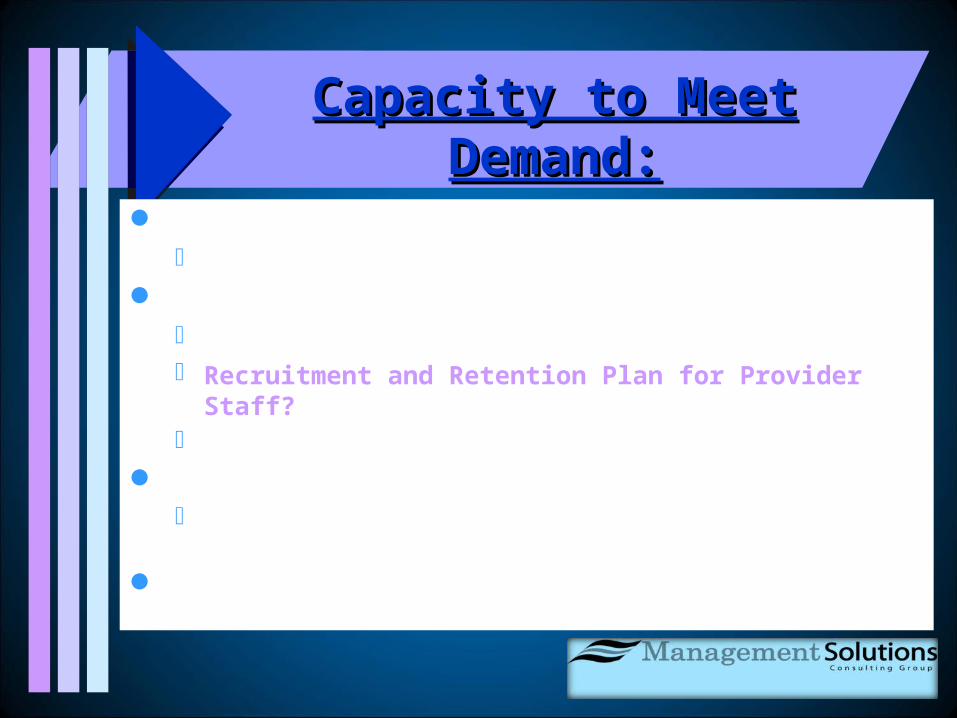
Capacity to Meet Demand:Capacity to Meet Demand:
Location and Facility Space? Minimum 2 Exam Rooms per Provider – prefer 3
Provider Staffing? N - 1,100 to 1,200 Active Patients per Provider Recruitment and Retention Plan for Provider Staff? Provider Replacement Cycle Time?
Support Staffing? N - 2.9 – 3.0 Medical & Patient Support FTEs per Provider
Management Staffing & Management Systems?

Interrelationship:Interrelationship:
PATIENTS
Access to Primary Care
Budget
PROVIDERS
PATIENT
SERVICES
REVENUE

Efficiency:Efficiency:Provider Productivity?
4,200 Visit per FTE per Year? 3 Visits per Clinic Hour? 36 Clinic Hours per Week?
Visit Cycle Time? Less than 45 minutes?
Incentivizing Performance? – within Budget Providers? Support Staff? Management Team?

Costs:Costs:
Average Cost Per Patient? Services Included? Trend? N - $588 in 2008
Average Medical Cost per Medical Visit? Trend? N - $129 ‘08
Variable versus Fixed Costs?Overhead Rates?
Facility – N – 7%, Admin N – 25%
Facility, Admin, & Patient Support FTEs – N - 40%
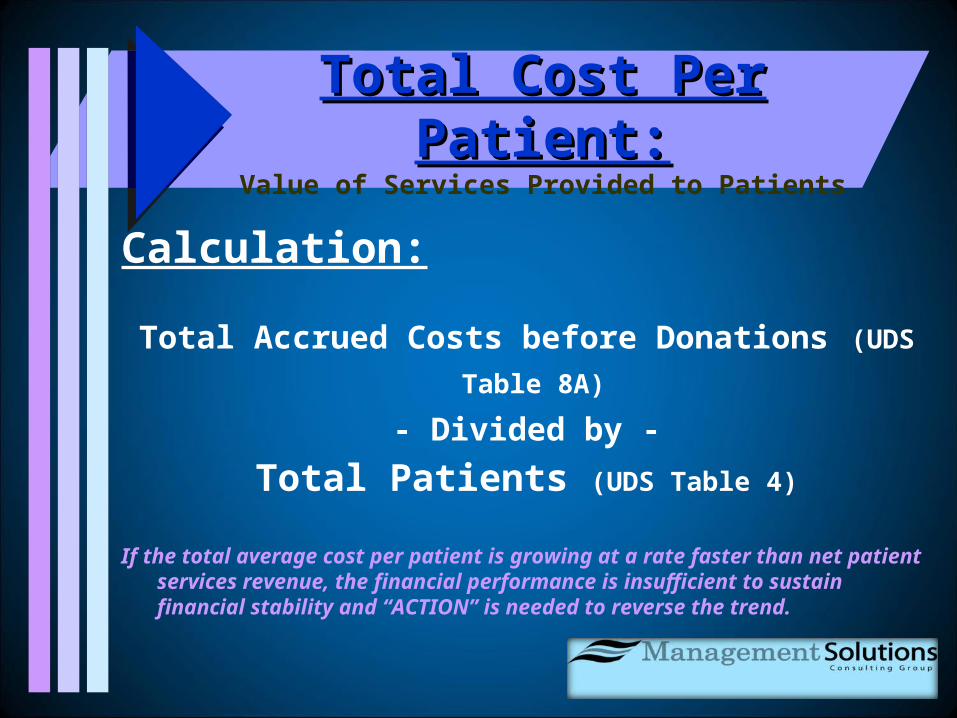
Total Cost Per Patient:Total Cost Per Patient:Value of Services Provided to Patients
Calculation:
Total Accrued Costs before Donations (UDS Table 8A) - Divided by -
Total Patients (UDS Table 4)
If the total average cost per patient is growing at a rate faster than net patient services revenue, the financial performance is insufficient to sustain financial stability and “ACTION” is needed to reverse the trend.
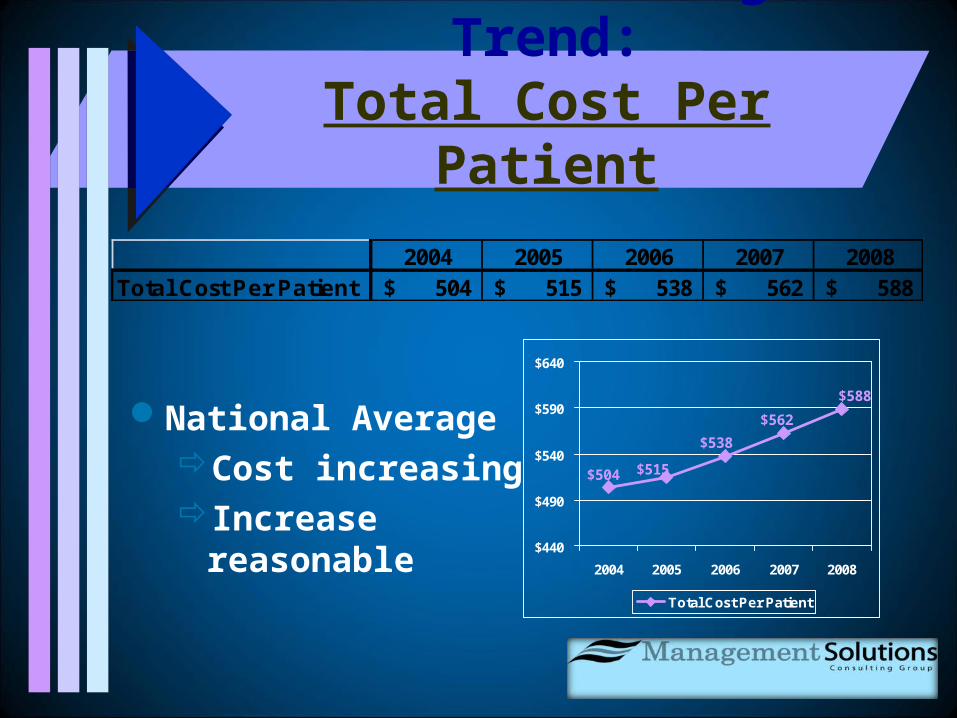
National Average Trend:Total Cost Per Patient
National AverageCost increasingIncrease
reasonable
2004 2005 2006 2007 2008Total Cost Per Patient 504$ 515$ 538$ 562$ 588$
$588
$562
$538
$515$504
$440
$490
$540
$590
$640
2004 2005 2006 2007 2008
Total Cost Per Patient

Medical Cost Per Medical Encounter:Medical Cost Per Medical Encounter:Measures Medical Cost Efficiency (excluding lab & Pharmacy)
Calculation:
Total Medical Costs (UDS Table 8A) - Divided by -
Total Billable Medical Encounters (UDS Table 5)
Medical costs are after the allocation of overhead and do not include lab or pharmacy costs. Billable medical encounters do not include nursing encounters or psychiatrist encounters.
If the average medical cost per medical encounter is growing at a rate faster than net patient services revenue, the financial performance is insufficient to sustain financial stability and “ACTION” is needed to reverse the trend.

National average Increasing Increasing faster
than total cost per patient
National Average Trend:Medical Cost Per Medical Encounter
2004 2005 2006 2007 2008Medical Cost Per Medical Encounter 109$ 111$ 117$ 123$ 129$
$129
$123
$117$111
$109
$100
$110
$120
$130
$140
2004 2005 2006 2007 2008
Medical Cost Per Medical Encounter

Revenues:Revenues: Fee Schedule? N - $176 in 2008
Market Based? Covers Costs – 114%? Uncompensated Care – N -141%
Sliding Fee Discounts? Minimums? Ancillaries? Lab? Pharmacy? Specialty?
Average Collection Per Billable Encounter? N - $105 in 2008 (calculate by payer type) Medicaid/SCHIP PPS Rates? Depends on Payer Mix and Effective Collection Practices 65% to 80% of Revenue for Operations
Grant Funding (20%) - New Opportunities? Other Sources – Activities Supported?
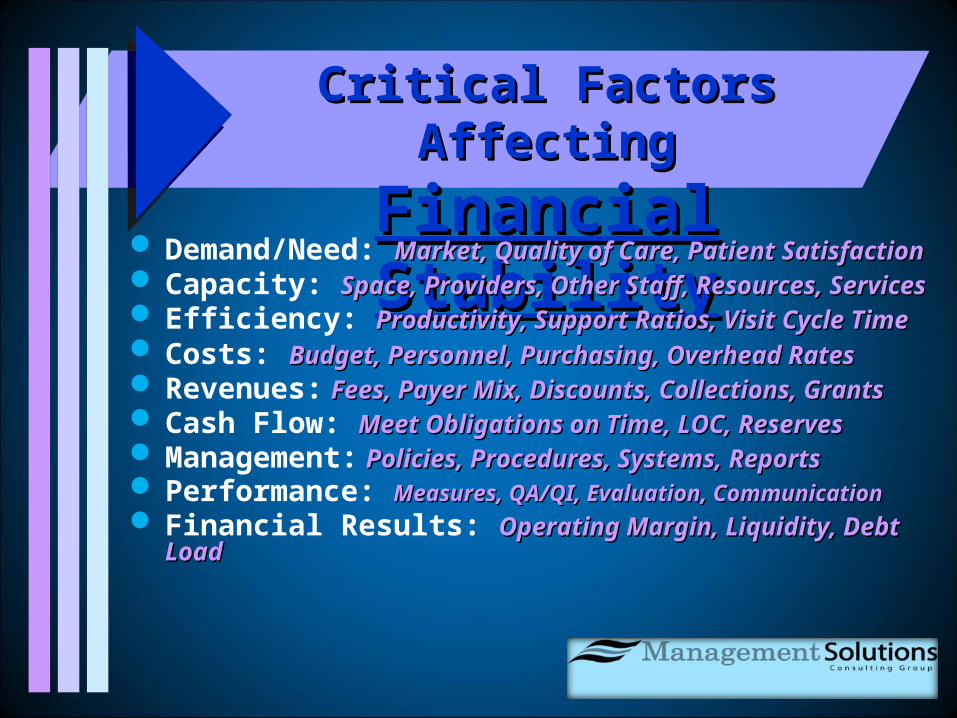
Critical Factors AffectingCritical Factors Affecting
Financial StabilityFinancial Stability Demand/Need: Market, Quality of Care, Patient SatisfactionMarket, Quality of Care, Patient Satisfaction Capacity: Space, Providers, Other Staff, Resources, ServicesSpace, Providers, Other Staff, Resources, Services Efficiency: Productivity, Support Ratios, Visit Cycle TimeProductivity, Support Ratios, Visit Cycle Time Costs: Budget, Personnel, Purchasing, Overhead RatesBudget, Personnel, Purchasing, Overhead Rates Revenues: Fees, Payer Mix, Discounts, Collections, GrantsFees, Payer Mix, Discounts, Collections, Grants Cash Flow: Meet Obligations on Time, LOC, ReservesMeet Obligations on Time, LOC, Reserves Management: Policies, Procedures, Systems, ReportsPolicies, Procedures, Systems, Reports Performance: Measures, QA/QI, Evaluation, CommunicationMeasures, QA/QI, Evaluation, Communication Financial Results: Operating Margin, Liquidity, Debt LoadOperating Margin, Liquidity, Debt Load
Measuring/MonitoringMeasuring/MonitoringFinancial Performance:Financial Performance:
To remain financially stable:Accounting and practice management systemsUtilize full accrual-basis of accounting (GAAP)Base-line budgeting - “Where are we now if nothing changes”
Complete both accrual & cash flow forecastsDevelop “What if” forecasting tools
Identify key measures/ratios to trackDevelop reports to monitor performanceIdentify underlying cause(s) for poor results
The Business Plan is a key tool for The Business Plan is a key tool for monitoring financial results.monitoring financial results.

MANAGINGMANAGINGby by withwith the numbers: the numbers:
Keeping ScoreMaintaining the historical record - timely, accurate
Designing the chart of accounts to facilitate analysisSet up of practice management system “master files”Report writer - capability, training, utilization
Turning Raw Data into Decision-making DataVariance Analysis & Learning the Underlying Story
PEOPLEPOLICIES
PROCEDURES
SYSTEMS
RESULTS

Group Exercise:Group Exercise:
Break into Groups of 4Each Group - Select 1 of the 5 ScenariosAppoint a Group Spokesperson & Recorder Identify the Key Strategic Decision Making
Factors for the Growth Opportunity Utilize the “Strategic Decision Making for Sustainable
Growth” Worksheet to Facilitate your group discussion
In Completing the Task – Utilize your Health Center as a Frame of Reference
Each Group will Present their Scenario
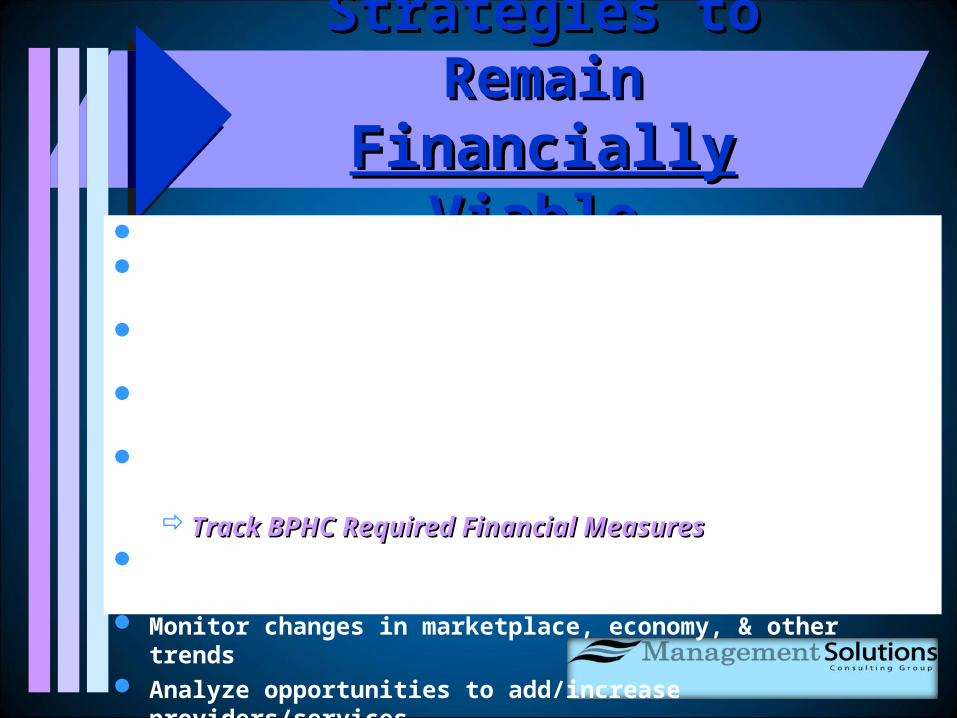
Strategies to Remain Strategies to Remain Financially ViableFinancially Viable
Develop an operating reserve Maintain current ratio > 2.0 & debt management ratio < 0.50 Maintain general ledger on full accrual basis of accounting Closely monitor & manage cash flow & financial performance Monitor performance - baseline, targets/goals, & industry standards
Track BPHC Required Financial MeasuresTrack BPHC Required Financial Measures Improve Payer Mix - increase/maintain Medicaid patients Monitor changes in marketplace, economy, & other trends Analyze opportunities to add/increase providers/services Closely monitor regulatory and policy changes Operations must result in financial surpluses, TAKE ACTIONTAKE ACTION

What GWhat Gets ets Measured, Gets Measured, Gets
DoneDoneWhat Gets What Gets
Incentivized, Really Incentivized, Really Gets DoneGets DoneBe Sure You Are Measuring What is
Important; and Incentivizing the Right Activities

QUESTIONQUESTIONSS
Contact Information:Contact Information:
Cynthia L. ProrokCynthia L. Prorok
Management Solutions Consulting Group, Inc.
(724) 355-3188 (cell)
Related Documents


![Tabletop Exercise Facilitator Handbook Template · Web viewFOR OFFICIAL USE ONLYAbout this Facilitator Guide FACILITATOR HANDBOOK [Exercise Name]Facilitator Handbook FACILITATOR HANDBOOK](https://static.cupdf.com/doc/110x72/5ae2303b7f8b9a0d7d8bfd35/tabletop-exercise-facilitator-handbook-viewfor-official-use-onlyabout-this-facilitator.jpg)

