II SUSTAINABLE DEVELOPMENT OF EXPORT-ORIENTATED FARMED SEAFOOD IN MEKONG DELTA, VIETNAM By Lam Phan Thanh A thesis submitted for the degree of Doctor of Philosophy Sustainable Aquaculture Research Group Institute of Aquaculture, The University of Stirling Scotland, UK 2014

Welcome message from author
This document is posted to help you gain knowledge. Please leave a comment to let me know what you think about it! Share it to your friends and learn new things together.
Transcript
II
SUSTAINABLE DEVELOPMENT OF EXPORT-ORIENTATED
FARMED SEAFOOD IN MEKONG DELTA, VIETNAM
By
Lam Phan Thanh
A thesis submitted for the degree of
Doctor of Philosophy
Sustainable Aquaculture Research Group
Institute of Aquaculture, The University of Stirling
Scotland, UK
2014
i
DECLARATION
I do hereby declare that this thesis has been achieved by myself and is the result of my own
investigations. The work presented in this thesis has not previously been submitted for any
other degree or qualification.
Lam Phan Thanh
2014
ii
ACKNOWLEDGEMENTS
First and foremost, I would like to thank the Institute of Aquaculture at the University of Stirling,
and the collaboration of the staff of the Can Tho University, all of whom made this work possible. I
would like to express sincere gratitude to my supervisors Prof. David Little, Dr. Francis Murray
and Prof. Nguyen Thanh Phuong for their full support and supervision both during the preparation
of the proposal, the fieldworks and the write up of the thesis. At large, thanks to the University of
Stirling for all the quality and effort you put in for the running of my PhD programme.
My sincere gratitude goes to the collaborative EU/FP7 research project called Sustaining Ethical
Aquaculture Trade (SEAT project no. 222889) for granting me the scholarship to undertake
graduate studies at the University of Stirling. I would also like to thank my Research Institute of
Aquaculture No.2 for allowing me to participate the SEAT project and studying at the University of
Stirling. I also thank to Dr. Nguyen Thanh Tung and my colleagues at RIA2 for their invaluable
support throughout the course of this study. The secondary data on this thesis were collected under
the provincial Department of Fisheries in the Mekong Delta, Institute of Economics & Fisheries
Planning, Department of Animal Health and Fisheries Directorate in Vietnam, special gratitude goes
to them for their permission to carry out this study and providing the data and relevant reports. I
also thank Dr. Vo Nam Son, Mr. Dao Minh Hai, Mr. Nguyen The Dien and Mr. Tran Huynh Quoc,
who work with me in the field of shrimp and striped catfish areas in the Mekong Delta. I express
thank to Dr. Corinne Critchlow-Watton for her comments and English review of manuscript.
I dearly thank my parents and little son for their never-ending love and moral support. Finally, I
thank my friends at the University of Stirling who have been part of my stay in Stirling, it was a
pleasure and experience to have acquainted with you all.
iii
ABSTRACT
Aquaculture is playing an important role in the development of fisheries in Vietnam, a role
which has accelerated since 2000. Sustainability in aquaculture is receiving increasing
attention, and this issue is not only the concern of government, but also stakeholders
participating in the value chain. Therefore, this study aims to identify sustainability issues
of farmed seafood by assessing the main sustainability issues raising concern. The Global
Value Chain framework described by Gereffi et al. (2005) is applied for this study to
explore the business relationships in supply chain and the perceptions of sustainability
concerned by the value chain actors. A combination of qualitative and quantitative
methods was used to collect data. An assessment of four species cultured on the Mekong
Delta, the countries farmed seafood ‘hub’, found a clear distinction between species
cultured with a local domestic market orientation (Giant Freshwater Prawn
Macrobrachium rosenbergii; and Tilapia Oreochromis niloticus) and the two key export
commodities - Striped catfish (Pangasianodon hypophthalmus) and Penaeid shrimp
(Penaeus monodon & Litopenaeus vannamei). These orientations were based on a range of
factors including the development of effective seed supplies and the cultural value of
marketing in the live format. This study, conducted in ten provinces in the Mekong Delta
from 2009 to 2013 had a focus on understanding the export-orientated commodities,
striped catfish and shrimp through collection of baseline information on the value chain of
farmed seafood, focusing on the farming sector, the actors and institutions involved and
beneficiaries. Sustainability issues and perceptions of experts (top-down) and primary
stakeholders (bottom-up) opinions were assessed through participatory workshops.
iv
Shrimp and striped catfish production are mainly farmed for export, with 83% and 95% of
its production, respectively, leaving the country mainly after processing. Currently, mainly
families operate small-/medium-scale farms; while large-farms are integrated within
seafood processors. Production efficiency of large-farms tends to be better than small-
/medium farms. Many striped catfish and shrimp farms are likely to reach several standard
criteria such as economic feed conversion ratio (eFCR), stocking density, no banned
chemical/drug and wild-seed use, and land property rights; however, there were still many
standard criteria that existing farms could not meet such as effluent management, farm
registration, fishmeal control, farm hygiene and record-keeping requirement. Hence,
current farming practices, especially small-/medium farms have a long way to go to meet
emergent international food standards. Recently, many small-/medium catfish farms faced
problems with low fish prices, so they have had to cease catfish farming activities and
temporarily stop farming; while some larger farms also had to temporarily stop farming.
Therefore, fish price has tended to be a main driving force for catfish farm changes. In the
shrimp industry, there were technical changes occurring in the high intensity level of
shrimp farms (HiLI); whereas, the remaining shrimp farms had fewer changes in farm
management. Most HiLI shrimp farms were affected by AHPNS disease, which was a
main factor driving their farm changes.
Many perceptions of sustainability were identified by stakeholder groups, however seven
sustainability issues had a high level of agreement among stakeholders including input
cost, capital & credit costs, unstable markets, government regulation & policy, disease,
seed quality, water quality and water availability factors. Hatcheries, farmers and manager
groups were more concerned about environmental issues; while for the input suppliers and
processors, economics was the main issue. Farmers and processors were two main actors
v
that played an important role in the production process of the value chain. Small-/medium
farms dominated the number of farms overall and still played an important role in primary
production. However, small-scale farms were considered as more vulnerable actors in the
value chain, and they faced more difficulties in meeting increasing requirements on food
quality/safety. To maintain the position in the value chain, the solutions could be
horizontal and vertical coordination. Thus policy makers will need to find ways to include
them in the planning processes. To reach sustainability will require the efforts of direct
stakeholders, the role of the state agencies is essential in negotiation and diplomacy to
create partnerships with the seafood importing countries. However, efforts to develop
sustainable production become impossible without participation from importers, retailers
and consumers.
vi
TABLE OF CONTENTS
DECLARATION ........................................................................................................................... I
ACKNOWLEDGEMENTS .......................................................................................................... II
ABSTRACT ................................................................................................................................ III
TABLE OF CONTENTS ............................................................................................................ VI
LIST OF FIGURES ...................................................................................................................... X
LIST OF TABLES ..................................................................................................................... XII
ABBREVIATIONS ................................................................................................................. XIV
CHAPTER 1. INTRODUCTION AND LITERATURE REVIEW ............................................. 1
1.1. RATIONALE FOR CONDUCTING RESEARCH .............................................................................. 1
1.2. SUSTAINABILITY ISSUES IN AQUACULTURE DEVELOPMENT ................................................... 4
1.2.1. Sustainability development .............................................................................................. 4
1.2.2. Sustainable aquaculture .................................................................................................. 12
1.2.3. Aquaculture certification ................................................................................................ 20
1.3. INTRODUCTION TO RESEARCH ............................................................................................... 31
1.3.1. Research objectives ........................................................................................................ 31
1.3.2. Focus of the research ...................................................................................................... 32
1.3.3. Structure of the thesis ..................................................................................................... 32
CHAPTER 2. RESEARCH METHODOLOGY ......................................................................... 34
2.1. INTRODUCTION ...................................................................................................................... 34
2.2. GLOBAL VALUE CHAINS: CONCEPTUAL FRAMEWORK FOR THE RESEARCH ........................... 34
2.3. RESEARCH DESIGN ................................................................................................................ 38
2.3.1. Phase One: Scoping survey ............................................................................................ 38
2.3.2. Phase Two: Integrated farm survey ................................................................................ 42
2.3.3. Phase Three: State of system workshop ......................................................................... 46
2.3.4. Phase Four: Farm transition survey ................................................................................ 48
2.4. DATA MANAGEMENT AND ANALYSIS .................................................................................... 51
2.4.1. Database and data management ..................................................................................... 51
2.4.2. Data analysis and interpretation ..................................................................................... 52
2.5. LIMITATIONS OF THE RESEARCH DESIGN AND IMPLEMENTATION ......................................... 53
CHAPTER 3. DEVELOPMENT TRENDS FOR THE INTERNATIONAL TRADE IN FARMED SEAFOOD SPECIES IN THE MEKONG DELTA ................................................. 55
3.1. INTRODUCTION ...................................................................................................................... 55
vii
3.2. GENERAL STATUS AND DEVELOPMENT OF FARMED SPECIES IN THE MKD ........................... 59
3.3. DEVELOPMENT TRENDS OF FARMED SPECIES IN THE MKD .................................................. 62
3.3.1. Development trends of farmed striped catfish ............................................................... 62
3.3.2. Development trends of farmed shrimp ........................................................................... 66
3.3.3. Development trends of farmed giant freshwater prawn ................................................. 73
3.3.4. Development trends of farmed tilapia ............................................................................ 76
3.4. GROWTH OF TRADE IN FARMED SEAFOOD ............................................................................. 79
3.5. GROWTH OF PROCESSING SECTORS ....................................................................................... 85
3.5.1. Growth of seafood processing plants ............................................................................. 85
3.5.2. Growth of aquafeed processing plants ........................................................................... 87
3.6. SOCIAL AND ENVIRONMENTAL IMPACT................................................................................. 89
3.6.1. Social impact .................................................................................................................. 89
3.6.2. Environmental impact .................................................................................................... 91
3.7. PRODUCT QUALITY AND CONSUMPTION ................................................................................ 93
3.7.1. Post-harvest issues ......................................................................................................... 93
3.7.2. Quality control of fishery products ................................................................................ 95
3.7.3. Status of standards and traceability application ............................................................. 97
3.8. ROLES OF FACILITATING INSTITUTIONS ................................................................................ 98
3.8.1. Management and supporting sectors .............................................................................. 98
3.8.2. Organization of production .......................................................................................... 100
3.9. STRIPED CATFISH AND SHRIMP VALUE CHAINS ................................................................... 104
3.9.1. Striped catfish value chain ........................................................................................... 104
3.9.2. Brackishwater shrimp value chain ............................................................................... 108
3.10. DISCUSSION AND CONCLUSIONS ........................................................................................ 112
3.10.1. Growth of export orientated farmed seafood species ................................................. 112
3.10.2. Striped catfish and shrimp: value chain coordination ................................................ 114
CHAPTER 4. FARM SCALE AND CURRENT FARMING PRACTICES OF STRIPED CATFISH AND SHRIMP IN THE MEKONG DELTA .......................................................... 121
4.1. INTRODUCTION .................................................................................................................... 121
4.2. FARM CLASSIFICATION ........................................................................................................ 123
4.2.1. Striped catfish farm category ....................................................................................... 123
4.2.2. Shrimp farm category ................................................................................................... 124
4.3. CURRENT STRIPED CATFISH FARMING PRACTICES .............................................................. 125
4.3.1. General information ..................................................................................................... 125
4.3.2. Technical aspects ......................................................................................................... 128
viii
4.3.3. Economic aspects ......................................................................................................... 136
4.3.4. Catfish farm certification and sustainability issues ...................................................... 139
4.4. CURRENT SHRIMP FARMING PRACTICES .............................................................................. 146
4.4.1. General information ..................................................................................................... 146
4.4.2. Technical aspects ......................................................................................................... 150
4.4.3. Economic aspects ......................................................................................................... 159
4.4.4. Shrimp farm certification and sustainability issues ...................................................... 161
4.5. DISCUSSION AND CONCLUSIONS .......................................................................................... 168
4.5.1. Factors driving the farm category ................................................................................ 168
4.5.2. Factors driving different farming practices .................................................................. 170
4.5.3. Farming practices - the risk profiles affect ................................................................... 176
4.5.4. Farming practices: challenges to reach food standards ................................................ 178
4.5.5. Farm upgrading - the key barriers to upgrading ........................................................... 180
CHAPTER 5. UNDERSTANDING TRANSITION IN STRIPED CATFISH AND SHRIMP FARMING IN THE MEKONG DELTA ................................................................................... 184
5.1. INTRODUCTION .................................................................................................................... 184
5.2. GENERAL INFORMATION ON THE TELEPHONE FARM SURVEYS ........................................ 185
5.3. TRANSITIONS IN STRIPED CATFISH FARMING PRACTICES .................................................... 187
5.3.1. General development trends of striped catfish farming ............................................... 187
5.3.2. Farm status and reason for changes.............................................................................. 192
5.3.3. Changes in technical aspects ........................................................................................ 196
5.3.4. Changes in economic aspects ....................................................................................... 197
5.3.5. The responses of farms for sustainable development ................................................... 203
5.4. TRANSITIONS IN SHRIMP FARMING PRACTICES.................................................................... 207
5.4.1. General development trends of shrimp farming ........................................................... 207
5.4.2. Farm status and reason for changes.............................................................................. 212
5.4.3. Changes in technical aspects ........................................................................................ 216
5.4.4. Changes in economic aspects ....................................................................................... 218
5.4.5. Responses of farms for sustainable development ........................................................ 223
5.5. DISCUSSION AND CONCLUSIONS .......................................................................................... 226
5.5.1. Factors affecting the farming dynamics ....................................................................... 226
5.5.2. Farming transition and outcomes for sustainable livelihoods ...................................... 228
5.5.3. Farming sustainability: vertical and horizontal coordination ....................................... 233
CHAPTER 6. PERCEPTIONS OF SUSTAINABLE DEVELOPMENT ISSUES FOR FARMED SEAFOOD SPECIES IN THE MEKONG DELTA ............................................... 242
ix
6.1. INTRODUCTION .................................................................................................................... 242
6.2. CHAIN ACTORS: POSITION AND OPERATIONAL CONTRAINTS ............................................... 243
6.2.1. Catfish value chain: current constraints of key chain actors ........................................ 243
6.2.2. Brackishwater shrimp value chain: current constraints of key chain actors ................ 247
6.3. PERCEPTIONS ON SUSTAINABILITY ISSUES AND MEASUREMENT ........................................ 250
6.3.1. Sustainability issues perceived by different stakeholder groups .................................. 250
6.3.2. Perceived sustainability issues by farmed species systems .......................................... 266
6.3.3. Measurement of sustainability issues ........................................................................... 269
6.4. DISCUSSION AND CONCLUSIONS .......................................................................................... 273
6.4.1. Role and operational constraints of major stakeholders ............................................... 273
6.4.2. Farm sustainability perceptions and standard criteria .................................................. 276
6.4.3. Value chain: sustainability perceptions of stakeholders ............................................... 278
6.4.4. Sustainability issues: measurement and mitigation actions ......................................... 282
CHAPTER 7. OVERALL DISCUSSION AND CONCLUSIONS .......................................... 285
7.1. ROLE OF FARMED SPECIES FOR SEAFOOD EXPORTING ......................................................... 285
7.2. FARMING SUSTAINABILITY .................................................................................................. 288
7.2.1. Farming practices dynamic .......................................................................................... 288
7.2.2. Main constraints to sustainable farming and proposed responses ................................ 292
7.2.3. Food certification: challenges for small-scale farms .................................................... 295
7.3. SUSTAINABILITY FACTORS AND THEIRS RESPONSES ........................................................... 298
7.3.1. Major sustainability factors .......................................................................................... 298
7.3.2. Responses to sustainability issues ................................................................................ 301
7.4. VALUE CHAIN COORDINATION ............................................................................................ 305
7.4.1. Value chain governance forms ..................................................................................... 305
7.4.2. Vertical and horizontal coordination ............................................................................ 306
REFERENCES ............................................................................................................................. 317
APPENDICES .............................................................................................................................. 366
APPENDIX 1. CHECKLIST QUESTIONNAIRES OF THE SCOPING SURVEY ...................................... 366
APPENDIX 2. SOS EXERCISES AND QUESTIONNAIRES ................................................................. 370
APPENDIX 3. QUESTIONNAIRES OF TELEPHONE SURVEY ........................................................... 371
APPENDIX 4. CHECKLIST QUESTIONNAIRES OF IN-DEPTH FARM SURVEY .................................. 374
APPENDIX 5. CHECKLIST QUESTIONNAIRES OF KEY INFORMANTS ............................................ 377
x
LIST OF FIGURES
Figure 1.1. An Agriculture Innovation System: conceptual framework ............................................ 8
Figure 1.2. Schematic diagram of thesis .......................................................................................... 33
Figure 2.1. Five global value chain governance types ..................................................................... 38
Figure 2.2. The four phases of research design ................................................................................ 38
Figure 2.3. Location of scoping survey of four farmed species in the MKD ................................... 41
Figure 2.4. Integrated survey sites in the MKD ............................................................................... 43
Figure 3.1. Development trends in culture area & production in the MKD and Vietnam ............... 60
Figure 3.2. Development trends in striped catfish culture in the MKD ........................................... 63
Figure 3.3. Distribution of striped catfish farmers in the MKD ....................................................... 66
Figure 3.4. Development trends in shrimp culture in the MKD ...................................................... 68
Figure 3.5. Development trends in white-legged shrimp culture in the MKD and Vietnam ........... 70
Figure 3.6. The shrimp culture area by farming systems in the MKD ............................................. 73
Figure 3.7. Development trends in prawn culture in the MKD ........................................................ 74
Figure 3.8. Trend lines of the Vietnam seafood export turnover by major species ......................... 80
Figure 3.9. Market share movement of Vietnam catfish export in value ......................................... 82
Figure 3.10. Market share movement of Vietnam shrimp export in value ...................................... 83
Figure 3.11. The growth of seafood processing sector in Vietnam and MKD ................................. 87
Figure 3.12. Value chain map of striped catfish in the MKD ........................................................ 105
Figure 3.13. Marketing channels of striped catfish farmed in the MKD ....................................... 106
Figure 3.14. Market channel and share of net added value of catfish to Spanish market .............. 107
Figure 3.15. Value chain map of shrimp in the MKD .................................................................... 109
Figure 3.16. Marketing channels of shrimp farmed in the MKD ................................................... 110
Figure 3.17. Market channel and share of net added value of shrimp to Spanish markets ............ 111
Figure 5.1. Reasons for non-response to TLS by striped catfish enterprise scale .......................... 186
Figure 5.2. Reasons for non-response to telephone interview by shrimp farmers by system ........ 187
Figure 5.3. Trendlines of striped catfish farming growth in An Giang and Vinh Long ................. 188
Figure 5.4. Distribution of catfish farms in An Giang and Vinh Long province ........................... 189
Figure 5.5. Average farm gate price for different catfish sizes in the MKD .................................. 192
xi
Figure 5.6. Farm change status in striped catfish farming practice ................................................ 193
Figure 5.7. Reasons for stopping striped catfish farming .............................................................. 195
Figure 5.8. Rank of financial source by change status of striped catfish farms ............................ 200
Figure 5.9. Rank of income source by change status of the striped catfish farms ......................... 203
Figure 5.10. Striped catfish farm’s responses for sustainable development .................................. 206
Figure 5.11. Movement trend of white legged shrimp farming in the MKD ................................. 209
Figure 5.12. Shrimp farmed area affected by AHPNS disease since 2012 .................................... 211
Figure 5.13. Monthly Vietnam shrimp export to major markets in 2012 ...................................... 211
Figure 5.14. Average farm gate price of different shrimp sizes in the MKD ................................ 212
Figure 5.15. Farm change status in shrimp farming practice ......................................................... 213
Figure 5.16. Reason for temporarily stopped farming in semi-/intensive system .......................... 215
Figure 5.17. Rank of financial source by change status of the shrimp farms ................................ 220
Figure 5.18. Rank of income source by change status of the shrimp farms ................................... 222
Figure 5.19. Evaluation of the shrimp farm economics status after three years ............................ 223
Figure 5.20. The shrimp farm’s responses for sustainable development ....................................... 225
Figure 6.1. Sustainability issues perceptions by catfish hatcheries ................................................ 252
Figure 6.2. Sustainability issues perceptions by shrimp hatcheries ............................................... 253
Figure 6.3. Sustainability issues perceptions by operational impacts of catfish farmers ............... 254
Figure 6.4. Sustainability issues perceptions by scale levels of catfish farmers ............................ 256
Figure 6.5. Children farming future by catfish farm scale ............................................................. 257
Figure 6.6. Sustainability issues perceptions by operational impacts of shrimp farmers ............... 258
Figure 6.7. Sustainability issues perceptions by culture models of shrimp farmers ...................... 260
Figure 6.8. Children farming future by shrimp system .................................................................. 261
Figure 6.9. Perceptions of sustainability issues by input suppliers ................................................ 262
Figure 6.10. Perceptions of sustainability issues seafood processors ............................................ 263
Figure 6.11. Perceptions of sustainability issues by supporting actors .......................................... 265
Figure 7.1. The value chain governance forms in the MKD .......................................................... 306
Figure 7.2. Chain actors directly relevant for agricultural innovation ........................................... 312
Figure 7.3. Interactions between internal and external value chain actors ..................................... 313
xii
LIST OF TABLES
Table 1.1. Emphasis placed on key issues by three major certification schemes ............................ 22
Table 2.1. Key determinants of global value chain governance ...................................................... 36
Table 2.2. Summary of surveyed samples in the scoping survey .................................................... 40
Table 2.3. Cross-table of stakeholder numbers by group at the SoS workshop ............................... 47
Table 2.4. Sample size of telephone and in-depth farm survey ..................................................... 49
Table 3.1. Culture area and production by major farmed species in the MKD ................................ 61
Table 3.2. Comparison of the characteristics of shrimp farming in the MKD ................................. 71
Table 3.3. Technical characteristic of various prawn culture models .............................................. 76
Table 3.4. Development trends in tilapia culture in the MKD ......................................................... 77
Table 3.5. Analysis of economic efficiency by main catfish marketing channel ........................... 107
Table 3.6. Analysis of economic efficiency by major shrimp marketing channel ......................... 111
Table 4.1. Major indicators of striped catfish farm-scales classification ....................................... 124
Table 4.2. Major indicators of shrimp farm-systems classification ............................................... 125
Table 4.3. Striped catfish farming: Farm characteristics ............................................................... 126
Table 4.4. Striped catfish farming: Information on workers .......................................................... 127
Table 4.5. Striped catfish farming: Pond preparation and stocking management .......................... 129
Table 4.6. Striped catfish farming: Feed management ................................................................... 131
Table 4.7. Striped catfish farming: Water management ................................................................. 132
Table 4.8. Striped catfish farming: Effluent management ............................................................. 134
Table 4.9. Striped catfish farming: Fish health management ........................................................ 135
Table 4.10. Striped catfish farming: Harvesting and marketing .................................................... 137
Table 4.11. Striped catfish farming: Economic efficiency ............................................................. 138
Table 4.12. Comparison of selected standard criteria and current catfish farming practices ......... 141
Table 4.13. The major factors related to sustainable development of catfish farming .................. 145
Table 4.14. Shrimp farming: Farms characteristics ....................................................................... 147
Table 4.15. Shrimp farming: Information on workers ................................................................... 149
Table 4.16. Shrimp farming: Pond preparation and stocking management ................................... 151
Table 4.17. Shrimp farming: Feed management ........................................................................... 152
xiii
Table 4.18. Shrimp farming: Water management .......................................................................... 154
Table 4.19. Shrimp farming: Effluent management ....................................................................... 156
Table 4.20. Shrimp farming: Shrimp health management ............................................................. 158
Table 4.21. Shrimp farming: Harvesting and marketing ................................................................ 160
Table 4.22. Shrimp farming: Economic efficiency ........................................................................ 161
Table 4.23. Comparison of selected standard criteria and current shrimp farming practices ........ 163
Table 4.24. The major factors related to sustainable development of shrimp farming .................. 167
Table 4.25. Risk profiles: Comparison between striped catfish and shrimp farming .................... 177
Table 4.26. Barriers to upgrading: Comparison between striped catfish and shrimp farming ....... 182
Table 5.1. Changing activities implemented over time by striped catfish farms ........................... 194
Table 5.2. Major indicators on technical aspects of the existing catfish farming ......................... 197
Table 5.3. Major indicators of economic aspects of the existing catfish farming .......................... 198
Table 5.4. Finance source for striped catfish farming investment ................................................. 199
Table 5.5. Income source of the striped catfish farms ................................................................... 201
Table 5.6. Variation of shrimp farming system in the MKD ......................................................... 208
Table 5.7. Information on the AHPNS disease outbreak in Vietnam shrimp farming ................... 210
Table 5.8. Changing activities implemented over time by shrimp farms ....................................... 214
Table 5.9. Major indicators on technical aspects of the existing shrimp farming .......................... 217
Table 5.10. Major indicators of economic aspects of the existing shrimp farming ....................... 218
Table 5.11. Finance source for shrimp farming investment ........................................................... 219
Table 5.12. Income source of the shrimp farms ............................................................................. 221
Table 6.1. Top five sustainability issues of actors along striped catfish value chain ..................... 267
Table 6.2. Top five sustainability issues of actors along shrimp value chain ................................ 268
Table 6.3. Major sustainability issues with catfish value chain and their measurements .............. 270
Table 6.4. Major sustainability issues with shrimp value chain and their measurements .............. 272
Table 6.5. Catfish farming: comparison between sustainability perceptions and standards .......... 276
Table 6.6. Shrimp farming: comparison between sustainability perceptions and standards .......... 277
Table 7.1. Comparison of farm change status between shrimp and catfish ................................... 290
Table 7.2. Major sustainability issues perceived by catfish and shrimp value chain ..................... 299
xiv
ABBREVIATIONS
AHPNS Acute Hepatopancreatic Necrosis Syndrome
AIS Agricultural innovation system
ASC Aquaculture Stewardship Council
BAP Best aquaculture practices
BMP Better management practices
BNP Bacillary Necrosis of Pangasius
BOD Biological Oxygen Demand
BTS Black tiger shrimp
CoC Code of conduct
COD Chemical Oxygen Demand
CTU Can Tho University
DO Dissolved Oxygen
DoAH Department of Animal Health
DOFI Department of Fisheries
DPSIR Driving force-pressure-state-impact-response
EF Extended family
eFCR Economic Feed Conversion Ratio
EMS Early mortality syndrome
FAO Food and Agriculture Organization
FM Fish mortality
GAA Global Aquaculture Alliance
GAP Good aquaculture practice
GFP Giant freshwater prawn
GSO General Statictics Office
GSSI Global Sustainable Seafood Initiative
GVC Global value chain
HiLI High level of investment
HOSO Head-on Shell-on
IDS In-depth survey
IFS Integrated farm survey
xv
LoLI Low level of investment
MARD Ministry of Agriculture & Rural Development
MAS Motile Aeromonad Septicaemia
MKD Mekong Delta
MOFI Ministry of Fisheries
MT Metric tonnes
NGO Non Government Organization
PCR Polymerase Chain Reaction
PL Post larvae
RASFF Rapid Alert System for Food and Feed
RIA Research Institute for Aquaculture
SC Standards categories
SD Stocking density
ShAD Shrimp aquaculture dialoges
SIn Sustainability indicator
SIs Sustainability issues
SoS State of system
SPF Specific pathogen free
SPSS Statistical Package for the Social Sciences
SR Survival rate
TLS Telephone survey
TSS Total suspended solids
US$ US Dollars
VASEP Vietnamese Association of Seafood Exporters and Producers
VIFEP Vietnamese Institute of Fisheries and Economic Planning
VINAFIS Vietnamese Fisheries Society
VND Vietnam Dong (Vietnam currency)
WLS White-legged shrimp
WSSV White Spot Syndrome Virus
YHV Yellow Head Virus
1
CHAPTER 1
Chapter 1. Introduction and Literature review
1.1. Rationale for conducting research
Vietnam is a major seafood exporter with products being sold to more than 163 countries
(MARD 2009a; VASEP 2010). Aquaculture plays an important role in fisheries
development, having grown rapidly since 2000 (MARD 2009b). Shrimp and striped catfish
are considered as the main target species for farmed seafood exports in Vietnam up to 2020
(MARD 2009b; MARD 2009c; GOV 2013). In 2013, shrimp and striped catfish products
accounted for 46% and 26% of seafood export value, respectively (Fisheries Directorate
2014). The Mekong Delta (8033’-10055’N, 104030’-106050’E), the termination of the
Lower Mekong Basin (Van Zalinge et al. 2004; Vu & Phan 2008), is popularly referred as
the food basket of Vietnam (Phan et al. 2009; De Silva 2012). The aquaculture sector in the
Mekong Delta (MKD) made up 76% of shrimp and all of the striped catfish exports in
2013 (Fisheries Directorate 2014). Striped catfish is produced intensively on a relatively
small area (6,000ha) concentrated along main channels of the Mekong (Tien) and Bassac
(Hau) rivers and primary canals; there are potentially large inland areas including 13,000ha
available for further development, which 10,000ha of them planned for catfish farming in
the master plan up to 2020 (MARD 2009; Nguyen et al. 2009; VIFEP 2009; GOV 2013).
Shrimp is produced in a range of different systems located along a broad coastal belt
stretching from Ca Mau province in the southwest tip to Long An province in the east
(Nguyen et al. 2009; VIFEP 2009b). An analysis of the current status of farming practices
shows that family-operated farms still dominate in terms of culture area and production
(Phan et al. 2009; Tran et al. 2013). An assessment of current farming practices based on
farm characteristics and allocation into different categories can help to show a clearly
2
comprehensive view of the catfish and shrimp farming. Such an analysis can contribute to
improved understanding useful for managers and policy makers, and lead to improved
policies and management that are likely to differ by farm category.
Certifiers of aquaculture products increasingly require evidence of environmental
protection and social responsibility that some types of farms may fulfill more easily than
others. Technical barriers affecting long-term development of production are unlikely to be
scale neutral; small-scale farms often particularly suffer from limited farm infrastructure
and capital investment (Dey & Ahmed 2005; Siar & Sajise 2009; Umesh et al. 2009;
Belton et al. 2011; Washington & Ababouch 2011). Market trends towards increased
demand for certified products are likely to continue (Corsin et al. 2007; Reilly 2007;
Yamprayoon & Sukhumparnich 2010). Increasingly consumers are interested in the
process through which a product is produced, and consumers are increasingly concerned
about the farming practices (Bush & Oosterveer 2007; Corsin et al. 2007; Reilly 2007;
Brunori et al. 2011; Bush & Belton 2012; Han & Immink 2013). Therefore, an assessment
of the gaps between the range of current farming practices and standard criteria required
for certification are critical. Equally those responsible for certification that may
disadvantage certain producers need to be aware of development trends and evolution
within the sector as well as the potential impacts of these changes on the various actors
involved. Understanding of changes on the farm over time and what needs to be improved
to ensure sustainable development is necessary. Furthermore, sustainable development of a
value chain will be affected by many actors, of which farmers are only one, so any changes
at the farm level will also impact on the value chain (Khoi 2007; Vo et al. 2009a; Le 2011;
Le et al. 2011; Khoi 2011).
Aquatic animal products play an important role in the world’s food system, and the market
for them is growing strongly (Busch & Bain 2004; Valdimarsson 2007; Subasinghe et al.
3
2009; Young et al. 2011; Belton & Bush 2014). To satisfy the high demand for seafood
products, aquaculture has been undergoing diversification of farmed species and
intensification of production systems (Lin & Yi 2003; Crab et al. 2007; Bosma &
Verdegem 2011). Food is a major issue in the politics of sustainable consumption and
production because of its impact on the environment, economy and social cohesion
(Neiland et al. 2001; Crab et al. 2007; De Silva & Hasan 2007; Kluts et al. 2012; Reisch et
al. 2013). In Vietnam, since 2000, limits for aquaculture development have been identified
(Nguyen et al. 2009; Tuan et al. 2013) that acknowledge i) development of aqua-farming is
unstable and has a high risk; ii) aquaculture has been a cause of environmental pollution of
soil and water; iii) the operational linkages among stakeholders along the value chain of
farmed species are limited; and iv) guaranteed food safety standards for farmed production
are insufficient. As an outcome, sustainability issues have been made a higher priority in
the master plan of the fisheries sector up to 2020 (Nguyen et al. 2009; MARD 2009b;
GOV 2013). Although sustainable development has become a target for aquaculture
planners (MARD 2009b; MARD 2009c); its value has been to direct strategies for future
development in general. There has been a lack of specific analysis on factors that drive
sustainability, such as the role of value chain actors and which factors influence their
operations, etc. Value chains of aquatic production typically include many stakeholders,
either as direct, indirect or supporting actors. To upgrade a value chain towards sustainable
development, clarification on current practices and the role of stakeholders along the value
chain are needed. Consideration of the gradually increasing interest in sustainable food
consumption (Subasinghe et al. 2009; Bostock et al. 2010; Brunori et al. 2011; Reisch et al.
2013), an understanding of the perceptions of sustainability issues by different stakeholder
groups along value chains and their corresponding measurement tools should be within the
scope of the planning process. Thus, this study aims to identify the sustainability issues of
4
striped catfish and shrimp industries by assessing what the main sustainability issues are
raising concern. These are likely to encompass social, economic and environmental factors
at a defined level in the system hierarchy in the context of this study. The further
expectation of this study is to develop a framework for sustainability assessment of aquatic
farmed products. This chapter begins with a literature review of sustainability issues and
certification in the aquaculture sector. This is followed by an introduction to research,
including research objectives, research scope and structure of the thesis.
1.2. Sustainability issues in Aquaculture development
1.2.1. Sustainability development
a). Sustainable development concept
There are various definitions of terms used by different authors and organizations, that are
synonyms for sustainable development such as, ‘green chemistry’, ‘cleaner production’
and ‘pollution prevention’, etc. (Glavič & Lukman 2007; Bell & Morse 2008). The general
definition of sustainable development defined by the International Institute for Sustainable
Development is:“Sustainable development is not a ‘fixed state of harmony’. Rather, it is an
ongoing process of evolution in which people take actions leading to development that meets their
current needs without compromising ability of future generations to meet their own needs” (Hardi
& Zdan 1997).
Sustainability in the context of sustainable development is characterized by its many
dimensions (Sheriff 2004; Bell & Morse 2008). Sustainability can be defined by principles
that have environmental and ecological, economic, and societal dimensions (Lehtonen
2004; Glavič & Lukman 2007; Simard et al. 2008; SustainAqua 2009). Disregard of any of
these three dimensions of sustainable development cannot adequately address
sustainability (Sheriff 2004; Setthasakko 2007). Three-dimensional principles can serve
5
as a basis for building a more complex system (Glavič & Lukman 2007). The definition of
the system in a sustainability context allows us to determine what it is we are trying to
sustain (Sheriff 2004; Bell & Morse 2008). The system is a whole and has the potential to
change itself; the system is involved with its own sustainability; it can change as its
environment alters in order to be sustained (Bell & Morse 2008). Sustainable systems
present the highest level of activities required to make progress towards sustainable
development (Glavič & Lukman 2007). Sustainable development emphasizes the
evolution of human society from a responsible economic point of view, in accordance with
environmental and natural processes. Furthermore, in the sustainable development
paradigm the limitations of economic, societal and environmental resources are considered
in order to contribute to present and future generations’ welfare and can be applied at local,
regional, national and international levels (Glavič & Lukman 2007). However,
sustainability is vaguely defined and it does not provide explicit directions as to what the
values of sustainable development are and little guidance on how to set priorities (Olesen
et al. 2010). In the literature, there is frequent reference to two types of sustainability
depending upon the costs incurred in attaining them: strong and weak sustainability.
Strong sustainability implies that the environment is critical for our, and our children’s,
survival, and that any damage will have negative repercussions. It equates to what some
call ecological sustainability and the focus is primarily on the environment (Sheriff 2004;
Bell & Morse 2008; Gandini et al. 2009; Ekins 2011). Weak sustainability equates to a sort
of economic sustainability where the emphasis is upon allocation of resources and levels of
consumption, and financial value is a key element of system quality. Of these two, weak
sustainability currently dominates in the global economy (Sheriff 2004; Bell & Morse
2008).
6
b). Innovation and agriculture development
Development enables agriculture and people to adapt when challenges occur and to
respond readily when opportunities arise; because agriculture’s characteristics, including
physical, social and economic environment, change continually (Juma 2011; World Bank
2012). The World Bank (2012) noted that agricultural development depends on innovation,
and innovation is recognised as a major source of improved productivity, competitiveness,
and economic growth throughout advanced and emerging economies (Sumberg 2005;
World Bank 2006; Spielman et al. 2009; Juma 2011; World Bank 2012). However,
innovation in addition to technology, also includes social and institutional change; and has
a systemic and co-evolutionary nature (Biggs 1990; Kilelu et al. 2013). Innovation also
plays an important role in creating jobs, generating income, alleviating poverty, and
driving social development (Sumberg 2005; Juma 2011; World Bank 2012). In this regard
to the context, markets, globalization and a changing environment not only influence
patterns of consumption, competition and trade, but also drive agricultural development
and innovation (World Bank 2012). Actors involved in the value chain and in providing
knowledge providing interact in new ways to generate ideas or develop responses to
changing agricultural conditions (World Bank 2006; World Bank 2012). If the actors
(farmers, agribusinesses, and even nations) are to cope, compete and thrive in the midst of
changes in agriculture, they must innovate continuously (Juma 2011; EU SCAR 2012;
World Bank 2012). Therefore, the agriculture sector is required to continually innovate if it
is to contribute to sustainable development. In this context, the agricultural innovation
system (AIS) approach has advocated as a framework for understanding bottlenecks and
identifying opportunities for enhancing the innovation capacity of agricultural systems
(World Bank 2006; World Bank 2012; Kilelu et al. 2013).
7
The AIS framework has been increasingly applied to analyze technological, economical
and institutional change in the agriculture sector (Hall et al. 2003; Temel et al. 2003;
Sumberg 2005; World Bank 2006; Spielman et al. 2008; Spielman et al. 2009; Klerkx et al.
2010; Juma 2011; EU SCAR 2012; World Bank 2012; Kilelu et al. 2013). The AIS
approach shows innovation is the process of networking and interactive learning among
multiple actors, such as farmers, input industries, processors, traders, researchers,
government officials, and civil society organizations (World Bank 2006; Klerkx et al.
2010; Juma 2011; EU SCAR 2012; World Bank 2012). An innovation system can be
defined as a system of innovation that involves these multiple actors and their interactions
that involved in the production, use of knowledge, and the institutional and policy context
that shapes the processes of interacting, knowledge sharing and learning (Sumberg 2005;
World Bank 2006; Spielman et al. 2009; Juma 2011; EU SCAR 2012; World Bank 2012;
Hermans et al. 2013; Hall 2014). An orchestrated innovation system has three main phases
of development (World Bank 2006; Juma 2011; EU SCAR 2012): i) pre-planned phase, in
which no research or other policy intervention has been made, as new opportunities have
not yet been identified; ii) foundation phase, priority sectors and commodities have been
identified, and the government supports them through research and policy interventions;
and iii) an expansion phase, the government intervenes with projects and special
programmes to link actors in the innovation system. Agricultural innovation typically
arises through dynamic interaction among the actors who involved in value chain (i.e.
growing, processing, packaging, distributing, and consuming or otherwise using
agricultural products), and thus interactions between these diverse actors need to be open
and to draw upon the most appropriate available knowledge (Juma 2011; EU SCAR 2012;
World Bank 2012).
8
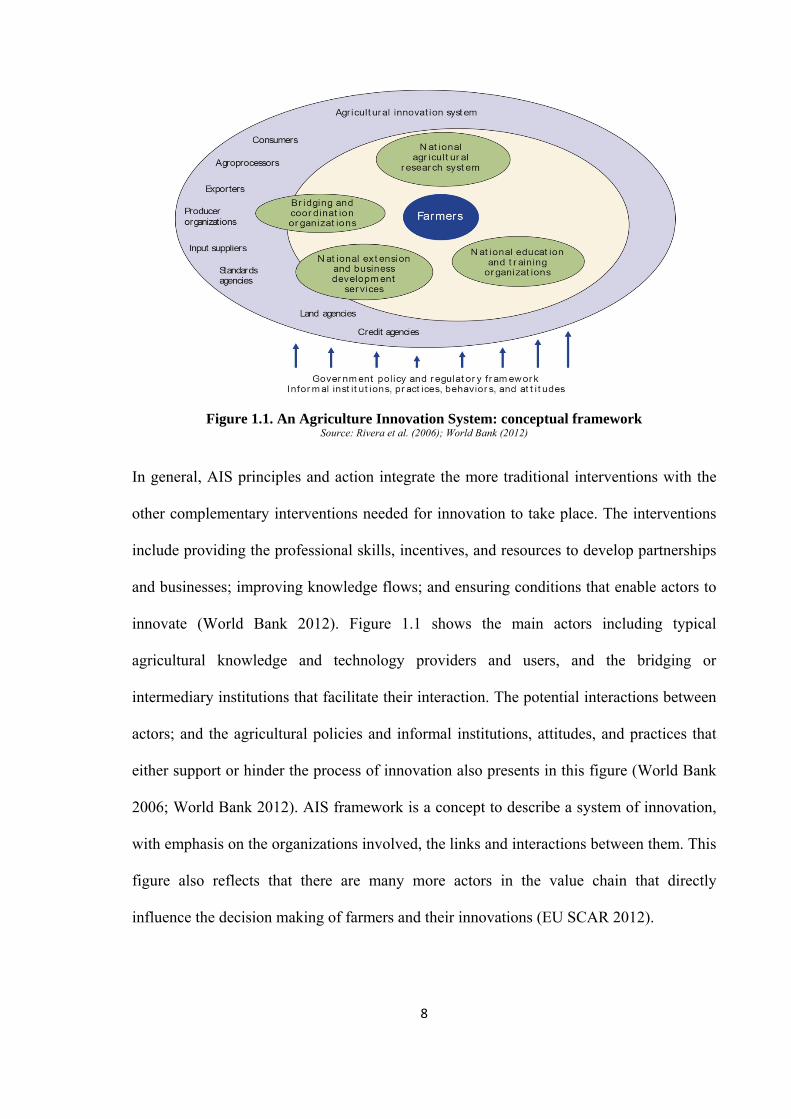
Figure 1.1. An Agriculture Innovation System: conceptual framework Source: Rivera et al. (2006); World Bank (2012)
In general, AIS principles and action integrate the more traditional interventions with the
other complementary interventions needed for innovation to take place. The interventions
include providing the professional skills, incentives, and resources to develop partnerships
and businesses; improving knowledge flows; and ensuring conditions that enable actors to
innovate (World Bank 2012). Figure 1.1 shows the main actors including typical
agricultural knowledge and technology providers and users, and the bridging or
intermediary institutions that facilitate their interaction. The potential interactions between
actors; and the agricultural policies and informal institutions, attitudes, and practices that
either support or hinder the process of innovation also presents in this figure (World Bank
2006; World Bank 2012). AIS framework is a concept to describe a system of innovation,
with emphasis on the organizations involved, the links and interactions between them. This
figure also reflects that there are many more actors in the value chain that directly
influence the decision making of farmers and their innovations (EU SCAR 2012).
9
In regards to the aquaculture sector, aquaculture is one of the fastest growing agro-food
sectors globally, and this phenomenon is often referred to as the ‘blue revolution’ (Ponte et
al. 2014). The ‘blue revolution’ in aquaculture sector rapidly increased productivity
through technology-driven intensification of aquaculture production (Culver & Castle
2008; Ponte et al. 2014). Technology-driven intensification is an ordinary extension of past
practices, and is still a better way to increase the aquaculture production in the future
(Culver & Castle 2008). However, technology is just one among many other sources of
innovation, and innovation is only one among many factors that influences sustainable
livelihoods (Baur et al. 2003; Temel et al. 2003; Sumberg 2005; Spielman et al. 2008;
Spielman et al. 2009; Klerkx et al. 2010; Kilelu et al. 2013). In this regard, ‘innovation’ of
aquaculture may be associated with the introduction of new technology, significantly
improved product (good or service) or process, and implementation of a new
organizational method in business practices (World Bank 2006; Culver & Castle 2008).
However, transformation of communities may not be positive if technological change
challenges core community values to point that social cohesion is threatened. This reflects
that the resistance to technological change can be strong when the potential beneficiaries of
innovation have no pressing need for those benefits (Culver & Castle 2008).
c). Aquaculture and factors driving for sustainability
Aquaculture is producing an increasing proportion of fish to meet global demand for
seafood as capture fisheries decline (Asche & Guttormsen 2009; Subasinghe et al. 2009;
Smith et al. 2010; Bosma & Verdegem 2011; Huysveld et al. 2013). In value terms, fishery
and aquaculture products are the most traded food in the world. In 2010 some 148.50
million MT accounting for 38% of total fisheries production was traded internationally
(Young et al. 2011; FAO 2012). Developing countries accounted for over half the value of
all seafood exports; of which 67% were directed to developed countries (FAO 2012), and
10
the EU, Japan and the United States were the main importing markets (SEAT 2009; Smith
et al. 2010; FAO 2012). Aquaculture can enhance both food security and employment in
developing countries, and it is important for many economies in particular for developing
nations (Browdy & Hargreaves 2008; Hishamunda et al. 2009; FAO 2012; Belton & Bush
2014). Aquaculture represents one strategy put forward by WCED (1987), and endorsed
through Agenda 21 to tackle issues of food security, as it has the potential to make
significant contributions to development by improving incomes, providing employment
opportunities and increasing the returns on resource use (Nhuong et al. 2002; Sheriff 2004;
Gandini et al. 2009; Le 2009; Subasinghe et al. 2009; Costa-Pierce et al. 2011; Belton
2013; Hishamunda et al. 2014). Increasing international trade in farmed seafood
potentially affects large numbers of people, far removed from the sites of production, with
wider implications for sustainability. In contrast, those promoting bio-economic
interpretations of sustainable aquaculture use profitability based on sound environmental
management as their key objective; in practice, tradeoffs are likely between environmental
impacts and profitability. Trade-offs between policy and practice reflects weak and strong
sustainability, and has become a constant tension (SEAT 2009) and the focus on
sustainable production alone has shifted to incorporate to sustainable consumption
(Brunori et al. 2011).
Some view the most sustainable way to increase aquaculture production is through
intensification of existing systems (Lin & Yi 2003; Subasinghe et al. 2009; Costa-
Pierce 2010; Bosma & Verdegem 2011). However, rapid growth of aquaculture could
lead to a number of technical, environmental, economic and social problems (Neiland et
al. 2001; Lin & Yi 2003; Crab et al. 2007; De Silva & Hasan 2007; Gandini et al. 2009;
Kluts et al. 2012). The sector also faces resource allocation and technological challenges
(De Silva & Hasan 2007). Consequently, the impacts of aquaculture on the environment
11
and on society have been a major source of criticism, and caused reflection on the nature of
sustainability within the aquaculture sector (Simard et al. 2008; Gandini et al. 2009;
Valenti et al. 2011; EU 2013; USAID 2013). Further expansion of aquaculture is
constrained by many factors, including lack of appropriate extension approaches and
technological know-how, high prices of feed and other inputs, lack of quality seed, lack of
suitable sites, water quality degradation and lack of investment capital (Costa-Pierce 2010;
Murshed-E-Jahan & Pemsl 2011). A critical constraint in all livestock production is the
challenge of maintaining health and welfare, particularly during intensification (Shang et
al. 1998; Lebel et al. 2002; Rico et al. 2012). In addition, among the factors that might
influence the sustainability and growth of seafood trade are the evolution of production and
transportation costs, the products prices and alternative commodities (FAO 2012; Kelling
2012). Thus, if aquaculture is to continue its rapid expansion into the 21st century, a focus
on sustainability and equity must go hand in hand with a focus on productivity (Dey &
Ahmed 2005). Tacon et al. (2009) suggested that a strategy to ensure the contribution of
aquaculture to sustainable development should be guide by three main principles: i)
aquaculture should be developed in the context of ecosystem functions and services with
no degradation of these beyond their resilience capacity; ii) aquaculture should improve
human well-being and equity for stakeholders; and iii) aquaculture should be developed in
the context of other relevant sectors. Aquaculture development needs be balanced among
all four dimensions, namely food supply, food safety, environment and social/poverty
concerns, which implies the nature of aquaculture development does pose trade-offs
between social or economic benefits and environmental impacts (Steinfeld et al. 2006).
Sustainability in aquaculture can therefore not only be weak sustainability (Bell & Morse
2008), but also environmental protection that is a form of strong sustainability as
aquaculture development depends on a sound environment (Zhang 2014).
12
1.2.2. Sustainable aquaculture
The FAO definition of sustainable agricultural development is “…such sustainable
development in agriculture, forestry and fisheries sectors conserves land, water, plant and animal
genetic resources, is environmentally non-degrading, technically appropriate, economically viable
and socially acceptable” (FAO 1995).
Sustainability of aquaculture has to be considered along with broader economic and
environmental sustainability. It appears from examples in the region that aquaculture
seriously damages the environment and can be economically unsustainable (Kutty 1995;
Simard et al. 2008; Valenti et al. 2011). Sustainability of aquaculture not only requires that
it has a neutral effect on the environment, but also that it be economically feasible, and
take a more holistic approach to sustainability in which social issues receive progressively
more attention (Sheriff 2004; Barrington et al. 2008). Sustainability in aquaculture is
receiving increasing attention; emphasis is placed on policy development and the
production of guidelines for sustainability. In a development context, the concept of
sustainable aquaculture is often to be found associated with that of sustainable livelihoods,
as development agencies and national governments seek to conserve natural resources
whilst simultaneously improving the livelihoods of farmers (Sheriff 2004). It has been
claimed that sustainable aquaculture occurs when it is capable of self-regeneration with
fewer inputs from the outside, and with minimal negative environmental, social, and
economic impacts (Jolly et al. 2009; Exequiel et al. 2009). Unfortunately, the imprecision
of such definitions makes them difficult to use as ‘self-generation’ and ‘fewer’ inputs are
subjective. At the farm level highly integrated systems described for China in the 1970s
(Ruddle & Gongfu 1988; Little & Edwards 2003) were actually dependent of large
volumes of outside nutrients from beyond the farm. For example, the EU strategy for
sustainable development of the European aquaculture industry aims at creating long-
13
term secure employment, assuring the availability to consumers of products that are
healthy, safe and of good quality, as well as promoting animal welfare standards and
ensuring an environmentally sound industry (Focardi et al. 2005; Brunori et al. 2011).
Again this may be misleading in that Europe is, and is likely to remain, highly dependent
on flows of nutrients from outside the region as imported feed ingredients, the production
of such concentrated feeds has large global environmental impact (Mungkung et al. 2006;
Bosma et al. 2011; Cao et al. 2011; Heijungs et al. 2012; Huysveld et al. 2013).
There have been several efforts to create a conceptual framework for understanding and
defining sustainable aquaculture. The objectives of aquaculture development are aligned
with the three national goals of economic development, social development and
environmental sustainability (Simard et al. 2008; Bueno 2009; Paul & Vogl 2011). With
scarce resources and a growing population, decision-makers face the challenge of
developing a sustainable aquaculture industry in their planning decisions (Martinez-
Cordero & Leung 2003). For aquaculture to survive and be sustainable it also has to
compete with other systems to achieve its designated goal (Jolly et al. 2009). Thus, the
necessity for inter-sectoral linkages to promote sustainable rural development; loss of
access to the natural resource base may be due to unsustainable models of resource
management and exclusion of use as a result of other competing uses such protected areas,
tourism and large-scale agriculture development (Siar & Sajise 2009). Consequently, the
absence of a system perspective on the development plan are the major barriers to the
creation of corporate sustainability (Setthasakko 2007). Recently, a consensus or
stakeholder view has approached sustainability of aquaculture from three perspectives that
are presented in the following sections (Frankic & Hershner 2003; Sheriff 2004; Pullin
et al. 2007; Simard et al. 2008; Ommani & Chizari 2010; Samuel-Fitwi et al. 2012).
14
a). Environmental sustainability
Aquaculture operations must be environmentally friendly over a long-time horizon to be
sustainable. Sustainable development requires intergenerational equity, that is, the potential
of future generations must be at least as high as the present (Hishamunda &Ridler 2008).
Thus, it is logical to define environmental sustainability as the maintenance of important
environmental functions, and hence the maintenance of the capacity of the capital stock to
provide those functions (Ekins 2011). Environmentally sustainable aquaculture can be said
to be concerned with the maintenance of environmental sink and source capacities, keeping
waste emissions within the assimilative capacities of the environment without impairing it
and maintaining the supply of required inputs for the future of the production system
(Sheriff 2004). Environmental concerns have focused on the quantity of land, water and
energy use; water quality and control of effluents. In creating a sustainable aquaculture, it
is essential to strike a balance between the need for aquaculture development and the need
for natural resource conservation (Kutty 1995; Frankic & Hershner 2003; Ommani &
Chizari 2010). Hence, aquaculture needs an enabling policy environment to grow in a
sustainable manner and to be integrated into the agro-ecosystems, while minimizing
conflict occurrence (Lehtonen 2004; Subasinghe et al. 2009). Environmental policy
should be considered not only in terms of environmental impacts but also the interactions
between the environmental, social and economic dimensions of development (Lehtonen
2004). The main actors in aquaculture, including policy makers, the private sector,
development donors, producers and consumers will have to strive more for its
sustainability (Pullin et al. 2007).
Aquaculture has been vigorously developed in recent years (Muir 2005; Subasinghe et al.
2009; Bostock et al. 2010; FAO 2012; Belton & Bush 2014), and to satisfy these demands
of aquatic animal products, aquaculture development requires a larger share of natural
15
resources and has a greater environmental impact (Lin & Yi 2003; Subasinghe et al. 2009).
Therefore, the challenge for sustainable aquaculture growth is to improve production
performance while, at the same time, to minimize the environmental impacts
(Frankic & Hershner 2003; Martinez-Cordero & Leung 2003). For example, the
intensification and expansion of striped catfish production is a strategy to meet increasing
export demands; however, this may lead to an increase in environmental impacts in both
local impacts (i.e. pollution of surface water in the Mekong rivers) and global impacts (i.e.
contributing to most impact categories on the eutrophication and freshwater aquatic
ecotoxicity because of high feed production (ingredient production, transport and milling)),
which is one of the main outcomes of the sector expanding (Bosma et al. 2009; Nguyen &
Dang 2009; Phan et al. 2009; Anh et al. 2010b; Cao et al. 2010; Bosma et al. 2011; De
Silva & Nguyen 2011; Le 2011; Kluts et al. 2012; Nguyen et al. 2013; Huysveld et al.
2013). The sustainability of striped catfish farming is well related to external water
environment and effluent management. Striped catfish ponds are characterized by highly
intensive, high flow-through systems that produce high volume dilute effluents. Such
effluents are impractical to treat and have been considered as a source of pollutant causing
degradation of water environment in the long-term (Bosma et al. 2009; Anh et al. 2010b;
Cao et al. 2010; Truong et al. 2011; Kluts et al. 2012; Nguyen et al. 2013; Phan et al. 2013;
Mungkung et al. 2006; Nguyen et al. 2014). Effluents only cause problems when
discharged to surface waters, and this is always the case if they are not managed
judiciously (Avnimelech 2003; Rahman & Yakupitiyage 2004; Anh et al. 2010b; Truong et
al. 2011; Phan et al. 2013). Managing of effluent from striped catfish ponds so that
environmental pollution can be minimized is crucial for more sustainable farming striped
catfish culture in the MKD (Phuong et al. 2008; Cao et al. 2010; Truong et al. 2011; Phan
et al. 2013). Management practices should be implemented to reduce the amount of
16
suspended solids lost from farms in effluents and erosion, and to ensure that each
individual farm operates in as environmentally responsible manner (Boyd et al. 2000).
Environmental impacts can be reduced by using pond sludge in agriculture (Boyd &
Michael 1996; Rahman & Yakupitiyage 2004; Cao et al. 2010; Truong et al. 2011; Phan et
al. 2013; Haque et al. 2013) and by using feeds with a lower FCR (Boyd & Michael 1996;
Bosma et al. 2009; Anh et al. 2010b; Bosma & Verdegem 2011). Compared to pangasius, a
much greater range of intensity is obvious within the Vietnamese shrimp industry;
extensive systems, that receive very few nutrients, may be nutrient sinks. Many diseases of
importance to the aquaculture industry are linked to environmental deterioration and stress
associated with farm intensification (Shang et al. 1998; Lebel et al. 2002; Rico et al. 2012).
The shrimp industry has been overwhelmed by aquatic animal health problems (Kutty
1995; Rico et al. 2012), and shrimp diseases have emerged as a major constraint to
sustainable growth of shrimp culture (Shang et al. 1998; Lebel et al. 2002; Rico et al.
2012). Shrimp disease problems provoke the largest losses in the sector with many
countries having faced a significant reduction in production (Gräslund & Bengtsson 2001;
FAO 2013a). To solve this problem, farmers have relied on a wide variety of synthetic and
natural chemical and biological treatments to prevent and treat disease (Bush et al. 2010b;
Rico et al. 2012), giving rise to concerns about impacts of such chemicals on surrounding
ecosystems (Rico et al. 2012; Rico et al. 2013). Governments, shrimp farmers and the
chemical industry all have the responsibility to promote and inaugurate restrictive and
relevant use of chemicals in shrimp farming (Gräslund & Bengtsson 2001). Solutions to
the problem must deal with site selection, design and sustainable farm management (Shang
et al. 1998; Lebel et al. 2002; Rico et al. 2012).
17
b). Economic sustainability
Development of aquaculture typically seeks to serve major purposes: food security, income
generation and employment (Lin & Yi 2003). To achieve sustainability policies should be
considered that constrain day to day operations of the economy in ways that enhance the
natural resource endowments of future generations, but with an eye towards the economic
implications of specific steps to implement such a policy (Ekins 2011). In reality, a
trade-off is likely to be sought by policy makers and governments who seek to find a
balance between a strong and weak sustainability approach (Sheriff 2004). Economically
sustainable aquaculture ensures an income sufficient over the long term to enable
continued inputs, necessary developments, and profitability consistent with those of other
long-term agriculture investments (Kutty 1995). Economic issues have revolved around
profitability, market demand and production efficiency (Bueno 2009; Ommani & Chizari
2010). To be sustainable, aquaculture must offer the prospect of adequate returns; this
means that not only should returns be positive, but also they should be comparable to those
from similar activities (Khiem et al. 2010; Ommani & Chizari 2010; Ha et al. 2013).
Although some research suggest that the level of returns must be stable, meaning mortality
rates and prices of inputs and outputs should not be too volatile (Hishamunda & Ridler
2008), in practice the stability of returns may be more important, especially for
smallholders with limited assets to support perturbations in such input and market prices.
Aquaculture is essentially an economic activity, carried out in order to generate a financial
benefit for operators; thus, economic sustainability is also a goal for most farm operations.
The relationship between good farm management to reduce negative impacts on the
environment, and the subsequent economic benefits which can result, is therefore a key
topic in sustainable aquaculture (Sheriff 2004). For example, the striped catfish industry
generates income for producers, processors, exporters; and creates employment (Nguyen &
18
Dang 2009; VIFEP 2009a; Nguyen et al. 2009; Le 2011; De Silva & Nguyen 2011). The
financial sustainability of fish farming depends mainly on the market prices of products
and inputs, and on the production efficiency. Concern about the variability of price reflects
the fact that catfish farmers are producing their product without any guarantee of a sales
price as a result of weak operational linkages between farmers and processors (Bremer et
al. 2013). Le & Cheong (2010) also pointed out that striped catfish price variability and
unstable input costs were perceived generally as the most significant risk of this industry.
Both of these factors can be potentially detrimental and risk threatening the sustainability
of this sector. To ensure the economic viability of the catfish farming sector, more realistic
price structures need to be established (De Silva & Nguyen 2011), along with long-term
relationships between farmers and processors. In addition, improvement in farm
management and technical measures were perceived to be a more effective way to price
risk reduction (Le & Cheong 2010).
c). Social sustainability
Sustainable aquaculture must not only maximize benefits, but also minimize accumulation
of detriments, as well as other types of negative impacts on the natural and social
environment (Frankic & Hershner 2003). Social objectives are of equal importance to
economic and environmental concerns, in terms of well-being and equity for present and
future generations (Sheriff 2004; Glavič & Lukman 2007). The aim is to ensure that the
basic needs of the entire global community are met, excess consumption of materials and
energy is reduced and environmental damage is avoided (Glavič & Lukman 2007).
Sustainable production and consumption are about finding workable solution to social and
environmental imbalances through more responsible behavior by stakeholders.
Sociological interests have centered on employment, local concerns such as ownership,
19
regional sources of inputs and labour (Ommani & Chizari 2010); and thus social
sustainability depends on household capabilities, entitlements to resources, and on market
chain organization (Bosma & Verdegem 2011). To be sustainable, aquaculture must have
appropriate sites and systems acceptable to the local communities (Kutty 1995).
Setthasakko (2007) indicated that building a good relationship with local communities is
important for doing business in the long-run. In order to integrate sustainability,
development and management of aquaculture, it is essential that the conflicts between the
use of resources and their users should be well managed (Kutty 1995; Gandini et al. 2009).
For instance, considering the growing population pressure and competitive uses of land in
areas suitable for aquaculture, the potential to increase aquaculture production by
expanding the farmed area is limited. Intensification of existing systems may be the most
sustainable way to increase aquaculture and avoiding social conflicts (Bosma &
Verdegem 2011).
“Sustainable consumption” has emerged as being a key component of ethically responsible
food systems. This concept encompasses multiple aspects, ranging from food and water
security to fair trading conditions, to species-appropriate livestock breeding (Reisch et al.
2013). Thus, aquaculture should promote both food security and safety as key components
of human well-being as well as ensuring high welfare outcomes for both the fish and those
vulnerable actors in associated value chains. Planning for sustainable seafood supplies for
society must involve the close interaction of both aquaculture and fisheries planners
(Costa-Pierce 2010). The growth of aquaculture has been coincidental with increased
social awareness of the environmental consequences of development (Sheriff 2004) and
social responsibility (De Silva & Nguyen 2011; Khoi et al. 2011). For example, the rapid
growth of the striped catfish industry has led to a series of concerns over environmental
and social sustainability (Anh et al. 2010b; Pham et al. 2011; Le 2011; De Silva & Nguyen
20
2011). Little et al. (2012) noted the negative coverage of the striped catfish and its trade
with the EU by organizations such as the WWF and members of the European Parliament
in terms of environmental, social and safety attributes. However, the same authors
recommend that all risk analyses should be science based. Moreover, safety and quality
control systems need to be based on risk assessment, and any actions taken should be
communicated to all interested parties in a manner that is unambiguous, transparent and
accessible (Ababouch 2007). The sustainability of aquaculture requires the development of
new national policies and regulations (De Silva & Nguyen 2011; Rico et al. 2012; Rico et
al. 2013). Based on the recognized human health hazards of consuming antibiotic residues,
the government has supported the establishment of several food safety controls at the
National level as well as in the private sector (Rico et al. 2012). It reflects that Vietnam has
strived to comply with the requirements set by the international markets in order to retain
access to them. Strengthened food safety control systems have resulted in a decline in
Rapid Alert System for Food and Feed (RASFF) notifications and the number of rejections
at EU borders in recent years, for instance, there was a significant number of rejections at
EU border of pangasius fillets consignments in 2009, but by 2012 the total number of
border rejections was relatively low (Palin et al. 2013). This gives more assurance that the
products being exported from Vietnam do not pose a significant danger to EU consumers
(Little et al. 2012; Palin et al. 2013).
1.2.3. Aquaculture certification
a). Major certification standards for aquaculture farming
Seafood markets have become increasingly stringent towards food quality and safety in
recent years, and then these issues increasingly began to include criteria related to
environmental and socioeconomic sustainability (Corsin et al. 2007; Bush 2008; Bush
21
2009; Brunori et al. 2011; CBI 2012). These criteria are generally expressed as standards,
however standards can be either mandatory or voluntary (Corsin et al. 2007; De Silva &
Nguyen 2011; Mohan 2013). Mohan (2013) interpreted the drivers for food standards
development as i) society looking for sustainable consumption, food safety, quality and
equity products; and ii) markets looking for an endorsement declaring compliance or
conformity to standards. Thus, certification schemes specific to aquaculture have
developed and emerged over the last decade (Bostock et al. 2010; Belton 2010;
Washington & Ababouch 2011; Belton et al. 2011). Certification standards are mostly a set
of criteria developed by private organisations and NGOs (Belton et al. 2011; De Silva &
Nguyen 2011). Certification is a market driven tool that provides guarantees related to
quality, safety, environmental impacts, social responsibility, traceability and transparency
of production processes (Washington & Ababouch 2011; Mohan 2013).
The popular aquaculture certification standards promoted by NGOs and industrial
organisations such as ASC, GlobalGAP and GAA-BAP are designed to improve social and
environmental performance of global aquaculture production (Tran et al. 2013; Mohan
2013). A brief summary of information on three popular certification schemes promoted in
the aquaculture sector, and the degree emphasis placed by each of the three schemes in a
number of important categories and selected criteria is presented in Table 1.1 (Corsin et al.
2007; Bush et al. 2009; GAA 2009; GAA 2010; ASC 2010; GlobalGAP 2011; Ponte et al.
2011; Belton et al. 2011; Nguyen 2012; Haugen et al. 2013). The level of emphasis of each
category and criteria describe the level of legal compliance of the standard requirements,
and it depends on the goal and type of standards such as GlobalGAP mainly relating to
food safety and quality while GAA-BAP and ASC mostly focusing on broader
sustainability attributes and environmental protection (GAA 2009; GAA 2010; ASC 2010;
GlobalGAP 2011).
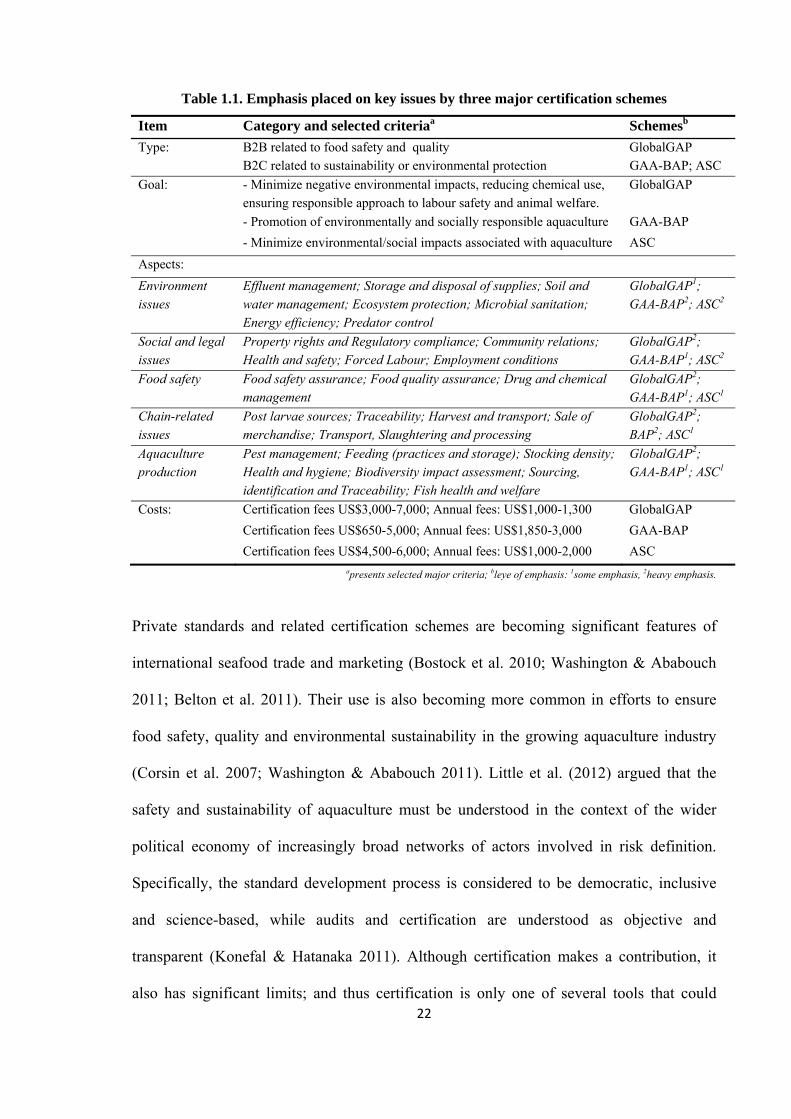
22
Table 1.1. Emphasis placed on key issues by three major certification schemes
Item Category and selected criteriaa Schemesb
Type: B2B related to food safety and quality GlobalGAP B2C related to sustainability or environmental protection GAA-BAP; ASC
Goal: - Minimize negative environmental impacts, reducing chemical use, ensuring responsible approach to labour safety and animal welfare.
GlobalGAP
- Promotion of environmentally and socially responsible aquaculture GAA-BAP
- Minimize environmental/social impacts associated with aquaculture ASC
Aspects:
Environment issues
Effluent management; Storage and disposal of supplies; Soil and water management; Ecosystem protection; Microbial sanitation; Energy efficiency; Predator control
GlobalGAP1; GAA-BAP2; ASC2
Social and legal issues
Property rights and Regulatory compliance; Community relations; Health and safety; Forced Labour; Employment conditions
GlobalGAP2; GAA-BAP1; ASC2
Food safety
Food safety assurance; Food quality assurance; Drug and chemical management
GlobalGAP2; GAA-BAP1; ASC1
Chain-related issues
Post larvae sources; Traceability; Harvest and transport; Sale of merchandise; Transport, Slaughtering and processing
GlobalGAP2; BAP2; ASC1
Aquaculture production
Pest management; Feeding (practices and storage); Stocking density; Health and hygiene; Biodiversity impact assessment; Sourcing, identification and Traceability; Fish health and welfare
GlobalGAP2; GAA-BAP1; ASC1
Costs: Certification fees US$3,000-7,000; Annual fees: US$1,000-1,300 GlobalGAP
Certification fees US$650-5,000; Annual fees: US$1,850-3,000 GAA-BAP
Certification fees US$4,500-6,000; Annual fees: US$1,000-2,000 ASC apresents selected major criteria; bleye of emphasis: 1some emphasis, 2heavy emphasis.
Private standards and related certification schemes are becoming significant features of
international seafood trade and marketing (Bostock et al. 2010; Washington & Ababouch
2011; Belton et al. 2011). Their use is also becoming more common in efforts to ensure
food safety, quality and environmental sustainability in the growing aquaculture industry
(Corsin et al. 2007; Washington & Ababouch 2011). Little et al. (2012) argued that the
safety and sustainability of aquaculture must be understood in the context of the wider
political economy of increasingly broad networks of actors involved in risk definition.
Specifically, the standard development process is considered to be democratic, inclusive
and science-based, while audits and certification are understood as objective and
transparent (Konefal & Hatanaka 2011). Although certification makes a contribution, it
also has significant limits; and thus certification is only one of several tools that could
23
move the industry towards more sustainable production and indeed a ‘sustainability
thinking process’, but not a solution to all problems (Allsopp et al. 2008; Bush et al. 2013;
Mohan 2013; Han & Immink 2013). Recently, certification moved from control of the
finished product at the processing plants to control on the overall process (Corsin et al.
2007; Reilly 2007; Yamprayoon & Sukhumparnich 2010; Nguyen 2012). Certification
might require the introduction of new management systems; however, seafood producers in
developing countries already struggle to meet mandatory requirements (Washington &
Ababouch 2011). For instance, the Vietnamese striped catfish industry has garnered
increasing international interest and scrutiny recently due to its rapid ascendance to global
prominence (Bush et al. 2009; Belton et al. 2011), as a result it has become the potential
subject of certification standards. Although food safety is probably the most significant
issue there is evidence of increasing awareness of the environmental and social issues
related to striped catfish industry (Bush et al. 2009; Anh 2010). To meet the growing
sustainability expectations of these export markets, Vietnam has made a number of steps
towards certification; the VietGAP standards were developed, promoted and considered a
stepping stone towards compliance to internationally recognized standards such as the
ASC, GlobalGAP and BAP (Nguyen et al. 2009; Ponte et al. 2011; GOV 2013).
b). Role of food standards in sustainable aquaculture
Certification is to increase consumer trust, provide legitimacy to producers and reduce
liability by ensuring compliance with food safety and quality standards (Bush et al. 2013).
Trifkovic (2013) indicated that food quality and safety standards have gained an important
position in world markets recently. However, until recently there was only a small
proportion of world aquaculture production certified (4.6%), and an estimate of additional
demand was low (7.9%) (Bush et al. 2013). The greatest demand for certified aquaculture
24
products comes from North America and Europe (Bush et al. 2013). Constraints to further
growth are the higher market prices for certified products; the price of striped catfish
products certified by ASC was 10-25% higher than uncertified products in the Netherlands
market (Beukers et al. 2012). Overall, the impact of private standards on the trade and
marketing of seafood is likely to increase as supermarket chains consolidate their role as
the primary distributors, and as their procurement policies move away from open markets
towards contractual supply relationships (Washington & Ababouch 2011). Standards are
becoming increasingly important for developing country farms and firms because they
determine the mechanisms of participation in specific global value chains and shape
market access to specific countries (SEAT 2009). Standards have been characterised as a
tool of communication between the primary producers and the end consumers, enabling
primary producer economic freedom with social responsibility (De Silva & Nguyen 2011).
Moreover, standards set entry barriers to new participants in a value chain and raise new
challenges to existing developing country suppliers (SEAT 2009).
Certification in aquaculture can have positive effects by spurring new competitive
advantages and investments, but it can also disguise underlying intentions to protect
domestic industries and restrict market access (Subasinghe et al. 2009). Even though the
producers bear high costs of investment in standards, previous studies have found that the
return from standards can be positive compared to uncertified cases (Trifković 2013).
Application of ASC standards to striped catfish farms increased productivity by 15%
(Corsin 2013) and shrimp farms certified by GAA-BAP achieved better production
efficiency (Lam & Truong 2010). In Thailand, Code of Conduct (CoC) shrimp farms
obtained a higher net profit of US$0.48/kg (Pongthanapanich & Eva 2006). In addition, the
large impacts of certifying programmes can be partly explained with reference to the
higher prices from production with standards (Trifković 2013), such as the ASC certified
25
catfish farms can receive 5% premium price (Corsin 2013); shrimp farms can get 6%
premium price when their farm are certified by Naturland (Ha et al. 2012; Omoto 2012; Vu
et al. 2013); shrimp farms certified by GAA-BAP received an 11% premium price (Lam &
Truong 2010); and CoC shrimp farms in Thailand achieved a price premium of
US$0.63/kg over conventional shrimp (Pongthanapanich & Eva 2006). The higher than
standard price is most likely a consequence of better quality, which is achieved through
application of standards (Trifković 2013; Corsin 2013). One should expect farms that
apply standards to be better off than comparable farms with traditional production (Pham
& Truong 2011; Tuan 2013; Trifković 2013). For farmers and processors alike, the
adoption of standards is motivated by a desire to improve market access by ensuring
quality supply (Bush et al. 2010; Trifković 2013). Belton et al. (2011) also indicated that
certification is an increasingly pervasive form of market governance through which
retailers and NGOs are able to exert control over producers of primary products in order to
secure their interests. Although certification is an important contributor to sustainable
production and consumption, the long-term impact of certification should also be
considered, such as i) only commodities exported to developed markets are covered, while
dominant species like carps are not seriously considered; and ii) only better performing
segment of the sector are considered (Mohan 2013).
c). Producer compliance constraints and the way forward
The complexities of food safety and public health regarding the origins of products,
production process and potential dangers to importing countries can dramatically affect
access to markets by producers in developing countries (Dey & Ahmed 2005; SEAT 2009;
Kelling et al. 2010). A lack of proper knowledge and awareness, poor access to
information on requirements, lack of expertise and trained people to examine compliance
26
requirements, lack of technological capacity and weak implementation and monitoring
capacity, have all been cited as major constraints for developing countries (Kelling et al.
2010; Mohan 2013; Ponte et al. 2014; Jespersen et al. 2014). As certification programmes
proliferate, questions will be raised about which certification programmes best serve
consumer protection, the environment, the public and the producers (Subasinghe et al.
2009). Compliance with some certification requirements could be difficult for producers,
especially small-farmers, who own or lease their farms and operate them individually
(Corsin et al. 2007; Nguyen et al. 2009; Subasinghe et al. 2009; Umesh et al. 2009;
Bostock et al. 2010; Bush et al. 2010b; Khiem et al. 2010; Belton et al. 2011; Belton &
Little 2011; Pham et al. 2011; Washington & Ababouch 2011; De Silva & Nguyen
2011; Ha et al. 2013; Haugen et al. 2013; Mohan 2013; Bush et al. 2013). For instance,
certification is not widespread at the striped catfish farm level, a higher prevalence of
certification is found among the vertically integrated farms owned by pangasius processors
(Belton et al. 2011; Bush & Belton 2012; Trifković 2013). The larger catfish farms are
most likely to achieve certification, since they tend to possess organizational structures and
characteristics amenable to the adaptation which will be needed to meet standard
requirements, and the requisite capitals required to facilitate proactive engagement with
certifiers (Bush et al. 2010; Belton et al. 2011; Bush & Belton 2012; Jespersen et al. 2014).
There appears to be a general belief that for the long-term sustainability and economic
survival of this sector it will have to make a shift towards large-scale farming practices
(Phan et al. 2009; De Silva & Nguyen 2011; Bosma & Verdegem 2011; Bush & Belton
2012; Trifković 2013; Jespersen et al. 2014; Ponte et al. 2014). The application of private
standards at the farm level is inhibited by financial constraints, as the costs of farm
upgrading and certification are high and tend to exclude the small-producers from the
export supply chain (Dey & Ahmed 2005; Oosterveer 2006; Subasinghe et al. 2009; Belton
27
2010; Khiem et al. 2010; Belton et al. 2011; Pham et al. 2011; Haugen et al. 2013). In
addition, at the producer level, the main concern is that standards may marginalize the
small farmers who are unable to meet the strict requirements due to a lack of technical
skills as well as a lack of ability to meet complex documentation requirements (Umesh et
al. 2009; Khiem et al. 2010; Belton & Little 2011; Pham et al. 2011; Trifković 2013;
Haugen et al. 2013). However, not all food certifications will exclude the small-scale
farmers in the supply chain but in order to maintain their position in the markets the small-
scale farms need to form cooperatives, and they can certify their products through contract
production for export companies using a group certification scheme. For example, Fair
trade for organic coffee production in Nicaragua (Bacon 2005; Utting 2008; Valkila 2009;
Bacon 2010), in Mexico (Gómez Tovar et al. 2005; González & Nigh 2005) and in Peru
(Ruben et al. 2009; Ruben & Fort 2012); Fair trade is a form of alternative trade that seeks
to improve the position of disempowered producers by ensuring that they are paid fair
prices for their goods and that financial benefits are used to promote sustainable
development in their communities (Lyon 2006; Valkila & Nygren 2009; Bacon 2010;
Ruben & Fort 2012). Fair Trade certification is only available to cooperatives of small-
scale farmers, therefore, for a small-scale farmer to be Fair trade and organically certified,
a cooperative membership is mandatory (Gómez Tovar et al. 2005; Cruz 2006; Valkila &
Nygren 2009; Valkila 2009; Bacon 2010).
Small-scale farmers make up the majority of Asian aquaculture and are mainly operated by
families and individuals (Subasinghe et al. 2009; De Silva & Davy 2009b; Tacon et al.
2009; Lazard et al. 2010; De Silva & Nguyen 2011) and capacity for collective action
necessary for such forms of certification limited. Small-scale aquaculture has been
characterized variously as family owned and operated, with a large percentage of the
labour usually provided by household members, utilizing small areas of land and/or water,
28
and limited investment in assets and operational costs (Siar & Sajise 2009; Bueno 2009;
Belton 2010; Belton & Little 2011; Belton 2013). Small-scale fish farmers, especially of
pangasius, are not necessarily ‘poor’, their systems are intensive and require significant
capital (Belton 2010; Belton & Little 2011; Belton 2013); for instance, the difference
between small-scale rice farmers and pangasius farmers shows that the ‘Vietnamese
pangasius farmers cannot be considered as poor smallholders’ due to the high levels of
investment required to partake in the activity and the returns which can be achieved
(Mantingh & Dung 2008; Belton et al. 2011). In contrast a typical small-scale rice
farmer is likely to be poor, practicing low-input farming on a limited land holding (1.2ha)
and earning just US$470 per annum (Belton 2010; Belton 2013). Because the small-scale
farmers operate independently and individually, the certification for individual farmers is
not only prohibitively expensive but also impractical (De Silva & Nguyen 2011). However,
participation in certification programmes will be essential for better market access in the
future. If the small-farmers are to benefit from this potentially profitable trade, policy-
makers will need to find ways to include them in these processes (Dey & Ahmed 2005; De
Silva & Nguyen 2011). Group certification of small-farmers could be a solution to retain
them in the participation of certification programmes (Umesh et al. 2009; Nguyen et al.
2010; Le 2011; Pham et al. 2011; Mohan 2013; Trifković 2013). The grouping of small-
farmers that share common natural resources becomes imperative to extend coverage to all
small-scale farmers in a cost-effective manner (Srinath et al. 2000; Umesh et al. 2009; De
Silva & Nguyen 2011). There is growing evidence that a farmer group based approach can
save on certification costs, as well as enable improved internal monitoring systems,
upgrading of communal infrastructure, improved economies of scale in production (Umesh
2007; Umesh et al. 2009; Nguyen et al. 2010; Tran et al. 2013). Thus, the group
certification approach can be one way forward; it can help to achieve economy of scale,
29
reduce costs and efforts of certification, and enable small-scale farmers to participate. Fair
trade certification for organic coffee production in Central and South America as an
example for the group certification of the small-scale producers, to apply Fair trade
certification the small-scale farmers must be organized into independent and democratic
associations (Gómez Tovar et al. 2005; Lyon 2006; Utting 2008; Ruben et al. 2009;
Valkila & Nygren 2009; Valkila 2009; Bacon 2010; Ruben & Fort 2012). For many small-
farmers organizing into group certification, they are able to produce sufficient quantities to
interest international buyers and may be one way for reducing these high costs in cases of
coffee production (Rice 2001; Gómez Tovar et al. 2005; Valkila 2009; Markelova &
Mwangi 2010), organic fruit production in Uganda (Preißel & Reckling 2010), dragon fruit
in Vietnam (Thao et al. 2006), and the group forest certification for smallholders
(Nussbaum 2002; Auer 2012). However, Ha et al. (2013) noted that producer farmer
groups are not a panacea for solving the challenges faced by small-holder farmers alone;
and if farmers are not able to improve market access or an increased price for their product,
they are unlikely to continue on a certification path (Ha & Bush 2010), and such groups are
prone to breakup if they cannot get positive economic benefits from their collective action
(Khiem et al. 2010). Hence, the government must play a more direct role in facilitating
farmer cooperatives by providing infrastructure and creating a legal framework for
agreement between farmers and the private sector (Nguyen et al. 2010; Le 2011; De Silva
& Nguyen 2011; Ha et al. 2012; Tran et al. 2013). Besides, vertical coordination is suitable
for improving the socioeconomic performance of small-scale farmers, thus reducing the
gaps in the supply chain performance (Grunert et al. 2005; Khoi 2011). For instance, to
meet increasing requirements for quality assurance, the striped catfish industry should set
up models of vertical integration in which seafood processors play key roles based on well-
known quality standards (Nguyen 2008; Nguyen 2009; Nguyen 2010). Thus, a substantial
30
investment and policy support for the small-scale sector will be required (Nguyen et al.
2010; Le 2011; De Silva & Nguyen 2011; Pham et al. 2011; Tran et al. 2013; Mohan
2013). One of the prerequisites enabling aquaculture to make a contribution to sustainable
development lies with a government’s commitment to providing appropriate support to the
sector (Dey & Ahmed 2005; Subasinghe et al. 2009; Nguyen 2010; Bush & Oosterveer
2012a; Ha et al. 2013). Moreover, the value chain actors in the seafood producing
countries have invested considerably in upgrading to meet basic food quality and safety
requirements, with the aim to access high-end European retail chains. Upgrading also
enabled them to access less demanding end-markets and market segments (Ponte et al.
2014). Many seafood suppliers are increasingly able to meet stringent demands (i.e.
logistics, quality, food safety, sustainability, etc.) placed by European value chain drivers
(Jespersen et al. 2014).
There are over 75 global certification programmes with different sustainability promises.
However, in some circumstances, there is poor transparency of performance of existing
certification programmes, higher costs because of duplication and confusion among
producers, buyers and consumers. Thus, global benchmarking tools are being developed
for seafood certification and labeling programmes to ensure confidence in the supply and
promotion of sustainable seafood to consumers, as well as to promote improvement in the
certification programmes (Prein 2013). Benchmarking certification is a tool to help solving
the compliance constraints for application and expanding of certification programmes.
Weymann (2013) reported that the GlobalGAP, ASC and GAA-BAP organizations had a
first meeting on 24th April 2013 to discuss benchmarking certification and also defined the
first areas on which they will work together, which are i) reducing duplication of effort for
farms that undertake certification against more than one standard; ii) exploring common
approaches to the management of certificate information potentially through shared IT
31
platforms; iii) developing common approaches to auditor training; and iv) developing
shared approaches to chain of custody certification. Moreover, the Global Sustainable
Seafood Initiative (GSSI) project is ongoing. The GSSI milestones are the development of
benchmarked tools in 2013 and capacity-building of producers/suppliers in 2015 (Prein
2013).
1.3. Introduction to research
1.3.1. Research objectives
General objectives: the objectives of this study was to identify the main sustainability
issues of striped catfish and shrimp industries in the Mekong Delta, Vietnam: establishing
the main sustainability issues raising concern and assessing how stakeholders are dealing
with the challenges of sustainability issues for future development.
The specific objectives of the study were:
o To provide an assessment of the development trends of major farmed seafood species
in the MKD that are exported or have potential for export, and also identify the major
factors that explain variation between them.
o To analyse the major factors affecting farming practices among farm categories; and
the distance between current farming practices and the standard criteria (i.e.
ASC/GAA-BAP/Global GAP).
o To assess the main changes of catfish and shrimp farming practices over time; the
major factors driving any changes; and the factors related to sustainability issues.
o To identify perceptions of sustainability held by different stakeholder groups along the
value chain; and their corresponding measurement tools and mitigation actions.
32
1.3.2. Focus of the research
The Sustaining Ethical Aquaculture Trade (SEAT), a large collaborative EU research
project (EU/FP7 funded project no. 222889), aimed to enhance the sustainability of four
major aquatic food commodities farmed (Striped catfish, Pangasianodon hypophthalmus;
Giant freshwater prawn, Macrobrachium rosenbergii; Shrimp, Penaeus
monodon/Litopenaeus vannamei; Tilapia, Oreochromis niloticus) in four Asian countries
(Bangladesh, China, Thailand and Vietnam) and exported to Europe (SEAT 2009). The
project concept was to develop an improved framework for sustainability assessment of the
trade in farmed aquatic products between Asia and Europe. This study was under taken as
a part of the SEAT project, and the primary fieldwork focusing on the shrimp and striped
catfish industries was carried-out in the MKD, Vietnam between 2009 and 2013. Both of
these species are fast growing, and are systemically important in terms of seafood export.
However, the rate of growth and levels of intensification of their systems in geographically
restricted areas is unprecedented, leading to serious sustainability concerns. Therefore, this
study focuses on identifying sustainability issues of shrimp and striped catfish industry
development in the MKD to gain an in-depth understanding of selected food chains from a
holistic systems perspective.
1.3.3. Structure of the thesis
The thesis is divided into four parts with seven chapters (Figure 1.2). Chapter 1 presents a
literature review and introduction to research. Chapter 2 explains the conceptual
framework of this study and research methodology. Chapter 3 provides an overview of the
development trend of seafood farmed species, which includes four main farmed species
(i.e. striped catfish; giant freshwater prawn; brackish-water shrimp; tilapia). The following
chapters focus on the striped catfish and brackish-water shrimp, which are major seafood
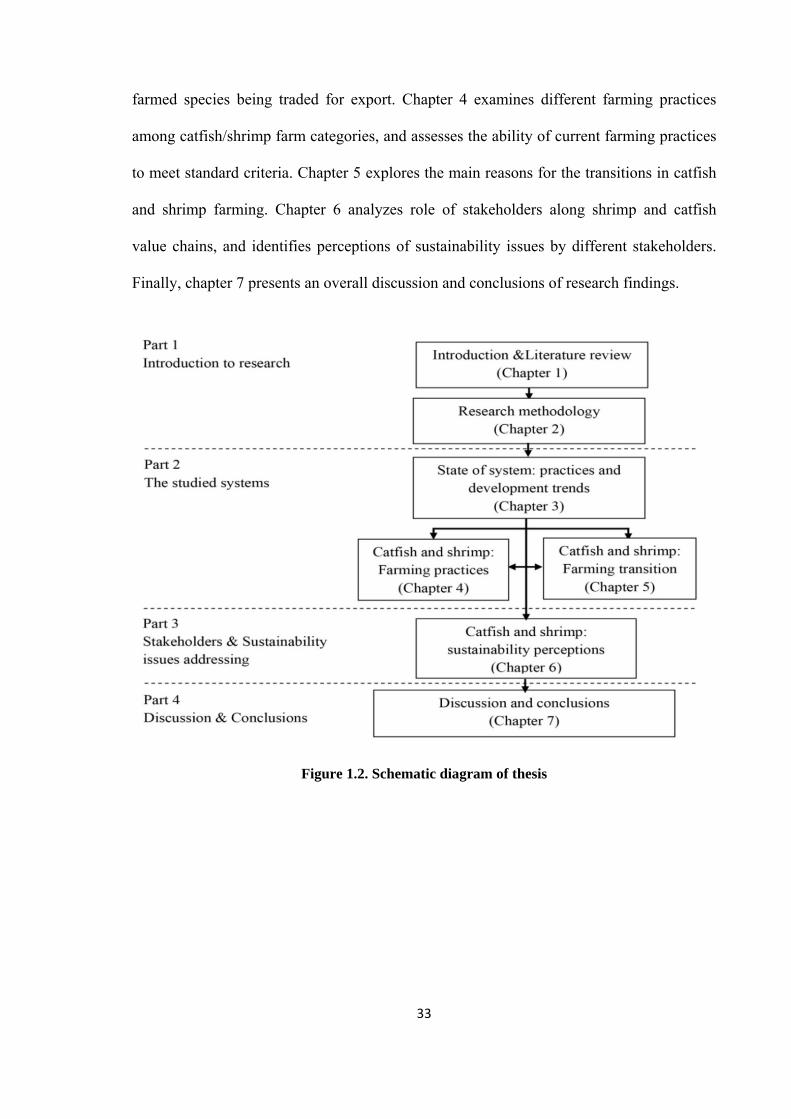
33
farmed species being traded for export. Chapter 4 examines different farming practices
among catfish/shrimp farm categories, and assesses the ability of current farming practices
to meet standard criteria. Chapter 5 explores the main reasons for the transitions in catfish
and shrimp farming. Chapter 6 analyzes role of stakeholders along shrimp and catfish
value chains, and identifies perceptions of sustainability issues by different stakeholders.
Finally, chapter 7 presents an overall discussion and conclusions of research findings.
Figure 1.2. Schematic diagram of thesis
34
CHAPTER 2
Chapter 2. Research methodology
2.1. Introduction
This chapter presents a conceptual framework for the study, research design, and steps of
data collection, data management and analysis. Firstly, the Global Value Chain framework
described by Gereffi et al. (2005) is applied for this study to explore the business
relationships in the supply chain and the perceptions of sustainability by different value
chain actors. Secondly, the research design presents the research phases used to collect
data. Data management and analysis are presented in the final section of this chapter.
2.2. Global value chains: conceptual framework for the research
The main objective of this study is to identify perceptions of sustainability held by
different stakeholder groups along the value chain and their corresponding measurement
tools. In order to answer the research questions, the global value chain (GVC) framework
was applied to examine governance issues that structure relationships between farmers,
traders, processors, exporters in the MKD, and buyers in importing countries. Inquiry into
the organisation of global production systems has been transformed by the development of
the global value chain framework (Trifković 2013). This approach reveals the structure of
business relations, including transactions and human behavior, related to information,
product, and financial flows through the chains. Therefore, the GVC approach offers an
opportunity to capture the synergy of intra- and intercompany integration and management
(Porter 1985; Lambert & Cooper 2000; Luning et al. 2006; Khoi 2011). Additionally, the
main concept of a value chain is taken to mean how private actors are organised in a set of
exchanges from production to consumption. Further to this vertical dimension of the chain,
horizontal dimensions are referred to; incorporating the organisation and relationship
35
between producers, and to a lesser degree the interventions made by actors outside the
value chain – most notably the government. The thesis lends itself to these concepts and in
fact it is this value chain that better defines the ‘system’ under study.
The GVC analysis (GVCA) is an analytical tool that has been widely used to explain the
dynamics of economic globalization and international trade, and is particularly pertinent to
farmed seafood (Ponte et al. 2014; Jespersen et al. 2014). The study on governance in
global value chains has covered a wide range of commodities such as textiles and apparel
(Gereffi & Korzeniewicz 1994; Frederick & Gereffi 2011), automobiles (Sturgeon et al.
2009), electronics (Sturgeon 2002), services and technologies (Dillemuth et al. 2011), and
agri-food sectors (Ponte 2002; Taylor 2005; Neilson 2008) and horticulture products
(Dolan & Humphrey 2000; Busch & Bain 2004; Challies & Murray 2011). GVCA is based
on examining discrete value chains that are explicitly governed to different degrees by one
or more groups of lead firms (Ponte et al. 2014; Jespersen et al. 2014). Value chains
represent the full range of value-adding activities that firms, farmers and workers carry out
to bring a product from its conception to its end use and beyond. Ponte et al. (2014)
indicated that GVCA has been employed to understand the wide variation of benefits
accruing from participation in different value chains and end markets in development
studies. GVCA focuses also on the vertical relationships between buyers and suppliers and
the movement of a product from producer to consumer (Ponte & Gibbon 2006; Khoi
2011). Moreover, GVCA allows examination of relationships between different value
chain actors engaged in production and trade of specific products, and the factors crucial
for understanding specific governance outcomes (Trifković 2013).
Gereffi et al. (2005) have formulated an analytical framework that yields governance
classifications that go beyond the original distinction between buyer-driven and producer-
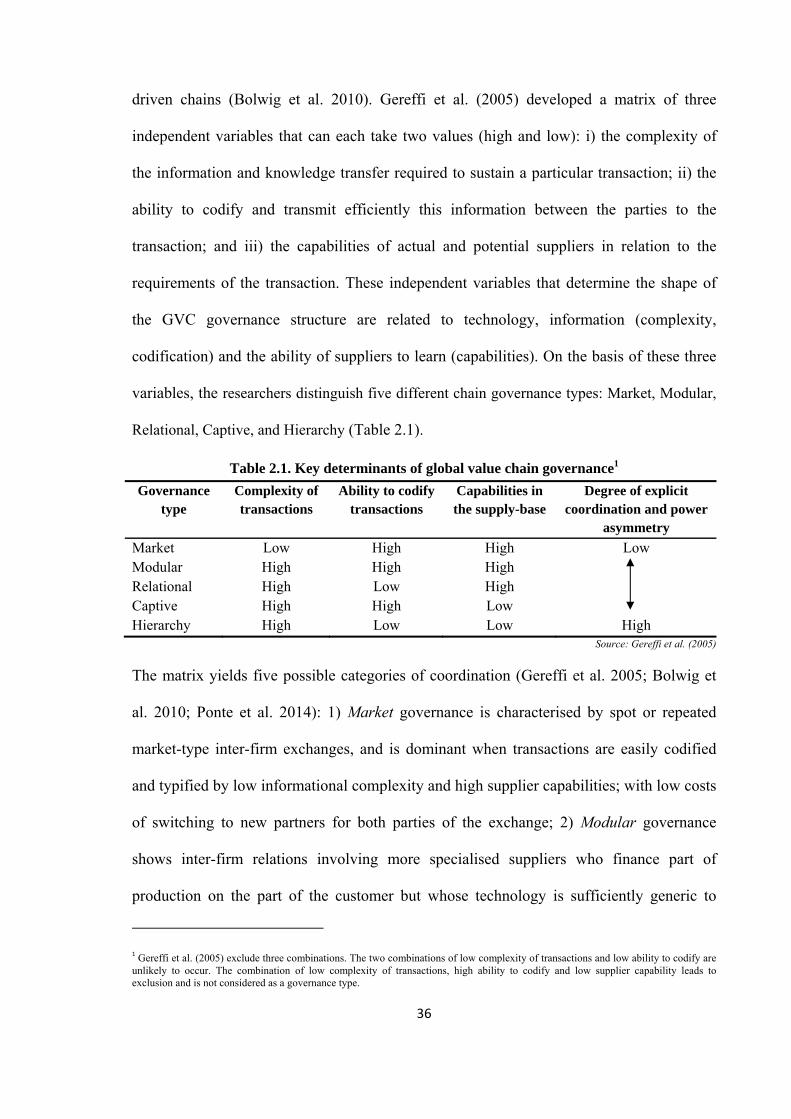
36
driven chains (Bolwig et al. 2010). Gereffi et al. (2005) developed a matrix of three
independent variables that can each take two values (high and low): i) the complexity of
the information and knowledge transfer required to sustain a particular transaction; ii) the
ability to codify and transmit efficiently this information between the parties to the
transaction; and iii) the capabilities of actual and potential suppliers in relation to the
requirements of the transaction. These independent variables that determine the shape of
the GVC governance structure are related to technology, information (complexity,
codification) and the ability of suppliers to learn (capabilities). On the basis of these three
variables, the researchers distinguish five different chain governance types: Market, Modular,
Relational, Captive, and Hierarchy (Table 2.1).
Table 2.1. Key determinants of global value chain governance1
Governance type
Complexity of transactions
Ability to codify transactions
Capabilities in the supply-base
Degree of explicit coordination and power
asymmetry
Market Low High High Low Modular High High High Relational High Low High Captive High High Low Hierarchy High Low Low High
Source: Gereffi et al. (2005)
The matrix yields five possible categories of coordination (Gereffi et al. 2005; Bolwig et
al. 2010; Ponte et al. 2014): 1) Market governance is characterised by spot or repeated
market-type inter-firm exchanges, and is dominant when transactions are easily codified
and typified by low informational complexity and high supplier capabilities; with low costs
of switching to new partners for both parties of the exchange; 2) Modular governance
shows inter-firm relations involving more specialised suppliers who finance part of
production on the part of the customer but whose technology is sufficiently generic to
1 Gereffi et al. (2005) exclude three combinations. The two combinations of low complexity of transactions and low ability to codify are
unlikely to occur. The combination of low complexity of transactions, high ability to codify and low supplier capability leads to exclusion and is not considered as a governance type.
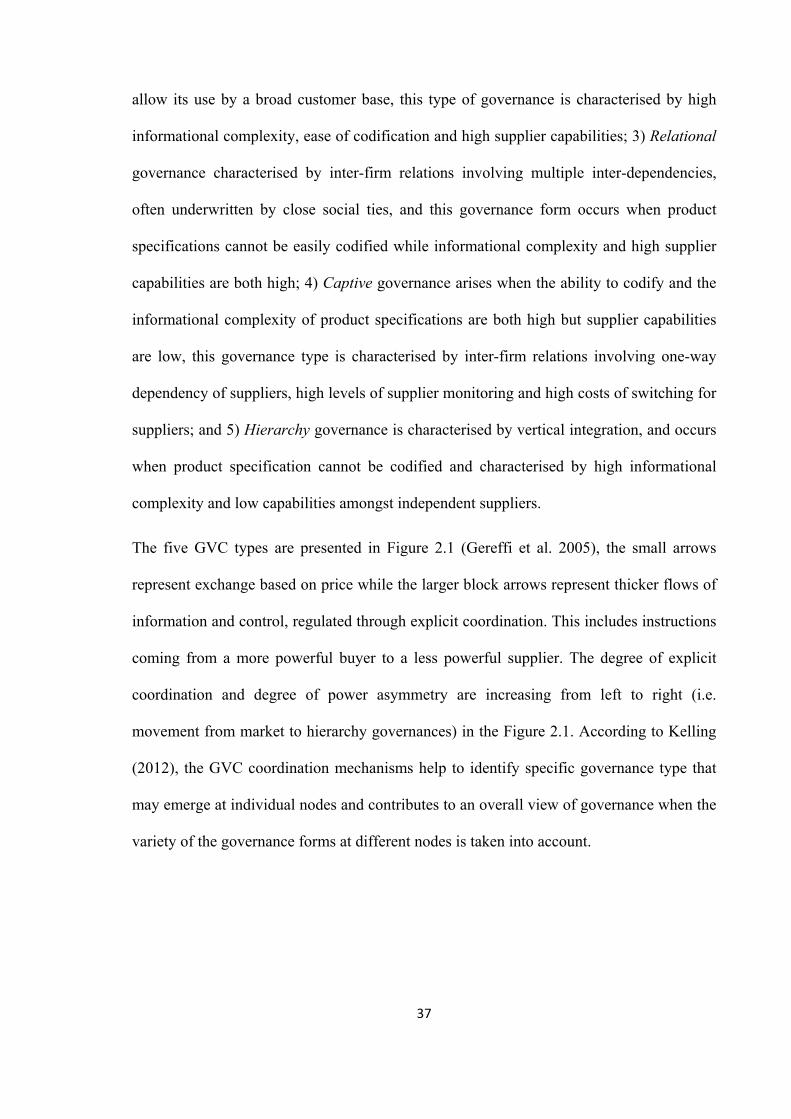
37
allow its use by a broad customer base, this type of governance is characterised by high
informational complexity, ease of codification and high supplier capabilities; 3) Relational
governance characterised by inter-firm relations involving multiple inter-dependencies,
often underwritten by close social ties, and this governance form occurs when product
specifications cannot be easily codified while informational complexity and high supplier
capabilities are both high; 4) Captive governance arises when the ability to codify and the
informational complexity of product specifications are both high but supplier capabilities
are low, this governance type is characterised by inter-firm relations involving one-way
dependency of suppliers, high levels of supplier monitoring and high costs of switching for
suppliers; and 5) Hierarchy governance is characterised by vertical integration, and occurs
when product specification cannot be codified and characterised by high informational
complexity and low capabilities amongst independent suppliers.
The five GVC types are presented in Figure 2.1 (Gereffi et al. 2005), the small arrows
represent exchange based on price while the larger block arrows represent thicker flows of
information and control, regulated through explicit coordination. This includes instructions
coming from a more powerful buyer to a less powerful supplier. The degree of explicit
coordination and degree of power asymmetry are increasing from left to right (i.e.
movement from market to hierarchy governances) in the Figure 2.1. According to Kelling
(2012), the GVC coordination mechanisms help to identify specific governance type that
may emerge at individual nodes and contributes to an overall view of governance when the
variety of the governance forms at different nodes is taken into account.
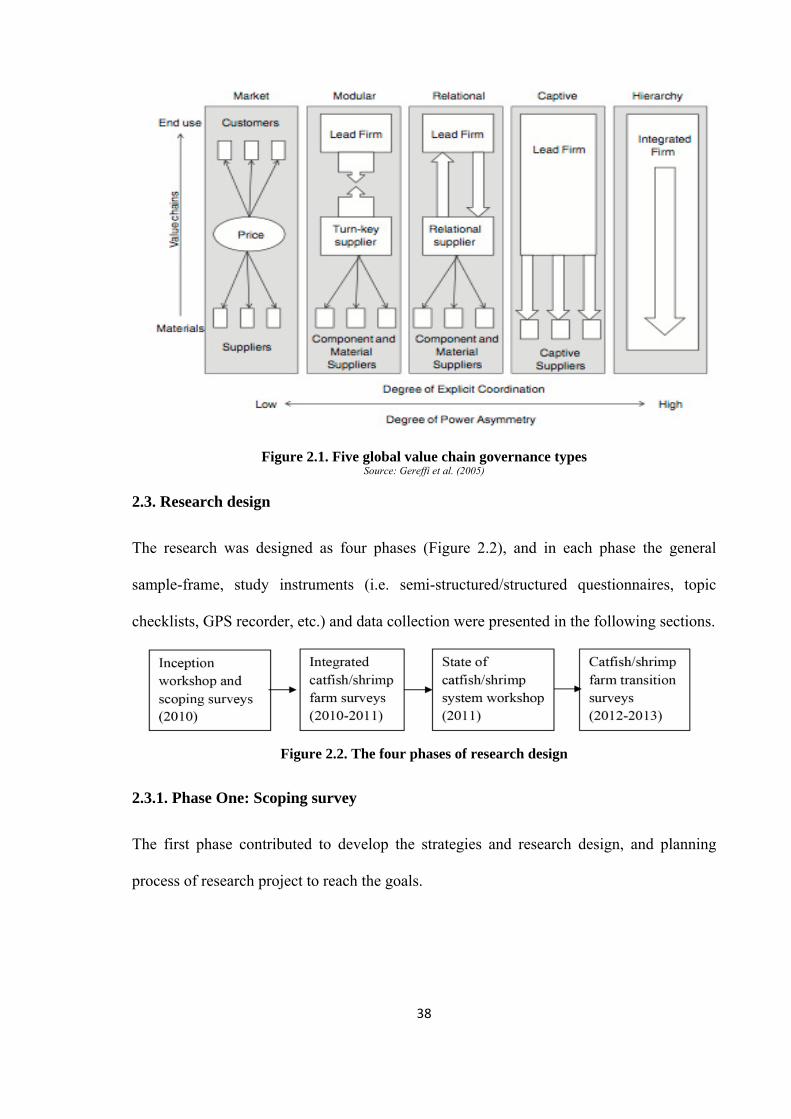
38
Figure 2.1. Five global value chain governance types Source: Gereffi et al. (2005)
2.3. Research design
The research was designed as four phases (Figure 2.2), and in each phase the general
sample-frame, study instruments (i.e. semi-structured/structured questionnaires, topic
checklists, GPS recorder, etc.) and data collection were presented in the following sections.
Figure 2.2. The four phases of research design
2.3.1. Phase One: Scoping survey
The first phase contributed to develop the strategies and research design, and planning
process of research project to reach the goals.
39
a). Inception workshop
Workshop preparations were begun two months before the date set for the inception
workshop allowing time for secondary data collection, a brief report and presentation on
the planning process. Secondary data about the development trends of farmed species
production were collected from the Fisheries Directorate, Department of Aquaculture,
VASEP, and provincial Department of Fisheries. In addition, secondary data on
aquaculture development were also obtained through visits to local government
institutions. Secondary data/information was revised and synthesized to prepare a report on
the overview of the farmed species development in the MKD and a planning process (i.e.
research objectives, contents of future research activities and schedule) of the research
project that was presented in the workshop. The inception workshop was aimed to provide
an assessment and overview of the major farmed species’ development and to identify
system boundaries and stakeholders. An initial typology of sustainability issues was
developed to triangulate with the 30 participants drawn from different stakeholder groups
along the value chain of farmed species. The workshop was held in Can Tho University in
January 2010 and a participatory approach was used to foster interaction with the
stakeholders, stimulate broader support and involvement and encourage ownership of the
research project (Reed et al. 2006).
b). Scoping survey
The scoping survey was aimed to get an overview of the state of the system of relevant
stakeholders along the value chain of farmed species that focused on four main species
(striped catfish, brackish-water shrimp, giant freshwater prawn, and tilapia), and it also
evaluated the current challenges and constraints for future development. Based on the
secondary data and results of the inception workshop, the emerging understanding of the
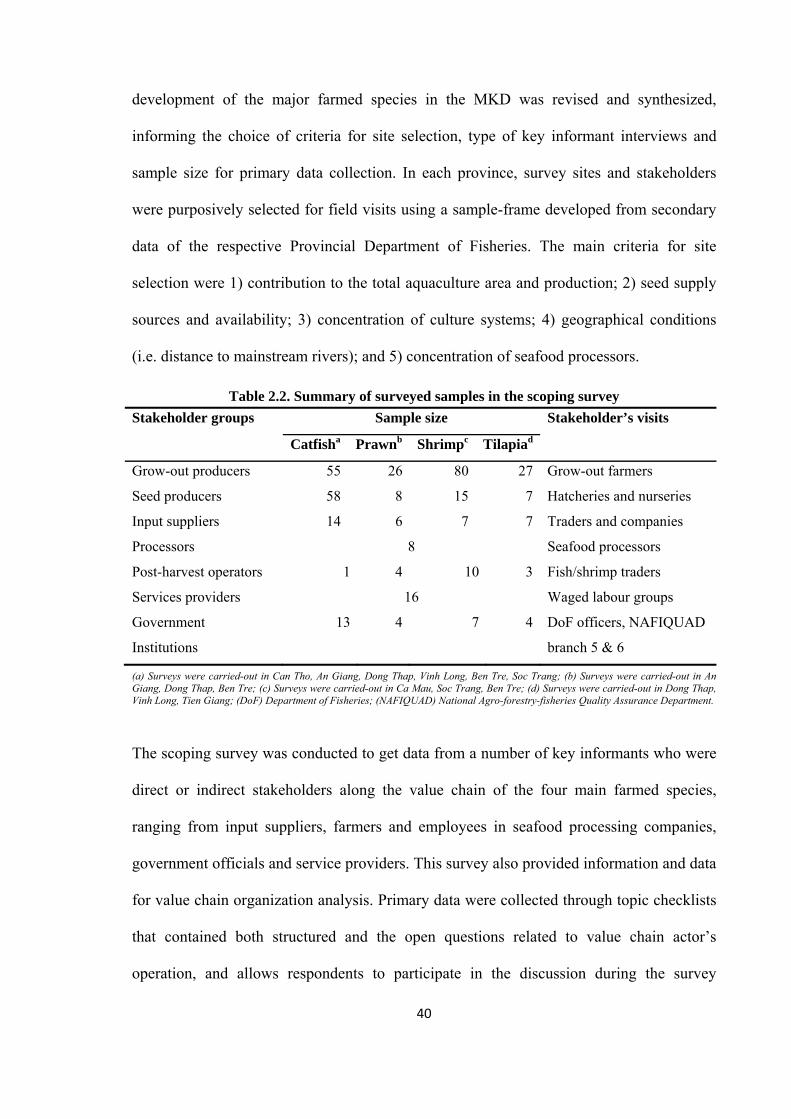
40
development of the major farmed species in the MKD was revised and synthesized,
informing the choice of criteria for site selection, type of key informant interviews and
sample size for primary data collection. In each province, survey sites and stakeholders
were purposively selected for field visits using a sample-frame developed from secondary
data of the respective Provincial Department of Fisheries. The main criteria for site
selection were 1) contribution to the total aquaculture area and production; 2) seed supply
sources and availability; 3) concentration of culture systems; 4) geographical conditions
(i.e. distance to mainstream rivers); and 5) concentration of seafood processors.
Table 2.2. Summary of surveyed samples in the scoping survey
Stakeholder groups Sample size Stakeholder’s visits
Catfisha Prawnb Shrimpc Tilapiad
Grow-out producers 55 26 80 27 Grow-out farmers
Seed producers 58 8 15 7 Hatcheries and nurseries
Input suppliers 14 6 7 7 Traders and companies
Processors 8 Seafood processors
Post-harvest operators 1 4 10 3 Fish/shrimp traders
Services providers 16 Waged labour groups
Government
Institutions
13 4 7 4 DoF officers, NAFIQUAD
branch 5 & 6
(a) Surveys were carried-out in Can Tho, An Giang, Dong Thap, Vinh Long, Ben Tre, Soc Trang; (b) Surveys were carried-out in An Giang, Dong Thap, Ben Tre; (c) Surveys were carried-out in Ca Mau, Soc Trang, Ben Tre; (d) Surveys were carried-out in Dong Thap, Vinh Long, Tien Giang; (DoF) Department of Fisheries; (NAFIQUAD) National Agro-forestry-fisheries Quality Assurance Department.
The scoping survey was conducted to get data from a number of key informants who were
direct or indirect stakeholders along the value chain of the four main farmed species,
ranging from input suppliers, farmers and employees in seafood processing companies,
government officials and service providers. This survey also provided information and data
for value chain organization analysis. Primary data were collected through topic checklists
that contained both structured and the open questions related to value chain actor’s
operation, and allows respondents to participate in the discussion during the survey
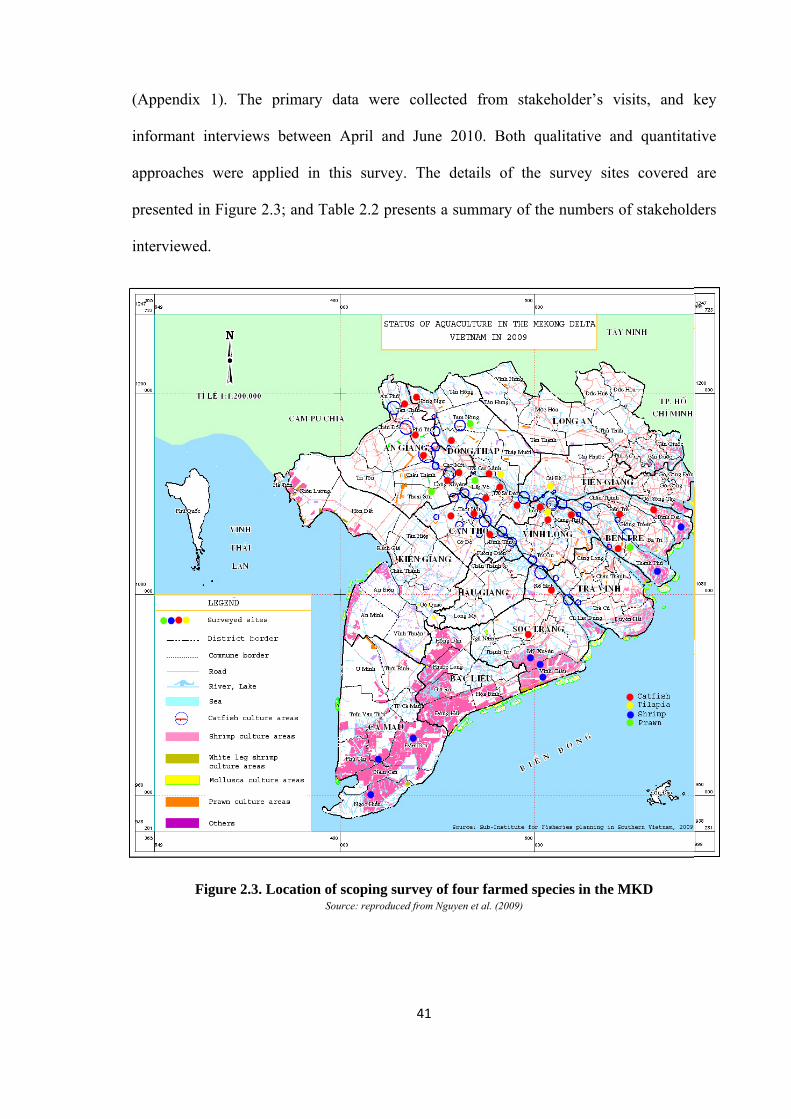
41
(Appendix 1). The primary data were collected from stakeholder’s visits, and key
informant interviews between April and June 2010. Both qualitative and quantitative
approaches were applied in this survey. The details of the survey sites covered are
presented in Figure 2.3; and Table 2.2 presents a summary of the numbers of stakeholders
interviewed.
Figure 2.3. Location of scoping survey of four farmed species in the MKD Source: reproduced from Nguyen et al. (2009)
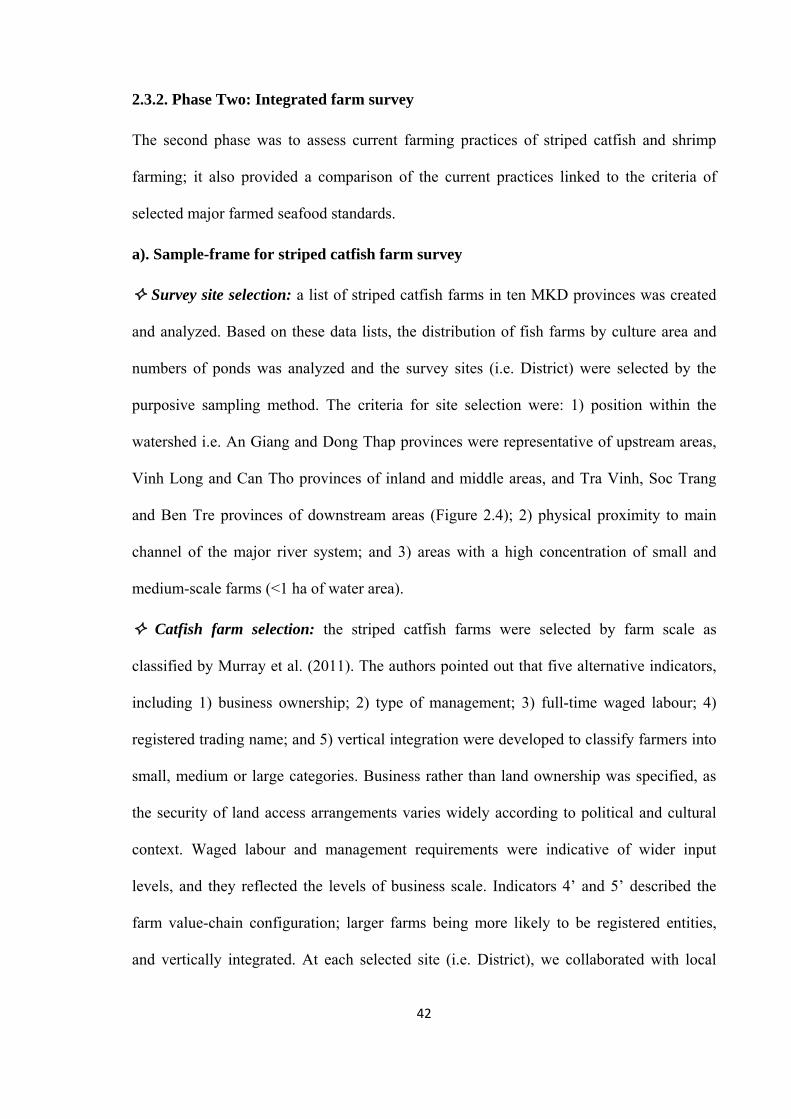
42
2.3.2. Phase Two: Integrated farm survey
The second phase was to assess current farming practices of striped catfish and shrimp
farming; it also provided a comparison of the current practices linked to the criteria of
selected major farmed seafood standards.
a). Sample-frame for striped catfish farm survey
Survey site selection: a list of striped catfish farms in ten MKD provinces was created
and analyzed. Based on these data lists, the distribution of fish farms by culture area and
numbers of ponds was analyzed and the survey sites (i.e. District) were selected by the
purposive sampling method. The criteria for site selection were: 1) position within the
watershed i.e. An Giang and Dong Thap provinces were representative of upstream areas,
Vinh Long and Can Tho provinces of inland and middle areas, and Tra Vinh, Soc Trang
and Ben Tre provinces of downstream areas (Figure 2.4); 2) physical proximity to main
channel of the major river system; and 3) areas with a high concentration of small and
medium-scale farms (<1 ha of water area).
Catfish farm selection: the striped catfish farms were selected by farm scale as
classified by Murray et al. (2011). The authors pointed out that five alternative indicators,
including 1) business ownership; 2) type of management; 3) full-time waged labour; 4)
registered trading name; and 5) vertical integration were developed to classify farmers into
small, medium or large categories. Business rather than land ownership was specified, as
the security of land access arrangements varies widely according to political and cultural
context. Waged labour and management requirements were indicative of wider input
levels, and they reflected the levels of business scale. Indicators 4’ and 5’ described the
farm value-chain configuration; larger farms being more likely to be registered entities,
and vertically integrated. At each selected site (i.e. District), we collaborated with local
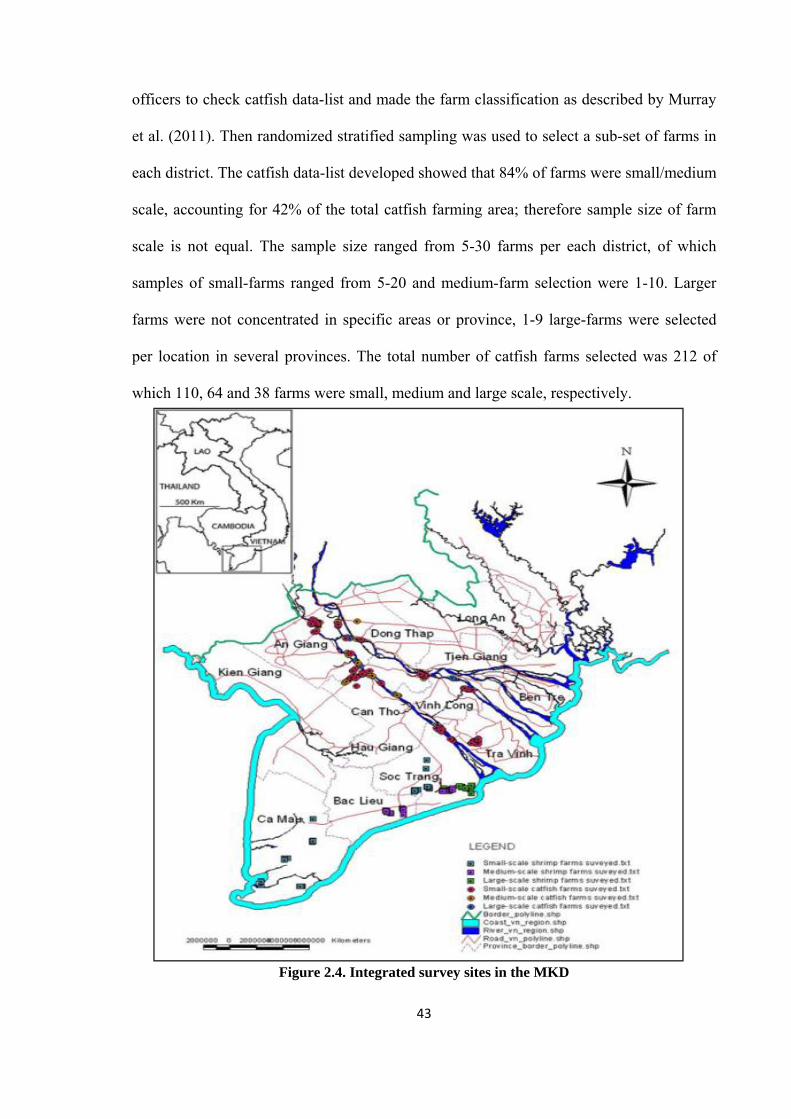
43
officers to check catfish data-list and made the farm classification as described by Murray
et al. (2011). Then randomized stratified sampling was used to select a sub-set of farms in
each district. The catfish data-list developed showed that 84% of farms were small/medium
scale, accounting for 42% of the total catfish farming area; therefore sample size of farm
scale is not equal. The sample size ranged from 5-30 farms per each district, of which
samples of small-farms ranged from 5-20 and medium-farm selection were 1-10. Larger
farms were not concentrated in specific areas or province, 1-9 large-farms were selected
per location in several provinces. The total number of catfish farms selected was 212 of
which 110, 64 and 38 farms were small, medium and large scale, respectively.
Figure 2.4. Integrated survey sites in the MKD
44
b). Sample-frame for shrimp farm survey
Survey site selection: data on shrimp culture of the farm system in eight the MKD
provinces was collected and analyzed. The distribution of shrimp farms by culture area and
production was analyzed and the survey sites (i.e. District) were selected by the purposive
sampling method. The criteria for site selection were 1) concentration of shrimp systems
(i.e. type of shrimp system per district) such as mixed mangrove-shrimp and improved-
extensive systems in Ca Mau province, semi-intensive/intensive and rice-shrimp rotation
system in Soc Trang province, and semi-intensive system in Bac Lieu and Ben Tre
provinces (Figure 2.4); 2) concentration of culture area (i.e. shrimp pond (ha) per disitrict);
and 3) historical development of shrimp farming systems.
Shrimp farms selection: the current shrimp farm systems in the MKD are quite diverse
and there is a big difference in terms of technical and economic aspects among shrimp
systems presented in Table 3.2 (Nguyen et al. 2009; VIFEP 2009). It is difficult to classify
shrimp farms by farm scale as in the catfish farming sector; thus the shrimp farms were
selected by farming systems as described by VIFEP (2009b) and Nguyen et al. (2009). Six
indicators, including 1) seed source; 2) stocking density; 3) water exchange; 4) yield; 5)
feed type; and 6) eFCR were used to classify farms into five categories (mixed mangrove-
shrimp, improved extensive, rice-shrimp, semi-intensive and intensive shrimp system). The
first four indicators were technical characteristics, and the remaining indicators represented
economic differences. At each selected site, we collaborated with local officers to check
shrimp data-lists and classify farms. After that, randomized stratified sampling was used to
select a sub-set of farms in each district for interview. The improved-extensive and rice-
shrimp rotation systems are the main systems in terms of culture area and production.
Thus, the sample size was not equal among shrimp systems, and in each district selected
45
the sample size ranged 5-30 farms. The total sample size was 230, of which 20 farms were
intensive systems, 60 semi-intensive systems, 60 improved-extensive systems, 30 rice-
shrimp systems and 30 mixed mangrove-shrimp. Additionally, 30 white-legged shrimp
farms in the semi-intensive system were interviewed in Ben Tre province where white-
legged shrimp culture was introduced firstly in the MKD.
c). IFS data collection
Structured-questionnaires were developed through contributions from the SEAT project
partners, different sustainability perspectives were ensured through participation by
different disciplines provided by different SEAT project partners, responsible for
individual work packages on the project. The questionnaire was standardized by piloted
interviews and the standardized questionnaire was used for the integrated farm survey to
collect data (Murray et al. 2011)/(see questionaires at www.seatglobal.eu). Eight
enumerators were trained in interviewing skills, data recording and method of minimizing
errors in the investigation process. Interviewees selected were owners, managers or
technicians who participated in and managed farm operations; and sometimes interviewees
are a group of people who work in the same large-scale farms. The interviewees had to
have reasonably good knowledge about the operation of their farm. The information was
recorded and checked on the same interview day and the information gaps were
supplemented by telephone. Farms selected in a district were all interviewed by eight
enumerators before moving to the next district. The integrated farm survey (IFS) was
carried-out between October 2010 and February 2011 to interview 212 striped catfish and
200 black tiger shrimp farmers, and 30 white-legged shrimp farmers in the period
November and December 2011 to assess the status of these species in the MKD. The
information collected in the study provided data from the last production cycle. In addition,
46
the secondary data on the status of farming and relevant documents were also collected at
the local fisheries office in the survey site.
2.3.3. Phase Three: State of system workshop
The third phase was to review and summarize significant outcomes of systems analysis
conducted and sustainability issues identified during the earlier phases of the research
project. The State of system workshop (SoS) mainly provided an analysis of sustainability
perceptions concerned by different stakeholder groups. With participants coming from the
different stakeholder group along value chains (Table 2.3), the SoS contributed to the
formulation of sustainability perceptions based on expert (top-down) and primary
stakeholder (bottom-up) opinion. According to Reed et al. (2006), although there are clear
benefits to both bottom–up and top–down approaches to sustainability monitoring,
integration of these approaches will produce more accurate and relevant results.
Participatory action research is a reflective approach used by groups of stakeholders to
identify and understand problems and challenges (SEAT 2009). Moreover, when the views
of all stakeholders have been gathered together, they can be included in an overall
framework for reference, learning and reflection (Bell & Morse 2008; Reed et al. 2006).
Tools to evaluate the management options that emerge from this process in a multi-
stakeholder, participatory framework are developed. To avoid bias arising from initial group
composition, focus group data were triangulated through semi-structured interviews with
key informant representatives identified (Prell et al. 2007).
The SoS workshop was held in May 2011 to evaluate the preliminary results on the
sustainability issues that were identified from our previous steps, and this workshop was
also a forum for confidence and relationship building with local stakeholders, support from
whom was vital to follow-on activities. The key informants from stakeholder groups along
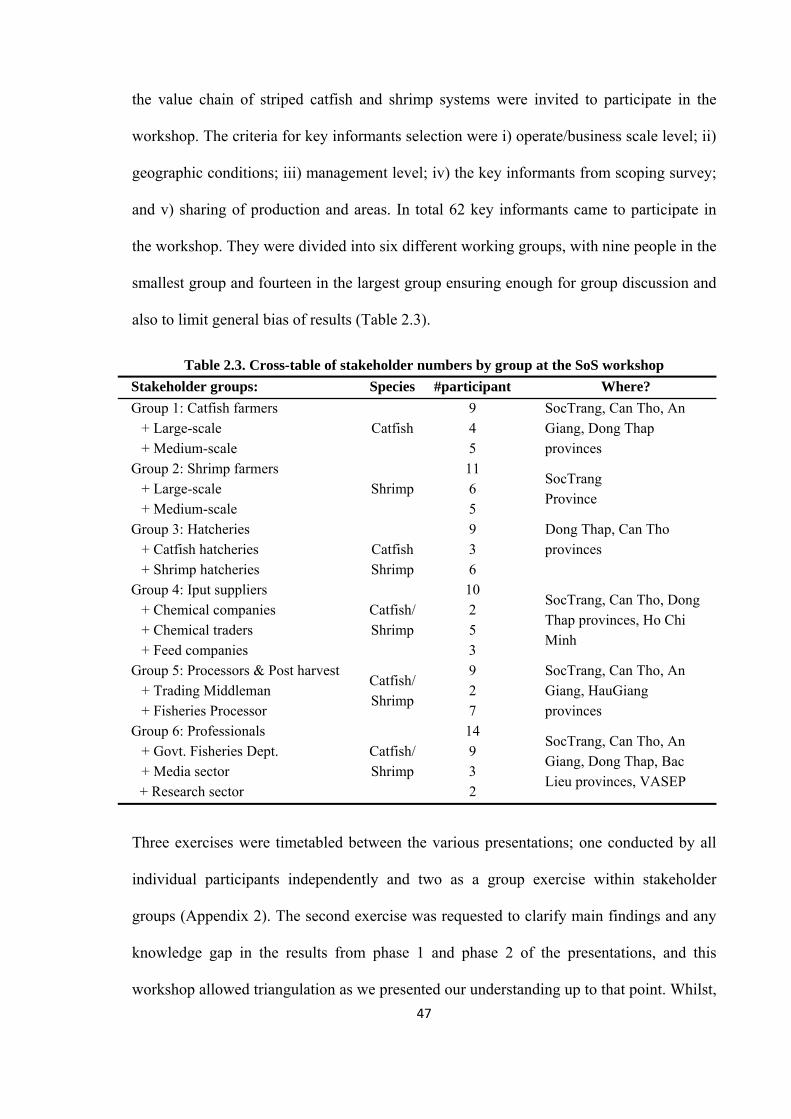
47
the value chain of striped catfish and shrimp systems were invited to participate in the
workshop. The criteria for key informants selection were i) operate/business scale level; ii)
geographic conditions; iii) management level; iv) the key informants from scoping survey;
and v) sharing of production and areas. In total 62 key informants came to participate in
the workshop. They were divided into six different working groups, with nine people in the
smallest group and fourteen in the largest group ensuring enough for group discussion and
also to limit general bias of results (Table 2.3).
Table 2.3. Cross-table of stakeholder numbers by group at the SoS workshop
Stakeholder groups: Species #participant Where?
Group 1: Catfish farmers Catfish
9 SocTrang, Can Tho, An Giang, Dong Thap provinces
+ Large-scale 4 + Medium-scale 5
Group 2: Shrimp farmers Shrimp
11 SocTrang Province
+ Large-scale 6 + Medium-scale 5
Group 3: Hatcheries 9 Dong Thap, Can Tho provinces
+ Catfish hatcheries Catfish 3 + Shrimp hatcheries Shrimp 6
Group 4: Iput suppliers Catfish/ Shrimp
10 SocTrang, Can Tho, Dong Thap provinces, Ho Chi Minh
+ Chemical companies 2 + Chemical traders 5 + Feed companies 3
Group 5: Processors & Post harvest Catfish/ Shrimp
9 SocTrang, Can Tho, An Giang, HauGiang provinces
+ Trading Middleman 2 + Fisheries Processor 7
Group 6: Professionals Catfish/ Shrimp
14 SocTrang, Can Tho, An Giang, Dong Thap, Bac Lieu provinces, VASEP
+ Govt. Fisheries Dept. 9 + Media sector 3
+ Research sector 2
Three exercises were timetabled between the various presentations; one conducted by all
individual participants independently and two as a group exercise within stakeholder
groups (Appendix 2). The second exercise was requested to clarify main findings and any
knowledge gap in the results from phase 1 and phase 2 of the presentations, and this
workshop allowed triangulation as we presented our understanding up to that point. Whilst,
48
sustainability perceptions by individual participants were identified by the first exercise;
and based on the preliminary results of sustainability perceptions of all people in the same
group the main sustainability issues and their corresponding measurement tools by each
stakeholder group were discussed in the third exercise. Results from the first exercise
(individual) fed directly into the third exercise (group); the first being concerned with
identification of sustainability issues and the third with identification of corresponding
measurement tools.
2.3.4. Phase Four: Farm transition survey
The fourth phase was aimed at understanding changes of farming practices over time,
mainly comparison between the integrated farm survey and this survey. This phase also
contributed to evaluate the state of the system, and to revise perceptions of sustainability
addressed from the integrated survey and SoS workshop.
a). Sample-frame of farm transition survey
Based on a list of 442 integrated farm surveys (212 catfish farms, 230 shrimp farms) in late
2010, we conducted interviews to assess a transition of farming practices over 2-3 years.
Interviews were conducted in two steps i) step 1: a conducting interviews with all IFS
farms by telephone survey (TLS) to get a general assessment of the farm changes; and ii)
step 2: based on preliminary results from TLS, the farms who had some significant
changes were selected randomly to interview directly (IDS) to verify the results of TLS
and also to learn more about the farming movements (Table 2.4).
Sample-frame of telephone survey: Information on farming practice from IFS database
such as farm phone-number, farm areas, information on production activities were
reviewed. Each survey site will have its own characteristics of natural conditions and
socioeconomics related to farm activities, thus to facilitate the effective data collection, we
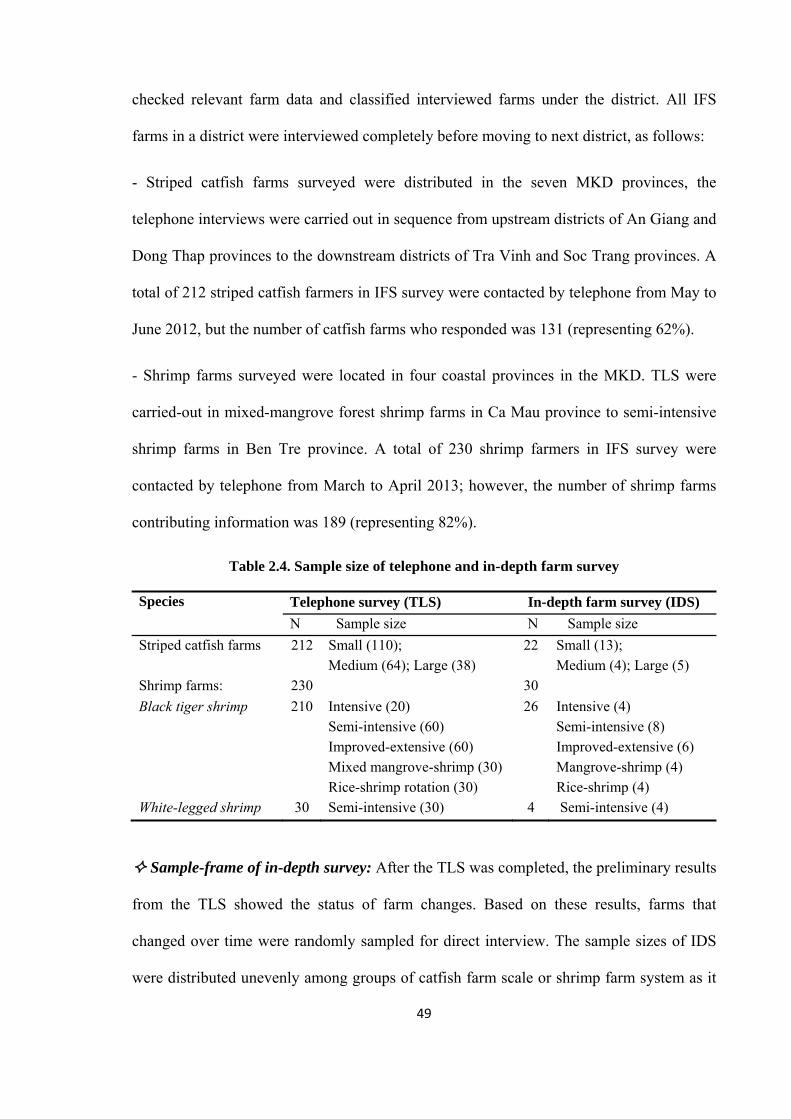
49
checked relevant farm data and classified interviewed farms under the district. All IFS
farms in a district were interviewed completely before moving to next district, as follows:
- Striped catfish farms surveyed were distributed in the seven MKD provinces, the
telephone interviews were carried out in sequence from upstream districts of An Giang and
Dong Thap provinces to the downstream districts of Tra Vinh and Soc Trang provinces. A
total of 212 striped catfish farmers in IFS survey were contacted by telephone from May to
June 2012, but the number of catfish farms who responded was 131 (representing 62%).
- Shrimp farms surveyed were located in four coastal provinces in the MKD. TLS were
carried-out in mixed-mangrove forest shrimp farms in Ca Mau province to semi-intensive
shrimp farms in Ben Tre province. A total of 230 shrimp farmers in IFS survey were
contacted by telephone from March to April 2013; however, the number of shrimp farms
contributing information was 189 (representing 82%).
Table 2.4. Sample size of telephone and in-depth farm survey
Species Telephone survey (TLS) In-depth farm survey (IDS)
N Sample size N Sample size
Striped catfish farms 212 Small (110); Medium (64); Large (38)
22 Small (13); Medium (4); Large (5)
Shrimp farms: 230 30
Black tiger shrimp 210 Intensive (20) Semi-intensive (60) Improved-extensive (60) Mixed mangrove-shrimp (30) Rice-shrimp rotation (30)
26 Intensive (4) Semi-intensive (8) Improved-extensive (6) Mangrove-shrimp (4) Rice-shrimp (4)
White-legged shrimp 30 Semi-intensive (30) 4 Semi-intensive (4)
Sample-frame of in-depth survey: After the TLS was completed, the preliminary results
from the TLS showed the status of farm changes. Based on these results, farms that
changed over time were randomly sampled for direct interview. The sample sizes of IDS
were distributed unevenly among groups of catfish farm scale or shrimp farm system as it
50
as was dependent on the number of farms that answered the TLS and the status of farm
changes, as follows:
- 22 catfish farms were randomly sampled from a list of TLS farms which had significantly
changed over time for the IDS (i.e. face-to-face interviews) and data cross-checking,
comprised of 5 large-farms, 4 medium-farms and 13 small-farms. The IDS farms
accounted for 17% of TLS farms, and interviews were conducted from February to March
2013.
- 30 shrimp farms representative of the farm change status over time by each system were
randomly sampled for the IDS and data cross-checking, of which 4 were intensive farms, 8
semi-intensive farms, 6 improved extensive farms, 4 mixed mangrove–shrimp farms, 4
rice-shrimp farms and 4 white-legged shrimp farms. The IDS farms accounted for 16% of
TLS farms, and the interviews were conducted from May to June 2013.
b). TLS and IDS data collection
Structured questionnaires for the TLS (Appendix 3) and a topic checklist for IDS
(Appendix 4) were developed and standardized through the trial farm surveys.
Telephone survey: before the telephone survey, farm information was reviewed which
could lead to a better understanding of farm conditions and production in order to increase
the effectiveness of interview questions, such as reducing surplus questions and efficient
use of interview time. Based on the living habits of local people, interviews were often
conducted by telephone between 9-11AM or 2-4PM. A telephone interview lasted between
10 and 25 minutes, depending on the ability of respondents, level of farm changes and free
time of respondents for interviews. Information on farm production of the last crop were
collected and used for data analysis.
51
In-depth survey: at the survey sites, we conducted a quick interview with local officers
using Rapid Rural Appraisal techniques (FAO 1997) and checklist questions to know an
overall situation on the survey sites before conducting the actual face-to-face survey at
selected farms. During the farm interviews, information from the TLS were checked again,
and information collected from local officers was also cross-checked with interviewees.
Information on the farm production of the last production cycle was collected and used for
data analysis.
In addition, to improve interpretation and stimulate discussion related to the transition of
farming practices over time, interviews were also conducted with a number of stakeholders
in catfish and shrimp value chains using a checklist of questions (Appendix 5). Key
informants from two shrimp hatcheries, two catfish hatcheries, two shrimp traders, four
processors, two shops of veterinary medicinal products, eight local staffs, one certified
staff member and one bank officer were interviewed. Besides, the secondary data on the
status of farming and related documents were also collected at the local fisheries office on
the survey site.
2.4. Data management and analysis
2.4.1. Database and data management
Both quantitative and qualitative data derived from the scoping survey, TLS and IDS were
coded and entered into the corresponding databases designed in the MS Excel 2007
(Microsoft Corporation, USA). The fields in the databases were designed in groups with
similar information in the questionnaires structures to help facilitate the inspection of data
entry and data checking. Data from IFS was entered into a MS Access 2007-database
designed by Murray et al. (2011). All questionnaires were checked and completed before
entering into the databases. After completing the data entry stage, the databases were
52
checked using quick check tools to correct typing mistakes. Also, the data checking step
aimed to identify information gaps that could be filled-in by telephone. In addition, various
data AHPNS disease progression and farm gate price were also entered and stored in data-
sheets in MS Excel 2007 for further data analysis.
2.4.2. Data analysis and interpretation
Data analysis was performed by specific topic to answer research questions and data from
the databases were exported to relevant statistical software packages such as SPSS 21
(SPSS Inc., Illinois, USA) and MS Excel 2007 for statistical analysis. Descriptive analysis
was used to estimate the frequency of responses, mean and standard deviation of the
factors. Chi-square (X2), Kruskal-Wallis H and Friedman’s test were applied to check
significant difference of qualitative factors among farm categories, or among factors that
need to be compared together. While, one way-ANOVA and independent sample T-tests
were applied to check significant difference of relevant quantitative factors among farm
scales/systems. The significant differences are indicated by *P<0.05.
Information about the scoping survey and SoS workshop were synthesized and used to
describe the value chain. The global value chain (GVC) approach is used to understand
business relationships between actors in the supply chain (Gereffi et al. 2005); revealing
the structure of business relations related to information, product, and financial flows
through the chains. Top-down and bottom-up approaches were applied to make a
stakeholder analysis (Reed et al. 2006). Based on the guidelines of Bell & Morse (2008), a
simple matrix was developed to identify and compare sustainability issues by different
stakeholder groups. The Driving force-Pressure-State-Impact-Response (DPSIR)
framework approach was applied to interpret analyses of responses to cope with the
sustainability issues identified (Smeets & Weterings 1999; Bell & Morse 2008).
53
2.5. Limitations of the research design and implementation
Sample-frame: a multiphase stratified random sampling strategy was applied to select the
study sites across the MKD, and a purposive sampling was applied to select the farms for
the interviews. However, sample-frame also faced limitations, such as limitation on
availability of secondary data related to farm category, which can cause difficulties to
sample-frame design.
Sample size: the constraints of time, finance, and trained labour force have caused
difficulties to the sample-size, such as: i) sample size of farm survey was limited compared
to the total population. However, the sample size still ensured the representativeness of the
industries because farms were selected using a stratified random sampling process from the
ten provinces that contributed more than 98% and 70% of total production of catfish and
shrimp in Vietnam, respectively; and ii) limitation on the number of stakeholders who were
representatives of their group participated the workshop.
Data collection and management: i) the study conducted mainly surveys by face to face
interviews value chain actors, but focused primarily on farming sector. A State of system
workshop was used to evaluate perceptions on the sustainability issues (SIs) by different
stakeholder groups; however, the number of participants was still limited and it also
affected by the results that cover a large range; ii) this study based on synthesis of
secondary/primary data collected by recall methods so the information in several cases was
still limited because of non-record keeping practices in most existing farms; iii) the study
sites mainly focused on catfish and shrimp farming, many farmers had a lower educational
level, and the answers to most of the questions were based on estimation of the respondents
so their estimations were also large variations; iv) a major challenge was obtaining the data
54
from commercial actors (i.e. seafood processors, aqua-feed companies, chemical/drug
companies; input suppliers and traders) and thus the need for a high degree of trust/strong
relationship between the researcher and the researched; Kelling (2012) also faced
difficulties to obtain accurate data from EU processing, wholesale and distribution sectors;
v) a production chain from pond to plate, can only reach sustainable development when it
has participation from both sides, i.e. importers and producers. However, this study
focused on exploration of the stakeholder groups in the MKD and lacked of
data/information surveys from the importing actors such importers, retailers and
consumers, which limited our conclusions from a truly a global picture; vi) the survey time
was the same time as AHPNS outbreak and low catfish price, so it could effect to
responses that inevitably was drawn to those issues; vii) a simple matrix table was used to
aggregate key sustainability factors for the value chain; but, the results were more
qualitative than quantitative.
55
CHAPTER 3
Chapter 3. Development trends for the international trade in
farmed seafood species in the Mekong Delta
3.1. Introduction
Vietnam is currently ranked among the top ten seafood exporters in the world (VASEP
2011; Fisheries Directorate 2014). In 1999, Vietnam contributed 1.8% to the World
seafood export value, increasing to 4.9% in 2011, with annual growth rates of 16.9% (FAO
2012; FAO 2013b). Fishery products contributed 5.3% of the total national export value
and were the fourth biggest national export commodity (after crude oil, garments and
footwear) in 2012 (Nguyen 2008; GSO 2013). Aquaculture plays an important role in
fisheries development in Vietnam. It has developed quickly since 2000 and by 2013
contributed around 55% of national fisheries production (Fisheries Directorate 2014).
Shrimp and striped catfish are the two main farmed species exported contributing 46% and
26% of seafood export value, respectively in 2013 (Fisheries Directorate 2014). Their
products were exported to 82 and 136 countries, respectively (VASEP 2011; VASEP
2012); with Japan, EU and USA initially the main markets.
The MKD is comprised of 13 provinces, 8 of which are coastal to the East Sea and the
Gulf of Thailand. The Mekong River runs through the MKD via two major rivers: the
Mekong and Bassac rivers with a length of approximately 230km each and a combined
catchment of approximately 40,000km2 (Van Zalinge et al. 2004; Vu & Phan 2008).
Although the MKD only accounts for 12% of total land area in Vietnam, this region plays
an important role in the agriculture sector; contributing almost 60% of national rice
production (GSO 2012; GSO 2013). With its diverse and productive river basin, the MKD
is popularly referred to as the food basket and center of aquaculture in Vietnam (Khoi
56
2007; Phan et al. 2009; De Silva 2012). In 2013, aquaculture in the MKD accounted for
71% of national aquaculture production. Striped catfish, shrimp, tilapia and giant
freshwater prawn (GFP) were the main farmed species in the MKD, accounting for large
culture areas, a large number of farmers and contributed 1.62 billion tonnes to aquaculture
production in 2013 (Fisheries Directorate 2014). In 2013, the MKD contributed 76% of
national shrimp raw material and the entire striped catfish production to export. In
addition, 77% of national tilapia production and 58% of national giant freshwater prawn
production respectively were produced there, and mostly consumed by the domestic
market (GSO 2013; Fisheries Directorate 2014). With large areas of saline intrusion,
shrimp is a target farmed species in the coastal areas, whereas the large and dependable
volumes of riverine freshwater have been important for striped catfish farming
development. Besides this, a huge rice-field area, floodplain area and rivers are also
advantages for aquaculture development, especially for economically valueable species
such as tilapia and GFP (Vu & Phan 2008; Nguyen et al. 2009). These four species have
become more important in the aquaculture sector plans until 2020 for both the MKD and
Vietnam as a whole (MARD 2009b; Nguyen et al. 2009). While shrimp and striped catfish
production have a continued export focus, tilapia and GFP are considered crucial to
diversification to meet domestic demand but with expectations of expansion to export in
the longer-term (MARD 2009c; MARD 2009b; GOV 2013).
Demand for seafood products in the world has been increasing (Smith et al. 2010; FAO
2012). The world trade in fish and fishery products grew significantly in value terms, rising
from US$8 billion to US$125 billion during the period 1976–2011 (FAO 2012; FAO
2013b). Capture production has tended to be stable (Young et al. 2011; FAO 2012), so it is
considered that global demand for aquatic food will most likely be satisfied by aquaculture
production (Valdimarsson 2007; Subasinghe et al. 2009; Asche & Guttormsen 2009;
57
Bosma & Verdegem 2011; De Silva 2012). Considering the important role of farmed
species for seafood export, this chapter attempts to describe the development of value
chain actors for the main farmed species in the MKD, and to identify factors leading to the
different development status among farmed species.
This chapter is divided into two main parts, the first half of the chapter (section 3.1. to 3.5)
provides the information on the primary actors or chain actors who were directly involved
in the transformation of inputs into outputs of the farmed seafood species. The second half
of chapter (section 3.6 to 3.9) contributes an overall picture about the indirect actors
(external actors or networks, excluded actors, and non-participants). Both of the two main
categories of actors play important roles in the value chain coordination forms, because the
changes in position of different chain actors are connected in relation to the vertical
linkages and horizontal elements in the value chain (Bolwig et al. 2010). The first half of
the chapter attempts to assess the development trends of four farmed seafood species and
major chain actors (hatcheries, grow-out farmers, feed manufacturers, and seafood
processors) directly involved in within-chain exchanges (Bolwig et al. 2010). It also
contributes to identifying the main constraints of the production systems during their
development, that related to the sustainability issues for analysis of pangasius and shrimp
value chain in the following chapters. The first part of the chapter begins with a review of
the status and development of the farmed species. An assessment of four species cultured
in the MKD, the countries farmed seafood ‘hub’, namely Giant Freshwater Prawn
(Macrobrachium rosenbergii), Tilapia (Oreochromis niloticus), Striped catfish
(Pangasianodon hypophthalmus) and Penaeid shrimp (Penaeus monodon & Litopenaeus
vannamei) is presented. Secondly, it presents an analysis of the practices and obstacles
during the development process. Thirdly, growth of the processing sector and support
58
services is examined to identify the issues related to the production and trading of farmed
species.
The second part of the chapter aims to bring together insights related to the organization of
the vertical and horizontal dimensions of the value chain – food safety, government
support, cooperation between farmers. This part focuses on the participation in value chain
in turn related to the rest of actor categories who are external actors or networks, excluded
actors and non-participants (see details in Bolwig et al. (2010)). The second part begins
with a review of the social and environmental impacts that are important issues related to
the sustainable aquaculture development. This is followed by a review on the current
production quality and consumption management activities. Thirdly, the roles of
facilitating institutions for farmed species production and trading are described. Finally,
the value chain of the two key export commodities (Striped catfish and Penaeid shrimp) is
presented.
Generally, Giant Freshwater Prawn and Tilapia are mainly farmed with a local domestic
market orientation, and both of these are potential export candidates in the future (VIFEP
2009b; MARD 2010; GOV 2013); whereas, Striped catfish and Penaeid shrimp are
already established and key export commodities (Nguyen et al. 2009; Fisheries Directorate
2013b). This chapter provides an overview of the development trend of seafood farmed
species which includes four main farmed species (i.e. striped catfish; giant freshwater
prawn; brackish-water shrimp; tilapia), and practices of the four categories of actors who
participate in the value chain and organization of the value chain are reviewed. The
following chapters focus on the Striped catfish and Penaeid shrimp, which are major
seafood farmed species being traded for export.
59
3.2. General status and development of farmed species in the MKD
Aquaculture in the MKD has grown significantly in both culture area and production in the
recent years (Figure 3.1), reaching around 9.7% and 22.2% of annual growth rates between
2000 and 2010, respectively (Nguyen et al. 2009). This suggests immediately that a
process of intensification has also occurred, i.e. faster growth of production compared to
land use. The aquaculture sector has developed quickly as a positive result of the new
policy “Decree 09/2000/NQ-CP” that allowed transfer of low yield agricultural land to
aquaculture production (i.e. rice farming in the coastal area transferred to shrimp farming;
fruit garden/orchards along river side to striped catfish farming; and rice farming in the
inland area to GFP farming) (MARD 2009b). Since 2000 this region also has had large
areas of land which have been transferred from rice farming to shrimp farming as
described in more detail in the following sections. The successful artificial breeding of
farmed species and adoption of mass production in the early 1990's was a driving force for
the rapid growth of the aquaculture sector. The availability of markets, especially export
markets, has also been one of the key factors contributing to the fast growth of this
industry. In addition, the improvement of culture techniques gradually moving from
extensive to semi-/intensive systems, government support of rural infrastructure
improvement (i.e. irrigation canals, roads and electricity), technical training and
consultation programmes, and international trade promotion programmes have also
contributed to the fast growth of aquaculture (Nguyen & Dang 2009; MARD 2009b;
Nguyen et al. 2009; De Silva & Nguyen 2011).
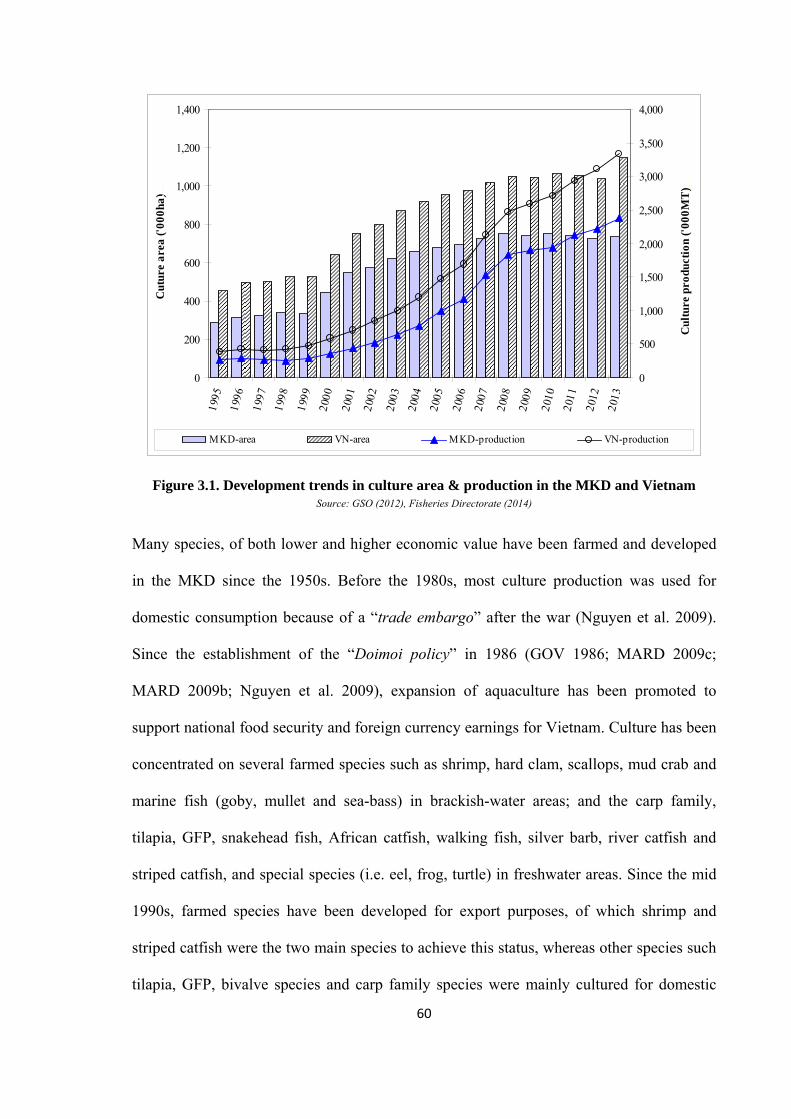
60
Figure 3.1. Development trends in culture area & production in the MKD and Vietnam Source: GSO (2012), Fisheries Directorate (2014)
Many species, of both lower and higher economic value have been farmed and developed
in the MKD since the 1950s. Before the 1980s, most culture production was used for
domestic consumption because of a “trade embargo” after the war (Nguyen et al. 2009).
Since the establishment of the “Doimoi policy” in 1986 (GOV 1986; MARD 2009c;
MARD 2009b; Nguyen et al. 2009), expansion of aquaculture has been promoted to
support national food security and foreign currency earnings for Vietnam. Culture has been
concentrated on several farmed species such as shrimp, hard clam, scallops, mud crab and
marine fish (goby, mullet and sea-bass) in brackish-water areas; and the carp family,
tilapia, GFP, snakehead fish, African catfish, walking fish, silver barb, river catfish and
striped catfish, and special species (i.e. eel, frog, turtle) in freshwater areas. Since the mid
1990s, farmed species have been developed for export purposes, of which shrimp and
striped catfish were the two main species to achieve this status, whereas other species such
tilapia, GFP, bivalve species and carp family species were mainly cultured for domestic
0
200
400
600
800
1,000
1,200
1,400
1995
1996
1997
1998
1999
2000
2001
2002
2003
2004
2005
2006
2007
2008
2009
2010
2011
2012
2013
Cut
ure
area
('00
0ha)
....
0
500
1,000
1,500
2,000
2,500
3,000
3,500
4,000
Cul
ture
pro
duct
ion
('00
0MT
)….
MKD-area VN-area MKD-production VN-production
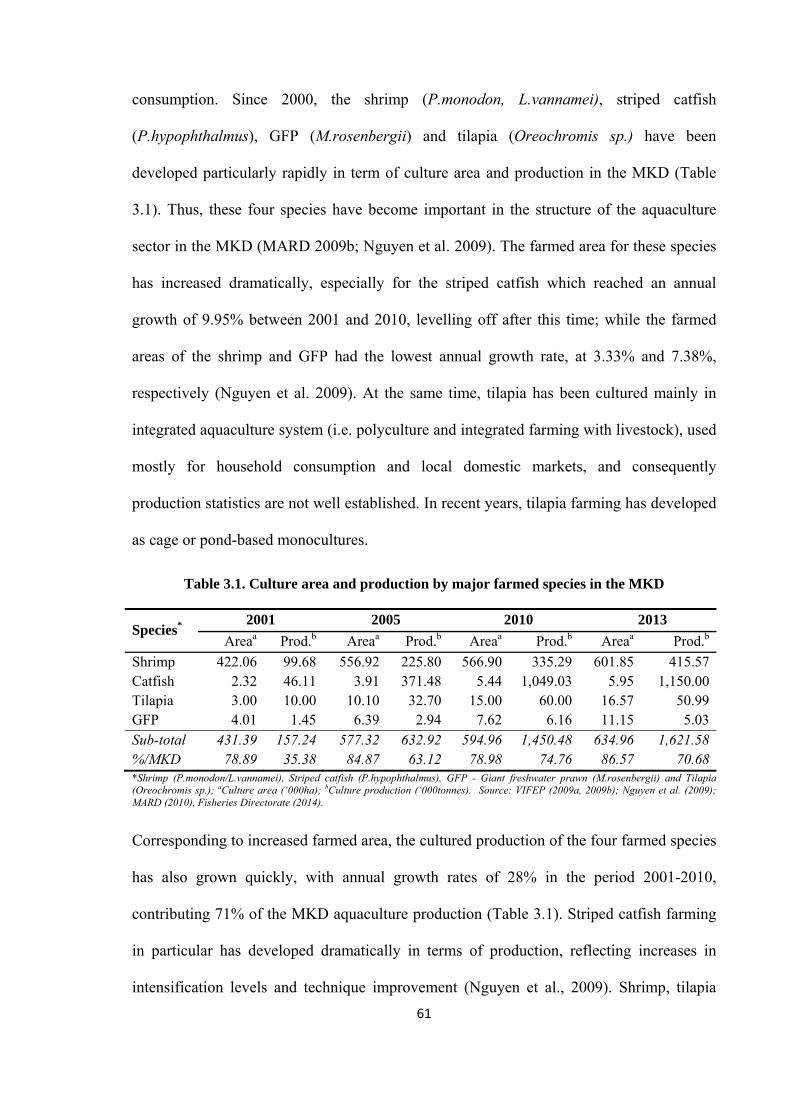
61
consumption. Since 2000, the shrimp (P.monodon, L.vannamei), striped catfish
(P.hypophthalmus), GFP (M.rosenbergii) and tilapia (Oreochromis sp.) have been
developed particularly rapidly in term of culture area and production in the MKD (Table
3.1). Thus, these four species have become important in the structure of the aquaculture
sector in the MKD (MARD 2009b; Nguyen et al. 2009). The farmed area for these species
has increased dramatically, especially for the striped catfish which reached an annual
growth of 9.95% between 2001 and 2010, levelling off after this time; while the farmed
areas of the shrimp and GFP had the lowest annual growth rate, at 3.33% and 7.38%,
respectively (Nguyen et al. 2009). At the same time, tilapia has been cultured mainly in
integrated aquaculture system (i.e. polyculture and integrated farming with livestock), used
mostly for household consumption and local domestic markets, and consequently
production statistics are not well established. In recent years, tilapia farming has developed
as cage or pond-based monocultures.
Table 3.1. Culture area and production by major farmed species in the MKD
Species* 2001 2005 2010 2013
Areaa Prod.b Areaa Prod.b Areaa Prod.b Areaa Prod.b
Shrimp 422.06 99.68 556.92 225.80 566.90 335.29 601.85 415.57Catfish 2.32 46.11 3.91 371.48 5.44 1,049.03 5.95 1,150.00Tilapia 3.00 10.00 10.10 32.70 15.00 60.00 16.57 50.99GFP 4.01 1.45 6.39 2.94 7.62 6.16 11.15 5.03Sub-total 431.39 157.24 577.32 632.92 594.96 1,450.48 634.96 1,621.58%/MKD 78.89 35.38 84.87 63.12 78.98 74.76 86.57 70.68*Shrimp (P.monodon/L.vannamei), Striped catfish (P.hypophthalmus), GFP - Giant freshwater prawn (M.rosenbergii) and Tilapia (Oreochromis sp.); aCulture area (‘000ha); bCulture production (‘000tonnes). Source: VIFEP (2009a, 2009b); Nguyen et al. (2009); MARD (2010), Fisheries Directorate (2014).
Corresponding to increased farmed area, the cultured production of the four farmed species
has also grown quickly, with annual growth rates of 28% in the period 2001-2010,
contributing 71% of the MKD aquaculture production (Table 3.1). Striped catfish farming
in particular has developed dramatically in terms of production, reflecting increases in
intensification levels and technique improvement (Nguyen et al., 2009). Shrimp, tilapia
62
and GFP have also increased their production at the same time, with a high annual growth
rate compared to the growth rate of culture area; and the key factor driving force for this
trend has been improvement in culture techniques (i.e. feeding, pond management, seed
availability).
3.3. Development trends of farmed species in the MKD
3.3.1. Development trends of farmed striped catfish
a). General development trend
River catfish including the Mekong river catfish, basa (Pangasius bocourti) and Striped
catfish, tra (Pangasianodon hypophthalmus) have been cultured in small cages and family
ponds respectively, using fingerlings from wild-capture in An Giang and Dong Thap
provinces since the 1960s (Nguyen & Dang 2009; De Silva & Nguyen 2011). There were
few changes up to the latter part of the 1990s, when striped catfish farming began to grow
dramatically as a result of the successful artificial propagation techniques for striped
catfish and mass scale seed production since 1998 (Nguyen & Dang 2009; Belton et al.
2011).
Intensive striped catfish culture has been developed and improved in terms of productivity
and management skills since 2000, as farmers gradually shifted from farm-made feeds to
commercial feeds (De Silva & Nguyen, 2011). Intensive catfish culture along the Mekong
and Bassac rivers started in An Giang and Dong Thap provinces where traditional catfish
farmed area and seed availability sources were already established. Since 2005, catfish
culture in cages and pens has all but disappeared and shifted to culture in ponds reflecting
the significant improvements in pond culture techniques and marked increases in
productivity (Nguyen & Dang 2009; De Silva & Nguyen 2011). Nguyen & Dang (2009)
reported that available seed sources all year-round, low infrastructural investment, short
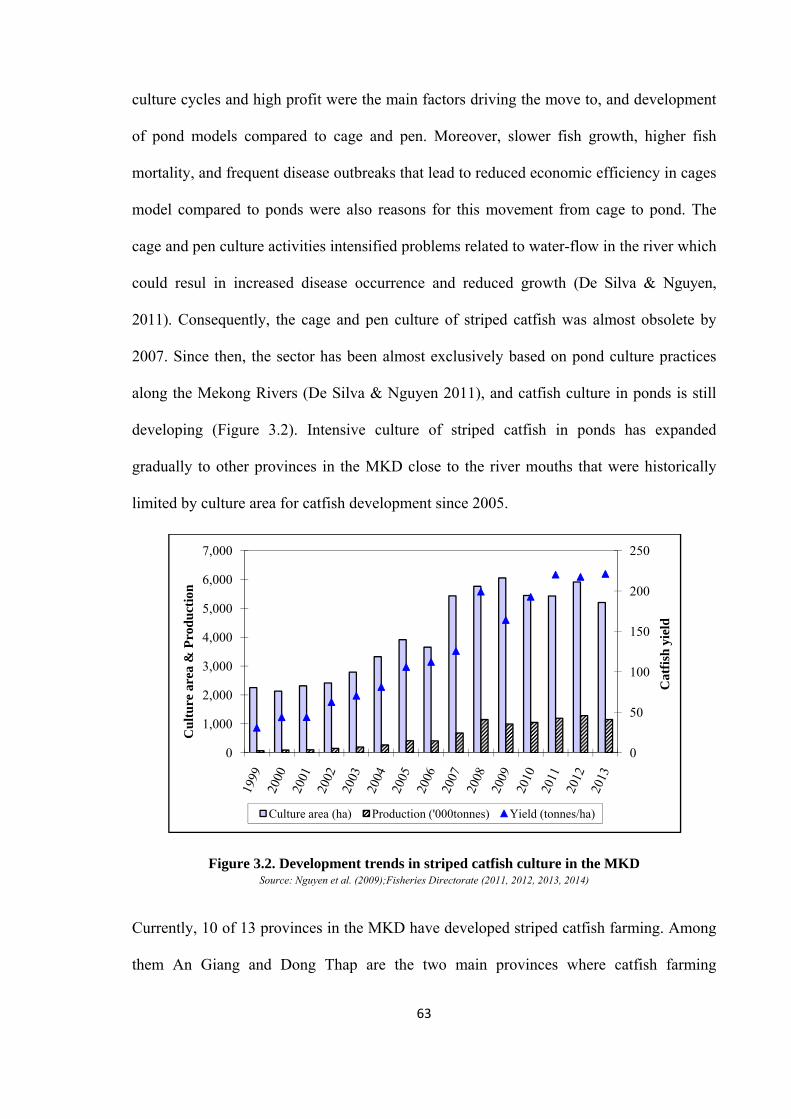
63
culture cycles and high profit were the main factors driving the move to, and development
of pond models compared to cage and pen. Moreover, slower fish growth, higher fish
mortality, and frequent disease outbreaks that lead to reduced economic efficiency in cages
model compared to ponds were also reasons for this movement from cage to pond. The
cage and pen culture activities intensified problems related to water-flow in the river which
could resul in increased disease occurrence and reduced growth (De Silva & Nguyen,
2011). Consequently, the cage and pen culture of striped catfish was almost obsolete by
2007. Since then, the sector has been almost exclusively based on pond culture practices
along the Mekong Rivers (De Silva & Nguyen 2011), and catfish culture in ponds is still
developing (Figure 3.2). Intensive culture of striped catfish in ponds has expanded
gradually to other provinces in the MKD close to the river mouths that were historically
limited by culture area for catfish development since 2005.
Figure 3.2. Development trends in striped catfish culture in the MKD Source: Nguyen et al. (2009);Fisheries Directorate (2011, 2012, 2013, 2014)
Currently, 10 of 13 provinces in the MKD have developed striped catfish farming. Among
them An Giang and Dong Thap are the two main provinces where catfish farming
0
50
100
150
200
250
0
1,000
2,000
3,000
4,000
5,000
6,000
7,000
Cat
fish
yie
ld...
Cu
ltu
re a
rea
& P
rod
uct
ion
...
Culture area (ha) Production ('000tonnes) Yield (tonnes/ha)
64
increased rapidly and collectively contributed 55% to total catfish production in 2012
(Fisheries Directorate 2013a). The important differences in the intensity of culture in the
different provinces are the amount of land used and natural conditions; the coastal
provinces have a limitation on land used for striped catfish compared to inland provinces.
b). Growth of striped catfish hatcheries
The artificial propagation of striped catfish was first started in 1978; however, it was not
sufficiently reliable for mass seed production and the activity remained undeveloped until
1995 (Nguyen & Dang 2009). Before 1996, striped catfish culture depended heavily on
wild-fry sources (Nguyen & Dang 2009; Belton et al. 2011). Study on induced spawning of
striped catfish was started again in 1995 by Can Tho University (CTU), and successful
techniques for the artificial propagation of striped catfish were primarily established in
1996 (Belton et al. 2011). The supply of privately produced pangasius seed
(P.hypophthalmus) was established in 1998 after quickly adopting hatchery-based
spawning techniques (Belton et al. 2008; Nguyen & Dang 2009). Nguyen & Dang (2009)
reported that techniques for inducing spawning were fully achieved and transferred to
commercial hatchery operators since 2000. Moreover, the ban on fishing wild-fry
implemented by the Government in 2000 led to the reinforcement of hatchery production
system (Belton et al. 2008). Since then, the seed production of striped catfish has increased
rapidly in private sectors (i.e. at private hatcheries), from 52 hatcheries in 2002, increasing
to 172 hatcheries in 2009. This has since (has reduced to 140 hatcheries by 2012) with a
total seed production of 4.6 billion fingerlings satisfying demand of the farming sector.
Dong Thap and An Giang provinces that have good natural conditions for hatcheries and
nurseries had also been the main area of catfish seed production with 87 and 23 hatcheries
in 2012, respectively (Fisheries Directorate 2013a). Striped catfish is spawned throughout
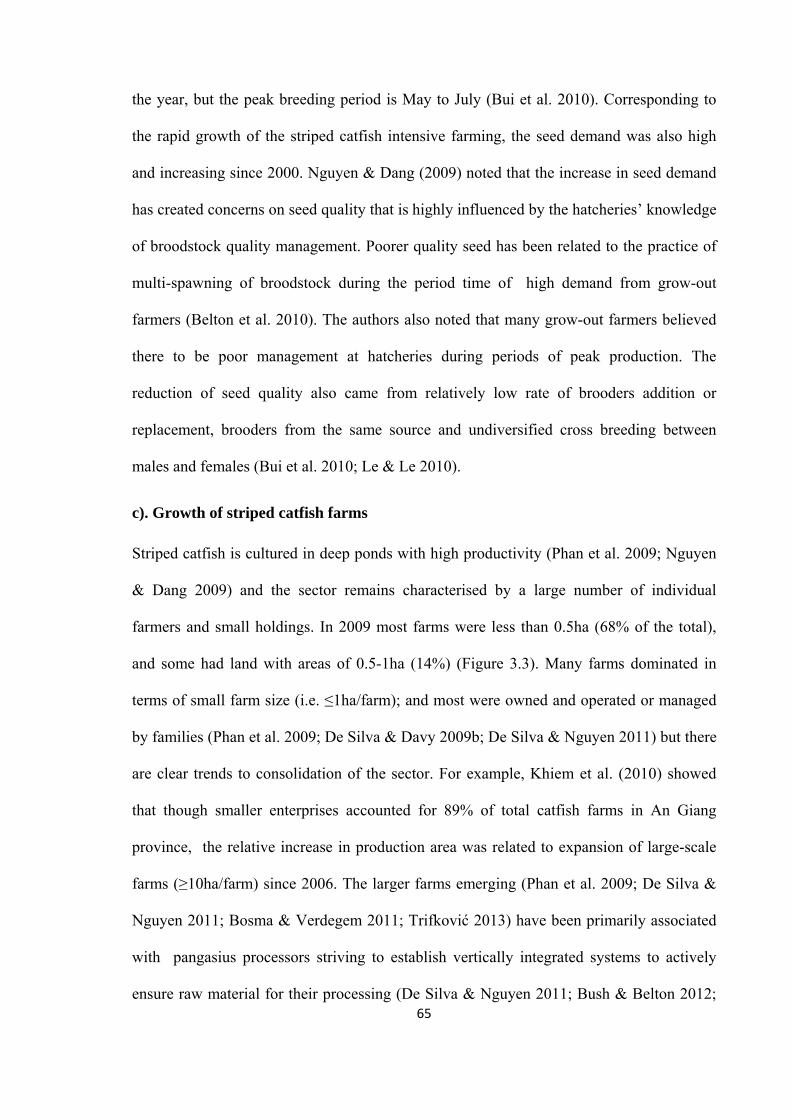
65
the year, but the peak breeding period is May to July (Bui et al. 2010). Corresponding to
the rapid growth of the striped catfish intensive farming, the seed demand was also high
and increasing since 2000. Nguyen & Dang (2009) noted that the increase in seed demand
has created concerns on seed quality that is highly influenced by the hatcheries’ knowledge
of broodstock quality management. Poorer quality seed has been related to the practice of
multi-spawning of broodstock during the period time of high demand from grow-out
farmers (Belton et al. 2010). The authors also noted that many grow-out farmers believed
there to be poor management at hatcheries during periods of peak production. The
reduction of seed quality also came from relatively low rate of brooders addition or
replacement, brooders from the same source and undiversified cross breeding between
males and females (Bui et al. 2010; Le & Le 2010).
c). Growth of striped catfish farms
Striped catfish is cultured in deep ponds with high productivity (Phan et al. 2009; Nguyen
& Dang 2009) and the sector remains characterised by a large number of individual
farmers and small holdings. In 2009 most farms were less than 0.5ha (68% of the total),
and some had land with areas of 0.5-1ha (14%) (Figure 3.3). Many farms dominated in
terms of small farm size (i.e. ≤1ha/farm); and most were owned and operated or managed
by families (Phan et al. 2009; De Silva & Davy 2009b; De Silva & Nguyen 2011) but there
are clear trends to consolidation of the sector. For example, Khiem et al. (2010) showed
that though smaller enterprises accounted for 89% of total catfish farms in An Giang
province, the relative increase in production area was related to expansion of large-scale
farms (≥10ha/farm) since 2006. The larger farms emerging (Phan et al. 2009; De Silva &
Nguyen 2011; Bosma & Verdegem 2011; Trifković 2013) have been primarily associated
with pangasius processors striving to establish vertically integrated systems to actively
ensure raw material for their processing (De Silva & Nguyen 2011; Bush & Belton 2012;
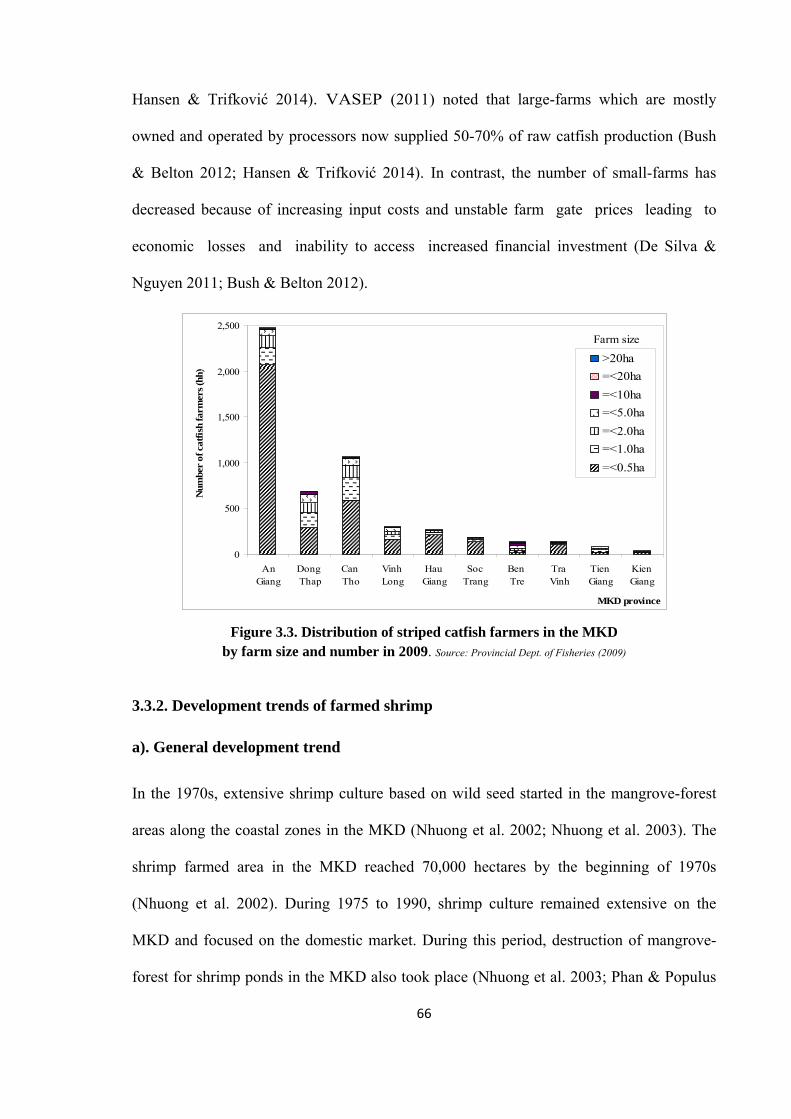
66
Hansen & Trifković 2014). VASEP (2011) noted that large-farms which are mostly
owned and operated by processors now supplied 50-70% of raw catfish production (Bush
& Belton 2012; Hansen & Trifković 2014). In contrast, the number of small-farms has
decreased because of increasing input costs and unstable farm gate prices leading to
economic losses and inability to access increased financial investment (De Silva &
Nguyen 2011; Bush & Belton 2012).
Figure 3.3. Distribution of striped catfish farmers in the MKD by farm size and number in 2009. Source: Provincial Dept. of Fisheries (2009)
3.3.2. Development trends of farmed shrimp
a). General development trend
In the 1970s, extensive shrimp culture based on wild seed started in the mangrove-forest
areas along the coastal zones in the MKD (Nhuong et al. 2002; Nhuong et al. 2003). The
shrimp farmed area in the MKD reached 70,000 hectares by the beginning of 1970s
(Nhuong et al. 2002). During 1975 to 1990, shrimp culture remained extensive on the
MKD and focused on the domestic market. During this period, destruction of mangrove-
forest for shrimp ponds in the MKD also took place (Nhuong et al. 2003; Phan & Populus
MKD province
0
500
1,000
1,500
2,000
2,500
AnGiang
Dong Thap
Can Tho
Vinh Long
Hau Giang
Soc Trang
Ben Tre
Tra Vinh
Tien Giang
Kien Giang
Farm size
Num
ber
of c
atfi
sh fa
rmer
s (h
h)..
>20ha
=<20ha
=<10ha
=<5.0ha
=<2.0ha
=<1.0ha
=<0.5ha
67
2007); around 75,000ha of mangrove forest were reduced to exploit fuels and develop
agriculture and shrimp culture. A step change occurred in shrimp culture around 1987
(Nhuong et al. 2003), when international trade spurred expansion in the early years of the
1990s (Tran et al. 2013). Development of shrimp culture in this time was also driven by the
introduction of artificial hatchery production, gradual improvement in culture technology
for grow-out farming, and broader Government economic reform (Doimoi policy) (Nhuong
et al. 2002; Nhuong 2011; Tran et al. 2013). Hatchery development occurred mainly in
Central Vietnam where Nha Trang University introduced the technology to local hatcheries
and conditions were favourable for its spread to the private sector. By the middle of the
1990s, shrimp farming faced serious epidemic diseases in the MKD, and the industry came
to a halt. After that, shrimp disease declined as a result of effective improvement in the
seed quality and management practices but it still caused significant economic damage to
farmers (Nhuong et al. 2003).
Since 2000, the shrimp industry has developed rapidly in both farmed area and production
volume as a positive result of the Decree 09/2000/NQ-CP allowing farmers to convert low
producing and saline rice fields, and salt pans in the coastal areas into shrimp ponds. The
area farmed for shrimp increased from 171,820ha in 1999 to 422,060ha in 2001, and it
reached 601,850ha in 2013 (Figure 3.4). According to MOFI (2006), the total conversion
of agricultural land to shrimp culture was around 310,000ha during the period 1999 to
2005, in which 42% came from low yield rice land conversion. Since 2005, shrimp
farming has continued to grow but mainly as improved-extensive and semi-intensive
culture systems instead of the traditional extensive system (Figure 3.6). However, culture
techniques were still limited, particularly in terms of farm infrastructure and access to good
quality seed, and high risk of disease has persisted particularly in the more intensive
systems. Large shrimp mortalities have occurred over a wide area in the MKD since 2008
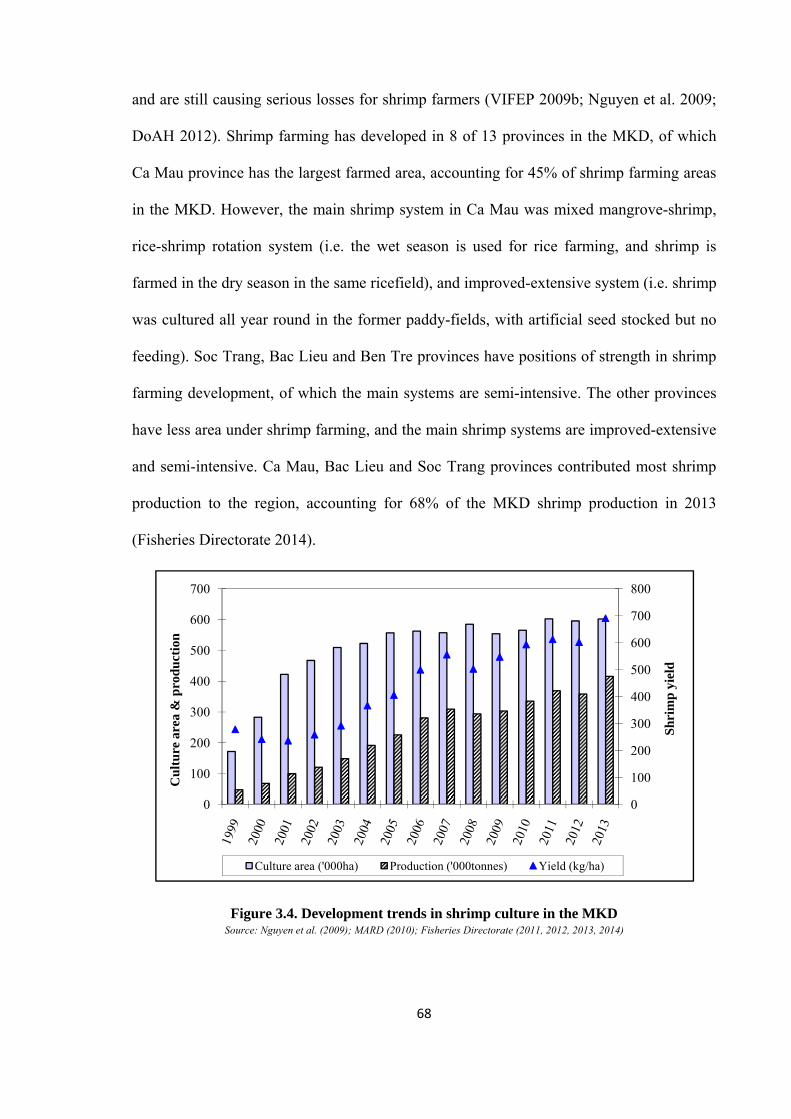
68
and are still causing serious losses for shrimp farmers (VIFEP 2009b; Nguyen et al. 2009;
DoAH 2012). Shrimp farming has developed in 8 of 13 provinces in the MKD, of which
Ca Mau province has the largest farmed area, accounting for 45% of shrimp farming areas
in the MKD. However, the main shrimp system in Ca Mau was mixed mangrove-shrimp,
rice-shrimp rotation system (i.e. the wet season is used for rice farming, and shrimp is
farmed in the dry season in the same ricefield), and improved-extensive system (i.e. shrimp
was cultured all year round in the former paddy-fields, with artificial seed stocked but no
feeding). Soc Trang, Bac Lieu and Ben Tre provinces have positions of strength in shrimp
farming development, of which the main systems are semi-intensive. The other provinces
have less area under shrimp farming, and the main shrimp systems are improved-extensive
and semi-intensive. Ca Mau, Bac Lieu and Soc Trang provinces contributed most shrimp
production to the region, accounting for 68% of the MKD shrimp production in 2013
(Fisheries Directorate 2014).
Figure 3.4. Development trends in shrimp culture in the MKD Source: Nguyen et al. (2009); MARD (2010); Fisheries Directorate (2011, 2012, 2013, 2014)
0
100
200
300
400
500
600
700
800
0
100
200
300
400
500
600
700
Sh
rim
p y
ield
Cu
ltu
re a
rea
& p
rod
uct
ion
.
Culture area ('000ha) Production ('000tonnes) Yield (kg/ha)
69
White-legged shrimp (L.vannamei) farming has been developed in the north and central
Vietnam since 2002. As a result of successful trial models, it was planned for promotion in
the Central and North of Vietnam (VIFEP 2009b; MARD 2009b). Several farms in Ben
Tre and Tien Giang provinces bought white-legged shrimp seed from the hatcheries in
Central Vietnam and introduced culture of white-legged shrimp to the MKD in 2007.
Based on the positive results and pressures from seafood processors to diversify away from
reliance on black tiger shrimp, white-legged shrimp farming was allowed by Ministry of
Agriculture & Rural Development (MARD) to develop in the MKD since 2008, with a
total culture area of 1,400ha,which by 2013 had increased rapidly to 41,120ha (Figure 3.5).
Black tiger shrimp disease outbreaks have become more serious recently and are the main
reason leading many semi-/intensive farmers to switch to white-legged shrimp culture
(Briggs et al. 2005; Lebel et al. 2008; Lebel et al. 2010). To date, the black tiger shrimp
industry depends heavily on wild brood-stock sources. The quality of this source is still
unstable and is not controlled effectively; while white-legged shrimp brood-stock is
imported and quality control is generally considered to be better. Yamprayoon and
Sukhumparnich (2010) noted that black tiger shrimp was too susceptible to disease with
the slow growth syndrome that led to the unavailability of good quality brood-stock, while
white-legged shrimp farming became more popular due to easy access to specific pathogen
free2 brood-stock. Shrimp farmers also enjoy rapid turnover because of the shorter farming
period (De Silva & Nguyen 2011).
2Specific-pathogen-free (SPF) is a term used for laboratory animals that are guaranteed free of particular pathogen (see more in http://en.wikipedia.org/wiki/Specific_Pathogen_Free). The specific pathogen free (SPF) Litopenaeus Vannamei has capacity to produce quality seeds with faster growth and higher survival rates for commercial farm (Briggs et al. 2005; Barman et al. 2012)
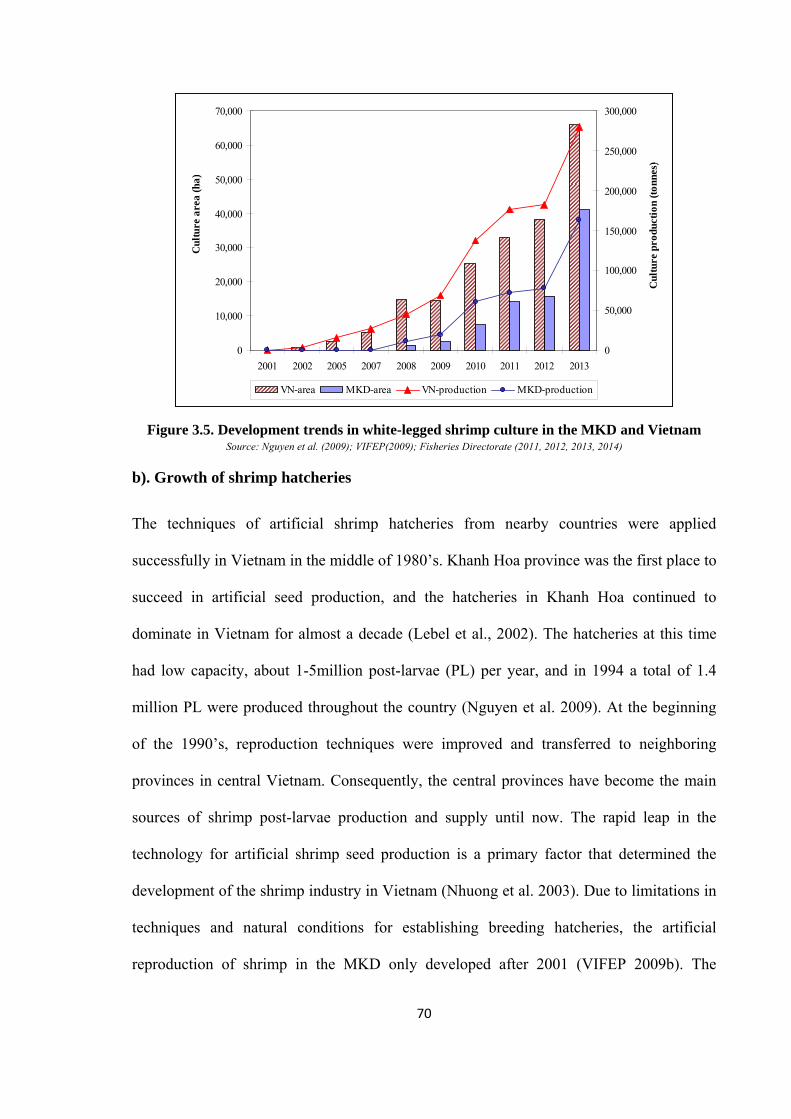
70
Figure 3.5. Development trends in white-legged shrimp culture in the MKD and Vietnam Source: Nguyen et al. (2009); VIFEP(2009); Fisheries Directorate (2011, 2012, 2013, 2014)
b). Growth of shrimp hatcheries
The techniques of artificial shrimp hatcheries from nearby countries were applied
successfully in Vietnam in the middle of 1980’s. Khanh Hoa province was the first place to
succeed in artificial seed production, and the hatcheries in Khanh Hoa continued to
dominate in Vietnam for almost a decade (Lebel et al., 2002). The hatcheries at this time
had low capacity, about 1-5million post-larvae (PL) per year, and in 1994 a total of 1.4
million PL were produced throughout the country (Nguyen et al. 2009). At the beginning
of the 1990’s, reproduction techniques were improved and transferred to neighboring
provinces in central Vietnam. Consequently, the central provinces have become the main
sources of shrimp post-larvae production and supply until now. The rapid leap in the
technology for artificial shrimp seed production is a primary factor that determined the
development of the shrimp industry in Vietnam (Nhuong et al. 2003). Due to limitations in
techniques and natural conditions for establishing breeding hatcheries, the artificial
reproduction of shrimp in the MKD only developed after 2001 (VIFEP 2009b). The
0
10,000
20,000
30,000
40,000
50,000
60,000
70,000
2001 2002 2005 2007 2008 2009 2010 2011 2012 2013
Cul
ture
are
a (h
a)
0
50,000
100,000
150,000
200,000
250,000
300,000
Cul
ture
pro
duct
ion
(ton
nes).
.
VN-area MKD-area VN-production MKD-production
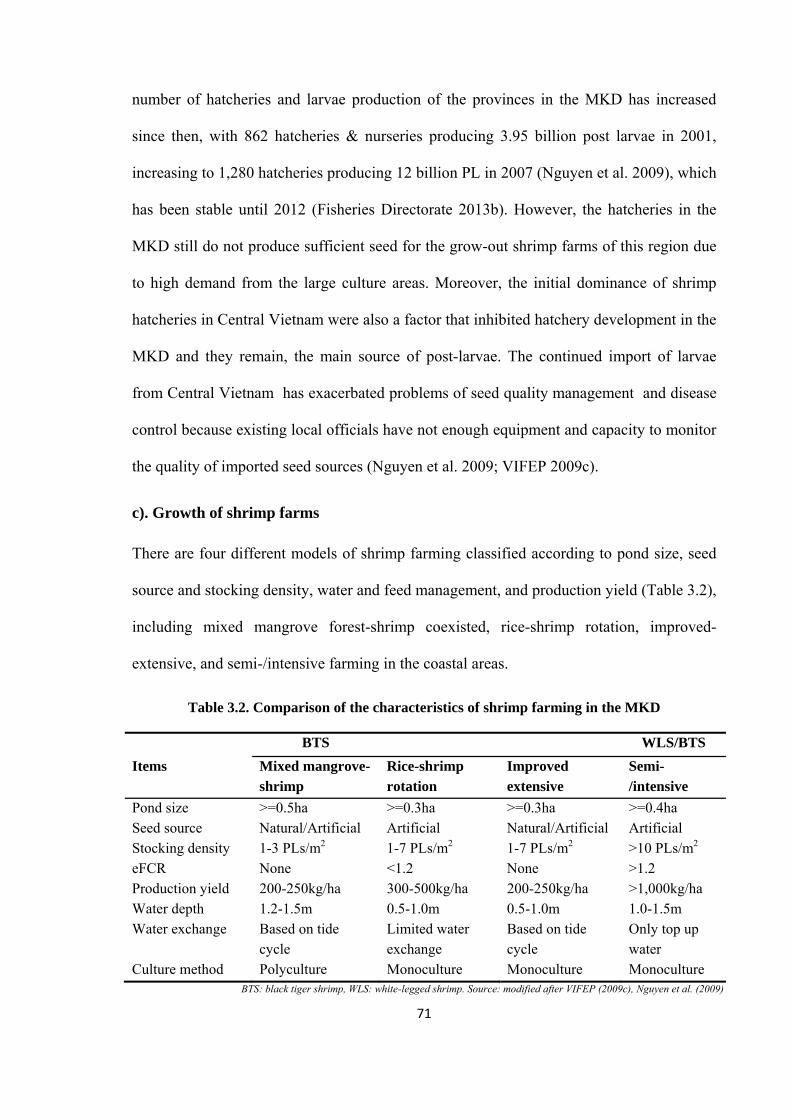
71
number of hatcheries and larvae production of the provinces in the MKD has increased
since then, with 862 hatcheries & nurseries producing 3.95 billion post larvae in 2001,
increasing to 1,280 hatcheries producing 12 billion PL in 2007 (Nguyen et al. 2009), which
has been stable until 2012 (Fisheries Directorate 2013b). However, the hatcheries in the
MKD still do not produce sufficient seed for the grow-out shrimp farms of this region due
to high demand from the large culture areas. Moreover, the initial dominance of shrimp
hatcheries in Central Vietnam were also a factor that inhibited hatchery development in the
MKD and they remain, the main source of post-larvae. The continued import of larvae
from Central Vietnam has exacerbated problems of seed quality management and disease
control because existing local officials have not enough equipment and capacity to monitor
the quality of imported seed sources (Nguyen et al. 2009; VIFEP 2009c).
c). Growth of shrimp farms
There are four different models of shrimp farming classified according to pond size, seed
source and stocking density, water and feed management, and production yield (Table 3.2),
including mixed mangrove forest-shrimp coexisted, rice-shrimp rotation, improved-
extensive, and semi-/intensive farming in the coastal areas.
Table 3.2. Comparison of the characteristics of shrimp farming in the MKD
BTS WLS/BTS
Items Mixed mangrove-shrimp
Rice-shrimp rotation
Improved extensive
Semi-/intensive
Pond size >=0.5ha >=0.3ha >=0.3ha >=0.4ha Seed source Natural/Artificial Artificial Natural/Artificial Artificial Stocking density 1-3 PLs/m2 1-7 PLs/m2 1-7 PLs/m2 >10 PLs/m2 eFCR None <1.2 None >1.2 Production yield 200-250kg/ha 300-500kg/ha 200-250kg/ha >1,000kg/ha Water depth 1.2-1.5m 0.5-1.0m 0.5-1.0m 1.0-1.5m Water exchange Based on tide
cycle Limited water exchange
Based on tide cycle
Only top up water
Culture method Polyculture Monoculture Monoculture Monoculture BTS: black tiger shrimp, WLS: white-legged shrimp. Source: modified after VIFEP (2009c), Nguyen et al. (2009)
72
The distribution of area among types of shrimp farming has changed significantly during
the period 1999-2013 (Figure 3.6). From 2001 to 2005, the culture area increased quickly
(MOFI 2006), but subsequently grew more slowly. The annual growth rate of semi-
/intensive was the highest, as many farmed areas of the improved-extensive system have
been upgraded to semi-intensive systems. However, semi-/intensive systems still
accounted for a relatively small proportion (<15%) of the MKD farmed shrimp area in
2013.
According to VIFEP (2009b), the rice-shrimp rotation, mixed mangrove-shrimp and
improved-extensive systems required lower levels of investment and intensification; they
are often owned, operated and managed by small-farmers, while more intensive farming
involved large-scale farmers or corporate companies. This reflects the high number of
shrimp farmers still at a small-scale level (Tran et al. 2013). Improved-extensive and rice-
shrimp rotation systems are the two main shrimp systems accounting for 77% of the MKD
shrimp farmed area in 2013. Although these two shrimp systems only accounted for 35%
of the MKD shrimp production, they play an important role in solving unemployment for
local people in the rural coastal areas, and provide employment for more than 200,000
labourers in rural areas, based on an average of 1 labourer per ha (Nguyen et al. 2009).
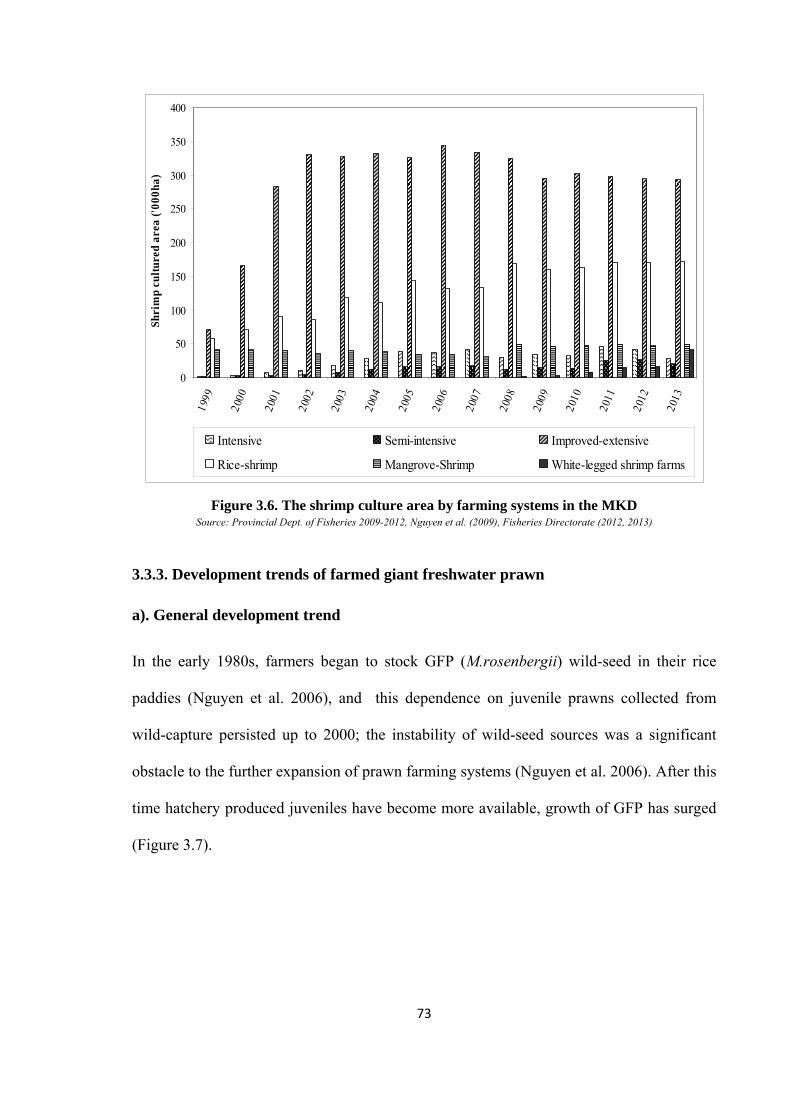
73
Figure 3.6. The shrimp culture area by farming systems in the MKD Source: Provincial Dept. of Fisheries 2009-2012, Nguyen et al. (2009), Fisheries Directorate (2012, 2013)
3.3.3. Development trends of farmed giant freshwater prawn
a). General development trend
In the early 1980s, farmers began to stock GFP (M.rosenbergii) wild-seed in their rice
paddies (Nguyen et al. 2006), and this dependence on juvenile prawns collected from
wild-capture persisted up to 2000; the instability of wild-seed sources was a significant
obstacle to the further expansion of prawn farming systems (Nguyen et al. 2006). After this
time hatchery produced juveniles have become more available, growth of GFP has surged
(Figure 3.7).
0
50
100
150
200
250
300
350
400
1999
2000
2001
2002
2003
2004
2005
2006
2007
2008
2009
2010
2011
2012
2013
Shri
mp
cult
ured
are
a ('
000h
a)….
Intensive Semi-intensive Improved-extensive
Rice-shrimp Mangrove-Shrimp White-legged shrimp farms
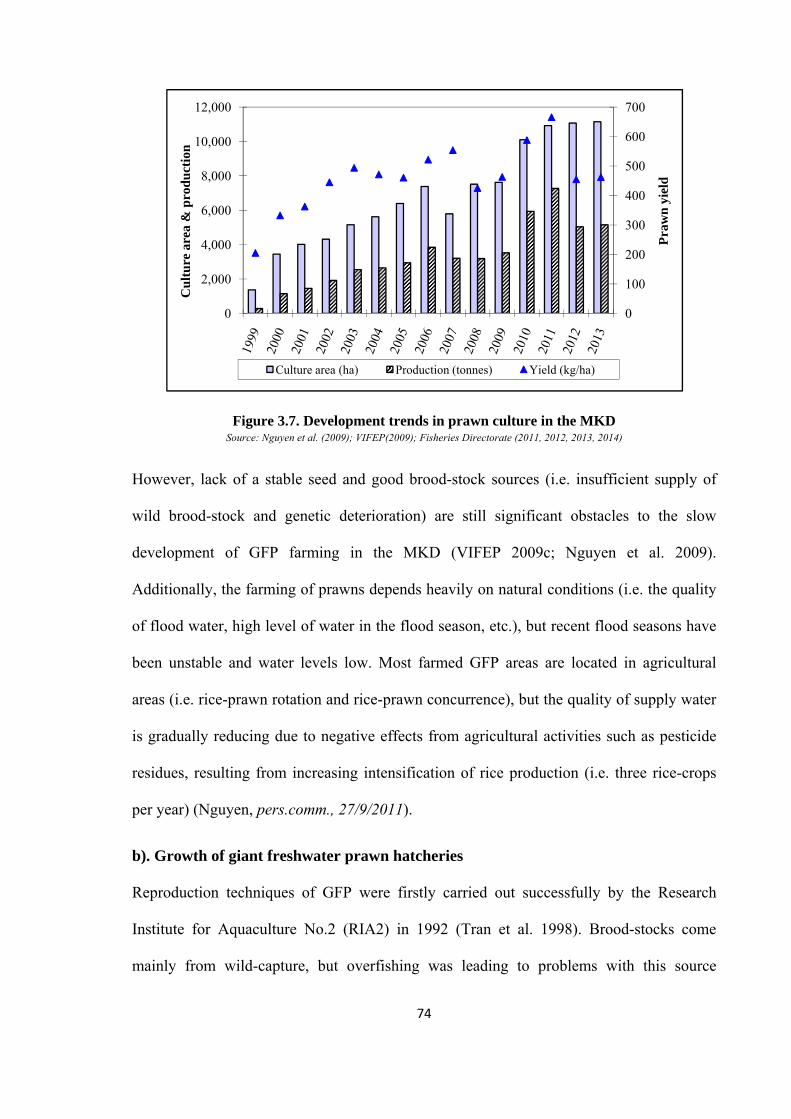
74
Figure 3.7. Development trends in prawn culture in the MKD Source: Nguyen et al. (2009); VIFEP(2009); Fisheries Directorate (2011, 2012, 2013, 2014)
However, lack of a stable seed and good brood-stock sources (i.e. insufficient supply of
wild brood-stock and genetic deterioration) are still significant obstacles to the slow
development of GFP farming in the MKD (VIFEP 2009c; Nguyen et al. 2009).
Additionally, the farming of prawns depends heavily on natural conditions (i.e. the quality
of flood water, high level of water in the flood season, etc.), but recent flood seasons have
been unstable and water levels low. Most farmed GFP areas are located in agricultural
areas (i.e. rice-prawn rotation and rice-prawn concurrence), but the quality of supply water
is gradually reducing due to negative effects from agricultural activities such as pesticide
residues, resulting from increasing intensification of rice production (i.e. three rice-crops
per year) (Nguyen, pers.comm., 27/9/2011).
b). Growth of giant freshwater prawn hatcheries
Reproduction techniques of GFP were firstly carried out successfully by the Research
Institute for Aquaculture No.2 (RIA2) in 1992 (Tran et al. 1998). Brood-stocks come
mainly from wild-capture, but overfishing was leading to problems with this source
0
100
200
300
400
500
600
700
0
2,000
4,000
6,000
8,000
10,000
12,000
Pra
wn
yie
ld
Cu
ltu
re a
rea
& p
rod
uct
ion
.
Culture area (ha) Production (tonnes) Yield (kg/ha)
75
(Wilder et al. 1998; Nguyen et al. 2003; Nguyen et al. 2006). Moreover, the unstable
quality of wild brood-stock could make for poor quality of seed, and various larval
diseasere was also a major factor hampering the success of prawn hatcheries at that time
(Nguyen et al. 2003; Nguyen et al. 2006). Therefore, the mass production of prawn seed
remained difficult until the end of the 1990’s (Nguyen et al. 2003); the prawn hatcheries in
the MKD had little consistent production until after 1998, and was held back by a shortage
of seed that still heavily depended on wild-seed sources. The lessons learnt from previous
studies has led to the development of new seed production technology based on the ‘green
water system’ by CTU in the end of 1990s. Since 2000, successful ‘green water system’
techniques were transferred to hatcheries in both public and private sectors (Nguyen et al.,
2003). Since then, GFP seed production developed rapidly in the MKD with more than 100
hatcheries producing more than with 100 million PLs by 2006 (Nguyen et al. 2009). These
endeavors met with various degrees of success, with hatcheries facing technical and
management-related difficulties such as high mortality rate at the hatcheries and quality of
brood-stock sources related to genetic deterioration leading to slow growth and disease in
seed production (Nguyen et al. 2006; Nietes-Satapornvanit et al. 2011; Nietes-
Satapornvanit 2014).
c). Growth of giant freshwater prawn farms
Since the early 1980s, the first GFP culture method in An Giang and Dong Thap provinces
in the MKD was based on the recruitment of seed into farms through sluice gates with the
changing of the tides (Nguyen et al. 2006); seed would then be trapped and allowed to
grow to full size. After that, the success of artificial seed production technology in
hatcheries, rice–prawn farming has intensified and management practices have become
very diverse. GFP is currently cultured in many ways (Table 3.3), including improved-
76
extensive systems in rice fields (i.e. integrated rice-prawn farming, alternation with rice
farming/rice-prawn rotation) similar to the extensive system, but with added artificial seed
with lower stocking density and supplementary feed that complements natural feed, pen
culture in the flooding plain areas and semi-intensive culture in ponds. However, the rice–
prawn farming is the most important production system in freshwater areas (Nguyen et al.
2006).
Table 3.3. Technical characteristic of various prawn culture models
Integrated rice-prawn
Rice-prawn rotation
Pen Culture
Pond culture
Pond size (ha) 0.1-0.7 0.68-2.93 35-900m2 0.38 Seed source Artificial Artificial Artificial Artificial Density (PL/m2) 1.5-5 1.5-15 62 10-15 Productivity (kg/ha) 42-566 100-1500 1,420-15,710 1,200-1,500 No. of crop/year 1 1-2 1 1-2 Culture time (months) 5-7 6-8 5-6 5-6 Feeding Home-made
/Pellet Home-made/Pellet
Home-made/Pellet
Pellet
Source: modified after Nguyen et al. (2003), Nguyen et al. (2006)
3.3.4. Development trends of farmed tilapia
a). General development trend
Tilapia has been farmed in Vietnam since the 1950s with the main species being
O.mossabicus and their hybrid. From 1970 to 1990, tilapia species, O.niloticus was
imported from Taiwan; by the early 1970’s it had became the main species for farming
due to good growth rate and fish size and was mainly cultured in polyculture system such
as VAC (garden-pond-livestock) (MARD 2010). From 1993 to 2000, the Research
Institute for Aquaculture No.1 (RIA1) imported several strains including Thailand GIFT
generation V, O.Swansea, O.Aureus from Philippines, and red tilapia from
Thailand/Taiwan for genetic programmes. The successful generation of RIA1 studies
brought a chance for tilapia farming development in Vietnam, however, before 1995 the
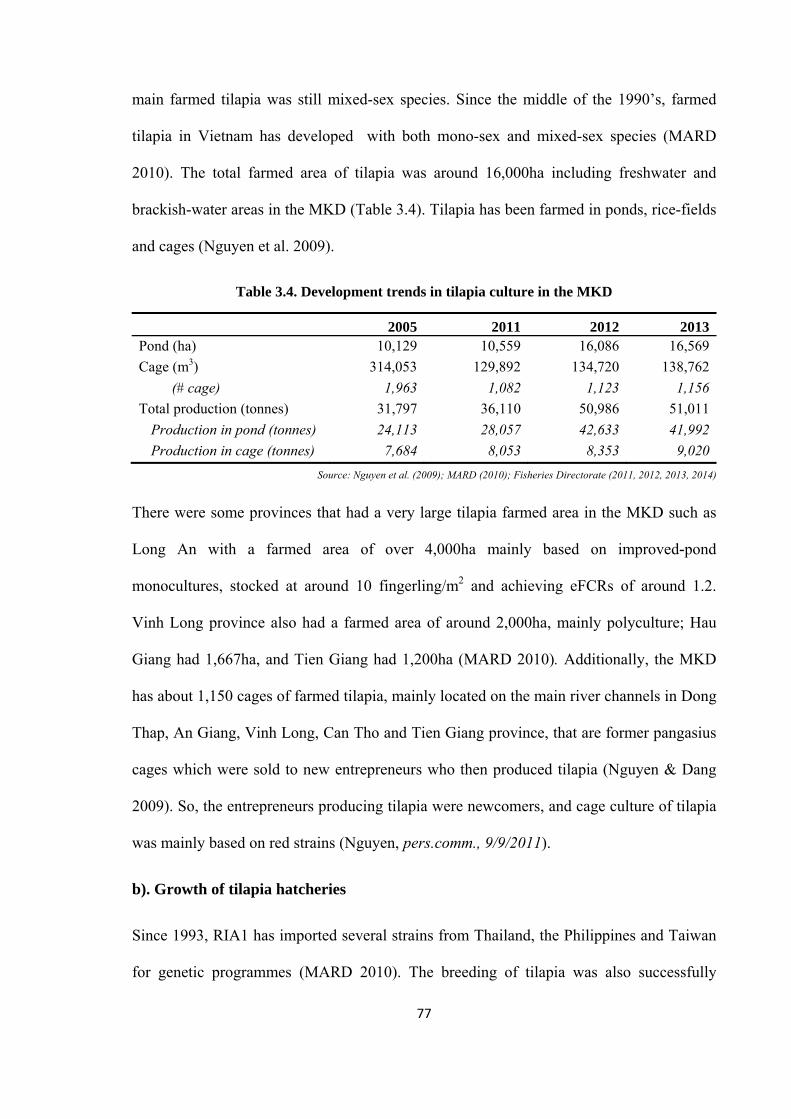
77
main farmed tilapia was still mixed-sex species. Since the middle of the 1990’s, farmed
tilapia in Vietnam has developed with both mono-sex and mixed-sex species (MARD
2010). The total farmed area of tilapia was around 16,000ha including freshwater and
brackish-water areas in the MKD (Table 3.4). Tilapia has been farmed in ponds, rice-fields
and cages (Nguyen et al. 2009).
Table 3.4. Development trends in tilapia culture in the MKD
2005 2011 2012 2013Pond (ha) 10,129 10,559 16,086 16,569
Cage (m3) 314,053 129,892 134,720 138,762
(# cage) 1,963 1,082 1,123 1,156
Total production (tonnes) 31,797 36,110 50,986 51,011
Production in pond (tonnes) 24,113 28,057 42,633 41,992
Production in cage (tonnes) 7,684 8,053 8,353 9,020
Source: Nguyen et al. (2009); MARD (2010); Fisheries Directorate (2011, 2012, 2013, 2014)
There were some provinces that had a very large tilapia farmed area in the MKD such as
Long An with a farmed area of over 4,000ha mainly based on improved-pond
monocultures, stocked at around 10 fingerling/m2 and achieving eFCRs of around 1.2.
Vinh Long province also had a farmed area of around 2,000ha, mainly polyculture; Hau
Giang had 1,667ha, and Tien Giang had 1,200ha (MARD 2010). Additionally, the MKD
has about 1,150 cages of farmed tilapia, mainly located on the main river channels in Dong
Thap, An Giang, Vinh Long, Can Tho and Tien Giang province, that are former pangasius
cages which were sold to new entrepreneurs who then produced tilapia (Nguyen & Dang
2009). So, the entrepreneurs producing tilapia were newcomers, and cage culture of tilapia
was mainly based on red strains (Nguyen, pers.comm., 9/9/2011).
b). Growth of tilapia hatcheries
Since 1993, RIA1 has imported several strains from Thailand, the Philippines and Taiwan
for genetic programmes (MARD 2010). The breeding of tilapia was also successfully

78
conducted by RIA2, the CTU and Nong Lam University in the late 1990s. The mono-sex
hatcheries and particularly the improved strains have supported the development of tilapia
in the South of Vietnam. For example, a genetically improved strain of red tilapia at RIA2
has been positively evaluated (with better growth rate and lower FCR) by farmers, but the
supply of the improved tilapia seed has been low (at 5-10% of requirements) so far
(Nguyen, pers.comm., 9/9/2011). The result, then, was applied in some Western regions,
the reproduction of GIFT tilapia is now mainly in Tien Giang and Vinh Long provinces.
MARD (2010) reported that the South of Vietnam contained around 100 tilapia hatcheries
(including 90 mixed-sex species and 10 mono-sex hatcheries) in 2004. However, the
quality of GIFT tilapia fingerlings coming from these hatcheries was generally not good.
Therefore, the lack of a stable supply of seed, especially mono-sex sources and seed
quality were the main constraint to the further expansion and development of tilapia
culture (MARD 2010). Moreover, an existing brood-stock source with a high inbreeding
rate and lower genetic diversification is also a key obstacle for further development (Pham
2010). To overcome barriers, improved strains of tilapia (i.e. higher growth, lower FCR,
more resistant to diseases and better survival) and improved culture techniques should be
supported and implemented (Nguyen, pers.comm., 9/9/2011). Several programmes to
improve strains of tilapia for artificial seed production have been implemented by research
sectors in the MKD; however, the results are still limited for expanding or are at the on-
going development stage.
c). Grow-out tilapia farms
Tilapia is cultured together with other fish species (i.e. polyculture) or cage culture in the
MKD. Total farmed tilapia covers around 16,000ha but at low production, with yields
ranging from 2-6 tonnes/ha in pond practices (Phan et al. 2011). To date, tilapia are also
79
raised in cages in some MKD provinces with about 1,150 cages (MARD 2010; Fisheries
Directorate 2014). According to our survey in 2010, each tilapia farm owns 1-5 cages
containing 105m3 of water; stocking density depends on fingerling size but is usually
around 5kg/m3 and productivity can reach 65kg/m3 with harvested fish size ranged from
300-500gram/fish (Phan et al. 2011). Until now, a shortage of good fry production and
poor brood-stock productivity were significant constraints to commercial tilapia production
(Gupta & Acosta 2004; Pham 2010). In addition, lack of attention given to marketing (e.g.
lack of international markets), economic factors and other business aspects have also been
identified as constraints to success of commercial tilapia farming (MARD, 2010).
3.4. Growth of trade in farmed seafood
Striped catfish and shrimp have contributed an increasing proportion of Vietnam’s
exported fishery products over the last decade, whereas in comparison, tilapia and GFP
have hardly featured in the statistics. Farmed species, mainly shrimp and striped catfish,
have brought huge export value from seafood export and have had a rapid growth since
2001. In 2001, the export turnover of both species reached only US$787.62 million
(accounted for 44% of seafood export turnover), but has since increased to US$4.86 billion
(73%) in 2013 (Figure 3.8).
Striped catfish has shown the highest growth in seafood export value, reaching an annual
growth rate of 61.44% compare with that of shrimp (12.20%) since 2001. Whereas, the
export turnover of tilapia and GFP were still low, with US$1.26 million and US$11.23
million in 2008, respectively; however, these are two potential species to be developed in
the future. Tilapia and GFP have been mainly consumed domestically rather than exported.
Besides, the main constraints leading to slow growth of farmed tilapia and GFP described
in the above sections, MARD (2010) and VIFEP (2009) pointed out other factors
constrained exports including i) the small harvest size of farmed tilapia, often around
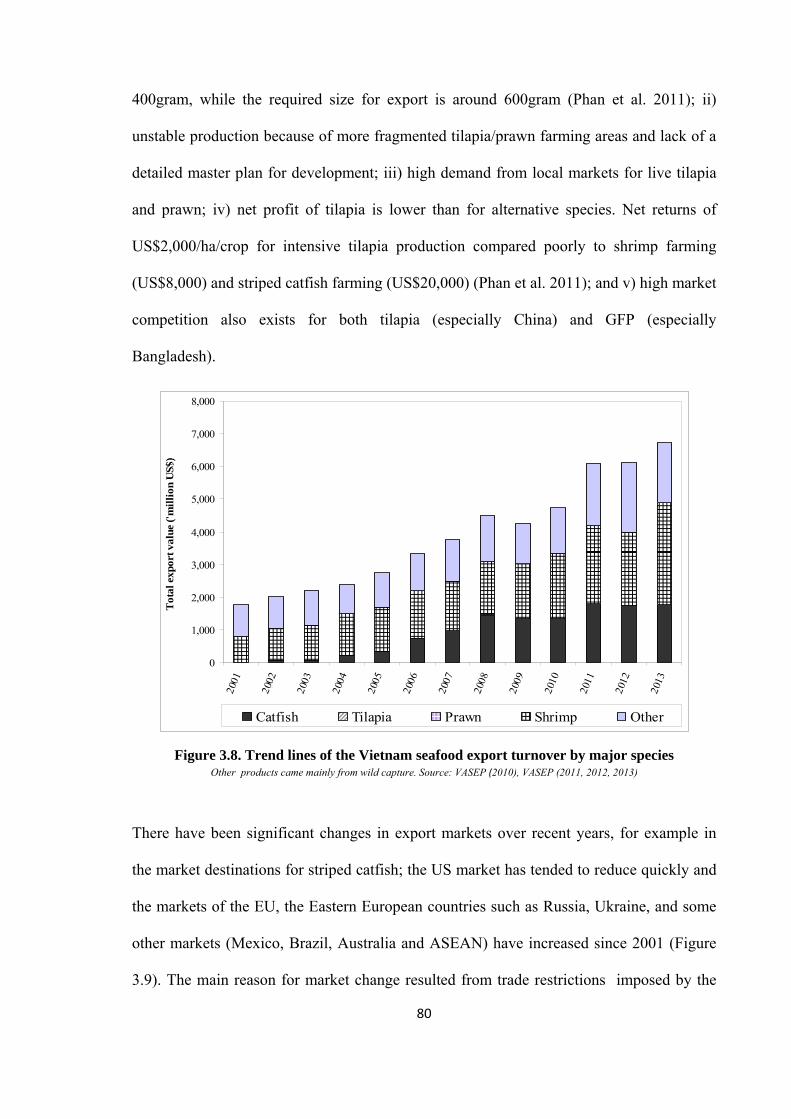
80
400gram, while the required size for export is around 600gram (Phan et al. 2011); ii)
unstable production because of more fragmented tilapia/prawn farming areas and lack of a
detailed master plan for development; iii) high demand from local markets for live tilapia
and prawn; iv) net profit of tilapia is lower than for alternative species. Net returns of
US$2,000/ha/crop for intensive tilapia production compared poorly to shrimp farming
(US$8,000) and striped catfish farming (US$20,000) (Phan et al. 2011); and v) high market
competition also exists for both tilapia (especially China) and GFP (especially
Bangladesh).
Figure 3.8. Trend lines of the Vietnam seafood export turnover by major species Other products came mainly from wild capture. Source: VASEP (2010), VASEP (2011, 2012, 2013)
There have been significant changes in export markets over recent years, for example in
the market destinations for striped catfish; the US market has tended to reduce quickly and
the markets of the EU, the Eastern European countries such as Russia, Ukraine, and some
other markets (Mexico, Brazil, Australia and ASEAN) have increased since 2001 (Figure
3.9). The main reason for market change resulted from trade restrictions imposed by the
0
1,000
2,000
3,000
4,000
5,000
6,000
7,000
8,000
2001
2002
2003
2004
2005
2006
2007
2008
2009
2010
2011
2012
2013
Tot
al e
xpor
t val
ue ('
mil
lion
US$
)…...
Catfish Tilapia Prawn Shrimp Other
81
US (i.e. antidumping duty imposed since 2002) that gave the impetus and increasing
opportunities (e.g. increasing the worldwide advertising) for the catfish sector to develop
new markets (Bush & Duijf 2011; Belton et al. 2011; De Silva & Nguyen 2011).
Moreover, the striped catfish has become a strong competitor in the European whitefish
market, because of its highly competitive prices and its substitutability for other types of
whitefish (Little et al. 2012). The EU has gradually become the most important market
for striped catfish. New markets have emerged, such as Australia together with many
other countries which accounted for 41% of striped catfish export value in 2010, and 44%
in 2013. Striped catfish has competed effectively in virtually every global market it has
entered (Little et al. 2012). Recently, striped catfish entered the list of top ten most
consumed seafood in the US in 2009, and it now competes successfully with a wide range
of farmed and wild-caught whitefish in various market segments (Little et al. 2012).
Moreover, the diversified markets could lead to potentially reduce price instability, risks of
shocks in specific markets (e.g. heavy dependence on the US market before 2003) and
trade fraud between exporters. Since 2008, the US market has recovered and increased due
to increasing demand for seafood products with a cheaper price during the period of World
economic crisis. However, at the same time the EU market has been gradually decreasing
as a result of increasing technical barriers, high competition from the Alaska Pollock
species that is already available with MSC trademark, negative consumer perception of
pangasius affected by negative media impacts, and reduced spending power for seafood
consumption by customers affected by the Eurozone crisis (VASEP 2011; CBI 2012a;
Beukers et al. 2012; Fisheries Directorate 2013a; VASEP 2014a). Generally, the EU
market share has been in decline since 2008 and the US market is regaining share, but the
pangasius market is characterised by increased diversification of its markets (Nguyen &
Dang 2009; Bush et al. 2010; De Silva & Nguyen 2011).
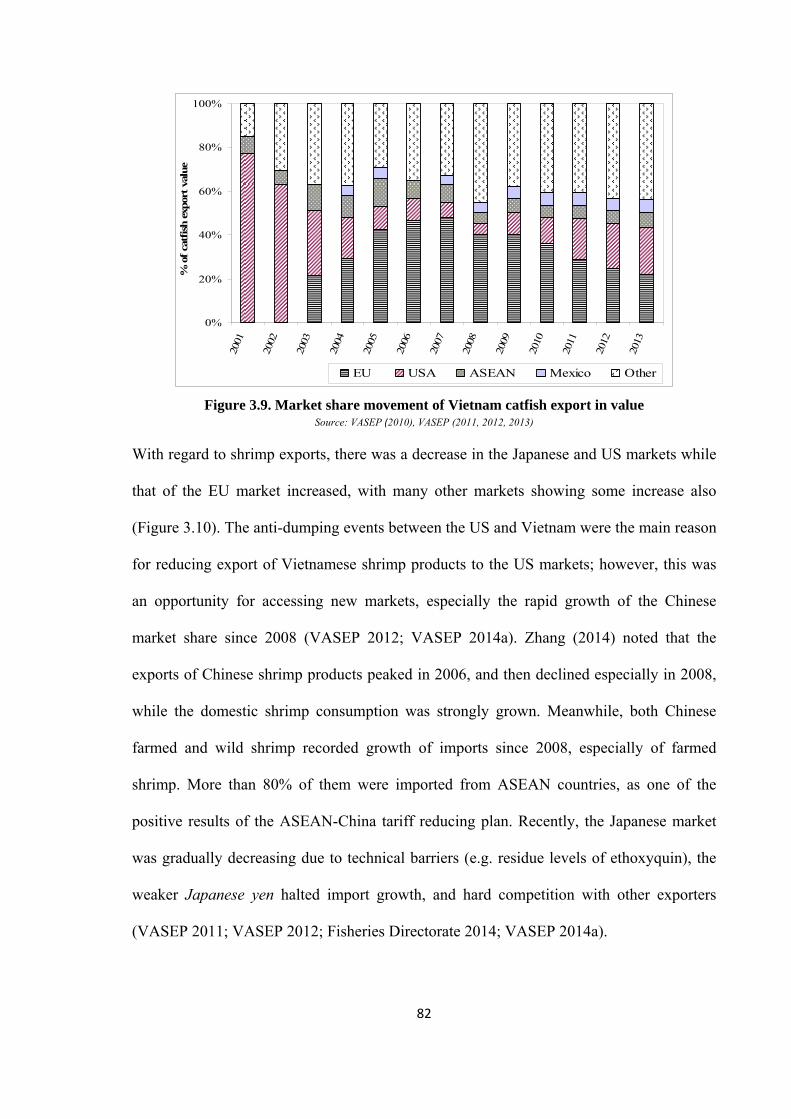
82
Figure 3.9. Market share movement of Vietnam catfish export in value
Source: VASEP (2010), VASEP (2011, 2012, 2013)
With regard to shrimp exports, there was a decrease in the Japanese and US markets while
that of the EU market increased, with many other markets showing some increase also
(Figure 3.10). The anti-dumping events between the US and Vietnam were the main reason
for reducing export of Vietnamese shrimp products to the US markets; however, this was
an opportunity for accessing new markets, especially the rapid growth of the Chinese
market share since 2008 (VASEP 2012; VASEP 2014a). Zhang (2014) noted that the
exports of Chinese shrimp products peaked in 2006, and then declined especially in 2008,
while the domestic shrimp consumption was strongly grown. Meanwhile, both Chinese
farmed and wild shrimp recorded growth of imports since 2008, especially of farmed
shrimp. More than 80% of them were imported from ASEAN countries, as one of the
positive results of the ASEAN-China tariff reducing plan. Recently, the Japanese market
was gradually decreasing due to technical barriers (e.g. residue levels of ethoxyquin), the
weaker Japanese yen halted import growth, and hard competition with other exporters
(VASEP 2011; VASEP 2012; Fisheries Directorate 2014; VASEP 2014a).
0%
20%
40%
60%
80%
100%
2001
2002
2003
2004
2005
2006
2007
2008
2009
2010
2011
2012
2013
% o
f ca
tfis
h e
xpor
t va
lue
...
EU USA ASEAN Mexico Other
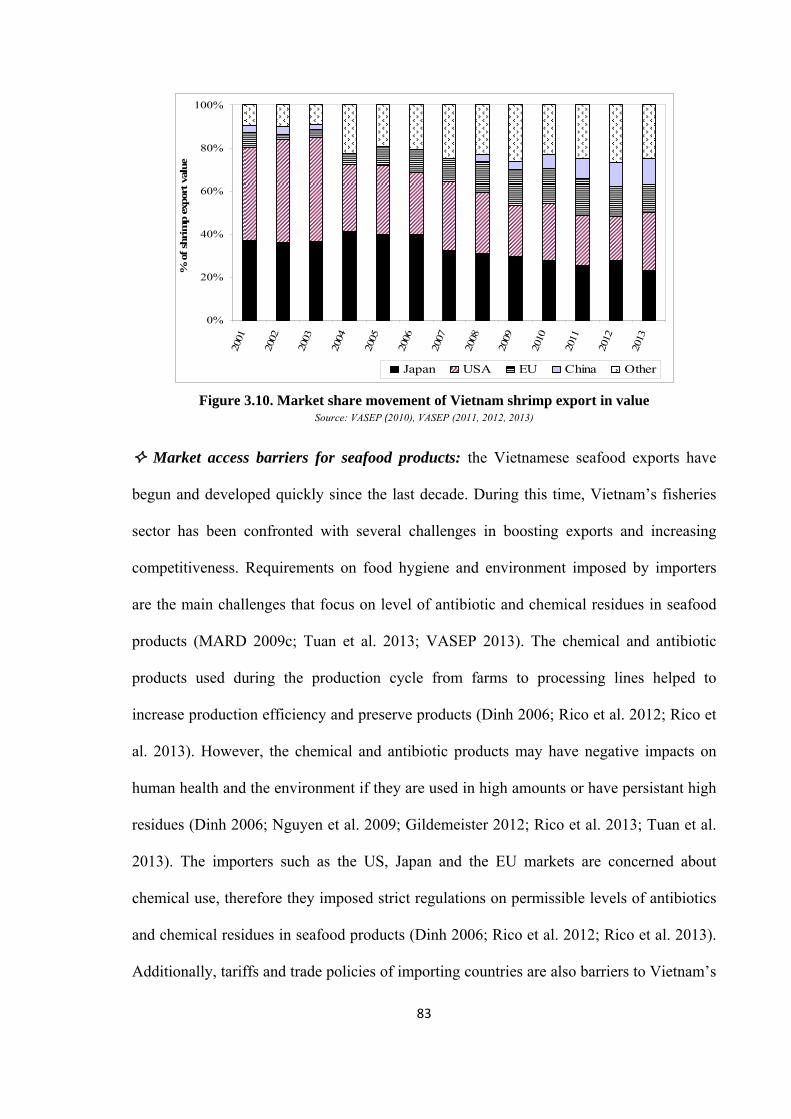
83
Figure 3.10. Market share movement of Vietnam shrimp export in value
Source: VASEP (2010), VASEP (2011, 2012, 2013)
Market access barriers for seafood products: the Vietnamese seafood exports have
begun and developed quickly since the last decade. During this time, Vietnam’s fisheries
sector has been confronted with several challenges in boosting exports and increasing
competitiveness. Requirements on food hygiene and environment imposed by importers
are the main challenges that focus on level of antibiotic and chemical residues in seafood
products (MARD 2009c; Tuan et al. 2013; VASEP 2013). The chemical and antibiotic
products used during the production cycle from farms to processing lines helped to
increase production efficiency and preserve products (Dinh 2006; Rico et al. 2012; Rico et
al. 2013). However, the chemical and antibiotic products may have negative impacts on
human health and the environment if they are used in high amounts or have persistant high
residues (Dinh 2006; Nguyen et al. 2009; Gildemeister 2012; Rico et al. 2013; Tuan et al.
2013). The importers such as the US, Japan and the EU markets are concerned about
chemical use, therefore they imposed strict regulations on permissible levels of antibiotics
and chemical residues in seafood products (Dinh 2006; Rico et al. 2012; Rico et al. 2013).
Additionally, tariffs and trade policies of importing countries are also barriers to Vietnam’s
0%
20%
40%
60%
80%
100%
2001
2002
2003
2004
2005
2006
2007
2008
2009
2010
2011
2012
2013
% o
f sh
rim
p e
xpor
t va
lue ...
Japan USA EU China Other
84
seafood exports; for example, trade restrictions after the anti-dumping event led to the
reduction of catfish exported to the US market until approximately 2005 (Nguyen 2010;
De Silva & Nguyen 2011). In general, there are some challenges and implications for
Vietnam seafood exporters (Dinh 2006; MARD 2009c; Tuan et al. 2013), as follows i) a
complex process for seafood exporters to understand the food hygiene and environmental
requirements in individual importing markets. To export products, seafood enterprises are
faced with sophisticated and ever changing layers of standards set by national and
international governmental bodies; ii) the diversity of standards in place in export markets
is very large (Corsin et al. 2007; Bostock et al. 2010; Ponte et al. 2011). Although there
are some common trends in food safety regulations in importing countries, they have not
adopted common product standards, processor inspection requirements. As Vietnamese
enterprises expand their export markets, the diversity of requirements they need to meet
also increases; iii) hygiene and environmental standards have become increasingly
stringent in response to scientific evidence and consumer concern. For example, the
producers and processors sought clarification about maximum residue limits for
ethoxyquin, which caused rejection of shrimp in Japanese market in 2012, as there were
39 cases of rejection of shrimp from Vietnam and India by Japan due to the presence of
this compound at levels of more than 0.01ppm (Karunasagar 2013); iv) costs of
compliance for the Vietnamese seafood industry are significant and impact on its
competitiveness as well as its ability to gain market access; and iv) tariff and trade policy
that used to protect local producers of importing countries are still barriers for seafood
exports.
85
3.5. Growth of processing sectors
3.5.1. Growth of seafood processing plants
The export of seafood from Vietnam began at the end of the 1970s, with export values at
US$16.60 million in 1979. The Sea Products Import-Export Join Stock Corporation
(SEAPRODEX) was the first company allowed to export fisheries products to the Japanese
market, was established in 1978. However, until the mid 1980s, all seafood processors
were state-owned and all export trade was a state monopoly, with the main products
coming from wild-capture. Since the establishment of the ‘Doimoi policy’ in 1986, the
Vietnamese government has encouraged the privatization of state-owned companies.
Seafood products have grown gradually in terms of export volume and value, reaching
US$175 million in 1989 with around 100 seafood processing plants (Tuan et al. 2013). Up
to the beginning of the 1990s, all private seafood processors were required to export their
products through SEAPRODEX (Kagawa & Bailey 2006; Tuan et al. 2013). In the period
from 1985 to 1990, frozen products increased with an annual growth rate of 26%,
increasing to 32% per year in the period of 1990-1995. Frozen products increased
continuously and by 2000 accounted for 86% of the total processed products with shrimp
alone accounting for almost one quarter (23%), followed by squid, fish and molluscs.
Dried products were also component of processed, exported product (Nguyen et al. 2009;
VIFEP 2009c). Corresponding to the rapid growth of the aquaculture sector since 2001, as
a positive result of the new policy “Decree 09/2000/NQ-CP” and accessibility to the
international seafood markets, seafood processing plants grew in both total output and
technologies, with the diversification of products and more attention to value-added
products. Standards for food safety equal that met international requirements were
considered and issued. By the end of 2002, there were 246 processing enterprises in
Vietnam, of which 211 were frozen processing plants with a Almost 69% of processing
86
enterprises were located in the south of Vietnam, 27% in the Centre and 4% in the North.
Frozen raw products were still the main output of processing due to limitations in
processing technology for value added products at this time. In 2003, over 60% of
enterprises had met the requirements for food safety with around 100 processing
enterprises in Vietnam included in the first list of fishery exporters into the EU, with
Vietnam fishery products present in over 75 countries and territories. The seafood
processing sector continued to increase and expansion of the export market diversified
during the last decade. By 2008, Vietnam had 470 seafood processing plants, of which 269
qualified to export to the EU; this increased to 429 in 2010. Tuan et al. (2013) noted that
there was a significant increase in the number of seafood processors and their production
capacity per day during 2002 and 2009, with annual growth rates of 10.7% and 12.3%,
respectively.
Many seafood plants acquired food safety certifications (e.g. GAP, BAP, SQF) required by
their major trading partners, and most applied product quality controls such as
International Standards Organization (ISO), Hazard Analysis and Critical Control Point
(HACCP), and Good Manufacturing Practices (GMP) (Dinh 2006; VASEP 2011). MKD is
the main area of seafood processing plants as it has grown in parallel with farming, with
the main products coming from shrimp and catfish industries (Figure 3.11). In 2002, there
were 143 seafood processing plants in the Southeast provinces and MKD, with an average
production capacity reaching nearly 15.5tonnes/plant per day. After that, the fast growth of
the aquaculture sector led to an increase in the processing sector, and it reached 317
seafood processing plants with an average capacity of 18.4 tonnes/plant per day (Nguyen et
al. 2009; Tuan et al. 2013). However, less effective planning and management of the
processing sector has recently led to several problems such as operating under capacity,
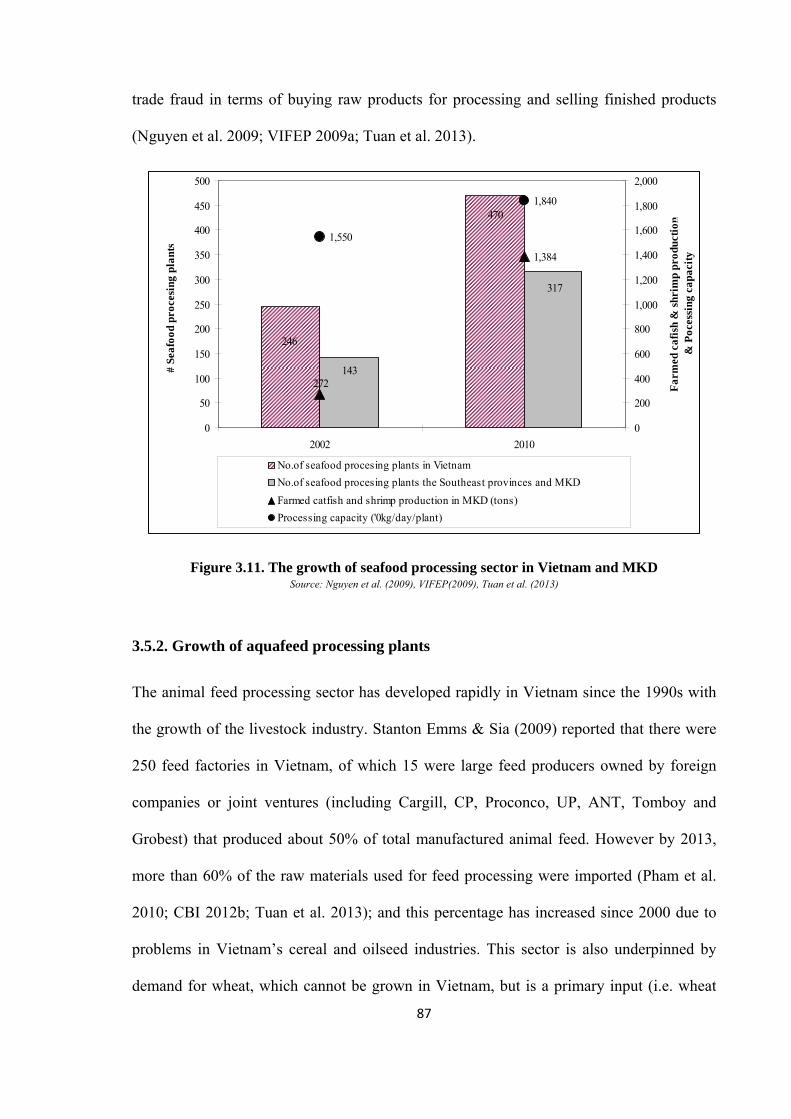
87
trade fraud in terms of buying raw products for processing and selling finished products
(Nguyen et al. 2009; VIFEP 2009a; Tuan et al. 2013).
Figure 3.11. The growth of seafood processing sector in Vietnam and MKD Source: Nguyen et al. (2009), VIFEP(2009), Tuan et al. (2013)
3.5.2. Growth of aquafeed processing plants
The animal feed processing sector has developed rapidly in Vietnam since the 1990s with
the growth of the livestock industry. Stanton Emms & Sia (2009) reported that there were
250 feed factories in Vietnam, of which 15 were large feed producers owned by foreign
companies or joint ventures (including Cargill, CP, Proconco, UP, ANT, Tomboy and
Grobest) that produced about 50% of total manufactured animal feed. However by 2013,
more than 60% of the raw materials used for feed processing were imported (Pham et al.
2010; CBI 2012b; Tuan et al. 2013); and this percentage has increased since 2000 due to
problems in Vietnam’s cereal and oilseed industries. This sector is also underpinned by
demand for wheat, which cannot be grown in Vietnam, but is a primary input (i.e. wheat
470
246
317
143
1,384
1,550
1,840
272
0
50
100
150
200
250
300
350
400
450
500
2002 2010
# Se
afoo
d pr
oces
ing
plan
ts….
0
200
400
600
800
1,000
1,200
1,400
1,600
1,800
2,000
Far
med
caf
ish
& s
hrim
p pr
oduc
tion.
..&
Poc
essi
ng c
apac
ity
No.of seafood procesing plants in Vietnam
No.of seafood procesing plants the Southeast provinces and MKD
Farmed catfish and shrimp production in MKD (tons)
Processing capacity ('0kg/day/plant)
88
flour) for the rapidly growing livestock and aquaculture feed industry. In 2000, the total
value of imported wheat was US$77.8 million, which soared to 763.8 million by 2012
(GSO 2013). Moreover, local availability of inputs (e.g. rice bran, soybean, fishmeal &
fish oil) for feed production, particularly the protein rich ingredients, is limited in terms of
quality and quantity used for feed processing (Pham et al. 2010; Tuan et al. 2013). The
same authors indicated that more than ten types of ingredients out of twenty-two were
imported by feed enterprises, and the animal feed sector depends more on imports for
protein inputs than those for energy. In recent years, the heavy dependence on imports of
raw materials, high import taxes and low domestic yield of these inputs have been
considered the causes of the high livestock feed prices. Therefore, the industrial feed prices
were around 10-15% higher than in other countries in the region, such as Thailand and
China which produce comparatively more of the raw materials they require (CBI 2012b).
High livestock feed prices directly affect producers as they result in higher production
costs, especially when the prices of livestock products cannot increase sufficiently to cover
the increased costs (Pham et al. 2010).
Aquaculture feeds in the MKD are mainly available in two forms: home-made and
commercial. Up to 2008, the MKD had a total of 78 commercial feed factories and about
1,599 distributors (Nguyen et al.2009). The total production of pellet feed produced in the
MKD was 140,500 tonnes, accounting for 26% of the demand, and the remaining feed was
home-made or imported from outside MKD provinces (i.e. Ho Chi Minh, Dong Nai and
Binh Duong provinces). Can Tho, Dong Thap, Tien Giang and Long An provinces have
become the main locations for production of pellet feed for fish and shrimp in the MKD.
Provincial Department of Fisheries reports showed that almost all provinces in the MKD,
apart from those self-insufficient in feed production, imported a large amount of feed from
other factories (e.g. CP, Cargill, UP etc.) in the southeast provinces where the industrial
89
zones were located. The feed companies firstly established in the southeast provinces (i.e.
HCM city and Dong Nai), because this area had industrial zones with better infrastructure
and policies for attracting investment of foreign feed companies (e.g. CP, UP, Cargill). The
companies began with livestock feeds and then expanded to aqua-feeds as the sector
developed. In general, the situation for aqua feeds is the same as livetock feeds sector in
terms of constraints on the imported and local domestic raw material sources (Nguyen et
al. 2009; Tuan et al. 2013). Thus, this issue is a main constraint to the reduction of
competition capacity in trading in the international markets and the future development of
aquaculture (Nguyen et al.2009). Feed cost accounted for around 80% of total production
cost (Phan et al. 2009), directly affecting producers’ operations during periods of
increasing feed prices and unstable markets (Pham et al. 2010).
3.6. Social and environmental impact
3.6.1. Social impact
The aquaculture sector has developed rapidly in recent years, generating significant
employment opportunities and income to rural communities, as well as becoming a
significant foreign exchange earner for Vietnam (Vu & Phan 2008; Nguyen et al. 2009).
For example, the shrimp industry has brought about great social and economic benefits
and generated jobs, created income for coastal communities as well as improved local
infrastructure (Nguyen et al. 2009; Tran et al. 2013). Shrimp farming, in particular,
resulted in direct benefits to coastal regions where people had fewer livelihood options.
Since 2000, many people who produced salt and rice inefficiently have moved to shrimp
farming, in so doing have diversified their livelihood, and enhanced their living standards.
In addition, shrimp farming also brings about growth of services such as seed and feed
supply, etc., creating new jobs and increased income of the local people (Nhuong et al.
2003). However, encouraging the poor households to participate directly in shrimp

90
farming could be risky as shrimp farming is a complex technology and requires high
investment that is beyond the poor’s resources (Nhuong et al. 2003; VIFEP 2009; Nhuong
2011). On the other hand, the most important complaints about the negative impacts of
shrimp farming sector were i) the shrimp households who obtained continuous losses from
shrimp crops after several years could not re-invest in aquaculture, consequently they had
to sell or to lease their lands and fell into poverty (Le 2009; Nguyen et al. 2009); ii) the
poverty situation, reduction in free surface water and lower quality of public water, as well
as the need to diversify species for aquaculture have become the main reasons for
overfishing which caused rapid depletion of natural aquatic resources (Le 2009; Ha & van
Dijk 2013); and iii) the conflicts around water use among stakeholder groups e.g. between
rice-farmers and shrimp farmers (RIA2 2009; Tuan et al. 2013) and a negative impact on
fishing, which represents an important source of livelihood for the poor (Irz et al. 2007).
Recently, the striped catfish development has become a significant source of export
earnings (Nguyen 2008; VIFEP 2009a), and it also reportedly supports the livelihoods of
around 100,000 individuals and provides an additional 170,000 jobs in the processing
sector, mostly women in 2009 (Nguyen et al. 2009; De Silva & Nguyen 2011). De Silva &
Nguyen (2011) indicated that obviously a highly intensive farming system in striped
catfish farming tends to generate high revenues and can bring large profits to all
stakeholders along the value chain during a period of high product price. As well as the
positive impacts, aquaculture also had some negative impacts during the development
process. For example, the immediate effect of the anti-dumping decision was a decline in
the farm gate price of striped catfish to below production costs, leading to the loss of an
estimated 8,000 jobs (Zweig et al. 2005). Bush et al. (2009) noted that as a negative
impact of the US antidumping event, the striped catfish sector may have lost between 14-
63% of its market share, with a 3-10% reduction in real income (Brambilla et al. 2009);
91
and 10% of workers at the processing plants were made redundant (Nguyen et al. 2004).
De Silva & Nguyen (2011) indicated that during the time of low fish prices, many catfish
farmers suspended farming or some farms left the sector due to poor economic
performance (Nguyen et al. 2009; Vo et al. 2010).
3.6.2. Environmental impact
The rapid development of Vietnam’s aquaculture has caused several environmental issues
in the short and long-terms (Nhuong et al. 2002; Nhuong et al. 2003; Anh et al. 2010a; Anh
et al. 2010b; Pham et al. 2011), such as mangrove forest degradation, biodiversity loss,
ecological imbalance and disease epidemics (Le 2009; Ha et al. 2012). One of the most
serious environmental problems has resulted from the pressure of expanding aqua-farming
on natural resources in coastal areas, especially mangrove forests. During the period 1983-
2000, the total area of shrimp farming in the MKD increased by 35 times, with the loss of
15,000 hectares of mangrove forest annually (Nhuong et al. 2003); and many of the
mangroves lost in the 1990s were due to aquaculture development. After 2000,
deforestation slowed down in response to strict government measures, and the recognition
that sediment zones in mangrove forests are not suitable for shrimp farming (Binh et al.
1997; Dinh 2006).
Environmental pollution has increased in many zones of intensive aquaculture (Nguyen et
al. 2009). With the development of intensive farming, the use of shrimp feed, drugs and
chemicals increased proportionately (Nhuong et al. 2003), resulting in excess shrimp feed
and untreated waste polluting rivers and coastal habitats, destroying the ecological balance
and reducing biodiversity. In addition, the spread of epidemic diseases has been a key
concern, as the outbreak of disease can be connected to environmental factors, as well as
insufficient quality control of shrimp seed. Recent studies showd that more than 75% of
92
shrimp farms confirmed that the main reasons leading to shrimp disease came from the bad
seed quality (Nhuong et al. 2002; Nguyen et al. 2009; RIA2 2009; VIFEP 2009b; Le et al.
2011); thus low quality shrimp seed may have contributed to massive loss of shrimps in the
MKD in recent years.
On the other hand, as a result of the rapid growth of the aquaculture industry the water
pollution, degradation of land resources, soil erosion, over exploitation of natural resources
and threats to the ecosystem are among the challenges (Bosma et al. 2009; Anh et al.
2010b). For example, with the concentrations of intensive catfish farming along the
Mekong Rivers, effluents from striped catfish ponds have become a potential pollutant
source (Cao et al. 2010; Truong et al. 2011). The major issue is associated with high pond
sludge levels in catfish ponds amounting to around 8,000m3 of sediment per hectare for
each growth cycle of 8-10 months (Anh et al. 2010b) which pollutes surface waters if
drained or pumped directly into water bodies without treatment (Cao et al. 2010; Truong
et al. 2011; Phan et al. 2013). Although striped catfish farms are located mainly along the
Mekong Rivers that can help to carry wastes to minimize pollution, localized pollution of
water has been recorded in several culture areas that are far from main river streams, such
as catfish farming areas at Chau Phu district in An Giang province and Tieu Can district in
Tra Vinh province (Bosma et al. 2009; Phuong et al. 2009; Nguyen et al. 2013). However,
De Silva et al. (2010) noted that the quantity of potential discharge from the striped catfish
farming sector was relatively small compared to the potential run-off of nitrogen and
phosphorus from fertilizers used in rice farming. Hence, in order for Vietnamese seafood
exports to remain competitive it is necessary for the industry to improve and demonstrate
good environmental performance through the adoption of environmental management
systems through the life cycle of seafood production and processing.
93
3.7. Product quality and consumption
3.7.1. Post-harvest issues
The system for shrimp traders who buy shrimp from grow-out farmers has also developed
in terms of numbers and trading network together with the farming system (Nguyen et al.
2009). There were around 1,000 shrimp wholesalers operating in the MKD in 2007. These
shrimp wholesalers play an intermediary role in the purchase of raw materials/production
from the local grow-out producers and sell them to processing plants. In practice, the
gathering and processing network also extends to lower levels of trading (i.e. shrimp
collectors). The shrimp collectors often live on the farm sties in the remoter areas where
collectors come to buy shrimp at the farm gate, which are then sent up a trading level (i.e.
shrimp wholesalers) in the local town. Relatively few collectors sell their production
directly to processors due to limitations on equipment for storing and transferring (Phan et
al. 2011; Le et al. 2011; Vu et al. 2013). Whereas, semi-/intensive shrimp farms mainly
sold shrimp to wholesalers (88% of their production), collectors were responsible for
purchasing almost 70% of the shrimp from other systems (Le et al. 2011; Tran et al. 2013).
Shrimp farming areas are complex with many canals, often located in remote areas far
away from processing plants with difficult access for transportation, so the intermediate
shrimp traders (i.e. wholesalers and collectors) can play an important role in the shrimp
supply flows. Nguyen et al. (2009) noted that shrimp collecting networks had been very
positive, with an important contribution to better production of processed seafood.
However, limitations of this system lie in the small-scale facilities of most traders, and
maintenance as well as rudimentary transportation equipment, lack of knowledge of food
hygiene and safety etc. The collection network has proven to be very dynamic over time
and has worked effectively to meet the demand needs of the seafood processors in the
94
MKD, especially given the fragmented and small-scale nature of most shrimp production
on the MKD. With more than 200,000 shrimp farms, processing plants must rely on a
lengthy chain of traders to move shrimp from ponds to their factories (Tran et al. 2013).
Shrimp processors faced constraints on food safety and quality control along the value
chain of the pond to their factories, particularly when the product comes from many farms
and complex intermediate networks (Le et al. 2011; Tran et al. 2013). In the longer term,
the requirements on aquatic products’ quality and safety will be stricter, and thus current
intermediate networks must be improved and replaced by the wholesale seafood or markets
centres in each province. The wholesale markets for seafood need to fulfil important
functions and create favorable conditions for local stakeholders (i.e. farmers, traders,
processors, managers) for selling/buying shrimps and controlling shrimp quality (Nguyen
et al. 2009; Phan et al. 2011). Wholesale seafood markets were developed in and proved a
critical platform for development of international trade. The Mahachai Talay Thai market
was an auction wholesale market for seafood coming from the nearby fish landing port as
well as for farmed shrimp from many provinces in Thailand. This market continues to be
an important location for the seafood industry and a processing hub, facilitated by its status
of a major port (Nietes-Satapornvanit 2014).
By way of contrast, most catfish grow-out producers now sell directly to pangasius
processors. Cuyvers & Tran (2008) found that after the catfish war between US and
Vietnam in 2003, more than 80% of live striped catfish was directly sold to the processors
and less than 20% to the traders, whereas in 2010 the ratio was 99% and 1% respectively
(Le 2011). Traders were important for smaller-scale farmers to access processors taking
responsibility for quality (colour, size, and weight) and covering transportation losses.
Another study in 2010 also found that almost all surveyed farms sold live catfish directly
to processors rather than via traders (Phan et al. 2011; Nguyen et al. 2013). Processors own
95
or sub-contracted harvest teams transport fish live usually by boats; a figure of 5% is used
to cover mortality of fish (Khoi 2011).
Other farmed species in the MKD such tilapia and GFP are often harvested and sold
directly to traders at the farm gate before transfer to local urban markets or big cities.
Tilapia and GFP are often marketed live, limiting harvest volumes on each occasion. The
movement of product from producers through different intermediaries to consumers is
facilitated mostly by the traders (Nguyen et al. 2009; Phan et al. 2011). In generally, in the
MKD provinces, production prices depend on the market, while the linkages between
farmers and buyers are still weak, and verbal arrangements are quite easily broken when
markets are unstable. There are no formal contracts on risk-sharing, some traders are
fraudulent when measuring and weighing and such trading methods do occur, affecting the
interests of grow-out producers (Nguyen et al. 2009). These factors may also contribute to
the slow expansion and development of tilapia and GFP culture in the MKD.
3.7.2. Quality control of fishery products
National Agro-forestry-fisheries Quality Assurance (NAFIQAD) is the national competent
authority for fishery food safety assurance and quality control in Vietnam. They deal with
local governments, provincial Fisheries Departments, processing/export companies and
other relevant institutions and organizations. In 2003, the remit of the center’s work was
expanded to include veterinary matters (fish and shrimp disease control). The control of
sanitary conditions and food safety at seafood processing plants and preliminary treatment
facilities is regulated by six NAFIQAD branches along the country. In the early days,
regional NAFIQAD centers focused on the management of output quality, i.e. the
management of products in the processing facilities. Recently, there has been increased
control on inputs that focus not only on raw material sources of processing plants, but also
96
provides quality control from grow-out farms to processing stages. Moreover, MARD
(2009a) promulgated regulations on drug, chemicals and antibiotics banned/or limitedly
using for manufacturing and trading in the aquaculture sector, the regulations are enforced
to all stakeholders along value chains and they are monitored by local fisheries authorities
to meet requirements from importers on food safety. The regulations have also positively
contributed to the strong growth of the aquaculture sector over the last two decades.
Besides, most seafood processing plants have a quality control unit (i.e. laboratory and
specialized staff) that is responsible for self-control in the quality of raw materials and their
finished products. On the other hand, the quality control is also considered and
implemented by farmers, who have increased their knowledge about management practices
and food safety through technical training courses. In general, the management of quality,
hygiene and safety of aquatic food now complies with international norms and standards,
the evidence being that key products such as catfish and shrimp have entered stricter
markets, such as the EU, Japan and US markets. Up until now, some 269 processing
enterprises qualified for export to the EU, of which 133 enterprises are in the MKD (Tuan
et al. 2013). However, along with these achievements there is also the less effective
mechanism of coordination and co-operation between regional NAFIQAD agencies and
local fisheries departments that leads to difficulties in implementing the State’s
management of aquatic products, seafood quality, hygiene from rearing, catching and
processing stages. The State’s management agencies in at Provincial level are short of
qualified, experienced human resources, facilities and funding for the implementation of
food quality, hygiene and safety control (Nguyen et al. 2009; Tuan et al. 2013).
97
3.7.3. Status of standards and traceability application
The Ministry of Agriculture & Rural Development (MARD) developed sectoral standards
for aquaculture since 1990. The main purposes were for regulation of culture systems in
terms of hatcheries and grow-out operations, feed/chemical/drug use and culture
conditions, and to help the aquaculture industry improve on quality and food safety.
However, the enforcement of sectoral standards was limited and the programmes were
considered leading the standards to be abandoned and a reorientation of effort (Vu & Don
2008). MARD has carried out many related research projects with an aim to improve the
quality of farmed fish, and the national sectoral standards for aquaculture products are the
results from these studies. Additonally, to meet the requirements of food safety demanded
by international markets, several regulations on banned/or limited use of drugs, chemicals
and antibiotics for manufacturing and trading in aquaculture were promulgated by MARD.
In recent years, many attempts have been made to apply these standards in aquaculture (Vu
& Don 2008; Nguyen et al. 2009). Although many studies and programmes were carried-
out or are being implemented, their results are still limited and less effective. Fisheries
Directorate (2010) pointed out that certification systems such as GlobalGAP and GAA-
BAP are needed as a priority activity in order to reach the market requirement in the
strategies for aquaculture development up to 2020. The Fisheries Directorate developed
VietGAP documentation for both catfish and shrimp farming systems, in the short term,
encouraged farmers to apply with the expectation that it will be enforced in the longer
term. Recently, in An Giang and Can Tho provinces, for example, 526ha of striped catfish
farms were certified in 2010 (Nguyen, pers.comm., 21/1/2011) by GlobalGAP and Safe
Quality Food. Additionally, in the MKD seven pangasius processing plants have achieved
GlobalGAP certification for their catfish farms. According to some processors’ assessment,
the production cost based on the GlobalGAP’s process increased only 3% compared with
98
its usual, whereas its value increased to 12% (Fisheries Directorate 2013). Recently,
around 40 catfish processing plants have applied to the Aquaculture Stewardship Council
(ASC) standards, of which 28 processors achieved the ASC for their grow-out farmed
areas (VASEP 2014b). The Fisheries Directorate (2013) reported that around 10% of total
striped catfish production reached the ASC standard in 2012 and it will increase to 50% in
2015. Moreover, there have been many farmed areas of catfish and shrimp that belong to
seafood enterprises such as Hung Vuong, Nam Viet, Hung Ca companies etc., that are
applying the GAA-BAP and GlobalGAP guidelines to their farms.
3.8. Roles of facilitating institutions
3.8.1. Management and supporting sectors
There are two key actor groups providing support for aquaculture sector development in
the MKD, the public sector (i.e. DOFs at national and local levels, VINAFIS, VASEP) and
the private sector (i.e. aquaculture companies, input suppliers, and post-harvest actors).
Both public and private sector actors played important roles in aquaculture development in
the MKD. While the roles of government are cast as providing the economic, political, and
infrastructural conditions necessary for private investment; the private sector, in turn, is
tasked with the responsibility of driving the integration of producers into higher-value
markets via business relationships and associated provision of market information,
technical advice, and logistics and other services (Khoi 2011; Tuan et al. 2013). The
Directorate of Fisheries (DOFI) is a national public administration; and the other
institutions of the fisheries sector, including technical departments, research institutions,
educational institutions, and provincial advisory departments implement DOFI’s
directions. Moreover, there are socio-political organizations and professional societies that
also play an important role in organizing and encouraging enterprises to develop their
99
business and production, such as the Vietnamese Association of Seafood Exporters and
Producers (VASEP) and the Vietnamese Fisheries Society (VINAFIS).
Seafood exports began from the end of the 1970s, however the growth of seafood export
was quite slow until the late 1990s and also faced several challenges such as overfishing,
backward technology processing, lack of knowledge on the food safety and quality, weak
trade promotion activities, unprompted development and lack of horizontal integration
among processors, and less competitive capacity in the international markets, the
challenges lead to very poor business performances (VASEP 2013). VASEP, a non-
governmental organization, was established in 1998 to make the horizontal linkages among
seafood processors, and to promote growth of Vietnam's seafood industry and to facilitate
the smooth export of seafood products internationally (Cuyvers & Tran 2008). VASEP
also provided essential market information; watched trends and developed national
strategies for the seafood industry so that each of their members can better determine its
orientation for development; organized and implemented trade-promotion activities and
short-term training; and supported the business expansion of their members (Le 2011).
VASEP represented and protected its members' legitimate rights and interests in regard to
governmental authorities and third-party bodies (Tuan et al. 2013). VASEP initially had 54
member seafood processors that were State-owned, but by 2013 had expanded to 273
members mainly from the private sector (VASEP 2013). VASEP established committees
for seafood sub-sectors to share experiences and co-operate in order to deal with current
problems and to keep up with specialization trends in seafood processing and export
activities. VASEP freshwater Fish Committess (VFFC) linked the pangasius processors
and exporters to solve trade and technical barriers, market volatility and overcome
difficulties caused by the economic crisis. While VASEP Shrimp Committee (VSC) often
introduces action programmes for enterprises to cope with complaints and claims on
100
shrimp quality. The VSC also coordinated with enterprises to solve difficulties after the
shrimp anti-dumping case and dealt with the shrimp countervailing duty lawsuit against the
US. The VSC was proactive in meeting and negotiating with partners in importing markets
when barriers were imposed to prevent purchase of Vietnamese shrimp products.
VINAFIS, a civil society organization of people working in the fisheries sector, was
established in 1982 and has played an important part for fisheries development in Vietnam.
VINAFIS has a nation wide network at the provincial level where most of the members are
fish farmers, processors, and aquaculture input suppliers. It provides market information,
such as prices of raw material in the national and international markets to its members
(Tuan et al. 2013). In addition, VINAFIS regularly gathers recommendations from member
committees to submit to the Government and relevant regulatory agencies in an effort to
suggest measures to develop fisheries production and reduce burdens for members. For
example, suggestions on financial support for the catfish sector during the low fish price
and economic crisis were taken by government to support VINAFIS members to overcome
difficulties and strengthen their operations. Catfish farms received US$268.03 million of
total loans from State banks in 2011, increasing to US$374.52 million in 2012, while the
loans of seafood processors were US$608.22 million and US$720.48 million, respectively
(Fisheries Directorate 2013a). However, a widespread belief exists among its members that
to be more effective, this association must take a stronger lead in the contract negotiations
of farmers with processors (Khoi 2011).
3.8.2. Organization of production
Around 80% of the aquaculture farms in the MKD are privately owned by farmers who
have developed their skills through experience rather than any formal education (Tran et al.
2003; Nguyen et al. 2009; Phan et al. 2009; Tran et al. 2013). The importance of
101
cooperation among producers in the agriculture sector has been gradually recognized after
many crop losses (Nguyen et al. 2009; Le 2011), encouraging farmers to form groups. The
same authors also reported that farmers faced a number of technical and managerial
constraints such as production technology knowledge, market information, access to credit,
and business relations; moreover, they limit their participation in an export-oriented supply
chain (Subasinghe et al. 2009). Hence, the establishment and improvement of farmers’
organizations are a base for the involvement of farmers in coordinated supply chains that
provide access to export markets (Umesh et al. 2009; Bosma & Verdegem 2011; Tran et al.
2013). Additionally, farmers through organization, gain economies of scale in accessing
services and markets (Khoi 2011). Umesh et al. (2009) indicated that farmers groups
create potential for cooperative action which changes the position of the farmer in the
value chain and influences the business environment. Farmers’ groups also improve
information exchange and sharing among group members. Such groups help members
enhance their technical skills and save on production costs by working collectively and
activities include purchase of seed and other inputs (feed, chemical, pond preparation,
water pumping, harvesting) together (RIA2 2009). Most of the cooperation between
farmers now are established in terms of cooperatives and farmers groups (Nguyen et al.
2009). At the present, MKD has around 115 cooperatives, an increase of 75 cooperatives
compared with 2003, and 352 farmers groups (i.e. lower level of the cooperative model),
an increase of 136 groups since 2003. Cooperatives are legally bound institutions that
requires higher management levels, while rmembers’ awareness is often limited; in
general, the economic cooperative activities model is still limited and less effective
(Nguyen et al. 2009). Many farmers’ organizations (farmers’ clubs and cooperatives) in the
aquaculture sector were established after 2000; however, they still did not show clear
positive outcomes in terms of improved economic performance for members through
102
effective cooperative action. The main reason for this were perceived as i) poor
cooperative management skills: leader teams often have lower education levels and lack of
management skills to develop and manage cooperatives; ii) lack of cooperative actions:
this remained very limited among members, the main actions still focused on developing
technical skills and production information sharing, and a lack of vertical linkages with
other actors and trust between members remained; iv) uncompleted cooperative structures:
many cooperatives had incomplete management teams such as lack of an accountant; and
iii) lack of appropriate policy supports (financial and technical supports). Generally, due
to the low educational level of cooperative leaders and limitation of their operational
management skills, the farmers’ organizations should be begun with the ‘farmers group’
level that can be a pre-cooperative. The leader teams of farmers’ groups can be
strengthened in term of organization on the cooperation actions and group management
over time, and then the farmers’ groups could be upgraded to the cooperatives through
‘functional upgrading’ tools (Nguyen et al. 2009; RIA2 2009). However, there are several
examples of successful cooperatives or farmers’ organisations such as the Thoi An
pangasius cooperative in Can Tho province that has good vertical linkages with Hung
Vuong pangasius processor through contract farming system (Anh 2014), shrimp farmers’
organizations in India that create strong vertical integrated linkages with input suppliers
(seed and feed suppliers) (Umesh et al. 2010). Therefore, vertical dimensions can be an
important cooperative action leading to sustain the farmers’ organizations. Stockbridge et
al. (2003) states that three main factors that influence the effectiveness of organizations
include individuals (i.e. ability, motivation to work role), the organization (i.e. leadership,
group relation, systems and structures), and the environment (economic, physical,
technical, cultural and social aspects). Increasing demand for higher value internationally
traded export species, such as shrimp has led to more integrated production-distribution
103
chains and coordinated exchange between farmers, processors and retailers (Reardon et al.
2009; Bolwig et al. 2010; Kassam et al. 2011; Trifković 2013).
Recently, vertically integrated production that is co-operation among stakeholders along
the value chain has tended to increase, mainly for striped catfish systems in An Giang,
Dong Thap and Can Tho provinces (Khoi 2011), and intensive shrimp farming in Soc
Trang, Ben Tre and Tien Giang provinces (RIA2 2009). Many businesses can achieve a
competitive advantage and improve performance by developing cooperative relations with
buyers, suppliers, competitors and other firms (Khoi 2011). For example, several business
promotion programmes of the processors were set up with the striped catfish farmers that
became contracted farms improving availability of raw material for processors. Thus,
production costs could be reduced and traceability improved in line with the international
standards and consumer demand (Cuyvers & Tran 2008). Ha et al. (2013) noted that an
intensive farmers group was better able to establish favourable terms in vertical
contractualisation with up and downstream chain actors, and thus making it easier for them
to negotiate improved terms of access to markets and technical support. Cooperative
arrangements for producers that are supported by exporting processors are successful in
providing access to international markets (Pham et al. 2011). Moreover, collective action
through participation in farmers’ organizations can provide an effective mechanism to
assist small-scale producers overcome these challenges and contribute to and influence
modern market chains and trade (Srinath et al. 2000; Umesh et al. 2010; Kassam et al.
2011). To promote collective action and farmers’ organisations development as a strategy
to achieve market access for small-scale farmers, the Government must promote the
provision of market services such as training, extension and market information services.
The government must also intervene to either facilitate the development of those services
104
that are critical for small-scale farmers and markets to develop or to provide those services
themselves (Bolwig et al. 2010; Kassam et al. 2011).
3.9. Striped catfish and shrimp value chains
3.9.1. Striped catfish value chain
a). Value chain configuration
The value chain of striped catfish covers all stages that a product or service passes through.
It can be divided into five functional stages: input provision, production, transformation,
trade and consumption; and each stage is characterized by certain processes and activities
(Kai 2006; Khoi 2007; Le 2011). Figure 3.12 outlines the actors and processes of the
value chains of striped catfish at the time of this study. They include primary and support
activities for domestic and export markets. Primary actors who are directly involved in the
transformation of inputs into outputs include seed suppliers (hatcheries, nurseries,
seed/brood-stock traders); farmers (individual, contracted, and company’s farms/or
corporation); export agents; local traders; and processing plants/export firms. The indirect
actors who facilitate the activities of the primary actors include feed/chemical and drug
suppliers; service providers; input suppliers; and supporting actors (state agencies, society
associations, research sectors). Most catfish production is directly sold to seafood
processors through a contract signed one month before harvesting between farmers and
processors. Thus, the farmers and processors have played important roles in the value
chain in the MKD. Demand in terms of quantity and quality is mainly determined by the
processors, which places them in a powerful position as ‘lead actors’ in the mapped
section of the value chains. Jespersen et al. (2014) found that the processors may operate
different forms of coordination upstream: own-farm production (hierarchy), relational or
captive coordination of suppliers depending on the nature of relationship (preferred
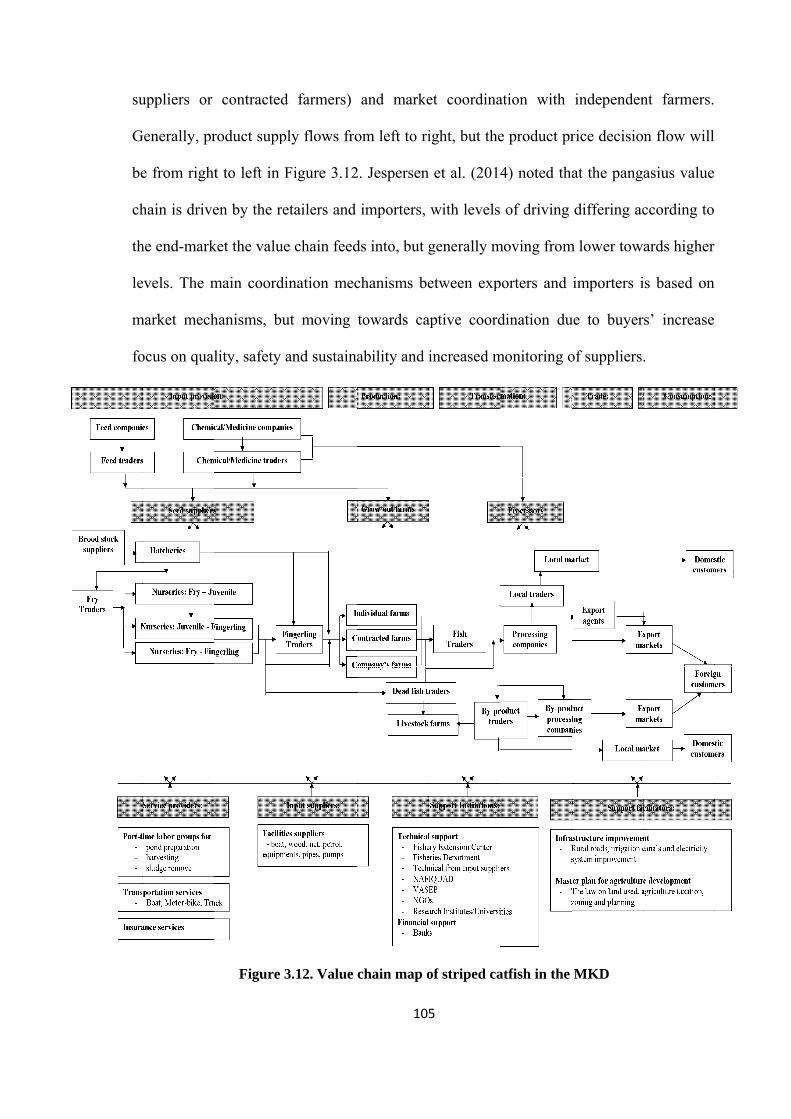
su
G
be
ch
th
le
m
fo
uppliers or
Generally, pr
e from right
hain is drive
he end-mark
evels. The m
market mech
ocus on qual
contracted
roduct supp
t to left in F
en by the re
ket the value
main coordi
hanisms, bu
lity, safety a
Figure 3
d farmers)
ply flows fro
Figure 3.12
etailers and
e chain feed
ination mec
ut moving
and sustaina
3.12. Value
105
and marke
om left to ri
2. Jespersen
importers,
ds into, but g
chanisms be
towards ca
ability and i
chain map o
5
et coordina
ight, but the
et al. (2014
with levels
generally m
etween exp
aptive coord
increased m
of striped ca
ation with
e product pr
4) noted tha
of driving
moving from
porters and
dination du
monitoring o
atfish in the
independen
rice decisio
at the pang
differing ac
m lower tow
importers i
ue to buyer
of suppliers.
MKD
nt farmers.
n flow will
asius value
ccording to
ards higher
is based on
s’ increase
.
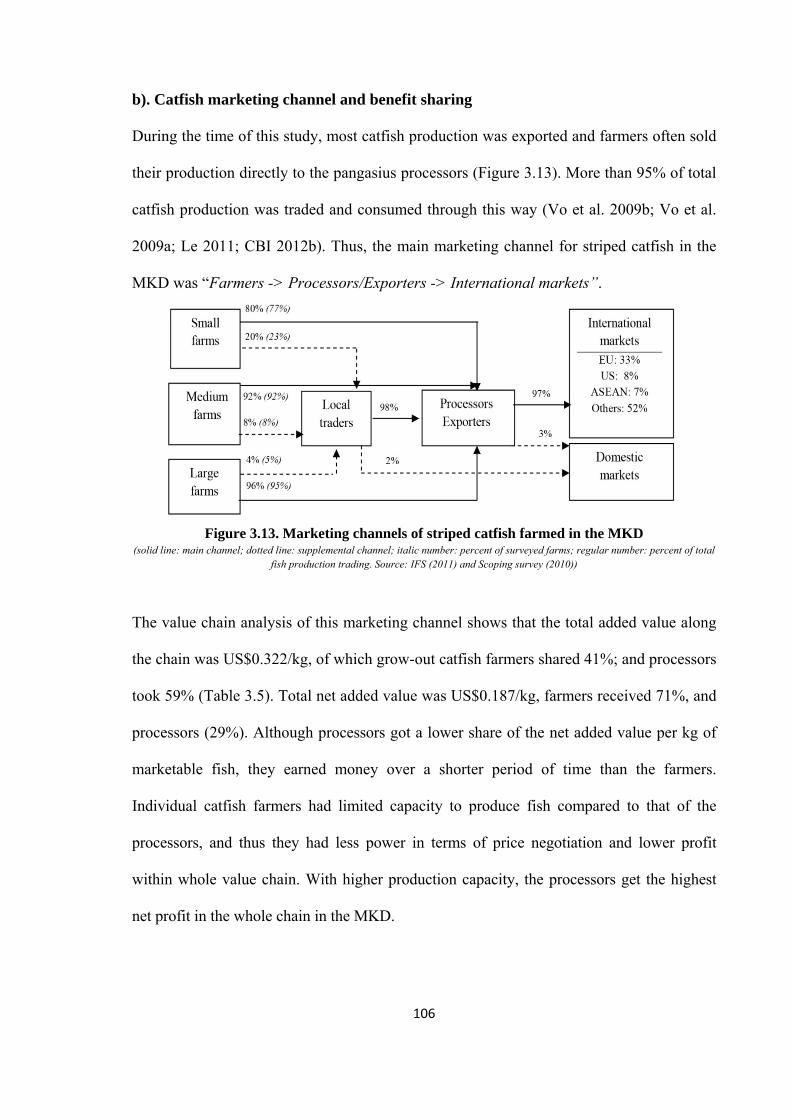
106
b). Catfish marketing channel and benefit sharing
During the time of this study, most catfish production was exported and farmers often sold
their production directly to the pangasius processors (Figure 3.13). More than 95% of total
catfish production was traded and consumed through this way (Vo et al. 2009b; Vo et al.
2009a; Le 2011; CBI 2012b). Thus, the main marketing channel for striped catfish in the
MKD was “Farmers -> Processors/Exporters -> International markets”.
Figure 3.13. Marketing channels of striped catfish farmed in the MKD (solid line: main channel; dotted line: supplemental channel; italic number: percent of surveyed farms; regular number: percent of total
fish production trading. Source: IFS (2011) and Scoping survey (2010))
The value chain analysis of this marketing channel shows that the total added value along
the chain was US$0.322/kg, of which grow-out catfish farmers shared 41%; and processors
took 59% (Table 3.5). Total net added value was US$0.187/kg, farmers received 71%, and
processors (29%). Although processors got a lower share of the net added value per kg of
marketable fish, they earned money over a shorter period of time than the farmers.
Individual catfish farmers had limited capacity to produce fish compared to that of the
processors, and thus they had less power in terms of price negotiation and lower profit
within whole value chain. With higher production capacity, the processors get the highest
net profit in the whole chain in the MKD.
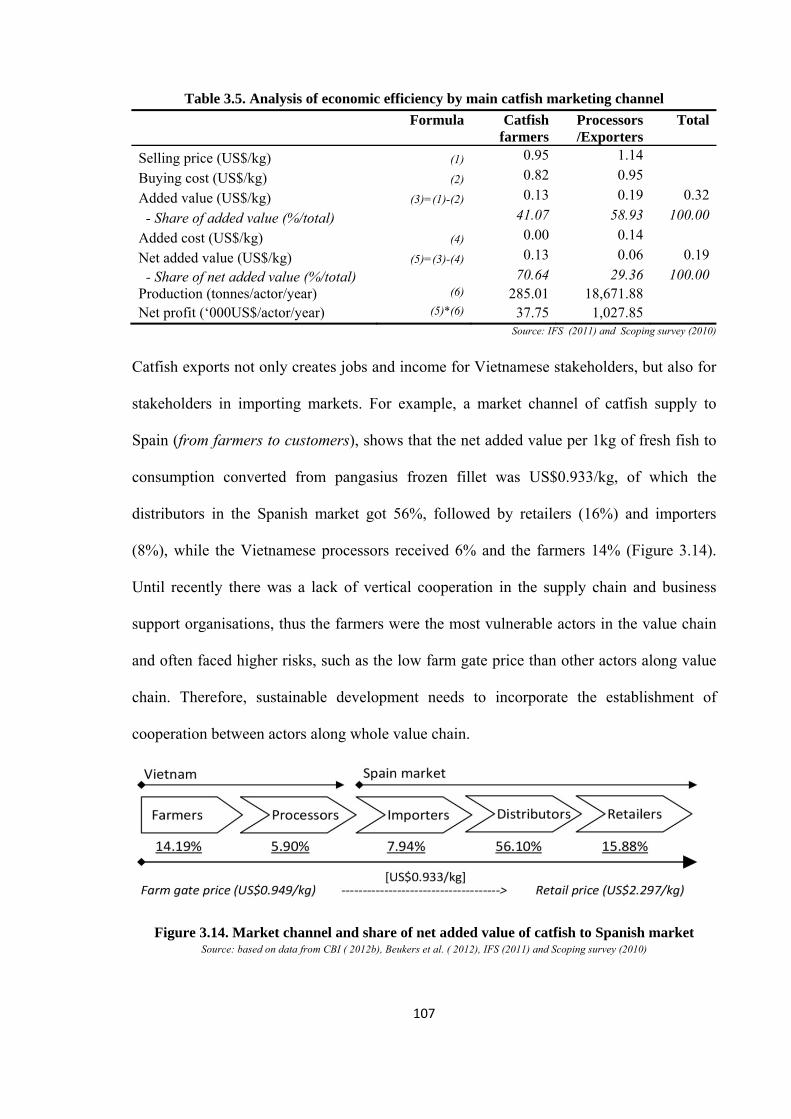
107
Table 3.5. Analysis of economic efficiency by main catfish marketing channel
Formula Catfishfarmers
Processors /Exporters
Total
Selling price (US$/kg) (1) 0.95 1.14
Buying cost (US$/kg) (2) 0.82 0.95
Added value (US$/kg) (3)=(1)-(2) 0.13 0.19 0.32
- Share of added value (%/total) 41.07 58.93 100.00
Added cost (US$/kg) (4) 0.00 0.14
Net added value (US$/kg) (5)=(3)-(4) 0.13 0.06 0.19
- Share of net added value (%/total) 70.64 29.36 100.00Production (tonnes/actor/year) (6) 285.01 18,671.88 Net profit (‘000US$/actor/year) (5)*(6) 37.75 1,027.85
Source: IFS (2011) and Scoping survey (2010)
Catfish exports not only creates jobs and income for Vietnamese stakeholders, but also for
stakeholders in importing markets. For example, a market channel of catfish supply to
Spain (from farmers to customers), shows that the net added value per 1kg of fresh fish to
consumption converted from pangasius frozen fillet was US$0.933/kg, of which the
distributors in the Spanish market got 56%, followed by retailers (16%) and importers
(8%), while the Vietnamese processors received 6% and the farmers 14% (Figure 3.14).
Until recently there was a lack of vertical cooperation in the supply chain and business
support organisations, thus the farmers were the most vulnerable actors in the value chain
and often faced higher risks, such as the low farm gate price than other actors along value
chain. Therefore, sustainable development needs to incorporate the establishment of
cooperation between actors along whole value chain.
Figure 3.14. Market channel and share of net added value of catfish to Spanish market Source: based on data from CBI ( 2012b), Beukers et al. ( 2012), IFS (2011) and Scoping survey (2010)
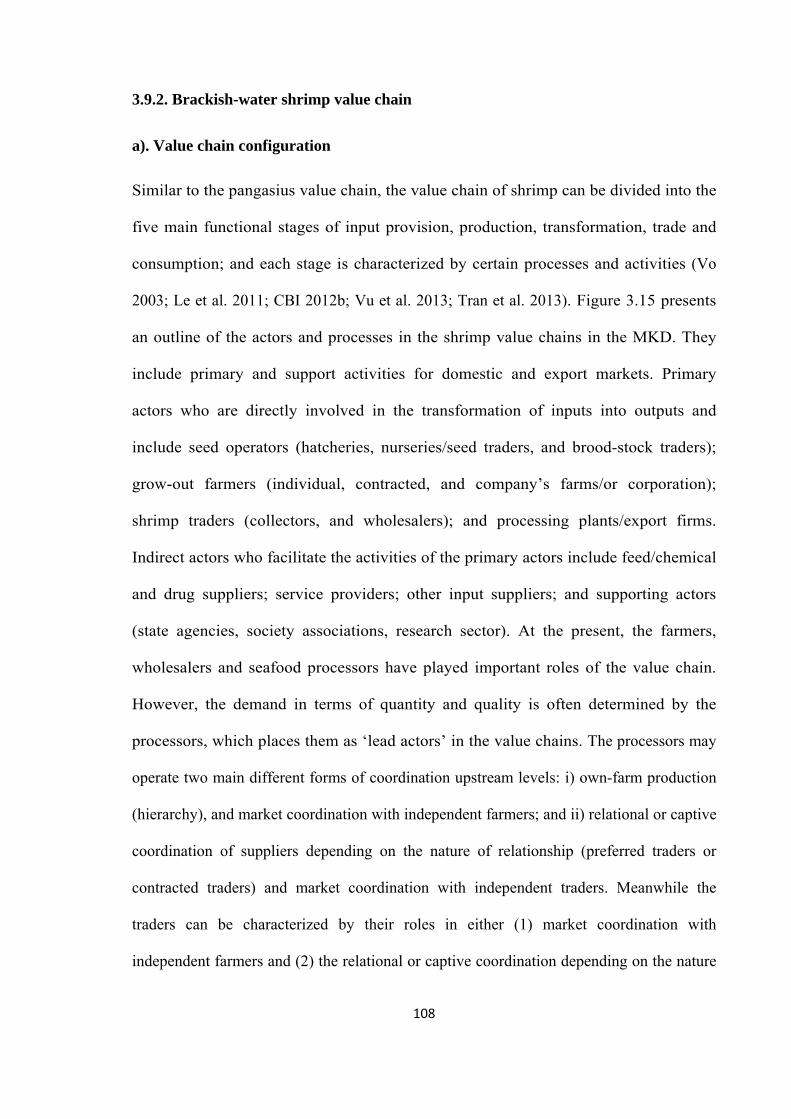
108
3.9.2. Brackish-water shrimp value chain
a). Value chain configuration
Similar to the pangasius value chain, the value chain of shrimp can be divided into the
five main functional stages of input provision, production, transformation, trade and
consumption; and each stage is characterized by certain processes and activities (Vo
2003; Le et al. 2011; CBI 2012b; Vu et al. 2013; Tran et al. 2013). Figure 3.15 presents
an outline of the actors and processes in the shrimp value chains in the MKD. They
include primary and support activities for domestic and export markets. Primary
actors who are directly involved in the transformation of inputs into outputs and
include seed operators (hatcheries, nurseries/seed traders, and brood-stock traders);
grow-out farmers (individual, contracted, and company’s farms/or corporation);
shrimp traders (collectors, and wholesalers); and processing plants/export firms.
Indirect actors who facilitate the activities of the primary actors include feed/chemical
and drug suppliers; service providers; other input suppliers; and supporting actors
(state agencies, society associations, research sector). At the present, the farmers,
wholesalers and seafood processors have played important roles of the value chain.
However, the demand in terms of quantity and quality is often determined by the
processors, which places them as ‘lead actors’ in the value chains. The processors may
operate two main different forms of coordination upstream levels: i) own-farm production
(hierarchy), and market coordination with independent farmers; and ii) relational or captive
coordination of suppliers depending on the nature of relationship (preferred traders or
contracted traders) and market coordination with independent traders. Meanwhile the
traders can be characterized by their roles in either (1) market coordination with
independent farmers and (2) the relational or captive coordination depending on the nature
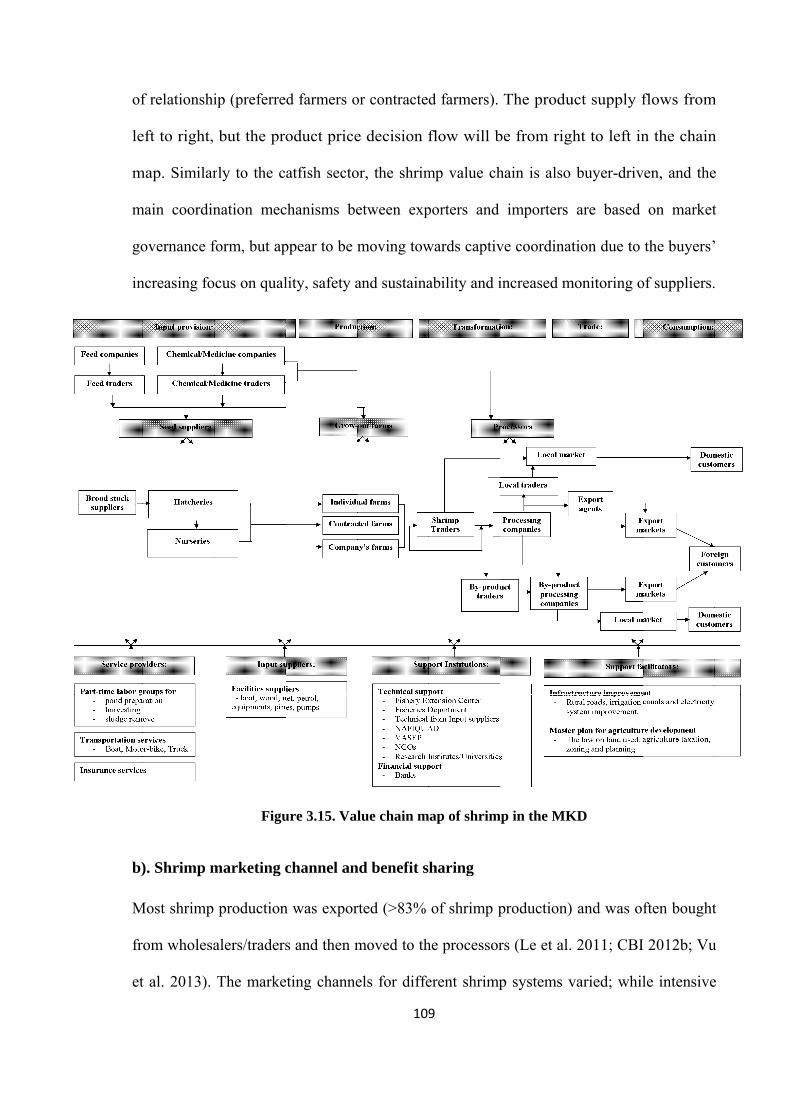
of
le
m
m
go
in
b)
M
fr
et
f relationshi
eft to right,
map. Similar
main coordin
overnance f
ncreasing fo
). Shrimp m
Most shrimp
om wholesa
t al. 2013).
ip (preferre
but the pro
rly to the c
nation mec
form, but ap
cus on qual
Figu
marketing c
production
alers/traders
The marke
d farmers o
oduct price
atfish secto
chanisms be
ppear to be m
lity, safety a
ure 3.15. Val
channel an
n was expor
s and then m
eting channe
109
or contracted
e decision f
or, the shrim
etween exp
moving tow
and sustaina
lue chain m
nd benefit s
rted (>83%
moved to th
els for diffe
9
d farmers).
flow will b
mp value ch
porters and
wards captiv
ability and i
ap of shrim
haring
of shrimp p
he processor
erent shrimp
The produ
be from rig
hain is also
importers
ve coordinat
increased m
p in the MK
production)
rs (Le et al.
p systems v
uct supply f
ht to left in
buyer-driv
are based
tion due to
monitoring o
KD
and was of
2011; CBI
varied; whil
flows from
n the chain
ven, and the
on market
the buyers’
of suppliers.
ften bought
2012b; Vu
le intensive
m
n
e
t
t
u
e
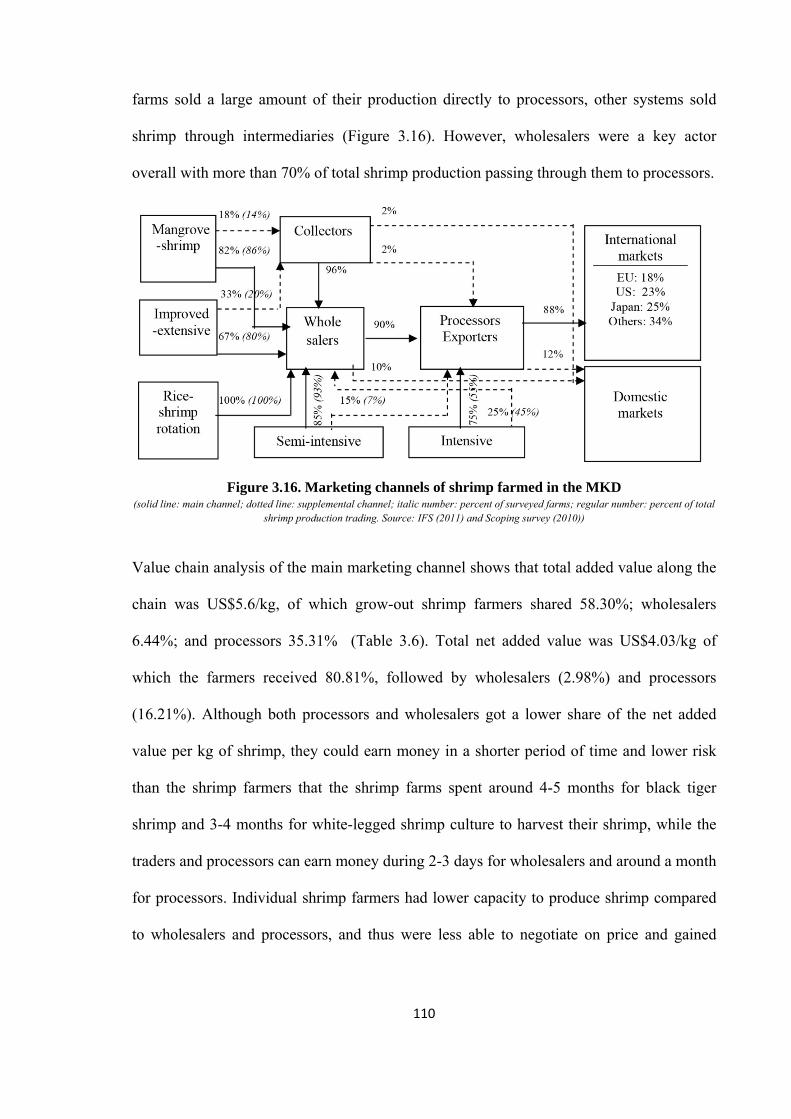
110
farms sold a large amount of their production directly to processors, other systems sold
shrimp through intermediaries (Figure 3.16). However, wholesalers were a key actor
overall with more than 70% of total shrimp production passing through them to processors.
Figure 3.16. Marketing channels of shrimp farmed in the MKD (solid line: main channel; dotted line: supplemental channel; italic number: percent of surveyed farms; regular number: percent of total
shrimp production trading. Source: IFS (2011) and Scoping survey (2010))
Value chain analysis of the main marketing channel shows that total added value along the
chain was US$5.6/kg, of which grow-out shrimp farmers shared 58.30%; wholesalers
6.44%; and processors 35.31% (Table 3.6). Total net added value was US$4.03/kg of
which the farmers received 80.81%, followed by wholesalers (2.98%) and processors
(16.21%). Although both processors and wholesalers got a lower share of the net added
value per kg of shrimp, they could earn money in a shorter period of time and lower risk
than the shrimp farmers that the shrimp farms spent around 4-5 months for black tiger
shrimp and 3-4 months for white-legged shrimp culture to harvest their shrimp, while the
traders and processors can earn money during 2-3 days for wholesalers and around a month
for processors. Individual shrimp farmers had lower capacity to produce shrimp compared
to wholesalers and processors, and thus were less able to negotiate on price and gained
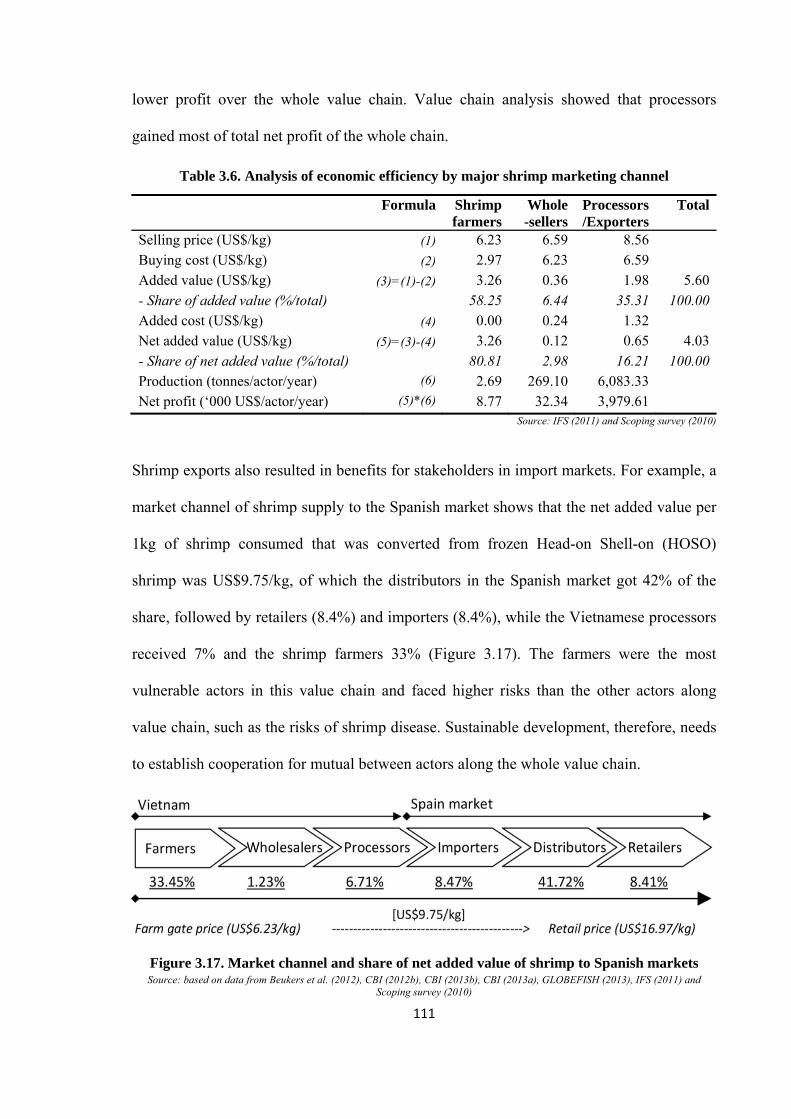
111
lower profit over the whole value chain. Value chain analysis showed that processors
gained most of total net profit of the whole chain.
Table 3.6. Analysis of economic efficiency by major shrimp marketing channel
Formula Shrimp
farmersWhole -sellers
Processors /Exporters
Total
Selling price (US$/kg) (1) 6.23 6.59 8.56 Buying cost (US$/kg) (2) 2.97 6.23 6.59 Added value (US$/kg) (3)=(1)-(2) 3.26 0.36 1.98 5.60
- Share of added value (%/total) 58.25 6.44 35.31 100.00Added cost (US$/kg) (4) 0.00 0.24 1.32 Net added value (US$/kg) (5)=(3)-(4) 3.26 0.12 0.65 4.03
- Share of net added value (%/total) 80.81 2.98 16.21 100.00Production (tonnes/actor/year) (6) 2.69 269.10 6,083.33 Net profit (‘000 US$/actor/year) (5)*(6) 8.77 32.34 3,979.61
Source: IFS (2011) and Scoping survey (2010)
Shrimp exports also resulted in benefits for stakeholders in import markets. For example, a
market channel of shrimp supply to the Spanish market shows that the net added value per
1kg of shrimp consumed that was converted from frozen Head-on Shell-on (HOSO)
shrimp was US$9.75/kg, of which the distributors in the Spanish market got 42% of the
share, followed by retailers (8.4%) and importers (8.4%), while the Vietnamese processors
received 7% and the shrimp farmers 33% (Figure 3.17). The farmers were the most
vulnerable actors in this value chain and faced higher risks than the other actors along
value chain, such as the risks of shrimp disease. Sustainable development, therefore, needs
to establish cooperation for mutual between actors along the whole value chain.
Figure 3.17. Market channel and share of net added value of shrimp to Spanish markets Source: based on data from Beukers et al. (2012), CBI (2012b), CBI (2013b), CBI (2013a), GLOBEFISH (2013), IFS (2011) and
Scoping survey (2010)
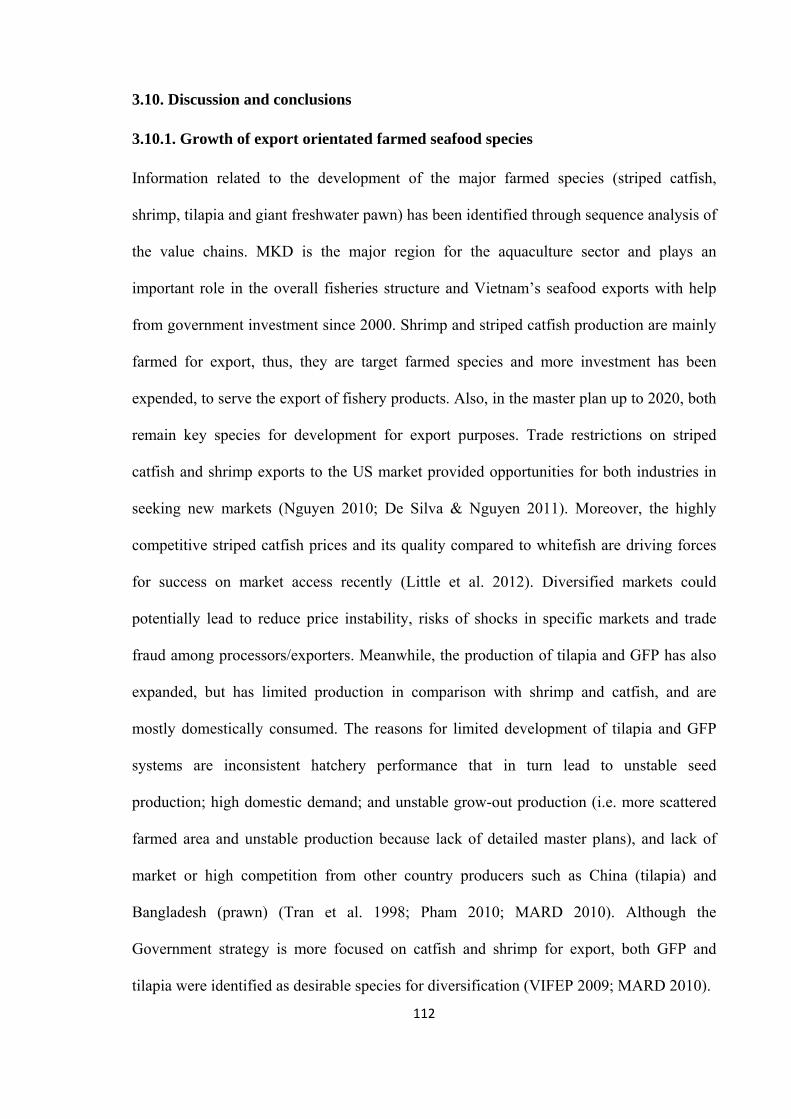
112
3.10. Discussion and conclusions
3.10.1. Growth of export orientated farmed seafood species
Information related to the development of the major farmed species (striped catfish,
shrimp, tilapia and giant freshwater pawn) has been identified through sequence analysis of
the value chains. MKD is the major region for the aquaculture sector and plays an
important role in the overall fisheries structure and Vietnam’s seafood exports with help
from government investment since 2000. Shrimp and striped catfish production are mainly
farmed for export, thus, they are target farmed species and more investment has been
expended, to serve the export of fishery products. Also, in the master plan up to 2020, both
remain key species for development for export purposes. Trade restrictions on striped
catfish and shrimp exports to the US market provided opportunities for both industries in
seeking new markets (Nguyen 2010; De Silva & Nguyen 2011). Moreover, the highly
competitive striped catfish prices and its quality compared to whitefish are driving forces
for success on market access recently (Little et al. 2012). Diversified markets could
potentially lead to reduce price instability, risks of shocks in specific markets and trade
fraud among processors/exporters. Meanwhile, the production of tilapia and GFP has also
expanded, but has limited production in comparison with shrimp and catfish, and are
mostly domestically consumed. The reasons for limited development of tilapia and GFP
systems are inconsistent hatchery performance that in turn lead to unstable seed
production; high domestic demand; and unstable grow-out production (i.e. more scattered
farmed area and unstable production because lack of detailed master plans), and lack of
market or high competition from other country producers such as China (tilapia) and
Bangladesh (prawn) (Tran et al. 1998; Pham 2010; MARD 2010). Although the
Government strategy is more focused on catfish and shrimp for export, both GFP and
tilapia were identified as desirable species for diversification (VIFEP 2009; MARD 2010).
113
Farmed species production is still dominated by numerous household-based operations,
especially for shrimp, tilapia and GFP systems, which accounted for around 80% of total
grow-out farmers per each species; while striped catfish farmers operated and managed by
families accounted for around 60%. Vertical linkages between value chain actors are still
limited, and the relationship between them was commonly by verbal agreements rather
than enforceable contracts. The grow-out farmers and seafood processors played important
roles in the value chain of striped catfish and shrimp systems, while traders of
tilapia/prawn and grow-out producers are key value chains actors of tilapia and GFP
systems. The demand in terms of quantity and quality is also determined by the
shrimp/catfish processors and tilapia/GFP traders which place them in a powerful position
as ‘lead actors’ in the mapped sections of the value chains. However, the weak position of
grow-out producers combined with processing over-capacity means that processors are
increasingly taking a more strategic interest in the sustainability of their supply through
contract farming arrangements and development of their own farms. Therefore, actors,
especially small producers may have little influence, but the high number of this group and
their continued role in supplying a large proportion of raw material for processing for
export make it important. On the other hand, to ensure products meet the standards,
attention should be paid to issues of sustainable development, as the appropriate solution is
from the first link of the value chain, especially small-scale groups which are often actors
to challenges such as the compliance with the food certification (Umesh et al. 2009;
Subasinghe et al. 2009; Pham et al. 2011; Bosma & Verdegem 2011). Hence, appropriate
management measures are required to ensure cultured systems continue to develop in a
sustainable manner. Strengthening of value chain linkages should be considered as a
priority activity in future development.
114
3.10.2. Striped catfish and shrimp: value chain coordination
a). Value chain configuration
Development of striped catfish and shrimp value chains has increased rapidly since 2000.
Stakeholders involved in the value chain of the farmed species are highly diversified in the
MKD, including chain actors or primary actors who involved directly in within-chain
exchanges, and indirect actors (external actors or networks, excluded actors and non
participants). Stakeholder participation in the striped catfish and shrimp value chains was
highly diverse and complex, but farmers and processors were the two main actors that
played important roles in production process of the value chain in the MKD. The largest
net added value per kg of fish/shrimp produced was achieved by farmers, but they did not
have an important role in the price-decision due to their small production capacity. In
contrast, processors made less profit per unit volume of fish, the processors play important
roles in regulating production and product prices due to their high production capacity.
Product supply flows from left to right (i.e. farms–>traders –>processors–>customers),
but the product price decision and money flows from right to left in the value chain cluster
(i.e. farms<–traders<–processors<–customers); this also mentioned in the previous study
on shrimp value chain by Tran et al. (2013). The same authors also noted that governing
power to coordinate GVC will be from right to left in the value chain. In this view of GVC,
the value chain of both shrimp and striped catfish can be buyer-driven value chains that are
characteristic of labour-intensive consumer goods production in which large retailers,
branding enterprises and trading companies control decentralized production networks (Le
et al. 2011; CBI 2012; Trifković 2013; Tran et al. 2013; Jespersen et al. 2014).
Currently, a large amount of striped catfish and brackish-water shrimp production has been
used as raw materials for processing and then for export (Le 2011; Le et al. 2011); thus, the
role of seafood processors in the transformation stage and exporters at the trading stage in
115
the value chain are very important and a key actor. Most value chain nodes of striped
catfish and shrimp systems are the same; however, seed producers are relatively more
complex and important in the striped catfish value chain, and intermediaries (i.e.
wholesalers and collectors) are more important in the shrimp value chain. Striped catfish
production is often directly sold to seafood processors by a contract that was signed before
harvesting a month between farmers and processing plants, with 95% of farmed production
following this way (Bush et al. 2009; Le 2011), and a small proportion of grow-out farmers
(i.e. mainly smaller farms) sold their production through traders in cases of small quantity
or low quality and/or selling at the period of oversupply. In contrast, around 5% of shrimp
production was directly sold to shrimp processing plants and the rest of the production was
often traded through intermediate networks such as shrimp collectors and wholesalers
before reaching to processors (Vo 2003; Le et al. 2011). Up to present, the production of
striped catfish and shrimp system is still dominated by large number of small-scale
household-based operations (Phan et al. 2009; Bush et al. 2009; De Silva & Nguyen 2011;
Tran et al. 2013), and the linkages between value chains’ actors are still limited. The
demand in terms of quantity and quality is determined by the processors that place them in
a powerful position as lead actors in the mapped sections of the value chains (Khoi 2007;
Le et al. 2011; Le 2011). Although seafood processors are very important in production
supply flows, their business still depends on the contracts with buyers who affect strongly
to decide demand/supply and product price of seafood market. However, the dependence
of processors on importers supplying retailers is offset by their diversification of buyers
and markets (Jespersen et al. 2014). Additionally, all the major markets for Vietnamese
seafood export have now shrunk compared to a few years ago, and that market portfolio is
now very diversified; this is a positive step to address problems and makes marketing
planning such as strengthening of trade promotion and advertising activities.
116
b). Role of government in the value chain coordination
The findings show the value chain of both the striped catfish and shrimp are buyer-driven
value chains. Value chain driven by the retailers and importers, with levels of driving
differing according to the end-market the value chain feeds into, but generally moving
from lower towards higher levels (Tran et al. 2013; Jespersen et al. 2014). The value chain
analysis states that seafood exporters in Vietnam, and distributors in the importing
countries capture the most added value of products. In contrast, the farmers are the most
vulnerable actors in the value chain and often faced higher risks than other chain actors,
such as risks of low farm gate price and shrimp disease. Currently, the seafood processors
operate mainly two main different forms of coordination upstream levels on both these
species: own-farm production (hierarchy) and market coordination with independent
farmers; and the catfish sector is also characterized by relational or captive coordination of
suppliers depending on the nature of relationship (preferred suppliers or contracted
farmers) compared to shrimp sector (Jespersen et al. 2014).
Up to the present time, there has been a lack of vertical cooperation in the supply chain and
business support organisations in both these species value chain (Nguyen et al. 2009;
Nguyen & Dang 2009; Tuan et al. 2013). Sustainable development, therefore, needs to
incorporate the establishment of cooperation between actors along whole value chain to
reduce risks for the chain actors. To reduce the risks for the primary production-level,
especially small-scale farmers, horizontal and vertical coordination of the value chain
should be implemented and this is discussed in more detail in Chapter 5. Horizontal
dimensions relate to coordination between producers and horizontal the support and
interventions from the government. Vertical coordination focused on the vertical
contractualisation between the chain actors is also suggested as a tool to reduce the risks
for both these species. The integration of the vertical and horizontal coordination of the
117
value chain is organized through four types of changes in the vertical ‘position’ of chain
actors (inclusion into the chain, continued participation under new terms, exclusion and
non-participation) (Bolwig et al. 2010).
Government agencies are important actors in the value chains because they set, monitor,
and enforce the regulation on production and policy supports such as food safety standards
and financial supports (Nhuong 2011; Tran et al. 2013). The government provides
adequate laws, regulation and enforcement necessary for doing business of chain actors.
Moreover, the government facilitate market access for small-scale farms in organization,
technology and training (Van der Meer 2006; Khoi 2011). The governments appears to
play a crucial role in helping industries improve their food safety and quality (Khoi 2011).
Sevral case studies on the value chain governance of shrimp clusters in India (Umesh et al.
2010), the Surat Thani shrimp farmers club in Thailand (Kassam et al. 2011), the An Giang
pangasius farmers’ association organization (Khiem et al. 2010) and My Xuyen shrimp
farm organizations (RIA2 2009) in Vietnam, dairy farmers’ cooperatives in Ethiopia
(Francesconi 2009) and in Kenya (Kilelu et al. 2013), fruit production in Ghana (Dannson
2004), and Fair trade coffee cooperatives in American countries (Ponte 2002; Lyon 2006;
Ruben et al. 2009; Valkila & Nygren 2009), showed that food safety and quality assurance
cannot be implemented successfully in a country without the support of its government
Additionally, the public sector plays the important role of facilitating the inclusion of
smallholders in global markets, through provision of market information, technical advice,
and logistical and other services (Van der Meer 2006; Sriwichailamphan 2007; Henson et
al. 2008; Amanor 2009; Khoi 2011). Hence, government intervention is suggested as a way
to take control of risks and inequities in the value chain, that may conduct through master
plans, minimum price control or financial regulations. The master plan generally provides
the strategies for local government in relation to development of the detail plan for local
118
aquaculture zoning and the policy-decision making (technical and financial supports; and
relevant regulations on seafood producing). The master plan also allows the improvement
of infrastructure in terms of irrigation canals (water supplying and draining), electricity
networks and transportation services. Through the master plan, the local government
agencies should make a detailed plan for the farming, processing and service sectors; and
regulations to manage the operation at the farm level, processing level, and the operation of
input supplying actors. World Bank (2012) notes that Governments in developing countries
increasingly intervene actively in supporting private sector development. They can
facilitate or stimulate private investment through supporting a conducive policy, legal, and
institutional environment. Public investments in business supports can direct private
investments towards areas of significant public interest where the private sector alone
would generally underinvest. The Vietnamese government has intervened successfully in
the rice leading to stable growth in relation to both production (production and farm gate
rice) and export (markets and exporting price) as a good example. The master plan for rice
production and export is more successful in terms of area-based management,
intensification system, irrigation system and export markets (GSO 2013). The government
of Thailand has been very proactive in legislating for the aquaculture industry with a long
history of regulation and policy support that has resulted in a mature and highly disciplined
industry. Proactive intervention in supporting private sector development has contributed
to Thailand building a good reputation in international seafood markets (Ponte et al. 2014;
Jespersen et al. 2014; Nietes-Satapornvanit 2014). Therefore, the interventions are needed
to improve the awareness and ability of the existing actors to scan for new opportunities
(World Bank 2006). The government promotes innovation as a policy instrument to
mitigate negative external effects such as environmental pollution. Innovation is first of all
the responsibility of businesses, but it is a government responsibility too (EU SCAR 2012).
119
Innovation is influenced by consumer preferences, government policies, and market factors
at regional, national, and global level (Klerkx et al. 2010; Kilelu et al. 2013).
The master and detailed implementation plan for striped catfish and shrimp will affect all
stakeholders along value chain as results of Government intervention and control on the
production at farm-level, processing-level and operation of support actors. All chain actors
have to follow the plan related to their business in terms of area-based management and the
regulations on the operation (seasonal calendar, effluence management, chemical/drug use,
animal health management, trading registration, production etc.). The chain actors in the
aquaculture zones should be eligible for financial support such as access to the credit and
receive preferential services supports (e.g. improvement of irrigation canals, electricity and
road improvement, technical supports). However, there are different affects among chain
actors, such i) farm-level: regulations on farm practices are more strict in relation to food
safety and quality control; ii) processor-level: quota registration, fair trade (e.g. minimum
price agreement on the farm gate price with producers and exporting price between
processors), food safety and quality control, and requirements on the product traceability;
and iii) input suppliers-level: strict regulation on the seed producing and quality,
regulations on the feed ingredients use in feed manufacturers, and quality control on the
chemical/drug manufacturers and trading. Previous studies reported that both shrimp and
pangasius value chains are already heavily regulated by national agencies as well as by
those in importing countries (Tran et al. 2013; Trifković 2013), it is similar to findings in
other agri-food chain studies (Busch & Bain 2004). Recently, public regulations in
producing countries and importing countries are particularly focused on food safety and
standards; and thus the role of the government has changed from ‘regulation maker’ to
merely ‘regulations implementer’ that has involved restructuring of its institutions as well
as paying costs to implement private regulations (Islam 2008; Ha & Bush 2010). Public
120
regulation on food safety has moved towards environment protection, but it is making
production more expensive. Enforcement of these regulations is weak due to the high costs
for farmers that are the costs of constructing sediment basins for waste water treatment
(Trifković 2013; Hansen & Trifković 2014).
Government interventions can also impact on the different risk and vulnerability profiles of
different producers in the pangasius and shrimp value chains, through i) the exclusion of
participants in the value chain, especially independent small-scale producers or weak
actors due to the increasing requirements for food safety and quality control, horizontal and
vertical coordination forms, and transparency in the production; ii) the chain actors located
outside the planning zone will be squeezed out of the value chains; and iii) use of a quota
approach at production and processing levels may increase risks for some chain actors in
competitive markets; and iv) minimum price management often lead to difficulties in
achieving consensus on price, leading to difficult-to-solve conflicts between chain actors
on benefit sharing. Krugman et al. (2010) notes that Governments interventions’ to control
minimum price at producer- and processor-levels, and minimum prices have been
legislated for agricultural products like wheat and milk, as a way to support the incomes of
farmers. Although minimum prices are intended to help some people, they generate
predictable and undesirable side effects. In the case of the unwanted surplus or oversupply,
a minimum price means that would be sellers cannot find buyers. The persistent unwanted
surplus that results from a minimum price creates missed opportunities and inefficiencies
that include inefficient allocation of sales among sellers, wasted resources, and the
temptation to break the law by selling below the legal price.
121
CHAPTER 4
Chapter 4. Farm scale and current farming practices of striped
catfish and shrimp in the Mekong Delta
4.1. Introduction
Striped catfish are raised in deep ponds along the Mekong and Bassac rivers at a high level
of intensity and investment; while shrimp farming takes place in the coastal areas in a
greater diversity of farming system (Vu & Phan 2008; Nguyen & Dang 2009; Nguyen et
al. 2009; Tran et al. 2013). Both of these species play an important role in Vietnamese
aquaculture, and they not only contribute to significant export earning but also create jobs
and increase the income of local people (Nguyen et al. 2009; De Silva & Nguyen 2011;
CBI 2012b; Tran et al. 2013; Cannon & Johnson 2013). Small-farms owned and managed
by families still dominate in the MKD (Phan et al. 2009; Tran et al. 2013). Aquaculture
farms, especially small-farms are considered highly vulnerable in the value chain (Siar &
Sajise 2009; Washington & Ababouch 2011; Tran et al. 2013). Despite this small-farms
should be included in the future development of the aquaculture sector, because they
account for more than 200,000 shrimp farms under improved-extensive systems and
around 2,000 small catfish farms with farm-size less than 1ha (Phan et al. 2011; SFP 2013;
Tran et al. 2013). Small-scale shrimp farmers are located mainly in the coastal areas, and
their land is mostly used for shrimp culture. Shrimp culture is their main occupation and
they have very few chances to diversify their livelihoods (Nhuong et al. 2003; Le 2009;
Tran et al. 2013). Meanwhile, smaller catfish farms should be still maintained in the value
chain, because the catfish processors need to buy 20-30% of raw material source from the
independent farms who are mainly smaller scale farms (Bush & Belton 2012). Irz et al.
122
(2007) found little evidence that aquaculture contributes to the marginalisation of the
smallholders and aquacultural income is clearly inequality-reducing. However, the
possible solutions for the inclusion of smaller scale farms in the value chain could be
horizontal coordination and vertical coordination (Umesh et al. 2009; Khiem et al. 2010;
Khoi 2011; De Silva & Nguyen 2011). Hence, policymakers need to find suitable
measures to support them in the planning processes (Dey & Ahmed 2005; De Silva &
Nguyen 2011). An overview of the difference in farming practices among farm categories
can provide valuable information to the policy makers, thus support policies and develop
strategies suited to specific farm categories.
On the other hand, market trends for certified seafood products is increasing and
customers pay more attention to control on the processes of products (Corsin et al. 2007;
Reilly 2007; Yamprayoon & Sukhumparnich 2010). Recently, certification in the
aquaculture sector has become mainly the realm of large-farms operated by seafood
processors (Bush et al. 2010b; Belton et al. 2011; Trifković 2013). Some large-farms
have achieved certification such as ASC, GAA-BAP and GlobalGAP to meet the
requirements of their clients (Lam & Truong 2010; SFP 2013; Fisheries Directorate 2013b;
Vu et al. 2013). Whereas, small-farms are not likely to achieve certification due to their
limited capacity (Umesh et al. 2009; Khiem et al. 2010; Belton & Little 2011; Pham et al.
2011; Bush & Belton 2012; Trifković 2013; Haugen et al. 2013). They may not pursue
certification as it may not be worth their while economically; the economic efficiency of
certified production may not be much higher than uncertified production because of more
costly investment and difficulties to reach strict standard criteria (Dey & Ahmed 2005;
Oosterveer 2006; Khiem et al. 2010; Haugen et al. 2013; Tran et al. 2013). Assessment of
the sustainability of catfish/shrimp farming seems to only be carried out through the
certification programmes. From the current farming practices, analysis should be carried-
123
out on which category of farms can potentially meet the standards and what the constraints
are to success. Sustainable development of an industry will be affected by many value
chain actors (Grunert et al. 2005; Vo et al. 2009a; Tran et al. 2013), on which grow-out
farms are the primary producers of the value chain; and thus to understand their operation
would provide the basis for policy-making process to create more appropriate strategies to
support the development of the value chain as a whole. Therefore, this chapter aims to
describe and assess the current farming practices of the two target species. The study
attempts to analyse major factors, reflecting on the differences in farming practices among
fish farm categories and shrimp farming systems. It also provides an assessment of
distances between current farming practices and selected food standard criteria. Finally,
this chapter gives insight into factors related to sustainability issues for the farm’s
operation.
4.2. Farm classification
4.2.1. Striped catfish farm category
Striped catfish is now cultured in super-intensive systems and the model is unique to
Vietnam (Phan et al. 2009; De Silva & Nguyen 2011), with high stocking density in very
deep ponds, high water exchange frequency and volume, and high productivity compared
to pangasius farming in Bangladesh (Ahmed et al. 2010; Belton et al. 2011; Ali et al. 2012)
and Thailand (Nietes-Satapornvanit et al. 2011). Based on actual production and business
relations, catfish farms can be divided into three farm scales (Table 4.1); there are six basic
elements in the classification of farm scale. The culture area, farm management regime and
business ownership are important factors used for farm classification. Small- and medium
sized farms are often independently operated, while large-farms are corporate companies
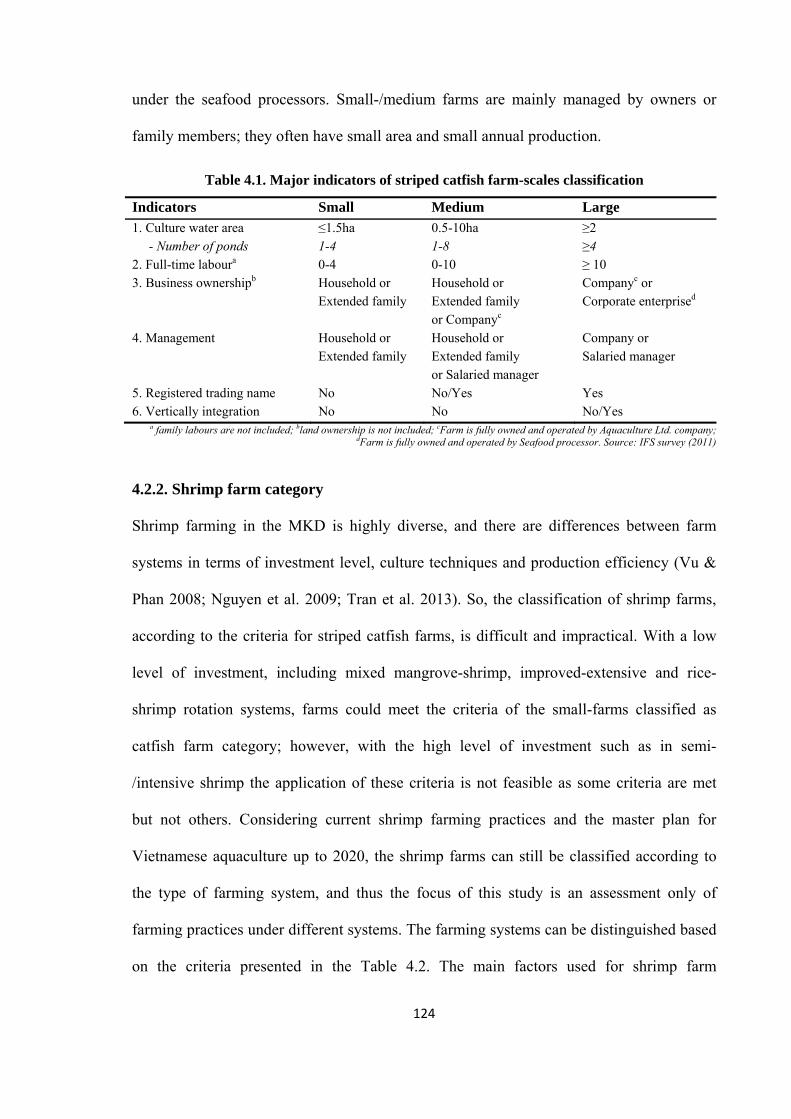
124
under the seafood processors. Small-/medium farms are mainly managed by owners or
family members; they often have small area and small annual production.
Table 4.1. Major indicators of striped catfish farm-scales classification
Indicators Small Medium Large 1. Culture water area ≤1.5ha 0.5-10ha ≥2 - Number of ponds 1-4 1-8 ≥4 2. Full-time laboura 0-4 0-10 ≥ 10 3. Business ownershipb Household or
Extended family Household or Extended family or Companyc
Companyc or Corporate enterprised
4. Management Household or Extended family
Household or Extended family or Salaried manager
Company or Salaried manager
5. Registered trading name No No/Yes Yes 6. Vertically integration No No No/Yes
a family labours are not included; bland ownership is not included; cFarm is fully owned and operated by Aquaculture Ltd. company; dFarm is fully owned and operated by Seafood processor. Source: IFS survey (2011)
4.2.2. Shrimp farm category
Shrimp farming in the MKD is highly diverse, and there are differences between farm
systems in terms of investment level, culture techniques and production efficiency (Vu &
Phan 2008; Nguyen et al. 2009; Tran et al. 2013). So, the classification of shrimp farms,
according to the criteria for striped catfish farms, is difficult and impractical. With a low
level of investment, including mixed mangrove-shrimp, improved-extensive and rice-
shrimp rotation systems, farms could meet the criteria of the small-farms classified as
catfish farm category; however, with the high level of investment such as in semi-
/intensive shrimp the application of these criteria is not feasible as some criteria are met
but not others. Considering current shrimp farming practices and the master plan for
Vietnamese aquaculture up to 2020, the shrimp farms can still be classified according to
the type of farming system, and thus the focus of this study is an assessment only of
farming practices under different systems. The farming systems can be distinguished based
on the criteria presented in the Table 4.2. The main factors used for shrimp farm
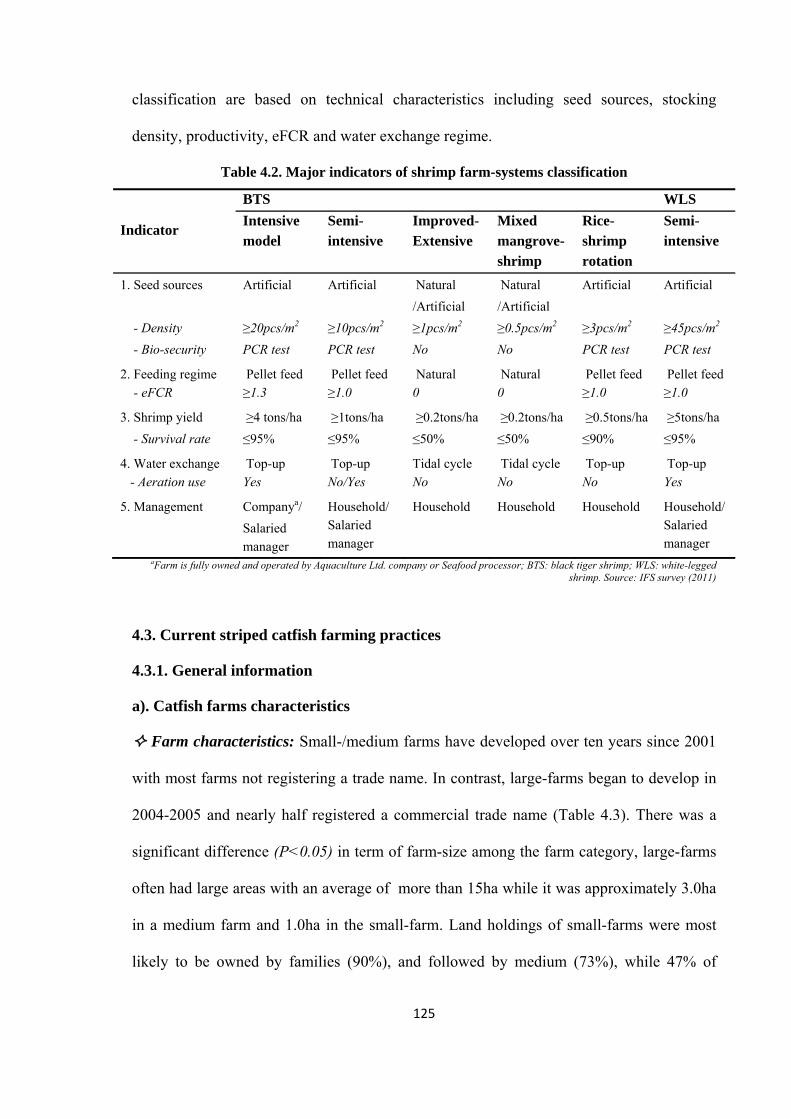
125
classification are based on technical characteristics including seed sources, stocking
density, productivity, eFCR and water exchange regime.
Table 4.2. Major indicators of shrimp farm-systems classification
Indicator
BTS WLS
Intensive model
Semi- intensive
Improved- Extensive
Mixed mangrove-shrimp
Rice-shrimp rotation
Semi- intensive
1. Seed sources Artificial Artificial Natural
/Artificial
Natural
/Artificial
Artificial Artificial
- Density ≥20pcs/m2 ≥10pcs/m2 ≥1pcs/m2 ≥0.5pcs/m2 ≥3pcs/m2 ≥45pcs/m2
- Bio-security PCR test PCR test No No PCR test PCR test
2. Feeding regime Pellet feed Pellet feed Natural Natural Pellet feed Pellet feed - eFCR ≥1.3 ≥1.0 0 0 ≥1.0 ≥1.0
3. Shrimp yield ≥4 tons/ha ≥1tons/ha ≥0.2tons/ha ≥0.2tons/ha ≥0.5tons/ha ≥5tons/ha
- Survival rate ≤95% ≤95% ≤50% ≤50% ≤90% ≤95%
4. Water exchange Top-up Top-up Tidal cycle Tidal cycle Top-up Top-up - Aeration use Yes No/Yes No No No Yes
5. Management Companya/
Salaried manager
Household/ Salaried manager
Household Household Household Household/ Salaried manager
aFarm is fully owned and operated by Aquaculture Ltd. company or Seafood processor; BTS: black tiger shrimp; WLS: white-legged shrimp. Source: IFS survey (2011)
4.3. Current striped catfish farming practices
4.3.1. General information
a). Catfish farms characteristics
Farm characteristics: Small-/medium farms have developed over ten years since 2001
with most farms not registering a trade name. In contrast, large-farms began to develop in
2004-2005 and nearly half registered a commercial trade name (Table 4.3). There was a
significant difference (P<0.05) in term of farm-size among the farm category, large-farms
often had large areas with an average of more than 15ha while it was approximately 3.0ha
in a medium farm and 1.0ha in the small-farm. Land holdings of small-farms were most
likely to be owned by families (90%), and followed by medium (73%), while 47% of
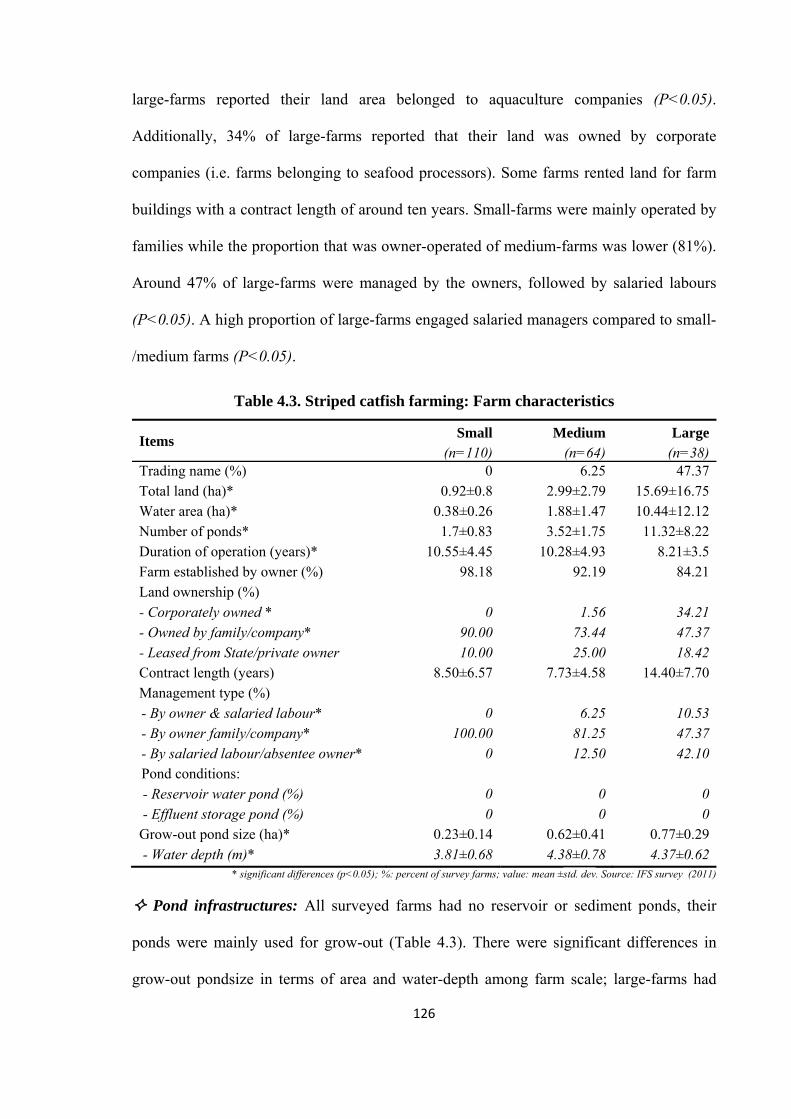
126
large-farms reported their land area belonged to aquaculture companies (P<0.05).
Additionally, 34% of large-farms reported that their land was owned by corporate
companies (i.e. farms belonging to seafood processors). Some farms rented land for farm
buildings with a contract length of around ten years. Small-farms were mainly operated by
families while the proportion that was owner-operated of medium-farms was lower (81%).
Around 47% of large-farms were managed by the owners, followed by salaried labours
(P<0.05). A high proportion of large-farms engaged salaried managers compared to small-
/medium farms (P<0.05).
Table 4.3. Striped catfish farming: Farm characteristics
Items Small Medium Large
(n=110) (n=64) (n=38)Trading name (%) 0 6.25 47.37Total land (ha)* 0.92±0.8 2.99±2.79 15.69±16.75Water area (ha)* 0.38±0.26 1.88±1.47 10.44±12.12Number of ponds* 1.7±0.83 3.52±1.75 11.32±8.22Duration of operation (years)* 10.55±4.45 10.28±4.93 8.21±3.5Farm established by owner (%) 98.18 92.19 84.21Land ownership (%)
- Corporately owned * 0 1.56 34.21- Owned by family/company* 90.00 73.44 47.37- Leased from State/private owner 10.00 25.00 18.42Contract length (years) 8.50±6.57 7.73±4.58 14.40±7.70Management type (%)
- By owner & salaried labour* 0 6.25 10.53- By owner family/company* 100.00 81.25 47.37- By salaried labour/absentee owner* 0 12.50 42.10Pond conditions: - Reservoir water pond (%) 0 0 0 - Effluent storage pond (%) 0 0 0Grow-out pond size (ha)* 0.23±0.14 0.62±0.41 0.77±0.29
- Water depth (m)* 3.81±0.68 4.38±0.78 4.37±0.62* significant differences (p<0.05); %: percent of survey farms; value: mean ±std. dev. Source: IFS survey (2011)
Pond infrastructures: All surveyed farms had no reservoir or sediment ponds, their
ponds were mainly used for grow-out (Table 4.3). There were significant differences in
grow-out pondsize in terms of area and water-depth among farm scale; large-farms had
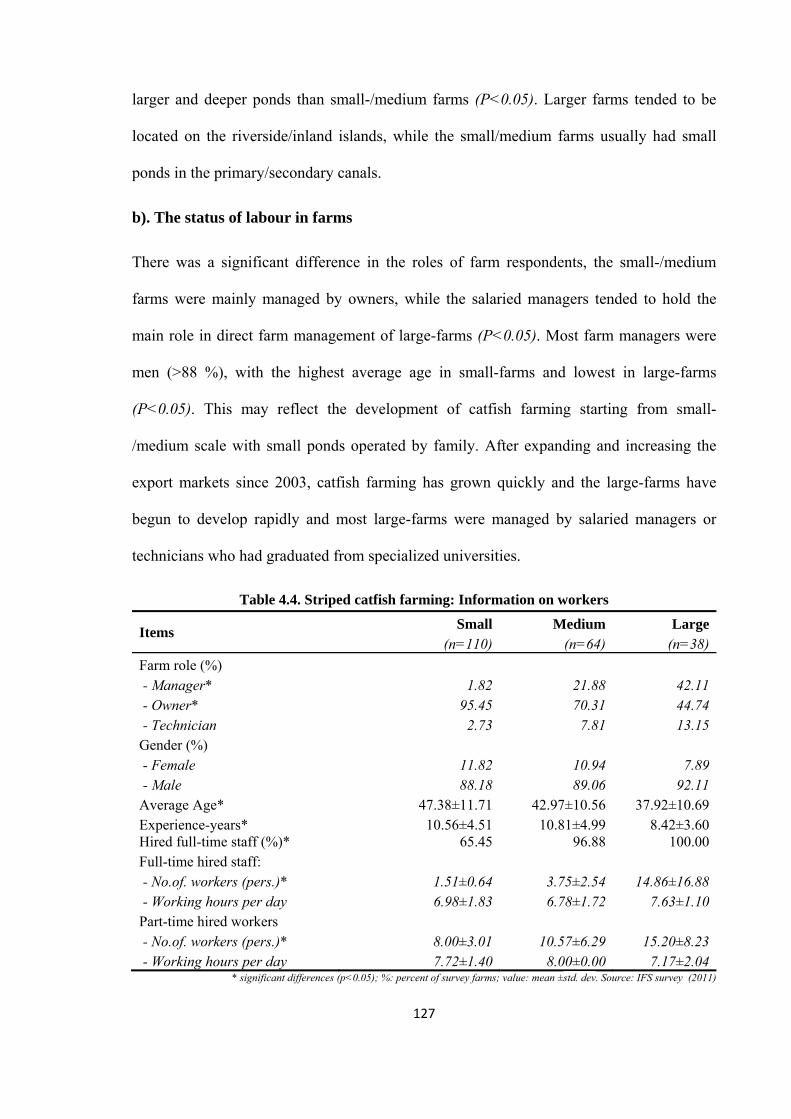
127
larger and deeper ponds than small-/medium farms (P<0.05). Larger farms tended to be
located on the riverside/inland islands, while the small/medium farms usually had small
ponds in the primary/secondary canals.
b). The status of labour in farms
There was a significant difference in the roles of farm respondents, the small-/medium
farms were mainly managed by owners, while the salaried managers tended to hold the
main role in direct farm management of large-farms (P<0.05). Most farm managers were
men (>88 %), with the highest average age in small-farms and lowest in large-farms
(P<0.05). This may reflect the development of catfish farming starting from small-
/medium scale with small ponds operated by family. After expanding and increasing the
export markets since 2003, catfish farming has grown quickly and the large-farms have
begun to develop rapidly and most large-farms were managed by salaried managers or
technicians who had graduated from specialized universities.
Table 4.4. Striped catfish farming: Information on workers
Items Small Medium Large
(n=110) (n=64) (n=38)
Farm role (%) - Manager* 1.82 21.88 42.11 - Owner* 95.45 70.31 44.74 - Technician 2.73 7.81 13.15Gender (%) - Female 11.82 10.94 7.89 - Male 88.18 89.06 92.11Average Age* 47.38±11.71 42.97±10.56 37.92±10.69Experience-years* 10.56±4.51 10.81±4.99 8.42±3.60Hired full-time staff (%)* 65.45 96.88 100.00Full-time hired staff: - No.of. workers (pers.)* 1.51±0.64 3.75±2.54 14.86±16.88 - Working hours per day 6.98±1.83 6.78±1.72 7.63±1.10Part-time hired workers - No.of. workers (pers.)* 8.00±3.01 10.57±6.29 15.20±8.23 - Working hours per day 7.72±1.40 8.00±0.00 7.17±2.04
* significant differences (p<0.05); %: percent of survey farms; value: mean ±std. dev. Source: IFS survey (2011)
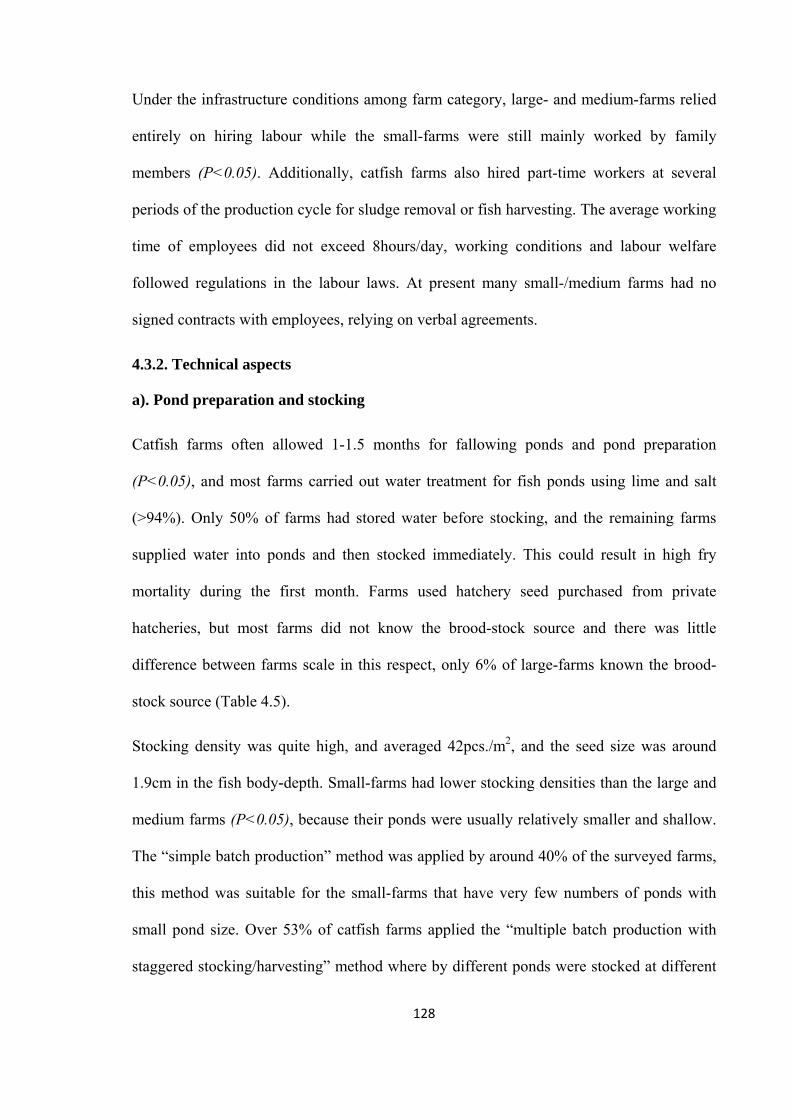
128
Under the infrastructure conditions among farm category, large- and medium-farms relied
entirely on hiring labour while the small-farms were still mainly worked by family
members (P<0.05). Additionally, catfish farms also hired part-time workers at several
periods of the production cycle for sludge removal or fish harvesting. The average working
time of employees did not exceed 8hours/day, working conditions and labour welfare
followed regulations in the labour laws. At present many small-/medium farms had no
signed contracts with employees, relying on verbal agreements.
4.3.2. Technical aspects
a). Pond preparation and stocking
Catfish farms often allowed 1-1.5 months for fallowing ponds and pond preparation
(P<0.05), and most farms carried out water treatment for fish ponds using lime and salt
(>94%). Only 50% of farms had stored water before stocking, and the remaining farms
supplied water into ponds and then stocked immediately. This could result in high fry
mortality during the first month. Farms used hatchery seed purchased from private
hatcheries, but most farms did not know the brood-stock source and there was little
difference between farms scale in this respect, only 6% of large-farms known the brood-
stock source (Table 4.5).
Stocking density was quite high, and averaged 42pcs./m2, and the seed size was around
1.9cm in the fish body-depth. Small-farms had lower stocking densities than the large and
medium farms (P<0.05), because their ponds were usually relatively smaller and shallow.
The “simple batch production” method was applied by around 40% of the surveyed farms,
this method was suitable for the small-farms that have very few numbers of ponds with
small pond size. Over 53% of catfish farms applied the “multiple batch production with
staggered stocking/harvesting” method where by different ponds were stocked at different
129
times and thus had different harvesting times, because most farms often faced financial
constraints with insufficient funds for simple batch production methods.
Table 4.5. Striped catfish farming: Pond preparation and stocking management
Items Small Medium Large
(n=110) (n=64) (n=38)Pond preparation (%)
- Water storage 53.64 43.75 47.37- Water treatment 98.18 98.44 94.74Days between stocking* 43.76±28.51 38.41±24.26 27.83±15.40
Artificial seed sources (%)
- Hatchery - broodstock known 0.00 0.00 2.63
- Hatchery - broodstock unknown 100.00 100.00 94.74
- Own hatchery 0.00 0.00 2.63
Seed stocking (pcs/m2)* 38.50±19.15 47.48±17.80 43.97±13.20
Seed size (in body depth, cm) 1.90±0.54 1.88±0.48 1.89±0.22
No.of ponds stocked together 1.20±0.47 1.42±0.85 1.92±1.10
Production scheduling (%)
- Simple batch production 46.36 32.81 42.11
- Multiple batch production 53.64 67.19 57.89 * significant differences (p<0.05); %: percent of survey farms; value: mean ±std. dev. Source: IFS survey (2011)
b). Feed management
Around 70% of surveyed small-/medium farms used commercial feed, while in large farms
this increased to 90%. However, there were still many small-/medium farms using farm-
made feed compared to large-farms (Table 4.6). Although farms still used farm-made feed,
catfish farms have tended to increase their use of commercial feed compared to the
previous surveys in 2008 of Phan et al. (2009) and in 2009 of Da et al. (2013). The shift
from farm-made feed to commercial feed is linked to pressure from processors who prefer
to buy fish produced using commercial feed. The production cycle, when using farm-made
feed, is often 4-6 weeks longer than commercial feed (Phan et al. 2009), while the farms
paid more attention to the turnover of investment and cost efficiency due to high interest
rates and short time of loans. In addition, the lack of raw materials, especially fishmeal or
130
trash fish for feed ingredients was also a driving force for changing trends (Nguyen et al.
2009; Tuan et al. 2013). The eFCR of commercial feeds was around 1.6 and there was a
significant difference among farm scales (P<0.05), and eFCR of farm-made feed had also
a distinct difference among farm categories (P<0.05). Small-farms used trash fish in their
recipes, while large-farms mainly used fishmeal in their farm-made feed. As a result
eFCRs of farm-made feeds from the small-farms was higher (2.77) than large-farms (2.01)
P<0.05). Some small-/medium farms used both commercial and farm-made feed for fish
ponds, in this case, the farms did not use both of feed types simultaneously. Commercial
feed tended to be used during the 1st and last month of the production cycle to ensure fish
health and to increase fish quality, whereas farm-made feed was used in the interim period
before harvest. The estimated amount of daily feed supplied was based on regular meals to
appetite on feed packs. Larger farms tended buy feed directly from aquafeed processors
more so than the small-/medium farms (P<0.05), as when buying feed directly and not
through traders/agents farms received promotional discounts leading to reduced production
costs. Moreover, the large-farms often purchased feed in large amounts so they are also
likely to receive preferential services from the aquafeed processors than small or medium
farms.
The feed protein content varied between 22-30% and was dependent on the stage of fish
growth. Generally payment for fish feed was on receipt although in some places farms can
still buy feed under credit arrangements (i.e. delay payment term) through long-term
relationships with aquafeed plants or traders/agents. Besides, 34% of large-farms had
vertically integrated production so they could complete full payment after harvest, while
this proportion for small-/medium farms was very low.
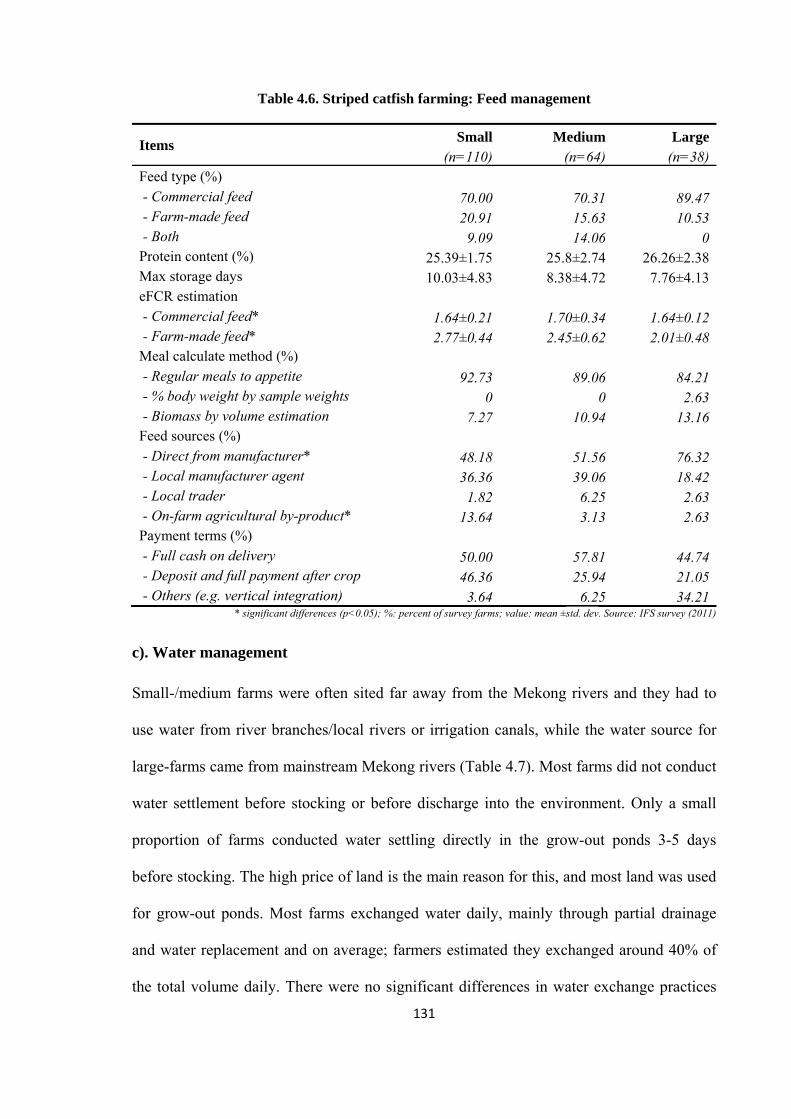
131
Table 4.6. Striped catfish farming: Feed management
Items Small Medium Large
(n=110) (n=64) (n=38)Feed type (%) - Commercial feed 70.00 70.31 89.47 - Farm-made feed 20.91 15.63 10.53 - Both 9.09 14.06 0Protein content (%) 25.39±1.75 25.8±2.74 26.26±2.38Max storage days 10.03±4.83 8.38±4.72 7.76±4.13eFCR estimation - Commercial feed* 1.64±0.21 1.70±0.34 1.64±0.12 - Farm-made feed* 2.77±0.44 2.45±0.62 2.01±0.48Meal calculate method (%) - Regular meals to appetite 92.73 89.06 84.21 - % body weight by sample weights 0 0 2.63 - Biomass by volume estimation 7.27 10.94 13.16Feed sources (%) - Direct from manufacturer* 48.18 51.56 76.32 - Local manufacturer agent 36.36 39.06 18.42 - Local trader 1.82 6.25 2.63 - On-farm agricultural by-product* 13.64 3.13 2.63Payment terms (%) - Full cash on delivery 50.00 57.81 44.74 - Deposit and full payment after crop 46.36 25.94 21.05 - Others (e.g. vertical integration) 3.64 6.25 34.21
* significant differences (p<0.05); %: percent of survey farms; value: mean ±std. dev. Source: IFS survey (2011)
c). Water management
Small-/medium farms were often sited far away from the Mekong rivers and they had to
use water from river branches/local rivers or irrigation canals, while the water source for
large-farms came from mainstream Mekong rivers (Table 4.7). Most farms did not conduct
water settlement before stocking or before discharge into the environment. Only a small
proportion of farms conducted water settling directly in the grow-out ponds 3-5 days
before stocking. The high price of land is the main reason for this, and most land was used
for grow-out ponds. Most farms exchanged water daily, mainly through partial drainage
and water replacement and on average; farmers estimated they exchanged around 40% of
the total volume daily. There were no significant differences in water exchange practices
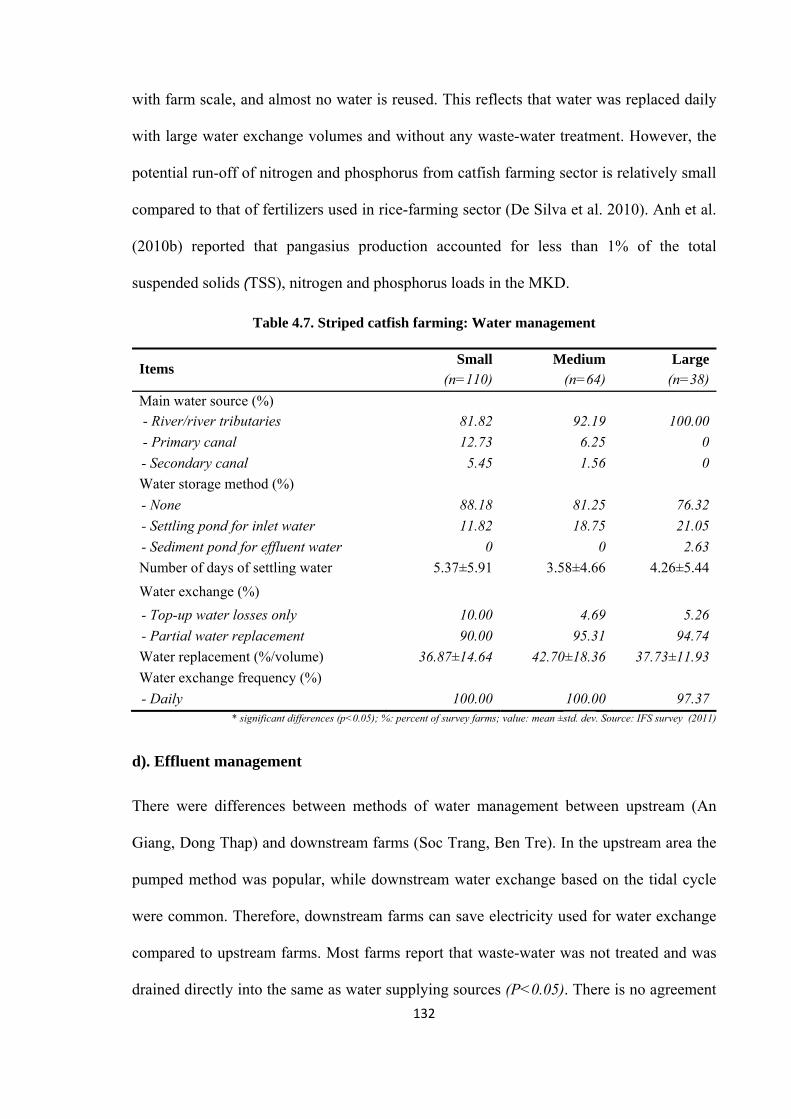
132
with farm scale, and almost no water is reused. This reflects that water was replaced daily
with large water exchange volumes and without any waste-water treatment. However, the
potential run-off of nitrogen and phosphorus from catfish farming sector is relatively small
compared to that of fertilizers used in rice-farming sector (De Silva et al. 2010). Anh et al.
(2010b) reported that pangasius production accounted for less than 1% of the total
suspended solids (TSS), nitrogen and phosphorus loads in the MKD.
Table 4.7. Striped catfish farming: Water management
Items Small Medium Large
(n=110) (n=64) (n=38)
Main water source (%) - River/river tributaries 81.82 92.19 100.00
- Primary canal 12.73 6.25 0
- Secondary canal 5.45 1.56 0
Water storage method (%)
- None 88.18 81.25 76.32
- Settling pond for inlet water 11.82 18.75 21.05
- Sediment pond for effluent water 0 0 2.63
Number of days of settling water 5.37±5.91 3.58±4.66 4.26±5.44
Water exchange (%)
- Top-up water losses only 10.00 4.69 5.26
- Partial water replacement 90.00 95.31 94.74
Water replacement (%/volume) 36.87±14.64 42.70±18.36 37.73±11.93
Water exchange frequency (%)
- Daily 100.00 100.00 97.37* significant differences (p<0.05); %: percent of survey farms; value: mean ±std. dev. Source: IFS survey (2011)
d). Effluent management
There were differences between methods of water management between upstream (An
Giang, Dong Thap) and downstream farms (Soc Trang, Ben Tre). In the upstream area the
pumped method was popular, while downstream water exchange based on the tidal cycle
were common. Therefore, downstream farms can save electricity used for water exchange
compared to upstream farms. Most farms report that waste-water was not treated and was
drained directly into the same as water supplying sources (P<0.05). There is no agreement
133
of water effluent management from the local community; however, the government has
regulations on water effluent management that allow water to be abstracted from one
supplying source and the effluent be discharged to another water source. Although the
government regulations are mandatory for catfish farms, the control and monitoring of
implementing this regulation were practically very limited.
Most farms often pump out the sludge during and after the culture cycle, the method is
mainly a sludge pump operated by divers. Sludge from fish ponds was removed 3-4 times
per crop with the number of sludge removal times dependent on the stocking density, feed
types and fish growth stage. Normally, the sludge was removed with higher frequency in
the case of ponds using farm-made feed compared to that of pellet feed use. The sludge
was mainly removed into orchards/gardens/cash crop fields (45% of catfish farms)
followed by sediment basins (33%). This information did not fully reflect that the catfish
farms have enough sediment basins or storages. Catfish farmers answered questions about
effluent storage and disposal in a way that confirmed they followed Goverment
regulations. The sludge was often removed wet as mixed water and bottom soil. During a
production cycle there was 5,880m3 of wet-sludge/ha removed from catfish ponds. In
2012, the striped catfish farmed area reached 5,911ha (Fisheries Directorate 2013b); thus
the estimate of sludge removal from catfish sector per year can be 34.74million m3. If the
sludge is not managed, most will be released to adjacent water-bodies and becomes a
potential source of pollution in the long run. Therefore, further impact reductions are
possible through more efficient use of inputs and low-cost treatment, and consideration of
the reuse of sediments in agriculture where appropriate (Anh et al. 2010b; Phan et al. 2013;
Henriksson et al. 2014).
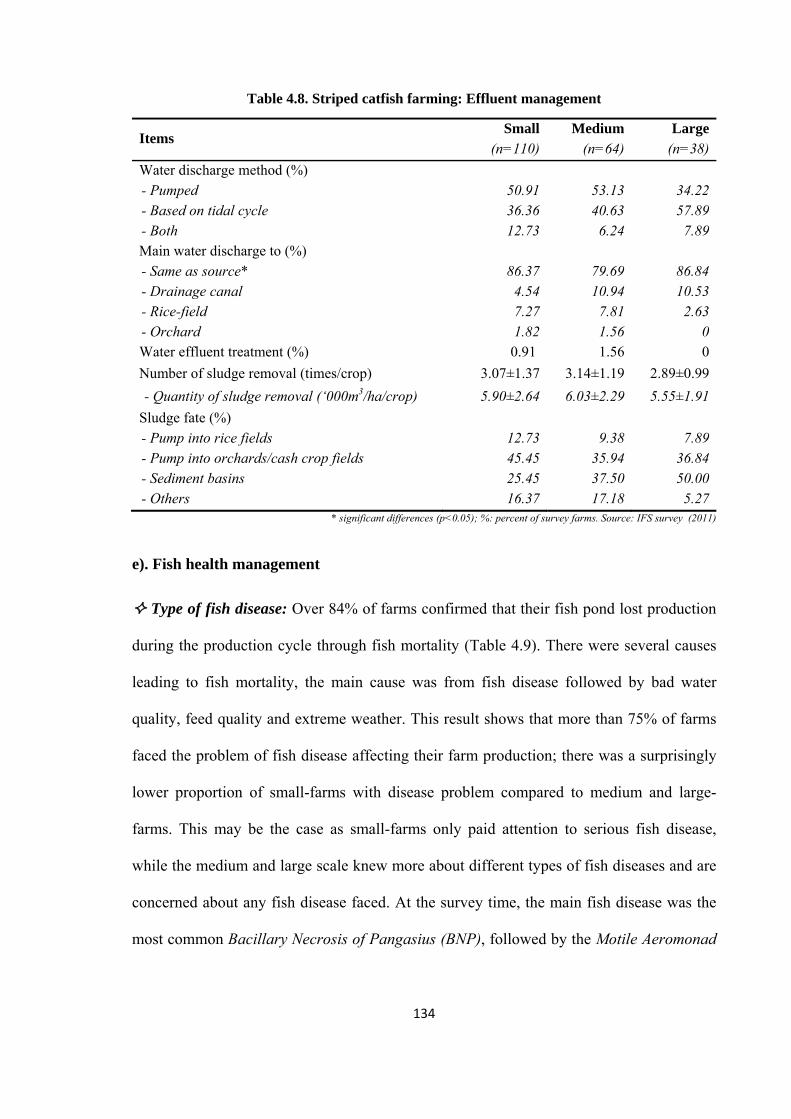
134
Table 4.8. Striped catfish farming: Effluent management
Items Small Medium Large
(n=110) (n=64) (n=38)
Water discharge method (%)
- Pumped 50.91 53.13 34.22- Based on tidal cycle 36.36 40.63 57.89- Both 12.73 6.24 7.89Main water discharge to (%)
- Same as source* 86.37 79.69 86.84- Drainage canal 4.54 10.94 10.53- Rice-field 7.27 7.81 2.63- Orchard 1.82 1.56 0Water effluent treatment (%) 0.91 1.56 0
Number of sludge removal (times/crop) 3.07±1.37 3.14±1.19 2.89±0.99
- Quantity of sludge removal (‘000m3/ha/crop) 5.90±2.64 6.03±2.29 5.55±1.91
Sludge fate (%)
- Pump into rice fields 12.73 9.38 7.89- Pump into orchards/cash crop fields 45.45 35.94 36.84- Sediment basins 25.45 37.50 50.00- Others 16.37 17.18 5.27
* significant differences (p<0.05); %: percent of survey farms. Source: IFS survey (2011)
e). Fish health management
Type of fish disease: Over 84% of farms confirmed that their fish pond lost production
during the production cycle through fish mortality (Table 4.9). There were several causes
leading to fish mortality, the main cause was from fish disease followed by bad water
quality, feed quality and extreme weather. This result shows that more than 75% of farms
faced the problem of fish disease affecting their farm production; there was a surprisingly
lower proportion of small-farms with disease problem compared to medium and large-
farms. This may be the case as small-farms only paid attention to serious fish disease,
while the medium and large scale knew more about different types of fish diseases and are
concerned about any fish disease faced. At the survey time, the main fish disease was the
most common Bacillary Necrosis of Pangasius (BNP), followed by the Motile Aeromonad
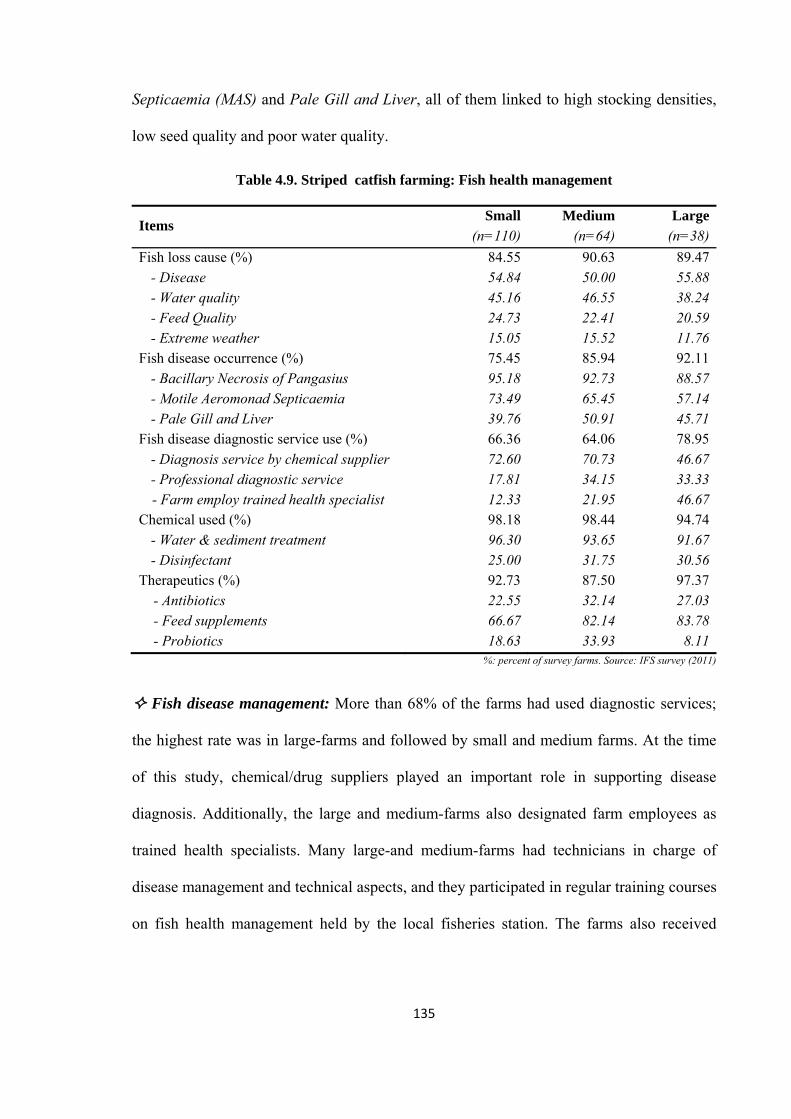
135
Septicaemia (MAS) and Pale Gill and Liver, all of them linked to high stocking densities,
low seed quality and poor water quality.
Table 4.9. Striped catfish farming: Fish health management
Items Small Medium Large
(n=110) (n=64) (n=38)
Fish loss cause (%) 84.55 90.63 89.47
- Disease 54.84 50.00 55.88- Water quality 45.16 46.55 38.24- Feed Quality 24.73 22.41 20.59- Extreme weather 15.05 15.52 11.76
Fish disease occurrence (%) 75.45 85.94 92.11
- Bacillary Necrosis of Pangasius 95.18 92.73 88.57- Motile Aeromonad Septicaemia 73.49 65.45 57.14- Pale Gill and Liver 39.76 50.91 45.71
Fish disease diagnostic service use (%) 66.36 64.06 78.95
- Diagnosis service by chemical supplier 72.60 70.73 46.67- Professional diagnostic service 17.81 34.15 33.33
- Farm employ trained health specialist 12.33 21.95 46.67Chemical used (%) 98.18 98.44 94.74
- Water & sediment treatment 96.30 93.65 91.67- Disinfectant 25.00 31.75 30.56
Therapeutics (%) 92.73 87.50 97.37
- Antibiotics 22.55 32.14 27.03- Feed supplements 66.67 82.14 83.78- Probiotics 18.63 33.93 8.11
%: percent of survey farms. Source: IFS survey (2011)
Fish disease management: More than 68% of the farms had used diagnostic services;
the highest rate was in large-farms and followed by small and medium farms. At the time
of this study, chemical/drug suppliers played an important role in supporting disease
diagnosis. Additionally, the large and medium-farms also designated farm employees as
trained health specialists. Many large-and medium-farms had technicians in charge of
disease management and technical aspects, and they participated in regular training courses
on fish health management held by the local fisheries station. The farms also received
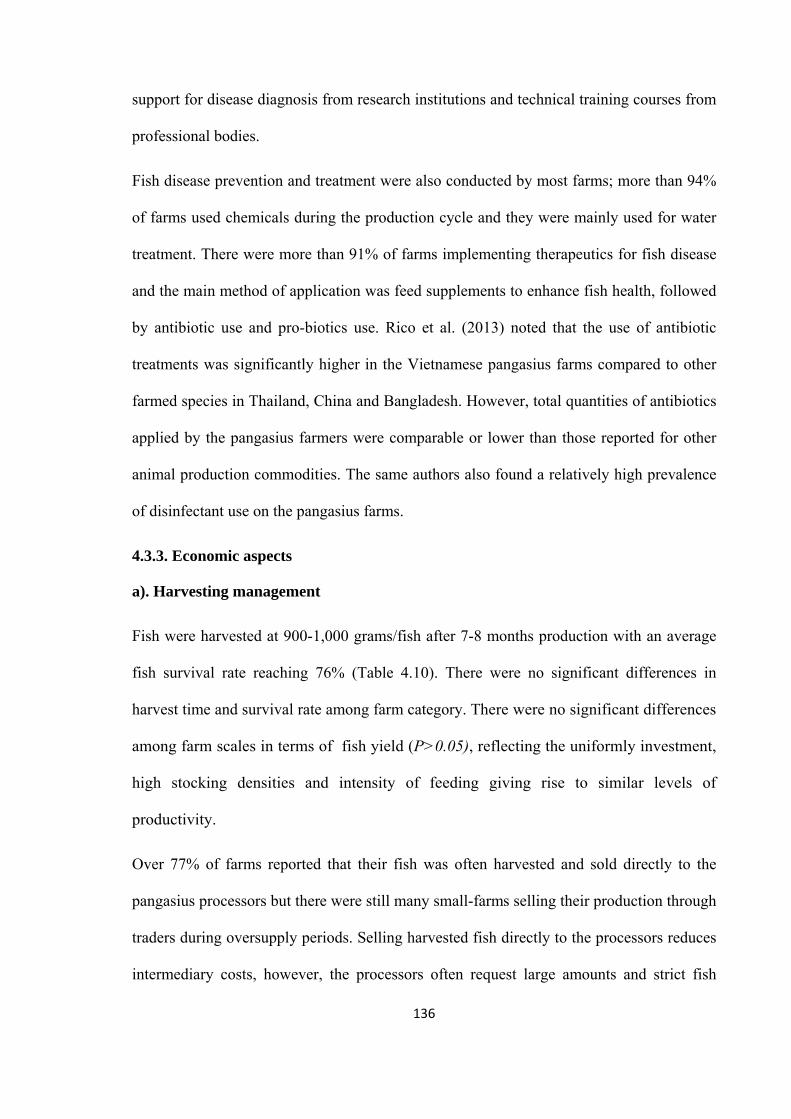
136
support for disease diagnosis from research institutions and technical training courses from
professional bodies.
Fish disease prevention and treatment were also conducted by most farms; more than 94%
of farms used chemicals during the production cycle and they were mainly used for water
treatment. There were more than 91% of farms implementing therapeutics for fish disease
and the main method of application was feed supplements to enhance fish health, followed
by antibiotic use and pro-biotics use. Rico et al. (2013) noted that the use of antibiotic
treatments was significantly higher in the Vietnamese pangasius farms compared to other
farmed species in Thailand, China and Bangladesh. However, total quantities of antibiotics
applied by the pangasius farmers were comparable or lower than those reported for other
animal production commodities. The same authors also found a relatively high prevalence
of disinfectant use on the pangasius farms.
4.3.3. Economic aspects
a). Harvesting management
Fish were harvested at 900-1,000 grams/fish after 7-8 months production with an average
fish survival rate reaching 76% (Table 4.10). There were no significant differences in
harvest time and survival rate among farm category. There were no significant differences
among farm scales in terms of fish yield (P>0.05), reflecting the uniformly investment,
high stocking densities and intensity of feeding giving rise to similar levels of
productivity.
Over 77% of farms reported that their fish was often harvested and sold directly to the
pangasius processors but there were still many small-farms selling their production through
traders during oversupply periods. Selling harvested fish directly to the processors reduces
intermediary costs, however, the processors often request large amounts and strict fish
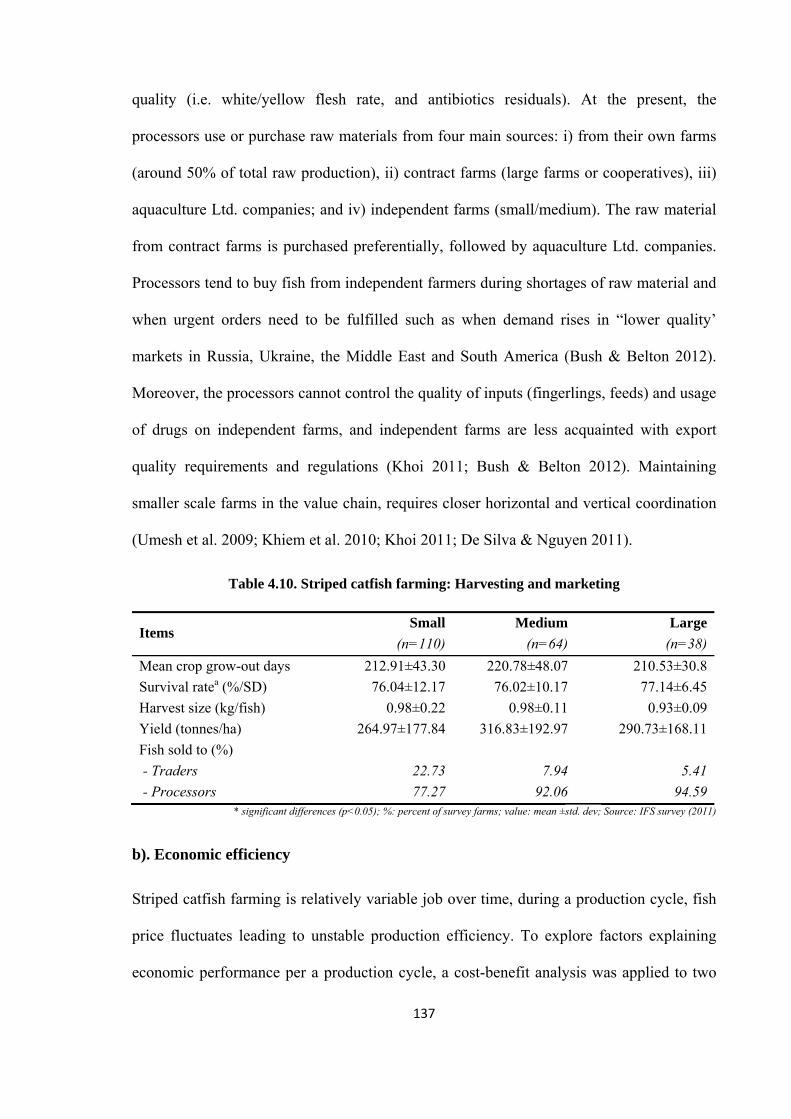
137
quality (i.e. white/yellow flesh rate, and antibiotics residuals). At the present, the
processors use or purchase raw materials from four main sources: i) from their own farms
(around 50% of total raw production), ii) contract farms (large farms or cooperatives), iii)
aquaculture Ltd. companies; and iv) independent farms (small/medium). The raw material
from contract farms is purchased preferentially, followed by aquaculture Ltd. companies.
Processors tend to buy fish from independent farmers during shortages of raw material and
when urgent orders need to be fulfilled such as when demand rises in “lower quality’
markets in Russia, Ukraine, the Middle East and South America (Bush & Belton 2012).
Moreover, the processors cannot control the quality of inputs (fingerlings, feeds) and usage
of drugs on independent farms, and independent farms are less acquainted with export
quality requirements and regulations (Khoi 2011; Bush & Belton 2012). Maintaining
smaller scale farms in the value chain, requires closer horizontal and vertical coordination
(Umesh et al. 2009; Khiem et al. 2010; Khoi 2011; De Silva & Nguyen 2011).
Table 4.10. Striped catfish farming: Harvesting and marketing
Items Small Medium Large
(n=110) (n=64) (n=38)
Mean crop grow-out days 212.91±43.30 220.78±48.07 210.53±30.8
Survival ratea (%/SD) 76.04±12.17 76.02±10.17 77.14±6.45
Harvest size (kg/fish) 0.98±0.22 0.98±0.11 0.93±0.09
Yield (tonnes/ha) 264.97±177.84 316.83±192.97 290.73±168.11
Fish sold to (%)
- Traders 22.73 7.94 5.41
- Processors 77.27 92.06 94.59* significant differences (p<0.05); %: percent of survey farms; value: mean ±std. dev; Source: IFS survey (2011)
b). Economic efficiency
Striped catfish farming is relatively variable job over time, during a production cycle, fish
price fluctuates leading to unstable production efficiency. To explore factors explaining
economic performance per a production cycle, a cost-benefit analysis was applied to two
138
disaggregated farm groups; Group 1 who lost money or achieved negative net returns and
Group 2 who made a positive net return. Comparison between the two farm groups showed
that there was a difference in production efficiency between two groups. Most farms have
a relatively high harvest (≥247tonnes/ha) (Table 4.11). Although the fish yield of group 1
was higher than that of group 2, the farms from group 1 still lost money. The main reasons
were higher production cost and lower fish price, and their production cost was higher than
the fish price at harvest time leading to lost profit. It reflects that the fish price at harvest
time is the most important factor affecting profitability efficiency.
Table 4.11. Striped catfish farming: Economic efficiency
Items Small Medium Large
(n=110) (n=64) (n=38)
Group 1: negative net return (n) 67 40 19
% of total farms 60.91 63.49 54.29
Yield (tonnes/ha) 276.40±199.94 333.69±177.28 300.03±137.69
Gross revenue (‘000 US$/ha) 216.39±170.76 258.42±137.95 248.15±128.80
Total cost (‘000 US$/ha) 270.08±213.81 352.26±211.92 308.92±146.68
Net return (‘000 US$/ha) -53.68±70.44 -93.84±101.68 -60.76±73.40
- Production cost (US$/kg)* 0.99±0.23 1.07±0.25 1.03±0.13
- Fish price (US$/kg)* 0.78±0.08 0.78±0.1 0.82±0.21
Group 2: positive net return (n) 43 23 16
% of total farms 39.09 36.51 45.71
Yield (tonnes/ha) 247.16±136.84 287.50±218.65 279.69±202.65
Gross revenue(‘000 US$/ha) 215.78±120.59 281.96±225.75 306.65±225.23
Total cost (‘000 US$/ha) 184.91±106.49 235.66±178.67 259.51±196.56
Net return(‘000 US$/ha)* 30.87±46.34 46.3±57.73 47.13±48.01
- Production cost (US$/kg) 0.77±0.15 0.83±0.09 0.93±0.15
- Fish price (US$/kg) 0.89±0.14 0.96±0.12 1.09±0.09
* significant differences (p<0.05); value: mean ±std.dev., exchange rate 20800 VND/1US$. Source: IFS survey (2011)
Table 4.11 shows all scales of catfish farms faced economic losses, the small-/medium farms
accounted for around 60% of total farms and large farms (54%). This suggests that
performance was relatively independent of farm scale; and was linked to other attributes
such as management (e.g. feeding, stocking) and timing of fish sales in the economic cycle
139
(that greatly affected the farm-gate price achievable). This gives evidence for the likely
characterisitics of consolidation of the sector, and suggests that smaller scale farms can still
maintain themselves in the value chain if they can improve their farming practice and
management.
4.3.4. Catfish farm certification and sustainability issues
a). Main certification issues of catfish farms
To make an assessment of which farming practices meet major certification standards, a
number of standard criteria of the GAA-BAP, GlobalGAP and ASC were selected and
presented in Table 4.123. Comparisons between selection criteria and current practices by
farm scale shows that many farms have achieved several standard criteria such as eFCR
(≤1.68), stocking density (≤38kg/m2), no banned chemical/drug and wild-seed source use,
working hours per day (≤8), community relations, property rights and biodiversity
protection. However, there are still many standard principles/criteria that farms could not
meet such as i) the criteria on effluent management (most farms release their waste water
without treatment, and have no sediment basins or lack of evidence on the sludge
treatment, water use >5,000m3/tonnes of fresh fish, no water monitoring). The sediment
basin or pond to collect sludge from fish ponds is a mandatory requirement by the GAA-
BAP standard (GAA 2010); and/or the farms have to show an evidence that sludge is not
discharged directly into receiving waters or natural ecosystem (ASC 2010; GlobalGAP
2011); ii) registration of farms (many farms have not registered a legal farm name); iii) fish
meal control (farms cannot control fishmeal/oil ingredients); iv) fish mortality management
3The information on the bracket present indicators of the current farming practices
140
(fish mortality >20%); iv) labour arrangements (lack of written contracts and reliance on
verbal arrangements); v) farm hygiene; and vi) record keeping requirement.
Current practices of small-/medium catfish farms tended to be quite weak in relation to
indicators compared to the standard criteria such selection of site, employment conditions,
storage and disposal of supplies, effluent management, microbial sanitation, pest
management, fish health and welfare, and traceability recordkeeping. Large-farms also
faced the same issues, but they were generally at a higher level in relation to indicators to
meet the standard criteria. Moreover, with a higher capacity of infrastructure (large farm-
size, feed/chemicals storage, pond construction, water supply system) and financial
resources, large-farms were better able to improve their operations towards standards than
small or medium farms. Existing farms needed considerable investment and also required
support from the local officers (e.g. technical support, guidelines on trading name
registration and certification of property rights) to meet the standards criteria. These would
likely lead to increased production costs; that a financial constraint for small and medium
farms. Certification fee is also a constraint for small-/medium farms and are
proportionately more expensive for smaller operations, because auditing costs are not
related to farm size. Additionally, small-farms may not have enough land for restructuring
their farms to follow criteria such as using land for reservoir and sediment basins, storage
of input material and living quarters for labourers. Therefore, the capacity of small- and
medium-farms to meet the standards for certification is very difficult compared to the
large-farms. To overcome this issue, small/medium should be linked into groups, and then
work together to obtain group certification.
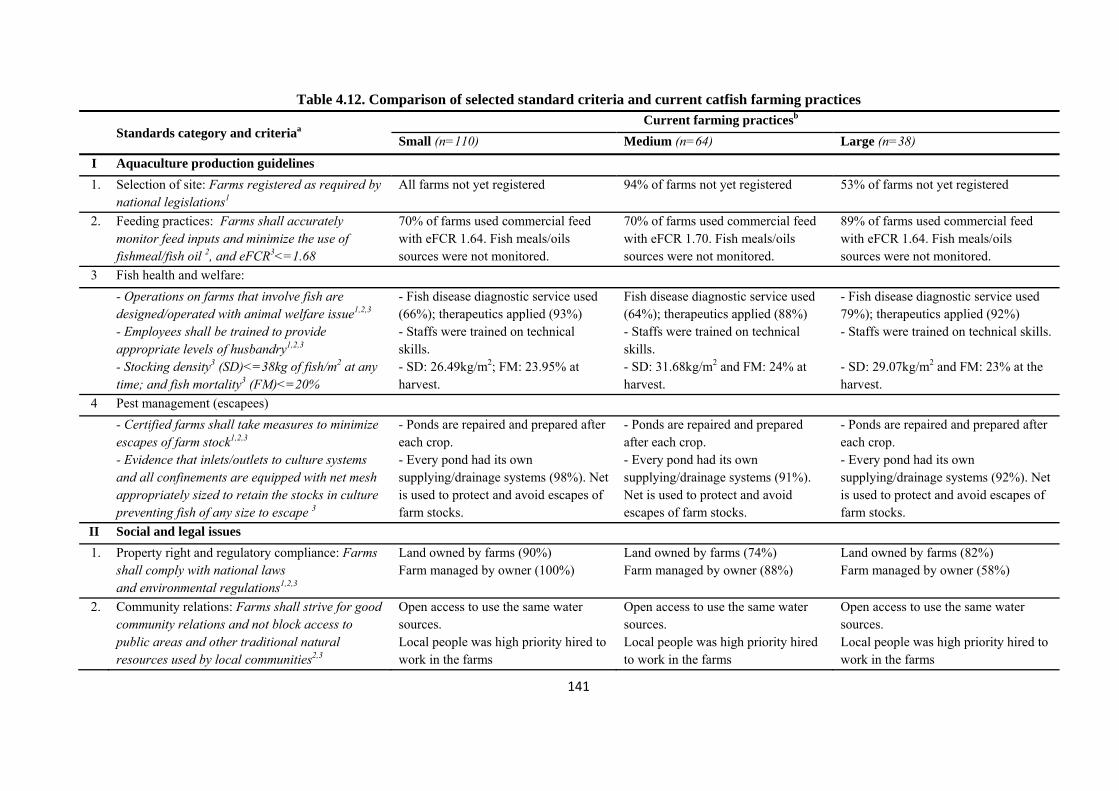
141
Table 4.12. Comparison of selected standard criteria and current catfish farming practices
Standards category and criteriaa Current farming practicesb
Small (n=110) Medium (n=64) Large (n=38)
I Aquaculture production guidelines
1. Selection of site: Farms registered as required by national legislations1
All farms not yet registered 94% of farms not yet registered 53% of farms not yet registered
2. Feeding practices: Farms shall accurately monitor feed inputs and minimize the use of fishmeal/fish oil 2, and eFCR3<=1.68
70% of farms used commercial feed with eFCR 1.64. Fish meals/oils sources were not monitored.
70% of farms used commercial feed with eFCR 1.70. Fish meals/oils sources were not monitored.
89% of farms used commercial feed with eFCR 1.64. Fish meals/oils sources were not monitored.
3 Fish health and welfare:
- Operations on farms that involve fish are designed/operated with animal welfare issue1,2,3 - Employees shall be trained to provide appropriate levels of husbandry1,2,3 - Stocking density3 (SD)<=38kg of fish/m2 at any time; and fish mortality3 (FM)<=20%
- Fish disease diagnostic service used (66%); therapeutics applied (93%) - Staffs were trained on technical skills. - SD: 26.49kg/m2; FM: 23.95% at harvest.
Fish disease diagnostic service used (64%); therapeutics applied (88%) - Staffs were trained on technical skills. - SD: 31.68kg/m2 and FM: 24% at harvest.
- Fish disease diagnostic service used 79%); therapeutics applied (92%) - Staffs were trained on technical skills. - SD: 29.07kg/m2 and FM: 23% at the harvest.
4 Pest management (escapees)
- Certified farms shall take measures to minimize escapes of farm stock1,2,3 - Evidence that inlets/outlets to culture systems and all confinements are equipped with net mesh appropriately sized to retain the stocks in culture preventing fish of any size to escape 3
- Ponds are repaired and prepared after each crop. - Every pond had its own supplying/drainage systems (98%). Net is used to protect and avoid escapes of farm stocks.
- Ponds are repaired and prepared after each crop. - Every pond had its own supplying/drainage systems (91%). Net is used to protect and avoid escapes of farm stocks.
- Ponds are repaired and prepared after each crop. - Every pond had its own supplying/drainage systems (92%). Net is used to protect and avoid escapes of farm stocks.
II Social and legal issues
1. Property right and regulatory compliance: Farms shall comply with national laws and environmental regulations1,2,3
Land owned by farms (90%) Farm managed by owner (100%)
Land owned by farms (74%) Farm managed by owner (88%)
Land owned by farms (82%) Farm managed by owner (58%)
2. Community relations: Farms shall strive for good community relations and not block access to public areas and other traditional natural resources used by local communities2,3
Open access to use the same water sources. Local people was high priority hired to work in the farms
Open access to use the same water sources. Local people was high priority hired to work in the farms
Open access to use the same water sources. Local people was high priority hired to work in the farms
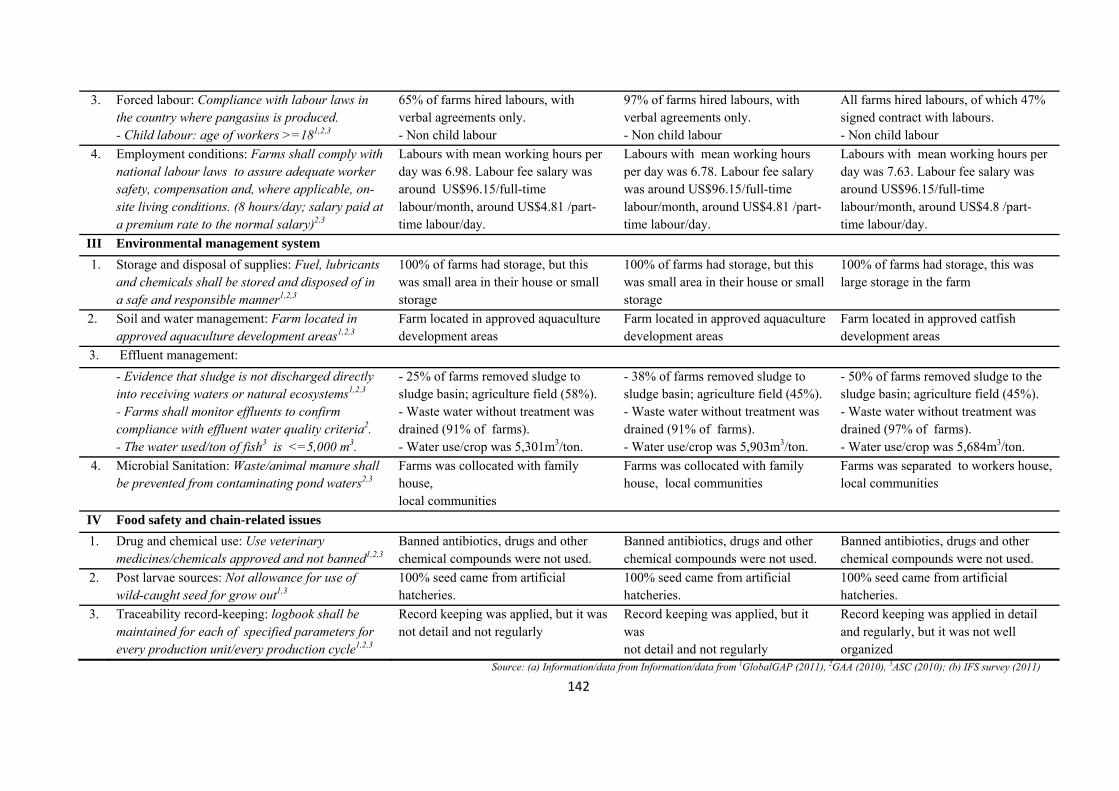
142
3. Forced labour: Compliance with labour laws in the country where pangasius is produced. - Child labour: age of workers >=181,2,3
65% of farms hired labours, with verbal agreements only. - Non child labour
97% of farms hired labours, with verbal agreements only. - Non child labour
All farms hired labours, of which 47% signed contract with labours. - Non child labour
4. Employment conditions: Farms shall comply with national labour laws to assure adequate worker safety, compensation and, where applicable, on-site living conditions. (8 hours/day; salary paid at a premium rate to the normal salary)2,3
Labours with mean working hours per day was 6.98. Labour fee salary was around US$96.15/full-time labour/month, around US$4.81 /part-time labour/day.
Labours with mean working hours per day was 6.78. Labour fee salary was around US$96.15/full-time labour/month, around US$4.81 /part-time labour/day.
Labours with mean working hours per day was 7.63. Labour fee salary was around US$96.15/full-time labour/month, around US$4.8 /part-time labour/day.
III Environmental management system
1. Storage and disposal of supplies: Fuel, lubricants and chemicals shall be stored and disposed of in a safe and responsible manner1,2,3
100% of farms had storage, but this was small area in their house or small storage
100% of farms had storage, but this was small area in their house or small storage
100% of farms had storage, this was large storage in the farm
2. Soil and water management: Farm located in approved aquaculture development areas1,2,3
Farm located in approved aquaculture development areas
Farm located in approved aquaculture development areas
Farm located in approved catfish development areas
3. Effluent management:
- Evidence that sludge is not discharged directly into receiving waters or natural ecosystems1,2,3 - Farms shall monitor effluents to confirm compliance with effluent water quality criteria2. - The water used/ton of fish3 is <=5,000 m3.
- 25% of farms removed sludge to sludge basin; agriculture field (58%). - Waste water without treatment was drained (91% of farms). - Water use/crop was 5,301m3/ton.
- 38% of farms removed sludge to sludge basin; agriculture field (45%).- Waste water without treatment was drained (91% of farms). - Water use/crop was 5,903m3/ton.
- 50% of farms removed sludge to the sludge basin; agriculture field (45%). - Waste water without treatment was drained (97% of farms). - Water use/crop was 5,684m3/ton.
4. Microbial Sanitation: Waste/animal manure shall be prevented from contaminating pond waters2,3
Farms was collocated with family house, local communities
Farms was collocated with family house, local communities
Farms was separated to workers house, local communities
IV Food safety and chain-related issues 1. Drug and chemical use: Use veterinary
medicines/chemicals approved and not banned1,2,3 Banned antibiotics, drugs and other chemical compounds were not used.
Banned antibiotics, drugs and other chemical compounds were not used.
Banned antibiotics, drugs and other chemical compounds were not used.
2. Post larvae sources: Not allowance for use of wild-caught seed for grow out1,3
100% seed came from artificial hatcheries.
100% seed came from artificial hatcheries.
100% seed came from artificial hatcheries.
3. Traceability record-keeping: logbook shall be maintained for each of specified parameters for every production unit/every production cycle1,2,3
Record keeping was applied, but it was not detail and not regularly
Record keeping was applied, but it was not detail and not regularly
Record keeping was applied in detail and regularly, but it was not well organized
Source: (a) Information/data from Information/data from 1GlobalGAP (2011), 2GAA (2010), 3ASC (2010); (b) IFS survey (2011)
143
b). Main constraints to sustainable development
There were five important factors affecting the long-term development of catfish farming
perceived by farmers (Table 4.13). Factors related to environmental sustainability aspects
including fish disease, water quality and seed quality. Concerns on social responsibility
includes the quality of products and prices, and the capital/credit cost is the main factor for
economic viability.
Currently, 68% of catfish farms faced the disease, and 92% of them used various
therapeutic methods. Fish disease has tended to be increasingly complex with new types of
diseases emerging, so disease was perceived as the most important sustainability factor.
The responses should be improvement of the technical skills and use certified seed.
Water quality was also addressed as a sustainability factor, the water quality fluctuated and
tend to decline, because farms confirmed that the trend of chemical use was increased over
the last five years. Moreover, most farms applied water exchange methods daily, large
amount of water was exchanged directly per time, and the water quality cannot be fully
controlled. The farmers thought that bad water quality maybe come from nutrient
discharge by other industries such rice farming into the river, because rice is produced at
higher intensification levels (i.e. two or three rice-crops per year), and was cultivated on
1.9 million ha representing nearly 50% of the total natural MKD land (Sebesvari et al.
2012; GSO 2013).
Seed quality was perceived as an important factor driving sustainability, and the main
cause can be slow genetic improvement of the brood-stock population such as a low
number of brooders being added or changed at the hatcheries. At present, fish mortality
was still high in both nursing and grow-out stages, and this was related to poor seed
quality.
144
With the trend toward increasingly stringent requirements for product quality and food
safety assurance from import markets, the quality of current products needs to be improved
to meet the market demands and to expand the markets when creating trust with customers.
There were many catfish exporters, half of them had processing plants leading to unfair
competition among catfish exporters such dumping export price occur (e.g. reducing
exporting price from US$3.1 in 2007 to US$2.7 per kg of pangasius fillet in 2012) to gain
the buyers, and thus it led to unstable markets and fluctuation of farm gate price over time
(Fisheries Directorate 2013; VASEP 2014). Farmers suggested that the farm gate price
should be managed and improved by regulation on the ceiling price to ensure premium
price for catfish farms, if the fish price is not higher than the production cost in a long term
many farms will leave the catfish industry.
In addition, the operation of a catfish farm requires huge capital investment, and currently
a farm's capital is limited and dependent on credit, especially loans from State banks and
money lenders, but regulations about loans from the State bank in terms of time and
amount of the loan do not meet the minimum needs of the farms and it is also less
effective. The investment required for 1ha per production cycle is around US$300,000; but
the credit offered by State banks is usually a fraction of this amount because farmers
typically did not have adequate collateral required by banks for such size of land, which
were also typically only available on a short-term basis which does not meet the
requirements of the pangasius production cycle. To cope with the financial constraints,
many smaller scale farms got large amount from informal lenders with high interest rates
(e.g. relatives, money-lenders), and through delay payment terms of feed and/or vertical
linkage to processors (e.g. contracting farms).
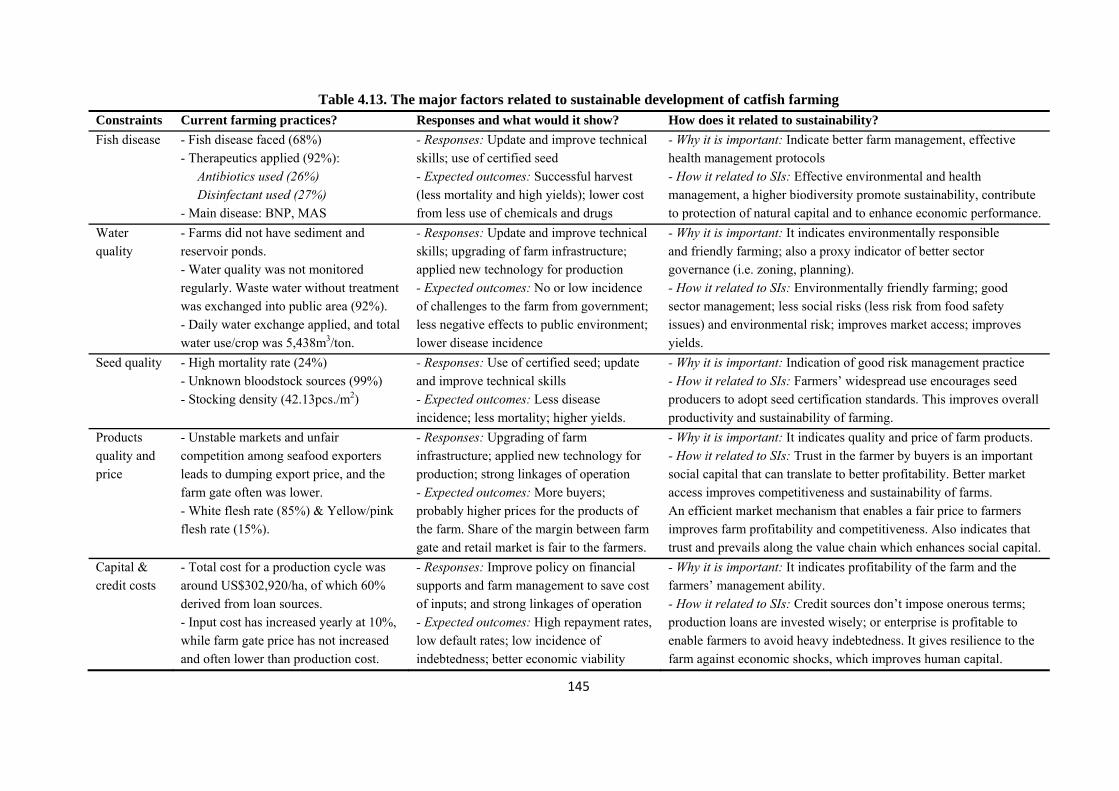
145
Table 4.13. The major factors related to sustainable development of catfish farming Constraints Current farming practices? Responses and what would it show? How does it related to sustainability?
Fish disease - Fish disease faced (68%) - Therapeutics applied (92%): Antibiotics used (26%) Disinfectant used (27%) - Main disease: BNP, MAS
- Responses: Update and improve technical skills; use of certified seed - Expected outcomes: Successful harvest (less mortality and high yields); lower cost from less use of chemicals and drugs
- Why it is important: Indicate better farm management, effective health management protocols - How it related to SIs: Effective environmental and health management, a higher biodiversity promote sustainability, contribute to protection of natural capital and to enhance economic performance.
Water quality
- Farms did not have sediment and reservoir ponds. - Water quality was not monitored regularly. Waste water without treatment was exchanged into public area (92%). - Daily water exchange applied, and total water use/crop was 5,438m3/ton.
- Responses: Update and improve technical skills; upgrading of farm infrastructure; applied new technology for production - Expected outcomes: No or low incidence of challenges to the farm from government; less negative effects to public environment; lower disease incidence
- Why it is important: It indicates environmentally responsible and friendly farming; also a proxy indicator of better sector governance (i.e. zoning, planning). - How it related to SIs: Environmentally friendly farming; good sector management; less social risks (less risk from food safety issues) and environmental risk; improves market access; improves yields.
Seed quality - High mortality rate (24%) - Unknown bloodstock sources (99%) - Stocking density (42.13pcs./m2)
- Responses: Use of certified seed; update and improve technical skills - Expected outcomes: Less disease incidence; less mortality; higher yields.
- Why it is important: Indication of good risk management practice - How it related to SIs: Farmers’ widespread use encourages seed producers to adopt seed certification standards. This improves overall productivity and sustainability of farming.
Products quality and price
- Unstable markets and unfair competition among seafood exporters leads to dumping export price, and the farm gate often was lower. - White flesh rate (85%) & Yellow/pink flesh rate (15%).
- Responses: Upgrading of farm infrastructure; applied new technology for production; strong linkages of operation - Expected outcomes: More buyers; probably higher prices for the products of the farm. Share of the margin between farm gate and retail market is fair to the farmers.
- Why it is important: It indicates quality and price of farm products. - How it related to SIs: Trust in the farmer by buyers is an important social capital that can translate to better profitability. Better market access improves competitiveness and sustainability of farms. An efficient market mechanism that enables a fair price to farmers improves farm profitability and competitiveness. Also indicates that trust and prevails along the value chain which enhances social capital.
Capital & credit costs
- Total cost for a production cycle was around US$302,920/ha, of which 60% derived from loan sources. - Input cost has increased yearly at 10%, while farm gate price has not increased and often lower than production cost.
- Responses: Improve policy on financial supports and farm management to save cost of inputs; and strong linkages of operation - Expected outcomes: High repayment rates, low default rates; low incidence of indebtedness; better economic viability
- Why it is important: It indicates profitability of the farm and the farmers’ management ability. - How it related to SIs: Credit sources don’t impose onerous terms; production loans are invested wisely; or enterprise is profitable to enable farmers to avoid heavy indebtedness. It gives resilience to the farm against economic shocks, which improves human capital.
146
4.4. Current shrimp farming practices
4.4.1. General information
a). Shrimp farms characteristics
Farm characteristics4: Most farms were established and owned by families, at a low
level of investment (LoLI: mixed mangrove-shrimp, improve extensive and rice-shrimp
rotation system) more than 15 years before this study. High level investment systems have
emerged more recently (HiLI: semi-/intensive system) following improvement in technical
skills and the introduction of new techniques in farming practices. Aquaculture Ltd.
companies have gradually formed and concentrated in high intensive farming areas in Soc
Trang, Bac Lieu and Kien Giang provinces. There were large differences in farm size and
surface water area between the farm systems (P<0.05). Intensive farms were often larger
farms with large farm-size in terms of water area, amount of required labour,
intensification level and high investment, followed by mixed mangrove -shrimp farms with
large land area, the other types of shrimp farming systems were characterised by relatively
small land holdings (around 1.5ha). Land holdings were mostly owned by families with a
small proportion of shrimp farms renting land based on 3-5 year contracts. Most shrimp
farms were operated by the families (LoLI) and aquaculture companies (HiLI) and they
were mainly individual farms and only 15% of intensive farms were run by salaried
managers.
Pond infrastructures: Not all shrimp farms had sediment ponds, and more than 40% of
HiLI shrimp farms had reservoir ponds. In particular, mixed mangrove-shrimp and
improved-extensive farms did not have reservoirs and sediment ponds, their ponds were
4LoLI and HiLI were classified by the level of intensification. The LoIL system is the improved-extensive shrimp system and open
system; while the HoLI is the semi-intensive/intensive shrimp system and closed system
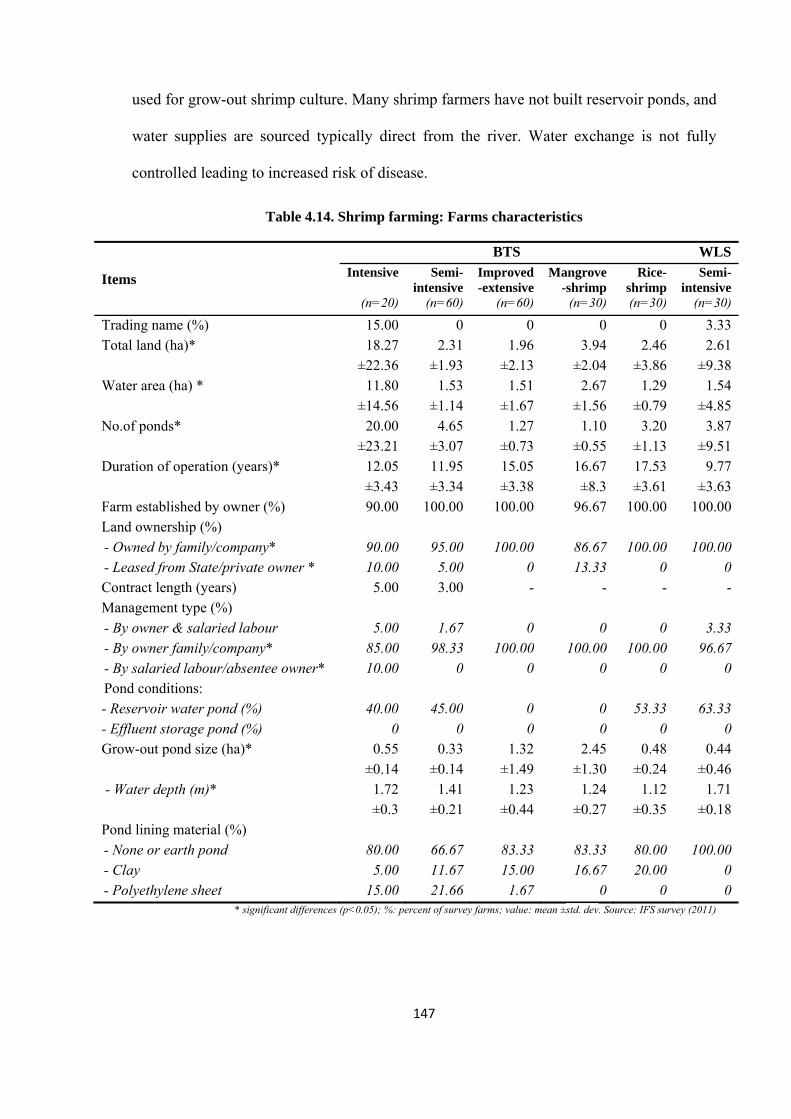
147
used for grow-out shrimp culture. Many shrimp farmers have not built reservoir ponds, and
water supplies are sourced typically direct from the river. Water exchange is not fully
controlled leading to increased risk of disease.
Table 4.14. Shrimp farming: Farms characteristics
Items
BTS WLSIntensive Semi-
intensive Improved -extensive
Mangrove -shrimp
Rice-shrimp
Semi-intensive
(n=20) (n=60) (n=60) (n=30) (n=30) (n=30)
Trading name (%) 15.00 0 0 0 0 3.33Total land (ha)* 18.27
±22.362.31
±1.931.96
±2.133.94
±2.04 2.46
±3.862.61
±9.38Water area (ha) * 11.80
±14.561.53
±1.141.51
±1.672.67
±1.56 1.29
±0.791.54
±4.85No.of ponds* 20.00
±23.214.65
±3.071.27
±0.731.10
±0.55 3.20
±1.133.87
±9.51Duration of operation (years)* 12.05
±3.4311.95 ±3.34
15.05 ±3.38
16.67 ±8.3
17.53 ±3.61
9.77 ±3.63
Farm established by owner (%) 90.00 100.00 100.00 96.67 100.00 100.00Land ownership (%)
- Owned by family/company* 90.00 95.00 100.00 86.67 100.00 100.00- Leased from State/private owner * 10.00 5.00 0 13.33 0 0Contract length (years) 5.00 3.00 - - - -Management type (%)
- By owner & salaried labour 5.00 1.67 0 0 0 3.33- By owner family/company* 85.00 98.33 100.00 100.00 100.00 96.67- By salaried labour/absentee owner* 10.00 0 0 0 0 0Pond conditions: - Reservoir water pond (%) 40.00 45.00 0 0 53.33 63.33- Effluent storage pond (%) 0 0 0 0 0 0Grow-out pond size (ha)* 0.55
±0.140.33
±0.141.32
±1.492.45
±1.30 0.48
±0.240.44
±0.46
- Water depth (m)* 1.72 ±0.3
1.41 ±0.21
1.23 ±0.44
1.24 ±0.27
1.12 ±0.35
1.71 ±0.18
Pond lining material (%)
- None or earth pond 80.00 66.67 83.33 83.33 80.00 100.00- Clay 5.00 11.67 15.00 16.67 20.00 0- Polyethylene sheet 15.00 21.66 1.67 0 0 0
* significant differences (p<0.05); %: percent of survey farms; value: mean ±std. dev. Source: IFS survey (2011)
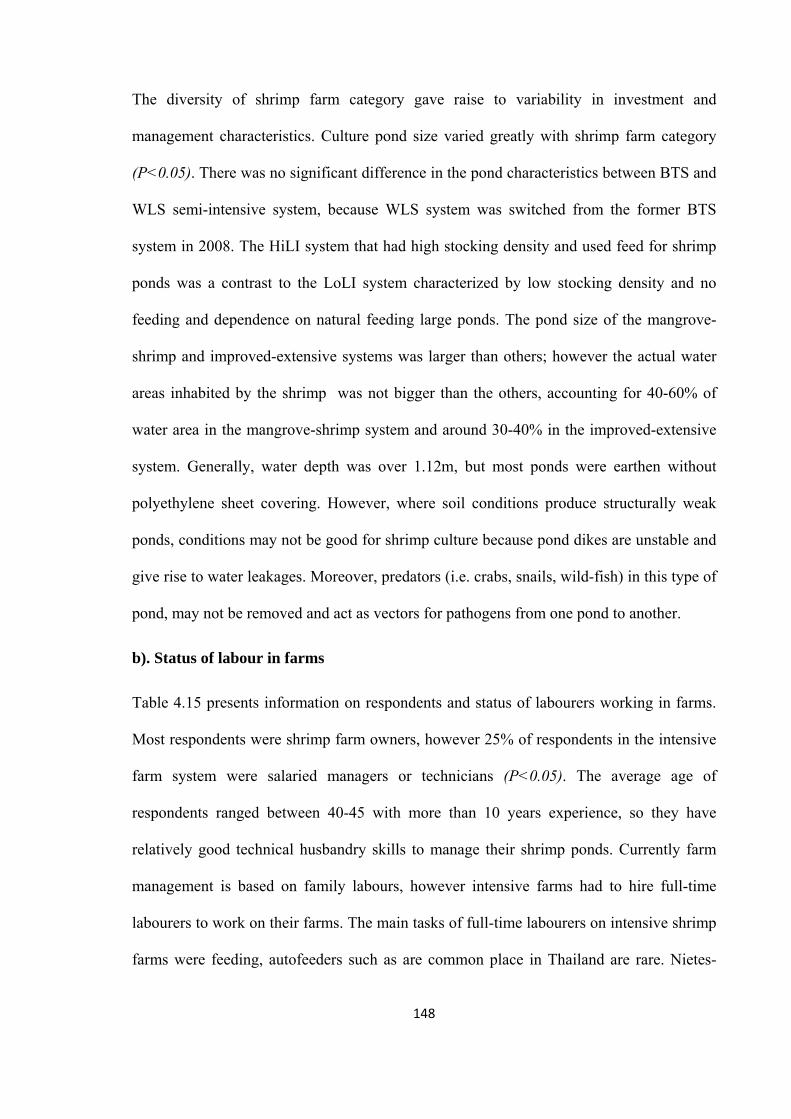
148
The diversity of shrimp farm category gave raise to variability in investment and
management characteristics. Culture pond size varied greatly with shrimp farm category
(P<0.05). There was no significant difference in the pond characteristics between BTS and
WLS semi-intensive system, because WLS system was switched from the former BTS
system in 2008. The HiLI system that had high stocking density and used feed for shrimp
ponds was a contrast to the LoLI system characterized by low stocking density and no
feeding and dependence on natural feeding large ponds. The pond size of the mangrove-
shrimp and improved-extensive systems was larger than others; however the actual water
areas inhabited by the shrimp was not bigger than the others, accounting for 40-60% of
water area in the mangrove-shrimp system and around 30-40% in the improved-extensive
system. Generally, water depth was over 1.12m, but most ponds were earthen without
polyethylene sheet covering. However, where soil conditions produce structurally weak
ponds, conditions may not be good for shrimp culture because pond dikes are unstable and
give rise to water leakages. Moreover, predators (i.e. crabs, snails, wild-fish) in this type of
pond, may not be removed and act as vectors for pathogens from one pond to another.
b). Status of labour in farms
Table 4.15 presents information on respondents and status of labourers working in farms.
Most respondents were shrimp farm owners, however 25% of respondents in the intensive
farm system were salaried managers or technicians (P<0.05). The average age of
respondents ranged between 40-45 with more than 10 years experience, so they have
relatively good technical husbandry skills to manage their shrimp ponds. Currently farm
management is based on family labours, however intensive farms had to hire full-time
labourers to work on their farms. The main tasks of full-time labourers on intensive shrimp
farms were feeding, autofeeders such as are common place in Thailand are rare. Nietes-
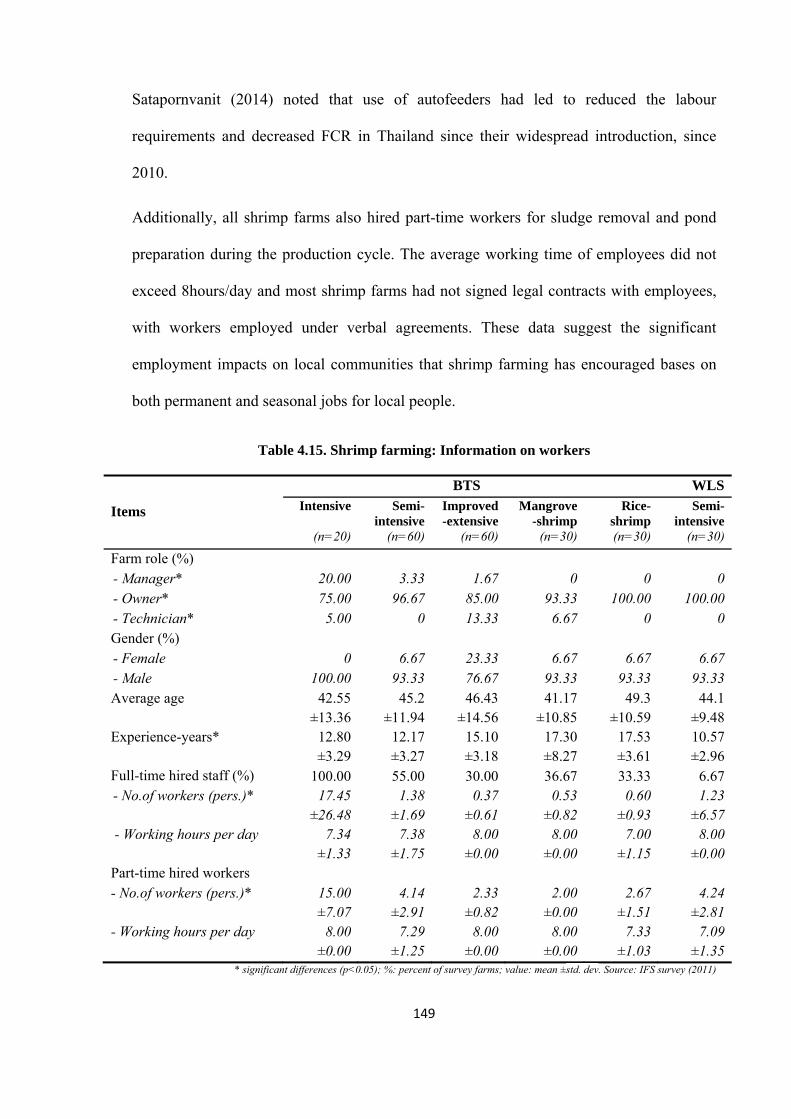
149
Satapornvanit (2014) noted that use of autofeeders had led to reduced the labour
requirements and decreased FCR in Thailand since their widespread introduction, since
2010.
Additionally, all shrimp farms also hired part-time workers for sludge removal and pond
preparation during the production cycle. The average working time of employees did not
exceed 8hours/day and most shrimp farms had not signed legal contracts with employees,
with workers employed under verbal agreements. These data suggest the significant
employment impacts on local communities that shrimp farming has encouraged bases on
both permanent and seasonal jobs for local people.
Table 4.15. Shrimp farming: Information on workers
Items
BTS WLSIntensive Semi-
intensive Improved-extensive
Mangrove -shrimp
Rice-shrimp
Semi-intensive
(n=20) (n=60) (n=60) (n=30) (n=30) (n=30)
Farm role (%) - Manager* 20.00 3.33 1.67 0 0 0- Owner* 75.00 96.67 85.00 93.33 100.00 100.00- Technician* 5.00 0 13.33 6.67 0 0Gender (%) - Female 0 6.67 23.33 6.67 6.67 6.67- Male 100.00 93.33 76.67 93.33 93.33 93.33Average age 42.55
±13.3645.2
±11.9446.43
±14.5641.17
±10.85 49.3
±10.59 44.1
±9.48Experience-years* 12.80
±3.2912.17 ±3.27
15.10 ±3.18
17.30 ±8.27
17.53 ±3.61
10.57 ±2.96
Full-time hired staff (%) 100.00 55.00 30.00 36.67 33.33 6.67- No.of workers (pers.)* 17.45
±26.481.38
±1.690.37
±0.610.53
±0.82 0.60
±0.93 1.23
±6.57 - Working hours per day 7.34
±1.337.38
±1.758.00
±0.008.00
±0.00 7.00
±1.15 8.00
±0.00Part-time hired workers - No.of workers (pers.)* 15.00
±7.074.14
±2.912.33
±0.822.00
±0.00 2.67
±1.51 4.24
±2.81- Working hours per day 8.00
±0.007.29
±1.258.00
±0.008.00
±0.00 7.33
±1.03 7.09
±1.35* significant differences (p<0.05); %: percent of survey farms; value: mean ±std. dev. Source: IFS survey (2011)
150
4.4.2. Technical aspects
a). Pond preparation and stocking
The HiLI shrimp farms paid more attention to pond preparation tasks with more than 80%
of farms carrying out water preparation such water storage and treatment before stocking;
while the proportion of the LoLI farms implementing such preparation was around 30%.
All shrimp post-larvae use were purchased from private hatcheries, but most farms were
not aware of the brood-stock source. The HiLI farms have implemented a PCR test for
post-larvae before buying and stocking, while the LoLI farms did not care about this.
Shrimp mortality rates were higher in the LoLI due to inconsistent seed quality, and seed
quality selection can be an important factor affecting production efficiency. Stocking
density varied significantly with system is high or low; the highest stocking density was
recorded in the semi-intensive system of white-legged shrimp while the improved-
extensive system showed the lowest stocking density.
The HiLI farms usually produced a single crop per year and the method of “simple batch
production” was applied mainly for stocking and harvesting. A production cycle of the
intensive system for black tiger shrimp ranged from 6 to 8 months in total, including two
months for pond preparation and the following months for shrimp growth. Moreover, each
local provincial government had a regulation on the single crop and stocking time for the
intensive and semi-intensive systems, because the fallow days between two crops could
help to reduce the risk in the offseason (i.e. rainy season), and to decrease the high
pressures on the pond exploitation. However, some larger farms used multiple batch
production with staggered stocking and harvesting. In contrast, LoLI farms typically
stocked at lower densities with intermittent restocking and harvest.
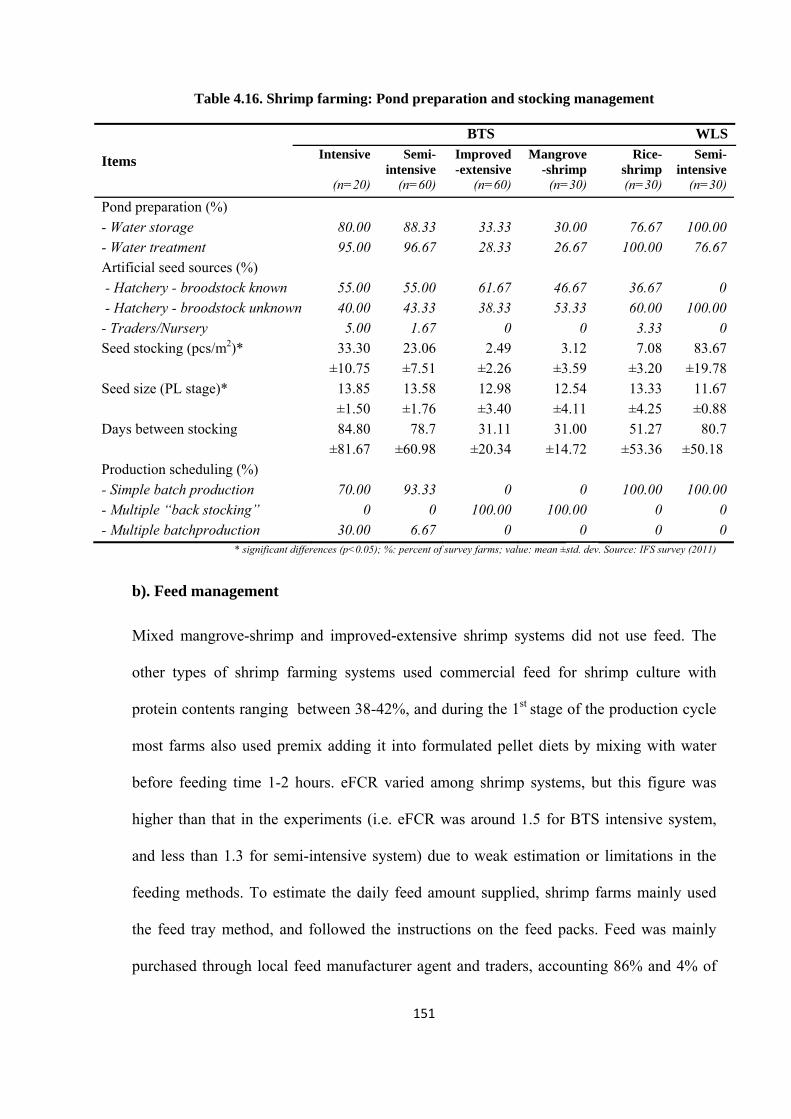
151
Table 4.16. Shrimp farming: Pond preparation and stocking management
Items
BTS WLSIntensive Semi-
intensive Improved -extensive
Mangrove -shrimp
Rice-shrimp
Semi-intensive
(n=20) (n=60) (n=60) (n=30) (n=30) (n=30)
Pond preparation (%)
- Water storage 80.00 88.33 33.33 30.00 76.67 100.00- Water treatment 95.00 96.67 28.33 26.67 100.00 76.67Artificial seed sources (%)
- Hatchery - broodstock known 55.00 55.00 61.67 46.67 36.67 0 - Hatchery - broodstock unknown 40.00 43.33 38.33 53.33 60.00 100.00- Traders/Nursery 5.00 1.67 0 0 3.33 0Seed stocking (pcs/m2)* 33.30
±10.7523.06 ±7.51
2.49 ±2.26
3.12 ±3.59
7.08 ±3.20
83.67 ±19.78
Seed size (PL stage)* 13.85 ±1.50
13.58 ±1.76
12.98 ±3.40
12.54 ±4.11
13.33 ±4.25
11.67 ±0.88
Days between stocking 84.80 ±81.67
78.7 ±60.98
31.11 ±20.34
31.00 ±14.72
51.27 ±53.36
80.7 ±50.18
Production scheduling (%)
- Simple batch production 70.00 93.33 0 0 100.00 100.00- Multiple “back stocking” 0 0 100.00 100.00 0 0- Multiple batchproduction 30.00 6.67 0 0 0 0
* significant differences (p<0.05); %: percent of survey farms; value: mean ±std. dev. Source: IFS survey (2011)
b). Feed management
Mixed mangrove-shrimp and improved-extensive shrimp systems did not use feed. The
other types of shrimp farming systems used commercial feed for shrimp culture with
protein contents ranging between 38-42%, and during the 1st stage of the production cycle
most farms also used premix adding it into formulated pellet diets by mixing with water
before feeding time 1-2 hours. eFCR varied among shrimp systems, but this figure was
higher than that in the experiments (i.e. eFCR was around 1.5 for BTS intensive system,
and less than 1.3 for semi-intensive system) due to weak estimation or limitations in the
feeding methods. To estimate the daily feed amount supplied, shrimp farms mainly used
the feed tray method, and followed the instructions on the feed packs. Feed was mainly
purchased through local feed manufacturer agent and traders, accounting 86% and 4% of
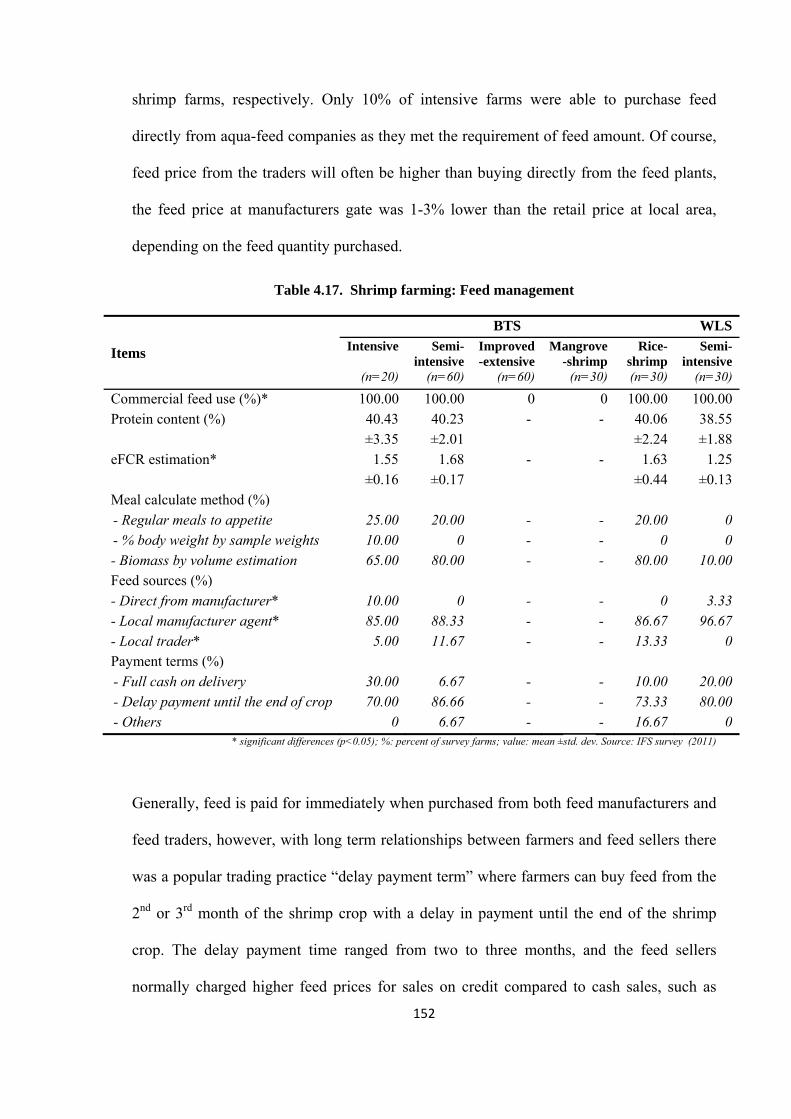
152
shrimp farms, respectively. Only 10% of intensive farms were able to purchase feed
directly from aqua-feed companies as they met the requirement of feed amount. Of course,
feed price from the traders will often be higher than buying directly from the feed plants,
the feed price at manufacturers gate was 1-3% lower than the retail price at local area,
depending on the feed quantity purchased.
Table 4.17. Shrimp farming: Feed management
Items
BTS WLSIntensive Semi-
intensive Improved -extensive
Mangrove -shrimp
Rice-shrimp
Semi-intensive
(n=20) (n=60) (n=60) (n=30) (n=30) (n=30)
Commercial feed use (%)* 100.00 100.00 0 0 100.00 100.00Protein content (%) 40.43
±3.3540.23 ±2.01
- - 40.06 ±2.24
38.55 ±1.88
eFCR estimation* 1.55 ±0.16
1.68 ±0.17
- - 1.63 ±0.44
1.25 ±0.13
Meal calculate method (%)
- Regular meals to appetite 25.00 20.00 - - 20.00 0- % body weight by sample weights 10.00 0 - - 0 0- Biomass by volume estimation 65.00 80.00 - - 80.00 10.00Feed sources (%)
- Direct from manufacturer* 10.00 0 - - 0 3.33- Local manufacturer agent* 85.00 88.33 - - 86.67 96.67- Local trader* 5.00 11.67 - - 13.33 0Payment terms (%)
- Full cash on delivery 30.00 6.67 - - 10.00 20.00- Delay payment until the end of crop 70.00 86.66 - - 73.33 80.00- Others 0 6.67 - - 16.67 0
* significant differences (p<0.05); %: percent of survey farms; value: mean ±std. dev. Source: IFS survey (2011)
Generally, feed is paid for immediately when purchased from both feed manufacturers and
feed traders, however, with long term relationships between farmers and feed sellers there
was a popular trading practice “delay payment term” where farmers can buy feed from the
2nd or 3rd month of the shrimp crop with a delay in payment until the end of the shrimp
crop. The delay payment time ranged from two to three months, and the feed sellers
normally charged higher feed prices for sales on credit compared to cash sales, such as

153
total cost for 20kg per feed pack was 420,000VND (≈US$20.19) for delay payment terms
compared to 400,000VND (≈US$19.23) by cash on delivery (i.e. 5% higher than normal
price). It reflects that feed sellers want to avoid trading risk, because shrimp farms can
profit from this stage of the production cycle. Tran et al. (2013) pointed out that making
delayed payment term from the third culture month reduced the risk of losing money for
feed sellers as the crop could be harvested early if shrimp disease occurs; however, larger
and successful farmers were more able to access such terms of purchase than small-scale
farmers.
c). Water management
Shrimp farms are often located in coastal areas and estuaries, so the water source used for
shrimp ponds comes mainly from the river-mouth, coastal canals, and a few farms get
water from primary and secondary canals. Around 50% of shrimp farms conducted water
preparation in reservoir ponds and/or in grow-out ponds before stocking, and the time
taken for water preparation ranged from 7-17 days. In a particular case, the mixed
mangrove-shrimp and improved-extensive system put water directly into shrimp ponds
with PLs stocked 2-3 days later. Most farms did not have sediment ponds, and only 35% of
intensive farms had drainage canals.
Currently shrimp farms have applied limited water exchange methods for shrimp ponds.
LoLI farms mainly applied the “partial drainage & water replacement” method; while the
“top-up water losses only” method was mostly applied by the HiLI farms (P<0.05). The
main reason was due to fluctuation of environmental conditions and risks from disease
outbreaks, so most farms did not want to use water directly from rivers to avoid disease
risk. There was a significant difference in the frequency of water exchange between shrimp
farming systems (P<0.05), the water exchange of the mixed mangrove-shrimp and the
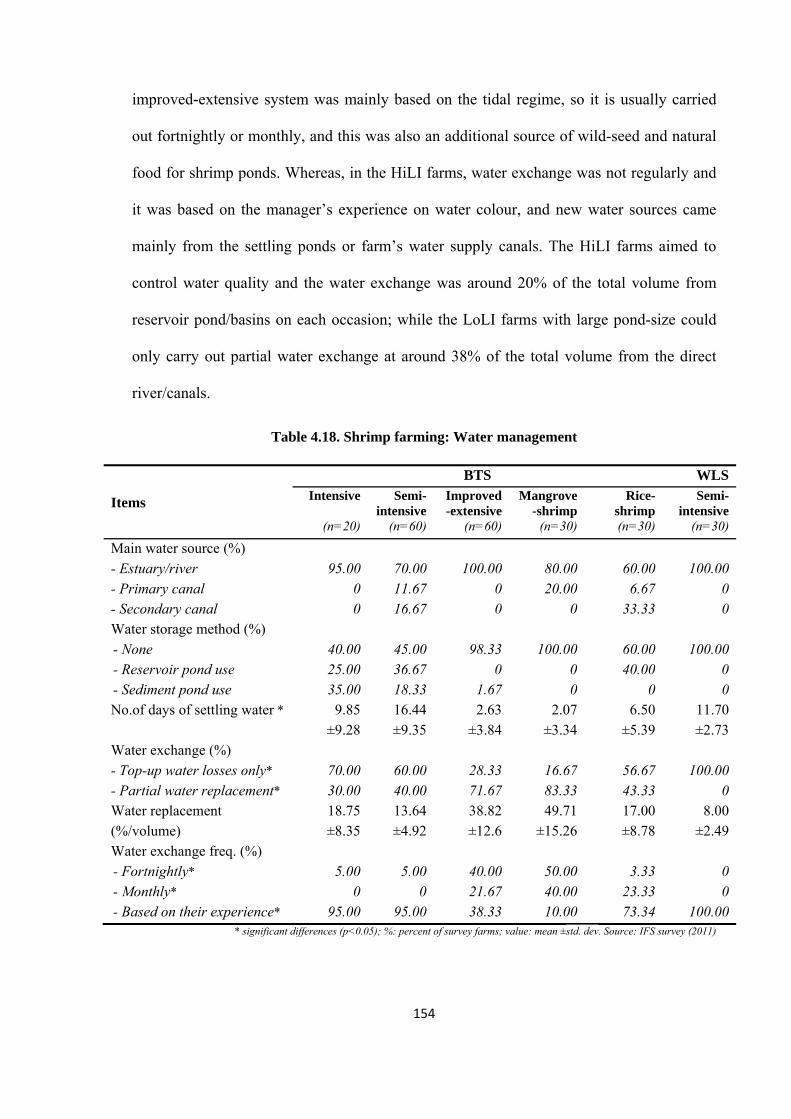
154
improved-extensive system was mainly based on the tidal regime, so it is usually carried
out fortnightly or monthly, and this was also an additional source of wild-seed and natural
food for shrimp ponds. Whereas, in the HiLI farms, water exchange was not regularly and
it was based on the manager’s experience on water colour, and new water sources came
mainly from the settling ponds or farm’s water supply canals. The HiLI farms aimed to
control water quality and the water exchange was around 20% of the total volume from
reservoir pond/basins on each occasion; while the LoLI farms with large pond-size could
only carry out partial water exchange at around 38% of the total volume from the direct
river/canals.
Table 4.18. Shrimp farming: Water management
Items
BTS WLSIntensive Semi-
intensive Improved -extensive
Mangrove -shrimp
Rice-shrimp
Semi-intensive
(n=20) (n=60) (n=60) (n=30) (n=30) (n=30)
Main water source (%)
- Estuary/river 95.00 70.00 100.00 80.00 60.00 100.00- Primary canal 0 11.67 0 20.00 6.67 0- Secondary canal 0 16.67 0 0 33.33 0Water storage method (%)
- None 40.00 45.00 98.33 100.00 60.00 100.00- Reservoir pond use 25.00 36.67 0 0 40.00 0- Sediment pond use 35.00 18.33 1.67 0 0 0No.of days of settling water * 9.85
±9.2816.44 ±9.35
2.63 ±3.84
2.07 ±3.34
6.50 ±5.39
11.70 ±2.73
Water exchange (%)
- Top-up water losses only* 70.00 60.00 28.33 16.67 56.67 100.00- Partial water replacement* 30.00 40.00 71.67 83.33 43.33 0Water replacement (%/volume)
18.75 ±8.35
13.64 ±4.92
38.82 ±12.6
49.71 ±15.26
17.00 ±8.78
8.00 ±2.49
Water exchange freq. (%)
- Fortnightly* 5.00 5.00 40.00 50.00 3.33 0- Monthly* 0 0 21.67 40.00 23.33 0- Based on their experience* 95.00 95.00 38.33 10.00 73.34 100.00
* significant differences (p<0.05); %: percent of survey farms; value: mean ±std. dev. Source: IFS survey (2011)
155
d). Effluent management
The water release using the gravity drainage method was mainly applied in the mixed
mangrove-shrimp and improved-extensive shrimp system. Other shrimp systems used a
method of pumping or both methods were applied. Most farms designed their own
supplying/drainage system to facilitate water exchange. Most farms reported that waste-
water is not treated and is drained directly into rivers or canals that are the same as the
supply source. A small number of shrimp farms reused effluent from shrimp ponds to
culture other species in the same pond after the shrimp have been harvested, or waste water
was partially reused for the next crop because the water could not be fully drained in the
large pond-size in mixed mangrove-shrimp and improved-extensive systems. Currently,
there is no agreement concerning water effluent management from the local community.
Sludge from shrimp ponds was mostly removed to pond dykes after each harvest. Although
the un-fed mangrove-shrimp and improved-extensive systems resulted in much lower
volumes, sludge that accumulated from water exchange was removed annually. A few
shrimp farms had sediment ponds or basins, or several farms had small drainage canals and
empty land for sludge storage. There was no difference found in terms of the sludge
management between BTS intensive and semi-intensive systems. The key differences in
practice between BTS and WLS semi-intensive should be type of sludge disposal, whereas
BTL farms removed sludge to the pond dyke, sediment basins were commonly used in
WLS farms. However, the storage capacity of the areas was limited and sludge still
indirectly went to the rivers. Discharge of untreated waste water and sludge, especially
during shrimp disease outbreaks, may be a cause of the spread of diseases that affect farm
production efficiency. Shrimp diseases were often caused by polluted water in the pond
itself, and the bad water quality such as high Biological Oxygen Demand (BOD) and
Chemical Oxygen Demand (COD) concentrations is a favorable condition for pathogenic
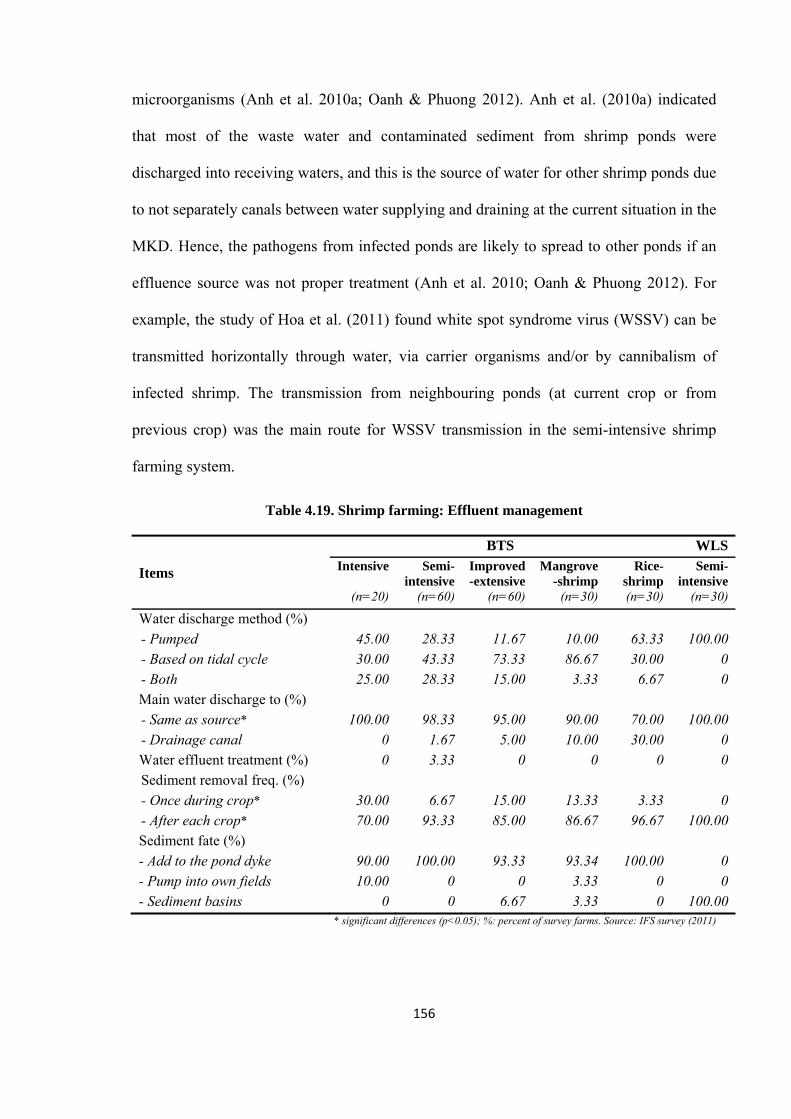
156
microorganisms (Anh et al. 2010a; Oanh & Phuong 2012). Anh et al. (2010a) indicated
that most of the waste water and contaminated sediment from shrimp ponds were
discharged into receiving waters, and this is the source of water for other shrimp ponds due
to not separately canals between water supplying and draining at the current situation in the
MKD. Hence, the pathogens from infected ponds are likely to spread to other ponds if an
effluence source was not proper treatment (Anh et al. 2010; Oanh & Phuong 2012). For
example, the study of Hoa et al. (2011) found white spot syndrome virus (WSSV) can be
transmitted horizontally through water, via carrier organisms and/or by cannibalism of
infected shrimp. The transmission from neighbouring ponds (at current crop or from
previous crop) was the main route for WSSV transmission in the semi-intensive shrimp
farming system.
Table 4.19. Shrimp farming: Effluent management
Items
BTS WLSIntensive Semi-
intensive Improved -extensive
Mangrove -shrimp
Rice-shrimp
Semi-intensive
(n=20) (n=60) (n=60) (n=30) (n=30) (n=30)
Water discharge method (%)
- Pumped 45.00 28.33 11.67 10.00 63.33 100.00- Based on tidal cycle 30.00 43.33 73.33 86.67 30.00 0- Both 25.00 28.33 15.00 3.33 6.67 0Main water discharge to (%) - Same as source* 100.00 98.33 95.00 90.00 70.00 100.00- Drainage canal 0 1.67 5.00 10.00 30.00 0Water effluent treatment (%) 0 3.33 0 0 0 0Sediment removal freq. (%)
- Once during crop* 30.00 6.67 15.00 13.33 3.33 0- After each crop* 70.00 93.33 85.00 86.67 96.67 100.00Sediment fate (%)
- Add to the pond dyke 90.00 100.00 93.33 93.34 100.00 0- Pump into own fields 10.00 0 0 3.33 0 0- Sediment basins 0 0 6.67 3.33 0 100.00
* significant differences (p<0.05); %: percent of survey farms. Source: IFS survey (2011)
157
e). Shrimp health management
Type of shrimp disease: Most farms faced the problem of shrimp mortality during the
production cycle, thus better management skills can help to reduce the rate of shrimp
mortality. Around 55% of farms in the semi-/intensive system confirmed that their shrimp
pond faced losses over the production cycle, while the rate for white-legged shrimp system
was only 37% of farms. The rice-shrimp rotation system shows better production
efficiency, a small number of farms suffered shrimp mortality (i.e. partial loss) throughout
the production cycle. There were several causes of shrimp loss, with the main cause
coming from shrimp disease problems (>75%), followed by extreme weather and seed
quality. Most shrimp farms faced shrimp disease problems affecting shrimp production;
however, around 65% of intensive farms faced shrimp disease and this ratio was the lower
than other types of farm due to better farm management. At the time of the survey, three
main shrimp diseases were common White Spot Syndrome Virus (WSSV), followed by the
Yellow Head Virus (YHV) and Vibrosis. Although the HiLI farms screened for pathogens
of seed source, they still faced shrimp disease. The reason for this could be poor water
quality.
Shrimp disease management: The HiLI farms used more disease diagnostic services
(≥75% of the HiLI fams) compared to the LoLI farms (≤30%). The high stocking density
and investment often required more effort and technical skill, therefore the HiLI farms
were more interested in shrimp health care compared to the LoLI farms with low stocking
density and no feeding. There is also a clear difference on the type of diagnostic service
used among the shrimp systems. The LoLI farms had to learn prevention and treatment of
shrimp diseases from technical training courses while the HiLI farms focused on the use of
professional diagnostic services, followed by support for disease diagnosis from
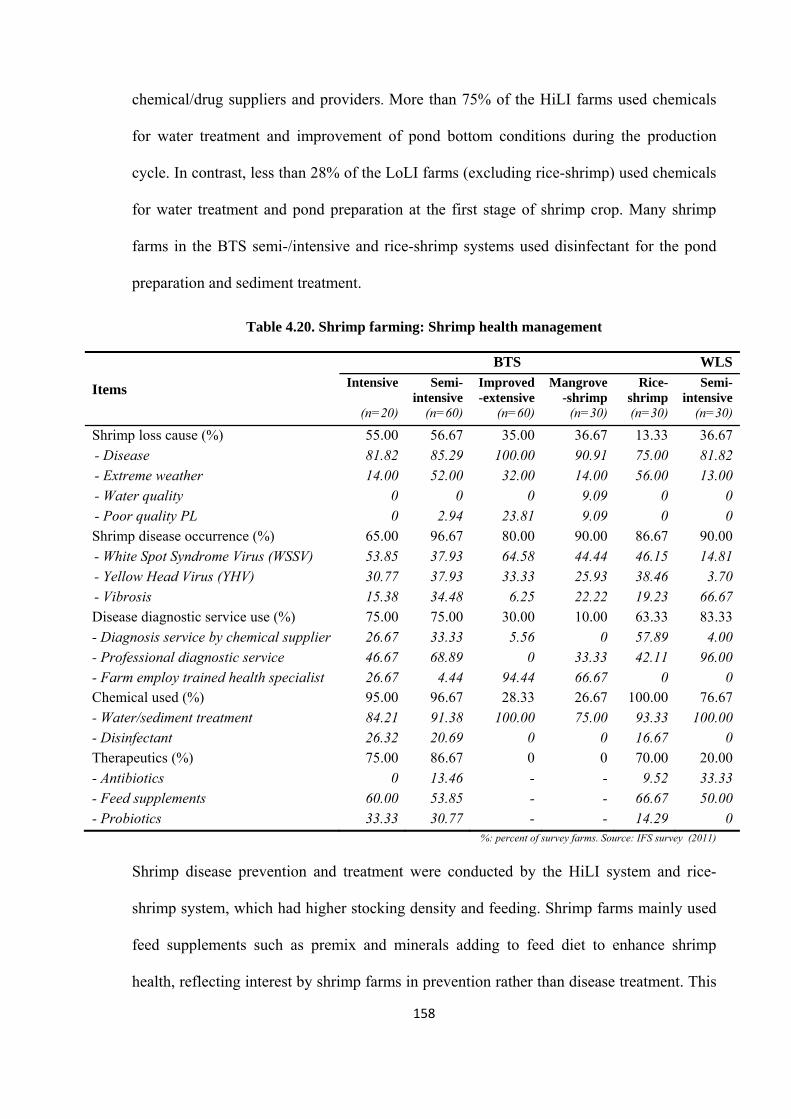
158
chemical/drug suppliers and providers. More than 75% of the HiLI farms used chemicals
for water treatment and improvement of pond bottom conditions during the production
cycle. In contrast, less than 28% of the LoLI farms (excluding rice-shrimp) used chemicals
for water treatment and pond preparation at the first stage of shrimp crop. Many shrimp
farms in the BTS semi-/intensive and rice-shrimp systems used disinfectant for the pond
preparation and sediment treatment.
Table 4.20. Shrimp farming: Shrimp health management
Items
BTS WLSIntensive Semi-
intensive Improved -extensive
Mangrove -shrimp
Rice-shrimp
Semi-intensive
(n=20) (n=60) (n=60) (n=30) (n=30) (n=30)
Shrimp loss cause (%) 55.00 56.67 35.00 36.67 13.33 36.67
- Disease 81.82 85.29 100.00 90.91 75.00 81.82- Extreme weather 14.00 52.00 32.00 14.00 56.00 13.00- Water quality 0 0 0 9.09 0 0- Poor quality PL 0 2.94 23.81 9.09 0 0Shrimp disease occurrence (%) 65.00 96.67 80.00 90.00 86.67 90.00
- White Spot Syndrome Virus (WSSV) 53.85 37.93 64.58 44.44 46.15 14.81- Yellow Head Virus (YHV) 30.77 37.93 33.33 25.93 38.46 3.70- Vibrosis 15.38 34.48 6.25 22.22 19.23 66.67Disease diagnostic service use (%) 75.00 75.00 30.00 10.00 63.33 83.33
- Diagnosis service by chemical supplier 26.67 33.33 5.56 0 57.89 4.00- Professional diagnostic service 46.67 68.89 0 33.33 42.11 96.00- Farm employ trained health specialist 26.67 4.44 94.44 66.67 0 0Chemical used (%) 95.00 96.67 28.33 26.67 100.00 76.67
- Water/sediment treatment 84.21 91.38 100.00 75.00 93.33 100.00- Disinfectant 26.32 20.69 0 0 16.67 0Therapeutics (%) 75.00 86.67 0 0 70.00 20.00
- Antibiotics 0 13.46 - - 9.52 33.33- Feed supplements 60.00 53.85 - - 66.67 50.00- Probiotics 33.33 30.77 - - 14.29 0
%: percent of survey farms. Source: IFS survey (2011)
Shrimp disease prevention and treatment were conducted by the HiLI system and rice-
shrimp system, which had higher stocking density and feeding. Shrimp farms mainly used
feed supplements such as premix and minerals adding to feed diet to enhance shrimp
health, reflecting interest by shrimp farms in prevention rather than disease treatment. This
159
study also found that 33% of WLS farms used antibiotics for shrimp disease prevention
and treatment, followed by the rice-shrimp (10%) and the BTS semi-intensive system
(13%). There was no case of BTS intensive system using antibiotics. This reflected a trend
towards reduced use of antibiotics by the sector and increasing use of feed supplements
and probiotics. Rico et al. (2013) found that semi-intensive and intensive shrimp farms in
China, Thailand and Vietnam showed a decreased use of antibiotic treatments. It also
shows a relatively high prevalence of probiotics used on the Vietnamese and Thailand
shrimp farms.
4.4.3. Economic aspects
a). Harvesting management
The HiLI farms harvested shrimp after 4-5 months of a production cycle for black tiger
shrimp culture and 3-4 months for white-legged shrimp farming; while the LoLI farms
could harvest shrimp after three months and then carry out monthly stocking and
harvesting for the remaining months. Due to better technical skills and management, the
HiLI farms get high shrimp survival rate at harvest time compared to that in the LoLI
farms (P<0.05). There were also differences in the harvested shrimp sizes; with 20-30
pieces/kg in the LoLI system and 30-40 pieces/kg in the HiLI system of black tiger shrimp
and 70-100 pieces/kg in the white-legged shrimp system. Different intensification levels
lead to different shrimp yields (P<0.05) and the shrimp yield tended to increase from the
LoLI to the HiLI system. Improved-extensive and mixed mangrove-shrimp produced less
than 300kg/ha, rice-shrimp rotation reached around 1tonnes/ha, while the HiLI farms
achieved yields of more than 3tonnes/ha.
Shrimp was often harvested and sold to the collectors or wholesalers, and 55% of intensive
farms sold their shrimp production directly to the processors. Mixed mangrove-shrimp and
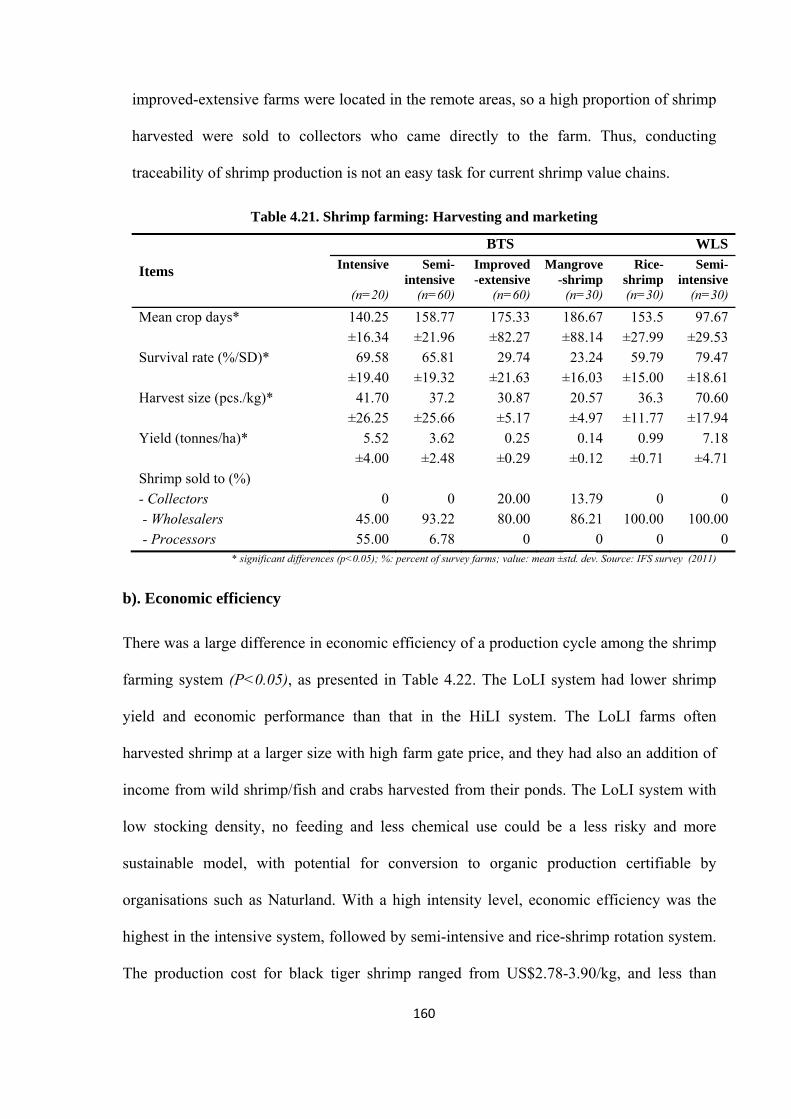
160
improved-extensive farms were located in the remote areas, so a high proportion of shrimp
harvested were sold to collectors who came directly to the farm. Thus, conducting
traceability of shrimp production is not an easy task for current shrimp value chains.
Table 4.21. Shrimp farming: Harvesting and marketing
Items
BTS WLSIntensive Semi-
intensive Improved -extensive
Mangrove -shrimp
Rice-shrimp
Semi-intensive
(n=20) (n=60) (n=60) (n=30) (n=30) (n=30)
Mean crop days* 140.25 ±16.34
158.77 ±21.96
175.33 ±82.27
186.67 ±88.14
153.5 ±27.99
97.67 ±29.53
Survival rate (%/SD)* 69.58 ±19.40
65.81 ±19.32
29.74 ±21.63
23.24 ±16.03
59.79 ±15.00
79.47 ±18.61
Harvest size (pcs./kg)* 41.70 ±26.25
37.2 ±25.66
30.87 ±5.17
20.57 ±4.97
36.3 ±11.77
70.60 ±17.94
Yield (tonnes/ha)* 5.52 ±4.00
3.62 ±2.48
0.25 ±0.29
0.14 ±0.12
0.99 ±0.71
7.18 ±4.71
Shrimp sold to (%)
- Collectors 0 0 20.00 13.79 0 0
- Wholesalers 45.00 93.22 80.00 86.21 100.00 100.00
- Processors 55.00 6.78 0 0 0 0* significant differences (p<0.05); %: percent of survey farms; value: mean ±std. dev. Source: IFS survey (2011)
b). Economic efficiency
There was a large difference in economic efficiency of a production cycle among the shrimp
farming system (P<0.05), as presented in Table 4.22. The LoLI system had lower shrimp
yield and economic performance than that in the HiLI system. The LoLI farms often
harvested shrimp at a larger size with high farm gate price, and they had also an addition of
income from wild shrimp/fish and crabs harvested from their ponds. The LoLI system with
low stocking density, no feeding and less chemical use could be a less risky and more
sustainable model, with potential for conversion to organic production certifiable by
organisations such as Naturland. With a high intensity level, economic efficiency was the
highest in the intensive system, followed by semi-intensive and rice-shrimp rotation system.
The production cost for black tiger shrimp ranged from US$2.78-3.90/kg, and less than
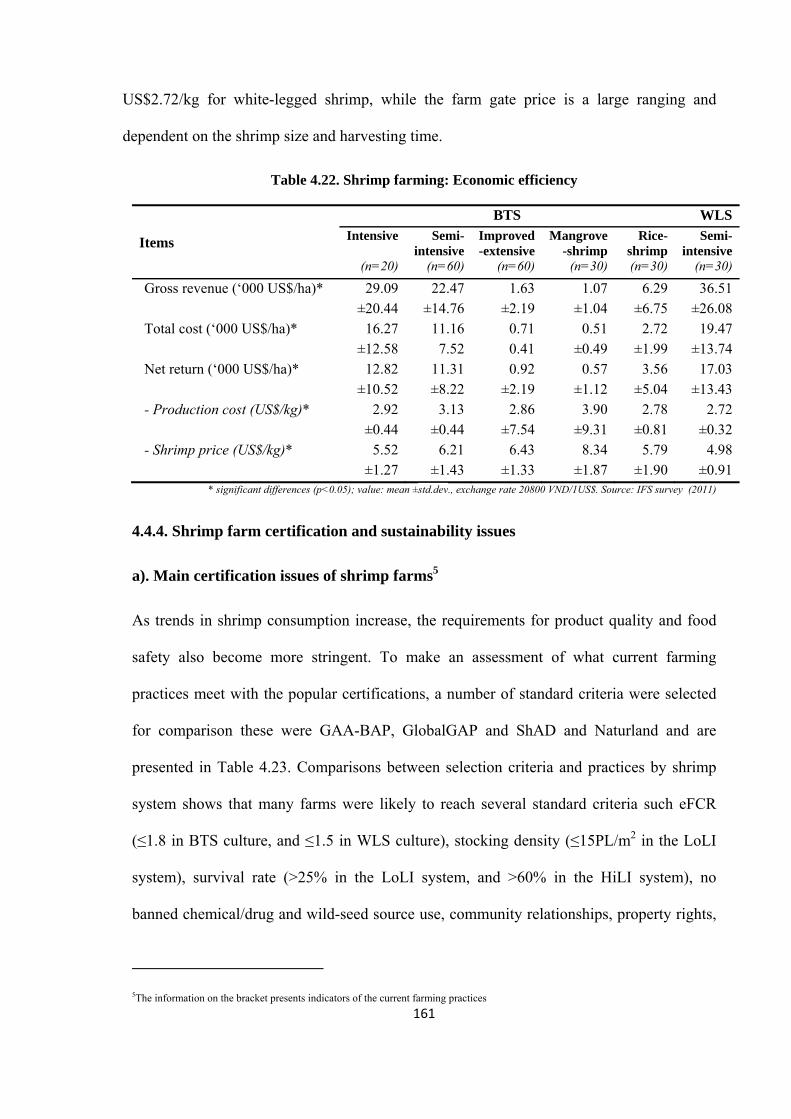
161
US$2.72/kg for white-legged shrimp, while the farm gate price is a large ranging and
dependent on the shrimp size and harvesting time.
Table 4.22. Shrimp farming: Economic efficiency
Items
BTS WLSIntensive Semi-
intensive Improved -extensive
Mangrove -shrimp
Rice-shrimp
Semi-intensive
(n=20) (n=60) (n=60) (n=30) (n=30) (n=30)
Gross revenue (‘000 US$/ha)* 29.09 ±20.44
22.47 ±14.76
1.63 ±2.19
1.07 ±1.04
6.29 ±6.75
36.51 ±26.08
Total cost (‘000 US$/ha)* 16.27 ±12.58
11.16 7.52
0.71 0.41
0.51 ±0.49
2.72 ±1.99
19.47 ±13.74
Net return (‘000 US$/ha)* 12.82 ±10.52
11.31 ±8.22
0.92 ±2.19
0.57 ±1.12
3.56 ±5.04
17.03 ±13.43
- Production cost (US$/kg)* 2.92 ±0.44
3.13 ±0.44
2.86 ±7.54
3.90 ±9.31
2.78 ±0.81
2.72 ±0.32
- Shrimp price (US$/kg)* 5.52 ±1.27
6.21 ±1.43
6.43 ±1.33
8.34 ±1.87
5.79 ±1.90
4.98 ±0.91
* significant differences (p<0.05); value: mean ±std.dev., exchange rate 20800 VND/1US$. Source: IFS survey (2011)
4.4.4. Shrimp farm certification and sustainability issues
a). Main certification issues of shrimp farms5
As trends in shrimp consumption increase, the requirements for product quality and food
safety also become more stringent. To make an assessment of what current farming
practices meet with the popular certifications, a number of standard criteria were selected
for comparison these were GAA-BAP, GlobalGAP and ShAD and Naturland and are
presented in Table 4.23. Comparisons between selection criteria and practices by shrimp
system shows that many farms were likely to reach several standard criteria such eFCR
(≤1.8 in BTS culture, and ≤1.5 in WLS culture), stocking density (≤15PL/m2 in the LoLI
system), survival rate (>25% in the LoLI system, and >60% in the HiLI system), no
banned chemical/drug and wild-seed source use, community relationships, property rights,
5The information on the bracket presents indicators of the current farming practices
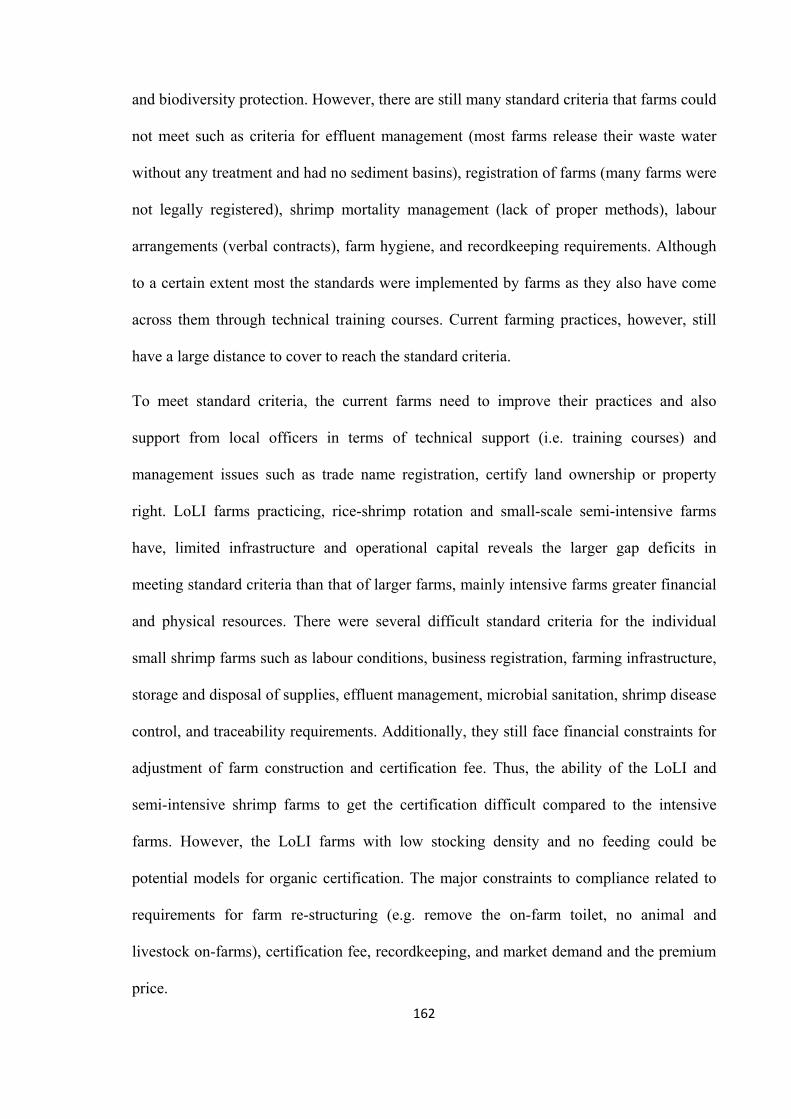
162
and biodiversity protection. However, there are still many standard criteria that farms could
not meet such as criteria for effluent management (most farms release their waste water
without any treatment and had no sediment basins), registration of farms (many farms were
not legally registered), shrimp mortality management (lack of proper methods), labour
arrangements (verbal contracts), farm hygiene, and recordkeeping requirements. Although
to a certain extent most the standards were implemented by farms as they also have come
across them through technical training courses. Current farming practices, however, still
have a large distance to cover to reach the standard criteria.
To meet standard criteria, the current farms need to improve their practices and also
support from local officers in terms of technical support (i.e. training courses) and
management issues such as trade name registration, certify land ownership or property
right. LoLI farms practicing, rice-shrimp rotation and small-scale semi-intensive farms
have, limited infrastructure and operational capital reveals the larger gap deficits in
meeting standard criteria than that of larger farms, mainly intensive farms greater financial
and physical resources. There were several difficult standard criteria for the individual
small shrimp farms such as labour conditions, business registration, farming infrastructure,
storage and disposal of supplies, effluent management, microbial sanitation, shrimp disease
control, and traceability requirements. Additionally, they still face financial constraints for
adjustment of farm construction and certification fee. Thus, the ability of the LoLI and
semi-intensive shrimp farms to get the certification difficult compared to the intensive
farms. However, the LoLI farms with low stocking density and no feeding could be
potential models for organic certification. The major constraints to compliance related to
requirements for farm re-structuring (e.g. remove the on-farm toilet, no animal and
livestock on-farms), certification fee, recordkeeping, and market demand and the premium
price.
163
Table 4.23. Comparison of selected standard criteria and current shrimp farming practices
Standards category and criteriaa
Current farming practicesb
Intensive (n=20)
Semi-intensive (n=60)
Improved-extensive (n=60)
Mixed mangrove-shrimp (n=30)
Rice-shrimp rotation (n=30)
White-legged shrimp (n=30)
I Aquaculture production guidelines
1. Selection of site: Farms registered as required by national legislations1
85% of farms not yet registered
All farms not yet registered
All farms not yet registered
All farms not yet registered
All farms not yet registered
All farms not yet registered
2. Feeding practices: eFCR2,3 is <=1.5 for L.vannamei and <=1.8 for P.monodon
Commercial feed use with eFCR 1.55
Commercial feed use with eFCR 1.68
No feeding No feeding Commercial feed use with eFCR 1.63
Commercial feed use with eFCR 1.25
3. Shrimp health and welfare:
- Employees shall be trained to provide appropriate levels of husbandry1,2,3 - Survival rate3 (SR):unfed pond>25%;
fed/non-permanently aerated pond >45%;fed/permanently aerated pond >60%. - Stocking density4 (SD) <=15 PL/m2/year and yield <=1.6tons/ha
- Staffs were trained on technical skills. - SR: 70% at harvest - SD: 33.30PL/m2 Yield: 5.52tons/ha
- Staffs were trained on technical skills. - SR: 66% at harvest - SD: 23.06PL/m2
Yield: 3.62tons/ha
- Staffs were trained on technical skills. - SR: 30% at harvest - SD: 2.49PL/m2
Yield: 0.25tons/ha
- Staffs were trained on technical skills. - SR: 23% at harvest . - SD: 3.12PL/m2
Yield: 0.14tons/ha
- Staffs were trained on technical skills. - SR: 60% at harvest - SD: 7.08PL/m2
Yield: 0.99tons/ha
- Staffs were trained on technical skills. - SR: 80% at harvest - SD: 83.67PL/m2
Yield: 7.18tons/ha
II Social and legal issues
1. Property right and regulatory compliance: Farms shall comply with national laws and environmental regulations1,2,3
Land owned by farms (90%) Farm managed by owner (85%)
Land owned by farms (95%) Farm managed by owner (98%)
Land owned by farms (100%) Farm managed by owner (100%)
Land owned by farms (87%) Farm managed by owner (100%)
Land owned by farms (100%) Farm managed by owner (100%)
Land owned by farms (100%) Farm managed by owner (97%)
2. Community relations: Farms shall not block access to natural resources used by local communities2,3
Open access to use the same water sources.
Open access to use the same water sources.
Open access to use the same water sources.
Open access to use the same water sources.
Open access to use the same water sources.
Open access to use the same water sources.
3. Forced labour: Compliance with labour laws in the country where shrimp is produced. - Child labour: age of workers >=181,2,3
All farms hired labours, 15% signed contract with labours. - Non child labour
55% of farms hired labours, with verbal agreements only. - Non child labour
30% of farms hired labours, with verbal agreements only. - Non child labour use
36% of farms hired labours, with verbal agreements only. - Non child labour
33% of farms hired labours, with verbal agreements only. - Non child labour
7% of farms hired labours, with verbal agreements only. - Non child labour
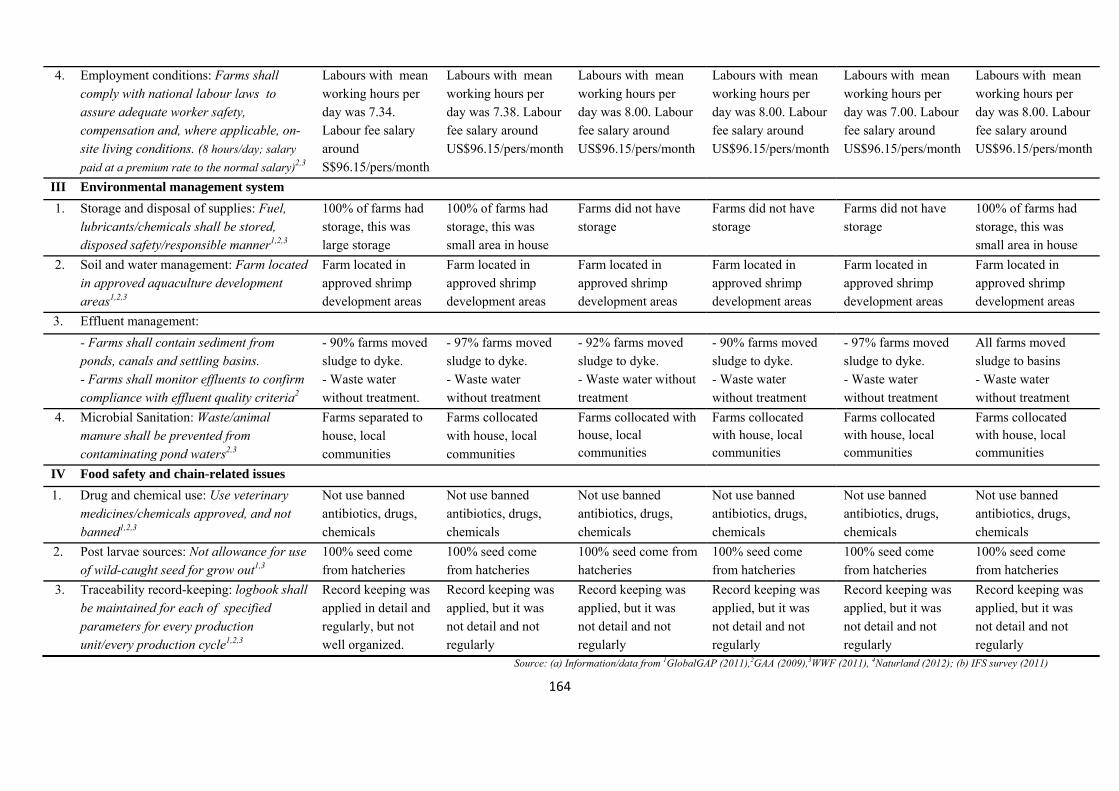
164
4. Employment conditions: Farms shall comply with national labour laws to assure adequate worker safety, compensation and, where applicable, on-site living conditions. (8 hours/day; salary
paid at a premium rate to the normal salary)2,3
Labours with mean working hours per day was 7.34. Labour fee salary around S$96.15/pers/month
Labours with mean working hours per day was 7.38. Labour fee salary around US$96.15/pers/month
Labours with mean working hours per day was 8.00. Labour fee salary around US$96.15/pers/month
Labours with mean working hours per day was 8.00. Labour fee salary around US$96.15/pers/month
Labours with mean working hours per day was 7.00. Labour fee salary around US$96.15/pers/month
Labours with mean working hours per day was 8.00. Labour fee salary around US$96.15/pers/month
III Environmental management system
1. Storage and disposal of supplies: Fuel, lubricants/chemicals shall be stored, disposed safety/responsible manner1,2,3
100% of farms had storage, this was large storage
100% of farms had storage, this was small area in house
Farms did not have storage
Farms did not have storage
Farms did not have storage
100% of farms had storage, this was small area in house
2. Soil and water management: Farm located in approved aquaculture development areas1,2,3
Farm located in approved shrimp development areas
Farm located in approved shrimp development areas
Farm located in approved shrimp development areas
Farm located in approved shrimp development areas
Farm located in approved shrimp development areas
Farm located in approved shrimp development areas
3. Effluent management: - Farms shall contain sediment from
ponds, canals and settling basins. - Farms shall monitor effluents to confirm compliance with effluent quality criteria2
- 90% farms moved sludge to dyke. - Waste water without treatment.
- 97% farms moved sludge to dyke. - Waste water without treatment
- 92% farms moved sludge to dyke. - Waste water without treatment
- 90% farms moved sludge to dyke. - Waste water without treatment
- 97% farms moved sludge to dyke. - Waste water without treatment
All farms moved sludge to basins - Waste water without treatment
4. Microbial Sanitation: Waste/animal manure shall be prevented from contaminating pond waters2,3
Farms separated to house, local communities
Farms collocated with house, local communities
Farms collocated with house, local communities
Farms collocated with house, local communities
Farms collocated with house, local communities
Farms collocated with house, local communities
IV Food safety and chain-related issues 1. Drug and chemical use: Use veterinary
medicines/chemicals approved, and not banned1,2,3
Not use banned antibiotics, drugs, chemicals
Not use banned antibiotics, drugs, chemicals
Not use banned antibiotics, drugs, chemicals
Not use banned antibiotics, drugs, chemicals
Not use banned antibiotics, drugs, chemicals
Not use banned antibiotics, drugs, chemicals
2. Post larvae sources: Not allowance for use of wild-caught seed for grow out1,3
100% seed come from hatcheries
100% seed come from hatcheries
100% seed come from hatcheries
100% seed come from hatcheries
100% seed come from hatcheries
100% seed come from hatcheries
3. Traceability record-keeping: logbook shall be maintained for each of specified parameters for every production unit/every production cycle1,2,3
Record keeping was applied in detail and regularly, but not well organized.
Record keeping was applied, but it was not detail and not regularly
Record keeping was applied, but it was not detail and not regularly
Record keeping was applied, but it was not detail and not regularly
Record keeping was applied, but it was not detail and not regularly
Record keeping was applied, but it was not detail and not regularly
Source: (a) Information/data from 1GlobalGAP (2011),2GAA (2009),3WWF (2011), 4Naturland (2012); (b) IFS survey (2011)
165
b). Main constraints to sustainable development
There are four important factors affecting the long term development of shrimp farming
perceived by the shrimp farmers (Table 4.24). Factors relating to environmental
sustainability aspects include shrimp diseases, water quality and seed quality; while
concerns on the economic viability relate mainly to capital/credit costs.
There was more than 65% of shrimp farms faced the shrimp disease problems, and most of
them were forced to use therapeutic methods during the production cycle. Shrimp health
management has tended to become increasingly complex with new diseases such as
AHPNS disease in recent years as an example on the higher severity affecting the
production performance. Therefore, shrimp disease is still the most important factor for
sustainability and strongly affects production efficiency at the different level due to
different impacts with farming systems and type of shrimp disease that occur.
Both shrimp and catfish farms have a common issue in the importance of water quality to
sustainability. Water quality fluctuated and had tended to decline, many farms pointed out
that the trend of chemical use was increased over the last five years. The shrimp farmers
also thought that bad water quality maybe come from nutrient discharge by other industries
such rice farming.
Seed quality was also perceived as an important factor driving for sustainability. At the
present, shrimp mortality was still high proportion in the grow-out stage, reached 35% in
the HoLI and 70% in the LoLI system, and the main cause was perceived coming from the
seed quality. Moreover, due to biological characteristics, shrimp are sensitive to
environmental changes, therefore water quality and extreme weather variability should be
viewed as major factors affecting production efficiency.
166
In addition, the capital/credit cost was also addressed as a sustainability factor. Although
the shrimp farms did not require high investment compared to that in the catfish farming
sector (i.e. less than US$19,000 vs. US$300,000/ha/crop, respectively), many shrimp farms
still faced the financial constraints, because currently farmers own saving was limited and
farmers borrowed from money lenders, the state banks, and the feed traders through
various types of delay payment terms. However, the shrimp farmers faced difficulties to
access loan from the state bank due to outstanding debts. Meanwhile, it is also not easily
access the type of delay payment term; because feed traders only accept the delay payment
term if they can find evidence that the farmers will be able to pay back. Hence, financial
policy should be created and improved to effectively support the shrimp industry.
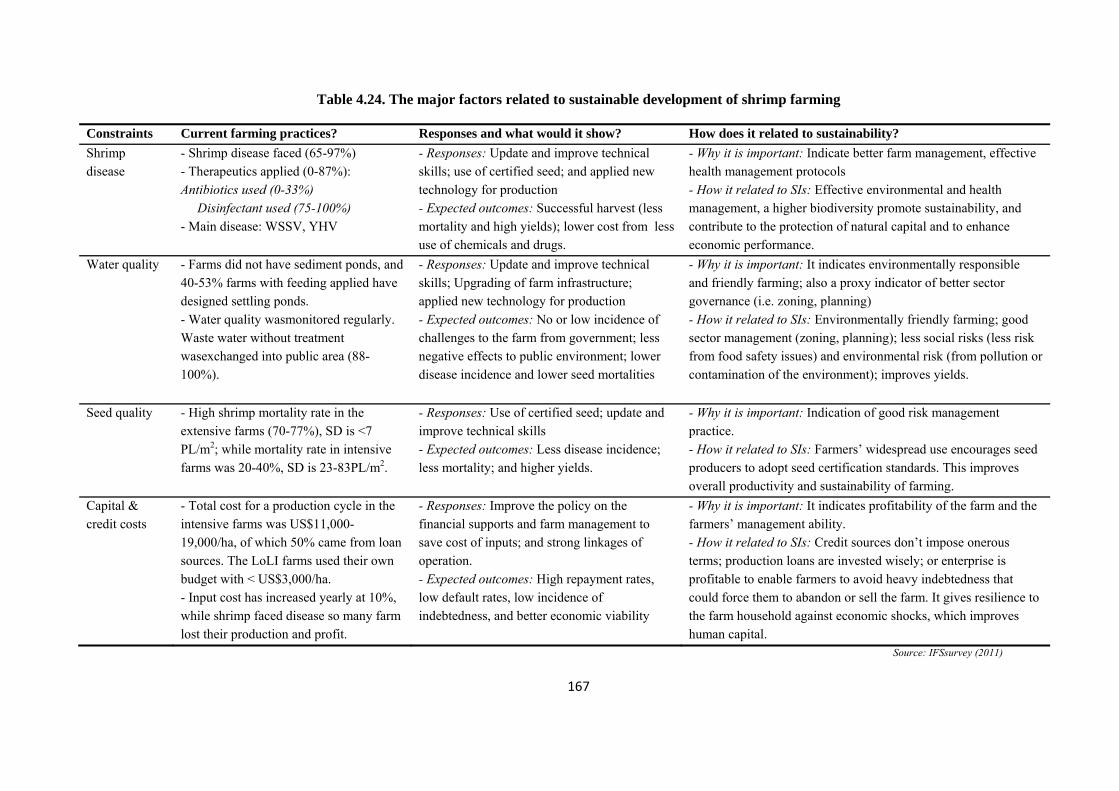
167
Table 4.24. The major factors related to sustainable development of shrimp farming
Constraints Current farming practices? Responses and what would it show? How does it related to sustainability?
Shrimp disease
- Shrimp disease faced (65-97%) - Therapeutics applied (0-87%): Antibiotics used (0-33%) Disinfectant used (75-100%) - Main disease: WSSV, YHV
- Responses: Update and improve technical skills; use of certified seed; and applied new technology for production - Expected outcomes: Successful harvest (less mortality and high yields); lower cost from less use of chemicals and drugs.
- Why it is important: Indicate better farm management, effective health management protocols - How it related to SIs: Effective environmental and health management, a higher biodiversity promote sustainability, and contribute to the protection of natural capital and to enhance economic performance.
Water quality - Farms did not have sediment ponds, and 40-53% farms with feeding applied have designed settling ponds. - Water quality wasmonitored regularly. Waste water without treatment wasexchanged into public area (88-100%).
- Responses: Update and improve technical skills; Upgrading of farm infrastructure; applied new technology for production - Expected outcomes: No or low incidence of challenges to the farm from government; less negative effects to public environment; lower disease incidence and lower seed mortalities
- Why it is important: It indicates environmentally responsible and friendly farming; also a proxy indicator of better sector governance (i.e. zoning, planning) - How it related to SIs: Environmentally friendly farming; good sector management (zoning, planning); less social risks (less risk from food safety issues) and environmental risk (from pollution or contamination of the environment); improves yields.
Seed quality - High shrimp mortality rate in the extensive farms (70-77%), SD is <7 PL/m2; while mortality rate in intensive farms was 20-40%, SD is 23-83PL/m2.
- Responses: Use of certified seed; update and improve technical skills - Expected outcomes: Less disease incidence; less mortality; and higher yields.
- Why it is important: Indication of good risk management practice. - How it related to SIs: Farmers’ widespread use encourages seed producers to adopt seed certification standards. This improves overall productivity and sustainability of farming.
Capital & credit costs
- Total cost for a production cycle in the intensive farms was US$11,000-19,000/ha, of which 50% came from loan sources. The LoLI farms used their own budget with < US$3,000/ha. - Input cost has increased yearly at 10%, while shrimp faced disease so many farm lost their production and profit.
- Responses: Improve the policy on the financial supports and farm management to save cost of inputs; and strong linkages of operation. - Expected outcomes: High repayment rates, low default rates, low incidence of indebtedness, and better economic viability
- Why it is important: It indicates profitability of the farm and the farmers’ management ability. - How it related to SIs: Credit sources don’t impose onerous terms; production loans are invested wisely; or enterprise is profitable to enable farmers to avoid heavy indebtedness that could force them to abandon or sell the farm. It gives resilience to the farm household against economic shocks, which improves human capital.
Source: IFSsurvey (2011)
168
4.5. Discussion and conclusions
4.5.1. Factors driving the farm category
Striped catfish farming can be classified under three farm scales (small, medium and
large). Previous studies used farm-size exclusively to classify farm category, i.e. small-
farm ≤0.5ha and large-scale farms ≥1.5ha/farms (Khiem et al. 2010; Belton et al. 2011;
Bush & Belton 2012; Trifković 2013; Hansen & Trifković 2014). Farm-size alone did not
provide fully an actual picture of existing catfish farming that is more complex in term of
business ownership and management regime. Belton et al. (2011) used five criteria to
classify catfish farm category, including market orientation, production intensity, farm
size, ownership and labour, and organization of production. However, the criteria of
market orientation and intensity level are not necessary as, all striped catfish are farmed
under a high intensive system and almost all are produced principally for export. The
criteria of farm-size, business ownership and organization of production showed clear
differences among three types of farms. Small-farms were typically owned and operated by
the family, while large-farms were owned and operated by the corporate enterprises and
medium-farms were in the middle (Belton et al. 2011; Belton & Little 2011; Bush &
Belton 2012). Labour source was also an important factor for farm category, large-farms
were highly dependent on hired, full-time labour and managed by salaried managers, while
small-farms were mainly managed by family members (Belton et al. 2011; Belton & Little
2011). However, we found that 65% of small-farms also used full-time salaried permanent
labours, with an average 1-2 labourers/farm (Table 4.4). Other reports also showed that
Asian aquaculture in general is by and large a small-scale farming activity, where most
practices are family-owned, managed and operated, and use a large percentage of family
169
labours (Siar & Sajise 2009; Bueno 2009; Melba G. Bondad-Reantaso et al. 2009; De Silva
& Davy 2009a; Belton & Little 2011).
By way of contrast, shrimp is farmed in the MKD under very different systems (i.e. from
more extensive to more intensive systems), with significant distinct investment levels
compared to the catfish farming sector (i.e. only farmed in the intensive system). Hence, a
simple ‘scale definition’ like catfish farm category is not appropriate because of
heterogeneity of farming systems. Previous studies classified shrimp farms into the
farming system based on pond-size, seed source and stocking density, feed use, water
exchange level, and shrimp yield (Primavera 1998; Nhuong et al. 2003; Nguyen et al.
2009; Anh et al. 2010a; Ha et al. 2012; Tran et al. 2013). Bush et al. (2010b; 2010a)
contend that shrimp industry can be classified under two competing scenarios for
sustainable development, including the small-scale landscape integrated farmers and
industrial-scale closed system. The reality in the MKD is a more complex, with a range of
heterogeneous farming systems that defy such as simple dichotomy in the MKD. Because
of the highly diverse system, based on the results of previous studies (Nguyen et al. 2009;
VIFEP 2009b), we modified and classified shrimp farms under six types of shrimp system
(Table 4.2), and main factors used for classification based on technical characteristics.
Shrimp farming methods categorized as improved-extensive, semi-intensive and intensive
systems. The essential features differentiating production systems along the extensive to
intensive are additional seed stocking, feeding and water management. This study also
used the same criteria as previous studies, and added three more important factors that are
method of water management, seed quality control and management regime. Shrimp
farming systems classified in this study do not fit neatly into Bush et al. (2010a; 2010b)
170
dichotomy and most shrimp is raised in neither typical landscape (mangrove) nor biosecure
(intensive) but rather systems that have features of neither/both.
Intensive farms mainly industrial-scale producers owned and operated by aquaculture Ltd.
companies; their farms often managed by salaried managers and heavily depended on full-
time labours (Nguyen et al. 2009; Bush et al. 2010b; Bush et al. 2010a; Belton & Little
2011). Intensive farms applied a closed system approach and the biosecure models that
used only ‘top-up water’ method for water exchange; PCR test for post-larvae source,
aeration system and this system could fit in the biosecure category described by Bush et al.
(2010b). Similar to intensive farm, semi-intensive farms and rice-shrimp farms also applied
closed system for shrimp ponds; however, rice-shrimp farms did not use aerators or purchase
PCR tested PLs. Semi-intensive and rice-shrimp systems were mainly operated by
households and mostly managed by family labour. In contrast, the mixed mangrove-shrimp
and improved-extensive were open systems relying on ‘tidal water exchange’; used non-
screened PLs in addition to naturally recruited seed and no feeding. They are operated by
households and mostly depended on family labour (Nguyen et al. 2009; Bush et al. 2010b;
Bush et al. 2010a; Belton & Little 2011). Generally, most shrimp farms, excluding
intensive systems in the MKD were small-scale producers farming, small water area per
farm (less than 1,5ha). Other studies in Asia found that shrimp farming sector essentially
consists of small-scale owner-managed and operated practices in several Asian countries
with average farm-size ≤1.6ha (Kongkeo 1997; Primavera 1998; Umesh 2007; Umesh et
al. 2009; Kongkeo & Davy 2009).
4.5.2. Factors driving different farming practices
Factors driving different catfish farming practices by farm scale
171
Analysis of the current practices of catfish farming in the MKD shows that small catfish
farms had relatively poor farm infrastructure characterised by small and shallow ponds,
incomplete water supply system and lack of feed storage facilities compared to that in the
large-farms. Normally, small-farms had 1-2 ponds mainly used for grow-out, while larger
farms reserved area for sediment basins and other facilities such as feed storage. Khoi
(2011) found that most small-farmers lack land for waste water treatment ponds because
the majority of their land has been converted into grow-out ponds. With a limited number
of ponds, small-farms also have to apply “simple batch production” stocking method, thus
the small-farms often faced problems with low fish price during the oversupply period. In
contrast, larger farms could be more flexible and use “multiple batch production” where
both stocking and harvest times can be staggered to reduce being impacted by temporal
declines in farm gate price. Belton et al. (2009) came to the same conclusion in their study,
noting the importance in capacity for flexible fish harvesting being important to
maintaining viability over time.
Different feed practices were also key aspects differentiating pangasius farms by scale. Use
of farm-made feeds was much more common among small and medium farms than large-
farms. Sustainability perceptions suggest that small and medium farmers are more
motivated by economic sustainability than environmental so this is no surprise. Generally,
catfish farms of all scales tended to use commercial feed for better performance and
convenience. Although, use of farm-made feeds remains more cost effective than
commercial feed (Phan et al. 2009; Bush & Belton 2012; Ali et al. 2012), many small-
/medium farms shifted to use commercial feed compared to the previous surveys in 2008
of Phan et al. (2009) and in 2009 of Da et al. (2013). The main reason for this trend were
linked to pressure from processors who prefer to buy fish produced using commercial feed
172
(Khoi 2011). When using farm-made feed, culture period are also up to 4-6 weeks longer
than when commercial feed are used (Phan et al. 2009), while the farms paid more
attention to the turnover of investment and cost efficiency due to high interest rates and
short time of loans. In addition, the lack of raw materials, especially fishmeal or trash fish
for feed ingredients was also a driving force for changing trends (Nguyen et al. 2009; Tuan
et al. 2013). The master plan of catfish sector development up to 2020 also motivated the
catfish farms using the commercial feed instead of farm-made feed to reduce the constraint
of feed ingredients and environmental impact (VIFEP 2009a). The environmental impacts
are reduced by using commercial feeds with a lower FCR (Boyd & Michael 1996; Cripps
& Bergheim 2000; Lin & Yi 2003; Bosma et al. 2011).
High amount of feed use and dense stocking density required careful water quality
management (Phuong et al. 2009; De Silva & Nguyen 2011). With high stocking density
and feeding, most farms exchange water daily, and effluent water is not treated and could
be a potential pollution source for surface water of the Mekong river in the long run (Khoi
2011; Cao et al. 2010; Truong et al. 2011). Comparing inlet and outlet water parameters
shows that values of DO and TSS are lower and the BOD and COD are higher value in the
outlet water (Phuong et al. 2008). However, these four water quality parameters in outlet
water do not exceed these Vietnamese standard for surface water quality/TCNVN 5942-
1995 (i.e. DO 6.8mg/L, BOD 4.8mg/L, COD 9.0mg/L and TSS 46.1mg/L in outlet water
compared to >2mg/L, <25mg/L, <35mg/L and <80mg/L on maximum residue limits of
TCNNVN 5942-1995, respectively), catfish farming has been characterised as ‘non-
polluting’ (Phuong et al. 2009; Anh et al. 2010a; De Silva et al. 2010). Anh et al. (2010b)
reported that pangasius production accounted for less than 1% of the total suspended solids
(TSS), nitrogen and phosphorus loads in the MKD and contributed relatively little to the
overall nutrient discharge into the river. Additionally, the relatively high effluent water
173
quality associated with the design of very deep ponds that essentially ‘treat’ water suggests
that they are acting as sedimentation ponds for waste feed and faeces; and hence
requirement to remove sludge 2-3 times per cycle. This was a farmer innovation based on
better growth and returns from fish raised in deeper ponds. Phan et al. (2009) noted that
there was a positive relationship between the water depth and fish yield in case of the same
stocking density and feed use. This reflects the farmers perception of sustainability being
geared towards economics in this case being complementary to environemental
sustainability.
There was no significant difference in the productivity among farm scales, which is partly
explained by the similar level of intensification applied by all catfish farms. Nguyen &
Dang (2009) observed that the exceptionally high productivity of striped catfish culture
can be related to the biological features of this air-breathing species but the development of
simple methods for maintaining water quality deep ponds, high water exchange, similar
reliance on the same formulated diets and regular, manual in solids removal that have few
economies of scale also explain the lack of difference between smaller and larger
enterprises. However such densely stocked ‘open’ systems, often located in close
proximity to other similar enterprises, increases vulnerability to disease (Phan et al. 2009;
Khoi 2011; Truc 2013). In this respect striped catfish is not unlike cage farming, for which
consequences of a lack of a zonal approach to planning have been painful lessons as
demonstrated by the Atlantic salmon in Chile (Kvaløy & Tveterås 2008; Gildemeister
2012). Striped catfish relies on relatively large amounts of chemical inputs (Rico et al.
2012; Rico et al. 2013). Rico et al. (2013) noted that the use of antibiotic treatments was
significantly higher in the Vietnamese pangasius farms compared to other farmed species
in Thailand, China and Bangladesh. However, total quantities of antibiotics applied by the
pangasius farmers were comparable or lower than those reported for other animal
174
production commodities. The same authors suggest that the main alternative to extensive
antibiotic use could be the introduction of vaccines, as already done in the European
salmon industry (Gildemeister 2012; Rico et al. 2013).
Factors driving different shrimp farming practices by farm system
Shrimp farming practices are highly differentiated from the perspective of stocking
density, water management, shrimp health management, and feed management etc.
compared to the catfish farming practices. Large areas of shrimp farm could be
characterised as improved-extensive system, and shrimp farms are mostly owned and
operated by families (Nguyen et al. 2009; VIFEP 2009b; Tran et al. 2013). Shrimp farming
practices were very different between shrimp systems, including preparation of the culture
unit, stocking density, water exchange and feeding regimes, and resultant productivity.
Due to the closed system approach, pond preparation (e.g. water storage and water
treatment) was carried-out by most intensive, semi-intensive and rice-shrimp farms.
Whereas, with large pond size and open system application, around 30% of mangrove-
shrimp and improved-extensive farms conducted the pond preparation. Indicators of the
position of a given system within the landscape to biosecure continuum (Bush et al. 2010b)
include the use of juveniles screened for disease. The HiLI farms (semi-intensive and
intensive) tended to purchase post-larvae directly from hatcheries that screened for
pathogens; whereas, LoLI farms mainly purchased post-larvae through traders without the
PCR test and of unknown provenance (Tran et al. 2013). Unscreened post-larvae were
recognised as a major factor in the high shrimp mortalities of LoLI farm; once introduced
such pathogens would endure and their impacts exacerbated by multiple stocking,
extended harvest practiced in large, extensive systems. The pathogens from infected ponds
are likely to spread to other ponds if an effluence source was not proper treatment (Anh et
175
al. 2010; Oanh & Phuong 2012). For example, the study of Hoa et al. (2011) found that
white spot syndrome virus (WSSV) can be transmitted horizontally through water, via
carrier organisms and/or by cannibalism of infected shrimp. The transmission from
neighbouring ponds (at current crop or from previous crop) was the main route for WSSV
transmission in the semi-intensive shrimp farming.
The HiLI shrimp systems paid more attention to reducing risks associated with poor water
quality and shrimp disease from the environment. Semi-intensive and intensive farming,
based on higher stocking densities, and fundamentally more reliant on good water and seed
quality to reduce the risk of disease (Primavera 1998; Anh et al. 2010a; Bush et al. 2010a;
Bush et al. 2010b; Ha et al. 2013; Tran et al. 2013). Most HiLI shrimp farms have applied
limited water exchange methods for shrimp ponds. The “top-up water to make good losses
only” method was mostly applied by the HiLI farms, and water exchange was not regular
but based on the manager’s experience of water colour, and new water sources came
mainly from the settling ponds or farm’s water supply canal. In contrast, LoLI farms
mainly applied the “partial drainage & water replacement” method, and water exchange
was mainly based on the tidal regime. Most farms reported that waste-water was not
treated, but drained directly into rivers or canals that are the same as the supply source.
Discharge of untreated waste water, especially during shrimp disease outbreaks, may be a
cause of the spread of diseases that affect farm production efficiency. Shrimp diseases are
often caused by polluted water in the pond itself, and the bad water quality such as high
BOD and COD concentrations is a favorable condition for pathogenic microorganisms
(Anh et al. 2010a; Oanh & Phuong 2012). Anh et al. (2010a) indicated that most of the
waste water and contaminated sediment from shrimp ponds is discharged into receiving
waters, and this is the source of water for other shrimp ponds due to not separately canals
176
between water supplying and draining at the current situation in the MKD (Nguyen et al.
2009).
4.5.3. Farming practices - the risk profiles affect
The comparison of farming practices between striped catfish and shrimp sectors seems to
point to two distinct outcomes. On the one hand, this study states that there is no
relationship between striped catfish farm scale and fish productivity and economic
efficiency. This in turn supports a social relations hypothesis for explaining why
smallholders are unable to keep up – social relations that control access to credit, and
material constraints to accessing land for sedimentation. On the other hand, the analysis of
shrimp farming practices outlines the persistence of a widevariety of systems with very
different risk profiles – and again a dependence on social relations that provide access (or
not) to the credit and resources necessary for upgrading production. Additionally, a
comparison on the key risk profiles between striped catfish and shrimp farms showed that
there were differences on the risks between smaller and larger farms for both these species,
smaller farms often faced higher level of operational risks compared to larger farms (Table
4.25). Striped catfish farms, especially small and medium-farms, faced higher risks in
securing capital/credit), maintaining fish quality, and markets (i.e. fish farm gate price,
unstable marketd, and lack of market information) compared to the shrimp farms;
however, technical skills of catfish farmers were higher than shrimp farmers, and fish
yields were more stable. Other risk factors appeared to have a similar level of influence on
both species; with smaller farms being more vulnerable than the larger operations,
reflecting the numerous challenges, constraints and risks that small-scale producers of both
species face participating in global value chains.
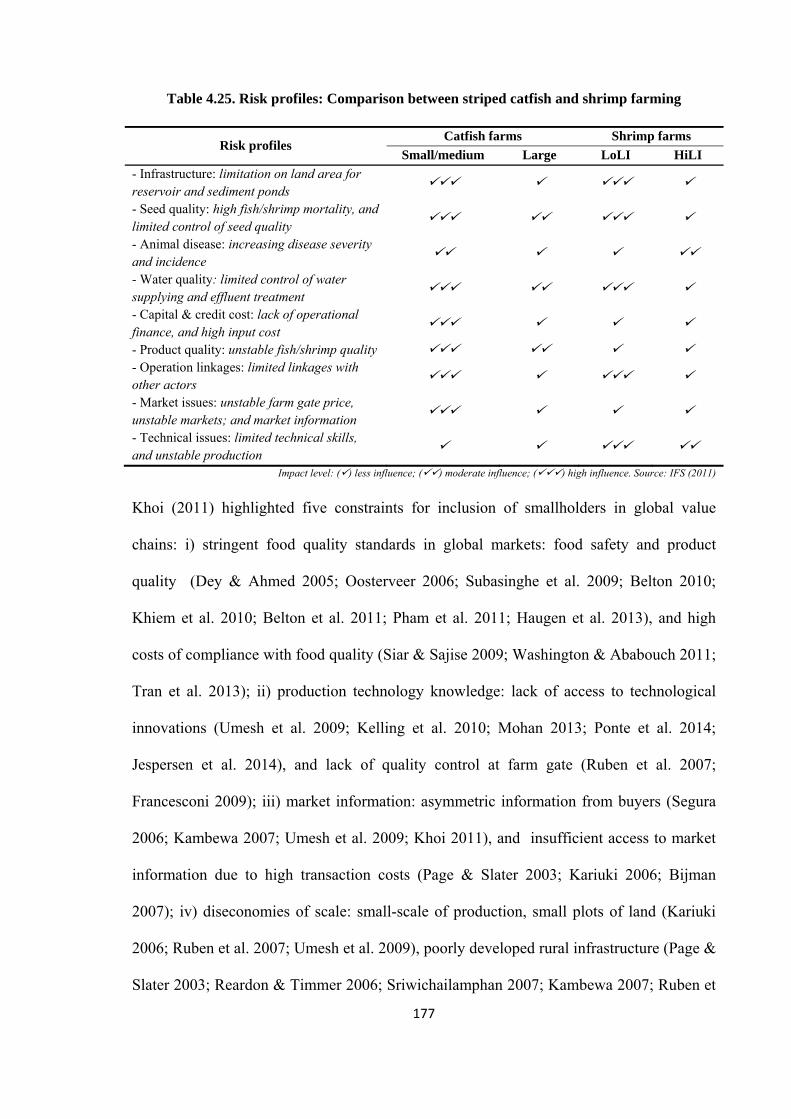
177
Table 4.25. Risk profiles: Comparison between striped catfish and shrimp farming
Risk profiles Catfish farms Shrimp farms
Small/medium Large LoLI HiLI
- Infrastructure: limitation on land area for reservoir and sediment ponds
- Seed quality: high fish/shrimp mortality, and limited control of seed quality
- Animal disease: increasing disease severity and incidence
- Water quality: limited control of water supplying and effluent treatment
- Capital & credit cost: lack of operational finance, and high input cost
- Product quality: unstable fish/shrimp quality - Operation linkages: limited linkages with other actors
- Market issues: unstable farm gate price, unstable markets; and market information
- Technical issues: limited technical skills, and unstable production
Impact level: () less influence; () moderate influence; () high influence. Source: IFS (2011)
Khoi (2011) highlighted five constraints for inclusion of smallholders in global value
chains: i) stringent food quality standards in global markets: food safety and product
quality (Dey & Ahmed 2005; Oosterveer 2006; Subasinghe et al. 2009; Belton 2010;
Khiem et al. 2010; Belton et al. 2011; Pham et al. 2011; Haugen et al. 2013), and high
costs of compliance with food quality (Siar & Sajise 2009; Washington & Ababouch 2011;
Tran et al. 2013); ii) production technology knowledge: lack of access to technological
innovations (Umesh et al. 2009; Kelling et al. 2010; Mohan 2013; Ponte et al. 2014;
Jespersen et al. 2014), and lack of quality control at farm gate (Ruben et al. 2007;
Francesconi 2009); iii) market information: asymmetric information from buyers (Segura
2006; Kambewa 2007; Umesh et al. 2009; Khoi 2011), and insufficient access to market
information due to high transaction costs (Page & Slater 2003; Kariuki 2006; Bijman
2007); iv) diseconomies of scale: small-scale of production, small plots of land (Kariuki
2006; Ruben et al. 2007; Umesh et al. 2009), poorly developed rural infrastructure (Page &
Slater 2003; Reardon & Timmer 2006; Sriwichailamphan 2007; Kambewa 2007; Ruben et
178
al. 2007; Henson et al. 2008), and low investment in advanced technology (Ruben et al.
2007; Kariuki 2006); and v) access to credit: lack of access to credit for production inputs
(Segura 2006; Kambewa 2007; Umesh et al. 2009), and banks and buying firms large scale
transactions (Key & Runsten 1999; Dannson 2004; Henson et al. 2008). Khoi (2011) also
indicated that these constraints for smallholder inclusion are related to the GVC
governance forms developed by Gereffi et al. (2005), the ‘captive’ and the ‘relational’
governance types are the most relevant for understanding the relationships between
importers-exporters and smallholders. Increasing quality standards and the lack of market
information make ‘market’ governance less effective. Jespersen et al. (2014) noted that
hierarchy, relational, captive and market forms of coordination are all present
simultaneously in the Vietnamese pangasius value chain, though the trend is towards
hierarchical forms as the industry consolidates. The ‘modular’ governance form will
become possible in the future if Vietnam producers manages to resolve the problems
related to technology and production knowledge (Khoi 2011).
4.5.4. Farming practices: challenges to reach food standards
Consumers are increasingly concerned about the environmental and social impacts of food
production in developing countries (Oosterveer 2006; Corsin et al. 2007; Bush &
Oosterveer 2007; Bush 2008; Brunori et al. 2011; Belton & Bush 2014; Jespersen et al.
2014). Additionally, consumers are interested in the process through which a product
travels and it’s process-oriented quality (Corsin et al. 2007; Reilly 2007; Yamprayoon &
Sukhumparnich 2010; Brunori et al. 2011; Young et al. 2011). Hence, food certification
has been identified as an easy way of demonstrating sustainability (Bush & Oosterveer
2007; Bush et al. 2010b; Bush & Oosterveer 2012b; Young et al. 2011; Kelling 2012;
Mohan 2013). Catfish and shrimp are target-farmed species for Vietnamese seafood
179
export, have begun to move towards meeting various food standards to maintain access to
these markets as such private governance becomes the norm. Bush et al. (2010) noted that
farmers have to respond to food quality and safety standards to gain or maintain their
position in export markets. Many catfish and shrimp farms have been able to meet several
of the standard criteria such eFCR, stocking density, no use of banned chemical/drug and
wild-seed source uses, positive community relations, valid property rights, and biodiversity
protection. However, there remain many standard criteria that could not be easily met by
farms such as those for effluent management, registration of farms, limiting fishmeal use in
diets, mortality management, labour arrangements, farm hygiene, and recordkeeping
requirements. To cope with the increasing requirements on food safety, quality and
sustainability of seafood production, current farms both species have to improve.
Additionally, they also needed support from local officers who can give technical supports
(i.e. training courses) and management issues such as trade name registration, certify land
ownership or property rights. Reilly (2007) noted that the focus of new regulations from
the markets is from farm-to-fork and places the responsibility for marketing safe food with
the producers. General principles of food hygiene legislation now extend to all operations
involved in the primary production of food (Reilly 2007; Washington & Ababouch 2011;
Tran et al. 2013), so these could be viewed as a trade barrier (Reilly 2007; De Silva &
Nguyen 2011; Tran et al. 2013). However, Dalsgaard et al. (2013) found that the bacterial
microflora on pangasius in frozen fillets reaching Europe was not related to any
contamination in the fish pond, but rather at the processor level. Seafood producing
countries should overcome challenges by continuously improving the whole production
chain and to achieve sustainability of the seafood industry food standards must be
promoted and practiced by farmers (Reilly 2007; Bush et al. 2010; Bush & Belton 2012).
Although food standards paid more concern to the primary production at the farm level,
180
fraud in the value chain is often not associated with farmers but rather intermediaries such
as secondary processors where illegal/poor practices such as lack of knowledge of food
hygiene and safety, use of polyphosphates and over-glazing are common place (Fisheries
Directorate 2012; Vu et al. 2013; VASEP 2014a). Generally, farmers often face the
compliance constraints when they try to apply the food standard; because farmers had lack
of proper knowledge and awareness, poor access to information on requirements, lack of
expertise and trained people to examine compliance requirements, lack of technological
capacity and weak implementation and monitoring capacity (Kelling et al. 2010; Mohan
2013; Ponte et al. 2014; Jespersen et al. 2014). Washington & Ababouch (2011) suggested
that farms follow the national standards as the foundation to achieve sustainable
production, making it easier to meet the additional criteria from private standards and
certification (Nietes-Satapornvanit 2014). Moreover, the certification schemes should be
integrated with other governance mechanisms and public rulings, including local standards
that are already in place, making use of the existing local expertise (Bush et al. 2013).
Although farm-level certification contributes to sustainable seafood trading, is still beset
with significant limits such as measuring the impacts of the external environment on the
farms (Allsopp et al. 2008; Bush & Belton 2012; Bush et al. 2013; Han & Immink 2013).
4.5.5. Farm upgrading - the key barriers to upgrading
Striped catfish and shrimp are the target farmed seafood species for exporting, and thus the
increasing pressure from the international seafood markets such as the EU, US and Japan
markets related to food safety and sustainability of farmed seafood has prompted value
chain upgrading that can contribute to reducing environmental, social and economic risks.
(Khiem et al. 2010; Pham et al. 2011; Jespersen et al. 2014; Ponte et al. 2014). However,
this study showed that both catfish and shrimp producers have faced several major barriers
181
that influence to their capacity for upgrading (Table 4.26). Smaller farms have to cope with
higher level of these barriers for upgrading compared to the larger farms on both these
species. The shrimp farms, especially the LoLI systems, faced higher influence level of
barriers on the process upgrading (i.e. limited improvement of seed quality, disease
management); the functional upgrading (i.e. limited improvement of increasing yield
through management practices or use of new technology, and limited horizontal
contractualisation to group formation leading to changed provisioning production and trade
practices); and the inter-chain upgrading (i.e. limited expansion with existing product
categories, and limited certification skills acquired in monitoring and evaluating national
regulation on food safety are transferable to forthcoming international food standards). In
contrast, the striped catfish farms have to cope seriously with the product upgrading (i.e.
limited improvement of product quality and product size) and the process upgrading (i.e.
limited improvement of input management). Both these species sectors, especially small
farms faced the same influence level of barriers to the process upgrading (i.e. limited
improvement of water quality), the product upgrading (i.e. guarantee on the absence of
chemical residues) and the functional upgrading (i.e. limited vertical contractualisation:
contract with other actors to change in provisioning practices of feed, seed; and in selling
their products). Ponte et al. (2014) presented the upgrading strategies for the seafood farm-
level in Asia including improve process, improve product, improve volume and improve
variety. The same authors noted that the barriers to upgrading at the farm-level include
lack of explicit economic incentives (e.g. improved market access or increased price),
limited access to capital to invest in improved management practices, and lack of
appropriate skills for smallholders. Additionally, the other barriers may be come from the
economic risks associated with market volatility and quality regulation (Bush & Belton
2012; Ponte et al. 2014).
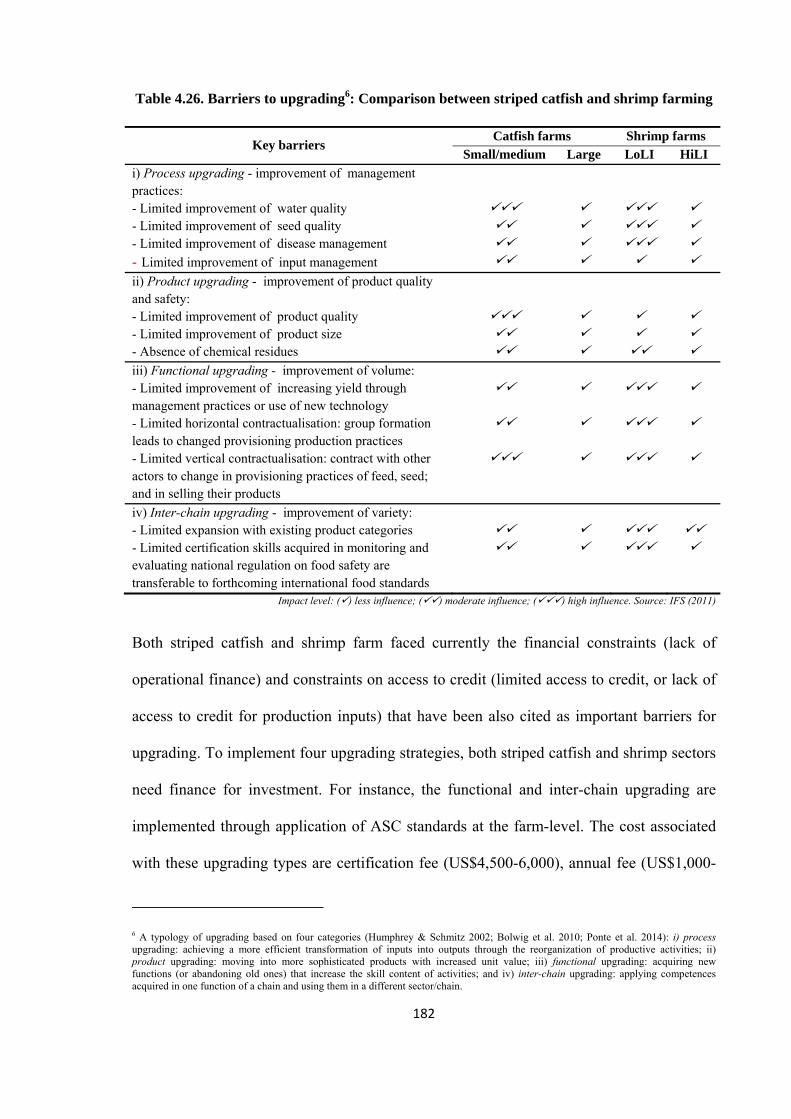
182
Table 4.26. Barriers to upgrading6: Comparison between striped catfish and shrimp farming
Key barriers Catfish farms Shrimp farms
Small/medium Large LoLI HiLI
i) Process upgrading - improvement of management practices:
- Limited improvement of water quality - Limited improvement of seed quality - Limited improvement of disease management - Limited improvement of input management
ii) Product upgrading - improvement of product quality and safety:
- Limited improvement of product quality - Limited improvement of product size - Absence of chemical residues iii) Functional upgrading - improvement of volume: - Limited improvement of increasing yield through management practices or use of new technology
- Limited horizontal contractualisation: group formation leads to changed provisioning production practices
- Limited vertical contractualisation: contract with other actors to change in provisioning practices of feed, seed; and in selling their products
iv) Inter-chain upgrading - improvement of variety: - Limited expansion with existing product categories - Limited certification skills acquired in monitoring and evaluating national regulation on food safety are transferable to forthcoming international food standards
Impact level: () less influence; () moderate influence; () high influence. Source: IFS (2011)
Both striped catfish and shrimp farm faced currently the financial constraints (lack of
operational finance) and constraints on access to credit (limited access to credit, or lack of
access to credit for production inputs) that have been also cited as important barriers for
upgrading. To implement four upgrading strategies, both striped catfish and shrimp sectors
need finance for investment. For instance, the functional and inter-chain upgrading are
implemented through application of ASC standards at the farm-level. The cost associated
with these upgrading types are certification fee (US$4,500-6,000), annual fee (US$1,000-
6 A typology of upgrading based on four categories (Humphrey & Schmitz 2002; Bolwig et al. 2010; Ponte et al. 2014): i) process upgrading: achieving a more efficient transformation of inputs into outputs through the reorganization of productive activities; ii) product upgrading: moving into more sophisticated products with increased unit value; iii) functional upgrading: acquiring new functions (or abandoning old ones) that increase the skill content of activities; and iv) inter-chain upgrading: applying competences acquired in one function of a chain and using them in a different sector/chain.
183
2,000) (Nguyen 2012; Haugen et al. 2013), cost of consultants (US$10,000-15,000) for
technical supports, cost for farm re-structuring and cost for water/effluent parameters
monitoring (Fisheries Directorate 2014). Consequently, the production cost for ASC
application was 8.96% higher than the uncertified production (Tuan 2013). Even though
the producers bear high costs of investment in standards, application of ASC standards to
striped catfish farms increased productivity by 15% (Corsin 2013) and shrimp farms
certified by GAA-BAP achieved better production efficiency (Lam & Truong 2010).
Additionally, the ASC certified catfish farms can receive 5% premium price (Corsin 2013),
and shrimp farms certified by GAA-BAP received an 11% premium price (Lam & Truong
2010). However, application of food standards at the farm-level is inhibited by financial
constraints, as the costs of farm upgrading and certification are high and tend to exclude
the weak farms (e.g. small-producers) from the export supply chain (Dey & Ahmed 2005;
Oosterveer 2006; Subasinghe et al. 2009; Belton 2010; Khiem et al. 2010; Belton et al.
2011; Pham et al. 2011; Haugen et al. 2013).
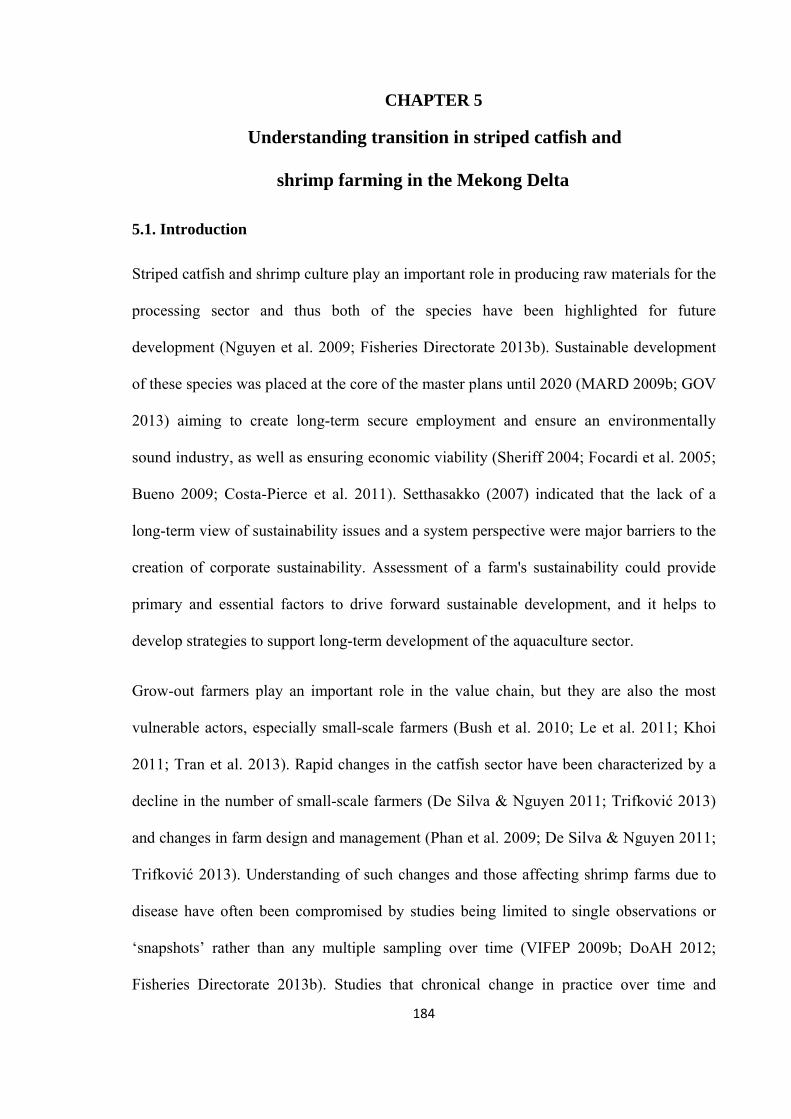
184
CHAPTER 5
Chapter 5. Understanding transition in striped catfish and
shrimp farming in the Mekong Delta
5.1. Introduction
Striped catfish and shrimp culture play an important role in producing raw materials for the
processing sector and thus both of the species have been highlighted for future
development (Nguyen et al. 2009; Fisheries Directorate 2013b). Sustainable development
of these species was placed at the core of the master plans until 2020 (MARD 2009b; GOV
2013) aiming to create long-term secure employment and ensure an environmentally
sound industry, as well as ensuring economic viability (Sheriff 2004; Focardi et al. 2005;
Bueno 2009; Costa-Pierce et al. 2011). Setthasakko (2007) indicated that the lack of a
long-term view of sustainability issues and a system perspective were major barriers to the
creation of corporate sustainability. Assessment of a farm's sustainability could provide
primary and essential factors to drive forward sustainable development, and it helps to
develop strategies to support long-term development of the aquaculture sector.
Grow-out farmers play an important role in the value chain, but they are also the most
vulnerable actors, especially small-scale farmers (Bush et al. 2010; Le et al. 2011; Khoi
2011; Tran et al. 2013). Rapid changes in the catfish sector have been characterized by a
decline in the number of small-scale farmers (De Silva & Nguyen 2011; Trifković 2013)
and changes in farm design and management (Phan et al. 2009; De Silva & Nguyen 2011;
Trifković 2013). Understanding of such changes and those affecting shrimp farms due to
disease have often been compromised by studies being limited to single observations or
‘snapshots’ rather than any multiple sampling over time (VIFEP 2009b; DoAH 2012;
Fisheries Directorate 2013b). Studies that chronical change in practice over time and
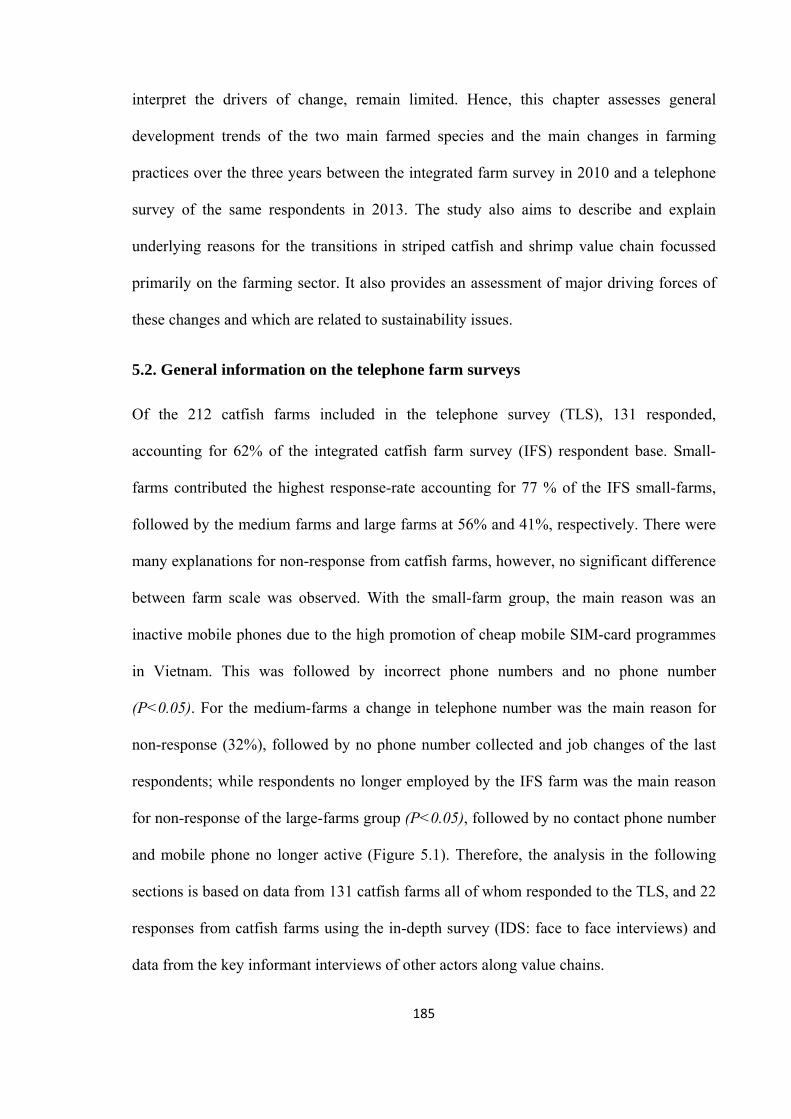
185
interpret the drivers of change, remain limited. Hence, this chapter assesses general
development trends of the two main farmed species and the main changes in farming
practices over the three years between the integrated farm survey in 2010 and a telephone
survey of the same respondents in 2013. The study also aims to describe and explain
underlying reasons for the transitions in striped catfish and shrimp value chain focussed
primarily on the farming sector. It also provides an assessment of major driving forces of
these changes and which are related to sustainability issues.
5.2. General information on the telephone farm surveys
Of the 212 catfish farms included in the telephone survey (TLS), 131 responded,
accounting for 62% of the integrated catfish farm survey (IFS) respondent base. Small-
farms contributed the highest response-rate accounting for 77 % of the IFS small-farms,
followed by the medium farms and large farms at 56% and 41%, respectively. There were
many explanations for non-response from catfish farms, however, no significant difference
between farm scale was observed. With the small-farm group, the main reason was an
inactive mobile phones due to the high promotion of cheap mobile SIM-card programmes
in Vietnam. This was followed by incorrect phone numbers and no phone number
(P<0.05). For the medium-farms a change in telephone number was the main reason for
non-response (32%), followed by no phone number collected and job changes of the last
respondents; while respondents no longer employed by the IFS farm was the main reason
for non-response of the large-farms group (P<0.05), followed by no contact phone number
and mobile phone no longer active (Figure 5.1). Therefore, the analysis in the following
sections is based on data from 131 catfish farms all of whom responded to the TLS, and 22
responses from catfish farms using the in-depth survey (IDS: face to face interviews) and
data from the key informant interviews of other actors along value chains.
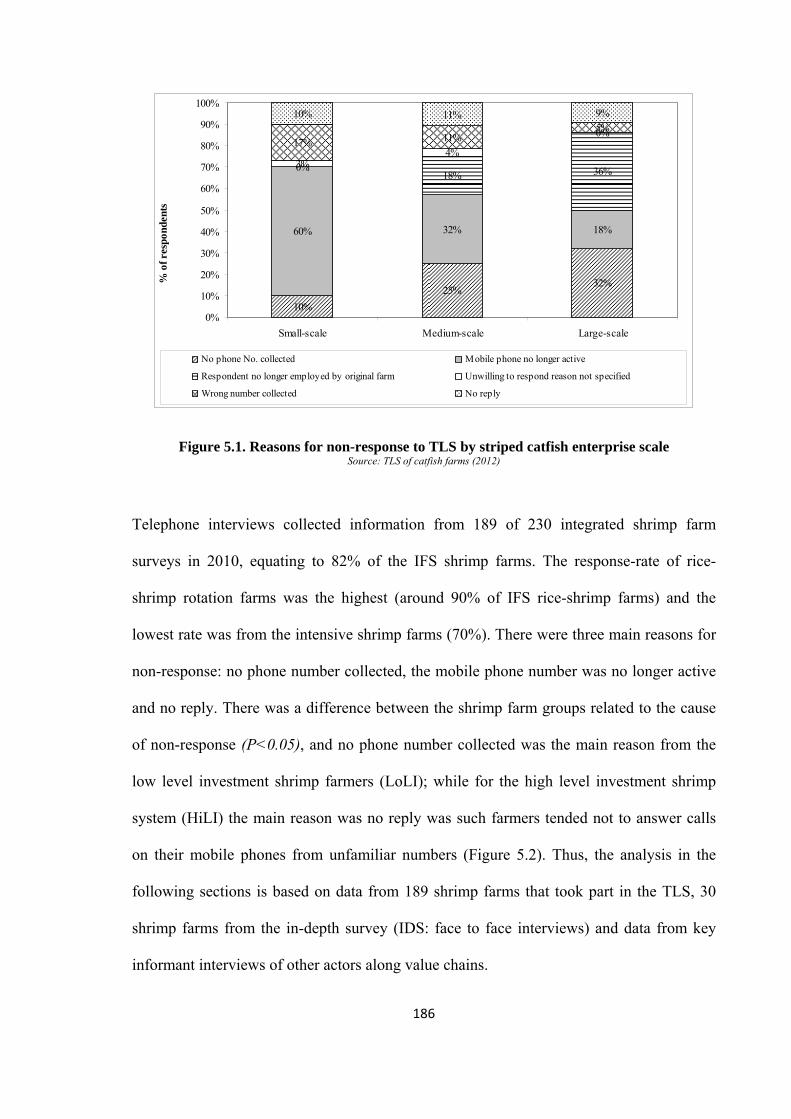
186
Figure 5.1. Reasons for non-response to TLS by striped catfish enterprise scale Source: TLS of catfish farms (2012)
Telephone interviews collected information from 189 of 230 integrated shrimp farm
surveys in 2010, equating to 82% of the IFS shrimp farms. The response-rate of rice-
shrimp rotation farms was the highest (around 90% of IFS rice-shrimp farms) and the
lowest rate was from the intensive shrimp farms (70%). There were three main reasons for
non-response: no phone number collected, the mobile phone number was no longer active
and no reply. There was a difference between the shrimp farm groups related to the cause
of non-response (P<0.05), and no phone number collected was the main reason from the
low level investment shrimp farmers (LoLI); while for the high level investment shrimp
system (HiLI) the main reason was no reply was such farmers tended not to answer calls
on their mobile phones from unfamiliar numbers (Figure 5.2). Thus, the analysis in the
following sections is based on data from 189 shrimp farms that took part in the TLS, 30
shrimp farms from the in-depth survey (IDS: face to face interviews) and data from key
informant interviews of other actors along value chains.
10%
25%32%
32% 18%
0%18% 36%
3%4%
0%17% 11%
5%10% 11% 9%
60%
0%
10%
20%
30%
40%
50%
60%
70%
80%
90%
100%
Small-scale Medium-scale Large-scale
% o
f res
pond
ents
No phone No. collected Mobile phone no longer active
Respondent no longer employed by original farm Unwilling to respond reason not specified
Wrong number collected No reply
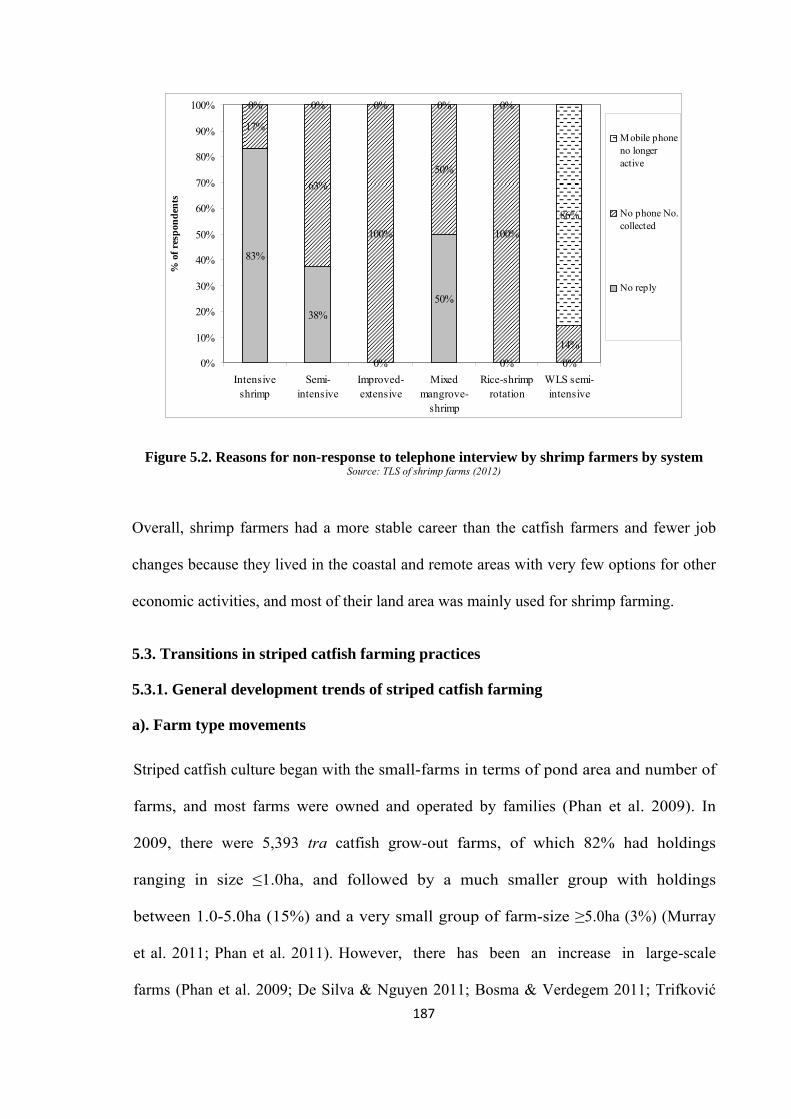
187
Figure 5.2. Reasons for non-response to telephone interview by shrimp farmers by system Source: TLS of shrimp farms (2012)
Overall, shrimp farmers had a more stable career than the catfish farmers and fewer job
changes because they lived in the coastal and remote areas with very few options for other
economic activities, and most of their land area was mainly used for shrimp farming.
5.3. Transitions in striped catfish farming practices
5.3.1. General development trends of striped catfish farming
a). Farm type movements
Striped catfish culture began with the small-farms in terms of pond area and number of
farms, and most farms were owned and operated by families (Phan et al. 2009). In
2009, there were 5,393 tra catfish grow-out farms, of which 82% had holdings
ranging in size ≤1.0ha, and followed by a much smaller group with holdings
between 1.0-5.0ha (15%) and a very small group of farm-size ≥5.0ha (3%) (Murray
et al. 2011; Phan et al. 2011). However, there has been an increase in large-scale
farms (Phan et al. 2009; De Silva & Nguyen 2011; Bosma & Verdegem 2011; Trifković
83%
38%
0%
50%
0% 0%
17%
63%
100%
50%
100%
14%
0% 0% 0% 0% 0%
86%
0%
10%
20%
30%
40%
50%
60%
70%
80%
90%
100%
Intensiveshrimp
Semi-intensive
Improved-extensive
Mixedmangrove-
shrimp
Rice-shrimprotation
WLS semi-intensive
% o
f re
spon
den
ts
Mobile phoneno longeractive
No phone No.collected
No reply
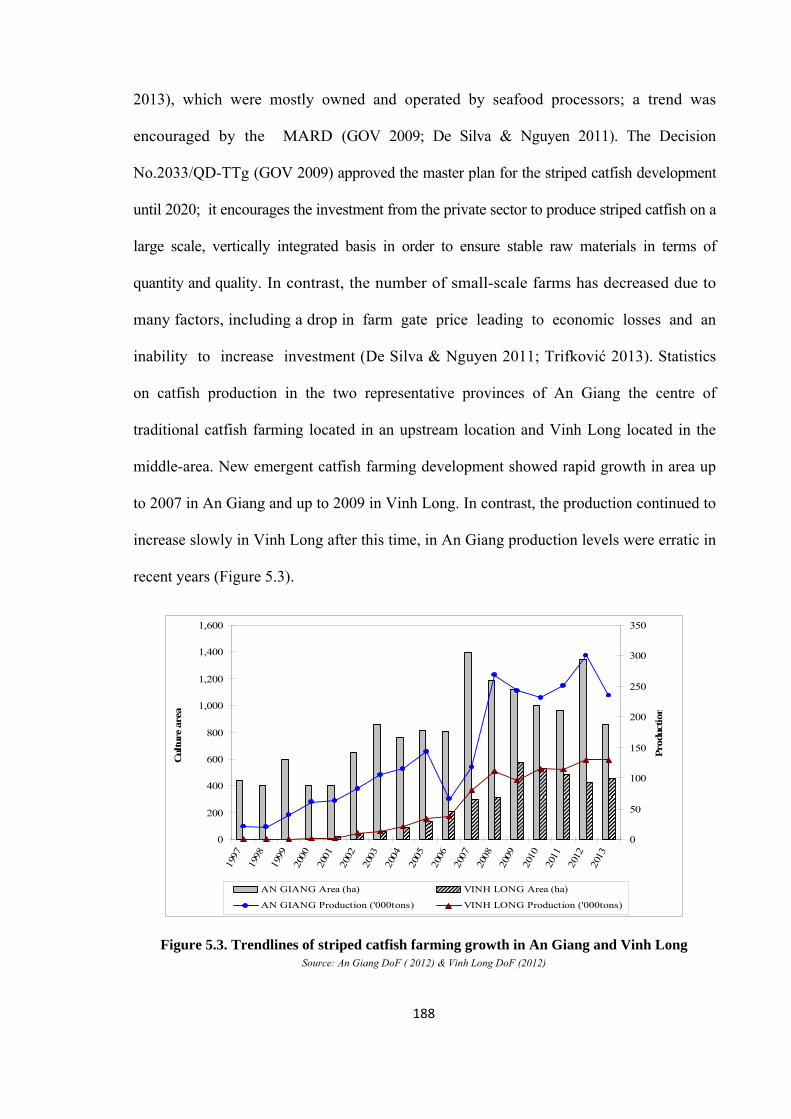
188
2013), which were mostly owned and operated by seafood processors; a trend was
encouraged by the MARD (GOV 2009; De Silva & Nguyen 2011). The Decision
No.2033/QD-TTg (GOV 2009) approved the master plan for the striped catfish development
until 2020; it encourages the investment from the private sector to produce striped catfish on a
large scale, vertically integrated basis in order to ensure stable raw materials in terms of
quantity and quality. In contrast, the number of small-scale farms has decreased due to
many factors, including a drop in farm gate price leading to economic losses and an
inability to increase investment (De Silva & Nguyen 2011; Trifković 2013). Statistics
on catfish production in the two representative provinces of An Giang the centre of
traditional catfish farming located in an upstream location and Vinh Long located in the
middle-area. New emergent catfish farming development showed rapid growth in area up
to 2007 in An Giang and up to 2009 in Vinh Long. In contrast, the production continued to
increase slowly in Vinh Long after this time, in An Giang production levels were erratic in
recent years (Figure 5.3).
Figure 5.3. Trendlines of striped catfish farming growth in An Giang and Vinh Long Source: An Giang DoF ( 2012) & Vinh Long DoF (2012)
0
200
400
600
800
1,000
1,200
1,400
1,600
1997
1998
1999
2000
2001
2002
2003
2004
2005
2006
2007
2008
2009
2010
2011
2012
2013
Cul
ture
are
a
0
50
100
150
200
250
300
350
Pro
duct
ion
AN GIANG Area (ha) VINH LONG Area (ha)
AN GIANG Production ('000tons) VINH LONG Production ('000tons)
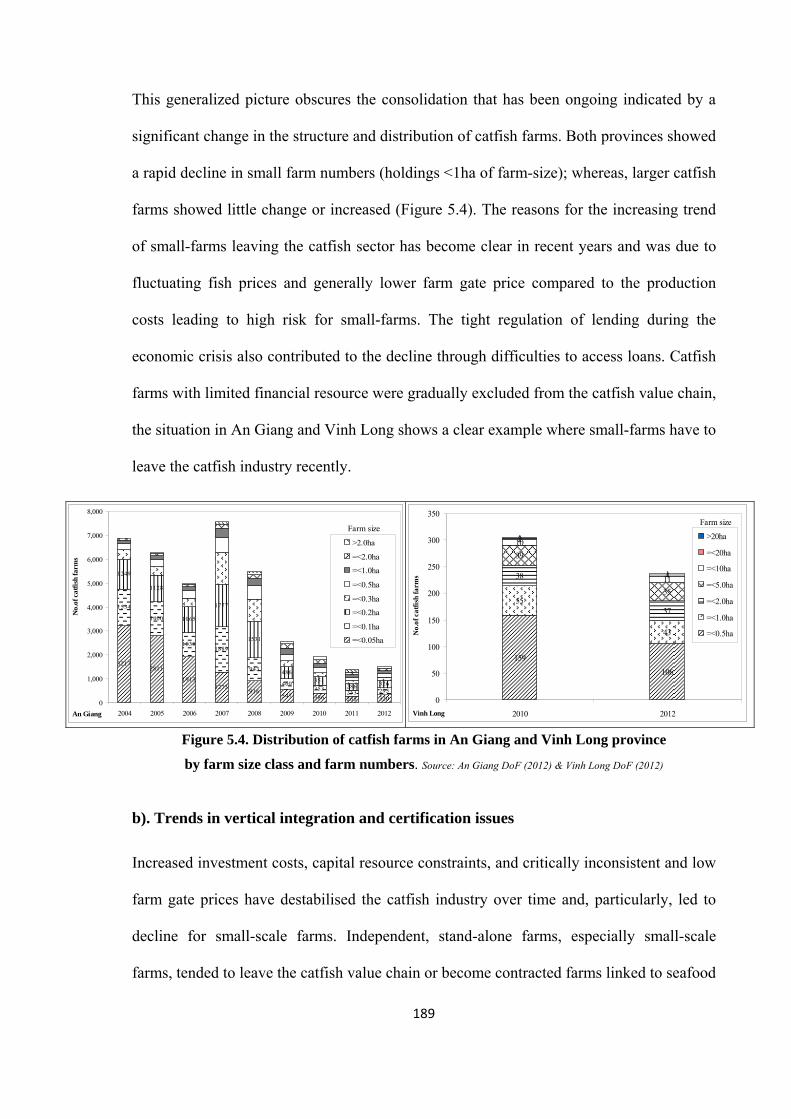
189
This generalized picture obscures the consolidation that has been ongoing indicated by a
significant change in the structure and distribution of catfish farms. Both provinces showed
a rapid decline in small farm numbers (holdings <1ha of farm-size); whereas, larger catfish
farms showed little change or increased (Figure 5.4). The reasons for the increasing trend
of small-farms leaving the catfish sector has become clear in recent years and was due to
fluctuating fish prices and generally lower farm gate price compared to the production
costs leading to high risk for small-farms. The tight regulation of lending during the
economic crisis also contributed to the decline through difficulties to access loans. Catfish
farms with limited financial resource were gradually excluded from the catfish value chain,
the situation in An Giang and Vinh Long shows a clear example where small-farms have to
leave the catfish industry recently.
Figure 5.4. Distribution of catfish farms in An Giang and Vinh Long province
by farm size class and farm numbers. Source: An Giang DoF (2012) & Vinh Long DoF (2012)
b). Trends in vertical integration and certification issues
Increased investment costs, capital resource constraints, and critically inconsistent and low
farm gate prices have destabilised the catfish industry over time and, particularly, led to
decline for small-scale farms. Independent, stand-alone farms, especially small-scale
farms, tended to leave the catfish value chain or become contracted farms linked to seafood
An Giang
32172811
19131273
916547 386 265 320
1534
1400
10381889
943
460353
253 295
1249
1128
1065
1777
1531
486351
286 326
0
1,000
2,000
3,000
4,000
5,000
6,000
7,000
8,000
2004 2005 2006 2007 2008 2009 2010 2011 2012
Farm size
No.
of c
atfi
sh fa
rms .
..
>2.0ha
=<2.0ha
=<1.0ha
=<0.5ha
=<0.3ha
=<0.2ha
=<0.1ha
=<0.05ha
Farm size
159
106
55
43
38
37
39
35
10
11
2
4
1
1
0
50
100
150
200
250
300
350
2010 2012Vinh Long
No.
of c
atfi
sh fa
rms .
.
>20ha
=<20ha
=<10ha
=<5.0ha
=<2.0ha
=<1.0ha
=<0.5ha
190
processors. The trend for large-farms operated by the seafood processors has increased and
to independently ensure the quality and availability of raw materials for processing
(Trifković 2013; Fisheries Directorate 2013; Ponte et al. 2014; Jespersen et al. 2014).
Many processors now produced 50-70% of the total raw material on their own farms
(VASEP 2011; Khoi 2011; Trifković 2013). The balance is sourced from the aquaculture
Ltd. companies and independent farms; but there is a strong tendency for them to develop
vertical linkages with such farms through contract farming arrangements to ensure stable
raw material sources and also to control the fish quality and food safety issues. Large-
farms operated by the processors have grown through purchase and conversion of
agricultural, often orchard land. Most large-farms are located on the inland islands that
were previously orchards (VIFEP 2009; Khoi 2011). Large-farms have also developed
through the purchase or lease of ponds from catfish farms that were not able to continue
farming. In 2009, statistics showed that around 15% of total catfish farmed areas came
from farms with farm-size ≥10ha and this group made up approximately 909ha (Phan et al.
2011). However, by 2012 the catfish farmed areas from the eleven largest pangasius
processors totalled 2,080ha, with farm-sizes ranging between 50-700ha and accounting for
35% of the total catfish farmed area (Fisheries Directorate 2013a). This reflects the rapid
expansion of large-farms and ongoing attrition of small-farms from the sector.
Another important driver of this trend has been the need to respond to the demands of
international certification, the remit of which extend far beyond product quality and food
safety, and requiring compliance with environmental and societal standards. Most certified
farms are large-scale and mainly associated with the processors in the aquaculture zone
(Belton et al. 2011; Trifković 2013). There were 103 catfish farms with 2,800 ha (around
40% of the total area of catfish farming) achieving various sustainability certificates; and
more than 50% of pangasius processors attained certificates from GlobalGAP and ASC
191
(Fisheries Directorate 2013). By 2012, around 10% of catfish products had already
achieved the ASC certification accounting for 9% of the total catfish farmed area and it is
envisioned that by 2015, ASC certified products will reach 50% of the total catfish export-
volume contributing to 30% of the total catfish farmed area (Fisheries Directorate 2013a).
Currently, there were no small-/medium farms with certification, who have faced
difficulties in application for certification due to limitated capital resources and farm
conditions. VietGAP (Vietnamese Good Aquaculture Practices) is being applied to major
farmed species at present. The fisheries sector has a target of 80% of semi-/intensive farms
getting the VietGAP certification before 2020 (MARD 2009b; MARD 2009c; GOV 2009;
GOV 2013).
c). Catfish price trends and its effects to farm changes
The farm gate price was unstable during the production cycle and there has been a further
downward trend recently (Figure 5.5). The fish farm gate price decrease over time can be
caused by unfair competition between the seafood exporters discounting prices to gain the
buyers; and the farm gate price could be driven by foreign importers or supermarkets
demanding lower prices to secure contracts. There were 136 pangasius exporters of which
only 64 exporters had their own processing plants; and thus the high competition in the
market led to a dumping situation (i.e. export price race to bottom) and reduced the
purchase price at the farm gate (Fisheries Directorate 2013a; Tuan et al. 2013). The
processors do not want to reduce their net return during the low exporting price as a result
of dumping exporting price occurs; and reducing farm gate price is a way to cope with this
issue from processors side. While farm gate prices declined, the cost of farming inputs
such as feed, chemicals and labour cost have increased by more than 10% per year. Fish
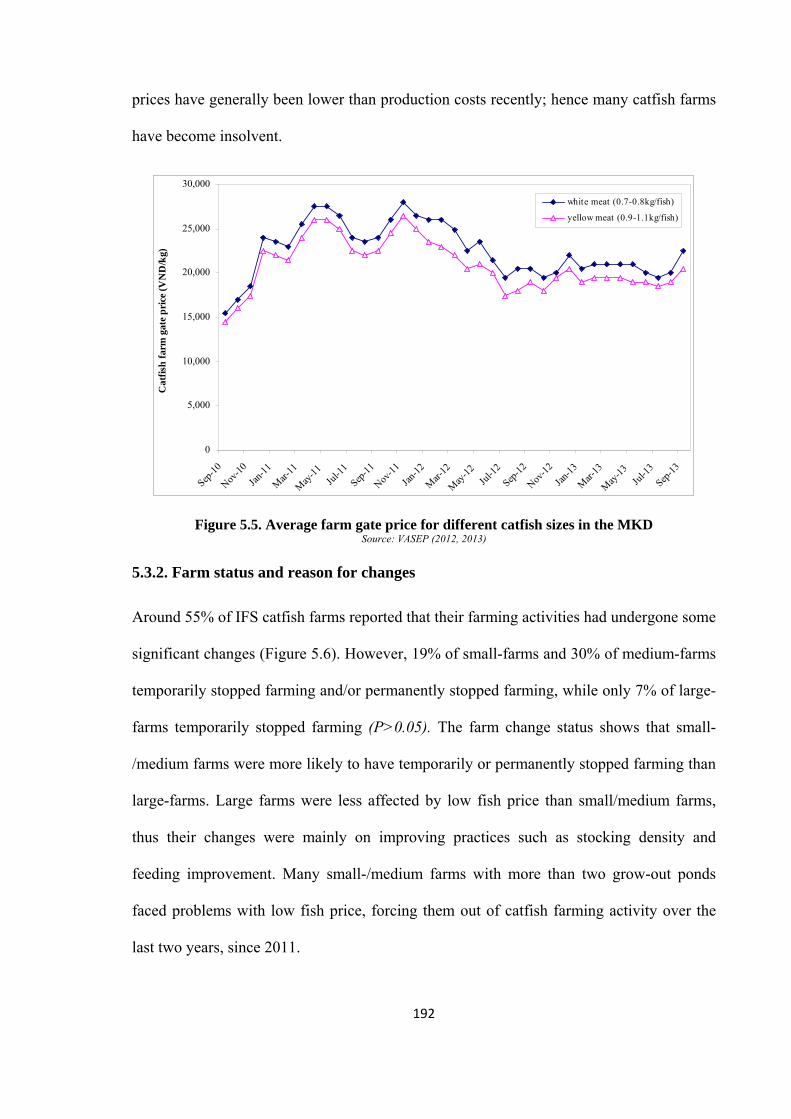
192
prices have generally been lower than production costs recently; hence many catfish farms
have become insolvent.
Figure 5.5. Average farm gate price for different catfish sizes in the MKD Source: VASEP (2012, 2013)
5.3.2. Farm status and reason for changes
Around 55% of IFS catfish farms reported that their farming activities had undergone some
significant changes (Figure 5.6). However, 19% of small-farms and 30% of medium-farms
temporarily stopped farming and/or permanently stopped farming, while only 7% of large-
farms temporarily stopped farming (P>0.05). The farm change status shows that small-
/medium farms were more likely to have temporarily or permanently stopped farming than
large-farms. Large farms were less affected by low fish price than small/medium farms,
thus their changes were mainly on improving practices such as stocking density and
feeding improvement. Many small-/medium farms with more than two grow-out ponds
faced problems with low fish price, forcing them out of catfish farming activity over the
last two years, since 2011.
0
5,000
10,000
15,000
20,000
25,000
30,000
Sep-1
0
Nov-1
0
Jan-
11
Mar-
11
May
-11
Jul-1
1
Sep-1
1
Nov-1
1
Jan-
12
Mar-
12
May
-12
Jul-1
2
Sep-1
2
Nov-1
2
Jan-
13
Mar-
13
May
-13
Jul-1
3
Sep-1
3
Cat
fish
far
m g
ate
pri
ce (
VN
D/k
g)
white meat (0.7-0.8kg/fish)
yellow meat (0.9-1.1kg/fish)
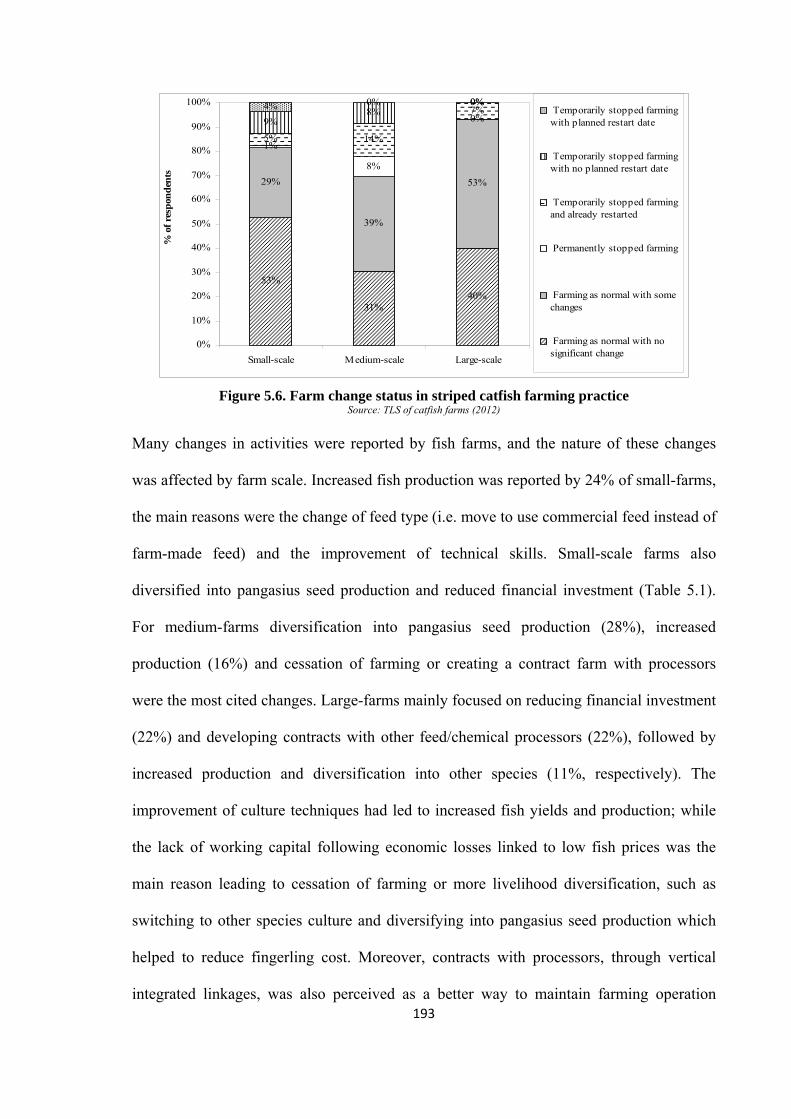
193
Figure 5.6. Farm change status in striped catfish farming practice
Source: TLS of catfish farms (2012)
Many changes in activities were reported by fish farms, and the nature of these changes
was affected by farm scale. Increased fish production was reported by 24% of small-farms,
the main reasons were the change of feed type (i.e. move to use commercial feed instead of
farm-made feed) and the improvement of technical skills. Small-scale farms also
diversified into pangasius seed production and reduced financial investment (Table 5.1).
For medium-farms diversification into pangasius seed production (28%), increased
production (16%) and cessation of farming or creating a contract farm with processors
were the most cited changes. Large-farms mainly focused on reducing financial investment
(22%) and developing contracts with other feed/chemical processors (22%), followed by
increased production and diversification into other species (11%, respectively). The
improvement of culture techniques had led to increased fish yields and production; while
the lack of working capital following economic losses linked to low fish prices was the
main reason leading to cessation of farming or more livelihood diversification, such as
switching to other species culture and diversifying into pangasius seed production which
helped to reduce fingerling cost. Moreover, contracts with processors, through vertical
integrated linkages, was also perceived as a better way to maintain farming operation
53%
31%40%
29%
39%
53%
1%
8%
0%
5% 14%
7%9%
8%0%4% 0% 0%
0%
10%
20%
30%
40%
50%
60%
70%
80%
90%
100%
Small-scale Medium-scale Large-scale
% o
f re
spon
den
ts
Temporarily stopped farmingwith planned restart date
Temporarily stopped farmingwith no planned restart date
Temporarily stopped farmingand already restarted
Permanently stopped farming
Farming as normal with somechanges
Farming as normal with nosignificant change
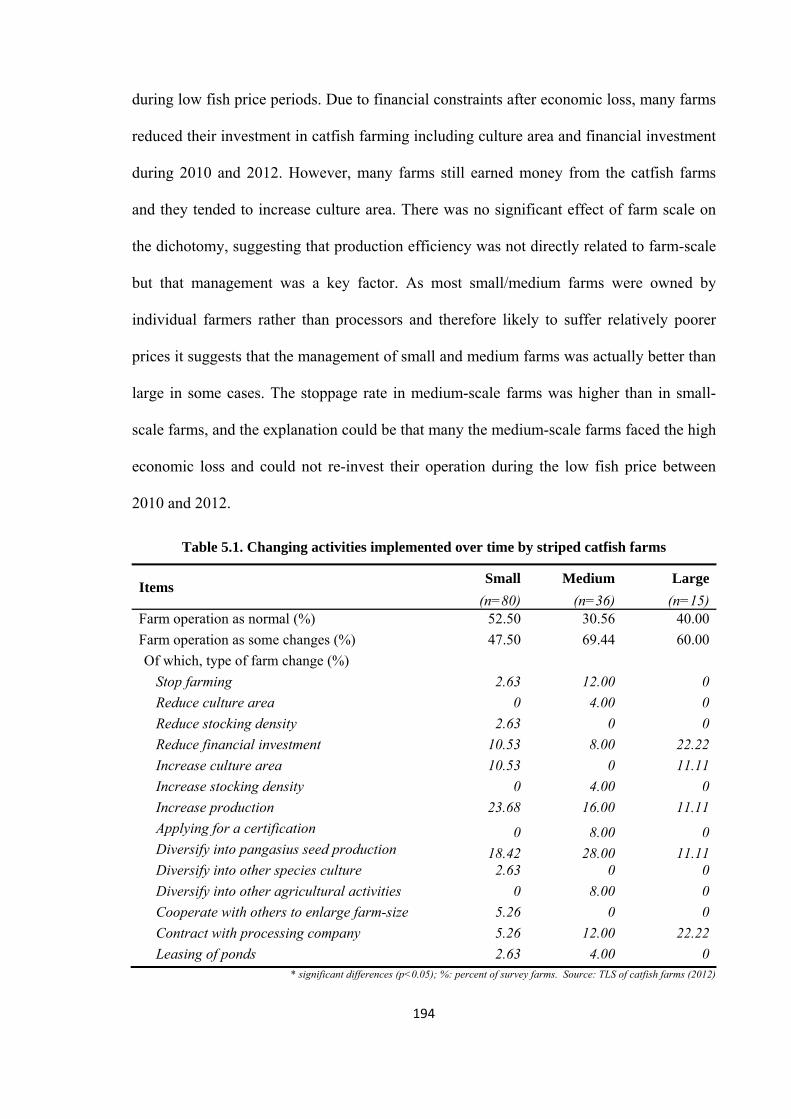
194
during low fish price periods. Due to financial constraints after economic loss, many farms
reduced their investment in catfish farming including culture area and financial investment
during 2010 and 2012. However, many farms still earned money from the catfish farms
and they tended to increase culture area. There was no significant effect of farm scale on
the dichotomy, suggesting that production efficiency was not directly related to farm-scale
but that management was a key factor. As most small/medium farms were owned by
individual farmers rather than processors and therefore likely to suffer relatively poorer
prices it suggests that the management of small and medium farms was actually better than
large in some cases. The stoppage rate in medium-scale farms was higher than in small-
scale farms, and the explanation could be that many the medium-scale farms faced the high
economic loss and could not re-invest their operation during the low fish price between
2010 and 2012.
Table 5.1. Changing activities implemented over time by striped catfish farms
Items Small Medium Large
(n=80) (n=36) (n=15)Farm operation as normal (%) 52.50 30.56 40.00
Farm operation as some changes (%) 47.50 69.44 60.00
Of which, type of farm change (%)
Stop farming 2.63 12.00 0
Reduce culture area 0 4.00 0
Reduce stocking density 2.63 0 0
Reduce financial investment 10.53 8.00 22.22
Increase culture area 10.53 0 11.11
Increase stocking density 0 4.00 0
Increase production 23.68 16.00 11.11
Applying for a certification 0 8.00 0Diversify into pangasius seed production 18.42 28.00 11.11Diversify into other species culture 2.63 0 0
Diversify into other agricultural activities 0 8.00 0
Cooperate with others to enlarge farm-size 5.26 0 0
Contract with processing company 5.26 12.00 22.22
Leasing of ponds 2.63 4.00 0 * significant differences (p<0.05); %: percent of survey farms. Source: TLS of catfish farms (2012)
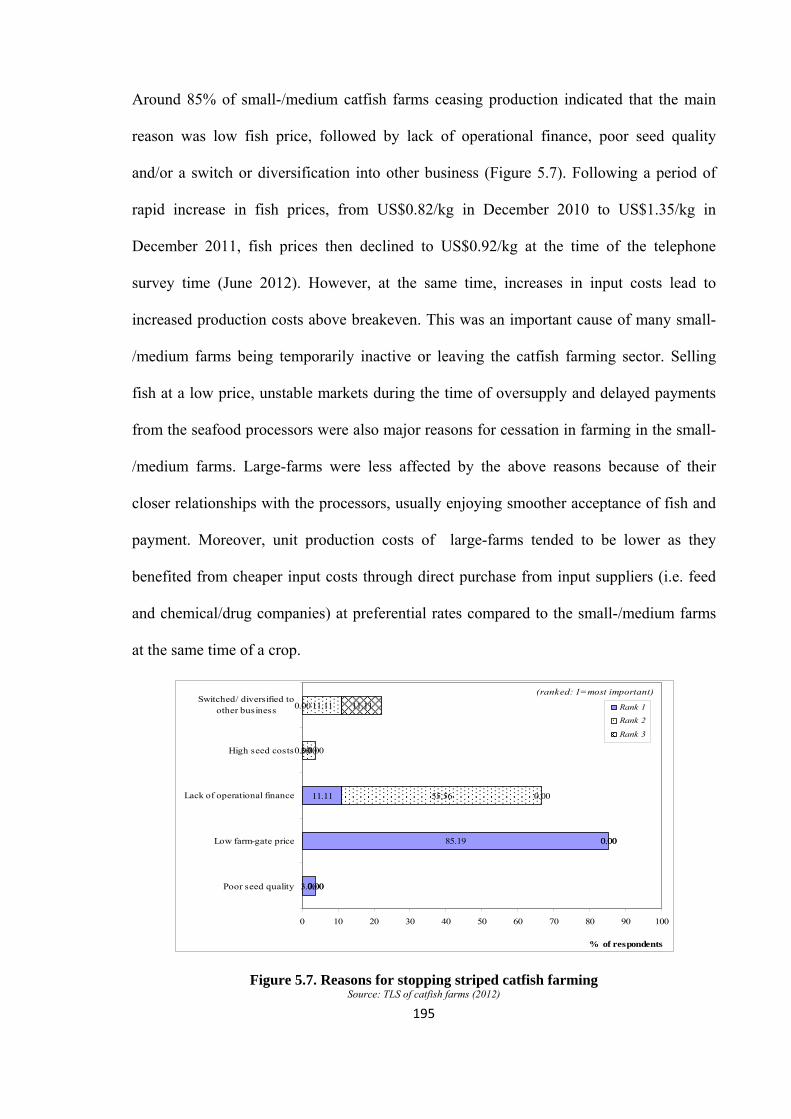
195
Around 85% of small-/medium catfish farms ceasing production indicated that the main
reason was low fish price, followed by lack of operational finance, poor seed quality
and/or a switch or diversification into other business (Figure 5.7). Following a period of
rapid increase in fish prices, from US$0.82/kg in December 2010 to US$1.35/kg in
December 2011, fish prices then declined to US$0.92/kg at the time of the telephone
survey time (June 2012). However, at the same time, increases in input costs lead to
increased production costs above breakeven. This was an important cause of many small-
/medium farms being temporarily inactive or leaving the catfish farming sector. Selling
fish at a low price, unstable markets during the time of oversupply and delayed payments
from the seafood processors were also major reasons for cessation in farming in the small-
/medium farms. Large-farms were less affected by the above reasons because of their
closer relationships with the processors, usually enjoying smoother acceptance of fish and
payment. Moreover, unit production costs of large-farms tended to be lower as they
benefited from cheaper input costs through direct purchase from input suppliers (i.e. feed
and chemical/drug companies) at preferential rates compared to the small-/medium farms
at the same time of a crop.
Figure 5.7. Reasons for stopping striped catfish farming Source: TLS of catfish farms (2012)
(ranked: 1=most important)
3.70
85.19
11.11
0.00
0.00
0.00
0.00
55.56
3.70
11.11
0.00
0.00
0.00
0.00
11.11
0 10 20 30 40 50 60 70 80 90 100
Poor seed quality
Low farm-gate price
Lack of operational finance
High seed costs
Switched/ diversified toother business
% of respondents
Rank 1
Rank 2
Rank 3
196
The adaptations used by farmers to maintain catfish farming during periods of low farm-
gate prices and credit access were mainly i) suspending pond production until the farm
gate prices attained an economically viable level, ii) changes to feed management (i.e.
temporarily stopped feeding or abnormal feeding conditions), iii) reduced investment
levels (i.e. reduced in culture area, stocking density), iv) shifts to other species (i.e.
snakehead fish, African catfish, walking fish, and catfish nursing farming), and v)
contracting the farm to processors. There were differences among farm scale on how to
cope with the problem of low fish price, small-/medium farms temporarily stopped farming
and waited until the fish price increased, shifting to culture other species and leasing or
suspending ponds. In contrast, large-farms mainly reduced their investment level (i.e.
reduced culture area, stocking density and restricted feeding) or temporarily stopped
farming with a planned restart date. For farms that permanently stopped production, most
of the ponds were empty or suspended due to difficulty in leasing or selling the ponds
during the low fish price periods.
5.3.3. Changes in technical aspects
Comparing the indicators of technical aspects between the two-survey periods (i.e. IFS vs.
TLS) shows there was no significant difference suggesting few changes occurred in this
period in the technology of highly intensive catfish system among the farm categories. The
grow-out pond size and water depth did not change between 2010 and 2012; however,
significant differences emerged in pond size between farm scales, the small farms had
smaller and shallower ponds compared to medium and large farms (P<0.05). Technical
changes also occurred on feed management. The eFCR was reduced around 2-7%
compared to the data on the IFS survey in 2010 (Table 5.2, Table 4.6). Larger farms
showed better improvement in the feed management compared to smaller farms.
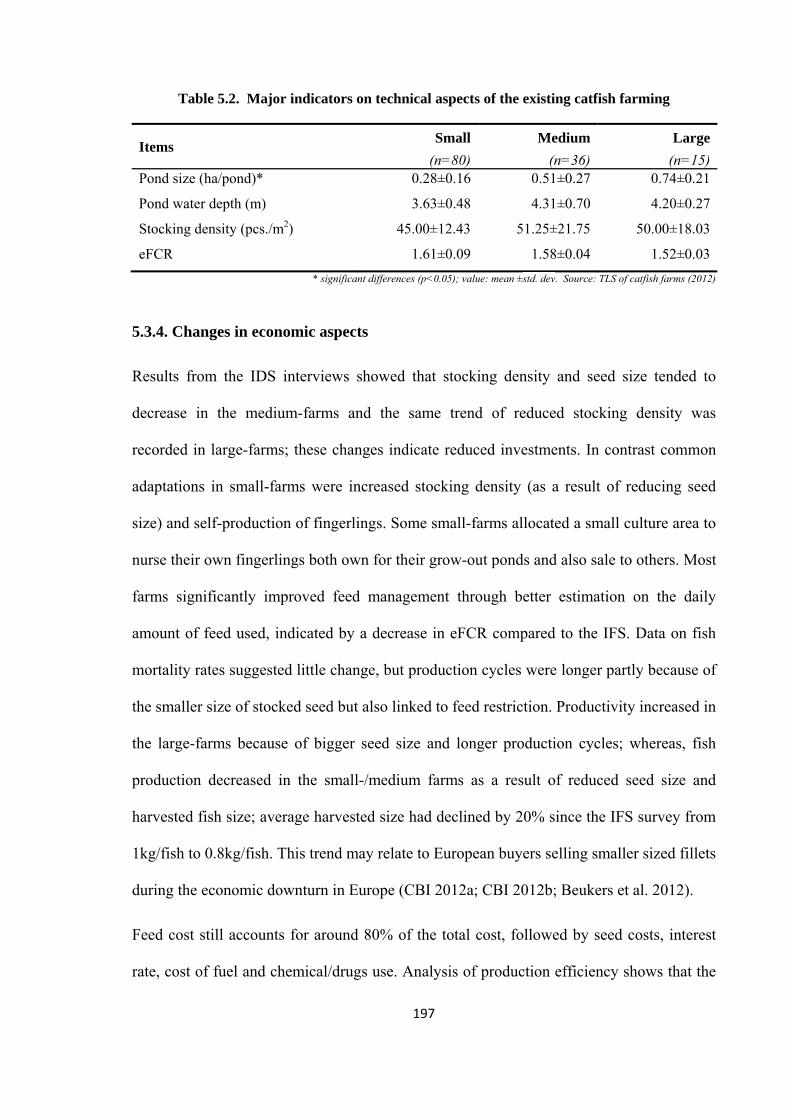
197
Table 5.2. Major indicators on technical aspects of the existing catfish farming
Items Small Medium Large
(n=80) (n=36) (n=15)Pond size (ha/pond)* 0.28±0.16 0.51±0.27 0.74±0.21
Pond water depth (m) 3.63±0.48 4.31±0.70 4.20±0.27
Stocking density (pcs./m2) 45.00±12.43 51.25±21.75 50.00±18.03
eFCR 1.61±0.09 1.58±0.04 1.52±0.03
* significant differences (p<0.05); value: mean ±std. dev. Source: TLS of catfish farms (2012)
5.3.4. Changes in economic aspects
Results from the IDS interviews showed that stocking density and seed size tended to
decrease in the medium-farms and the same trend of reduced stocking density was
recorded in large-farms; these changes indicate reduced investments. In contrast common
adaptations in small-farms were increased stocking density (as a result of reducing seed
size) and self-production of fingerlings. Some small-farms allocated a small culture area to
nurse their own fingerlings both own for their grow-out ponds and also sale to others. Most
farms significantly improved feed management through better estimation on the daily
amount of feed used, indicated by a decrease in eFCR compared to the IFS. Data on fish
mortality rates suggested little change, but production cycles were longer partly because of
the smaller size of stocked seed but also linked to feed restriction. Productivity increased in
the large-farms because of bigger seed size and longer production cycles; whereas, fish
production decreased in the small-/medium farms as a result of reduced seed size and
harvested fish size; average harvested size had declined by 20% since the IFS survey from
1kg/fish to 0.8kg/fish. This trend may relate to European buyers selling smaller sized fillets
during the economic downturn in Europe (CBI 2012a; CBI 2012b; Beukers et al. 2012).
Feed cost still accounts for around 80% of the total cost, followed by seed costs, interest
rate, cost of fuel and chemical/drugs use. Analysis of production efficiency shows that the
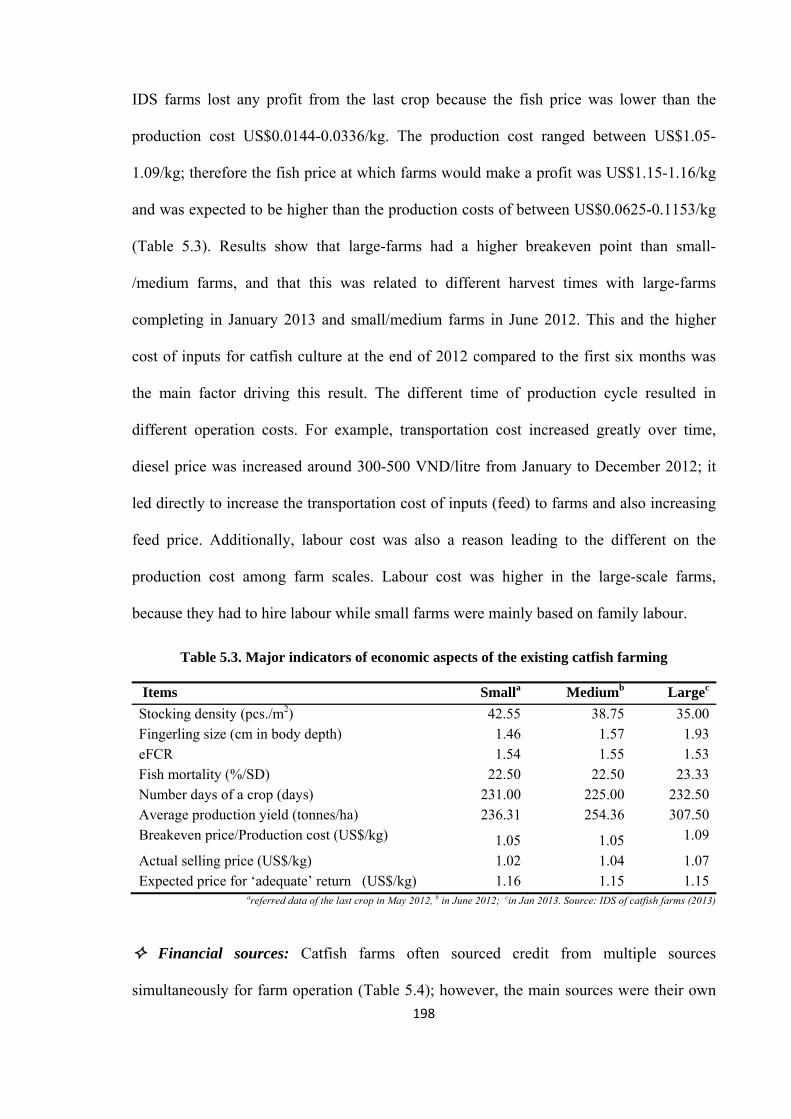
198
IDS farms lost any profit from the last crop because the fish price was lower than the
production cost US$0.0144-0.0336/kg. The production cost ranged between US$1.05-
1.09/kg; therefore the fish price at which farms would make a profit was US$1.15-1.16/kg
and was expected to be higher than the production costs of between US$0.0625-0.1153/kg
(Table 5.3). Results show that large-farms had a higher breakeven point than small-
/medium farms, and that this was related to different harvest times with large-farms
completing in January 2013 and small/medium farms in June 2012. This and the higher
cost of inputs for catfish culture at the end of 2012 compared to the first six months was
the main factor driving this result. The different time of production cycle resulted in
different operation costs. For example, transportation cost increased greatly over time,
diesel price was increased around 300-500 VND/litre from January to December 2012; it
led directly to increase the transportation cost of inputs (feed) to farms and also increasing
feed price. Additionally, labour cost was also a reason leading to the different on the
production cost among farm scales. Labour cost was higher in the large-scale farms,
because they had to hire labour while small farms were mainly based on family labour.
Table 5.3. Major indicators of economic aspects of the existing catfish farming
Items Smalla Mediumb Largec
Stocking density (pcs./m2) 42.55 38.75 35.00Fingerling size (cm in body depth) 1.46 1.57 1.93eFCR 1.54 1.55 1.53Fish mortality (%/SD) 22.50 22.50 23.33Number days of a crop (days) 231.00 225.00 232.50Average production yield (tonnes/ha) 236.31 254.36 307.50Breakeven price/Production cost (US$/kg) 1.05 1.05 1.09
Actual selling price (US$/kg) 1.02 1.04 1.07Expected price for ‘adequate’ return (US$/kg) 1.16 1.15 1.15
areferred data of the last crop in May 2012, b in June 2012; cin Jan 2013. Source: IDS of catfish farms (2013)
Financial sources: Catfish farms often sourced credit from multiple sources
simultaneously for farm operation (Table 5.4); however, the main sources were their own
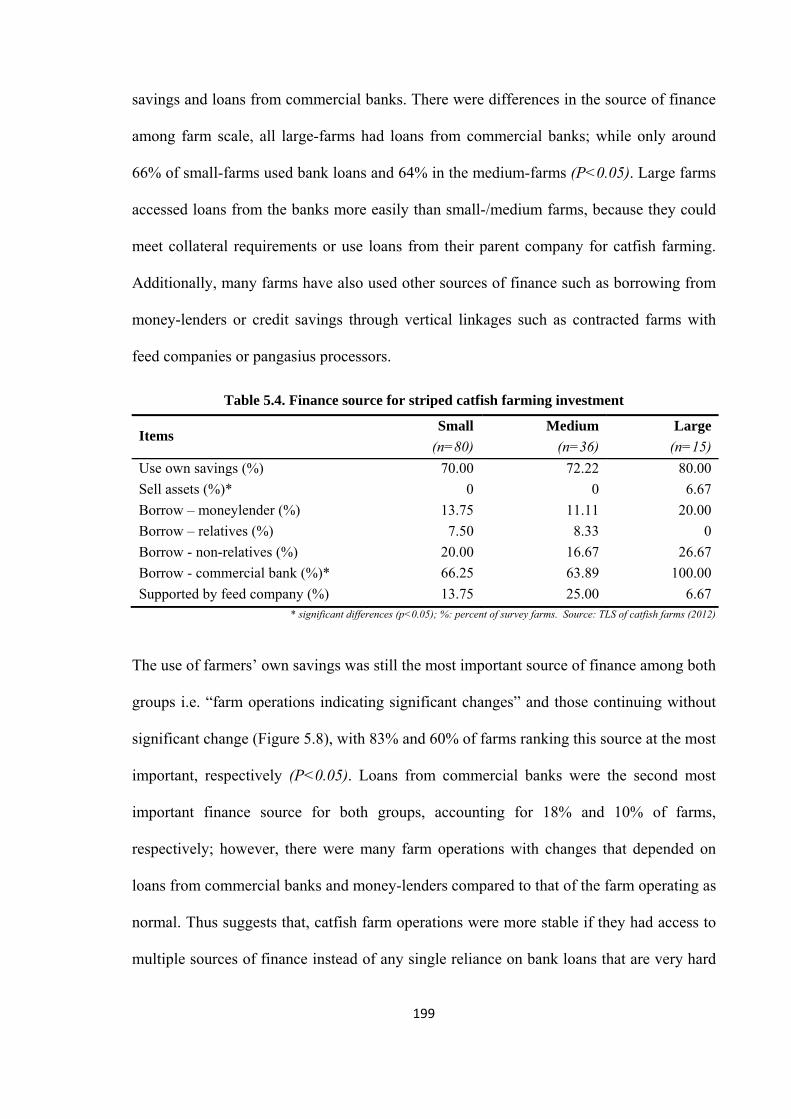
199
savings and loans from commercial banks. There were differences in the source of finance
among farm scale, all large-farms had loans from commercial banks; while only around
66% of small-farms used bank loans and 64% in the medium-farms (P<0.05). Large farms
accessed loans from the banks more easily than small-/medium farms, because they could
meet collateral requirements or use loans from their parent company for catfish farming.
Additionally, many farms have also used other sources of finance such as borrowing from
money-lenders or credit savings through vertical linkages such as contracted farms with
feed companies or pangasius processors.
Table 5.4. Finance source for striped catfish farming investment
Items Small Medium Large
(n=80) (n=36) (n=15)
Use own savings (%) 70.00 72.22 80.00
Sell assets (%)* 0 0 6.67
Borrow – moneylender (%) 13.75 11.11 20.00
Borrow – relatives (%) 7.50 8.33 0
Borrow - non-relatives (%) 20.00 16.67 26.67
Borrow - commercial bank (%)* 66.25 63.89 100.00
Supported by feed company (%) 13.75 25.00 6.67 * significant differences (p<0.05); %: percent of survey farms. Source: TLS of catfish farms (2012)
The use of farmers’ own savings was still the most important source of finance among both
groups i.e. “farm operations indicating significant changes” and those continuing without
significant change (Figure 5.8), with 83% and 60% of farms ranking this source at the most
important, respectively (P<0.05). Loans from commercial banks were the second most
important finance source for both groups, accounting for 18% and 10% of farms,
respectively; however, there were many farm operations with changes that depended on
loans from commercial banks and money-lenders compared to that of the farm operating as
normal. Thus suggests that, catfish farm operations were more stable if they had access to
multiple sources of finance instead of any single reliance on bank loans that are very hard
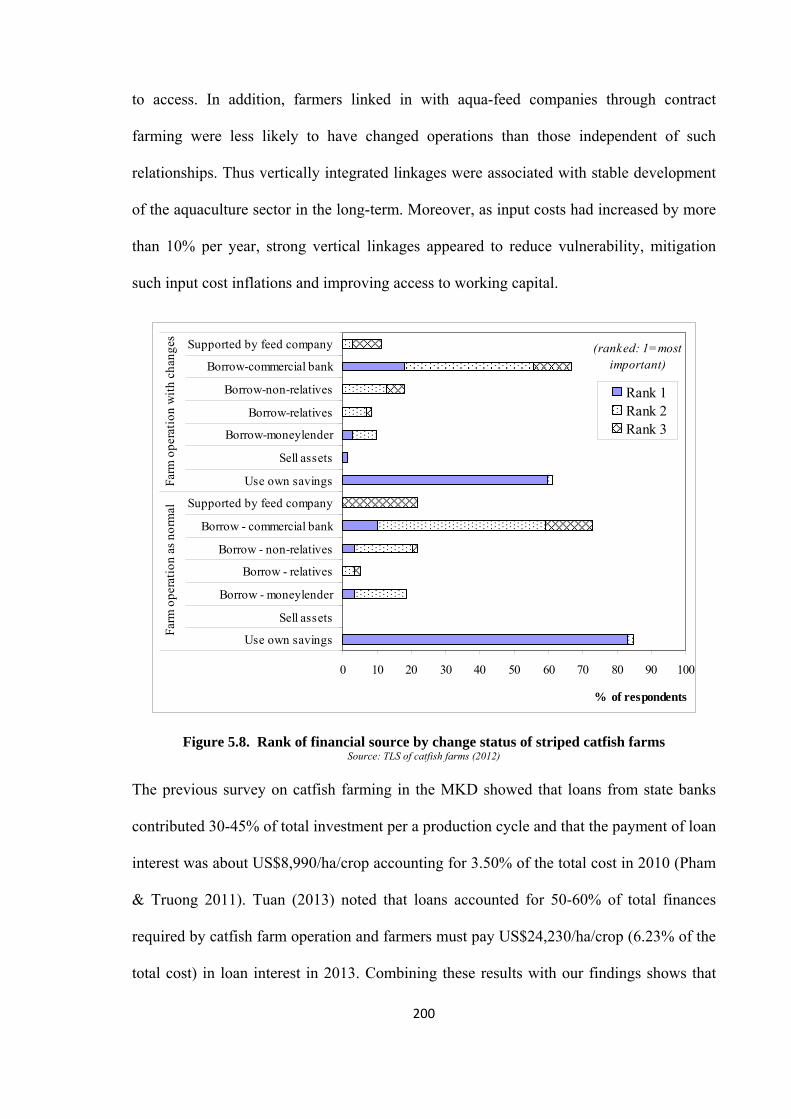
200
to access. In addition, farmers linked in with aqua-feed companies through contract
farming were less likely to have changed operations than those independent of such
relationships. Thus vertically integrated linkages were associated with stable development
of the aquaculture sector in the long-term. Moreover, as input costs had increased by more
than 10% per year, strong vertical linkages appeared to reduce vulnerability, mitigation
such input cost inflations and improving access to working capital.
Figure 5.8. Rank of financial source by change status of striped catfish farms Source: TLS of catfish farms (2012)
The previous survey on catfish farming in the MKD showed that loans from state banks
contributed 30-45% of total investment per a production cycle and that the payment of loan
interest was about US$8,990/ha/crop accounting for 3.50% of the total cost in 2010 (Pham
& Truong 2011). Tuan (2013) noted that loans accounted for 50-60% of total finances
required by catfish farm operation and farmers must pay US$24,230/ha/crop (6.23% of the
total cost) in loan interest in 2013. Combining these results with our findings shows that
0 10 20 30 40 50 60 70 80 90 100
Use own savings
Sell assets
Borrow - moneylender
Borrow - relatives
Borrow - non-relatives
Borrow - commercial bank
Supported by feed company
Use own savings
Sell assets
Borrow-moneylender
Borrow-relatives
Borrow-non-relatives
Borrow-commercial bank
Supported by feed company
Farm
ope
rati
on a
s no
rmal
Farm
ope
rati
on w
ith
chan
ges
(ranked: 1=most important)
% of respondents
Rank 1Rank 2Rank 3
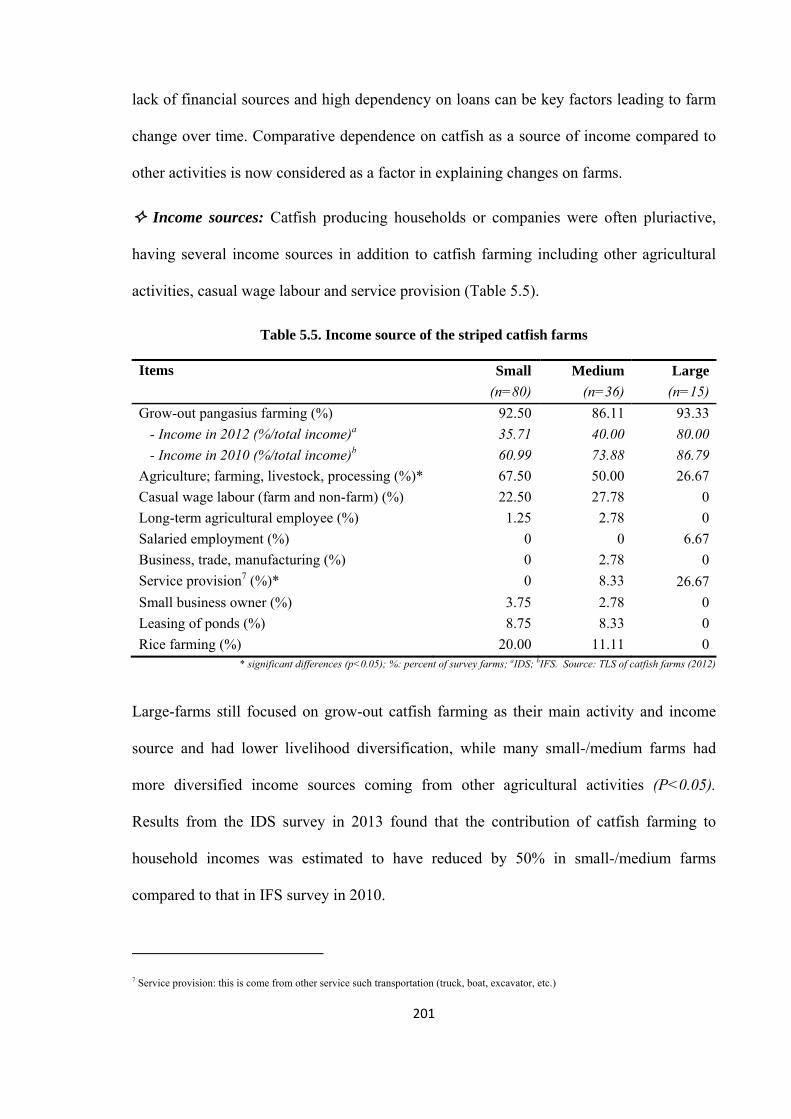
201
lack of financial sources and high dependency on loans can be key factors leading to farm
change over time. Comparative dependence on catfish as a source of income compared to
other activities is now considered as a factor in explaining changes on farms.
Income sources: Catfish producing households or companies were often pluriactive,
having several income sources in addition to catfish farming including other agricultural
activities, casual wage labour and service provision (Table 5.5).
Table 5.5. Income source of the striped catfish farms
Items Small Medium Large
(n=80) (n=36) (n=15)
Grow-out pangasius farming (%) 92.50 86.11 93.33
- Income in 2012 (%/total income)a 35.71 40.00 80.00
- Income in 2010 (%/total income)b 60.99 73.88 86.79
Agriculture; farming, livestock, processing (%)* 67.50 50.00 26.67
Casual wage labour (farm and non-farm) (%) 22.50 27.78 0
Long-term agricultural employee (%) 1.25 2.78 0
Salaried employment (%) 0 0 6.67
Business, trade, manufacturing (%) 0 2.78 0
Service provision7 (%)* 0 8.33 26.67
Small business owner (%) 3.75 2.78 0
Leasing of ponds (%) 8.75 8.33 0
Rice farming (%) 20.00 11.11 0* significant differences (p<0.05); %: percent of survey farms; aIDS; bIFS. Source: TLS of catfish farms (2012)
Large-farms still focused on grow-out catfish farming as their main activity and income
source and had lower livelihood diversification, while many small-/medium farms had
more diversified income sources coming from other agricultural activities (P<0.05).
Results from the IDS survey in 2013 found that the contribution of catfish farming to
household incomes was estimated to have reduced by 50% in small-/medium farms
compared to that in IFS survey in 2010.
7 Service provision: this is come from other service such transportation (truck, boat, excavator, etc.)
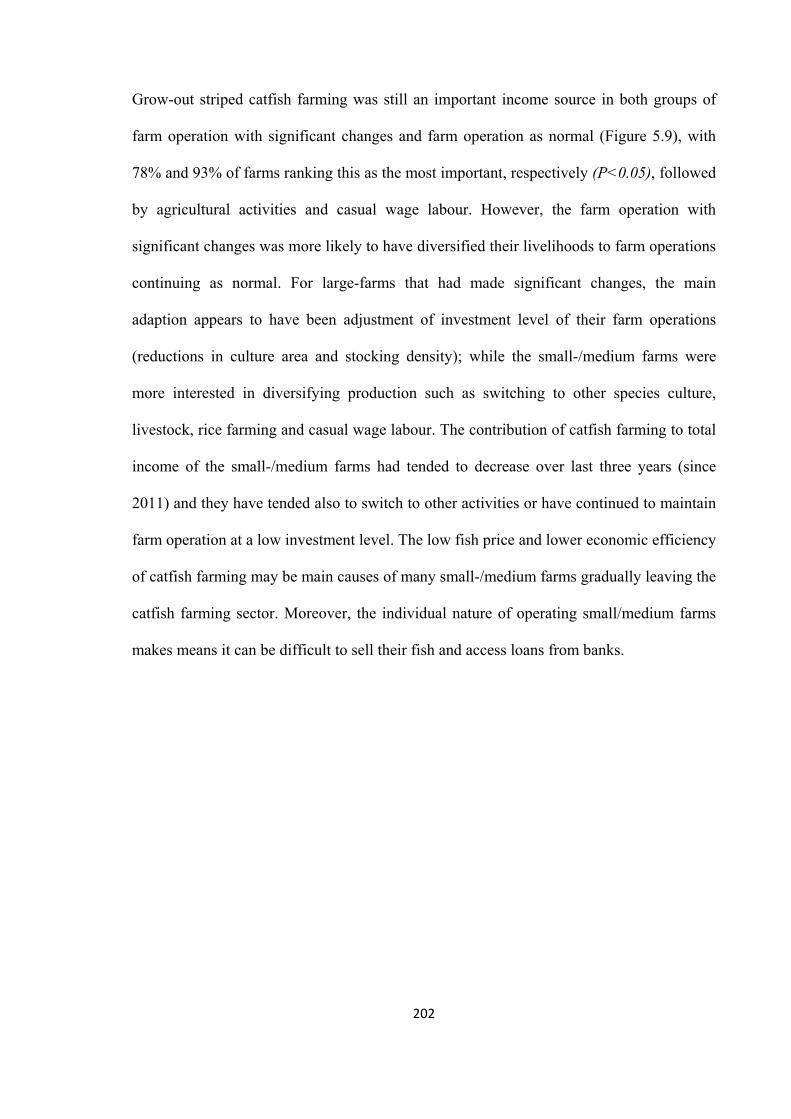
202
Grow-out striped catfish farming was still an important income source in both groups of
farm operation with significant changes and farm operation as normal (Figure 5.9), with
78% and 93% of farms ranking this as the most important, respectively (P<0.05), followed
by agricultural activities and casual wage labour. However, the farm operation with
significant changes was more likely to have diversified their livelihoods to farm operations
continuing as normal. For large-farms that had made significant changes, the main
adaption appears to have been adjustment of investment level of their farm operations
(reductions in culture area and stocking density); while the small-/medium farms were
more interested in diversifying production such as switching to other species culture,
livestock, rice farming and casual wage labour. The contribution of catfish farming to total
income of the small-/medium farms had tended to decrease over last three years (since
2011) and they have tended also to switch to other activities or have continued to maintain
farm operation at a low investment level. The low fish price and lower economic efficiency
of catfish farming may be main causes of many small-/medium farms gradually leaving the
catfish farming sector. Moreover, the individual nature of operating small/medium farms
makes means it can be difficult to sell their fish and access loans from banks.
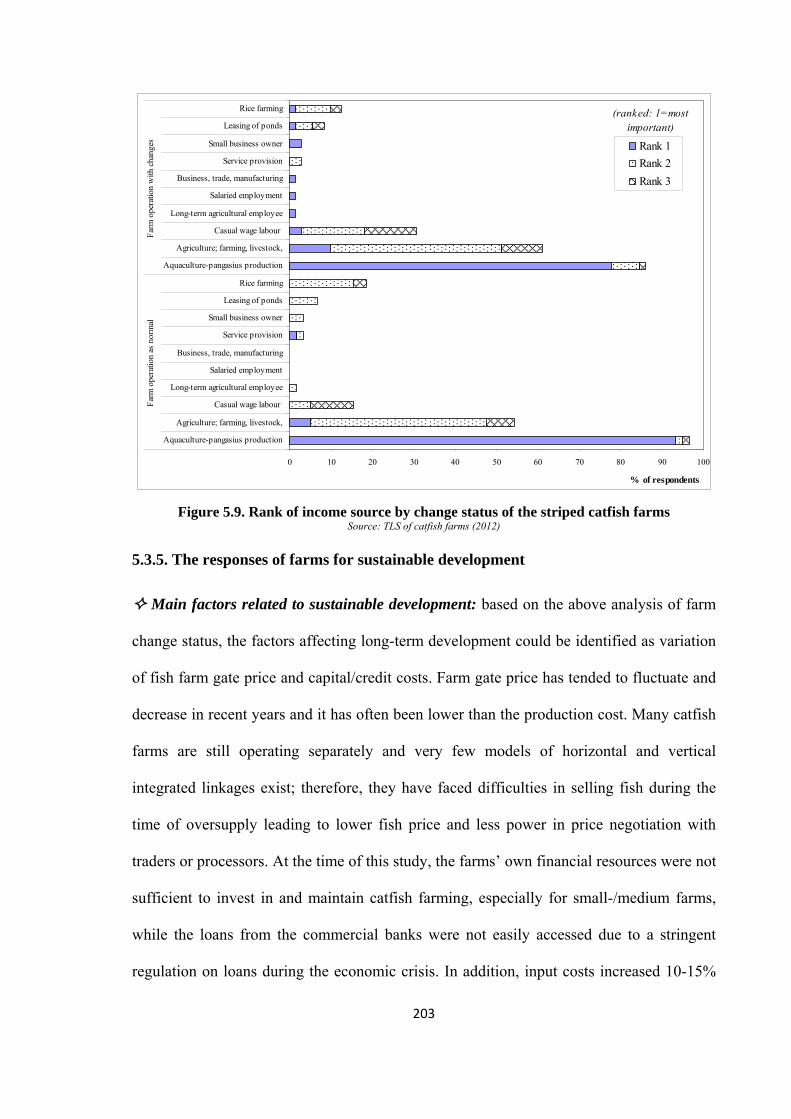
203
Figure 5.9. Rank of income source by change status of the striped catfish farms Source: TLS of catfish farms (2012)
5.3.5. The responses of farms for sustainable development
Main factors related to sustainable development: based on the above analysis of farm
change status, the factors affecting long-term development could be identified as variation
of fish farm gate price and capital/credit costs. Farm gate price has tended to fluctuate and
decrease in recent years and it has often been lower than the production cost. Many catfish
farms are still operating separately and very few models of horizontal and vertical
integrated linkages exist; therefore, they have faced difficulties in selling fish during the
time of oversupply leading to lower fish price and less power in price negotiation with
traders or processors. At the time of this study, the farms’ own financial resources were not
sufficient to invest in and maintain catfish farming, especially for small-/medium farms,
while the loans from the commercial banks were not easily accessed due to a stringent
regulation on loans during the economic crisis. In addition, input costs increased 10-15%
0 10 20 30 40 50 60 70 80 90 100
Aquaculture-pangasius production
Agriculture; farming, livestock,
Casual wage labour
Long-term agricultural employee
Salaried employment
Business, trade, manufacturing
Service provision
Small business owner
Leasing of ponds
Rice farming
Aquaculture-pangasius production
Agriculture; farming, livestock,
Casual wage labour
Long-term agricultural employee
Salaried employment
Business, trade, manufacturing
Service provision
Small business owner
Leasing of ponds
Rice farming
Far
m o
pera
tion
as n
orm
alF
arm
ope
ratio
n w
ith c
hang
es
(ranked: 1=most important)
% of respondents
Rank 1
Rank 2
Rank 3
204
annually, leading to increased production cost; many farms lost profit from catfish farming
and so were forced to change their farming practice such as reducing investment, switching
to other activities, and temporarily or permanently ceasing farming. These two main
factors strongly affected the status of farm changes between IFS (in 2010) and TLS
surveys (in 2012), and were mentioned in Table 4.13. To solve the constraints of low farm
gate price, rising input cost, lack of financial resources, technical barriers and increasing
the competitive price, the catfish farmers need to make i) a reasonable return on
investment, and ii) institute the main ‘costs’ associated with the main certification
schemes.
Pangasius products have highly competitive prices compared to whitefish in the
international food markets, for example, the retail price of frozen plain pangasius fillets
was €4.65-4.79/kg in the Netherlands, €7.65/kg in the UK compared to €3.98-6.83/kg and
€4.53/kg of frozen plain Alaska pollock fillets in 2011, respectively (Beukers et al. 2012).
The Netherlands and UK markets have higher requirements with respect to production
quality and sustainability and therefore pay high import prices (€2.13-2.48/kg). Whereas,
Spanish and Polish markets have lower requirements which is reflected by significantly
lower import prices (€1.64-1.90/kg) (Beukers et al. 2012). There is a big difference within
European markets; the pangasius product is very competitive in the Netherlands market
while less in the UK market. This suggests that the fish can be ‘marketed’ in different
segments that could have much more impact on profitability. This reflects there is the high
potential for future development of the catfish farming sector, but the requirement for food
quality and safety will be stringent. Although pangasius is highly competitive prices and its
quality (e.g. white flesh colour, mild taste and texture) compared to whitefish (Little et al.
2012), the catfish sector should be made to complement the investment being made to meet
international standards with greater emphasis on marketing that fact and the positive credence
205
qualities of panagaisus compared to its competitors to maintain and gain markets. Moreover,
whitefish traditionally has a strong focus on Alaska pollock, which is sometimes sold at a
lower price than pangasius, with rather stable stocks and MSC certification. This
constrains opportunities for positioning pangasius as a higher value product (CBI 2012a;
CBI 2012b; Beukers et al. 2012). In addition, with the increasing requirement on the
environmental sustainability from the NGOs and customers, sustainable production will be
paid more attention on the global environmental impact of seafood products. In this point of
view, an analysis on life cycle assessment of Vietnamese catfish production shows the
greenhouse gas (GHG) emissions, acidification and eutrophication value were in a similar
range as tilapia production in China while lower than in Thailand, that were 8,000kg CO2-
eq, 60kg SO2-eq, 65kg PO4-eq per tonne product in Vietnam compared to 10,000kg CO2-
eq, 80kg SO2-eq, 100kg PO4-eq in Thailand (Henriksson et al. 2014). This suggests the
pangasius products have competitive qualities in terms of their low global environmental
impacts even compared to tilapias, often extolled for their ‘green’ credentials (e.g. Little et
al. 2012).
Farms responses: Of the farms questioned, 33% had no plans or proposals, while many
farmers were still confused and made passive suggestions (Figure 5.10). Around 31% of
farms planned to discuss proposals with local authorities regarding the situation of fish
production/consumption in order to looking for the way to solve their difficulties or
constraints. For example, through the VINAFIS and local authorities the discussion and
suggestions on the financial support during the low fish price and economic crisis were
taken by the government to support catfish farms during 2011 and 2012 (as mentioned in
Chapter 3). Although the financial support did not reach all request from farms, it also
helped many farms solving their financial constraint. The active responses and plans were
to improve technical skills (21% of farms), followed by improvement of farm management
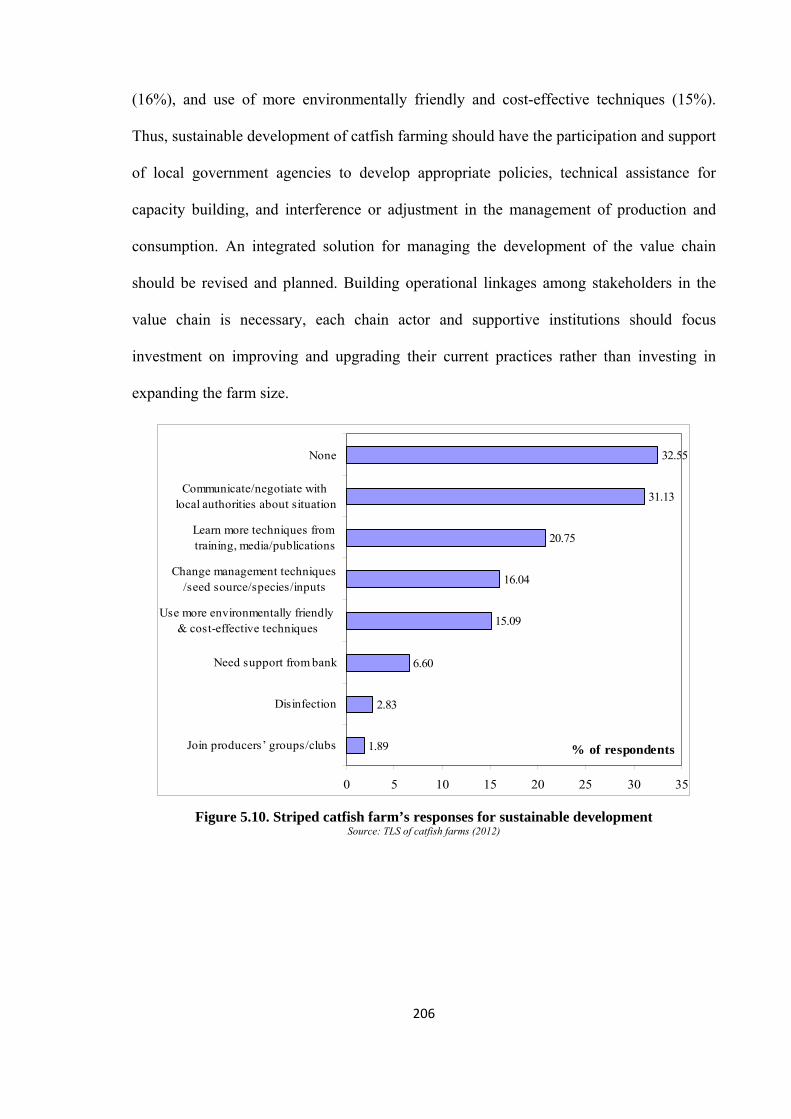
206
(16%), and use of more environmentally friendly and cost-effective techniques (15%).
Thus, sustainable development of catfish farming should have the participation and support
of local government agencies to develop appropriate policies, technical assistance for
capacity building, and interference or adjustment in the management of production and
consumption. An integrated solution for managing the development of the value chain
should be revised and planned. Building operational linkages among stakeholders in the
value chain is necessary, each chain actor and supportive institutions should focus
investment on improving and upgrading their current practices rather than investing in
expanding the farm size.
Figure 5.10. Striped catfish farm’s responses for sustainable development
Source: TLS of catfish farms (2012)
1.89
2.83
6.60
15.09
16.04
20.75
31.13
32.55
0 5 10 15 20 25 30 35
Join producers’ groups/clubs
Disinfection
Need support from bank
Use more environmentally friendly & cost-effective techniques
Change management techniques/seed source/species/inputs
Learn more techniques from training, media/publications
Communicate/negotiate with local authorities about situation
None
% of respondents
207
5.4. Transitions in shrimp farming practices
5.4.1. General development trends of shrimp farming
a). Farm type movements
Before the 1990s, shrimp were mainly cultured under the extensive system in mangrove-
forests and this sector began to develop quickly when artificial breeding was successful
and transferred to mass production in the early 1990's. However, at this stage shrimp farms
were mainly in mixed mangrove-shrimp systems. Shrimp farming grew rapidly since the
end of the 1990s, when the Government implemented the Decree 09/2000/NQ-CP and
seafood markets became more accessible to the shrimp industry. Since 2000 many saline
rice fields and salt pans were converted to shrimp farming; and improved-extensive and
rice-shrimp rotation systems were started. Since 2002, when farming techniques improved,
many culture areas of the improved-extensive and rice-shrimp systems developed into
mainly semi- and intensive shrimp farming systems. The semi-/intensive shrimp system
required high investment in feed/chemicals and relatively high technical skills; however,
the farms could be highly productive, while risking negative impacts on the environment.
Therefore, semi-/intensive shrimp systems are not widespread, remain limited in range to
less than 15% of the total shrimp farming area and are geographically limited to specific
sites with good infrastructure conditions (e.g. road and irrigation canal system, electricity
networks, transportation services) and capacity for monitoring and controlling the impact
on the environment. Semi-/intensive shrimp systems have grown quickly. In 2002 together
these shrimp systems accounted for around 15,310ha (3.28% of shrimp farmed area) and
28,000tonnes (23.16% of shrimp farmed production), which then increased to 88,200ha
(14.65%) and 260,320tonnes (61.91%) in 2013 (Table 5.6). Improvements of culture
techniques and increased culture area as well as a switch to white-legged shrimp were the
main factors driving this change.
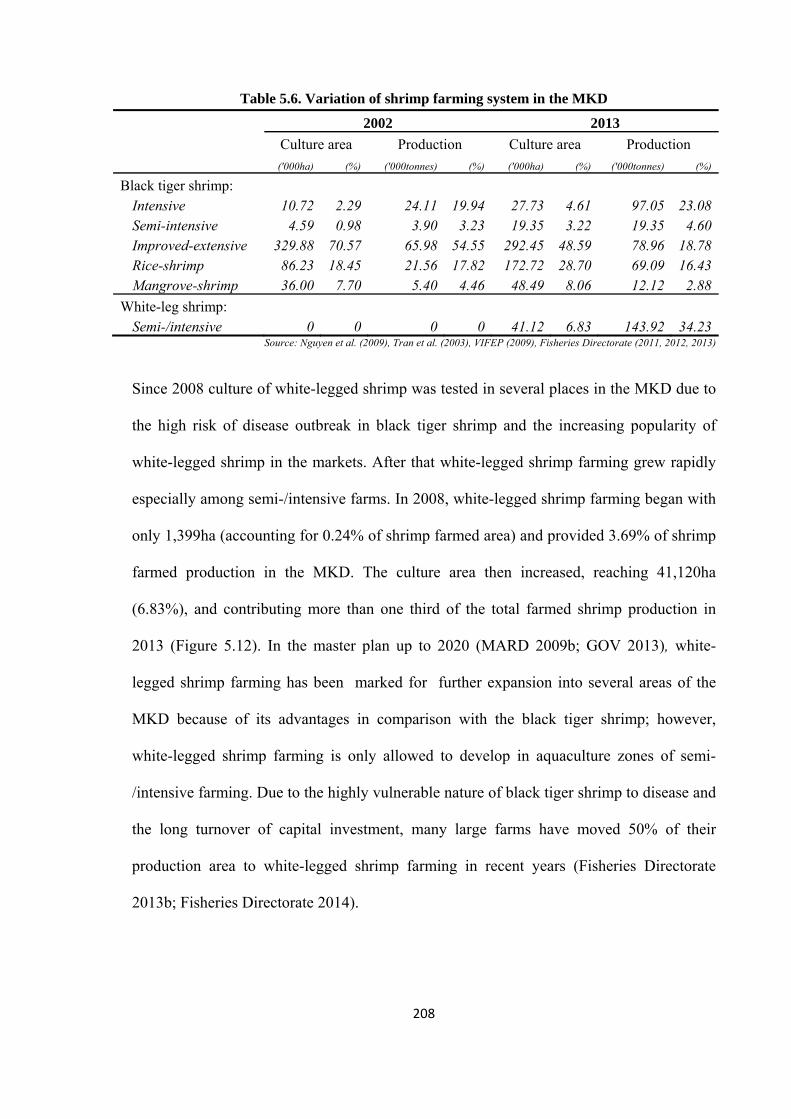
208
Table 5.6. Variation of shrimp farming system in the MKD
2002 2013
Culture area Production Culture area Production
('000ha) (%) ('000tonnes) (%) ('000ha) (%) ('000tonnes) (%)
Black tiger shrimp: Intensive 10.72 2.29 24.11 19.94 27.73 4.61 97.05 23.08Semi-intensive 4.59 0.98 3.90 3.23 19.35 3.22 19.35 4.60Improved-extensive 329.88 70.57 65.98 54.55 292.45 48.59 78.96 18.78Rice-shrimp 86.23 18.45 21.56 17.82 172.72 28.70 69.09 16.43Mangrove-shrimp 36.00 7.70 5.40 4.46 48.49 8.06 12.12 2.88
White-leg shrimp: Semi-/intensive 0 0 0 0 41.12 6.83 143.92 34.23
Source: Nguyen et al. (2009), Tran et al. (2003), VIFEP (2009), Fisheries Directorate (2011, 2012, 2013)
Since 2008 culture of white-legged shrimp was tested in several places in the MKD due to
the high risk of disease outbreak in black tiger shrimp and the increasing popularity of
white-legged shrimp in the markets. After that white-legged shrimp farming grew rapidly
especially among semi-/intensive farms. In 2008, white-legged shrimp farming began with
only 1,399ha (accounting for 0.24% of shrimp farmed area) and provided 3.69% of shrimp
farmed production in the MKD. The culture area then increased, reaching 41,120ha
(6.83%), and contributing more than one third of the total farmed shrimp production in
2013 (Figure 5.12). In the master plan up to 2020 (MARD 2009b; GOV 2013), white-
legged shrimp farming has been marked for further expansion into several areas of the
MKD because of its advantages in comparison with the black tiger shrimp; however,
white-legged shrimp farming is only allowed to develop in aquaculture zones of semi-
/intensive farming. Due to the highly vulnerable nature of black tiger shrimp to disease and
the long turnover of capital investment, many large farms have moved 50% of their
production area to white-legged shrimp farming in recent years (Fisheries Directorate
2013b; Fisheries Directorate 2014).
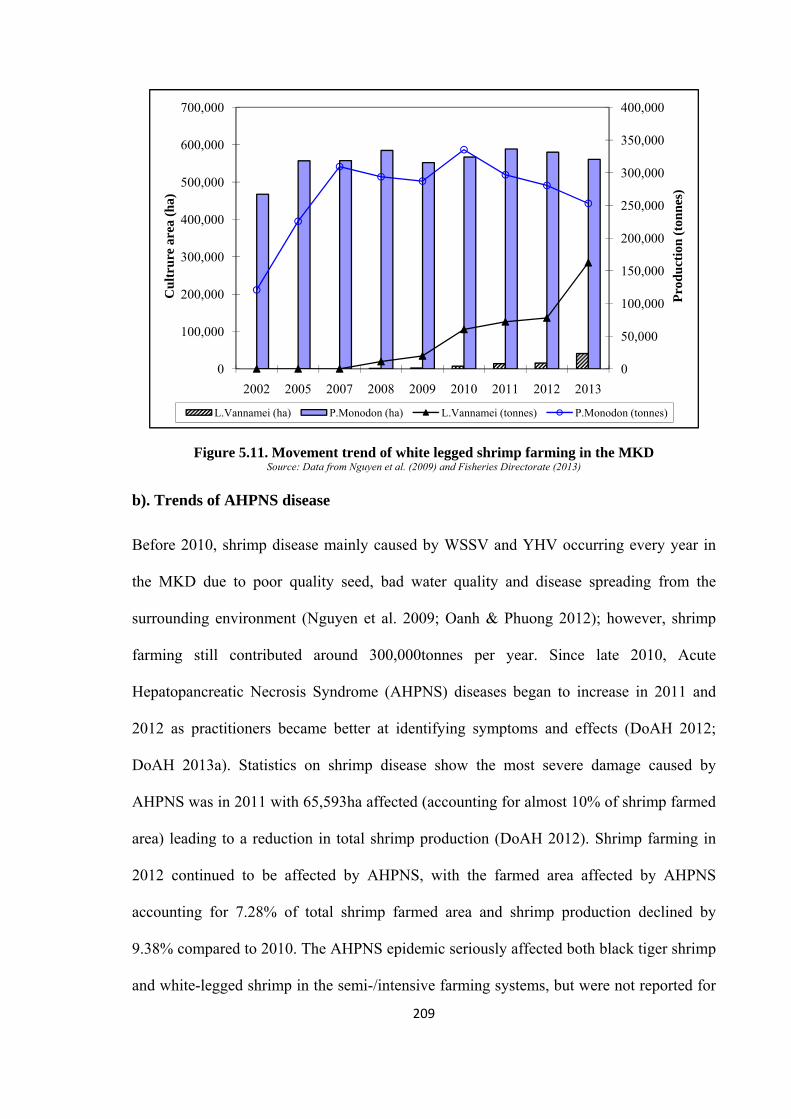
209
Figure 5.11. Movement trend of white legged shrimp farming in the MKD Source: Data from Nguyen et al. (2009) and Fisheries Directorate (2013)
b). Trends of AHPNS disease
Before 2010, shrimp disease mainly caused by WSSV and YHV occurring every year in
the MKD due to poor quality seed, bad water quality and disease spreading from the
surrounding environment (Nguyen et al. 2009; Oanh & Phuong 2012); however, shrimp
farming still contributed around 300,000tonnes per year. Since late 2010, Acute
Hepatopancreatic Necrosis Syndrome (AHPNS) diseases began to increase in 2011 and
2012 as practitioners became better at identifying symptoms and effects (DoAH 2012;
DoAH 2013a). Statistics on shrimp disease show the most severe damage caused by
AHPNS was in 2011 with 65,593ha affected (accounting for almost 10% of shrimp farmed
area) leading to a reduction in total shrimp production (DoAH 2012). Shrimp farming in
2012 continued to be affected by AHPNS, with the farmed area affected by AHPNS
accounting for 7.28% of total shrimp farmed area and shrimp production declined by
9.38% compared to 2010. The AHPNS epidemic seriously affected both black tiger shrimp
and white-legged shrimp in the semi-/intensive farming systems, but were not reported for
0
50,000
100,000
150,000
200,000
250,000
300,000
350,000
400,000
0
100,000
200,000
300,000
400,000
500,000
600,000
700,000
2002 2005 2007 2008 2009 2010 2011 2012 2013
Pro
du
ctio
n (
ton
nes
)
Cu
ltru
re a
rea
(ha)
L.Vannamei (ha) P.Monodon (ha) L.Vannamei (tonnes) P.Monodon (tonnes)
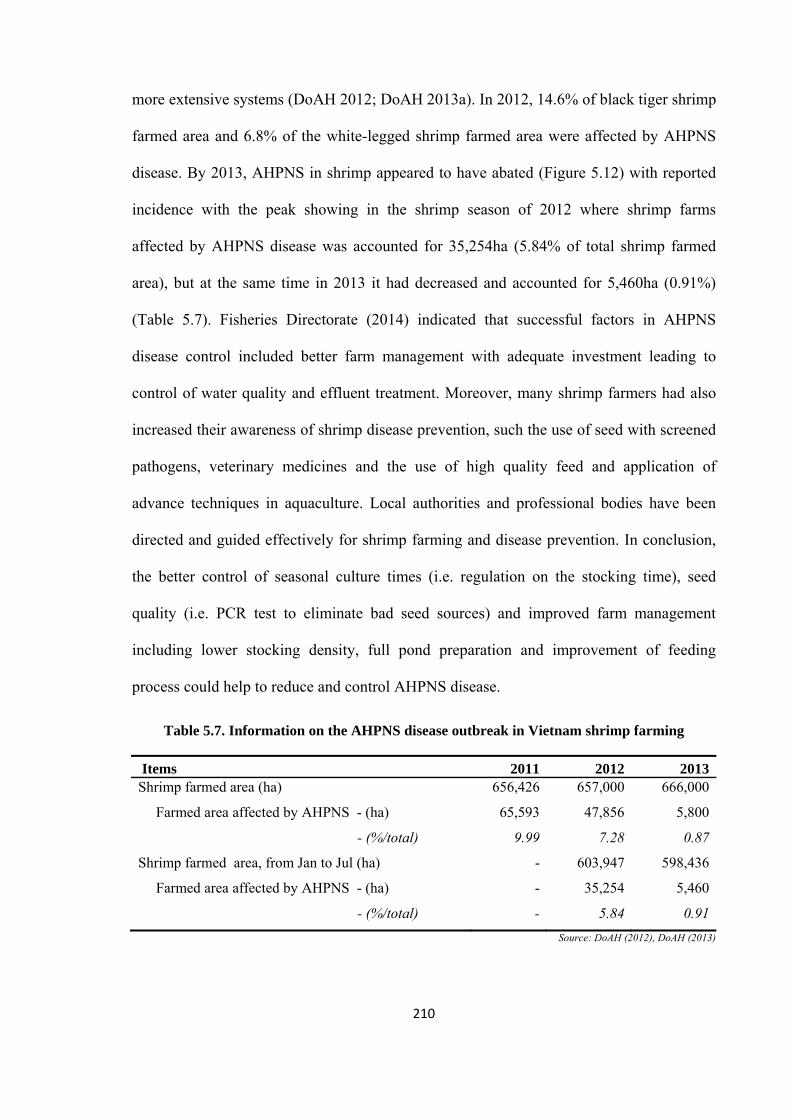
210
more extensive systems (DoAH 2012; DoAH 2013a). In 2012, 14.6% of black tiger shrimp
farmed area and 6.8% of the white-legged shrimp farmed area were affected by AHPNS
disease. By 2013, AHPNS in shrimp appeared to have abated (Figure 5.12) with reported
incidence with the peak showing in the shrimp season of 2012 where shrimp farms
affected by AHPNS disease was accounted for 35,254ha (5.84% of total shrimp farmed
area), but at the same time in 2013 it had decreased and accounted for 5,460ha (0.91%)
(Table 5.7). Fisheries Directorate (2014) indicated that successful factors in AHPNS
disease control included better farm management with adequate investment leading to
control of water quality and effluent treatment. Moreover, many shrimp farmers had also
increased their awareness of shrimp disease prevention, such the use of seed with screened
pathogens, veterinary medicines and the use of high quality feed and application of
advance techniques in aquaculture. Local authorities and professional bodies have been
directed and guided effectively for shrimp farming and disease prevention. In conclusion,
the better control of seasonal culture times (i.e. regulation on the stocking time), seed
quality (i.e. PCR test to eliminate bad seed sources) and improved farm management
including lower stocking density, full pond preparation and improvement of feeding
process could help to reduce and control AHPNS disease.
Table 5.7. Information on the AHPNS disease outbreak in Vietnam shrimp farming
Items 2011 2012 2013Shrimp farmed area (ha) 656,426 657,000 666,000
Farmed area affected by AHPNS - (ha) 65,593 47,856 5,800
- (%/total) 9.99 7.28 0.87
Shrimp farmed area, from Jan to Jul (ha) - 603,947 598,436
Farmed area affected by AHPNS - (ha) - 35,254 5,460
- (%/total) - 5.84 0.91
Source: DoAH (2012), DoAH (2013)
211
Figure 5.12. Shrimp farmed area affected by AHPNS disease since 2012 Source: DoAH (2012), DoAH (2013)
c). Shrimp price trends and its effects to farm changes
Shrimp prices fluctuate seasonally throughout the year, and depend mainly on the
harvested shrimp-size. Shrimp price at the farm gate is usually higher at the end of the year
when there is high demand for several festivals in importing countries (Figure 5.13) and
the price is often lower at peak harvesting time from July to September (Figure 4.14).
Figure 5.13. Monthly Vietnam shrimp export to major markets in 2012
Source: VASEP (2011), VASEP (2012)
0
1000
2000
3000
4000
5000
6000
7000
8000
9000
10000
Jan Feb Mar Apr May Jun Jul Aug Sep Oct Nov Jan Feb Mar Apr May Jun Jul
2012 2013
Cul
ture
affec
ted
by A
HPN
S di
seas
e (h
a) ..
0
10
20
30
40
50
60
70
80
90
Jan Feb Mar Apr May Jun Jul Aug Sep Oct Nov Dec
Shri
mp
expo
rt v
alue
('00
0 U
S$)…
.
Japan US EU China
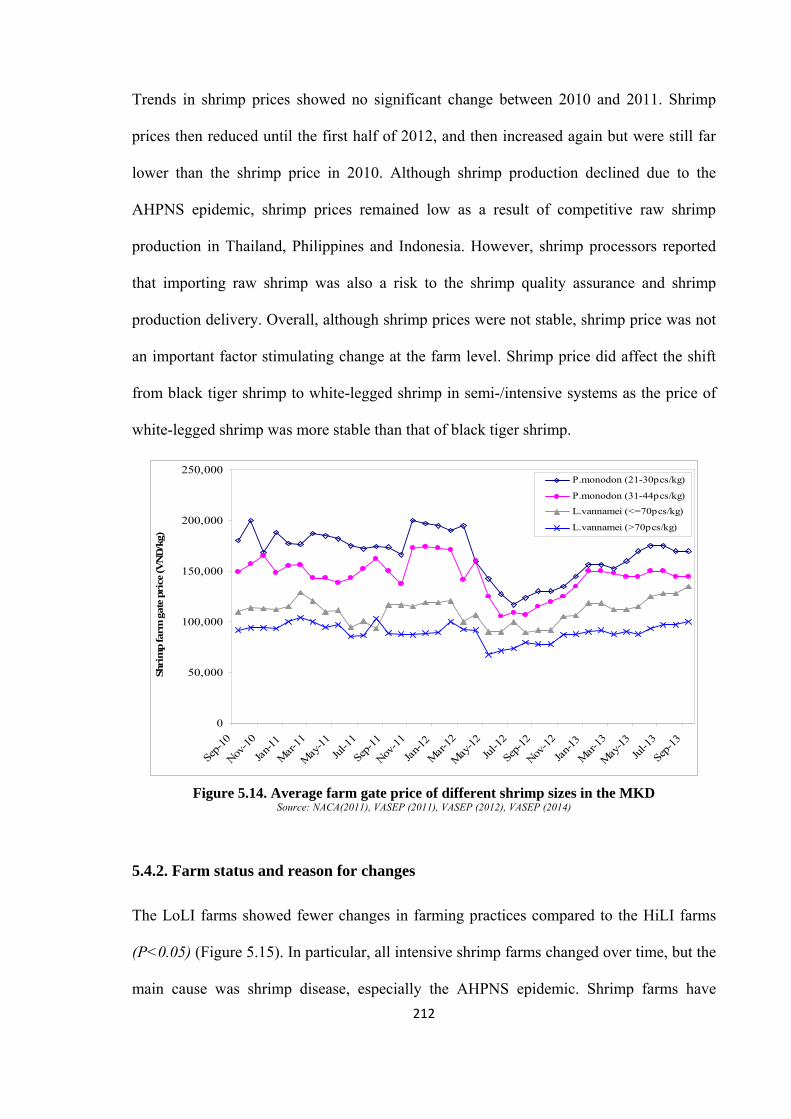
212
Trends in shrimp prices showed no significant change between 2010 and 2011. Shrimp
prices then reduced until the first half of 2012, and then increased again but were still far
lower than the shrimp price in 2010. Although shrimp production declined due to the
AHPNS epidemic, shrimp prices remained low as a result of competitive raw shrimp
production in Thailand, Philippines and Indonesia. However, shrimp processors reported
that importing raw shrimp was also a risk to the shrimp quality assurance and shrimp
production delivery. Overall, although shrimp prices were not stable, shrimp price was not
an important factor stimulating change at the farm level. Shrimp price did affect the shift
from black tiger shrimp to white-legged shrimp in semi-/intensive systems as the price of
white-legged shrimp was more stable than that of black tiger shrimp.
Figure 5.14. Average farm gate price of different shrimp sizes in the MKD
Source: NACA(2011), VASEP (2011), VASEP (2012), VASEP (2014)
5.4.2. Farm status and reason for changes
The LoLI farms showed fewer changes in farming practices compared to the HiLI farms
(P<0.05) (Figure 5.15). In particular, all intensive shrimp farms changed over time, but the
main cause was shrimp disease, especially the AHPNS epidemic. Shrimp farms have
0
50,000
100,000
150,000
200,000
250,000
Sep-
10
Nov-1
0
Jan-
11
Mar
-11
May
-11
Jul-1
1
Sep-
11
Nov-1
1
Jan-
12
Mar
-12
May
-12
Jul-1
2
Sep-
12
Nov-1
2
Jan-
13
Mar
-13
May
-13
Jul-1
3
Sep-
13
Shri
mp
farm
gat
e pr
ice
(VN
D/k
g) ...
P.monodon (21-30pcs/kg)
P.monodon (31-44pcs/kg)
L.vannamei (<=70pcs/kg)
L.vannamei (>70pcs/kg)
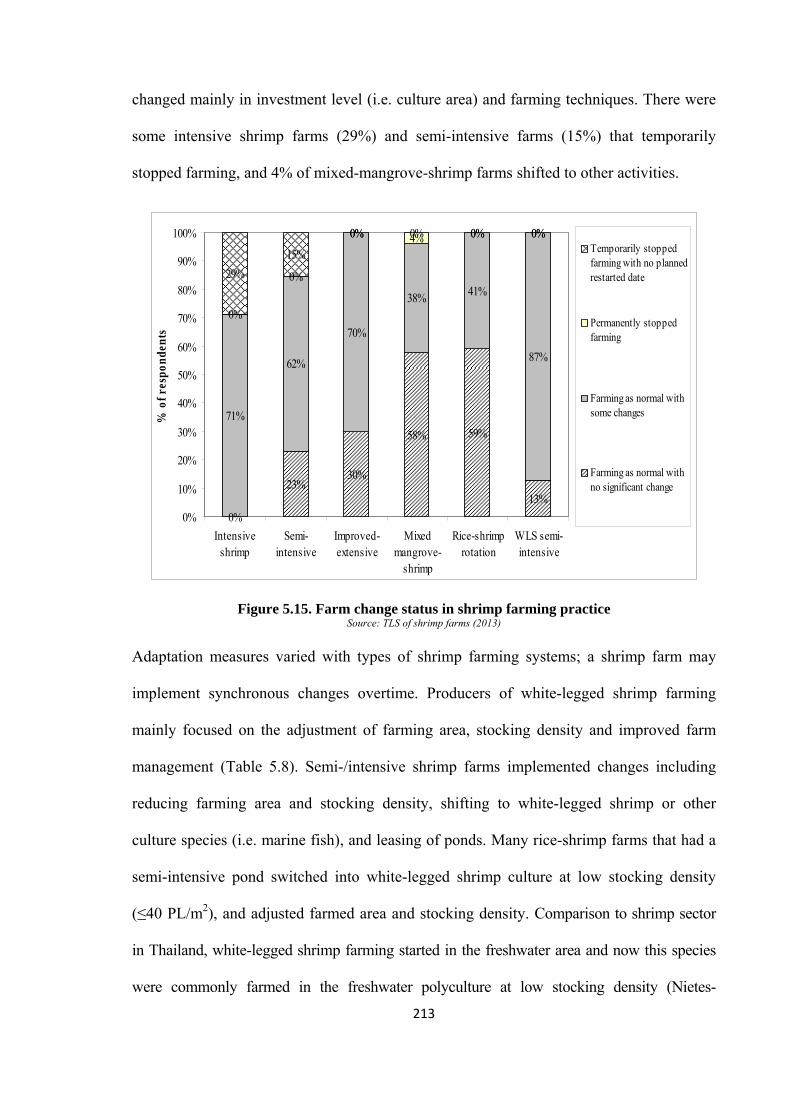
213
changed mainly in investment level (i.e. culture area) and farming techniques. There were
some intensive shrimp farms (29%) and semi-intensive farms (15%) that temporarily
stopped farming, and 4% of mixed-mangrove-shrimp farms shifted to other activities.
Figure 5.15. Farm change status in shrimp farming practice Source: TLS of shrimp farms (2013)
Adaptation measures varied with types of shrimp farming systems; a shrimp farm may
implement synchronous changes overtime. Producers of white-legged shrimp farming
mainly focused on the adjustment of farming area, stocking density and improved farm
management (Table 5.8). Semi-/intensive shrimp farms implemented changes including
reducing farming area and stocking density, shifting to white-legged shrimp or other
culture species (i.e. marine fish), and leasing of ponds. Many rice-shrimp farms that had a
semi-intensive pond switched into white-legged shrimp culture at low stocking density
(≤40 PL/m2), and adjusted farmed area and stocking density. Comparison to shrimp sector
in Thailand, white-legged shrimp farming started in the freshwater area and now this species
were commonly farmed in the freshwater polyculture at low stocking density (Nietes-
0%
23%30%
58% 59%
13%
71%
62%
70%
38% 41%
87%
0%
0%
0% 4% 0% 0%
29%
15%
0% 0% 0% 0%
0%
10%
20%
30%
40%
50%
60%
70%
80%
90%
100%
Intensiveshrimp
Semi-intensive
Improved-extensive
Mixedmangrove-
shrimp
Rice-shrimprotation
WLS semi-intensive
% o
f res
pond
ents
Temporarily stoppedfarming with no plannedrestarted date
Permanently stoppedfarming
Farming as normal withsome changes
Farming as normal withno significant change
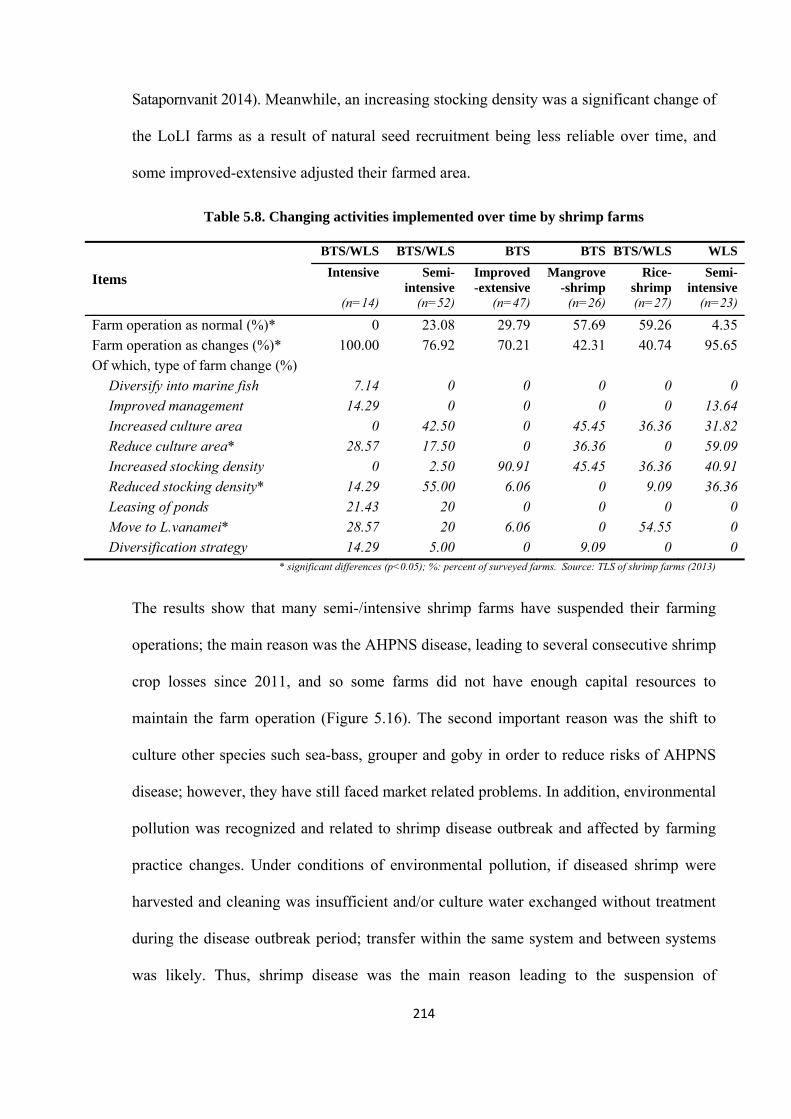
214
Satapornvanit 2014). Meanwhile, an increasing stocking density was a significant change of
the LoLI farms as a result of natural seed recruitment being less reliable over time, and
some improved-extensive adjusted their farmed area.
Table 5.8. Changing activities implemented over time by shrimp farms
Items
BTS/WLS BTS/WLS BTS BTS BTS/WLS WLS
Intensive Semi-intensive
Improved -extensive
Mangrove -shrimp
Rice- shrimp
Semi-intensive
(n=14) (n=52) (n=47) (n=26) (n=27) (n=23)
Farm operation as normal (%)* 0 23.08 29.79 57.69 59.26 4.35Farm operation as changes (%)* 100.00 76.92 70.21 42.31 40.74 95.65Of which, type of farm change (%)
Diversify into marine fish 7.14 0 0 0 0 0Improved management 14.29 0 0 0 0 13.64Increased culture area 0 42.50 0 45.45 36.36 31.82Reduce culture area* 28.57 17.50 0 36.36 0 59.09Increased stocking density 0 2.50 90.91 45.45 36.36 40.91Reduced stocking density* 14.29 55.00 6.06 0 9.09 36.36Leasing of ponds 21.43 20 0 0 0 0Move to L.vanamei* 28.57 20 6.06 0 54.55 0Diversification strategy 14.29 5.00 0 9.09 0 0
* significant differences (p<0.05); %: percent of surveyed farms. Source: TLS of shrimp farms (2013)
The results show that many semi-/intensive shrimp farms have suspended their farming
operations; the main reason was the AHPNS disease, leading to several consecutive shrimp
crop losses since 2011, and so some farms did not have enough capital resources to
maintain the farm operation (Figure 5.16). The second important reason was the shift to
culture other species such sea-bass, grouper and goby in order to reduce risks of AHPNS
disease; however, they have still faced market related problems. In addition, environmental
pollution was recognized and related to shrimp disease outbreak and affected by farming
practice changes. Under conditions of environmental pollution, if diseased shrimp were
harvested and cleaning was insufficient and/or culture water exchanged without treatment
during the disease outbreak period; transfer within the same system and between systems
was likely. Thus, shrimp disease was the main reason leading to the suspension of
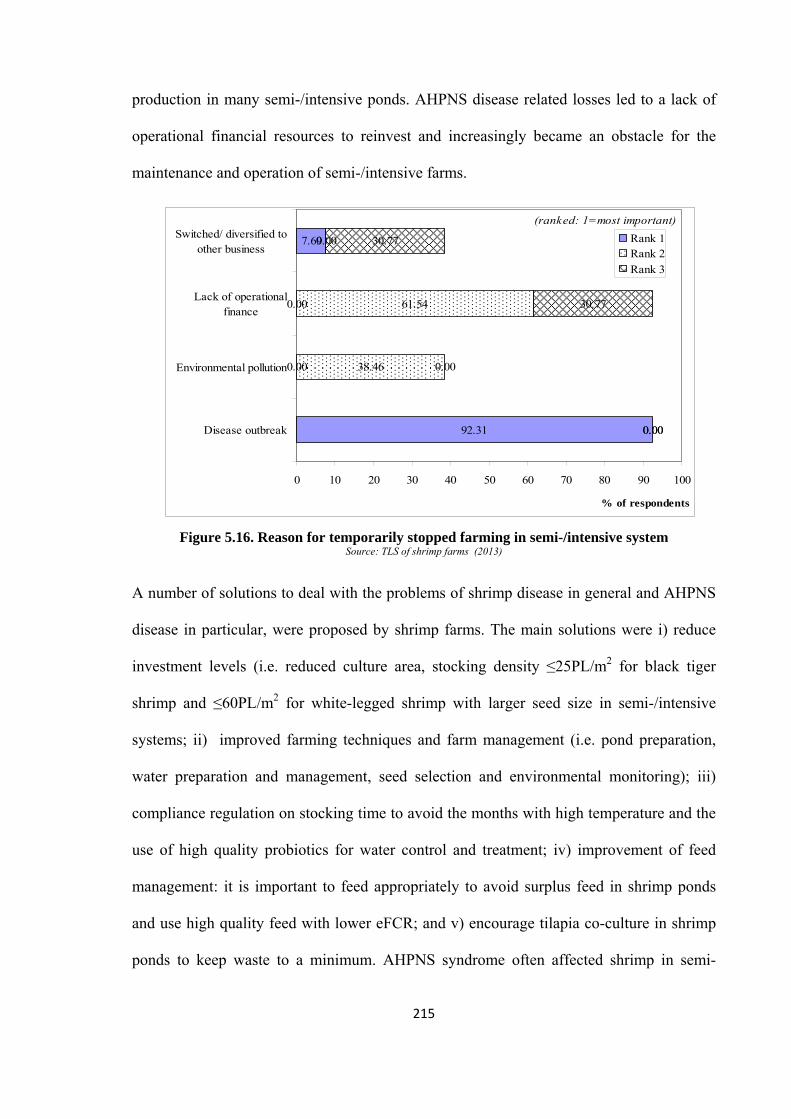
215
production in many semi-/intensive ponds. AHPNS disease related losses led to a lack of
operational financial resources to reinvest and increasingly became an obstacle for the
maintenance and operation of semi-/intensive farms.
Figure 5.16. Reason for temporarily stopped farming in semi-/intensive system Source: TLS of shrimp farms (2013)
A number of solutions to deal with the problems of shrimp disease in general and AHPNS
disease in particular, were proposed by shrimp farms. The main solutions were i) reduce
investment levels (i.e. reduced culture area, stocking density ≤25PL/m2 for black tiger
shrimp and ≤60PL/m2 for white-legged shrimp with larger seed size in semi-/intensive
systems; ii) improved farming techniques and farm management (i.e. pond preparation,
water preparation and management, seed selection and environmental monitoring); iii)
compliance regulation on stocking time to avoid the months with high temperature and the
use of high quality probiotics for water control and treatment; iv) improvement of feed
management: it is important to feed appropriately to avoid surplus feed in shrimp ponds
and use high quality feed with lower eFCR; and v) encourage tilapia co-culture in shrimp
ponds to keep waste to a minimum. AHPNS syndrome often affected shrimp in semi-
(ranked: 1=most important)
92.31
0.00
0.00
7.69
0.00
38.46
61.54
0.00
0.00
0.00
30.77
30.77
0 10 20 30 40 50 60 70 80 90 100
Disease outbreak
Environmental pollution
Lack of operationalfinance
Switched/ diversified toother business
% of respondents
Rank 1Rank 2
Rank 3
216
/intensive systems of both black tiger and white-legged shrimps 15-40 days after stocking
(DoAH 2012; Oanh & Phuong 2012). AHPNS is caused by a unique strain of a relatively
common bacterium, Vibrio parahaemolyticus, that is infected by a virus known as a phage
(Loc et al. 2013). Therefore, shrimp farmers need to control water quality factors to reduce
the potential for the development of this bacterial species including, high temperature,
reduced depth of pond water, suitable pH around 7.0 and regular sludge removal (DoAH
2012; Fisheries Directorate 2012).
5.4.3. Changes in technical aspects
The major technical changes occurring between 2010 and 2013 in the HiLI farming
systems were related to feeding improvement and water management, while in the LoLI
systems of improved-extensive and mixed-mangrove shrimp systems, improvements were
essentially increased pond preparation time, increased stocking density due to depletion of
natural seed sources and a longer culture period. Over 86% of the HiLI farms faced
AHPNS disease, followed by rice-shrimp system (59%). The LoLI farms did not report the
occurrence of AHPNS disease in their farms, possibly related to better water quality, low
stocking density (≤4 PL/m2), large pond area with no feeding all of which result in less
polluted pond sediments. Additionally, there were wild-fish in the pond helping to ‘clean’
the water, low pH (≤7) and S%o (≤10), and a low rate of chemical use for pond treatment,
all of which do not favour V.parahaemolyticus development.
The HiLI farms had solutions to cope with AHPNS disease over time such as increasing
reservoir pond use, reducing stocking density, improving feed management, careful pond
preparation and stocking time selection. Most semi-/intensive farms created
reservoir/settling ponds, while only 22% of rice-shrimp farms had them. Seed source was
carefully selected and was tested using the PCR method to eliminate bad quality seed; the
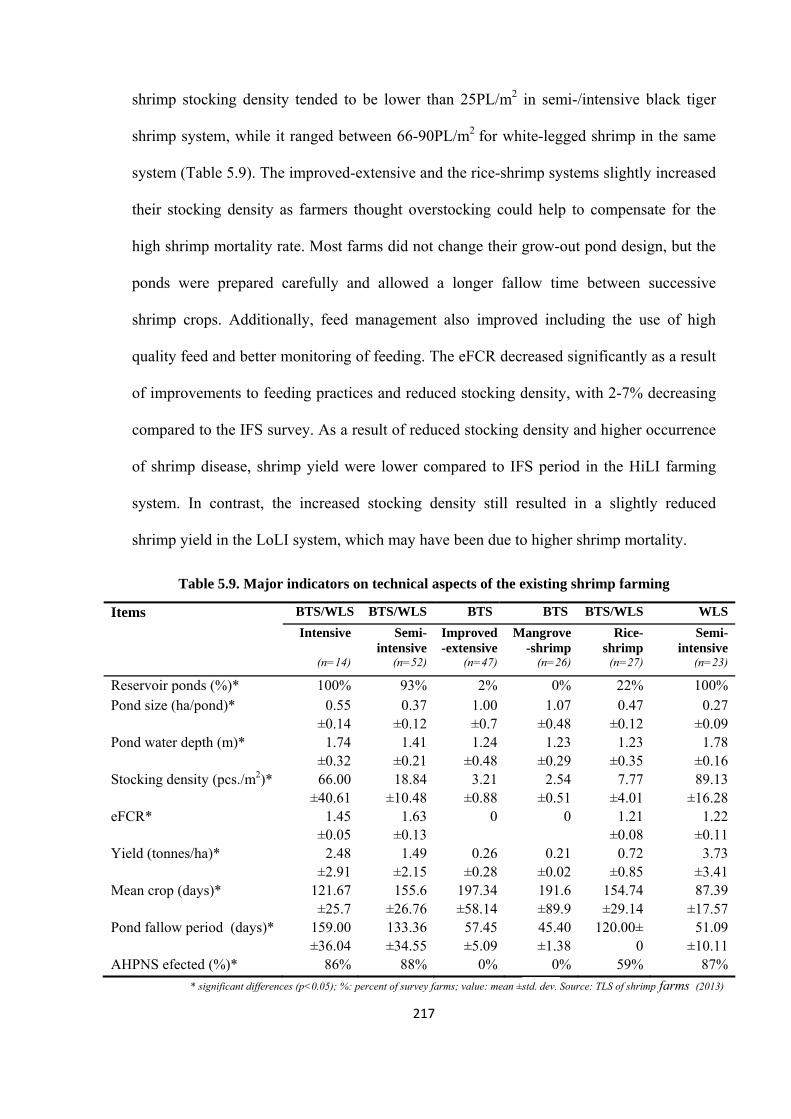
217
shrimp stocking density tended to be lower than 25PL/m2 in semi-/intensive black tiger
shrimp system, while it ranged between 66-90PL/m2 for white-legged shrimp in the same
system (Table 5.9). The improved-extensive and the rice-shrimp systems slightly increased
their stocking density as farmers thought overstocking could help to compensate for the
high shrimp mortality rate. Most farms did not change their grow-out pond design, but the
ponds were prepared carefully and allowed a longer fallow time between successive
shrimp crops. Additionally, feed management also improved including the use of high
quality feed and better monitoring of feeding. The eFCR decreased significantly as a result
of improvements to feeding practices and reduced stocking density, with 2-7% decreasing
compared to the IFS survey. As a result of reduced stocking density and higher occurrence
of shrimp disease, shrimp yield were lower compared to IFS period in the HiLI farming
system. In contrast, the increased stocking density still resulted in a slightly reduced
shrimp yield in the LoLI system, which may have been due to higher shrimp mortality.
Table 5.9. Major indicators on technical aspects of the existing shrimp farming
Items BTS/WLS BTS/WLS BTS BTS BTS/WLS WLS
Intensive Semi-intensive
Improved -extensive
Mangrove -shrimp
Rice- shrimp
Semi-intensive
(n=14) (n=52) (n=47) (n=26) (n=27) (n=23)
Reservoir ponds (%)* 100% 93% 2% 0% 22% 100%Pond size (ha/pond)* 0.55
±0.140.37
±0.121.00 ±0.7
1.07 ±0.48
0.47 ±0.12
0.27 ±0.09
Pond water depth (m)* 1.74 ±0.32
1.41 ±0.21
1.24 ±0.48
1.23 ±0.29
1.23 ±0.35
1.78 ±0.16
Stocking density (pcs./m2)* 66.00 ±40.61
18.84 ±10.48
3.21 ±0.88
2.54 ±0.51
7.77 ±4.01
89.13 ±16.28
eFCR* 1.45 ±0.05
1.63 ±0.13
0 0 1.21 ±0.08
1.22 ±0.11
Yield (tonnes/ha)* 2.48 ±2.91
1.49 ±2.15
0.26 ±0.28
0.21 ±0.02
0.72 ±0.85
3.73 ±3.41
Mean crop (days)* 121.67 ±25.7
155.6 ±26.76
197.34 ±58.14
191.6 ±89.9
154.74 ±29.14
87.39 ±17.57
Pond fallow period (days)* 159.00 ±36.04
133.36 ±34.55
57.45 ±5.09
45.40 ±1.38
120.00± 0
51.09 ±10.11
AHPNS efected (%)* 86% 88% 0% 0% 59% 87%
* significant differences (p<0.05); %: percent of survey farms; value: mean ±std. dev. Source: TLS of shrimp farms (2013)
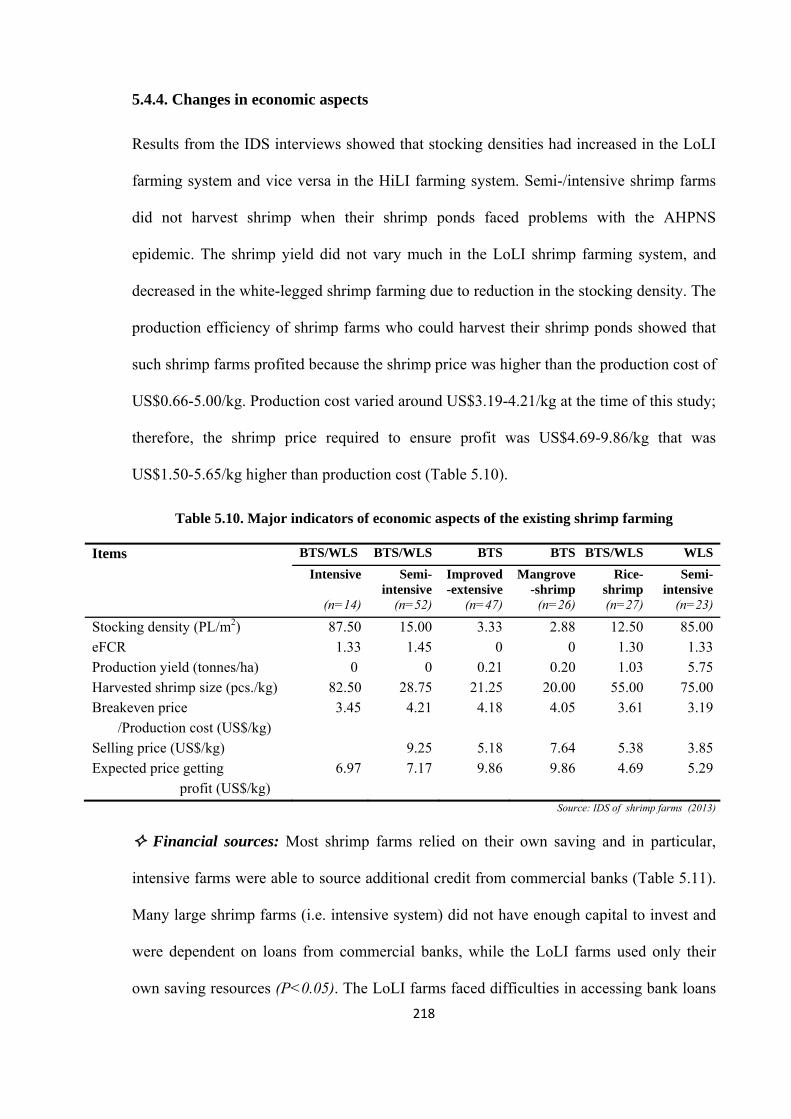
218
5.4.4. Changes in economic aspects
Results from the IDS interviews showed that stocking densities had increased in the LoLI
farming system and vice versa in the HiLI farming system. Semi-/intensive shrimp farms
did not harvest shrimp when their shrimp ponds faced problems with the AHPNS
epidemic. The shrimp yield did not vary much in the LoLI shrimp farming system, and
decreased in the white-legged shrimp farming due to reduction in the stocking density. The
production efficiency of shrimp farms who could harvest their shrimp ponds showed that
such shrimp farms profited because the shrimp price was higher than the production cost of
US$0.66-5.00/kg. Production cost varied around US$3.19-4.21/kg at the time of this study;
therefore, the shrimp price required to ensure profit was US$4.69-9.86/kg that was
US$1.50-5.65/kg higher than production cost (Table 5.10).
Table 5.10. Major indicators of economic aspects of the existing shrimp farming
Items BTS/WLS BTS/WLS BTS BTS BTS/WLS WLS
Intensive Semi-intensive
Improved -extensive
Mangrove -shrimp
Rice- shrimp
Semi-intensive
(n=14) (n=52) (n=47) (n=26) (n=27) (n=23)
Stocking density (PL/m2) 87.50 15.00 3.33 2.88 12.50 85.00eFCR 1.33 1.45 0 0 1.30 1.33Production yield (tonnes/ha) 0 0 0.21 0.20 1.03 5.75Harvested shrimp size (pcs./kg) 82.50 28.75 21.25 20.00 55.00 75.00Breakeven price /Production cost (US$/kg)
3.45 4.21 4.18 4.05 3.61 3.19
Selling price (US$/kg) 9.25 5.18 7.64 5.38 3.85Expected price getting profit (US$/kg)
6.97 7.17 9.86 9.86 4.69 5.29
Source: IDS of shrimp farms (2013)
Financial sources: Most shrimp farms relied on their own saving and in particular,
intensive farms were able to source additional credit from commercial banks (Table 5.11).
Many large shrimp farms (i.e. intensive system) did not have enough capital to invest and
were dependent on loans from commercial banks, while the LoLI farms used only their
own saving resources (P<0.05). The LoLI farms faced difficulties in accessing bank loans
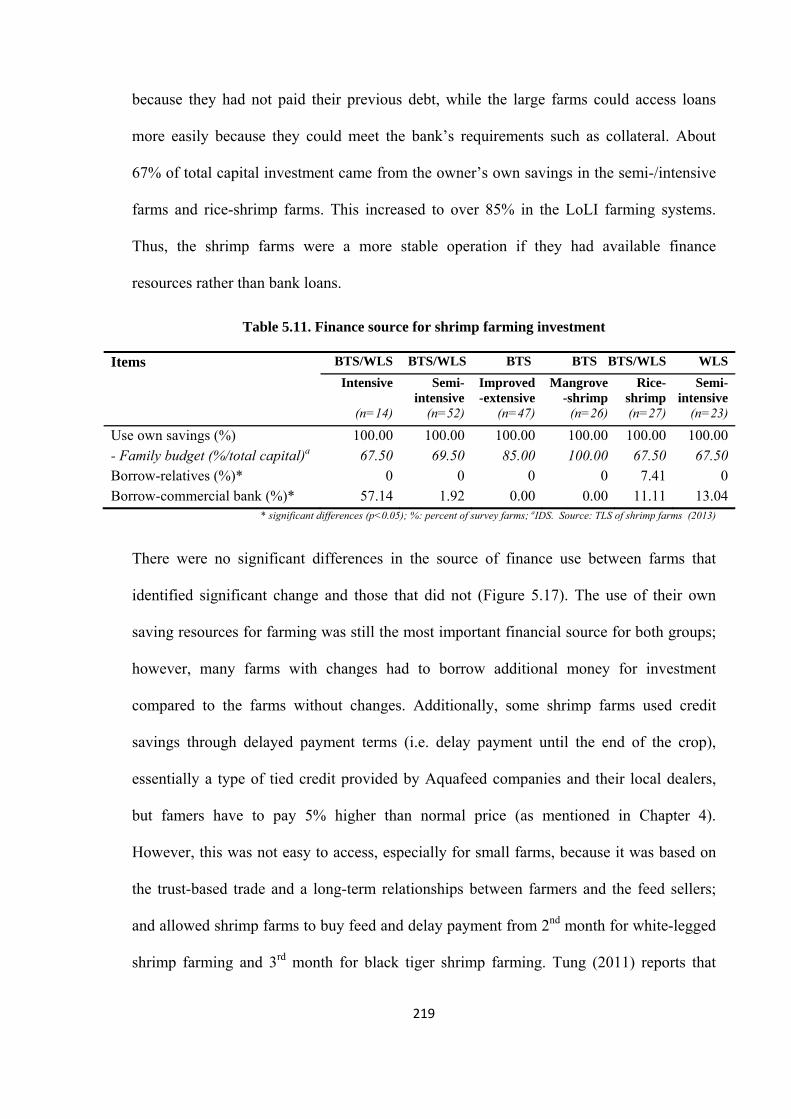
219
because they had not paid their previous debt, while the large farms could access loans
more easily because they could meet the bank’s requirements such as collateral. About
67% of total capital investment came from the owner’s own savings in the semi-/intensive
farms and rice-shrimp farms. This increased to over 85% in the LoLI farming systems.
Thus, the shrimp farms were a more stable operation if they had available finance
resources rather than bank loans.
Table 5.11. Finance source for shrimp farming investment
Items BTS/WLS BTS/WLS BTS BTS BTS/WLS WLS
Intensive Semi-intensive
Improved -extensive
Mangrove -shrimp
Rice- shrimp
Semi-intensive
(n=14) (n=52) (n=47) (n=26) (n=27) (n=23)
Use own savings (%) 100.00 100.00 100.00 100.00 100.00 100.00
- Family budget (%/total capital)a 67.50 69.50 85.00 100.00 67.50 67.50Borrow-relatives (%)* 0 0 0 0 7.41 0Borrow-commercial bank (%)* 57.14 1.92 0.00 0.00 11.11 13.04
* significant differences (p<0.05); %: percent of survey farms; aIDS. Source: TLS of shrimp farms (2013)
There were no significant differences in the source of finance use between farms that
identified significant change and those that did not (Figure 5.17). The use of their own
saving resources for farming was still the most important financial source for both groups;
however, many farms with changes had to borrow additional money for investment
compared to the farms without changes. Additionally, some shrimp farms used credit
savings through delayed payment terms (i.e. delay payment until the end of the crop),
essentially a type of tied credit provided by Aquafeed companies and their local dealers,
but famers have to pay 5% higher than normal price (as mentioned in Chapter 4).
However, this was not easy to access, especially for small farms, because it was based on
the trust-based trade and a long-term relationships between farmers and the feed sellers;
and allowed shrimp farms to buy feed and delay payment from 2nd month for white-legged
shrimp farming and 3rd month for black tiger shrimp farming. Tung (2011) reports that
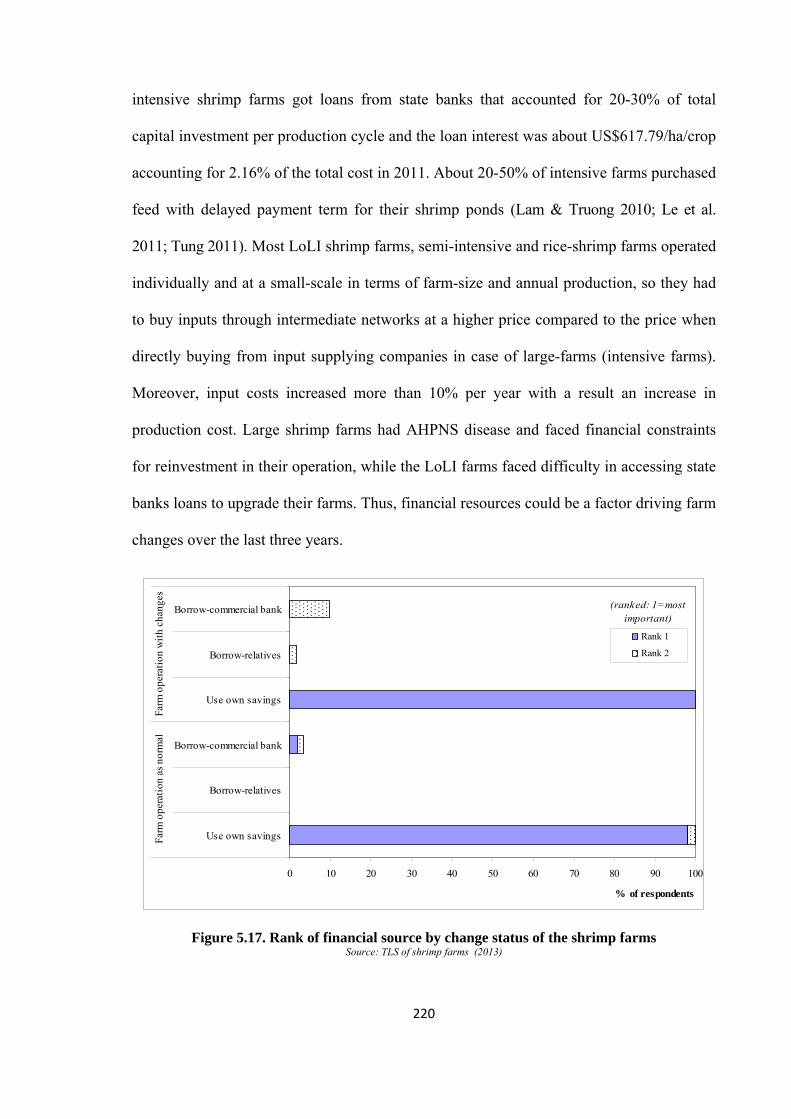
220
intensive shrimp farms got loans from state banks that accounted for 20-30% of total
capital investment per production cycle and the loan interest was about US$617.79/ha/crop
accounting for 2.16% of the total cost in 2011. About 20-50% of intensive farms purchased
feed with delayed payment term for their shrimp ponds (Lam & Truong 2010; Le et al.
2011; Tung 2011). Most LoLI shrimp farms, semi-intensive and rice-shrimp farms operated
individually and at a small-scale in terms of farm-size and annual production, so they had
to buy inputs through intermediate networks at a higher price compared to the price when
directly buying from input supplying companies in case of large-farms (intensive farms).
Moreover, input costs increased more than 10% per year with a result an increase in
production cost. Large shrimp farms had AHPNS disease and faced financial constraints
for reinvestment in their operation, while the LoLI farms faced difficulty in accessing state
banks loans to upgrade their farms. Thus, financial resources could be a factor driving farm
changes over the last three years.
Figure 5.17. Rank of financial source by change status of the shrimp farms Source: TLS of shrimp farms (2013)
0 10 20 30 40 50 60 70 80 90 100
Use own savings
Borrow-relatives
Borrow-commercial bank
Use own savings
Borrow-relatives
Borrow-commercial bank
Farm
ope
rati
on a
s no
rmal
Farm
ope
rati
on w
ith
chan
ges
(ranked: 1=most important)
% of respondents
Rank 1
Rank 2
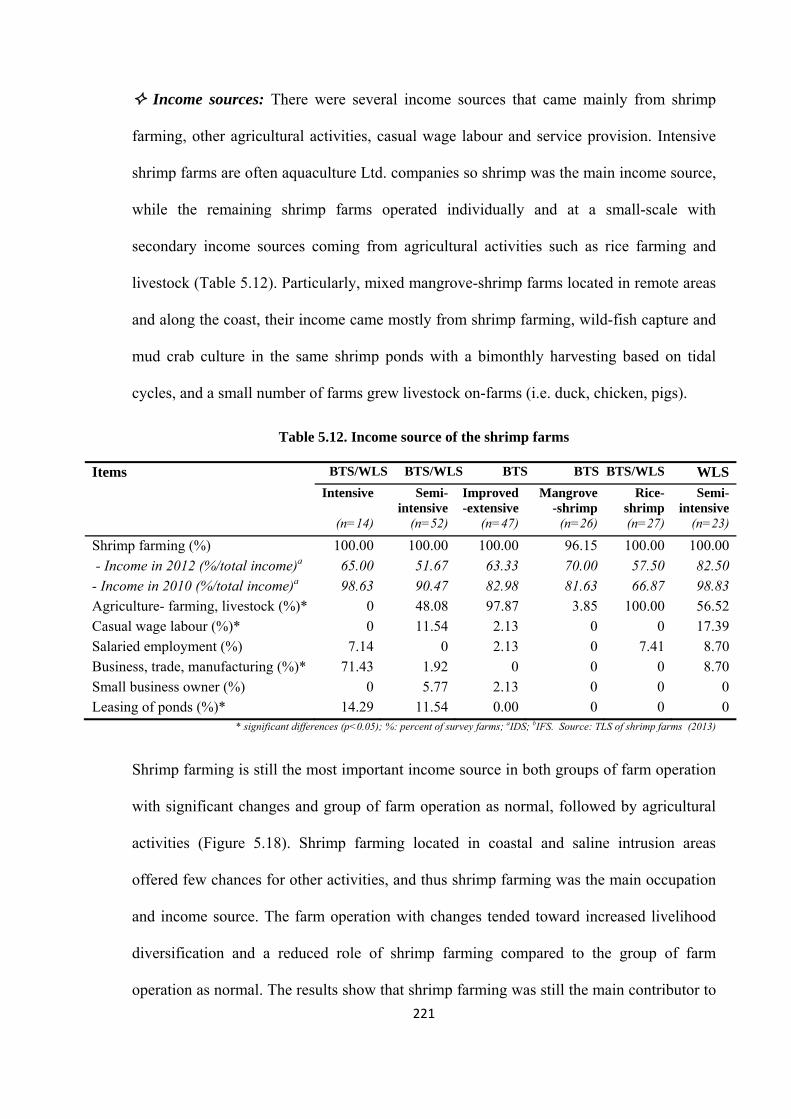
221
Income sources: There were several income sources that came mainly from shrimp
farming, other agricultural activities, casual wage labour and service provision. Intensive
shrimp farms are often aquaculture Ltd. companies so shrimp was the main income source,
while the remaining shrimp farms operated individually and at a small-scale with
secondary income sources coming from agricultural activities such as rice farming and
livestock (Table 5.12). Particularly, mixed mangrove-shrimp farms located in remote areas
and along the coast, their income came mostly from shrimp farming, wild-fish capture and
mud crab culture in the same shrimp ponds with a bimonthly harvesting based on tidal
cycles, and a small number of farms grew livestock on-farms (i.e. duck, chicken, pigs).
Table 5.12. Income source of the shrimp farms
Items BTS/WLS BTS/WLS BTS BTS BTS/WLS WLS
Intensive Semi-intensive
Improved -extensive
Mangrove -shrimp
Rice- shrimp
Semi-intensive
(n=14) (n=52) (n=47) (n=26) (n=27) (n=23)
Shrimp farming (%) 100.00 100.00 100.00 96.15 100.00 100.00
- Income in 2012 (%/total income)a 65.00 51.67 63.33 70.00 57.50 82.50- Income in 2010 (%/total income)a 98.63 90.47 82.98 81.63 66.87 98.83Agriculture- farming, livestock (%)* 0 48.08 97.87 3.85 100.00 56.52Casual wage labour (%)* 0 11.54 2.13 0 0 17.39Salaried employment (%) 7.14 0 2.13 0 7.41 8.70Business, trade, manufacturing (%)* 71.43 1.92 0 0 0 8.70Small business owner (%) 0 5.77 2.13 0 0 0Leasing of ponds (%)* 14.29 11.54 0.00 0 0 0
* significant differences (p<0.05); %: percent of survey farms; aIDS; bIFS. Source: TLS of shrimp farms (2013)
Shrimp farming is still the most important income source in both groups of farm operation
with significant changes and group of farm operation as normal, followed by agricultural
activities (Figure 5.18). Shrimp farming located in coastal and saline intrusion areas
offered few chances for other activities, and thus shrimp farming was the main occupation
and income source. The farm operation with changes tended toward increased livelihood
diversification and a reduced role of shrimp farming compared to the group of farm
operation as normal. The results show that shrimp farming was still the main contributor to
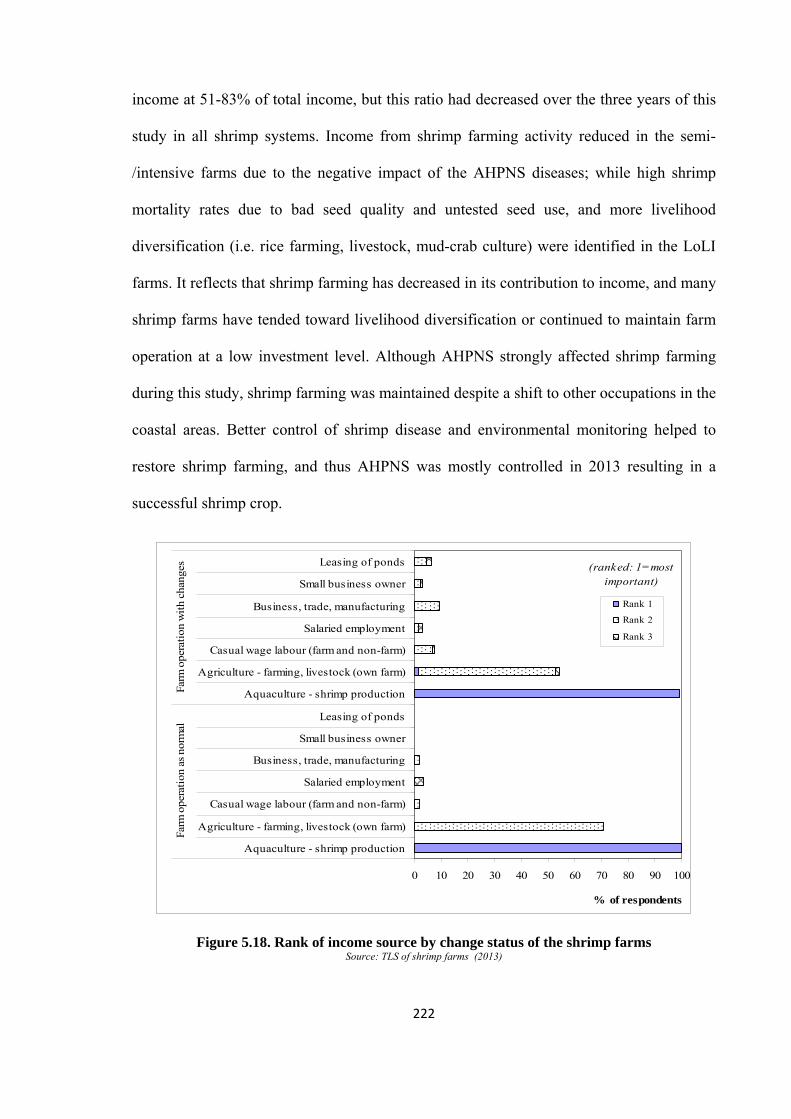
222
income at 51-83% of total income, but this ratio had decreased over the three years of this
study in all shrimp systems. Income from shrimp farming activity reduced in the semi-
/intensive farms due to the negative impact of the AHPNS diseases; while high shrimp
mortality rates due to bad seed quality and untested seed use, and more livelihood
diversification (i.e. rice farming, livestock, mud-crab culture) were identified in the LoLI
farms. It reflects that shrimp farming has decreased in its contribution to income, and many
shrimp farms have tended toward livelihood diversification or continued to maintain farm
operation at a low investment level. Although AHPNS strongly affected shrimp farming
during this study, shrimp farming was maintained despite a shift to other occupations in the
coastal areas. Better control of shrimp disease and environmental monitoring helped to
restore shrimp farming, and thus AHPNS was mostly controlled in 2013 resulting in a
successful shrimp crop.
Figure 5.18. Rank of income source by change status of the shrimp farms Source: TLS of shrimp farms (2013)
0 10 20 30 40 50 60 70 80 90 100
Aquaculture - shrimp production
Agriculture - farming, livestock (own farm)
Casual wage labour (farm and non-farm)
Salaried employment
Business, trade, manufacturing
Small business owner
Leasing of ponds
Aquaculture - shrimp production
Agriculture - farming, livestock (own farm)
Casual wage labour (farm and non-farm)
Salaried employment
Business, trade, manufacturing
Small business owner
Leasing of ponds
Farm
ope
rati
on a
s no
rmal
Farm
ope
rati
on w
ith
chan
ges (ranked: 1=most
important)
% of respondents
Rank 1
Rank 2
Rank 3
223
The survey showed that the LoLI farms operated with very few changes and more stability;
while many farms in the HiLI farming system faced a ‘worse-off’ situation (Figure 5.19).
This also correlated with negative impacts associated with AHPNS diseases, and the higher
the intensification level the higher the risk level for AHPNS. The intensive shrimp systems
had the highest risk of AHPNS disease, followed by semi-intensive shrimp and white-
legged shrimp farms; however, some shrimp farms in the HiLI farming system still
succeeded and were not affected by AHPNS disease. Therefore, sharing of information on
shrimp production through farmers’ clubs and/or open fora were essential for farmers and
other stakeholders to improve farm management skills.
Figure 5.19. Evaluation of the shrimp farm economics status after three years Source: TLS of shrimp farms (2013)
5.4.5. Responses of farms for sustainable development
Main factors related to sustainable development: based on the above analysis of farm
change status, the factors affecting long-term development were identified as shrimp
disease outbreak and capital/credit costs. The AHPNS disease occurrence was a greater
risk to shrimp farmers during 2011 and 2012. The main cause of AHPNS disease was
identified as V.parahaemolyticus; however, poor seed quality, environmental degradation
86%
58%
9%15%
22%
43%
7%
33%
89%85%
56%
35%
7% 10%2% 0%
22% 22%
0%
10%
20%
30%
40%
50%
60%
70%
80%
90%
100%
Intensiveshrimp farms
Semi-intensive
farms
Improved-extensive
farms
Mixedmangrove-
shrimp
Rice-shrimprotation farms
White-leggedshrimp
% o
f res
pond
ents
Worse-off No-different Better-off
224
and weak farm management were considered as pre-conditions for disease occurrence and
spread. Shrimp diseases pose latent risks in every crop and were increasingly
unpredictable, so shrimp disease will still be considered as a factor affecting future
development. To overcome this issue, shrimp farmers had to change their management to
cope with shrimp disease. On the other hand, financial resources mainly came from the
farmers own savings; however, after several crop failures due to AHPNS most of the HiLI
shrimp farms did not have enough capital resource to reinvest and continue farming. In
addition, with the trends towards intensification as well as emerging demands for
certification, shrimp farms need financial resources to invest in their operations. Input
prices have increased 10-15% yearly, leading to increased production costs; many farms
lost profit from previous shrimp crops and so were forced to change their farms and reduce
investment level, switch to other activities and temporarily or permanently stop farming.
Thus, these two main factors strongly affected the farm changes between IFS and TLS
periods, and were also mentioned in Table 4.24.
Farm responses: The main factors affecting the farm changes were AHPNS disease and
capital/credit costs. Two factors led to farm changes or no changes and there were no
significant differences among shrimp farming systems. Particularly, the LoLI farms not
affected by the AHPNS disease still faced other shrimp diseases and natural resource
depletion led to reduce income from wild-fish/shrimp capture, and so they had to adjust
their activities. Shrimp farms that operated as normal, were more independent in terms of
operational capital, less affected by the AHPNS disease and more successful with their
shrimp crops so their farms was less affected by the described factors, and shrimp farming
remained an important income source. In contrast, shrimp farms changing practice often
saw negative returns from 2011 onwards because of negative impacts from AHPNS
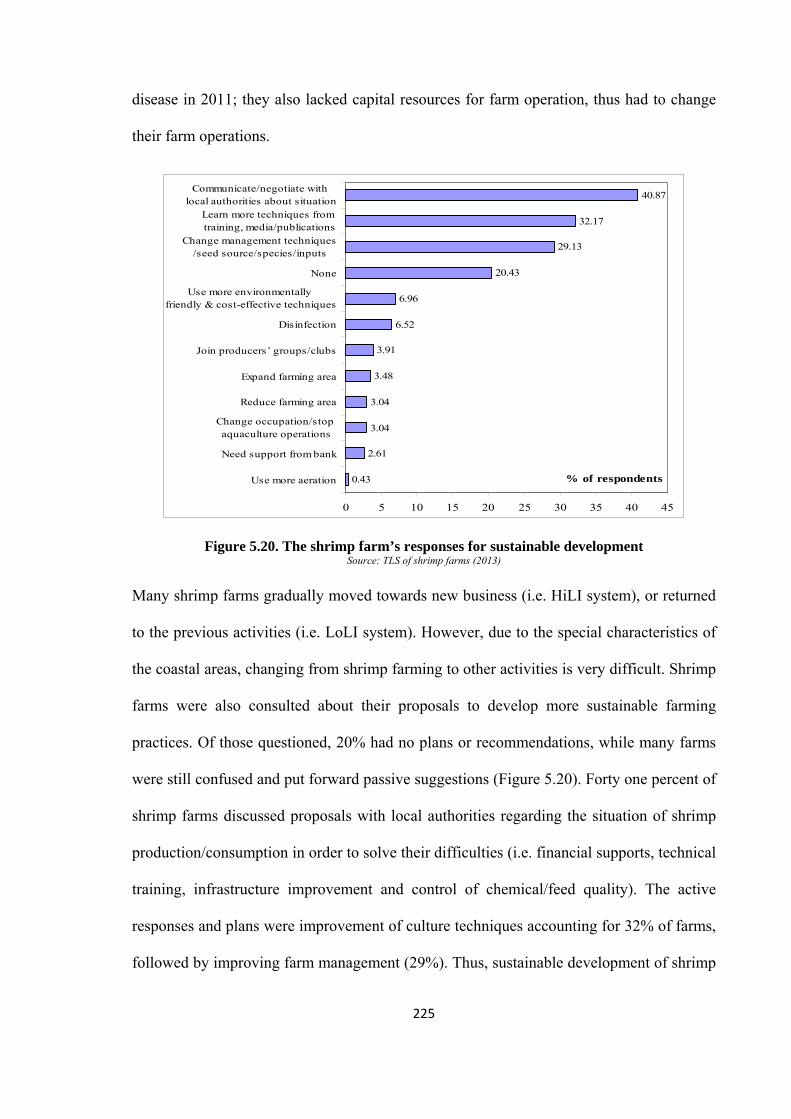
225
disease in 2011; they also lacked capital resources for farm operation, thus had to change
their farm operations.
Figure 5.20. The shrimp farm’s responses for sustainable development Source: TLS of shrimp farms (2013)
Many shrimp farms gradually moved towards new business (i.e. HiLI system), or returned
to the previous activities (i.e. LoLI system). However, due to the special characteristics of
the coastal areas, changing from shrimp farming to other activities is very difficult. Shrimp
farms were also consulted about their proposals to develop more sustainable farming
practices. Of those questioned, 20% had no plans or recommendations, while many farms
were still confused and put forward passive suggestions (Figure 5.20). Forty one percent of
shrimp farms discussed proposals with local authorities regarding the situation of shrimp
production/consumption in order to solve their difficulties (i.e. financial supports, technical
training, infrastructure improvement and control of chemical/feed quality). The active
responses and plans were improvement of culture techniques accounting for 32% of farms,
followed by improving farm management (29%). Thus, sustainable development of shrimp
0.43
2.61
3.04
3.04
3.48
3.91
6.52
6.96
20.43
29.13
32.17
40.87
0 5 10 15 20 25 30 35 40 45
Use more aeration
Need support from bank
Change occupation/stop aquaculture operations
Reduce farming area
Expand farming area
Join producers’ groups/clubs
Disinfection
Use more environmentally friendly & cost-effective techniques
None
Change management techniques/seed source/species/inputs
Learn more techniques from training, media/publications
Communicate/negotiate with local authorities about situation
% of respondents
226
farming should have the participation and support of local government agencies in creating
appropriate policies, technical assistance for capacity building and interference or
adjustment in the management of production and consumption.
5.5. Discussion and conclusions
5.5.1. Factors affecting the farming dynamics
Shrimp farming dynamic
Shrimp farming systems are diverse however, two major shrimp systems (improved-
extensive and rice-shrimp), accounted for 77% of MKD shrimp farmed area and 35% of
MKD shrimp production in 2013. Farming systems have gradually shifted from traditional
extensive systems to improved-extensive, and then to semi-/intensive production (Nguyen
et al. 2009; Anh et al. 2010a). Semi-intensive farms tended to have been upgraded from
improved-extensive and rice-shrimp rotation systems by the same operators, while
intensive shrimp farms were established by newcomers. Although improved-extensive
systems continue to exist in parallel, production does appear to have intensified overall
(Pham et al. 2010; Ha & Bush 2010). However, intensive shrimp systems also are limited
in range less than 15% of total shrimp farmed area that were planned by MARD in the
master plan of shrimp sector up to 2020 (VIFEP 2009b; MARD 2009b), and such shrimp
farming is concentrated at specific sites where have good infrastructure conditions (e.g.
road and irrigation canal system, electricity networks, transportation services) and better in
the monitoring and controlling the impact on the environment. Since 2008 many black
tiger shrimp farms, including semi-intensive and intensive systems gradually shifted to
white-legged shrimp culture, because the production cycle was shorter and more economic
efficient but also because the former was regarded as having higher disease susceptibility
(Nhuong et al. 2002; Funge-smith & Briggs 2003; Briggs et al. 2005; Yamprayoon &
227
Sukhumparnich 2010; Nietes-Satapornvanit et al. 2011). Although many shrimp farms
shifted to raising white-legged shrimp, the black tiger shrimp still remains as the most
important species in the MKD and remains preferred in most international markets (Tuan
et al. 2013; MARD 2014).
Catfish farming dynamic
Catfish farming began in small backyard ponds, and cage and pen-in-river systems but
quickly evolved to larger, very deep ponds. Key factors driving the rapid development of
pond culture practice include the availability of seed all year-round; low infrastructural
investment, short culture period and high economic efficiency compared to cages and pens.
Catfish farming in the MKD is an old tradition, from an era when the fish was raised in
backyard ponds primarily for household consumption. This practice was also known as
as overhung latrine systems because the latrines of the households were located above
the ponds (VIFEP 2009; De Silva & Nguyen 2011). Commercial catfish farming began on
small-farms dominated and operated by families (Phan et al. 2009; De Silva &
Nguyen 2011; Cannon & Johnson 2013), but quickly evolved through a rapid increase
in large-scale farms, mostly owned and operated by pangasius processors (Phan et al.
2009; De Silva & Nguyen 2011; Bosma & Verdegem 2011; Trifković 2013; Jespersen et
al. 2014). The market dominance of industrial or large-scale farming has come to
undermine the position of small-farms (Cuyvers & Tran 2008; Vo et al. 2009a; Bush &
Belton 2012; Trifković 2013; Jespersen et al. 2014; Ponte et al. 2014), as has a lack of
capital to invest in catfish culture and declining terms of trade, have been the key factors
driving this trend. Farm gate price instability and a downward trend in fish price were the
main reasons for smaller producers leaving catfish farming. Bush et al. (2010) noted that
reasons for small-farms leaving varied, but the most cited poor economic performance and
228
high risk due to lower farm gate price (Le & Cheong2010). Furthermore, the trend for
pangasius processors to vertically coordinate production and develop their own farms has
been influenced by concerns over the stable supply and control input quality (Vo et al.
2009; Bush & Belton 2012; Jespersen et al. 2014; Hansen & Trifković 2014). De Silva &
Nguyen (2011) noted that there appear to be a general belief that for the long-term
sustainability and economic survival of this sector it will have to make a shift towards
large-scale farming practices, and small-scale farms are likely to be further marginalized in
the industry (Belton & Little 2011; Bush & Belton 2012). To remain in operation, the
small-/medium farms have had to develop close relationships with processors, often on a
contract basis helps to ensure the selling their product and stable material sources for
processors (Trifković 2013; Fisheries Directorate 2013a). Contract farming, or the process
by which privately owned farm enterprises are supplied by a larger company with feed
(and/or seed) with an agreement to sell back harvest at a pre-agreed price is common
practice in the poultry business. Contract farming between processors and small-scale
farms has been viewed as a way to increase income for farmers, and to ensure a stable
supply of product in terms of quantity and quality for processors (Miyata et al. 2009;
Zhang 2014). However, pre-agreed prices have been problematic for both sides in a period
of unstable market, and agreed feed delivery, harvesting and payment terms were cited as
major constraints to undermining such business arrangements (Miyata et al. 2009; Pham &
Truong 2011; Fisheries Directorate 2013).
5.5.2. Farming transition and outcomes for sustainable livelihoods
Transition of shrimp farming practices
The LoLI farms tended to more stable operation than the HiLI farms (Table 5.8). Shrimp
disease was perceived as the main reason leading to the suspension operation of many
229
semi-/intensive farming systems. Although the shrimp farms were affected by disease
losses, most shrimp farms continued in production as alternative livelihood options in
coastal areas only suitable for aquaculture were limited and investment costs were
relatively low compared to pangasius farming sector (Nhuong et al. 2002; Le 2009). Farm
changes were different among the various types of shrimp systems, and typically shrimp
farms had implemented synchronous changes over time. Stocking density was main
change of LoLI farms as a result of declining natural seed source and rise in importance of
hatchery seed (Johnston et al. 2000; Nguyen et al. 2009). The most common change in
semi-/intensive shrimp farms was to reduce farmed area and stocking density and shift to
white-legged shrimp or other species. Shrimp farmers were encouraged to diversify their
livelihoods by Government through switching into other farmed species (Nguyen et al.
2009; MARD 2009b; Fisheries Directorate 2013b). The increasing demands of the markets
was an important reason for switching into white-legged shrimp culture (VASEP 2010;
Tuan et al. 2013; CBI 2013b; MARD 2014), and Vietnam has followed many other
countries who switched to white-legged shrimp culture (Kongkeo 1997; Lebel et al. 2002;
Funge-smith & Briggs 2003; Kongkeo & Davy 2009; Yamprayoon & Sukhumparnich
2010; De Silva & Nguyen 2011; Bondad-reantaso et al. 2012). However, this change has
only been partial perhaps because the shrimp industry in Vietnam did not face collapse as
in Taiwan (1987-1988) and Thailand (1994-1997), and this is possibly linked to the
enduring heterogeneity of culture systems and, in particular the persistence of more
resilient, landscape systems. This affords good opportunities for the Vietnamese shrimp
industry to maintain a differentiated position in seafood markets. Recently, during the
outbreak of AHPNS disease, HiLI farming systems were disproportionately affected, the
more intense the farming, the higher risk of AHPNS (Fisheries Directorate 2011; DoAH
2012; Fisheries Directorate 2013b; DoAH 2013a; FAO 2013). The AHPNS disease was
230
caused by V.parahaemolyticus (Loc et al. 2013; FAO 2013a); however, seed quality,
environmental degradation and weak farm management were believed to be contributory
factors (DoAH 2013a; FAO 2013a; Saleetid et al. 2013). Shrimp disease latent risks in
every crop (i.e. WSSV, AHPNS) and increasingly unpredictable, shrimp disease will be a
factor affecting future development. The serious shrimp diseases during this study were
WSSV and YHV, and both occurred annually and tended to increase due to poor quality
seed, poor water quality and spread of disease from the surrounding environment (Nguyen
et al. 2009; Oanh & Phuong 2012). Pond-to-pond transmission is more likely a
contributing factor to the spread of WSSV in semi-/intensive systems, while its
transmission within the pond occurs in improved-extensive shrimp systems (Hoa et al.
2011). Before 2010, serious shrimp diseases were WSSV and YHV, both types of disease
occurred yearly and have tended to increase. For example, in 2011, 1,000ha of shrimp
farmed area was infected by WSSV and this increased to 12,250ha by 2013.WSSV disease
affected both black tiger shrimp and white-legged shrimp in all shrimp systems (Fisheries
Directorate 2010; DoAH 2013a). Since late 2010, AHPNS disease has been prevalent in
semi-/intensive systems, over a wide area in the MKD and it is still causing serious losses
for farmers (DoAH 2013b). Statistics on shrimp disease show the most severe damage
caused by AHPNS was in 2011 with 65,593ha affected (accounting for 10% of shrimp
farmed area) leading to a reduction in total shrimp production (DoAH 2012). Shrimp
farming in 2012 continued to be affected by AHPNS, with the farmed area affected by
AHPNS accounting for 7.28% of total shrimp farmed area and shrimp production declined
by 9.38% compared to 2010. Hence, shrimp farmers had to change their management to
cope with shrimp disease and farmers were encouraged to use screened post-larvae,
practice pond preparation and strictly follow regulations on stocking time (Hoa et al. 2011;
Fisheries Directorate 2012; Oanh & Phuong 2012; DoAH 2013b). Specifically for coping
231
with the AHPNS disease, semi-intensive and intensive shrimp farmers were encouraged to
maintain water quality through control of algae growth, water exchange, increasing water
depth, suitable pH and regular sludge removal to reduce the potential for
V.parahaemolyticus growth. In Thailand, the farmed shrimp sector was seriously affected
by AHPNS in 2013, and shrimp production volumes declined by 50% (GLOBEFISH
2013). The important risk factors associated with AHPNS in Thailand were the frequency
of sludge removal, and improved measures were identified as having potential for
prevention (Saleetid et al.2013). After several crop failures through AHPNS disease, most
semi-/intensive shrimp farms, accounting for 85% of farms faced by AHPNS, exhausted
their capital resources to reinvest and maintain their operation. The lack of access to credit
to allow reinvestment has become an obstacle for shrimp farmers though may also have
prevented them becoming too highly indebted. Some commentators have advised that,
small-farms should form working groups to save operational costs and improve their
position horizontal and vertical coordination with their buyers (Khoi et al. 2011; Abreu et
al. 2011) but its not obvious that such action would insulate farmers from the impacts of
shocks such as AHPNS. Tran et al. (2013) indicated that shrimp production is essentially
controlled by shrimp processors and that integration of commodity chains would help
reduce transaction costs, ensure stable food supplies and increase control quality and food
safety (Grunert et al. 2005; Bush et al. 2010b; Bush et al. 2010a; Young et al. 2011; Abreu
et al. 2011; Jespersen et al. 2014). Moreover, vertical strategy of contract farming is seen
as the solution for small-scale shrimp farmers in improving market performance (Khiem et
al. 2010; Ha et al. 2013). The authors suggest that small-farmers can organise into
cooperative groups to gain production efficiencies, through sharing some management
tasks and reducing disease risk and environmental impacts through cooperative action.
However to date, shrimp farmers have not demonstrated much interest in farmers groups,
232
possibly because the organization, structure and operation are still weak and have not
showed clear positive benefit for farmers (RIA2 2009; Umesh et al. 2009; Nguyen et al.
2009).
Transition of catfish farming practices
Lack of financial sources and high dependence on credit can be key factors leading to farm
changes over time (Table 5.1), low fish price was perceived as being an important factor
driving catfish farm changes, and the small-/medium farms strongly affected by than larger
farms. Le & Cheong (2010) indicated that catfish price was the most significant risks for
catfish farming. Price fluctuations and declines, often to levels lower than the production
cost, led to poor economic performance and many small-/medium farms leaving this
sector. It was the same problem for pangasius hatcheries and coffee farming sectors during
periods of low farm gate price; 37% of small-hatcheries temporarily stopped their
operation (Fisheries Directorate 2013a), while the small coffee farms become contract
farms with wholesalers or temporarily stopped producing (Khoa 2014). The authorities
have now realized that ensuring an economically viable farm gate price is key to
sustaining the production side of the sector (De Silva & Nguyen 2011). Belton et al. (2009)
indicated that small-scale production is risky, substantial financial losses are probable in
the event of low farm-gate price; while large intensive operations are far more sustainable
from an economic perspective, since production can be staggered across a number of
ponds harvested on a rotation, and risk related to poor growth. The coping mechanism for
dealing with the problem of low price varied by farm scale; small-/medium farms
temporarily stopped farming and waited until price firmed, shifted to culture other species
or leased out their ponds whereas, large farms mainly reduced their investment level.
Farmers responded to lower prices by decreasing their costs or scale of operation;
233
offsetting their losses with other business interests; downgrading to fingerling production;
or growing other fish species (Vo et al. 2009a; Bush et al. 2009; Khiem et al. 2010; Belton
& Little 2011; Bush & Belton 2012). However, these strategies still have limitations,
especially marketing challenges when switching to other species and/or seed production.
For those operators that permanently ceased production, most of their ponds remained
empty or suspended or lease or sale of ponds was forced during difficult low price periods.
Small-producers may often suspend farming until the farm gate prices attain an
economically viable level (Khiem et al. 2010; De Silva & Nguyen 2011). However, we
argue that the small-/medium farms could not come back to the catfish farming sector if
they were carrying outstanding debts from previous crops, because access to the required
credit would be problematic. Moreover, small-/medium catfish farms that continue to
operate independently are disadvantaged even during ‘normal’ price periods when most
faced difficulties in selling fish during periods of oversupply. Small-farms are the most
vulnerable to changes in the political economy and unstable markets, and this is likely to
increase with a shift away from relational modes of governance such as vertical integration
(Khiem et al. 2010; Nguyen 2010; Grunert et al. 2010; Khoi 2011). In addition, input costs
have increased yearly leading to increased production cost that could not be offset through
efficiency gains, forcing them to temporarily stop their operation or leave the sector.
5.5.3. Farming sustainability: vertical and horizontal coordination
This study provides insights to the changing risk profile of catfish and shrimp farming in
the MKD, for which catfish relate mainly to the risks of economic change and for shrimp
to the risk of disease. Vertical and horizontal dimensions of coordination in value chains
234
are suggested to reduce the risk and vulnerability8 of both these species. Bolwig et al.
(2010) presents that the vertical linkages present contractual relationship and flows of
products/services, information, inputs, and finance between a node and other nodes in the
value chain; and the horizontal elements of value chains are represented by ‘discs’
radiating from each node that shows the chain actors in the centre of the disc and in the
periphery the external actors, the excluded actors, the non-participants, and the
communities surrounding these. Riisgaard et al. (2008) indicates that value chain
coordination around the production node may be strengthened as part of a broader
‘upgrading strategy’ to improve value chain participation for farmers, especially small
producers. The change in position of farmers is discussed in relation to the vertical and
horizontal linkages in value chains, as follow:
a). Vertical coordination
Risk profiles were mainly influenced by unstable catfish farm gate price, shrimp disease
and financial constraints that lead to farm changes over time. Small-medium catfish farms
are independent farms and they faced higher level of these risks compared to larger catfish
farms that are owned and operated by the pangasisus processors; while the shrimp farms
faced more serious shrimp disease (AHPNS in intensive system; and WSSV, YHV in the
more extensive systems). The main reasons were lack of the operation linkages between
value chain actors e.g. between catfish farmers and pangasius processors; between shrimp
farms and input suppliers (seed, feed, chemical/drug), and limited access to capital to
invest production inputs. Enhancing vertical integrated linkages between farms and the
other value chain actors is suggested as a way to reduce the risks and vulnerability for the
small-/medium catfish farms as well as the shrimp farms. Vertical coordination is an
8 risk is the likelihood of a specific shock occurring, while vulnerability is a property of systems and is a way of describing their response to shocks (Bolwig et al. 2010)
235
umbrella term used for describing institutional arrangements. Various forms of
coordination exist, but production contracts (i.e. full ownership management) are the most
relevant in the agri-food sector in developing countries (Reardon et al. 2009; Trifković
2013). Vertical contractualisation requests longer-term relationships or ‘contracts’ between
famers and other actors (e.g. pangasius processors, shrimp input suppliers) which can
provide a security of market for small producers (pangasius) as well as benefits such as
improved access to market information (e.g. on quality demands), services and inputs
(Bolwig et al. 2010). This vertical coordination is related to the ‘captive’ governance form
of GVC (Jespersen et al. 2014). Strengthening value chain coordination through increased
contractualisation (longer-term and more complex linkages between chain actors) is an
important part of upgrading for weak actors due to widespread factor and product market
failure (Gibbon 2001; Giuliani et al. 2005; Ponte & Ewert 2009; Bolwig et al. 2010).
Vertical contractualisation can also be useful for reducing price risks for small producers
(pangasius), and reducing marketing costs. In the shrimp sector, the vertical linkages with
the input suppliers can reduce risk associated with shrimp disease and financial constraints.
Contracted catfish farms privately owned by a farm enterprise, has risk reduced the
pangasius processor supplying feed and seed based on agreement to sell back harvest at
pre-agreed price. Shrimp farms could also develop contracts with input suppliers in terms
of high quality of farming inputs (e.g. screened shrimp seed pathogen, high quality of feed
and chemical/drug) and payment terms. In the case of vertical linkages with pangasius
processors, small-/medium catfish farms may solve the financial constraints because of
changes in providing feed and seed from the pangasius processors. Such contracted
small/medium catfish farms based on pre-agreed prices with processors, can clear 500-
1,000VND/kg marketable fish of net profit. For example, members of Thoi An Pangasius
cooperative in Can Tho province were contracted by Hung Vuong pangasius Joint-stock
236
company, receiving feed and seed from them in addition to technical support. However,
the farmers have to pay the labour, electricity and chemical costs. At the end of production
cycle, Hung Vuong company bought fish and paid the farmers 3,000VND/kg after
deducting cost of feed and seed cost (Anh 2014). Although the net profit was lower in the
contract system compared to the ‘normal’ farming practices, the system benefits the
farmers through greater stability of prices and access to finance, and for processor who is
assured of a stable supply raw materials and quality control. However, pre-agreed prices
have been problematic for both sides during periods of unstable market; and agreed feed
delivery, harvesting and payment terms were cited as major constraints to undermining
such business arrangements (Miyata et al. 2009; Pham & Truong 2011; Fisheries
Directorate 2013). Zhang (2014) indicated that vertical integration through contract system
between feed companies and agricultural farms had failed in China due to unstable
relationships and unbalanced power between companies and farmers (Wang 2009).
Contract farming does not in itself change the status of small-scale and scattered farming
practices, and cannot resolve the food safety problems (Lin & Ren 2006), for instance the
notorious food scandal of melamine contamination in milk product in China occurred
within small-scale farms working under contract farming (Wang 2009).
In the shrimp sector, seed quality was studied as an important cause leading to shrimp
disease occurs (Nguyen et al. 2009; Oanh & Phuong 2012; Hoa et al. 2011). In the LoLI
system, most shrimp farms used unscreened post-larvae and high shrimp mortality was
very high. Although shrimp seed were checked for pathogens (WSSV, YHV) using PCR,
the HiLI shrimp farms still faced problems of AHPNS disease. AHPNS can be caused by
the seed source and pond environment conditions that are controlled mainly by the
chemical treatments. Shrimp farms need to control the seed quality and the farming inputs
(feed and chemical/drug), and vertical linkages with prestigious input suppliers can help to
237
reduce the risks of shrimp disease. Vertical coordination between a shrimp farm group and
large-scale shrimp hatchery in India helped to reduce risk of shrimp disease for shrimp
farm members (Umesh et al. 2009).
Smaller farms can benefit from participation in global trade because of positive effects of
participation in export on farmers’ productivity (Minten et al. 2009), employment
opportunities (Maertens & Swinnen 2009), and access to technology, inputs and
investment (Gow & Swinnen 1998; Dries & Swinnen 2004). However, many of these
benefits are available mainly to vertically integrated farms (Dries & Swinnen 2004). The
salmon value chain in Europe is a good example, where both vertical and horizontal
integration has developed. Salmon supply chains are the most industrialised in aquaculture,
with an increasing degree of vertical coordination from salmon farms to the supermarkets,
a model that has more similarities with manufacturing and the most industrialised value
chains in agriculture (Kvaløy & Tveterås 2008).
b). Horizontal coordination
Vertical coordination can bring good chances for small-/medium catfish and shrimp farms
to cope with the risks and vulnerability. However, pangasius processors are not attracted to
make contract with the individual small-scale farms due to the small volume and dispersed
nature of fish production. In this regard, horizontal coordination is asserted as being
important for reducing risks and vulnerability for small-/medium catfish farms.
Meanwhile, the LoLI shrimp farms also faced the same problems as catfish sector when
individual farms attempt to form contracts with the prestigious input suppliers. Horizontal
contractualization is a way to implement this coordination, where producers agree among
themselves to cooperate over input provision, marketing, certification, crop insurance or
other forms of collective action in order to increase revenues, reduce costs, or reduce
238
individual risks (Bolwig et al. 2010). The model of Fair trade coffee producer cooperatives
in Latin American countries is a good example of this, the Fair trade chains contribute to
reduce risk and improve credit access, enabling producers to make long-term investments
(Lyon 2006; Valkila & Nygren 2009; Ruben et al. 2009; Bacon 2010; Ruben & Fort 2012).
However, Fair trade certification is only available to cooperatives of small-scale farmers,
and for a small-scale farmer to be organically certified a cooperative membership is
mandatory (Gómez Tovar et al. 2005; Cruz 2006; Valkila & Nygren 2009; Valkila 2009;
Bacon 2010). The change in position of small-scale farmers through forms of upgrading
(technological and functional) often depend on creating stronger contractual ties among the
weak actors themselves or with buyers (Gibbon 2001; Ponte & Ewert 2009; Bolwig et al.
2010). Therefore, independent small farmers should be formed into the farm groups or
cooperatives, because the Government also has policy to support the operation of farm
groups in terms of technical aspects (training on the management of farm groups and
technical training) and financial supports (investment and tax incentive, preferential
interest rates and debt rescheduling). Moreover, the pangasius processors have incentives
to develop and establish the vertical contractualisation with the farm cooperatives and farm
groups, because they are also motivated by the Government through policy supports (loan
incentive and preferential interest rates).
Literature reviews show that agriculture cooperatives and group actions are important for
development, improving farm performance significantly (Council & Cooperatives 1987;
Parliament et al. 1990; Srinath et al. 2000; Garrido 2007). Small-scale farms can enhance
competitiveness and achieve improved economies of scale by collaborating and through
working as clusters of organisations (Berdegué Sacristán 2001; Tain & Diana 2007).
Moreover, a group farming approach was an effective way for extension intervention to
239
educate farmers on sustainability while helping them to improve their farming practices
(Srinath et al. 2000; Umesh et al. 2009).
Bolwig et al. (2010) noted that the two dimensions of contractualisation are often
connected, as collective action (horizontal contractualisation) among small producers is
frequently necessary for increasing vertical contractualisation. Vertical contractualisation
is determining factor in the success of group formation, as well as providing important
explicit incentives for process, product and functional upgrading (Khiem et al. 2010).
Working in the farm group, farmers can receive many benefits through the collective
actions, such as: i) reducing the transactions cost: they buy input (feed/seed/chemical)
directly from the input manufacturers to get high product quality, preferential price and
free services, and shrimp seed source is controlled in terms of quality and pathogen; ii)
reducing risks: they can become contract farms with processors (pangasius), and they can
buy high input quality and get supports on disease diagnostic services from professional
sector and input suppliers; and iii) improvement of management practices (technical and
management skills): they can share the experience on the husbandry skills and receive
frequently technical training courses from the local government. Collective action through
farmers’ organizations can help small-scale farmers overcome challenges related to market
liberalization, globalization and increasingly stringent quality and safety requirements for
aquaculture products (Kassam et al. 2011). For example, Thoi An Pangasius cooperative
was established in 2003 with 10 farmers, and a successful model on the co-operation with
Hung Vuong company led to increased the number of cooperatives members, by 2010
there were 20 members. To join the co-operatives, the farmers have to contribute their fish
ponds and investment, the benefit sharing being based on the amount of capital investment
and land area contributed in each production cycle. Working as a cooperative helps the
farmers to overcome the difficulties of securing operational finance and reduce risks of
240
farm gate price through vertical linkages with Hung Vuong company. Moreover, they can
more easily obtain loans from the state bank with preferential interest rate (Anh 2014).
Although vertical and horizontal contractualisation are necessary for risks and
vulnerability to be reduced, the government agencies play an important role in providing
support and interventions. Agro-food value chains often are characterised by highly
asymmetrical power relations, and that the terms of participation in these chains to a large
extent are controlled by downstream actors (Bolwig et al. 2010), and particularly small-
scale farms are very weak power relations. The role of the government is important in
establishing regulatory control programmes for ensuring food quality at the primary
production level. The private sector’s role is to invest in supply chain infrastructure,
develop service markets, and transfer technical and market information to smallholders
(Humphrey 2006; Ruben et al. 2007). Horizontal coordination in terms of support and
interventions from the government should be improved to make these dimensions of
contractulisation becoming feasible and effective. The policy on financial and technical
supports are revised to support for the vertical and horizontal contractualisation, but
simultaneously the Government intervention is needed to create and enforce legal contracts
between farmer groups and processors (pangasius), and ensure control on the quality of
farming input products, especially seed quality and chemical products. The government
institutional environment plays a decisive role in guaranteeing the legal framework and
defining transparent rules for conflict settlement (Key & Runsten 1999; Ruben et al. 2007;
Amanor 2009). For example, current catfish farming practices show that the payment
schedule between farmers and processors was often delayed by processors, and this
increased the operation cost of farmers due to their interest payment of loan for the delay
period (Belton 2010; Trifković 2013; Hansen & Trifković 2014). Hence, the intervention
should be ensure legal agreement in term of payment schedules and minimum price are in
241
place and observed (Bush et al. 2010; Le & Cheong 2010). Key & Runsten (1999) indicate
that contract farming provides best outcomes under conditions in which public surveillance
is guaranteed. Moreover, the Government needs to improve the cooperative law and farmer
group regulations, with special attention to smaller scale groups to improve economic
performance (Bush et al. 2009; Ha & Bush 2010; Pham et al. 2011).
242
CHAPTER 6
Chapter 6. Perceptions of sustainable development issues for farmed
seafood species in the Mekong Delta
6.1. Introduction
Aquaculture plays an important role in the global fish system and contributes more fish to
global food demand than capture fisheries (Subasinghe et al. 2009; Asche & Guttormsen
2009; Belton & Little 2011). The aquaculture sector has continued to grow, however, it has
to guarantee sustainable development that not only meets the needs of seafood producing
countries, but also the requirements of importing countries in terms of customers’
requirements on food safety, animal welfare, environmental sound and social
responsibilities (Corsin et al. 2007; Subasinghe et al. 2009; Bostock et al. 2010; FAO
2012). Hence, the challenge for the sustainable growth of aquaculture is to improve
production performance while simultaneously minimizing impacts (Martinez-Cordero &
Leung 2003; Frankic & Hershner 2003). Aquaculture can make significant contributions
to development by improving incomes, providing employment opportunities and
increasing the returns on resource use (Subasinghe et al. 2009; FAO 2012; Hishamunda et
al. 2014; Belton & Bush 2014). However, growth of aquaculture must not only maximize
benefits, but also minimize negative impacts on the natural and social environment (Kutty
1995; Frankic & Hershner 2003). Sustainable aquaculture systems can avoid most
conflicts among reasonable interests, and three-dimensional sustainability principles can
serve as a basis for building a more complex sustainability system (Kutty 1995; Glavič
& Lukman 2007).
The use of sustainability indicators has proved to be both an objective and efficient
monitoring tool to assess the rational use and management of natural resources
243
(Moctezuma-Malagón et al. 2008; Bell & Morse 2008). Sustainability indicators are not only
useful for measuring progress but also for identifying problems, setting sustainable
development goals and identifying suitable management strategies (Reed et al. 2006; Bell
& Morse 2008). Development towards a sustainable trajectory for the Vietnamese
aquaculture sector in the master plan until 2020 (MARD 2009b; MARD 2009c); however,
there are only general guidelines for how this will be accomplished. There is a lack of
specific analysis on factors driving sustainability such as the role of actors along the value
chain, the nature of the specific sustainability issues to be concerned about and which
factors are driving forces for sustainability through the value chain. Considering the
gradual increase in seafood consumption and requirements from the customers regarding
sustainability issues in recent years, for instance the Netherlands, Germany and UK
markets have higher requirements for pangasius products with respect to production
quality and sustainability (Beukers et al. 2012; CBI 2012a; CBI 2012b). This chapter,
therefore, analyses value chain clusters of farmed striped catfish and shrimp, the main
marketing channels and constraints of main stakeholders along the value-chain. This study
also provides an assessment of perception of sustainability issues by different stakeholder
groups along the value chains and their corresponding measurement tools and mitigation
actions.
6.2. Chain actors: position and operational constraints
6.2.1. Catfish value chain: current constraints of key chain actors
Stakeholders in the striped catfish value chain are highly diversified (Figure 3.12). In
chapter 3, general information on the current situation of stakeholders along the value
chain in the MKD was described, and its value chain has also been described in the detail
in previous studies (Vo et al. 2009a; Vo et al. 2009b; Le 2011; Khoi 2011; CBI 2012b;
244
Trifković 2013). Therefore, in this section, based on the scoping survey, the current
constraints of major stakeholder groups affecting the process of commodity flow are
presented as follows:
a). Input suppliers
Input suppliers can be classified into two main sub-groups i) feed manufacturers and
traders; and ii) veterinary medicine manufacturers and traders. These actors participate
indirectly in the production chain, providing inputs for production flows. This group also
plays an important role in ensuring the quality of inputs for production and affects the
production efficiency of the value chain. The system of feed and veterinary product
distribution is quite diversified; however, diversity of distribution channels could make for
difficulties of quality control and management. At the time of this study, feed costs
accounted for 80-83% of production cost per kg of fish at the farm level, and can bring
US$0.163-0.254/kg harvested fish of net profit for feed suppliers. While the cost of
veterinary products used was 1.50-2.20% of production cost per kg of fish, and thus the
chemical/drug suppliers could earn US$0.0036-0.0054/kg of harvested fish. By
participating in the catfish value chain, the input suppliers profit while facing low business
risk compared to the farmers. There were however, several problems faced including i)
market issues/trade competition (71% of respondents) with many input suppliers leading to
high trade competition among them; ii) operational linkages (36%) with a lack of
horizontal and vertical integrated linkages leading to unstable markets in term of customers
and the volumes of product traded; iii) capital investment (29%) as they faced financial
constraints related to operation and upgrade; iv) supply materials sources (21%) with more
than 60% of raw-materials for feed production imported feed manufacturers often faced
problems obtaining raw-materials in term of unstable sources and quality; and v) policy
245
and regulation issues (14%) where the lack of proper policies for financial support and
high import tax on feed raw materials also increased production cost.
b). Seed suppliers
There are several stakeholders related to seed production, including brood-stock suppliers,
hatcheries, nurseries and seed traders. Hatcheries play an important role in this group;
however the hatcheries developed spontaneously and the production target of hatcheries
depends on the demand from grow-out farmers (Khoi 2011; Rigg 2012). The seed supplier
group is a key foundation node of the value chain, and it can directly affect the value chain
through the quality and cost of production. Seed quality is a key measure of the successful
operation of a hatchery, and directly relates to and depends on the quality of brood-stock
(Khoi 2007; Le & Le 2010; Khoi 2011). Seed comprised between 5.96-7.20% of
production cost per kg of marketable fish, so the seed suppliers could earn US$0.0121-
0.0181/kg harvested fish. With the higher intensification level of catfish farming, this
sector also provides greater opportunities for seed suppliers to gain profit and provide jobs
for local people. However, they also faced several constraints i) market issues/trade
competitions (91% of respondents) as many hatcheries were concentrated in a small area
leading to high competition, inconsistent sales price and unpredictable supply/demand
situation; ii) capital investment (59%) with a lack of operational finances for operation and
upgrading; iii) water sources (43%) where poor water quality may contribute to increased
seed mortality and reduced seed quality; iv) seed disease (34%) where seed disease can
lead to high mortality rate from fry to fingerling, caused by poor water quality and slow
replacement/improvement of brood-stock population; and v) operation linkages (28%)
where a lack of horizontal/vertical integrated linkages leads to unstable markets in terms of
customers and seed production.
246
c). Grow-out farmers
This group is an important actor of the value chain, providing the main source of raw
material for processing. The quality of raw materials depends on technical skills, seed
sources, type of feed, drugs/chemicals used and environmental conditions. Striped catfish
farming can be classified into three main types: i) type 1: farm is fully owned and operated
by a pangasius processor who takes all or most of its harvest (i.e. vertically integrated
business); ii) type 2: privately owned by a farm enterprise to which a pangasius processor
supplies feed (and/or seed) based on agreement to sell back harvest at pre-agreed price;
and iii) type 3: privately owned by an independent farm enterprise that independently
sources feed (and/or seed) inputs and sells the harvest to processors at an ‘on the spot’
price. Recent trends have shown that the farm type 1 and 2 are gradually increasing with
the reverse trend for farm type 3. In order to become farm type 2, farms often come from
co-operatives or large-scale farms, as it is not easy for independent small-/medium farms
to become contracted farms as they do not meet the criteria for contract terms and also lack
a historical business relationship (Pham & Truong 2011).
From the scoping study it was clear that during operation fish farmers faced some
problems the most important being i) capital investment (i.e. finance for investment)
identified by 80% of respondents; ii) 71% of catfish farms faced market issues (i.e.
fluctuation of farm gate price and unpredictable supply/demand); iii) fish disease (67%) has
increased, especially BNP and MAS diseases; iv) 67% of farms reported degradation in
water quality due to increased chemical/drug use; and v) reduced seed quality (58%)
leading to higher mortality and increased frequency of fish disease.
d). Pangasius processors
Processors play an important role in the value chain of catfish, by regulating the value
chain in terms of raw material and fish price. Processors share a lower proportion of net
247
added value per 1kg of fish (Table 3.5), but with large production capacities the processors
always play important role in the value chain (Le et al. 2011; Le 2011). During this study,
processors perceived several constraints, such as i) market issues/trade competition (86%
of respondents) where the large number of pangasius exporters had resulted in high and
unfair competition and trade fraud; ii) trademark or brand name building (63%) as without
product trademarks, processors have to sell their products through export agents or
importers, thereby reducing their profit and the competition of products on the market; iii)
lack of an effective master plan for the processing sector (63%); iv) technical/trading
barriers (50%) including increasing requirements of importers with regard to environmental
protection and social responsibility; anti-dumping; traceability and standards requirements
or food safety assurance; and v) policy/regulation issues (38%) where the policies on
financial support were still not effective.
6.2.2. Brackish-water shrimp value chain: current constraints of key chain actors
An overview of information on the current situation of stakeholders along the shrimp value
chain was presented in chapter 3, and the value chain of shrimp in the MKD has also been
described in detail in previous studies (Vo 2003; Le et al. 2011; CBI 2012b; Vu et al. 2013;
Tran et al. 2013). Based on the scoping survey, this section presents the current constraints
of major stakeholder groups who affect the process of commodity flow:
a). Input suppliers
Input suppliers included i) feed manufacturers and traders; and ii) veterinary medicine
manufacturers and traders. This group plays an important role in ensuring the quality of the
inputs for production and affects the production efficiency of the shrimp value chain. The
system of feed and veterinary product distributionis quite diversified; however, the
diversity of distribution channels could make difficulties for quality control and
248
management. At the time of this study, feed accounted for 55-60% of production cost per
kg of shrimp in the semi-/intensive and rice-shrimp farming systems, and resulted in
US$0.43-0.65/kg harvested shrimp net profit for feed suppliers. The cost of veterinary
products used was 12-14% of production cost per kg of shrimp, and thus the chemical/drug
suppliers could earn US$0.096-0.144/kg harvested shrimp. With the trend toward farm
intensification, such input suppliers could increase profits with little risk compared to the
farmers. However, they also faced several problems such as i) a crowded market with
resultant intense competition between input suppliers (86% of respondents); ii) poorly
developed operational linkages with customers resulting in unstable demand (43%); iii)
instability of availability and quality of feed ingredients (29%); and iv) constrained access
to both short-term and capital investment (14%).
b). Seed suppliers
There are several stakeholders related to seed production, including brood-stock suppliers,
hatcheries, nurseries who produce only post-larvae from Nauplius stage, and seed traders
who buy post-larvae from provinces in Central Vietnam and sell to local farmers. At the
time of this study, the cost of seed for grow-out farming was 4.26-6.10% of production
cost per kg harvested shrimp, so the seed suppliers could earn US$0.0337-0.0507/kg
harvested shrimp. A large area of shrimp farming in the MKD brought opportunities for
the development of the seed production sector. In their current practices, seed suppliers
faced the following constraints: i) market issues/trade competitions (80% of respondents)
as there were many hatcheries in the MKD and central provinces leading to high
competition; ii) water sources (67%) where some hatcheries in Can Tho and Soc Trang
faced problems with hyper-saline water sources (e.g. non availability water sources in local
area, and higher cost of hyper-saline water use), and water quality degradation increased
seed mortality and reduced seed quality; iii) brood-stock and seed quality (40%) as the
249
hatcheries depended heavily on wild brood-stock sources, thus they were unsure about the
quality of brood-stock, seed quality varied and was unstable between production cycles; iv)
juvenile disease (33%) leading to high mortality rates at hatching and nursing stages; and
v) capital investment (27%) where there was a lack of operational finances for operation
and upgrading.
c). Grow-out farmers
This group is an important value chain actor that provides the main source of raw material
for processing. The quality of raw material depends on technical skills, seed sources, type
of feed, drugs/chemicals use and environmental conditions. Similar to catfish farms,
shrimp farming has also developed mainly under three farm types: i) type 1: the farm is
fully owned and operated by a seafood processor, and they are mainly intensive shrimp
systems; ii) type 2: privately owned by aquaculture Ltd. company, they are contract farms
with the processors and are mainly intensive shrimp systems; and iii) type 3: privately
owned by independent farm enterprises, they are mainly individual mixed mangrove-
shrimp, improved-extensive, rice-shrimp rotation and semi-intensive shrimp systems, and
some aquaculture Ltd. companies with intensive-shrimp system.
Around 40 shrimp processors in the MKD are currently operating, and their raw material
sources mainly come from independent shrimp farms (Le et al. 2011). Wholesalers had an
important role to buy and collect shrimp for processors. Our survey found that shrimp
farmers faced some problems, being i) lack of available credit was mentioned by 70% of
respondents; ii) shrimp disease (69%) especially AHPNS and WSSV diseases; iii) seed
quality (68%) being inconsistent and generally in decline leading to high mortality; iv) 59%
of farms report water resources were degraded in terms of water quality due to increased
use of chemical/drug; and v) 31% of farms faced technical issues regarding methods of
250
disease prevention and treatment and also skills related to water management during extreme
weather.
d). Shrimp processors
Processors regulated the value chain in terms of raw material sources and shrimp prices.
Although the processors share a low proportion of the net added value per 1kg of shrimp
produced (Table 3.6), with their large production capacity they play an important role in
the value chain (Le et al. 2011; Vu et al. 2013). At the present, processors have faced
several problems such as i) market issues/trade competition (88% of respondents) asthere
was high competition with other country producers; ii) trademark or brand name building
(63%) as without a trademark, processors have to sell their products through export agents
or importers, so reducing profit and the competition of products on the market; iii) lack of
an effective master plan for the processing sector (63%); iv) technical/and trading barriers
(50%) where requirements of importers are increasing with regard to environmental
protection and social responsibility; anti-dumping; traceability and standard requirements or
food safety assurance; and v) policy/regulation issues (38%) where the policies on financial
support was still not appropriate and effective.
6.3. Perceptions on sustainability issues and measurement
6.3.1. Sustainability issues perceived by different stakeholder groups
a). Seed producers group
Striped catfish hatcheries: There were twelve different factors affecting their future
development, of which water quality & availability, disease management, unstable
markets and management & technical skills, were raised by 67% of respondents (Figure
6.1). The hatcheries suggested that water quality & availability and disease management
251
should be considered as key factors for future development. Water quality & availability
were viewed as negative impact factors as a reduction in water quality could affect
production efficiency and contribute to high seed mortality and disease. Recently, seed
quality degradation was raised as a main reason for slow growth rate and increasing fish
mortality at the grow-out stage. The reduction of seed quality, an universal concern of
hatchery managers in Asia (Little et al. 2012) may have derived from overuse of a brood-
stock population over time with a low number of brooders being added or changed, and
sometimes multi-spawning of the same brood-stock per year during periods of high
demand and overuse of the hormone (HCG) to induce spawning (VIFEP 2009a; Bui et al.
2010; Le & Le 2010). It has been recommended that 3-6+ year old broodstock should be
used for spawning, and that individual fish should not be spawned more than twice in a 12
month period (Phuong et al. 2011). Bui et al. (2010) noted a significant negative trend
between the combined hormone dose rate for females and hatching rate during the peak
season. Additionally, disease management is still a constraint for the future operation of
hatcheries, especially during nursing stages from fry to fingerling. Hatcheries often faced
disease in juveniles and difficulties on how to increase survival rate and seed quality.
Maintaining seed quality was identified as critical to ensuring sustainable production of
catfish, with attention to improved breeding practices and genetic factors being necessary
(Bui et al. 2010; Le & Le 2010; Sang 2010).
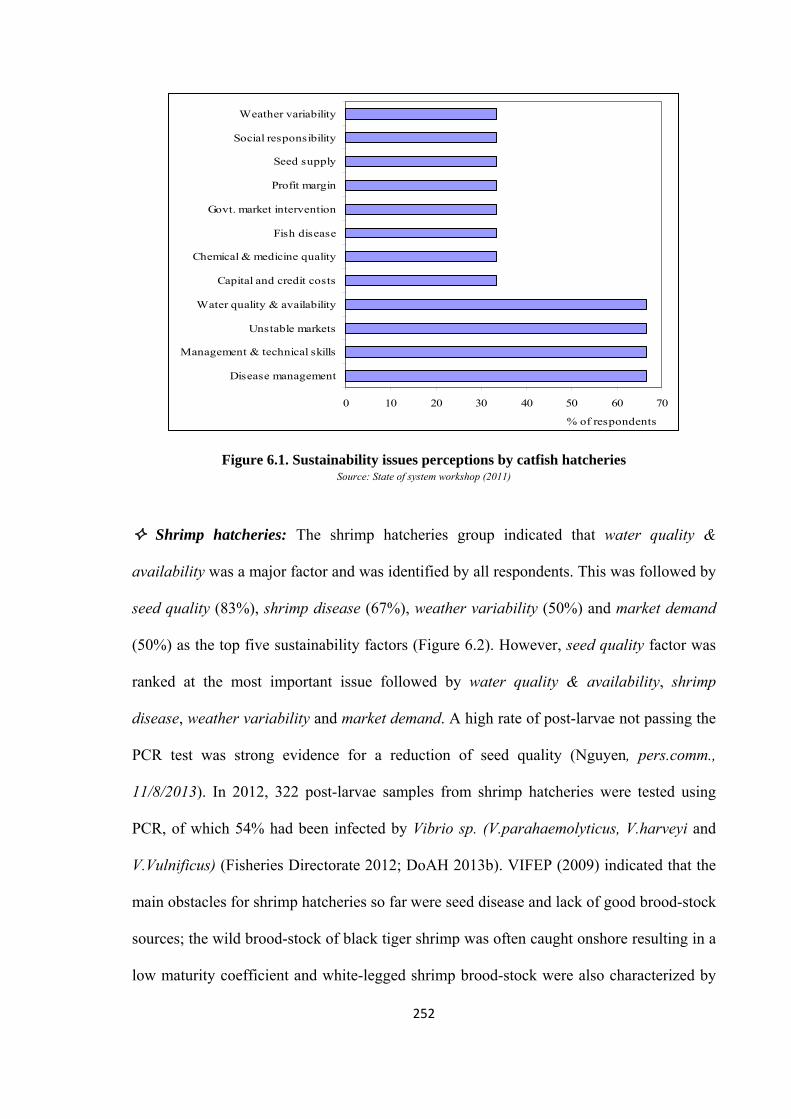
252
Figure 6.1. Sustainability issues perceptions by catfish hatcheries Source: State of system workshop (2011)
Shrimp hatcheries: The shrimp hatcheries group indicated that water quality &
availability was a major factor and was identified by all respondents. This was followed by
seed quality (83%), shrimp disease (67%), weather variability (50%) and market demand
(50%) as the top five sustainability factors (Figure 6.2). However, seed quality factor was
ranked at the most important issue followed by water quality & availability, shrimp
disease, weather variability and market demand. A high rate of post-larvae not passing the
PCR test was strong evidence for a reduction of seed quality (Nguyen, pers.comm.,
11/8/2013). In 2012, 322 post-larvae samples from shrimp hatcheries were tested using
PCR, of which 54% had been infected by Vibrio sp. (V.parahaemolyticus, V.harveyi and
V.Vulnificus) (Fisheries Directorate 2012; DoAH 2013b). VIFEP (2009) indicated that the
main obstacles for shrimp hatcheries so far were seed disease and lack of good brood-stock
sources; the wild brood-stock of black tiger shrimp was often caught onshore resulting in a
low maturity coefficient and white-legged shrimp brood-stock were also characterized by
0 10 20 30 40 50 60 70
Disease management
Management & technical skills
Unstable markets
Water quality & availability
Capital and credit costs
Chemical & medicine quality
Fish disease
Govt. market intervention
Profit margin
Seed supply
Social responsibility
Weather variability
% of respondents
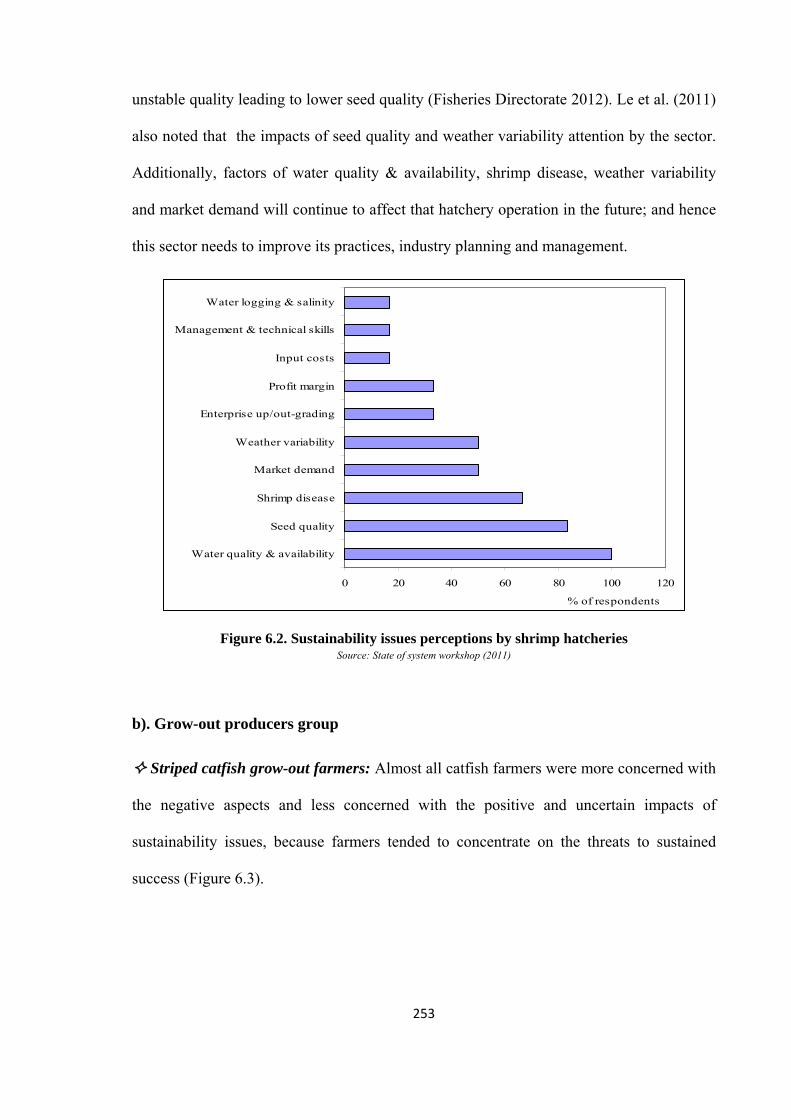
253
unstable quality leading to lower seed quality (Fisheries Directorate 2012). Le et al. (2011)
also noted that the impacts of seed quality and weather variability attention by the sector.
Additionally, factors of water quality & availability, shrimp disease, weather variability
and market demand will continue to affect that hatchery operation in the future; and hence
this sector needs to improve its practices, industry planning and management.
Figure 6.2. Sustainability issues perceptions by shrimp hatcheries Source: State of system workshop (2011)
b). Grow-out producers group
Striped catfish grow-out farmers: Almost all catfish farmers were more concerned with
the negative aspects and less concerned with the positive and uncertain impacts of
sustainability issues, because farmers tended to concentrate on the threats to sustained
success (Figure 6.3).
0 20 40 60 80 100 120
Water quality & availability
Seed quality
Shrimp disease
Market demand
Weather variability
Enterprise up/out-grading
Profit margin
Input costs
Management & technical skills
Water logging & salinity
% of respondents
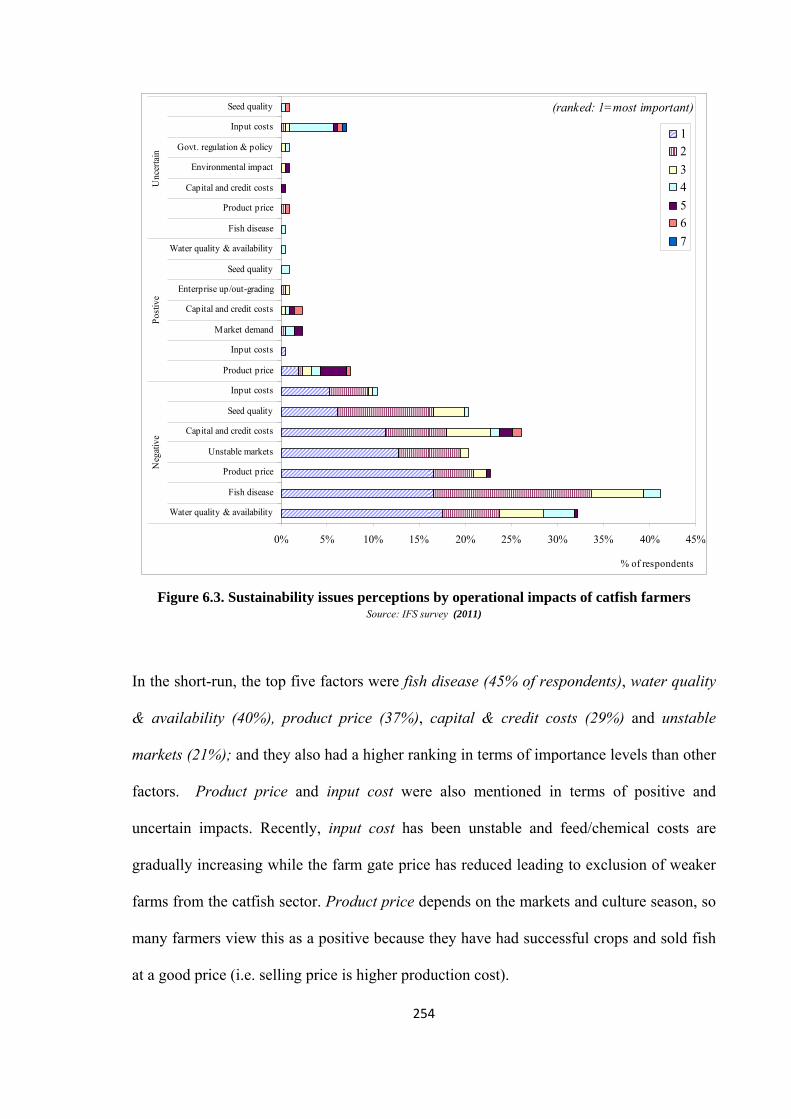
254
Figure 6.3. Sustainability issues perceptions by operational impacts of catfish farmers Source: IFS survey (2011)
In the short-run, the top five factors were fish disease (45% of respondents), water quality
& availability (40%), product price (37%), capital & credit costs (29%) and unstable
markets (21%); and they also had a higher ranking in terms of importance levels than other
factors. Product price and input cost were also mentioned in terms of positive and
uncertain impacts. Recently, input cost has been unstable and feed/chemical costs are
gradually increasing while the farm gate price has reduced leading to exclusion of weaker
farms from the catfish sector. Product price depends on the markets and culture season, so
many farmers view this as a positive because they have had successful crops and sold fish
at a good price (i.e. selling price is higher production cost).
(ranked: 1=most important)
0% 5% 10% 15% 20% 25% 30% 35% 40% 45%
Water quality & availability
Fish disease
Product price
Unstable markets
Capital and credit costs
Seed quality
Input costs
Product price
Input costs
Market demand
Capital and credit costs
Enterprise up/out-grading
Seed quality
Water quality & availability
Fish disease
Product price
Capital and credit costs
Environmental impact
Govt. regulation & policy
Input costs
Seed quality
Neg
ativ
eP
ostiv
eU
ncer
tain
% of respondents
12
34
56
7
255
Perceptions of sustainability issues (SIs) were significantly different by farmer scale
(P<0.05). Product price was identified as a key factor by small-farmers (P<0.05) being
relatively more important to this group than for larger-scale farms (Figure 6.4), and
exacerbated by the lack of operational linkages that this group had with processors, low
levels of production insufficient to meet processors’ requirements and higher rates of
yellow flesh-meat quality (15-20% compared to <15% in case of medium and large farms).
If the farm gate price is low over the long term and input costs increased, these farms
tended to temporarily stop farming. De Silva & Nguyen (2011) noted that a shift in low
farm gate price, particularly in the wake of the increasing costs of inputs often
makes the practices economically unviable. Small-farms often operated on an individual
basis, and face this problem more so than contracted farms and large-farms that are
vertically integrated with processors. It also was the same problem for the hatcheries sector
during the low farm gate price, in 2012 there were 140 hatcheries, this was a reduction of
80 hatcheries compared to that in 2010. Most of the hatcheries that suspended operations
temporarily were small scale, and they faced problems of marketing and low seed price
(Fisheries Directorate 2013a). Generally, the small-/medium farms were more concerned
about the economic aspects of sustainability issues (i.e. product price, unstable markets,
and capital & credit cost factors), while large-farms were mainly concerned with
environmental issues (i.e. water quality & availability, environmental impact, and seed
quality). Large-farms are often corporations or aquaculture companies or
contracted/linkage farms, and have activities linkages with other value chain actors; hence
they were less impacted with issues of farm gate price and capital investment. Seed quality
was identified as a negative impact factor and mentioned by all farm scales, and thus
indicated the need for an improvement programme for brood-stock and seed quality
supply.
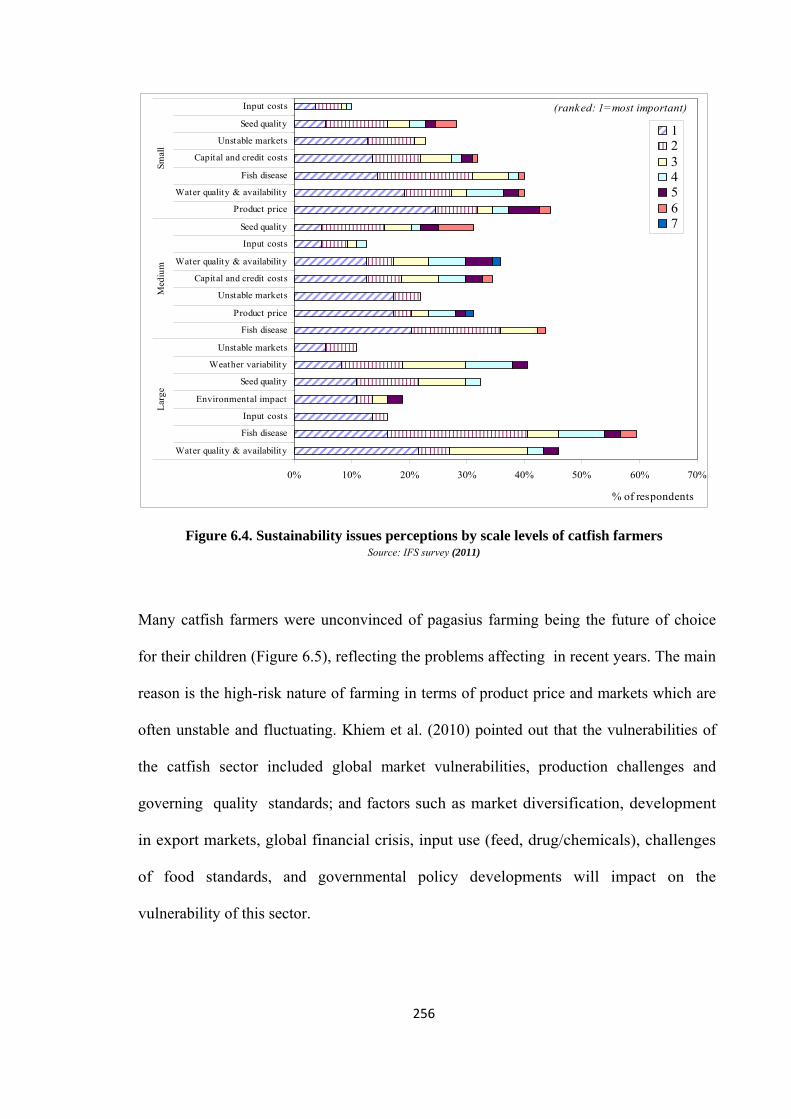
256
Figure 6.4. Sustainability issues perceptions by scale levels of catfish farmers Source: IFS survey (2011)
Many catfish farmers were unconvinced of pagasius farming being the future of choice
for their children (Figure 6.5), reflecting the problems affecting in recent years. The main
reason is the high-risk nature of farming in terms of product price and markets which are
often unstable and fluctuating. Khiem et al. (2010) pointed out that the vulnerabilities of
the catfish sector included global market vulnerabilities, production challenges and
governing quality standards; and factors such as market diversification, development
in export markets, global financial crisis, input use (feed, drug/chemicals), challenges
of food standards, and governmental policy developments will impact on the
vulnerability of this sector.
(ranked: 1=most important)
0% 10% 20% 30% 40% 50% 60% 70%
Water quality & availability
Fish disease
Input costs
Environmental impact
Seed quality
Weather variability
Unstable markets
Fish disease
Product price
Unstable markets
Capital and credit costs
Water quality & availability
Input costs
Seed quality
Product price
Water quality & availability
Fish disease
Capital and credit costs
Unstable markets
Seed quality
Input costs
Lar
geM
ediu
mSm
all
% of respondents
1234567
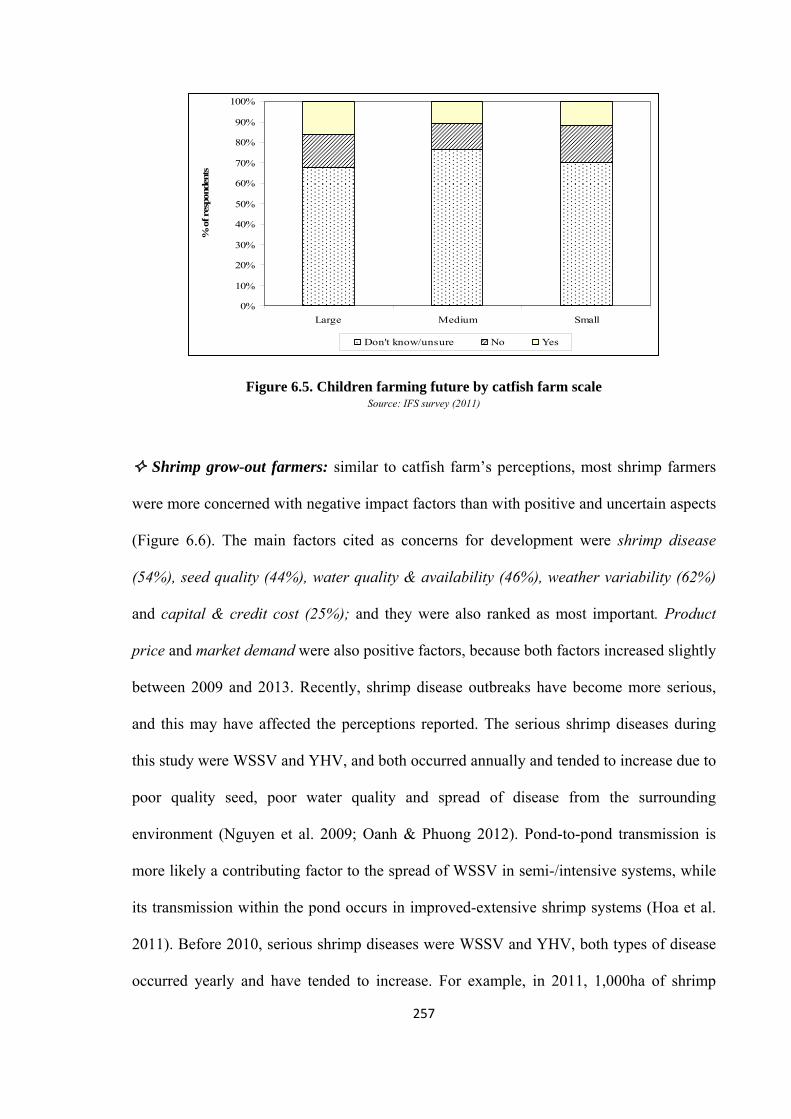
257
Figure 6.5. Children farming future by catfish farm scale Source: IFS survey (2011)
Shrimp grow-out farmers: similar to catfish farm’s perceptions, most shrimp farmers
were more concerned with negative impact factors than with positive and uncertain aspects
(Figure 6.6). The main factors cited as concerns for development were shrimp disease
(54%), seed quality (44%), water quality & availability (46%), weather variability (62%)
and capital & credit cost (25%); and they were also ranked as most important. Product
price and market demand were also positive factors, because both factors increased slightly
between 2009 and 2013. Recently, shrimp disease outbreaks have become more serious,
and this may have affected the perceptions reported. The serious shrimp diseases during
this study were WSSV and YHV, and both occurred annually and tended to increase due to
poor quality seed, poor water quality and spread of disease from the surrounding
environment (Nguyen et al. 2009; Oanh & Phuong 2012). Pond-to-pond transmission is
more likely a contributing factor to the spread of WSSV in semi-/intensive systems, while
its transmission within the pond occurs in improved-extensive shrimp systems (Hoa et al.
2011). Before 2010, serious shrimp diseases were WSSV and YHV, both types of disease
occurred yearly and have tended to increase. For example, in 2011, 1,000ha of shrimp
0%
10%
20%
30%
40%
50%
60%
70%
80%
90%
100%
Large Medium Small
% o
f res
pond
ents
Don't know/unsure No Yes
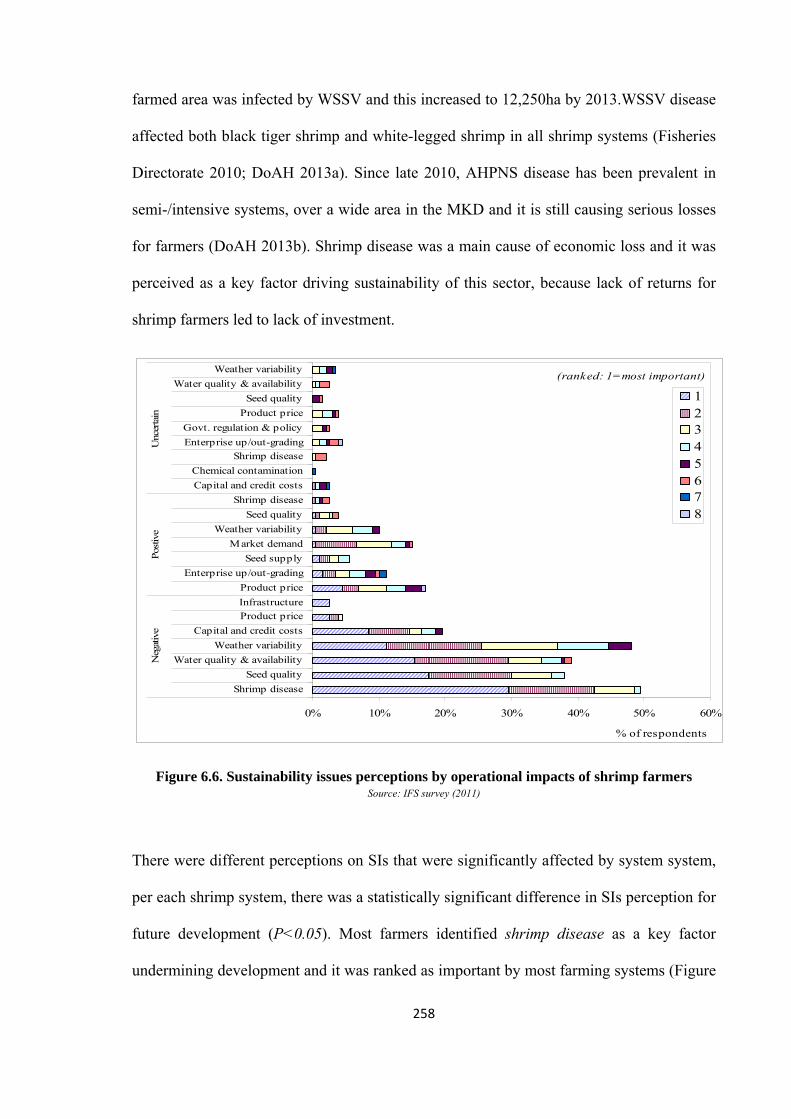
258
farmed area was infected by WSSV and this increased to 12,250ha by 2013.WSSV disease
affected both black tiger shrimp and white-legged shrimp in all shrimp systems (Fisheries
Directorate 2010; DoAH 2013a). Since late 2010, AHPNS disease has been prevalent in
semi-/intensive systems, over a wide area in the MKD and it is still causing serious losses
for farmers (DoAH 2013b). Shrimp disease was a main cause of economic loss and it was
perceived as a key factor driving sustainability of this sector, because lack of returns for
shrimp farmers led to lack of investment.
Figure 6.6. Sustainability issues perceptions by operational impacts of shrimp farmers Source: IFS survey (2011)
There were different perceptions on SIs that were significantly affected by system system,
per each shrimp system, there was a statistically significant difference in SIs perception for
future development (P<0.05). Most farmers identified shrimp disease as a key factor
undermining development and it was ranked as important by most farming systems (Figure
(ranked: 1=most important)
0% 10% 20% 30% 40% 50% 60%
Shrimp disease
Seed quality
Water quality & availability
Weather variability
Capital and credit costs
Product price
Infrastructure
Product price
Enterprise up/out-grading
Seed supply
Market demand
Weather variability
Seed quality
Shrimp disease
Capital and credit costs
Chemical contamination
Shrimp disease
Enterprise up/out-grading
Govt. regulation & policy
Product price
Seed quality
Water quality & availability
Weather variability
Neg
ativ
ePos
tive
Unc
erta
in
% of respondents
12345678
259
6.7), with a statistically significant difference among five shrimp systems (P<0.05).
However, it was less important in the rice-shrimp rotation system due to the seemingly
increased sustainability of this model (i.e. one crop for shrimp and one crop for rice). This
helps to improve environmental conditions within ponds and reduce shrimp disease risk
(MOFI 2006; RIA2 2009; FAO 2013a). Seed quality issue needs to be considered as a
priority issue for development. Weather variability and water quality/availability have
been resulting innegative impacts recently that are main factors affecting outbreak of
shrimp disease. The result shows weather variability has a bigger impact on the most
intensive system. Shrimp farmers said that with high stocking density, high fluctuation of
weather (heavy rain, unstable weather etc.) makes water quality unstable and difficult to
control, so it affects to shrimp health because shrimp is very sensitive with variation of
water condition and farmers have to spend more money for chemical/probiotics use and
labour for pond management.
Seed quality is percieved as a way to help farmers overcome this. Seed quality was a
greater concern for the farm group with less than five years experience than the others,
while shrimp disease was a greater issue for the farm group with more than five years
experience.
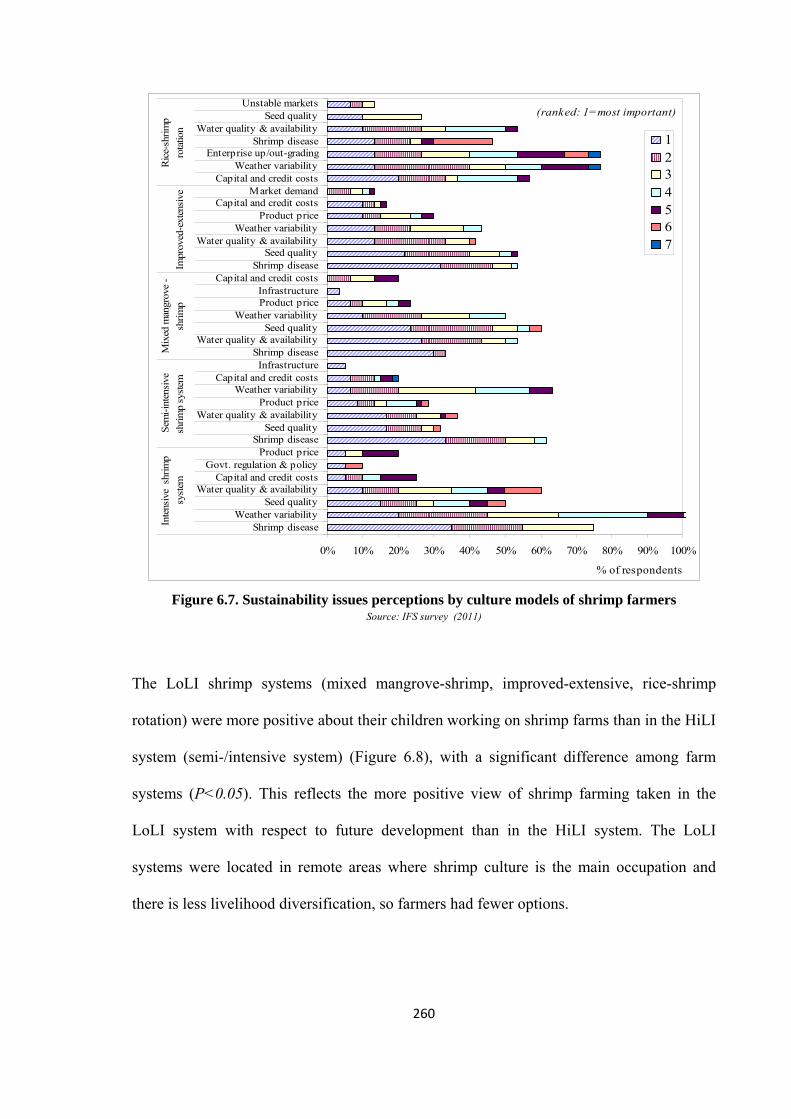
260
Figure 6.7. Sustainability issues perceptions by culture models of shrimp farmers
Source: IFS survey (2011)
The LoLI shrimp systems (mixed mangrove-shrimp, improved-extensive, rice-shrimp
rotation) were more positive about their children working on shrimp farms than in the HiLI
system (semi-/intensive system) (Figure 6.8), with a significant difference among farm
systems (P<0.05). This reflects the more positive view of shrimp farming taken in the
LoLI system with respect to future development than in the HiLI system. The LoLI
systems were located in remote areas where shrimp culture is the main occupation and
there is less livelihood diversification, so farmers had fewer options.
(ranked: 1=most important)
0% 10% 20% 30% 40% 50% 60% 70% 80% 90% 100%
Shrimp diseaseWeather variability
Seed qualityWater quality & availability
Capital and credit costsGovt. regulation & policy
Product priceShrimp disease
Seed qualityWater quality & availability
Product priceWeather variability
Capital and credit costsInfrastructure
Shrimp diseaseWater quality & availability
Seed qualityWeather variability
Product priceInfrastructure
Capital and credit costsShrimp disease
Seed qualityWater quality & availability
Weather variabilityProduct price
Capital and credit costsMarket demand
Capital and credit costsWeather variability
Enterprise up/out-gradingShrimp disease
Water quality & availabilitySeed quality
Unstable markets
Inte
nsiv
e s
hrim
p
syst
em
Sem
i-in
tens
ive
shri
mp
syst
em
Mix
ed m
angr
ove
-
shri
mp
Impr
oved
-ext
ensi
ve
Ric
e-sh
rim
p
rota
tion
% of respondents
1234567
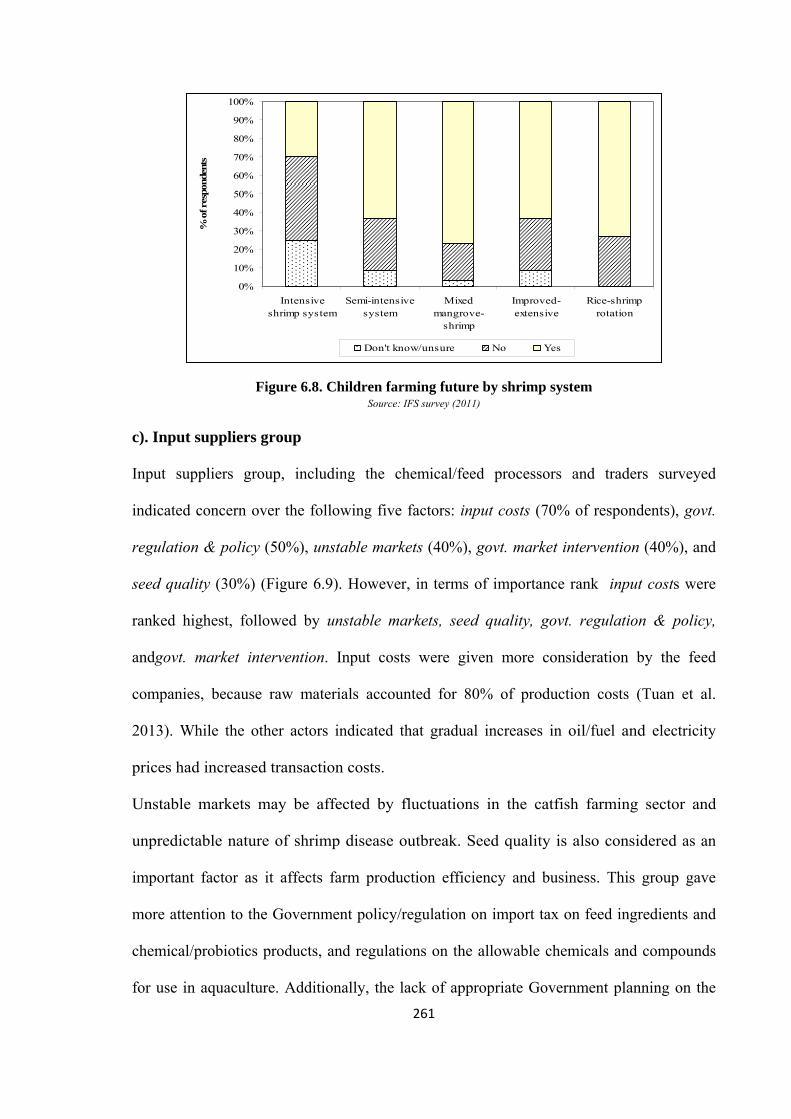
261
Figure 6.8. Children farming future by shrimp system Source: IFS survey (2011)
c). Input suppliers group
Input suppliers group, including the chemical/feed processors and traders surveyed
indicated concern over the following five factors: input costs (70% of respondents), govt.
regulation & policy (50%), unstable markets (40%), govt. market intervention (40%), and
seed quality (30%) (Figure 6.9). However, in terms of importance rank input costs were
ranked highest, followed by unstable markets, seed quality, govt. regulation & policy,
andgovt. market intervention. Input costs were given more consideration by the feed
companies, because raw materials accounted for 80% of production costs (Tuan et al.
2013). While the other actors indicated that gradual increases in oil/fuel and electricity
prices had increased transaction costs.
Unstable markets may be affected by fluctuations in the catfish farming sector and
unpredictable nature of shrimp disease outbreak. Seed quality is also considered as an
important factor as it affects farm production efficiency and business. This group gave
more attention to the Government policy/regulation on import tax on feed ingredients and
chemical/probiotics products, and regulations on the allowable chemicals and compounds
for use in aquaculture. Additionally, the lack of appropriate Government planning on the
0%
10%
20%
30%
40%
50%
60%
70%
80%
90%
100%
Intensiveshrimp system
Semi-intensivesystem
Mixedmangrove-
shrimp
Improved-extensive
Rice-shrimprotation
% o
f res
pond
ents
Don't know/unsure No Yes
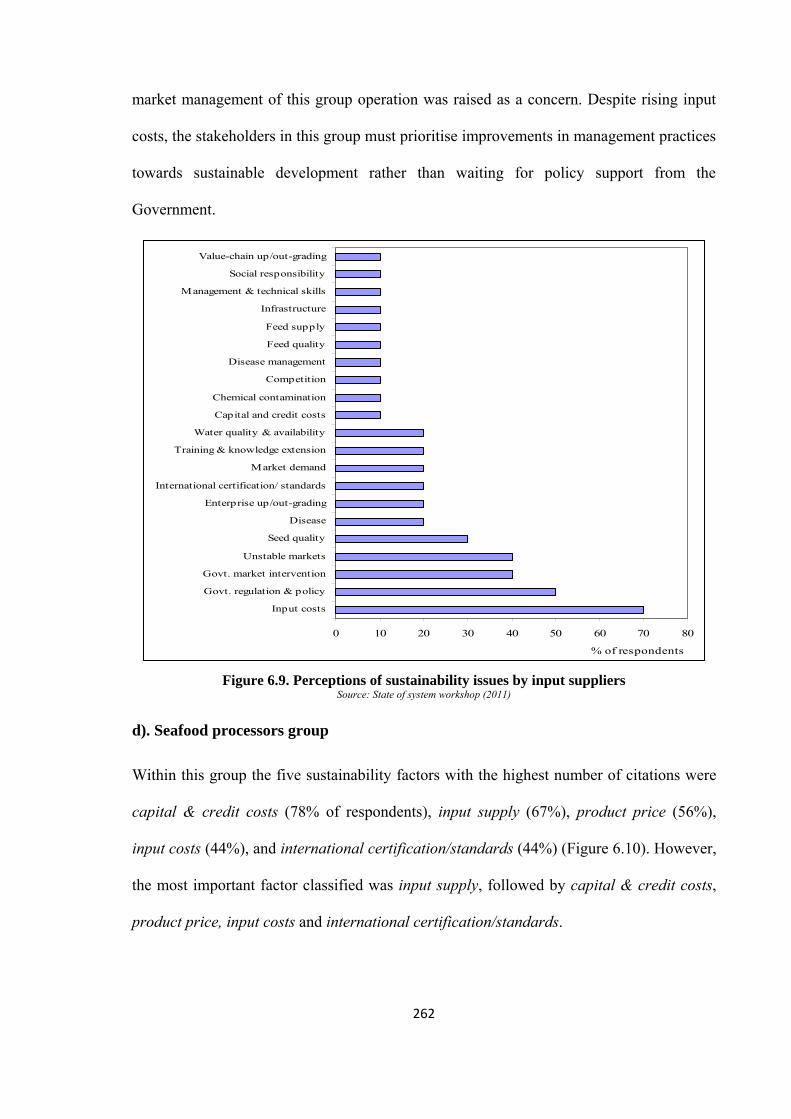
262
market management of this group operation was raised as a concern. Despite rising input
costs, the stakeholders in this group must prioritise improvements in management practices
towards sustainable development rather than waiting for policy support from the
Government.
Figure 6.9. Perceptions of sustainability issues by input suppliers
Source: State of system workshop (2011)
d). Seafood processors group
Within this group the five sustainability factors with the highest number of citations were
capital & credit costs (78% of respondents), input supply (67%), product price (56%),
input costs (44%), and international certification/standards (44%) (Figure 6.10). However,
the most important factor classified was input supply, followed by capital & credit costs,
product price, input costs and international certification/standards.
0 10 20 30 40 50 60 70 80
Input costs
Govt. regulation & policy
Govt. market intervention
Unstable markets
Seed quality
Disease
Enterprise up/out-grading
International certification/ standards
Market demand
Training & knowledge extension
Water quality & availability
Capital and credit costs
Chemical contamination
Competition
Disease management
Feed quality
Feed supply
Infrastructure
Management & technical skills
Social responsibility
Value-chain up/out-grading
% of respondents
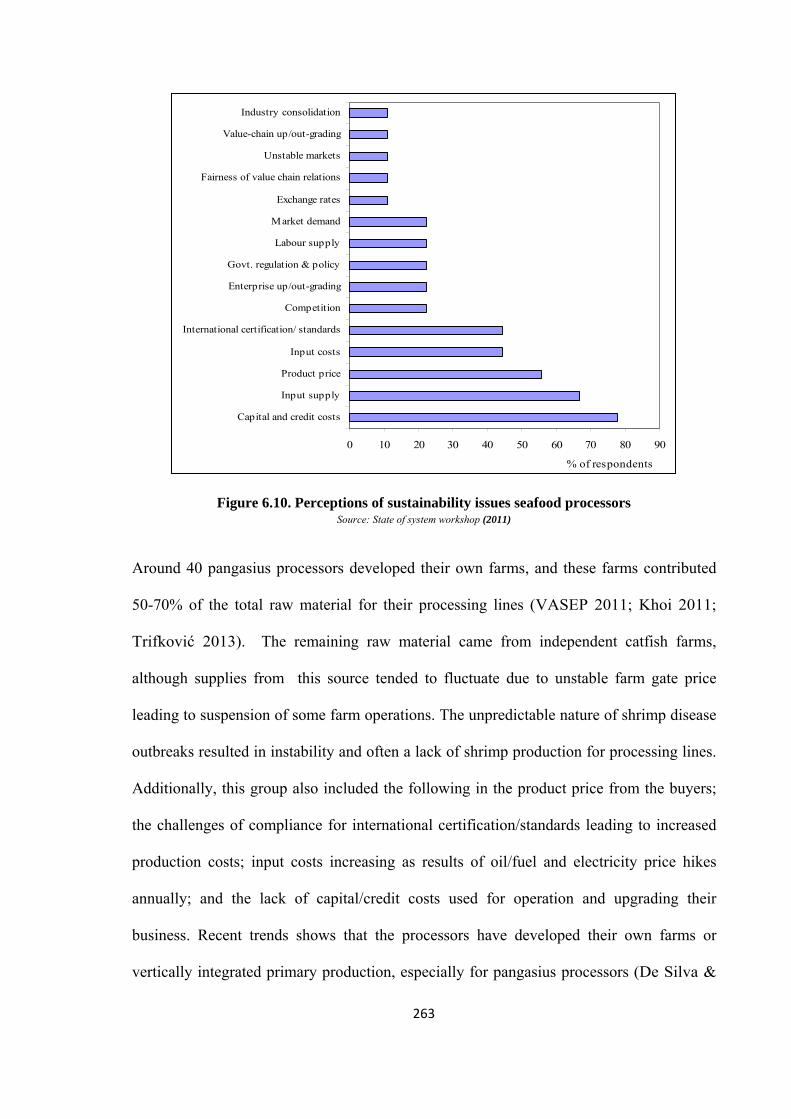
263
Figure 6.10. Perceptions of sustainability issues seafood processors Source: State of system workshop (2011)
Around 40 pangasius processors developed their own farms, and these farms contributed
50-70% of the total raw material for their processing lines (VASEP 2011; Khoi 2011;
Trifković 2013). The remaining raw material came from independent catfish farms,
although supplies from this source tended to fluctuate due to unstable farm gate price
leading to suspension of some farm operations. The unpredictable nature of shrimp disease
outbreaks resulted in instability and often a lack of shrimp production for processing lines.
Additionally, this group also included the following in the product price from the buyers;
the challenges of compliance for international certification/standards leading to increased
production costs; input costs increasing as results of oil/fuel and electricity price hikes
annually; and the lack of capital/credit costs used for operation and upgrading their
business. Recent trends shows that the processors have developed their own farms or
vertically integrated primary production, especially for pangasius processors (De Silva &
0 10 20 30 40 50 60 70 80 90
Capital and credit costs
Input supply
Product price
Input costs
International certification/ standards
Competition
Enterprise up/out-grading
Govt. regulation & policy
Labour supply
Market demand
Exchange rates
Fairness of value chain relations
Unstable markets
Value-chain up/out-grading
Industry consolidation
% of respondents
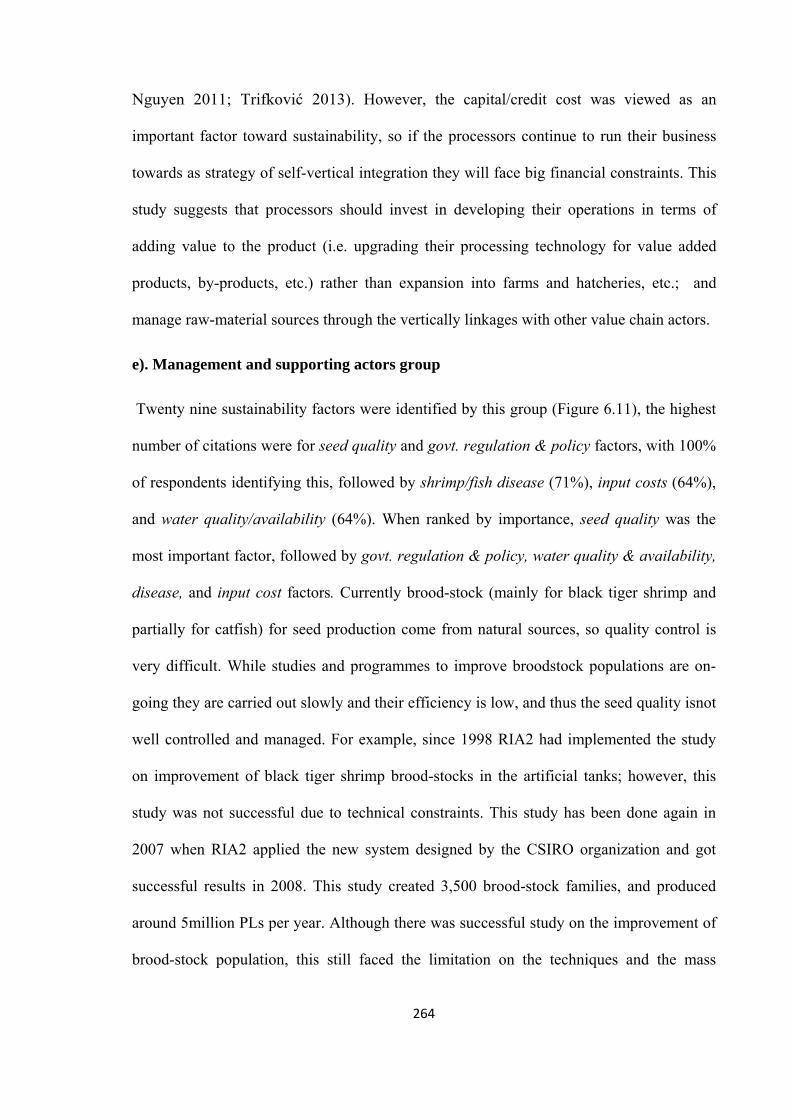
264
Nguyen 2011; Trifković 2013). However, the capital/credit cost was viewed as an
important factor toward sustainability, so if the processors continue to run their business
towards as strategy of self-vertical integration they will face big financial constraints. This
study suggests that processors should invest in developing their operations in terms of
adding value to the product (i.e. upgrading their processing technology for value added
products, by-products, etc.) rather than expansion into farms and hatcheries, etc.; and
manage raw-material sources through the vertically linkages with other value chain actors.
e). Management and supporting actors group
Twenty nine sustainability factors were identified by this group (Figure 6.11), the highest
number of citations were for seed quality and govt. regulation & policy factors, with 100%
of respondents identifying this, followed by shrimp/fish disease (71%), input costs (64%),
and water quality/availability (64%). When ranked by importance, seed quality was the
most important factor, followed by govt. regulation & policy, water quality & availability,
disease, and input cost factors. Currently brood-stock (mainly for black tiger shrimp and
partially for catfish) for seed production come from natural sources, so quality control is
very difficult. While studies and programmes to improve broodstock populations are on-
going they are carried out slowly and their efficiency is low, and thus the seed quality isnot
well controlled and managed. For example, since 1998 RIA2 had implemented the study
on improvement of black tiger shrimp brood-stocks in the artificial tanks; however, this
study was not successful due to technical constraints. This study has been done again in
2007 when RIA2 applied the new system designed by the CSIRO organization and got
successful results in 2008. This study created 3,500 brood-stock families, and produced
around 5million PLs per year. Although there was successful study on the improvement of
brood-stock population, this still faced the limitation on the techniques and the mass
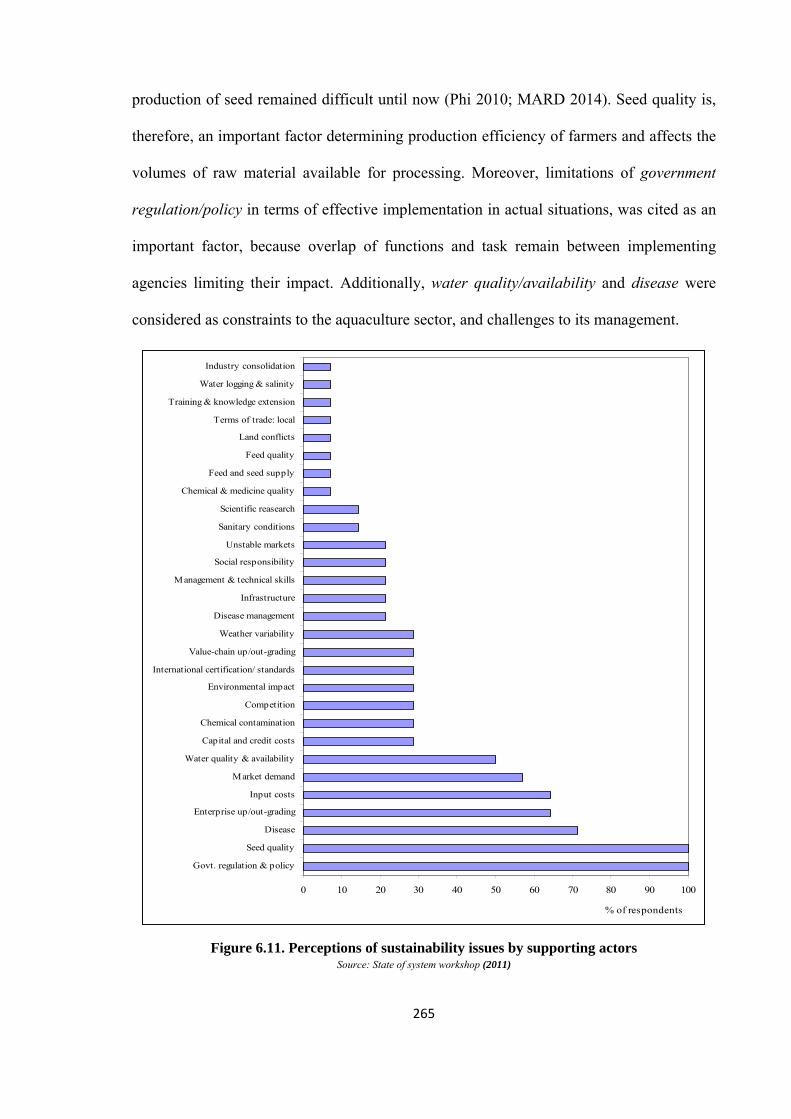
265
production of seed remained difficult until now (Phi 2010; MARD 2014). Seed quality is,
therefore, an important factor determining production efficiency of farmers and affects the
volumes of raw material available for processing. Moreover, limitations of government
regulation/policy in terms of effective implementation in actual situations, was cited as an
important factor, because overlap of functions and task remain between implementing
agencies limiting their impact. Additionally, water quality/availability and disease were
considered as constraints to the aquaculture sector, and challenges to its management.
Figure 6.11. Perceptions of sustainability issues by supporting actors Source: State of system workshop (2011)
0 10 20 30 40 50 60 70 80 90 100
Govt. regulation & policy
Seed quality
Disease
Enterprise up/out-grading
Input costs
Market demand
Water quality & availability
Capital and credit costs
Chemical contamination
Competition
Environmental impact
International certification/ standards
Value-chain up/out-grading
Weather variability
Disease management
Infrastructure
Management & technical skills
Social responsibility
Unstable markets
Sanitary conditions
Scientific reasearch
Chemical & medicine quality
Feed and seed supply
Feed quality
Land conflicts
Terms of trade: local
Training & knowledge extension
Water logging & salinity
Industry consolidation
% of respondents
266
6.3.2. Perceived sustainability issues by farmed species systems
Based on the above results and stakeholder analysis approach (Bell & Morse 2008), a
matrix was modified and developed to assess major issues for sustainable development.
Major sustainability issues were addressed by key stakeholder groups based on similar
characteristics and their nature of influence on the operation. All individual sustainability
factors were classified and synthesized into three sustainability dimensions (i.e. economic,
environmental, and social aspects), to pull out important factors along the value chain.
Each stakeholder group identified particular SIs related to future development, and the top
five SIs classified by each stakeholder group were aggregated to find major SIs for the
whole value chain and are presented in the following sections:
a). Sustainability issues for stripped catfish value chain
Results show that 15 sustainability factors were considered important by the five main
stakeholder groups, of which input cost was ranked highly by most stakeholder groups;
followed by capital & credit costs, unstable markets, and govt. regulation & policy. The
catfish disease, seed quality, and water quality & availability factors in the environmental
dimension were also indicated by most stakeholder groups (Table 6.1). These seven
sustainability factors were identified by most of stakeholder groups and could be key
factors for future development of the striped catfish system. The hatcheries, grow-out
farmers and managers groups were more concerned with the environmental dimension;
while the input suppliers and processors were concerned with the economic dimension.
Institutional/social dimensions were more important to input suppliers, processors and
managers groups than to the farmers and hatcheries.
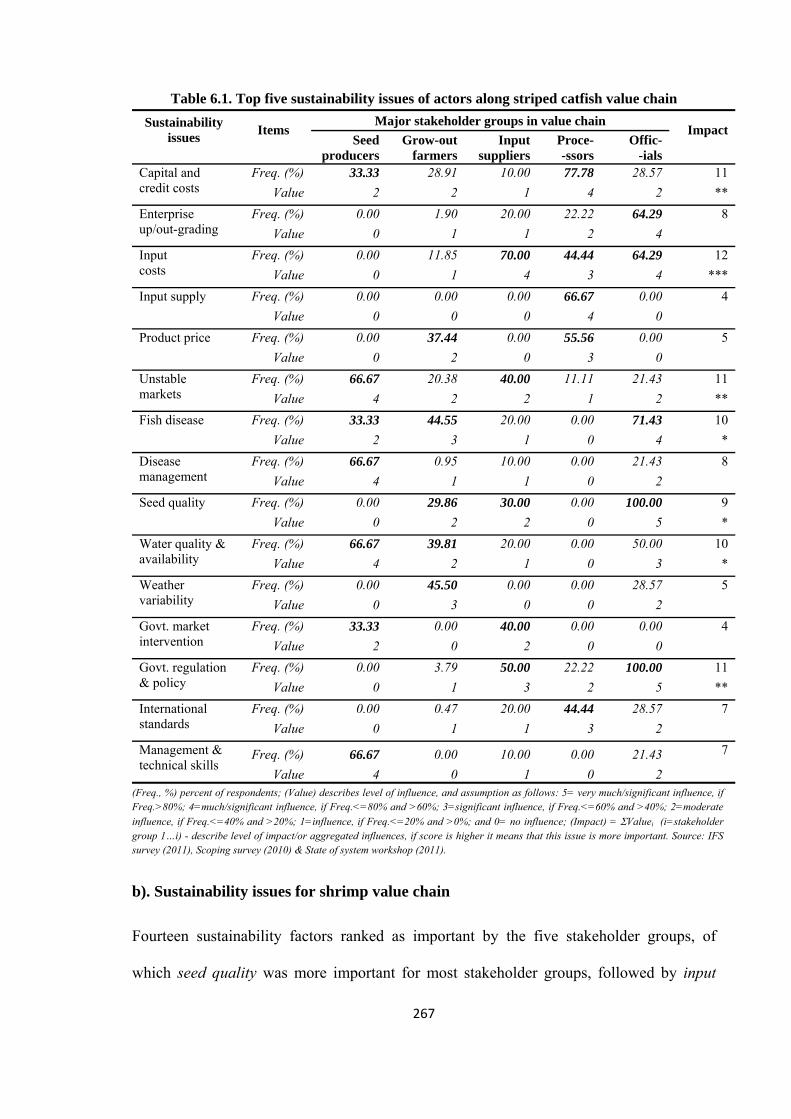
267
Table 6.1. Top five sustainability issues of actors along striped catfish value chain
Sustainability issues
Items
Major stakeholder groups in value chain Impact
Seed producers
Grow-out farmers
Input suppliers
Proce- -ssors
Offic- -ials
Capital and credit costs
Freq. (%) 33.33 28.91 10.00 77.78 28.57 11
Value 2 2 1 4 2 **
Enterprise up/out-grading
Freq. (%) 0.00 1.90 20.00 22.22 64.29 8
Value 0 1 1 2 4
Input costs
Freq. (%) 0.00 11.85 70.00 44.44 64.29 12
Value 0 1 4 3 4 ***
Input supply Freq. (%) 0.00 0.00 0.00 66.67 0.00 4
Value 0 0 0 4 0
Product price Freq. (%) 0.00 37.44 0.00 55.56 0.00 5
Value 0 2 0 3 0
Unstable markets
Freq. (%) 66.67 20.38 40.00 11.11 21.43 11
Value 4 2 2 1 2 **
Fish disease Freq. (%) 33.33 44.55 20.00 0.00 71.43 10
Value 2 3 1 0 4 *
Disease management
Freq. (%) 66.67 0.95 10.00 0.00 21.43 8
Value 4 1 1 0 2
Seed quality Freq. (%) 0.00 29.86 30.00 0.00 100.00 9
Value 0 2 2 0 5 *
Water quality & availability
Freq. (%) 66.67 39.81 20.00 0.00 50.00 10
Value 4 2 1 0 3 *
Weather variability
Freq. (%) 0.00 45.50 0.00 0.00 28.57 5
Value 0 3 0 0 2
Govt. market intervention
Freq. (%) 33.33 0.00 40.00 0.00 0.00 4
Value 2 0 2 0 0
Govt. regulation & policy
Freq. (%) 0.00 3.79 50.00 22.22 100.00 11
Value 0 1 3 2 5 **
International standards
Freq. (%) 0.00 0.47 20.00 44.44 28.57 7
Value 0 1 1 3 2
Management & technical skills
Freq. (%) 66.67 0.00 10.00 0.00 21.43 7
Value 4 0 1 0 2
(Freq., %) percent of respondents; (Value) describes level of influence, and assumption as follows: 5= very much/significant influence, if Freq.>80%; 4=much/significant influence, if Freq.<=80% and >60%; 3=significant influence, if Freq.<=60% and >40%; 2=moderate
influence, if Freq.<=40% and >20%; 1=influence, if Freq.<=20% and >0%; and 0= no influence; (Impact) = Valuei (i=stakeholder group 1…i) - describe level of impact/or aggregated influences, if score is higher it means that this issue is more important. Source: IFS survey (2011), Scoping survey (2010) & State of system workshop (2011).
b). Sustainability issues for shrimp value chain
Fourteen sustainability factors ranked as important by the five stakeholder groups, of
which seed quality was more important for most stakeholder groups, followed by input
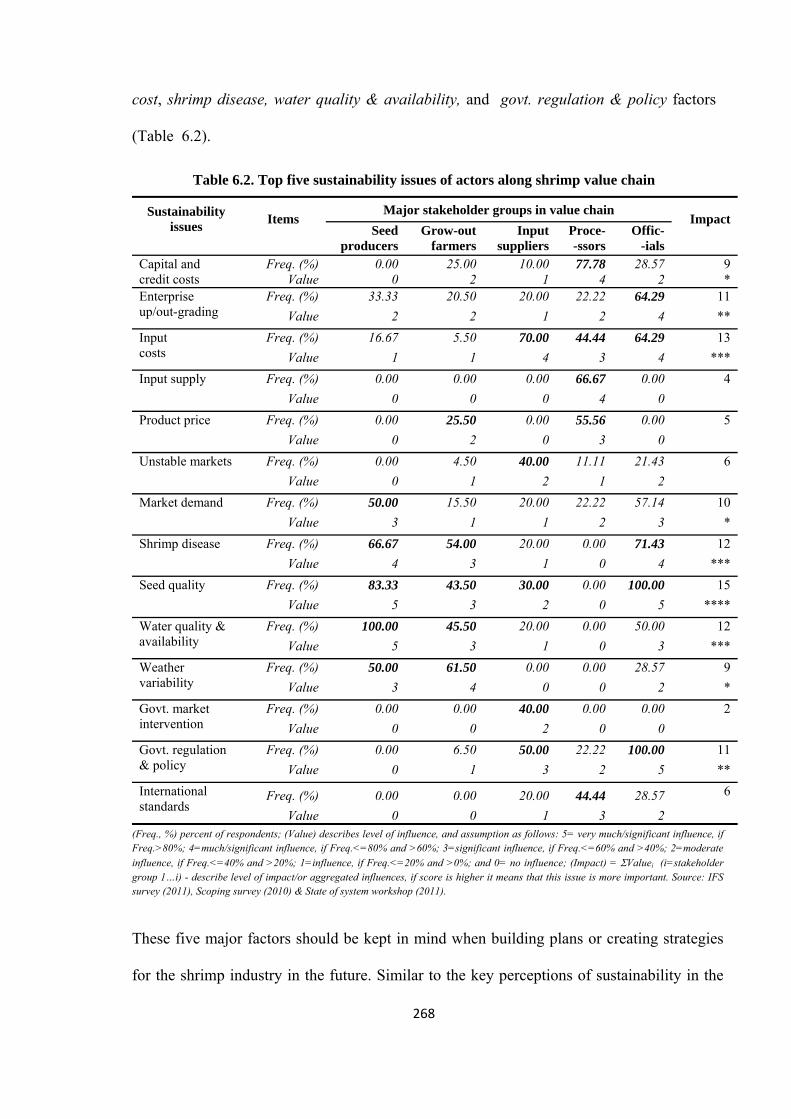
268
cost, shrimp disease, water quality & availability, and govt. regulation & policy factors
(Table 6.2).
Table 6.2. Top five sustainability issues of actors along shrimp value chain
Sustainability issues
Items
Major stakeholder groups in value chain Impact
Seed producers
Grow-out farmers
Input suppliers
Proce- -ssors
Offic- -ials
Capital and credit costs
Freq. (%) 0.00 25.00 10.00 77.78 28.57 9 Value 0 2 1 4 2 *
Enterprise up/out-grading
Freq. (%) 33.33 20.50 20.00 22.22 64.29 11
Value 2 2 1 2 4 **
Input costs
Freq. (%) 16.67 5.50 70.00 44.44 64.29 13
Value 1 1 4 3 4 ***
Input supply Freq. (%) 0.00 0.00 0.00 66.67 0.00 4
Value 0 0 0 4 0
Product price Freq. (%) 0.00 25.50 0.00 55.56 0.00 5
Value 0 2 0 3 0
Unstable markets Freq. (%) 0.00 4.50 40.00 11.11 21.43 6
Value 0 1 2 1 2
Market demand Freq. (%) 50.00 15.50 20.00 22.22 57.14 10
Value 3 1 1 2 3 *
Shrimp disease Freq. (%) 66.67 54.00 20.00 0.00 71.43 12
Value 4 3 1 0 4 ***
Seed quality Freq. (%) 83.33 43.50 30.00 0.00 100.00 15
Value 5 3 2 0 5 ****
Water quality & availability
Freq. (%) 100.00 45.50 20.00 0.00 50.00 12
Value 5 3 1 0 3 ***
Weather variability
Freq. (%) 50.00 61.50 0.00 0.00 28.57 9
Value 3 4 0 0 2 *
Govt. market intervention
Freq. (%) 0.00 0.00 40.00 0.00 0.00 2
Value 0 0 2 0 0
Govt. regulation & policy
Freq. (%) 0.00 6.50 50.00 22.22 100.00 11
Value 0 1 3 2 5 **
International standards
Freq. (%) 0.00 0.00 20.00 44.44 28.57 6
Value 0 0 1 3 2
(Freq., %) percent of respondents; (Value) describes level of influence, and assumption as follows: 5= very much/significant influence, if Freq.>80%; 4=much/significant influence, if Freq.<=80% and >60%; 3=significant influence, if Freq.<=60% and >40%; 2=moderate
influence, if Freq.<=40% and >20%; 1=influence, if Freq.<=20% and >0%; and 0= no influence; (Impact) = Valuei (i=stakeholder group 1…i) - describe level of impact/or aggregated influences, if score is higher it means that this issue is more important. Source: IFS survey (2011), Scoping survey (2010) & State of system workshop (2011).
These five major factors should be kept in mind when building plans or creating strategies
for the shrimp industry in the future. Similar to the key perceptions of sustainability in the
269
catfish value chain, shrimp hatcheries, grow-out farmers and managers groups were more
concerned with the environmental dimension; while the input suppliers and processors were
concerned with the economic dimension. Institutional/social dimensions were more
important to input suppliers, processors and managers groups than to the farmers and
hatcheries.
6.3.3. Measurement of sustainability issues
The DPSIR framework approach (Smeets & Weterings 1999; Bell & Morse 2008) was
used to develop a matrix of measurements and mitigation actions for sustainability issues
identified. The results from a stakeholder meeting, secondary/primary data collection and
the above analysis were the basic data and information used to build a matrix of
measurement and response to the major sustainability issues. To find appropriate tools for
measuring, the stakeholder groups were requested to discuss them and identify options.
Their opinions were classified by comparing them to similar ideas and/or other comparable
tools for measuring factors, hence several stakeholder groups with the same sustainability
factors were grouped and responses for measuring tools were synthesized in the same field.
Measurement tools and mitigation actions/responses are presented in the section below and
the suggestions of the major sustainability factors identified from group discussions.
a). Catfish value chain: SIs and their measurements
Seven major sustainability factors were identified and are presented in Table 6.1. These
were used as a basis for discussion with stakeholder groups to discover potential
measurement tools and their responses to them. The aggregated results of group
discussions are presented in Table 6.3. The main reasons for factor selection is described in
three sustainability dimensions as follows:
Environmental issues: water quality & availability; seed quality; and catfish disease
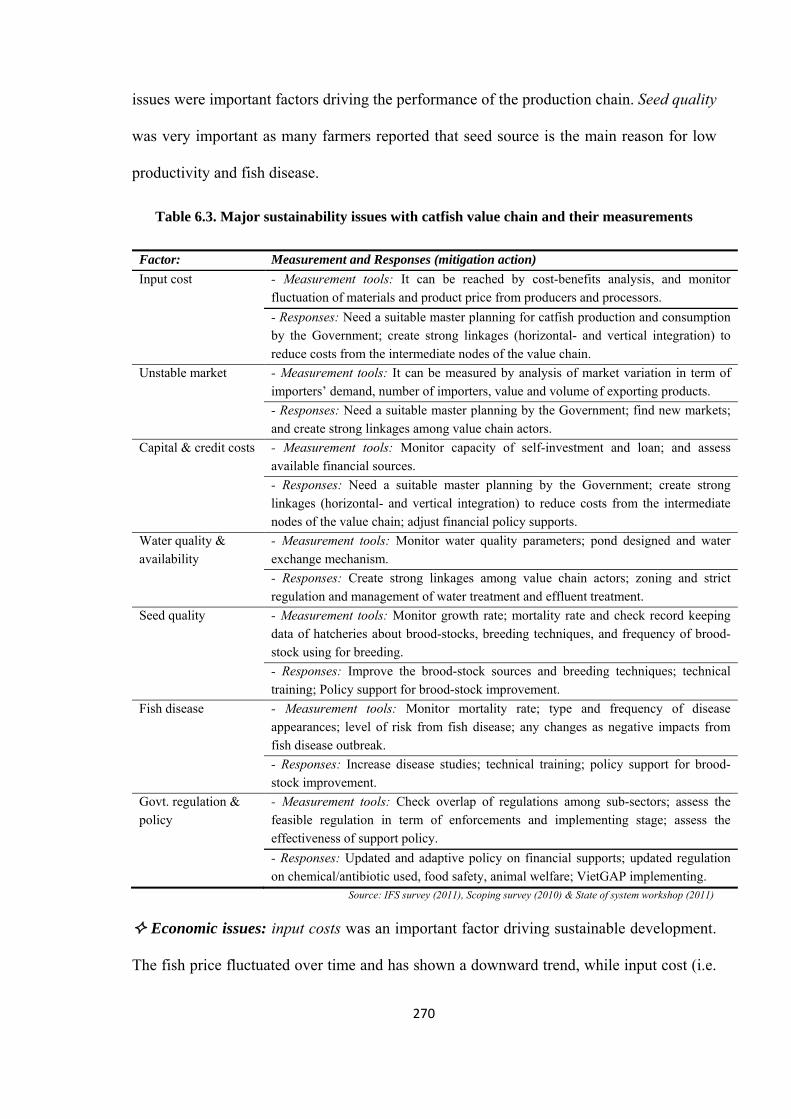
270
issues were important factors driving the performance of the production chain. Seed quality
was very important as many farmers reported that seed source is the main reason for low
productivity and fish disease.
Table 6.3. Major sustainability issues with catfish value chain and their measurements
Factor: Measurement and Responses (mitigation action)
Input cost - Measurement tools: It can be reached by cost-benefits analysis, and monitor fluctuation of materials and product price from producers and processors.
- Responses: Need a suitable master planning for catfish production and consumption by the Government; create strong linkages (horizontal- and vertical integration) to reduce costs from the intermediate nodes of the value chain.
Unstable market - Measurement tools: It can be measured by analysis of market variation in term of importers’ demand, number of importers, value and volume of exporting products.
- Responses: Need a suitable master planning by the Government; find new markets; and create strong linkages among value chain actors.
Capital & credit costs - Measurement tools: Monitor capacity of self-investment and loan; and assess available financial sources.
- Responses: Need a suitable master planning by the Government; create strong linkages (horizontal- and vertical integration) to reduce costs from the intermediate nodes of the value chain; adjust financial policy supports.
Water quality & availability
- Measurement tools: Monitor water quality parameters; pond designed and water exchange mechanism.
- Responses: Create strong linkages among value chain actors; zoning and strict regulation and management of water treatment and effluent treatment.
Seed quality - Measurement tools: Monitor growth rate; mortality rate and check record keeping data of hatcheries about brood-stocks, breeding techniques, and frequency of brood-stock using for breeding.
- Responses: Improve the brood-stock sources and breeding techniques; technical training; Policy support for brood-stock improvement.
Fish disease - Measurement tools: Monitor mortality rate; type and frequency of disease appearances; level of risk from fish disease; any changes as negative impacts from fish disease outbreak.
- Responses: Increase disease studies; technical training; policy support for brood-stock improvement.
Govt. regulation & policy
- Measurement tools: Check overlap of regulations among sub-sectors; assess the feasible regulation in term of enforcements and implementing stage; assess the effectiveness of support policy.
- Responses: Updated and adaptive policy on financial supports; updated regulation on chemical/antibiotic used, food safety, animal welfare; VietGAP implementing.
Source: IFS survey (2011), Scoping survey (2010) & State of system workshop (2011)
Economic issues: input costs was an important factor driving sustainable development.
The fish price fluctuated over time and has shown a downward trend, while input cost (i.e.
271
feed, chemicals, labour cost) increased yearly, therefore net profit or marginal profit was
also reduced. The unstable markets in terms of quantity affected the strategies and plans of
catfish systems, and could be a major factor considered along the whole value chain.
Movement in markets over the last decade showed that an importing market can be a
controlling factor affecting the operation of producers. By reducing import seafood volume
from main markets such as the US and EU the fish price can fall due to over-supply.
Capital & credit costs were also important factor as policies on financial support are less
effective or inappropriate and the lack of operation cost leads it to be considered as
important SIs.
Institutional/social issues: government regulation & policy can help to support system
development, especially policies on finance, regulation of practices and management.
Most existing financial policies for the catfish industry were mainly target support over a
short term that unsuitable for the catfish sector that needs long term investment.
b). Shrimp value chain: SIs and their measurements
There were five major sustainability issues that were deemed important and have had an
effect on shrimp systems (Table 6.4). The main reasons for factor selection can be
presented in three sustainability dimensions as follows:
Environmental issues: water quality & availability; seed quality; and shrimp disease
issues were important driving forces influencing the performance of the production chain.
Seed quality was very important and many farmers reported that seed source was the main
reason for low productivity and shrimp disease outbreaks. Water quality & availability will
be become more important in the future due to climate changed and its impacts cannot be
predicted. As shrimp are more sensitive to fluctuating water conditions, so water quality
will be the main factor affecting shrimp health and performance.
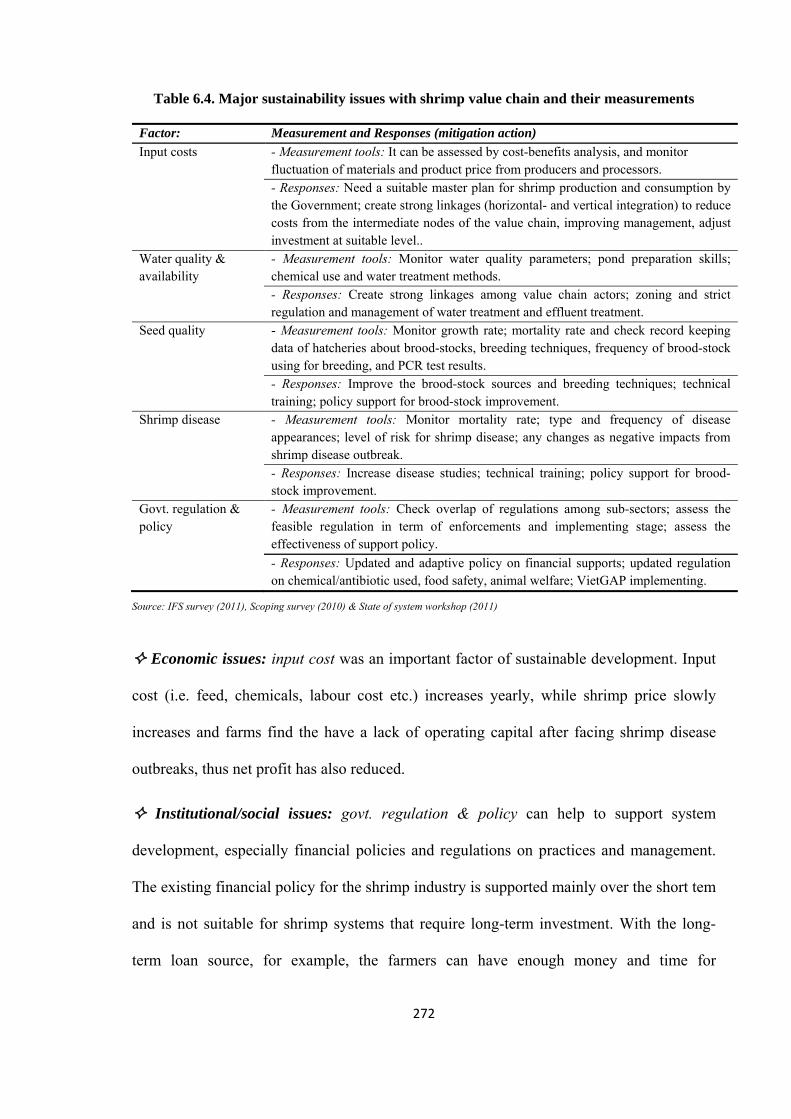
272
Table 6.4. Major sustainability issues with shrimp value chain and their measurements
Factor: Measurement and Responses (mitigation action)
Input costs - Measurement tools: It can be assessed by cost-benefits analysis, and monitor fluctuation of materials and product price from producers and processors.
- Responses: Need a suitable master plan for shrimp production and consumption by the Government; create strong linkages (horizontal- and vertical integration) to reduce costs from the intermediate nodes of the value chain, improving management, adjust investment at suitable level..
Water quality & availability
- Measurement tools: Monitor water quality parameters; pond preparation skills; chemical use and water treatment methods.
- Responses: Create strong linkages among value chain actors; zoning and strict regulation and management of water treatment and effluent treatment.
Seed quality - Measurement tools: Monitor growth rate; mortality rate and check record keeping data of hatcheries about brood-stocks, breeding techniques, frequency of brood-stock using for breeding, and PCR test results.
- Responses: Improve the brood-stock sources and breeding techniques; technical training; policy support for brood-stock improvement.
Shrimp disease - Measurement tools: Monitor mortality rate; type and frequency of disease appearances; level of risk for shrimp disease; any changes as negative impacts from shrimp disease outbreak.
- Responses: Increase disease studies; technical training; policy support for brood-stock improvement.
Govt. regulation & policy
- Measurement tools: Check overlap of regulations among sub-sectors; assess the feasible regulation in term of enforcements and implementing stage; assess the effectiveness of support policy.
- Responses: Updated and adaptive policy on financial supports; updated regulation on chemical/antibiotic used, food safety, animal welfare; VietGAP implementing.
Source: IFS survey (2011), Scoping survey (2010) & State of system workshop (2011)
Economic issues: input cost was an important factor of sustainable development. Input
cost (i.e. feed, chemicals, labour cost etc.) increases yearly, while shrimp price slowly
increases and farms find the have a lack of operating capital after facing shrimp disease
outbreaks, thus net profit has also reduced.
Institutional/social issues: govt. regulation & policy can help to support system
development, especially financial policies and regulations on practices and management.
The existing financial policy for the shrimp industry is supported mainly over the short tem
and is not suitable for shrimp systems that require long-term investment. With the long-
term loan source, for example, the farmers can have enough money and time for
273
improvement farm infrastructure (e.g. pond dykes, water supplying/draining system) and
upgrading.
6.4. Discussion and conclusions
6.4.1. Role and operational constraints of major stakeholders
Value chain of catfish and shrimp can be buyer-driven in which large retailers, branding
enterprises and trading companies control decentralized production networks (Simard et al.
2008; Tran et al. 2013). Seafood production and consumption is driven by the market, and
thus international buyers and customers play important roles (Young et al. 2011; Ponte et
al. 2014; Jespersen et al. 2014). Setthasakko (2007) noted that international buyers
tended to purchase on the basis of hygienic quality, safety and cheapness, and did not take
the environmental and social impact of seafood production into consideration when
making agreements. Societal concerns have resulted in demand from consumers and
retailers for assurances that the food they purchase has been produced respecting
environmental and social sustainability standards (Bush & Oosterveer 2007; Young et al.
2011; Bush & Oosterveer 2012b; EU 2013). To meet the high requirements from retailers
and customers, large-scale seafood buyers are seeking products resulting from responsible
methods to satisfy an increasing consumer demand (Boyd et al. 2007; Pham et al. 2011).
Additionally, among buyer-driven agro-food commodity chains in the international
seafood markets, some are driven by large supermarket retailers, but others are dominated by
processors, international traders, or global branders (Islam 2008). Retailers rapidly become
more global and oligopolistic, and retailers together with private standards are at the center
of the transformation of the global agri-food system (Busch & Bain 2004). Vertical
linkages between value chain actors are still limited, and the relationship between them
was commonly by verbal agreements. Farmers and seafood processors still play important
274
roles in the development of value chains in the MKD. As production capacity is small, the
farmers do not have a role in regulating the market, especially pricing decisions, whereas,
processors with large production capacity play an important role in the regulation of
production and price decision (Vo et al. 2009a; Le et al. 2011; Le 2011; Tran et al. 2013;
Jespersen et al. 2014). Previous studies such as Vo (2003), Kai (2006), Khoi (2007), Vo et
al. (2009a), Le (2010) and Le (2011) also illustrate the important role of processors and
producers in the value chain of catfish and shrimp.
Certification schemes specific to aquaculture have emerged over the last decade (Bostock
et al. 2010; Washington & Ababouch 2011; Tran et al. 2013) and increasing consumers are
interested in the process through which a product is produced (Corsin et al. 2007; Reilly
2007; Yamprayoon & Sukhumparnich 2010; Young et al. 2011). To ensure products meet
standards, appropriate solutions need to be in place from the first link of the value chain
and small-farms, especially, often face big challenges of compliance with such certification
(Umesh et al. 2009; Subasinghe et al. 2009; Bush et al. 2010b; Bosma & Verdegem 2011;
Pham et al. 2011; Belton & Little 2011; Bush & Belton 2012). Moreover, there are many
seafood exporters for striped catfish and shrimp, and the linkages among them is very
poor. This is a major driver for the unfair competition such as dumping leading to price
fluctuations and the ‘race to the bottom’ (Volden 2002; Aurthur & Nierentz 2007) that has
characterised pangasius over the last few years (Nguyen 2008; Tuan et al. 2013). The
processors purchase raw material from independent farmers, however, lack of vertical
integrated linkages leads to increased transaction and production costs. Market access
remains a key constraint for both the striped catfish and shrimp industries as competition
between seafood producing countries has intensified, and the number and costs of adoption
to meet and overcome the technical and trade barriers of the importers has continued to
275
increase (Nguyen 2008; Tuan et al. 2013). Consumer demand in international seafood
markets will continue to drive policies for strengthening trade barriers (Young et al. 2011).
Food safety regulations, HACCP processes, and technical barriers to trade have introduced
high costs that tend to exclude the small producers/processors from the supply chain (Dey
& Ahmed 2005; Tran et al. 2013). To overcome this, a vertical linkage between farms
with the processors, small-farmers need to form groups to fill capacity associated with the
processors. Farmer groups may bring opportunities for small-farmers to upgrade
production and production efficiency (Vo et al. 2009a; Pham et al. 2011; Ha et al. 2013),
because through the groups farmers can improve their position by horizontal and vertical
coordination (Umesh 2007; Umesh et al. 2009; Khoi 2011). Moreover, small-scale farms
can enhance competitiveness and achieve improved economies of scale by collaborating
and through working as clusters (Tain & Diana 2007; Zhang 2014). The question is how to
establish such linkages that are feasible and effective, and thus the role of state agencies is
potentially very important. State agencies must be involve in supporting the production
linkages with appropriate policies and regulations on financial support that provide proper
terms of loan in the short- and long-term for aquaculture activities; and also provide
appropriate sanctions to ensure the linkages run legally. Previous attempts to strengthen the
sector have tended to identify constraints to striped catfish and shrimp industries that have,
mainly focused on technical aspects and referred to constraints of specific stakeholders
rather than the general picture of the value chain (Vo 2003; Kai 2006; Khoi 2007; Vo et al.
2009b; Phan et al. 2009; Le & Le 2010; Bui et al. 2010; Anh et al. 2010b; Anh et al.
2010a; Pham et al. 2011; Da et al. 2012).
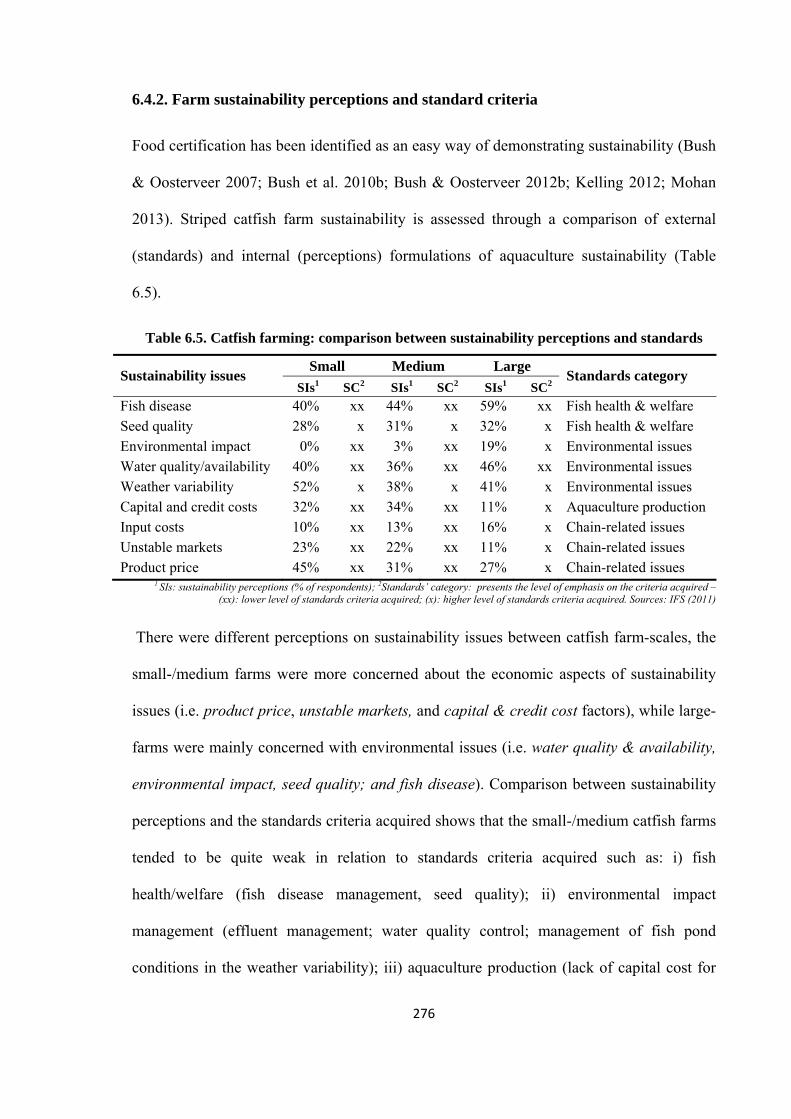
276
6.4.2. Farm sustainability perceptions and standard criteria
Food certification has been identified as an easy way of demonstrating sustainability (Bush
& Oosterveer 2007; Bush et al. 2010b; Bush & Oosterveer 2012b; Kelling 2012; Mohan
2013). Striped catfish farm sustainability is assessed through a comparison of external
(standards) and internal (perceptions) formulations of aquaculture sustainability (Table
6.5).
Table 6.5. Catfish farming: comparison between sustainability perceptions and standards
Sustainability issues Small Medium Large
Standards category SIs1 SC2 SIs1 SC2 SIs1 SC2
Fish disease 40% xx 44% xx 59% xx Fish health & welfare Seed quality 28% x 31% x 32% x Fish health & welfare Environmental impact 0% xx 3% xx 19% x Environmental issues Water quality/availability 40% xx 36% xx 46% xx Environmental issues Weather variability 52% x 38% x 41% x Environmental issues Capital and credit costs 32% xx 34% xx 11% x Aquaculture production Input costs 10% xx 13% xx 16% x Chain-related issues Unstable markets 23% xx 22% xx 11% x Chain-related issues Product price 45% xx 31% xx 27% x Chain-related issues
1 SIs: sustainability perceptions (% of respondents); 2Standards’ category: presents the level of emphasis on the criteria acquired – (xx): lower level of standards criteria acquired; (x): higher level of standards criteria acquired. Sources: IFS (2011)
There were different perceptions on sustainability issues between catfish farm-scales, the
small-/medium farms were more concerned about the economic aspects of sustainability
issues (i.e. product price, unstable markets, and capital & credit cost factors), while large-
farms were mainly concerned with environmental issues (i.e. water quality & availability,
environmental impact, seed quality; and fish disease). Comparison between sustainability
perceptions and the standards criteria acquired shows that the small-/medium catfish farms
tended to be quite weak in relation to standards criteria acquired such as: i) fish
health/welfare (fish disease management, seed quality); ii) environmental impact
management (effluent management; water quality control; management of fish pond
conditions in the weather variability); iii) aquaculture production (lack of capital cost for
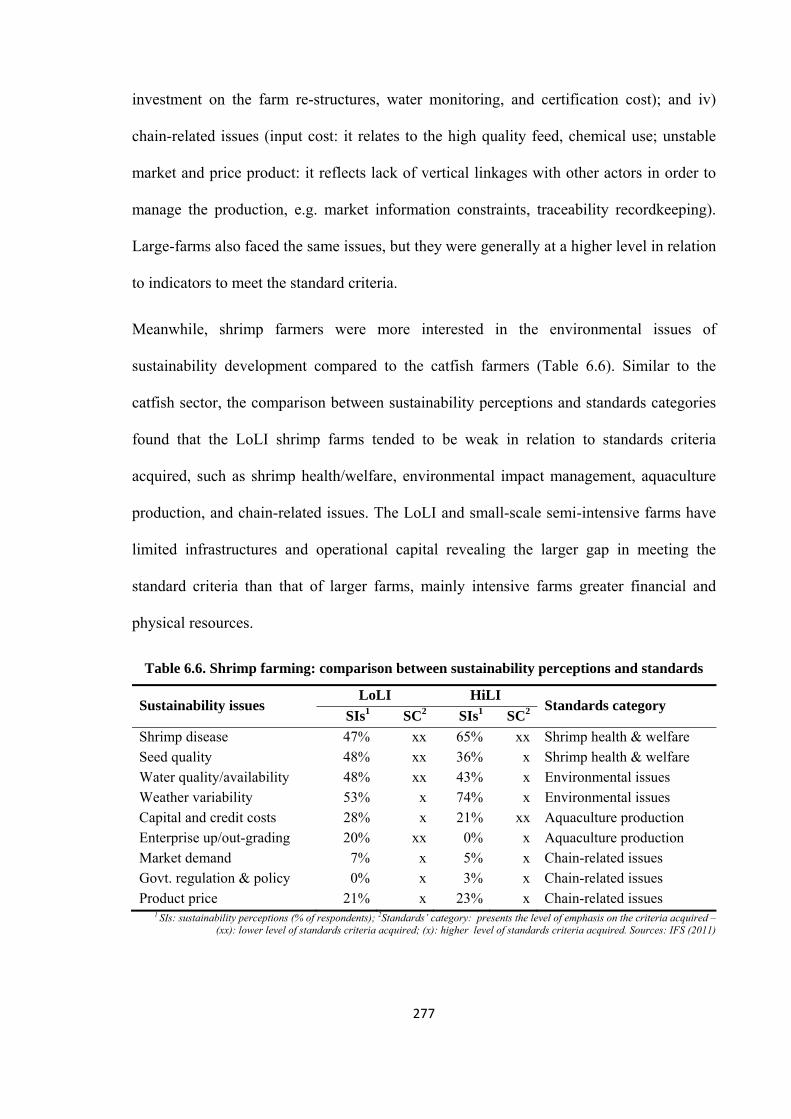
277
investment on the farm re-structures, water monitoring, and certification cost); and iv)
chain-related issues (input cost: it relates to the high quality feed, chemical use; unstable
market and price product: it reflects lack of vertical linkages with other actors in order to
manage the production, e.g. market information constraints, traceability recordkeeping).
Large-farms also faced the same issues, but they were generally at a higher level in relation
to indicators to meet the standard criteria.
Meanwhile, shrimp farmers were more interested in the environmental issues of
sustainability development compared to the catfish farmers (Table 6.6). Similar to the
catfish sector, the comparison between sustainability perceptions and standards categories
found that the LoLI shrimp farms tended to be weak in relation to standards criteria
acquired, such as shrimp health/welfare, environmental impact management, aquaculture
production, and chain-related issues. The LoLI and small-scale semi-intensive farms have
limited infrastructures and operational capital revealing the larger gap in meeting the
standard criteria than that of larger farms, mainly intensive farms greater financial and
physical resources.
Table 6.6. Shrimp farming: comparison between sustainability perceptions and standards
Sustainability issues LoLI HiLI
Standards category SIs1 SC2 SIs1 SC2
Shrimp disease 47% xx 65% xx Shrimp health & welfare Seed quality 48% xx 36% x Shrimp health & welfare Water quality/availability 48% xx 43% x Environmental issues Weather variability 53% x 74% x Environmental issues Capital and credit costs 28% x 21% xx Aquaculture production Enterprise up/out-grading 20% xx 0% x Aquaculture production Market demand 7% x 5% x Chain-related issues Govt. regulation & policy 0% x 3% x Chain-related issues Product price 21% x 23% x Chain-related issues
1 SIs: sustainability perceptions (% of respondents); 2Standards’ category: presents the level of emphasis on the criteria acquired – (xx): lower level of standards criteria acquired; (x): higher level of standards criteria acquired. Sources: IFS (2011)
278
The key risk profiles between striped catfish and shrimp farms showed that there were
differences on the risks between smaller and larger farms for both these species, smaller
farms often faced higher level of operation risks such as the low farm gate price and
shrimp disease compared to the larger farms. The small-scale farms were the most
vulnerable actors in the value chain, and they had to cope with higher level barriers for
upgrading compared to larger farms on both these species. In contrast, the larger farms
tended to demonstrate farm sustainability to sustained success. With a higher capacity of
infrastructure (large farm-size, feed/chemicals storage, pond construction, water supply
system) and financial resources, large-farms were better able to improve their operations
towards standards or upgrading than small-/medium farms. The larger farms, especially
catfish farms, were most likely to achieve certification since they tend to possess
organizational structures and characteristics amenable to the adaptation which will be
needed to meet standard requirements, and the requisite capitals required to facilitate
proactive engagement with certifiers (Bush et al. 2010; Belton et al. 2011; Bush & Belton
2012; Jespersen et al. 2014).
6.4.3. Value chain: sustainability perceptions of stakeholders
Sustainable development is a concern of all stakeholders in the production chain (Sheriff
2004). Each stakeholder involved in the production chain addressed the issues related to
sustainable development affecting their business specifically and generally the whole value
chain. The hatcheries, farmers and fisheries managers were more interested in the
environmental aspects, because this is a fundamental issue to ensure long-term resources
used for aquaculture development. While, the input suppliers and seafood processors paid
more attention to input cost, capital & credit costs, unstable markets and product prices in
the economic dimension. This reflects that the stakeholders are looking for business and
279
economic profit, so they are less interested in the environmental aspects. Setthasakko
(2007) indicated that smaller and younger producers tend to focus more on economic
aspects rather than social and environmental sustainability, reflecting the lack of a long-
term view of environmental and social sustainability for the seafood supply chain is major
barrier to the creation of corporate sustainability.
An outstanding issue related to environmental sustainability focused on water availability
and quality. Further aquaculture development is being increasingly constrained by
environmental problems caused by poorly managed aquaculture operations and by
resource-use conflicts (Simard et al. 2008; Gandini et al. 2009; Valenti et al. 2011;
Samuel-Fitwi et al. 2012; EU 2013; USAID 2013). A major challenge to a sustainable
industry is to improve production performance, and simultaneously to minimize
environmental impacts (Martinez-Cordero & Leung 2003), particularly for an industry
where the aquaculture production is mainly operated by small-scale farms and lack of
horizontal/vertical integrated linkages. Thus, the state agencies should produce and
regularly update aquaculture development strategies and plans, as required, to ensure
that aquaculture development is ecologically sustainable and to allow the rational use of
resources shared by aquaculture and other activities (Pullin et al. 2007). The continued
expansion of aquaculture will require the adoption of production technologies that
minimize damage to the environment (Whitmarsh et al. 2006). Aquaculture must become
more integrated with other sectors that use natural resources (Pullin et al. 2007), for
example, sediment from fish ponds can be reused for agriculture production crops such as
rice farming, orchards and cash crops (Rahman & Yakupitiyage 2004; Dang et al. 2008;
Anh et al. 2010; Cao et al. 2010; Wang et al. 2011).
280
Shrimp and fish diseases continue to increase in occurrence and severity, for example the
BNP/MAS in striped catfish (Crumlish et al. 2002; Phan et al. 2009; Crumlish et al. 2010;
De Silva & Nguyen 2011) and WSSV/AHPNS in shrimp (Hoa et al. 2011; Oanh & Phuong
2012; Loc et al. 2013; DoAH 2013b). Main causes from degradation of water quality, poor
brood-stock sources and seed quality (Le & Le 2010; Bui et al. 2010; Oanh & Phuong
2012). Diseases of aquatic animals are closely linked to the environment and
environmental issues, including disease control must be considered in the broader context
of farming systems design, sitting and management (Kutty 1995; Kongkeo 1997; Shang et
al. 1998). Additionally, Seed quality was perceived as key factor for sustainability of both
shrimp and catfish industry. Environmental condition combined with other factors such as
poor seed quality and degradation of pond condition after many years of exploitation, have
made increase disease issues and will continue to be problems in the coming years.
Aquatic animal disease will limit future food supply from global aquaculture sectors
(Valenti et al. 2011; Stentiford et al. 2012), and shrimp/catfish disease is still a main factor
future development (Primavera 1998; Shang et al. 1998; Lebel et al. 2002; Biao & Kaijin
2007; Kongkeo & Davy 2009; Bush et al. 2010a; Bush et al. 2010b; CBI 2012b; Rico et al.
2012; SFP 2013; Paul & Vogl 2013). In addition, one problem is intensive use of natural
coastal habitats for monoculture technology, often exceed the carrying capacity of the area
(Primavera 1998; Valenti et al. 2011). This often causes environmental degradation and
disease outbreaks (Neiland et al. 2001; Frankic & Hershner 2003; Valenti et al. 2011). Thus,
relevant stakeholders should consider any environmental concerns carefully and develop
strategies that will sustain the industry in the long-run with minimal environmental
perturbations (Whitmarsh et al. 2006; De Silva & Nguyen 2011). Environmental impacts
caused by aquaculture may be quantified monetarily and included in the production costs
281
(Valenti et al. 2011), and there needs for a partnership approach between environmental
agencies and the industry (Abreu et al. 2011).
One important issue related to sustainable development is capital/investment costs; the lack
of operational cost is not only difficult for the aquaculture industry but also the concerns of
the other industries. Input cost is increasing yearly, while the own saving of farmers is still
limited for investment, large amount was borrowed. To solve the constraints of
capital/investment costs, input cost, and lack of financial source and cost adapting
technical barriers, the catfish and shrimp industries need to self-improve their operations to
make a reasonable return on investment. The main production cost comes from feed cost
(i.e. 80% of catfish production cost and 60% in shrimp culture), and thus to save the
operation cost the feed management should be considered as a priority. Until now, aqua-
feed processing plants still heavily depend on imported raw materials (CBI 2012b; Tuan et
al. 2013), so the feed prices are often higher than that of the other seafood producing
countries leading to reduced trade competitiveness. Thus improving policy to encourage
the domestic production of raw materials is essential to help reduce operational costs for
the aquaculture sector. Feed requirements affecting sustainable growth of the aquaculture
sector (Focardi et al. 2005), and important prerequisites for sustainable production are
appropriate governmental policies (Olesen et al. 2010). Although input cost is rising and
affecting operations of most stakeholders along value chain, the stakeholders need to adjust
their business at the suitable investment level and self-improve practices to sustainable
development. The striped catfish industry is more interested in the issue of
capital/investment costs than the shrimp industry. Financial sustainability of fish farming
depends mainly on market-prices of products and inputs, and the production efficiency
depend on the farmer’s management capabilities, institutional support and the scale of
production, etc. (Bosma & Verdegem 2011). By way of contrast, the shrimp price
282
increases and tends to have less negative impact on the production chain. Moreover, the
shrimp market is large and always has a high demand while production did not meet
demand because shrimp industry affected often by shrimp disease.
6.4.4. Sustainability issues: measurement and mitigation actions
The DPSIR framework approach (Smeets & Weterings 1999; Bell & Morse 2008) was
used to develop a matrix of measurements and mitigation actions for sustainability issues.
The findings of this study were more qualitative than quantitative sustainability indicators
(SIn) that were obtained through the state of system workshop (SoS). The qualitative
method allowed respondents to participate in development discussions. Bell & Morse
(2008) set out a system sustainability analysis approach that takes the participatory
deconstruction and negotiation of what sustainability means to a group of people, along
with the identification and method of assessment of indicators to assess that vision of
sustainability. However, SIn developed in the SoS workshop were more focused on
economic aspects, especially at the farm level. The unbalanced SIn reveals stakeholders
perspective from a bottom-up approach (Zhang 2014). SIn at broader levels, such as value
chain level and macro level, are more difficult to measure than those SIn at local or farm
level. This also raised the question of who will use these SIn, as different stakeholders may
focus on different levels of the value chain coordination, they may be more efficient in
using particular SIn. For example, it may be more appropriate that farmers apply SIn for
farm level than government officers, while government officers are better able to apply SIn
at the city level (Shen et al. 2011; Rametsteiner et al. 2011; Zhang 2014).
Sustainability perceptions that were identified in exercise 1 of the SoS workshop were used
as a basis for discussion with stakeholder groups to discover potential measurement tools
and their responses to them (Table 6.3 & 6.4). Each emerging challenge to sustainable
283
development also requires specific solutions and broader sustainability should incorporate
as many different aspects as being manageable (Wurts 2000). This study found several
potential sustainability indicators that were suggested to measure the risks of sustainability
development. Firstly, sustainability issues in relation to economics dimension, such i)
‘input cost’ should be monitored through the fluctuation of materials and product price
from producers and processors; ‘capital & credit costs’ could be assessed by monitor on
capacity of self-investment and loan; and iii) ‘unstable market’ can be measured by
analysis of market variation in term of importers’ demand, number of importers, value and
volume of exporting products. To cope with the sustainability issues, a suitable master
planning for production and consumption by the Government were suggested.
Additionally, horizontal and vertical integration among chain actors were identified to
reduce costs from the intermediate nodes of the value chain and also reduce the risks of
unstable markets and product prices (Khiem et al. 2010; Bolwig et al. 2010; Khoi 2011;
Tran et al. 2013; Trifković 2013). Secondly, measurement of the key environmental issues
include i) ‘water quality & availability’ may be measured by monitoring on water quality
parameters, water treatment and water exchange mechanism; ii) ‘seed quality’ should be
measured by the monitor of growth rate, mortality rate, record keeping (brood-stocks,
breeding techniques, and frequency of brood-stock use), and results on the seed disease-
pathogen screened; and iii) ‘fish/shrimp diseases’ monitored mortality rate, type and
frequency of disease appearances, level of risk from disease, and any changes indicating a
disease outbreak. Solutions for the seed quality and animal disease are discussed as
improvement of the brood-stock sources and breeding techniques, technical training,
policy support for brood-stock improvement, and increase disease studies (Nguyen &
Dang 2009; Umesh et al. 2010; Kongkeo & Davy 2009; Sang 2010; De Silva & Nguyen
2011). Meanwhile, create strong linkages among value chain actors, zoning and strict
284
regulation and management of water treatment and effluent treatment are potential
responses as mitigation actions of ‘water quality/availability’ (Nguyen et al. 2009; Umesh
et al. 2010; Kongkeo & Davy 2009; Oanh & Phuong 2012; Rico et al. 2012). Thirdly,
regarding institutional sustainability issues, ‘government regulation & policy’ could be
measured by inventory on the overlap of regulations among sub-sectors, assess the feasible
regulation in term of enforcements and implementing stage, and assess the effectiveness of
support policy. The updated and adaptive policy on financial supports, updated regulation
on chemical/antibiotic use, food safety and animal welfare are suggested to cope with this
sustainability concerns (World Bank 2006; Nguyen et al. 2009; Klerkx et al. 2010; EU
SCAR 2012; World Bank 2012; Kilelu et al. 2013).
As mentioned above, the findings were more qualitative than quantitative sustainability
factors, so follow on research should focus on the quantitative indicators. However, the
proposed sustainability indicators also need to be tested in reality before using them (Choi
& Sirakaya 2006; Bell & Morse 2008). The sustainability focus changes with the stage of
development from social in developing countries to environmental in developed countries
(OECD 2001; Valenti et al. 2011; USAID 2013), and SIn need to be adjusted over time
(Bell & Morse 2008; Rametsteiner et al. 2011; Zhang 2014). Although the measurements
of sustainability issues were generally suggested, our findings outline what those in value
chain think are the key drivers of business risk. Sustainability factors are not only useful
for measuring progress but also for identifying problems, setting sustainable development
goals and identifying suitable management strategies (Reed et al. 2006). Moreover, the use
of sustainability factors has proved to be both an objective and efficient monitoring
tool to assess the rational use and management of natural resources, thus contributing to
conserve the natural capital for future generations, by establishing useful criteria and
parameters for decision-making processes (Moctezuma-Malagón et al. 2008).
285
CHAPTER 7
Chapter 7. Overall Discussion and Conclusions
7.1. Role of farmed species for seafood exporting
Aquaculture is a significant source of income contributing to the national economy as well
as a considerable source of dietary animal protein for the Vietnamese people, with nearly
half the fish consumed now being farmed (Fisheries Directorate 2013b; GSO 2013). The
Mekong Delta has a particularly important role in Vietnam seafood exports. Aquaculture in
the MKD contributed around 71% of national aquaculture production, mainly coming from
the striped catfish, shrimp, giant freshwater prawn and tilapia (accounting for 71% of
MKD aquaculture production). Striped catfish and shrimp are mostly produced for export;
while giant freshwater prawn and tilapia are mainly consumed by domestic market.
Although the Government strategy is more focused on catfish and shrimp for export, both
freshwater prawn and tilapia were identified as desirable species for diversification (VIFEP
2009b; MARD 2010; GOV 2013).
Most shrimp and striped catfish production are exported, accounting for over 83% and
95% of production respectively (Vo et al. 2009a; Le 2011; Le et al. 2011; CBI 2012b).
Vietnam’s trade policy reforms in 1994, the subsequent advent of reliable hatchery
technology, improvement of culture techniques, policy supports and more access to
international seafood markets were key drivers in the emergence of the burgeoning export-
orientated trade in both of these farmed species (De Silva & Nguyen 2011; Sebesvari et al.
2012; Tuan et al. 2013; Tran et al. 2013). Additionally, trade restrictions on striped catfish
and shrimp exports to the US market provided motivation for seeking new markets (De
Silva & Nguyen 2011; Tuan et al. 2013; MARD 2014). The highly competitive price of
striped catfish compared to alternative whitefish was also a driving force for successful
286
market access (Little et al. 2012). Substitution of black tiger for white legged shrimp in
other major shrimp producing countries has resulted inVietnam becoming the biggest
producer of black tiger shrimp; large areas are still used for the species, usually culture at a
lower level of intensity presenting opportunities for Vietnam to differentiate it’s shrimp
export. Overall, striped catfish and shrimp have come to dominate Vietnam’s seafood
exports over the last decade (Fisheries Directorate 2013b; Tuan et al. 2013). Striped catfish
has shown the highest growth in seafood export value, with annual growth rates of over
60% compared to that of shrimp (12%) since 2001. With current emerging trends, it is
likely that both commodities will continue to head towards sustainable production
practices promoted strongly by the third party standards food safety animal welfare,
environmental integrity and social responsible (De Silva & Nguyen 2011; Tuan et al. 2013;
MARD 2014).
By way of contrast, the production of tilapia and GFP has also expanded in the MKD, but
has limited production in comparison with shrimp and catfish, and are mostly domestically
consumed. The reasons for limited development of tilapia industry for export are
inconsistent hatchery performances that lead to unstable seed production; high domestic
demand; unstable grow-out production (i.e. more scattered farmed area and unstable
production because lack of detailed master plans); the small harvest size of farmed tilapia,
often around 400gram while the required size for export is around 600gram (Phan et al.
2011); and lack of market or high market competition from other country producers such
as China (tilapia) (Tran et al. 1998; Pham 2010; MARD 2010). According to Zhang (2014)
the success factors of Chinese tilapia in export market is its good texture and flavour;
lower cost and competitive price; large volume and stable supply; and success in all-male
tilapia seed producing and improvement in both nursing and grow-out technologies.
Chinese tilapias with greater geographical concentration and intensification have come
287
greater dependence on export markets; however, they still face problems with fish disease
and the labour shortage problems in the near future. The competitor of China in tilapia
exports is Thailand; and the high quality of Thai processed products and good reputation of
processing methods are advantages, including efficient logistics and strong institutional
support. However, the major constraints facing processors in relation to tilapia are still the
quality (muddy/off-flavour and chemical/antibiotic residues) and quantity (enough supply
of raw material of the right size as per orders) (Nietes-Satapornvanit 2011; Nietes-
Satapornvanit 2014). The issue of off-flavour in tilapia is recognized as a constraint for the
Thai processors if farmers could not produce on-flavour tilapia, especially if they do not
see the importance of investing capital and management to improve their systems (Nietes-
Satapornvanit 2014).
Similar to the tilapia industry, the giant freshwater prawn is also an important farmed
species in the MKD; however, this species was still be limited in term of production for
export due to reasons of inconsistent hatchery performances; unstable seed production;
unstable grow-out production, high domestic demand; and lack of market or high market
competition from other country producers such as Bangladesh (prawn) (Tran et al. 1998;
Pham 2010; MARD 2010). Nietes-Satapornvanit (2014) pointed out that Thai freshwater
prawn also faced limitted with export market and its domestic demand will remain high;
and volume production of processed praw seems to be limited by vulnerability to diseases
and cannibalism at higher densities and higher costs of production than competitors such
Bangladesh (prawn). Vietnamese and Thai hatcheries (prawn) also faced technical and
management-related difficulties such as quality of brood-stock sources related to genetic
deterioration leading to slow growth and disease in seed production (Nguyen et al. 2006;
Nietes-Satapornvanit et al. 2011; Nietes-Satapornvanit 2014). In addition, the domestic
market for freshwater prawn is stable i.e. good price and higher demand as it is a favoured
288
food item in Thai cuisine (Nietes-Satapornvanit 2014), and this may be the same issue in
case of Vietnam. The situation is similar in China where high prices and a cultural
preference for live seafood has led to a domestic focus (Zhang 2014). Processing of
freshwater prawns in general results in a loss of their differentiated qualities; for example
the heads, which are comparatively larger than penaieds, are particularly favoured in Asia
for use in soup on account of their high fat content.
7.2. Farming sustainability
7.2.1. Farming practices dynamic
Striped catfish and shrimp farming have developed rapidly in the 10 years between 2001
and 2010, and both species have shown changes in farm design and management and
operational linkages within the value chain over time. Catfish farming began with small-
farms operated by households but there has been an increase in large-scale farms
mostly owned and operated by seafood processors (Phan et al. 2009; De Silva & Nguyen
2011; Bosma & Verdegem 2011; Trifković 2013; Jespersen et al. 2014). De Silva &
Nguyen (2011) forecast that the catfish farming sector will shift torwards large-scale
farming prractices. This trend was the same as that of tilapia industry in China (Ponte et al.
2014; Jespersen et al. 2014) and salmon industry in Europe (Kvaløy & Tveterås 2008). For
example, salmon industry supply chains are developed with an increasing degree of
vertical coordination from salmon farms to the supermarkets. Most striking is the rise in
large vertically integrated companies with direct ownership of production activities
including hatcheries, fish processing and exporting (Kvaløy & Tveterås 2008).
Farm gate price instability and a downward trend in fish price have been important factors
leading to poor economic performances of many small/medium farms, and lack of
operational finance resources has also lead some stopping, temporarily stopping or leaving
289
catfish farming (Table 7.1). Another was come from the trend of vertical integration of the
processors (Hansen & Trifković 2014), because the pangasius processors have tended to
cycle their production processes leading to develop their own farms instead of dependence
on the independent farms (small-/medium farms).
This study found that there were not significant differences on the production and
economic efficiency among catfish farm scale, and this suggests that farm performance
was relatively independent of farm scale. Many small farms made money and some larger
farms did not (Chapter 4 & 5), this reflects that persistence of small farms if well managed
such as management (e.g. feeding, stocking) and timing of fish sales in the economic cycle
(that greatly affected the farm-gate price achievable). The smaller scale farms can still
maintain themselves in the value chain if they can improve their farming practice and
management.
However, the small-scale farms can be considered as more vulnerable actors in the value
chain due to many constraints compared to the others. Therefore, the small-/medium farms
showed a tendency to develop linkages with the processors through contract farming
systems in order to maintain their farms, as this helps to ensure that they can sell their
product to processors in both the fish quantity and quality. Moreover, contract farming
between processors and small-scale farms was seen as a way to increase income for
farmers (Miyata et al. 2009; Zhang 2014); through the diversification of small contract
farmers, the increased income permeates their households and communities (Glover &
Kusterer 1990; Miyata et al. 2009). Dorward (2009) and Zhang(2014) suggested that there
were three broad types of livelihood strategy or transformation for smaller scale farmers in
the face of the threats of stresses and shocks, including i) ‘hanging-in’ strategies, which are
concerned to maintain and protect current levels by keeping farming at a low level; ii)
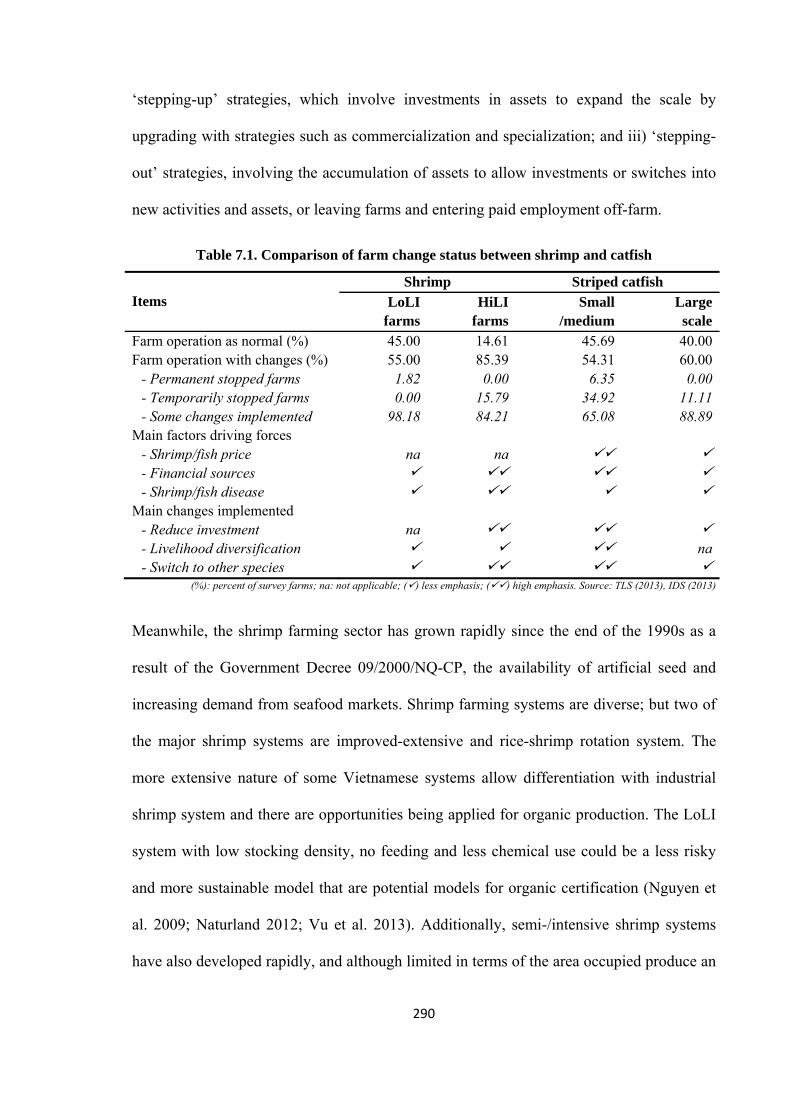
290
‘stepping-up’ strategies, which involve investments in assets to expand the scale by
upgrading with strategies such as commercialization and specialization; and iii) ‘stepping-
out’ strategies, involving the accumulation of assets to allow investments or switches into
new activities and assets, or leaving farms and entering paid employment off-farm.
Table 7.1. Comparison of farm change status between shrimp and catfish
Items Shrimp Striped catfish
LoLI farms
HiLI farms
Small /medium
Largescale
Farm operation as normal (%) 45.00 14.61 45.69 40.00Farm operation with changes (%) 55.00 85.39 54.31 60.00
- Permanent stopped farms 1.82 0.00 6.35 0.00- Temporarily stopped farms 0.00 15.79 34.92 11.11- Some changes implemented 98.18 84.21 65.08 88.89
Main factors driving forces - Shrimp/fish price na na - Financial sources - Shrimp/fish disease
Main changes implemented - Reduce investment na - Livelihood diversification na- Switch to other species
(%): percent of survey farms; na: not applicable; () less emphasis; () high emphasis. Source: TLS (2013), IDS (2013)
Meanwhile, the shrimp farming sector has grown rapidly since the end of the 1990s as a
result of the Government Decree 09/2000/NQ-CP, the availability of artificial seed and
increasing demand from seafood markets. Shrimp farming systems are diverse; but two of
the major shrimp systems are improved-extensive and rice-shrimp rotation system. The
more extensive nature of some Vietnamese systems allow differentiation with industrial
shrimp system and there are opportunities being applied for organic production. The LoLI
system with low stocking density, no feeding and less chemical use could be a less risky
and more sustainable model that are potential models for organic certification (Nguyen et
al. 2009; Naturland 2012; Vu et al. 2013). Additionally, semi-/intensive shrimp systems
have also developed rapidly, and although limited in terms of the area occupied produce an
291
increasingly level of the total harvested crop. However, the rapid growth of semi-intensive
and intensive system faced several challenges during the development such as the slow
improvement of irrigation canals; seed quality and inputs quality; and infrastructure (e.g.
electricity networks; transportation etc.). These are cited as major constraints for
expanding of industrial shrimp systems and are reasons why these systems were
geographically limited to specific sites (VIFEP 2009b; Nguyen et al. 2009; Anh et al.
2010a). Since 2008 many black tiger shrimp farms (mainly semi-intensive, and intensive
systems) have moved into white-legged shrimp culture, due to the short production cycle
and better economic efficiency. The dramatic shift to white-legged shrimp farming system
also faced similar constraints as the black tiger shrimp intensive system. White-legged
shrimp systems were sometimes farmed outside aquaculture zone, and they more
difficulties on the electricity use. They also made the pollution for the local areas due to
high stocking density, high feed use and weak irrigation system for water discharge in this
area (VIFEP 2009b; Nguyen et al. 2009). Electricity use for aeration system in white-
legged shrimp is higher than black tiger shrimp culture (i.e. 20h of aeration operation per
day in WLS compared to around 5h of BTS culture), but the current situation of the
electricity network cannot meet all requirement for this system. Thus, white-legged shrimp
farms still based on the machine run by diesel, this make more costly and increasing
production cost compared to that of the electric use (VASEP 2012; Fisheries Directorate
2012).
Since late 2010 the AHPNS disease began to appear with identification and negative
effects becoming clear during 2011 and 2012. By 2013, the AHPNS disease situation was
being managed, through better control of seasonal culture time, control of seed quality and
improvement of farm management. In particular, all intensive shrimp farms changed over
time, and the main cause was shrimp disease, especially the AHPNS epidemic. Shrimp
292
disease was perceived as the main reason leading to the suspension of operation of many
semi-/intensive shrimp farms. In contrast, the LoLI farms showed fewer changes in
farming practices over time compared to the HiLI farms (Table 7.1). Shrimp farmers locate
mainly in the coastal areas, and their land is mostly used for shrimp culture. Although the
shrimp farms affected by disease outbreak and financial constraints (i.e. mainly on the
semi-/intensive system), most shrimp farms are still maintained due to very difficult shift
to the other occupations in the coastal areas where are only suitable for aquaculture
(Nhuong et al. 2002; Le 2009). However, in order to maintain the position in the value
chain, they should improve their practices to make a reasonable return on the investment.
Similar to the catfish farming sector, shrimp farms should consider to the three type of
livelihood strategies including i) ‘hanging-in’; ii) ‘stepping-up’; and iii) ‘stepping-out’
strategies (Dorward 2009; Zhang 2014). Aquaculture contributes to inequality-reducing,
and there was very little evidence that aquaculture contributes to the marginalisation of the
smallholders (Irz et al. 2007). Moreover, until now most shrimp farms are small-scale
farms, and thus the small-farms should be included in the future development of the
aquaculture sector. However, the possible solutions for the inclusion of smaller scale farms
in the value chain could be horizontal coordination and vertical coordination (Umesh et al.
2009; Khiem et al. 2010; Khoi 2011; De Silva & Nguyen 2011).
7.2.2. Main constraints to sustainable farming and proposed responses
Catfish and shrimp farms are likely to face increasing problems with aquatic animal
diseases, especially as disease complexes emerge such as BNP/MAS in catfish and
WSSV/AHPNS in shrimp. Disease was perceived as the most important factor affecting
long-term development. Rico et al. (2012) also noted that the proliferation of viral,
bacterial and fungal infections and parasitic pests has resulted in large economic losses,
293
and these problems have become one of the major constraints to the sustainable growth of
the aquaculture sector (Shang et al. 1998; Bush et al. 2010b; Rico et al. 2012; Stentiford et
al. 2012; Rico et al. 2013). Seed quality is also a key factor of sustainability and the
evidence for a decline in quality has been linked to broodstock quality. Wild black tiger
shrimp brood-stock are limited and often contaminated with disease, because they were
often caught onshore resulting in a low maturity coefficient (Fisheries Directorate 2012);
and the inconsistent quality of seed from genetic improvement programmes of catfish and
white-legged shrimp are common perceptions (VIFEP 2009a; Bui et al. 2010; Le & Le
2010; CBI 2012b). Additionally, trends in poorer water quality have been related to the
impact of waste water released by other industries into the rivers (Nguyen et al. 2009; De
Silva et al. 2010; Sebesvari et al. 2012; Nguyen et al. 2013; Tuan et al. 2013), and was also
considered as an important factor for sustainability of the farming sector. This suggests
that a sectoral plan for water use based on watershed management principle is overdue in
Vietnam and that a zonal approach is urgently required to accommodate multiple uses and
users (Sebesvari et al. 2012; Han & Immink 2013).
On the other hand, the consumption of certified products increased gradually in importing
countries (Belton et al. 2011; Nguyen 2012; Bush & Oosterveer 2012b). Product quality
was also a major sustainability factor, and thus the quality of products needs to be
improved to meet current and expanded market demands. Ababouch (2007) noted that is
that emerging standards, safety and quality requirements were serious constraints for both
producers and exporters. Vertical integration has been advanced as a the most likely
mechanism that would allow for the necessary levels of self-improvement (Nguyen 2008;
Nguyen 2009; Khoi 2011; MARD 2014; Jespersen et al. 2014; Ponte et al. 2014),
particularly the level of control necessary to ensure quality and food safety (Young et al.
2011; Jespersen et al. 2014; Hansen & Trifković 2014). Used extensively in the livestock
294
sector, the high degree of vertical integration in the Danish pork sector is viewed as an
advantage, ensuring stable supplies and homogeneous quality (Grunert et al. 2005).
Although this study found that medium to large catfish producers with close relationships
to, or integrated with, processors enjoyed better outcomes, fluctuations in catfish value
were a major challenge to the whole sector. In agreement with our own study, Le &
Cheong (2010) found that catfish price was perceived as the most significant risk to catfish
farming in the MKD. Concern about the variability of price that catfish farmers receive and
lack of any guarantee of a sales price (Bremer et al. 2013). Moreover, the payment
schedule was often delayed by processors, and this led to increase the operation cost of
farmers due to their interest payment of loan for this delayed period. Hence, Government
intervention is needed to create and enforce legal contracts between farmer groups and
processors in term of payment schedules and minimum price (Bush et al. 2010; Le &
Cheong 2010).
Financing of catfish and shrimp farms requires capital investment, however the catfish
farms need a higher operational finance than shrimp farms, for example total cost for a
catfish production cycle was around US$300,000 per ha compared to US$19,000 per ha of
a crop in the intensive shrimp system. Catfish farms used around 60% of financial source
from the loans, especially from the commercial banks. Capital has become increasingly
limited and dependent on the commercial banks; however, low returns has eroded this
source recently. In contrast, shrimp farms mainly used their own savings but these are
limited and shrimp farmers faced difficulties to access loans from commercial banks due to
outstanding debts. Farmers often loan with small amount that did not reach their need
because their collateral cannot meet the requirements from the banks. Additionally,
farmers can only access short-term loans, so the farms can become default or cannot
reinvest their operation if they face the economics loss. There is an urgent need to improve
295
long-term regulation of loans and operational linkages (horizontal and vertical) to reduce
transaction costs, production cost and financial constraints (Grunert et al. 2005; CBI
2012b). Although a government’s commitment is necessary for aquaculture development,
it is not sufficient to ensure sustainability (Subasinghe et al. 2009). Actors within value
chains need to self-improve to make a reasonable return on investment. This has been
demonstrated by Norwegian farmed salmon trade with Japan, that adjusted to price
declines of 20% between 1998 and 2004 through restructuring, and consolidation of many
small-farmers into several major producer- exporter networks, and on-going improvements
in salmon farming technology (Grunert et al. 2010). The rapid growth of aquaculture
production and increasing competition between exporters led to price reduction, and thus
suitable way for producers to survive and remain profitable is to reduce production costs
through productivity growth (Asche et al. 2008; Zhang 2014).
7.2.3. Food certification: challenges for small-scale farms
Small catfish and shrimp farms faced more difficulties and constraints in meeting
standards criteria than large-scale farms. Nietes-Satapornvanit (2014) notes that looking
more specifically on the compliance to various standards and certifications, it will be a bit
difficult and more complicated for smaller scale farms to comply with them. The large
scale farms are more able to comply with the various criteria set by the global standards
and certifications, because these standards were designed with the “industrial” and
“intensive” nature of production in mind (Nietes-Satapornvanit 2014). This is a major
social issue affecting small-scale farms which are still dominant in Asia, and potentially
the large numbers of other, often poor, actors in associated value chains (Busch & Bain
2004; Subasinghe et al. 2009; De Silva & Davy 2009; Melba G. Bondad-Reantaso et al.
2009; Umesh et al. 2009; Bush et al. 2010b; Bosma & Verdegem 2011; Belton & Little
296
2011). Belton et al. (2011) indicated that catfish producers at the smaller-scale end of the
spectrum were at a disadvantage to attain certification; while larger operations are most
likely to achieve certification since they tend to possess organizational structures and
characteristics amenable for adaptation to standard requirements (Belton & Little 2011;
Bush & Belton 2012; Hansen & Trifković 2014).
Meanwhile, Bush et al. (2010a; 2010b) indicated that certification would play an
important role in restructuring the shrimp industry, however the small-scale shrimp
producers will be left with the choice of compliance due to the high cost. The small-
/medium catfish farms and the LoLI shrimp farms showed a long way to go to meet the
standard criteria, because they had small farm size and poor farm infrastructure compared
to the larger scale farms. Additionally, small-farms also faced financial constraints to
adjust farm construction and improve farming practices to meet standard criteria.
Certification has financial costs (e.g. cost for adjust farm construction, improvement of
farming practices, certify fee and annual certified fee) which may be burden some for
value chain actors, and compliance for certification requirements could be costly for small-
farmers (Siar & Sajise 2009; Washington & Ababouch 2011; Tran et al. 2013).
Washington & Ababouch (2011) noted that certification might require the introduction of
new management systems and farms to invest to adjust infrastructure and improve
practices that may be a financial constraint for small-farmers (Siar & Sajise 2009;
Washington & Ababouch 2011; Omoto 2012; Trifković 2013; Tran et al. 2013). This is a
main reason why the certification for aquaculture has not become more widespread (Bush
& Belton 2012; USAID 2013). With the current situation, most small-farms could be
excluded from international certification regimes and the certification may be a substantial
barrier for the future development of this group.
297
The standards tend to marginalize the small-farmers who are unable to meet the strict
requirements due to a lack of technical skills (Dey & Ahmed 2005; Oosterveer 2006;
Subasinghe et al. 2009; Belton 2010; Khiem et al. 2010; Belton et al. 2011; Pham et al.
2011; Haugen et al. 2013); therefore, certification creates market barriers that specifically
exclude these small-producers from the markets, and/or by denying them access to wider
international markets (Trifković 2013; Haugen et al. 2013). In addition, technical barriers
to trade have introduced high costs that tend also to exclude the small-producers from the
export supply chain (Dey & Ahmed 2005; Bostock et al. 2010; Belton et al. 2011).
Small-scale farmers are facing difficulties in producing for export, as these farmers strive
to meet export consumer requirements, they might become uncompetitive (Muir 2005; Siar
& Sajise 2009; Dasgupta & Durborow 2009; De Silva & Nguyen 2011). If small-scale
producers are excluded from the certified products supply chains, they are likely to divert
their attention to lower-quality markets that require lower product quality and cheap price
such as pangasius export to Russia, Ukraine, South America markets (Bush et al. 2010b;
Bush et al. 2010a; Belton & Little 2011; Bush & Belton 2012; Belton 2013) and export of
raw shrimp materials to China (Fisheries Directorate 2012; VASEP 2014a).
Certification for individual small-farmers is not only prohibitively expensive, but also
impractical (Subasinghe et al. 2009; De Silva & Davy 2009b; Melba G. Bondad-Reantaso
et al. 2009). To overcome this issue and ensure market access where applicable, the small-
/medium should be linked into groups or clusters and work together to obtain group
certification. Collective action through farmers’ organizations such as cluster management
and group certification can help small-scale farmers overcome challenges related to market
liberalization, globalization and increasingly stringent quality and safety requirements for
aquaculture products (Kassam et al. 2011; Zhang 2014). Working in farmers group can
help to solve difficulties in land use, to share experiences on farm management and to save
298
operation cost. Grouping small-farmers that share common natural resources becomes
imperative to extend coverage to all small-scale farmers in a cost-effective manner (Umesh
et al. 2009; De Silva & Nguyen 2011). There is growing evidence that a cluster based
approach can save on certification costs (Bush et al. 2010b; Ha et al. 2012), small-scale
farmers need to cooperate in groups to share the cost of infrastructure and input (Umesh
2007; Pham & Truong 2011; Khoi 2011). However, to enable cooperative groups to
develop the necessary skills, they also need supports from the government and the private
sector to ensure a successful business model (Bush et al. 2010). The government and the
private sector can help farmers expand and upgrade their capabilities and practices to meet
the quality requirements of global markets (Umesh 2007; Umesh et al. 2009; Khoi et al.
2011). Moreover, encouraging farms towards certification markets for certified products,
premium prices would be a major incentive. If farmers are not able to improve market
access or an increased price for their product, they are unlikely to continue on a
certification path (Ha & Bush 2010). Although farmers’ groups can bring good
opportunities for smaller farms, a range of compliance constraints remain, particularly
difficulties in meeting the technical requirements of traceability and the high costs of
certification (Pham et al. 2011). Strengthening farmer organizations would support
implementation (Pongthanapanich & Eva 2006; RIA2 2009), and the Government needs
to improve the cooperative law, with special attention to smaller scale groups to improve
economic performance (Bush et al. 2009; Ha & Bush 2010; Pham et al. 2011).
7.3. Sustainability factors and theirs responses
7.3.1. Major sustainability factors
Striped catfish and shrimp have been identified as target farmed species for Vietnam
seafood exports up to 2020, and they will be steered towards sustainable development
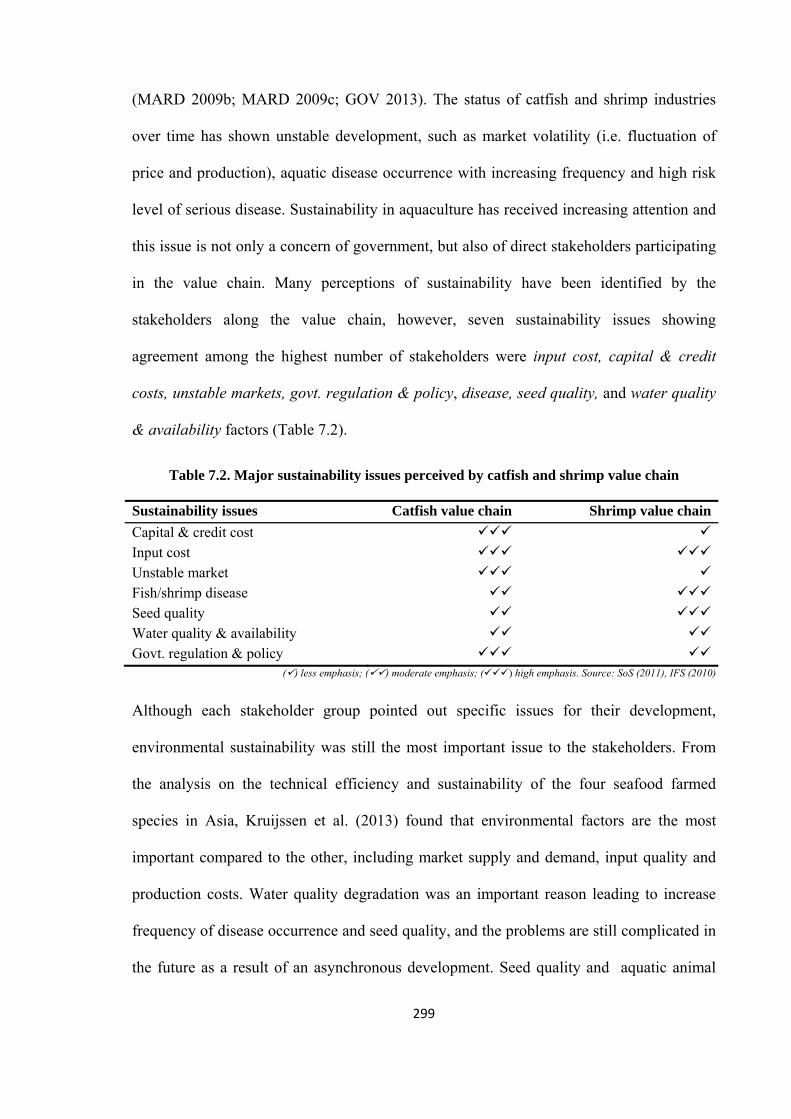
299
(MARD 2009b; MARD 2009c; GOV 2013). The status of catfish and shrimp industries
over time has shown unstable development, such as market volatility (i.e. fluctuation of
price and production), aquatic disease occurrence with increasing frequency and high risk
level of serious disease. Sustainability in aquaculture has received increasing attention and
this issue is not only a concern of government, but also of direct stakeholders participating
in the value chain. Many perceptions of sustainability have been identified by the
stakeholders along the value chain, however, seven sustainability issues showing
agreement among the highest number of stakeholders were input cost, capital & credit
costs, unstable markets, govt. regulation & policy, disease, seed quality, and water quality
& availability factors (Table 7.2).
Table 7.2. Major sustainability issues perceived by catfish and shrimp value chain
Sustainability issues Catfish value chain Shrimp value chain
Capital & credit cost
Input cost
Unstable market
Fish/shrimp disease
Seed quality
Water quality & availability
Govt. regulation & policy () less emphasis; () moderate emphasis; () high emphasis. Source: SoS (2011), IFS (2010)
Although each stakeholder group pointed out specific issues for their development,
environmental sustainability was still the most important issue to the stakeholders. From
the analysis on the technical efficiency and sustainability of the four seafood farmed
species in Asia, Kruijssen et al. (2013) found that environmental factors are the most
important compared to the other, including market supply and demand, input quality and
production costs. Water quality degradation was an important reason leading to increase
frequency of disease occurrence and seed quality, and the problems are still complicated in
the future as a result of an asynchronous development. Seed quality and aquatic animal
300
disease factors were mentioned often, as negative impacts of environmental degradation
were the reasons leading to increased frequency of disease occurrence. Cooperation across
policy sectors is required such as with irrigation authorities to improve water availability
and quality improvements. Aquatic animal disease will limit future food supply from
global aquaculture sectors (Valenti et al. 2011; Stentiford et al. 2012), and in particular
shrimp/catfish disease is a main factor affecting future development (Primavera 1998;
Shang et al. 1998; Lebel et al. 2002; Biao & Kaijin 2007; Kongkeo & Davy 2009; Bush et
al. 2010a; Bush et al. 2010b; CBI 2012b; Rico et al. 2012; SFP 2013; Paul & Vogl 2013).
Generally, aquaculture development is being increasingly constrained by environmental
problems caused by poorly managed aquaculture operations and by resource-use conflicts
(Simard et al. 2008; Gandini et al. 2009; Valenti et al. 2011; Samuel-Fitwi et al. 2012; EU
2013; USAID 2013). In an industry where the aquaculture production is mainly operated
by small-scale farms and lacks of horizontal/vertical integrated linkages, in order to ensure
growth in this industry while concentration on environmental protection and certification is
big challenge. Thus, the state agencies should produce and regularly update aquaculture
development strategies and plans, as required, to ensure that aquaculture development is
ecologically sustainable and to allow the rational use of resources shared by aquaculture
and other activities (Pullin et al. 2007). The continued expansion of aquaculture will
require the adoption of production technologies that minimize damage to the environment
(Whitmarsh et al. 2006). Efficient aquaculture systems requiring fewer inputs and
producing wider benefits and fewer wastes could be expected to be more sustainable (Muir
2005; Zhang 2014).
301
7.3.2. Responses to sustainability issues
Each emerging challenge to sustainable development requires specific solutions and
broader sustainability should incorporate as many different aspects as being manageable
(Wurts 2000). Since the growth of certified products in the international seafood markets,
programmes to encourage farmers to develop their production to meet this trend have been
implemented for some time but often lacked linkages to related policies and regulations
that could support producers. Ideally, such policies and regulations would support the
various stakeholders’ rights and obligations throughout the value chain. The government
and private sector must cooperate in a proactive way to establish confidence among
consumers (Yamprayoon & Sukhumparnich 2010). The government has plans to
restructure the fisheries sector towards sustainable development and increase value added
products until 2020, especially for striped catfish and shrimp industries that are targeted
national seafood products (MARD 2014). The policy support aims to be bottom-up but
encourages state agencies to participate actively in the process of initiating and final
decision-making. Stakeholder participation can lead to more effective and durable
decisions; however, the quality of decisions made through stakeholder participation is
strongly dependant on the nature of the process leading to them (Reed et al. 2006; Reed
2008; Bell & Morse 2008). Sustainability policy is a set of ideas in particular situations that
has been officially agreed by a group of people, a business organization and/or a political
party (Glavič & Lukman 2007; Olesen et al. 2010). The planning process should look at
suitable and potential zones for the development of aquaculture (Frankic & Hershner 2003;
Simard et al. 2008).
Sustainable development is the right direction for striped catfish and shrimp industries; and
the Vietnamese Government has dealt with many trade-related issues, and has tried to
302
ensure that the catfish producers have not been impacted adversely, except for some short-
term shocks and that the sector continues to retain its growth (De Silva & Nguyen 2011).
Instituting an effective minimum price for pangasius, suggested by many observers
(VIFEP 2009; De Silva & Nguyen 2011; Khoi 2011; Le 2011) has not been forthcoming
and may have resulted the sectors perceived ‘race to the bottom’ with negative impacts on
many, particularly poorer stakeholders. The highly competitive prices of pangasius
compared to substitute whitefish in the international markets (Beukers et al. 2012; Little et
al. 2012) may have encouraged this passivity and undermined a longer term strategy to
build a more sustainable sector that is required to ensure food quality and safety. To reach
the sustainability purpose, apart from the requirements of the direct stakeholders’ efforts in
improving their practices, the role of state agencies e.g. MARD and VASEP is essential in
the negotiation and diplomacy to create partnerships with the seafood importing countries.
Efforts to develop a sustainable production would become impossible without the
participation of importers, retailers and consumers. Vertical and horizontal business
relations between the producers and different levels of sellers and buyers of their products
are crucial for business negotiations and building trust (Lebel et al. 2009; Nietes-
Satapornvanit 2014). Until now, retailers have played an important role in operationalizing
regulations over aquaculture at a global scale (Busch & Bain 2004; Bush & Duijf 2011;
Ponte et al. 2014; Jespersen et al. 2014), while producers have mainly responded to the
consumers’ requirements on the food safety, animal welfare and sustainability conditions
when forced to do so. Development of aquaculture in a sustainable manner requires
benefits to farmers, local communities and other stakeholders to be attractive (Frankic &
Hershner 2003), thus, requiring any planning process to be a package of measures that
offers highly integrated solutions to achieve development effectiveness. Planning for
change in production and processing requires balance in stakeholders’ benefit sharing.
303
There needs to be increased managerial and technical skills of value chain actors if these
developments are to be possible. Farmers should enhance their performance measurement
capability to improve their technology for disease and environmental control. Additionally,
farmers also need to improve their farming practices to make a reasonable return on
investment, which will often require some level of consolidation and increase in farm size.
Kruijssen et al. (2013) indicated that farms could reach higher efficiency scores when
farmed holdings were increased and reached a certain threshold, beyond which they again
became less efficient. Irz1 & Stevenson (2012) also poited out that there exists a
significant inverse relationship between farm size and productivity in some cases. For
example, the relationship between farmed area and production efficiency shows an
inverted U-shape for pangasius farmers in Vietnam; and the catfish farm achieved the
highest efficiency scores in the farm-size at 15ha (Kruijssen et al. 2013). On the other
hand, techniques of processing plants should be developed to improve the fillet yield,
portion size and product range, value added products and by-products, and to build trade
brand-names (Tuan et al. 2013; MARD 2014). Markets pay more interest in seafood
products with affordable prices; food and brand safety; optimal portion sizes; and product
range (Brunori et al. 2011; Kelling 2012; Bremer et al. 2012). Moreover, ready-to-cook
and ready-to-eat meals, and pre-packaged food have increased their market share because
customers have paid more attention to the convenience food products that could help to
make the cooking easier and faster (CBI 2012a; Kelling 2012; Bremer et al. 2012;
Spaargaren et al. 2012; CBI 2013a; CBI 2013b).
The development of tools and indicators for sustainable development are essential to
evaluate and adjust production in terms of sustainability issues (Moctezuma-Malagón et al.
2008; Bell & Morse 2008). Based on the current difficulties and sustainability issues
addressed, upgrading the value chain or setting up and improving the efficiency of
304
operational linkages among actors is essential, the horizontal/vertical operational linkages
will strongly contribute to the articulation of production chains and reduce intermediate
costs and improve competitiveness. Vertical integration occurs when an enterprise owns or
controls more than one sector of the value chain, such as integration of producing,
processing, transporting and distribution; whereas horizontal integration means an
enterprise owns or controls multiple business in the same sector of the value chain, i.e.
different branches (Abila 2003; Zhang 2014). Additionally, improving the regulation of
production and supporting policies should be carried out to bring them in line with the
actual practices. All relevant stakeholders should be involved in the key steps to improve
regulations and supporting policies, resulting in their greater commitment to, and
responsibility for, implementation and increased efficiency. Sustainable development of
the shrimp and catfish sectors also requires the involvement of state agencies that have an
important role in the regulation of production. The state agencies should make a detailed
plan for the farming, processing and service sectors; and regulations to manage the producing,
processing and exporting at the farm level, processing level, and the operation of input
supplying level. For example, Decree 36/2014/ND-CD on conditions for catfish production,
processing and exporting dated 29/4/2014 by the Vietnamese Government is a legal
regulation to manage catfish sector, according to the decree, all catfish farms and
processors have to meet requirements on the specific conditions when they participate in
the value chain, and that seem to be a license for the value chain actor (GOV 2014). This
management form seem to be ‘intentional development’ that is a focussed and directed
process whereby government implement programmes to help develop the under-
developed. However, the ‘immanent development’ also occurs in parallel, this is a broad
process of change in human societies driven by a host of factors including advances in
science, communication, governance etc. (Belton & Little 2011).
305
7.4. Value chain coordination
7.4.1. Value chain governance forms
Several recent studies have co included that the value chains of striped catfish and shrimp
are ‘buyer-driven’ whereby large retailers, importers and trading companies define what is
to be produced and under which conditions (Tran et al. 2013; Trifković 2013; Jespersen et
al. 2014; Ponte et al. 2014). In these chains, production functions are usually out-sourced
and key actors concentrate on branding, design and marketing functions (Gereffi &
Korzeniewicz 1994; Bolwig et al. 2010). Agro-food value chains are often characterised by
highly asymmetrical power relations and the terms of participation in these chains are, to a
large extent, controlled by downstream actors (Bolwig et al. 2010). Value chain
coordination mechanisms, including ‘captive’ and ‘market’ forms, were similar between
shrimp and catfish sector in terms of ‘processors-importers’ and ‘importers-wholesalers-
retailers’ relationships. They were different in the relationship between primary actors and
processing actors (Figure 7.1). Generally, the value chain coordination is moving towards a
‘captive’ form due to buyers’ increased focus on quality, safety and sustainability and
increased monitoring of suppliers for both these species (Tran et al. 2013; Jespersen et al.
2014; Ponte et al. 2014). This trend is the same as the tilapia value chain in China
(Jespersen et al. 2014; Ponte et al. 2014).
At the present, most catfish were sold directly to the processors (>95%), and a ‘hierarchy’
was the main coordination form between catfish farmers and processors due to 70% of
catfish production coming from the processers’ own-farm production. However, around
30% of catfish production also came from the independent (20%) and contract farms
(10%) (VASEP 2014; Anh 2014), and thus ‘market’ and ‘captive’ coordination forms
continue to exist, respectively. By way of contrast, the shrimp processors often purchased
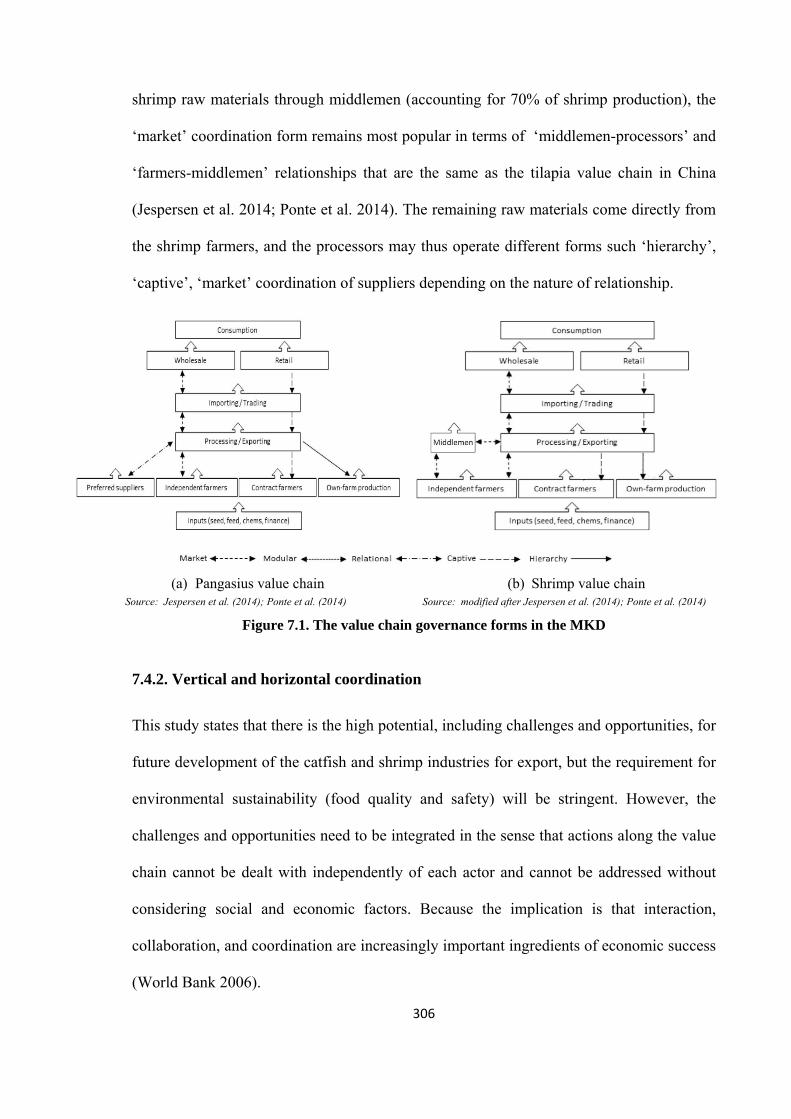
306
shrimp raw materials through middlemen (accounting for 70% of shrimp production), the
‘market’ coordination form remains most popular in terms of ‘middlemen-processors’ and
‘farmers-middlemen’ relationships that are the same as the tilapia value chain in China
(Jespersen et al. 2014; Ponte et al. 2014). The remaining raw materials come directly from
the shrimp farmers, and the processors may thus operate different forms such ‘hierarchy’,
‘captive’, ‘market’ coordination of suppliers depending on the nature of relationship.
(a) Pangasius value chain Source: Jespersen et al. (2014); Ponte et al. (2014)
(b) Shrimp value chain Source: modified after Jespersen et al. (2014); Ponte et al. (2014)
Figure 7.1. The value chain governance forms in the MKD
7.4.2. Vertical and horizontal coordination
This study states that there is the high potential, including challenges and opportunities, for
future development of the catfish and shrimp industries for export, but the requirement for
environmental sustainability (food quality and safety) will be stringent. However, the
challenges and opportunities need to be integrated in the sense that actions along the value
chain cannot be dealt with independently of each actor and cannot be addressed without
considering social and economic factors. Because the implication is that interaction,
collaboration, and coordination are increasingly important ingredients of economic success
(World Bank 2006).
307
Our findings provide insights to the changing risk profile of catfish and shrimp farming in
the MKD, of which the risks of economic change to catfish and shrimp disease are most
critical. Vertical and horizontal dimensions of coordination in value chains are suggested
to reduce the risk and vulnerability of both these species. Riisgaard et al. (2008) indicated
that value chain coordination through an ‘upgrading strategy’ may be strengthened to
improve value chain participation. However, this study showed that both catfish and
shrimp producers have faced several major barriers that influence to their capacity for
upgrading. Smaller farms have to cope with a higher level of these barriers for upgrading
compared to the larger farms for both these species. Both these species sectors, especially
small farms faced the same influence level of barriers to the process upgrading (i.e. limited
improvement of water quality, seed quality and disease management), the product
upgrading (i.e. guarantee on the absence of chemical residues), the functional upgrading
(i.e. limited vertical and horizontal contractualisation), and the inter-chain upgrading (i.e.
limited certification skills acquired in monitoring on the food safety). Therefore, an
improvement in the current GVC governance forms is required for both these species. The
improvement of each sector requires coordinated actions at different stages of the value
chain, and not only has to raise profitability but also comply with social and environmental
conditions. Both vertical and horizontal coordination are required in the value chain, and
expected that they might help to mitigate this risk and vulnerability of different production
systems in the MKD.
a). Horizontal coordination
As discussed details in the chapter 3, 4 and 5, the catfish processors have preferred to
develop the contract with a farmers’ group instead of individual small farms, and the
independent LoLI shrimp farms also faced difficulties to make contract with the
prestigious input suppliers. Therefore, small farmers need to organize as groups or
308
cooperatives, which, through the cooperative action, could help their members to cope with
risks and vulnerability, such as fluctuation of fish price and shrimp disease. Such collective
action can help small-scale farmers overcome challenges related to market liberalization,
globalization and increasingly stringent quality and safety requirements for aquaculture
products (Kassam et al. 2011). Moreover, working in the group can provide important
explicit incentives for process, product and functional upgrading (Khiem et al. 2010).
Bijman (2007) reveals that producer organizations can help their members obtain market
information, negotiate prices with buyers, and learn from international best practices.
Producer organization can train farmers on production technology knowledge, drug
application, disease control and overall management of the production to ensure that
quality products are produced (Francesconi 2009; Umesh et al. 2009). Umesh et al. (2009)
recognizes that the organization of shrimp farmers’ groups in India through clusters
become attractive to buyers who are looking for ways to ensure traceability and reduce
transaction costs. Additionally, the internal economies of scale are also reinforced through
the establishment of farmers’ associations (Ruben et al. 2007; Khoi 2011). The salmon
farming industry in Europe is a good example of the significant consolidation moving from
smaller scale production to large-scale production, and upgrading with innovative
technologies, producing better quality and cheaper products, more educated labour and
mergers in the sector (Roth 2002; Zhang 2014). As society becomes more industrialised,
greater focus on food safety and the environment is needed rather than food supply and
social/poverty concerns. Once industrialisation of the aquaculture sector begins, the
smallholder sector tends to diminish in relative importance (Edwards 2010). Steinfeld et al.
(2006) stated that the governments’ policy needs to fit in to the social and economic
situation. Policy needs to be rebalanced among four dimensions, namely food supply, food
safety, environment and social/poverty concerns (Steinfeld et al. 2006; Zhang 2014).
309
b). Vertical coordination
Our findings show that the lack of operational linkages among chain actors, and limited
access to capital/credit were cited as important constraints for development of both these
species. Moreover, the LoLI shrimp farms and small-/medium catfish farms have operated
independently, and they faced higher levels of risks and barriers to upgrading compared to
the larger farms. In this situation, the processors are powerful actors in the pangasius sector
as they are able to dictate the terms in the market (Trifković 2013); while the
intermediaries and shrimp processors are more control on the shrimp value chain, and
input suppliers have strongly influenced to the performance of farm’s production in terms
of production and profit efficiency. On the other hand, the processors cannot control the
quality of inputs (fingerlings, feeds) and usage of drugs on independent farms, and
independent farms are less acquainted with export quality requirements and regulations
(Khoi 2011; Bush & Belton 2012). Maintaining smaller scale farms in the value chain,
requires closer horizontal and vertical coordination (Umesh et al. 2009; Khiem et al. 2010;
Khoi 2011; De Silva & Nguyen 2011). Because if processors lack of competences in the
control food safety and quality on the raw material sources, vertical integration (i.e. own
farm production or ‘hierarchy’ governance form) tends to be developed and occurs when
are difficult to codify and captive (Pietrobelli & Rabellotti 2011). In our findings,
capital/credit cost was viewed as an important factor affected to the chain actors’ operation
and upgrading toward sustainability. We suggest that to solve the constraints of rising
input cost, lack of financial resources, technical barriers and increasing the competitive
price, the farmers need to make i) a reasonable return on investment, and ii) institute the
main ‘costs’ associated with the main certification schemes. Meanwhile, the processors
should invest in developing their operations in terms of adding value to the product rather
than expansion into farms and hatcheries, etc., and they may manage raw-material sources
310
through the vertically linkages with other value chain actors. In this situation, the GVC
governance form is likely to change from ‘market’ and ‘hierarchy’ toward more ‘captive’
coordination (i.e. contract farms or vertical contractualisation) (Khiem et al. 2010; Khoi
2011; Pietrobelli & Rabellotti 2011; Tran et al. 2013). Moreover, to guarantee the quality
standards, vertical coordination between farmers or group of small-farmers and their chain
actors is crucial (Ziggers & Trienekens 1999; Schulze et al. 2006; Khoi 2011). Vertical
coordination is important when examining ways to reduce transaction costs, and this
reduction is beneficial to the firms (e.g. processors) and the farmers mutually (Khoi 2011).
The firm receives an assured and timely supply of the desired raw material; while the
farmers acquire an assured market for their production. Moreover, farmers gain more
reliable access to production inputs, capital, technology and market information (Ruben et
al. 2007; Khoi 2011).
Moving from ‘market’ to ‘captive’ form of value chain coordination or increased number
of contract farmers could be translated into rural poverty reduction. However, contract
farming schemes should be exercised, as a lot of effort needs to go into the design of
contracts that are equitable and inclusive of smaller farmers’ group or cooperatives who
would not be selected for contracting without a third-party intervention (Trifković 2013).
Therefore, the government intervention is needed to create and enforce legal contracts
between farmer groups and processors, and pay more control on the quality of farming
input products, especially seed quality and chemical products. The government
institutional environment plays a decisive role in guaranteeing the legal framework and
defining transparent rules for conflict settlement (Key & Runsten 1999; Ruben et al. 2007;
Amanor 2009).
311
c). Aquaculture innovation system
The GVC represent an increasingly important opportunity for chain actors to learn and to
innovate (Pietrobelli & Rabellotti 2011). For chain actors in developing countries inclusion
in GVC not only provides opportunities markets for their products, it also plays a growing
and crucial role in access to knowledge and enhanced learning and innovation. Innovation
is one of the policy instruments to mitigate negative external effects such as environmental
pollution (EU SCAR 2012). Development of aquaculture sector is often concerned with
production and profit, but also need to gives attention to the environmental and social
conditions in which it operates (Juma 2011). Technology may be at the heart of some but
certainly not all innovation (Temel et al. 2003; Sumberg 2005), and innovation is also
about investing in the capacity to apply novelty on a large scale (World Bank 2006). The
innovation process may fail because there are no financial means to introduce change on a
large scale, and weak sector upgrading when organizations are ineffective at dealing with
changing trade standards or developing a national brand image (World Bank 2006). Striped
catfish farming sector in the MKD was an example for this, the technology (stocking
density, productivity etc.) at farm-level has been grown rapidly, moving from shallow
ponds and cage culture to deep pond practices led to increasing production from less than
15tonnes/ha to around 300tonnes/ha. The rate of growth and levels of intensification of
their systems in geographically restricted areas is unprecedented, leading to serious
sustainability concerns. The lack of interaction of multiple actors was a main constraint of
innovation of this sector. The main reasons are cited as weak integration of social and
environmental concerns into sector planning and development, weak sector upgrading (i.e.
functional upgrading: horizontal and vertical coordination), and weak connection to
sources of financing for innovation.
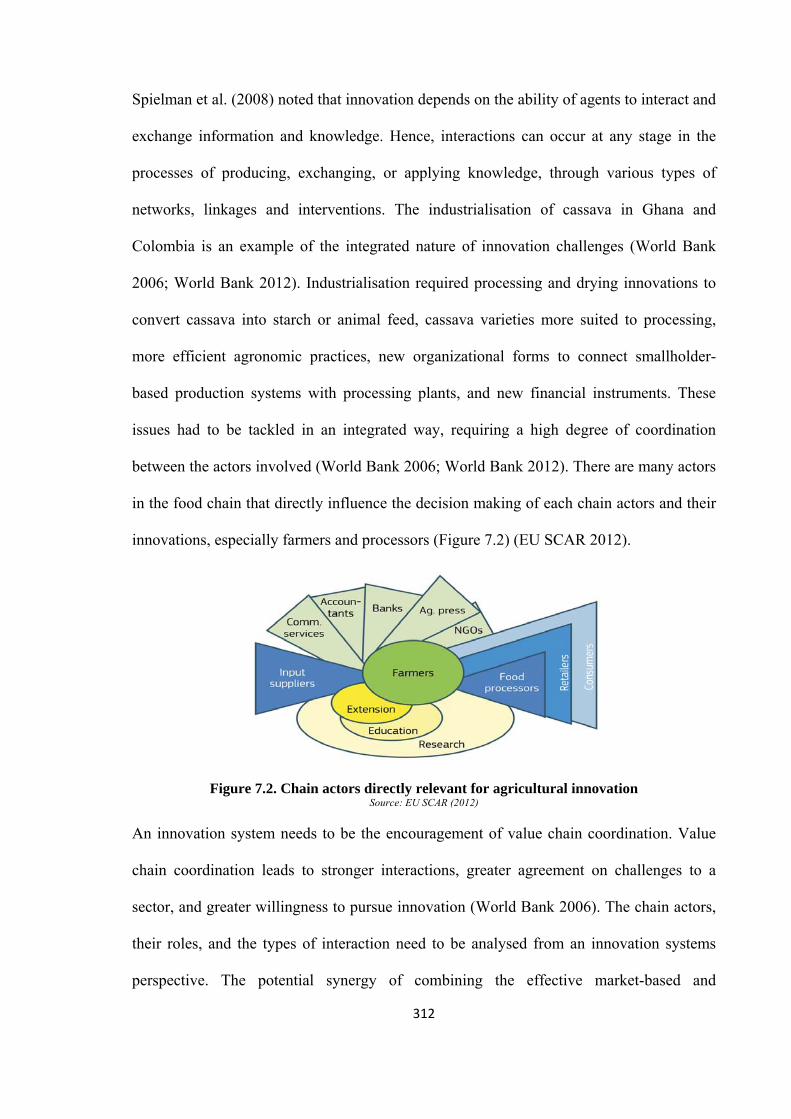
312
Spielman et al. (2008) noted that innovation depends on the ability of agents to interact and
exchange information and knowledge. Hence, interactions can occur at any stage in the
processes of producing, exchanging, or applying knowledge, through various types of
networks, linkages and interventions. The industrialisation of cassava in Ghana and
Colombia is an example of the integrated nature of innovation challenges (World Bank
2006; World Bank 2012). Industrialisation required processing and drying innovations to
convert cassava into starch or animal feed, cassava varieties more suited to processing,
more efficient agronomic practices, new organizational forms to connect smallholder-
based production systems with processing plants, and new financial instruments. These
issues had to be tackled in an integrated way, requiring a high degree of coordination
between the actors involved (World Bank 2006; World Bank 2012). There are many actors
in the food chain that directly influence the decision making of each chain actors and their
innovations, especially farmers and processors (Figure 7.2) (EU SCAR 2012).
Figure 7.2. Chain actors directly relevant for agricultural innovation Source: EU SCAR (2012)
An innovation system needs to be the encouragement of value chain coordination. Value
chain coordination leads to stronger interactions, greater agreement on challenges to a
sector, and greater willingness to pursue innovation (World Bank 2006). The chain actors,
their roles, and the types of interaction need to be analysed from an innovation systems
perspective. The potential synergy of combining the effective market-based and
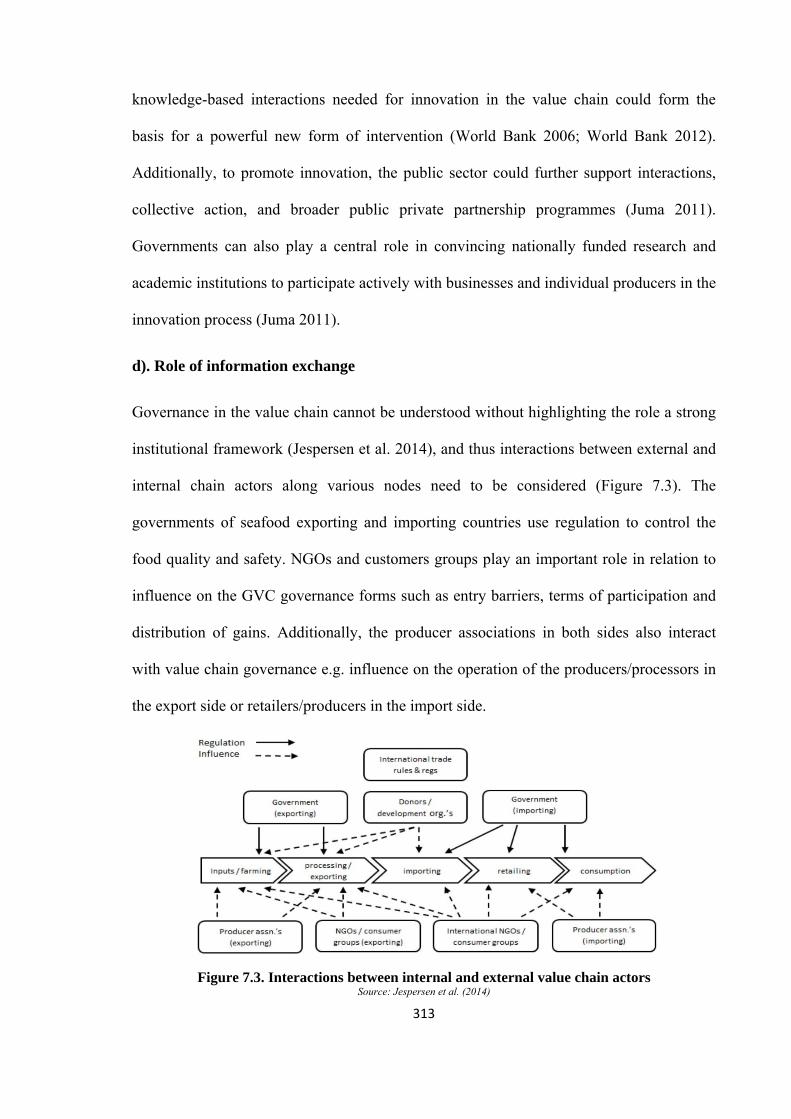
313
knowledge-based interactions needed for innovation in the value chain could form the
basis for a powerful new form of intervention (World Bank 2006; World Bank 2012).
Additionally, to promote innovation, the public sector could further support interactions,
collective action, and broader public private partnership programmes (Juma 2011).
Governments can also play a central role in convincing nationally funded research and
academic institutions to participate actively with businesses and individual producers in the
innovation process (Juma 2011).
d). Role of information exchange
Governance in the value chain cannot be understood without highlighting the role a strong
institutional framework (Jespersen et al. 2014), and thus interactions between external and
internal chain actors along various nodes need to be considered (Figure 7.3). The
governments of seafood exporting and importing countries use regulation to control the
food quality and safety. NGOs and customers groups play an important role in relation to
influence on the GVC governance forms such as entry barriers, terms of participation and
distribution of gains. Additionally, the producer associations in both sides also interact
with value chain governance e.g. influence on the operation of the producers/processors in
the export side or retailers/producers in the import side.
Figure 7.3. Interactions between internal and external value chain actors Source: Jespersen et al. (2014)
314
The global market for seafood is becoming increasingly demanding in terms of standards
and labels, and it focuses on quality, safety, traceability, sustainability, animal health and
welfare and socioeconomic aspects along the value chain (Kelling 2012; Trifković 2013).
Therefore, the production and market information flows play important roles in the value
chain governance. In the seafood producing countries, the information is needed not only
to be able the produce the right product and to supply what is demanded, but also to
provide the right incentive to smallholders (Page & Slater 2003; Kambewa 2007; Khoi
2011). The information on the production and market were currently come to farmers
through the technical training courses, media channels (e.g. VASEP, VINAFIS, DoFIs
websites and VTV television programmes), farmers’ associations or transferred from
processors who signed contract with farmers. However, the farmers, especially small
farmers faced difficulties to access the market information sources, because most farmers
have lived in the rural or remote areas and they are not familiar with this type of
information disseminations. Additionally, market information reaching farmers was often
infrequent, late and less effective. In contrast, the production information (i.e. regulation
on chemical/drug use, stocking time, and information on the environmental monitoring)
were more effective in terms of the frequency and update data. For example, most catfish
and shrimp farms know and follow the regulations on drug, chemicals and antibiotics
ban/or limitation for manufacturing and trading in the aquaculture sector promulgated by
MARD (2009a). This reflects the position that the Vietnamese government and producers
have strived to comply with the requirements set by the international markets in order to
retain access to them. Several literatures show that lack of market information constrains
farmers, especially smaller farms, to link to export markets (Page & Slater 2003; Kambewa
2007; Umesh et al. 2009; Khoi 2011). It is often difficult and costly for smaller farms to
obtain appropriate information on market demand (Page & Slater 2003; Segura 2006;
315
Bijman 2007). Smaller farms lack information on type and quality of the product
demanded, and information on market regulations, seasons of demands, and price
fluctuations (Umesh et al. 2009; Khoi 2011). Kelling (2012) illustrated that weaknesses in
relationships among chain actors undermine supplier power by reducing access to market
information, lessening incentives for sharing information, and restricting response
capabilities.
Agri-food products are subject to information asymmetry problems because consumers
cannot easily verify all the quality characteristics before the purchase (Trifković 2013).
When information about product quality is imperfect, consumers will be buying a product
of uncertain quality; and thus the imperfect information in product markets will lead to an
inefficient level of food quality and safety and lower quality products will dominate
(Akerlof 1970; Trifković 2013; Hansen & Trifković 2014). Since a production chain will
start early from farm to fork, value chain can only reach sustainable development when
both sides of the importers and producers engage to participate in the value chain with a
level of responsibility and shared vision of mutual benefit through sustained trade.
Transparency in both commercial aspects and product quality is required to support such
linkages. Although the exchange of information on the production and market should be
transparent among value chain actors (Grunert et al. 2005; Bush & Oosterveer 2007;
Grunert et al. 2010), Bush et al. (2007) indicated that information flows are currently clear
down the chain between retailers, distributors, importers and exporters, but less clear from
exporters down to producers. The same authors noted that the strong link between
consumers and producers could lead to more effective ethical trade practices through the
improved management of social and environmental outcomes. Additionally, the
sustainability conditions will require a marked improvement in the availability of
quantitative information locally, nationally and internationally (Frankic & Hershner 2003;
316
Pullin et al. 2007). There are several methods for overcoming these constraints such as
develop directly links between market and value chain agents (Kelling 2012). On the other
hand, certified standards are another popular response to imperfect information because the
main reason behind the emergence of various standards and codes of conducts is the
response to the information asymmetry between producers and buyers (Khoi 2011; Hansen
& Trifković 2014). These standards can disclose different product attributes and the
elements of the production process, which must be identified and preserved as the product
moves along the value chain (Trifković 2013; Hansen & Trifković 2014). In this situation,
previous relationships that were based on the exchange of private information are altered
as the information becomes codified through standards (Trifković 2013). These trends
towards higher degree of value chain coordination (i.e. moving from ‘market’ to ‘captive’
and ‘hierarchy’ forms) are induced by market failures such as asymmetric information,
failures in markets for credit, inputs or services (Key & Runsten 1999; Trifković 2013).
The information and knowledge system is composed of research, extension and
educational organizations, structured and governed by the government through a sectoral
agricultural policy. In all cases the historical goal was to increase the productivity of the
agricultural sector, by making farmers more professional (EU SCAR 2012).
317
REFERENCES
Ababouch, L. (2007). Causes of detentions and rejections in international fish trade. In W.
Einarsson, H.; Emerson (Ed.), International seafood trade: challenges and
opportunities (pp. 57–65). Akureyri, Iceland: FAO Fisheries & Aquaculture
Proceeding 13. FAO.
Abila, R. O. (2003). Fish Trade and Food Security: Are they Reconcilable in Lake
Victoria. Report of the Expert Consultation on International Fish Trade and Food
Security. FAO Fisheries Report. No. 708. FAO (Vol. 708, pp. 128–154). Rome.
Abreu, M. C. S. De, Mattos, P. De, Lima, P. E. S., & Padula, A. D. (2011). Shrimp farming
in coastal Brazil: Reasons for market failure and sustainability challenges. Ocean &
Coastal Management, 54(9), 658–667.
Akerlof, G. A. (1970). The Market for “Lemons”: Quality Uncertainty and the Market
Mechanism. The Quarterly Journal of Economics, 84(3), 488–500.
Ahmed, N., Alam, F., & Hasan, M. R. (2010). The economics of sutchi catfish
(Pangasianodon hypophthalmus) aquaculture under three different farming systems in
rural Bangladesh. Aquaculture, 1–15.
Ali, H., Haque, M. M., & Belton, B. (2012). Striped catfish (Pangasianodon
hypophthalmus, Sauvage, 1878) aquaculture in Bangladesh: an overview. Aquaculture
Research, 44(6), 950–965.
Allsopp, M., Johnston, P., & Santillo, D. (2008). Challenging the Aquaculture Industry on
Sustainability: Technical overview. Greenpeace Research Laboratories Technical
Note 01/2008 (p. 59). Exeter. Retrieved from
http://www.greenpeace.to/publications/aquaculture_report_technical.pdf
Amanor, K. S. (2009). Global food chains, African Smallholders and World Bank
governance. Journal of Agrarian Change, 9(2), 247–262.
318
An Giang DoF. (2012). Annual statistics on the aquaculture sector in An Giang province
(in Vietnamese). An Giang Department of Fisheries (p. 30). Long Xuyen.
Anh, N. (2014). Thoi An Pangasius Cooperative: A successful story of new coperative
model. Vietnamese Fisheries Mangarzine. Retrieved June 19, 2014, from
http://thuysanvietnam.com.vn/htx-thuy-san-thoi-an-chung-suc-chung-long-article-
8178.tsvn
Anh, P. T. (2010). Mitigating water pollution in Vietnamese aquaculture production and
processing industry: The case of pangasius and shrimp. Wageningen University.
Retrieved from http://edepot.wur.nl/152031
Anh, T. P., Kroeze, C., Bush, S. R., & Mol, A. P. J. (2010a). Water pollution by intensive
brackish shrimp farming in south-east Vietnam: Causes and options for control.
Agricultural Water Management, 97(6), 872–882.
Anh, T. P., Kroeze, C., Bush, S. R., & Mol, A. P. J. (2010b). Water pollution by Pangasius
production in the Mekong Delta, Vietnam: causes and options for control.
Aquaculture Research, 42(1), 108–128.
ASC. (2010). ASC Pangasius Standard. Version 1.0. Aquaculture Stewardship Council
(ASC) (pp. 1–62). Retrieved from http://www.asc-aqua.org/upload/ASC Pangasius
Better Management Practices_v1.01.pdf
Asche, F., & Guttormsen, A. G. (2009). Introduction to the special issue: innovation,
production and new markets in aquaculture. Economics & Management, 13(2), 71–
75.
Asche, F., Roll, K. H., & Tveterås, S. (2008). Future Trends in Aquaculture: Productivity
Growth and Increased Production. In M. Holmer, K. Black, C. M. Duarte, N. Marba,
& I. Karakassis (Eds.), Aquaculture in the Ecosystem (pp. 271–292). Springer.
Auer, M. R. (2012). Group Forest Certification for Smallholders in Vietnam: An Early
Test and Future Prospects. Human Ecology, 40(1), 5–14.
319
Aurthur, R., & Nierentz, J. (2007). Global Trade Conference on Aquaculture. FAO
Fisheries proceedings (p. 271). Qingdao.
Avnimelech, Y. (2003). Shrimp and fish pond soils: processes and management.
Aquaculture, 220(1-4), 549–567.
Bacon, C. (2005). Confronting the Coffee Crisis: Can Fair Trade, Organic, and Specialty
Coffees Reduce Small-Scale Farmer Vulnerability in Northern Nicaragua? World
Development, 33(3), 497–511.
Bacon, C. M. (2010). A Spot of Coffee in Crisis: Nicaraguan Smallholder Cooperatives,
Fair Trade Networks, and Gendered Empowerment. Latin American Perspectives,
37(2), 50–71.
Barrington, K., Ridler, N., Chopin, T., Robinson, S., & Robinson, B. (2008). Social aspects
of the sustainability of integrated multi-trophic aquaculture. Aquaculture
International, 18(2), 201–211.
Baur, H., Poulter, G., Puccioni, M., Castro, P., Lutzeyer, H.-J., & Krall, S. (2003). Impact
assessment and evaluation in agricultural research for development. Agricultural
Systems, 78(2), 329–336.
Bell, S., & Morse, S. (2008). Sustainability Indicators: Measuring the Immeasurable? (p.
223). London: Earthscan.
Belton, B. (2010). The Social Relations of Aquaculture Development in South and South
East Asia. The University of Stirling. Retrieved from
http://dspace3.stir.ac.uk/bitstream/1893/3424/3/Belton thesis_The Social Relations of
Aquaculture Development in South and Southeast Asia.pdf
Belton, B. (2013). Small-scale aquaculture, development and poverty: a reassessment. In
M. G. Bondad-Reantaso & R. P. Subasinghe (Eds.), Enhancing the contribution of
small-scale aquaculture to food security, poverty alleviation and socioeconomic
development: report and proceedings of an expert workshop. FAO Fisheries and
Aquaculture Technical Paper. No. 572 (pp. 27–42). Rome.
320
Belton, B., & Bush, S. R. (2014). Beyond net deficits: new priorities for an aquacultural
geography. The Geographical Journal, 180(1), 3–14.
Belton, B., Haque, M. M., Little, D. C., & Le, S. X. (2011). Certifying catfish in Vietnam
and Bangladesh: Who will make the grade and will it matter? Food Policy, 36(2),
289–299.
Belton, B., Le, S. X., & Little, D. C. (2008). The Development and Status of Catfish Seed
Production Systems in Vietnam. PMI2 project report. (p. 49). Intitute of Aquaculture,
The University o Stirling, Stirling.
Belton, B., & Little, D. C. (2011a). Contemporary visions for small-scale aquaculture. In
R. Chuenpagdee (Ed.), World Small-scale Fisheries: Contemporary Visions (pp. 151–
170). Delf: Eburon.
Belton, B., & Little, D. C. (2011b). Immanent and Interventionist Inland Asian
Aquaculture Development and its Outcomes. Development Policy Review, 29(4),
459–484.
Belton, B., Little, D. C., & Le, S. X. (2010). Pangasius catfish seed quality in Vietnam -
Part 2. User and producer perceptions on broodstock and hatchery production. AQUA
Culture Asia Pacific Magazine, (May⁄June 6 (3)), 24–26.
Belton, B., Little, D. C., & Le, S. X. (2011). The social relations of catfish production in
Vietnam. Geoforum, 42(5), 567–577.
Belton, B., Little, D., & Grady, K. (2009). Is Responsible Aquaculture Sustainable
Aquaculture? WWF and the Eco-Certification of Tilapia. Society & Natural
Resources, 22(9), 840–855.
Berdegué Sacristán, J. A. (2001). Cooperating to compete: associative peasant business
firms in Chile. PhD diss., Wageningen University.
Beukers, R., van der pijl, W., & Pieter van duijn, A. (2012). Pangasius in the EU market:
prospects for the position of (ASC certified) pangasius in the EU retail and food
service sector (p. 29). Wageningen. Retrieved from
321
http://www.cbi.eu/system/files/marketintel/Tailored intelligence Pangasius in the EU
market - Prospects for the position of %28ASC-certified%29 pangasius in the EU
retail and food service sector.pdf
Biao, X., & Kaijin, Y. (2007). Shrimp farming in China: Operating characteristics,
environmental impact and perspectives. Ocean & Coastal Management, 50(7), 538–
550.
Biggs, S. D. (1990). A multiple source of innovation model of agricultural research and
technology promotion. World Development, 18, 1481–1499.
Bijman, J. (2007). The role of producer organizations in quality-oriented agrifood chains;
an economic organization perspective. In R. Ruben, A. V. Tilburg, J. Trinekens, & M.
V. Boekel (Eds.), Tropical food chains. Governance regimes for quality management
(pp. 257–277). Wageningen Academic Publishers.
Binh, C. T., Phillips, M. J., & Demaine, H. (1997). Integrated shrimp-mangrove farming
systems in the Mekong delta of Vietnam. Aquaculture Research, 28(8), 599–610.
Bolwig, S., Ponte, S., Toit, A., & Halberg, N. (2010). Integrating Poverty and
Environmental Concerns into Value-Chain Analysis: A Conceptual Framework.
Development Policy Review, 28(2), 173–194.
Bondad-reantaso, M. G., Subasinghe, R. P., Josupeit, H., Cai, J., & Zhou, X. (2012). The
role of crustacean fisheries and aquaculture in global food security: Past, present and
future. Journal of Invertebrate Pathology, 110(2), 158–165.
Bosma, R., Anh, P. T., & Potting, J. (2011). Life cycle assessment of intensive striped
catfish farming in the Mekong Delta for screening hotspots as input to environmental
policy and research agenda. International Journal-Life Cycle Assess, 16, 903–915.
Bosma, R. H., Hanh, C. T. T., Potting, J., Anh, P. T., Dung, V. V., Fransen, M., Ut, V. N.
(2009). Environmental impact assessment of the pangasius sector in the Mekong
Delta. Retrieved from
322
http://www.narcis.nl/publication/RecordID/oai:library.wur.nl:wurpubs/381127/coll/pe
rson/id/8
Bosma, R. H., & Verdegem, M. C. J. (2011). Sustainable aquaculture in ponds: Principles,
practices and limits. Livestock Science, 139(1-2), 58–68.
Bostock, J., McAndrew, B., Richards, R., Jauncey, K., Telfer, T., Lorenzen, K., Corner, R.
(2010). Aquaculture: global status and trends. Philosophical Transactions of the
Royal Society of London. Series B, Biological Sciences, 365(1554), 2897–912.
Boyd, C. E., & Michael, F. S. (1996). Suggested Management to Improve Quality and
Reduce Quantity of -Channel Catfish Pond Effluents (p. 4). Alabama. Retrieved from
http://aurora.auburn.edu/repo/bitstream/handle/11200/1273/0397LEAF.pdf?sequence
=1
Boyd, C. E., Queiroz, J., Lee, J., Rowan, M., Whitis, G. N., & Gross, A. (2000).
Environmental Assessment of Channel Catfish Zctalurus punctatus Farming in
Alabama. Journal Of The World Aquaculture Society, 31(4), 511–544.
Boyd, C. E., Tucker, C., Mcnevin, A., Bostick, K., & Clay, J. (2007). Indicators of
Resource Use Efficiency and Environmental Performance in Fish and Crustacean
Aquaculture. Reviews in Fisheries Science, 15, 327–360.
Brambilla, I., Porto, G., & Tarozzi, A. (2009). Adjusting to Trade-Policy Changes in
Export Markets: Evidence from U.S. Antidumping Duties on Vietnamese Catfish.
Policy Research Working Paper 4990, The World Bank (No. 4990) (p. 50). Retrieved
from
https://openknowledge.worldbank.org/bitstream/handle/10986/4182/WPS4990.pdf?se
quence=1
Bremer, S., Haugen, A. S., & Kaiser, M. (2012). European consumer perspectives on
seafood from aquaculture; a review of consumer values, knowledge and perceptions.
SEAT Deliverable 8.8, Centre for the Study of the Sciences and Humanities,
University of Bergen (pp. 1–36). Bergen. Retrieved from
323
http://www.extranet.seatglobal.eu/download.php?f=deliverable88europeanconsumerp
erspectiveson_1385241705.pdf
Bremer, S., Johansen, J. C., Gram, W., Haugen, S., & Kaiser, M. (2013). Mapping Asian
aquaculture stakeholders’ realities as “ethical landscapes”. SEAT Deliverable 8.10,
Centre for the Study of the Sciences and Humanities, University of Bergen (p. 129).
Bergen. Retrieved from
http://www.extranet.seatglobal.eu/download.php?f=d810mappingasianethicallandscap
es_1385242151.pdf
Briggs, M., Funge-Smith, S., P Subasinghe, R., & Phillips, M. (2005). Introductions and
movement of two penaeid shrimp species in Asia and the Pacific. Organization, FAO
fisher. Retrieved from http://www.mendeley.com/research/introductions-movement-
two-penaeid-shrimp-species-asia-pacific/
Browdy, C. L., & Hargreaves, J. A. (2008). Overcoming Technical Barriers to the
Sustainable Development of Competitive Marine Aquaculture in the United States (p.
120). Florida. Retrieved from
http://www.nmfs.noaa.gov/aquaculture/docs/aquaculture_docs/noaanist_techbarriers_
final.pdf
Brunori, G., Damianova, Z., Faroult, E., Gomis, J. G. i, O´Brien, L., & Treyer, S. (2011).
Sustainable food consumption and production in a resource-constrained world. 3rd
SCAR Foresight Exercise, Standing Committee on Agricultural Research (SCAR),
European Commission (p. 232). Luxembourg. doi:10.2777/49719
Bueno, P. B. (2009). Indicators of sustainable small-scale aquaculture development. In M.
Bondad-Reantaso M.G.; Prein (Ed.), Measuring the contribution of small-scale
aquaculture: an assessment. FAO Tecnical paper 534 (pp. 145–161). Rome: FAO.
Bui, T. M., Phan, L. T., Ingram, B. A., Nguyen, T. T. T., Gooley, G. J., Nguyen, H. V., De
Silva, S. S. (2010). Seed production practices of striped catfish, Pangasianodon
hypophthalmus in the Mekong Delta region, Vietnam. Aquaculture, 306(1-4), 92–
100.
324
Busch, L., & Bain, C. (2004). New! Improved? The Transformation of the Global
Agrifood System. Rural Sociology, 69(3), 321–346.
Bush, S. R. (2008). The social science of sustainable bioenergy production in Southeast
Asia. Biofuels, Bioprod. Bioref, 2, 126–132.
Bush, S. R. (2009). Governing “Spaces of Interaction” for Sustainable Fisheries. The Royal
Dutch Geographical Society, 101(3), 305–319.
Bush, S. R., & Belton, B. (2012). Out of the Factory and Into the Fish Pond Can Certifi
cation Transform Vietnamese Pangasius? In and A. L. Gert Spaargaren, Peter
Oosterveer (Ed.), Food practices in Transition: changing food consumption, retail
and production in the Age of reflexive modernity (pp. 257–290). New York:
Routledge.
Bush, S. R., Belton, B., Hall, D., Vandergeest, P., Murray, F. J., Ponte, S., Kusumawati, R.
(2013). Certify Sustainable Aquaculture ? Science, 341(September), 1067–1068.
Bush, S. R., & Duijf, M. (2011). Searching for (un)sustainabilty in pangasius aquaculture:
A political economy of quality in European retail. Geoforum, 42(2), 185–196.
Bush, S. R., Khiem, N. T., & Chau, N. M. (2010). Is there a business case for small-
holders in Vietnamese Pangasius? Aquaculture Asia Magazine, XV(4), 18–23.
Bush, S. R., Khiem, N. T., & Sinh, L. X. (2009). Governing the Environmental and Social
Dimensions of Pangasius Production in Vietnam: a Review. Aquaculture Economics
& Management, 13(4), 271–293.
Bush, S. R., & Oosterveer, P. (2007). The Missing Link: Intersecting Governance and
Trade in the Space of Place and the Space of Flows. Sociologia Ruralis, 47(4), 385–
399.
Bush, S. R., & Oosterveer, P. (2012a). Environment, governance and global markets.
Fishponds in Farming Systems, 203–210.
325
Bush, S. R., & Oosterveer, P. (2012b). Linking global certification schemes and local
practices in fisheries and aquaculture. SPC Traditional Marine Resource Management
and Knowledge Information Bulletin, 29, 15–21.
Bush, S. R., Toonen, H., Oosterveer, P., & Mol, A. P. J. (2013). The “devils triangle” of
MSC certification: Balancing credibility, accessibility and continuous improvement.
Marine Policy, 37, 288–293.
Bush, S. R., Zwieten, P. A. M. Van, Visser, L., Dijk, H. Van, Bosma, R., Boer, W. F. de, &
Verdegem, M. (2010a). Rebuilding Resilient Shrimp Aquaculture in South-east Asia:
Disease Management, Coastal Ecology and Decision Making. In C.T. Hoanh et al.
(Ed.), Tropical Deltas and Coastal Zones: Food Production, Communities and
Environment at the Land–Water Interface (pp. 117–132). CAB International 2010.
Bush, S. R., Zwieten, P. A. M. Van, Visser, L., Dijk, H. Van, Bosma, R., Boer, W. F. de, &
Verdegem, M. (2010b). Scenarios for Resilient Shrimp Aquaculture in Tropical
Coastal Areas. Ecology and Society, 15(2), 15.
Cannon, J., & Johnson, H. (2013). Assessment of the vulnerability of the Mekong Delta
Pangasius catfish industry to development and climate change in the Lower Mekong
Basin. Report prepared for the Sustainable Fisheries Partnership (p. 95). Retrieved
from
http://cmsdevelopment.sustainablefish.org.s3.amazonaws.com/2013/01/22/Pangasius
Mekong Delta-4b2036ad.pdf
Cao, L., Diana, J. S., Keoleian, G. A., & Lai, Q. (2011). Life Cycle Assessment of Chinese
Shrimp Farming Systems Targeted for Export and Domestic Sales. Environmental
Science & Technology, 6531–6538.
Cao, P. V., Nguyen, B. P., Tran, H. K., & Bell, R. W. (2010). Nutrient recovery by rice
crops as a treatment for aquaculture solid waste: crop yield, nutrient status and
nutrient budgets. Cuu Long Rice Research Institute (p. 24). Can Tho. Retrieved from
http://researchrepository.murdoch.edu.au/18524/1/nutrient_recovery_by_rice_crops.p
df
326
Cao, P. V., Stephanie, B., Nguyen, T. T., & Bell, R. (2010). Solid waste treatment through
vermi-culture – including market potential and returns for vermin-compost and
worms for fish food, financial analysis, and benefits to smallholders. Cuu Long Rice
Research Institute (in Vietnamese) (p. 37). Can Tho. Retrieved from
http://yeumoitruong.vn/forum/attachment.php?attachmentid=2429&d=1304589229
CBI. (2012a). CBI Product Factsheet: Pangasius in Germany (p. 12). Wageningen.
Retrieved from
http://www.cbi.eu/system/files/marketintel_documents/2013_pfs_pangasius_in_germ
any_-_fish_and_seafood_0.pdf
CBI. (2012b). The Vietnamese seafood sector A value chain analysis (p. 87). Wageningen.
Retrieved from http://www.wageningenur.nl/web/file?uuid=6cd9c1db-11ee-4761-
a51e-54c0dc077b32&owner=c66d6b72-d1ee-455e-8ebc-9490063f80b3
CBI. (2013a). CBI Product Factsheet: Frozen cultured Black Tiger shrimp in the EU (p.
13). Wageningen. Retrieved from
http://www.cbi.eu/system/files/marketintel_documents/2013_pfs_monodon_in_the_e
u_-_fish_and_seafood.pdf
CBI. (2013b). CBI Product Factsheet: Frozen cultured Vannamei shrimp in the EU (p.
13). Wageningen. Retrieved from
http://www.cbi.eu/system/files/marketintel_documents/2013_pfs_vannamei_in_the_e
u_-_fish_and_seafood.pdf
Challies, E. R. T., & Murray, W. E. (2011). The Interaction of Global Value Chains and
Rural Livelihoods : The Case of Smallholder Raspberry Growers in Chile. Journal of
Agrarian Change, 11(1), 29–59.
Choi, H. C., & Sirakaya, E. (2006). Sustainability indicators for managing community
tourism. Tourism Management, 27(6), 1274–1289.
Corsin, F. (2013). Value-chain arrangements and the business case for certification. In
VIETFISH 2013: Trade Show and Conference in Vietnam, Vietnam Association of
Seafood Exporters and Producers. Ho Chi Minh.
327
Corsin, F., Funge-Smith, S., & Jesper, C. (2007). A qualitative assessment of standards
and certification schemes applicable to aquaculture in the Asia – Pacific region. RAP
PUBLICATION 2007/25. FAO Regional Office for Asia and the Pacific. Office (p.
106). Bangkok, Thailand.
Costa-Pierce, B. A. (2010). Sustainable Ecological Aquaculture Systems: The Need for a
New Social Contract for Aquaculture Development. Marine Technology Society
Journal, 44(3), 88–112. doi:10.4031/MTSJ.44.3.3
Costa-Pierce, B. A., Bartley, D. M., Hasan, M., Yusoff, F., Kaushik, S. J., Rana, K.,
Yakupitiyage, A. (2011). Responsible use of resources for sustainable aquaculture. In
Global Conference on Aquaculture 2010, Sept. 22-25, 2010 (pp. 1–38). Phuket: FAO.
Council, C. N., & Cooperatives, F. (1987). Recent developments in the theory of
agricultural cooperation. Journal of Agricultural Cooperation, 2, 74–95.
Crab, R., Avnimelech, Y., Defoirdt, T., Bossier, P., & Verstraete, W. (2007). Nitrogen
removal techniques in aquaculture for a sustainable production. Aquaculture, 270(1-
4), 1–14.
Cripps, S. J., & Bergheim, A. (2000). Solids management and removal for intensive land-
based aquaculture production systems. Aquacultural Engineering, 22(1-2), 33–56.
Crumlish, M., Dung, T. T., Turnbull, J. F., Ngoc, N. T. N., & Ferguson, H. W. (2002).
Identification of Edwardsiella ictaluri from diseased freshwater catfish, Pangasius
hypophthalmus (Sauvage), cultured in the Mekong Delta, Vietnam. Journal of Fish
Diseases, 25, 733–736.
Crumlish, M., Thanh, P. C., Koesling, J., Tung, V. T., & Gravningen, K. (2010).
Experimental challenge studies in Vietnamese catfish, Pangasianodon hypophthalmus
(Sauvage), exposed to Edwardsiella ictaluri and Aeromonas hydrophila. Journal of
Fish Diseases, 33(9), 717–722.
Cruz, G. L. A. (2006). The contribution of fair trade towards market access by smallholder
banana producers. In R. Ruben, M. Slingerland, & H. Nijhoff (Eds.), Agro-food
328
chains and networks for development (pp. 69–78). Wageningen: Springer
Netherlands.
Culver, K., & Castle, D. (2008). Aquaculture, Innovation and Social Transformation. (K.
Culver & D. Castle, Eds.). Springer Science + Business Media B.V.
Cuyvers, L., & Tran, B. V. (2008). Aquaculture export development in Vietnam and the
changing environment: the case of Pangasius in the Mekong Delta. CAS Discussion
paper No 59, Centre for ASEAN Studies and Department, Can Tho (p. 26). CAS
Discussion paper No 59, Centre for ASEAN Studies and Department, Can Tho.
Retrieved from http://webh01.ua.ac.be/cas/PDF/CAS59.pdf
Da, C. T., Hung, L. T., Berg, H., Lindberg, J. E., & Lundh, T. (2013). Evaluation of
potential feed sources, and technical and economic considerations of small-scale
commercial striped catfish (Pangasius hypothalamus) pond farming systems in the
Mekong Delta of Vietnam. Aquaculture Research, 44(3), 427–438.
Da, C. T., Lundh, T., & Lindberg, J. E. (2012). Evaluation of local feed resources as
alternatives to fish meal in terms of growth performance, feed utilisation and
biological indices of striped catfish (Pangasianodon hypophthalmus) fingerlings.
Aquaculture, 364-365(null), 150–156.
Dalsgaard, A., Popovic, M., & Clausen, J. (2013). Identification and characterization of
main food safety hazards in seafood imported into EU. SEAT Deliverable 6.1, SEAT
project (pp. 1–36). Stirling.
Dang, B. T., Cao, D. N., & Truong, P. Q. (2008). Nitrogen Removal in wastewater of
catfish fish ponds by Pseudomonas stutzeri and Rhodopseudomonas sp. in the
Mekong Delta (in Vietnamese). Delta (p. 19). College of Aquaculture and Fisheries,
Can Tho University, Can Tho.
Dannson, A. (2004). Strengthening farm-agribusiness linkages in Africa, Agricultural
Management, Marketing and Finance Service. Occasional Paper 6, FAO. Rome.
329
Dasgupta, S., & Durborow, R. (2009). Small-Scale Marketing of Aquaculture Products (p.
8). SRAC Publication No. 350. Southern Regional Aquaculture Center. Retrieved
from http://ces.ca.uky.edu/aquaculture-
files/SRAC_350_Small_Scale_Marketing_of_Aquaculture_Products.pdf
De Silva, S. S. (2012). Aquaculture: a newly emergent food production sector—and
perspectives of its impacts on biodiversity and conservation. Biodiversity and
Conservation, 21(12), 3187–3220.
De Silva, S. S., & Davy, F. B. (2009a). Aquaculture Successes in Asia: Contributing to
Sustained Development and Poverty Alleviation. In S. S. De Silva & F. B. Davy
(Eds.), Success Stories in Asian Aquaculture (Vol. 0, pp. 1–15). Springer and IDRC,
Canada, Drodecht, The Netherlands.
De Silva, S. S., & Davy, F. B. (2009b). Success Stories in Asian Aquaculture (Vol. 0, p.
214). Springer.
De Silva, S. S., & Hasan, M. R. (2007). Feeds and fertilizers: the key to long-term
sustainability of Asian aquaculture. In M. R. Hasan, T. Hecht, S. S. De Silva, & A. G.
J. Tacon (Eds.), Study and analysis of feeds and fertilizers for sustainable aquaculture
development. (pp. 19–47). Rome: FAO Fisheries Technical Paper. No. 497, FAO.
De Silva, S. S., Ingram, B. A., Nguyen, P. T., Bui, T. M., Gooley, G. J., & Turchini, G. M.
(2010). Estimation of Nitrogen and Phosphorus in Effluent from the Striped Catfish
Farming Sector in the Mekong Delta, Vietnam. Ambio, 39(7), 504–514.
De Silva, S. S., & Nguyen, P. T. (2011). Striped catfish farming in the Mekong Delta,
Vietnam: a tumultuous path to a global success. Reviews in Aquaculture, 3(2), 45–73.
Dey, M. M., & Ahmed, M. (2005). Aquaculture—Food and Livelihoods for the Poor in
Asia: a Brief Overview of the Issues. Aquaculture Economics & Management, 9(1-2),
1–10.
330
Dillemuth, J., Frederick, S., Parker, R., Gereffi, G., & Appelbaum, R. (2011). Traveling
Technologies: Societal Implications of Nanotechnology Through the Global Value
Chain. Journal of Nano Education, 3(1-2), 36–44.
Dinh, T. D. (2006). Trade and Environment Dimensions in the Food and Food Processing
Industries in Asia and the Pacific: A Country Case Study of Vietnam (p. 22). Faculty
of Environmental and Natural Resource Economics, Vietnam National Economics
University, Ha Noi.
DoAH. (2012). Report on status of shrimp disease outbreak and management 2011-2012
(in Vietnamese). Department of Animal Health, Ministry of Agriculture & Rural
Developemnt (p. 46). Ha Noi.
DoAH. (2013a). Report on status of shrimp disease outbreak and management 2012-2013
(in Vietnamese). Department of Animal Health, Ministry of Agriculture & Rural
Developemnt (p. 8). Ha Noi.
DoAH. (2013b). Report on the shrimp disease outbreak in Vietnam in 2012 (in
Vietnamese). Department of Animal Health, Ministry of Agriculture & Rural
Developemnt (p. 15). Ha Noi.
Dolan, C., & Humphrey, J. (2000). Governance and Trade in Fresh Vegetables: The
Impact of UK Supermarkets on the. Journal of Development Studies, 37(2), 147–176.
Dorward, A. (2009). Integrating Contested Aspirations, Processes and Policy:
Development as Hanging In, Stepping Up and Stepping Out. Development Policy
Review, 27(2), 131–146.
Dries, L., & Swinnen, J. F. M. (2004). Foreign Direct Investment, Vertical Integration, and
Local Suppliers: Evidence from the Polish Dairy Sector. World Development, 32(9),
1525–1544.
Edwards, P. (2010). Review of small-scale aquaculture: definitions; characterization;
numbers. In FAO Expert Workshop on Enhancing the Contribution of Small-Scale
Aquaculture (SSA) to Food Security (p. 36). Ha Noi.
331
Ekins, P. (2011). Environmental sustainability: From environmental valuation to the
sustainability gap. Progress in Physical Geography, 35(5), 629–651.
EU. (2013). Strategic guidelines for the sustainable development of EU aquaculture (p.
12). Brussels. Retrieved from
http://ec.europa.eu/fisheries/cfp/aquaculture/official_documents/com_2013_229_en.p
df
EU SCAR. (2012). Agricultural Knowledge and Innovation Systems in Transition – a
reflection paper. Brussels. doi:10.2777/34991
Exequiel, G. P., Tinkham, S., & Phillips, M. J. (2009). Development of an APEC: Strategy
on sustainable aquaculture (p. 90). Singapore. Retrieved from
http://sta.epa.gov.tw/cooperation/APEC MRC web/wwwroot/RI/RI001.pdf
FAO. (1995). Dimensions of need: An atlas of food and agriculture. Food and Agriculture
Organization, Rome. Food and Agriculture Organization, Rome:
http://www.fao.org/docrep/u8480e/U8480E0l.htm#Sustainable agriculture and rural
development. Retrieved March 11, 2014, from
http://www.fao.org/docrep/u8480e/U8480E0l.htm#Elements for sustainable
agriculture and rural development
FAO. (1997). Marketing Research and Information Systems. (Marketing and Agribusiness
Texts - 4). Rome: FAO. Retrieved from
http://www.fao.org/docrep/W3241E/W3241E00.htm
FAO. (2012). The state of world fisheries and aquaculture 2012 (p. 209). Food and
Agriculture Organization, Rome.
FAO. (2013a). FAO/MARD Technical Workshop on Early Mortality Syndrome (EMS) or
Acute Hepatopancreatic Necrosis Syndrome (AHPNS) of Cultured Shrimp (under
TCP/VIE/3304) (Vol. 1053, p. 65). Ha Noi.
FAO. (2013b). Fishery Statistical Collections: Commodity Trade and Production. Fishery
Commodities Global Production and Trade (online query). Retrieved February 11,
332
2014, from
http://www.fao.org/figis/servlet/SQServlet?file=/work/FIGIS/prod/webapps/figis/tem
p/hqp_1773611564069290434.xml&outtype=html
Fisheries Directorate. (2010). Review on the achievements of 2010 plan and
implementation of 2011 plan (in Vietnamese), Ministry of Agriculture & Rural
Developemnt (p. 23). Ha Noi.
Fisheries Directorate. (2011). Review on the achievements of 2011 plan and
implementation of 2012 plan (in Vietnamese), Ministry of Agriculture & Rural
Developemnt (p. 18). Ha Noi.
Fisheries Directorate. (2012). Report on the Vietnam shrimp production and consumption
in 2012 and plan of 2013 (in Vietnamese). Ministry of Agriculture & Rural
Development (p. 13). Ha Noi.
Fisheries Directorate. (2013a). Report on the striped catfish production and consumption
at the Mekong Delta in 2012 and plan of 2013 (in Vietnamese). Ministry of
Agriculture & Rural Development (p. 12). Ha Noi.
Fisheries Directorate. (2013b). Review on the achievements of 2012 plan and
implementation of 2013 plan (in Vietnamese), Ministry of Agriculture & Rural
Developemnt (p. 12). Ha Noi.
Fisheries Directorate. (2014). Review on the achievements of 2013 plan and
implementation of 2014 plan (in Vietnamese), Ministry of Agriculture & Rural
Developemnt (p. 17). Ha Noi.
Focardi, S., Corsi, I., & Franchi, E. (2005). Safety issues and sustainable development of
European aquaculture: new tools for environmentally sound aquaculture. Aquaculture
International, 13(1-2), 3–17.
Francesconi, G. N. (2009). Cooperation for competition-Linking Ethiopian farmers to
markets. Wageningen University, the Netherlands.
333
Frankic, A., & Hershner, C. (2003). Sustainable aquaculture: developing the promise of
aquaculture. Aquaculture International, 11(6), 517–530.
Frederick, S., & Gereffi, G. (2011). Upgrading and restructuring in the global apparel
value chain: why China and Asia are outperforming Mexico and Central America.
International Journal of Technological Learning, Innovation and Development, 4(1-
3), 67–95.
Funge-smith, S., & Briggs, M. (2003). Is white shrimp (Penaeus vannamei) a threat to
Asian shrimp culture? FAO Aquaculture Newsletter, 30, 19–23.
GAA. (2009). Aquaculture Facility Certification: Shrimp Farms. Best Aquaculture
Practices Certification Standards, Guidelines. Global Aquaculture Alliance (GAA)
(pp. 8–22). Retrieved from http://www.gaalliance.org/cmsAdmin/uploads/BAP-
ShrimpF-612S.pdf
GAA. (2010). Aquaculture Facility Certification: Pangasius Farms. Best Aquaculture
Practices Certification Standards, Guidelines. Global Aquaculture Alliance (GAA) (p.
20). Retrieved from www.gaalliance.org/cmsAdmin/uploads/BAP-PangasiusF-
612S.pdf
Gandini, G., Ababouch, L., & Anichini, L. (2009). From eco-sustainability to risk
assessment of aquaculture products. Veterinary Research Communications, 33 Suppl
1, 3–8.
Garrido, S. (2007). Why Did Most Cooperatives Fail? Spanish Agricultural Cooperation in
the Early Twentieth Century. Rural History, 18(02), 183–200.
Gereffi, G., Humphrey, J., & Sturgeon, T. J. (2005). The governance of global value
chains. Review of International Political Economy, 12(1), 78–104.
Gereffi, G., & Korzeniewicz, M. (1994). Commodity Chains and Global Capitalism (p.
352). Westport: Praeger.
Gibbon, P. (2001). Upgrading Primary Production: A Global Commodity Chain Approach.
World Development, 29(2), 345–363.
334
Gildemeister, A. T. (2012, June). A study into the effects and environmental risk of
antibiotics used in freshwater aquaculture on environmental bacteria. The University
of Stirling. Retrieved from http://hdl.handle.net/1893/9930
Giuliani, E., Pietrobelli, C., & Rabellotti, R. (2005). Upgrading in Global Value Chains:
Lessons from Latin American Clusters. World Development, 33(4), 549–573.
Glavič, P., & Lukman, R. (2007). Review of sustainability terms and their definitions.
Journal of Cleaner Production, 15(18), 1875–1885.
GlobalGAP. (2011). Control Points and Compliance Criteria: All Farm Base. Code ref:
IFA V4.0 March11; Edition AF 4.0-1; English Version. Retrieved from
http://www.globalgap.org/export/sites/default/.content/.galleries/documents/130621_g
g_ifa_cpcc_af_ab_coc_v4_0-2_en.pdf
GLOBEFISH. (2013). European Price Report. GLOBEFISH, (04), 12–20. Retrieved from
http://www.globefish.org/upl/Publications/EPR-04-2013.pdf
Glover, D., & Kusterer, K. (1990). Small farmers, big business: contract farming and rural
development (p. 175). London: UK: MACMILLAN. Retrieved from
http://www.cabdirect.org/abstracts/19916710935.html
Gómez Tovar, L., Martin, L., Gómez Cruz, M. A., & Mutersbaugh, T. (2005). Certified
organic agriculture in Mexico: Market connections and certification practices in large
and small producers. Journal of Rural Studies, 21(4), 461–474.
González, A. A., & Nigh, R. (2005). Smallholder participation and certification of organic
farm products in Mexico. Journal of Rural Studies, 21(4), 449–460.
GOV. (1986). Doi moi policy reforms. Government of Vietnam (in Vietnamese). Ha Noi.
GOV. (2009). Decision No.2033/QD-TTg: Approval of master plan for the Striped catfish
sector development until 2020. Government of Vietnam (in Vietnamese) (p. 3). Ha
Noi.
335
GOV. (2013). Decision No.1445/QD-TTg: Approval of overal planning master plan for the
Vietnamese fisheries sector development until 2020 and torwards to 2030.
Government of Vietnam (in Vietnamese) (p. 17). Ha Noi.
GOV. (2014). Decree 36/2014/ND-CD on conditions for catfish production, processing
and exporting (in Vietnamese) (p. 10). Ha Noi.
Gow, H. R., & Swinnen, J. F. M. (1998). Up- and downstream restructuring, foreign direct
investment, and hold-up problems in agricultural transition. European Review of
Agricultural Economics, 25(3), 331–350.
Gräslund, S., & Bengtsson, B. E. (2001). Chemicals and biological products used in south-
east Asian shrimp farming, and their potential impact on the environment--a review.
The Science of the Total Environment, 280(1-3), 93–131.
Grunert, K. G., Jeppesen, L. F., Jespersen, K. R., Sonne, A., Young, J. A., Hansen, K., &
Trondsen, T. (2005). Market orientation of value chains: A conceptual framework
based on four case studies from the food industry. European Journal of Marketing,
39(5/6), 428–455.
Grunert, K. G., Trondsen, T., Campos, E. G., & Young, J. A. (2010). Market orientation in
the mental models of decision makers: two cross-border value chains. International
Marketing Review, 27(1), 7–27.
GSO. (2012). Annual statistics yearbook in Vietnam 2011. (General Statistics Office, Ed.)
(p. 125). Ha Noi: Statistical publishing house.
GSO. (2013). Annual statistics yearbook in Vietnam 2012. (General Statistics Office, Ed.)
(p. 135). Ha Noi: Statistical publishing house.
Gupta, M. V, & Acosta, B. O. (2004). Tilapia farming: A global review. NACA, 1–14.
Retrieved from http://www.enaca.org/modules/news/article.php?storyid=453
Ha, T. T. P., & van Dijk, H. (2013). Fishery livelihoods and (non-)compliance with fishery
regulations—A case study in Ca Mau Province, Mekong Delta, Viet Nam. Marine
Policy, 38, 417–427.
336
Ha, T. T. T., & Bush, S. R. (2010). Transformations of Vietnamese shrimp aquaculture
policy: empirical evidence from the Mekong Delta. Environment and Planning C:
Government and Policy, 28(6), 1101–1119.
Ha, T. T. T., Bush, S. R., Mol, A. P. J., & van Dijk, H. (2012). Organic coasts? Regulatory
challenges of certifying integrated shrimp–mangrove production systems in Vietnam.
Journal of Rural Studies, 28(4), 631–639.
Ha, T. T. T., Bush, S. R., van Dijk, H., Tran, H. T. T., & Dijk, H. Van. (2013). The cluster
panacea?: Questioning the role of cooperative shrimp aquaculture in Vietnam.
Aquaculture, 388-391, 89–98.
Ha, T. T. T., Dijk, H. Van, & Bush, S. R. (2012). Mangrove conservation or shrimp farmer
’ s livelihood ? The devolution of forest management and bene fi t sharing in the
Mekong Delta, Vietnam. Ocean and Coastal Management, 69, 185–193.
Hall, A. (2014). Agriculture innovation systems: an introduction. Retrieved June 18, 2014,
from http://www.slideshare.net/LINKInnovationStudies/agricultural-innovation-
systems-an-introduction#
Hall, A., Sulaiman, V. R., & Clark, N. (2003). From measuring impact to learning
institutional lessons: an innovation systems perspective on improving the
management of international agricultural research. Agricultural Systems, 78, 213–241.
Han, H., & Immink, A. (2013). A zonal approach for aquaculture sustainability.
INFOFISH International. Retrieved from
http://cmsdevelopment.sustainablefish.org.s3.amazonaws.com/2013/11/26/26 - 28 _
Han Han - A zonal approach for aquaculture-2-bdfaec03.pdf
Hansen, H., & Trifković, N. (2014). Food Standards are Good – For Middle-Class
Farmers. World Development, 56, 226–242.
Haque, M. M., Monira, M. S., Salam, M. A., Shinn, A. P., & Little, D. C. (2013). Use of
pangasius pond sediment for roof top bag gardening: potential for rural-urban
integrated aquaculture-horticulture. Aquaculture Asia, NACA, XVIII(4), 21–24.
337
Hardi, P., & Zdan, T. (1997). Assessing Sustainable Development: Principles in Practice
(p. 161). Winnipeg. Retrieved from http://www.iisd.org/pdf/bellagio.pdf
Haugen, A. S., Bremer, S., & Kaiser, M. (2013). Assessment of costs and benefits of
mandatory and voluntary certification schemes applied to Asian producers. SEAT
Deliverable 8.5,Centre for the Study of the Sciences and Humanities, University of
Bergen (p. 11). Bergen. Retrieved from
http://www.extranet.seatglobal.eu/download.php?f=d85andd86costsandbenefitsofcerti
fication_1385800978.pdf
Heijungs, R., Settanni, E., & Guinée, J. (2012). Toward a computational structure for life
cycle sustainability analysis: unifying LCA and LCC. The International Journal of
Life Cycle Assessment. doi:10.1007/s11367-012-0461-4
Henriksson, P. J. G., Zhang, W., Nahid, S. A. A., Newton, R., Phan, L. T., Hai, D. M.,
Little, D. C. (2014). Results of LCA studies of Asian Aquaculture Systems for Tilapia,
Catfish, Shrimp, and Freshwater prawn. SEAT Deliverable Ref: D 3.5 (p. 182).
Stirling.
Henson, S., Jaffee, S., Cranfield, J., & Siegel, P. (2008). Linking African smallholders to
high-value markets: practitioner perspectives on benefits, constrains, and
interventions. Policy research working paper, the World Bank.
Hermans, F., Apeldoorn, D. Van, Stuiver, M., & Kok, K. (2013). Niches and networks:
Explaining network evolution through niche formation processes. Research Policy,
42(3), 613–623.
Hishamunda, N., Bueno, P., Menezes, A. M., Ridler, N., & Martone, E. (2014). Improving
governance of aquaculture employment: A global assessment. FAO Fisheries and
Aquaculture Technical Paper 575 (p. 48). Roma.
Hishamunda, N., & Ridler, N. B. (2008). Sustainable commercial aquaculture: A survey of
administrative procedures and legal frameworks. Aquaculture Economics &
Management, 7(3-4), 167–178.
338
Hishamunda, N., Ridler, N. B., Bueno, P., & Yap, W. G. (2009). Commercial aquaculture
in Southeast Asia: Some policy lessons. Food Policy, 34(1), 102–107.
Hoa, T. T. T., Zwart, M. P., Thanh, N., Vlak, J. M., & Jong, M. C. M. De. (2011).
Transmission of white spot syndrome virus in improved-extensive and semi-intensive
shrimp production systems: A molecular epidemiology study. Aquaculture, 313(1-4),
7–14.
Humphrey, J. (2006). Policy implications of trends in agribusiness value chains. The
European Journal of Development Research, 18(4), 572–592.
Humphrey, J., & Schmitz, H. (2002). Developing country firms in the global economy:
Governance and upgrading in global value chains. INEF-Report Nr. 61. Duisburg.
Huysveld, S., Schaubroeck, T., Meester, S. De, Sorgeloos, P., Langenhove, H. Van, Van,
V., & Dewulf, J. (2013). Resource use analysis of Pangasius aquaculture in the
Mekong Delta in Vietnam using Exergetic Life Cycle Assessment. Journal of Cleaner
Production, 51, 225–233.
Irz, X., Stevenson, J. R., Tanoy, A., & Morissens, P. (2007). The Equity and Poverty
Impacts of Aquaculture: Insights from the Philippines. Development Policy Review,
25(April 2004), 495–516.
Irz1, X., & Stevenson, J. R. (2012). Efficiency and Farm Size in Philippine Aquaculture.
Analysis in a Ray Production Frontier Framework. Bio-Based and Applied
Economics, 1(2), 175–198.
Islam, M. S. (2008). From pond to plate: Towards a twin-driven commodity chain in
Bangladesh shrimp aquaculture. Food Policy, 33(3), 209–223.
Jespersen, K. S., Kelling, I., Ponte, S., & Kruijssen, F. (2014). Institutional frameworks
and the governance of aquaculture value chains: Lessons from Asia. Food Policy, in
press.
339
Johnston, D., Trong, N. Van, Tien, D. Van, & Xuan, T. T. (2000). Shrimp yields and
harvest characteristics of mixed shrimp–mangrove forestry farms in southern
Vietnam: factors affecting production. Aquaculture, 188(3-4), 263–284.
Jolly, C. M., Umali-Maceina, G., & Hishamunda, N. (2009). Small-scale aquaculture: a
fantasy or economic opportunity. In M. Bondad-Reantaso M.G.; Prein (Ed.),
Measuring the contribution of small-scale aquaculture: an assessment. FAO Tecnical
paper 534 (pp. 73–87). Rome: FAO.
Juma, C. (2011). Agricultural Innovation Systems. In C. Juma (Ed.), The New Harvest:
Agricultural Innovation in Africa (pp. 50–83). New York: Oxford University Press.
Kagawa, M., & Bailey, C. (2006). Trade Linkages in Shrimp Exports: Japan, Thailand and
Vietnam. Development Policy Review, 24(3), 303–319.
Kai, S. (2006). Facilitation of the market for Business Development Services to overcome
difficulties of the Pangasius fish farmers in An Giang province, Vietnam. Fisheries
(Bethesda). GTZ Vietnam, An Giang. Retrieved from http://www.sme-
gtz.org.vn/Portals/0/AnPham/Pangasius-BDS Report_Vietnam.pdf
Kambewa, E. V. (2007). Balancing the people, profit and planet dimensions in
international marketing channels - A study on coordinating mechanisms in the Nile
perch channel from Lake Victoria. Wageningen University, the Netherlands.
Kariuki, L. . (2006). Participation of smallholders in international trade. Agro-Food Chains
and Network for Development, 14, 41–48.
Karunasagar, I. (2013). Report on ICT/MIS capacity building methods and outcommes for
targeted end users. SEAT Deliverable D 10.3. The University of Stirling (p. 15).
Stirling.
Kassam, L., Subasinghe, R., & Phillips, M. (2011). Aquaculture farmer organizations and
cluster management: concepts and experiences. FAO Fisheries and Aquaculture
Technical Paper No.563, FAO (p. 90). Rome.
340
Kelling, I. (2012). Knowledge is Power? A market orientation approach to the global
value chain analysis of aquaculture: Two cases linking Southeast Asia and the EU.
The University of Stirling. Retrieved from
https://dspace.stir.ac.uk/bitstream/1893/12941/1/KELLING Ingrid_Knowledge is
Power%3F_PhD Thesis_2012.pdf
Kelling, I., Kruijssen, F., & Li, C. O. (2010). Review of trade, regulation and certification
issues related to farmed aquatic animals. SEAT Deliverable 2.7, The WorldFish
Center (p. 30). Penang.
Key, N., & Runsten, D. (1999). Contract farming, smallholders, and rural development in
Latin America: The organization of Agro-processing firms and the scale of out
grower production. World Development, 27(2), 381–401.
Khiem, N. T., Bush, S. R., Nguyen, C. M., & Vo, L. T. T. (2010). Upgrading small-
holders in the Vietnamese Pangasius value chain. Training (p. 158). Final Report,
ODI grant number RO334, An Giang. Retrieved from
http://www.fao.org/uploads/media/UpgradingPangasiusFINAL.pdf
Khoa, N. A. (2014). The small-scale coffee farmers lack of operational cost for re-
investment. Gia Lai online. Retrieved March 04, 2014, from
http://baogialai.com.vn/channel/722/201402/nien-vu-ca-phe-2014-nong-dan-san-xuat-
quy-mo-nho-thieu-kinh-phi-tai-dau-tu-2293574/
Khoi, L. D. N. (2007). Description of the Pangasius value chain in Vietnam. CAS
Discussion paper No 56, Centre for ASEAN Studies and Department, Can Tho (No.
56). Business (p. 49). CAS Discussion paper No 56, Centre for ASEAN Studies and
Department, Can Tho. Retrieved from http://webh01.ua.ac.be/cas/PDF/CAS56.pdf
Khoi, L. D. N. (2011). Quality Management in the Pangasius Export Supply Chain in
Vietnam: The Case of Small-Scale Pangasius Farming in the Mekong River Delta.
University of Groningen. Retrieved from http://irs.ub.rug.nl/ppn/333152026
Khoi, L. N. D., Son, N. P., Stewart, M. A., & Coclanis, P. A. (2011). Relationship quality
in fish value chains: buyer-supplier management in the Pangasius industry, Vietnam.
341
In M. A. Stewart & P. A. Coclanis (Eds.), Environmental Change and Agricultural
Sustainability in the Mekong Delta (Vol. 45, pp. 287–301). Dordrecht: Springer
Netherlands.
Kilelu, C. W., Klerkx, L., & Leeuwis, C. (2013). Agricultural Systems Unravelling the role
of innovation platforms in supporting co-evolution of innovation: Contributions and
tensions in a smallholder dairy development programme. Agricultural Systems, 118,
65–77.
Klerkx, L., Aarts, N., & Leeuwis, C. (2010). Adaptive management in agricultural
innovation systems: The interactions between innovation networks and their
environment. Agricultural Systems, 103(6), 390–400.
Kluts, I. N., Potting, J., Bosma, R. H., Phong, L. T., & Udo, H. M. J. (2012).
Environmental comparison of intensive and integrated agriculture-aquaculture
systems for striped catfish production in the Mekong Delta, Vietnam, based on two
existing case studies using life cycle assessment. Reviews in Aquaculture, 4(4), 195–
208.
Konefal, J., & Hatanaka, M. (2011). Enacting third-party certification: A case study of
science and politics in organic shrimp certification. Journal of Rural Studies, 27(2),
125–133.
Kongkeo, H. (1997). Comparison of intensive shrimp farming systems. Aquaculture
Research, 28, 789–796.
Kongkeo, H., & Davy, F. B. (2009). Backyard hatcheries and small scale shrimp and
prawn farming in Thailand. In S. S. De Silva & F. B. Davy (Eds.), Success Stories in
Asian Aquaculture (pp. 67–83). Springer and IDRC, Canada, Drodecht, The
Netherlands.
Kruijssen, F., Hong, M. C., & Qasim, M. (2013). Livelihood implications of global seafood
trade. Deliverable report 5.8 of the Sustaining Ethical Aquaculture Trade (SEAT)
project (p. 65). WorldFish, Penang.
342
Krugman, P., Wells, R., & Graddy, K. (2010). Essentials of Economics. In P. Krugman, R.
Wells, & K. Graddy (Eds.), Business & Economics (Second Edi., pp. 84–110).
Business & Economics.
Kutty, M. N. (1995). Aquaculture Development and Sustainability in Southeast Asia. In T.
U. Bagarinao & E. E. C. Flores (Eds.), Towards Sustainable Aquaculture in Southeast
Asia and Japan (pp. 91–108). lloilo: SEAFDEC Aquaculture Department.
Kvaløy, O., & Tveterås, R. (2008). Cost structure and vertical integration between farming
and processing. Journal of Agricultural Economics, 59(2), 296–311.
Lam, X. T., & Truong, M. H. (2010). Current status of best aquaculture practices (BAP)
certification apply for the black tiger shrimp (Penaeus monodon) culture in the
Mekong River Delta (p. 11). College of Aquaculture & Fisheries, Can Tho University,
Can Tho.
Lambert, D. M., & Cooper, M. C. (2000). Issues in Supply Chain Management. Industrial
Marketing Management, 29, 65–83.
Lazard, J., Baruthio, A., Mathé, S., Rey-valette, H., Chia, E., Clément, O., René, F. (2010).
Aquaculture system diversity and sustainable development: fish farms and their
representation. Aquatic Living Resources, 23, 187–198.
Le, C. T. (2011). A Risk Management Framework for Aquaculture: The Case of
Vietnamese Catfish Farming. RMIT University. Retrieved from
http://researchbank.rmit.edu.au/eserv/rmit:160178/le.pdf
Le, S. X. (2009). Social impacts of coastal aquaculture in the Mekong Delta. In M.
Bondad-Reantaso M.G.; Prein (Ed.), Measuring the contribution of small-scale
aquaculture: an assessment. FAO Tecnical paper 534 (pp. 95–107). Rome: FAO.
Le, S. X. (2010). Lecture on Fisheries Economics. Can Tho University Publisher, Can
Tho.
343
Le, S. X. (2011). Value chain of catfish (Pangasianodon hypophthalmus) in the Mekong
Delta. Vietnam Journal of Agriculture and Rural Development, (ISSN 0866-7020),
67–73.
Le, S. X., & Le, H. L. (2010). Supply and use of catfi sh (Pangasianodon hypophthalmus)
seed in the Mekong Delta of Vietnam. Aquacuture Asia Magazine, XV(1), 26–33.
Le, S. X., Nguyen, T. T., & Nguyen, Q. K. T. (2011). Value chain of black tiger shrimp in
the Mekong Delta. In Prceedings of the 4th Aquaculture and Fisheries Conference
(pp. 524–535). Can Tho: Agriculture publisher.
Le, T. C., & Cheong, F. (2010). Peceptions of risk and risk management in Vietnames
catfish farming: an empirical study. Aquaculture Economics & Management, 14(4),
282–314.
Lebel, L., Garden, P., Luers, A., Manuel-Navarrete, D., & Giap, D. H. (2009). Knowledge
and innovation relationships in the shrimp industry in Thailand and Mexico. In
Proceedings of the National Academy of Sciences of the United States of America (p.
6). doi:10.1073/pnas.0900555106
Lebel, L., Lebel, P., Garden, P., Giap, D. H., Khrutmuang, S., & Nakayama, S. (2008).
Places, Chains, and Plates: Governing Transitions in the Shrimp Aquaculture
Production-Consumption System. Globalizations, 5(2), 211–226.
Lebel, L., Mungkung, R., Gheewala, S. H., & Lebel, P. (2010). Innovation cycles, niches
and sustainability in the shrimp aquaculture industry in Thailand. Environmental
Science & Policy, 13(4), 291–302.
Lebel, L., Tri, N. H., Saengnoree, A., Pasong, S., Buatama, U., & Thoa, L. K. (2002).
Industrial transformation and shrimp aquaculture in Thailand and Vietnam: pathways
to ecological, social, and economic sustainability? Ambio, 31(4), 311–23.
Lehtonen, M. (2004). The environmental–social interface of sustainable development:
capabilities, social capital, institutions. Ecological Economics, 49(2), 199–214.
344
Lin, C. K., & Yi, Y. (2003). Minimizing environmental impacts of freshwater aquaculture
and reuse of pond effluents and mud. Aquaculture, 226(1-4), 57–68.
Lin, K., & Ren, H. (2006). The Function Defects of “Company Plus Farmers” Model and
Food Safety (In Chinese). Science-Economic-Society, 24(2), 69–72.
Little, D. C., Bush, S. R., Belton, B., Thanh Phuong, N., Young, J. A., & Murray, F. J.
(2012). Whitefish wars: Pangasius, politics and consumer confusion in Europe.
Marine Policy, 36(3), 738–745.
Little, D. C., & Edwards, P. (2003). Integrated Livestock-fish Farming Systems (p. 161).
Rome: FAO.
Loc, T., Nunan, L., Redman, R. M., Mohney, L. L., Pantoja, C. R., Fitzsimmons, K., &
Lightner, D. V. (2013). Determination of the infectious nature of the agent of acute
hepatopancreatic necrosis syndrome affecting penaeid shrimp. Diseases of Aquatic
Organisms, 105(1), 45–55.
Luning, P. A., Devlieghere, F., & Verhé, R. (2006). Safety in the Agri-Food Chain (p. 684
(249–301)). Wageningen: Wageningen Academic Publishers.
Lyon, S. (2006). Evaluating fair trade consumption: politics, defetishization and producer
participation. International Journal of Consumer Studies, 30(5), 452–464.
Maertens, M., & Swinnen, J. F. M. (2009). Trade, Standards, and Poverty: Evidence from
Senegal. World Development, 37(1), 161–178.
Mantingh, I., & Dung, V. N. (2008). Pre-Assessment of the Pangasius Sector: Towards
Sustainability. Dutch Ministry of Agriculture, Nature and Food Quality.
MARD. (2009a). Circular No. 15/2009/TT-BNN dated 17 April 2009 of Head of the
MARD on “promulgating regulations on drug, chemicals and antibiotics banned/or
limitedly using for manufacturing and trading in aquaculture” (in Vietnamese).
Ministry of Agriculture & Rural D. Ha Noi.
345
MARD. (2009b). Project on aquaculture development of Vietnam up to 2020 (in
Vietnamese). Ministry of Agriculture & Rural Developemnt (p. 38). Ha Noi.
MARD. (2009c). Strategies for fisheries development of Vietnam up to 2020 (in
Vietnamese). Ministry of Agriculture & Rural Developemnt (p. 83). Ha Noi.
MARD. (2010). Project on development planning for Tilapia production and consumption
of Vietnam up to 2015 and strategic planning to 2020 (in Vietnamese). Ministry of
Agriculture & Rural Developemnt (p. 160). Ha Noi.
MARD. (2014). Restucture of fisheries sector torwards sustainable development and
increasing of value added products. Mistritry of Agriculture & Rural Development (in
Vietnamese) (p. 42). Ha Noi.
Markelova, H., & Mwangi, E. (2010). Collective Action for Smallholder Market Access:
Evidence and Implications for Africa. Review of Policy Research, 27(5), 621–640.
Martinez-Cordero, F. J., & Leung, P. (2003). Sustainable aquaculture and producer
performance: measurement of environmentally adjusted productivity and efficiency of
a sample of shrimp farms in Mexico. Aquaculture, 241(1-4), 249–268.
Melba G. Bondad-Reantaso, P. B. B., Demaine, H., & Tipparat, O. (2009). Development
of an indicator system for measuring the contribution of small-scale aquaculture to
sustainable rural development. In M. Bondad-Reantaso M.G.; Prein (Ed.), Measuring
the contribution of small-scale aquaculture: an assessment. FAO Tecnical paper 534
(pp. 161–179). Rome: FAO.
Minten, B., Randrianarison, L., & Swinnen, J. F. M. (2009). Global Retail Chains and Poor
Farmers: Evidence from Madagascar. World Development, 37(11), 1728–1741.
Miyata, S., Minot, N., & Hu, D. (2009). Impact of Contract Farming on Income: Linking
Small Farmers, Packers, and Supermarkets in China. World Development, 37(11),
1781–1790.
346
Moctezuma-Malagón, A., González-Esquivel, C. E., De la Lanza-Espino, G., & González-
Rebeles Islas, C. (2008). A methodology for evaluating the sustainability of inland
wetland systems. Aquaculture International, 16, 525–537.
MOFI. (2006). Evaluate results of “Decree 09/2000/NQ-CP” implementing on
aquaculture sector during 2000 - 2005 (in Vietnamese). Ministry of Fisheries (p. 45).
Ha Noi.
Mohan, C. V. (2013). Aquaculture Certification: Producer Compliance Constraints. In
VIETFISH 2013: Trade Show and Conference in Vietnam, Vietnam Association of
Seafood Exporters and Producers. Ho Chi Minh.
Muir, J. (2005). Managing to harvest? Perspectives on the potential of aquaculture
Managing to harvest? Perspectives on the potential of aquaculture. Phil. Trans. R.
Soc. B, 360, 191–218.
Mungkung, R., Udo de Haes, H., & Clift, R. (2006). Potentials and Limitations of Life
Cycle Assessment in Setting Ecolabelling Criteria: A Case Study of Thai Shrimp
Aquaculture Product (5 pp). The International Journal of Life Cycle Assessment,
11(1), 55–59.
Murray, F. J., Zhang, W., Arlene, N. S., Phan, L. T., Haque, M. M., Henriksson, P., &
Little, D. C. (2011). Report on Boundary Issues. SEAT Deliverable 2.8. (p. 83). SEAT
project, Institute of Aquaculture, The University of Stirling, Stirling.
Murshed-E-Jahan, K., & Pemsl, D. E. (2011). The impact of integrated aquaculture–
agriculture on small-scale farm sustainability and farmers’ livelihoods: Experience
from Bangladesh. Agricultural Systems, 104(5), 392–402.
NACA. (2011). Evaluation of the impact of the Indian Ocean tsunami and US antidumping
duties on the shrimp farming sector of South and South-East Asia. Shrimp Price
Study, Phase III-NACA (p. 157). Bangkok.
Naturland. (2012). Naturland Standards for Organic Aquaculture. Naturland - Association
for Organic Agriculture, Registered Association. (pp. 1–28). Gräfelfing, Germany.
347
Retrieved from
http://www.naturland.de/fileadmin/MDB/documents/Richtlinien_englisch/Naturland-
Standards_Aquaculture.pdf
Neiland, A. E., Soley, N., Varley, J. B., & Whitmarsh, D. J. (2001). Shrimp aquaculture:
economic perspectives for policy development. Marine Policy, 25(4), 265–279.
Neilson, J. (2008). Global Private Regulation and Value-Chain Restructuring in Indonesian
Smallholder Coffee Systems. World Development, 36(9), 1607–1622.
Nguyen, A. L., Dang, V. H., Bosma, R. H., Verreth, J. a J., Leemans, R., & De Silva, S. S.
(2014). Simulated Impacts of Climate Change on Current Farming Locations of
Striped Catfish (Pangasianodon hypophthalmus; Sauvage) in the Mekong Delta,
Vietnam. Ambio.
Nguyen, D. M. (2009). Marketing challanges in Vietnamese striped catfish globalization
(p. 13). Department of Fisheries Management and Development, Nong Lam
University, Ho Chi Minh.
Nguyen, D. M. (2010). Application of econometric models for price impact assessment of
antidumping measures and labelling laws on global markets: a case study of
Vietnamese striped catfish. Reviews in Aquaculture, 2, 86–101.
Nguyen, H. D., Luu, D. D., Nguyen, H. V., Truong, T. T., Nguyen, T. V., Doan, B.,
Nguyen, P. V. (2013). Evaluation of environmetal carrying capacity of Mekong and
Bassac rivers related to planning of suatinable catfish farming (Pangasianodon
hypophthalmus) (in Vietnamese). Ministry of Agriculture & Rural Development (p.
325). Ho Chi Minh.
Nguyen, N. H. (2012). Aquaculture Certification. In Aquaculture certification systems.
WWF Vietnam Forum, Can Tho.
Nguyen, P. T., & Dang, O. T. H. (2009). Striped catfish aquaculture in Viet Nam: A
decade of unprecedented development. In S. S. De Silva & F. B. Davy (Eds.), Success
348
Stories in Asian Aquaculture (pp. 133–150). Springer and IDRC, Canada, Drodecht,
The Netherlands.
Nguyen, P. T., Nguyen, T. T., Nguyen, A. T., Tran, H. T. T., Tran, H. N., Wilder, M.,
Maeno, Y. (2003). Development of Freshwater Prawn (Macrobrachium rosenbergii)
Seed Production and Culture Technology in the Mekong Delta Region of Viet Nam: A
Review of the JIRCAS Project at Cantho University. Aquaculture (p. 8). Can Tho.
Retrieved from
http://www.researchgate.net/publication/242221163_Development_of_Freshwater_Pr
awn_(Macrobrachium_rosenbergii)_Seed_Production_and_Culture_Technology_in_t
he_Mekong_Delta_Region_of_Viet_Nam_A_Review_of_the_JIRCAS_Project_at_C
antho_University
Nguyen, P. T., Tran, H. N., Tran, H. T. T., Tran, B. V., Do, H. T. T., Vo, S. N., Wilder, M.
N. (2006). Current status of freshwater prawn culture in Vietnam and the
development and transfer of seed production technology. Fisheries Science, 72(1), 1–
12.
Nguyen, P. T., Vu, S. N., Tran, B. V., Nguyen, T. A., & Wilder, M. N. (2003). Research,
Development and Economics of Giant Freshwater Prawn (Macrobrachium
rosenbergii) Culture in the Mekong River Delta, Vietnam: A Review. Aquaculture (pp.
1–12). College of Aquaculture & Fisheries, Can Tho University, Can Tho.
Nguyen, T. T., Le, L. T., Tran, D. T., Cao, Q. L., Nguyen, H. T., Phan, D. N., & Tran, T.
X. (2009). Project on development planning for aquaculture sector in the Mekong
Delta up to 2015 and strategic planning up to 2020 (in Vietnamese). Ministry of
Agriculrue & Rural Development (p. 124). Ho Chi Minh.
Nguyen, T. T., Nguyen, T. V., & Phillips, M. J. M. (2004). Policy Research–Implications
of Liberalization of Fish Trade for Developing Countries—A Case Study of Vietnam.
Policy (p. 71). FAO, Roma.
Nguyen, D. V. (2008). Achieving a Sustainable Future for Vietnamese Seafood Industry.
Presentation in IIFET 2008 Vietnam: “Achieving a Sustainable Future: Managing
Aquaculture, Fishing, Trade and Development (p. 15). Nha Trang.
349
Nhuong, T. V., Dinh, T. V., Bui, H. T. T., Trinh, T. Q., Tuong, L. P., & Le, K. V. (2003).
The Shrimp Industry in Vietnam: Status, Opportunities and Challenges. Delta (p. 18).
Research Institute for Aquaculture No.1, Ha Noi.
Nhuong, T. V., Le, L. T., Trinh, T. Q., Pham, T. M. T., & Thi, A. N. (2002). Vietnam
shrimp farming review. Individual Partner Report for the Project (EC INCO-DEV
Project PORESSFA No.IC4-2001-10042): Policy research for sustainable shrimp
farming in Asia (p. 19). Research Institute for Aquaculture No.1, Bac Ninh. Retrieved
from
http://www.port.ac.uk/research/cemare/publications/pdffiles/sustainableshrimpfarmin
ginasia/filetodownload,28779,en.pdf
Nhuong, T. Van. (2011). Three Essays on Market and Non-Market Factors Affecting
International Seafood Trade. Auburn University.
Nietes-Satapornvanit, A. (2014). Sustainable development of export-orientated farmed
seafood in Thailand. The University of Stirling.
Nietes-Satapornvanit, A., Kriengkrai, S., Murray, J. M., & Little, D. C. (2011).
Development trends and local sustainability perceptions for the international trade in
seafood farmed in Thailand. SEAT Deliverable 2.1, The University of Stirling (p. 64).
Stirling. Retrieved from
http://www.extranet.seatglobal.eu/download.php?f=draftthailandscopingandsustainabi
lityreportall_1341394618.pdf
Nussbaum, R. (2002). Group certification for forests: a practical guide (p. 59). Oxford.
Oanh, D. T. H., & Phuong, N. T. (2012). Serious diseases in marine shrimp and freshwater
prawn farming in the Mekong river delta. Science Journal of Can Tho University,
22c, 106–118.
OECD. (2001). The DAC Guidelines Strategies for Sustainable Development: Guidance
for Development Co-operation. Paris: OECD Publications.
350
Olesen, I., Myhr, A. I., & Rosendal, G. K. (2010). Sustainable Aquaculture: Are We
Getting There? Ethical Perspectives on Salmon Farming. Journal of Agricultural and
Environmental Ethics, 24(4), 381–408.
Ommani, A. R., & Chizari, M. (2010). Strategies for Sustainable Aquaculture: Designing
for the future. College of Agriculture, Tarbiat Modaress University (p. 11). Tehran.
Retrieved from http://www.freewebs.com/ommani/a35.pdf
Omoto, R. (2012). Small-scale producers and the governance of certified organic seafood
production in Vietnam’s Mekong Delta. The University of Waterloo. Retrieved from
https://uwspace.uwaterloo.ca/bitstream/handle/10012/7078/Omoto_Reiko.pdf
Oosterveer, P. (2006). Globalization and sustainable consumption of shrimp: consumers
and governance in the global space of flows. International Journal of Consumer
Studies, (September), 465–476.
Page, S., & Slater, R. (2003). Small Producer Participation in Global Food Systems: Policy
Opportunities and Constraints. Development Policy Review, 21(5-6), 641–654.
Palin, C., Gaudin, C., Espejo-hermes, J., & Nicolaides, L. (2013). Compliance of imports
of fishery and aquaculture products with EU legislation. Policy Department Structural
and Cohesion Policies, European Parliament, EU. Retrieved from
http://www.europarl.europa.eu/RegData/etudes/etudes/join/2013/513968/IPOL-
PECH_ET(2013)513968_EN.pdf
Parliament, C., Lerman, Z., & Fulton, J. (1990). Performance of cooperatives and investor-
owned firms in the dairy industry. Journal of Agricultural Cooperation, 5, 1–16.
Paul, B. G., & Vogl, C. R. (2011). Impacts of shrimp farming in Bangladesh: Challenges
and alternatives. Ocean & Coastal Management, 54(3), 201–211.
Paul, B. G., & Vogl, C. R. (2013). Organic shrimp aquaculture for sustainable household
livelihoods in Bangladesh. Ocean and Coastal Management, 71, 1–12.
Pham, A. T., Bus, S. R., Mol, A. P. J., & Kroeze, C. (2011). The Multi-level
Environmental Governance of Vietnamese Aquaculture: Global Certification ,
351
National Standards , Local Cooperatives. Journal of Environmental Policy &
Planning, 13(4), 373–397.
Pham, L. T. (2010). Current practices of tilapia broodstocks and quality improved
measurements in Vietnam. UV Company Limited, Ho Chi Minh. Retrieved from
http://uv-vietnam.com.vn/NewsDetail.aspx?newsId=739
Pham, O. T. K., & Truong, M. H. (2011). The status of Striped catfish (Pangasianodon
hypophthalamus Sauvage, 1878) farming integration and non-integration in the
Mekong Delta. Science Journal of Can Tho University, 20b, 48–58.
Pham, P. T. L., Nguyen, T. T., Donna, B., Sally, M., & Bui, N. H. (2010). SEMs in the
livestock feed sector in Vietnam. Volume I: Livestock feed production (p. 89). CARD
Project 030/06 VIE, Institute of Policy & Strategy for Agriculture and Rural
development, Ha Noi. Retrieved from
http://www.docstoc.com/docs/128280425/SMALL-MEDIUM-ENTERPRISES-IN-
THE-LIVESTOCK-FEED---CARD
Phan, L. T., Bui, T. M., Nguyen, T. T. T., Gooley, G. J., Ingram, B. A., Nguyen, H. V., De
Silva, S. S. (2009). Current status of farming practices of striped catfish,
Pangasianodon hypophthalmus in the Mekong Delta, Vietnam. Aquaculture, 296(3-
4), 227–236.
Phan, L. T., Nguyen, P. T., Murray, F. J., & Little, D. C. (2011). Development trends and
local sustainability perceptions for the international trade in seafood farmed in
Vietnam. SEAT Deliverable 2.1, The University of Stirling (p. 62). Stirling. Retrieved
from
http://www.extranet.seatglobal.eu/download.php?f=d21bvietnamscopingreport_13415
97368.pdf
Phan, T. L., Anh, N. D., Hai, D. M., Son, V. N., Dien, N. T., & Phuong, N. T. (2013).
Nutrient characteristics and utilization of striped catfish pond sediment (Pangasiandon
hypophthalus) in the Mekong Delta, Viet Nam. In International Fisheries Symposium
2013. Pattaya.
352
Phan, T. M., & Populus, J. (2007). Status and changes of mangrove forest in Mekong
Delta: Case study in Tra Vinh, Vietnam. Estuarine, Coastal and Shelf Science, 71(1-
2), 98–109.
Phi, T. T. (2010). Resutl on the improvement of black tiger shrimp broodstock. VASEP.
Retrieved May 16, 2014, from http://vietfish.org/2010080503289818p48c63/viet-
nam-gia-hoa-thanh-cong-tom-su-bo-me-sach-benh.htm
Phuong, N. T., Hao, N. Van, Tam, B. M., Lam, P. T., Son, V. M., Nhut, N., Silva, S. S. De.
(2011). Better Management Practices for Striped Catfish Farming in the Mekong
Delta-Viet Nam. Collaboration for Agriculture and Rural Development (CARD)
project (001/07VIE). Aquaculture (p. 92). Bangkok. Retrieved from
http://library.enaca.org/inland/catfishbmps/catfish_bmp_version3_final.pdf
Phuong, N. T., Vu, U. N., Vuong, T. T., Nguyen, H. T. T., & Ernesto, M. J. (2009). Water
quality monitoring in striped catfish (Pangasianodon hypophthalmus) farms in the
Mekong Delta, Vietnam - phase 2 (p. 53). College of Aquaculture & Fisheries, Can
Tho University, Can Tho.
Phuong, N. T., Vu, U. N., Vuong, T. T., Nguyen, H. T. T., Nguyen, L. T. K., Duong, O. T.
H., Do, H. T. T. (2008). Water quality monitoring in striped catfish (Pangasianodon
hypophthalmus) farms in the Mekong Delta, Vietnam - phase 1 (p. 53). College of
Aquaculture & Fisheries, Can Tho University, Can Tho.
Pietrobelli, C., & Rabellotti, R. (2011). Global Value Chains Meet Innovation Systems:
Are There Learning Opportunities for Developing Countries? World Development,
39(7), 1261–1269.
Pongthanapanich, T., & Eva, R. (2006). Toward Environmental Responsibility of Thai
Shrimp Farming through a Voluntary Management Scheme (p. 44). IME working
paper 70/06. Department of Environmental and Business Economics, University of
Southern Denmark. Retrieved from
http://busieco.samnet.sdu.dk/ime/PDF/pongthanapanich70.pdf
353
Ponte, S. (2002). The “Latte Revolution ”? Regulation, Markets and Consumption in the
Global Coffee Chain. World Development, 30(7), 1099–1122.
Ponte, S., Corsin, F., Jespersen, K. S., & Young, J. A. (2011). Review of aquaculture
certification schemes. SEAT Deliverable 8.4, The University of Stirling (p. 73).
Stirling. Retrieved from
http://www.extranet.seatglobal.eu/download.php?f=d84reviewofcertificationschemesf
inal_1300269325.pdf
Ponte, S., & Ewert, J. (2009). Which Way is “Up” in Upgrading? Trajectories of Change in
the Value Chain for South African Wine. World Development, 37(10), 1637–1650.
Ponte, S., & Gibbon, P. (2006). Quality standards, conventions and the governance of
global value chains. Economy and Society, 34(1), 1–31.
Ponte, S., Kelling, I., Jespersen, K. S., & Kruijssen, F. (2014). The Blue Revolution in
Asia: Upgrading and Governance in Aquaculture Value Chains. World Development,
64, 52–64.
Porter, M. E. (1985). Competitive advantage: creating and sustaining superior
performance. New York: Free Press.
Prein, M. (2013). Aquaculture certification: Global Sustainable Seafood Initiative (GSSI).
In VIETFISH 2013: Trade Show and Conference in Vietnam, Vietnam Association of
Seafood Exporters and Producers. Ho Chi Minh.
Preißel, S., & Reckling, M. (2010). Smallholder group certification in Uganda – Analysis
of internal control systems in two organic export companies. Journal of Agriculture
and Rural Development in the Tropics and Subtropics, 111(1), 13–22.
Prell, C., Hubacek, K., & Reed, M. (2007). Stakeholder Analysis and Social Network
Analysis in Natural Resource Management. SRI Papers, 22(6), 501–518.
Primavera, J. H. (1998). Tropical shrimp farming and its sustainability (p. 33). Tigbauan.
Retrieved from http://repository.seafdec.org.ph/handle/10862/426
354
Pullin, R. S. V., Froese, R., & Pauly, D. (2007). Indicators for the Sustainability of
Aquaculture. In T. M. Bert (Ed.), Ecological and Genetic Implications of Aquaculture
Activities (pp. 53–72). Springer.
Rahman, M., & Yakupitiyage, A. (2004). Agricultural Use of Fishpond Sediment for
Environ mental Amelioration. Thammasat Int.J.Sc.Tech., Vol.9, No.4, 9(4), 10.
Rametsteiner, E., Pülzl, H., Alkan-Olsson, J., & Frederiksen, P. (2011). Sustainability
indicator development-Science or political negotiation? Ecological Indicators, 11(1),
61–70.
Reardon, T., Barrett, C. B., Berdegué, J. A., & Swinnen, J. F. M. (2009). Agrifood Industry
Transformation and Small Farmers in Developing Countries. World Development,
37(11), 1717–1727.
Reardon, T., & Timmer, C. P. (2006). Transformation of Markets for Agricultural Output
in Developing Countries Since 1950: How Has Thinking Changed? In T. Reardon &
C. P. Timmer (Eds.), Handbook of Agricultural Economics. Elsevier.
Reed, M., Fraser, E., & Dougill, A. (2006). An adaptive learning process for developing
and applying sustainability indicators with local communities. Ecological Economics,
59(4), 406–418.
Reed, M. S. (2008). Stakeholder participation for environmental management: A literature
review. Biological Conservation, 141(10), 2417–2431.
Reilly, A. (2007). From farm to fork – new European food hygiene regulations. In W.
Einarsson, H.; Emerson (Ed.), International seafood trade: challenges and
opportunities (pp. 47–57). Akureyri, Iceland: FAO Fisheries & Aquaculture
proceeding 13. FAO.
Reisch, L., Eberle, U., & Lorek, S. (2013). Sustainable food consumption: an overview of
contemporary issues and policies. Sustainability: Science, Practice, & Policy, 9(2), 7–
25.
355
RIA2. (2009). Fisheries comanagement: A case study in rice-shrimp rotation in Soc Trang
province (p. 25). Research Institute for Aquaculture No.2, Ho Chi Minh.
Rice, R. A. (2001). Noble goals and challenging terrain: organic and fair trade coffee
movements in the global marketplace. Journal of Agricultural and Environmental
Ethics, 14, 39–66.
Rico, A., Phu, T. M., Satapornvanit, K., Min, J., Shahabuddin, a. M., Henriksson, P. J. G.,
Van den Brink, P. J. (2013). Use of veterinary medicines, feed additives and
probiotics in four major internationally traded aquaculture species farmed in Asia.
Aquaculture, 412-413, 231–243.
Rico, A., Satapornvanit, K., Haque, M. M., Min, J., Nguyen, P. T., Telfer, T. C., & van den
Brink, P. J. (2012). Use of chemicals and biological products in Asian aquaculture
and their potential environmental risks: a critical review. Reviews in Aquaculture,
4(2), 75–93.
Riisgaard, L., Bolwig, S., du Toit, A., Matose, F., Halberg, N., & Ponte, S. (2008). Tools
for action research with small producers in global value chains. Danish Institute for
International Studies. Copenhagen.
Rigg, J. (2012). Unplanned Development: Tracking Change in South-East Asia. (J. Rigg,
Ed.) (p. 239). London: Zed Books.
Rivera, W. M., Alex, G., Hanson, J., & Birner, R. (2006). Enabling Agriculture: The
Evolution and Promise of Agricultural Knowledge Frameworks. In Association for
International Agricultural and Extension Education (AIAEE) 22nd Annual
Conference Proceedings. Clearwater Beach.
Roth, E. (2002). Does globalization of markets influence the Aquaculture challenge in
Asia? In Proceedings of the ASEM Workshop AQUACHALLENGE (pp. 27–30).
Retrieved from http://www.aseanbiotechnology.info/Abstract/22003464.pdf
Ruben, R., & Fort, R. (2012). The Impact of Fair Trade Certification for Coffee Farmers in
Peru. World Development, 40(3), 570–582.
356
Ruben, R., Fort, R., & Zúñiga-Arias, G. (2009). Measuring the impact of fair trade on
development. Development in Practice, 19(6), 777–788.
Ruben, R., Tilburg, A. V., Trinekens, J., & Boekel, M. V. (2007). Linking market
integration, supply chain governance, quality and value added. In In Tropical Food
Chains: Governance Regimes for Quality Management. Wageningen, the
Netherlands: Wageningen Academic Publishers.
Ruddle, K., & Gongfu, Z. (1988). Integrated Agriculture-aquaculture in South China: The
Dike-pond System of the Zhujiang Delta (p. 173). Cambridge University Press.
Saleetid, N., Little, D. C., Murray, F., & Green, D. (2013). Evaluating risk factors
associated with prevalence and incidence. MSc thesis. Institute of Aquaculture, The
University of Stirling.
Samuel-Fitwi, B., Wuertz, S., Schroeder, J. P., & Schulz, C. (2012). Sustainability
assessment tools to support aquaculture development. Journal of Cleaner Production,
32, 183–192.
Sang, N. V. (2010). Genetic studies on improvement of striped catfish (Pangasianodon
hypophthalmus) for economically important traits. Life Sciences. Norwegian
University of Life Sciences.
Schulze, B., Wocken, C., & Spiller, A. (2006). Relationship quality in agrifood chains:
Supplier management in the German pork and dairy sector. Journal on Chain and
Network Science, 6(1), 55–68.
SEAT. (2009). Sustaining Ethical Aquaculture Trade: Description of Work (p. 149). SEAT
project, Institute of Aquaculture, The University of Stirling, Stirling.
Sebesvari, Z., Thi, H., Le, T., Toan, P. Van, Arnold, U., & Renaud, F. G. (2012).
Agriculture and Water Quality in the Vietnamese Mekong Delta. (F. G. Renaud & C.
Kuenzer, Eds.)The Mekong Delta System (pp. 331–361). Dordrecht: Springer
Netherlands.
357
Segura, S. F. (2006). Contract Farming in Costa Rica. Opportunities for smallholders?
Wageningen University, the Netherlands.
Setthasakko, W. (2007). Determinants of corporate sustainability: Thai frozen seafood
processors. British Food Journal, 109(2), 155–168.
SFP. (2013). Vietnamese Pangasius Aquaculture Improvement Project. Sustainable
Fisheries Partnership. Retrieved February 16, 2014, from
http://www.sustainablefish.org/aquaculture-improvement/pangasius/pangasius-
aquaculture-improvement-partnership
Shang, Y. C., Leung, P., & Ling, B.-H. (1998). Comparative economics of shrimp farming
in Asia. Aquaculture, 164(1-4), 183–200.
Shen, L.-Y., Jorge Ochoa, J., Shah, M. N., & Zhang, X. (2011). The application of urban
sustainability indicators - A comparison between various practices. Habitat
International, 35(1), 17–29.
Sheriff, N. (2004). Fisher Livelihoods in Southern Thailand : Sustainability and the Role of
Grouper Culture. The University of Stirling. Retrieved from
http://hdl.handle.net/1893/72
Siar, S. V., & Sajise, P. E. (2009). Access rights for sustainable small-scale aquaculture
and rural development. In M. Bondad-Reantaso M.G.; Prein (Ed.), Measuring the
contribution of small-scale aquaculture: an assessment. FAO Tecnical paper 534 (pp.
87–95). Rome: FAO.
Simard, F., Ojeda, J., & Haroun, R. (2008). The sustainable development of Mediterranean
aquaculture: Problems and perspectives. Options Méditerranéennes, Series B(62),
113–124.
Smeets, E., & Weterings, R. (1999). Environmental indicators: Typology and overview (p.
Technical report No 25, 19). Copenhagen. Retrieved from
http://www.brahmatwinn.uni-
358
jena.de/fileadmin/Geoinformatik/projekte/brahmatwinn/Workshops/FEEM/EEA_tech
_rep_25_Env_Ind.pdf
Smith, M. D., Roheim, C. A., Crowder, L. B., Halpern, B. S., Turnipseed, M., Anderson, J.
L., Selkoe, K. A. (2010). Sustainability and Global Seafood. Science, 327(February),
784–786.
Spaargaren, G., Oosterveer, P., & Loeber, A. (2012). Sustainability transitions in food
consumption, retail and production. In and A. L. Gert Spaargaren, Peter Oosterveer
(Ed.), Food practices in Transition: changing food consumption, retail and
production in the Age of reflexive modernity (pp. 1–31). New York: Routledge.
Spielman, D. J., Ekboir, J., & Davis, K. (2009). The art and science of innovation systems
inquiry: Applications to Sub-Saharan African agriculture. Technology in Society,
31(4), 399–405.
Spielman, D. J., Ekboir, J., Davis, K., & Ochieng, C. M. O. (2008). An innovation systems
perspective on strengthening agricultural education and training in sub-Saharan
Africa. Agricultural Systems, 98(1), 1–9.
Srinath, K., Sridhar, M., Kartha, P. N. R., & Mohanan, A. N. (2000). Group farming for
sustainable aquaculture. Ocean & Coastal Management, 43, 557–571.
Sriwichailamphan, T. (2007). Global Food Chains and Environment: Agro-Food
Production and Processing in Thailand. Wageningen University, the Netherlands.
Stanton Emms & Sia. (2009). Characteristics of Vietnam’s Market for Animal Feed.
Regional Agri-Food Trade Commissioner, Singapore. Retrieved March 11, 2013,
from http://www.vietnamoverseas.com/?p=971
Steinfeld, H., Gerber, P., & Wassenaar, T. (2006). Livestock’s long shadow: environmental
issues and options. Rome. Retrieved from
http://www.fao.org/docrep/010/a0701e/a0701e00.HTM
Stentiford, G. D., Neil, D. M., Peeler, E. J., Shields, J. D., Small, H. J., Flegel, T. W.,
Lightner, D. V. (2012). Disease will limit future food supply from the global
359
crustacean fishery and aquaculture sectors. Journal of Invertebrate Pathology, 110(2),
141–157.
Stockbridge, M., Dorward, A., & Kydd, J. (2003). Farmer organizations for market access.
In Stakeholders Meeting on Farmer Organisations in Malawi, 18–19 June 2003.
Lilongwe.
Sturgeon, T. J. (2002). Modular production networks: a new American model of industrial
organization. Industrial and Corporate Change, 11(3), 451–496.
Sturgeon, T. J., Biesebroeck, J. Van, & Gereffi, G. (2009). The North American
automotive value chain: Canada’s role and prospects. International Journal of
Technological Learning, Innovation and Development, 2(1-2), 25–52.
Subasinghe, R., Soto, D., & Jia, J. (2009). Global aquaculture and its role in sustainable
development. Reviews in Aquaculture, 1(1), 2–9.
Sumberg, J. (2005). Systems of innovation theory and the changing architecture of
agricultural research in Africa. Food Policy, 30(1), 21–41.
SustainAqua. (2009). A handbook for Sustainable aquaculture (p. 111). SustainAqua
Collective Research project (Project no: COLL-CT-2006-0300384), EC/FP6,
Wageninigen. Retrieved from
http://www.haki.hu/tartalom/SUSTAIN0906/SustainAqua handbook_EN.pdf
Tacon, A. G. J., Metian, M., Turchini, G. M., & De Silva, S. S. (2009). Responsible
Aquaculture and Trophic Level Implications to Global Fish Supply. Reviews in
Fisheries Science, 18(1), 94–105.
Tain, F. H., & Diana, J. S. (2007). Impacts of Extension Practice: Lessons From Small
Farm-Based Aquaculture of Nile Tilapia in Northeastern Thailand. Society & Natural
Resources, 20(7), 583–595.
Taylor, P. L. (2005). In the Market But Not of It: Fair Trade Coffee and Forest
Stewardship Council Certification as Market-Based Social Change. World
Development, 33(1), 129–147.
360
Temel, T., Janssen, W., & Karimov, F. (2003). Systems analysis by graph theoretical
techniques: assessment of the agricultural innovation system of Azerbaijan.
Agricultural Systems, 77(2), 91–116.
Thao, N. P., Campbell, J., Bowman, J. E., & Chau, N. M. (2006). Good Agricultural
Practices and EUREPGAP Certification for Vietnam’s Small Farmer - Based Dragon
Fruit Industry (p. 11). Ho Chi Minh.
Tran, H. T. T., Nguyen, P. T., Truong, M. H., & Wilder, M. N. (1998). Current status of
freshwater prawn culture in the Mekong River Delta of Vietnam. JIRCAS J. 1998; 6:
89–100 (Vol. 6, pp. 89–100). College of Aquaculture & Fisheries, Can Tho
University, Can Tho.
Tran, N., Bailey, C., Wilson, N., & Phillips, M. (2013). Governance of Global Value
Chains in Response to Food Safety and Certification Standards: The Case of Shrimp
from Vietnam. World Development, 45(202374), 325–336.
Trifković, N. (2013). The Role of Food Standards in Development: An Empirical
Perspective. University of Copenhagen. Retrieved from
http://www.ifro.ku.dk/english/research/past_phd_defences/phd20june2013/
Truc, L. T. T. (2013). Investigation into Jaundice in farmed catfish (Pangasianodon
hypophthalmus, Sauvage) in the Mekong Delta, Vietnam. The University of Stirling.
Retrieved from https://dspace.stir.ac.uk/bitstream/1893/13060/1/INVESTIGATION
INTO JAUNDICE IN FARMED CATFISH (Pangasianodon hypophthalmus,
Sauvage) IN THE MEKONG DELTA, VIETNAM.pdf
Truong, P. Q., Le, B. V., To, T. C., & Tran, T. K. (2011). Study on Nutritional, chemical
contaminants and micro-organism composition analysis of catfish sludge and re-use
for agriculture sector (p. 147). College of Aquaculture & Fisheries, Can Tho
University, Can Tho.
Tuan, P. A., Dung, T. T., Luan, T. D., Mieng, T. T., Phuc, N. K., Thi, D. Van, Vinh, N. D.
(2013). 50 years of Vietnam Fisheries development (in Vietnamese). (P. A. Tuan, Ed.)
(p. 252). Ha Noi: Agriculture publisher.
361
Tuan, T. H. (2013). Assessemnt of production efficiency of catfish farming certified by ASC
and GlobalGAP in the Mekong Delta. MSC thesis. College of Aquaculture &
Fisheries, Can Tho University.
Tung, L. T. (2011). Assessment of technical and financial efficiency in the production
linkages or collaboration of different intensive shrimp (Penaeus monodon) farming
models in Ben Tre and Soc Trang provinces. MSC thesis. College of Aquaculture &
Fisheries, Can Tho University.
Umesh, N. R. (2007). Development and adoption of BMPs by self-help farmer groups.
Aquaculture Asia Magazine, XII, 8–10.
Umesh, N. R., Chandra Mohan, A. B., Ravi Babu, G., Padiyar, P. A., Phillips, M. J.,
Mohan, C. V., & Bhat, B. V. (2009). Shrimp farmer in India: Empowering small scale
farmer through a cluster-based approach. In S. S. De Silva & F. B. Davy (Eds.),
Success Stories in Asian Aquaculture (pp. 43–65). Springer and IDRC, Canada,
Drodecht, The Netherlands.
USAID. (2013). Sustainable fisheries responsibility aquaculture: A guide for USAID staff
and partners (p. 160). Washington, DC. Retrieved from
http://www.crc.uri.edu/download/FishAquaGuide14Jun13Final.pdf
Utting, K. (2008). Assessing the Impact of Fair Trade Coffee: Towards an Integrative
Framework. Journal of Business Ethics, 86(S1), 127–149.
Valdimarsson, G. (2007). Fish in the global food chain: challenges and opportunities. In
W. Einarsson, H.; Emerson (Ed.), International seafood trade: challenges and
opportunities (pp. 17–27). Akureyri, Iceland: FAO Fisheries & Aquaculture
proceeding 13. FAO.
Valenti, W. C., Kimpara, J. M., & Preto, B. de L. (2011). Measuring aquaculture
sustainability. World Aquaculture, 42(3), 26–30.
Valkila, J. (2009). Fair Trade organic coffee production in Nicaragua - Sustainable
development or a poverty trap? Ecological Economics, 68(12), 3018–3025.
362
Valkila, J., & Nygren, A. (2009). Impacts of Fair Trade certification on coffee farmers,
cooperatives, and laborers in Nicaragua. Agriculture and Human Values, 27(3), 321–
333.
Van Zalinge, N., Degen, P., Pongsri, C., Nuov, S., Jensen, J. G., Nguyen, V. H., &
Choulamany, X. (2004). The Mekong River system. In R. L. Welcome & T. Petr
(Eds.), The Mekong River system (pp. 335–357). RAP Publication 2004 ⁄ 16, Vol. 1,
pp. 335-357. FAO Regional Office for Asia and the Pacific, Bangkok: Proceedings of
the Second International Symposium on the Management of Large Rivers for
Fisheries. Retrieved from http://www.fao.org/docrep/007/ad525e/ad525e0l.htm#bm21
VASEP. (2010). Seafood export statistics, period 1998-2010. Vietnam Association of
Seafood Exporters and Producers. 2009 IEEE International Symposium on Industrial
Electronics (p. 100). Ha Noi: Ieee.
VASEP. (2011). Report on Vietnam seafood export in 2011 (in Vietnamese). Vietnam
Association of Seafood Exporters and Producers (p. 58). Ha Noi.
VASEP. (2012). Report on the shrimp production and conumption in 2012 and plan of
2013 (in Vietnamese). Vietnam Association of Seafood Exporters and Producers (p.
15). Ha Noi.
VASEP. (2013). VASEP 15 years (1998-2013) (p. 114). Ha Noi. Retrieved from
http://www.vasep.com.vn/vasep15nam.htm
VASEP. (2014a). Report on Vietnam seafood export in 2013 (in Vietnamese). Vietnam
Association of Seafood Exporters and Producers (p. 78). Ha Noi.
VASEP. (2014b). Vietnam seafood exports in 2013 surpassed US$6.5 billion. Retrieved
February 11, 2014, from http://www.vasep.com.vn/Tin-Tuc/785_34182/Xuat-khau-
thuy-san-Viet-Nam-2013-vuot-xa-muc-tieu-65-ty-USD.htm
VIFEP. (2009a). Project on development planning for catfish production and consumption
in the Mekong Delta up to 2015 and strategic planning up to 2020(in Vietnamese).
Vietnam Institute of Fisheries & Economic plan (p. 135). Ha Noi.
363
VIFEP. (2009b). Project on development planning for crustacean production and
consumption of Vietnam upto 2020 (in Vietnamese). Vietnam Institute of Fisheries &
Economic plan. Ha Noi.
Vinh Long DoF. (2012). Annual statistics on the aquaculture sector in Vinh Long province
(in Vietnamese). Vinh Long Department of Fisheries (p. 27). Vinh Long.
Vo, L. T. T. (2003). Quality management in shrimp supply chain in the Mekong Delta,
Vietnam: problems and measures. CAS Discussion paper No 43, Centre for ASEAN
Studies and Department (No. 43). Quality Assurance. Can Tho. Retrieved from
http://webhost.ua.ac.be/cas/PDF/CAS43.pdf
Vo, L. T. T., Bush, S. R., & Le, S. X. (2009a). Assessment of value chains for promoting
sustainable fisheries development in the Mekong Basin: Cases of Pangasius in
Vietnam and Cambodia. Vietnam Economic Management Review, 26(5-6), 32–42.
Vo, L. T. T., Bush, S. R., & Le, S. X. (2009b). Value chains for sustainable Mekong
fisheries: the case of Pangasius hypopthalmus and Henicorhynchus/Labiobarbus spp.
in Vietnam and Cambodia. Policy (p. 55). Can Tho. Retrieved from
http://www.sumernet.org/old_sumernet/2009Learning_Forum/Mekong_fisheries_valu
e_chain.pdf
Vo, L. T. T., Bush, S. R., Le, S. X., & Nguyen, K. T. (2010). High and low value fish
chains in the Mekong Delta: challenges for livelihoods and governance. Environment,
Development and Sustainability, 12(6), 889–980.
Volden, C. (2002). The Politics of Competitive Federalism: A Race to the Bottom in
Welfare Benefits? American Journal of Political Science, 46(2), 352–363.
Vu, T. A., Phan, L. T., Do, H. V., Ngo, T. T. N., Nguyen, K. D., Phan, V. Q., & Nguyen,
H. T. (2013). Status of small-scale environmentall friendly shrimp production in the
Ca Mau province, the Mekong Delta, Vietnam (p. 111). GIZ Vietnam, Ca Mau.
364
Vu, T. D., & Don, G. (2008). Shrimp GAP and BMPs in Vietnam: Policy, current status
and future direction. SUDA project, FSPSII, Ministry of Agriculture & Rural
Developemnt (p. 21). Ha Noi.
Vu, A. V., & Phan, L. T. (2008). Inland Fisheries and Aquaculture in the Mekong Delta: A
Review. (p. 75). Research Institute for Aquaculture No.2, Ho Chi Minh.
Wang, A. (2009). Historical Evlution and System Rethinking of Company Plus Farmer (In
Chinese). Journal of Anhui Agricultural Sciences, 37(10), 4819–4821.
Wang, X., He, X., Chen, B., & Xie, C. (2011). Rice field for the treatment of pond
aquaculture effluents. African Journal of Biotechnology, 10(1684-5315), 6456–6465.
Washington, S., & Ababouch, L. (2011). Private standards and certification in fisheries
and aquaculture: current practice and emerging issues (p. 181). Food and Agriculture
Organization, Rome.
Washington, S., & Ababouch, L. (2011). Private standards and certification in fisheries
and aquaculture: current practice and emerging issues (FAO Fisher., p. 181). Rome:
FAO.
WCED. (1987). Our Common Future. Oxford.
Weymann, V. (2013). Aquaculture certification: Benchmarking certification. In VIETFISH
2013: Trade Show and Conference in Vietnam, Vietnam Association of Seafood
Exporters and Producers. Ho Chi Minh.
Whitmarsh, D. J., Cook, E. J., & Black, K. D. (2006). Searching for sustainability in
aquaculture: An investigation into the economic prospects for an integrated salmon–
mussel production system. Marine Policy, 30(3), 293–298.
Wilder, M. N., Yang, W., Do, H. T. T., & Maeda, M. (1998). Reproductive mechanisms in
the giant freshwater prawn, and cooperative research to improve seed production
technology in the MKD. Retrieved September 05, 2011, from
http://www.lib.noaa.gov/retiredsites/japan/aquaculture/proceedings/report28/Wilder.p
df
365
World Bank. (2006). Enhancing Agricultural Innovation: How to Go Beyond the
Strengthening of Research Systems. The International Bank for Reconstruction and
Development, The World Bank (p. 135). Washington.
World Bank. (2012). Agricultural innovation systems: an investment sourcebook.
International Bank for Reconstruction and Development, The World Bank (p. 684).
Washington.
Wurts, W. A. (2000). Sustainable Aquaculture in the Twenty-First Century. Reviews in
Fisheries Science, 8(2), 141–150.
WWF. (2011). Draft stabdards for responsible shrimp aquaculture. Version 3.0 for
Guidance Development and Field Testing, ShAD. (p. 104). Retrieved from
http://worldwildlife.org/publications/responsible-shrimp-aquaculture-standards-final
Yamprayoon, J., & Sukhumparnich, K. (2010). Thai Aquaculture: Achieving Quality and
Safety through Management and Sustainability. Journal of the World Aquaculture
Society, 41(2), 274–280.
Young, J. A., Goulding, I., & Stirrat, R. L. (2011). Post-harvest to consumer driver review
of the aquatic supply chain. Driver Review-DR17/Foresight Project on Global Food
and Farming Futures (p. 62). London.
Zhang, W. (2014). Sustaining export-oriented value chains of farmed seafood in China.
The University of Stirling.
Ziggers, G. W., & Trienekens, J. (1999). Quality assurance in food and agribusiness supply
chains: developing successful partnerships. Journal of Production Economics, 60(61),
271–279.
Zweig, R. D., Thong, H. X., Luu, T. L., Cook, J. R., & Phillips, M. (2005). Vietnam:
Aquaculture and Fisheries Sector Study. East-Asia Pacific Rural Development and
Natural Resources Sector Unit, World Bank (p. 141). Ha Noi. Retrieved from
http://siteresources.worldbank.org/INTVIETNAM/Resources/vn_fisheries-report-
final.pdf
366
APPENDICES
Appendix 1. Checklist questionnaires of the scoping survey
1. General information:
1.1. History information [occupation before this business/operation, established year, other occupation outside this occupation/business?, income structure…]
1.2. Infrastructure information [land used, no.of farms/building/factories, water area, no.of ponds/processing lines/shop, infrastructure (houses for labours, pumps systems, storages, boat, lorry…, other facilities), code for traceability, capital sources, land ownership ….]
1.3. Human resources [family labours, hiring labours, labours sources and trends, educational/technical levels of labours….]
1.4. Mode of business/operation management [organization structure, role of labours/staff, mode of management: individual or co-operation with other sector (contacted farms with processors/suppliers, other households…)….]
2. The information on current practices of operation/business activities:
2.1. Current practices of activities
a). Farmers/Nurseries/Hatcheries: [culture area, no.of farms/nurseries/hatcheries, no.of ponds (i.e. grow-out; fry to juvenile; juvenile to fingerling; no.of pre-/broodstock ponds), yield and production, stocking density, seed sources, water resources, sediment pond….]. At the hatcheries [number of incubating tanks, hatching tanks, containing of water, fry/juvenile/fingerling production, hatching density, egg fertilisation rate, hatching rate of eggs, larvae to fry survival rate, fry to fingerling survival rate, brood-stock sources, water sources …]
c) Seafood/Feed processors: [no.of factories, processing lines, storages, transportation means (i.e. truck, lorry, boat…), aquaculture zone, quality control lab., network of traders/collectors, capital sources, land owners/lease, raw material sources (self-produce, contracted farms, other farms, traders networks), type of products, 5 main products (rank, % of total production), permanent labours, mode of selling products...]
d). Feed/chemical traders: [no.of shops, transportation means (i.e. truck, boat…), storages, network of customers, input products sources, type of trading products, yield (tons/day, or tons/year…), 5 main products (rank, % of total production), permanent labours, mode of selling products (main products, networks….]
367
2.2. Input management
a). Farmers/Nurseries/Hatcheries: [pond preparation, feed & chemical/drug use, seed/broodstocks sources (size, sources, quality…), labours (salary, training, working regulation …), water management (monitoring, water treatment, water exchange, sediment treatment…), disease management (mortality rate, dead shrimp/fish disposal, type of disease and occurrence freq., prevent/treatment methods), information on prices of input materials, mode of buying/selling (payments, thought middle-men or directly contract with farmers, and/or suppliers/processors…)
b) Wholesalers: [storages/truck/boat preparation, pre-processing of product after buying, labours (salary, training, working regulation …), information on prices of input materials, mode of buying/selling (payments, thought middle-men or directly contract with suppliers/processors, linkage of farming), network of regular customers …
c) Seafood/Feed processors: [processing stages management (raw material sources and quality control, processing stages?), storages management, labours (salary, training, working regulation …), information on prices of input materials, mode of buying/selling (payments, thought middle-men or directly contract with suppliers/importers, activity linkages, …logbook, price decision …)
d). Feed/chemical traders: [storages management (cross- contaminant management among products in the storage?), labours (salary, training, regulation …), information on prices of input materials, mode of buying/selling (payments, thought middle-men or directly contract with suppliers/importers, activity linkages, …logbook, price decision …)
2.3. Output management
a). Farmers/Nurseries/Hatcheries: [water exchange mechanism (freq., volume, sources…), waste water/sediment treatment (where is waste go?, methods’ treatment), disease/seasons/harvesting, mode of selling production (via traders, direct to processors?, gate price decision (who decide the price)…?)].
b) Wholesalers: [trading seasons, dead fish/shrimp treatment, waste water treatment (where is waste go?, mode of selling production (via higher levels of traders, direct to processors?, logbook and price decision…?)].
c) Seafood/Feed processors: [type of products, seasons, by-product treatment, mode of selling products (via traders, importers?), quality control, waste water treatment, price decision, logbook, markets of 5 main products?.
d). Feed/chemical traders: [type of products, seasons, mode of selling products (via traders, suppliers?), quality control, waste treatment, price decision, logbook, markets of 5 main products?.
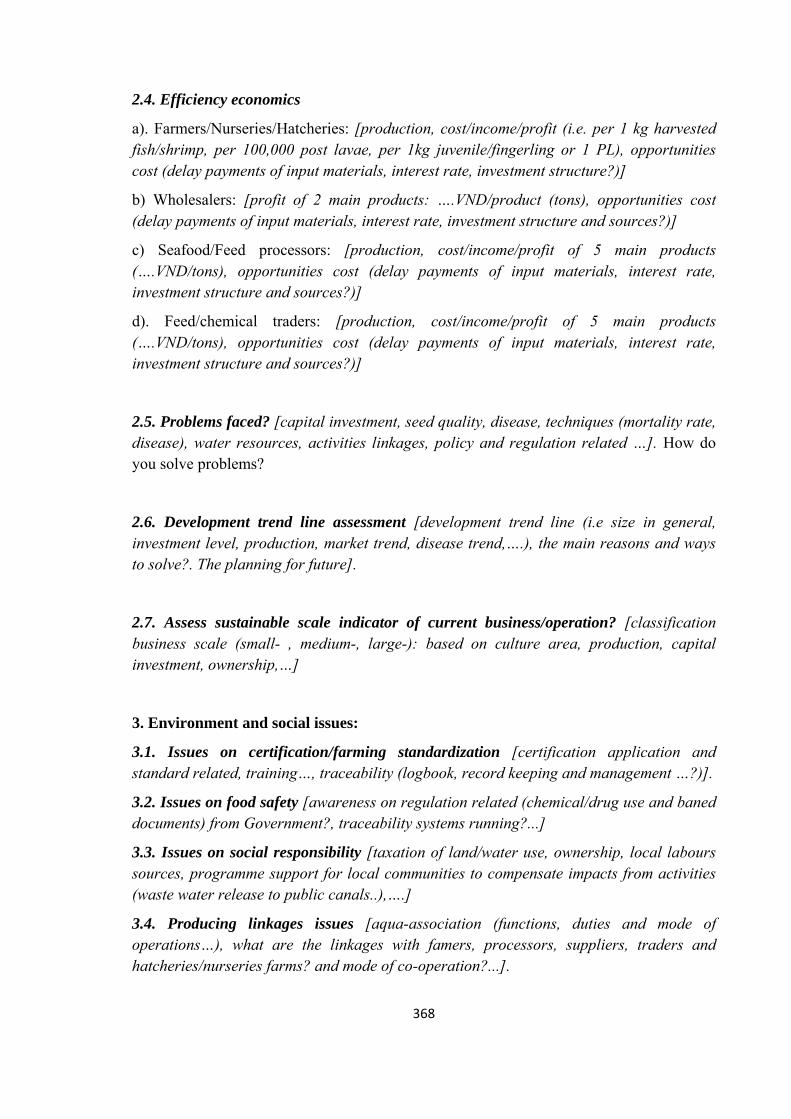
368
2.4. Efficiency economics
a). Farmers/Nurseries/Hatcheries: [production, cost/income/profit (i.e. per 1 kg harvested fish/shrimp, per 100,000 post lavae, per 1kg juvenile/fingerling or 1 PL), opportunities cost (delay payments of input materials, interest rate, investment structure?)]
b) Wholesalers: [profit of 2 main products: ….VND/product (tons), opportunities cost (delay payments of input materials, interest rate, investment structure and sources?)]
c) Seafood/Feed processors: [production, cost/income/profit of 5 main products (….VND/tons), opportunities cost (delay payments of input materials, interest rate, investment structure and sources?)]
d). Feed/chemical traders: [production, cost/income/profit of 5 main products (….VND/tons), opportunities cost (delay payments of input materials, interest rate, investment structure and sources?)]
2.5. Problems faced? [capital investment, seed quality, disease, techniques (mortality rate, disease), water resources, activities linkages, policy and regulation related …]. How do you solve problems?
2.6. Development trend line assessment [development trend line (i.e size in general, investment level, production, market trend, disease trend,….), the main reasons and ways to solve?. The planning for future].
2.7. Assess sustainable scale indicator of current business/operation? [classification business scale (small- , medium-, large-): based on culture area, production, capital investment, ownership,…]
3. Environment and social issues:
3.1. Issues on certification/farming standardization [certification application and standard related, training…, traceability (logbook, record keeping and management …?)].
3.2. Issues on food safety [awareness on regulation related (chemical/drug use and baned documents) from Government?, traceability systems running?...]
3.3. Issues on social responsibility [taxation of land/water use, ownership, local labours sources, programme support for local communities to compensate impacts from activities (waste water release to public canals..),….]
3.4. Producing linkages issues [aqua-association (functions, duties and mode of operations…), what are the linkages with famers, processors, suppliers, traders and hatcheries/nurseries farms? and mode of co-operation?...].
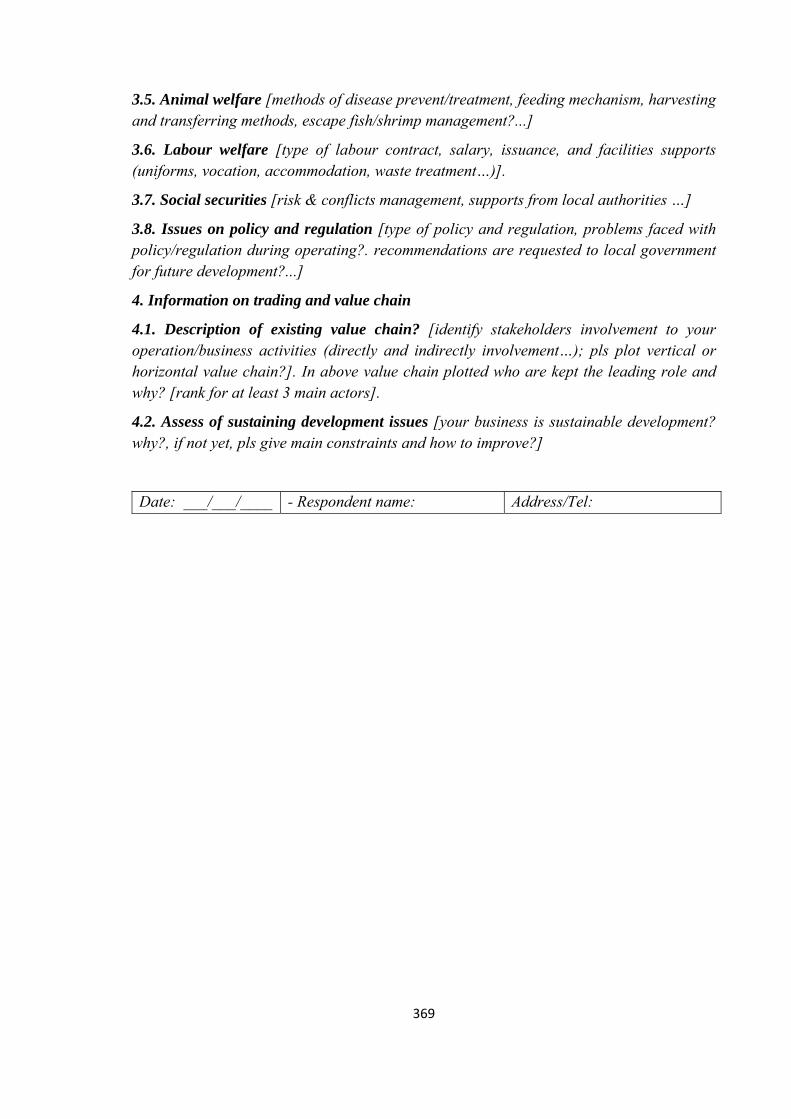
369
3.5. Animal welfare [methods of disease prevent/treatment, feeding mechanism, harvesting and transferring methods, escape fish/shrimp management?...]
3.6. Labour welfare [type of labour contract, salary, issuance, and facilities supports (uniforms, vocation, accommodation, waste treatment…)].
3.7. Social securities [risk & conflicts management, supports from local authorities …]
3.8. Issues on policy and regulation [type of policy and regulation, problems faced with policy/regulation during operating?. recommendations are requested to local government for future development?...]
4. Information on trading and value chain
4.1. Description of existing value chain? [identify stakeholders involvement to your operation/business activities (directly and indirectly involvement…); pls plot vertical or horizontal value chain?]. In above value chain plotted who are kept the leading role and why? [rank for at least 3 main actors].
4.2. Assess of sustaining development issues [your business is sustainable development? why?, if not yet, pls give main constraints and how to improve?]
Date: ___/___/____ - Respondent name: Address/Tel:
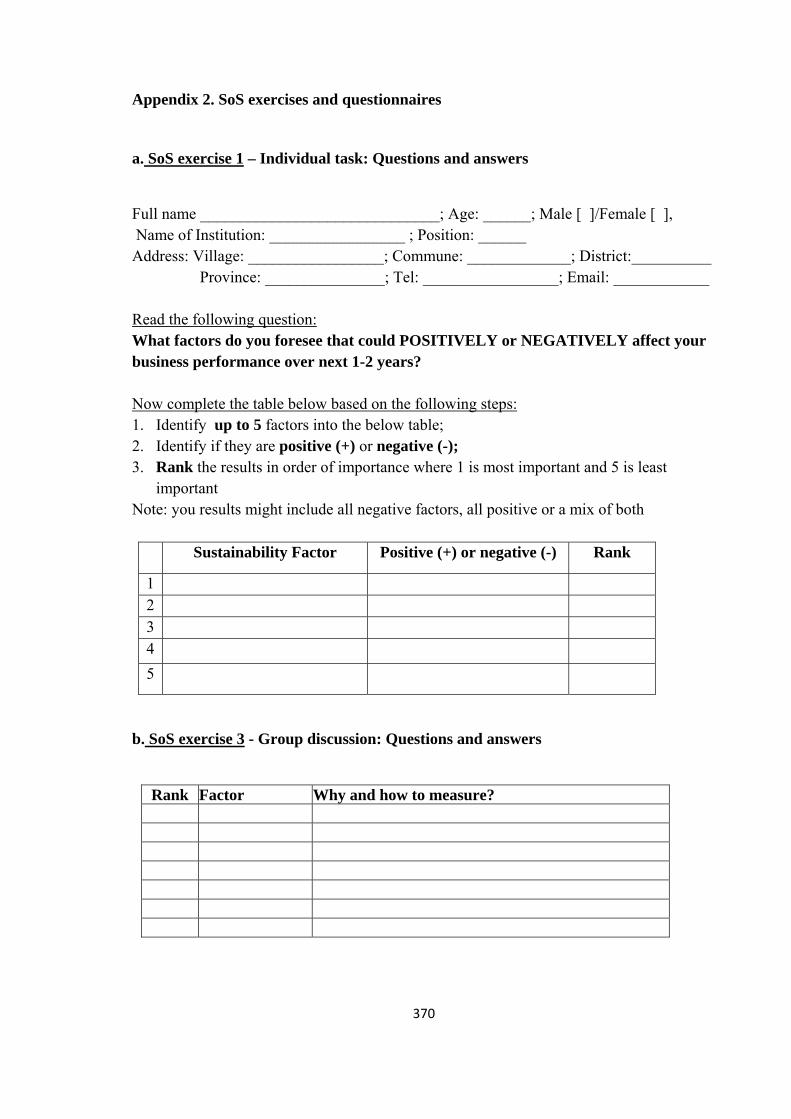
370
Appendix 2. SoS exercises and questionnaires
a. SoS exercise 1 – Individual task: Questions and answers
Full name ______________________________; Age: ______; Male [ ]/Female [ ], Name of Institution: _________________ ; Position: ______ Address: Village: _________________; Commune: _____________; District:__________ Province: _______________; Tel: _________________; Email: ____________ Read the following question: What factors do you foresee that could POSITIVELY or NEGATIVELY affect your business performance over next 1-2 years? Now complete the table below based on the following steps: 1. Identify up to 5 factors into the below table; 2. Identify if they are positive (+) or negative (-); 3. Rank the results in order of importance where 1 is most important and 5 is least
important Note: you results might include all negative factors, all positive or a mix of both
Sustainability Factor Positive (+) or negative (-) Rank
1 2 3 4
5
b. SoS exercise 3 - Group discussion: Questions and answers
Rank Factor Why and how to measure?
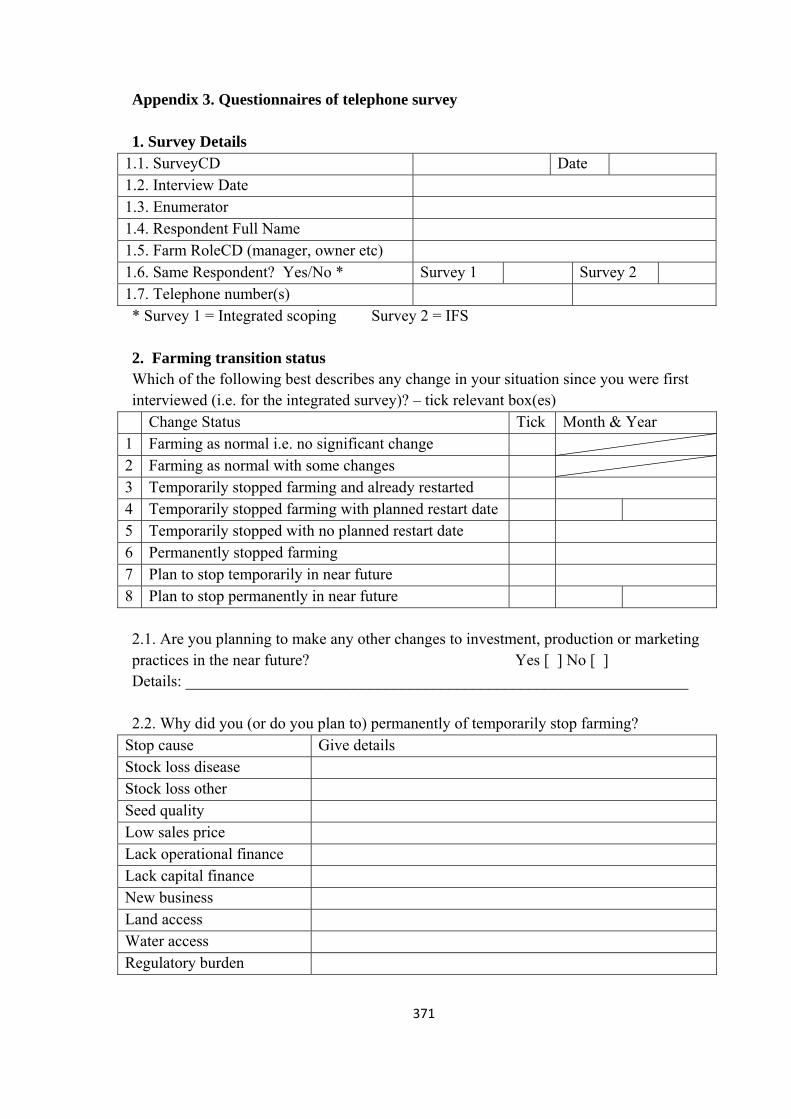
371
Appendix 3. Questionnaires of telephone survey
1. Survey Details 1.1. SurveyCD Date 1.2. Interview Date 1.3. Enumerator 1.4. Respondent Full Name 1.5. Farm RoleCD (manager, owner etc) 1.6. Same Respondent? Yes/No * Survey 1 Survey 2 1.7. Telephone number(s) * Survey 1 = Integrated scoping Survey 2 = IFS 2. Farming transition status Which of the following best describes any change in your situation since you were first interviewed (i.e. for the integrated survey)? – tick relevant box(es)
Change Status Tick Month & Year 1 Farming as normal i.e. no significant change 2 Farming as normal with some changes 3 Temporarily stopped farming and already restarted 4 Temporarily stopped farming with planned restart date 5 Temporarily stopped with no planned restart date 6 Permanently stopped farming 7 Plan to stop temporarily in near future 8 Plan to stop permanently in near future 2.1. Are you planning to make any other changes to investment, production or marketing practices in the near future? Yes [ ] No [ ] Details: _______________________________________________________________ 2.2. Why did you (or do you plan to) permanently of temporarily stop farming?
Stop cause Give details Stock loss disease Stock loss other Seed quality Low sales price Lack operational finance Lack capital finance New business Land access Water access Regulatory burden
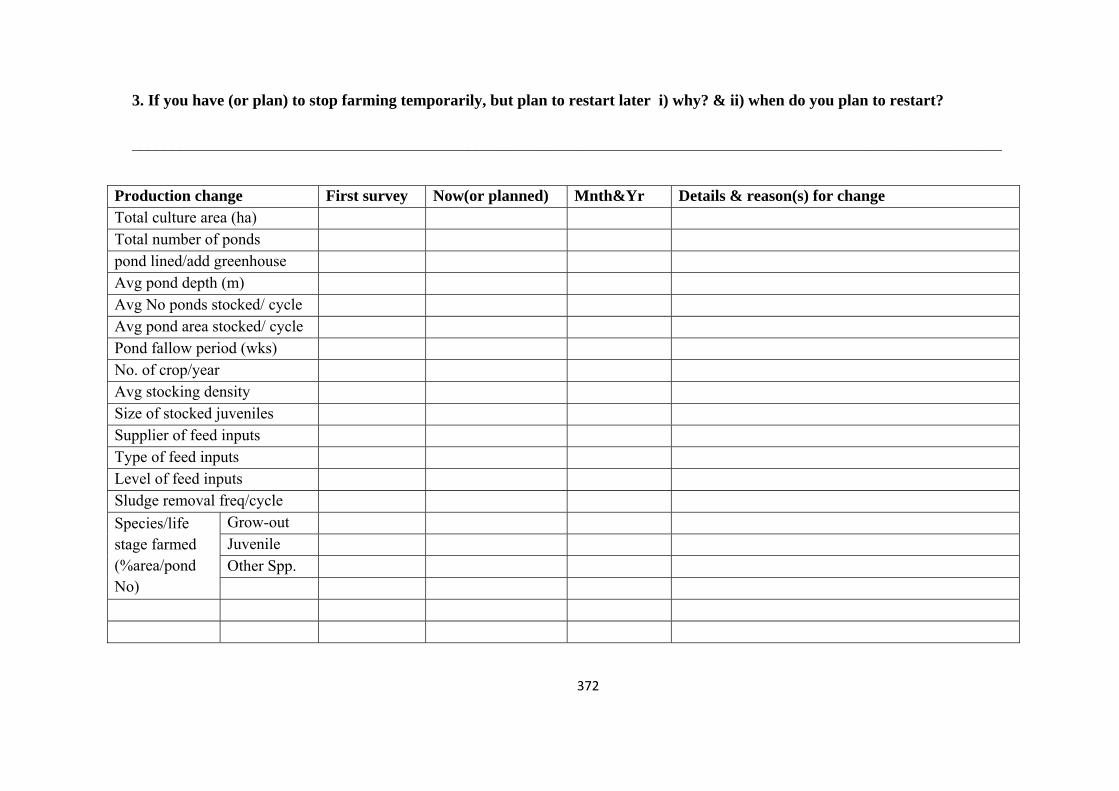
372
3. If you have (or plan) to stop farming temporarily, but plan to restart later i) why? & ii) when do you plan to restart? _____________________________________________________________________________________________________________
Production change First survey Now(or planned) Mnth&Yr Details & reason(s) for change Total culture area (ha) Total number of ponds pond lined/add greenhouse Avg pond depth (m) Avg No ponds stocked/ cycle Avg pond area stocked/ cycle Pond fallow period (wks) No. of crop/year Avg stocking density Size of stocked juveniles Supplier of feed inputs Type of feed inputs Level of feed inputs Sludge removal freq/cycle
Species/life stage farmed (%area/pond No)
Grow-out Juvenile Other Spp.
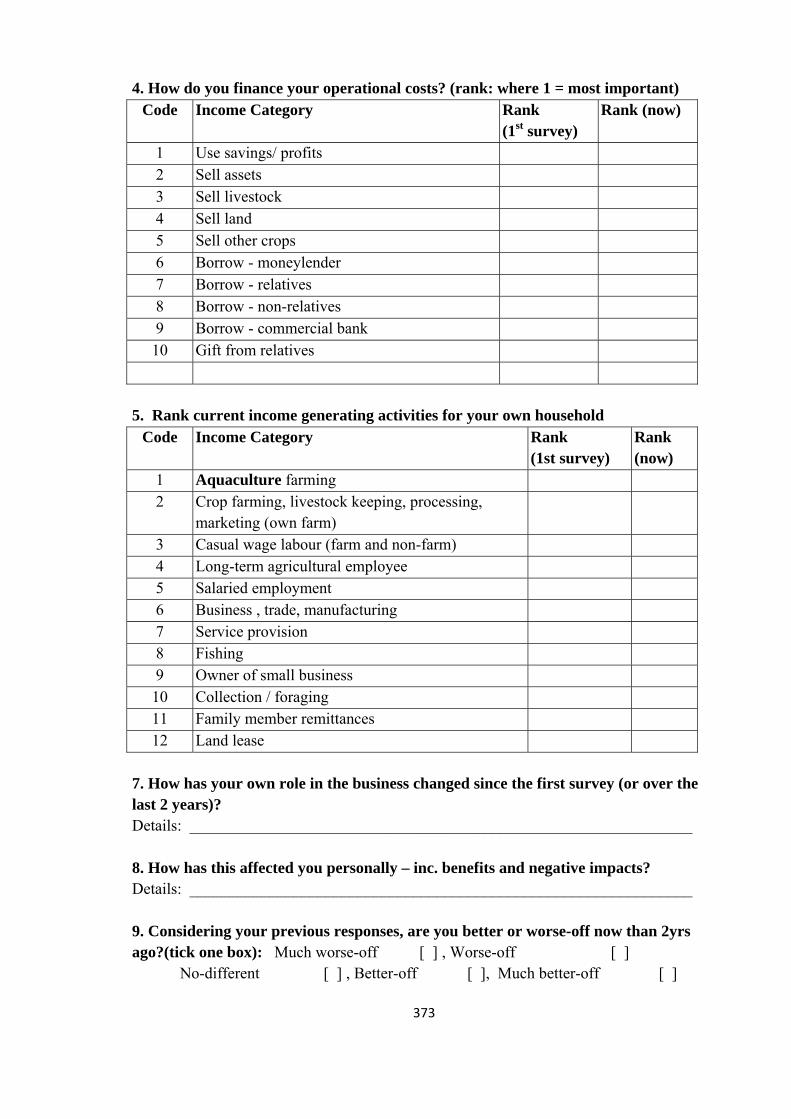
373
4. How do you finance your operational costs? (rank: where 1 = most important) Code Income Category Rank
(1st survey) Rank (now)
1 Use savings/ profits 2 Sell assets 3 Sell livestock 4 Sell land 5 Sell other crops 6 Borrow - moneylender 7 Borrow - relatives 8 Borrow - non-relatives 9 Borrow - commercial bank 10 Gift from relatives
5. Rank current income generating activities for your own household
Code Income Category Rank (1st survey)
Rank (now)
1 Aquaculture farming 2 Crop farming, livestock keeping, processing,
marketing (own farm)
3 Casual wage labour (farm and non-farm) 4 Long-term agricultural employee 5 Salaried employment 6 Business , trade, manufacturing 7 Service provision 8 Fishing 9 Owner of small business 10 Collection / foraging 11 Family member remittances 12 Land lease
7. How has your own role in the business changed since the first survey (or over the last 2 years)? Details: _______________________________________________________________ 8. How has this affected you personally – inc. benefits and negative impacts? Details: _______________________________________________________________ 9. Considering your previous responses, are you better or worse-off now than 2yrs ago?(tick one box): Much worse-off [ ] , Worse-off [ ]
No-different [ ] , Better-off [ ], Much better-off [ ]
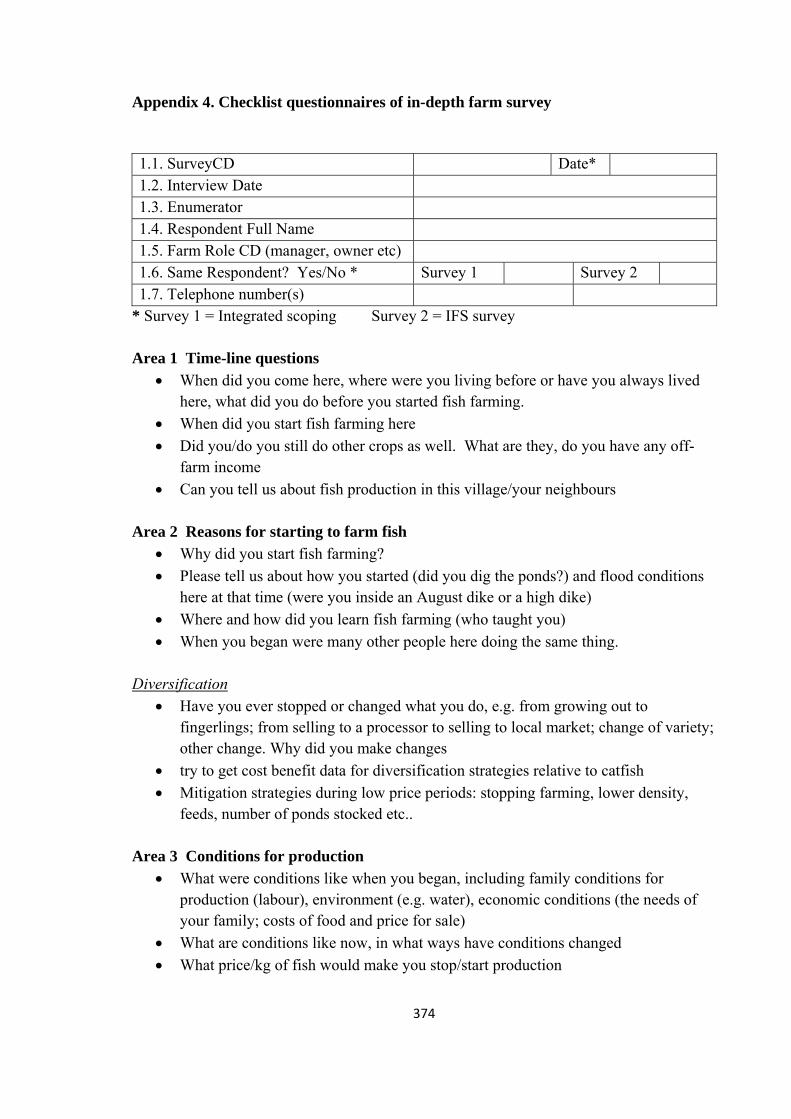
374
Appendix 4. Checklist questionnaires of in-depth farm survey
1.1. SurveyCD Date* 1.2. Interview Date 1.3. Enumerator 1.4. Respondent Full Name 1.5. Farm Role CD (manager, owner etc) 1.6. Same Respondent? Yes/No * Survey 1 Survey 2 1.7. Telephone number(s)
* Survey 1 = Integrated scoping Survey 2 = IFS survey Area 1 Time-line questions
When did you come here, where were you living before or have you always lived here, what did you do before you started fish farming.
When did you start fish farming here
Did you/do you still do other crops as well. What are they, do you have any off-farm income
Can you tell us about fish production in this village/your neighbours Area 2 Reasons for starting to farm fish
Why did you start fish farming?
Please tell us about how you started (did you dig the ponds?) and flood conditions here at that time (were you inside an August dike or a high dike)
Where and how did you learn fish farming (who taught you)
When you began were many other people here doing the same thing. Diversification
Have you ever stopped or changed what you do, e.g. from growing out to fingerlings; from selling to a processor to selling to local market; change of variety; other change. Why did you make changes
try to get cost benefit data for diversification strategies relative to catfish
Mitigation strategies during low price periods: stopping farming, lower density, feeds, number of ponds stocked etc..
Area 3 Conditions for production
What were conditions like when you began, including family conditions for production (labour), environment (e.g. water), economic conditions (the needs of your family; costs of food and price for sale)
What are conditions like now, in what ways have conditions changed
What price/kg of fish would make you stop/start production
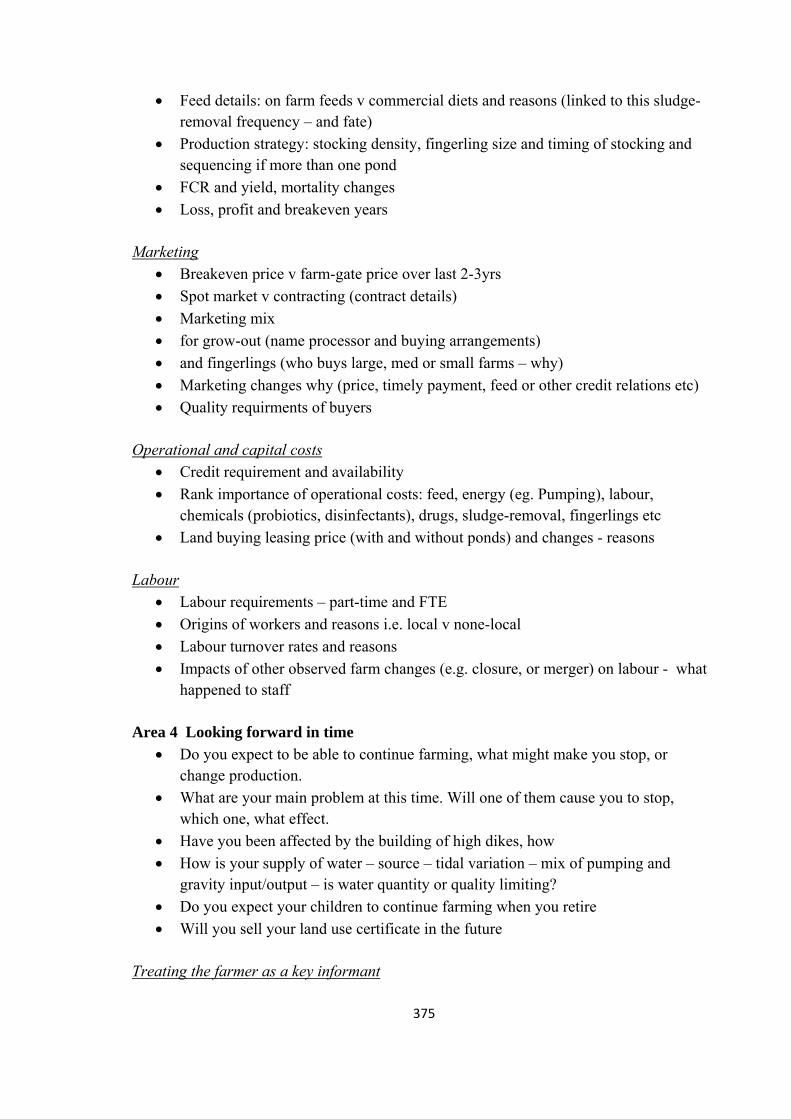
375
Feed details: on farm feeds v commercial diets and reasons (linked to this sludge-removal frequency – and fate)
Production strategy: stocking density, fingerling size and timing of stocking and sequencing if more than one pond
FCR and yield, mortality changes
Loss, profit and breakeven years Marketing
Breakeven price v farm-gate price over last 2-3yrs
Spot market v contracting (contract details)
Marketing mix
for grow-out (name processor and buying arrangements)
and fingerlings (who buys large, med or small farms – why)
Marketing changes why (price, timely payment, feed or other credit relations etc)
Quality requirments of buyers Operational and capital costs
Credit requirement and availability
Rank importance of operational costs: feed, energy (eg. Pumping), labour, chemicals (probiotics, disinfectants), drugs, sludge-removal, fingerlings etc
Land buying leasing price (with and without ponds) and changes - reasons Labour
Labour requirements – part-time and FTE
Origins of workers and reasons i.e. local v none-local
Labour turnover rates and reasons
Impacts of other observed farm changes (e.g. closure, or merger) on labour - what happened to staff
Area 4 Looking forward in time
Do you expect to be able to continue farming, what might make you stop, or change production.
What are your main problem at this time. Will one of them cause you to stop, which one, what effect.
Have you been affected by the building of high dikes, how
How is your supply of water – source – tidal variation – mix of pumping and gravity input/output – is water quantity or quality limiting?
Do you expect your children to continue farming when you retire
Will you sell your land use certificate in the future Treating the farmer as a key informant
376
Are you aware of any other farms in the village/ locale that have stopped catfish farming recently or in the past? – details / why?
What happened to their ponds (filled in, leased, sold etc – to whom from where)?
Awareness of other local catfish farmer diversification strategies (other aquatic species, fingerlings etc reasons?)
Trends in changing size (area depth) of farms and ponds – where why who? Mapping
Locate of ponds along the same stretch of canal – assoc. houses, rice fields and other land marks
Annotate pond size, year of construction, change in ownership/ farm stoppage, filled ponds, switched species etc.
Try to get explanations of any emerging spatial patterns
377
Appendix 5. Checklist questionnaires of key informants
1.1. Survey CD Date 1.2. Interview Date 1.3. Enumerator 1.4. Respondent Full Name 1.5. Role CD (manager, owner etc) 1.6. Same Respondent? Yes/No Scoping survey [ ] 1.7. Telephone number(s)
A. Begin by treating the respondents as key informants on general industry trends - Perceptions on transitional change in the wider industry and drivers - numbers of enterprises etc. - Check validity major secondary statistics on industry concentration (Govt, VASEP etc.) against their perceptions
B. Then move to reflection on their own business situation - History of their business -- Trends in production capacity and actual operating capacity since inception -- Any mergers and acquisitions - historic or planned - along with reasons - Value-chain relational trends -- e.g trends in contractual arrangements with raw material suppliers - reasons for change -- credit provision arrangements to or from input suppliers/ buyers - Perceptions of the main problems and opportunities for the future of your business - What are you adaption strategies to historic and future problems and opportunities - including competition strategy (e.g. value-addition versus lower-margin, high volume strategy) - Profit and loss - history and reasons - The respondents perceptions on personal security and their future in the sector (who you want your children to do the same job?) - Attitudes towards and requirement for industry support (from Govt. producer organisations etc.)
C. Additional questions for respondents involved in credit provision - What type of business (along the value-chain, scale etc) are most likely to request credit and for what purpose? - How has demand changed over time and why? - What are your main assessment criteria for loan provision? Who is most likely to be accepted/ rejected and why? - How do you evaluate risk?
378
- What are the rates and terms of credit provision for different types of risk - and how have they changed over time and why? - How important is the role of your type of business in credit-provision to different parts/ nodes of the value-chain? - How do you think your service compares to informal credit - or credit from input suppliers etc. (check credit arrangement with all types of respondent)? - What is the impact of government policy on credit provision.
Related Documents


![Lesson 3 Seafood: Wild and Farmed · Lesson 3: Seafood: Wild and Farmed | [1] 2016 Johns Hopkins University Lesson 3 Seafood: Wild and Farmed [Lesson Duration: 45 minutes, plus 15](https://static.cupdf.com/doc/110x72/5f6dcd508293d73bc7753858/lesson-3-seafood-wild-and-farmed-lesson-3-seafood-wild-and-farmed-1-2016.jpg)


