This article was published in an Elsevier journal. The attached copy is furnished to the author for non-commercial research and education use, including for instruction at the author’s institution, sharing with colleagues and providing to institution administration. Other uses, including reproduction and distribution, or selling or licensing copies, or posting to personal, institutional or third party websites are prohibited. In most cases authors are permitted to post their version of the article (e.g. in Word or Tex form) to their personal website or institutional repository. Authors requiring further information regarding Elsevier’s archiving and manuscript policies are encouraged to visit: http://www.elsevier.com/copyright

Welcome message from author
This document is posted to help you gain knowledge. Please leave a comment to let me know what you think about it! Share it to your friends and learn new things together.
Transcript

This article was published in an Elsevier journal. The attached copyis furnished to the author for non-commercial research and
education use, including for instruction at the author’s institution,sharing with colleagues and providing to institution administration.
Other uses, including reproduction and distribution, or selling orlicensing copies, or posting to personal, institutional or third party
websites are prohibited.
In most cases authors are permitted to post their version of thearticle (e.g. in Word or Tex form) to their personal website orinstitutional repository. Authors requiring further information
regarding Elsevier’s archiving and manuscript policies areencouraged to visit:
http://www.elsevier.com/copyright
Author's personal copy
Sustainable development in Pakistan in the context
of energy consumption demand and
environmental degradation
Shaista Alam *, Ambreen Fatima 1, Muhammad S. Butt 1
Applied Economics Research Centre, University of Karachi, Karachi-75270, Pakistan
Received 26 December 2006; received in revised form 11 April 2007; accepted 30 June 2007
Abstract
The aim of this paper is to analyze the impact of population growth, economic growth, energy intensity
(EI) growth and urbanization growth on environmental degradation in Pakistan. The paper will investigate
simultaneously the effect of population growth, urbanization, energy consumption and environmental
degradation on the sustainable economic growth as well. To ensure the sustainable development of the
economy environmental degradation should not increase with time but be reduced or at least remain
constant. If it increases, we will move further away for sustainability, while if it decreases, we will move
closer towards it. The results indicate that 1% increase in GDP growth leads to 0.84% increase in growth rate
of carbon dioxide emissions, and an increase of 1% in the energy intensity growth rate causes almost 0.24%
increases in growth rate of CO2 emissions. As far as results of co-integrating vector normalized on GDP
growth is concerned, the coefficients of EI growth and CO2 emissions growth are found to be affecting the
level of development significantly and positively by 0.3% and 1.2%, respectively. This indicates that in
Pakistan process of economic development is dependent on the level of energy use and the resultant of this
energy use, CO2 emissions caused economic growth significantly and positively. In addition to the rapid
urbanization and increased population growth affect positively to environmental degradation while
negatively and significantly to the economic development in the long run.
# 2007 Elsevier Inc. All rights reserved.
JEL classification : Q41; Q20; Q01; Q43; O40
Keywords: Economic growth; Environmental degradation; CO2 emission; Energy intensity; Urbanization
Journal of Asian Economics 18 (2007) 825–837
* Corresponding author. Tel.: +92 21 9243168/9243175; fax: +92 21 4829730.
E-mail addresses: [email protected], [email protected], [email protected], [email protected]
(S. Alam), [email protected], [email protected] (A. Fatima), [email protected], [email protected]
(M.S. Butt).1 Tel.: +92 21 9243168/9243175; fax: +92 21 4829730.
1049-0078/$ – see front matter # 2007 Elsevier Inc. All rights reserved.
doi:10.1016/j.asieco.2007.07.005
Author's personal copy
1. Introduction
Human-induced environmental degradation is the most troubling and complex global issue
facing the world as a whole. The Earth’s climate is changing at an unprecedented rate, and its
future implications are wide-ranging, particularly, the security implications of changes in the
natural environment. Environmental degradation is expected to have considerable impacts on
natural resource systems, and thereby changes in the natural environment can affect human
sustenance and economic activities. The unique combination of environmental, economic and
human security concerns embodied in the environmental damage. A growing body of research
has developed to explore the concept of vulnerability and its link to recent environmental
degradation. The question of link or the relationship between the global environmental
degradation and the sustainable economic development becomes the major issue and comes to
the focal point of research. In this study we try to find out the linkage between environmental
degradation and economic growth.
Let us consider a certain level of income, up to which one may reasonably expect high green
house gas-intensive income growth to affect adversely the environment globally. But beyond a
critical level, climatic degradation may, in principle, reach a stage where further income growth
becomes difficult. Thus, the people face the economic as well as social insecurity due to climate
change. Climate may act as a constraint to income growth at this latter stage if the green house
gas-intensive income growth process is continued. Thus, the global economy faces a serious
challenge from the global climate change. To save the world economy or in other way to protect
humanity, proper environmental policy should be adopted at appropriate time.
Economic activity promotes wealth creation but has negative effects on the environment. The
production systems currently used in industrialized countries generate vast quantities of waste
and contamination, causing degradation to natural resources. These impacts are more severe
when accompanied by demographic growth, as long as population increases lead to increases in
energy consumption and, consequently, to greater atmospheric pollution. A number of
researchers have recently considered demographic factors in order to explain the sources of air
pollution. The first studies where based on cross-sectional data for only one time period. In this
line, Cramer (1998, 2002) and Cramer and Cheney (2000) evaluated the effects of population
growth on air pollution in California and found a positive relation only for some sources of
emissions but not for others. Dietz and Rosa (1997) and York, Rosa, and Dietz (2003) studied the
impact of population on carbon dioxide emissions and energy use. The results from these studies
indicate that the elasticity of CO2 emissions and energy use with respect to population are close
to unity.
In a panel data context, Shi (2003) found a direct relationship between population changes and
carbon dioxide emissions in 93 countries over the period 1975–1996. A similar result was
obtained by Cole and Neumayer (2004). These authors considered 86 countries during the period
1975–1998 and they found a positive link between CO2 emissions and a set of explanatory
variables including population, urbanization rate, energy intensity and smaller household sizes.
In addition, several studies have discussed and tested the existence of an environmental Kuznets
curve (EKC) where the relationship between pollution and income is considered to have an
inverted U shape. These models frequently take emissions per capita for different pollutants as an
endogenous variable, assuming implicitly that the elasticity emission-population is unitary. A
few of them considered population density as an additional explanatory variable (e.g. Cole,
Rayner, & Bates, 1997; Panayotou, 2000). However, their tests are not based on an underlying
theory and testing variables individually are subject to the problem of omitted variables bias. The
S. Alam et al. / Journal of Asian Economics 18 (2007) 825–837826
Author's personal copy
results obtained within this framework are not homogeneous and their validity has been
questioned in recent surveys of the EKC literature (e.g. Stern, 1999, 2003).
A number of studies utilized total energy use as a proxy for total environmental impact. In this
line, Cole et al. (1997) and Suri and Chapman (1998) found that energy use per capita increases
monotonically with income per capita. However, when energy intensity is considered as the
dependent variable, it declines with rising income or even shows a U-shaped curve (Galli, 1998).
The relationship between energy use and income is a widely studied topic in the field of energy
economics. The empirical findings presented in the last two decades, since the seminal article
published in the late seventies by Kraft and Kraft (1978), have been mixed or conflicting. The
results depend on the sample of countries, the years under analysis and the estimation techniques
used. Some studies found evidence in favor of causality running from GDP to energy
consumption (Kraft & Kraft, 1978), for some others no causal relationship was found (Yu &
Choi, 1985; Yu & Hwang, 1984) and there are also studies showing that the causality runs in the
opposite direction: from energy consumption to GDP (e.g. Lee, 2005). While Alam and Butt
(2002) found evidence that there exists bidirectional causality between energy consumption and
economic growth in Pakistan.
The rate of urbanization and its attendant impacts differ in regions across the globe. Asia
contains almost half the world’s mega cities and continues to urbanize rapidly. Given its current
annual growth rate, Asia’s urban population is expected to double in less than 20 years.
Urbanizations reflect more than demographic change. It is both driven by and profoundly
influences the context and processes of development. It exerts both direct and indirect advantages
in the struggle towards global sustainability and human development. The origins of many global
environmental problems related to air and water pollution are located in cities—this is the
urbanization–pollution linkage (Reddy, 2004).
Per capita energy consumption remains low in the developing world. However, many African
and Asian urban centers, is being consumed biomass fuel in a large portion of energy needs. As
these countries urbanize, energy demand increases, food and other materials consumed in urban
areas must be transported across greater distances. Urban manufacturing and industry also
require more energy than traditional agriculture. In addition, the provision of infrastructure and
services to new urban residents requires energy that is not typically consumed in rural
settlements. Energy use is already high in industrialized countries and is increasing rapidly in
developing countries as they industrialize. But energy can be an instrument for sustainable
development with an emphasis on more efficient use of energy, and an increased use of renewable
energy sources, among other measures (Reddy, 2004).
The aim of this paper is to analyze the impact of population growth, economic growth, energy
intensity growth and urbanization growth on environmental degradation in Pakistan. The paper will
investigate simultaneously the effect of population growth, urbanization, energy consumption and
environmental degradation on the sustainable economic growth as well. The environmental
degradation is measured as rate of growth of CO2 emissions in that they are greenhouse effect
among the gases produced by fossil fuels (IPCC, 2001) and a reference parameter for the
aggregation of the other greenhouse gases (often measured in terms of tones of CO2 emissions
equivalent). To ensure the sustainable development of the economy environmental degradation
should not increasewith time but be reduced or at least remain constant. If it increases, we will move
further away for sustainability, while if it decreases, we will move closer towards it.
To best of our knowledge, this is the first systematic quantitative study about the relationship
between the sustainable development, energy intensity and environmental degradation within the
South Asian region particularly for Pakistan. We specify a model in which CO2 emissions growth
S. Alam et al. / Journal of Asian Economics 18 (2007) 825–837 827
Author's personal copy
rate are related with the level of economic growth, the population growth, the urbanization growth
and the energy intensity growth rate. The study specify an other model in which level of economic
growth is as an dependent variable related with the CO2 emissions growth, the population growth,
the urbanization growth and the energy intensity growth rate. The paper is organized as follows.
Section 2 presents the theoretical framework and specifies the model. Section 3 describes the
empirical analysis. Section 4 discusses the main results and Section 5 concludes.
2. Theoretical framework
As a rule of thumb, economic growth is closely related to growth in energy consumption
because the more energy is used, the higher the economic growth. However, it is possible to
decouple energy consumption and economic growth to some extent. More efficient use of energy
may entail economic growth and reduction in energy use. Energy efficiency may very well be an
economic driving force. With an increased use of sustainable energy sources, the link between
energy use and carbon dioxide emissions may be decoupled as well. The old rule saying that
pollution is an unavoidable side effect of energy use, which again is a prerequisite for economic
growth is not valid, where decision makers have a will to think differently. Based on the above,
the theoretical framework for this empirical study is set as follows:
If EI represents energy intensity, GDP is income per capita, POP is population, URBN is the
rate of urbanization and CO2 is per capita carbon dioxide emission, then we can reasonably
expect the following relationship:
CO2 ¼ f ðEI;GDP; POP;URBNÞ (1)
Expressing the variables in natural logarithms, the base regressions are:
ln CO2t ¼ b0 þ b1lnEIt þ b2lnGDPt þ b3lnPOPt þ b4lnURBNt þ e1 (2)
where b1–b4 are the elasticities and e1 is the stochastic terms with standard properties. Carbon
dioxide is a result of burning of fossil fuels and fossil fuels are burned to a large extent in the
production and consumption. Therefore, relationship between EI and CO2 emissions is positive
because, a country that is more energy-efficient (means less energy-intensive) should concei-
vably produce less CO2 emissions per capita as compared to a country that is less energy-efficient
(means more energy-intensive emits more carbon dioxide).
Another variable that could possibly have a relationship with per capita CO2 emissions is per
capita national income. Holtz-Eakin and Selden (1995) found evidence that CO2 emissions and
national income were positively related. However, Martı́nez-Zarzoso and Bengochea-Morancho
(2004) found evidence that CO2 emissions and national income were negatively related at low-
income levels, but positively related at high-income levels. Yet another possibility was found by
Liu (2005), in which there is a negative relationship between national income and CO2 emissions
when energy consumption is included in the model. Evidence also suggests that the process of
economic development has a negative effect on CO2 emission, especially for the advanced stages
of development. Behind this the idea is that new technology produces less CO2 emissions per
capita than old; that is countries with advanced technology (developed countries) have a negative
effect on per capita CO2 emission.
Thus, for developing countries like Pakistan there is basis to suggest that economic
development should have a positive relationship with CO2 emissions because the technology is
being increased to a larger extent than it is being replenished. The assumption of the emission
efficiency of new technology could even be expanded to include the further assumption that new
S. Alam et al. / Journal of Asian Economics 18 (2007) 825–837828
Author's personal copy
technology is cleaner in developed countries than in developing countries due to a technology
gap. So, there appears to be sufficient theoretical basis to include a measure of economic
development in the model, because the model will be dealing with per capita CO2 emission, the
relevant variable should be the percentage change in per capita national income. We expect
(@CO2/@GDP) to be positively related to level of economic development.
While considering the work cited by Murthy, Panda, and Parikh (1997) on rural–urban
differences in India based on an input–output modeling perspective, population growth and
urbanization rate are also included in the model. Murthy et al. (1997) argue that migration and
aggregate population growth will separately affect per capita CO2 emissions. Murthy et al. (1997)
suggest that the population density effect works through a uniform increase in energy demand
across income groups as individuals relocate from agricultural areas to the cities. This is thought
to be due to changes in lifestyle, such as the increased use of electricity, public transportation and
hot water. Therefore, increases in the population of a country will have positive effects on per
capita CO2 emissions of its inhabitants. While for rate of urbanization, there exist two alternate
views. First view argues that increase in urbanization is the main contributor to environment
pollution. For instance, Panayatou (1993) points out environmental degradation tends to first
increase as the structure of the economy changes from rural to urban, from agricultural to
industrial.
But second view suggests that urbanization impacts environment positively as urbanization
involves more efficient use of infrastructure, more efficient use of transportation and more
efficient energy use. More specifically, urban household consumes less energy than their rural
counterparts when biomass is taken into account. So, the partial derivative (@CO2/@URBN) is
either negative or positive. Furthermore, we extended our empirical analysis to explore the link
between energy intensity and economic development. In this context study also explores the
impact of environmental degradation cause by CO2 emission on economic development of
Pakistan. A separate model is run to investigate the effect of energy intensity, environmental
degradation, population growth and urbanization on economic development.
GDP ¼ f ðEI;CO2; POP;URBNÞ (3)
where again taking the natural log of the variables our base regression is:
ln GDPt ¼ a0 þ a1lnECt þ a2ln CO2t þ a3lnPOPt þ a4lnURBNt þ e2 (4)
where a1–a4 are the elasticities and e2 is the stochastic terms with standard properties.
We expect (@GDP/@EI) to be positive because energy intensity is associated with higher
economic growth via increase in productivity. However, the relationship between CO2 emissions
and GDP is complex, because the process of economic growth is closely related to growth in
energy consumption while this rapid growth in energy consumption is clearly the main driven
force of the tremendous increased in carbon dioxide emissions. Thus limiting these emissions
would affect the process of economic growth. Thus one can reasonably expect positive relation
between the two.
Finally, the first-order partial derivative of the POP2 is expected to be positive based upon
changes-in-productivity arguments. However, the sign of (@GDP/@URBN) could be either
S. Alam et al. / Journal of Asian Economics 18 (2007) 825–837 829
2 Growth in the population increased per capita energy consumption exponentially. This increased use, by the human
economy return back into the environment as waste. It has multiplied many times over and threatening the environmental
system upon which the life on earth depends.
Author's personal copy
positive or negative. For example, realizing the importance of urbanization to socioeconomic
development, Chinese government altered urbanization policy in the era of economic reform,
which greatly enhanced urbanization (Jiang & O’Neill, 2004). This rapid urbanization induced
difficulties for the cities in terms of infrastructure shortage, congestion and pollution control. On
the other hand, urbanization might be environmental-friendly. For example, urban residents do
not use biomass and use other fuels in the more efficient way. Therefore, urbanization may cause
energy transition and may independently contribute to the drop of CO2 emission and thus result in
sustainable economic development.
3. Econometric methodology
The distinction between whether the levels or differences of a series is stationary leads to
substantially different conclusions and hence test of non-stationarity, that is unit roots are the
usual practice today. Engle and Granger (1987) define a non-stationary time series to be
integrated of order d if it achieves stationarity after being differentiated d times. This notion is
usually denoted by Xt � I(d). Hence all the series are tested for the probable order of difference
stationarity by using the augmented Dickey-Fuller (ADF) tests. ADF test is a standard unit root
test, it analyzes order of integration of the data series. These statistics are calculated with a
constant and a constant plus a time trend, respectively; these tests have a null hypothesis of non-
stationarity against an alternative of stationarity. ADF test to check the stationarity of the series is
based on the equation of the form:
DYt ¼ b1 þ b2t þ d Yt�1 þ ai
Xm
i¼1
DYt�i þ et (5)
where et is a pure white noise error term and DYt � 1 = (Yt � 1 � Yt � 2), DYt � 2 = (Yt � 2 � Yt � 3),
etc.
ADF test determines whether the estimates of d are equal to zero. Fuller (1976) provided the
cumulative distribution of the ADF statistics, if the calculated t-ratio of the coefficient d is less
than the critical value from Fuller table, then Yt is said to be stationary. (Note that ‘t’-ratio of
coefficient d is always with a negative sign). Now, consider for example two series Xt and Yt both
integrated of order (d). Engle and Granger have shown that their linear combination will in
general also be I(d). It is an empirical fact that many important macroeconomic variables appear
to be integrated of order (d) or I(d) in the terminology of Engle and Granger (1987) so that their
changes are stationary. Hence, if the variables are each I(d) than it may be true that any linear
combination of these variables will also be I(d). Having established that all the series are
integrated of order (d) that is I(d) the study then proceeds to determine the long run behavioral
relationships among the variables for the purpose to examine the long-run relationship among the
variables.
3.1. Testing co-integration using vector autoregressive (VAR) approach
The VAR model used is denoted as follows:
Xt ¼ r1Xt�1 þ r2Xt�2 þ . . . . . . . . .þ rkXt�kþt þ hþ mt 1 � t � T (6)
where Xt is a vector containing GDP, CO2, EI, POP and URBN in the model. Starting from the
highest possible lag order, and sequentially testing down to the lowest, the optimal lag order is
S. Alam et al. / Journal of Asian Economics 18 (2007) 825–837830
Author's personal copy
chosen based on AIC and SBC. After running the VAR model and obtaining the most efficient lag
order by observing the AIC and SBC values, long-run relationship among the variables has been
tested using the Johansen and Juselius (J–J) co-integration technique.
Two or more variables are said to be co-integrated if their linear combination is integrated to
any order less than ‘d’. Co-integration test provides the basis for tracing the long-term
relationship. The theory of co-integration put forward by Johanson and Juselies (1990) indicates
that the maximum likelihood method is more appropriate in a multivariate system. Therefore this
study used this method to identify the number of co-integrated vectors in the model. The selection
of ‘‘r’’ co-integrating vectors is based on the two statistics defined by Johansen as the maximal
eigenvalue and the trace statistic. There is ‘‘r’’ or more co-integrating vectors. The Johansen
model is given by:
Dxt ¼ a0 þPxt�1 þXk
i¼1
uiDst�k þ vt 1 � t � T (7)
where Xt is a column vector of m endogenous variables,Q
and u are m � m matrices of unknown
parameters and vt is a Gaussian error term.Q
can be dichotomized into two m � r matrices V
and s. The reduced rank r < m ofQ
is hypothesized as H(r):Q
= �VsT. The vectors of s
representing the r linear combinations of sTXt are stationary. The matrix V represents the error-
correction parameters. To investigate the relationship, two main likelihood ratio tests, also known
as the trace test to evaluate the null hypothesis of at most r co-integrating vectors and the
maximum eigenvalue test, used to evaluate the null hypothesis of r co-integrating vectors against
the alternative of (r + 1) co-integrating vectors, are used.
3.2. Data and variables information
The study is based on annual data covering a time period from 1971 to 2005 for Pakistan. All
the time series data of energy consumption, CO2 emissions, gross domestic product per capita,
total population and the urbanization (percentage of urban population from total population) are
compile from World Development Indicators (WDI, 2005).3 The series of energy consumption
taken from WDI is available in tones of oil equivalent (toe). To generate the time series of energy
intensity (EI), energy consumption divided by gross domestic product. All these variables are
expressed in natural logarithm and hence their first differences approximate their growth rates.
4. Empirical analysis
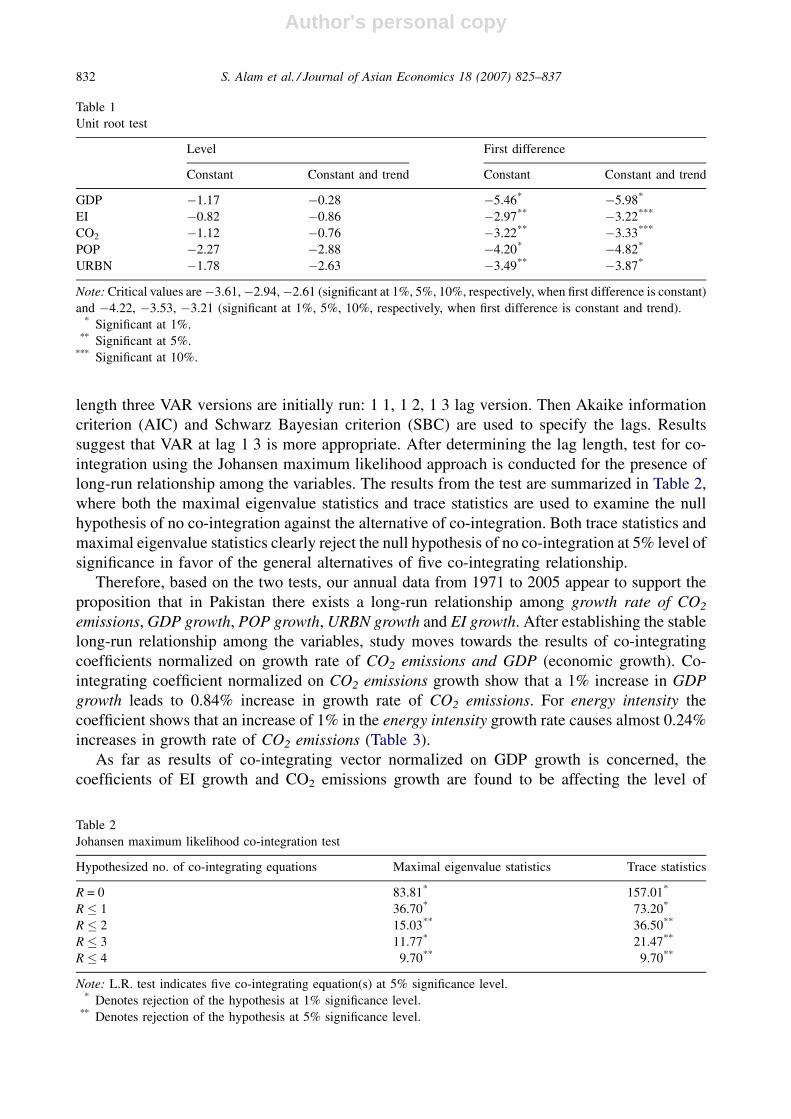
The preliminary step in our analysis is concerned with establishing the degree of integration of
each variable. For this purpose we tested for the existence of a unit root in the level and first
difference of each of the variable in our sample using the well-known augmented Dickey-Fuller
test (ADF test). ADF test statistic checks the stationarity of the series. The result presented in
Table 1 reveals that all variables are non-stationary in their level data. However, the stationarity
property is found in the first difference of the variables.
After establishing that all the individual series under consideration are stationary, VAR model
is used to estimate the co-integrating vectors among the variables. For the determination of lag
S. Alam et al. / Journal of Asian Economics 18 (2007) 825–837 831
3 Data taken from WDI (2005) are up to 2003 which was updated till 2005 by using the growth rate.
Author's personal copy
length three VAR versions are initially run: 1 1, 1 2, 1 3 lag version. Then Akaike information
criterion (AIC) and Schwarz Bayesian criterion (SBC) are used to specify the lags. Results
suggest that VAR at lag 1 3 is more appropriate. After determining the lag length, test for co-
integration using the Johansen maximum likelihood approach is conducted for the presence of
long-run relationship among the variables. The results from the test are summarized in Table 2,
where both the maximal eigenvalue statistics and trace statistics are used to examine the null
hypothesis of no co-integration against the alternative of co-integration. Both trace statistics and
maximal eigenvalue statistics clearly reject the null hypothesis of no co-integration at 5% level of
significance in favor of the general alternatives of five co-integrating relationship.
Therefore, based on the two tests, our annual data from 1971 to 2005 appear to support the
proposition that in Pakistan there exists a long-run relationship among growth rate of CO2
emissions, GDP growth, POP growth, URBN growth and EI growth. After establishing the stable
long-run relationship among the variables, study moves towards the results of co-integrating
coefficients normalized on growth rate of CO2 emissions and GDP (economic growth). Co-
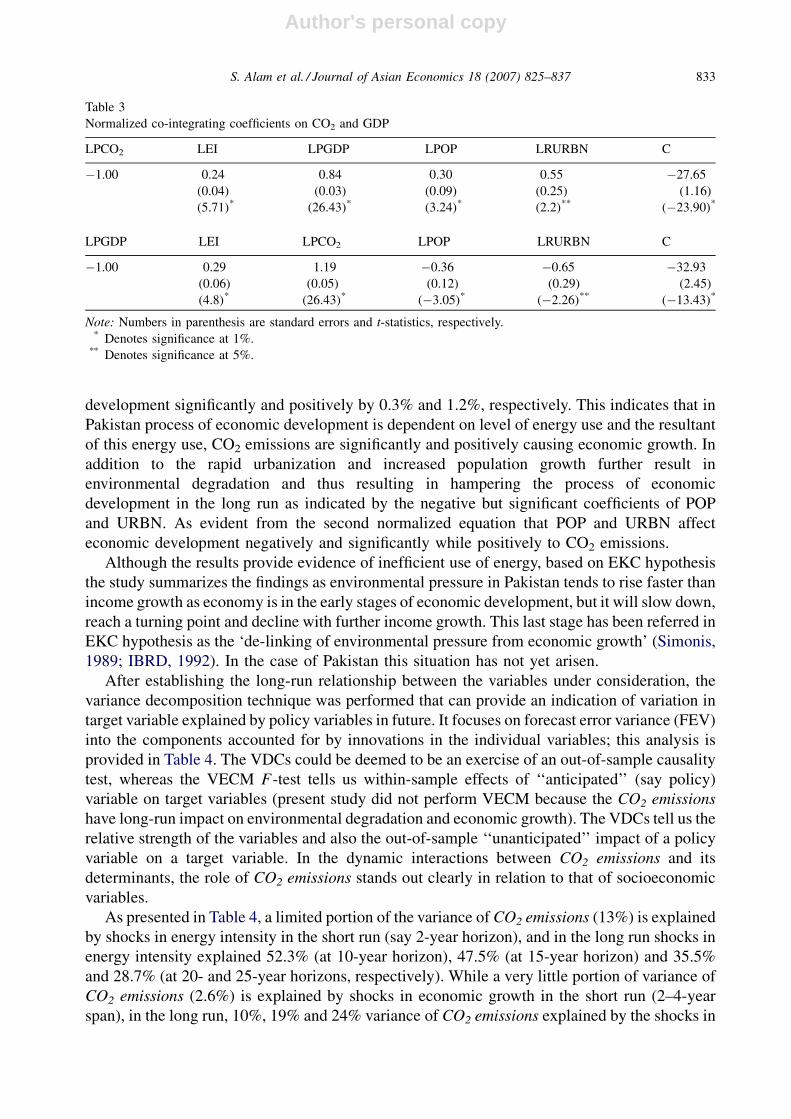
integrating coefficient normalized on CO2 emissions growth show that a 1% increase in GDP
growth leads to 0.84% increase in growth rate of CO2 emissions. For energy intensity the
coefficient shows that an increase of 1% in the energy intensity growth rate causes almost 0.24%
increases in growth rate of CO2 emissions (Table 3).
As far as results of co-integrating vector normalized on GDP growth is concerned, the
coefficients of EI growth and CO2 emissions growth are found to be affecting the level of
S. Alam et al. / Journal of Asian Economics 18 (2007) 825–837832
Table 1
Unit root test
Level First difference
Constant Constant and trend Constant Constant and trend
GDP �1.17 �0.28 �5.46* �5.98*
EI �0.82 �0.86 �2.97** �3.22***
CO2 �1.12 �0.76 �3.22** �3.33***
POP �2.27 �2.88 �4.20* �4.82*
URBN �1.78 �2.63 �3.49** �3.87*
Note: Critical values are�3.61,�2.94,�2.61 (significant at 1%, 5%, 10%, respectively, when first difference is constant)
and �4.22, �3.53, �3.21 (significant at 1%, 5%, 10%, respectively, when first difference is constant and trend).* Significant at 1%.
** Significant at 5%.*** Significant at 10%.
Table 2
Johansen maximum likelihood co-integration test
Hypothesized no. of co-integrating equations Maximal eigenvalue statistics Trace statistics
R = 0 83.81* 157.01*
R � 1 36.70* 73.20*
R � 2 15.03** 36.50**
R � 3 11.77* 21.47**
R � 4 9.70** 9.70**
Note: L.R. test indicates five co-integrating equation(s) at 5% significance level.* Denotes rejection of the hypothesis at 1% significance level.
** Denotes rejection of the hypothesis at 5% significance level.
Author's personal copy
development significantly and positively by 0.3% and 1.2%, respectively. This indicates that in
Pakistan process of economic development is dependent on level of energy use and the resultant
of this energy use, CO2 emissions are significantly and positively causing economic growth. In
addition to the rapid urbanization and increased population growth further result in
environmental degradation and thus resulting in hampering the process of economic
development in the long run as indicated by the negative but significant coefficients of POP
and URBN. As evident from the second normalized equation that POP and URBN affect
economic development negatively and significantly while positively to CO2 emissions.
Although the results provide evidence of inefficient use of energy, based on EKC hypothesis
the study summarizes the findings as environmental pressure in Pakistan tends to rise faster than
income growth as economy is in the early stages of economic development, but it will slow down,
reach a turning point and decline with further income growth. This last stage has been referred in
EKC hypothesis as the ‘de-linking of environmental pressure from economic growth’ (Simonis,
1989; IBRD, 1992). In the case of Pakistan this situation has not yet arisen.
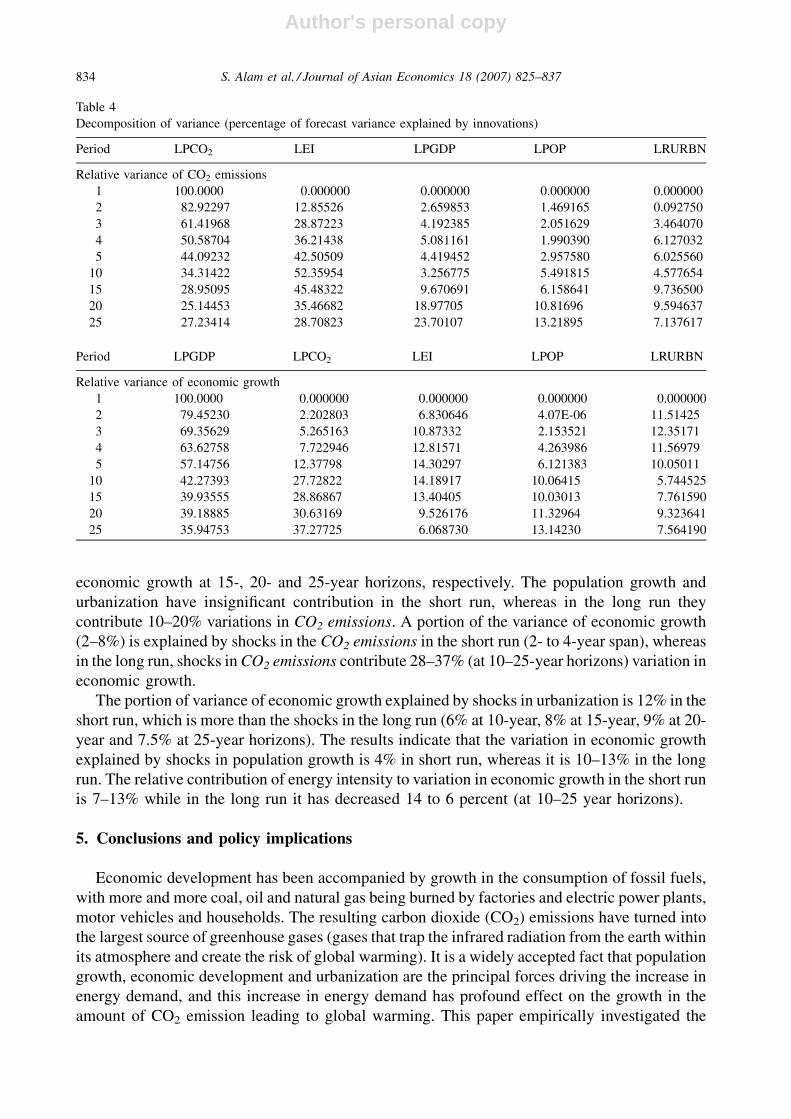
After establishing the long-run relationship between the variables under consideration, the
variance decomposition technique was performed that can provide an indication of variation in
target variable explained by policy variables in future. It focuses on forecast error variance (FEV)
into the components accounted for by innovations in the individual variables; this analysis is
provided in Table 4. The VDCs could be deemed to be an exercise of an out-of-sample causality
test, whereas the VECM F-test tells us within-sample effects of ‘‘anticipated’’ (say policy)
variable on target variables (present study did not perform VECM because the CO2 emissions
have long-run impact on environmental degradation and economic growth). The VDCs tell us the
relative strength of the variables and also the out-of-sample ‘‘unanticipated’’ impact of a policy
variable on a target variable. In the dynamic interactions between CO2 emissions and its
determinants, the role of CO2 emissions stands out clearly in relation to that of socioeconomic
variables.
As presented in Table 4, a limited portion of the variance of CO2 emissions (13%) is explained
by shocks in energy intensity in the short run (say 2-year horizon), and in the long run shocks in
energy intensity explained 52.3% (at 10-year horizon), 47.5% (at 15-year horizon) and 35.5%
and 28.7% (at 20- and 25-year horizons, respectively). While a very little portion of variance of
CO2 emissions (2.6%) is explained by shocks in economic growth in the short run (2–4-year
span), in the long run, 10%, 19% and 24% variance of CO2 emissions explained by the shocks in
S. Alam et al. / Journal of Asian Economics 18 (2007) 825–837 833
Table 3
Normalized co-integrating coefficients on CO2 and GDP
LPCO2 LEI LPGDP LPOP LRURBN C
�1.00 0.24 0.84 0.30 0.55 �27.65
(0.04) (0.03) (0.09) (0.25) (1.16)
(5.71)* (26.43)* (3.24)* (2.2)** (�23.90)*
LPGDP LEI LPCO2 LPOP LRURBN C
�1.00 0.29 1.19 �0.36 �0.65 �32.93
(0.06) (0.05) (0.12) (0.29) (2.45)
(4.8)* (26.43)* (�3.05)* (�2.26)** (�13.43)*
Note: Numbers in parenthesis are standard errors and t-statistics, respectively.* Denotes significance at 1%.
** Denotes significance at 5%.
Author's personal copy
economic growth at 15-, 20- and 25-year horizons, respectively. The population growth and
urbanization have insignificant contribution in the short run, whereas in the long run they
contribute 10–20% variations in CO2 emissions. A portion of the variance of economic growth
(2–8%) is explained by shocks in the CO2 emissions in the short run (2- to 4-year span), whereas
in the long run, shocks in CO2 emissions contribute 28–37% (at 10–25-year horizons) variation in
economic growth.
The portion of variance of economic growth explained by shocks in urbanization is 12% in the
short run, which is more than the shocks in the long run (6% at 10-year, 8% at 15-year, 9% at 20-
year and 7.5% at 25-year horizons). The results indicate that the variation in economic growth
explained by shocks in population growth is 4% in short run, whereas it is 10–13% in the long
run. The relative contribution of energy intensity to variation in economic growth in the short run
is 7–13% while in the long run it has decreased 14 to 6 percent (at 10–25 year horizons).
5. Conclusions and policy implications
Economic development has been accompanied by growth in the consumption of fossil fuels,
with more and more coal, oil and natural gas being burned by factories and electric power plants,
motor vehicles and households. The resulting carbon dioxide (CO2) emissions have turned into
the largest source of greenhouse gases (gases that trap the infrared radiation from the earth within
its atmosphere and create the risk of global warming). It is a widely accepted fact that population
growth, economic development and urbanization are the principal forces driving the increase in
energy demand, and this increase in energy demand has profound effect on the growth in the
amount of CO2 emission leading to global warming. This paper empirically investigated the
S. Alam et al. / Journal of Asian Economics 18 (2007) 825–837834
Table 4
Decomposition of variance (percentage of forecast variance explained by innovations)
Period LPCO2 LEI LPGDP LPOP LRURBN
Relative variance of CO2 emissions
1 100.0000 0.000000 0.000000 0.000000 0.000000
2 82.92297 12.85526 2.659853 1.469165 0.092750
3 61.41968 28.87223 4.192385 2.051629 3.464070
4 50.58704 36.21438 5.081161 1.990390 6.127032
5 44.09232 42.50509 4.419452 2.957580 6.025560
10 34.31422 52.35954 3.256775 5.491815 4.577654
15 28.95095 45.48322 9.670691 6.158641 9.736500
20 25.14453 35.46682 18.97705 10.81696 9.594637
25 27.23414 28.70823 23.70107 13.21895 7.137617
Period LPGDP LPCO2 LEI LPOP LRURBN
Relative variance of economic growth
1 100.0000 0.000000 0.000000 0.000000 0.000000
2 79.45230 2.202803 6.830646 4.07E-06 11.51425
3 69.35629 5.265163 10.87332 2.153521 12.35171
4 63.62758 7.722946 12.81571 4.263986 11.56979
5 57.14756 12.37798 14.30297 6.121383 10.05011
10 42.27393 27.72822 14.18917 10.06415 5.744525
15 39.93555 28.86867 13.40405 10.03013 7.761590
20 39.18885 30.63169 9.526176 11.32964 9.323641
25 35.94753 37.27725 6.068730 13.14230 7.564190
Author's personal copy
relationship among economic development, energy intensity, CO2 emission, population growth
and urbanization in case of Pakistan during the period 1971–2005. Results indicate that
economic development in Pakistan is energy driven, which contributes considerably to CO2
emissions.
Results also indicate that 1% increase in economic growth in the long run will increase the
CO2 emission up to 0.84% while 1% increase in CO2 emission and energy intensity will increase
the level of development up to 1.2% and 0.3%, respectively. This indicates extremely inefficient
energy use, which could become the biggest economic problem for Pakistan but following EKC
hypothesis the situation may not reach. High rate of CO2 emissions in Pakistan is also explained
by its high level of urbanization and population growth, leading to congestion and pollution
problem.
The paper goes further (through variance decomposition technique), decomposes the total
impact of an unanticipated shock to each of the variables, beyond the sample period, into
proportions attributable to shocks in the other variables, including its own. The exercise therefore
enables us to examine the relative contributions of the determinants of CO2 emissions in
explaining the FEV of CO2 emissions. The VDCs exercise provides the additional information
that a substantial part of the (forecast error) variance of CO2 emissions is explained by changes in
energy intensity alone (13%) in the short run (at 2-year horizon), but in the long run variance of
CO2 emissions explained by changes in the energy intensity and economic growth is 55–56% (at
10–25-year span). The exercise also brings to light the significant and predominant role played by
the CO2 emissions, in explaining the variance of economic growth.
For the policy prescriptions, this paper suggests that in the national policy, country should
protect and preserve her own natural resources. These natural resources would be the basis for the
economic activities, which lead to future economic growth and development. The country should
increase the forest area up to an optimum level (at least one-third of land). Thus, the highest
priority should be given to the land-use and land conversions in the national policy.
Country should invest in infrastructure to exploit as yet underutilized energy resources,
including natural gas, coal and hydro-electricity. There is need to investments in improved
generation, distribution and consumption technology. In the longer term, strategies will be
required to find alternative sources of energy. The major tasks are to remove incentives that
promote environmental degradation, such as subsidies for unsustainable use of land, water and
forests; to create enabling conditions to ensure that resource extraction does not harm
neighboring communities; to strengthen regulations governing pollution and their enforcement
and, perhaps most important, to improve environmental policy and its implementation.
Linking the use of these resources in a sustainable manner to demand from a fast-growing
country will enable the benefits of rapid growth. A major challenge will be to maximize efficient
and sustainable use of resources. A particular concern is to minimize the impact of resource
(forests, fisheries) licensing mechanisms on the livelihoods of local communities. Involving local
communities in managing natural resources directly (e.g. forests, coral reefs and fisheries) has
been shown to be an effective way of tackling environmental issues in some areas. Similarly,
environmental regulations and their implementation merit strengthening in order to promote
investment in environmental management and place limits on potentially damaging activities,
such as excessive drawdown of resources, (e.g. timber, groundwater resources and fish) and
pollution (including greenhouse gases).
Rapid and intensive agricultural and industrial growth, together with urbanization, has
increased environmental problems across the country in recent decades. The problems include
deforestation, land degradation, pressure on water supplies, industrial pollution, pollution from
S. Alam et al. / Journal of Asian Economics 18 (2007) 825–837 835
Author's personal copy
energy generation and the problems of rapidly growing cities. Investments in renewable energy
(hydro, wind, solar, biogas) will make a minor contribution, as will increased efficiency in using
conventional resources. Energy use has a variety of impacts. Energy extraction and processing
always involve some forms of environmental disruption including both geomorphological and
ecological disruption as well as pollution. Energy use involves both pollution and other impacts
such as noise from transport and land use impacts such as the construction of roads, etc. As all
human activities require energy use, in fact all human impacts on the environment could be seen
as the consequences of energy use.
A shift from lower- to higher-quality energy sources not only reduces the total energy required
to produce a unit of GNP but also may reduce the environmental impact of the remaining energy
use. An obvious example would be a shift from coal use to natural gas use. Natural gas is cleaner
burning and produces less carbon dioxide per unit of energy derived. The environmental impact
of energy use may also change over time due to technological innovation that reduces the
emissions of various pollutants or other environmental impacts associated with each energy
source. Therefore, despite the strong connections between energy use and economic growth there
are several pathways through which the environmental impact of growth can be reduced. Again,
however, if there are limits to substitution and technological change then the potential reduction
in the environmental intensity of economic production is eventually limited.
Finally, reducing energy consumption through lifestyle changes requires a strategy: using
pricing and taxation for discouraging the use of energy-intensive devices and encouraging the use
of energy-conserving devices. To be successful, the strategies outlined above must harness both
appropriate supply and end-use technologies. The strategies must also be converted into policies
wielded by policy agents through policy instruments. Complete hardware plus ‘software’—
policies, management, financing, training, institutions—solutions are essential for the
deployment of energy as an instrument of sustainable development.
In the last, we end with the word of caution that the amount of carbon dioxide emission
depends on the size of its economy, the level of industrialization and the efficiency of energy use.
Even though developing countries contain most of the world’s population, their industrial
production and energy consumption per capita are relatively low. Hence, until recently there has
been little doubt that the primary responsibility for creating the risk of global warming lies with
the developed countries.
References
Alam, S., & Butt, M. S. (2002). Causality between energy and economic growth in Pakistan: An application of co-
integration and error correction modeling techniques. Pacific and Asia Journal of Energy, 12(2), 151–165.
Cole, M. A., & Neumayer, E. (2004). Examining the impact of demographic factors on air pollution. Population and
Development Review, 26(1), 5–21.
Cole, M. A., Rayner, A. J., & Bates, J. M. (1997). The environmental Kuznets curve: An empirical analysis. Environment
and Development Economics, 2(Part 4), 401–416.
Cramer, C. J. (1998). Population growth and air quality in California. Demography, 35(1), 45–56.
Cramer, C. J. (2002). Population growth and local air pollution: Methods, models and results. In Lutz, W., Prkawetz, A., &
Sanderson, W. C. (Eds.), Population and environment. A supplement to Vol. 28, 2002, population and development
review (pp. 22–52). New York: Population Council.
Cramer, J. C., & Cheney, R. P. (2000). Lost in the ozone: Population growth and ozone in California. Population and
Environment, 21(3), 315–337.
Dietz, T., & Rosa, E. A. (1997). Effects of population and affluence on CO2 emissions. Proceedings of the National
Academy of Sciences USA, 94, 175–179.
S. Alam et al. / Journal of Asian Economics 18 (2007) 825–837836
Author's personal copy
Engle, R. F., & Granger, C. W. J. (1987). Co-integration and error correction: Representation, estimation and testing.
Econometrica, 55, 251–276.
Fuller, W. A. (1976). Introduction to statistical time series (pp. 371–373). New York: John Wiley.
Galli, R. (1998). The relationship between energy intensity and income levels: Forecasting log-term energy demand in
Asian emerging countries. Energy Journal, 19(4), 85–105.
Holtz-Eakin, D., & Selden, T. M. (1995). Stoking the fires? CO2 emissions and economic growth. Journal of Public
Economics, 57, 85–101.
IBRD (International Bank for Reconstruction and Development). (1992). Development and the Environment. World
Development Report (World Bank). Oxford University Press, Oxford, p. 308.
IPCC (Intergovernmental Panel on Climate Change). (2001). Third assessment report – climate change. Geneva,
Switzerland.
Johanson, S., & Juselies, K. (1990). Maximum likelihood estimation and inference on cointegration with applications for
the demand for money. Oxford Bulletin of Economic and Statistics, 52, 169–210.
Jiang, L., & O’Neill, B. (2004). Energy transition in rural China. International Journal of Global Energy Issues, 1/2, 2–26.
Kraft, J., & Kraft, A. (1978). On the relationship between energy and GNP. Journal of Energy and Development, 3, 401–
403.
Lee, C. C. (2005). Energy consumption and GDP in developing countries: A cointegrated panel analysis. Energy
Economic, 27(3), 415–427.
Liu, Xu em ei (2005). Explaining the relationship between CO2 emissions and national income: The role of energy
consumption. Economics Letters, 87, 325–328.
Martı́nez-Zarzoso, I., & Bengochea-Morancho, A. (2004). Testing for environmental Kuznets curves for CO2: Evidence
from pooled mean group estimates. Economic Letters, 82(1), 121–126.
Murthy, N. S., Panda, M., & Parikh, J. (1997). Economic growth, energy demand and carbon dioxide emissions in India:
1990–2020. Environment and Development Economics, 2, 173–193.
Panayatou, T. (1993). Empirical tests and policy analysis of environmental degradation at different stages of economic
development (p. 42) (World Employment Research Programme Working Paper). Geneva: International Labour Office.
Panayotou, T. (2000). Empirical tests and policy analysis of environmental degradation at different stages of economic
development (Working Paper WP238, Technology and Employment Programme). Geneva: International Labour
Office.
Reddy, A. K. N. (2004). Energy and Social Issue. In T. B. Johansson & J. Goldemberg (Eds.), Energy and the challenge of
sustainability. New York: UNDP, UNDESA and WEC.
Shi, A. (2003). The impact of population pressure on global carbon dioxide emissions, 1975–1996: Evidence from pooled
cross-country data. Ecological Economics, 44, 29–42.
Simonis, U. E. (1989). Industrial restructuring for sustainable development: three points of departure. Berlin: Science
Centre Berlin FS II 89-40 1.
Stern, D. I. (1999). Is energy cost an accurate indicator of natural resource quality? Ecological Economics, 31, 381–394.
Stern, D. I. (2003). Energy and Economic Growth. Mimeo.
Suri, V., & Chapman, D. (1998). Economic growth, trade and energy: Implications for the environmental Kuznets curve.
Ecological Economics, 25, 195–208.
World Bank. (2005). World development indicators (WDI) 2005 CD-ROM. Washington: The World Bank.
York, R., Rosa, E. A., & Dietz, t. (2003). STIRPAT, IPAT and IMPACT: Analytic tools for unpacking the driving forces of
environmental impacts. Ecological Economics, 46(3), 351–365.
Yu, E. S. H., & Hwang, B. (1984). The relationship between energy and GNP: An international comparison. Journal of
Energy and Development, 10, 249–272.
Yu, S. H. Eden, & Choi, J. (1985). The causal relationship between energy and GDP: An international comparison. The
Journal of Energy and Development, 10(2), 249–270.
S. Alam et al. / Journal of Asian Economics 18 (2007) 825–837 837
Related Documents