Sustainable consumption of bakery products; a challenge for Czech consumers and producers. Tomas Ratinger 1 , Iveta Boskova 2 and Adam Tomka 3 1 Strategic studies, Technology Centre of the Academy of Sciences of the Czech Republic, Prague, [email protected] 2 Agricultural Market dept., Institute of Agricultural Economics and Information, Prague, [email protected] 3 Dept. for Economics and Development, Faculty of Tropical Agriculture, Czech University of Life Sciences, Prague, [email protected] Paper prepared for presentation at the EAAE-AAEA Joint Seminar ‘Consumer Behavior in a Changing World: Food, Culture, Society” March 25 to 27, 2015, Naples, Italy Abstract Reducing food wastes attracts increasingly public attention in the context of global food security. Bakery products belong to food with relatively high level of wastes in Czech households. It has motived us to launch an explorative research to investigate reasons for such wastes. We have adopted several recent approaches to sustainability of consumption, i.e. product-service perspective, social practices approach combined with classical consumer behaviour analysis. In our investigation we analysed statistical household survey data, conducted online survey on bakery product wastes organised focus groups on social practices in purchasing and consuming bakery products and did several interviews with bakery processors. Our research indicates that bakery products wastes are rather low in contrast to the presumption. This is likely due to the different understanding of wastes in various surveys. We found that price is less important in decision on purchasing bakery products than it is generally thought. The critical issue for bread and rolls consumption is “freshness” of the product. It has appeared that it is not easy to deal with that at the household level: households lack equipment, knowledge and trust to various methods of keeping bread. To respond to it the bakery processors either returned to traditional high content of rye flour or experiment with aseptic packaging. The norms on handling with bread in households are likely not as strong as in the past, nevertheless, participants in the focus groups agreed that bread should not be wasted. It seems that bread has lost a lot of its social role. Keywords: food waste, bread consumption, consumer behaviour, social practices Topic: The new dimensions of food consumption: ideological, social, cultural

Welcome message from author
This document is posted to help you gain knowledge. Please leave a comment to let me know what you think about it! Share it to your friends and learn new things together.
Transcript
Sustainable consumption of bakery products; a challenge for Czech consumers and producers.
Tomas Ratinger1, Iveta Boskova2 and Adam Tomka3 1Strategic studies, Technology Centre of the Academy of Sciences of the Czech Republic,
Prague, [email protected] 2 Agricultural Market dept., Institute of Agricultural Economics and Information, Prague,
[email protected] 3 Dept. for Economics and Development, Faculty of Tropical Agriculture, Czech University
of Life Sciences, Prague, [email protected]
Paper prepared for presentation at the EAAE-AAEA Joint Seminar ‘Consumer Behavior in a Changing World: Food, Culture, Society”
March 25 to 27, 2015, Naples, Italy
Abstract Reducing food wastes attracts increasingly public attention in the context of global food
security. Bakery products belong to food with relatively high level of wastes in Czech
households. It has motived us to launch an explorative research to investigate reasons for such
wastes. We have adopted several recent approaches to sustainability of consumption, i.e.
product-service perspective, social practices approach combined with classical consumer
behaviour analysis. In our investigation we analysed statistical household survey data,
conducted online survey on bakery product wastes organised focus groups on social practices
in purchasing and consuming bakery products and did several interviews with bakery
processors. Our research indicates that bakery products wastes are rather low in contrast to the
presumption. This is likely due to the different understanding of wastes in various surveys. We
found that price is less important in decision on purchasing bakery products than it is generally
thought. The critical issue for bread and rolls consumption is “freshness” of the product. It has
appeared that it is not easy to deal with that at the household level: households lack equipment,
knowledge and trust to various methods of keeping bread. To respond to it the bakery
processors either returned to traditional high content of rye flour or experiment with aseptic
packaging. The norms on handling with bread in households are likely not as strong as in the
past, nevertheless, participants in the focus groups agreed that bread should not be wasted. It
seems that bread has lost a lot of its social role.
Keywords: food waste, bread consumption, consumer behaviour, social practices
Topic: The new dimensions of food consumption: ideological, social, cultural
1
Sustainable consumption of bakery products; a challenge for Czech consumers and producers.
Tomas Ratinger, Iveta Boskova and Adam Tomka
Introduction Reducing food consumption and wastes attracts increasingly public attention in the context of
global food security. According to the European Commission about 100 million tonnes of food
is wasted annually in the EU, of it 40 % happen at the retail and consumption level (DG
SANCO, 2014). In 2011, the OECD Green Growth Strategy identified reducing food waste as
one of the future challenges to meet the growing global food demand while lowering the
pressures on resources and the climate (OECD, 2011). Recent communication from the
European Commission (2014) proposes that member states develop national food-waste
prevention strategies and attempt to ensure the reducing of food waste in the manufacturing,
retail/distribution, food service/hospitality sectors and households by at least 30 % by 2025.
Worldwide, there is a wide range of policies applied or considered to reduce food consumption
and wastes; on the one pole there are restrictive measures (Ushikubo, 2013; Takata et al.,
2012), on the other pole the countries concentrate on raising of public awareness, education
and voluntary measures (WRAP, 2011). As pointed out by Mont (2002) reducing food
consumption as a principle is difficult because there are large groups of people for which it is
desirable to increase the intake of nutrients. Thus, voluntary measures are preferable, however,
these require a certain level of understanding coming from rational, ethical and cultural
motives.
Bread and bakery products belong to food with relatively high level of wastes at the household
level in Europe (Katajajuuri et al., 2014, Prieffer et al., 2013). In the Czech Republic there was
found that this kind of products even rank to the most frequently wasted food (CVVN, 2014B).
The consumption of bread and bakery products has undergone a considerable change in recent
years in the Czech Republic as the supply changed in the ways of distribution, the range of
products and their qualitative characteristics, price, etc. Just only the figures of the shares of
bread and bakery products consumed indicate significant changes in the branch. While in 1989
the average annual per capita consumption accounted 55 kg for bread and 33 kg for other
bakery and cereal products, the shares reversed during 25 years and in 2013 they reached 42 kg
for bread and 68 kg for other bakery and cereal products (ČSÚ, 2014).
2
In order to work on a strategy for the reducing of consumers wasting it is to understand
consumers’ motives and habits of their purchase and consumption, as well as their desires and
critics of bread and bakery supply and retail distribution. It is to examine if the wasting relates
rather to the way of life and consumers themselves (such as their values scale, life speed or
other incentives) or if it relates more to the assortment supplied and way of sale coming from
the production and retail side.
The objective of our research is to investigate economic, social and institutional factors which
affect consumption and wastes of bread and bakery products in the Czech Republic; if there are
tendencies of the shift toward a more sustainable consumption (reduction of wastes), and
which role play producers, retailers and consumers themselves in it.
It is an explorative research to provide information on the challenges in the investigation of
sustainable food consumption and food waste.
The paper is structured as follows: in the next section we review literature on the subject of
sustainable consumption and food waste and introduce the conceptual framework of our study.
It is followed by the specification of the methodology, i.e. research methods and data. After
that we shortly introduce the recent development of the consumption of bakery products in the
Czech Republic. We present results of our research in three consequent sections: the analysis
of households’ behavior concerning bread consumption and waste; insight in social practices
concerning bread and rolls; and finding from interviews on consumption alternatives with
some processors and retailers. Findings are summarized and discussed in the concluding
paragraph.
Conceptual framework
The term “sustainable consumption and production” emphasises the role of consumption and
consumers in achieving improvement of global sustainability. While most attention has been
paid to the regulation of the production sectors so far, the recognition that changing attitude of
consumers might yield much larger effects is at its outset. The argument for focusing on
consumption rest in the fact that consumer choice plays a leading role in orienting production.
The concept of sustainable consumption includes three areas of changes
• Reducing consumption;
• Shifting consumption pattern to a more sustainable one;
• Reducing waste and recycling.
3
Reducing food consumption as a principle is difficult because there are large groups of people
for which it is desirable to increase the intake of nutrients (Mont, 2002). In the developed
countries, reducing food consumption is often associated with health concerns/ health
recommendations (see for example Duchin, 2005).
The most policy and research attention concentrates on shifts toward more sustainable food
products and on food losses. The former includes issues like reducing meat consumption or
increasing the consumption of locally produced food and organic products. Concerning the
latter, about one-third of the food produced for human consumption is lost or wasted every
year (Gustavsson et al., 2011). Parfitt et al. (2010) distinguishes between food losses and food
wastes, arguing that the former relates to early stages of the food supply chain (FSC) and refers
to a system which needs investment in infrastructure. In contrast, the term food waste is
applied to later stages of the FSC, and generally relates to behaviour of food suppliers and
consumers. Priefer et al (2013) in the accord with Ventour (2008) identified four main reasons
for food being wasted in households: ‘left on the plate’, ‘passed its date’, ‘looked, smelt or
tasted bad’, ‘went mouldy’ and ‘left over from cooking’. According to survey results of Gusia
(2012) main reason for food being wasted in households are: ‘too long in fridge’, ‘wrong
storage’ and ‘cooked too much’. These investigations indicate that, in spite of being well
educated, people in the developed countries either lack knowledge how to preserve food, or
they do not care or that their life style simply prevent them to manage food in a proper way.
In spite of being identified on the side of consumers, moderating these hurdles is not possible
without changes in production, infrastructure and social contexts. In this respect some authors
(e.g. Mont, 2002) propose concept of sustainable product-service system (SPSS) in which
consumers buy utilisation of products (mobility) instead of products (cars) . According to Mont
(2002), the advantage of adopting product service approach enables to seek consumption
options which contribute to environmental protection without reducing consumer welfare. This
linking of production and consumption together is appreciated by Mylan (2014) when
proposing to adopt the social practices approach from the sociology of consumption (Warde,
2005) in studying sustainability of consumption. The basic idea of social practices is that
people use and consume many resources and products while they engage in routine activities.
Practices usually entail number of element like material, cultural aspects, norms, habits and
skills. Practices are dynamic, they reproduce and change. Thus Warde, (2005) and Mylan
(2014) argue that patterns of consumption cannot be changed only by educating or persuading
4
individuals to make different decisions, but that the nature of the practices themselves must be
changed.
In her research, Mylan (2014) contrasted the success of the lighting transition and so far the
failure in introducing low temperature washing. She argues that the former was prone to
changes since consumers were looking for diversity of lighting, but also that constituent
elements of social practices (lighting use) were only loosely coupled among themselves while
the spread of low temperature washing was blocked by tight coupling between constituent
elements: Contemporary understandings of clean clothes (meaning) are deeply linked to the
use of automatic washing machines, synthetic detergents (material) and high temperature.
Garonne et al. (2014) introduced a conceptual model of surplus food generation and
management (called ASRW, i.e. Availability-Surplus-Recoverability-Waste) along the
integrated food supply chain. Food availability is defined as all food passing throughout the
food supply chain and households. Food availability includes three food categories: consumed
food, surplus food and food scrap. Consumed food is the edible food that is delivered through
the traditional market and is consumed by humans. Surplus food is the edible food that is
produced, manufactured, retailed or served but for various reasons is not sold to or consumed
by the intended customer. Food scrap consists of non-edible food, e.g. leftovers at the
manufacturing stage or the non-edible parts of otherwise edible food. See the central scheme in
Figure 1 and later comments when describing our conceptual scheme.
Garonne et al. (2014) considers four main surplus food management techniques: feeding
humans (e.g. donations to food banks), feeding animals, waste recovery (e.g. composting,
production of energy), and finally environmentally unfriendly food disposal. The transition
from surplus food to food waste is regarded as a degree of recoverability. Surplus food
recoverability for human consumption is inherently different at different stages in the food
supply chain and for different kinds of products. Garonne at al. (2014) argues that the degree
of recoverability at the household consumption stage is low as a result of a low value of
intrinsic recoverability and high management intensity. The intrinsic recoverability of surplus
food is very low because products are either not consumed before the end of their shelf life or
they are cooked but not consumed. As a consequence, surplus food is mainly managed through
waste disposal. The disconnection across individual households, and the absence of special
equipment to rapidly cool the food at home reduce recoverability of surplus food too.
5
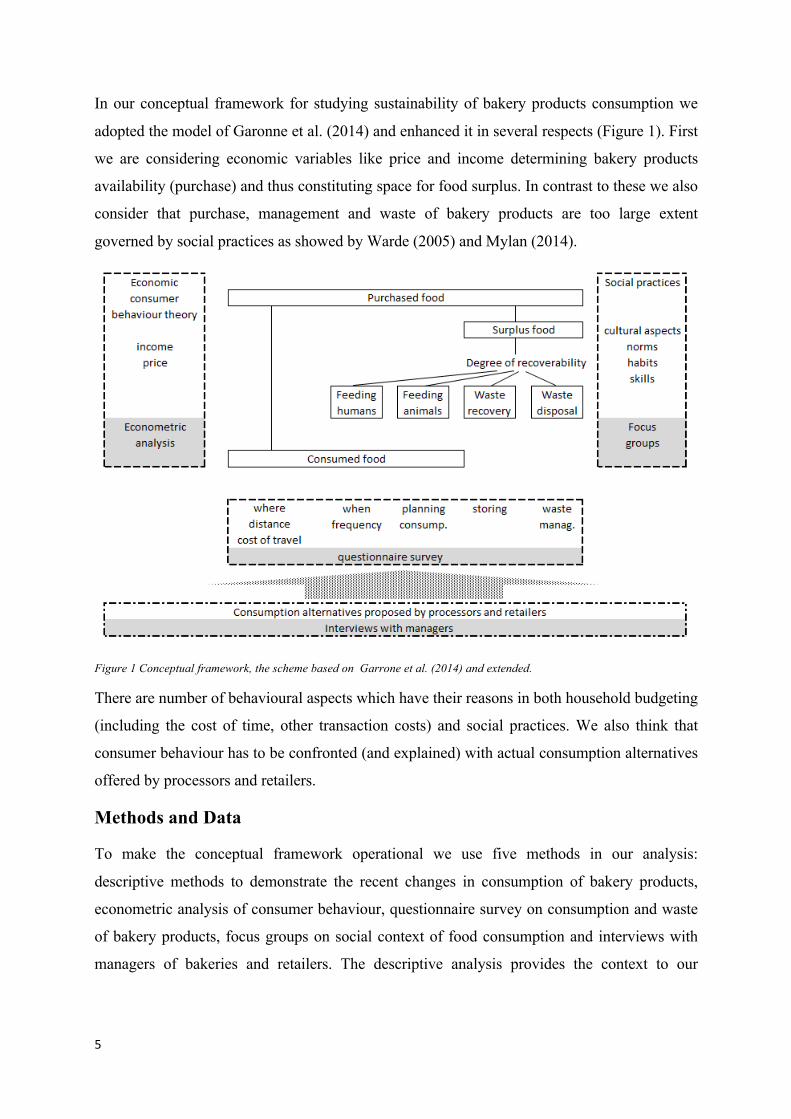
In our conceptual framework for studying sustainability of bakery products consumption we
adopted the model of Garonne et al. (2014) and enhanced it in several respects (Figure 1). First
we are considering economic variables like price and income determining bakery products
availability (purchase) and thus constituting space for food surplus. In contrast to these we also
consider that purchase, management and waste of bakery products are too large extent
governed by social practices as showed by Warde (2005) and Mylan (2014).
Figure 1 Conceptual framework, the scheme based on Garrone et al. (2014) and extended.
There are number of behavioural aspects which have their reasons in both household budgeting
(including the cost of time, other transaction costs) and social practices. We also think that
consumer behaviour has to be confronted (and explained) with actual consumption alternatives
offered by processors and retailers.
Methods and Data
To make the conceptual framework operational we use five methods in our analysis:
descriptive methods to demonstrate the recent changes in consumption of bakery products,
econometric analysis of consumer behaviour, questionnaire survey on consumption and waste
of bakery products, focus groups on social context of food consumption and interviews with
managers of bakeries and retailers. The descriptive analysis provides the context to our
6
investigation and thus is not include in Figure 1, the other four of them are included and
associated with the area of investigation.
The main purpose of the econometric analysis was to investigate the effect of price and income
development on bakery consumption. We used annual data from the household surveys of the
Czech Statistical Office (CzSO) for two socio-economic groups of respondents: economic
active (ea) and pensioners (pn) and the period 1993 – 2013. We estimated income and price
elasticities using Cobb-Douglass demand function and Stone’s analysis (both with imposed
homogeneity restriction). In the former model, prices and income were deflated by the general
consumer price index (CPI). In the latter, we used Stone’s Price Index (Deaton, A.,
Muellbauer, 1980). These rather simple models were used mainly because of low number of
observations (21 years, 20 for fist differences). The models were estimated in first differences
to avoid the problem of serial correlation. The considered there level of budgeting: i) total
consumption differentiated in three categories: food, manufacturing goods and
housing&services; ii) food consumption differentiated in bakery&cereal products, animal
protein products and other products; and finally the more detailed level of bakery and cereal
products encompassing bread (containing rye flour and weighting more than 350g ), rolls &
baguettes (predominantly wheat products) and other bakery&cereal products.
The questionnaire consists of 26 questions and aimed at the issues located below the Garonne’s
scheme in Figure 1. The questionnaire is divided into two parts – the identification part and the
main research part. The identification part incudes 11 questions on the characteristics of the
respondents including their awareness of the food waste problem. The second part consists of
15 questions, including binary answer, multiple choice and ranking questions. It basically
examines two areas of consumers’ behaviours: households’ shopping habits and households’
handling of bakery products at home including evaluation and management of bakery wastes.
The questionnaire posted on the web (survio.com) and the survey was conducted purely
through internet for three weeks in January 2015. The respondents (presumably the main
bakery products purchasers) were encouraged through personal and social networks of the
authors of paper, thus by no means the sample can be regarded as fully representative, although
its composition is surprisingly balanced in terms of geographic location and age (see the
paragraph on Social Practices). To evaluate the questionnaire we used frequencies of answers
and chi2 tests to check associations between selected questions (variables); to assess the
associations between characteristics and consumer preferences or the choice of shopping place
(i.e. figures which are expressed in percentages of use) we used ANOVA and MANOVA.
7
Eight focus groups (FG) on social practices have been intended of which four have been
completed so far. For each focus group we invited 10 representatives of households (preferably
the main purchasers of bakery products) of which minim 7 turned up at the event. The
discussion lasted between 1 ½ and 2 hours. It was structured in three parts: a) on consumption
patterns, b) on quality attributes of bread/rolls “product service” and c) on social norms of
bread consumption. The FGs were facilitated by the authors.
We have envisaged 8 interviews with the managers of bakery processors and retailers, in each
category 2 large and 2 small businesses. At the moment we completed interviews with one
small and one large processor and one small retailer. The both processors have got nets of their
own outlets. The interview guidelines include: i) changes in product offers in terms of
sustainable consumption (e.g. shelf-life, packaging, size), b) motives for such changes and c)
consumption alternatives provided or envisaged by processors and retailers..
Some Basic Facts on Consumption of Bakery Products
Over the last two decades the share of food on total expenditure declined from 29% to 22% for
the households of the economic active head (EA-HH) and from 39% to 24% for pensioners
(PN-HH) in nominal terms. Some decline can be observed also for real expenditure (by 2 and 7
percentage points for EA-HH and PN-HH respectively), which in turn mean that consumption
slightly reduced. The share of bakery products on food expenditure increased for the both
household groups from 14 to 17 % in nominal terms while the share of consumption (i.e. real
spending) stagnated (EA-HH) or slightly declined (PN-HH). The actual consumption (i.e. real
expenditure) of bakery products increased by 11% and 3% for EA-HH and PN-HH
respectively. The contrast between the relative decline in the consumption structure and
increase in the real expenditure refers to the real income increase and more pronounced
increase of real figures for fruits and animal proteins.
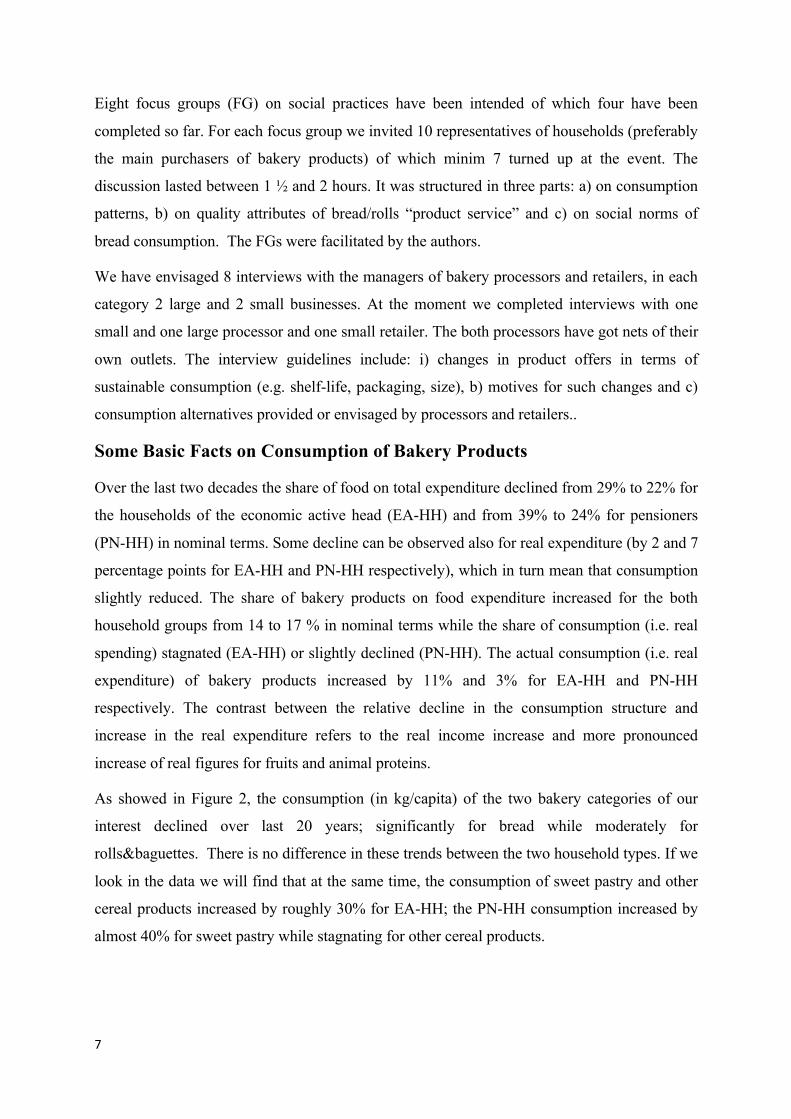
As showed in Figure 2, the consumption (in kg/capita) of the two bakery categories of our
interest declined over last 20 years; significantly for bread while moderately for
rolls&baguettes. There is no difference in these trends between the two household types. If we
look in the data we will find that at the same time, the consumption of sweet pastry and other
cereal products increased by roughly 30% for EA-HH; the PN-HH consumption increased by
almost 40% for sweet pastry while stagnating for other cereal products.
8
EA –Economic Active, PN - Pensioners
Figure 2 Development of bread and rolls consumption, 1993-2013.
It is likely that the decline of bread consumption is largely affected by price. The unit price for
bread (i.e. the price for which bread was purchased in the surveyed households;
expenditure/consumption in kg) tripled over last 20 years, the unit price of rolls&baguettes
increased 2.5 times while the unit price of other cereal products increased only by 60%.
Economic Behaviour of Consumers of Bakery Products
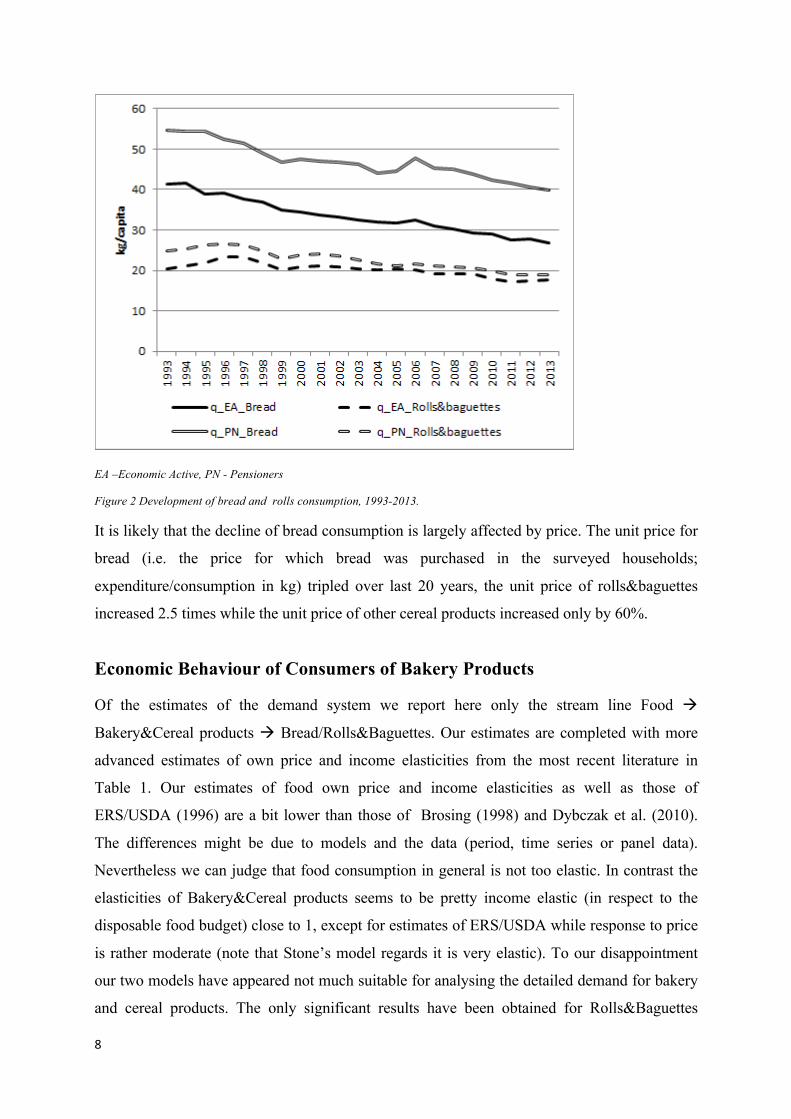
Of the estimates of the demand system we report here only the stream line Food à
Bakery&Cereal products à Bread/Rolls&Baguettes. Our estimates are completed with more
advanced estimates of own price and income elasticities from the most recent literature in
Table 1. Our estimates of food own price and income elasticities as well as those of
ERS/USDA (1996) are a bit lower than those of Brosing (1998) and Dybczak et al. (2010).
The differences might be due to models and the data (period, time series or panel data).
Nevertheless we can judge that food consumption in general is not too elastic. In contrast the
elasticities of Bakery&Cereal products seems to be pretty income elastic (in respect to the
disposable food budget) close to 1, except for estimates of ERS/USDA while response to price
is rather moderate (note that Stone’s model regards it is very elastic). To our disappointment
our two models have appeared not much suitable for analysing the detailed demand for bakery
and cereal products. The only significant results have been obtained for Rolls&Baguettes
9
subgroup with moderate income and own price elasticities. In respect to bread, we can
hypothesize that the product is inelastic which will modify our assumption from the previous
paragraph, that rising price was behind the decline of bread consumption. More research is
definitely needed; likely there is need for using a model in which we can control for theoretical
assumptions (adding-up, curvature, symmetry).
Price elasticities (uncompensated)
Stone C-D model,
homog Brosig(1999) Dybcak et al.
(2010) ERS/USDA
Food in Total Expenditure -0.543 -0.329 -0.760 -0.679 -0.338
Bakery&Cereals in Food Expenditure -1.136 -0.653 -0.620
-0.22
Bread in Bakery&Cereals
(-0.022) Rolls&Baguettes in Bakery&Cereals
-0.542
Income elasticities
Stone C-D model,
homog Brosig(NQD) Dybcak ERS/USDA
Food in Total Expenditure 0.386 0.386 0.650 0.894 0.477
Bakery&Cereals in Food Expenditure 0.949 0.890 0.800
0.272
Bread in Bakery&Cereals
(-0.058) Rolls&Baguettes in Bakery&Cereals 0.609
Stone: Stone’s analysis (own) C-D: Cobb-Douglas demand function (own) ( ) insignificant model
Brosig (1999): Normalised Quadratic Expenditure Function ERS/USDA International food demand for year 1996.
Dybczak et al. (2010) : The Quadratic Almost Ideal Demand System
Reported are only significant figures at the level α=10%.
Table 1 Price and income elasticities of bakery products
Qualitative aspects of purchase and consumption of bakery products (of our interest) were
included in the questionnaire survey which will be analysed in details in the next section on
Social practices. We asked about shares of four categories of breads and rolls&baguettes:
common bread (wheat and ray, 1 kg loaf with little other ingredients like seeds and nuts),
special bread (usually smaller loafs, higher share of ray flour, whole grain or with high share of
nuts, seeds or grains; also what might be called “traditional” or “regional), common rolls (80g,
plain, wheat flour only) and special rolls and baguettes (multi grain, high fat, whole grain,
various special shapes or with coverage or filling). For the categories “special” it is also typical
that their unit (kg) price is significantly higher than for the categories “common”.
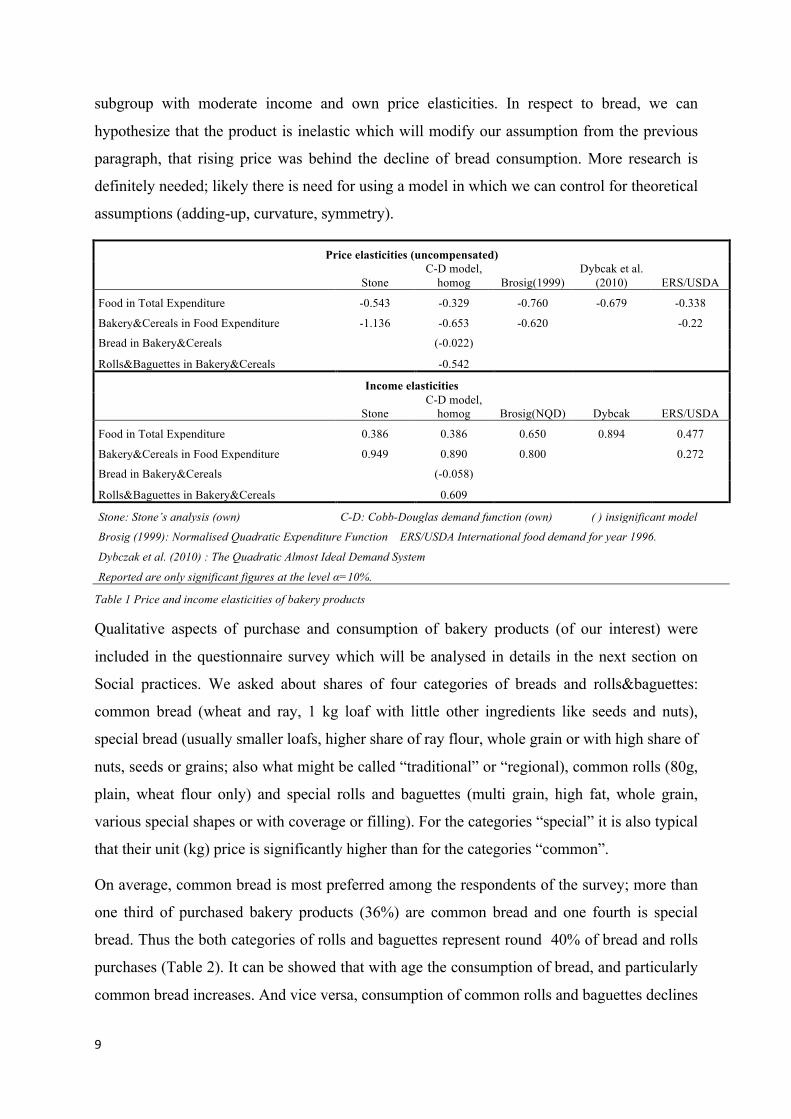
On average, common bread is most preferred among the respondents of the survey; more than
one third of purchased bakery products (36%) are common bread and one fourth is special
bread. Thus the both categories of rolls and baguettes represent round 40% of bread and rolls
purchases (Table 2). It can be showed that with age the consumption of bread, and particularly
common bread increases. And vice versa, consumption of common rolls and baguettes declines
10
with age. The differences in bread and rolls consumptions among the age categories (6, in
Table 2 they are aggregated to 2) are significant at α=0.01, using ANOVA or MANOVA
except for special rolls&baguettes.
Age categories Common bread
Common roll&
baguettes Special bread
Special rolls&
baguettes Total Number of
households
All 36% 23% 25% 16% 100% 251 19 to 49 33% 25% 26% 16% 100% 156 over 50 43% 18% 23% 16% 100% 95
Source: own examination
Table 2 The percentage shares of bread and rolls consumptions according to the age categories
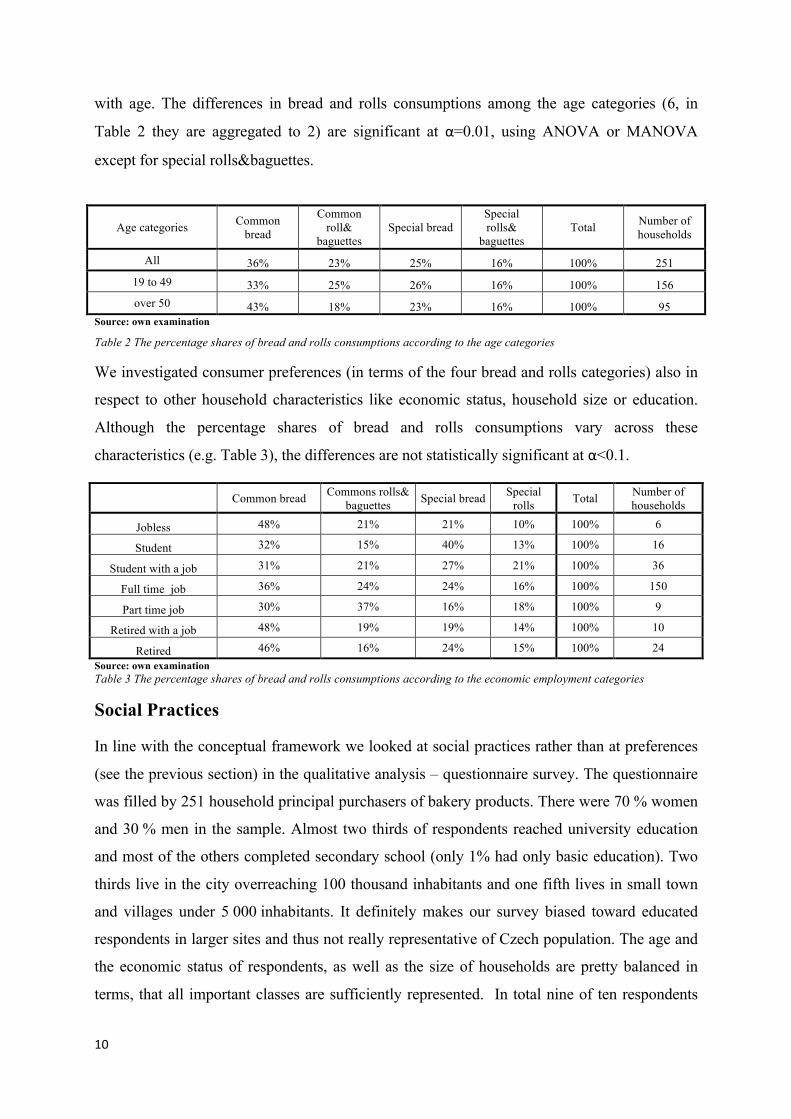
We investigated consumer preferences (in terms of the four bread and rolls categories) also in
respect to other household characteristics like economic status, household size or education.
Although the percentage shares of bread and rolls consumptions vary across these
characteristics (e.g. Table 3), the differences are not statistically significant at α<0.1.
Common bread Commons rolls& baguettes Special bread Special
rolls Total Number of households
Jobless 48% 21% 21% 10% 100% 6
Student 32% 15% 40% 13% 100% 16
Student with a job 31% 21% 27% 21% 100% 36
Full time job 36% 24% 24% 16% 100% 150
Part time job 30% 37% 16% 18% 100% 9
Retired with a job 48% 19% 19% 14% 100% 10
Retired 46% 16% 24% 15% 100% 24 Source: own examination Table 3 The percentage shares of bread and rolls consumptions according to the economic employment categories
Social Practices
In line with the conceptual framework we looked at social practices rather than at preferences
(see the previous section) in the qualitative analysis – questionnaire survey. The questionnaire
was filled by 251 household principal purchasers of bakery products. There were 70 % women
and 30 % men in the sample. Almost two thirds of respondents reached university education
and most of the others completed secondary school (only 1% had only basic education). Two
thirds live in the city overreaching 100 thousand inhabitants and one fifth lives in small town
and villages under 5 000 inhabitants. It definitely makes our survey biased toward educated
respondents in larger sites and thus not really representative of Czech population. The age and
the economic status of respondents, as well as the size of households are pretty balanced in
terms, that all important classes are sufficiently represented. In total nine of ten respondents
11
indicated that they sort the waste which was deemed as an indicator of environmental concern
of answering households. It is well in line with the survey of the Centre for Public Opinion
Research (CVVM, 2014), that 83% of the population sort waste always or frequently.
Concerning the shopping place; our respondents make on average 64% of bakery product
purchases in supermarkets and 22% in specialized bakery shops; 5% of respondents indicated
that they bake some bread or rolls home, which in turn also mean that on average 5% of
consumed bread and rolls are made home. There is no statistically significant relationship
between household characteristics and the place of shopping. Although the tendency to large
shops (supermarkets) might seem very high, it is below the estimate (84%) of Incoma GFK
(2014) for all food and home chemical products.
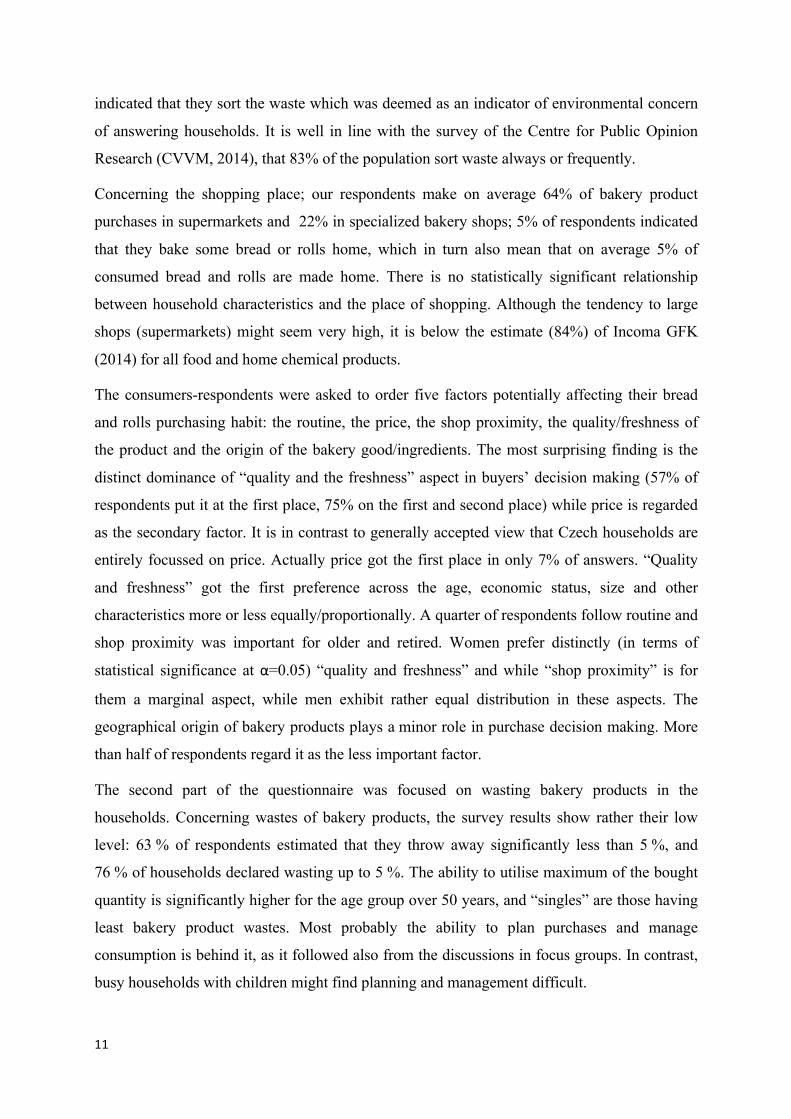
The consumers-respondents were asked to order five factors potentially affecting their bread
and rolls purchasing habit: the routine, the price, the shop proximity, the quality/freshness of
the product and the origin of the bakery good/ingredients. The most surprising finding is the
distinct dominance of “quality and the freshness” aspect in buyers’ decision making (57% of
respondents put it at the first place, 75% on the first and second place) while price is regarded
as the secondary factor. It is in contrast to generally accepted view that Czech households are
entirely focussed on price. Actually price got the first place in only 7% of answers. “Quality
and freshness” got the first preference across the age, economic status, size and other
characteristics more or less equally/proportionally. A quarter of respondents follow routine and
shop proximity was important for older and retired. Women prefer distinctly (in terms of
statistical significance at α=0.05) “quality and freshness” and while “shop proximity” is for
them a marginal aspect, while men exhibit rather equal distribution in these aspects. The
geographical origin of bakery products plays a minor role in purchase decision making. More
than half of respondents regard it as the less important factor.
The second part of the questionnaire was focused on wasting bakery products in the
households. Concerning wastes of bakery products, the survey results show rather their low
level: 63 % of respondents estimated that they throw away significantly less than 5 %, and
76 % of households declared wasting up to 5 %. The ability to utilise maximum of the bought
quantity is significantly higher for the age group over 50 years, and “singles” are those having
least bakery product wastes. Most probably the ability to plan purchases and manage
consumption is behind it, as it followed also from the discussions in focus groups. In contrast,
busy households with children might find planning and management difficult.
12
Routine Price Shop proximity Quality/freshness Origin
On average
1st preference 24 7 11 56 2
2nd preference 12 34 16 19 19
3rd preference 16 30 36 8 11
4th preference 25 20 21 17 17
5th preference 23 9 16 0 51
Total 100 100 100 100 100 Note: 1) The figures in columns show which share of households put the stated preference to the factor stated in the headings
of the column.
Source: own examination
Table 4 Key factors for deciding on buying bakery products.
The most declared reasons for wastes are lack of freshness and low quality of bakery products
(here likely that bread or rolls get off soon after bought) – both were stated by roughly 50% of
respondents. Uneaten rests and other reasons are rather rare except for the youngest generation.
In line with our conceptual framework we regard these reasons constituting food surplus.
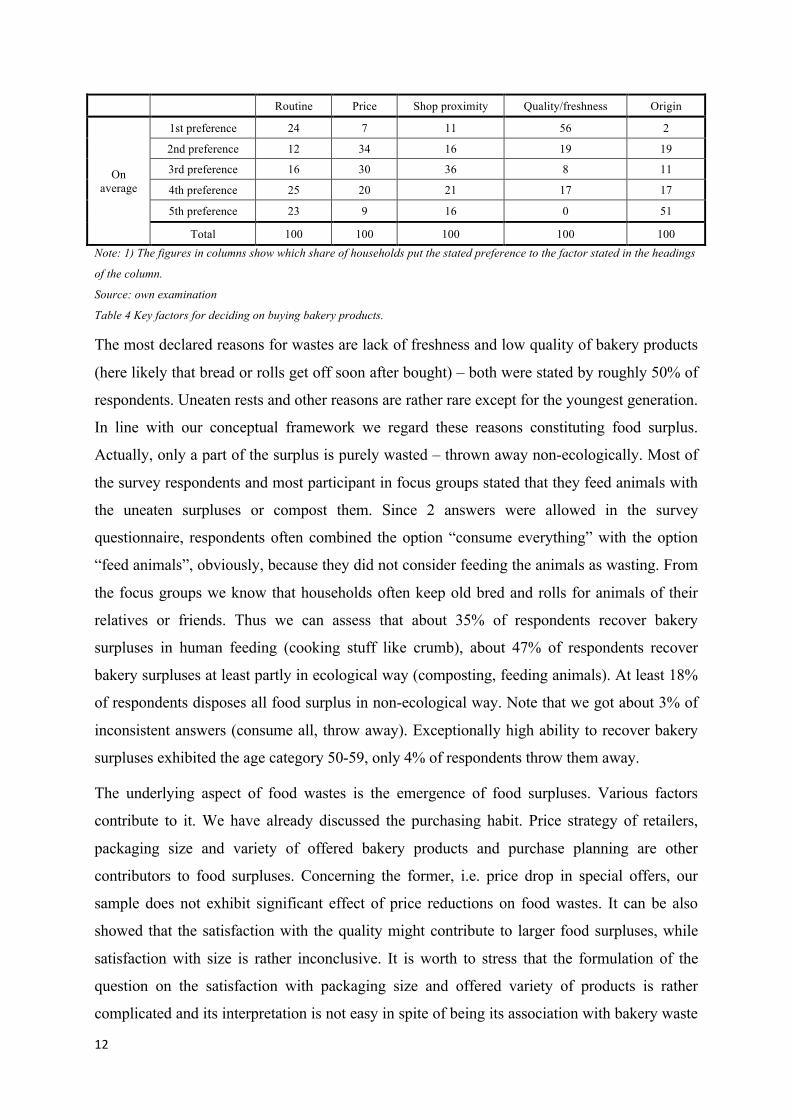
Actually, only a part of the surplus is purely wasted – thrown away non-ecologically. Most of
the survey respondents and most participant in focus groups stated that they feed animals with
the uneaten surpluses or compost them. Since 2 answers were allowed in the survey
questionnaire, respondents often combined the option “consume everything” with the option
“feed animals”, obviously, because they did not consider feeding the animals as wasting. From
the focus groups we know that households often keep old bred and rolls for animals of their
relatives or friends. Thus we can assess that about 35% of respondents recover bakery
surpluses in human feeding (cooking stuff like crumb), about 47% of respondents recover
bakery surpluses at least partly in ecological way (composting, feeding animals). At least 18%
of respondents disposes all food surplus in non-ecological way. Note that we got about 3% of
inconsistent answers (consume all, throw away). Exceptionally high ability to recover bakery
surpluses exhibited the age category 50-59, only 4% of respondents throw them away.
The underlying aspect of food wastes is the emergence of food surpluses. Various factors
contribute to it. We have already discussed the purchasing habit. Price strategy of retailers,
packaging size and variety of offered bakery products and purchase planning are other
contributors to food surpluses. Concerning the former, i.e. price drop in special offers, our
sample does not exhibit significant effect of price reductions on food wastes. It can be also
showed that the satisfaction with the quality might contribute to larger food surpluses, while
satisfaction with size is rather inconclusive. It is worth to stress that the formulation of the
question on the satisfaction with packaging size and offered variety of products is rather
complicated and its interpretation is not easy in spite of being its association with bakery waste
13
percentage statistically significant at α=0.05. A bit surprisingly, the assessment of the
questions on purchase planning and wastes reveal (sig. at α=0.01) that longer planning period
results in lower food wastes (surpluses). In contrast to it, most of respondents state shorter
period of planning, one fifth only for only a day. This is confirmed by the participants of focus
groups who often mentioned coordination of bakery products purchases by phone calls, which
witnesses rather about short term planning.
Consume everything, no waste
(feeding humans) Composting Feeding animals Waste disposal
Number of responses 127 8 110 57
Age groups The shares within the age groups
All 45% 2% 44% 28% 19 – 29 49% 2% 45% 34% 30 – 39 49% 3% 49% 23% 40 – 49 40% 9% 40% 21% 50 – 59 71% 2% 42% 4% over 60 45% 2% 44% 28%
Note: 1) Consumers were enabled to choose more options. The figures show the share of consumers of all ones in the
category who chose the option.
Source: own survey
Table 5 The ways how the surveyed households treat bakery surpluses, along age groups.
We created the focus groups (FG) in the way that they differentiate by age, i.e. two FG
included people younger than 45 years and the other two people over 45 years. It appeared
rational, since the different age groups differ in their opinions while the same age groups
expressed consistently similar attitudes. There were three rounds of discussion. The first round
concerned the position of bread and rolls in consumption patterns, and some of the results were
already mentioned when we evaluated the questionnaire survey. The second concerned the
notion of the quality of bakery products and we are not including the results in this paper. The
third round concerned two aspects: the social role of bread and rolls consumption and the
norms.
The older generation prefers rye-wheat bread over rolls, they consider bread to be basic food,
but they do not find any strong social role of bread consumption. Nevertheless, they can agree
that offering good bread to guests or bringing bread to the visit might be appreciated. Although
it was obvious that there are health reasons for their preference to bread, they did not find
health concerns or presenting themselves as people following healthy diet as relevant.
In contrast, the younger generation have more or less equal preferences to bread and
rolls&baguettes. Because of small size and large variety of tastes, rolls are suitable for snack or
14
supper. They see at least partly, consuming bread and rolls as a pleasure, they are willing spend
more for it. Younger people see also bread and rolls as a mean for presenting their health
concerns (presenting themselves as followers of healthy diet). They are finding relevant
bringing good bread or rolls to visits/parties or paying attention to the quality of bread and rolls
when inviting guests.
The both generations regard the thesis “bread does not throw away” as a norm, however
neither group added stronger attribute like “bread is God’s gift”.
Response of Bakery Producers – Consumption Alternatives
The aim of the interviews with bakery processors is to examine what are their practises in
respect to sustainable consumption. An especial focus is on consumption alternatives provided
by these processors. The interviews have been conducted with the managers of two baker
companies so far. One of them was the huge processing company (LC), covering round one
third of baking industrial production in the country, the second one was a medium size
enterprise (SME) with a regional scope.
Both companies confirmed a continuous effort to capture and to follow new consumers’ trends
and to come with innovative products convenient for different consumers clusters. Both
companies stipulated that their product innovations aim at sensual characteristics, size and
product durability. In addition, the LC is concerned with the technology development which
will better enable retailers to offer fresh products for lower energy costs. The managers
stressed that rolls and baguettes are principally products for immediate consumption. A day is
a maximum, but obviously, the products are tasty if they are consumed within 4 to 10 hours
after backed. Thus either finishing products in the market place or flexible and continuous
(several times a day) delivery is important to offer consumers fresh products. The SME sees
these issues as a constraint which it cannot deal with and focus its strategy on morning sales
close the places where people concentrate when travelling to the work. In contrast, the LC is
proactive: first it produces rolls (as well as bread) continuously (24 hour a day) and deliver
them throughout the day to super markets or in their own shops; second the LC offers prepared
products to be finished (baked) in the shops which can last with the retailer for 5 days while
they are not frozen, thus energy saving.
Both processors realized increasing interest of consumers in prolonging durability of bread.
The SME manager emphasizes that their bread has got qualitative characteristics which
enables keep bread tasty for 4 days at home. The manager believes that keeping the traditional
15
rising technology based on rye flour is sufficient to maintain the expectations of consumers in
respect to durability of bread. The SME does not provide much marketing research; it works
by trial and error approach to address the needs of consumers.
The main customers of the LC are the marketing chains. The individual enterprises of the LC
serve customers in the circle up to 100 km radian. In this context the LC sees two ways how to
expand freshness durability of bread: i) to reduce the time lag between the production and the
shelf availability and supply the shops flexibly during the day; and ii) to introduce aseptic
packaging which will prevent the development of moulds even if open and closed again, while
maintain most of sensual characteristics of bread.
The managers of the both companies state that consumers gradually appreciate more softness
of bread and rolls as an indicator of freshness which goes against the traditional notion bread
and rolls being crisp and crunchy.
Conclusions
Our research indicates that bakery product wastes are rather low (below 5% of purchased
amount) which is a bit in contrast with the results of CVVM (2014B) where bread was stated
as the most wasted food by 27% (first answer) and 42% (first and second answer) respondents.
These high figures, and thus second place after fruits and vegetables, were one of the reasons
why we decided to focus our research on bakery products. Evidently, results of both
investigations are difficult to compare since the measurement and likely also the understanding
of wastes are not the same. It is clear that our respondents do not consider feeding animals as
wasting.
We found by our own demand analysis, meta-analysis and from the survey and focus groups
that price is less important in decision on purchasing bakery products than it is generally
thought. Large retail chains – their shops: supermarkets and hypermarkets are the main
shopping place for bread and rolls&baguettes (64 % of purchases); nevertheless their use is
significantly lower for these product than for purchasing food in general (over 80%, Incoma
GFK, 2013) .
The critical issue for bread and rolls consumption is “freshness” of the product. The notion of
freshness of bakery products has changed; consumers want them to be soft. It followed from
the discussions in the focus groups that storing bread at home is an issue: some people
complained that it goes off (moulds develop) faster than earlier, others emphasized the
advantage of freezing sliced bread and rolls and defrosting them when needed and only in the
16
amount which will be consumed immediately. Since this practice i) might not be acceptable by
some consumers and ii) might also be viewed as energetically unsustainable, the bakery
processors try to prolong freshness and stability of bread by a) going back to traditional high
content of rye flour and b) by using aseptic packaging which can be open, close and reopen
several times, protecting the product against development of moulds for 5 and more days.
The norms on handling with bread in households are likely not as strong as in the past,
nevertheless, most of the participants in the focus groups agreed that bread is food which
should not be wasted. It seems that bread lost a lot of its social role; presenting themselves
(household) by offering good bread was not deeply anchored among the participants.
Our research confirms that people are aware of the problem of food waste and are concerned,
as it has already been showed by other surveys e.g. CVVM (2014A) on the attitudes of Czech
citizens to global problems, CVVM(2014B) on food wastes or by Hebakova et al.(2015) in
results of Citizens Consultation on sustainable consumption.
The issue of sustainable food consumption and production is largely recognised at the EU
level; it is an integral part of the Europe 2020 Strategy; more explicitly it appears in The
Roadmap to a Resource-Efficient Europe highlighting the food sector as priority area for
taking action - calling for: "…incentives for healthier and more sustainable production and
consumption of food and to halve the disposal of edible food waste in the EU by 2020." For
Czech citizens the concept is rather new (Hebakova et al., 2015) and national debate, policies
and strategies are rather limited (Ratinger et al., 2014).
Priefer et al. (2013) proposes 14 policy options how to reduce food waste of which 3 aim at the
policy itself (setting targets, collecting data and coordinating with food safety policy), 6 at
providing a range of alternatives for consumers to safe food by improving the food system
(labelling, delivering products at right time, opening alternative supply channels, supporting
food redistributive programmes and consumer aided networks) and finally 3 options for
stimulating a change of behaviour (educating consumers, introducing economic incentives and
fees on waste). Undoubtedly, it holds for sustainability of bakery product consumption in the
Czech Republic, too.
As stated at the beginning of this paper, the presented research has been designed as
exploratory and has not been completed yet. More has to be dome in all areas identified in the
conceptual framework.
Acknowledgement
17
This paper refers to the research conducted under the project VATES (2015-2020).
References
BROSIG, S. (1999) Die private Nachfrage nach Nahrungsmitteln im Transformationprozess
Tschechiens und Poland (Private Demand for Food in the Transformation Process in
Poland and Czech Republic), PhD Thesis. Georg-August-Universität Göttingen, pp. 169
CzSO ( 2014). Statistika rodinnych uctu (Household Statistics). The Czech Statistical Office.
www.czso.cz
CVVM (2014A). Občané o globálních problémech (The Citizens about the Global problems).
Press releases on related to the survey of the citizens’ concerns of the environment and the
related policy issues. The institute of Sociology, the Czech Academy of Sciences.
http://cvvm.soc.cas.cz/ekologie/ceska-verejnost-o-globalnich-problemech-kveten-2014
CVVM (2014B). Občané o způsobu zacházení s potravinami – duben 2014 (Citizens about
the way of food handling – April 2014). Press release. The institute of Sociology, the
Czech Academy of Sciences. http://cvvm.soc.cas.cz/ostatni-ruzne/postoj-obcanu-k-
plytvani-potravinami-duben-2014
DG SANCO (2014). Stop food waste. Directorate Health and Consumers,
http://ec.europa.eu/food/food/sustainability/index_en.htm.
DEATON, A., MUELLBAUER (1980) Economics and Consumer Behavior. Cambridge
University Press, pp. 450.
DUCHIN, F. 2005. Sustainable consumption of food: a framework for analysing scenarios
about changes in diets. Journal of Industrial Ecology, 9(1–2):99–114.
http://dx.doi.org/10.1162/1088198054084707
DYBCZAK, K., TÓTH, P., VOŇKA, D. (2010). Effects of Price Shocks to Consumer
Demand. Estimating the QUAIDS Demand System on Czech Household Budget Survey
Data. Working Paper Series 8, Czech National Bank.
EUROPEAN COMMISSION (2014). Towards a circular economy: A zero waste programme
for Europe, COM(2014) 398 final, Brussels, p. 12,
http://ec.europa.eu/environment/circular-economy/pdf/circular-economy-
communication.pdf.
18
GARRONE, P., MELACINI, M., PEREGO, A. (2014) Opening the black box of food waste
reduction. Food Policy 46, 129–139
GUSIA, D. (2012): Lebensmittelabfälle in Musterhaushalten im Landkreis Ludwigsburg.
Ursachen Einflussfaktoren – Vermeidungsstrategien. Diplomarbeit für den Studiengang.
Umweltschutztechnik, Universität Stuttgart. Cited in Priefer et al. (2013).
GUSTAVSSON, J., CEDERBERG, C., SONESSON, U., VAN OTTERDIJK, R.,
MEYBECK A. (2011). Global food losses and food waste – Extent, causes and
prevention. A study conducted for the International Congress SAVE FOOD! at Interpack
2011 Düsseldorf, Germany. Rome: FAO.
http://www.fao.org/docrep/014/mb060e/mb060e00.pdf.
HEBAKOVA L, MICHALEK, T., RATINGER, T. (2015) Národní zpráva o občanské
konzultaci k udržitelné spotřebě (National Report on the Citizens’ Consultation on
Sustainable Consumption). Technology Centre AS CR, pp. 50
INCOMA GFK (2014). Press Releases to the Shopping Monitor.
http://www.incoma.cz/en/default.aspx
KATAJAJUURI, J. M., SILVENNOINEN, K., HARTIKAINEN, H., HEIKKILÄ, L.,
REINIKAINEN, A. (2014). Food Waste in the Finish Food Chain. Journal of Cleaner
Production 73 (2014) 322e329.
OECD (2011). A Green Growth Strategy for Food and Agriculture, Preliminary Report.
OECD, May 2011, pp.20-21. http://www.oecd.org/greengrowth/sustainable-
agriculture/48224529.pdf.
MONT, O.K. (2002). Clarifying the concept of product-service system. J. Clean. Prod. 10,
237-245. http://www.sciencedirect.com/science/article/pii/S0959652601000397.
MYLAN, J. (2014) Understanding the diffusion of Sustainable Product-Service Systems:
Insights from the sociology of consumption and practice theory. J. Clean Prod DOI:
10.1016/j.jclepro.2014.01.065. Available at:
http://www.sciencedirect.com/science/article/pii/S0959652614000791
PARFITT, J., BARTHEL, M., MACNAUGHTON, S. (2010): Food waste within food supply
chains: quantification and potential for change to 2050. Philosophical Transactions of the
Royal Society B 365, 3065-3081.
19
PRIEFER, C., JÖRISSEN, J.,BRÄUTIGAM, K.R. (2013). Options for Cutting Food Waste -
Technology options for feeding 10 billion people, IP/A/STOA/FWC/2008-
096/Lot7/C1/SC2-SC4, p. 12.
http://www.europarl.europa.eu/RegData/etudes/etudes/join/2013/513515/IPOL-
JOIN_ET(2013)513515(SUM01)_EN.pdf
RATINGER, T. HEBAKOVA, L., MICHALEK, T. STIKOVA, O., MRHALKOVA, I. (2014)
Sustainable food consumption – the Case of the Czech Republic. Review of Agricultural
and Applied Economics, XVII (Number 2, 2014): 65-73
TAKATA, M., FUKUSHIMA, K., KINO-KIMATA, N., NIWA, C., TODA, T. (2012). The
effects of recycling loops in food waste management in Japan: based on the environmental
and economic evaluation of food recycling. Science of the Total Environment (432), pp.
309-317.
USHIKUBO, A. (2013). Recycling of food waste in Japan. OECD. Retrieved from:
http://www.oecd.org/site/agrfcn/Session%204_Akikuni%20Ushikubo.pdf
VENTOUR, L. (2008): Food waste report - The food we waste. Waste & Resources Action
Programme (WRAP), Banbury.
WARDE, A. (2005). Consumption and theories of practice. J. Consumer Cult. 5, 131-153.
http://dx.doi.org/10.1177/1469540505053090.
WRAP (2011). New estimates for household food and drink waste in the UK. Waste and
Resource Action Programme. Retrieved from http://www.wrap.org.uk/content/estimates-
household-food-and-drink-waste-uk-2011.
Related Documents