SUSTAINABLE CITIES REPORT

Welcome message from author
This document is posted to help you gain knowledge. Please leave a comment to let me know what you think about it! Share it to your friends and learn new things together.
Transcript
S U S T A I N A B L E
CITIESREPORT


RE
PO
RTS U S T A I N A B L E
CITIESA summary of cities’ vulnerabilities as they transition towards sustainability

Joburg Metro Building,
16th � oor,
158 Civic Boulevard,
Braamfontein 2017
Tel: +27 (0)11 407–6471
Fax: +27 (0)11 403–5230
email: [email protected]
www.sacities.net

Table of Contents
About the South African Cities Network . . . . . . . . . . . . . . . . . . . . . . . . . . . . . . . . . . . . . . . .4
About the Publication . . . . . . . . . . . . . . . . . . . . . . . . . . . . . . . . . . . . . . . . . . . . . . . . . . . . . . . . . . . .5
Research used to compile this report . . . . . . . . . . . . . . . . . . . . . . . . . . . . . . . . . . . . . . . . . . . .5
Cities and Vulnerabilities . . . . . . . . . . . . . . . . . . . . . . . . . . . . . . . . . . . . . . . . . . . . . . . . . . . . . . . . .7
Sustainable Cities . . . . . . . . . . . . . . . . . . . . . . . . . . . . . . . . . . . . . . . . . . . . . . . . . . . . . . . . . . . . . . . .8
Evolution of policy towards sustainable cities . . . . . . . . . . . . . . . . . . . . . . . . . . . . . . . . . . . .9
City sustainability strategies . . . . . . . . . . . . . . . . . . . . . . . . . . . . . . . . . . . . . . . . . . . . . . . . . . . 10
Understanding Cities’ Vulnerabilities . . . . . . . . . . . . . . . . . . . . . . . . . . . . . . . . . . . . . . . . . . 12
Sustainable energy . . . . . . . . . . . . . . . . . . . . . . . . . . . . . . . . . . . . . . . . . . . . . . . . . . . . . . . . . . . . 12
Water management . . . . . . . . . . . . . . . . . . . . . . . . . . . . . . . . . . . . . . . . . . . . . . . . . . . . . . . . . . . 20
Waste management . . . . . . . . . . . . . . . . . . . . . . . . . . . . . . . . . . . . . . . . . . . . . . . . . . . . . . . . . . . 24
Food security . . . . . . . . . . . . . . . . . . . . . . . . . . . . . . . . . . . . . . . . . . . . . . . . . . . . . . . . . . . . . . . . . 29
Climate change . . . . . . . . . . . . . . . . . . . . . . . . . . . . . . . . . . . . . . . . . . . . . . . . . . . . . . . . . . . . . . . 31
Green transport . . . . . . . . . . . . . . . . . . . . . . . . . . . . . . . . . . . . . . . . . . . . . . . . . . . . . . . . . . . . . . . 33
Cross-cutting Issues that Support a City’s Sustainable Functioning . . . . . . 36
Human capacity . . . . . . . . . . . . . . . . . . . . . . . . . . . . . . . . . . . . . . . . . . . . . . . . . . . . . . . . . . . . . . . 36
Socio-political instability . . . . . . . . . . . . . . . . . . . . . . . . . . . . . . . . . . . . . . . . . . . . . . . . . . . . . . . 38
Land . . . . . . . . . . . . . . . . . . . . . . . . . . . . . . . . . . . . . . . . . . . . . . . . . . . . . . . . . . . . . . . . . . . . . . . . . . 39
Rural-urban linkages . . . . . . . . . . . . . . . . . . . . . . . . . . . . . . . . . . . . . . . . . . . . . . . . . . . . . . . . . 42
State of City Finances 2015 . . . . . . . . . . . . . . . . . . . . . . . . . . . . . . . . . . . . . . . . . . . . . . . . . . . 48
Continuing the Journey towards Sustainable Cities . . . . . . . . . . . . . . . . . . . . . . . . . 50
References . . . . . . . . . . . . . . . . . . . . . . . . . . . . . . . . . . . . . . . . . . . . . . . . . . . . . . . . . . . . . . . . . . . . . . . . . . . . . 52
4 SUSTAINABLE CITIES REPORT
Aboutthe South African Cities Network
Since 2002, its objectives are to promote good governance and
management in South African cities; analyse strategic challenges
facing South African cities; collect, collate, analyse, assess,
disseminate and apply the experience of large city governments in
a South African context; and encourage shared-learning partnerships
among spheres of government in order to enhance good governance
of South African cities.
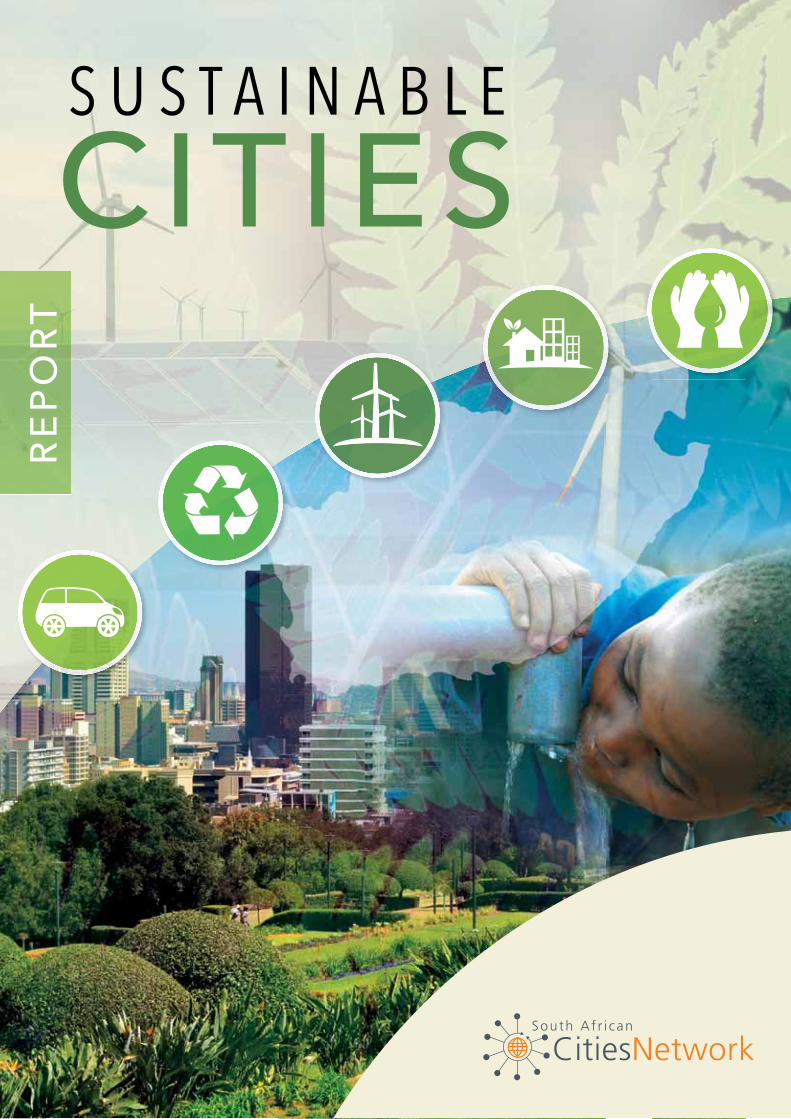
The SACN’s Strategic Framework 2011–2016 established � ve strategic
priorities or pillars (Figure 1).
FIGURE 1: SACN’s programmatic pillars for period 2011–2016
TRANSFORM THE BUILT ENVIRONMENT FUNCTION
Cities have ef� cient and effective spatial form and
functioning
THE STATE OF CITIES REPORT
2016
IMPROVE THE IMAGE OF LOCAL GOVERNMENT
Experience and perception of city governance and delivery
is improved
DEAL DECISIVELY WITH CITIES’ VULNERABILITIES
Stakeholders address key challenges affecting
cities’ performance
• cities’ � nancial performance and management are understood and improving
• vulnerable natural resources (esp. water, energy, food, waste) are managed better
• development of human capacity for effective delivery and management
• socio-political stability by ensuring participation, safety, and support of vulnerable populations
• effective spatial planning and land-use management strategies and systems
• effective public transport systems enabling livelihoods and economic development
• effectively planned human settlements that meet developmental objectives and enhance social cohesion
ACT WITH A BETTER UNDERSTANDING
Cities are effectively planned and managed based on
coherent evidence
• credible city development strategies
• a national urban development policy
• robust and effi cient system for measuring and monitoring city performance indicators and data
• better understanding of rural-urban interdependencies is re� ected in policy frameworks
• production of the fourth state of the cities report
• city leaders able to competently champion and communicate city knowledge
• leading experts and authorities on urban development are advising and advocating for South Africa’s cities
ENHANCE THE IMPACT OF SACN’S KNOWLEDGE
PRODUCTS
SACN delivers value products to policy-makers and practitioners
The SACN:
• has the human and fi nancial capacity to deliver its programmes and plans
• has the monitoring and evaluation capacity to report adequately
• is disseminating and communicating city knowledge to key user communities
• Shared-learning platforms and partnerships• Clear and effective City Development Strategies• Enabling frameworks• Monitoring systems
GOAL
1 2 3 4 5
THROUGH
Cities that:• understand their developmental role• are enabled to play their developmental role• are improving and monitoring their performance
OUTCOME INDICATORS
The South
African Cities
Network (SACN) is an
established network of South
African cities and partners that
encourages the exchange of
information, experience and best
practices on urban
development and city
management.

5ABOUT THE PUBLICATION
Aboutthe Publication
This publication provides a consolidated summary of research
done under Pillar 3: ‘deal decisively with cities’ vulnerabilities’ in
support of better understanding and management of cities (Pillar 1)
and of transforming the built environment function (Pillar 2). A
snapshot of the key sectors and cross-cutting issues is provided
from the full research reports and papers. Pillar 3 was born from the
2011 State of Cities Report (SACN, 2011). It continues the dialogue
around broadening the notion of sustainable cities beyond green issues, to
include soft and cross-cutting issues such as rural-urban linkages, socio-political
stability, human capacity and � nancial management. This pillar falls under SACN’s
Sustainable Cities thematic area.
Research used to compile this reportModelling Energy Ef� ciency Potential in SACN Cities. A study looking at the energy
savings potential that can be realised from energy ef� ciency (EE) interventions in
municipal facilities and operations in its nine member cities.
A Case for Renewable Energy & Energy Ef� ciency. A discussion paper on the
� nancial implication of transitioning to the green economy by cities.
Consolidation of Lessons Learnt for Energy Ef� ciency and Renewable Energy
(RE) Initiatives within Cities. A report presenting the consolidated lessons learnt from
EE and RE initiatives within SACN member cities.
State of Water in Cities. An assessment of the current state and quality of water
infrastructure within cities as well as the condition of the freshwater resources (rivers and
wetlands).
State of Waste Management in Cities – Phase 2: Modelling the effects of
land� lling as a disposal method. A study of the effects of land� lling as the main
disposal method for solid waste.
A Case for Municipal Solid Waste Management towards transitioning to green
economy. A technical paper on municipal solid waste management’s contribution to
cities transitioning to the green economy.
This
publication aims to
create awareness of
SACN research and to
stimulate continued
dialogue on the issues
covered.

6 SUSTAINABLE CITIES REPORT
Current and Future Realities for Urban Food Security in South Africa. An overview
of current urban food insecurity in South Africa.
Cities Resilience to Climate Change. An analysis of cities’ climate change resilience
relating to food security, transportation and water provision, through three case studies:
the City of Johannesburg, Mangaung Metropolitan Municipality and Ekurhuleni
Metropolitan Municipality.
Minibus Taxi Scenarios 2035. A report on a scenario exercise involving mobility thought
leaders from national government, the cities, the minibus taxi industry and civil society.
Research on Establishing a South African Cities Green Transport Programme
(forthcoming).
Assessing Capacity for Spatial Transformation in SACN Member Cities. An
assessment of the capacity for spatial transformation in eThekwini, Msunduzi, Tshwane,
Johannesburg, Ekurhuleni, Buffalo City, Mangaung and Nelson Mandela Bay.
Migration, Mobility and Urban Vulnerability – Implications for Urban Governance
in South Africa. A report that explores the challenges and opportunities associated with
migration and mobility into and within South African cities, and the implications for urban
governance.
The Urban Land Paper Series Volume 1. A set of eight working papers that seek to
de� ne land and outline the roles that land can play as a catalyst for spatial transformation
in municipalities.
Papers on rural-urban linkages:
• Planning and Governance Challenges of Cities with Extensive Rural
Geographies. Research into the challenges faced by three metropolitan municipalities
with extensive rural geographies: Buffalo City, eThekwini and Tshwane.
• Tourism. A study that uses the lens of the tourism sector to show the linkages and
connectivities between urban and rural environments through spatial and sectoral � ows.
• Agro-food Value Chain. An assessment of South Africa’s urban and rural agro-food
value chains and their interdependencies.
• Social Value Chains. A study that examines seven areas located along the north-
eastern migration corridor into Tshwane metro in order to understand rural social
value chains.
State of City Finances. An update of the state of � nances in nine of the largest cities in
South Africa: Johannesburg, Cape Town, eThekwini, Ekurhuleni, Tshwane, Nelson
Mandela Bay, Mangaung and Msunduzi, under the theme of Basics + Innovation .

7CITIES AND VULNERABILITIES
Citiesand Vulnerabilities
Cities tend to be de� ned spaces that are built
around key assets i.e. land, natural and
� nancial resources. The poor management of
these assets, which are limited and � nite by
nature, brings different forms of vulnerabilities
to cities.
Cities have a duty to respond to the social needs of
their inhabitants, address safety issues and have
adequate institutional planning and administrative capacity to
be able to govern and develop their urban spaces. This responsibility happens in an
environment where there is unsustainable consumption of resources (e.g. water, food,
energy etc.) and increasing demand for services (roads, transport, houses, health and
educational facilities).
Cities are the sphere of government closest to communities and, therefore, responsible
for implementing national service delivery imperatives. This distinct feature of local
government, in particular cities, puts them under constant pressure to consistently deliver
good standard services. However, implementation becomes a challenge without
adequate resources, support from the national sphere, as well as
effective and ef� cient urban development planning. Cities cannot
fall short on urban planning, which Cities of basic services
as a primary function, as this may result in the spate of
sometimes violent protests plaguing many
municipalities in the country.
City governance needs to be viewed as two-
pronged, i.e. accountability by both the
authorities and citizens themselves. Community
involvement in decision making should not be
seen as a compliance issue but rather a
consultative and engagement process by all
affected stakeholders. Sustainable partnerships
must be formed with the aim of achieving a
common vision. This approach can facilitate a
better understanding of how a city is run, thereby
minimising the level of vulnerability and unrest that
protests and other events bring to the city administration.
Cities are the
drivers of a country’s
economic growth and
continuously attract people
for different reasons,
including personal growth
and aspirations.
Cities are responsible for implementing national service
delivery imperatives.

8 SUSTAINABLE CITIES REPORT
Sustainable Cities
The national Department of Environmental Affairs lays a foundation
for sustainable development through its National Strategy for
Sustainable Development and Action Plan (NSSD 1). The NSSD 1 (DEA,
2011c) promotes a systems approach to sustainability, whereby the
economic, socio-political and the ecological systems are embedded within
each other, and then integrated through the governance system that holds them
together in a legitimate regulatory framework. This approach implies that sustainability is
a continuous and mutually compatible integration of these systems over time. Figure 2
illustrates this further.
FIGURE 2: Systems approach to sustainability Socio
Ecosystem services
Governance
Socio-political
Socio
Economy
Cities should view city sustainability from the sustainable development foundation, in the
long-term broad perspective that aims to balance the parameters in order to achieve
sustainable urban development.
City
sustainability will
not be achieved if
administrations focus
primarily on green issues at
the expense of other areas
within the spectrum of
service delivery.
9SUSTAINABLE CITIES
Living sustainably means grappling with the ‘perfect storm’ associated with the
inseparability of water, food, energy and climate change (Oxford Martin School, 2013: 18).
Water is necessary for life, acting as a messenger within the body, � ushing out toxins
and regulating the body temperature. Water is also necessary for economic development,
energy production and agriculture, speci� cally food production. Agriculture and water
availability are affected by climate change, which is a dynamic threat that exacerbates
the varying degrees of droughts and � oods. Any threat to the natural base has a direct
impact on society, reducing economic outputs and affecting social health through
diseases associated with � ooding, excessive heat or air pollution from over reliance on
fossil-based fuels.
Therefore, sustainability must be viewed holistically, as a fundamental concept that straddles
the different city departments, supported by robust and long-term governance and policy
choices. There is no � xed method of developing a path for transitioning towards sustainability,
as each city is unique and must create this path based on their needs and available
resources. The transition to a sustainable city is thus a journey, not a destination, and so
sustainability needs to be an integral part of the city’s growth and development strategies.
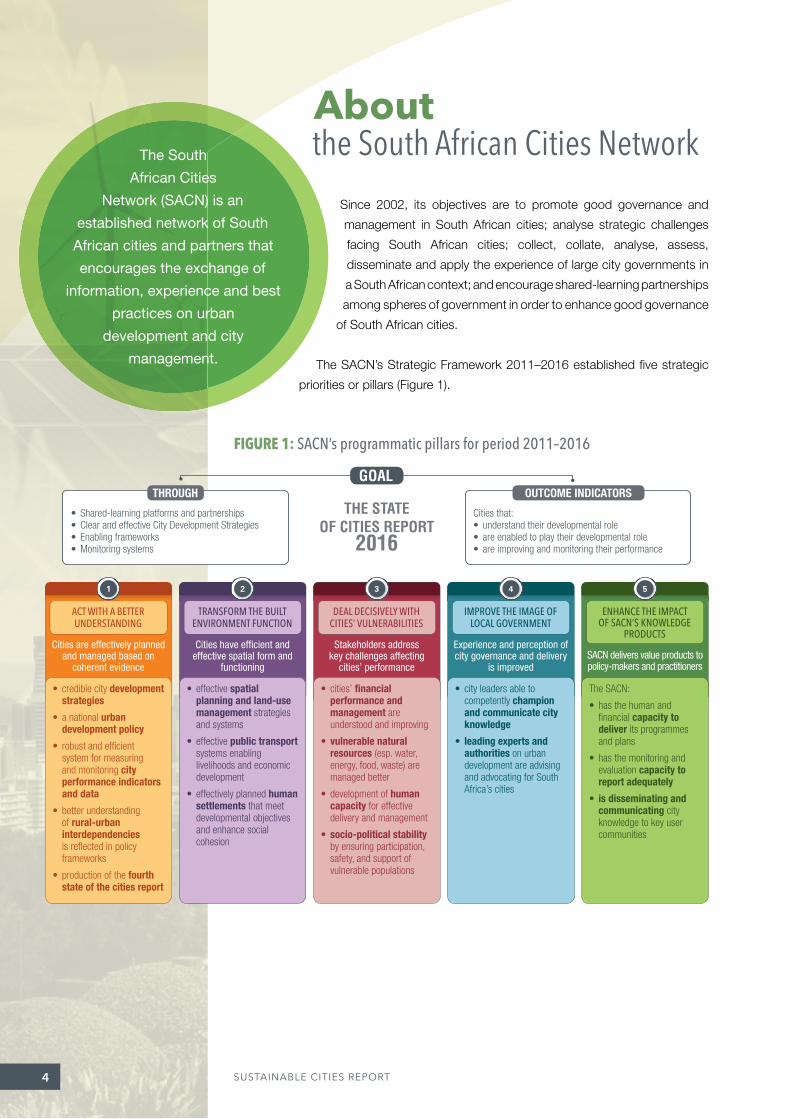
Evolution of policy towards sustainable citiesThe Constitution of South Africa (1996) introduced a rights-based approach to
environmental sustainability. It enshrines environmental rights and equity in the values
guiding the management of the environment and natural resources. It implies that, in
pursuit of a clean and healthy environment, the state must ensure that negative impacts
do not adversely affect people. Environmental justice is, therefore, to be pursued in order
to achieve environmental sustainability.
Environmental sustainability has been mainstreamed across government and all sectors
of society. The National Environmental Management Act (NEMA) (No. 107 of 1998,
amended by Act No. 25 of 2014) provides the legislative framework that is articulated
through a suite of more detailed sectoral pieces of legislation. However, the slow
development of strategic environmental planning tools, such as strategic environmental
assessments (SEAs) and environmental management frameworks (EMFs) is intended to
reduce the over-reliance on the reactive environmental impact assessment (EIA) system.
The National Energy Act (No. 34 of 2008) aims to ensure the availability of diverse energy
resources to all South Africans. It addresses environmental management requirements
and increased renewable energy generation and consumption. It further obliges the
Minister of Energy to develop an Integrated Energy Plan, which should address issues
relating to the supply, transformation, transport, storage and demand of energy, taking
into account the availability of energy sources and the environment, among other things.
In addition, the Renewable Energy White Paper (DME, 2003) and the Energy Ef� ciency
Strategy (DME, 2005) promotes the roll-out and uptake of sustainable energy, while the
Integrated Resources Plan (DoE, 2010) details how South Africa’s electricity demand
should be met in terms of capacity, type, timing and cost.

10 SUSTAINABLE CITIES REPORT
Similarly, the National Water Act (No. 36 of 1998), complemented by the National Water
Resources Strategy, provides a framework for the water sector. Currently the Department
of Water and Sanitation the (DWS) is responsible for planning, developing and managing
water resources, while municipalities are ‘water service authorities’ (WSAs). Under this
arrangement, DWS is responsible for the bulk infrastructural systems that provide water
to the WSAs, while the WSAs are tasked with ensuring access to water services as
prescribed in the Act. Some municipalities have water service providers (WSP) that
provide water services in accordance with the Constitution, the Water Services Act (No.
108 of 1997), bylaws and any speci� c conditions set by the respective WSA.
The National Environmental Management Waste Act (No. 59 of 1998, amended by Act
No. 62 of 2014) provides a coherent and integrated legislative framework for waste
management. To achieve the Act’s objectives, the National Waste Management Strategy
(DEA, 2011a) highlights eight strategic goals that are structured around the waste
management hierarchy. This hierarchy ‘consists of options for waste management during
the life-cycle of waste, arranged in descending order of priority: waste avoidance and
reduction, reuse and recycling, recovery, and treatment and disposal as the last resort’
(DEA, 2011: 6). The goals are promoting waste minimisation, reuse, recycling and
recovery of waste; ensuring ef� cient delivery of waste services; growing the contribution
of the waste sector to the green economy; ensuring that people are aware of the impact
of waste on their health, wellbeing and the environment; achieving integrated waste
management planning; ensuring sound budgeting and � nancial management for waste
services; providing measures to rehabilitate contaminated land; and establishing effective
compliance with and enforcement of the Waste Act.
The national Climate Change Response Policy (DEA, 2011b) was developed to drive
national mitigation and adaptation interventions. It recognises that climate change is a
major global concern that will have signi� cant environmental and societal impacts, and in
particular increase the vulnerability of communities, especially the poor.
City sustainability strategiesCities have growth and development strategies that display pro-active thinking and
planning towards sustainable cities. In 1993, the ICLEI1 initiated the Cities for Climate
Protection (CCP) Programme, as a global transnational municipal network aimed at
reducing urban greenhouse gas (GHG) emissions, improving air quality, and enhancing
urban liveability and sustainability. More than 650 local governments participated in the
programme. Certain South African municipalities have subsequently developed policies
and strategies for transitioning to low-carbon and resource-ef� cient cities.
1. ICLEI-Local Governments for Sustainability is the world’s leading network of over 1,000 cities, towns and metropolises committed to building a sustainable future. It was founded in 1990 by 200 local governments from 43 countries who convened for the fi rst World Congress of Local Governments for a Sustainable Future at the United Nations headquarters in New York. Operations started in 1991 at the World Secretariat in Toronto, Canada, and the European Secretariat in Freiburg, Germany. http://www.iclei.org/about/who-is-iclei.html

11SUSTAINABLE CITIES
In 1994, Durban (now eThekwini) became the � rst Council to accept Local Agenda 212
as a corporate responsibility. After launching an Environmental Management Policy in
1998, the municipality participated in the CCP campaign (2001–2006), developed an
Energy Strategy (2008) and established an Energy Of� ce (2009). More recently (2014),
the municipality � nalised the draft Durban Climate Change Strategy.
In the early 2000s, the leadership of the City of Tshwane realised the importance of
ensuring the development of a clear strategy. This led to the 2004 City Development
Strategy, which was later reviewed and became Tshwane Vision 2055. It provides a set
of focus areas for city planning and � nds traction in the Framework for a Green Economy
Transition (2013). The framework is aimed at directing development and investment
towards a low-carbon, climate-resilient and resource-ef� cient city.
The City of Joburg’s strategy, Johannesburg 2040, aspires for a vibrant, equitable African
city that is strengthened through its diversity, real quality of life and sustainability for all its
citizens as well as a resilient and adaptive society. The city is in the process of reviewing
its climate change response into an overarching framework for both mitigation and
adaptation response.
Ekurhuleni bene� ted from the support of the Danish Development Agency (DANIDA) in
developing an Energy and Climate Change Strategy (2007) that aims ‘to integrate and
entrench sustainable energy approaches and practices’, prioritising energy and climate
change response interventions in the city (EMM, 2007: 2).
Although not at the level of large metros, other municipalities have shown their
commitment to sustainable development through policies and strategies. Furthermore,
the spatial development frameworks (SDFs), integrated development plans (IDPs) and
other planning instruments are tools that can be used to support the journey towards
sustainable cities.
The various policies described above provide a framework for programmes and
progress made on service delivery across different core functions. The SACN research
supports these city imperatives and encourages the acceleration of the transition to
sustainable cities..
2. Local Agenda 21 is a local-government-led, community-wide, and participatory effort to establish a comprehensive action strategy for environmental protection, economic prosperity and community well-being in the local jurisdiction or area. http://www.gdrc.org/uem/la21/la21.html
12 SUSTAINABLE CITIES REPORT
Understanding Cities’ Vulnerabilities
Links to the original reports are provided in each section.
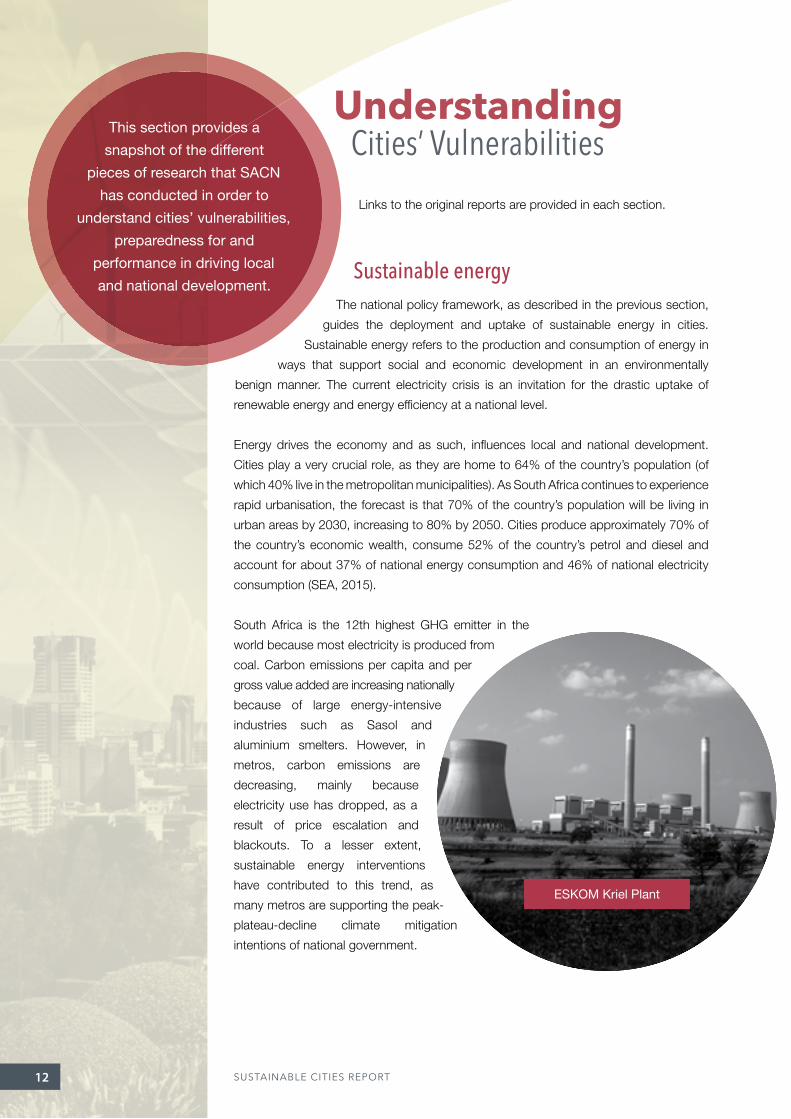
Sustainable energyThe national policy framework, as described in the previous section,
guides the deployment and uptake of sustainable energy in cities.
Sustainable energy refers to the production and consumption of energy in
ways that support social and economic development in an environmentally
benign manner. The current electricity crisis is an invitation for the drastic uptake of
renewable energy and energy ef� ciency at a national level.
Energy drives the economy and as such, in� uences local and national development.
Cities play a very crucial role, as they are home to 64% of the country’s population (of
which 40% live in the metropolitan municipalities). As South Africa continues to experience
rapid urbanisation, the forecast is that 70% of the country’s population will be living in
urban areas by 2030, increasing to 80% by 2050. Cities produce approximately 70% of
the country’s economic wealth, consume 52% of the country’s petrol and diesel and
account for about 37% of national energy consumption and 46% of national electricity
consumption (SEA, 2015).
South Africa is the 12th highest GHG emitter in the
world because most electricity is produced from
coal. Carbon emissions per capita and per
gross value added are increasing nationally
because of large energy-intensive
industries such as Sasol and
aluminium smelters. However, in
metros, carbon emissions are
decreasing, mainly because
electricity use has dropped, as a
result of price escalation and
blackouts. To a lesser extent,
sustainable energy interventions
have contributed to this trend, as
many metros are supporting the peak-
plateau-decline climate mitigation
intentions of national government.
This section provides a
snapshot of the different
pieces of research that SACN
has conducted in order to
understand cities’ vulnerabilities,
preparedness for and
performance in driving local
and national development.
ESKOM Kriel Plant

13UNDERSTANDING CITIES’ VULNERABILITIES
Urbanisation presents both a challenge and
an opportunity for transitioning to more
sustainable energy, through reduced
energy consumption and the clean
production of energy by using
renewable energy technologies.
Renewable energy use is still in its
infancy and supplies negligible
amounts of electricity compared to
Eskom. Nevertheless, much is
happening at local level, despite cities
not having a clear mandate to generate
electricity. In light of the current electricity
crisis, municipalities are likely to do more, through
biogas and waste-to-electricity projects and small-
scale solar photo-voltaic (PV) rooftop generation. In particular, the application of small-
scale embedded PV is expected to accelerate in the next few years.
Some examples of city renewable energy projects with a potential for scaling-up are
described below. These are installed at both city-owned buildings and facilities, as well
as stand-alone units.
PV projects
Cape TownIn 2014, installed 167kWp of rooftop PV panels, with 90kWp planned for
installation by June 2016.
eThekwini
A Solar City Framework developed to promote the local manufacturing of PV
technology, and its uptake in residential and commercial properties. The
output of this framework is an online solar map that can be used to quantify
solar potential before further investment. There are plans to install 150kWp
on municipal buildings.
EkurhuleniIn 2012, installed 200kW of solar PV plant from 860 solar panels, with plans
to scale up to 600kW.
Cities have different tariff structures for small-scale embedded generations. Johannesburg,
Cape Town, Mangaung and eThekwini have developed speci� c tariffs, while Ekurhuleni
and Nelson Mandela Bay have no tariffs. eThekwini, Nelson Mandela Bay and Cape
Town have developed guidelines and procedures, whereas Mangaung and Johannesburg
have adopted the National Regulatory Standards speci� cation (SEA, 2015).
Solar roof panels

14 SUSTAINABLE CITIES REPORT
Wind power
Cape Town Darling wind farm offers 5.2MW of installed capacity.
Nelson Mandela Bay
The private development of 1.8MW Coega wind farm is supported
through a municipal Power Purchase Agreement (PPA) and
wheeling agreement.
Landfi ll gas to electricity The largest plant is in eThekwini, where the Bisasar Road land� ll produces 7MW per year
from land� ll gas. Johannesburg is planning 18.6MW from its � ve land� ll sites, while
Ekurhuleni and Buffalo City continue to � are as feasibility studies are undertaken.
Wastewater gas to electricityJohannesburg’s Northern Water Works Treatment Plant has plans to ramp up production
to 4.5MW.
Waste to electricityTshwane’s Bronkhorstspruit facility currently produces 3MW with expected full capacity
of 4.5MW.
Micro-hydro Cape Town has 2775kW installed capacity at the Wemmershoek, Blackheath, Faure and
Steenbras water treatment plant facilities (SEA, 2015).
Energy effi ciency potential report in municipal operationsThe SACN commissioned a study to investigate the energy ef� ciency (EE) potential in
municipal operations. Municipalities can promote EE by developing and implementing
projects to improve the energy ef� ciency of municipal facilities and operations. In so
doing, they lead by example and so motivate the private sector and other stakeholders
to become more energy ef� cient. In addition, municipalities can save money by improving
the energy ef� ciency of municipal facilities and day-to-day operations.
As Figure 3 shows, the dominant energy-consuming sector is the municipal vehicle
� eet, which accounts for 35% of the total energy consumed, followed by electricity used
in buildings and facilities (31%), electricity used in water supply and wastewater
treatment (17%), and street lighting (16%). Traf� c lighting accounts for just 1% of the
total electricity consumption.

15UNDERSTANDING CITIES’ VULNERABILITIES
FIGURE 3: Average baseline energy consumption per sector (GJ/a)
Water supply & wastewater treatment
Buildings & facilities
17%
1%
31%
16%
35%Street lighting
Traf�c lighting
Vehicle �eet (petrol & diesel)
The study also looked at the potential for energy ef� ciency across the sectors. It found
that the potential end-use savings were 39% for the municipal vehicle � eet sector, 29%
for the water supply and wastewater sector, 18% for buildings and facilities, and 14% for
street lighting. The municipal vehicle � eet sector has a high energy-saving potential but
would result in a lower reduction in carbon emissions compared to grid-supplied
electricity, which has a higher carbon content than liquid fuels.
Among the electricity-consuming sectors, the water supply and wastewater treatment
sectors have the highest potential for electricity ef� ciency savings. The greatest potential is
in retro� tting the standard motors in water pumps with energy ef� cient motors coupled with
Variable Speed Drives (VSDs). Capturing the full potential of energy savings would also lead
to a signi� cant reduction in carbon emissions across the sectors, as depicted in Figure 4.
FIGURE 4: Potential energy savings and carbon emissions reductions per sector yearly
Water supply & wastewater treatment
Buildings & facilities18%
14%
29%
39%Street lighting
Traf�c lighting
Vehicle �eet (petrol & diesel)
16 SUSTAINABLE CITIES REPORT
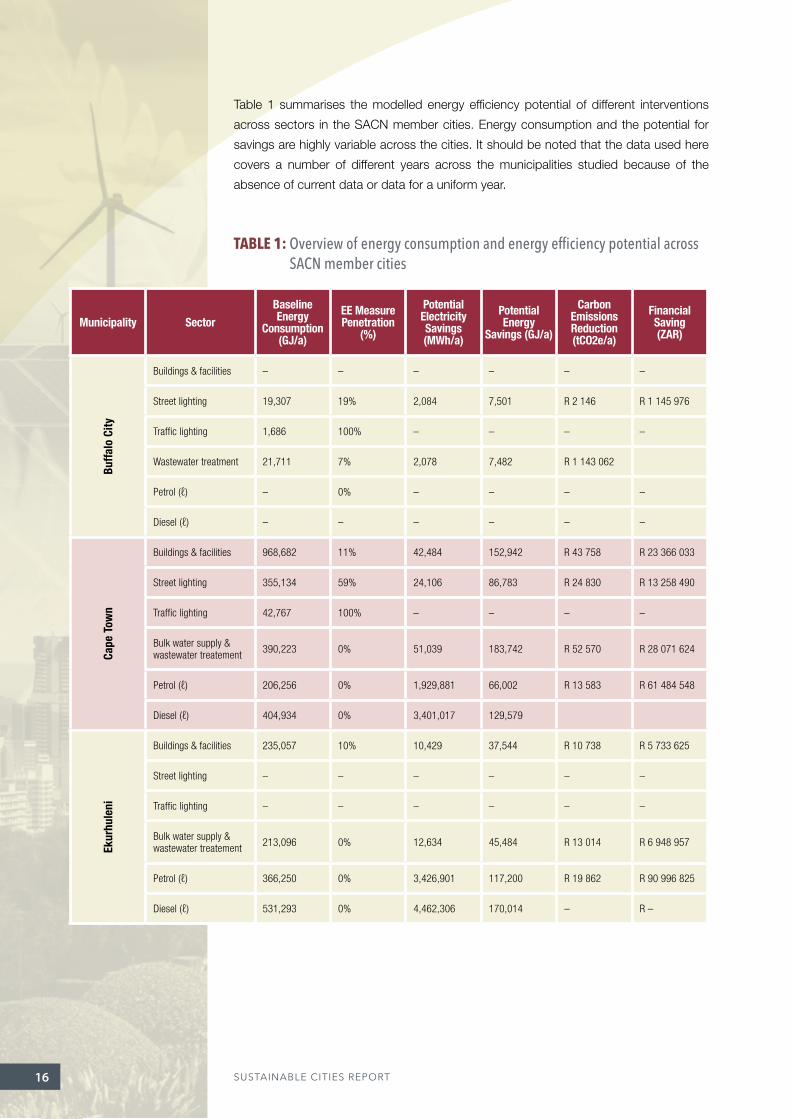
Table 1 summarises the modelled energy ef� ciency potential of different interventions
across sectors in the SACN member cities. Energy consumption and the potential for
savings are highly variable across the cities. It should be noted that the data used here
covers a number of different years across the municipalities studied because of the
absence of current data or data for a uniform year.
TABLE 1: Overview of energy consumption and energy effi ciency potential across SACN member cities
Municipality Sector
Baseline Energy
Consumption (GJ/a)
EE Measure Penetration
(%)
Potential Electricity Savings (MWh/a)
Potential Energy
Savings (GJ/a)
Carbon Emissions Reduction (tCO2e/a)
Financial Saving (ZAR)
Buffa
lo C
ity
Buildings & facilities – – – – – –
Street lighting 19,307 19% 2,084 7,501 R 2 146 R 1 145 976
Traffi c lighting 1,686 100% – – – –
Wastewater treatment 21,711 7% 2,078 7,482 R 1 143 062
Petrol (ℓ) – 0% – – – –
Diesel (ℓ) – – – – – –
Cape
Tow
n
Buildings & facilities 968,682 11% 42,484 152,942 R 43 758 R 23 366 033
Street lighting 355,134 59% 24,106 86,783 R 24 830 R 13 258 490
Traffi c lighting 42,767 100% – – – –
Bulk water supply & wastewater treatement 390,223 0% 51,039 183,742 R 52 570 R 28 071 624
Petrol (ℓ) 206,256 0% 1,929,881 66,002 R 13 583 R 61 484 548
Diesel (ℓ) 404,934 0% 3,401,017 129,579
Ekur
hule
ni
Buildings & facilities 235,057 10% 10,429 37,544 R 10 738 R 5 733 625
Street lighting – – – – – –
Traffi c lighting – – – – – –
Bulk water supply & wastewater treatement 213,096 0% 12,634 45,484 R 13 014 R 6 948 957
Petrol (ℓ) 366,250 0% 3,426,901 117,200 R 19 862 R 90 996 825
Diesel (ℓ) 531,293 0% 4,462,306 170,014 – R –

17UNDERSTANDING CITIES’ VULNERABILITIES
Municipality Sector
Baseline Energy
Consumption (GJ/a)
EE Measure Penetration
(%)
Potential Electricity Savings (MWh/a)
Potential Energy
Savings (GJ/a)
Carbon Emissions Reduction (tCO2e/a)
Financial Saving (ZAR)
eThe
kwin
i
Buildings & facilities 692,076 10% 30,694 110,498 R 31 614 R 16 881 467
Street lighting 535,120 23% 47,116 169,618 R 48 529 R 25 913 788
Traffi c lighting 22,430 100% – – – –
Bulk water supply 175,55 – 15,445 55,603 – –
Wastewater treatment 83,066 0% – – R 15 909 R 8 494 964
Petrol (ℓ) 152,707 0% 1,428,837 48,866 R 11 203 R 50 419 556
Diesel (ℓ) 350,380 0% 2,942,825 112,122 – R –
Joha
nnes
burg
Buildings & facilities 103,334 10% 4,835 17,406 R 4 980 R 2 659 029
Street lighting 22,866 – – – – –
Traffi c lighting – – – – – –
Bulk water supply & wastewater treatment 1,308 0% 38,700 139,320 R 39 861 R 21 285 000
Petrol (ℓ) 14,268 0% 133,505 4,566 R 1 174 R 5 252 817
Diesel (ℓ) 38,333 0% 321,957 12,267 – –
Man
gaun
g
Buildings & facilities 92,710 10% 4,112 14,803 R 4 325 R 2 261 429
Street lighting 142,165 20% – – – –
Traffi c lighting – – – – – –
Bulk water supply & wastewater treatment 36,473 0% 26,139 94,100 R 26 923 R 14 376 440
Petrol (ℓ) 30,780 0% 288,000 9,850 R 1 693 R 7 751 040
Diesel (ℓ) 45,720 0% 384,000 14,630 – –
Msu
nduz
i
Buildings & facilities 22,723 10% 1,008 3,629 R 1 038 R 554 266
Street lighting 4,269 – – – – –
Traffi c lighting – – – – – –
Water & wastewater treatment Umgeni Water – – – – –
Petrol (ℓ) 4 0% 348 12 R 26 R 111 415
Diesel (ℓ) 1,109 0% 9,315 355 – –

18 SUSTAINABLE CITIES REPORT
Municipality Sector
Baseline Energy
Consumption (GJ/a)
EE Measure Penetration
(%)
Potential Electricity Savings (MWh/a)
Potential Energy
Savings (GJ/a)
Carbon Emissions Reduction (tCO2e/a)
Financial Saving (ZAR)
Nels
on M
ande
la B
ay
Buildings & facilities 18,458 10% 819 2,948 R 843 R 450 238
Street lighting 42,268 20% 4,068 14,646 R 4 190 R2 237 601
Traffi c lighting – 100% – – – –
Bulk water supply 95,144 0% 10,846 39,046 R 11 172 R 5 965 368
Wasterwater treatment 86,465 – – – – –
Petrol (ℓ) – – – – – –
Diesel (ℓ) – – – – – –
Tshw
ane
Buildings & facilities 173,754 40% 5,137 18,493 R 5 291 R 2 825 530
Street lighting 32,572 25% 2,860 10,298 R 2 946 R 1 573 267
Traffi c lighting 4,666 37% 1,090 3,924 R 1 122 R 599 229
Bulk water supply & wastewater treatment 171,662 0% 10,252 36,907 R 10 560 R 5 638 633
Petrol (ℓ) 75,001 0% 701,762 24,000 R 8 675 R 38 311 331
Diesel (ℓ) 311,989 0% 2,620,382 99,837 – –
Source: SACN (2014)
Municipalities may delay implementing energy ef� ciency improvements because of the
high upfront costs. However, a delay can also be costly because inef� cient energy use
results in high operating costs. Municipalities can use a variety of � nancial instruments to
fund their energy ef� ciency projects, including internal funds, loans, bonds, energy
performance contracting, lease purchase agreements and grants.
Institutionalising and mainstreaming energy ef� ciencies in relevant strategies, including IDPs,
is an important � rst step in raising awareness within the municipality about the need to
become more energy ef� cient. Municipal staff need to proactively implement energy ef� ciency
programmes and develop green procurement policies. Resources should be allocated to
enable implementation, and passionate champions identi� ed (similar to the City of Tshwane’s
Green Ambassadors) in order to sustain an energy ef� ciency culture within a city.
More information can be found in the full report Modelling Energy Ef� ciency Potential in
Cities.
19UNDERSTANDING CITIES’ VULNERABILITIES
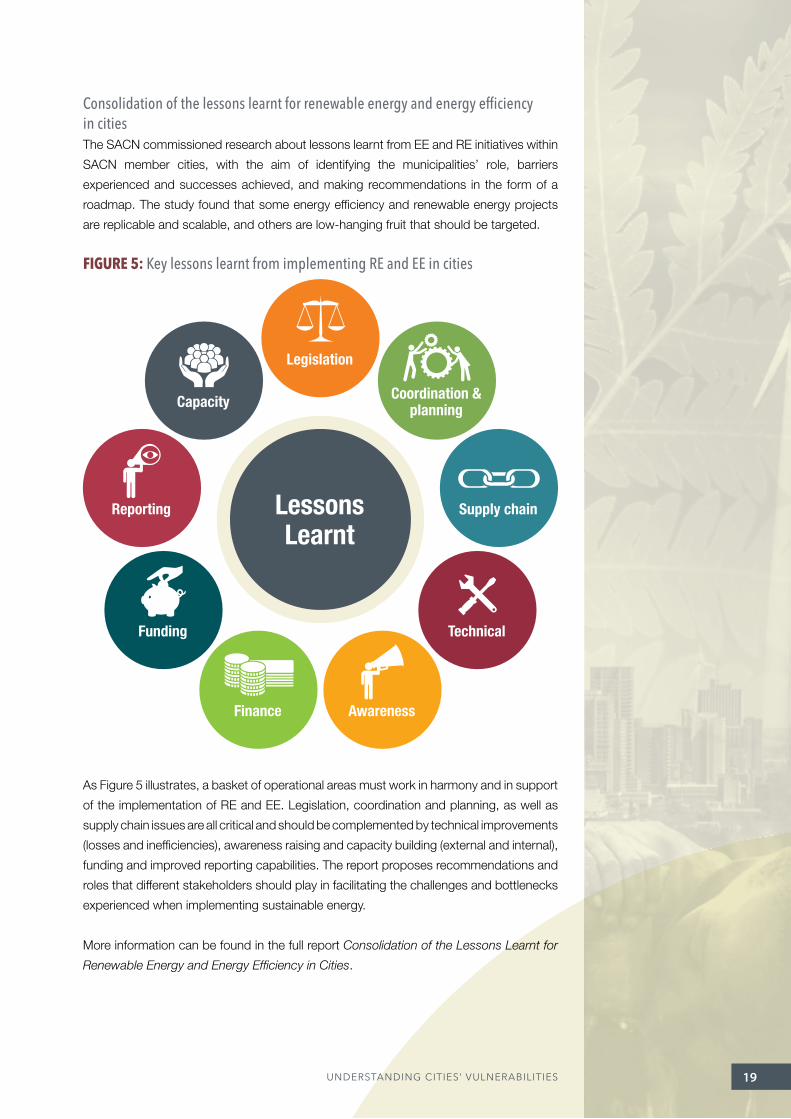
Consolidation of the lessons learnt for renewable energy and energy effi ciency in citiesThe SACN commissioned research about lessons learnt from EE and RE initiatives within
SACN member cities, with the aim of identifying the municipalities’ role, barriers
experienced and successes achieved, and making recommendations in the form of a
roadmap. The study found that some energy ef� ciency and renewable energy projects
are replicable and scalable, and others are low-hanging fruit that should be targeted.
FIGURE 5: Key lessons learnt from implementing RE and EE in cities
Legislation
Lessons Learnt
Capacity
Reporting
Funding
Finance
Coordination & planning
Supply chain
Technical
Awareness
As Figure 5 illustrates, a basket of operational areas must work in harmony and in support
of the implementation of RE and EE. Legislation, coordination and planning, as well as
supply chain issues are all critical and should be complemented by technical improvements
(losses and inef� ciencies), awareness raising and capacity building (external and internal),
funding and improved reporting capabilities. The report proposes recommendations and
roles that different stakeholders should play in facilitating the challenges and bottlenecks
experienced when implementing sustainable energy.
More information can be found in the full report Consolidation of the Lessons Learnt for
Renewable Energy and Energy Ef� ciency in Cities.

20 SUSTAINABLE CITIES REPORT
Water managementIn 2013, the SACN commissioned research into the state of water resources and their
management in cities. The National Water Act and Water Services Act govern the
protection, conservation and sustainable management of water resources. The National
Water Resource Strategy: Water for an Equitable and Sustainable Future provides the
strategic direction and guidance for catchment management, water allocations and
water quality management.
Clean fresh water is needed not only for consumption, but also for farming (of food),
manufacturing and producing electricity. Access to potable water and electricity are
directly linked to quality of life. The country’s fresh water supply is under threat, largely
as a consequence of increasing demand, pollution, unsustainable use and climate
change. South Africa has a semi-arid, water-scarce environment, and many areas, such
as the Northern Cape, are already experiencing severe water stress.
South Africa is a water-scarce country with highly variable water resources, both over
time and space. As a result, and to create security of water supply, South Africa has a
highly regulated and engineered water infrastructure with some of the highest levels of
impoundments worldwide. Water resources are necessary for basic human needs,
economic development, social needs and ecological and environmental requirements.
Within a water-scarce country, this means that most water is already allocated to existing
uses and competing demands. Unfortunately, water is not valued as a scarce resource
and is often wasted, polluted and poorly managed. As cities and the economy grow,
demands for the limited available water supplies will only increase. The current water
restrictions and drought in KwaZulu-Natal is a good example of the social and economic
stresses that water shortages can cause.
Challenges to managing water relate to water availability, water quality or its � tness for
use (issues like acid mine drainage have become increasingly prominent), development
and maintenance of water infrastructure to ensure its usability for people and the
economy, as well as maintaining the ecological services that provide us with water (� ood
mitigation, water puri� cation etc.). Cities in South Africa are responsible for providing,
maintaining and collecting revenue for water supply and sanitation. Balancing the needs
for infrastructure to new residents, maintaining existing infrastructure and collecting
revenue to fund these services where many residents cannot afford to pay will remain a
complex challenge going forward. Skills and human capacity in the water sector,
particularly at a local level, are often too small to cope with the scale and complexity of
the challenges.
As a scarce and valuable resource, water needs to be treated with care. The whole
infrastructure – from extracting fresh water, to treating wastewater and delivering potable
water to the consumer – needs to be as ef� cient as possible. This means ensuring the
state and quality of water infrastructure within cities, and freshwater resources (rivers and
wetlands) are in a good condition.
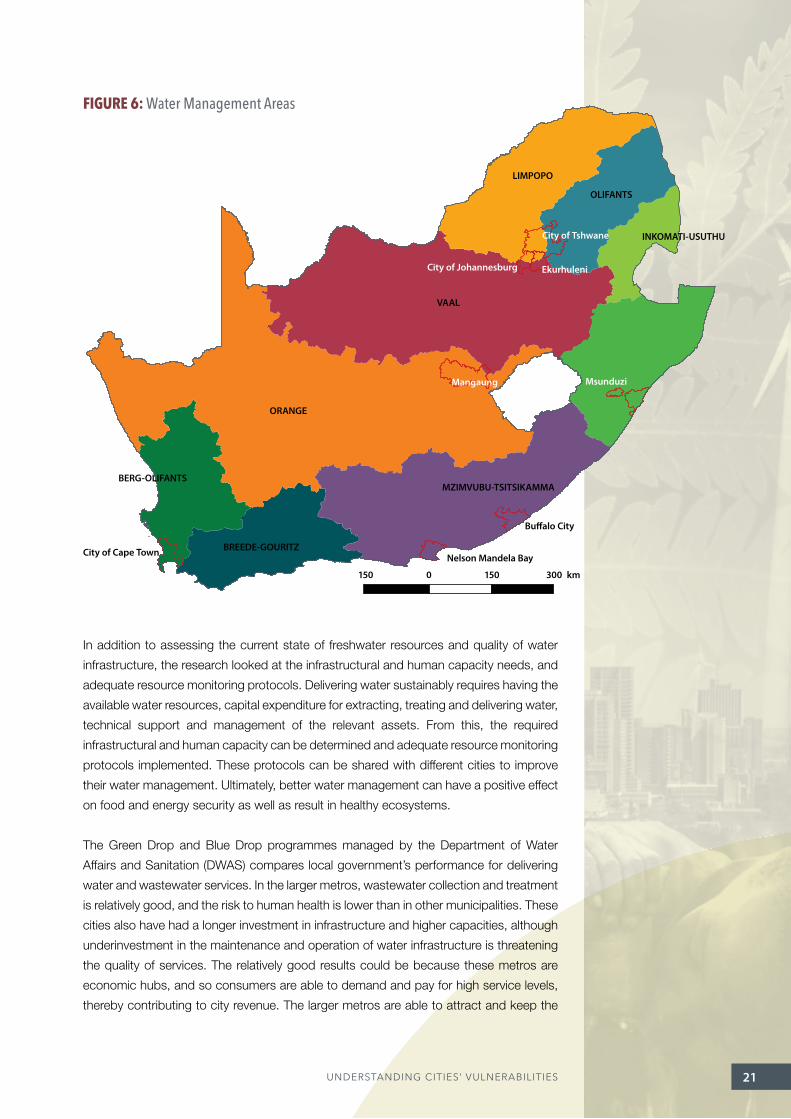
Figure 6 is a map of the cities and their water management areas.
21UNDERSTANDING CITIES’ VULNERABILITIES
FIGURE 6: Water Management Areas
City of Cape Town
BERG-OLIFANTS
Bu�alo City
Nelson Mandela Bay
150 1500 300 km
Msunduzi
MZIMVUBU-TSITSIKAMMA
VAAL
BREEDE-GOURITZ
City of Tshwane
EkurhuleniCity of Johannesburg
INKOMATI-USUTHU
OLIFANTS
LIMPOPO
Mangaung
ORANGE
In addition to assessing the current state of freshwater resources and quality of water
infrastructure, the research looked at the infrastructural and human capacity needs, and
adequate resource monitoring protocols. Delivering water sustainably requires having the
available water resources, capital expenditure for extracting, treating and delivering water,
technical support and management of the relevant assets. From this, the required
infrastructural and human capacity can be determined and adequate resource monitoring
protocols implemented. These protocols can be shared with different cities to improve
their water management. Ultimately, better water management can have a positive effect
on food and energy security as well as result in healthy ecosystems.
The Green Drop and Blue Drop programmes managed by the Department of Water
Affairs and Sanitation (DWAS) compares local government’s performance for delivering
water and wastewater services. In the larger metros, wastewater collection and treatment
is relatively good, and the risk to human health is lower than in other municipalities. These
cities also have had a longer investment in infrastructure and higher capacities, although
underinvestment in the maintenance and operation of water infrastructure is threatening
the quality of services. The relatively good results could be because these metros are
economic hubs, and so consumers are able to demand and pay for high service levels,
thereby contributing to city revenue. The larger metros are able to attract and keep the

22 SUSTAINABLE CITIES REPORT
technical skills essential for adequately treating wastewater and delivering treated water
to the � nal consumer. Adequately treated wastewater released into the environment has
a lower impact on freshwater resources, and reduces the likelihood of outbreaks and
spread of water-borne epidemics. Figure 7 highlights the negative changes in surface
water quality since 2005.
FIGURE 7: Surface water quality trends for chlorides and sulphates (2006–2008), total dissolved solids and nitrates (2005–2010).
1
1
5
4
7
6
89
32
58
4
7
6
9
32
5
4
7
6
89
32
1
5
4
7
6
89
31
2
Chloride
Total dissolved solids
Sulphate
Nitrates
5
4
7
6
89
311
5
7
6
89
3
5
7
6
89
311
58
4
7
6
9
3
Steady
Deteriorating
Improving
1. Johannesburg 4. Cape Town 7. Buffalo City
2. Tshwane 5. Ethekwini 8. Msunduzi
3. Ekurhuleni 6. Nelson Mandela Bay 9. Mangaung
Pollution is having a negative impact on freshwater ecosystems. Mining may be responsible
for the salinity observed in the Vaal, Crocodile and Olifants River systems, while poorly
treated ef� uent and solid waste pollute rivers across the cities.
The cities have good water management (Figure 8). Cape Town’s water and wastewater
infrastructure is considered the most adequate, based on the proportion of households
and persons with access to water and sanitation, and the relatively low new infrastructural
needs. However, this does not account for the quality of the service provided.

23UNDERSTANDING CITIES’ VULNERABILITIES
FIGURE 8: Access to water (2010)
Piped water inside dwelling/institution Piped water in yard
Piped water on community stand (<200m from dwelling/institution) Piped water on community stand (200m – 500m from dwelling/institution)
Piped water on community stand (500m – 1000m from dwelling/institution) Piped water on community stand (>1000m from dwelling/institution)
No access to piped water
0
10
20
30
40
50
60
70
80
90
100
Cape TownJohannesburg eThekwini Tshwane Ekurhuleni Nelson Mandela Bay
Mangaung Buffalo City Msunduzi
As Figure 8 shows, Cape Town and Nelson Mandela Bay have the highest proportion
of households with piped water inside dwellings. Cape Town, eThekwini, Mangaung
and Msunduzi have the highest proportion of households with metered connections. In
addition, Cape Town, Ekurhuleni, eThekwini, Nelson Mandela Bay have the best
performance for budgeting for spending on asset management. eThekwini (whose
Water and Sanitation Department won the 2014 Stockholm Industry Water Award),
Buffalo City and Cape Town have the best technical capacity, measured by the number
and quali� cations of people occupying technical positions in their water infrastructure
departments.
FIGURE 9: Non revenue water – water loss
2009/10 2010/11 2011/12 2012/13
0
10
20
30
40
50
60
70
80
90
100
Cape TownJohannesburg eThekwini Tshwane Ekurhuleni Nelson Mandela Bay
Mangaung Buffalo City Msunduzi

24 SUSTAINABLE CITIES REPORT
Between 2009 and 2013, Cape Town, Tshwane and Nelson Mandela Bay kept the
percentage of water losses below 30% (Figure 9). However, 30% water losses is of
concern, highlighting the state of South Africa’s ageing water infrastructure, inadequate
maintenance and old leaking pipes. Investment in improved infrastructure needs to be
prioritised, in order to manage the non-revenue water levels, especially in a water-scarce
country like South Africa that ought to conserve water resources. Furthermore, in the
case of Tshwane, Ekurhuleni and Johannesburg, their location on the headwaters means
that the water available locally cannot meet the demand, and they are heavily reliant on
interbasin transfers to provide water.
Reliable assessments of the sustainability of water resources and their management are
affected by data gaps, especially in the smaller metros that are only beginning to improve
their information management systems. While the data gaps vary from city to city, in all
cities the ‘� tness for use’ indicator is inadequately monitored at city level. Therefore, the
study used data from a nationwide project – the NFEPA (National Freshwater Ecosystem
Priority Areas) – conducted at a sub-Water Management Area level.
To manage water resources sustainably and to support social and economic development
of the country, municipalities need to:
• Improve knowledge about the relationship between water and water users and the
importance of ecosystems.
• Consider the different water resource types that are available.
• Improve understanding of the existing and any emerging threats to the reliable delivery
of water to consumers.
• Build the necessary capacity (technical and � nancial) to address the challenges.
More information can be found in the full report State of Water in Cities.
Waste managementThe SACN commissioned research into the state of waste management in its member
cities. Indicators were co-developed with cities and data collected. The data was
clustered into three interrelated groups: Governance and Finance, Basic Service Provision
and Economic Opportunities, re� ecting the main waste service responsibilities.
Waste is a valuable resource and should not be discarded or disposed with no regard for
future use. A wide range of bene� ts can be reaped from rational and consistent waste
management practices. The long-term result of adopting the waste hierarchy approach
will be ef� cient production and consumption of products and materials. In the short to
medium term, the options of recycle, reuse and waste-to-energy conversion present an
opportunity for new jobs and new business opportunities, thus contributing to the green
economy. It will also lead to improved air and water quality, and reduced GHG emissions
through capturing methane at land� ll sites.

25UNDERSTANDING CITIES’ VULNERABILITIES
Constitutionally, proper waste management is a core municipal function. Integrated
sustainable waste management in cities is guided by national policy, including the
National Environmental Management Waste Act and the National Waste Management
Strategy (NWMS).
The study found that waste management in the SACN member cities has improved
tremendously over the past two decades. Mangaung‘s waste collection service increased
by more than 10% between 2001 and 2011. Waste collection in all cities is above the
national average of 65% (Stats SA, 2011).
The Integrated Waste Management Plans (IWMPs) are key to
strengthening waste governance in local municipalities. Cities
with IWMPs perform much better than cities without
these plans in place. In 2013, Johannesburg, Cape
Town and Nelson Mandela Bay all had up-to date
and functional IWMPs, and were the three best-
performing cities for waste management. Cities
need to complete IWMPs, review them on a
frequent basis and have them approved by their
Council (as legally required). The more
comprehensive an IWMP is, the better the city’s
overall performance. Cities should also explore
ongoing research into new waste management
and recycling methods, and learn from other
cities. New opportunities and new technologies are
being developed continuously, as waste management
is high on the agenda for cities globally. Properly
managed, structured and resourced waste management
services will enable municipalities to take advantage of many
developmental and economic opportunities. A fully exploited and
developed waste industry presents opportunities for job creation, energy
generation and value-add through recycling. Waste-to-energy generation helps reduce
the pressure on the national power utility and is a new source of revenue for municipalities.
A part of the IWMPs that needs special attention is budgeting and � nancing waste
management, including collecting, transporting, disposing, outsourcing and recycling the
waste. The waste management function is a huge cost factor in cities and, if not properly
budgeted for, will strain limited municipal � nancial resources. However, compared to
other city services, the budget for waste is relatively low in many cities. The � ndings of
the benchmarking survey conducted by National Treasury in 2012 illustrated that
municipalities whose services have cost-re� ective tariffs were able to realise surpluses.
Only � ve municipalities, including three cities (Nelson Mandela Bay, Ekurhuleni, Msunduzi),
use cost-re� ective tariffs and recorded a surplus.
The waste management function is a huge cost factor in cities

26 SUSTAINABLE CITIES REPORT
Although cities have developed alternative waste handling facilities, land� lling remains the
most common method of waste disposal in the country. In 2013, the national South
African Waste Information System (SAWIS) website indicated that, every year, more than
35 million tons of general waste is deposited in land� ll sites, with cities accounting for
more than half of this � gure. Land� lling not only takes up valuable land space but also
causes air, water and soil pollution. It discharges carbon dioxide (CO2) and methane into
the atmosphere, and chemicals and pesticides into the ground.
In some cities, land� ll sites are under stress, unable to cope with the volumes of waste
generated by a nation that is not environmentally conscious. For instance, in 2015 City of
Tshwane reported a closure of three of its land� ll sites because they were full in a space
of six months (June–December 2013), while the remaining � ve sites have diminishing
airspace. It takes approximately � ve years to apply for, get approval and develop a new
land� ll site. If business as usual continues, cities will still be grappling with high volumes
of waste by 2030 (Figure 10), and so cities need to come up with alternative waste-
disposal methods and encourage waste reduction.
FIGURE 10: Waste volumes disposed of at landfi ll sites per city
City of Cape Town
Year
Tons
0
500000
1000000
1500000
2000000
2500000
2011
2013
2015
2017
2019
2021
2023
2025
2027
2029
Waste disposed of
Waste recycled
City of Johannesburg
Year
Tons
0200000400000600000800000
100000012000001400000160000018000002000000
2011
2013
2015
2017
2019
2021
2023
2025
2027
2029
Waste disposed of
Waste recycled

27UNDERSTANDING CITIES’ VULNERABILITIES
eThekwini
Year
Tons
0
500000
1000000
1500000
2000000
2500000
3000000
2011
2013
2015
2017
2019
2021
2023
2025
2027
2029
Waste disposed of
Waste recycled
Mangaung
Year
Tons
0
100000
200000
300000
400000
500000
600000
700000
800000
2011
2013
2015
2017
2019
2021
2023
2025
2027
2029
Waste disposed of
Waste recycled
Ekurhuleni
Waste disposed of
Waste recycled
Year
Tons
0
500000
1000000
1500000
2000000
2500000
2011
2013
2015
2017
2019
2021
2023
2025
2027
2029
Even with waste diversion and waste minimisation efforts, a regional land� ll site in
Gauteng is critical and urgent. The rollout of a waste minimisation strategy would simply
affect the scale (size and capacity) of the regional site, which would provide relief to
Tshwane, Johannesburg, Ekurhuleni and Mogale City Municipality (Krugersdorp).
Figure 11 depicts a hypothetical scenario showing the effects of increased recycling on
airspace. Increased recycling, whether the national average of 10% or NWMS target of
25%, would lead to an increase in available airspace.

28 SUSTAINABLE CITIES REPORT
FIGURE 11: Hypothetical scenario of effects of increased recycling on airspaceAi
rspa
ce (m
3 )
Baseline: Airspace available m3
Increase recycling to 10%
Increase recycling to 25%
-20000000
0
20000000
40000000
60000000
80000000
100000000
2011
2012
2013
2014
2015
2016
2017
2018
2019
2020
2021
2022
2023
2024
2025
2026
2027
2028
2029
2030
Cities can adopt various land� ll diversion strategies, which will require recon� guring the
overall planning and regulatory framework to encourage the reduction of waste to land� ll
sites. These include:
• Reviewing the outdated IWMPs and ensuring alignment with the IDPs for budgeting
purposes in order to secure funding for sustainable waste management practices.
• Amending by-laws to include reasonable waste recovery initiatives for the
implementation and enforcement thereof. This should be a phased in approach e.g.
Year 1: paper separation, Year 2: glass separation etc.
• Reviewing city waste management policies to re� ect mainstreaming of climate
change, mandatory recycling and composting. For example, investigating community
composting programmes and curbside recycling programmes.
• Increasing education and awareness by developing programmes with realistic
timelines for implementing sustainable solutions, which must be supported by the
executive management of the city.
• Designing inclusive programmes, providing ’user-friendly’ recycling and composting
services to all communities including small and rural communities (moving away from
isolated separation at source in certain communities), with the goal of reducing waste
disposed at land� lls in line with national targets.
• Providing suf� cient funding for a comprehensive materials-recovery programme and
incentives to develop markets.
More information can be found in the full report, State of Waste Management in Cities –
modelling the effects of land� lling as a disposal method.
The research on waste management also looked at the promise of the green economy,
speci� cally how municipalities might turn their waste management into economic

29UNDERSTANDING CITIES’ VULNERABILITIES
activities that will not only relieve the negative impact of waste on the environment but
also elevate the living standards of their citizens. The transition towards sustainable
municipal solid waste management practices demands engaging and preparing both the
public and private sector. Substantial investment is required in both soft (organisational)
and hard (equipment, civil) infrastructure. Moreover, to ensure the sustainability of
initiatives, the right implementation models need to be applied, including cost recovery
and law enforcement precautions.
The research identi� ed several requirements for developing green waste management
initiatives, including the need to:
• build organisational capacity/skills,
• remove regulatory restrictions in the MFMA,
• draw up solid development and implementation plans including MRV procedures,
• unlock investments in the green economy through industry and international funding
agencies, and
• build external skills and sensitise stakeholders.
More information can be found in the full report A Case for Municipal Solid Waste
Management towards transitioning to green economy.
Food security Having identi� ed food insecurity as one of the potential city vulnerabilities, the SACN
commissioned research into the current and future realities for urban food security in
South Africa. The research argues that food security needs to be viewed and
contextualised within the entire food system, which consists of (i) the activities, actors
and institutions who grow, process, distribute, acquire, consume and dispose of food
and how they interact with other systems and actors; and (ii) the outcomes of these
activities contributing to food security. Therefore, if food security depends on the food
and broader systems, approaches to addressing food insecurity must extend beyond the
individual and household to consider food systems at the neighbourhood, city and
national scales, as well as the interface of these different systems.
The National Policy on Food and Nutrition Security introduced in 2013 builds on existing
initiatives to ensure a rigorous and dynamic response to food and nutrition in order to
achieve the objectives of the National Development Plan (NDP) (NPC, 2012). Prior to this
policy, the state’s role in food security had been spread across various departments: the
Integrated Food Security Strategy, housed in the Department of Agriculture, Forestry and
Fisheries (DAFF), the Integrated Nutrition Programme (housed in the Department of
Health), and the National School Nutrition Programme (housed in the Department of Basic
Education). The 2012 Food for All Campaign linking the DAFF and the Department of
Social Development was informed by Brazil’s Zero Hunger strategy. Its focus was largely
on rural areas and unfortunately lost traction shortly after the initial launch phase (SACN,
2014). These national strategies informed the approach to food security as articulated in
broader strategic documents, such as the Medium Term Strategic Framework.
30 SUSTAINABLE CITIES REPORT
This approach left little scope for municipalities to address food insecurity as (a) municipalities
do not have equivalent departments (of agriculture, forestry and � sheries, health or
education), with the exception of the City of Tshwane’s Agriculture and Environmental
Management Department; (b) food security is overwhelmingly identi� ed as a rural
problem, which means that no funding is allocated to urban food insecurity. However, the
NDP and the draft Integrated Urban Development Framework elevate the role of local
government and refer to urban food security.
Like the rural poor, the urban poor in South Africa experience food security. The South
African National Health and Nutrition Examination Survey found that over half of
households nationally are at risk of hunger (28%) or experience hunger (26%). In urban
informal areas, over two-thirds of households are at risk of hunger (32%) or experience
hunger (36%). The equivalent � gures in urban informal areas were 32% and 36%
respectively. Supporting this � nding are case studies, which consistently show high levels
of food insecurity in urban areas. With regard to trends nationally, food insecurity was in
decline but appears to have plateaued. However, with ever-increasing food and other
prices, the levels of urban food insecurity are unlikely to improve.
Urban household food security depends on the availability, accessibility and use of food,
and is affected by the household’s disposable income. This is because urban residents
have to purchase most of their food (whereas people in rural areas can produce their own
food). Urban food insecurity is characterised by low dietary diversity, high malnutrition
and obesity, and distinct hunger seasons. This is caused by factors such as household
income, income stability, household structure and household asset base.
The research found that the informal food retail sector is more responsive to the food
security needs of the poor than the supermarket sector. Although more expensive per
unit, the informal food retail is by design more attuned to the retail needs of the poor. Poor
households make small, frequent purchases because of limited disposable income,
storage and refrigeration. Poor households also tend to get home after supermarkets
have closed because of the current urban form and inadequate public transport. Informal
sector food retailers have longer opening hours than supermarkets, while street vendors
sell ready-to-eat foods that satisfy the needs of these communities.
Despite a constant supply of food to cities, vulnerable households struggle to access
suf� cient foods during distinct hunger seasons (Figure 12). (a) January, as a result of
households overspending on food during the festive season and having to cover other
expenses, such as school fees; in addition, most businesses close down over December
and January, reducing income and casual labour opportunities. (b) June, as a result of
adverse weather conditions that prevent industries from operating at full capacity, thus
employing less manual labour, which means that poor households have lower incomes.
This pattern has signi� cant health implications, particularly for individuals on chronic
medication who require consistent nutrition. Therefore, social safety nets are needed to
respond to these predictable times of food insecurity.

31UNDERSTANDING CITIES’ VULNERABILITIES
FIGURE 12: Months of inadequate household food provisioning: Cape Town, Msunduzi, and Johannesburg
Cape Town
Msunduzi
Johannesburg
0%
10%
20%
30%
40%
50%
60%
70%
80%Ja
nuar
y
Febr
uary
Mar
ch
April
May
June
July
Augu
st
Sept
embe
r
Octo
ber
Nove
mbe
r
Dece
mbe
r
Cities should play a wider role, beyond providing access to urban agriculture, and shape
the characteristics and trends of the food system as a whole. Cities can use existing
policies and plans to leverage food security interventions, for example: IDPs, SDFs, open
space master plans, land-use planning, housing and transport plans.
Strategies must also be developed that recognise the informal food retail sector and that
ensure the sustainable management of fresh produce markets, in order to create a
thriving business environment that could appeal to unemployed youth. The partnerships
identi� ed in the current city interventions need to be strengthened.
More information can be found in the full report, Current and Future Realities for Urban
Food Security in South Africa.
Climate changeThe SACN undertook an analysis of cities’ resilience to climate change, with a particular
focus on food security, water provision and transportation. The three cities chosen as
case studies were Johannesburg, Mangaung and Ekurhuleni.
Climate change is likely to have damaging effects globally on natural and human
systems, economies and infrastructure. It cannot be addressed in isolation, as purely
an environmental issue. Accordingly, the national Climate Change Response Policy
32 SUSTAINABLE CITIES REPORT
was developed to drive national mitigation and adaptation
interventions. South Africa is signatory to a number of
global environmental treaties, and realising the
commitments made through these treaties resides at
local government level. To support their climate
change actions, South African cities are members of
various networks and platforms. Johannesburg and
(recently) Tshwane are members of the C40 Cities
Group, which actively reports on the reduction of
GHG emissions. Until recently, eThekwini represented
local government in the South African delegation at the
Conference of Parties (COP) and hosted the United
Nations Framework Convention on Climate Change
negotiations in 2011.
To date, little emphasis has been placed on the impact of climate
change on the day-to-day operations and municipal services of cities. Climate
change is seen as removed from the operational and implementation side of service
delivery. Even within strategic planning, although recognised to some extent, climate
change is not addressed in terms of the physical and direct impacts that will result from
climate variables, and the subsequent impacts on service delivery.
The following emerged when food security, water provision and transportation were
linked to the overall adequate resilience of the city as a system:
• Water provision is the high risk sector across all three cities. Increasing temperatures
will have an impact on water provision and usage: as the demand for water rises,
pressure on the city’s existing water reserves will increase. Projections show that
Mangaung will have a lower rainfall, which makes water and sustainable water
provision a major issue that needs to be addressed in municipal plans for the future.
Interestingly, water provision was seen as a high risk in the Mangaung workshops but
an extreme risk in Ekurhuleni.
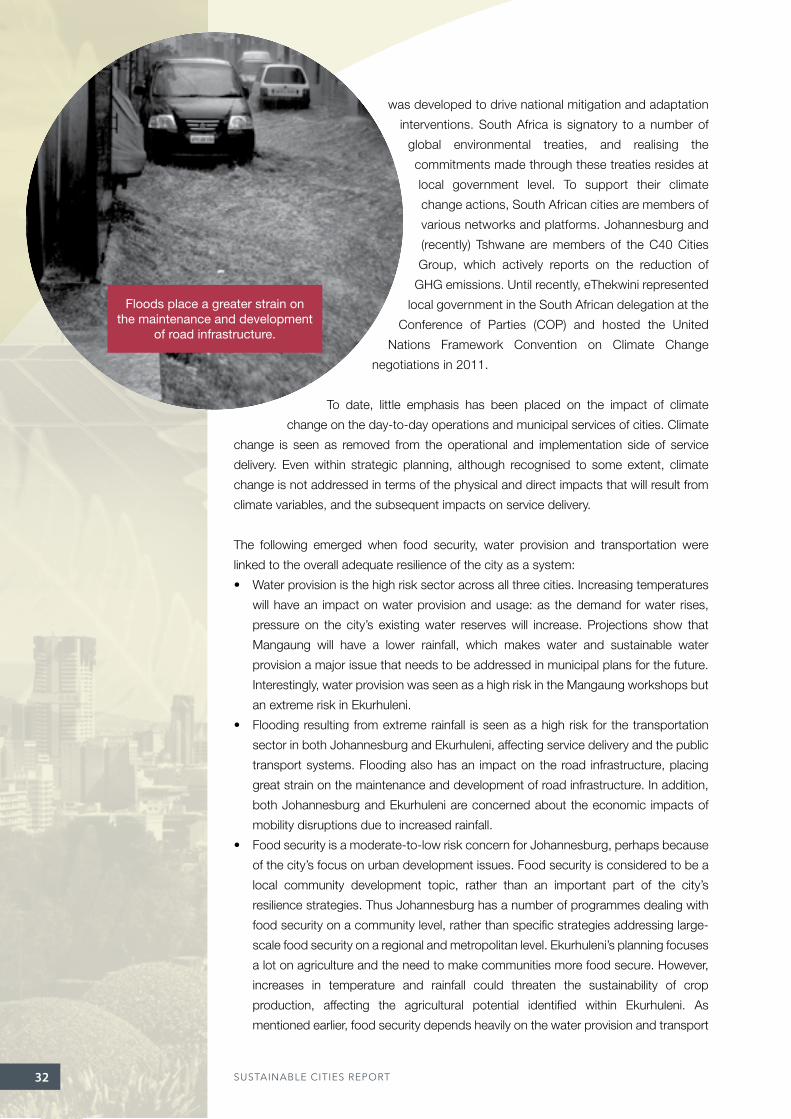
• Flooding resulting from extreme rainfall is seen as a high risk for the transportation
sector in both Johannesburg and Ekurhuleni, affecting service delivery and the public
transport systems. Flooding also has an impact on the road infrastructure, placing
great strain on the maintenance and development of road infrastructure. In addition,
both Johannesburg and Ekurhuleni are concerned about the economic impacts of
mobility disruptions due to increased rainfall.
• Food security is a moderate-to-low risk concern for Johannesburg, perhaps because
of the city’s focus on urban development issues. Food security is considered to be a
local community development topic, rather than an important part of the city’s
resilience strategies. Thus Johannesburg has a number of programmes dealing with
food security on a community level, rather than speci� c strategies addressing large-
scale food security on a regional and metropolitan level. Ekurhuleni’s planning focuses
a lot on agriculture and the need to make communities more food secure. However,
increases in temperature and rainfall could threaten the sustainability of crop
production, affecting the agricultural potential identi� ed within Ekurhuleni. As
mentioned earlier, food security depends heavily on the water provision and transport
Floods place a greater strain on the maintenance and development
of road infrastructure.

33UNDERSTANDING CITIES’ VULNERABILITIES
sectors. However, the fact that food security was not highlighted as a major risk
shows that climate change is not yet seen from a holistic perspective, and the intricate
inter-linkages between sectors are not acknowledged.
City resilience was evaluated based on whether cities have a system in place for addressing
and planning for resilience. The study found:
• Johannesburg has an EMERGING resilience system. The city’s long-term planning
documents make reference to climate change, but integration and implementation
are lacking. However, the city is becoming more proactive and is reviewing its
Adaptation Strategy. Therefore, the conclusion is that Johannesburg’s climate change
resilience system is well advanced and moving towards a fully-� edged resilience
planning platform.
• Ekurhuleni’s climate change resilience system is NOT DEVELOPED. Climate change
impacts are considered but not effectively integrated into the city’s overarching
planning documents. The existing Climate Change Strategy focuses predominantly
on renewable energy and does not provide a holistic context of climate change in the
metropolitan area.
• Mangaung’s climate change resilience system is NOT DEVELOPED. The city’s long-
term planning documents make isolated references to climate change, but the
concept is not adequately integrated into the overall strategic planning of the
municipality. In addition, no supporting data management system is in place to feed
into pro-active resilience planning, which, coupled with limited external partnerships,
does not provide suf� cient support to effectively integrate climate change planning
and strategies.
Planning for and managing climate change impacts must be incorporated into all
overarching city development strategies, to ensure effective awareness, preparedness
and integration across all disciplines and departments.
More information can be found in the report Cities Resilience to Climate Change.
Green transportAlthough public transport forms part of SACN’s Built Environment pillar, the need for
sustainability and emissions reduction in the transport sector is relevant for cities’
vulnerabilities. A study on various scenarios for integrating the minibus taxi industry into
the broader public transport system was conducted. It explored major global and local
trends affecting the future of public transport and assessed the potential of technology,
leadership, incentives, regulatory reform and other interventions to improve service
quality, safety and ef� ciency in the minibus taxi industry.
Public transport plays an essential role in addressing the spatial and socioeconomic
inheritance in South Africa. Apartheid planning created cities where lower income people
live predominantly on the periphery, resulting in long travelling times mostly by private car
and minibus taxis (Table 2). Developing integrated, ef� cient, affordable and sustainable
public transport networks is seen as one of the strategies for reversing the situation.

34 SUSTAINABLE CITIES REPORT
TABLE 2: NHTS results comparison 2003–2013,
MODAL SHARE 2003
MODAL SHARE 2013 % CHANGE
Public
Transport
Train 7.1% 6.6% -0.,5%
Bus 7.5% 6.2% -1.3%
Taxi 22.5% 25.1% 2.6%
Total 37.1% 37.9% 0.8%
Private
Transport
Car 28.5% 34.2% 5.8%
Walk 32.3% 25.8% -6.5%
Other 2.2% 2.0% -0.1%
Total 62.9% 62.1% -0.8%
The study brought together mobility thought leaders from national government, cities, the
minibus taxi industry and civil society to explore the possibilities for collaboration between
South Africa’s cities and minibus taxi industry. The focus was on innovation, improving
services and integrating the industry with other public transport modes. The report concluded
that the minibus taxi industry is a key component of public transport in South African cities.
More information can be found in the report Minibus Taxi Scenarios 2035.
The SACN also led a team that conducted research into establishing a South African
Cities Green Transport Programme, funded by the Green Fund.
Congestion caused by the heavy dependence on private cars increases travel time,
thereby reducing productivity and affecting economic growth. More importantly, it
contributes to high levels of air pollution and GHG emissions in cities. As Figure 13
illustrates, the transport sector accounts for 38% of these emissions, compared to 28%
from industrial activities and 26% from the residential sector (SEA, 2015).
FIGURE 13: Emissions by sector
Residential
Transport
26%
6%
2%
28%
38%Commercial
Industrial
Government

35UNDERSTANDING CITIES’ VULNERABILITIES
Having accepted the need to shift from private to public
transport, the study explored options for further ‘greening’
of transport. Switching to green vehicle technologies and
fuels were investigated in terms of costs, environmental
performance and the policy and regulatory environment,
with particular reference to municipal bus � eets and
the minibus taxi industry.
The research found that the life-cycle costs for
procuring and operating green bus � eets using either
biofuels, compressed natural gas (CNG), biogas or
electric batteries have largely converged with those of
EuroV diesel buses. While all options comply with EuroV
tailpipe emissions standards, the wells to wheels3 emissions
are lower for ‘green’ buses than for diesel buses, with biogas
providing the best environmental performance.
South African cities are willing to commit to greening their municipal � eets and,
in principle, the projected demand for new buses from municipalities is suf� cient to
support the local manufacture of green buses. However, cities currently have no appetite
for a centralised procurement mechanism that could provide bus manufacturers with the
guarantees needed to justify such an investment.
In Gauteng, there is already some momentum around CNG as a vehicle fuel for buses
and minibus taxis. An analysis of a gas retailer’s business model found that an additional
charge on the gas price could cover the costs of converting minibus taxis (so that they
can switch between CNG or petrol), while at the same time reduce the operator’s fuel
costs. However, transport fuel levies similar to those placed on petrol and diesel are not
currently placed on gas.
Cities can assist in rapidly expanding the scale of minibus taxi conversions in a number of
ways. These range from facilitating awareness and dialogue between gas retailers and taxi
associations, to providing refuelling infrastructure, and � nancing minibus taxi conversions
in partnership with the private sector and/or � nance institutions. Furthermore, cities own
and operate thousands of vehicles, which account for more than 20% of their total direct
municipal energy consumption (SACN, 2014). Greening municipal � eets makes sense in
all respects – reduced air pollution, reduced respiratory illnesses and savings on fuel costs.
More information can be found in the Green Transport report (forthcoming).
3. Historically, evaluation of vehicle/fuel systems from wells to wheels was called fuel-cycle analysis. It takes into account the production and distribution of the fuel, thereby allowing comparison of emissions over the entire life cycle of a vehicle – from the energy and materials used to power a vehicle, to the direct tailpipe emissions (http://www.electricridecolorado.com/are_you_ready/wells_to_wheels/what-does-it-mean/what-does-wells-to-wheels-mean).
The minibus taxi industry is a key component of public
transport in South African cities.

36 SUSTAINABLE CITIES REPORT
Cross-cutting Issues that Support a City’s Sustainable Functioning
Human capacityService delivery depends upon capable human resources. In this regard,
SACN commissioned research into the skills capacity for spatial transformation
in eThekwini, Msunduzi, Tshwane, Johannesburg, Ekurhuleni, Buffalo City,
Mangaung and Nelson Mandela Bay.
Since the demarcation of democratic local government boundaries in 2000, metropolitan
municipalities have faced institutional challenges, as a result of the amalgamation of
formerly separate local authorities. The spatial legacy of inef� ciency and segregated
developments from the apartheid era persists, despite strides made in creating integrated
sustainable human settlements, as evidenced by sporadic linked developments and
improvements in basic service delivery. The majority of the underprivileged black
population in South Africa’s major cities still live in peripheral low-income settlements
located far from socioeconomic opportunities. The need for spatial transformation is
recognised, but certain challenges � rst need to be overcome.
Horizontal and vertical integrationSenior of� cials have a good understanding of spatial transformation, but more ‘integrators’
are needed. These are people who can work beyond the con� nes of their line departments
and develop good relationships with other sector departments within the municipality
and other spheres of government. Although a well-developed hierarchy of spatial plans
exists, from the spatial development framework (SDF) to precinct plans, these plans lack
clear-cut spatial targeting and fail to align inter-departmental spatial transformation roles
and responsibilities. The introduction of built environment performance plans is aimed at
providing integrated implementation of these plans. These need to be resourced in order
for them to be effective. In most cities, top management and Council seriously take this
opportunity for of� cials to work together in a more integrated fashion.
In addition to the need for greater horizontal integration, vertical integration is also
lacking because of several serious intergovernmental relations challenges related to
the complementary role that national government and provinces are supposed to play
in local government spatial transformation initiatives. For instance, in eThekwini, the
province’s lack of commitment to sharing the costs of key infrastructure (e.g.
interchanges, bridges and roads) is having a detrimental effect on progress towards
spatial transformation. Another problem is delays from other national or provincial
departments, e.g. the issuing of water licences. In Ekurhuleni, the provincial housing
and education departments have not proactively supported the municipality’s spatial
This section provides
a summary of research
into areas that enable or (if
neglected) could have a
negative impact on city
vulnerabilities: human capacity,
socio-political stability and
rural-urban linkages.

37CROSS-CUTTING ISSUES THAT SUPPORT A CITY’S SUSTAINABLE FUNCTIONING
transformation initiatives, despite the existence of several forums in which municipal
planning, housing and transportation departments can engage with their national and
provincial counterparts.
Institutional stability Institutional instability is also a key challenge, especially for relatively small SACN member
cities. For instance, long-term political and administrative instability has severely affected
the Nelson Mandela Bay Municipality’s ability to address spatial transformation, although
optimism appears to be increasing among of� cials and in the private sector. This optimism
is, however, fairly fragile, and any sign of renewed insecurity is likely to damage con� dence
and the ability to implement spatial transformation initiatives. In Ekurhuleni, the weak
institutional development stems from the historical amalgamation of several long-
established municipalities, unlike other metropolitan municipalities where existing cities
were extended. To address this, in 2012 Ekurhuleni initiated an institutional review, with
the aim of recon� guring departmental structures to improve operational ef� ciency and
ensuring that personnel with the right skills and competences occupied all job positions
in the municipality. For Msunduzi, instability was mostly because of corruption allegations
against senior managers. By mid-March 2010, the budget de� cit for 2009/10 was
estimated at R162-million, the result of poor collections processes, unfunded expenditure
and high municipal expenditure on services. A number of senior staff members were
suspended for corruption and mismanagement.
National and provincial supportGovernment legislation is not always supportive of the municipalities’ role in spatial
transformation. Although the Spatial Planning and Land Use Management Act (SPLUMA)
gives legal status to detailed plans, private investment is hampered by the Subdivision of
Agricultural Land Act (No. 70 of 1970), which affects the rate of land release by DAFF. In
some areas, heritage requirements hinder proposed developments. For example, inner
city developments need to meet the requirements of Amafa, the heritage conservation
agency for KwaZulu-Natal.
Municipal departments of human settlements do not have the freedom to develop low-
income housing in line with their priorities, as the funding for housing comes from national
government (via the provincial housing departments), which in turn dictates where the
money should be invested, sometimes in contradiction to the cities’ development plans.
A densi� cation policy and subsidy regime is needed that is aligned to densi� cation
objectives. Other impediments include the culture of the local city populations, in
particular the NIMBYism (‘not in my backyard’) that prevents low-income housing in� ll
projects taking place in upmarket neighbourhoods. For example, residents in the
upmarket neighbourhood of Esseline Park in Ekurhuleni were reported to be resisting the
low-cost housing proposed for the suitable adjacent land. At the same time, many low-
income black families do not want to live in high-rise apartments (part of the densi� cation),
as they prefer owner-occupied freestanding housing units with a yard. Linked to this is
the socio-cultural preference for home ownership, rather than rental.

38 SUSTAINABLE CITIES REPORT
The SACN member cities need to have a clear understanding of the local government
agenda for spatial transformation, both in South Africa and in their speci� c contexts.
However, while most cities have some commendable and worthy strengths, certain capacity
weaknesses hinder spatial transformation. These include a shortage of the technical skills
that are central to spatial transformation, i.e. planning, architectural, urban design, project
management, and engineering skills. This situation is compounded by a high vacancy rate
within the cities and challenges in attracting and retaining skilled staff. There is also a
tendency to rely on consultants for critical skills such as engineering and GIS.
The links and coordination of interdepartmental spatial transformation initiatives need to be
improved, especially in the relatively smaller metropolitan municipalities, such as Ekurhuleni
and Buffalo City, which have ‘weak’ planning departments. In some cases, departmental
inputs to spatial transformation are not aligned, especially among transportation, economic
development and human settlements departments. This is possibly a consequence of the
lack of clear-cut spatial targeting for the spatial transformation interventions contained in
the growth and development strategies, SDFs and local SDFs in cities.
More information can be found in the report Assessing Capacity for Spatial Transformation
in SACN Member Cities.
Socio-political instabilityAs migration and mobility can challenge the urban governance of cities, SACN undertook
research that explored the challenges and opportunities associated with migration and
mobility into and within South African cities.
South African local government has a ‘developmental mandate’, which means a ‘local
government committed to working with citizens and groups within the community to � nd
sustainable ways to meet their social, economic and material needs and improve the
quality of their lives’ (White Paper on Local Government, 1998: 23). Within this context,
cities must remain governable, and this is viewed as a two-way responsibility between
local authorities and citizens themselves aimed at � nding solutions.
South African cities are urbanising faster than cities in neighbouring countries, and an
estimated 60% of the population currently live in urban areas. The cause is not only
natural growth and mobility, but also internal and cross-border migration. Poor urban
groups, including migrants, are affected by a range of urban vulnerabilities, resulting in
different forms of socioeconomic and political instability. These vulnerabilities include
ethnic tensions, violent political rivalries, violent delivery protests, xenophobic violence,
livelihood insecurities, poor health and a lack of access to services and opportunities.
The study found that residents of urban informal settlements have insecure and unstable
income, poor health, poor living conditions and violence. This is the case both for long-
term South African residents and cross-border migrants. However, the two groups face
different vulnerabilities. For example, in Gauteng, the economic centre of South Africa,
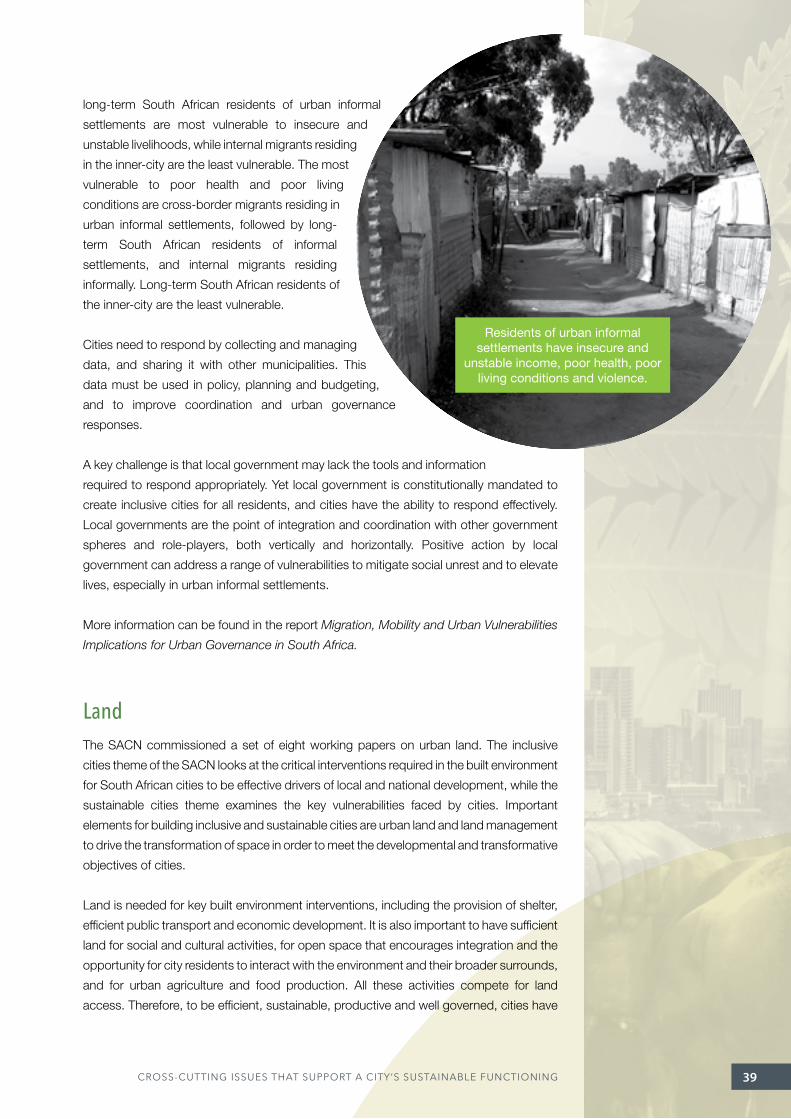
39CROSS-CUTTING ISSUES THAT SUPPORT A CITY’S SUSTAINABLE FUNCTIONING
long-term South African residents of urban informal
settlements are most vulnerable to insecure and
unstable livelihoods, while internal migrants residing
in the inner-city are the least vulnerable. The most
vulnerable to poor health and poor living
conditions are cross-border migrants residing in
urban informal settlements, followed by long-
term South African residents of informal
settlements, and internal migrants residing
informally. Long-term South African residents of
the inner-city are the least vulnerable.
Cities need to respond by collecting and managing
data, and sharing it with other municipalities. This
data must be used in policy, planning and budgeting,
and to improve coordination and urban governance
responses.
A key challenge is that local government may lack the tools and information
required to respond appropriately. Yet local government is constitutionally mandated to
create inclusive cities for all residents, and cities have the ability to respond effectively.
Local governments are the point of integration and coordination with other government
spheres and role-players, both vertically and horizontally. Positive action by local
government can address a range of vulnerabilities to mitigate social unrest and to elevate
lives, especially in urban informal settlements.
More information can be found in the report Migration, Mobility and Urban Vulnerabilities
Implications for Urban Governance in South Africa.
LandThe SACN commissioned a set of eight working papers on urban land. The inclusive
cities theme of the SACN looks at the critical interventions required in the built environment
for South African cities to be effective drivers of local and national development, while the
sustainable cities theme examines the key vulnerabilities faced by cities. Important
elements for building inclusive and sustainable cities are urban land and land management
to drive the transformation of space in order to meet the developmental and transformative
objectives of cities.
Land is needed for key built environment interventions, including the provision of shelter,
ef� cient public transport and economic development. It is also important to have suf� cient
land for social and cultural activities, for open space that encourages integration and the
opportunity for city residents to interact with the environment and their broader surrounds,
and for urban agriculture and food production. All these activities compete for land
access. Therefore, to be ef� cient, sustainable, productive and well governed, cities have
Residents of urban informal settlements have insecure and
unstable income, poor health, poor living conditions and violence.

40 SUSTAINABLE CITIES REPORT
to respond to each of these aspects. The situation is complicated by South Africa’s
sensitive land history, which has a great deal of emotional, political and cultural investment.
In order to address and respond to the above, it is necessary to navigate this challenging
context honestly.
The � rst (and perhaps most sensitive) issue is the politics of land. Nomalanga Mkhize
traces the use of planning reform instruments in urban areas and proposes that a
Western approach to planning is insuf� cient for land reform in African cities. She re� ects
on the different forms of power and in� uences that different urban actors use to stake
their urban land claims. Urban spatial transformation needs to be understood not only
as a matter of planning but as part of the land question, which means addressing the
‘politics of housing’, the lack of attention to the contradictions facing cities and ‘the
way in which land contestation emerges through the interests and actions of multiple
stakeholders and agents’.
In his paper, Paul Hendler offers a concise history of urban land and how these dynamics
continue to in� uence the present. The paper analyses urban land over � ve periods: pre-1913,
1913–1948 (from the Natives Land Act to the start of apartheid), 1948–1976 (Soweto
revolt), 1976–1994 (time of apartheid reformism), and post-1994 (the � rst 21 years of
post-apartheid democracy). Hendler looks at the history of land rights, land ownership
and development, and environmental concerns, and presents limits and possibilities for
municipal interventions.
Mercy Brown-Luthango makes an important argument for rethinking how land is valued.
She argues that a shift in mind-set is needed, particularly among city planners and
decision-makers, about the value of urban land and its role in changing how South
African cities function. This means that municipalities should understand the tools and
instruments at their disposal for creating more mixed-use and mixed-income
neighbourhoods, affordable and accessible public transport, and spaces that are more
conducive to the overall public good and function of South African cities.
Following on from the land value paper, Stacey-Leigh Joseph argues that the role of local
government in driving spatial transformation is being foregrounded, providing the opportunity
for metros to make better decisions about land that will contribute towards more effective
and ef� cient spatial form and functioning. To achieve this, they will need to interrogate and
rethink who is allowed access to land, challenge vested interests and the entrenchment of
unequal land rights, and recognise current and future land requirements – in a context where
land is a � nite resource. Essentially cities need to � nd a balance between the need for shelter,
effective transport infrastructure that increases mobility, economic development, and mixed-
land use that results in more compact cities, and the need for open space, agricultural and
environmental activities and maintaining ecological balance.
Stephen Berrisford makes a valuable contribution, focusing on the evolution of planning
law over the past 20 years, broken into three periods: 1993/4–1999, 2000–2009 and
post-2010. The Development Facilitation Act (1995) and the events that led to the drafting
41CROSS-CUTTING ISSUES THAT SUPPORT A CITY’S SUSTAINABLE FUNCTIONING
and � nalisation of SPLUMA are important aspects covered in the paper. He suggests that
cities should adopt a proactive and collaborative approach for implementing SPLUMA,
which allows municipalities to steer and guide land developments. Metros in particular
need to understand and harness this authority for more effective land interventions and
different spatial outcomes. However, this will require cities to scale up their capacity,
improve the land development decision-making process and determine an effective
process for resolving intergovernmental relations disputes.
Poor planning alignment is an ongoing challenge, and in her paper, Nellie Lester investigates
the poor implementation of land-use legislation and related instruments through three case
studies. These recent examples highlight the growing frustration with current land-use
procedures and the poor enforcement of land-use decisions by municipalities. The paper
argues that land-use planning and management is a collective process, and clear
procedures will be integral to achieving spatial transformation. The alignment of actions and
greater awareness of processes across spheres of government and between local
government and communities is central to developing successful solutions.
The focus of the paper by Nicola King and Mark Napier is understanding the land market,
why it fails and how to develop better-informed interventions. The paper considers how
policies, developmental interventions and land-use markets affect spatial development (in
the context of divergent local needs and green economy objectives) and how they could
contribute to the creation of more sustainable cities. They consider the concepts of urban
land distortion, the nature of land markets, the concept of equity and fairness in the land
market, and a range of possible interventions in land markets that could be used to improve
ef� ciencies. The paper contains a framework for sustainable urban land markets, based on
the interventions identi� ed, and concludes that achieving socially desirable outcomes will
be a complex and challenging task because of the intricacies of the land market system.
The � nal paper deals with how to translate policy to practice and, in particular, the
challenges for local government. Peter Magni considers the recommendations in urban
land policy documents from the past two decades in relation to the existing land system
in operation within cities. A systems approach is used to determine where government
might intervene within the system. He discusses the consequences of an unequal,
culturally diverse society where formal, informal and traditional land market actors operate
in the same context. One of these players is local government, which has to drive spatial
transformation but is constricted by a range of factors, including the fact that it derives
signi� cant income from land trade and property tax on well-located and developed land.
He concludes that current government policy fails to understand the complexities of the
urban land system and the needs of its interrelated role-players. This is particularly the
case for local government, which has responsibilities and contradictions in relation to
urban land that go beyond current policy considerations.
These papers are published as The Urban Land Paper Series Volume 1

42 SUSTAINABLE CITIES REPORT
Rural-urban linkages As the literature on rural-urban linkages is still evolving, knowledge is scant of the multi-
faceted and interrelated nature of rural and urban spaces in the developing world,
particularly in South Africa. Therefore, to contribute to this emerging body of knowledge,
the SACN produced a series of papers that will be consolidated into a book. The book
will address both the theoretical and empirical realities of rural-urban interdependencies,
and provide a set of policy recommendations for the strategic development of rural-
urban interactions that can foster sustainable social, economic and governance relations
between rural and urban areas.
The importance of rural-urban linkages, and the importance of nurturing such links, is
increasingly being recognised. However, the strict division of rural and urban spaces
continues to make it dif� cult to develop strategic interventions that can bene� t the whole
space continuum. Rural-urban linkages allude to the social, political, economic and
physical interdependence, which includes activities and land uses that occur within the
rural-urban space continuum.
Urban centres play a signi� cant role in rural-urban linkages, providing services to both
their own populations and the surrounding rural hinterland populations, and markets for
rural producers. Urban centres also host migrants from rural areas who are attracted to
the perceived socioeconomic opportunities in cities. At the same time, rural areas are a
consumer market for the urban manufacturing and service sectors. They are also centres
of production, especially of agricultural produce consumed in urban areas, and of natural
resources such as water which remains an essential ingredient of urban growth.
The papers look at planning and governance challenges for cities with vast rural
geographies, a perspective on tourism, agro-food value chains, and social value chains
within the context of rural-urban linkages.
Planning and governance challenges for cities with vast rural geographiesThis paper consolidated � ndings from preliminary research into the particular planning
and governance issues that affect South Africa’s metropolitan regions with large rural
spaces. The analysis highlights key problems with applying the urban-rural dichotomy as
a basis for planning. Several Asian, African and Latin American cities are confronting the
challenges of planning and governing areas that include large rural spaces. These
dynamics of urbanisation in the global south are producing various forms of extended
metropolitan regions that challenge this simplistic dualism. In South Africa, the urban-
rural dichotomy is clearly inadequate for interpreting and managing the dynamics of
change in the country’s extended metropolitan areas. ‘Rural’ does not describe spaces
that are diversi� ed economically beyond natural resources. Indeed the planning
challenges facing these ‘rural’ areas in South Africa exhibit parallels to those described
as peri-urban in the international literature. Therefore, it is useful to learn from the peri-
urban experience in Asian, Latin American and African cities when discussing the
planning and governance of South Africa’s extended metropolitan spaces.

43CROSS-CUTTING ISSUES THAT SUPPORT A CITY’S SUSTAINABLE FUNCTIONING
Planning needs to shift away from localised solutions to consider broader regional
frameworks, and to shift away from traditional urban/rural planning approaches or tools.
Peri-urban zones require a regional approach in order to address complex poverty and
environmental challenges, especially when sustainability and a search for social justice
are the objectives.
The research underpinning ‘rural development’ policies in South African metropolitan
areas makes no reference at all to policy and practices of planning in any other part of the
world. Breaking out of this isolated and blinkered view of planning and governance, by
drawing upon international debates (if not best practice), can be an important starting
point for evolving fresh planning insights. Policy-making needs to be informed by greater
in-depth, evidenced-based research. Comprehensive research is needed to understand
the dynamics of change in these contested spaces.
Finally, given the unique challenges facing South Africa’s extended metropolitan areas,
establishing a learning network to connect the municipalities of Buffalo City, eThekwini
and Tshwane would be bene� cial. The purpose of this learning network would simply be
for practitioners and local scholars to engage in evidence-based discussions that explore
the dynamics of change and best practice planning. An international expert could be
invited to discuss lessons from international experience at the launch of such a network.
More information can be found in the paper Planning and Governance Challenges of
Cities with Extensive Rural Geographies.
A tourism angleThe international experience shows that the growth of tourism and recreation activities can
have important impacts on local economies, especially as a catalyst for economic and social
development in marginal regions or rural areas. Since the democratic transition and South
Africa’s reincorporation into the global economy, the tourism sector has grown signi� cantly
and is considered a critical pillar for national economic development in the immediate future.
The study commissioned by the SACN shows the complexity of urban and rural spaces,
by examining the rural-urban linkages through the lens of the tourism sector. It shows
how urban and rural areas are linked and connected by spatial and sectoral � ows. The
spatial � ows are the movement of tourists across urban and rural spaces, while the
sectoral � ows are between tourism and agriculture. From this study, some key policy-
related issues emerged and are summarised below.
Capacity building is needed in tourism planning at local government level, especially in
those municipalities that are leading tourist destinations. In addition, a greater
understanding is needed of the different forms of tourism that can be drivers of local
economic development. Local economic development planning for tourism must
recognise the range and potential for leverage of different forms of tourism (e.g. leisure,
business, visiting friends and relatives, religious pilgrimage). This recommendation applies
equally in urban and in rural areas.

44 SUSTAINABLE CITIES REPORT
Local economic development programmes need to understand the issues related to
developing nature tourism, especially in small towns and the former homelands. The
weak state of tourism planning in these areas points to the need for capacity building
at local government level and engagement with the private companies involved in
nature tourism, in order to seek opportunities for local suppliers to form part of the
accommodation providers’ supply chain. International best practice shows that local
interventions need to raise the capacity of local enterprises to deliver the quality
standards and reliability required in nature tourism accommodation, in particular for the
high-end luxury safari lodges.
Strengthening the inter-sectoral linkages between tourism and agriculture offers multiple
opportunities for local economic development in many parts of South Africa. Such
opportunities would also harmonise with climate change/green economy interventions,
through promoting reduced food miles and thus be a step towards the making of a low
carbon tourism economy. However, these remain ‘missed opportunities’ because the
agriculture and tourism departments continue to plan in silos and so neglect potential
synergies between the two sectors.
To build local linkages between tourism and agriculture, each area’s speci� c demand-
side, supply-side and market-related issues need to be understood. The aim should be
to encourage and enhance the participation of local producers in the food supply chains.
However, local producers often lack the capacity to deliver the quality, consistency and
volume of fresh produce required by nature accommodation providers.
Nurturing these linkages, including local sourcing, requires national
government and the tourism private sector to acknowledge
the importance of boosting backward linkages through
coordinated actions.
More information can be found in the Tourism
paper.
An agro-food value chain: a case of tomatoes and potatoes This study looked at the rural and urban
dependencies of the South African
tomato and potato agro-food value
chains in Limpopo. It analysed the
internal and external dynamics that could
affect rural and urban policy developments,
and identi� ed interventions that can enhance
innovation, address imbalances and improve
pro� tability, especially at the lower end of the
value chain. Fruit and vegetable market

45CROSS-CUTTING ISSUES THAT SUPPORT A CITY’S SUSTAINABLE FUNCTIONING
Large commercial operations (e.g. ZZ24) dominate agro-food value chains. For smallholder
farmers, land, access to � nance and quality are the major constraints that they face
within the value chains. In the more pro� table markets, barriers to entry are generally
relatively low, although a strong barrier to entry is the ability to produce products of the
required quality and quantity. Other constraints include cheaper imported processed
products, cold chain maintenance, retailers and market agents with signi� cant buying
power. Most production occurs in the rural areas, while processing and retailing occurs
in the urban and peri-urban areas.
The tomato and potato value chains illustrate the rural-urban linkages and how
inef� ciencies within either space affect the other. For example, production problems in
rural areas affects supply to urban areas, where most � nal consumers of agricultural
products are found. An interesting disconnect is that an aging smallholder farming
population dominates rural areas, whereas unemployed youth are found in urban areas.
These youths either do not consider agriculture as a viable source of livelihood or do not
have access to the resources needed to participate in the agricultural value chains. This
disconnect arises from the lack of and/or inadequate investment in commercial
agricultural institutions and systems, markets and infrastructure within
rural communities, and the example of smallholder farmers who
are poor and for whom farming is dif� cult. However, the narrative
of the poor smallholder farmer can be changed. What is
required is innovative solutions to the problems faced by
smallholder farmers, i.e. access to � nance and inputs in
the value chains.
Both local and national government should ensure that
agricultural value chains function effectively in their
entirety, so as to attract the youth into agriculture.
Interventions within agricultural value chains should not
occur in silos but rather as part of a broader strategy.
While local governments have the responsibility to create
and maintain an enabling environment for business and
investment in both rural and urban areas, public-private
partnerships are also important. All players within the value
chain, at all levels have a role and responsibility towards the value
chain and its ef� ciency. As such, the buy-in of local communities, private
sector, and civil society is important for ensuring that local government-led
interventions in both rural and urban areas are successful.
4. ZZ2 is a farming conglomerate operating in Mooketsi, Politsi, Polokwane and Musina in the Limpopo Province, as well as in the Eastern and Western Cape. It produces tomatoes, onions, avocados, apples, pears and cattle. Tomatoes are the main crop with about 160 000 tonnes produced annually. ZZ2 is a world leader in tomato production and large scale biological farming practices (or ‘natuurboerdery®). http://www.zz2.biz/
Local and national government should ensure that agricultural value chains
function effectively in their entirety, so as to attract the youth into agriculture.

46 SUSTAINABLE CITIES REPORT
The study recommends that a strong public-private sector platform be established based
on common goals such as economic development within the urban and rural spaces.
Local government’s role is to bring together the various actors in order to improve the
rural-urban linkages in agro-food value chains. Local government must also reach poor
and marginalised rural populations and communities. The services provided should cover
the following key areas:
• Advice on options for strengthening the agro-industrial sector and fostering the
equitable integration of agro-based SMEs into viable markets.
• Capacity building at institutional and industry levels, as a key means of enhancing
agro-based productivity and marketing performance.
• Support to traditional agro-industries to improve their productivity and ef� ciency
and increase their integration into national/global value chains and promote rural
livelihood diversity.
More information can be found in the paper about the Agro-food Value Chain.
An angle on social value chainsSocial value chains are the web of relationships among individuals and households that
maintain social connections and help each other access work, land, housing and
information within the space economy. Their capacities to transfer information and social,
� nancial and other value, determine where and how households can tap into the
resources that enable them to survive. Social value chains also affect how and where
population movement take place, through their role in accessing the economy and
entering the community.
The draft Integrated Urban Development Framework recognises that the urban and rural
sectors are interconnected, with ongoing exchanges between cities and the rural districts.
In urban areas, poor households seek to � nd the best affordable location from where they
can access the metro and local economies, at the lowest possible cost of living. The
immediate household objective is a reliable and adequate income stream, along with
decent housing and a safe, welcoming community. In rural areas, population movement
is refocusing around rural towns and densifying settlements that function as connection
and/or access points for access to the metro and local economies.
The social value chain study looked at seven areas located along the north-eastern
migration corridor into Tshwane metro, in an attempt to understand some of the
economic, social and strategic considerations that poor rural households address
through their social value chains. Thirty respondents were interviewed about their lived
experience, in terms of using social connectivity through value chains to advance their
personal and household goals, emphasising migration and population movement along
the corridor from Jane Furse in the outer northern sector to Mamelodi, as the urban gate
point that � lters and connects demographic � ows into and out of Pretoria. Interviews
were collected from old-style traditional settlements, shack areas and urban backyards
units at the population nodes selected along the migration corridor.

47CROSS-CUTTING ISSUES THAT SUPPORT A CITY’S SUSTAINABLE FUNCTIONING
New economic activity is emerging around rural nodes where the population is densifying,
and in former farming towns as a result of in-migration by poor African families seeking
economic opportunities. Half of the employed sample population is now working inside
the local economy of the rural towns, rather than directly in agriculture – only one person
in the sample is still working as a rural farmworker.
Based on the sample interviewed, three categories emerged:
• Category 1: rural-committed people, i.e. those wanting to stay in the rural sector who
identify strongly with their local settlement regardless of their migration history;
• Category 2: rural-mobile people, i.e. those currently residing in the rural sector who
perceive themselves as relatively footloose, not strongly rooted in the present
settlement, who have urban aspirations and may be edging toward moving into or
closer to the metro sector;
• Category 3: metro migrants, i.e. rural-born people now living or working long-term in the
metro sector who expect to remain there and eventually obtain high-quality urban housing.
Social value chains within these different categories differ substantially. Rural households
rely heavily on friends as ad hoc personal contacts to � nd the information needed to
obtain work and locate at an optimal point in economic space. In contrast, value chains
among rural-born migrants in the metro sector revolve around links among siblings, with
own brothers being the most signi� cant link for both men and women migrants facing the
impersonal city.
The social value chain networks shape the likelihood of individuals and households
moving within the rural sector or moving into the metro sphere, or staying in place.
Category 1 tends to � nd paid work inside the local economy at their present spatial point
and expects to build a new house in the present settlement if able to mobilise the
necessary resources; Category 2 usually does not work locally, tends to be less certain
about home building intentions, and is either considering other destination points or
already committed to a move into or closer to the metro city; Category 2 migrants may
choose to position themselves on the far rural rim, beyond the of� cial boundaries of the
metro city region. Only Category 3 clearly appears to represent the � ow of poor rural-to-
urban migrants who want to live inside the city and are most often perceived as threats
to the city’s � nancial sustainability by the city administrations.
How far the emerging rural economy will be able to generate the employment needed to
maintain the Category 1 households, with rural preferences for local work at their current
spatial locations, will depend on the extent to which the rural sector can continue to
generate employment, both inside and outside the farming sector. Recommendations
address the options for using social value chains to leverage the ongoing demographic
trend to densi� cation, in order to bring poor rural households into maximum contact with
the local economy in well-connected nodes that are generating work.
More information can be found in the paper on Social Value Chains.

48 SUSTAINABLE CITIES REPORT
State of City Finances 2015The State of City Finances publication is produced every two years and reviews the � nancial
position of nine of the largest cities in South Africa: Johannesburg, Cape Town, eThekwini,
Ekurhuleni, Tshwane, Nelson Mandela Bay, Buffalo City, Mangaung and Msunduzi.
Urban local government is playing an increasingly prominent role in transforming South
African society. Over the past decade, the combined population of these cities has
increased by about 3.5 million (18.7%), from 18.6 million in 2004 to 22 million in 2014, or
40.8% of South Africa’s total population of 54 million (Stats SA: 2011). For cities to be able
to ful� l their developmental local government mandate and enable inclusive and
sustainable growth, effective � nancing and � nancial management is essential.
The theme of the State of City Finances 2105 Report is Basics + Innovation. It calls upon
cities to address gaps and inef� ciencies in the current system, while keeping a close eye
on the complexity of their future role. It also considers the need to rethink how cities are
� nanced and funded, so that they are able to drive important agendas, such as green
growth, the provision of sustainable human settlements and improved mobility through
affordable and integrated public transport.
The report shows that South Africa’s largest cities are getting better at doing the basics
right. Their revenues have held up remarkably well since the 2008 economic crisis, their
billing is better than most other municipalities, and their audit outcomes continue to
improve. However, this performance has to continue improving in order to maximise
economy, ef� ciency and con� dence in the municipal systems. Furthermore, given the
much-awaited devolution of key built environment functions, cities need to plan carefully
for taking on the additional responsibilities to avoid being placed under even more
pressure. This will require rethinking how cities are funded and seeking innovative ways
to increase their revenues, as well as further improving the day-to-day � nancial
management (the basics).
Funding the expansion of cities is a global challenge. Like all municipalities (and nearly all
governments around the world), the cities would like to have access to additional
revenues. The 2015 SOCF report concludes with the following recommendations:
1. Spend funds more ef� ciently by eliminating wasteful and irregular spending, which will
result in direct savings that can be reallocated to fund necessary, priority services and
infrastructure.
2. Make better use of existing revenue sources by using the full range of own-revenue
sources available to them, appropriately structuring service charges, tariffs and indigent
policies, and checking that their billing systems are complete and up-to-date.
3. Explore options for additional taxes and charges revenues in consultation with the
Minister of Finance and the Minister of Cooperative Governance.
4. Continue to argue for an increased equitable share from the national � scus based on
their ongoing development needs as a result of in-migration and on their importance
to the national economy.
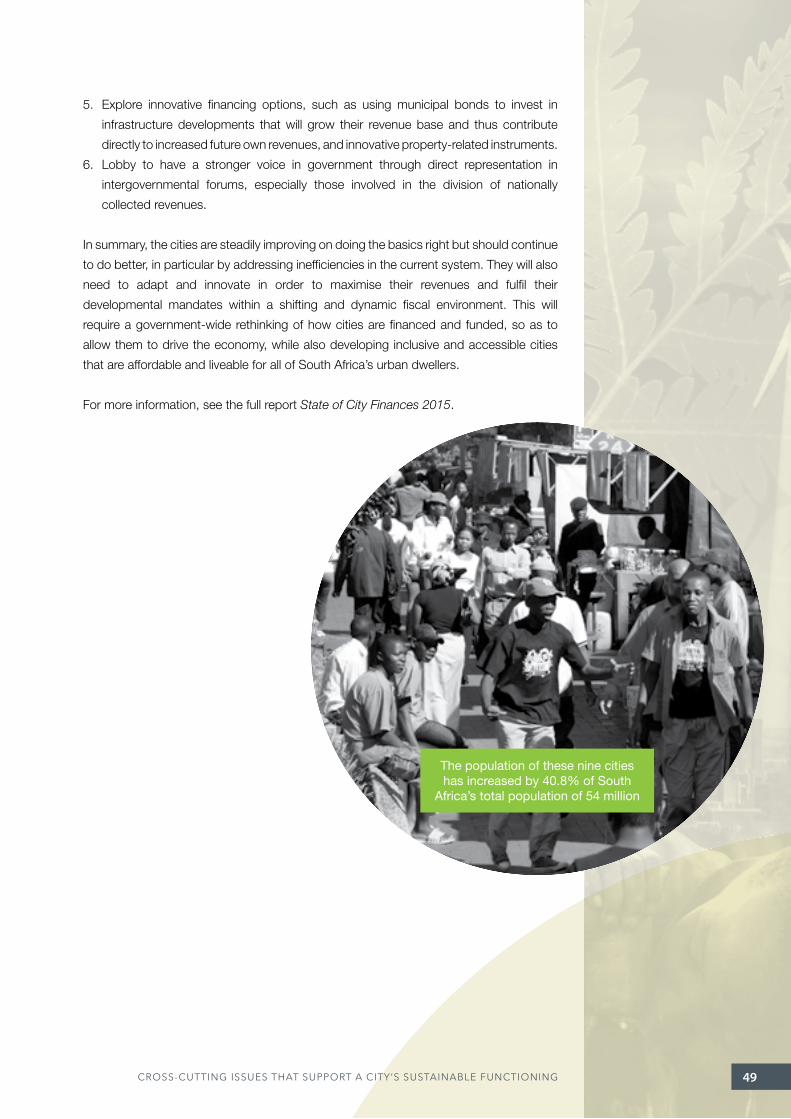
49CROSS-CUTTING ISSUES THAT SUPPORT A CITY’S SUSTAINABLE FUNCTIONING
5. Explore innovative � nancing options, such as using municipal bonds to invest in
infrastructure developments that will grow their revenue base and thus contribute
directly to increased future own revenues, and innovative property-related instruments.
6. Lobby to have a stronger voice in government through direct representation in
intergovernmental forums, especially those involved in the division of nationally
collected revenues.
In summary, the cities are steadily improving on doing the basics right but should continue
to do better, in particular by addressing inef� ciencies in the current system. They will also
need to adapt and innovate in order to maximise their revenues and ful� l their
developmental mandates within a shifting and dynamic � scal environment. This will
require a government-wide rethinking of how cities are � nanced and funded, so as to
allow them to drive the economy, while also developing inclusive and accessible cities
that are affordable and liveable for all of South Africa’s urban dwellers.
For more information, see the full report State of City Finances 2015.
The population of these nine cities has increased by 40.8% of South
Africa’s total population of 54 million
50 SUSTAINABLE CITIES REPORT
Continuing the Journey towards Sustainable CitiesSustainability can no longer be viewed only through the environmental
lens. It has grown to demonstrate its economic and social relevance.
Take an example of waste management: communities living in informal
settlements can protect their environments through waste picking, selling on
to buy-back centres and thus earning income to support their livelihoods.
Sustainability is a journey that must be anchored in the long-term growth and
development strategies. This trend is being observed in a number of cities, with some
taking it further by developing a supportive implementation framework and human capacity.
Cities are complex, dynamic and constantly evolving environments, and the pace of
change will only increase, with new technologies rapidly shifting the context in which they
operate. The journey towards long-term sustainability is dif� cult and challenging, and will
require building resilience and spatial transformation that supports development and
improved quality of life. Strengthening collaboration, away from working in silos both
internally within city departments and with external communities, is critical in the journey
to sustainability. Forming sustainable partnerships and working together will realise the
scale and impact of development needed to sustain life that exists in cities.
Cities do not operate in isolation. They are networked globally and locally, and part of
feedback loops in a competitive playing � eld. To � nd their ‘place’ in a globalised world,
they need to be attractive places in which to live and work. They operate in a space that
has vulnerabilities, such as global economic factors, environmental shocks, and social
unrests including civil wars. Therefore, cities need to understand these vulnerabilities in
order to transform them into opportunities. Central to this transformation is technology.
For example, global supply chain models spanning the continents may become a thing
of the past. Shipping raw materials to another country, where value is added, and then
shipping the � nished goods back to their country of extraction is unsustainable, from an
energy, timescale and ef� ciency perspective. The logistics associated with shipping raw
materials and products around the world could be negated by technologies, such as 3D
printing that allows consumers to have what they require on site in minutes. In addition,
the materials of choice today (steel, concrete, fossil fuels) may not be the materials of the
future. To adapt and thrive, cities need to be aware of these risks and their associated
opportunities, which must be re� ected in their growth and development strategies, and
be allocated the necessary resources. Linked to this are performance indicators to
monitor progress, success and failures.
To measure performance, systems for full-cycle data management must be in place i.e.
data collection, analysis and interpretation, recording, reporting, record keeping as well
as monitoring and evaluation. This practice has a direct in� uence on improved service
delivery, mainly because it becomes easier to manage what one knows. In this regard,
Good
management of
natural resources such
as land, water and energy
from which cities depend on to
sustain life and economy will
reduce the level of
vulnerabilities that
cities face.

51CONTINUING THE JOURNEY TOWARDS SUSTAINABLE CITIES
the six capitals model can be used as a tool to organise the data. It provides a lens to
strengthen the cross-departmental interdependencies needed for effective development
and sustainability within cities (Figure 14).
FIGURE 14: The six capitals model
Natural capital
Social and relationship
capital
Human capital
Intellectual capital
Human capital
Intellectual capital
Financialcapital
Manufacturedcapital
The model acknowledges that all other forms of capital depend on natural capital to
function optimally. For example, if the air that people breathe is toxic, human capital will
be affected because people will be sick, which has an impact on the other capitals:
• Manufactured capital because more clinics are needed to treat the sick people.
• Financial capital, as money is needed to treat the sick people and the same sick
people are not economically productive.
• Social and relationship capital, as the communities have diminished trust because the
cause of their illness is not being addressed, their happiness is reduced and
communities are not productive.
The SACN aims to continue with generating knowledge around holistic sustainability
through programmatic research and data collection in order to measure, inform and
support sustainable development. With data and knowledge, cities will be able to manage
the scarce resources ef� ciently, thus reducing the impact of vulnerabilities discussed in
this publication. More importantly, cities will have increased capability to contribute to
local and national development.

52 SUSTAINABLE CITIES REPORT
References
DEA (Department of Environmental Affairs). 2011a. National Waste Management Strategy.
Pretoria: DEA.
DEA. 2011b. National Climate Change Response Policy. Pretoria: DEA.
DEA. 2012. Chapter 8: Inland Water. In South African Environment Outlook. Pretoria:
DEA. https://www.environment.gov.za/sites/default/� les/reports/2012saeochapter8_
inlandwater.pdf
DME (Department of Minerals and Energy). 2003. White Paper on Renewable Energy.
Pretoria: Government Printers.
DME. 2005. Energy Ef� ciency Strategy of the Republic of South Africa. Pretoria: DME.
http://www.energy.gov.za/� les/esources/electricity/ee_strategy_05.pdf
DOE (Department of Energy). 2010. Integrated Resource Plan for Electricity (IRP) 2010–
2030. Pretoria: DOE.
EMM (Ekurhuleni Metropolitan Municipality). 2007. Energy and Climate Change Strategy.
http://www.ekurhuleni.gov.za/468-energy-and-climate-change-strategy-2007/� le
NPC (National Planning Commission) 2012. National Development Plan 2030 - Our future –
make it work: Executive Summary. Pretoria: NPC. http://www.info.gov.za/issues/
national-development-plan/ (23 August 2014).
Oxford Martin School. 2013. Now for the Long Term. The Report of the Oxford Martin
Commission for Future Generations. Oxford: Oxford University, Oxford Martin School.
SALGA (South African Local Government Association) and WRC (Water Research Council). 2014.
Annual Report on Water Services in South Africa 2013. Municipal Benchmarking Initiative.
SEA (Sustainable Energy Africa). 2015. State of Energy in South African Cities. Cape Town: SEA.
Stats SA (Statistics South Africa). 2011. Census. Pretoria: Stats SA.
The Presidency. 2014. Background paper: environment and sustainable development. In
Twenty-Year Review South Africa 1994–2014. Pretoria: The Presidency.
Tel: + 27 11 407 6471 • Fax: + 27 11 403 5230P.O. Box 32160 • Braamfontein 2017www.sacities.net
Related Documents