THE FUTURE OF SUSTAINABILITY IS NOW A Forcast on Architectural Sustainable Practices in 2017 11/18/2016

Welcome message from author
This document is posted to help you gain knowledge. Please leave a comment to let me know what you think about it! Share it to your friends and learn new things together.
Transcript

THE FUTUREOF SUSTAINABILITYIS NOWA Forcast on Architectural Sustainable Practices in 2017
11/18/2016

From hotels to healthcare, LEED is everywhere you look. In just under 20 years, LEED revolutionized the green building marketplace, becoming the international standard for the design, construction and operation of high-performance structures.
RevolutionizingThe Industry ”
”-- USGBC

Commercial projects
68,000150COUNTRIESH A V E L E E DC E R T I F I E DB U I L D I N G S
Certified LEED for Homes residential units
71,400
AT A GLOBAL SCALE
Certified K-12 projects
1,400Certified higher
education projects
3,050
Certified stategovernment projects
620Certified local
government projects
1,930

As of October 31, 2016, all new projects that are considering LEED certification must meet LEED v4.0 requirements. The new version claims to be streamlined, specialized, and allow for a better user experience, but what does this really mean and how will it affect our projects in the future?
The latest versionof LEED is here

LEED v4.0 ChangesThe 5 most important changes to the LEED Green Building Rating System.
California’s Sustainable Road MapThe action plan to achieve California’s sustainable goals by 2030.
Innovative StrategiesSustainable strategies of 2016 and how they could inform trends in 2017 and beyond
123
What You Will Learn...

LEED Categories
Sustainable Sites
Materials & Resources
Energy &Atmosphere
Indoor Environmental Quality
WaterEfficiency
RegionalPriority
Innovation& Design
MAX PTS: 37
MAX PTS: 11
MAX PTS: 14
MAX PTS: 6MAX PTS: 17
MAX PTS: 4
MAX PTS: 21

LEED Updated Categories
Energy &Atmosphere
WaterEfficiency
MAX PTS: 37
MAX PTS: 11

1234
Energy MeteringPrerequisite for all projects to measure whole building use & share data with USGBC.
Demand ResponseDemand response system must be fullyautomated & is included in the commissioning scope
Renewable EnergyIncreases the number of pointsawarded for renewable energy
Water MeteringTwo new prerequisites, for building-level water metering and outdoor water use reduction

LEED AP vs LEED AP with Speciality 5

For the early adopters of LEED green building professional credentials, the GBCI holds a special place for you in their da-tabase. Your LEED AP without specialty-more warmly referred to as ‘Legacy LEED AP’- never expires.
What is a LEED AP? ”
”-- GBES

The Bad NewsFor LEED APs without specialty, if you have not specialized yet, nor reported continuing educa-tion units every two years, you must re-test to get a specialty.
The USGBC now recognizes your knowledge level as equiva-lent to the LEED Green Associ-ate. So you don’t have to take the basic exam. But you do have to take the two-hour exam related to the specialty you want to be recognized for.
And after that, you must keep up with your continuing educa-tion.
-- GBES

What’s Next For California?

Green Road Map / Action Plan
20182020
2025
Established in 2012 by the California Government as a roadmap for state agencies to achieve Executive Orders B-18-12 and B-16-12
20% reduction of grid-based energy purchases for State Owned
20% Greenhouse Gas Emmission Reduction
50% of New & Renovatedmust be Zero Net Energy (ZNE)
20% reduction in water use
25% of fleet LDV purchases
50% of Existing Buildings to be Zero Net Energy (ZNE)
100% of New & Rennovated mustbe ZNE

Green Road Map / Action Plan
New & Major Renovation State Buildings Over 10,000 Sq Ft.
Use clean, on-site power generation such as photo-voltaic, solar thermal, and wind power generation
Obtain LEED Silver certification or higher
Meet California Green Building Standard’s Tier 1 measures
Pursue monitoring-based commissioning
All Existing State Buildings Over 50,000 Sq Ft.
Complete LEED-EB certification, to the maximum extent cost-effective

San Francisco GoalsSan Francisco was named Greenest City in the US. Since then, smart city strategies have been thought of as one way to take sus-tainability to the next level in San Francisco.
20172020
- Reduce greenhouse gas emissions by 25% from 1997 levels. SF Environment is promot-ing smart commuting, electric transportation, and biofuels to help meet goals.
- Achieve zer0 waste by 2020 (currently waste diversion rate = 80%)
2020- 100% carbon-free. SF Environment is imple-menting a comprehensive suite of incentive programs to improve the performance of new and existing buildings

Sustainable Strategies ForA Greener FutureInnovative ideas from 2016

Renewable Energy

Center for Sustainable LandscapesPittsburgh, PA
at Phipps Conservatory and Botanical Gardens

Designed to be the greenest building in the world 1st
TO MEET 4 OF THE
HIGHEST GREEN
CERTIFICA-TIONS
Living Building Challenge, LEED Platinum, WELL Building Platinum, and Four-Stars Sustainable SITES.


Interal part of the vistor experience
2ndIN AIA‘S 10 MOST
SUSTAINABLE PROJECTS OF
2016

MISSION: Inspire and educate with all the beauty and importance of plants, advance sustainabiilty and human and environmental wellbeing through action and research, and to celebrate it’s historic greenhouses.

Generates all of its own energy


Treats all storm and sanitarywater captured on-site


ExploratoriumPier 15
San Francisco, CA

GOAL: to have Net-Zero Operation and be the largest Net-Zero Museum in the U.S.
1,874SUNPOWER
HIGH EFFICIENCY PV MODELS

Capitalized on its unique location by using the surrounding San Francisco Bay for heating and cooling.

16% of the roof area will capture and store up to 338,000 gallons of rainwater for toilet flushing and floor drain trap-primers.
1MILLION GALLONS
OF DOMESTIC
WATERSAVED
ANNUALLY

The existing pier building was completely remodeled 3rd
IN AIA’S10 MOST
SUSTAINABLEPROJECTS OF
2016


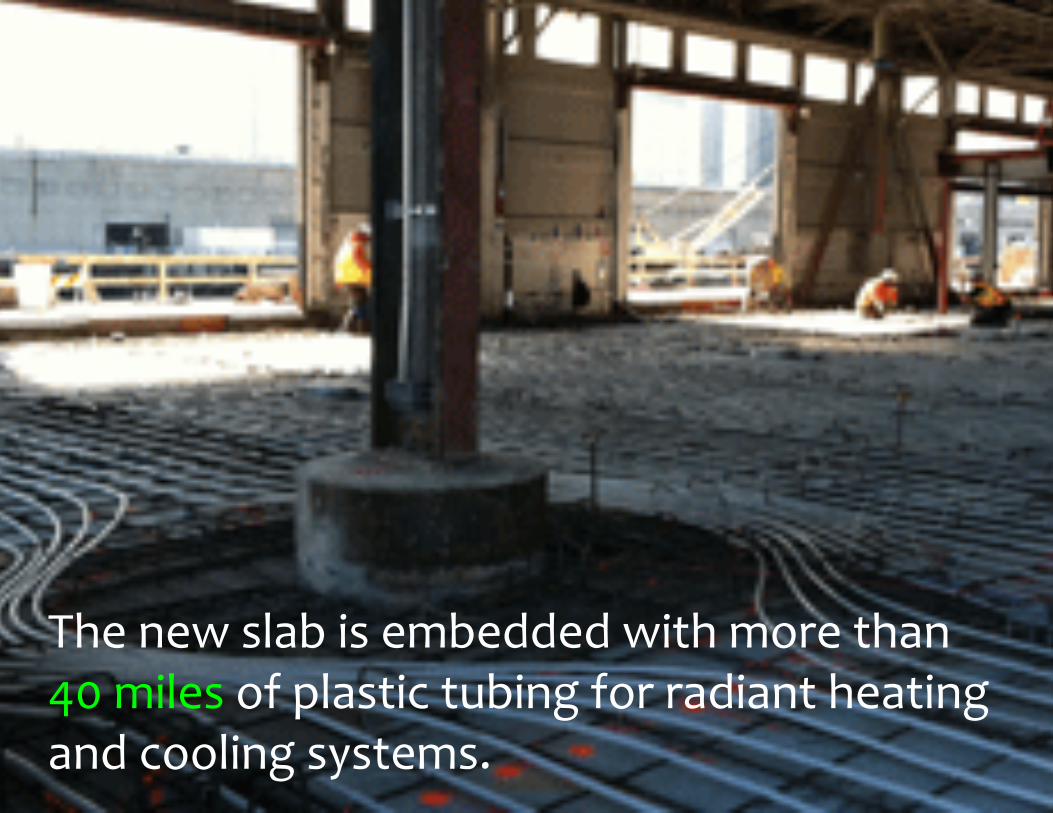
The new slab is embedded with more than 40 miles of plastic tubing for radiant heating and cooling systems.

New exhibits were carefully integrated into the building and even spill out to the surrounding bay.


CENTER
Artist Fujiko Nakaya creates artificial fog clouds at the Exploratorium


Renewable EnergyBuilding Lifecycle

2016 Rio Olympicsand Paralympic Games
RIo, Brazil

GOAL: act as a catalyst for development, improve the quality of life for all its citizens leave a lasting legacy

The masterplanning process included the goal of deliv-ering transportation, utility and social infrastructure, as well as open space provision that would support the future creation of a new neighbourhood.


GAMES FREE FROM WHITE ELEPHANTSAreas built for the
competition venues
RIO DE JANEIRO
Pedra Branca State Park Tijuca National Park
N
1
2
3
4
Deodoro2Deodoro Olympic Stadium
Copacabana4Lagoa Stadium
Marina da Glória
Beach Volleyball Arena
Fort Copacabana
Maracanã3Olympic Stadium
Maracanã
Maracanãzinho
Julio Delamare Aquatics Centre
1 Barra
Riocentro
Barra Olympic Park
Olympic Golf Course
Existing/to be renovated
To be built
Overlay
The competition venues are located in four regions across Rio de Janeiro, so as to spread the legacy benefits to the population as a whole, as well as making the best possible use of structures already in place – thus avoiding white elephants after the Rio 2016 Games.
Each new venue is built according to a plan that assures its sustainability. That includes, for instance, structures designed in a way so as to maximise the use of natural lighting; reuse of rainwater; use of water and energy-saving devices within the venues; reuse of materials employed in the overlay.
71%
17%12%
Existing/to be renovatedTo be builtOverlay
Pontal
Sambódromo
4 FOCUS: RIO 2016 SUSTAINABILITY - NOVEMBER 2015
The competition venues are located in four regions across Rio de Janeiro, so as to spread the legacy benefits to the population as a whole

People
Planet Prosperity
1) Engagement & Awareness Raising2) Universal Accessibility3) Diversity & Inclusion
1) Transport & Logistics2) Sustainable Building3) Conservation & Environmental Recovery
1) Sustainable Supply Chain2) Management & Reporting
Strategic Pilars

The largest carbon mitigation in Games history 3.6
MILLION TONS OF CARBON DIOXIDE

That accounts for direct emissions, emissions frompartners (such as ones stemming from construction carried out by governments) and third party emissions (for example, spectators’ trips to attend competitions).

• Reduce the carbon incorporated to materials used by means of intelligent design and sustainable procurement
• Substitute renewable or alternate fuels for fossil fuels
Compensation under the responsibility of the Rio 2016 Committee – to be executed in partnership with Dow, world sponsor and official chemical company of the Olympic Games – will be the largest in the history of the Games. Starting with the use of technological mitigation, said
project as a whole. That accounts for direct emissions (those the Committee is responsible for), emissions from partners (such as ones stemming from construction carried out by governments) and third party emissions (for example, spectators’ trips to attend competitions). Within that scenario, the Rio 2016 Committee intends to cut 18.2 per cent of its own emissions. In order to achieve that goal, the following measures have been taken:
• Avoid emissions through careful planning of energy, transport, overlay and use of visual identity material
Total Games emissions
3,6 million tonnes of CO2eq
Rio 2016 emissions
724 tonnes of CO2eq
Accommodation20
Sportingequipment20
Others61
Media33
Energyconsumption30
Athlete travel66
Transport and logistics40
Food and drink180
Temporarystructures200
18 FOCUS: RIO 2016 SUSTAINABILITY - NOVEMBER 2015

Spectators
1,380City infrastructure (legacy)
800
Venue construction
730Operations
650
Games carbon footprint(origin of emissions)In thousands of tonnes CO2eq
mitigation will generate environmental, economic and social gains.
The Rio 2016 Games’ technological carbon mitigation plans focus on three sectors of the Brazilian economy that have the highest emissions and biggest potential
for the introduction of sustainable technologies: agriculture, industry and infrastructure. Projects range from reducing food waste to improvement in energy efficiency, going through the construction of thermal insulation that will reduce the need for air-conditioning.
IDENTIFY PREVENTREDUCE
minimise and substituteCOMPENSATE
technological mitigation and compensation
19 FOCUS: RIO 2016 SUSTAINABILITY - NOVEMBER 2015

Several buildings in the Olympic Park will be taken apart, rebuilt, and repurposed elsewhere.

Future Arena, the handball venue
4 500-student primary schools in the city’s Jacarepaguá neighborhood.
Transformations
Olympics Aquatics Stadium
Two community swimming centers
The International Broadcast Centre
High school dormitory
Barra Olympic Park—a 300-acre, triangular peninsula that features nine Olympic venues
Will host public parks and pri-vate development after the Games

Prefabricated Modular PartsRio’s nomadic venues feature puzzle-like compositions of shared components —standardized steel columns and beams, modular steel panels, concrete slabs, and event-specific elements like seating bowls, playing surfaces, and water tubs.

Renewable EnergyEnhancing User Experience

Transbay TerminalSan Francisco, CA

Rooftop Park: Instead of a five-acre roof absorbing and radiating heat, the 5.4 acre rooftop park will absorb carbon dioxide from bus exhaust, absorb and filter stormwater, and provide a habitat forlocal wildlife

Reduced Emissions:
Significantly reduces emissions of air pol-lutants, including re-ducing carbon diox-ide emissions by tens of thousands of tons each year, by encour-aging public transit use throughout the Bay Area

Strategy Overview

Extensive Use of Natural Lighting:
Lighting is the big-gest energy use in the Transbay Transit Cen-ter building. Light col-umns and skylights will be used extensively to bring natural light into the building and reduce energy costs.


350kGALLONS PER YEAR REDUCED COOLING TOWER
USE
Geothermal System:
To significantly reduce the energy required to cool the building, a geothermal system will harness the relatively low temperature of the ground to chill water passively

Natural Ventilation:
The building is substantially a naturally ventilated facility.
The bus deck is open on the sides andwill not require exhaust or air filtration – similar to an open parking garage.


Renewable EnergyEco-Systems

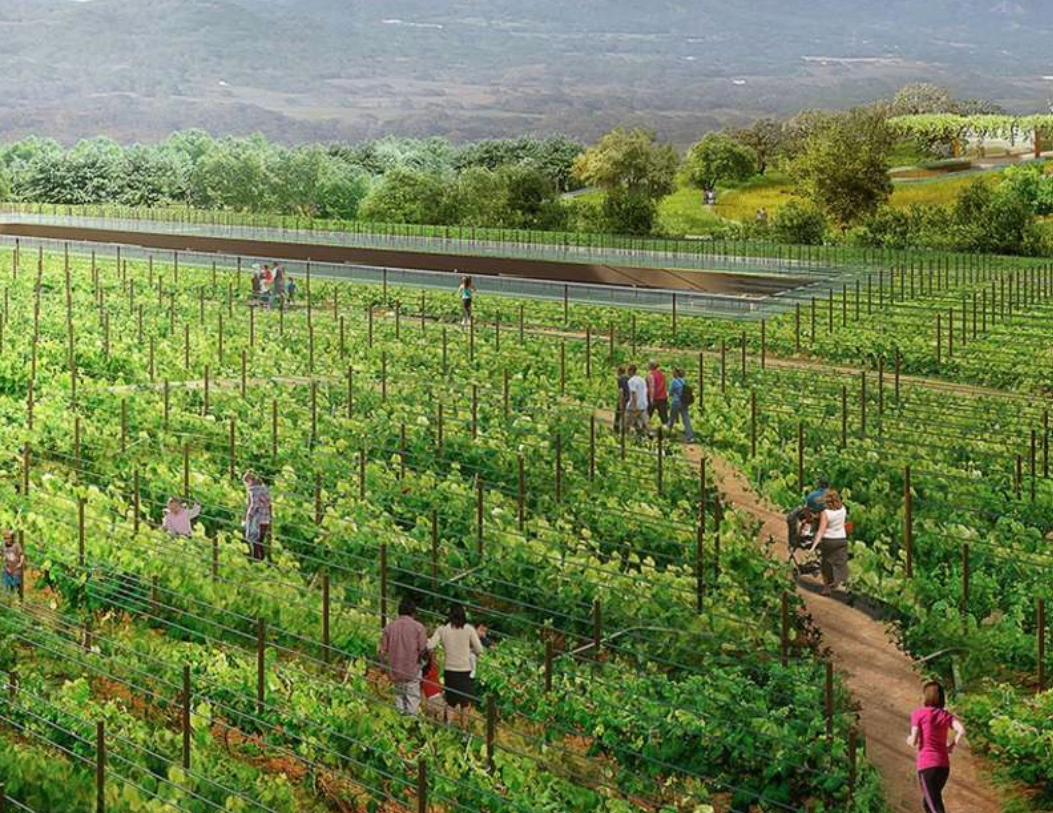
Revitalize Vallco30-acre skypark over Mixed-Use Neighborhood
Cupertino, CA

Proposed to be the largest green roof in the world: 30-acre community park.

Expanding on the live/work/shop model to create a micro eco-system

A hybrid hub of downtown-style retail and office buildings as well as hundreds of rental homes all wrapped within a man-made open space preserve
“”


The developer plans to partner with local water agencies and providers to extend recycled water to the site for irrigation, heating, and cooling systems.

Plans to widen and rebuild the Wolfe Road and Interstate 280 interchange between the shopping center and the Apple Campus 2


Biophilic DesignThe Social Aspect of Sustainablity

Biophilic Design is a focused area of research that brings people to the center of the sustainability discussion. It attempts to scientifically understand how people interact with their environment and, consequently, how their environment can be de-signed to better support them.
“
”-- Perkins Eastman

Social
Economic Environmental
Sustainability Pilars
VALUE

Social
Economic Environmental
Biophilic Design
VALUE
Focuses on how we interact with our environments, and how our environments interact with us, measurably impacting our health, well-being and performance

Related Documents