i Sustainability Assessment of Urban Transport System in Greater Jakarta Ir. Resdiansyah., ST., MT., Ph.D., IPM Director of Center for Urban Studies, Universitas Pembangunan Jaya Vice President Intelligent Transportation System Indonesia 2021

Welcome message from author
This document is posted to help you gain knowledge. Please leave a comment to let me know what you think about it! Share it to your friends and learn new things together.
Transcript
i
Sustainability Assessment of Urban Transport System in Greater Jakarta
Ir. Resdiansyah., ST., MT., Ph.D., IPM
Director of Center for Urban Studies, Universitas Pembangunan Jaya
Vice President Intelligent Transportation System Indonesia
2021

ii
TABLE OF CONTENTS Table of contents ii List of Table iii Table of Figures iv Executive Summary 1 Chapter One Introduction 5 1.1 Geographical Condition 5 1.2 Demographic 9 1.3 Economy 10 1.4 Governance and Cooperation 12 Chapter Two Current State of Urban Transport Systems and Services 14 2.1 Introduction 14 2.2 Traffic and Private Vehicle Ownership 19 2.3 Land Use 21 2.4 Main Network and Systems 24 2.5 Key Connections 35 2.6 Public Transportation 36 2.6.1 Commuter Train (KRL) 38 2.6.2 Bus Rapid Transit (Transjakarta) 40 2.6.3 Mass Rapid Transit (MRT) 51 2.6.4 Light rail Transit (LRT) 60 2.6.5 Integration Transportation System (Jak Lingko Payment Integration) 65 2.7 Commuter Travel in JMA 66 2.8 Urban Transport Policies in GJMA 71 2.9 On Going Project in GJMA 76 2.10 Current Situation and Impacts due to Spread of COVID-19 on Urban Mobility 82 Chapter Three Data Collection Approach for SUTI 87 3.1 Introduction 87 3.2 Data Collection 88 Chapter Four Data for SUTI 93 4.1 Sustainable Urban Transportation Index 93 4.2 Data collection for each SUTI indicators in Jakarta Metropilitan Area (Greater
Jakarta) 94
Chapter Five SUTI Data Analysis 117 5.1 Analysis of Data (Input Data in Excel sheet and results) 117 5.2 Spider diagram (interpretation of result, observation, etc) 133 5.3 Interpretation of value, index number, observation of SUTI 133 Chapter Six Impacts of COVID-19 on Urban Mobility 135 6.1 Public Transportation Situation Before COVID-19 and Current Situation 135 6.2 Public Transportation Daily Passenger 140 6.3 Impact of Mobility Restrictions in Greater Jakarta – JMA 143 6.4 City Perspective dan Strategies on Post COVID-19 Mobility 158
iii
Chapter Seven Concluding Remarks and Recommendation to Improve Sustainability of Urban Mobility
164
7.1 Viewpoint on SUTI Assessment and Results 164 7.2 Views on the Transportation Policy and Regulation 165 7.3 Views on the Decarbonization of Public Transport 166 7.4 Addressing the Needs of Differently Abled and Aged Users 173 References 177
Disclaimer: The views expressed in this publication are those of the authors and do not necessarily reflect the views of the United Nations Economic and Social Commission of Asia and the Pacific (ESCAP). The designation employed and the presentation of the material in the report do not imply the expression of any opinion whatsoever on the part of the Secretariat of the United Nations concerning the legal status of any country, territory, city, or area or of its authorities, or concerning the delimitation of its frontiers or boundaries. The views expressed, analysis, conclusions and recommendations are those of the authors, and should not necessarily be considered as reflecting the views or carrying the endorsement of the United Nations. Mention of firm names and commercial products does not imply the endorsement of the United Nations ESCAP. This report has been issued without formal editing

iv
LIST OF TABLE Table 1.1 Table Population of Greater Jakarta Metropolitan Area in 2020 9 Table 2.1 List of Operated Toll Road Sections in JABODETABEK 26 Table 2.2 Existing BRT (Transjakarta) Main Corridor 45 Table 2.3 Number of Transjakarta Bus by Name of Company and Type of Fuel 48 Table 3.1 The ten SUTI indicators 87 Table 3.2 Ten indicators of Sustainable Urban Transport Indeks 91 Table 4.1. Ten indicators for Sustainable Urban Transport Index 94 Table 4.2 Indicator 1: Extent to which transport plans cover public transport,
intermodal facilities and infrastructure for active modes 95
Table 4.3 Standard of Pedestrian Path LOS in Ministry of Public Works Regulation No: 03/PRT/M/2014
97
Table 5.1 Indicator 1 for Greater Jakarta 117 Table 5.2 Summary of Indicator 1 for Greater Jakarta 118 Table 5.3 Explanation of Indicator 1 for Greater Jakarta 118 Table 5.4 Cycling and Walking in Jakarta 121 Table 5.5 Selected Cluster Data within 500m Buffer Zone of Commuting Trips
(BRT) 122
Table 5.6 Selected Station Data within 500m Buffer Zone of Commuting Trips (KLR-Commuter)
123
Table 5.7 Percent of operational costs recovered by fares (all values in million US $)
130
Table 5.8 Percent of transport investment spending; running five-year average
130
Table 5.9 Air Quality - Micrograms per cubic meter (μg/m3) 131 Table 5.10 Emission 131 Table 5.11 SUTI Result 132 Table 6.1 Data of Passenger in Public Transportation (Transport Control
During Eid Festival) 153
Table 6.2 Impact of Change in MRT Operation Hours on Potential Farebox Revenue Loss
157
Table 6.3 Aggregated Potential Farebox Revenue Losses Due to COVID-19 Mobility Restriction
157
Table 7.1 Useful References and Persons, eEperts and Officials Met 175
v
TABLE OF FIGURES Figure 1.1 Greater Jakarta Metropolitan Area (GJMA) 6 Figure 1.2 Detail Jakarta Metropolitan Area (Greater of Jakarta) 7 Figure 1.3 Illustration of the Development of Built-up Areas in Metropolitan 8 Figure 1.4 Share of Each Kota and Kabupaten in Greater Jakarta Metropolitan
Area (2017) 11
Figure 2.1 The Greater Jakarta Area Commuters Travelling 15 Figure 2.2 Masterplan Greater Jakarta Metropolitan Area 2018-2029 16 Figure 2.3 Roadmap Towards 60 Percent of Public Transportation in Greater
Jakarta 18
Figure 2.4 Anticipated Serious Traffic Congestion 19 Figure 2.5 Registered Private Vehicle in Greater Jakarta Metropolitan Area 20 Figure 2.6 Land-use Change in GJMA during Year 2000 –2017 21 Figure 2.7 GJMA Land-use Comparation Year 2017 and 2035 22 Figure 2.8 Land Used Greater Jakarta Metropolitan Area (GJMA) 2000-2015 23 Figure 2.9 Physical Development Pattern of GJMA Year 2000, 2006, and 2015 23 Figure 2.10 Comparative land use maps of Greater Jakarta, Indonesia (a) 2009
original, (b) 2030 original, (c) 2009 derived, and (d) 2030 derived 24
Figure 2.11 Highway Network Development in the GJMA 27 Figure 2.12 Historical Road Network in the GJMA 28 Figure 2.13 Railway Networking for Public Transportation in GJMA 29 Figure 2.14 Toll Highway Networking GJMA 29 Figure 2.15 Jakarta Inner-City Elevated Toll Road 30 Figure 2.16 Cross-section Jakarta Inner-City Elevated Toll Road 30 Figure 2.17 Road Network Map for Greater Jakarta Metropolitan Area 31 Figure 2.18 Rail Based Road Network Map for Greater Jakarta Metropolitan
Area 31
Figure 2.19 2020 Road Network by JUTPI Revised Master Plan 32 Figure 2.20 2020 Public Transport Network by JUTPI Revised Master Plan 33 Figure 2.21 Jakarta-Cikampek Elevated Toll Road 34 Figure 2.22 KRL Situation in 2005 and 2020 After Total KRL Reform 39 Figure 2.23 BRT network Plan 2014-2030 in Greater Jakarta Metropolitan Area 40 Figure 2.24 BRT network Plan 2020 in Greater Jakarta Metropolitan 41 Figure 2.25 Transjakarta BRT Integration Map 2020 42 Figure 2.26 BRT Services with AC 43 Figure 2.27 Pedestrian Crossing Facilities at BRT Station 44 Figure 2.28 Number of Transjakarta Pasengger 2004-2018 46 Figure 2.29 Ilustration of BRT and MRT Integration Infrastructure (ASEAN-CSW
MRT Station) 50
Figure 2.30 Ilustration of MRT Infrastructure 52 Figure 2.31 MRT Network Map- Phase 1 and 2 54
vi
Figure 2.32 Integration MRT Network with Other Ring Rail Network to Accommodate Sub-Urban Area
55
Figure 2.33 New Culture in Transportation 57 Figure 2.34 Friendly City in MRT Surrounding Area 57 Figure 2.35 MRT Jakarta Network 58 Figure 2.36 TOD Area along MRT Lines 60 Figure 2.37 LRT Station Velodrome-Kelapa Gading 61 Figure 2.38 LRT Corridor Plan 62 Figure 2.39 Work on the Jabodebek Light Rail Transit (LRT) project in Cawang-
Dukuh Atas 64
Figure 2.40 The Proposed Greater Jakarta Light Rail Transit Alignment 64 Figure 2.41 Person Trip Distribution in JMA 68 Figure 2.42 Commuter Travel Distance in JMA (comparison 2014 vs 2019) 69 Figure 2.43 Commuter Travel Time in 10 Cities In JABODETABEK (comparison
2014 vs 2019) 70
Figure 2.44 Indonesia Emission prediction in 2005-2030 71 Figure 2.45 Five Pillars of Urban Transportation Policy 74 Figure 2.46 Phase 2A of MRT Jakarta (Bundaran HI – Kota) 78 Figure 2.47 U-Shaped Girder Construction- Phase 1 LRT Jabodetabek 79 Figure 2.48 Long Span Arch Bridge Construction- Phase 1 LRT Jabodetabek 79 Figure 2.49 Lifting of the First Train (trainset)- Phase 1 LRT Jabodetabek 80 Figure 2.50 Construction Progress of Six Inner-City Toll Roads 81 Figure 2.51 Road Network of Six Inner-City Toll Roads 82 Figure 2.52 Daily fraction of users staying at home 84 Figure 2.53 Infographic of KRL during Covid-19 Pandemi 85 Figure 2.54 Before and After Pandemi (Sudirman Street Jakarta) 86 Figure 2.55 PM25 Measurement Before and After Pandemi in Greater Jakarta 86 Figure 3.1 Meeting with Director of Traffic, Greater Jakarta Transport
Authority (BPTJ) 89
Figure 3.2 Meeting with City Transport Authority in Jabodetabek 90 Figure 4.1 Pedestrian Revitalisation in Jakarta 98 Figure 4.2 Pedestrian Facilities at Thamrin Street Jakarta 99 Figure 4.3 Sample cross section from the guideline incorporating dedicated
space for walking, cycling, and public transport in Greater Jakarta 100
Figure 4.4 Transit Mode Share in Greater Jakarta 101 Figure 4.5 Jabodetabek Commuters’ Travel Distances 102 Figure 4.6 Bicycle and Walking Network in Jakarta 103 Figure 4.7 Cycling Network in Jakarta 104 Figure 4.8 Integrated Cycling Network with Public Transport in Jakarta 105 Figure 4.9 Cycling Network Plan 2019-2030 106 Figure 4.10 Transit station’s service area with walking radius 106 Figure 4.11 Transit station’s service area with cycling radius 107 Figure 4.12 Smart Pedestrian Hub Competition, DKI Jakarta 2021 108 Figure 4.13 Modal Share in JABODETABEK 109
vii
Figure 4.14 Modal Share in JABODETABEK (Excluding NMT) 110 Figure 4.15 TransJakarta BRT network 112 Figure 4.16 Transjakarta Daily Passenger Demand by Shelter 113 Figure 4.17 Commuter Line (KRL) Network 113 Figure 4.18 Desire Line by Railway Station on Commuterline 114 Figure 4.19 Daily Bandwidth on Commuterline 115 Figure 4.20 Non-Overlapping Service Area of KRL Stations (4km) 116 Figure 4.21 Total Population per Kelurahan (District) 116 Figure 6.1 Decrease in the Number of Passengers due to Covid-19 136 Figure 6.2 Sosial Distancing in BRT Transjakarta 137 Figure 6.3 Sosial Distancing in KRL Commuterline 138 Figure 6.4 Quiet Streets in the Beginning of Pandemic in Jakarta 139 Figure 6.5 Clean the MRT 139 Figure 6.6 Physical distancing COVID-19 in public transportation Indonesia
2020 140
Figure 6.7 Number of Passenger in Top 11 BRT Corridor 141 Figure 6.8 Number of Routes/Corridors According to Services 142 Figure 6.9 Activity at Home During PSBB and PPKM 149 Figure 6.10 Activity of Outside of Home During PSBB and PPKM 150 Figure 6.11 Activity of Outside of Home (Others) 151 Figure 6.12 Change in Mobility Level 152 Figure 6.13 Public Transport Passenger Data- All Modes Of Transportation 154 Figure 6.14 Technology Driven Micro Systems 160 Figure 6.15 Mass Vaccination Program at Station 160 Figure 7.1 Area of Improvement in Greater Jakarta SUTI 164 Figure 7.2 Energy Consumption and Renewable Energy Share in the
Transportation 166
Figure 7.3 The Pillars of Decarbonization 168 Figure 7.4 Decarbonization in Transport Sector 169 Figure 7.5 Electric buses Dominate Transjakarta's Fleet starting 2025 170 Figure 7.6 Transjakarta Electric Vehicle 170 Figure 7.7 Four Categories Root Cuases in Gender Inequality in Public
Transportation 171
Figure 7.8 Gender Insecurity in Public Transportation in Greater Jakarta 173 Figure 7.9 Lower Deck BRT (Transjakarta) 174 Figure 7.10 Disable Facility in LRT Jakarta 174 Figure 7.11 Disable and Eledery People Facility and Signage in Greater Jakarta 175
1
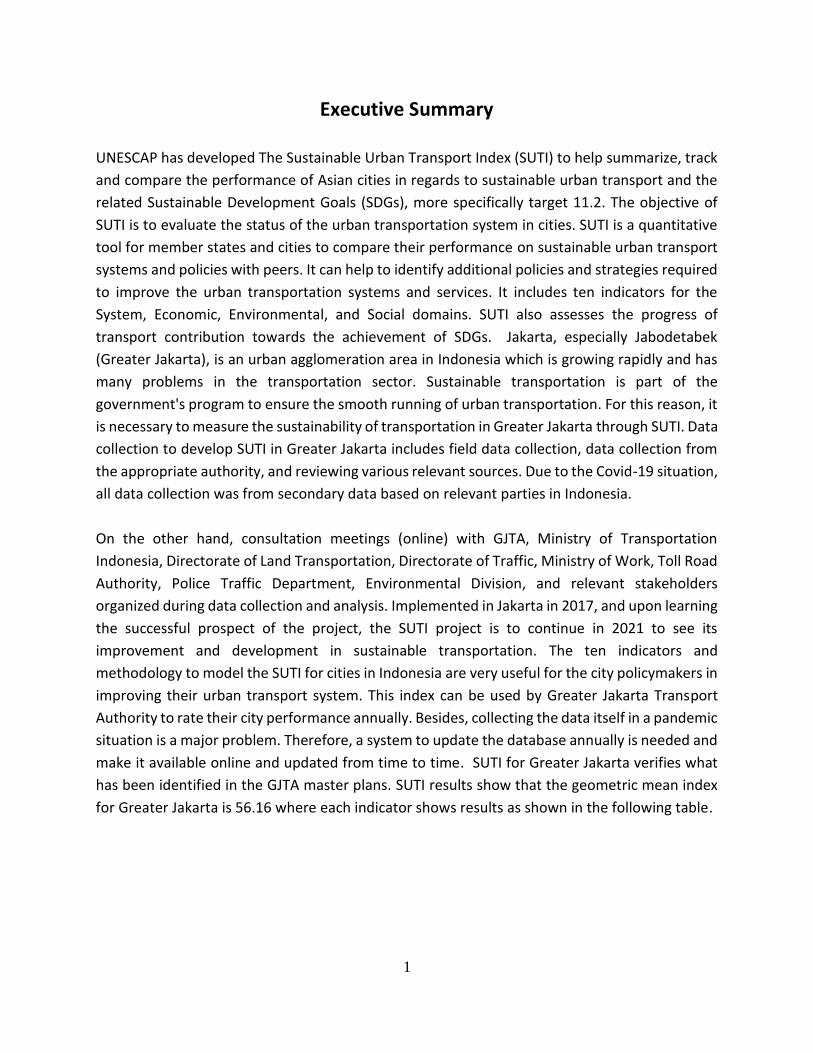
Executive Summary UNESCAP has developed The Sustainable Urban Transport Index (SUTI) to help summarize, track
and compare the performance of Asian cities in regards to sustainable urban transport and the
related Sustainable Development Goals (SDGs), more specifically target 11.2. The objective of
SUTI is to evaluate the status of the urban transportation system in cities. SUTI is a quantitative
tool for member states and cities to compare their performance on sustainable urban transport
systems and policies with peers. It can help to identify additional policies and strategies required
to improve the urban transportation systems and services. It includes ten indicators for the
System, Economic, Environmental, and Social domains. SUTI also assesses the progress of
transport contribution towards the achievement of SDGs. Jakarta, especially Jabodetabek
(Greater Jakarta), is an urban agglomeration area in Indonesia which is growing rapidly and has
many problems in the transportation sector. Sustainable transportation is part of the
government's program to ensure the smooth running of urban transportation. For this reason, it
is necessary to measure the sustainability of transportation in Greater Jakarta through SUTI. Data
collection to develop SUTI in Greater Jakarta includes field data collection, data collection from
the appropriate authority, and reviewing various relevant sources. Due to the Covid-19 situation,
all data collection was from secondary data based on relevant parties in Indonesia.
On the other hand, consultation meetings (online) with GJTA, Ministry of Transportation
Indonesia, Directorate of Land Transportation, Directorate of Traffic, Ministry of Work, Toll Road
Authority, Police Traffic Department, Environmental Division, and relevant stakeholders
organized during data collection and analysis. Implemented in Jakarta in 2017, and upon learning
the successful prospect of the project, the SUTI project is to continue in 2021 to see its
improvement and development in sustainable transportation. The ten indicators and
methodology to model the SUTI for cities in Indonesia are very useful for the city policymakers in
improving their urban transport system. This index can be used by Greater Jakarta Transport
Authority to rate their city performance annually. Besides, collecting the data itself in a pandemic
situation is a major problem. Therefore, a system to update the database annually is needed and
make it available online and updated from time to time. SUTI for Greater Jakarta verifies what
has been identified in the GJTA master plans. SUTI results show that the geometric mean index
for Greater Jakarta is 56.16 where each indicator shows results as shown in the following table.
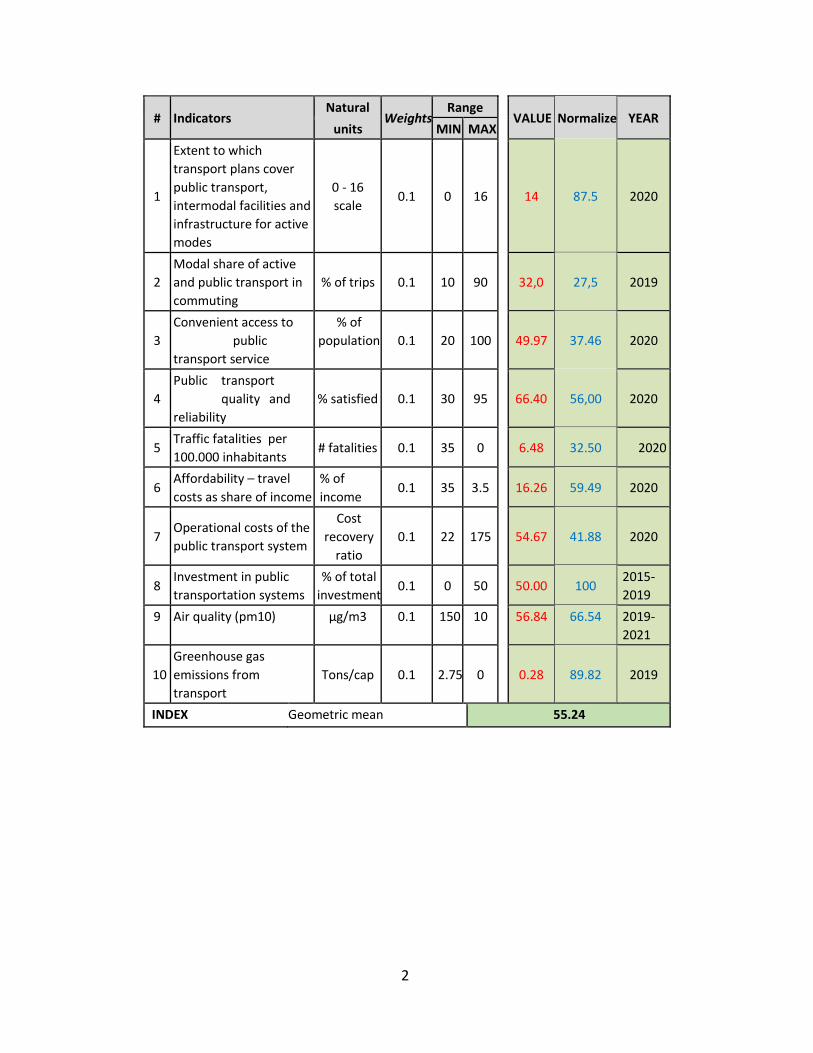
2
# Indicators Natural
Weights Range
VALUE Normalize YEAR units MIN MAX
1
Extent to which
transport plans cover
public transport,
intermodal facilities and
infrastructure for active
modes
0 - 16
scale 0.1 0 16 14 87.5 2020
2
Modal share of active
and public transport in
commuting
% of trips 0.1 10 90 32,0 27,5 2019
3
Convenient access to
public
transport service
% of
population 0.1 20 100 49.97 37.46 2020
4
Public transport
quality and
reliability
% satisfied 0.1 30 95 66.40 56,00 2020
5 Traffic fatalities per
100.000 inhabitants # fatalities 0.1 35 0 6.48 32.50 2020
6 Affordability – travel
costs as share of income
% of
income 0.1 35 3.5 16.26 59.49 2020
7 Operational costs of the
public transport system
Cost
recovery
ratio
0.1 22 175 54.67 41.88 2020
8 Investment in public
transportation systems
% of total
investment 0.1 0 50 50.00 100
2015-
2019
9 Air quality (pm10) μg/m3 0.1 150 10 56.84 66.54 2019-
2021
10
Greenhouse gas
emissions from
transport
Tons/cap 0.1 2.75 0 0.28 89.82 2019
INDEX Geometric mean 55.24
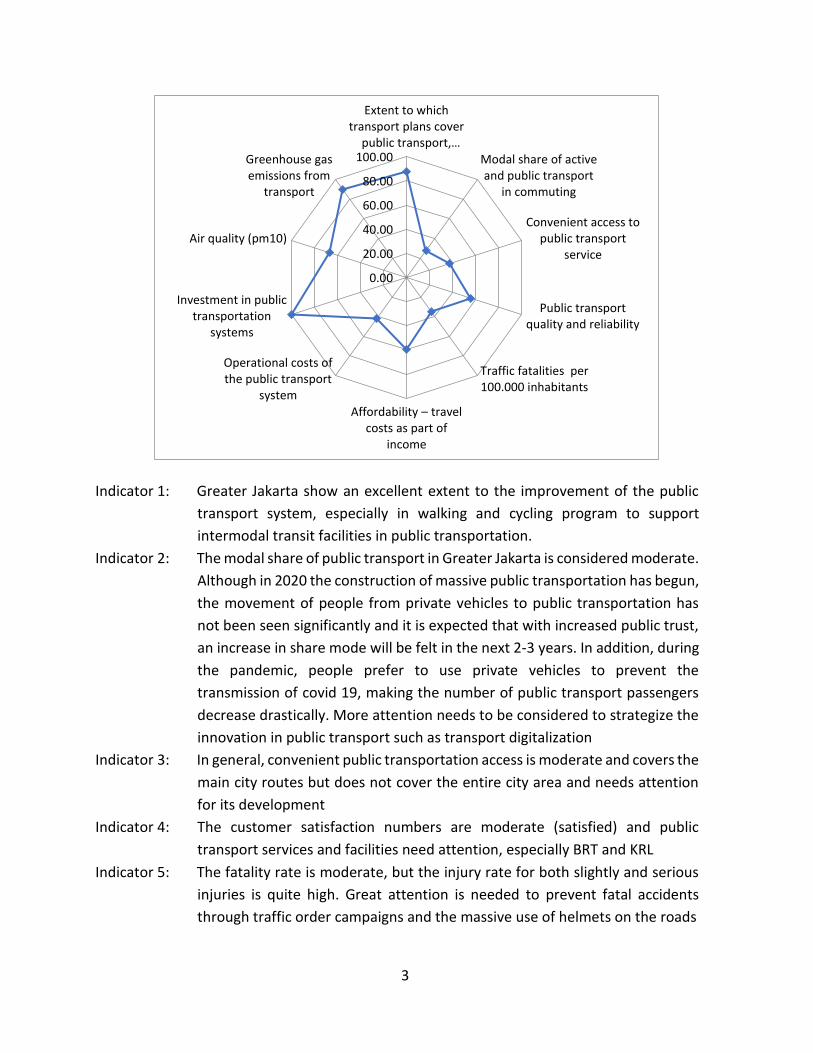
3
Indicator 1: Greater Jakarta show an excellent extent to the improvement of the public
transport system, especially in walking and cycling program to support
intermodal transit facilities in public transportation.
Indicator 2: The modal share of public transport in Greater Jakarta is considered moderate.
Although in 2020 the construction of massive public transportation has begun,
the movement of people from private vehicles to public transportation has
not been seen significantly and it is expected that with increased public trust,
an increase in share mode will be felt in the next 2-3 years. In addition, during
the pandemic, people prefer to use private vehicles to prevent the
transmission of covid 19, making the number of public transport passengers
decrease drastically. More attention needs to be considered to strategize the
innovation in public transport such as transport digitalization
Indicator 3: In general, convenient public transportation access is moderate and covers the
main city routes but does not cover the entire city area and needs attention
for its development
Indicator 4: The customer satisfaction numbers are moderate (satisfied) and public
transport services and facilities need attention, especially BRT and KRL
Indicator 5: The fatality rate is moderate, but the injury rate for both slightly and serious
injuries is quite high. Great attention is needed to prevent fatal accidents
through traffic order campaigns and the massive use of helmets on the roads
0.00
20.00
40.00
60.00
80.00
100.00
Extent to whichtransport plans cover
public transport,…
Modal share of activeand public transport
in commuting
Convenient access topublic transport
service
Public transportquality and reliability
Traffic fatalities per100.000 inhabitants
Affordability – travel costs as part of
income
Operational costs ofthe public transport
system
Investment in publictransportation
systems
Air quality (pm10)
Greenhouse gasemissions from
transport
4
Indicator 6: Travel costs as part of income, especially travel by public transport in
Jabodetabek (Greater Jakarta), are still in the affordable category.
Indicator 7: The farebox ratio is below 100; therefore, the government needs to subsidize
the operational costs of public transport or by mobilizing private investment
in the development of public transport operations
Indicator 8: Cities under the Greater Jakarta area invest quite aggressively and pay great
attention, especially with the help of the central government in developing
public transportation and its integration (MRT, LRT, BRT, and Commuter line).
Investment reached the maximum value (50) shows the seriousness of
investment in the field of public transportation
Indicator 9: Air quality (PM10) is at a satisfactory level based on Air Quality Index (AQI)
categories, pollutants, and health breakpoints
Indicator 10: Greenhouse gas emissions from transport toward 0 and indicate a good
condition
Additionally, the results of the SUTI measurement show that for the 10 indicators that have been
measured, It shows that the following areas such as modal share of active and public
transportation in commuting, convenient access to public transportation services, public
transport quality and reliability, affordability – travel cost as part of income, and operational cost
of public transportation system can be improved in order to increase the SUTI index for Greater
Jakarta. Furthermore, SUTI provided new insights to Greater Jakarta Transport Authority, these
include:
a. Initiative and innovative strategies to increase the mode share of public transportation
through convenient services and ease of access and at the same time restricting private
vehicles
b. Create a strategy for public transport users to strengthen their ability to travel by public
transport
c. Collaborating with operators and other stakeholders in finding the right strategy to save
operating costs with innovation, especially the post-Covid-19 strategy
d. Coordinate with cities and regencies within the greater Jakarta area for monitoring and
air quality programs for PM 10/PM 2.5
e. Develop a green vehicle program in public transportation in line with the Central
Government's vision towards electric mobility.

5
Chapter One Introduction
1. Introduction
1.1. Geographical Condition
The Jakarta Metropolitan Area (JMA), or Greater Jakarta known locally as Jabodetabek,
Jabodetabekjur, or Jabodetabekpunjur (an acronym of Jakarta–Bogor–Depok–Tangerang–
Bekasi–Puncak– Cianjur), is the most populous metropolitan area in Indonesia. Located at
coordinates 6°10′30″S 106°49′43″E, it includes the national capital city of Jakarta as the core city
as well as other five satellite cities and four regencies. The original term "Jabotabek" was dated
back to the late 1970s and was revised into "Jabodetabek" in 1999 when the syllable "De" for
"Depok") was inserted. Jabodetabekpunjur (JMA) had developed from the small and separated
City regions into a vast and unified megacity. Recently Jabodetabekpunjur (JMA) has become the
largest megacity in Indonesia and plays the most crucial role within social, economic, and political
aspects. The term "Jabodetabekjur" or "Jabodetabekpunjur" was legalized by Presidential Decree
Number 54 of 2008, although 'Jabodetabek' is the more preferred and commonly used term.
Furthermore, President Joko Widodo on 13 April, 2020 signed the Presidential Decree Number
60 of 2020 on Spatial Planning for Urban Areas in Jakarta, Bogor, Depok, Tangerang, Bekasi,
Puncak, and Cianjur (Jabodetabek-Punjur). The Presidential Decree about Jabodetabek was
issued based on the law on Spatial Planning that stipulates the establishment of
Jabodetabekpunjur as a National Strategic Area. The area comprises Jakarta, and parts of West
Java and Banten provinces, specifically the three regencies - Bekasi Regency and Bogor
Regency in West Java, and Tangerang Regency in Banten. The area also includes
Bogor, Depok, Bekasi, Tangerang, and South Tangerang. All of which are not included
administratively in the regencies. The name of each of the regions is stood in for by the first two
(or three) letters of each city's name: Ja-bo-de-ta-bek from Jakarta, Bogor, Depok, Tangerang,
and Bekasi. The whole territory is a conurbation with a vast natural and human resources base.
It is also an enormous economic hub and an intense marketplace.

6
In addition to having geographically strategic widespread, thus being an extensive international
hub, Jabodetabek is a prime foreign investment destination in Indonesia. In the South part of
Jakarta, a pivotal water reservoir is submitted for land preservation, while in the North side lies
the bay. Irrefutably, this is the reason why the development is mainly East-West oriented.
Furthermore, the population of the Jakarta metropolitan area (Greater Jakarta), with an area of
7,062 km2 (2,449 sq mi), was 31.24 million according to the Indonesia 2020 census, making it the
most populated region in Indonesia, as well as the second-most populated urban area in the
world after Tokyo. This part of Jakarta is the centre of government, culture, education, and
economy of Indonesia. It has pulled many people from throughout Indonesia to come, live and
work. Its economic capacity makes Jakarta metropolitan area (Greater Jakarta) the country’s
prime center for finance, manufacture, and commerce. Data in 2019 has shown that the area
contributes a gross domestic product of US$297.7 billion with a per capita GDP of $8,775 and
a purchasing power parity of US$978.5 billion with a per capita PPP of $28,840, equal to 26.2%
of the economy of Indonesia. The region was established in 1976 through Presidential Instruction
No. 13 in response to the need to sustain the growing population of the capital city. Indonesia's
government established the Jabotabek Cooperation Body (Badan Kerjasama Pembangunan) of
the joint secretariat of the Government of DKI Jakarta and West Java province.
Figure.1.1. Greater Jakarta Metropolitan Area (GJMA)
Source: Haryo Winarso et al, 2015
7
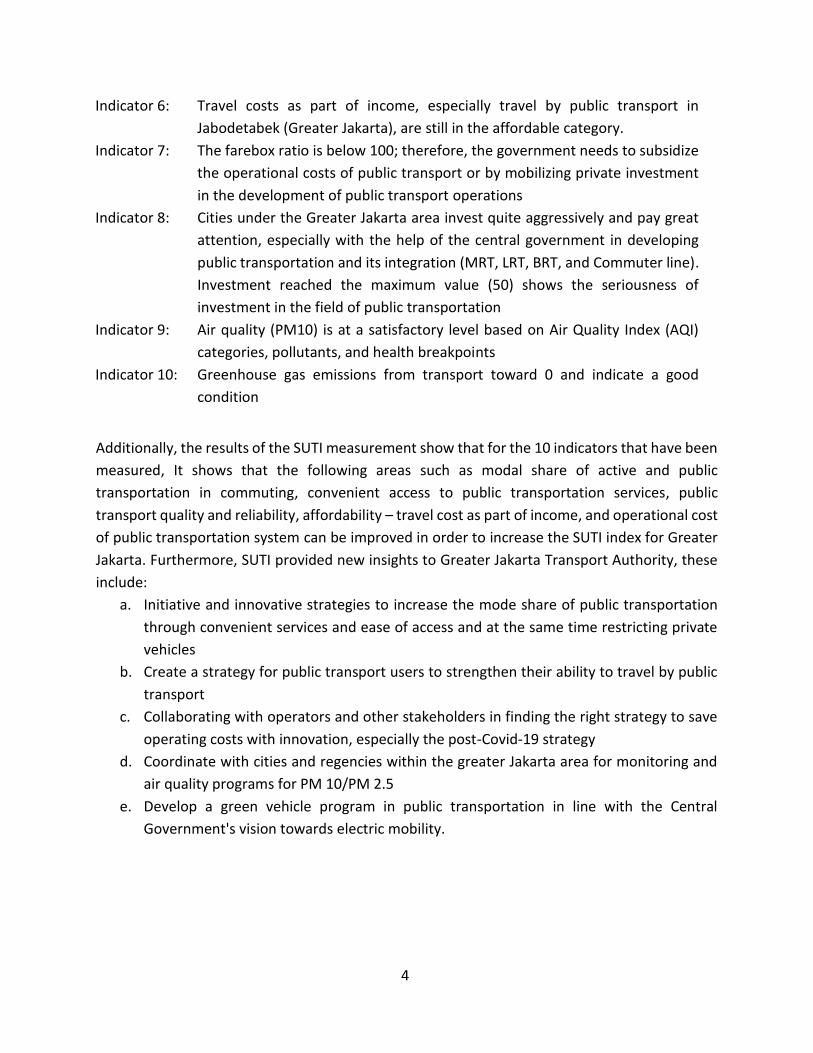
Figure.1.2 Detail Jakarta Metropolitan Area (Greater of Jakarta)
Source: Wahyudi, 2019
Situated within a 7,062 square kilometers area with inhabitants of around 31.24 million people
in 2020 and a population growth rate of 2.9 percent per year, Metropolitan Jakarta depicts the
story of a colossal urbanization process that occurred in Southeast Asia. The depiction of Jakarta's
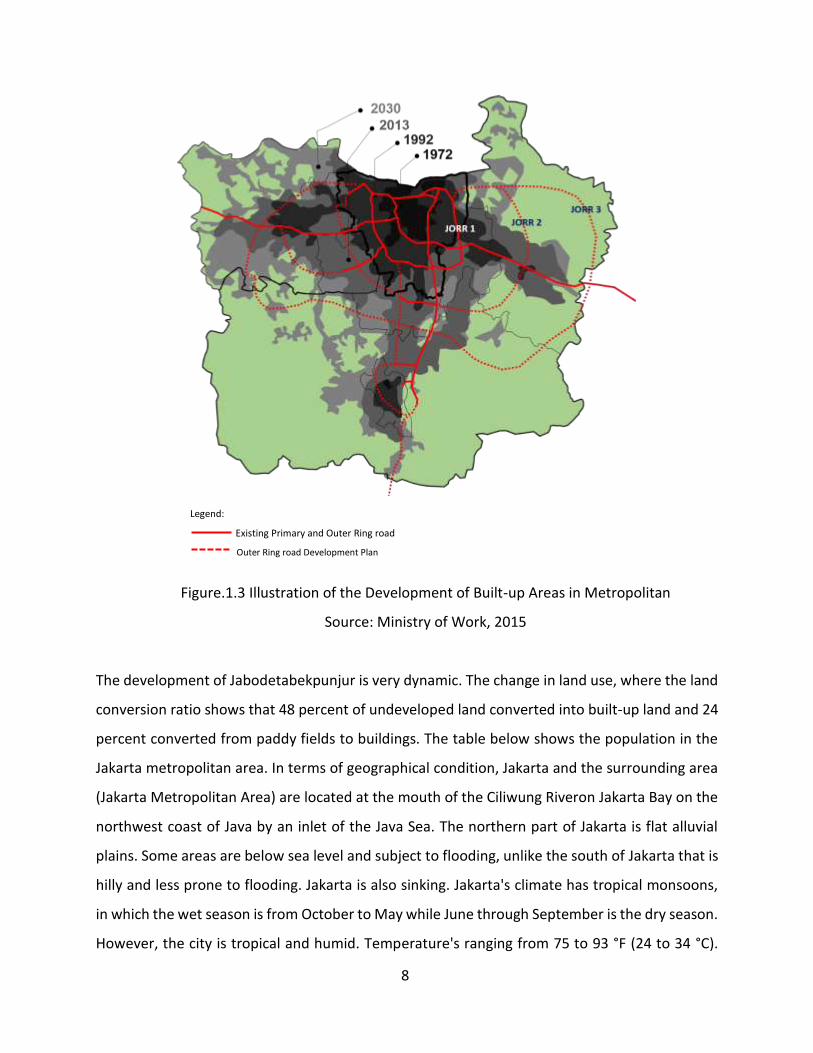
development is mapped out and displayed in Figure 1.3. It shows that the development works
had started in the size of a small urban area. Then Metropolitan Jakarta expanded to the West,
East, and South. In 2030, it's projected that all city administration areas within Metropolitan
Jakarta (Jakarta, Bogor, Depok, Bekasi, Tangerang, and South Tangerang, including Puncak and
Cianjur) will all be fully developed (Rustiadi et al 2018) and inhabited by 39 million people by
2030 (Ministry of Public works 2015).
8
Legend:
Existing Primary and Outer Ring road
Outer Ring road Development Plan
Figure.1.3 Illustration of the Development of Built-up Areas in Metropolitan
Source: Ministry of Work, 2015
The development of Jabodetabekpunjur is very dynamic. The change in land use, where the land
conversion ratio shows that 48 percent of undeveloped land converted into built-up land and 24
percent converted from paddy fields to buildings. The table below shows the population in the
Jakarta metropolitan area. In terms of geographical condition, Jakarta and the surrounding area
(Jakarta Metropolitan Area) are located at the mouth of the Ciliwung Riveron Jakarta Bay on the
northwest coast of Java by an inlet of the Java Sea. The northern part of Jakarta is flat alluvial
plains. Some areas are below sea level and subject to flooding, unlike the south of Jakarta that is
hilly and less prone to flooding. Jakarta is also sinking. Jakarta's climate has tropical monsoons,
in which the wet season is from October to May while June through September is the dry season.
However, the city is tropical and humid. Temperature's ranging from 75 to 93 °F (24 to 34 °C).
9
The humidity level is between 75 and 85 percent throughout the year 17 cm (6.7 inches) annually,
which has worsened flooding in the area and has caused the national government to consider
moving the Indonesian capital to a different city.
1.2. Demographic
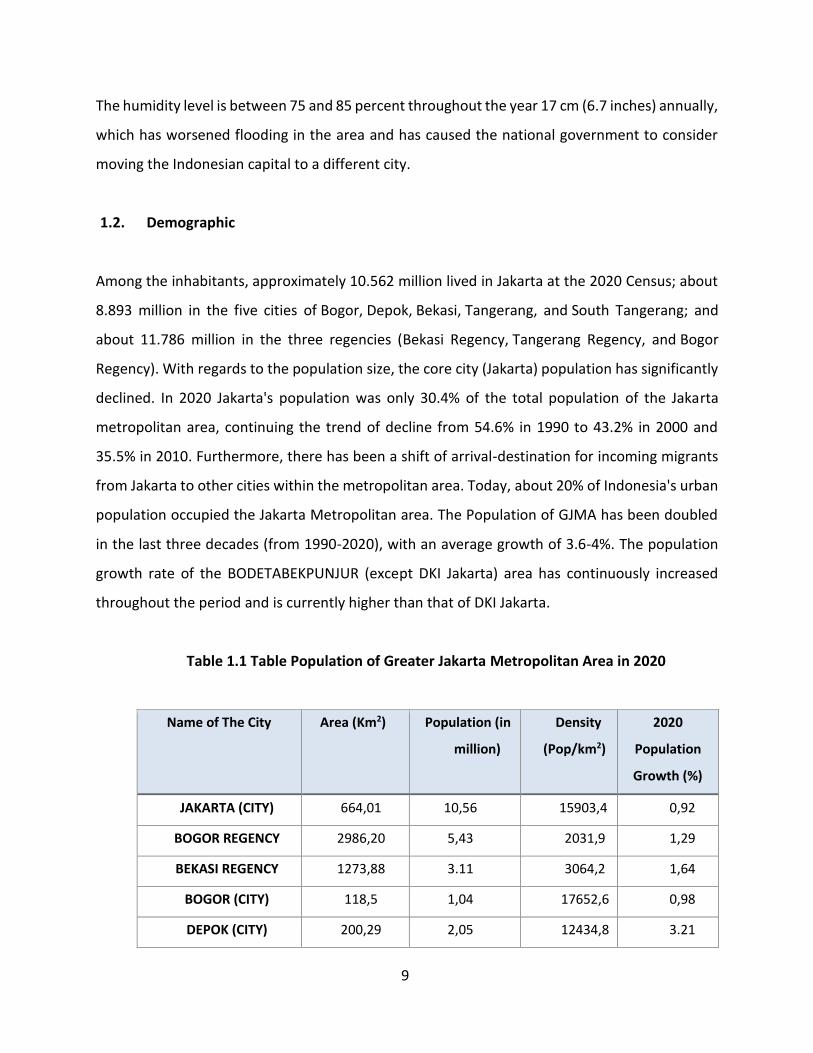
Among the inhabitants, approximately 10.562 million lived in Jakarta at the 2020 Census; about
8.893 million in the five cities of Bogor, Depok, Bekasi, Tangerang, and South Tangerang; and
about 11.786 million in the three regencies (Bekasi Regency, Tangerang Regency, and Bogor
Regency). With regards to the population size, the core city (Jakarta) population has significantly
declined. In 2020 Jakarta's population was only 30.4% of the total population of the Jakarta
metropolitan area, continuing the trend of decline from 54.6% in 1990 to 43.2% in 2000 and
35.5% in 2010. Furthermore, there has been a shift of arrival-destination for incoming migrants
from Jakarta to other cities within the metropolitan area. Today, about 20% of Indonesia's urban
population occupied the Jakarta Metropolitan area. The Population of GJMA has been doubled
in the last three decades (from 1990-2020), with an average growth of 3.6-4%. The population
growth rate of the BODETABEKPUNJUR (except DKI Jakarta) area has continuously increased
throughout the period and is currently higher than that of DKI Jakarta.
Table 1.1 Table Population of Greater Jakarta Metropolitan Area in 2020
Name of The City Area (Km2) Population (in
million)
Density
(Pop/km2)
2020
Population
Growth (%)
JAKARTA (CITY) 664,01 10,56 15903,4 0,92
BOGOR REGENCY 2986,20 5,43 2031,9 1,29
BEKASI REGENCY 1273,88 3.11 3064,2 1,64
BOGOR (CITY) 118,5 1,04 17652,6 0,98
DEPOK (CITY) 200,29 2,05 12434,8 3.21
10
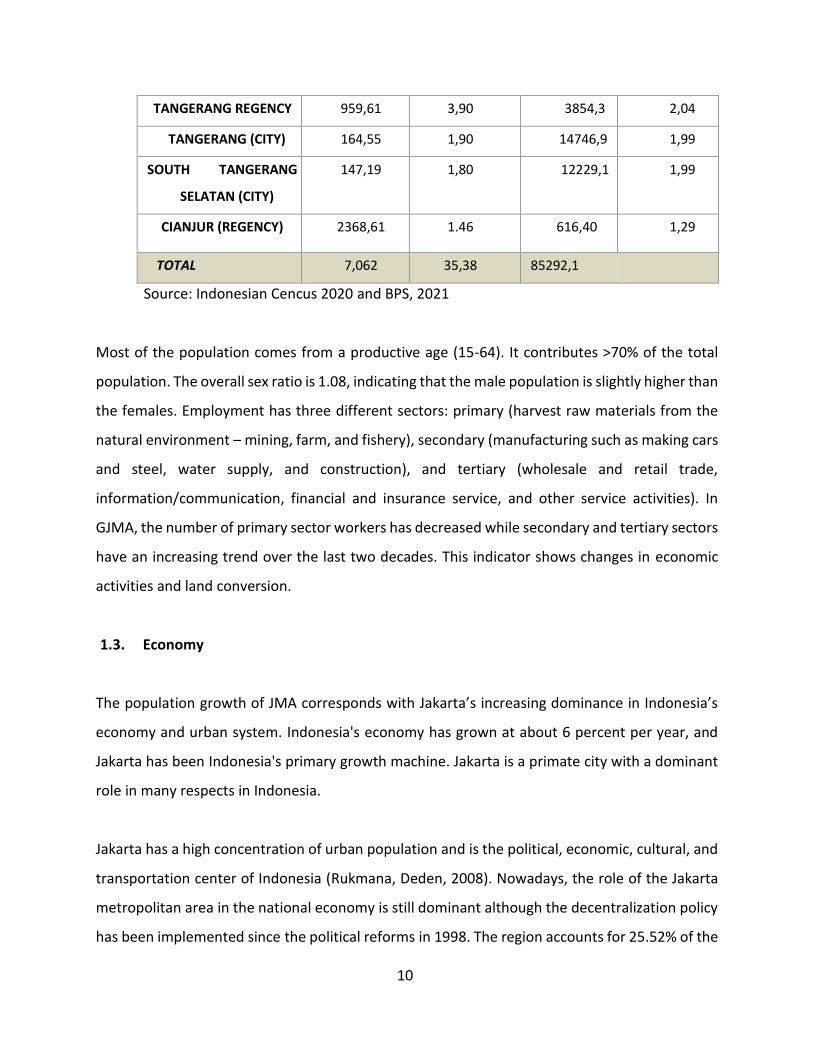
TANGERANG REGENCY 959,61 3,90 3854,3 2,04
TANGERANG (CITY) 164,55 1,90 14746,9 1,99
SOUTH TANGERANG
SELATAN (CITY)
147,19 1,80 12229,1 1,99
CIANJUR (REGENCY) 2368,61 1.46 616,40 1,29
TOTAL 7,062 35,38 85292,1
Source: Indonesian Cencus 2020 and BPS, 2021
Most of the population comes from a productive age (15-64). It contributes >70% of the total
population. The overall sex ratio is 1.08, indicating that the male population is slightly higher than
the females. Employment has three different sectors: primary (harvest raw materials from the
natural environment – mining, farm, and fishery), secondary (manufacturing such as making cars
and steel, water supply, and construction), and tertiary (wholesale and retail trade,
information/communication, financial and insurance service, and other service activities). In
GJMA, the number of primary sector workers has decreased while secondary and tertiary sectors
have an increasing trend over the last two decades. This indicator shows changes in economic
activities and land conversion.
1.3. Economy
The population growth of JMA corresponds with Jakarta’s increasing dominance in Indonesia’s
economy and urban system. Indonesia's economy has grown at about 6 percent per year, and
Jakarta has been Indonesia's primary growth machine. Jakarta is a primate city with a dominant
role in many respects in Indonesia.
Jakarta has a high concentration of urban population and is the political, economic, cultural, and
transportation center of Indonesia (Rukmana, Deden, 2008). Nowadays, the role of the Jakarta
metropolitan area in the national economy is still dominant although the decentralization policy
has been implemented since the political reforms in 1998. The region accounts for 25.52% of the

11
total national gross domestic product and 42.8% of the total GDP of Java. Central Jakarta, South
Jakarta, and Bekasi have respectively accounted for 4.14%; 3.78%, and 2.11% of total national
GDP (Maikel, 2017). There are three dominant sectors that have a high contribution to the total
Jakarta metropolitan area's GDP comprising: industrial sector (28.36%), the financial sector
(20.66%) as well as trade, hotel, and restaurant sectors (20.24%). Based on the contribution of
each sector to the total national GDP in 2010, Jakarta metropolitan area contributed 41.87% for
the finance sector, 33.1% for construction and building, as well as 30.86% for transportation.
According to the JUTPI II report (2020), Kota Tangerang Selatan is the most rapidly growing region
with the highest GRDP growth among all with an average of 7.9%.
Figure.1.4. Share of Each Kota and Kabupaten in Greater Jakarta Metropolitan Area
(2017)
Source: JUTPI Phase 2, 2019
On the other hand, in terms of innovative economic sectors, the most visible phenomenon of the
most recent urban development initiatives is the leadership taken by the private sector in
developing new economic clusters (new housing, new-towns, industrial estates, leisure,
commercial, health & institutional facilities) as well as infrastructure (toll-road, public-transport,
12
water & sanitation) and even urban services. There's a booming of young and a more
consumptive middle-class with a voracious appetite for international-standard urban goods,
services, and lifestyles. This trend tells that governments have to adopt a new role and thus
should change their habits which means better service-delivery abilities and infrastructure
improvement to create a favorable business climate. The increasing competition for private
investments means that public goods management has to be more effective. A most recent trend
is that a more democratic urban electorate demands change from an old vertical political
hierarchy towards innovative and accountable governance. Remarkable improvement is
appreciable in new malls, office parks, industrial parks, leisure destinations, and even public
green. Innovative urban design, green marks, and probing solutions have become more
acceptable.
1.4. Governance and Cooperation
Government Autonomy lies with the regencies (Bogor, Puncak and Cianjur, Bekasi in West Java,
and Tangerang in Banten) while Jakarta with its five municipals has a Special Capital City Status
and has a Governor as the head of the autonomous region. The other cities (Bogor, Tangerang,
South Tangerang, Bekasi, and Depok) select a Mayor as the head of the autonomous region. They
lie within three provinces of DKI Jakarta, West Java, and Banten. in Jakarta Special Capital Region,
the Governor names the Mayors and Regents. There is a national island-wide metropolitan level
apart from an urban spatial and strategic planning regime complying with the existing spatial law.
The spatial and local plans nominally go along with the hierarchy of Plans. Many areas are still
lacking continuity of planning, implementation, and supervision is mainly due to the very dynamic
nature of the economic and political development.
The BKSP of Jabodetabekpunjur (Jabodetabekpunjur Metropolitan Coordination Board) is
responsible for coordinating inter-territorial issues like the rivers, water distribution, and
transportation. Inter-territorial matters are coordinated autonomously in Jakarta Special Capital
administrative area at the provincial level. The preeminence of Jakarta signifies that BKSP shall
13
coordinate more symbolically than effectively concerning each territory: Common metropolitan
policies are translated and adapted into the local political-economic reality. Yet this may change
with the new Governor in Jakarta opening a direct dialogue between his two colleagues to help
tackle Jakarta's persistent problems of water supply, flooding, and transportation
(all upstream, thus they're inter-territorial problems).
In terms of new forms of urbanity and metropolitan environments, The Jakarta Metropolitan
Area (Jabodetabekpunjur) long-term masterplan outlines vital E-W axis development with limited
N-S development (Northern coastline and southern marsh and water-dominated). Thus the
major metropolitan-form determinants in addition to the infrastructural arteries (toll-road, rail,
and public transport) follow this pattern (that in turn connects to the national grid) augmented
by three-ring feeder axis Public transport corridors (bus-ways, commuter train, monorail (2014),
and MRT (2018), Airports and harbors (West and East), Dams (South) and improved treatment of
rivers (including sanitation) for water supply to the Flood control canals (East and West)
augmenting the natural watershed areas. These metropolitan-scale infrastructural projects are
funded at the national level and tend to override local differences. Inter-territorial fiscal transfer
can also be applied to alleviate imbalances.
14
Chapter Two
Current State of Urban Transport Systems and Services
2.1. Introduction
Greater Jakarta Metropolitan Area (GJMA) or Jabodetabekpunjur is a primate urban area in
Indonesia, marked with only 0.33% of the national land area. Still, this region contributes about
one-fourth of Indonesia's Gross Domestic Products (GDP) and accommodates about 12,4 % of
Indonesia's total population in 2017. GJMA is still rapidly growing and encouraging the expansion
of residents into its suburbs, and this affected the travel behavior of daily commuting to and from
home to destination. In the GJMA concept, Jakarta is the core area; on the other hand, five
Kabupaten and five Kota's as peri-urban of GJMA. There is a relation between a core area and its
peri-urban area in the functional one, characterized by a commuting flow from the core area to
the peri-urban area and vice versa (Winarso et al, 2015). Present-day Jakarta and its metro area
(GJMA) seem a massive and chaotic jumble of concrete, asphalt, vehicles, and people. Each day
the streets carry more than 20 million vehicles; every year, approximately 11% more motorcycles,
cars, buses, and trucks take to the streets (BPS Provinsi DKI Jakarta, 2020). On average, motorists
spend more than half their daylight hours stuck in traffic, and when they can move, their speed
is only about 5 km/h during a rush period (Tempo.com 2015). The current challenges of urban
transportation include the high use of private vehicles both motorcycles, and cars. The total
number of people traveling inside Jakarta, Bogor, Tangerang, and Bekasi (Jabodetabek) increase
from year to year. According to 2018 data, there are at least 49.5 million people travel per day.
Of that number, as many as 23.4 million people move within the city of Jakarta when the other
20.02 million are Bodetabek residents whose mobility is from outside the city into the city of
Jakarta.
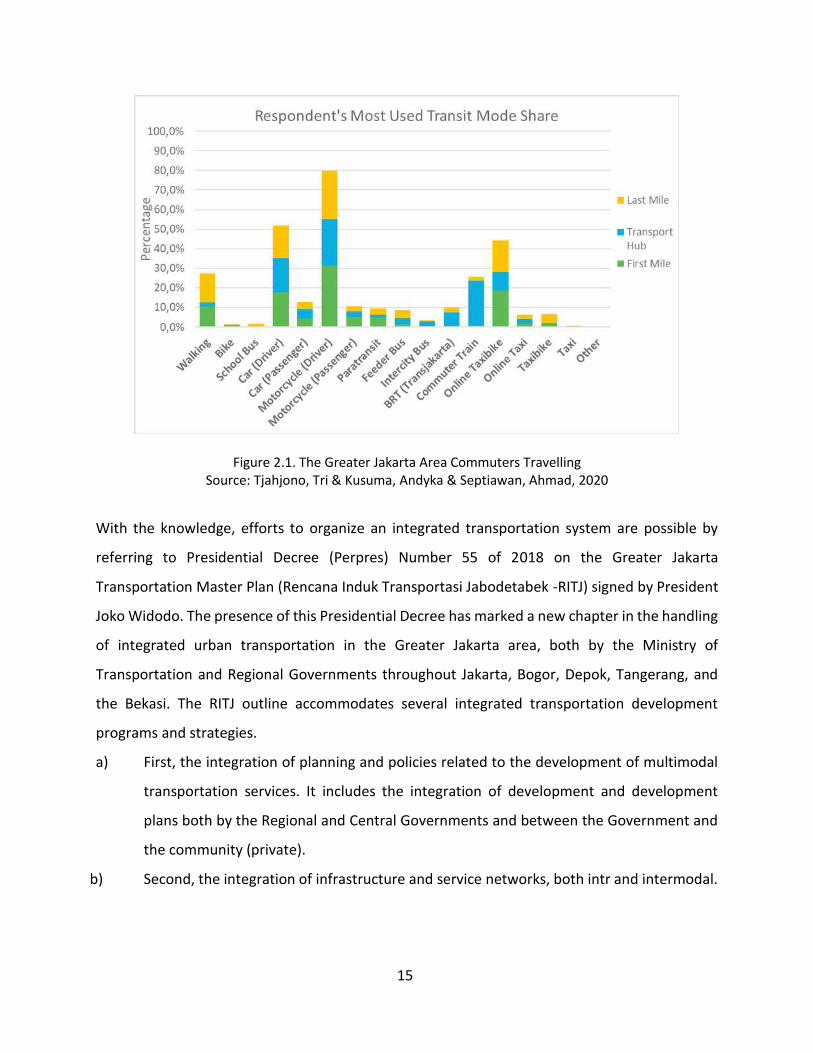
Meanwhile, the number of users of public transport modes is still relatively small. Most of the
mobility of Bodetabek residents still uses private vehicles as shown in figure below.
15
Figure 2.1. The Greater Jakarta Area Commuters Travelling Source: Tjahjono, Tri & Kusuma, Andyka & Septiawan, Ahmad, 2020
With the knowledge, efforts to organize an integrated transportation system are possible by
referring to Presidential Decree (Perpres) Number 55 of 2018 on the Greater Jakarta
Transportation Master Plan (Rencana Induk Transportasi Jabodetabek -RITJ) signed by President
Joko Widodo. The presence of this Presidential Decree has marked a new chapter in the handling
of integrated urban transportation in the Greater Jakarta area, both by the Ministry of
Transportation and Regional Governments throughout Jakarta, Bogor, Depok, Tangerang, and
the Bekasi. The RITJ outline accommodates several integrated transportation development
programs and strategies.
a) First, the integration of planning and policies related to the development of multimodal
transportation services. It includes the integration of development and development
plans both by the Regional and Central Governments and between the Government and
the community (private).
b) Second, the integration of infrastructure and service networks, both intr and intermodal.
16
c) Third, the integration of transportation modes. The integration of the development of
urban transportation modes includes the planning, development, and operation stages
(time integration).
d) Fourth, fare/ticket integration. The integration of fares/tickets is possible by
implementing an e-ticketing system for intramodal and intermodal services. With the
use of electronic payment systems, the integration of the payment system (cashless
transactions) and by providing the public with this form of multipurpose service.
e) Fifth, information system integration. Integration of Information systems should utilize
information technology that provides information on public transportation facilities and
infrastructure accessible by the public. Information about public transportation modes,
schedules, and routes will make it easier for people to take advantage of public
transportation services that are better than before.
f) Sixth, integration of financing and institutions. The integration of the financing plan is
primarily for development financing so that synergies allow supports between modes.
Meanwhile, institutional integration ensures coordination between institutions in a
framework of planning, implementation, and operation of various integrated modes.
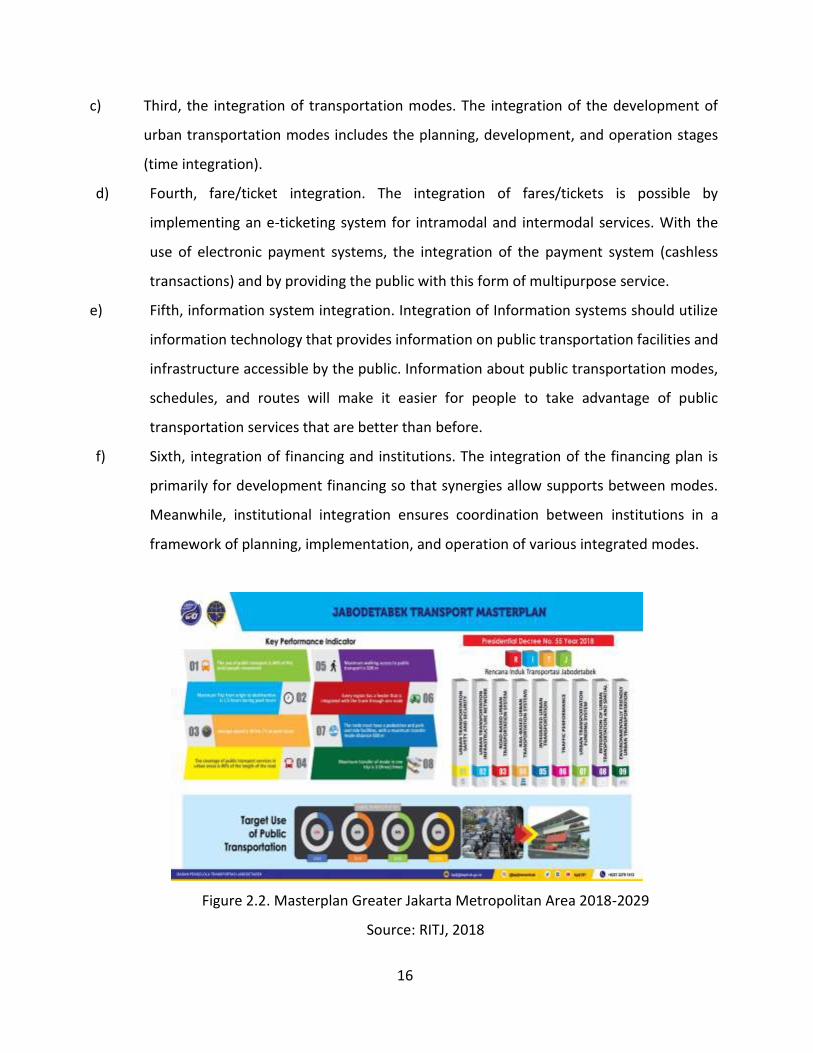
Figure 2.2. Masterplan Greater Jakarta Metropolitan Area 2018-2029
Source: RITJ, 2018
17
These targets refer to different transportation development concepts: the nine pillars of RITJ.
They are transportation safety and security; environmentally friendly transportation;
infrastructure network; road-based transportation system; rail-based transportation system;
engineering management and traffic control; integrated transportation system; financing
system; and integration of transportation and spatial planning. Referring to the clusterization of
the program and targets to be achieved in the RITJ, by the end of 2029, the target for the
movement of people using urban mass public transportation will reach 60%. The target travel
time by public transports is a maximum of 1 hour 30 minutes from the place of origin to the
destination. This can be achieved if the change of transportation mode in one trip is a maximum
of 3 times the integrated mode of transportation. For this reason, the average speed of urban
public transport vehicles at peak hours is at least 30 km/hour.
The development of the mass transportation system carried out must also pay attention to the
accessibility of urban public transportation services available 80% of the length of the road. With
this target, each region must have a local transportation service network/feeder integrated with
the principal network through one urban transportation node. The urban transportation node
must also have facilities for pedestrians and park and ride so that changing modes to public
transportation is easy and fast. For this reason, the distance between modes of movement is not
more than 500 meters. Likewise, pedestrian access to public transports is a maximum of 500
meters. Part of the fundamental performance indicators in the RITJ had become a joint
agreement with all relevant stakeholders, which are the result of the consensus between all
parties, including the Ministry of Transportation and the City and Regency Provincial
Governments throughout the Greater Jakarta Metropolitan Area.
Currently in 2021, BPTJ has launched an online monitoring dashboard for the implementation of
RITJ (in the network) or a special online called the Greater Jakarta Transportation Master Plan
Monitoring and Information System (SPIRIT JABODETABEK). The monitoring dashboard for the
implementation of RITJ is an initiative of BPTJ, one of which is intended to facilitate all
stakeholders of transportation management in Jabodetabek in conveying and monitoring the
18
progress of the implementation of RITJ activities in accordance with their respective authorities.
This online system can also be used as a database in carrying out evaluations for each period.
Through a username and password, all stakeholders who are directly involved in the
implementation of RITJ can access and utilize this system.
Until the end of 2021, the implementation of RITJ is still experiencing problems and has not
reached the real target, especially during the pandemic. However, it will be accelerated towards
2030. Until the end of 2021, the implementation of RITJ is still experiencing problems and has
not reached the real target, especially during the pandemic. However, it will be accelerated
towards 2030. The overall target will be achieved as shown in the following roadmap.
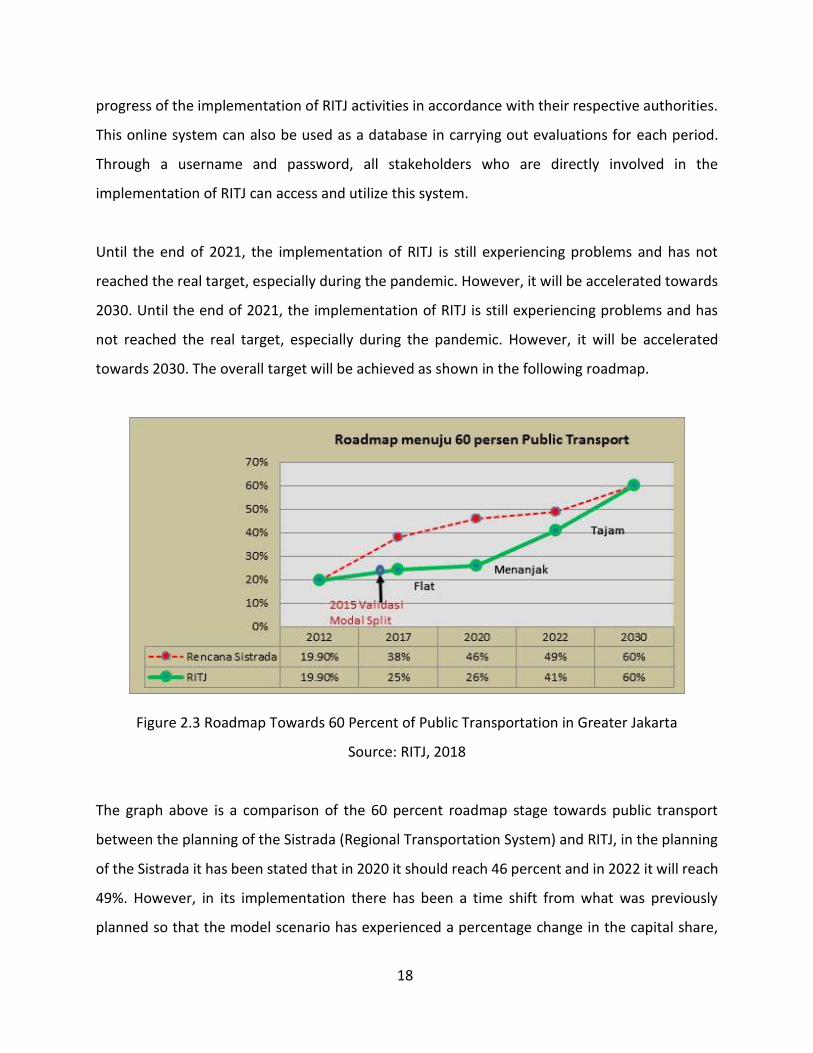
Figure 2.3 Roadmap Towards 60 Percent of Public Transportation in Greater Jakarta
Source: RITJ, 2018
The graph above is a comparison of the 60 percent roadmap stage towards public transport
between the planning of the Sistrada (Regional Transportation System) and RITJ, in the planning
of the Sistrada it has been stated that in 2020 it should reach 46 percent and in 2022 it will reach
49%. However, in its implementation there has been a time shift from what was previously
planned so that the model scenario has experienced a percentage change in the capital share,
19
but even though there is a shift in the value of the capital share, it is still expected to achieve the
same target in 2030, which is 60% so that in the process of achieving the 60% target by 2030
there will be stages that will be attempted to increase drastically.
2.2. Traffic and Private Vehicle Ownership
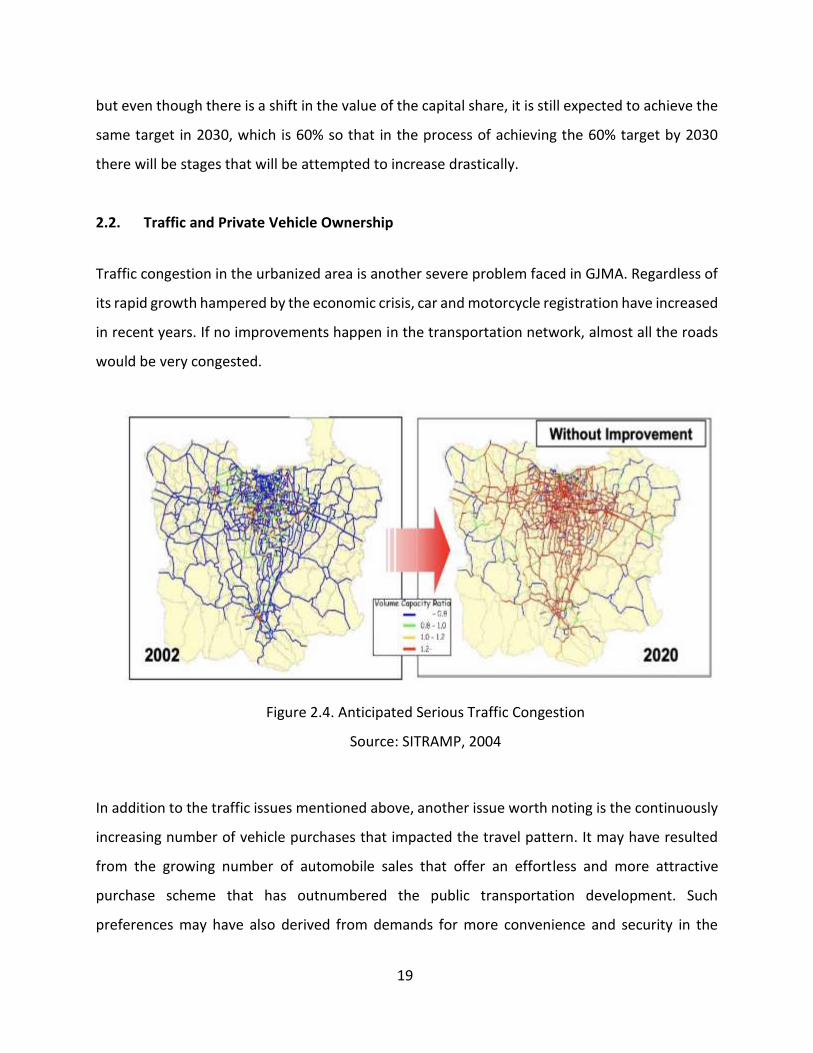
Traffic congestion in the urbanized area is another severe problem faced in GJMA. Regardless of
its rapid growth hampered by the economic crisis, car and motorcycle registration have increased
in recent years. If no improvements happen in the transportation network, almost all the roads
would be very congested.
Figure 2.4. Anticipated Serious Traffic Congestion
Source: SITRAMP, 2004
In addition to the traffic issues mentioned above, another issue worth noting is the continuously
increasing number of vehicle purchases that impacted the travel pattern. It may have resulted
from the growing number of automobile sales that offer an effortless and more attractive
purchase scheme that has outnumbered the public transportation development. Such
preferences may have also derived from demands for more convenience and security in the
20
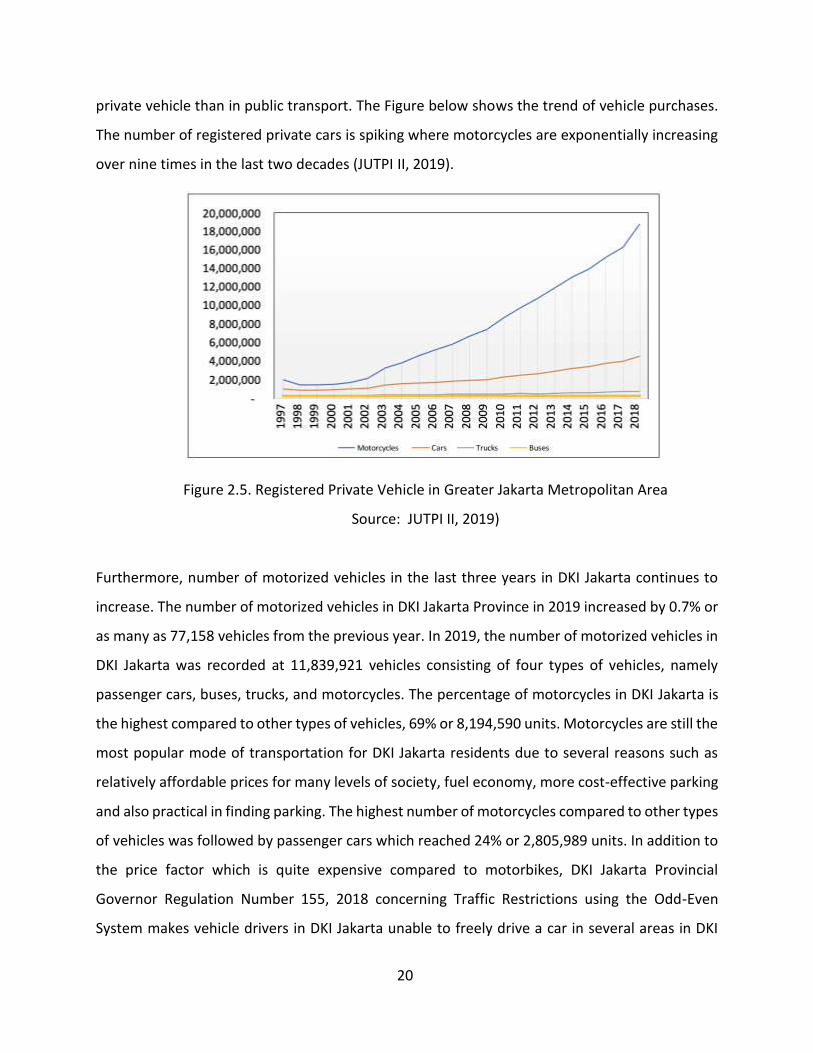
private vehicle than in public transport. The Figure below shows the trend of vehicle purchases.
The number of registered private cars is spiking where motorcycles are exponentially increasing
over nine times in the last two decades (JUTPI II, 2019).
Figure 2.5. Registered Private Vehicle in Greater Jakarta Metropolitan Area
Source: JUTPI II, 2019)
Furthermore, number of motorized vehicles in the last three years in DKI Jakarta continues to
increase. The number of motorized vehicles in DKI Jakarta Province in 2019 increased by 0.7% or
as many as 77,158 vehicles from the previous year. In 2019, the number of motorized vehicles in
DKI Jakarta was recorded at 11,839,921 vehicles consisting of four types of vehicles, namely
passenger cars, buses, trucks, and motorcycles. The percentage of motorcycles in DKI Jakarta is
the highest compared to other types of vehicles, 69% or 8,194,590 units. Motorcycles are still the
most popular mode of transportation for DKI Jakarta residents due to several reasons such as
relatively affordable prices for many levels of society, fuel economy, more cost-effective parking
and also practical in finding parking. The highest number of motorcycles compared to other types
of vehicles was followed by passenger cars which reached 24% or 2,805,989 units. In addition to
the price factor which is quite expensive compared to motorbikes, DKI Jakarta Provincial
Governor Regulation Number 155, 2018 concerning Traffic Restrictions using the Odd-Even
System makes vehicle drivers in DKI Jakarta unable to freely drive a car in several areas in DKI
21
Jakarta every day, so many people still choose motorbikes as their main mode of transportation.
On the other hand, the percentage of buses is the lowest percentage, which is only 2% or 295,370
units. The significant increase in private vehicle ownership over the years has impacted the mode
share of GMJA itself.
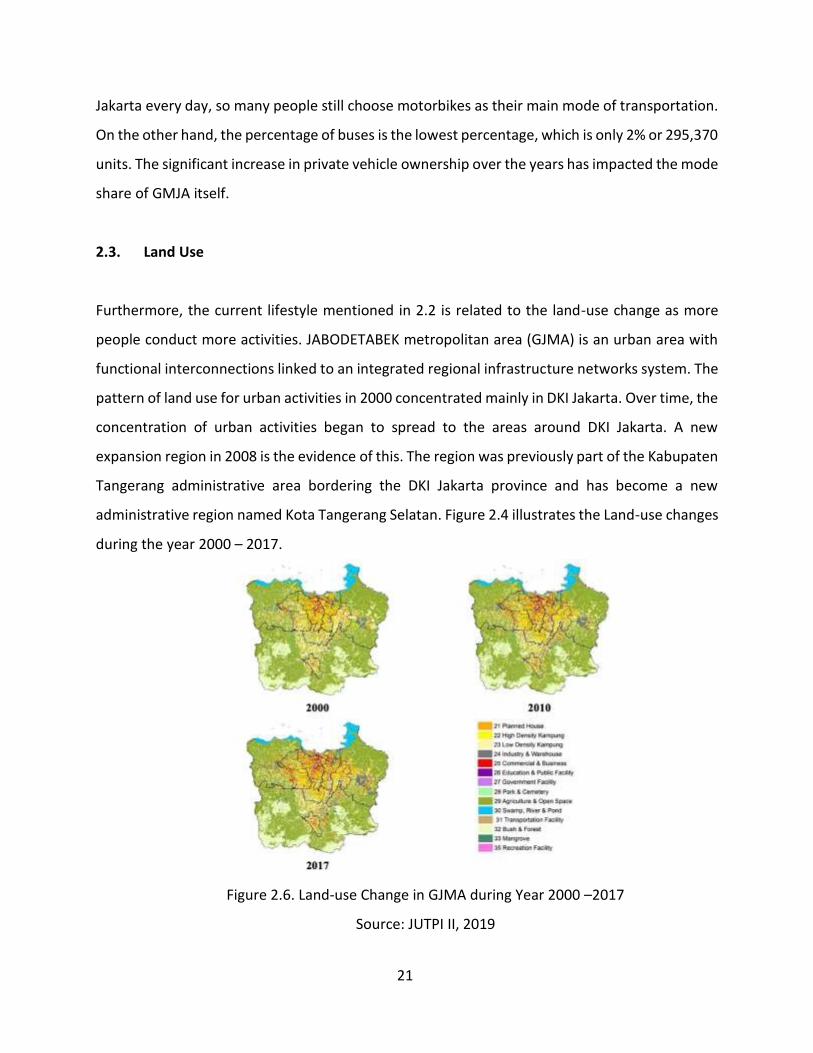
2.3. Land Use
Furthermore, the current lifestyle mentioned in 2.2 is related to the land-use change as more
people conduct more activities. JABODETABEK metropolitan area (GJMA) is an urban area with
functional interconnections linked to an integrated regional infrastructure networks system. The
pattern of land use for urban activities in 2000 concentrated mainly in DKI Jakarta. Over time, the
concentration of urban activities began to spread to the areas around DKI Jakarta. A new
expansion region in 2008 is the evidence of this. The region was previously part of the Kabupaten
Tangerang administrative area bordering the DKI Jakarta province and has become a new
administrative region named Kota Tangerang Selatan. Figure 2.4 illustrates the Land-use changes
during the year 2000 – 2017.
Figure 2.6. Land-use Change in GJMA during Year 2000 –2017
Source: JUTPI II, 2019

22
The Figure above shows two functions of land use division: urban land use and natural land use.
Furthermore, there are different groups of land use: Urban land use (Planned House, High-
Density Kampung, Low-Density Kampung, Industry & Warehouse, Commercial & Business,
Education & Public Facility, Government Facility, Park & Cemetery, Recreation Facility, and
Transportation Facility) and Natural land use (Agriculture and Open Space, Swamp, River & Pond,
Bush & Forest, Mangrove, Rocky Ground). All natural land such as bushes and forests there are
still natural forests and some are used as tourist areas and all of them can be accessed both
access which is still a dirt road and access which is a local road.
Following the regional spatial plan of each Kota and Kabupaten in 2035, land-use conditions
forecasted a significant change in urban and natural function. Most of the changes are in the
residential area and agriculture area. Factors that trigger the increased number of housing areas
are the necessity of dwelling areas to support industry, business, and commercial activities.
Meanwhile, agricultural areas have decreased cause the shifting of land use from the green space
into urban land use function. The Figure below interpreted this in detail.
2017 2035
Figure 2.7. GJMA Land-use Comparation Year 2017 and 2035
Source: JUTPI II, 2019
23
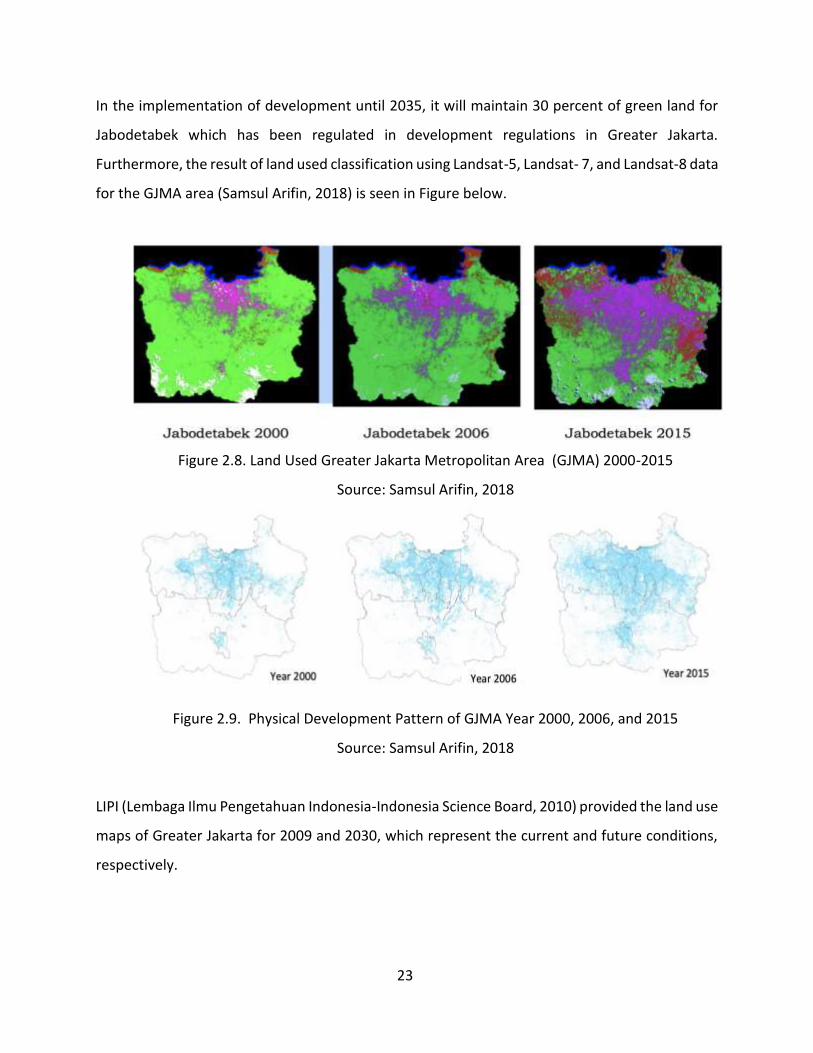
In the implementation of development until 2035, it will maintain 30 percent of green land for
Jabodetabek which has been regulated in development regulations in Greater Jakarta.
Furthermore, the result of land used classification using Landsat-5, Landsat- 7, and Landsat-8 data
for the GJMA area (Samsul Arifin, 2018) is seen in Figure below.
Figure 2.8. Land Used Greater Jakarta Metropolitan Area (GJMA) 2000-2015
Source: Samsul Arifin, 2018
Figure 2.9. Physical Development Pattern of GJMA Year 2000, 2006, and 2015
Source: Samsul Arifin, 2018
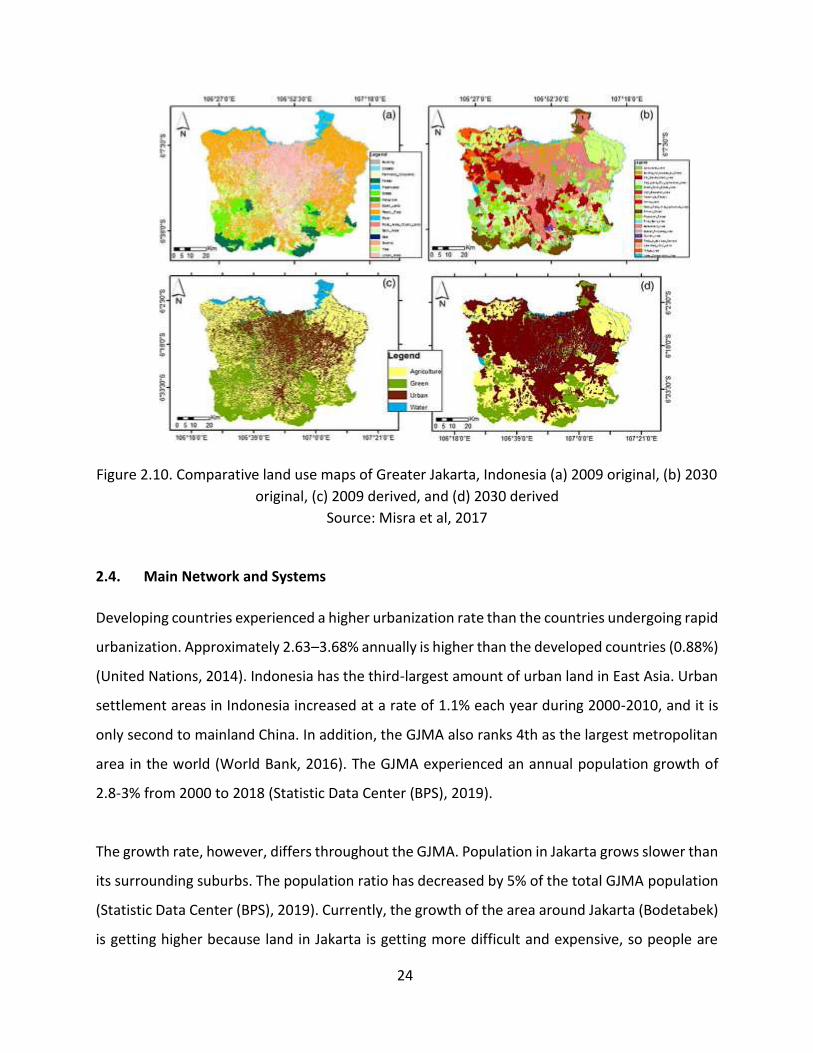
LIPI (Lembaga Ilmu Pengetahuan Indonesia-Indonesia Science Board, 2010) provided the land use
maps of Greater Jakarta for 2009 and 2030, which represent the current and future conditions,
respectively.
24
Figure 2.10. Comparative land use maps of Greater Jakarta, Indonesia (a) 2009 original, (b) 2030
original, (c) 2009 derived, and (d) 2030 derived
Source: Misra et al, 2017
2.4. Main Network and Systems
Developing countries experienced a higher urbanization rate than the countries undergoing rapid
urbanization. Approximately 2.63–3.68% annually is higher than the developed countries (0.88%)
(United Nations, 2014). Indonesia has the third-largest amount of urban land in East Asia. Urban
settlement areas in Indonesia increased at a rate of 1.1% each year during 2000-2010, and it is
only second to mainland China. In addition, the GJMA also ranks 4th as the largest metropolitan
area in the world (World Bank, 2016). The GJMA experienced an annual population growth of
2.8-3% from 2000 to 2018 (Statistic Data Center (BPS), 2019).
The growth rate, however, differs throughout the GJMA. Population in Jakarta grows slower than
its surrounding suburbs. The population ratio has decreased by 5% of the total GJMA population
(Statistic Data Center (BPS), 2019). Currently, the growth of the area around Jakarta (Bodetabek)
is getting higher because land in Jakarta is getting more difficult and expensive, so people are
25
starting to move to the outskirts and commute every day. Urban density in the GJMA also grows
from 12,200 persons per square kilometer of urban land in 2000 to more than 15,000 in
clusterization in the GJMA is high. It still attracts people to live and work in the area. Compared
to other metropolitans in Indonesia, Jakarta contributes to 12% of the country’s built-up land but
has approximately 20% of the urban population.
Based on JUPT 2 report (2019), The first structured road network GJMA area was developed at
the beginning of the 19th century as part of the “Java Great Post Road” by the Dutch Colonial
Government. During the following decades, the primary network (road) expanded to a great
extent regardless it has been outrun by the rapid increase of motorized vehicles and congestion,
particularly in the city center area. Initially, there were three radial toll road corridors with DKI
Jakarta as the core. First, a core southward corridor: Jakarta – Bogor – Ciawi (abbreviation is
Jagorawi) toll road. Second is a core to eastward: Jakarta – Cikampek (abbreviation is Japek) toll
road. The third is a core to westward: Jakarta – Tangerang toll road. The toll road runs under
state-owned enterprises or private companies under close supervision of BPJT (Toll Road
Authority).
Extensive highway development in the GJMA was started in 1973 with the construction of the
Jagorawi toll road to improve connectivity from Jakarta to Bogor. The effort to connect Jakarta
and its peripheries continued with the development of new toll roads to Tangerang (1984),
Cikampek (1988), and Jakarta Inner Ring Road (1989). Since 1990, no less than 150 km of
highways have been built all around the GJMA. The national highway authorities plan to further
expand the highway networks inside the JMA until 2030, most notably through the second layer
of Jakarta Outer Ring Road (JORR II) construction with a total length of 133 kilometers. Tabel
below shows the operator toll road section since 1978.
26
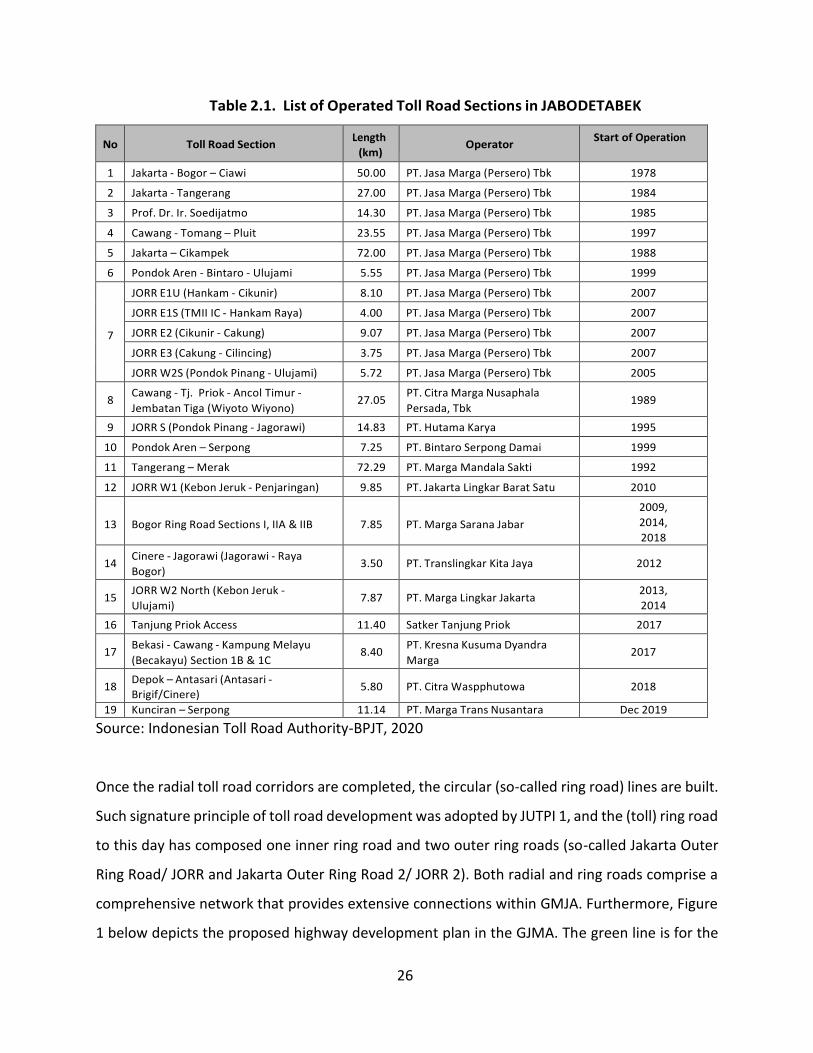
Table 2.1. List of Operated Toll Road Sections in JABODETABEK
No Toll Road Section Length
(km) Operator
Start of Operation
1 Jakarta - Bogor – Ciawi 50.00 PT. Jasa Marga (Persero) Tbk 1978
2 Jakarta - Tangerang 27.00 PT. Jasa Marga (Persero) Tbk 1984
3 Prof. Dr. Ir. Soedijatmo 14.30 PT. Jasa Marga (Persero) Tbk 1985
4 Cawang - Tomang – Pluit 23.55 PT. Jasa Marga (Persero) Tbk 1997
5 Jakarta – Cikampek 72.00 PT. Jasa Marga (Persero) Tbk 1988
6 Pondok Aren - Bintaro - Ulujami 5.55 PT. Jasa Marga (Persero) Tbk 1999
7
JORR E1U (Hankam - Cikunir) 8.10 PT. Jasa Marga (Persero) Tbk 2007
JORR E1S (TMII IC - Hankam Raya) 4.00 PT. Jasa Marga (Persero) Tbk 2007
JORR E2 (Cikunir - Cakung) 9.07 PT. Jasa Marga (Persero) Tbk 2007
JORR E3 (Cakung - Cilincing) 3.75 PT. Jasa Marga (Persero) Tbk 2007
JORR W2S (Pondok Pinang - Ulujami) 5.72 PT. Jasa Marga (Persero) Tbk 2005
8 Cawang - Tj. Priok - Ancol Timur -
Jembatan Tiga (Wiyoto Wiyono) 27.05
PT. Citra Marga Nusaphala
Persada, Tbk 1989
9 JORR S (Pondok Pinang - Jagorawi) 14.83 PT. Hutama Karya 1995
10 Pondok Aren – Serpong 7.25 PT. Bintaro Serpong Damai 1999
11 Tangerang – Merak 72.29 PT. Marga Mandala Sakti 1992
12 JORR W1 (Kebon Jeruk - Penjaringan) 9.85 PT. Jakarta Lingkar Barat Satu 2010
13
Bogor Ring Road Sections I, IIA & IIB
7.85
PT. Marga Sarana Jabar
2009,
2014,
2018
14 Cinere - Jagorawi (Jagorawi - Raya
Bogor) 3.50 PT. Translingkar Kita Jaya 2012
15 JORR W2 North (Kebon Jeruk -
Ulujami) 7.87 PT. Marga Lingkar Jakarta
2013,
2014
16 Tanjung Priok Access 11.40 Satker Tanjung Priok 2017
17 Bekasi - Cawang - Kampung Melayu
(Becakayu) Section 1B & 1C 8.40
PT. Kresna Kusuma Dyandra
Marga 2017
18 Depok – Antasari (Antasari -
Brigif/Cinere) 5.80 PT. Citra Waspphutowa 2018
19 Kunciran – Serpong 11.14 PT. Marga Trans Nusantara Dec 2019
Source: Indonesian Toll Road Authority-BPJT, 2020
Once the radial toll road corridors are completed, the circular (so-called ring road) lines are built.
Such signature principle of toll road development was adopted by JUTPI 1, and the (toll) ring road
to this day has composed one inner ring road and two outer ring roads (so-called Jakarta Outer
Ring Road/ JORR and Jakarta Outer Ring Road 2/ JORR 2). Both radial and ring roads comprise a
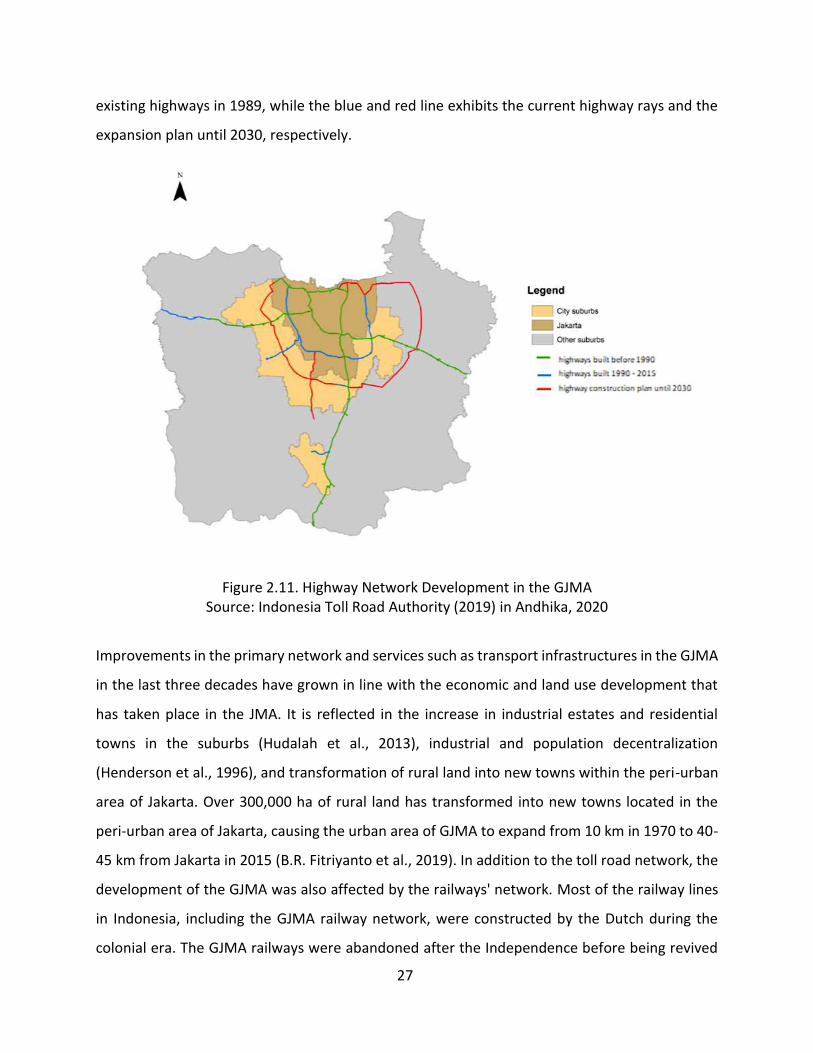
comprehensive network that provides extensive connections within GMJA. Furthermore, Figure
1 below depicts the proposed highway development plan in the GJMA. The green line is for the
27
existing highways in 1989, while the blue and red line exhibits the current highway rays and the
expansion plan until 2030, respectively.
Figure 2.11. Highway Network Development in the GJMA
Source: Indonesia Toll Road Authority (2019) in Andhika, 2020
Improvements in the primary network and services such as transport infrastructures in the GJMA
in the last three decades have grown in line with the economic and land use development that
has taken place in the JMA. It is reflected in the increase in industrial estates and residential
towns in the suburbs (Hudalah et al., 2013), industrial and population decentralization
(Henderson et al., 1996), and transformation of rural land into new towns within the peri-urban
area of Jakarta. Over 300,000 ha of rural land has transformed into new towns located in the
peri-urban area of Jakarta, causing the urban area of GJMA to expand from 10 km in 1970 to 40-
45 km from Jakarta in 2015 (B.R. Fitriyanto et al., 2019). In addition to the toll road network, the
development of the GJMA was also affected by the railways' network. Most of the railway lines
in Indonesia, including the GJMA railway network, were constructed by the Dutch during the
colonial era. The GJMA railways were abandoned after the Independence before being revived

28
by the national railway corporation (PNKA) during the 1970s. Since early the 1990s, the national
railway authority has gradually opened the old lines, such as Tanah Abang – Serpong (1992),
Jakarta – Bekasi (1992), Duri – Tangerang (1997), and Serpong – Parung Panjang (2009).
Figure 2.12. Historical Road and Rail Network in the GJMA Source: Leiden University Library (2019) in Andhika, 2020
Currently, the existing railway network in Jabodetabek only covers 170,2 km. The networks
include City-Manggarai 9.7 km, Manggarai-Bogor 44.9 km, Jatinegara-Bekasi 14.6 km, Kota-
Jatinegara (via Pasar Senen) 11.4 km, Kota-Jatinegara (via Tanah Abang) 15 .6 km, Tanah Abang-
Serpong 23.2 km, Duri-Tangerang 19.3 km, Kota-Tanjung Priok 9 km, Tanjung Priok-Kemayoran
9.5 km, and Citayam-Nambo 13 km. The plan is to add a new train network in Jabodetabek. The
railroad track will be increased from 170,2 km, there will be an additional 533 km of rail network.
29
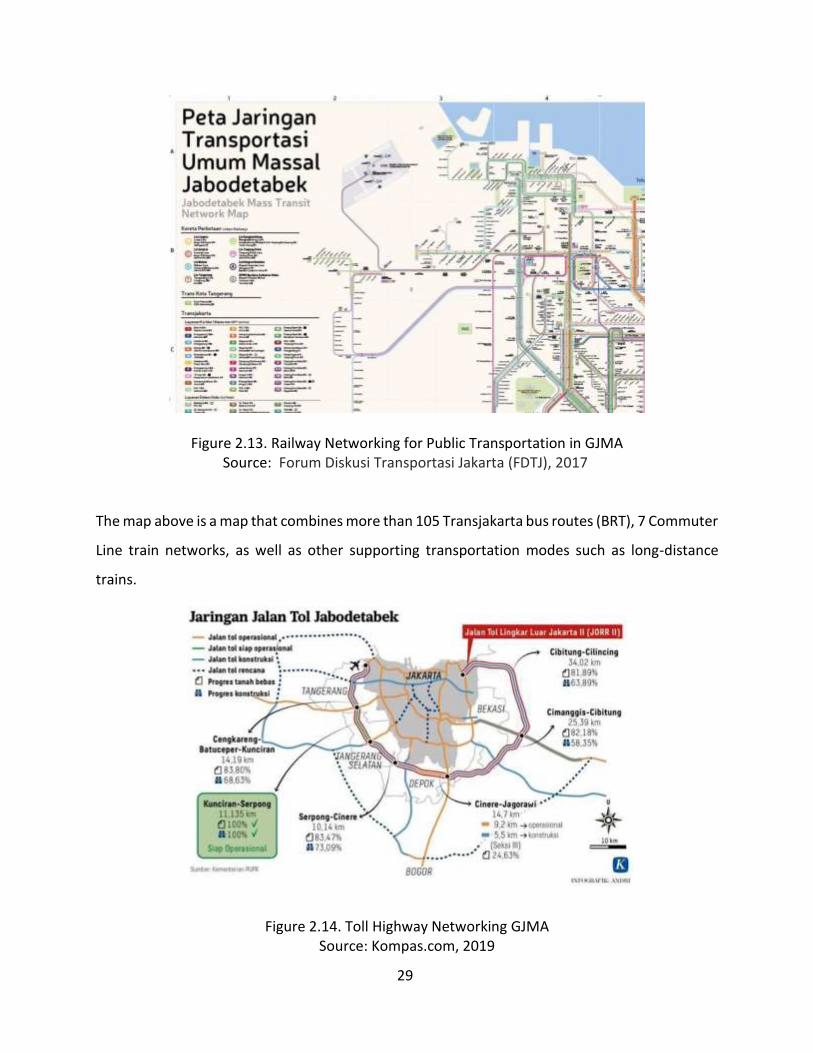
Figure 2.13. Railway Networking for Public Transportation in GJMA Source: Forum Diskusi Transportasi Jakarta (FDTJ), 2017
The map above is a map that combines more than 105 Transjakarta bus routes (BRT), 7 Commuter
Line train networks, as well as other supporting transportation modes such as long-distance
trains.
Figure 2.14. Toll Highway Networking GJMA Source: Kompas.com, 2019
30
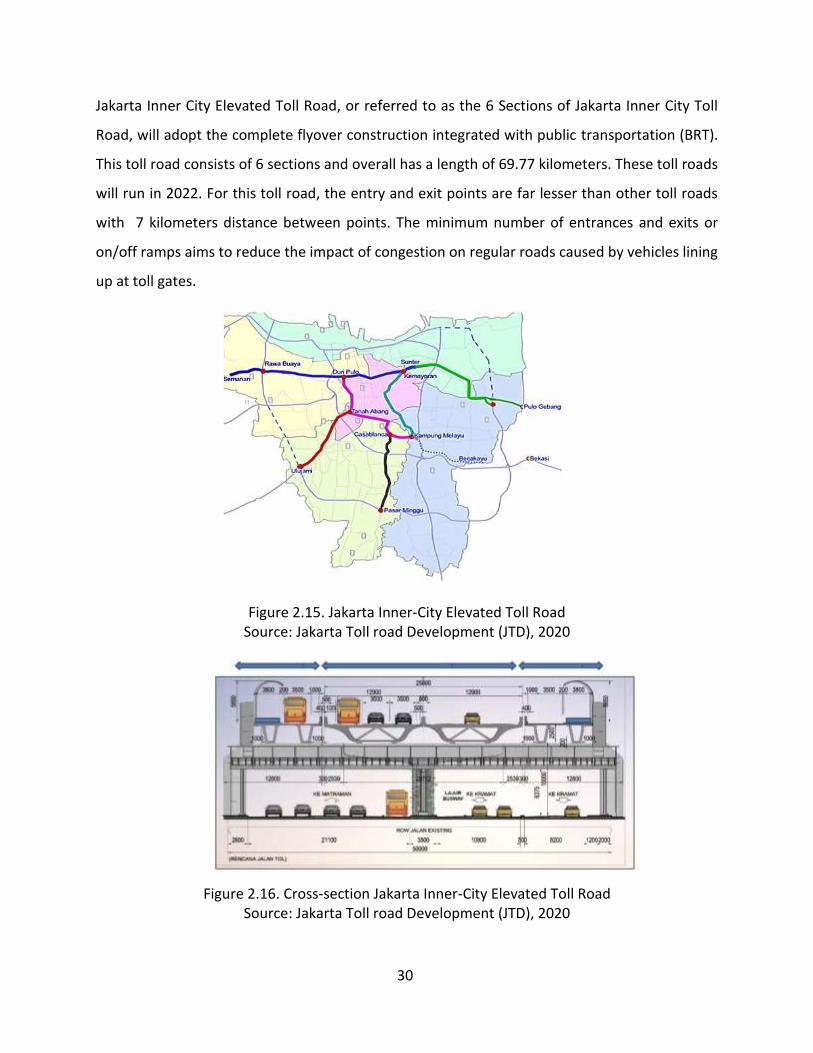
Jakarta Inner City Elevated Toll Road, or referred to as the 6 Sections of Jakarta Inner City Toll
Road, will adopt the complete flyover construction integrated with public transportation (BRT).
This toll road consists of 6 sections and overall has a length of 69.77 kilometers. These toll roads
will run in 2022. For this toll road, the entry and exit points are far lesser than other toll roads
with 7 kilometers distance between points. The minimum number of entrances and exits or
on/off ramps aims to reduce the impact of congestion on regular roads caused by vehicles lining
up at toll gates.
Figure 2.15. Jakarta Inner-City Elevated Toll Road Source: Jakarta Toll road Development (JTD), 2020
Figure 2.16. Cross-section Jakarta Inner-City Elevated Toll Road Source: Jakarta Toll road Development (JTD), 2020
31
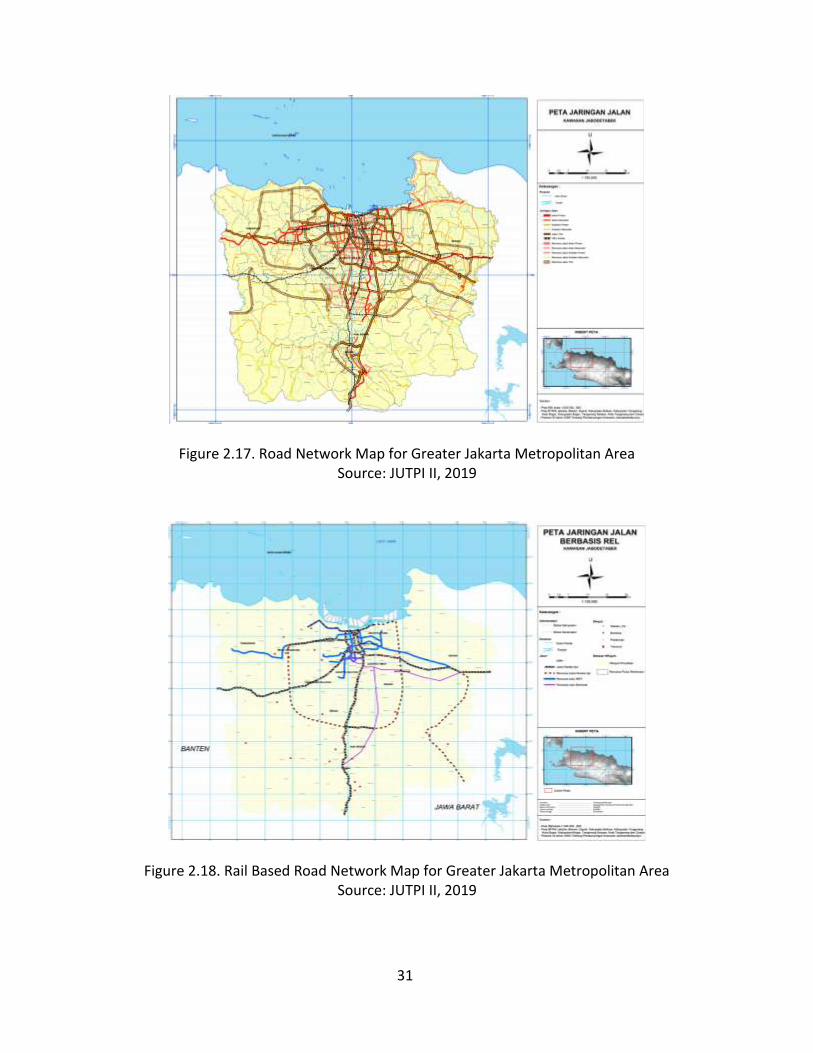
Figure 2.17. Road Network Map for Greater Jakarta Metropolitan Area Source: JUTPI II, 2019
Figure 2.18. Rail Based Road Network Map for Greater Jakarta Metropolitan Area Source: JUTPI II, 2019

32
Based on the revised master plan (JUTPI, 2010) proposed backbone network of urban transport
system until the target year of 2020 (refer to Figure 2.7 and Figure 2.8): several ring roads and
radial roads, inner toll roads, non-toll elevated roads, road widening and access roads to the
station also were proposed in the master plan. As for public transportation networks, several
busway developments, MRT, airport access, and monorail were proposed.
Figure 2.19. 2020 Road Network by JUTPI Revised Master Plan Source: JUTPI II, 2019
33
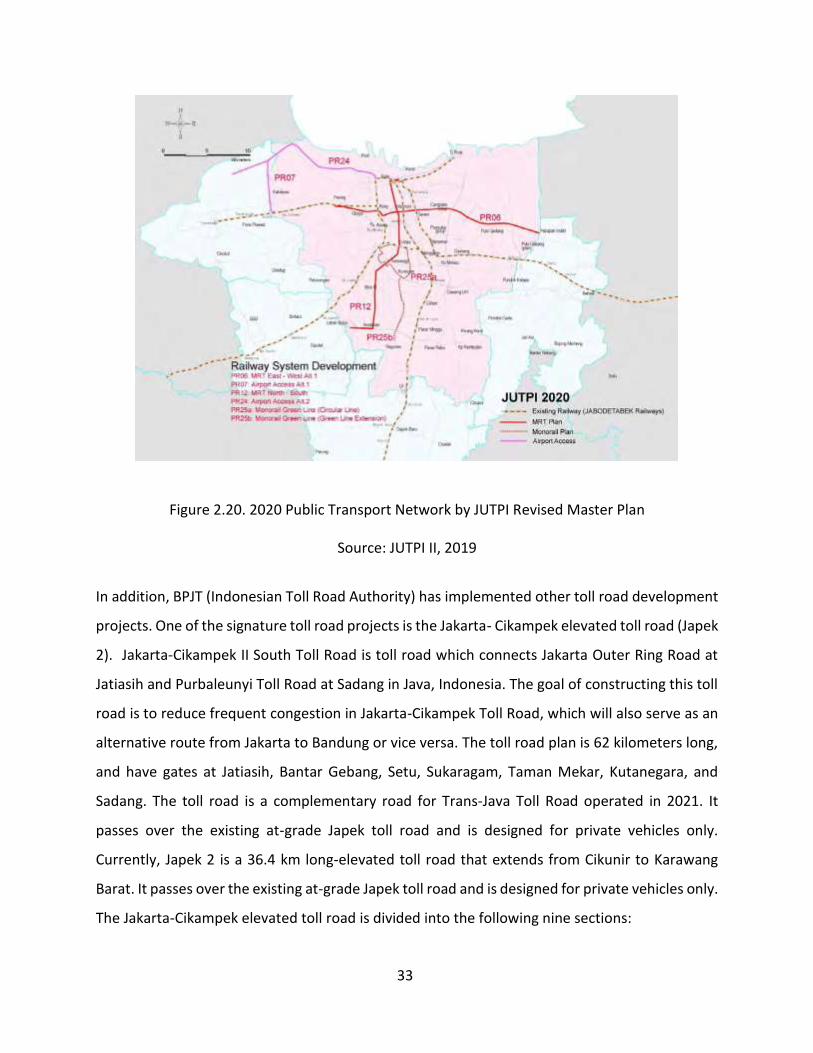
Figure 2.20. 2020 Public Transport Network by JUTPI Revised Master Plan
Source: JUTPI II, 2019
In addition, BPJT (Indonesian Toll Road Authority) has implemented other toll road development
projects. One of the signature toll road projects is the Jakarta- Cikampek elevated toll road (Japek
2). Jakarta-Cikampek II South Toll Road is toll road which connects Jakarta Outer Ring Road at
Jatiasih and Purbaleunyi Toll Road at Sadang in Java, Indonesia. The goal of constructing this toll
road is to reduce frequent congestion in Jakarta-Cikampek Toll Road, which will also serve as an
alternative route from Jakarta to Bandung or vice versa. The toll road plan is 62 kilometers long,
and have gates at Jatiasih, Bantar Gebang, Setu, Sukaragam, Taman Mekar, Kutanegara, and
Sadang. The toll road is a complementary road for Trans-Java Toll Road operated in 2021. It
passes over the existing at-grade Japek toll road and is designed for private vehicles only.
Currently, Japek 2 is a 36.4 km long-elevated toll road that extends from Cikunir to Karawang
Barat. It passes over the existing at-grade Japek toll road and is designed for private vehicles only.
The Jakarta-Cikampek elevated toll road is divided into the following nine sections:
34
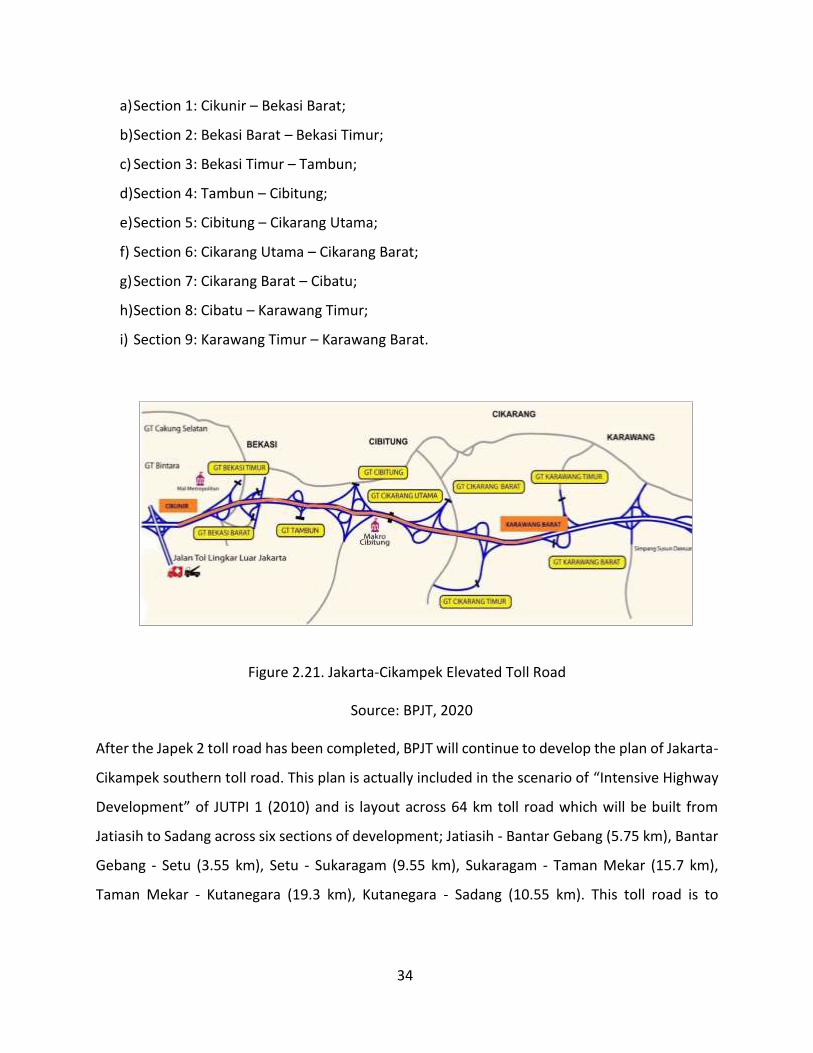
a) Section 1: Cikunir – Bekasi Barat;
b) Section 2: Bekasi Barat – Bekasi Timur;
c) Section 3: Bekasi Timur – Tambun;
d) Section 4: Tambun – Cibitung;
e) Section 5: Cibitung – Cikarang Utama;
f) Section 6: Cikarang Utama – Cikarang Barat;
g) Section 7: Cikarang Barat – Cibatu;
h) Section 8: Cibatu – Karawang Timur;
i) Section 9: Karawang Timur – Karawang Barat.
Figure 2.21. Jakarta-Cikampek Elevated Toll Road
Source: BPJT, 2020
After the Japek 2 toll road has been completed, BPJT will continue to develop the plan of Jakarta-
Cikampek southern toll road. This plan is actually included in the scenario of “Intensive Highway
Development” of JUTPI 1 (2010) and is layout across 64 km toll road which will be built from
Jatiasih to Sadang across six sections of development; Jatiasih - Bantar Gebang (5.75 km), Bantar
Gebang - Setu (3.55 km), Setu - Sukaragam (9.55 km), Sukaragam - Taman Mekar (15.7 km),
Taman Mekar - Kutanegara (19.3 km), Kutanegara - Sadang (10.55 km). This toll road is to
35
significantly cut travel time from Jakarta to Cikampek via the Southern side. In addition, the toll
road is also connected to JORR, JORR 2, and Cipularang toll roads to reduce.
All of these massive toll road developments are financed through a BOT (built-operation and
transfer) scheme where investors will become toll road operators based on a concession scheme
granted by the government.
2.5. Key Connections
Indonesia is the fourth-largest country in the world. Its population is nearly 290 million. As the
capital of Indonesia, Jakarta is home to more than 10 percent of the country’s population. In the
Greater Jakarta region (which includes parts of West Java and Banten provinces, there are more
than 35 million people while the capital itself is only 255 square miles, The number of people in
the city increases on weekdays because Jakarta is also a center for business and commercial
activities within the country, and people commute from neighboring provinces. This enormous
number of people creates a significant number of travel demands. According to the Jabodetabek
Urban Transport Policy Integration surveys in 2018, the number of daily trips in Jakarta is around
107 million per day and only 12 percent was served by public transportation. The majority mode
choices of people to fulfill their travel needs are motorcycle and cars. This has led to dreadful
traffic congestion.
As noted above, Greater Jakarta experiences severe traffic-related problems associated with the
exponential growth in traffic activity. As Greater Jakarta suffered significant losses due to the
congestion, the government and other stakeholders must establish efforts to minimize potential
losses in the future by developing some strategies to reduce the number of private vehicles and
shift people from using private vehicles to public transportation. This situation compelled the
government of Greater Jakarta to implement a package of regulations to tackle the problem. The
Transportation Master Plan was unveiled; the regulations described in the package of policies to
relieve the traffic in Jakarta consist of three main programs: public transport development via
the BRT, MRT, LRT and Commuter line network, traffic restraint and network capacity

36
improvement. However, due to limitations on implementing the transportation master plan
policy, private cars and motorcycles are not going away any time soon. Jakarta is still facing a
major challenge in how to manage a massive number of private vehicles and how to integrate
public transportation mode into a comprehensive urban transit system. Eventually, in a critical
time of traffic gridlock, the Jakarta government initiated the transportation integration program
which aims to integrate and improve public transportation services within the city in Greater
Jakarta.
One of key connection in Greater Jakarta is urban mobility. Transport infrastructure
developments for public transport modes (such as MRT, BRT, transit systems, feeder buses,
paratransit), transport-demand management measures (parking management, traffic calming,
road pricing, and reducing—or even eliminating—subsidies, and higher taxation for private
vehicles) as well as non-motorized transport (walking and biking) have not begun to keep pace
with the high urbanization rate in Indonesia (ADB, 2016). According to ADB (2016), over 55% of
Indonesians are living in some 300 cities, of which six urban agglomeration centers suffer the
most severe transportation problems. This traffic congestion is characterized by insufficient
public transport with very low modal shares; no urban rail systems (excepting some commuter
train services); one sub-optimal BRT (bus rapid transit) system in Jakarta, with 16 other cities
having an immature semi-BRT and the remaining major cities left to rely on paratransit for public
transport. Vast urban sprawl and the loss of public space, particularly in the six agglomeration
centers, cause over-saturated occupation by private vehicles, environmental degradation (heavy
air pollution), and lost productivity in traffic jams and gridlock, which negatively impacts the
country’s investment climate and GDP.
2.6. Public Transportation
Jabodetabek (Greater Jakarta Metropolitan Area), a mega metropolitan area with population of
approximately 35 million at present, has been suffering severe transportation problems which
has gradually become worse each year and as a consequence caused large economic losses in
37
the daily activities and lives of people and a clear physical hindrance to the effectiveness of
distribution of goods and services around the metropolitan area. Efforts have been made to make
other cities outside Jabodetabek more attractive so that the distribution of population is more
even. These efforts include equitable distribution of infrastructure development, diverting large
industries to regions outside Jabodetabek, building small industries around the province of West
Java (the province closest to Jabodetabek), promoting investment in areas outside Jabodetabek,
and limiting investment.
To alleviate this severe transportation problem, the central development and local governments
have been promoting many development programs such as the revitalization of the existing
commuter railway system, introduction of Bus Rapid Transit (BRT) system, and developing a
network of Mass Rapid Transit (MRT) system. MRT Jakarta system currently consists of Phase 1,
Phase 2, and Phase 2B; and together they make up the MRT Jakarta North-South line. On the
focus point, the urban transportation system in Greater Jakarta Metropolitan Area (GJMA) can
be better integrated to increase convenience for passengers, increase efficiency and meet the
government’s target to lure more people to use public transportation. Greater Jakarta
commuters listed impracticality as one of the concerns that had dissuaded them from using
public transportation, besides lengthy travel duration and a lack of access, according to a survey
by Statistics Indonesia (BPS) in 2019. To make it easier for commuters, stakeholders must also
integrate public transport fares, payment systems and information, under one roof. The Jakarta
Transportation Master Plan (RITJ) includes the government's target to increase the share of
public transport use to 60 percent of all movements and expand the coverage area to 80 percent
of all roads in Greater Jakarta by 2029. In 2019, the share of public transport use only reached 32
percent of all movements and only covered 67 percent of roads in Jabodetabek, BPTJ annual
report 2019. Jakarta's per capita number of trips is 2.8 trips, meaning that 88 million trips are
taken using public transportation in the area every day. In addition, a separate survey conducted
by the Bandung Institute of Technology (ITB) between December 2019 and March 2020 showed
that the average one-way trip distance for Jabodetabek residents was 25.15 kilometers with an
average travel time of 1.1 hours. According to data from the National Development Planning
38
Agency (Bappenas), traffic congestion in Greater Jakarta costs around Rp 65 trillion (US$4.6
billion) each year. Currently, public transport in Greater Jakarta consists of TransJakarta BRT, KRL
Jabodetabek commuter rail, and Jakarta MRT. Other transit systems under construction are
Jakarta LRT, Soekarno-Hatta Airport Rail Link, and LRT Jabodebek. Jakarta LRT is to be fully
operational by late 2021, and LRT Jabodebek by 2022.
2.6.1. Commuter Train (KRL)
A commuter train known as KRL Commuter Jabodetabek serves the Jakarta metropolitan area
with five lines:
a) Bogor - Jakarta Kota line, the busiest commuter railroad in Jabotabek. It has six major
terminals at Bogor Station (Bogor), Depok Station (Depok), Depok Baru Station (Depok),
Manggarai Station (South Jakarta) (Main Transfer Point), Gambir Station (Central Jakarta)
and finally at Jakarta Kota Station.
b) Bogor - Jatinegara loop line. It has seven major terminal at Bogor Station (Bogor), Depok
Station (Depok), Depok Baru Station (Depok), Manggarai Station, (South Jakarta) (Main
Transfer Point), Tanah Abang Station (Central Jakarta), Duri Station (West Jakarta), and finally
at Jatinegara Station (East Jakarta).
c) Bekasi - Jakarta Kota line, the second busiest commuter railroad in Jabotabek. It has four
main terminals at Bekasi station in Bekasi City, Jatinegara Station (East Jakarta), Manggarai
Station in South Jakarta (Main Transfer Point), and finally at Jakarta Kota Station.
d) Nambo - Depok line. It has two major terminal at Nambo Station (Bogor Regency) and Depok
Station (Depok).
e) Rangkasbitung - Tanah Abang line. It has five major terminals at Rangkasbitung Station
(Lebak Regency), Maja Station (Lebak Regency), Parung Panjang railway station (Bogor
Regency), Serpong railway station (South Tangerang City), and finally at Tanah Abang Station
(Central Jakarta).
f) Tanjung Priok - Jakarta Kota. It has two major terminal at Tanjung Priok Station (North
Jakarta) and Jakarta Kota Station (North Jakarta).
39
g) Tangerang - Duri line. It has two main terminals at Tangerang railway station (Tangerang City)
and Duri Station (West Jakarta).
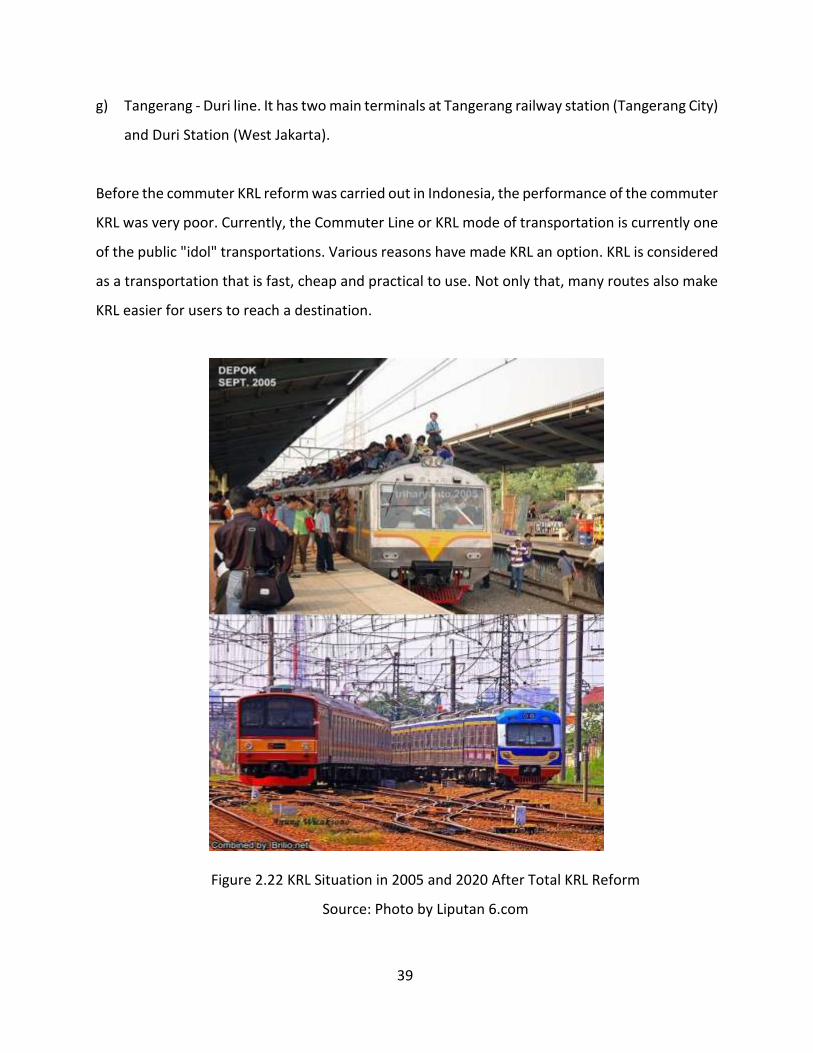
Before the commuter KRL reform was carried out in Indonesia, the performance of the commuter
KRL was very poor. Currently, the Commuter Line or KRL mode of transportation is currently one
of the public "idol" transportations. Various reasons have made KRL an option. KRL is considered
as a transportation that is fast, cheap and practical to use. Not only that, many routes also make
KRL easier for users to reach a destination.
Figure 2.22 KRL Situation in 2005 and 2020 After Total KRL Reform
Source: Photo by Liputan 6.com
40
2.6.2. Bus Rapid Transit (Transjakarta)
In the beginning, the TransJakarta bus rapid transit service (known as Busway) was developed
throughout Jakarta with 12 corridors (active) and three corridors (planned). The system connects
Bekasi, Depok, and Tangerang with three routes connecting Jakarta with Bekasi vice versa,
namely Harapan Indah - Pasar Baru, West Bekasi - Bunderan HI, and East Bekasi - Tanjung Priok.
While for Depok, only one route is currently active: Margonda - Manggarai. In addition to the
main corridors, the feeder buses of Transjakarta serve commuters from satellite cities, such as
Bumi Serpong Damai and Bintaro Jaya (South Tangerang) and Kemang Pratama, Grand Galaxy
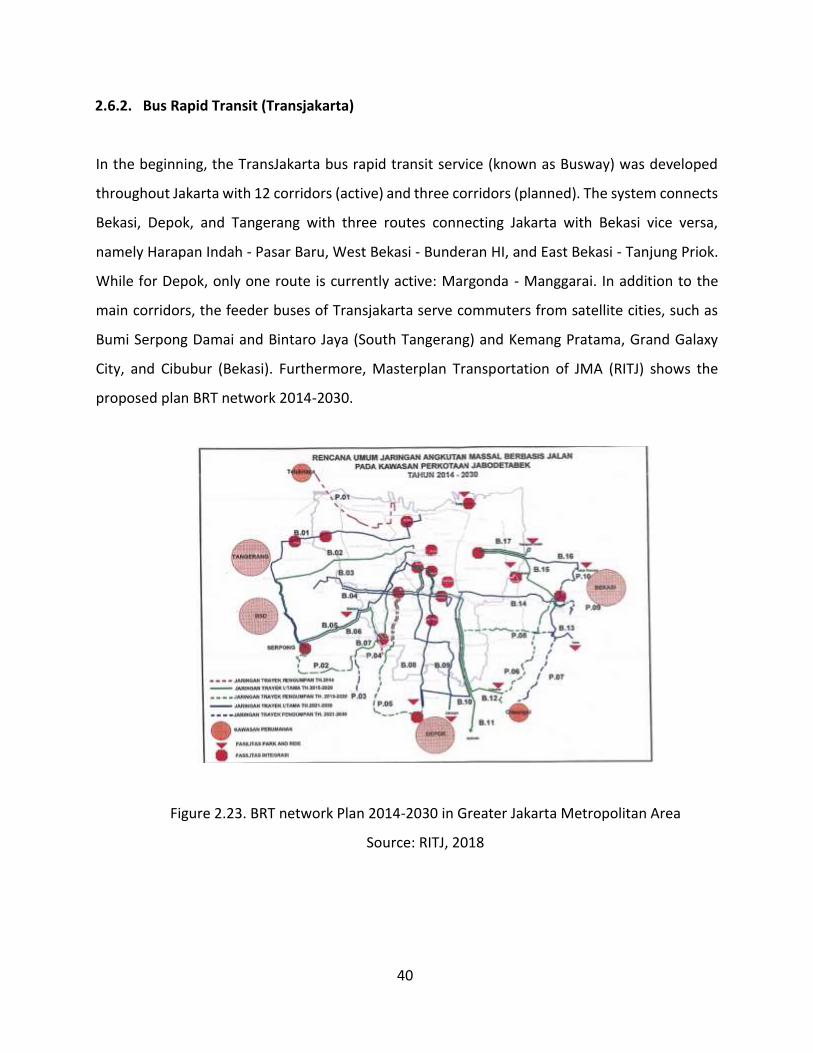
City, and Cibubur (Bekasi). Furthermore, Masterplan Transportation of JMA (RITJ) shows the
proposed plan BRT network 2014-2030.
Figure 2.23. BRT network Plan 2014-2030 in Greater Jakarta Metropolitan Area
Source: RITJ, 2018
41
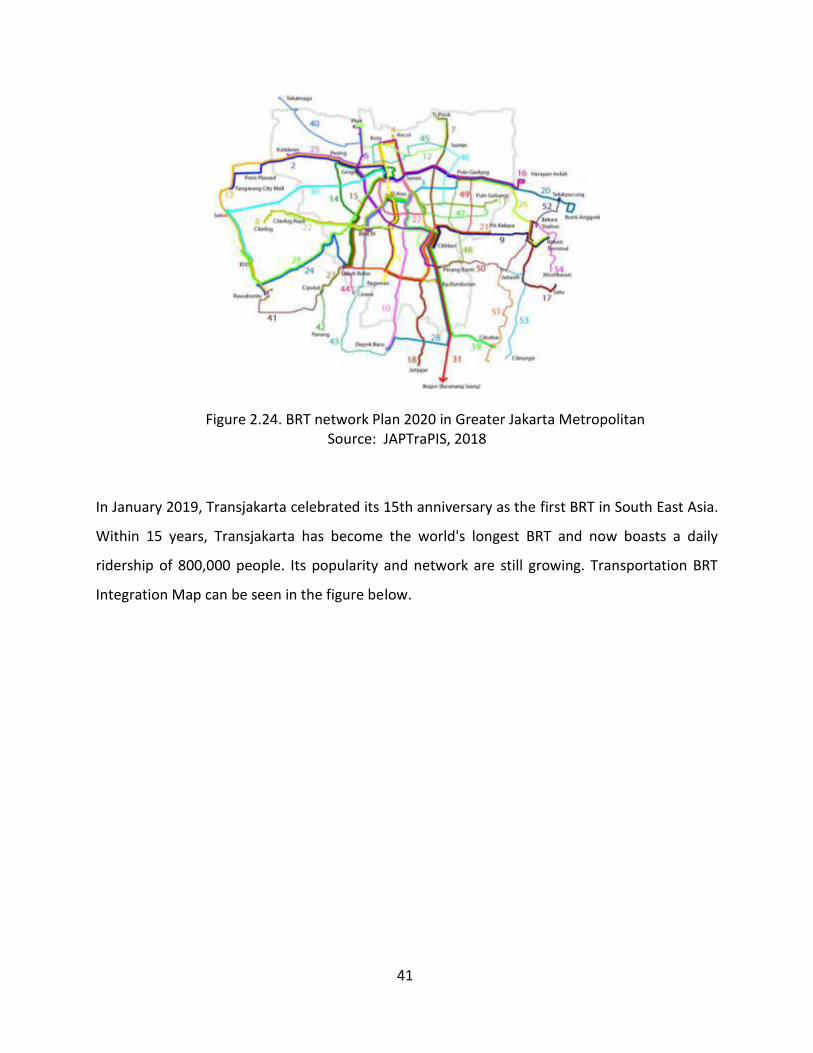
Figure 2.24. BRT network Plan 2020 in Greater Jakarta Metropolitan Source: JAPTraPIS, 2018
In January 2019, Transjakarta celebrated its 15th anniversary as the first BRT in South East Asia.
Within 15 years, Transjakarta has become the world's longest BRT and now boasts a daily
ridership of 800,000 people. Its popularity and network are still growing. Transportation BRT
Integration Map can be seen in the figure below.

42
Figure 2.25. Transjakarta BRT Integration Map
Source: FDTJ, 2019
43
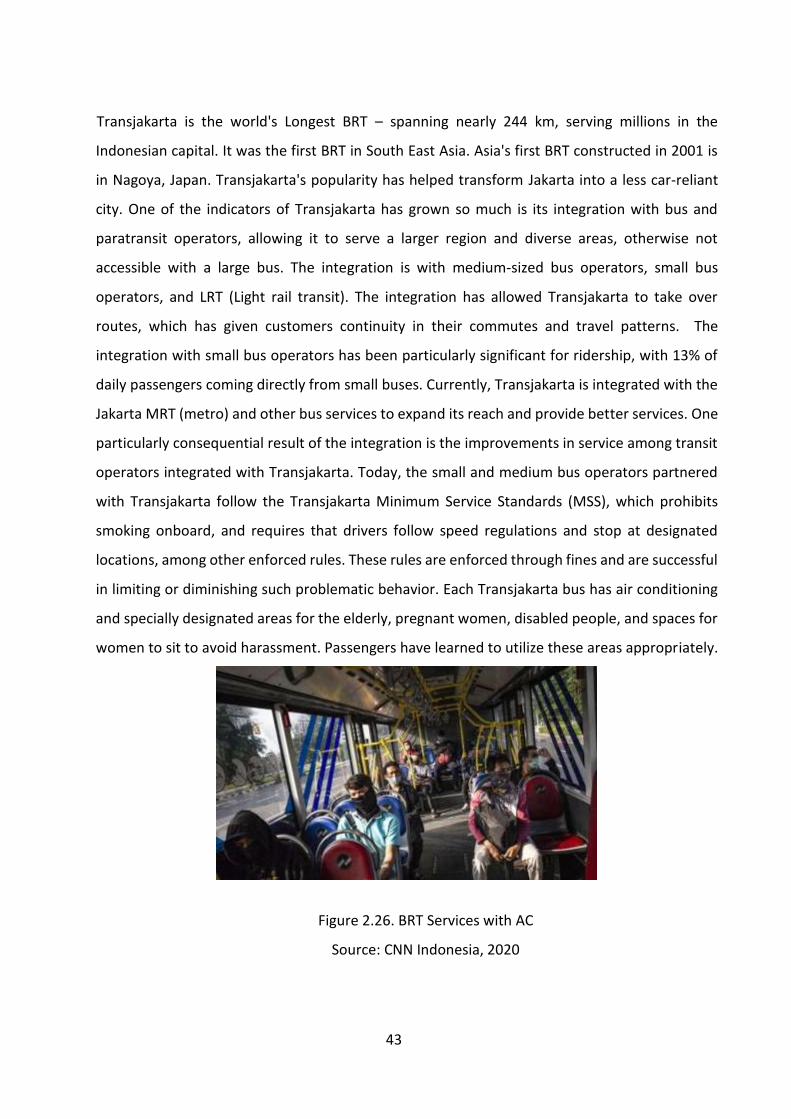
Transjakarta is the world's Longest BRT – spanning nearly 244 km, serving millions in the
Indonesian capital. It was the first BRT in South East Asia. Asia's first BRT constructed in 2001 is
in Nagoya, Japan. Transjakarta's popularity has helped transform Jakarta into a less car-reliant
city. One of the indicators of Transjakarta has grown so much is its integration with bus and
paratransit operators, allowing it to serve a larger region and diverse areas, otherwise not
accessible with a large bus. The integration is with medium-sized bus operators, small bus
operators, and LRT (Light rail transit). The integration has allowed Transjakarta to take over
routes, which has given customers continuity in their commutes and travel patterns. The
integration with small bus operators has been particularly significant for ridership, with 13% of
daily passengers coming directly from small buses. Currently, Transjakarta is integrated with the
Jakarta MRT (metro) and other bus services to expand its reach and provide better services. One
particularly consequential result of the integration is the improvements in service among transit
operators integrated with Transjakarta. Today, the small and medium bus operators partnered
with Transjakarta follow the Transjakarta Minimum Service Standards (MSS), which prohibits
smoking onboard, and requires that drivers follow speed regulations and stop at designated
locations, among other enforced rules. These rules are enforced through fines and are successful
in limiting or diminishing such problematic behavior. Each Transjakarta bus has air conditioning
and specially designated areas for the elderly, pregnant women, disabled people, and spaces for
women to sit to avoid harassment. Passengers have learned to utilize these areas appropriately.
Figure 2.26. BRT Services with AC
Source: CNN Indonesia, 2020
44
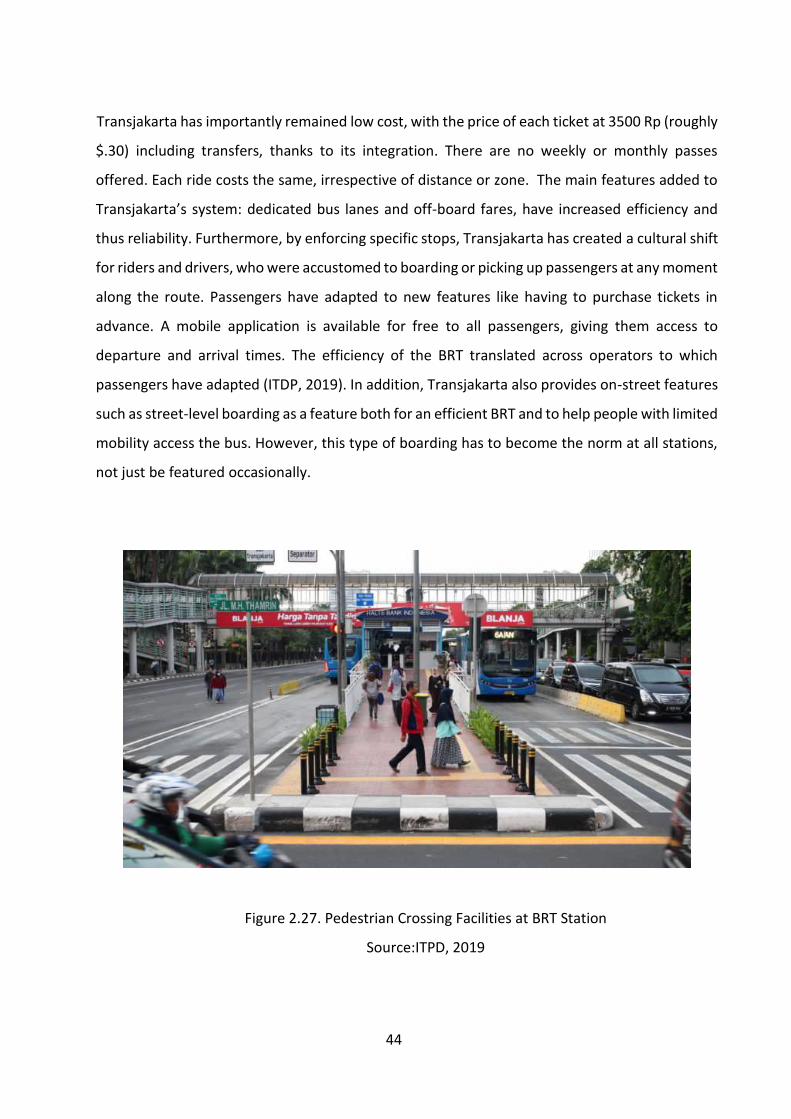
Transjakarta has importantly remained low cost, with the price of each ticket at 3500 Rp (roughly
$.30) including transfers, thanks to its integration. There are no weekly or monthly passes
offered. Each ride costs the same, irrespective of distance or zone. The main features added to
Transjakarta’s system: dedicated bus lanes and off-board fares, have increased efficiency and
thus reliability. Furthermore, by enforcing specific stops, Transjakarta has created a cultural shift
for riders and drivers, who were accustomed to boarding or picking up passengers at any moment
along the route. Passengers have adapted to new features like having to purchase tickets in
advance. A mobile application is available for free to all passengers, giving them access to
departure and arrival times. The efficiency of the BRT translated across operators to which
passengers have adapted (ITDP, 2019). In addition, Transjakarta also provides on-street features
such as street-level boarding as a feature both for an efficient BRT and to help people with limited
mobility access the bus. However, this type of boarding has to become the norm at all stations,
not just be featured occasionally.
Figure 2.27. Pedestrian Crossing Facilities at BRT Station
Source:ITPD, 2019
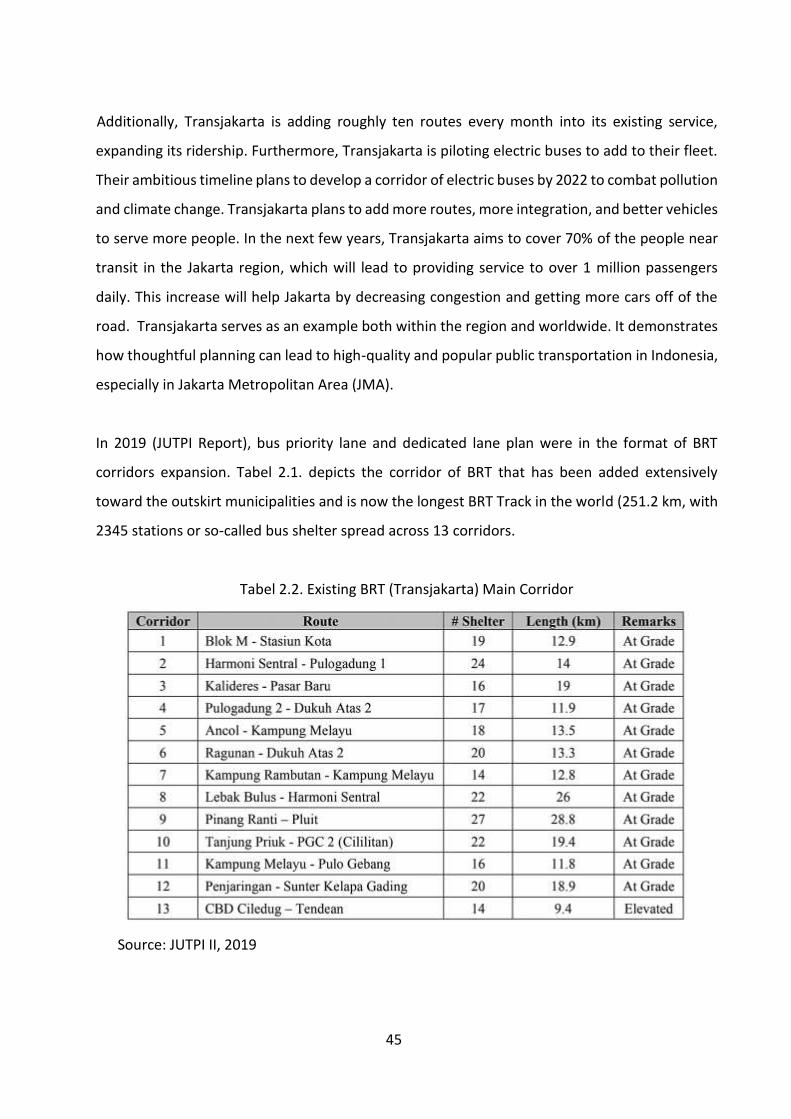
45
Additionally, Transjakarta is adding roughly ten routes every month into its existing service,
expanding its ridership. Furthermore, Transjakarta is piloting electric buses to add to their fleet.
Their ambitious timeline plans to develop a corridor of electric buses by 2022 to combat pollution
and climate change. Transjakarta plans to add more routes, more integration, and better vehicles
to serve more people. In the next few years, Transjakarta aims to cover 70% of the people near
transit in the Jakarta region, which will lead to providing service to over 1 million passengers
daily. This increase will help Jakarta by decreasing congestion and getting more cars off of the
road. Transjakarta serves as an example both within the region and worldwide. It demonstrates
how thoughtful planning can lead to high-quality and popular public transportation in Indonesia,
especially in Jakarta Metropolitan Area (JMA).
In 2019 (JUTPI Report), bus priority lane and dedicated lane plan were in the format of BRT
corridors expansion. Tabel 2.1. depicts the corridor of BRT that has been added extensively
toward the outskirt municipalities and is now the longest BRT Track in the world (251.2 km, with
2345 stations or so-called bus shelter spread across 13 corridors.
Tabel 2.2. Existing BRT (Transjakarta) Main Corridor
Source: JUTPI II, 2019

46
Corridor number 13 was designed as the non-toll elevated road in 2018 (JUTPI 1, 2018). While
the construction remains at an elevated level, the use is limited only to the BRT system. When
Transjakarta development commenced in 2004, 15 corridors were planned to be developed.
Corridor 14 (Pondok Kelapa-Blok-M) and 15 (Manggarai – Universitas Indonesia) were planned
to elevated BRT lines. At present, the development of these two corridors has yet to start,
although they were included in the DKI Jakarta’s RPJMD for the years 2012-2017. The primary
cause is related to the overlapping service alignment with the current BRT and commuter train.
Thus, adjustments are required. In line with the expansion of corridors and the procurement of
articulated buses to increase capacity, the number of passengers has increased as seen in the
Figure below.
Figure 2.28. Number of Transjakarta Pasengger 2004-2018
Source: BPS Jakarta, 2019
From the data above, in 2018, the number of Transjakarta passengers was 186.1 million people
and the latest data based on Transjakarta's annual report increased to 264.03 million people in
2019. Due to the Covid-19 pandemic there was a decline to 126.8 million people in 2020 ( down
51.96%) compared to 2019. Based on the actual ridership projection, in 2019 it has exceeded the
target of around 200 million passengers, but in 2020 the target was not achieved and
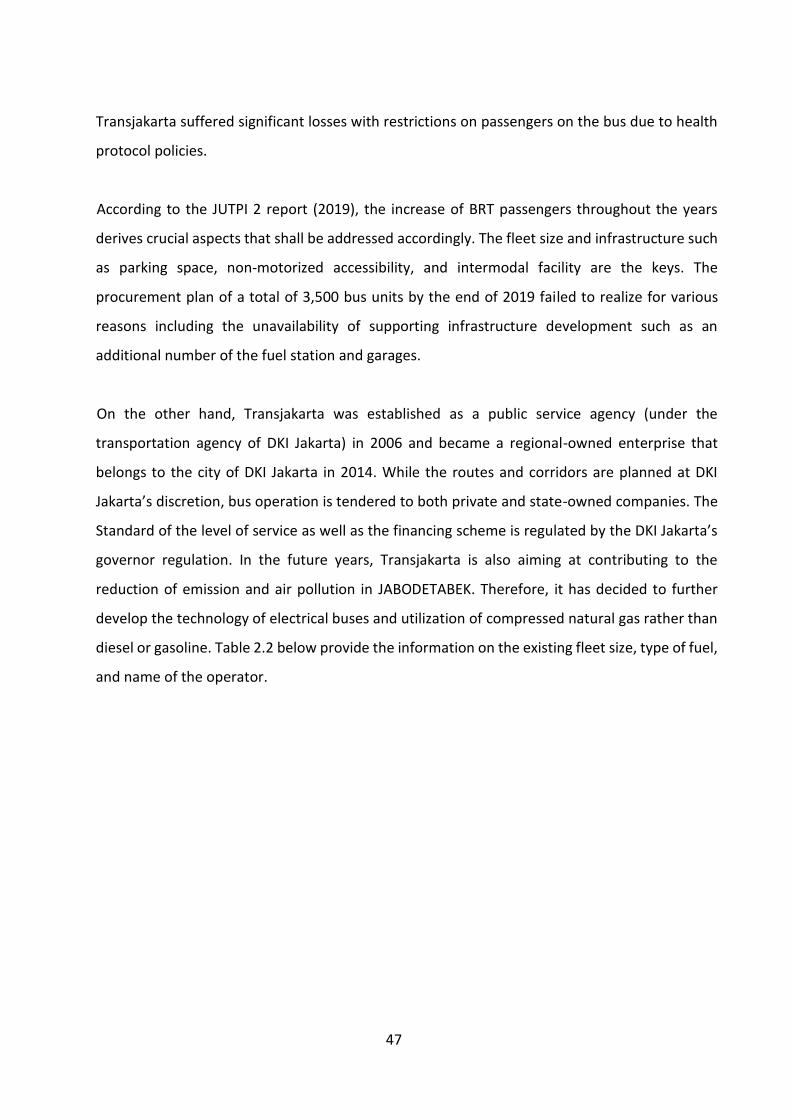
47
Transjakarta suffered significant losses with restrictions on passengers on the bus due to health
protocol policies.
According to the JUTPI 2 report (2019), the increase of BRT passengers throughout the years
derives crucial aspects that shall be addressed accordingly. The fleet size and infrastructure such
as parking space, non-motorized accessibility, and intermodal facility are the keys. The
procurement plan of a total of 3,500 bus units by the end of 2019 failed to realize for various
reasons including the unavailability of supporting infrastructure development such as an
additional number of the fuel station and garages.
On the other hand, Transjakarta was established as a public service agency (under the
transportation agency of DKI Jakarta) in 2006 and became a regional-owned enterprise that
belongs to the city of DKI Jakarta in 2014. While the routes and corridors are planned at DKI
Jakarta’s discretion, bus operation is tendered to both private and state-owned companies. The
Standard of the level of service as well as the financing scheme is regulated by the DKI Jakarta’s
governor regulation. In the future years, Transjakarta is also aiming at contributing to the
reduction of emission and air pollution in JABODETABEK. Therefore, it has decided to further
develop the technology of electrical buses and utilization of compressed natural gas rather than
diesel or gasoline. Table 2.2 below provide the information on the existing fleet size, type of fuel,
and name of the operator.
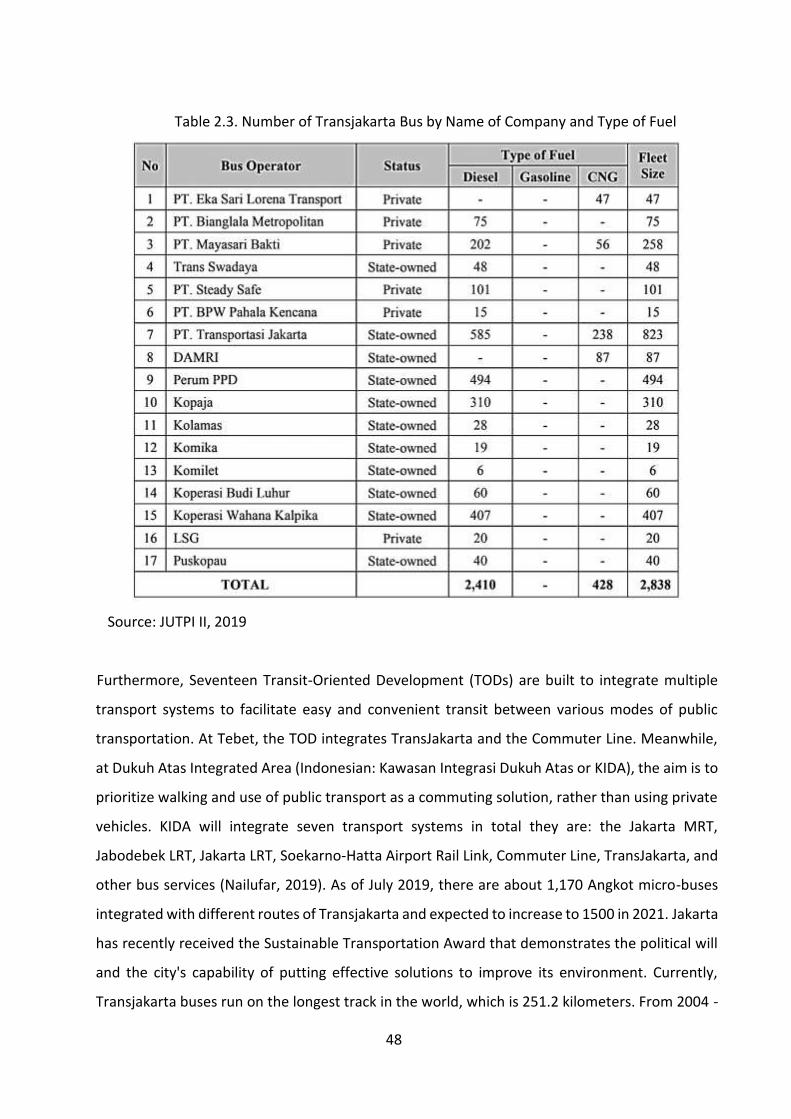
48
Table 2.3. Number of Transjakarta Bus by Name of Company and Type of Fuel
Source: JUTPI II, 2019
Furthermore, Seventeen Transit-Oriented Development (TODs) are built to integrate multiple
transport systems to facilitate easy and convenient transit between various modes of public
transportation. At Tebet, the TOD integrates TransJakarta and the Commuter Line. Meanwhile,
at Dukuh Atas Integrated Area (Indonesian: Kawasan Integrasi Dukuh Atas or KIDA), the aim is to
prioritize walking and use of public transport as a commuting solution, rather than using private
vehicles. KIDA will integrate seven transport systems in total they are: the Jakarta MRT,
Jabodebek LRT, Jakarta LRT, Soekarno-Hatta Airport Rail Link, Commuter Line, TransJakarta, and
other bus services (Nailufar, 2019). As of July 2019, there are about 1,170 Angkot micro-buses
integrated with different routes of Transjakarta and expected to increase to 1500 in 2021. Jakarta
has recently received the Sustainable Transportation Award that demonstrates the political will
and the city's capability of putting effective solutions to improve its environment. Currently,
Transjakarta buses run on the longest track in the world, which is 251.2 kilometers. From 2004 -
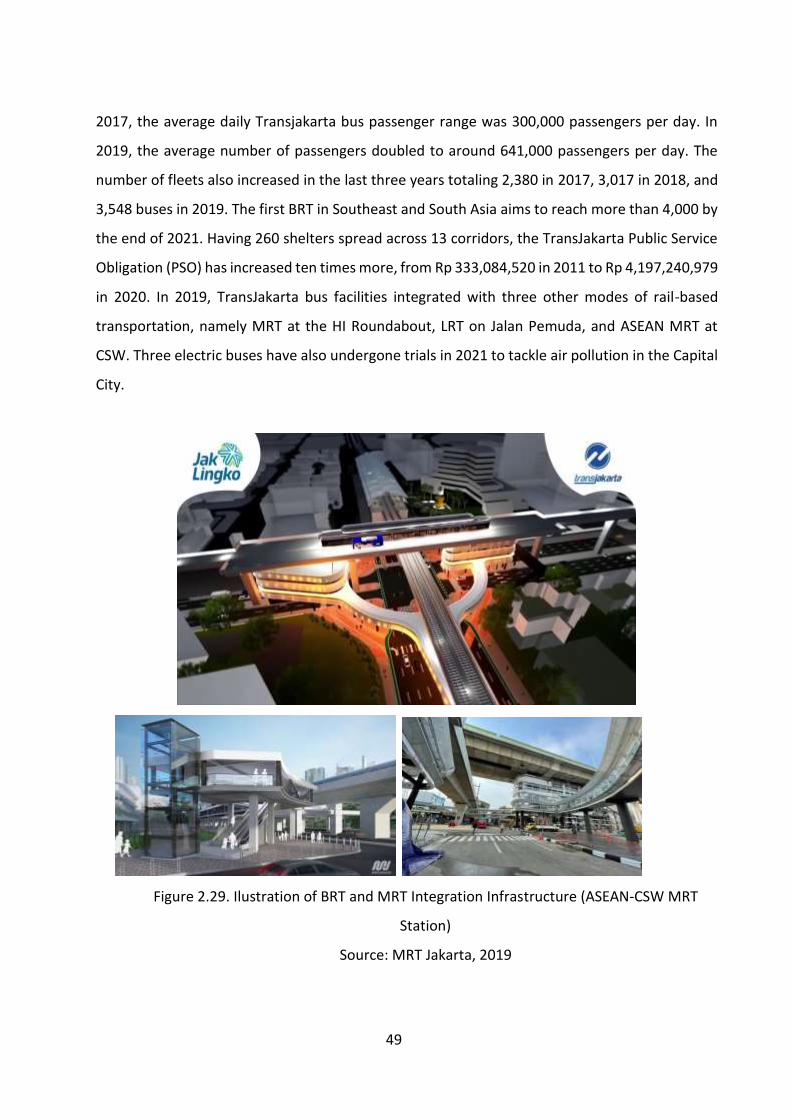
49
2017, the average daily Transjakarta bus passenger range was 300,000 passengers per day. In
2019, the average number of passengers doubled to around 641,000 passengers per day. The
number of fleets also increased in the last three years totaling 2,380 in 2017, 3,017 in 2018, and
3,548 buses in 2019. The first BRT in Southeast and South Asia aims to reach more than 4,000 by
the end of 2021. Having 260 shelters spread across 13 corridors, the TransJakarta Public Service
Obligation (PSO) has increased ten times more, from Rp 333,084,520 in 2011 to Rp 4,197,240,979
in 2020. In 2019, TransJakarta bus facilities integrated with three other modes of rail-based
transportation, namely MRT at the HI Roundabout, LRT on Jalan Pemuda, and ASEAN MRT at
CSW. Three electric buses have also undergone trials in 2021 to tackle air pollution in the Capital
City.
Figure 2.29. Ilustration of BRT and MRT Integration Infrastructure (ASEAN-CSW MRT
Station)
Source: MRT Jakarta, 2019
50
Apart from the success of BRT (Transjakarta) in changing people's travel patterns in Jabodetabek,
there are still several things that need to be improved. In early year of implementation and In the
hope to battle congestion, the Jakarta government constructed the TransJakarta bus rapid transit
(BRT) system with special lanes, which is now the largest BRT in the world. Unfortunately, its
occupancy is very low. With an average of 3,500 vehicles operating every day, the occupancy rate
is only 35 percent, with the average number of passengers carried only 650.000 per day. The low
number of passengers per day indicates the primary goal of the BRT operations, which is to have
travelers shift from their private vehicles to public transportation, was not achieved. The
evaluation implied that the low occupancy rate was because of the limited route network and
gaps in service between the BRT and feeder buses.
Besides, Several significant accidents in 2021 brought safety issues into the Transjakarta BRT into
question. One focus of the evaluation is on the health of the drivers to reduce the possibility of
accidents because some accidents involve human error. In terms of performance, Transjakarta
operations (BRT) must be reorganized. The existence of the Transjakarta bus (BRT) is expected to
reduce congestion. Because it has its own path, the length of travel time can be predicted. It
turns out that many other public transportations and private vehicles often break through the
busway so that Transjakarta buses get stuck too. For this reason, it is necessary to emphasize
traffic enforcement and BRT operations based on a smart transportation system to make it more
efficient. On the other hand, the condition of the road network in Jakarta, which tends to be
chaotic because it was built without a clear planning pattern in the past, actually makes the
busway ideal because the network can be made as much as possible with connecting points
between one lane and another that can be held in many places.
2.6.3. Mass Rapid Transit (MRT)
The MRT concept was brought into GJMA in the 1980s and had been included in the master plan
of JABODETABEK transportation since then. The alignment in Figure 2.25 is phase 1 of the north-
south line that connects Ancol to Lebak Bulus areas. Phase 1 that connects Lebak Bulus and
Bundaran HI has been fully in operation since March 2019. The first phase lays out a 15.7 km
railway line (10 km is an elevated track and 5.7 km is an underground track) with 13 MRT stations
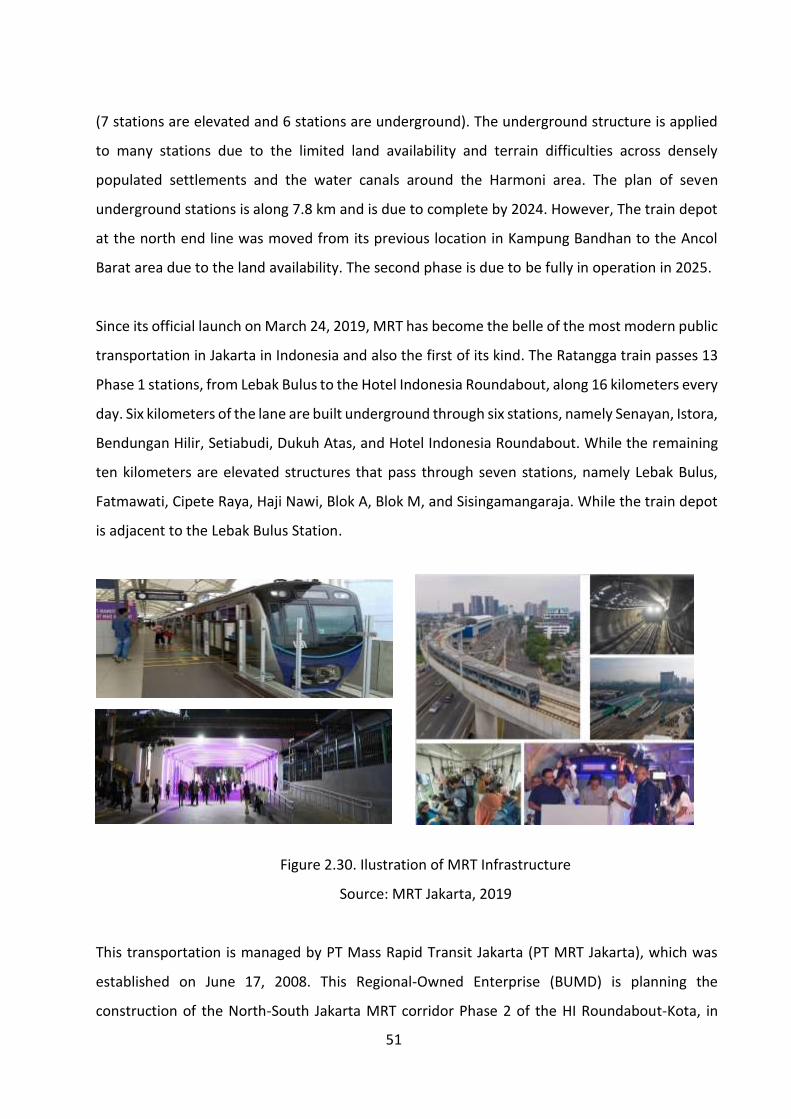
51
(7 stations are elevated and 6 stations are underground). The underground structure is applied
to many stations due to the limited land availability and terrain difficulties across densely
populated settlements and the water canals around the Harmoni area. The plan of seven
underground stations is along 7.8 km and is due to complete by 2024. However, The train depot
at the north end line was moved from its previous location in Kampung Bandhan to the Ancol
Barat area due to the land availability. The second phase is due to be fully in operation in 2025.
Since its official launch on March 24, 2019, MRT has become the belle of the most modern public
transportation in Jakarta in Indonesia and also the first of its kind. The Ratangga train passes 13
Phase 1 stations, from Lebak Bulus to the Hotel Indonesia Roundabout, along 16 kilometers every
day. Six kilometers of the lane are built underground through six stations, namely Senayan, Istora,
Bendungan Hilir, Setiabudi, Dukuh Atas, and Hotel Indonesia Roundabout. While the remaining
ten kilometers are elevated structures that pass through seven stations, namely Lebak Bulus,
Fatmawati, Cipete Raya, Haji Nawi, Blok A, Blok M, and Sisingamangaraja. While the train depot
is adjacent to the Lebak Bulus Station.
Figure 2.30. Ilustration of MRT Infrastructure
Source: MRT Jakarta, 2019
This transportation is managed by PT Mass Rapid Transit Jakarta (PT MRT Jakarta), which was
established on June 17, 2008. This Regional-Owned Enterprise (BUMD) is planning the
construction of the North-South Jakarta MRT corridor Phase 2 of the HI Roundabout-Kota, in
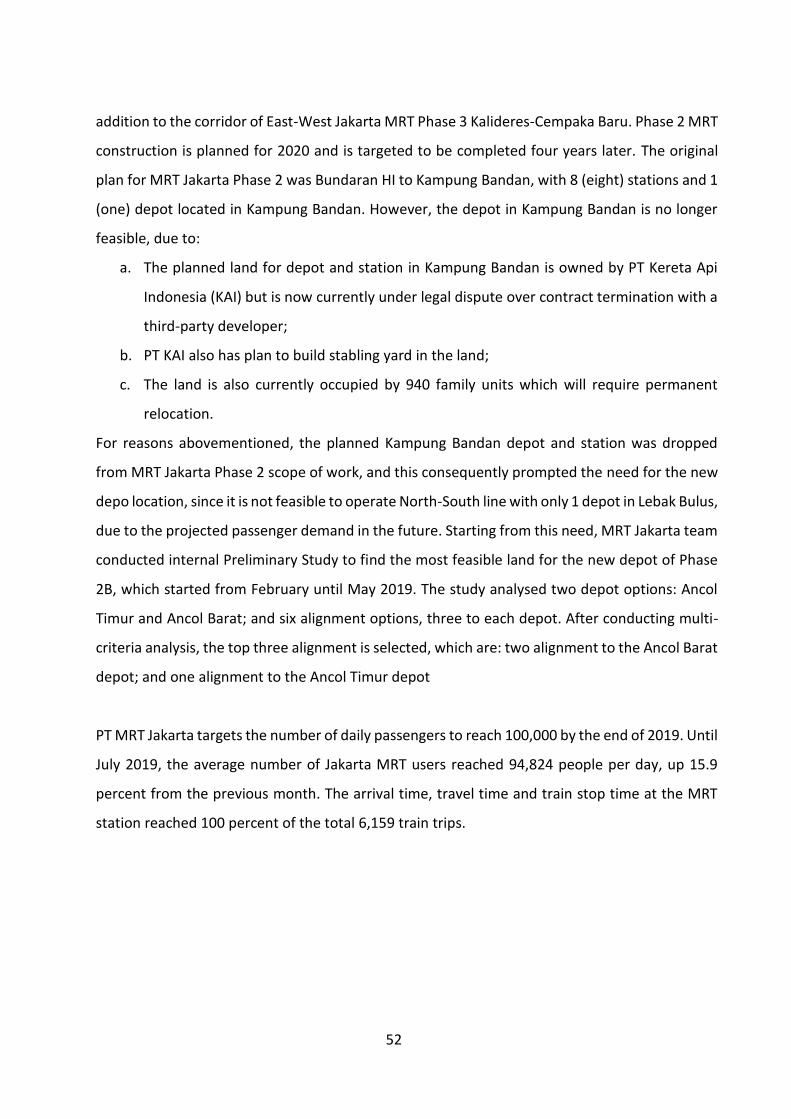
52
addition to the corridor of East-West Jakarta MRT Phase 3 Kalideres-Cempaka Baru. Phase 2 MRT
construction is planned for 2020 and is targeted to be completed four years later. The original
plan for MRT Jakarta Phase 2 was Bundaran HI to Kampung Bandan, with 8 (eight) stations and 1
(one) depot located in Kampung Bandan. However, the depot in Kampung Bandan is no longer
feasible, due to:
a. The planned land for depot and station in Kampung Bandan is owned by PT Kereta Api
Indonesia (KAI) but is now currently under legal dispute over contract termination with a
third-party developer;
b. PT KAI also has plan to build stabling yard in the land;
c. The land is also currently occupied by 940 family units which will require permanent
relocation.
For reasons abovementioned, the planned Kampung Bandan depot and station was dropped
from MRT Jakarta Phase 2 scope of work, and this consequently prompted the need for the new
depo location, since it is not feasible to operate North-South line with only 1 depot in Lebak Bulus,
due to the projected passenger demand in the future. Starting from this need, MRT Jakarta team
conducted internal Preliminary Study to find the most feasible land for the new depot of Phase
2B, which started from February until May 2019. The study analysed two depot options: Ancol
Timur and Ancol Barat; and six alignment options, three to each depot. After conducting multi-
criteria analysis, the top three alignment is selected, which are: two alignment to the Ancol Barat
depot; and one alignment to the Ancol Timur depot
PT MRT Jakarta targets the number of daily passengers to reach 100,000 by the end of 2019. Until
July 2019, the average number of Jakarta MRT users reached 94,824 people per day, up 15.9
percent from the previous month. The arrival time, travel time and train stop time at the MRT
station reached 100 percent of the total 6,159 train trips.
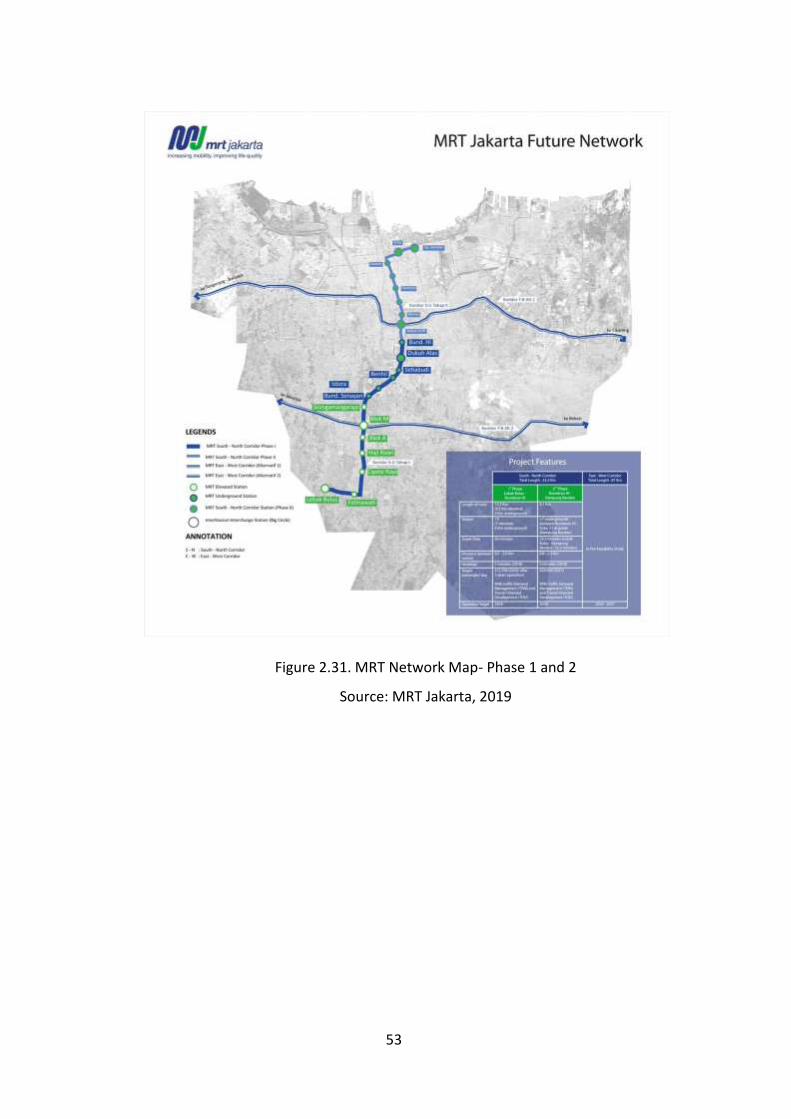
53
Figure 2.31. MRT Network Map- Phase 1 and 2
Source: MRT Jakarta, 2019
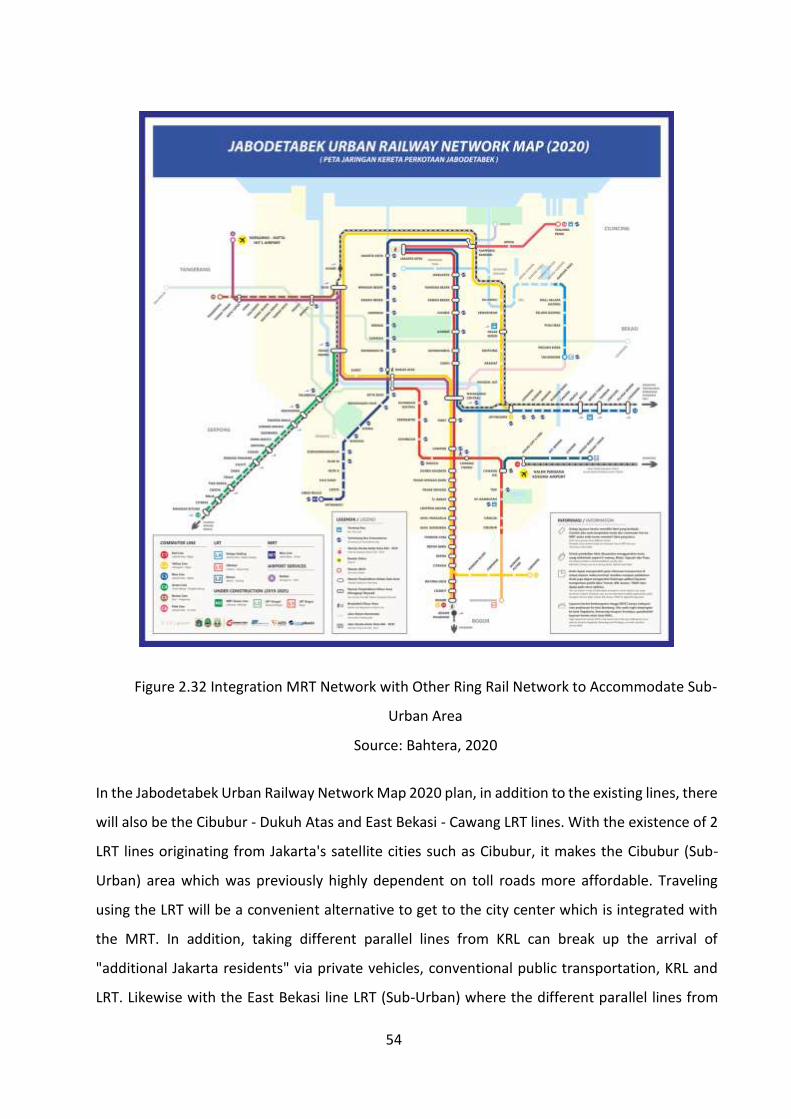
54
Figure 2.32 Integration MRT Network with Other Ring Rail Network to Accommodate Sub-
Urban Area
Source: Bahtera, 2020
In the Jabodetabek Urban Railway Network Map 2020 plan, in addition to the existing lines, there
will also be the Cibubur - Dukuh Atas and East Bekasi - Cawang LRT lines. With the existence of 2
LRT lines originating from Jakarta's satellite cities such as Cibubur, it makes the Cibubur (Sub-
Urban) area which was previously highly dependent on toll roads more affordable. Traveling
using the LRT will be a convenient alternative to get to the city center which is integrated with
the MRT. In addition, taking different parallel lines from KRL can break up the arrival of
"additional Jakarta residents" via private vehicles, conventional public transportation, KRL and
LRT. Likewise with the East Bekasi line LRT (Sub-Urban) where the different parallel lines from
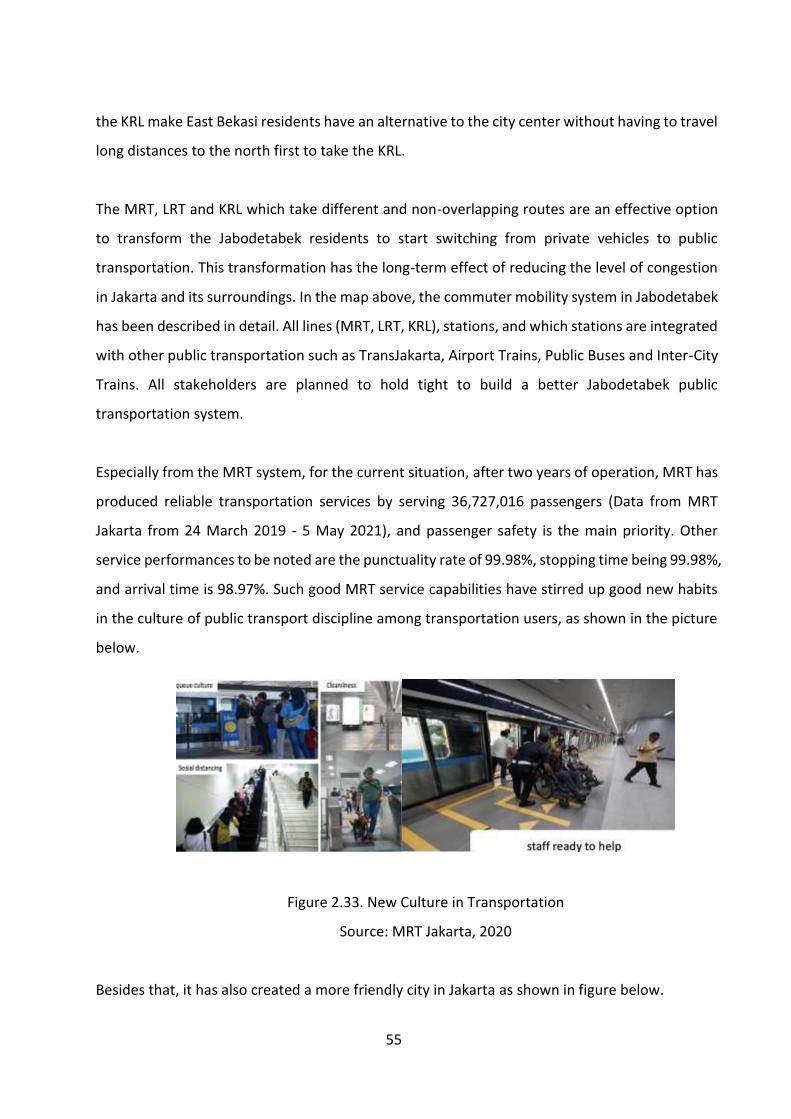
55
the KRL make East Bekasi residents have an alternative to the city center without having to travel
long distances to the north first to take the KRL.
The MRT, LRT and KRL which take different and non-overlapping routes are an effective option
to transform the Jabodetabek residents to start switching from private vehicles to public
transportation. This transformation has the long-term effect of reducing the level of congestion
in Jakarta and its surroundings. In the map above, the commuter mobility system in Jabodetabek
has been described in detail. All lines (MRT, LRT, KRL), stations, and which stations are integrated
with other public transportation such as TransJakarta, Airport Trains, Public Buses and Inter-City
Trains. All stakeholders are planned to hold tight to build a better Jabodetabek public
transportation system.
Especially from the MRT system, for the current situation, after two years of operation, MRT has
produced reliable transportation services by serving 36,727,016 passengers (Data from MRT
Jakarta from 24 March 2019 - 5 May 2021), and passenger safety is the main priority. Other
service performances to be noted are the punctuality rate of 99.98%, stopping time being 99.98%,
and arrival time is 98.97%. Such good MRT service capabilities have stirred up good new habits
in the culture of public transport discipline among transportation users, as shown in the picture
below.
Figure 2.33. New Culture in Transportation
Source: MRT Jakarta, 2020
Besides that, it has also created a more friendly city in Jakarta as shown in figure below.
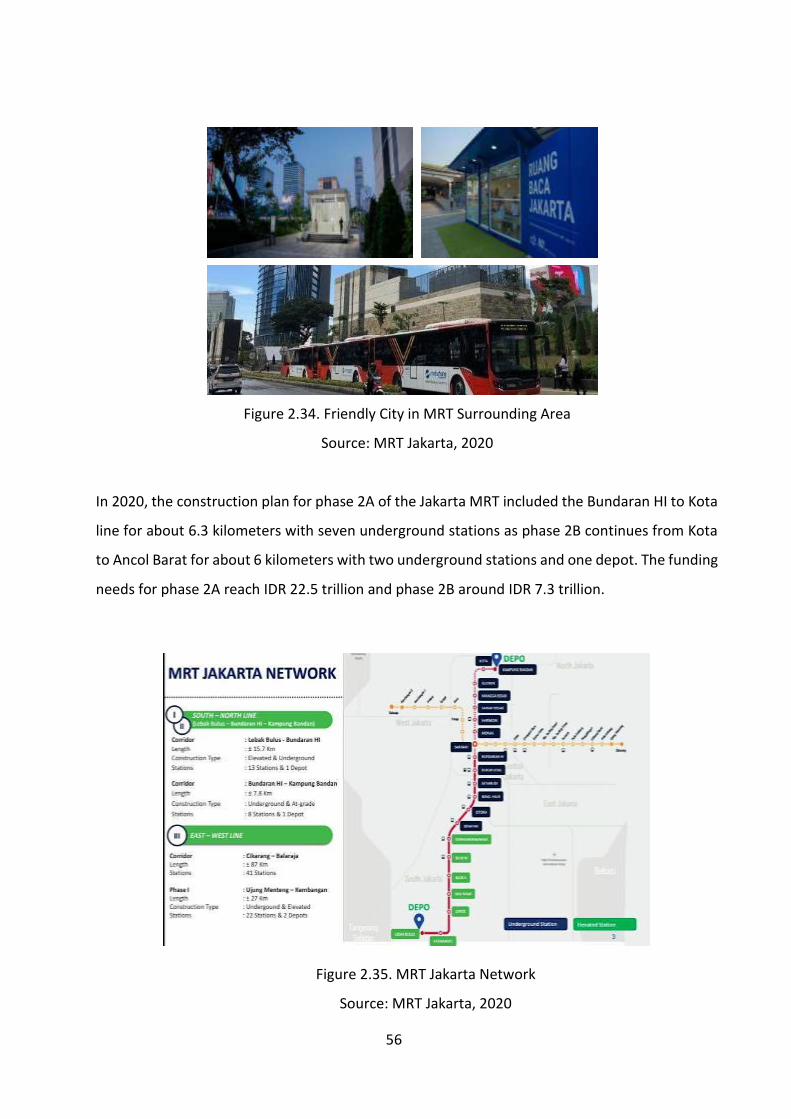
56
Figure 2.34. Friendly City in MRT Surrounding Area
Source: MRT Jakarta, 2020
In 2020, the construction plan for phase 2A of the Jakarta MRT included the Bundaran HI to Kota
line for about 6.3 kilometers with seven underground stations as phase 2B continues from Kota
to Ancol Barat for about 6 kilometers with two underground stations and one depot. The funding
needs for phase 2A reach IDR 22.5 trillion and phase 2B around IDR 7.3 trillion.
Figure 2.35. MRT Jakarta Network
Source: MRT Jakarta, 2020
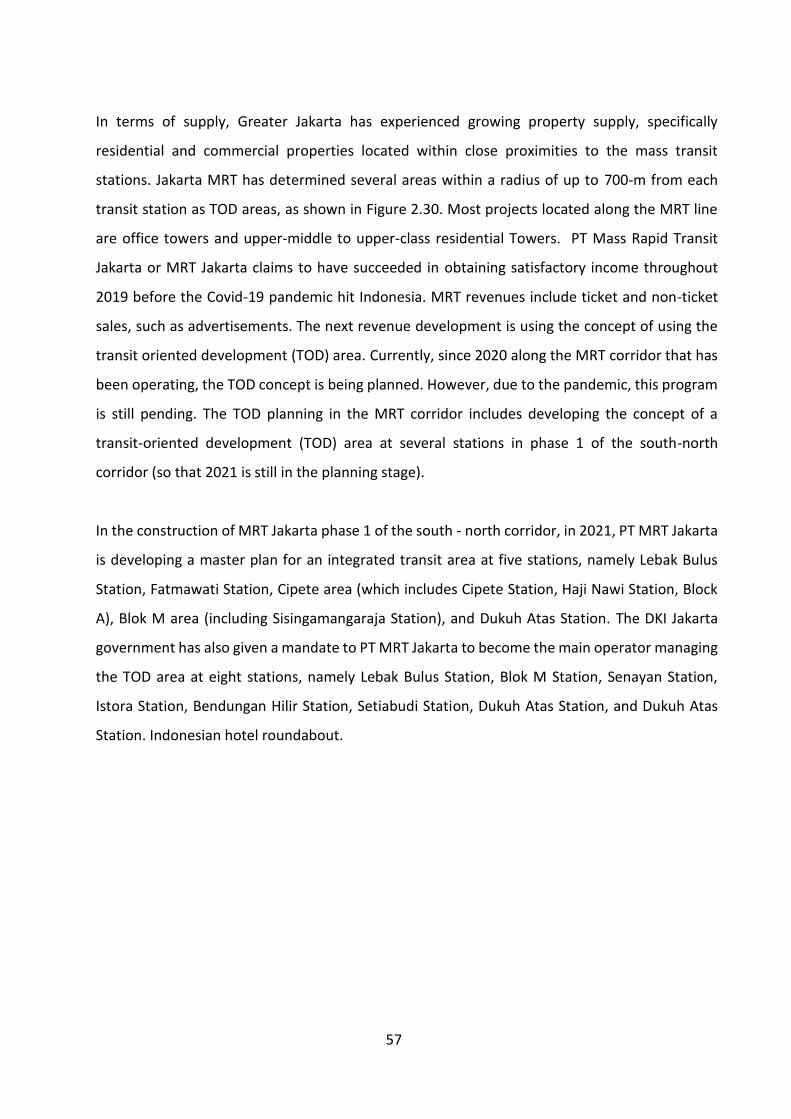
57
In terms of supply, Greater Jakarta has experienced growing property supply, specifically
residential and commercial properties located within close proximities to the mass transit
stations. Jakarta MRT has determined several areas within a radius of up to 700-m from each
transit station as TOD areas, as shown in Figure 2.30. Most projects located along the MRT line
are office towers and upper-middle to upper-class residential Towers. PT Mass Rapid Transit
Jakarta or MRT Jakarta claims to have succeeded in obtaining satisfactory income throughout
2019 before the Covid-19 pandemic hit Indonesia. MRT revenues include ticket and non-ticket
sales, such as advertisements. The next revenue development is using the concept of using the
transit oriented development (TOD) area. Currently, since 2020 along the MRT corridor that has
been operating, the TOD concept is being planned. However, due to the pandemic, this program
is still pending. The TOD planning in the MRT corridor includes developing the concept of a
transit-oriented development (TOD) area at several stations in phase 1 of the south-north
corridor (so that 2021 is still in the planning stage).
In the construction of MRT Jakarta phase 1 of the south - north corridor, in 2021, PT MRT Jakarta
is developing a master plan for an integrated transit area at five stations, namely Lebak Bulus
Station, Fatmawati Station, Cipete area (which includes Cipete Station, Haji Nawi Station, Block
A), Blok M area (including Sisingamangaraja Station), and Dukuh Atas Station. The DKI Jakarta
government has also given a mandate to PT MRT Jakarta to become the main operator managing
the TOD area at eight stations, namely Lebak Bulus Station, Blok M Station, Senayan Station,
Istora Station, Bendungan Hilir Station, Setiabudi Station, Dukuh Atas Station, and Dukuh Atas
Station. Indonesian hotel roundabout.
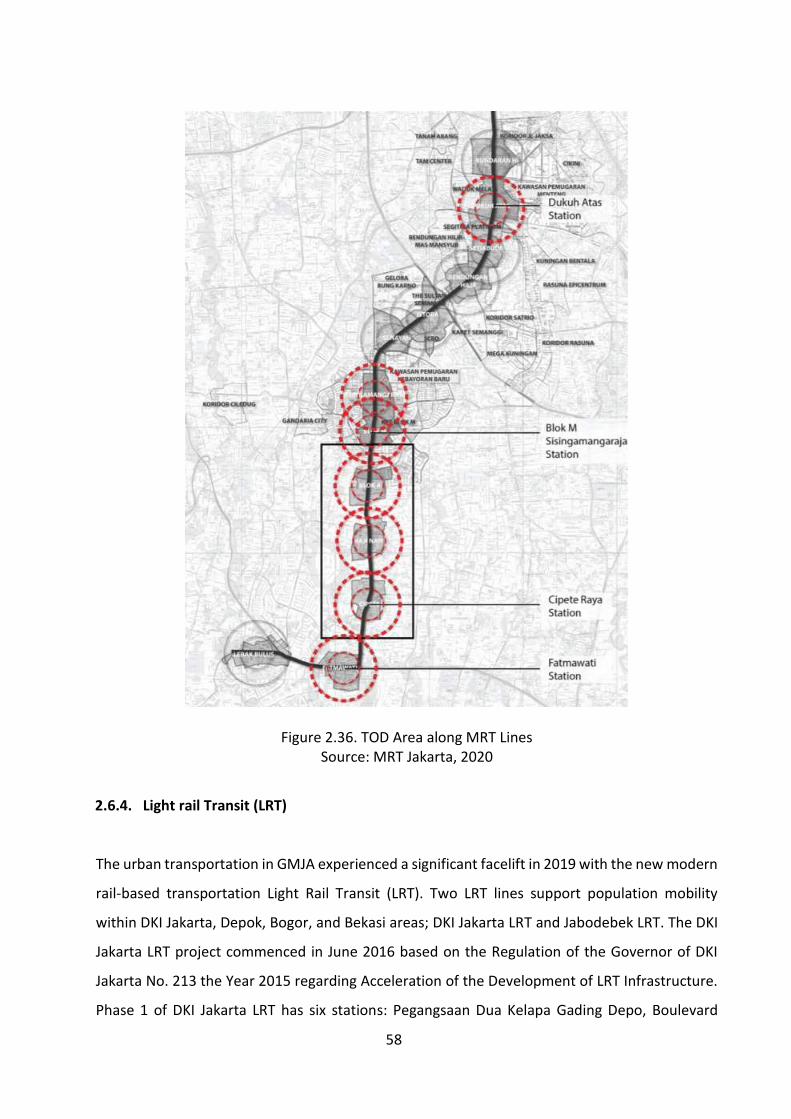
58
Figure 2.36. TOD Area along MRT Lines Source: MRT Jakarta, 2020
2.6.4. Light rail Transit (LRT)
The urban transportation in GMJA experienced a significant facelift in 2019 with the new modern
rail-based transportation Light Rail Transit (LRT). Two LRT lines support population mobility
within DKI Jakarta, Depok, Bogor, and Bekasi areas; DKI Jakarta LRT and Jabodebek LRT. The DKI
Jakarta LRT project commenced in June 2016 based on the Regulation of the Governor of DKI
Jakarta No. 213 the Year 2015 regarding Acceleration of the Development of LRT Infrastructure.
Phase 1 of DKI Jakarta LRT has six stations: Pegangsaan Dua Kelapa Gading Depo, Boulevard

59
Utara, Boulevard Selatan, Pulomas, Equestrian, and Velodrome Stations. Phase 1 of the DKI
Jakarta LRT route is from Kelapa Gading to Velodrome with a length of 5.8 km and completed in
July 2019. LRT Phase 1 has been operating since 2019 for LRT trips from Velodrome station to
Kelaga Gading Station or vice versa with a fare of IDR 5 thousand for one trip. In this route, the
LRT only covers a distance of 5.8 kilometers. Sixteen trains are operating, with a headway or train
departure distance of 5 and five minutes. The Kelapa Gading – Velodrome LRT route serves six
stations, Pegangsaan Dua (Kelapa Gading) LRT Station, North Boulevard LRT Station, South
Boulevard LRT Station, Pulomas LRT Station, Equestrian LRT Station, Velodrome LRT Station
(Rawamangun).
Figure 2.37. LRT Station Velodrome-Kelapa Gading
Source: Vidya Pinandhita / Lokadata.id, 2020
On other parts, the development of Phase 2 from Kelapa Gading to Dukuh Atas of 17.3 km was
in the preparation stage. Furthermore, Integrated Railroad or Light Rail Transit (LRT) is a
passenger transportation service mode that operates on light rail. Although the average speed is
around 50 kilometers per hour, Jakarta LRT trains can reach a maximum of 90 kilometers per
hour. The Jakarta LRT train made by Hyundai Rotem from South Korea has the advantage that is
using the articulated bogie system. This technology was first implemented in Indonesia, allows
trains to drive safely and flexibly, following the contours of the track in sharp turns. Besides being
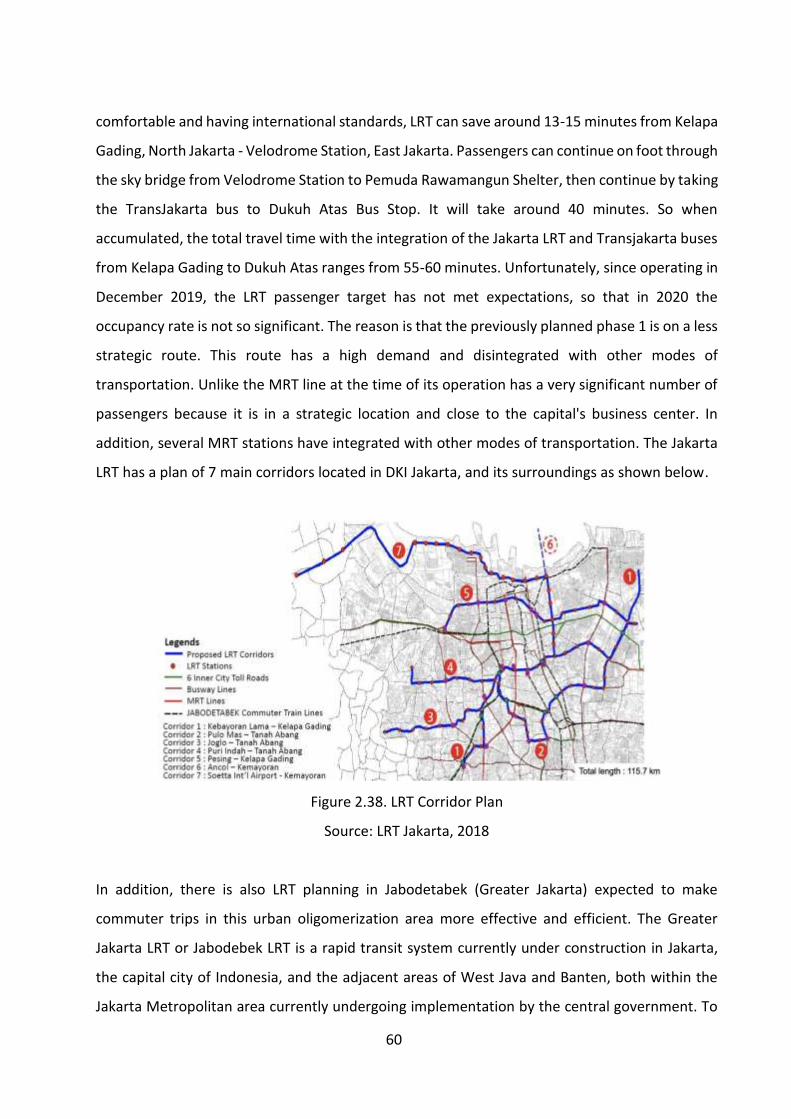
60
comfortable and having international standards, LRT can save around 13-15 minutes from Kelapa
Gading, North Jakarta - Velodrome Station, East Jakarta. Passengers can continue on foot through
the sky bridge from Velodrome Station to Pemuda Rawamangun Shelter, then continue by taking
the TransJakarta bus to Dukuh Atas Bus Stop. It will take around 40 minutes. So when
accumulated, the total travel time with the integration of the Jakarta LRT and Transjakarta buses
from Kelapa Gading to Dukuh Atas ranges from 55-60 minutes. Unfortunately, since operating in
December 2019, the LRT passenger target has not met expectations, so that in 2020 the
occupancy rate is not so significant. The reason is that the previously planned phase 1 is on a less
strategic route. This route has a high demand and disintegrated with other modes of
transportation. Unlike the MRT line at the time of its operation has a very significant number of
passengers because it is in a strategic location and close to the capital's business center. In
addition, several MRT stations have integrated with other modes of transportation. The Jakarta
LRT has a plan of 7 main corridors located in DKI Jakarta, and its surroundings as shown below.
Figure 2.38. LRT Corridor Plan
Source: LRT Jakarta, 2018
In addition, there is also LRT planning in Jabodetabek (Greater Jakarta) expected to make
commuter trips in this urban oligomerization area more effective and efficient. The Greater
Jakarta LRT or Jabodebek LRT is a rapid transit system currently under construction in Jakarta,
the capital city of Indonesia, and the adjacent areas of West Java and Banten, both within the
Jakarta Metropolitan area currently undergoing implementation by the central government. To

61
be directly operated by Kereta Api Indonesia (KAI), the system will connect the Jakarta city center
with suburbs in Greater Jakarta such as Bogor, Depok, and Bekasi. The operation was due to begin
in 2019. However, due to a delay in the implementation, it is scheduled to operate in December
2022. As of September 2021, the progress of the Jabodebek LRT reached 94.36 percent with the
following details: Cross Service I Cawang-Harjamukti by 98.98 percent, Cross Service II Cawang -
Dukuh Atas by 90.7 percent, Cross Service III Cawang - Jatimulya by 91.8 percent, Station access
42.71 percent, Depot construction 51.39 percent, Facilities 64.70 percent and Integration 35.49
percent.
If we look at the structure of the building on the LRT, especially the LRT in Indonesia, almost all
of the building structures are elevated with high pillars. Not only in Indonesia, in other countries
such as Dubai, the Philippines and Malaysia, there are also elevated LRT structures.
The basic reason why the LRT is elevated is because of the level crossing that we often encounter,
especially in the densely-vehicle area, Greater Jakarta. Therefore, the LRT is built elevated with
the reason during operation it will not interfere with existing traffic. If the LRT is built at grade
(parallel to the ground) it will disturb the existing traffic as well as KRL crossings which are often
the cause of heavy traffic. Therefore, the LRT is built elavated and is in line with its goal of
reducing congestion. In addition, the LRT built elevated also reduces the frequency of accidents
encountered on at grade train lines (parallel to the ground).
The Jabodebek LRT was built by considering the current condition of the land and trying to
minimize land acquisition. In addition, from the condition of the Jabodetabek spatial layout which
is very dense and has many flyovers and pedestrian bridges or electrical cables that have been
installed before the construction of the LRT, this is also the basis for consideration of the elevated
Jabodebek LRT.
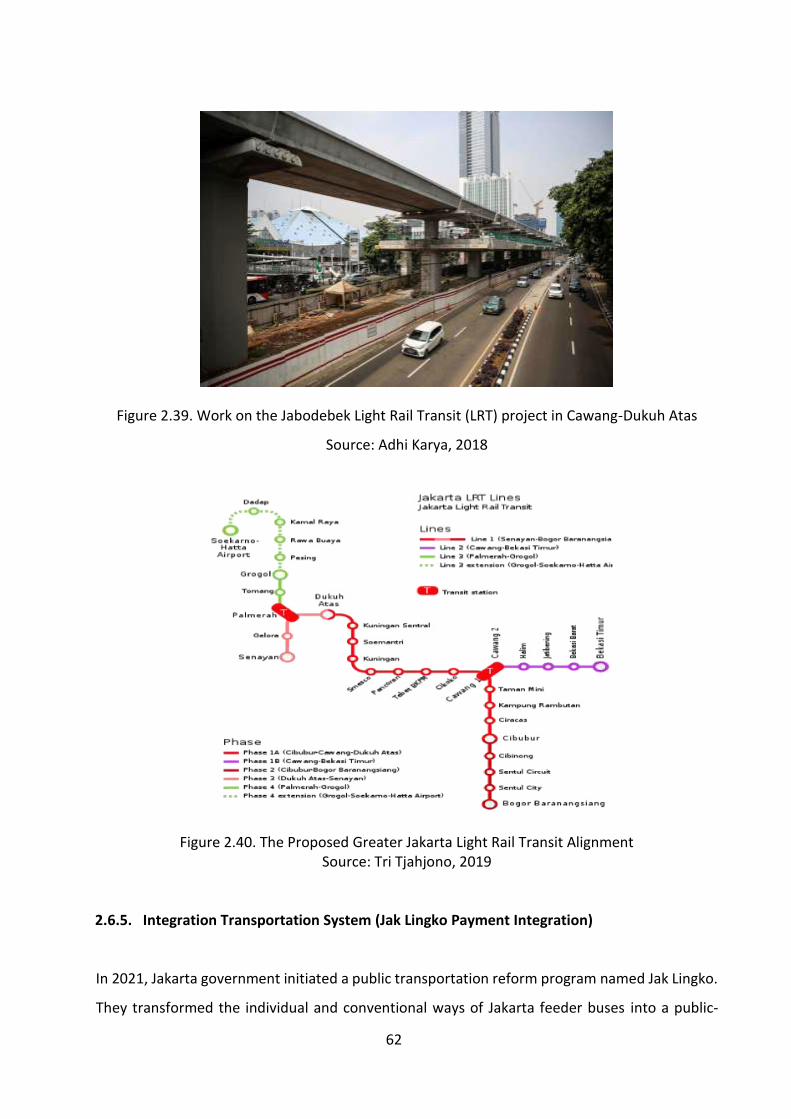
62
Figure 2.39. Work on the Jabodebek Light Rail Transit (LRT) project in Cawang-Dukuh Atas
Source: Adhi Karya, 2018
Figure 2.40. The Proposed Greater Jakarta Light Rail Transit Alignment Source: Tri Tjahjono, 2019
2.6.5. Integration Transportation System (Jak Lingko Payment Integration)
In 2021, Jakarta government initiated a public transportation reform program named Jak Lingko.
They transformed the individual and conventional ways of Jakarta feeder buses into a public-
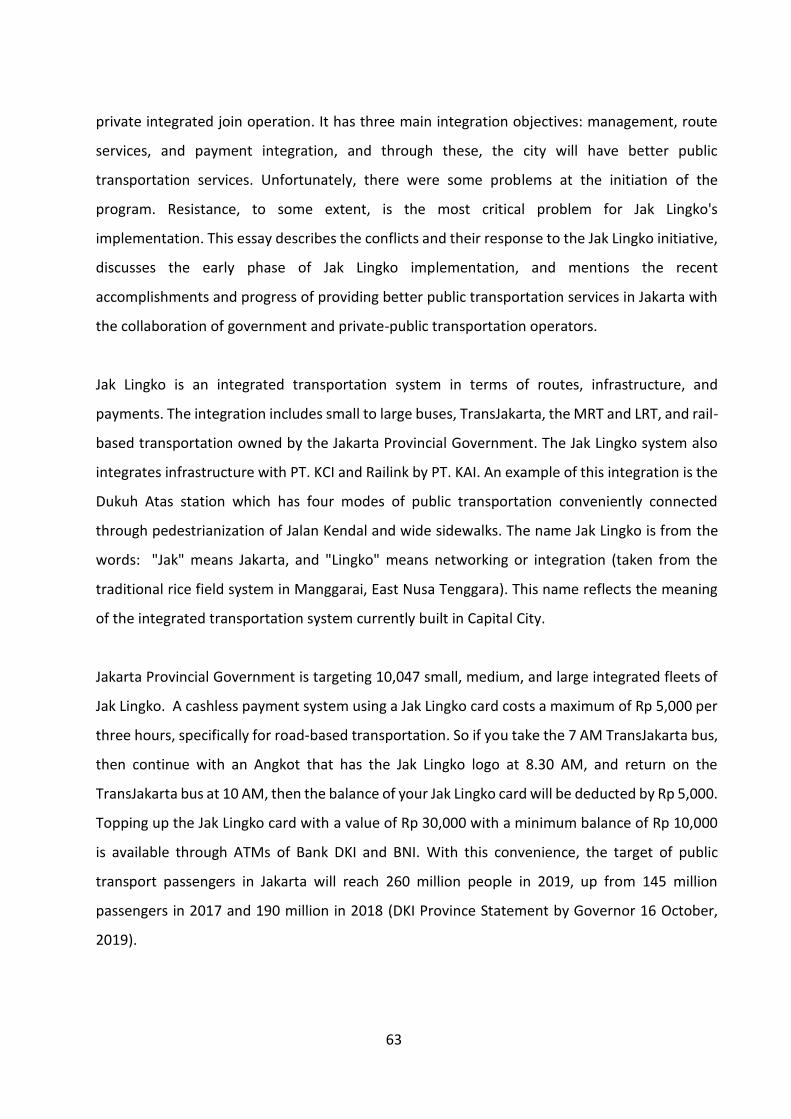
63
private integrated join operation. It has three main integration objectives: management, route
services, and payment integration, and through these, the city will have better public
transportation services. Unfortunately, there were some problems at the initiation of the
program. Resistance, to some extent, is the most critical problem for Jak Lingko's
implementation. This essay describes the conflicts and their response to the Jak Lingko initiative,
discusses the early phase of Jak Lingko implementation, and mentions the recent
accomplishments and progress of providing better public transportation services in Jakarta with
the collaboration of government and private-public transportation operators.
Jak Lingko is an integrated transportation system in terms of routes, infrastructure, and
payments. The integration includes small to large buses, TransJakarta, the MRT and LRT, and rail-
based transportation owned by the Jakarta Provincial Government. The Jak Lingko system also
integrates infrastructure with PT. KCI and Railink by PT. KAI. An example of this integration is the
Dukuh Atas station which has four modes of public transportation conveniently connected
through pedestrianization of Jalan Kendal and wide sidewalks. The name Jak Lingko is from the
words: "Jak" means Jakarta, and "Lingko" means networking or integration (taken from the
traditional rice field system in Manggarai, East Nusa Tenggara). This name reflects the meaning
of the integrated transportation system currently built in Capital City.
Jakarta Provincial Government is targeting 10,047 small, medium, and large integrated fleets of
Jak Lingko. A cashless payment system using a Jak Lingko card costs a maximum of Rp 5,000 per
three hours, specifically for road-based transportation. So if you take the 7 AM TransJakarta bus,
then continue with an Angkot that has the Jak Lingko logo at 8.30 AM, and return on the
TransJakarta bus at 10 AM, then the balance of your Jak Lingko card will be deducted by Rp 5,000.
Topping up the Jak Lingko card with a value of Rp 30,000 with a minimum balance of Rp 10,000
is available through ATMs of Bank DKI and BNI. With this convenience, the target of public
transport passengers in Jakarta will reach 260 million people in 2019, up from 145 million
passengers in 2017 and 190 million in 2018 (DKI Province Statement by Governor 16 October,
2019).
64
In addition to reducing air pollution by moving from private vehicles to public transportation,
congestion is also reduced from the number four to seventh in the world. The expansion of the
odd-even system from nine to 25 roads that began on September 9, 2019, also diverts people
from private vehicles to public transportation. The evaluation of the Jakarta Provincial
Government during the trial period for the even-odd expansion from August 12, 2019, to
September 6, 2019, the volume of vehicles indeed decreased by 25.24 percent. By switching from
private cars to public transportation, congestion has also reduced from number four to seventh
in the world. It also reduces air pollution.
2.7. Commuter Travel in JMA
An estimated 4m people commute from Greater Jakarta (JMA) into the city center for work every
day. Public transport was outrun by the capital’s rapid growth in recent decades, leading to its
international notoriety as a congested mega-city. With Jakarta representing about a fifth of all
economic activity in Indonesia, congestion costs the economy an estimated $5bn per year. In
response, the government has set the ambitious goal of having 60% of travelers use public
transport in the capital by 2030, up from the current level of 23%. Key to the achievement of this
target is the full operation of a 112-km mass rapid transit (MRT) system with more than 60
stations by 2025, the total cost of which is expected to exceed $7bn.
JMA has some centers as attraction zones for commuters. The function of those attraction zones
can be as a destination for the commuter mainly for work. Those zones, especially in the form of
services, trades, and industrial areas, are located in some of the central business districts (CBD)
of Jakarta as the core of JMA and in several activities centers in the peri-urban of JMA.
Interrelated amongst attraction zones show that the CBD of Jakarta is still dominated as a
destination area of commuters from the peri-urban of JMA. The results of the 2019 Jabodetabek
Commuter Survey show that of the 29 million Jabodetabek residents aged 5 years and over,
around 11 percent are commuters. The highest percentage is in Depok City, which is 19.6 percent,
while the district/city with the lowest percentage is Bekasi Regency, which is 7.3 percent
(Jabodetabek Commuter Statistic, 2019). On the other hand, 30.3 percent of commuters travel
from 10 to 20 kilometers to get to their place of activity, and 34.6 percent of commuters spend
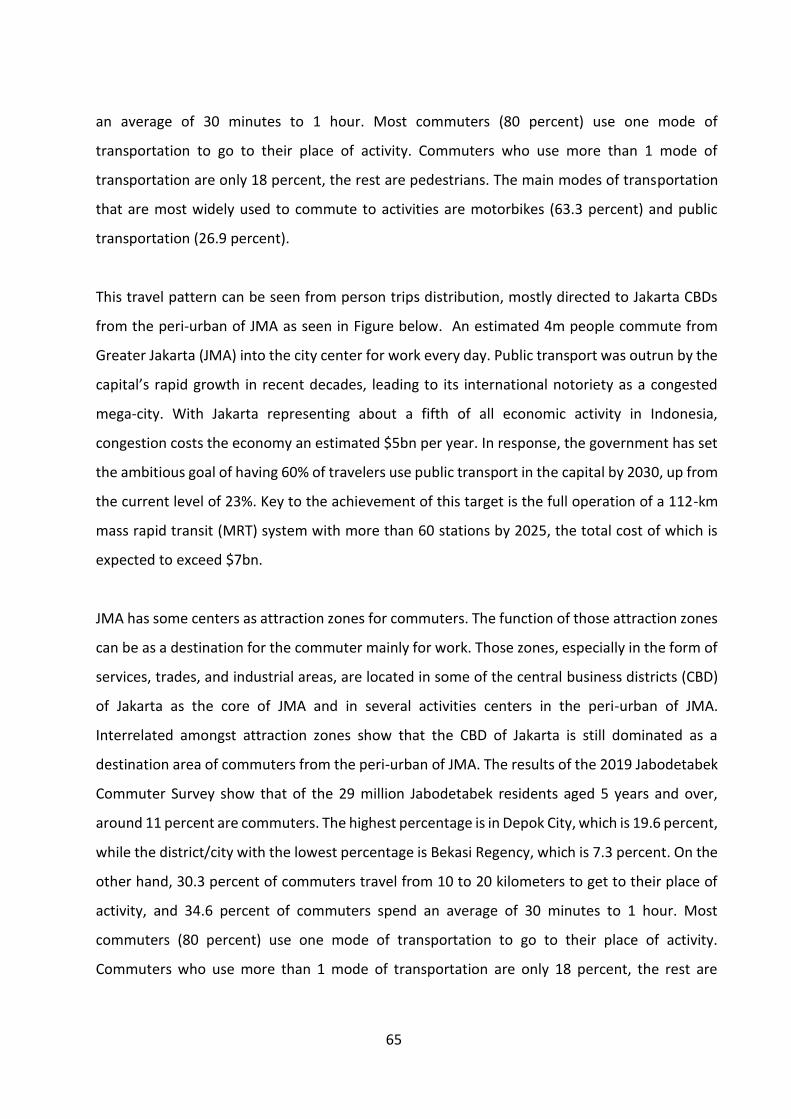
65
an average of 30 minutes to 1 hour. Most commuters (80 percent) use one mode of
transportation to go to their place of activity. Commuters who use more than 1 mode of
transportation are only 18 percent, the rest are pedestrians. The main modes of transportation
that are most widely used to commute to activities are motorbikes (63.3 percent) and public
transportation (26.9 percent).
This travel pattern can be seen from person trips distribution, mostly directed to Jakarta CBDs
from the peri-urban of JMA as seen in Figure below. An estimated 4m people commute from
Greater Jakarta (JMA) into the city center for work every day. Public transport was outrun by the
capital’s rapid growth in recent decades, leading to its international notoriety as a congested
mega-city. With Jakarta representing about a fifth of all economic activity in Indonesia,
congestion costs the economy an estimated $5bn per year. In response, the government has set
the ambitious goal of having 60% of travelers use public transport in the capital by 2030, up from
the current level of 23%. Key to the achievement of this target is the full operation of a 112-km
mass rapid transit (MRT) system with more than 60 stations by 2025, the total cost of which is
expected to exceed $7bn.
JMA has some centers as attraction zones for commuters. The function of those attraction zones
can be as a destination for the commuter mainly for work. Those zones, especially in the form of
services, trades, and industrial areas, are located in some of the central business districts (CBD)
of Jakarta as the core of JMA and in several activities centers in the peri-urban of JMA.
Interrelated amongst attraction zones show that the CBD of Jakarta is still dominated as a
destination area of commuters from the peri-urban of JMA. The results of the 2019 Jabodetabek
Commuter Survey show that of the 29 million Jabodetabek residents aged 5 years and over,
around 11 percent are commuters. The highest percentage is in Depok City, which is 19.6 percent,
while the district/city with the lowest percentage is Bekasi Regency, which is 7.3 percent. On the
other hand, 30.3 percent of commuters travel from 10 to 20 kilometers to get to their place of
activity, and 34.6 percent of commuters spend an average of 30 minutes to 1 hour. Most
commuters (80 percent) use one mode of transportation to go to their place of activity.
Commuters who use more than 1 mode of transportation are only 18 percent, the rest are
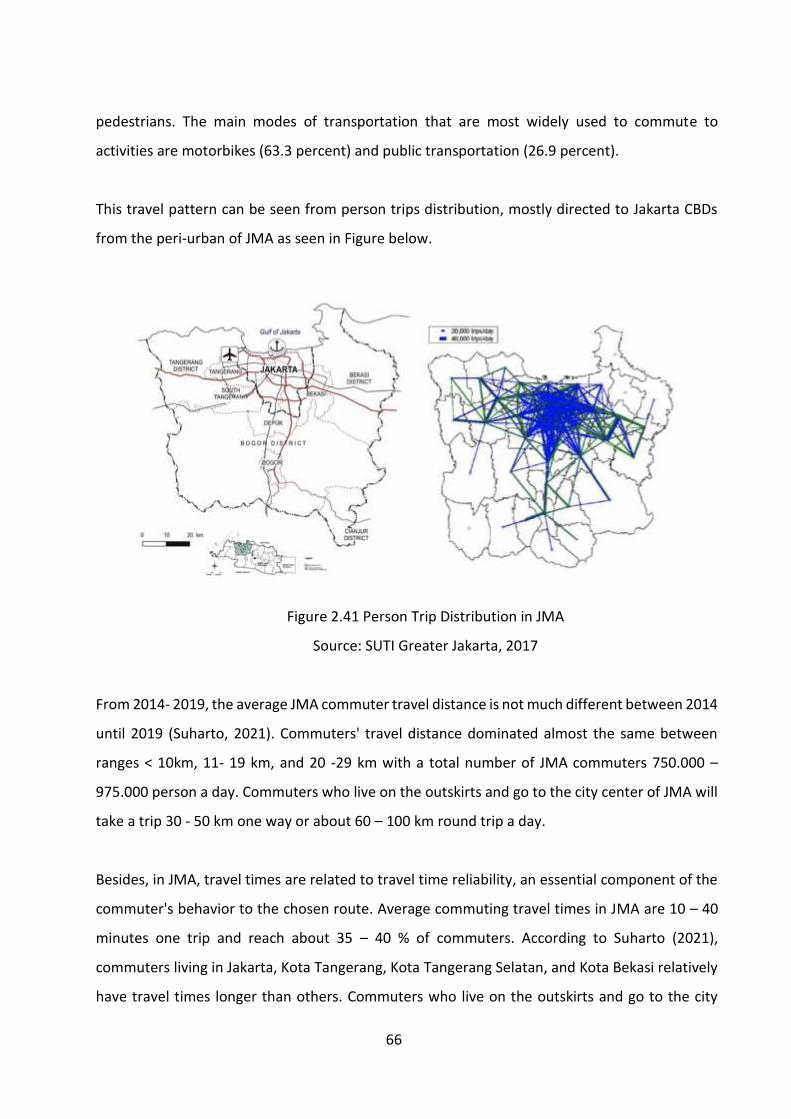
66
pedestrians. The main modes of transportation that are most widely used to commute to
activities are motorbikes (63.3 percent) and public transportation (26.9 percent).
This travel pattern can be seen from person trips distribution, mostly directed to Jakarta CBDs
from the peri-urban of JMA as seen in Figure below.
Figure 2.41 Person Trip Distribution in JMA
Source: SUTI Greater Jakarta, 2017
From 2014- 2019, the average JMA commuter travel distance is not much different between 2014
until 2019 (Suharto, 2021). Commuters' travel distance dominated almost the same between
ranges < 10km, 11- 19 km, and 20 -29 km with a total number of JMA commuters 750.000 –
975.000 person a day. Commuters who live on the outskirts and go to the city center of JMA will
take a trip 30 - 50 km one way or about 60 – 100 km round trip a day.
Besides, in JMA, travel times are related to travel time reliability, an essential component of the
commuter's behavior to the chosen route. Average commuting travel times in JMA are 10 – 40
minutes one trip and reach about 35 – 40 % of commuters. According to Suharto (2021),
commuters living in Jakarta, Kota Tangerang, Kota Tangerang Selatan, and Kota Bekasi relatively
have travel times longer than others. Commuters who live on the outskirts and go to the city
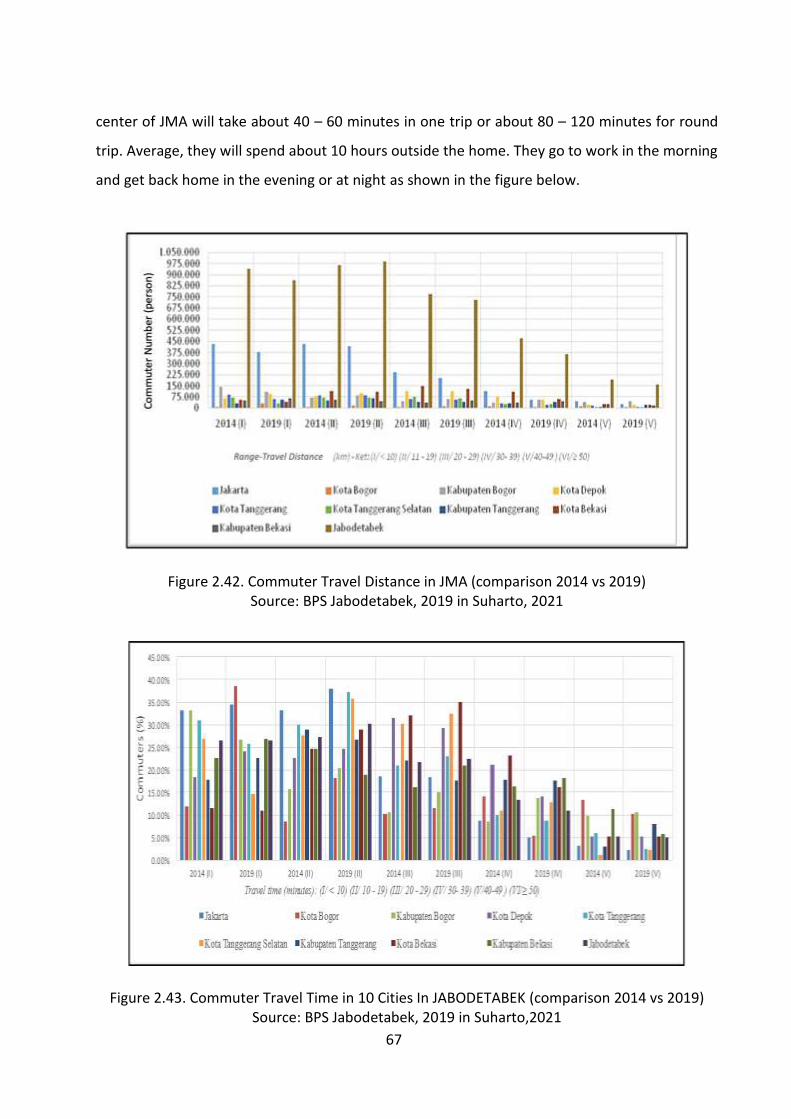
67
center of JMA will take about 40 – 60 minutes in one trip or about 80 – 120 minutes for round
trip. Average, they will spend about 10 hours outside the home. They go to work in the morning
and get back home in the evening or at night as shown in the figure below.
Figure 2.42. Commuter Travel Distance in JMA (comparison 2014 vs 2019) Source: BPS Jabodetabek, 2019 in Suharto, 2021
Figure 2.43. Commuter Travel Time in 10 Cities In JABODETABEK (comparison 2014 vs 2019) Source: BPS Jabodetabek, 2019 in Suharto,2021
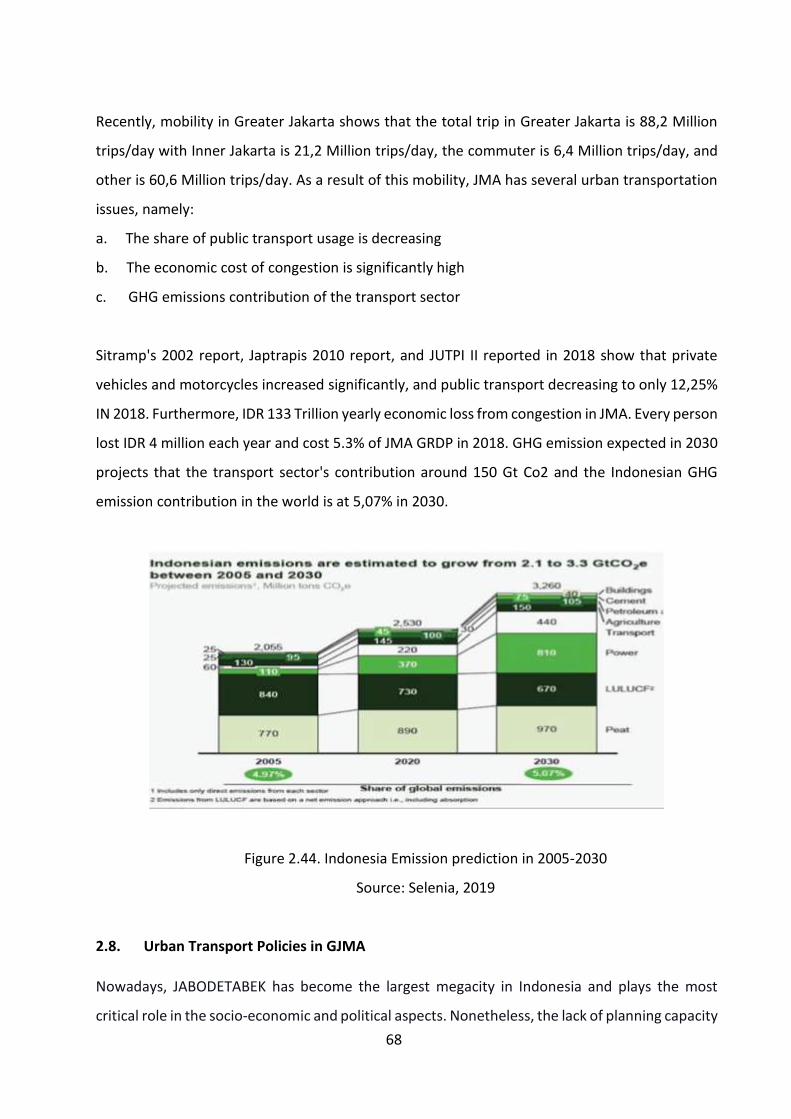
68
Recently, mobility in Greater Jakarta shows that the total trip in Greater Jakarta is 88,2 Million
trips/day with Inner Jakarta is 21,2 Million trips/day, the commuter is 6,4 Million trips/day, and
other is 60,6 Million trips/day. As a result of this mobility, JMA has several urban transportation
issues, namely:
a. The share of public transport usage is decreasing
b. The economic cost of congestion is significantly high
c. GHG emissions contribution of the transport sector
Sitramp's 2002 report, Japtrapis 2010 report, and JUTPI II reported in 2018 show that private
vehicles and motorcycles increased significantly, and public transport decreasing to only 12,25%
IN 2018. Furthermore, IDR 133 Trillion yearly economic loss from congestion in JMA. Every person
lost IDR 4 million each year and cost 5.3% of JMA GRDP in 2018. GHG emission expected in 2030
projects that the transport sector's contribution around 150 Gt Co2 and the Indonesian GHG
emission contribution in the world is at 5,07% in 2030.
Figure 2.44. Indonesia Emission prediction in 2005-2030
Source: Selenia, 2019
2.8. Urban Transport Policies in GJMA
Nowadays, JABODETABEK has become the largest megacity in Indonesia and plays the most
critical role in the socio-economic and political aspects. Nonetheless, the lack of planning capacity
69
to deal with the growing complexities in managing this area can cause problems in
accommodating the region's growth. According to the mandate of the Presidential Regulation
No. 103 the Year 2015 regarding Greater Jakarta Transport Authority (BPTJ), the policy of the
development and management for urban transportation in the JABODETABEK area directed the
following:
1. Integration in the construction and development of transportation infrastructure
network system and transportation services network, both intra- and inter-regional
modes;
2. Integration in the construction and development of urban transportation between
regions in JABODETABEK in one single Urban area;
3. Integration in the operation of urban transportation; and
4. Integration in the urban transportation financing plan.
Different strategies and measures are possible to improve the efficiency of the urban
transportation system. To accelerate urban transportation development, the Government of
Indonesia give special attention to the five issues which handled the following strategies:
1. Transportation and land use interaction strategy to improve the role of transportation to
support land use development through park and ride facility, Transit-Oriented
Development (TOD), Transportation Impact Control (TIC), and accessibility improvement
up to the endpoint in the urban area;
2. Strategy to improve urban mobility to optimize public transport role through urban
facility improvement (road and multimodal facility), urban public transport improvement,
and logistic services;
3. Strategy to reduce traffic congestion to reduce congestion load in urban areas by
strengthening the Transportation Demand Management (TDM) through the “push” policy
(such as Electronic Road Pricing/ERP, and parking system) and “pull” policy (such as the
development of BRT, LRT and MRT) and improving Traffic Supply Management (TSM)
through the development of Intelligent Transport System (ITS) to arrange the capacity
and priority management;
70
4. Strategy to reduce air pollution to reduce urban pollution load by reducing greenhouse
emission, air pollution, and noise; and
Strategy to improve safety for road transportation safety improvement by improving citizen’s
awareness and to improve and develop facilities supporting road transportation safety following
the National Safety Plan and Decade of Action for Road Safety.
On July 20, 2018, President Joko Widodo signed Presidential Regulation (Perpres) Number 55 of
2018 concerning the Transportation Master Plan for Jakarta, Bogor, Depok, Tangerang, and
Bekasi for 2018-2029. In RITJ, there are expressway corridor developments to support people’s
movement using a private vehicle. Types of expressway development are loops, bypasses, and
radial roads. Besides expressway development in RITJ, there are mass rail corridor developments
with radial development, light rail corridor development with types of radial, looping at the city.
According to this Presidential Regulation, the Jabodetabek Transportation Masterplan is a
guideline for the Central and Regional Governments to plan and implemented development,
management, monitoring, and evaluating transportation in the urban areas of Jakarta, Bogor,
Depok, Tangerang, and Bekasi. Regional Government as referred to includes:
1. DKI Jakarta Provincial Government;
2. West Java Provincial Government;
3. Banten Provincial Government;
4. Bogor City Government;
5. Bogor Regency Government;
6. Depok City Government;
7. Tangerang City Government;
8. South Tangerang City Government;
9. Tangerang Regency Government;
10. Bekasi City Government;
11. Bekasi Regency Government.
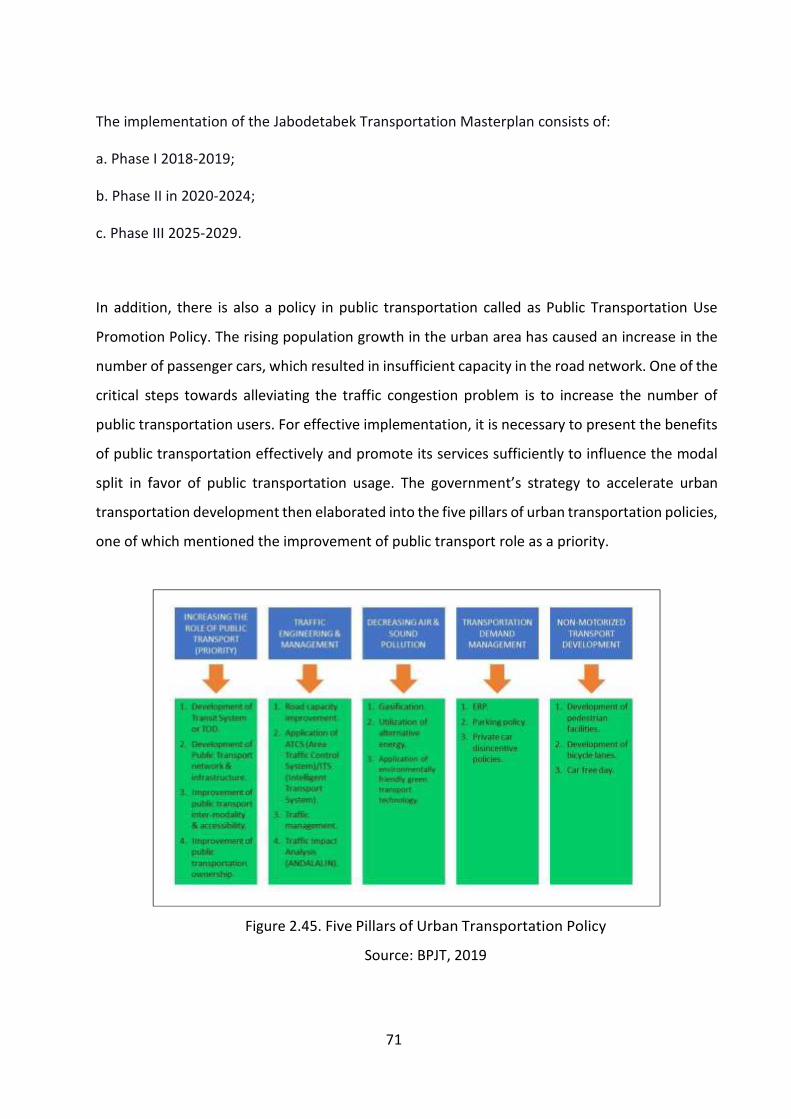
71
The implementation of the Jabodetabek Transportation Masterplan consists of:
a. Phase I 2018-2019;
b. Phase II in 2020-2024;
c. Phase III 2025-2029.
In addition, there is also a policy in public transportation called as Public Transportation Use
Promotion Policy. The rising population growth in the urban area has caused an increase in the
number of passenger cars, which resulted in insufficient capacity in the road network. One of the
critical steps towards alleviating the traffic congestion problem is to increase the number of
public transportation users. For effective implementation, it is necessary to present the benefits
of public transportation effectively and promote its services sufficiently to influence the modal
split in favor of public transportation usage. The government’s strategy to accelerate urban
transportation development then elaborated into the five pillars of urban transportation policies,
one of which mentioned the improvement of public transport role as a priority.
Figure 2.45. Five Pillars of Urban Transportation Policy
Source: BPJT, 2019
72
In managing traffic, some policies include traffic congestion alleviation policy. Over the years, the
government (local, provincial, and national levels) has been applying quite various regulations
that aim at congestion alleviation. One of the most impeccable ones would be the transportation
demand management (TDM) that is applied at a certain location of the busiest area and at a
certain time of the day. According to JUTP-2 Report (2019), the following explanations are the
elaboration of historical policies implemented to this day. In the years of 2016-now, the odd-
even number plate regulation to enter toll roads has been proven effective to reduce a load of a
truck on the trunk road. The regulation was initiated by BPTJ to smoothen the traffic in general
in the city center. The regulation was also complemented by the regulation of container ban from
entering the toll road from 5 AM - 10 PM. The limited time for container service created the truck
traffic concentration in the nigh ttime period.
Finally, it is assessed by the model that TDM policies would still be required in the
implementation year of the transportation master plan. The TDM policy that is proposed in this
master plan is ERP with main reasons:
1. To alleviate traffic in the designated area,
To receive revenue that is necessary to fund other transportation-related projects (mainly for the
public transportation system improvement). In this sense, ERP is one of the approaches to create
financial independence across JABODETABEK area. To explore the policy for traffic congestion
alleviation, TOD concept can be considered. TOD concept encourages land-use planning strategy
in delivering demand management since it will maximize the efficient use of land and existing
infrastructure, making it more integrated and efficient. As a result, distance that was taken to
access goods, services, and workplaces will be reduced, eventually helping to tackle the traffic
congestion. In terms of economic benefit, TOD is responding to livability and sustainability in
reducing private vehicle use that leads to lower cost of urban congestion.
Other policies are environmental betterment policy. JABODETABEK (especially DKI Jakarta)
notorious as the city with a high congestion level is burdened with air pollution and noise
disturbance quite extensively. While the current transportation condition is inevitably one of the
main causes for both issues, existing enforcement policy may not be able to bring significant
reduction/ betterment due to lack of local government initiative. In JUTPI-2 report propose no
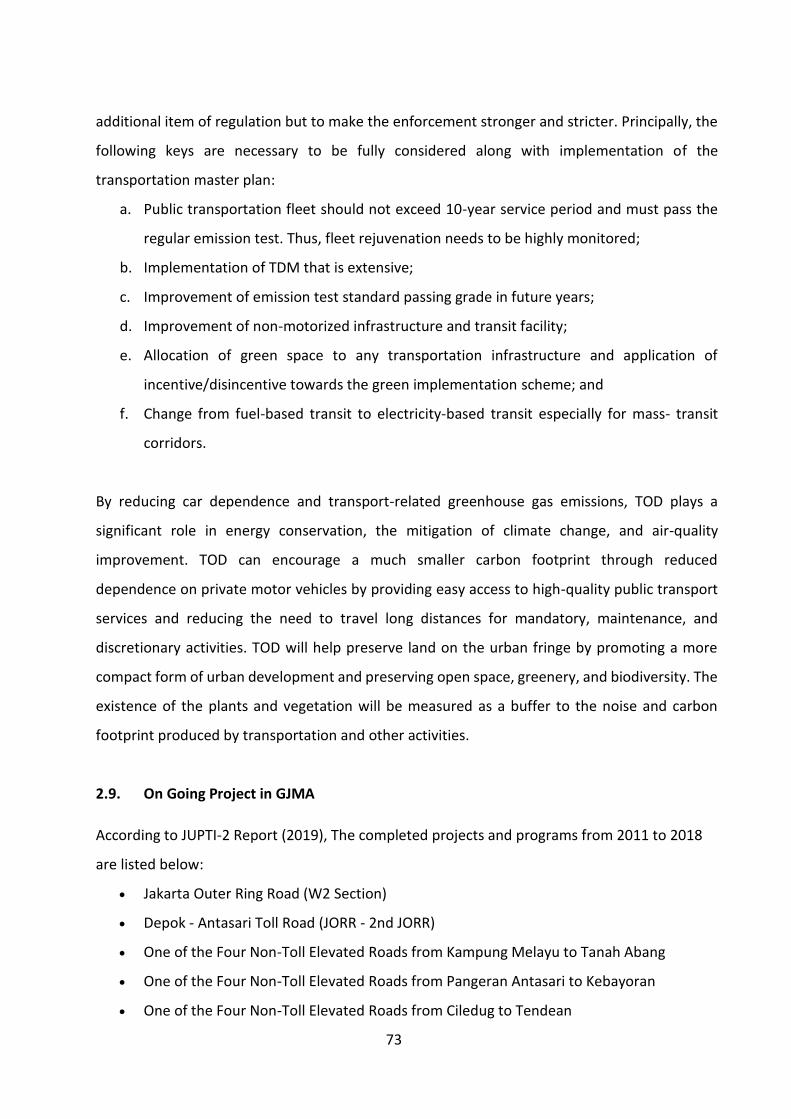
73
additional item of regulation but to make the enforcement stronger and stricter. Principally, the
following keys are necessary to be fully considered along with implementation of the
transportation master plan:
a. Public transportation fleet should not exceed 10-year service period and must pass the
regular emission test. Thus, fleet rejuvenation needs to be highly monitored;
b. Implementation of TDM that is extensive;
c. Improvement of emission test standard passing grade in future years;
d. Improvement of non-motorized infrastructure and transit facility;
e. Allocation of green space to any transportation infrastructure and application of
incentive/disincentive towards the green implementation scheme; and
f. Change from fuel-based transit to electricity-based transit especially for mass- transit
corridors.
By reducing car dependence and transport-related greenhouse gas emissions, TOD plays a
significant role in energy conservation, the mitigation of climate change, and air-quality
improvement. TOD can encourage a much smaller carbon footprint through reduced
dependence on private motor vehicles by providing easy access to high-quality public transport
services and reducing the need to travel long distances for mandatory, maintenance, and
discretionary activities. TOD will help preserve land on the urban fringe by promoting a more
compact form of urban development and preserving open space, greenery, and biodiversity. The
existence of the plants and vegetation will be measured as a buffer to the noise and carbon
footprint produced by transportation and other activities.
2.9. On Going Project in GJMA
According to JUPTI-2 Report (2019), The completed projects and programs from 2011 to 2018
are listed below:
• Jakarta Outer Ring Road (W2 Section)
• Depok - Antasari Toll Road (JORR - 2nd JORR)
• One of the Four Non-Toll Elevated Roads from Kampung Melayu to Tanah Abang
• One of the Four Non-Toll Elevated Roads from Pangeran Antasari to Kebayoran
• One of the Four Non-Toll Elevated Roads from Ciledug to Tendean

74
• Road widening for the busway system (Perintis Kemerdekaan - Bekasi Raya); (Bekasi
Raya); (Bogor Raya (1); (Bogor Raya (2); (Ciledug Raya); (Daan Mogot (1); (Daan Mogot
(2); (Serpong Raya) and (West Side of Pulogadung).
• Toll Road Information System
• Electronic Toll Collection (ETC)
• Repair and installation of traffic signals
• CNG station development
• Serpong line double-track rail lines between Serpong and Tanah Abang
• Construction of workshop at Depok station to Tendean
• Road widening for the busway system (Perintis Kemerdekaan - Bekasi Raya); (Bekasi
Raya); (Bogor Raya (1); (Bogor Raya (2); (Ciledug Raya); (Daan Mogot (1); (Daan Mogot
(2); (Serpong Raya) and (West Side of Pulogadung).
• Toll Road Information System
• Electronic Toll Collection (ETC)
• Repair and installation of traffic signals
• CNG station development
• Serpong line double-track rail lines between Serpong and Tanah Abang
• Construction of workshop at Depok station
In 2020 and up to now, the MRT Project has continued the construction on MRT Jakarta Phase
2A (HI Roundabout - West Ancol). On June 15th, 2020, construction was carried out with the first
civil works package, the 2.7 km underground line from Bundaran HI to Harmoni, and the
construction of Thamrin and Monas Stations. Phase 2A of MRT Jakarta (Bundaran HI – Kota) is to
start operating in two phases, with the completion of the first phase from Bundaran HI to
Harmoni in March 2025 and the completion of the second phase from Harmoni to Kota in 2027.
Phase 2A of MRT Jakarta is located underground and supported by the Communication-Based
Train Control Signaling (CBTC) system and level 2 of the Automated Train Operation (ATO) system.
According to MRT Report, as of June 25th, 2021, logged the progress of Jakarta Mass Rapid
Transit (MRT) project phase 2A segment one had reached 14.9%, which was higher than the
target of 12.70%. Moreover, the project’s physical construction progress is accumulating to 23%
by the end of this year.
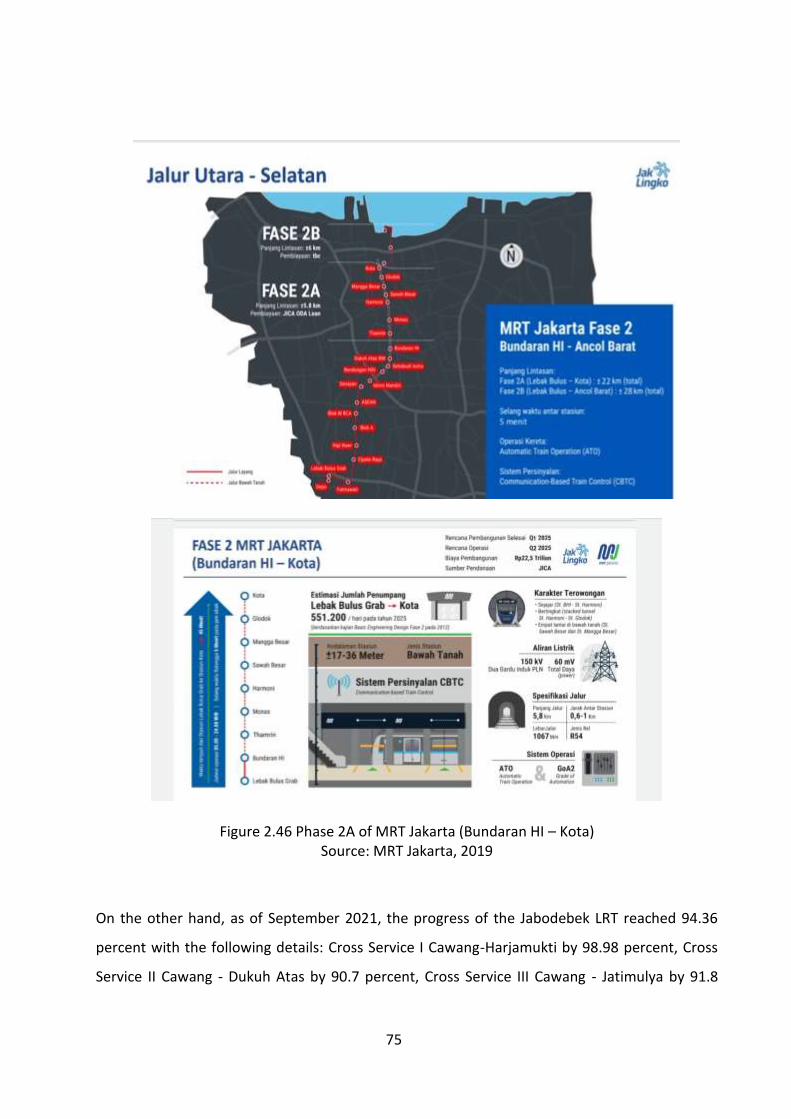
75
Figure 2.46 Phase 2A of MRT Jakarta (Bundaran HI – Kota) Source: MRT Jakarta, 2019
On the other hand, as of September 2021, the progress of the Jabodebek LRT reached 94.36
percent with the following details: Cross Service I Cawang-Harjamukti by 98.98 percent, Cross
Service II Cawang - Dukuh Atas by 90.7 percent, Cross Service III Cawang - Jatimulya by 91.8
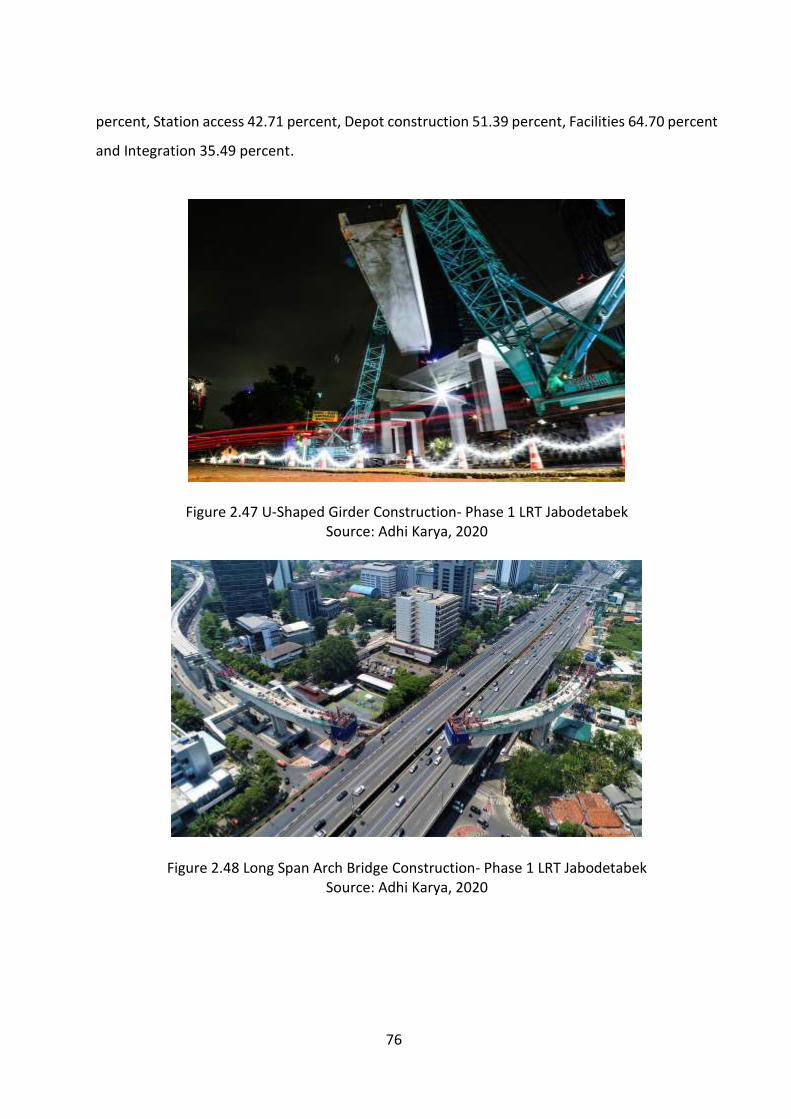
76
percent, Station access 42.71 percent, Depot construction 51.39 percent, Facilities 64.70 percent
and Integration 35.49 percent.
Figure 2.47 U-Shaped Girder Construction- Phase 1 LRT Jabodetabek Source: Adhi Karya, 2020
Figure 2.48 Long Span Arch Bridge Construction- Phase 1 LRT Jabodetabek Source: Adhi Karya, 2020
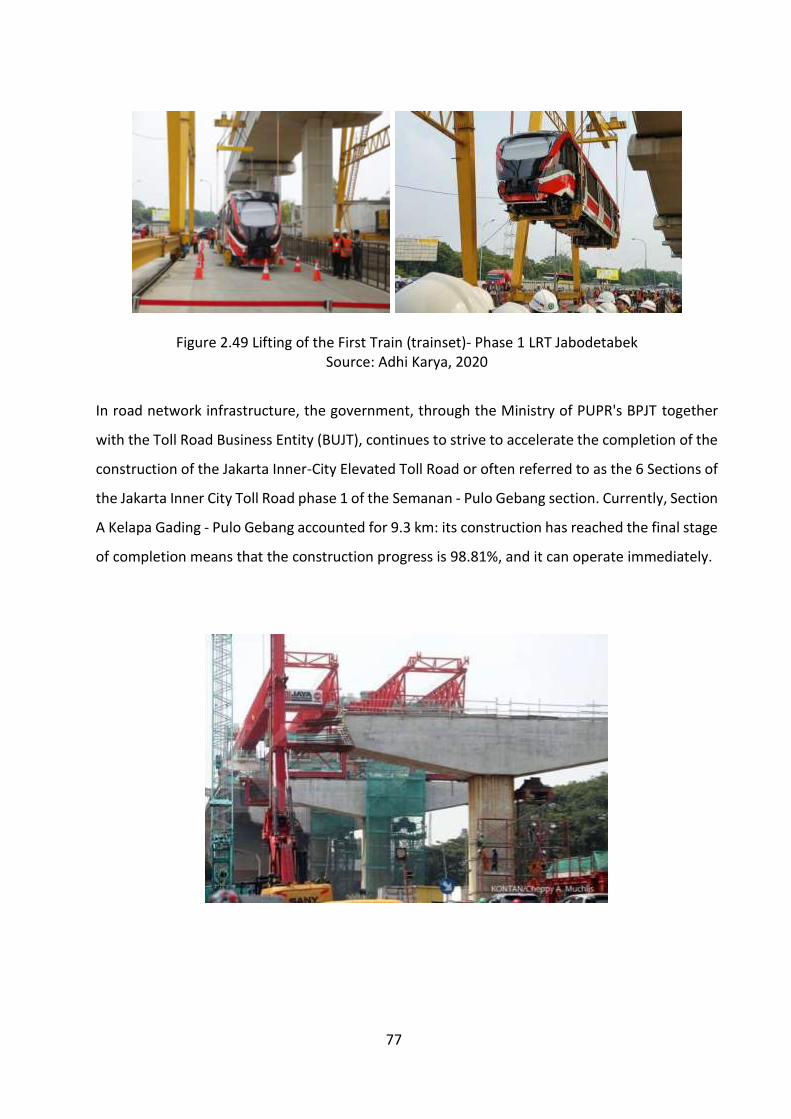
77
Figure 2.49 Lifting of the First Train (trainset)- Phase 1 LRT Jabodetabek Source: Adhi Karya, 2020
In road network infrastructure, the government, through the Ministry of PUPR's BPJT together
with the Toll Road Business Entity (BUJT), continues to strive to accelerate the completion of the
construction of the Jakarta Inner-City Elevated Toll Road or often referred to as the 6 Sections of
the Jakarta Inner City Toll Road phase 1 of the Semanan - Pulo Gebang section. Currently, Section
A Kelapa Gading - Pulo Gebang accounted for 9.3 km: its construction has reached the final stage
of completion means that the construction progress is 98.81%, and it can operate immediately.

78
Figure 2.50 Construction Progress of Six Inner-City Toll Roads
Source: Jakarta Toll Road Development (JTD), 2019
The phase 1 construction of Semanan - Pulogebang toll road managed by BUJUT PT Jakarta
Tollroad Development (JTD) and the implementing contractor PT Jaya Konstruksi - PT Adhi Karya
(KSO) with an investment value of Rp 2.05 trillion has a total length of 31.2 km consisting of 3
Sections. Section A is Kelapa Gading – Pulo Gebang with a length of 9.3 km, Section B of the
Semanan-Grogol section of 9.5 km and Section C of the Grogol-Kelapa Gading section of 12.4 km.
For phase 1 of the B & C Section, the construction is due to complete in 2024, and it can be
connected entirely from Semanan to Pulo Gebang. The 6 Jakarta Inner-City Toll Roads are one of
the National Strategic Projects following Presidential Regulation (Perpres) No. 56 of 2018. The six
toll roads are 69.77 Km long.
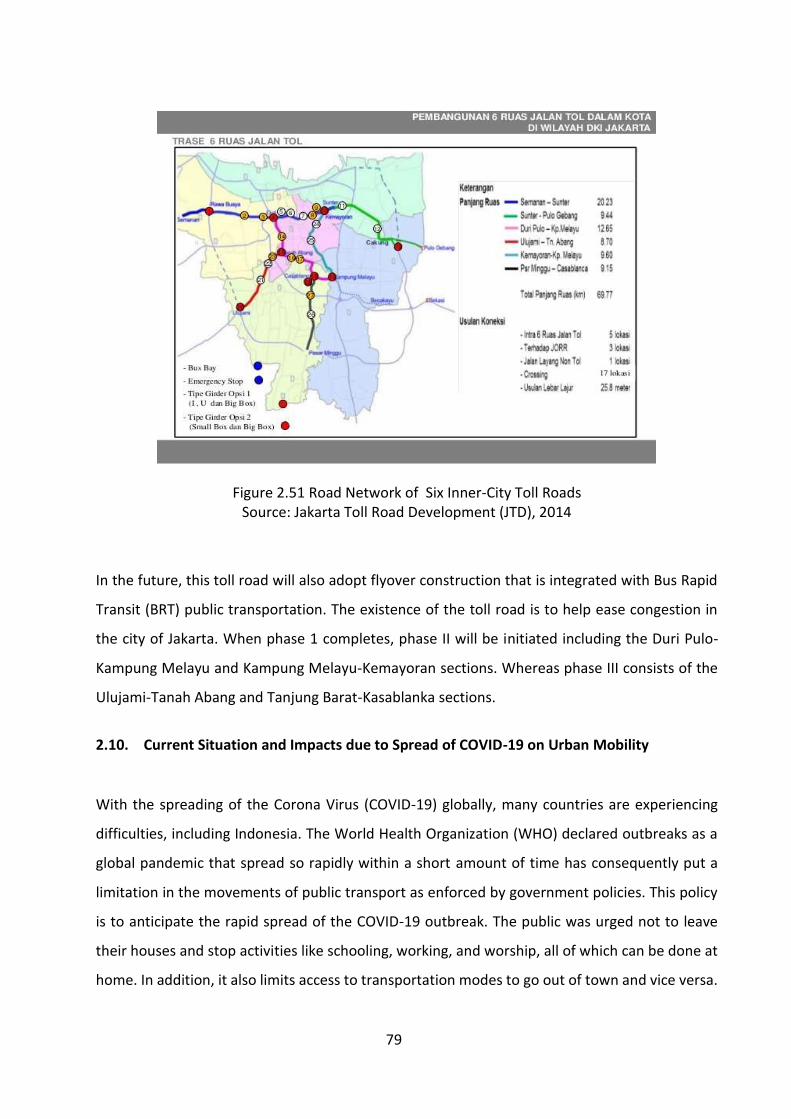
79
Figure 2.51 Road Network of Six Inner-City Toll Roads Source: Jakarta Toll Road Development (JTD), 2014
In the future, this toll road will also adopt flyover construction that is integrated with Bus Rapid
Transit (BRT) public transportation. The existence of the toll road is to help ease congestion in
the city of Jakarta. When phase 1 completes, phase II will be initiated including the Duri Pulo-
Kampung Melayu and Kampung Melayu-Kemayoran sections. Whereas phase III consists of the
Ulujami-Tanah Abang and Tanjung Barat-Kasablanka sections.
2.10. Current Situation and Impacts due to Spread of COVID-19 on Urban Mobility
With the spreading of the Corona Virus (COVID-19) globally, many countries are experiencing
difficulties, including Indonesia. The World Health Organization (WHO) declared outbreaks as a
global pandemic that spread so rapidly within a short amount of time has consequently put a
limitation in the movements of public transport as enforced by government policies. This policy
is to anticipate the rapid spread of the COVID-19 outbreak. The public was urged not to leave
their houses and stop activities like schooling, working, and worship, all of which can be done at
home. In addition, it also limits access to transportation modes to go out of town and vice versa.
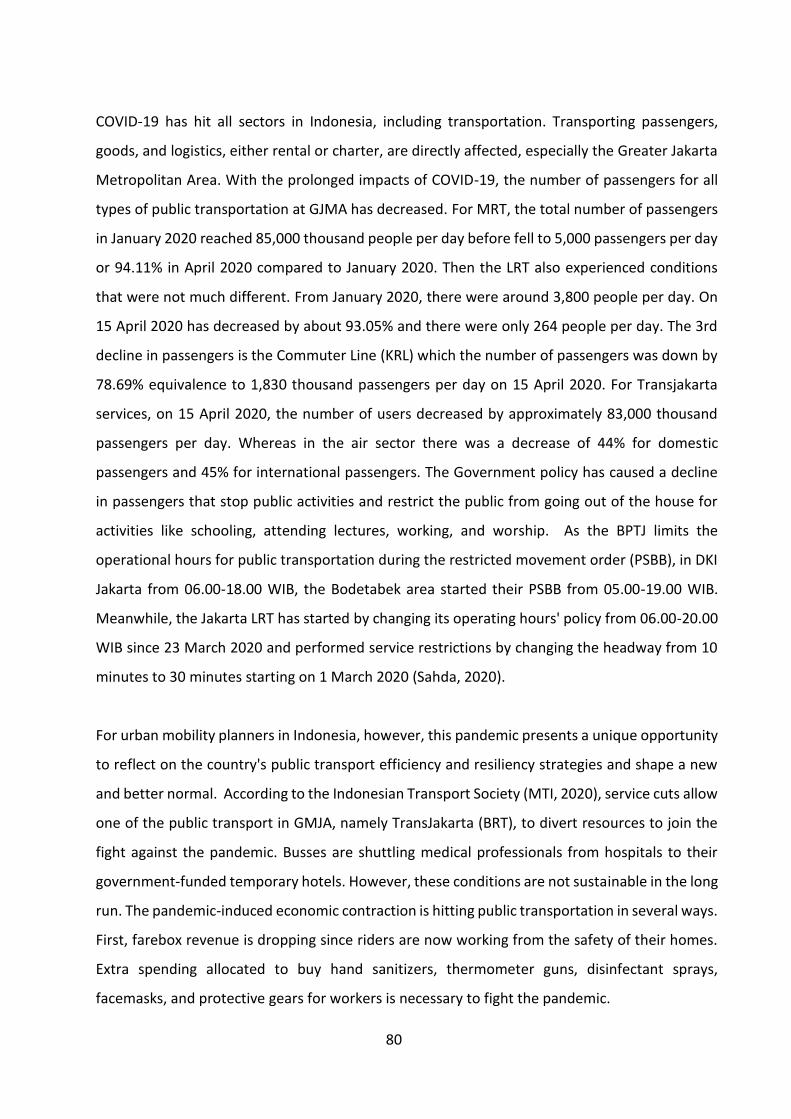
80
COVID-19 has hit all sectors in Indonesia, including transportation. Transporting passengers,
goods, and logistics, either rental or charter, are directly affected, especially the Greater Jakarta
Metropolitan Area. With the prolonged impacts of COVID-19, the number of passengers for all
types of public transportation at GJMA has decreased. For MRT, the total number of passengers
in January 2020 reached 85,000 thousand people per day before fell to 5,000 passengers per day
or 94.11% in April 2020 compared to January 2020. Then the LRT also experienced conditions
that were not much different. From January 2020, there were around 3,800 people per day. On
15 April 2020 has decreased by about 93.05% and there were only 264 people per day. The 3rd
decline in passengers is the Commuter Line (KRL) which the number of passengers was down by
78.69% equivalence to 1,830 thousand passengers per day on 15 April 2020. For Transjakarta
services, on 15 April 2020, the number of users decreased by approximately 83,000 thousand
passengers per day. Whereas in the air sector there was a decrease of 44% for domestic
passengers and 45% for international passengers. The Government policy has caused a decline
in passengers that stop public activities and restrict the public from going out of the house for
activities like schooling, attending lectures, working, and worship. As the BPTJ limits the
operational hours for public transportation during the restricted movement order (PSBB), in DKI
Jakarta from 06.00-18.00 WIB, the Bodetabek area started their PSBB from 05.00-19.00 WIB.
Meanwhile, the Jakarta LRT has started by changing its operating hours' policy from 06.00-20.00
WIB since 23 March 2020 and performed service restrictions by changing the headway from 10
minutes to 30 minutes starting on 1 March 2020 (Sahda, 2020).
For urban mobility planners in Indonesia, however, this pandemic presents a unique opportunity
to reflect on the country's public transport efficiency and resiliency strategies and shape a new
and better normal. According to the Indonesian Transport Society (MTI, 2020), service cuts allow
one of the public transport in GMJA, namely TransJakarta (BRT), to divert resources to join the
fight against the pandemic. Busses are shuttling medical professionals from hospitals to their
government-funded temporary hotels. However, these conditions are not sustainable in the long
run. The pandemic-induced economic contraction is hitting public transportation in several ways.
First, farebox revenue is dropping since riders are now working from the safety of their homes.
Extra spending allocated to buy hand sanitizers, thermometer guns, disinfectant sprays,
facemasks, and protective gears for workers is necessary to fight the pandemic.
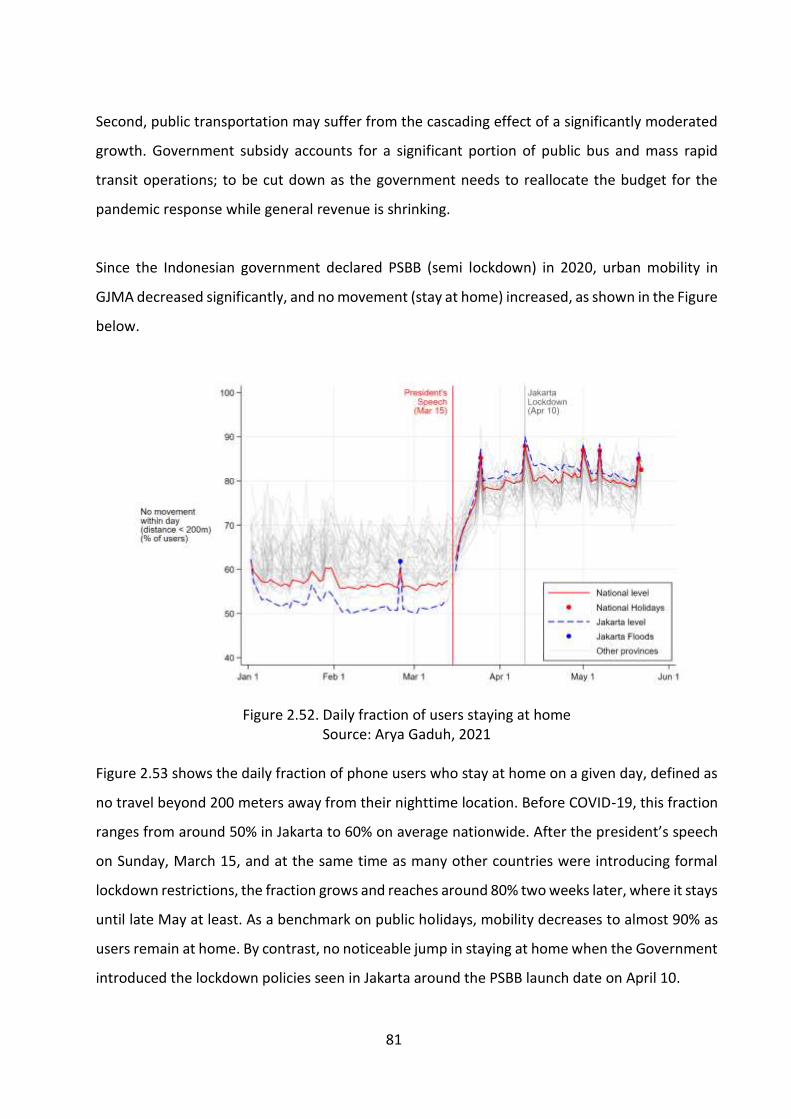
81
Second, public transportation may suffer from the cascading effect of a significantly moderated
growth. Government subsidy accounts for a significant portion of public bus and mass rapid
transit operations; to be cut down as the government needs to reallocate the budget for the
pandemic response while general revenue is shrinking.
Since the Indonesian government declared PSBB (semi lockdown) in 2020, urban mobility in
GJMA decreased significantly, and no movement (stay at home) increased, as shown in the Figure
below.
Figure 2.52. Daily fraction of users staying at home Source: Arya Gaduh, 2021
Figure 2.53 shows the daily fraction of phone users who stay at home on a given day, defined as
no travel beyond 200 meters away from their nighttime location. Before COVID-19, this fraction
ranges from around 50% in Jakarta to 60% on average nationwide. After the president’s speech
on Sunday, March 15, and at the same time as many other countries were introducing formal
lockdown restrictions, the fraction grows and reaches around 80% two weeks later, where it stays
until late May at least. As a benchmark on public holidays, mobility decreases to almost 90% as
users remain at home. By contrast, no noticeable jump in staying at home when the Government
introduced the lockdown policies seen in Jakarta around the PSBB launch date on April 10.
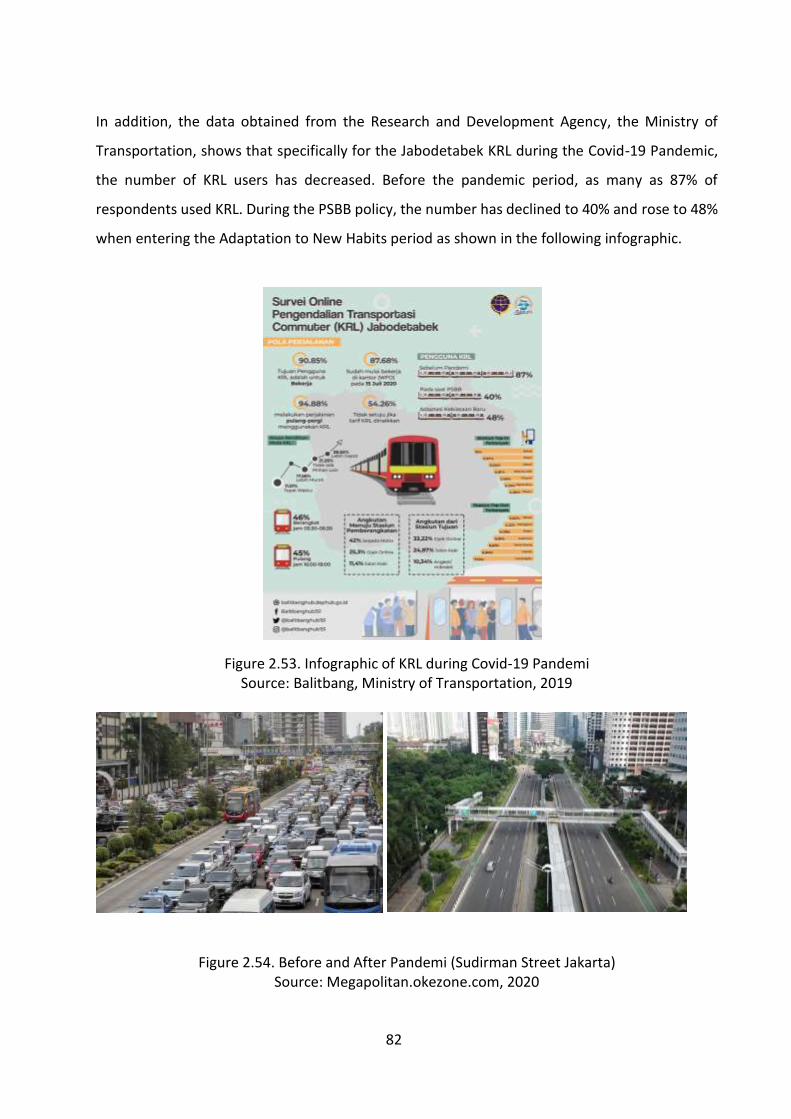
82
In addition, the data obtained from the Research and Development Agency, the Ministry of
Transportation, shows that specifically for the Jabodetabek KRL during the Covid-19 Pandemic,
the number of KRL users has decreased. Before the pandemic period, as many as 87% of
respondents used KRL. During the PSBB policy, the number has declined to 40% and rose to 48%
when entering the Adaptation to New Habits period as shown in the following infographic.
Figure 2.53. Infographic of KRL during Covid-19 Pandemi Source: Balitbang, Ministry of Transportation, 2019
Figure 2.54. Before and After Pandemi (Sudirman Street Jakarta) Source: Megapolitan.okezone.com, 2020
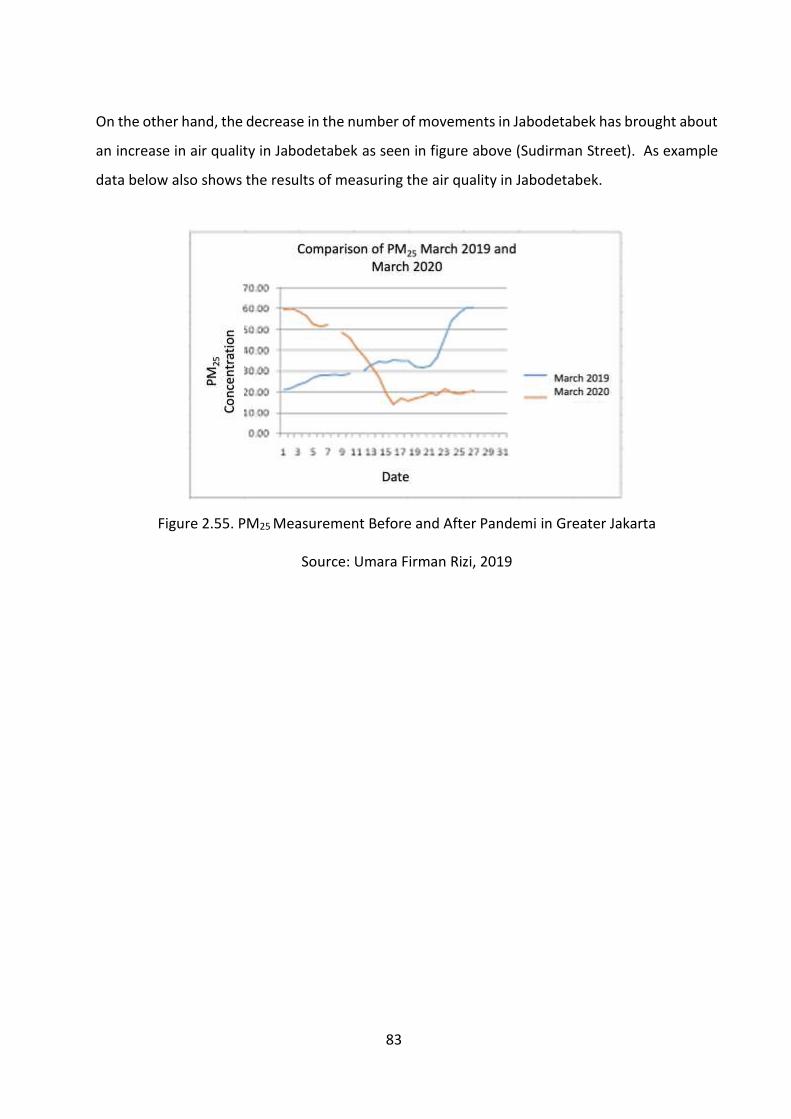
83
On the other hand, the decrease in the number of movements in Jabodetabek has brought about
an increase in air quality in Jabodetabek as seen in figure above (Sudirman Street). As example
data below also shows the results of measuring the air quality in Jabodetabek.
Figure 2.55. PM25 Measurement Before and After Pandemi in Greater Jakarta
Source: Umara Firman Rizi, 2019
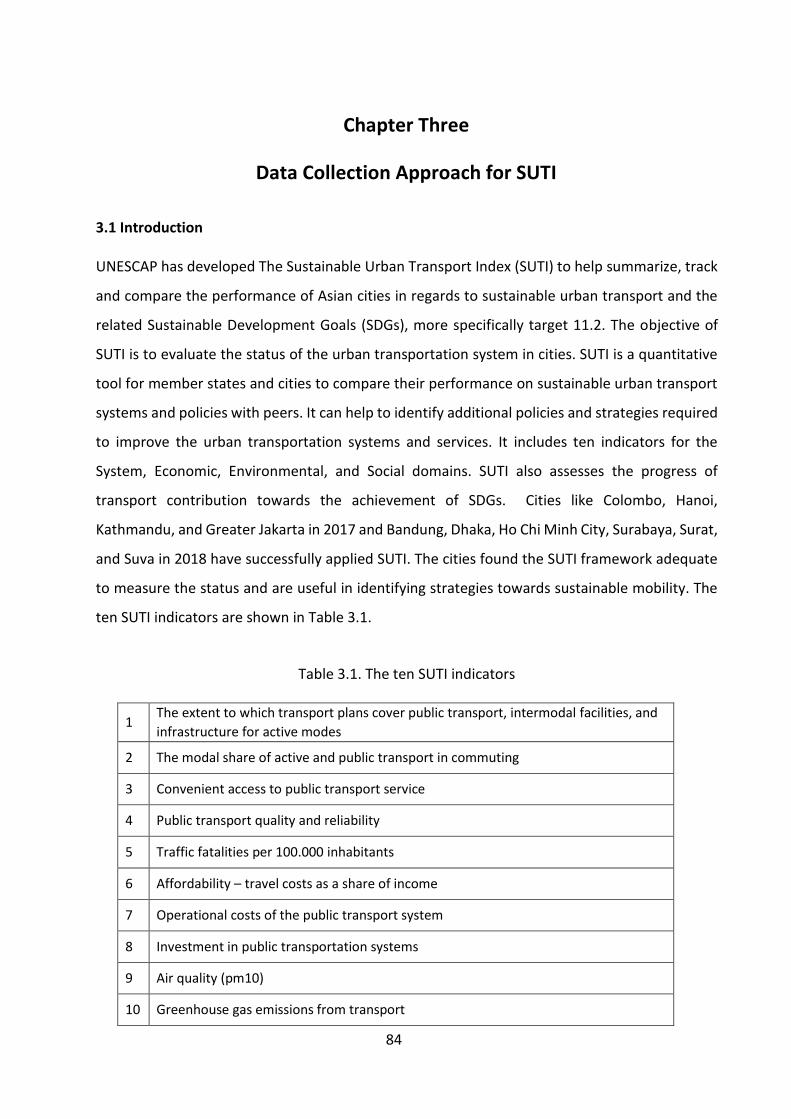
84
Chapter Three
Data Collection Approach for SUTI
3.1 Introduction UNESCAP has developed The Sustainable Urban Transport Index (SUTI) to help summarize, track
and compare the performance of Asian cities in regards to sustainable urban transport and the
related Sustainable Development Goals (SDGs), more specifically target 11.2. The objective of
SUTI is to evaluate the status of the urban transportation system in cities. SUTI is a quantitative
tool for member states and cities to compare their performance on sustainable urban transport
systems and policies with peers. It can help to identify additional policies and strategies required
to improve the urban transportation systems and services. It includes ten indicators for the
System, Economic, Environmental, and Social domains. SUTI also assesses the progress of
transport contribution towards the achievement of SDGs. Cities like Colombo, Hanoi,
Kathmandu, and Greater Jakarta in 2017 and Bandung, Dhaka, Ho Chi Minh City, Surabaya, Surat,
and Suva in 2018 have successfully applied SUTI. The cities found the SUTI framework adequate
to measure the status and are useful in identifying strategies towards sustainable mobility. The
ten SUTI indicators are shown in Table 3.1.
Table 3.1. The ten SUTI indicators
1 The extent to which transport plans cover public transport, intermodal facilities, and
infrastructure for active modes
2 The modal share of active and public transport in commuting
3 Convenient access to public transport service
4 Public transport quality and reliability
5 Traffic fatalities per 100.000 inhabitants
6 Affordability – travel costs as a share of income
7 Operational costs of the public transport system
8 Investment in public transportation systems
9 Air quality (pm10)
10 Greenhouse gas emissions from transport
85
3.2. Data Collection
Data collection to develop SUTI in Greater Jakarta includes field data collection, data collection
from the appropriate authority, and reviewing various relevant sources. Due to the Covid-19
situation, all data collection was from secondary data based on relevant parties in Indonesia. On
the other hand, consultation meetings (online) with GJTA, Ministry of Transportation Indonesia,
Directorate of Land Transportation, Directorate of Traffic, Ministry of Work, Toll Road Authority,
Police Traffic Department, Environmental Division, and relevant stakeholders organized during
data collection and analysis.
With the above activities, the approach taken is as follows:
1. Thoroughly researched the assessment and data collection guidelines to find
discrepancies and discussed with GJTA and UNESCAP experts to clarify issues in data
collection;
2. Researching and considering the development of transportation that has been planned
(JUTPI I Report 2018, JUTPI II Report 2020, RITJ 2018 Report, Japtrapis, 2018 Report, ITDP,
2019 Report, and other relevant reports)
3. Researching data and reports; analyze the survey results collected from all secondary data
such as published scientific research projects/research or statistical data from the
government.
4. Coordinate closely with functional agencies and stakeholders to collect the necessary
data for the ten SUTI indicators.
Many data collection activities are carried out online, both scheduled meetings with BPTJ and
also with transport authorities in all cities and regencies in the Greater Jakarta area. Below are
the data collection activities that have been carried out.

86
Figure 3.1 Meeting with Director of Traffic, Greater Jakarta Transport Authority (BPTJ) Source: Author Documentation, 2021
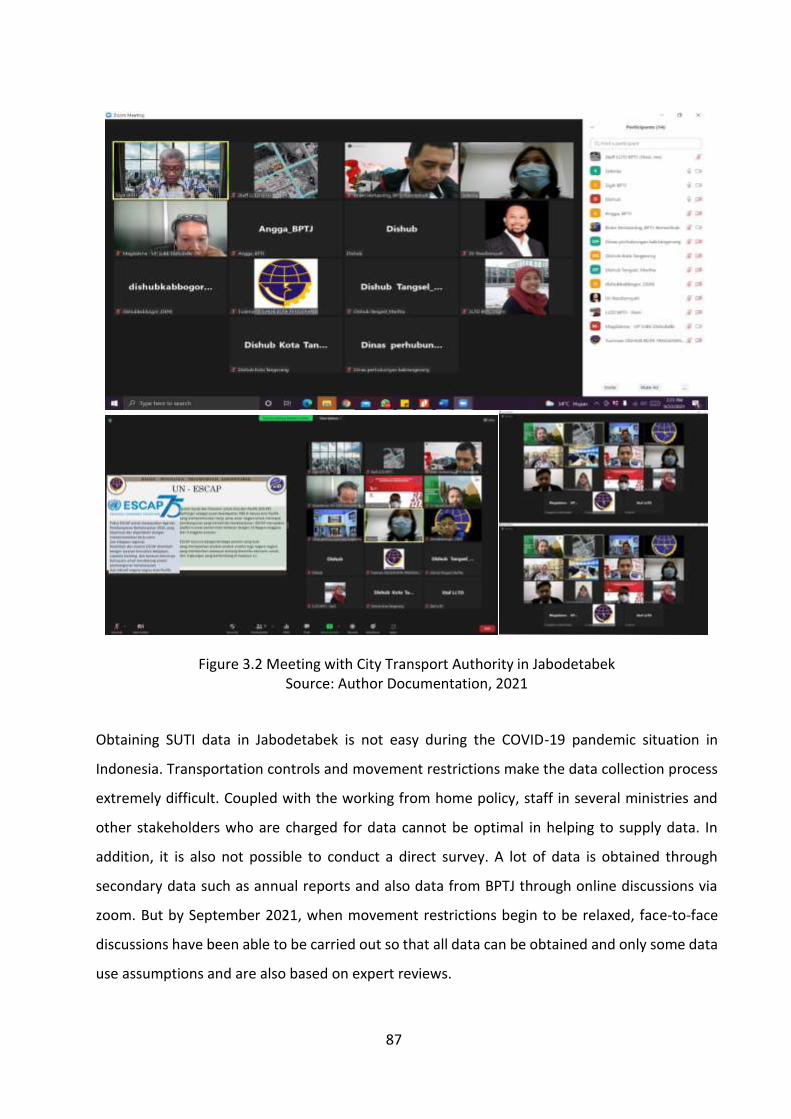
87
Figure 3.2 Meeting with City Transport Authority in Jabodetabek Source: Author Documentation, 2021
Obtaining SUTI data in Jabodetabek is not easy during the COVID-19 pandemic situation in
Indonesia. Transportation controls and movement restrictions make the data collection process
extremely difficult. Coupled with the working from home policy, staff in several ministries and
other stakeholders who are charged for data cannot be optimal in helping to supply data. In
addition, it is also not possible to conduct a direct survey. A lot of data is obtained through
secondary data such as annual reports and also data from BPTJ through online discussions via
zoom. But by September 2021, when movement restrictions begin to be relaxed, face-to-face
discussions have been able to be carried out so that all data can be obtained and only some data
use assumptions and are also based on expert reviews.

88
Table 3.2 Ten indicators of Sustainable Urban Transport Indeks
No Indicators Data
Sources Officals source
1
The extent to which transport plans cover public transport, intermodal facilities and infrastructure for active modes
- JABODETABEK Urban Transportation Policy Integration Project Phase 2 in the Republic of Indonesia Annex 02: JABODETABEK Urban Transportation Master Plan (Detailed RITJ) – 2019
- Jakarta Non-Motorized Transport (NMT) Vision and Design Guideline: Institute for Transportation Development Policy (ITDP – 2017-2022
- Guidelines for Planning, Provisioning and Utilization of Pedestrian Network Infrastructure and Facilities -Ministry of Work, Indonesia (PM PU No. 03/Prt/M/2014 Tentang Pedoman Perencanaan, Penyediaan, Dan Pemanfaatan Prasarana Dan Sarana Jaringan Pejalan Kaki Di Kawasan Perkotaan)
GJTA ITDP
Ministry of Work
2 Modal share of active and public transport in commuting
- JABODETABEK Urban Transportation Policy Integration Project Phase 2 in the Republic of Indonesia Annex 02: JABODETABEK Urban Transportation Master Plan (Detailed RITJ) – 2019
- Final Report of Study on KPI of Public Transportation GJTA, 2020
GTJA
3 Convenient access to public transport service
- Greater Jakarta Transport Autority
(GJTA)
- PT. KCI Annual Report 2017 and 2018
GTJA KCI
4 Public transport quality and reliability
- Study of Customer Satisfaction Index of BRT Transjakarta, 2019, International Conference on Science and Applied Science (ICSAS) 2019
GTJA BRT-Transjakata
5 Traffic fatalities per 100,000 inhabitants
- Traffic Police Report in 2019 for Greater Jakarta.
GTJA Traffic Police
6 Affordability – travel costs as part of income
- Survey on Transportation Cost-Jakarta City Transportation Council (DTKJ), 2021
- Final Report of Study on KPI of Public Transportation GJTA, 2020
DKTJ GJTA
7 Operational costs of the public transport system
- Annual Report MRT (2018-2020)
- Annual Report BRT (2018-2020)
- Annual Report LRT (2018-2020)
- Annual Report KRL (2018-2020)
MRT BRT
Transjakarta LRT KRL
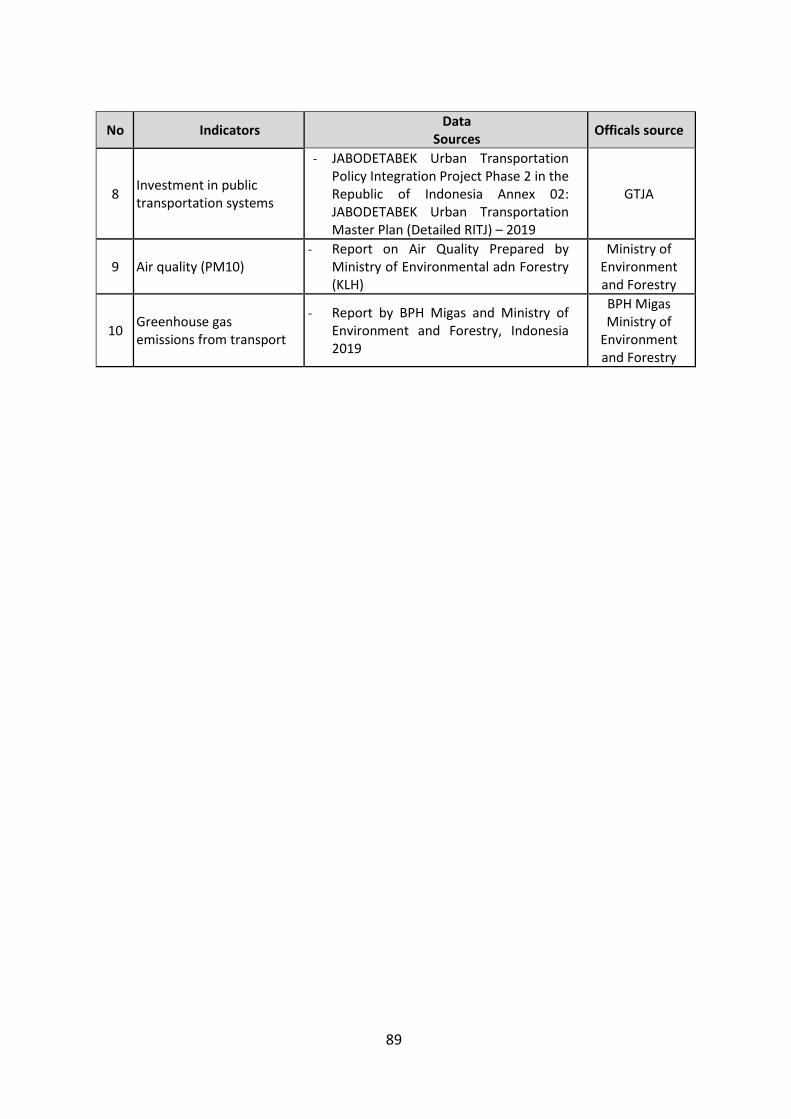
89
No Indicators Data
Sources Officals source
8 Investment in public transportation systems
- JABODETABEK Urban Transportation Policy Integration Project Phase 2 in the Republic of Indonesia Annex 02: JABODETABEK Urban Transportation Master Plan (Detailed RITJ) – 2019
GTJA
9 Air quality (PM10) - Report on Air Quality Prepared by
Ministry of Environmental adn Forestry (KLH)
Ministry of Environment and Forestry
10 Greenhouse gas emissions from transport
- Report by BPH Migas and Ministry of Environment and Forestry, Indonesia 2019
BPH Migas Ministry of
Environment and Forestry
90
Chapter Four
Data for SUTI 4.1. Sustainable Urban Transportation Index
The Sustainable Urban Transport Index (SUTI) developed by UNESCAP is to help summarize, track
and compare the performance of Asian cities concerning sustainable urban transport and the
related Sustainable Development Goals (SDGs), more specifically target 11.2. The objective of
SUTI is to evaluate the status of the urban transportation system in cities. SUTI is a quantitative
tool for member States and cities of a region to compare their performance on sustainable urban
transport systems and policies with peers. It can help to identify additional policies and strategies
required to improve the urban transportation systems and services. It includes the ten indicators
of the system, economic, environmental, and social domains. SUTI is also to assess the progress
of transport contribution towards the achievement of SDGs. The ten cities that have successfully
applied SUTI; Colombo, Hanoi, Kathmandu, and Greater Jakarta in 2017 and Bandung, Dhaka, Ho
Chi Minh City, Surabaya, Surat, and Suva in 2018. The cities found that the SUTI framework was
adequate to measure the status and helpful in identifying strategies towards sustainable
mobility.
The following table lists the ten indicators, measurement units, and normalization range. The
indicators and SUTI can help summarize, track and compare the state of urban transport
performance in a city. SUTI can serve as a helpful tool for cities to assess the achievement of the
SDG 11, more specifically target 11.2 and implementation of the New Urban Agenda.
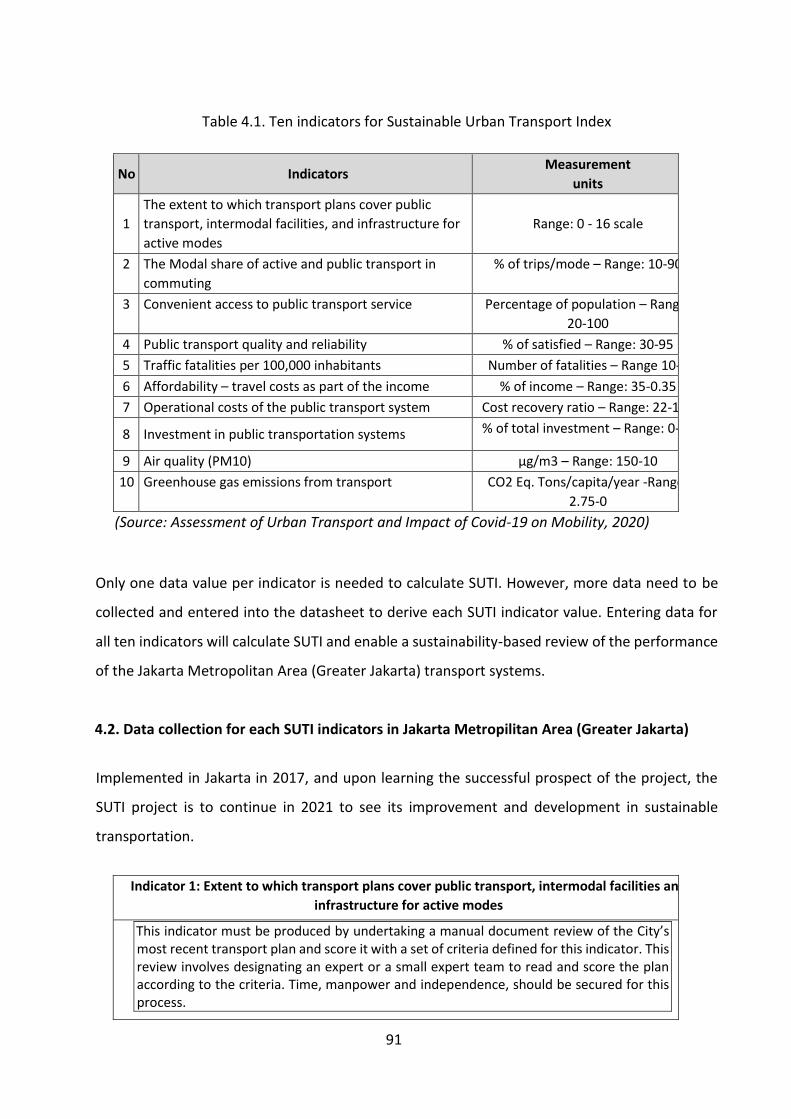
91
Table 4.1. Ten indicators for Sustainable Urban Transport Index
No Indicators Measurement
units
1
The extent to which transport plans cover public
transport, intermodal facilities, and infrastructure for
active modes
Range: 0 - 16 scale
2 The Modal share of active and public transport in
commuting
% of trips/mode – Range: 10-90
3 Convenient access to public transport service Percentage of population – Range:
20-100
4 Public transport quality and reliability % of satisfied – Range: 30-95
5 Traffic fatalities per 100,000 inhabitants Number of fatalities – Range 10-0
6 Affordability – travel costs as part of the income % of income – Range: 35-0.35
7 Operational costs of the public transport system Cost recovery ratio – Range: 22-100
8 Investment in public transportation systems % of total investment – Range: 0-50
9 Air quality (PM10) μg/m3 – Range: 150-10
10 Greenhouse gas emissions from transport CO2 Eq. Tons/capita/year -Range:
2.75-0
(Source: Assessment of Urban Transport and Impact of Covid-19 on Mobility, 2020)
Only one data value per indicator is needed to calculate SUTI. However, more data need to be
collected and entered into the datasheet to derive each SUTI indicator value. Entering data for
all ten indicators will calculate SUTI and enable a sustainability-based review of the performance
of the Jakarta Metropolitan Area (Greater Jakarta) transport systems.
4.2. Data collection for each SUTI indicators in Jakarta Metropilitan Area (Greater Jakarta)
Implemented in Jakarta in 2017, and upon learning the successful prospect of the project, the
SUTI project is to continue in 2021 to see its improvement and development in sustainable
transportation.
Indicator 1: Extent to which transport plans cover public transport, intermodal facilities and
infrastructure for active modes
This indicator must be produced by undertaking a manual document review of the City’s most recent transport plan and score it with a set of criteria defined for this indicator. This review involves designating an expert or a small expert team to read and score the plan according to the criteria. Time, manpower and independence, should be secured for this process.

92
Is City’s most recent (<10
years) transport plan
available? If yes when was it
prepared/approved?
Year: 2019
Title of the document:
JABODETABEK Urban Transportation Policy Integration Project Phase 2 in the Republic of Indonesia Annex 02: JABODETABEK Urban Transportation Master Plan (Detailed RITJ) – 2019 Jakarta Non-Motorized Transport (NMT) Vision and Design Guideline: Institute for Transportation Development Policy (ITDP – 2017-2022 Guidelines for Planning, Provisioning and Utilization of Pedestrian Network Infrastructure and Facilities -Ministry of Work, Indonesia (PM PU No. 03/Prt/M/2014 Tentang Pedoman Perencanaan, Penyediaan, Dan Pemanfaatan Prasarana Dan Sarana Jaringan Pejalan Kaki Di Kawasan Perkotaan)
Expert (s) reviewing the
document (Name,
Designation & affiliation)
Resdiansyah Ph.D, UPJ, Urban Transport Expert Selenia,
Greater Jakarta Transportation Agency.
Tabel 4.2 Indicator 1: Extent to which transport plans cover public transport, intermodal
facilities and infrastructure for active modes
Score
Aspects
0 No
coverage
1 Limited 2 Middle 3 Extensive 4 Leading
I) walking networks
No goals
No
designation
No budget
Vague goal
Little designation
seen in plans
Small or
unclear
budget
Qualitative
goals
Some designation in
1-2 major areas/corridors
Some budget
Quantitative goals Much
designation across city; Increasing
but realistic
budget
Ambitious
goals
Full designation across city
Major
secured new
funding
II) cycling
networks
No goals
No
designation
No budget
Vague goal
Little designation
seen in plans
Small or
unclear
budget
Qualitative
goals
Some designation in
1-2 major areas/corridors
Some budget
Quantitative goals Much
designation across city: Increasing
but realistic
budget
Ambitious
goals
Full designation across city
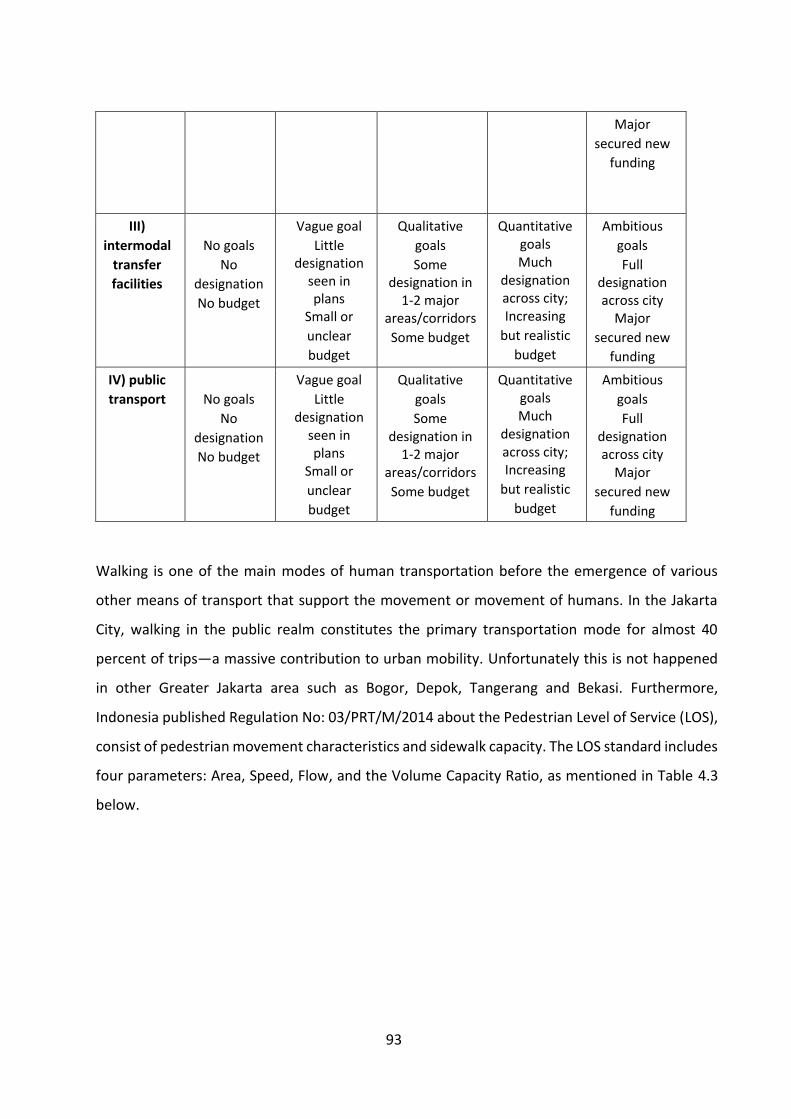
93
Major
secured new
funding
III)
intermodal
transfer
facilities
No goals
No
designation
No budget
Vague goal
Little designation
seen in plans
Small or
unclear
budget
Qualitative
goals
Some designation in
1-2 major areas/corridors
Some budget
Quantitative goals Much
designation across city; Increasing
but realistic
budget
Ambitious
goals
Full designation across city
Major
secured new
funding
IV) public
transport
No goals
No
designation
No budget
Vague goal
Little designation
seen in plans
Small or
unclear
budget
Qualitative
goals
Some designation in
1-2 major areas/corridors
Some budget
Quantitative goals Much
designation across city; Increasing
but realistic
budget
Ambitious
goals
Full designation across city
Major
secured new
funding
Walking is one of the main modes of human transportation before the emergence of various
other means of transport that support the movement or movement of humans. In the Jakarta
City, walking in the public realm constitutes the primary transportation mode for almost 40
percent of trips—a massive contribution to urban mobility. Unfortunately this is not happened
in other Greater Jakarta area such as Bogor, Depok, Tangerang and Bekasi. Furthermore,
Indonesia published Regulation No: 03/PRT/M/2014 about the Pedestrian Level of Service (LOS),
consist of pedestrian movement characteristics and sidewalk capacity. The LOS standard includes
four parameters: Area, Speed, Flow, and the Volume Capacity Ratio, as mentioned in Table 4.3
below.
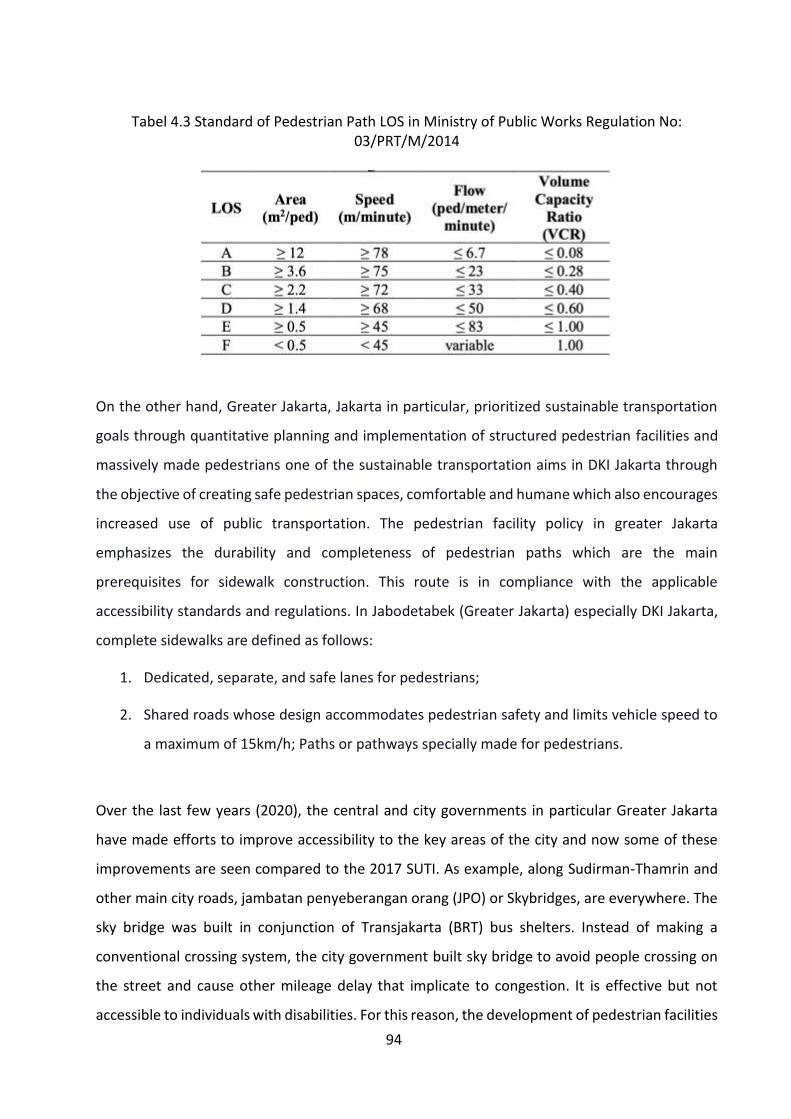
94
Tabel 4.3 Standard of Pedestrian Path LOS in Ministry of Public Works Regulation No: 03/PRT/M/2014
On the other hand, Greater Jakarta, Jakarta in particular, prioritized sustainable transportation
goals through quantitative planning and implementation of structured pedestrian facilities and
massively made pedestrians one of the sustainable transportation aims in DKI Jakarta through
the objective of creating safe pedestrian spaces, comfortable and humane which also encourages
increased use of public transportation. The pedestrian facility policy in greater Jakarta
emphasizes the durability and completeness of pedestrian paths which are the main
prerequisites for sidewalk construction. This route is in compliance with the applicable
accessibility standards and regulations. In Jabodetabek (Greater Jakarta) especially DKI Jakarta,
complete sidewalks are defined as follows:
1. Dedicated, separate, and safe lanes for pedestrians;
2. Shared roads whose design accommodates pedestrian safety and limits vehicle speed to
a maximum of 15km/h; Paths or pathways specially made for pedestrians.
Over the last few years (2020), the central and city governments in particular Greater Jakarta
have made efforts to improve accessibility to the key areas of the city and now some of these
improvements are seen compared to the 2017 SUTI. As example, along Sudirman-Thamrin and
other main city roads, jambatan penyeberangan orang (JPO) or Skybridges, are everywhere. The
sky bridge was built in conjunction of Transjakarta (BRT) bus shelters. Instead of making a
conventional crossing system, the city government built sky bridge to avoid people crossing on
the street and cause other mileage delay that implicate to congestion. It is effective but not
accessible to individuals with disabilities. For this reason, the development of pedestrian facilities
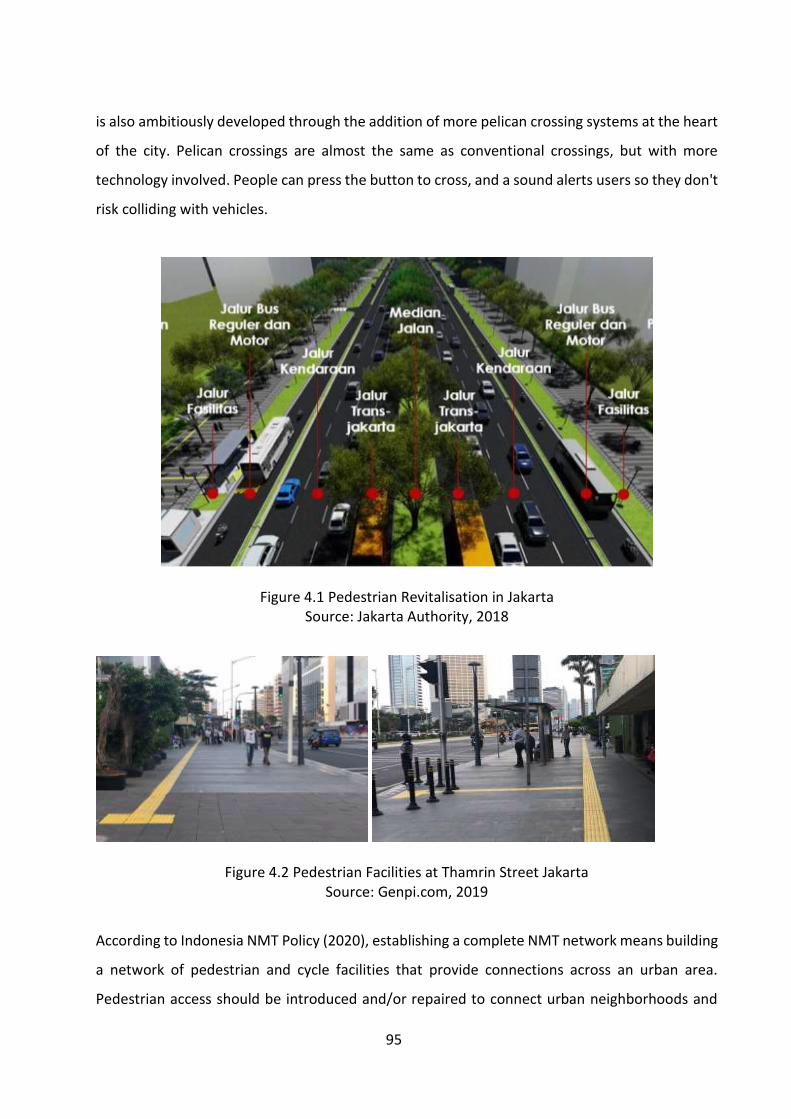
95
is also ambitiously developed through the addition of more pelican crossing systems at the heart
of the city. Pelican crossings are almost the same as conventional crossings, but with more
technology involved. People can press the button to cross, and a sound alerts users so they don't
risk colliding with vehicles.
Figure 4.1 Pedestrian Revitalisation in Jakarta Source: Jakarta Authority, 2018
Figure 4.2 Pedestrian Facilities at Thamrin Street Jakarta Source: Genpi.com, 2019
According to Indonesia NMT Policy (2020), establishing a complete NMT network means building
a network of pedestrian and cycle facilities that provide connections across an urban area.
Pedestrian access should be introduced and/or repaired to connect urban neighborhoods and

96
encourage walking as a preferred mode of mobility. A key objective of the network is to link
various land uses and activities to public transport. Supporting the creation of complete
pedestrian facilities means connecting pedestrian facilities to the public transport system and
improving the crossings to public transport stops. Areas needed to be prioritized to support this
function are streets within 500– 1,000 m of bus stops and mass rapid transit stations (e.g.,
Transjakarta, (BRT), KRL Commuter Line, MRT, and LRT). Below is the guideline that illustrates
how commercial activity and street vending can coexist with pedestrian space and sample cross-
section from the guideline incorporating dedicated space for walking, cycling, and public
transport in Greater Jakarta.
Figure 4.3 Sample cross section from the guideline incorporating dedicated space for walking, cycling, and public transport in Greater Jakarta
Source: UN Environment, 2020
In addition, according to Indonesia NMT Guideline (2020), the cycling network in Jabodetabek
has become a priority since 2019, and the goal of making NMT (cycling) one of the parameters in
suitable transportation is massively developed in the Jakarta metropolitan area with the action
plan.
1. Ensure the infrastructure is accessible to vulnerable groups (elderly, children, women,
and people with disabilities)/ provide universal access;
2. Develop high-quality NMT infrastructure which complies with applicable design and
construction standards;
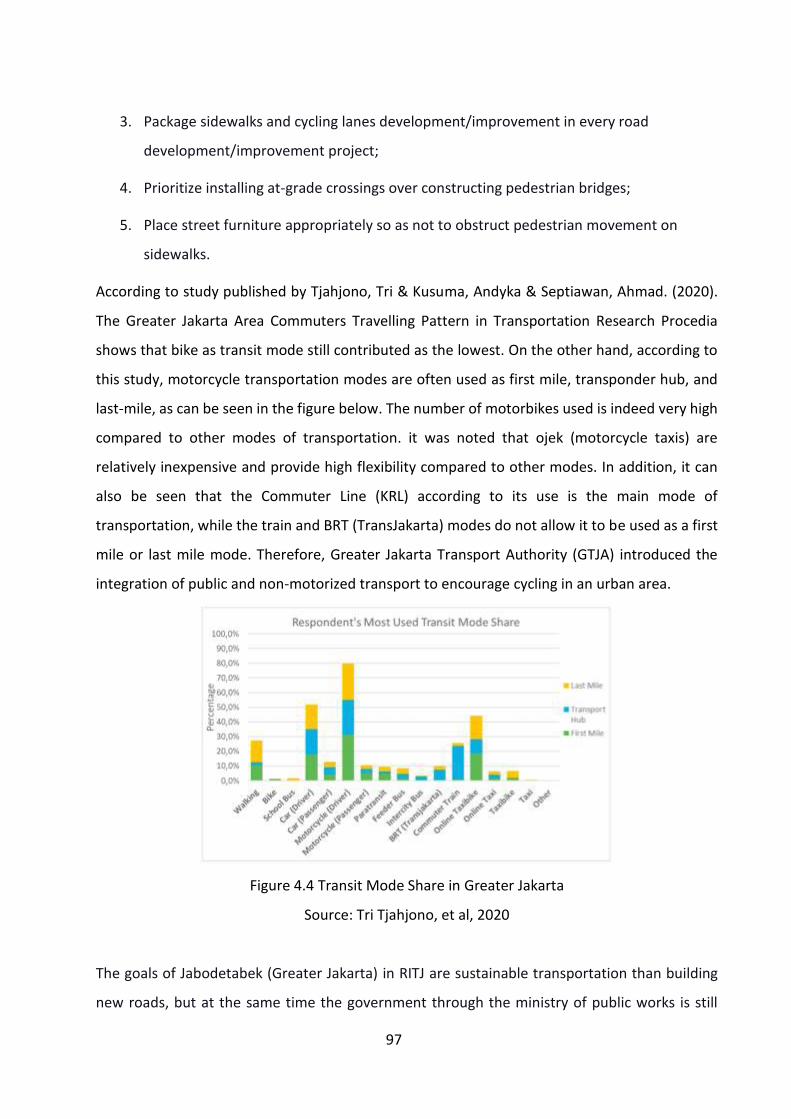
97
3. Package sidewalks and cycling lanes development/improvement in every road
development/improvement project;
4. Prioritize installing at-grade crossings over constructing pedestrian bridges;
5. Place street furniture appropriately so as not to obstruct pedestrian movement on
sidewalks.
According to study published by Tjahjono, Tri & Kusuma, Andyka & Septiawan, Ahmad. (2020).
The Greater Jakarta Area Commuters Travelling Pattern in Transportation Research Procedia
shows that bike as transit mode still contributed as the lowest. On the other hand, according to
this study, motorcycle transportation modes are often used as first mile, transponder hub, and
last-mile, as can be seen in the figure below. The number of motorbikes used is indeed very high
compared to other modes of transportation. it was noted that ojek (motorcycle taxis) are
relatively inexpensive and provide high flexibility compared to other modes. In addition, it can
also be seen that the Commuter Line (KRL) according to its use is the main mode of
transportation, while the train and BRT (TransJakarta) modes do not allow it to be used as a first
mile or last mile mode. Therefore, Greater Jakarta Transport Authority (GTJA) introduced the
integration of public and non-motorized transport to encourage cycling in an urban area.
Figure 4.4 Transit Mode Share in Greater Jakarta
Source: Tri Tjahjono, et al, 2020
The goals of Jabodetabek (Greater Jakarta) in RITJ are sustainable transportation than building
new roads, but at the same time the government through the ministry of public works is still
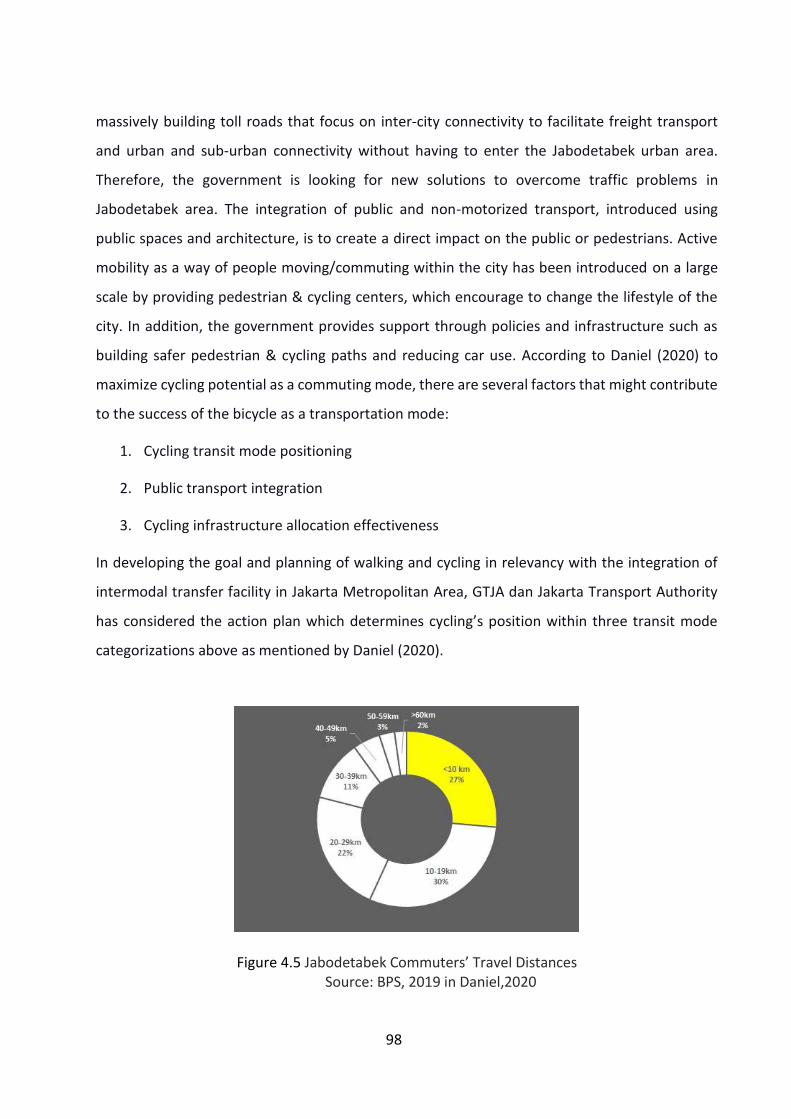
98
massively building toll roads that focus on inter-city connectivity to facilitate freight transport
and urban and sub-urban connectivity without having to enter the Jabodetabek urban area.
Therefore, the government is looking for new solutions to overcome traffic problems in
Jabodetabek area. The integration of public and non-motorized transport, introduced using
public spaces and architecture, is to create a direct impact on the public or pedestrians. Active
mobility as a way of people moving/commuting within the city has been introduced on a large
scale by providing pedestrian & cycling centers, which encourage to change the lifestyle of the
city. In addition, the government provides support through policies and infrastructure such as
building safer pedestrian & cycling paths and reducing car use. According to Daniel (2020) to
maximize cycling potential as a commuting mode, there are several factors that might contribute
to the success of the bicycle as a transportation mode:
1. Cycling transit mode positioning
2. Public transport integration
3. Cycling infrastructure allocation effectiveness
In developing the goal and planning of walking and cycling in relevancy with the integration of
intermodal transfer facility in Jakarta Metropolitan Area, GTJA dan Jakarta Transport Authority
has considered the action plan which determines cycling’s position within three transit mode
categorizations above as mentioned by Daniel (2020).
Figure 4.5 Jabodetabek Commuters’ Travel Distances Source: BPS, 2019 in Daniel,2020

99
According to Jabodetabek Commuters Statistic by BPS (2019), only 27% of total commuters have
less than 10km of total travel distance, while the remaining 83% must travel beyond 10 km. The
5–10 km comfortable cycling radius is less than able to make cycling the main transport hub that
works for the majority of commuters. Therefore, we can safely assume that cycling works best if
positioned as a first-mile and last-mile mode. But in reality, cycling in Jabodetabek is not yet an
alternative mode of transport for work, even though 27% of the journey distance is less than 10
km. The majority still use online motorcycle taxis (Gojek and Grab). Until now, there is no
complete data on how many bicycle users are used for work trips in Jabodetabek.
Figure 4.6 Bicycle and Walking Network in Jakarta Source: Abimantra Pradhana, JAM_City, 2015
In 2021, Jakarta, Indonesia, a city of 10 million, whose transport network serves 30 million in the
greater city area, is the winner of the 2021 Sustainable Transport Award. Jakarta's win is the
culmination of years of groundbreaking work and transformation by the city. The city has taken
concrete steps to shift its car-oriented city planning paradigm and provide seamless mobility
through the "Jaklingko" scheme, an interconnected transit trip for the passenger. They are
beginning with fare integration that allows passengers a three-hour window with the once flat
fare for road-based transit, and that will be expanded to rail. The city is also improving physical
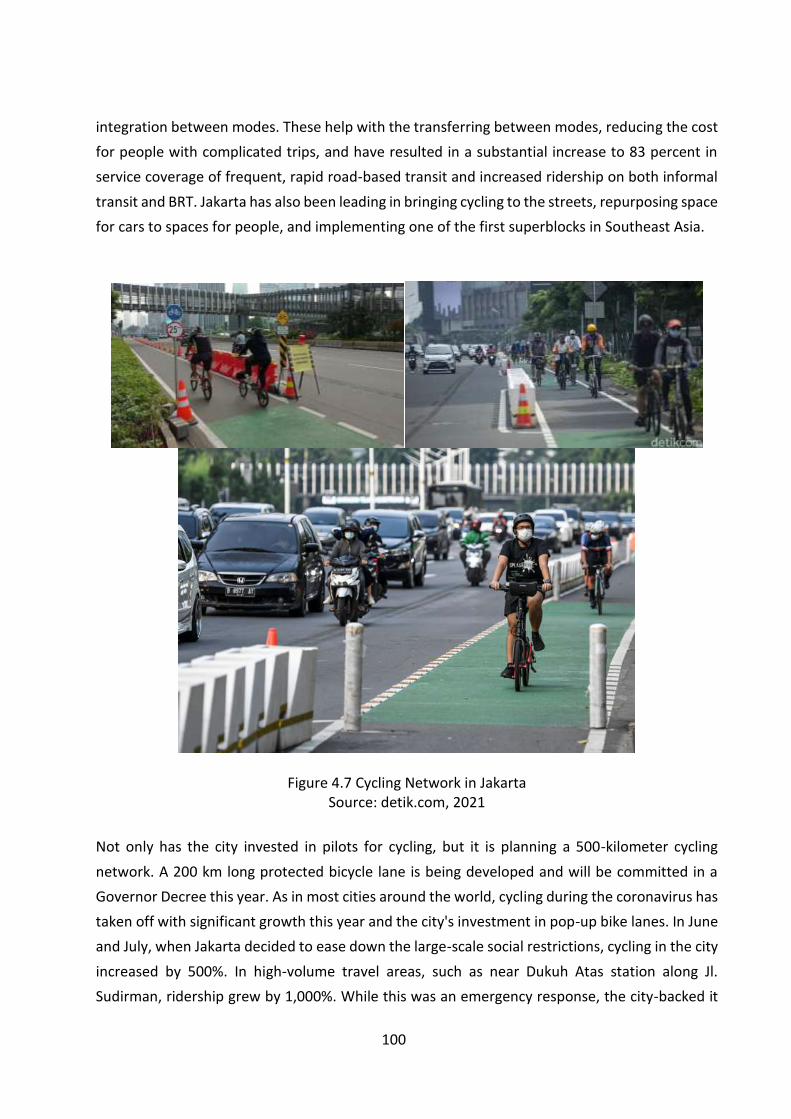
100
integration between modes. These help with the transferring between modes, reducing the cost
for people with complicated trips, and have resulted in a substantial increase to 83 percent in
service coverage of frequent, rapid road-based transit and increased ridership on both informal
transit and BRT. Jakarta has also been leading in bringing cycling to the streets, repurposing space
for cars to spaces for people, and implementing one of the first superblocks in Southeast Asia.
Figure 4.7 Cycling Network in Jakarta Source: detik.com, 2021
Not only has the city invested in pilots for cycling, but it is planning a 500-kilometer cycling
network. A 200 km long protected bicycle lane is being developed and will be committed in a
Governor Decree this year. As in most cities around the world, cycling during the coronavirus has
taken off with significant growth this year and the city's investment in pop-up bike lanes. In June
and July, when Jakarta decided to ease down the large-scale social restrictions, cycling in the city
increased by 500%. In high-volume travel areas, such as near Dukuh Atas station along Jl.
Sudirman, ridership grew by 1,000%. While this was an emergency response, the city-backed it
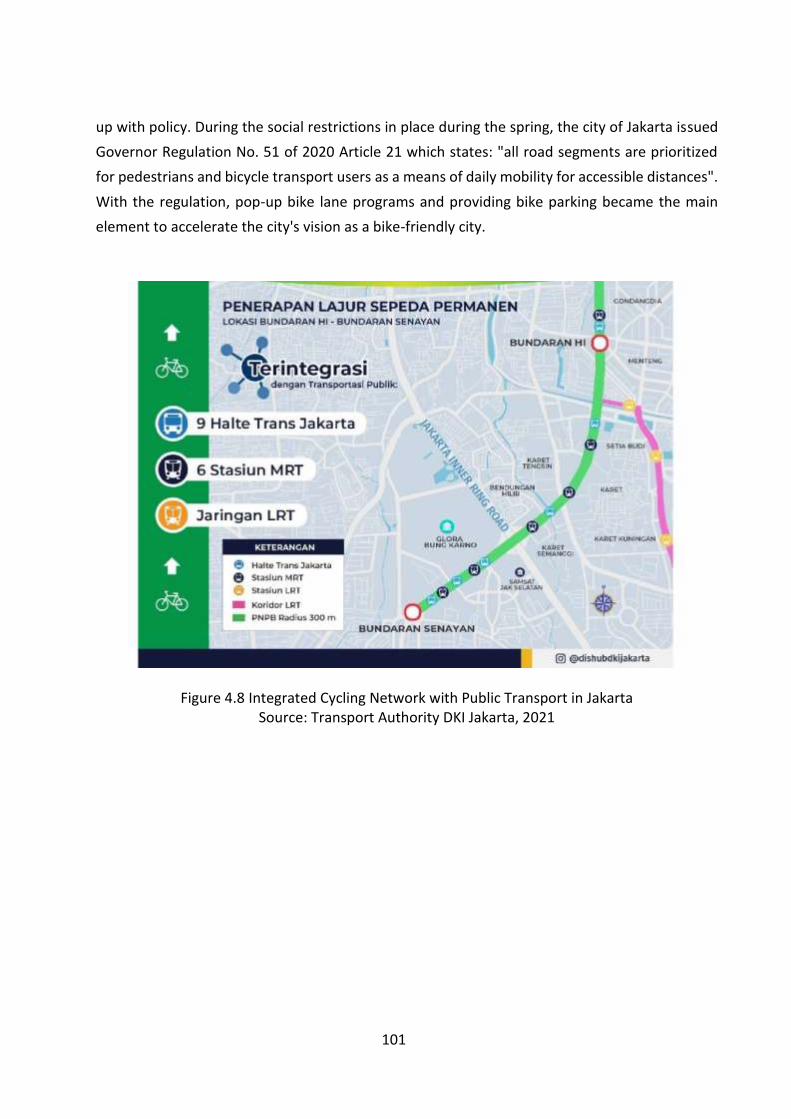
101
up with policy. During the social restrictions in place during the spring, the city of Jakarta issued
Governor Regulation No. 51 of 2020 Article 21 which states: "all road segments are prioritized
for pedestrians and bicycle transport users as a means of daily mobility for accessible distances".
With the regulation, pop-up bike lane programs and providing bike parking became the main
element to accelerate the city's vision as a bike-friendly city.
Figure 4.8 Integrated Cycling Network with Public Transport in Jakarta Source: Transport Authority DKI Jakarta, 2021
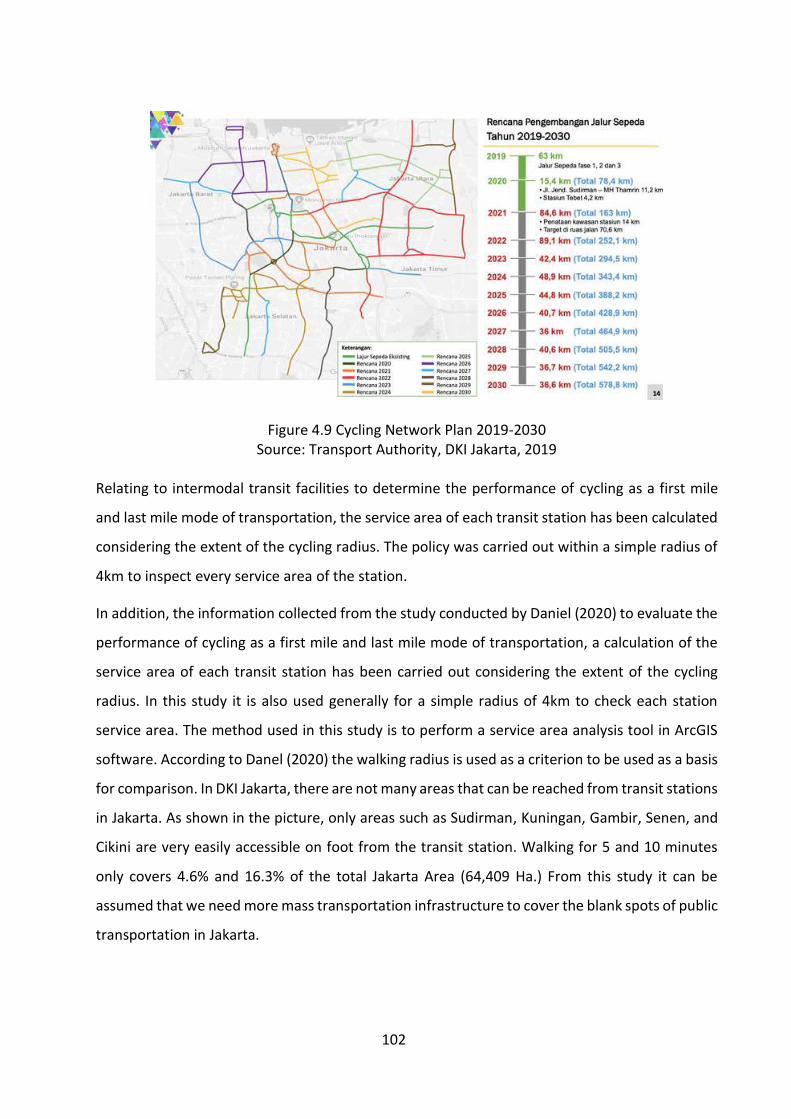
102
Figure 4.9 Cycling Network Plan 2019-2030 Source: Transport Authority, DKI Jakarta, 2019
Relating to intermodal transit facilities to determine the performance of cycling as a first mile
and last mile mode of transportation, the service area of each transit station has been calculated
considering the extent of the cycling radius. The policy was carried out within a simple radius of
4km to inspect every service area of the station.
In addition, the information collected from the study conducted by Daniel (2020) to evaluate the
performance of cycling as a first mile and last mile mode of transportation, a calculation of the
service area of each transit station has been carried out considering the extent of the cycling
radius. In this study it is also used generally for a simple radius of 4km to check each station
service area. The method used in this study is to perform a service area analysis tool in ArcGIS
software. According to Danel (2020) the walking radius is used as a criterion to be used as a basis
for comparison. In DKI Jakarta, there are not many areas that can be reached from transit stations
in Jakarta. As shown in the picture, only areas such as Sudirman, Kuningan, Gambir, Senen, and
Cikini are very easily accessible on foot from the transit station. Walking for 5 and 10 minutes
only covers 4.6% and 16.3% of the total Jakarta Area (64,409 Ha.) From this study it can be
assumed that we need more mass transportation infrastructure to cover the blank spots of public
transportation in Jakarta.
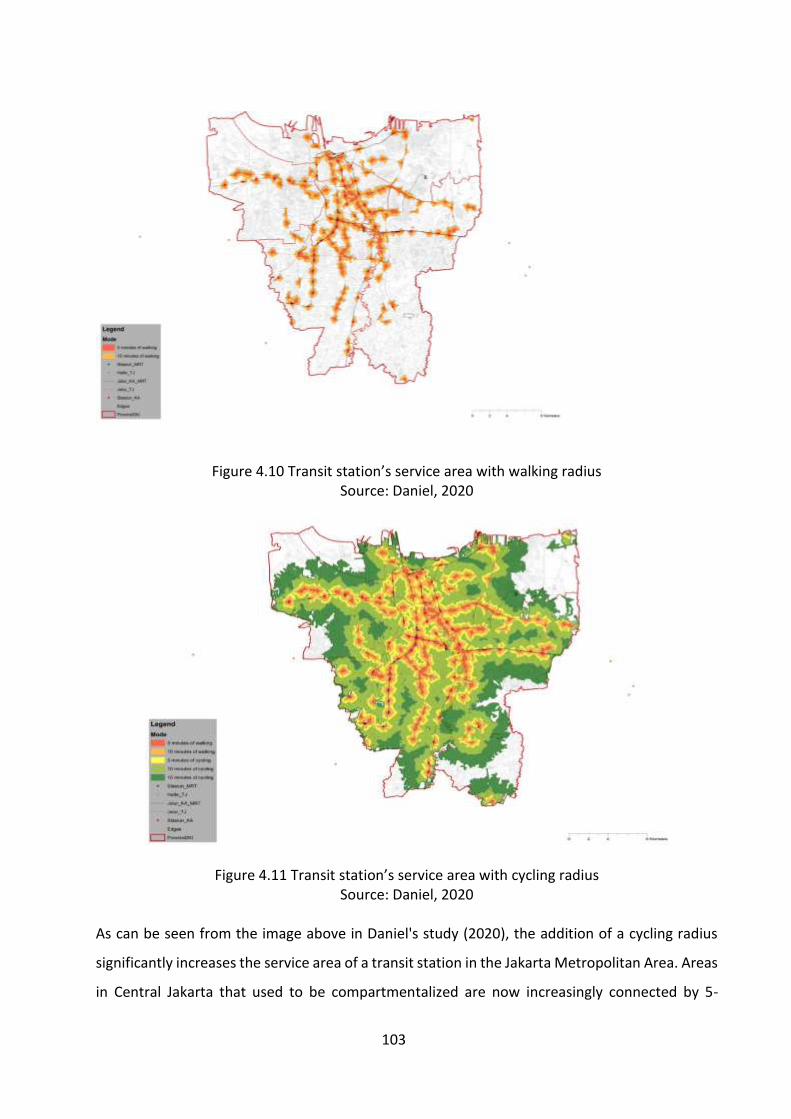
103
Figure 4.10 Transit station’s service area with walking radius
Source: Daniel, 2020
Figure 4.11 Transit station’s service area with cycling radius Source: Daniel, 2020
As can be seen from the image above in Daniel's study (2020), the addition of a cycling radius
significantly increases the service area of a transit station in the Jakarta Metropolitan Area. Areas
in Central Jakarta that used to be compartmentalized are now increasingly connected by 5-
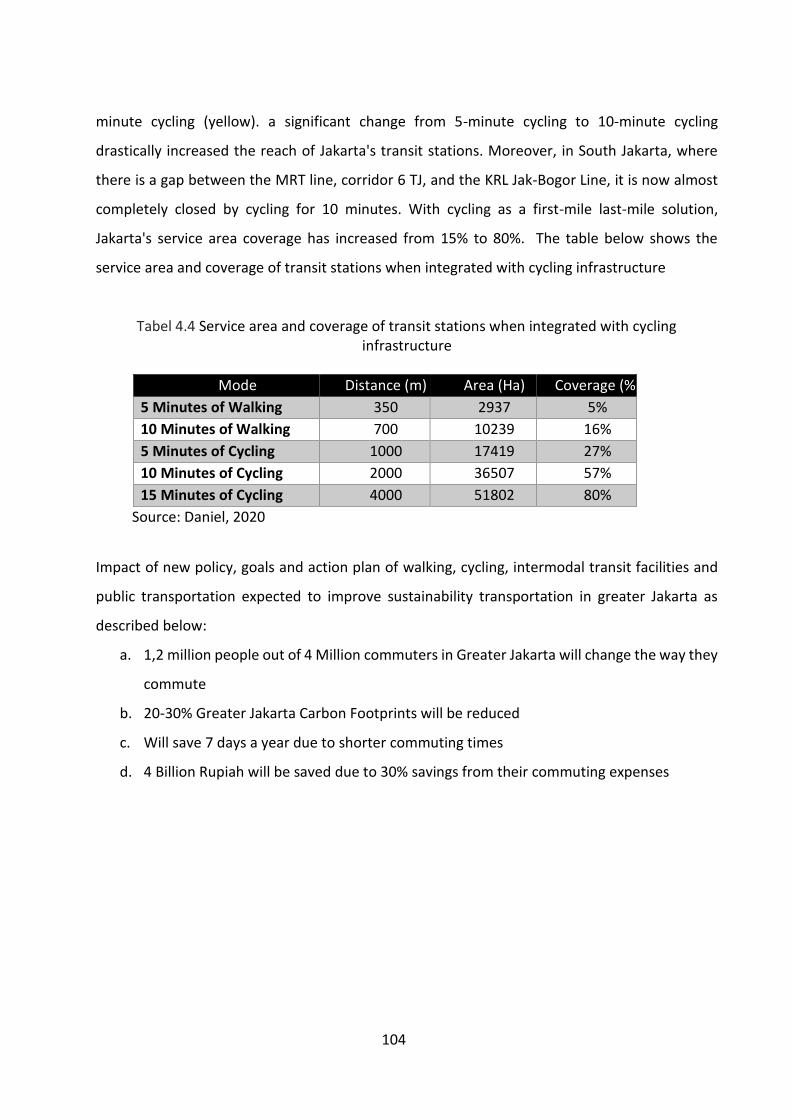
104
minute cycling (yellow). a significant change from 5-minute cycling to 10-minute cycling
drastically increased the reach of Jakarta's transit stations. Moreover, in South Jakarta, where
there is a gap between the MRT line, corridor 6 TJ, and the KRL Jak-Bogor Line, it is now almost
completely closed by cycling for 10 minutes. With cycling as a first-mile last-mile solution,
Jakarta's service area coverage has increased from 15% to 80%. The table below shows the
service area and coverage of transit stations when integrated with cycling infrastructure
Tabel 4.4 Service area and coverage of transit stations when integrated with cycling infrastructure
Mode Distance (m) Area (Ha) Coverage (%)
5 Minutes of Walking 350 2937 5%
10 Minutes of Walking 700 10239 16%
5 Minutes of Cycling 1000 17419 27%
10 Minutes of Cycling 2000 36507 57%
15 Minutes of Cycling 4000 51802 80%
Source: Daniel, 2020
Impact of new policy, goals and action plan of walking, cycling, intermodal transit facilities and
public transportation expected to improve sustainability transportation in greater Jakarta as
described below:
a. 1,2 million people out of 4 Million commuters in Greater Jakarta will change the way they
commute
b. 20-30% Greater Jakarta Carbon Footprints will be reduced
c. Will save 7 days a year due to shorter commuting times
d. 4 Billion Rupiah will be saved due to 30% savings from their commuting expenses
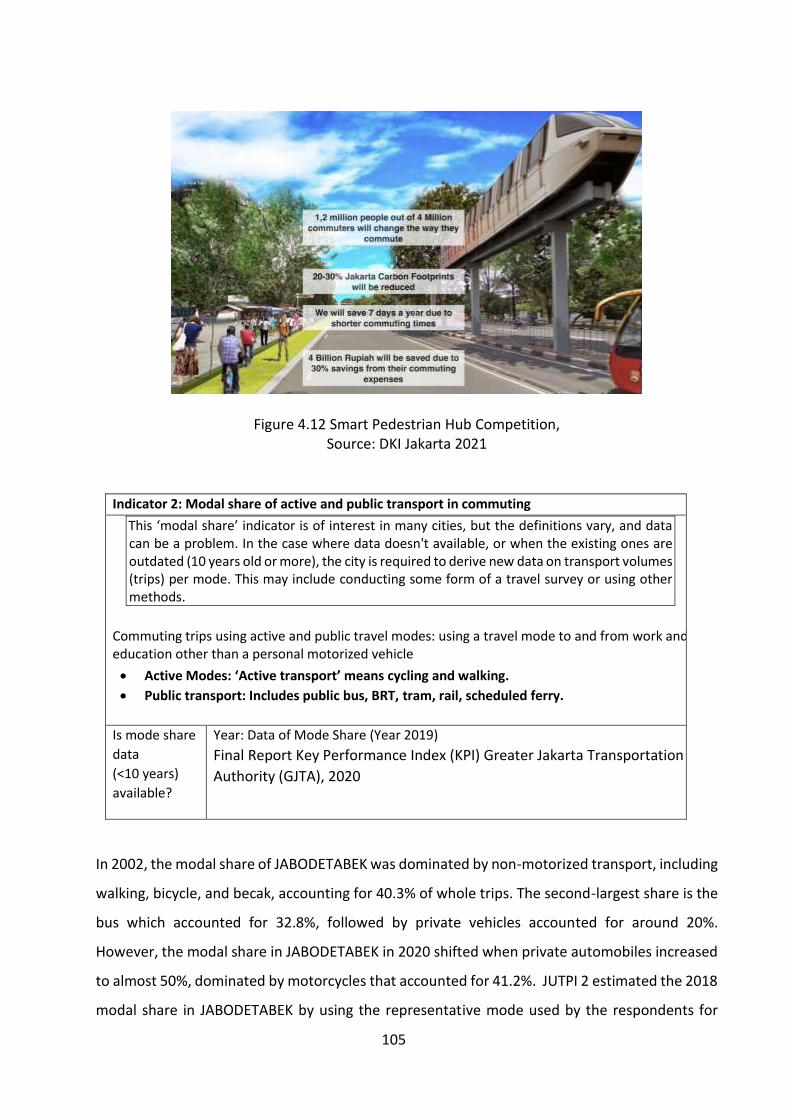
105
Figure 4.12 Smart Pedestrian Hub Competition, Source: DKI Jakarta 2021
Indicator 2: Modal share of active and public transport in commuting
This ‘modal share’ indicator is of interest in many cities, but the definitions vary, and data can be a problem. In the case where data doesn't available, or when the existing ones are outdated (10 years old or more), the city is required to derive new data on transport volumes (trips) per mode. This may include conducting some form of a travel survey or using other methods.
Commuting trips using active and public travel modes: using a travel mode to and from work and education other than a personal motorized vehicle
• Active Modes: ‘Active transport’ means cycling and walking.
• Public transport: Includes public bus, BRT, tram, rail, scheduled ferry.
Is mode share
data
(<10 years)
available?
Year: Data of Mode Share (Year 2019)
Final Report Key Performance Index (KPI) Greater Jakarta Transportation
Authority (GJTA), 2020
In 2002, the modal share of JABODETABEK was dominated by non-motorized transport, including
walking, bicycle, and becak, accounting for 40.3% of whole trips. The second-largest share is the
bus which accounted for 32.8%, followed by private vehicles accounted for around 20%.
However, the modal share in JABODETABEK in 2020 shifted when private automobiles increased
to almost 50%, dominated by motorcycles that accounted for 41.2%. JUTPI 2 estimated the 2018
modal share in JABODETABEK by using the representative mode used by the respondents for

106
every tour. Private automobile share has been rocketing and now dominating the mode share
of JABODETABEK with over 90% in total (especially motorcycles, for 75.8%) except for NMT.
Meanwhile, the share of public transport (Conventional Bus, TransJakarta, Commuterline (Train),
Ojek, Taxi, Bajaj) has drastically declined over the years.
Figure 4.13. Modal Share in JABODETABEK
Source: Transportation Authority (GJTA), 2020
Figure 4.14. Modal Share in JABODETABEK (Excluding NMT) Source: Transportation Authority (GJTA), 2020
Figure 4.14 shows a comparison of modal share in the DKI Jakarta and BODETABEK areas. In
general, modal share in DKI Jakarta and BODETABEK showed a similar trend. However, the share
of Ojek in DKI Jakarta dominates the modal share among all types of public transport. Unlike DKI
Jakarta, BODETABEK has the largest share in taking conventional buses among other public
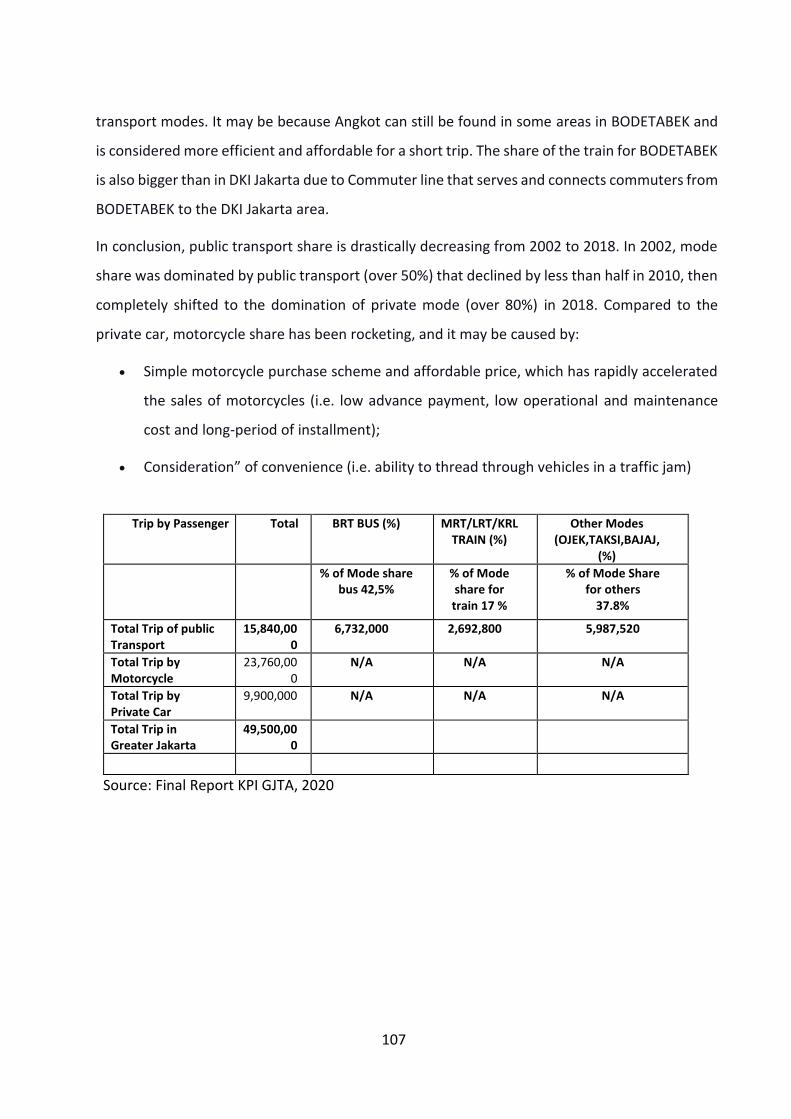
107
transport modes. It may be because Angkot can still be found in some areas in BODETABEK and
is considered more efficient and affordable for a short trip. The share of the train for BODETABEK
is also bigger than in DKI Jakarta due to Commuter line that serves and connects commuters from
BODETABEK to the DKI Jakarta area.
In conclusion, public transport share is drastically decreasing from 2002 to 2018. In 2002, mode
share was dominated by public transport (over 50%) that declined by less than half in 2010, then
completely shifted to the domination of private mode (over 80%) in 2018. Compared to the
private car, motorcycle share has been rocketing, and it may be caused by:
• Simple motorcycle purchase scheme and affordable price, which has rapidly accelerated
the sales of motorcycles (i.e. low advance payment, low operational and maintenance
cost and long-period of installment);
• Consideration” of convenience (i.e. ability to thread through vehicles in a traffic jam)
Trip by Passenger Total BRT BUS (%) MRT/LRT/KRLTRAIN (%)
Other Modes (OJEK,TAKSI,BAJAJ,
(%)
% of Mode share bus 42,5%
% of Mode share for train 17 %
% of Mode Share for others
37.8%
Total Trip of public Transport
15,840,000
6,732,000
2,692,800 5,987,520
Total Trip by Motorcycle
23,760,000
N/A N/A N/A
Total Trip by Private Car
9,900,000 N/A N/A N/A
Total Trip in Greater Jakarta
49,500,000
Source: Final Report KPI GJTA, 2020

108
In January 2019, Transjakarta celebrated its 15thanniversary as the first BRT in South East Asia.
Transjakarta has become the longest BRT in the world within 15 years and now boasts a daily
ridership of 800,000 people. Its popularity and network are still growing due to the ease of access
for residents and making the BRT corridor part of the implementation of transit-oriented
development (TOD). The number of Transjakarta passengers continues to grow together with the
system improvements, including ticketing systems, integration with other public transportation,
corridors, and route expansion. The increase in the number of passengers is directly proportional
to the population density around the BRT network through the increase in BRT access, making
residents around the 500-1000 m zone choose to use this BRT.
Indicator 3: Convenient access to public transport service
This indicator requires the combination of data for the density and frequency of the public
transport (PT) service network, and data for the number of citizens living in 500 m buffer
zones of main nodes in the network. There are different methods to estimate these data as
described in section 3.3, but it may require some effort to derive data both for PT frequency
and population inside the buffer zones.
Population density Based on population density data around the public
transportation network (BRT and Commuter line),
2020. Data is obtained from:
a. Greater Jakarta Transport Autority (GJTA)
b. PT. KCI Annual Report 2017 and 2018
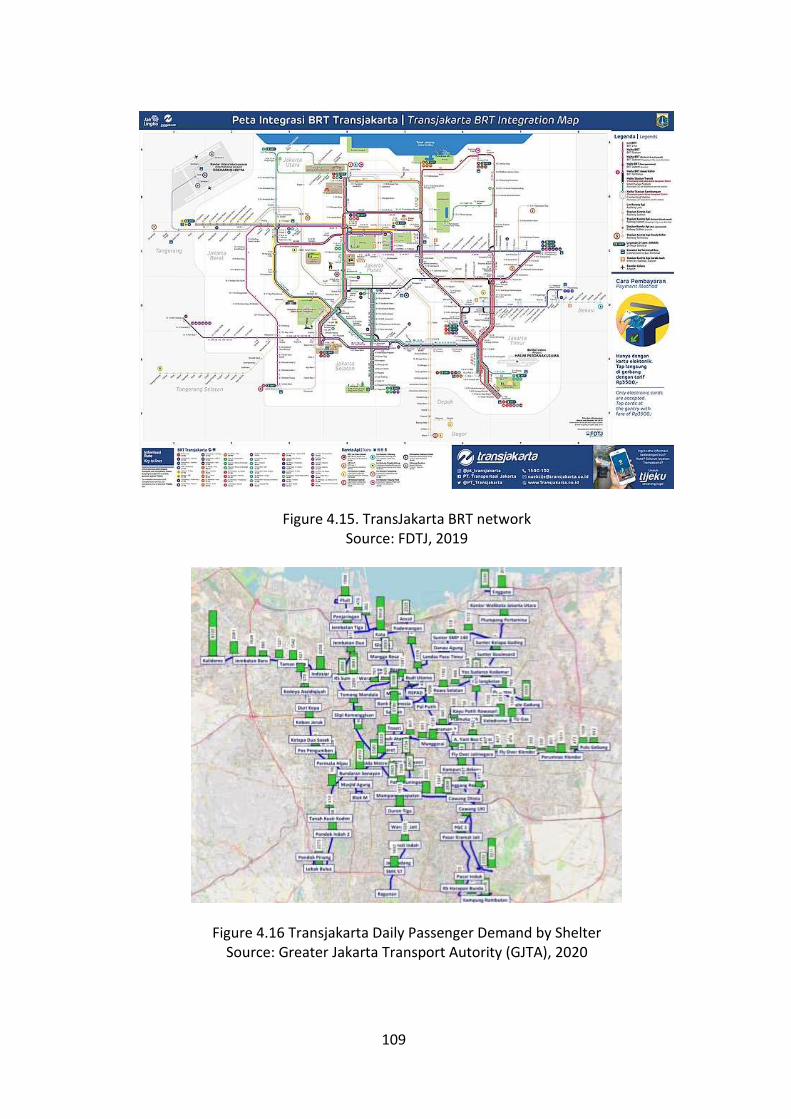
109
Figure 4.15. TransJakarta BRT network Source: FDTJ, 2019
Figure 4.16 Transjakarta Daily Passenger Demand by Shelter Source: Greater Jakarta Transport Autority (GJTA), 2020

110
Figure 4.17 Commuter Line (KRL) Network Source: PT. KCI Annual Report 2017 and 2018
Based on PT. KCI Annual Report 2017 and 2018, until 2017, with the total route length more than
400 km, Commuterline serves seven services lines, they are:
• Central line: Bogor – Depok – Jakarta Kota
• Loop Line: Bogor – Depok – Tanah Abang – Kampung Badan – Jatinegara
• Cikarang4/Bekasi Line: Cikarang – Bekasi – Jatinegara – Jakarta Kota
• Rangkas Bitung/Maja/Serpong Line: Rangkas Bitung – Maja – Serpong – Tanah Abang
• Tangerang Line: Tangerang – Duri
• Nambo Line: Angke – Tanah Abang – Nambo
• Tanjung Priok Line: Jakarta Kota – Tanjung Priok
With continuous improvements made (ticketing system, number, and quality of the train,
platform extension, accessibility, etc.), in 2017, the total yearly passengers of Commuterline is
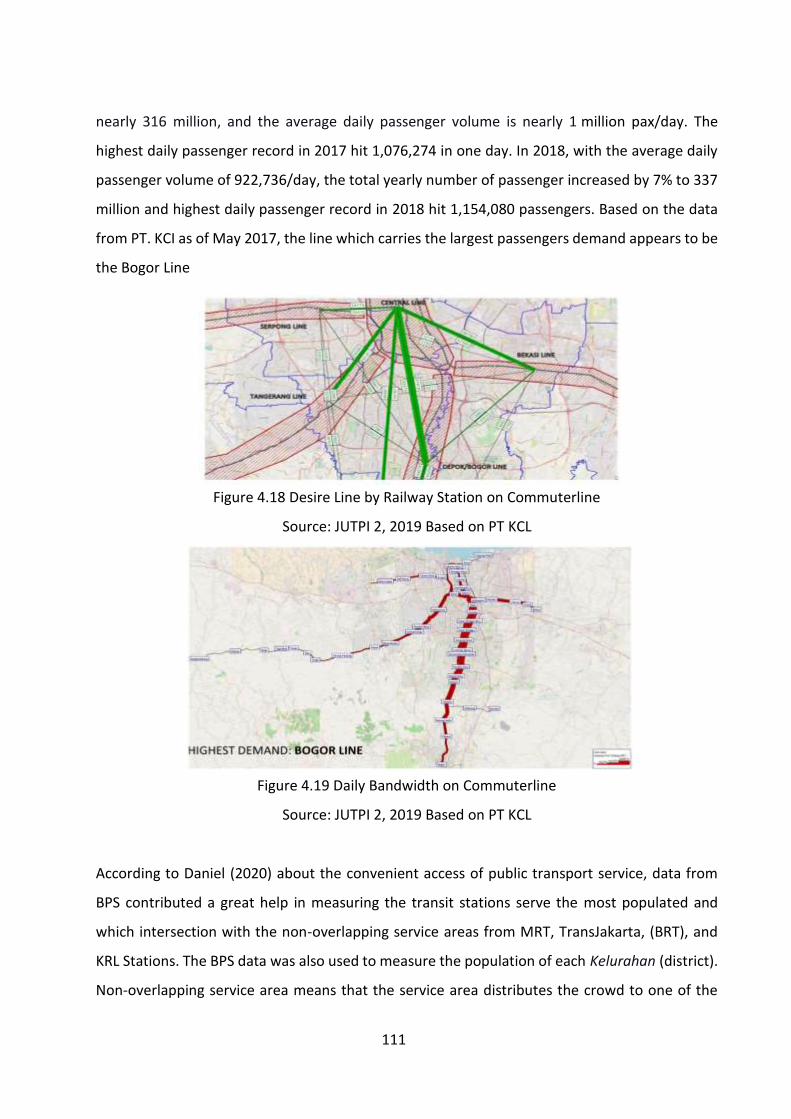
111
nearly 316 million, and the average daily passenger volume is nearly 1 million pax/day. The
highest daily passenger record in 2017 hit 1,076,274 in one day. In 2018, with the average daily
passenger volume of 922,736/day, the total yearly number of passenger increased by 7% to 337
million and highest daily passenger record in 2018 hit 1,154,080 passengers. Based on the data
from PT. KCI as of May 2017, the line which carries the largest passengers demand appears to be
the Bogor Line
Figure 4.18 Desire Line by Railway Station on Commuterline
Source: JUTPI 2, 2019 Based on PT KCL
Figure 4.19 Daily Bandwidth on Commuterline
Source: JUTPI 2, 2019 Based on PT KCL
According to Daniel (2020) about the convenient access of public transport service, data from
BPS contributed a great help in measuring the transit stations serve the most populated and
which intersection with the non-overlapping service areas from MRT, TransJakarta, (BRT), and
KRL Stations. The BPS data was also used to measure the population of each Kelurahan (district).
Non-overlapping service area means that the service area distributes the crowd to one of the

112
nearest MRT stations, Bus Stops, or KRL Stations. The resulting area is divided by the original area
then multiplied by the original population to find the approximate served population.
Figure 4.20 Non-Overlapping Service Area of KRL Stations (4km) Source: Daniel, 2020
Figure 4.21 Total Population per Kelurahan (District) Source: Daniel, 2020
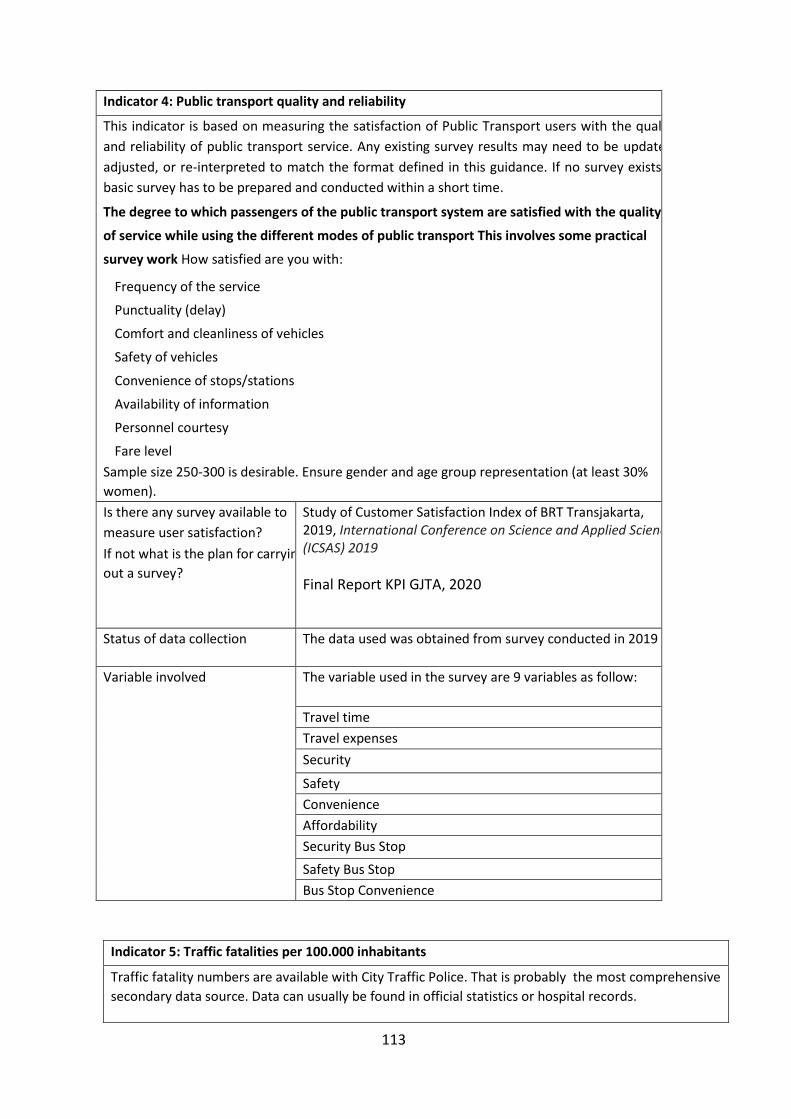
113
Indicator 5: Traffic fatalities per 100.000 inhabitants
Traffic fatality numbers are available with City Traffic Police. That is probably the most comprehensive
secondary data source. Data can usually be found in official statistics or hospital records.
Indicator 4: Public transport quality and reliability
This indicator is based on measuring the satisfaction of Public Transport users with the quality
and reliability of public transport service. Any existing survey results may need to be updated,
adjusted, or re-interpreted to match the format defined in this guidance. If no survey exists, a
basic survey has to be prepared and conducted within a short time.
The degree to which passengers of the public transport system are satisfied with the quality
of service while using the different modes of public transport This involves some practical
survey work How satisfied are you with:
• Frequency of the service
• Punctuality (delay)
• Comfort and cleanliness of vehicles
• Safety of vehicles
• Convenience of stops/stations
• Availability of information
• Personnel courtesy
• Fare level
Sample size 250-300 is desirable. Ensure gender and age group representation (at least 30%
women).
Is there any survey available to
measure user satisfaction?
If not what is the plan for carrying
out a survey?
Study of Customer Satisfaction Index of BRT Transjakarta, 2019, International Conference on Science and Applied Science (ICSAS) 2019
Final Report KPI GJTA, 2020
Status of data collection The data used was obtained from survey conducted in 2019
Variable involved The variable used in the survey are 9 variables as follow:
Travel time
Travel expenses
Security
Safety
Convenience
Affordability
Security Bus Stop
Safety Bus Stop
Bus Stop Convenience
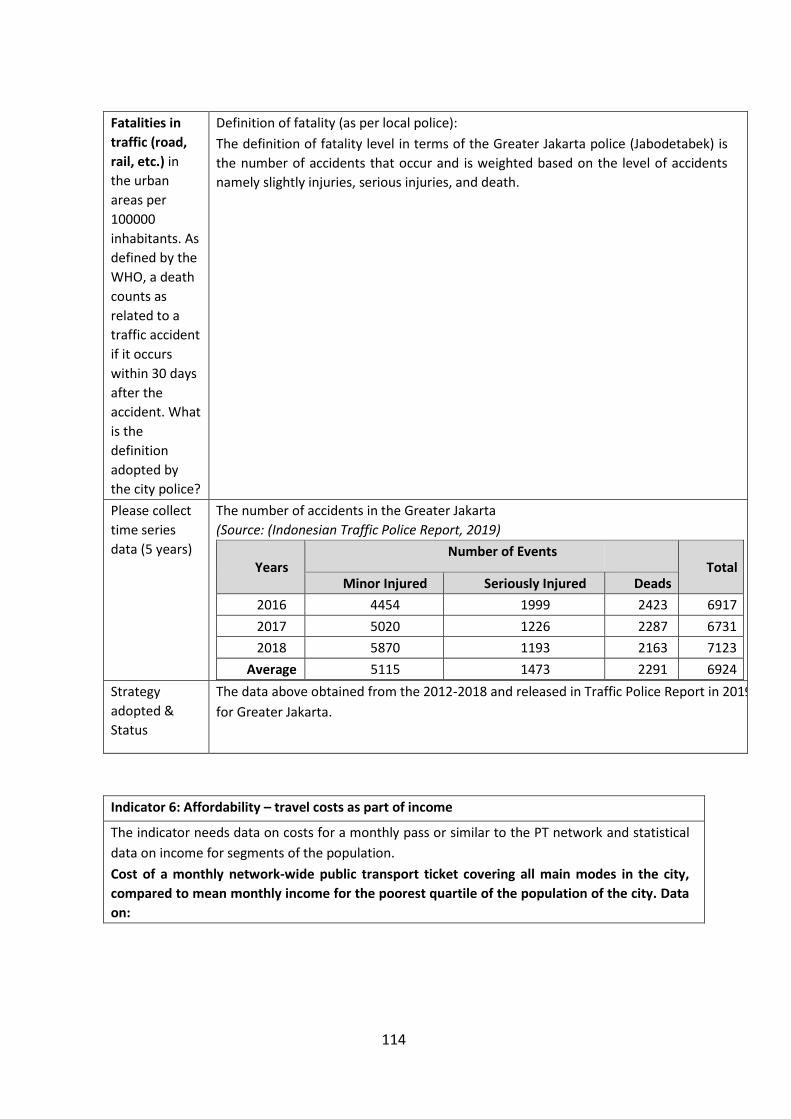
114
Fatalities in
traffic (road,
rail, etc.) in
the urban
areas per
100000
inhabitants. As
defined by the
WHO, a death
counts as
related to a
traffic accident
if it occurs
within 30 days
after the
accident. What
is the
definition
adopted by
the city police?
Definition of fatality (as per local police):
The definition of fatality level in terms of the Greater Jakarta police (Jabodetabek) is
the number of accidents that occur and is weighted based on the level of accidents
namely slightly injuries, serious injuries, and death.
Please collect
time series
data (5 years)
The number of accidents in the Greater Jakarta
(Source: (Indonesian Traffic Police Report, 2019)
Years Number of Events
Total Minor Injured Seriously Injured Deads
2016 4454 1999 2423 6917
2017 5020 1226 2287 6731
2018 5870 1193 2163 7123
Average 5115 1473 2291 6924
Strategy
adopted &
Status
The data above obtained from the 2012-2018 and released in Traffic Police Report in 2019
for Greater Jakarta.
Indicator 6: Affordability – travel costs as part of income
The indicator needs data on costs for a monthly pass or similar to the PT network and statistical
data on income for segments of the population.
Cost of a monthly network-wide public transport ticket covering all main modes in the city,
compared to mean monthly income for the poorest quartile of the population of the city. Data
on:
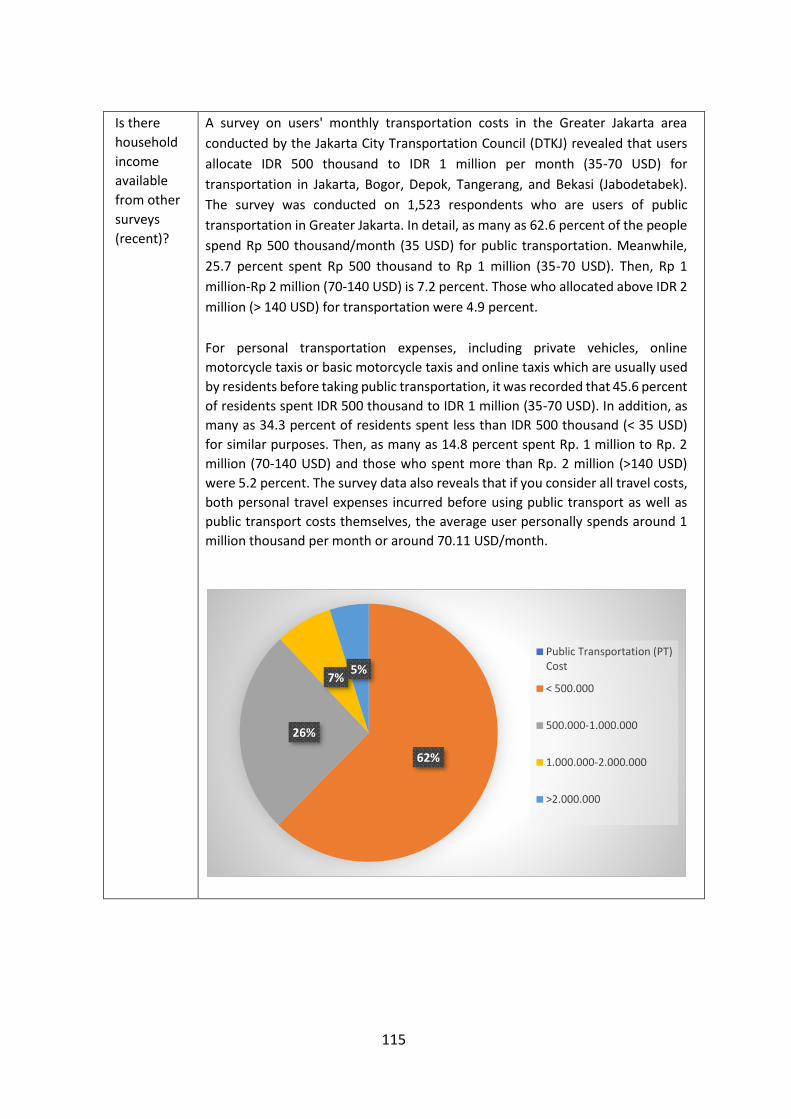
115
Is there
household
income
available
from other
surveys
(recent)?
A survey on users' monthly transportation costs in the Greater Jakarta area
conducted by the Jakarta City Transportation Council (DTKJ) revealed that users
allocate IDR 500 thousand to IDR 1 million per month (35-70 USD) for
transportation in Jakarta, Bogor, Depok, Tangerang, and Bekasi (Jabodetabek).
The survey was conducted on 1,523 respondents who are users of public
transportation in Greater Jakarta. In detail, as many as 62.6 percent of the people
spend Rp 500 thousand/month (35 USD) for public transportation. Meanwhile,
25.7 percent spent Rp 500 thousand to Rp 1 million (35-70 USD). Then, Rp 1
million-Rp 2 million (70-140 USD) is 7.2 percent. Those who allocated above IDR 2
million (> 140 USD) for transportation were 4.9 percent.
For personal transportation expenses, including private vehicles, online
motorcycle taxis or basic motorcycle taxis and online taxis which are usually used
by residents before taking public transportation, it was recorded that 45.6 percent
of residents spent IDR 500 thousand to IDR 1 million (35-70 USD). In addition, as
many as 34.3 percent of residents spent less than IDR 500 thousand (< 35 USD)
for similar purposes. Then, as many as 14.8 percent spent Rp. 1 million to Rp. 2
million (70-140 USD) and those who spent more than Rp. 2 million (>140 USD)
were 5.2 percent. The survey data also reveals that if you consider all travel costs,
both personal travel expenses incurred before using public transport as well as
public transport costs themselves, the average user personally spends around 1
million thousand per month or around 70.11 USD/month.
62%
26%
7%5%
Public Transportation (PT)Cost
< 500.000
500.000-1.000.000
1.000.000-2.000.000
>2.000.000
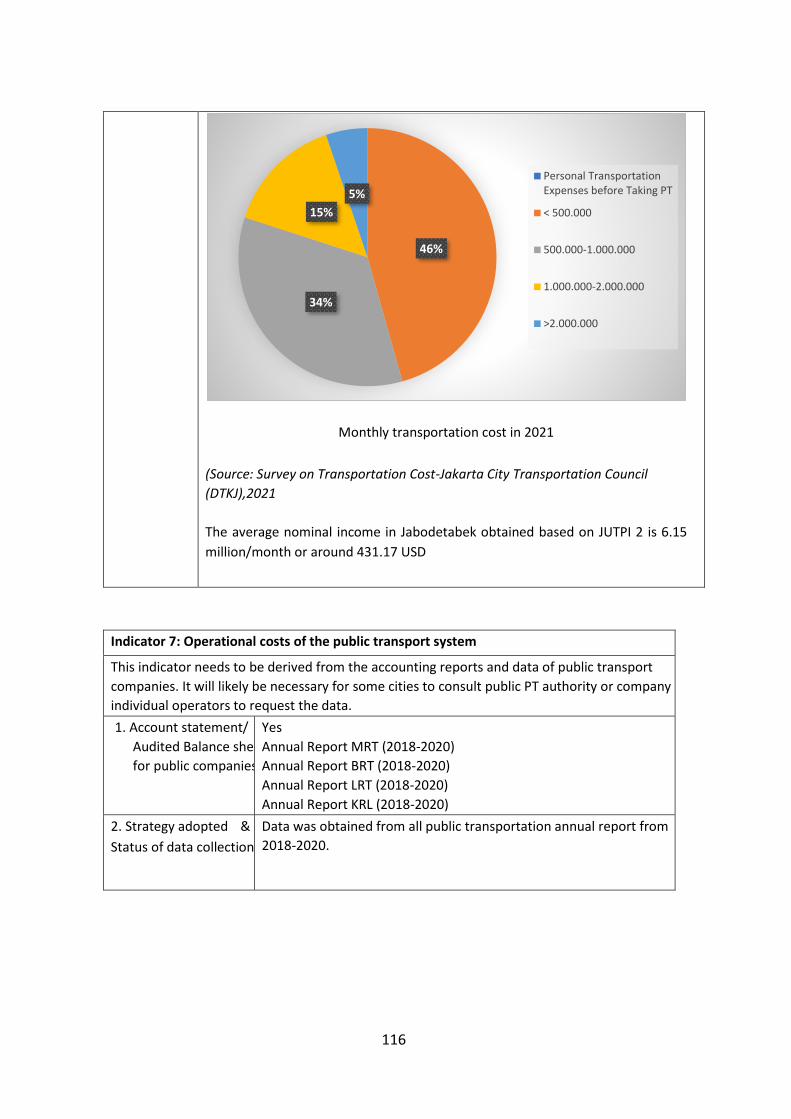
116
Monthly transportation cost in 2021
(Source: Survey on Transportation Cost-Jakarta City Transportation Council
(DTKJ),2021
The average nominal income in Jabodetabek obtained based on JUTPI 2 is 6.15
million/month or around 431.17 USD
Indicator 7: Operational costs of the public transport system
This indicator needs to be derived from the accounting reports and data of public transport
companies. It will likely be necessary for some cities to consult public PT authority or company or
individual operators to request the data.
1. Account statement/
Audited Balance sheet
for public companies
Yes
Annual Report MRT (2018-2020)
Annual Report BRT (2018-2020)
Annual Report LRT (2018-2020)
Annual Report KRL (2018-2020)
2. Strategy adopted &
Status of data collection
Data was obtained from all public transportation annual report from
2018-2020.
46%
34%
15%
5%
Personal TransportationExpenses before Taking PT
< 500.000
500.000-1.000.000
1.000.000-2.000.000
>2.000.000

117
MRT
MRT Jakarta’s achievements in its first year of operations have pushed the Corporation forward
into profit for the first time. In 2019, the Corporation had successfully recorded revenue of Rp
933.23 billion ($ 66.103.074) through passenger ticket sales and non-fare box revenue . Total cost
revenue related to transportation operation cost based on MRT Annual report 2019 is Rp.
760.414.806.769 or equivalent to $ 53.312.496
Transjakarta (BRT)
Based on BRT Transjakarta Annual Report 2019 and 2020, fare revenue (BRT) in 2019 was the
peak income of Rp. 675.14 billion or the equivalent of $ 47,333,900 and decreased in 2020 due
to the pandemic situation.
KRL (Commuter Line)
Total fare revenue KRL Jabodetabek of 2019 Rp. 1.288.558.000.000 or equivalent to $ 90.340.486
increase from the year of 2018 with transportation operational costs of 2.981.393.000.000 or $
209.024.735 in 2019
Indicator 8: Investment in public transportation systems
This indicator is derived from combining two values of public expenditure. The first is data on
investments in public transport systems and facilities including pedestrian and bicycle
infrastructure over the latest five-year period in the city. The second is data on total transport
investments by the city over the same period (including, roads, signals, infrastructure, public
transport facilities, facilities for pedestrians and cyclists, etc.).
Status/ strategy Data from JUTPI 2, 2019
Data
INVESTMENTS BY
THE CITY
2015 2016 2017 2018 2019 Total (million USD) Average (million
USD)
PUBLIC
TRANSPORT
FACILITIES
N/A
N/A
N/A
N/A
N/A
106.95
2.49
TOTAL
TRANSPORT
N/A
N/A
N/A
N/A
N/A
163.48
32.70
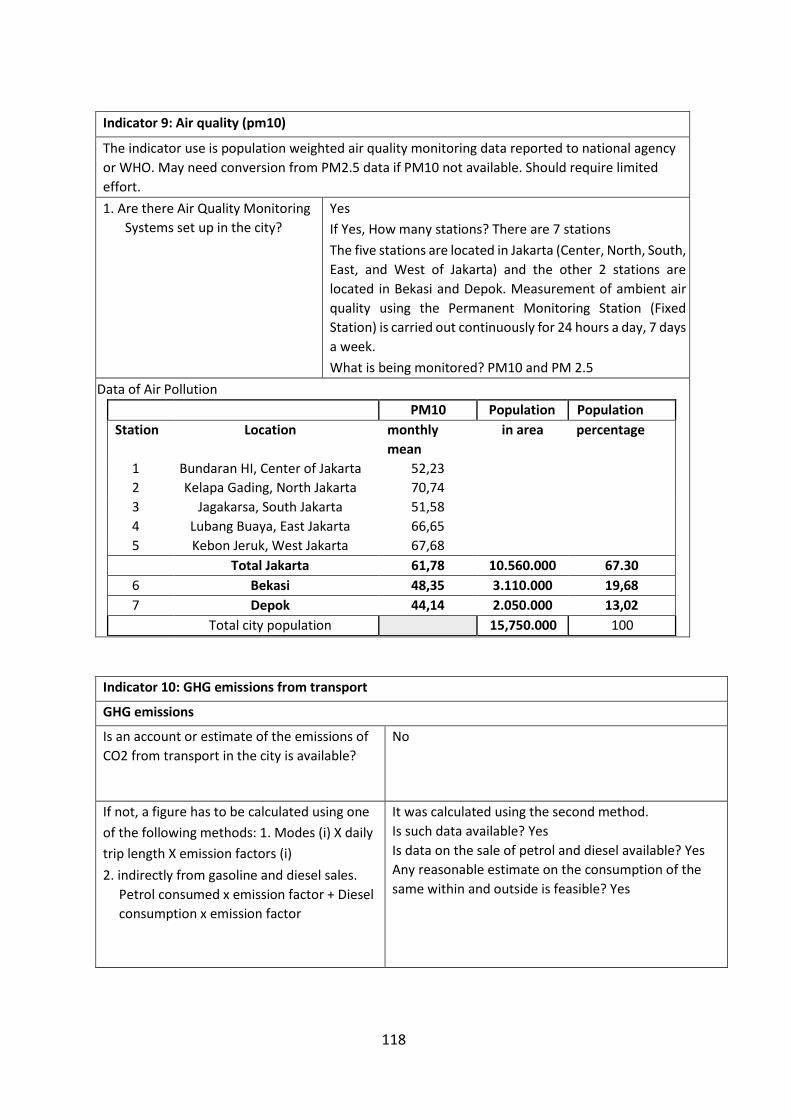
118
Indicator 9: Air quality (pm10)
The indicator use is population weighted air quality monitoring data reported to national agency
or WHO. May need conversion from PM2.5 data if PM10 not available. Should require limited
effort.
1. Are there Air Quality Monitoring
Systems set up in the city?
Yes
If Yes, How many stations? There are 7 stations
The five stations are located in Jakarta (Center, North, South,
East, and West of Jakarta) and the other 2 stations are
located in Bekasi and Depok. Measurement of ambient air
quality using the Permanent Monitoring Station (Fixed
Station) is carried out continuously for 24 hours a day, 7 days
a week.
What is being monitored? PM10 and PM 2.5
Data of Air Pollution
PM10 Population Population
Station Location monthly
mean
in area percentage
1 Bundaran HI, Center of Jakarta 52,23
2 Kelapa Gading, North Jakarta 70,74
3 Jagakarsa, South Jakarta 51,58
4 Lubang Buaya, East Jakarta 66,65
5 Kebon Jeruk, West Jakarta 67,68
Total Jakarta 61,78 10.560.000 67.30
6 Bekasi 48,35 3.110.000 19,68
7 Depok 44,14 2.050.000 13,02
Total city population 15,750.000 100
Indicator 10: GHG emissions from transport
GHG emissions
Is an account or estimate of the emissions of
CO2 from transport in the city is available?
No
If not, a figure has to be calculated using one
of the following methods: 1. Modes (i) X daily
trip length X emission factors (i)
2. indirectly from gasoline and diesel sales.
Petrol consumed x emission factor + Diesel
consumption x emission factor
It was calculated using the second method.
Is such data available? Yes
Is data on the sale of petrol and diesel available? Yes
Any reasonable estimate on the consumption of the
same within and outside is feasible? Yes

119
How is city collecting data? What is the
status?
This data is the data resulting from BPH Migas and the Ministry of Environment and Forestry, Indonesia based on the sale of fuel oil, especially in the use of the transportation sector. Calculation:
1. Based on data BPH Migas 2019, petrol sale inland transportation is 11.000.000.000 liter. Total vehicle in Indonesia (private car/public bus/motorcycle) 128,35 million. Total vehicle in Jabodetabek (private car /motorcycle) 19.7 million. So, % vehicle used petrol in Jabodetabek is 15.3% which is equal to 2.167.000.000 liter.
2. Based on data BPH Migas 2019, Diesel sales inland transportation is 9.042.963.000 liter. Total vehicle in Indonesia (truck and Bus) 5,3 million. Total vehicle in Jabodetabek (Truck and Bus) 1,1 million. So, % vehicle used diesel in Jabodetabek is 20% which is equal to 1.808.592.600 liter
Litres sold
(Jabodetabek)
CO2-factor kg/l Emissions Population Emission/capital
tons/year
GASOLINE/PETROL 2.167.000.000
2.272 4.923.424
DIESEL 1.808.592.600 2.676
4.839.794
TOTAL 9.763.218 35.000.000
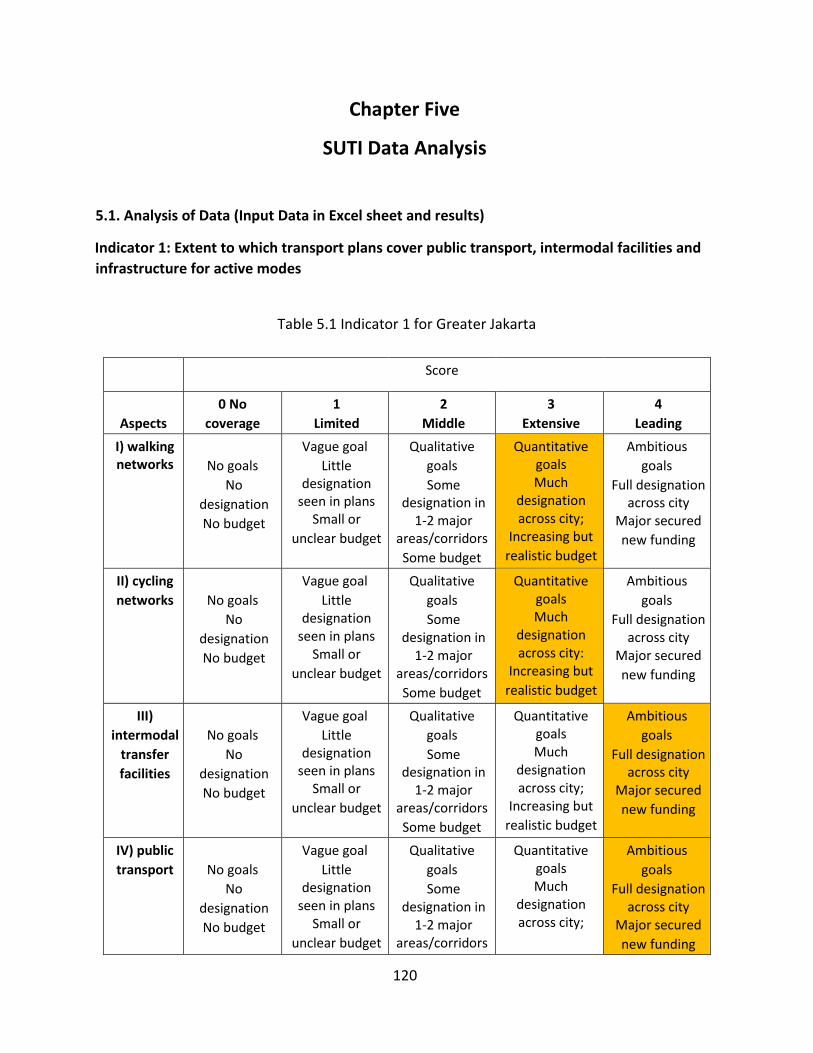
120
Chapter Five
SUTI Data Analysis
5.1. Analysis of Data (Input Data in Excel sheet and results)
Indicator 1: Extent to which transport plans cover public transport, intermodal facilities and
infrastructure for active modes
Table 5.1 Indicator 1 for Greater Jakarta
Score
Aspects
0 No
coverage
1
Limited
2
Middle
3
Extensive
4
Leading
I) walking networks
No goals
No
designation
No budget
Vague goal
Little designation
seen in plans Small or
unclear budget
Qualitative
goals
Some designation in
1-2 major areas/corridors
Some budget
Quantitative goals Much
designation across city;
Increasing but
realistic budget
Ambitious
goals
Full designation across city
Major secured
new funding
II) cycling
networks
No goals
No
designation
No budget
Vague goal
Little designation
seen in plans Small or
unclear budget
Qualitative
goals
Some designation in
1-2 major areas/corridors
Some budget
Quantitative goals Much
designation across city:
Increasing but
realistic budget
Ambitious
goals
Full designation across city
Major secured
new funding
III)
intermodal
transfer
facilities
No goals
No
designation
No budget
Vague goal
Little designation
seen in plans Small or
unclear budget
Qualitative
goals
Some designation in
1-2 major areas/corridors
Some budget
Quantitative goals Much
designation across city;
Increasing but
realistic budget
Ambitious
goals
Full designation across city
Major secured
new funding
IV) public
transport
No goals
No
designation
No budget
Vague goal
Little designation
seen in plans Small or
unclear budget
Qualitative
goals
Some designation in
1-2 major areas/corridors
Quantitative goals Much
designation across city;
Ambitious
goals
Full designation across city
Major secured
new funding
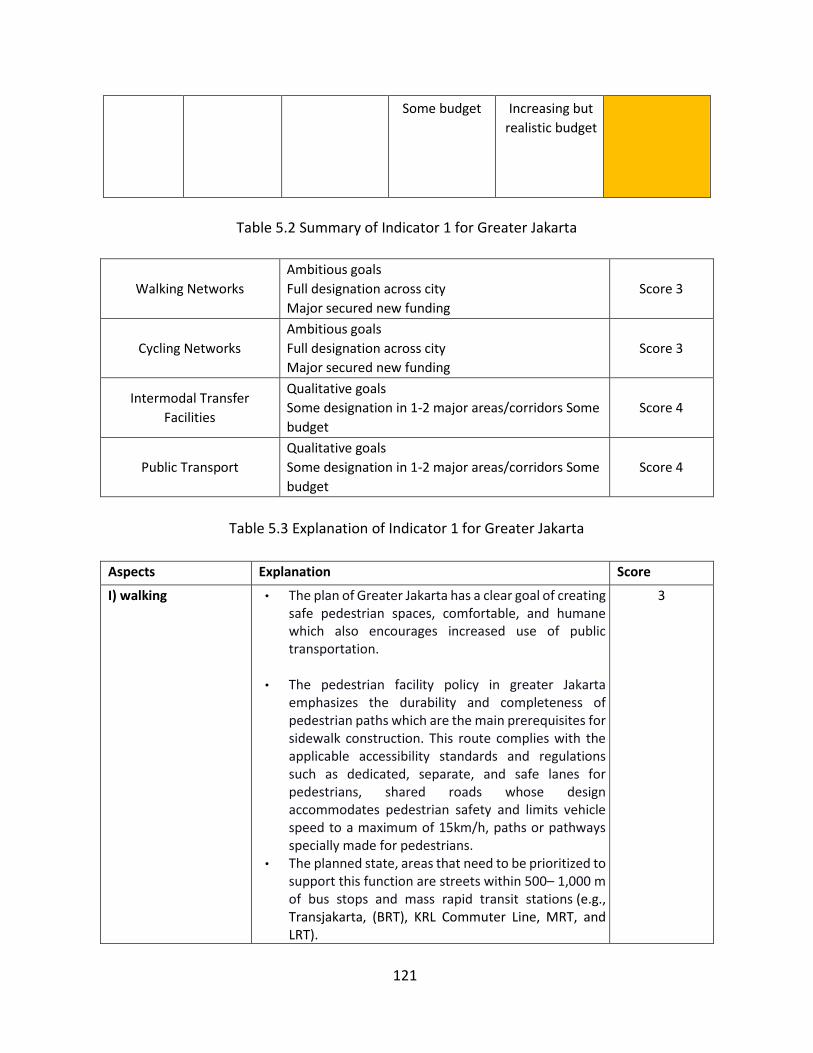
121
Some budget Increasing but
realistic budget
Table 5.2 Summary of Indicator 1 for Greater Jakarta
Walking Networks
Ambitious goals
Full designation across city
Major secured new funding
Score 3
Cycling Networks
Ambitious goals
Full designation across city
Major secured new funding
Score 3
Intermodal Transfer
Facilities
Qualitative goals
Some designation in 1-2 major areas/corridors Some
budget
Score 4
Public Transport
Qualitative goals
Some designation in 1-2 major areas/corridors Some
budget
Score 4
Table 5.3 Explanation of Indicator 1 for Greater Jakarta
Aspects Explanation Score
I) walking • The plan of Greater Jakarta has a clear goal of creating safe pedestrian spaces, comfortable, and humane which also encourages increased use of public transportation.
• The pedestrian facility policy in greater Jakarta emphasizes the durability and completeness of pedestrian paths which are the main prerequisites for sidewalk construction. This route complies with the applicable accessibility standards and regulations such as dedicated, separate, and safe lanes for pedestrians, shared roads whose design accommodates pedestrian safety and limits vehicle speed to a maximum of 15km/h, paths or pathways specially made for pedestrians.
• The planned state, areas that need to be prioritized to support this function are streets within 500– 1,000 m of bus stops and mass rapid transit stations (e.g., Transjakarta, (BRT), KRL Commuter Line, MRT, and LRT).
3
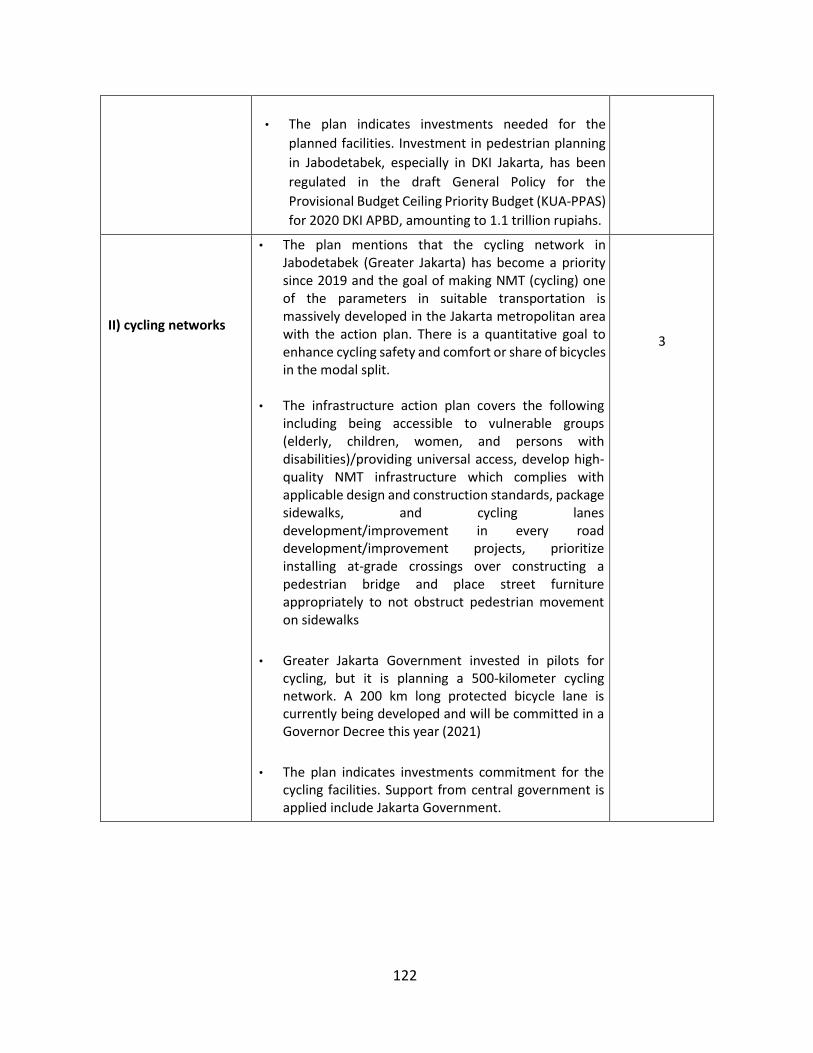
122
• The plan indicates investments needed for the
planned facilities. Investment in pedestrian planning
in Jabodetabek, especially in DKI Jakarta, has been
regulated in the draft General Policy for the
Provisional Budget Ceiling Priority Budget (KUA-PPAS)
for 2020 DKI APBD, amounting to 1.1 trillion rupiahs.
II) cycling networks
• The plan mentions that the cycling network in Jabodetabek (Greater Jakarta) has become a priority since 2019 and the goal of making NMT (cycling) one of the parameters in suitable transportation is massively developed in the Jakarta metropolitan area with the action plan. There is a quantitative goal to enhance cycling safety and comfort or share of bicycles in the modal split.
• The infrastructure action plan covers the following including being accessible to vulnerable groups (elderly, children, women, and persons with disabilities)/providing universal access, develop high-quality NMT infrastructure which complies with applicable design and construction standards, package sidewalks, and cycling lanes development/improvement in every road development/improvement projects, prioritize installing at-grade crossings over constructing a pedestrian bridge and place street furniture appropriately to not obstruct pedestrian movement on sidewalks
• Greater Jakarta Government invested in pilots for
cycling, but it is planning a 500-kilometer cycling network. A 200 km long protected bicycle lane is currently being developed and will be committed in a Governor Decree this year (2021)
• The plan indicates investments commitment for the
cycling facilities. Support from central government is applied include Jakarta Government.
3
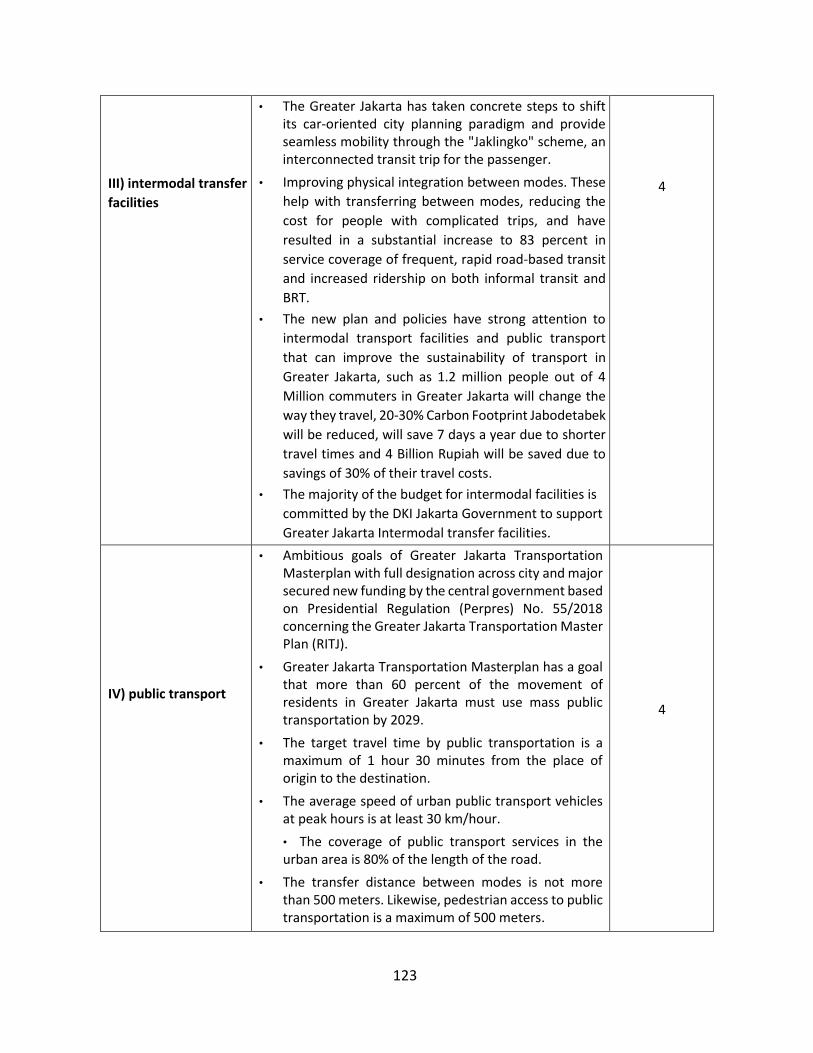
123
III) intermodal transfer
facilities
• The Greater Jakarta has taken concrete steps to shift its car-oriented city planning paradigm and provide seamless mobility through the "Jaklingko" scheme, an interconnected transit trip for the passenger.
• Improving physical integration between modes. These
help with transferring between modes, reducing the
cost for people with complicated trips, and have
resulted in a substantial increase to 83 percent in
service coverage of frequent, rapid road-based transit
and increased ridership on both informal transit and
BRT.
• The new plan and policies have strong attention to
intermodal transport facilities and public transport
that can improve the sustainability of transport in
Greater Jakarta, such as 1.2 million people out of 4
Million commuters in Greater Jakarta will change the
way they travel, 20-30% Carbon Footprint Jabodetabek
will be reduced, will save 7 days a year due to shorter
travel times and 4 Billion Rupiah will be saved due to
savings of 30% of their travel costs.
• The majority of the budget for intermodal facilities is
committed by the DKI Jakarta Government to support
Greater Jakarta Intermodal transfer facilities.
4
IV) public transport
• Ambitious goals of Greater Jakarta Transportation Masterplan with full designation across city and major secured new funding by the central government based on Presidential Regulation (Perpres) No. 55/2018 concerning the Greater Jakarta Transportation Master Plan (RITJ).
• Greater Jakarta Transportation Masterplan has a goal that more than 60 percent of the movement of residents in Greater Jakarta must use mass public transportation by 2029.
• The target travel time by public transportation is a maximum of 1 hour 30 minutes from the place of origin to the destination.
• The average speed of urban public transport vehicles at peak hours is at least 30 km/hour.
• The coverage of public transport services in the urban area is 80% of the length of the road.
• The transfer distance between modes is not more than 500 meters. Likewise, pedestrian access to public transportation is a maximum of 500 meters.
4
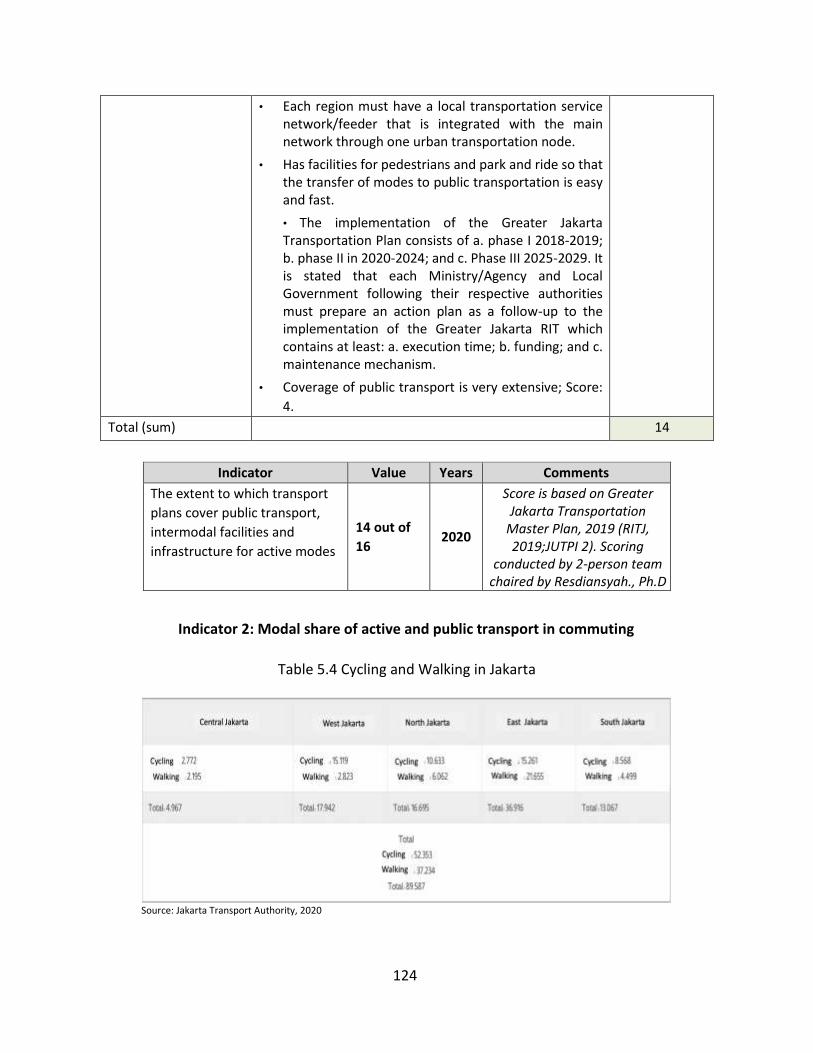
124
• Each region must have a local transportation service network/feeder that is integrated with the main network through one urban transportation node.
• Has facilities for pedestrians and park and ride so that the transfer of modes to public transportation is easy and fast.
• The implementation of the Greater Jakarta Transportation Plan consists of a. phase I 2018-2019; b. phase II in 2020-2024; and c. Phase III 2025-2029. It is stated that each Ministry/Agency and Local Government following their respective authorities must prepare an action plan as a follow-up to the implementation of the Greater Jakarta RIT which contains at least: a. execution time; b. funding; and c. maintenance mechanism.
• Coverage of public transport is very extensive; Score:
4.
Total (sum) 14
Indicator Value Years Comments
The extent to which transport
plans cover public transport,
intermodal facilities and
infrastructure for active modes
14 out of
16 2020
Score is based on Greater Jakarta Transportation
Master Plan, 2019 (RITJ, 2019;JUTPI 2). Scoring
conducted by 2-person team chaired by Resdiansyah., Ph.D
Indicator 2: Modal share of active and public transport in commuting
Table 5.4 Cycling and Walking in Jakarta
Source: Jakarta Transport Authority, 2020
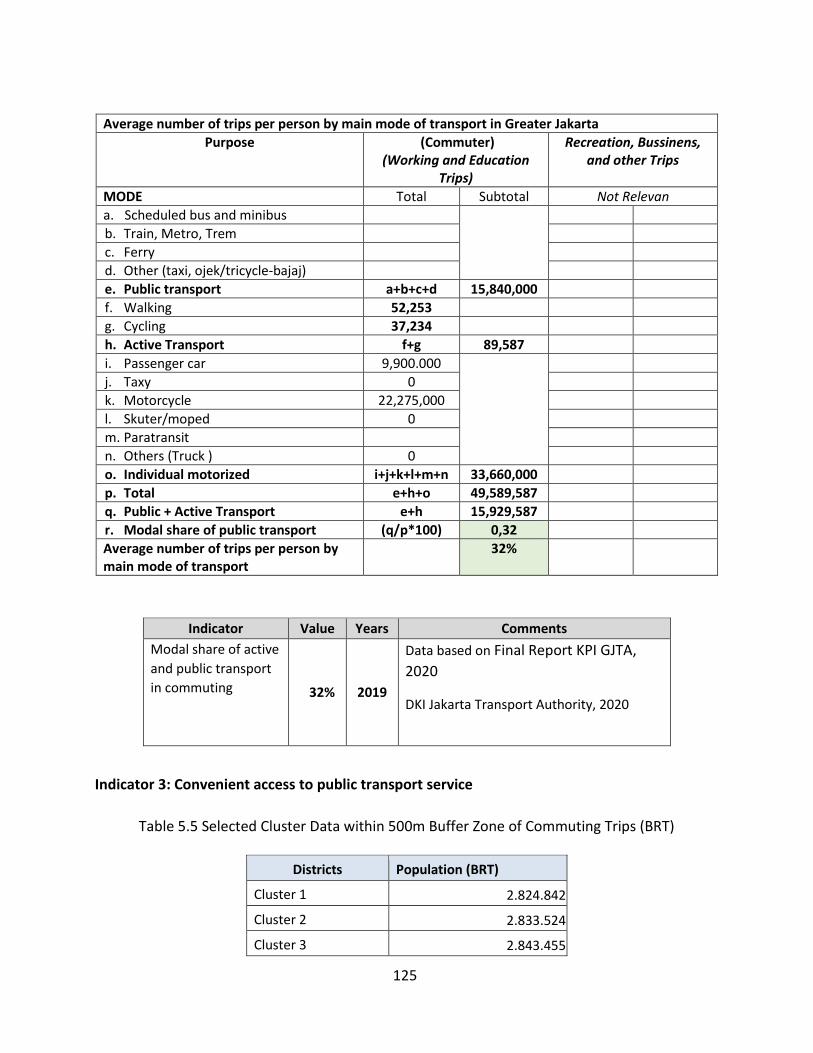
125
Average number of trips per person by main mode of transport in Greater Jakarta
Purpose (Commuter) (Working and Education
Trips)
Recreation, Bussinens, and other Trips
MODE Total Subtotal Not Relevan
a. Scheduled bus and minibus
b. Train, Metro, Trem
c. Ferry
d. Other (taxi, ojek/tricycle-bajaj)
e. Public transport a+b+c+d 15,840,000
f. Walking 52,253
g. Cycling 37,234
h. Active Transport f+g 89,587
i. Passenger car 9,900.000
j. Taxy 0
k. Motorcycle 22,275,000
l. Skuter/moped 0
m. Paratransit
n. Others (Truck ) 0
o. Individual motorized i+j+k+l+m+n 33,660,000
p. Total e+h+o 49,589,587
q. Public + Active Transport e+h 15,929,587
r. Modal share of public transport (q/p*100) 0,32
Average number of trips per person by main mode of transport
32%
Indicator Value Years Comments
Modal share of active
and public transport
in commuting 32% 2019
Data based on Final Report KPI GJTA,
2020
DKI Jakarta Transport Authority, 2020
Indicator 3: Convenient access to public transport service
Table 5.5 Selected Cluster Data within 500m Buffer Zone of Commuting Trips (BRT)
Districts Population (BRT)
Cluster 1 2.824.842
Cluster 2 2.833.524
Cluster 3 2.843.455
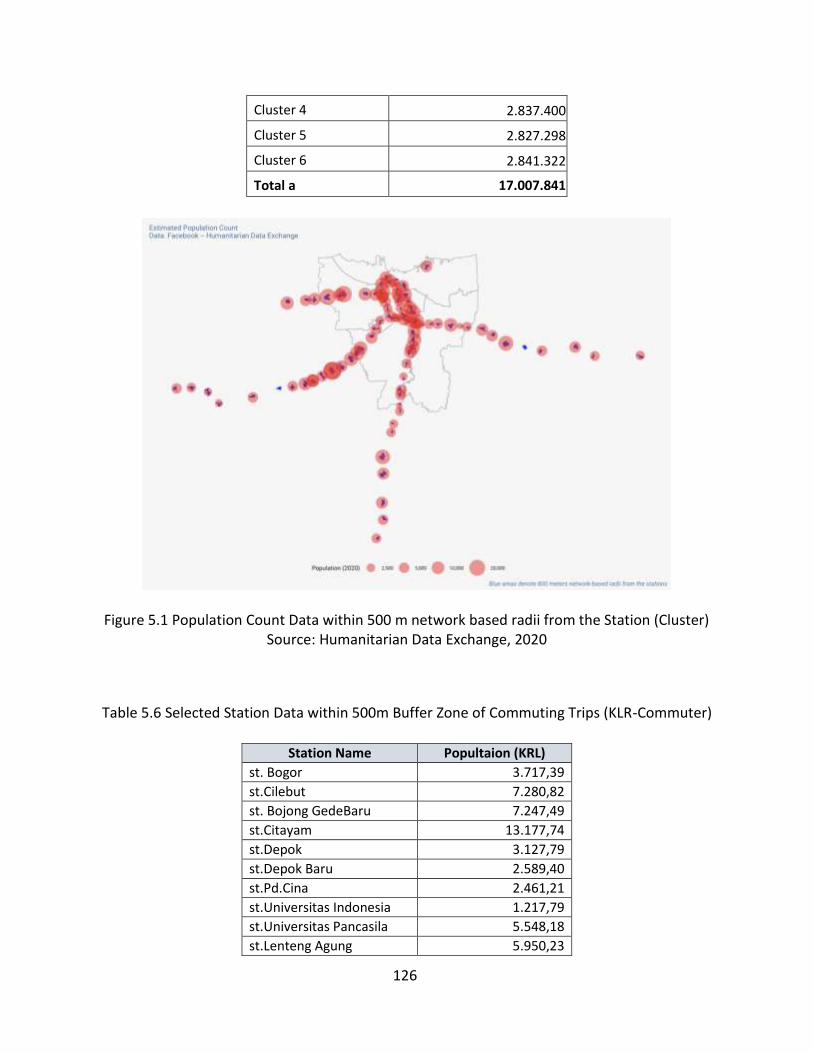
126
Cluster 4 2.837.400
Cluster 5 2.827.298
Cluster 6 2.841.322
Total a 17.007.841
Figure 5.1 Population Count Data within 500 m network based radii from the Station (Cluster) Source: Humanitarian Data Exchange, 2020
Table 5.6 Selected Station Data within 500m Buffer Zone of Commuting Trips (KLR-Commuter)
Station Name Popultaion (KRL)
st. Bogor 3.717,39
st.Cilebut 7.280,82
st. Bojong GedeBaru 7.247,49
st.Citayam 13.177,74
st.Depok 3.127,79
st.Depok Baru 2.589,40
st.Pd.Cina 2.461,21
st.Universitas Indonesia 1.217,79
st.Universitas Pancasila 5.548,18
st.Lenteng Agung 5.950,23
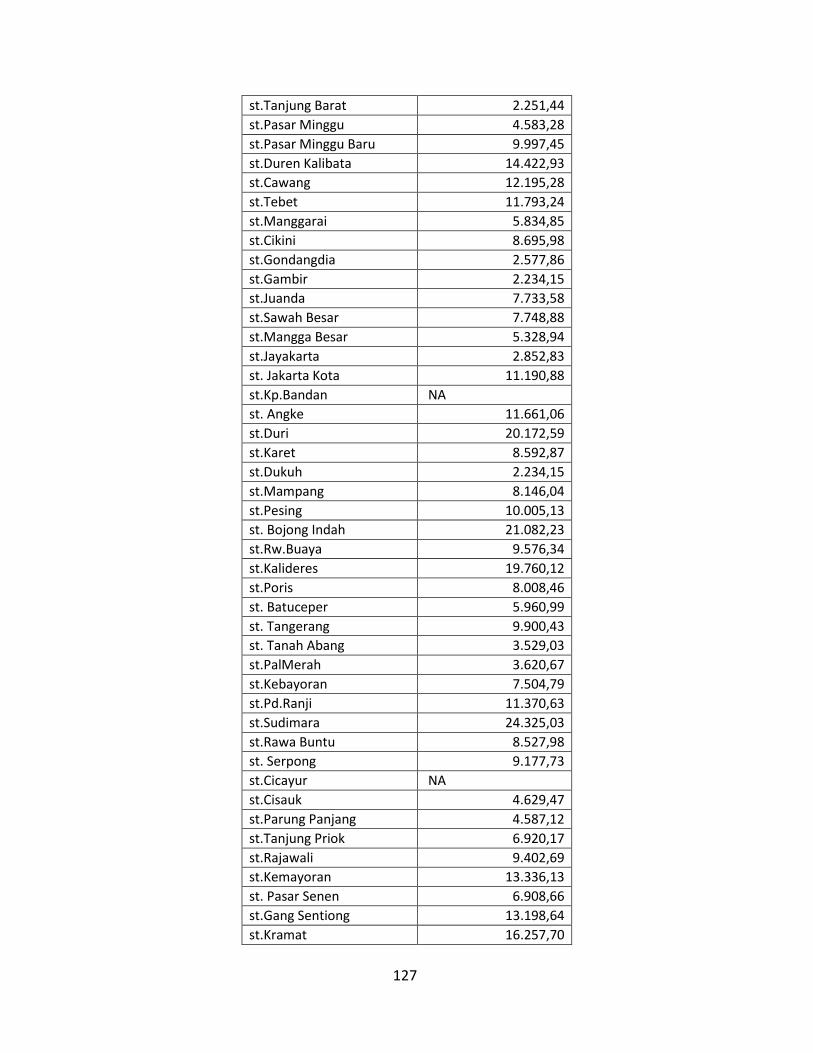
127
st.Tanjung Barat 2.251,44
st.Pasar Minggu 4.583,28
st.Pasar Minggu Baru 9.997,45
st.Duren Kalibata 14.422,93
st.Cawang 12.195,28
st.Tebet 11.793,24
st.Manggarai 5.834,85
st.Cikini 8.695,98
st.Gondangdia 2.577,86
st.Gambir 2.234,15
st.Juanda 7.733,58
st.Sawah Besar 7.748,88
st.Mangga Besar 5.328,94
st.Jayakarta 2.852,83
st. Jakarta Kota 11.190,88
st.Kp.Bandan NA
st. Angke 11.661,06
st.Duri 20.172,59
st.Karet 8.592,87
st.Dukuh 2.234,15
st.Mampang 8.146,04
st.Pesing 10.005,13
st. Bojong Indah 21.082,23
st.Rw.Buaya 9.576,34
st.Kalideres 19.760,12
st.Poris 8.008,46
st. Batuceper 5.960,99
st. Tangerang 9.900,43
st. Tanah Abang 3.529,03
st.PalMerah 3.620,67
st.Kebayoran 7.504,79
st.Pd.Ranji 11.370,63
st.Sudimara 24.325,03
st.Rawa Buntu 8.527,98
st. Serpong 9.177,73
st.Cicayur NA
st.Cisauk 4.629,47
st.Parung Panjang 4.587,12
st.Tanjung Priok 6.920,17
st.Rajawali 9.402,69
st.Kemayoran 13.336,13
st. Pasar Senen 6.908,66
st.Gang Sentiong 13.198,64
st.Kramat 16.257,70
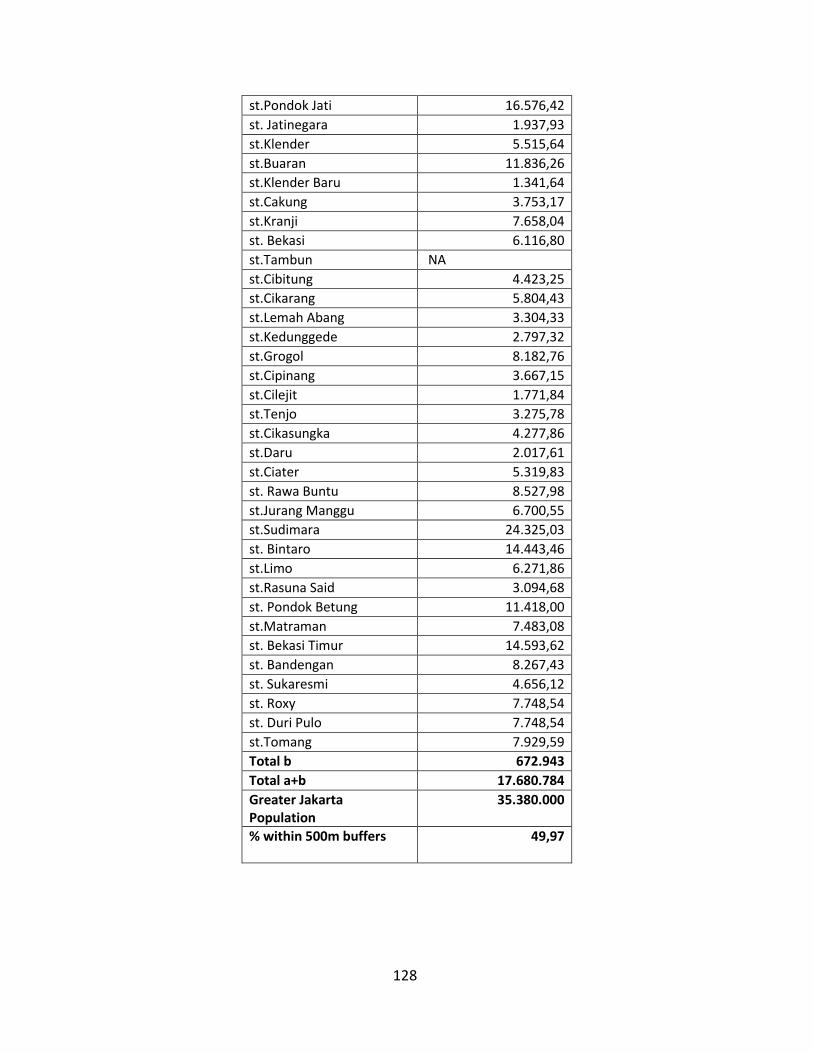
128
st.Pondok Jati 16.576,42
st. Jatinegara 1.937,93
st.Klender 5.515,64
st.Buaran 11.836,26
st.Klender Baru 1.341,64
st.Cakung 3.753,17
st.Kranji 7.658,04
st. Bekasi 6.116,80
st.Tambun NA
st.Cibitung 4.423,25
st.Cikarang 5.804,43
st.Lemah Abang 3.304,33
st.Kedunggede 2.797,32
st.Grogol 8.182,76
st.Cipinang 3.667,15
st.Cilejit 1.771,84
st.Tenjo 3.275,78
st.Cikasungka 4.277,86
st.Daru 2.017,61
st.Ciater 5.319,83
st. Rawa Buntu 8.527,98
st.Jurang Manggu 6.700,55
st.Sudimara 24.325,03
st. Bintaro 14.443,46
st.Limo 6.271,86
st.Rasuna Said 3.094,68
st. Pondok Betung 11.418,00
st.Matraman 7.483,08
st. Bekasi Timur 14.593,62
st. Bandengan 8.267,43
st. Sukaresmi 4.656,12
st. Roxy 7.748,54
st. Duri Pulo 7.748,54
st.Tomang 7.929,59
Total b 672.943
Total a+b 17.680.784
Greater Jakarta Population
35.380.000
% within 500m buffers
49,97
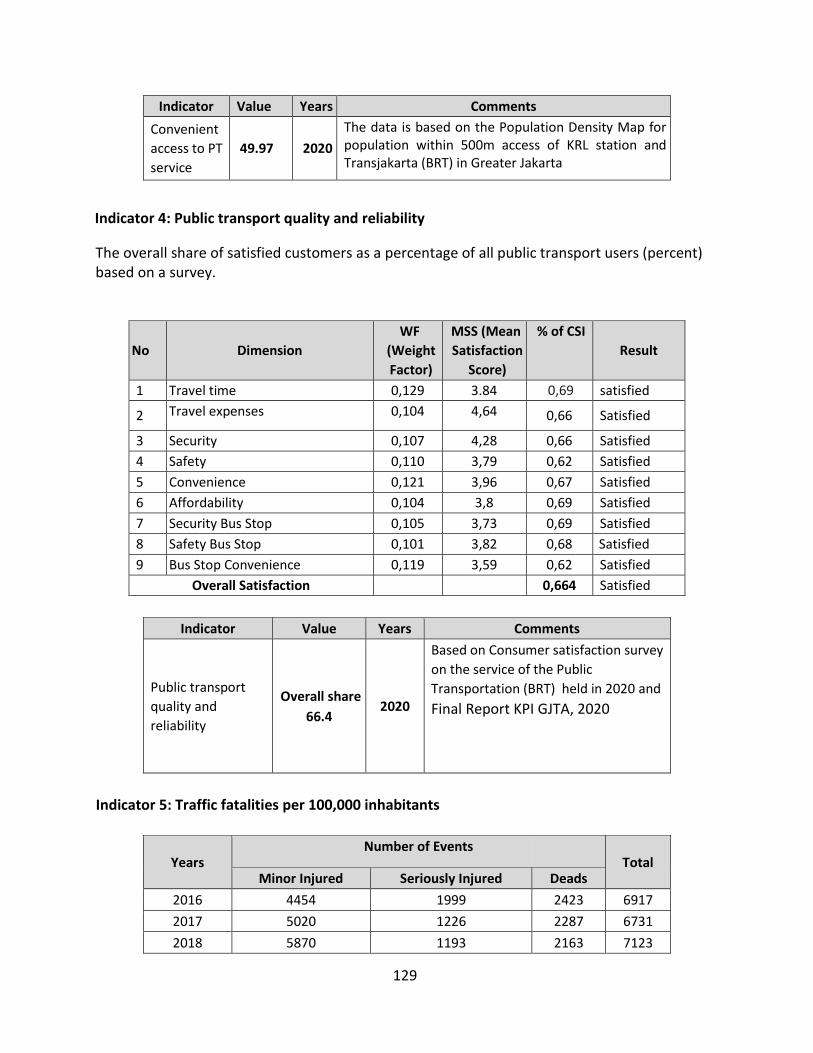
129
Indicator Value Years Comments
Convenient
access to PT
service
49.97 2020
The data is based on the Population Density Map for population within 500m access of KRL station and Transjakarta (BRT) in Greater Jakarta
Indicator 4: Public transport quality and reliability
The overall share of satisfied customers as a percentage of all public transport users (percent) based on a survey.
No Dimension
WF
(Weight
Factor)
MSS (Mean
Satisfaction
Score)
% of CSI
Result
1 Travel time 0,129 3.84 0,69 satisfied
2 Travel expenses 0,104 4,64 0,66 Satisfied
3 Security 0,107 4,28 0,66 Satisfied
4 Safety 0,110 3,79 0,62 Satisfied
5 Convenience 0,121 3,96 0,67 Satisfied
6 Affordability 0,104 3,8 0,69 Satisfied
7 Security Bus Stop 0,105 3,73 0,69 Satisfied
8 Safety Bus Stop 0,101 3,82 0,68 Satisfied
9 Bus Stop Convenience 0,119 3,59 0,62 Satisfied
Overall Satisfaction 0,664 Satisfied
Indicator Value Years Comments
Public transport
quality and
reliability
Overall share
66.4 2020
Based on Consumer satisfaction survey
on the service of the Public
Transportation (BRT) held in 2020 and
Final Report KPI GJTA, 2020
Indicator 5: Traffic fatalities per 100,000 inhabitants
Years Number of Events
Total Minor Injured Seriously Injured Deads
2016 4454 1999 2423 6917
2017 5020 1226 2287 6731
2018 5870 1193 2163 7123
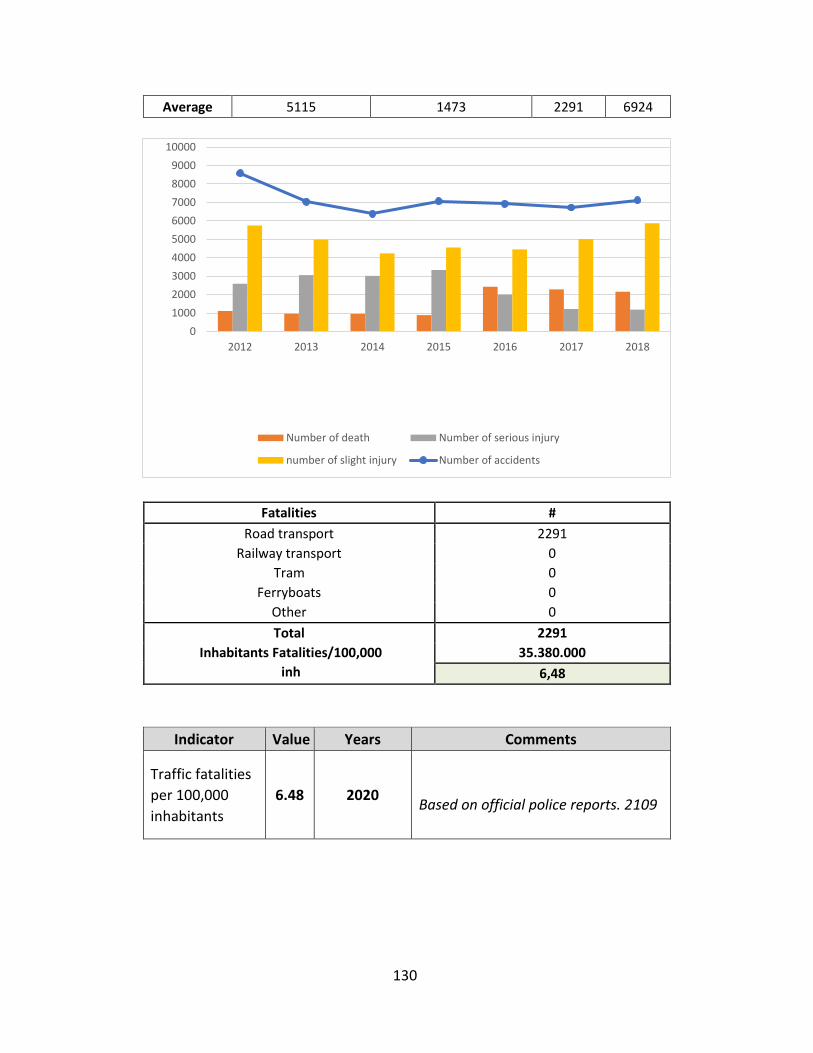
130
Average 5115 1473 2291 6924
Fatalities #
Road transport 2291
Railway transport 0
Tram 0
Ferryboats 0
Other 0
Total 2291
Inhabitants Fatalities/100,000
inh
35.380.000
6,48
Indicator Value Years Comments
Traffic fatalities
per 100,000
inhabitants
6.48 2020
Based on official police reports. 2109
0
1000
2000
3000
4000
5000
6000
7000
8000
9000
10000
2012 2013 2014 2015 2016 2017 2018
Number of death Number of serious injury
number of slight injury Number of accidents
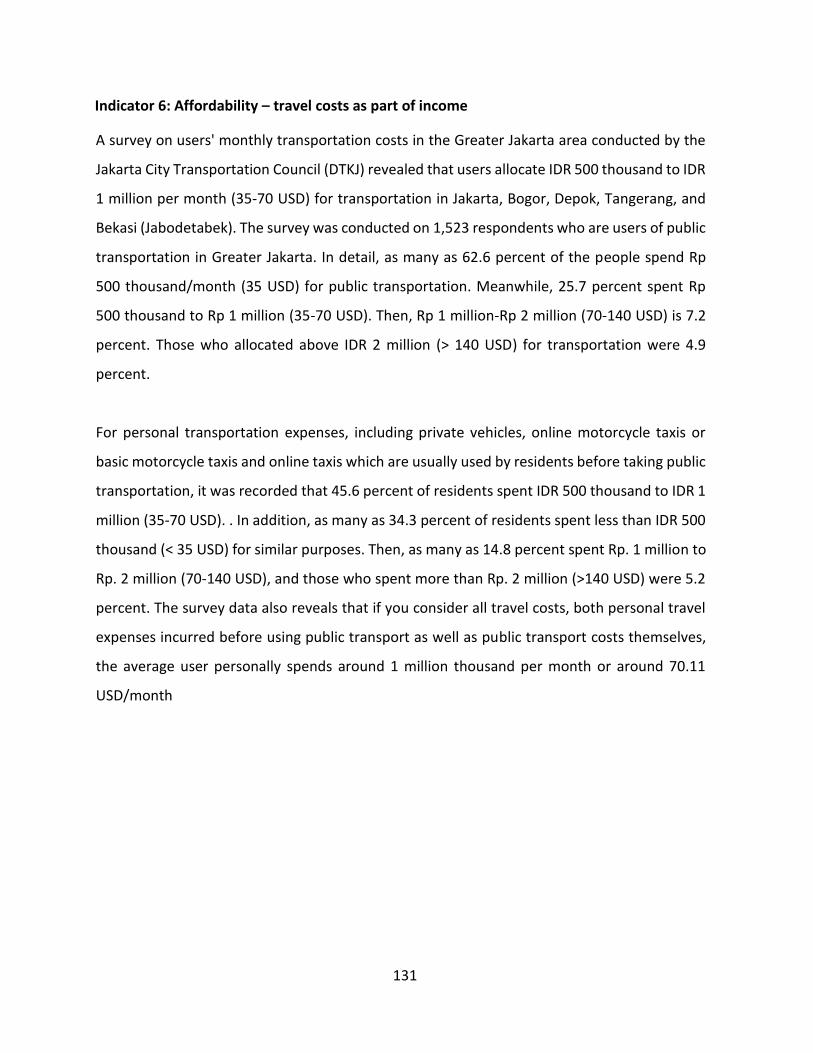
131
Indicator 6: Affordability – travel costs as part of income
A survey on users' monthly transportation costs in the Greater Jakarta area conducted by the
Jakarta City Transportation Council (DTKJ) revealed that users allocate IDR 500 thousand to IDR
1 million per month (35-70 USD) for transportation in Jakarta, Bogor, Depok, Tangerang, and
Bekasi (Jabodetabek). The survey was conducted on 1,523 respondents who are users of public
transportation in Greater Jakarta. In detail, as many as 62.6 percent of the people spend Rp
500 thousand/month (35 USD) for public transportation. Meanwhile, 25.7 percent spent Rp
500 thousand to Rp 1 million (35-70 USD). Then, Rp 1 million-Rp 2 million (70-140 USD) is 7.2
percent. Those who allocated above IDR 2 million (> 140 USD) for transportation were 4.9
percent.
For personal transportation expenses, including private vehicles, online motorcycle taxis or
basic motorcycle taxis and online taxis which are usually used by residents before taking public
transportation, it was recorded that 45.6 percent of residents spent IDR 500 thousand to IDR 1
million (35-70 USD). . In addition, as many as 34.3 percent of residents spent less than IDR 500
thousand (< 35 USD) for similar purposes. Then, as many as 14.8 percent spent Rp. 1 million to
Rp. 2 million (70-140 USD), and those who spent more than Rp. 2 million (>140 USD) were 5.2
percent. The survey data also reveals that if you consider all travel costs, both personal travel
expenses incurred before using public transport as well as public transport costs themselves,
the average user personally spends around 1 million thousand per month or around 70.11
USD/month
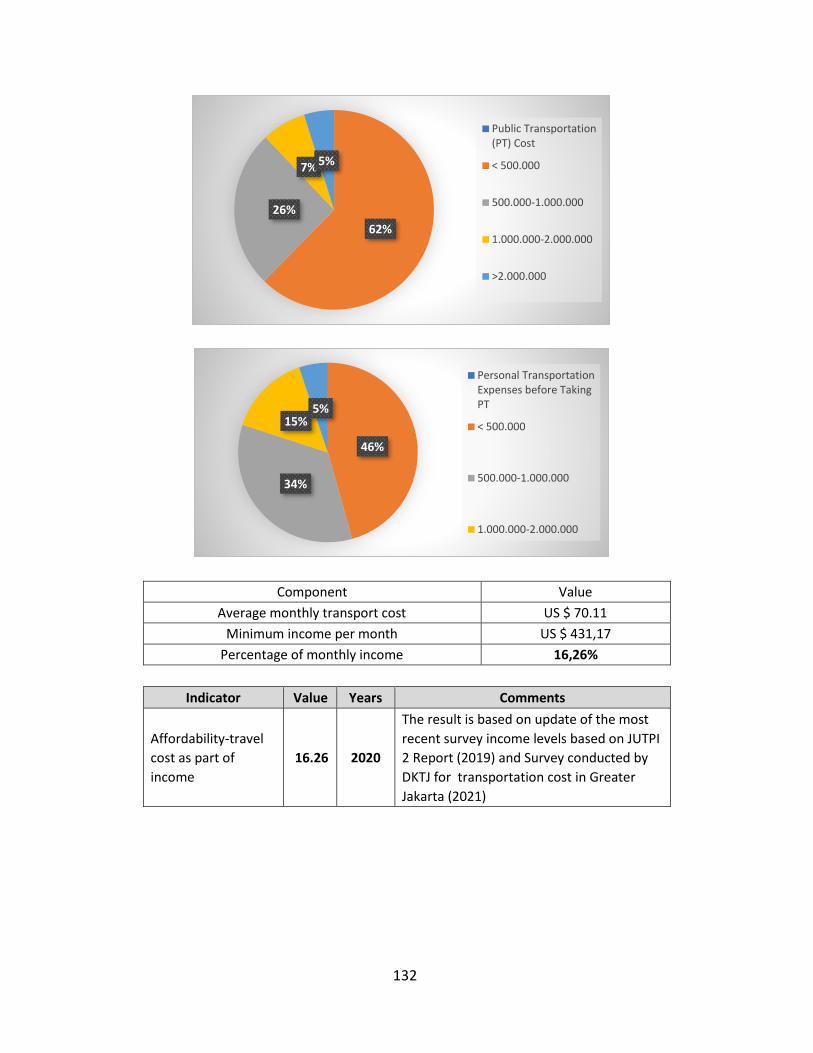
132
Component Value
Average monthly transport cost US $ 70.11
Minimum income per month US $ 431,17
Percentage of monthly income 16,26%
Indicator Value Years Comments
Affordability-travel
cost as part of
income
16.26 2020
The result is based on update of the most
recent survey income levels based on JUTPI
2 Report (2019) and Survey conducted by
DKTJ for transportation cost in Greater
Jakarta (2021)
62%
26%
7%5%
Public Transportation(PT) Cost
< 500.000
500.000-1.000.000
1.000.000-2.000.000
>2.000.000
46%
34%
15%5%
Personal TransportationExpenses before TakingPT
< 500.000
500.000-1.000.000
1.000.000-2.000.000
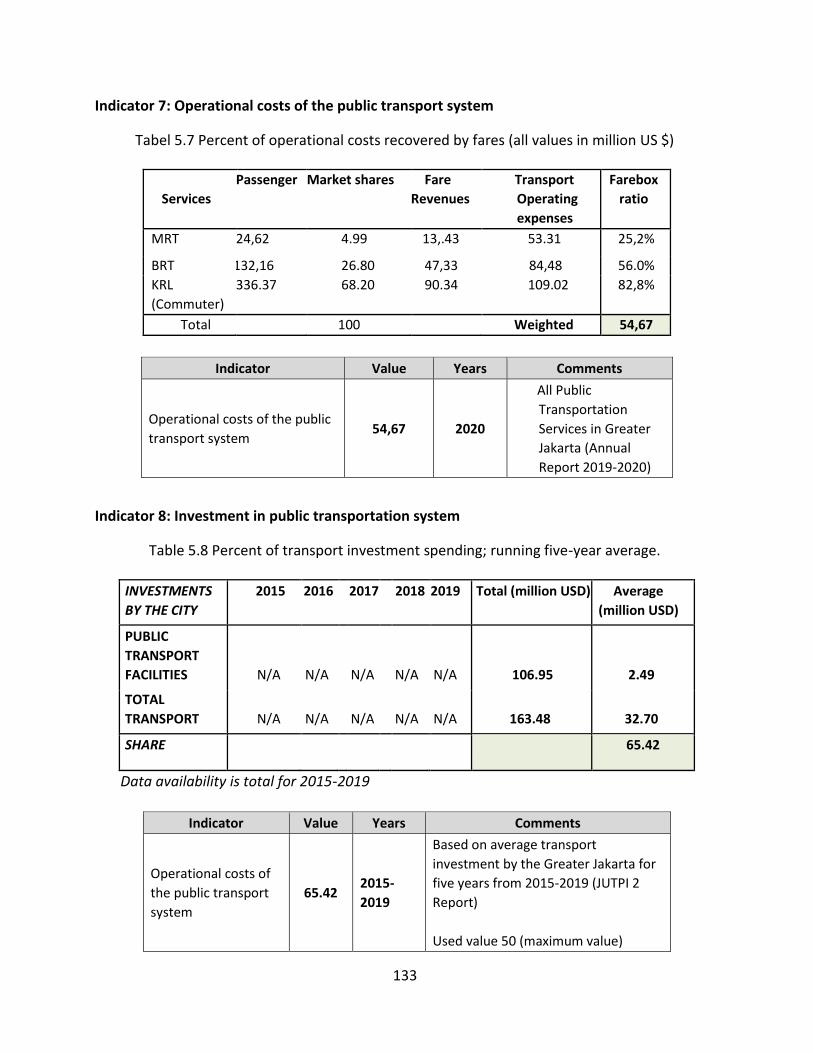
133
Indicator 7: Operational costs of the public transport system
Tabel 5.7 Percent of operational costs recovered by fares (all values in million US $)
Services
Passenger Market shares Fare
Revenues
Transport
Operating
expenses
Farebox
ratio
MRT 24,62 4.99 13,.43 53.31 25,2%
BRT 132,16 26.80 47,33 84,48 56.0%
KRL
(Commuter)
336.37 68.20 90.34 109.02 82,8%
Total 100 Weighted 54,67
Indicator Value Years Comments
Operational costs of the public
transport system 54,67 2020
All Public
Transportation
Services in Greater
Jakarta (Annual
Report 2019-2020)
Indicator 8: Investment in public transportation system
Table 5.8 Percent of transport investment spending; running five-year average.
INVESTMENTS
BY THE CITY
2015 2016 2017 2018 2019 Total (million USD) Average
(million USD)
PUBLIC
TRANSPORT
FACILITIES
N/A
N/A
N/A
N/A
N/A
106.95
2.49
TOTAL
TRANSPORT
N/A
N/A
N/A
N/A
N/A
163.48
32.70
SHARE 65.42
Data availability is total for 2015-2019
Indicator Value Years Comments
Operational costs of
the public transport
system
65.42 2015-
2019
Based on average transport
investment by the Greater Jakarta for
five years from 2015-2019 (JUTPI 2
Report)
Used value 50 (maximum value)
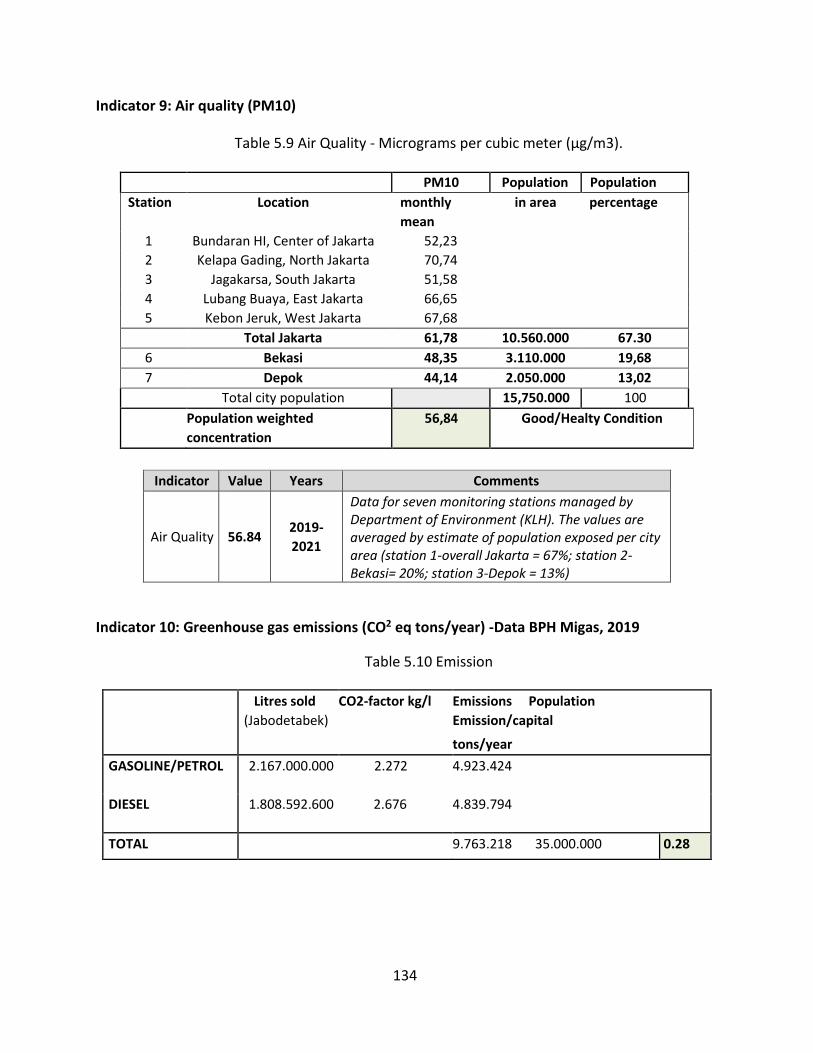
134
Indicator 9: Air quality (PM10)
Table 5.9 Air Quality - Micrograms per cubic meter (μg/m3).
PM10 Population Population
Station Location monthly
mean
in area percentage
1 Bundaran HI, Center of Jakarta 52,23
2 Kelapa Gading, North Jakarta 70,74
3 Jagakarsa, South Jakarta 51,58
4 Lubang Buaya, East Jakarta 66,65
5 Kebon Jeruk, West Jakarta 67,68
Total Jakarta 61,78 10.560.000 67.30
6 Bekasi 48,35 3.110.000 19,68
7 Depok 44,14 2.050.000 13,02
Total city population 15,750.000 100
Population weighted
concentration
56,84 Good/Healty Condition
Indicator Value Years Comments
Air Quality 56.84 2019-
2021
Data for seven monitoring stations managed by Department of Environment (KLH). The values are averaged by estimate of population exposed per city area (station 1-overall Jakarta = 67%; station 2-Bekasi= 20%; station 3-Depok = 13%)
Indicator 10: Greenhouse gas emissions (CO2 eq tons/year) -Data BPH Migas, 2019
Table 5.10 Emission
Litres sold
(Jabodetabek)
CO2-factor kg/l Emissions Population
Emission/capital
tons/year
GASOLINE/PETROL 2.167.000.000
2.272 4.923.424
DIESEL 1.808.592.600 2.676
4.839.794
TOTAL 9.763.218 35.000.000 0.28
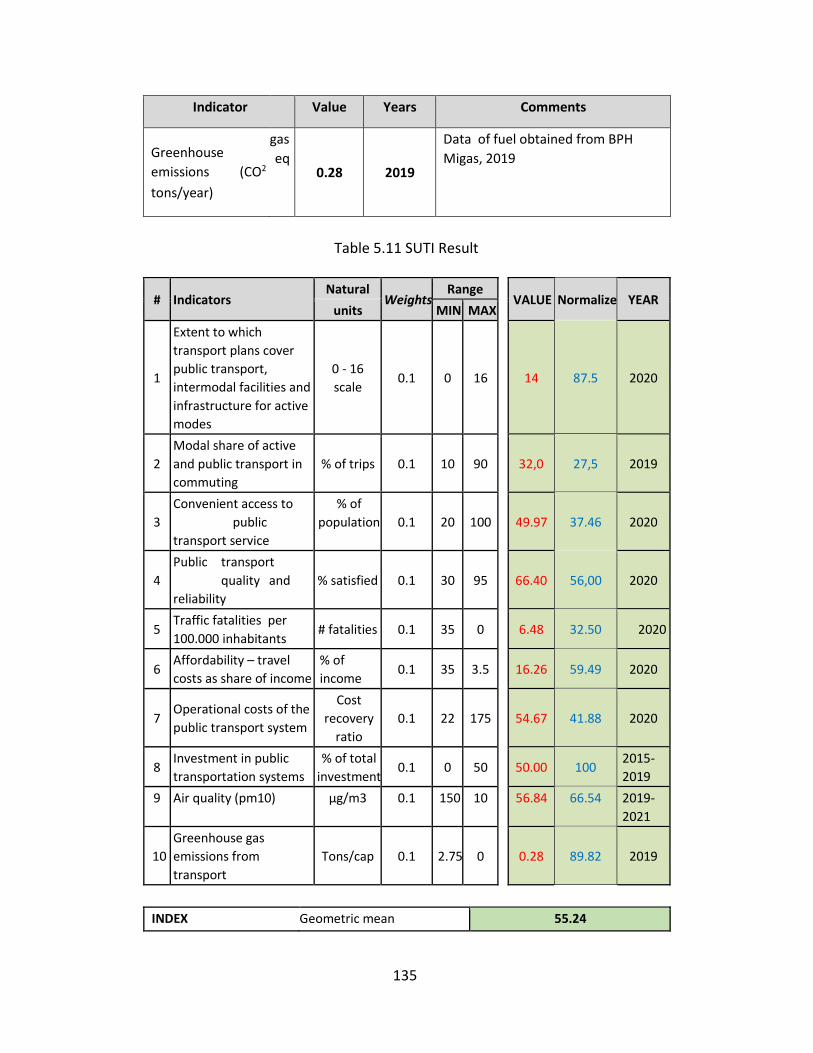
135
Indicator Value Years Comments
Greenhouse
emissions (CO2
tons/year)
gas
eq 0.28 2019
Data of fuel obtained from BPH
Migas, 2019
Table 5.11 SUTI Result
# Indicators Natural
Weights Range
VALUE Normalize YEAR units MIN MAX
1
Extent to which
transport plans cover
public transport,
intermodal facilities and
infrastructure for active
modes
0 - 16
scale 0.1 0 16 14 87.5 2020
2
Modal share of active
and public transport in
commuting
% of trips 0.1 10 90 32,0 27,5 2019
3
Convenient access to
public
transport service
% of
population 0.1 20 100 49.97 37.46 2020
4
Public transport
quality and
reliability
% satisfied 0.1 30 95 66.40 56,00 2020
5 Traffic fatalities per
100.000 inhabitants # fatalities 0.1 35 0 6.48 32.50 2020
6 Affordability – travel
costs as share of income
% of
income 0.1 35 3.5 16.26 59.49 2020
7 Operational costs of the
public transport system
Cost
recovery
ratio
0.1 22 175 54.67 41.88 2020
8 Investment in public
transportation systems
% of total
investment 0.1 0 50 50.00 100
2015-
2019
9 Air quality (pm10) μg/m3 0.1 150 10 56.84 66.54 2019-
2021
10
Greenhouse gas
emissions from
transport
Tons/cap 0.1 2.75 0 0.28 89.82 2019
INDEX Geometric mean 55.24
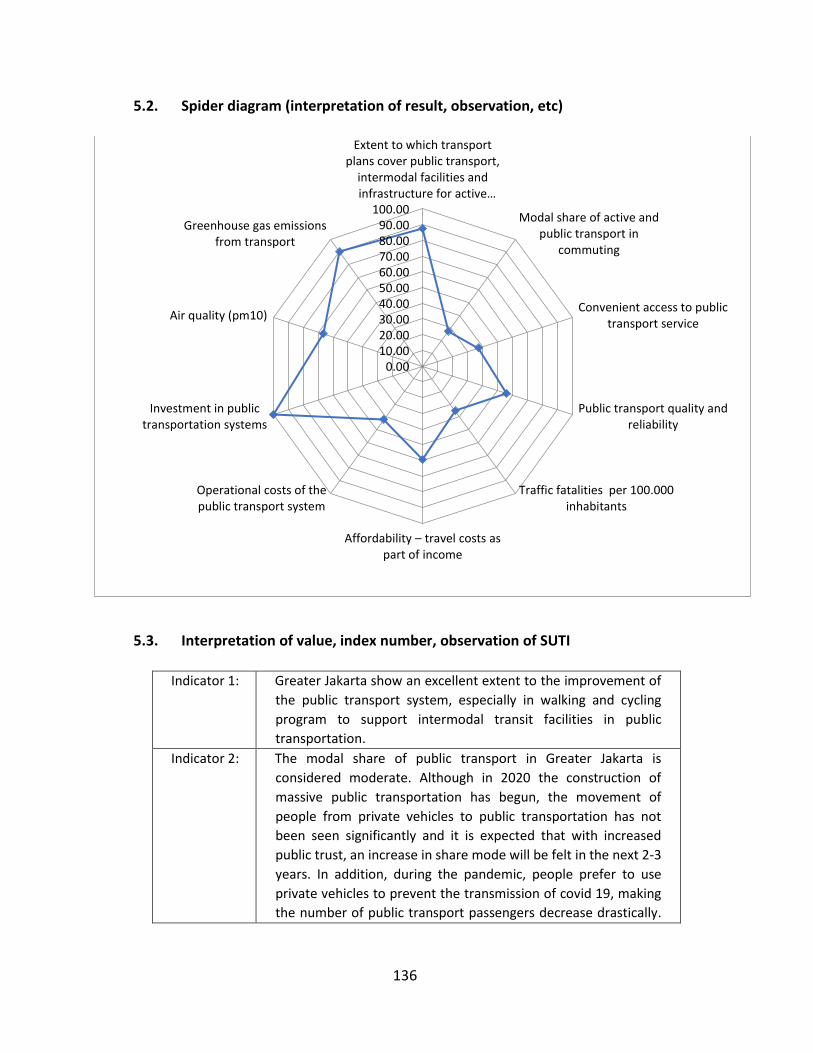
136
5.2. Spider diagram (interpretation of result, observation, etc)
5.3. Interpretation of value, index number, observation of SUTI
Indicator 1: Greater Jakarta show an excellent extent to the improvement of
the public transport system, especially in walking and cycling
program to support intermodal transit facilities in public
transportation.
Indicator 2: The modal share of public transport in Greater Jakarta is
considered moderate. Although in 2020 the construction of
massive public transportation has begun, the movement of
people from private vehicles to public transportation has not
been seen significantly and it is expected that with increased
public trust, an increase in share mode will be felt in the next 2-3
years. In addition, during the pandemic, people prefer to use
private vehicles to prevent the transmission of covid 19, making
the number of public transport passengers decrease drastically.
0.0010.0020.0030.0040.0050.0060.0070.0080.0090.00
100.00
Extent to which transportplans cover public transport,
intermodal facilities andinfrastructure for active…
Modal share of active andpublic transport in
commuting
Convenient access to publictransport service
Public transport quality andreliability
Traffic fatalities per 100.000inhabitants
Affordability – travel costs as part of income
Operational costs of thepublic transport system
Investment in publictransportation systems
Air quality (pm10)
Greenhouse gas emissionsfrom transport
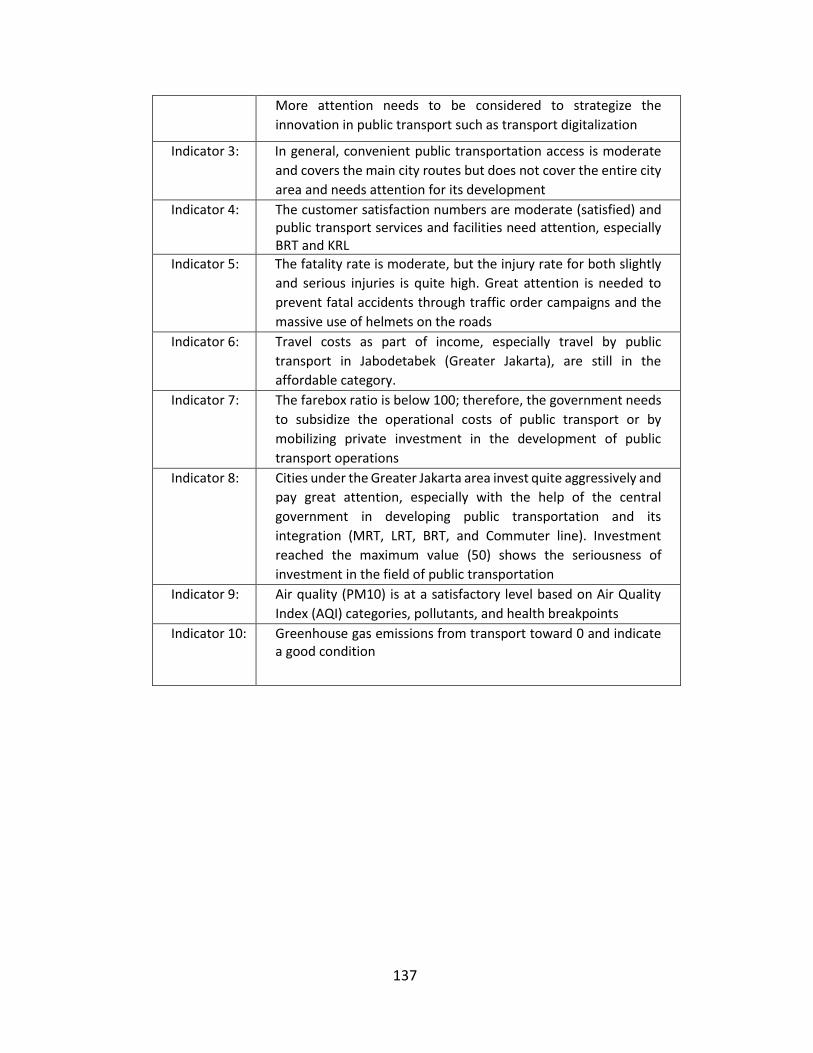
137
More attention needs to be considered to strategize the
innovation in public transport such as transport digitalization
Indicator 3: In general, convenient public transportation access is moderate
and covers the main city routes but does not cover the entire city
area and needs attention for its development
Indicator 4: The customer satisfaction numbers are moderate (satisfied) and public transport services and facilities need attention, especially BRT and KRL
Indicator 5: The fatality rate is moderate, but the injury rate for both slightly
and serious injuries is quite high. Great attention is needed to
prevent fatal accidents through traffic order campaigns and the
massive use of helmets on the roads
Indicator 6: Travel costs as part of income, especially travel by public
transport in Jabodetabek (Greater Jakarta), are still in the
affordable category.
Indicator 7: The farebox ratio is below 100; therefore, the government needs
to subsidize the operational costs of public transport or by
mobilizing private investment in the development of public
transport operations
Indicator 8: Cities under the Greater Jakarta area invest quite aggressively and
pay great attention, especially with the help of the central
government in developing public transportation and its
integration (MRT, LRT, BRT, and Commuter line). Investment
reached the maximum value (50) shows the seriousness of
investment in the field of public transportation
Indicator 9: Air quality (PM10) is at a satisfactory level based on Air Quality
Index (AQI) categories, pollutants, and health breakpoints
Indicator 10: Greenhouse gas emissions from transport toward 0 and indicate a good condition
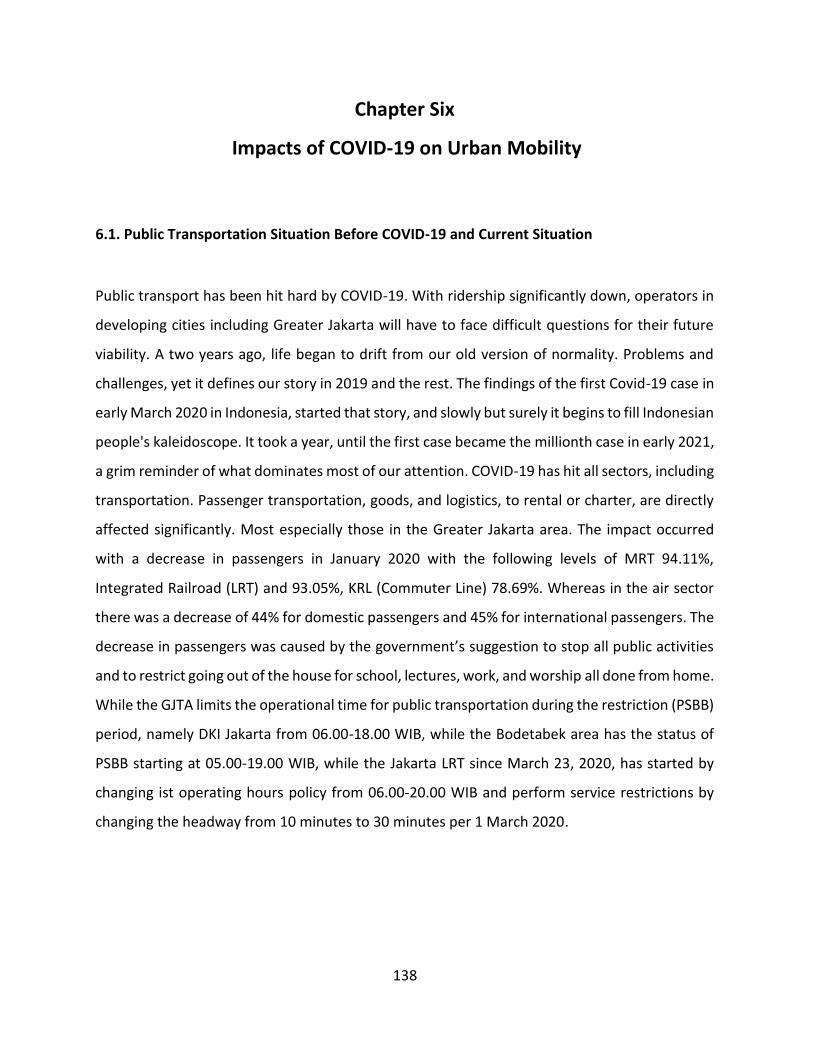
138
Chapter Six
Impacts of COVID-19 on Urban Mobility
6.1. Public Transportation Situation Before COVID-19 and Current Situation
Public transport has been hit hard by COVID-19. With ridership significantly down, operators in
developing cities including Greater Jakarta will have to face difficult questions for their future
viability. A two years ago, life began to drift from our old version of normality. Problems and
challenges, yet it defines our story in 2019 and the rest. The findings of the first Covid-19 case in
early March 2020 in Indonesia, started that story, and slowly but surely it begins to fill Indonesian
people's kaleidoscope. It took a year, until the first case became the millionth case in early 2021,
a grim reminder of what dominates most of our attention. COVID-19 has hit all sectors, including
transportation. Passenger transportation, goods, and logistics, to rental or charter, are directly
affected significantly. Most especially those in the Greater Jakarta area. The impact occurred
with a decrease in passengers in January 2020 with the following levels of MRT 94.11%,
Integrated Railroad (LRT) and 93.05%, KRL (Commuter Line) 78.69%. Whereas in the air sector
there was a decrease of 44% for domestic passengers and 45% for international passengers. The
decrease in passengers was caused by the government’s suggestion to stop all public activities
and to restrict going out of the house for school, lectures, work, and worship all done from home.
While the GJTA limits the operational time for public transportation during the restriction (PSBB)
period, namely DKI Jakarta from 06.00-18.00 WIB, while the Bodetabek area has the status of
PSBB starting at 05.00-19.00 WIB, while the Jakarta LRT since March 23, 2020, has started by
changing ist operating hours policy from 06.00-20.00 WIB and perform service restrictions by
changing the headway from 10 minutes to 30 minutes per 1 March 2020.
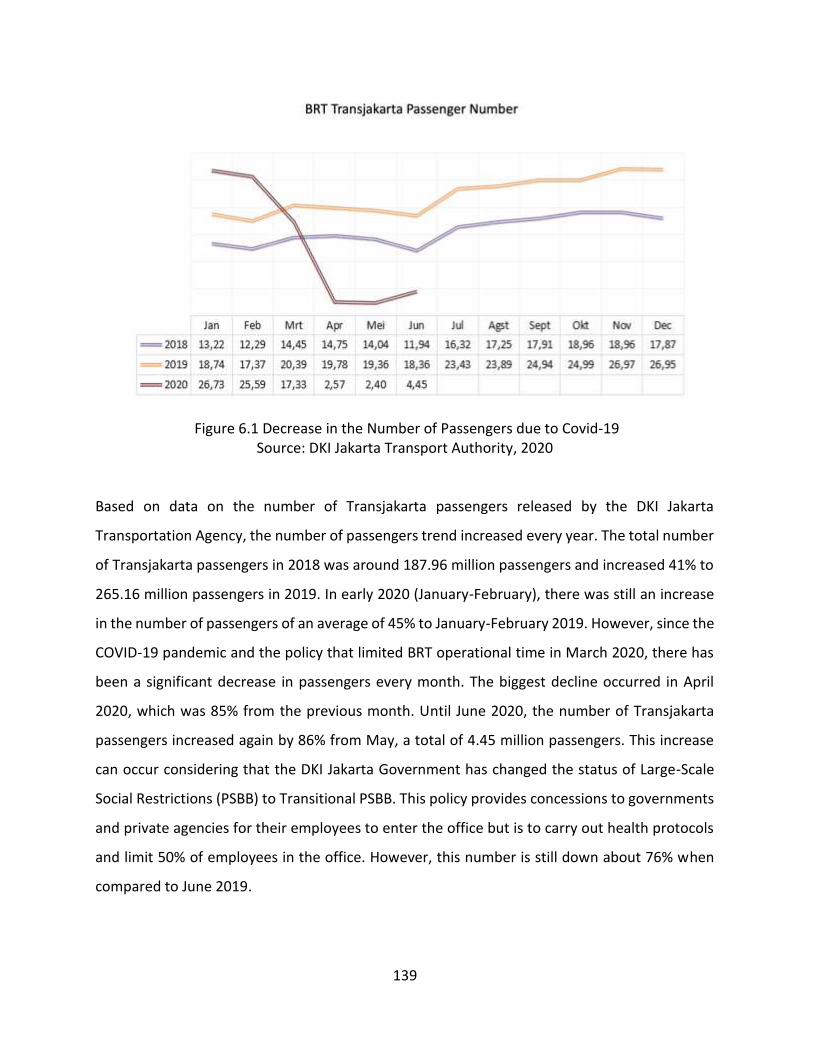
139
Figure 6.1 Decrease in the Number of Passengers due to Covid-19 Source: DKI Jakarta Transport Authority, 2020
Based on data on the number of Transjakarta passengers released by the DKI Jakarta
Transportation Agency, the number of passengers trend increased every year. The total number
of Transjakarta passengers in 2018 was around 187.96 million passengers and increased 41% to
265.16 million passengers in 2019. In early 2020 (January-February), there was still an increase
in the number of passengers of an average of 45% to January-February 2019. However, since the
COVID-19 pandemic and the policy that limited BRT operational time in March 2020, there has
been a significant decrease in passengers every month. The biggest decline occurred in April
2020, which was 85% from the previous month. Until June 2020, the number of Transjakarta
passengers increased again by 86% from May, a total of 4.45 million passengers. This increase
can occur considering that the DKI Jakarta Government has changed the status of Large-Scale
Social Restrictions (PSBB) to Transitional PSBB. This policy provides concessions to governments
and private agencies for their employees to enter the office but is to carry out health protocols
and limit 50% of employees in the office. However, this number is still down about 76% when
compared to June 2019.
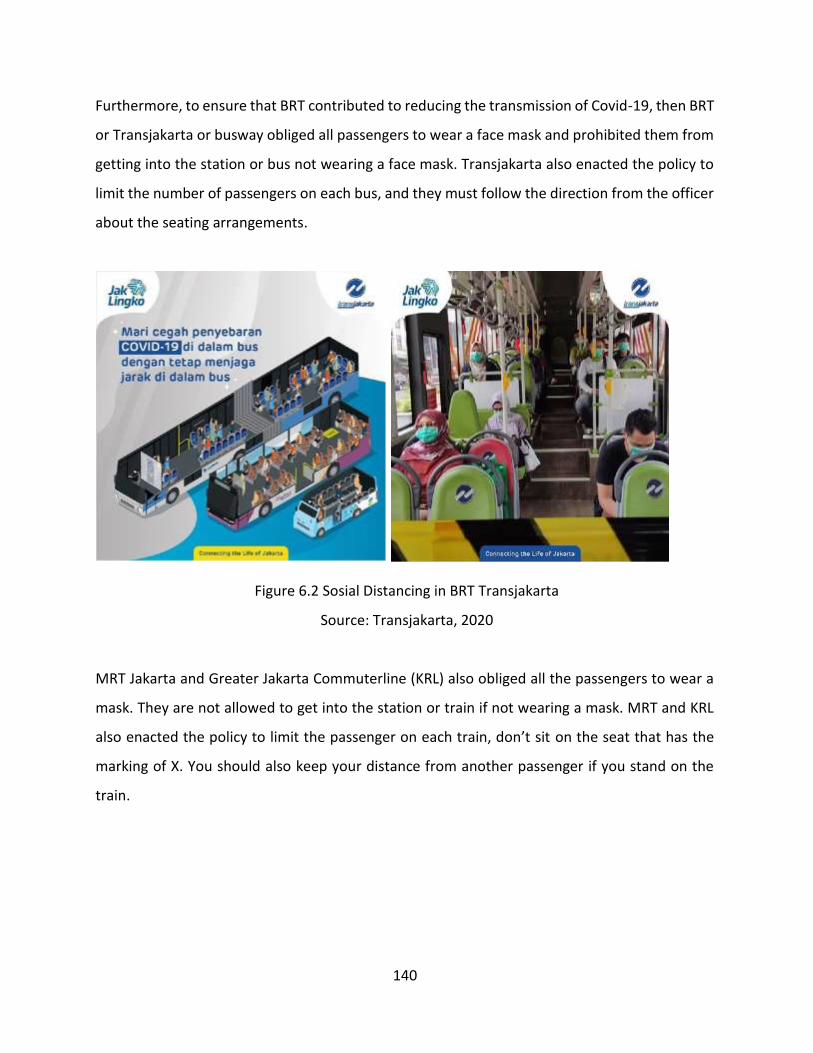
140
Furthermore, to ensure that BRT contributed to reducing the transmission of Covid-19, then BRT
or Transjakarta or busway obliged all passengers to wear a face mask and prohibited them from
getting into the station or bus not wearing a face mask. Transjakarta also enacted the policy to
limit the number of passengers on each bus, and they must follow the direction from the officer
about the seating arrangements.
Figure 6.2 Sosial Distancing in BRT Transjakarta
Source: Transjakarta, 2020
MRT Jakarta and Greater Jakarta Commuterline (KRL) also obliged all the passengers to wear a
mask. They are not allowed to get into the station or train if not wearing a mask. MRT and KRL
also enacted the policy to limit the passenger on each train, don’t sit on the seat that has the
marking of X. You should also keep your distance from another passenger if you stand on the
train.

141
Figure 6.3 Sosial Distancing in KRL Commuterline Source: KRL, 2020
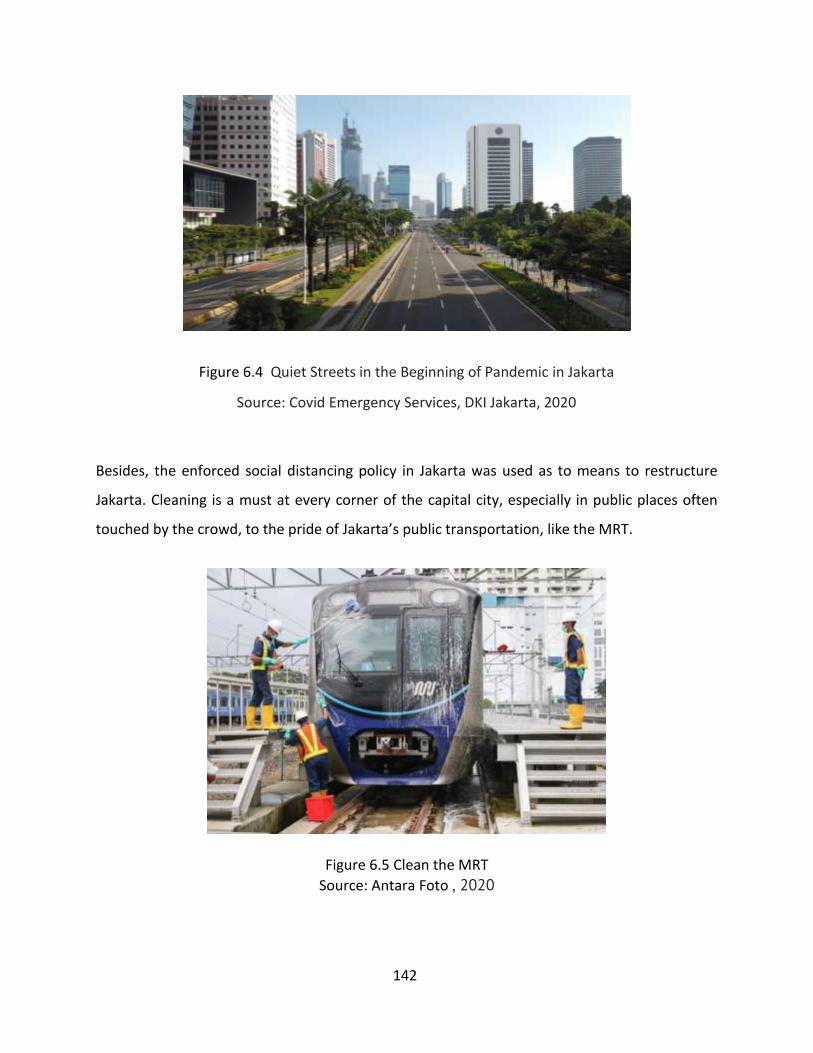
142
Figure 6.4 Quiet Streets in the Beginning of Pandemic in Jakarta
Source: Covid Emergency Services, DKI Jakarta, 2020
Besides, the enforced social distancing policy in Jakarta was used as to means to restructure
Jakarta. Cleaning is a must at every corner of the capital city, especially in public places often
touched by the crowd, to the pride of Jakarta’s public transportation, like the MRT.
Figure 6.5 Clean the MRT
Source: Antara Foto , 2020
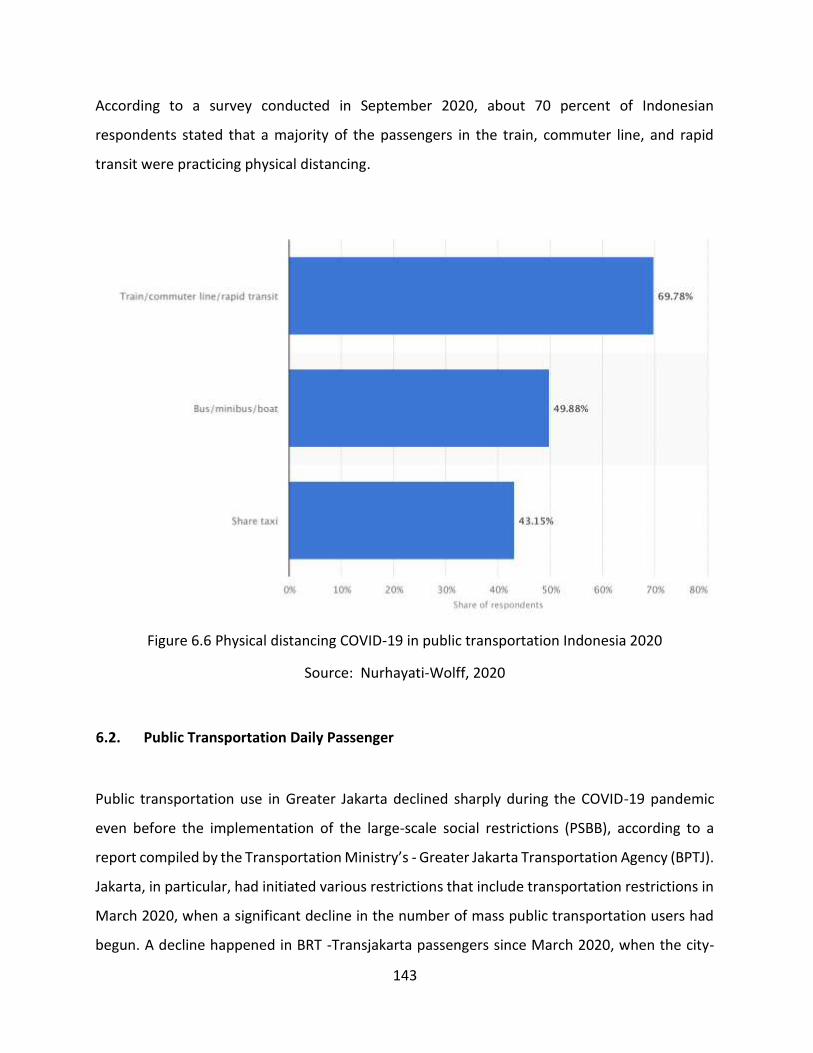
143
According to a survey conducted in September 2020, about 70 percent of Indonesian
respondents stated that a majority of the passengers in the train, commuter line, and rapid
transit were practicing physical distancing.
Figure 6.6 Physical distancing COVID-19 in public transportation Indonesia 2020
Source: Nurhayati-Wolff, 2020
6.2. Public Transportation Daily Passenger
Public transportation use in Greater Jakarta declined sharply during the COVID-19 pandemic
even before the implementation of the large-scale social restrictions (PSBB), according to a
report compiled by the Transportation Ministry’s - Greater Jakarta Transportation Agency (BPTJ).
Jakarta, in particular, had initiated various restrictions that include transportation restrictions in
March 2020, when a significant decline in the number of mass public transportation users had
begun. A decline happened in BRT -Transjakarta passengers since March 2020, when the city-
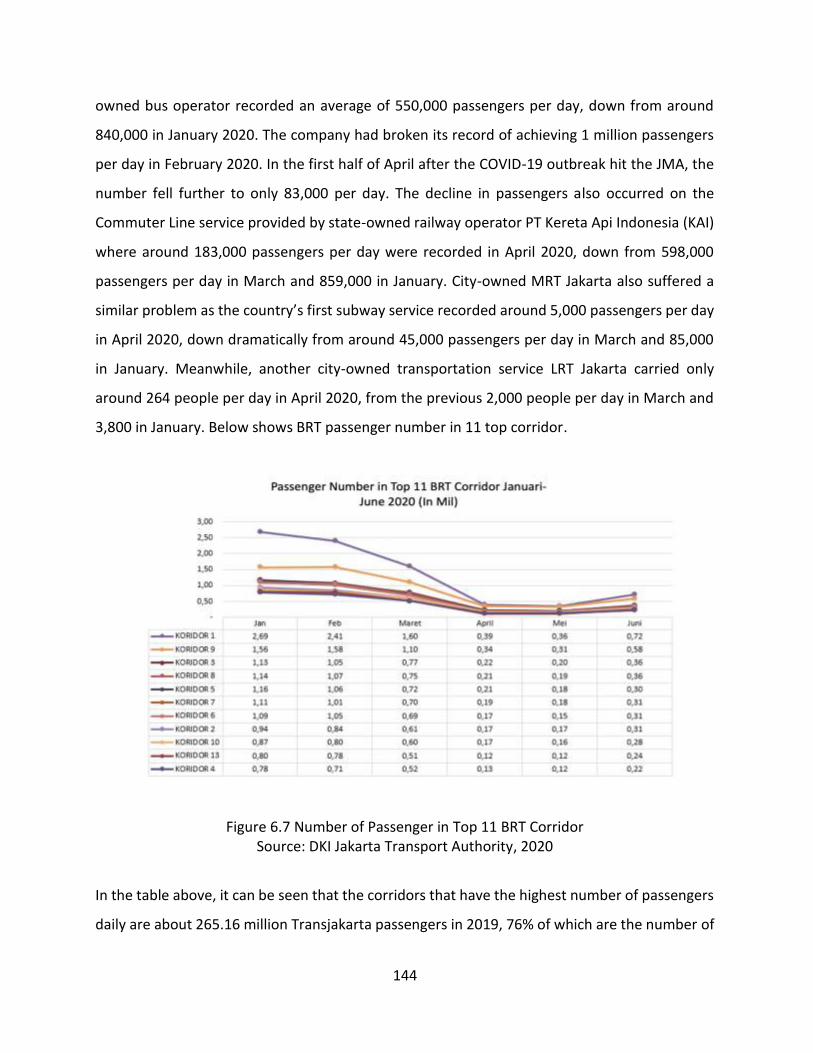
144
owned bus operator recorded an average of 550,000 passengers per day, down from around
840,000 in January 2020. The company had broken its record of achieving 1 million passengers
per day in February 2020. In the first half of April after the COVID-19 outbreak hit the JMA, the
number fell further to only 83,000 per day. The decline in passengers also occurred on the
Commuter Line service provided by state-owned railway operator PT Kereta Api Indonesia (KAI)
where around 183,000 passengers per day were recorded in April 2020, down from 598,000
passengers per day in March and 859,000 in January. City-owned MRT Jakarta also suffered a
similar problem as the country’s first subway service recorded around 5,000 passengers per day
in April 2020, down dramatically from around 45,000 passengers per day in March and 85,000
in January. Meanwhile, another city-owned transportation service LRT Jakarta carried only
around 264 people per day in April 2020, from the previous 2,000 people per day in March and
3,800 in January. Below shows BRT passenger number in 11 top corridor.
Figure 6.7 Number of Passenger in Top 11 BRT Corridor Source: DKI Jakarta Transport Authority, 2020
In the table above, it can be seen that the corridors that have the highest number of passengers
daily are about 265.16 million Transjakarta passengers in 2019, 76% of which are the number of

145
passengers from the 11 corridors above. Although in 2020 the number of passengers decreased,
the corridors with the highest number of passengers were still in the 11 corridors above.
Before the spread of Covid-19 in Jakarta, the DKI Jakarta Provincial Government had a target of
an average of 1 million BRT-Transjakarta passengers per day. Therefore, one of the efforts of the
DKI Jakarta Provincial Government to achieve this target is to increase the routes (departments)
to increase the Transjakarta bus fleet. This can be seen from the trend in the graph above that
the number of routes each month has increased with an average increase of 3%. As of June 2020,
there are 248 Transjakarta routes.
Figure 6.8 Number of Routes/Corridors According to Services Source: DKI Jakarta Transport Authority, 2020
From 248 Transjakarta corridors in June 2020, the highest number of routes is the Small Bus
Integrated Transport service with a total of 69 routes. Furthermore, there are Integrated Public
Transport and Transjabodetabek services with 61 and 27 corridors, respectively. Then there are
different types of services compared to 2019, namely there are 3 corridors that serve for the
transportation of Social Assistance Packing Officers (bansos) during this pandemic.
146
6.3. Impact of Mobility Restrictions in Greater Jakarta - JMA
As of 14 March 2020, the Indonesian government has declared the COVID-19 pandemic a
national disaster and the President set forth several mitigation measures including a
recommendation to ‘work, learn, and worship from/at home’ to reduce the potential spread of
this highly contagious disease. The interpretation of that strategy inevitably influences the
transportation sector since the adopted measures should reduce people’s mobility. One of the
transportation policies that the GJTA has tried to implement concerning COVID-19 was the
sudden reduction of public transport services, which was criticized by many because it caused
long queus passengers at several transit stops and stations that potentially increased
transmission risk. Indonesian Government and GJTA has set that transportation policy during a
pandemic must aim at finding a balance point between avoiding increasing transmission risk on
one hand while guaranteeing an unbroken supply chain of consumer goods.
According to ERIA, 2020 the basic principle to inhibit the transmission of COVID-19 is social
distancing actions that minimize contact between humans to stop or reduce the rate of
transmission through primary activities such as work, school, recreation or socializing. Human
mobility or movement is just a derivative activity or demand generated by these primary
activities and transportation modes, especially for passengers, have the potential to become a
coronavirus transmission vector. The reduction of public transit frequency, as attempted by the
Jakarta city government, is an example of conventional policies that are commonly carried out
in the transport sector to deal with a pandemic by reducing people mobility. However, an
effective implementation of the policy should focus on eliminating primary activities that have
the potential to generate trips and not on limiting the trip itself. Several recent studies related
to the COVID-19 pandemic found that restricting the flow of people movement as attempted by
the GJTA was ineffective in reducing or stopping the growth in the number of cases significantly.
As part of the COVID-19 transitional period in Indonesia known as the “new normal,” the
Minister of Transportation (“MOT”) has enacted MOT Regulation No. 41 of 2020 regarding the

147
Amendment of MOT Regulation No. 18 regarding Transportation Control to prevent the Spread
of Corona Disease 2019 (“COVID-19”) (“MOT Reg 18/2020, as amended”). This new regulation
provides further provisions on controls for (i) land, (ii) sea, (iii) air and (iv) rail transportation. It
also contains administrative sanctions for violations. Generally, the MOT prohibits the
transportation of passengers who are unhealthy/have a temperature above 38 degrees Celsius,
and requires transported goods to be sanitized before and after their arrival. Both regulations
stipulate basic obligations during COVID-19. These obligations include the wearing of face masks
by passengers/personnel, the implementation of physical distancing, the periodic disinfection of
vehicles, stations, ports, terminals, etc., the provision of handwashing facilities/hand sanitizers,
and adequate medical screening at transportation facilities. This article discusses the specific
transportation control obligations and administrative sanctions under MOT Reg 18/2020, as
amended.
Parties subject to transportation controls are (i) passengers, (ii) operators of transportation
facilities for passengers/goods, (iii) operators of transportation infrastructure, (iv) operational
managers for the transportation of goods, and (iii) the senders/recipients of goods. In
transporting passengers, the MOT requires passengers and operators of transportation facilities
to prioritize the online purchase/sale of tickets. If a passenger is found to be unhealthy or has a
fever, particularly if they show symptoms consistent with COVID-19, they will be removed from
the vehicle/vessel and referred to a health facility for screening. For the transportation of goods,
the operational manager shall ensure that the vehicle used is equipped with a special sticker to
indicate the vehicle is transporting logistical goods. In areas of Indonesia under social distancing
restrictions (“PSBB”), controls on the transportation of goods are waived for essential goods such
as:
• Medical, health and sanitation necessities;
• Primary goods;
• Food and drinks;
• Oil/gas fuel;
• Raw materials for manufacturing and assembling industries; and
148
• Necessities for export or import.
• Operators of transportation facilities must monitor the health of their personnel and
require that they report any changes in their health. To maintain the health of personnel,
rest areas shall be set aside in transportation facilities.
Transportation operators must also take steps to prepare for emergency medical situations
when conducting transportation activities. For the transportation of passengers, transportation
facilities must provide health posts (with medical personnel) in coordination with a COVID-19
referral hospital. For the transportation of goods, the operators of transportation facilities and
operational managers must prepare emergency contacts in all regions along the transportation
route to anticipate any emergency.
i. Land Transportation Controls
In addition to limiting the number of passengers to 50% of the vehicle’s total capacity,
operational hours for public motorized vehicles may be limited by an official with the
authority to make such a decision. For river, lake, and water crossing transportation, the
operational hours of ports shall be limited and adjusted to ships’ schedules. The MOT
specifies that buses shall only transport passengers to places that are permitted under the
applicable provisions of laws and regulations. In addition, the number of stops a bus is
allowed before the destination terminal is limited to one-stop, for a maximum of 30 minutes,
for distances of less than 500 kilometers. Buses can have additional stops for distances of
more than 500 kilometers. In addition to the basic obligations for transportation activities
during COVID-19, motorbikes used for either personal or public transportation are permitted
to carry passengers only if they comply with specific health protocols, which include only
carrying out activities that are permitted during PSBB.
ii. Rail Transportation Controls
Intercity trains (except for luxury trains), urban trains, local trains, Prambanan express
trains, and airport rail links shall limit the number of passengers to 50% of the train’s total
number of seats. Physical distancing must be implemented following the seating
configuration, and no standing passengers are allowed
149
iii. Sea Transportation Controls
Passenger ships, including those carrying economy-class passengers and pioneer transport ships
that serve the public interest, shall limit the number of passengers to 50% of the ship’s total
capacity of seats or beds and implement physical distancing. Ships are permitted to transport
goods and materials needed for the handling and prevention of COVID-19, as well as materials
for primary needs and essential goods. A passenger ship can transport cargo under the following
conditions:
• There is a shortage of cargo ships in a PSBB area necessitating the use of a passenger ship
to transport goods.
• A passenger ship is used to transport goods/materials for the handling and prevention of
COVID-19, or materials for primary needs or essential goods.
• The transportation of cargo on a passenger ship shall take into account the safety and
capabilities of the ship.
Port operations are permitted as follows:
• Activities such as ship operation, stevedoring, cargo during and delivery are permitted
with the implementation of physical distancing.
• If the number of officials, workers, and visitors is limited and physical distancing is
implemented.
• For the loading and unloading of export/import goods, goods for primary needs, and
essential goods
• For the loading and unloading of logistical support for the handling and prevention of
COVID-19.
iv. Air Transportation Controls
Air transportation operators shall evaluate and adjust the slot-time capacity for airports and
limit the number of passengers to 50% of the air transportation’s total capacity. Air
transportation passengers must submit a Health Alert Card (“HAC”) when arriving at their
destination. Operators of air transportation facilities must take steps to remind passengers of
150
the HAC requirement. In the event of a health emergency, air transportation operators shall
coordinate with the COVID-19 crisis center or air traffic controller at the destination airport.
Similar to sea transportation, a configured passenger plane may be used to carry cargo in the
passenger compartment provided it is for the transportation of medical, health, and/or
sanitation necessities, or foodstuffs.
Furthermore, in Jakarta under the legal protection of Governor Regulation No. 33 of 2020,
Governor Anies Baswedan imposed a Large-Scale Social Restriction (PSBB) in Jakarta for the first
time. During the PSBB period, people were again advised not to travel outside the home except
for essential and medical needs. The government also provides exceptions to 11 sectors that are
allowed to continue operating, including health, communication, and finance. After the official
large-scale social restrictions (PSBB) status, it can be ascertained that public transportation user
numbers have declined as people’s mobility has been limited. During the partial lockdown, there
has been a limitation on the operational time for all public transportation modes, whereby they
only operate from 6 a.m. to 6 p.m. in Jakarta and from 5 a.m. to 7 p.m. in other areas in Greater
Jakarta. Based on The GJTA claimed there had been few violations of the PSBB provisions
because people had been prohibited from using public transportation services if they did not
meet health protocols. Besides, most private vehicle users had complied with the correct
physical distancing protocols as they used proper masks and limited the number of passengers,
as noticed by officials at checkpoints.
On the other hand, Greater Jakarta-based intercity and interprovincial (AKAP) buses also carried
many fewer passengers during the pandemic, as observed from the service data on several bus
terminals under the authority of the GJTA. According to a monthly report by GJTA,
Baranangsiang Terminal in satellite city, Bogor in West Java recorded an average of only 3,356
arrivals per day in March 2020, down from 20,164 arrivals in January 2020. Meanwhile, the
average departing passenger numbers declined to 8,467 people per day in March 2020, from an
average of 50,718 people in January 2020. In several other terminals such as Paris Plawad
Terminal in Tangerang, Banten; Pondok Cabe Terminal in South Tangerang; and Jatijajar Terminal
151
in Depok, West Java, a significant decrease also occurred in the number of arrivals, but not in
departing passengers. The GJTA reported it had been consistently applying health protocols at
the terminals since early March 2020 based on its Circular No. 4/2020 regarding the prevention
of COVID-19.
after the PSBB was implemented, the easing slowly began to be implemented with the
Transitional PSBB. During this transition period, offices are allowed to operate at 50% capacity,
while the other 50% continue to work from home. Shopping centers have also begun to open
with strict health protocols. In early 2021, the Transitional PSBB was replaced with the
Enforcement of Community Activity Restrictions (PPKM). If the PSBB is applied at the request of
the regional government, the PPKM is decided by the central government. However, the rules
for the Transitional PSBB and PPKM tend to be the same. In-office regulations, for example, the
Transitional PSBB and PPKM both limit capacity to 50%. Places/restaurants are also allowed to
open with a capacity of 50%. Even with the same allowance, is there a difference in mobility
during the Transitional PSBB and PPKM in DKI Jakarta? To find out the answer, a baseline or
measurement basis is used. The basis for the measurement is the median value taken over five
weeks from January 3, 2020, to February 6, 2020. By comparing the two restrictions on the
Transitional PSBB and PPKM, the Jakarta Smart City Unit monitors these two conditions using
Google Mobility and Apple Mobility. The data compared to the baseline is the Transitional PSBB
period (8 June-8 July 2020) and the PPKM period (9 March-9 April 2021).
With the various #StayHome campaigns during the PSBB restrictions, many residents are starting
to choose to stay at home instead of going out. Then, during the Transitional PSBB period, even
though the easing has begun, activities at home are still higher than before the pandemic, as
shown in the data below.
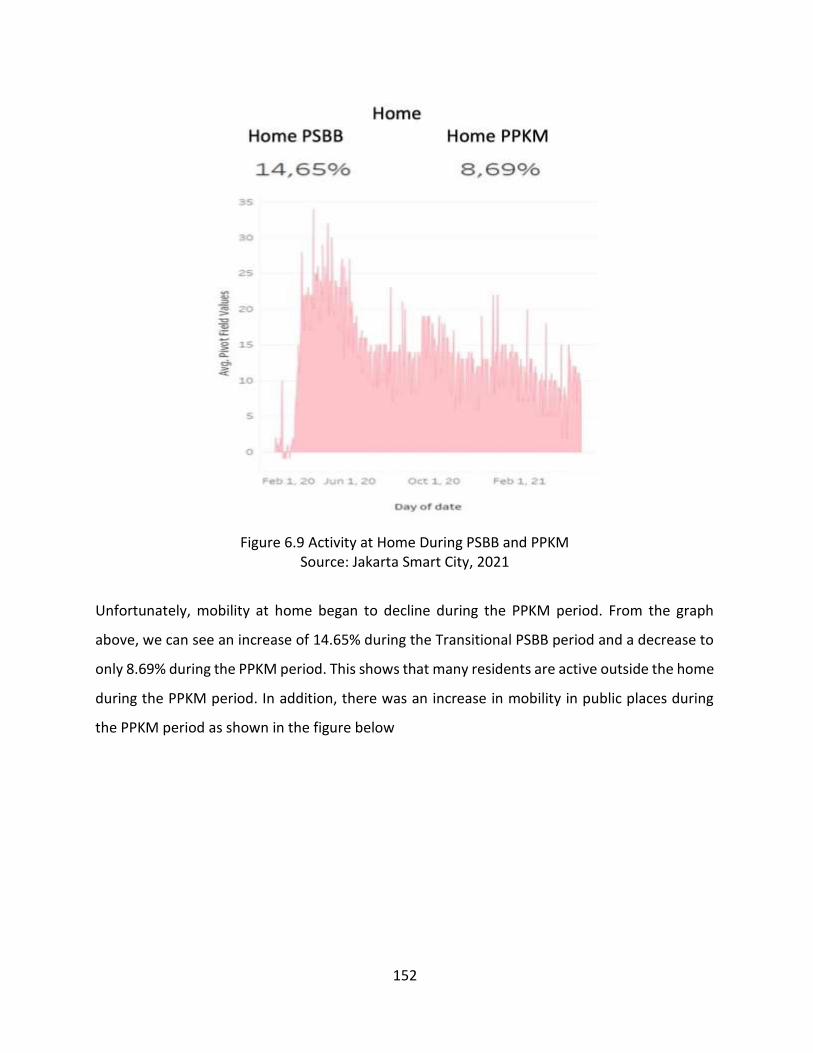
152
Figure 6.9 Activity at Home During PSBB and PPKM Source: Jakarta Smart City, 2021
Unfortunately, mobility at home began to decline during the PPKM period. From the graph
above, we can see an increase of 14.65% during the Transitional PSBB period and a decrease to
only 8.69% during the PPKM period. This shows that many residents are active outside the home
during the PPKM period. In addition, there was an increase in mobility in public places during
the PPKM period as shown in the figure below
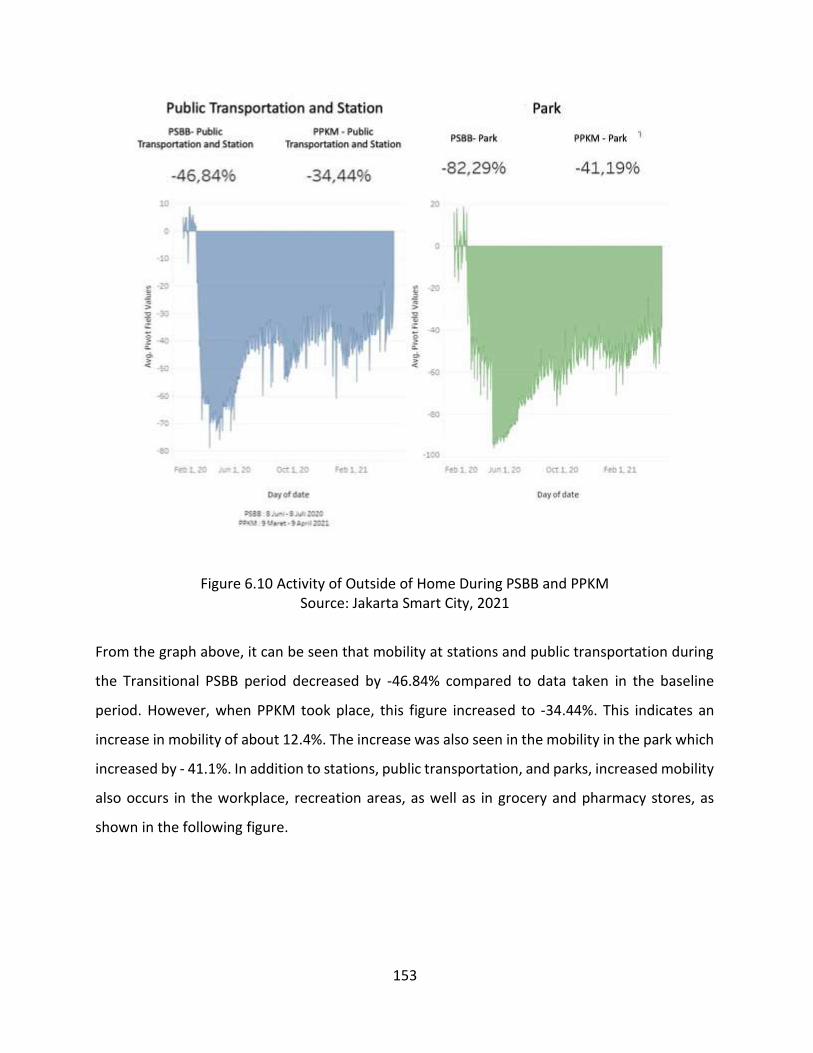
153
Figure 6.10 Activity of Outside of Home During PSBB and PPKM Source: Jakarta Smart City, 2021
From the graph above, it can be seen that mobility at stations and public transportation during
the Transitional PSBB period decreased by -46.84% compared to data taken in the baseline
period. However, when PPKM took place, this figure increased to -34.44%. This indicates an
increase in mobility of about 12.4%. The increase was also seen in the mobility in the park which
increased by - 41.1%. In addition to stations, public transportation, and parks, increased mobility
also occurs in the workplace, recreation areas, as well as in grocery and pharmacy stores, as
shown in the following figure.
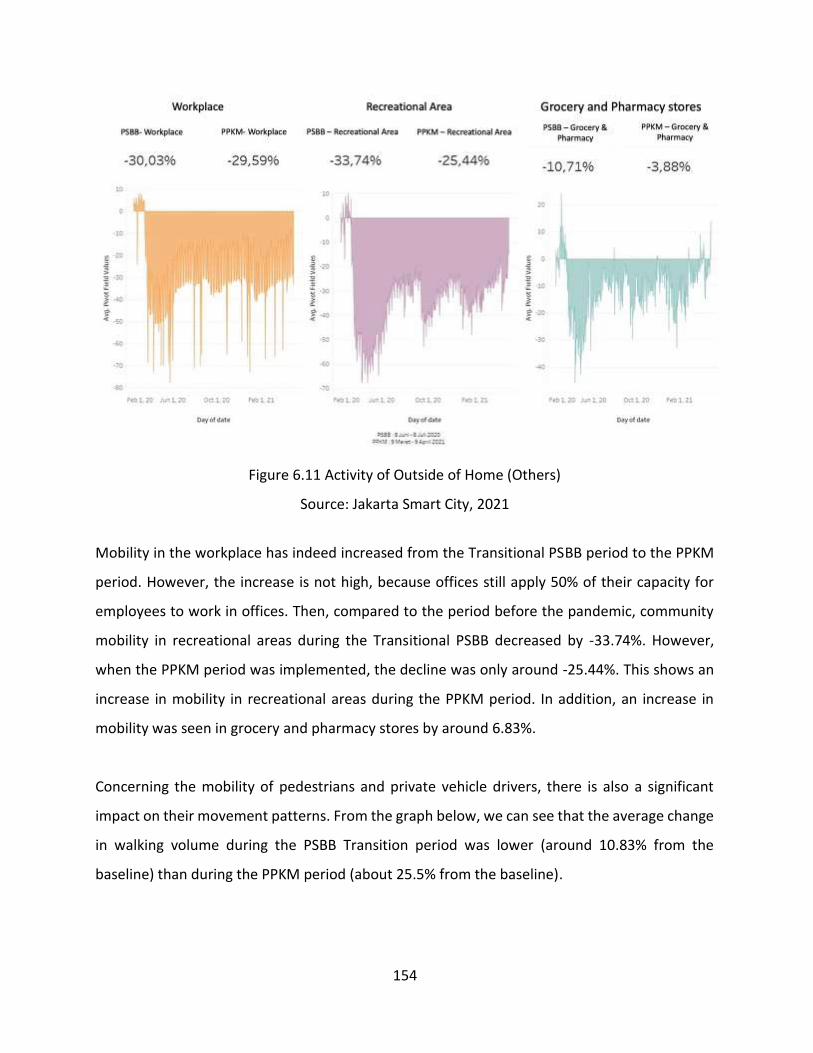
154
Figure 6.11 Activity of Outside of Home (Others)
Source: Jakarta Smart City, 2021
Mobility in the workplace has indeed increased from the Transitional PSBB period to the PPKM
period. However, the increase is not high, because offices still apply 50% of their capacity for
employees to work in offices. Then, compared to the period before the pandemic, community
mobility in recreational areas during the Transitional PSBB decreased by -33.74%. However,
when the PPKM period was implemented, the decline was only around -25.44%. This shows an
increase in mobility in recreational areas during the PPKM period. In addition, an increase in
mobility was seen in grocery and pharmacy stores by around 6.83%.
Concerning the mobility of pedestrians and private vehicle drivers, there is also a significant
impact on their movement patterns. From the graph below, we can see that the average change
in walking volume during the PSBB Transition period was lower (around 10.83% from the
baseline) than during the PPKM period (about 25.5% from the baseline).
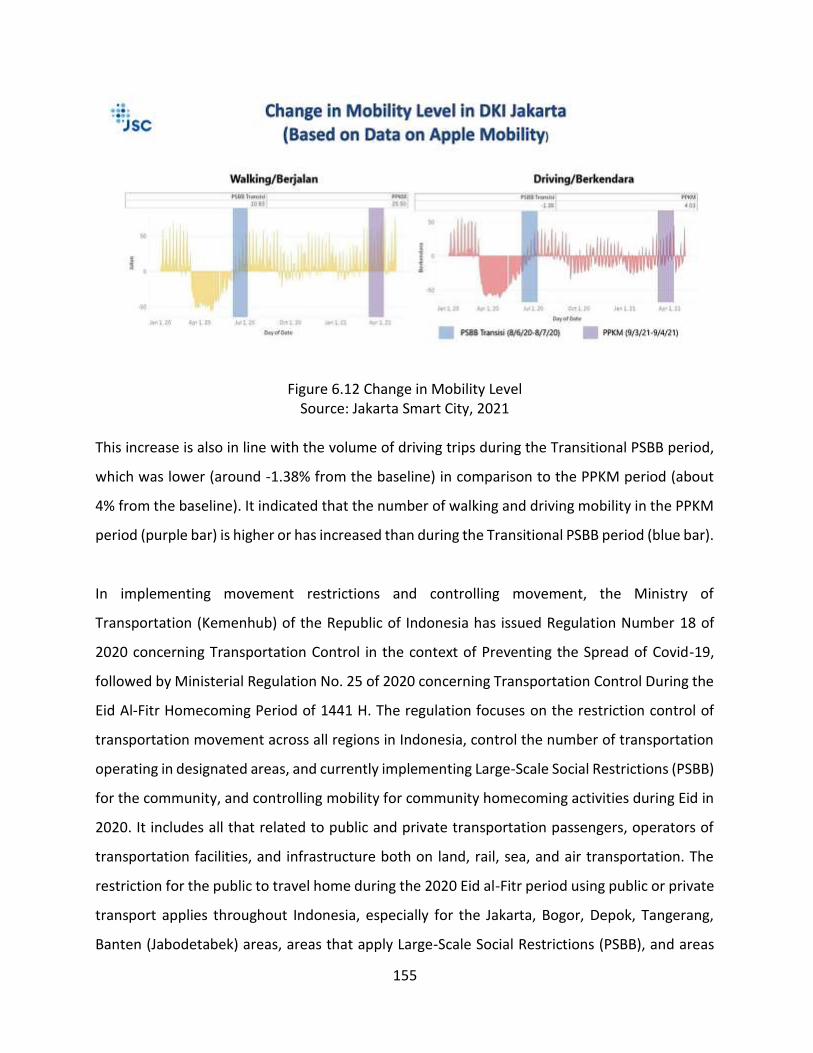
155
Figure 6.12 Change in Mobility Level
Source: Jakarta Smart City, 2021
This increase is also in line with the volume of driving trips during the Transitional PSBB period,
which was lower (around -1.38% from the baseline) in comparison to the PPKM period (about
4% from the baseline). It indicated that the number of walking and driving mobility in the PPKM
period (purple bar) is higher or has increased than during the Transitional PSBB period (blue bar).
In implementing movement restrictions and controlling movement, the Ministry of
Transportation (Kemenhub) of the Republic of Indonesia has issued Regulation Number 18 of
2020 concerning Transportation Control in the context of Preventing the Spread of Covid-19,
followed by Ministerial Regulation No. 25 of 2020 concerning Transportation Control During the
Eid Al-Fitr Homecoming Period of 1441 H. The regulation focuses on the restriction control of
transportation movement across all regions in Indonesia, control the number of transportation
operating in designated areas, and currently implementing Large-Scale Social Restrictions (PSBB)
for the community, and controlling mobility for community homecoming activities during Eid in
2020. It includes all that related to public and private transportation passengers, operators of
transportation facilities, and infrastructure both on land, rail, sea, and air transportation. The
restriction for the public to travel home during the 2020 Eid al-Fitr period using public or private
transport applies throughout Indonesia, especially for the Jakarta, Bogor, Depok, Tangerang,
Banten (Jabodetabek) areas, areas that apply Large-Scale Social Restrictions (PSBB), and areas
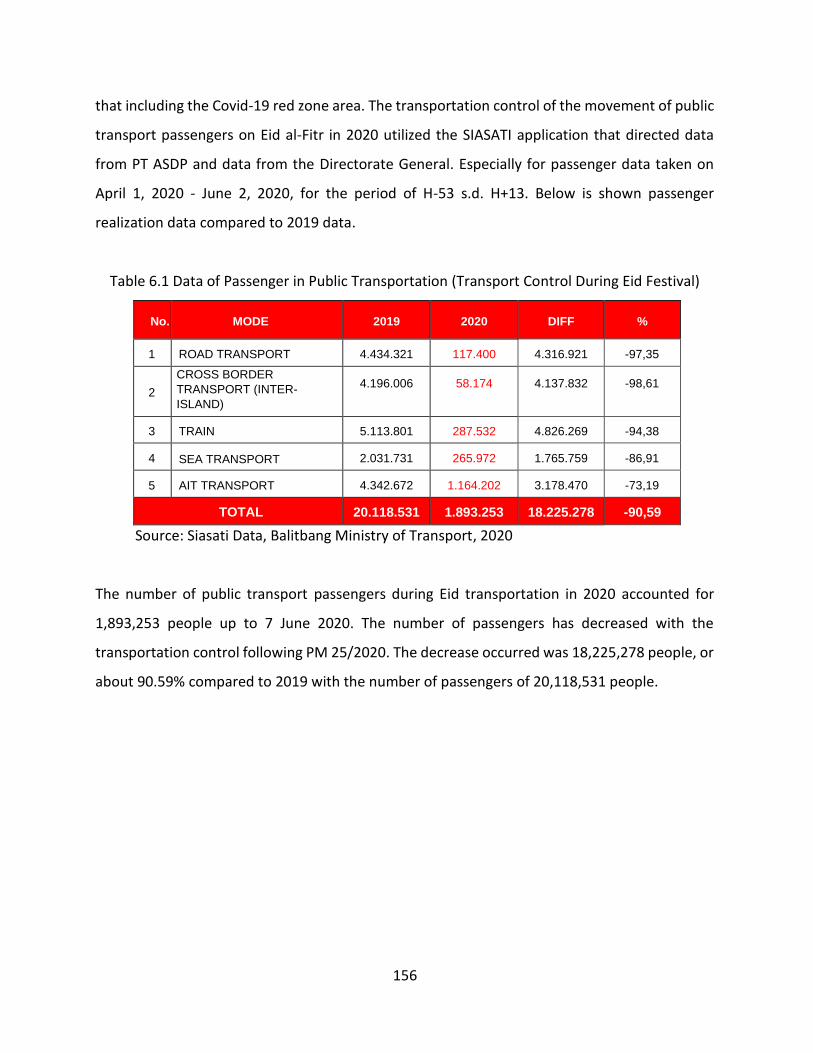
156
that including the Covid-19 red zone area. The transportation control of the movement of public
transport passengers on Eid al-Fitr in 2020 utilized the SIASATI application that directed data
from PT ASDP and data from the Directorate General. Especially for passenger data taken on
April 1, 2020 - June 2, 2020, for the period of H-53 s.d. H+13. Below is shown passenger
realization data compared to 2019 data.
Table 6.1 Data of Passenger in Public Transportation (Transport Control During Eid Festival)
No. MODE 2019 2020 DIFF %
1 ROAD TRANSPORT 4.434.321 117.400 4.316.921 -97,35
2
CROSS BORDER
TRANSPORT (INTER-
ISLAND)
4.196.006 58.174 4.137.832 -98,61
3 TRAIN 5.113.801 287.532 4.826.269 -94,38
4 SEA TRANSPORT 2.031.731 265.972 1.765.759 -86,91
5 AIT TRANSPORT 4.342.672 1.164.202 3.178.470 -73,19
TOTAL 20.118.531 1.893.253 18.225.278 -90,59
Source: Siasati Data, Balitbang Ministry of Transport, 2020
The number of public transport passengers during Eid transportation in 2020 accounted for
1,893,253 people up to 7 June 2020. The number of passengers has decreased with the
transportation control following PM 25/2020. The decrease occurred was 18,225,278 people, or
about 90.59% compared to 2019 with the number of passengers of 20,118,531 people.
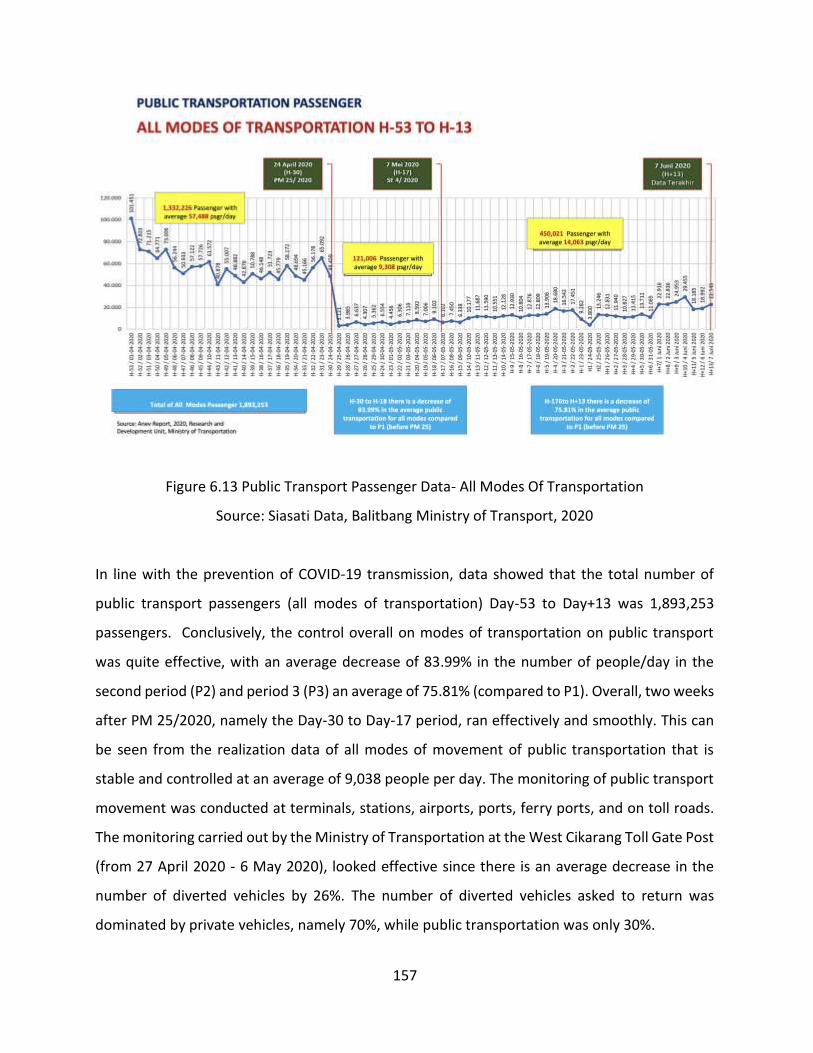
157
Figure 6.13 Public Transport Passenger Data- All Modes Of Transportation
Source: Siasati Data, Balitbang Ministry of Transport, 2020
In line with the prevention of COVID-19 transmission, data showed that the total number of
public transport passengers (all modes of transportation) Day-53 to Day+13 was 1,893,253
passengers. Conclusively, the control overall on modes of transportation on public transport
was quite effective, with an average decrease of 83.99% in the number of people/day in the
second period (P2) and period 3 (P3) an average of 75.81% (compared to P1). Overall, two weeks
after PM 25/2020, namely the Day-30 to Day-17 period, ran effectively and smoothly. This can
be seen from the realization data of all modes of movement of public transportation that is
stable and controlled at an average of 9,038 people per day. The monitoring of public transport
movement was conducted at terminals, stations, airports, ports, ferry ports, and on toll roads.
The monitoring carried out by the Ministry of Transportation at the West Cikarang Toll Gate Post
(from 27 April 2020 - 6 May 2020), looked effective since there is an average decrease in the
number of diverted vehicles by 26%. The number of diverted vehicles asked to return was
dominated by private vehicles, namely 70%, while public transportation was only 30%.
158
The data visualization and analysis related to mobility restrictions above shows that the
Transitional PSBB has succeeded in reducing mobility outside the home compared to the pre-
pandemic period. Although there have been some relaxations in the social restriction
regulations, residents of DKI Jakarta and its surroundings (Bodetabek) have proven to be able to
reduce their mobility. However, since the beginning of 2021, especially when PPKM was
implemented, the road looks more crowded, congestion has started to appear. This is supported
by the visualization that has been shown that during the PPKM period, the mobility of residents
outside the home began to increase compared to the Transitional PSBB period. If this continues,
mobility in DKI Jakarta and Greater Jakarta may return to the way it was before the pandemic,
even though the Covid-19 pandemic is still not over. This can be seen from the number of active
cases in Jakarta as of May 7, 2021, as many as 7,249 cases. For this reason, the Government has
implemented Emergency PPKM (PPKM Darurat) since July 2021 in the hope of being able to
suppress the movement of people outside the house.
Recently in 2021, during the press release at the Presidential Palace on July 1, 2021, President
Joko Widodo announced restrictions towards community activities, known as PPKM Darurat,
from July 3 until July 20, 2021 in Java and Bali. The current policy was issued based on the latest
epidemiological data (Indonesia is experiencing a surge during the second wave as high as 381%
increase in cases as of June 21, 2021), existence of the COVID-19 delta variant and political
considerations. PPKM Darurat regulates community activities on the islands of Java and Bali
more strictly. Based on the press statement of the National COVID-19 Task Force on 1 July 2021,
PPKM Darurat is carried out in line with the World Health Organization policies on zoning
management. Within the PPKM Darurat framework, the details of mobility and activity
arrangements are as follows:
a. Essential sectors (such as finance, ICT, export oriented industries, non-quarantine hotels)
apply 50% Work From Home (WFH) and 50% Work From Office (WFO)
b. Essential-Government sectors providing public services that cannot be delayed apply
25% WFO
159
c. Critical sectors (such as energi, health, security, logistics and transporation, basic utilities)
apply 100% WFO
d. Non-essential sectors to implement 100% WHO
e. Educational institutions to conduct online learning
f. Shopping centers, grocery stores, small shops and traditional markets, at 50% capacity,
to close at 20:00 local time (WIB/WITA/WIT)
g. Restaurants, cafés and food stalls only serve take away/delivery and do not accept on
site dining
h. Places of worship are temporarily closed
i. Pharmacies and drug stors can operate 24 hours a day
j. Art, culture, sports and social activities are suspended
k. Weddings can be attended by a maximum of 30 people, food shall not be provided at the
reception
l. All mass transportation, including online based transportation, will serve at 70% capacity
m. The use of a face shield must be word with a mask that covers the mouth and nose
n. Long distance travellers must show a vaccine card (at least the first dose of vaccine) and
PCR test result two days prior (for planes) or rapid antigen test result one day prior (for
busses, trains, private vehicles (cars and motorcylces) and sea transportation).
Additionally, related to the impact of COVID-19 on public transportation revenue especially from
the perspective of urban transport operators, the COVID- 19 related travel restrictions have been
significantly affecting people mobility leading to a decrease in the public transit ridership as well
as the financial performance of transport service companies, particularly for the fare-box items.
Lower ticket revenues could bring unwanted consequences to the financial health of public
transport companies and the government who provide funding to support the public transport
services (Yusuf Sofiyandi, 2021). Below is an example for MRT Jakarta.
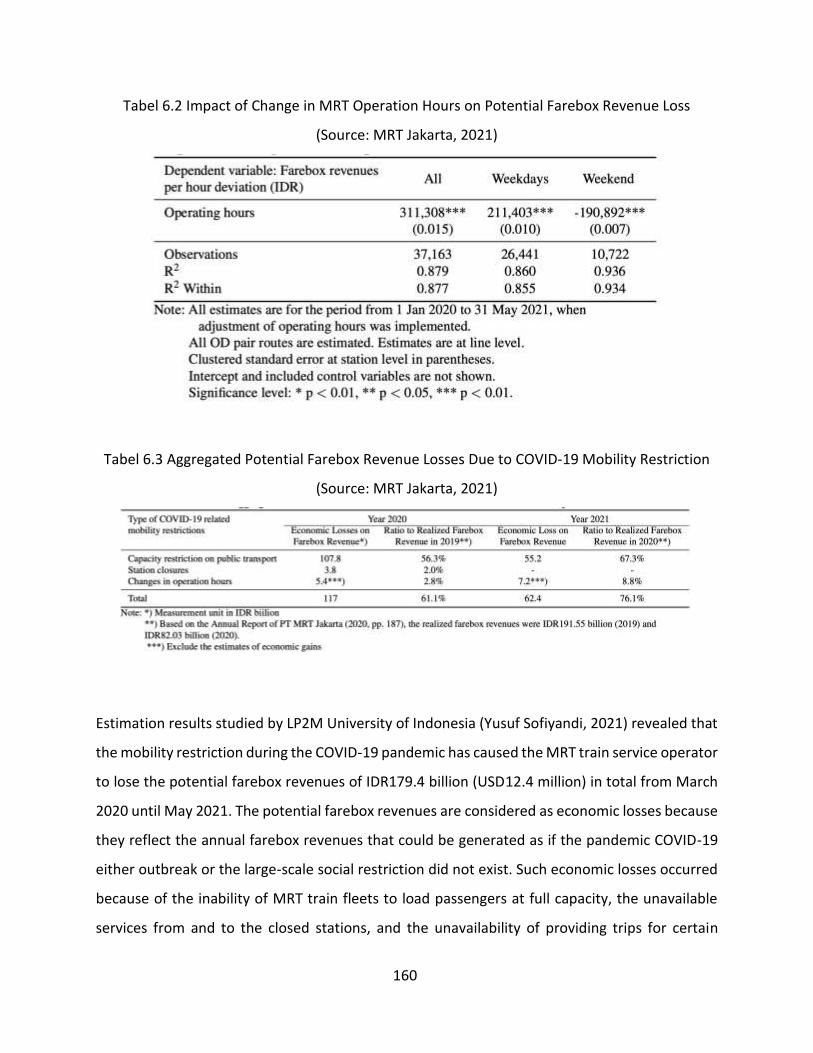
160
Tabel 6.2 Impact of Change in MRT Operation Hours on Potential Farebox Revenue Loss
(Source: MRT Jakarta, 2021)
Tabel 6.3 Aggregated Potential Farebox Revenue Losses Due to COVID-19 Mobility Restriction
(Source: MRT Jakarta, 2021)
Estimation results studied by LP2M University of Indonesia (Yusuf Sofiyandi, 2021) revealed that
the mobility restriction during the COVID-19 pandemic has caused the MRT train service operator
to lose the potential farebox revenues of IDR179.4 billion (USD12.4 million) in total from March
2020 until May 2021. The potential farebox revenues are considered as economic losses because
they reflect the annual farebox revenues that could be generated as if the pandemic COVID-19
either outbreak or the large-scale social restriction did not exist. Such economic losses occurred
because of the inability of MRT train fleets to load passengers at full capacity, the unavailable
services from and to the closed stations, and the unavailability of providing trips for certain
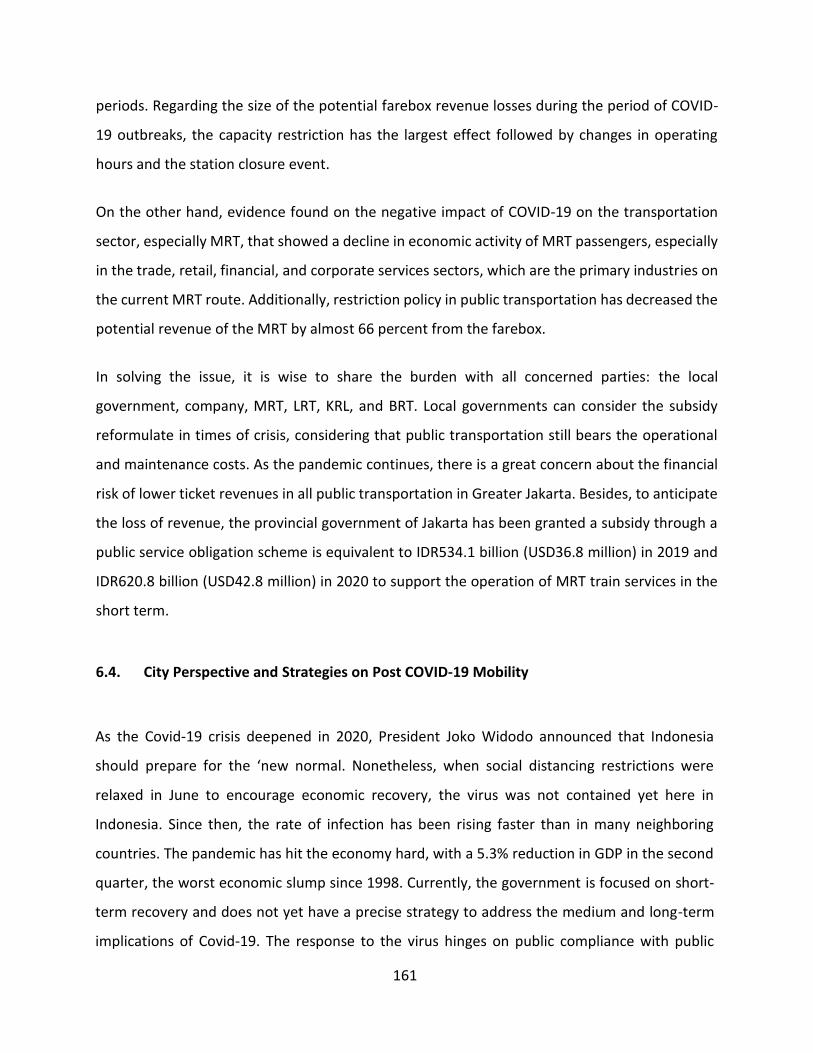
161
periods. Regarding the size of the potential farebox revenue losses during the period of COVID-
19 outbreaks, the capacity restriction has the largest effect followed by changes in operating
hours and the station closure event.
On the other hand, evidence found on the negative impact of COVID-19 on the transportation
sector, especially MRT, that showed a decline in economic activity of MRT passengers, especially
in the trade, retail, financial, and corporate services sectors, which are the primary industries on
the current MRT route. Additionally, restriction policy in public transportation has decreased the
potential revenue of the MRT by almost 66 percent from the farebox.
In solving the issue, it is wise to share the burden with all concerned parties: the local
government, company, MRT, LRT, KRL, and BRT. Local governments can consider the subsidy
reformulate in times of crisis, considering that public transportation still bears the operational
and maintenance costs. As the pandemic continues, there is a great concern about the financial
risk of lower ticket revenues in all public transportation in Greater Jakarta. Besides, to anticipate
the loss of revenue, the provincial government of Jakarta has been granted a subsidy through a
public service obligation scheme is equivalent to IDR534.1 billion (USD36.8 million) in 2019 and
IDR620.8 billion (USD42.8 million) in 2020 to support the operation of MRT train services in the
short term.
6.4. City Perspective and Strategies on Post COVID-19 Mobility
As the Covid-19 crisis deepened in 2020, President Joko Widodo announced that Indonesia
should prepare for the ‘new normal. Nonetheless, when social distancing restrictions were
relaxed in June to encourage economic recovery, the virus was not contained yet here in
Indonesia. Since then, the rate of infection has been rising faster than in many neighboring
countries. The pandemic has hit the economy hard, with a 5.3% reduction in GDP in the second
quarter, the worst economic slump since 1998. Currently, the government is focused on short-
term recovery and does not yet have a precise strategy to address the medium and long-term
implications of Covid-19. The response to the virus hinges on public compliance with public
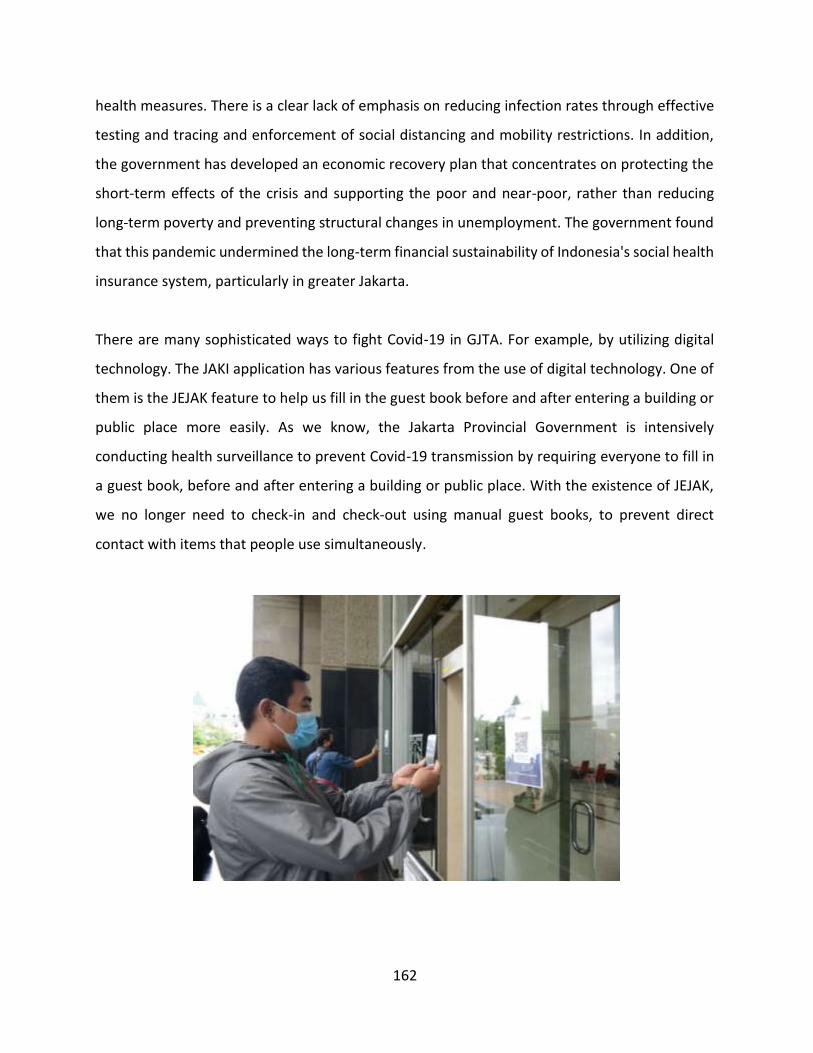
162
health measures. There is a clear lack of emphasis on reducing infection rates through effective
testing and tracing and enforcement of social distancing and mobility restrictions. In addition,
the government has developed an economic recovery plan that concentrates on protecting the
short-term effects of the crisis and supporting the poor and near-poor, rather than reducing
long-term poverty and preventing structural changes in unemployment. The government found
that this pandemic undermined the long-term financial sustainability of Indonesia's social health
insurance system, particularly in greater Jakarta.
There are many sophisticated ways to fight Covid-19 in GJTA. For example, by utilizing digital
technology. The JAKI application has various features from the use of digital technology. One of
them is the JEJAK feature to help us fill in the guest book before and after entering a building or
public place more easily. As we know, the Jakarta Provincial Government is intensively
conducting health surveillance to prevent Covid-19 transmission by requiring everyone to fill in
a guest book, before and after entering a building or public place. With the existence of JEJAK,
we no longer need to check-in and check-out using manual guest books, to prevent direct
contact with items that people use simultaneously.
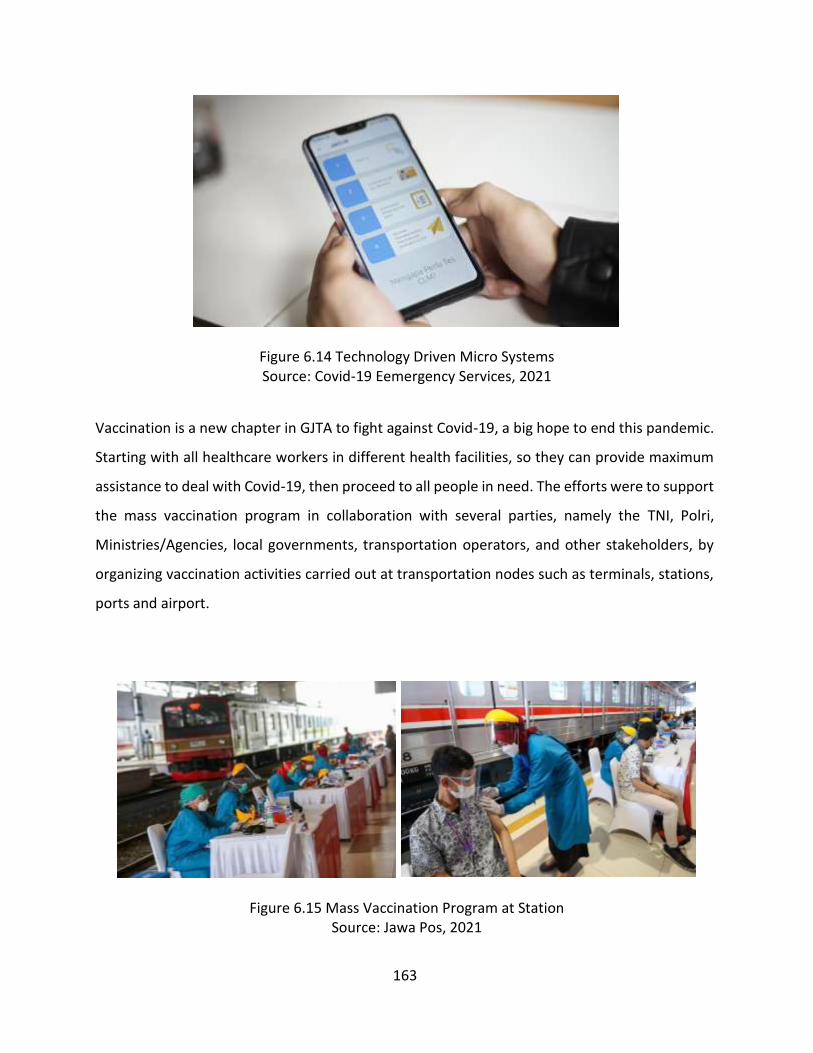
163
Figure 6.14 Technology Driven Micro Systems Source: Covid-19 Eemergency Services, 2021
Vaccination is a new chapter in GJTA to fight against Covid-19, a big hope to end this pandemic.
Starting with all healthcare workers in different health facilities, so they can provide maximum
assistance to deal with Covid-19, then proceed to all people in need. The efforts were to support
the mass vaccination program in collaboration with several parties, namely the TNI, Polri,
Ministries/Agencies, local governments, transportation operators, and other stakeholders, by
organizing vaccination activities carried out at transportation nodes such as terminals, stations,
ports and airport.
Figure 6.15 Mass Vaccination Program at Station Source: Jawa Pos, 2021

164
Apart from strategies and finding solutions during and post-pandemic in the transportation
sector, there are also several impacts of a mobility control program or strategy, namely in
supporting the achievement of the SDGs. COVID-19 has and will continue to, affect SDG target
achievement in Indonesia, particularly Greater Jakarta. More efforts must be put into mitigating
the environmental and social risks of current economic practices that risks have increased. For
example, air pollution in Greater Jakarta. At first, the unprecedented PSBB measures had short-
term advantageous effects on the environment. The policy that encouraged people to minimize
their commuting and travel activities reduced air pollution significantly. During the PSBB, the
nitrogen dioxide concentration in Jakarta’s airdropped by 40% compared to 2019. At the global
level, emissions are predicted to fall by 8% in 2020 compared to 2019. Besides the well-
documented general health risks, there is a risk of underinvestment in the green agenda as
economic recovery is prioritized “at all costs.” Once the PSBB policy and the restrictions on
movement were lifted, the air quality worsened. In the case of Jakarta, the air quality in the
second week of June was recorded as the worst in the world, with an AQI index reading of 177
(not healthy). The COVID-19 outbreak has made people fearful of using public transportation.
People currently prefer to use private transportation, which is mostly carbon-intensive and
contributes significantly to worsening the air quality. Failing to embed sustainable policies in the
COVID-19 recovery policy might result in environmental risk, including worsening air quality. Oil
prices remaining historically low for a sustained period could add to this risk as well. Therefore,
how the government restarts the economic engines do matter in terms of environmental risk,
more precisely, the air quality.
Furthermore, one of GTJA's strategies to restore the transportation, human movement, and
logistics sectors must be guaranteed safety. In the past, the transportation sector was only
required to run smoothly, but in the new normal situation, it is also required to be safe and
smooth with health protocols as an important key to implementation. How to restore the
transportation sector which stems from the conclusion that the community needs to understand
and apply health protocols during a pandemic. One of the crucial policies is the application of
physical distancing in transportation services to minimize physical contact and the strict
165
application of other health protocols. In addition, one of the basic recovery policies for the
transportation sector is to develop innovation and synergy between modes, particularly the
integration of rail and road services. In economic development, the central government together
with GJTA have developed a post-Covid-19 recovery strategy. The strategy focuses on
accelerating investment, strengthening the national and rational system in general, industrial
recovery, tourism recovery, human resource development, expansion of infrastructure
development, and the use of information technology to facilitate communication in the
implementation of transportation for both users and operators. In digital technology, Last Mile
is used to connect people moving to and from their homes or their destination. Additionally, the
Ministry of Transportation has contributed its support in the acceleration of post-Covid-19
handling, including through a plan to provide subsidies for transportation services, whether by
land, sea, air, or train. In the land transportation sector, the Ministry of Transportation has and
will continue to provide subsidies for local road transportation operators, urban transportation,
mode guide transportation, freight transportation, ferry transportation, and Ro-Ro Long
Distance Ferry (LDF). In addition to subsidies, establishing transportation control policies
according to the rules of the Covid-19 Handling Task Force was also put in place. These policies
include the addition of rules for showing vaccine certificates, mandatory antigen/PCR tests,
restrictions on the number of passengers, restrictions on operational time, restrictions on public
transport capacity, and others.
Furtermore, it is clear to all that mobility systems have been drastically affected by the COVID-
19 pandemic. As a result of lockdowns, social distancing and hygiene requirements, demand for
personal mobility has plummeted, while operational complexity has increased. At the same time,
demand for e-commerce and home delivery has exploded. As well as a major economic
downturn, at least some of the changes in behaviors we have seen during the crisis will endure
in the medium- to long-term. The post-COVID world is unlikely to look exactly the same. In order
to prevent the spread of the virus, the government, especially in Jabodetabek, has made various
regulations that have limited space for movement. Apart from being socially and economically,
this clearly affects the way of commuting. Mobility trends shift according to regulatory
166
adjustments and consumer attitudes. The rules that apply in Jabodetabek affect the way
residents move. The movement of mass transportation is restricted, requiring people to look for
other modes of transportation. The most important thing is to minimize contact. On the one
hand it has been answered. But on the other hand, as a result, the use of private vehicles has
increased even though the number of passengers is limited.
In Greater Jakarta, operators now face uncertainty and are required to implement strict hygiene
protocols. These include masks, checking passenger health, or limiting the number of users on
trains and stations to comply with distance rules. Another influence is felt by the mobility
industry players. Ride hailers – online taxis – have seen a 60 to 70 percent drop. Micro-mobility
and carpooling companies have also temporarily suspended their services. It is expected that
post-covid in Jabodetabek area, while still enforcing the regulations for restricting private
vehicles, the trend of cycling and walking will continue with a significant increase. But on
condition that the government provides all walking and cycling infrastructure that is integrated
with public transport supporting facilities. For mobility trends, It is believed that in Jabodetabek,
private vehicle owners will use their car or motorbike more often. For users of public
transportation, it may shift the habit of relying on bicycles or walking. However, the majority of
this trend shift is believed to be temporary. Shared-mobility solutions, including public transport,
will be back in demand. Micro-mobility solutions, such as electric scooters, will recover faster if
strict disinfection protocols are established. But it is not impossible that the COVID-19 pandemic
will also create a permanent transition. An example of the increasing interest in autonomous
vehicles, if one day it is approved for urban commuting, because it supports physical distancing.
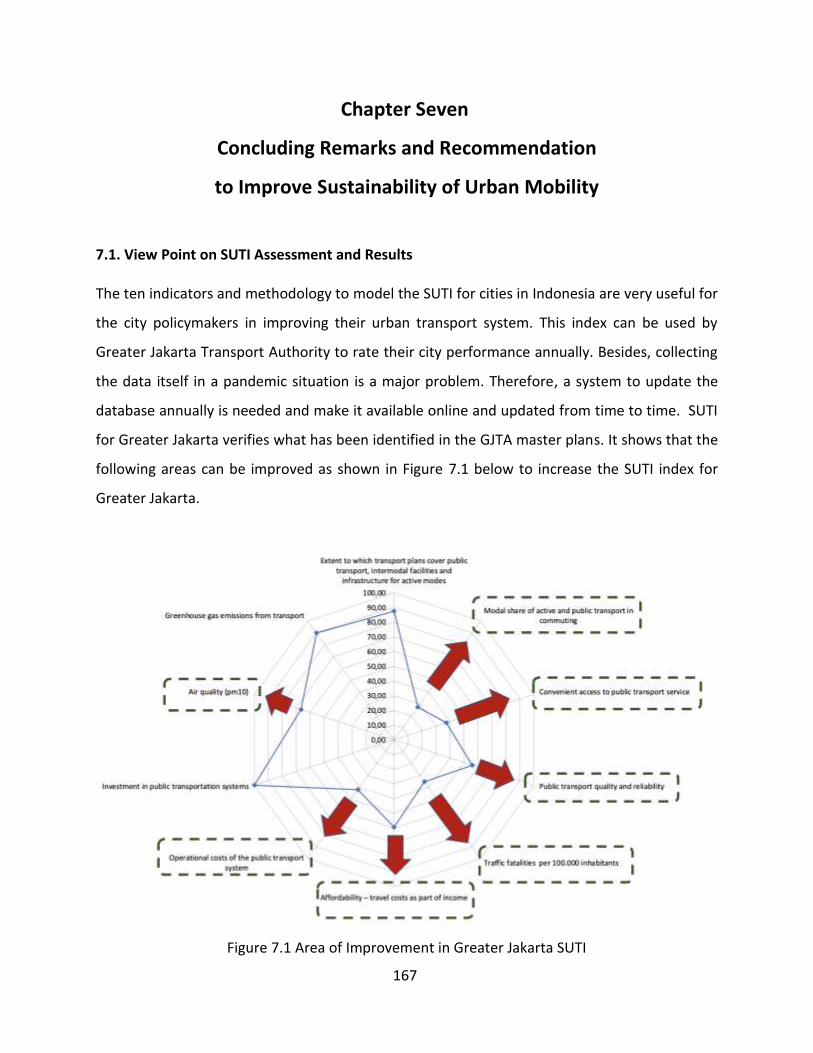
167
Chapter Seven
Concluding Remarks and Recommendation
to Improve Sustainability of Urban Mobility
7.1. View Point on SUTI Assessment and Results The ten indicators and methodology to model the SUTI for cities in Indonesia are very useful for
the city policymakers in improving their urban transport system. This index can be used by
Greater Jakarta Transport Authority to rate their city performance annually. Besides, collecting
the data itself in a pandemic situation is a major problem. Therefore, a system to update the
database annually is needed and make it available online and updated from time to time. SUTI
for Greater Jakarta verifies what has been identified in the GJTA master plans. It shows that the
following areas can be improved as shown in Figure 7.1 below to increase the SUTI index for
Greater Jakarta.
Figure 7.1 Area of Improvement in Greater Jakarta SUTI
168
a. Modal share of active and public transportation in commuting
b. Convenient access to public transportation services
c. Public transport quality and reliability
d. Traffic Fatalities per 100.000 inhabitans
e. Affordability – travel cost as part of income
f. Operational cost of public transportation system
g. Air Quality
Additionally, SUTI provided new insights to Greater Jakarta Transport Authority, these include:
a. Initiative and innovative strategies to increase the mode share of public transportation
through convenient services and ease of access and at the same time restricting private
vehicles
b. Create a strategy for public transport users to strengthen their ability to travel by public
transport
c. Collaborating with operators and other stakeholders in finding the right strategy to save
operating costs with innovation, especially the post-Covid-19 strategy
d. Coordinate with cities and regencies within the greater Jakarta area for monitoring and
air quality programs for PM 10/PM 2.5
e. Develop a green vehicle program in public transportation in line with the Central
Government's vision towards electric mobility.
7.2. Views on the Transportation Policy and Regulation
The suitability of the planning is enshrined in Presidential Regulation Number 55 of 2018
concerning the Greater Jakarta Transportation Master Plan (RITJ) 2018-2029 which was
stipulated by President Joko Widodo on July 20, 2018. The master plan is a guideline for the
central government and regional governments in planning development, development,
management , monitoring, and evaluating transportation in the Jabodetabek urban area.
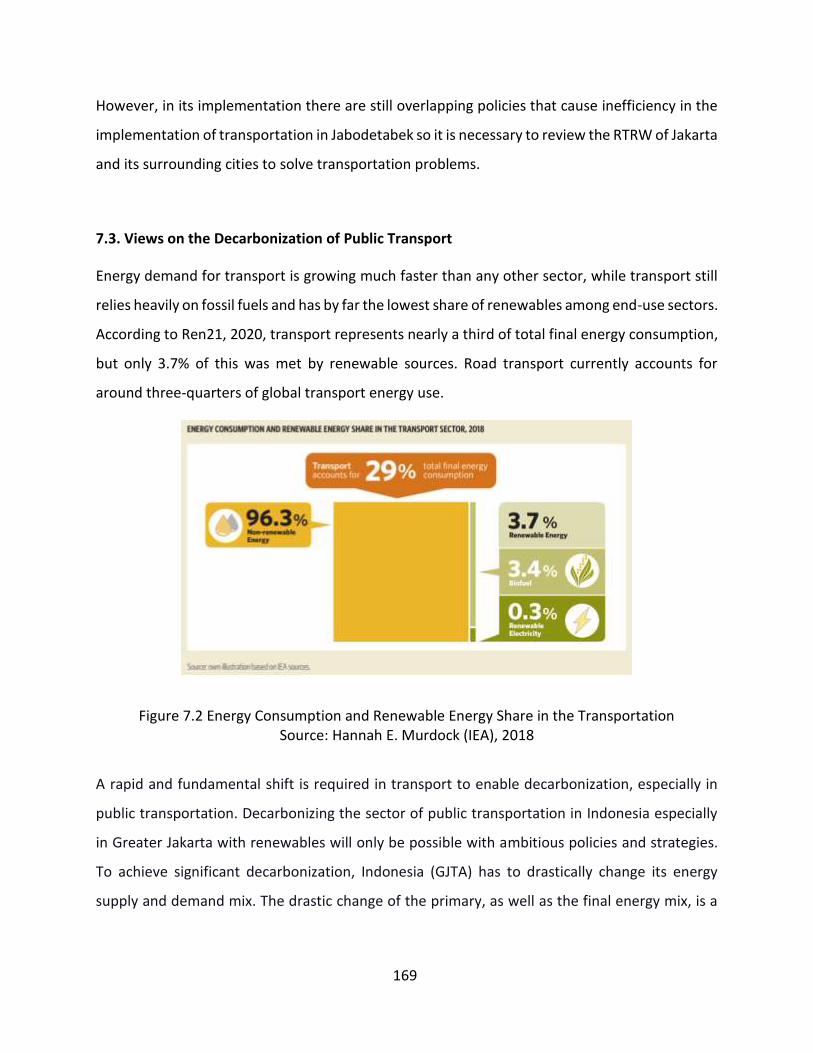
169
However, in its implementation there are still overlapping policies that cause inefficiency in the
implementation of transportation in Jabodetabek so it is necessary to review the RTRW of Jakarta
and its surrounding cities to solve transportation problems.
7.3. Views on the Decarbonization of Public Transport
Energy demand for transport is growing much faster than any other sector, while transport still
relies heavily on fossil fuels and has by far the lowest share of renewables among end-use sectors.
According to Ren21, 2020, transport represents nearly a third of total final energy consumption,
but only 3.7% of this was met by renewable sources. Road transport currently accounts for
around three-quarters of global transport energy use.
Figure 7.2 Energy Consumption and Renewable Energy Share in the Transportation Source: Hannah E. Murdock (IEA), 2018
A rapid and fundamental shift is required in transport to enable decarbonization, especially in
public transportation. Decarbonizing the sector of public transportation in Indonesia especially
in Greater Jakarta with renewables will only be possible with ambitious policies and strategies.
To achieve significant decarbonization, Indonesia (GJTA) has to drastically change its energy
supply and demand mix. The drastic change of the primary, as well as the final energy mix, is a
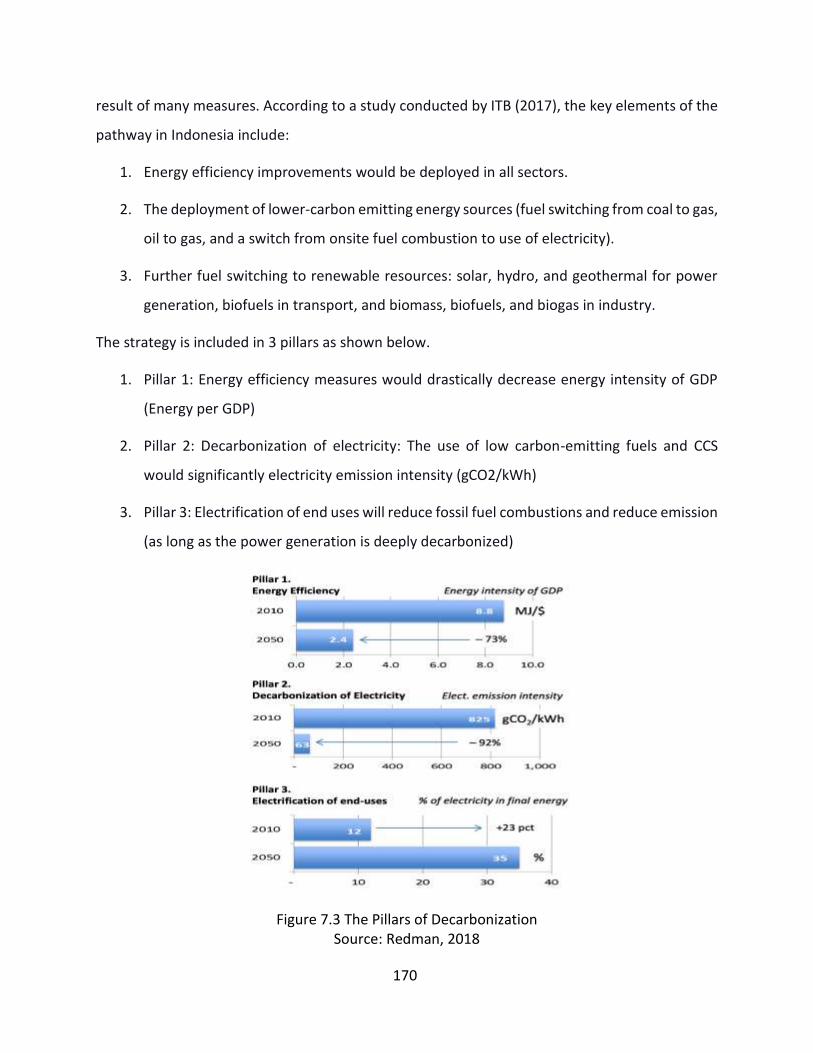
170
result of many measures. According to a study conducted by ITB (2017), the key elements of the
pathway in Indonesia include:
1. Energy efficiency improvements would be deployed in all sectors.
2. The deployment of lower-carbon emitting energy sources (fuel switching from coal to gas,
oil to gas, and a switch from onsite fuel combustion to use of electricity).
3. Further fuel switching to renewable resources: solar, hydro, and geothermal for power
generation, biofuels in transport, and biomass, biofuels, and biogas in industry.
The strategy is included in 3 pillars as shown below.
1. Pillar 1: Energy efficiency measures would drastically decrease energy intensity of GDP
(Energy per GDP)
2. Pillar 2: Decarbonization of electricity: The use of low carbon-emitting fuels and CCS
would significantly electricity emission intensity (gCO2/kWh)
3. Pillar 3: Electrification of end uses will reduce fossil fuel combustions and reduce emission
(as long as the power generation is deeply decarbonized)
Figure 7.3 The Pillars of Decarbonization Source: Redman, 2018

171
In the transportation sector, this strategy of carbon intensity will decrease from 73 gCO2/MJ to
49 gCO2/MJ. Component of Decarbonization includes a modal shift to mass transport,
electrification, fuel switching to gas and biofuels, more energy-efficient vehicles shift of freight
transport from road to railway and expected personal vehicles decrease from 60% in 2010 to 40%
in 2050 and share of electric cars reach 30% in 2050.
Figure 7.4 Decarbonization in Transport Sector
Source: Ucok WR Siagian, 2018
In Indonesia, the transport sector contributed 28% of energy-related greenhouse gas (GHG)
emissions in 2018, mostly from road transport. Unfortunately, the mitigation plan in this sector
is currently limited to biofuel blending. The adoption of electric vehicles (EVs) has been viewed
by many as an important strategy to reduce emissions in the transport sector in Indonesia
especially in Greater Jakarta. In Greater Jakarta, the BRT-Transjakarta serves nearly 200 million
riders every year. Jakarta's bus rapid transit system is the largest in the world with its passenger
continues to rapidly grow forcing the addition of new routes and more buses to tackle the traffic
jams plaguing the capital. The transition to electric vehicles is a logical step taken by the DKI
government and GJTA to combat an irritant that is more dangerous for Jakarta residents than
traffic: air pollution. City-owned bus operator Transjakarta has ambitious plans to expand its
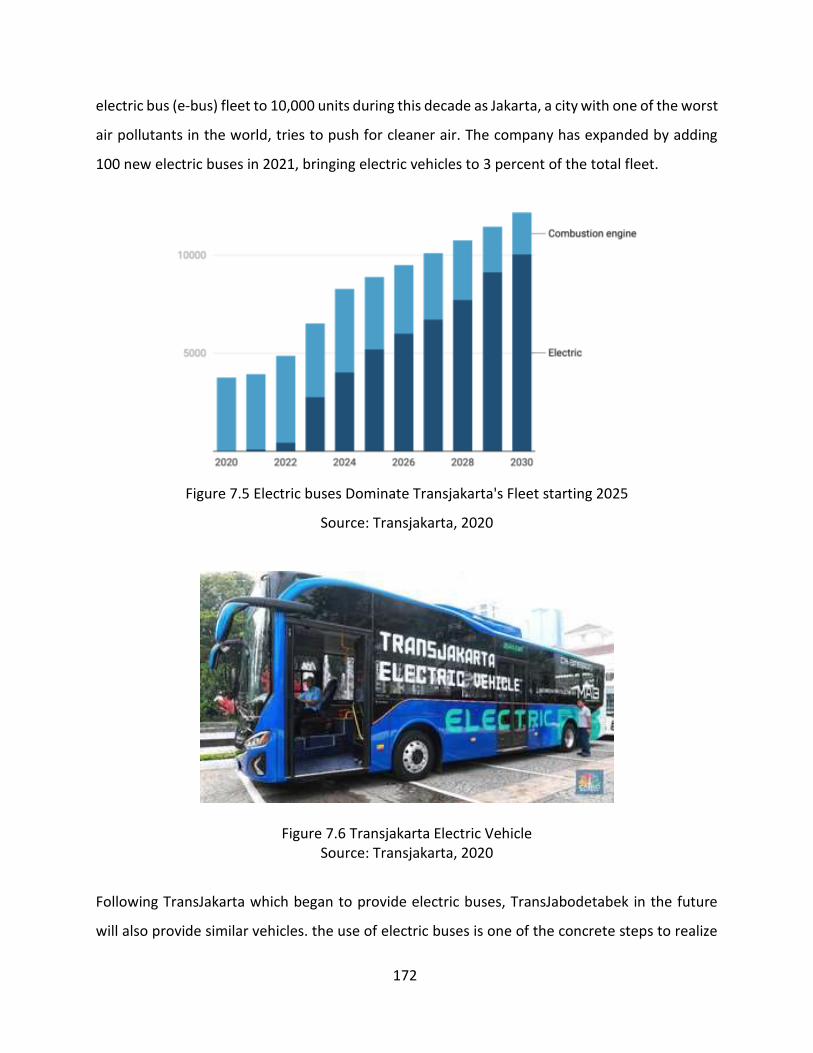
172
electric bus (e-bus) fleet to 10,000 units during this decade as Jakarta, a city with one of the worst
air pollutants in the world, tries to push for cleaner air. The company has expanded by adding
100 new electric buses in 2021, bringing electric vehicles to 3 percent of the total fleet.
Figure 7.5 Electric buses Dominate Transjakarta's Fleet starting 2025
Source: Transjakarta, 2020
Figure 7.6 Transjakarta Electric Vehicle Source: Transjakarta, 2020
Following TransJakarta which began to provide electric buses, TransJabodetabek in the future
will also provide similar vehicles. the use of electric buses is one of the concrete steps to realize
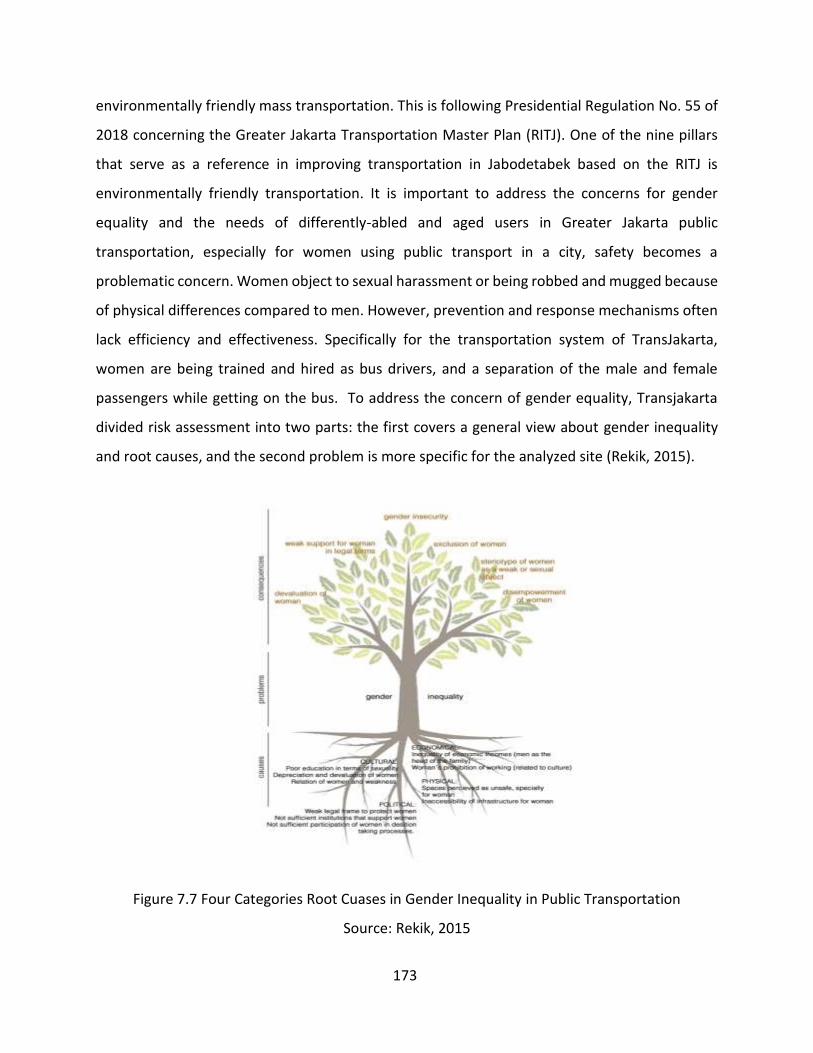
173
environmentally friendly mass transportation. This is following Presidential Regulation No. 55 of
2018 concerning the Greater Jakarta Transportation Master Plan (RITJ). One of the nine pillars
that serve as a reference in improving transportation in Jabodetabek based on the RITJ is
environmentally friendly transportation. It is important to address the concerns for gender
equality and the needs of differently-abled and aged users in Greater Jakarta public
transportation, especially for women using public transport in a city, safety becomes a
problematic concern. Women object to sexual harassment or being robbed and mugged because
of physical differences compared to men. However, prevention and response mechanisms often
lack efficiency and effectiveness. Specifically for the transportation system of TransJakarta,
women are being trained and hired as bus drivers, and a separation of the male and female
passengers while getting on the bus. To address the concern of gender equality, Transjakarta
divided risk assessment into two parts: the first covers a general view about gender inequality
and root causes, and the second problem is more specific for the analyzed site (Rekik, 2015).
Figure 7.7 Four Categories Root Cuases in Gender Inequality in Public Transportation
Source: Rekik, 2015
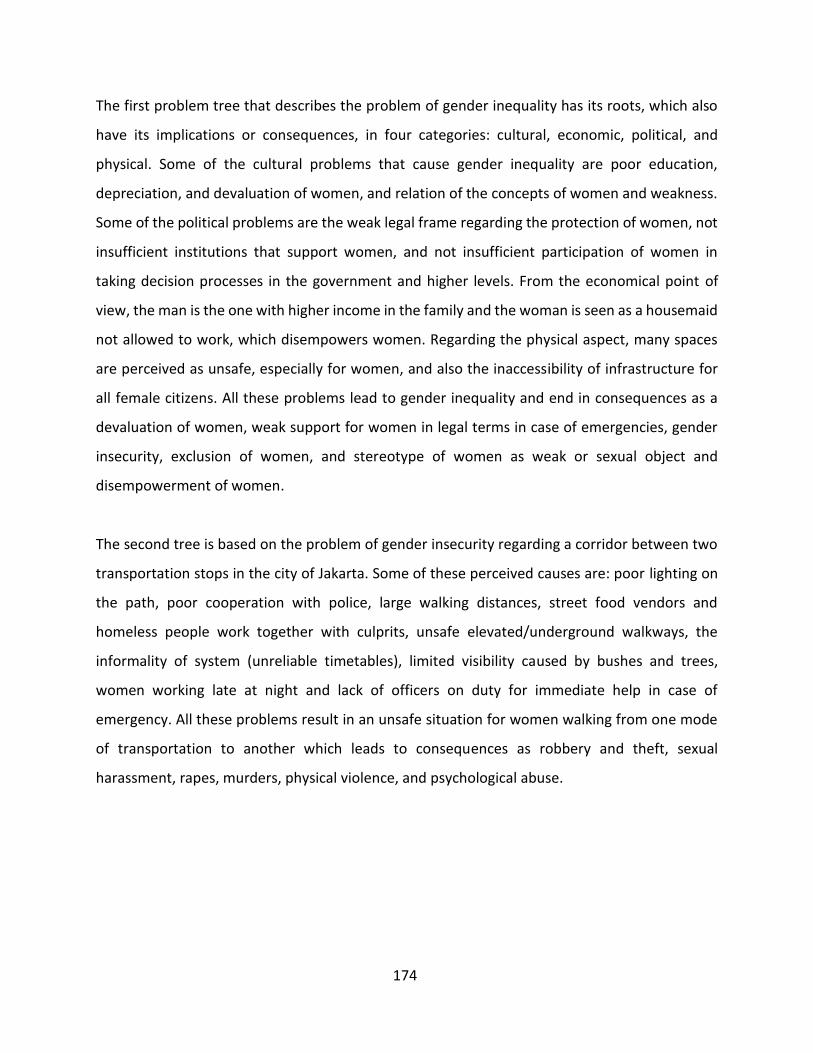
174
The first problem tree that describes the problem of gender inequality has its roots, which also
have its implications or consequences, in four categories: cultural, economic, political, and
physical. Some of the cultural problems that cause gender inequality are poor education,
depreciation, and devaluation of women, and relation of the concepts of women and weakness.
Some of the political problems are the weak legal frame regarding the protection of women, not
insufficient institutions that support women, and not insufficient participation of women in
taking decision processes in the government and higher levels. From the economical point of
view, the man is the one with higher income in the family and the woman is seen as a housemaid
not allowed to work, which disempowers women. Regarding the physical aspect, many spaces
are perceived as unsafe, especially for women, and also the inaccessibility of infrastructure for
all female citizens. All these problems lead to gender inequality and end in consequences as a
devaluation of women, weak support for women in legal terms in case of emergencies, gender
insecurity, exclusion of women, and stereotype of women as weak or sexual object and
disempowerment of women.
The second tree is based on the problem of gender insecurity regarding a corridor between two
transportation stops in the city of Jakarta. Some of these perceived causes are: poor lighting on
the path, poor cooperation with police, large walking distances, street food vendors and
homeless people work together with culprits, unsafe elevated/underground walkways, the
informality of system (unreliable timetables), limited visibility caused by bushes and trees,
women working late at night and lack of officers on duty for immediate help in case of
emergency. All these problems result in an unsafe situation for women walking from one mode
of transportation to another which leads to consequences as robbery and theft, sexual
harassment, rapes, murders, physical violence, and psychological abuse.
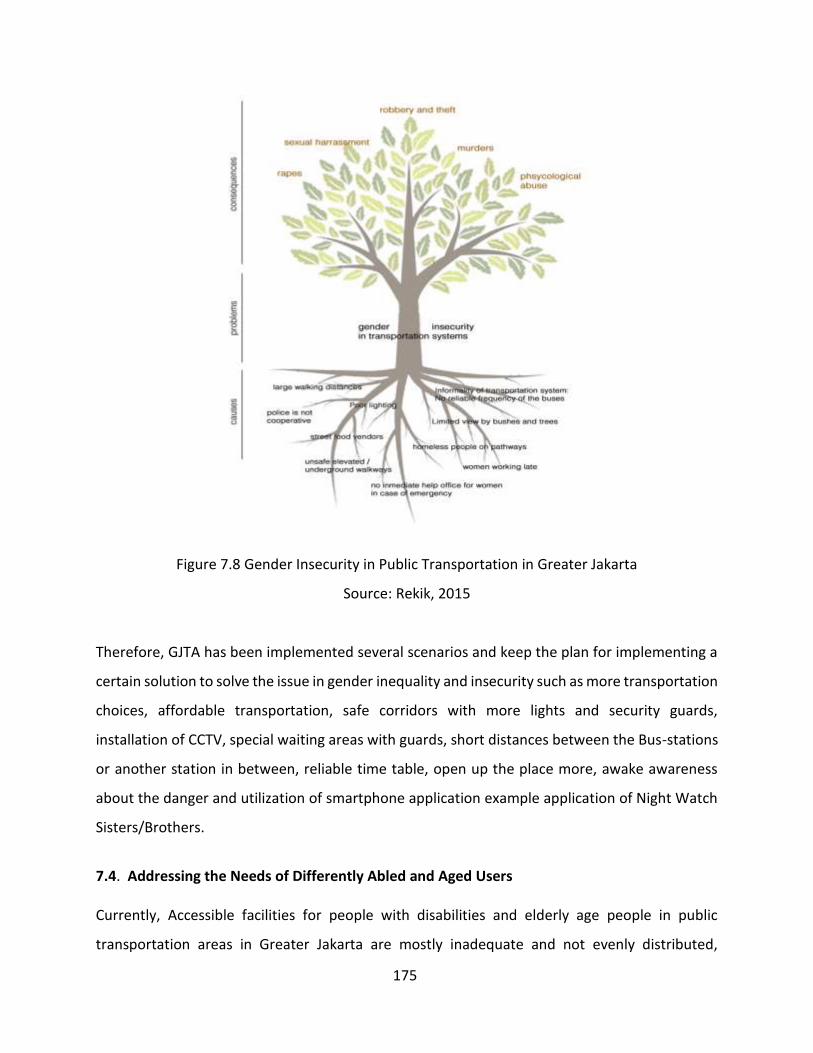
175
Figure 7.8 Gender Insecurity in Public Transportation in Greater Jakarta
Source: Rekik, 2015
Therefore, GJTA has been implemented several scenarios and keep the plan for implementing a
certain solution to solve the issue in gender inequality and insecurity such as more transportation
choices, affordable transportation, safe corridors with more lights and security guards,
installation of CCTV, special waiting areas with guards, short distances between the Bus-stations
or another station in between, reliable time table, open up the place more, awake awareness
about the danger and utilization of smartphone application example application of Night Watch
Sisters/Brothers.
7.4. Addressing the Needs of Differently Abled and Aged Users Currently, Accessible facilities for people with disabilities and elderly age people in public
transportation areas in Greater Jakarta are mostly inadequate and not evenly distributed,

176
particularly outside urban areas (Bodetabek). The government regulations have explicitly
mandated the operators such as MRT, BRT, KRL, and LRT to provide accessible facilities. GJTA has
adequate regulations mandating the provision of accessible facilities in public facilities, the
problem is to ensure its implementation down to the regional government in Greater Jakarta. To
anticipate this issue, Public transportation provider PT Transportasi Jakarta (Transjakarta) has
purchased 300 low-entry buses this year to help disabled and elderly people get around the urban
area. The buses are considered friendly to people with disabilities because their low entries mean
their floors are on the same level as the pavement.
Figure 7.9 Lower Deck BRT (Transjakarta) Source: Transjakarta, 2020
Figure 7.10 Disable Facility in LRT Jakarta Source: Transjakarta, 2020
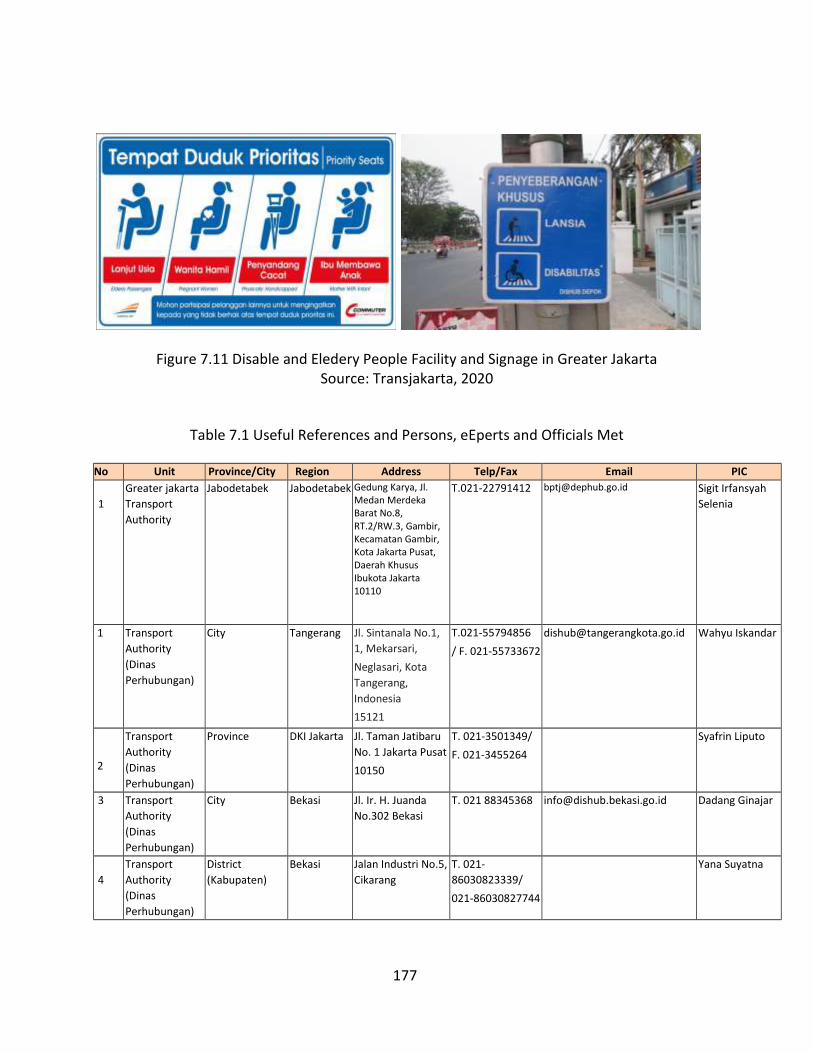
177
Figure 7.11 Disable and Eledery People Facility and Signage in Greater Jakarta Source: Transjakarta, 2020
Table 7.1 Useful References and Persons, eEperts and Officials Met
No Unit Province/City Region Address Telp/Fax Email PIC
1
1
Greater jakarta
Transport
Authority
Jabodetabek Jabodetabek Gedung Karya, Jl. Medan Merdeka Barat No.8, RT.2/RW.3, Gambir, Kecamatan Gambir, Kota Jakarta Pusat, Daerah Khusus Ibukota Jakarta 10110
T.021-22791412
[email protected] Sigit Irfansyah
Selenia
1
Transport
Authority
(Dinas
Perhubungan)
City Tangerang Jl. Sintanala No.1,
1, Mekarsari,
Neglasari, Kota
Tangerang,
Indonesia
15121
T.021-55794856
/ F. 021-55733672
[email protected] Wahyu Iskandar
2
Transport
Authority
(Dinas
Perhubungan)
Province DKI Jakarta Jl. Taman Jatibaru
No. 1 Jakarta Pusat
10150
T. 021-3501349/
F. 021-3455264
Syafrin Liputo
3 Transport
Authority
(Dinas
Perhubungan)
City Bekasi Jl. Ir. H. Juanda
No.302 Bekasi
T. 021 88345368 [email protected] Dadang Ginajar
4
Transport
Authority
(Dinas
Perhubungan)
District
(Kabupaten)
Bekasi Jalan Industri No.5,
Cikarang
T. 021-
86030823339/
021-86030827744
Yana Suyatna
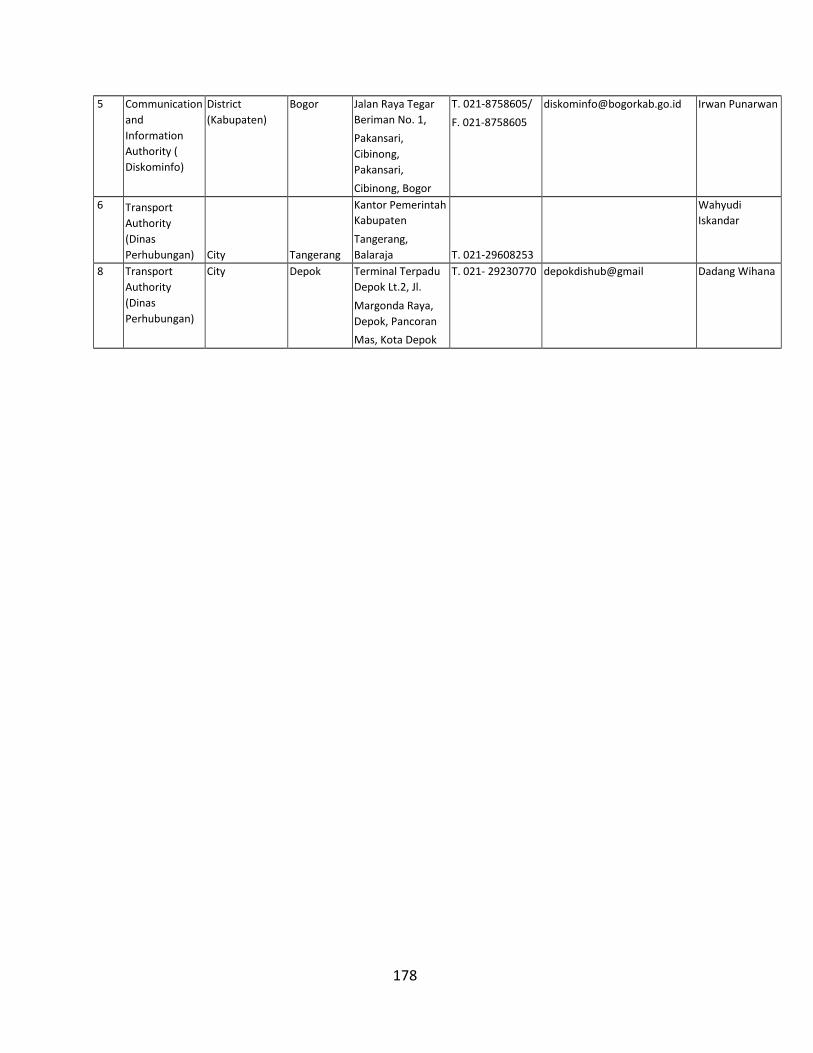
178
5
Communication
and
Information
Authority (
Diskominfo)
District
(Kabupaten)
Bogor Jalan Raya Tegar
Beriman No. 1,
Pakansari,
Cibinong,
Pakansari,
Cibinong, Bogor
T. 021-8758605/
F. 021-8758605
[email protected] Irwan Punarwan
7 6 Transport
Authority
(Dinas
Perhubungan) City Tangerang
Kantor Pemerintah
Kabupaten
Tangerang,
Balaraja T. 021-29608253
Wahyudi
Iskandar
8
Transport
Authority
(Dinas
Perhubungan)
City Depok Terminal Terpadu
Depok Lt.2, Jl.
Margonda Raya,
Depok, Pancoran
Mas, Kota Depok
T. 021- 29230770 depokdishub@gmail Dadang Wihana
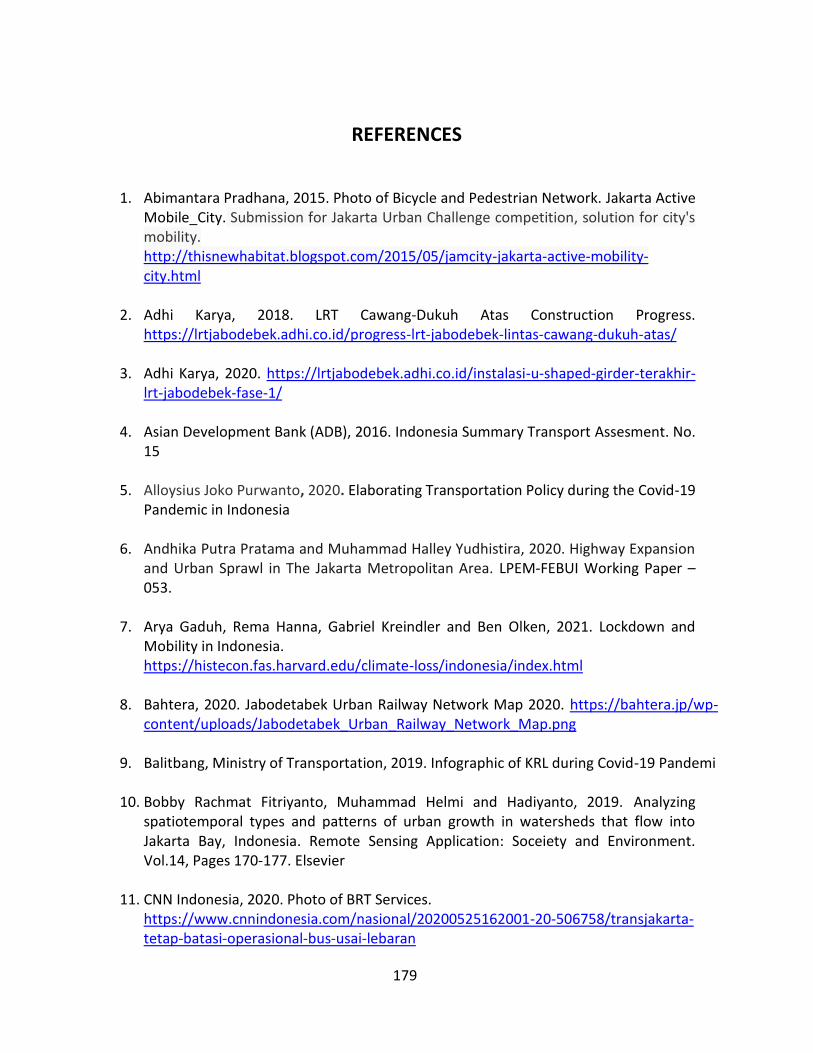
179
REFERENCES
1. Abimantara Pradhana, 2015. Photo of Bicycle and Pedestrian Network. Jakarta Active
Mobile_City. Submission for Jakarta Urban Challenge competition, solution for city's mobility. http://thisnewhabitat.blogspot.com/2015/05/jamcity-jakarta-active-mobility-city.html
2. Adhi Karya, 2018. LRT Cawang-Dukuh Atas Construction Progress. https://lrtjabodebek.adhi.co.id/progress-lrt-jabodebek-lintas-cawang-dukuh-atas/
3. Adhi Karya, 2020. https://lrtjabodebek.adhi.co.id/instalasi-u-shaped-girder-terakhir-lrt-jabodebek-fase-1/
4. Asian Development Bank (ADB), 2016. Indonesia Summary Transport Assesment. No. 15
5. Alloysius Joko Purwanto, 2020. Elaborating Transportation Policy during the Covid-19 Pandemic in Indonesia
6. Andhika Putra Pratama and Muhammad Halley Yudhistira, 2020. Highway Expansion and Urban Sprawl in The Jakarta Metropolitan Area. LPEM-FEBUI Working Paper – 053.
7. Arya Gaduh, Rema Hanna, Gabriel Kreindler and Ben Olken, 2021. Lockdown and Mobility in Indonesia. https://histecon.fas.harvard.edu/climate-loss/indonesia/index.html
8. Bahtera, 2020. Jabodetabek Urban Railway Network Map 2020. https://bahtera.jp/wp-
content/uploads/Jabodetabek_Urban_Railway_Network_Map.png
9. Balitbang, Ministry of Transportation, 2019. Infographic of KRL during Covid-19 Pandemi
10. Bobby Rachmat Fitriyanto, Muhammad Helmi and Hadiyanto, 2019. Analyzing spatiotemporal types and patterns of urban growth in watersheds that flow into Jakarta Bay, Indonesia. Remote Sensing Application: Soceiety and Environment. Vol.14, Pages 170-177. Elsevier
11. CNN Indonesia, 2020. Photo of BRT Services. https://www.cnnindonesia.com/nasional/20200525162001-20-506758/transjakarta-tetap-batasi-operasional-bus-usai-lebaran
180
12. Covid Emergency Services DKI Jakarta, 2020.
https://corona.jakarta.go.id/en/artikel/potret-satu-tahun-pandemi-covid-19-di-jakarta
13. Daniel Caesar Pratama, 2020. Considering Cycling as A mode of Commuting in Jakarta: A GIS Analysis Exercise. Medium.com. https://medium.com/@danielcaesarpratama/considering-cycling-as-a-mode-of-commuting-in-jakarta-a-gis-analysis-exercise-cdba46e9832.
14. Forum Diskusi Transportasi Jakarta (FDTJ), 2017. Peta Jaringan Transportasi Umum
Massal Jakarta.
15. Genpi.com, 2019. Photo of Thamrin Street. https://www.genpi.co/berita/4852/pedestrian-jalan-mh-thamrin-sudirman-aman-dari-laka-lantas
16. Greater Jakarta Transport Authority (Badan Pengelola Transportasi Jabodetabek),
2020
17. Hudalah, D., Viantari, D., Firman, T., & Woltjer, J. (2013). Industrial land development and manufacturing deconcentration in greater Jakarta. Urban Geography, 34(7), 950–971. doi: https://doi.org/10.1080/02723638.2013.783281.
18. Henderson, J. V., Kuncoro, A., & Nasution, D. (1996). The dynamics of Jabotabek
development. Bulletin of Indonesian Economic Studies, 32(1), 71–95. doi: https://doi.org/10.1080/00074919612331336898.
19. Hanadian Nurhayati, 2020. Physical distancing practice as a COVID-19 measure in public transportation in Indonesia
20. Hannah E. Murdock (IEA), 2018. Decarbonising the Transport Sector with Renewable Requires Urgent Action. REN 21
21. Haryo Winarso, Delik Hudalah, Tommy Firman, 2015. Peri-urban transformation in the Jakarta metropolitan area. Habitat International 49 (2015) 221-229
22. Henderson, J. V., Kuncoro, A., & Nasution, D. (1996). The dynamics of Jabotabek development. Bulletin of Indonesian Economic Studies, 32(1), 71–95. doi: https://doi.org/10.1080/00074919612331336898.
23. Henderson, J.V. 1996. Effects of Air Quality Regulation. The American Economic Review. Vol. 86, No. 4 (Sep., 1996), pp. 789-813. American Economic Association
181
24. Hudalah, Delik & Viantari, Dimitra & Firman, Tommy & Woltjer, Johan. (2013). Industrial Land Development and Manufacturing Deconcentration in Greater Jakarta. Urban Geography. 34. 950-971. 10.1080/02723638.2013.783281.
25. Humanitarian Data Exchange, 2020. https://data.humdata.org
26. Indonesia Toll Road Authority (Badan Pengatur Jalan Tol), 2020
27. Indonesia Transport Development Policy (ITDP), 2019. Pedoman Intergrasi Antarmoda
28. Indonesia Transport Development Policy (ITDP), 2020, Non-Motorized Policy
Guideline for Mid-Size Cities in Indonesia
29. Jakarta Smart City Unit, 2020. https://smartcity.jakarta.go.id/new/
30. Jabodetabek Urban Transportation Policy Integration (JUTPI-1) Report, 2010.
31. Jabodetabek Urban Transportation Policy Integration (JUTPI-2) Report, 2019.
32. Jabodetabek Commuter Statistic, 2019. BPS Indonesia. https://www.bps.go.id/publication/2019/12/04/eab87d14d99459f4016bb057/statistik-komuter-jabodetabek-2019.html
33. Jakarta Toll Road Development (JTD), 2020. Jakarta Inner-City Elevated Toll Road 34. Kompas.com, 2019. Peta Jalan Tol Indonesia. Kompas Infografis.
https://twitter.com/adepedia/status/1203624823638777856
35. LRT Jakarta, 2018. https://www.lrtjakarta.co.id/masukan_publik_untuk_operasional_lrt_jakarta_berita325.html
36. Liputan 6.com. Photo of Commuter: Past and Present. https://www.liputan6.com/citizen6/read/3917498/berubah-drastis-begini-7-potret-perubahan-krl-dulu-vs-sekarang
37. Kompas.com, 2019. Peta Jalan Tol Indonesia. Kompas Infografis. https://twitter.com/adepedia/status/1203624823638777856
38. Martinez, R., & Masron, I. N. 2020. Jakarta: A city of cities. Cities (London, England), 106, 102868. https://doi.org/10.1016/j.cities.2020.102868
39. Masyarakat Transportasi Indonesia, Harya S. Dillon, 2020. A New and Better Normal
for Urban Mobility in Indonesia. Urbanet.
182
40. Ministry of Work, 2015. Materi Teknis Revisi Perpres 54 tahun 2008 tentang Rencana Tata
Ruang Kawasan Jabodetabekpunjur.
41. Masterplan Greater Jakarta metropolitan Area (Rencana Induk Transportasi Jabodetabek), Greater Jakarta Transportation Authority (GJTA), 2018
42. Mishra, Binaya & Rafiei Emam, Ammar & Masago, Yoshifumi & Kumar, Pankaj & Regmi, Ram & Fukushi, K. (2017). Assessment of future flood inundations under climate and land use change scenarios in the Ciliwung River Basin, Jakarta. Journal of Flood Risk Management. 11. 10.1111/jfr3.12311.
43. Megapolitan.okezone.com, 2020. Before and After Pandemi (Sudirman Street Jakarta). https://megapolitan.okezone.com/read/2021/07/04/338/2435178/foto-foto-jalan-sudirman-jakarta-lenggang-saat-ppkm-darurat
44. Hanasian Nurhayati and Wolff, 2020. Physical distancing COVID-19 in public transportation Indonesia 2020 by type. Statista
45. Pingki Elka Pangestu, 2013. Sustainability Mobility for Graeter Jakarta. International
Urban Development Assocation
46. Public transportation use in Greater Jakarta plummets during COVID-19 pandemic: BPTJ - City - The Jakarta Post". https://www.thejakartapost.com/news/2020/04/20/public-transportation-use-in-greater-jakarta-plummets-during-covid-19-pandemic-bptj.html.
47. Presidential Decree (Perpres) Number 55 of 2018 on the Greater Jakarta Transportation Master Plan (Rencana Induk Transportasi Jabodetabek -RITJ)
48. Rafael Martinez, Irna Nurlina Masron, 2020. Jakarta: A City of Cities. Cities. 106: 102868.
49. Rekik.B, Pinar.B, Adha. M, Qiong.S, and Gladys.V, 2015. Gender Friendly Public Transportation – Case Study of Jakarta, Indonesia
50. Reedman, Luke & Köberle, et al (2018). Long-term, Low-emission Pathways in Australia, Brazil, Canada, China, EU, India, Indonesia, Japan, Republic of Korea, Russian Federation, and the United States. 10.13140/RG.2.2.29944.70407.
51. Rukmana, Deden. (2008). The Growth of Jakarta Metropolitan Area and the Sustainability of Urban Development in Indonesia. The International Journal of Environmental, Cultural, Economic, and Social Sustainability: Annual Review. 4. 99-106. 10.18848/1832-2077/CGP/v04i01/54398.
183
52. Rustiadi, E., 2018. Perencanaan dan pengembangan wilayah. Yayasan Pustaka Obor Indonesia.
53. Study on Jabodetabek Public Transportation Policy Impelementation Strategy (JAPTraPIS), 2012
54. Suryono Herlambang, Helga Leitner, Liong Ju Tjung, Eric Sheppard, Dimitar Anguelov,
2018. Jakarta’s great land transformation: Hybrid neoliberalisation and informality. Urban Studies, Volume 56, Issue:4, page(s): 627-648
55. Statistic Data Center (BPS). Jakarta dalam Angka, 2020. Badan Pusat Statistik
56. Statistic Data Center (BPS). Bogor dalam Angka, 2020. Badan Pusat Statistik
57. Statistic Data Center (BPS). Bekasi cdalam Angka, 2020. Badan Pusat Statistik
58. Statistic Data Center (BPS). Depok dalam Angka, 2020. Badan Pusat Statistik
59. Statistic Data Center (BPS). Tangerang dalam Angka, 2020. Badan Pusat Statistik
60. Statistic Data Center (BPS), 2019. Indonesian Population Census 2000 & 2010: micro
data. Downloaded from https://bps.go.id/.
61. Samsul Arifin, Mukhoriyah and Dipo Yudhatama, 2018. Analysis of Land Use Spatial Pattern Change of Town Development Using Remote Sensing. International Journal of Remote Sensing and Earth Sciences (IJReSES). Vol 15, No 1 (2018)
62. Selenia E.P, 2019. Integration in Intelligent Transportation System to Reduce Green Gas Emission in Indonesia. Capacity Building Workshop on Utilizing Smart Transport Technology to Mitigate GHG Emissions Seoul, ROK. November 27-28th 2019
63. Siasati Data, Balitbang Ministry of Transport, 2020. Analisis dan Evaluasi pengedalian Transportasi Pada Masa Idul Fitri 2020
64. SUTI Report, 2017. Data Collection Report. Sustainable Urban Transport Index (SUTI) for Asian Cities. Greater Jakarta Area (Jabodetabek) Indonseia
65. Suharto, B & Kusuma, M & Wijaya, K. (2021). The implications of urban expansion to commuter travel behavior in the Jakarta Metropolitan Area. IOP Conference Series: Earth and Environmental Science. 737. 012020. 10.1088/1755-1315/737/1/012020.
66. Talitha Sahda, Luthfiyah, Fidel Miro, 2020. Impact of Covid-19 to Transportation in
Jabodetabek. Journa Universitas Bung Hatta.
184
67. Tjahjono, Tri & Kusuma, Andyka & Septiawan, Ahmad. (2020). The Greater Jakarta Area Commuters Travelling Pattern. Transportation Research Procedia. 47. 585–592. 10.1016/j.trpro.2020.03.135.
68. Tempointeraktif news.com
69. Tirto.id, 2020. Menguji Kesiapan LRT dan MRT Jakarta Tangkal Corona COVID-19", https://tirto.id/eDrA
70. Ucok WR Siagian, 2018. Pathways to Deep Decarbonization in Indonesia Energy Sector.
LoCARNet 7th Annual Meeting November 21–22, 2018 Jakarta Indonesia Center, Institut Teknologi Bandung.
71. Umara Firman Rizi, Suradi, Sunaryo, Andriyani Agus, Mizani Ahmad, Sheila Dewi Ayu Kusumaningtyas, Hanifah Nurhayati, Aulia Nisa’ul Khoir, Cici Sucianingsih, and Nur Faris Prih W, 2019. Analisis Dampak Diterapkannya kebijakan Working from Home Saat Pandemi Covid-19 Terhadap Kondisi Kualitas Udara di Jakarta. Jurnal Meteorologi Klimatologi dan Geofisika Vol.6 No.3, November 2019
72. UN Environment, 2019. Indonesia NMT Design Guideline. http://airqualityandmobility.org/STR/NMTStrategy_Indonesia_200402.pdf
73. The Study on Integrated Transportation Master Plan for JABODETABEK (SITRAMP), 2004
74. Vidya Pinandhita / Lokadata.id, 2020. https://lokadata.id/artikel/rute-masih-terbatas-lrt-
jakarta-sepi-penumpang
75. Wahyudi, Agung & Liu, Yan & Corcoran, Jonathan. (2019). Generating Different Urban Land Configurations Based on Heterogeneous Decisions of Private Land Developers: An Agent-Based Approach in a Developing Country Context. ISPRS International Journal of Geo-Information. 8. 229. 10.3390/ijgi8050229.
76. Winarso, Haryo & Hudalah, Delik & Firman, Tommy. (2015). Pen-urban transformation in the Jakarta metropolitan area. Habitat International. 49. 10.1016/j.habitatint.2015.05.024.
77. Yusuf Sofiyandi, Yusuf Reza Kurniawan, Prayoga Wiradisuria, and Dikki Nur Ahmad Saleh, 2021. Quantifying the Impacts of COVID-19 Mobility Restrictions on Ridership and Farebox Revenues: The Case of Mass Rapid Transit in Jakarta, Indonesia. LPEM FEBUI Working Papers. Issue. 202162
Related Documents