MSc RENE is a cooperation between Universitat Politècnica de Catalunya, Spain │ KTH-Royal Institute of Technology, Sweden Instituto Superior Técnico, Portugal │ École Polytechnique (ParisTech), France EIT KIC InnoEnergy Master’s Programme Renewable Energy - RENE MSc Thesis Sustainability Assessment of Electricity Production Technologies based on the Turkish RES Scenario in 2020 Author: Korhan TUNARLI Supervisors: Principal supervisor: Santiago Silvestre / UPC Partner co-supervisor: Cristina de la Rúa Lope / CIEMAT Session: September 2014

Welcome message from author
This document is posted to help you gain knowledge. Please leave a comment to let me know what you think about it! Share it to your friends and learn new things together.
Transcript
MSc RENE is a cooperation between
Universitat Politècnica de Catalunya, Spain │ KTH-Royal Institute of Technology, Sweden
Instituto Superior Técnico, Portugal │ École Polytechnique (ParisTech), France
EIT KIC InnoEnergy Master’s Programme
Renewable Energy - RENE
MSc Thesis
Sustainability Assessment of Electricity Production
Technologies based on the Turkish RES Scenario in
2020
Author: Korhan TUNARLI
Supervisors:
Principal supervisor: Santiago Silvestre / UPC
Partner co-supervisor: Cristina de la Rúa Lope / CIEMAT
Session: September 2014

Sustainability Assessment of Electricity Production TechnologIes based on the Turkish RES Scenario in 2020 Page 1
Abstract
Environmental protection, economic development and social development are known to be
three pillars of sustainability that should exist together for sustainable development.
Sustainability assessment can be carried out for products, technologies, policies and
processes. In this master thesis project, three pillars of sustainability are deeply studied with
regards to electricity production technologies in Turkey for year 2020, in which futuristic
projections are based on one chosen renewable energy scenario.
In the context of this work, sustainability assessment of electricity production technologies is
carried out in a way to cover greenhouse emissions, economical activity contribution and
employment generation stemming from each type of technology with regards to
environmental, social and economic aspects, respectively. The methods followed to realize
this work comprise life cycle assessment and extended input-output analysis techniques. As
extended input-output analysis enables to evaluate all three pillars of sustainability, a
separate life cycle assessment is carried out for all electricity producing technologies to
obtain a more peculiar environmental evaluation in the end. As all technologies are identified
with respect to their impacts concerning environmental, social and economical concerns, the
types of technologies to promote or eliminate are recommended finally.

Page 2 Thesis Report
Sustainability Assessment of Electricity Production TechnologIes based on the Turkish RES Scenario in 2020 Page 3
This master thesis is respectfully dedicated to the memory of
hundreds of coal miners who lost their lives in the mining
explosion in Soma coal basin, Turkey, on May 13th, 2014.

Page 4 Thesis Report

Sustainability Assessment of Electricity Production TechnologIes based on the Turkish RES Scenario in 2020 Page 5
Table of Contents
ABSTRACT ___________________________________________________ 1
1. GLOSSARY _____________________________________________ 11
2. PREFACE _______________________________________________ 13
3. INTRODUCTION __________________________________________ 15
3.1. Sustainability and Sustainable Energy ......................................................... 15
3.2. Turkey: Facts and RES Deployment in the Country..................................... 18
4. METHODOLOGY AND SCOPE ______________________________ 25
4.1. Input-Output Analysis (IOA).......................................................................... 25
4.2. Extended Input-Output Analysis (EIOA) ....................................................... 29
4.3. Life Cycle Assessment (LCA) ....................................................................... 31
4.4. Comparison of EIOA and LCA ..................................................................... 35
5. HYPOTHESES AND CALCULATIONS ________________________ 37
5.1. Electricity Mix in 2020 ................................................................................... 37
5.2. IOA and EIOA ............................................................................................... 42
5.2.1. Input-Output Tables (IOT) ............................................................................... 45
5.2.2. “Y” Vector: Cost-Breakdown of Technologies ................................................. 51
5.2.3. “X” Vector Calculations ................................................................................... 65
5.3. Life Cycle Assessment (LCA) ....................................................................... 66
6. RESULTS AND DISCUSSIONS ______________________________ 68
6.1. IOA & EIOA .................................................................................................. 68
6.1.1. Comparison of Technologies .......................................................................... 68
6.1.2. Overall Results ................................................................................................ 71
6.1.3. Sensitivity Analysis .......................................................................................... 72
6.2. LCA .............................................................................................................. 75
6.3. EIO-LCA Comparison ................................................................................... 76
CONCLUSIONS ______________________________________________ 79
FURTHER LINES OF STUDY ___________________________________ 81
ACKNOWLEDGEMENTS _______________________________________ 83
REFERENCES _______________________________________________ 85

Page 6 Thesis Report
Sustainability Assessment of Electricity Production TechnologIes based on the Turkish RES Scenario in 2020 Page 7
List of Figures
Fig. 3.1.Environmental Kuznets curve [6] ___________________________________ 16
Fig. 3.2. Venn diagram of sustainable development [9] _________________________ 17
Fig. 3.3. Distribution of primary energy _____________________________________ 19
Fig. 3.4. Electricity mix __________________________________________________ 20
Fig. 3.5. Turkish Wind Atlas [21] __________________________________________ 21
Fig. 3.6 Global Irradiation Map of Turkey [21] ________________________________ 22
Fig. 4.1 A Symbolic Input-Output Table _____________________________________ 26
Fig. 4.2. Relation between Input, Output and the Final Demand [31] ______________ 27
Fig. 4.3. LCA stages from Input to Output [40] _______________________________ 31
Fig. 4.4. LCA phases ___________________________________________________ 34
Fig. 5.1. Electricity Mix on Pie Chart _______________________________________ 41
Fig. 5.2. Allocation of RES _______________________________________________ 41
Fig. 5.3. Investment Cost Breakdown of Small Scale Hydro Plants [45] ____________ 53
Fig. 5.4. O&M Cost Breakdown of Small Scale Hydro Plants [45] _________________ 53
Fig. 5.5. An example of a Wind Turbine Cost Structure [46] _____________________ 55
Fig. 5.6. BOS & Module Cost Disaggregation [47] _____________________________ 56
Fig. 5.7. Investment Cost Disassociation of CSP [27] __________________________ 58
Fig. 5.8. O&M Cost Breakdown of CSP _____________________________________ 58
Fig. 5.9. Example of Investment Cost Breakdown [48] _________________________ 59
Fig. 5.10. Capital Cost Range in USD/kW [49] _______________________________ 60
Fig. 5.11.Cost Breakdown Bio-Based Systems with respect to Technology [50] ______ 61
Fig. 5.12. Capital Cost of Bio-Power Plants with respect to Technology [50] _________ 62
Fig. 5.13. LCA Branches of PV Systems on Software __________________________ 66
Fig. 5.14. Impacts Ilustration of PV Systems on SimaPro _______________________ 67
Fig. 6.1. Economical Activity Illustration by Technology _________________________ 68
Fig. 6.2. Environmental Impacts Illustration by Technology ______________________ 70
Fig. 6.3. Employment Illustration by Technology ______________________________ 71
Fig. 6.4. Proportions of conventional and renewable technologies in the mix ________ 71
Fig. 6.5. Overall Sustainability Ranking _____________________________________ 72
Fig. 6.6. Overall Points-1 ________________________________________________ 73
Fig. 6.7. Overall Points-2 ________________________________________________ 74
Fig. 6.8. LCA Results ___________________________________________________ 75
Fig. 6.9. LCA Results Illustrations _________________________________________ 75
Fig. 6.10. Comparison of EIOA and LCA results ______________________________ 76

Page 8 Thesis Report
Sustainability Assessment of Electricity Production TechnologIes based on the Turkish RES Scenario in 2020 Page 9
List of Tables
Table 3.1. Power Consumption per Capita Values [19] _________________________ 20
Table 3.2. FiT rates in Turkey for renewable energy sources [24] _________________ 23
Table 4.1. GWP values for selected greenhouse gases [35] _____________________ 30
Table 4.2. Comparison of LCA and EIOA [44] ________________________________ 36
Table 5.1. Current electricity production in Turkey (2014) _______________________ 38
Table 5.2. Electricity production mix in Turkey (2020) __________________________ 39
Table 5.3. National Domestic Output Table of Turkey(2011) _____________________ 46
Table 5.4. National Import Output Table (2011) _______________________________ 47
Table 5.5. Green House Emissions per Related Economic Activity ________________ 49
Table 5.6. Employment per Unit Economic Activity ____________________________ 50
Table 5.7. Characteristics of RES power plants _______________________________ 51
Table 5.8 Cost Breakdown of Small Scale Hydro Power Plants. __________________ 52
Table 5.9. Cost Breakdown of Wind Power Plants _____________________________ 54
Table 5.10. Cost Breakdown of PV Systems _________________________________ 56
Table 5.11. Cost Breakdown of CSP Systems ________________________________ 57
Table 5.12. Cost Breakdown of Geothermal Plant _____________________________ 60
Table 5.13. Cost Breakdown of Solid Biomass Plant ___________________________ 63
Table 5.14. Cost Breakdown of Biogas Plant _________________________________ 63
Table 5.16. LCOE of Conventional Mix (Prices close to [51]) _____________________ 64
Table 5.17. “X” Resultant Vector per each technology __________________________ 65
Table 6.1. Economic Multipliers by Technology _______________________________ 68
Table 6.2. Environmental Impacts by Technology _____________________________ 69
Table 6.3. Job Creation by Technology _____________________________________ 70
Table 6.4.Grading for Sensitivity Analysis ___________________________________ 73

Page 10 Thesis Report
Sustainability Assessment of Electricity Production TechnologIes based on the Turkish RES Scenario in 2020 Page 11
1. Glossary
CSP Concentrated Solar Power
EIOA Extended Input Output Analysis
EU European Union
FiT Feed-in Tariff
GDP Gross Domestic Product
GWP Global Warming Potential
IEA International Energy Association
IOA Input Output Analysis
IOT Input Output Table
IRENA International Renewable Energy Agency
LCA Life Cycle Assessment
LCOE Levelized Cost of Electricity
Mtoe Mega Tones of Oil Equivalent
NREL National Renewable Energy Laboratory
O&M Operation and Maintenance
PPP Purchasing Power Parity
PV Photovoltaics
RES Renewable Energy Sources
UN United Nations
WCED World Commission on Environment and Development
WIOD World Input-Output Database

Pág. 12 Memoria
Sustainability Assessment of Electricity Production TechnologIes based on the Turkish RES Scenario in 2020 Page 13
2. Preface
This thesis work covers the definition of sustainability, the relationship with sustainable
development and energy. A case study of Turkey in year 2020 is adapted. Overall, it is aimed
to unearth the most sustainable electricity production technology to invest in Turkish case.
This thesis work pursues three principal objectives mainly:
- To quantify environmental and socio-economic impacts of the electricity production
by RES and conventional technologies
- To associate these impacts with the defined Turkish electricity production scenario in
year 2020
- To propose scenarios regarding the electricity mix in order to deliver a sustainable
road map as desired

Sustainability Assessment of Electricity Production TechnologIes based on the Turkish RES Scenario in 2020 Page 15
3. Introduction
3.1. Sustainability and Sustainable Energy
Ever since the first industrial revolution, the mankind had been witnessing a progressive
industrialization that resulted in continuous economic growth and development all over the
globe. In parallel with technological revolutions which simplified the one’s life, economic
growth brought about a dramatic change in societies in the way they behave, primarily
altering the means of production and consumption. Owing to easiness in producing,
transporting and selling of goods, much closer commercial interactions are enabled and
therefore a competitive global market economy has been constituted over time. A greater
amount of commodities have begun to be devised, circulated, and purchased in the global
system. This market economy was empowered by research and development (R&D)
activities focusing on “efficiency” paradigm, which proceeded in pursuit of saving time and
money in manufacturing so as to produce and sell cheaper and thus to trigger the overall
economy. However, this continuous economic growth showed a very poor concern with
environmental issues as earth’s resources (mainly fossil fuels) had been recklessly
exploited.[1]
It was not earlier than the second half of 20th century; the “sustainability” came into view of
the global picture as a function of social, economic, technological and ecological aspects. [2]
In year 1987, “United Nations World Commission on Environment and Development”
(WCED) introduced the term “sustainable development” as the “development that meets the
needs of the present without compromising the ability of future generations to meet their own
needs”. [2] The necessity to bring up this phenomenon was deemed necessary to provide
the essential needs of future generations and it was attributable to the consequences of
environmental degradation, social inequalities and ongoing political conflicts regarding the
natural sources, according the UN Report. [3-4]
With depleting fossil fuels, deteriorating social conditions of poor societies and striking
environmental degradation, sustainable development gathered significant attention in the last
decades by many scientists. Some scientists correlated “sustainable development” to the
“sustainable consumption”, a new concept defined by them and was expressed as “the use
of services and related products which respond to basic needs and bring a better quality of
life while minimizing the use of natural resources and toxic materials as well as the emissions
of waste and pollutants over the life cycle of the service or product so as not to jeopardize the
needs of future generations” .This definition, however, focused heavily on environmental
considerations, ignoring the social and economic sides of the phenomenon. [3] The relation
between economic growth and environment has been a scope of study for several
Page 16 Thesis Report
researchers from distinct disciplines. Some economists favored a more balanced mitigation
program distributed over long term and being exerted gradually, whereas environmentalist
scientists proposed a set of more strict regulations which are promised to solve
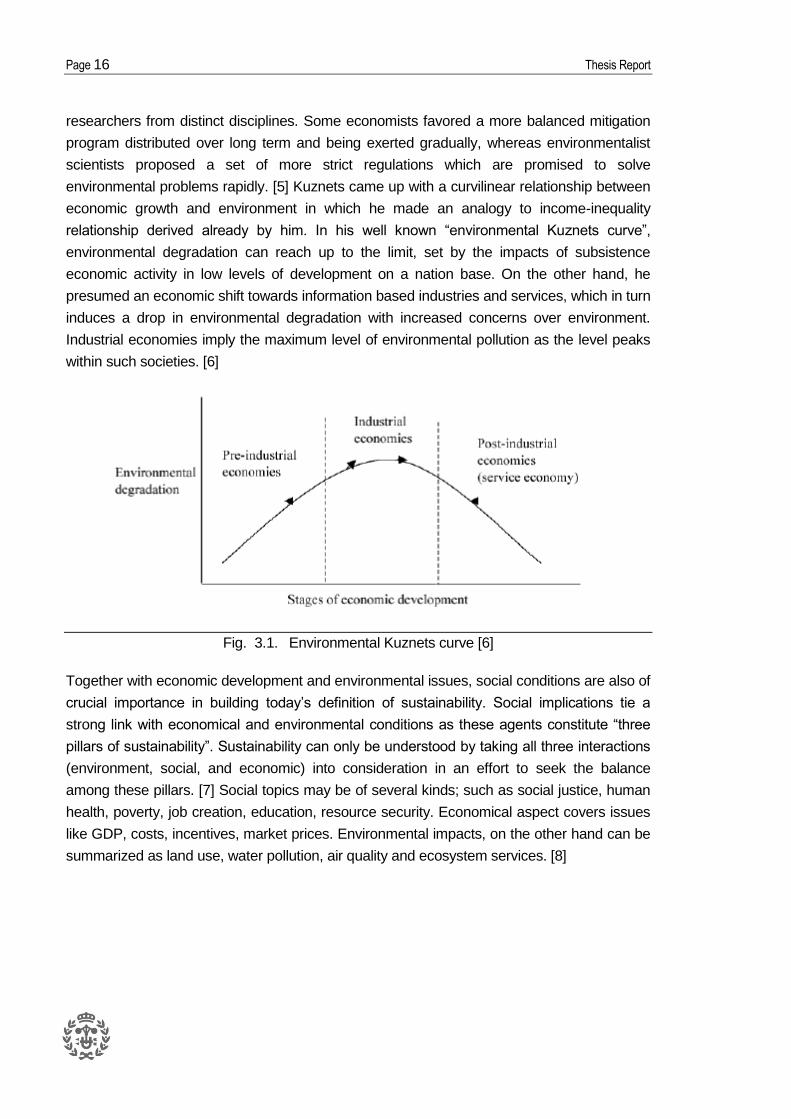
environmental problems rapidly. [5] Kuznets came up with a curvilinear relationship between
economic growth and environment in which he made an analogy to income-inequality
relationship derived already by him. In his well known “environmental Kuznets curve”,
environmental degradation can reach up to the limit, set by the impacts of subsistence
economic activity in low levels of development on a nation base. On the other hand, he
presumed an economic shift towards information based industries and services, which in turn
induces a drop in environmental degradation with increased concerns over environment.
Industrial economies imply the maximum level of environmental pollution as the level peaks
within such societies. [6]
Fig. 3.1. Environmental Kuznets curve [6]
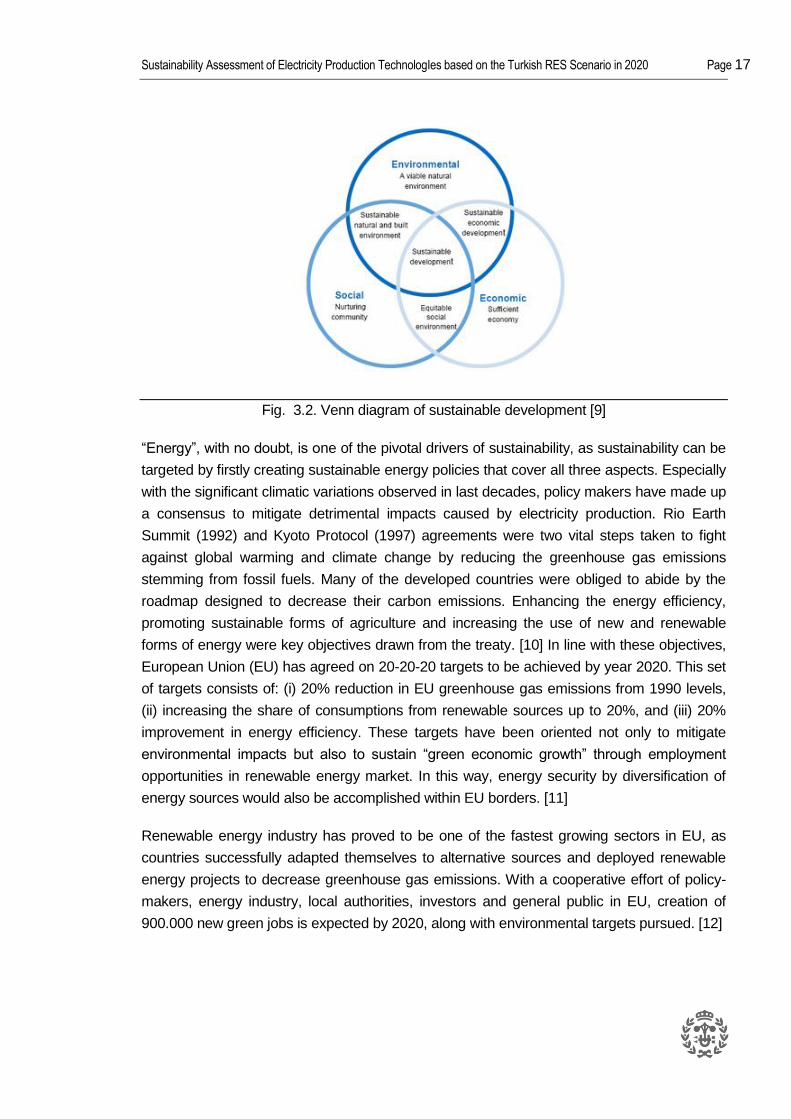
Together with economic development and environmental issues, social conditions are also of
crucial importance in building today’s definition of sustainability. Social implications tie a
strong link with economical and environmental conditions as these agents constitute “three
pillars of sustainability”. Sustainability can only be understood by taking all three interactions
(environment, social, and economic) into consideration in an effort to seek the balance
among these pillars. [7] Social topics may be of several kinds; such as social justice, human
health, poverty, job creation, education, resource security. Economical aspect covers issues
like GDP, costs, incentives, market prices. Environmental impacts, on the other hand can be
summarized as land use, water pollution, air quality and ecosystem services. [8]
Sustainability Assessment of Electricity Production TechnologIes based on the Turkish RES Scenario in 2020 Page 17
Fig. 3.2. Venn diagram of sustainable development [9]
“Energy”, with no doubt, is one of the pivotal drivers of sustainability, as sustainability can be
targeted by firstly creating sustainable energy policies that cover all three aspects. Especially
with the significant climatic variations observed in last decades, policy makers have made up
a consensus to mitigate detrimental impacts caused by electricity production. Rio Earth
Summit (1992) and Kyoto Protocol (1997) agreements were two vital steps taken to fight
against global warming and climate change by reducing the greenhouse gas emissions
stemming from fossil fuels. Many of the developed countries were obliged to abide by the
roadmap designed to decrease their carbon emissions. Enhancing the energy efficiency,
promoting sustainable forms of agriculture and increasing the use of new and renewable
forms of energy were key objectives drawn from the treaty. [10] In line with these objectives,
European Union (EU) has agreed on 20-20-20 targets to be achieved by year 2020. This set
of targets consists of: (i) 20% reduction in EU greenhouse gas emissions from 1990 levels,
(ii) increasing the share of consumptions from renewable sources up to 20%, and (iii) 20%
improvement in energy efficiency. These targets have been oriented not only to mitigate
environmental impacts but also to sustain “green economic growth” through employment
opportunities in renewable energy market. In this way, energy security by diversification of
energy sources would also be accomplished within EU borders. [11]
Renewable energy industry has proved to be one of the fastest growing sectors in EU, as
countries successfully adapted themselves to alternative sources and deployed renewable
energy projects to decrease greenhouse gas emissions. With a cooperative effort of policy-
makers, energy industry, local authorities, investors and general public in EU, creation of
900.000 new green jobs is expected by 2020, along with environmental targets pursued. [12]
Page 18 Thesis Report
One of the projects regarding the renewable energy deployment within EU is called
“BETTER (Bringing Europe and Third countries closer together through renewable
Energies)1”, which aims to realize RES cooperation between the EU and third countries. In
the context of this project, the EU’s chance to collaborate with North Africa, Western Balkans
and Turkey is sought in order to stimulate the deployment of RES electricity projects in third
countries as well as to help EU to accomplish its 20-20-20 targets at the same time. [13]
Being evaluated under the case study of this project, Turkey exhibits a great profile in terms
of RES potential. In line with the sustainability criteria defined earlier, the electricity
production in Turkey in year 2020 is studied and analyzed in the context of this master thesis
work. Based on a defined electricity production mix scenario, greenhouse gas emissions,
monetary contribution and potential employment generation are analyzed with regards to
environmental, economical and social impacts, respectively. The methods followed to realize
this work comprise life cycle assessment and extended input-output analysis techniques. As
extended input-output analysis helps to evaluate all three pillars of sustainability, a separate
life cycle assessment is carried out for all electricity producing technologies to obtain a more
peculiar environmental evaluation in the end.
In the next part of this introduction section, more detailed information about Turkey and RES
situation in the country are provided to provide insight to sustainable progress in the country.
3.2. Turkey: Facts and RES Deployment in the Country
Bridging Europe and Asia, Turkey is located on a very important geographic hot spot,
inheriting special characteristics of cultural, economic, and historical legacy. Turkey covers
an area of 783,562.38 km2 and it is surrounded by four seas: the Mediterranean Sea, the
Aegean Sea, the Sea of Marmara, and the Black Sea. With a grand proportion of young
population (almost half of the population aged below 30 years), the country delivers high
consumption and economic growth rates in which energy-related demand is naturally
soaring. [14] Recently, Turkey is ranked 69th on Human Development Index (HDI) with a life
expectancy of 75.3 years and GDP per capita value of $19,080 (PPP). The country excels as
the 16th largest economy in the world and 6th largest economy compared to EU countries.
This level of economic growth rendered an average real GDP growth of 5.1% between years
1 http://www.better-project.net/
Sustainability Assessment of Electricity Production TechnologIes based on the Turkish RES Scenario in 2020 Page 19
2003 and 2013. The country is easily distinguished with emerging markets in information
technologies (IT) and manufacturing industries, and possesses a well-established structure
in construction, textile and agriculture sectors. [15] However, this economic growth is leading
the country to emit great amount of greenhouse gases, which makes it one of the largest
contributors in GHG in the world, together with US, China, Australia and Canada. [16] Fossil
sources still constitute a major share in electricity production nation-wide and most of the
sources are being imported. Thus, the growth based on imported fossil energy supply not
only implies severe threats to sustainable development, but also endangers the country’s
financial accounts. [17]
Turkish yearly energy consumption is around 110.000 Mtpe (Mega tons of petroleum
equivalent) (2011) with a power demand corresponding to roughly 230 TWh, where foreign
dependence of the energy sector reaches a level of 73%. Coal, oil and natural gas are
imported sources that make up a big fragment in primary energy supply mix of the nation. Oil
is imported mostly from Saudi Arabia, Iraq, Russia and Iran as natural gas is transported
from Russia, Azerbaijan, Iran, Algeria and Nigeria. Russia, USA and Australia, on the other
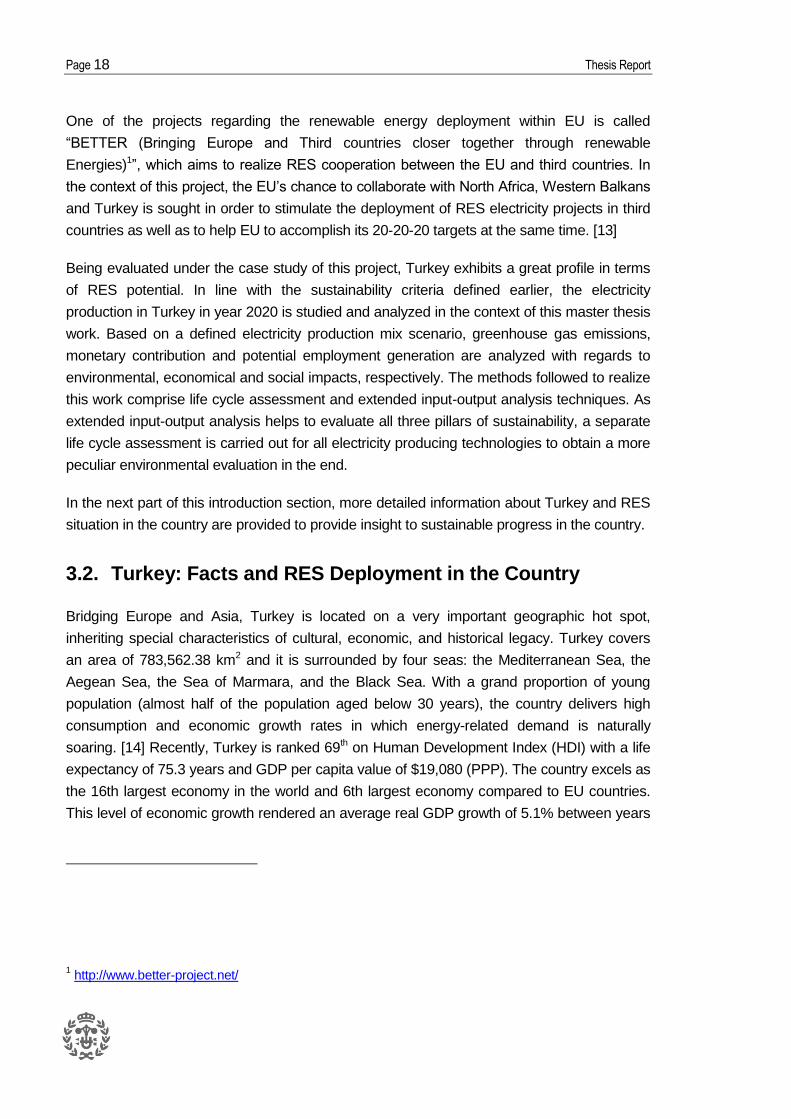
hand, are the biggest exporters of coal to Turkey. [17] Turkey exploits plenty of major lignite
basins that are distributed around the country. Distribution of primary energy resources and
recent electricity mix shares with respect to sources are illustrated in the figures below.
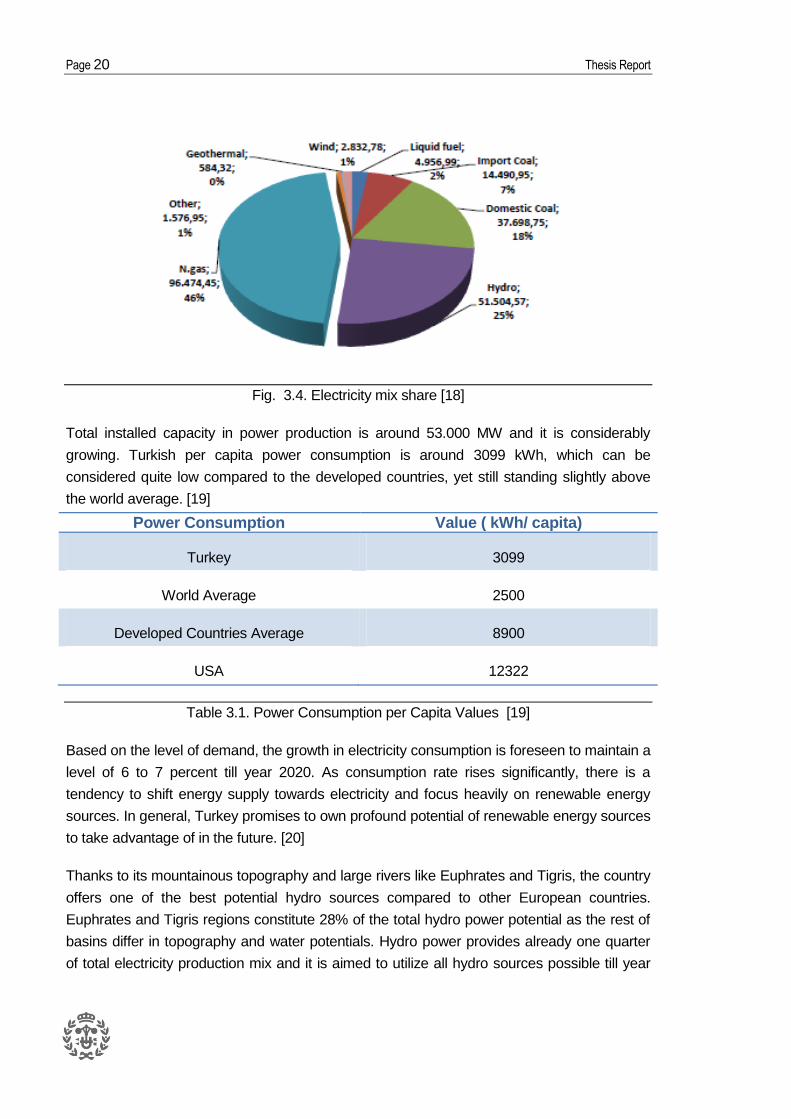
Natural gas is the most utilized energy source (33%) and followed by imported oil with a
share of approximately 30%. [18]
Fig. 3.3. Distribution of primary energy resources [18]
Page 20 Thesis Report
Fig. 3.4. Electricity mix share [18]
Total installed capacity in power production is around 53.000 MW and it is considerably
growing. Turkish per capita power consumption is around 3099 kWh, which can be
considered quite low compared to the developed countries, yet still standing slightly above
the world average. [19]
Power Consumption Value ( kWh/ capita)
Turkey 3099
World Average 2500
Developed Countries Average 8900
USA 12322
Table 3.1. Power Consumption per Capita Values [19]
Based on the level of demand, the growth in electricity consumption is foreseen to maintain a
level of 6 to 7 percent till year 2020. As consumption rate rises significantly, there is a
tendency to shift energy supply towards electricity and focus heavily on renewable energy
sources. In general, Turkey promises to own profound potential of renewable energy sources
to take advantage of in the future. [20]
Thanks to its mountainous topography and large rivers like Euphrates and Tigris, the country
offers one of the best potential hydro sources compared to other European countries.
Euphrates and Tigris regions constitute 28% of the total hydro power potential as the rest of
basins differ in topography and water potentials. Hydro power provides already one quarter
of total electricity production mix and it is aimed to utilize all hydro sources possible till year
Sustainability Assessment of Electricity Production TechnologIes based on the Turkish RES Scenario in 2020 Page 21
2023. The big construction companies have recently levied some of their investments on run-
of river type hydropower construction as this sector is expanding abruptly. Yet, some
environmental concerns regarding the habitat of the dams have been arising from locals
settled near these hydropower works and need to be met with particular attention. [18, 21]
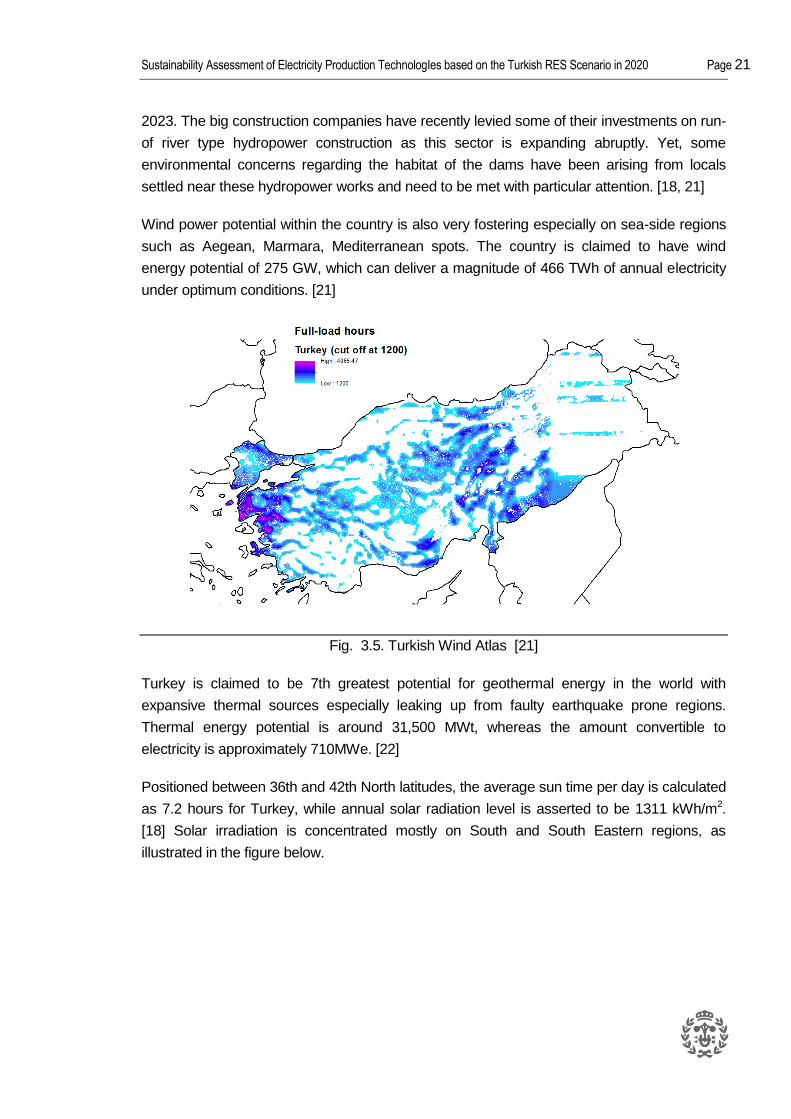
Wind power potential within the country is also very fostering especially on sea-side regions
such as Aegean, Marmara, Mediterranean spots. The country is claimed to have wind
energy potential of 275 GW, which can deliver a magnitude of 466 TWh of annual electricity
under optimum conditions. [21]
Fig. 3.5. Turkish Wind Atlas [21]
Turkey is claimed to be 7th greatest potential for geothermal energy in the world with
expansive thermal sources especially leaking up from faulty earthquake prone regions.
Thermal energy potential is around 31,500 MWt, whereas the amount convertible to
electricity is approximately 710MWe. [22]
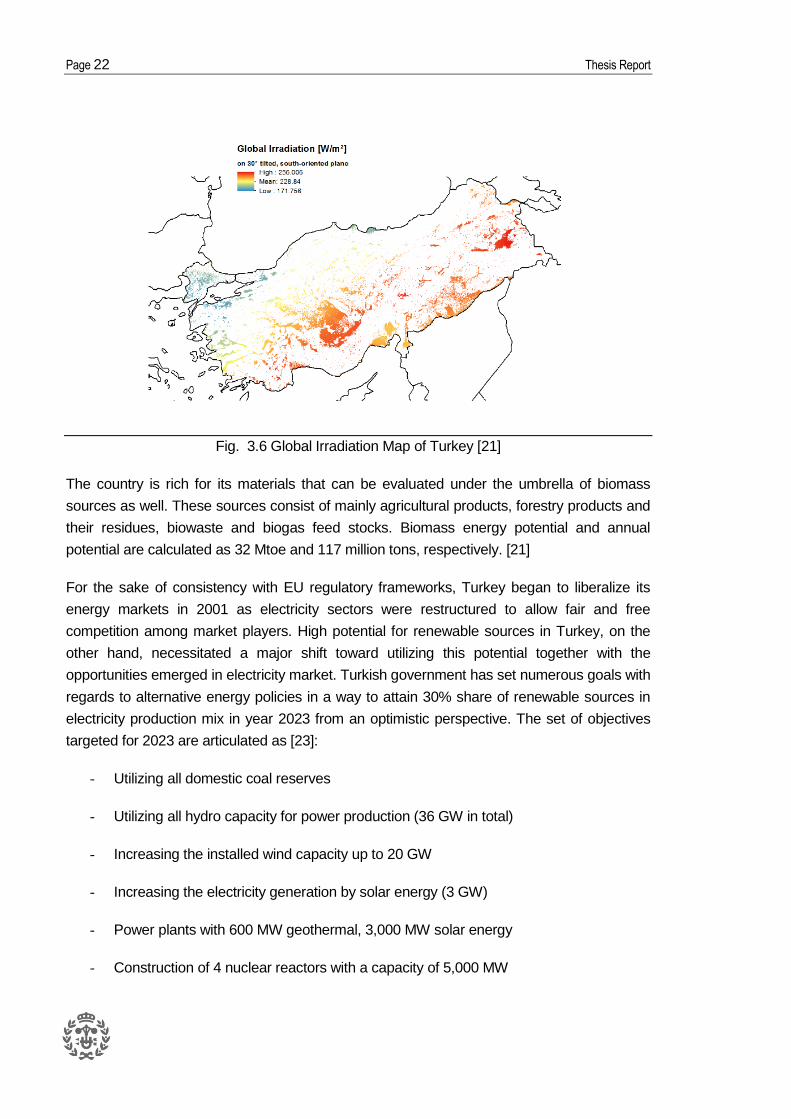
Positioned between 36th and 42th North latitudes, the average sun time per day is calculated
as 7.2 hours for Turkey, while annual solar radiation level is asserted to be 1311 kWh/m2.
[18] Solar irradiation is concentrated mostly on South and South Eastern regions, as
illustrated in the figure below.
Page 22 Thesis Report
Fig. 3.6 Global Irradiation Map of Turkey [21]
The country is rich for its materials that can be evaluated under the umbrella of biomass
sources as well. These sources consist of mainly agricultural products, forestry products and
their residues, biowaste and biogas feed stocks. Biomass energy potential and annual
potential are calculated as 32 Mtoe and 117 million tons, respectively. [21]
For the sake of consistency with EU regulatory frameworks, Turkey began to liberalize its
energy markets in 2001 as electricity sectors were restructured to allow fair and free
competition among market players. High potential for renewable sources in Turkey, on the
other hand, necessitated a major shift toward utilizing this potential together with the
opportunities emerged in electricity market. Turkish government has set numerous goals with
regards to alternative energy policies in a way to attain 30% share of renewable sources in
electricity production mix in year 2023 from an optimistic perspective. The set of objectives
targeted for 2023 are articulated as [23]:
- Utilizing all domestic coal reserves
- Utilizing all hydro capacity for power production (36 GW in total)
- Increasing the installed wind capacity up to 20 GW
- Increasing the electricity generation by solar energy (3 GW)
- Power plants with 600 MW geothermal, 3,000 MW solar energy
- Construction of 4 nuclear reactors with a capacity of 5,000 MW
Sustainability Assessment of Electricity Production TechnologIes based on the Turkish RES Scenario in 2020 Page 23
Achieving these objectives are supposed to enable Turkey (i) to diversify energy sources and
to avoid dependence on energy imports, (ii) to foster private investment (both foreign and
domestic) in electricity sector, (iii) to reduce greenhouse gas emissions, (iv) to assign the
country as a transit area between Europe and Asia through upgraded grid connections and,
(v) to improve the concept of “reliability of electricity”.
The government efforts to stimulate in investing in renewable energies can be summarized
as [24]:
- Reducing costs in licensing
- Providing with minimum price guarantees such as feed-in tariffs (FiT)
- Providing incentives on land acquisition and domestic components for the power
plants
- Supporting for priority connection to the national grid
Feed-in tariffs granted by Turkish regulatory framework is provided in the table below.
Technology FiT ($/kWh)
Hydro 7.3
Wind 7.3
Geothermal 10.5
Biomass 13.3
Solar 13.3
Table 3.2. FiT rates in Turkey for renewable energy sources [24]
In this master thesis work, a defined scenario for electricity production mix of Turkey in 2020
is analyzed with regards to sustainability. The scenario is developed under the light of
futuristic estimates handled by BETTER project, along with the Turkish RES targets for 2023.
The study is evaluated with more focus on renewable sources, which are classified as (1)
small hydro power, (2) wind power, (3) solar thermal power (Concentrated Solar Power –
CSP), (4) solar photovoltaic (PV) power, (5) geothermal power, (6) solid biomass sources,
(7) biowaste, (8) biogas, and (9) conventional sources.
Page 24 Thesis Report
Sustainability assessment is identified with the following perspectives in regards to three
sustainability pillars that are already defined:
- Environmental: Greenhouse gas emissions
- Economical: Monetary output contribution
- Social: Number of jobs created
Conventional sources include fossil sources such as lignite, hard coal, oil, natural gas
(combined cycle and regular). Besides, big hydro power plants are embedded in
conventional sources since the major proportion of this type is already existent in current
electricity mix (which is conventional) and the share of this source is anticipated to remain at
the very same level, as all others differ in the context of this study. Besides, the planned
nuclear activities are taken out of scope in this sustainability assessment.
Sustainability assessment is carried out by applying methods of (i) input-output analysis, (ii)
extended input-output analysis and (iii) life cycle assessment, all of which are neatly
discussed in following parts.
This section is followed by objectives of the study, which is succeeded by the methodology
and scope part. The study continues with hypotheses and calculations section, and then
results are provided upon calculations. Along with conclusion drawn, discussion section is
followed by the further study lines, which is the ultimate part of the entire master thesis work.

Sustainability Assessment of Electricity Production TechnologIes based on the Turkish RES Scenario in 2020 Page 25
4. Methodology and Scope
The methodology of this research is developed by the following concepts in respective order:
- Input-Output Analysis (IOA)
- Extended Input-Output Analysis (EIOA)
- Life Cycle Assessment (LCA)
- Comparison of EIOA and LCA
4.1. Input-Output Analysis (IOA)
Input-Output Analysis was developed by Russian-American Nobel laureate economist
Wassily Leontief in the first half of 20th century, to be exploited in modelling of US economy.
Leontief came up with a quantitative equilibrium model, called input-output model, where
inter-industry relationships within an economy are specified to show how output from one
industrial sector may become an input to another industrial sector. When introduced initially
in USA, this methodology is carried out spanning around 500 hundred sectors present in the
economy. [25]
Today, Input-Output Analysis (IOA) is regarded to be a robust tool utilized to analyze and
differentiate the outcomes associated to a change in the final demand for a particular good or
services, reflected on overall economic outlook in a region or country. The analysis
eventually provides an accounting framework to estimate changes in total economic activity
wherever it is applied. [26] In a very systematic structure, the analysis relates output levels of
all different sectors to the amount of inputs provided within an economy. [27]
This analysis is developed on data provided by national input-output tables which consist of
all sectors available within an economic system. Inputs and outputs from every sector are
placed in such tables in a way to track the amount of input necessitated by one sector from
another in a quantitative sense. [28]
Input-Output tables are normally produced and published by National Statistics Institutes.
The Seventh Framework Programme Project World Input-Output Database (WIOD) has
produced and published Input-Output Tables form more than 35 industrialized countries and
several regions. [r] In national input-output tables, all commodities in sectors are embedded
with respect to their monetary value, namely costs. [29]
Page 26 Thesis Report
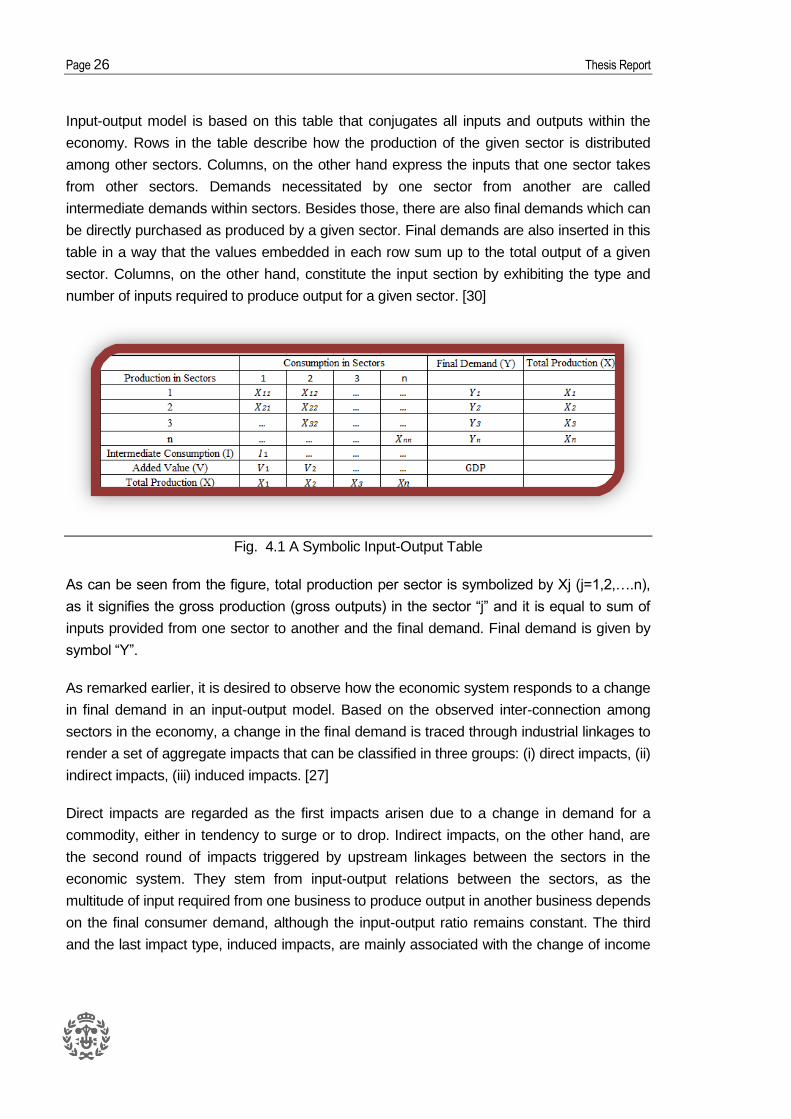
Input-output model is based on this table that conjugates all inputs and outputs within the
economy. Rows in the table describe how the production of the given sector is distributed
among other sectors. Columns, on the other hand express the inputs that one sector takes
from other sectors. Demands necessitated by one sector from another are called
intermediate demands within sectors. Besides those, there are also final demands which can
be directly purchased as produced by a given sector. Final demands are also inserted in this
table in a way that the values embedded in each row sum up to the total output of a given
sector. Columns, on the other hand, constitute the input section by exhibiting the type and
number of inputs required to produce output for a given sector. [30]
Fig. 4.1 A Symbolic Input-Output Table
As can be seen from the figure, total production per sector is symbolized by Xj (j=1,2,….n),
as it signifies the gross production (gross outputs) in the sector “j” and it is equal to sum of
inputs provided from one sector to another and the final demand. Final demand is given by
symbol “Y”.
As remarked earlier, it is desired to observe how the economic system responds to a change
in final demand in an input-output model. Based on the observed inter-connection among
sectors in the economy, a change in the final demand is traced through industrial linkages to
render a set of aggregate impacts that can be classified in three groups: (i) direct impacts, (ii)
indirect impacts, (iii) induced impacts. [27]
Direct impacts are regarded as the first impacts arisen due to a change in demand for a
commodity, either in tendency to surge or to drop. Indirect impacts, on the other hand, are
the second round of impacts triggered by upstream linkages between the sectors in the
economic system. They stem from input-output relations between the sectors, as the
multitude of input required from one business to produce output in another business depends
on the final consumer demand, although the input-output ratio remains constant. The third
and the last impact type, induced impacts, are mainly associated with the change of income
Sustainability Assessment of Electricity Production TechnologIes based on the Turkish RES Scenario in 2020 Page 27
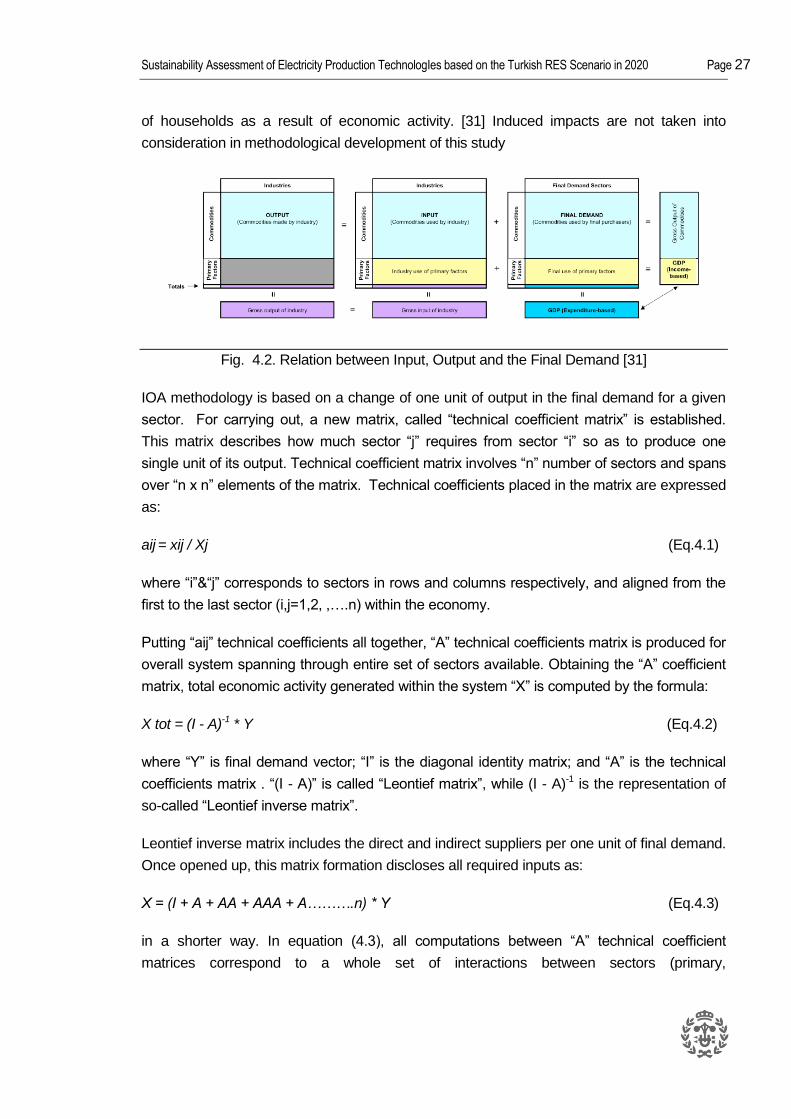
of households as a result of economic activity. [31] Induced impacts are not taken into
consideration in methodological development of this study
Fig. 4.2. Relation between Input, Output and the Final Demand [31]
IOA methodology is based on a change of one unit of output in the final demand for a given
sector. For carrying out, a new matrix, called “technical coefficient matrix” is established.
This matrix describes how much sector “j” requires from sector “i” so as to produce one
single unit of its output. Technical coefficient matrix involves “n” number of sectors and spans
over “n x n” elements of the matrix. Technical coefficients placed in the matrix are expressed
as:
aij = xij / Xj (Eq.4.1)
where “i”&“j” corresponds to sectors in rows and columns respectively, and aligned from the
first to the last sector (i,j=1,2, ,….n) within the economy.
Putting “aij” technical coefficients all together, “A” technical coefficients matrix is produced for
overall system spanning through entire set of sectors available. Obtaining the “A” coefficient
matrix, total economic activity generated within the system “X” is computed by the formula:
X tot = (I - A)-1 * Y (Eq.4.2)
where “Y” is final demand vector; “I” is the diagonal identity matrix; and “A” is the technical
coefficients matrix . “(I - A)” is called “Leontief matrix”, while (I - A)-1 is the representation of
so-called “Leontief inverse matrix”.
Leontief inverse matrix includes the direct and indirect suppliers per one unit of final demand.
Once opened up, this matrix formation discloses all required inputs as:
X = (I + A + AA + AAA + A……….n) * Y (Eq.4.3)
in a shorter way. In equation (4.3), all computations between “A” technical coefficient
matrices correspond to a whole set of interactions between sectors (primary,
Page 28 Thesis Report
secondary,…and the ultimate ) so that not only the final demands but also the intermediate
ones are taken into consideration. Direct impacts are given by the equation:
X dir = (I + A) * Y (Eq.4.4)
in this case. With regards to this methodology, a linear relation between the final demand “Y”
and the total output X tot (given in text as “X” from now on) is set up. Additionally, any
incremental change in final demand can be computed as a result of change in total output,
with the following equation:
ΔX = (I - A)-1 * ΔY (Eq.4.5)
where ΔX and ΔY stands for changes in final output and final demand, respectively.
In the context of this study, all the values in IOA are utilized with respect to their monetary
values, rather than the amounts. Based on the investment and operation & maintenance
(O&M) costs of various technologies existent in electricity production mix of year 2020, these
costs are allocated to the distinct sectors included in the Input-Output table, in accordance
with the electricity demand and costs. Afterwards, the total economic activity to be generated
in overall system is computed to distinguish the type of technology that is more cost-wise
advantageous. [31]
Total output per final demand (X/Y) is a very subtle indicator in means to illustrate
economical impact of a change in the demand in question. The magnitude of this ratio
embodies to what extent the invested technology stimulates other sectors and renders an
overall monetary output. “Multiplier effect” is the scientific term attributed to this ratio as an
economic indicator. [32] For economical implications in this work, the cost per unit of
electricity (€/kWh in this text) on final demand by distinct technologies are evaluated.
IOA can be utilized for both domestic and import products manufactured and circulated in
economy. In national economic input-output tables provided by WIOD, values for imports are
also indicated. For the imported materials, these tables are referred in Turkish case study so
that the economical contribution within and outside the country are to be computed.
Apart from showing economical implications, IOA is apt to lay the basic foundation for other
means through Extended Input-Output Analysis (EIOA). Two pillars of sustainability, namely
socio-economical and environmental impacts are assessed with EIOA, as meticulously
discussed in following sub-sections.

Sustainability Assessment of Electricity Production TechnologIes based on the Turkish RES Scenario in 2020 Page 29
4.2. Extended Input-Output Analysis (EIOA)
Conceptually speaking, any increase in product output brings about corresponding non-
economic impacts as well These impacts can be classified as environmental impacts such as
global warming, land use, conventional pollutants, energy use, and so forth. IOA outcomes
make it possible to interpret economic findings to socio-economic means, once the relation
between economic production and social implication is set forth. Conversion of monetary
outputs to non-economic impacts is attained by extending IOA data in a way to incorporate
environmental and socio-economic data. This process is regarded as one step further
practice of IOA and known as EIOA. [33]
EIOA was initially introduced to quantify environmental burden arisen due to economic
activities. It was oriented to propose the magnitude of impacts of different types of products,
materials, industries and services in regards to their emission rates and resource uses
throughout the upstream side of the supply chain associated with downstream activities. [34]
It is quite conventional to call this method as “Environmental Input- Output Life Cycle
Assessment” (EIO-LCA), for providing environmental impacts during the whole life time of a
product, although it is referred as EIOA throughout this text since socio-economic
implications are also taken into consideration.
Environmental and social impacts are introduced to IOA outputs with a very simple matrix
operation. Environmental and socio-economic data are defined by a joint vector “R” and this
vector is multiplied by monetary outputs rendered as a result of IOA, which is already in the
form of “X”, as can be remembered. The resultant impacts shown by vector “Z” and it is
mathematically expressed as:
Z = R * X = R * (I - A)-1 * Y (Eq.4.6)
and ΔZ = R * X = R * (I - A)-1 * ΔY (Eq.4.7)
As expressed, linear relation between the change in final demand and resultant vector is
maintained in EIOA. (i.e. ΔZ corresponds to change in environmental/ socio-economical
impacts in the same order of ΔY)
In the context of this research, environmental impacts are associated with three main
greenhouse gases; namely CO2 (Carbon dioxide), CH4 (Methane) and N2O, (Nitrous oxide)
while number of employments generated per unit monetary output is taken as the socio-
economical indicator.
Page 30 Thesis Report
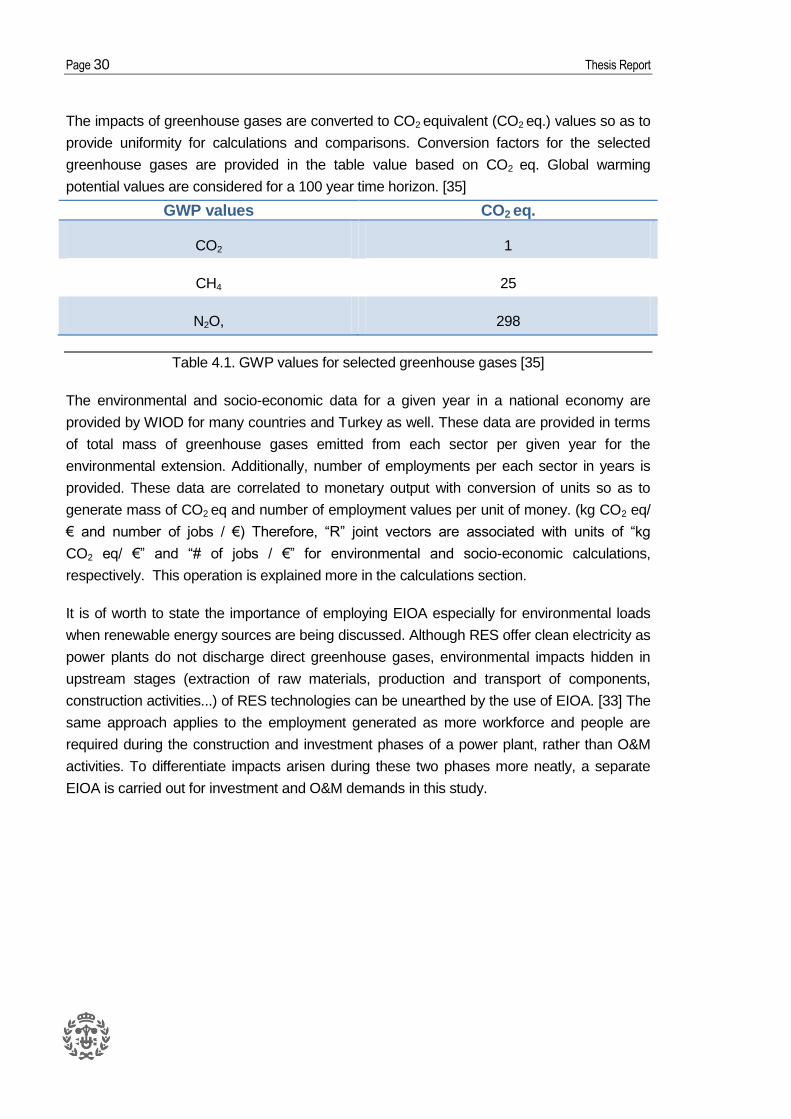
The impacts of greenhouse gases are converted to CO2 equivalent (CO2 eq.) values so as to
provide uniformity for calculations and comparisons. Conversion factors for the selected
greenhouse gases are provided in the table value based on CO2 eq. Global warming
potential values are considered for a 100 year time horizon. [35]
GWP values CO2 eq.
CO2 1
CH4 25
N2O, 298
Table 4.1. GWP values for selected greenhouse gases [35]
The environmental and socio-economic data for a given year in a national economy are
provided by WIOD for many countries and Turkey as well. These data are provided in terms
of total mass of greenhouse gases emitted from each sector per given year for the
environmental extension. Additionally, number of employments per each sector in years is
provided. These data are correlated to monetary output with conversion of units so as to
generate mass of CO2 eq and number of employment values per unit of money. (kg CO2 eq/
€ and number of jobs / €) Therefore, “R” joint vectors are associated with units of “kg
CO2 eq/ €” and “# of jobs / €” for environmental and socio-economic calculations,
respectively. This operation is explained more in the calculations section.
It is of worth to state the importance of employing EIOA especially for environmental loads
when renewable energy sources are being discussed. Although RES offer clean electricity as
power plants do not discharge direct greenhouse gases, environmental impacts hidden in
upstream stages (extraction of raw materials, production and transport of components,
construction activities...) of RES technologies can be unearthed by the use of EIOA. [33] The
same approach applies to the employment generated as more workforce and people are
required during the construction and investment phases of a power plant, rather than O&M
activities. To differentiate impacts arisen during these two phases more neatly, a separate
EIOA is carried out for investment and O&M demands in this study.
Sustainability Assessment of Electricity Production TechnologIes based on the Turkish RES Scenario in 2020 Page 31
4.3. Life Cycle Assessment (LCA)
Concerns over resource depletion and energy use led the development of Life Cycle
Assessment (LCA) concept in 1960’s. LCA was initially experimented by Coca-Cola
Company in 1969, under supervision of Harry E. Teasley, who was the manager of
packaging unit that time and considering whether to produce the beverage cans inside the
company, rather than outsourcing. [36] LCA practices had expanded along with oil crisis in
1970’s and later with “Green Movements” in Europe, and afterwards environmental releases
were adjoined with raw material, energy and waste considerations in LCA. [37] It was not
until late 1990’s when LCA practices began to be standardized internationally, when
International Organization for Standardization regulated and revised the concepts associated
with LCA. Today, principles and frameworks are set by ISO Standard 14040, while ISO
14044 sets forth the requirements and guidelines of LCA. [38]
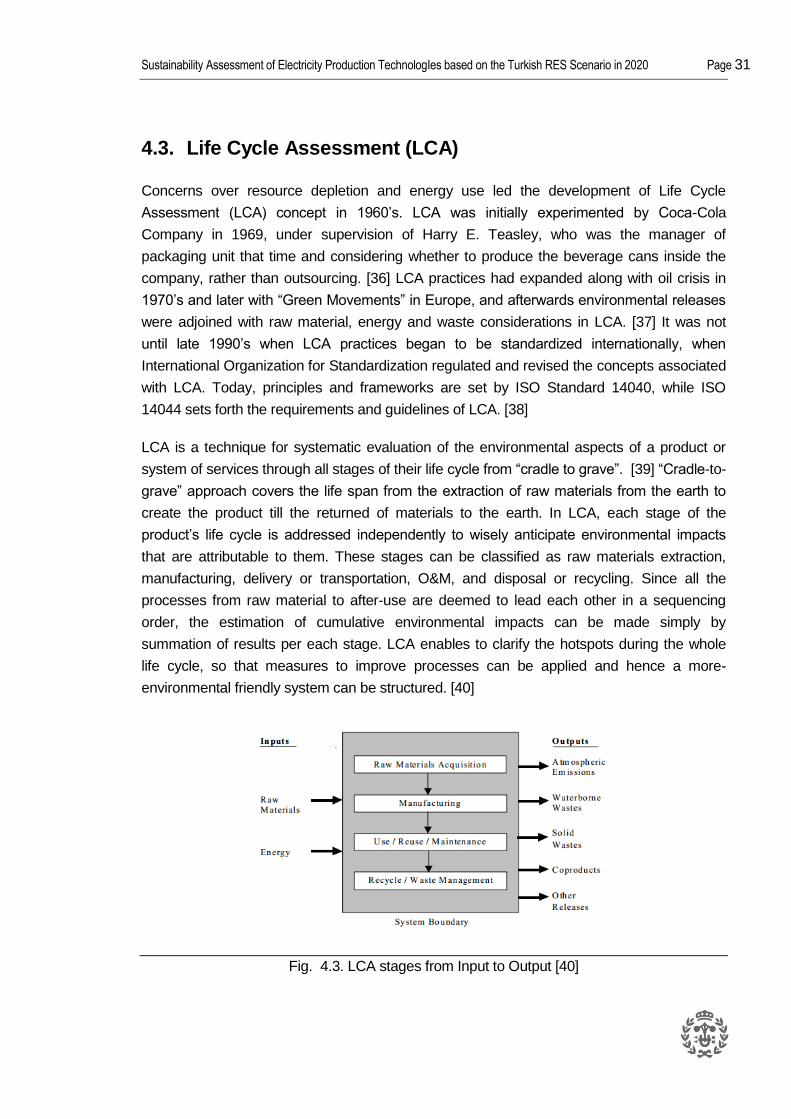
LCA is a technique for systematic evaluation of the environmental aspects of a product or
system of services through all stages of their life cycle from “cradle to grave”. [39] “Cradle-to-
grave” approach covers the life span from the extraction of raw materials from the earth to
create the product till the returned of materials to the earth. In LCA, each stage of the
product’s life cycle is addressed independently to wisely anticipate environmental impacts
that are attributable to them. These stages can be classified as raw materials extraction,
manufacturing, delivery or transportation, O&M, and disposal or recycling. Since all the
processes from raw material to after-use are deemed to lead each other in a sequencing
order, the estimation of cumulative environmental impacts can be made simply by
summation of results per each stage. LCA enables to clarify the hotspots during the whole
life cycle, so that measures to improve processes can be applied and hence a more-
environmental friendly system can be structured. [40]
Fig. 4.3. LCA stages from Input to Output [40]
Page 32 Thesis Report
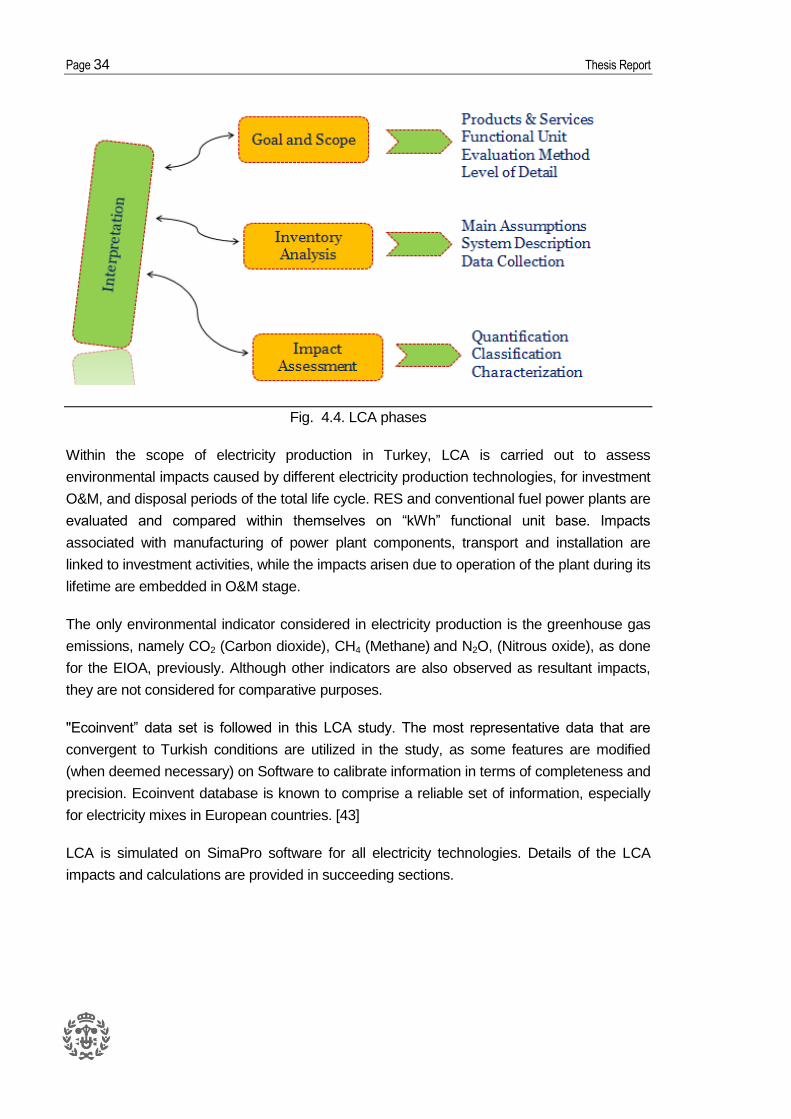
According to ISO, LCA consists of four inter-related components [41] :
- Goal and scope definition
- Life Cycle Inventory Analysis
- Life Cycle Impact Assessment
- Interpretation of Results
These four phases are briefly expressed as following:
Goal and scope definition: This component explains the context and aim of the study to the
target audience. Product or process is described along with all limitations and assumptions
involved in development of LCA. Impact categories, allocation and evaluation methods are
provided. Functional unit, which provides a basis to calculate inputs and outputs and to
compare environmental impacts, is also introduced at this stage. [40] For example, the
functional unit of a milk produced in glass or plastic bottle can be “volume” of the milk, such
as 1 liter (1 l) to carry out a LCA on equal amount of product packed in plastic or glass. The
functional unit in the scope of this work is kWh in terms of electricity production.
Life Cycle Inventory Analysis (LCI): With regards to the goal and scope defined in the
previous phase, entire set of data that can be associated with products and processes are
collected in this stage. For compiling LCI, either process or input-output analysis is utilized.
Data compilation is the crucial activity in this stage as data are classified in two groups:
foreground data and back ground data. Background data involves environmental flowchart
indirectly linked with the process or product. These can consist of upstream processes of a
supply-chain system. Foreground data, on the other hand, exhibits elementary flows directly
linked with the analyzed product or process. [42] All the data compiled generate inventories
and analysis of inventories involves a full set of information regarding environmental
emissions, resource and energy use, etc. Inventories are generated by following the steps
listed below:
- Drawing a flow diagram of processes evaluated
- Developing a data collection plan
- Collecting the data
- Assessment and reporting of results
Additionally, inventories can be regarded as helpful set of information for the use of policy-
makers to issue environmental regulations.
Sustainability Assessment of Electricity Production TechnologIes based on the Turkish RES Scenario in 2020 Page 33
Life Cycle Impact Assessment (LCIA): Based on the LCI flows, environmental impacts are
evaluated at this very important stage of LCA. In this step, ecological and human health
effects, as well as resource use are correlated with LCI and possible net impacts are
identified. It consists of four stages called (i) classification, (ii) characterization, (iii)
normalization and (iv) weighting. [42]
In classification, impact categories are defined and elementary flows obtained by LCI are
assigned to those categories. These categories may emerge in various kinds such as
greenhouse gas emission, acidification, human toxicity, land use, ionizing radiation and so
forth. [42]
Characterization is the stage where conversion factors are used to quantify all impact
categories with respect to the common unit of each distinct category so as to provide a
uniform base for comparison within the impact type. Converting all greenhouse gases into to
the CO2 eq. unit base is a fruitful example of this practice.
Normalization is carried out once the characterization is completed. The results obtained in
characterization are taken and they are divided by a reference value related to the impact
category. A reference can be one of the following values: (i) the highest value in the impact
category, (ii) the total values of all impacts (iii) a broader example that can be associated with
the impact. [40,42]
Being the last step within LCIA, weighting step is taken by assigning weights to the
environmental impacts so that they could add up to a single value when taken all together.
Yet, since this step depends on nothing but only on the user’s preferences, it is far away to
mean a scientific outcome unless they are weighting procedure is explicitly documented.
[40,42]
Interpretation of Results: It is the last phase of LCA, in which all the results are obtained and
all outcomes from previous steps can be evaluated quantitatively. In this stage conclusions
are made, results are analyzed and interconnections between previous steps are reviewed.
Recommendations can be set forth upon interpretation. It is recommended to relate this step
to all preceding stages during LCA so as to distinguish the relations that lead to aggregate
results. [40,42]
Page 34 Thesis Report
Fig. 4.4. LCA phases
Within the scope of electricity production in Turkey, LCA is carried out to assess
environmental impacts caused by different electricity production technologies, for investment
O&M, and disposal periods of the total life cycle. RES and conventional fuel power plants are
evaluated and compared within themselves on “kWh” functional unit base. Impacts
associated with manufacturing of power plant components, transport and installation are
linked to investment activities, while the impacts arisen due to operation of the plant during its
lifetime are embedded in O&M stage.
The only environmental indicator considered in electricity production is the greenhouse gas
emissions, namely CO2 (Carbon dioxide), CH4 (Methane) and N2O, (Nitrous oxide), as done
for the EIOA, previously. Although other indicators are also observed as resultant impacts,
they are not considered for comparative purposes.
"Ecoinvent” data set is followed in this LCA study. The most representative data that are
convergent to Turkish conditions are utilized in the study, as some features are modified
(when deemed necessary) on Software to calibrate information in terms of completeness and
precision. Ecoinvent database is known to comprise a reliable set of information, especially
for electricity mixes in European countries. [43]
LCA is simulated on SimaPro software for all electricity technologies. Details of the LCA
impacts and calculations are provided in succeeding sections.
Sustainability Assessment of Electricity Production TechnologIes based on the Turkish RES Scenario in 2020 Page 35
4.4. Comparison of EIOA and LCA
Resultant environmental impacts obtained by EIOA and LCA are compared in this
subsection in order to see whether the outcomes are in parallel or divergent. Although
methods provide very useful information on environmental implications they may vary to a
big extent due to the specific characteristics and limitations of each. Both methods render an
opinion concerning the level of environmental impacts that can be expected from electricity
production facility. Depending on the specific conditions taken into consideration during
assessment, one of the results may be more realistic and hence preferable by the analyst. In
this last stage of the methodological work greenhouse gas emission rates from EIOA and
LCA are compared along with identifying the possible causes responsible for the differences.
EIOA and LCA are conceived to have some advantages and drawbacks. IOA has some
limitations worth mentioning. First of all, technical coefficients are static, meaning that the
results are not adaptable to change in consumption patterns, technological developments
and price changes in time. In other words, the amount of inputs required by one sector from
another depends on nothing but the number of outputs to be produced. Hence, possible
changes in the proportion of input-output relation are not reflected in aggregate result. [Irene]
Second limitation brought by EIOA is the use of publicly available data rather than the sector-
specific ones. Besides, EIOA assumes an unlimited production capacity within the economy,
and thus may result in inconveniences. Another limitation set by EIOA is the sector-based
representation of inputs and outputs rather than the commodity-base approach. Sectors are
regarded to be homogeneous so that any activity within one sector is evaluated equally,
regardless of the type of the product. [27] For example construction of a reinforced concrete
building can imply equal effects as drilling of a well since they both fall in “construction” sector
as an economic activity. LCA involves some weaknesses as well. These can be summarized
as (i) existence of system boundaries, (ii) non-available or uncertain data involvement, (iii)
large economic resource commitment, (iv) difficulty in identifying all possible impacts (v)
exclusion of social and economical impacts and (vi) underestimation of upstream impacts in
the analysis. [37]
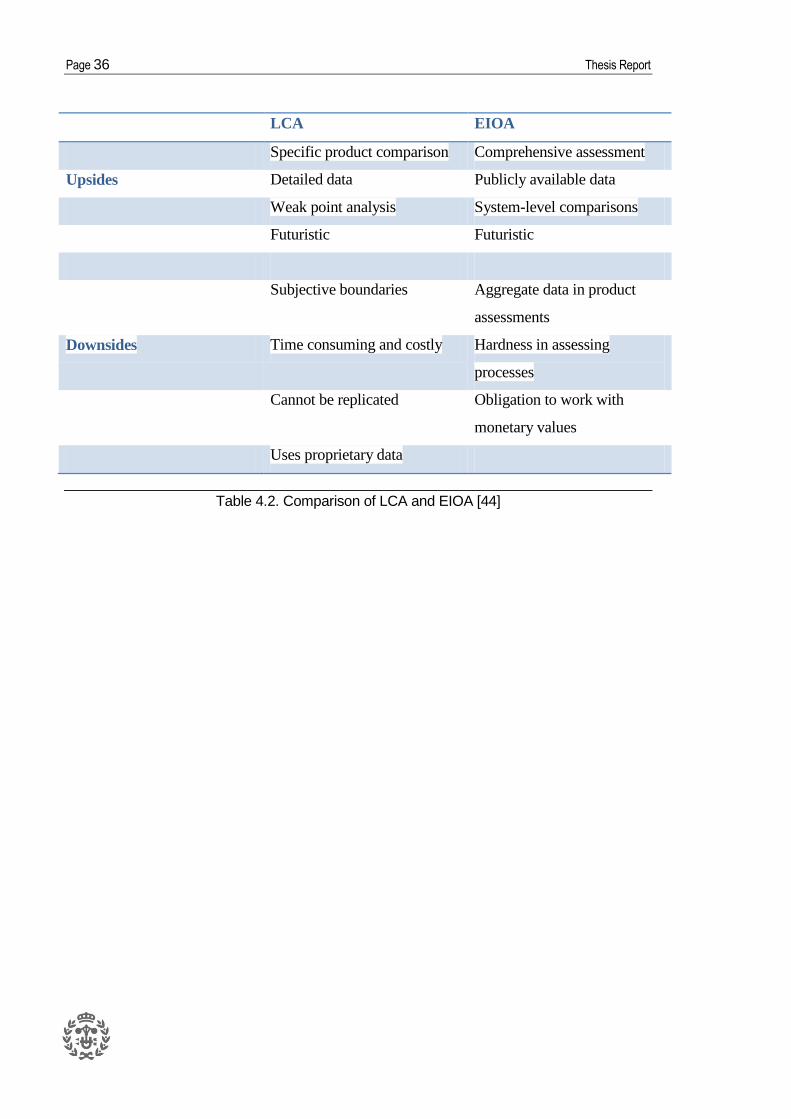
EIOA offers a simple, holistic model that is easy to practice, while LCA involves more
disaggregated components more difficult to compile and run. Up and down sides of the two
tools are indicated in the following table.
Page 36 Thesis Report
LCA EIOA
Specific product comparison Comprehensive assessment
Upsides Detailed data Publicly available data
Weak point analysis System-level comparisons
Futuristic Futuristic
Subjective boundaries Aggregate data in product
assessments
Downsides Time consuming and costly Hardness in assessing
processes
Cannot be replicated Obligation to work with
monetary values
Uses proprietary data
Table 4.2. Comparison of LCA and EIOA [44]
Sustainability Assessment of Electricity Production TechnologIes based on the Turkish RES Scenario in 2020 Page 37
5. Hypotheses and Calculations
In this section, entire set of data obtained and hypotheses developed are provided. All the
computations to obtain results are based on these hypotheses.
5.1. Electricity Mix in 2020
The data provided by “BETTER” project is followed as the main guide line to hypothesize the
electricity production in year 2020. In this project data set, electricity consumption in Turkey is
estimated till year 2030, with specification of the source that the electricity is produced from.
Current electricity production and consumption values are also provided, along with historical
data. Electricity production is equalized with electricity consumption so that electricity export
or import is not questioned. The rest of this work assumes all the electricity production takes
place in power plants in Turkey, where most of the production comes from conventional
technologies which use imported fossil fuels.
All the electricity sources are classified into two groups (i) RES, (ii) fossil sources. RES are of
primary interest throughout this work. Renewable electricity sources are classified as:
- -Biogas: Obtained from biodegradable materials such as manure and sewage
- Solid biomass : Mostly derived from agricultural products made from dry plant
- Biowaste : Derived from municipal solid waste, food waste, and so on
- Geothermal electricity
- Large-scale hydro power
- Small-scale hydro power
- Photovoltaics (PV)
- Solar thermal electricity ( Concentrated solar power plants (CSP))
- Onshore wind power
Page 38 Thesis Report
Fossil fuels consist of:
- Hard coal
- Lignite
- Oil
- Natural Gas (Gas turbine)
- Combined Cycle Gas ( Gas CC )
In combined cycle gas power plants, the fuel source is same as regular NG power plants, yet
the efficiency in electricity production is higher. Hence, they are evaluated separately.
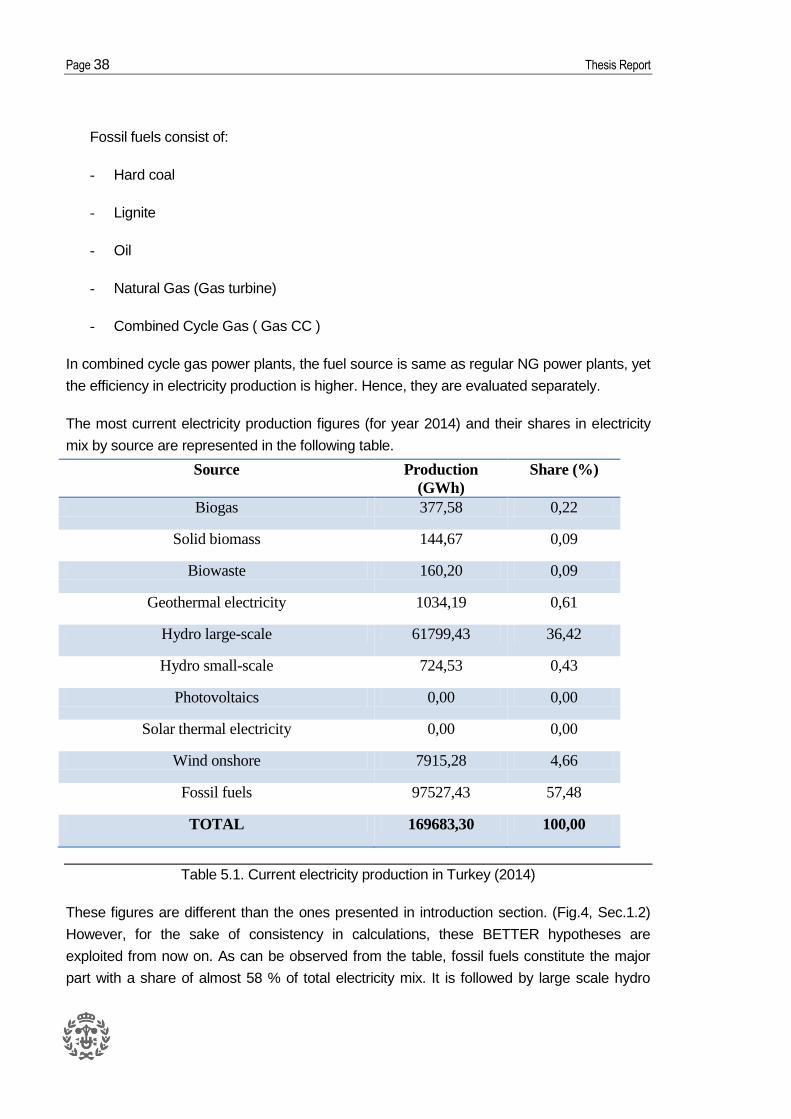
The most current electricity production figures (for year 2014) and their shares in electricity
mix by source are represented in the following table.
Source Production
(GWh)
Share (%)
Biogas 377,58 0,22
Solid biomass 144,67 0,09
Biowaste 160,20 0,09
Geothermal electricity 1034,19 0,61
Hydro large-scale 61799,43 36,42
Hydro small-scale 724,53 0,43
Photovoltaics 0,00 0,00
Solar thermal electricity 0,00 0,00
Wind onshore 7915,28 4,66
Fossil fuels 97527,43 57,48
TOTAL 169683,30 100,00
Table 5.1. Current electricity production in Turkey (2014)
These figures are different than the ones presented in introduction section. (Fig.4, Sec.1.2)
However, for the sake of consistency in calculations, these BETTER hypotheses are
exploited from now on. As can be observed from the table, fossil fuels constitute the major
part with a share of almost 58 % of total electricity mix. It is followed by large scale hydro
Sustainability Assessment of Electricity Production TechnologIes based on the Turkish RES Scenario in 2020 Page 39
power plants that come up as the second biggest contributor to the grid. It is worth to remark
at this stage that no investment is assumed on photovoltaic and concentrated solar power
plants as they are supposed to develop from zero level and to be integrated in the mix by
year 2020.
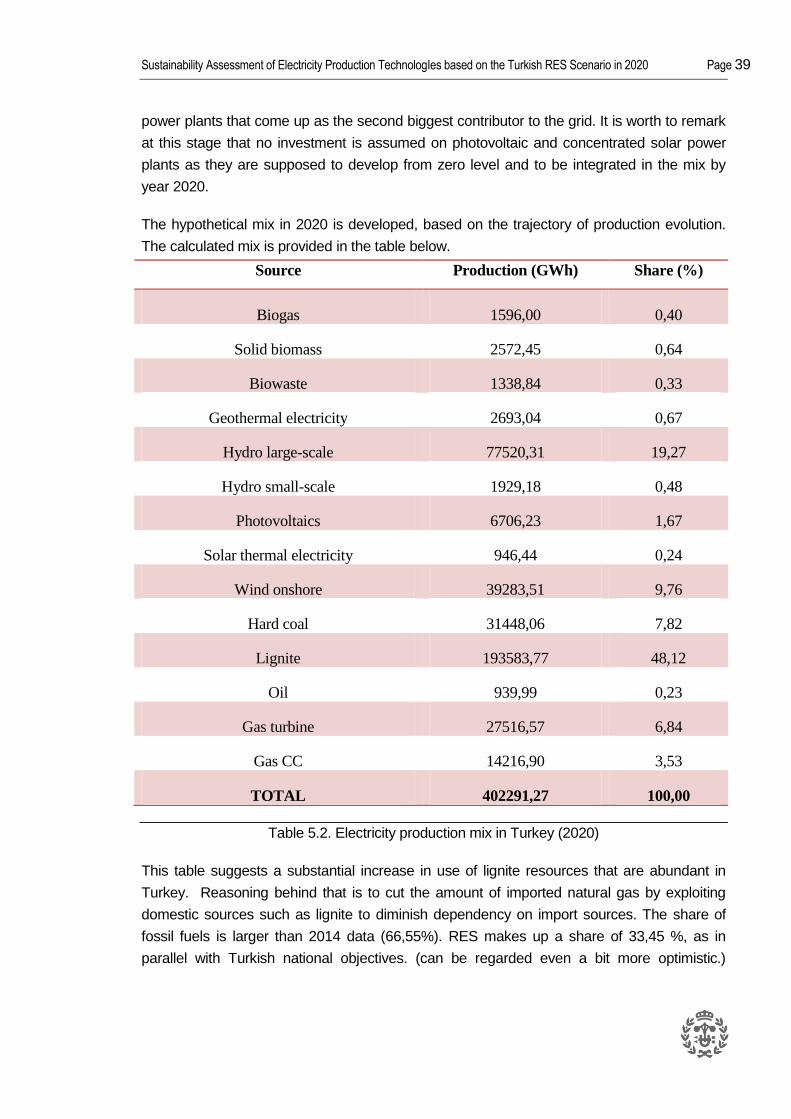
The hypothetical mix in 2020 is developed, based on the trajectory of production evolution.
The calculated mix is provided in the table below.
Source Production (GWh) Share (%)
Biogas 1596,00 0,40
Solid biomass 2572,45 0,64
Biowaste 1338,84 0,33
Geothermal electricity 2693,04 0,67
Hydro large-scale 77520,31 19,27
Hydro small-scale 1929,18 0,48
Photovoltaics 6706,23 1,67
Solar thermal electricity 946,44 0,24
Wind onshore 39283,51 9,76
Hard coal 31448,06 7,82
Lignite 193583,77 48,12
Oil 939,99 0,23
Gas turbine 27516,57 6,84
Gas CC 14216,90 3,53
TOTAL 402291,27 100,00
Table 5.2. Electricity production mix in Turkey (2020)
This table suggests a substantial increase in use of lignite resources that are abundant in
Turkey. Reasoning behind that is to cut the amount of imported natural gas by exploiting
domestic sources such as lignite to diminish dependency on import sources. The share of
fossil fuels is larger than 2014 data (66,55%). RES makes up a share of 33,45 %, as in
parallel with Turkish national objectives. (can be regarded even a bit more optimistic.)
Page 40 Thesis Report
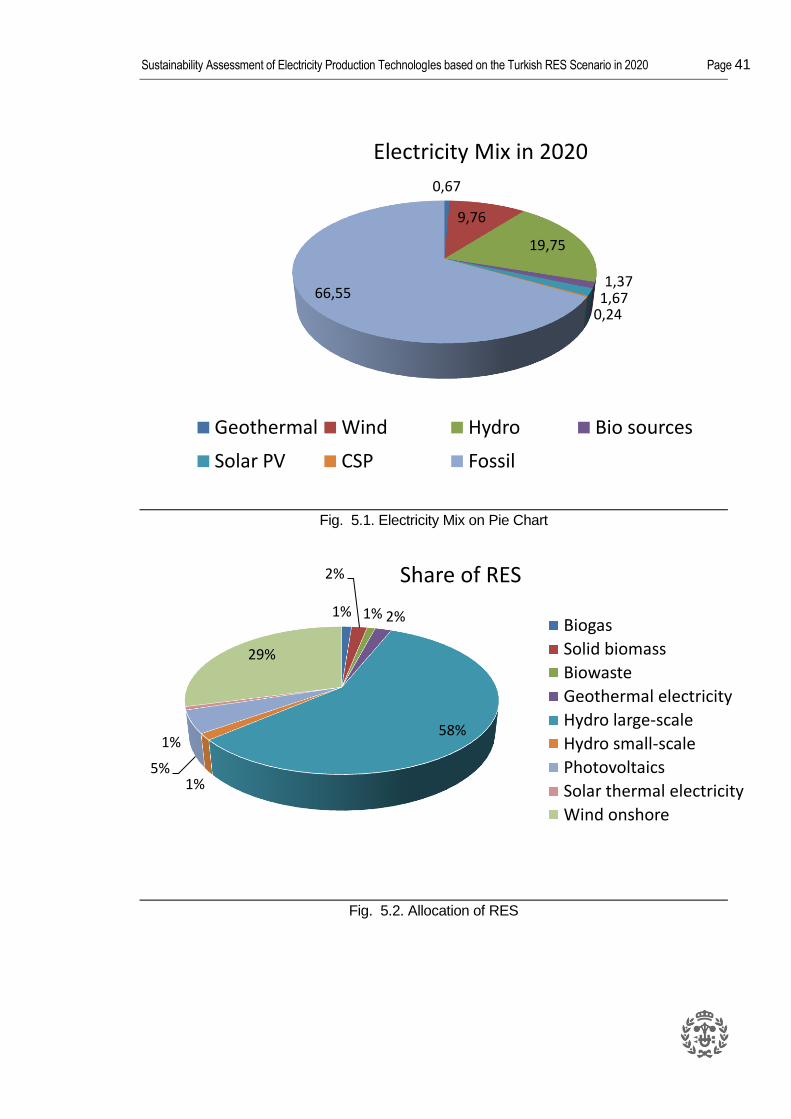
Although the share of big-scale hydro power plants in the mix drops, the generated electricity
amount increases from the 2014 data set. Large scale hydro power is utilized to the
maximum extent in this case. In other words, hydro power plants are installed on all possible
hydro sources that can be convertible to electricity, as targeted by Turkish policy makers.
Drop in share of big hydro is compensated by growing investments on RES, mainly on wind
and PV. Other RES types such as offshore wind and tidal energy are not considered in the
context of this scenario.
The illustration of electricity production mix and RES mix are provided in the following pie
charts.
Sustainability Assessment of Electricity Production TechnologIes based on the Turkish RES Scenario in 2020 Page 41
Fig. 5.1. Electricity Mix on Pie Chart
Fig. 5.2. Allocation of RES
0,67
9,76
19,75
1,37 1,67
0,24
66,55
Electricity Mix in 2020
Geothermal Wind Hydro Bio sources
Solar PV CSP Fossil
1%
2%
1% 2%
58%
1% 5%
1%
29%
Share of RES
Biogas
Solid biomass
Biowaste
Geothermal electricity
Hydro large-scale
Hydro small-scale
Photovoltaics
Solar thermal electricity
Wind onshore
Page 42 Thesis Report
5.2. IOA and EIOA
As discussed earlier in methodology section, IOA and EIOA are based on national input-
output tables that provide accounting frameworks for calculating total economic activity. Total
economic activity is computed by applying equation (4.2), as
X tot = (I - A)-1 * Y
once the final demand vector “Y” vector is defined. Since electricity production technologies
constitute the base of total economic activity, “Y” is associated with monetary value related to
the final electricity demand. In other words, a spending on producing one defined unit of
electricity demand (“Y”) stimulates the overall economy in a way that all the associated
sectors with electricity production are triggered to produce this unit of output and
consequentially total economic activity (“X”) is generated.
To apply this process, a cost breakdown is realized by distributing the total cost of the final
demand of electricity to all of the linked sectors in final demand. This operation is repeated
for all electricity production technologies separately. In this perspective, RES are subjected to
an arduous effort to clearly distinguish the sectors that costs are referring to. All renewable
electricity technologies are evaluated on this basis, with regards to lifetime, capacity factor,
investment and O&M costs associated with power plants of each technology. Conventional
sources, on the other hand, are evaluated separately.
It is of crucial importance to differentiate big-scale hydro power plants with small-scale plants
in the sense that big hydro power plants require a different cost structure than small ones for
investment, mostly due to the characteristics of the power plant. Big hydro power facilities
comprise dam-type plants, while small facilities refer mostly to run-of river type.
As can be interpreted from Table 5, the current mix consists of mostly fossil sources,
together with big hydro power plants, as those two make up a proportion of 93,9% of total
electricity production. In year 2020, those two make up a share of 86,3%. One main
assumption developed on these data is that big hydro power plants can be evaluated
together with fossil fuels under “conventional sources” classification. There are two reasons
for justifying this approach: First, most of the hydro power potential in Turkey is already
utilized with installation of big hydro power plants which are already in operation and the
remaining investments till year 2020 make up a marginal part, compared to this existent
amount. Most of the remaining hydro power activity till 2020 is assumed to be covered by
small-scale hydro power installations. Secondly, the electricity production from big hydro
power plants are already embedded in current electricity mix possessing a large proportion
and therefore, production costs are already accounted in the national Input-Output Table.
Other RES, on the other hand are deemed to grow very considerably and they are claimed to
Sustainability Assessment of Electricity Production TechnologIes based on the Turkish RES Scenario in 2020 Page 43
change the price structure by 2020. Except for the wind power, almost all RES begin to
develop from nearly zero level to a grand amount of installed capacity, as projected in the
mix of year 2020.
All conventional sources are evaluated together. Therefore cost disaggregation is not carried
out for oil, gas, hard coal, lignite and big scale hydro power plants. Final demand associated
to them is placed under “electricity, gas and water” supply sector segment and inter-sectoral
economic activities are traced accordingly. Therefore, the distinction between investment and
O&M costs is not made for conventional sources, contrary to the approach maintained in
RES assessment.
The functional unit in this assessment is “kWh” for electricity production. All the cost
structure, environmental burdens and socio-economic impacts are based on this functional
unit so as to render an opportunity to neatly compare all the outcomes obtained finally. If
necessary, “GWh” unit is also used especially in employment creation.
Investment costs are given for installed capacity, and then converted to “kWh” unit base,
using the lifetime and capacity factors of the power plant. O&M costs are mostly taken in
reference with their ratio to investment costs and provided in “kWh” base. Power plants are
analyzed through the whole lifetime of each RES kind.
In deciding the costs associated with RES, mostly International Renewable Energy National
Agency (IRENA) recommendations are followed, along with some other organizations
‘publications, such as NREL and IEA data. For cost breakdown in final demand, many
research papers and publications are reviewed. Cost rates are selected in a way to represent
Turkish market and price conditions in the most accurate, realistic way although the
assumptions are subjective and may differ with analyst’s attitude. In regards to the cost of
conventional sources, Levelized Cost of Electricity (LCOE) is estimated per each of source
components within the conventional mix. Aggregate mix is obtained by multiplying source-
specific costs of technologies with their respective share in overall conventional sources mix.
Similar to the differentiating between investment and O&M costs, domestic and import
production are also differentiated in calculations. Domestic and import input-output tables
(IOT) are exploited from WIOD to obtain monetary information about Turkey. Economic
impacts are evaluated separately for domestic productions and imports so as to reflect total
economic activity within and outside the national economy system. For environmental
concerns, this distinction is not made and they are assessed together since green house
gases impose global environmental problems that bind all countries. On the other hand, only
domestic input- output table is used in analyzing the socio-economic impacts in terms of
creation of jobs solely within Turkey.
Page 44 Thesis Report
For IOT, the most recent data set obtained is referenced to year 2011. Technical coefficient
matrix based on this IOT is maintained to project calculations to year 2020. Although the
amount of outputs is expected to grow in number by 2020, the ratio between input-outputs
are supposed to remain as today in this study, with the same technical coefficients. (“A
matrix”).
Since Input-Output tables are expressed in monetary units of American dollar ($), dollar to
euro conversion is implemented for all calculations. Exchange rate is taken 0,72 for dollar /
euro ($/€) conversion.
For conducting EIOA, the most recent environmental and socioeconomic data obtained by
WIOD belongs to year 2009. Therefore, these data sets are taken into consideration for
producing “R” joint vectors both for environmental and socio-economic aspects. Technical
coefficients are kept as same as 2009 values in 2020.
Hypotheses developed and calculations operated are in full compliance with the information
delivered in methodology section. This information covers all the equations used,
environmental aspects concerned (GWP, CO2 eq. base etc.) and the structure followed.
The context of this subsection can be divided as:
- Input-Output Tables (IOT)
- “Y” Vector: Cost-Breakdown of Technologies
- “X” Vector: Calculations
Sustainability Assessment of Electricity Production TechnologIes based on the Turkish RES Scenario in 2020 Page 45
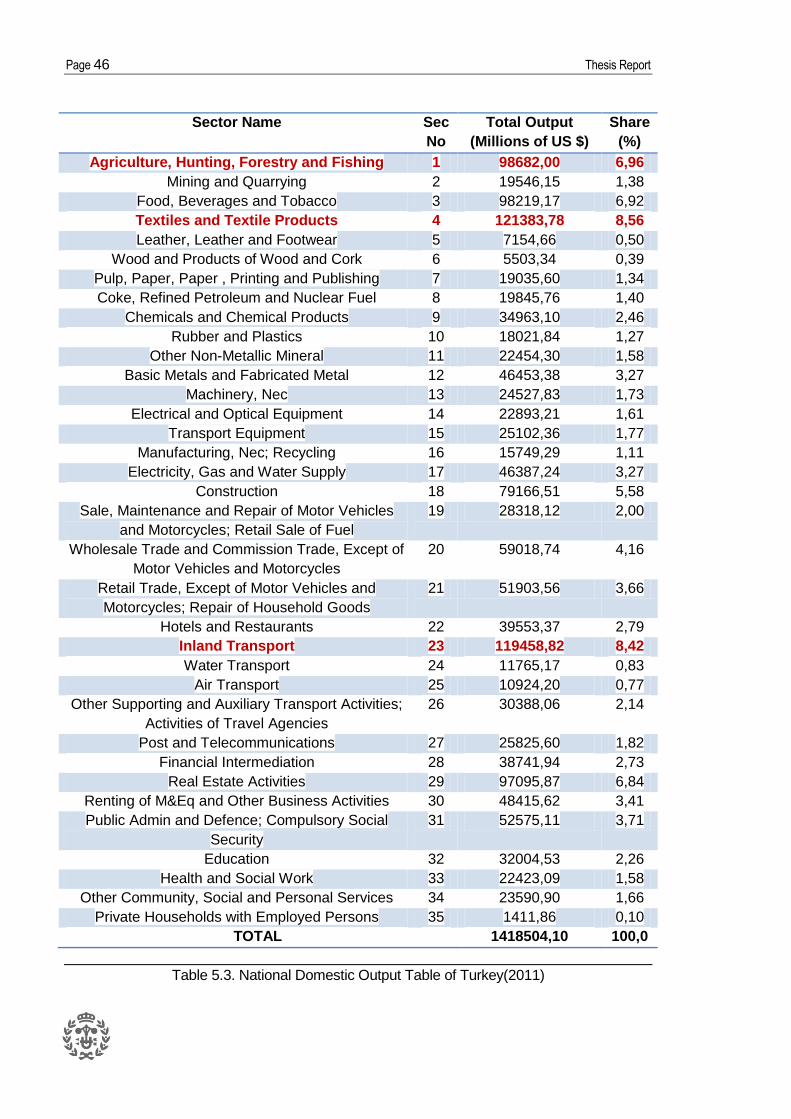
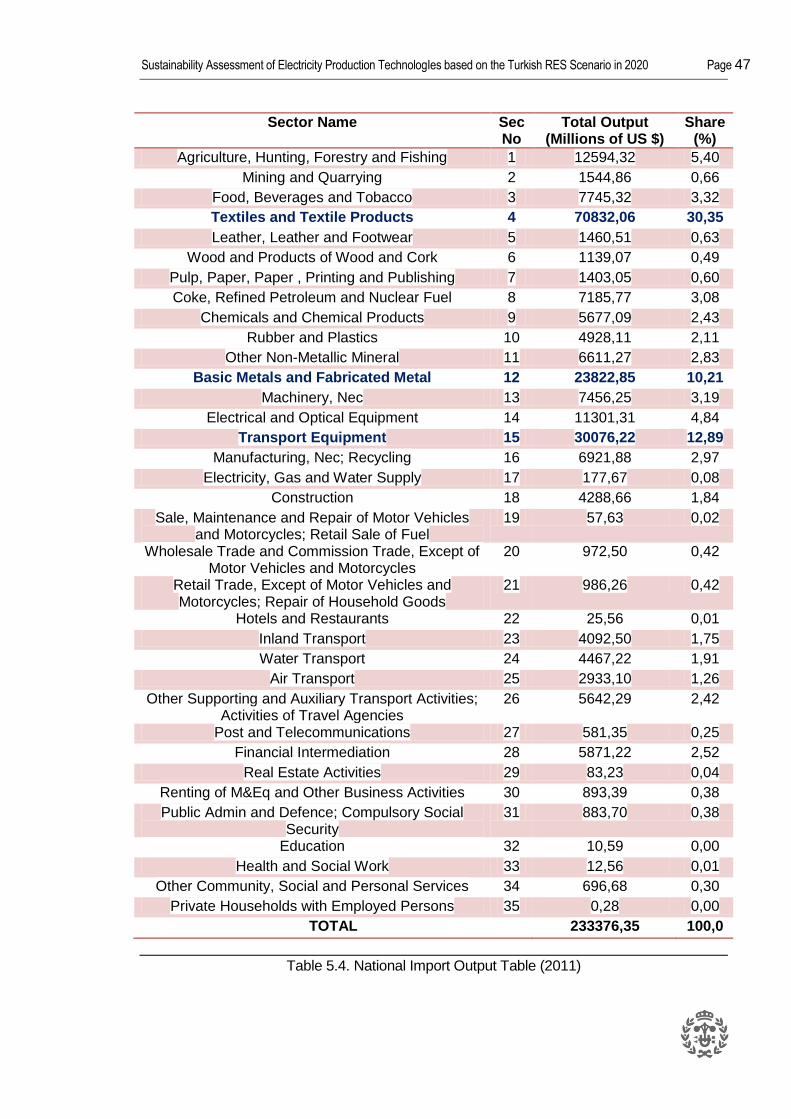
5.2.1. Input-Output Tables (IOT)
IO tables are downloaded from WIOD for year 2011. [29] The figures are given in US Million
Dollars and the table spans over 35 sectors existent in the economy. Output section of
domestic and import IO table are illustrated below in respective order with all affiliated
sectors. Tables represent the outputs provided in terms of monetary output and share of
each sector within entire economy.
Technical coefficient matrices for 35x35 sectors economic framework are generated based
on these tables, although input- output relations between industries are not shown due to
space constraints.
In the following domestic production table, it is shown that the most contributing sectors are
Sectors 4, 23 and 1 respectively. Textile, agriculture and inland transport are generating the
largest output. In imports table, on the other hand these sectors happen to be Sectors 4, 15
and 12 when put in order. The biggest item of import is textile, and then comes transport
equipments and metals industry.
Page 46 Thesis Report
Sector Name Sec
No
Total Output
(Millions of US $)
Share
(%)
Agriculture, Hunting, Forestry and Fishing 1 98682,00 6,96
Mining and Quarrying 2 19546,15 1,38
Food, Beverages and Tobacco 3 98219,17 6,92
Textiles and Textile Products 4 121383,78 8,56
Leather, Leather and Footwear 5 7154,66 0,50
Wood and Products of Wood and Cork 6 5503,34 0,39
Pulp, Paper, Paper , Printing and Publishing 7 19035,60 1,34
Coke, Refined Petroleum and Nuclear Fuel 8 19845,76 1,40
Chemicals and Chemical Products 9 34963,10 2,46
Rubber and Plastics 10 18021,84 1,27
Other Non-Metallic Mineral 11 22454,30 1,58
Basic Metals and Fabricated Metal 12 46453,38 3,27
Machinery, Nec 13 24527,83 1,73
Electrical and Optical Equipment 14 22893,21 1,61
Transport Equipment 15 25102,36 1,77
Manufacturing, Nec; Recycling 16 15749,29 1,11
Electricity, Gas and Water Supply 17 46387,24 3,27
Construction 18 79166,51 5,58
Sale, Maintenance and Repair of Motor Vehicles
and Motorcycles; Retail Sale of Fuel
19 28318,12 2,00
Wholesale Trade and Commission Trade, Except of
Motor Vehicles and Motorcycles
20 59018,74 4,16
Retail Trade, Except of Motor Vehicles and
Motorcycles; Repair of Household Goods
21 51903,56 3,66
Hotels and Restaurants 22 39553,37 2,79
Inland Transport 23 119458,82 8,42
Water Transport 24 11765,17 0,83
Air Transport 25 10924,20 0,77
Other Supporting and Auxiliary Transport Activities;
Activities of Travel Agencies
26 30388,06 2,14
Post and Telecommunications 27 25825,60 1,82
Financial Intermediation 28 38741,94 2,73
Real Estate Activities 29 97095,87 6,84
Renting of M&Eq and Other Business Activities 30 48415,62 3,41
Public Admin and Defence; Compulsory Social
Security
31 52575,11 3,71
Education 32 32004,53 2,26
Health and Social Work 33 22423,09 1,58
Other Community, Social and Personal Services 34 23590,90 1,66
Private Households with Employed Persons 35 1411,86 0,10
TOTAL 1418504,10 100,0
Table 5.3. National Domestic Output Table of Turkey(2011)
Sustainability Assessment of Electricity Production TechnologIes based on the Turkish RES Scenario in 2020 Page 47
Sector Name SecNo
Total Output (Millions of US $)
Share (%)
Agriculture, Hunting, Forestry and Fishing 1 12594,32 5,40
Mining and Quarrying 2 1544,86 0,66
Food, Beverages and Tobacco 3 7745,32 3,32
Textiles and Textile Products 4 70832,06 30,35
Leather, Leather and Footwear 5 1460,51 0,63
Wood and Products of Wood and Cork 6 1139,07 0,49
Pulp, Paper, Paper , Printing and Publishing 7 1403,05 0,60
Coke, Refined Petroleum and Nuclear Fuel 8 7185,77 3,08
Chemicals and Chemical Products 9 5677,09 2,43
Rubber and Plastics 10 4928,11 2,11
Other Non-Metallic Mineral 11 6611,27 2,83
Basic Metals and Fabricated Metal 12 23822,85 10,21
Machinery, Nec 13 7456,25 3,19
Electrical and Optical Equipment 14 11301,31 4,84
Transport Equipment 15 30076,22 12,89
Manufacturing, Nec; Recycling 16 6921,88 2,97
Electricity, Gas and Water Supply 17 177,67 0,08
Construction 18 4288,66 1,84
Sale, Maintenance and Repair of Motor Vehicles and Motorcycles; Retail Sale of Fuel
19 57,63 0,02
Wholesale Trade and Commission Trade, Except of Motor Vehicles and Motorcycles
20 972,50 0,42
Retail Trade, Except of Motor Vehicles and Motorcycles; Repair of Household Goods
21 986,26 0,42
Hotels and Restaurants 22 25,56 0,01
Inland Transport 23 4092,50 1,75
Water Transport 24 4467,22 1,91
Air Transport 25 2933,10 1,26
Other Supporting and Auxiliary Transport Activities; Activities of Travel Agencies
26 5642,29 2,42
Post and Telecommunications 27 581,35 0,25
Financial Intermediation 28 5871,22 2,52
Real Estate Activities 29 83,23 0,04
Renting of M&Eq and Other Business Activities 30 893,39 0,38
Public Admin and Defence; Compulsory Social Security
31 883,70 0,38
Education 32 10,59 0,00
Health and Social Work 33 12,56 0,01
Other Community, Social and Personal Services 34 696,68 0,30
Private Households with Employed Persons 35 0,28 0,00
TOTAL 233376,35 100,0
Table 5.4. National Import Output Table (2011)
Page 48 Thesis Report
For the environmental assessment, environmental joint vector formation is desired.
Emissions of main three greenhouse gases are classified with respect to the sector they are
affiliated to in WIOD tables. (2009 data) The mass of emission per monetary activity
(tones/M$) is illustrated in the table of the next page.
Sectors that impose the maximum amount of greenhouse gases are 17,11 and 24,
respectively. Non metallic minerals impose high levels of environmental detriments as can
be read from the table. Electricity, gas and water supply sector emits greenhouse gases
owing to large share of fossil fuels in electricity production. These data are evaluated on CO2
eq. basis in calculations, as meticulously described earlier.
For socio-economical assessment number of people employed within each sector per unit
monetary output is also provided in the table, following the environmental vector. (2009 data)
Sectors 1, 34 and 35 create the greater employment opportunities, as can be seen.
Environmental and socio-economical joint vectors “R” are based on these tables.
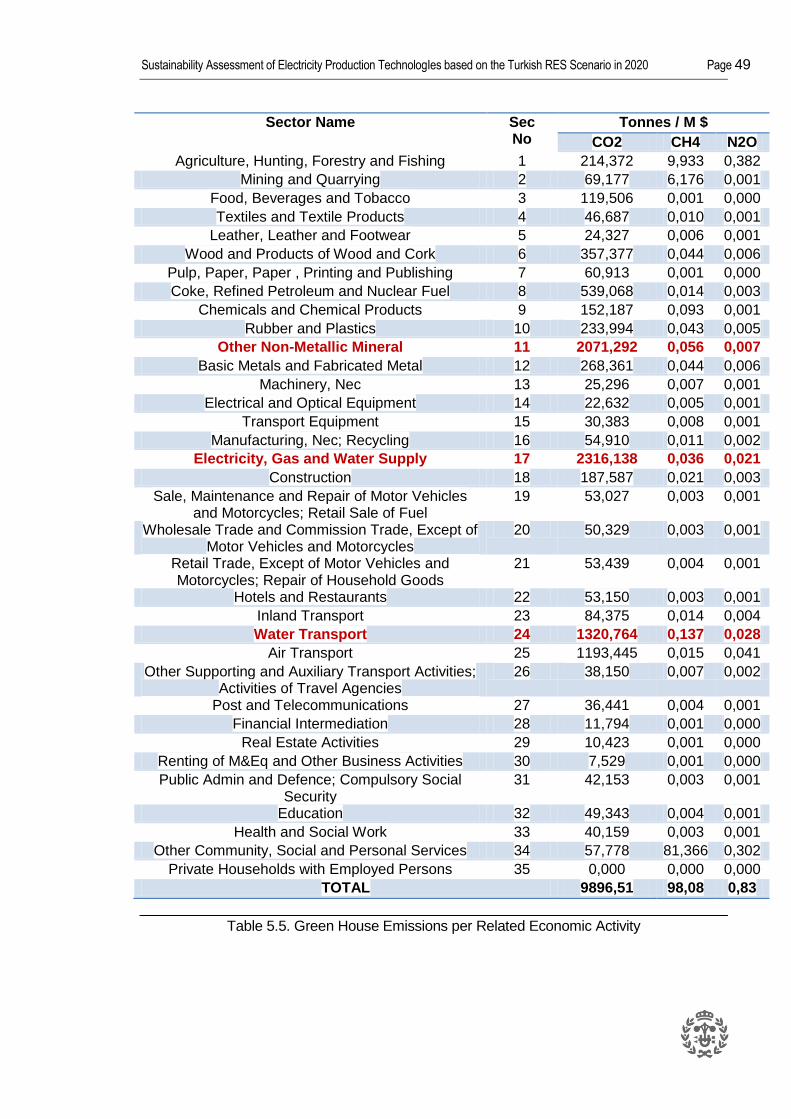
Sustainability Assessment of Electricity Production TechnologIes based on the Turkish RES Scenario in 2020 Page 49
Sector Name Sec No
Tonnes / M $
CO2 CH4 N2O
Agriculture, Hunting, Forestry and Fishing 1 214,372 9,933 0,382
Mining and Quarrying 2 69,177 6,176 0,001
Food, Beverages and Tobacco 3 119,506 0,001 0,000
Textiles and Textile Products 4 46,687 0,010 0,001
Leather, Leather and Footwear 5 24,327 0,006 0,001
Wood and Products of Wood and Cork 6 357,377 0,044 0,006
Pulp, Paper, Paper , Printing and Publishing 7 60,913 0,001 0,000
Coke, Refined Petroleum and Nuclear Fuel 8 539,068 0,014 0,003
Chemicals and Chemical Products 9 152,187 0,093 0,001
Rubber and Plastics 10 233,994 0,043 0,005
Other Non-Metallic Mineral 11 2071,292 0,056 0,007
Basic Metals and Fabricated Metal 12 268,361 0,044 0,006
Machinery, Nec 13 25,296 0,007 0,001
Electrical and Optical Equipment 14 22,632 0,005 0,001
Transport Equipment 15 30,383 0,008 0,001
Manufacturing, Nec; Recycling 16 54,910 0,011 0,002
Electricity, Gas and Water Supply 17 2316,138 0,036 0,021
Construction 18 187,587 0,021 0,003
Sale, Maintenance and Repair of Motor Vehicles and Motorcycles; Retail Sale of Fuel
19 53,027 0,003 0,001
Wholesale Trade and Commission Trade, Except of Motor Vehicles and Motorcycles
20 50,329 0,003 0,001
Retail Trade, Except of Motor Vehicles and Motorcycles; Repair of Household Goods
21 53,439 0,004 0,001
Hotels and Restaurants 22 53,150 0,003 0,001
Inland Transport 23 84,375 0,014 0,004
Water Transport 24 1320,764 0,137 0,028
Air Transport 25 1193,445 0,015 0,041
Other Supporting and Auxiliary Transport Activities; Activities of Travel Agencies
26 38,150 0,007 0,002
Post and Telecommunications 27 36,441 0,004 0,001
Financial Intermediation 28 11,794 0,001 0,000
Real Estate Activities 29 10,423 0,001 0,000
Renting of M&Eq and Other Business Activities 30 7,529 0,001 0,000
Public Admin and Defence; Compulsory Social Security
31 42,153 0,003 0,001
Education 32 49,343 0,004 0,001
Health and Social Work 33 40,159 0,003 0,001
Other Community, Social and Personal Services 34 57,778 81,366 0,302
Private Households with Employed Persons 35 0,000 0,000 0,000
TOTAL 9896,51 98,08 0,83
Table 5.5. Green House Emissions per Related Economic Activity
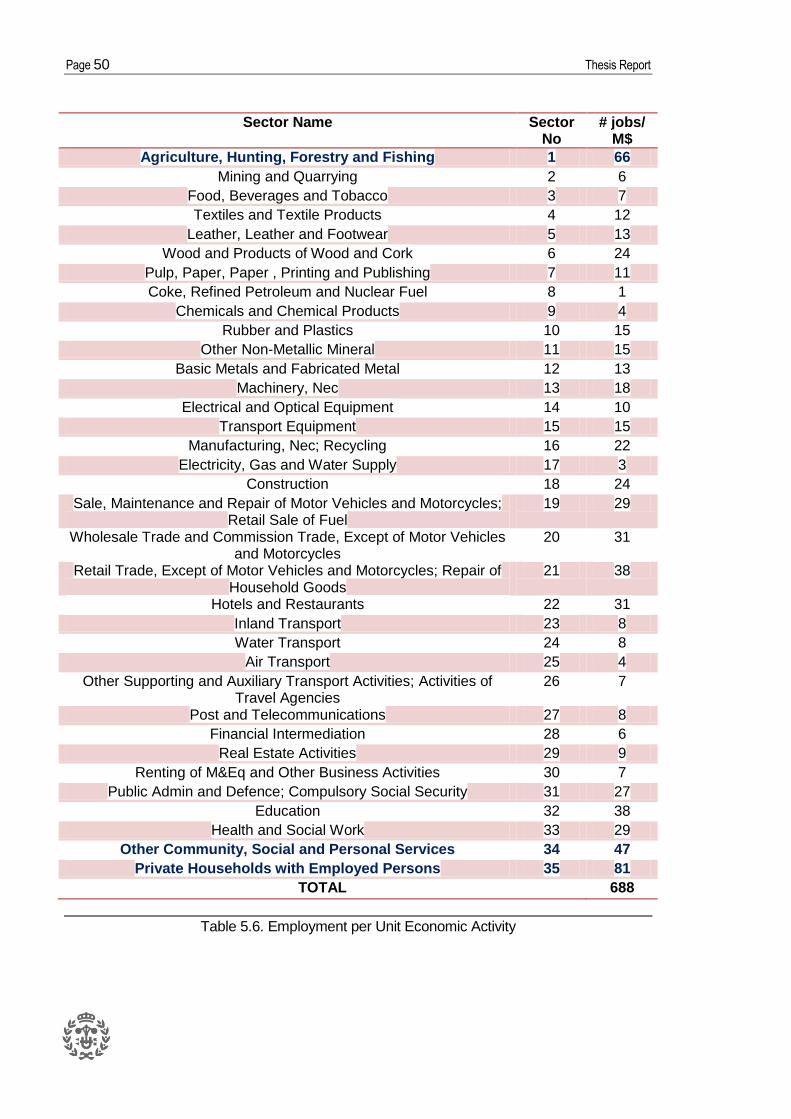
Page 50 Thesis Report
Sector Name Sector No
# jobs/ M$
Agriculture, Hunting, Forestry and Fishing 1 66
Mining and Quarrying 2 6
Food, Beverages and Tobacco 3 7
Textiles and Textile Products 4 12
Leather, Leather and Footwear 5 13
Wood and Products of Wood and Cork 6 24
Pulp, Paper, Paper , Printing and Publishing 7 11
Coke, Refined Petroleum and Nuclear Fuel 8 1
Chemicals and Chemical Products 9 4
Rubber and Plastics 10 15
Other Non-Metallic Mineral 11 15
Basic Metals and Fabricated Metal 12 13
Machinery, Nec 13 18
Electrical and Optical Equipment 14 10
Transport Equipment 15 15
Manufacturing, Nec; Recycling 16 22
Electricity, Gas and Water Supply 17 3
Construction 18 24
Sale, Maintenance and Repair of Motor Vehicles and Motorcycles; Retail Sale of Fuel
19 29
Wholesale Trade and Commission Trade, Except of Motor Vehicles and Motorcycles
20 31
Retail Trade, Except of Motor Vehicles and Motorcycles; Repair of Household Goods
21 38
Hotels and Restaurants 22 31
Inland Transport 23 8
Water Transport 24 8
Air Transport 25 4
Other Supporting and Auxiliary Transport Activities; Activities of Travel Agencies
26 7
Post and Telecommunications 27 8
Financial Intermediation 28 6
Real Estate Activities 29 9
Renting of M&Eq and Other Business Activities 30 7
Public Admin and Defence; Compulsory Social Security 31 27
Education 32 38
Health and Social Work 33 29
Other Community, Social and Personal Services 34 47
Private Households with Employed Persons 35 81
TOTAL 688
Table 5.6. Employment per Unit Economic Activity
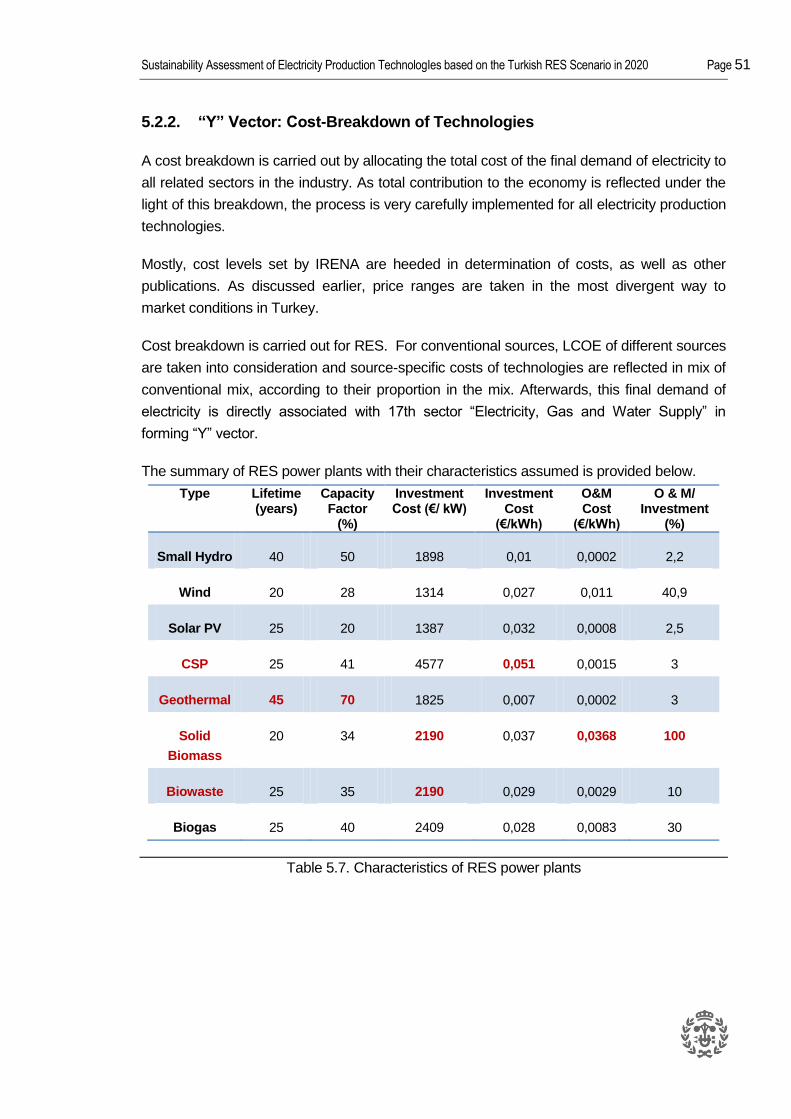
Sustainability Assessment of Electricity Production TechnologIes based on the Turkish RES Scenario in 2020 Page 51
5.2.2. “Y” Vector: Cost-Breakdown of Technologies
A cost breakdown is carried out by allocating the total cost of the final demand of electricity to
all related sectors in the industry. As total contribution to the economy is reflected under the
light of this breakdown, the process is very carefully implemented for all electricity production
technologies.
Mostly, cost levels set by IRENA are heeded in determination of costs, as well as other
publications. As discussed earlier, price ranges are taken in the most divergent way to
market conditions in Turkey.
Cost breakdown is carried out for RES. For conventional sources, LCOE of different sources
are taken into consideration and source-specific costs of technologies are reflected in mix of
conventional mix, according to their proportion in the mix. Afterwards, this final demand of
electricity is directly associated with 17th sector “Electricity, Gas and Water Supply” in
forming “Y” vector.
The summary of RES power plants with their characteristics assumed is provided below.
Type Lifetime (years)
Capacity Factor
(%)
Investment Cost (€/ kW)
Investment Cost
(€/kWh)
O&M Cost
(€/kWh)
O & M/ Investment
(%)
Small Hydro 40 50 1898 0,01 0,0002 2,2
Wind 20 28 1314 0,027 0,011 40,9
Solar PV 25 20 1387 0,032 0,0008 2,5
CSP 25 41 4577 0,051 0,0015 3
Geothermal 45 70 1825 0,007 0,0002 3
Solid
Biomass
20 34 2190 0,037 0,0368 100
Biowaste 25 35 2190 0,029 0,0029 10
Biogas 25 40 2409 0,028 0,0083 30
Table 5.7. Characteristics of RES power plants
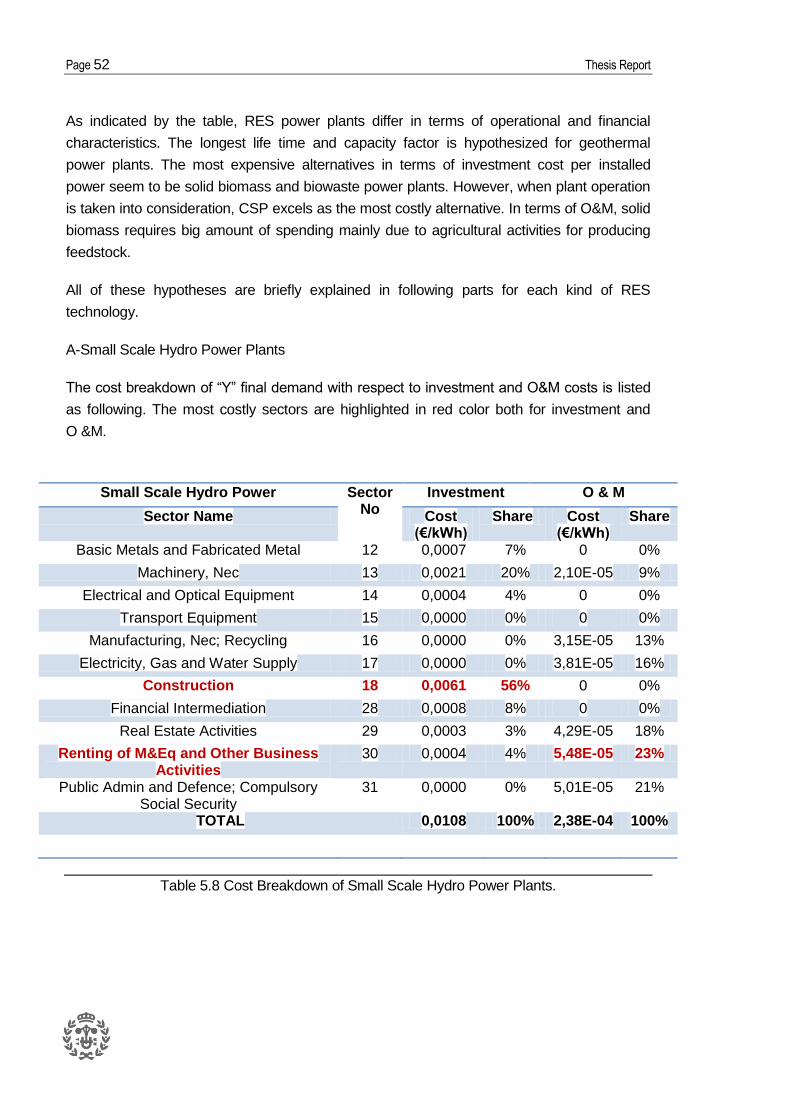
Page 52 Thesis Report
As indicated by the table, RES power plants differ in terms of operational and financial
characteristics. The longest life time and capacity factor is hypothesized for geothermal
power plants. The most expensive alternatives in terms of investment cost per installed
power seem to be solid biomass and biowaste power plants. However, when plant operation
is taken into consideration, CSP excels as the most costly alternative. In terms of O&M, solid
biomass requires big amount of spending mainly due to agricultural activities for producing
feedstock.
All of these hypotheses are briefly explained in following parts for each kind of RES
technology.
A-Small Scale Hydro Power Plants
The cost breakdown of “Y” final demand with respect to investment and O&M costs is listed
as following. The most costly sectors are highlighted in red color both for investment and
O &M.
Small Scale Hydro Power Sector No
Investment O & M
Sector Name Cost (€/kWh)
Share Cost (€/kWh)
Share
Basic Metals and Fabricated Metal 12 0,0007 7% 0 0%
Machinery, Nec 13 0,0021 20% 2,10E-05 9%
Electrical and Optical Equipment 14 0,0004 4% 0 0%
Transport Equipment 15 0,0000 0% 0 0%
Manufacturing, Nec; Recycling 16 0,0000 0% 3,15E-05 13%
Electricity, Gas and Water Supply 17 0,0000 0% 3,81E-05 16%
Construction 18 0,0061 56% 0 0%
Financial Intermediation 28 0,0008 8% 0 0%
Real Estate Activities 29 0,0003 3% 4,29E-05 18%
Renting of M&Eq and Other Business Activities
30 0,0004 4% 5,48E-05 23%
Public Admin and Defence; Compulsory Social Security
31 0,0000 0% 5,01E-05 21%
TOTAL 0,0108 100% 2,38E-04 100%
Table 5.8 Cost Breakdown of Small Scale Hydro Power Plants.
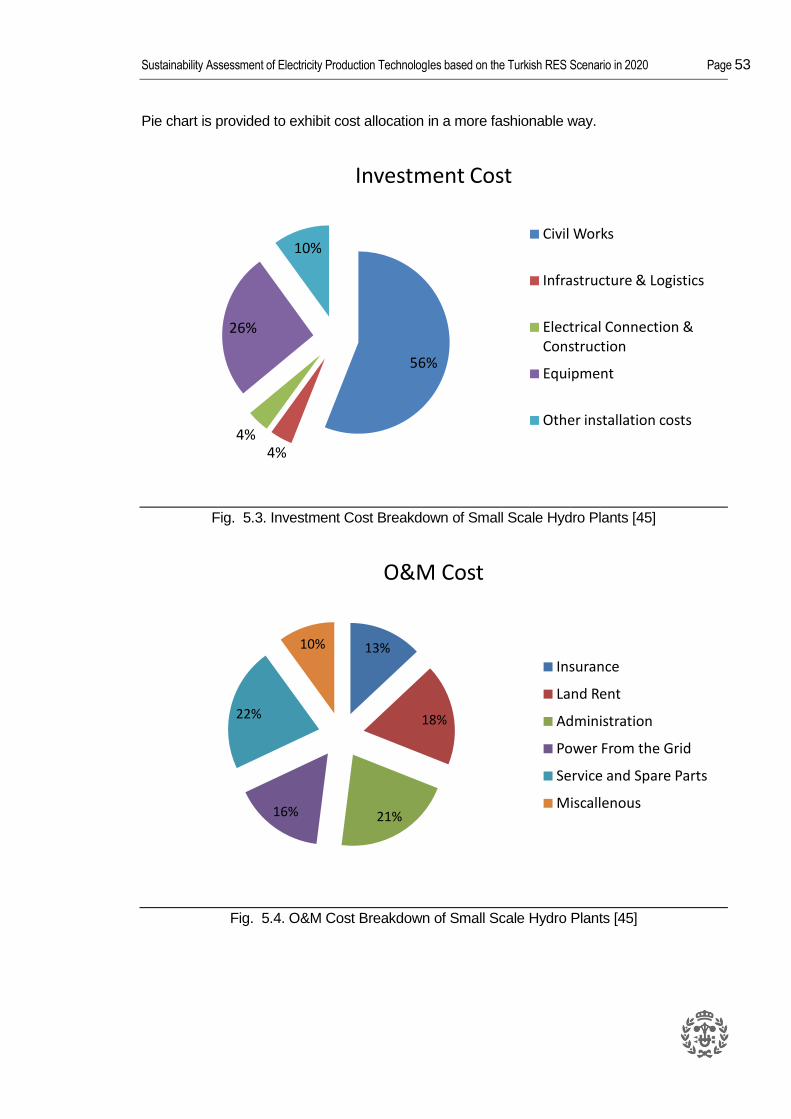
Sustainability Assessment of Electricity Production TechnologIes based on the Turkish RES Scenario in 2020 Page 53
Pie chart is provided to exhibit cost allocation in a more fashionable way.
Fig. 5.3. Investment Cost Breakdown of Small Scale Hydro Plants [45]
Fig. 5.4. O&M Cost Breakdown of Small Scale Hydro Plants [45]
56%
4% 4%
26%
10%
Investment Cost
Civil Works
Infrastructure & Logistics
Electrical Connection & Construction
Equipment
Other installation costs
13%
18%
21% 16%
22%
10%
O&M Cost
Insurance
Land Rent
Administration
Power From the Grid
Service and Spare Parts
Miscallenous

Page 54 Thesis Report
B-Wind Power Plants
The cost breakdown of wind power plant is provided in the same manner as hydro power
plants. O&M costs of wind power plants are relatively high, being approximately 41% of
investment costs throughout the lifetime. [IRENA] Components in wind power systems such
as gearboxes are generally expensive and require costly maintenance.
Most of the cost is assigned to “Basic and Fabricated Metals” sector in wind power. The
reason for that is the high number of components made of steel or metal. Tower, blades,
generators and some other components are fabricated metals which are quite costly. The
biggest items for O&M costs are “Renting of Machinery and Equipment” and “Real Estate
Activities”. The cost breakdown is provided below. Here, a regular 3 MW onshore wind
turbine is considered for all installations.
Wind Power Sector No
Investment O & M
Sector Name Cost (€/kWh)
Share Cost (€/kWh)
Share
Basic Metals and Fabricated Metal 12 0,0107 40% 0,00E+00 0%
Machinery, Nec 13 0,0076 28% 1,10E-03 10%
Electrical and Optical Equipment 14 0,0034 13% 0,00E+0 0%
Manufacturing, Nec; Recycling 16 0,0000 0% 1,64E-03 15%
Electricity, Gas and Water Supply 17 0,0000 0% 1,75E-03 16%
Construction 18 0,0031 12% 0,00E+00 0%
Financial Intermediation 28 0,0008 3% 0,00E+0 0%
Real Estate Activities 29 0,0004 2% 2,41E-03 22%
Renting of M&Eq and Other Business Activities
30 0,0008 3% 2,41E-03 22%
Public Admin and Defence; Compulsory Social Security
31 0,0000 0% 1,64E-03 15%
TOTAL 0,0452 100% 1,10E-02 100%
Table 5.9. Cost Breakdown of Wind Power Plants
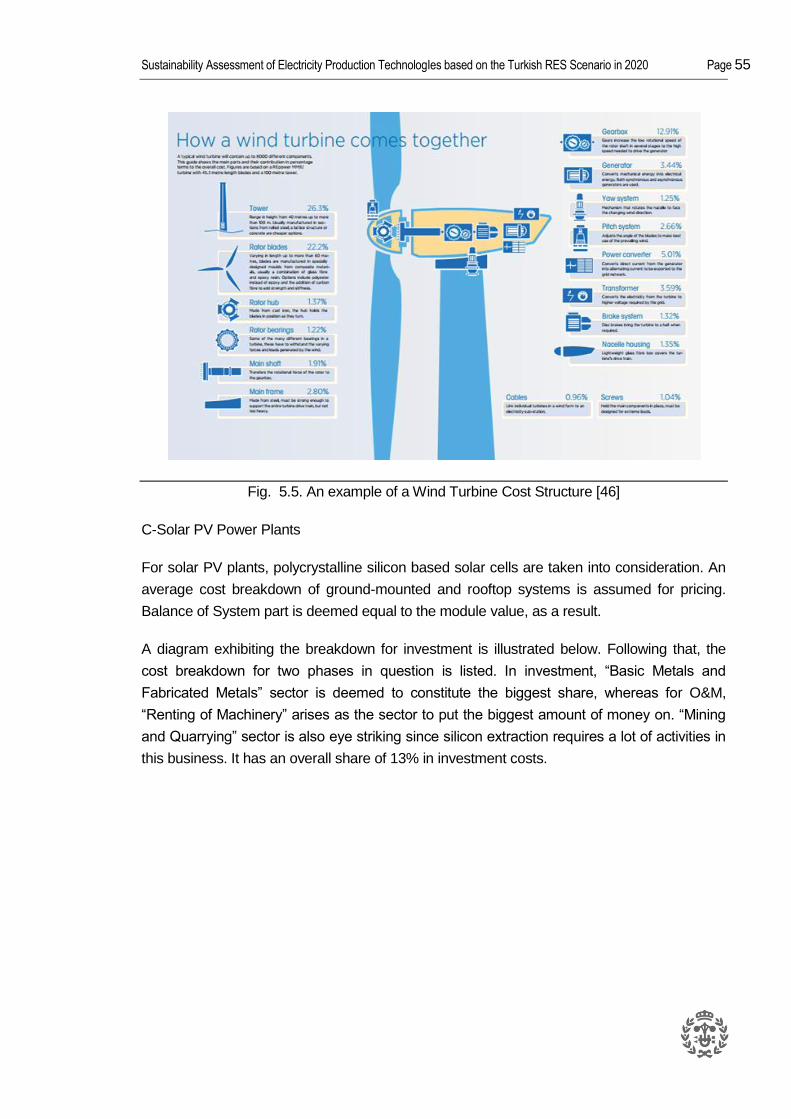
Sustainability Assessment of Electricity Production TechnologIes based on the Turkish RES Scenario in 2020 Page 55
Fig. 5.5. An example of a Wind Turbine Cost Structure [46]
C-Solar PV Power Plants
For solar PV plants, polycrystalline silicon based solar cells are taken into consideration. An
average cost breakdown of ground-mounted and rooftop systems is assumed for pricing.
Balance of System part is deemed equal to the module value, as a result.
A diagram exhibiting the breakdown for investment is illustrated below. Following that, the
cost breakdown for two phases in question is listed. In investment, “Basic Metals and
Fabricated Metals” sector is deemed to constitute the biggest share, whereas for O&M,
“Renting of Machinery” arises as the sector to put the biggest amount of money on. “Mining
and Quarrying” sector is also eye striking since silicon extraction requires a lot of activities in
this business. It has an overall share of 13% in investment costs.
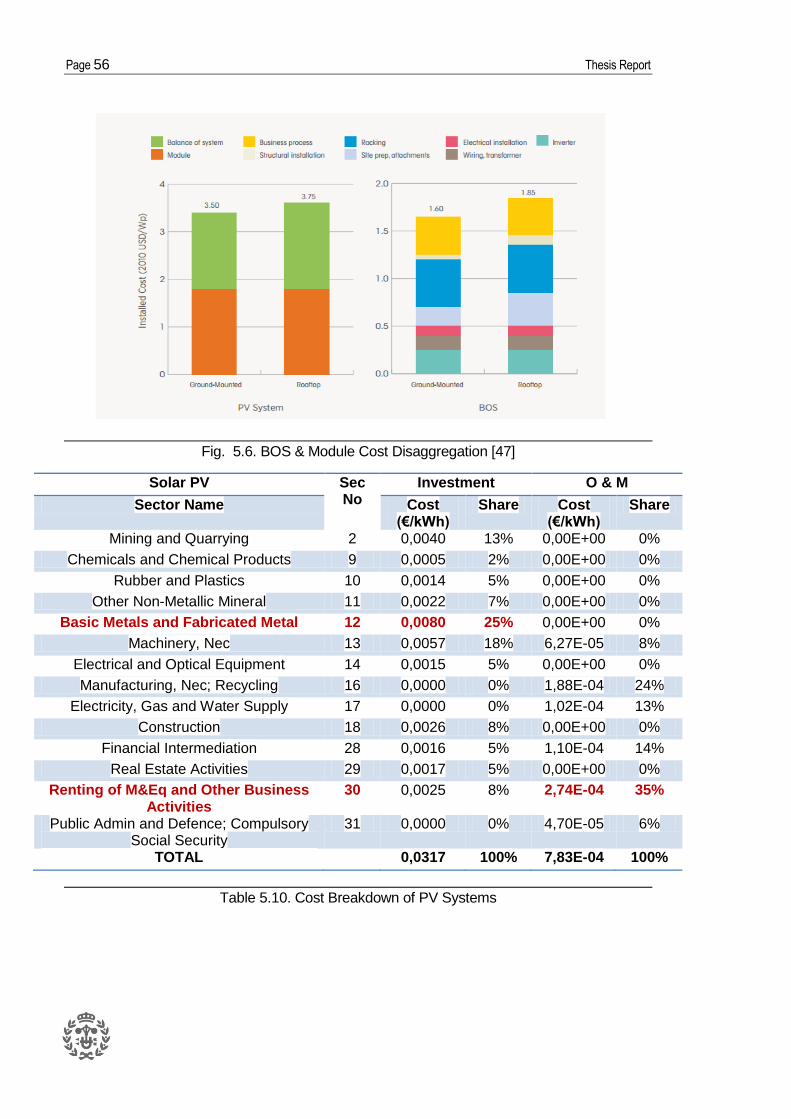
Page 56 Thesis Report
Fig. 5.6. BOS & Module Cost Disaggregation [47]
Solar PV Sec No
Investment O & M
Sector Name Cost (€/kWh)
Share Cost (€/kWh)
Share
Mining and Quarrying 2 0,0040 13% 0,00E+00 0%
Chemicals and Chemical Products 9 0,0005 2% 0,00E+00 0%
Rubber and Plastics 10 0,0014 5% 0,00E+00 0%
Other Non-Metallic Mineral 11 0,0022 7% 0,00E+00 0%
Basic Metals and Fabricated Metal 12 0,0080 25% 0,00E+00 0%
Machinery, Nec 13 0,0057 18% 6,27E-05 8%
Electrical and Optical Equipment 14 0,0015 5% 0,00E+00 0%
Manufacturing, Nec; Recycling 16 0,0000 0% 1,88E-04 24%
Electricity, Gas and Water Supply 17 0,0000 0% 1,02E-04 13%
Construction 18 0,0026 8% 0,00E+00 0%
Financial Intermediation 28 0,0016 5% 1,10E-04 14%
Real Estate Activities 29 0,0017 5% 0,00E+00 0%
Renting of M&Eq and Other Business Activities
30 0,0025 8% 2,74E-04 35%
Public Admin and Defence; Compulsory Social Security
31 0,0000 0% 4,70E-05 6%
TOTAL 0,0317 100% 7,83E-04 100%
Table 5.10. Cost Breakdown of PV Systems
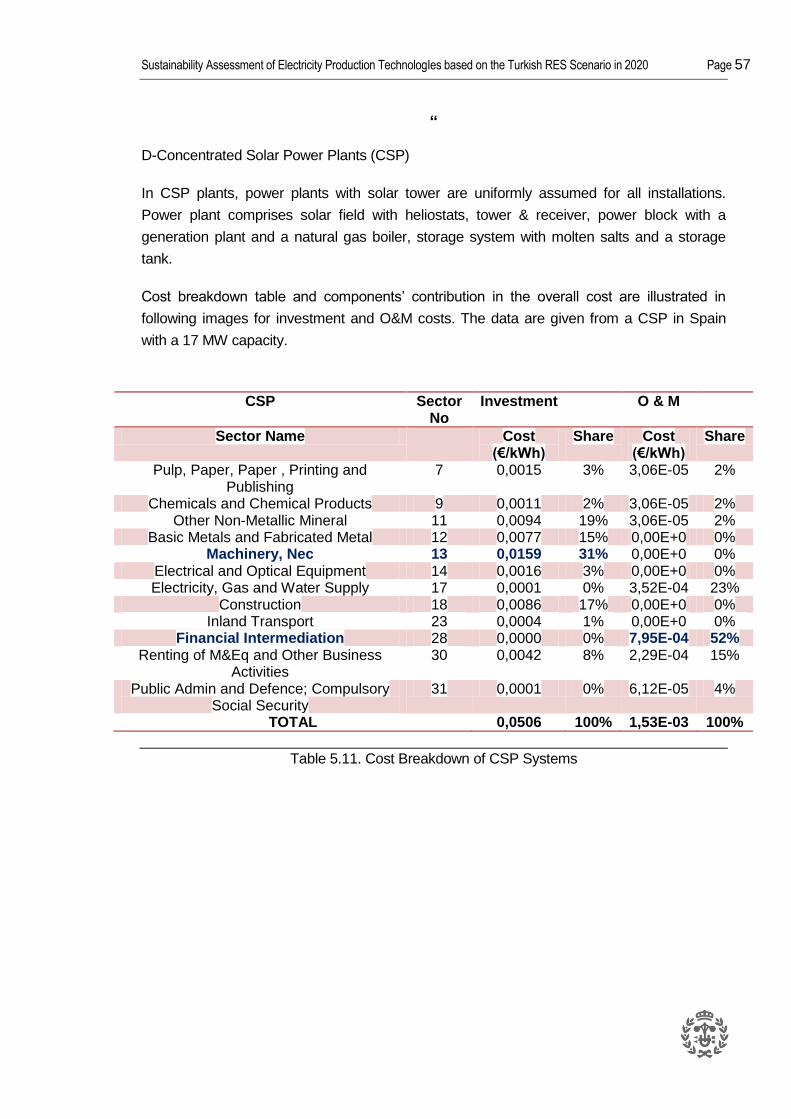
Sustainability Assessment of Electricity Production TechnologIes based on the Turkish RES Scenario in 2020 Page 57
“
D-Concentrated Solar Power Plants (CSP)
In CSP plants, power plants with solar tower are uniformly assumed for all installations.
Power plant comprises solar field with heliostats, tower & receiver, power block with a
generation plant and a natural gas boiler, storage system with molten salts and a storage
tank.
Cost breakdown table and components’ contribution in the overall cost are illustrated in
following images for investment and O&M costs. The data are given from a CSP in Spain
with a 17 MW capacity.
CSP Sector No
Investment O & M
Sector Name Cost (€/kWh)
Share Cost (€/kWh)
Share
Pulp, Paper, Paper , Printing and Publishing
7 0,0015 3% 3,06E-05 2%
Chemicals and Chemical Products 9 0,0011 2% 3,06E-05 2% Other Non-Metallic Mineral 11 0,0094 19% 3,06E-05 2%
Basic Metals and Fabricated Metal 12 0,0077 15% 0,00E+0 0% Machinery, Nec 13 0,0159 31% 0,00E+0 0%
Electrical and Optical Equipment 14 0,0016 3% 0,00E+0 0% Electricity, Gas and Water Supply 17 0,0001 0% 3,52E-04 23%
Construction 18 0,0086 17% 0,00E+0 0% Inland Transport 23 0,0004 1% 0,00E+0 0%
Financial Intermediation 28 0,0000 0% 7,95E-04 52% Renting of M&Eq and Other Business
Activities 30 0,0042 8% 2,29E-04 15%
Public Admin and Defence; Compulsory Social Security
31 0,0001 0% 6,12E-05 4%
TOTAL 0,0506 100% 1,53E-03 100%
Table 5.11. Cost Breakdown of CSP Systems

Page 58 Thesis Report
Fig. 5.7. Investment Cost Disassociation of CSP [27]
Fig. 5.8. O&M Cost Breakdown of CSP
18%
20%
39%
11%
12%
O&M
Fixed Operation
Maintenance
Financing
Natural Gas
Electricity
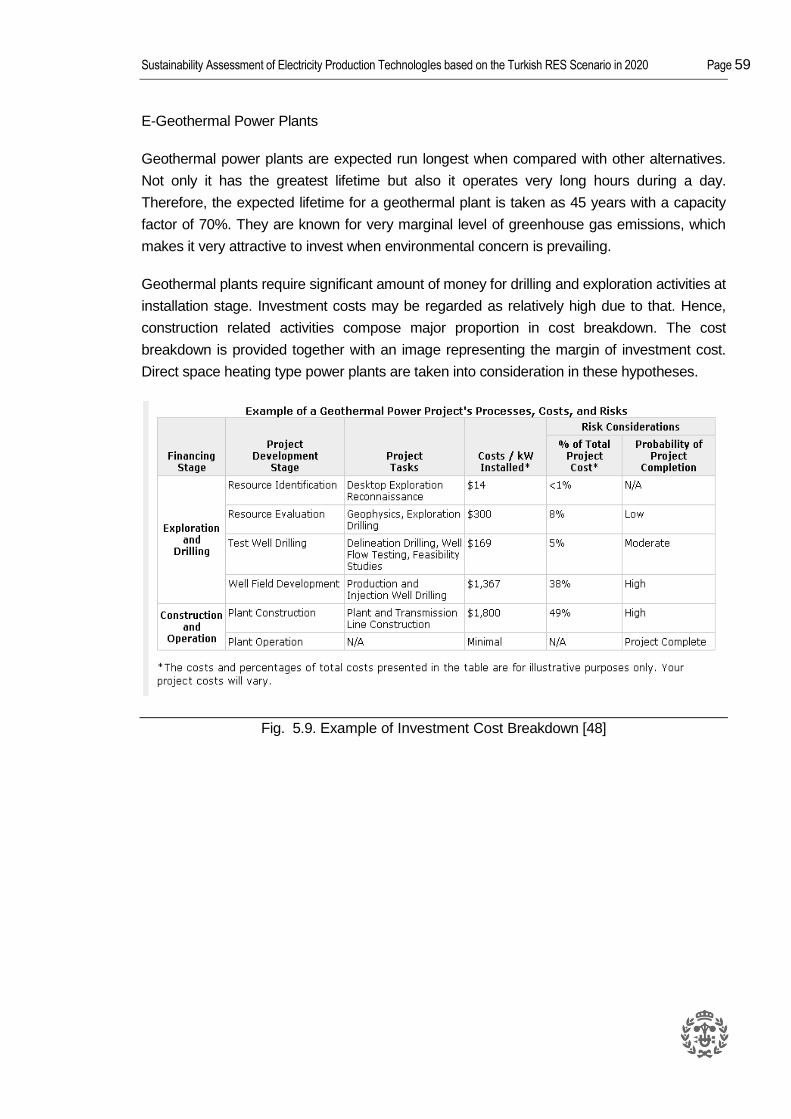
Sustainability Assessment of Electricity Production TechnologIes based on the Turkish RES Scenario in 2020 Page 59
E-Geothermal Power Plants
Geothermal power plants are expected run longest when compared with other alternatives.
Not only it has the greatest lifetime but also it operates very long hours during a day.
Therefore, the expected lifetime for a geothermal plant is taken as 45 years with a capacity
factor of 70%. They are known for very marginal level of greenhouse gas emissions, which
makes it very attractive to invest when environmental concern is prevailing.
Geothermal plants require significant amount of money for drilling and exploration activities at
installation stage. Investment costs may be regarded as relatively high due to that. Hence,
construction related activities compose major proportion in cost breakdown. The cost
breakdown is provided together with an image representing the margin of investment cost.
Direct space heating type power plants are taken into consideration in these hypotheses.
Fig. 5.9. Example of Investment Cost Breakdown [48]

Page 60 Thesis Report
Fig. 5.10. Capital Cost Range in USD/kW [49]
Geothermal Power Plant Sec No
Investment O & M
Sector Name Cost (€/kWh)
Share
Cost (€/kWh)
Share
Chemicals and Chemical Products 9 0,0003 4% 0,00E+0 0%
Other Non-Metallic Mineral 11 0,0001 2% 0,00E+0 0%
Basic Metals and Fabricated Metal 12 0,0014 21% 0,00E+0 0%
Machinery, Nec 13 0,0008 13% 0,00E+0 0%
Electrical and Optical Equipment 14 0,0002 3% 0,00E+0 0%
Manufacturing, Nec; Recycling 16 0,0000 0% 5,56E-05 28%
Electricity, Gas and Water Supply 17 0,0002 4% 4,37E-05 22%
Construction 18 0,0023 34% 0,00E+0 0%
Financial Intermediation 28 0,0003 5% 2,58E-05 13%
Real Estate Activities 29 0,0004 6% 0,00E+00
0%
Renting of M&Eq and Other Business Activities
30 0,0006 9% 2,38E-05 12%
Public Admin and Defence; Compulsory Social Security
31 0,0000 0% 4,96E-05 25%
TOTAL 0,0066 100% 1,98E-04 100%
Table 5.12. Cost Breakdown of Geothermal Plant

Sustainability Assessment of Electricity Production TechnologIes based on the Turkish RES Scenario in 2020 Page 61
F- Biomass & Biowaste & Biogas Plants
According to the bio-source power plants are evaluated for following classification should be
remembered.
- Biogas: Obtained from biodegradable materials such as manure and sewage
- Solid biomass : Mostly derived from agricultural products made from dry plant
- Biowaste : Derived from municipal solid waste, food waste, and so on
For the cost breakdown hypotheses, a very similar approach is maintained for all of these
three types of power plants. Technological components, as well as structural activities are
regarded to be more or less equal for investments. However, a clear distinction can be made
with respect to the combustion mechanism, on which the cost breakdown is defined.
For solid biomass power plants fluidized bed combustion systems are utilized. Biogas power
plants are assumed to possess Manure-Slurry Anaerobic Digestion (AD) systems installed.
Biowaste power plants, on the other hand, are associated with Stoker systems. Details on
the cost breakdown of those units are illustrated by the bars in the following diagram.
Fig. 5.11.Cost Breakdown Bio-Based Systems with respect to Technology [50]
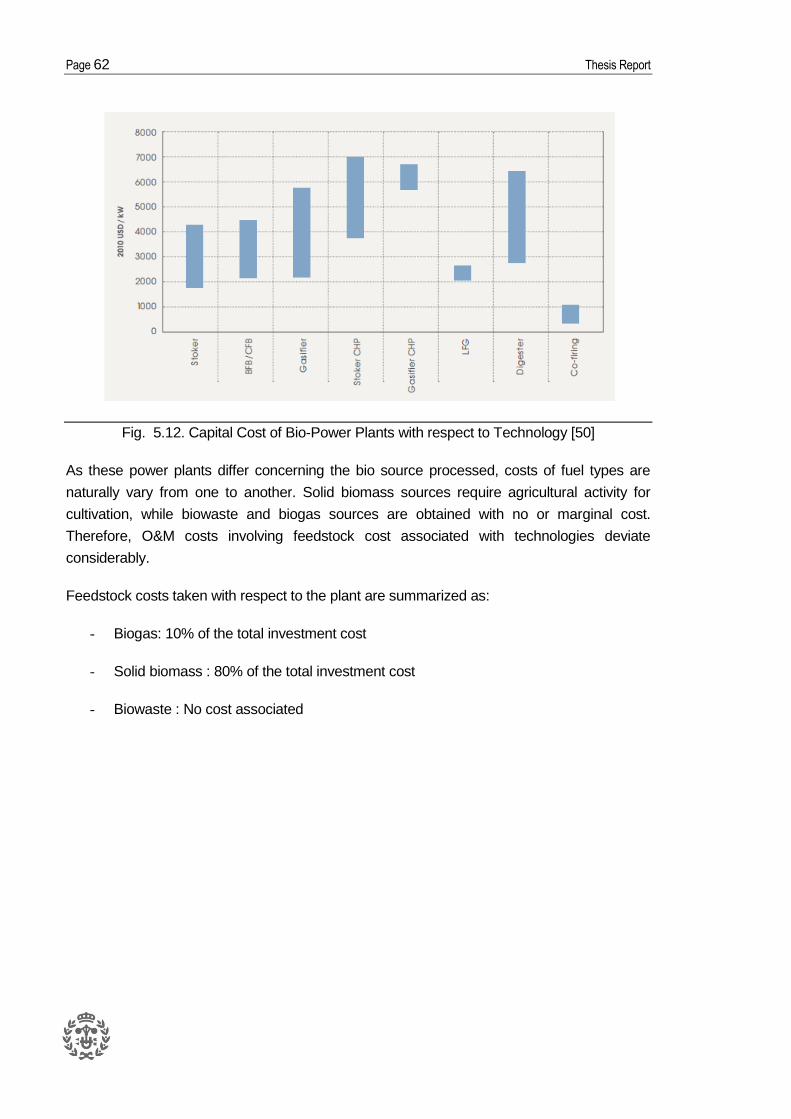
Page 62 Thesis Report
Fig. 5.12. Capital Cost of Bio-Power Plants with respect to Technology [50]
As these power plants differ concerning the bio source processed, costs of fuel types are
naturally vary from one to another. Solid biomass sources require agricultural activity for
cultivation, while biowaste and biogas sources are obtained with no or marginal cost.
Therefore, O&M costs involving feedstock cost associated with technologies deviate
considerably.
Feedstock costs taken with respect to the plant are summarized as:
- Biogas: 10% of the total investment cost
- Solid biomass : 80% of the total investment cost
- Biowaste : No cost associated
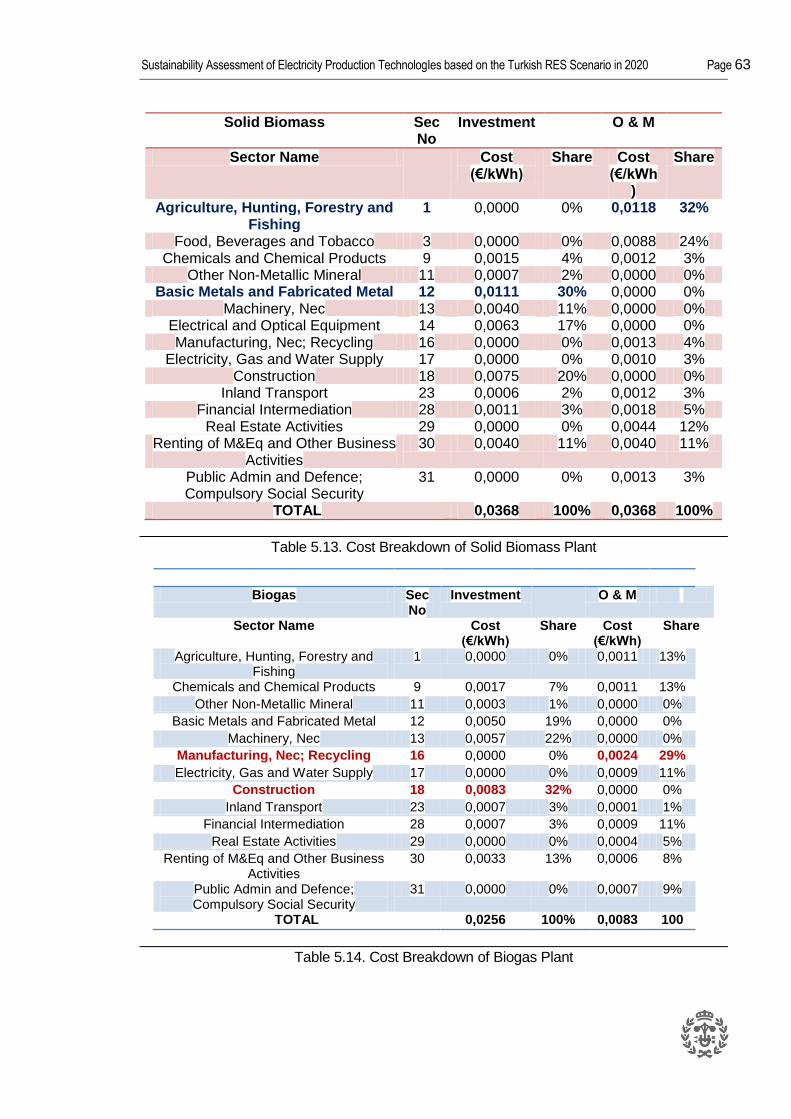
Sustainability Assessment of Electricity Production TechnologIes based on the Turkish RES Scenario in 2020 Page 63
Solid Biomass Sec No
Investment O & M
Sector Name Cost (€/kWh)
Share Cost (€/kWh
)
Share
Agriculture, Hunting, Forestry and Fishing
1 0,0000 0% 0,0118 32%
Food, Beverages and Tobacco 3 0,0000 0% 0,0088 24% Chemicals and Chemical Products 9 0,0015 4% 0,0012 3%
Other Non-Metallic Mineral 11 0,0007 2% 0,0000 0% Basic Metals and Fabricated Metal 12 0,0111 30% 0,0000 0%
Machinery, Nec 13 0,0040 11% 0,0000 0% Electrical and Optical Equipment 14 0,0063 17% 0,0000 0% Manufacturing, Nec; Recycling 16 0,0000 0% 0,0013 4%
Electricity, Gas and Water Supply 17 0,0000 0% 0,0010 3% Construction 18 0,0075 20% 0,0000 0%
Inland Transport 23 0,0006 2% 0,0012 3% Financial Intermediation 28 0,0011 3% 0,0018 5%
Real Estate Activities 29 0,0000 0% 0,0044 12% Renting of M&Eq and Other Business
Activities 30 0,0040 11% 0,0040 11%
Public Admin and Defence; Compulsory Social Security
31 0,0000 0% 0,0013 3%
TOTAL 0,0368 100% 0,0368 100%
Table 5.13. Cost Breakdown of Solid Biomass Plant
Biogas Sec
No Investment O & M
Sector Name Cost (€/kWh)
Share Cost (€/kWh)
Share
Agriculture, Hunting, Forestry and Fishing
1 0,0000 0% 0,0011 13%
Chemicals and Chemical Products 9 0,0017 7% 0,0011 13%
Other Non-Metallic Mineral 11 0,0003 1% 0,0000 0%
Basic Metals and Fabricated Metal 12 0,0050 19% 0,0000 0%
Machinery, Nec 13 0,0057 22% 0,0000 0%
Manufacturing, Nec; Recycling 16 0,0000 0% 0,0024 29%
Electricity, Gas and Water Supply 17 0,0000 0% 0,0009 11%
Construction 18 0,0083 32% 0,0000 0%
Inland Transport 23 0,0007 3% 0,0001 1%
Financial Intermediation 28 0,0007 3% 0,0009 11%
Real Estate Activities 29 0,0000 0% 0,0004 5%
Renting of M&Eq and Other Business Activities
30 0,0033 13% 0,0006 8%
Public Admin and Defence; Compulsory Social Security
31 0,0000 0% 0,0007 9%
TOTAL 0,0256 100% 0,0083 100
Table 5.14. Cost Breakdown of Biogas Plant
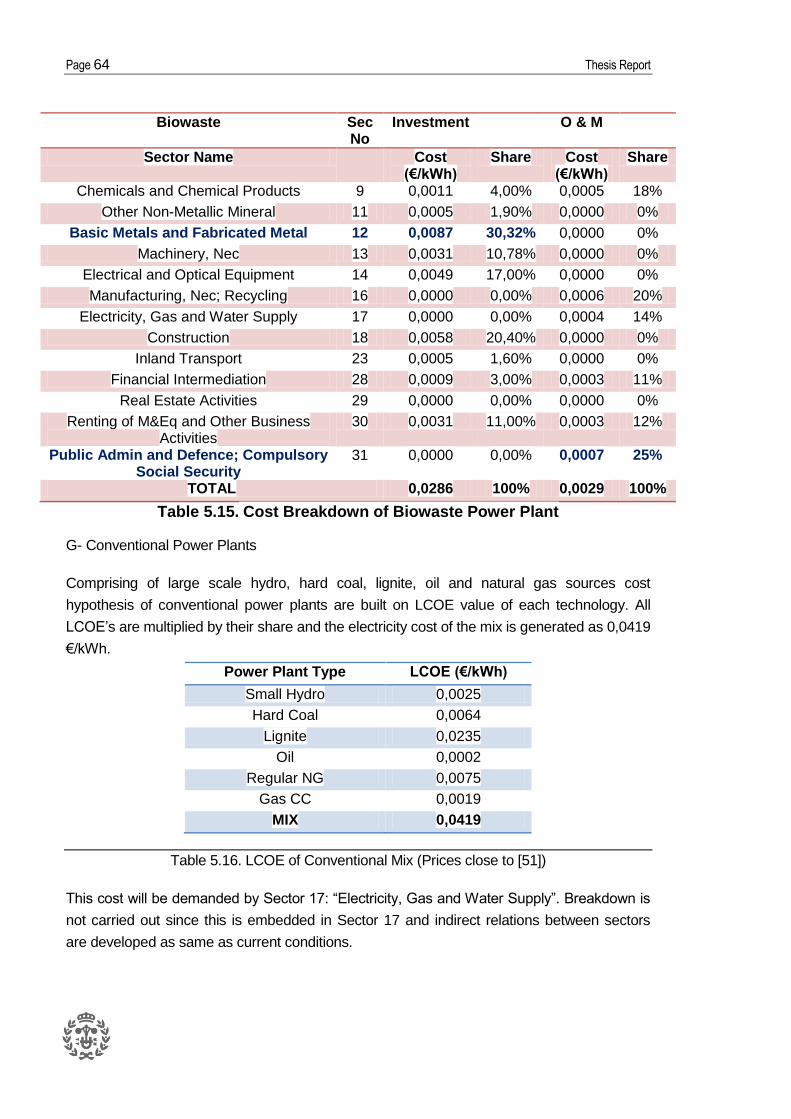
Page 64 Thesis Report
Biowaste Sec No
Investment O & M
Sector Name Cost (€/kWh)
Share Cost (€/kWh)
Share
Chemicals and Chemical Products 9 0,0011 4,00% 0,0005 18%
Other Non-Metallic Mineral 11 0,0005 1,90% 0,0000 0%
Basic Metals and Fabricated Metal 12 0,0087 30,32% 0,0000 0%
Machinery, Nec 13 0,0031 10,78% 0,0000 0%
Electrical and Optical Equipment 14 0,0049 17,00% 0,0000 0%
Manufacturing, Nec; Recycling 16 0,0000 0,00% 0,0006 20%
Electricity, Gas and Water Supply 17 0,0000 0,00% 0,0004 14%
Construction 18 0,0058 20,40% 0,0000 0%
Inland Transport 23 0,0005 1,60% 0,0000 0%
Financial Intermediation 28 0,0009 3,00% 0,0003 11%
Real Estate Activities 29 0,0000 0,00% 0,0000 0%
Renting of M&Eq and Other Business Activities
30 0,0031 11,00% 0,0003 12%
Public Admin and Defence; Compulsory Social Security
31 0,0000 0,00% 0,0007 25%
TOTAL 0,0286 100% 0,0029 100%
Table 5.15. Cost Breakdown of Biowaste Power Plant
G- Conventional Power Plants
Comprising of large scale hydro, hard coal, lignite, oil and natural gas sources cost
hypothesis of conventional power plants are built on LCOE value of each technology. All
LCOE’s are multiplied by their share and the electricity cost of the mix is generated as 0,0419
€/kWh.
Power Plant Type LCOE (€/kWh)
Small Hydro 0,0025
Hard Coal 0,0064
Lignite 0,0235
Oil 0,0002
Regular NG 0,0075
Gas CC 0,0019
MIX 0,0419
Table 5.16. LCOE of Conventional Mix (Prices close to [51])
This cost will be demanded by Sector 17: “Electricity, Gas and Water Supply”. Breakdown is
not carried out since this is embedded in Sector 17 and indirect relations between sectors
are developed as same as current conditions.
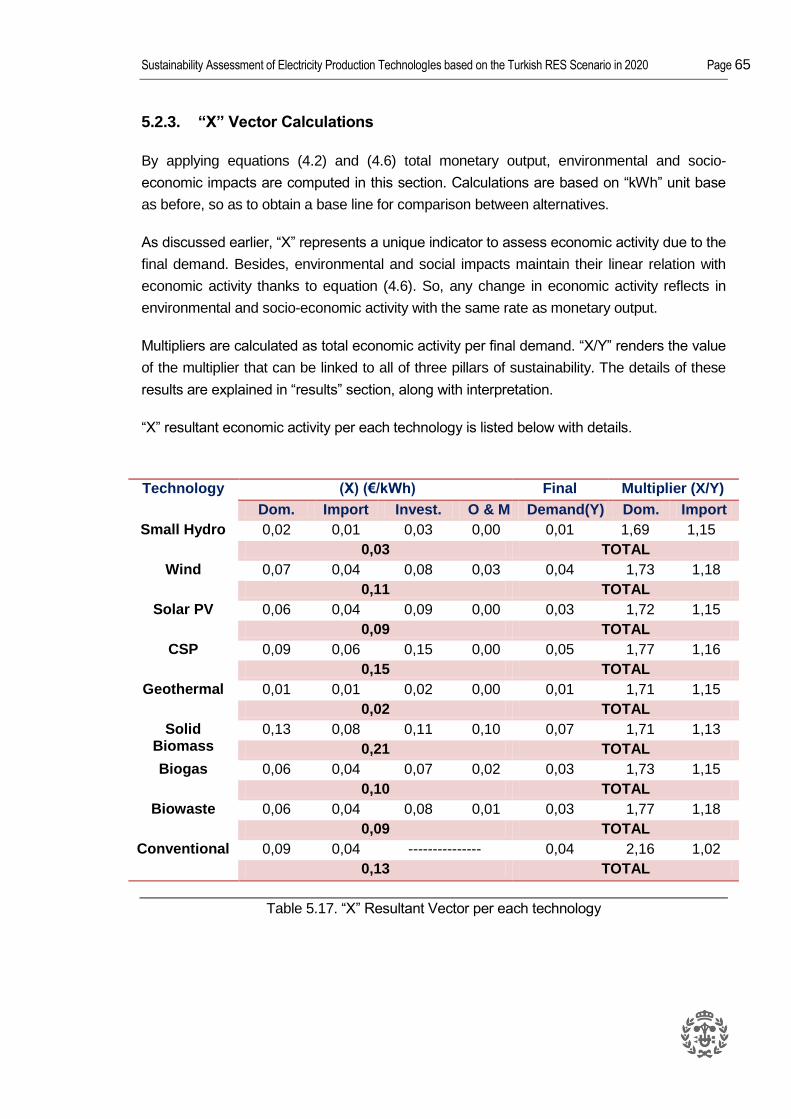
Sustainability Assessment of Electricity Production TechnologIes based on the Turkish RES Scenario in 2020 Page 65
5.2.3. “X” Vector Calculations
By applying equations (4.2) and (4.6) total monetary output, environmental and socio-
economic impacts are computed in this section. Calculations are based on “kWh” unit base
as before, so as to obtain a base line for comparison between alternatives.
As discussed earlier, “X” represents a unique indicator to assess economic activity due to the
final demand. Besides, environmental and social impacts maintain their linear relation with
economic activity thanks to equation (4.6). So, any change in economic activity reflects in
environmental and socio-economic activity with the same rate as monetary output.
Multipliers are calculated as total economic activity per final demand. “X/Y” renders the value
of the multiplier that can be linked to all of three pillars of sustainability. The details of these
results are explained in “results” section, along with interpretation.
“X” resultant economic activity per each technology is listed below with details.
Technology (X) (€/kWh) Final Multiplier (X/Y)
Dom. Import Invest. O & M Demand(Y) Dom. Import
Small Hydro 0,02 0,01 0,03 0,00 0,01 1,69 1,15
0,03 TOTAL
Wind 0,07 0,04 0,08 0,03 0,04 1,73 1,18
0,11 TOTAL
Solar PV 0,06 0,04 0,09 0,00 0,03 1,72 1,15
0,09 TOTAL
CSP 0,09 0,06 0,15 0,00 0,05 1,77 1,16
0,15 TOTAL
Geothermal 0,01 0,01 0,02 0,00 0,01 1,71 1,15
0,02 TOTAL
Solid Biomass
0,13 0,08 0,11 0,10 0,07 1,71 1,13
0,21 TOTAL
Biogas 0,06 0,04 0,07 0,02 0,03 1,73 1,15
0,10 TOTAL
Biowaste 0,06 0,04 0,08 0,01 0,03 1,77 1,18
0,09 TOTAL
Conventional 0,09 0,04 --------------- 0,04 2,16 1,02
0,13 TOTAL
Table 5.17. “X” Resultant Vector per each technology
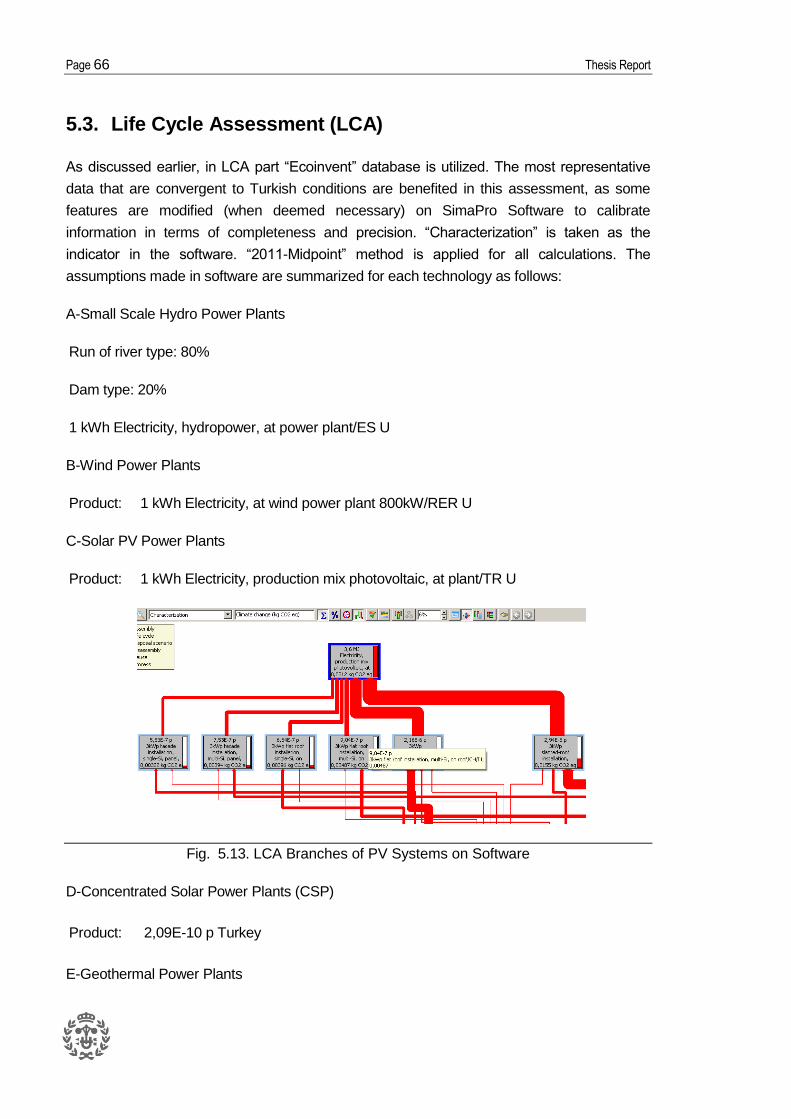
Page 66 Thesis Report
5.3. Life Cycle Assessment (LCA)
As discussed earlier, in LCA part “Ecoinvent” database is utilized. The most representative
data that are convergent to Turkish conditions are benefited in this assessment, as some
features are modified (when deemed necessary) on SimaPro Software to calibrate
information in terms of completeness and precision. “Characterization” is taken as the
indicator in the software. “2011-Midpoint” method is applied for all calculations. The
assumptions made in software are summarized for each technology as follows:
A-Small Scale Hydro Power Plants
Run of river type: 80%
Dam type: 20%
1 kWh Electricity, hydropower, at power plant/ES U
B-Wind Power Plants
Product: 1 kWh Electricity, at wind power plant 800kW/RER U
C-Solar PV Power Plants
Product: 1 kWh Electricity, production mix photovoltaic, at plant/TR U
Fig. 5.13. LCA Branches of PV Systems on Software
D-Concentrated Solar Power Plants (CSP)
Product: 2,09E-10 p Turkey
E-Geothermal Power Plants
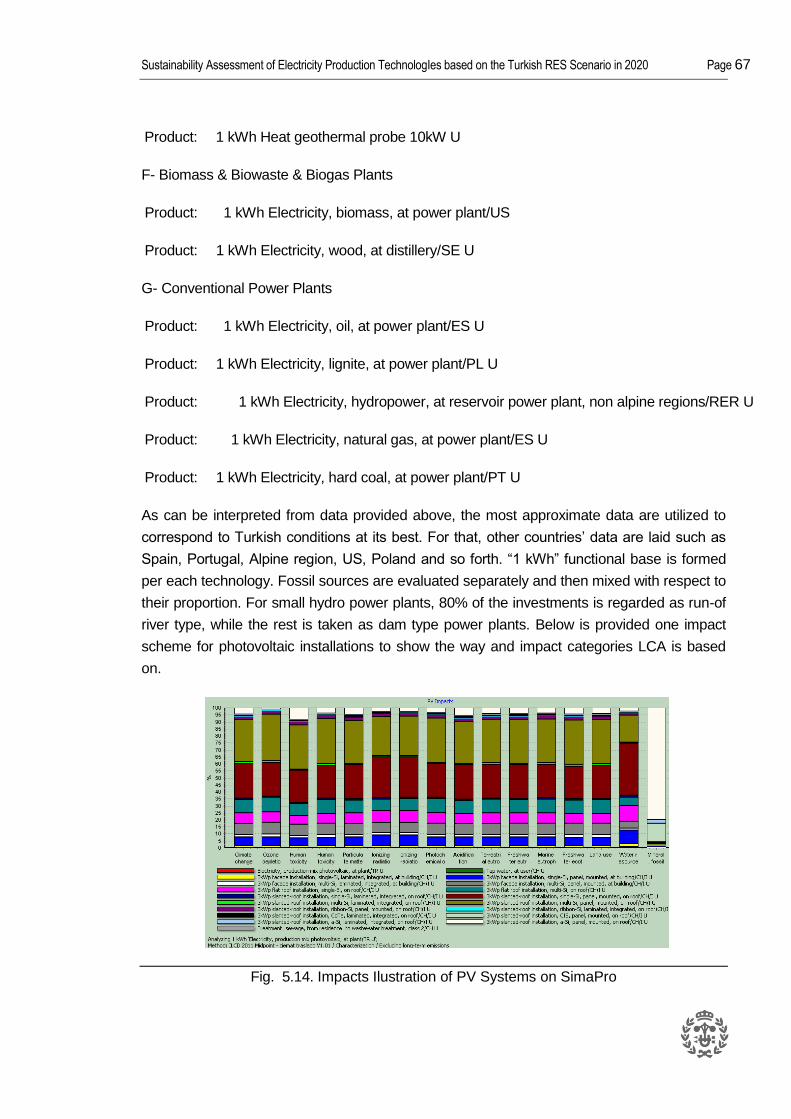
Sustainability Assessment of Electricity Production TechnologIes based on the Turkish RES Scenario in 2020 Page 67
Product: 1 kWh Heat geothermal probe 10kW U
F- Biomass & Biowaste & Biogas Plants
Product: 1 kWh Electricity, biomass, at power plant/US
Product: 1 kWh Electricity, wood, at distillery/SE U
G- Conventional Power Plants
Product: 1 kWh Electricity, oil, at power plant/ES U
Product: 1 kWh Electricity, lignite, at power plant/PL U
Product: 1 kWh Electricity, hydropower, at reservoir power plant, non alpine regions/RER U
Product: 1 kWh Electricity, natural gas, at power plant/ES U
Product: 1 kWh Electricity, hard coal, at power plant/PT U
As can be interpreted from data provided above, the most approximate data are utilized to
correspond to Turkish conditions at its best. For that, other countries’ data are laid such as
Spain, Portugal, Alpine region, US, Poland and so forth. “1 kWh” functional base is formed
per each technology. Fossil sources are evaluated separately and then mixed with respect to
their proportion. For small hydro power plants, 80% of the investments is regarded as run-of
river type, while the rest is taken as dam type power plants. Below is provided one impact
scheme for photovoltaic installations to show the way and impact categories LCA is based
on.
Fig. 5.14. Impacts Ilustration of PV Systems on SimaPro

Page 68 Thesis Report
6. Results and Discussions
6.1. IOA & EIOA
6.1.1. Comparison of Technologies
A- Economical
Ranking Technology Multiplier
Domestic Import Total
1 Conventional 2,16 1,02 3,18
2 Biowaste 1,77 1,18 2,95
3 CSP 1,80 1,14 2,94
4 Wind 1,73 1,18 2,92
5 Biogas 1,73 1,15 2,88
6 Geothermal 1,71 1,15 2,87
7 Solar PV 1,71 1,16 2,87
8 Small Hydro 1,69 1,15 2,84
9 Solid Biomass 1,71 1,13 2,83
Table 6.1. Economic Multipliers by Technology
The most contribution to the economic activity is provided from conventional sources (fossil
fuels and hydro) with a total multiplier value of 3,18 with a domestic contribution level of 2,16.
In terms of domestic activity, small hydro power plants are ranked the last with multiplier
effect of 1,69, whereas it is solid biomass technology with least contribution in total
(domestic+imports.)
Fig. 6.1. Economical Activity Illustration by Technology

Sustainability Assessment of Electricity Production TechnologIes based on the Turkish RES Scenario in 2020 Page 69
Activity per unit electricity demand, on the other hand is boosted with solid biomass power
plants, mostly due to the agricultural activities they necessitate for the feedstock. It reflects a
half-to-half ratio between investment and O&M activities. These findings can be interpreted
from the diagram above, where all four components of cost are distinguished by their color.
Conventional sources are ranked at 3rd overall in terms of economic activity, while
geothermal implies the minimum when compared to other alternatives. As can be
interpreted, RES mix reflects in less economical activity than total mix, owing to the large
contribution of conventional sources in aggregate mix.
B- Environmental
Ranking Technology g CO2 / kWh
Domestıc Import Total
1 Geothermal 5,94 3,05 8,99
2 Small Hydro 7,12 3,19 10,31
3 Biowaste 22,35 11,22 33,57
4 Biogas 24,96 12,59 37,55
5 Wind 29,53 14,39 43,92
6 Solar PV 29,76 18,15 47,91
7 Solid Biomass 53,22 28,54 81,77
8 CSP 60,20 39,83 100,03
9 Conventional 235,29 134,19 369,47
Table 6.2. Environmental Impacts by Technology
According to the calculations based on this study, the most environmentally-friendly
technology seems to be geothermal power plants with almost 9 grams of CO2 eq. emission
per kWh. As expected, conventional power plants produce large amounts of greenhouse
gases and thus they render a poor performance in terms of environmental concerns.
It should be remarked that the environmental impacts in these calculations represent a more
optimistic outcome, since large hydro power plants are also evaluated within fossil fuels and
have a significant share in the conventional mix. Normally, fossil fuels are known to emit
greenhouse gases in a range of 750-850 grams per kWh, with the current technology. CSP
technologies also result in considerable environmental impacts, due to the massive
production activities for components such as heliostats, solar tower and wiring. Wind and
solar PV power plants result in a very similar pattern in terms of green house gas emission
per unit of electricity production, slightly above the RES mix. A big share of environmental
impacts stems from domestic production processes.
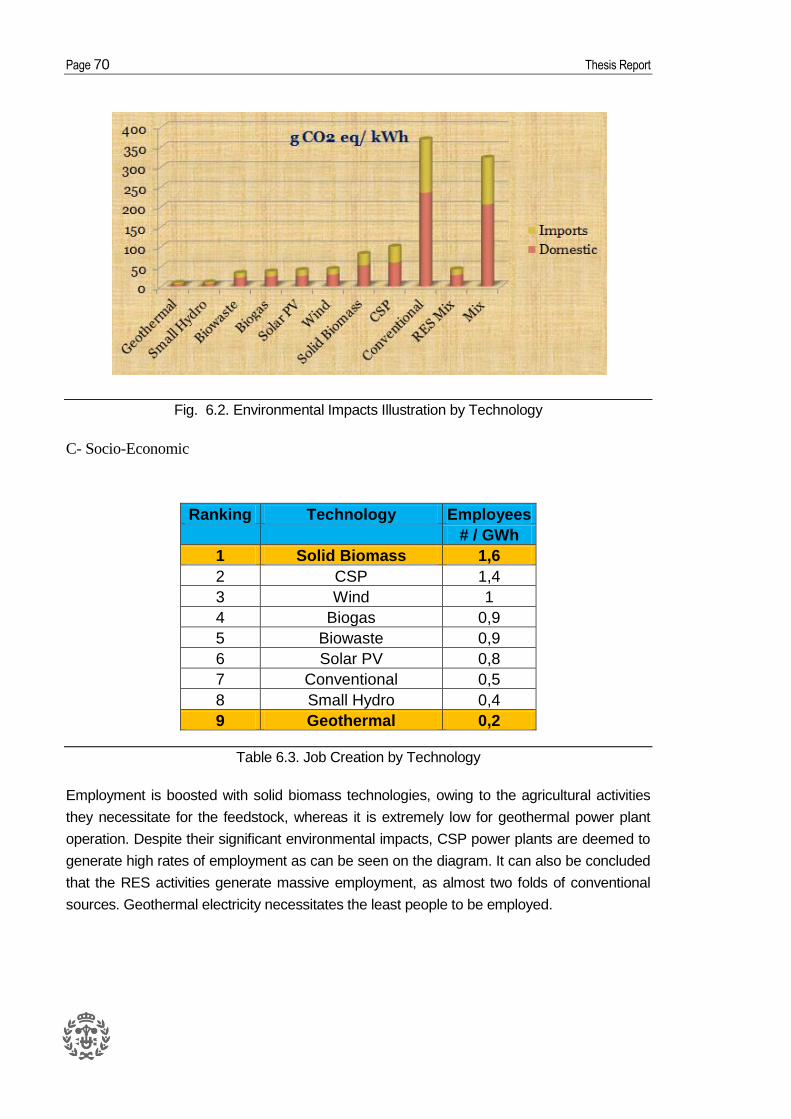
Page 70 Thesis Report
Fig. 6.2. Environmental Impacts Illustration by Technology
C- Socio-Economic
Ranking Technology Employees
# / GWh
1 Solid Biomass 1,6
2 CSP 1,4
3 Wind 1
4 Biogas 0,9
5 Biowaste 0,9
6 Solar PV 0,8
7 Conventional 0,5
8 Small Hydro 0,4
9 Geothermal 0,2
Table 6.3. Job Creation by Technology
Employment is boosted with solid biomass technologies, owing to the agricultural activities
they necessitate for the feedstock, whereas it is extremely low for geothermal power plant
operation. Despite their significant environmental impacts, CSP power plants are deemed to
generate high rates of employment as can be seen on the diagram. It can also be concluded
that the RES activities generate massive employment, as almost two folds of conventional
sources. Geothermal electricity necessitates the least people to be employed.
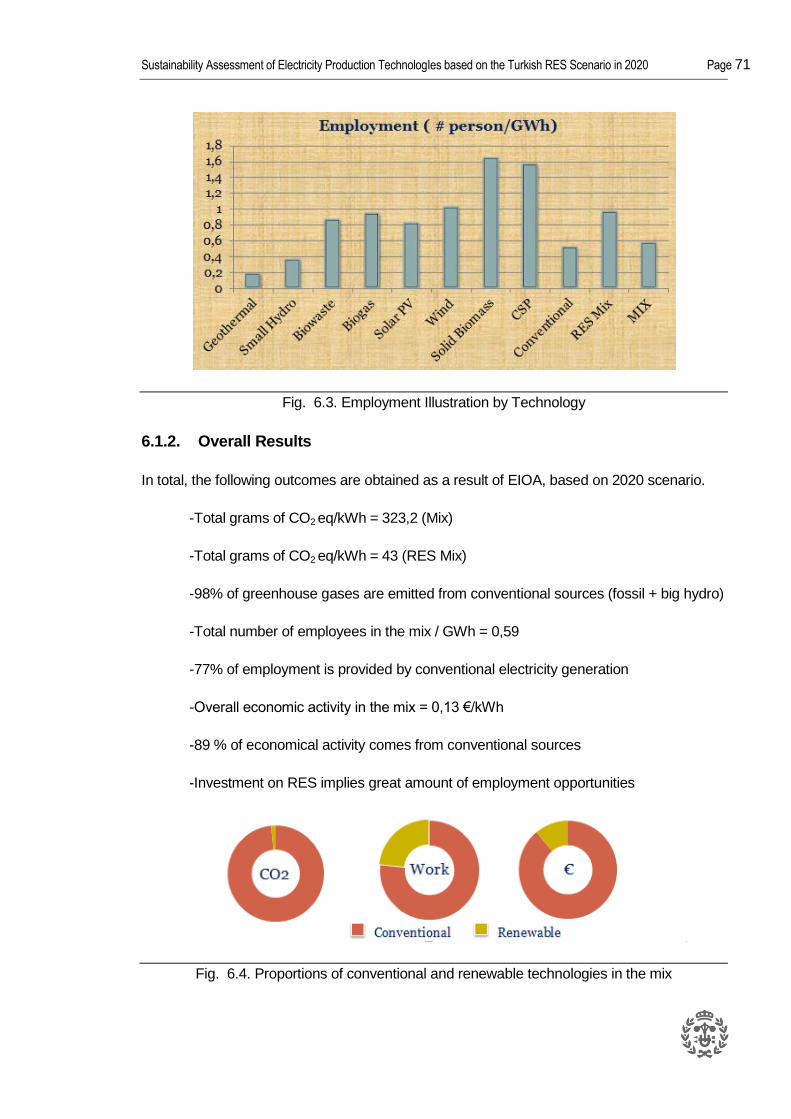
Sustainability Assessment of Electricity Production TechnologIes based on the Turkish RES Scenario in 2020 Page 71
Fig. 6.3. Employment Illustration by Technology
6.1.2. Overall Results
In total, the following outcomes are obtained as a result of EIOA, based on 2020 scenario.
-Total grams of CO2 eq/kWh = 323,2 (Mix)
-Total grams of CO2 eq/kWh = 43 (RES Mix)
-98% of greenhouse gases are emitted from conventional sources (fossil + big hydro)
-Total number of employees in the mix / GWh = 0,59
-77% of employment is provided by conventional electricity generation
-Overall economic activity in the mix = 0,13 €/kWh
-89 % of economical activity comes from conventional sources
-Investment on RES implies great amount of employment opportunities
Fig. 6.4. Proportions of conventional and renewable technologies in the mix
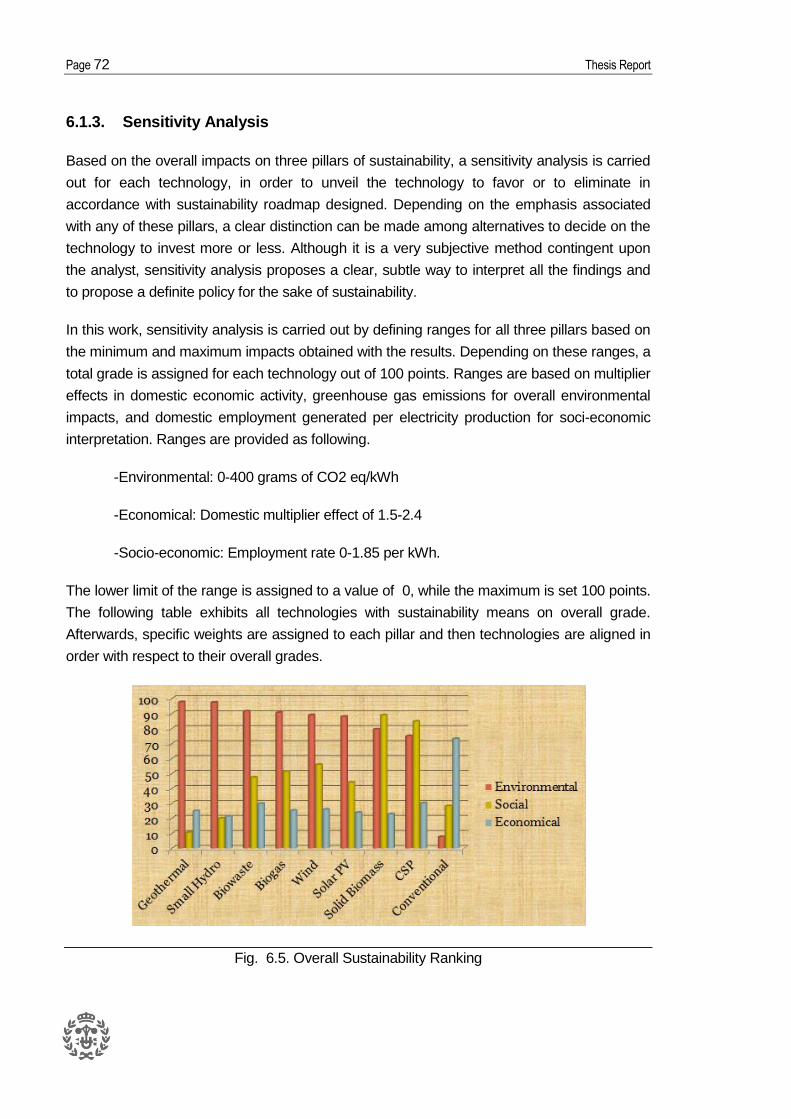
Page 72 Thesis Report
6.1.3. Sensitivity Analysis
Based on the overall impacts on three pillars of sustainability, a sensitivity analysis is carried
out for each technology, in order to unveil the technology to favor or to eliminate in
accordance with sustainability roadmap designed. Depending on the emphasis associated
with any of these pillars, a clear distinction can be made among alternatives to decide on the
technology to invest more or less. Although it is a very subjective method contingent upon
the analyst, sensitivity analysis proposes a clear, subtle way to interpret all the findings and
to propose a definite policy for the sake of sustainability.
In this work, sensitivity analysis is carried out by defining ranges for all three pillars based on
the minimum and maximum impacts obtained with the results. Depending on these ranges, a
total grade is assigned for each technology out of 100 points. Ranges are based on multiplier
effects in domestic economic activity, greenhouse gas emissions for overall environmental
impacts, and domestic employment generated per electricity production for soci-economic
interpretation. Ranges are provided as following.
-Environmental: 0-400 grams of CO2 eq/kWh
-Economical: Domestic multiplier effect of 1.5-2.4
-Socio-economic: Employment rate 0-1.85 per kWh.
The lower limit of the range is assigned to a value of 0, while the maximum is set 100 points.
The following table exhibits all technologies with sustainability means on overall grade.
Afterwards, specific weights are assigned to each pillar and then technologies are aligned in
order with respect to their overall grades.
Fig. 6.5. Overall Sustainability Ranking
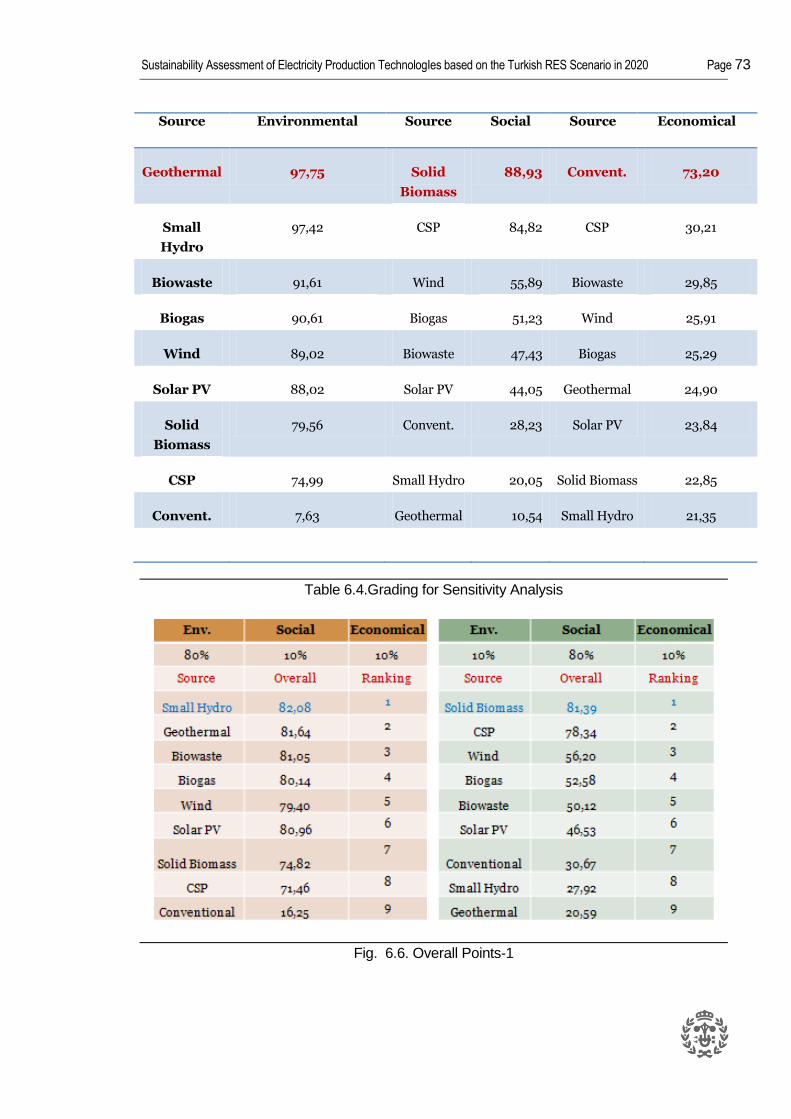
Sustainability Assessment of Electricity Production TechnologIes based on the Turkish RES Scenario in 2020 Page 73
Source Environmental Source Social Source Economical
Geothermal 97,75 Solid
Biomass
88,93 Convent. 73,20
Small
Hydro
97,42 CSP 84,82 CSP 30,21
Biowaste 91,61 Wind 55,89 Biowaste 29,85
Biogas 90,61 Biogas 51,23 Wind 25,91
Wind 89,02 Biowaste 47,43 Biogas 25,29
Solar PV 88,02 Solar PV 44,05 Geothermal 24,90
Solid
Biomass
79,56 Convent. 28,23 Solar PV 23,84
CSP 74,99 Small Hydro 20,05 Solid Biomass 22,85
Convent. 7,63 Geothermal 10,54 Small Hydro 21,35
Table 6.4.Grading for Sensitivity Analysis
Fig. 6.6. Overall Points-1
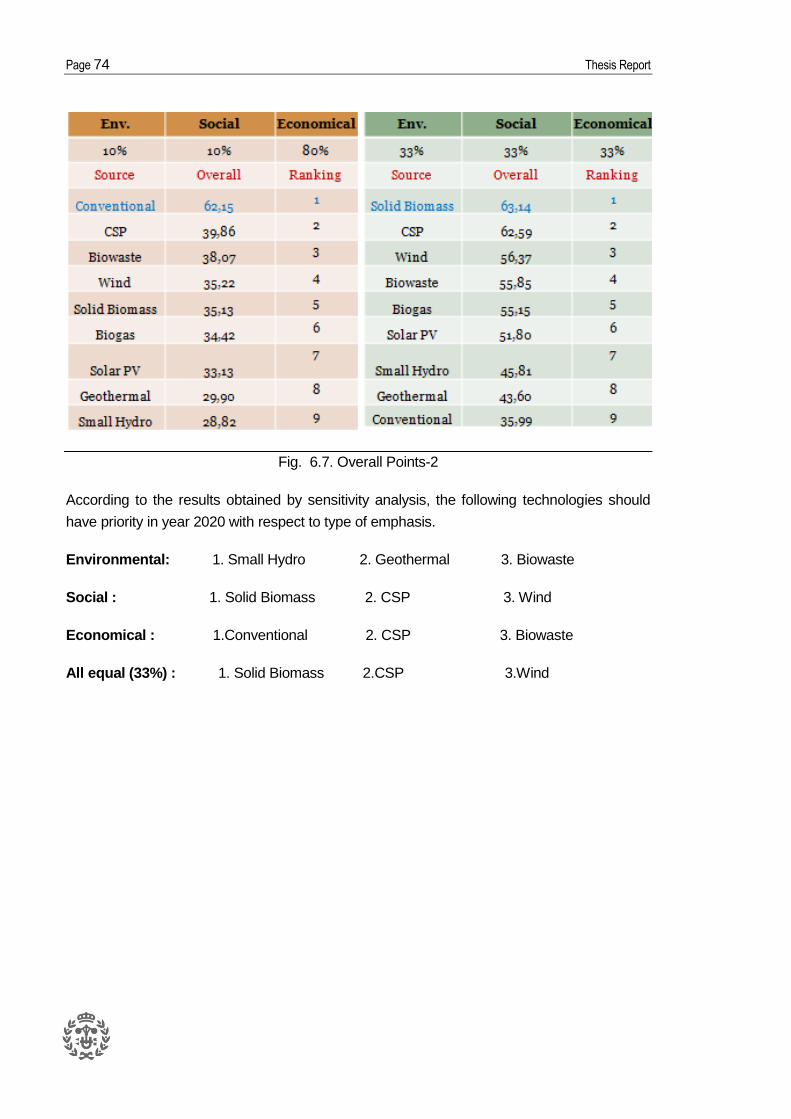
Page 74 Thesis Report
Fig. 6.7. Overall Points-2
According to the results obtained by sensitivity analysis, the following technologies should
have priority in year 2020 with respect to type of emphasis.
Environmental: 1. Small Hydro 2. Geothermal 3. Biowaste
Social : 1. Solid Biomass 2. CSP 3. Wind
Economical : 1.Conventional 2. CSP 3. Biowaste
All equal (33%) : 1. Solid Biomass 2.CSP 3.Wind
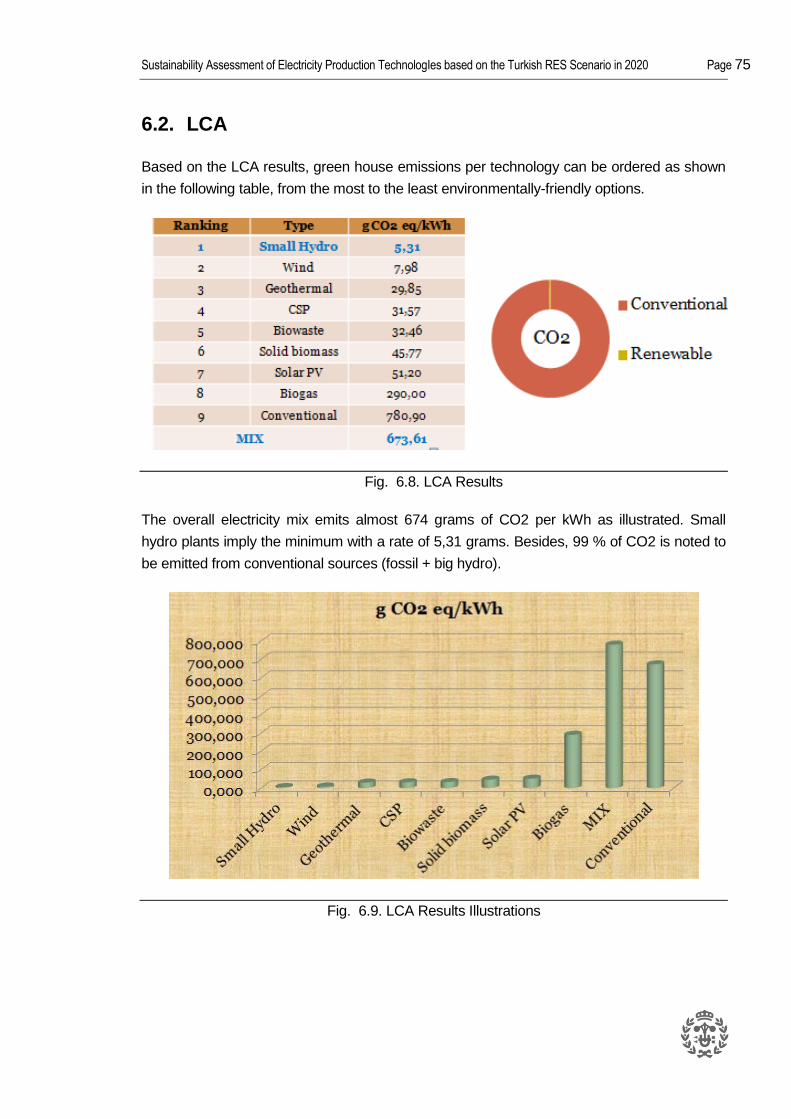
Sustainability Assessment of Electricity Production TechnologIes based on the Turkish RES Scenario in 2020 Page 75
6.2. LCA
Based on the LCA results, green house emissions per technology can be ordered as shown
in the following table, from the most to the least environmentally-friendly options.
Fig. 6.8. LCA Results
The overall electricity mix emits almost 674 grams of CO2 per kWh as illustrated. Small
hydro plants imply the minimum with a rate of 5,31 grams. Besides, 99 % of CO2 is noted to
be emitted from conventional sources (fossil + big hydro).
Fig. 6.9. LCA Results Illustrations
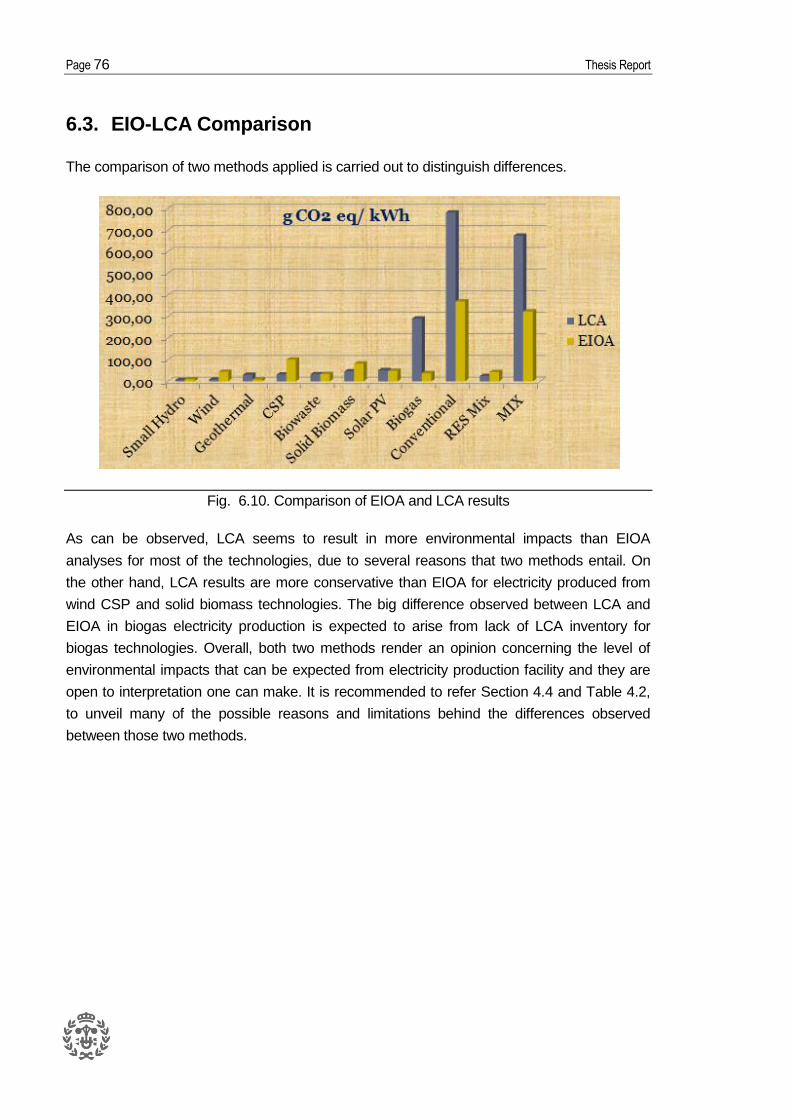
Page 76 Thesis Report
6.3. EIO-LCA Comparison
The comparison of two methods applied is carried out to distinguish differences.
Fig. 6.10. Comparison of EIOA and LCA results
As can be observed, LCA seems to result in more environmental impacts than EIOA
analyses for most of the technologies, due to several reasons that two methods entail. On
the other hand, LCA results are more conservative than EIOA for electricity produced from
wind CSP and solid biomass technologies. The big difference observed between LCA and
EIOA in biogas electricity production is expected to arise from lack of LCA inventory for
biogas technologies. Overall, both two methods render an opinion concerning the level of
environmental impacts that can be expected from electricity production facility and they are
open to interpretation one can make. It is recommended to refer Section 4.4 and Table 4.2,
to unveil many of the possible reasons and limitations behind the differences observed
between those two methods.

Sustainability Assessment of Electricity Production TechnologIes based on the Turkish RES Scenario in 2020 Page 77

Sustainability Assessment of Electricity Production TechnologIes based on the Turkish RES Scenario in 2020 Page 79
Conclusions
Under the light of all assumptions, calculations and results obtained in this master study,
following articles can be drawn as conclusions.
A through sustainability analysis should take environmental, social and economical
factors into account.
IOA and EIOA prove to be very useful methods to assess all related impacts.
LCA analysis conducts a deeper analysis in terms of environmental impacts if more
inventory data are embedded. EIOA, on the other hand, provides a comprehensive
outlook with a widened scope.
Both methods depend on user’s approach and thus flexible to render subjective
outcomes.
There are divergences in results obtained from LCA and EIOA, as can be observed.
These discrepancies may arise from rough assumptions, insufficient or incomplete
data, limitations of the methods and erred disaggregation.
A sustainable roadmap can be designed by deciding which sustainability factor has
more or less priority among others, based on the EIOA findings.
These methodology can be applied in any location once the input output database is
obtained.
Based on the needs the most sustainable technology should be favored.
In Turkish electricity production case, the following technologies should have priority
in year 2020.
Environmental: 1. Small Hydro 2. Geothermal 3. Biowaste
Social : 1. Solid Biomass 2. CSP 3. Wind
Economical : 1.Conventional 2. CSP 3. Biowaste
All equal (33%) : 1. Solid Biomass 2.CSP 3.Wind


Sustainability Assessment of Electricity Production TechnologIes based on the Turkish RES Scenario in 2020 Page 81
Further Lines of Study
Further lines of study that can be derived from this master thesis work include:
Remaking of LCA with more up-to-date inventory
Including other environmental impacts (beyond GHG) of LCA and EIOA
Investing more effort in social side by utilizing social hot spot databases
Obtaining more clear information on import countries and commodities for a more
elaborate analysis
Applying this study to any country or region, once the input-output table is provided


Sustainability Assessment of Electricity Production TechnologIes based on the Turkish RES Scenario in 2020 Page 83
Acknowledgements
I would like to express my appreciation to all the people who in one way or another
contributed to the development of this research.
I wish to thank, first and foremost, my supervisor in CIEMAT, Dr. Cristina de la Rúa
Lope, whom I had the honor to work during my stay at the institute. I would like to
express my gratitude for her endless effort to teach and to guide me throughout this
thesis work.
I will always remember the great people I had the chance to meet in CIEMAT, Dr.
Daniel Garraín, Dr.Yolanda Lechón, Dr. Natàlia Caldés, Dr. Israel Herrera, Dr. Diego
Garcia, Lic. Carmen Lago, Irene, Inés and Manuel, with their smiling faces always
ready to help. I wish them all more success and happiness for the rest of their lives.
I would like to thank Dr.Santiago Silvestre for his valuable supervision in
development of this thesis work.
I am also indebted to my academic director Dr. Enrique Velo, for his continuous
assistance throughout the graduate study.
I would like to thank all the members of KIC InnoEnergy family; organizers,
professors and my colleagues for enabling to study this program in such a unique
environment.
Additionally, I would like to thank my professors of my bachelor years in Boğaziçi
University; Dr. Erhan Karaesmen, Dr. Cem Avcı, Dr. Kutay Orakçal, Dr. Haluk Beker,
Dr. Selçuk Esenbel and Dr. Yavuz Selim Karakışla, who directly or indirectly inspired
me to further my studies.
Finally, my deepest gratitude goes to my family; my mum, my dad and my brother,
for their unconditional love, unfailing support and encouragement throughout my life.


Sustainability Assessment of Electricity Production TechnologIes based on the Turkish RES Scenario in 2020 Page 85
References
[1] Jovane, F., Yoshikawa, H.,Alting, L., Boer, C.R., Westkamper, E., Tseng, D.M,
Seliger, G., Paci, A.M. “The incoming global technological and industrial revolution towards
competitive sustainable manufacturing”. Manufacturing Technology. 57, 2008, p. 641–659.
[2] Cabezas, H., Fath, B.D. “Towards a theory of sustainable systems”. Fluid Phase
Equilibria. 194-197, 2002, p. 3-14.
[3] Hofstetter, P., Madjar, M. “Linking change in happiness, time-use, sustainable
consumption, and environmental impacts; An attempt to understand time-rebound effects”.
BAO Consultrix GmbH, Final Report, 2003.
[4] Brundtland, G., Our Common Future: World Commission on Environment and
Development. Oxford University Press, 1987
[5] Mendelsohn, R., “Climate Change and Economic Growth”. Working Paper No. 60,
Commission on Growth and Development. World Bank, 2009.
[6] Panayotou, T. "Economic Growth and the Environment". CID Working Papers 56,
Center for International Development at Harvard University, 2000
[7] United Nations Environment Programme (UNEP) Report. Regional Seas Visioning
Workshop, Geneva, Switzerland, 3-4 July 2014
[8] Maxim, A. “Sustainability assessment of electricity generation technologies using
weighted multi-criteria decision analysis”. Energy Policy. 65, 2014, p.284-297.
[9] PITTSBURG STATE UNIVERSITY, WHAT IS SUSTAINABILITY?
[http://www.pittstate.edu/office/president/initiatives/sustainability/what-is-sustainability.dot, 3
September 2014]
[10] Kyoto Protocol To The United Nations Framework Convention On Climate Change,
Article 2. UN, 1998.
[11] Markaki, M., Belegri-Roboli, A., Michaelides, P. “The impact of clean energy
investments on the Greek economy: An input–output analysis (2010–2020)”. Energy
Policy. 57, 2013, p.263-275.
[12] ECOTEC Research & Consulting Limited, A Final Report to DG Environment.
Renewable Energy Sector in the EU: Its Employment and Export Potential.
Page 86 Thesis Report
[13] BETTER Project Website I [http://www.better-project.net/content/action-better-brief, 9
March 2014]
[14] Turkish Statistical Institute (TURKSTAT) I [http://www.turkstat.gov.tr, 19 April 2014]
[15] World Bank Data I [http://www.worldbank.org/en/country/turkey, 19 April 2014]
[16] Trends In Global CO2 Emissions, 2013 Report. PBL Netherlands Environmental
Assessment Agency & EU Joint Research Center, 2013.
[17] IEA, 2009 Review
[18] BETTER Report. D5.2.2: Existing and expected framework conditions for RES
development in Turkey, 2013
[19] U.S Energy Information Administration, Turkey Overview, 2013.
[20] Çapik, M., Yılmaz, A.O., Çavuşoğlu, İ. “Present situation and potential role of
renewable energy in Turkey” Energy Policy. 46, 2012, p.1-13.
[21] BETTER Report. D5.1: Report on power system inventory and status of RES(-E)
deployment in Turkey, 2013
[22] Parlaktuna, M., Mertoğlu, O., Şimşek, Ş., Paksoy, H., Başarır, N., Geothermal
Country Update Report of Turkey (2010-2013). European Geothermal Congress 2013 Pisa,
Italy, 3‐7 June 2013
[23] MENR 2009, The Republic of Turkey Ministry of Energy and Natural Resources
Strategic Plan (2010-2014). I [http://www.enerji.gov.tr/, 25 August 2014]
[24] BETTER Report. D5.2.1: Renewable energy targets, potentials and energy demand
scenarios of Turkey, 2013
[25] Miller,R.E., Blair, P.D. Input-Output Analysis : Foundations and extensisons, 2nd
Edition. Cambridge: Cambridge University Press, 2009, p.732.
[26] Kulišić, B., Loizou, E., Rozakis, S., Šegon, V. “Impacts of biodiesel production on
Croatian economy”. Energy Policy. 35 (12), 2007, p.6036–6045.
[27] Caldés, N., Varela, M., Santamaría, M., Sáez, R. “Economic impact of solar thermal
electricity deployment in Spain”. Energy Policy. 2009
[28] Leontief,W. “Environmental Repercussions and the Economic Structure: an Input-
Output Approach”. Review of Economics and Statistics. 2 (3), 1970, p. 262-271.
Sustainability Assessment of Electricity Production TechnologIes based on the Turkish RES Scenario in 2020 Page 87
[29] WORLD INPUT OUTPUT DATABASE I [http://www.wiod.org/new_site/home.htm, 19
April 2014]
[30] Stocker, A., Environmental Extended Input-output analysis: the basic method
:Sustainable Europe Research Institute
[http://www.old.seri.at/index.php?option=com_docman&task=doc_download&gid=182&Itemi
d=39.]
[31] NWT Bureau of Statistics Government of the Northwest Territories. Input-Output
Model: An Overview, 2006
[32] Rodriguez, I., Impactos Económicos, Ambientales y sociales de un Proyecto de
Energía Solar de Concentración en el Norte de Chile. MSc Thesis, UPM, 2014
[33] Hendrickson, C., Horvath, A., Joshi, S., Lave, L. “Economic Input-Output Models for
Environmental Life-Cycle Assessment”. Environmental Policy Analysis. 32(7), 1998, p.184a-
191a.
[34] Kitzes, J. An Introduction to Environmentally-Extended Input-Output Analysis 2 (4),
2013, p. 489-503.
[35] IPCC Report. Fourth Assessment Report: Climate Change. 2007. I
[http://www.ipcc.ch/publications_and_data/ar4/wg1/en/ch2s2-10-2.html, 23 April 2014]
[36] Hunt, R.G., Franklin, W.E., “LCA- How it Came About”. The International Journal of
Life Cycle Assessment. 1 (1), 1996, p.4-7.
[37] Glick, S., Life-cycle Assessment and Life-cycle Costs: A Framework with Case Study.
Pro Quest LCC, 2007
[38] Curran, M.A., Life Cycle Assessment Handbook: A Guide for Environmentally
Sustainable Product,1st Edition. New Jersey: John Wiley & Sons, 2012.
[39] Raj, S.A., Introduction to Environmental Science and Technology. Laxmi
Publications, 2005.
[40] U.S. Environmental Protection Agency. Life Cycle Assessment: Principles And
Practice. Ohio, 2006.
[41] International Organization Standardization. ISO 14040:2006. Environmental
management -- Life cycle assessment -- Principles and framework. 2006.
Page 88 Thesis Report
[42] De la Rúa, C., Lechón, Y., Caldés,N, Saez, R. “Comparing Process LCA and IO-
LCA: Bioethanol Production in Spain”
[43] Ecoinvent Inventory Report. Implementation of Life Cycle Impact Assessment
Methods Data v2.0, Report 3. Dübendorf, 2007.
[44] CARNEGIE MELLON UNIVERSITY, ECONOMIC INPUT-OUTPUT LIFE CYCLE
ASSESSMENT I [http://www.eiolca.net/Method/Limitations.html, 12 August 2014]
[45] IRENA Report. Renewable Energy Technologies: Cost Analysis Series: Hydropower.
Volume 1: Power Sector, Issue 3/5, 2012.
[46] IRENA Report. Renewable Energy Technologies: Cost Analysis Series: Wind Power.
Volume 1: Power Sector, Issue 5/5, 2012.
[47] IRENA Report. Renewable Energy Technologies: Cost Analysis Series: Solar
Photovoltaics. Volume1: Power Sector, Issue 4/5, 2012.
[48] National Renewable Energy Laboratory. Financing Geothermal Power Projects. I
[http://www.nrel.gov/geothermal/financing/overview.html, 7 September 2014]
[49] IEA Report. Renewable Energy Essentials: Geothermal, 2010 I
[http://www.iea.org/publications/freepublications/publication/Geothermal_Essentials.pdf, 7
September 2014]
[50] IRENA Report. Renewable Energy Technologies: Cost Analysis Series: Biomass for
Power Generation. Volume1: Power Sector, Issue 1/5, 2012.
[51] U.S Energy Information Administration Report. Annual Energy Outlook with
Projections to 2040. Washington, 2014.
Related Documents