Sustainability and Utilization of Forest Energy Resources
Jan 01, 2016
Sustainability and Utilization of Forest Energy Resources. Randy Dye, Director, West Virginia Division of Forestry. Rail fences-------- 4.0 Billion BF Housing------------ .5 Billion BF Lumber ------------ 7.0 Billion BF Fuel --------------- 10.0 Billion BF Cut & Burned- 239.0 Billion BF - PowerPoint PPT Presentation
Welcome message from author
This document is posted to help you gain knowledge. Please leave a comment to let me know what you think about it! Share it to your friends and learn new things together.
Transcript


Sustainability and Utilization of Forest Energy
Resources
Randy Dye, Director,
West Virginia Division of Forestry

3

Timber Removed Prior to 1910
• Rail fences-------- 4.0 Billion BF
• Housing------------ .5 Billion BF
• Lumber ------------ 7.0 Billion BF
• Fuel --------------- 10.0 Billion BF
• Cut & Burned- 239.0 Billion BF
• Total ------------- 260.5 Billion BF – (A B Brooks, 1910)

Estimated Volumes
• 1790---150 Billion Board Feet– (A. B. Brooks 1910)
• 1910--- 30 Billion Board Feet– (A. B. Brooks 1910)
• 2000--- 71 Billion Board Feet– (USFS 2000)
• 2010--- 89.6 Billion Board Feet– (USFS 2010)
The 2010 Statewide Inventory
2nd Leading Hardwood State in the Nation
NE Forest Inventory and Analysis
Total Hardwood Growing-stock Volumeof Top Five Hardwood States

The 3rd Most Heavily Forested State in the Nation
40-69
90+
80-89
70-79
Percent
44
78
7278
8079
82
88
84
6962
89
93
70
64
6689
74
62
7161
81
81
75
80
81
83
8266
66
89
79
77
85
93
76
63
69
81
87
82
8484 85
80
6776
87
86
85
Percentage of Land in Forest
The 2010 Statewide Inventory
NE Forest Inventory and Analysis

The 2010 Statewide Inventory
Most Forestland is Privately Owned
NE Forest Inventory and Analysis
Distribution of Forestland Area by Owner

The 2010 Statewide Inventory
West Virginia’s Forests Are Maturing
NE Forest Inventory and Analysis
Percentage of Timberland by Size Class
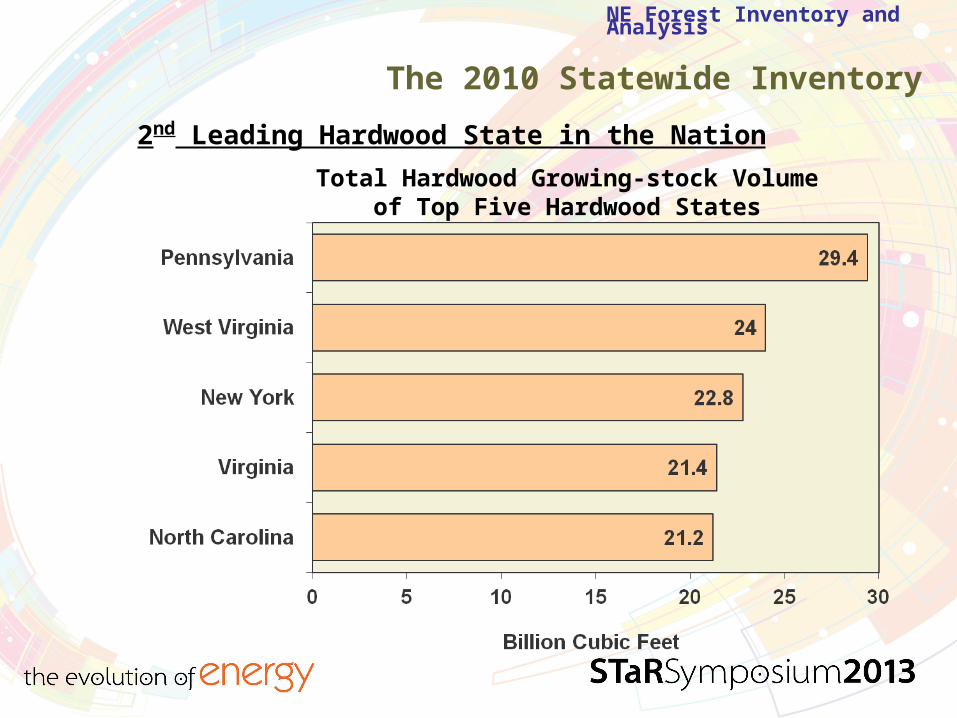
The 2010 Statewide Inventory
Stocking on Timberland
NE Forest Inventory and Analysis
Stocking of Growing-stock Trees on Timberland

The 2010 Statewide Inventory
Increases in Volume Continue
NE Forest Inventory and Analysis
Average Volume Per Acre on Timberland
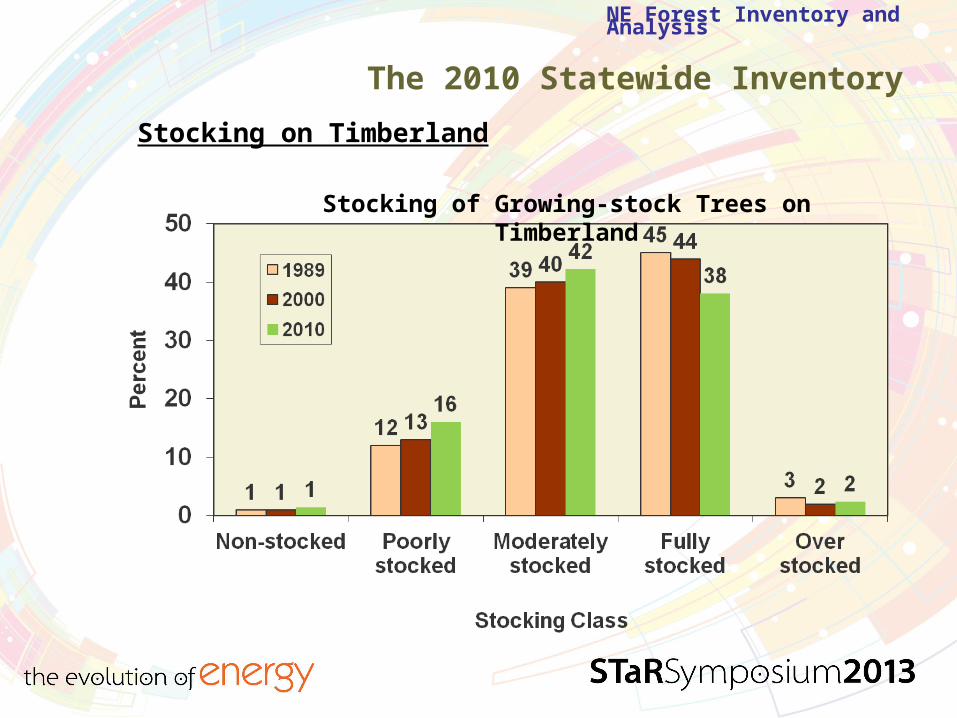
The 2010 Statewide Inventory
Volume of Hardwoods Up in All but Smallest Diameters
NE Forest Inventory and Analysis
Hardwood Growing-stock Volume by Diameter Class and Year

The 2010 Statewide InventoryYellow-poplar Leads in Sawtimber Volume
NE Forest Inventory and Analysis
Board-foot Volume of Top Species
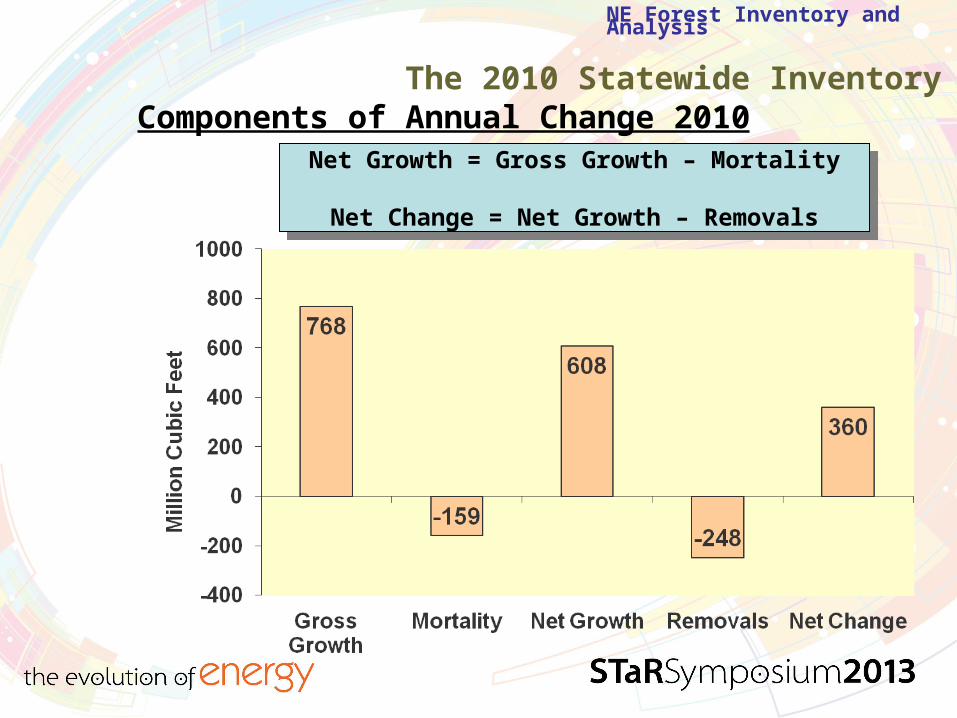
Net Growth = Gross Growth – Mortality
Net Change = Net Growth – Removals
Net Growth = Gross Growth – Mortality
Net Change = Net Growth – Removals
The 2010 Statewide InventoryComponents of Annual Change 2010
NE Forest Inventory and Analysis

The 2010 Statewide Inventory
Average Annual Net Growth and Removals 2000-2010
NE Forest Inventory and Analysis
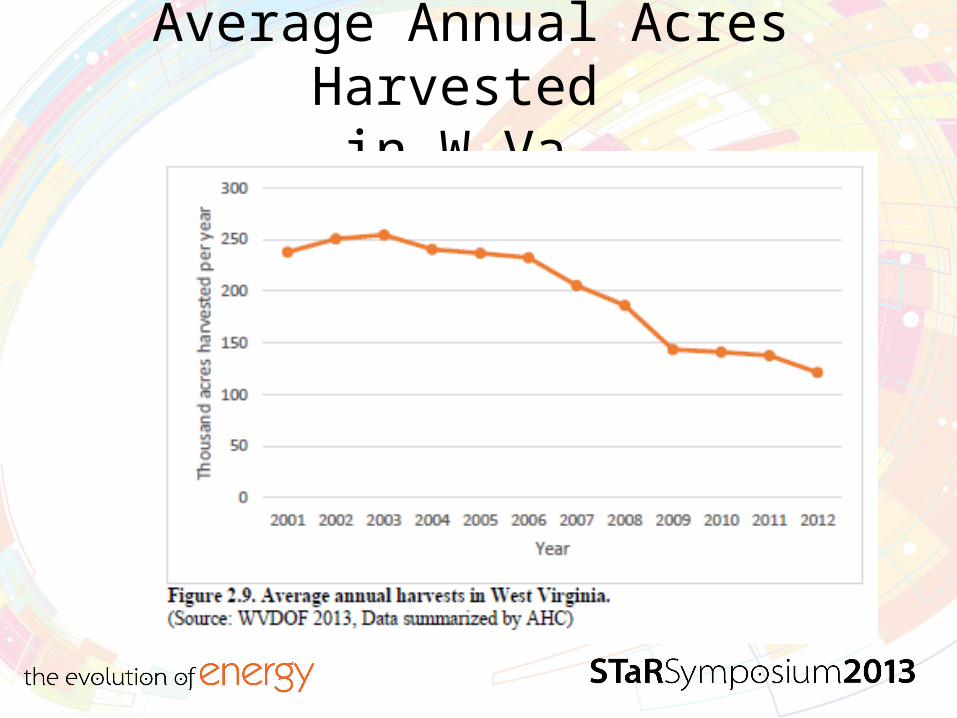
Average Annual Acres Harvested
in W.Va.

Energy Potential
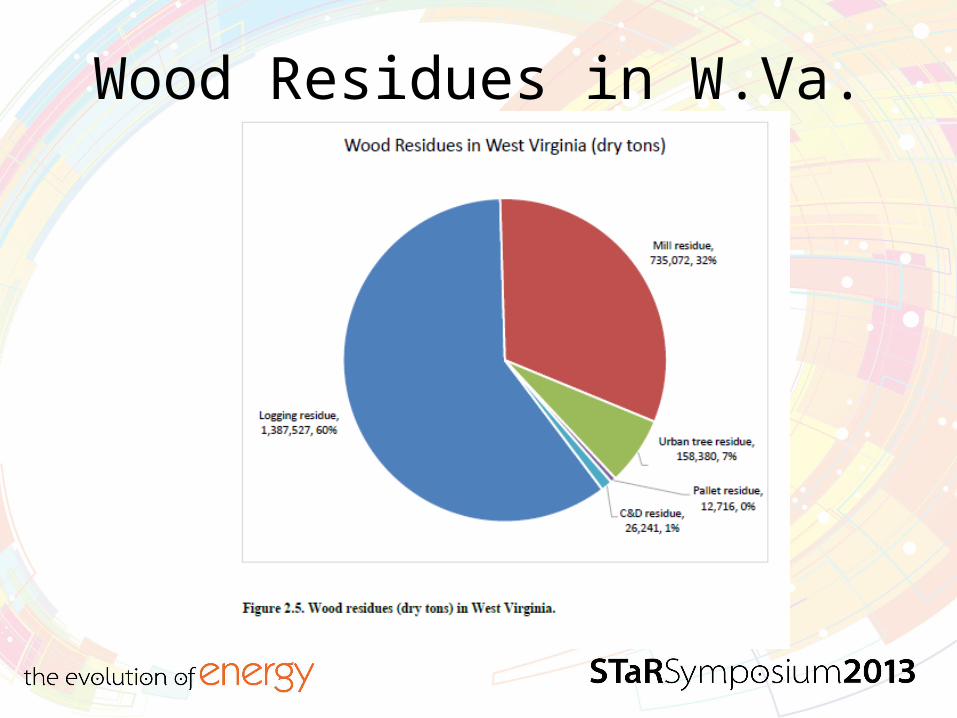
Wood Residues in W.Va.
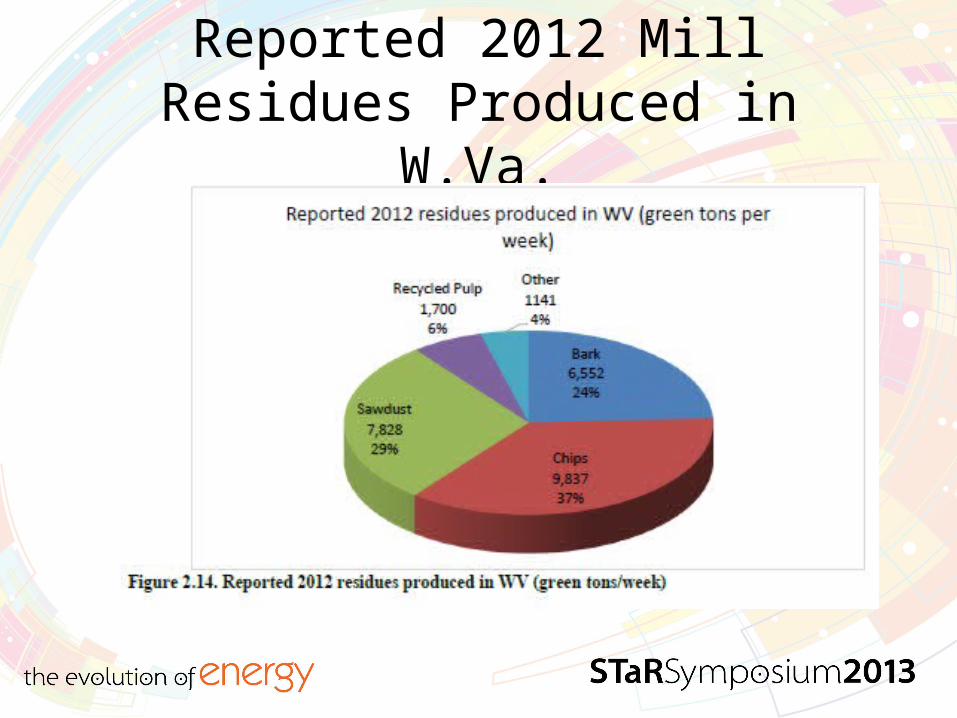
Reported 2012 Mill Residues Produced in W.Va.
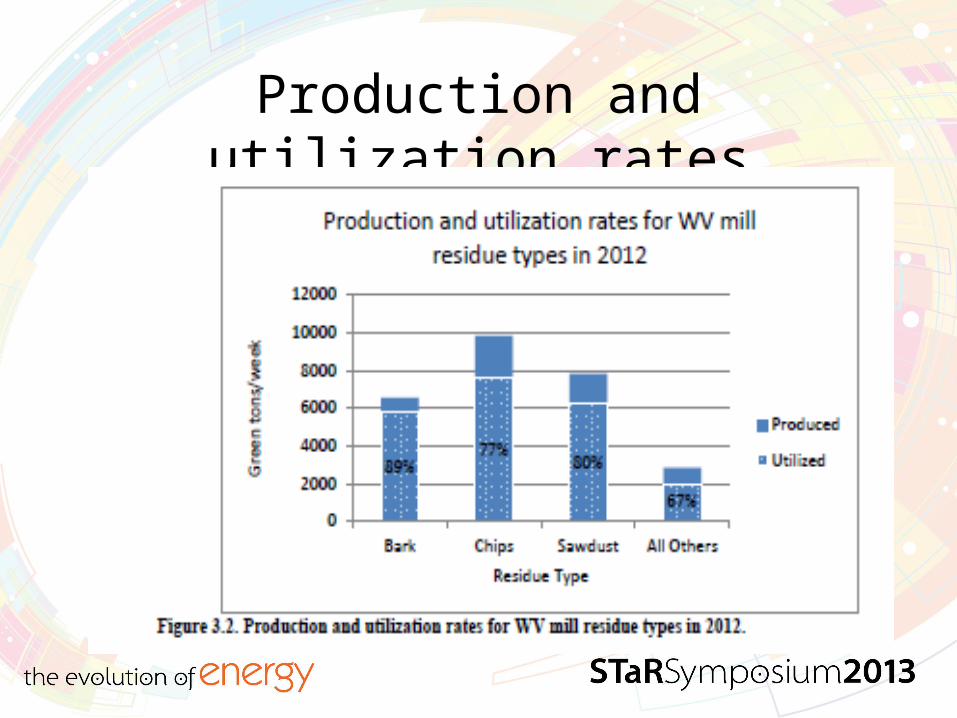
Production and utilization rates

Production and utilization rates

Adaptation to Climate Change

Carbon Sequestration
• WV power plants produce 85 million tons of CO2 annually
• WV forest sequester 72 million tons
• 85% of emissions captured

Forest Management Objectives
• Increase harvest equal to annual growth
• Intensify management activities
• Shorter rotations / Harvest cycles
• Ensure afforestation

Related Documents