Sustainability and quality in the food supply chain. A case study of shipment of edible oils Riccardo Manzini and Riccardo Accorsi Department of Industrial Engineering, Alma Mater Studiorum – Bologna University, Bologna, Italy Ziad Ayyad Department of Agricultural and Food Sciences, Alma Mater Studiorum – Bologna University, Bologna, Italy Alessandra Bendini Department of Agricultural and Food Sciences, and Interdepartmental Centre for Industrial Research in Agri-Food, Alma Mater Studiorum – Bologna University, Bologna, Italy Marco Bortolini Department of Industrial Engineering, Alma Mater Studiorum – Bologna University, Bologna, Italy Mauro Gamberi Department of Management and Engineering, Padua University, Padua, Italy Enrico Valli Interdepartmental Centre for Industrial Research in Agri-Food, Alma Mater Studiorum – Bologna University, Cesena, Italy, and Tullia Gallina Toschi Department of Agricultural and Food Sciences, and Interdepartmental Centre for Industrial Research in Agri-Food, Alma Mater Studiorum – Bologna University, Bologna, Italy Abstract Purpose – Modern supply chains collect and deliver products worldwide and link vendors and consumers over thousands of miles. In the food industry, the quality of products is affected by manufacturing/processing and logistics activities, such as transportation and packaging. Specifically, transportation is likely the most critical step throughout the “food journey” from farm to fork because of the potential stresses that affect the products during shipment and storage activities. The purpose of this paper is to present and apply an original assessment of quality, safety and environmental effects due to the international distribution of food products via different container solutions. A case study that examines the shipment of edible oils from Italy to Canada demonstrates that the quality of a product at the place of consumption can be significantly affected by the use of different containers. The current issue and full text archive of this journal is available at www.emeraldinsight.com/0007-070X.htm Received 22 November 2013 Revised 8 July 2014 Accepted 18 July 2014 British Food Journal Vol. 116 No. 12, 2014 pp. 2069-2090 r Emerald Group Publishing Limited 0007-070X DOI 10.1108/BFJ-11-2013-0338 The authors would like to heartily thank the company Giorgio Gori S.r.l. significantly and fruitfully involved in this study. Especially in the name of Nino Caponi, Riccardo Pazzaglia and Alexander Braun, for their valuable inputs, their support and their willingness to cooperate in this research project about Giorgio Gori (www2.ggori.com/). 2069 Sustainability and quality in the food supply chain

Welcome message from author
This document is posted to help you gain knowledge. Please leave a comment to let me know what you think about it! Share it to your friends and learn new things together.
Transcript

Sustainability and quality in thefood supply chain. A case study
of shipment of edible oilsRiccardo Manzini and Riccardo Accorsi
Department of Industrial Engineering,Alma Mater Studiorum – Bologna University, Bologna, Italy
Ziad AyyadDepartment of Agricultural and Food Sciences,
Alma Mater Studiorum – Bologna University, Bologna, Italy
Alessandra BendiniDepartment of Agricultural and Food Sciences, and Interdepartmental Centre forIndustrial Research in Agri-Food, Alma Mater Studiorum – Bologna University,
Bologna, Italy
Marco BortoliniDepartment of Industrial Engineering,
Alma Mater Studiorum – Bologna University, Bologna, Italy
Mauro GamberiDepartment of Management and Engineering, Padua University, Padua, Italy
Enrico ValliInterdepartmental Centre for Industrial Research in Agri-Food,
Alma Mater Studiorum – Bologna University, Cesena, Italy, and
Tullia Gallina ToschiDepartment of Agricultural and Food Sciences, and Interdepartmental Centre forIndustrial Research in Agri-Food, Alma Mater Studiorum – Bologna University,
Bologna, Italy
Abstract
Purpose – Modern supply chains collect and deliver products worldwide and link vendors andconsumers over thousands of miles. In the food industry, the quality of products is affectedby manufacturing/processing and logistics activities, such as transportation and packaging.Specifically, transportation is likely the most critical step throughout the “food journey” from farmto fork because of the potential stresses that affect the products during shipment and storageactivities. The purpose of this paper is to present and apply an original assessment of quality, safetyand environmental effects due to the international distribution of food products via differentcontainer solutions. A case study that examines the shipment of edible oils from Italy to Canadademonstrates that the quality of a product at the place of consumption can be significantly affectedby the use of different containers.
The current issue and full text archive of this journal is available atwww.emeraldinsight.com/0007-070X.htm
Received 22 November 2013Revised 8 July 2014
Accepted 18 July 2014
British Food JournalVol. 116 No. 12, 2014
pp. 2069-2090r Emerald Group Publishing Limited
0007-070XDOI 10.1108/BFJ-11-2013-0338
The authors would like to heartily thank the company Giorgio Gori S.r.l. significantly andfruitfully involved in this study. Especially in the name of Nino Caponi, Riccardo Pazzaglia andAlexander Braun, for their valuable inputs, their support and their willingness to cooperate inthis research project about Giorgio Gori (www2.ggori.com/).
2069
Sustainabilityand quality in
the food supplychain

Design/methodology/approach – A simulation-based quality assessment, combined with a lifecycle and environmental analysis, supports the logistic manager in the decision-making process inorder to guarantee the highest level of product quality at the place of consumption.Findings – The proposed approach and the illustrated case study demonstrate the importance ofconducting safety and quality assessment combined with environmental analyses of sustainable foodsupply chains.Originality/value – This paper highlights the interdependency of implications and decisions on foodquality and environmental sustainability of supply chain processes and activities.
Keywords Supply chain, Food, Freight container, International shipment,Life cycle assessment (LCA), Edible oil
Paper type Research paper
1. IntroductionGlobal supply chains ship products worldwide by linking vendors and demand overthousands of miles. Consumers can detect the brand and the origin of the productsaccording to the package label, which usually even reports certifications and standards.Despite the amount of data that tags the products, further details that describe theefficiency, quality and impact on the environment of transportation as well as otherlogistic activities have not yet been identified. This information might play a key role inmarketing to affect the purchasing behavior of consumers.
Global food supply chains are expanding to match worldwide seasonal foodproduction and demand, following a trend that is expected to accelerate in the future(Ahumada and Villalobos, 2009; World Bank, 2013). Food specialties will increaseexportation because consumers seek quality, taste, flavor and specific healthy propertiesworldwide.
The quality and taste of food products depend both on harvesting and manufacturing/processing as well as on logistics, transportation and packaging processes (Manzini andAccorsi, 2013). In particular, transportation and packaging are critical issues in the “foodjourney” due to the stressors affecting the shipment and storage activities within the foodsupply chain (FSC). Quality (including customer service level and satisfaction), safety,sustainability and cost efficiency are the main targets of an effective FSC.
This paper aims to present an original assessment of the effects on qualityand further environmental factors of adopting different container solutions tointernationally distribute food products. This analysis is supported by the developmentand application of an original control system, which consists of an on-field monitoringactivity combined with a laboratory simulation process and a chemical and sensorialplan of analysis of the food products that are virtually shipped to the consumers.The methodology and the technological devices that comprise this closed-loop controlsystem are illustrated in Manzini and Accorsi (2013).
Manzini and Accorsi (2013) do not conduct chemical and sensorial analyses of foodproducts in addition to the quality analysis of food products at the place ofconsumption and the environmental assessment due to logistic solutions. The noveltyand principle improvement of this manuscript lies in the inclusion of these analyses.
To this end, a case study of a shipment of edible oils from Italy to Canada isillustrated. The results demonstrate that the quality is significantly affected by the useof a standard (or non-standard) container.
The remainder of the paper is organized as follows. Section 2 presents a review ofthe literature on topics and issues studied in this paper. Section 3 presents the originalmethodology developed, proposed and applied to conduct the proposed jointassessment. Sections 4-6 present the case study, the analyses conducted and the results
2070
BFJ116,12
obtained in the selected international shipment of edible oil packages. Section 7presents and discusses the main conclusions and further research issues.
2. Review of the literatureGlobal supply chains strengthened worldwide transportation trends and encouragescompanies to control more accurately the quality of products during the distributionactivities. Despite the global financial crisis, the top ten exporters of agriculturalproducts in 2011 recorded growth rates of 15 percent or more (World TradeOrganization (WTO), 2012). This growth is partly due to the increase in the prices andthe value of exported food products and the agri-food raw materials. In 2011, China,Japan and the USA recorded the highest percentage increases in food and drinkimports at 27, 23 and 17 percent, respectively, which confirmed the trend over the lastfive years (WTO, 2012).
The increasing trend in the global food distribution highlights new challengesfor shippers, importers and logistic providers. Logistic managers and practitionersdetermine the proper distribution system, the transportation means and the use offreight containers.
Various container systems are available depending on the requirements of theshipped products (i.e. natural, partially air-conditioned or temperature-controlledatmosphere) including ventilated container, refrigerated container and, further, sub-categories, including insulated containers equipped with thermal insulations.
The primary role of each container system is to preserve the cargoes from a widerange of environmental stresses, which can affect the storage, handling and transport aswell as the associated operations. These stresses are classified as follows: static/dynamicmechanical stresses (e.g. vibration and pressure), climatic stresses (e.g. temperature,humidity, dust and ultraviolet light), biotic stresses and chemical stresses (Wild, 2012).
In FSC, the large set of decisions on logistics and operations, including packagingand containment issues, affect not only costs but also the quality of products andprocesses and the level of sustainability and safety of the supply system. These factorshave direct and indirect impacts on the safety, health and well-being of consumers.
These effects motivated this manuscript, whose main goal is to assess the qualityand safety of different edible oils shipped from Italy to Canada in response to theadoption of different container solutions. This analysis is supported by a life cycleassessment (LCA) of the available containment solutions. To further support thesearguments, the authors present a brief discussion of quality and safety issues in FSC,sustainability issues in FSC, and edible oil properties and critical factors.
2.1 Quality, safety and sustainabilityFood deterioration essentially depends on intrinsic and extrinsic factors, such asthe storage temperature, the concentration of oxygen, the relative humidity, the solarradiation, the acidity, the microbial growth, the endogenous enzyme activities, and soon (Alasalvar et al., 2001; Howard et al., 1994; Zhang et al., 2009). The chemicaldeterioration of food is caused by adverse reactions (e.g. oxidation) that affect sensitivecomponents, such as polyphenols, fats, vitamins and flavorings (Xia and Sun, 2002).This process has negative consequences on the quality of food products, e.g. edible oilsand cheeses (Fox et al., 2004; Goff and Hill, 1993).
Consequently, food quality is determined by age and environmental conditions,which depend by the type of packaging, loading method and the availability oftemperature-controlled packages, transportation modes, etc.
2071
Sustainabilityand quality in
the food supplychain

Virgin olive oils are rich in polyphenols (Bendini et al., 2007), which play a favorablerole in preventing cardiovascular disease and delaying cellular aging and death. Thiscontent can be sensitive to physical and environmental stresses.
The packaging and container system play a special role in the determination andcontrol of quality and safety of food products, such as fruits and vegetables (Singhand Xu, 1993), wines (Robinson et al., 2010) fish (Margeirsson et al., 2012), etc.
Temperature is renowned as one of the most critical factors affecting the qualityand the state of conservation of perishable foods. Rodriguez-Bermejo et al. (2007)analyzed maritime shipments by comparing the temperature records tracked withinfreight reefer or standard containers (SCs). This study tests and analyzes differentexperimental conditions, such as cooling modes, the onset of defrosting and twovarying set points.
Several literature studies focussed on the influence of one-parameter stress (such astemperature, humidity, vibrations) on products (Xiang and Eschke, 2004; Chonhenchobet al., 2012; Raghav and Gupta, 2003; Mahajerin and Burgess, 2010). However,contributions that integrate the environmental impacts of food transportation, on-fieldstress monitoring activity, laboratory simulation and chemical analysis of foodproducts at the place of consumption are lacking. Therefore, this paper constitutes anoriginal contribution whose main focus is on container solutions for edible oils.
Carter and Easton (2011) presented a systematic review of the literature on sustainablesupply chain management. They analyzed the evolution of the SCM from a so-called“standalone” approach to a corporate social responsibility (CSR)-based approach.
The literature on operations and management as well as that on food science andtechnology increasingly focussed on original contributions to the environmentalsustainability evaluation of new and existing food products, processes and systems. Inparticular, LCA assesses products and processes along the entire life cycle (LC) from a“cradle to grave” perspective and is based on the analysis of materials and energyflows at each phase of the LC (Institute for Environment and Sustainability (IES) et al.,2010; International Standard Organisation (ISO), 1997, 1998). This approach consistsof four analysis steps:
(1) goal and scope definition;
(2) life cycle inventory (LCI);
(3) life cycle impact assessment; and
(4) the interpretation of the results.
The analysis of the environmental impacts of transportation activities is widelydebated in the literature (Corbett et al., 2009; Chang et al., 2013).
Recent studies conducted on environmental assessment and the LCA of foodproducts, processes and systems are in Poritosh et al. (2009), Savino et al. (2013), Garnett(2013), Pawelzik et al. (2013), Herath et al. (2013) and Virtanen et al. (2011). Wognum et al.(2011) discussed new perspectives and challenges for sustainability in FSC.
2.2 Edible oilsLipolysis and oxidation are the two unavoidable chemical processes during the supplychain that mainly influence and limit the shelf-life of edible oils. The lipolytic rate strictlydepends on the quality of the raw materials (seeds and olives) because endogenous andexogenous lipases may act prior to the extraction of the oil. In the case of olive oils, thisprocess occurs if the fruits are damaged, injured or not well preserved (Boskou, 1996).
2072
BFJ116,12
Oxidation occurs mainly during extraction and storage (Morales and Przybylski,2000). Lipid oxidation involves the interaction of fatty acids in triacylglyceridestructure with molecular oxygen, giving rise, by a free radical mechanism, to theformation of hydroperoxides. These latter are unstable primary compounds thatdecompose to produce several secondary oxidation compounds, such as volatile andnon-volatile products. In particular, adehydic molecules are responsible for negativeeffects on the sensorial properties of the oils due to the development of a rancid flavor(Frankel, 1991; Gallina Toschi et al., 1997).
Temperature, which is the most varying environmental parameter throughout aglobal distribution chain, is one of the key factors that affects the rate of the oxidationprocess (Frankel, 1991). Temperature has harmful effects on the oxidation stability ofedible oils. Indeed, the proper storage temperature for edible oils is between 10 and 181C.In particular, the optimal condition for olive oil is 14-151C (Piscopo and Poiana, 2012).
The increase in the temperature during storage for long time could promoteautoxidation of oils and speeds the decomposition rate of hydroperoxides, since therate of the reaction increases exponentially with the temperature (Bendini et al., 2009).Such a result is obtained by G�omez-Alonso et al. (2004), by performing a kinetic studyof the autoxidation in olive oils subjected to different temperatures (25, 40, 50, 60 and751C) during storage in darkness.
Nevertheless, very low temperatures (such as freezing) may negatively alter somemicro-components (phenolic compounds) and the physical characteristics of olive oil(mainly due to the crystallization of triacylglicerols and waxes) (Bendini et al., 2007).Moreover, a loss of oxidation stability and a decrease in sensorial quality may occur asa result of temperature variations, such as freezing and defrosting (Bendini et al., 2007).
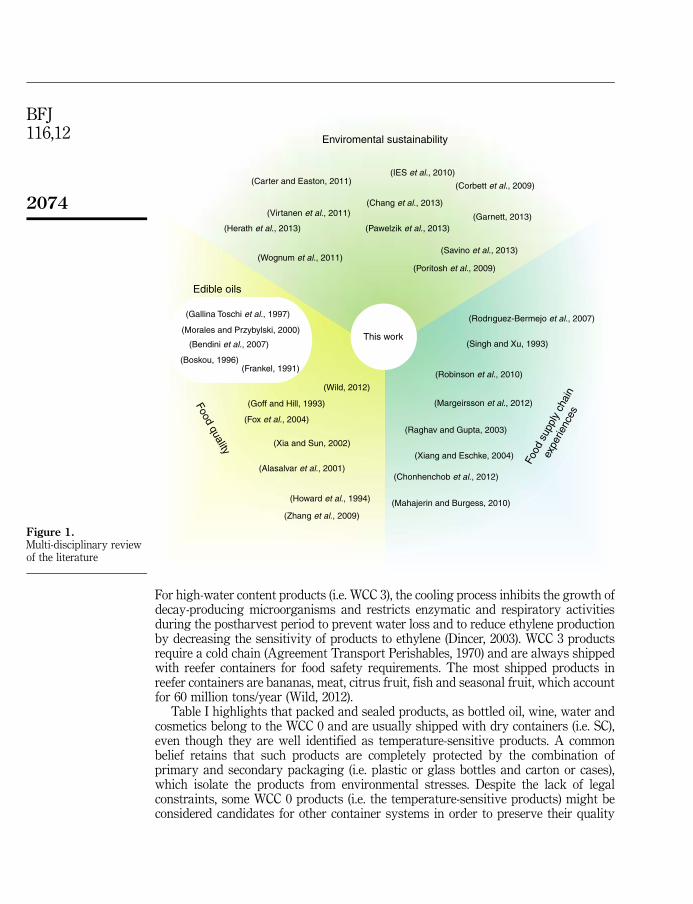
The literature overview summarized in Figure 1 highlights the multi-disciplinaryapproach adopted in this work, which integrates quality and safety aspects of foodafter supply chain operations combined with an evaluation of effects of packaging andcontainer solutions on environmental factors. Specifically, this paper focusses on aninternational edible oil supply chain and applies a multi-disciplinary methodology tostudy the impacts of the logistic activities on the food LC over quality andenvironmental criteria.
3. MethodologyThe adopted methodology evaluates the performance of an international shipmentwith a focus on the quality of the food product and the environmental sustainability ofthe packaging solution through a chemical and sensorial evaluation of the products.This analysis integrates the LCA methodology to evaluate the environmental effectsof alternative shipping containers.
3.1 Container systemsThe paper examines temperature-sensitive products that are not recognized as perishablesby law. These products are usually shipped with reefer or controlled atmospherecontainers. They are sometimes shipped with dry containers equipped with a wide varietyof insulating materials (Singh et al., 2012). The choice of the system container depends onthe limitations of the classification of products set forth by law. The transportationrequirements are largely determined by the water content of the product and its resultinginteraction with the environment humidity and temperature (Isengard, 2009). The watercontent of a product is the percentage of water on the total mass. Goods are classifiedaccording to the water content classes (WCC) (Wild, 2012) reported in Table I.
2073
Sustainabilityand quality in
the food supplychain
For high-water content products (i.e. WCC 3), the cooling process inhibits the growth ofdecay-producing microorganisms and restricts enzymatic and respiratory activitiesduring the postharvest period to prevent water loss and to reduce ethylene productionby decreasing the sensitivity of products to ethylene (Dincer, 2003). WCC 3 productsrequire a cold chain (Agreement Transport Perishables, 1970) and are always shippedwith reefer containers for food safety requirements. The most shipped products inreefer containers are bananas, meat, citrus fruit, fish and seasonal fruit, which accountfor 60 million tons/year (Wild, 2012).
Table I highlights that packed and sealed products, as bottled oil, wine, water andcosmetics belong to the WCC 0 and are usually shipped with dry containers (i.e. SC),even though they are well identified as temperature-sensitive products. A commonbelief retains that such products are completely protected by the combination ofprimary and secondary packaging (i.e. plastic or glass bottles and carton or cases),which isolate the products from environmental stresses. Despite the lack of legalconstraints, some WCC 0 products (i.e. the temperature-sensitive products) might beconsidered candidates for other container systems in order to preserve their quality
Enviromental sustainability
(Carter and Easton, 2011)(IES et al., 2010)
(Corbett et al., 2009)
(Chang et al., 2013)
(Wognum et al., 2011)(Poritosh et al., 2009)
(Savino et al., 2013)
(Garnett, 2013)(Pawelzik et al., 2013)(Herath et al., 2013)
(Virtanen et al., 2011)
Food quality
(Zhang et al., 2009)
(Alasalvar et al., 2001)
Edible oils
(Xia and Sun, 2002)
(Fox et al., 2004)
(Goff and Hill, 1993)
(Bendini et al., 2007)
(Boskou, 1996)
(Morales and Przybylski, 2000)
(Frankel, 1991)
(Gallina Toschi et al., 1997)
(Wild, 2012)
(Howard et al., 1994)
(Singh and Xu, 1993)
(Robinson et al., 2010)
(Margeirsson et al., 2012)
(Rodrıguez-Bermejo et al., 2007)
(Mahajerin and Burgess, 2010)
(Xiang and Eschke, 2004)
(Chonhenchob et al., 2012)
(Raghav and Gupta, 2003)
Food
sup
ply
chai
n
expe
rienc
es
This work
Figure 1.Multi-disciplinary reviewof the literature
2074
BFJ116,12

WC
CW
CD
escr
ipti
onS
tora
ge
tem
per
atu
reC
onta
iner
Pro
du
ctca
teg
ory
Ex
amp
le
WC
C0
0P
rod
uct
sco
nta
inin
gn
ow
ater
5-251C
Sta
nd
ard
con
tain
erB
ulk
con
tain
erR
awm
ater
ial
Bev
erag
eH
ealt
hca
reG
ener
alg
ood
Met
alC
eram
icP
last
icG
lass
Bot
tled
win
eB
ottl
edoi
lB
ottl
edw
ater
Cos
met
ics
Tex
tile
WC
C1
0-1.
5%P
rod
uct
sco
nta
inin
ga
litt
lew
ater
5-251C
Sta
nd
ard
con
tain
erB
ulk
con
tain
erV
enti
late
dco
nta
iner
Ag
ricu
ltu
ral
raw
mat
eria
lS
pic
es
Su
gar
Coc
oaS
alt
Fer
tliz
er
WC
C2
1.5-
30%
Pro
du
cts
wit
hp
oor
wat
erco
nte
nt.
Wat
eris
rem
oved
by
nat
ura
lor
arti
fcia
ld
ryin
g
5-151C
Sta
nd
ard
con
tain
erB
ulk
con
tain
erV
enti
late
dco
nta
iner
Raw
mat
eria
lL
ux
ury
pro
du
ctA
nim
alra
wm
ater
ial
Pap
er
Coa
lF
lav
our
Woo
dF
iber
sC
hoc
olat
e
WC
C3
430
%P
rod
uct
sw
ith
hig
hw
ater
con
ten
t0-
41C
/-201C
Ree
fer
con
tain
erP
eris
hab
les
Fro
zen
pro
du
ctF
ruit
Fis
hV
eget
able
sM
eat
Dai
ry
Table I.Classification of product
categories according to theWC and the system
container
2075
Sustainabilityand quality in
the food supplychain

during transportation and supply chain operations. The literature widely discusses theneed to change regulations and standards, which assign new categories of products toa specific container system (Panozzo and Cortella, 2008). For example, beveragesrequire a particular temperature, humidity and ventilation conditions because oftemperature-determined physical changes, such as ice expansion rupture or thermaldilatation. High humidity and temperature fluctuations can affect the product in termsof shelf-life reduction and/or packaging spoilage.
Table I illustrates the proper temperature range for the conservation of each productcategory. It reports that a range of 5-201C is deemed optimal for beverages (Wild, 2012),and the choice of the container system can range over a wide set of alternatives.
Given a particular product category, many alternative container solutions are usedto transport products, which results in widely different energy requirements andrelated greenhouse gas (GHG) emission profiles. This study suggests involvinga multi-criteria perspective to determine the container system for long-range shipmentsthat merges the concerns of the consumer (i.e. the quality of products) of supply chainactors (i.e. revenue) and of environment.
Three main container systems for food packages are:
. SC. Also known as general-purpose containers, dry cargo containers or boxcontainers. SCs are typically sized at 20-foot equivalent units (FEU) (i.e. 6.10meters long and 2.44 meters wide) and the 40-foot equivalent units (FEU) size(Singh et al., 2012).
. Reefer container. This container is equipped with its own refrigeration unit,which normally relies on a three-phase electrical power supply that enables coldair to flow through and around the goods in the container.
. Insulated container. This category consists of generic SCs that are equipped witha thermal insulating liner. Section 4 illustrates the liner adopted by the casestudy discussed in this paper.
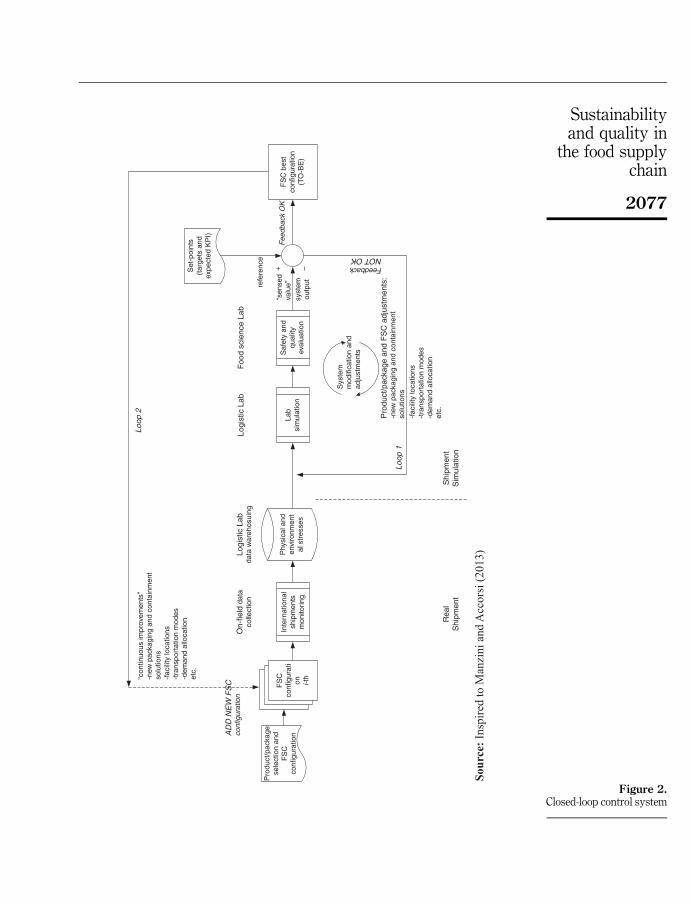
3.2 Monitoring and simulationThe quality, safety and environmental assessment in this study are supported by thedevelopment and application of a proactive ex-post and closed-loop control system.It takes inspiration from the control system presented by Manzini and Accorsi (2013)and introduces the so-called “safety and quality evaluation” phase.
This system consists of two main blocks (see Figure 2): the “monitoring block” andthe “simulator block.” The aim of the first block is to measure the physical andenvironmental conditions during the distribution activities.
The second block is the so-called simulation system (see the “Lab simulation” task inFigure 2). This climate room simulator virtually simulates the monitored physical andenvironmental stresses, e.g. time-dependent temperature variability, to measure the effectsof logistic activities and intercontinental shipments. This simulation activity gives theanalyst the opportunity to investigate the status of the quality and safety of a foodproduct at the place of consumption even, if it is located far from the production site.
The closed loop system illustrated in Figure 1 is based on two different loops.The first loop addresses the laboratory chemical and sensorial analyses. Thesimulation activity gives the decision-maker the opportunity to measure the effects ofdifferent logistic decisions in a what-if laboratory environment. The so-called “sensedvalues,” i.e. the output of the simulation run (task 2) followed by a chemical and
2076
BFJ116,12
Pro
duct
/pac
kage
sele
ctio
n an
dF
SC
conf
igur
atio
n
FS
Cco
nfig
urat
ion i-t
h
Inte
rnat
iona
lsh
ipm
ents
mon
itorin
g
Lab
sim
ulat
ion
Phy
sica
l and
envi
ronm
ent
al s
tres
ses
Set
-poi
nts
(tar
gets
and
expe
cted
KP
I)
+ –
Sys
tem
mod
ifica
tion
and
adju
stm
ents
FeedbackNOT OK
refe
renc
e
FS
C b
est
conf
igur
atio
n(T
O-B
E)
Fee
dbac
k O
K
AD
D N
EW
FS
Cco
nfig
urat
ion
Loop
1
Loop
2“c
ontin
uous
impr
ovem
ents
”-n
ew p
acka
ging
and
con
tain
men
tso
lutio
ns-f
acili
ty lo
catio
ns-t
rans
port
atio
n m
odes
-dem
and
allo
catio
net
c.
“sen
sed
valu
e”sy
stem
outp
ut
Saf
ety
and
qual
ityev
alua
tion
On-
field
dat
aco
llect
ion
Logi
stic
Lab
data
war
ehos
uing
Logi
stic
Lab
Foo
d sc
ienc
e La
b
Pro
duct
/pac
kage
and
FS
C a
djus
tmen
ts:
-new
pac
kagi
ng a
nd c
onta
inm
ent
solu
tions
-fac
ility
loca
tions
-tra
nspo
rtat
ion
mod
es-d
eman
d al
loca
tion
etc.
Shi
pmen
tS
imul
atio
nR
eal
Shi
pmen
t
Sour
ce: I
nspi
red
to M
anzi
ni a
nd A
ccor
si (2
013)
Figure 2.Closed-loop control system
2077
Sustainabilityand quality in
the food supplychain
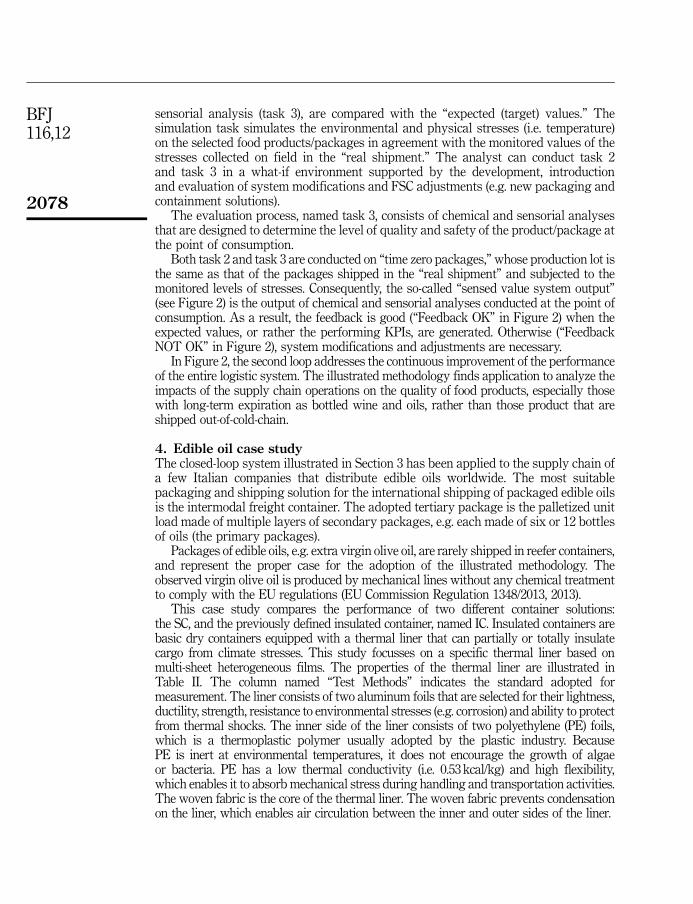
sensorial analysis (task 3), are compared with the “expected (target) values.” Thesimulation task simulates the environmental and physical stresses (i.e. temperature)on the selected food products/packages in agreement with the monitored values of thestresses collected on field in the “real shipment.” The analyst can conduct task 2and task 3 in a what-if environment supported by the development, introductionand evaluation of system modifications and FSC adjustments (e.g. new packaging andcontainment solutions).
The evaluation process, named task 3, consists of chemical and sensorial analysesthat are designed to determine the level of quality and safety of the product/package atthe point of consumption.
Both task 2 and task 3 are conducted on “time zero packages,” whose production lot isthe same as that of the packages shipped in the “real shipment” and subjected to themonitored levels of stresses. Consequently, the so-called “sensed value system output”(see Figure 2) is the output of chemical and sensorial analyses conducted at the point ofconsumption. As a result, the feedback is good (“Feedback OK” in Figure 2) when theexpected values, or rather the performing KPIs, are generated. Otherwise (“FeedbackNOT OK” in Figure 2), system modifications and adjustments are necessary.
In Figure 2, the second loop addresses the continuous improvement of the performanceof the entire logistic system. The illustrated methodology finds application to analyze theimpacts of the supply chain operations on the quality of food products, especially thosewith long-term expiration as bottled wine and oils, rather than those product that areshipped out-of-cold-chain.
4. Edible oil case studyThe closed-loop system illustrated in Section 3 has been applied to the supply chain ofa few Italian companies that distribute edible oils worldwide. The most suitablepackaging and shipping solution for the international shipping of packaged edible oilsis the intermodal freight container. The adopted tertiary package is the palletized unitload made of multiple layers of secondary packages, e.g. each made of six or 12 bottlesof oils (the primary packages).
Packages of edible oils, e.g. extra virgin olive oil, are rarely shipped in reefer containers,and represent the proper case for the adoption of the illustrated methodology. Theobserved virgin olive oil is produced by mechanical lines without any chemical treatmentto comply with the EU regulations (EU Commission Regulation 1348/2013, 2013).
This case study compares the performance of two different container solutions:the SC, and the previously defined insulated container, named IC. Insulated containers arebasic dry containers equipped with a thermal liner that can partially or totally insulatecargo from climate stresses. This study focusses on a specific thermal liner based onmulti-sheet heterogeneous films. The properties of the thermal liner are illustrated inTable II. The column named “Test Methods” indicates the standard adopted formeasurement. The liner consists of two aluminum foils that are selected for their lightness,ductility, strength, resistance to environmental stresses (e.g. corrosion) and ability to protectfrom thermal shocks. The inner side of the liner consists of two polyethylene (PE) foils,which is a thermoplastic polymer usually adopted by the plastic industry. BecausePE is inert at environmental temperatures, it does not encourage the growth of algaeor bacteria. PE has a low thermal conductivity (i.e. 0.53 kcal/kg) and high flexibility,which enables it to absorb mechanical stress during handling and transportation activities.The woven fabric is the core of the thermal liner. The woven fabric prevents condensationon the liner, which enables air circulation between the inner and outer sides of the liner.
2078
BFJ116,12
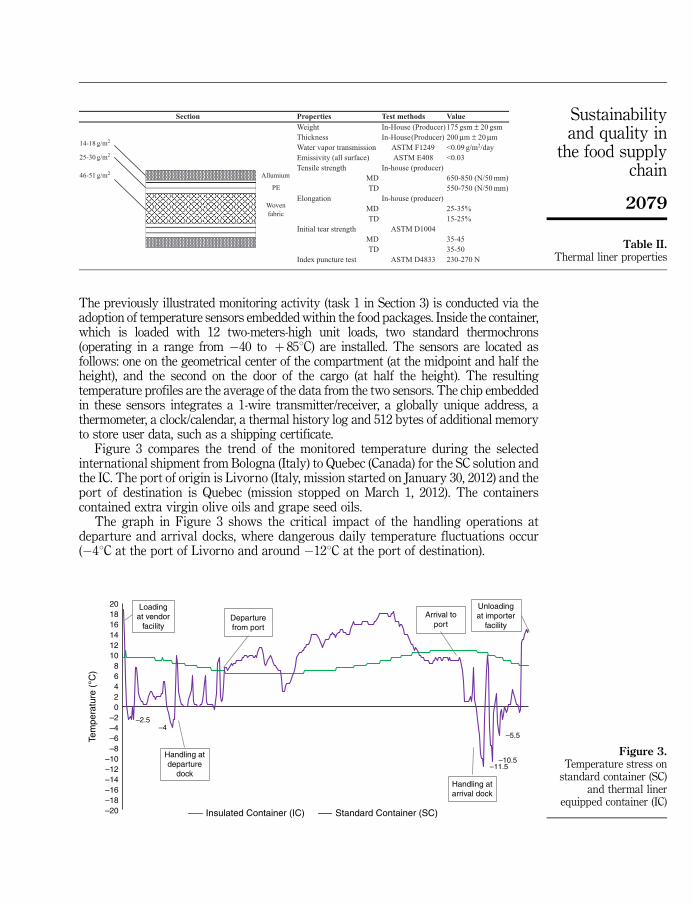
The previously illustrated monitoring activity (task 1 in Section 3) is conducted via theadoption of temperature sensors embedded within the food packages. Inside the container,which is loaded with 12 two-meters-high unit loads, two standard thermochrons(operating in a range from �40 to þ 851C) are installed. The sensors are located asfollows: one on the geometrical center of the compartment (at the midpoint and half theheight), and the second on the door of the cargo (at half the height). The resultingtemperature profiles are the average of the data from the two sensors. The chip embeddedin these sensors integrates a 1-wire transmitter/receiver, a globally unique address, athermometer, a clock/calendar, a thermal history log and 512 bytes of additional memoryto store user data, such as a shipping certificate.
Figure 3 compares the trend of the monitored temperature during the selectedinternational shipment from Bologna (Italy) to Quebec (Canada) for the SC solution andthe IC. The port of origin is Livorno (Italy, mission started on January 30, 2012) and theport of destination is Quebec (mission stopped on March 1, 2012). The containerscontained extra virgin olive oils and grape seed oils.
The graph in Figure 3 shows the critical impact of the handling operations atdeparture and arrival docks, where dangerous daily temperature fluctuations occur(�41C at the port of Livorno and around �121C at the port of destination).
–2.5–4
–11.5–10.5
–5.5
–20–18–16–14–12–10–8–6–4–202468
101214161820
Tem
pera
ture
(°C
)
Insulated Container (IC) Standard Container (SC)
Loadingat vendor
facility
Handling atdeparture
dock
Departurefrom port
Arrival toport
Handling atarrival dock
Unloadingat importer
facility
Figure 3.Temperature stress on
standard container (SC)and thermal liner
equipped container (IC)
Section Properties Test methods ValueWeight In-House (Producer)175 gsm ± 20 gsmThickness In-House(Producer) 200 µm ± 20 µmWater vapor transmission ASTM F1249 <0.09 g/m2/dayEmissivity (all surface) ASTM E408 <0.03Tensile strength In-house (producer)
MD 650-850 (N/50 mm)TD 550-750 (N/50 mm)
Elongation In-house (producer)MD 25-35%TD 15-25%
Initial tear strength ASTM D1004MD 35-45TD 35-50
Index puncture test ASTM D4833 230-270 N
14-18 g/m2
25-30 g/m2
46-51 g/m2 Allumium
PE
Woven fabric
Table II.Thermal liner properties
2079
Sustainabilityand quality in
the food supplychain
The time spent at port docks is critic for the environmental conditions experienced bycontainers, and unfortunately this time is often not under direct control of neitherlogistic providers (i.e. carriers), nor of importers.
4.1 Samples and notationsThree samples of commercial extra virgin olive oils (respectively named S1, S2 and S3),one sample of refined grape seed oil (S4) and one sample of refined rice oil (S5) traveledfrom Italy to Canada. The samples are analyzed after the two different simulationsruns: the samples virtually traveled from Italy to Canada within ICs or SCs. Anon-simulated sample (named NS) is also analyzed for each type of oil. The non-simulated benchmarking samples are stored at 121C and in absence of light (in a darkplace) before they are analyzed.
4.2 Chemical and sensorial analysesA brief discussion of the typology of analyses conducted on the selected simulatedand NSs of edible oils is reported. The obtained results are reported in comparativeand qualitative tables. The list of conducted analyses are grouped in the followingsubsections.
4.2.1 Chemical analyses. Free acidity (FA), which is an important parameter todetermine the hydrolytic progress of triglyceride in edible oils, peroxide value (PV), whichshows the development of primary oxidation compounds (hydro-peroxides) in edible oilsand UVabsorption indexes (K232, K270), that indicate the primary and secondary oxidationproducts in olive oils were evaluated in the analyzed samples. These parameters arecomputed according to the official methods described in European CommunityCommission Regulation 2568/91. For samples S4 and S5, the FA values obtained by theofficial method (and expressed as g oleic acid in 100 g of oil) are converted to mg KOH/g ofoil in order to standardize and compare the results with the limits reported by the CodexAlimentarius for vegetable oils (Codex-Stan 210). The thiobarbituric acid reactantsubstances content is a measure of the secondary oxidation products of edible oils(thiobarbituric acid reactant (TBARs), mg of malonaldehyde, eq kg�1 oil) complied withthe AOCS Official Method Cd 19-90 (2006). The oxidation stability test values (OSI),determined at 901C, are expressed in hours (Maggio et al., 2011). The total phenolic (TP)compounds, which represent the main antioxidant fraction found in olive oils expressedas mg of gallic acid kg�1 oil, respond to Pirisi et al. (2000) and are evaluated at 750 nm(Singleton and Rossi, 1965). The FA values strictly depend on the quality of the rawmaterials (olives, seeds), while PV, UV absorption indices (K232, K270), the TBARssubstances content and OSI are important indices for evaluating the oxidative status ofthe oils. The TP compounds are related to the quality of extra virgin olive oil becauseof their antioxidant activity and healthy properties (Bendini et al., 2007). A trial campaignof three replicates has been performed for each sample.
4.2.2 Sensory analysis. A sensory analysis of all the EVOOs (S1, S2 and S3) isperformed according to the European Community, Commission Regulation (640/2008),(2008) by a fully trained group of 8 expert tasters. Sensory analysis is an essential toolfor determining the commercial categories of oils obtained from olives, together withchemical parameters. The median and the robust standard deviation EuropeanCommunity, Commission Regulation (640/2008), (2008) are calculated for each attribute.If the value of the robust standard deviation exceeded 20 percent, the sensory analysis isrepeated. Moreover, the analyses applied a triangle test that consisted of a standardizedsensorial procedure (ISO, 2004) for determining perceptible differences or similarities
2080
BFJ116,12

between two samples. In this case, the analysis shows the differences between thenon-simulated EVOOs (NS) and the respective simulated samples (both SC and IC).
For the adequate interpretation of the results, an analysis of variance are performedwith XLSTAT 7.5.2 (Addinsoft, NY, USA) at a 95 percent confidence level (Fisher LSD,po0.05) and Three replications were performed for each sample.
5. Quality and safety assessmentTable III reports the results obtained for the performance comparison of the SCsand the ICs in terms of chemical parameters that are linked to the quality and theoxidative status of samples S1, S2 and S3 (commercial extra virgin olive oils). Given ageneric chemical metrics (e.g. acidity, phenolic content, etc.), a value of 0 indicatesthat the performance of the SC and the IC does not differ; þ 1 indicates that the ICperformed significantly better than the SC solution in terms of the selectedperformance category, while �1 indicates that the SC performed better. Table IV refersto samples S4 and S5.
In general, the detailed results show a significant decrease in the chemical quality ofall the edible oils because of the stress of temperature applied during the simulations.This loss is higher for the simulation in a SC than in an insulated container, asexplained by the multiple reported analytical parameters. In particular, the IC solutionhas a significantly more protective effect than the SC solution in terms of the FA values(samples 2 and 5), PVs (samples 1 and 2), oxidative stability indices (samples 3 and 4),
FA PV TBARs OSI
S4 0 0 0 1S5 1 �1 0 0
Table IV.Free acidity (FA, mg KOH
g�1 oil), peroxide value(PV, meq of active oxygen
kg�1 oil), thiobarbituricacid reactant substances
content (TBARs, mg ofmalonaldehyde eq kg�1
oil), oxidation stabilityindex (OSI, hours),
analyzed for grape seed oil(S4) and rice bran oil (S5)
FA PV K232 K270 OSI TP TBARs
S1 0 1 0 0 0 0 0S2 1 1 0 0 0 1 1S3 �1 0 0 0 1 �1 0
Table III.Free acidity (FA, % oleic
acid), peroxide value(PV, meq of active oxygen
kg�1 oil), UV absorptionindexes (K232 and K270,
specific extinctions at dieneand triene UV zones),
oxidation stability index(OSI, hours), total amount
of phenolic compound(TP, mg gallic acid kg�1
oil), thiobarbituric acidreactant substances
content (TBARs, mg ofmalonaldehyde eq kg�1 oil)
2081
Sustainabilityand quality in
the food supplychain

total phenols (sample 2) and TBARs (sample 2) (see Tables III and IV). The generaltrends of the obtained results per each chemical parameter present rare exceptions (e.g.FA for sample 3) that deserve further compositional analysis on triacylglycerols,particularly involved in the crystallization process at low temperature.
If the chemical analyses would support the adoption of the IC solution for itsprotective effects, no significant variations on the resulting intensities of the positivesensorial attributes of fruitiness, bitterness and pungency are observed among thesimulated and not simulated extra virgin olive oil samples; moreover, no sensorialdefects are evidenced. Two are the reasonable arguments to motivate such resultsof the sensorial analysis. The former is that the samples show light intensity of thepositive sensorial attributes before the simulation, so their natural decrease along theproduct shelf-life can be only slightly evidenced. The latter is the nature of the thermalstress experienced by the products in the simulated shipment: the low temperaturesprofiles experiences by the products (see Figure 2) did not occur the appearance of ranciddefect, which are consequences of the exposure to high temperatures. Sensorial attributesare in fact more sensible to high temperature, than to low temperature, as far as heataccelerates the oxidation process. Conversely, storage at low and stable temperatures(6-111C, see IC in Figure 2) may avoid significant changes in the chemical and sensoryparameters of edible oils, especially verified for extra virgin olive oils (Li et al., in press).
6. Environmental assessmentThe LCA methodology quantifies the environmental and health impacts and theresource depletion issues that are associated with the entire LC of products and/orprocesses (IES et al., 2010). This methodology is applied to the alternative containersystems compared in this paper.
For the IC system, this analysis considers the whole LC of the thermal insulatingliner, including the materials and the processes from manufacturing to the finaldisposal. A set of hypotheses are adopted for each phase of the LC in accordance withthe general rules and standard guidelines. The benchmark of the analysis consists ofthe evaluation of the environmental impacts generated by a traditional shipment by SCin a typical vessel.
6.1 Goal definition and functional unit (FU)The proposed study compares the environmental impact of the two alternativeshipping containers adopted for a specific shipment from Italy to Canada. Thisshipment represents the so-called FU of the analysis. Any explored environmentalimpacts refer to the FU and are thus accordingly normalized and scaled.
6.2 Impact categoriesThe Environmental Product Declaration (2007) is adopted to compute the environmentalimpact. The EPD standard reports a set of impact categories, such as the equivalentCarbon dioxide equivalent (CO2eq), as a metric of global warming potential to 100 years(GWP100), the gross calorific values, also referred to as the higher heating values,the GHGs, the ozone-depleting gases, the acidifying compounds, the gases creatingground-level ozone (photochemical ozone creation) and the eutrophicating compounds.These impact categories are evaluated for a defined population, system or activityby considering all relevant sources, sinks and storage solutions within the spatialand temporal boundaries of the population, system or activity of interest (Wrightet al., 2011).
2082
BFJ116,12

6.3 BoundariesFigure 4 highlights the boundaries of the LCA methodologies and remarks theenvironmental cost driver considered for the comparative analysis: the thermal linerLC (i.e. manufacturing, use and disposal) for the IC solution is the “additional” impactin comparison with the SC.
In particular, the light blue blocks represent the manufacturing and assemblingprocesses for the SC. The IC results by the assembling of a SC with the thermal insulatingliner. The light green blocks represent the IC LC from the manufacturing of the liner to itsdisposal. The environmental impacts of the IC LC are computed by a differential analysiswith respect to the benchmark. The FU of the analysis is one shipment (i.e. s¼ 1 inFigure 4) that includes the whole LC of the liner from cradle-to-grave, while the impacts forthe containers LC until its disposal (i.e. 1ospsd in Figure 4) are not accounted.
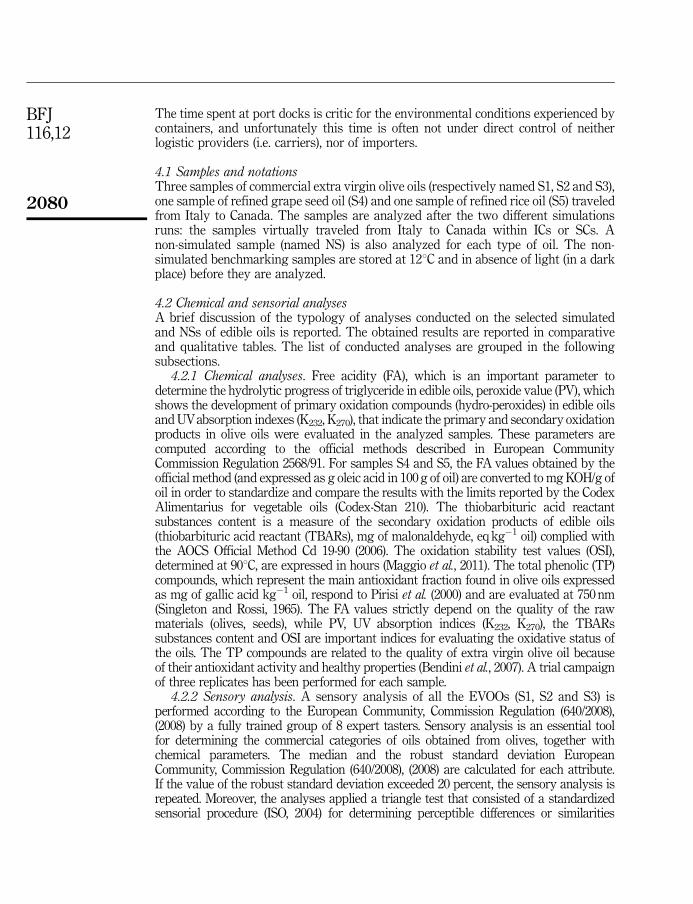
A TEU container is considered for the analysis. This container measures 6.1 meterslong and 2.4 meters wide, with an average load capacity between 15 and 22 tons. Thesize of the container determines the quantity of the insulating liner necessary to equipone shipment. This quantity is split into fractions for each of the liner components (i.e.aluminum foil, PE foil and woven fabric). A TEU container carries about 18 tons ofproducts (i.e. oil bottles, cartons and pallets) for a total weight of 20 tons. The dataobtained from the liner material, production and disposal activities creates the LCIfor the SimaPro 7.1 software analysis by the EPD standard. Table V reports thecomparison between the IC and SC solutions over the aforementioned environmentalimpacts. For the observed FU, the IC presents a higher load due to the thermal liner,and accounts the impacts for its raw material supply, assembling and disposal. Given ageneric impact category, the column percent indicates the variance in percentage of theIC in comparison with the SC.
The insulating manufacturing processes are the raw materials (i.e. aluminum, PE,woven fabric) treatments and the thermoforming process composes the three materialsinto a unique foil. In the comparison, the vessel shipment does not represent a significantphase for the alternative containers, because the liner weight (i.e. approximately 8 kg) isnegligible compared to the overall shipped load (i.e. 20 tons).
The insulating liner disposal step, which occurs after each shipment, consistsof the transportation of waste to treatment sites and the end-of-life treatments.The former cost driver refers to the standard process provided by Ecoinvent databank(2010), while the latter considers the complete recycling of aluminum as well as the landfilling (i.e. 50 percent) and incineration (i.e. 50 percent) of the remained fraction.
Table V highlights the influence of the adoption of the IC solution on the globalwarming potential and the exploitation of non-renewable fossil sources, which representimpact increases of 16 and 17 percent, respectively, compared to the SC solution.
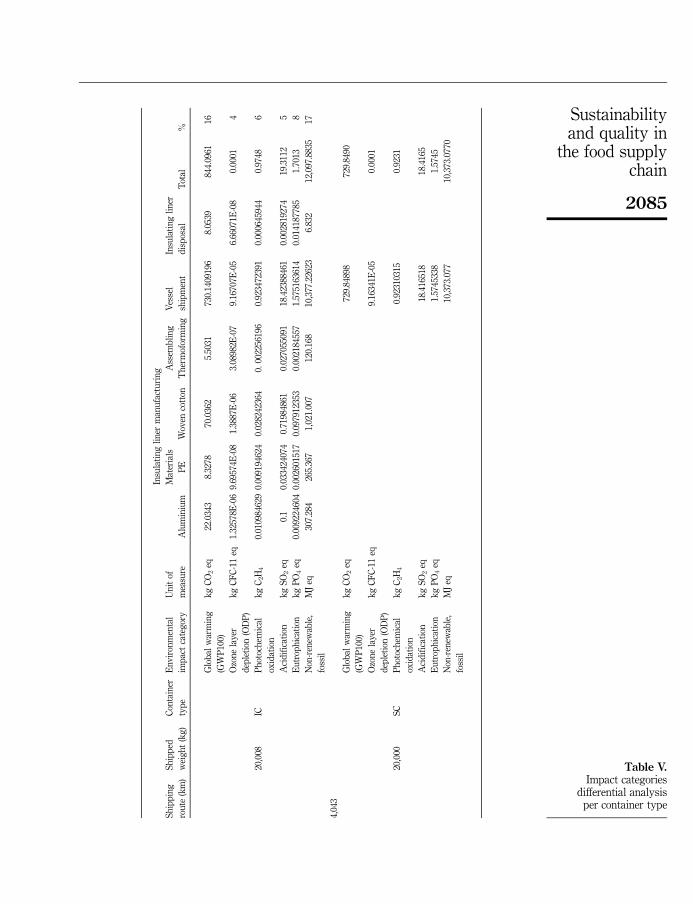
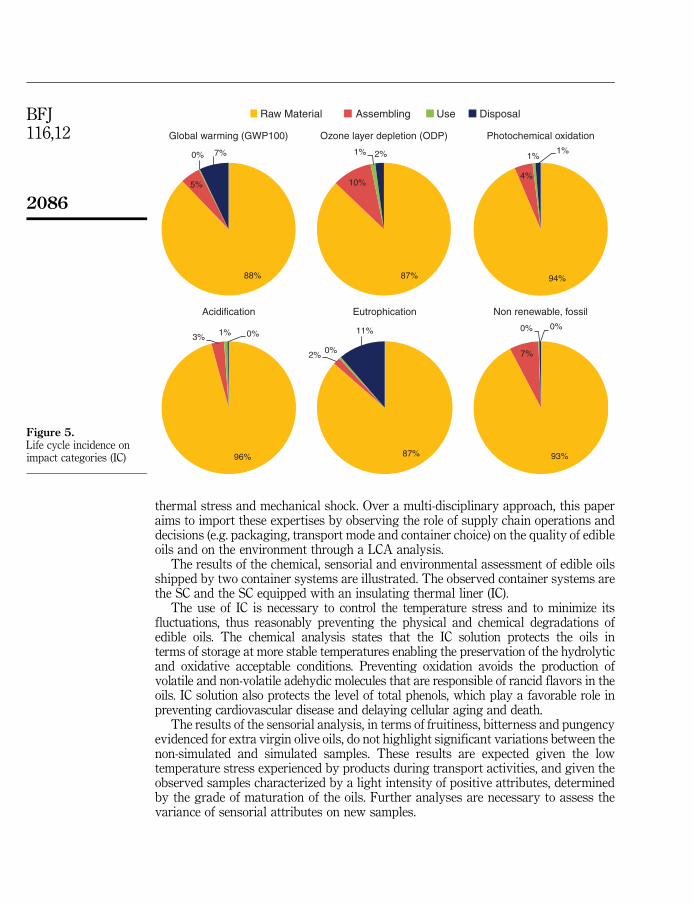
Figure 5 concludes the analysis focussing on the LC activities that mostly affect theenvironmental performance of the IC. The remark from Figure 5 is that the rawmaterials composing the thermal liner are largely the main stressors for all the impactcategories. Therefore, the adequate selection of the materials for non-reusablesupplementary packaging or thermal liner is crucial to provide environmental caresolutions that meet food preservation issues.
7. ConclusionLogistics plays an increasingly important role in FSC, but this awareness must beshared between different actors in the chain. Food scientists widely debated on theeffects on the quality of product resulting by the uncontrolled exposition to light,
2083
Sustainabilityand quality in
the food supplychain

Con
tain
erM
anuf
actu
ring/
Ass
embl
ing
Foo
dS
uppl
y C
hain
Ope
ratio
ns
Han
dlin
gLo
adin
gS
hipp
ing
Rec
eivi
ng
Unl
oadi
ng
Sta
ndar
dC
onta
iner
(SC
)
Insu
late
dC
onta
iner
(IC
)
Insu
latin
g lin
erM
anuf
actu
ring/
Ass
embl
ing
Insu
late
dC
onta
iner
Dis
asse
mbl
ing
Shi
pmen
t s=
1..S
Raw
mat
eria
lsu
pply
(i.e.
Ste
el)
Raw
mat
eria
lsu
pply
(i.e.
Alu
min
um,
PE
, Wov
en fa
bric
)
Sta
ndar
dC
onta
iner
(SC
)
Con
tain
erD
ispo
sal
s =
s +
1
yes
no
s =
1
s =
1In
sula
ting
liner
Dis
posa
lLi
fe C
ycle
Bou
ndar
ies
Life
Cyc
leB
ench
mar
k
If s�
sd
Figure 4.Life cycle boundaries forCF comparative analysis
2084
BFJ116,12
Insu
lati
ng
lin
erm
anu
fact
uri
ng
Sh
ipp
ing
rou
te(k
m)
Sh
ipp
ed
wei
gh
t(k
g)
Con
tain
er
typ
e
En
vir
onm
enta
l
imp
act
cate
gor
y
Un
itof
mea
sure
Alu
min
ium
Mat
eria
ls
PE
Wov
enco
tton
Ass
emb
lin
g
Th
erm
ofor
min
g
Ves
sel
ship
men
t
Insu
lati
ng
lin
er
dis
pos
alT
otal
%
Glo
bal
war
min
g
(GW
P10
0)
kg
CO
2eq
22.0
343
8.32
7870
.036
25.
5031
730.
1409
196
8.05
3984
4.09
6116
Ozo
ne
lay
er
dep
leti
on(O
DP
)
kg
CF
C-1
1eq
1.32
578E
-06
9.69
574E
-08
1.38
87E
-06
3.08
982E
-07
9.16
707E
-05
6.66
071E
-08
0.00
014
20,0
08IC
Ph
otoc
hem
ical
oxid
atio
n
kg
C2H
40.
0109
8462
90.
0091
9462
40.
0282
4236
40.
0022
5619
60.
9234
7239
10.
0006
4594
40.
9748
6
Aci
dif
icat
ion
kg
SO
2eq
0.1
0.03
3424
074
0.71
9848
610.
0270
5509
118
.423
8846
10.
0028
1927
419
.311
25
Eu
trop
hic
atio
nk
gP
O4
eq0.
0092
2460
40.
0026
0151
70.
0979
1235
30.
0021
8455
71.
5751
6361
40.
0141
8778
51.
7013
8
Non
-ren
ewab
le,
foss
il
MJ
eq30
7.28
426
5.36
71,
021.
007
120.
168
10,3
77.2
2623
6.83
212
,097
.883
517
4,04
3
Glo
bal
war
min
g
(GW
P10
0)
kg
CO
2eq
729.
8489
872
9.84
90
Ozo
ne
lay
er
dep
leti
on(O
DP
)
kg
CF
C-1
1eq
9.16
341E
-05
0.00
01
20,0
00S
CP
hot
och
emic
al
oxid
atio
n
kg
C2H
40.
9231
0315
0.92
31
Aci
dif
icat
ion
kg
SO
2eq
18.4
1651
818
.416
5
Eu
trop
hic
atio
nk
gP
O4
eq1.
5745
338
1.57
45
Non
-ren
ewab
le,
foss
il
MJ
eq10
,373
.077
10,3
73.0
770
Table V.Impact categories
differential analysisper container type
2085
Sustainabilityand quality in
the food supplychain
thermal stress and mechanical shock. Over a multi-disciplinary approach, this paperaims to import these expertises by observing the role of supply chain operations anddecisions (e.g. packaging, transport mode and container choice) on the quality of edibleoils and on the environment through a LCA analysis.
The results of the chemical, sensorial and environmental assessment of edible oilsshipped by two container systems are illustrated. The observed container systems arethe SC and the SC equipped with an insulating thermal liner (IC).
The use of IC is necessary to control the temperature stress and to minimize itsfluctuations, thus reasonably preventing the physical and chemical degradations ofedible oils. The chemical analysis states that the IC solution protects the oils interms of storage at more stable temperatures enabling the preservation of the hydrolyticand oxidative acceptable conditions. Preventing oxidation avoids the production ofvolatile and non-volatile adehydic molecules that are responsible of rancid flavors in theoils. IC solution also protects the level of total phenols, which play a favorable role inpreventing cardiovascular disease and delaying cellular aging and death.
The results of the sensorial analysis, in terms of fruitiness, bitterness and pungencyevidenced for extra virgin olive oils, do not highlight significant variations between thenon-simulated and simulated samples. These results are expected given the lowtemperature stress experienced by products during transport activities, and given theobserved samples characterized by a light intensity of positive attributes, determinedby the grade of maturation of the oils. Further analyses are necessary to assess thevariance of sensorial attributes on new samples.
Raw Material Assembling Use Disposal
88%
5%
0% 7%
Global warming (GWP100)
87%
10%
1% 2%
Ozone layer depletion (ODP)
94%
4%
1%1%
Photochemical oxidation
96%
3% 1% 0%
Acidification
87%
2% 0%
11%
Eutrophication
93%
7%
0% 0%
Non renewable, fossil
Figure 5.Life cycle incidence onimpact categories (IC)
2086
BFJ116,12

According to the environmental assessment of the two container systems,the IC solution has a marginal added impact on the product distribution in comparisonwith the SC. For example, the impact on global warming of the IC is 16 percent higherthan for the SC. For all the environmental impact categories, the proper definition of thethermal liner materials (or other supplementary packaging) is crucial to provideenvironmental care solutions to preserve product quality across transportation.
Further research are expected on the integration and food logistics issues (e.g.container loading, transportation modes, packaging solutions, storage conditions,delivery planning), with the assessment of food quality and safety perceptions by theconsumer, as well as with environmental aspects. Consumers detect brand and origin ofproducts from label and packages, reporting also the complied certifications andstandards. Unfortunately, no reports are currently given about the efficiency, the quality,the environmental sustainability of manufacturing, consolidation and distributionprocesses. Such information should play a crucial role in marketing and brand promotionand should affect more and more the purchasing habits and prices.
References
Agreement Transport Perishables (1970), United Nations Economic Commission for Europe.Agreement on the International Carriage of Perishable Foodstuffs and on the SpecialEquipment to be Used for Such Carriage, ATP, Geneva.
Ahumada, O. and Villalobos, R. (2009), “Application of planning models in the agri-food supplychain: a review”, European Journal of Operational Research, Vol. 195 No. 1, pp. 1-20.
Alasalvar, C., Grigor, J., Zhang, D., Quantick, P. and Shahidi, P. (2001), “Comparison of volatiles,phenolics, sugars, antioxidant vitamins, and sensory quality of different colored carrotvarieties”, Journal of Agriculture and Food Chemistry, Vol. 49 No. 3, pp. 1410-1416.
Bendini, A., Cerretani, L., Salvador, M.D., Fregapane, G. and Lercker, G. (2009), “Stability of thesensory quality of virgin olive oil during storage: an overview”, Italian Journal of FoodScience, Vol. 21 No. 12, pp. 389-406.
Bendini, A., Cerretani, L., Carrasco-Pancorbo, A., G�omez-Caravaca, A.M., Segura-Carretero, A.,Fern�andez-Gutierrez, A. and Lercker, G. (2007), “Phenolic molecules in virgin olive oils: asurvey of their sensory properties, health effects, antioxidant activity and analyticalmethods. An overview of the last decade”, Molecules, Vol. 12 No. 12, pp. 1679-1719.
Boskou, D. (1996), Olive Oil: Chemistry and Technology, AOCS Press, Champaign, IL.
Carter, C.R. and Easton, P.L. (2011), “Sustainable supply chain management: evolution and futuredirections”, International Journal of Physical Distribution & Logistics Management,Vol. 141 No. 1, pp. 46-62.
Chang, Y., Song, Y. and Roh, Y. (2013), “Assessing greenhouse gas emissions from port vesseloperations at the Port of Incheon”, Transportation Research Part D: Transport andEnvironment, Vol. 25, pp. 1-4.
Chonhenchob, V., Singh, S.P., Singh, J.J., Stallings, J. and Grewal, G. (2012), “Measurement andanalysis of vehicle vibration for delivering packages in small-sized and medium-sizedtrucks and automobiles”, Packaging Technology and Science, Vol. 25 No. 1, pp. 31-38.
Corbett, J.J., Wang, H. and Winebrake, J.J. (2009), “The effectiveness and costs of speed reductionson emissions from international shipping”, Transportation Research Part D: Transportand Environment, Vol. 14 No. 8, pp. 593-598.
Dincer, I. (2003), Refrigeration Systems and Applications, Wiley, Chichester.
Ecoinvent Databank (Version 2.2) (2010), “Swiss centre for life cycle inventories (ecoinventCentre)”, available at: www.ecoinvent.org/database/
2087
Sustainabilityand quality in
the food supplychain

Environmental Product Declaration (2007), “Swedish Environmental Management Council(SEMC)”, Revision of the EPDssystem into an International EPDs, March, available at:www.environdec.com
EU Commission Regulation No (1348/2013) (2013), Amending Regulation No. 2568/1991 on thecharacteristics of olive oil and olive residue oil and on the relevant methods of analysis,Official Journal of the European Communities, L 338/31.
European Community Commission Regulation (2568/91) (1991), “Official Journal EuropeanCommunities”, L248, pp. 1-82.
European Community, Commission Regulation (640/2008) (2008), “Amending Regulation No2568/91/EEC. Official Journal of the European Communities”, July 4, L178, pp. 11-16.
Fox, P.F., McSweeney, P.L.H., Cogan, T.M. and Guinee, T.P. (2004), Cheese – Chemistry, Physicsand Microbiology, Vol. 1, General Aspects, Elsevier, London.
Frankel, E.N. (1991), “Recent advances in lipid oxidation”, Journal of the Science of Food andAgriculture, Vol. 54 No. 4, pp. 495-511.
Gallina Toschi, T., Costa, A. and Lercker, G. (1997), “Gas chromatographic study on high-temperature thermal degradation products of methyl linoleate hydroperoxides”, Journal ofthe American Oil Chemists’ Society, Vol. 74 No. 4, pp. 387-391.
Garnett, T. (2013), “Three perspectives on sustainable food security: efficiency, demand restraint,food system transformation. What role for LCA?”, Journal of Cleaner Production,(in press).
Goff, H.D. and Hill, A.R. (1993), “Chemistry and Phisics”, in Hui, Y.H. (Ed.), Dairy Science andTechnology Handbook, Vol. 1, Principles and Properties, Vhc, NY, pp. 1-181.
G�omez-Alonso, S., Mancebo-campos, V., Salvador, M.D. and Fregapane, G. (2004), “Oxidationkinetics in olive oil triacylglycerols under accelerated shelf-life testing (25-75 7oC)”,European Journal of Lipid Science and Technology, Vol. 106 No. 6, pp. 369-375.
Herath, I., Green, S., Horne, D., Singh, R., McLaren, S. and Clothier, B. (2013), “Water footprintingof agricultural products: evaluation of different protocols using a case study ofNew Zealand wine”, Journal of Cleaner Production, Vol. 44, pp. 159-167.
Howard, L.R., Griffin, L.E. and Lee, T. (1994), “Steam treatment of minimally processedcarrot sticks to control surface discoloration”, Journal of Food Science, Vol. 59 No. 2,pp. 356-358.
Institute for Environment and Sustainability (IES), Joint Research Centre ( JRC), European Commission(2010), International Reference Life Cycle Data System (ILCD) Handbook: General guide for LifeCycle Assessment – Provisions and action steps, 1st ed., r European Union, Varese.
Isengard, H.-D. (2009), “Determination of the water content in food”, Food Science and Technology,Vol. 23 No. 4, pp. 17-19.
International Organization Standardization (ISO) (1997), Environmental Management – LifeCycle Assessment – Principles and Framework, ISO14040, Geneva.
International Organization Standardization (ISO) (1998), Environmental Management. Life CycleAssessment. Goal and Scope Definition and Life Cycle Inventory Analysis, ISO14041, Madrid.
International Organization Standardization (ISO) (2004), Sensory Analysis – Methodology –Triangle Test, 2nd ed., ISO4120, Geneva.
Li, X., Zhu, H., Shoemaker, C.F. and Wang, S.C. (in press), “The effect of different cold storageconditions on the compositions of extra virgin olive oil”, Journal of American Oil Chemists’Society, Vol. 91 No. 9, pp. 1559-1570.
Maggio, R.M., Valli, E., Bendini, A., Gomez-Caravaca, A.M., Toschi-Gallina, T. and Cerretani, L.(2011), “A spectroscopic and chemometric study of virgin olive oils subjected to thermalstress”, Food Chemistry, Vol. 127 No. 1, pp. 216-221.
2088
BFJ116,12

Mahajerin, E. and Burgess, G. (2010), “Investigation of package vibration during the repetitiveshock test”, WCE 2010 World Congress on Engineering, Vol. 2, pp. 1016-1018.
Manzini, R. and Accorsi, R. (2013), “The new conceptual framework for food supply chainassessment”, Journal of Food Engineering, Vol. 115 No. 3, pp. 251-263.
Margeirsson, B., Lauzon, H.L., Palsson, H., Popov, V., Gospavic, R., Jonsson, M., Sigurgıslad�ottir,S. and Arason, S. (2012), “Temperature fluctuations and quality deterioration of chilledcod (Gadus morhua) fillets packaged in different boxes stored on pallets underdynamic temperature conditions”, International Journal of Refrigeration, Vol. 35,pp. 187-201.
Morales, M.T. and Przybylski, R. (2000), “Olive oil oxidation”, in Harwood, J.L. and Aparicio, R.(Eds), Handbook of Olive Oil, Aspen Publications, Gaithersburg, MD, pp. 459-490.
Panozzo, G. and Cortella, G. (2008), “Standards for transport of perishable goods are stilladequate? Connections between standards and technologies in perishable foodstuffstransport”, Trends in Food Science and Technology, Vol. 19 No. 8, pp. 432-440.
Pawelzik, P., Carus, M., Hotchkiss, J., Narayan, R., Selke, S., Wellisch, M., Weiss, M., Wicke, B. andPatel, M.K. (2013), “Critical aspects in the life cycle assessment (LCA) of bio-basedmaterials – Reviewing methodologies and deriving recommendations”, Resources,Conservation and Recycling, Vol. 73, April, pp. 211-228.
Pirisi, F.M., Cabras, P., Falqui Cao, C., Migliorini, M. and Mugelli, M. (2000), “Phenolic compoundsin virgin olive oil. 2. Reappraisal of the extraction, HPLC separation, and quantificationprocedures”, Journal of Agricultural and Food Chemistry, Vol. 48 No. 4, pp. 1191-1196.
Piscopo, A. and Poiana, M. (2012), “Packaging and storage of olive oil”, in Muzzalupo, I. (Ed.),Olive Germplasm – The Olive Cultivation, Table Olive and Olive Oil Industry in Italy (ISBN:978-953-51-0883-2), InTech, Rijeka, available at: www.intechopen.com/books/olive-germplasm-the-olive-cultivation-table-olive-and-olive-oil-industry-in-italy/packaging-and-storage-of-olive-oil
Poritosh, R., Nei, D., Orikasa, T., Xu, Q., Okadome, H., Nakamura, N. and Shiina, T. (2009),“A review of life cycle assessment (LCA) on some food products”, Journal of FoodEngineering, Vol. 90 No. 1, pp. 1-10.
Raghav, P.K. and Gupta, A.K. (2003), “Simulated transportation of individually shrink wrappedkinnow fruits”, Journal of Food Science and Technology, Vol. 40 No. 4, pp. 389-397.
Robinson, A., Mueller, M., Heymann, H., Ebeler, S., Boss, P., Solomon, P. and Trengove, R. (2010),“Effect of simulated shipping conditions on sensory attributes and volatile composition ofcommercial white and red wines”, American Journal of Enology and Viticulture, Vol. 61No. 3, pp. 337-347.
Rodriguez-Bermejo, J., Barreiro, P., Robla, J.I. and Ruiz-Garcia, L (2007), “Thermal study of atransport container”, Journal of Food Engineering, Vol. 80 No. 2, pp. 517-527.
Savino, M.M, Manzini, R. and Mazza, A (2013), “Environmental and economic assessment offresh fruit supply chain through value chain analysis. A case study in chestnuts industry”,Production Planning and Control: The Management of Operations, doi:10.1080/09537287.2013.839066.
Singh, S.P. and Xu, M. (1993), “Bruising in apples as a function of truck vibration andpackaging”, Applied Engineering in Agriculture, Vol. 9 No. 5, pp. 455-460.
Singh, S.P., Saha, K., Singh, J. and Sandhu, A.P.S. (2012), “Measurement and analysis of vibrationand temperature levels in global intermodal container shipments on truck, rail and ship”,Packaging Technology and Science, Vol. 25 No. 3, pp. 149-160.
Singleton, V.L. and Rossi, J.A. (1965), “Colorimetry of total phenolics with phosphomolybdic-phosphotungstic acid reagents”, American Journal of Enology, Vol. 16 No. 3,pp. 144-158.
2089
Sustainabilityand quality in
the food supplychain
Virtanen, Y., Kurppa, S., Saarinen, M., Katajajuuri, J.-M., Usva, K., Maenpaa, I., Makela, J.,Gronroos, J. and Nissinen, A 2011, “Carbon footprint of food – approaches from nationalinput-output statistics and a LCA of a food portion”, Journal of Cleaner Production, Vol. 19No. 16, pp. 1849-1856.
Wild, Y. (2012), Container Handbook, Gesamtverband der Deutschen Versicherungswirtschaft e.V. (GDV), German Insurance Association.
Wognum, P.M., Bremmers, H., Trienekens, J.H., Van Der Vorst, J.G.A.J. and Bloemhof, J.M. (2011),“Systems for sustainability and transparency of food supply chains – current status andchallenges”, Advanced Engineering Informatics, Vol. 25 No. 1, pp. 65-76.
World Bank (2013), “Global economics prospects”, Less Volatile, but Slower Growth. A WorldBank Group Flagship Report (ISBN: 978-1-4648-0036-8), Vol. 7.
World Trade Organization (WTO) (2012), International Trade Statistics, Word Export 2011Document, World Trade Organization, available at: www.wto.org/statistics.
Wright, L., Kemp, S. and Williams, I. (2011), “Carbon footprinting’: towards a universallyaccepted definition”, Carbon Management, Vol. 2 No. 1, pp. 61-72.
Xia, B. and Sun, D. (2002), “Applications of computational fluid dynamics (CFD) in the foodindustry: a review”, Computers and Electronics in Agriculture, Vol. 34, pp. 5-24.
Xiang, M. and Eschke, R. (2004), “Modelling of the effects of continual shock loads in thetransport process”, Packaging Technology and Science, Vol. 17 No. 1, pp. 31-35.
Zhang, J., Liu, L., Mu, W., Moga, L.M. and Zhang, X. (2009), “Development of temperature-managed traceability system for frozen and chilled food during storage andtransportation”, Journal of Food, Agriculture & Environment, Vol. 7 Nos 3/4, pp. 28-31.
Further reading
Codex Standard For Named Vegetable Oils and Codex-Stan 210. (Amended 2003, 2005, 2009).
Corresponding authorProfessor Riccardo Manzini can be contacted at: [email protected]
To purchase reprints of this article please e-mail: [email protected] visit our web site for further details: www.emeraldinsight.com/reprints
2090
BFJ116,12
Related Documents