Suspended sediment concentration and its variation with water discharge in a dryland ephemeral channel, northern Negev, Israel Yulia Alexandrov % , Jonathan B. Laronne % * Ian Reidw % Department of Geography and Environmental Development, Ben Gurion University of the Negev, P.O. Box 653, Beer Sheva 84105, Israel wDepartment of Geography, Loughborough University, Loughborough LE11 3TU, UK (Received 25 July 2000, accepted 13 March 2002) Relations between suspended sediment concentration and water discharge during flash floods in an ephemeral stream of the northern Negev are analysed. Water samples were obtained with a pre-programmed sampler. The mean suspended sediment concentration measured during 6 years of monitoring was 34,000 mg l 1 , with individual flood maxima in the range 21,000–229,000 mg l 1 . Regression of suspended sediment concentration on water discharge takes the form SSC = 10 4?41 Q 0?42 . However, only 50% of the variance in suspended sediment concentration is explained by variations in discharge. This indicates that changes in sediment supply and variations in the importance of source areas are also significant in this semi-arid water catchment. # 2002 Elsevier Science Ltd. Keywords: ephemeral channel; flash floods; suspended sediment; hysteresis Introduction Most quantitative estimates of sediment load depend on establishing a relation between sediment concentration and water discharge after logarithmic transformation of the data (Ferguson, 1987). In dryland ephemeral rivers, suspended sediment has been shown to constitute more than 90% of the very high total sediment loads (Powell et al., 1996). Therefore, an appropriate assessment of suspended sediment concentration is of particular importance in estimating sediment yields that rank among the highest in the world (Langbein & Schumm, 1958). However, the measurement of both flow and sedimentary processes in ephemeral rivers is complicated by the fact that runoff is extremely spasmodic. This makes it essential to establish automatic monitoring stations (Lekach & Schick, 1982; Reid & Frostick, 1987; Schick & Lekach 1993; Reid et al., 1998), but these are rare in this *Corresponding author. E-mail: [email protected] 0140-1963/03/010073 + 12 $35.00/0 # 2002 Elsevier Science Ltd. Journal of Arid Environments (2003) 53: 73–84 doi:10.1006/jare.2002.1020, available online at http://www.idealibrary.com on

Welcome message from author
This document is posted to help you gain knowledge. Please leave a comment to let me know what you think about it! Share it to your friends and learn new things together.
Transcript
Journal of Arid Environments (2003) 53: 73–84doi:10.1006/jare.2002.1020, available online at http://www.idealibrary.com on
Suspended sediment concentration and its variationwith water discharge in a dryland ephemeral channel,
northern Negev, Israel
Yulia Alexandrov%, Jonathan B. Laronne%* Ian Reidw
%Department of Geography and Environmental Development, Ben GurionUniversity of the Negev, P.O. Box 653, Beer Sheva 84105, Israel
wDepartment of Geography, Loughborough University, Loughborough LE113TU, UK
(Received 25 July 2000, accepted 13 March 2002)
Relations between suspended sediment concentration and water dischargeduring flash floods in an ephemeral stream of the northern Negev areanalysed. Water samples were obtained with a pre-programmed sampler. Themean suspended sediment concentration measured during 6 years ofmonitoring was 34,000 mg l�1, with individual flood maxima in the range21,000–229,000 mg l�1. Regression of suspended sediment concentration onwater discharge takes the form SSC = 104?41Q0?42. However, only 50% of thevariance in suspended sediment concentration is explained by variations indischarge. This indicates that changes in sediment supply and variations inthe importance of source areas are also significant in this semi-arid watercatchment.
# 2002 Elsevier Science Ltd.
Keywords: ephemeral channel; flash floods; suspended sediment; hysteresis
Introduction
Most quantitative estimates of sediment load depend on establishing a relationbetween sediment concentration and water discharge after logarithmic transformationof the data (Ferguson, 1987). In dryland ephemeral rivers, suspended sediment hasbeen shown to constitute more than 90% of the very high total sediment loads (Powellet al., 1996). Therefore, an appropriate assessment of suspended sedimentconcentration is of particular importance in estimating sediment yields that rankamong the highest in the world (Langbein & Schumm, 1958). However, themeasurement of both flow and sedimentary processes in ephemeral rivers iscomplicated by the fact that runoff is extremely spasmodic. This makes it essentialto establish automatic monitoring stations (Lekach & Schick, 1982; Reid & Frostick,1987; Schick & Lekach 1993; Reid et al., 1998), but these are rare in this
*Corresponding author. E-mail: [email protected]
0140-1963/03/010073 + 12 $35.00/0 # 2002 Elsevier Science Ltd.
74 Y. ALEXANDROV ET AL.
environment. As a result, data concerning flash floods are few and information aboutsuspended sediment concentration has been obtained mainly by manual sampling andoften by chance (Fisher & Minckley, 1978; Frostick et al., 1983; Sharma et al., 1984,1985; Dunkerley & Brown, 1999).
This paper analyses 6 years of suspended sediment data at a monitoring station onNahal Eshtemoa in the northern Negev, Israel. A suspended sediment concentration/water discharge relation is established. The data are placed in the global context ofpreviously published information about suspended sediment in dryland flash floods.
Study area
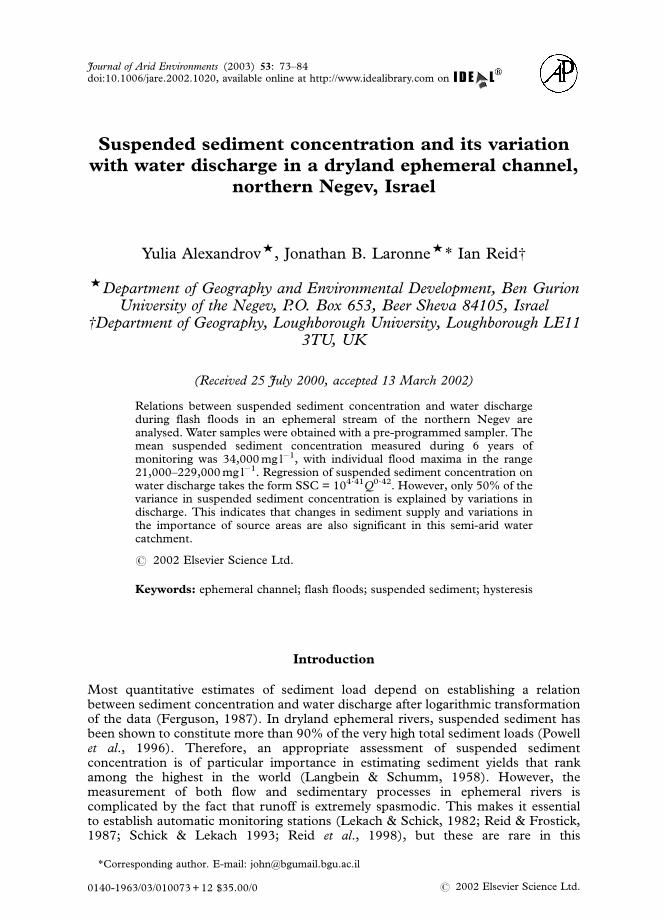
The Eshtemoa basin is located in the northern Negev Desert, its headwaters drainingthe Hebron Hills of southern Judea (Fig. 1). The catchment is underlain by lateCretaceous limestones, dolomites, cherts and marls. The rocky hillslopes arecommonly covered by a calcareous crust (Nari ). During the Holocene, loess
Figure 1. Location map of the Nahal Eshtemoa catchment. The pecked lines are isohyets ofaverage annual rainfall.
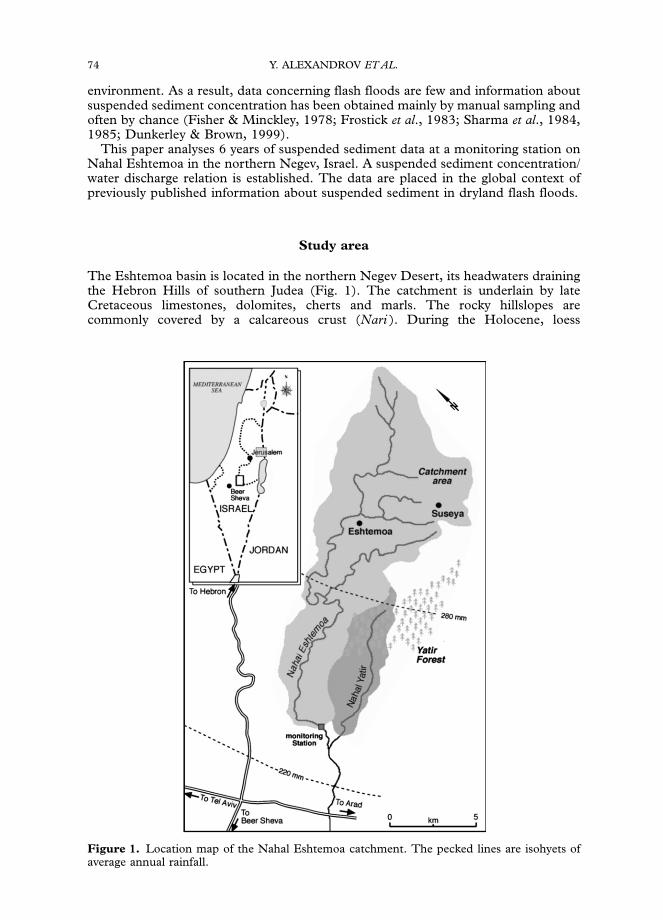
Figure 2. View across the Eshtemoa valley that is typical of the middle and upper catchments.The soils on the hillslopes are stoney and regolithic. Loess mixed with colluvium and alluviumcomprises valley deposits. In this part of the channel network, vegetation does not protect wadibanks, which contribute to the sediment load. Channel width here is approximately 4 m.
SUSPENDED SEDIMENT CONCENTRATION AND ITS VARIATION 75
blanketed much of the landscape, but presently, a residual depositFoftenreworkedFis confined mainly to valley bottoms. Indeed, the erosional cut banks ofwadis reveal a sometimes complex stratigraphy of loess interdigitated with colluviumand coarse-grained alluvium. Valley bottom loess terraces thin northward and becomemuch narrower in the middle and upper reaches of the catchment. Away from theseterraces, soils are stoney and regolithic and the soil cover is discontinuous. TypicalMediterranean terra rossa and rendzinas develop on hillslopes and interfluves,contrasting with the loess and sandy loessial soils of the narrow valley bottomland(Fig. 2).
The annual rainfall ranges from 220 mm at the catchment outlet to 350 mm in theheadwaters. It usually occurs between November and March, with a monthlymaximum in January. There are two types of synoptic meteorological system whichbring rain to this part of the Levant: fronts sweep westward along the Mediterraneanbasin; while highly localized convective rainstorms associated with atmosphericperturbations that often originate in the Sinai–Red Sea area move northward fromEgypt. Some of the convective storms are associated with local components of aMediterranean front. Frontal rain is usually widespread, prolonged and of relativelylow intensity. Convective storms are characterized by high intensities and geographicalspottiness, such that they may affect only a fraction of a catchment.
This annual rainfall is set against a potential evaporation of about 2000 mm year�1.Vegetation is sparse and can be sclerophytic or xerophytic, though winter rainsencourage grasses to germinate, providing a thin sward over some parts of the basin.There are small Bedouin encampments throughout the catchment. Bedouins cultivateareas where the soil permits; they often use ancient stone bunds that were originallybuilt across first-order streams to collect runoff and prevent soil erosion; they also usethe longitudinal stream terraces for growing winter wheat (Fig. 2). The steeperhillslopes of the catchment are used for grazing, especially during winter and spring.As part of a landscape rehabilitation and soil conservation programme, the Land
76 Y. ALEXANDROV ET AL.
Development Authority has planted trees over an increasing fraction of the lowercatchmentFthe part that lies within the 1948 Israeli border. The Yatir Forest (Fig. 1)is a maturing, open-canopy pine woodland that was established in 1968. Other areas,including the lowest parts of the Eshtemoa basin, have recently been contour furrowedand planted with both conifers and a variety of native tree species, including acaciasand other broad leaves.
Monitoring site and methods
The monitoring station lies about halfway along a 250 m straight reach of the channel.The primary reason for the choice of site was to avoid the complications brought bybend-flow, such as instability of bed elevation, variable cross-sectional water depthand an uncertain pattern of shear stress associated with the cross-stream trajectory ofsecondary currents. The water catchment at the monitoring site is 112 km2 (119 at theconfluence with Nahal Yatir, a left-bank tributary for which there is also a record ofsediment transport); channel slope is 0?75%, channel width is 6?0 m and bankfulldepth is 1?2 m. The median grain size (D50) of the surface bed material is 17 mm. D50
of the subsurface bed material is 25 mm in channel bars, 18 mm in the longerintervening channel ‘flat’ areas and 18% of the bed material is sand.
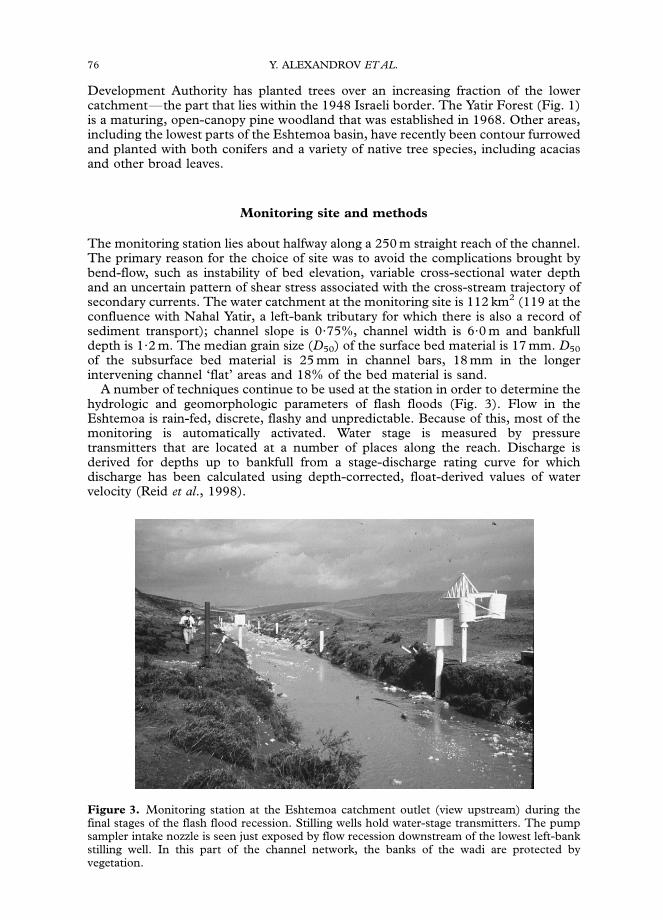
A number of techniques continue to be used at the station in order to determine thehydrologic and geomorphologic parameters of flash floods (Fig. 3). Flow in theEshtemoa is rain-fed, discrete, flashy and unpredictable. Because of this, most of themonitoring is automatically activated. Water stage is measured by pressuretransmitters that are located at a number of places along the reach. Discharge isderived for depths up to bankfull from a stage-discharge rating curve for whichdischarge has been calculated using depth-corrected, float-derived values of watervelocity (Reid et al., 1998).
Figure 3. Monitoring station at the Eshtemoa catchment outlet (view upstream) during thefinal stages of the flash flood recession. Stilling wells hold water-stage transmitters. The pumpsampler intake nozzle is seen just exposed by flow recession downstream of the lowest left-bankstilling well. In this part of the channel network, the banks of the wadi are protected byvegetation.
SUSPENDED SEDIMENT CONCENTRATION AND ITS VARIATION 77
Suspended sediment concentration is determined by two methods. Watersamples are obtained using a programmed pump sampler containing 24 bottles.Sampling occurs at discrete intervals. The duration of each sampling episode isapproximately 1 min, so that the concentration is an average for this period of time.The pump is programmed to sample in sympathy with the flashy character offloods in semi-desert regions (Reid et al., 1997). Hydrograph rise time is very short,ranging from 2 to 58 min (Reid et al., 1998), with a median value of 10 min.Hence, during the first hour, sampling is undertaken every 3 min and then 5 min.The recession of the flood is more prolonged and may continue for several hours.Therefore, after the first hour, the sampling interval increases to 10 min and then to40 minutes. This programme works well when hydrographs have only one peak andflow duration is short. However, many events observed have been multi-peaked (Reidet al., 1998) and extension of the flood hydrograph means that for much of the timethe river has been running, there are no records of suspended sediment concentration.
The intake nozzle of the water sampler is set at a fixed height of 0?15 m above thebed surface and at the centreline of the channel. This polypropylene pipe is protectedfrom both moving bed material and vandalism by a steel pipe. A continuous flow ofwater past the nozzle is facilitated by a multitude of perforations. Because the intake isfixed, samples do not integrate vertically and laterally. However, the flow is highlyturbulent, thereby tending to eliminate any vertical gradient in suspended sedimentconcentration (Powell et al., 1996). Moreover, because most of the suspendedsediment is silty, the size distribution is likely to be vertically non-varying, at least forin-bank flows.
In order to test that turbulence of the flow is sufficiently high to provide a uniformvertical distribution of the suspended sediment and to establish a measure of samplerefficiency, depth-integrated samples have been taken manually during several flowevents and compared with those obtained contemporaneously with the fixed-depthautomatic sampler. There is no significant difference between the methods (regressioncoefficient = 1?01; correlation coefficient = 0?92; a = 0?05).
Once obtained, samples have been allowed to stand for several days to facilitate thesettling of all sediment, including clay particles. After recording individual weights,the liquid has been carefully decanted, the sediment is oven-dried at 1051C.Concentrations are expressed as weight-per-volume (Vanoni, 1975).
Results and discussion
Hydrological and sedimentological data
The data collected at the Nahal Eshtemoa monitoring station over four winter seasonsare presented (2 years of the 6 year record experienced no flow events). In the main,sampling was undertaken automatically and this sometimes covered an entire flowevent. But the data set also contains a number of individual values obtained by handsampling during either long, comparatively steady flows or during flow recession afterthe sampler’s programme had ended. Hydrologic characteristics of the flow events aresummarized in Table 1.
The range in observed runoff is large. Two events in the data set are the first floodsof the winter season (5 November 1994 and 18 October 1997); both of these, togetherwith the flood of 10 November 1997, resulted from high-intensity convectiverainstorms. But despite having these factors in common, suspended sedimentconcentration differs considerably and appears to relate strongly to maximum waterdischarge. The other events resulted from low-intensity frontal rains of varyingduration. Those of 22 January and 4 February 1997 were characterized by relativelylow suspended sediment concentrations. A comparatively low concentration is also
Table 1. Hydrologic characteristics of flow events in Nahal Eshtemoa
Event Rainfall*(mm)
Flood volume(103 m3)
Qw
(m3 s�1)SSCz
(mg l�1)Dry period before
event (days)
5 Nov-94 23 30 9?7 21,000 25024 Nov-94 43 391 22?7 56,000 192/5 Dec 94 118 2332 52?9 No data} 822 Jan-97 12 0?3 0?24 15,500 64 Feb-97 17 9?7 0?47 17,700 1218 Oct-97 17 94 23?1 185,000 21110 Nov-97 17 331 84?4 187,000 2319 Dec-97 22 22 1?6 63,000 611 Jan-98 48 38 4?0 44,000 23
*Rainfall during 1994–1995 was collected by a rain gauge near the monitoring station, and the valuerepresents point rainfall. The rest of the rain data are derived from ground-based meteorological radar andrepresents average rainfall for the catchment. These data were placed at our disposal by The Electrical–Mechanical Survey of Israel and were processed by the Soil Erosion Research Station.
wPeak discharge.zMaximum suspended sediment concentration.}Samples were not taken on the rising stage and at peak discharge because of a broken pump.
78 Y. ALEXANDROV ET AL.
observed during the 19 December 1997 event. This last may have had such relativelylow sediment concentrations because it occurred only 6 days after a previous runoffevent of very high magnitude that had almost certainly removed readily availablesediment from the watershed. However, a simple plot of maximum suspendedsediment concentration against the time that has elapsed since the last flow providesno indication that this variable helps to explain the variance in sediment load ingeneral.
Suspended sediment concentration–discharge relation
A scattergraph of suspended sediment concentration vs. water discharge is presentedin Fig. 4. Suspended sediment concentration varied from 1200 to 186,500 mg l�1 witha mean value of 34,000 mg l�1. The range of observed values is larger and the meanconcentration is higher than that has previously been published for the catchment(Powell et al., 1996), a product of the continued monitoring programme and becausethe number of observations has increased from 115 to 245 in the present study. Theleast-squares relation fitted to all the points in Fig. 4 is SSC = 104?41Q0?42, r2 = 0?49, a= 0?05, where SSC is the suspended sediment concentration (mg l�1) and Q is thewater discharge (m3 s�1). The relation has been adjusted for the statistical biasintroduced by logarithmic transformation of the data (Ferguson, 1987). It is perhapsnot unexpected that only 50% of the variance in suspended sediment concentration isexplained by water discharge. In other words, not only the hydraulic properties of theflow but also the supply of sediment in the catchment determine the suspendedsediment response (Graf, 1988).
The filled symbols in Fig. 4 relate to the event of 18 October 1998. This was thefirst flood of the season and resulted from a convective rain cell that moved up thecatchment from the monitoring station. Tributaries contributed in turn, one after theother, resulting in a multi-peaked hydrograph. In this case, suspended sedimentsupply was governed by sub-catchment soil character, the concentration increasingwith tributary flows from loess-rich terrain and diluted by flows from sub-catchmentscharacterized more by regosols. This flood stands out from the main body of data for
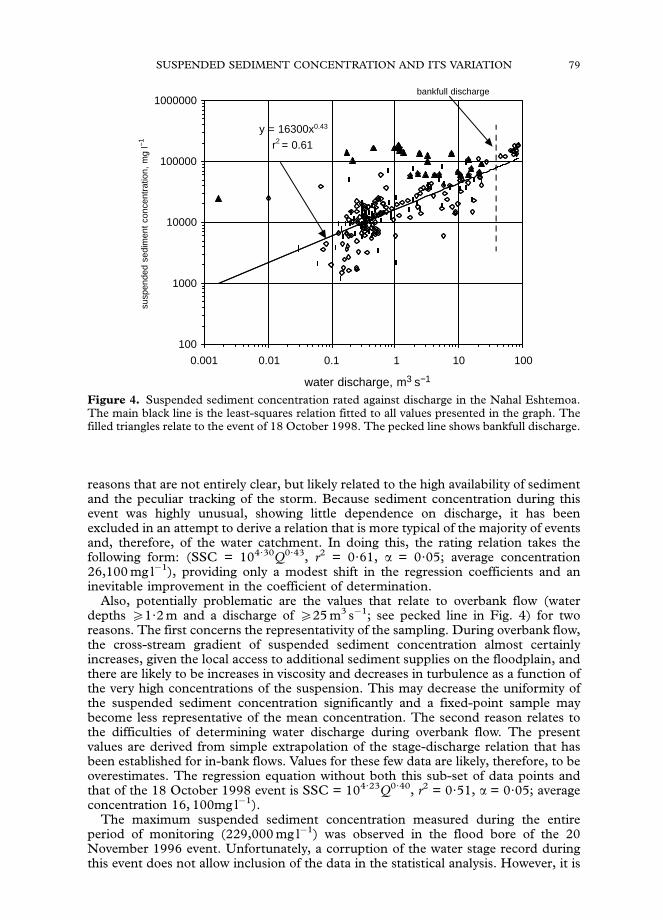
y = 16300x0.43
r2 = 0.61
100
1000
10000
100000
1000000
water discharge, m3 s−1
susp
ende
d se
dim
ent
conc
entr
atio
n, m
g l−1
0.001 0.01 0.1 1 10 100
bankfull discharge
Figure 4. Suspended sediment concentration rated against discharge in the Nahal Eshtemoa.The main black line is the least-squares relation fitted to all values presented in the graph. Thefilled triangles relate to the event of 18 October 1998. The pecked line shows bankfull discharge.
SUSPENDED SEDIMENT CONCENTRATION AND ITS VARIATION 79
reasons that are not entirely clear, but likely related to the high availability of sedimentand the peculiar tracking of the storm. Because sediment concentration during thisevent was highly unusual, showing little dependence on discharge, it has beenexcluded in an attempt to derive a relation that is more typical of the majority of eventsand, therefore, of the water catchment. In doing this, the rating relation takes thefollowing form: (SSC = 104?30Q0?43, r2 = 0?61, a = 0?05; average concentration26,100 mg l�1), providing only a modest shift in the regression coefficients and aninevitable improvement in the coefficient of determination.
Also, potentially problematic are the values that relate to overbank flow (waterdepths X1?2 m and a discharge of X25 m3 s�1; see pecked line in Fig. 4) for tworeasons. The first concerns the representativity of the sampling. During overbank flow,the cross-stream gradient of suspended sediment concentration almost certainlyincreases, given the local access to additional sediment supplies on the floodplain, andthere are likely to be increases in viscosity and decreases in turbulence as a function ofthe very high concentrations of the suspension. This may decrease the uniformity ofthe suspended sediment concentration significantly and a fixed-point sample maybecome less representative of the mean concentration. The second reason relates tothe difficulties of determining water discharge during overbank flow. The presentvalues are derived from simple extrapolation of the stage-discharge relation that hasbeen established for in-bank flows. Values for these few data are likely, therefore, to beoverestimates. The regression equation without both this sub-set of data points andthat of the 18 October 1998 event is SSC = 104?23Q0?40, r2 = 0?51, a = 0?05; averageconcentration 16, 100mg l�1).
The maximum suspended sediment concentration measured during the entireperiod of monitoring (229,000 mg l�1) was observed in the flood bore of the 20November 1996 event. Unfortunately, a corruption of the water stage record duringthis event does not allow inclusion of the data in the statistical analysis. However, it is
80 Y. ALEXANDROV ET AL.
interesting to note that this was the first flow event after a drought year andthat the flow resulted from a convective rainstorm. The very high concentrationsin the flood bore and the gradual decline with time (which appears to havebeen independent of changes in discharge) testify to the rapid flushing of sedimentnot only from the catchment hillslopes, but also from the river bed and banks.Suspended sediment dynamics during this event were obviously strongly dependenton supply.
Suspended sediment concentration is considerably higher in the flood bore than atsimilar discharge during flow recession (see also Reid & Frostick, 1987). This flushingeffect may produce clockwise hysteresis in the relation between sediment concentra-tion and water discharge. In these circumstances, suspended sediment concentrationdecreases during the rising stage of the hydrograph. This is demonstrated by the eventof 18 October 1997 in Fig. 5(a), sediment concentration then becoming more or lessinvariant during the major part of the flow recession, rising dramatically towards theend of the record immediately after the arrival of a minor wave in discharge that verylikely reflects the late arrival of water from an upstream tributary offering an abundantsupply of sediment.
Other factors add complexity to the relation between suspended sedimentconcentration and water discharge. So, for instance, the hysteresis can be counter-clockwise. This is illustrated by the event of 5 November 1994 (Fig. 5(b)).
Both patterns of hysteresis complicate the relation between suspendedsediment concentration and water discharge. Walling (1977) suggested a needfor separate rising and falling stage curves in order to improve sediment yieldestimation. Negev (1969) also developed a (conceptual) ‘loop’ model fromobservations on the Nahal Quishon, with different curves not only for the risingand falling stages of a single flood event, but also a systematic shift to lowerconcentrations from event to event as the runoff season progressed. However,although the Eshtemoa exhibits hysteresis in some floods, the sense of responseappears to be unpredictable by comparison with the other rivers, sometimes involvinga clockwise, sometimes an anticlockwise loop, and sometimes showing no behaviourof this kind. It seems that the variation in suspended sediment concentration cannotbe explained always by invoking the flushing of sediments at the beginning of runoffand the dilution or exhaustion of sediment supply towards the end. Of importanceappears to be the complex interplay of a changing spatio-temporal pattern of sedimentsupplyFin part a function of the distribution of the loessFand a complicatedspatioFtemporal pattern of rainfall-runoff which reflects the peculiarities of a rainfallregime that involves both discrete, wandering thunderstorms and ubiquitous frontalrainfalls.
Comparison with other drainage basins
The range of suspended sediment concentration measured in the Eshtemoacatchment covers similar orders of magnitude as those established in othersemi-arid and arid-zone drainage basins (Table 2). Values are higher thanthose reported for the Verde River, Il Kimere and Homestead Creek, but similarto those from the extreme-arid environment of the southern Negev, represented byNahal Yael, and sub-catchments of the Luni River of Punjab. Undoubtedly, theloessial soils in the Eshtemoa catchment contribute an abundance of sediment, thesupply of which is large and the availability of which is sufficient to allow rivers of thenorthern Negev to match flash floods generated by discrete convective rain in otherdrylands.
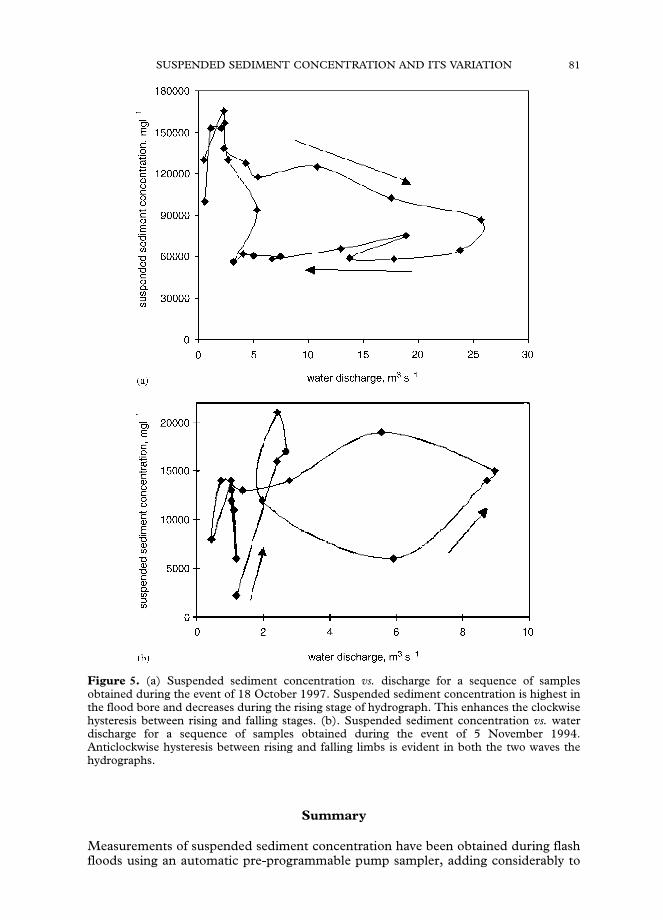
Figure 5. (a) Suspended sediment concentration vs. discharge for a sequence of samplesobtained during the event of 18 October 1997. Suspended sediment concentration is highest inthe flood bore and decreases during the rising stage of hydrograph. This enhances the clockwisehysteresis between rising and falling stages. (b). Suspended sediment concentration vs. waterdischarge for a sequence of samples obtained during the event of 5 November 1994.Anticlockwise hysteresis between rising and falling limbs is evident in both the two waves thehydrographs.
SUSPENDED SEDIMENT CONCENTRATION AND ITS VARIATION 81
Summary
Measurements of suspended sediment concentration have been obtained during flashfloods using an automatic pre-programmable pump sampler, adding considerably to
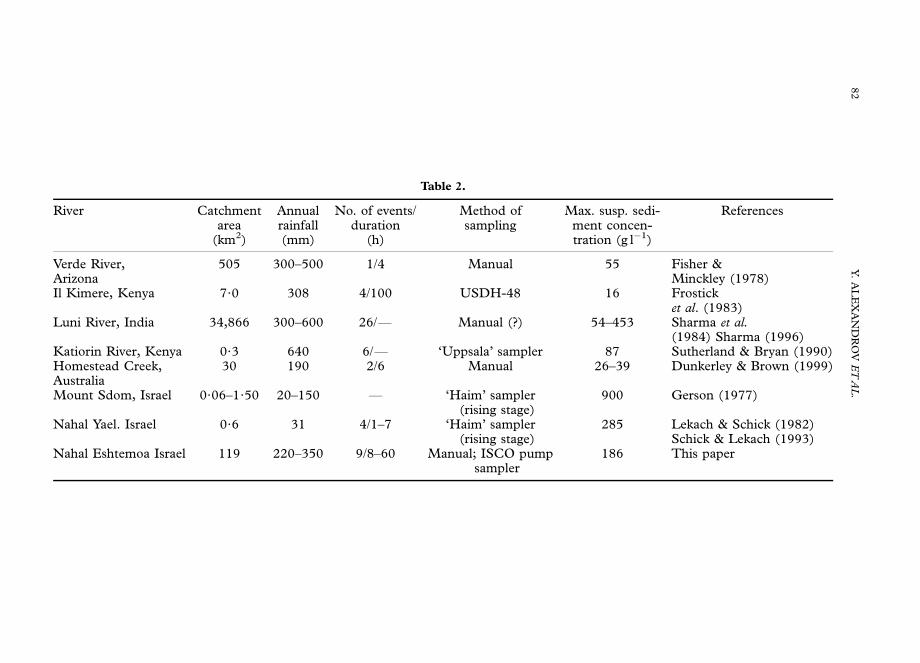
Table 2.
River Catchmentarea
(km2)
Annualrainfall(mm)
No. of events/duration
(h)
Method ofsampling
Max. susp. sedi-ment concen-tration (g l�1)
References
Verde River,Arizona
505 300–500 1/4 Manual 55 Fisher &Minckley (1978)
Il Kimere, Kenya 7?0 308 4/100 USDH-48 16 Frosticket al. (1983)
Luni River, India 34,866 300–600 26/F Manual (?) 54–453 Sharma et al.(1984) Sharma (1996)
Katiorin River, Kenya 0?3 640 6/F ‘Uppsala’ sampler 87 Sutherland & Bryan (1990)Homestead Creek,Australia
30 190 2/6 Manual 26–39 Dunkerley & Brown (1999)
Mount Sdom, Israel 0?06–1?50 20–150 F ‘Haim’ sampler(rising stage)
900 Gerson (1977)
Nahal Yael. Israel 0?6 31 4/1–7 ‘Haim’ sampler(rising stage)
285 Lekach & Schick (1982)Schick & Lekach (1993)
Nahal Eshtemoa Israel 119 220–350 9/8–60 Manual; ISCO pumpsampler
186 This paper
82
Y.
AL
EX
AN
DR
OV
ET
AL
.
SUSPENDED SEDIMENT CONCENTRATION AND ITS VARIATION 83
the amount of information available about the sediment dynamics of dryland streams.The data provide the basis of a suspended sediment concentration/water dischargerating curve. A high degree of inter- and intra-event variability in sedimentconcentrations at similar water discharge reflects the differences in rainfall–runoffgeneration, which result from the variety of synoptic meteorological conditions,especially the localized nature of convective rain cells (Reid et al., 1997). In thesecircumstances, only 50% of the variance in suspended sediment concentration in theEshtemoa is explained by the variations in discharge. The level of explanation isincreased by excluding from the statistical analysis those events which draw onunusually large supplies of fine-grained sediment (i.e. first flood of the season andoverbank flow). Hysteresis between rising and falling limbs of the flood hydrograph isshown to contribute a considerable amount of indeterminacy at individual flood level.However, any attempt at partitioning the entire database in order to derive separaterating relations for rising and falling limbs has been confounded by the fact that thehysteresis can be clockwise and counterclockwise in successive floods for reasons thatare not yet fully understood. It is interesting that the equation derived from anexpanded data set is in reasonably good agreement with that based on much less data(Powell et al., 1996), despite the fact that the growing database shows that there is highinter-event variability of suspended sediment behaviour and that the relation withwater discharge is highly complex.
The current investigation is a part of the Northern Negev River SedimentMonitoring Programme that has been supported in various ways by the IsraelAcademy of Sciences, the Natural Environment Research Council of the U.K., theIsrael Ministry of Absorption, the University of London Central Research Fund, theBritish Geomorphological Research Group, the Humphrey Research Institute, BenGurion University of the Negev, the Israel Ministry of Science, the Israel Ministry ofAgriculture, the Israel Water Authority and the Land Development Authority. We owethanks to Mark Powell, the first to collect suspended sediment data in the Eshtemoa,Hai Cohen, Lev Meirovich, Moshe Taig, Leo Volin and Yitshak Yitshak for theirassistance in the field and in the laboratory. Our thanks go also to the Electrical–Mechanical Survey of Israel, which placed at our disposal the ground-basedmeteorological radar data. These data were processed by Efrat Morin of the SoilErosion Research Station, to whom we are very grateful. We also thank twoanonymous reviewers for their useful comment, which have helped us to improve thepaper.
References
Dunkerley, D. & Brown, K. (1999). Flow behaviour, suspended sediment transport andtransmission losses in a small (sub-bank-full) flow event in an Australian desert stream.Hydrological Processes, 13: 1577–1588.
Ferguson, R.I. (1987). Accuracy and precision of methods for estimating river loads. EarthSurface Processes and Landforms, 12: 95–104.
Fisher, S.G. & Minckley, W.L. (1978). Chemical characteristics of a desert stream in flash flood.Journal of Arid Environment, 1: 25–33.
Frostick, L.E., Reid, I. & Layman, J.T. (1983). Changing Size Distribution of Suspended Sedimentin Arid Zone Flash-Floods. Special Publication of the International Association of Sedimentologists, 6: pp. 97–106.
Gerson, R. (1977). Sediment transport for desert watersheds in erodible materials. Earth SurfaceProcesses, 2: 343–361.
Gippel, C.J. (1995). Potential of turbidity monitoring for measuring the transport of suspendedsolids in streams. Hydrological Processes, 9: 83–97.
Graf, W.H. (1988). Fluvial Processes in Dryland Rivers. Vol. XIY. Berlin: Springer-Verlag. 346 pp.
84 Y. ALEXANDROV ET AL.
Langbein, W.B. & Schumm, S.A. (1958). Yield of sediment in relation to mean annualprecipitation. Transactions of the American Geophysical Union, 39: 1076–1084.
Lekach, J. & Schick, A.P. (1982). Suspended sediments in desert floods in small catchments.Israel Journal of Earth Science, 31: 144–156.
Negev, M. (1969). Analysis of data on suspended sediment discharge in several streams in Israel.Israel Hydrological Service, Hydrological Paper No. 12.
Powell, D.M., Reid, I., Laronne, J.B. & Frostick L.E. (1996). Bedload as a component ofsediment yield from a semiarid watershed of the northern Negev. In: Erosion and SedimentYield: Global and Regional Perspectives pp. 389–397 (Proceedings of the Exeter Symposium, July1996). International Association of Hydrological Sciences Publication No. 236.
Reid, I. & Frostick, L.E. (1987). Flow dynamics and suspended sediment properties in arid zoneflash floods. Hydrological Processes, 1: 239–253.
Reid, I., Bathurst, J.C., Carling P.A., Walling, D.E. & Webb, B.W. (1997). Sediment erosion,transport and deposition. In: Thorne, C.R., Hey, R.D. & Newson, M.D. (Eds), FluvialGeomorphology for River Engineering and Management, pp. 96–135. Chichester: John Wiley &Sons. 376 pp.
Reid, I., Laronne, J.B. & Powell, D.M. (1998). Flash-flood and bedload dynamics of desertgravel-bed streams. Hydrological Processes, 12: 543–557.
Schick, A.P. & Lekach, J. (1993). An evaluation of two ten-year sediment budgets, Nahal Yael,Israel. Physical Geography, 14/3: 225–238.
Vanoni, V.A. (Ed.) (1975). Sedimentation Engineering. American Society of Civil Engineers Manualon Sedimentation, Vol. 54. New York: American Society of Civil Engineers.
Sharma, K.D., Vangani, N.S. & Choudhari, J.S. (1984). Sediment transport characteristics ofdesert streams in India. Journal of Hydrology, 67: 261–272.
Sharma, K.D. (1996). Soil erosion and sediment yield in the Indian arid zone. In: Walling, D.E.& Webb, B.W. (Eds), Erosion and Sediment Yield: Global and Regional Perspectives pp. 175–182(Proceedings of the Exeter Symposium, July 1996). International Association of Hydrological SciencesPublication, No. 236.
Sutherland, R.A. & Bryan, R.B. (1990). Runoff and erosion from a small semiarid catchment,Baringo District, Kenya. Applied Geography, 10: 91–109.
Walling, D.E. (1977). Limitations on the rating curve technique for estimating suspendedsediment loads, with particular reference to British rivers. International Association ofHydrological Sciences Publication No. 122: 34–48.
Related Documents