Genome Biology 2008, 9:R111 Open Access 2008 Lukas et al. Volume 9, Issue 7, Article R111 Research Susceptibility to glaucoma: differential comparison of the astrocyte transcriptome from glaucomatous African American and Caucasian American donors Thomas J Lukas ¤* , Haixi Miao ¤† , Lin Chen † , Sean M Riordan † , Wenjun Li † , Andrea M Crabb † , Alexandria Wise ‡ , Pan Du § , Simon M Lin § and M Rosario Hernandez † Addresses: * Department of Molecular Pharmacology and Biological Chemistry, Feinberg School of Medicine, Northwestern University, E Chicago Ave, Chicago, IL 60611 USA. † Department of Ophthalmology, Feinberg School of Medicine, Northwestern University, E Chicago Ave, Chicago, IL 60611 USA. ‡ Department of Biology, City College of New York, Convent Ave, New York, NY 10031, USA. § Robert H Lurie Comprehensive Cancer Center, Feinberg School of Medicine, Northwestern University, E Chicago Ave, Chicago, IL 60611 USA. ¤ These authors contributed equally to this work. Correspondence: Thomas J Lukas. Email: [email protected] © 2008 Lukas et al.; licensee BioMed Central Ltd. This is an open access article distributed under the terms of the Creative Commons Attribution License (http://creativecommons.org/licenses/by/2.0), which permits unrestricted use, distribution, and reproduction in any medium, provided the original work is properly cited. Abstract Background: Epidemiological and genetic studies indicate that ethnic/genetic background plays an important role in susceptibility to primary open angle glaucoma (POAG). POAG is more prevalent among the African-descent population compared to the Caucasian population. Damage in POAG occurs at the level of the optic nerve head (ONH) and is mediated by astrocytes. Here we investigated differences in gene expression in primary cultures of ONH astrocytes obtained from age- matched normal and glaucomatous donors of Caucasian American (CA) and African American (AA) populations using oligonucleotide microarrays. Results: Gene expression data were obtained from cultured astrocytes representing 12 normal CA and 12 normal AA eyes, 6 AA eyes with POAG and 8 CA eyes with POAG. Data were normalized and significant differential gene expression levels detected by using empirical Bayesian shrinkage moderated t-statistics. Gene Ontology analysis and networks of interacting proteins were constructed using the BioGRID database. Network maps included regulation of myosin, actin, and protein trafficking. Real-time RT-PCR, western blots, ELISA, and functional assays validated genes in the networks. Conclusion: Cultured AA and CA glaucomatous astrocytes retain differential expression of genes that promote cell motility and migration, regulate cell adhesion, and are associated with structural tissue changes that collectively contribute to neural degeneration. Key upregulated genes include those encoding myosin light chain kinase (MYLK), transforming growth factor-β receptor 2 (TGFBR2), rho-family GTPase-2 (RAC2), and versican (VCAN). These genes along with other differentially expressed components of integrated networks may reflect functional susceptibility to chronic elevated intraocular pressure that is enhanced in the optic nerve head of African Americans. Published: 9 July 2008 Genome Biology 2008, 9:R111 (doi:10.1186/gb-2008-9-7-r111) Received: 9 May 2008 Revised: 18 June 2008 Accepted: 9 July 2008 The electronic version of this article is the complete one and can be found online at http://genomebiology.com/2008/9/7/R111

Welcome message from author
This document is posted to help you gain knowledge. Please leave a comment to let me know what you think about it! Share it to your friends and learn new things together.
Transcript

Genome Biology 2008, 9:R111
Open Access2008Lukaset al.Volume 9, Issue 7, Article R111ResearchSusceptibility to glaucoma: differential comparison of the astrocyte transcriptome from glaucomatous African American and Caucasian American donorsThomas J Lukas¤*, Haixi Miao¤†, Lin Chen†, Sean M Riordan†, Wenjun Li†, Andrea M Crabb†, Alexandria Wise‡, Pan Du§, Simon M Lin§ and M Rosario Hernandez†
Addresses: *Department of Molecular Pharmacology and Biological Chemistry, Feinberg School of Medicine, Northwestern University, E Chicago Ave, Chicago, IL 60611 USA. †Department of Ophthalmology, Feinberg School of Medicine, Northwestern University, E Chicago Ave, Chicago, IL 60611 USA. ‡Department of Biology, City College of New York, Convent Ave, New York, NY 10031, USA. §Robert H Lurie Comprehensive Cancer Center, Feinberg School of Medicine, Northwestern University, E Chicago Ave, Chicago, IL 60611 USA.
¤ These authors contributed equally to this work.
Correspondence: Thomas J Lukas. Email: [email protected]
© 2008 Lukas et al.; licensee BioMed Central Ltd. This is an open access article distributed under the terms of the Creative Commons Attribution License (http://creativecommons.org/licenses/by/2.0), which permits unrestricted use, distribution, and reproduction in any medium, provided the original work is properly cited.
Abstract
Background: Epidemiological and genetic studies indicate that ethnic/genetic background plays animportant role in susceptibility to primary open angle glaucoma (POAG). POAG is more prevalentamong the African-descent population compared to the Caucasian population. Damage in POAGoccurs at the level of the optic nerve head (ONH) and is mediated by astrocytes. Here weinvestigated differences in gene expression in primary cultures of ONH astrocytes obtained from age-matched normal and glaucomatous donors of Caucasian American (CA) and African American (AA)populations using oligonucleotide microarrays.
Results: Gene expression data were obtained from cultured astrocytes representing 12 normal CAand 12 normal AA eyes, 6 AA eyes with POAG and 8 CA eyes with POAG. Data were normalizedand significant differential gene expression levels detected by using empirical Bayesian shrinkagemoderated t-statistics. Gene Ontology analysis and networks of interacting proteins wereconstructed using the BioGRID database. Network maps included regulation of myosin, actin, andprotein trafficking. Real-time RT-PCR, western blots, ELISA, and functional assays validated genes inthe networks.
Conclusion: Cultured AA and CA glaucomatous astrocytes retain differential expression of genesthat promote cell motility and migration, regulate cell adhesion, and are associated with structuraltissue changes that collectively contribute to neural degeneration. Key upregulated genes includethose encoding myosin light chain kinase (MYLK), transforming growth factor-β receptor 2 (TGFBR2),rho-family GTPase-2 (RAC2), and versican (VCAN). These genes along with other differentiallyexpressed components of integrated networks may reflect functional susceptibility to chronicelevated intraocular pressure that is enhanced in the optic nerve head of African Americans.
Published: 9 July 2008
Genome Biology 2008, 9:R111 (doi:10.1186/gb-2008-9-7-r111)
Received: 9 May 2008Revised: 18 June 2008Accepted: 9 July 2008
The electronic version of this article is the complete one and can be found online at http://genomebiology.com/2008/9/7/R111
http://genomebiology.com/2008/9/7/R111 Genome Biology 2008, Volume 9, Issue 7, Article R111 Lukas et al. R111.2
BackgroundGlaucoma comprises a group of diseases that are character-ized by optic neuropathy associated with optic disc cuppingand loss of visual field and, in many patients, with elevatedintraocular pressure (IOP) [1]. There are several types of glau-coma, including juvenile and adult-onset types, primary openangle glaucoma (POAG), narrow-angle glaucoma, and sec-ondary glaucoma, with different pathogenic mechanisms.POAG is more prevalent in Black Americans of African Amer-ican (AA) ancestry than in Caucasian American (CA) popula-tions of European ancestry (CA), with reported frequencies of3-4% in the AA population over the age of 40 years, as com-pared with approximately 1% in CA populations [2]. The dis-ease is particularly frequent in Afro-Caribbean persons, witha prevalence of 7% in Barbados and 8.8% in St Lucia [3]. Onaverage, African Americans have the longest duration [4] andhigher progression of disease [5] compared to other popula-tions. In addition to racial differences, a positive family his-tory of POAG is a major risk factor for the disease in AfricanAmericans [6]. The Advanced Glaucoma Intervention Study(AGIS), which compared the glaucoma outcomes in AA andCA patients, concluded that after failure of medical therapy,surgical trabeculectomy delayed progression of glaucomamore effectively in CA than in AA patients [7,8].
Abnormally elevated IOP elicits a complex sequence of puta-tive neurodestructive and neuroprotective cellular responsesin the optic nerve head (ONH) [9]. Previous studies demon-strated that gene expression in astrocytes of the glaucoma-tous ONH serve as the basis for these responses [10]. Here wepresent evidence that primary cultures of AA and CA astro-cytes derived from POAG donors exhibit differential geneexpression of genes that relate to reactive astrocytes and topathological changes that occur in the glaucomatous ONH.Validations of changes in expression of selected genes weredone by quantitative real-time RT-PCR, western blots,enzyme-linked immunosorbent assay (ELISA) and variousfunctional assays. Network analysis of gene product interac-tions focused our findings on specific functional pathways.Our data indicate that both normal and glaucomatous astro-cytes from AA donors exhibit differential expression in genesthat regulate signal transduction, cell migration, intracellulartrafficking and secretory pathways.
Results and discussionPrimary cultures of ONH astrocytes from normal and glaucomatous donorsDemographics and clinical historyDemographic characteristics of the normal AA and CA donorsused in this study are detailed in Additional data file 2. Demo-graphic and clinical data for AA donors with glaucoma(AAGs) and CA donors with glaucoma (CAGs) included in themicroarray analyses and other assays are detailed in Addi-tional data file 1. Twelve eyes from ten CAG donors and sixeyes from AAG donors were used in this study. Glaucoma
drug treatment history was available for some POAG donors.None of the drug treatments are known to affect astrocytes inthe ONH. The degree of glaucomatous damage in donors withPOAG was assessed using histories when available and byevaluating axon degeneration in cross-sections of the myeli-nated optic nerve (Additional data file 1). A limitation of thisstudy is that only six eyes from three AAG donors were avail-able due to the extreme rarity of these samples. Consequently,we used all six eyes to generate primary cultures for all exper-iments in our study. Primary cultures of samples from AAGand CAG donors were fully characterized as ONH astrocytesas described in detail earlier [11].
Identification of differentially expressed genes in ONH astrocytes from AA and CA donors with POAGComparisonsFor the comparisons amongst the four groups, our primaryfocus was to establish the differentially expressed genesbetween AAG and CAG donors (Additional data file 7); oursecondary focus was the comparison between normal andglaucomatous astrocytes and our tertiary focus was to identifydifferentially expressed genes within each population: AAGversus AA and CAG versus CA.
The comparisons allowed us to identify the unique geneexpression profile in AAG astrocytes compared to CAG astro-cytes and AAG compared to AA (Additional data file 8). Inaddition, we identified a common group of genes that exhibita similar gene expression pattern in both AAG and CAG com-pared to normal AA and CA astrocytes, which we named com-mon glaucoma-related genes (Tables 1 and 2).
Eight eyes from six CAG donors were used to generate astro-cytes for eight Hu95v2 chips. Six eyes from three AAG wereused to generate astrocytes for six Hu95Av2 chips and sixHu133A 2.0 chips. Eighteen Hu133 2.0 chips from nine nor-mal AA and nine normal CA donors, and seven Hu95v2 chipsfrom six normal CA donors were used for comparisons withinthe appropriate platform. All microarray data have beendeposited in the NCBI GEO database under the series acces-sion number GSE9963.
The data measured by the two types of chips were normalizedseparately by RMA normalization as described in Materialsand methods. Differentially expressed genes required an upor down fold-change of more than 1.5-fold (p < 0.01, falsediscovery rate < 0.05). A total of 618 genes were differentiallyexpressed in AAG-CAG comparisons, 484 upregulated and134 downregulated (Additional data file 7); 509 genes weredifferentially expressed in AAG compared to normal AAastrocytes, 167 upregulated and 342 downregulated (Addi-tional data file 5); and 195 genes were differentially expressedin the CAG-CA comparison, 132 upregulated and 63 downreg-ulated (Additional data file 6). We used empirical Bayesianmethods to identify differentially expressed genes; both ourresults (not shown) and previous studies [12,13] have sug-
Genome Biology 2008, 9:R111
http://genomebiology.com/2008/9/7/R111 Genome Biology 2008, Volume 9, Issue 7, Article R111 Lukas et al. R111.3
gested that the empirical Bayesian method has performancesimilar to statistical analysis of microarrays (SAM). To reducebatch effects, we added fold-change criteria because geneswith larger fold-change are less likely to be affected by sucheffects.
Gene OntologyGene Ontology (GO) analysis of differential expression inglaucomatous astrocytes was done with GoMiner [14]. Therewere 33 significant categories for CAG-CA, 80 for AAG-AA,and 67 for AAG-CAG comparisons (p < 0.01). The significantgenes in selected categories were mined using GOstats in Bio-conductor (Additional data file 9). The phosphorylation cate-gory (GoID: 16310) was significant in the three datasets. Thepercent distribution of the genes common to all of the data-sets in this category was determined (Additional data file 10).For example, the genes encoding myosin light chain kinase(MYLK) and calcium/calmodulin-dependent serine proteinkinase (CASK1) were found in all three glaucoma compari-sons. Those encoding the regulatory subunit of phosphati-dylinositol-3-kinase (PIK3R1), transforming growth factor(TGF)β-receptor 2 (TGFBR2), ERBB2, and Ephrin receptorA5 were some of the genes found in two datasets (AAG-CAGand AAG-AA). Similarly, another category with overlapsbetween the datasets was cell-cell signaling (Additional datafile 10). Some of the genes in this category include thoseencoding latent transforming growth factor beta binding pro-tein 4 (LTBP4), the glutamate receptor subunit (GRIK2), andparathyroid hormone-like protein (PTHLH). As we showbelow, expansion of these and other GO categories using net-
work-protein interaction software yielded three networksthat include differentially expressed GTPases, proteinkinases, transmembrane receptors, and proteins involved intrafficking at cellular membranes. Altogether, the GO analy-sis suggests that alterations in the signaling networks thatregulate cell motility, polarity, adhesion, and trafficking arepresent in glaucomatous astrocytes. Moreover, the overlapamong the datasets in multiple categories suggests that thereis a spectrum of changes in gene expression in glaucoma.
Network analysisThree detailed network maps were constructed from the dif-ferential gene expression data. We focused mainly on the dif-ferences between AAG and CAG as this difference representsthe maximal differential expression group (Additional datafile 7). The networks include regulation of myosin, actin,TGFβ signaling and protein trafficking. For the myosin net-work, the initial node was myosin light chain kinase (MYLK)(Figure 1b). The actin regulatory networks were initiatedusing the TGFβ receptors (Figure 2a), and the protein traf-ficking networks were initiated using GOLGA3, catenin beta1(CTNNB1) and RAB4A as nodes (Figure 3a). These wereexpanded using the BioGrid database for protein-proteininteractions. In each network graph, the differentiallyexpressed genes are shown by large nodes and font (red forincreased, blue for decreased expression), while theconnecting genes that are not differentially expressed areshown by black smaller nodes and font. Expression data fornetwork nodes that are differentially expressed in the AAG-CAG comparison (Additional data file 7) are included in Table
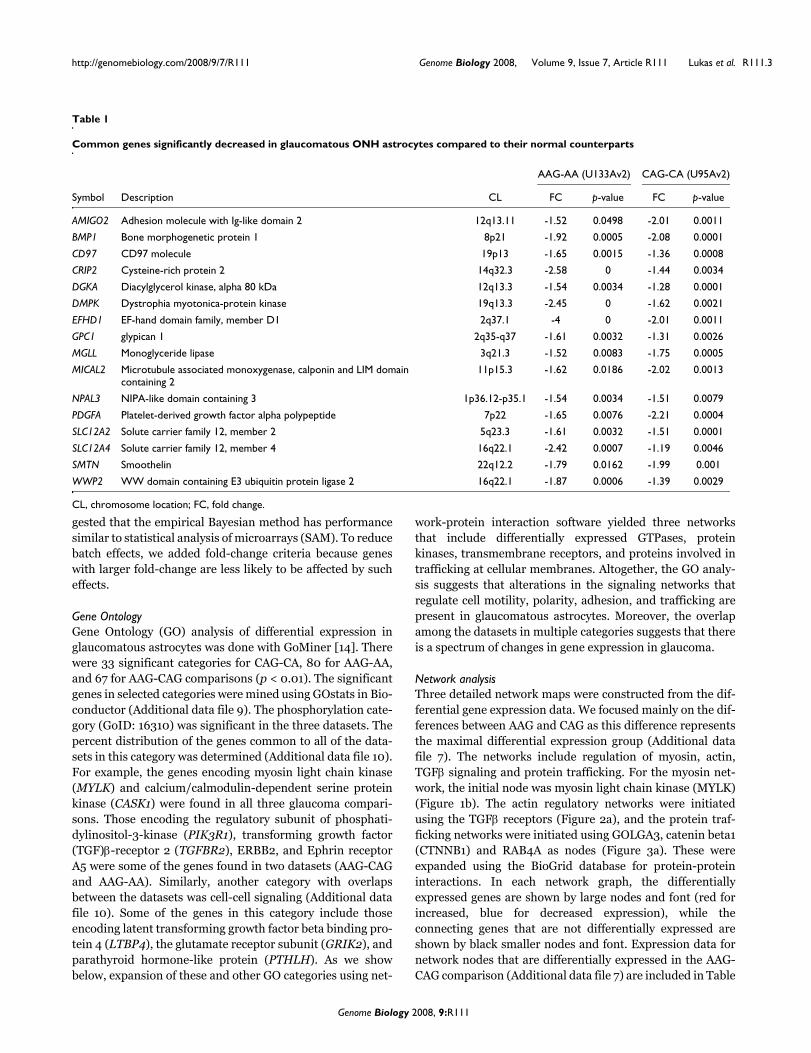
Table 1
Common genes significantly decreased in glaucomatous ONH astrocytes compared to their normal counterparts
AAG-AA (U133Av2) CAG-CA (U95Av2)
Symbol Description CL FC p-value FC p-value
AMIGO2 Adhesion molecule with Ig-like domain 2 12q13.11 -1.52 0.0498 -2.01 0.0011
BMP1 Bone morphogenetic protein 1 8p21 -1.92 0.0005 -2.08 0.0001
CD97 CD97 molecule 19p13 -1.65 0.0015 -1.36 0.0008
CRIP2 Cysteine-rich protein 2 14q32.3 -2.58 0 -1.44 0.0034
DGKA Diacylglycerol kinase, alpha 80 kDa 12q13.3 -1.54 0.0034 -1.28 0.0001
DMPK Dystrophia myotonica-protein kinase 19q13.3 -2.45 0 -1.62 0.0021
EFHD1 EF-hand domain family, member D1 2q37.1 -4 0 -2.01 0.0011
GPC1 glypican 1 2q35-q37 -1.61 0.0032 -1.31 0.0026
MGLL Monoglyceride lipase 3q21.3 -1.52 0.0083 -1.75 0.0005
MICAL2 Microtubule associated monoxygenase, calponin and LIM domain containing 2
11p15.3 -1.62 0.0186 -2.02 0.0013
NPAL3 NIPA-like domain containing 3 1p36.12-p35.1 -1.54 0.0034 -1.51 0.0079
PDGFA Platelet-derived growth factor alpha polypeptide 7p22 -1.65 0.0076 -2.21 0.0004
SLC12A2 Solute carrier family 12, member 2 5q23.3 -1.61 0.0032 -1.51 0.0001
SLC12A4 Solute carrier family 12, member 4 16q22.1 -2.42 0.0007 -1.19 0.0046
SMTN Smoothelin 22q12.2 -1.79 0.0162 -1.99 0.001
WWP2 WW domain containing E3 ubiquitin protein ligase 2 16q22.1 -1.87 0.0006 -1.39 0.0029
CL, chromosome location; FC, fold change.
Genome Biology 2008, 9:R111
http://genomebiology.com/2008/9/7/R111 Genome Biology 2008, Volume 9, Issue 7, Article R111 Lukas et al. R111.4
3. Some network nodes were also selected from differentiallyexpressed genes in AAG-AA (Additional data file 5) and incommon AAG-AA and CAG-CA comparisons (Tables 1 and 2).In the description of each network, we present selected exper-
imental data that verify changes in gene expression andeffects on function.
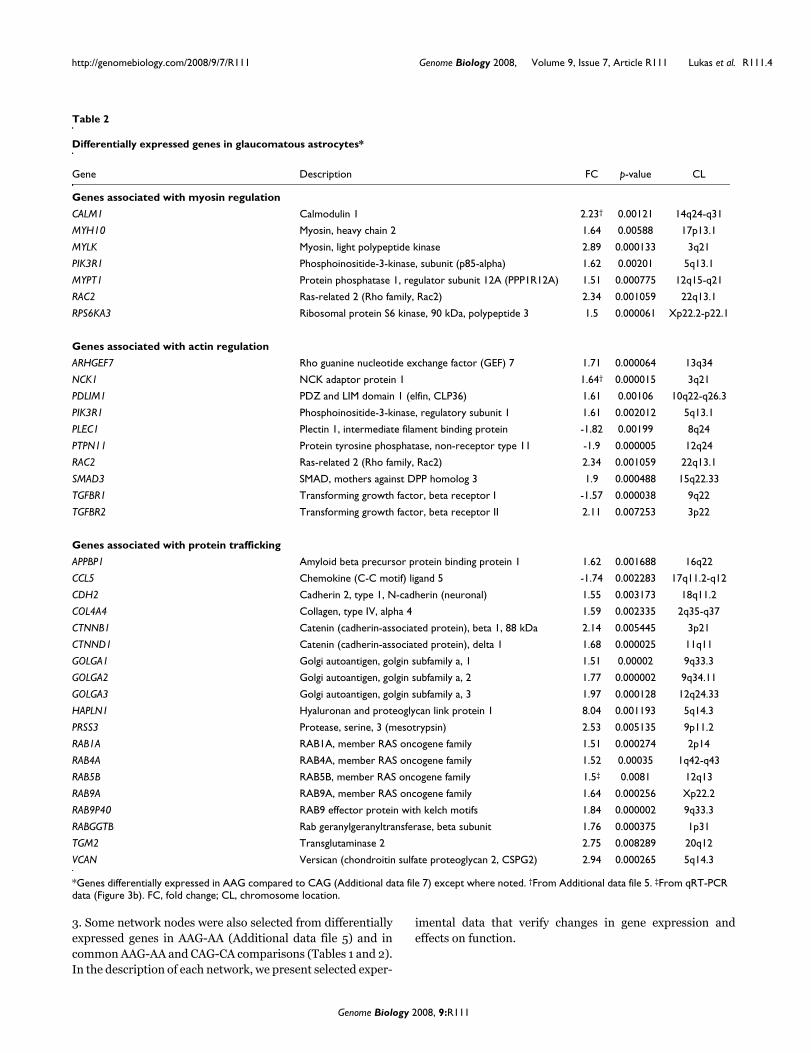
Table 2
Differentially expressed genes in glaucomatous astrocytes*
Gene Description FC p-value CL
Genes associated with myosin regulation
CALM1 Calmodulin 1 2.23† 0.00121 14q24-q31
MYH10 Myosin, heavy chain 2 1.64 0.00588 17p13.1
MYLK Myosin, light polypeptide kinase 2.89 0.000133 3q21
PIK3R1 Phosphoinositide-3-kinase, subunit (p85-alpha) 1.62 0.00201 5q13.1
MYPT1 Protein phosphatase 1, regulator subunit 12A (PPP1R12A) 1.51 0.000775 12q15-q21
RAC2 Ras-related 2 (Rho family, Rac2) 2.34 0.001059 22q13.1
RPS6KA3 Ribosomal protein S6 kinase, 90 kDa, polypeptide 3 1.5 0.000061 Xp22.2-p22.1
Genes associated with actin regulation
ARHGEF7 Rho guanine nucleotide exchange factor (GEF) 7 1.71 0.000064 13q34
NCK1 NCK adaptor protein 1 1.64† 0.000015 3q21
PDLIM1 PDZ and LIM domain 1 (elfin, CLP36) 1.61 0.00106 10q22-q26.3
PIK3R1 Phosphoinositide-3-kinase, regulatory subunit 1 1.61 0.002012 5q13.1
PLEC1 Plectin 1, intermediate filament binding protein -1.82 0.00199 8q24
PTPN11 Protein tyrosine phosphatase, non-receptor type 11 -1.9 0.000005 12q24
RAC2 Ras-related 2 (Rho family, Rac2) 2.34 0.001059 22q13.1
SMAD3 SMAD, mothers against DPP homolog 3 1.9 0.000488 15q22.33
TGFBR1 Transforming growth factor, beta receptor I -1.57 0.000038 9q22
TGFBR2 Transforming growth factor, beta receptor II 2.11 0.007253 3p22
Genes associated with protein trafficking
APPBP1 Amyloid beta precursor protein binding protein 1 1.62 0.001688 16q22
CCL5 Chemokine (C-C motif) ligand 5 -1.74 0.002283 17q11.2-q12
CDH2 Cadherin 2, type 1, N-cadherin (neuronal) 1.55 0.003173 18q11.2
COL4A4 Collagen, type IV, alpha 4 1.59 0.002335 2q35-q37
CTNNB1 Catenin (cadherin-associated protein), beta 1, 88 kDa 2.14 0.005445 3p21
CTNND1 Catenin (cadherin-associated protein), delta 1 1.68 0.000025 11q11
GOLGA1 Golgi autoantigen, golgin subfamily a, 1 1.51 0.00002 9q33.3
GOLGA2 Golgi autoantigen, golgin subfamily a, 2 1.77 0.000002 9q34.11
GOLGA3 Golgi autoantigen, golgin subfamily a, 3 1.97 0.000128 12q24.33
HAPLN1 Hyaluronan and proteoglycan link protein 1 8.04 0.001193 5q14.3
PRSS3 Protease, serine, 3 (mesotrypsin) 2.53 0.005135 9p11.2
RAB1A RAB1A, member RAS oncogene family 1.51 0.000274 2p14
RAB4A RAB4A, member RAS oncogene family 1.52 0.00035 1q42-q43
RAB5B RAB5B, member RAS oncogene family 1.5‡ 0.0081 12q13
RAB9A RAB9A, member RAS oncogene family 1.64 0.000256 Xp22.2
RAB9P40 RAB9 effector protein with kelch motifs 1.84 0.000002 9q33.3
RABGGTB Rab geranylgeranyltransferase, beta subunit 1.76 0.000375 1p31
TGM2 Transglutaminase 2 2.75 0.008289 20q12
VCAN Versican (chondroitin sulfate proteoglycan 2, CSPG2) 2.94 0.000265 5q14.3
*Genes differentially expressed in AAG compared to CAG (Additional data file 7) except where noted. †From Additional data file 5. ‡From qRT-PCR data (Figure 3b). FC, fold change; CL, chromosome location.
Genome Biology 2008, 9:R111
http://genomebiology.com/2008/9/7/R111 Genome Biology 2008, Volume 9, Issue 7, Article R111 Lukas et al. R111.5
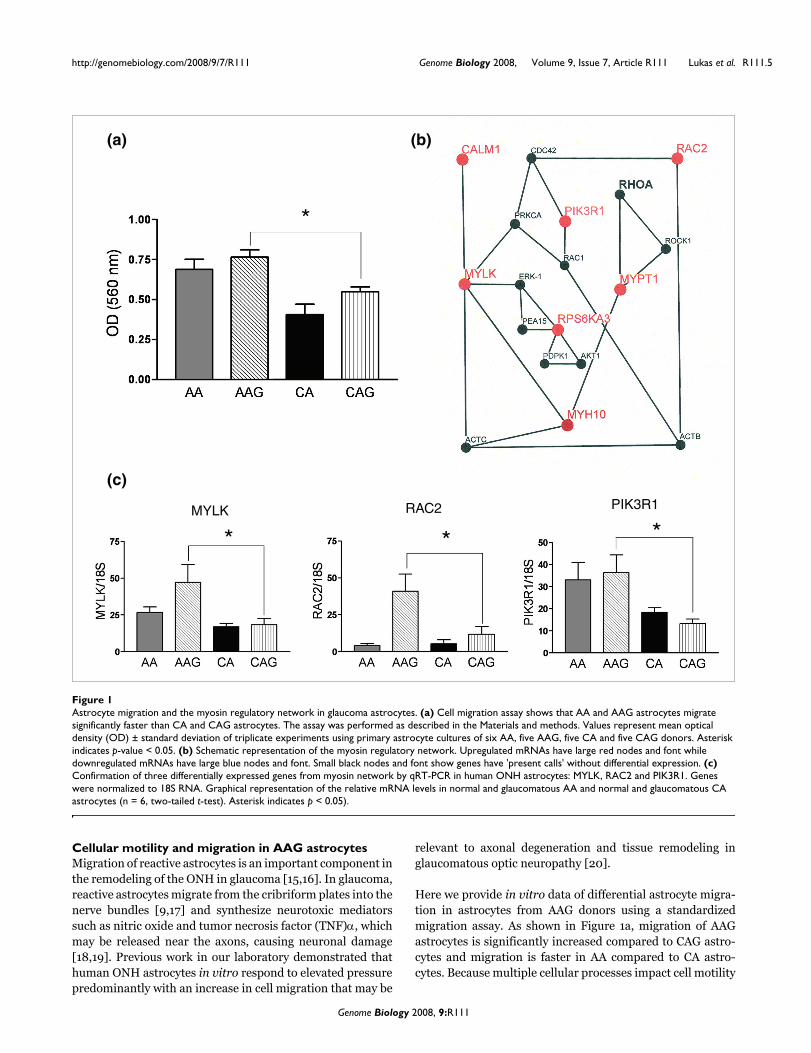
Cellular motility and migration in AAG astrocytesMigration of reactive astrocytes is an important component inthe remodeling of the ONH in glaucoma [15,16]. In glaucoma,reactive astrocytes migrate from the cribriform plates into thenerve bundles [9,17] and synthesize neurotoxic mediatorssuch as nitric oxide and tumor necrosis factor (TNF)α, whichmay be released near the axons, causing neuronal damage[18,19]. Previous work in our laboratory demonstrated thathuman ONH astrocytes in vitro respond to elevated pressurepredominantly with an increase in cell migration that may be
relevant to axonal degeneration and tissue remodeling inglaucomatous optic neuropathy [20].
Here we provide in vitro data of differential astrocyte migra-tion in astrocytes from AAG donors using a standardizedmigration assay. As shown in Figure 1a, migration of AAGastrocytes is significantly increased compared to CAG astro-cytes and migration is faster in AA compared to CA astro-cytes. Because multiple cellular processes impact cell motility
Astrocyte migration and the myosin regulatory network in glaucoma astrocytesFigure 1Astrocyte migration and the myosin regulatory network in glaucoma astrocytes. (a) Cell migration assay shows that AA and AAG astrocytes migrate significantly faster than CA and CAG astrocytes. The assay was performed as described in the Materials and methods. Values represent mean optical density (OD) ± standard deviation of triplicate experiments using primary astrocyte cultures of six AA, five AAG, five CA and five CAG donors. Asterisk indicates p-value < 0.05. (b) Schematic representation of the myosin regulatory network. Upregulated mRNAs have large red nodes and font while downregulated mRNAs have large blue nodes and font. Small black nodes and font show genes have 'present calls' without differential expression. (c) Confirmation of three differentially expressed genes from myosin network by qRT-PCR in human ONH astrocytes: MYLK, RAC2 and PIK3R1. Genes were normalized to 18S RNA. Graphical representation of the relative mRNA levels in normal and glaucomatous AA and normal and glaucomatous CA astrocytes (n = 6, two-tailed t-test). Asterisk indicates p < 0.05).
(a)
(c)PIK3R1
*RAC2
**MYLK
(b)
*
Genome Biology 2008, 9:R111

http://genomebiology.com/2008/9/7/R111 Genome Biology 2008, Volume 9, Issue 7, Article R111 Lukas et al. R111.6
and migration, we divided our analysis between two interact-ing networks that regulate myosin and actin.
Myosin-dependent astrocyte migrationFrom the microarray and quantitative RT-PCR (qRT-PCR)data, the following genes related to myosin regulation weredifferentially expressed in AAG: MYLK, MYPT1, RAC2,CALM1, RPS6KA3, MYH10, and PIK3R1. Shown in Figure 1bis the network of proteins associated with the phosphoryla-tion of the regulatory light chain of myosin II and activationof myosin-ATPase (MYH10). Two network nodes are critical
for the regulation of myosin. These include MYLK, a calmod-ulin-activated protein kinase that phosphorylates Ser19 onthe myosin regulatory light chain and MYPT1, the regulatorysubunit of myosin-light chain phosphatase, whichdephosphorylates the myosin light chain. We found that bothgenes were expressed in AAG astrocytes at significantlyhigher levels than in CAG astrocytes (Table 3). Similarly, cal-modulin (CALM1), the activator of MYLK is also upregulatedin AAG astrocytes (Table 3)
Actin regulatory network and TGFβ signaling in AAG astrocytesFigure 2Actin regulatory network and TGFβ signaling in AAG astrocytes. (a) Schematic representation of the actin and TGFβ regulatory network. Upregulated mRNAs have large red nodes and capital font, while downregulated mRNAs are shown with large blue nodes and capital font. Small black nodes and capital font indicate genes that have 'present calls' without differential expression. The RhoA GTPase is in bold in black because of higher activity in glaucoma astrocytes. (b) Representative western blot of the pull-down Rho activation assay demonstrated that both AAG and CAG astrocytes exhibit significantly higher Rho activity than normal astrocytes under unstimulated conditions. (c) Densitometry analysis of the blots from Rho activation assay. Bars show mean fold difference in density ± standard error of two independent experiments. (Asterisk indicates p < 0.05)
(a)
(c)* *(b)
CA1-4 CAG1-4Rho
24 kDa
Rho24 kDa
AA1-4 AAG1-4
Genome Biology 2008, 9:R111

http://genomebiology.com/2008/9/7/R111 Genome Biology 2008, Volume 9, Issue 7, Article R111 Lukas et al. R111.7
The upregulation of MYLK suggests that the myosin regula-tory system may exhibit increased responsiveness towardsmodulation by various cellular second messenger signalingsystems such as Ca2+, diacylglycerol, and cyclic nucleotides[21]. Similarly, changes in expression of RAC2 indicate that
other members of the Rho-family signaling network arealtered in AAG astrocytes (Figure 1c). These changes allow usto predict that the myosin-regulated motility may be sensi-tized to signals from Ca2+, Rho GTPase, and growth/trophicfactors coupled to the activation of phosphoinositides. Within
Intracellular trafficking networks associated with golgi, plasma membrane, and endosomes that have differentially expressed genes in glaucoma astrocytesFigure 3Intracellular trafficking networks associated with golgi, plasma membrane, and endosomes that have differentially expressed genes in glaucoma astrocytes. (a) Schematic representation of the intracellular trafficking network. Upregulated mRNAs have a large red node and font, while downregulated genes have a large blue node and font. Small black nodes and font indicate genes that have 'present calls' without differential expression. (b) Confirmation of four differentially expressed genes from the trafficking network by qRT-PCR in human ONH astrocytes: RAB4A, RAB5B, HAPLN and VCAN. Genes were normalized to 18S RNA. Graphical representation of the relative mRNA levels in normal and glaucomatous AA and normal and glaucomatous CA astrocytes (n = 6, two-tailed t-test). Asterisk indicates p < 0.05. (c) Representative double immunofluorescent staining of versican (VCAN; red) and astrocyte marker GFAP (green) in sections of human ONH from an AA donor (51 year old female), AAG donor (70 year old male), CA donor (70 year old male) and CAG donor (76 year old male). Nuclei (blue) are stained with DAPI. Note staining of VCAN (red) in the cribriform plates and surrounding the blood vessels (arrowheads). Arrows indicate versican co-localized with GFAP in astrocytes in the cribriform plates of the lamina cribrosa. VCAN staining is stronger in astrocytes of the glaucomatous lamina cribrosa. V, blood vessel; NB, nerve bundle. Scale bar 35 μm.
RAB5BRAB4A
(a)
(b)
HAPLN VCAN
(c)
*
*
*
*
Genome Biology 2008, 9:R111
http://genomebiology.com/2008/9/7/R111 Genome Biology 2008, Volume 9, Issue 7, Article R111 Lukas et al. R111.8
the phosphoinositide pathway, PIK3R1 is upregulated in AAGastrocytes (Figure 1c). The PIK3R1 pathway is important forthe motility of ONH astrocytes [22] and their responses toincreased hydrostatic pressure [20]. PIK3R1 is the regulatorysubunit of the lipid kinase that transforms phosphoinositide(4,5) biphosphate (PIP2) into the triphosphate (PIP3). PIP3in turn mediates activation of several of the Rho GTPases aswell as selected protein kinases. Thus, in AAG astrocytes,lipid-activated pathways that modulate astrocyte motility arealtered.
ERK1 potentiates MYLK activity through phosphorylation[23] and interacts with PEA15 (Phosphoprotein enriched inastrocytes) [24]. The increased expression of the S6-familykinase (RPS6KA3) may compete with ERK1 for binding to thephosphoprotein PEA15 [25], potentially increasing the poolof active ERK1. Consistent with this finding, we have shownthat ERK1 is activated in normal CA ONH astrocytes, underincreased hydrostatic pressure and in experimental glaucomain primates [26]. Thus, myosin-based motility may be influ-enced by changes in MYLK expression and potentiationthrough ERK1 activation under hydrostatic pressure.
Co-localization of MYLK and glial acidic fibrillar protein(GFAP) by immunohistochemistry indicates that ONH astro-cytes in tissue sections in the lamina cribrosa of normal AAand AAG expressed visibly higher levels of MYLK protein insitu (Figure 4a).
The MYLK gene has multiple genes within its locus [27]. Insome tissues up to three transcripts are expressed, includingfor long and short forms of the kinase and a protein identicalto the carboxyl-terminal sequence [27]. ONH astrocytesexpress both the 130 kDa (MYLK-130) and 210 kDa (MYLK-210) kinase isoforms and we quantified changes in both usingstandard densitometry measurements. Western blots (Figure4b) show that the fraction of MYLK-210 in ONH astrocytes ishigher in AAG and CAG compared to normal astrocytes, whilethe fraction of the MYLK-130 isoform decreases (Figure 4b).These differences were quantified using densitometry (Figure4c, d). Thus, in glaucoma there appears to be MYLK isoformswitching towards the larger protein. The difference betweenthe two proteins is the presence of an amino-terminal exten-sion in the 210 kDa species that contains additional actinbinding domains. Other studies have shown that MYLK-210displays enhanced interaction with the actin cytoskeletoncompared to the 130 kDa isoform [28,29]. These results areconsistent with the enhanced migration of ONH astrocytesmediated in part by increased expression of MYLK-210.
MYLK variants have been found to confer risk of lung injury[30], asthma or sepsis [31], particularly in African Americans[32]. Some of the common polymorphisms in MYLK affect itsexpression [31]. Therefore, in some populations, it is possiblethat the effects of increased expression of MYLK may be fur-ther modified by genetic polymorphisms.
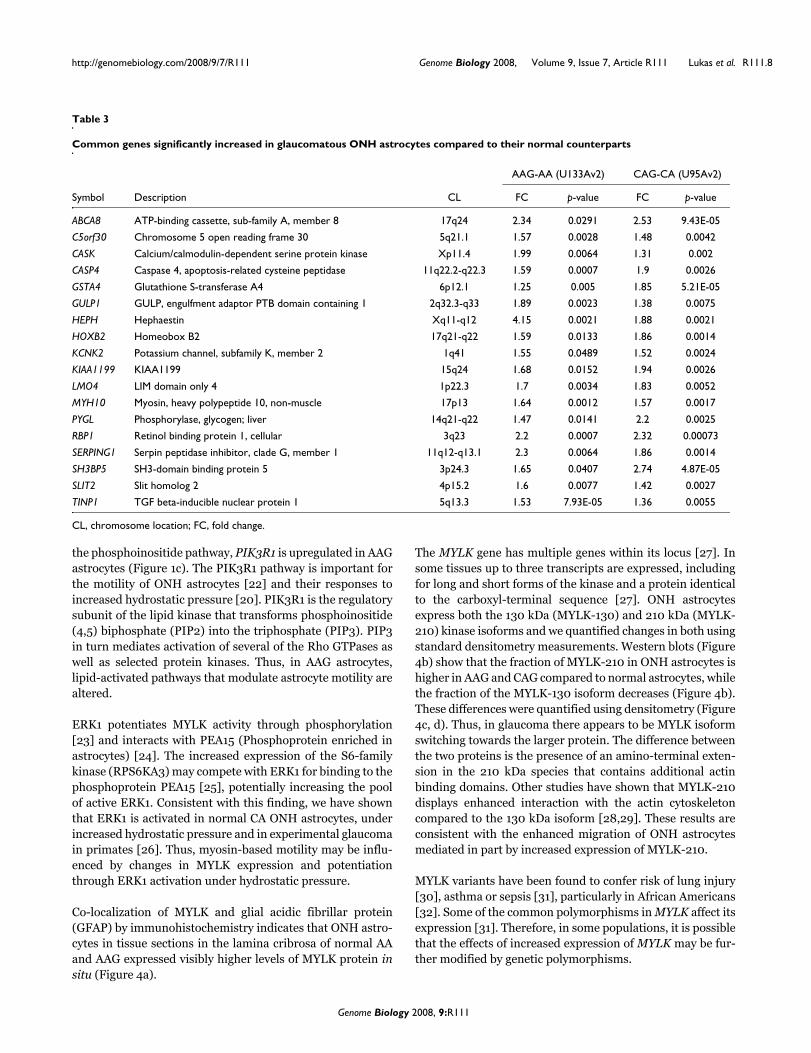
Table 3
Common genes significantly increased in glaucomatous ONH astrocytes compared to their normal counterparts
AAG-AA (U133Av2) CAG-CA (U95Av2)
Symbol Description CL FC p-value FC p-value
ABCA8 ATP-binding cassette, sub-family A, member 8 17q24 2.34 0.0291 2.53 9.43E-05
C5orf30 Chromosome 5 open reading frame 30 5q21.1 1.57 0.0028 1.48 0.0042
CASK Calcium/calmodulin-dependent serine protein kinase Xp11.4 1.99 0.0064 1.31 0.002
CASP4 Caspase 4, apoptosis-related cysteine peptidase 11q22.2-q22.3 1.59 0.0007 1.9 0.0026
GSTA4 Glutathione S-transferase A4 6p12.1 1.25 0.005 1.85 5.21E-05
GULP1 GULP, engulfment adaptor PTB domain containing 1 2q32.3-q33 1.89 0.0023 1.38 0.0075
HEPH Hephaestin Xq11-q12 4.15 0.0021 1.88 0.0021
HOXB2 Homeobox B2 17q21-q22 1.59 0.0133 1.86 0.0014
KCNK2 Potassium channel, subfamily K, member 2 1q41 1.55 0.0489 1.52 0.0024
KIAA1199 KIAA1199 15q24 1.68 0.0152 1.94 0.0026
LMO4 LIM domain only 4 1p22.3 1.7 0.0034 1.83 0.0052
MYH10 Myosin, heavy polypeptide 10, non-muscle 17p13 1.64 0.0012 1.57 0.0017
PYGL Phosphorylase, glycogen; liver 14q21-q22 1.47 0.0141 2.2 0.0025
RBP1 Retinol binding protein 1, cellular 3q23 2.2 0.0007 2.32 0.00073
SERPING1 Serpin peptidase inhibitor, clade G, member 1 11q12-q13.1 2.3 0.0064 1.86 0.0014
SH3BP5 SH3-domain binding protein 5 3p24.3 1.65 0.0407 2.74 4.87E-05
SLIT2 Slit homolog 2 4p15.2 1.6 0.0077 1.42 0.0027
TINP1 TGF beta-inducible nuclear protein 1 5q13.3 1.53 7.93E-05 1.36 0.0055
CL, chromosome location; FC, fold change.
Genome Biology 2008, 9:R111

http://genomebiology.com/2008/9/7/R111 Genome Biology 2008, Volume 9, Issue 7, Article R111 Lukas et al. R111.9
Actin-dependent astrocyte migrationFrom the microarray and qRT-PCR data the following geneswere differentially expressed in AAG: TGFBR2, TGFBR1,SMAD3, NCK1, PTPN11, ARHGEF7, PDLIM1, LM04, andPLEC1. Figure 2a shows several signal transduction networksthat participate in the regulation of actin. Remodeling orredistribution of actin at cellular edges is an essential part ofestablishing cell polarity [33] and the formation of processesin astrocytes [34]. Actomyosin interactions and actin polym-erization are regulated by intracellular proteins such as α-actinin (ACTN4) and the ARP protein complex (ACTR2,WASP: Figure 2a). These networks involve the Rho GTPasesignaling pathway. Therefore, we used a pull-down Rho acti-vation assay to measure activated Rho in cell lysates. ONHastrocytes from CAG and AAG donors exhibited significantly
higher Rho activity compared to those from normal AA andCA donors (Figure 2b, c), consistent with the differentialexpression of Rho regulatory components. Rho activity wasalso increased in astrocytes exposed to elevated hydrostaticpressure [35]. Thus, increased Rho activity is another con-tributor towards increased migration of AAG astrocytes. Wesuspect that Rho activity may be altered by changes in the sig-naling proteins included in these networks. For example,RAC2 and ARGEF7 are upregulated in AAG. The Rho-familyGTPase, RAC2, is downstream of TGFβ signaling [36] andARHGEF7 stimulates guanine nucleotide exchange on Rhofamily GTP-binding proteins. We further elaborated changesin TGFβ signaling as a driver to changes in Rho activity.
MYLK isoform expression in ONH astrocytesFigure 4MYLK isoform expression in ONH astrocytes. (a) Representative double immunofluorescent staining of MYLK (red) and astrocyte marker GFAP (green) in sections of human ONH from an AA donor (51 year old male), AAG donor (70 year old male), CA donor (56 year old female) and CAG donor (76 year old male). Nuclei (blue) are stained with DAPI. Note strong granular staining of MYLK in astrocytes (arrows) in the cribriform plates of the lamina cribrosa of AA and AAG donors compared to CA and CAG donors. V, blood vessel; NB, nerve bundle. Scale bar 35 μm. (b) Representative western blots of astrocyte cell lysates with MYLK antibody. β-Actin was used as a loading control. Note that AAG1-4 donors express more MYLK-210 and less MYLK-130 than CAG1-4 donors. (c) Graph of MYLK-210 expressed as the fraction of MYLK-210 in the four groups. (d) Graph of the fraction of MYLK-130 expressed in the four groups. These results represent densitometry analysis of western blots using seven AA, five AAG, eight CA and eight CAG donor samples.
(a)
(c)
** **
(d)
CA1-4 CAG1-4
MYLK
b-actin
130 kDa
210 kDa
210 kDa
130 kDaMYLK
b-actin
AA1-4 AAG1-4
****
(b)
Genome Biology 2008, 9:R111

http://genomebiology.com/2008/9/7/R111 Genome Biology 2008, Volume 9, Issue 7, Article R111 Lukas et al. R111.10
TGFβ signaling in AAG astrocytesTGFβ1 and TGFβ2 act via TGFBR1 and TGFBR2 receptors.Using qRT-PCR we confirmed that TGFBR2 and thedownstream signaling protein SMAD3 are up-regulated inAAG astrocytes, suggesting increased responsiveness (Figure5a). TGFBR1 is down-regulated in AAG compared to CAG(Figure 5a). SMAD proteins not only function as transcrip-tional regulators in ONH astrocytes [37] and other cells in thecentral nervous system [38], but also participate in the regu-lation of cell polarity. SMAD3 was also upregulated in ONHastrocytes exposed to hydrostatic pressure in vitro, suggest-ing that pressure activates the TGFβ pathway [35]. Inaddition, LM04, a LIM domain protein that modulatesSMAD3 transcriptional activity [39], is upregulated in glau-comatous astrocytes in both populations (Table 1). One paththat limits SMAD3 signaling is ubiquitin-linked degradationby SMURF2. Although SMURF2 expression is not altered inglaucomatous astrocytes, SMURF2 is downregulated by anincrease in hydrostatic pressure [35]. Thus, there may beadditional potentiation of TGFβ signaling in AAG astrocyteswith changes in intraocular pressure, which may be a suscep-tibility factor to glaucomatous changes in the AA population.
TGFβ regulates cellular motility through two components.One is through the expression of extracellular matrix (ECM)proteins, which will be discussed in detail below. Contractileforces are transmitted to the ECM through actin-based stressfibers via focal adhesions, which are assemblies of ECM pro-teins, transmembrane receptors, and cytoplasmic structuraland signaling proteins, such as integrins. TGFβ modulatesintegrin-mediated cellular migration, where FYN is one of theprimary signal transducing proteins. A second component ofTGFβ signaling is the regulation of cell polarity. For example,PARD3 and PARD6 are part of a multi-component polaritycomplex that controls polarized cell migration [40]. Thesecomplexes involve the Rho, CDC42, and RAC signaling path-ways, which provide the means to remodel actin duringmigration [33,41]
As shown in Figure 2a, NCK1 was upregulated in AAG (Table3). The Nck1 SH2/SH3 adaptor couples phosphotyrosine sig-nals to the actin cytoskeleton and receptor signaling to theregulatory machinery of the cytoskeleton [42]. The enigmafamily member PDLIM1 was upregulated in AAG astrocytes(Table 3) and functions by allowing interactions amongcytoskeletal proteins through PDZ and amino LIM domains[43,44]. Downregulation of other actin binding proteins suchas PLEC1 (Table 3) may alter actin dynamics with respect tocytoskeletal changes induced by Rho-GTPase, phospholipids,and tyrosine kinase (Src) mediated signaling [45].
TGFBR2 receptors in optic nerve head astrocytesFigure 5b illustrates immunohistochemistry of the TGFBR2on astrocytes in normal and glaucomatous ONH tissue. GFAPpositive astrocytes in the lamina cribrosa of AAG exhibithigher expression of TGFBR2 compared with astrocytes in
normal ONH tissue. Consistent with these findings, westernblots of lysates of ONH astrocytes from AAG indicate higherlevels of TGFBR2 protein compared to the normal tissue andCAG (Figure 5c).
To further investigate alterations in TGFβ signaling in ONHastrocytes, we examined the production of TGFβ1 and TGFβ2.As seen in Figure 5d, TGFβ2 is the primary form of TGFβ pro-duced by ONH astrocytes [46]. There are significantlyincreased levels of secreted TGFβ1 in AA compared to CAastrocyte supernatants but the increases in AAG and CAGastrocytes were not significant compared to normal astro-cytes. These data suggest that most of the changes in TGFβsignaling are due to alterations at the level of TGFβ receptorsin astrocytes from AAG.
Mutations in TGFBR2 are associated with Marfan syndrometype 2 [47-49]. Ocular abnormalities, including glaucoma, areassociated with Marfan syndrome type 1 in which there aremutations in the gene for fibrillin (FBN1) [50]. However, ithas not been established that mutations of TGFBR2 are asso-ciated with ocular problems in Marfan syndrome type 2[48,49].
Intracellular trafficking and the endoplasmic reticulum/Golgi compartmentsFrom the microarray and quantitative RT-PCR data the fol-lowing genes were differentially expressed in AAG. Endosomegroup, RAB4A, RAB5B, RAB9P40, RAB9A; plasma mem-brane group, PRSS3, APPB1, CTNND1, CTNNB1, CDH2,VCAN, HAPLN1, CCL5, COL4A4, TGM2, SLIT2, GPC1; Golgigroup, GOLGA1, GOLGA3, GOLGA2, RAB1A, RABGGTB(Figure 3a). Six Rab family signaling genes involved in intra-cellular transport of organelles were differentially regulated(Table 3). Three small GTPases, RAB4A, RAB5B, and RAB9A,were upregulated (Table 3, Figure 3b), suggesting increasedendosomal transport and processing. RAB4A and RAB5Bselectively regulate intracellular trafficking and signaling of Gprotein-coupled receptors, such as the angiotensin receptorand adrenergic receptors (β2-AR and α2B-AR) from the cellsurface [51,52]. RAB9A participates in late endosomal eventsleading to fusion with the lysosomal compartment [52].
In AAG astrocytes there was a predominant increase in tran-scription of Golgi-resident protein transcripts (Additionaldata file 7). These include RAB1A, and three members of thegolgin family, GOLGA1, GOLGA2 and GOLGA3 (Table 3),which may function in the stacking of Golgi cisternae and invesicular transport [53]. GOLGA3 promotes cell surfaceexpression of the beta adrenergic receptors [54]. Thus, theincreased expression of Golgi proteins may further enhanceadrenergic receptor signaling. Note that the RAB proteinsupregulated in the endosomal pathway (above) also affecttrafficking of these receptors.
Genome Biology 2008, 9:R111

http://genomebiology.com/2008/9/7/R111 Genome Biology 2008, Volume 9, Issue 7, Article R111 Lukas et al. R111.11
Included in the protein trafficking network are plasma mem-brane associated proteins involved in cell-cell communica-tion from the junctional matrix (Figure 3a). Catenins
(CTNNB1, CTNND1) form membrane trafficking complexesthat integrate other cadherins (CDH2), and members of theamyloid precursor protein complex (presenilin, APPBP1,
TGFβ and its receptors in ONH astrocytesFigure 5TGFβ and its receptors in ONH astrocytes. (a) Confirmation of three differentially expressed genes from the TGFβ-actin network (Figure 3a) by qRT-PCR in human ONH astrocytes: TGFBR2, SMAD3 and TGFBR1. Genes were normalized to 18S. Graphical representation of the relative mRNA levels in normal and glaucomatous AA and normal and glaucomatous CA astrocytes (n = 6, two-tailed t-test was used. Asterisk indicates p < 0.05). (b) Representative double immunofluorescent staining of TGFBR2 (red) and astrocyte marker GFAP (green) in sections of human ONH from an AA donor (51 year old male), AAG donor (70 year old male), CA donor (54 year old male) and CAG donor (76 year old male). Nuclei (blue) are stained with DAPI. Note granular staining of TGFBR2 in astrocytes (arrows) in the cribriform plates of the lamina cribrosa in AAG and CAG donors. Fewer astrocytes stain for TGFBR2 in the lamina cribrosa of CA donors. V, blood vessel; NB, nerve bundle. Scale bar 35 μm. (c) Representative western blots of astrocyte cell lysates with TGFBR2 antibody. β-Actin was used as a loading control. Note that AAG donors express more TGFBR2 than CAG donors. Normal AA and CA express lessTGFBR2 than glaucomatous donors. (d) Secreted TGFβ1 and TGFβ2 detected by ELISA. TGFβ2 is the primary form of TGFβ produced by ONH astrocytes. Secreted TGFβ1 is significantly higher in AA astrocytes compared to CA astrocytes (Asterisk indicates p < 0.05, two-tailed t-test); however, the increase in glaucomatous astrocytes compared to normal astrocytes is not significant. Secreted TGFβ2 levels are elevated significantly from normal AA astrocytes compared to all other donors (n = 24; asterisk indicates p < 0.05, two-tailed t-test).
TGFBR1
TGFBR2(a) (b)
*
(c) (d)
SMAD3
*
*
Genome Biology 2008, 9:R111

http://genomebiology.com/2008/9/7/R111 Genome Biology 2008, Volume 9, Issue 7, Article R111 Lukas et al. R111.12
PRSS3). In particular, CTNND1 functions to regulate mem-brane trafficking either through blocking cadherin interac-tions, or through Rho-GTPases such as Rho A, Rac andCDC42 [55]. As with the myosin and actin motility networks,the change in expression of GTPase regulatory proteins willlikely impact plasma membrane trafficking. The upregulationof chondroitin sulfate proteoglycan 2 (versican; VCAN),transglutaminase 2 (TGM2), and hyaluronan and proteogly-can link protein 1 (HAPLN1) are significant modifiers of theECM [56]. Both HAPLN1 and VCAN mRNA levels wereupregulated in AAG compared to CAG astrocytes by qRT-PCR(Figure 3b). VCAN immunoreactivity was observed in theECM of the cribriform plates, the perivascular matrix and afew astrocytes in the lamina cribrosa of normal AA and CAdonors (Figure 3c). In glaucomatous tissues there was amarked increase in VCAN staining in astrocytes in the cribri-form plates and hypertrophied reactive astrocytes in thenerve bundles in both populations (Figure 3c). TGFβ2 signal-ing upregulates VCAN [57] in astrocyte cell types andexpression of collagen type 4 and transglutaminase 2 in ONHastrocytes [37]. Our data on changes in TGFβ receptor expres-sion and ECM proteins are similar to those found in microar-ray profiling of ONH tissue from a rat model of glaucoma[58]. Expression of ECM proteins is also modulated by TGFβin GFAP-negative lamina cribrosa cells in culture [59].
There is substantial evidence that ONH astrocytes are respon-sible for the normal maintenance of the ECM in normal tissueand that reactive astrocytes remodel the ECM in response toelevated IOP in human and experimental glaucoma[10,60,61]. Reactive astrocytes in the ONH express abnormalECM in glaucoma, leading to loss of resiliency and deforma-bility in response to elevated IOP. Alterations in TGFβ2 levelsand TGFβ receptors and abnormal synthesis of ECM in AAGmay convey connective tissue components of susceptibility toelevated IOP to this population.
cAMP signaling in glaucomatous ONH astrocytesEarlier work in our laboratory indicated upregulation of twoadenylyl cyclases (ADYC3 and ADYC9) in normal AA com-pared to CA astrocytes, suggesting changes in cyclic AMP(cAMP) levels in this population (L Chen, MR Hernandez,ARVO (Association for Research in Vision and Ophthamol-ogy) 2007 abstract 3265). To test whether glaucomatousONH astrocytes exhibit differential basal levels in cAMP, weconducted a standard cAMP assay in normal AA and CAastrocytes and in AAG and CAG astrocytes. Under unstimu-lated conditions, normal AA and CA astrocytes exhibit no dif-ference in basal levels of cAMP, whereas AAG and CAGastrocytes have significantly higher basal levels of cAMP com-pared with the normal counterparts (Figure 6a). Cyclic AMPis a key intracellular second messenger in astrocytes. ThecAMP signaling cascade opposes pro-inflammatory cytokinessuch as IL1β and TNFα and maintains astrocytes in a quies-cent (non-activated) state [62]. Thus, the higher basal levelsof cAMP in astrocytes from glaucomatous donors may be a
response to pro-inflammatory cytokines such as TNFα in theglaucomatous ONH [19].
We searched the expression data for differentially expressedgenes that might explain the difference in basal cAMP levelsbetween glaucomatous and normal astrocytes. One potentialcandidate for increasing basal cAMP is PTHLH, a parathyroidhormone-like protein that is upregulated in glaucomatous
astrocytes (Figure 6b). This protein binds to ubiquitous PTHreceptors that are coupled to stimulation of adenylate cyclaseand elevated cyclic AMP [63]. Thus, upregulation of PTHLHprovides an autocrine pathway leading to increased basalcyclic AMP levels in glaucomatous astrocytes. Another genethat might also contribute to the activity of adenylate cyclasesis CAP2 [64]. However, we found that CAP2 was notdifferentially expressed in glaucomatous ONH astrocytes byqRT-PCR (Figure 6b).
cAMP signaling in glaucomatous astrocytesFigure 6cAMP signaling in glaucomatous astrocytes. (a) cAMP levels in unstimulated ONH astrocytes were determined as described in the Materials and methods. The basal cAMP level was significantly higher in glaucomatous astrocytes compared to their normal counterparts. Values are the mean ± standard deviation of cAMP expressed in pmol/mg of protein. Eight AA, four AAG, nine CA and four CAG individual samples were used in this study. (b) Confirmation of PTHLH and CAP2 expression by qRT-PCR in human ONH astrocytes. Genes were normalized to 18S. Graphical representation of the relative mRNA levels in normal and glaucomatous AA and normal and glaucomatous CA astrocytes (n = 6, two-tailed t-test). Asterisk indicates p < 0.05).
PTHLH CAP2
(a)
(b)*
*
*
*
Genome Biology 2008, 9:R111

http://genomebiology.com/2008/9/7/R111 Genome Biology 2008, Volume 9, Issue 7, Article R111 Lukas et al. R111.13
Other disease-associated genes differentially regulated in glaucomatous OHN astrocytesCell-cell communicationThe secondary and tertiary comparisons identified genes thatwere differentially expressed in AAG compared to AA and inCAG compared to CA, including BMP1, LTBP1, AMIGO2,SLIT2, GPC1, and OLR1 (Tables 1 and 2). Selected genes wereconfirmed by qRT-PCR (Figure 7).
In this list we found that specific cell-surface-associated pro-teins are downregulated in glaucoma. These include BMP1,which activates cleavage of LTBP1 proteins that release nas-cent TGFβ1 [65], and AMIGO2, a type I transmembrane pro-
tein that regulates axon extension [66]. Down-regulation ofBMP1 may reduce the levels of free TGFβ1 and thus unbalancesignaling between TGFβ isoforms. A decrease in AMIGO2might negatively impact axon survival.
Two differentially expressed genes that are involved in reac-tive astrocyte responses to neuronal injury are SLIT2 andGPC1 (glypican-1). SLIT2 serves as a chemorepellant for mul-tiple types of axons [67], while GPC1 is a proteoglycan thatbinds SLIT2 [67]. Upregulation of expression of SLIT2 and areduction of GPC1 by glaucomatous astrocytes suggest aninhibitory microenvironment for RGC axons in the ONH.These data are consistent with the idea that the enhancedmigratory properties of glaucomatous astrocytes coupledwith the release of factors that negatively impact upon axonsurvival are part of the pathophysiology of the disease.
Finally, lectin-like oxidized-LDL receptor (OLR1; also knownas LOX-1) is highly upregulated (Additional data files 5 and11) in AAG astrocytes. OLR1 expression is induced by TGFβ1signaling and is known to be a component of the fluid shearstress response of endothelial cells in early atheroscleroticlesions [68]. These data are further confirmation of enhancedTGFβ signaling in AAG astrocytes as suggested by the differ-ential receptor expression described earlier.
Intracellular calcium signaling/transport systems in ONH astrocytesTwo genes directly involved in Ca2+ homeostasis are differen-tially regulated in ONH astrocytes of AAG (Additional datafiles 5 and 7). CACNB4 encodes a beta subunit of the voltage-dependent calcium channel complex. CACNB4 plays animportant role in calcium channel function by modulating Gprotein inhibition, increasing peak calcium current, control-ling the alpha-1 subunit targeting to the membrane and shift-ing the voltage dependence of activation and inactivation. Thesecond gene, ATP2C1 (Additional data file 7), encodes a pro-tein that belongs to the family of P-type primary ion transportATPases, which pump Ca2+ into the endoplasmic reticulum.
Transcripts encoding the calcium/calmodulin-related signal-ing proteins calmodulin 1 (CALM1) and Ca2+/calmodulin-dependent membrane-associated kinase (CASK1) are differ-entially expressed in one or more glaucoma groups. CALM1was increased in AAG compared to AA donors (Additionaldata file 5), while CASK1 was increased in glaucomatousastrocytes from both AA and CA donors (Table 1, Figure 7).Calmodulin is the Ca2+ sensor of key signaling molecules,such as adenylyl cyclase, CAMKII, CAMKIV, and MYLK dis-cussed above. CASK1 is a member of the membrane-associ-ated guanylate kinase proteins (MAGUKs), a prominentfamily of scaffolding molecules associated with intercellularjunctions. CASK1 targets Ca2+ and K+ channels [69] and/orthe Ca2+ pump 4b/CI [70] to the plasma membrane, interactswith liprins [71] and regulates transcription by interactingwith transcription factors in the nucleus [72]. Interestingly,CASK is a candidate gene for X-linked optic atrophy [73]. Thedifferential expression of genes in Ca2+ signaling pathwayscould be a common theme in glaucomatous astrocytes thatmay have a higher impact in optic nerves from AA donors dueto increased sensitivity to elevated IOP in these donors.
Glaucoma disease-associated genes differentially regulated in glaucomatous OHN astrocytesFigure 7Glaucoma disease-associated genes differentially regulated in glaucomatous OHN astrocytes. Differential expression of six glaucoma disease associated genes (BMP1, AMIGO2, DMPK, SLIT2, RBP-1 and CASK) was validated by qRT-PCR in human ONH astrocytes. Genes were normalized to 18S. Graphical representation of the relative mRNA levels in normal and glaucomatous AA and normal and glaucomatous CA astrocytes (n = 6, two-tailed t-test). Asterisk indicates p < 0.05).
SLIT2
CASK
** *
*
*
DMPK
AMIGO2
**
*
**
*
RBP-1
BMP 1
Genome Biology 2008, 9:R111

http://genomebiology.com/2008/9/7/R111 Genome Biology 2008, Volume 9, Issue 7, Article R111 Lukas et al. R111.14
ConclusionGlaucomatous ONH astrocytes share many characteristics ofreactive astrocytes in the central nervous system; however,certain properties may be specific to the pathophysiology ofglaucoma. The current work and previous studies demon-strate that cultured glaucomatous ONH astrocytes exhibit dif-ferential expression of genes that promote cell motility andmigration, downregulate cell adhesion, are associated withstructural tissue changes, and contribute to neural degenera-tion. Our data further strengthen the idea that reprogram-ming of transcription in glaucomatous astrocytes shiftssignaling towards TGFβ, Rho GTPase and Ca2+ systems,which impact the multiple networks described earlier.
Our demonstration of this wide variety of genes that remaindifferentially expressed after weeks in culture suggests thatglaucomatous ONH astrocytes have an altered phenotype. Inthe current study, using microarray analysis, we identified anumber of genes (for example, MYLK, TGFBR2, VCAN, andRAC2) whose expression may underlie higher susceptibilityof astrocytes of AA individuals to elevated IOP and that maybe relevant to reactive astrocyte responses in glaucoma. Somelimitations of our approach should be noted. First, ONHastrocyte derived from human glaucomatous eyes during thedisease process does not allow assessment of changes or theidentification of early mechanisms of disease that might beavailable from animal models. In addition, the difficulty toobtain and include more AA glaucomatous eyes limited ourability to identify differentially expressed genes in this group.However, stringent filters allowed the selection of a group ofgenes with functional significance. For each comparison,selected genes were validated by qRT-PCR and relevant geneproducts were confirmed by western blots in the four groups.
We propose that part of the increased susceptibility to ele-vated IOP in AAG relates directly to astrocyte functions in theONH. Astrocytes in AAG, which are reactive astrocytes, mayhave increased responsiveness to TGFβ signaling andenhanced migratory abilities, which may impact theremodeling of the ECM, inhibit axon survival, and alter vas-cular permeability in the glaucomatous ONH. Any one ofthese changes may represent a susceptibility risk factor in theAA population to withstand abnormally elevated IOP.
This study provides an initial survey of the molecular differ-ences of ONH astrocytes from AA and CA donors with glau-coma. Genes encoding many potential therapeutic targets,such as motility genes, ion channels, adhesion molecules, andsignaling pathways, are selectively expressed in glaucoma-tous astrocytes, making them interesting as potential targetsfor astrocyte-specific therapeutics. Additional applications ofthese data include identification and characterization of sign-aling pathways involved in astrocyte function and furtherexploration of the role of selected identified genes in experi-mental animal and in vitro models of glaucoma.
Materials and methodsHuman eyesThirteen eyes from eleven CA donors (age 73 ± 9 years) withPOAG (referred to as CAG) and six eyes from three AA donors(age 62 ± 13 years) with POAG (referred to as AAG) were usedto generate ONH astrocyte cultures as described (Additionaldata file 1). Myelinated optic nerves were fixed in 4% parafor-maldehyde, post-fixed in osmium, embedded in epoxy resinand stained with paraphenylendiamine to detect axon degen-eration as described earlier to confirm glaucoma and to assessoptic nerve damage (Additional data file 1). Normal eyes werefrom 12 CA donors (age 60 + 11 years) and 12 AA donors (age58 + 12 years) with no history of eye disease, diabetes, orchronic central nervous system disease (Additional data file2).
Astrocyte culturesPrimary cultures of human ONH astrocytes were generated asdescribed previously [11]. Briefly, four explants from eachlamina cribrosa were dissected and placed into 25 cm2 Prima-ria tissue culture flasks (Falcon, Lincoln Park, NJ, USA).Explants were maintained in DMEM-F12 supplemented with10% fetal bovine serum (Biowhittaker, Walkerswille, MD,USA) and 10 μl/ml of PSFM (10,000 U/ml penicillin, 10,000μg/ml streptomycin and 25 μg/ml amphotericin B; Gibco/BRL, Gaithersburg, MD, USA). Cells were kept in a 37°C, 5%CO2 incubator. Primary cultures were purified by using animmunopanning procedure [11]. Purified cells were expandedafter characterization by immunostaining for astrocytemarkers GFAP and NCAM (Neural cell adhesion molecule) asdescribed [11]. Second passage cell cultures were stored inRPMI 1640 with 10% DMSO in liquid nitrogen until use. Foreach set of experiments, cells were thawed and cultured sothat sufficient cells from the same batch were available formultiple experiments.
AntibodiesAn affinity purified rabbit polyclonal antibody to MYLK was agift from Dr Linda van Eldik (Northwestern University). Itwas used in western blotting (1:10,000) and immunohisto-chemistry (1:50). Another MYLK antibody (M7905) is amouse monoclonal antibody (Sigma-Aldrich, St Louis, MO,USA) and it was used in western blotting (1:10,000) andimmunohistochemistry(1:50). TGFBRII (L-21) is a rabbit pol-yclonal antibody (Santa Cruz Biotechnology Inc., Santa Cruz,CA, USA). It was used in western blotting (1: 200) and immu-nohistochemistry (1:50). VCAN is a goat polyclonal antibody(R&D Systems, Minneapolis, MN, USA). It was used in immu-nohistochemistry (1:20).
Oligonucleotide microarray analysisTotal RNA was extracted using Qiagen RNeasy mini kits (Qia-gen, Valencia, CA, USA). RNA was then purified and quanti-fied by measuring absorbance at 260 nm. Quality andintactness of the RNA was assessed by capillary electrophore-sis analysis using an Agilent 2100 Bioanalyzer (Agilent, Palo
Genome Biology 2008, 9:R111
http://genomebiology.com/2008/9/7/R111 Genome Biology 2008, Volume 9, Issue 7, Article R111 Lukas et al. R111.15
Alto, CA, USA). cDNA was synthesized from 2-5 μg purifiedRNA by using Superscript Choice system (Gibco BRL LifeTechnologies, Gaithersburg, MD, USA) and T7-(dT)24primer (GENSET, La Jolla, CA, USA). Using Bioassay HighYield RNA Transcript Labeling Kit (Enzo Diagnostics,Farmingdale, NY, USA), in vitro transcription was carried outwith the cleaned double-stranded cDNA as a template in thepresence of biotinylated UTP and CTP. Purified biotin-labeled cRNA was fragmented before the hybridization.Hybridization of the labeled cRNA to Human GenomeU95Av2, U133A, U133A 2.0 chips (Affymetrix, Santa Clara,CA, USA) was carried out by using Genechip Instrument Sys-tem (Affymetrix) at the Genechip Core Facility of WashingtonUniversity School of Medicine. The arrays were washed andstained with streptavidin-phycoerythrin (Molecular Probes,Eugene, OR, USA) followed by scanning on an Agilent Gene-Array Scanner G2500A (Agilent Technologies, Palo Alto, CA,USA).
Data analysisPretreatment of dataThe first step in the analysis of the microarray data was todetermine which genes to consider 'present' or 'absent'. Weestimated the probe-set present/absent calls by using theWilcoxon signed rank-based algorithm. In order to reducefalse positives, we removed the probe-sets with all samples as'absent' (Additional data file 3).
Comparison between glaucomatous ONH astrocytes from AA and CA normal donorsAs the experiments were done at different times, two types ofAffymetrix microarrays (Human Genome U95Av2 array andHuman Genome U133A 2.0 array) were used. Samples fromeight CAG donors, seven CA normal donors and six AAG sam-ples were measured using a Human Genome U95Av2 array.Eighteen CA samples, eighteen AA samples and six AAGsamples were measured using a Human Genome U133A 2.0array. The data measured by two types of arrays were normal-ized separately by RMA normalization [74,75]. We definedcommon glaucoma-related genes as genes differentiallyexpressed in both CAG versus CA and AAG versus AA, and didcomparisons of CAG versus CA and AAG versus AA sepa-rately. The differentially expressed genes were identified bythe empirical Bayesian shrinkage moderated t-statistics inthe limma Bioconductor package [76]. A mixed effects modelwas used to account for the effect of technical replicates.Genes exhibiting a fold-change >1.5 and p-value < 0.01 wereconsidered significant. To reduce false positives because theAAG has only three biological replicates, we applied the Ben-jamini and Hochberg false discovery rate multiple testing cor-rection with a false discovery rate of 0.05 (AAG versus CAGand AAG versus AA).
To compare the significant gene list based on two types ofmicroarray platforms, the Affymetrix probeset IDs weretransferred as Entrez IDs based on the Bioconductor library.
Genes whose Entrez IDs appear in both the differentiallyexpressed gene list from CAG versus CA (using the HumanGenome U95Av2 array) and AAG versus AA comparisons(using the Human Genome U133A 2.0 array) and change inthe same direction were considered as common glaucoma-related genes. Genes that are differentially expressed for AAGversus CAG (using the Human Genome U95Av2 array), butwithout significant changes for AA versus CA (using HumanGenome U133A 2.0 array), were considered as the glaucomarace-related genes. Here we considered a p-value > 0.05 asindicative of changes that were not significant.
GO analysis of differential expression in glaucomatous astro-cytes was done with GoMiner [14]. Briefly, gene lists of up-and downregulated genes (p < 0.01 as described above) werenormalized to 1 and -1, respectively, for genes that exhibitedat least a 1.5-fold change in either direction. These lists werethen loaded into GoMiner using local GO databases accessedusing the 'Derby' module. GoMiner output was analyzed witha significance cutoff of p < 0.01 and at least four genes percategory.
Network constructionInitially, we scanned the differentially expressed gene lists forAAG-CAG, AAG-AA, and CAG-CA comparisons for groups ofgenes that were either in common GO categories, or werehighly over- or underexpressed (>1.5-fold, p < 0.01). Theseshort lists were then used as a source of nodes for eachnetwork group. Networks of interacting proteins were con-structed using the BioGRID database [77]. BioGRID is a freelyaccessible database of physical and genetic interactions.BioGRID release version 2.0 includes more than 116,000interactions from Saccharomyces cerevisiae, Caenorhabditiselegans, Drosophila melanogaster and Homo sapiens.Graphs with embedded protein, gene and interactionattributes were constructed with a visualization program,Osprey [78], that is dynamically linked to the BioGRID. Eachnetwork was begun using a single gene or node. Then moreinteractions were added using The BioGrid Database lookupfunction. These were curated to simplify the graphs, and non-expanded nodes were minimized. In general, nodes that werenot differentially expressed required at least two connectionsor edges to remain in the network. Expression of genesdepicted in the networks were checked for a 'present call' inthe microarray data or otherwise validated by quantitativereal time RT-PCR.
Real-time qRT-PCRReal time qRT-PCR was done as previously described [60]. Tocompare expression of specific genes amongst the four groupsincluded in this study (AA, CA, AAG and CAG), we used 12ONH astrocyte cultures from normal CA and 12 cultures fromnormal AA donors. cDNA of eight eyes from eight CAGdonors and of six eyes from three AAG donors were used.Individual samples were processed simultaneously under thesame conditions and the data were analyzed for significance
Genome Biology 2008, 9:R111

http://genomebiology.com/2008/9/7/R111 Genome Biology 2008, Volume 9, Issue 7, Article R111 Lukas et al. R111.16
using a two-tailed t-test on sample pairs (Prism 3.0 GraphPadsoftware, San Diego, CA, USA). Primers used in this study arelisted in Additional data file 4.
Western blottingProtein lysates from four samples of each group of ONHastrocytes were processed together in the appropriate combi-nations: four AAG and four AA; four CA and four CAG. West-ern blots were run in triplicate to accommodate all availablesamples. Protein lysates containing 3-10 μg were useddepending on the specific antibody. β-Actin was used as aloading control. Films of blots were scanned using a flatbedscanner in 8-bit gray scale mode. ImageJ (National Institutesof Health) was used to quantify band intensities on the blots.
Detection of TGFβ1 and TGFβ2 by ELISATGFβ1 and TGFβ2 were measured in cell culture superna-tants using ELISA kits (R & D Systems) specific for each pro-tein. Briefly, astrocytes (70-80% confluent) were incubatedfor 24 h in 6 ml of cell culture medium without serum. Mediawas harvested and divided into 1 ml aliquots and frozen at -80°C until analysis. For each sample, cell counts were madeand recorded. Media samples were thawed on ice and 200 μlaliquots activated by incubating with 40 μl of 0.1 N HCl atroom temperature for 40 minutes. The reactions werequenched by adding 40 μl of 0.1 N NaOH in 0.5 M HEPES andmixed. Samples were diluted with the appropriate ELISAassay buffer to 400 μl. Aliquots of these solutions (50 μlTGFβ1:100 μl TGFβ2) were then assayed according to themanufacturers' protocol. Experiments were performed induplicate and each astrocyte cell culture (n = 5-7 samples pereach group) was assayed at least twice. Expressed protein val-ues in picograms of TGFβ1/2 per ml were normalized to 106
cells using the cell counts obtained at harvest. The means ofthe content were considered significantly different if p < 0.05(two-tailed t-test; Prism 3.0 GraphPad software.).
Cyclic AMP assayPrimary ONH astrocyte cultures obtained from six normalAA, six normal CA, eight CAG and three AAG were grown in60 mm dishes until 80% confluence. Growth media wasreplaced with serum free media and the cells incubated for anadditional 24 h. After washing with ice-cold phosphate-buff-ered saline (PBS), cells were lysed in 95% chilled ethanol for 1h and then centrifuged at 2000 × g for 15 minutes at 4°C. Thesupernatant was evaporated using a Speed Vac concentratorand resuspended in 100 μl of the assay buffer and analyzed asdescribed in the cAMP Biotrak Enzyme Immunoassay Kit(Amersham Bioscience RPN225, Piscataway, NJ, USA).cAMP concentration per well was expressed as pmol/mg ofprotein. Each value represents the mean cAMP level (± stand-ard deviation) of independent experiments using primaryastrocyte cultures from each donor and performed in tripli-cate. Sample pairs were analyzed by two-tailed t-test (Prism3.0 GraphPad software) for significance (p < 0.05).
Migration assayCytoSelect™ 24-well cell migration assay (Cell BioLabs, SanDiego, CA USA) was used to measure the migratory proper-ties of cells. The assay was performed according to the manu-facture's protocol. Briefly, media with 10% fetal bovine serumwas placed in the lower wells followed by 50,000 cells in 300μl of serum free media in each of the well inserts. After incu-bation at 37°C in a 5% CO2 atmosphere for 24 h, the mediawas removed from the inserts. Cells that did not migrate wereremoved from the inserts using a cotton swab. The insertswere stained with 400 μl of cell staining solution and washedthree times with water. Cells were treated with 200 μl ofextraction solution and the solution transferred to individualwells of a new plate. The absorbance of the extracted sampleswas measured at 560 nm by a Thermo Multiskan Spectrumplate reader. Six astrocyte cultures from each group (AA, CA,AAG and CAG) were used in the assay and data were analyzedfor significance with ANOVA (Prism 3.0 GraphPad software).
Rho activation assayRho activation assay kit (Upstate Biotechnology Billerica,MA, USA) was used to detect activated Rho in cell lysates.Unstimulated cells were cultured in 60 mm dishes until 85-90% confluence and then harvested in ice cold 1 × Mg2+ Lysis/Wash (MLB) buffer (according to the manufacturer's proto-col). Protein concentration was determined by the Bradfordmethod. Protein lysate (200 μg) were mixed with 32 μl of Rhoassay reagent slurry containing GST-Rhotekin-RBD fusionprotein, and incubated for 45 minutes at 4°C with gentle agi-tation. After pelleting and washing three times with 1 × MLB,the beads were resuspended in 2 × NuPage LDS sample buffer(Invitrogen Carlsbad, CA, USA) supplemented with 0.075 MDTT and boiled at 95°C for 5 minutes. Samples weresubjected to western blot analysis. An anti-Rho antibody thatrecognizes Rho-A, Rho-B and Rho-C was used for detection.Four cultures from each group (AA, CA, AAG and CAG) wereused in the assay. Western blots were performed in duplicate.Representative blots are shown in the results and the meanoptical density was used in density analysis. Statistical signif-icance was based upon two-tailed t-test (Prism 3.0 GraphPadsoftware) and p-value < 0.05
ImmunohistochemistrySix eyes from normal CA donors, six eyes from normal AAdonors, six eyes from CAG donors and four eyes from AAGdonors were used. All donors were age matched. Tissues werefixed with 4% paraformaldehyde in 0.1 M phosphate-bufferedsaline pH 7.4 and processed for paraffin embedding. Twoslides were stained per donor containing at least two 6 μmoptic nerve sections each. In double labeling experiments weused monoclonal or polyclonal antibodies against humanglial acidic fibrillar protein (GFAP) as an astrocyte marker.Secondary antibodies labeled with Alexa 488 and Alexa 568(1:800) were from Molecular Probes. For negative controls,the primary antibody was replaced with non-immune serum.Serial sections used in comparisons (AAG versus CAG) were
Genome Biology 2008, 9:R111
http://genomebiology.com/2008/9/7/R111 Genome Biology 2008, Volume 9, Issue 7, Article R111 Lukas et al. R111.17
stained simultaneously to control for variations in immunos-taining. Slides were examined in a Nikon Eclipse 80 i micro-scope (Tokyo, Japan) equipped with epifluorescentillumination and digital cameras (CoolSnap ES and CF, Pho-tometrics). The images were processed using MetaMorphsoftware (Molecular Devices Sunnyvale, CA, USA).
AbbreviationsAA, African American; AAG, AA donor with glaucoma; CA,Caucasian American; CAG, CA donor with glaucoma; cAMP,cyclic AMP; ECM, extracellular matrix; ELISA, enzyme-linked immunosorbent assay; GFAP, glial acidic fibrillar pro-tein; GO, Gene Ontology; IOP, intraocular pressure; MYLK,myosin light chain kinase; ONH, optic nerve head; POAG,primary open angle glaucoma; qRT-PCR, quantitative RT-PCR; TGF, transforming growth factor; TNF, tumor necrosisfactor.
Authors' contributionsMRH conceived the study, directed individual efforts, andwrote drafts of the manuscript. TJL performed network anal-ysis, data mining, and wrote drafts of the manuscript. HMcoordinated molecular biology studies, cultured cell prepara-tions, and contributed sections of the manuscript. LC and WLperformed molecular biology and biochemical analyses.SMR, AMC, and AW performed migration assays and cell/tis-sue immunohistochemistry experiments. SNL and PD per-formed statistical analysis and bioinformatics on themicroarray data. All authors viewed and approved themanuscript.
Additional data filesThe following additional data files are available in the onlineversion of the paper. Additional data file 1 is a table listingclinical information about CAG and AAG eyes used to gener-ate primary cultures of ONH astrocytes. Additional data file 2is a table listing demographic information of CA and AA nor-mal donor eyes used to generate primary cultures of ONHastrocytes. Additional data file 3 is a table that summarizesthe number of probe-sets on the chip and used in analysis.Additional data file 4 is spreadsheet listing the primers usedfor qRT-PCR. Additional data file 5 is a spreadsheet listinggenes differentially expressed in glaucomatous ONH astro-cytes and including the comparison between AAG versus nor-mal AA. Additional data file 6 is a spreadsheet listingdifferentially expressed genes between CAG and normal CA.Additional data file 7 is a spreadsheet listing differentiallyexpressed genes between AAG and CAG. Additional data file8 is a spreadsheet listing genes differentially expressed inONH astrocytes from AAG compared to both normal AA andCAG. Additional data file 7 is a spreadsheet summarizingGene Ontology for the comparisons between AAG and AAdata. Additional data file 8 is a spreadsheet with Gene
ontology comparisons for CAG and CA. Additional data file 9is a spreadsheet with GO comparisons for AAG versus CAGexpression sets. Additional data file 10 is a figure showing thedistribution of genes in two GO categories. Additional datafile 11 is a figure showing qRT-PCR data that confirm addi-tional differentially expressed genes from the CAG-CAcomparison.Additional data file 1Clinical information about CAG and AAG eyes used to generate pri-mary cultures of ONH astrocytesClinical information about CAG and AAG eyes used to generate pri-mary cultures of ONH astrocytes.Click here for fileAdditional data file 2Demographic information of CA and AA normal donor eyes used to generate primary cultures of ONH astrocytesDemographic information of CA and AA normal donor eyes used to generate primary cultures of ONH astrocytes.Click here for fileAdditional data file 3Probe-sets on the chip and used in analysisProbe-sets on the chip and used in analysis.Click here for fileAdditional data file 4Primers used for qRT-PCRPrimers used for qRT-PCR.Click here for fileAdditional data file 5Genes differentially expressed in glaucomatous ONH astrocytesIncludes the comparison between AAG versus normal AA.Click here for fileAdditional data file 6Differentially expressed genes between CAG and normal CADifferentially expressed genes between CAG and normal CA.Click here for fileAdditional data file 7Differentially expressed genes between AAG and CAGDifferentially expressed genes between AAG and CAG.Click here for fileAdditional data file 8Differentially expressed genes in ONH astrocytes from AAG com-pared to both normal AA and CAGDifferentially expressed genes in ONH astrocytes from AAG com-pared to both normal AA and CAG.Click here for fileAdditional data file 9GO comparisons for AAG versus CAG expression setsGO comparisons for AAG versus CAG expression sets.Click here for fileAdditional data file 10Distribution of genes in two GO categoriesCommon genes were selected from the GO lists (Additional data files 7-9) for each dataset (AAG-CAG, AAG-AA, and CAG-CA com-parisons). The fraction of common genes (y-axis) for the GO terms 'phosphorylation' (grey bar) and 'cell-cell signaling' categories (black bar) are shown.Click here for fileAdditional data file 11qRT-PCR data that confirm additional differentially expressed genes from the CAG-CA and AAG-AA comparisons(a-e) CAG-CA and comparison: CALM (a), CAPG (b), GJA1 (c), GPNMB (d) and SOD2 (e). (f-j) AAG-AA comparison: GSTA4 (f), LOXL2 (g), MYH10 (h), PDLIM7 (i) and OLR1 (j). Genes were nor-malized to 18S. Graphical representation of the relative mRNA lev-els in normal and glaucomatous AA and normal and glaucomatous CA astrocytes (n = 6, two-tailed t-test was used. Asterisk indicates p < 0.05).Click here for file
AcknowledgementsWe thank Jose Bongolan for immunohistochemistry staining and Ping Yangand Marina Vracar-Grabar for generating cell cultures. This work was sup-ported in part by NIH grant EY 06416 and an unrestricted grant fromResearch to Prevent Blindness.
References1. Weinreb RN, Khaw PT: Primary open-angle glaucoma. Lancet
2004, 363:1711-1720.2. Friedman DS, Wolfs RC, O'Colmain BJ, Klein BE, Taylor HR, West S,
Leske MC, Mitchell P, Congdon N, Kempen J: Prevalence of open-angle glaucoma among adults in the United States. ArchOphthalmol 2004, 122:532-538.
3. Nemesure B, He Q, Mendell N, Wu SY, Hejtmancik JF, Hennis A,Leske MC: Inheritance of open-angle glaucoma in the Barba-dos family study. Am J Med Genet 2001, 103:36-43.
4. Quigley HA, Vitale S: Models of open-angle glaucoma preva-lence and incidence in the United States. Invest Ophthalmol VisSci 1997, 38:83-91.
5. Broman AT, Quigley HA, West SK, Katz J, Munoz B, Bandeen-RocheK, Tielsch JM, Friedman DS, Crowston J, Taylor HR, Varma R, LeskeMC, Bengtsson B, Heijl A, He M, Foster PJ: Estimating the rate ofprogressive visual field damage in those with open-angleglaucoma, from cross-sectional data. Invest Ophthalmol Vis Sci2008, 49:66-76.
6. Leske MC, Wu SY, Hennis A, Honkanen R, Nemesure B: Risk fac-tors for incident open-angle glaucoma: the Barbados eyestudies. Ophthalmology 2007, 115:85-93.
7. Beck AD: Review of recent publications of the AdvancedGlaucoma Intervention Study. Curr Opin Ophthalmol 2003,14:83-85.
8. Ederer F, Gaasterland DA, Dally LG, Kim J, VanVeldhuisen PC, Black-well B, Prum B, Shafranov G, Allen RC, Beck A: The AdvancedGlaucoma Intervention Study (AGIS): 13. Comparison oftreatment outcomes within race: 10-year results. Ophthalmol-ogy 2004, 111:651-664.
9. Hernandez MR, Pena JD: The optic nerve head in glaucomatousoptic neuropathy. Arch Ophthalmol 1997, 115:389-395.
10. Hernandez MR, Agapova OA, Yang P, Salvador-Silva M, Ricard CS,Aoi S: Differential gene expression in astrocytes from humannormal and glaucomatous optic nerve head analyzed bycDNA microarray. Glia 2002, 38:45-64.
11. Yang P, Hernandez MR: Purification of astrocytes from adulthuman optic nerve heads by immunopanning. Brain Res BrainRes Protoc 2003, 12:67-76.
12. Kooperberg C, Aragaki A, Strand AD, Olson JM: Significance test-ing for small microarray experiments. Stat Med 2005,24:2281-2298.
13. Ritchie ME, Silver J, Oshlack A, Holmes M, Diyagama D, Holloway A,Smyth GK: A comparison of background correction methodsfor two-colour microarrays. Bioinformatics 2007, 23:2700-2707.
14. Zeeberg BR, Feng W, Wang G, Wang MD, Fojo AT, Sunshine M, Nar-asimhan S, Kane DW, Reinhold WC, Lababidi S, Bussey KJ, Riss J, Bar-rett JC, Weinstein JN: GoMiner a resource for biologicalinterpretation of genomic and proteomic data. Genome Biol2003, 4:R28.
15. Varela HJ, Hernandez MR: Astrocyte responses in human opticnerve head with primary open-angle glaucoma. J Glaucoma1997, 6:303-313.
16. Hernandez MR, Pena JD, Selvidge JA, Salvador-Silva M, Yang P:Hydrostatic pressure stimulates synthesis of elastin in cul-tured optic nerve head astrocytes. Glia 2000, 32:122-136.
17. Pena JD, Varela HJ, Ricard CS, Hernandez MR: Enhanced tenascin
Genome Biology 2008, 9:R111
http://www.ncbi.nlm.nih.gov/entrez/query.fcgi?cmd=Retrieve&db=PubMed&dopt=Abstract&list_uids=9008633
http://www.ncbi.nlm.nih.gov/entrez/query.fcgi?cmd=Retrieve&db=PubMed&dopt=Abstract&list_uids=9008633
http://www.ncbi.nlm.nih.gov/entrez/query.fcgi?cmd=Retrieve&db=PubMed&dopt=Abstract&list_uids=9076213
http://www.ncbi.nlm.nih.gov/entrez/query.fcgi?cmd=Retrieve&db=PubMed&dopt=Abstract&list_uids=9076213
http://www.ncbi.nlm.nih.gov/entrez/query.fcgi?cmd=Retrieve&db=PubMed&dopt=Abstract&list_uids=9327349
http://genomebiology.com/2008/9/7/R111 Genome Biology 2008, Volume 9, Issue 7, Article R111 Lukas et al. R111.18
expression associated with reactive astrocytes in humanoptic nerve heads with primary open angle glaucoma. Exp EyeRes 1999, 68:29-40.
18. Liu B, Neufeld AH: Expression of nitric oxide synthase-2 (NOS-2) in reactive astrocytes of the human glaucomatous opticnerve head. Glia 2000, 30:178-186.
19. Yuan L, Neufeld AH: Tumor necrosis factor-alpha: a potentiallyneurodestructive cytokine produced by glia in the humanglaucomatous optic nerve head. Glia 2000, 32:42-50.
20. Salvador-Silva M, Aoi S, Parker A, Yang P, Pecen P, Hernandez MR:Responses and signaling pathways in human optic nervehead astrocytes exposed to hydrostatic pressure in vitro. Glia2004, 45:364-377.
21. Lukas TJ: A signal transduction pathway model prototype II:Application to Ca2+-calmodulin signaling and myosin lightchain phosphorylation. Biophys J 2004, 87:1417-1425.
22. Tezel G, Hernandez MR, Wax MB: In vitro evaluation of reactiveastrocyte migration, a component of tissue remodeling inglaucomatous optic nerve head. Glia 2001, 34:178-189.
23. Nguyen DH, Catling AD, Webb DJ, Sankovic M, Walker LA, SomlyoAV, Weber MJ, Gonias SL: Myosin light chain kinase functionsdownstream of Ras/ERK to promote migration of urokinase-type plasminogen activator-stimulated cells in an integrin-selective manner. J Cell Biol 1999, 146:149-164.
24. Callaway K, Abramczyk O, Martin L, Dalby KN: The anti-apoptoticprotein PEA-15 is a tight binding inhibitor of ERK1 andERK2, which blocks docking interactions at the D-recruit-ment site. Biochemistry 2007, 46:9187-9198.
25. Vaidyanathan H, Ramos JW: RSK2 activity is regulated by itsinteraction with PEA-15. J Biol Chem 2003, 278:32367-32372.
26. Hashimoto K, Parker A, Malone P, Gabelt BT, Rasmussen C, KaufmanPS, Hernandez MR: Long-term activation of c-Fos and c-Jun inoptic nerve head astrocytes in experimental ocular hyper-tension in monkeys and after exposure to elevated pressurein vitro. Brain Res 2005, 1054:103-115.
27. Birukov KG, Schavocky JP, Shirinsky VP, Chibalina MV, Van Eldik LJ,Watterson DM: Organization of the genetic locus for chickenmyosin light chain kinase is complex: multiple proteins areencoded and exhibit differential expression and localization.J Cell Biochem 1998, 70:402-413.
28. Smith L, Parizi-Robinson M, Zhu MS, Zhi G, Fukui R, Kamm KE, StullJT: Properties of long myosin light chain kinase binding to F-actin in vitro and in vivo. J Biol Chem 2002, 277:35597-35604.
29. Kudryashov DS, Stepanova OV, Vilitkevich EL, Nikonenko TA,Nadezhdina ES, Shanina NA, Lukas TJ, Van Eldik LJ, Watterson DM,Shirinsky VP: Myosin light chain kinase (210 kDa) is a potentialcytoskeleton integrator through its unique N-terminaldomain. Exp Cell Res 2004, 298:407-417.
30. Gao L, Grant A, Halder I, Brower R, Sevransky J, Maloney JP, Moss M,Shanholtz C, Yates CR, Meduri GU, Shriver MD, Ingersoll R, Scott AF,Beaty TH, Moitra J, Ma SF, Ye SQ, Barnes KC, Garcia JG: Novelpolymorphisms in the myosin light chain kinase gene conferrisk for acute lung injury. Am J Respir Cell Mol Biol 2006,34:487-495.
31. Gao L, Grant AV, Rafaels N, Stockton-Porter M, Watkins T, Gao P,Chi P, Munoz M, Watson H, Dunston G, Togias A, Hansel N, Sevran-sky J, Maloney JP, Moss M, Shanholtz C, Brower R, Garcia JG, Grigo-ryev DN, Cheadle C, Beaty TH, Mathias RA, Barnes KC:Polymorphisms in the myosin light chain kinase gene thatconfer risk of severe sepsis are associated with a lower riskof asthma. J Allergy Clin Immunol 2007, 119:1111-1118.
32. Flores C, Ma SF, Maresso K, Ober C, Garcia JG: A variant of themyosin light chain kinase gene is associated with severeasthma in African Americans. Genet Epidemiol 2007, 31:296-305.
33. Gutjahr MC, Rossy J, Niggli V: Role of Rho, Rac, and Rho-kinasein phosphorylation of myosin light chain, development ofpolarity, and spontaneous migration of Walker 256 carci-nosarcoma cells. Exp Cell Res 2005, 308:422-438.
34. Kalman D, Gomperts SN, Hardy S, Kitamura M, Bishop JM: Ras fam-ily GTPases control growth of astrocyte processes. Mol BiolCell 1999, 10:1665-1683.
35. Yang P, Agapova O, Parker A, Shannon W, Pecen P, Duncan J, Salva-dor-Silva M, Hernandez MR: DNA microarray analysis of geneexpression in human optic nerve head astrocytes in responseto hydrostatic pressure. Physiol Genomics 2004, 17:157-169.
36. Kim JS, Kim JG, Moon MY, Jeon CY, Won HY, Kim HJ, Jeon YJ, SeoJY, Kim JI, Kim J, Lee JY, Kim PH, Park JB: Transforming growthfactor-beta1 regulates macrophage migration via RhoA.
Blood 2006, 108:1821-1829.37. Fuchshofer R, Birke M, Welge-Lussen U, Kook D, Lutjen-Drecoll E:
Transforming growth factor-beta 2 modulated extracellularmatrix component expression in cultured human opticnerve head astrocytes. Invest Ophthalmol Vis Sci 2005, 46:568-578.
38. Flanders KC, Ren RF, Lippa CF: Transforming growth factor-betas in neurodegenerative disease. Prog Neurobiol 1998,54:71-85.
39. Lu Z, Lam KS, Wang N, Xu X, Cortes M, Andersen B: LMO4 caninteract with Smad proteins and modulate transforminggrowth factor-beta signaling in epithelial cells. Oncogene 2006,25:2920-2930.
40. Warner DR, Pisano MM, Roberts EA, Greene RM: Identification ofthree novel Smad binding proteins involved in cell polarity.FEBS Lett 2003, 539:167-173.
41. Etienne-Manneville S, Hall A: Integrin-mediated activation ofCdc42 controls cell polarity in migrating astrocytes throughPKCzeta. Cell 2001, 106:489-498.
42. Frese S, Schubert WD, Findeis AC, Marquardt T, Roske YS, StradalTE, Heinz DW: The phosphotyrosine peptide binding specifi-city of Nck1 and Nck2 Src homology 2 domains. J Biol Chem2006, 281:18236-18245.
43. Bauer K, Kratzer M, Otte M, de Quintana KL, Hagmann J, Arnold GJ,Eckerskorn C, Lottspeich F, Siess W: Human CLP36, a PDZ-domain and LIM-domain protein, binds to alpha-actinin-1and associates with actin filaments and stress fibers in acti-vated platelets and endothelial cells. Blood 2000, 96:4236-4245.
44. Kotaka M, Kostin S, Ngai S, Chan K, Lau Y, Lee SM, Li H, Ng EK,Schaper J, Tsui SK, Fung K, Lee C, Waye MM: Interaction ofhCLIM1, an enigma family protein, with alpha-actinin 2. J CellBiochem 2000, 78:558-565.
45. Andra K, Nikolic B, Stocher M, Drenckhahn D, Wiche G: Not justscaffolding: plectin regulates actin dynamics in cultured cells.Genes Dev 1998, 12:3442-3451.
46. Pena JD, Taylor AW, Ricard CS, Vidal I, Hernandez MR: Transform-ing growth factor beta isoforms in human optic nerve heads.Br J Ophthalmol 1999, 83:209-218.
47. Akutsu K, Morisaki H, Takeshita S, Sakamoto S, Tamori Y, YoshimutaT, Yokoyama N, Nonogi H, Ogino H, Morisaki T: Phenotypic het-erogeneity of Marfan-like connective tissue disordersassociated with mutations in the transforming growth fac-tor-beta receptor genes. Circ J 2007, 71:1305-1309.
48. Singh KK, Rommel K, Mishra A, Karck M, Haverich A, Schmidtke J,Arslan-Kirchner M: TGFBR1 and TGFBR2 mutations inpatients with features of Marfan syndrome and Loeys-Dietzsyndrome. Hum Mutat 2006, 27:770-777.
49. Mizuguchi T, Collod-Beroud G, Akiyama T, Abifadel M, Harada N,Morisaki T, Allard D, Varret M, Claustres M, Morisaki H, Ihara M,Kinoshita A, Yoshiura K, Junien C, Kajii T, Jondeau G, Ohta T, KishinoT, Furukawa Y, Nakamura Y, Niikawa N, Boileau C, Matsumoto N:Heterozygous TGFBR2 mutations in Marfan syndrome. NatGenet 2004, 36:855-860.
50. Izquierdo NJ, Traboulsi EI, Enger C, Maumenee IH: Glaucoma inthe Marfan syndrome. Trans Am Ophthalmol Soc 1992, 90:111-117.
51. Dale LB, Seachrist JL, Babwah AV, Ferguson SS: Regulation of angi-otensin II type 1A receptor intracellular retention, degrada-tion, and recycling by Rab5, Rab7, and Rab11 GTPases. J BiolChem 2004, 279:13110-13118.
52. Seachrist JL, Ferguson SS: Regulation of G protein-coupledreceptor endocytosis and trafficking by Rab GTPases. Life Sci2003, 74:225-235.
53. Hicks SW, Machamer CE: Golgi structure in stress sensing andapoptosis. Biochim Biophys Acta 2005, 1744:406-414.
54. Hicks SW, Horn TA, McCaffery JM, Zuckerman DM, Machamer CE:Golgin-160 promotes cell surface expression of the beta-1adrenergic receptor. Traffic 2006, 7:1666-1677.
55. Xiao K, Oas RG, Chiasson CM, Kowalczyk AP: Role of p120-cat-enin in cadherin trafficking. Biochim Biophys Acta 2007,1773:8-16.
56. Shi S, Grothe S, Zhang Y, O'Connor-McCourt MD, Poole AR, Rough-ley PJ, Mort JS: Link protein has greater affinity for versicanthan aggrecan. J Biol Chem 2004, 279:12060-12066.
57. Arslan F, Bosserhoff AK, Nickl-Jockschat T, Doerfelt A, Bogdahn U,Hau P: The role of versican isoforms V0/V1 in glioma migra-tion mediated by transforming growth factor-beta2. Br JCancer 2007, 96:1560-1568.
58. Johnson EC, Jia L, Cepurna WO, Doser TA, Morrison JC: Globalchanges in optic nerve head gene expression after exposure
Genome Biology 2008, 9:R111
http://www.ncbi.nlm.nih.gov/entrez/query.fcgi?cmd=Retrieve&db=PubMed&dopt=Abstract&list_uids=9986739
http://www.ncbi.nlm.nih.gov/entrez/query.fcgi?cmd=Retrieve&db=PubMed&dopt=Abstract&list_uids=9986739
http://www.ncbi.nlm.nih.gov/entrez/query.fcgi?cmd=Retrieve&db=PubMed&dopt=Abstract&list_uids=9706877
http://www.ncbi.nlm.nih.gov/entrez/query.fcgi?cmd=Retrieve&db=PubMed&dopt=Abstract&list_uids=9706877
http://www.ncbi.nlm.nih.gov/entrez/query.fcgi?cmd=Retrieve&db=PubMed&dopt=Abstract&list_uids=9460794
http://www.ncbi.nlm.nih.gov/entrez/query.fcgi?cmd=Retrieve&db=PubMed&dopt=Abstract&list_uids=9460794
http://www.ncbi.nlm.nih.gov/entrez/query.fcgi?cmd=Retrieve&db=PubMed&dopt=Abstract&list_uids=9808630
http://www.ncbi.nlm.nih.gov/entrez/query.fcgi?cmd=Retrieve&db=PubMed&dopt=Abstract&list_uids=9808630
http://www.ncbi.nlm.nih.gov/entrez/query.fcgi?cmd=Retrieve&db=PubMed&dopt=Abstract&list_uids=1494814

http://genomebiology.com/2008/9/7/R111 Genome Biology 2008, Volume 9, Issue 7, Article R111 Lukas et al. R111.19
to elevated intraocular pressure in a rat glaucoma model.Invest Ophthalmol Vis Sci 2007, 48:3161-3177.
59. Kirwan RP, Leonard MO, Murphy M, Clark AF, O'Brien CJ: Trans-forming growth factor-beta-regulated gene transcriptionand protein expression in human GFAP-negative lamina cri-brosa cells. Glia 2005, 52:309-324.
60. Agapova OA, Kaufman PL, Lucarelli MJ, Gabelt BT, Hernandez MR:Differential expression of matrix metalloproteinases in mon-key eyes with experimental glaucoma or optic nervetransection. Brain Res 2003, 967:132-143.
61. Hernandez MR: The optic nerve head in glaucoma: role ofastrocytes in tissue remodeling. Prog Retin Eye Res 2000,19:297-321.
62. Schubert P, Morino T, Miyazaki H, Ogata T, Nakamura Y, Marchini C,Ferroni S: Cascading glia reactions: a common pathomecha-nism and its differentiated control by cyclic nucleotidesignaling. Ann NY Acad Sci 2000, 903:24-33.
63. Hastings RH, Araiza F, Burton DW, Bedley M, Deftos LJ: Parathy-roid hormone-related protein regulates apoptosis in lungcancer cells through protein kinase A. Am J Physiol Cell Physiol2004, 287:C1616-C1622.
64. Yu G, Swiston J, Young D: Comparison of human CAP andCAP2, homologs of the yeast adenylyl cyclase-associatedproteins. J Cell Sci 1994, 107:1671-1678.
65. Ge G, Greenspan DS: BMP1 controls TGFbeta1 activation viacleavage of latent TGFbeta-binding protein. J Cell Biol 2006,175:111-120.
66. Kuja-Panula J, Kiiltomaki M, Yamashiro T, Rouhiainen A, Rauvala H:AMIGO, a transmembrane protein implicated in axon tractdevelopment, defines a novel protein family with leucine-rich repeats. J Cell Biol 2003, 160:963-973.
67. Hagino S, Iseki K, Mori T, Zhang Y, Hikake T, Yokoya S, Takeuchi M,Hasimoto H, Kikuchi S, Wanaka A: Slit and glypican-1 mRNAsare coexpressed in the reactive astrocytes of the injuredadult brain. Glia 2003, 42:130-138.
68. Minami M, Kume N, Kataoka H, Morimoto M, Hayashida K, SawamuraT, Masaki T, Kita T: Transforming growth factor-beta(1)increases the expression of lectin-like oxidized low-densitylipoprotein receptor-1. Biochem Biophys Res Commun 2000,272:357-361.
69. Leonoudakis D, Conti LR, Radeke CM, McGuire LM, Vandenberg CA:A multiprotein trafficking complex composed of SAP97,CASK, Veli, and Mint1 is associated with inward rectifierKir2 potassium channels. J Biol Chem 2004, 279:19051-19063.
70. Schuh K, Uldrijan S, Gambaryan S, Roethlein N, Neyses L: Interac-tion of the plasma membrane Ca2+ pump 4b/CI with theCa2+/calmodulin-dependent membrane-associated kinaseCASK. J Biol Chem 2003, 278:9778-9783.
71. Olsen O, Moore KA, Fukata M, Kazuta T, Trinidad JC, Kauer FW,Streuli M, Misawa H, Burlingame AL, Nicoll RA, Bredt DS: Neuro-transmitter release regulated by a MALS-liprin-alphapresynaptic complex. J Cell Biol 2005, 170:1127-1134.
72. Hsueh YP, Wang TF, Yang FC, Sheng M: Nuclear translocationand transcription regulation by the membrane-associatedguanylate kinase CASK/LIN-2. Nature 2000, 404:298-302.
73. Dimitratos SD, Stathakis DG, Nelson CA, Woods DF, Bryant PJ: Thelocation of human CASK at Xp11.4 identifies this gene as acandidate for X-linked optic atrophy. Genomics 1998,51:308-309.
74. Irizarry RA, Bolstad BM, Collin F, Cope LM, Hobbs B, Speed TP:Summaries of Affymetrix GeneChip probe level data. NucleicAcids Res 2003, 31:e15.
75. Bolstad BM, Irizarry RA, Astrand M, Speed TP: A comparison ofnormalization methods for high density oligonucleotidearray data based on variance and bias. Bioinformatics 2003,19:185-193.
76. Gentleman RC, Carey VJ, Bates DM, Bolstad B, Dettling M, Dudoit S,Ellis B, Gautier L, Ge Y, Gentry J, Hornik K, Hothorn T, Huber W,Iacus S, Irizarry R, Leisch F, Li C, Maechler M, Rossini AJ, Sawitzki G,Smith C, Smyth G, Tierney L, Yang JY, Zhang J: Bioconductor: opensoftware development for computational biology andbioinformatics. Genome Biol 2004, 5:R80.
77. Stark C, Breitkreutz BJ, Reguly T, Boucher L, Breitkreutz A, Tyers M:BioGRID: a general repository for interaction datasets.Nucleic Acids Res 2006, 34:D535-D539.
78. Breitkreutz BJ, Stark C, Tyers M: Osprey: a network visualizationsystem. Genome Biol 2003, 4:R22.
Genome Biology 2008, 9:R111
http://www.ncbi.nlm.nih.gov/entrez/query.fcgi?cmd=Retrieve&db=PubMed&dopt=Abstract&list_uids=7962207
http://www.ncbi.nlm.nih.gov/entrez/query.fcgi?cmd=Retrieve&db=PubMed&dopt=Abstract&list_uids=7962207
http://www.ncbi.nlm.nih.gov/entrez/query.fcgi?cmd=Retrieve&db=PubMed&dopt=Abstract&list_uids=7962207
http://www.ncbi.nlm.nih.gov/entrez/query.fcgi?cmd=Retrieve&db=PubMed&dopt=Abstract&list_uids=9722958
http://www.ncbi.nlm.nih.gov/entrez/query.fcgi?cmd=Retrieve&db=PubMed&dopt=Abstract&list_uids=9722958
Related Documents