Survival probability of white spruce and trembling aspen in boreal pure and mixed stands experiencing self-thinning Valentin Reyes-Hernández ⇑,1 , Philip G. Comeau Department of Renewable Resources, University of Alberta, 751 General Services Building, Edmonton, AB T6G 2H1, Canada article info Article history: Received 28 November 2013 Received in revised form 28 February 2014 Accepted 7 March 2014 Available online xxxx Keywords: Density-dependent mortality One-sided competition Two-sided competition Boreal mixedwoods White spruce Trembling aspen abstract Tree mortality due to competition is one of the key drivers of forest succession in Canadian boreal mixedwood forests. We analyzed survival probability of trembling aspen (Populus tremuloides Michx.) and white spruce (Picea glauca (Moench) Voss.) trees and saplings, growing in pure and mixed stands experiencing self-thinning, in the Boreal Forest Natural Region of Alberta, Canada. Generalized logistic regression models were utilized to evaluate the effects of tree and stand characteristics on the survival probability of both species. Absolute size of the individuals, characterized by diameter at breast height, had a positive effect on the survival of both aspen and spruce. Aspen experienced decreasing survival with size, which is most likely linked to age rather than competition. Significant effects of basal area of trees larger than the subject tree indicated that one-sided inter- and intra-specific competition, rather than two-sided, is the primary driving force of competition-related mortality for both aspen and spruce. Periodic annual increment in diameter was a better predictor of survival than basal area of larger trees, indicating that growth rate is the most important individual characteristic that defines survival of both aspen and spruce in these self-thinning stands. Ó 2014 Elsevier B.V. All rights reserved. 1. Introduction Tree mortality has long term effects on stand composition, structure, productivity, and dynamics (Caspersen and Kobe, 2001; Mencuccini et al., 2005; Chen et al., 2008). Whereas large scale disturbances, such as wildfires and insect outbreaks, may act largely as whole stand replacing events (Turner et al., 1997), mortality of individual trees results from competition and carbon starvation and other local events (such as root or stem diseases, in- sects, or snow or wind damage) (Kneeshaw and Bergeron, 1998). Mortality due to these other events has also been called back- ground mortality (Kenkel, 1998). In general, mechanical damage and the inability of trees to defend themselves against diseases are among the most important factors that cause background mor- tality of trees in forest stands (Luo and Chen, 2011). While the main causes of mortality might be known, it remains poorly under- stood and is not well quantified as a component of growth and yield estimation models (Yang et al., 2003). Nevertheless, a number of studies have shown that reliable estimates and predictions of the probability of mortality (or survival) of individual trees in for- est stands are possible based on individual tree characteristics and stand level attributes (Hamilton, 1986; Yang et al., 2003; Chen et al., 2008). In the specific case of density-dependent mortality in single species stands, which is thought to be mainly caused by the inabil- ity of trees to maintain a positive carbon balance causing them to die as a consequence of carbon starvation (Weiner, 1990; Guneralp and Gertner, 2007), it is widely assumed that the relative size of an individual tree as related to its neighbors has a substantial influ- ence on the probability of a tree survival (Westoby, 1984; Weiner, 1990). The smallest trees in the stand are the most affected by asymmetric competition (i.e. larger individuals affect the ability of smaller individuals to acquire resources), thus variation in tree mortality can be better explained with measures of tree size, stand density, indicators of competition, and tree growth rate (Hamilton, 1986; Chen et al., 2008; Yang and Huang, 2013). With a limited supply of resources, the smallest size classes are usually the most affected and higher mortality rates of smaller and slow-growing individuals is anticipated (Westoby, 1984; Weiner, 1990). The rel- ative competitiveness of the trees (i.e. degree of intraspecific com- petition), stand composition, tree longevity, and other factors influence the occurrence of this type of mortality (Chen et al., http://dx.doi.org/10.1016/j.foreco.2014.03.010 0378-1127/Ó 2014 Elsevier B.V. All rights reserved. ⇑ Corresponding author. Fax: +1 780 492 4323. E-mail addresses: [email protected] (V. Reyes-Hernández), phil.comeau@ afhe.ualberta.ca (P.G. Comeau). 1 Present address: Colegio de Postgraduados-Campus Montecillo, 56230 Texcoco, Mexico. Tel.: +52 595 9520200x1474. Forest Ecology and Management xxx (2014) xxx–xxx Contents lists available at ScienceDirect Forest Ecology and Management journal homepage: www.elsevier.com/locate/foreco Please cite this article in press as: Reyes-Hernández, V., Comeau, P.G. Survival probability of white spruce and trembling aspen in boreal pure and mixed stands experiencing self-thinning. Forest Ecol. Manage. (2014), http://dx.doi.org/10.1016/j.foreco.2014.03.010

Welcome message from author
This document is posted to help you gain knowledge. Please leave a comment to let me know what you think about it! Share it to your friends and learn new things together.
Transcript
Forest Ecology and Management xxx (2014) xxx–xxx
Contents lists available at ScienceDirect
Forest Ecology and Management
journal homepage: www.elsevier .com/locate / foreco
Survival probability of white spruce and trembling aspen in boreal pureand mixed stands experiencing self-thinning
http://dx.doi.org/10.1016/j.foreco.2014.03.0100378-1127/� 2014 Elsevier B.V. All rights reserved.
⇑ Corresponding author. Fax: +1 780 492 4323.E-mail addresses: [email protected] (V. Reyes-Hernández), phil.comeau@
afhe.ualberta.ca (P.G. Comeau).1 Present address: Colegio de Postgraduados-Campus Montecillo, 56230 Texcoco,
Mexico. Tel.: +52 595 9520200x1474.
Please cite this article in press as: Reyes-Hernández, V., Comeau, P.G. Survival probability of white spruce and trembling aspen in boreal pure andstands experiencing self-thinning. Forest Ecol. Manage. (2014), http://dx.doi.org/10.1016/j.foreco.2014.03.010
Valentin Reyes-Hernández ⇑,1, Philip G. ComeauDepartment of Renewable Resources, University of Alberta, 751 General Services Building, Edmonton, AB T6G 2H1, Canada
a r t i c l e i n f o
Article history:Received 28 November 2013Received in revised form 28 February 2014Accepted 7 March 2014Available online xxxx
Keywords:Density-dependent mortalityOne-sided competitionTwo-sided competitionBoreal mixedwoodsWhite spruceTrembling aspen
a b s t r a c t
Tree mortality due to competition is one of the key drivers of forest succession in Canadian borealmixedwood forests. We analyzed survival probability of trembling aspen (Populus tremuloides Michx.)and white spruce (Picea glauca (Moench) Voss.) trees and saplings, growing in pure and mixed standsexperiencing self-thinning, in the Boreal Forest Natural Region of Alberta, Canada. Generalized logisticregression models were utilized to evaluate the effects of tree and stand characteristics on the survivalprobability of both species. Absolute size of the individuals, characterized by diameter at breast height,had a positive effect on the survival of both aspen and spruce. Aspen experienced decreasing survivalwith size, which is most likely linked to age rather than competition. Significant effects of basal areaof trees larger than the subject tree indicated that one-sided inter- and intra-specific competition, ratherthan two-sided, is the primary driving force of competition-related mortality for both aspen and spruce.Periodic annual increment in diameter was a better predictor of survival than basal area of larger trees,indicating that growth rate is the most important individual characteristic that defines survival of bothaspen and spruce in these self-thinning stands.
� 2014 Elsevier B.V. All rights reserved.
1. Introduction
Tree mortality has long term effects on stand composition,structure, productivity, and dynamics (Caspersen and Kobe,2001; Mencuccini et al., 2005; Chen et al., 2008). Whereas largescale disturbances, such as wildfires and insect outbreaks, mayact largely as whole stand replacing events (Turner et al., 1997),mortality of individual trees results from competition and carbonstarvation and other local events (such as root or stem diseases, in-sects, or snow or wind damage) (Kneeshaw and Bergeron, 1998).Mortality due to these other events has also been called back-ground mortality (Kenkel, 1998). In general, mechanical damageand the inability of trees to defend themselves against diseasesare among the most important factors that cause background mor-tality of trees in forest stands (Luo and Chen, 2011). While themain causes of mortality might be known, it remains poorly under-stood and is not well quantified as a component of growth andyield estimation models (Yang et al., 2003). Nevertheless, a number
of studies have shown that reliable estimates and predictions ofthe probability of mortality (or survival) of individual trees in for-est stands are possible based on individual tree characteristics andstand level attributes (Hamilton, 1986; Yang et al., 2003; Chenet al., 2008).
In the specific case of density-dependent mortality in singlespecies stands, which is thought to be mainly caused by the inabil-ity of trees to maintain a positive carbon balance causing them todie as a consequence of carbon starvation (Weiner, 1990; Guneralpand Gertner, 2007), it is widely assumed that the relative size of anindividual tree as related to its neighbors has a substantial influ-ence on the probability of a tree survival (Westoby, 1984; Weiner,1990). The smallest trees in the stand are the most affected byasymmetric competition (i.e. larger individuals affect the abilityof smaller individuals to acquire resources), thus variation in treemortality can be better explained with measures of tree size, standdensity, indicators of competition, and tree growth rate (Hamilton,1986; Chen et al., 2008; Yang and Huang, 2013). With a limitedsupply of resources, the smallest size classes are usually the mostaffected and higher mortality rates of smaller and slow-growingindividuals is anticipated (Westoby, 1984; Weiner, 1990). The rel-ative competitiveness of the trees (i.e. degree of intraspecific com-petition), stand composition, tree longevity, and other factorsinfluence the occurrence of this type of mortality (Chen et al.,
mixed
2 V. Reyes-Hernández, P.G. Comeau / Forest Ecology and Management xxx (2014) xxx–xxx
2008; Yang and Huang, 2013). Since mortality of trees is stronglyinfluenced by annual tree growth (Kozlowski et al., 1991), severalstudies that have analyzed survival probability based on recentgrowth rates have suggested a strong link between annual treegrowth and survival of trees (Hamilton, 1986; Kobe and Coates,1997; Yang et al., 2003; Bigler and Bugmann, 2004a,b; Chenet al., 2008; Yang and Huang, 2013). If individual annual diameterincrement decreases below a certain absolute or relative limit, thetree is expected to be under high stress and will experience an in-crease in the risk of mortality (Wunder et al., 2006).
In mixed species stands where species with differences in mor-phology and physiological characteristics, as well as ecologicalrequirements (such as differences in shade tolerance) are growingtogether, mortality is more difficult to understand and predict thanin even-aged mono-specific stands (Westoby, 1984; Yang et al.,2003). The capacity of some species to live and photosynthesizein a shaded environment can provide them with certain advanta-ges against competition. For example, in boreal mixedwoods aspenusually quickly re-occupy mixedwood sites after disturbance andremain dominant for extended periods; while, there is generallyenough light reaching the understory to allow shade tolerant spe-cies such as white spruce to survive and grow under the canopy ofthe shade intolerant trembling aspen (Lieffers and Stadt, 1994;Chen and Popadiouk, 2002).
The logistic function has been the standard approach for mod-eling the probability of mortality or survival for a number of treespecies (Monserud, 1976; Hamilton, 1986; Monserud and Sterba,1999; Yang et al., 2003), and it represents perhaps the best ap-proach for modelling tree mortality behavior (Yang et al., 2003;Feng et al., 2006; Groom et al., 2012). Standard logistic regressionanalysis works well with data collected in permanent sample plotsin which the time interval between consecutive measurements isfrequently homogenous (i.e. equal number of years between con-secutive measurements). When the time interval is not equalamong measurements, adjustments to the traditional logistic mod-el may have to be made and a generalized logistic regression modelshould be used (Monserud, 1976).
Models for predicting the probability of either mortality or sur-vival for individual trees have been developed for boreal tree spe-cies in western Canada including white spruce, trembling aspen,and jack pine (Yao et al., 2001; Yang et al., 2003; Yang and Huang,2013). In the case of trembling aspen and white spruce in borealforests of Alberta, Yang et al. (2003) found that a number of standattributes are powerful predictors of individual tree mortality,including total stand basal area, diameter increment, relative size,and basal area of larger deciduous and conifer trees. However,these studies did not evaluate whether the probability of survivalor mortality of individual trees is affected by stand compositionin pure and mixed stands of these two species experiencing self-thinning; rather, these previous models were developed for pre-dicting probability of mortality in a more general context, andalthough the effects of two-sided and one-sided competition wereanalyzed, these analyses did not focus on stands experiencing onlydensity-dependent mortality.
The general objective of this study was to examine factors influ-encing the probability of survival of trembling aspen and whitespruce trees growing in pure and mixed stands in Alberta borealforests, which were previously identified as experiencing density-dependent mortality (Reyes-Hernandez et al., 2013). It is impor-tant to note that it is not the purpose of this research to generatenew and/or more powerful models to predict individual tree sur-vival or mortality of the above mentioned species in a more generalcontext, since these models have already been generated and val-idated (Yang et al., 2003; Yang and Huang, 2013); rather, our mainobjective is to evaluate some of the stand and individual tree char-acteristics, including stand composition, that might be affecting
Please cite this article in press as: Reyes-Hernández, V., Comeau, P.G. Survivalstands experiencing self-thinning. Forest Ecol. Manage. (2014), http://dx.doi.or
and defining mortality that is occurring exclusively in self-thinningstands.
We hypothesize that the probability of survival of individualtrees in boreal pure and mixed self-thinning stands comprised bytrembling aspen and white spruce, can be modeled and predictedwith measures of density and relative density (such as Reineke’sStand Density Index or SDI), stand structure and stand composi-tion. We also hypothesize that stand composition (percentage ofbasal area in deciduous species) has an important effect and influ-ences the probability of survival of individual trees in these stands,because the species of interest have differences in ecologicalrequirements (i.e. there is niche separation between these two spe-cies). We attempt to elucidate whether species, size, relative size,and competitiveness are important in defining which trees surviveand which trees die in self-thinning boreal pure and mixed standsof these two species. Also, these analyses will allow for furthertesting of stand characteristics to determine whether or not one-sided and not two-sided competition, is one of the key drivers oftree mortality in these stands. One-sided competition is definedas competition resulting exclusively from individuals larger thanthe subject tree, whereas two-sided competition results from allindividuals larger, equal, and smaller than the subject tree (Cannellet al., 1984).
2. Methods
2.1. Study sites and data
This study was completed using long-term data from perma-nent sample plots (PSPs) established in pure and mixed stands oftrembling aspen and white spruce, located in the Boreal ForestNatural Region of Alberta, Canada. The region ranges in elevationfrom 150 m in the Northern Mixedwood Natural Subregion to over1100 m in the Upper Boreal Highlands Natural Subregion, with le-vel to undulating plains with extensive wetlands, high elevationplateaus and dune fields (Forest Management Branch, 2005). Theoverall climate is characterized by long, cold, dry winters andshort, warm, and moist summers, with between 50 and 100frost-free days per year, mean annual temperature of about�0.2 �C, and an average annual precipitation of 470 mm (NaturalRegions Committee, 2006). Our study included PSPs located mainlyin the Central Mixedwood, the Dry Mixedwood, and the Northernmixedwood Ecological Subregions (Beckingham and Archibald,1996). The PSPs are located in stands that originated following fireand that have been maintained free of any managementactivity (Forest Management Branch, 2005). Establishment andre-measurement of these PSPs were made following rigorous stan-dards, albeit their size, establishment date, and re-measurementintervals are variable (Forest Management Branch, 2005). Most ofthese PSPs are 0.10 ha in size with all trees taller than 1.3 m or lar-ger than 2.5 cm in diameter at breast height tagged and measuredat time intervals ranging between 3 and 10 years.
For this analysis we used only stands that were previouslyidentified as experiencing density-dependent mortality (Reyes-Hernandez et al., 2013). Identification of self-thinning standswas performed by developing maximum size–density relation-ships at the individual stand level, also called ‘dynamic self-thin-ning lines’ (Weller, 1987, 1990; VanderSchaaf and Burkhart,2007b), with the use of a mixed model approach. We refer thereaders to Hann et al. (2003), Poage et al. (2007), VanderSchaafand Burkhart (2007a), VanderSchaaf and Burkhart (2007b), andVanderSchaaf (2010), for a more detailed description of themethodology and criteria used to separate self-thinning fromnon-self-thinning stands. A total of 179 plots were available forour study, with 653 observations at the stand level. A minimum
probability of white spruce and trembling aspen in boreal pure and mixedg/10.1016/j.foreco.2014.03.010
V. Reyes-Hernández, P.G. Comeau / Forest Ecology and Management xxx (2014) xxx–xxx 3
of two and a maximum of six repeated measurements wereavailable for each stand, with an average measurement intervalof 10 years among the plots. From these PSPs, individual treeobservations of white spruce and trembling aspen were separatedand used in further analysis. A total of 22,391 individual treeobservations were available for both species; trembling aspenaccounted for 11,615 total observations, with 10,176 live treesand 1439 mortality events (trees that died during the period ofmeasurement). White spruce accounted for 10,776 individualobservations, with 9379 live trees and 1397 mortality eventsregistered during the measurement period (Table 1). Trees thatwere recorded as ‘dead’ when the first measurement in the plotwas taken (or at plot establishment) were not considered foranalysis and were removed from the data set.
Data from these self-thinning plots were compiled and a num-ber of stand and tree attributes were calculated to be used as po-tential independent variables. Predictor variables included were:(a) individual tree characteristics: diameter at breast height (cm),diameter at breast height squared (cm2), height (m), individual ba-sal area (m2), and individual periodic annual increment in diameter(PAId); (b) stand level characteristics: total density (number oftrees per hectare), stand basal area (m2 ha�1), stand composition(percentage of basal area in deciduous), Reineke’s Stand Density In-dex (Reineke, 1933, Eq. (1)) quadratic mean diameter (cm), andmean height (m). In the case of Reineke’s SDI (Eq. (1)), we usedthe slope value (b = �1.74) reported by Reyes-Hernandez et al.(2013), which was calculated based on maximum size–densityrelationships developed for these stands (‘dynamic self-thinninglines’). Also, In order to test whether or not one-sided competitioninfluences the probability of survival of the two species of interest,basal area (m2 ha�1) of individuals larger than the subject tree wasalso calculated and tested in the models. Basal area of trees larger
Table 1Individual-tree and stand attributes by tree status and species used for probability of surv
Variable Species Tree status N Me
DBH Aspen Live 10,176 23Dead 1439 18
Spruce Live 9379 19Dead 1397 14
HT Aspen Live 10,176 20Dead 1439 17
Spruce Live 9379 16Dead 1397 13
BAHT Aspen Live 10,176 42Dead 1439 41
Spruce Live 9379 49Dead 1397 51
L Aspen Live 8162 8.9Dead 1425 9.8
Spruce Live 7738 9.0Dead 1393 10
QMD Aspen Live 10,176 24Dead 1439 24
Spruce Live 9379 22Dead 1397 23
SDI Aspen Live 10,176 60Dead 1439 59
Spruce Live 9379 69Dead 1397 68
PAId Aspen Live 8162 0.1Dead 1425 0.0
Spruce Live 7738 0.1Dead 1393 �0
BAHLT Aspen Live 10,176 13Dead 1439 17
Spruce Live 9379 12Dead 1397 13
N = number of trees; DBH = diameter at breast height (cm); HT = height (m); BAHT = todiameter (cm); SDI = Stand density index (dynamic MSDR); PAId = periodic annual incre
Please cite this article in press as: Reyes-Hernández, V., Comeau, P.G. Survivalstands experiencing self-thinning. Forest Ecol. Manage. (2014), http://dx.doi.or
than the subject tree has been one of the most frequently usedvariables to assess the effects of one-sided competition (Monserudand Sterba, 1999). The effects of inter- and intra-specific competi-tion were also assessed by partitioning the effects of basal area oflarger trees into conifer and deciduous components (Yang et al.,2003). Table 1 summarizes the individual characteristics and thesestands attributes.
SDI ¼ NðDq=25:4Þb ð1Þ
where N = number of trees per hectare, Dq = quadratic mean diam-eter, b = slope (�1.74)
2.2. Data analysis and model
A logistic regression function was used to model the probabilityof survival of individual white spruce and trembling aspen trees.The general equation has the following form:
PS ¼ 1=½1þ eð�XbÞ� ð2Þ
where PS is probability of survival of an individual tree, b is the vec-tor of unknown parameters (i.e. to be estimated); and X is the ma-trix of predictor variables.
All variables summarized in Table 1 were considered as poten-tial predictors for fitting Eq. (2). The full data set was used for theanalyses, which allowed testing for the effects of stand composi-tion (i.e. percentage of basal area of deciduous species) on Ps foreach species, in both pure and mixed stands at the same time. Sep-arate models were developed for Ps of white spruce and Ps of trem-bling aspen.
A generalized logistic regression analysis was performed withPROC GENMOD of SAS� ver. 9.2 to fit Eq. (2). This SAS procedure
ival model fit in self-thinning boreal stands.
an Standard deviation Minimum Maximum
.8 9.1 2.0 58.1
.9 8.8 2.0 56.7
.6 11.3 2.0 59.8
.8 8.5 2.0 58.9
.7 4.6 2.2 37.2
.9 4.2 4.3 26.1
.9 7.6 1.4 41.2
.4 5.9 2.5 31.4
.49 10.1 18.3 76.1
.4 9.9 21.6 76.1
.4 9.9 18.3 76.1
.0 10.9 19.4 76.13.1 3.0 30.03.2 3.0 23.03.4 3.0 30.0
.4 3.2 3.0 24.0
.0 6.5 10.6 50.5
.9 5.8 11.9 48.9
.5 5.9 5.5 43.1
.2 5.2 11.9 39.96.1 228.7 8.4 10941.9 231.9 101.2 10947.5 258.1 1.35 13394.1 264.1 28.1 133958 0.115 �0.47 1.06098 0.077 �0.39 0.82004 0.121 �0.486 1.029.019 0.074 �0.41 0.94.9 11.0 0 57.0.1 14.1 0 57.0.4 10.3 0 49.8.9 10.9 0 59.7
tal basal area (m2 ha�1); L = measurement interval (years); QMD = quadratic meanment in diameter (cm); BAHLT = Basal area larger trees (m2 ha�1).
probability of white spruce and trembling aspen in boreal pure and mixedg/10.1016/j.foreco.2014.03.010
4 V. Reyes-Hernández, P.G. Comeau / Forest Ecology and Management xxx (2014) xxx–xxx
allows modeling of autocorrelated data, which is probable fordata collected through time in permanent sample plots, using aREPEATED statement, and the estimation methodology that isreferred to as a Generalized Estimation Equation (GEE) (SAS, 2010).
Since many alternative functions with different combinations ofindependent variables were fitted, the most parsimonious modelfor each species was selected based on goodness-of-fit statistics,and a minimal correlation between independent variables(r < 0.5). We avoided the inclusion of highly correlated variablessimultaneously in the same model. When some explanatory vari-ables recorded a significant correlation with each other, indepen-dent variables were discriminated based on the significance oftheir correlation coefficient (p > 0.01) and the amount of variationthat each variable explained in the model. This was evaluatedthrough changes in AIC and ROC values with and without thehighly correlated variables under examination. For example, indi-vidual height and diameter at breast height showed similar explan-atory performance in some models; however, height values werenot measured directly in the field but estimated from equationspreviously generated for Alberta tree species (Huang et al.,1994); these two variables showed a highly significant correlationwith each other (p > 0.01) and their effects were inconsistent whenincluded in the same model. In general, diameter at breast heightperformed better than height when fitting the models. For this rea-son, and because diameter was directly measured in the field (andnot estimated), it was selected for use in the models. In addition,goodness-of-fit was poor for models with other variables.
Additional analyses to explore relationships between Ps andindividual tree growth rates were performed. Periodic annualincrement in diameter (PAId) for each individual tree was usedand incorporated in the best models already obtained for each spe-cies. When individual PAId is included in the models the number ofobservations is reduced. Incorporating PAId for trembling aspen re-duces the dataset from 11,615 individual observations initiallyavailable to 9587 observations, whereas for white spruce thereduction causes a loss of 1645 observations.
The Akaike Information Criterion (AIC) was also used to dis-criminate between the alternative models. Receiver OperatingCharacteristic Curves (ROC curves), which are a graphical represen-tation of the proportion of ‘true positives’ (events predicted to beactual events) vs. the proportion of ‘false positives’ (noneventspredicted to be events), were generated and used to evaluateand compare the performance and fit of alternative models (SAS,2010). Finally, a Hosmer and Lemeshow goodness-of-fit test(Hosmer and Lemeshow, 2000) was performed. This test dividesthe entire data set in ten groups of approximately the same size(i.e. with similar number of individual observations, trees in thiscase), based on the percentiles of their estimated probabilities.The differences between the observed and the expected numberof observations within each group are summarized by a Pearsonchi-square statistic and then compared to a Chi-square distributionwith ‘t’ degrees of freedom, where ‘t’ is the number of groupsminus ‘n’ (default n = 2).
3. Results
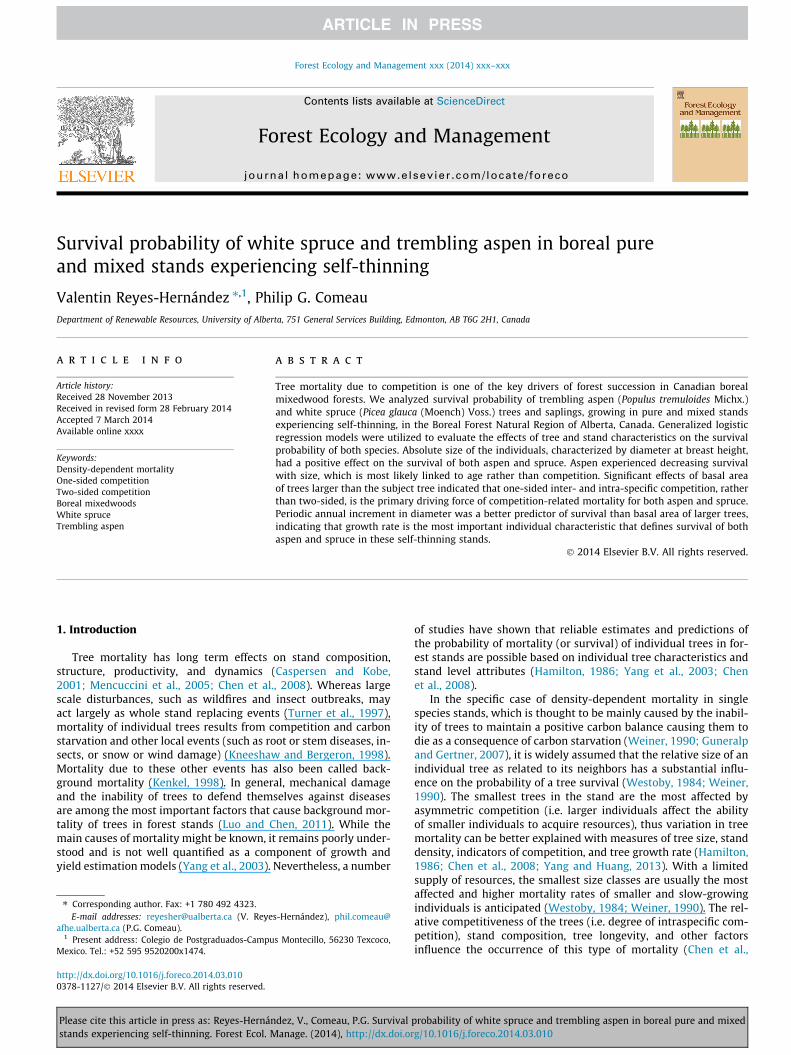
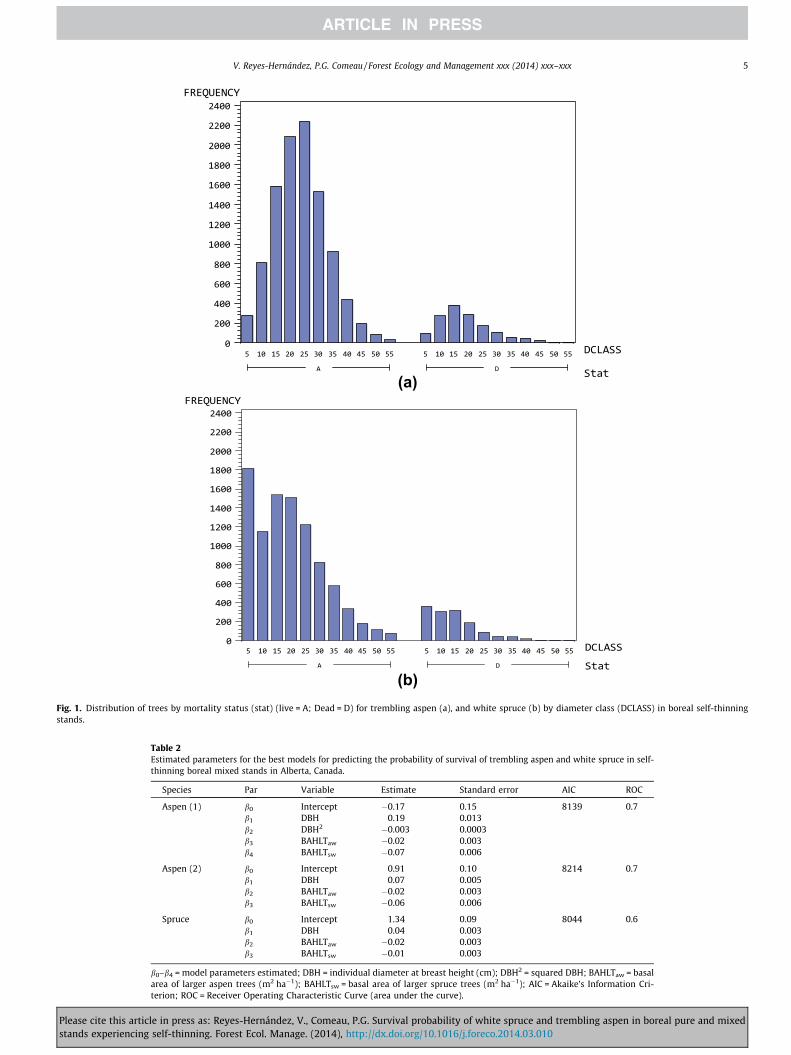
Occurrence of mortality events was evident during the wholeperiod in which the stands experienced density-dependent mortal-ity (i.e. during the self-thinning stage). Mortality of white sprucewas mainly concentrated in the 5, 10, and 15 cm diameter classes(from 2.5 to 7.5 cm, 7.6 to 12.5 cm, and from 12.6 to 17.5 cm,respectively), whereas trembling aspen mortality was concen-trated in the 10, 15, and 20 cm diameter classes (from 7.6 to12.5 cm, from 12.6 to 17.5 m, and from 12.6 to 17.5 cm, respec-tively) (Fig. 1); there were also some mortality events in larger
Please cite this article in press as: Reyes-Hernández, V., Comeau, P.G. Survivalstands experiencing self-thinning. Forest Ecol. Manage. (2014), http://dx.doi.or
diameter classes for both species (diameter classes larger than45 cm) (Fig. 1).
The area under an ROC curve essentially measures discrimina-tion among the events, that is, the ability of the model to accu-rately categorize individuals that have the characteristic ofinterest from those who do not have it (Hanley and McNeil,1982), in this case, dead individuals from live individuals. AnROC curve value close to 1 indicates that the model is excellentat discriminating the events (live vs. dead trees).
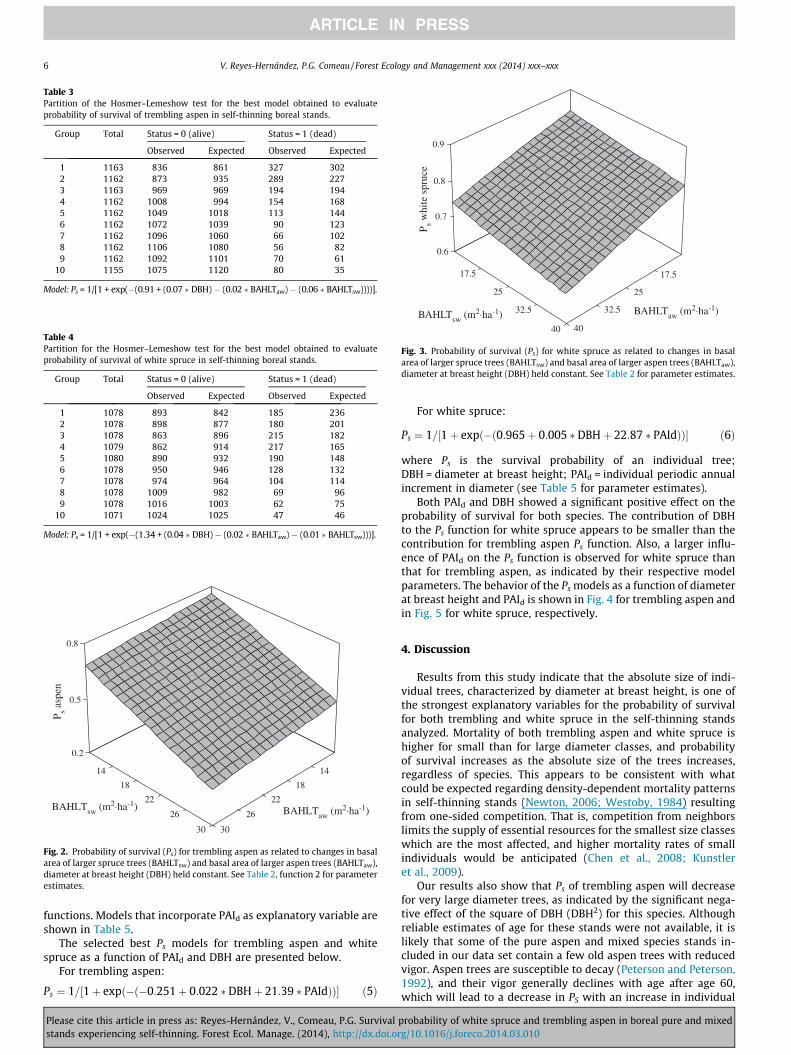
For trembling aspen, significant effects of diameter at breastheight, the square of diameter at breast height, basal area of largertrembling aspen trees, and basal area of larger white spruce treeson the probability of survival are observed (Table 2). A small butsignificant improvement (a decrease of AIC, but no difference inROC value) in the Ps function performance is observed for trem-bling aspen when separate values of basal area of larger trees forboth the deciduous and the conifer components, and when thesquare of DBH were included (Table 2, function 1 for aspen). How-ever, performance differences (i.e. fit) between the model that in-cludes DBH2 from the one that does not include this variable areminimal, as can be observed in Table 2. Due to this, and becauseof the evident correlation between DBH and squared DBH, function2 for PS of aspen is preferred over function 1 (i.e. without DBH2).
For white spruce, significant effects of diameter at breast height,basal area of larger aspen trees, and basal area of larger sprucetrees, on the probability of survival are observed (Table 2). The par-tition of the Hosmer–Lemeshow test for the best survival probabil-ity model is presented, for trembling aspen (Table 3), and for whitespruce (Table 4). These tables are useful to compare the differencesbetween the observed and the expected number of trees that werecalculated with the selected models, for each species within eachof the ten groups formed according to tree status (dead and live)as indicated.
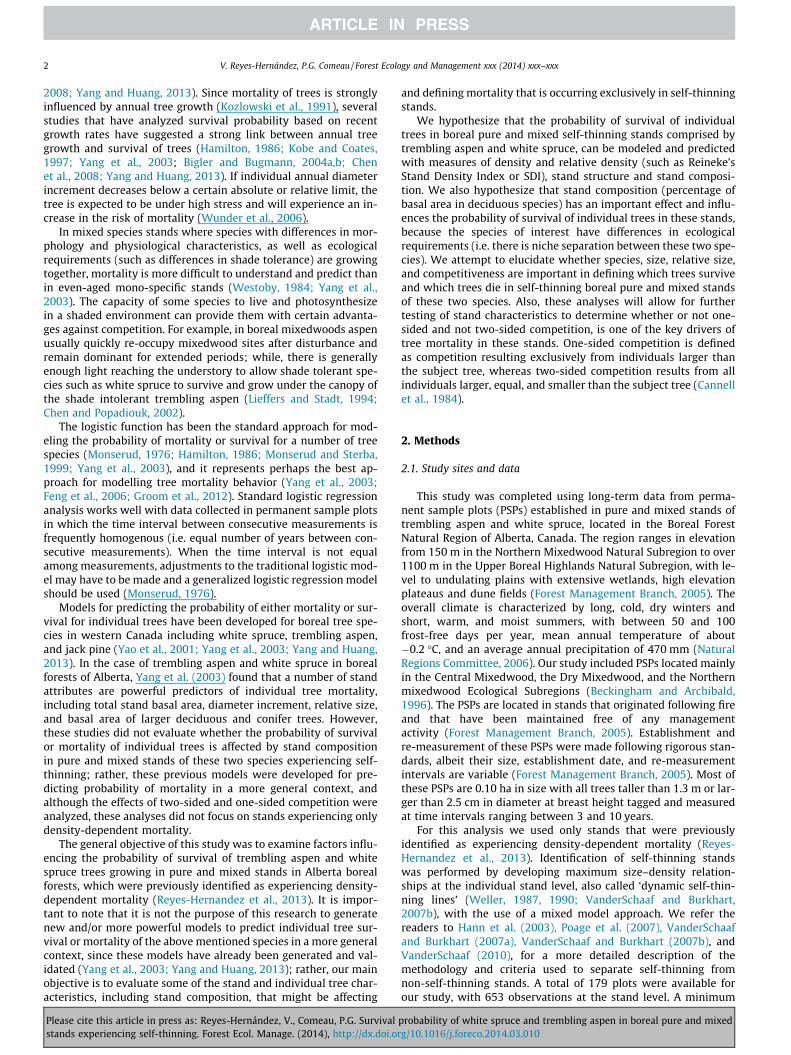
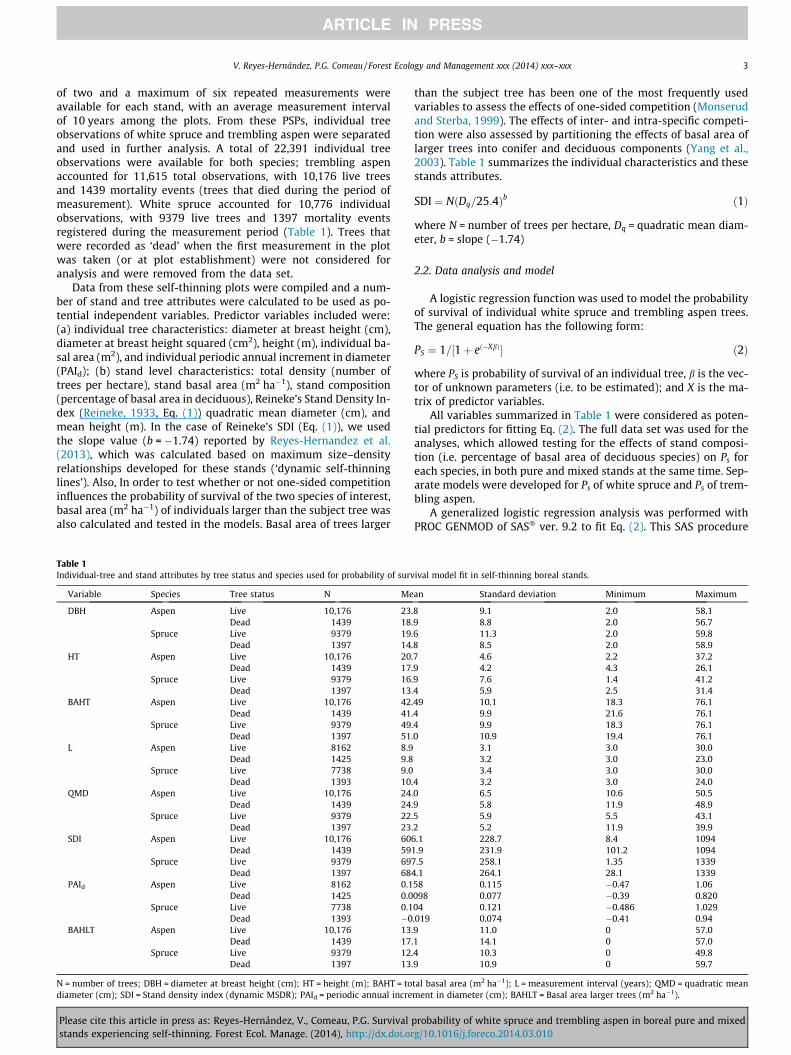
The selected best models of both species show in general anacceptable fit (Table 2, ROC = 0.70 for trembling aspen andROC = 0.6 for white spruce). ROC values and the results ofHosmer-Lemeshow test indicate that 60% of the total number oftrees for trembling aspen is correctly discriminated by the model,and up to 70% for white spruce, and that the model for tremblingaspen showed a better fit than that for white spruce. The behaviorof the probability of survival function with changes in basal area oflarger aspen and larger spruce trees is shown for trembling aspenin Fig. 2, and for white spruce in Fig. 3. The best survival probabilityfunctions for each species are presented below.
For trembling aspen:
Ps ¼ 1=½1þ expð�ðb0 þ b1 �DBH� b2 �BAHLTaw � b3 �BAHLTswÞÞ�ð3Þ
For white spruce:
Ps ¼ 1=½1þ expð�ðb0 þ b1 �DBH� b2 �BAHLTaw � b3 �BAHLTswÞÞ�ð4Þ
where Ps is the survival probability of an individual tree; b0–b3 arethe model parameters estimated; DBH = diameter at breast height;BAHLTaw = basal area of larger aspen trees (m2 ha�1); BAHLTsw =basal area of larger white spruce trees (m2 ha�1) (see Table 2 forparameter estimates).
The incorporation of PAId in the Ps functions produced a strongreduction in the significance of many of the independent variablespreviously used (i.e. stand characteristics) and that were includedin the original models. Both AIC and ROC values did not show anyimprovement when these variables were used together with PAId.This and the fact that many of these stand variables showed ahighly significant correlation with PAId (r > 0.5, P > 0.01) were themain reasons to remove most of these variables in the new
probability of white spruce and trembling aspen in boreal pure and mixedg/10.1016/j.foreco.2014.03.010
(a)
(b) Fig. 1. Distribution of trees by mortality status (stat) (live = A; Dead = D) for trembling aspen (a), and white spruce (b) by diameter class (DCLASS) in boreal self-thinningstands.
Table 2Estimated parameters for the best models for predicting the probability of survival of trembling aspen and white spruce in self-thinning boreal mixed stands in Alberta, Canada.
Species Par Variable Estimate Standard error AIC ROC
Aspen (1) b0 Intercept �0.17 0.15 8139 0.7b1 DBH 0.19 0.013b2 DBH2 �0.003 0.0003b3 BAHLTaw �0.02 0.003b4 BAHLTsw �0.07 0.006
Aspen (2) b0 Intercept 0.91 0.10 8214 0.7b1 DBH 0.07 0.005b2 BAHLTaw �0.02 0.003b3 BAHLTsw �0.06 0.006
Spruce b0 Intercept 1.34 0.09 8044 0.6b1 DBH 0.04 0.003b2 BAHLTaw �0.02 0.003b3 BAHLTsw �0.01 0.003
b0–b4 = model parameters estimated; DBH = individual diameter at breast height (cm); DBH2 = squared DBH; BAHLTaw = basalarea of larger aspen trees (m2 ha�1); BAHLTsw = basal area of larger spruce trees (m2 ha�1); AIC = Akaike’s Information Cri-terion; ROC = Receiver Operating Characteristic Curve (area under the curve).
V. Reyes-Hernández, P.G. Comeau / Forest Ecology and Management xxx (2014) xxx–xxx 5
Please cite this article in press as: Reyes-Hernández, V., Comeau, P.G. Survival probability of white spruce and trembling aspen in boreal pure and mixedstands experiencing self-thinning. Forest Ecol. Manage. (2014), http://dx.doi.org/10.1016/j.foreco.2014.03.010
30
26
22
18
14
BAHLTaw (m2⋅ha-1)
30
26
22
18
14
BAHLTsw (m2⋅ha-1)
0.2
0.5
0.8
P s asp
en
Fig. 2. Probability of survival (Ps) for trembling aspen as related to changes in basalarea of larger spruce trees (BAHLTsw) and basal area of larger aspen trees (BAHLTaw),diameter at breast height (DBH) held constant. See Table 2, function 2 for parameterestimates.
40
32.5
25
17.5
BAHLTaw (m2⋅ha-1)
40
32.5
25
17.5
BAHLTsw (m2⋅ha-1)
0.6
0.7
0.8
0.9
P s whi
te s
pruc
e
Fig. 3. Probability of survival (Ps) for white spruce as related to changes in basalarea of larger spruce trees (BAHLTsw) and basal area of larger aspen trees (BAHLTaw),diameter at breast height (DBH) held constant. See Table 2 for parameter estimates.
Table 3Partition of the Hosmer–Lemeshow test for the best model obtained to evaluateprobability of survival of trembling aspen in self-thinning boreal stands.
Group Total Status = 0 (alive) Status = 1 (dead)
Observed Expected Observed Expected
1 1163 836 861 327 3022 1162 873 935 289 2273 1163 969 969 194 1944 1162 1008 994 154 1685 1162 1049 1018 113 1446 1162 1072 1039 90 1237 1162 1096 1060 66 1028 1162 1106 1080 56 829 1162 1092 1101 70 61
10 1155 1075 1120 80 35
Model: Ps = 1/[1 + exp(�(0.91 + (0.07 � DBH)� (0.02 � BAHLTaw)� (0.06 � BAHLTsw))))].
Table 4Partition for the Hosmer–Lemeshow test for the best model obtained to evaluateprobability of survival of white spruce in self-thinning boreal stands.
Group Total Status = 0 (alive) Status = 1 (dead)
Observed Expected Observed Expected
1 1078 893 842 185 2362 1078 898 877 180 2013 1078 863 896 215 1824 1079 862 914 217 1655 1080 890 932 190 1486 1078 950 946 128 1327 1078 974 964 104 1148 1078 1009 982 69 969 1078 1016 1003 62 75
10 1071 1024 1025 47 46
Model: Ps = 1/[1 + exp(�(1.34 + (0.04 � DBH)� (0.02 � BAHLTaw)� (0.01 � BAHLTsw)))].
6 V. Reyes-Hernández, P.G. Comeau / Forest Ecology and Management xxx (2014) xxx–xxx
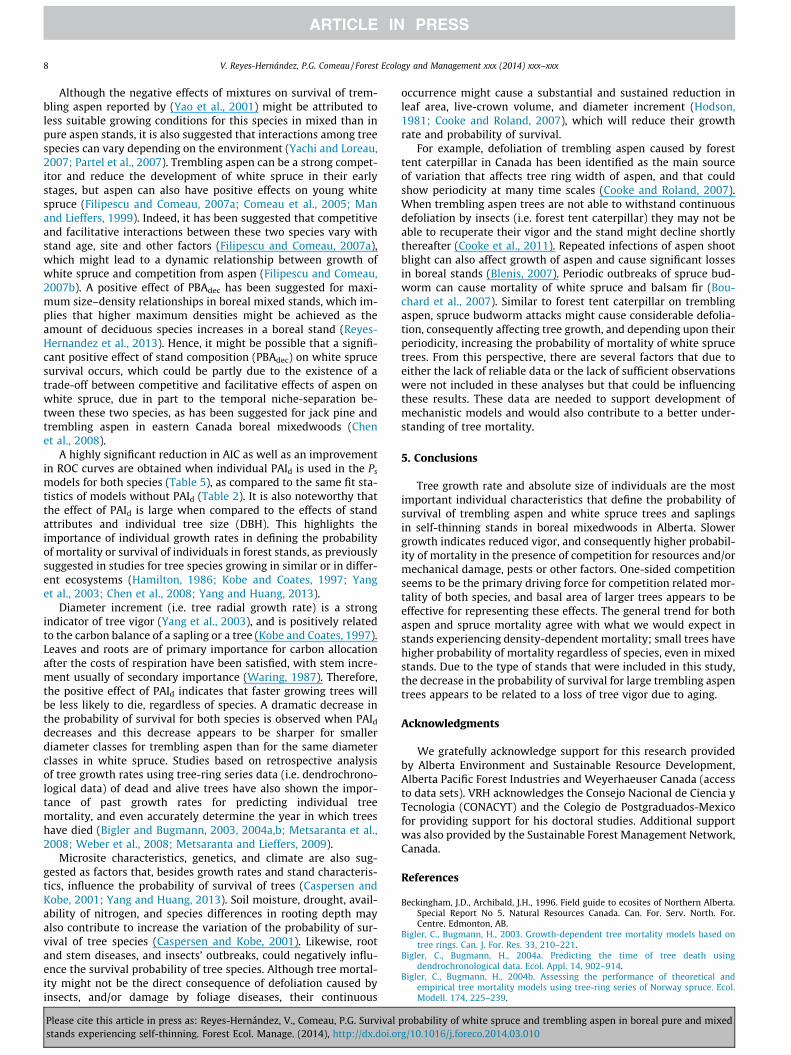
functions. Models that incorporate PAId as explanatory variable areshown in Table 5.
The selected best Ps models for trembling aspen and whitespruce as a function of PAId and DBH are presented below.
For trembling aspen:
Ps ¼ 1=½1þ expð�ð�0:251þ 0:022 � DBHþ 21:39 � PAIdÞÞ� ð5Þ
Please cite this article in press as: Reyes-Hernández, V., Comeau, P.G. Survivalstands experiencing self-thinning. Forest Ecol. Manage. (2014), http://dx.doi.or
For white spruce:
Ps ¼ 1=½1þ expð�ð0:965þ 0:005 � DBHþ 22:87 � PAIdÞÞ� ð6Þ
where Ps is the survival probability of an individual tree;DBH = diameter at breast height; PAId = individual periodic annualincrement in diameter (see Table 5 for parameter estimates).
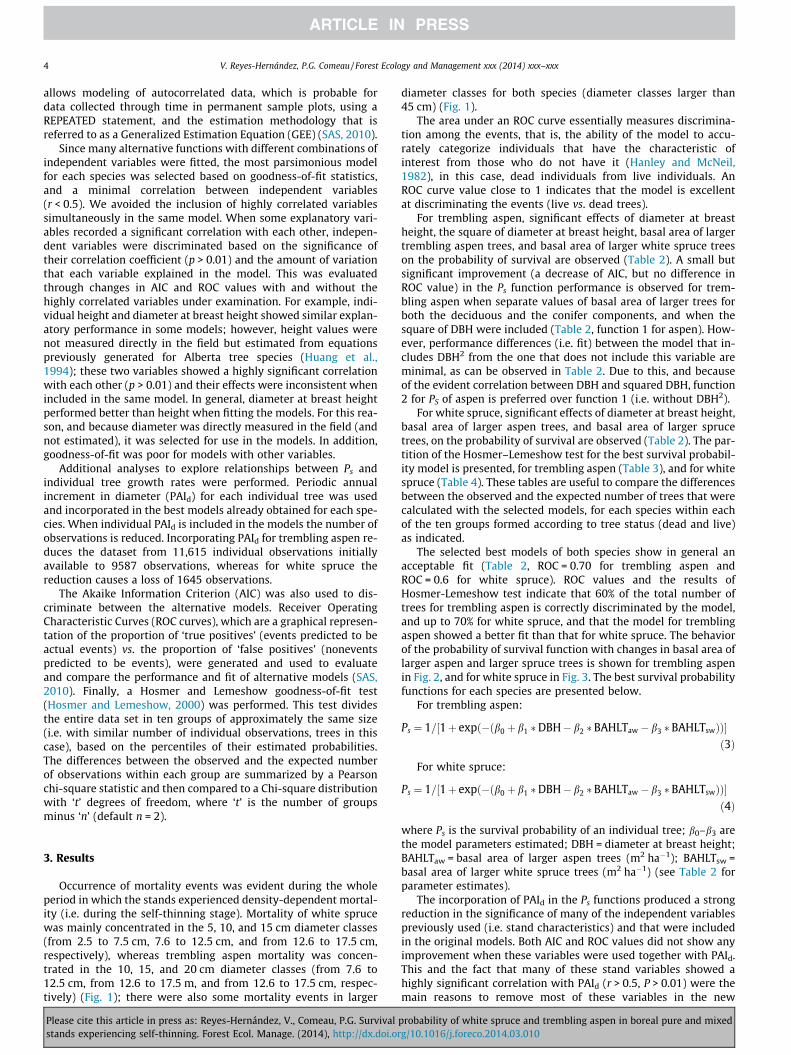
Both PAId and DBH showed a significant positive effect on theprobability of survival for both species. The contribution of DBHto the Ps function for white spruce appears to be smaller than thecontribution for trembling aspen Ps function. Also, a larger influ-ence of PAId on the Ps function is observed for white spruce thanthat for trembling aspen, as indicated by their respective modelparameters. The behavior of the Ps models as a function of diameterat breast height and PAId is shown in Fig. 4 for trembling aspen andin Fig. 5 for white spruce, respectively.
4. Discussion
Results from this study indicate that the absolute size of indi-vidual trees, characterized by diameter at breast height, is one ofthe strongest explanatory variables for the probability of survivalfor both trembling and white spruce in the self-thinning standsanalyzed. Mortality of both trembling aspen and white spruce ishigher for small than for large diameter classes, and probabilityof survival increases as the absolute size of the trees increases,regardless of species. This appears to be consistent with whatcould be expected regarding density-dependent mortality patternsin self-thinning stands (Newton, 2006; Westoby, 1984) resultingfrom one-sided competition. That is, competition from neighborslimits the supply of essential resources for the smallest size classeswhich are the most affected, and higher mortality rates of smallindividuals would be anticipated (Chen et al., 2008; Kunstleret al., 2009).
Our results also show that Ps of trembling aspen will decreasefor very large diameter trees, as indicated by the significant nega-tive effect of the square of DBH (DBH2) for this species. Althoughreliable estimates of age for these stands were not available, it islikely that some of the pure aspen and mixed species stands in-cluded in our data set contain a few old aspen trees with reducedvigor. Aspen trees are susceptible to decay (Peterson and Peterson,1992), and their vigor generally declines with age after age 60,which will lead to a decrease in PS with an increase in individual
probability of white spruce and trembling aspen in boreal pure and mixedg/10.1016/j.foreco.2014.03.010
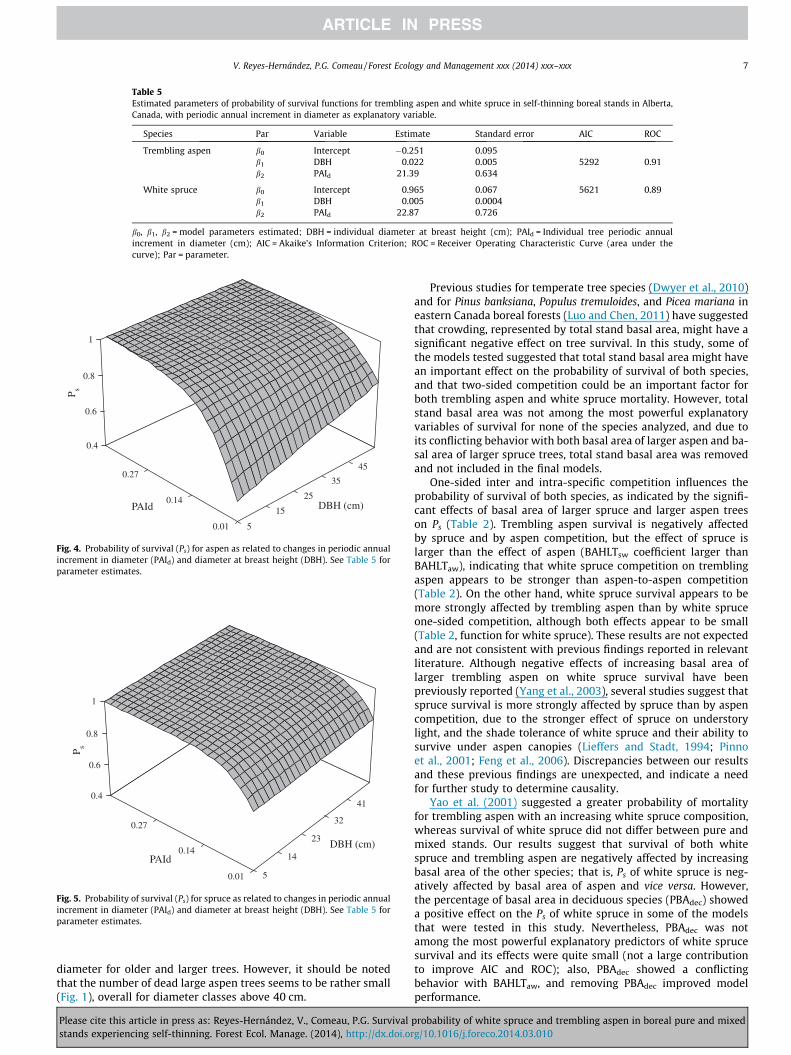
Table 5Estimated parameters of probability of survival functions for trembling aspen and white spruce in self-thinning boreal stands in Alberta,Canada, with periodic annual increment in diameter as explanatory variable.
Species Par Variable Estimate Standard error AIC ROC
Trembling aspen b0 Intercept �0.251 0.095b1 DBH 0.022 0.005 5292 0.91b2 PAId 21.39 0.634
White spruce b0 Intercept 0.965 0.067 5621 0.89b1 DBH 0.005 0.0004b2 PAId 22.87 0.726
b0, b1, b2 = model parameters estimated; DBH = individual diameter at breast height (cm); PAId = Individual tree periodic annualincrement in diameter (cm); AIC = Akaike’s Information Criterion; ROC = Receiver Operating Characteristic Curve (area under thecurve); Par = parameter.
5
14
23
32
41
DBH (cm)
0.01
0.14
0.27
PAId
0.4
0.6
0.8
1
P s
Fig. 5. Probability of survival (Ps) for spruce as related to changes in periodic annualincrement in diameter (PAId) and diameter at breast height (DBH). See Table 5 forparameter estimates.
5
15
25
35
45
DBH (cm)
0.01
0.14
0.27
PAId
0.4
0.6
0.8
1
P s
Fig. 4. Probability of survival (Ps) for aspen as related to changes in periodic annualincrement in diameter (PAId) and diameter at breast height (DBH). See Table 5 forparameter estimates.
V. Reyes-Hernández, P.G. Comeau / Forest Ecology and Management xxx (2014) xxx–xxx 7
diameter for older and larger trees. However, it should be notedthat the number of dead large aspen trees seems to be rather small(Fig. 1), overall for diameter classes above 40 cm.
Please cite this article in press as: Reyes-Hernández, V., Comeau, P.G. Survivalstands experiencing self-thinning. Forest Ecol. Manage. (2014), http://dx.doi.or
Previous studies for temperate tree species (Dwyer et al., 2010)and for Pinus banksiana, Populus tremuloides, and Picea mariana ineastern Canada boreal forests (Luo and Chen, 2011) have suggestedthat crowding, represented by total stand basal area, might have asignificant negative effect on tree survival. In this study, some ofthe models tested suggested that total stand basal area might havean important effect on the probability of survival of both species,and that two-sided competition could be an important factor forboth trembling aspen and white spruce mortality. However, totalstand basal area was not among the most powerful explanatoryvariables of survival for none of the species analyzed, and due toits conflicting behavior with both basal area of larger aspen and ba-sal area of larger spruce trees, total stand basal area was removedand not included in the final models.
One-sided inter and intra-specific competition influences theprobability of survival of both species, as indicated by the signifi-cant effects of basal area of larger spruce and larger aspen treeson Ps (Table 2). Trembling aspen survival is negatively affectedby spruce and by aspen competition, but the effect of spruce islarger than the effect of aspen (BAHLTsw coefficient larger thanBAHLTaw), indicating that white spruce competition on tremblingaspen appears to be stronger than aspen-to-aspen competition(Table 2). On the other hand, white spruce survival appears to bemore strongly affected by trembling aspen than by white spruceone-sided competition, although both effects appear to be small(Table 2, function for white spruce). These results are not expectedand are not consistent with previous findings reported in relevantliterature. Although negative effects of increasing basal area oflarger trembling aspen on white spruce survival have beenpreviously reported (Yang et al., 2003), several studies suggest thatspruce survival is more strongly affected by spruce than by aspencompetition, due to the stronger effect of spruce on understorylight, and the shade tolerance of white spruce and their ability tosurvive under aspen canopies (Lieffers and Stadt, 1994; Pinnoet al., 2001; Feng et al., 2006). Discrepancies between our resultsand these previous findings are unexpected, and indicate a needfor further study to determine causality.
Yao et al. (2001) suggested a greater probability of mortalityfor trembling aspen with an increasing white spruce composition,whereas survival of white spruce did not differ between pure andmixed stands. Our results suggest that survival of both whitespruce and trembling aspen are negatively affected by increasingbasal area of the other species; that is, Ps of white spruce is neg-atively affected by basal area of aspen and vice versa. However,the percentage of basal area in deciduous species (PBAdec) showeda positive effect on the Ps of white spruce in some of the modelsthat were tested in this study. Nevertheless, PBAdec was notamong the most powerful explanatory predictors of white sprucesurvival and its effects were quite small (not a large contributionto improve AIC and ROC); also, PBAdec showed a conflictingbehavior with BAHLTaw, and removing PBAdec improved modelperformance.
probability of white spruce and trembling aspen in boreal pure and mixedg/10.1016/j.foreco.2014.03.010
8 V. Reyes-Hernández, P.G. Comeau / Forest Ecology and Management xxx (2014) xxx–xxx
Although the negative effects of mixtures on survival of trem-bling aspen reported by (Yao et al., 2001) might be attributed toless suitable growing conditions for this species in mixed than inpure aspen stands, it is also suggested that interactions among treespecies can vary depending on the environment (Yachi and Loreau,2007; Partel et al., 2007). Trembling aspen can be a strong compet-itor and reduce the development of white spruce in their earlystages, but aspen can also have positive effects on young whitespruce (Filipescu and Comeau, 2007a; Comeau et al., 2005; Manand Lieffers, 1999). Indeed, it has been suggested that competitiveand facilitative interactions between these two species vary withstand age, site and other factors (Filipescu and Comeau, 2007a),which might lead to a dynamic relationship between growth ofwhite spruce and competition from aspen (Filipescu and Comeau,2007b). A positive effect of PBAdec has been suggested for maxi-mum size–density relationships in boreal mixed stands, which im-plies that higher maximum densities might be achieved as theamount of deciduous species increases in a boreal stand (Reyes-Hernandez et al., 2013). Hence, it might be possible that a signifi-cant positive effect of stand composition (PBAdec) on white sprucesurvival occurs, which could be partly due to the existence of atrade-off between competitive and facilitative effects of aspen onwhite spruce, due in part to the temporal niche-separation be-tween these two species, as has been suggested for jack pine andtrembling aspen in eastern Canada boreal mixedwoods (Chenet al., 2008).
A highly significant reduction in AIC as well as an improvementin ROC curves are obtained when individual PAId is used in the Ps
models for both species (Table 5), as compared to the same fit sta-tistics of models without PAId (Table 2). It is also noteworthy thatthe effect of PAId is large when compared to the effects of standattributes and individual tree size (DBH). This highlights theimportance of individual growth rates in defining the probabilityof mortality or survival of individuals in forest stands, as previouslysuggested in studies for tree species growing in similar or in differ-ent ecosystems (Hamilton, 1986; Kobe and Coates, 1997; Yanget al., 2003; Chen et al., 2008; Yang and Huang, 2013).
Diameter increment (i.e. tree radial growth rate) is a strongindicator of tree vigor (Yang et al., 2003), and is positively relatedto the carbon balance of a sapling or a tree (Kobe and Coates, 1997).Leaves and roots are of primary importance for carbon allocationafter the costs of respiration have been satisfied, with stem incre-ment usually of secondary importance (Waring, 1987). Therefore,the positive effect of PAId indicates that faster growing trees willbe less likely to die, regardless of species. A dramatic decrease inthe probability of survival for both species is observed when PAId
decreases and this decrease appears to be sharper for smallerdiameter classes for trembling aspen than for the same diameterclasses in white spruce. Studies based on retrospective analysisof tree growth rates using tree-ring series data (i.e. dendrochrono-logical data) of dead and alive trees have also shown the impor-tance of past growth rates for predicting individual treemortality, and even accurately determine the year in which treeshave died (Bigler and Bugmann, 2003, 2004a,b; Metsaranta et al.,2008; Weber et al., 2008; Metsaranta and Lieffers, 2009).
Microsite characteristics, genetics, and climate are also sug-gested as factors that, besides growth rates and stand characteris-tics, influence the probability of survival of trees (Caspersen andKobe, 2001; Yang and Huang, 2013). Soil moisture, drought, avail-ability of nitrogen, and species differences in rooting depth mayalso contribute to increase the variation of the probability of sur-vival of tree species (Caspersen and Kobe, 2001). Likewise, rootand stem diseases, and insects’ outbreaks, could negatively influ-ence the survival probability of tree species. Although tree mortal-ity might not be the direct consequence of defoliation caused byinsects, and/or damage by foliage diseases, their continuous
Please cite this article in press as: Reyes-Hernández, V., Comeau, P.G. Survivalstands experiencing self-thinning. Forest Ecol. Manage. (2014), http://dx.doi.or
occurrence might cause a substantial and sustained reduction inleaf area, live-crown volume, and diameter increment (Hodson,1981; Cooke and Roland, 2007), which will reduce their growthrate and probability of survival.
For example, defoliation of trembling aspen caused by foresttent caterpillar in Canada has been identified as the main sourceof variation that affects tree ring width of aspen, and that couldshow periodicity at many time scales (Cooke and Roland, 2007).When trembling aspen trees are not able to withstand continuousdefoliation by insects (i.e. forest tent caterpillar) they may not beable to recuperate their vigor and the stand might decline shortlythereafter (Cooke et al., 2011). Repeated infections of aspen shootblight can also affect growth of aspen and cause significant lossesin boreal stands (Blenis, 2007). Periodic outbreaks of spruce bud-worm can cause mortality of white spruce and balsam fir (Bou-chard et al., 2007). Similar to forest tent caterpillar on tremblingaspen, spruce budworm attacks might cause considerable defolia-tion, consequently affecting tree growth, and depending upon theirperiodicity, increasing the probability of mortality of white sprucetrees. From this perspective, there are several factors that due toeither the lack of reliable data or the lack of sufficient observationswere not included in these analyses but that could be influencingthese results. These data are needed to support development ofmechanistic models and would also contribute to a better under-standing of tree mortality.
5. Conclusions
Tree growth rate and absolute size of individuals are the mostimportant individual characteristics that define the probability ofsurvival of trembling aspen and white spruce trees and saplingsin self-thinning stands in boreal mixedwoods in Alberta. Slowergrowth indicates reduced vigor, and consequently higher probabil-ity of mortality in the presence of competition for resources and/ormechanical damage, pests or other factors. One-sided competitionseems to be the primary driving force for competition related mor-tality of both species, and basal area of larger trees appears to beeffective for representing these effects. The general trend for bothaspen and spruce mortality agree with what we would expect instands experiencing density-dependent mortality; small trees havehigher probability of mortality regardless of species, even in mixedstands. Due to the type of stands that were included in this study,the decrease in the probability of survival for large trembling aspentrees appears to be related to a loss of tree vigor due to aging.
Acknowledgments
We gratefully acknowledge support for this research providedby Alberta Environment and Sustainable Resource Development,Alberta Pacific Forest Industries and Weyerhaeuser Canada (accessto data sets). VRH acknowledges the Consejo Nacional de Ciencia yTecnologia (CONACYT) and the Colegio de Postgraduados-Mexicofor providing support for his doctoral studies. Additional supportwas also provided by the Sustainable Forest Management Network,Canada.
References
Beckingham, J.D., Archibald, J.H., 1996. Field guide to ecosites of Northern Alberta.Special Report No 5. Natural Resources Canada. Can. For. Serv. North. For.Centre. Edmonton, AB.
Bigler, C., Bugmann, H., 2003. Growth-dependent tree mortality models based ontree rings. Can. J. For. Res. 33, 210–221.
Bigler, C., Bugmann, H., 2004a. Predicting the time of tree death usingdendrochronological data. Ecol. Appl. 14, 902–914.
Bigler, C., Bugmann, H., 2004b. Assessing the performance of theoretical andempirical tree mortality models using tree-ring series of Norway spruce. Ecol.Modell. 174, 225–239.
probability of white spruce and trembling aspen in boreal pure and mixedg/10.1016/j.foreco.2014.03.010
V. Reyes-Hernández, P.G. Comeau / Forest Ecology and Management xxx (2014) xxx–xxx 9
Blenis, P., 2007. Impact of simulated aspen shoot blight on trembling aspen. Can. J.For. Res. 37, 719–725.
Bouchard, M., Kneeshaw, D., Messier, C., 2007. Forest dynamics following sprucebudworm outbreaks in the northern and southern mixedwoods of centralQuebec. Can. J. For. Res. 37, 763–772. http://dx.doi.org/10.1139/X06-278.
Cannell, M.G.R., Rothery, P., Ford, E.D., 1984. Competition within stands of Piceasitchensis and Pinus contorta. Ann. Bot. 53, 349–362.
Caspersen, J.P., Kobe, R.K., 2001. Interspecific variation in sapling mortality inrelation to growth and soil moisture. Oikos 92, 160–168.
Chen, H.Y.H., Popadiouk, R., 2002. Dynamics of North American boreal mixedwoods.Environ. Rev. 10, 137–166.
Chen, H.Y.H., Fu, S., Monserud, R.A., Gillies, I.C., 2008. Relative size and stand agedetermine Pinus banksiana mortality. For. Ecol. Manage. 255, 3980–3984.
Comeau, P.G., Kabzems, R., McClarnon, J., Heineman, J.L., 2005. Implications ofselected approaches for regenerating and managing western borealmixedwoods. For. Chron. 81 (4), 559–574.
Cooke, B.J., Roland, J., 2007. Trembling aspen responses to drought and defoliationby forest tent caterpillar and reconstruction of recent outbreaks in Ontario. Can.J. For. Res. 37, 1586–1598.
Cooke, B.J., MacQuarrie, C.J.K., Lorenzetti, F., 2011. The dynamics of forest tentcaterpillar outbreaks across east-central Canada. Ecography 35, 422–435.http://dx.doi.org/10.1111/j.1600-0587.2011.07083.x.
Dwyer, J.M., Fensham, R.J., Fairfax, R.J., Buckley, Y.M., 2010. Neighbourhood effectsinfluence drought-induced mortality of savanna trees in Australia. J. Veget. Sci.21, 573–585.
Feng, Z., Stadt, K.J., Lieffers, V.J., 2006. Linking juvenile white spruce density,dispersion, stocking, and mortality to future yield. Can. J. For. Res. 36, 3173–3182. http://dx.doi.org/10.1139/X06-192.
Filipescu, C., Comeau, P.G., 2007a. Aspen competition affects light and white sprucegrowth across several boreal sites in western Canada. Can. J. For. Res. 37, 1701–1713.
Filipescu, C., Comeau, P.G., 2007b. Competitive interactions between aspen andwhite spruce vary with stand age in boreal mixedwoods. For. Ecol. Manage. 247,175–184.
Forest Management Branch, 2005. Permanent Sample plot (PSP) Field ProceduresManual. Alberta Sustainable Resource Development. Public Lands and ForestDivision, Edmonton, AB.
Groom, J.D., Hann, D.W., Temesgen, H., 2012. Evaluation of mixed-effects models forpredicting Douglas-fir mortality. For. Eocl. Manage. 276, 139–145. http://dx.doi.org/10.1016/j.foreco.2012.03.029.
Guneralp, B., Gertner, G., 2007. Feedback loop dominance analysis of two treemortality models: relationship between behavior. Tree Physiol. 27, 269–280.
Hamilton Jr., D.A., 1986. A logistic model of mortality in thinned and unthinnedmixed conifer stands of northern Idaho. For. Sci. 32, 989–1000.
Hanley, J.A., McNeil, B.J., 1982. The meaning and use of the area under a ReceiverOperating Characteristic (ROC) Curve. Radiology 143 (1), 29–36.
Hann, D.W., Marshall, D.D., Hanus, M.L., 2003. Equations for predicting height-to-crown-base, 5-year-diameter-growth-rate, 5-year height-growth rate, 5-yearmortality rate, and maximum size- density trajectory for Douglas-fir andwestern hemlock in the coastal region of the Pacific Northwest. Res.Contribution 40, Forest Research Laboratory, Oregon State University,Corvallis, OR. 83 pp.
Hodson, A.C., 1981. The response of aspen (Populus tremuloides) to artificialdefoliation. Great Lakes Entomol. 14, 167–169.
Hosmer Jr., D.W., Lemeshow, S., 2000. Applied Logistic Regression, 2nd ed. JohnWiley & Sons, New York, USA, 369 p.
Huang, S., Titus, S.J., Lakusta, T.W., Held, R.J., 1994. Ecologically based individual treeheight-diameter models for major Alberta tree species. Alberta Env. Protection.Land and Forest Services. Forest Management Division. 27 p.
Kenkel, N.C., 1998. Pattern of self-thinning in jack pine-testing the randommortality hypothesis. Ecology 69, 1017–1024.
Kneeshaw, D.D., Bergeron, Y., 1998. Canopy gap characteristics and treereplacement in the southeastern boreal forest. Ecology 79, 783–794.
Kobe, R.K., Coates, K.D., 1997. Models of sapling mortality as a function of growth tocharacterize interspecific variation in shade tolerance of eight tree species ofNorthwestern British Columbia. Can. J. For. Res. 27, 227–236.
Kozlowski, T.T., Kramer, P.J., Pallardy, S.G., 1991. The physiological ecology of woodyplants. Academic Press, New York, 657 pp.
Kunstler, G., Coomes, D.A., Canham, C.D., 2009. Size-dependence of growth andmortality influence the shade tolerance of trees in a lowland temperate rainforest. J. Ecol. 97, 685–695.
Lieffers, V.J., Stadt, K.J., 1994. Growth of understory Picea glauca, CalamagrostisCanadensis, and Epilobium angustifolium in relation to overstory lighttransmission. Can. J. For. Res. 24, 1193–1198.
Luo, Y., Chen, H.Y.H., 2011. Competition, species interaction and ageing control treemortality in boreal forests. J. Ecol. 99, 1470–1480.
Please cite this article in press as: Reyes-Hernández, V., Comeau, P.G. Survivalstands experiencing self-thinning. Forest Ecol. Manage. (2014), http://dx.doi.or
Man, R., Lieffers, V.J., 1999. Are mixtures of aspen and white spruce more productivethan single species stands? For. Chron. 75 (3), 505–513.
Mencuccini, M., Martinez-Vilalta, J., Vanderklein, D., Hamid, H.A., Korakaki, E., Lee,S., Michiels, B., 2005. Size-mediated ageing reduces vigor in trees. Ecol. Lett. 8,1183–1190.
Metsaranta, J., Lieffers, V.J., 2009. Using dendrochronology to obtain annual data formodelling stand development: a supplement to permanent sample plots.Forestry 82 (2), 163–173.
Metsaranta, J., Lieffers, V.J., Wein, R.W., 2008. Dendrochronological reconstructionof Jack pine snag and downed log dynamics in Saskatchewan and Manitoba,Canada. For. Ecol. Manage. 255, 1262–1270.
Monserud, R.A., 1976. Simulation of forest tree mortality. For. Sci. 22, 438–444.Monserud, R.A., Sterba, H., 1999. Modeling individual tree mortality for Austrian
forest species. For. Ecol. Manage. 113, 109–123.Natural Regions Committee, 2006. Natural regions and subregions of Alberta.
Compiled by Downing, D.J., Pettapiece, W.W., Government of Alberta. Pub. No.T/852.
Newton, P.F., 2006. Asymptotic size–density relationships within self-thinningblack spruce and jack pine stand-types: parameter estimation and modelreformulation. For. Ecol. Manage. 226, 49–59.
Partel, M., Laanisto, L., Zobel, M., 2007. Contrasting plant productivity-diversityrelationships across latitude: the role of evolutionary history. Ecology 88, 1091–1097.
Peterson, E.B., Peterson, N.M., 1992. Ecology, management, and use of aspen andbalsam poplar in the Prairie Provinces. Can. For. Serv. North. Cent. Spec. Rep. 1,252 pp.
Pinno, B.D., Lieffers, V.J., Stadt, K.J., 2001. Measuring and modeling the crown andlight transmission characteristics of juvenile aspen. Can. J. For. Res. 31, 1930–1939.
Poage, N.J., Marshall, D.D., McClellan, M.H., 2007. Maximum stand density index of40 western Hemlock-Sitka spruce stands on southeast Alaska. West. J. Appl. For.22, 99–104.
Reineke, L.H., 1933. Perfecting a stand-density index for even-aged forests. J. Agri.Res. 46, 627–638.
Reyes-Hernandez, V., Comeau, P.G., Bokalo, M., 2013. Static and dynamic maximumsize–density relationships for mixed trembling aspen and white spruce standsin western Canada. For. Ecol. Manage. 289, 300–311.
SAS, 2010. Statistical Analysis System for windows, V 9.2. SAS-Institute, Inc., Cary,NC, USA.
Turner, M.G., Romme, W.H., Gardner, R.H., Hargrove, W.W., 1997. Effects of fire sizeand pattern on early succession in Yellowstone National Park. Ecol. Monogr. 67,411–433.
VanderSchaaf, C.L., 2010. Estimating individual stand size-density trajectories and amaximum size-density relationship species boundary line slope. For. Sci. 56 (4),327–335.
VanderSchaaf, C.L., Burkhart, H.E., 2007a. Using segmented regression to estimatestages and phases of stand development. For. Sci. 54 (2), 167–175.
VanderSchaaf, C.L., Burkhart, H.E., 2007b. Comparison of methods to estimateReineke’s maximum size–density relationship species boundary line slope. For.Sci. 53 (3), 435–442.
Waring, R.H., 1987. Characteristics of trees predisposed to die. Bioscience 37 (8),569–574.
Weber, P., Bugmann, P., Fonti, P., Rigling, A., 2008. Using a retrospective dynamiccompetition index to reconstruct forest succession. For. Ecol. Manage. 254, 96–106.
Weiner, J., 1990. Asymmetric competition in plant populations. Trends in Ecol. &Evol. 5, 360–364.
Weller, D.E., 1987. A reevaluation of the -3/2 power rule of plant self-thinning. Ecol.Monogr. 57 (1), 23–43.
Weller, D.E., 1990. Will the real self-thinning rule please stand-up? –a reply toOsawa and Sugita. Ecology 71 (3), 1204–1207.
Westoby, M., 1984. The self-thinning rule. Adv. Ecol. Res. 14, 167–225.Wunder, J., Bigler, C., Reineking, B., Fahse, L., Bugmann, H., 2006. Optimisation
of tree mortality models based on growth patterns. Ecol. Modell. 197, 196–206.
Yachi, S., Loreau, M., 2007. Does complementarity resource use enhance ecosystemfunctioning? A model of light competition in plan communities. Ecol. Lett. 10,54–62.
Yang, Y., Huang, S., 2013. A generalized mixed logistic model for predictingindividual tree survival probability with unequal measurement intervals. For.Sci. 59 (2), 177–187.
Yang, Y., Titus, S.J., Huang, S., 2003. Modeling individual tree mortality for whitespruce in Alberta. Ecol. Model. 163, 209–222.
Yao, X., Titus, S.J., MacDonald, S.E., 2001. A generalized logistic model of individualtree mortality for aspen, white spruce, and lodgepole pine in Albertamixedwood forests. Can. J. For. Res. 31 (2), 283–291.
probability of white spruce and trembling aspen in boreal pure and mixedg/10.1016/j.foreco.2014.03.010
Related Documents