POPULATION ECOLOGY - ORIGINAL PAPER Survival of female common eiders Somateria m. mollissima in a declining population of the northern Baltic Sea Martti Hario Marc J. Mazerolle Pertti Saurola Received: 20 February 2008 / Accepted: 8 December 2008 / Published online: 13 January 2009 Ó Springer-Verlag 2009 Abstract In long-lived species, adult survival is the population parameter having the highest elasticity, and therefore, it can be expected to be least affected by climatic variations. We studied the dynamics and survival of breeding female common eiders Somateria mollissima mollissima in the Baltic Sea from 1960 to 2007. Using nest censuses and capture–recapture methods, we investigated: (1) the annual apparent survival (u) of breeding females, (2) the survival-mediated population fluctuation, (3) weather effects on survival, and (4) long-term population trends. Based on capture histories of 6,393 females, aver- age u was 0.882 (95% confidence interval 0.864, 0.899). We found no relationship between population growth rate and survival. Furthermore, the highest ranking models, based on Akaike’s information criterion, indicated no effect of the North Atlantic Oscillation index on the u of eider females. Population size, assessed from nest counts, has been steadily declining since 1985. Despite the long time series (48 years), the overall variation in the u rates remained comparatively narrow, at maximum ranging only 10% between 2 consecutive years. Results imply that declining female survival is not the driving force behind the population decline, and we hypothesize that the overall poor fledging success and the consequent low recruitment explain the decreasing trend of nest densities since 1985. Keywords Adult female apparent survival Mark-recapture North Atlantic Oscillation Common eider Baltic Sea Introduction Seabirds are considered the paradigm of extreme K-selec- ted species with low reproductive rates and long life expectancies (Lack 1967; reviewed in Croxall and Rothery 1991). Their reproductive output is small, but is compen- sated for by high adult survival, leading to comparatively stable population development. The consistently high adult survival leaves few vacancies, and K-selected populations remain permanently close to the carrying capacity of their habitat. Like sea ducks in general, the common eider Somateria mollissima is thought to exhibit life history patterns typical of K-species (Goudie et al. 1994). Annual survival of adult birds has been fairly high, the average ranging from 0.85 to 0.95 in most studies published so far (see below). The reproductive rate, on the other hand, can be very low owing to frequent breeding failures (brood losses rather than low initial output in the form of small clutch size; Hario et al. 2005). Years with low reproduction may occur in succes- sion and, as a whole, may outnumber those with high reproduction. Thus, understanding population processes in the common eider requires long-term data, especially for Communicated by Peter Banks. M. Hario (&) Finnish Game and Fisheries Research Institute, So ¨derska ¨r Game Research Station, P.O. Box 2, 00791 Helsinki, Finland e-mail: martti.hario@rktl.fi M. J. Mazerolle Centre d’Etude de la Fore ˆt, Universite ´ du Que ´bec en Abitibi-Te ´miscamingue, 445 boulevard de l’Universite ´, Rouyn-Noranda, QC J9X 5E9, Canada P. Saurola Ringing Centre, Finnish Museum of Natural History, University of Helsinki, P.O. Box 17, 00014 Helsinki, Finland 123 Oecologia (2009) 159:747–756 DOI 10.1007/s00442-008-1265-x

Welcome message from author
This document is posted to help you gain knowledge. Please leave a comment to let me know what you think about it! Share it to your friends and learn new things together.
Transcript
POPULATION ECOLOGY - ORIGINAL PAPER
Survival of female common eiders Somateria m. mollissimain a declining population of the northern Baltic Sea
Martti Hario Æ Marc J. Mazerolle Æ Pertti Saurola
Received: 20 February 2008 / Accepted: 8 December 2008 / Published online: 13 January 2009
� Springer-Verlag 2009
Abstract In long-lived species, adult survival is the
population parameter having the highest elasticity, and
therefore, it can be expected to be least affected by climatic
variations. We studied the dynamics and survival of
breeding female common eiders Somateria mollissima
mollissima in the Baltic Sea from 1960 to 2007. Using nest
censuses and capture–recapture methods, we investigated:
(1) the annual apparent survival (u) of breeding females,
(2) the survival-mediated population fluctuation, (3)
weather effects on survival, and (4) long-term population
trends. Based on capture histories of 6,393 females, aver-
age u was 0.882 (95% confidence interval 0.864, 0.899).
We found no relationship between population growth rate
and survival. Furthermore, the highest ranking models,
based on Akaike’s information criterion, indicated no
effect of the North Atlantic Oscillation index on the u of
eider females. Population size, assessed from nest counts,
has been steadily declining since 1985. Despite the long
time series (48 years), the overall variation in the u rates
remained comparatively narrow, at maximum ranging only
10% between 2 consecutive years. Results imply that
declining female survival is not the driving force behind
the population decline, and we hypothesize that the overall
poor fledging success and the consequent low recruitment
explain the decreasing trend of nest densities since 1985.
Keywords Adult female apparent survival �Mark-recapture � North Atlantic Oscillation �Common eider � Baltic Sea
Introduction
Seabirds are considered the paradigm of extreme K-selec-
ted species with low reproductive rates and long life
expectancies (Lack 1967; reviewed in Croxall and Rothery
1991). Their reproductive output is small, but is compen-
sated for by high adult survival, leading to comparatively
stable population development. The consistently high adult
survival leaves few vacancies, and K-selected populations
remain permanently close to the carrying capacity of their
habitat.
Like sea ducks in general, the common eider Somateria
mollissima is thought to exhibit life history patterns typical
of K-species (Goudie et al. 1994). Annual survival of adult
birds has been fairly high, the average ranging from 0.85 to
0.95 in most studies published so far (see below). The
reproductive rate, on the other hand, can be very low owing
to frequent breeding failures (brood losses rather than low
initial output in the form of small clutch size; Hario et al.
2005). Years with low reproduction may occur in succes-
sion and, as a whole, may outnumber those with high
reproduction. Thus, understanding population processes in
the common eider requires long-term data, especially for
Communicated by Peter Banks.
M. Hario (&)
Finnish Game and Fisheries Research Institute,
Soderskar Game Research Station,
P.O. Box 2, 00791 Helsinki, Finland
e-mail: [email protected]
M. J. Mazerolle
Centre d’Etude de la Foret,
Universite du Quebec en Abitibi-Temiscamingue,
445 boulevard de l’Universite, Rouyn-Noranda,
QC J9X 5E9, Canada
P. Saurola
Ringing Centre, Finnish Museum of Natural History,
University of Helsinki, P.O. Box 17, 00014 Helsinki, Finland
123
Oecologia (2009) 159:747–756
DOI 10.1007/s00442-008-1265-x
studies examining the role of survival in population regu-
lation and carrying capacity of the habitat. As rates of
reproduction vary around a low average, population growth
rates are believed to be most sensitive to changes in adult
survival (Goudie et al. 1994; Wilson et al. 2007). Yet,
despite its importance, the impact of adult survival on
population growth rate has seldom been reported in long-
term eider data sets (but see Coulson 1984; Kats et al.
2007).
In this paper, we explore population processes in a 48-
year data set of common eiders from a discrete population
in the Baltic Sea. We have previously shown that fledgling
production is the trait bearing the highest population
regulatory effect among the breeding parameters of this
population and found significant direct density dependence
(Hario and Rintala 2006). Here, we aim to investigate the
role of adult female survival in population dynamics, and
whether or not survival responds to large-scale climatic
variations. The climatic variable chosen here was the well-
studied North Atlantic Oscillation (NAO) index. This index
is based on the winter (December–March) difference
between the normalized sea level pressure between Lisbon,
Portugal, and Reykjavik, Iceland. Positive values of the
index reflect stronger than average west winds over the
middle latitudes resulting in milder winter temperatures
than normally encountered, whereas negative ones indicate
colder winter conditions. The NAO captures a large part of
the interannual variation in the climate of the northern
Atlantic and adjoining landmasses (Hurrell et al. 2003). We
expect that NAO measures weather conditions that possibly
affect seabirds’ survival rates, either directly (e.g., severe
weather causing seabird ‘‘wrecks’’) or indirectly (e.g.,
anomalies in food acquisition lead to lowering body con-
dition and lowering resistance against secondary
pathogens; Harvell et al. 1999; Friend et al. 2001).
Our study population is part of the large Baltic/Wadden
Sea flyway population, reportedly having declined from ca
1.2 million individuals in 1991 to ca. 760,000 in 2000, a
36% reduction in 10 years (Desholm et al. 2002). This is a
big change in an environment that is comparatively stable
with no catastrophically massive changes in food avail-
ability for seabirds, like those brought about by extreme El
Nino events in the Pacific (e.g., Oedekoven et al. 2001).
Yet, climatic factors in the Atlantic influence several
oceanographic and ecological parameters in the Baltic Sea
(Hanninen et al. 2000), although these changes progress
slowly and become visible only gradually (such as the
effects of the eutrophication; Ronka et al. 2005).
The reasons behind the population decline are so far
only speculative (Desholm et al. 2002). Pinpointing crucial
factors is hampered by the absence of information on the
mechanism of the eider decline, whether due to increasing
mortality or decreasing natality. Emigration can be ruled
out as a factor, because there has been no evidence of
large-scale movements of female eiders out from the
Baltic/Wadden Sea area (Desholm et al. 2002). The bulk of
this population breeds in Finland, Sweden, and Estonia,
and overwinters in the Danish Straits, 1,000 km southwest
from the core breeding areas (Noer 1991). No long-term
documentation of basic dynamic parameters has yet been
published for this population. Here, we make the first
attempt to document survival rates from extensive mark-
recapture data of Baltic common eiders and assess long-
term population trends.
Materials and methods
Study area
The fieldwork was conducted at the Soderskar Game
Research Station, central Gulf of Finland (60�070N,
25�250E), northern Baltic Sea. Soderskar archipelago is a
bird sanctuary consisting of 25 islands and islets. Most of
them are small rocky skerries with patchy grassy vegeta-
tion, averaging 1.14 ha in size. The larger ones, averaging
3.35 ha, have dense juniper Juniperus communis cover and
small stands of aspen Populus tremula and Norway spruce
Picea abies. The total land area of the study islands
amounts to approximately 0.5 km2, and water area of the
whole sanctuary amounts to 13.3 km2 (for detailed
description, see Hario and Selin 1988). The sanctuary is
closed to the general public from May to August, and, due
to active management, there are no mammalian predators
or raptors present during the eiders’ breeding period. The
only nest predators are hooded crows Corvus corone
cornix, but they prey upon single eggs during egg laying,
not entire clutches, and their numbers have always
remained limited (from three to five pairs in the entire
sanctuary) due to the territorial behavior of the species. In
the event of partial nest losses (e.g., single eggs lost to
crows), eider females select another nest cup where they
will continue laying; they do not leave the area or give up
laying (personal observations). Partial nest losses cannot
create confounded patterns to the encounter probabilities in
our recapture data.
Nest abundance
As a measure of population size, we used the annual
number of active nests (nest abundance). Being a capital
breeder (sensu Drent and Daan 1980), the common eider
produces only one clutch in a given year. Thus, the number
of active nests becomes a measure of density, as the size of
the study area was the same every year. Furthermore, all
the islets were searched thoroughly once or twice to locate
748 Oecologia (2009) 159:747–756
123
all the nests each year. As the islands are small and the total
land area is only 0.5 km2, it is relatively easy to find all the
nests, even in the juniper cover. The fieldwork has been
conducted by the same people for more than 30 years (and
by their predecessors for nearly 20 years). During surveys,
nests were always covered with down after the females had
been flushed. In this report, we use the nest abundance data
from 1960 to 2007.
Eider capture–recapture
Female eiders were captured and ringed, or recaptured on
their nests during a 2-week period in May and June each
year from 1960 to 2007 using a long-handled dipnet.
Capture was conducted during the nest count, starting not
earlier than at day 20 of population incubation (median
date). The median incubation date was known from direct
observations at nests of a plot studied intensively (for
additional details, see Hario and Selin 1988). We chose to
undertake our study at least 20 days into the incubation
period in order to minimize the possibility of nest desertion
(sensu Laurila and Hario 1988). Median date of the 20th
incubation day was 21 May for our study period, ranging
24 days (11 May–4 June). Timing of breeding varied
between years according to the ice disappearance (median
date of ice disappearance was 15 April from 1960 to 2007,
range 39 days). Female eiders on the northern breeding
grounds do not start laying until the ice connection to the
mainland has broken up (Hario and Selin 1988). During
this study, we only sampled breeding females (i.e., those at
nests) because there was no logistically feasible way to
catch the non-nesting portion of the population (i.e.,
prospecting immatures). As a result, our study focuses on
the population of genuine female breeders.
Once recruited, the females seem to be faithful to the
same breeding islet for years (only three out of 255 females
controlled at nests in adjacent archipelagos within
10–20 km had previously nested at Soderskar; M. Hario,
and K. Selin, unpublished data). The mean annual capture
success was 52.9% for incubating females [median 53.3%,
SE = 1.84; 95% confidence interval (CI): 56.6, 49.2)] The
range of variation is fairly small except for the 1960s (95%
CI: 69.2, 44.7, mean 57.0%), when the population was still
scarce. The retrieval of individuals might have been better
in those early days.
Modeling density and climatic effects on survival
We used mark-recapture models to investigate density
dependence and weather effects on the annual apparent
survival (u) of eiders. Adopting an information-theoretic
approach (Burnham and Anderson 2002), we formulated a
number of candidate models (see specific hypotheses
below). Some included the annual number of nests (nest
abundance, standardized by subtracting the mean and
dividing by SD) as a covariate influencing the u of eiders,
to evaluate density dependence. Because weather variables
can influence life history traits in animals (e.g., Sandvik
et al. 2005; Stenseth and Mysterud 2005), other models
also included the NAO index (Hurrell 2006). We consid-
ered the annual NAO index corresponding to survival of
the same year, as well as with the survival 1, 2, 3, and
4 years later (i.e., lags 1–4 year). We limited our investi-
gation to lags of 4 years because climate conditions beyond
this time frame were presumably less likely to influence
eider survival. Values of the covariates were entered
directly in the design matrix and all models were computed
using program MARK 5.1 (White and Burnham 1999).
We started by searching for a suitable general model
from which we would build our set of candidate models.
We fit the Cormack–Jolly–Seber (CJS) model to our data,
but goodness-of-fit tests suggested substantial lack-of-fit
(Release test 2 ? test 3, v2 = 1,941.83, df = 373,
P \ 0.0001; U-CARE tests 2.Cl ? 2.Ct ? 3.Sm ? 3.Sr,
v2 = 2,428.54, df = 490, P \ 0.0001). Test 2.Ct indicated
strong deviations from expected values (v2 = 696.36,
df = 45, P \ 0.0001). Though this test was originally
designed to detect immediate trap response, it can also
indicate Markovian or non-random temporary emigration
(Pradel 1993; Schaub et al. 2004; Choquet et al. 2005).
In our data set, female eiders were captured during a
single period each year and encounters of some individuals
were separated by 1–20 years. Because this pattern can be
due to temporary emigration or deferred breeding, we
attempted to alleviate this problem by removing outliers
(individuals that remained undetected for 2 years or more),
but this only marginally improved fit. Though Pollock’s
robust design (e.g., Pollock et al. 1990; Williams et al.
2002) allows one to directly estimate emigration, we could
not use this method because the data had not been collected
in this framework. As a result, we opted for the approach
suggested by Pradel (1993), which consists of creating, for
a given individual, as many encounter histories as there are
events of capture for the same individual. This is achieved
by deleting the individual from the sample following its
second capture, treating it as a removal, and then creating a
new encounter history starting with the occasion of this
capture. These steps are repeated for each capture until we
reach the end of the original encounter history. Each new
encounter history has, at the most, two encounters per
history. In essence, this conversion results in transforming
‘‘time elapsed since previous capture’’ in the original data
set into ‘‘time elapsed since marking’’ in the new data set.
To automate this process, one can either use a small
program (cnv2pradel.exe) developed by J. E. Hines
(USGS Patuxent Wildlife Research Center, Laurel, Md.) or
Oecologia (2009) 159:747–756 749
123
U-CARE 2.2 (Choquet et al. 2005). Once all original
encounter histories were converted as above, we fit a general
model with time-dependent u and different capture proba-
bilities (p and p0) for periods that did and did not follow a
capture, respectively. This model, which we denote as
utpm(t?t) (notation sensu Lebreton et al. 1992), had additive
time and trap effects on capture and corresponds to model
ITEC? of Pradel (1993). A likelihood-ratio test between
model ITEC? and CJS indicated the presence of trap
dependence (v2 = 693.288, df = 1, P \ 0.0001).
We could not implement typical goodness-of-fit
approaches such as the parametric bootstrap or median
variance inflection factor (c) to assess the fit of our
models because Program MARK excludes losses on
captures, whereas our data were coded with a large
number of removals (see Pradel 1993 conversion above).
As a surrogate, we computed a goodness-of-fit test based
on the Release v2 for the CJS model of the full data set
(original capture histories), and on the likelihood-ratio test
(v2) between models ITEC? and CJS for the coded
encounter histories. Here, the test suggested substantial
overdispersion (v2 = 1,394.1154, df = 372, P \ 0.001)
with a cð Þ of 3.75. Burnham and Anderson (2002, p. 68)
advise that we should expect c\4 from models that are
appropriate for the data. As a further check, we compared
the results with different increments of c to assess the
consistency of model ranking and its effect on our
conclusions.
From our general model utpm(t?t) (ITEC?), we
developed a set of candidate models to test the following
eight hypotheses: (1) constant survival, (2) time-depen-
dent survival, (3) linear relationship of survival on nest
abundance, (4) linear relationship of survival on the NAO
index, (5) linear relationship of survival on the NAO
index lagged by 1 year, (6) linear relationship of survival
on the NAO index lagged by 2 years, (7) linear rela-
tionship of survival on the NAO index lagged by 3 years,
and (8) linear relationship of survival on the NAO index
lagged by 4 years. For each hypothesis, we applied each
of the following constraints on p: (1) both capture prob-
abilities held constant (p for periods following a capture
and p0 for periods that did not); (2) both capture proba-
bilities time dependent; (3) constant capture probability of
eiders in periods following an encounter, time-dependent
capture of eiders in periods not following an encounter;
(4) time-dependent capture probability following an
encounter, constant probability of capture not following
an encounter. This yielded a total of 32 candidate models
(8 survival hypotheses 9 4 types of constraints on p). We
proceeded with the quasi Akaike’s information criterion
corrected for small sample sizes (AICc) to rank our can-
didate model set and adjusted the SEs of the estimates byffiffiffi
cp
(Burnham and Anderson 2002).
Population trends and climatic effects
on nest abundance
We analyzed the long-term nest data using regressions with
autoregressive errors from the gls function of program R
(Ihaka and Gentleman 1996; Pinheiro and Bates 2000). The
first analysis consisted of assessing the trends across years.
Nest abundance was natural log transformed prior to ana-
lyzes to homogenize variances. Inspection of the partial
autocorrelation plot suggested an autoregressive process of
order 1 (i.e., nest abundance at a given year depended on
the nest abundance the year before). Plots of residuals
(quantile–quantile plots, residuals vs. fitted values) indi-
cated good model fit.
In a second analysis, we investigated the effects of the
NAO index at lags of 0–4 years on the log number of
nests with regressions for correlated errors (as defined
above). Here again, we inspected the residual plots to
ensure that the assumptions were met and the fit was
adequate. Given that it is inappropriate to compare time
series models with different fixed effects (here, the NAO
index at different lags), we could not rank the autore-
gressive models among each other using the AICc
(Pinheiro and Bates 2000).
Finally, we used regressions with autoregressive errors
to assess the effect of female eider survival (estimated from
mark-recapture analyzes described above) on the popula-
tion growth rate of the same year. Here, we defined the
population growth rate as the logarithmic change in the
nest abundance from year t to t ? 1. It is worth noting that
growth rate is assigned to the year t, not t ? 1. Thus,
growth rate of a given year is plotted against the survival of
the same period. As our population shows long-term trends
(first increase, then decrease), we may expect a positive
relationship between density and survival. We explored to
what extent this holds, i.e., whether survival bears a
demonstrable effect on population trends.
Results
Annual apparent survival
A total of 6,393 females were captured and marked during
this study from 1960 to 2007. Given the data and the set of
candidate models, model utpm(t?t) (ITEC?) had virtually
all the support as being the most parsimonious, with an
Akaike weight of 0.92 after applying the variance inflation
factor of 3.75. Model ranking remained the same for values
of c from 1 to 3.75 with model utpm(t?t) consistently having
Akaike weights [0.92. The evidence ratio (ER) between
Akaike weights of model utpm(t?t) and the second-ranked
model [uNAO lag3pm(t?t)] was 17 for c ¼ 3:75; and this
750 Oecologia (2009) 159:747–756
123
value increased markedly with lower values of c (e.g., with
c ¼ 3:5; ER = 499; with c ¼ 3:25; ER = 24998). Thus,
we based our inference on model utpm(t?t) (sensu Burnham
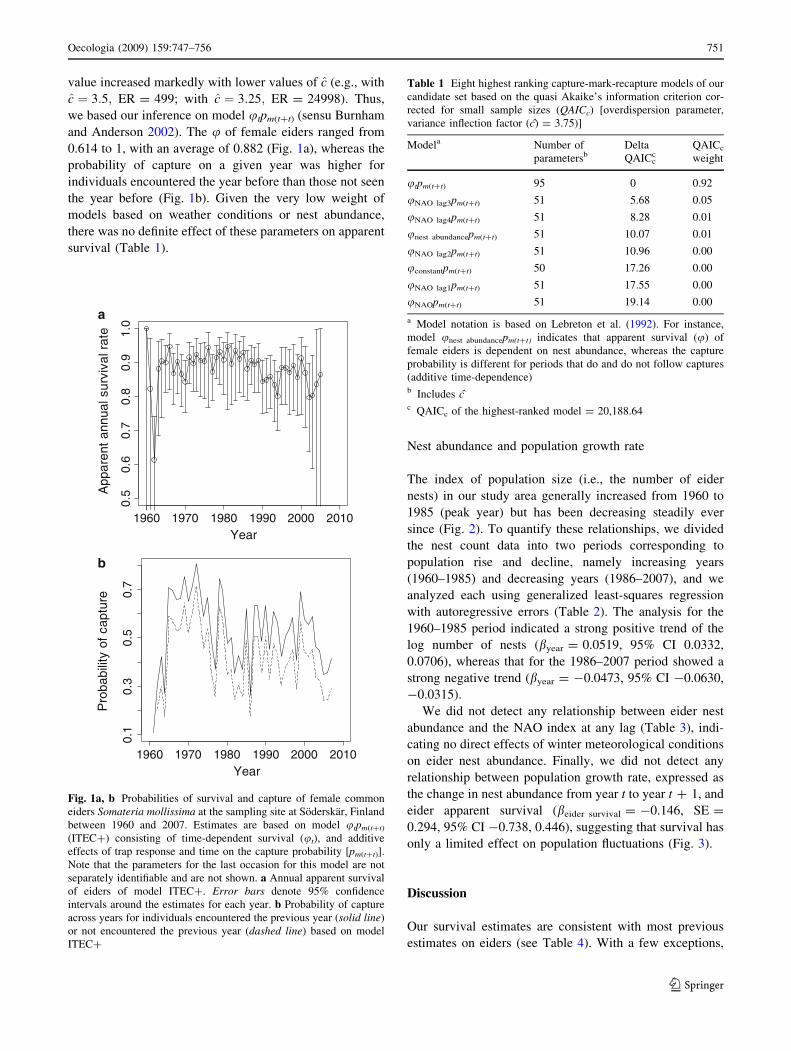
and Anderson 2002). The u of female eiders ranged from
0.614 to 1, with an average of 0.882 (Fig. 1a), whereas the
probability of capture on a given year was higher for
individuals encountered the year before than those not seen
the year before (Fig. 1b). Given the very low weight of
models based on weather conditions or nest abundance,
there was no definite effect of these parameters on apparent
survival (Table 1).
Nest abundance and population growth rate
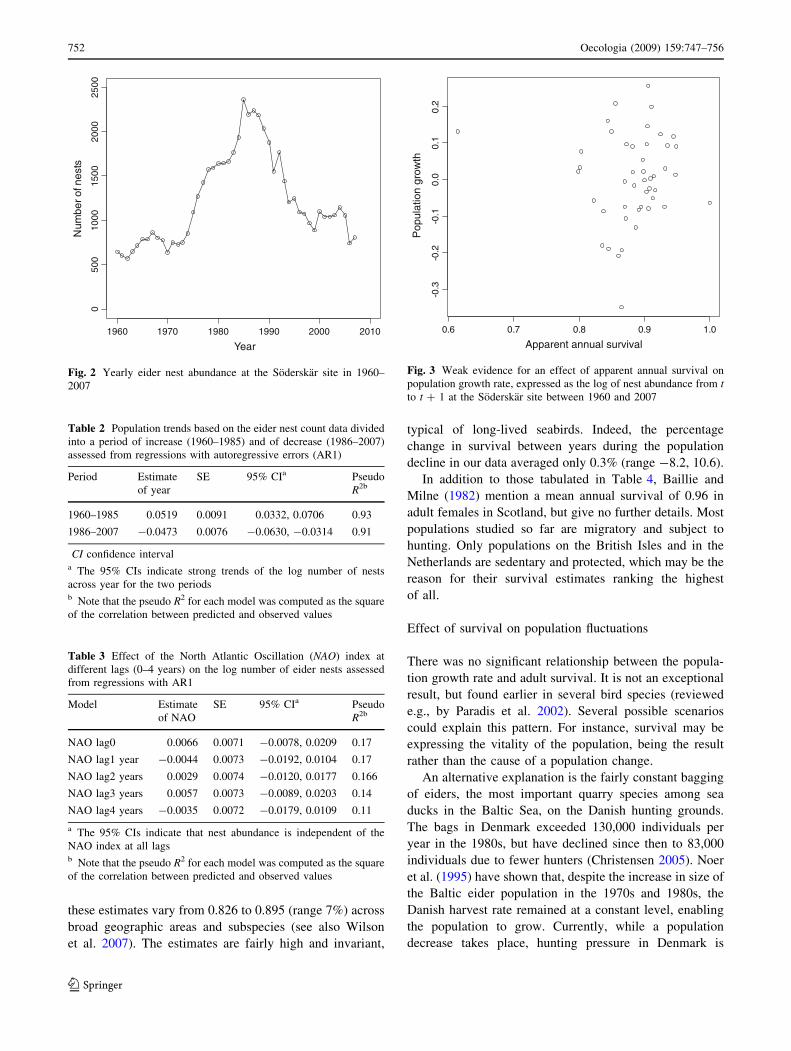
The index of population size (i.e., the number of eider
nests) in our study area generally increased from 1960 to
1985 (peak year) but has been decreasing steadily ever
since (Fig. 2). To quantify these relationships, we divided
the nest count data into two periods corresponding to
population rise and decline, namely increasing years
(1960–1985) and decreasing years (1986–2007), and we
analyzed each using generalized least-squares regression
with autoregressive errors (Table 2). The analysis for the
1960–1985 period indicated a strong positive trend of the
log number of nests (byear = 0.0519, 95% CI 0.0332,
0.0706), whereas that for the 1986–2007 period showed a
strong negative trend (byear = -0.0473, 95% CI -0.0630,
-0.0315).
We did not detect any relationship between eider nest
abundance and the NAO index at any lag (Table 3), indi-
cating no direct effects of winter meteorological conditions
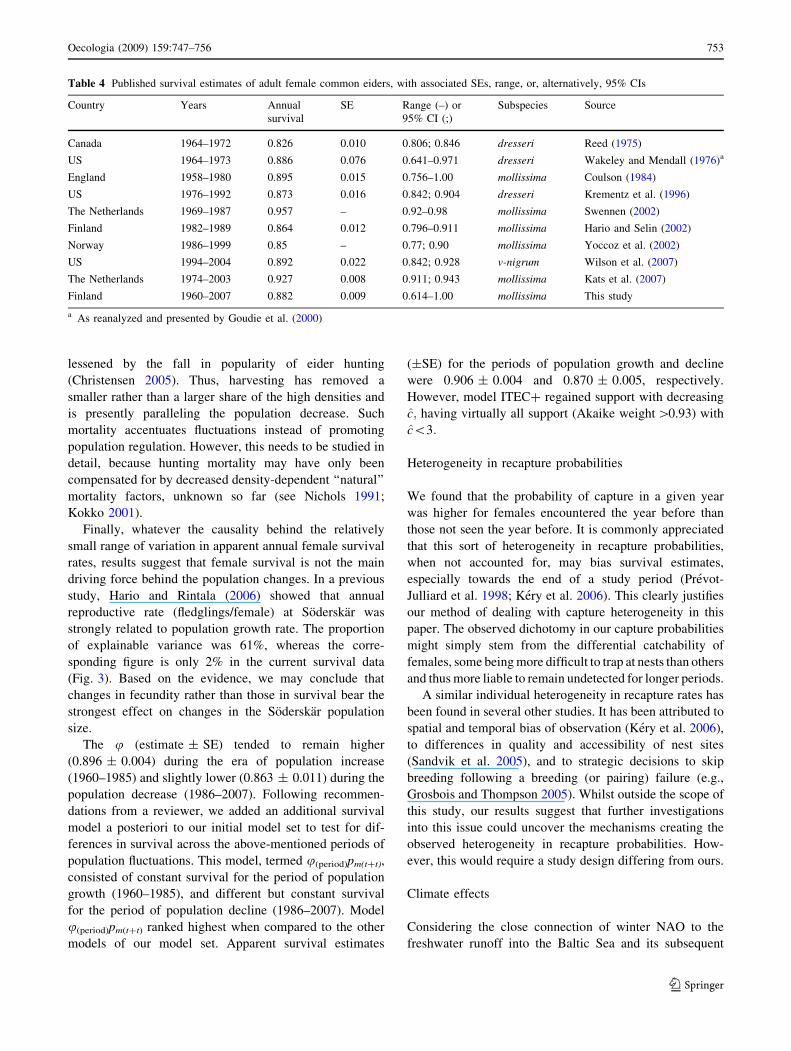
on eider nest abundance. Finally, we did not detect any
relationship between population growth rate, expressed as
the change in nest abundance from year t to year t ? 1, and
eider apparent survival (beider survival = -0.146, SE =
0.294, 95% CI -0.738, 0.446), suggesting that survival has
only a limited effect on population fluctuations (Fig. 3).
Discussion
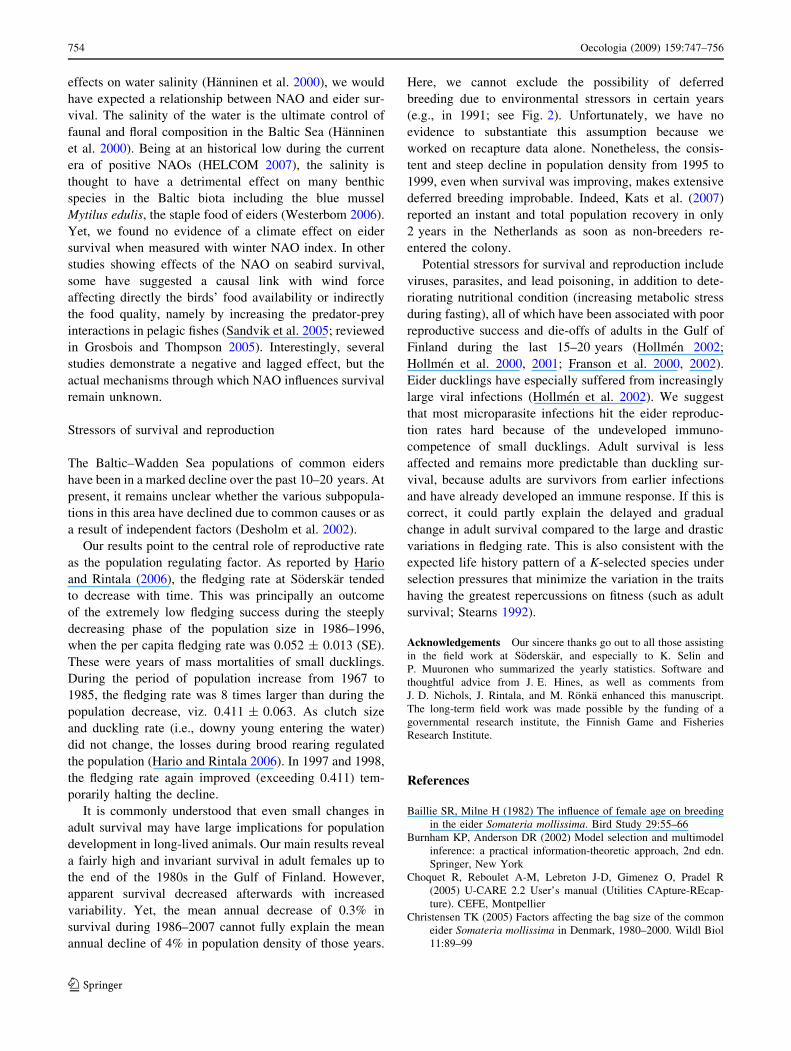
Our survival estimates are consistent with most previous
estimates on eiders (see Table 4). With a few exceptions,
1960 1970 1980 1990 2000 2010
0.5
0.6
0.7
0.8
0.9
1.0
Year
App
aren
t an
nual
sur
viva
l rat
e
1960 1970 1980 1990 2000 2010
0.1
0.3
0.5
0.7
Year
Pro
babi
lity
of c
aptu
re
a
b
Fig. 1a, b Probabilities of survival and capture of female common
eiders Somateria mollissima at the sampling site at Soderskar, Finland
between 1960 and 2007. Estimates are based on model utpm(t?t)
(ITEC?) consisting of time-dependent survival (ut), and additive
effects of trap response and time on the capture probability [pm(t?t)].
Note that the parameters for the last occasion for this model are not
separately identifiable and are not shown. a Annual apparent survival
of eiders of model ITEC?. Error bars denote 95% confidence
intervals around the estimates for each year. b Probability of capture
across years for individuals encountered the previous year (solid line)
or not encountered the previous year (dashed line) based on model
ITEC?
Table 1 Eight highest ranking capture-mark-recapture models of our
candidate set based on the quasi Akaike’s information criterion cor-
rected for small sample sizes (QAICc) [overdispersion parameter,
variance inflection factor (c) = 3.75)]
Modela Number of
parametersbDelta
QAICcc
QAICc
weight
utpm(t?t) 95 0 0.92
uNAO lag3pm(t?t) 51 5.68 0.05
uNAO lag4pm(t?t) 51 8.28 0.01
unest abundancepm(t?t) 51 10.07 0.01
uNAO lag2pm(t?t) 51 10.96 0.00
uconstantpm(t?t) 50 17.26 0.00
uNAO lag1pm(t?t) 51 17.55 0.00
uNAOpm(t?t) 51 19.14 0.00
a Model notation is based on Lebreton et al. (1992). For instance,
model unest abundancepm(t?t) indicates that apparent survival (u) of
female eiders is dependent on nest abundance, whereas the capture
probability is different for periods that do and do not follow captures
(additive time-dependence)b Includes cc QAICc of the highest-ranked model = 20,188.64
Oecologia (2009) 159:747–756 751
123
these estimates vary from 0.826 to 0.895 (range 7%) across
broad geographic areas and subspecies (see also Wilson
et al. 2007). The estimates are fairly high and invariant,
typical of long-lived seabirds. Indeed, the percentage
change in survival between years during the population
decline in our data averaged only 0.3% (range -8.2, 10.6).
In addition to those tabulated in Table 4, Baillie and
Milne (1982) mention a mean annual survival of 0.96 in
adult females in Scotland, but give no further details. Most
populations studied so far are migratory and subject to
hunting. Only populations on the British Isles and in the
Netherlands are sedentary and protected, which may be the
reason for their survival estimates ranking the highest
of all.
Effect of survival on population fluctuations
There was no significant relationship between the popula-
tion growth rate and adult survival. It is not an exceptional
result, but found earlier in several bird species (reviewed
e.g., by Paradis et al. 2002). Several possible scenarios
could explain this pattern. For instance, survival may be
expressing the vitality of the population, being the result
rather than the cause of a population change.
An alternative explanation is the fairly constant bagging
of eiders, the most important quarry species among sea
ducks in the Baltic Sea, on the Danish hunting grounds.
The bags in Denmark exceeded 130,000 individuals per
year in the 1980s, but have declined since then to 83,000
individuals due to fewer hunters (Christensen 2005). Noer
et al. (1995) have shown that, despite the increase in size of
the Baltic eider population in the 1970s and 1980s, the
Danish harvest rate remained at a constant level, enabling
the population to grow. Currently, while a population
decrease takes place, hunting pressure in Denmark is
1960 1970 1980 1990 2000 2010
050
010
0015
0020
0025
00
Year
Num
ber o
f nes
ts
Fig. 2 Yearly eider nest abundance at the Soderskar site in 1960–
2007
Table 2 Population trends based on the eider nest count data divided
into a period of increase (1960–1985) and of decrease (1986–2007)
assessed from regressions with autoregressive errors (AR1)
Period Estimate
of year
SE 95% CIa Pseudo
R2b
1960–1985 0.0519 0.0091 0.0332, 0.0706 0.93
1986–2007 -0.0473 0.0076 -0.0630, -0.0314 0.91
CI confidence intervala The 95% CIs indicate strong trends of the log number of nests
across year for the two periodsb Note that the pseudo R2 for each model was computed as the square
of the correlation between predicted and observed values
Table 3 Effect of the North Atlantic Oscillation (NAO) index at
different lags (0–4 years) on the log number of eider nests assessed
from regressions with AR1
Model Estimate
of NAO
SE 95% CIa Pseudo
R2b
NAO lag0 0.0066 0.0071 -0.0078, 0.0209 0.17
NAO lag1 year -0.0044 0.0073 -0.0192, 0.0104 0.17
NAO lag2 years 0.0029 0.0074 -0.0120, 0.0177 0.166
NAO lag3 years 0.0057 0.0073 -0.0089, 0.0203 0.14
NAO lag4 years -0.0035 0.0072 -0.0179, 0.0109 0.11
a The 95% CIs indicate that nest abundance is independent of the
NAO index at all lagsb Note that the pseudo R2 for each model was computed as the square
of the correlation between predicted and observed values
0.6 0.7 0.8 0.9 1.0
-0.3
-0.2
-0.1
0.0
0.1
0.2
Apparent annual survival
Pop
ulat
ion
grow
th
Fig. 3 Weak evidence for an effect of apparent annual survival on
population growth rate, expressed as the log of nest abundance from tto t ? 1 at the Soderskar site between 1960 and 2007
752 Oecologia (2009) 159:747–756
123
lessened by the fall in popularity of eider hunting
(Christensen 2005). Thus, harvesting has removed a
smaller rather than a larger share of the high densities and
is presently paralleling the population decrease. Such
mortality accentuates fluctuations instead of promoting
population regulation. However, this needs to be studied in
detail, because hunting mortality may have only been
compensated for by decreased density-dependent ‘‘natural’’
mortality factors, unknown so far (see Nichols 1991;
Kokko 2001).
Finally, whatever the causality behind the relatively
small range of variation in apparent annual female survival
rates, results suggest that female survival is not the main
driving force behind the population changes. In a previous
study, Hario and Rintala (2006) showed that annual
reproductive rate (fledglings/female) at Soderskar was
strongly related to population growth rate. The proportion
of explainable variance was 61%, whereas the corre-
sponding figure is only 2% in the current survival data
(Fig. 3). Based on the evidence, we may conclude that
changes in fecundity rather than those in survival bear the
strongest effect on changes in the Soderskar population
size.
The u (estimate ± SE) tended to remain higher
(0.896 ± 0.004) during the era of population increase
(1960–1985) and slightly lower (0.863 ± 0.011) during the
population decrease (1986–2007). Following recommen-
dations from a reviewer, we added an additional survival
model a posteriori to our initial model set to test for dif-
ferences in survival across the above-mentioned periods of
population fluctuations. This model, termed u(period)pm(t?t),
consisted of constant survival for the period of population
growth (1960–1985), and different but constant survival
for the period of population decline (1986–2007). Model
u(period)pm(t?t) ranked highest when compared to the other
models of our model set. Apparent survival estimates
(±SE) for the periods of population growth and decline
were 0.906 ± 0.004 and 0.870 ± 0.005, respectively.
However, model ITEC? regained support with decreasing
c; having virtually all support (Akaike weight [0.93) with
c\3:
Heterogeneity in recapture probabilities
We found that the probability of capture in a given year
was higher for females encountered the year before than
those not seen the year before. It is commonly appreciated
that this sort of heterogeneity in recapture probabilities,
when not accounted for, may bias survival estimates,
especially towards the end of a study period (Prevot-
Julliard et al. 1998; Kery et al. 2006). This clearly justifies
our method of dealing with capture heterogeneity in this
paper. The observed dichotomy in our capture probabilities
might simply stem from the differential catchability of
females, some being more difficult to trap at nests than others
and thus more liable to remain undetected for longer periods.
A similar individual heterogeneity in recapture rates has
been found in several other studies. It has been attributed to
spatial and temporal bias of observation (Kery et al. 2006),
to differences in quality and accessibility of nest sites
(Sandvik et al. 2005), and to strategic decisions to skip
breeding following a breeding (or pairing) failure (e.g.,
Grosbois and Thompson 2005). Whilst outside the scope of
this study, our results suggest that further investigations
into this issue could uncover the mechanisms creating the
observed heterogeneity in recapture probabilities. How-
ever, this would require a study design differing from ours.
Climate effects
Considering the close connection of winter NAO to the
freshwater runoff into the Baltic Sea and its subsequent
Table 4 Published survival estimates of adult female common eiders, with associated SEs, range, or, alternatively, 95% CIs
Country Years Annual
survival
SE Range (–) or
95% CI (;)
Subspecies Source
Canada 1964–1972 0.826 0.010 0.806; 0.846 dresseri Reed (1975)
US 1964–1973 0.886 0.076 0.641–0.971 dresseri Wakeley and Mendall (1976)a
England 1958–1980 0.895 0.015 0.756–1.00 mollissima Coulson (1984)
US 1976–1992 0.873 0.016 0.842; 0.904 dresseri Krementz et al. (1996)
The Netherlands 1969–1987 0.957 – 0.92–0.98 mollissima Swennen (2002)
Finland 1982–1989 0.864 0.012 0.796–0.911 mollissima Hario and Selin (2002)
Norway 1986–1999 0.85 – 0.77; 0.90 mollissima Yoccoz et al. (2002)
US 1994–2004 0.892 0.022 0.842; 0.928 v-nigrum Wilson et al. (2007)
The Netherlands 1974–2003 0.927 0.008 0.911; 0.943 mollissima Kats et al. (2007)
Finland 1960–2007 0.882 0.009 0.614–1.00 mollissima This study
a As reanalyzed and presented by Goudie et al. (2000)
Oecologia (2009) 159:747–756 753
123
effects on water salinity (Hanninen et al. 2000), we would
have expected a relationship between NAO and eider sur-
vival. The salinity of the water is the ultimate control of
faunal and floral composition in the Baltic Sea (Hanninen
et al. 2000). Being at an historical low during the current
era of positive NAOs (HELCOM 2007), the salinity is
thought to have a detrimental effect on many benthic
species in the Baltic biota including the blue mussel
Mytilus edulis, the staple food of eiders (Westerbom 2006).
Yet, we found no evidence of a climate effect on eider
survival when measured with winter NAO index. In other
studies showing effects of the NAO on seabird survival,
some have suggested a causal link with wind force
affecting directly the birds’ food availability or indirectly
the food quality, namely by increasing the predator-prey
interactions in pelagic fishes (Sandvik et al. 2005; reviewed
in Grosbois and Thompson 2005). Interestingly, several
studies demonstrate a negative and lagged effect, but the
actual mechanisms through which NAO influences survival
remain unknown.
Stressors of survival and reproduction
The Baltic–Wadden Sea populations of common eiders
have been in a marked decline over the past 10–20 years. At
present, it remains unclear whether the various subpopula-
tions in this area have declined due to common causes or as
a result of independent factors (Desholm et al. 2002).
Our results point to the central role of reproductive rate
as the population regulating factor. As reported by Hario
and Rintala (2006), the fledging rate at Soderskar tended
to decrease with time. This was principally an outcome
of the extremely low fledging success during the steeply
decreasing phase of the population size in 1986–1996,
when the per capita fledging rate was 0.052 ± 0.013 (SE).
These were years of mass mortalities of small ducklings.
During the period of population increase from 1967 to
1985, the fledging rate was 8 times larger than during the
population decrease, viz. 0.411 ± 0.063. As clutch size
and duckling rate (i.e., downy young entering the water)
did not change, the losses during brood rearing regulated
the population (Hario and Rintala 2006). In 1997 and 1998,
the fledging rate again improved (exceeding 0.411) tem-
porarily halting the decline.
It is commonly understood that even small changes in
adult survival may have large implications for population
development in long-lived animals. Our main results reveal
a fairly high and invariant survival in adult females up to
the end of the 1980s in the Gulf of Finland. However,
apparent survival decreased afterwards with increased
variability. Yet, the mean annual decrease of 0.3% in
survival during 1986–2007 cannot fully explain the mean
annual decline of 4% in population density of those years.
Here, we cannot exclude the possibility of deferred
breeding due to environmental stressors in certain years
(e.g., in 1991; see Fig. 2). Unfortunately, we have no
evidence to substantiate this assumption because we
worked on recapture data alone. Nonetheless, the consis-
tent and steep decline in population density from 1995 to
1999, even when survival was improving, makes extensive
deferred breeding improbable. Indeed, Kats et al. (2007)
reported an instant and total population recovery in only
2 years in the Netherlands as soon as non-breeders re-
entered the colony.
Potential stressors for survival and reproduction include
viruses, parasites, and lead poisoning, in addition to dete-
riorating nutritional condition (increasing metabolic stress
during fasting), all of which have been associated with poor
reproductive success and die-offs of adults in the Gulf of
Finland during the last 15–20 years (Hollmen 2002;
Hollmen et al. 2000, 2001; Franson et al. 2000, 2002).
Eider ducklings have especially suffered from increasingly
large viral infections (Hollmen et al. 2002). We suggest
that most microparasite infections hit the eider reproduc-
tion rates hard because of the undeveloped immuno-
competence of small ducklings. Adult survival is less
affected and remains more predictable than duckling sur-
vival, because adults are survivors from earlier infections
and have already developed an immune response. If this is
correct, it could partly explain the delayed and gradual
change in adult survival compared to the large and drastic
variations in fledging rate. This is also consistent with the
expected life history pattern of a K-selected species under
selection pressures that minimize the variation in the traits
having the greatest repercussions on fitness (such as adult
survival; Stearns 1992).
Acknowledgements Our sincere thanks go out to all those assisting
in the field work at Soderskar, and especially to K. Selin and
P. Muuronen who summarized the yearly statistics. Software and
thoughtful advice from J. E. Hines, as well as comments from
J. D. Nichols, J. Rintala, and M. Ronka enhanced this manuscript.
The long-term field work was made possible by the funding of a
governmental research institute, the Finnish Game and Fisheries
Research Institute.
References
Baillie SR, Milne H (1982) The influence of female age on breeding
in the eider Somateria mollissima. Bird Study 29:55–66
Burnham KP, Anderson DR (2002) Model selection and multimodel
inference: a practical information-theoretic approach, 2nd edn.
Springer, New York
Choquet R, Reboulet A-M, Lebreton J-D, Gimenez O, Pradel R
(2005) U-CARE 2.2 User’s manual (Utilities CApture-REcap-
ture). CEFE, Montpellier
Christensen TK (2005) Factors affecting the bag size of the common
eider Somateria mollissima in Denmark, 1980–2000. Wildl Biol
11:89–99
754 Oecologia (2009) 159:747–756
123

Coulson JC (1984) The population dynamics of the eider duck
Somateria mollissima and evidence of extensive non-breeding by
adult ducks. Ibis 126:525–543
Croxall JP, Rothery P (1991) Population regulation of seabirds:
implications of their demography for conservation. In: Perrins
CM, Lebreton J-D, Hirons GJM (eds) Bird population studies.
Oxford University Press, Oxford, pp 272–296
Desholm M, Christensen TK, Scheiffarth G, Hario M, Andersson A,
Ens B, Camphuisen CJ, Nilsson L, Waltho CM, Lorentsen S-H,
Kuresoo A, Kats RKH, Fleet DM, Fox AD (2002) Status of the
Baltic/Wadden Sea population of the common eider Somateriam. mollissima. Wildfowl 53:167–203
Drent RH, Daan S (1980) The prudent parent: energetic adjustments
in avian breeding. Ardea 68:225–252
Franson JC, Hollmen T, Poppenga RH, Hario M, Kilpi M (2000)
Metals and trace elements in tissues of common eiders (Soma-teria mollissima) from the Finnish archipelago. Ornis Fenn
77:57–63
Franson JC, Hollmen T, Hario M, Kilpi M, Finley DL (2002) Lead
and delta-aminolevulinic acid dehydratase in blood of common
eiders (Somateria mollissima) from the Finnish archipelago.
Ornis Fenn 79:87–91
Friend M, McLean RG, Dein FJ (2001) Disease emergence in birds:
challenges for the twenty-first century. Auk 118:290–303
Goudie RI, Brault S, Conant B, Kondratyev AV, Petersen, MR,
Vermeer K (1994) The status of seaducks in the North Pacific
Rim: toward their conservation and management. Trans 59th N
Am Wildl Nat Res Conf, pp 27–49
Goudie RI, Robertson GJ, Reed A (2000) Common eider (Somateriamollissima). In: Poole A, Gill F (eds) The birds of North
America, no. 546. The Birds of North America, Philadelphia,
pp 1–32
Grosbois V, Thompson PM (2005) North Atlantic climate variation
influences survival in adult fulmars. Oikos 109:273–290
Hanninen J, Vuorinen I, Hjelt P (2000) Climatic factors in the
Atlantic control the oceanographic and ecological changes in the
Baltic Sea. Limnol Oceanogr 45:703–710
Hario M, Rintala J (2006) Fledgling production and population trends
in Finnish common eiders (Somateria m. mollissima)—evidence
for density dependence. Can J Zool 84:1038–1046
Hario M, Selin K (1988) Thirty-year trends in an eider population:
timing of breeding, clutch size, and nest site preferences. Finn
Game Res 45:3–10
Hario M, Selin K (2002) Cohort-specific differences in reproductive
output in a declining common eider Somateria mollissimapopulation. Danish Rev Game Biol 16:33–45
Hario M, Rintala J, Selin K (2005) Fledgling production as the factor
regulating the population of the common eider (in Finnish with
English summary). Suomen Riista 51:6–26
Harvell CD, Kim K, Burkholder JM, Colwell RR, Epstein PR, Grimes
DJ, Hofmann EE, Lipp EK, Osterhaus ADME, Overstreet RM,
Porter JW, Smith GW, Vasta GR (1999) Emerging marine
diseases—climate links and anthropogenic factors. Science
285:1505–1510
HELCOM (2007) Climate change in the Baltic Sea area. Thematic
Assessment 2007. http://www.havet.nu/?d=186&id=54640279
Hollmen T (2002) Biomarkers of health and disease in common
eiders (Somateria mollissima) in Finland. Doctoral thesis,
Department of Basic Veterinary Sciences, University of Helsinki
Hollmen T, Franson JC, Docherty DE, Kilpi M, Hario M, Creekmore
LH, Petersen MR (2000) Infectious bursal disease virus
antibodies in eider ducks and herring gulls. Condor 102:688–691
Hollmen T, Franson JC, Hario M, Sankari S, Kilpi M, Lindstrom K
(2001) Use of serum biochemistry to evaluate nutritional status
and health of incubating common eiders (Somateria mollissima)
in Finland. Physiol Biochem Zool 74:333–342
Hollmen T, Franson JC, Kilpi M, Docherty DE, Hansen WR, Hario M
(2002) Isolation and characterization of a reovirus from common
eiders (Somateria mollissima) from Finland. Avian Dis 46:478–
484
Hurrell JW (2006) North Atlantic Oscillation (NAO) indices infor-
mation. Available from http://www.cgd.ucar.edu/cas/jhurrell/
indices.html. Accessed 11 Jan 2006
Hurrell JW, Kushnir Y, Ottersen G, Visbeck M (2003) An overview
of the North Atlantic Oscillation. In: Hurrell JW, Kushnir Y,
Ottersen G, Visbeck M (eds) The North Atlantic Oscillation:
climate significance and environmental impact. Geophys
Monogr Ser 134:1–35
Ihaka R, Gentleman R (1996) R: a language for data analysis and
graphics. J Comput Graph Stat 5:299–314
Kats RKH, Drent RH, Ens BJ, Duiven P, Swennen C, Van der Meer J
(2007) Rise and fall of the nesting population of the Common
Eider Somateria mollissima in the Netherlands since 1906: a
demographic reconstruction distinguishing between catastrophic
mortality events and non-breeding. Biol Conserv (to be
submitted)
Kery M, Madsen J, Lebreton JD (2006) Survival of Svalbard pink-
footed geese Anser brachyrhynchus in relation to winter climate,
density and land-use. J Anim Ecol 75:1172–1181
Kokko H (2001) Optimal and suboptimal use of compensatory
responses to harvesting: timing of hunting as an example. Wildl
Biol 7:141–150
Krementz DG, Hines JE, Caithamer DF (1996) Survival and recovery
rates of American eiders in eastern North America. J Wildl
Manage 60:855–862
Lack D (1967) The natural regulation of animal numbers. Clarendon
Press, Oxford
Laurila T, Hario M (1988) Environmental and genetic factors
influencing clutch size, egg volume, date of laying and female
weight in the common eider Somateria mollissima. Finn Game
Res 45:19–30
Lebreton JD, Burnham KP, Clobert J, Anderson DR (1992) Modeling
survival and testing biological hypotheses using marked animals:
a unified approach with case-studies. Ecol Monogr 62:67–118
Nichols JD (1991) Responses of North American duck populations to
exploitation. In: Perrins CM, Lebreton JD, Hirons GJM (eds)
Bird population studies. Oxford University Press, Oxford,
pp 498–525
Noer H (1991) Distributions and movements of eider Somateriamollissima populations wintering in Danish waters, analysed
from ringing recoveries. Danish Rev Game Biol 14(3):1–32
Noer H, Clausager I, Asferg T (1995) The bag of eider Somateriamollissima in Denmark 1958–1990. Danish Rev Game Biol
14(5):1–24
Oedekoven CS, Ainley DG, Spear LB (2001) Variable responses of
seabirds to change in marine climate: California current, 1985–
1994. Mar Ecol Progr Ser 212:265–281
Paradis E, Baillie SR, Sutherland WJ, Gregory RD (2002) Exploring
density dependent relationships in demographic parameters in
populations of birds at a large spatial scale. Oikos 97:293–307
Pinheiro JC, Bates DM (2000) Mixed-effects models in S and
S-PLUS. Springer, New York
Pollock KH, Nichols JD, Brownie C, Hines JE (1990) Statistical
inference for capture-recapture experiments. Wildl Monogr
107:1–98
Pradel R (1993) Flexibility in survival analysis from recapture data:
handling trap-dependence. In: Lebreton J-D, North PM (eds)
Marked individuals in the study of bird population. Birkhauser,
Berlin, pp 29–37
Prevot-Julliard A-C, Lebreton J-D, Pradel R (1998) Re-evaluation of
adult survival of black-headed gulls (Larus ridibundus) in
presence of capture heterogeneity. Auk 115:85–95
Oecologia (2009) 159:747–756 755
123
Reed A (1975) Migration, homing, and mortality of breeding female
eiders Somateria mollissima dresseri of the St Lawrence estuary,
Quebec. Ornis Scand 6:41–47
Ronka MTH, Saari CLV, Lehikoinen EA, Suomela J, Hakkila K
(2005) Environmental changes and population trends of breeding
waterfowl in northern Baltic Sea. Ann Zool Fenn 42:587–602
Sandvik H, Erikstad KE, Barrett RT, Yoccoz NG (2005) The effect of
climate on adult survival in five species of North Atlantic
seabirds. J Anim Ecol 74:817–831
Schaub M, Gimenez O, Schmidt BR, Pradel R (2004) Estimating
survival and temporary emigration in the multistate capture-
recapture framework. Ecology 85:2107–2113
Stearns S (1992) The evolution of life histories. Oxford University
Press, Oxford
Stenseth NC, Mysterud A (2005) Weather packages: finding the right
scale and composition of climate in ecology. J Anim Ecol
74:1195–1198
Swennen C (2002) Development and population dynamics of
common eider Somateria mollissima colonies in the Netherlands.
Danish Rev Game Biol 16:63–74
Wakeley JS, Mendall HL (1976) Migrational homing and survival of
adult female eiders in Maine. J Wildl Manage 40:15–21
Westerbom M (2006) Population dynamics of blue mussels in a
variable environment at the edge of their range. Doctoral thesis,
Faculty of Biosciences, Department of Biological and Environ-
mental Sciences, University of Helsinki
White GC, Burnham KP (1999) Program MARK: survival estimation
from populations of marked animals. Bird Study 46[Suppl]:
120–138
Williams BK, Nichols JD, Conroy MJ (2002) Analysis and manage-
ment of animal populations. Academic Press, New York
Wilson HM, Flint PL, Moran CL, Powell AN (2007) Survival of
breeding pacific common eiders on the Yukon–Kuskokwim
Delta, Alaska. J Wildl Manage 71:403–410
Yoccoz NG, Erikstad KE, Bustnes JO, Hanssen SA, Tveraa T (2002)
Costs of reproduction in common eiders (Somateria mollissima):
an assessment of relationships between reproductive effort and
future survival and reproduction based on observational and
experimental studies. J Appl Stat 29:57–64
756 Oecologia (2009) 159:747–756
123
Related Documents


