Survival and Mortality of Hedge Funds Mr. Fabrice Rouah ∗ Chicago Quantitative Alliance Meeting September 14, 2005 ∗ Ph.D. Candidate (Finance), Faculty of Management, McGill University, Montreal, Canada. Financial help from the Foundation for Managed Derivatives Research (FMDR), the Institut de finance math´ ematique de Montr´ eal (IFM2) and the Centre de recherche en e-finance (CREF) is gratefully acknowledged. I thank Professor Susan Christoffersen for helpful comments and suggestions. F. Rouah, CQA Presentation 1 September 14, 2005

Welcome message from author
This document is posted to help you gain knowledge. Please leave a comment to let me know what you think about it! Share it to your friends and learn new things together.
Transcript

Survival and Mortality of HedgeFunds
Mr. Fabrice Rouah∗
Chicago Quantitative Alliance Meeting
September 14, 2005
∗Ph.D. Candidate (Finance), Faculty of Management, McGill University, Montreal,Canada. Financial help from the Foundation for Managed Derivatives Research (FMDR),the Institut de finance mathematique de Montreal (IFM2) and the Centre de rechercheen e-finance (CREF) is gratefully acknowledged. I thank Professor Susan Christoffersenfor helpful comments and suggestions.
F. Rouah, CQA Presentation 1 September 14, 2005
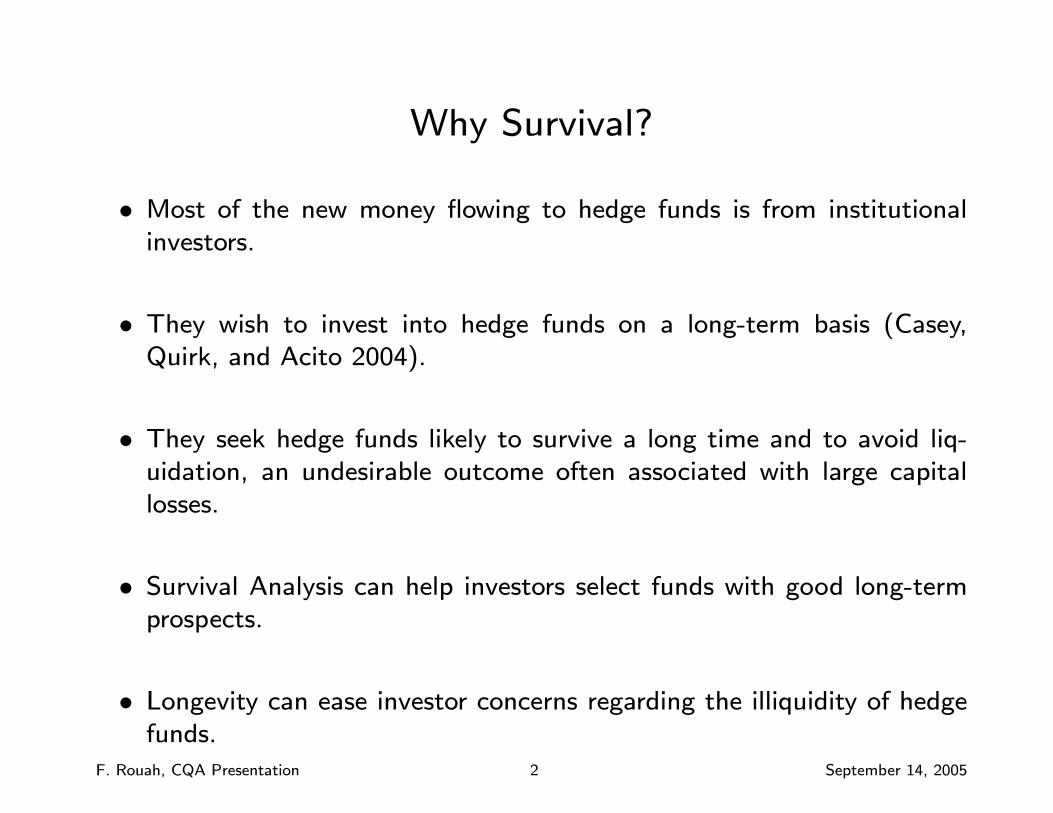
Why Survival?
• Most of the new money flowing to hedge funds is from institutionalinvestors.
• They wish to invest into hedge funds on a long-term basis (Casey,Quirk, and Acito 2004).
• They seek hedge funds likely to survive a long time and to avoid liq-uidation, an undesirable outcome often associated with large capitallosses.
• Survival Analysis can help investors select funds with good long-termprospects.
• Longevity can ease investor concerns regarding the illiquidity of hedgefunds.
F. Rouah, CQA Presentation 2 September 14, 2005

Estimating Mortality and Survival
• Annual mortality rate (or rate of attrition) is a proportion.
Number of funds dying during the yearNumber of funds alive at the beginning of the year × 100%
• Survival is modeled via the survival function S(t) = probability that
the hedge fund survives past time t, or the hazard function λ(t) =
instantaneous rate of death at time t.
• Authors have also used probit or logit regression with outcome corre-sponding to survival status (dead or alive).
• Studies have aggregated all hedge fund deaths into a single group, butmany “dead” funds are alive and well (Fung and Hsieh, 2000).
F. Rouah, CQA Presentation 3 September 14, 2005

Two Issues Related to Mortality and Survival
• Issue #1 is longevity. Why do some hedge funds liquidate shortly afterbeing launched, while others remain alive and healthy for a long time?
• Survival Analysis has been used to identify hedge fund characteristicsrelated to longevity.
• Issue #2 is survivorship bias.
— typically 300 to 400 bps / year for hedge funds.
— typically less than 100 bps / year for mutual funds.
• Factors driving survival and mortality are the same factors driving sur-vivorship bias.
F. Rouah, CQA Presentation 4 September 14, 2005

Annual Mortality Rates
• Estimates of mortality vary across studies, across time periods, andacross databases used.
• Even within the same study, mortality varies by investment style andover time.
• Studies point to increasing mortality over the last 10 years.
• Could reflect managers closing down faster nowadays than one decadeago, an influx of mediocre funds, or limited investment opportunities
(Amin and Kat, 2003).
• One consistent pattern : mortality was high in late 1998. Many fundsdied, and few were born.
F. Rouah, CQA Presentation 5 September 14, 2005
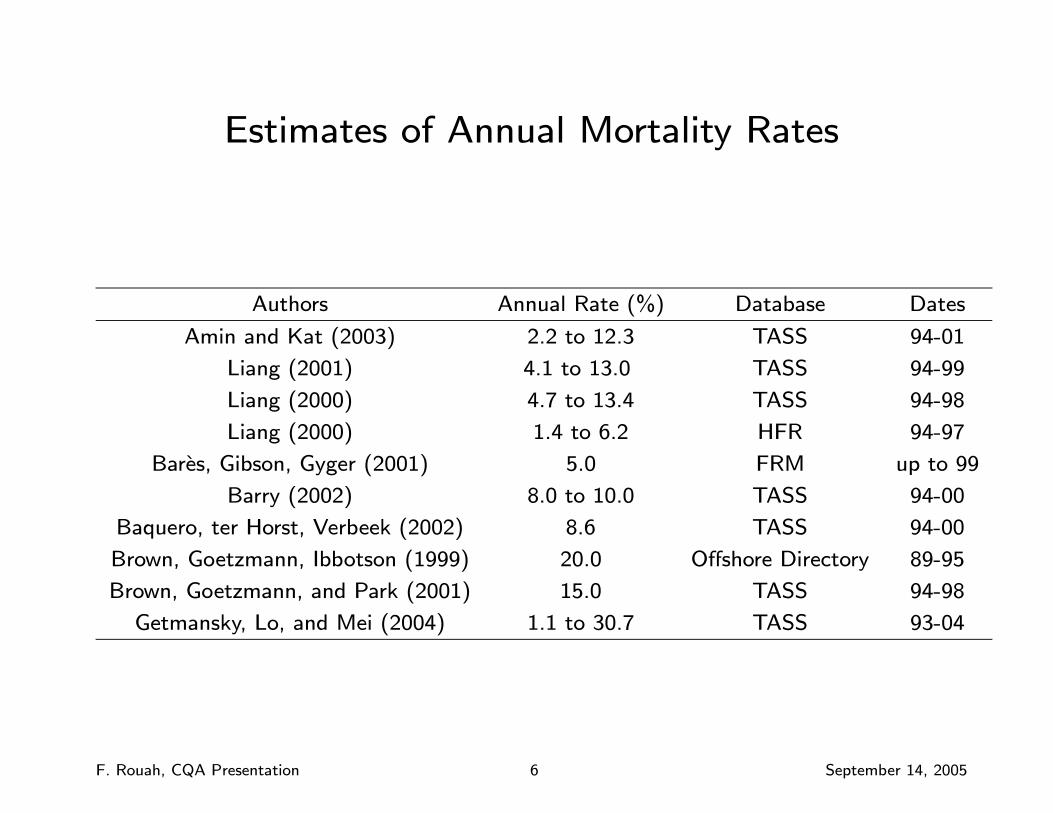
Estimates of Annual Mortality Rates
Authors Annual Rate (%) Database Dates
Amin and Kat (2003) 2.2 to 12.3 TASS 94-01
Liang (2001) 4.1 to 13.0 TASS 94-99
Liang (2000) 4.7 to 13.4 TASS 94-98
Liang (2000) 1.4 to 6.2 HFR 94-97
Bares, Gibson, Gyger (2001) 5.0 FRM up to 99
Barry (2002) 8.0 to 10.0 TASS 94-00
Baquero, ter Horst, Verbeek (2002) 8.6 TASS 94-00
Brown, Goetzmann, Ibbotson (1999) 20.0 Offshore Directory 89-95
Brown, Goetzmann, and Park (2001) 15.0 TASS 94-98
Getmansky, Lo, and Mei (2004) 1.1 to 30.7 TASS 93-04
F. Rouah, CQA Presentation 6 September 14, 2005

Annual Mortality Rates by Style
Eq LS Con Ev Man Sh FI Em Mult Glob
Yr MN Eq Arb Driv Fut Sell Arb Mkt Strat Mac FoF All
94 8.3 1.2 0 0 4.4 0 13.6 0 17.6 0 1.8 3.0
95 0 3.2 0 1.1 13.3 8.3 5.7 1.4 10.5 30.7 5.5 6.1
96 0 7.4 13.7 2.7 20.8 9.1 8.9 3.9 4.2 25.6 6.3 9.7
97 0 3.9 5.2 2.2 15.7 7.7 7.0 6.5 8.1 37.1 7.0 6.9
98 3.8 6.8 7.7 1.2 16.1 0 20.6 16.1 10.6 0 9.6 9.5
99 17.7 7.4 4.1 9.8 18.3 6.3 11.4 11.8 4.0 5.8 5.7 9.7
00 12.9 8.0 3.7 7.4 16.4 5.3 14.7 15.6 3.4 11.7 9.9 11.1
01 8.6 13.4 5.3 8.4 9.9 30.0 9.6 18.1 1.5 18.4 10.3 11.4
02 9.7 12.4 5.2 12.4 16.8 6.7 5.8 8.3 6.2 14.7 5.1 10.0
03 18.6 12.3 7.6 9.2 11.7 6.7 8.7 10.4 15.6 18.0 7.5 10.7
All 8.0 7.6 5.2 5.4 14.4 8.0 10.6 9.2 8.2 12.6 6.9 8.8
• Source: Getmansky, Lo, and Mei (2004). Notes: (i) mortality increasesover 10 years, (ii) 2001-2002 tech bubble for Long-Short Equity, (iii)1998 effect for others, (iv) variation across styles.
F. Rouah, CQA Presentation 7 September 14, 2005

Estimating Survival : 50% Survival Time
• Definition of the 50% survival time: the time at which one-half of the
hedge funds die.
• One-half of the funds die before that time, the other half lives longer.
• Much variation in the estimates, across databases.
Authors 50% Survival Time Database
Brown, Goetzmann, Park (2001) 2.5 years TASS
Amin & Kat (2003) 5.0 years TASS
Gregoriou (2002) 5.5 years MAR
Securities & Exchange Commission (2003) 5.5 years Van Hedge
Bares, Gibson, and Gyger (2001) >10 years FRM
F. Rouah, CQA Presentation 8 September 14, 2005

Example of the 50% Survival Time
• This Kaplan-Meier curve estimates the survival function S(t) = Pr (T > t).
• To get the 50% survival time, draw a horizontal line at 50% probabilityuntil it hits S(t), then draw a vertical line to the x-axis = 6.1 years.
• Can also obtain theMean Survival Time as µ = R∞0 S(t)dt = 6.7 years.
0.00
0.25
0.50
0.75
1.00
0 2 4 6 8 10
Survival Time (years)
Prob
abili
ty
The 50% survival time is 6.1 years
F. Rouah, CQA Presentation 9 September 14, 2005

Fund Characteristics Related to Survival
• We can create different groups of hedge funds, small and large forexample.
• Fit separate Kaplan-Meier curves in each group, and apply the Log-Rank test to ascertain whether they are the same (Amin and Kat,2003).
• But we suffer a loss of sample size as the number of groups increases,and only one characteristic (or factor) can be tested at once.
• Better to apply a multivariate analysis, such as the Cox ProportionalHazards (PH) model.
• The effects of explanatory factors on survival (via the hazard function)can be assessed simultaneously in a regression-like framework.
F. Rouah, CQA Presentation 10 September 14, 2005
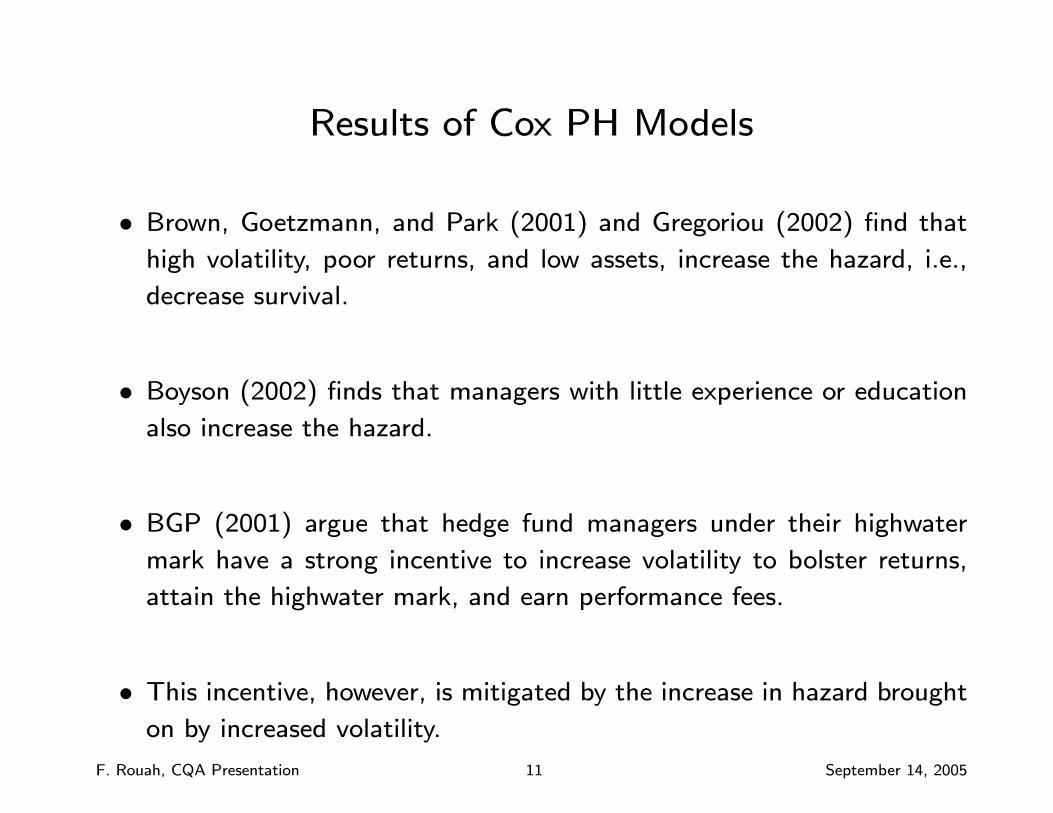
Results of Cox PH Models
• Brown, Goetzmann, and Park (2001) and Gregoriou (2002) find thathigh volatility, poor returns, and low assets, increase the hazard, i.e.,
decrease survival.
• Boyson (2002) finds that managers with little experience or educationalso increase the hazard.
• BGP (2001) argue that hedge fund managers under their highwater
mark have a strong incentive to increase volatility to bolster returns,
attain the highwater mark, and earn performance fees.
• This incentive, however, is mitigated by the increase in hazard broughton by increased volatility.
F. Rouah, CQA Presentation 11 September 14, 2005

Gregoriou (2002) Cox PH Model
Variable Hazard Ratio (HR) p-valueMean Monthly Return (%) 0.899 0.0404Average AUM ($M) 0.994 <.0001Leverage (Y/N) 1.026 <.0001Minimum Purchase ($100K) 0.978 0.0271
Note: HR>1 increases the hazard, while HR<1 decreases the hazard.
• Every 1% increase in mean monthly return is associated with a 10.1%decrease in the hazard, (0.899− 1)× 100% = −10.1%.
• Size effects: every $1M increase in average AUM decreases the hazardby 0.6%, while every $100K increase in minimum purchase decreasesthe hazard by 2.19%.
• Funds employing leverage have a 2.6% increase in the hazard comparedto those that don’t use leverage (1.026− 1)× 100% = 2.6%.
F. Rouah, CQA Presentation 12 September 14, 2005

Hedge Fund Survivorship Bias
• Defined as the difference in returns between two portfolios. Twogeneral methods to compare portfolios.
1. Live+Dead funds versus Live funds only (most common).
2. Dead funds versus Live funds.
• Three ways to define portfolios (Brown, Goetzmann, and Ibbotson1999, Fung and Hsieh 2000).
• (1) Surviving Portfolio, (2) Complete Portfolio, or (3) Observable Port-folio.
• Estimates vary across databases and time periods, but most are at 3%to 4% yearly.
F. Rouah, CQA Presentation 13 September 14, 2005
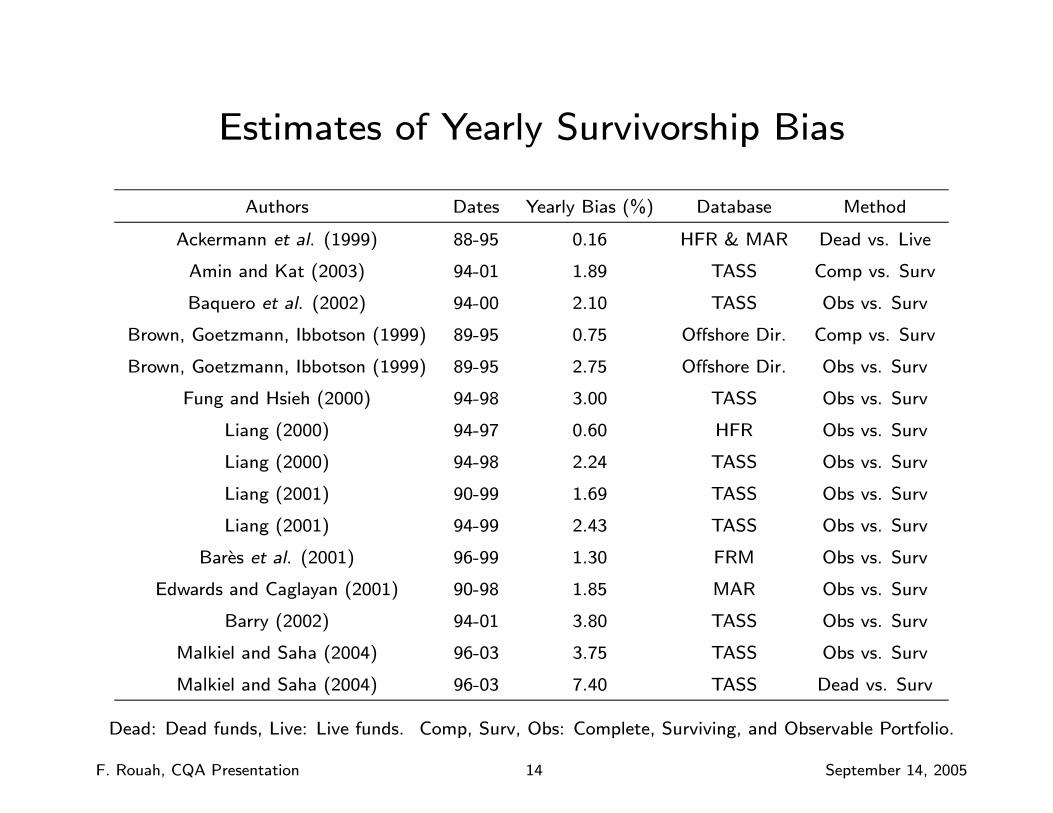
Estimates of Yearly Survivorship Bias
Authors Dates Yearly Bias (%) Database Method
Ackermann et al. (1999) 88-95 0.16 HFR & MAR Dead vs. Live
Amin and Kat (2003) 94-01 1.89 TASS Comp vs. Surv
Baquero et al. (2002) 94-00 2.10 TASS Obs vs. Surv
Brown, Goetzmann, Ibbotson (1999) 89-95 0.75 Offshore Dir. Comp vs. Surv
Brown, Goetzmann, Ibbotson (1999) 89-95 2.75 Offshore Dir. Obs vs. Surv
Fung and Hsieh (2000) 94-98 3.00 TASS Obs vs. Surv
Liang (2000) 94-97 0.60 HFR Obs vs. Surv
Liang (2000) 94-98 2.24 TASS Obs vs. Surv
Liang (2001) 90-99 1.69 TASS Obs vs. Surv
Liang (2001) 94-99 2.43 TASS Obs vs. Surv
Bares et al. (2001) 96-99 1.30 FRM Obs vs. Surv
Edwards and Caglayan (2001) 90-98 1.85 MAR Obs vs. Surv
Barry (2002) 94-01 3.80 TASS Obs vs. Surv
Malkiel and Saha (2004) 96-03 3.75 TASS Obs vs. Surv
Malkiel and Saha (2004) 96-03 7.40 TASS Dead vs. Surv
Dead: Dead funds, Live: Live funds. Comp, Surv, Obs: Complete, Surviving, and Observable Portfolio.
F. Rouah, CQA Presentation 14 September 14, 2005
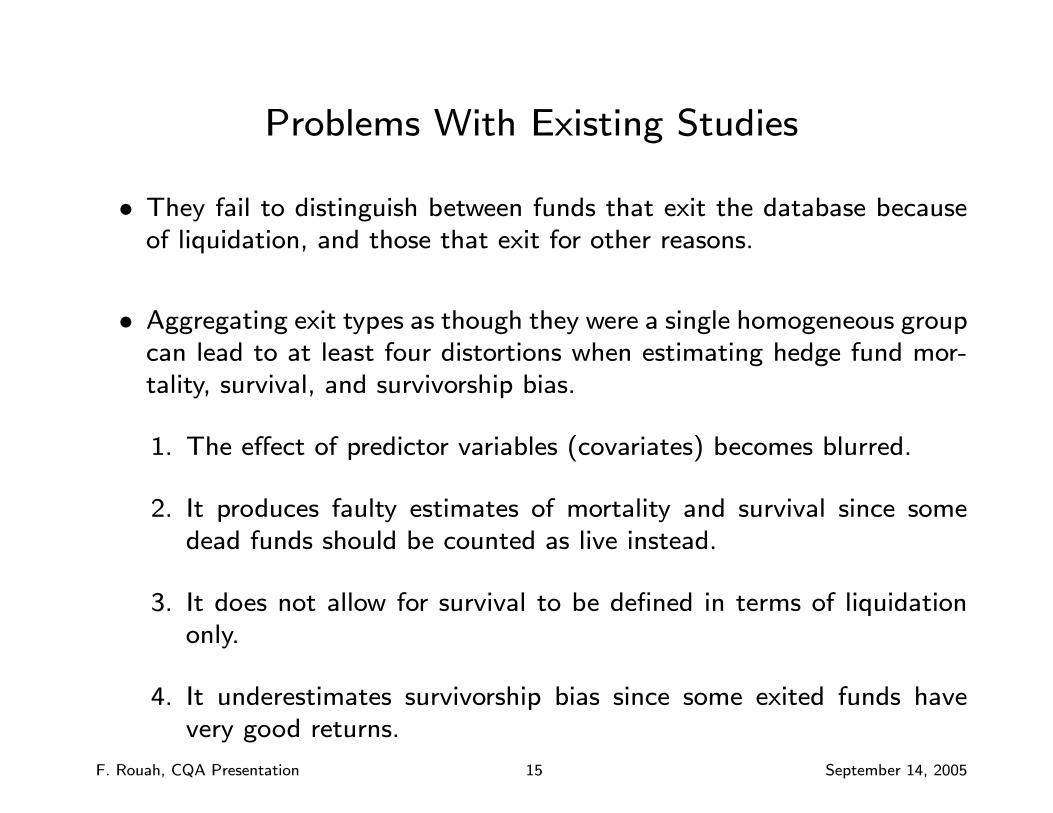
Problems With Existing Studies
• They fail to distinguish between funds that exit the database becauseof liquidation, and those that exit for other reasons.
• Aggregating exit types as though they were a single homogeneous groupcan lead to at least four distortions when estimating hedge fund mor-tality, survival, and survivorship bias.
1. The effect of predictor variables (covariates) becomes blurred.
2. It produces faulty estimates of mortality and survival since somedead funds should be counted as live instead.
3. It does not allow for survival to be defined in terms of liquidationonly.
4. It underestimates survivorship bias since some exited funds havevery good returns.
F. Rouah, CQA Presentation 15 September 14, 2005

Current Study (Rouah, 2005)
• I use hedge fund data over the 1994 to 2003 period. Funds in thedead pool experience three types of exit
1. Liquidation: fund returns investor money and is no longer operating.
2. Closed to New Investors: fund accepts no new investors.
3. Stopped Reporting: fund stops reporting to the database vendor.
• I apply a Competing Risks survival model, in which each exit type istreated separately, and treat all variables whose values change over timeas Time Dependent Covariates (Kalbfleisch and Prentice, 2002).
• Findings: the effect of explanatory variables on survival are differentwhen exits are separated, and isolating liquidation from the other exittypes alters the estimates of mortality and of survivorship bias.
F. Rouah, CQA Presentation 16 September 14, 2005
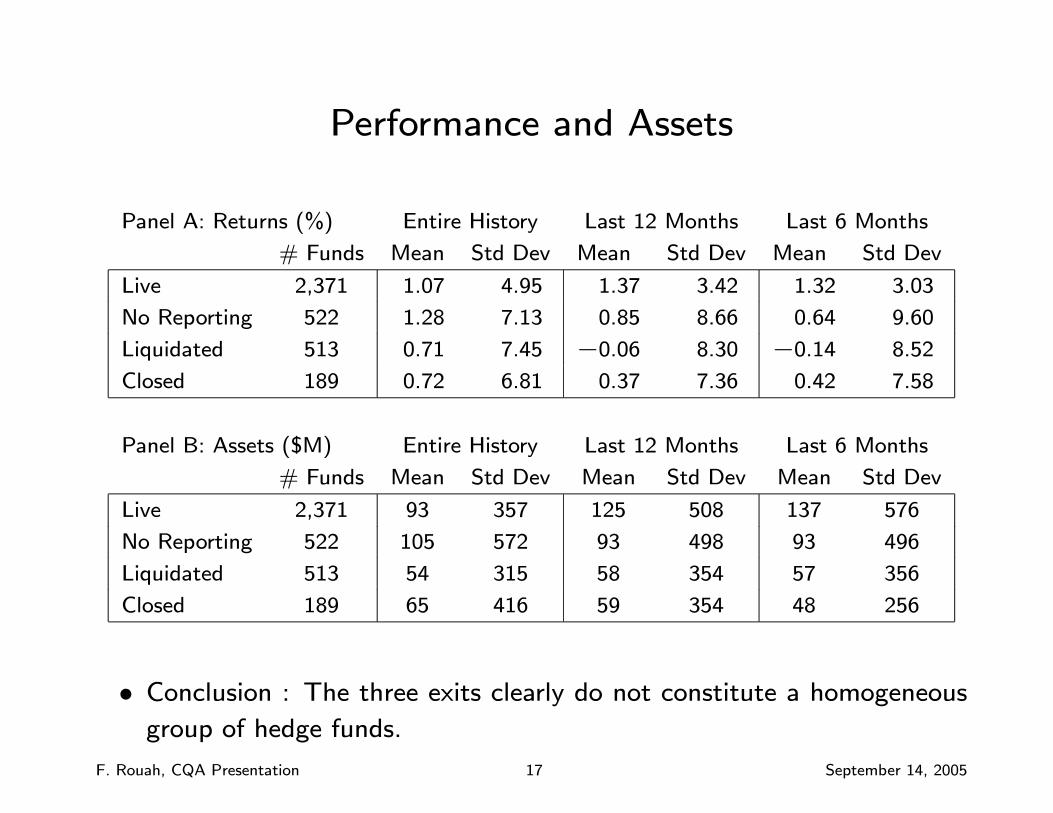
Performance and Assets
Panel A: Returns (%) Entire History Last 12 Months Last 6 Months
# Funds Mean Std Dev Mean Std Dev Mean Std Dev
Live 2,371 1.07 4.95 1.37 3.42 1.32 3.03
No Reporting 522 1.28 7.13 0.85 8.66 0.64 9.60
Liquidated 513 0.71 7.45 −0.06 8.30 −0.14 8.52
Closed 189 0.72 6.81 0.37 7.36 0.42 7.58
Panel B: Assets ($M) Entire History Last 12 Months Last 6 Months
# Funds Mean Std Dev Mean Std Dev Mean Std Dev
Live 2,371 93 357 125 508 137 576
No Reporting 522 105 572 93 498 93 496
Liquidated 513 54 315 58 354 57 356
Closed 189 65 416 59 354 48 256
• Conclusion : The three exits clearly do not constitute a homogeneousgroup of hedge funds.
F. Rouah, CQA Presentation 17 September 14, 2005

Mean Survival Time Until Liquidation, in Years
By Style & AUM All Funds Large Funds Small Funds p-valueConvertible Arbitrage 3.5 n/a 3.4 n/a
Distressed Securities 5.3 5.5 5.0 0.0949
Emerging Markets 6.5 6.7 6.2 0.0439
Equity Hedge 6.6 7.0 5.6 0.0001
Equity Market Neutral 7.1 7.8 4.2 0.0003
Equity Non-Hedge 7.7 8.5 4.7 0.0015
Event Driven 4.6 4.8 3.7 0.0122
Fixed Income 7.4 7.8 4.1 0.0224
Fund of Funds 6.5 6.1 6.0 0.0001
Market Timing 5.3 5.6 4.5 0.3415
Merger Arbitrage 4.0 3.7 4.0 0.6753
Relative Value Arbitrage 4.6 4.7 4.4 0.2464
Sector 5.5 5.5 5.2 0.0083
Short Selling 4.4 4.5 1.3 0.7948
All Funds 8.3 8.9 6.4 0.0001
F. Rouah, CQA Presentation 18 September 14, 2005
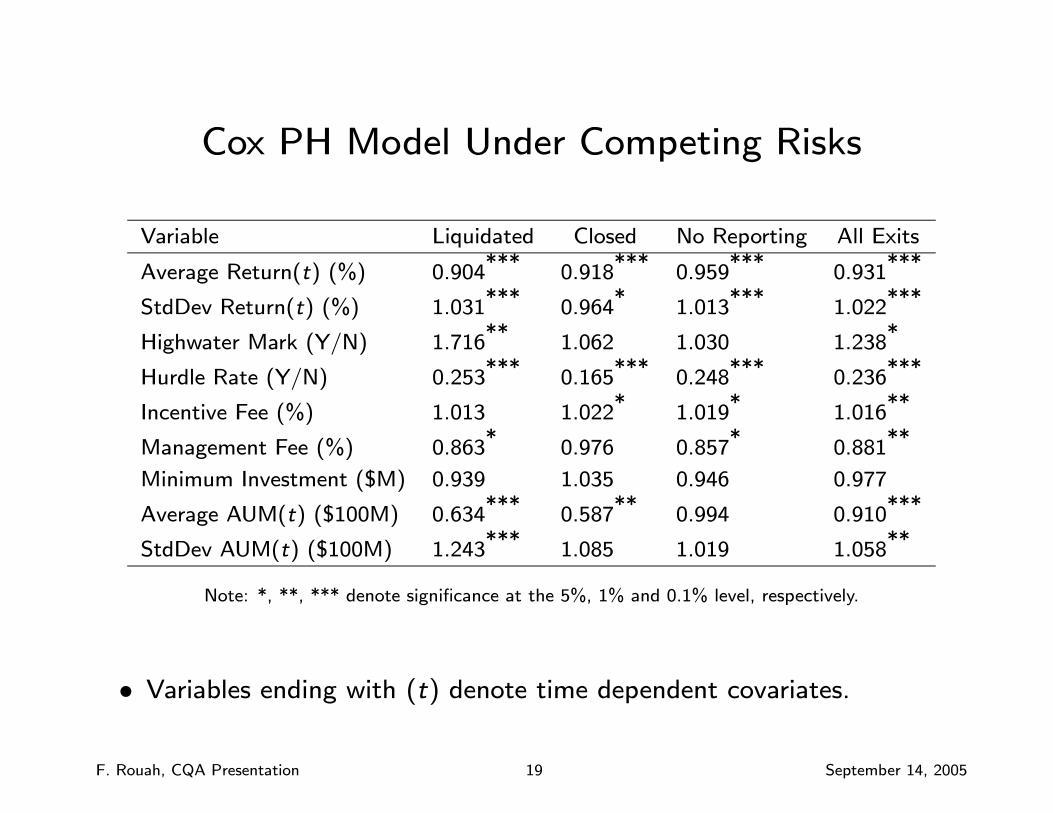
Cox PH Model Under Competing Risks
Variable Liquidated Closed No Reporting All Exits
Average Return(t) (%) 0.904*** 0.918*** 0.959*** 0.931***
StdDev Return(t) (%) 1.031*** 0.964* 1.013*** 1.022***
Highwater Mark (Y/N) 1.716** 1.062 1.030 1.238*
Hurdle Rate (Y/N) 0.253*** 0.165*** 0.248*** 0.236***
Incentive Fee (%) 1.013 1.022* 1.019* 1.016**
Management Fee (%) 0.863* 0.976 0.857* 0.881**
Minimum Investment ($M) 0.939 1.035 0.946 0.977
Average AUM(t) ($100M) 0.634*** 0.587** 0.994 0.910***
StdDev AUM(t) ($100M) 1.243*** 1.085 1.019 1.058**
Note: *, **, *** denote significance at the 5%, 1% and 0.1% level, respectively.
• Variables ending with (t) denote time dependent covariates.
F. Rouah, CQA Presentation 19 September 14, 2005
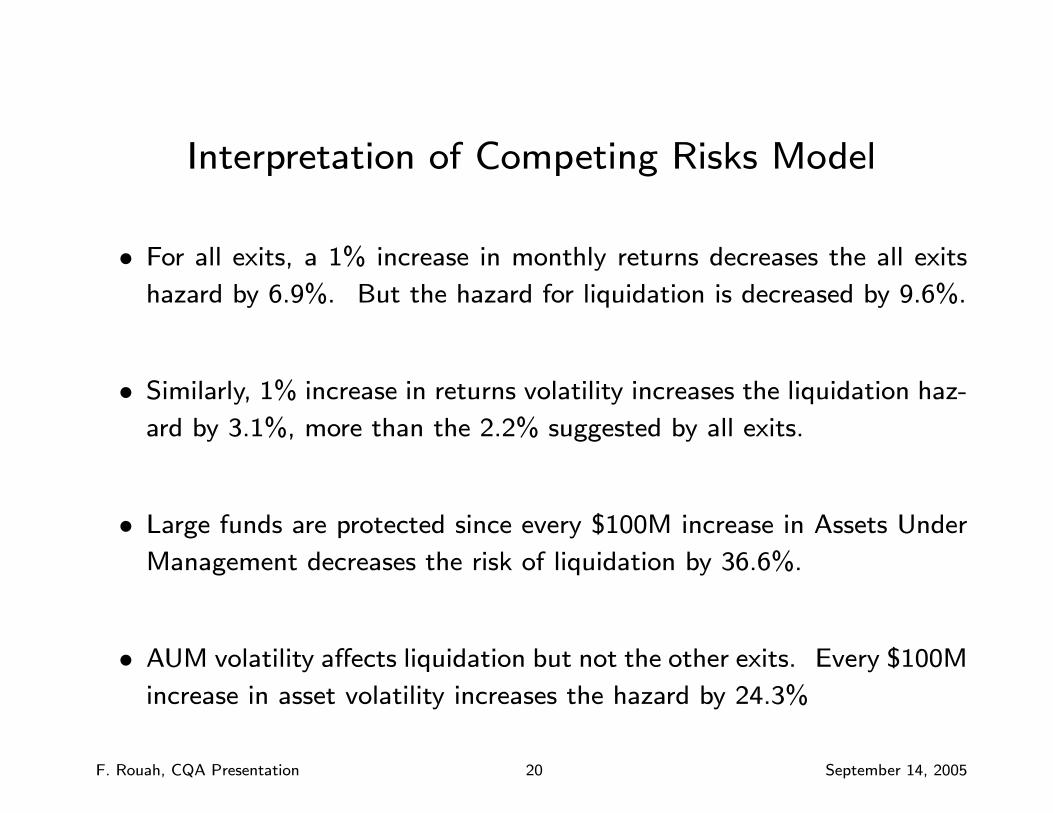
Interpretation of Competing Risks Model
• For all exits, a 1% increase in monthly returns decreases the all exits
hazard by 6.9%. But the hazard for liquidation is decreased by 9.6%.
• Similarly, 1% increase in returns volatility increases the liquidation haz-
ard by 3.1%, more than the 2.2% suggested by all exits.
• Large funds are protected since every $100M increase in Assets Under
Management decreases the risk of liquidation by 36.6%.
• AUM volatility affects liquidation but not the other exits. Every $100M
increase in asset volatility increases the hazard by 24.3%
F. Rouah, CQA Presentation 20 September 14, 2005

Estimates of Survivorship Bias
Panel A: Live Group = Alive at Dec 2003
Dead Group Live Return Dead Return Bias/Month Bias/Year
No Reporting +
Liquidated + Closed 1.043 0.917 0.126% 1.51%
Liquidated + Closed 1.043 0.770 0.273% 3.28%
No Reporting + Liquidated 1.043 0.900 0.143% 1.72%
No Reporting + Closed 1.043 1.073 −0.030% −0.36%Liquidated 1.043 0.667 0.376% 4.51%
Closed 1.043 0.999 0.044% 0.53%
No Reporting 1.043 1.103 −0.060% −0.72%
Panel B: Live Group = Alive at Dec 2003 + No Reporting
Dead Group Live Return Dead Return Bias/Month Bias/Year
Closed + Liquidated 1.050 0.771 0.279% 3.35%
Liquidated 1.050 0.667 0.383% 4.60%
Closed 1.050 1.000 0.050% 0.60%
F. Rouah, CQA Presentation 21 September 14, 2005

Survivorship Bias
• When exits are aggregated, annual bias is estimated at 1.51%, similarto 1.89% obtained by Amin and Kat (2003), 1.69% by Liang (2001)
and 1.85% by Edwards and Caglayan (2001).
• When the Live group also includes funds no longer reporting, it jumpsto 3.35%, since those funds have good returns. This is similar to
3.80% from Barry (2002) and 3.75% from Malkiel and Saha (2004).
• When only liquidated funds only constitute the dead group, it riseshigher still, to 4.51% and 4.60%.
• This number is higher than found in previous studies, typically 3% to
4%, but lower than 7.40% found by Malkiel and Saha (2004)..
F. Rouah, CQA Presentation 22 September 14, 2005
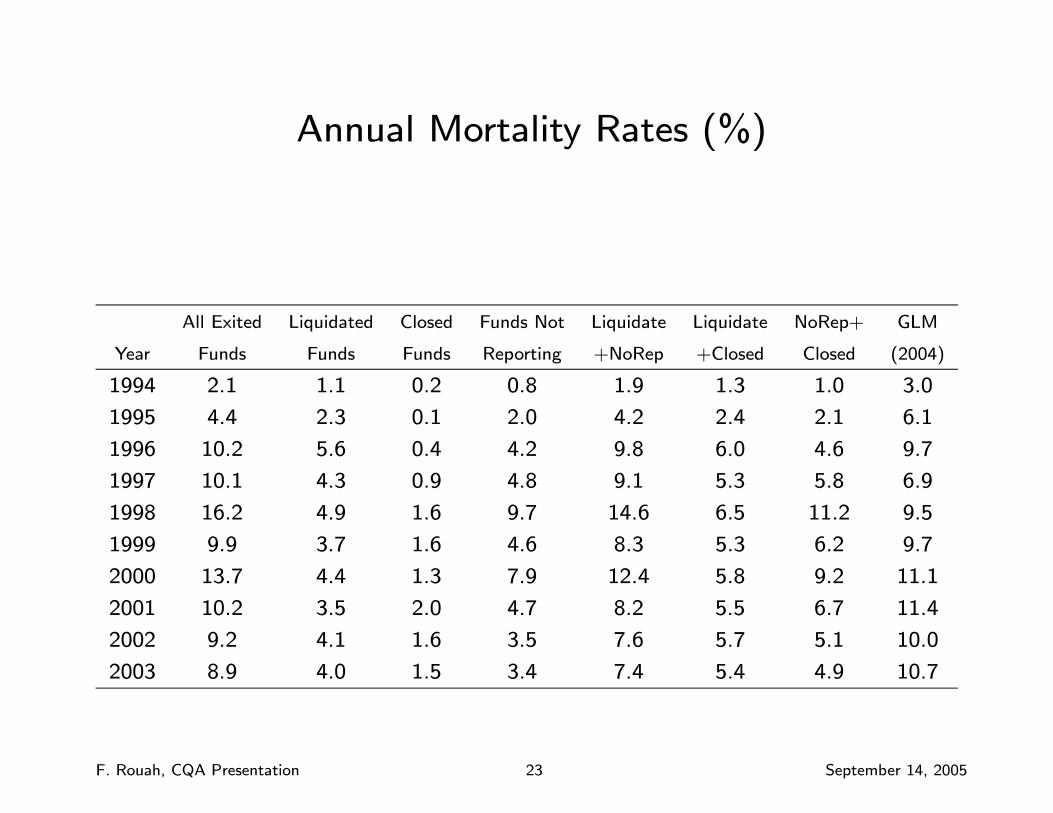
Annual Mortality Rates (%)
All Exited Liquidated Closed Funds Not Liquidate Liquidate NoRep+ GLM
Year Funds Funds Funds Reporting +NoRep +Closed Closed (2004)
1994 2.1 1.1 0.2 0.8 1.9 1.3 1.0 3.0
1995 4.4 2.3 0.1 2.0 4.2 2.4 2.1 6.1
1996 10.2 5.6 0.4 4.2 9.8 6.0 4.6 9.7
1997 10.1 4.3 0.9 4.8 9.1 5.3 5.8 6.9
1998 16.2 4.9 1.6 9.7 14.6 6.5 11.2 9.5
1999 9.9 3.7 1.6 4.6 8.3 5.3 6.2 9.7
2000 13.7 4.4 1.3 7.9 12.4 5.8 9.2 11.1
2001 10.2 3.5 2.0 4.7 8.2 5.5 6.7 11.4
2002 9.2 4.1 1.6 3.5 7.6 5.7 5.1 10.0
2003 8.9 4.0 1.5 3.4 7.4 5.4 4.9 10.7
F. Rouah, CQA Presentation 23 September 14, 2005

Annual Mortality Rates
• When All Exited Funds are aggregated, the increasing pattern of mor-tality is consistent with that found by Getmansky, Lo, and Mei (2004).
• When only Liquidated Funds are used, there is no apparent increase.
• The increase in Closed Funds is consistent with the argument of Aminand Kat (2003) that managers are closing down faster nowadays than
one decade ago.
• Part of the increase in mortality reported by Getmansky, Lo, and Mei(2004) and Amin and Kat (2003) can be attributed to an increase in
Closed Funds, and Funds Not Reporting.
F. Rouah, CQA Presentation 24 September 14, 2005
Conclusion (1)
• Institutional investors want hedge funds that are not likely to liquidatein the short-term. Survival Analysis can help them select funds with
longevity.
• Longevity and survivorship bias in returns are two important issuesrelated to hedge fund mortality and survival.
• Estimates of mortality rates and of survivorship bias are dependent onthe database employed and the time period under consideration.
• Cox proportional hazards modeling has pointed to a number of commonvariables significantly related to survival.
F. Rouah, CQA Presentation 25 September 14, 2005

Conclusion (2)
• It does not make sense to aggregate hedge funds with different exits,because they do not constitute a homogeneous group of “dead” funds.
• In order to identify factors driving liquidation — the main outcome ofeconomic interest to investors — liquidation must be isolated from the
other exit types.
• Competing risks modeling of hedge fund lifetimes shows that the factorsare acting differently on the different exit types.
• Mortality rates and estimates of survivorship bias are heavily dependenton which funds are used to define the dead group.
F. Rouah, CQA Presentation 26 September 14, 2005

Conclusion (3)
• Factors increasing hedge fund life expectancy, in order of importance
— High returns, a large asset base, low returns volatility, a hurdle rate.
• Factors decreasing life expectancy, in order of importance
— Excessive leverage, excessive incentive fees, high asset volatility.
• Lower attrition rate among certain styles, such as Funds of Funds,Event Driven, and Convertible Arbitrage.
• Some styles have longer mean survival times than others, but much ofthis difference can be attributed to differences in size.
F. Rouah, CQA Presentation 27 September 14, 2005

References
1. Ackermann, C., McEnally, R., and D. Ravenscraft (1999), The Performance of Hedge
Funds: Risk, Return, and Incentives, Journal of Finance, Vol. 54, No. 3, pp. 833-874.
2. Amin, G.S., and H. Kat (2003), Welcome to the Dark Side: Hedge Fund Attrition
and Survivorship Bias Over the Period 1994-2001, Journal of Alternative Investments,
Vol. 6, No. 1, pp. 57-73.
3. Baquero, H., ter Horst, J., and M. Verbeek (2002), Survival, Look-Ahead Bias and
the Performance of Hedge Funds. Working Paper, Erasmus University and Tiburg
University.
4. Bares, P.A., Gibson, R., and H. Gyger (2001), Style Consistency and Survival Prob-
ability in the Hedge Fund Industry, Working Paper, Swiss Federal Institute of Tech-
nology and University of Zurich.
F. Rouah, CQA Presentation 28 September 14, 2005

5. Barry, R. (2002), Hedge Funds: A Walk Through the Graveyard, Working Paper,
Macquarie University, Sydney, Australia.
6. Boyson, N. (2002), How Are Hedge Fund Manager Characteristics Related to Perfor-
mance, Volatility, and Survival, Working Paper, Ohio State University.
7. Brown, S.J, Goetzmman, W.N., and R.G. Ibbotson (1999), Offshore Hedge Funds:
Survival and Performance, 1989-95, Journal of Business, Vol. 72, No. 1, pp. 91-177.
8. Brown, S.J., Goetzmann, W.N., and J. Park (2001), Careers and Survival: Competi-
tion and Risk in the Hedge Fund and CTA Industry, Journal of Finance, Vol. 56, No.
5, pp. 1869-1886.
9. Casey, Quirk & Acito and The Bank of New York (2004), Institutional Demand for
Hedge Funds: New Opportunities and Standards, White Paper, CQA and The Bank
of New York, www.cqallc.com.
F. Rouah, CQA Presentation 29 September 14, 2005

10. Edwards, F.R., and M.O. Caglayan (2001), Hedge Fund Performance and Manager
Skill, Journal of Futures Markets, Vol. 21, No. 11, pp. 1003-1028.
11. Fung, W., and D. Hsieh (2000), Performance Characteristics of Hedge Funds and
Commodity Funds: Natural Versus Spurious Biases, Journal of Financial and Quan-
titative Analysis, Vol. 35, No. 3, pp. 291-307.
12. Getmansky, M., Lo, A.W., and S.X. Mei (2004), Sifting Through the Wreckage:
Lessons from Recent Hedge Fund Liquidations, Journal of Investment Management,
Vol. 2, pp. 6-38.
13. Gregoriou, G.N. (2002), Hedge Fund Survival Lifetimes, Journal of Asset Manage-
ment, Vol. 2, No. 3, pp. 237-252.
14. Kalbfleisch, J.D., and R. Prentice (2002), The Statistical Analysis of Failure Time
Data, Second Edition, New York, NY: John Wiley & Sons.
F. Rouah, CQA Presentation 30 September 14, 2005
15. Liang, B. (2001), Hedge Fund Performance: 1990-1999, Financial Analysts Journal,
Vol. 57, No. 1, pp. 11-18.
16. Liang, B. (2000), Hedge Funds: The Living and the Dead, Journal of Financial and
Quantitative Analysis, Vol. 35, No. 3, pp. 309-326.
17. Malkiel, B.G., and A. Saha (2004), Hedge Funds: Risks and Return, Working Paper,
Center for Economic Policy Research, Princeton University.
18. Rouah, F. (2005), Competing Risks in Hedge Fund Survival, Ph.D. Dissertation,
McGill University, Montreal, Canada.
19. Securities and Exchange Commission (2003), Implications of the Growth of Hedge
Funds, Staff Report to the United States Securities and Exchange Commission,
September 2003, Washington, DC.
F. Rouah, CQA Presentation 31 September 14, 2005
Related Documents