Survival and hunter reporting rate estimates of mourning doves based on 2003-2013 Pennsylvania bird banding data 1 S.M. Amburgey 1 , A. Barenblitt 2 , K.M. Serno 2 , M. Toenies 1 , J. Vernon 3 , 1 Intercollege Graduate Degree Program in Ecology, The Pennsylvania State University, Forest Resources Building, University Park PA 16823 2 Department of Ecosystem Sciences and Management, The Pennsylvania State University, Forest Resources Building, University Park, PA 16823 3 The Graduate Program in Acoustics, The Pennsylvania State University, Applied Science Building, University Park, PA 16823 1 This report was conducted as a class project for WFS 560, Population Estimation and Modeling, under the direction of Duane R. Diefenbach.

Welcome message from author
This document is posted to help you gain knowledge. Please leave a comment to let me know what you think about it! Share it to your friends and learn new things together.
Transcript

Survival and hunter reporting rate estimates of mourning doves based on 2003-2013 Pennsylvania bird banding data1
S.M. Amburgey1, A. Barenblitt2, K.M. Serno2, M. Toenies1, J. Vernon3,
1 Intercollege Graduate Degree Program in Ecology, The Pennsylvania State University, Forest Resources Building, University Park PA 16823
2 Department of Ecosystem Sciences and Management, The Pennsylvania State University, Forest Resources Building, University Park, PA 16823
3 The Graduate Program in Acoustics, The Pennsylvania State University, Applied Science Building, University Park, PA 16823
1 This report was conducted as a class project for WFS 560, Population Estimation and Modeling, under the direction of Duane R. Diefenbach.

INTROD
M
American
annual su
are widel
(Seaman
their rang
southwar
hunting p
traveled b
Figure 1: M
DUCTION
Mourning dov
n birds (KDW
urvival and h
ly distributed
s and Sander
ge. Mournin
rd to Mexico
practices or o
between sum
Mourning dov
ves (Zenaida
WPT, 2014)
hunter report
d throughou
rs, 2014; Fig
g doves may
o and Centra
other threats
mmer and wi
e range map (N
a macroura)
), and therefo
ting rates for
ut North Ame
g. 1); thus na
y reside in th
al America (A
s. As surviva
inter ranges
NatureServe, 2
) are one of t
ore it is impo
r effective p
erica and int
ational-scale
heir breeding
Aldrich, 199
al and harves
and range of
007)
the most freq
ortant to obt
opulation m
to Canada an
e, robust data
g range throu
93), exposing
st rates likely
f origin, regi
quently hunt
tain reliable
management.
nd Central A
a are availab
ughout winte
g these birds
y vary based
ional analys
ted North
estimates of
Mourning d
America
ble for much
er or migrate
s to various
d on distance
es are impor
f
doves
of
e
e
rtant.

Mourning dove abundances have generally increased over the last 48 years in the eastern
portion of the range, but in the last five years, abundance estimates were stable (Seamans and
Sanders, 2014). Pennsylvania mourning dove populations appear stable based on recent
assessments despite a significant increase in calling along survey routes reported in 2012
(Seamans and Sanders, 2012). To better inform managers and assess current practices, regular
analysis of banding data should occur as data become available. The Pennsylvania Game
Commission, via the U.S. Geological Survey’s Bird Banding Lab, tracks mortalities of animals
as reported by hunters (including year and cause of death) and records information about the sex
(Male, Female, Unknown), age (Hatch Year [HY], After Hatch Year [AHY], Unknown), and
region (Piedmont, Non-Piedmont) where animals are banded and harvested (see Methods for
more details).
When modeling survival and reporting rates, better estimation of responses to hunting
can be obtained by using demographic and regional information. Male and female survival and
reporting rates are expected to be relatively similar due to shared parental duties (e.g. incubation
and feeding) (Hitchcock and Mirarchi, 1984) and similar hunter harvest rates are likely because
the sexes are indistinguishable in the field.. The primary difference between Piedmont and non-
Piedmont regions is of primary importance for this report. This roughly represents the Northwest
and Southeast portions of Pennsylvania (Fig. 2). Hunting pressure is hypothesized to be different
between the regions, with higher hunting rates in the Piedmont due to an increased amount of
farmland ideal for hunting (L. Williams, pers. comm.).

Figure 2: Mnon-Piedm
METHO
W
survival a
before th
birds. So
Bands ar
for mour
W
recovery
regions (
Map of Pennsymont for purpos
ODS
We utilized d
and reportin
he hunting se
me birds ban
re routinely a
ning doves t
We used ArcM
regions of a
Fig. 3). Thi
ylvania regionsses of the analy
data collected
ng rates of m
eason and du
nded in 2004
applied to do
typically last
Map 10.2.2
all individua
is allowed us
s. The Piedmonysis (Zimmerm
d by L. Willi
ourning dov
uring the hun
4 received re
oves in the su
ts from Sept
(ESRI 2014)
ls, separatin
s to test regio
nt region is labman, 2011)
iams (Penns
ves from 200
nting season
eward bands
ummer betw
tember to Jan
) to plot prov
g mourning
onal differen
beled, with all o
sylvania Gam
03-2013. Do
hunters repo
s, but this inf
ween July and
nuary (Seam
vided coordi
doves into P
nces in survi
other regions b
me Commiss
oves were ba
orted harves
formation w
d August. H
mans and San
inate data of
Piedmont an
ival.
being summariz
sion) to asse
anded each y
sted or dead
was not provi
Hunting seas
nders, 2014)
f banding an
nd Non-Piedm
zed as
ss
year
ded.
son
.
nd
mont

Figure 3: M
W
rates by r
a Seber D
reporting
interval.
(i.e. (1-S)
cannot be
D
banding l
Map of Pennsy
We used Prog
region, year,
Dead Recove
g rates (r) ba
Recovery ra
)*r), but due
e estimated.
Due to limite
locations oc
ylvania depictin
gram MARK
, sex, or a co
ery model (S
sed on numb
ates are depe
e to a lack of
d data, only p
curred throu
ng all banding
K (White & B
ombination o
Seber, 1970)
ber of doves
endent on th
f reward ban
parameters w
ughout sever
locations betw
Burnham, 19
of parameter
, allowing fo
banded and
he individual
nd informatio
with sufficient
al ecoregion
ween 2003 and
999) to estim
rs (Table 1).
or estimation
d dead doves
l doves being
on across eac
t data availabl
ns within Pen
2013
mate surviva
We analyze
n of survival
s recovered (f
g killed and
ch year of th
le were consi
nnsylvania, w
l and reporti
ed the data us
l (S) and
(f) for each t
being report
he project, f
dered. Whil
we grouped
ing
sing
ime
ted
le
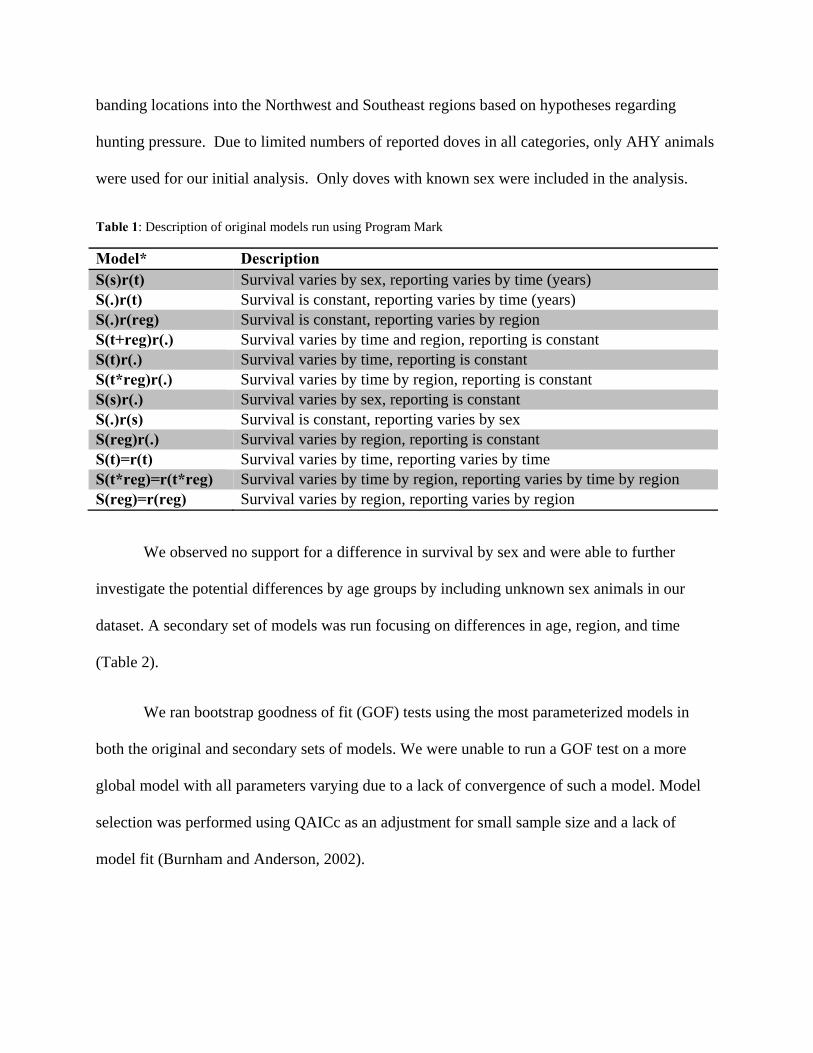
banding locations into the Northwest and Southeast regions based on hypotheses regarding
hunting pressure. Due to limited numbers of reported doves in all categories, only AHY animals
were used for our initial analysis. Only doves with known sex were included in the analysis.
Table 1: Description of original models run using Program Mark
Model* Description S(s)r(t) Survival varies by sex, reporting varies by time (years) S(.)r(t) Survival is constant, reporting varies by time (years) S(.)r(reg) Survival is constant, reporting varies by region S(t+reg)r(.) Survival varies by time and region, reporting is constant S(t)r(.) Survival varies by time, reporting is constant S(t*reg)r(.) Survival varies by time by region, reporting is constant S(s)r(.) Survival varies by sex, reporting is constant S(.)r(s) Survival is constant, reporting varies by sex S(reg)r(.) Survival varies by region, reporting is constant S(t)=r(t) Survival varies by time, reporting varies by time S(t*reg)=r(t*reg) Survival varies by time by region, reporting varies by time by region S(reg)=r(reg) Survival varies by region, reporting varies by region
We observed no support for a difference in survival by sex and were able to further
investigate the potential differences by age groups by including unknown sex animals in our
dataset. A secondary set of models was run focusing on differences in age, region, and time
(Table 2).
We ran bootstrap goodness of fit (GOF) tests using the most parameterized models in
both the original and secondary sets of models. We were unable to run a GOF test on a more
global model with all parameters varying due to a lack of convergence of such a model. Model
selection was performed using QAICc as an adjustment for small sample size and a lack of
model fit (Burnham and Anderson, 2002).

Table 2: Description of secondary models run after adding in unknown individuals
Model Description
{S(age) r(t)} Survival varies by age, reporting varies by time (years) {S(t*reg) r(.)} Survival varies by time (years) by region, reporting is constant {S(age) r(.)} Survival varies by age, reporting is constant {S(t+reg) r(.)} Survival varies by time (years) and region, reporting is constant {S(t) r(.)} Survival varies by time (years), reporting is constant {S(.) r(age)} Survival is constant, reporting varies by age {S(.) r(t)} Survival is constant, reporting varies by time (years) {S(reg) r(.)} Survival varies by region, reporting is constant {S(.) r(reg)} Survival is constant, reporting varies by region {S(age) r(reg)} Survival varies by age, reporting varies by region {S(t) = r(t)} Survival varies by time (years), reporting varies by time (years) {S(t*reg) = r(t*reg)}
Survival varies by time (years) by region, reporting varies by time (years) by region
{S(.) r(age)} Survival is constant, reporting varies by age {S(reg) = r(reg)} Survival varies by region, reporting varies by region {S(t*age) r(t*age)}
Survival varies by time (years) by age, reporting varies by time (years) by age
We also investigated other model structures on reporting rate for both original and
secondary sets of models based on visualizations of reporting rates over the years (See Results,
Fig. 6 for more detail). This model had survival varying by age and reporting rates for the years
2003, 2010-2013 held equal and reporting rates for 2004 – 2009 held equal (S(age)
r(1=8,9,10,11, 2-7)).
RESULTS
The total number of mourning doves banded from 2003-2013 was 15,570 (Fig. 4). Of the
banded birds, 2,437 were banded in the Piedmont. Only 87 of the 532 reported birds were
reported in the Piedmont.

Figure 4: T
E
banded a
Our seco
reported
although
Total animals b
Excluding an
animals (3,69
ondary analy
(approximat
fewer birds
banded per yea
imals with u
90 males, 1,0
sis was cond
tely 4%). On
were origin
ar by region (to
unknown sex
003 females)
ducted on 14
nly 83 of the
nally banded
op) and reporte
x, our origina
), of which o
4,703 banded
e 586 reporte
in the Piedm
ed per year by r
al analyses w
only 197 wer
d animals, of
ed birds were
mont (2,215)
region (bottom
were conduc
re reported (
f which only
e from the P
).
m)
cted on 5,369
(3.7%; Fig. 5
y 586 were
Piedmont reg
9
5).
gion,

Figure 5: T
T
our hypo
bootstrap
model c-
reporting
were held
7)). From
rates wer
(non-Pied
Confiden
Total numbers
To investigate
otheses conce
p GOF test o
hat by 2.471
g rates that v
d equal and r
m this model
re found to b
dmont, years
nce Intervals
of banded and
e differences
erning mour
on the most p
1. Our top ra
ary by regio
reporting rat
S is estimat
be 0.0519 (Pi
s 1, 8-11), an
s are provide
d reported male
s in sex, regi
rning dove su
parameterize
anked model
ons and by ye
tes for 2004
ted as 0.528
iedmont, yea
nd 0.030 (no
ed in Table 4
e and female bi
ion, and tim
urvival (S) a
ed model (S(
(w = 0.999)
ears: reportin
– 2009 were
(SE ± 0.041
ars 1, 8-11),
on-Piedmont
4.
irds per region
e, we ran mo
and reporting
(t*reg)r(.)) p
) allowed for
ng rates for t
e held equal
, 95% CI =
0.0243 (Pie
t, years 2-7).
n from 2003-20
odels (n = 13
g rate (r) (Ta
prompted us
r a constant
the years 20
(S(.) r(reg,
0.446 – 0.60
edmont, year
. Standard er
013
3) to investig
able 3). The
to adjust the
survival rate
003, 2010-20
1=8,9,10,11
09). Reportin
rs 2-7), 0.118
rrors and 95
gate
e
e and
013
, 2-
ng
8
%

Table 3: Survival and reporting rate original models for mourning doves banded in Pennsylvania from 2003 – 2013
Model Δ QAICc
QAICc Weights
Model Likelihood
Num. Par
QDeviance -2log(L)
S(.)r(reg, 1=8-11, 2-7)
0 0.99922 1 5 108.5854 2145.678
S(.)r(reg) 14.8249 0.0006 0.0006 3 127.417 2192.211S(.)r(t) 20.0008 0.00005 0.0001 12 114.5392 2160.39S(s)r(.) 20.2811 0.00004 0 3 132.8733 2205.693S(.)r(s) 20.6089 0.00003 0 3 133.201 2206.503S(r)r(.) 20.69 0.00003 0 3 133.2821 2206.703S(s)r(t) 21.0041 0.00003 0 13 113.5327 2157.903S(t+reg)r(.) 27.579 0 0 12 122.1174 2179.115S(t)r(.) 28.4048 0 0 12 122.9432 2181.156S(t*reg)r(.) 44.1776 0 0 23 116.5676 2165.402S(t)=r(t) 111.491
7 0 0 11 208.039 2391.428
S(t*reg)=r(t*reg) 128.4744
0 0 22 202.8817 2378.684
S(reg)=r(reg) 262.45 0 0 2 377.0443 2809.04* Variables are time (t), region (reg), sex (s), and constant (.)
Table 4: Reporting rates and confidence intervals for highest ranking model
Region Years Reporting Rate (r) Standard Error 95% CI Piedmont 1, 8-11 0.0519 0.0092 (0.0365, 0.0731) Piedmont 2-7 0.0242 0.0048 (0.0164, 0.0357)
Other 1, 8-11 0.1182 0.0273 (0.0743, 0.1831) Other 2-7 0.0302 0.0114 (0.0144, 0.0626)
We chose to set r equal for the years 2003, 2010—2013 and 2004—2009 due to strong
evidence from a preliminary time-varying model (S (.) r (t)) that recovery rates varied by these
year groups (Fig. 6). For this model, r ranged from 0.022 to 0.029 for 2004—2009, and from
0.052 to 0.076 for 2003, 2010—2013.

Figure 6: Mourning dove reporting rates by year
We found no support for a difference in survival or reporting rates by sex. We therefore
excluded sex in a set of secondary models (n = 15) and were able to include animals with
unknown sex to increase sample size and be able to investigate potential effects of age (HY vs.
AHY). The bootstrap GOF test on the most parameterized model (S(t*reg)r(.)) prompted us to
adjust the model c-hat by 1.804. We found support for two top models (Table 5). The effect of
age on survival was supported along with a constant effect on reporting rate (S(age)r(.); w =
0.56) or an effect of time (S(age)r(t); w = 0.33). Due to their high QAICc weights, we model
averaged the two.
Our top ranked model (w = 0.951) had survival varying by age and reporting rates for the
years 2003, 2010-2013 held equal and reporting rates for 2004 – 2009 held equal (S(age)
r(1=8,9,10,11, 2-7)). From this model, HY survival was 0.288 (SE ± 0.032, 95% CI = 0.229 –
0.356) and AHY survival was 0.509 (SE ± 0.030, 95% CI = 0.450– 0.568). Reporting rate for
0
0.01
0.02
0.03
0.04
0.05
0.06
0.07
0.08
0.09
0.1
2002 2003 2004 2005 2006 2007 2008 2009 2010 2011 2012 2013 2014
Reporting Rate
Year
Mourning Dove Recovery (r) by Year

2003, 2010-2013 was r = 0.052 (SE ± 0.004, 95% CI = 0.045 – 0.061) and for 2004-2009 was r =
0.038 (SE ± 0.003, 95% CI = 0.033 – 0.043).
Table 5: Survival and reporting rate secondary models for mourning doves banded in Pennsylvania from 2003 – 2013
Model Δ QAICc QAICc Weights
Model Likelihood
Num. Par
QDeviance -2log(L)
S(age) r(1=8-11, 2-7)
0 0.9508 1 4 228.1703 6179.02
S(age) r(.) 7.1009 0.0273 0.0287 3 237.2724 6195.44S(age) r(t) 8.1377 0.01626 0.0171 13 218.2861 6161.189S(.) r(age) 10.4991 0.00499 0.0052 3 240.6706 6201.571S(t+reg) r(.) 15.73 0.00037 0.0004 12 227.8819 6178.5S(t) r(.) 16.3164 0.00027 0.0003 12 228.4683 6179.558S(t*reg) r(.) 21.7237 0.00002 0 23 211.8216 6149.527S(reg) r(.) 25.6853 0 0 3 255.8568 6228.966S(.) r(t) 29.6844 0 0 12 241.8362 6203.673S(.) r(reg) 33.6792 0 0 3 263.8507 6243.388S(age) r(reg)} 268.857 0 0 2 501.0293 6671.258S(t) = r(t) 320.3302 0 0 11 534.4854 6731.612S(t*reg) = r(t*reg) 431.3722 0 0 22 623.4763 6892.152S(.) r(age)} 544.3196 0 0 4 772.49 7160.973S(reg) = r(reg) 618.3441 0 0 2 850.5164 7301.732S(t*age) r(t*age)} 673.5975 0 0 12 885.7494 7365.293* Variables are time (t), region (reg), age, and constant (.)
DISCUSSION
As we hypothesized, our best-supported model showed no differences in mourning dove
survival or reporting rate by sex. In addition, we found no differences in reporting or survival
rates of mourning doves between the Piedmont and the non-Piedmont regions of Pennsylvania.
Reporting rate did vary by year, with consistently lower reporting rates from 2004 to 2009
compared to 2003 and 2010 to 2013. Our best-supported model found no differences in dove
survival by year.

After finding no differences by sex in survival or reporting rate, we were able to run a
second set of models which included birds of unknown sex and age, since any differences could
be attributed to age alone. Of the models that included these unknown birds, our best-supported
model showed differences in survival by age and differences in reporting rate by year. Therefore,
it appears that HY mourning dove survival was lower than AHY survival, and that survival
differed by year as in our first set of models.
These findings on mourning doves are similar to those of a study of mourning dove
demographic characteristics in western Oklahoma (Lewis and Morrison, 1978). In this study, 410
of the 14,088 doves banded were recovered, mostly from hunter harvest. The top-rated model
accounted for a time-varying recovery rate and a constant survival rate (as our best-supported
model did) (Lewis and Morrison, 1978). Survival did not vary by sex, and both age classes were
grouped due to very little adult recovery data (Lewis and Morrison, 1978).
Additionally, the latest report from the US Fish and Wildlife Service estimated survival
and harvest rates for mourning doves in the past 11 years in the eastern United States. These
estimates concluded that annual harvest rate was higher for HY individuals compared to AHY
individuals (HY rate 42% greater than AHY harvest rate). However, these estimates were
obtained by examining a much larger region than the state of Pennsylvania alone (Seamans and
Sanders, 2014).
A further study performed synthesized demographic information on a national scale to
examine relationships between annual survival and harvest rates of mourning doves. Similar to
our analysis, this study utilized program Mark to analyze the predictive ability of various models.
The top model of this study showed indicated survival rate varying by age class and by region

and recovery varying by age class and region by time (Otis, 2002). Our top model did not
indicate this same variation by region. However, this study was done at a much larger scale than
ours and so variation by region is to be expected (Otis, 2002).
Limitations of the Data
Our analyses of the banding data were limited by several aspects of the dataset. For
example, sex was unknown for many of the banded birds. In order to analyze the data for
differences in survival and reporting rate by this variable, we had to first remove all birds with
unknown sex from the analysis. However, after removing these birds, our models did not provide
evidence of survival or reporting rate varying by sex. Also, because there were not enough data
on HY birds to include age in our analysis, we considered only the AHY birds in our initial
models. However, because our models found no differences by sex, we were then able to include
the unknown birds in our later models to examine potential differences by age.
In addition, while some birds were banded with reward bands in 2004, the data available
for each bird did not include any indication of whether a bird was given a reward band.
Therefore, the effect of reward bands could not be modeled even in models accounting for
differences by year. However, because the reporting rate for 2004 (r = 0.028) was similar to that
for other years (r for 2005 to 2009 ranges from 0.02 to 0.04), it is unlikely that any effect of
reward bands in that year is responsible for our models showing reporting rate varying across the
eleven years (see Fig. 5).
Although the primary objective of the analysis was to determine whether survival and
recovery rates differed by the two regions, the numbers of banded and recovered birds for the
Piedmont region were much smaller than those for the non-Piedmont region (Fig. 4 and 5). This
may have restricted our ability to detect a difference between the regions due to low sample size.

LITERATURE CITED
Aldrich, J.W. 1993. Classification and distribution in ecology and management of the mourning
dove. Editors Baskett, T.S., Sayre, M.W., Tomlinson, R.E., Mirarchi, R.E. Stackpole
Books, Harrisburg, PA, USA. pgs. 47-54.
Burnham, K.P. and Anderson, D.R. 2002. Model selection and multi-modal inference: a practical
information-theoretic approach. 2nd edition. Springer-Verlag, New York, USA.
ESRI. 2014. ArcMap. Version 10.2.2. Environmental Systems Research Institute, Inc. Redlands,
CA, USA. Available http://support.esri.com/en/downloads.
Hitchcock, R.R. and Mirarchi, R.E. 1984. Duration of dependence of wild fledgling mourning
doves upon parental care. The Journal of Wildlife Management 48: 99-108.
Lewis, J.C., and Morrison, J.A. 1978. Some demographic characteristics of mourning dove
populations in western Oklahoma. Oklahoma Cooperative Wildlife Research Unit,
Oklahoma State University, Stillwater, OK, USA. Available
http://digital.library.okstate.edu/oas/oas_pdf/v58/p27_31.pdf. (Accessed: 28 April 2015).
Kansas Department of Wildlife, Parks, and Tourism (KDWPT). 2014. Doves. Available
http://kdwpt.state.ks.us/news/Hunting/Migratory-Birds/Doves. (Accessed: 27 April
2015).
NatureServe. 2007. NatureServe Web Service. Arlington, VA. U.S.A. Available
http://www.tnwatchablewildlife.org. (Accessed: 10 April 2015).
Otis, David. 2002. Survival models for harvest management of mourning dove populations. The
Journal of Wildlife Management 66: 1052-1063.

Seamans, M.E. and Sanders, T.A. 2012. Mourning dove population status, 2012. U.S.
Department of the Interior, Fish and Wildlife Service, Division of Migratory Bird
Management, Washington, D.C. Available
http://www.fws.gov/migratorybirds/MourningDove.pdf.
Seamans, M.E. and Sanders, T.A. 2014. Mourning dove population status, 2014. U.S.
Department of the Interior, Fish and Wildlife Service, Division of Migratory Bird
Management, Washington, D.C. Available
http://www.fws.gov/migratorybirds/MourningDove.pdf.
Seber, G.A.F. 1970. Estimating time-specific survival and reporting rates for adult birds from
band returns. Biometrika 57: 313-318.
White, G.C. and Burnham, K.P. 1999. Program MARK: survival estimation from populations of
marked animals. Bird Study 46(Supplement): 120-138.
Zimmerman, E. 2011. Pennsylvania Natural Heritage Program. Oak-Mixed Hardwood Palustrine
Forest Factsheet. Available http://www.naturalheritage.state.pa.us/. (Accessed: 15 April
2015).
Related Documents