POLICY RESEARCH WORKING PAPER 3 071 Survey Techniques to Measure and Explain Corruption Ritva Reinikka Jakob Svensson The World Bank Development Research Group Public Services June 2003 Public Disclosure Authorized Public Disclosure Authorized Public Disclosure Authorized Public Disclosure Authorized Public Disclosure Authorized Public Disclosure Authorized Public Disclosure Authorized Public Disclosure Authorized

Welcome message from author
This document is posted to help you gain knowledge. Please leave a comment to let me know what you think about it! Share it to your friends and learn new things together.
Transcript

POLICY RESEARCH WORKING PAPER 3 071
Survey Techniques to Measureand Explain Corruption
Ritva ReinikkaJakob Svensson
The World BankDevelopment Research Group
Public ServicesJune 2003
Pub
lic D
iscl
osur
e A
utho
rized
Pub
lic D
iscl
osur
e A
utho
rized
Pub
lic D
iscl
osur
e A
utho
rized
Pub
lic D
iscl
osur
e A
utho
rized
Pub
lic D
iscl
osur
e A
utho
rized
Pub
lic D
iscl
osur
e A
utho
rized
Pub
lic D
iscl
osur
e A
utho
rized
Pub
lic D
iscl
osur
e A
utho
rized
| POLICY RESEARCH WORKING PAPER 3071
Abstract
Reinikka and Svensson demonstrate that, with these surveys permit measurement of corruption at theappropriate survey methods and interview techniques, it level of individual agents, such as schools, health clinics,is possible to collect quantitative micro-level data on or firms. They also permit the study of mechanismscorruption. Public expenditure tracking surveys, service responsible for corruption, including leakage of fundsprovider surveys, and enterprise surveys are highlighted and bribery, as data on corruption can be combined withwith several applications. While often broader in scope, other data collected in these surveys.
This paper-a product of Public Services, Development Research Group-is part of a larger effort in the group to measureand explain corruption at micro level and to explore its effects on service delivery. Copies of the paper are available freefrom the World Bank, 1818 H Street NW, Washington, DC 20433. Please contact Hedy Sladovich, room MC3-607,telephone 202-473-7698, fax 202-522-1154, email address [email protected]. Policy Research Working Papersare also posted on the Web at http:H/econ.worldbank.org. The authors may be contacted at [email protected] [email protected]. June 2003. (16 pages)
The Policy Research Working Paper Series disseminates the findings of work in progress to encourage the exchange of ideas aboutdevelopment issues. An objective of the series is to get the findings out quickly, even if the presentations are less than fully polished. Thepapers carry the names of the authors and should be cited accordingly. The findings, interpretations, and conclusions expressed in thispaper are entirely those of the authors. They do not necessarily represent the view of the World Bank, its Executive Directors, or thecountries they represent.
Produced bv PartnershiDs. Cavacitv Building. and Outreach
Survey Techniques to Measure and Explain Corruption
Ritva ReinikkaResearch Manager, Development Research Group, World Bank
1818 H Street, N.W., Washington, DC 20433E-mail: rreinikka(a)worldbank.org.Website: www.publicspending.org
Jakob SvenssonSenior Economist, Development Research Group, World Bank
1818 H Street, N.W., Washington, DC 20433Institute for International Economic Studies, Stockholm University,
10691 Stockholm, SwedenEmail: iakob.svensson(0iies.su.se
Website: www.iies.su.se /-svenssoj/
We thank conference participants at the University of East Anglia (UK) for useful comments andsuggestions.

1. Introduction
The past decade has witnessed a boom in the empirical economic literature oncorruption. With few exemptions, the existing literature has three common features.' First,it is based on cross-country analyses. 2 Second, the literature exploits data on corruptionderived from perception indices. Finally, it explains corruption as a function of countries'policy and institutional environment. Although the literature has provided importantinsights on the aggregate determinants of corruption, it has drawbacks. In particular,perception indices raise concerns about biases. Also, the aggregate nature of the data tellsus little about the relationship between corruption and individual agents, such as firms orservice providers. Conceptually macro-level determinants cannot satisfactorily explain thewithin-country variation of corruption; firms and service providers facing similarinstitutions and policies may still end up paying or demanding different amounts in bribes.
The quantitative measurement of corruption is difficult, but not impossible. Weshow this using three different data collection approaches: public expenditure trackingsurveys, service provider surveys, and firm surveys. Although each approach has a moregeneral focus, corruption-broadly defined-is often identified as a key issue.
The rest of the paper is organized as follows. Section 2 discusses the key featuresand findings of the expenditure tracking surveys (PETS) in education and health carewhere the focus is on leakage of public funds. Section 3 looks at the experience withprovider surveys to explore incentives and performance problems, such as absenteeism, onthe frontline. Section 4 presents the fnmn-level approach and discusses key findings on theincidence, level, and effects of corruption on enterprise performance. Section 5 concludeswith a discussion on policy implications.
2. Public Expenditure Tracking Surveys (PETS)
Government resources allocated for particular uses flow within a legally definedinstitutional framework. Funds often pass through several layers of governmentbureaucracy on the way to service facilities, which are charged with the responsibility ofexercising the spending. Policymakers in developing countries seldom have information onactual public spending at the provider or facility level or by activity. A public expendituretracking survey (PETS) tracks the flow of resources through these strata, on a samplesurvey basis, in order to determine how much of the originally allocated resources reacheach level. It is therefore useful as a method for locating and quantifying political andbureaucratic capture, leakage of funds, and problems in the deployment of human and in-
1. See Svensson (2003a).
2. Recent contributions on the determninants of corruption include Ades and di Tella (1997, 1999),Persson, Tabellini, and Trebbi (2003), Svensson (2000a), and Treisman (2000). On the effects of corruption,see Mauro (1995), Wei (1997), and Johnson and others (1997).
I

kind resources, such as staff, textbooks, and drugs. A typical PETS of frontline providers
(schools and clinics and their staff) and local governments (politicians and public officials)
is complemented by central government financial data.
The PETS explicitly recognizes that an agent may have a strong incentive to
misreport. These incentives derive from the fact that information provided, for example, by
a school or a health facility partly determines its entitlement to public support. In cases
where resources, including staff time, are used for corruption or shirking, the agent
involved in the activity will most likely not report it truthfully. Likewise official charges
may only partly capture what the survey intends to measure (such as the user's cost of
service). The PETS deals with these data issues by (i) using a multiangular data collection
strategy (a combination of information from different sources); and (ii) carefully
considering which sources and respondents have incentives to misreport, and identifying
data sources that are the least contaminated by such incentives. This data collection
strategy serves to cross-validate the information obtained separately from each source.
The PETS allows us to observe the outputs and actions of service providers, andthereby provide new information to policymakers and beneficiaries on the complex
transformation of public budgets to services. When tailored to the specific circumstances,
these tools can help identify incentives and shed light on the interactions which these
incentives give rise to, such as collusion and bribery. They can also illuminate the political
economy, such as the effect of interest groups on spending outcomes. The novelty of the
PETS approach lies not so much in the development of new methods of analysis per se, but
the application proven methods (micro surveys) to service providers and governments.
2.1 Using PETS to Measure Corruption
Uganda was the first country to do a PETS in 1996. The study was motivated by
the observation that despite a substantial increase in public spending on education, the
official reports showed no increase in primary enrollment. The hypothesis was that actual
service delivery, proxied by primary enrollment, was worse than budgetary allocations
implied because public funds were subject to capture (by local politicians and public
officials) and did not reach the intended facilities (schools). To test this hypothesis, a PETS
was conducted to compare budget allocations to actual spending through various tiers of
government, including frontline service delivery points, which in this involved primary
schools (Ablo and Reinikka 1998; Reinikka 2001).
Adequate public accounts on actual spending were not available, so the survey
collected five years of data on spending (including in-kind transfers), service outputs, and
provider characteristics in 250 government primary schools. The initial objective of the
PETS was purely diagnostic, that is, to measure leakage in school funding. As sections 2.2
2
and 2.3 show, a PETS can also provide quantitative data on and explain leakage of publicfunds, as well as serve as a tool for impact evaluation.
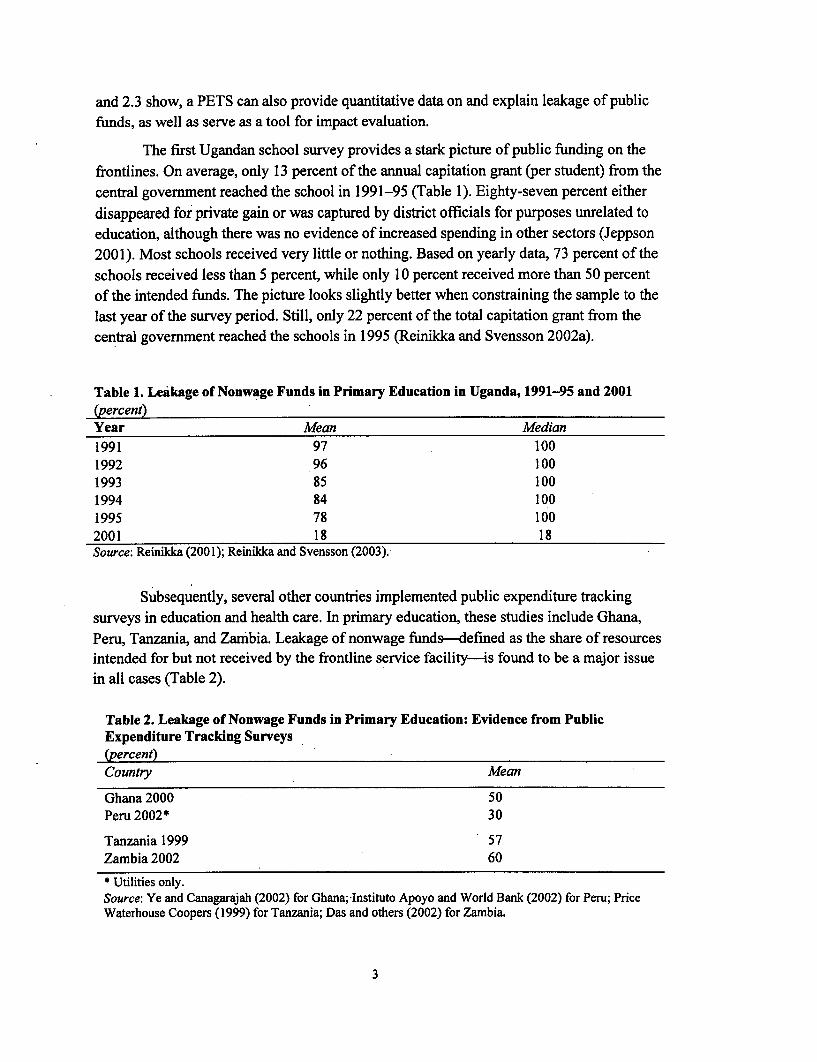
The first Ugandan school survey provides a stark picture of public funding on the
frontlines. On average, only 13 percent of the annual capitation grant (per student) from thecentral government reached the school in 1991-95 (Table 1). Eighty-seven percent either
disappeared for private gain or was captured by district officials for purposes unrelated toeducation, although there was no evidence of increased spending in other sectors (Jeppson2001). Most schools received very little or nothing. Based on yearly data, 73 percent of the
schools received less than 5 percent, while only 10 percent received more than 50 percentof the intended funds. The picture looks slightly better when constraining the sample to thelast year of the survey period. Still, only 22 percent of the total capitation grant from thecentral government reached the schools in 1995 (Reinikka and Svensson 2002a).
Table 1. Leakage of Nonwage Funds in Primary Education in Uganda, 1991-95 and 2001(percent)Year Mean Median
1991 97 1001992 96 1001993 85 1001994 84 1001995 78 1002001 18 18Source: Reinikka (2001); Reinikka and Svensson (2003).
Subsequently, several other countries implemented public expenditure trackingsurveys in education and health care. In primary education, these studies include Ghana,Peru, Tanzania, and Zambia. Leakage of nonwage funddefined as the share of resourcesintended for but not received by the frontline service facility-is found to be a major issuein all cases (Table 2).
Table 2. Leakage of Nonwage Funds in Primary Education: Evidence from PublicExpenditure Tracking Surveys(percent)Country Mean
Ghana 2000 50Peru 2002* 30
Tanzania 1999 57Zambia 2002 60
* Utilities only.Source: Ye and Canagarajah (2002) for Ghana; Instituto Apoyo and World Bank (2002) for Peru; PriceWaterhouse Coopers (1999) for Tanzania; Das and others (2002) for Zambia.
3

According to the PETS in Zambia-unlike in Uganda in the mid-1 990s-rule-
based allocations seemed to reach the intended beneficiaries: more than 90 percent of allschools received their rule-based nonwage allocations, and 95 percent of teachers receivedtheir salaries (Das and others 2002). But rule-based funding accounts only for 30 percent
of all funding. In discretionary allocations (70 percent of the total spending) the positiveresults no longer hold: less than 20 percent of schools receive any funding fromdiscretionary sources. The rest is spent at the provincial and district level. Similarly, in thecase of overtime allowances (which must be filed every term) or other discretionary
allowances, 50 percent were overdue by six months or more.
A few studies also quantify the share of ghosts on the payroll, that is, teachers orhealth workers who continue to receive a salary but who no longer are in government
service, or who have been included in the payroll without ever being in service. In
Honduras, for example, 5 percent of teachers on the payroll were found to be ghosts, whilein health care the percentage was 8.3 for general practitioners in 2000 (World Bank 2001).In Africa, the comparable figures are higher: 20 percent in Uganda in 1993 (Table 3).
Table 3. Ghost Workers on Payroll
(percent)Ghosts workers
Country Education HealthHonduras 2000 5.0 8.3Uganda 1993 20.0- Not available.Source: World Bank (2001) for Honduras; Reinikka (2001) for Uganda.
Taken together, the PETS carried out in Africa found leakage of nonwage funds on
a very large scale. Salaries and allowances also suffer from leakage but to a much lesserextent. Given that availability of books and other instructional materials are key toimproving the quality of schooling, the fact that between 87 percent (Uganda) and 50percent (Ghana) of the funding for these inputs never reach the schools makes leakage amajor policy concern in the education sector. Instead of instituting more general publicsector reforms, the PETS in Uganda shows that it may be more efficient to target reformnsand interventions at specific problem spots. For example, the PETS in 1996 pointed to the
fact that nonwage expenditures are much more prone to leakage than salary expenditures.They also demonstrate that leakage occurs at specific tiers within the government(typically at the local governments in Tanzania, Uganda, and Zambia). This knowledge can
be exploited to implement more focused and hence more efficient interventions.
4

2.2 Explaining Capture of Public Funds
A striking feature of the Uganda (PETS) data is that although a majority of schoolsdid not receive funding (in a given year), there was still large variation in leakage acrossschools. Reinikka and Svensson (2002a) develop a simple bargaining model to explain thisvariation. In the model, resource flows-and leakage-are endogenous to schoolcharacteristics, as schools use their bargaining power vis-a-vis other parts of thegovernment to secure greater shares of the funding. Specifically, in the absence of central
govermment oversight, local government officials and schools bargain over nonwageexpenditures disbursed by the central government to local governments (districts). The
district is supposed to pass the grant on to schools. Since district officials have discretion
over these funds, only they know the amount of monthly trarnsfers (which varies frequently
given cash budgeting). In principle, a school could obtain information on disbursements of
the capitation grant, but in practice contacting the central government is costly.
Even if the school decides to pay for obtaining the necessary information,exercising their voice (see Hirschman 1970) is also costly. It would require organizing the
parents and teachers and lodging a complaint with higher authorities. The key implicationof the model is that resources are not allocated according to the rules underlying the
government's budget decisions, with obvious equity and efficiency implications.
As shown in Reinikka and Svensson (2002a), the model's predictions are
confirmed in the data obtained from PETS. Specifically, larger schools appear to receive a
larger share of the intended funds (per student). Schools with children of better-off parents
also experience a lower degree of leakage, while schools with a higher share of unqualified
teachers experience a higher leakage. After addressing potential selection, endogeneity,
and measurement issues, these school characteristics have a quantitatively large impact on
the degree of leakage. A 1-percent increase in school size (evaluated at the mean of allexplanatory variables) reduces leakage by 2 percentage points. A 1-percent increase in
household income (proxied by PTA fees) increases the amount of public funding thatreaches the school by 0.25 percentage points, and a similar increase in the share of
qualified teachers reduces leakage by 0.27 percentage points.
These findings provide new insights into an area almost exclusively studied using
cross-country data. They show that a large part of the variation in corruption at the local
level can be explained by studying the interaction between local officials and end-users(schools in this case) as a bargaining game. From an analytical point of view, this approach
differs from much of the existing literature on corruption, since it focuses on theprincipal's (the school's) rather than the agent's (the district official's) incentives and
constraints.
5

2.3. Evaluating Impact of a Public Information Campaign
Following publication of the first PETS findings in 1996, the Ugandan centralgovernment made a swift attempt to remedy the situation. It began publishing the monthlyintergovernmental transfers of public funds in the main newspapers, broadcastinginformation on them on radio, and requiring prinmary schools to post information oninflows of funds for all to see. This not only made information available to parent-teacherassociations (PTA), but also signaled local governments that the center had resumed itsoversight function. An evaluation of the information campaign-using a repeatPETS-reveals great improvement. While schools on average are still not receiving the
entire grant (and there are delays) capture has been reduced from on average 78 percent in1995 to 18 percent in 2001 (Table 1).
A before-after comparison for the same schools in 1995 and 2001-and controllingfor a broad range of school-specific factors, such as household income, teacher education,school size, and degree of supervision-suggests that the information campaign canexplain two-thirds of this massive improvement (Reinikka and Svensson 2003). This islikely to be an upper bound on the effect, since it cannot distinguish the effect of theinformation campaign from other policy actions or changes that simultaneously influencedall schools' ability to claim their entitlement.
A key component in the information campaign was making monthly transfers ofpublic funds to the districts public in newspapers. Thus, schools with access to newspapershave been more extensively exposed to the information campaign. Interestingly, in 1995,
schools with and without access to newspapers suffered just as much from local capture.From 1995 to 2001, both groups experienced a large drop in leakage, which is consistentwith the before-after findings. However, the reduction in capture is significantly higher forthe schools with newspapers; these schools on average increased their funding by 10percentage points more than the schools that lacked newspapers. The results hold alsowhen controlling for differences in income, school size, staff qualifications, and theincidence of supervision across the two groups.
With a relatively inexpensive policy action-provision of massinformation-Uganda has dramatically reduced capture of a public program to increaseprimary education. Poor schools, being less able to claim their entitlement from the district
officials before the campaign, benefited most from the information campaign.
3. Frontline Provider Surveys
Service provider surveys are increasingly used to examine the efficiency of publicspending, incentives and various dimensions of service delivery in provider organizations,especially on the frontline. The quantitative service delivery survey (QSDS) is a variant ofthese provider surveys, with a heavy emphasis on systematic quantitative data. It can be
6

applied to government, private for-profit, and not-for-profit providers. It collects data oninputs, outputs, quality, pricing, oversight, and so forth. The facility or frontline serviceprovider is typically the main unit of observation in a QSDS in much the sarne way as thefirm is in enterprise surveys and the household is in household surveys. A QSDS requiresconsiderable effort, cost, and time compared to some of its alternatives, especially
surveying perceptions.
A QSDS-type survey conducted in Bangladesh made unannounced visits to healthclinics with the intention of discovering what fraction of medical professionals werepresent at their assigned post (Chaudhury and Hammer 2003). The survey quantified theextent of this problem on a nationally representative scale and collected other informationas well. Absentee rates for medical providers in general are quite high (35 percent), andhigher for doctors (40 percent; and 74 percent at lower-level health facilities).3
Determinants of staff absenteeism include whether the medical provider lives near the
health facility, has access to a road, or has an electricity connection.4-
Table 4. Absence Rates among Teachers and Health-Care Workers in the Public Sector
(percent)Country Primary schools Primary health facilitiesBangladesh 2002 - 35Honduras 2000 14 27India* 2002 23 43Peru 2002 13 26Uganda 2002 26 35Zambia 2002 17- Not available.* Average for 14 States.Source: Chaudhury and Hammer (2003) for Bangladesh; Chaudhury and others (2003) for India, Peru, andUganda; World Bank (2001) for Honduras; Habyarimana and others (2003) for Zambia.
Honduras used a combination of PETS and QSDS to diagnose moral hazard withrespect to frontline health and education staff (World Bank 2001). The study demonstratedthat even when salaries and nonwage funds reach frontline providers certain staff behaviorsand incentives in public service have an adverse effect on service delivery, particularlyabsenteeism and job capture by employees. Migration of posts (due to capture byemployees) was considered a major problem. The Honduran system of staffing assignsposts to the central ministry, not individual facilities. Because the central ministry hasdiscretion over the geographic distribution of posts, frontline staff have an incentive tolobby for having their posts transferred to more attractive locations, most often to urban
3. These rates do not separate excused and unexcused absences, but compare the staff roster to thosewho were physically present at the time of the survey.
4. The average absence rate is the same in Ugandan health facilities, but even higher (43 percent) inIndia (Table 4). In schools absence rates are generally lower (35 percent).
7
areas. The implication is that posts migrate from the rural and primary level to cities and
higher levels of health care/schooling. This is neither efficient nor equitable.
The PETS/QSDS set out to quantify the incongruity between budgetary and realstaff assignments and determine the degree of attendance at work. It used centralgovernment information sources and a nationally representative sample of frontline
facilities in health and education. Central government payroll data indicated eachemployee's place of work. The unit of observation was both the facility and the staff
member, both operational and administrative, and included all levels of the two sectorsfrom the ministry down to the service facility level.
In health, the study found absenteeism to be generic, with an average attendance
rate of 73 percent across all staff categories (Table 4). Thirty-nine percent of absences
were without justifiable reason (such as sick leave, vacations, and compensation for extra
hours worked). This amounts to 1O percent of total staff work time. Multiple jobs wereprevalent, especially for general practitioners and specialists. Fifty-four percent of
specialist physicians had two or more jobs, and 60 percent of these were in a related field.
Five percent of sampled staff members had migrated to posts other than the one assigned tothem in the central database, while 40 percent had moved since their first assignment. The
highest proportions of migrators were found among general practitioners. Migration was
always from lower- to higher-level institutions, although there was also some lateralmigration. Job migration was found to reflect a combination of employee capture and
budget inflexibility.
In education, staff migration was highest among nonteaching staff and secondary
teachers. Multiple jobs in education were twice as prevalent as in health, with 23 percent of
all teachers doing two or more jobs. Finally, 40 percent of workers in the education sector
worked in administrative jobs suggesting, perhaps, a preference for nonfrontline service
employment, or perhaps deliberate employment creation on the part of the government.
The QSDS is still a new tool but the results of the first surveys are encouraging.
There are ongoing attempts-for which published results are not yet available-to use the
QSDS to measure other aspects of corruption and inefficiencies across service providers,
including drug leakage, wastage, and informal user fees.
4. Measuring and Understanding Corruption at the Firm-Level
Can reliable micro data on corruption really be collected from firms? Given the
secretive nature of corrupt activities, the common view has been that it is virtually
impossible to collect reliable quantitative information on corruption. Kaufmann (1997)
argues that this presumption is incorrect. With appropriate survey methods and interview
techniques, rmanagers are willing to discuss corruption with remarkable candor. At the
same time, in order to collect reliable information on graft at the firm level, it is crucial to
8

design an empirical strategy that gives the manager an incentive to cooperate and truthfullyreport their experiences with corruption.
One such attempt was carried out in the late 1990s in Uganda. A "standard" firm-level survey tool was used to collect quantitative information on bribe payments acrossfirms (Reinikka and Svensson 2001). The idea was to combine detailed financial and
structural information from the firms with the quantitative graft data, yielding a uniquedata set to study the determinants and consequences of corruption at the firm level.5
The empirical strategy to collect information on bribe payments across firms inUganda had the following four key components. First, a local industry association, UgandaManufactures'Association Consultancy and Information Service, implemented the survey.In Uganda, as in many other countries, there is a deep-rooted distrust of the public sector.To avoid suspicion of the overall objective of the data collection effort, it was thereforedecided that a body in which most firms had confidence should implement the survey.Second, the questions on corruption were phrased in an indirect manner to avoidimplicating the respondent of wrongdoing. Third, the corruption-related questions wereasked at the end of the interview, when the enumerator had had enough time to establishthe necessary credibility and trust. Finally, to enhance the reliability of the corruption data,multiple questions were asked on corruption in different sections of the questionnaire.Consistent findings across measures significantly increase the reliability of the data.6 Thedata collection effort was also aided by the fact that corruption had, to a large extent, beendesensitized in Uganda. Prior to the survey, several awareness-raising campaigns had beenimplemented on the consequences of corruption.7
A striking finding of the survey was the large variation in reported graft acrossfirms (Svensson 2003a). Since the Uganda firm-level survey was designed to berepresentative of the population of firms, why would some firms need to pay bribes whileothers do not? Clearly, there might be several reasons. For instance, firms deal with publicofficials who differ on the personal (moral) cost of demanding bribes. Public officials'perception of the likelihood of getting caught if being corrupt and the perceivedpunishment if found guilty may also differ. However, the most likely explanation is that
5. Kaufinann and Wei (1999) use firm-level data (based on the Global Competitiveness Report index)to assess the validation of the "grease argument," but the data is perception-based and derived from questionsreferring to country characteristics. Ades and di Tella (1999) utilize the same source but use countryaverages. Hellman and others (2000a,b) also use micro (firmn-level) data. The data from 20 countries isnumerical but ordinal (based on multicategory responses to questions.on corruption). In line with (andcomplementary to) the cross-country literature, they explain corruption as a function of the political-institutional environment (property rights protection and civil liberties).
6. The firm survey had a more general focus. The survey data have been used to evaluate the effects oftrade liberalization on firm productivity (Gauthier 2001), assess the bad news principle (Svensson 2000b),and study the effects of, and coping with, poor public service provision (Reinikka and Svensson 2002b).Reinikka and Collier (2001) summarize several of the findings from the firm survey.
7. See Ruzindana and others (1998) and World Bank (1998).
9

officials' opportunity to extract bribes, that is, their opportunity to influence the firms'business decisions and cash flows, differ across sectors and locations. With private firms,these control rights stem from the existing regulatory system and the discretion public
officials have over implementing, executing, and enforcing rules and benefits that affectfirms, such as business regulations, licensing requirements, permissions, taxes,exemptions, and public-goods provision.
How much must graft-paying firms then pay? As discussed in Svensson (2003a), if
the firms face the same set of rules and regulations and there are no differences in thenumber (or the extent) of interactions with the public sector, the answer must be firmspecific. Consider a firm forced to pay bribes to continue its operations and that isbargaining with a rent-maximizing public official. The official will try to extort as high abribe as possible, subject to the constraints that she might get caught and punished and thatthe firm might exit. Two firm-specific features would influence the magnitude of the graftdemand according to this bargaining hypothesis: the firm's ability to pay the bribe and thefirm's refusal power, that is, the cost of not paying.
In line with the control right hypothesis, the survey data reveal that there arestatistical differences between the group of firms that pay graft and the group of firms thatdon't. Firms that don't pay graft tend to have characteristics suggesting that they operate insectors with little or no contact with the public sector, that is, in the informal sector. Theyreceive significantly less public services, are less involved in foreign trade, and pay fewertypes of taxes, particularly when controlling for tax exemptions. This interpretation isfurther supported by the finding that firms reporting positive bribe payments spendsignificantly more time dealing with government regulations and more money onaccountants and specialized service providers to deal with regulations and taxes. In otherrespects, the two groups of firms are similar.
Consistent with the bargaining hypothesis, Svensson (2003a) finds that firms'"ability to pay," proxied by firms' current and expected future profitability, and firms'
"ability to refuse to pay," proxied by the expected cost of reallocation, can explain a largepart of the variation in bribes across graft-reporting firms. The results are statisticallyrobust and remained intact when instrumenting for profits. These results suggest thatpublic officials act as price (bribe) discriminators, demanding higher bribes (for a givenpublic service) from firms that can afford to pay, and demanding lower bribes from thosethat can credibly threaten to exit the market or use other means of acquiring the service.
Do bribe payments constitute a heavy burden on firms? The evidence suggests thatthey do. For the firms reporting positive bribes, the average amount of corrupt paymentswas equivalent to US$ 8,280, with a median payment of US$ 1,820. These are large
amounts, on average corresponding to US$ 88 per worker, or roughly 8 percent of the totalcosts (1 percent in the mean). Including firms reporting zero bribe payments, the averagepayment is US$ 6,730, with a median payment of US$ 450.
10

Approximately 50 percent of the firms reporting positive bribe payments paid morein grafts (annually) than for security (including guards and investment in security-relatedequipment). Almost 50 percent of the firms reported larger bribe payments than totalinvestment. 8
When assessing these data, it should be stressed that despite the data collectionstrategy, there are likely to be cases of misreporting in the sample. The average graftnumbers may be sensitive to such misreporting. The strategy used to collect information ongraft, however, has minimized any obvious systematic biases in the correlation betweenreported graft and the set of explanatory variables discussed above.
Fisman and Svensson (2000) use the same firm-level data set to study the effects ofcorruption on firm performance. Evaluating the effects of corruption (for instance on firmgrowth) using firm-level data is difficult. The problem is identification, since both growthand corruption are likely to be jointly determined. A simple example illustrates the point.Consider two firms in a given sector of similar size and age. One of the firms is producinga good/brand perceived to have a very favorable demand forecast, while the other firm isproducing a good with much less favorable demand growth. Assume furthermore that thefirms need to clear a certain number of business regulations and licensing requirements, orrequire some public infrastructure services. Moreover, assume that public servants havediscretion in implementing and enforcing these regulations and services. A rational rent-extracting public official would try to extract as high a bribe as possible. In this setup, onewould expect a public official to demand higher bribes from the firm producing the goodwith a favorable demand forecast, simply because this firm's expected profits are higherand, thus, its ability to pay is larger. If the forecasts also influence the firms' willingness toinvest and expand, we would expect (comparing these two firms) a positive (observed)relationship between corruption and growth.
Fisman and Svensson (2001) try to overcome this simultaneity problem by usingindustry-location averages as instruments. They argue that if the simultaneity problem isspecific for firms, but not industries or locations, then netting out this firm-specificcomponent yields a bribe measure that only depends on the underlying characteristicsinherent to particular industries and/or locations.
Fisman and Svensson (2001) find the rate of bribery to be negatively correlatedwith firm growth. For the full data set, a 1 percentage point increase in the bribery rate isassociated with a reduction in firm growth of 3 percentage points, an effect about threetimes greater than that of taxation on firm growth. Moreover, after outliers have beenexcluded, they find a much greater negative impact of bribery on growth, while the effectof taxation is considerably reduced.
8. Part of the explanation to this striking finding is that a considerable number of firms invested verylittle or nothing in any given year.

Despite these strong results, it should once more be stressed that in reality, somefirms may still benefit (and possibly a great deal) from corruption. What this type of
econometric work identifies is what is true on average, or in general. The data suggest thatthere is a strong negative relationship between bribery payments and firm growth on
average.
In the firm survey work discussed above, the graft data measure the aggregate (foran individual firm) graft paid by firms. A complementary approach is to indirectly estimate
subcomponents of this firm-specific aggregate, using cost information on provision ofhomogeneous public services (goods). In the Uganda firm-survey, information on two
variables related to the delivery of public services was collected (Svensson 2001, Reinikka
and Svensson 2001). The respondents were asked about the total costs (including informal
payments to speed up the process) of getting connected to the public grid and the total cost
(including informal payments to speed up the process) of acquiring a telephone line. The
fee for a telephone connection (around US$ 100) was supposed to be fixed. Thus,
deviations from the set price typically reflect graft. Connection costs to the publicelectricity grid is more problematic. In fact, the cost of connection to the public grid is acomplex function of load requirements, necessary upgrades, and distance to existing
voltage connection. The complexity in determining the price of connection implies that thepublic electricity company in reality had large discretion over the cost. To the extent that
the other determinants of connection costs to the public grid can be controlled for,
deviations typically reflect graft.
Most fimns acquiring a telephone line had to pay more than the official (set) price
(Svensson 2003b). On average, the additional cost was around US$ 130 which, given thatthe official price was around US$ 100, implies that the average firm had to pay more thantwice the stated cost to acquire a telephone line. The results are similar when analyzing the
cost of connecting to the public grid. Interestingly, there is no clear relationship between
the excess price and the time it takes for firms to get access to the services they paid for
(Svensson 2003b).
A similar approach to collect quantitative data on corruption is used in di Tella and
Schargrodsky (2003). They collect procurement data (prices paid) on basic, homogeneousinputs for public hospitals in Buenos Aires, Argentina. During a crackdown on corruptionin public hospitals, they find that these prices fell by 15 percent.
5. Conclusion
The paper has argued that with appropriate survey methods and interviewtechniques, it is possible to collect quantitative data on corruption at the micro level. Inparticular, the public expenditure tracking survey (PETS) and related quantitative servicedelivery surveys (QSDS) are promising new microeconomic tools for diagnosingcorruption and other problems in basic service provision in developing countries (see
12

Dehn, Reinikka, and Svensson 2003 for a discussion). Until recently, the analysis ofservice delivery has focused almost entirely on financing services, while provision,particularly issues related to institutions, incentives, and provider behavior, has receivedmuch less attention. The PETS and QSDS address this omission.
From a policy perspective it should be noted that the extent (or variation acrossfirms and service providers) of corruption and capture seem to have less to do withconventional audit and supervision mechanisms, and more to do with the schools' orclinics' opportunity to voice their claims for the funds, and firms' bargaining positions.Traditionally, it has been left to the government and a country's legal institutions to deviseand enforce public accountability. The findings reviewed in this paper question this one-sided approach. As the government's role and services have expanded considerably duringthe past decades, it has become apparent that conventional mechanisms, such as audit andlegislative reviews, may not be enough. Collusion, organizational deficiencies, abuse, andlack of responsiveness to citizens' needs cannot easily be detected and rectified even withthe best of supervision. When the institutions are weak, as is common in many developingcountries, the government's potential role as auditor and supervisor is even moreconstrained.
The positive impact of the information campaign to reduce capture in Ugandafurther suggests that corruption can be effectively tackled only when the reform of thepolitical process and the restructuring of the regulatory systems are complemented by asystematic effort to increase the citizens' ability to monitor and challenge abuses of thesystem, and inform the citizens about their rights and entitlements.9 Breaking the culture ofsecrecy that pervades the functioning of the government and empowering people todemand public accountability are two important components in such an effort.
Recent reviews of growth performance in Sub-Saharan Africa have identified anumber of recurring features of African politics likely to undermine the results oftraditional institutional reforms. These features include restricted civil society involvement,the state perceived as a vehicle of wealth accumulation, the prevalence of patronagepolitics, and a small elite with close political connections. Although each feature may notbe applicable to every country, a successful national anticorruption program must alsotackle these fundamental determinants of corruption.
9. Paul (1997) makes the same argument.
13

References
The word "processed" describes informally reproduced works that may not be commonly
available through library systems.
Ablo, Emmanuel, and Ritva Reinikka. 1998. "Do budgets really matter? Evidence from publicspending on education and health in Uganda." Policy Research Working Paper 1926. WorldBank, Washington, D.C.
Ades, Alberto F., and Rafael di Tella. 1997. "National champions and corruption: some unpleasantinterventionist arithmetic." The Economic Journal 107(443): 1023-42.
. 1999. "Rents, Competition, and Corruption." American Economic Review 89(4): 982-93.
Bardhan, Pranab. 1997. "Corruption and development: A review of issues." Journal of EconomicLiterature XXXV (September): 1320-46.
Becker, G., and G. Stigler. 1974. "Law enforcement, malfeasance and the compensation ofenforcers." Journal of Legal Studies 3 (1): 1-19.
Chaudhury, Nazmul, and Jeffrey Hammer. 2003. "Ghost Doctors: Absenteeism in BangladeshiHealth Facilities." Policy Research Working Papers (forthcoming). World Bank, Washington,D.C.
Chaudhury, Nazmul, Jeffrey S. Hammer, Michael Kremer, Kharthik Muralidharan, and F. HalseyRogers. 2003. "Teacher and Health-Care Provider Absenteeism: A Multicountry Study."World Bank, Development Research Group, Washington, D.C. Processed.
Das, Jishnu, Stefan Dercon, James Habyarimana, and Pramila Krishnan. 2002. "Rules vs.Discretion: Public and Private Funding in Zambian Basic Education. Part I: Funding Equity."World Bank, Development Research Group, Washington, D.C. Processed.
Dehn, Jan, Ritva Reinikka, and Jakob Svensson. 2003. "Survey Tools for Assessing Performancein Service Delivery." In Francois Bourguignon and Luiz Pereira da Silva, eds., Evaluating thePoverty and Distributional Impact of Economic Policies. Oxford University Press and theWorld Bank. Forthcoming.
di Tella, Rafael, and Ernesto Schargrodsky. 2000. "The Role of Wages and Auditing during aCrackdown on Corruption in the City of Buenos Aires." Harvard Business School. Processed.
Fisman, Ray, and Jakob Svensson. 2000. "Are corruption and taxation really harmful to growth?Firm level evidence." Policy Research Working Paper Series No. 2485. World Bank,Washington, D.C.
Gauthier, Bemard. 2001. "Productivity and Exports." In Ritva Reinikka and Paul Colliers, eds.,Uganda's Recovery: The Role of Farms, Firms, and Government. World Bank SectoralStudies Series. Washington, D.C.: World Bank.
Habyarimana, James, Jishnu Das, Stefan Dercon, and Pramila Krishnan. 2003. "Sence andAbsence: Absenteeism and Learning in Zambian Schools." World Bank, DevelopmentResearch Group, Washington, D.C. Processed.
Hellman, Joel S., Geraint Jones, Daniel Kaufinann, and Mark Schankerman. 2000a. "Measuringgovernance, corruption, and state capture." Policy Research Working Paper 2312. WorldBank, Washington, D.C.
14
Hellman, Joel S., Geraint Jones, and Daniel Kaufmann. 2000b. "Seize the state, seize the day: Statecapture, corruption, and influence in transition." Policy Research Working Paper 2444. WorldBank, Washington, D.C.
Hirschman, Albert 0. 1970. Exit, voice, and loyalty: responses to decline in firms, organizations,and states. Cambridge, Mass.: Harvard University.
Instituto Apoyo and the World Bank. 2002."PETS: The Education Sector in Peru." Backgroundpaper for Report to the Public Expenditure Review: Peru, Restoring Fiscal Discipline forPoverty Reduction. Report No. 24286-PE. Washington, D.C. September 25. Processed.
Jeppson, Anders. 2001. "Financial Priorities under Decentralization in Uganda." Health Policy andPlanning 16(2): 187-92.
Johnson, Simon, Daniel Kaufinann, and Andrei Shleifer. 1997. "The unofficial economy intransition." Brookings Papers on Economic Activity 2: 159-239.
Kaufmann, Daniel, and Shang-Jin Wei. 1999. "Does grease money speed up the wheels ofcommerce?" Policy Research Working Paper 2254. World Bank, Washington, D.C.
Kaufmnann, Daniel. 1997. "Corruption: Some Myths and Facts." Foreign Policy (Summer): 114-131.
Mauro, Paolo. 1995. "Corruption and growth. " Quarterly Journal of Economics 110 (August):681-712.
Paul, Samuel 1998. "Making Voice Work: The Report Card on Bangalore's Public Services."Policy Research Working Paper 1921. World Bank, Washington, D.C.
Persson, Torsten, Guido Tabellini, and Francesco Trebbi. 2003. "Electoral rules and corruptionJournal of the European Economic Association (forthcoming).
Price Waterhouse Coopers. 1999. "Tanzania Public Expenditure Review: Health and educationfinancial tracking study. Final report, Vol. I-II." Dar es Salaam.
Reinikka, Ritva. 2001. "Recovery in Service Delivery: Evidence from Schools and HealthCenters." In Ritva Reinikka and Paul Collier, eds., Uganda's Recovery: The Role of Farms,Firms, and Government. World Bank Regional and Sectoral Studies. Washington, D.C.:World Bank.
Reinikka, Ritva, and Paul Collier, eds. 2001. Uganda's Recovery: The Role of Farms, Firms, andGovernment. World Bank Regional and Sectoral Studies. Washington, D.C.: World Bank.
Reinikka, Ritva, and Jakob Svensson. 2001. "Confronting Competition: Investment, Profit, andRisk." In Ritva Reinikka and Paul Collier, eds., Uganda's Recovery: The Role of Farms,Firms, and Government. World Bank Regional and Sectoral Studies. Washington, D.C.:World Bank.
Reinikka, Ritva, and Jakob Svensson. 2002a. "Explaining Leakage of Public Funds." CEPRDiscussion Paper No 3227. Center for Economic Policy Research, London, United Kingdom.
Reinikka, Ritva, and Jakob Svensson. 2002b. "Coping with Poor Public Capital." Journal ofDevelopment Economics 69(1): 51-69.
Reinikka, Ritva, and Jakob Svensson. 2003. "The Power of Information: Evidence from anInformation Campaign to Reduce Capture." World Bank, Development Research Group,Washington, D.C. Processed.
15

Ruzindana, Augustine, Petter Langseth, and Arthur Gakwandi. 1998. Fighting Corruption inUganda: The Process of Building a National Integrity System. Kampala: Fountain PublishingHouse.
Shleifer, Andrei, and R.W. Vishny. 1993. "Corruption." Quarterly Journal of Economics 108(August): 599-617.
Svensson, Jakob. 2000a. "Foreign aid and rent-seeking." Journal of International Economics 51(2):437-61.
Svensson, Jakob. 2000b. "Is the bad news principle for real?" Economic Letters 66(3): 327-331.
Svensson, Jakob. 2001. "The Cost of Doing Business: Ugandan Firms' Experiences withCorruption." In Ritva Reinikka and Paul Collier, eds., Uganda's Recovery: The Role ofFarms, Firms, and Government. World Bank Regional and Sectoral Studies. Washington,D.C.: World Bank.
Svensson, Jakob. 2003a. "Who must pay bribes and how much?: Evidence from a Cross-Section ofFirms." Quarterly Journal of Economics 118 (1): 207-3 0.
Svensson, Jakob. 2003b. "Speed money?" Institute of International Economic Studies, StockholmUniversity. Processed.
Treisman, Daniel. 2000. "The causes of corruption: a cross-national study." Journal of PublicEconomics 76(3, June): 399-457.
Wei, Shang-Jin. 1997. "How taxing is corruption on international investors." NBER WorkingPaper 6030. National Bureau of Economic Research, Cambridge, Mass.
World Bank. 1998. "Uganda: Recommendations for Strengthening the Anti-Corruption Program."PRSD (Africa Region) Anti-Corruption Series No. 1. World Bank, Washington, D.C.
World Bank. 2001. "Honduras: Public Expenditure Management for Poverty Reduction and FiscalSustainability." Report No. 22070. Poverty Reduction and Economic Sector ManagementUnit, Latin America and the Caribbean Region. Washington, D.C.
Ye, Xiao, and Sudharshan Canagarajah 2002. "Efficiency of Public Expenditure Distribution andBeyond: A Report on Ghana's 2000 Public Expenditure Tracking Survey in the Sectors ofPrimary Health and Education." Africa Region Working Paper3 1, (June). [Retrieved May 9,2003 from http://www.worldbank.org/afr/wps/wp3 1.htm]
16


Policy Research Working Paper Series
ContactTitle Author Date for paper
WPS3043 The Incentive-Compatible Design Thorsten Beck May 2003 K. Labrieof Deposit Insurance and Bank 31001Failure Resolution: Concepts andCountry Studies
WPS3044 Impregnated Nets Cannot Fully Mead over May 2003 H. SladovichSubstitute for DDT: Field Bernard Bakote'e 37698Effectiveness of Malaria Prevention Raman Velayudhanin Solomon Islands Peter Wilikai
Patricia M. Graves
WPS3045 Causes and Consequences of Civil Klaus Deininger May 2003 M. FernandezStrife: Micro-Level Evidence from 33766Uganda
WPS3046 Migration, Spillovers, and Trade Ross Levine May 2003 E. KhineDiversion: The Impact of Sergio L. Schmukler 37471Internationalization on Stock MarketLiquidity
WPS3047 Comparing Mortgage Credit Risk Robert Buckley May 2003 0. HimidPolicies: An Options-Based Approach Gulmira Karaguishiyeva 80225
Robert Van OrderLaura Vecvagare
WPS3048 Targeted Transfers in Poor Countries: Martin Ravallion May 2003 P. SaderRevisiting the Tradeoffs and Policy 33902Options
WPS3049 Hidden Impact? Ex-Post Evaluation Shaohua Chen May 2003 P. Saderof an Anti-Poverty Program Martin Ravallion 33902
WPS3050 The Changing Financial Landscape: Wafik Grais May 2003 R. VoOpportunities and Challenges for Zeynep Kantur 33722the Middle East and North Africa
WPS3051 Regional, Multilateral, and Unilateral Glenn W. Harrison May 2003 P. FlewittTrade Policies of MERCOSUR for Thomas F. Rutherford 32724Growth and Poverty Reduction in David G. TarrBrazil Angelo Gurgel
WPS3052 Long-Run Impacts of China's WTO Kym Anderson May 2003 S. LipscombAccession on Farm-Nonfarm Income Jikun Huang 87266Inequality and Rural Poverty Elena lanchovichina
WPS3053 Economic Impacts of China's Elena lanchovichina May 2003 S. LipscombAccession to the World Trade William Martin 87266Organization
WPS3054 The New Comparative Economics Simeon Djankov May 2003 G. SorensenEdward Glaeser 37088Rafael La PortaFlorencio Lopez-de-SilanesAndrei Shleifer
WPS3055 The Global Growth of Mutual Funds Deepthi Fernando May 2003 A. YaptencoLeora Klapper 31823Viktor SullaDimitri Vittas

Policy Research Working Paper Series
ContactTitle Author Date for paper
WPS3056 Avoiding the Pitfalls in Taxing Patrick Honohan May 2003 A. YaptencoFinancial Intermediation 31823
WPS3057 Teaching Adults to Read Better and Helen Abadzi May 2003 H. AbadziFaster: Results from an Experiment 80375in Burkina Faso
WPS3058 Working for God? Evaluating Service Ritva Reinikka May 2003 H. SladovichDelivery of Religious Not-for-Profit Jakob Svensson 37698Health Care Providers in Uganda
WPS3059 Do Capital Flows Respond to Risk Cesar Calder6n May 2003 T. Tourouguiand Return? Norman Loayza 87431
Luis Serven
WPS3060 World Market Integration through the Rui Albuquerque May 2003 T. TourouguiLens of Foreign Direct Investors Norman Loayza 87431
Luis Serven
WPS3061 Reciprocity in Free Trade Caroline Freund May 2003 P. FlewittAgreements 32724
WPS3062 Labor Effects of Adult Mortality in Kathleen Beegle May 2003 E. de CastroTanzanian Households 89121
WPS3063 Trade Liberalization, Firm Paolo Epifani May 2003 P. FlewittPerformance, and Labor Market 32724Outcomes in the Developing World:What Can We Learn from Micro-LevelData?
WPS3064 Trade Policy, Trade Volumes, and Ana M. Fernandes May 2003 A. FernandesPlant-Level Productivity in Colombian 33983Manufacturing Industries
WPS3065 Ghost Doctors: Absenteeism in Nazmul Chaudhury May 2003 H. SladovichBangladeshi Health Facilities Jeffrey S. Hammer 37698
WPS3066 The Potential Demand for and Shreelata Rao Seshadri May 2003 H. SladovichStrategic Use of an HIV-1 Vaccine P. Subramaniyam 37698in Southern India Prabhat Jha
WPS3067 The Mini-Integrated Macroeconomic Pierre-Richard Agenor May 2003 M. GosiengfiaoModel for Poverty Analysis: A Framework 33363for Analyzing the Unemployment andPoverty Effects of Fiscal and LaborMarket Reforms
WPS3068 Poverty and Economic Growth in Heba El-laithy June 2003 P. SaderEgypt, 1995-2000 Michael Lokshin 33902
Arup Banerji
WPS3069 International Migration, Remittances, Richard H. Adams, Jr. June 2003 N. Obiasand the Brain Drain: A Study of 24 31986Labor-Exporting Countries
WPS3070 Are You Satisfied? Citizen Feedback Uwe Deichmann June 2003 Y. D'Souzaand Delivery of Urban Services Somik V. Lall 31449
Related Documents