Survey Results By Charles Watts Sunday, 27 November 11

Survey Results Analysis
Mar 09, 2016
Analysis of Survey Monkey results
Welcome message from author
This document is posted to help you gain knowledge. Please leave a comment to let me know what you think about it! Share it to your friends and learn new things together.
Transcript

Survey ResultsBy Charles Watts
Sunday, 27 November 11
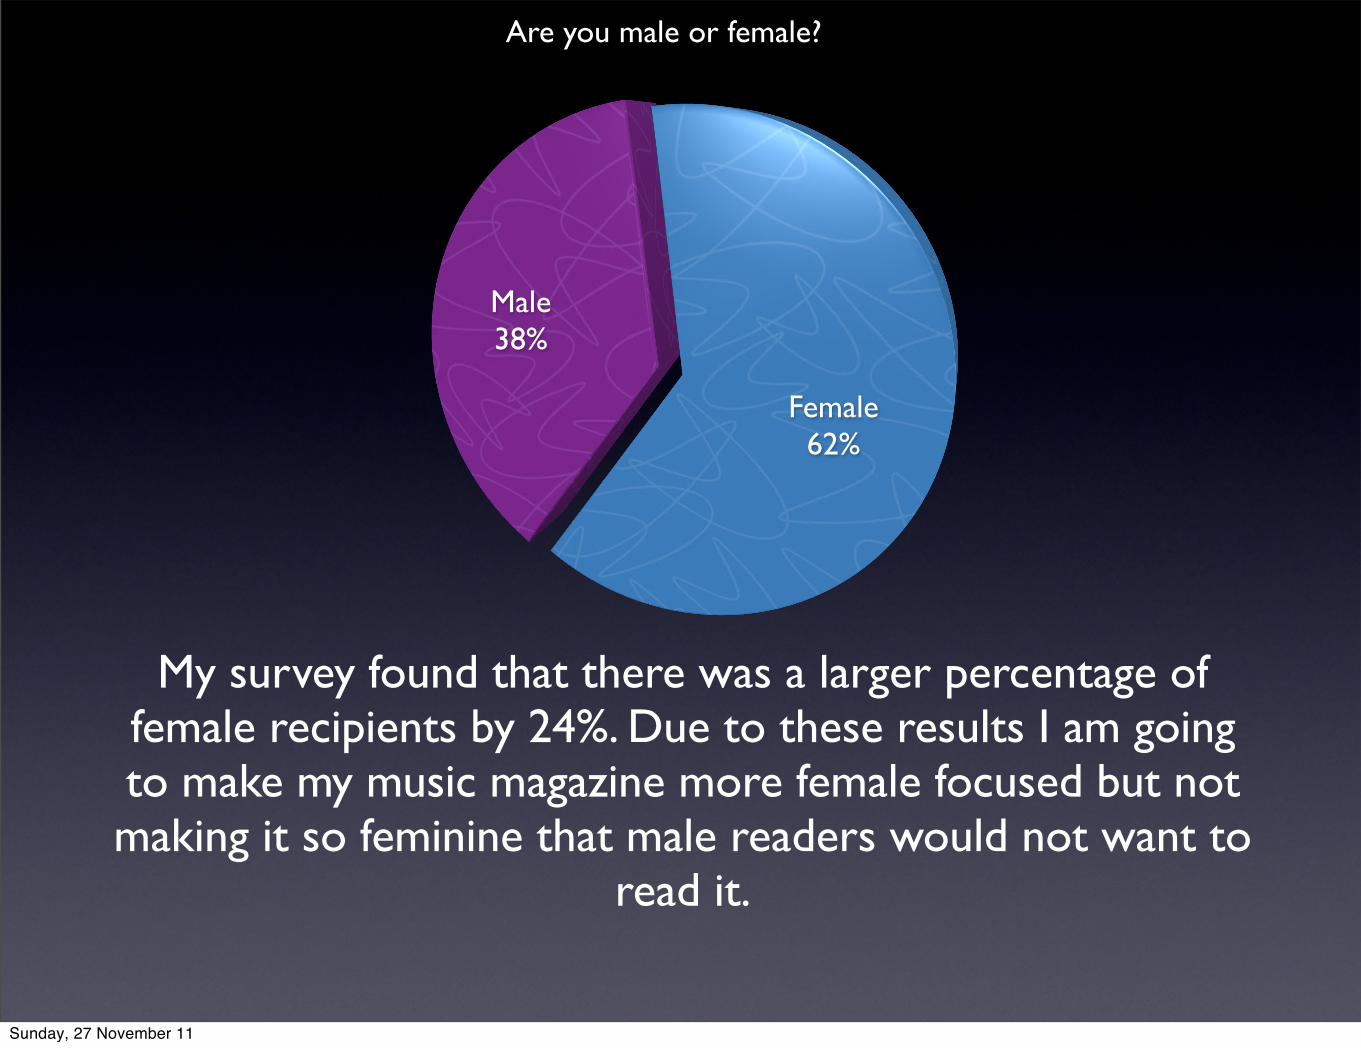
Male38%
Female62%
Are you male or female?
My survey found that there was a larger percentage of female recipients by 24%. Due to these results I am going to make my music magazine more female focused but not making it so feminine that male readers would not want to
read it.
Sunday, 27 November 11
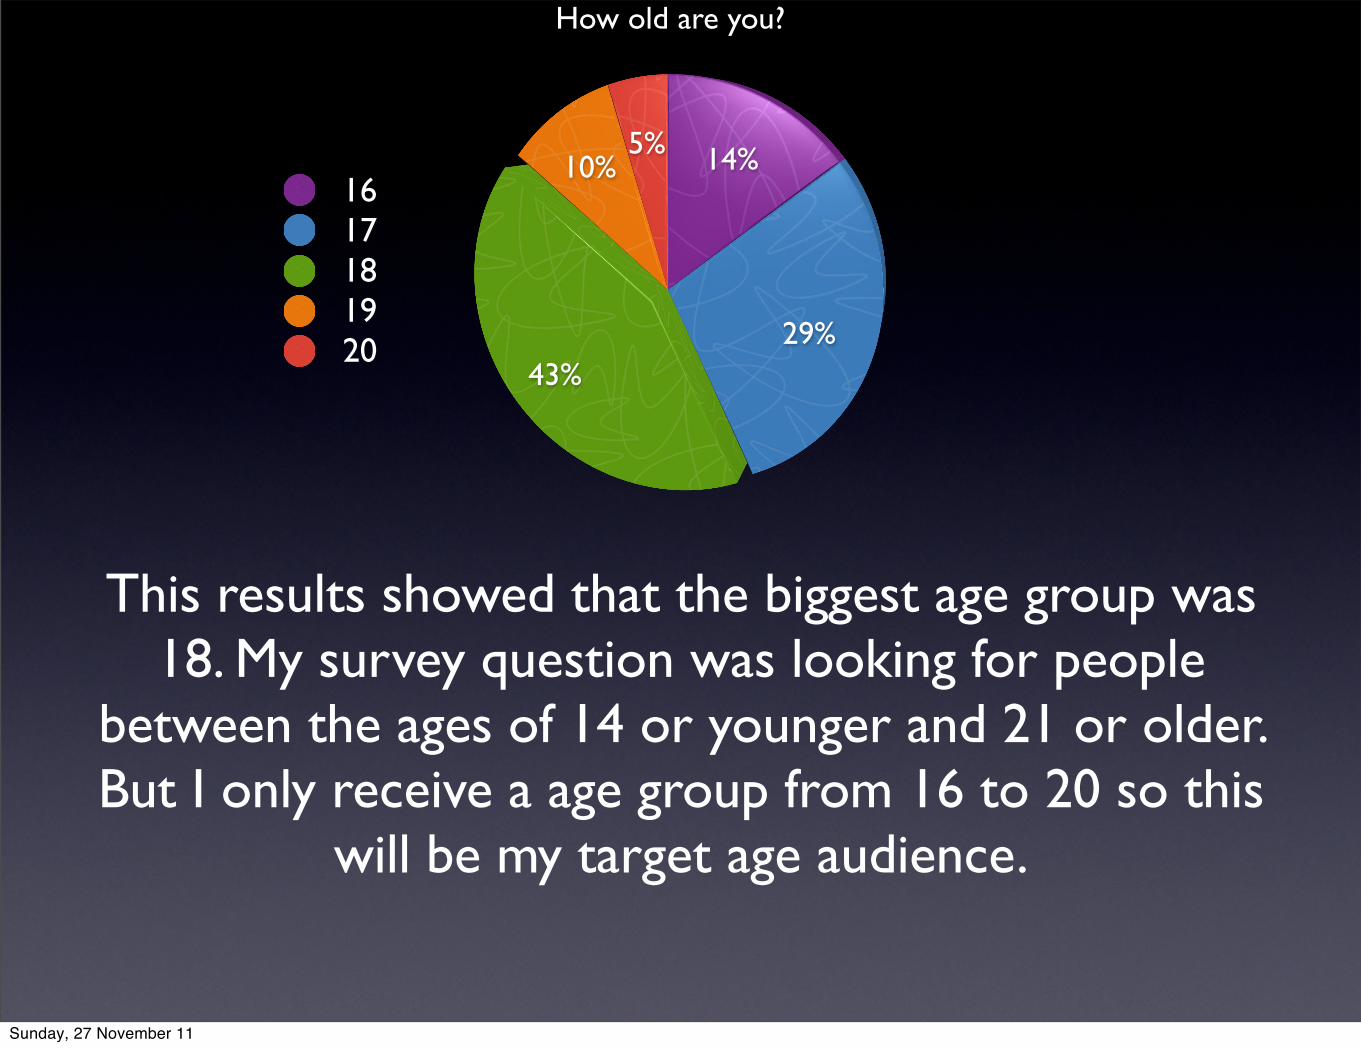
14%
29%43%
10%5%
How old are you?
1617181920
This results showed that the biggest age group was 18. My survey question was looking for people
between the ages of 14 or younger and 21 or older. But I only receive a age group from 16 to 20 so this
will be my target age audience.
Sunday, 27 November 11
24%
16%
4%16%
8%
16%
16%
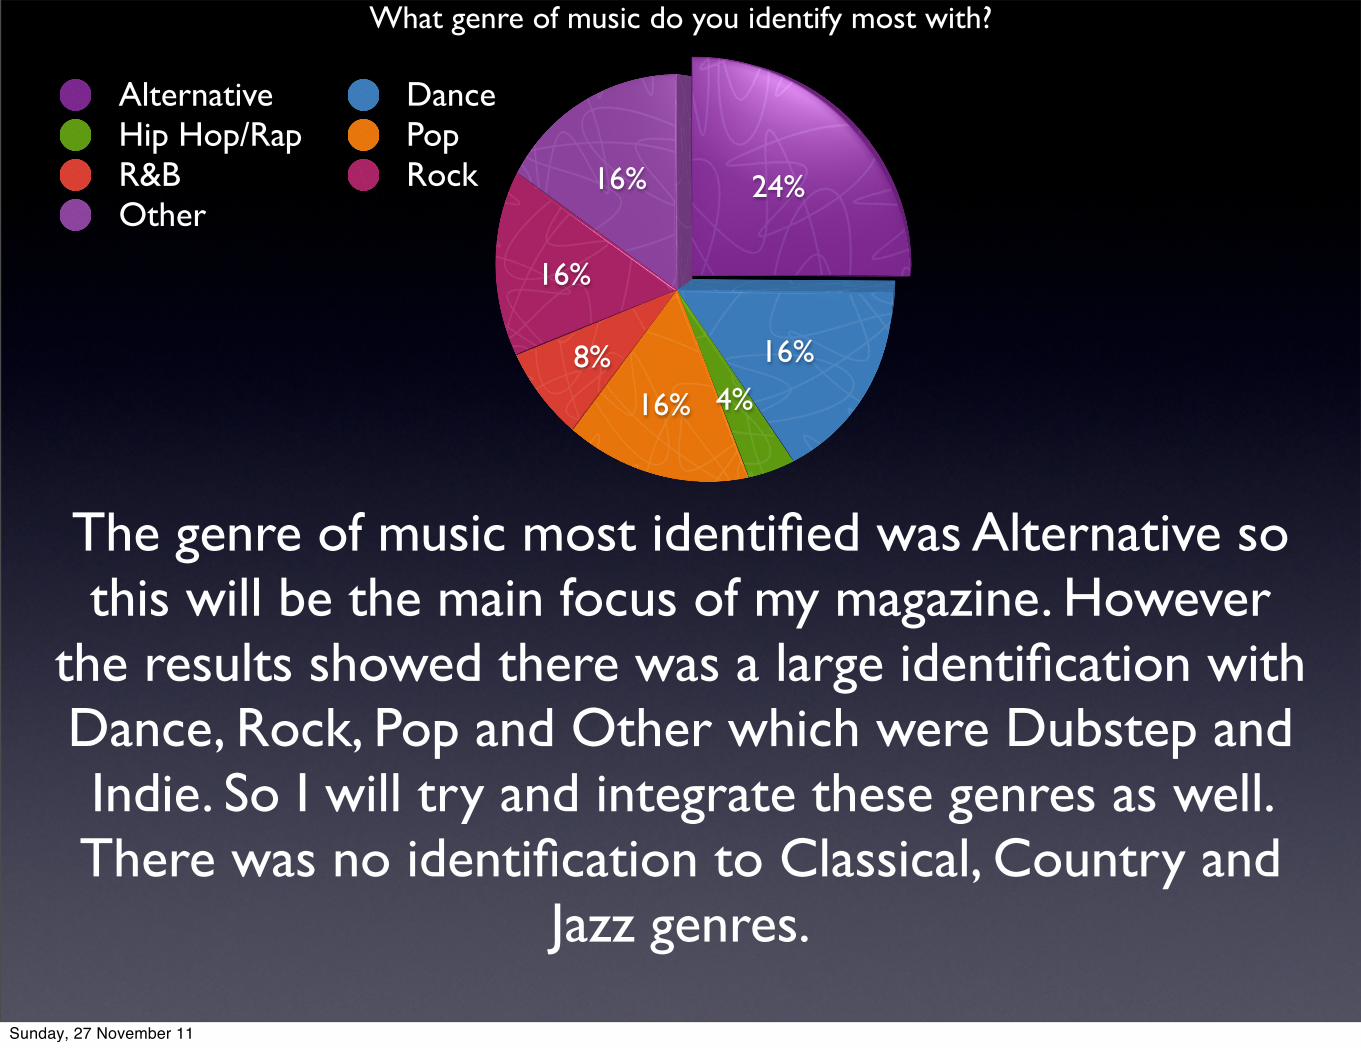
What genre of music do you identify most with?
Alternative DanceHip Hop/Rap PopR&B RockOther
The genre of music most identified was Alternative so this will be the main focus of my magazine. However
the results showed there was a large identification with Dance, Rock, Pop and Other which were Dubstep and Indie. So I will try and integrate these genres as well. There was no identification to Classical, Country and
Jazz genres.
Sunday, 27 November 11
10%
29%
14%5%
38%
5%
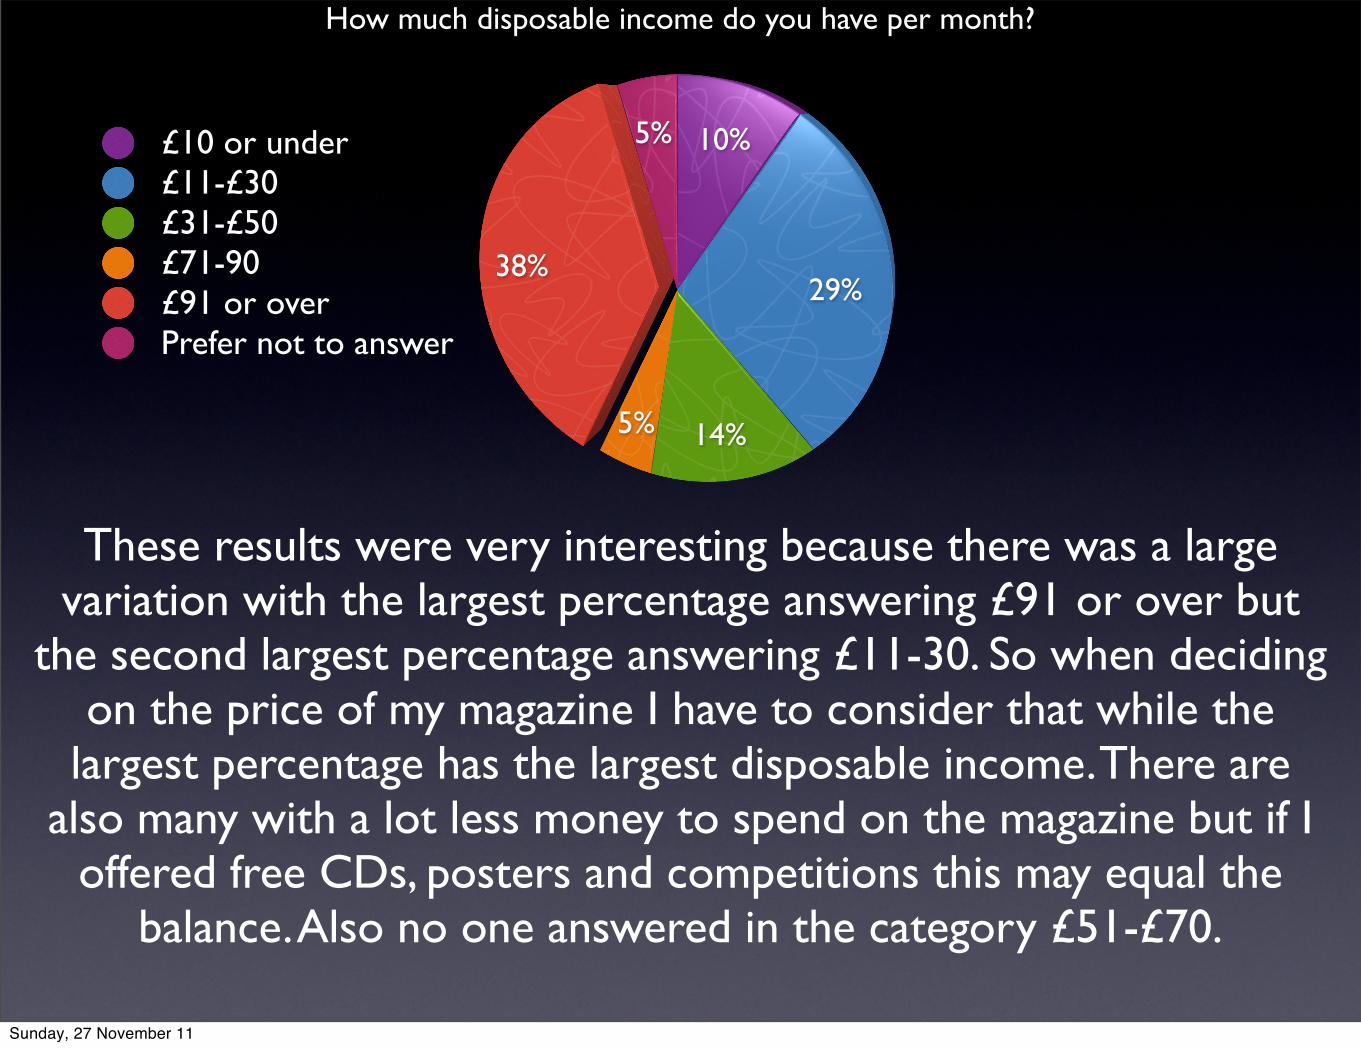
How much disposable income do you have per month?
£10 or under£11-£30£31-£50£71-90£91 or overPrefer not to answer
These results were very interesting because there was a large variation with the largest percentage answering £91 or over but
the second largest percentage answering £11-30. So when deciding on the price of my magazine I have to consider that while the
largest percentage has the largest disposable income. There are also many with a lot less money to spend on the magazine but if I
offered free CDs, posters and competitions this may equal the balance. Also no one answered in the category £51-£70.
Sunday, 27 November 11
5%
64%
27%
5%
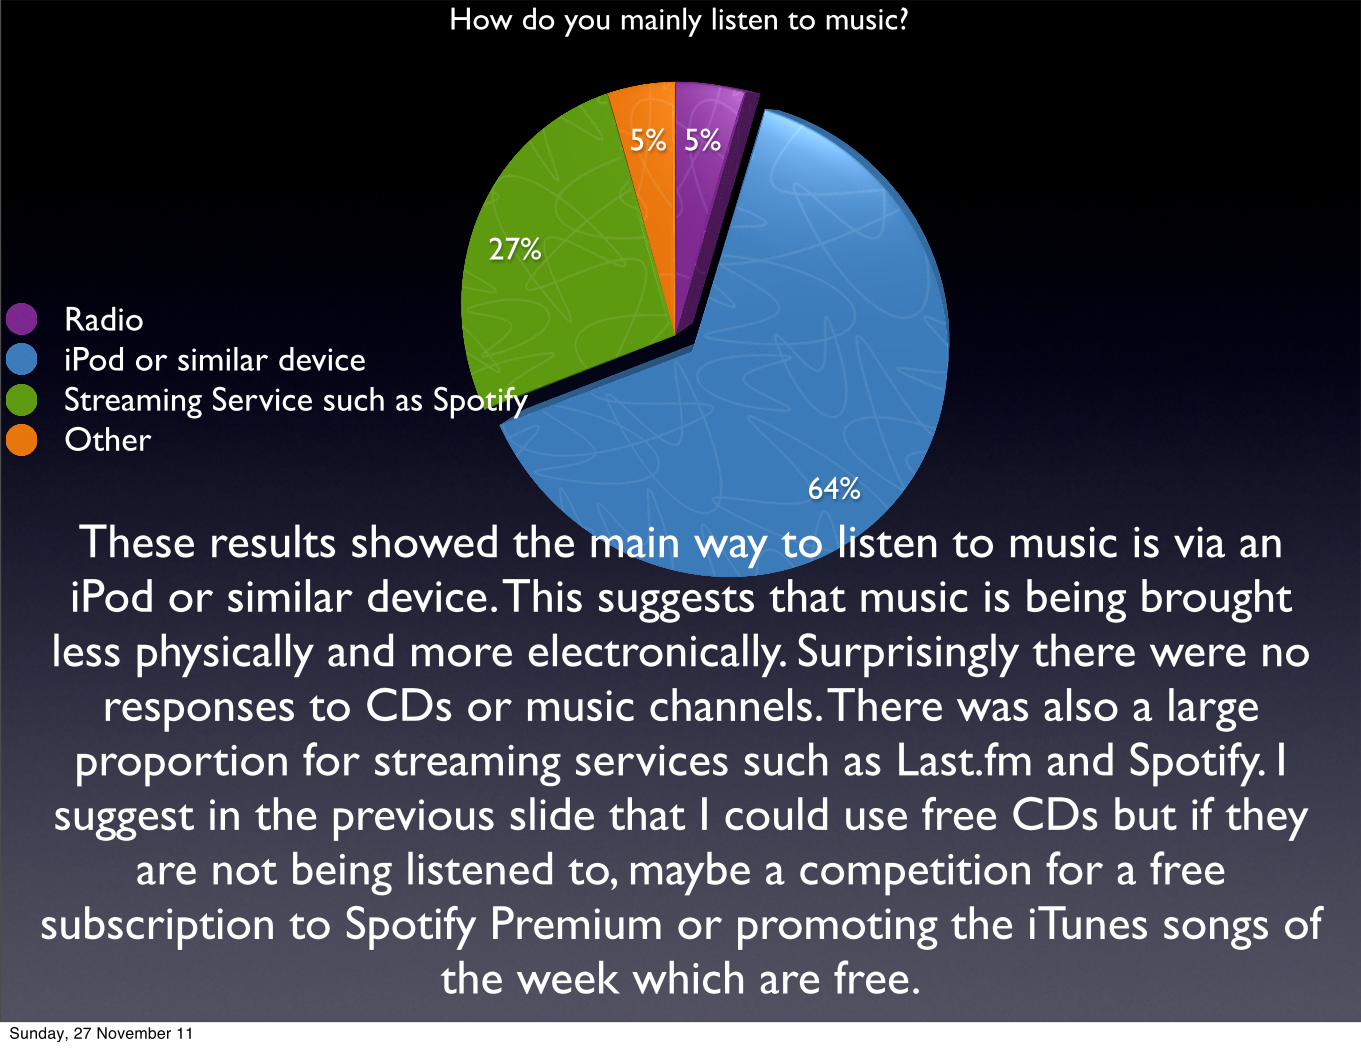
How do you mainly listen to music?
RadioiPod or similar deviceStreaming Service such as SpotifyOther
These results showed the main way to listen to music is via an iPod or similar device. This suggests that music is being brought
less physically and more electronically. Surprisingly there were no responses to CDs or music channels. There was also a large
proportion for streaming services such as Last.fm and Spotify. I suggest in the previous slide that I could use free CDs but if they
are not being listened to, maybe a competition for a free subscription to Spotify Premium or promoting the iTunes songs of
the week which are free.Sunday, 27 November 11
5%
24%
14%
57%
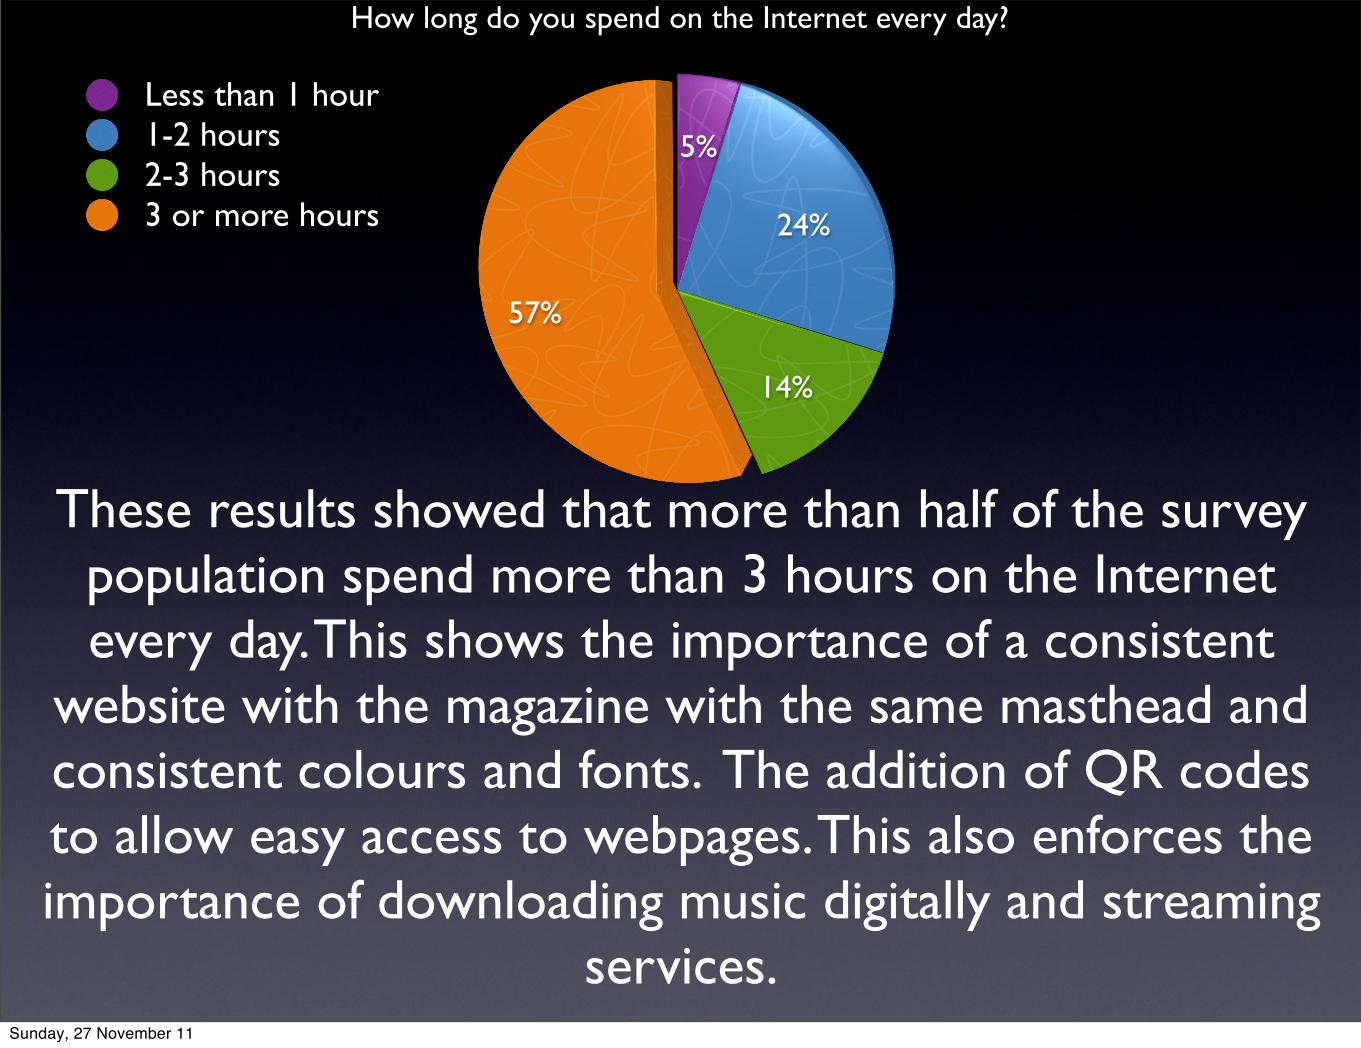
How long do you spend on the Internet every day?
Less than 1 hour1-2 hours2-3 hours3 or more hours
These results showed that more than half of the survey population spend more than 3 hours on the Internet every day. This shows the importance of a consistent
website with the magazine with the same masthead and consistent colours and fonts. The addition of QR codes to allow easy access to webpages. This also enforces the importance of downloading music digitally and streaming
services.Sunday, 27 November 11

0
5
10
15
20
25
30
3
21
2
10
2
Amazon FacebookTwitter
YoutubeOther
Which websites do you visit every day?
Out of 21 recipients
100% of the recipients visit Facebook every day so my magazine will have a dedicated Facebook page. 48% of the recipients visit Youtube every day so a channel which had
exclusive interviews and music videos. The other websites visited daily were Amazon, Twitter, Gmail and
Tumblr.
Sunday, 27 November 11
0 5.00 10.00 15.00 20.005
76
1318
3
192
12
Apple iPhone (Any Type)Microsoft Xbox 360
Sony Playstation 3Nintendo WiiApple iPad 2
Apple iPod (Any Type)Any smartphone that runs Android
LaptopAny other tablet device
Flat Screen TV
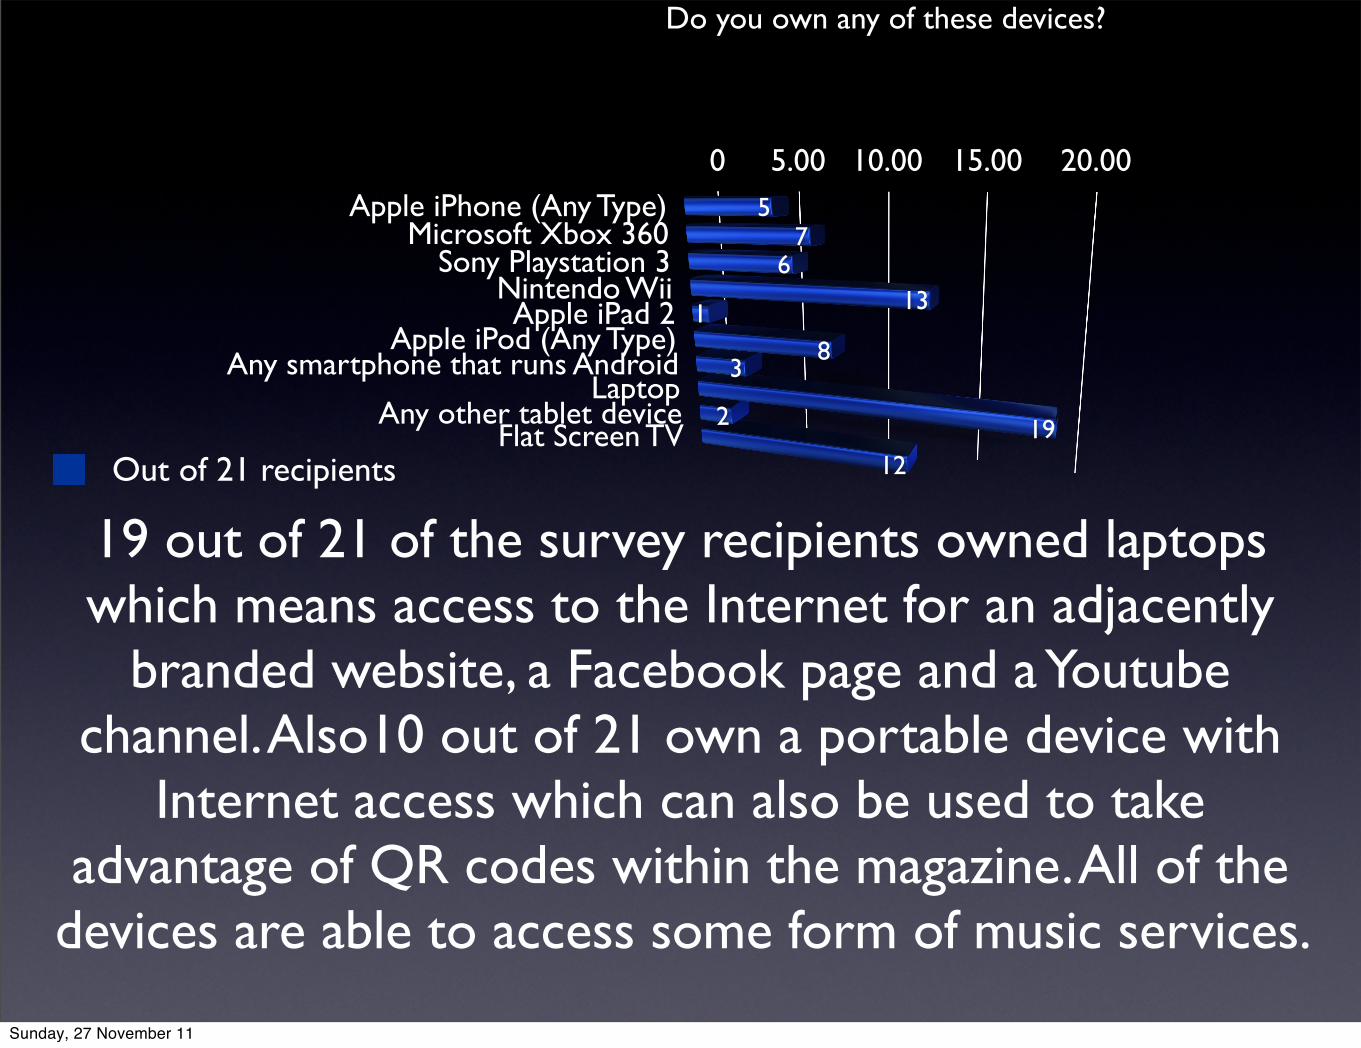
Do you own any of these devices?
Out of 21 recipients
19 out of 21 of the survey recipients owned laptops which means access to the Internet for an adjacently
branded website, a Facebook page and a Youtube channel. Also10 out of 21 own a portable device with
Internet access which can also be used to take advantage of QR codes within the magazine. All of the
devices are able to access some form of music services.
Sunday, 27 November 11
17%
29%
13%8%
21%
13%
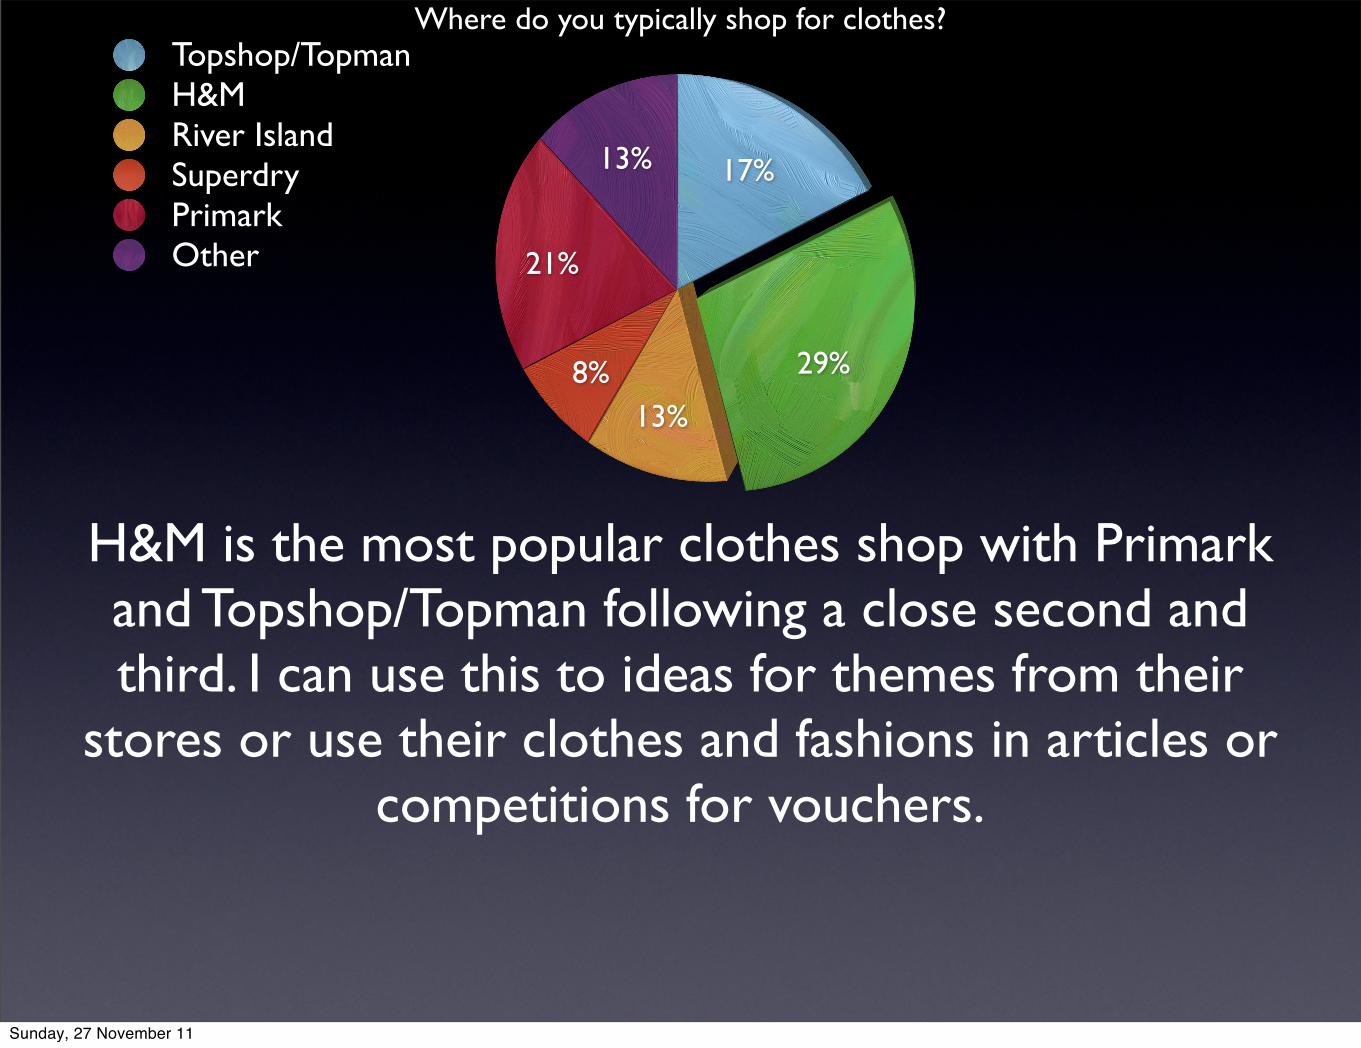
Where do you typically shop for clothes?Topshop/TopmanH&MRiver IslandSuperdryPrimarkOther
H&M is the most popular clothes shop with Primark and Topshop/Topman following a close second and third. I can use this to ideas for themes from their
stores or use their clothes and fashions in articles or competitions for vouchers.
Sunday, 27 November 11
18%
55%
9%
5%9%
5%
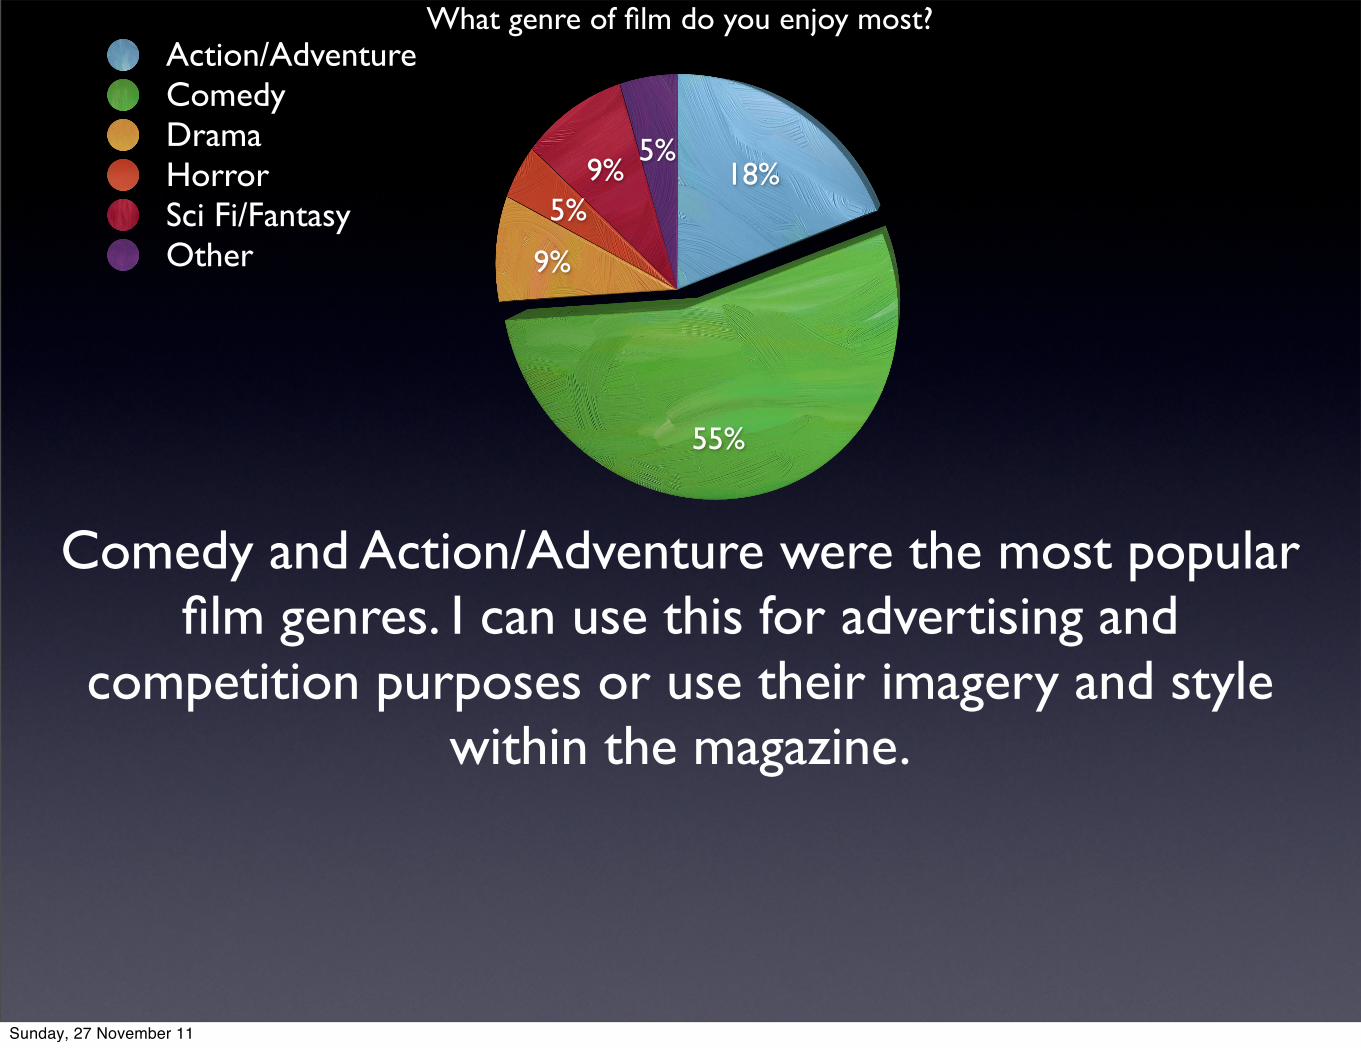
What genre of film do you enjoy most?Action/AdventureComedyDramaHorrorSci Fi/FantasyOther
Comedy and Action/Adventure were the most popular film genres. I can use this for advertising and
competition purposes or use their imagery and style within the magazine.
Sunday, 27 November 11
Related Documents