EUROPEAN COMMISSION-DIRECTORATE-GENERAL FOR ENVIRONMENT SURVEY OF WASTES SPREAD ON LAND - FINAL REPORT APPENDICES WRc Ref: CO 4953-2 JULY 2001

Welcome message from author
This document is posted to help you gain knowledge. Please leave a comment to let me know what you think about it! Share it to your friends and learn new things together.
Transcript

EUROPEAN COMMISSION-DIRECTORATE-GENERALFOR ENVIRONMENT
SURVEY OF WASTES SPREAD ON LAND - FINALREPORT
APPENDICES
WRc Ref: CO 4953-2JULY 2001


SURVEY OF WASTES SPREAD ON LAND - FINAL REPORT
APPENDICES
Report No.: CO 4953-2
July 2001
WRc - A. Gendebien, R. Ferguson, J. Brink, H. Horth, M. Sullivan and R. Davis.
SEDE - H. Brunet, F. Dalimier, B. Landrea, D Krack and J. Perot
REI - C. Orsi
Contract Manager: A.H. Gendebien
Contract No.: 11768-1
RESTRICTION: This report has the following limited distribution:
Internal: Contract Manager and Authors
Any enquiries relating to this report should be referred to the authors at the followingaddress:
WRc Medmenham, Henley Road, Medmenham, Marlow, Bucks, SL7 2HD.Telephone: (01491) 571531

The contents of this document are subject to copyright and all rights are reserved. No part ofthis document may be reproduced, stored in a retrieval system or transmitted, in any form orby any means electronic, mechanical, photocopying, recording or otherwise, without the priorwritten consent of the copyright owner.
This document has been produced by WRc plc.
CONTENTS
Detailed information on landspreading of wastes in individual Member States.
APPENDICES
APPENDIX A AUSTRIA 111
APPENDIX B BELGIUM 125
APPENDIX C DENMARK 149
APPENDIX D FINLAND 193
APPENDIX E FRANCE 207
APPENDIX F GERMANY 297
APPENDIX G GREECE 359
APPENDIX H IRELAND 371
APPENDIX I ITALY 389
APPENDIX J GRAND DUCHY OF LUXEMBOURG 435
APPENDIX K NETHERLANDS 443
APPENDIX L PORTUGAL 457
APPENDIX M SPAIN 463
APPENDIX N SWEDEN 477
APPENDIX O UNITED KINGDOM 499


European Commission-Directorate-General for Environment
WRc Ref:CO4953-2/11768-1July 2001
111
APPENDIX A AUSTRIA
SUMMARY
Similar to Germany, Austria is a Federal State where framework legislation is passed atFederal level, but the implementation and enforcement of legislation is generally under thecompetence of the individual Federal States (Länder) and regional government.
In principle, the main laws appropriate to the application of waste materials to land are; theFederal Waste Management Act 1990, the Federal Fertiliser Act 1994, the Soil ProtectionLaws of individual States and the Sewage Sludge Ordinances of individual States. A CompostOrdinance with limit values is in preparation.
Farm animal waste is normally applied to land where the waste is produced, although in somecases this has led to excess nutrient input to soils. No records appear to be available, neitherof quantities, nor of the quality, of farm animal wastes.
Industrial waste materials do not seem to be applied to land, except those permitted for thepreparation of fertilisers. Some other waste materials seem to be applied to land (e.g. from thefood and drinks industries, as compost) but it has not been possible to obtain any information.On the whole, it appears that farmers are not likely to accept industrial waste materials for useon agricultural land.
The main forms of disposal seem to be; land filling, incineration (energy production) andindustrial recycling. However, land filling of organic wastes will be greatly reduced by 2004,when legislation limiting the organic content to 5%, will come into force. It is expected thatland filling of such products will be replaced by incineration. The change is expected to resultin increased disposal costs.

European Commission-Directorate-General for Environment
WRc Ref:CO4953-2/11768-1July 2001
112

European Commission-Directorate-General for Environment
WRc Ref:CO4953-2/11768-1July 2001
113
A1 LEGAL AND REGULATORY FRAMEWORK
Similar to Germany, Austria is a Federal State where framework legislation is passed atFederal level, but the implementation and enforcement of legislation is generally under thecompetence of the individual Federal States (Länder) and regional government.
In principle, the following legislation is appropriate to the application of waste materials to land(Umweltbundesamt 1996, 1997):
• The Federal Waste Management Act 1990;
• The Federal Fertiliser Act 1994;
• Soil Protection Laws of individual States;
• The Sewage Sludge Ordinances of individual States.
The Federal Waste Management Act (Abfallwirtschaftsgesetz 1990) which came into force on1 July 1990, provides the legal framework for the avoidance, utilisation and disposal of waste.
There is at present no specific Federal law governing soil conservation or protection, althoughit has been declared, in the Federal Constitution (Amendment 1984), a sub-domain ofenvironmental protection, and thus represents a matter of environmental concern. However,some individual States have Soil Protection Laws (Umweltbundesamt 1996, 1997).
Industrial waste materials do not seem to be applied to land, except in the form of compost(food industry) or those permitted for the preparation of fertilisers (see Table A.1). A CompostOrdinance with limit values is in preparation (Dr. L. Zahrer, personal communication).
Where industrial waste waters are treated in municipal waste water treatment plants, theresulting sludge will be subject to regulations governing the application of waste watertreatment sludge to land. There are no separate regulations for industrial waste watertreatment sludge, but these are not normally applied to land (Dr. L. Zahrer, personalcommunication). The limit values for sewage sludge and soil are shown in Table A2, indicatingsome differences in the values in different Federal States.
In the past, animal waste production has been kept in check through the Animal HusbandryAct, which prescribed maximum live stock limits for animal breeding (Umweltbundesamt1994). However, this requirement has been changed in the adjustment to EU policy andlegislation (Amendment to the Animal Husbandry Act, allowing higher numbers of live stockper land area, Umweltbundesamt 1996, 1997).

European Commission-Directorate-General for Environment
WRc Ref:CO4953-2/11768-1July 2001
114
Table A1 Materials permitted for the preparation of fertilisers in Austria (dataprovided by T Brech, personal communication)
a) Plant materials:Green compostBark / bark productsWood chippings / wood fibresBeer and fruit filtration residuesPotato – residual waterResidual liquid from alcohol productionRice husks / chaffCoconut fibres / wasteCocoa bean skinsCoffee roasting wastePlant waste (jute, hemp, flax)Aspirator waste (cereal processing)Pressing and extraction residues (oil seed, sunflower),MolassesExtracts of plant material with low nutrient contentSpent residues (beer / wine production)CellulosePlant glycosidesWorm soil / mould (worm excreta)Algae, alginateSeaweedMycelia (penicillum chrysogenum, Aspergillus niger)b) Animal materials:Blood mealSkin meal (skin, hide, pelt, fur)Hoof meal and chippings (separated, roasted)Feather mealHair mealBone mealCarcass mealFish mealFish guanoCollagen protein hydrolysateSheep woolAnimal hide (treated and untreated)Deer hornAnimal excrementWorm soil / mould (worm excreta)c) Other materials:Calcium nitrate Calcium sulfateMagnesium nitrate Calcium carbonateSodium nitrate Calcium chlorideAmmonium nitrate Magnesium carbonateAmmonium sulfate Dolomite calcium oxideAmmonium sulfate nitrate Magnesium sulfateDicyandiamide Calcium hydroxideCalcium cyanamide Magnesium hydroxideUrea Silicates of calcium and magnesiumCrotonylidenediurea LimestoneOxamide Chalk

European Commission-Directorate-General for Environment
WRc Ref:CO4953-2/11768-1July 2001
115
c) Other materials (continued)Crude phosphate (ground, partially orcompletely processed / hydrolysed?)
Magnesite
Phosphoric acid ‘Burnt‘ limeMonocalcium phosphate Hydrated limeDicalcium phosphate Algae limeTricalcium phosphate Foundry limeAlkali calcium phosphate Residual lime (e.g. decarbonation lime)Calcium silica phosphate Carbonation limesAluminium calcium phosphate Lime from lime/nitrogen production processProcessed (hydrolysed?) phosphates Poultry excrement limeMonoammonium phosphate and diammoniumphosphate
Clay and clay minerals
Monopotassium phosphate Fullers earthColemanite and pandermite (Calcium borate) ‘Swelling’ slatePotassium salts (crude) PerlitePotassium chloride PumicePotassium sulfate Tile / brick splitsKieserite (magnesium sulfate) Stone mealMagnesium salts ClayBoric acid SandSodium borate SoilBoron ethanolamine Silica colloidsCalcium borate Humic materialCobalt chelate Micro organisms / bacteriaCobalt salts Sanoplant (hydrogel)Copper chelate Fertiferm (silica gel sludge)Copper hydroxide Polyethylene glycolCopper salts DMPPCopper oxychloride DTPAIron chelate Sodium molybdateIron-II salts Ammonium molybdateManganese chelate Zinc chelateManganese oxide Zinc saltsManganese-II salts Zinc oxides
European Commission-Directorate-General for Environment
WRc Ref:CO4953-2/11768-1July 2001
116
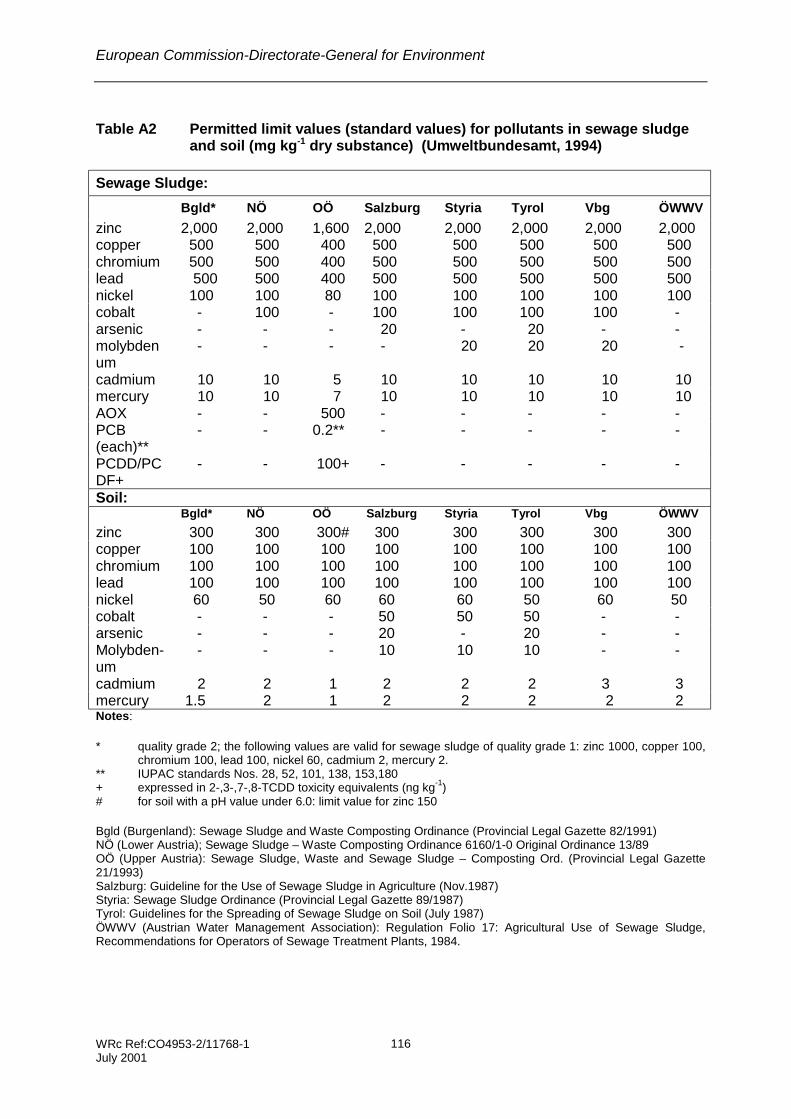
Table A2 Permitted limit values (standard values) for pollutants in sewage sludgeand soil (mg kg-1 dry substance) (Umweltbundesamt, 1994)
Sewage Sludge:
Bgld* NÖ OÖ Salzburg Styria Tyrol Vbg ÖWWV
zinc 2,000 2,000 1,600 2,000 2,000 2,000 2,000 2,000copper 500 500 400 500 500 500 500 500chromium 500 500 400 500 500 500 500 500lead 500 500 400 500 500 500 500 500nickel 100 100 80 100 100 100 100 100cobalt - 100 - 100 100 100 100 -arsenic - - - 20 - 20 - -molybdenum
- - - - 20 20 20 -
cadmium 10 10 5 10 10 10 10 10mercury 10 10 7 10 10 10 10 10AOX - - 500 - - - - -PCB(each)**
- - 0.2** - - - - -
PCDD/PCDF+
- - 100+ - - - - -
Soil:Bgld* NÖ OÖ Salzburg Styria Tyrol Vbg ÖWWV
zinc 300 300 300# 300 300 300 300 300copper 100 100 100 100 100 100 100 100chromium 100 100 100 100 100 100 100 100lead 100 100 100 100 100 100 100 100nickel 60 50 60 60 60 50 60 50cobalt - - - 50 50 50 - -arsenic - - - 20 - 20 - -Molybden-um
- - - 10 10 10 - -
cadmium 2 2 1 2 2 2 3 3mercury 1.5 2 1 2 2 2 2 2Notes:
* quality grade 2; the following values are valid for sewage sludge of quality grade 1: zinc 1000, copper 100,chromium 100, lead 100, nickel 60, cadmium 2, mercury 2.
** IUPAC standards Nos. 28, 52, 101, 138, 153,180+ expressed in 2-,3-,7-,8-TCDD toxicity equivalents (ng kg-1)# for soil with a pH value under 6.0: limit value for zinc 150
Bgld (Burgenland): Sewage Sludge and Waste Composting Ordinance (Provincial Legal Gazette 82/1991)NÖ (Lower Austria); Sewage Sludge – Waste Composting Ordinance 6160/1-0 Original Ordinance 13/89OÖ (Upper Austria): Sewage Sludge, Waste and Sewage Sludge – Composting Ord. (Provincial Legal Gazette21/1993)Salzburg: Guideline for the Use of Sewage Sludge in Agriculture (Nov.1987)Styria: Sewage Sludge Ordinance (Provincial Legal Gazette 89/1987)Tyrol: Guidelines for the Spreading of Sewage Sludge on Soil (July 1987)ÖWWV (Austrian Water Management Association): Regulation Folio 17: Agricultural Use of Sewage Sludge,Recommendations for Operators of Sewage Treatment Plants, 1984.
European Commission-Directorate-General for Environment
WRc Ref:CO4953-2/11768-1July 2001
117
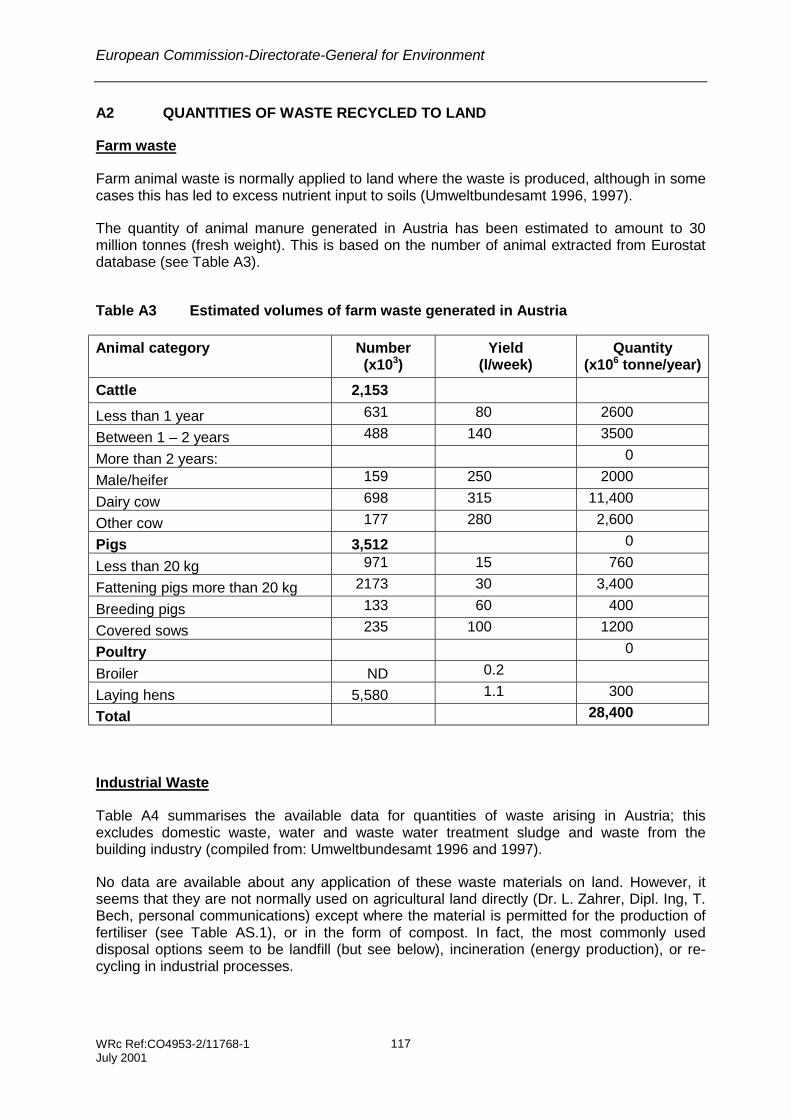
A2 QUANTITIES OF WASTE RECYCLED TO LAND
Farm waste
Farm animal waste is normally applied to land where the waste is produced, although in somecases this has led to excess nutrient input to soils (Umweltbundesamt 1996, 1997).
The quantity of animal manure generated in Austria has been estimated to amount to 30million tonnes (fresh weight). This is based on the number of animal extracted from Eurostatdatabase (see Table A3).
Table A3 Estimated volumes of farm waste generated in Austria
Animal category Number(x103)
Yield(l/week)
Quantity(x106 tonne/year)
Cattle 2,153
Less than 1 year 631 80 2600
Between 1 – 2 years 488 140 3500
More than 2 years: 0
Male/heifer 159 250 2000
Dairy cow 698 315 11,400
Other cow 177 280 2,600
Pigs 3,512 0
Less than 20 kg 971 15 760
Fattening pigs more than 20 kg 2173 30 3,400
Breeding pigs 133 60 400
Covered sows 235 100 1200
Poultry 0
Broiler ND 0.2
Laying hens 5,580 1.1 300
Total 28,400
Industrial Waste
Table A4 summarises the available data for quantities of waste arising in Austria; thisexcludes domestic waste, water and waste water treatment sludge and waste from thebuilding industry (compiled from: Umweltbundesamt 1996 and 1997).
No data are available about any application of these waste materials on land. However, itseems that they are not normally used on agricultural land directly (Dr. L. Zahrer, Dipl. Ing, T.Bech, personal communications) except where the material is permitted for the production offertiliser (see Table AS.1), or in the form of compost. In fact, the most commonly useddisposal options seem to be landfill (but see below), incineration (energy production), or re-cycling in industrial processes.

European Commission-Directorate-General for Environment
WRc Ref:CO4953-2/11768-1July 2001
118
For example, the proportion of industrial re-cycling of wood waste from the wood processingindustry was estimated at 98% (Umweltbundesamt 1996, 1997).
Solid waste materials from the food and drinks industry are mainly converted to compost,whilst liquid wastes are treated and the residues will be part of the wastewater treatmentsludge. However, industrial wastewater treatment sludges are not usually applied to land (Dr.L. Zahrer, Dipl. Ing. T. Bech, personal communications).
No details are given for drinking water treatment sludge, as this information is providedtogether with municipal wastewater treatment sludge.
The survey of pulp and paper sludge (Dr Zetti, in CEPI, 2000) has revealed clearly, that noneof these materials are applied to land (Table A4). The reason for this was given as non-acceptance by farmers who suspect the presence of hazardous substances (worst casescenario).
Table A4 Pulp and paper sludge production and methods of re-use and disposal inAustria (Dr. Zetti, Austropapier, in: CEPI, 2000)
SludgefromPulp
Production
Sludgefrom
PaperProduction
Sludgefrom
Recycling
Sludgefrom
De-inking
Quantities in (m3/a) 42 407 481 715 75 864 Included inpaperproduction
Quantities in t/a dry solids 19 083 239 981 38 336
Are data measured (M)or estimated (E) ?
M M M
Percentage recycled inagriculture
0 0 0
Percentage recycled onforest soils
0 0 0
Percentage recycled inland reclamation
0 0 0
Percentage landfilled 0.7 1.8 82.3
Percentage incinerated 76.3 84,6 17.7
Other (e.g. recycled inother industries)
23.0 13.6 0

European Commission-Directorate-General for Environment
WRc Ref:CO4953-2/11768-1July 2001
119
It seems that the re-use / disposal pattern is probably broadly typical for most wastes ofinterest in this study (except for farm wastes and wastes which are composted), i.e. thisseems to provide a good example with the main disposal options being incineration, landfilland industrial re-use.
However, the future trend for waste from the paper industry is expected to move away fromlandfill and towards incineration, because of the introduction of legislation, which, as from2004, will no longer permit land filling of materials with a carbon content of more than 5%.Thus, all currently land filled materials will have to be incinerated from 2004 onwards. There isa landfill tax (varying widely, depending on the material and landfill site) but the paper industryassociation expects a doubling of the disposal fees by incineration. As the recyclingpossibilities of waste paper increase, and lower qualities may be used, increased volumes ofsludge from recycling and de-inking are expected in Austria (Dr. Zetti, Austropapier, in: CEPI,2000).
We have no detail of other industrial wastes, but a similar scenario is likely to apply to manyother types of organic, industrial waste.
European Commission-Directorate-General for Environment
WRc Ref:CO4953-2/11768-1July 2001
120

European Commission-Directorate-General for Environment
WRc Ref:CO4953-2/11768-1July 2001
121
A3 QUALITY OF WASTE RECYCLED TO LAND
No information seems to be available on the quality of waste materials; this seems of littleimportance, since there does not seem to be much application of wastes directly on land.
However, wastes, which are used as a basis for fertiliser production, will be subject tostandards set out in legislation concerning fertiliser application, as well as soil and waterprotection. Similarly, waste materials that are composted and then applied to land, will besubject to soil protection legislation and the Compost Ordinance which is in preparation.

European Commission-Directorate-General for Environment
WRc Ref:CO4953-2/11768-1July 2001
122
European Commission-Directorate-General for Environment
WRc Ref:CO4953-2/11768-1July 2001
123
REFERENCES
Laws and regulations
Abfallwirtschaftsgesetz (Federal Waste Management Act) 1990, Bundesgesetzblatt (BGBl.)1990/325.
Amendment (1984) to the Federal Constitution, Federal Legal Gazette, No. 491, 1984.
Düngemittelgesetz (Federal Fertiliser Act) 1994, BGBl. 1994/513.
Other references
CEPI (2000) Inquiry on Pulp and Paper Sludges, April 2000, Survey carried out as part of thisproject by SEDE through CEPI (Confederation of European Paper Industries), Brussels.
Umweltbundesamt (1997) State of the Environment in Austria, Federal Environment Agency –Austria, Vienna.
Umweltbundesamt (1996) Umweltsituation in Österreich – Vierter Umweltkontrollbericht desBundesministers für Umwelt an den Nationalrat, Teil A (State of the Environment in Austria –4th Environmental Control Report from the Minister of the Environment to the NationalAssembly, Part A), Bundesministerium für Umwelt, Vienna.
Umweltbundesamt (1994) State of the Environment in Austria, Federal Environment Agency –Austria, Vienna.
Rech (2000) Information (in German) provided by Dipl. Ing. Thomas Rech, SektionLandwirtschaft (Department of Agriculture), Bundesministerium für Land- und Forstwirtschaft,Umwelt und Wasserwirtschaft (Federal ministry of Agriculture, Forestry, Environment andWater Management), Vienna.

European Commission-Directorate-General for Environment
WRc Ref:CO4953-2/11768-1July 2001
124
CONTACTS
SC Dr. L. Zahrer, Head of Waste Department, Sektion Umwelt (Environment Division),Bundesministerium für Land- und Forstwirtschaft, Umwelt und Wasserwirtschaft (Federalministry of Agriculture, Forestry, Environment and Water Management), Vienna.
Dipl. Ing. Thomas Rech, Sektion Landwirtschaft (Agriculture Division), Bundesministerium fürLand- und Forstwirtschaft, Umwelt und Wasserwirtschaft (Federal ministry of Agriculture,Forestry, Environment and Water Management), Vienna.
Mag. Ermer, Abteilung Recht, Sektion Landwirtschaft (Department of Legislation, AgricultureDivision), Bundesministerium für Land- und Forstwirtschaft, Umwelt und Wasserwirtschaft(Federal ministry of Agriculture, Forestry, Environment and Water Management), Vienna.
Dipl. Ing. Claudia Koreimann, Abteilung Internationale Wasserwirtschaft (Department ofInternational Water Management), Bundesministerium für Land- und Forstwirtschaft, Umweltund Wasserwirtschaft (Federal ministry of Agriculture, Forestry, Environment and WaterManagement), Vienna.
Mag. Werner Hennlich, Verbindungsstelle der Bundesländer (Co-ordination Centre for theFederal States), Vienna.
Amt Niederösterreichische Landesverwaltung.
Umweltbundesamt (Federal Environment Agency) website: www.ubavie.gv.at.
Dr Zetti, Austropapier (through CEPI survey).

European Commission-Directorate-General for Environment
WRc Ref:CO4953-2/11768-1July 2001
125
APPENDIX B BELGIUM
SUMMARY
In Belgium, the recycling of waste materials to land is regulated at the regional and federallevels. A waste producer has to submit a detailed report to the administration in order toreceive an exemption from licensing for landspreading of waste materials to land.
The landspreading of industrial waste is covered under the same law and regulations as thelandspreading of urban sewage sludge. There is no strict control on the spreading of animalmanure in the Walloon region apart from complying with the EC Directives on nitrate, surfacewater and ground water protection. On the other hand in the Flemish region there arestringent limits on the quantity of nitrogen and phosphorus spread per hectare.
The recycling in agriculture of industrial waste is mainly carried out by contractors who areresponsible for transport, contact with farmers, spreading and reporting to the differentadministrations.
It is estimated that about 320,000 tonnes (dry weight basis) of industrial waste are recycled inagriculture. The most important part of the production of industrial waste recycled inagriculture is generated from the food and paper industries. In addition, about 308 milliontonnes of nitrogen and 124 million tonnes of phosphorus (expressed as P2O5) are recycled toland through animal manures.

European Commission-Directorate-General for Environment
WRc Ref:CO4953-2/11768-1July 2001
126
European Commission-Directorate-General for Environment
WRc Ref:CO4953-2/11768-1July 2001
127
B1 LEGAL AND REGULATORY FRAMEWORK
Responsible parties
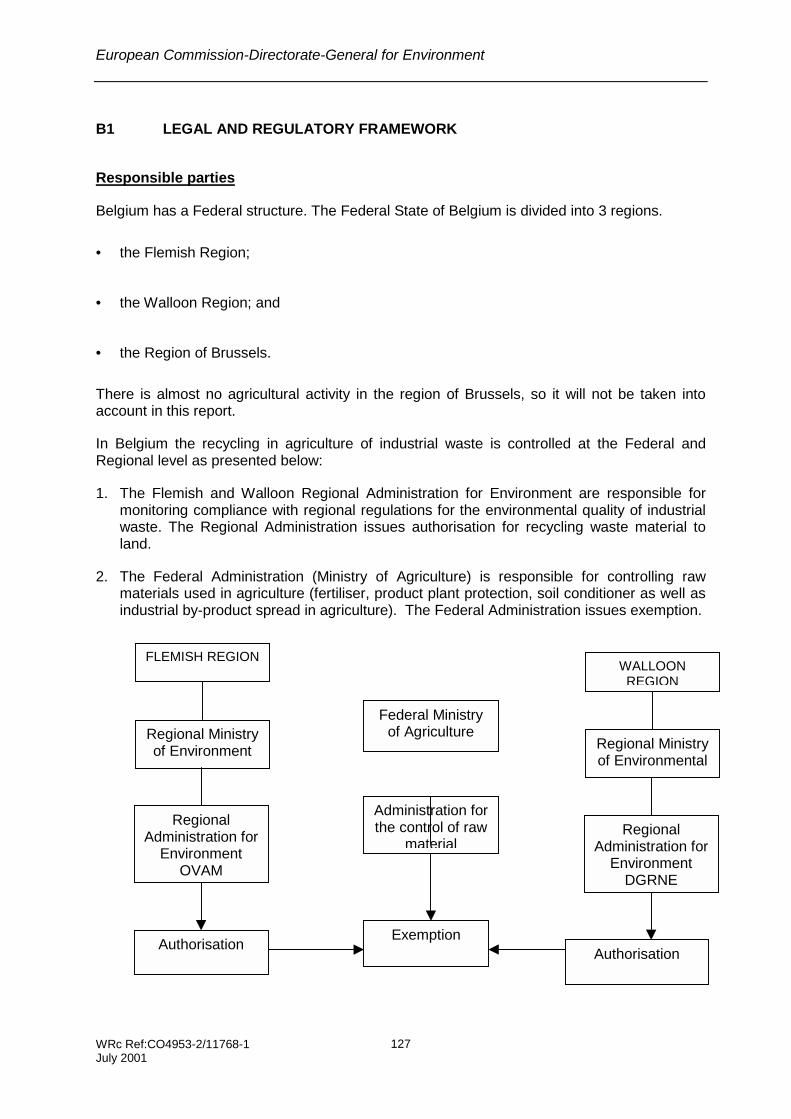
Belgium has a Federal structure. The Federal State of Belgium is divided into 3 regions.
• the Flemish Region;
• the Walloon Region; and
• the Region of Brussels.
There is almost no agricultural activity in the region of Brussels, so it will not be taken intoaccount in this report.
In Belgium the recycling in agriculture of industrial waste is controlled at the Federal andRegional level as presented below:
1. The Flemish and Walloon Regional Administration for Environment are responsible formonitoring compliance with regional regulations for the environmental quality of industrialwaste. The Regional Administration issues authorisation for recycling waste material toland.
2. The Federal Administration (Ministry of Agriculture) is responsible for controlling rawmaterials used in agriculture (fertiliser, product plant protection, soil conditioner as well asindustrial by-product spread in agriculture). The Federal Administration issues exemption.
Regional Ministryof Environment
Federal Ministryof Agriculture
Regional Ministryof Environmental
WALLOONREGION
FLEMISH REGION
Authorisation
Administration forthe control of raw
material
ExemptionAuthorisation
RegionalAdministration for
EnvironmentOVAM
RegionalAdministration for
EnvironmentDGRNE
European Commission-Directorate-General for Environment
WRc Ref:CO4953-2/11768-1July 2001
128
Control on farm waste landspreading
The regulation concerning livestock manure is very different between the Flemish and theWalloon region.
Flemish region
During the last 40 years, the livestock population in the Flemish Region has considerablyincreased, more specifically in the pig and poultry sector. This has lead to a great unbalancedsituation between the manure production and their potential beneficial utilisation on farm landand has had negative impacts on soil, surface and groundwater quality.
The Flemish government has to take strong measures and has introduced regulation onmanures input. The latest edition was published in 2000 and is called “MESTACTIEPLAN II”.This new regulation creates a strong competition between industrial waste and livestockmanure. It has not given rise to an increase transfer of livestock manure between the Flemishand Walloon region.
The main points of this new regulation are:
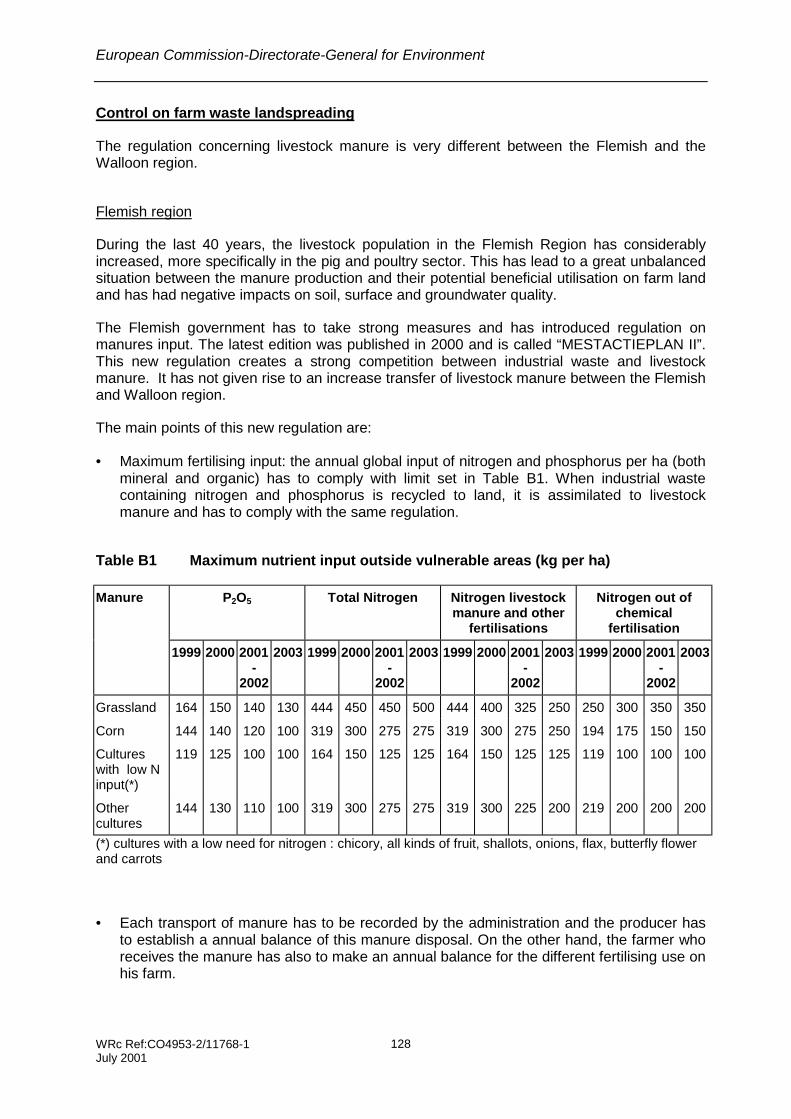
• Maximum fertilising input: the annual global input of nitrogen and phosphorus per ha (bothmineral and organic) has to comply with limit set in Table B1. When industrial wastecontaining nitrogen and phosphorus is recycled to land, it is assimilated to livestockmanure and has to comply with the same regulation.
Table B1 Maximum nutrient input outside vulnerable areas (kg per ha)
Manure P2O5 Total Nitrogen Nitrogen livestockmanure and other
fertilisations
Nitrogen out ofchemical
fertilisation
1999 2000 2001-
2002
2003 1999 2000 2001-
2002
2003 1999 2000 2001-
2002
2003 1999 2000 2001-
2002
2003
Grassland 164 150 140 130 444 450 450 500 444 400 325 250 250 300 350 350
Corn 144 140 120 100 319 300 275 275 319 300 275 250 194 175 150 150
Cultureswith low Ninput(*)
119 125 100 100 164 150 125 125 164 150 125 125 119 100 100 100
Othercultures
144 130 110 100 319 300 275 275 319 300 225 200 219 200 200 200
(*) cultures with a low need for nitrogen : chicory, all kinds of fruit, shallots, onions, flax, butterfly flowerand carrots
• Each transport of manure has to be recorded by the administration and the producer hasto establish a annual balance of this manure disposal. On the other hand, the farmer whoreceives the manure has also to make an annual balance for the different fertilising use onhis farm.
European Commission-Directorate-General for Environment
WRc Ref:CO4953-2/11768-1July 2001
129
• Spreading period: In order to reduce nitrate and phosphorus leaching and runoff duringthe period when the uptake by the crops is limited, the spreading of manure is forbiddenbetween 21 September and 15 February. Some exceptions are possible for manure with adry solid content higher than 20 %.
• Obligation of treatment: The farmer who has a manure production higher than 10,000 kgP2O5 have the obligation to treat an important part of his production and to find a solutionfor the by-product coming from outside the Flemish agriculture (other utilisation orexportation). It is expected that big scale measure treatment unit will be available withinone or two years.
Walloon region
The situation concerning livestock manure is completely different in the Walloon region wherethe development of the pig and poultry sector is limited. The sector is mainly constituted bymilk and meat production (cattle). For this reason there is no stringent regulation on thespreading of livestock manure. The only regulation is based on the EC Nitrates Directive andcode of good practice.
Control on industrial waste landspreading
In the Flemish and the Walloon region, the regulations concerning the industrial waste are thesame as the regulations concerning the urban sewage sludge.
The producer of the waste must receive a Regional and Federal licence before being allowedto reuse the industrial waste in agriculture. In order to get a complete waste licence a period of6 months is required. The Regional and Federal administrations have a soft approach on therecycling operation.
The regional regulations for each region which apply to recycling of industrial waste to landare:
• Flemish region: the VLAREA II and
• Walloon region: the AGW of 12/01/95 (it is expected that this regulation will be reviewed in2001)
These two regulations include a maximum allowed value for heavy metal and organic micro-pollutants as well as obligations concerning the control of the recycling operation (spreadingrate, information to the farmer, reporting, soil analysis, etc.).
The quality of any materials used in agriculture (fertiliser, product plant protection, soilconditioner as well as industrial by-product spread in agriculture) are regulated under THERoyal Decree of 7th January 1998.
Before starting the recycling of industrial waste in agriculture, the producer of the waste has togive a report to the regional administration including the following points :
• the annual production of the waste;

European Commission-Directorate-General for Environment
WRc Ref:CO4953-2/11768-1July 2001
130
• the quality of the waste (analysis on environmental parameters); and
• a description of the production process of the waste including details concerning the usedraw materials and analysis.
The Regional Administration will issue a waste licence specifying the landspreadingconditions. The report on waste given to the Regional Administration will also be analysed bythe Federal Administration for the Inspection of Raw Materials mainly on agronomicparameters. The Federal Administration will deliver an exemption if the industrial waste has asufficient agronomic value.
Other regulations
There are a number of regulations which have an indirect effect on industrial waste disposal.
• The Nitrates EC directive
• The different regulations concerning the protection of surface and groundwater
• The regulation which forbids the disposal of organic waste in landfill
• The regulation concerning waste incineration.
The two last regulations have a direct influence on the price or on the feasibility of landfilldisposal and incineration.

European Commission-Directorate-General for Environment
WRc Ref:CO4953-2/11768-1July 2001
131
B2 QUANTITIES OF WASTE RECYCLED TO LAND
Farm animal wastes
As specified before, there is a great difference between the Flemish and the Walloon regionconcerning livestock manure production. The livestock waste production has been expressedin terms of nitrogen and phosphorus production rather than quantity of slurry or manureproduced. It is estimated that around 308 million tonnes of nitrogen and 124 million tonnes ofphosphorus are produced annually by livestock (Table B2). The detailed calculation ispresented in Table B3. It is estimated that the total quantities of animal manure produced inBelgium amount to 20 million tonnes (fresh weight) based on yield coefficient presented inTable B4 below.
Until the end of 1999, it could be considered that all the livestock waste was reused inagriculture, but since the introduction of the new regulation in the Flemish region, it isexpected that an important quantity of the waste is being treated and is not spread on the farmland anymore.
Table B2 Quantity of nitrogen and phosphorus produced in livestock waste (1999)
Animal type Quantity of nitrogen(x106 t/annum)
Quantity ofphosphorous
(x 106 t P2O5/annum)
Cattle 198 64.2
Pig 85.5 46.4
Chicken 24.3 13.5
Total 307.8 124.1

European Commission-Directorate-General for Environment
WRc Ref:CO4953-2/11768-1July 2001
132
Table B3 Detailed calculation of nutrient production from livestock in Belgium
Flemish Region Walloon Region1999
Numberof animal
Annual production(x106t/y)
Numberof animal
Annual production(x106t/y)
Animal type P2O5 N P2O5 N
CATTLE
≤≤≤≤1 year
Veal 167,986 0.6 1.76 2,501 0.009 0.026
Other male 133,603 1.16 3.07 160,650 1.4 3.69
Other female 244,504 2.44 8.07 267,624 2.68 8.83
1 ≤≤≤≤ 2 years
Male 113,442 2.5 6.92 73,329 1.61 4.47
Female 30,058 0.66 1.83 3,653 0.8 0.22
Heifer 193,348 3.29 10.83 214,659 3.65 12.02
≥≥≥≥ 2 years
Male 24,582 0.72 1.89 19,157 0.56 1.47
Heifer 84,942 2.5 6.54 136,351 4.02 10.5
Dairy cow 333,395 10 32.34 274,192 8.22 26.6
Suckler 185,003 5.55 17.94 325,274 9.76 31.55
Beef Cow 73,685 2.17 5.67 22,753 0.67 1.75
Sub-Total 1 1,584,548 31.61 96.88 1,500,143 3.27 101.14
PIGS
≤ 20 kg 2,135,011 4.31 5.25 72,650 0.15 0.18
20 ≤ 50 kg 1,725,540 11.21 22.43 100,456 0.65 1.3
≥ 50 kg 2,766,948 17.98 35.97 127,212 0.83 1.65
For breeding (≥≥≥≥ 50kg)
Male 14,274 0.21 0.34 1,090 0.016 0.026
Female 541,485 7.85 12.99 25,221 0.36 0.60
Gilt 179,585 2.6 4.31 6,986 0.10 0.17
For reforming 8,845 0.13 0.21 322 0.005 0.008
Sub-Total 2 7,371,688 44.3 81.51 333,937 2.11 3.94
POULTRY
Chicken 21,851,234 6.34 13.55 2,350,843 0.68 1.46
Laying hens 11,376,411 5.57 7.85 788,338 0.39 0.54
Other 2,817,627 0.51 0.87 129,607 0.023 0.040
Sub-Total 3 36,045,272 3,268,788

European Commission-Directorate-General for Environment
WRc Ref:CO4953-2/11768-1July 2001
133
Table B4 Estimated quantities of animal waste produced annually in Belgium (1999basis)
Animal type Number(x103)
Yield(l/week)
Total(x103 tonnes per year)
Cattle
Less than 1 year 546 80 2 272
Between 1and 2 years 337 140 2 453
More than 2 years:
Male/heifer 109 250 1 417
Dairy cow 333 315 5 454
Other cow 259 280 3 766
Pigs
Less than 20 kg 2 135 15 1 665
Fattening pig at least 20 kg 4 501 30 7 022
Breeding pig 193 60 604
Covered sows 541 100 2 816
Poultry
Broiler 24,669 0.2 256
Laying hens 11 376 1.1 650
Total 19 851
Industrial wastes
In 1999, for the Flemish and Walloon regions combined, the total quantities of the industrialwaste reused in agriculture, excluding sewage sludge and animal manures, were estimated toamount to about 320,000 tonnes of dry solids per annum (Table B5). In most cases the globalwaste production per sector was not available. The main sectors relying on the agriculturaloutlet are listed below:
• food industry (brewery, sugar, dairy);
• paper industry and
• basic organic chemical industry (gelatine)

European Commission-Directorate-General for Environment
WRc Ref:CO4953-2/11768-1July 2001
134
Table B5 Quantities of industrial wastes recycled to land and to other outlets
Waste type Quantity recycled to land(x103 tds/annum)
Other disposal options(x103 tds/annum)
Rendering and slaughtering 3 -
Meat, fish and other foodfrom animal origin
2 NA
Vegetable waste 3 -
Sugar processing 200 -
Dairy industry 2 -
Baking and confectioneryindustry
NA NA
Soft drink 0.2 -
Brewery, distillery 10.5 -
Wood processing NA NA
Pulp and paper 51 39.4
Leather and tannery waste 0.3 NA
Textile 0.2 NA
Basic organic chemicalindustry
18 -
Pharmaceutical industry NA NA
Power industry 0.4 NA
Iron and steel industry NA NA
Cement and lime 20 70
Drinking water preparation 6 14
Dredgings NA NA
Total 316.6 123.4
NA not available
Renderings and slaughtering
The waste sludge produced by this activity is mainly spread on farm land. The stomachcontent of cattle is mainly composted before being reused in agriculture or in on otherbeneficial route.
Meat, fish or other food animal origin preparation and processing
The sludge arising from water treatment is re-used in agriculture. The other waste (meatwaste, bone, fat) is reused in other industries, such as the gelatine or fat industry.
European Commission-Directorate-General for Environment
WRc Ref:CO4953-2/11768-1July 2001
135
Vegetables, fruit, cereals, edible oils
In this sector the greatest part of the produced waste, used on land, originates from vegetableand potatoes processing and is constituted of sludge. A lot of other wastes of this sector areused in animal feed (vegetable waste, oil production rest and in the production of organicfertilisers (cacao by-product).
Sugar processing
The sugar industry produces large volumes of waste which can also be considered as by-product or co-product (pulp, calcium sugar waste, soil). The lime sugar waste as well as thesoil waste is reused on farm land following a very strong market organisation.
Dairy industry
The sludge arising from water treatment plant is recycled to agriculture.
Soft drink
The sludge arising from water treatment plant is recycled to agriculture.
Brewery and distillery
All the sludge arising from the waste water treatment plant is spread in agriculture. The otherwaste produced by this sector is mainly reused in the animal feed industry.
Wood processing
The waste arising from the wood industry is not reused in agriculture except bark, which canbe used to produce compost.
Pulp and paper
The Belgian paper industry produces 58,544 tonnes (dry solids) of sludge from the productionof pulp (25 000 tonnes ds) and paper (33,544 tds) which 88% is reused in agriculture and 12%incinerated. There is no recycling to land of the 14,500 tonnes (ds) of de-inking sludge whichare landfilled and of the 17,450 tonnes (ds) of other waste which are re-used in brick industry.
Basis organic chemical industry
This sector produces an important quantity of waste constituted by treated sludge comingfrom the production of gelatine.
Cement lime
The cement industry produces no waste. The lime producer produces a large quantity ofcalcium carbonate waste which, in some cases, is reused in agriculture. An importantproducer of lime waste used in agriculture is tile production.

European Commission-Directorate-General for Environment
WRc Ref:CO4953-2/11768-1July 2001
136

European Commission-Directorate-General for Environment
WRc Ref:CO4953-2/11768-1July 2001
137
B3 PROPERTIES OF WASTE SPREAD ON LAND
The data on quality of waste other than livestock waste were obtained from the analysis ofindustrial waste materials carried out by SEDE Benelux in the context of their landspreadingactivities. It provides a good indication of the composition of the material currently recycled toland in Belgium.
Livestock waste
Table B6 Typical nutrient content in animal waste in Belgium
1999 Nutrient content (kg/animal)
Animal type P2O5 N
CATTLE
≤1 year
Veal 3.6 10.5
Other male cattle 8.7 23
Other female cattle 10 33
1 ≤ 2 years
Male 22 61
Female 22 61
Heifer 17 56
≥ 2 years
Male 29.5 77
Heifer 29.5 77
Dairy cow 30 97
Suckler 30 97
Beef Cow 29.5 77
PIGS
≤ 20 kg 2.02 2.46
20 ≤ 50 kg 6.5 13
≥ 50 kg 6.5 13
For breeding (≥ 50kg)
Male 14.5 24
Female 14.5 24
Gilt 14.5 24
For reforming 14.5 24
POULTRY
Chicken 0.29 0.62
Laying hens 0.49 0.69
Other 0.18 0.31

European Commission-Directorate-General for Environment
WRc Ref:CO4953-2/11768-1July 2001
138
Basic organic chemical industry
Table B7 Typical composition of waste from gelatine production (SEDE Benelux,pers. comm. 2000)
Parameter Number ofsamples
Min(mg/kg ds)
Max(mg/kg ds)
Mean(mg/kg ds)
pH 83 7.2 12.6 11.8
MS 83 22 69 44
MO 83 142 631 300
Tot N 83 7.4 75 28.1
N-min 80 0.012 12.9 28.1
CaO 83 171 446 338
P2O5 83 10 66 27
K2O 83 0.22 14.5 2
MgO 83 1.3 19.8 6.5
Cd 27 0.7 2.5 1.3
Cu 27 4.1 45.3 17
Ni 27 1 39 13.6
Pb 27 1.9 22 11.9
Zn 27 92 1178 411
Hg 27 0 10 1.3
Cr 27 6.3 37.5 14.3

European Commission-Directorate-General for Environment
WRc Ref:CO4953-2/11768-1July 2001
139
Waterworks
Table B8 Typical composition of waterworks sludge (SEDE Benelux, pers. comm.2000)
Parameter Number ofsamples
Min(mg/kg ds)
Max(mg/kg ds)
Mean(mg/kg ds)
pH 12 8.1 10.5 9
MS 13 12 89 50
MO 12 32 771 247
Tot N 12 1 35 7
N-min 11 0.04 10.4 2.04
CaO 12 200 494 403
P2O5 12 1.7 58.2 13.2
K2O 12 0.3 8.4 2.1
MgO 12 1.1 25.3 9.1
Cd 13 0.1 1.9 1.1
Cu 13 7.5 81.1 25
Ni 13 10 32 18
Pb 13 10 32 14
Zn 13 29 284 123
Hg 13 0.1 0.5 0.2
Cr 13 6 26 16

European Commission-Directorate-General for Environment
WRc Ref:CO4953-2/11768-1July 2001
140
Lime industry
Table B9 Typical composition of lime waste (SEDE Benelux, pers. comm. 2000)
Parameter Number ofsamples
Min(mg/kg ds)
Max(mg/kg ds)
Mean(mg/kg ds)
pH 34 7.4 11.1 8.3
DS 34 41 93 74
DO 34 8.8 130 52
Tot N 34 0.2 4.9 0.8
N-min 10 0.02 2.9 0.7
CaO 34 251 535 399
P2O5 34 0.1 2.9 0.5
K2O 32 0.11 1.3 0.3
MgO 34 3.7 27.9 8.8
Cd 27 0.1 2.3 0.9
Cu 27 1.2 28.4 11.7
Ni 27 0.1 35.3 6.7
Pb 27 2 20 8
Zn 27 14 105 42
Hg 27 0 0.5 0.1
Cr 27 1.4 24.2 8.8

European Commission-Directorate-General for Environment
WRc Ref:CO4953-2/11768-1July 2001
141
Meat industry
Table B10 Typical composition of abattoir waste (SEDE Benelux, pers. comm. 2000)
Parameter Number ofsamples
Min(mg/kg ds)
Max(mg/kg ds)
Mean(mg/kg ds)
pH 16 6.1 8.4 6.5
MS 15 4 27 14
MO 15 779 935 838
Tot N 15 14 128 81
N-min 15 1.1 20.6 9.1
CaO 15 12 83 36
P2O5 15 4.8 78 39
K2O 15 2.1 15 9.1
MgO 15 0.5 13 3.3
Cd 16 0.1 1 0.7
Cu 16 5 173 90
Ni 16 8.9 36 16
Pb 16 3.2 44 13
Zn 16 57 643 410
Hg 16 0.03 0.6 0.2
Cr 16 5 71 31
European Commission-Directorate-General for Environment
WRc Ref:CO4953-2/11768-1July 2001
142
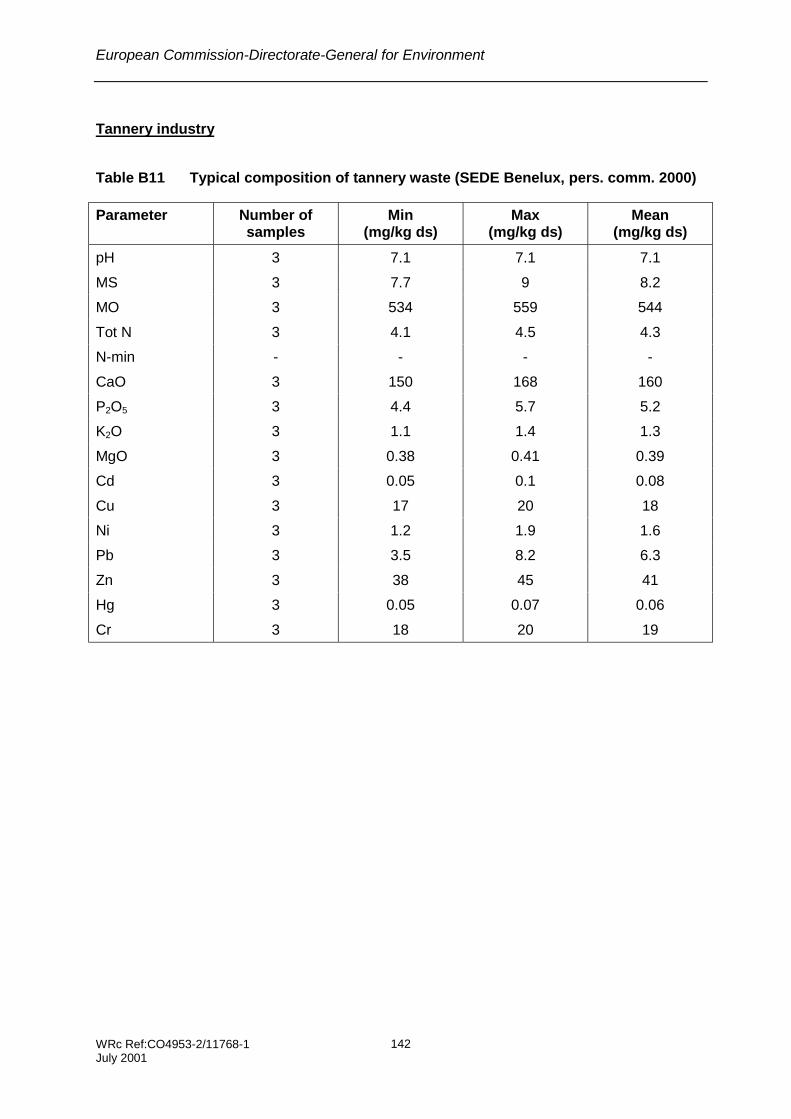
Tannery industry
Table B11 Typical composition of tannery waste (SEDE Benelux, pers. comm. 2000)
Parameter Number ofsamples
Min(mg/kg ds)
Max(mg/kg ds)
Mean(mg/kg ds)
pH 3 7.1 7.1 7.1
MS 3 7.7 9 8.2
MO 3 534 559 544
Tot N 3 4.1 4.5 4.3
N-min - - - -
CaO 3 150 168 160
P2O5 3 4.4 5.7 5.2
K2O 3 1.1 1.4 1.3
MgO 3 0.38 0.41 0.39
Cd 3 0.05 0.1 0.08
Cu 3 17 20 18
Ni 3 1.2 1.9 1.6
Pb 3 3.5 8.2 6.3
Zn 3 38 45 41
Hg 3 0.05 0.07 0.06
Cr 3 18 20 19

European Commission-Directorate-General for Environment
WRc Ref:CO4953-2/11768-1July 2001
143
Vegetable industry
Table B12 Typical composition of vegetable waste (SEDE Benelux, pers. comm.2000)
Parameter Number ofsamples
Min(mg/kg ds)
Max(mg/kg ds)
Mean(mg/kg ds)
pH 7 6.5 10 8.3
MS 7 0.8 11 4.4
MO 7 403 772 596
Tot N 7 52 122 72
N-min 4 3.7 5.9 5
CaO 7 23 400 112
P2O5 7 24 53 37
K2O 7 4.2 140 74
MgO 7 6.2 14 11
Cd 7 0.7 1.6 1
Cu 7 41 50 46
Ni 7 13 46 21
Pb 7 5.4 47 18
Zn 7 162 348 239
Hg 7 0.04 0.2 0.09
Cr 7 19 122 46

European Commission-Directorate-General for Environment
WRc Ref:CO4953-2/11768-1July 2001
144
Dairy industry
Table B13 Typical composition of dairy waste (SEDE Benelux, pers. comm. 2000)
Parameter Number ofsamples
Min(mg/kg ds)
Max(mg/kg ds)
Mean(mg/kg ds)
pH 44 4.9 13 8.6
MS 45 1.7 40 14
MO 43 53 1625 668
Tot N 44 2.3 92 40
N-min 23 0.2 113 11
CaO 44 26 565 170
P2O5 44 1.1 112 36
K2O 42 0.1 19 2.9
MgO 44 2.1 14 6
Cd 43 0.01 8.7 0.9
Cu 43 0.1 257 50
Ni 43 0.1 66 17
Pb 43 0.1 143 13
Zn 43 2.7 1046 186
Hg 43 0.02 1.5 0.3
Cr 43 0.05 90 28

European Commission-Directorate-General for Environment
WRc Ref:CO4953-2/11768-1July 2001
145
Soft drink industry
Table B14 Typical composition of waste resulting from the preparation of soft drinks(SEDE Benelux, pers. comm. 2000)
Parameter Number ofsamples
Min(mg/kg ds)
Max(mg/kg ds)
Mean(mg/kg ds)
pH 15 5.7 12 9.8
MS 15 0.8 30 19
MO 15 270 844 461
Tot N 15 15 83 41
N-min 15 1.2 12 3.9
CaO 15 30 407 262
P2O5 15 13 67 24
K2O 15 1.9 9.8 4.6
MgO 15 3.1 7.2 4.7
Cd 13 1 1.3 1.1
Cu 13 16 252 40
Ni 13 10 37 20
Pb 13 10 35 14
Zn 13 84 541 178
Hg 13 0.1 0.2 0.1
Cr 13 13 123 57

European Commission-Directorate-General for Environment
WRc Ref:CO4953-2/11768-1July 2001
146
Paper industry
The information on quality of paper sludge was provided by SEDE (Table B15) and byCOBELPA (Table B16).
Table B15 Typical composition of paper sludge (SEDE Benelux, pers. comm. 2000)
Parameter Number ofsamples
Min(mg/kg ds)
Max(mg/kg ds)
Mean(mg/kg ds)
pH 24 4.5 7.7 7
MS 27 19 40 30
MO 24 191 904 639
Tot N 24 5.8 49 18
N-min 24 0.3 12 4
CaO 24 5.2 174 52
P2O5 24 1.9 80 13
K2O 24 0.6 7.9 1.9
MgO 24 0.8 6.9 2.6
Cd 27 1 4.4 2.2
Cu 27 19 243 79
Ni 27 10 29 18
Pb 27 5 83 22
Zn 27 45 330 205
Hg 27 0.1 1.4 0.3
Cr 27 13 1165 80
Table B16 Typical composition of paper sludge (COBELPA, pers. comm. 2000)
Parameter Number ofsamples
Min(mg/kg ds)
Max(mg/kg ds)
Mean(mg/kg ds)
pH 21 5.9 12.5 7
MS (%) 21 20 55 30
C/N 9 30 40 35
Tot N 21 0.1 1 0.5
P2O5 21 0.06 0.3 0.1
K2O 21 0.001 0.02 0.008
Zn 21 50 350 120
Cu 21 15 95 50
Ni 21 5 20 11
Cd 21 0.6 1.9 1.1
Cr 21 5 150 30
Pb 21 7 160 30
As 21 1 6 3
European Commission-Directorate-General for Environment
WRc Ref:CO4953-2/11768-1July 2001
147
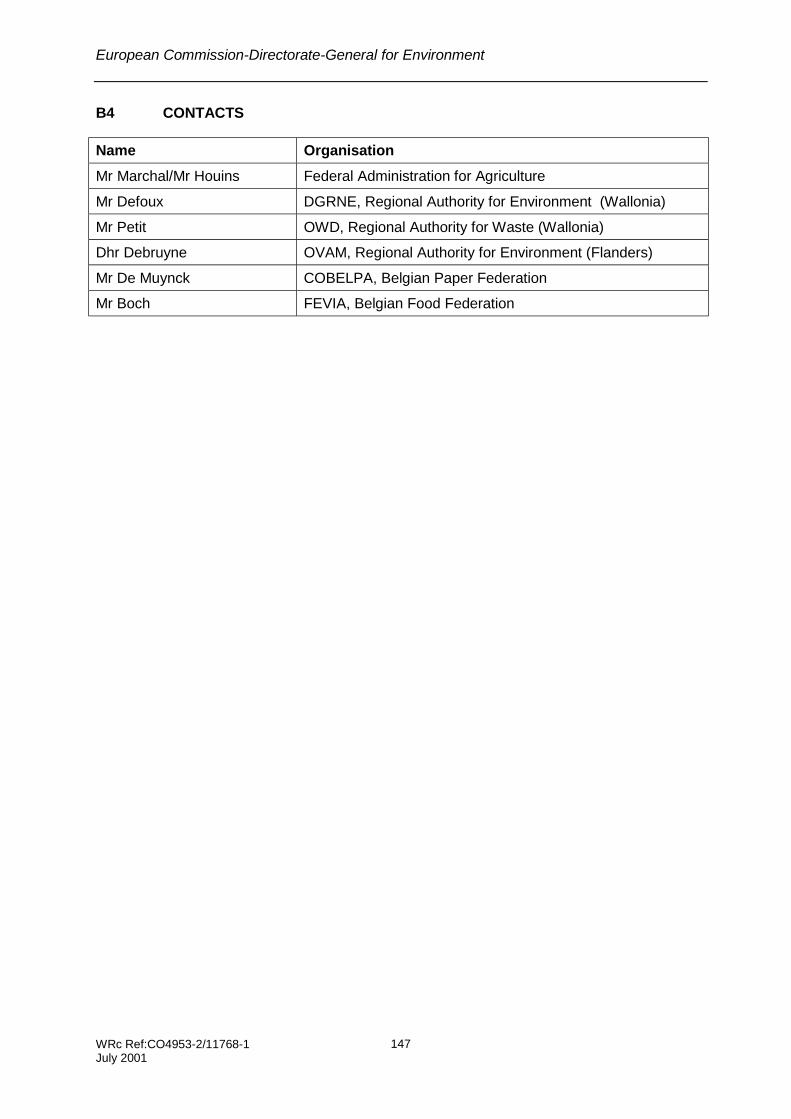
B4 CONTACTS
Name Organisation
Mr Marchal/Mr Houins Federal Administration for Agriculture
Mr Defoux DGRNE, Regional Authority for Environment (Wallonia)
Mr Petit OWD, Regional Authority for Waste (Wallonia)
Dhr Debruyne OVAM, Regional Authority for Environment (Flanders)
Mr De Muynck COBELPA, Belgian Paper Federation
Mr Boch FEVIA, Belgian Food Federation

European Commission-Directorate-General for Environment
WRc Ref:CO4953-2/11768-1July 2001
148

European Commission-Directorate-General for Environment
WRc Ref:CO4953-2/11768-1July 2001
149
APPENDIX C DENMARK
SUMMARY
In Denmark, there is a policy of recycling to land organic residues from household, agricultureand industry. All animal manures and a minor part of industrial wastes are currently applied toland.
The landspreading of industrial waste falls under the same regulations as the sewage sludgeapplication to land and industries are required to submit detailed information on quantities andquality of the waste. Summary reports are produced annually by the Danish EnvironmentalProtection Agency. Farmers are also required to report on farm waste. Summary reports onthis information is produced annually by the Danish Plant Directorate.
The regional and local authorities are the main bodies responsible for enforcing environmentallegislation in Denmark. The regional authorities supervise the authorisation for application ofindustrial waste to land and the local authorities monitor compliance. The DanishEnvironmental Protection Agency has a supervisory and reporting role. For farm waste, theresponsible authorities are the Danish Plant Directorate and the local authorities.
The liability/responsibility for landspreading of waste lies with the waste producer even when asubcontractor is hired to conduct the actual landspreading. Liability/responsibility for the wasteis normally transferred from the waste producer to the farmer after spreading, in accordancewith their mutual agreement. Farmers have to maintain detailed annual fertiliser budgets andensure a balance of inputs and outputs.
In 1997/98, about 200,000 tonnes on a dry weight basis of industrial wastes were recycled toland in Denmark. In addition, it is estimated that more than 4 million tds of animal manure andslurry are recycled to land. In comparison, 7,555 tds of sewage sludge and 5,752 tds ofhousehold wastes were also recycled to land.
The quantities of industrial organic waste disposed of to landfill have declined since theintroduction of a landfill tax diverting waste to agriculture. However, landspreading of wastes islikely to decrease because of legislation introduced in 1999 which prohibits the spreading ofliquid waste during the winter months and sets more stringent requirements to the quality ofthe waste. In addition, there is increasing resistance from some farmers to accept sewagesludge and other industrial waste because the growing of food to organic standards.

European Commission-Directorate-General for Environment
WRc Ref:CO4953-2/11768-1July 2001
150

European Commission-Directorate-General for Environment
WRc Ref:CO4953-2/11768-1July 2001
151
C1 LEGAL AND REGULATORY FRAMEWORK
In Denmark, landspreading of waste is well regulated. Legislation has been in force for anumber of years and is continuously being reviewed. Industrial and farm wastes are coveredby different pieces of legislation as presented below.
Controls on the landspreading of farm waste
Landspreading of farm waste is controlled by the Statutory Order No. 755 of 30 September1999 on Professional Livestock, Livestock Manure, Silage etc. (SO 1999/755) and theStatutory Order No. 523 of 8 July 1998 on Agricultural Use of Manure and on Plant Cover (SO1998/523). The former sets out the rules on the application of manure to land and the lattersets out the rules determining the nitrogen requirements of the soil.
Responsible parties
The Danish Plant Directorate and the local authorities are responsible for enforcing farmwaste regulations in Denmark. The Danish Plant Directorate monitors compliance with Ordersby controlling the manure plans sent in by farmers and conducting controls on farms.Approximately 2,000 to 3,000 physical controls on farms are conducted each year. The localauthorities supervise the storage and spreading of farm waste.
Livestock density rules
The structural development and the specialisation of Danish farming this century haveresulted in an imbalance between the amount of manure produced and the available landarea to spread the manure. As a consequence rules on livestock density were introduced bythe 1998 Statutory Order on Professional Livestock, Livestock Manure, Silage etc. Theserules apply to any area on which farm waste is applied. Land areas where the livestockdensity rules are excluded from individual farms’ nutrient management plans are leased outareas, areas without manuring need and areas where waste spreading is not allowed. Tenantland is included.
The livestock density rules impose restrictions on the quantity of farm waste to be spreadthrough restrictions on the maximum allowable animal units per hectare and per year (TableC1). One animal unit corresponds to the production of 100 kg nitrogen per year.
When a farm cannot comply with the restrictions set under the livestock density rules, theremust be a farm waste agreement securing the sale of the waste to another farm or to a biogasplant. Farm waste can then be subtracted from the manure plan but only if the receiving farmis registered with the Danish Plant Directorate.

European Commission-Directorate-General for Environment
WRc Ref:CO4953-2/11768-1July 2001
152
Table C1 Maximum allowable animal units per hectare and per year under thelivestock density rules
Farm type No of animal units per hectare and per year
Cattle1 2.1 (2.33)
Pigs2 1.7
Other animals 2.0
Farms without animals 1.7Notes:
1 At least 2/3 of the animal units are cattle.2 At least 2/3 of the animal units are pigs.3 More than 70% of the land must be planted with beet, grass.
The farm waste agreement must contain the following information:
1. Name, address and VAT number of the two farms involved;
2. Type and quantity of the manure or slurry;
3. The corresponding animal units and hectares to the manure delivered; and
4. The duration of the deal.
The responsibility for the manure during the transport between the two farms and duringspreading is agreed between the two farmers.
Other organic waste
If a farmer spreads industrial waste on his land, the nutrient management plan must be alteredaccordingly. The percentages for different types of industrial organic waste which must beincluded in the plan are shown in Table C2. Additionally, the farmer must be able to provide adeclaration from the industrial waste producer specifying the quantity and nitrogen content ofthe waste provided.
Table C2 Percentage of nitrogen from other organic waste types that must beincluded in nutrient plans
Industrial waste type Plan period 98/99 Plan period 99/00
Sewage sludge 30 (10) 30
Composted household waste 10 (10) 10
Potato fruit juice 50 50
Juice from the pressing into granules ofvegetable waste
25 (10) 40
Others 30 (10) 30 (10)Note: The figures in brackets are the percentages for the waste the year before to be subtracted in
the current plan period.

European Commission-Directorate-General for Environment
WRc Ref:CO4953-2/11768-1July 2001
153
Registered activities
The Danish Plant Directorate administers a register of agricultural premises. All agriculturalpremises required to register with the Danish Plant Directorate are also required to draw up anutrient management plan consisting of a crop plan, a manure plan and a manurestatement/budget. The manure statement is sent to the Danish Plant Directorate. The cropplan and the manure plan must be readily available on the farm and forwarded to theDirectorate if requested.
A premise (arable, livestock farm, with forestry or a combination of those) must register if ithas:
• an animal stock of more than 10 animal units; or
• an animal density of more than 1.0 animal unit per hectare; or
• apply more than 25 tonnes per year of animal manure or other organic waste.
Additionally, if a premise is not strictly recorded as a farming premise but has an annualturnover of more than DKr 20,000 (~Euro 2,700), it must register.
Agricultural premises that are not required to join the register are free to enter. If anagricultural premise is registered it is exempt from a fertiliser tax of DKr 5 per tonne.
Controls on the landspreading of industrial waste
The recycling of industrial waste to land is governed by the Statutory Order No. 49 of 20January 2000 on Application of Waste Products for Agricultural Purposes (SO 2000/49). ThisOrder came into force on 2 February 2000. It replaces Statutory Order No. 823 of 16September 1996 on Application of Waste Products for Agricultural Purposes (SO 1996/823).The Order implements the 86/278/EEC Sludge Directive and is known as the Sludge Order.
The Order applies to waste from private households, institutions and enterprises, includingcomposted waste, process wastewater and sewage sludge, whenever these wastes aresuitable for agricultural purposes and do not contain significant quantities of substancespresenting hazards to the environment.
The Order does not apply to composted and non-composted green waste from gardens andparks or products/waste covered by the Order on Professional Livestock, Livestock Manure,Ensilage etc (SO 1998/523). Additionally, the provisions made in the Sludge Order do notapply when they conflict with rules issued by the Ministry of Food, Agriculture and Fisheries onthe prevention and control of livestock diseases.
Responsible parties
The Danish EPA has the overall responsibility for enforcing the Sludge Order. However, itsinvolvement is limited to grant derogation from the provisions of the Sludge Order and to dealwith complaints against decisions of the local and regional councils.
The day to day control is performed by the regional and the local authorities. The regionalauthorities check the information supplied by the waste producer before landspreading and
European Commission-Directorate-General for Environment
WRc Ref:CO4953-2/11768-1July 2001
154
issue authorisation when required. The local authorities monitor compliance with the SludgeOrder and with conditions specified in the authorisation for the storage and application ofwaste products.
When the storage or landspreading of the waste has caused or may cause significantnuisance or pollution, the regulatory authority (regional council or local authority) can orderremedial measures to be taken and they can ban the use of the waste on land.
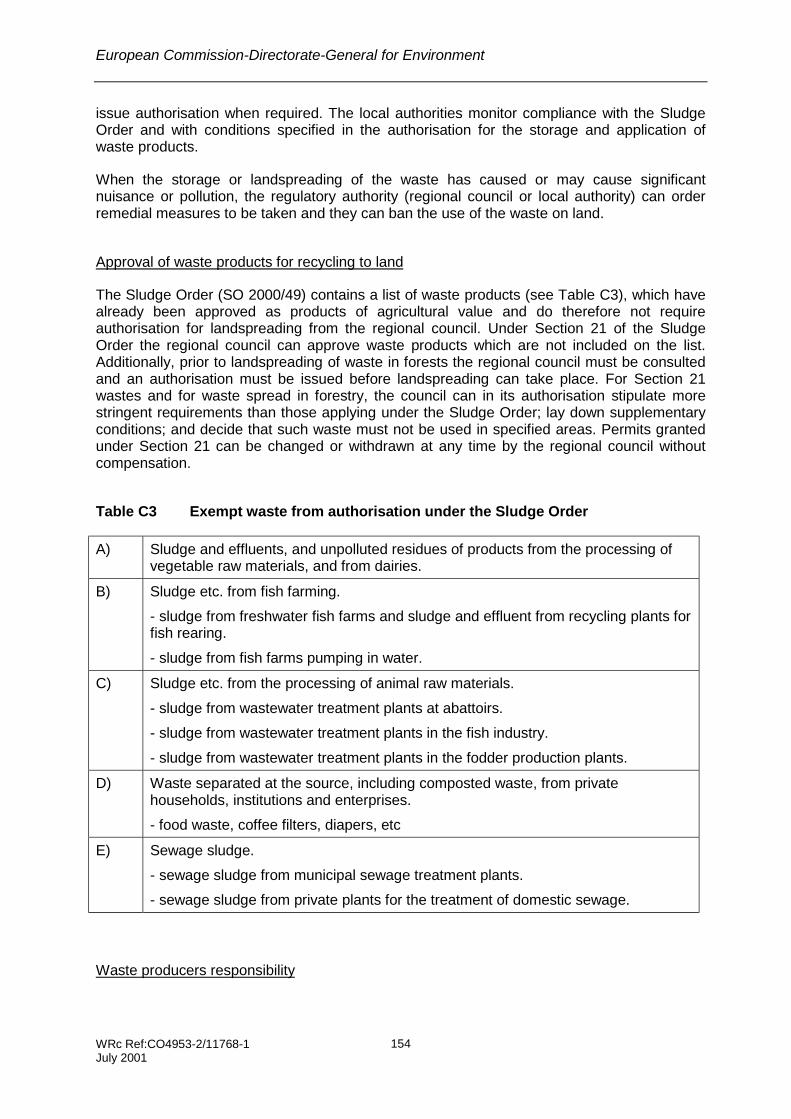
Approval of waste products for recycling to land
The Sludge Order (SO 2000/49) contains a list of waste products (see Table C3), which havealready been approved as products of agricultural value and do therefore not requireauthorisation for landspreading from the regional council. Under Section 21 of the SludgeOrder the regional council can approve waste products which are not included on the list.Additionally, prior to landspreading of waste in forests the regional council must be consultedand an authorisation must be issued before landspreading can take place. For Section 21wastes and for waste spread in forestry, the council can in its authorisation stipulate morestringent requirements than those applying under the Sludge Order; lay down supplementaryconditions; and decide that such waste must not be used in specified areas. Permits grantedunder Section 21 can be changed or withdrawn at any time by the regional council withoutcompensation.
Table C3 Exempt waste from authorisation under the Sludge Order
A) Sludge and effluents, and unpolluted residues of products from the processing ofvegetable raw materials, and from dairies.
B) Sludge etc. from fish farming.
- sludge from freshwater fish farms and sludge and effluent from recycling plants forfish rearing.
- sludge from fish farms pumping in water.
C) Sludge etc. from the processing of animal raw materials.
- sludge from wastewater treatment plants at abattoirs.
- sludge from wastewater treatment plants in the fish industry.
- sludge from wastewater treatment plants in the fodder production plants.
D) Waste separated at the source, including composted waste, from privatehouseholds, institutions and enterprises.
- food waste, coffee filters, diapers, etc
E) Sewage sludge.
- sewage sludge from municipal sewage treatment plants.
- sewage sludge from private plants for the treatment of domestic sewage.
Waste producers responsibility

European Commission-Directorate-General for Environment
WRc Ref:CO4953-2/11768-1July 2001
155
Notification by the waste producer must be given to the regional council in its area no laterthan 8 days prior to the delivery of waste to user. The information which must be provided inthe declaration to the authority is listed in Table C4. If the regional council has decided onspecial conditions, pursuant to section 21, it must be stated in the declaration.
Any waste producer, who makes an agreement about delivery of waste products, isresponsible for ensuring that the declaration accompanies the waste product and that theinformation given is correct. Delivery of waste products must only take place when a directwritten agreement has been made between the waste producer and the user. The agreementmust only cover deliveries intended for agricultural purposes in the coming growing season.When entering into an agreement of delivery, the waste producer must send a copy of theagreement and a map specifying the area where the waste will be spread to the municipalcouncil in the user’s local area. This applies to all waste, even solid waste that is stored on theuser’s land for a certain time before spreading.
Before delivery of a waste product to user, the party delivering the waste product must alsonotify the local council in the user’s local area in writing of the quantity delivered. Thenotification must state the name and address of the user, and be accompanied by thedeclaration and the time of delivery. Such notification must be made no later than 8 daysbefore delivery takes place. This notification duty does not apply to delivery to single users ofquantities below 10 tonnes of dry matter per year.
Before 1 March every year the waste producer must in writing report to the regional councilthe quantities of each waste product supplied for agricultural purposes in the precedingcalendar year, with quantities broken down on agricultural, forestry, horticultural, park, andprivate garden uses. When reporting reference must be made to the declaration worked outfor each of the waste products.
Table C4 Information to be included in the declaration for landspreading of waste
• Waste product, with description of origin and place of production, and reference to thewaste types listed in Table C3;
• Components and proportion of mixture of waste products produced by mixing of severalwaste types;
• Components and proportion of mixture of waste products mixed with manure or soilconditioners;
• Treatment, results of possible analyses, and possible restrictions on use, using thedesignations listed in legislation;
• Results of analysis, as set out in the Order, indicating the time of sampling and analysis;and
• Storage facilities.
Nutrient limit
European Commission-Directorate-General for Environment
WRc Ref:CO4953-2/11768-1July 2001
156
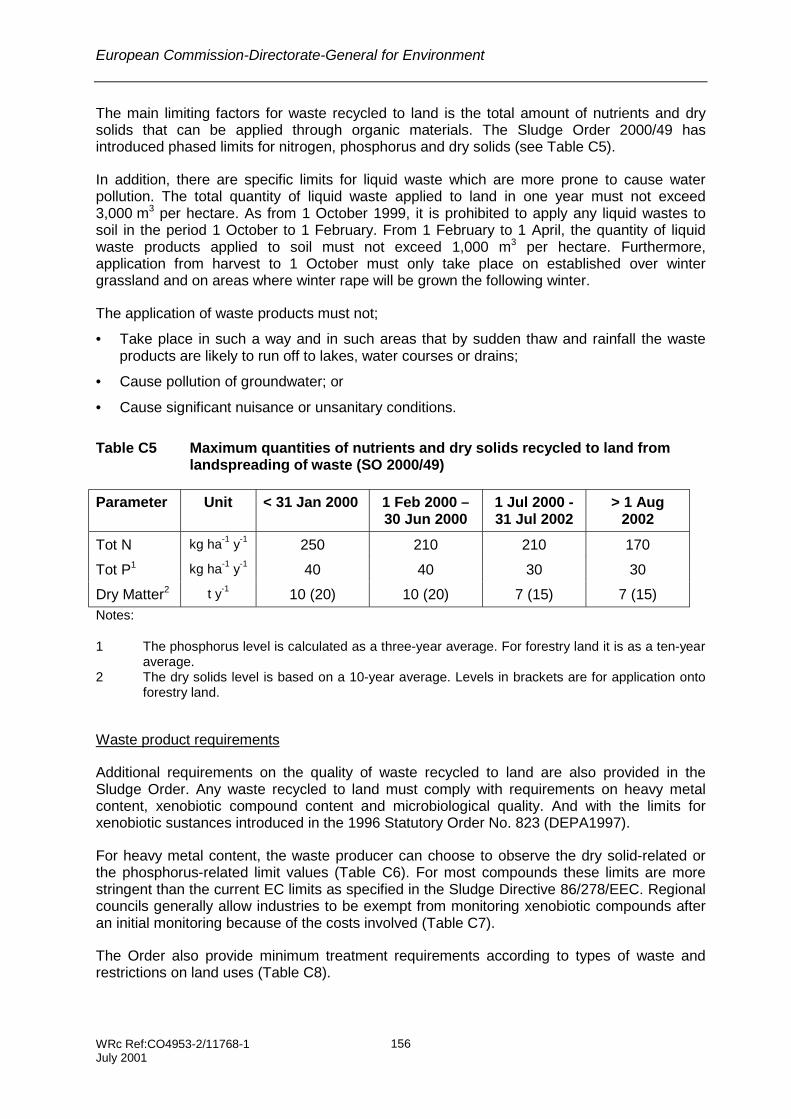
The main limiting factors for waste recycled to land is the total amount of nutrients and drysolids that can be applied through organic materials. The Sludge Order 2000/49 hasintroduced phased limits for nitrogen, phosphorus and dry solids (see Table C5).
In addition, there are specific limits for liquid waste which are more prone to cause waterpollution. The total quantity of liquid waste applied to land in one year must not exceed3,000 m3 per hectare. As from 1 October 1999, it is prohibited to apply any liquid wastes tosoil in the period 1 October to 1 February. From 1 February to 1 April, the quantity of liquidwaste products applied to soil must not exceed 1,000 m3 per hectare. Furthermore,application from harvest to 1 October must only take place on established over wintergrassland and on areas where winter rape will be grown the following winter.
The application of waste products must not;
• Take place in such a way and in such areas that by sudden thaw and rainfall the wasteproducts are likely to run off to lakes, water courses or drains;
• Cause pollution of groundwater; or
• Cause significant nuisance or unsanitary conditions.
Table C5 Maximum quantities of nutrients and dry solids recycled to land fromlandspreading of waste (SO 2000/49)
Parameter Unit < 31 Jan 2000 1 Feb 2000 –30 Jun 2000
1 Jul 2000 -31 Jul 2002
> 1 Aug2002
Tot N kg ha-1 y-1 250 210 210 170
Tot P1 kg ha-1 y-1 40 40 30 30
Dry Matter2 t y-1 10 (20) 10 (20) 7 (15) 7 (15)Notes:
1 The phosphorus level is calculated as a three-year average. For forestry land it is as a ten-yearaverage.
2 The dry solids level is based on a 10-year average. Levels in brackets are for application ontoforestry land.
Waste product requirements
Additional requirements on the quality of waste recycled to land are also provided in theSludge Order. Any waste recycled to land must comply with requirements on heavy metalcontent, xenobiotic compound content and microbiological quality. And with the limits forxenobiotic sustances introduced in the 1996 Statutory Order No. 823 (DEPA1997).
For heavy metal content, the waste producer can choose to observe the dry solid-related orthe phosphorus-related limit values (Table C6). For most compounds these limits are morestringent than the current EC limits as specified in the Sludge Directive 86/278/EEC. Regionalcouncils generally allow industries to be exempt from monitoring xenobiotic compounds afteran initial monitoring because of the costs involved (Table C7).
The Order also provide minimum treatment requirements according to types of waste andrestrictions on land uses (Table C8).
European Commission-Directorate-General for Environment
WRc Ref:CO4953-2/11768-1July 2001
157
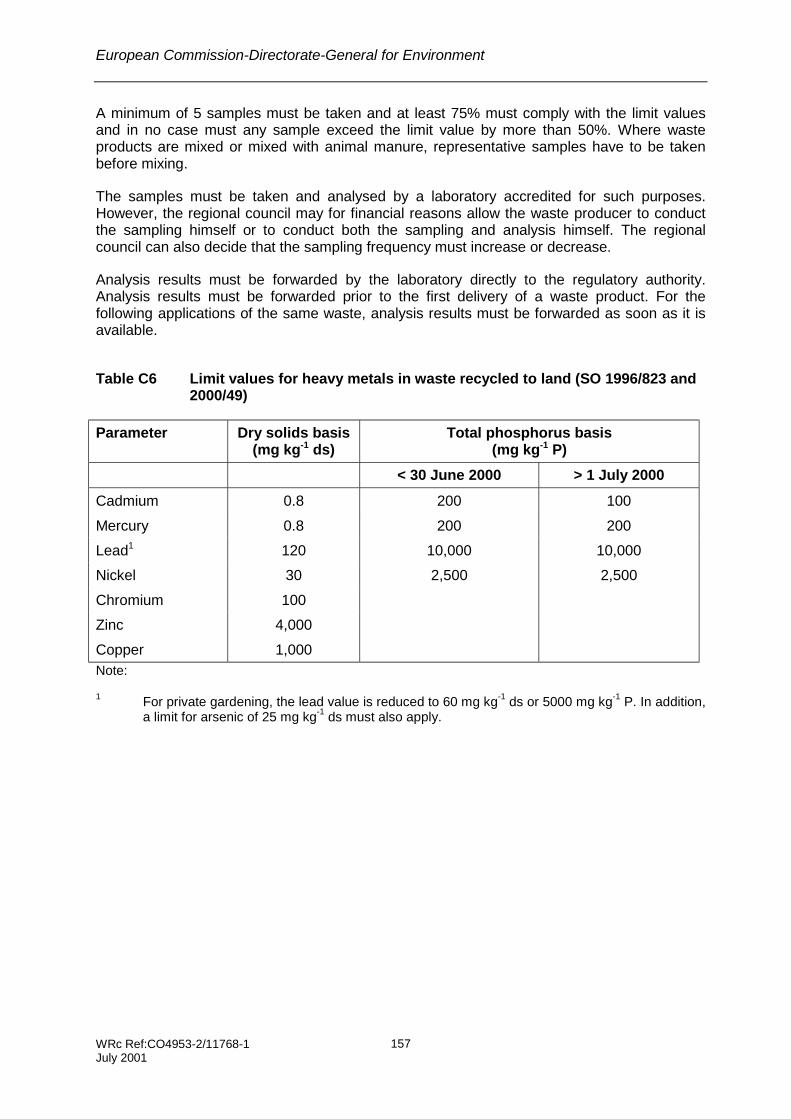
A minimum of 5 samples must be taken and at least 75% must comply with the limit valuesand in no case must any sample exceed the limit value by more than 50%. Where wasteproducts are mixed or mixed with animal manure, representative samples have to be takenbefore mixing.
The samples must be taken and analysed by a laboratory accredited for such purposes.However, the regional council may for financial reasons allow the waste producer to conductthe sampling himself or to conduct both the sampling and analysis himself. The regionalcouncil can also decide that the sampling frequency must increase or decrease.
Analysis results must be forwarded by the laboratory directly to the regulatory authority.Analysis results must be forwarded prior to the first delivery of a waste product. For thefollowing applications of the same waste, analysis results must be forwarded as soon as it isavailable.
Table C6 Limit values for heavy metals in waste recycled to land (SO 1996/823 and2000/49)
Parameter Dry solids basis(mg kg-1 ds)
Total phosphorus basis(mg kg-1 P)
< 30 June 2000 > 1 July 2000
Cadmium 0.8 200 100
Mercury 0.8 200 200
Lead1 120 10,000 10,000
Nickel 30 2,500 2,500
Chromium 100
Zinc 4,000
Copper 1,000Note:
1 For private gardening, the lead value is reduced to 60 mg kg-1 ds or 5000 mg kg-1 P. In addition,a limit for arsenic of 25 mg kg-1 ds must also apply.

European Commission-Directorate-General for Environment
WRc Ref:CO4953-2/11768-1July 2001
158
Table C7 Limit values for xenobiotic substances (SO 1996/823 and 2000/49)
Parameter Dry solids basis(mg kg-1 ds)
>30 June 2000 1 July 2000 – 30 June2002
<1 July 2002
LAS1 2,600 1,300 1,300
ΣPAH2 6 3 3
NPE3 50 30 10
DEHP4 100 50 50Notes:
1 LAS Linear alkylbenzene sulphonates.2 PAH Polycyclic aromatic hydrocarbons. ΣPAH Acenapthene, phenanthrene, fluorene, pyrene,
benzofluoranthenes, (b+j+k), benzo(a)pyrene, benzo(ghi)perylene, indeno(1, 2, 3-c, d)pyrene3 NPE Nonylphenol (+ethoxylates). NPE comprises the substances nonylphenol and nonylphenolethoxylates
with 1-2 ethoxy groups.4 DEHP Di(2-ethylhexyl)phthalate.

European Commission-Directorate-General for Environment
WRc Ref:CO4953-2/11768-1July 2001
159
Table C8 Sanitary application requirements for different waste types (SO 2000/49)
Treatment
Untreated Stabiliseda Controlledcompostingb
Controlledpasteurisationc
A) Sludge etc.fromvegetableproduction
✓ ✓ ✓ ✓
B) Sludge etc.from fishfarming
Not for gardening ✓ ✓ ✓
C) Sludge etc.from meatproduction
Not for agriculturalpurposes
Worked into thesoil within 12 hrsafter application.Not for gardening1.
✓ ✓
D) Sourceseparatedwaste
Not for agriculturalpurposes
Not for ediblecrops2 orgardening.Worked into thesoil within 12 hrsafter application3.
3 ✓
E) Sewagesludge
Not for agriculturalpurposes
Not for ediblecrops orgardening.Worked into4 thesoil within 12 hrsafter application5.
Not for ediblecrops2orgardening5.
✓
Notes:
✓ Can be used without sanitary restrictions.1 The restriction does not apply to stabilisation in biogas plants.2 Edible crops are crops which can be eaten raw excluding fruit tree crops.3 In fields rearing cloven-footed animals, compost shall be applied and worked into the soil before sowing.4 “Working in” means ploughing, harrowing, direct injection or other methods of working waste into the soil.5 In areas where sewage sludge is applied, until one year after last application only cereal or seed crops
grown to maturity can be grown, and grass or the like for industrial dry fodder production. Moreover, ediblecrops may not be grown. For instance potatoes, grass and maize for silage and fodder or sugar beetsmust not be grown.
a Stabilisation is defined as one of the following treatments; anaerobic digestion; aeration;composting without temperature control; addition of lime; 6 months storage.
b Controlled composting is defined as composting with daily temperature measurement to ensuretemperatures in all material not get below 55 °C for no less than two weeks.
c Controlled pasteurisation is defined as one of the following treatments; pasteurisation at 70°Cfor not less than 1 hour; addition of lime, to ensure pH 12 in all material for a minimum of threemonths; thermophilic digestion or a combination of thermophilic or mesophilic digestion. At thetime of delivery advanced treated products must have no occurrence of salmonella and faecalstreptococci must be below 100 g-1
European Commission-Directorate-General for Environment
WRc Ref:CO4953-2/11768-1July 2001
160
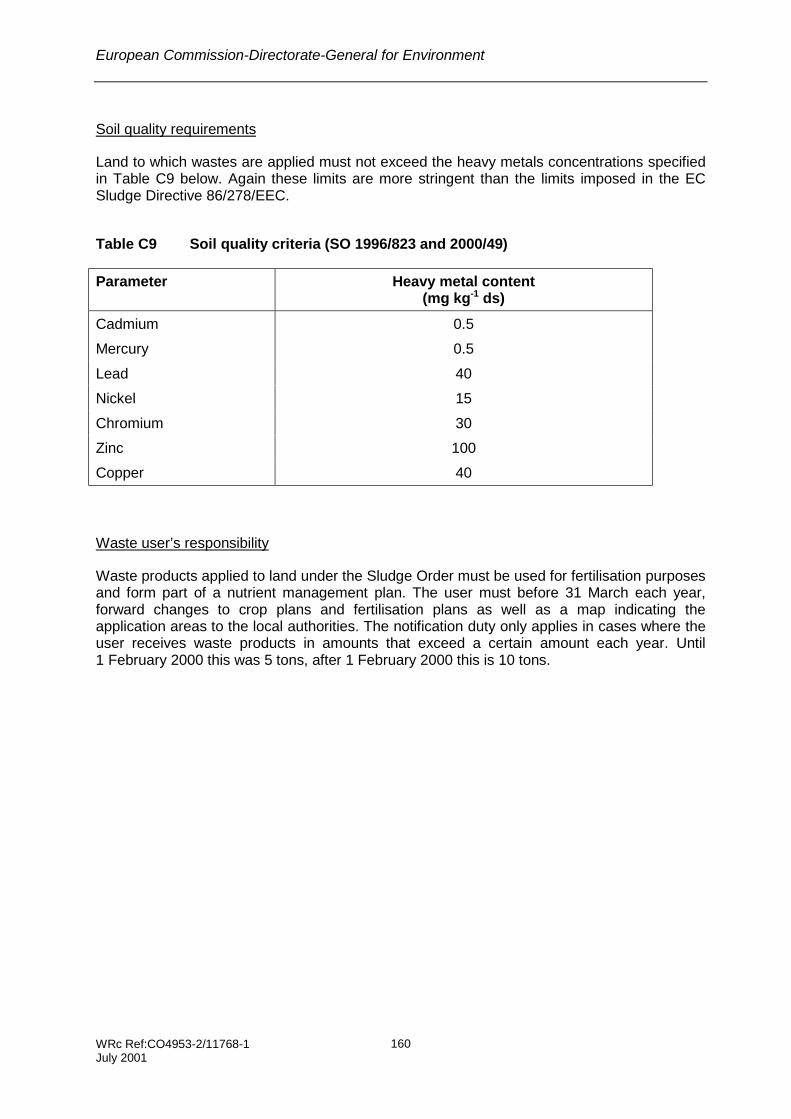
Soil quality requirements
Land to which wastes are applied must not exceed the heavy metals concentrations specifiedin Table C9 below. Again these limits are more stringent than the limits imposed in the ECSludge Directive 86/278/EEC.
Table C9 Soil quality criteria (SO 1996/823 and 2000/49)
Parameter Heavy metal content(mg kg-1 ds)
Cadmium 0.5
Mercury 0.5
Lead 40
Nickel 15
Chromium 30
Zinc 100
Copper 40
Waste user’s responsibility
Waste products applied to land under the Sludge Order must be used for fertilisation purposesand form part of a nutrient management plan. The user must before 31 March each year,forward changes to crop plans and fertilisation plans as well as a map indicating theapplication areas to the local authorities. The notification duty only applies in cases where theuser receives waste products in amounts that exceed a certain amount each year. Until1 February 2000 this was 5 tons, after 1 February 2000 this is 10 tons.
European Commission-Directorate-General for Environment
WRc Ref:CO4953-2/11768-1July 2001
161
C2 QUANTITIES OF WASTE RECYCLED TO LAND
The information provided below is extracted from the Environmental Project No. 397 by theDanish EPA (DEPA 1998) for industrial waste and from Manure Statements 1997/98 (DPD1999) and Petersen (1996) for farm waste. The Environmental Project is based onquestionnaires sent out to industries and data from Statistics Denmark, industry organisations,trade unions etc. Not all companies recycling waste to land replied to the questionnaire.
Farm waste
Reporting on farm waste was until 1996/97 based on 30,000 selected farms. For 1997/98survey all farms with more than 10 ha have been included. In total, 62,860 farms wereincluded in the survey. However, only 43,847 forms were used to produce the ManureStatement Report (DPD 1999) as some forms were not returned; some were insufficientlyfilled in; and some farms should not have been contacted.
The Danish farming industry is characterised by a large number of production units with fewemployees. The industry produces waste and by-products which are recycled on the farm orsold to be re-used without prior treatment such as manure, slurry, dead animals and surplusplant material such as straw.
The Danish Plant Directorate has chosen to report amounts of nitrogen produced rather thanquantities of farm waste. The quantity of nitrogen applied to land from all farms surveyed in1997/98 amount to approximately 156,000 tonnes nitrogen (Table C10). The tables do notinclude data for outdoor animals.
In a report from the Danish Environmental Protection Agency (DEPA 1998), it is estimatedthat the volume of animal manure and slurry produced in 1994/95 amounted to over 28 milliontonnes (fresh weight basis), equivalent to over 4 million tonnes of dry solids. All animalmanure is currently recycled to land. The quantity of farm wastes and their application isshown in Table C11 and Figure C1 below.
Most farm wastes are recycled to land untreated. About 5% of animal manures and slurry areanaerobically digested in centralised biogas plants before being recycled to land (Sommerand Moller 1999). The biogas plants often also treat industrial wastes. Anaerobic digestion isconsidered beneficial to the waste as it increases its nutrient content per weight/volume,improves its smell, improves the ease of landspreading etc. Furthermore, income from thesale of biogas is provided. However, the cost of transport of the slurry to the biogas plant isconsiderable compared to the benefits. The use of slurry in biogas production is thereforecentred around the existing biogas plants.
A large part of the straw production in farming is used on the farm. However, more straw isproduced than is required and this is then recycled to land or sold for incineration in districtheating plants. No data has been found on the amount of straw recycled to land. In 1995, theincineration of 110,000 tons of straw (approximately 95,000 tons dry solids) produced1,585 TJ.

European Commission-Directorate-General for Environment
WRc Ref:CO4953-2/11768-1July 2001
162
Figure C1 Main outlets for livestock/farm waste (DEPA 1998)
Table C10 Nitrogen content in livestock waste in Denmark for 1997/98 (DPD 1999)
Farm waste (tonnes N)Farm type
No. offarms
Area(x103ha) Landspread Produced Bought Sold
Cattle1 15,990 895 75,569 70,404 9,674 4,509
Pigs2 10,461 690 58,215 67,745 6,643 16,183
Arable3 13,535 609 8,920 122 9,028 217
Mixed 3,861 193 13,726 14,652 1,927 2,853
Total 43,847 2,368 156,446 152,938 27,273 23,765Notes:
1 at least 2/3 of the animal units is cattle2 at least 2/3 of the animal units are pigs3 with less than 2 animal units
Table C11 Waste products from farming, 1994/95 (DEPA 1998)
Wasteproducts
Amount(tonnes per year)
Composition Application
Animalmanure
Animal slurry
28,000,000
514,000
Mainly from pigs andcattle
Mainly pig slurry, butalso cattle slurry
Spread on land: 97.4 %
Biogas production then spread onland: 1.8 %
Surplus straw ?
110,000
86% ds Spread on land: ?
Incinerated with heat utilisation: 0.4%
Dead animals 100,000 Mainly pigs and cattle Raw material substitution (feed): 0.4 %
Spread on land
97.4%
Incinerated with heat utilisation
0.4%
Biogas then spread on
land1.8%Raw material
substitution0.4%
European Commission-Directorate-General for Environment
WRc Ref:CO4953-2/11768-1July 2001
163
Industrial waste
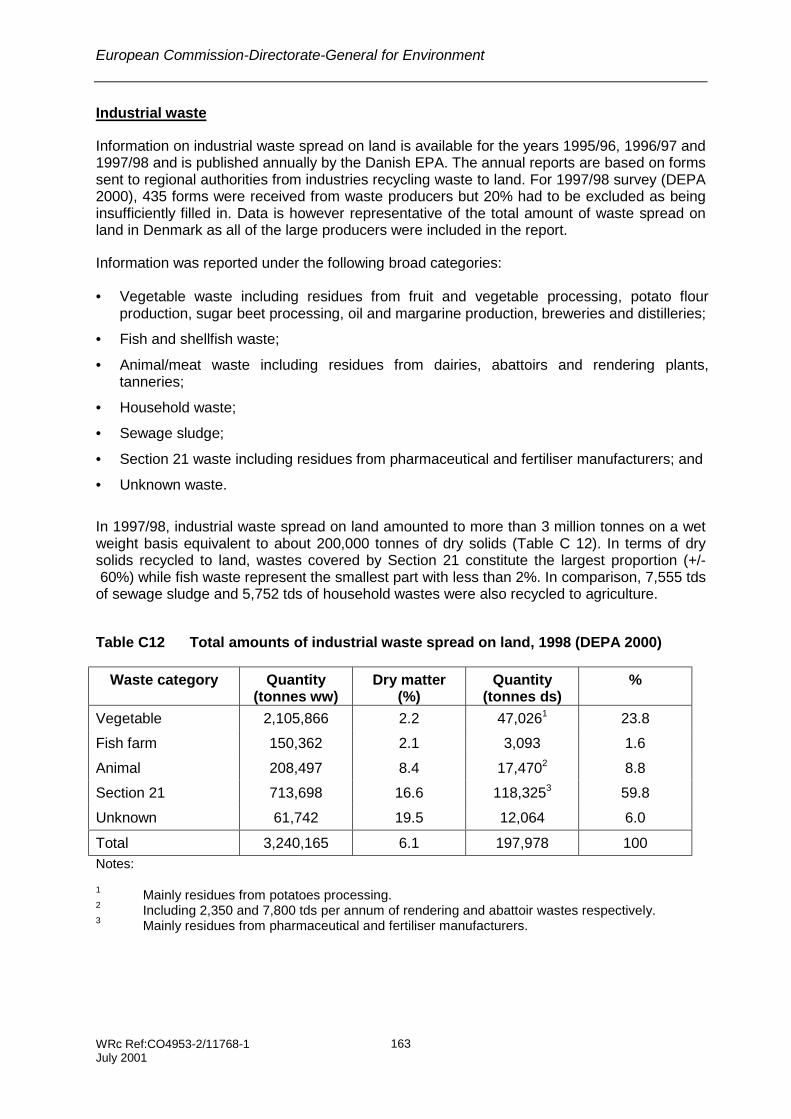
Information on industrial waste spread on land is available for the years 1995/96, 1996/97 and1997/98 and is published annually by the Danish EPA. The annual reports are based on formssent to regional authorities from industries recycling waste to land. For 1997/98 survey (DEPA2000), 435 forms were received from waste producers but 20% had to be excluded as beinginsufficiently filled in. Data is however representative of the total amount of waste spread onland in Denmark as all of the large producers were included in the report.
Information was reported under the following broad categories:
• Vegetable waste including residues from fruit and vegetable processing, potato flourproduction, sugar beet processing, oil and margarine production, breweries and distilleries;
• Fish and shellfish waste;
• Animal/meat waste including residues from dairies, abattoirs and rendering plants,tanneries;
• Household waste;
• Sewage sludge;
• Section 21 waste including residues from pharmaceutical and fertiliser manufacturers; and
• Unknown waste.
In 1997/98, industrial waste spread on land amounted to more than 3 million tonnes on a wetweight basis equivalent to about 200,000 tonnes of dry solids (Table C 12). In terms of drysolids recycled to land, wastes covered by Section 21 constitute the largest proportion (+/- 60%) while fish waste represent the smallest part with less than 2%. In comparison, 7,555 tdsof sewage sludge and 5,752 tds of household wastes were also recycled to agriculture.
Table C12 Total amounts of industrial waste spread on land, 1998 (DEPA 2000)
Waste category Quantity(tonnes ww)
Dry matter(%)
Quantity(tonnes ds)
%
Vegetable 2,105,866 2.2 47,0261 23.8
Fish farm 150,362 2.1 3,093 1.6
Animal 208,497 8.4 17,4702 8.8
Section 21 713,698 16.6 118,3253 59.8
Unknown 61,742 19.5 12,064 6.0
Total 3,240,165 6.1 197,978 100Notes:
1 Mainly residues from potatoes processing.2 Including 2,350 and 7,800 tds per annum of rendering and abattoir wastes respectively.3 Mainly residues from pharmaceutical and fertiliser manufacturers.

European Commission-Directorate-General for Environment
WRc Ref:CO4953-2/11768-1July 2001
164
The disposal routes for all organic waste including sewage and household waste according toregions are presented in Table C13. It was not possible to exclude quantities of sewagesludge and household waste. However, sewage sludge (3.6% ds) and household wastes(2.7% ds) represent only a small proportion of the total amount of waste recycled to land.
There are large regional variations in the number of waste producers applying waste to landand in the quantities/volumes of waste applied. For example, in the councils aroundCopenhagen, relatively few waste producers use the option of spreading waste on land.Instead, they discharge their effluent to municipal sewage system and thus are contributing tosewage sludge production. The reason for this is mainly that the cost and environmentaleffects of transporting the waste to farmers is considered too high for this to be an option.
Table C13 Quantity of waste (tonnes dry solids) according to disposal category(DEPA 2000)
County Agriculture Forestry Nursery Parks Privategardens
Others* Unknown
Bornholm 921 2
Frederiksborg 8,279 3 40 1,221
Funen 6,867 34 2,681 168
Copenhagen 1,109
Northern Jutland 11,636 26 5,603 117
Ribe 9,234
Ringkjøbing 31,265 231 105 2,747
Roskilde 7,104
Storstrøm 1,355 37
SouthernJutland
34,724 194 10
Vejle 3,926 122 1,072 108
West Zealand 48,929 98 156
Viborg 8,922 128 1,226
Aarhus 18,702 1,642
DK total 192,974(91.3%)
386(0.2%)
37(0.02%)
355(0.2%)
4,975(2.4%)
8,891(4.2%)
3,128(1.5%)
Note:
* Not applied to land, i.e. disposed of to landfill or sewage treatment plants
For 1998, it was reported that 34% of industrial waste were applied to land without any pre-treatment (Table C14). 38% of waste were treated to high level while 15% had beenstabilised, and less than 2% had been composted. For 11% the pre-treatment was unknown.

European Commission-Directorate-General for Environment
WRc Ref:CO4953-2/11768-1July 2001
165
Table C14 Pre-treatment according to waste type (tonnes) (DEPA 2000)
Waste type Untreated Stabiliseda Controlledcompostingb
Controlledpasteurisationc
Unknown
Vegetable 36,833 2,861 1,444 5,888
Fish farm 2,784 161 13 135
Meat 2,062 222 15,186 1
Section 21 23,571 24,749 3,328 58,910 7,766
Unknown 1,723 1,550 8,791
Total 66,973(34%)
29,543(15%)
3,328(< 2%)
75,553(38%)
22,581(11%)
Notes:
a Stabilisation is defined as one of the following treatments; anaerobic digestion; aeration; compostingwithout temperature control; addition of lime; 6 months storage.
b Controlled composting is defined as composting with daily temperature measurement to ensuretemperatures in all material not get below 55 °C for no less than two weeks.
c Controlled pasteurisation is defined as one of the following treatments; pasteurisation at 70 °C fornot less than 1 hour; addition of lime, to ensure pH 12 in all material for a minimum of three months;thermophilic digestion or a combination of thermophilic or mesophilic digestion.
The detailed information concerning the different sectors of industry which recycle their land toland is presented below.
Renderings and slaughtering
In Denmark, the rendering and slaughtering industry consists mainly of pig, cattle and poultryabattoirs. Horse, sheep and goat abattoirs have little effect on the figures.
Several mergers have taken place in the industry over the last 15-20 years. Three largecompanies which conduct 95% of all pig slaughtering in Denmark today dominate the pigabattoir industry. In total, there are 21 large pig abattoirs in Denmark; 19 in Jutland, 1 atSealand and 1 at Bornholm. Additionally, Denmark has 7 cattle and 8 poultry abattoirs withmore than 10 employees. Most of these are located in Jutland.
The slaughtering process starts with the animals being transported by truck to the abattoirwhere they are placed in pens. Normally, the animals spend only a few hours in the pens. Theanimals urinate and defecate in the pens which are subsequently washed down with water.Slaughtering takes place either by shooting or anaesthesia followed by bleeding and cutting,removal of the bowel etc. The animal blood is collected and is re-used.
Approximately 21% of an animal is waste (DEPA 1998). Abattoir wastes can be classified inthree major groups: stomach and bowel content and manure; waste products from theproduction of meat products (blood, bristle, bones, feathers etc.); and waste products from thewaste treatment (grating, fat grating, flotation sludge). Table C 15 summarises the quantitiesand treatment applied to the different waste produced by pig, cattle and poultry abattoirs and

European Commission-Directorate-General for Environment
WRc Ref:CO4953-2/11768-1July 2001
166
rendering plants. There are approximately 700,000 tonnes of abattoirs waste (on a wet weightbasis) produced per annum in Denmark.
Most abattoir wastes are re-used or recycled for economic reasons and hard competition inthe industry has resulted in almost all waste products being re-used. A large proportion ofabattoir wastes (75-80%) is used as raw material substitution such as meat and bone mealproduction. There is almost no abattoir organic waste products disposed of to landfill. Wasteproducts that previously were disposed of to landfill are now re-used in biogas plants (17%) orspread on land (5 to 10%).
The re-use of waste products in biogas plants have increased over recent years partlybecause of the establishment of centralised biogas plants which are well qualified for thetreatment of such waste types, and partly because of the introduction of a landfill tax. Wasteproducts treated in biogas plants are exempt from landfill tax if landfilled. Stomach and bowelcontent, manure, slurry, grating products, fat and flotation sludge are mainly re-used in biogasplants. Solids from grating and flotation tanks are also re-used for biogas production. Aproportion of these wastes is spread on land. The decision whether to dispose of abattoirwaste to biogas production or to land depends on the distance between the abattoir and thebiogas plant. At abattoirs without flotation tanks, most of the organic material (80-90%) isdischarged to the municipal wastewater treatment plant. At abattoirs with flotation tanksapproximately 80% of the organic material is retained in the grates and the flotation tanks.
A small amount of aseptic blood is used in consumer goods. Additionally, approximately 7,000tons of feathers are used annually as filling material in household furniture or destroyed forprotein extraction.
In recent years there has been a reduction in quantities of untreated abattoirs waste recycledto land and an increase in quantities of abattoirs waste being treated by anaerobic digestionbefore being spread on land. It is possible that this trend will continue. However, this dependson the establishment of further biogas plants and thereby the reduction in distance betweenabattoirs and biogas plants.
Abattoir waste and by-products are considered to contain only small concentrations ofenvironmentally undesirable substances. The abattoir industry samples waste products usedfor animal foodstuffs while the biogas industry samples flotation sludge and the biogas productfor heavy metals before application to land.

European Commission-Directorate-General for Environment
WRc Ref:CO4953-2/11768-1July 2001
167
Table C15 Waste products from pig, cattle (1994) and chicken abattoirs (1993) (DEPA1998)
Waste products Amount(tonne per year)
Application
Liquid manure:
Pigs
Cattle
40,000-68,000
7,000-27,000
Solids to biogas plant or spread to land.
Liquid to sewage treatment plant.
Wash water from transporttrucks
45,000 Flotation sludge to biogas plant or spreadon land.
Liquids to sewage treatment plant.
Blood:
Pigs
Cattle
66,000
14,000
Raw material substitution (consistencyregulating substance in consumer goods,animal foodstuff, meat and bone meal)
Bristle and hoof:
Pigs
Cattle
9,000
1,800
Raw material substitution (incinerationplant)
Bones:
Pigs
Cattle
185,000
60,000
Raw material substitution (incinerationplant)
Non-edible parts, heads,feet:
Chicken60,000 Raw material substitution (animal foodstuff)
Bowel content:
Pigs
Cattle
Stomach content:
Pigs
Cattle
49,000-55,000
16,000
8,000-31,000
36,000-72,000
Biogas plant, ploughed in agricultural land,and/or sewage treatment plant
Fat:
Pigs
Cattle
9,000
3,000
Biogas plant
Flotation sludge:
Pigs
Cattle
Chicken
30,000
Not used
20,000
Biogas plant
Biogas plant
Grating:
Pigs
Cattle
900-1,800
Unknown
Biogas plant or spread on land
Feather:
Chicken 7,000 Filling material, house articles or destroyed

European Commission-Directorate-General for Environment
WRc Ref:CO4953-2/11768-1July 2001
168
Fish and shellfish processing industry
This section describes Danish fish and shellfish processing industry and fish meal and oilindustry. The fish processing industry is characterised by a large number of small and a fewlarge companies. In 1991, there were 197 fish processing companies in Denmark. Theshellfish processing industry and the fish meal and oil industry is characterised by a few largecompanies. In 1991, there were 18 fish meal and oil companies in Denmark. For the 1998survey, 109 companies were contacted but only 9 replies. The information in the followingsections has been extrapolated from the 9 replies to provide estimates for the entire industry.
In 1992, 539,807 tonnes of fish, shellfish etc. were landed. Shellfish (mainly common mussel)accounted for 136,271 tonnes. In the processing of fish large amounts of waste are producedincluding fish scale, intestines, heads and other fish wastes. The fish meal and oil industry canutilise the main part of the waste products from fish processing except for blood water andflotation sludge from pre-rinsing of fish. Fish meal is produced by boiling, pressing and dryingthe fish. Fish oil is produced by condensating the water from the boiling of the fish. The mainwaste from the fish meal and oil industry is water. Additionally, smaller quantities of oily sludgeis produced. In 1994, the fish meal and oil industry processed 1,525,648 tonnes fish andproduced 127,368 tonnes fish waste. The waste from the processing of shellfish include sand,sludge, shells/mussels, other bottom fish and water. The quantity of fish and shellfish wastefrom fish and shellfish processing industry in 1992 is illustrated in Table C16 below.
The replies from two shellfish companies showed that 20% of their waste products were usedas raw material substitution, less than 1% were used in biogas production followed bylandspreading, 30% were landspread without treatment and 50% were landfilled. In biogasproduction shellfish meat and other fish were used. Sand, sludge, shells and shellfish meatand other fish were spread on land. Waste sent to landfill was sand, sludge, shells andshellfish meat and other fish residues from the rinsing process before boiling.
Data from 2 out of 8 fish meal and oil companies contacted were received. The twocompanies produced 4,250 tonnes sludge which was used for biogas production. Byextrapolating this figure an estimated sludge production for all 8 companies of 7,200 tonneswas calculated. If the dry solids content is estimated to be 10%, the total sludge productionamount to 720 tonnes dry solids. This is similar to earlier estimates.
Economic factors seem to control the use of waste products from the fish processing industryin Denmark. As a consequence most waste products are sold for raw material substitution asprofit can be achieved. The market for waste products from the fish processing industry is to alarge extent controlled by geographical and historical factors. For example in North Jutland,waste products are mainly used in the fish meal and oil industry whereas in West Jutland thewaste products are used as feedstuff. As a result of the economic benefits, it is assumed thatraw material substitution will remain the most popular choice for waste products from the fishprocessing industry.

European Commission-Directorate-General for Environment
WRc Ref:CO4953-2/11768-1July 2001
169
Table C16 Quantity of fish and shellfish waste, 1992 (DEPA 1998)
Waste product Quantity(tonne per
year)
Composition Application
Fish waste 237,000 Fish scale, fishintestines, fishheads etc.
Raw material substitution (fish mealand oil, fur animal feed)
27,000 Biogas plant followed bylandspreading
Shellfish waste 25,000 Shells/mussels Raw material substitution (firebreak,road material, packing of drainpipes)
13,000 Shellfish meatand other fish
27,000 Sand, graveletc.
25,000 Water Waste water or sewage treatmentplant
Fish meal and oilwaste
7,200 Sludge Biogas plant followed bylandspreading
Total 361,200
Fish processing waste is considered to contain minimal concentrations of environmentallyundesirable substances. The processing does not compromise the quality of residues andtherefore there is no restrictions on land application of fish processing waste. The flotationsludge may contain different precipitation agents which makes it unfit for fish meal and oilproduction. However, the agents are of no concern for biogas production. On the contrary,ferro and aluminium salts are useful for the gas quality as they reduce the content of hydrogensulfide. The precipitation agents contain small quantities of heavy metals. However, thequantities are so low they are not considered to be of concern.
The shellfish processing industry uses their waste products differently. Some companies re-use sludge and shells for landspreading, others uses shells for raw material substitution orlandfill. It is assumed that the re-use of the waste products is controlled by historical andeconomical parameters.
The shellfish industry is very interested in utilising its waste products more efficiently. One ofthe largest companies has therefore started investigating the possibility of producing limepowder from shells. The lime powder would be used in acidic Swedish and Norwegian lakes.The company assesses that if the research project becomes a success all shells from theDanish shellfish industry can be sold with profit. Additionally, the company is looking into usingshellfish meat as feed for pigs. However, there is concern about a possible after-taste in thepigs meat. As a consequence, the company is also looking into using the shellfish meat asfish food.

European Commission-Directorate-General for Environment
WRc Ref:CO4953-2/11768-1July 2001
170
Fruit and vegetable processing industry
In 1995, there were 78 companies processing fruits and vegetables. The annual amount offruit and vegetable sold in 1992/93 in Denmark is illustrated in Table C17 below.
Table C17 Annual sale of processed fruit and vegetable products, 1992/93 (DEPA1998)
Product Annual sale(tonne per year)
Frozen vegetables (excluding onions) 60,000
Juice and squash 121,000
Jam and marmalade 40,000
Pickled vegetables (red cabbage, beetroot,gherkins, marrow)
18,000
Tomato ketchup and sauce 12,000
Fried or frozen onions 10,000
Total 261,000
In the fruit and vegetable processing industry many raw materials are imported as semi-processed products. For example, strawberries for strawberry porridge and jam are importedas strawberry pulp. The processing of semi-processed products into finished productsproduces very little waste as the production consists of adding water, sugar and preservatives.Wastes produced from fruit processing include fruit, stalks etc. These wastes are used forbiogas production.
Waste products from the production of frozen vegetables, pickled vegetable and frozen onionsinclude peal, tops, pods etc. These waste products are sold mainly as animal feed. A smallquantity of the waste (leek tops) are spread on land. Waste oil resulting from the frying ofonions is used for biogas production. Wastes from the production of juice are limited as mostof it is produced from concentrated juice imported from abroad. One company reported of 40tonnes per year of waste from the production of apple juice. The waste is used as animal feed.Waste products from the production of squash include fruits, stalks, pips etc. is sold as animalfeed. Wastes that cannot be sold as animal feed are landfilled. Tomato ketchup and sauce areproduced from imported concentrate and creates therefore limited waste products.
The disposal routes for waste from the fruit and vegetable processing industry is illustrated inTable C18 below. Part of the waste presently deposited in landfills may be suitable for biogasproduction. However, this must be investigated further.

European Commission-Directorate-General for Environment
WRc Ref:CO4953-2/11768-1July 2001
171
Table C18 Waste products from the fruit and vegetable industry (DEPA 1998)
Quantity *(wet weight)Application
(tonnes per year) (%)
Quantity*(dry weight)
(tonnes per year)
Raw material substitution 20,000 64 2,000
Biogas plant followed bylandspreading
2,000-3,000 8 1,000-1,500
Landspreading 8,000 26 2,000
Landfill 500-1,000 2 300-600
Total 30,500-32,000 5,300-6,100* Estimates
Potato flour industry
The potato flour industry in Denmark is centred around five companies all located in Jutland.The companies produced in total approximately 180,000 tonnes of potato flour per year fromapproximately 900,000 tonnes of potatoes.
The production of potato flour is seasonal and takes place in the autumn when the potatoesare lifted. The production process includes washing, shredding and extraction of starchfollowed by refining and drying.
The waste products from the production of potato flour are potato pulp, process water andpotato fruit juice. The potato pulp accounts for approximately 16% of the potato and the potatofruit juice for approximately 68%. The process water is in some productions mixed with thepotato fruit juice, making potato fruit water. It depends on the marketing possibilities as thepotato fruit juice can be sold to farmers whereas the potato fruit water is given free of charge.It is estimated that about 2.4 million tonnes of potato fruit juice and water are produced peryear.
Additionally, processes for the extraction of proteins from potato fruit juice has beendeveloped. The processes are based on heat coagulation. It is estimated that approximately3,250 tonnes protein are produced per year. Based on the quantity of potato fruit juiceproduced annually and its dry solids content (4.8%), the quantity of protein in the potato fruitjuice amounts approximately to 20,000 tonnes per year. This means that only 16% of theprotein in the potato fruit juice is currently recovered.
The quantities of waste products from the production of potato flour are shown in Table C19below. The potato pulp is sold to farmers as animal feed while the potato fruit juice and wateris landspread.
Economic factors control to a large extend the use of waste products from the potato flourindustry in Denmark. The potato pulp is sold to farmers as animal feed with profits. The potatofruit juice is also sold to farmers but the cost of transport and landspreading consumes most ofthe profit. Some companies have pipe lines delivering waste to local farmers which reducesthe cost of transport considerably. The potato fruit water is landspread on the farmers land forfree as the benefit for the farmer is limited.

European Commission-Directorate-General for Environment
WRc Ref:CO4953-2/11768-1July 2001
172
Table C19 Waste products from the potato flour industry (DEPA 1998)
Waste products Quantity(tonne per year)
Application
Potato pulp 200,000 Animal feed
Potato fruit juice 850,000 Spread on land and proteinproduction
Potato fruit water 1,550,000 Spread on land
Total 2,600,000
New regulations prohibiting the spreading of liquid waste from 1 October until 1 February hashad large consequences for the potato flour industry as their production takes place in theautumn months. The problem has been solved by building more storage capacity.
The storage of the potato fruit juice and water may create odour nuisances. The liquid whenfresh has a moderate sweet sour odour (like butyric acid) which can when decomposing giverise to odour problems. Several studies have been conducted investigating the possibilities ofreducing odour (COWI 1999).
Pectin and carrageenan industry
In Denmark, there are two companies producing pectin and carrageenan. They are bothsituated in the Greater Copenhagen area.
Pectin is based on lemon peels and carrageenan is based on seaweed. Waste products fromthe production of pectin include lemon peels containing different inorganic additives. Wasteproducts from the carrageenan production include (boiled) seaweed, lime and chloride.
For confidentiality reasons, companies were unwilling to supply the DEPA survey withinformation about quantities. In a previous study, it was reported that annual production ofwaste from the pectin and carrageenan production was estimated at 20,000 tonnes. Thewaste spread on land include the leftovers from the boiling process in the pectin andcarrageenan production. The waste used for cattle feed is lemon peels (Table C20). In thefuture, there might be a need for the waste products to be stabilised before being recycled toland.

European Commission-Directorate-General for Environment
WRc Ref:CO4953-2/11768-1July 2001
173
Table C20 Waste products and outlets from the pectin and carrageenan industry,1991 (DEPA 1998)
Quantity* (wet weight)Application
(tonnes peryear)
(%)
Quantity* (dry weight)(tonnes per year)
Raw material substitution(cattle feed)
5,000 25 1,000
Spread on land 15,000 75 2,400
Total 20,000 3,400* Estimates
Oil and margarine industry
In Denmark, there are three oil mills and three margarine producers. The oil industry producesdifferent oils and fatty substances. The raw material is plant seeds or beans from which oil isextracted and then refined. A small quantity of water is added in the cooling process. Themargarine industry produces margarine from vegetable oils and to a lesser extend from fishoils. The oils are emulsified with water and eventually skimmed milk powder.
Approximately 450,000 tonnes of plant seeds and beans are used in the oil and margarineproduction every year. Of this approximately 400,000 tonnes are rape seeds. Other seeds andbeans used include sun flower seeds, soya beans and cocoa beans. Rape seeds containapproximately 40% oil of which 35% is extracted.
The waste products from the production of oil include seeds and beans, pressed plant seedsand beans (the cake), bleaching soil and oil waste. The bleaching soil is composed ofbentonite or other clay materials which is used in the filtration of vegetable oils and has a highcontent of vegetable oils (up to 40 % weight). Nickel is used in the hardening of the oil. Thebleaching soil therefore also contains nickel in quantities of 1,000-2,000 ppm. The nickelcontent limits the possible use of the bleaching soil. Bleaching soil containing nickel islandfilled. Bleaching soil from non-hardened oils can be utilised for biogas production. Themargarine production creates very small quantities of waste, mainly oil waste (Table C21).
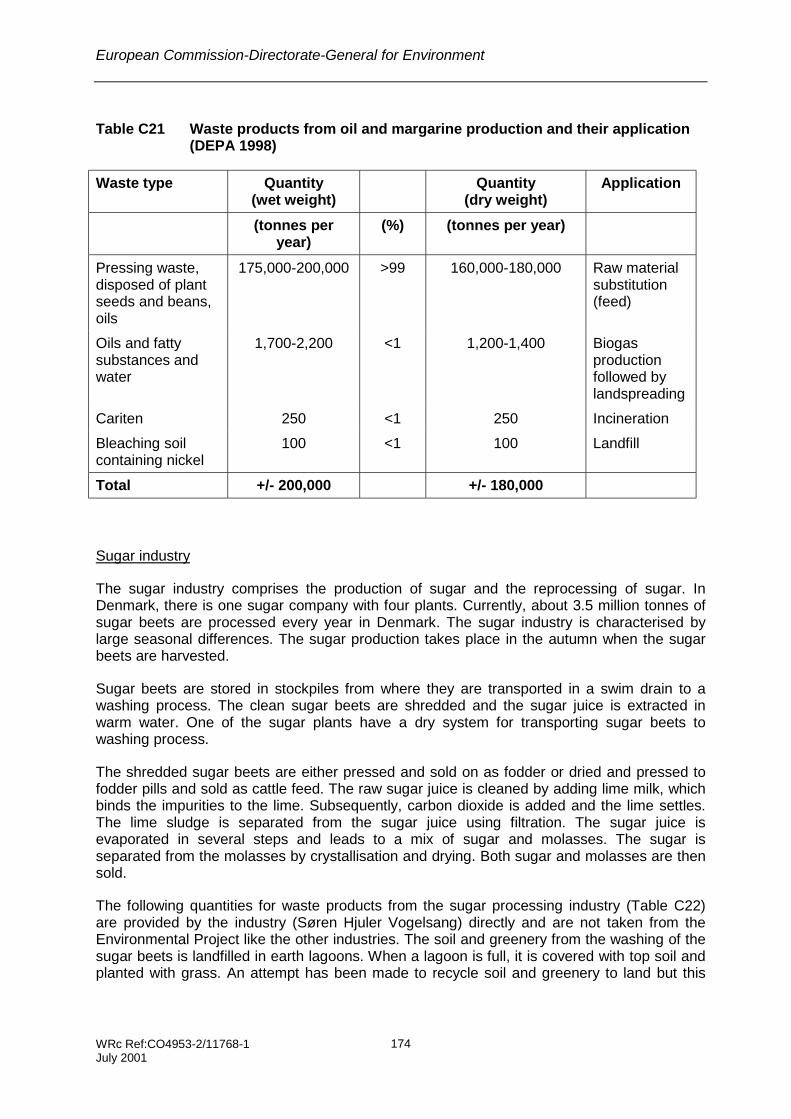
European Commission-Directorate-General for Environment
WRc Ref:CO4953-2/11768-1July 2001
174
Table C21 Waste products from oil and margarine production and their application(DEPA 1998)
Waste type Quantity(wet weight)
Quantity(dry weight)
Application
(tonnes peryear)
(%) (tonnes per year)
Pressing waste,disposed of plantseeds and beans,oils
175,000-200,000 >99 160,000-180,000 Raw materialsubstitution(feed)
Oils and fattysubstances andwater
1,700-2,200 <1 1,200-1,400 Biogasproductionfollowed bylandspreading
Cariten 250 <1 250 Incineration
Bleaching soilcontaining nickel
100 <1 100 Landfill
Total +/- 200,000 +/- 180,000
Sugar industry
The sugar industry comprises the production of sugar and the reprocessing of sugar. InDenmark, there is one sugar company with four plants. Currently, about 3.5 million tonnes ofsugar beets are processed every year in Denmark. The sugar industry is characterised bylarge seasonal differences. The sugar production takes place in the autumn when the sugarbeets are harvested.
Sugar beets are stored in stockpiles from where they are transported in a swim drain to awashing process. The clean sugar beets are shredded and the sugar juice is extracted inwarm water. One of the sugar plants have a dry system for transporting sugar beets towashing process.
The shredded sugar beets are either pressed and sold on as fodder or dried and pressed tofodder pills and sold as cattle feed. The raw sugar juice is cleaned by adding lime milk, whichbinds the impurities to the lime. Subsequently, carbon dioxide is added and the lime settles.The lime sludge is separated from the sugar juice using filtration. The sugar juice isevaporated in several steps and leads to a mix of sugar and molasses. The sugar isseparated from the molasses by crystallisation and drying. Both sugar and molasses are thensold.
The following quantities for waste products from the sugar processing industry (Table C22)are provided by the industry (Søren Hjuler Vogelsang) directly and are not taken from theEnvironmental Project like the other industries. The soil and greenery from the washing of thesugar beets is landfilled in earth lagoons. When a lagoon is full, it is covered with top soil andplanted with grass. An attempt has been made to recycle soil and greenery to land but this

European Commission-Directorate-General for Environment
WRc Ref:CO4953-2/11768-1July 2001
175
had to be abandoned because of obnoxious odours. Waste water from the sugar production isspread to land. Drained water is sent for treatment to a wastewater treatment plant.
Since 1995, approximately 1,500 tonnes BOD per year have been utilised for biogasproduction at one of the sugar processing plants. The advantage is that the produced biogascan be utilised in the company’s boiler system. The energy savings, however, does notcompensate for capital and operating expenditures.
It is considered that the recycling of sugar processing wastes is optimal with the exemption ofwaste water which contains a relatively large quantity of organic material which could beutilised for biogas production. The industry considers that sugar wastes do no contain anyhazardous substances.
Table C22 Waste products from the sugar processing industry, 1999
Waste products Quantity(tonne per year)
Composition Application
Lime sludge App. 100,000 Spread on land
Gravel and stone App. 40,000 Deposits from thesugar beets
Raw material substitution(road material)
Soil, greenery andwaste water
Huge quantity(not measured)
From the washingof the sugar beets
Deposited in soil basins
Dairy industry
The Danish dairy industry is dominated by two companies which produce approximately 80%of all dairy products. In Denmark, milk is processed into four main products: consumermilk/cream, butter, cheese and milk powder.
In 1992, approximately 4.6 million tonnes milk was produced. Of these, 4.4 million tonneswere bought by the dairy industry. For the consumer milk and cream production 0.71 milliontonnes were used while the rest was used for butter, cheese and milk powder production.
The production of waste in the dairy industry is minimal and is estimated to be less than 1%for milk production. In the production of cheese large amounts of whey is produced by theintroduction of rennet into milk. Rennet is an enzyme, which causes the protein casein in themilk to coagulate. The result is a solid phase (cheese grains) and a liquid phase (whey). Thewhey is drained from the cheese. This is used in the farming industry as animal feed ortransformed into whey powder, whey protein and milk sugar. Other waste products fromcheese production is cheese waste, which to a large extent is re-processed into cheesespread. In the production of milk powder, large quantities of water are separated from theproduct.
The quantity of dairy waste is unclear. However, statistical information and data from previoussurveys show that the main part of dairy waste (whey and whey permeate) is re-used for rawmaterial substitution. This is excluding peaks in production when whey is landspread or sentfor biogas treatment. In 1992, the production of whey amounted to 1,760,000 tonnes. It

European Commission-Directorate-General for Environment
WRc Ref:CO4953-2/11768-1July 2001
176
contains approximately 20% of the proteins from the milk corresponding to 13,000 tonnesprotein. The quantity of whey being landspread is unclear.
Several dairy plants have on-site wastewater treatment plants. In 1991, MD Foods forexample had 10 anaerobic biofilm plants, 2 activated sludge plants for pre-treatment and 3activated sludge plants for total treatment.
In 1995, farmers using whey as animal feed paid typically DKr 60 per tonne of whey. The costof transportation is relatively high, and the dairy industry does therefore not make much - ifany - profit. The whey is also sold to protein re-processing plants.
Breweries and distilleries
In 1995, Denmark had 12 breweries, 2 malt houses, 3 distilleries and one company producingfruit wine. Carlsberg A/S dominates the Danish brewery industry, producing approximately 60-65% of the total quantity of beer.
The organic waste products from breweries consist mainly of mash and trub, malt shoots,yeast, draff, hop waste and filter material. Mash is the non-soluble substances left over afterthe filtering of the wort in the brewery. Yeast and draff settle during the maturing of the beer.Yeast is the main constituent. The draff also contain proteins and tannin.
The beer passes through a filter material consisting of kieselguhr, a very fine grained materialextracted from marine deposits. The kieselguhr removes the yeast and draff that did not settleduring the maturing of the beer.
The organic waste products from distilleries consist mainly of draff, fusel, vinasse, berries.Draff is the waste product produced during distillation when starch is used for spirit production.A small quantity of impurities is also produced during distillation called fusel (acetaldehydeand higher alcohols). The fusel is burnt in the internal boiler system and the heat produced isused in the production process. If molasses are used for spirit production instead of starch,the waste products are vinasse and fusel.
In the reprocessing of bitter, liqueur and the main part of the fruit wine, water, spices/herbsand essences or fruit juice are added. The quantity of waste produced during these processesis very small.
In the reprocessing to fruit wine, waste products from the berry pressing and fermentation areproduced.
A number of the companies have their own biological wastewater treatment plants. Sludge isproduced as a waste product.
In 1994, approximately 941,000 m3 of beer were produced in Denmark. This corresponds toalmost 1 million tonne of beer. The production of beer is to some extent seasonal partlybecause of variable demand and partly because of seasonal beers such as Easter andChristmas brews. The variations in production intensity can be ±50% of the average.
Approximately 12,000 m3 of pure spirit is produced per year. The main part of this isreprocessed into bitter, snaps, liqueur and fruit wine.

European Commission-Directorate-General for Environment
WRc Ref:CO4953-2/11768-1July 2001
177
A detailed description of brewery and distillery waste products and their quantities are shownin Table C23 and Table C24 respectively. Mash and trub and malt shoots from breweries aresold as cattle feed. The yeast and draff are heat treated and propionic acid is added before itis sold as pig feed. The kieselguhr waste is used as a filter aid in sewage treatment plants, iscomposted or landfilled. As compost and sewage sludge, a large part of the kieselguhr is alsospread on land.
Draff and vinasse are sold as fodder. The fusel is incinerated in the companies’ internal boilersystems. And the sludge and berry waste are spread on land. One of the fruit wine producerslandspread the berry waste on its own orchard.
The percentage use of the brewery and distillery waste products is illustrated in Figure C2. Itshows that approximately 10-14% of total organic waste produced are landspread.
Table C23 Waste products from breweries (DEPA 1998)
Waste products Quantity(tonne per year)
Application
Mash and trub 90,000-100,000 Raw material substitution(animal feed)
Malt shoots 5,500 Raw material substitution(animal feed)
Yeast, draff and otherwaste products
50,000 Raw material substitution(animal feed)
Kieselguhr with yeast anddraff
20,000-25,000 Sewage treatment plants, compost orlandfill
Total +/- 180,000
Table C24 Waste products from distilleries (DEPA 1998)
Waste products Quantity(tonne per year)
Application
Draff 35,000 Animal feed
Fusel and non-distilledimpurities
150-250 Incinerated in internal boiler system
Sludge from biologicalwaste water treatmentplant.
8,000-15,000 Landspreading
Vinasse (after evaporation) 26,000 Fodder
Berry waste etc. <1,000 Landspreading
Total +/- 75,000

European Commission-Directorate-General for Environment
WRc Ref:CO4953-2/11768-1July 2001
178
Figure C2 Application of brewery and distillery waste (DEPA 1998)
The re-use of waste products from the brewery industry is reported to be optimal. Kieselguhrmay be useful in biogas production. However this should be investigated as the kieselguhr willsettle quickly in a biogas plant. Additionally, new filter methods for beer filtration are beingdeveloped such as cross-flow filtration which would replace kieselguhr from beer production.
The re-use of waste products from the distillery industry is also reported to be optimal. Thewaste that can be used for raw material substitution is used for this purpose. The potential forbiogas utilisation of the waste that currently is landspread, is low. These products musttherefore be considered to be used optimal.
It is easy for the brewery industry to sell its mash and trub as fodder. However, it isconsiderably harder to sell the yeast and draff and the industry has to pay to get rid of thekieselguhr. Generally, the waste user wants the products to be more consistent with regardsto the water content. The drying of yeast and draff may therefore be an option. Another optioncould be to use the products for biogas production.
Leather and tannery industry
There is in Denmark, two tanneries with more than 10 employees and 5 tanneries with veryfew employees. The tanneries treat leather, skin/hide and fur. Skin and leather consist almostfully of protein of which approximately 85% is collagen. However, skin also consists of smallamounts of carbohydrates and fat.
The tannery process produces two waste products; glue leather and fold leather (Table C25).Glue leather contains 20% dry matter and is produced when the meat side of the skin isscraped to the maximum. Glue leather consists of mainly proteins and small quantities of fat,lime, salt and sulphide. The fold leather is leather waste from when the leather is folded. Thisconsists mainly of proteins and water. Fold leather may contain chromium from the tanneryprocess and can therefore not be used for biogas production.
Landspread10-14%
Incineration<0.1%
Landfill<2%
Raw material
substitution86-88%

European Commission-Directorate-General for Environment
WRc Ref:CO4953-2/11768-1July 2001
179
Table C25 Waste products from the leather and tannery industry (DEPA 1998)
Quantity (wet weight)Wasteproduct
(tonne per y) (%)
Quantity(tonne ds per y)
Application
Glue leather 2,800 48-58 500 Biogas productionfollowed bylandspreading
Fold leather 2,000-3,000 42-52 380-570 Controlled landfill
Total +/- 6,000 +/- 1,000
Pharmaceutical industry
The Danish pharmaceutical industry is characterised by a few large companies that produceraw materials or pharmaceuticals and a number of small companies that reprocess rawmaterials. In 1995, there were 6 large companies (i.e. with more than 20 employees) thatproduced raw materials and 21 large companies that produced pharmaceuticals.
The organic wastes produced in the pharmaceutical industry are mainly biomass (cells fromthe fermentation process), synthesis residues, alcohol and organic solvents from the cleaningprocesses, product residues and dust from reprocessing.
Pharmaceuticals are produced using synthesis or fermentation. Waste products fromsynthesis are typically synthesis residues and solvents. Waste products from fermentation aretypically biomass and fermentation liquid.
Quantities of wastes produced by the pharmaceutical industry and outlets are presented inTable C26. These figures are estimates as there is a lack of data from the industry. Thequantity of waste products from the pharmaceutical industry is dominated by biomass which islandspread (Figure C3). It is a well-defined product and is therefore easy for the farmer toinclude in his manure statements. The main part of this waste arrives from one company. Thecompany provides it free of charge to farmers. The waste utilised in biogas production ismainly biomass and pure alcohol. Pure alcohol is also used as a carbon source at wastewatertreatment plants. The other waste products, mainly solvents and product residues areincinerated and can not be utilised in any other way.

European Commission-Directorate-General for Environment
WRc Ref:CO4953-2/11768-1July 2001
180
Table C26 Waste products from the pharmaceutical industry (DEPA 1998)
Waste products Quantity*(tonne per year)
Composition Application
Synthesis residues 1,000 Alcohol, solvents,product residues.
Incineration, biogasproduction, wastewater treatmentplants
Fermentation residues 1,200,000 Biomass,fermentation liquid.
Landspreading,biogas production,sewage treatmentplant
Residues from thepurification process
4,000-5,000 Solvents, productresidues.
Incineration, biogasproduction
Residues fromreprocessing
300-500 Product residues,dust.
Incineration
Total >1,200,000* Estimates
Figure C3 Application of pharmaceutical waste (DEPA 1998)
Spread on land95%
Raw material
substitution3%
Biogas production
1%
Incineration1%
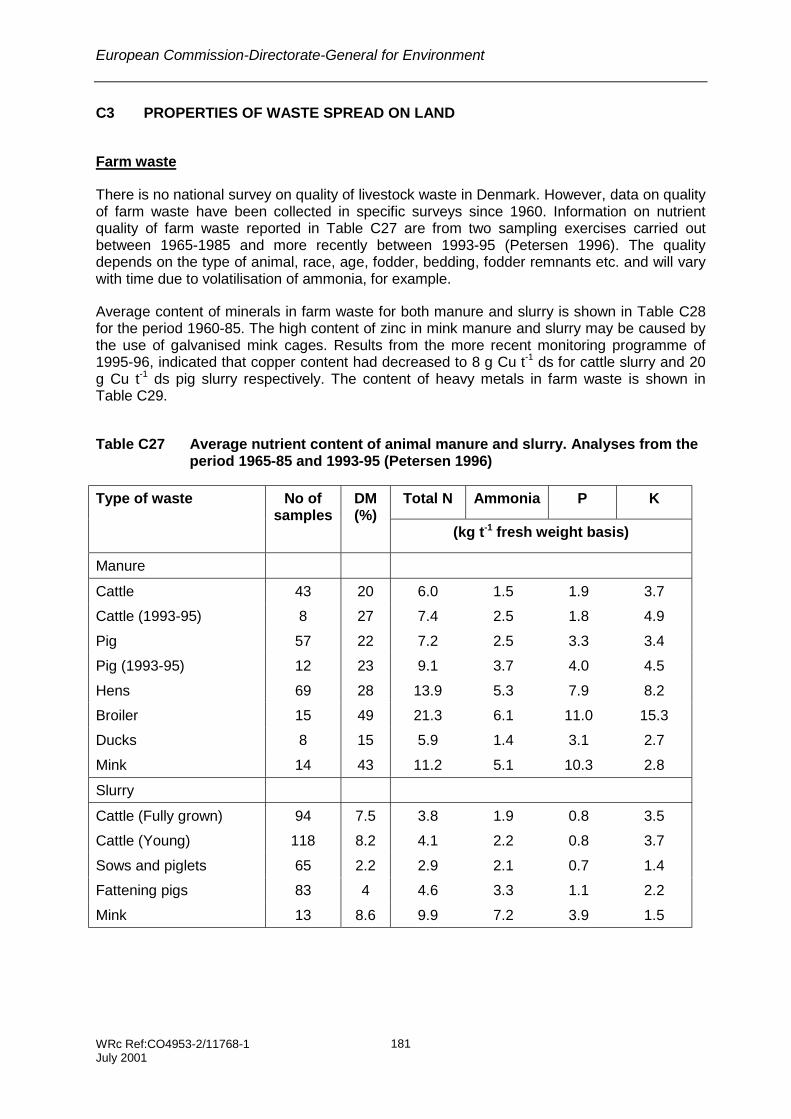
European Commission-Directorate-General for Environment
WRc Ref:CO4953-2/11768-1July 2001
181
C3 PROPERTIES OF WASTE SPREAD ON LAND
Farm waste
There is no national survey on quality of livestock waste in Denmark. However, data on qualityof farm waste have been collected in specific surveys since 1960. Information on nutrientquality of farm waste reported in Table C27 are from two sampling exercises carried outbetween 1965-1985 and more recently between 1993-95 (Petersen 1996). The qualitydepends on the type of animal, race, age, fodder, bedding, fodder remnants etc. and will varywith time due to volatilisation of ammonia, for example.
Average content of minerals in farm waste for both manure and slurry is shown in Table C28for the period 1960-85. The high content of zinc in mink manure and slurry may be caused bythe use of galvanised mink cages. Results from the more recent monitoring programme of1995-96, indicated that copper content had decreased to 8 g Cu t-1 ds for cattle slurry and 20g Cu t-1 ds pig slurry respectively. The content of heavy metals in farm waste is shown inTable C29.
Table C27 Average nutrient content of animal manure and slurry. Analyses from theperiod 1965-85 and 1993-95 (Petersen 1996)
Total N Ammonia P KType of waste No ofsamples
DM(%)
(kg t-1 fresh weight basis)
Manure
Cattle 43 20 6.0 1.5 1.9 3.7
Cattle (1993-95) 8 27 7.4 2.5 1.8 4.9
Pig 57 22 7.2 2.5 3.3 3.4
Pig (1993-95) 12 23 9.1 3.7 4.0 4.5
Hens 69 28 13.9 5.3 7.9 8.2
Broiler 15 49 21.3 6.1 11.0 15.3
Ducks 8 15 5.9 1.4 3.1 2.7
Mink 14 43 11.2 5.1 10.3 2.8
Slurry
Cattle (Fully grown) 94 7.5 3.8 1.9 0.8 3.5
Cattle (Young) 118 8.2 4.1 2.2 0.8 3.7
Sows and piglets 65 2.2 2.9 2.1 0.7 1.4
Fattening pigs 83 4 4.6 3.3 1.1 2.2
Mink 13 8.6 9.9 7.2 3.9 1.5
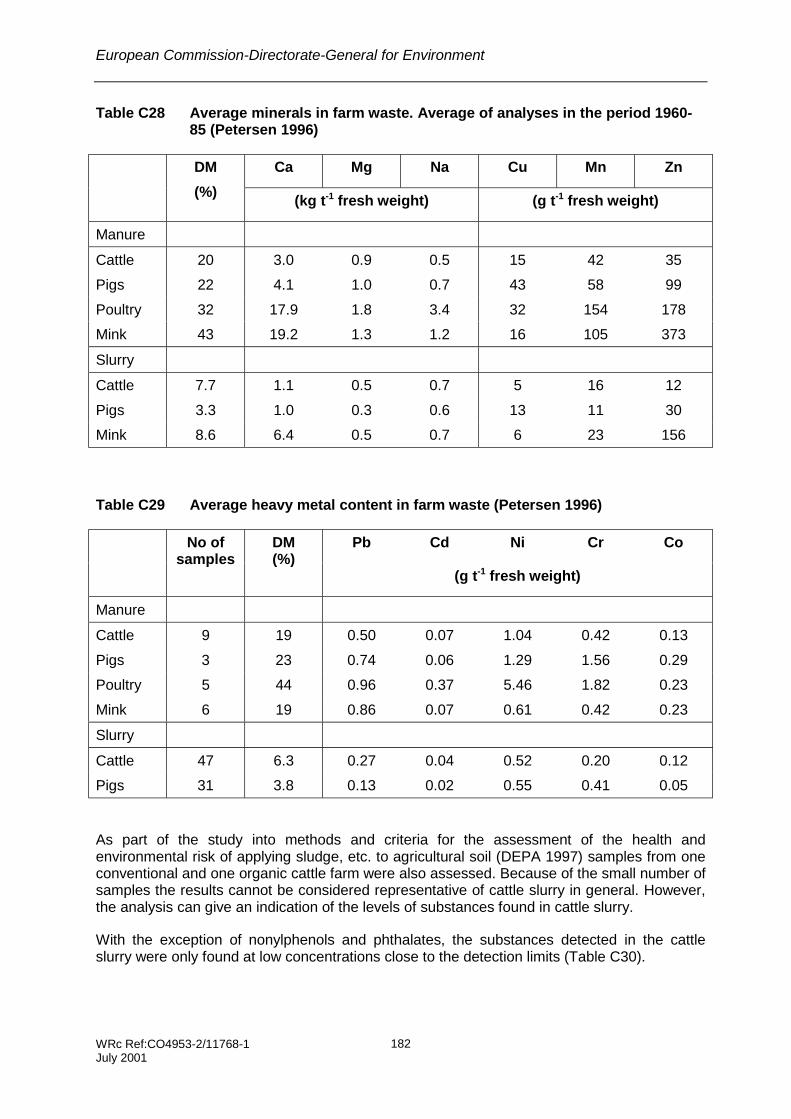
European Commission-Directorate-General for Environment
WRc Ref:CO4953-2/11768-1July 2001
182
Table C28 Average minerals in farm waste. Average of analyses in the period 1960-85 (Petersen 1996)
Ca Mg Na Cu Mn ZnDM
(%)(kg t-1 fresh weight) (g t-1 fresh weight)
Manure
Cattle 20 3.0 0.9 0.5 15 42 35
Pigs 22 4.1 1.0 0.7 43 58 99
Poultry 32 17.9 1.8 3.4 32 154 178
Mink 43 19.2 1.3 1.2 16 105 373
Slurry
Cattle 7.7 1.1 0.5 0.7 5 16 12
Pigs 3.3 1.0 0.3 0.6 13 11 30
Mink 8.6 6.4 0.5 0.7 6 23 156
Table C29 Average heavy metal content in farm waste (Petersen 1996)
Pb Cd Ni Cr CoNo ofsamples
DM(%)
(g t-1 fresh weight)
Manure
Cattle 9 19 0.50 0.07 1.04 0.42 0.13
Pigs 3 23 0.74 0.06 1.29 1.56 0.29
Poultry 5 44 0.96 0.37 5.46 1.82 0.23
Mink 6 19 0.86 0.07 0.61 0.42 0.23
Slurry
Cattle 47 6.3 0.27 0.04 0.52 0.20 0.12
Pigs 31 3.8 0.13 0.02 0.55 0.41 0.05
As part of the study into methods and criteria for the assessment of the health andenvironmental risk of applying sludge, etc. to agricultural soil (DEPA 1997) samples from oneconventional and one organic cattle farm were also assessed. Because of the small number ofsamples the results cannot be considered representative of cattle slurry in general. However,the analysis can give an indication of the levels of substances found in cattle slurry.
With the exception of nonylphenols and phthalates, the substances detected in the cattleslurry were only found at low concentrations close to the detection limits (Table C30).

European Commission-Directorate-General for Environment
WRc Ref:CO4953-2/11768-1July 2001
183
For the parameters assessed, only small differences between the conventional and theorganic cattle slurry with respect to organic xenobiotics was found. However, a higherconcentration of naphthalane was found in the organic slurry. Additionally, a higherconcentration of copper was found in the conventional slurry, possibly because of the use ofcopper-based agents for the disinfection of the cattle hooves.
Table C30 Organic xenobiotics in aqueous extracts, µg/l (DEPA 1997)
Parameter Conventional cattleslurry
Organic cattle slurry
Naphthalene 0.25 3.5
Trimethylnaphthalenes(C3)
5.0 1.3
Phenanthrene 0.04 0.13
Benzo(a)pyrene 0.51 0.45
Phenol 0.24 0.72
¾-methylphenol 4.4 17
2,4-methylphenol - 0.55
Nonylphenol(+ethoxylates)
64 45
Di-n-butylphthalate (DBP) 25 2.5
Butylbenzylphthalate 3.1 -
Di(2-ethylhexyl)phthalate 281 244
Diethylphthalate 2.3 2
di-n-octylphthalate 10 4.5
Tri-n-butylphosphate 0.16 0.17
Triphenylphosphate 4.5 1.6
tricresylphosphate 2.3 11
p,p’-DDT 3.2 2.6
Heptachloroepoxide 0.9 0.6
Cis- and trans-isosafrol 1.4 1.5
LAS 6 16
Note:
- below detection limit.

European Commission-Directorate-General for Environment
WRc Ref:CO4953-2/11768-1July 2001
184
Gaseous emissions
Several studies on ammonia emissions from farm waste spread on land have been carriedout. The most recent study on ammonia emissions from husbandry is a status report from1999 (Andersen 1999). The authors found little detailed data on spreading conditions of farmwaste. To overcome the lack of data the following assumptions were made (see Table C31).
Table C31 Estimated distribution of farm waste in 1996 (Andersen 1999)
Spreading method
Manure and slurry Solid manure
Crop Season Number ofhours after
spreading themanure is
plought intothe soil
Discspreading
Shoetrailing
Injection Disc spreading
Hours % of tot-N
- Spring <12 30 15 0 0
- Spring >12 10 10 0 0
-/+ Spring None 5 5 0 55
+ Summer None 2 5 1 0
+ Late summer- autumn
None 2 4 1 0
- Late summer– autumn
<12 3 3 0 0
- Late summer– autumn
>12 2 2 0 0
- Late summer- autumn
None 0 0 0 45
Total 54 44 2 100
Taking these assumptions into account, the total ammonia emissions from farm wasteamounted to 70,200 tonnes N in 1996. Of these 32% - equivalent to 22,500 tonnes N - wereemitted during and after landspreading.
The 1987 Action Plan on the Aquatic Environment made provisions for the farming industry tomake changes to slurry containers and to spread farm waste by injection on bare fields.Additionally, the Action Plan for a Sustainable Agriculture made provisions for the farmingindustry to increase the utilisation of the nitrogen in farm waste by 1 January 1997. Theseprovisions were not fully implemented in 1996 and the above figures have been alteredaccordingly.
The provisions of the 1998 Action Plan on the Aquatic Environment II also has an effect onthe ammonia emissions from agriculture. The plan provides for further utilisation of thenitrogen content of farm waste and fodder which will result in a reduction in total ammoniaemissions from agriculture. It is not shown how the increased utilisation is to be achieved. The
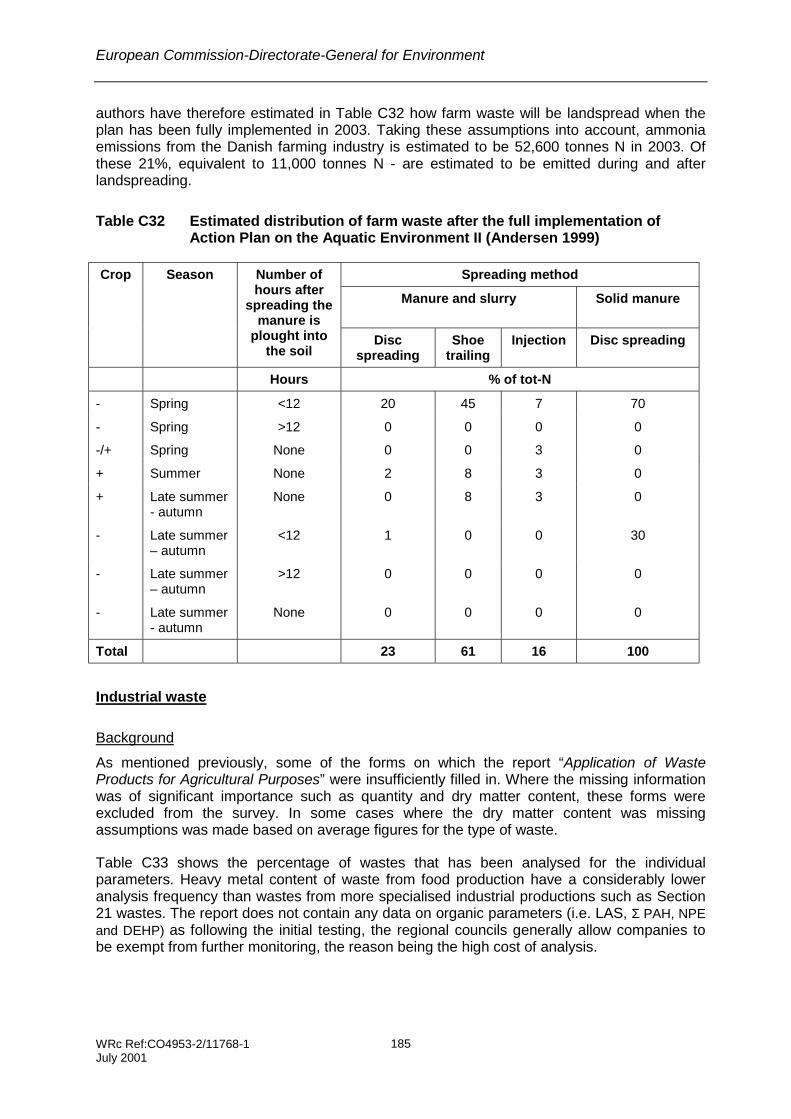
European Commission-Directorate-General for Environment
WRc Ref:CO4953-2/11768-1July 2001
185
authors have therefore estimated in Table C32 how farm waste will be landspread when theplan has been fully implemented in 2003. Taking these assumptions into account, ammoniaemissions from the Danish farming industry is estimated to be 52,600 tonnes N in 2003. Ofthese 21%, equivalent to 11,000 tonnes N - are estimated to be emitted during and afterlandspreading.
Table C32 Estimated distribution of farm waste after the full implementation ofAction Plan on the Aquatic Environment II (Andersen 1999)
Spreading method
Manure and slurry Solid manure
Crop Season Number ofhours after
spreading themanure is
plought intothe soil
Discspreading
Shoetrailing
Injection Disc spreading
Hours % of tot-N
- Spring <12 20 45 7 70
- Spring >12 0 0 0 0
-/+ Spring None 0 0 3 0
+ Summer None 2 8 3 0
+ Late summer- autumn
None 0 8 3 0
- Late summer– autumn
<12 1 0 0 30
- Late summer– autumn
>12 0 0 0 0
- Late summer- autumn
None 0 0 0 0
Total 23 61 16 100
Industrial waste
Background
As mentioned previously, some of the forms on which the report “Application of WasteProducts for Agricultural Purposes” were insufficiently filled in. Where the missing informationwas of significant importance such as quantity and dry matter content, these forms wereexcluded from the survey. In some cases where the dry matter content was missingassumptions was made based on average figures for the type of waste.
Table C33 shows the percentage of wastes that has been analysed for the individualparameters. Heavy metal content of waste from food production have a considerably loweranalysis frequency than wastes from more specialised industrial productions such as Section21 wastes. The report does not contain any data on organic parameters (i.e. LAS, Σ PAH, NPEand DEHP) as following the initial testing, the regional councils generally allow companies tobe exempt from further monitoring, the reason being the high cost of analysis.

European Commission-Directorate-General for Environment
WRc Ref:CO4953-2/11768-1July 2001
186
Table C33 Percentage of quality analysis performed in 1998 for industrial waste
Waste category TP TN K As Cd Hg Pb Ni Cr Zn Cu
Vegetable 91 91 69 1 17 12 9 11 7 7 6
Fish 100 100 5 0 23 2 2 17 1 1 1
Animal 88 88 79 17 30 26 26 26 25 25 62
Section 21 84 82 53 20 83 80 80 87 28 28 66
Unknown 42 37 20 1 35 11 35 35 13 13 13
Nutrients in waste spread on land
Industrial wastes spread on land in 1998 contributed to 3,297 tonnes Tot-P and 4,609 tonnesTot-N (Table C34). According to Section 16 of the Sludge Order, the maximum amount ofnutrient to be applied per hectare per year is 40 kg Tot P and 250 kg Tot N, respectively. Thismeans that there as a minimum is required approximately 83,000 hectare of landcorresponding to less than 1% of the total agricultural land in Denmark. Nutrients applied toland from industrial waste accounts for less than 1% of the nitrogen applied from fertilisersand farm waste while phosphorus accounts for 1-5%.
Section 21 wastes represent the largest contribution of nutrients of all industrial wastecategories. This is mainly from two large producers, Cheminova Agro A/S (fertilisermanufacturer) and Novo Nordisk A/S (pharmaceutical company) which contribute to 62% ofTot P and 23% Tot N.
Table C34 Total nutrient loading in waste per sector for 1998 (tonnes) (DEPA 2000)
Waste category TP TN K
Vegetable 438 1,630 2,740
Fish 21 42 0
Animal 337 1,306 1,288
Section 21 2,460 1,498 1,700
Unknown 41 133 101
Total 3,297 4,609 5,829

European Commission-Directorate-General for Environment
WRc Ref:CO4953-2/11768-1July 2001
187
Heavy metals in industrial waste spread on land
Table C35 below shows total load of heavy metal to soil per waste category. The contributionto heavy metal load to soil is for 60-80% due to other waste types than Section 21.
Table C35 Total metal loading per waste per category in 1998 (kg) (DEPA 2000)
Waste type As Pb Cd Cr Cu Hg Ni Zn
Vegetable 26 11 24 90 2 34 365
Fish 1 6 2
Animal 6 27 5 28 514 27 754
Section 21 351 500 58 339 4,798 82 686 15,023
Unknown 21 10 21 84 22 136
Total 357 574 85 412 5,486 84 775 16,280
Typical composition for specific waste streams recycled to land are given below.
Renderings and slaughtering
Table C36 Typical composition of abattoir wastes (DEPA 1998)
Waste products Composition
Liquid manure:
Pigs
Cattle
DM: 6-10%C/N ratio: 9-15BOD: approx. 30,000 mg l-1
DM: 10-12%C/N ratio: 9-15BOD: approx. 15,000 mg l-1
Wash water from transport trucks BOD: 10,000-20,000 mg l-1
Blood:
Pigs
Cattle
COD: 375,000 mg l-1
BOD: 150,000-200,000 mg l-1
DM: 18-20%Loss by ignition: 96%
Bristle and hoof:
Pigs
Cattle
Protein: 950 g kg-1 DM
Bones:
Pigs
DM: 57%Protein: 360 g kg-1 DM

European Commission-Directorate-General for Environment
WRc Ref:CO4953-2/11768-1July 2001
188
Waste products Composition
Cattle Fat: 220 g kg-1 DM
Bowel content:
Pigs
Cattle
Stomach content:
Pigs
Cattle
DM: 12-15%Loss by ignition: 80-87%C/N ratio: 17-21
Fat:
Pigs
Cattle
DM: 35-70%COD: 600,000-800,000 mg l-1
Sand: 20%Meat waste: 15%
Flotation sludge:
Pigs
Cattle
DM: 5-15%Loss by ignition: 83-98%Protein: 200-550 g kg-1 DMFat: 170-440 g kg-1 DM
Grating:
Pigs
Cattle
DM: 10-20%Loss by ignition: 95%COD: 300,000-450,000 mg kg-1
Chicken
Abattoir waste (non-edible parts,heads, feet)
Feather
Flotation sludge and fat
DM: 15-40%
DM: 40%
DM: 10-15%
Potato processing waste
Table C37 Waste products from the potato flour industry (DEPA 1998)
Waste products Composition
Potato pulp DM: 14.5%
Potato fruit juice and water of which DM: 1.7%
potato fruit juice DM: 4-4.5%

European Commission-Directorate-General for Environment
WRc Ref:CO4953-2/11768-1July 2001
189
Brewery and distillery waste
Table C38 Waste products from breweries and distilleries (DEPA 1998)
Waste products Composition
Brewery
Mash and trub 20% ds of which8% protein, 2% fat, 5% beer extract, 3%cellulose and 2% minerals.
Yeast, draff and other waste products 10-12% dsVSS: 10%
Kieselguhr with yeast and draff 12-22% dsVSS: 5-21%
Distillery
Draff 10-12% ds
Fusel and non-distilled impurities Alcohols, aldehydes
Sludge from biological waste watertreatment plant.
5% ds
Vinasse (after evaporation) 65% ds

European Commission-Directorate-General for Environment
WRc Ref:CO4953-2/11768-1July 2001
190

European Commission-Directorate-General for Environment
WRc Ref:CO4953-2/11768-1July 2001
191
REFERENCE
Andersen J.M., Sommer S.G., Hutchings N.J., Kristensen V.F., and Poulsen H.D. (1999)Emission af ammoniak fra landbruget – status og kilder (Ammonia emisions from husbandry –status and sources), the National Environmental Research Institute of Denmark (NERI) andthe Danish Institute of Agricultural Sciences (DIAS).
COWI (1999) Miljø og energy i forbindelse med håndtering af lugtemissioner ved opbevaringaf kartoffelfrugtvand (Environment and energy in connection with the handling of odouremissions from the storage of potato fruit water), The Danish Energy Agency, Copenhagen.
Danish Environmental Protection Agency (1997) Environmental Project No. 366 1997. Use ofWaste Products in Agriculture. Contamination Level, Environmental Risk Assessment andRecommendations for Quality Criteria, Danish Environmental Protection Agency.
Danish Environmental Protection Agency (1998) Environmental Project No. 397 1998.Organiske restprodukter i industrien. Del 1: Opgørelse af mængder og anvendelse (Organicby-products in industry. Part 1: Specification of amounts and application), DanishEnvironmental Protection Agency.
Danish Environmental Protection Agency (2000) Jordbrugsmæssig anvendelse afaffaldsprodukter fra industrien, 1998 (Application of Waste Products for Agricultural Purposes,1998), draft, Danish Environmental Protection Agency.
Danish Plant Directorate (1999) Vejledning og skemaer 1999/2000 (Guidance and forms1999/2000), Ministry of Food, Agriculture and Fisheries.
Danish Plant Directorate (1999) Gødningsregnskaber. Fysisk kontrol. Statistik 1997/98(Manure Statements. Physical Control. Statistics 1997/98), Ministry of Food, Agriculture andFisheries.
Petersen, J. (ed.) (1996) Husdyrgødning og dens anvendelse (Animal manure – a source ofnutrients), report No. 11, Statens Planteavlsforsøg (now Danish Institute of AgriculturalSciences).
Sommer S.G. and Moller H.B. (1999) Recycling of organic waste and animal manure inDenmark: Research and Development activities 1997-2003. In: Report of 2nd Meeting inGermany by the Recycling Organic Solids in Agriculture (ROSA), 25-26 February 1999.
Statutory Order No. 755 of 30 September 1999 on Professional Livestock, Livestock Manure,Silage etc., Retsinformation, Copenhagen.
Statutory Order No. 823 of 16 September 1996 on Application of Waste Products forAgricultural Purposes, Retsinformation, Copenhagen.
Statutory Order No. 49 of 20 January 2000 on Application of Waste Products for AgriculturalPurposes, Retsinformation, Copenhagen.

European Commission-Directorate-General for Environment
WRc Ref:CO4953-2/11768-1July 2001
192
CONTACTS
Name Organisation
Peter Greifenstein Danish Plant Directorate
Svend Erik Jepsen Danish Environmental Protection Agency
Leif Knudsen The Danish Agricultural Advisory Centre
Peder Mathiesen Novo Nordisk A/S
Jens Jørgen Nielsen Andelskartoffelmelsfabrikken Sønderjylland
Jørgen Olsen Municipality of Nørre-Rangstrup
Jens Petersen Danish Institute of Agricultural Sciences (DIAS)
Peter Vielsted County of West Zealand
Søren Hjuler Vogelsang Danisco Sugar
Related Documents


