International Journal of Fisheries and Aquaculture Research Vol.5, No.4, pp.10-24, November 2019 Published by ECRTD-UK ISSN: ISSN 2397-7507, Online ISSN: ISSN 2397-776 10 SURVEY OF TILAPIA CONSUMPTION IN BENUE STATE NIGERIA: A CASE STUDY OF MAKURDI METROPOLIS Emmanuel A.J., 1. National Cereals Research Institute N.C.R.I PMB 8 Badegi/Bida, Niger State. Research outreach Department: Farming system unit. Dr. S.O. Olufeagba 2. Department of Fisheries and Aquaculture Federal University of Agriculture Makurdi Benue State. Dr. A.M. Orire 3. Department of Water Resources Aquaculture and Fisheries Technology Federal University of Technology, Minna Niger State. Y.N. Elijah 4 Department of Fisheries and Aquaculture, Federal University of Agriculture Makurdi. ABSTRACT: This study examined and verified the interest of consumers on Tilapia consumption in makurdi metropolis Benue state. 50 structured questionnaires were used by random sampling techniques to collect Data from respondents. Statistical analysis was carried out using frequency distribution and statistical packages for social sciences (SPSS) the study reveals high consumers preference for Tilapia consumption, it was observed that family size and educational level have a significant positive effect on consumption of Tilapia. The result also revealed significantly high (p<0.05) tilapia consumption among married (60%) and students (48%). Family size of 6-10 accounted for 26% while 1-5 made up 18% consumption levels respectively. Fourteen percent (14%) of the study shows that tilapia consumption is high in Makurdi and can contribute to the economic growth of Benue state and Nigeria at large. Therefore, fish farmers should engage themselves in production of tilapia for improved wellbeing and overall benefits of farmers, marketers and the nation. KEY WORDS: Survey, consumer preference, tilapia, consumption. INTRODUCTION Fish plays an important role in human diet in towns and villages in Benue State by providing 77% of the total animal protein intake (Salam, 2005) whiles it constitutes about 16% to world animal protein consumption (FAO, 1999). Fish represents an essential and often irreplaceable food for the poor in developing countries in form of animal protein (Salam, 2005). Studies on fish demand and consumption has received little or no research attention resulting in insufficient knowledge on consumer preferences which is necessary information for fisheries development and products development geared towards meeting specific demand by consumers. It is a particularly important protein source in regions where livestock is relatively scarce-fish supplies less than 10% of animal protein consumed in North America and Europe,

Welcome message from author
This document is posted to help you gain knowledge. Please leave a comment to let me know what you think about it! Share it to your friends and learn new things together.
Transcript

International Journal of Fisheries and Aquaculture Research
Vol.5, No.4, pp.10-24, November 2019
Published by ECRTD-UK
ISSN: ISSN 2397-7507, Online ISSN: ISSN 2397-776
10
SURVEY OF TILAPIA CONSUMPTION IN BENUE STATE NIGERIA: A CASE
STUDY OF MAKURDI METROPOLIS
Emmanuel A.J., 1. National Cereals Research Institute N.C.R.I PMB 8 Badegi/Bida, Niger State. Research
outreach Department: Farming system unit.
Dr. S.O. Olufeagba
2. Department of Fisheries and Aquaculture Federal University of Agriculture Makurdi
Benue State.
Dr. A.M. Orire
3. Department of Water Resources Aquaculture and Fisheries Technology
Federal University of Technology, Minna Niger State.
Y.N. Elijah
4 Department of Fisheries and Aquaculture,
Federal University of Agriculture Makurdi.
ABSTRACT: This study examined and verified the interest of consumers on Tilapia
consumption in makurdi metropolis Benue state. 50 structured questionnaires were used by
random sampling techniques to collect Data from respondents. Statistical analysis was carried
out using frequency distribution and statistical packages for social sciences (SPSS) the study
reveals high consumers preference for Tilapia consumption, it was observed that family size
and educational level have a significant positive effect on consumption of Tilapia. The result
also revealed significantly high (p<0.05) tilapia consumption among married (60%) and
students (48%). Family size of 6-10 accounted for 26% while 1-5 made up 18% consumption
levels respectively. Fourteen percent (14%) of the study shows that tilapia consumption is high
in Makurdi and can contribute to the economic growth of Benue state and Nigeria at large.
Therefore, fish farmers should engage themselves in production of tilapia for improved
wellbeing and overall benefits of farmers, marketers and the nation.
KEY WORDS: Survey, consumer preference, tilapia, consumption.
INTRODUCTION
Fish plays an important role in human diet in towns and villages in Benue State by providing
77% of the total animal protein intake (Salam, 2005) whiles it constitutes about 16% to world
animal protein consumption (FAO, 1999). Fish represents an essential and often irreplaceable
food for the poor in developing countries in form of animal protein (Salam, 2005). Studies on
fish demand and consumption has received little or no research attention resulting in
insufficient knowledge on consumer preferences which is necessary information for fisheries
development and products development geared towards meeting specific demand by
consumers. It is a particularly important protein source in regions where livestock is relatively
scarce-fish supplies less than 10% of animal protein consumed in North America and Europe,
International Journal of Fisheries and Aquaculture Research
Vol.5, No.4, pp.10-24, November 2019
Published by ECRTD-UK
ISSN: ISSN 2397-7507, Online ISSN: ISSN 2397-776
11
but 17% in Africa, 26% in Asia and 22% in China (FAO, 2000). About one billion people
world-wide have been estimated to rely on fish as their primary source of animal protein (FAO,
2000). Fish also contribute to social and economic development. The FAQ estimates the value
of fish traded internationally to US$ 51 billion per annum while over 36 million people are
employed directly through fishing and aquaculture (FAO, 2000), and as many as 200 million
people derive direct and indirect income from fish (Garcia and Newton, 1997).
Tilapia culture has expanded worldwide at an average annual rate of 14.2 percent since 1984
(FAO, 1998). Global tilapia production through aquaculture reached 800,000 metric tons (MT)
in 1996 (Food and Agriculture organization of the United Nations (1998). Cultured tilapia
production has increases to constitute 57 percent of total tilapia production (wild-caught and
cultured) worldwide. In Africa the production of tilapia is less than 20 percent of the total
aquaculture production of tilapia (FAO, 1998). Egypt is the second largest producer,
worldwide, of tilapia and generates 58 percent of the total Africa production.
As a tropical fish, the distribution of tilapia production would be expected to be concentrated
in area with tropical climate by Alcester C.C 2001. This is largely the case, and tilapia
production has grown rapidly in the tropical areas. Nevertheless, tilapia production has also
expanded in to areas with temperature climates. The Unites States alone produced over 9,000
MT of tilapia in 2000 (American Tilapia Association, 2001). Much of the U.S. production is
indoor or greenhouse facilities. Given the well-developed air freight system in most regions of
the world (Neiraet al., 2003) the tropical areas would be expected to continue to have a
competitive advantage in tilapia production for many years to come.
Fishing is an ancient economic activity In Nigeria. It activities cover both the coastal and inland
waterways and it was of tremendous economic value to the pre-colonial Nigerians (Ethinmore,
2007). Fish was one of the major articles among Nigerian commodities of trade. Fish of various
kinds were either dried in the sun or smocked in order to preserve them for long or short
distance market (Strde and lfeka, 2006). Fresh fish were said to be marketed mostly in short
distance areas owing to the perishable nature and problem of storage facility. Professional
fishing is characterized by craftsmanship and special skills, such as boat, canoe, paddle, float,
buoy and net construction coupled with invention of a variety of indigenous fishing techniques
and gear. Fishing in pre-colonial Nigeria till date engenders migration as many of its
practitioners would have to leave their original settlements for better prospects elsewhere
(Ayodeji, 2008). Fishing of the migratory type was very prominent among these tribes: Ilaje,
Izo, Itsekiri, EfikJukun, Ijebu, Awori etc. from the precolonial period to date, the Ilaje are to
have been the most migratory, famous and professional both in land deep sea-fishing not only
in Nigeria but in West and Central Africa (IUCN, 2007). Around the early 16th century, fishing
is said to be practiced with rudimentary techniques and tools such as raffia materials, wood and
grasses add with very limited scope (Ehinmore, 2007).
By the late 18th century to early 19th century, most Nigerian fishermen had started developing
improved fishing gear and techniques such as clapnets, castnets, ita, egho, asuren, ojijon, agada,
ighee, iyanma, ekobiufo, riro, (Ethinmore, 1998) etc. Nigerian fishing economy was in this
progressive stage of development on the eve of British colonization. The 1960 Independence
led to advanced civi1zation and pronounced developments. It is on record however that the old
in system (trade by barter) phased out many decades, prior independence, gave room to the

International Journal of Fisheries and Aquaculture Research
Vol.5, No.4, pp.10-24, November 2019
Published by ECRTD-UK
ISSN: ISSN 2397-7507, Online ISSN: ISSN 2397-776
12
emergence of commercialization and trading in various commodities including fish which
started gaining prominence.
According to Alverson and Paulik (2002) Marketing is as old as human beings. It is closely
related so all endeavours. During the slave trade, marketing was primitive; it c in the form of
barters (an exchange of goods for goods) and later graduated into monetary trade (Cowries and
shells were commonly used in Nigeria then).
Tilapia Fish marketing in Nigeria, however, is hinged on some basic questions: What do
consumers want? Which species? What price, size, form, quality, quantity and grading? Others
are: what services do they want? When to sell? Where do people buy? etc. according to (Sen,
2005). It is important to know that: the less familiar specie is the greater the risk that it will be
rejected or taken a long time to build up demand for it, people’s taste are formed slowed and
strongly influenced by traditional eating habits. Demand increases at the time of festival and
holidays. As prices rise, less is bought and as prices fall, more is bought and poor people are
more likely to look for change substitutes than rich people.
The Environmental factors asserted by Flood 2006 have a major part to play in Nigeria’s fish
marketing system. In Nigeria market, a fall in income per head results in the reduction of fish
to be purchased, an awareness campaign about the importance of fish to human health will lead
to increase in the purchase and consumption rate, a growth in population will lead to an increase
in fish demand, a bumper harvest in other sectors of Agriculture, results in more money in
circulation hence increase in demand for fish and A ban on fish importation leads to a rising
demand for local fish.
With the progressive development of the ice conservation facilities, Nigerian Government
embarked on the importation of frozen fish to complement local production supply and to cover
the deficit in consumer demand. The increment in demand was a result of increase in population
(between 10-15% annual growth rate) and shift in consumption due to favourable fish price
compared to its substitutes. Also the rapid awareness that Tilapia is rich in nutrient contributing
an average of 20 — 25% of per caput animal protein intake and could be as high as 80% in
coastal and riverside communities (FAO, 2000).
The importation is exclusively limited to small pelagic, which are made up of horse mackerels
and sardines. In 2002 alone, the total value of fish import was $159 million (FAO, 2005).
Frozen fish imports constitute the category most widely distributed in the country, through a
network of privately owned cold stores located in major cities. The fish is available frozen in
city markets, and part of it is smoked for further distribution to village markets. The freshly
frozen landings of the industrial fish trawlers also follow the same distribution network, but its
availability far beyond the coastal landing sites is constrained by its limited quantity relative to
the cheaper imports.
There is a high demand from the large population and income levels close to the port. The
major freshwater species: Tilapia are preferred fresh, but are available fresh only at high cost.
For reservoirs and lakes which are within or close to major human settlements, markets develop
around the landing sites and the product is usually disposed of within hours of landing, partly
to direct consumers and partly to marketers who may preserve for few days.

International Journal of Fisheries and Aquaculture Research
Vol.5, No.4, pp.10-24, November 2019
Published by ECRTD-UK
ISSN: ISSN 2397-7507, Online ISSN: ISSN 2397-776
13
Most other landing sites in the inland water system are remote and facilities for preservation,
other than smoking, are bob-existent. Cooling vans also engage in distribution and marketing.
Larger commercial marketing channels through supermarkets and open markets do exist
catering for majority of wholesalers, retailers and urban consumers. Also, the processing and
packaging has been improved over the years, such that it has the highest shelf life among the
local products and is available in the markets of the very densely populated cities of Nigeria.
This necessitated research into this study to find out consumer’s preference for tilapia
consumption and its marketing trend within Makurdi metropolis, Benue State-Nigeria.
Plate 1: Southern Mouth-brooder
Plate 2: Redbreast Tilapia

International Journal of Fisheries and Aquaculture Research
Vol.5, No.4, pp.10-24, November 2019
Published by ECRTD-UK
ISSN: ISSN 2397-7507, Online ISSN: ISSN 2397-776
14
MATERIALS AND METHODS
Description of the Study Area
Benue is a state in the mid-eastern region of Nigeria with a population of about four million
two hundred and fifty three thousand six hundred and forty one (4,253,641) in 2006 National
Population Census (NPC, 2006). Idoma and Tiv, are spoken predominantly. There are other
ethnic groups, including Igede, Etulo and Abakwa. Jukun, Hausa, Akweya and Nyifon. With
its capital at Makurdi, Benue is a rich agricultural region; some of the crops grown are potatoes,
cassava, soya bean, guinea corn, flax, yams, sesame, rice, and ground nuts. Benue State is
named after the Benue River and was formed from the former Benue-Plateau State in 1976.
The state capital is Makurdi which lies on longitude 8°5599' and latitude 7°7252 (Google Map,
2015)
FIGURE 1: THE MAP OF MAKURDI LOCAL GOVERNMENT SHOWING
THESTUDY AREAS. (Source: htt://www.online Nigeria.)
METHOD OF DATA COLLECTIONS
The study areas were purposively selected due to high population densities and existence of
commercial oriented fish farmers most of whom were starting to turn to entrepreneurial
aquaculture practices. A random sampling was done m the identified areas to select fish
consumers to participate in the same as respondents. A total of 50 questionnaires were
administered to respondents in Makurdi Metropolis. Questions on age, sex, marital status,
household’s family size, and educational levels were included in the questionnaire as they were
found to relate to reasons for food purchases. Data collected from the field was analysed

International Journal of Fisheries and Aquaculture Research
Vol.5, No.4, pp.10-24, November 2019
Published by ECRTD-UK
ISSN: ISSN 2397-7507, Online ISSN: ISSN 2397-776
15
statistically using descriptive statistics of frequency and distribution with Statistical Packages
for social Sciences (SPSS).
RESULTS
The survey on consumer preference on tilapia revealed the age distribution, sex distribution,
marital status, occupation, educational levels of consumers of tilapia to significant difference.
Demographics status of respondents
Table 1: Sex Distribution of Consumers of Tilapia in Makurdi Metropolis
Research question Options Frequency Percentage
Sex Male
Female
19
31
38%
62%
Total frequency and percentage 50 100
The result as showing in Table 1 revealed that 62% of the respondents were female and out of
this, 50% consumed tilapia and 12% does not eat tilapia 38% of respondents were male and
out of this only 30% eat tilapia.
Marital status of respondents
Table 2: Marital status of consumers of tilapia in Makurdi Metropolis.
Research Question Options Frequency Percentage
Marital Status Divorce
Single
Married
2
18
30
4%
36%
60%
Total frequency and percentage 50 100
Marital status determines whether family pattern affects tilapia consumption in the study area.
The result in the table 2 shows that 36% of respondents were single and out of this, 30%
consume tilapia while 6% do not. A greater majority fell within married status, making up to
60% and among whom 55% consumed tilapia and the remaining 5% don’t like tilapia. The
lowest respondent was divorce category which was 4% and they consume tilapia respectively.
Occupation of respondents
Table 3: Occupational levels of consumers of tilapia in Makurdi Metropolis
Research question Options Frequency Percentage
Occupation Fisher farmer
Civil Servant
Business
Students
2
17
6
25
4%
34%
12%
50%
Total frequency and percentage 50 100
International Journal of Fisheries and Aquaculture Research
Vol.5, No.4, pp.10-24, November 2019
Published by ECRTD-UK
ISSN: ISSN 2397-7507, Online ISSN: ISSN 2397-776
16
Table 3 shows that the majority of the respondents are students and carried the highest
percentage of 50% amounted to 48% of tilapia consumption while 2% were left out. Thirty
four percent (34%) were civil servants of which 20% eat tilapia while the remaining 14% don’t
like tilapia. Twelve percent (12%) of respondents were business men and only 2% relish tilapia
while 10% were left out. The finding also revealed that, 4% of respondents are fish farmers
and all (100%) of them eat tilapia in the study area.
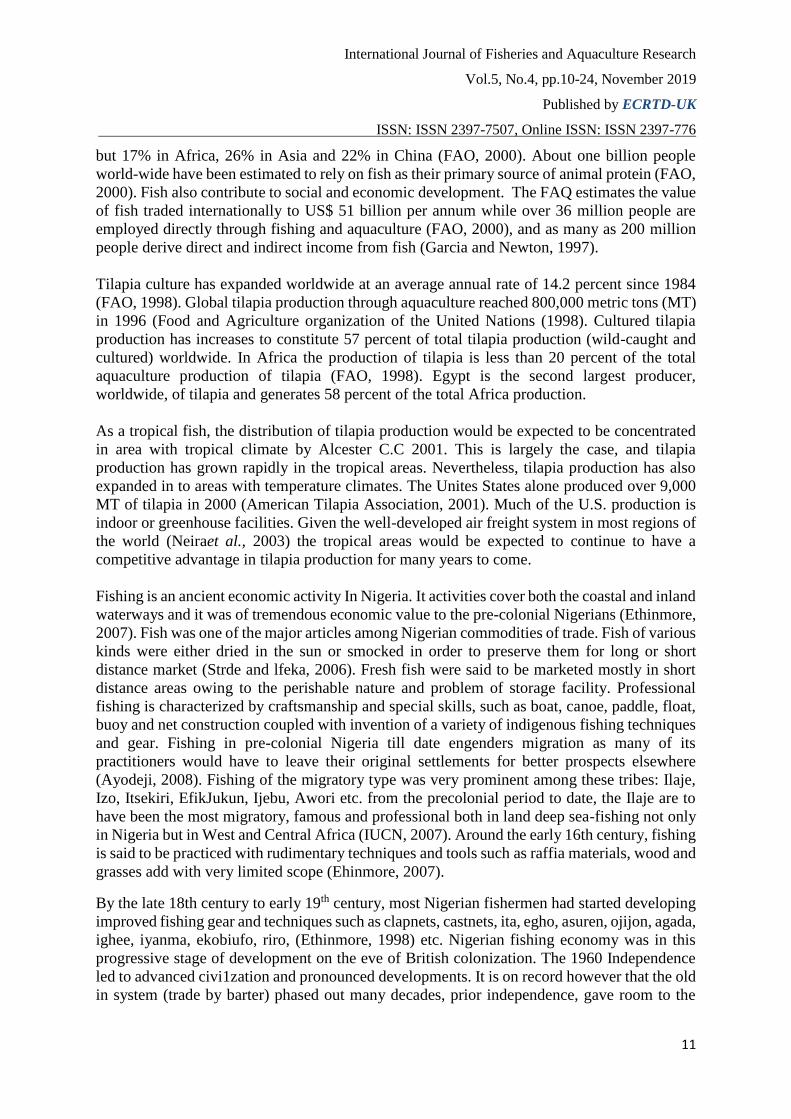
Age distribution of the respondents
Table 4: Age distribution of consumer of tilapia in Makurdi metropolis
Age groups (years) Frequency Percentage
<20 7 14
21 – 25 10 20
26 – 30 12 24
31 – 35 7 14
36 – 40 4 8
> 40yrs 10 20
Total frequency and percentage 50 100
The age of the respondents play an important role in the consumption pattern of the consumers
shown in Table 4. The age distribution revealed that 14% fall within 0 - 20 and only 4% eat
tilapia but greater majority fall within the middle age groups of 26 - 30 which make up to 24%
and out of this 20% were recorded that eat tilapia and 4% were not. Ages between 21-25 made
up to 20% and only 10% eat tilapia while 15% do not eat at all. Furthermore, 14% of
respondents are ages 31 - 35 and out of this 11% eat tilapia and 3% do not. Similarly, ages 40
and above constituted 20% of respondent, and all (100%) of them eat tilapia, in contrast ages
36 - 40 had the lowest percentage of 8% of those that consume tilapia which shows that between
the age group of 26-40 and above there is a significant difference between 26 - 40 and 0 - 25
age of consumers.
Educational level
Table 5: Relationship between Educational levels of consumers of tilapia in Makurdi
metropolis
Research question Options Frequency Percentage consumption
(%)
Educational Level Non-Formal- Education
Primary
Secondary
Tertiary
5
5
13
27
10
20
25
45
Total frequency and
percentage
50 100
The distribution of respondents on the basis of their educational attainment shows that they all
had one form of education or the other. Non-formal education respondents has 10% and 8% of
this eat tilapia while 2% do not. Primary education has 10% of respondents and all (100%) of

International Journal of Fisheries and Aquaculture Research
Vol.5, No.4, pp.10-24, November 2019
Published by ECRTD-UK
ISSN: ISSN 2397-7507, Online ISSN: ISSN 2397-776
17
them eat tilapia while secondary education has about 12% of respondents and 10% eat tilapia
where as 2% is count out but a greater majority of respondents are in tertiary education with
highest percentage of 54% and out of this, 50% were recorded for eating tilapia and only 4%
is left out. It was observed that the educational level of the respondents determines the quality
and quantity of fish consumed especially the tilapia among aquacultural system. This revealed
that quality of education has a significant difference in fish consumption rate.
Consumer preference of tilapia
Table 6: Reasons for consumers’ preference to tilapia consumption in Makurdi Metropolis
Research question Options Frequency Percentage (%)
Why do you prefer Tilapia Very cheap
Easy access
Very sweet
Marketable
Always available
20
8
16
1
5
40
16
32
2
10
Total frequency and percentage 50 100
In table 6 above, the highest percentage of respondents (40%) preferred tilapia because of its
affordability. Thirty two percent (32%) of respondent also preferred tilapia for its sweet taste
while 16% liked it for it easy accessibility and the lower percentage of respondents were found
from the marketability and availability which is 2% and 10% respectively
Table 7: Frequency of Consumption of Tilapia in Makurdi Metropolis
Research question Options Frequency Percentage (%)
How often do you eat Tilapia in a week No response
1 time
3 times
5 times
7 times
21
12
10
6
1
42
24
20
12
2
Total frequency and percentage 50 100
Table 7 shows that 42% of the respondents cannot tell or give account of how often they eat
tilapia in a week which means it’s not common to them, 24% of respondents, which is second
greater number of respondent that eats tilapia only once in a week. While 20% eat 3 times and
only few numbers of respondents eat tilapia regularly in a week which is making up to 12-7
times in a week respectively.
Table 8: Consumer preference of tilapia in Makurdi Metropolis
Research question Options Frequency Percentage (%)
How best do you enjoy tilapia? Fresh
Roasting
After cooking
Dried
Other forms
2
22
5
17
4
4
44
10
34
8
Total frequency and percentage 50 100

International Journal of Fisheries and Aquaculture Research
Vol.5, No.4, pp.10-24, November 2019
Published by ECRTD-UK
ISSN: ISSN 2397-7507, Online ISSN: ISSN 2397-776
18
There are different forms of tilapia preparation or processing, and it is determined by
consumers’ choice in the study area. Roasting is however identified to be the best choice of
some respondents in the study area. Table 8 shows that 44% of respondents who enjoy tilapia
best in roasting form is the highest, 34% enjoying tilapia best in dried form while after cooking
and other form were also not left out either and very few respondent choose fresh form of
tilapia respectively.
Table 9: Frequency of tilapia consumption in Makurdi Metropolis
Research question Options Frequency Percentage (%)
Consumption of tilapia in household’s No
Yes
No Responses
13
36
1
26
72
2
Total frequency and percentage 50 100
About 72% of respondents that had a household consumed tilapia in their household while 26%
do not consume tilapia in their household and only 2% do not respond that has household.
Table 10: Consumers preference of tilapia over meat in Makurdi Metropolis
Research question Options Frequency Percentage (%)
Preference of fish over meat Its proteinous
Its affordable
Easily available
Easy to cook
It is more tasty
7
20
9
6
8
14
40
18
12
16
Total frequency and percentage 50 100
The table 10 shows that the majority of respondents which accounted for 40% preferred fish
over meat because it is affordable in price compared to meat, 18% of respondents also preferred
fish for its easy access than meat, while 16% and 14% were attributed its proteinous and tasty
and finally 12% was because the fish is very easy to cook and fast to be done.
Table 11: Consumers choice of where to buy tilapia in Makurdi Metropolis
Research question Options Frequency Percentage (%)
Place of purchase No response
Wild
Local
1
12
37
2
24
74
Total frequency and percentage 50 100
The result in table 11 shows the location and the place where tilapia is been purchased by
consumers in the study area. About 74% of the respondents purchase or obtained their tilapia
from the local market while 24% was from wild and 2% of consumers was not respond to this
question

International Journal of Fisheries and Aquaculture Research
Vol.5, No.4, pp.10-24, November 2019
Published by ECRTD-UK
ISSN: ISSN 2397-7507, Online ISSN: ISSN 2397-776
19
Table 12: Consumers price of tilapia in MakurdiMertropolis
Research question Options Frequency Percentage (%)
Price (N/kg) >200
200- 300
300 - 400
400 – 500
500 – 600
600-700
8
10
10
11
10
1
16
20
20
22
20
2
Total frequency and percentage 50 100
The above table indicates the price per/kg of fish purchased by consumers. It shows that 22%
of respondents purchased the tilapia at the rate of 400 - 500 which has the highest percentage
among the consumers and 20% of respondent also get their tilapia at the rate of 200 - 300, 300-
400, and 500 - 600 respectively, while 16% buy the tilapia less than 200 and 2% get it at the
rate of 600 - 700 in the study area.
Table 13: Numbers of consumers Metropolis family that eat tilapia in Makurdi
Research question Options Frequency Percentage (%)
How many are you in your family? 1 - 5
6 -10
11-15
15-20
9
28
7
6
18
36
14
12
Total frequency and percentage 50 100
Above table 13 analysed the size of family of the respondents in the study area. The table shows
that 26% of respondents has about 6 - 10 family number, 18% has 1 - 5 while 14% of
respondents has 11 - 15 family number and only 12% has 15 - 20 respectively.
Table 14: Consumers preference of fish in Makurdi Metropolis
Research question Options Frequency Percentage (%)
Why do you dislike tilapia than other fish It is bony
Small in size
It has no taste
4
33
13
8
66
26
Total frequency and percentage 50 100
The above table shows the challenges and problems of tilapia towards consumers in the study
area which is major factor hinder the marketability of Tilapia species of fish.
Table 14 the result shows that 66% of respondents dislike tilapia because of its size which refer
8% which is small and bony, while 26% avoid it because of the taste and only 8% of
respondents recognized the stature of the tilapia which they refers to bony form and this is
simply means it is bony.

International Journal of Fisheries and Aquaculture Research
Vol.5, No.4, pp.10-24, November 2019
Published by ECRTD-UK
ISSN: ISSN 2397-7507, Online ISSN: ISSN 2397-776
20
Table 15 Consumers preference on form of tilapia in Makurdi Metropolis
Research question Options Frequency Percentage (%)
How do you prefer tilapia Fresh
Dried
32
18
64
36
Total frequency and percentage 50 100
The result in table 15 shows that 64% of respondents preferred tilapia in a fresh form while
36% of respondents prefer dried form of tilapia respectively.
Table 16 Consumers advice to those who don’t eat tilapia Makurdi Metropolis
Research question Options Frequency Percentage
(%)
Advice to those who dislike
tilapia
No response
They should start eating
it
Encourage to eat it
It is proteinous
10
15
15
10
20
30
30
20
Total frequency and percentage 50 100
Above table shows the consumers responds about the tilapia in the study area. The result shows
that 30% of the respondents encourage those who dislike tilapia to eat it with no reason while
20% respondents encourage eating it because it is considered proteinous and good for body
while 20% do not responds to the question.
DISCUSSION
It was observed in the course of this study that the sex distribution in the table one(1) revealed
that 62% of respondents were female and out of this 50% consumed tilapia and 12% was count
out while 38% of respondents were male and out of this 30% of them eat tilapia and the
remaining 8% don’t eat, this shows that there is significance differences between female and
male. This is similar to a study in Kenya which assessed urban consumers’ fish preferences
and determinants influencing fish selection and consumption. Esilaba et al., (2017) however
another work was carried out in India that reported a similar trend (Mugaonkar et al., 2011).
Table 2 Marital status of consumers of tilapia in Makurdi metropolis shows that 36% of
respondents were single and out of this 30% consumed tilapia while greater majority fall within
the married people which is making up to 60%. Among of this, 55% consumed tilapia and the
remaining 5% don’t eat tilapia. In table 4 Age distribution of consumers of tilapia in Makurdi
metropolis also observed that the size of some family determined the number of people that eat
tilapia in the study area. This observation was also noted in the Kenya study which assessed
urban consumers, fish preferences and determinants influencing fish selection and
consumption (Esilaba et al., 2017).
International Journal of Fisheries and Aquaculture Research
Vol.5, No.4, pp.10-24, November 2019
Published by ECRTD-UK
ISSN: ISSN 2397-7507, Online ISSN: ISSN 2397-776
21
The result obtained in table 3 Occupational level of consumers of tilapia in Makurdi metropolis
revealed that the majority of respondents are students which carried the highest percentage of
50% which about 48% eat tilapia and only 2% were left out. 34% were civil servant and 20%
eat tilapia and 12% were business men 2% eat tilapia and 10% were count out while 4% were
fish farmers and they all eat tilapia. In table 4 The Age distribution of respondents shows that
14% fall within the 0 - 20 and only 4% eat tilapia but the greater majority fall within the middle
age group of 26 - 30 which make up to 24% and out of this 20% were recorded that eat tilapia
and 4% were not, 21 - 25 age group make up to 20% and only 10% eat tilapia where as 15%
don’t eat at all, while 31-35 were 14% of respondents and out of this 11% eat tilapia and 40
and above make up to 20% and they all eat tilapia. This is shown that between the age group
of 26 - 40 and above revealed that there are significant differences between the age group of
26 - 40 and 0 -25 ages of consumers. This study supports the findings of Erdogan et al., 2011
and Storey and Forshee, 2007 who reported a strong positive relationship between fish
consumption and age.
The result in table 5 Relationship between educational levels of consumers of tilapiain Makurdi
metropolis. Shows that the respondents had one form of education or the other but the majority
are tertiary education which counted for 54% and out of this 50% were recorded that eat tilapia
and only 4% is left out. Non-formal education respondents had 10% and 8% of this eat tilapia
while 2% don’t and primary education had 10% of respondents and all of them eat tilapia
whereas secondary education had 12% of respondents and 10% eat tilapia where by 2% is count
out. This is in line with Agbebi and Fagbenro, (2006) that the educational level of respondents
determined to a great extent of skills possess by their cognitive ability and so the opinion of
Eyo and Ita, (1990) which viewed formal education as an important factor in the performance
and management of fish marketing and fisheries sectors in general. In the table 5 It also
observed that the educational level of the respondents determined great extend the quality and
balance diet of fish generally for the human body especially the tilapia as fish among
aquacultural systems. This revealed that there is a significant difference between the tertiary
education and other form of education.
The result in table 7 Frequency of consumption of tilapia in Makurdi metropolis shows that the
respondents on the question how often do you eats tilapia? stated that there was a very poor
performance of people respond to that question which is shows that the tilapia is been
consumed within the limit of the time and non-respond to this has the highest percentage, while
very few number of respondents eat tilapia regularly in a week which is making up to 2 — 7
times in a week in the options of the question. In table 7 Most of respondents on the question
how best do you prefer tilapia believed the roasting of tilapia as their best choice among the
options and it has the highest percentage of 44% while those enjoy tilapia after cooking are
average and other options has a very poor performance of the respondents. This is similar to
the report of (Brunso et-al 2009) which revealed that lack of the ability from consumers to
evaluate fish quality is another constraint to fish consumption.
The result derived in table 9 Frequency of tilapia consumption in Makurdi metropolis indicates
that about 72% of respondents had an house hold that consumed tilapia and it has a greater
number of respondents while No responds to this question were average among other options.
The table 10 Consumers preference of tilapia over meat in Makurdi metropolis also indicates
number of those that preferred fish over meat and the result shows that the highest percentage
of respondents

International Journal of Fisheries and Aquaculture Research
Vol.5, No.4, pp.10-24, November 2019
Published by ECRTD-UK
ISSN: ISSN 2397-7507, Online ISSN: ISSN 2397-776
22
Preferred fish than meat which counted for 40% because of his affordable prices, accessibility
and quality of it nutrition to the body. The observed consumers perception is similar to that of
observation reported by Trondsen et al. (2004). The perception of most consumers in this study
is that fish consumption is healthier than that of meat consumption. The result in table
11Consumers choice of where to buy tilapia in Makurdialso shows that 74% of respondents
obtained or purchased the tilapia in local market which has a very good reputation and has a
greater number among the options. In Table 12 Consumers price of tilapia in Makurdi
metropolis.The result shows the prince per kg of fish purchased by consumers. It understood
that respondents whose buy tilapia at the rate of 400 - 500 are the majority while 500 - 600 and
200 300, 300 - 400 are the average number of respondents.
In table 13Number of consumers family that eat tilapia in Makurdi metropolis. The results
analyse the number of respondents in the study area. This shows that 36% of respondents have
the highest family number from the research work. Table 14 Consumers preference of fish in
Makurdi metropolis. Also shows in the options why do you disliked Tilapia than other fish, the
tilapia is profitable in the study area but the greatest challenges it faces is that, is very small in
size and it has a greater percentage of 66% which shows significant difference with other fish
from the research work while 26% of respondents dislike it because it has no taste which
determined by the consumers choice but very few dislike it because of his bony structure. The
result obtained from table 15 Consumers preference on form of tilapia in Makurdi metropolis.
Shows or indicates how consumers or respondents prefer tilapia and it is understood from the
work done that the respondents preferred tilapia in a fresh form among the two options which
has the highest value of 64% and those prefer tilapia in dried form are average number which
is making up to 36% respectively. Table 16 Consumers advice to those who don’t eat tilapia in
Makurdi metropolis.Give the description of the advice given to those who dislike tilapia in the
study area. .The result shows that 30% of the respondents encourage those who don’t like
tilapia to eat it and this has the highest percentage while 20% of respondents also encourage
eating it because of it nutritious value especially in terms of protein and this has no any
significant different. The findings are consistently similar to a previous study in Turkey that
showed 84.47% of consumers ate fish and other seafood because of their beneficial effects to
human health (Erdogan et al., 2011). Similarly, a study carried out by Verbeke et al., 2007
showed that the general attitude towards eating fish was strongly positive and consumers were
most strongly convinced that fish consumption is healthy and nutritious.
CONCLUSION
The study shows that the consumers preferred tilapia mostly in fresh and dried form. Similarly,
most of the respondents preferred fish to other animal protein sources mainly for its
affordability, nutritive value, availability and palatability respectively. This can contribute to
the growth of Benue state economy and Nigeria entirely; however, the research helps provided
statistical record of fish production and market distribution of tilapia in the study area. The
various problems confronting tilapia fish in the study area is low level production of tilapia and
lack of research into culturing of hybrid tilapia.
REFERENCES
Agbebi F.O. and Fagbenro O.A (2006). Tilapia Culture and Risk Management in Nigeria.
Available (online) http://ag.arizona.edulazagna/istal/STA7/ paper.htm.

International Journal of Fisheries and Aquaculture Research
Vol.5, No.4, pp.10-24, November 2019
Published by ECRTD-UK
ISSN: ISSN 2397-7507, Online ISSN: ISSN 2397-776
23
Alverson, K.P. and Paulik, T.T. (2002).Fisheries in the Nineties from Development to
Management and Improved Marketing. Journal of Fisheries Economics, 27 (3) 3 – 7.
Ayodeji, O. (2008). Fishing, Migrations and Inter-ground Relations in the Gulf of Guinea
(Atlantic Coast of West Africa) in the l9t and 20th.
Brunso K, Verbeke W, Ottar O.S fruensgaard JL, (2009) motives, barriers and quality
evaluation in fish consumption situations; Exploring and comparing heavy and light
users in spain and belgium. British food journal;111(7):699-716.
Ethinmore, 0. M. (2007), Fishing in south-western Nigeria in the 19thCentury: A study of the
Ilaje Fishing Economy. African Studies Review, 1(1), 56.
Ethinmore, 0.M. (1998). A History of fishing in Ondo State (1950— 1997): A Case Study of
the Ilaje coastal Area. M. A. Thesis, submitted to Fisheries Department, University of
Lagos.
Erdogan BE,Mol S,Cosanca S, (2011) Factors influencing the consumption of seafood in
lstanbul, Turkey,Turkish journal of fisheries and Aquatic sciences;11;631-639.
Esilaba F,Moturi WN,Mokua MA.(2017)urban consumers fish preferences and the
determinants influencing fish selection and consumption;A case study of
nakura,Kenya.international journal of fisheries and aquatic studies;5(3);356-360.
Eyo, A. A. Ita E. 0. (1990) Investment prospect in inland capture fisheries revolving loan
scheme to artisanal fishermen. In proceeding annual conference of the FISON 22nd —
28th September (1986) Ilorin National Institute for Fresh Water Research. Pp. 105 —
120.
Food and Agricultural organization FAO. (1999) The Importance of Food Quality and Safety
for Developing Countries. Available on online at www.fao.org/docrep/meeting/xl
845E.htm.
Food and Agricultural organization FAO. (1999) the Importance of Food Quality and Safety
for Developing Countries. Available on online at www.fao.org/docrep/meeting/xl
845E.htm.
Food and Agricultural organization FAQ (2005).Annual Statistics of Fishing Nations. Vol.
54:78
Garcia S. and Newton, C. (1997) Cirrents Situation Trends and Prospects in World Capture
Fisheries. In Global Trends: Fisheries Management, eds. E. L. Pikitch, D. D. Huppert
and M. P. Sissenwine, Bethesda, MD American Fisheries Society, pp. 2 — 27.
Google map, 2015
IUCN (2007).Caring for the World: A strategy for sustainable living. World Conservation
United Nations Environmental Progarmmes and World Wildlife Fund, Gland,
Switzerland. 5opgs.
Mugaonker PH,Ananthan PS,Small SS,Debnath B.A,(2011) study on cosumers at organised
Retail outlet, Agricultural economic Research Review;24;133-140
Neira, I., C.R. Engle, and K. Quagraine (2003). Potential Restaurant markets for farm raised
Tilapia in Nicaragua. Aquaculture Economics and Management 7(3/4): 1-17.
Salam M.A. (2005) Introduction to Tilapia Nutrition Kevin Fitzsimons University of Arizona.
See G., Stride T. and Ifeka C. (2006). People and Empires of West Africa. Hong Kong: Thomas
Nelson.
Sen, S. (2005). The Environmental Effects of Trade in the Fisheries Sector. The Environmental
Effects of Trade, 1, 103 — 122.

International Journal of Fisheries and Aquaculture Research
Vol.5, No.4, pp.10-24, November 2019
Published by ECRTD-UK
ISSN: ISSN 2397-7507, Online ISSN: ISSN 2397-776
24
Trondsen T, Braaten T, lund E, Eggen A.E eggen (2004) Health and Seafood consumption
patterns among women Aged 45-69 years. A Norwegian seafood consumption study.
Food quality and preference;15:117-128.
Verbeke w,Vanhonacker f, Sioenl, Camp JV, Dehenauw s, (2007) perceived importance of
sustainability and ethics Related to fish;A consumer behaviour
perspective.Ambio;36(7);580-585.
Related Documents