Occupational and Environmental Medicine 1995;52:470-477 Survey of the respiratory health of the workers of a talc producing factory Pascal Wild, Michele RWfregier, Guy Auburtin, Bernard Carton, Jean-Jacques Moulin Abstract Objectives-To assess the effect of an occupational exposure to talc dust on respiratory health. Methods-166 talc millers from a French factory underwent spirometry and filled in a standardised respiratory question- naire during their annual medical visit in 1989. A full sized chest radiograph taken in 1987 for the subjects hired before 1982 was also available, for the others a radiograph taken when hired was used. Radiography was repeated in 1992 for all subjects still active at this date (n = 139). The occupational exposure to talc dust was characterized for each workplace with 1440 personal samples collected since 1986 and by semiquantitative estimates of the historical exposure. Results-The geometric mean (range) of estimated exposure was 1'87 (0.5 to 50) mglm3 and the estimated cumulative exposure at the date of spirometry was >150 y mglm3 for 41 subjects. After adjustment for smoking in a linear model the standardised residual values of both forced vital capacity and forced expira- tory volume in one second decreased significantly with increasing exposure. The prevalence of dyspnoea also increased after adjustment for smoking categories and age in a logistic regres- sion. The prevalence of small radiological opacities was significantly related to age and to the exposure after adjustment for age and smoking categories. The inci- dence of new opacities between the two radiographs (11 new opacities with a pro- fusion higher than 01) was significantly related to smoking (10 out of 11 are smokers) but not to the exposure. Conclusion-This study shows an effect of high levels of talc dust both on func- tional variables and on the prevalence of small radiological images, but provides no clear evidence about the possible effect of present levels of exposure. (Occup Environ Med 1995;52:470-477) Keywords: talc dust; respiratory health Guidelines on occupational exposure to talc dust are heterogeneous across countries. Although specific recommendations exist in some countries (United States of America, Germany) in others talc dust is considered as inert dust with no specific toxicity. Thus standards vary from 1 mg/M3 to 5 mg/M3 respirable dust (time weighted average for eight hours). Furthermore the British stan- dard (1 mg/M3) is currently being reassessed. This controversy about which level of exposure to talc dust can be considered safe is mainly due to the lack of epidemiological studies in which the levels of exposure are measured with some precision. In acknowl- edgement of this fact, the French talc industry organised a systematic exposure assessment along with a respiratory survey of their staff, the results of which are presented here. Population and methods STUDY DESIGN AND SUBJECTS The study population consisted of all workers employed in the production and maintenance workshops of a talc producing factory situated in south west France between June 1989 and June 1990. During the annual medical check up, each subject was given a standardized res- piratory health questionnaire combined with a questionnaire on smoking and occupational history. Furthermore each subject performed at least two valid spirometry tests under the supervision of the same technician who filled in the questionnaire. This technician had been trained according to the criteria of the American Thoracic Society for the spirometry and according to the recommendations of the European Coal and Steel Community (ECSC) for the questionnaire. For all sub- jects, a chest radiograph had been taken either at the date of their employment for the sub- jects who joined the company from 1982 onwards, or in 1987 for the subjects who joined the company before that date. In 1992, radiography was repeated for all subjects still employed at that date. Four subjects were excluded from the study population because of respiratory diseases unrelated to the exposure under study (two severe sequelae of tuberculosis treatment before hire, one sarcoidosis, and one farmer's lung) and four others did not participate in the study. Among the 166 remaining subjects, 139 had the second radiograph. Among the 27 subjects missing, 19 had retired in the meantime, the reason for leaving remained unknown for three subjects, three resigned, the other two were moved within the company. No attempt was made to follow up the retirees. Table 1 gives the general characteristics of the population. Institut National de Recherche et de Securite, Avenue de Bourgogne, BP 27, 54501 Vandoeuvre Cedex, France P Wild B Carton J-J Moulin Luzenac Europe, BP 1162, 31036 Toulouse Cedex, France M Refrkgier Institut National de l'Environnement Industries et des Risques, Parc Technologique Alata, BP 2, 60550 Verneuil en Halatte, France G Auburtin Correspondence to: Dr P Wild, INRS, Avenue de Bourgogne, BP 27, 54501 Vandoeuvre Cedex, France. Accepted 7 March 1995 470 group.bmj.com on July 15, 2011 - Published by oem.bmj.com Downloaded from

Welcome message from author
This document is posted to help you gain knowledge. Please leave a comment to let me know what you think about it! Share it to your friends and learn new things together.
Transcript

Occupational and Environmental Medicine 1995;52:470-477
Survey of the respiratory health of the workers ofa talc producing factory
Pascal Wild, Michele RWfregier, Guy Auburtin, Bernard Carton, Jean-Jacques Moulin
AbstractObjectives-To assess the effect of anoccupational exposure to talc dust onrespiratory health.Methods-166 talc millers from a Frenchfactory underwent spirometry and filledin a standardised respiratory question-naire during their annual medical visit in1989. A full sized chest radiograph takenin 1987 for the subjects hired before 1982was also available, for the others aradiograph taken when hired was used.Radiography was repeated in 1992 for allsubjects still active at this date (n = 139).The occupational exposure to talc dustwas characterized for each workplacewith 1440 personal samples collectedsince 1986 and by semiquantitativeestimates ofthe historical exposure.Results-The geometric mean (range) ofestimated exposure was 1'87 (0.5 to 50)mglm3 and the estimated cumulativeexposure at the date of spirometry was>150 y mglm3 for 41 subjects. Afteradjustment for smoking in a linear modelthe standardised residual values of bothforced vital capacity and forced expira-tory volume in one second decreasedsignificantly with increasing exposure.The prevalence of dyspnoea alsoincreased after adjustment for smokingcategories and age in a logistic regres-sion. The prevalence ofsmall radiologicalopacities was significantly related to ageand to the exposure after adjustment forage and smoking categories. The inci-dence of new opacities between the tworadiographs (11 new opacities with a pro-fusion higher than 01) was significantlyrelated to smoking (10 out of 11 aresmokers) but not to the exposure.Conclusion-This study shows an effectof high levels of talc dust both on func-tional variables and on the prevalence ofsmall radiological images, but providesno clear evidence about the possibleeffect ofpresent levels of exposure.
(Occup Environ Med 1995;52:470-477)
Keywords: talc dust; respiratory health
Guidelines on occupational exposure to talcdust are heterogeneous across countries.Although specific recommendations exist insome countries (United States of America,Germany) in others talc dust is considered as
inert dust with no specific toxicity. Thusstandards vary from 1 mg/M3 to 5 mg/M3respirable dust (time weighted average foreight hours). Furthermore the British stan-dard (1 mg/M3) is currently being reassessed.This controversy about which level ofexposure to talc dust can be considered safe ismainly due to the lack of epidemiologicalstudies in which the levels of exposure aremeasured with some precision. In acknowl-edgement of this fact, the French talc industryorganised a systematic exposure assessmentalong with a respiratory survey of their staff,the results of which are presented here.
Population and methodsSTUDY DESIGN AND SUBJECTSThe study population consisted of all workersemployed in the production and maintenanceworkshops of a talc producing factory situatedin south west France between June 1989 andJune 1990. During the annual medical checkup, each subject was given a standardized res-piratory health questionnaire combined with aquestionnaire on smoking and occupationalhistory. Furthermore each subject performedat least two valid spirometry tests under thesupervision of the same technician who filledin the questionnaire. This technician hadbeen trained according to the criteria of theAmerican Thoracic Society for the spirometryand according to the recommendations of theEuropean Coal and Steel Community(ECSC) for the questionnaire. For all sub-jects, a chest radiograph had been taken eitherat the date of their employment for the sub-jects who joined the company from 1982onwards, or in 1987 for the subjects whojoined the company before that date. In 1992,radiography was repeated for all subjects stillemployed at that date. Four subjects wereexcluded from the study population becauseof respiratory diseases unrelated to theexposure under study (two severe sequelae oftuberculosis treatment before hire, onesarcoidosis, and one farmer's lung) and fourothers did not participate in the study. Amongthe 166 remaining subjects, 139 had thesecond radiograph. Among the 27 subjectsmissing, 19 had retired in the meantime, thereason for leaving remained unknown forthree subjects, three resigned, the other twowere moved within the company. No attemptwas made to follow up the retirees. Table 1gives the general characteristics of thepopulation.
Institut National deRecherche et deSecurite, Avenue deBourgogne, BP 27,54501 VandoeuvreCedex, FranceP WildB CartonJ-J MoulinLuzenac Europe,BP 1162, 31036Toulouse Cedex,FranceM RefrkgierInstitut National del'EnvironnementIndustries et desRisques, ParcTechnologiqueAlata, BP 2, 60550Verneuil en Halatte,FranceG AuburtinCorrespondence to:Dr P Wild, INRS,Avenue de Bourgogne,BP 27, 54501Vandoeuvre Cedex, France.Accepted 7 March 1995
470
group.bmj.com on July 15, 2011 - Published by oem.bmj.comDownloaded from
Survey of the respiratory health of the workers ofa talc producingfactory
Table 1 General characteristics of the population
First study (n = 166, 8 women) Second study (n = 139, 8 women)
First First Secondradiograph Spiromety radiograph Spiromety radiograph
Age (SD) (y) 36-4 (11-8) 40-2 (10-6) 34-2 (10-2) 38-2 (9-1) 40-8 (9 1)Duration of exposure (SD) 12-0 (11-7) 15-8 (10-2) 9-6 (9-4) 13-7 (8-0) 16 2 (8-0)Smoking history:
Non-smokers (n(%)) 59 (36) 58 (35) 46 (33) 45 (32) 44 (32)Ex-smokers (n(%)) 31 (19) 40 (24) 24 (17) 32 (23) 41 (30)Time since end of smoking (SD) (y) 10-7 (7 0) 11-3 (7-8) 9 3 (6-4) 10 2 (7-3) 10-7 (7 5)
Smokers (n (%)) 76 (46) 68 (41) 69 (50) 62 (45) 54 (39)Pack-years (SD) 13-5 (11-3) 18-3 (13-1) 12-8 (11-0) 17 5 (13-1) 18-3 (14-3)
QUESTIONNAIRE AND SPIROMETRYThe respiratory questionnaire was based onthe ECSC questionnaire. The questionnaireconsidered past and present chronic bronchi-tis, cough, wheeze, and dyspnoea. Chronicbronchitis was defined as cough and phlegmfor at least three months each year for not lessthan two successive years. The term chroniccough or phlegm was used to define thosesubjects whose cough or phlegm did or didnot fulfil the criteria for chronic bronchitis.Dyspnoea on exertion was considered to bepresent when the subjects complained ofbreathlessness while walking up a slight hill.Non-smokers were defined as subjects whohad never regularly smoked one or more
cigarettes a day or had smoked one or more
cigarettes for less than one year. Currentsmokers were subjects who reported regularsmoking of one or more cigarettes a day for atleast one year. Ex-smokers were subjects whoreported smoking one or more cigarettes a dayregularly in the past but who had stoppedsmoking at least one year before the study.Pack-years were computed at the date ofthe examination and between the two radio-graphs to assess the quantitative impact ofsmoking.The occupational history consisted of a list
of jobs with dates covering the whole of thesubjects' working life. The jobs precedingemployment in the factory were classified intofive categories: agricultural, exposed tomineral dust (mines), exposed to other dust,building industry, no known exposure. Foreach period of work in the talc industry, thedetailed job title and the workplace were
recorded.The spirometry was performed with a
vitalograph that had been checked at thelaboratory of the Institute of OccupationalHealth (Toulouse) at the start of the study.During the study it was calibrated every threemonths with a calibrated 3 1 syringe. Forcedvital capacity (FVC), forced expiratoryvolume in one second (FEVy) and maximalmid-expiratory flow (MMEF) were measuredmanually on the curve produced by the vitalo-graph. The quality and repeatability of themeasures were assessed visually by one of us
(MR) according to professional judgementindependently from any exposure informationand before any analysis. When they were con-
sidered insufficient, the data were excludedfrom the data base. The measurements were
expressed as standardized residuals (observed-
predicted/residual SD) - that is, in numbers ofresidual SDs (RSDs) with the predicted val-ues and the RSD from the EuropeanRespiratory Society after the recommenda-tions of Quanjer et al.I For men, RSD = 0-61 1for FVC and 0-51 1/s for FEVI.
CHEST RADIOGRAPHSThe chest radiographs (full sized chestradiograph) were interpreted in two separatetrials: (a) in 1991, the chest radiographstaken in 1987 for all subjects hired before1982 and still at work in 1987; (b) in 1992,the radiographs taken in 1992 for all subjectsof the study population and the films taken atthe time of employment for all subjects hiredafter 1982 (not in the first trial).
In both trials, the radiographs were inter-preted by the same three independent medicalreaders-trained with the 1980 InternationalLabour Office (ILO) classification of pneu-moconioses2-reading several thousand filmsa year, blind to occupational, personal, andmedical characteristics of the subjects. Filmswere allocated to the readers in the same ran-dom order. The readers' classifications wererecorded by a clerical assistant on a recordingsheet and then computerized. To increase theconsistency of interpretation, the three read-ers interpreted a sample of films by consensusbefore the main and independent reading.These films have been included as "triggerfilms" as described by Trethowan et al.' Also,as an exercise, a sample of films read in thefirst trial were reinterpreted in the secondtrial. Variability between and within readerswas measured (not covered here).A median reading was determined for each
variable (film quality, profusion, and shapeand size of small opacities, categories of largeopacities, any pleural change, and any addi-tional symbol).
INDUSTRIAL PROCESSThe crude talc is extracted in a nearby opencast pit from which it is transported directly tothe factory through an overhead cable. Theextracted ore consists of a mixture of talc(Mg9Si4OI0 (OH)2), chlorite ((Mg, Fe)5 Al[AlSi4o01] [OH]8), some dolomite (<3%),sometimes quartz (<3%), and traces of cal-cite, apatite, pyrite, and mica. Amphiboleshave never been detected according to theCTFA J4-1 method.4The talc ore is sorted immediately after
being extracted into different grades of talc.
471
group.bmj.com on July 15, 2011 - Published by oem.bmj.comDownloaded from
Wild, Rifregier, Auburtin, Carton, Moulin
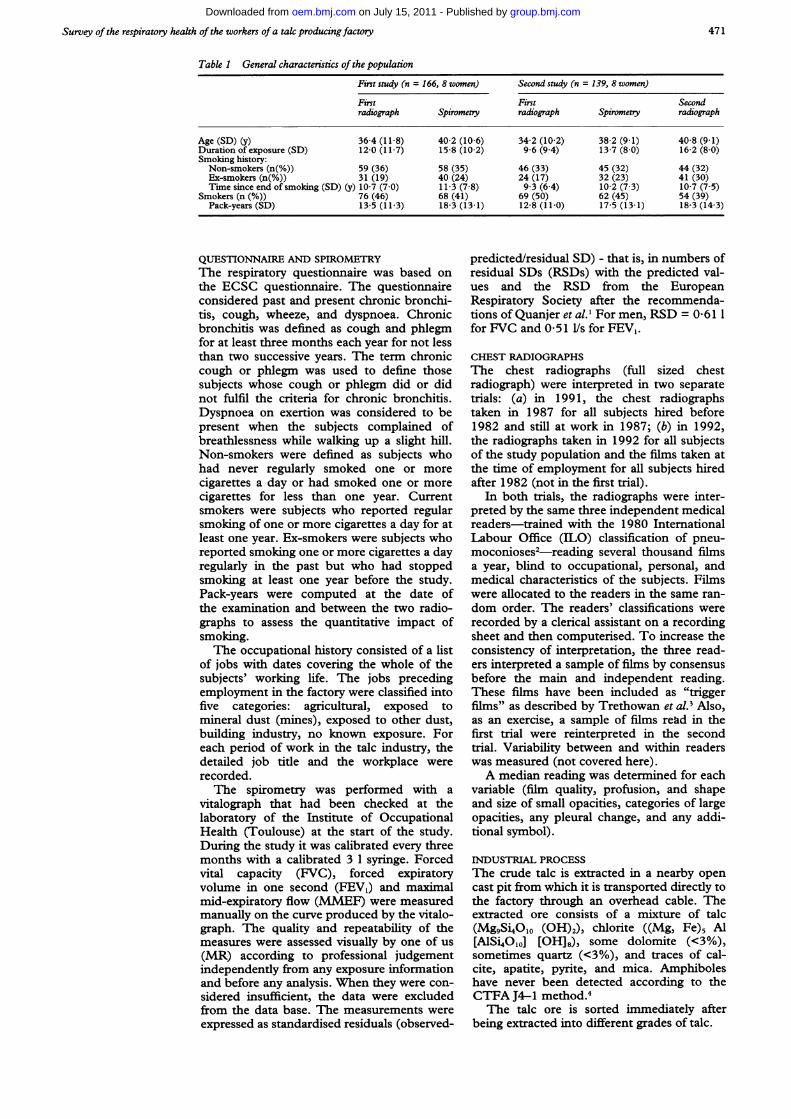
Figure I An example ofexposure assessment. At thedate ofspirometry, theestimated cumulativeexposure is (85-74) x 30+(87-85) x 15 + (90-87)x 0-5 = 301.5y mg/M3.
A Two workplaces
General cleaning
30 mg/m3 1985
Handling railway wagons
B An individual job history
General cleaning 1987 Handling railway wagons
*0 OE 1st Chest-
~~~~~~~~15radiograph Spirometry
1994 1985 1987 1988 1990
The first step of the process consists indrying the ore in ovens between 90 and 1 10Cdepending on the moisture level. The dry ore isthen ground finely (median diameter from10 pm to 1 gm) according to the qualityrequired; finally it is packaged either by bag-ging or by loading the trucks and railway wag-ons directly in bulk.
EXPOSURE ASSESSMENTIn 1986, 1989, and 1991 systematic exposuremeasurements were taken for every workplaceand job in the production and maintenanceareas with the CIP 10 personal dust sampler5worn by the worker for at least a half shift(four hours). In each measurement campaign,at least two shifts were thus characterised forevery worker in the production and mainte-nance workshops, in 1986 the clerical workerswere also included. The dust sampler mea-sures the gravimetric dust concentration col-lected at a flow rate of 10 1/minute. The headof the sampler acts as a particle selector thatenables the respirable (alveolar) dust fractionto be determined. The particles are collectedin a rotating cup filled with polyurethanefoam. The variation of the cup's mass (differ-ence of weight before and after sampling)gives the total amount of alveolar dust col-lected. As the weight of the polyurethane andthe plastic cup are sensitive to air humidity,three reference cups were used that wereweighted simultaneously with the cups usedfor sampling. The mass difference was cor-rected by subtracting the mean difference ofthe reference cups.The second stage consisted of drawing up a
list of all the combinations of job titles andworkplaces with start and stop dates. A quali-tative analysis of this list led to the definitionof 52 exposure groups after checking back forimprecise or incoherent data.
For each of these groups that still existed in1986, we analysed the corresponding expo-sure measurements both globally and year byyear to detect possible trends. Each series ofmeasurements was described by its arithmeticmean, its geometric mean and SD, and theestimate of the mean assuming a log normaldistribution.6 Every data set in which thegeometric SD (GSD) exceeded three, or inwhich the arithmetic mean was very differentfrom the estimated mean, was checked forpossible outliers that were compared with theoriginal records. These were only suppressedif independent evidence was found for theirinvalidity.
Furthermore a historical description wasavailable for every workplace, which indicatedthe technological changes, the aspirationdevices, and qualitative levels of dust. Thesewere obtained by interview of the long termemployees of the factory who compared thepast exposures with the present measuredconditions. Furthermore, some area dustsampling measurements (from differentdevices) existed since 1954. These differentmethods of collecting information resulted inimprecise estimates of past exposures.From a combination of these methods, up
to three levels of exposure by calendar periodwere attributed to every exposure group.Cumulative exposure indices for each subjectwere computed at the dates of the spirometry
15 mg/m3
14-4 mg/m3(n = 44)
13.5 mg/m3(n = 31)
2 mg/mr31991 1
1.8 mg/m3(n = 27)
0.5 mg/m3
0.7 mg/r3(n =7)
1974
t30.4 mg/r3(n =3)
t306 mg/r3(n =3)
1L
2nd Chestradiograph
InTf Cm/ /i // // // // // // U/D1993
* * v~~~~~~~
472
group.bmj.com on July 15, 2011 - Published by oem.bmj.comDownloaded from
Survey of the respiratory health of the workers ofa talc producingfactory
50
40
CoC)
+-
.)
C/)
30
20
10
0
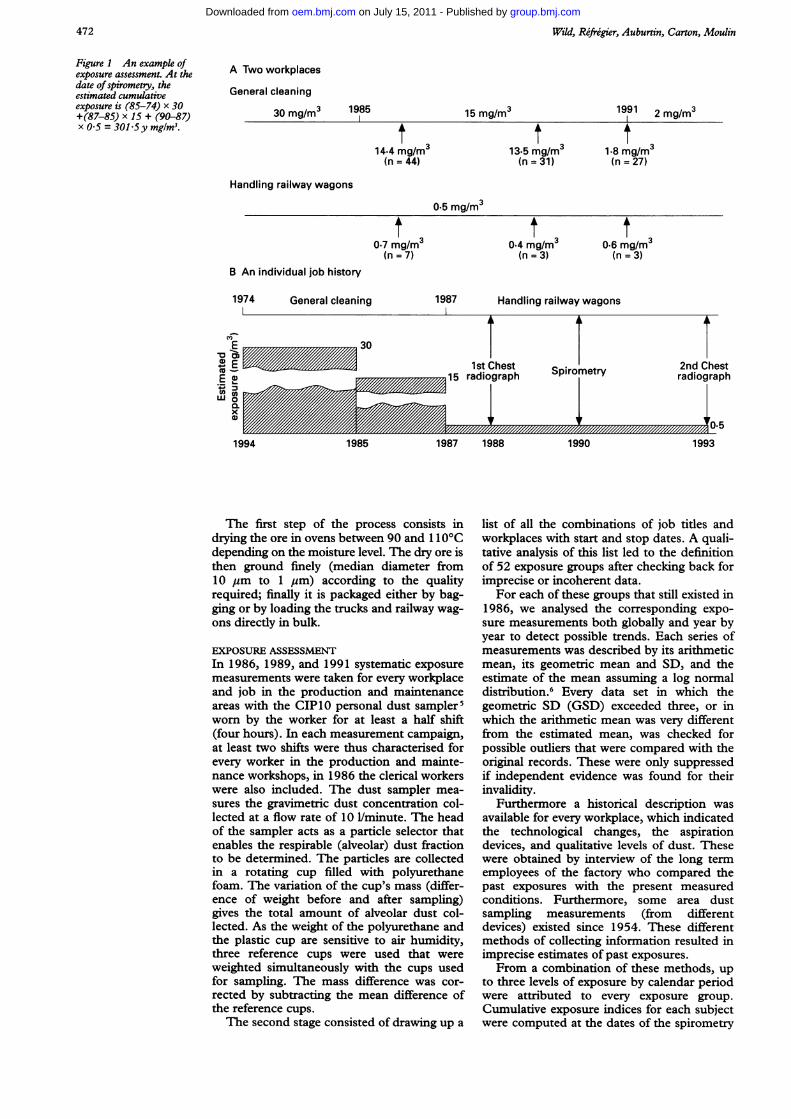
Cumulative exposure (y mg/mr3)Figure 2 Range of cumulative exposures
and radiographs as well as between spirometrytests and between radiographs by multiplyingthe concentrations extracted from the preced-ing job exposure matrix by the correspondingnumber of years. Figure 1 gives an example ofthis procedure. Exposure groups were definedfor each index with cut off points of 20, 50,and 150 ymg/M3 for the total exposure andcut off points of 4, 9, and 15 mg/M3 for thelongitudinal study. The cut off points werechosen to give rough quartiles of the population.
STATISTICAL METHODSAn initial analysis consisted of the question-naire, spirometry, and radiograph. The preva-
lence of symptoms or small opacities was
analysed in a multiple logistic regression thatincluded potentially confounding variables(age, smoking categories, pack-years) andcoded cumulative exposure.The analysis of the lung function data used
a multiple linear regression model of the stan-dardised residuals. The model did not includeage and height as they were accounted for inthe standardisation, but did include smokingvariables and the individual cumulative expo-sure. The flow variables FEV1, MMEF, andFEV1/FVC were adjusted quantitatively forsmoking by fitting the number of pack-yearsand time since the end of smoking, as it isknown that smoking is mostly related to an
obstructive syndrome. On the other hand, as
the FVC is, among healthy subjects, relativelyunaffected by smoking, its analysis includedsolely the qualitative smoking categories.The evolution of the radiographs was
described in four categories. A first groupconsisted of the subjects without any opacitycompatible with a diagnosis of pneumoconiosis(profusion higher than 0/1) at both studydates, a second group of subjects in which thisreading had been coded the first time and notcoded the second time, in the third grouppneumoconiosis appeared between the two
radiographs, in the fourth it was present onboth occasions.A logistic regression was used to see if the
appearance of the opacity (group 3) wasrelated to the cumulative exposure and cumu-lative smoking between the study dates.The description and analysis of data was
performed with SAS 7 and EGRET8 software.
ResultsEXPOSURE ASSESSMENTA total of 1440 personal samples was takenbetween 1986 and 1991. Thus among 52exposure groups, 49 could be characterised byactual individual measurements. The mea-sured mean exposure ranged from 0-5 mg/M3for secretaries, managerial staff, and outdoorworkers who handle the railway wagons to 15for the cleaning staff until 1991. Nowadaysonly one exposure group of maintenanceworkers that consists of four subjects isestimated to have a mean exposure of above5 mg/M3 although the probability of exceedingthis level remains above 10% for most mainte-nance and for some production exposuregroups. This is explained by the high variabil-ity of the exposure measurements amongmaintenance workers intrinsic to these occu-pations: eight out of 10 exposure groups inthe maintenance workshop had measure-ments with GSDs > 3. The measurementswere found to be more homogenous withinthe production exposure groups. When thelog concentrations were analysed in an analysisof variance, the grouping was found to be veryinformative especially in the first measure-ment campaign. The ratio of between groupvariance and within group variance (the F sta-tistic) decreased from 10-2 in 1986 to 2-3 in1991 in the production area and from 24-9 to4*9 among the maintenance groups. Thisreflects the efforts to reduce the dust levelsboth by the introduction of centralised aspira-tion devices and by the introduction of newwork procedures. These efforts have resultedin lower and more homogenous working con-ditions across the factory. On the other handthis variance ratio has not been found to besignificant when examining the variabilitybetween workers within exposure groups.After assigning a fixed level to each subjectbased on the group measurements as dis-cussed, the present geometric mean exposureof the population is 1-87 (GSD 2 5) mg/ml.
In the past, mean exposures up to 60mg/ml were estimated especially in the job ofstoring jute talc bags in wagons. Among stillexisting workplaces, the highest past expo-sures were estimated for the cleaning staffbefore 1985 (30 mg/M3n) and for a sackingworkplace before 1975 and for a workplace atthe dryer before 1975 (both 20 mg/M3). Thesevery different exposures led to a large spreadin cumulative exposures (fig 2).
RESPIRATORY SYMPTOMS AND LUNG FUNCTIONAnalysis by symptom (table 2) showed anincreased prevalence of chronic bronchitis
473
group.bmj.com on July 15, 2011 - Published by oem.bmj.comDownloaded from

Wild, Rifrigier, Auburtin, Carton, Moulin
Table 2 Prevalence ofsymptoms and standardisedffunctional variables (men only) according to cumulative exposure
< 20 20-50 5S-150 > 150 Slopel(y mg/M3) (y mgIM3) (y mg/rm3) (y mgIM3) 1Ogy mgIM3n = 46 n = 25 n = 54 n = 41 (SEM) Pvalue
Symptoms (n (%))Chronic bronchitis 0 (0) 1 (4) 7 (13) 1 (2) 0.22*Chronic cough or phlegm 4 (8 7) 5 (20) 14 (35 7) 6 (14-6) 0-43fDyspnoea 2 (4 4) 2 (8) 9 (17) 6 (14-6) 0 039*Wheeze 2 (4 4) 1 (4) 2 (3-7) 0 (0) >0 5*
Valid spirometries 36 20 44 36Functional variables (mean (SD)):FVC 1-33 (1-28) 0-82 (1-04) 1 10 (1-07) 0-65 (1-03) -0-24 (0 10)§ 0-015FEV, 1-22 (1-21) 0 77 (1-22) 0 74 (1-17) 0 50 (1-06) -0-26 (0 11)1 0-014FEVy/FVC 0-25 (0 70) 0-27 (0-79) -0 04 (0 80) 0-24 (0 75) -0-06 (0-07)¶ 040MMEF 0-66 (1-58) 0-36 (1-41) -0 19 (1-15) -0-06 (1-12) -0-26 (0-12)1 0-032
*Test for trend in a logistic regression; test for trend in a logistic regression after adjustment for smoking and pack-years; test for trend in a logistic regression afteradjustment for age and smoking; sin a linear regression model including smoking; ¶in a linear regression model including pack-years and time since the end ofsmoking.
Table 3 Radiological opacities (ILO) at the first radiograph according to cumulative exposure at this date and toprevious exposure to mineral dust
Former exposureTalc exposure in y mg/m3 to mineral dust
ILO code Non-exposed* <20 20-50 50-150 > 150+ No Yes
0/0 43 9 6 17 12 85 20/1 12 6 10 21 10 51 81/0 0 1 0 1 7 8 11/1 0 0 0 4 6 9 11/2 0 0 0 0 1 1 0
*Radiograph taken when hired.
and cough or phlegm in the cumulative expo-sure category from 50 to 150 y mg/M3, thiswas not confirmed in the highest exposuregroup. When this symptom (which includeschronic bronchitis) was analysed in a multiplelogistic regression that included smoking cate-gory (non-smoker, ex-smoker, and currentsmoker) and pack-years, the trend was farfrom significant. This was not the case fordyspnoea where the increasing trend foundwas confirmed by the logistic regressionmodel that included age and smokingcategory.
Only 138 spirometry tests (83 6%) wereconsidered to be of sufficient quality to beincluded in the statistical analysis.A significant downward trend was found
for the standardised FVC in a linear regres-sion model that included (or excluded) thesmoking categories. A similar trend was foundboth for FEV1 and MMEF after adjustmentfor smoking categories, pack-years, and timesince the end of smoking for ex-smokers. Thiswas not confirmed for the FEV1/FVC ratio,which decreased only slightly with increasingexposure.
Table 4 Logistic modelfor radiological opacities (ILO) at the first radiographAny opacity including 0/1 Any opacity excluding 0/1
Coefficient OR (95% CI) Coefficient OR (95% CI)
Intercept -2-71 - -8-80Smoking:Non-smoker 0 1 0 1Ex-smoker 0-44 1-56 (0-58-4-17) -0 20 0-82 (0 20-3 27)Smoker 0-31 1-37 (0-63-2-97) -0-82 0 44 (0-12-1-69)
Age (y) 0-040 1-041 (0-996-1-088) 0-093 1-098 (1-02-1-18)Former exposure to
mineral dust 1-86 6-40 (1-23-33-3) -0 30 0 74 (0 10-5-51)Coded cumulative
exposure to talc 0-33 1-39 (1-06-1-84) 0 97 2-65 (1-25-5-64)
RADIOLOGICAL FINDINGSFour pleural abnormalities were coded by atleast two readers, including one chest wallpleural thickening and three pleural thicken-ings in the interlobar fissures (pi). One wasfound on a radiograph taken when the subjectwas hired, the three others had cumulativeexposures estimated at 95, 160, and 240y mg/M3. Only the first had a second radi-ograph, and no pleural abnormality was foundon this second radiograph.
All observed opacities were coded between0/1 and 1/2 according to the ILO classifica-tion for pneumoconiosis. The dominantshapes of the opacities were mostly irregular(8-9% only were coded p or q) and no opacitywas coded larger than 3 mm (the only codesused were p,q and s,t). Tables 3 and 4 givethe opacities in terms of cumulative exposureto dust and former exposure to mineral dust.Both were found to be significantly related tothe prevalence of opacities in a multiplelogistic model although the effect of smokingwas less obvious.The prevalence of small opacities was
higher in the second radiograph (tables 5 and6) than in the first radiograph with 11 newopacities compatible with a diagnosis of pneu-moconiosis (1/0 and above) v two images thatwere not recognised as such in the secondradiological image. In the second series ofradiographs all images were coded s or tincluding the 11 new opacities. There was noevidence that this was attributable to cumula-tive exposure to dust as the highest meanexposures were seen in the groups withoutopacities with higher profusion than 1/0 in thesecond radiograph. In the logistic analysis ofany increase in profusion, the effect of thecumulative exposure groups was significantly
474
group.bmj.com on July 15, 2011 - Published by oem.bmj.comDownloaded from
Survey of the respiratory health of the workers of a tak producingfactory
Table 5 Longitudinal study: radiologicalfindings: crosstabulations of the two coded profusions
Second radiWgraph
First radiograph 0/0 0/1 1/0 1/1
0/0 53 22 2 00/1 18 26 7 21/0 1 1 2 01/1 0 0 3 11/2 0 0 1 0
negative. In contrast with this, smoking was
positively and significantly related to thisincrease: 10 out of 11 pneumoconiosis-likenew images were from smokers. Among thethree subjects who resigned, one had a 1/0image and the mean FVC was somewhatlower than the remaining population (0-074SD) although non-significant.
DiscussionSeveral old epidemiological studies have sug-
gested that exposure to talc can lead both to a
pneumoconiosis and to chronic respiratoryimpairment.9"7 This impairment was usuallyconsidered to be of the restrictive typealthough Fine et al also described an obstruc-tive syndrome among smokers.'8 Yet only twostudies'8-20 had quantitative estimates of theexposure to respirable dust, which are pre-
requisites to any threshold limit value (TLV)proposal. We shall thus focus the discussionon the comparison with the findings of thosestudies and the earlier studies carried out inthis factory. 22
A main strength of the present study is thegood quantitative knowledge of the exposure,which relies on a systematic and repeatedexposure assessment through personal sam-
plers worn over full shifts and the precise cod-ing of the work histories. This enabled us todetermine homogenous exposure groupsalthough homogeneity as measured by theGSD is less certain among maintenance work-ers whose different tasks lead to intrinsicallydifferent exposures. The quantitative expo-
sure estimates as used in the longitudinalstudy should therefore be accurate. The esti-mation of past exposures is less precise giventhat they are not based on actual personalmeasurements. Some area sampling data doexist since 1954 22; thus at least the order ofmagnitude of the estimation should be correctand the differences between exposure groups,as measured in 1986, are so great that even ifsome errors in the estimates of exposures have
occurred, their impact should be minor. This isfurther validated by the fact that the preva-
lence of small opacities is strongly correlatedwith exposure groups. It is highly unlikely thatthe exposure-response effects found could bedue to change in the chemical composition ofthe crude talc as it always came from the samedeposit nearby and its transformation doesnot alter its composition. Neither is it plausi-ble that exposure through ingestion may havebeen very different in the past from the pre-
sent.The exposures of the Vermont millers and
miners as reported by Boundy et al'9 were very
different from the present study. Not onlywere the estimated exposures much lowerthan in our study but the GSD never
exceeded 2-4 despite the fact that all work-places were pooled, which seems to indicatean overall homogeneity of exposures withinthe three mills, which was not found here.A possible weakness of our study is the less
than optimal quality of the spirometric teststhat led to the exclusion of 30 subjects in thisanalysis. The excluded tests could possiblycome from subjects with respiratory diseases.This is to some extent confirmed in the analy-sis of the functional variables of the subjectsexcluded, but it does not seem legitimate toreincorporate subjects who have beenexcluded because of their lack of repeatabilityin the quality control before analysis.A usual weakness of cross sectional stud-
ies-that is, self selection on a health basis, isunlikely here. The talc factory is situated in anisolated valley near the deposit and virtuallyno other industry, except for some aluminiumfoundries in which the working conditionswere more severe, existed near the study site.We do not think that the absence of an effect ofthe cumulative exposure on chronic bronchi-tis is attributable to this phenomenon. Thetwo subjects excluded with known respiratorydiseases unrelated to the exposure both had a
0/1 opacity and cumulative exposures of 66and 268 y mg/M3. Whereas it is not clearwhether their opacity is due to their illness or
their exposure, a conservative approach leavesthem out.The results of the lung function tests sug-
gest the hypothesis that high exposure to talcinduces a restrictive syndrome rather than an
obstructive one. The effect of obstructionshould reduce the FEV,/FVC ratio whereas a
restrictive syndrome could arguably reduceFEV, through the simple effect of reducedvolumes but it would not alter the FEVI/FVC
Table 6 Longitudinal study: smoking and exposure characteristics by evolution of the profusion1/0, 1/1 0/0, 0/1
0/0, 0/1 - 0/0, 0/1 - 1/0, 1/1 1/0, 1/1, 112n = 119 n = 2 n = 11 n = 7
Age at second radiograph 40-6 (8-9) 45-4 (7-0) 43-4 (9-4) 51-7 (6 8)Smokers n (%) 55 (46%) 0 10 (91%) 7 (43%)Cumulative pack-years between radiographs 2-5 (4-1) - 3-3 (1-6) 2-3 (3-7)Cumulative pack-years at second radiograph 11-2 (13-8) - 17-3 (9 8) 24-7 (17-7)Cumulative exposure between 23-7 (31-4) 8-4 (8-5) 12-1 (8-3) 15-8 (16-1)
radiographs (y mg/mr)Mean concentration of exposure between 3-5 (3-8) 1-5 (1-3) 2-3 (1-5) 3 3 (3 4)
radiographs (mg/M3)Cumulative exposure at second radiograph 92-0 (110-6) 102-0 (118-7) 72-1 (45 2) 255 7 (205 7)
475
group.bmj.com on July 15, 2011 - Published by oem.bmj.comDownloaded from

Wild, Rifrigier, Auburtin, Carton, Moulin
ratio as is the case here. The spirometric find-ings are unlikely to be confounded by smok-ing as the slope with cumulative exposure isnearly identical in all three smoking cate-gories. The fact that the prevalence of dysp-noea is greater in the high exposure groups,even after adjustment for age, does not throwany further light on the discussion so far. Yetthe absence of any increased prevalence ofchronic bronchitis with high exposures indi-rectly supports our interpretation of the spiro-metric findings. On the other hand, contraryto the findings of Fine et al,'8 the prevalence ofwheeze is low in our population and no rela-tion exists with the exposure groups. Onlyfour subjects (2 5%) reported dyspnoea whilewalking at their own pace on level ground(grade 3), moreover this feature is muchreduced when individual exposure estimateswere used. Despite the basically similar con-clusion, some differences exist between ourstudy and studies by Fine et al 18 and Wegmanet al.20 Wegman et al found that ratios ofobserved divided by predicted values weregenerally lower than one despite lower dustlevels, although this could be attributed to dif-ferences in the reference equations. Fine et alreported a higher prevalence of respiratorysymptoms but the number of smokers in theirpopulation of workers exposed to talc washigher and the assumption that exposure wasrestricted to talc and had been constanthistorically seems questionable in a study ofrubber workers.'8The earlier studies of the present popula-
tion by Leophonte et al are consistent with ourstudy although the reported lung functionmeasurements are lower in the 1980 study.2'22This can to a certain extent be explained bythe choice of reference equations; the ECSCreference values23 used by Leophonte et al2are higher than the more recent ones pro-posed by Quanjer et al,' as has been noted byPrefaut and Peslin.'4 The cross sectionalanalysis of the initial radiological data con-firms that high exposure leads to small opaci-ties. They cannot be attributed to silicacontamination as the characteristic regularopacities were few and disappeared altogetherin the second series of radiographs. There wascomplete agreement about this between read-ers. The overall agreement of size and shapebetween readers was good with icvarying from0-33 to 0-44. A surprising finding was thatsmoking did not seem to be a determinant inthe prevalence of opacities possibly becausethe exposure pattern distorted this establishedrelation; a slight and non-significant interac-tion was nevertheless found between smokingand cumulative exposure in the logistic regres-sion of the prevalence of opacities. In the pre-sent population no high profusions (ILOcodes 2/1 and above) were found, contrary tothe previous study by Leophonte and Didier.22Among subjects with an image consistent witha diagnosis of pneumoconiosis (ILO code 1/0and above), all except one had been exposedto at least 5 mg/M3; the 1/0 code for this lastsubject was not confirmed in the second radi-ograph. The prevalence of irregular opacities
in our study is comparable with the findings ofWegman et al20 although they found the num-ber of regular opacities to be much higher.The longitudinal results are somewhat at oddswith the previous findings as 11 new imagesconsistent with a diagnosis of pneumoconiosisappeared, all of which were in subjects with arelatively low exposure, but nearly all ofwhom were smokers. This, and the fact thatsome large studies (Graham et al,2" Castellanet al26) showed very low prevalences of smallopacities among blue collar workers with noor low exposure, suggests a possible synergyof smoking and exposure to talc dust at pre-sent levels, but it is possible that the resultswould have been different had retirees beenfollowed up. This incidence is not attributableto changes in reading levels as among 47 0/1images, nine were coded 0/0, three 1/0 andone 1/1 at the second reading. Among 17 1/0or 1/1 images, 13 stayed in this category andfour were coded 0/1. Thus reading levels werestable with a slight tendency for less severecodes in the second reading. On the otherhand a review by Dick et al states that "scantyirregular opacities are not uncommonlyobserved, they are found in association withcigarette smoking and dust exposure but thetype of dust seems to be of little moment".27
We thank the referees for helpful comments and Dr Bohadanafor his help in the interpretation of the respiratory data.
1 Quanjer PH, Tammeling GJ, Cotes JE, Pedersen OF,Peslin R, Yernault JC. Lung volumes and forcedventilatory flows. Eur RespirJ 1993;6:5-40.
2 International Labour Organisation. International classifica-tion of radiographs of pneumoconioses. Geneva: Inter-national Labour Office, Occupational Safety and Health,1980. Series No 22 rev)
3 Trethowan WN, Burge PS, Harrington JM, Calvert I,Rossiter CE. A study of the respiratory health of employeesin seven European ceramic fibre manufacturing plants. Finalreport to the European Ceramic Fibre Industries Association.University of Birmingham: Institute of OccupationalHealth, 1989.
4 Ferret J, Moreau P. Mineralogy of talc deposits. In:Bignon J, ed. Health related effects ofphyllosilicates. Berlin:Springer-Verlag, 1990:147-58. (NATO ASI series, volG21).
5 Courbon P, Wrobel R, Fabries JF. A new individual res-pirable dust sampler: the CIP 10. Ann Occup Hyg1988;32: 129-43.
6 Waters MA, Selvin S, Rappaport SM. A measure of good-ness-of-fit for the lognormal model applied to occupa-tional exposures. Am Ind HygAssocJ 199 1;52:493-502.
7 SAS Institute. SASISTAT users guide, version 6. Cary, NC:SAS Institute, 1989.
8 EGRET Software Program, version 0.26.6. Seattle: Statisticsand Epidemiology Research Corporation, 1990.
9 Dreessen WC, Dalla Valle JM. The effects of exposure todust in two Georgia talc mills and mines. Public HealthRep 1935;50:131-43.
10 Hogue WL, Mallette FS. A study of workers exposed totalc and other dusting compounds in the rubber indus-try. J Ind Hyg Toxicol 1949;31:359-64.
11 Mann B, Deasy JB. Talc pneumoconiosis in the textileindustry. BMJ7 1954;ii:1460-1.
12 Kipling MD, Bech AO. Talc pneumoconiosis. Transactionsof the Association of Industrial Medical Officers 1960;10:85-93.
13 Kleinfeld M, Messite J, Shapiro J, Kooyman 0, SwencickiR. Lung function in talc workers. Arch Environ Health1964;9:559-66.
14 Kleinfeld M, Messite J, Kooyman O, Shapiro J.Pulmonary ventilatory function in talcosis of lung. DisChest 1964;46:592-8.
15 Kleinfeld M, Messite J, Shapiro J, Swencicki R. Effects oftalc dust inhalation on lung function. Arch EnvironHealth 1965;10:431-7.
16 Miller A, Teirstein AS, Bader ME, Bader RA, Selikoff IU.Talc pneumoconiosis. AmJrMed 1971;50:395-402.
17 Kleinfeld M, Messite J, Langer AM. A study of workersexposed to asbestiform minerals in commercial talcmanufacture. Environ Res 1973;6:132-43.
18 Fine U, Peters JM, Burgess WA, Diberadinis U. Studiesof respiratory morbidity in rubber workers. Arch EnvironHealth 1976;31:195-200.
476
group.bmj.com on July 15, 2011 - Published by oem.bmj.comDownloaded from

Survey of the respiratory health of the workers ofa tale producingfactory
19 Boundy MG, Gold K, Martin KP, Burgess WA, DementJM. Occupational exposures to non-asbestiform talc inVermont. Dusts and disease. In: Lemen R, Dement JM,eds. Proceedings of the conference on occupational exposuresto fibrous and particulate dust and their extension into theenvironment. Park Forest South, II: Pathotox 1979.
20 Wegman DH, Peters JM, Boundy MG, Smith TJ.Evaluation of respiratory effects in miners and millersexposed to talc free of asbestos and silica. Br Ind Med1982;39:233-8.
21 Leophonte P, Fernet P, Pincemin J, Mousset iL, Rellier R,Delaude A. La pathologic respiratoire chronique destravailleurs du talc. Revue Franfaise des MaladiesRespiratoires 1980;8:43-5.
22 Leophonte P, Didier A. French talc pneumoconiosis. In:Bignon J, ed. Health related effects ofphyllosilicates. Berlin:Springer-Verlag, 1990:203-9. (NATO ASI series, volG21).
23 Cara M, Hentz P. Aide-mimoire of spirographic practice forexamining ventilatory function. 2nd ed. Luxembourg:Commission of the European Communities, 1971.(Industrial Health and Medicine, Series No 11.)
24 Prefaut C, Peslin R. L'exploration du souffle ou mesuredes volumes pulmonaires et des debits bronchiques. RevMal Resp 1986;3:323-32.
25 Graham WGB, Ashikaga T, Hemenway D, Weaver S,O'Grady RV. Radiographic abnormalities in Vermontgranite workers exposed to low levels of granite dust.Chest 1991;100:1507-14.
26 Castellan RM, Sanderson WT, Petersen MR. Prevalenceof radiographic appearance of pneumoconiosis in anunexposed blue collar population. Am Rev Respir Dis1985;131:684-6.
27 Dick JA, Morgan 'WKC, Muir DFC, Reger RB, SargentN. The significance of irregular opacities on the chestroentgenogram. Chest 1992;60:102-251.
Rejected manuscriptsFrom February 1994, authors whose sub- be returned to them. The Joumnal will destroymitted articles are rejected will be advised of remaining copies of the article but corres-the decision and one copy of the article, pondence and reviewers' comments will betogether with any reviewers' comments, will kept.
477
group.bmj.com on July 15, 2011 - Published by oem.bmj.comDownloaded from

doi: 10.1136/oem.52.7.470 1995 52: 470-477Occup Environ Med
P Wild, M Réfrégier, G Auburtin, et al. workers of a talc producing factory.Survey of the respiratory health of the
http://oem.bmj.com/content/52/7/470Updated information and services can be found at:
These include:
References http://oem.bmj.com/content/52/7/470#related-urls
Article cited in:
serviceEmail alerting
the box at the top right corner of the online article.Receive free email alerts when new articles cite this article. Sign up in
Notes
http://group.bmj.com/group/rights-licensing/permissionsTo request permissions go to:
http://journals.bmj.com/cgi/reprintformTo order reprints go to:
http://group.bmj.com/subscribe/To subscribe to BMJ go to:
group.bmj.com on July 15, 2011 - Published by oem.bmj.comDownloaded from
Related Documents