Survey of Employers’ Recruitment Experiences Sturt Employment Service Area August 2012 Labour Market Research and Analysis Branch August 2012 1

Welcome message from author
This document is posted to help you gain knowledge. Please leave a comment to let me know what you think about it! Share it to your friends and learn new things together.
Transcript

Survey of Employers’ Recruitment Experiences
Sturt Employment Service Area
August 2012
Labour Market Research and Analysis BranchAugust 2012 1
With the exception of the Commonwealth Coat of Arms, the Department’s logo, any material protected by a trade mark and where otherwise noted all material presented in this document is provided under a Creative Commons Attribution 3.0 Australia (http://creativecommons.org/licenses/by/3.0/au/) licence.
The details of the relevant licence conditions are available on the Creative Commons website (accessible using the links provided) as is the full legal code for the CC BY 3.0 AU licence (http://creativecommons.org/licenses/by/3.0/au/legalcode). The document must be attributed as the ‘DEEWR - Survey of Employers’ Recruitment Experiences – Sturt Employment Service Area – August 2012’.
This report was prepared by the Labour Market Research and Analysis Branch and is based on research conducted by the Branch.
For further information: www.deewr.gov.auPh: 1800 059 439 | [email protected] ABN: 63 578 775 294
ContentLabour Market Research and Analysis BranchAugust 2012 2

Sturt Employment Service Area Report
sThe Sturt Employment Service Area 4
Survey of Employers’ Recruitment Experiences 4
Report Summary 4
Recruitment Experiences 5
Applicants and Suitability 7
Future Recruitment Expectations 7
Opportunities for Job Seekers 8
More Information 8
3

Sturt Employment Service Area Report
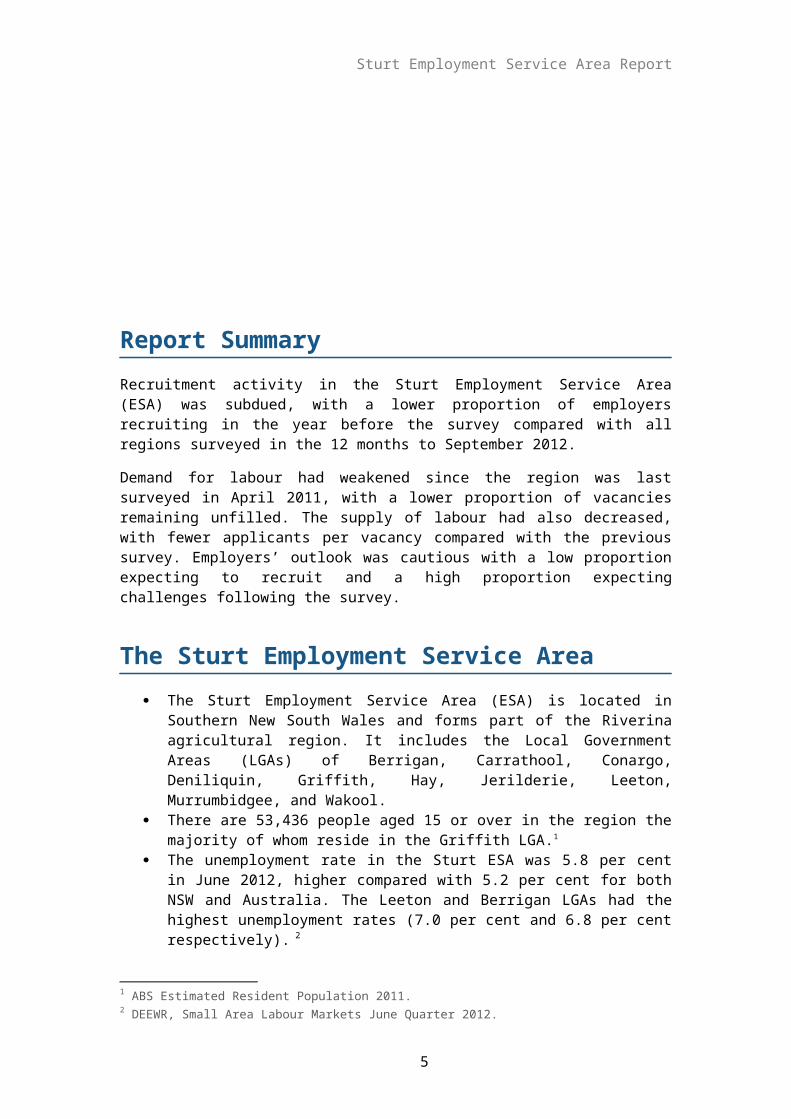
Report SummaryRecruitment activity in the Sturt Employment Service Area (ESA) was subdued, with a lower proportion of employers recruiting in the year before the survey compared with all regions surveyed in the 12 months to September 2012.
Demand for labour had weakened since the region was last surveyed in April 2011, with a lower proportion of vacancies remaining unfilled. The supply of labour had also decreased, with fewer applicants per vacancy compared with the previous survey. Employers’ outlook was cautious with a low proportion expecting to recruit and a high proportion expecting challenges following the survey.
The Sturt Employment Service Area The Sturt Employment Service Area (ESA) is located in Southern New South Wales
and forms part of the Riverina agricultural region. It includes the Local Government Areas (LGAs) of Berrigan, Carrathool, Conargo, Deniliquin, Griffith, Hay, Jerilderie, Leeton, Murrumbidgee, and Wakool.
There are 53,436 people aged 15 or over in the region the majority of whom reside in the Griffith LGA.1
The unemployment rate in the Sturt ESA was 5.8 per cent in June 2012, higher compared with 5.2 per cent for both NSW and Australia. The Leeton and Berrigan LGAs had the highest unemployment rates (7.0 per cent and 6.8 per cent respectively). 2
The major employing industries in the Sturt ESA are Agriculture, Forestry and Fishing
(19 per cent of workers) and Manufacturing (13 per cent of workers).3
The proportion of 25 to 34 year olds who had completed Year 12 in the Sturt ESA (56 per cent) is substantially lower compared with New South Wales and Australia (both 75 per cent).4
The average number of employees in businesses in the ESA (12) was low compared with all regions surveyed to September 2012 (24).
1 ABS Estimated Resident Population 2011.2 DEEWR, Small Area Labour Markets June Quarter 2012.3 ABS Census of Population and Housing 20114 ibid
4
Sturt Employment Service Area Report
Survey of Employers’ Recruitment ExperiencesThe department conducted a Survey of Employers’ Recruitment Experiences in the Sturt Employment Service Area (ESA), New South Wales, in August 2012. In total, 326 employers were surveyed, of whom 170 had recruited in the previous 12 months. The Sturt ESA was previously surveyed in April 2011.
Recruitment Experiences Around half of the employers surveyed had recruited in the year before the survey,
substantially lower compared with all regions surveyed in the 12 months to September 2012 (63 per cent).
The proportion of vacancies remaining unfilled (5.3 per cent) was lower compared with 7.1 per cent in the previous survey.
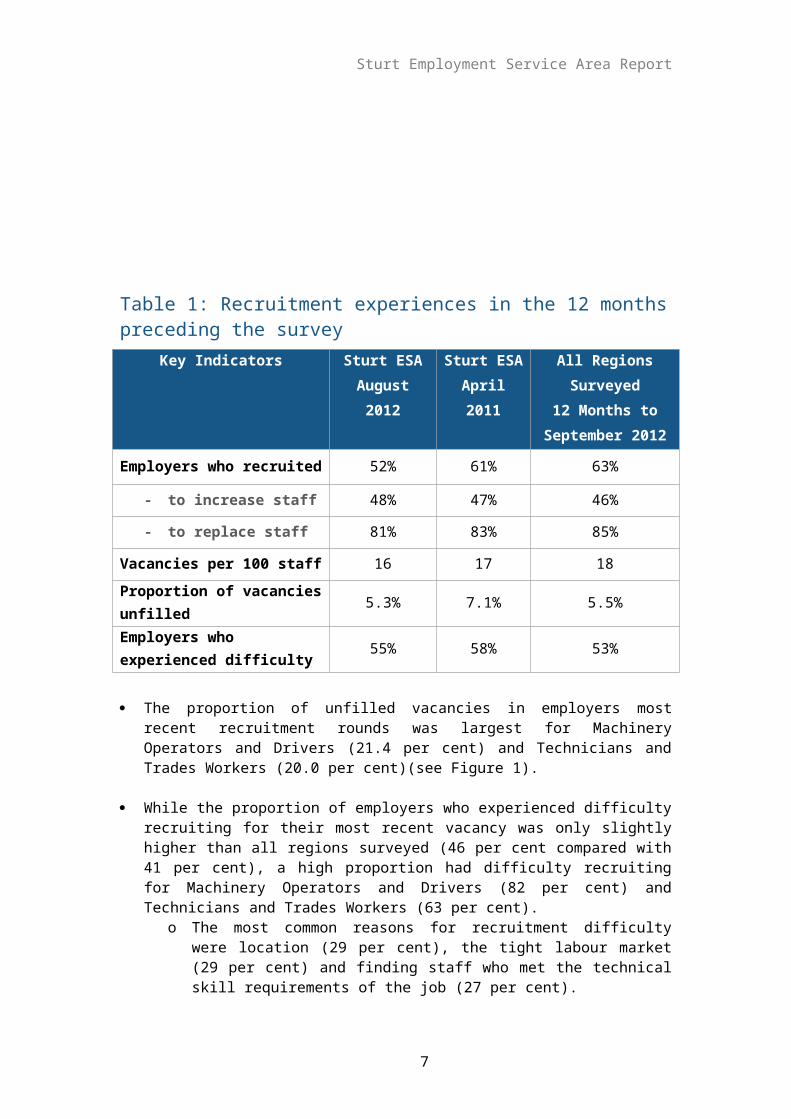
Table 1: Recruitment experiences in the 12 months preceding the surveyKey Indicators Sturt ESA
August 2012Sturt ESA April 2011
All Regions Surveyed12 Months to
September 2012
Employers who recruited 52% 61% 63%
- to increase staff 48% 47% 46%
- to replace staff 81% 83% 85%
Vacancies per 100 staff 16 17 18
Proportion of vacancies unfilled 5.3% 7.1% 5.5%
Employers who experienced difficulty
55% 58% 53%
The proportion of unfilled vacancies in employers most recent recruitment rounds was largest for Machinery Operators and Drivers (21.4 per cent) and Technicians and Trades Workers (20.0 per cent)(see Figure 1).
5

Sturt Employment Service Area Report
While the proportion of employers who experienced difficulty recruiting for their most recent vacancy was only slightly higher than all regions surveyed (46 per cent compared with 41 per cent), a high proportion had difficulty recruiting for Machinery Operators and Drivers (82 per cent) and Technicians and Trades Workers (63 per cent).
o The most common reasons for recruitment difficulty were location (29 per cent), the tight labour market (29 per cent) and finding staff who met the technical skill requirements of the job (27 per cent).
Figure 1: Unfilled vacancies by occupation – most recent recruitment
All regions surveyed, 12 months to September 2012
Sturt ESA April 2011
Sturt ESA August 2012
Labourers
Sales Workers
Machinery Operators and Drivers
Clerical and Administrative Workers
Community and Personal Service Workers
Technicians and Trades Workers
Managers & Professionals
0.0% 5.0% 10.0% 15.0% 20.0% 25.0%
7.2%
9.9%
8.9%
0.0%
0.0%
21.4%
8.0%
8.6%
20.0%
13.0%
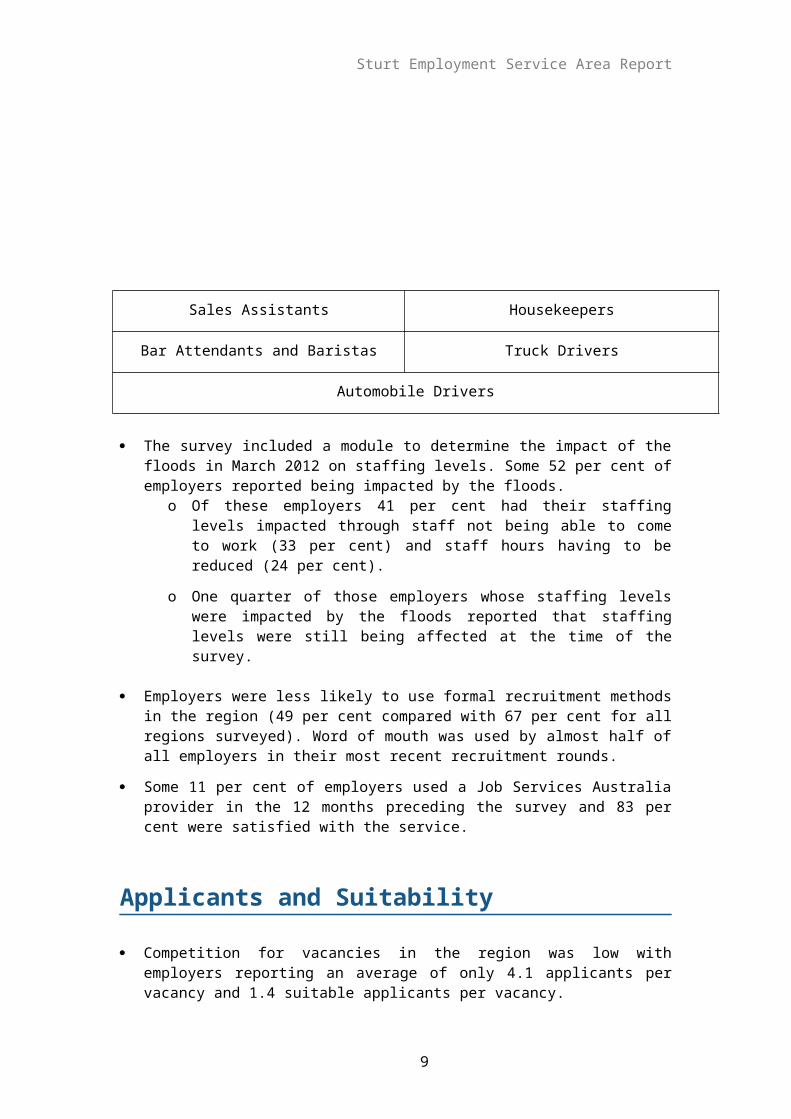
Employers reported recruitment difficulty for a range of occupations (Table 2).
Table 2: Difficult occupations by skill levelBachelor Degree or Higher VET Qualifications
6
Sturt Employment Service Area Report
Motor Mechanics Panel Beaters
Structural Steel and Welding Chefs
Electronic Trades Workers Early Childhood Teachers
Registered Nurses
Other Occupations
Sales Assistants Housekeepers
Bar Attendants and Baristas Truck Drivers
Automobile Drivers
The survey included a module to determine the impact of the floods in March 2012 on staffing levels. Some 52 per cent of employers reported being impacted by the floods.
o Of these employers 41 per cent had their staffing levels impacted through staff not being able to come to work (33 per cent) and staff hours having to be reduced (24 per cent).
o One quarter of those employers whose staffing levels were impacted by the floods reported that staffing levels were still being affected at the time of the survey.
Employers were less likely to use formal recruitment methods in the region (49 per cent compared with 67 per cent for all regions surveyed). Word of mouth was used by almost half of all employers in their most recent recruitment rounds.
Some 11 per cent of employers used a Job Services Australia provider in the 12 months preceding the survey and 83 per cent were satisfied with the service.
Applicants and Suitability
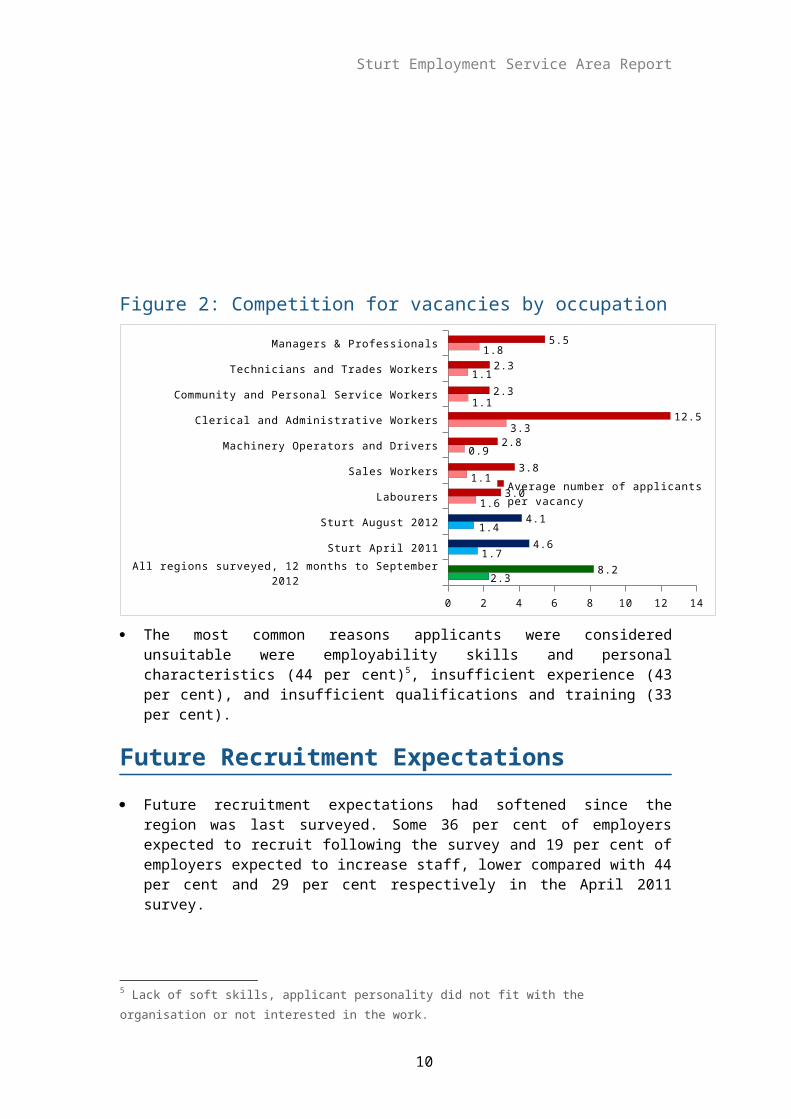
Competition for vacancies in the region was low with employers reporting an average of only 4.1 applicants per vacancy and 1.4 suitable applicants per vacancy.
7

Sturt Employment Service Area Report
Figure 2: Competition for vacancies by occupation
All regions surveyed, 12 months to September 2012
Sturt April 2011
Sturt August 2012
Labourers
Sales Workers
Machinery Operators and Drivers
Clerical and Administrative Workers
Community and Personal Service Workers
Technicians and Trades Workers
Managers & Professionals
0 2 4 6 8 10 12 14
2.3
1.7
1.4
1.6
1.1
0.9
3.3
1.1
1.1
1.8
8.2
4.6
4.1
3.0
3.8
2.8
12.5
2.3
2.3
5.5
Average number of applicants per vacancy
Average number of suitable applicants per vacancy
The most common reasons applicants were considered unsuitable were employability skills and personal characteristics (44 per cent)5, insufficient experience (43 per cent), and insufficient qualifications and training (33 per cent).
Future Recruitment Expectations
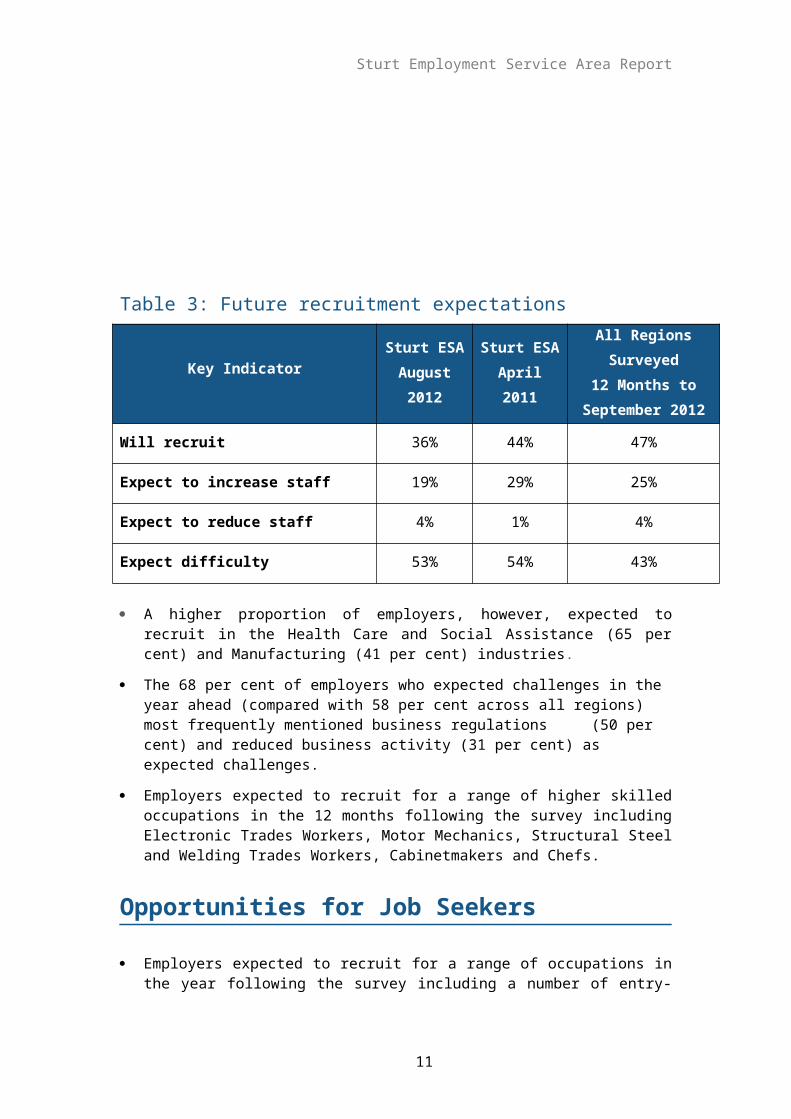
Future recruitment expectations had softened since the region was last surveyed. Some 36 per cent of employers expected to recruit following the survey and 19 per cent of employers expected to increase staff, lower compared with 44 per cent and 29 per cent respectively in the April 2011 survey.
Table 3: Future recruitment expectations
Key Indicator Sturt ESAAugust 2012
Sturt ESAApril 2011
All Regions Surveyed12 Months to
September 2012
Will recruit 36% 44% 47%
5 Lack of soft skills, applicant personality did not fit with the organisation or not interested in the work.
8
Sturt Employment Service Area Report
Expect to increase staff 19% 29% 25%
Expect to reduce staff 4% 1% 4%
Expect difficulty 53% 54% 43%
A higher proportion of employers, however, expected to recruit in the Health Care and Social Assistance (65 per cent) and Manufacturing (41 per cent) industries.
The 68 per cent of employers who expected challenges in the year ahead (compared with 58 per cent across all regions) most frequently mentioned business regulations (50 per cent) and reduced business activity (31 per cent) as expected challenges.
Employers expected to recruit for a range of higher skilled occupations in the 12 months following the survey including Electronic Trades Workers, Motor Mechanics, Structural Steel and Welding Trades Workers, Cabinetmakers and Chefs.
Opportunities for Job Seekers
Employers expected to recruit for a range of occupations in the year following the survey including a number of entry-level occupations such as Sales Assistants (General), Crop Farm Workers and Housekeepers.
There may also be opportunities in occupations for which employers experienced recruitment difficulty and a high proportion of unfilled vacancies, particularly Technicians and Trades Workers (Motor Mechanics, Panel Beaters and Structural Steel and Welding Workers) and Machinery Operators and Drivers (Truck Divers).
Opportunities may exist in the Health Care and Social Assistance and Manufacturing industries where a large proportion of employers expected to recruit.
One of the main reasons applicants were considered unsuitable for vacancies was a lack of experience. Support for work experience and work readiness programs could provide job seekers with the experience and skills that employers are seeking.
More Information Labour Market Information Portalwww.deewr.gov.au/lmip
9
Sturt Employment Service Area Report
Skill Shortages www.deewr.gov.au/skillshortages Survey of Employers’ Recruitment Experienceswww.deewr.gov.au/regionalreports Australian Jobs 2012www.deewr.gov.au/AustralianJobs Job Outlook
www.joboutlook.gov.au
SkillsInfo
www.skillsinfo.gov.au
10
Sturt Employment Service Area Report
11
Related Documents


