FEBRUARY 1945 UNITED STATES BUREAU OF FOREIGN AND DOMva,,..•"'-

Welcome message from author
This document is posted to help you gain knowledge. Please leave a comment to let me know what you think about it! Share it to your friends and learn new things together.
Transcript

FEBRUARY 1945
UNITED STATES DEPARTMENT.C)·;~c
BUREAU OF FOREIGN AND DOMva,,..•"'-
of ... ·
,~URRENT ' '
ABUSINESS FEBRUARY 1945
Contents Page
THE ECONOMY IN THE THIRD YEAR OF WAR-A Review of 1944:
National Income and Product................ 2
Munitions Production........................ 7
:Manufacturing Activity....................... 8
Agricultural Production...................... 10
Raw Materials. . . . . . . . . . . . . . . . . . . . . . . . . . . . . . . . . 12
Utilization of Labor.. . . . . . . . . . . . . . . . . . . . . . . . . . 13
The Productive Plant......................... 14
Domestic Transportation. . . . . . . . . . . . . . . . . . . . . 15
Retail Trade. . . . . . . . . . . . . . . . . . . . . . . . . . . . . . . . . . . 17
Foreign Trade................................. 19 Prices and Control of Inflation............... 20
STATISTICAL DATA:
New or Revised Series ...................... 23, 24
Monthly Business Statistics .•....•........• S-1
General Index. . . . . . . . . . . . . . . . . Inside back cover
N ote-coutents of this publication are not copyrighted and
IDay he reprinted freely. 1\fention of source will be appreciated.
T':., ;~~J~ythe Department of Commerce. WAYNE C. TAYLOR, Acting Secretary, and issued through the Bureau .. ,,,., . Of f~p ·~d Domestic Commerce, Amos E. Taylor, Director. Subscription price of the monthly SURVEY OF
t:•a!l'T B.u:SINESS, $2; Foreign, $2.75 a year. Single copy, 20 cents. Price of the 1942 Supplement is 50 cents.
M.k.;'remittimces only to Superintendent of.Documents, U.S. Government Printing Office, Washington 25, D. C. · .. · .. ' /··
The Economy • Ill the Third Year of War
T HE YEAR 1944 saw the culmination of the Nation's war production drive,
with the resources mobilized to provide an adequate flow of materiel to the fighting fronts and at the same time to sustain a volume of consumption by the civilian economy not excelled in any previous year.
Almost every phase of economic activity recorded substantial achievements, as witnessed by such general indicators of economic conditions as the gross national product, manufacturers' shipments, and transportation volume. Of course, the requirements of an economy geared to offensive warfare did not spread their impact evenly. In fact, the changing character of production requirements even necessitated contraction of certain fields, such as construction. Such contraction, however, was offset by the increased output in other sectors of economic activity.
Total 1944 production, or the gross national product, exceeded the output of the previous year by 6 percent in dollar terms, and by about half that relative amount in quantity terms. This further increase reflects the rise in munitions output.
Shifting Character. The economic character of 1944 dif
fered from that of the first two war years in two important respects. In the first place, it was a year in which major economic decisions were carried out rather than made. The entire framework of our economic mobilization for war, both with regard to machinery and policies had not only been determined but was actually functioning by the end of 1943.
During the previous years of war, steps had been taken to assure the proper allocation of materials. to mobilize the Nation's manpower, to build and set in operation the new industrial facilities required for wartime needs, and to adjust the entire structure of production to wartime requirements. Even the fiscal and administrative program for coping with inflationary pressures had been completed.
In 1944, by contrast, the only problems on the economic front were those of adjusting minor difficulties involved in maintaining operations of the productive machine. There were, of course, continuous problems in connection with specific items in the munitions program due to changing war requirements or bottleneck conditions, but meeting these did not require major decisions of policy or major changes in the administrative or productive machinery.
The high degree of economic stability is a second feature distinguishing 1944 from the first two years after Pearl Harbor .. · In contrast to the sharp upward
625844-45--1
A Review of 194:4
movement in productive activity which occurred in the two earlier years, there was very little change in the basic economic indicators from January to December of 1944. In all essential areas peak rates of production had been achieved by the beginning of the year so that 1944 as a whole represented a reaping of the benefits of the economic mobilization already established.
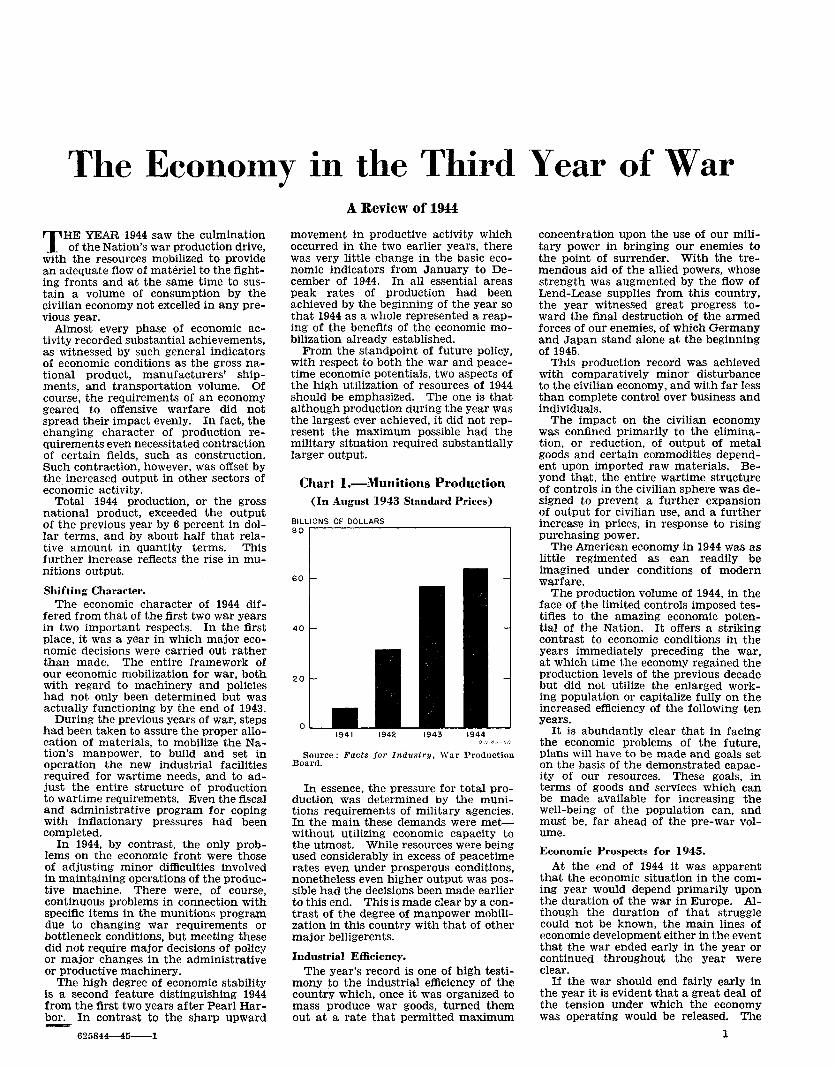
From the standpoint of future policy, with respect to both the war and peacetime economic potentials, two aspects of the high utilization of resources of 1944 should be emphasized. The one is that although production during the year was the largest ever achieved, it did not represent the maximum possible had the military situation required substantially larger output.
Chart I.-Munitions Production (In August 1943 Standard Prices)
BILLIONS OF DOLLARS 80
60
40
20
1941 1942 1943 1944
Source: Facts for Industry, \Var Production Board.
In essence, the pressure for total production was determined by the munitions requirements of military agencies. In the main these demands were metwithout utilizing economic capacity to the utmost. While resources were being used considerably in excess of peacetime rates even under prosperous conditions, nonetheless even higher output was possible had the decisions been made earlier to this end. This is made clear by a contrast of the degree of manpower mobilization in this country with that of other major belligerents.
Industrial Efficiency. The year's record is one of high testi
mony to the industrial efficiency of the country which, once it was organized to mass produce war goods, turned them out at a rate that permitted maximum
concentration upon the use of our military power in bringing our enemies to the point of surrender. With the tremendous aid of the allied powers, whose strength was augmented by the flow of Lend-Lease supplies from this country, the year witnessed great progress toward the final destruction of the armed forces of our enemies, of which Germany and Japan stand alone at the beginning of 1945.
This production record was achieved with comparatively minor disturbance to the civilian economy, and with far less than complete control over business and individuals.
The impact on the civilian economy was confined primarily to the elimination, or reduction, of output of metal goods and certain commodities dependent upon imported raw materials. Beyond that, the entire wartime structure of controls in the civilian sphere was designed to prevent a further expansion of output for civilian use, and a further increase in prices, in response to rising purchasing power.
The American economy in 1944 was as little regimented as can readily be imagined under conditions of modern warfare.
The production volume of 1944, in the face of the limited controls imposed testifies to the amazing economic potential of the Nation. It offers a striking contrast to economic conditions in the years immediately preceding the war, at which time the economy regained the production levels of the previous decade but did not utilize the enlarged working population or capitalize fully on the increased efficiency of the following ten years.
It is abundantly clear that in facing the economic problems of the future, plans will have to be made and goals set on the basis of the demonstrated capacity of our resources. These goals, in terms of goods and services which can be made available for increasing the well-being of the population can, and must be, far ahead of the pre-war volume.
Economic Prospects for 1945.
At the end of 1944 it was apparent that the economic situation in the coming year would depend primarily upon the duration of the war in Europe. Although the duration of that struggle could not be known, the main lines of economic development either in the event that the war ended early in the year or continued throughout the year were clear.
If the war should end fairly early in the year it is evident that a great deal of the tension under which the economy was operating would be released. The
1
2
fundamental factor would be a substantial curtailment of munitions production with the possibility of some reduction in the size of the armed forces and of the military drain on civilian-type goods. All in all this would mean a substantial freeing of economic resources which would open the way to partial reconversion on a sizable scale.
Under these conditions a decline in production volumes is a virtual certainty. This would be the case not only in the interval of the shift from war to civilian production but also after that shift was accomplished for the reason that therelease of the tension on the economy would result in some contraction of the labor force.
With job opportunities not so far in excess of persons seeking work, it is to be expected that the volume of frictional unemployment would increase, while the number of persons seeking work would tend to decrease. But, perhaps more important in the initial period there would be some reduction in the average length of the work-week through the elimination of overtime.
Furthermore, just as there has been some deterioration on the quality of service during the past three years because of the manpower shortage in many lines of business, so in the reconversion there will be absorption of manpower in these trades to improve the quality of such services.
All these factors will necessarily mean a smaller volume of output as it is usually conceived or measured.
It must be emphasized that business conditions in this period will be exceptionally good-even though there will be some contraction in the volume of output. So long as the war in the Far East continues, the volume of Government expenditures will remain high and, in conjunction with the deferred demand for both consumption and capital goods of various types, will assure favorable business volume.
While employment may be expected to be reasonably good during this period, nevertheless there will be an increase in the number of unemployed and there should be no difficulty in keeping the required forces on the job to meet the reduced munitions programs. It should be borne in mind that a very large part of the munitions is turned out by companies to which a high proportion of individuals must look for employment after the war.
The probable economic situation in 1945, if the war in Europe should continue, likewise seems clear. By the end of 1944 many more recurring tasks in the economic mobilization for war had been completed.
The military forces up to their planned size had been equipped; the wartime merchant fleet had been largely built; supply pipelines from the production centers to the battle fronts had been filled; reserve supplies of war materials had been built up; and the flow of LendLease war supplies of our Allies had passed its peak. Consequently, the military requirements of the coming months would be largely conditioned by attrition on the battlefields, by changes in needs brought to light through battle experi-
SURVEY OF CURRENT BUSINESS
ence and by improvements in the design of combat weapons.
While these factors were certain to cause upward revision of some individual schedules in the munitions program, they could not be expected to hold total output to the level established earlier during the mobilization period when the provision of initial equipment was such an important factor.
Total production will not be maintained with any substantial reduction in munitions output, unless measures are taken beforehand to shift the released resources to other uses. In the absence of the planning of these shifts, there will be a tendency for workers to drift from the labor market and for total activity to contract. Any such contraction, however, is not likely to be of significant proportions so long as largescale military operations continue in both Europe and the Far East.
National Income and Product
The main features of economic activity in 1944 and their relation to developments since the outbreak of the war are best shown by the statistics of national income and gross national product. These clearly support the generalization previously made-that 1944 was a year of record production volume but one in which the upward trend in activity of the earlier war years yielded to a stable pattern.
Gross National Product.
In 1944, the gross national productthe total value of currently produced goods and services flowing to Government, to consumers, and for purposes of gross capital formation to businessamounted to almost 200 billion dollars. In current dollars this was more than twice the total production of 1939, the last full year uninfluenced by rearmament and war (chart 2). War purchases absorbed the largest part of the increase. Total consumer expenditures-though not all components-were also substan-
Chart 2.-Gross National Product
BILLIONS OF 200
150
100
50
0 1939 1940 1941 1942 1943 1944
CONSUMERS' GOODS AND SERVICES
PRIVATE GROSS CAPITAL FORMATION
GOVERNMENT NONWAR
GOVERNMENT WAR
D. D. 45-47
Source: U. S. Department of Commerce.
February 1945
tially higher. The current dollar data showed reduction~ only in private gross capital formation and in Government nonwar purchases.
Change in Real Value.
It is well known, of course, that the rise in prices has accounted for a substantial part of the increase in total gross national product and its components since 1939. Although it is not feasible to correct for the inflationary factor in an exact manner, the available price data and the conventional methods of adjusting for price changes show that the gross national product in constant dollars rose more than three quarters from 1939 to 1944. The implicit price rise for output as a whole over this period is calculated at about one-fourth, with the price rise in the consumers' expenditure component calculated at one-third.
In evaluating this increase in gross national product after price adjustment in relation to either the pre-war or possible post-war production totals, it is necessary to recognize certain aspects of the wartime production measurement. Of considerable quantitative importance is the fact that the value placed upon the services of the armed forces is measured by the pre-war rates of pay of military personnel. This means that the contribution of the armed forces to the deflated gross national product is considerably less than the value of output that a similar quantity of manpower would contribute in nonmilitary pursuits.
On the other hand, there is the possibility that the value of munitions output, prices of which are assumed to have been constant in the price deflation of the gross product, tends to overstate the increase in total production during the past four years. This possibility does not rest upon the assumption of constant munitions prices, since the increase in munitions output determined from production records provides verification of the assumed price trend. However, the increase in total production would be overstated if the rates of compensation of the labor, capital, and enterprise in munitions production before the war had been higher than the rates prevailing in comparable types of production activity apart from munitions.
The fact that munitions prices at the initiation of the rearmament program and subsequently have not been determined by the usual play of market forces lends weight to this possibility. While some analysts are concerned that this was the case, the available evidence does not lead one to attach large quantitative importance to this factor. The high rates of compensation in munitions production would seem, rather, to be dependent upon the economies of larger scale production which have occurred in civilian types of production as well as in munitions output.
So far as the consumer goods and services component of the gross product is concerned, it is widely recognized that the existing price data do not fully reflect the poorer quality of goods and services, the absence of lower priced lines, and the more limited choice of goods available. This does not mean that
February 1!)4G
the measures of real consumption give a seriously misleading impression of the impact of the war upon consumers. It does not mean either that under peacetime conditions it is to be expected that the present value of consumers' goods output at existing prices could be produced with the economic resources now devoted to their production. Without the stresses and shortages of war, the consumer could demand and could obtain better quality and more services for the price he is now paying.
Notwithstanding the foregoing, the very large increase in production during the war is confirmed by everyday observation, and by the quantity measures that are available for particular products.
It is a fact that a huge war programthe efficacy of which is now being proved on the battlegrounds-was attained largely by increasing total production. It was superimposed upon the aggregate ftow of goods and services to civilians rather than displacing the latter. It disturbed and distorted that flow, no doubt, by forcing sharp reductions in some sectors, but at the same time it stimulated further expansion in others.
From 1943 to 1944 gross national product increased 11 billion dollars, as against an increase of more than 30 billions in each of the two preceding years. How aggregate production leveled off is shown, however, only by its movement during 1944. Gains over 1943 were made largely in the first half of the year and the levels reached were not significantly exceeded thereafter.
War Expenditures.
The key to the stabilization of the economic scene is, of course, to be found in the leveling off of war expenditures, whose spectacular increase in recent years was responsible for lifting production and incomes to their present record heights. These expenditures amounted to 86 billion dollars in 1944, as compared with 82 billions in 1943-an increase of only 4 billions, as against one of 33 billions from 1942 to 1943, and of 36 billions from 1941 to 1942.
During the year 1944 war expenditures did not advance further. Preliminary figures even indicate some decline from the peak reached in the first half of the year. The recent stability is also reflected in table 1 which gives the proportion of total output that was absorbed by war expenditures.
Table I.-Gross National Product and War Expenditures
Year
11139 .... . 1940 .... ----1941. ______ _ 1942 ..... ------1943 .... ----------1944 ___________ _
[Billions of dollars]
Gross national product
88.6 97.1
120.5 151.5 187.8 198.7
War expend
itures
1.4 2.8
13.3 49.5 82.5 86.3
Source: U. S. Department of Commerce.
War expenditures as percent
of gross national product
2 3
11 32 44 43
SURVEY OF CURRENT BUSINESS 3
Chart 3.-Components of the National Income
BILLIONS OF DOLLARS 200
1939 1942 1943 1944
OTHER..Y
COMPENSATION OF EMPLOYEES IN PRIVATE NONMANUFACTURING INDUSTRIES
COMPENSATION OF EMPLOYEES IN PRIVATE MANUFACTURING INDUSTRIES
NET INCOME OF FARM OPERATORS
INCOME ORIGINATING IN GOVERNMENT
0.0. 45-49
1 Includes corporate profits, net income of nonfarm proprietors, an<! priYate interest an<! net rents.
Source: U. S. Department of Commerce.
Additional light is thrown on the economic situation by a separate examination of outlays for munitions, construction, and nonmunitions, the major components of the war program. Nonmunitions include a miscellany of items. Their movement, however, has closely reflected the pay, travel, and subsistence of the armed forces, transportation and other contractual services, all of which are related either to size or scale of operations of the military establishment.
In the early phase of economic mobilization, munitions, construction, and nonmunitions each contributed to the increase in total war expenditures. Subsequent shifts have mirrored the gradual transition from the mobilization phase to the actual conduct of military operations.
From 1942 to 1943 construction fell off sharply, but munitions and nonmunitions registered further substantial advances with nonmunitions slowly gaining in relative importance. The direction of the movement was similar between 1943 and 1944, but the advance in munitions was only a small fraction of earlier gains, and as a consequence nonmunitions accounted for a significantly larger proportion of the total in spite of the fact that they, too, leveled off.
Government Nonwar Expenditures.
Government nonwar expenditures for goods and services in 1944 increased somewhat from the lows to which they had fallen in 1942 and 1943. The increase was due mainly to larger interest payments on the Federal debt, which are included in this classification even though their recent growth reflects the cost of financing the war. The sum of the remaining items showed little change.
This stability is explained by an examination of the components. The bu!k of the sharp cut in government nonwar outlays on goods and services during the war years was in Federal public works and work relief expenditures as well as
in state and local construction. These reductions had been made by 1943, and outlays continued even thereafter, further small economies in certain sectors being about offset by expansion in others.
Private Gross Capital Formation.
Private gross capital formation continued comparatively low-approximately two billion dollars. As in 1943 a small volume of private construction and machinery and equipment purchases was accompanied by reductions in inventories and in the foreign balance.
For several reasons the war had a particularly sharp impact on private capital formation. The war effort required a large volume of construction and of machinery and equipment which resulted in a record volume of total capital formation during the mobilization phase of the war program. The fact that the bulk of this capital formation was publicly financed was reflected in a sharp cut in the privately financed portion. In view of the durability of existing equipment, new purchases could be foregone by private industry, resulting in no immediate sacrifice to civilians.
The using up of business inventories permitted consumer and government expenditures to proceed at levels in excess of current production, and the draft on the foreign balance had a similar function. The cut of private gross capital formation thus provided not only a technically efficient method of obtaining war output but also the one that was felt least burdensome to civilians.
Sharply reduced Government outlays on war construction did not lead to any significant resumption of private construction activity in 1944. Manpower and other resources no longer required for Government projects were shifted to uses that were deemed more essential. Private construction amounted to only 1.6 billion dollars, a figure not much in excess of the low of 1.5 billion dollars to which it had fallen in 1943.
4
With respect to producer's durable goods the situation was somewhat different. These have a shorter life than construction and accordingly civilian replacement needs were more urgent. Hence reduced requirements of the war program in 1944 were accompanied by a sharp increase in rJlocations to civilian users.
Thus, for instance, trucks bought by private businesses about doubled between1943 and 1944. Purchases of farm machinery were three-fourths more, and exceeded the previous highs of 1937 and 1941. Preliminal'y data also indicate some increase in manufacturing machinery and equipment. In spite of these gains, however, this segment of private capital formation continued sharply restricted also.
Reduction of business inventories amounted to 1.7 billion dollars in 1944. This was considerably in excess of the rate at which liquidation had proceeded in the two precedtng years. The major declines were in manufacturing and farm inventories.
In contrast to this, trade inventories in 1942 and 1943 accounted for the net reduction more than offsetting an accumulation of manufacturing and farm stocks. The draft on the foreign balance also continued. As in the preceding year, merchandise and Government transactions contributed in approximately the same proportions to a deficit of about 2 billions.
Consumer Expenditures.
Consumers spent almost 98 billion dollars for goods and services in 1944, 7 billion more than in the previous year. The most important gains were registered in the food group, which also includes beverages and eating and drinking places, in clothing, and in consumer services. But all other major categories of expenditures also increased.
It is well known that the higher dollar total of consumer expenditures is due to a large extent to a rise in prices rather than to an increase in volume. If the current dollar figures for 1944 are corrected for the price rise which can be statistically measured, all categories of expenditures with the exception of food appear to be virtually unchanged from their 1943 level. In the food group alone an expansion beyond price rise is indicated. Such expansion refiects in part a genuine increase in volume. On the other hand, it refiects the fact that present statistical techniques of defiation are deficient, because price quotations representative of the true quantity change are not available for many important components of expenditures.
Because of the difficulties of correcting for the infiationary factor, it is not possible to evaluate precisely the current position of civilian consumers. But the statistics confirm what common observation suggests-that in overall terms 1944 was a year of continued high consumption, far above the pre-war year 1939.
The cuts that were made as early as in 1942 were confined to a small number of items. On these the impact of the war was sharp. In 1944 combined expendi-
SURVEY OF CURRENT BUSINESS
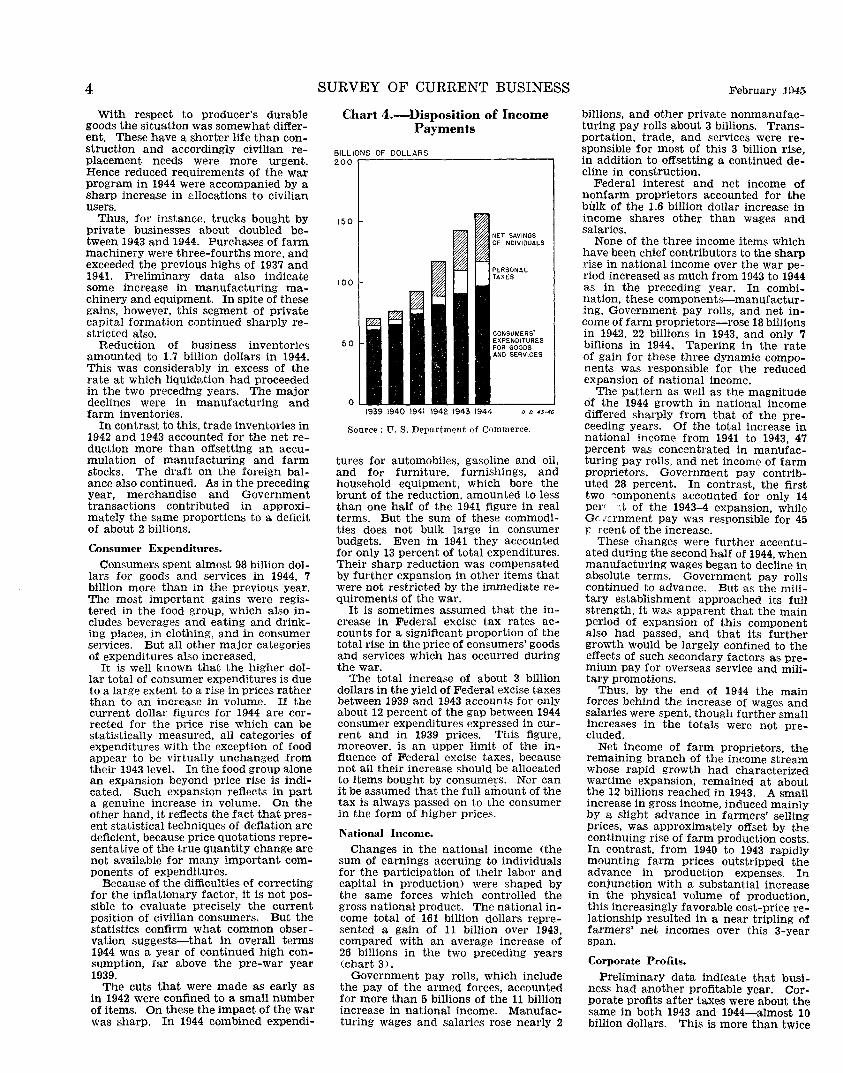
Chart 4.-Disposition of Income Payments
BILLIONS OF DOLLARS 200
150
100
50
0 1939 1940 1941 1942 1943 1944
NET SAVINGS OF 1NOIVIDUALS
PERSONAL TAXES
CONSUMERS' EXPENDITURES FOR GOODS AND SERVICES
0. 0. 45-46
Source: U. S. Department of Commerce.
tures for automobiles, gasoline and oil, and for furniture, furnishings, and household equipment, which bore the brunt of the reduction, amounted to less than one half of the 1941 figure in real terms. But the sum of these commodities does not bulk large in consumer budgets. Even in 1941 they accounted for only 13 percent of total expenditures. Their sharp reduction was compensated by further expansion in other items that were not restricted by the immediate requirements of the war.
It is sometimes assumed that the increase in Federal excise tax rates accounts for a significant proportion of the total rise in the price of consumers' goods and services which has occurred during the war.
The total increase of about 3 billion dollars in the yield of Federal excise taxes between 1939 and 1943 accounts for only about 12 percent of the gap between 1944 consumer expenditures expressed in current and in 1939 prices. This figure, moreover, is an upper limit of the infiuence of Federal excise taxes, because not all their increase should be allocated to items bought by consumers. Nor can it be assumed that the full amount of the tax is always passed on to the consumer in the form of higher prices.
National Income.
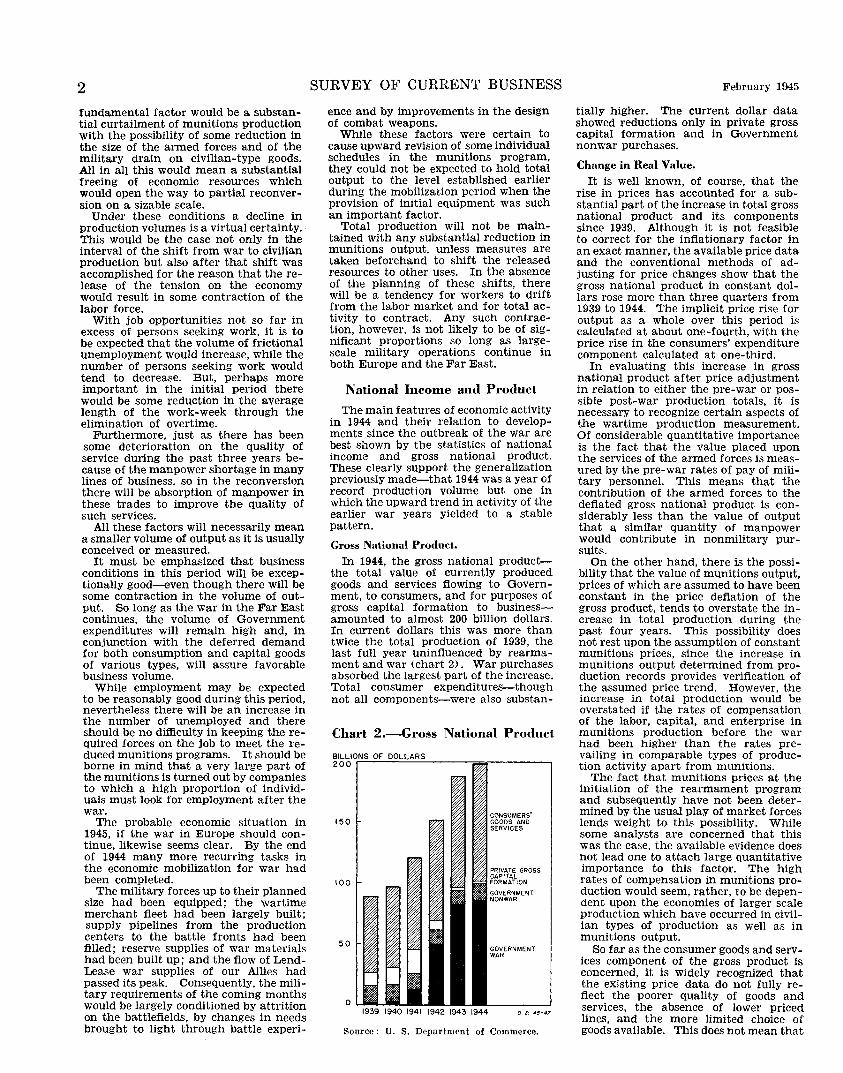
Changes in the national income (the sum of earnings accruing to individuals for the participation of their labor and capital in production) were shaped by the same forces which controlled the gross national product. The national in-· come total of 161 billion dollars represented a gain of 11 billion over 1943, compared with an average increase of 26 billions in the two preceding years (chart 3).
Government pay rolls, which include the pay of the armed forces, accounted for more than 5 billions of the 11 billion increase in national income. Manufacturing wages and salaries rose nearly 2
February 1945
billions, and other private nonmanufacturing pay rolls about 3 billions. Transportation, trade, and services were responsible for most of this 3 billion rise, in addition to offsetting a continued decline in construction.
Federal interest and net income of nonfarm proprietors accounted for the bulk of the 1.6 billion dollar increase in income shares other than wages and salaries.
None of the three income items which have been chief contributors to the sharp rise in national income over the war period increased as much from 1943 to 1944 as in the preceding year. In combination, these components-manufacturing, Government pay rolls, and net income of farm proprietors-rose 18 billions in 1942, 22 billions in 1943, and only 7 billions in 1944, Tapering in the rate of gain for these three dynamic components was responsible for the reduced expansion of national income.
The pattern as well as the magnitude of the 1944 growth in national income differed sharply from that of the preceeding years. Of the total increase in national income from 1941 to 1943, 47 percent was concentrated in manufacturing pay rolls, and net income of farm proprietors. Government pay contributed 28 percent. In contrast, the first two ~omponents accounted for only 14 per'· :t of the 1943-4 expansion, while Gr ;crnment pay was responsible for 45 r rcent of the increase.
These changes were further accentuated during the second half of 1944, when manufacturing wages began to decline in absolute terms. Government pay rolls continued to advance. But as the military establishment approached its full strength, it was apparent that the main period of expansion of this component also had passed, and that its further growth would be largely confined to the effects of such secondary factors as premium pay for overseas service and military promotions.
Thus, by the end of 1944 the main forces behind the increase of wages and salaries were spent, though further small increases in the totals were not precluded.
Net income of farm proprietors, the remaining branch of the income stream whose rapid growth had characterized wartime expansion, remained at about the 12 billions reached in 1943. A small increase in gross income, induced mainly by a slight advance in farmers' selling prices, was approximately offset by the continuing rise of farm production costs. In contrast, from 1940 to 1943 rapidly mounting farm prices outstripped the advance in production expenses. In conjunction with a substantial increase in the physical volume of production, this increasingly favorable cost-price relationship resulted in a near tripling of farmers' net incomes over this 3-year span.
Corporate Profits.
Preliminary data indicate that business had another profitable year. Corporate profits after taxes were about the same in both 1943 and 1944-almost 10 billion dollars. This is more than twice
February 1945 SURVEY OF CURRENT BUSINESS 5 the profits of 1939, the last full year uninfluenced by rearmament and war, and three billions higher than profits in the prosperous year 1929. It will be noted, however, that these profit estimates are significantly higher than those published previously before the availability of the latest corporate income tax data.
sible that the estimates, especially for 1944, are still too low. Unincorporated business has likewise experienced profitable business during the war though many proprietors were induced to go into war industries because of better opportunities for income, or for a variety of other reasons.
ence is mirrored, for instance, in the profits of the construction and machinery groups.
On the other hand, corporations whose full participation in war production was delayed for technical reasons, or whose production has continued to grow because of increasing military requirements, have further improved their profit position in the past year. Their experience is reflected, for example, in the profit record of the transportation equipment, oil refining, and rubber industries.
In interpreting these figures it should be kept in mind that for the last two years the estimates are based primarily upon data for large corporations. There are indications that in this period the earnings of smaller corporations have increased more rapidly than those of large ones, and although some allowance has been made for this factor, it is pos-
Over-all stability of corporate profits was the result of divergent component movements. As is well known, the profits of some companies have recently declined. These are generally corporations which converted to the war and attained full war production early, or whose output is related to segments of the war program with peaks past. Their experi-
One further generalization is warranted. It is apparent from the data that the rise in profits during the war
"' Itrm .s
..:l
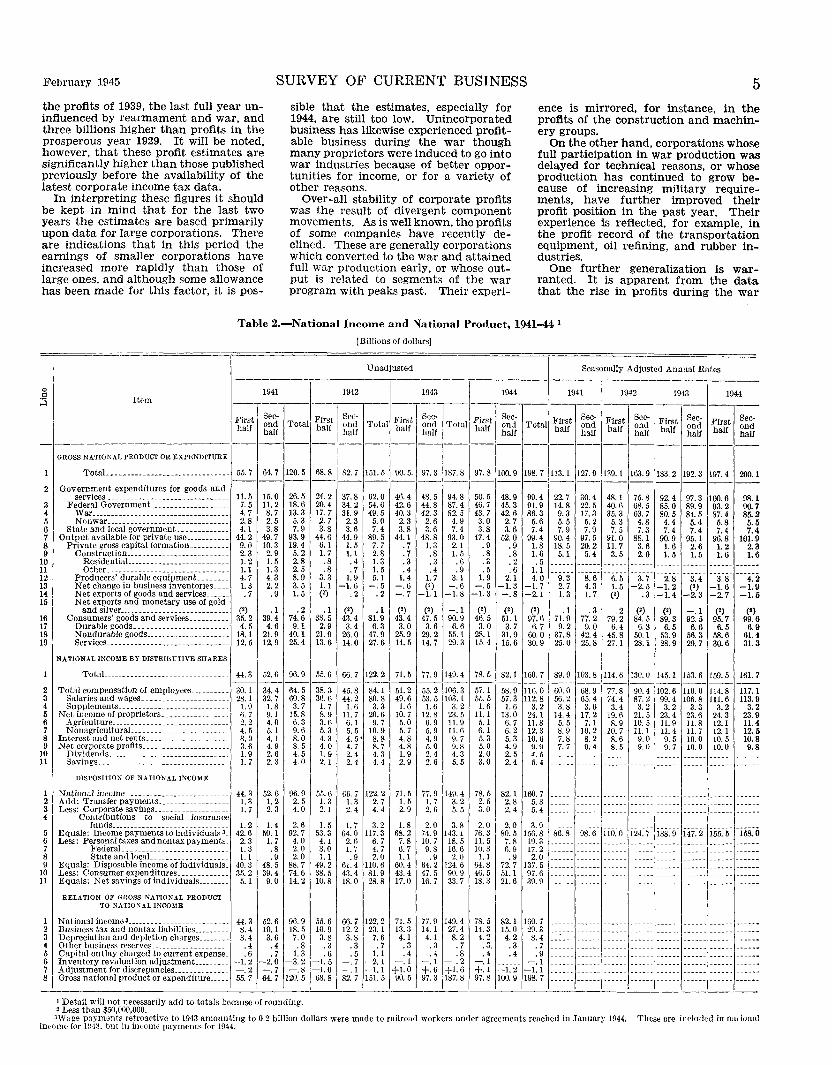
Table 2.-National Income and National Product, 1941-44 I
[Billions of dollars]
Unadjusted Seasonally Adjusted Annual Rates
Irs ond Total Irs ond Total' Irs ond Total IrS ond Total Irs ond 'Irst ond Irst ond First ond ~~ ~~ ~~ ~~ ~~~~~~~~
F' t~ -l-;-1 :::__{ ' :: --=~,T~~ F'
19~:~ F' ~~~c- ·
194:ec~ ----- ---------------------------------------__ , __ ----------- -----------
GROSS NATION AI. PRODUCT OR EXPENDITURE I I I TotaL .............................. 55.7 64.7 120.5 68.8 82.7 151.5 90 .. 5. 97.3 187.8 97.8 100.9 198.7 113.1 127.9 139.1 163.9 183.2 192.3 197.4 200.1
2 Government expenditures for goods and ------------------~--------~--------------
3 -i 5 6 7 8 9
10 11 12 13 14 15
16 17 18 19
2 3 4 5 6 7 8 9
10 11
1 2 3 4
5 6 7 8 9
10 11
1 2 3 4 5 6 7 8
services _______________________________ 11.5 15.0 26.5 24.2 37.8 62.0 46.4 48.5 94.8 50.5 48.9 99.4 22.7 30.4 48.1 75.8 92.4 97.3 100.6 98.1 Federal Government..__________________ 7. 5 11. 2 18.6 20.4 34. 2 54.6 42.6 44.8 87.4 46.7 45.3 91.9 14.8 22. 5 40.6 68. 5 85.0 89.9 93.2 90.7
War._ _________________________________ 4.7 8.7 13.3 17.7 31.9 49.5 40.3 42.3 82.5 43.7 42.6 86.3 9.3 17.3 35.3 63.7 80.5 84.5 87.4 85.2 Nonwar _______________________________ 2.8 2.5 5.3 2.7 2.3 5.0 2.3 2.6 4.9 3.0 2.7 5.6 5.5 5.2 5.3 4.8 4.4 5.4 5.8 5.5
State and local government .. ----------- 4. 1 3. 8 7. 9 3. 8 3. 6 7. 4 3. 8 3. 6 7. 4 3. 8 3. 6 7. 4 7. 9 7. 9 7. 5 7. 3 7. 4 7. 4 7. 4 7. 4 Output available for private use.. ...... ___ 44. 2 49. 7 93.9 44. 6 44.9 89. 5 44. 1 48. 8 93. 0 47.4 52.0 99.4 90. 4 97.5 91. 0 88. 1 90. 9 95. 1 96.8 101.9
Private gross capitalformation.......... 9. 0 10.3 19.4 6.1 1. 5 7. 7 . 7 1. 3 2.1 . 9 . 9 1. 8 18. 5 20.2 11. 7 3. 6 1. 6 2. 6 1. 2 2. 3 Construction __________________________ 2.3 2.9 5.2 1.7 1.1 2.8 .7 .8 1.5 .8 .8 1.6 5.1 5.4 3.5 2.0 1.5 1.5 1.6 1.6
ResidentiaL ________________________ 1.2 1.5 2.8 .8 .4 1.3 .3 .3 .6 .3 .2 .5 ______________________________________________ __ Other _______________________________ 1.1 1.3 2.5 .8 .7 1.5 .4 .4 .9 .5 .6 1.1 ______________________________________________ __
Producers'durableequipment. _______ 4.7 4.3 8.9 3.3 1.9 5.1 1.4 1.7 3.1 1.9 2.1 4.0 9.3 8.6 6.5 3.7 2.8 3.4 3.8 4.2 Netchangeinbnsinessinventories .... 1.3 2.2 3.5 1.1 -1.6 -.5 -.6 (') -.6 -.5 -1.3 -1.7 2.7 4.3 1.5 -2.5 -1.2 (') -1.6 -1.9 Netexportsofgoodsandservices...... .7 .9 1.5 (2) .2 .2 -.7 -1.1 -1.8 -1.3 -.8 -2.1 1.3 1.7 (') .3 -1.4 -2.3 -2.7 -1.5 Net exports and monetary nse of gold
andsilver, __________________________ (') .1 .2 .1 (') .1 (') (') -.1 (') (') (') .1 .3 .2 (') (') -.1 (') Consumers' goods and services __________ 35.2 39.4 74.6 38.5 43.4 81.9 43.4 47.5 90.9 46.5 51.1 97.6 71.9 77.2 79.2 84.5 89.3 92.5 95.7
Durablegoods ________________________ 4.5 4.6 9.1 2.9 3.4 6.3 3.0 3.6 6.6 3.0 3.7 6.7 9.2 9.0 6.4 6.3 6.5 6.6 6.5 Nondurablegoods__ ___________________ 18.1 21.9 40.1 21.9 26.0 47.9 25.9 29.2 55.1 28.1 31.9 60.0 37.8 42.4 45.8 50.1 53.9 56.3 58.6 Services _______________________________ 12.5 12.9 25.4 13.6 14.0 27.6 14.5 14.7 29.3 15 4 15.6 30.9 25.0 2/i.S 27.1 28.1 28.9 29.7 30.6
NATIONAL INCOME BY DISTRIBUTIVE SHARES
TotaL .... ______ .... _______________ 44.3 52.6 96.9 ------
Total compensation of employees __________ 30.1 34.4 64.5 Salaries and wages ______________________ 28.1 32.7 60.8 Supplements ___ .. _------------- _________ 1.9 1.8 3. 7
Net income of proprietors _________________ 6. 7 9.1 15.8 Agriculture _____ .. _ ..... ________ .. _______ 2. 2 4.0 6. 3 N onagricultnraL. ________________ .... __ 4. 5 5.1 9. 6
Interest and net rents _____________________ 3. 9 4.1 8.0 Net corporate profits ______________________ 3.6 4. 9 8. 5
Dividencls _________________ --------·--· ___ 1.9 2. 6 4. 5 Savings_ .. ______________________________ 1.7 2. 3 4.0
DISPOSITION OF NATIONAL INCOME
National income 44.3 52.6 96.9 Add: Transfer paymel1ts~~:::::::: :::::::: 1.3 1.2 2. 5 Less: Corporate savings __________________
Contributions to social insurance 1.7 2. 3 4.0
funds ________________________ . ____ 1.2 1.4 2. 6 Equals: Income payments to individuals a_ 42.6 50.1 92.7 Less: Personal taxes and non tax payments. 2. 3 1.7 4. 0
FederaL. _________________________ 1.3 . 8 2.0 State and locaL ______________ .. ___ 1.1 . 9 2.0
Equals: Disposable income of individuals. 40.3 48.5 88.7 Less: Consumer expenditures _____________ 35.2 39.4 74.6 Equals: Net savings of individuals ________ 5.1 9.0 14.2
RELATION OF GROSS NATIONAL PRODUCT TO NATIONAL INCOME
National income3 _________________________ . 44.3 52.6 96.9 Business tax and nontax liabilities _________ 8.4 10.1 18 . .5 Depreciation and depletion charges ________ 3. 4 3.6 7.0 Other business reserves ____________________ .4 .4 .8 Capital outlay charged to current expense. .6 . 7 1.3 Inventory revaluation adjustment. ____ .. __ -1.2 -2.0 -3.2 Adjustment for uiscrepancies .... __________ -.2 -.7 -.8 Gross national product or expenditure _____ 55.7 64.7 120.5
' Detail will not necessarily add to totals because of rounding. ' Less than $50,000,000.
55.6 66.7 122.2 71.5 77.9 ----------
38.3 45.8 84.1 51.2 55.2 36.6 44.2 80.8 49.6 53.5 1.7 1.6 3. 3 1.6 1.6 8.9 11.7 20.6 10.7 12.8 3.6 6.1 9. 7 5. 0 6. 9 5. 3 5. 5 10.9 5. 7 5. 9 4. 3 4. 5• 8. 8 4.8 4. 9 4.0 4. 7 8. 7 4. 8 5.0 1.9 2.4 4. 3 1.9 2. 4 2.1 2.4 4. 4 2.9 2.6
55.6 66.7 122.2 71.5 77.9 1.3 1.3 2. 7 1.5 1.7 2.1 2. 4 4. 4 2. 9 2.6
1.5 1.7 3. 2 1.8 2. 0 53.3 64.0 117.3 68.2 74.9 4.1 2.6 6. 7 7. 8 10. 7 3.0 1.7 4. 7 6. 7 9. 8 1.1 . 9 2. 0 1.1 . 9
49.2 61.4 110.6 60.4 64.2 38.5 43.4 81.9 43.4 47.5 10.8 18.0 28.8 17.0 16. 7
55.6 66.7 122.2 71. 5 77.9 10.9 12.2 23.1 13.3 14.1
3. 8 3.8 7.6 4.1 4.1 . 3 .3 .7 . 3 . 3 .6 . 5 1.1 .4 . 4
-1.5 -.7 -2.1 -.1 -.1 -1.0 -.1 -1.1 +LO +.6 68.8 82.7 151.5 90.5 97.3
149.4 78.5 82.1 160.7 89.9 103.8 114.6 130.0 145.1 153.6 159.5 -- ------- ---------------106.3 57. 1 58.9 116.0 60.0 68.9 77.8 90.4 !02.6 110.0 114.8 103.1 55.5 57.3 112.8 56.2 65.4 74.4 87.2 99.4 106.8 111.6
3. 2 1.6 1.6 3. 2 3.8 3. 6 3. 4 3.2 3. 2 3.3 3. 2 23. 5 11.1 13.0 24.1 14.4 17.2 19.6 21.5 23.4 23.6 24.3 11.9 5.1 6. 7 11.8 5. 5 7.1 8. 9 10.5 11.9 11.8 12.1 11.6 6.1 6.2 12.3 8. 9 10.2 10. 7 11.1 11.4 11. 7 12. 1 9. 7 fi. 3 5.3 10.6 7.8 8.2 8.6 9.0 9. 5 10.0 10.5 9.8 5.0 4. 9 9.9 7. 7 9. 4 8. 5 9.0 9. 7 10.0 10.0 4. 3 2.0 2. 5 4. 5 ------ ------ ------ ------ ------ ------ ------5.5 3.0 2.4 5. 4 ------ ------ ------ ------ ------ -----·- ------
149.4 78.5 82.1 160.7 ------ ------ ------ ------ ------ ------3. 2 2. 5 2.8 5. 3 ------ ------ ------ ------ ------ ------5. 5 3. 0 2.4 5. 4 ------ ------ ------ ------ ------3.8 2. 0 2.0 3. 9
i38~9- i47~2- i55.'5' 143.1 76.3 80.5 156.8 86.8 98.6 110.0 124.7 18. 5 11. 5 7.8 19.3 ------ ------ -----· ------ ------ ------16.6 10.3 6.9 17.?. ------ ------ ------ ------ ------ ------2. 0 1.1 .9 2.0 ------ ------ ------ ------ ------ ------ ------
124.6 64.8 72.7 137.5 ------ ------ ------ ------ ------ ------ ------90.9 46.5 51. 1 97.6 ------ ------ ------ ------ ------ ------ ------33.7 18.3 21.6 39.9 ------ ------ ----- ------ ------
149. 4 78.5 82.1 160.7 ------ ------ ------ --··--- ------ ------ ------27.4 14.3 15.0 29.3 ------ ------ ------ ------ ------ ------8. 2 4. 2 4. 2 8.4 ------ ------ ------ ------ ------ ------ ------.7 . 3 . .3 . 7 ------ ------ ------ ------ ------ ------ ------.8 .4 .4 .9 ------ ------ ------ ------ ----- ------ ------- .2 -.1 -.1 ------ ------ ------ ------ ------ ------ ------
+!.6 +.I -1.2 -1.1 ------ ------ ------ ------ ------ ------ ------187.8 97.8 100. 9 198.7 ------ ------ ------ ------ ------ ·----- ------
(') 99.6 6.9
61.4 31.3
161.7 --
117.1 ll3. 9
3. 2 23.9 11.4 12.5 10.8 9.8
------------
------------------
-i5s:o ------------------------------------
------------------------------------------------
'Wage payments retroactive to 1943 amounting to 0.2 billion dollars were made to railroad workers under agreements reached in January 1944. These are inc·luded in national income for HH~1. but in income payments for 1944.
6 was not confined to the industries directly associated with war production. In spite of individual variations, high earnings were general, spreading to industries that serve the entire economy, such as transportation, as well as to those that cater particularly to civilian consumers, such as retail and wholesale trade.
A rough division of manufacturing into war and nonwar industries shows that although the profits of the former have increased more rapidly during the war, the difference is by no means striking. The over-all picture is not very different from what it might have been in the course of an ordinary cyclical upswing in which the relative profit position of the heavy industries, of which war industries largely consist, regularly improves.
The high level of profits was reached and maintained in spite of a heavy increase in Federal corporation income and excess profits taxes. These are estimated at about 15 billion dollars in 1944, a more than tenfold increase as compared with 1939. Thus profits before taxes amounted to 25 billion dollars. This figure is indicative of the volume of profits which present corporate cost-price relationships tend to generate at full production.
Corporations distributed 4.5 billion dollars in dividends and retained over 5 billions in undistributed profits in 1944. In spite of increases in 1943 and 1944-and notwithstanding rising earnings during the war-dividend payments were still below their 1941 total. Throughout the war dividend disbursements have been conservative. As a consequence undistributed profits, both in absolute terms and in relation to total net profits, have been very high when judged by pre-war standards.
Disposition of Incomes.
Income payments to individuals, which differ from national income by excluding corporate savings and contributions to social insurance funds, and by including Government transfer payments, amounted to 157 billion dollars in 1944 (chart 4). This represented a 14 billion increase over 1943 as compared with 11 billion in national income.
During 1944 also, income payments were somewhat more buoyant. This is explained largely by the fact that Government payments to soldiers' dependents and mustering-out pay, which are part of transfer payments, have increased sharply, from one billion dollars in 1943 to almost 3 billion dollars in 1944.
Personal tax payments rose to 19.3 billion dollars in 1944. Substantially the entire sixfold, or 16 billion dollar, increase in these taxes since 1939 was in Federa taxes on individual incomes. Changes in the yield of other personal taxes have not been significant.
In view of the substantial increase in income payments, the gain in these taxes over the 18.5 billions paid in 1943 seems surprisingly small. But in this connection it should be noted, first, that an important part of the additional incomes received in 1944 consisted of military pay and allowances the bulk of which was not taxed.
SURVEY OF CURRENT BUSINESS
Secondly, in spite of the adoption of the current tax payments plan, individual income tax payments in 1943 and 1944 did not completely reflect liability on the year's income. Thus, for instance, 1944 collections were reduced owing to the postponement of the payment date of the fourth quarter instalment of the Federal individual income tax from December 1944 to January 1945. There were a number of other substantial adjustments which would have to be made both in the 1943 and in the 1944 collection figures in order to interpret their movement in relation to that of incomes.
In absolute terms personal taxes are large at present. But they are levied upon vastly expanded income payments so that even in 1943 and 1944 they absorbed less than 13 percent of this income. The impression that tax payments are moderate in proportion to incomes is not significantly altered if military pay rolls and allowances to dependents, the bulk of which are not taxed, are excluded. If attention is thus focussed on the civilian economy, the percentage of incomes absorbed is still only 14 percent.
Tax payments have been stationary recently. Quarterly payments of total personal taxes do not reveal this clearly,
February 1945
because both in 1943 and in 1944 they have moved erratically as the result of administrative changes that attended the transition to the current tax payments plan. But stability is clearly displayed by the monthly data of income tax withheld currently by employers.
Of the 138 billions of disposable income left after taxes, individuals- spent 98 billion for consumers goods and services. The remainder, 40 billions, was set aside for savings, an increase of 6 billions over 1943. In interpreting this figure it should be kept in mind that part of it consists of tax reserves of farmers with respect to 1944 Federal income tax liability and also tax liabilities of other tax payers with respect to the fourth quarter of 1944. Payments on these liabilities were due in January 1945, but at most an adjustment for this would not reduce the savings total by as much as 2 billion dollars.
In addition to this factor, a statistical imperfection of the data should be noted. It was not possible to include an estimate of soldiers' and sailors' expenditures abroad in the consumer expenditure figures. Since the incomes of the armed forces are included in income payments, savings, which are obtained as residual by deducting taxes and consumer ex-
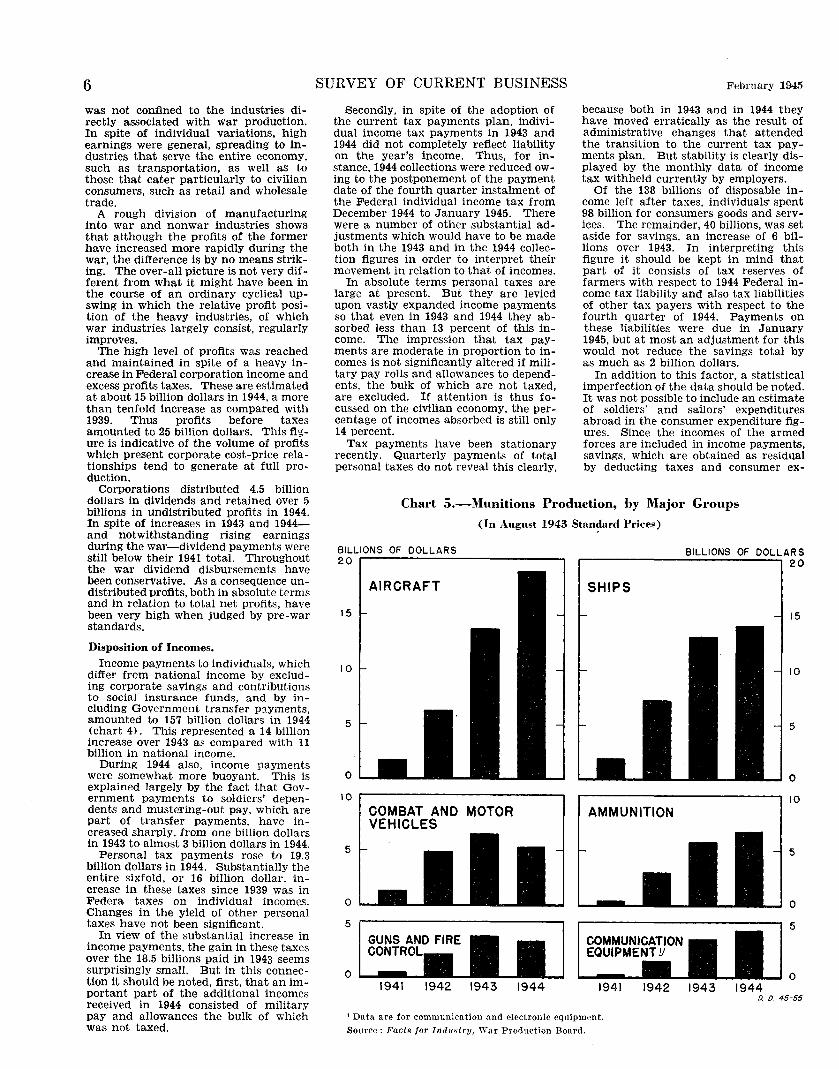
Chart 5.-Munitions Production, by Major Groups
(In August 1943 Stan~ard Prices)
BILLIONS OF DOLLARS 20
AIRCRAFT
15
10
5
0
10
SHIPS
COMBAT AND MOTOR VEHICLES
AMMUNITION
5
0
5
0 1941 1942 1943 1944 1941
1 Data are for communication and electronic equipment. Source: Facts for Industry, War Production Board.
1942
BILLIONS OF DOLLARS 20
1943 1944
15
10
5
0
10
5
0
5
0
D. D. 45-55
February 1945
penditures, are accordingly over-stated. Though the omission does not alter the fact of high personal savings, it does result in some overstatement of the volume of savings in recent years and also distorts its movement.
Munitions Production The flow of munitions in 1944 repre
sented the culmination of 4 years of sustained effort which had adapted mass production techniques of the peacetime economy to pouring out vast quantities of war materiel. Turning out this larger output in 1944 was in many respects an easier task than that accomplished in the 2 preceding years because, with the organizational and initial production stages well behind, it was more efficiently conducted.
Increased Efficiency.
This increased efficiency reflected the more extensive use of newly developed facilities; the broadened labor skills; the enlarged experience of labor and management with new techniques; the better organization of the flow of materials, components and intermediate products; and a firmer knowledge of the resources of men, materials and facilities required for a given volume of output.
Evidence of this improvement was provided by the more effective use of raw and semi-finished materials and, importantly by reason of the continued increase in the armed forces, by the more effective use of manpower.
During the year the number of persons employed in turning out munitions was steadily reduced-by December the total employment in munitions industries was 9.1 million or 11 percent less than at the end of 1943. The average number employed was cut from 10 million in 1943 to just over 9 Y2 million in 1944, and this notwithstanding the higher output.
This manpower saving reflected in part the declining rate of operations in some plants as schedules were reduced, but the basic cause was the more efficient use of labor in these factories and in the plants with steady or rising schedules. The trend freed a substantial supply of labor which was available for employment in plants where labor requirement was still increasing.
Output Up One-eighth.
Total output of munitions in 1944-in terms of the August 1943 standard munitions prices used by the War Production Board for measuring productionwas 63.7 billion dollars, an increase of 12 percent over the output of 1943. The chart on page 1 reveals the swift rise in 1942 and 1943, when the needs for all sorts of weapons and equipment were universal.
The increase last year was not so large and mirrored the lessened pressure for many items. In fact, it resulted from the maintenance of a high volume of output throughout the year, rather than a further expansion beyond the final quarter of 1943.
Thus, 1944 may be characterized as the maturity phase of the program, with the initial equipment of the armed forces substantially completed and with the
SURVEY OF CURRENT BUSINESS
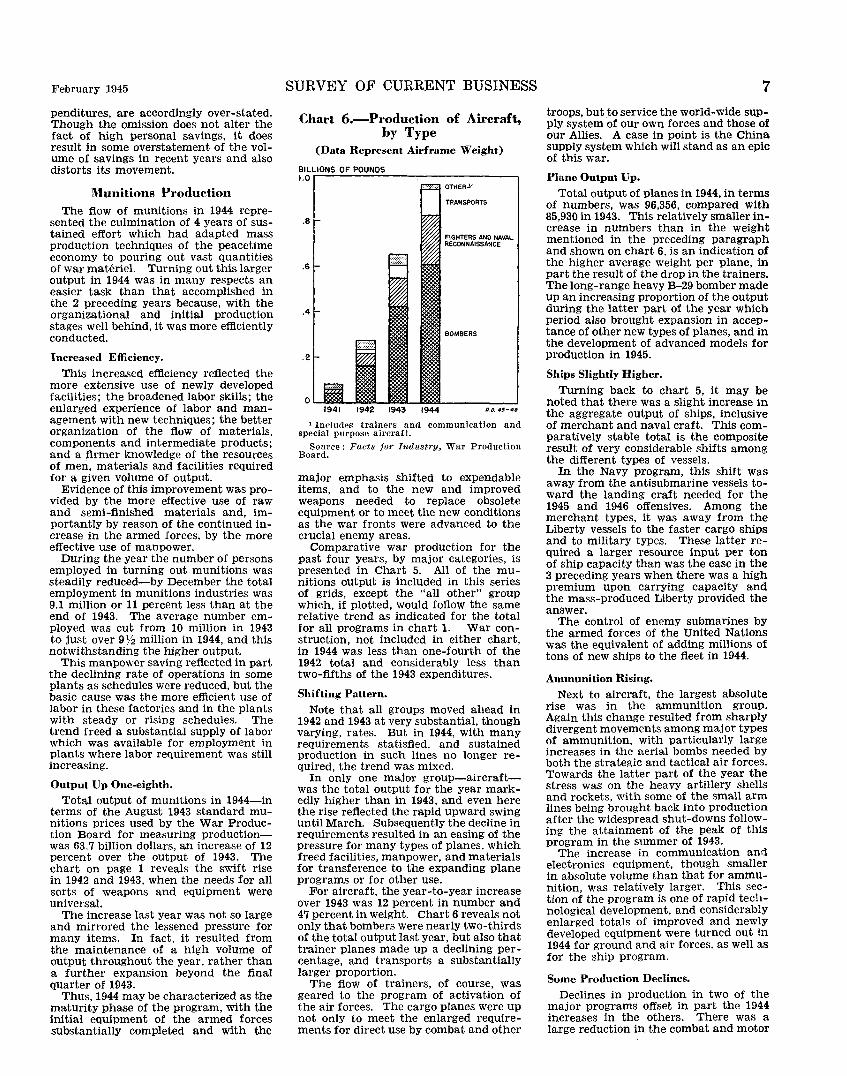
Chart 6.-Production of Aircraft, by Type
(Data Represent Airframe Weight)
BILLIONS OF POUNDS 1.0
.8
.6
.4
. 2
OTHER.l/
TRANSPORTS
FIGHTERS AND NAVAL RECONNAISSANCE
1944 D.O. 45•48
1 Includes trainers and communication and special purpose aircraft.
Bo~~~~ce: Facts for Industry, War Production
major emphasis shifted to expendable items, and to the new and improved weapons needed to replace obsolete equipment or to meet the new conditions as the war fronts were advanced to the crucial enemy areas.
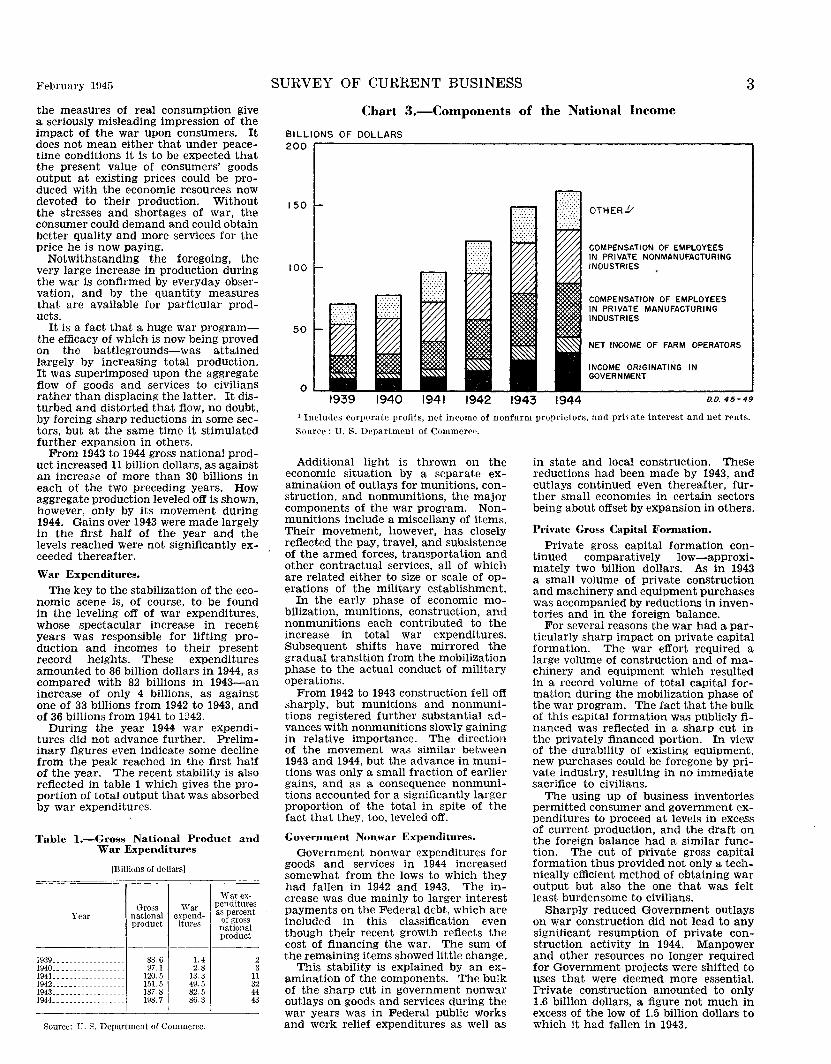
Comparative war production for the past four years, by major categories, is presented in Chart 5. All of the munitions output is included in this series of grids, except the "all other" group which, if plotted, would follow the same relative trend as indicated for the total for all programs in chart 1. War construction, not included in either chart, in 1944 was less than one-fourth of the 1942 total and considerably less than two-fifths of the 1943 expenditures.
Shifting Pattern.
Note that all groups moved ahead in 1942 and 1943 at very substantial, though varying, rates. But in 1944, with many requirements statisfied, and sustained production in such lines no longer required, the trend was mixed.
In only one major group-aircraftwas the total output for the year markedly higher than in 1943, and even here the rise reflected the rapid upward swing until March. Subsequently the decline in requirements resulted in an easing of the pressure for many types of planes, which freed facilities, manpower, and materials for transference to the expanding plane programs or for other use.
For aircraft, the year-to-year increase over 1943 was 12 percent in number and 47 percent in weight. Chart 6 reveals not only that bombers were nearly two-thirds of the total output last year, but also that trainer planes made up a declining percentage, and transports a substantially larger proportion.
The flow of trainers, of course, was geared to the program of activation of the air forces. The cargo planes were up not only to meet the enlarged requirements for direct use by combat and other
7
troops, but .to service the world-wide supply system of our own forces and those of our Allies. A case in point is the China supply system which will stand as an epic of this war.
Plane Output Up.
Total output of planes in 1944, in terms of numbers, was 96,356, compared with 85,930 in 1943. This relatively smaller increase in numbers than in the weight mentioned in the preceding paragraph and shown on chart 6, is an indication of the higher average weight per plane, in part the result of the drop in the trainers. The long-range heavy B-29 bomber made up an increasing proportion of the output during the latter part of the year which period also brought expansion in acceptance of other new types of planes, and in the development of advanced models for production in 1945 .
Ships Slightly Higher.
Turning back to chart 5, it may be noted that there was a slight increase in the aggregate output of ships, inclusive of merchant and naval craft. This comparatively stable total is the composite result of very considerable shifts among the different types of vessels.
In the Navy program, this shift was away from the antisubmarine vessels toward the landing craft needed for the 1945 and 1946 offensives. Among the merchant types, it was away from the Liberty vessels to the faster cargo ships and to military types. These latter required a larger resource input per ton of ship capacity than was the case in the 3 preceding years when there was a high premium upon carrying capacity and the mass-produced Liberty provided the answer.
The control of enemy submarines by the armed forces of the United Nations was the equivalent of adding millions of tons of new ships to the fleet in 1944.
Ammunition Rising.
Next to aircraft, the largest absolute rise was in the ammunition group. Again this change resulted from sharply divergent movements among major types of ammunition, with particularly large increases in the aerial bombs needed by both the strategic and tactical air forces. Towards the latter part of the year the stress was on the heavy artillery shells and rockets, with some of the small arm lines being brought back into production after the widespread shut-downs following the attainment of the peak of this program in the summer of 1943.
The increase in communication and electronics equipment, though smaller in absolute volume than that for ammunition, was relatively larger. This section of the program is one of rapid technological development, and considerably enlarged totals of improved and newly developed equipment were turned out in 1944 for ground and air forces, as well as for the ship program.
Some Production Declines.
Declines in production in two of the major programs offset in part the 1944 increases in the others. There was a large reduction in the combat and motor
8 vehicle group, entirely due to the cutbacks in the combat vehicles-tanks, armored and other cars, and personnel carriers.
The peak monthly output of tanks was in 1942, the subsequent low point in early 1944 being followed by a moderate rising tendency as the output of the latest models expanded. The largest trucks, which were in particularly urgent demand after the Normandy breakthrough in France, were on the critical list in 1944 and were subjected to extensive expediting efforts.
The other declining group was made up of the guns and fire-control equipment. Here again there was considerable divergency in production, with certain equipment, such as heavy field artillery, naval guns, and rocket launchers, being pushed ahead, while the output of other equipment was scheduled down.
The requirement for new anti-aircraft guns, for example, was lessened as the fighting fronts pushed far into enemy territory and by the effectiveness of the air arm and other combat forces in whittling down enemy air strength. The last one-the 40 mm. AA Navy gunwent off the special expediting list at the end of the year, together with the combat loaders-converted merchant ships for Navy use.
Current Situation.
The past year was, therefore, one of sustained high output, with widespread shifting of individual schedules which meant dislocations and change for manufacturers and employees alike. That is the character of the situation at present, and is likely to continue thus so long as both Germany and Japan continue to postpone their inevitable surrender.
It is not necessary in this annual number to review the present status of the production program. except to bring the record up to date. The status was reviewed in some detail in the December 1944 issue, pages 4 to 7. The analysis given therein is still valid today. Since then changes have been made in production plans which will require additional expansion in output of certain lines in 1945.
Chart 7 .-Munitions Production Programs With Scheduled Peaks Ahead
(In August 1943 Standard Prices)
BILLIONS OF DOLLARS 2.0
O~O~N~D~J~~F~M~A~M~-J~J~A~S~O~N~D 1943 1944 0 /) 44-854
Source: War Production Board.
SURVEY OF CURRENT BUSINESS
The general picture, however, will continue to be, as set forth in the chart on page 5 of the above-mentioned issue, one of both rising and falling programs.
The year 1945 is the first of the war program in which the job ahead is not larger than the one accomplished in the preceding year.
The basic production problem in 1945 will be to secure increasing quantities of new and improved equipment, to synchronize the output of special-purpose equipment to the timing of its use, and to gear the production of ammunition and other expendable items, not only to the rate of use but to the size of the stockpiles required to meet anticipated future use.
For most of the program, special efforts to secure the desired output will not be required. Actually, production of many items is scheduled down because requirements no longer make necessary the flow of equipment or supplies at the current rate. Where increased quantities of munitions are needed, they will be forthcoming.
Selective pressure will be essential, but the ways and means of meeting the needs where expansion is required are essentially no different from those necessary in 1942 and 1943, except that in these earlier periods resources devoted to munitions had to be expanded in the aggregate, with the competition which general need extending over practically all programs entailed.
Now, ample resources are available for the total program and the problem narrows, therefore, to diverting the requisite amount to the expanding programs. and getting the output in these segments organized on a mass production basis. That such, in fact, is being done is evident from the recent strong upward trend of output in the expanding programs. In the final 2 months of 1944, the average expansion in the programs with peaks yet ahead was almost double the rate for the earlier months of the year.
The sharp upsurge at the year-end in the critical programs is reflected in chart 7. The December increase in output of the planes on the criticallist-Superforts and other advanced types-was over 30 percent. The heavy-duty trucks, tanks, and heavy field artillery were each up 10 percent or more, and heavy artillery ammunition was up to 2 percent. The total munitions flow in December-5,237 million dollars in staml.ard prices-was at an annual rate just under 63 billion dollars.
Manufacturing Activity
In general the requirements for munitions and other supplies for the armed forces and for our allies, as well as the allocation of resources to assure the procurement of these supplies, determined the pattern of manufacturing activity.
The needs of the armed forces and exports extended into almost every phase of manufacturing, with over three-fifths of the total output delivered for these purposes. The maturing of the munitions program and the limits placed on the total resources allotted to manufacturing are reflected in the plateau of aggregate shipments established in 1944. Shipments aurmg the year were main-
February 1945
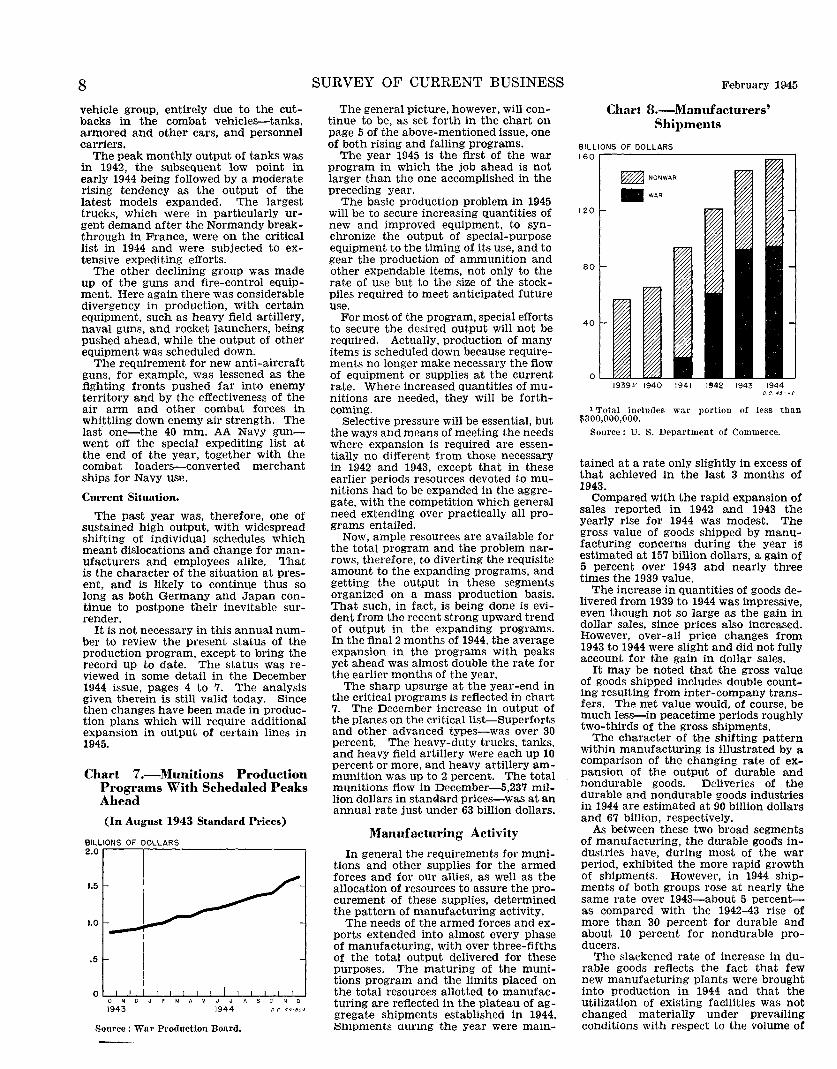
Chart B.-Manufacturers' Shipments
BILLIONS OF DOLLARS 160
120
80
40
~ NONWAR
-WAR
0 L-.=::d--'""'":.:;a...-1939-" 1940 1941 1!'!42 1943 1944
0.045-4?
1 Total includes war portion of l~ss than $300,000,000.
Source: U. S. Department of Commerce.
tained at a rate only slightly in excess of that achieved in the last 3 months of 1943.
Compared with the rapid expansion of sales reported in 1942 and 1943 the yearly rise for 1944 was modest. The gross value of goods shipped by manufacturing concerns during the year is estimated at 157 billion dollars, a gain of 5 percent over 1943 and nearly three times the 1939 value.
The increase in quantities of goods delivered from 1939 to 1944 was impressive, even though not so large as the gain in dollar sales, since prices also increased. However, over-all price changes from 1943 to 1944 were slight and did not fully account for the gain in dollar sales.
It may be noted that the gross value of goods shipped includes double counting resulting from inter-company transfers. The net value would, of course, be much less-in peacetime periods roughly two-thirds of the gross shipments.
The character of the shifting pattern within manufacturing is illustrated by a comparison of the changing rate of expansion of the output of durable and nondurable goods. Deliveries of the durable and nondurable goods industries in 1944 are estimated at 90 billion dollars and 67 billion, respectively.
As between these two broad segments of manufacturing, the durable goods industries have, during most of the war period, exhibited the more rapid growth of shipments. However, in 1944 shipments of both groups rose at nearly the same rate over 1943-about 5 percentas compared with the 1942-43 rise of more than 30 percent for durable and about 10 percent for nondurable producers.
The slackened rate of increase in durable goods reflects the fact that few new manufacturing plants were brought into production in 1944 and that the utilization of existing facilities was not changed materially under prevailing conditions with respect to the volume of
February 1945
output required as discussed in the preceding section on munitions. The increase for the nondurables reflects the rise in food processing and such factors as the increase in the petroleum products reqUired for the armed forces (chart 8).
Most of the new manufacturing facilities constructed during the war have been located in the durable goods industries, and it was this which provided the basis for the rapid sales expansion through 1943 set forth in chart 20. With most plants built and in operation by the end of 1943, and with many plants being cut back from peak rates of activity, this differential rate of expansion between the two industry groups largely disappeared. Moreover, certain of the new nondurable facilities, notably for synthetic rubber and aviation gasoline, were brought into full production in 1944.
The percentage distribution of manufacturers' shipments between war and civilian use was practically unchanged from the preceding year. The estimated ratio of military and export deliveries to the total was slightly more than three-fifths in both 1944 and 1943. The rise of shipments destined for war purposes from 91 billion dollars in 1943 to 96 billion in 1944 (including inter-plant transfers) is in sharp contrast to the rise of about 30 billion dollars which occurred from 1942 to 1943.
The war portion was less stable for individual industries than for manufacturing as a whole. The military share declined slightly in the metal producing industries and in certain of the machinery industries, while it rose in the food, tobacco, and lumber industries.
Table 3.-Manufacturers' Shipments
[Billions of dollarsf
--~~_:~ ____ _!~~~ 1942 1943 194~ •·· Total, all industries ... -- --·
Durable goods industries. _ Iron and steel and their
56. 8 121. 2 148.8 23. 2 64. 8 86. 4
products ____ --·------· 6.6 Nonferrous metals and
their products _. _. _ 2. 6 Electrical machinery ___ .. 1. 7
15.3
5. 5 4.8
Machinery (except elec· trical). _ -----------· ... 3. 3 i 10.7
Automobiles and equip-
T~;~~~ortation-- -e,:j!,iiJ: -r
1
ment (except autosL ..
4. o I e. 9
. 9 ' 13.6 Lumber and timber basic
products---·__________ 1.1 Furniture and finished
lumber products_ .. _ _ _ _ 1. 3 Stone, clay, and gla~s
products ______________ 1.4 Miscellaneous___________ .3
2. 5
2.2
2.6 . 7
16.5
6. 7 7. 5
13.3
10.9
22.7
2.6
2.5
2. 7 1.0
Nonduraule goods industries__ _ __ 33. 6 56. 4 62. 4
Food and kindred prod-ucts.--·---· 10.6
1.3 3. g 3. 3
18.8 20.6 Tobacco manufactures __ _ 1. 8 2. 0 Textile-mill products ___ _ 7. 8 8.1 Apparel. ______ .. ------- .5. 2 5. 2 Leather and leather
products ... --------·-·· 1.4 Paper and allied prod·
nets ___________________ 2.0 Printing and publishing 2. 6 Chemicals and allied
prorlucts. ____ . _ 3. 8 Products of petroleum
2. 4
3. 1 3.4
6. 5
and coaL__ __ __ --- :l. 0 4. 2 Rubber products_ Miscellaneous ______ .
. 9 1.6
.8 ! 1. 6
I Preliminary.
Source: U. S. Department of Commerce.
625844~45---2
2.3
3.4 4.1
7. 5
4. R 2.!) 1.9
1o6.6 89.6
-16.5 ..... f7. 2 8.8
13.2
12.4
22.3
2. 4
2. 8
2. 7 1.1
67.0
22.8 2.2 7.0 5. 1
2. 4
3.6 4. 9
7. 9
5. 6 2. 8 2. 1
SURVEY OF CURRENT BUSINESS 9
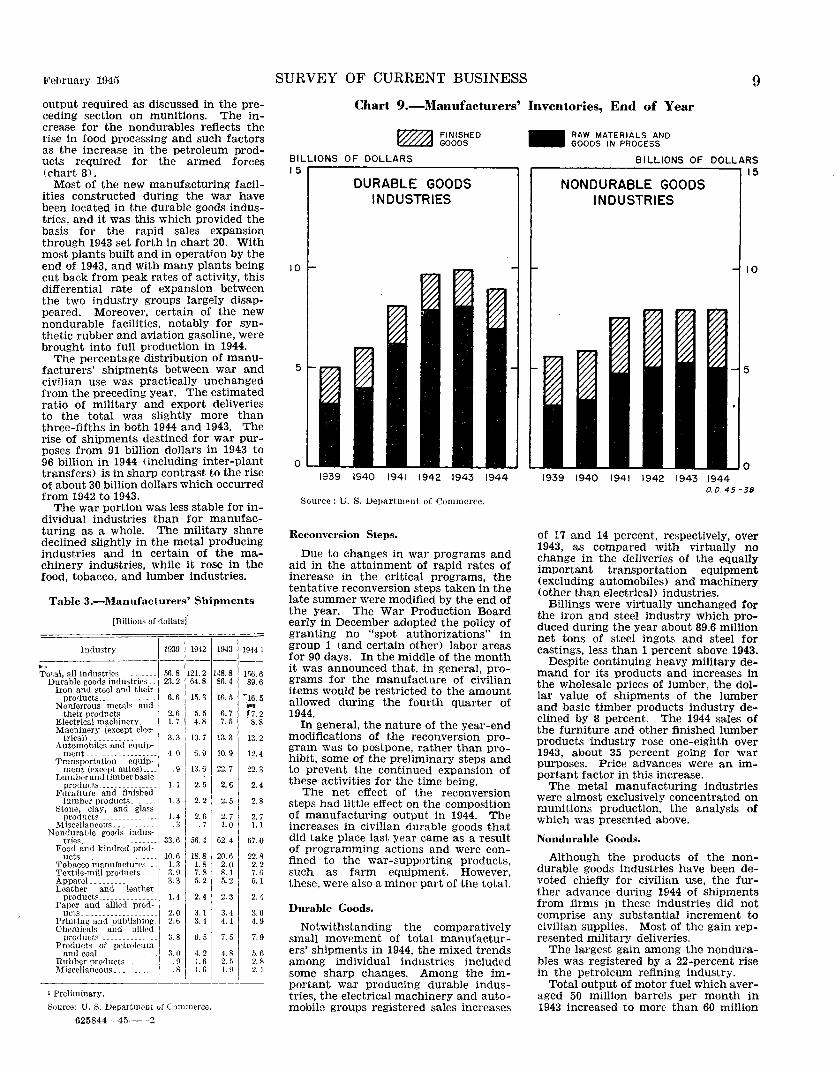
Chart 9.-Manufacturers' Inventories, End of Year
BILLIONS OF DOLLARS 15
FINISHED GOODS
DURABLE GOODS INDUSTRIES
10
5
0 1939 1940 1941 1942 1943 1944
Source: U. S. Department of Commerce.
Reconversion Steps.
Due to changes in war programs and aid in the attainment of rapid rates of increase in the critical programs, the tentative reconversion steps taken in the late summer were modified by the end of the year. The War Production Board early in December adopted the policy of granting no "spot authorizations" in group 1 (and certain other) labor areas for 90 days. In the middle of the month it was announced that, in general, programs for the manufacture of civilian items would be restricted to the amount allowed during the fourth quarter of 1944.
In general, the nature of the year-end modifications of the reconversion program was to postpone, rather than prohibit, some of the preliminary steps and to prevent the continued expansion of these activities for the time being.
The net effect of the reconversion steps had little effect on the composition of manufacturing output in 1944. The increases in civilian durable goods that did take place last year came as a result of programming actions and were confined to the war-supporting products, such as farm equipment. However, these, were also a minor part of the total.
Durable Goods.
Notwithstanding the comparatively small movement of total manufacturers' shipments in 1944, the mixed trends among individual industries included some sharp changes. Among the important war producing durable industries, the electrical machinery and automobile groups registered sales increases
.. RAW MATERIALS AND GOODS IN PROCESS
BILLIONS OF DOLLARS 15
NONDURABLE GOODS INDUSTRIES
10
1939 1940 1941 1942 1943 1944 0.0. 45-38
of 17 and 14 percent, respectively, over 1943, as compared with virtually no change in the deliveries of the equally important transportation equipment (excluding automobiles) and machinery (other than electrical) industries.
Billings were virtually unchanged for the iron and steel industry which produced during the year about 89.6 million net tons of steel ingots and steel for castings, less than 1 percent above 1943.
Despite continuing heavy military demand for its products and increases in the wholesale prices of lumber, the dollar value of shipments of the lumber and basic timber products industry declined by 8 percent. The 1944 sales of the furniture and other finished lumber products industry rose one-eighth over 1943, about 35 percent going for war purposes. Price advances were an important factor in this inerease.
The metal manufacturing industries were almost exclusively concentrated on munitions production, the analysis of which was presented above.
Nondurable Goods.
Although the products of the nondurable goods industries have been devoted chiefly for civilian use, the further advance during 1944 of shipments from firms in these industries did not comprise any substantial increment to civilian supplies. Most of the gain represented military deliveries.
The largest gain among the nondurables was registered by a 22-percent rise in the petroleum refining industry.
Total output of motor fuel which averaged 50 million barrels per month in 1943 increased to more than 60 million
10 SURVEY OF CURRENT BUSINESS February 1945
barrels per month for 1944 as a whole, and in the last months of the year motor fuel was being produced at a rate in excess of 65 million barrels per month. However, civilian supplies of gasoline remained tight in 1944 since production of military products, especially aviation gasoline, constituted the major portion of the increase, which occurred in part at the expense of automobile fuels.
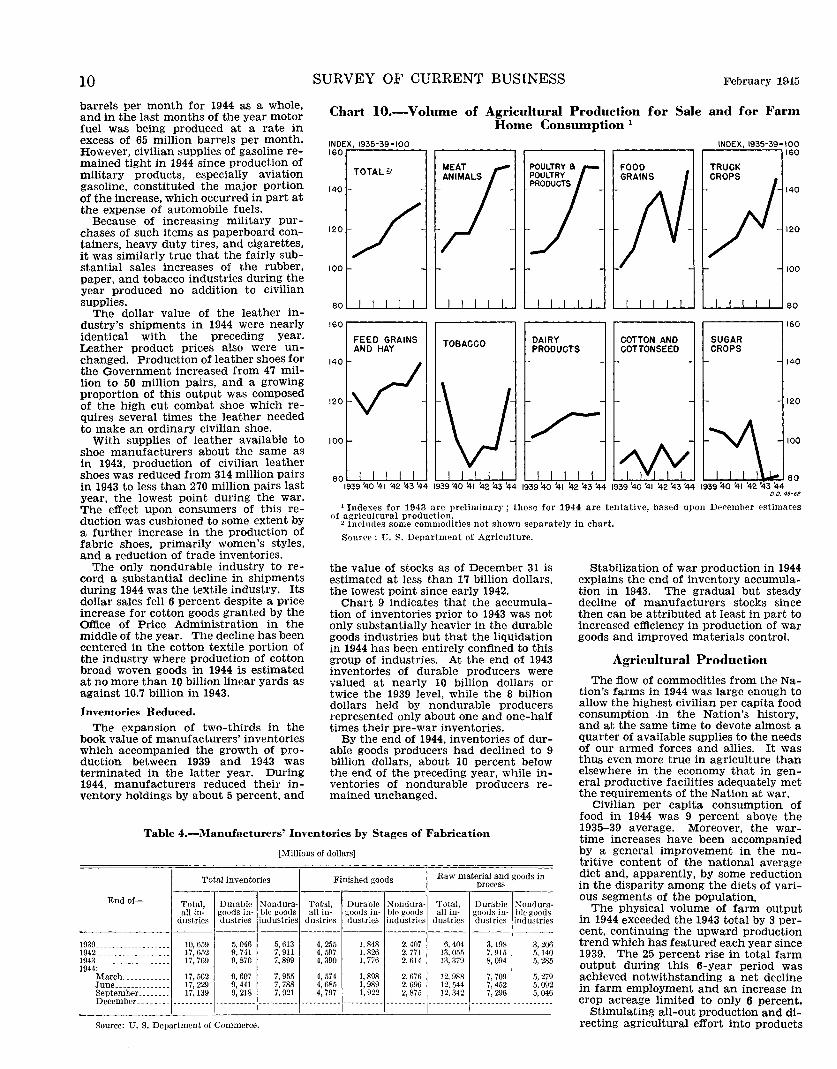
Chart 10.-Volume of Agricultural Production for Sale and for Farm Home Consumption 1
Because of increasing military purchases of such items as paperboard containers, heavy duty tires, and cigarettes, it was similarly true that the fairly substantial sales increases of the rubber, paper, and tobacco industries during the year produced no addition to civilian supplies.
INDEX, 1935-39 = 100 160
TOTALY
140
120 / 100
80 I I I I I
160
FEED GRAINS
MEAT ANIMALS
DAIRY
INDEX, 1935-39•100 160
FOOD TRUCK GRAINS
/l 140
120
r- 100
I I I I I 80
160
COTTON AND SUGAR
The dollar value of the leather industry's shipments in 1944 were nearly identical with the preceding year. Leather product prices also were unchanged. Production of leather shoes for the Government increased from 47 million to 50 million pairs, and a growing proportion of this output was composed of the high cut combat shoe which requires several times the leather needed to make an ordinary civilian shoe.
AND HAY PRODUCTS COTTONSEED CROPS
140
/ 120
140
120
100 100 With supplies of leather available to shoe manufacturers about the same as in 1943, production of civilian leather shoes was reduced from 314 million pairs in 1943 to less than 270 million pairs last year, the lowest point during the war. The effect upon consumers of this reduction was cushioned to some extent by a further increase in the production of fabric shoes, primarily women's styles, and a reduction of trade inventories.
I I I I I
1 Indexes for 1943 are preliminary; those for 1944 are tentative, based upon December estimates of agricultural production.
2 Includes some commodities not shown separately in chart.
The only nondurable industry to record a substantial decline in shipments during 1944 was the textile industry. Its dollar sales fell 6 percent despite a price increase for cotton goods granted by the Office of Price Administration in the middle of the year. The decline has been centered in the cotton textile portion of the industry where production of cotton broad woven goods in 1944 is estimated at no more than 10 billion linear yards as against 10.7 billion in 1943.
Inventories Reduced.
The expansion of two-thirds in the book value of manufacturers' inventories which accompanied the growth of production between 1939 and 1943 was terminated in the latter year. During 1944, manufacturers reduced their inventory holdings by about 5 percent, and
Source: D. S. Department of Agriculture.
the value of stocks as of December 31 is estimated at less than 17 billion dollars, the lowest point since early 1942.
Chart 9 indicates that the accumulation of inventories prior to 1943 was not only substantially heavier in the durable goods industries but that the liquidation in 1944 has been entirely confined to this group of industries. At the end of 1943 inventories of durable producers were valued at nearly 10 billion dollars or twice the 1939 level, while the 8 billion dollars held by nondurable producers represented only about one and one-half times their pre-war inventories.
By the end of 1944, inventories of durable goods producers had declined to 9 billion dollars, about 10 percent below the end of the preceding year, while inventories of nondurable producers remained unchanged.
Table 4.-Manufacturers' Inventories by Stages of Fabrication
[Millions of dollars]
Total inventories Finished goods Raw material and goods in process
--------------------------.----,,---End of- Total, Durable Nondura· Total, Durable ~ondura· Total, Durable ~ondura·
all in· goods in· ble goods all in· goods in· ble goods all in· goods in· ble ~oods dustries dustries industries dustries dustries industries dustries dustries industries
1939___________________ 10,659 1942___________________ 17,652 1943___________________ 17,769 1944:
5,046 9, 741 9, 870
5, 613 7, 911 7, 899
4, 255 4, 597 4, 390
1, 848 1,826 1, 776
2. 407 2, 771 2.6H
6, 404 13,055 13,379
3,198 7, 915 8, 094
3, 206 5,140 5, 285
March____________ 17,.562 9,607 7,955 4,574 1,898 2,676 12,988 7,709 5,279 June______________ 17,229 9,441 7, 788 4,685 1,989 2,696 12,544 7,452 5,092 September________ 17.139 9,218 7,921 4,797 1,922 2,875 12.342 7,296 5,046 December_ _________________ ---------------------------------------- ____________________ ---------- _________ _
Source: U. S. Department of Commerce.
Stabilization of war production in 1944 explains the end of inventory accumulation in 1943. The gradual but steady decline of manufacturers stocks since then can be attributed at least in part to increased efficiency in production of war goods and improved materials control.
Agricultural Production
The flow of commodities from the Nation's farms in 1944 was large enough to allow the highest civilian per capita food consumption .in the Nation's history, and at the same time to devote almost a quarter of available supplies to the needs of our armed forces and allies. It was thus even more true in agriculture than elsewhere in the economy that in general productive facilities adequately met the requirements of the Nation at war.
Civilian per capita consumption of food in 1944 was 9 percent above the 1935-39 average. Moreover, the wartime increases have been accompanied by a general improvement in the nutritive content of the national average diet and, apparently, by some reduction in the disparity among the diets of various segments of the population.
The physical volume of farm output in 1944 exceeded the 1943 total by 3 percent, continuing the upward production trend which has featured each year since 1939. The 25 percent rise in total farm output during this 6-year period was achieved notwithstanding a net decline in farm employment and an increase in crop acreage limited to only 6 percent.
Stimulating all-out production and directing agricultural effort into products
February 194G
most urgently needed were Government actions reflected in the setting of national production goals, broken down on a State and county basis, and in price policies permitting advances and guaranteeing minima for major farm products. The index of prices received by farmers more than doubled between 1939 and 1944 and averaged 15 percent above parity last year.
Factors Increasing Production.
Perhaps the most important single factor responsible for the wartime expansion in agricultural output has been the unusually favorable weather. There were other important contributing factors, however, which were not fortuitous in origin, not the least important of which was the increased allocation of resources to the production of farm equipment.
Chart 11.-Allocation of Total Food Production 1
POINTS IN TOTAL INDEX 175
(INDEX, 1935-39=100)
15 0 CJ LEND-LEASE AND OTHER EXPORTS
~ MILITARY PURCHASES
.. PR~~~gr~~~O~OR DOMESTIC
125
100
75
50
25
0 1939 1940 1941 1942 1943 1944
a o. 45-41
1 Production for domestic disposition for 1939 and 1940 indurl<>s small amounts of military purchas;•s.
Source: U. S. Department of Agriculture.
Rapid strides have been made in farm mechanization during the war years as indicated, for example, by the one-third increase in the number of tractors on farms since January 1, 1940. Not only did these additional machines enable farmers to handle larger crop acreages per worker, but the accompanying decline in the number of work animals released cropland previously used for feed purposes. Mechanization was also furthered by substantial additions to the number of such key equipment as milking machines, combine harvesters, and corn pickers. In order to keep farm equipment operating, production of spare parts has been boosted substantially.
Finally, a part of the increased output can be attributed to such technological advances as improved varieties of crops, better rotations, and more balanced livestock feeding, to the greater use of fertilizers, and to earlier soil conservation programs.
The net effect of these developments has been a 34 percent increase in output
SURVEY OF CURRENT BUSINESS
per worker since 1939 and a 16 percent increase in average crop yields per acre harvested.
Contrasting Production Trends.
The trends in total agricultural output since 1939 and in the output of the major commodities are contrasted in chart 10. The divergent production patterns are largely the result of the two control techniques relied upon by the Governmentthe promotion of production goals for the various crops, livestock, and livestock products and the establishment of price supports providing adequate financial incentives for increased output.
Oil-bearing crops <not shown in the chart) experienced by far the largest growth during the war. By 1943, the combined production of soybeans, peanuts, and flaxseed had expanded 135 percent relative to 1939. A substantial drop in flaxseed output in 1944 reduced the production of oil-bearing crops to 80 percent above 1939. This large growth served to more than offset the decline in imports.
Notable wartime gains were also experienced in the production of such major food products as mes.t animals, poul-
11
try and poultry products, food grains, and truck crops. Production of dairy products showed a milder uptrend, reflecting the less elastic supply conditions in the dairy industry, while sugar crops declined relative to prewar output.
The rapid expansion of livestock production was made possible by the increased annual output of feed grains and hay, as augmented by large carryovers of feed crops from earlier years. Within the meat group, the largest increases were recorded by veal and pork. The production of various types of meat is shown in table 5.
Table 5.-Meat Production hy Types
[;"viillions of pounds. dress•ld weight]
________ _1~~3~ ~~!~ ~~4~ ~~ !9431 19441
Beef__ _____________ 7,01l7,1828,092 8,831 8,536 9,100 VeaL_____________ 991 9781,02\1 1,139 I, 142 1, 700 Lamb and mutt0n 872 877 92f• I, 045 1, 107 985 Pork'------------- 8, 660 9, 958 9, 447 10,723 13,371 12,900
1 Pre lim inary. 2 Excludes lard.
Source: U. S. Department of Agriculture.
Chart 12.-Percentage Change in Production and Per Capita Civilian Consumption of Major Foods, 1944 From 1935-39 Average 1
KIND OF FOOD
FOODS, TOTAL g;
EGGS
VEGETABLES, CANNED
MEATS~
FATS AND OILS 11
CHICKENS AND TURKEYS~
FLOUR, WHEAT
FRUITS, CANNED
FRUITS, FRESH
MILK, TOTAL
FLUID MILK AND CREAM
BUTTER '§J
VEGETABLES, FRESH
PERCENT -40 -20 0 +20 +40
PRODUCTION
• / PER CAPITA
CONSUMPTION
+~0
t Data are on a calendar vear basis except for canned fruits and vegetables, which are for the pack year beginning in the year designated, and citrus fruits, which are for the crop year beginning in October of the previous year.
2 Total includes some foods not shown separately in chart. • Percentages are based upon dressed weight. • Excludes butter which is shown separately in chart. 'Indudes farm and factory production.
Source: U. S. Department of Agriculture.
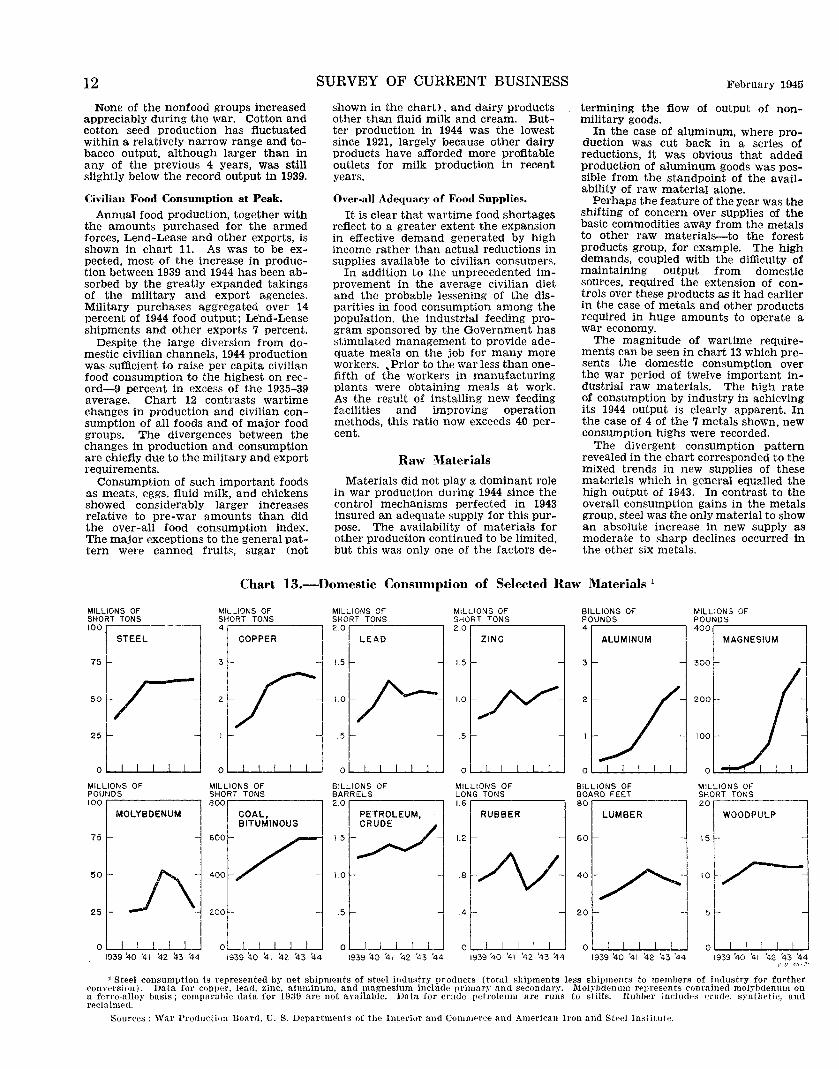
12 None of the nonfood groups increased
appreciably during the war. Cotton and cotton seed production has fluctuated within a relatively narrow range and tobacco output, although larger than in any of the previous 4 years, was still slightly below the record output in 1939.
Civilian Food Consumption at Peak.
Annual food production, together with the amounts purchased for the armed forces, Lend-Lease and other exports, is shown in chart 11. As was to be expected, most of the increase in production between 1939 and 1944 has been absorbed by the greatly expanded takings of the military and export agencies. Military purchases aggregated over 14 percent of 1944 food output; Lend-Lease shipments and other exports 7 percent.
Despite the large diversion from domestic civilian channels, 1944 production was sufficient to raise per capita civilian food consumption to the highest on record-9 percent in excess of the 1935-39 average. Chart 12 contrasts wartime changes in production and civilian consumption of all foods and of major food groups. The divergences between the changes in production and consumption are chiefly due to the military and export requirements.
Consumption of such important foods as meats, eggs, fluid milk, and chickens showed considerably larger increases relative to pre-war amounts than did the over-all food consumption index. The major exceptions to the general pattern were canned fruits, sugar (not
SURVEY OF CURRENT BUSINESS
shown in the chart), and dairy products other than fluid milk and cream. Butter production in 1944 was the lowest since 1921, largely because other dairy products have afforded more profitable outlets for milk production in rP.r.fmt years.
Over-all Adequacy of Food Supplies.
It is clear that wartime food shortages reflect to a greater extent the expansion in effective demand generated by high income rather than actual reductions in supplies available to civilian consumers.
In addition to the unprecedented improvement in the average civilian diet and the probable lessening of the disparities in food consumption among the population, the industrial feeding program sponsored by the Government has stimulated management to provide adequate meals on the job for many more workers. , Prior to the war less than onefifth of the workers in manufacturing plants were obtaining meals at work. As the result of installing new feeding facilities and improving operation methods, this ratio now exceeds 40 percent.
Raw Materials
Materials did not play a dominant role in war production during 1944 since the control mechanisms perfected in 1943 insured an adequate supply for this purpose. The availability of materials for other production continued to be limited, but this was only one of the factors de-
February 1945
termining the flow of output of nonmilitary goods.
In the case of aluminum, where production was cut back in a series of reductions, it was obvious that added production of aluminum goods was possible from the standpoint of the availability of raw material alone.
Perhaps the feature of the year was the shifting of concern over supplies of the basic commodities away from the metals to other raw materials-to the forest products group, for example. The high demands, coupled with the difficulty of maintaining output from domestic sources, required the extension of controis over these products as it had earlier in the case of metals and other products reqUired in huge amounts to operate a war economy.
The magnitude of wartime requirements can be seen in chart 13 which presents the domestic consumption over the war period of twelve important industrial raw materials. The high rate of consumption by industry in achieving its 1944 output is clearly apparent. In the case of 4 of the 7 metals shown, new consumption highs were recorded.
The divergent consumption pattern revealed in the chart corresponded to the mixed trends in new supplies of these materials which in general equalled the high output of 1943. In contrast to the overall consumption gains in the metals group, steel was the only material to show an absolute increase in new supply as moderate to sharp declines occurred in the other six metals.
Chart 13.-Domestic Consumption of Selected Raw Materials 1
MILLIONS OF SHORT TONS 100
STEEL
75 ~
25 1-
-
-
o ~-,....__I..__I..__I~IJ.......JI MILLIONS OF
i~~NrD~S~----------~ MOLYBDENUM
75
50 -
25 1-
0 I I 1 I I 1939 40 '41 42 43 44
0 1-...J.......l.-..l.-..1--l........J
MILLIONS OF SHORT TONS 800
COAL, BITUMINOUS
.5
MilLIONS OF SHORT TONS 2.0
ZINC
1.5 -
0 ~..1-...L....l...--l......J---J
MILLIONS OF LONG TONS 1.6
RUBBER
1.2 f- -
.Sf-/V
.4 - -
0 I I I I I
1939 '40 '41 '42 '43 '44
BILLIONS OF POUNDS 4
ALUMINUM
31-
0 ~..L-...L....l...--1.--.J
BILLIONS OF BOARD FEET 80
LUMBER
60
MILLIONS OF POUNDS 4oo.-------------,
MAGNESIUM
MILLIONS OF SHORT TONS 20
WOOD PULP
15
"~-1 "~~
': J J I J 1939 '40 '41 42 '43 '44 1939 '40 '41 4·2 '43 '44
iJ 0 '1-S-1'
1 Steel consumption is represented by net shipments of steel industry prouucts (total shipments less shipments to members of industry for further conversion). Data for copper, lead, zinc, aluminum, and magnesium include primar;: and seconuary. 1\Iolybuenum represents contained mol;·bdenum on a ferro-alloy basis; comparable data for 1939 are not available. Data for crude petroleum are runs to stills. Rubber inelud<'R nude, synthetic, and re<:lnimecl.
Sources: War Production Board, U. S. Departments of the Interior and Comnwree and Anwrican Iron and Steel Institute.
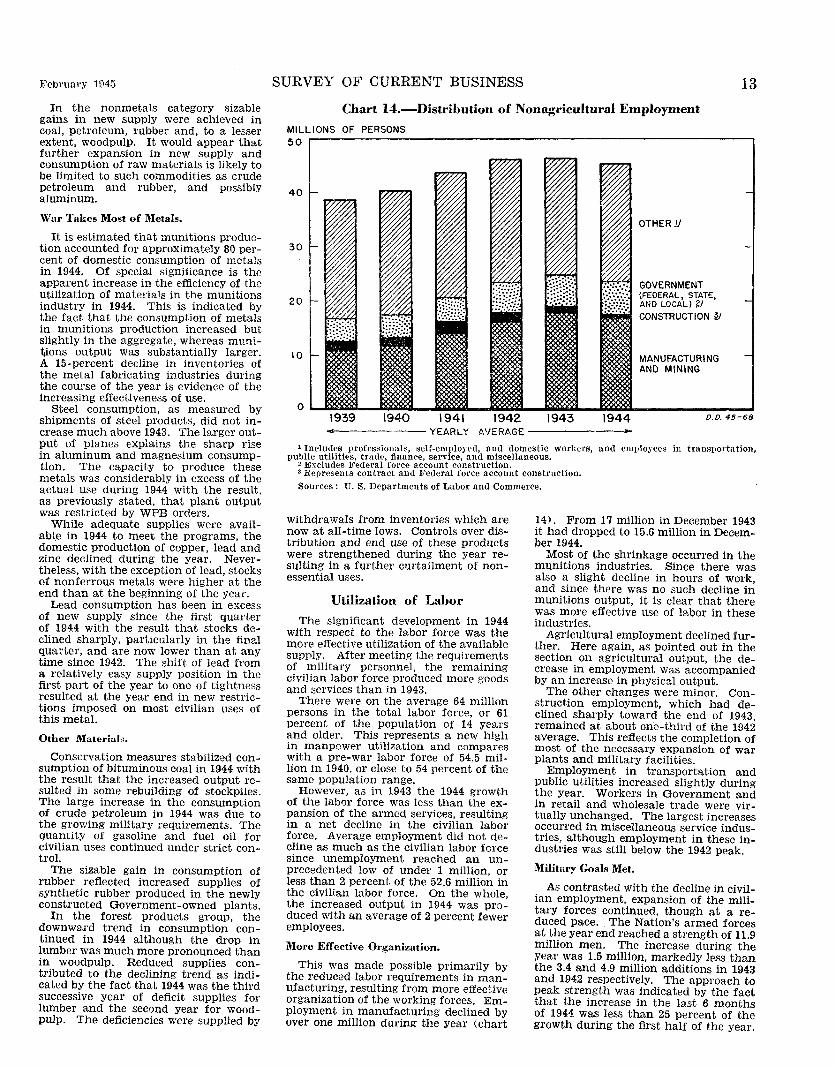
February 1\145
In the nonmetals category sizable gains in new supply were achieved in coal, petroleum, rubber and, to a lesser extent, woodpulp. It would appear that further expansion in new supply and consumption of raw materials is likely to be limited to such commodities as crude petroleum and rubber, and possibly aluminum.
War Takes Most of Metals.
It is estimated that munitions production accounted for approximately 80 percent of domestic consumption of metals in 1944. Of special significance is the apparent increase in the efficiency of the utilization of materials in the munitions industry in 1944. This is indicated by the fact that the consumption of metals in munitions production increased but slightly in the aggregate, whereas munitjions output was substantially larger. A 15-percent decline in inventories of the metal fabricating industries during the course of the year is evidence of the increasing effectiveness of use.
Steel consumption, as measured by shipments of steel products, did not increase much above 1943. The larger output of planes explains the sharp rise in aluminum and magnesium consumption. The capacity to produce these metals was considerably in excess of the actual use during 1944 with the result, as previously stated, that plant output was restricted by WPB orders.
While adequate supplies were available in 1944 to meet the programs, the domestic production of copper, lead and zinc declined during the year. Nevertheless, with the exception of lead, stocks of nonferrous metals were higher at the end than at the beginning of the year.
Lead consumption has been in excess of new supply since the first quarter of 1944 with the result that stocks declined sharply, particularly in the final quarter, and are now lower than at any time since 1942. The shift of lead from a relatively easy supply position in the first part of the year to one of tightness resulted at the year end in new restrictions imposed on most civilian uses of this metal.
Other Materials.
Conservation measures stabilized consumption of bituminous coal in 1944 with the result that the increased output resulted in some rebuilding of stockpiles. The large increase in the consumption of crude petroleum in 1944 was due to the growing military requirements. The quantity of gasoline and fuel oil for civilian uses continued under strict control.
The sizable gain in consumption of rubber reflected increased supplies of synthetic rubber produced in the newly constructed Government-owned plants.
In the forest products group, the downward trend in consumption continued in 1944 although the drop in lumber was much more pronounced than in woodpulp. Reduced supplies contributed to the declining trend as indicated by the fact that 1944 was the third successive year of deficit supplies for lumber and the second year for woodpulp. The deficiencies were supplied by
SURVEY OF CURRENT BUSINESS 13
Chart 14.-Distrihution of Nonagricultural Employment
MILLIONS OF PERSONS
50
40
30
20
10
0
OTHERY
GOVERNMENT (FEDERAL, STATE, AND LOCAL) ?,_/
CONSTRUCTION ~
MANUFACTURING AND MINING
0.0. 45-68
1 Includes professionals, self-employed, and domestic workers, and employees in transportation, public utilities, trade, finance, service, and miscellaneous.
2 Excludes Federal force account construction. . • Represents contract and Federal force account constructiOn. Sources: U. S. Departments of Labor and Commerce.
withdrawals from inventories which are now at all-time lows. Controls over distribution and end use of these products were strengthened during the year resulting in a further curtailment of nonessential uses.
Utilization of Labor
The significant development in 1944 with respect to the labor force was the more effective utilization of the available supply. After meeting the requirements of military personnel, the remaining civilian labor force produced more goods and services than in 1943.
There were on the average 64 million persons in the total labor force, or 61 percent of the population of 14 years and older. This represents a new high in manpower utilization and compares with a pre-war labor force of 54.5 million in 1940, or close to 54 percent of the same population range.
However, as in 1943 the 1944 growth of the labor force was less than the expansion of the armed services, resulting in a net decline in the civilian labor force. Average employment did not decline as much as the civilian labor force since unemployment reached an unprecedented low of under 1 million, or less than 2 percent of the 52.6 million in the civilian labor force. On the whole, the increased output in 1944 was produced with an average of 2 percent fewer employees.
More Effective Organization.
This was made possible primarily by the reduced labor requirements in manufacturing, resulting from more effective organization of the working forces. Employment in manufacturing declined by over one million during the Year (chart
14). From 17 million in December 1943 it had dropped to 15.6 million in December 1944.
Most of the shrinkage occurred in the munitions industries. Since there was also a slight decline in hours of work, and since there was no such decline in munitions output, it is clear that there was more effective use of labor in these industries.
Agricultural employment declined further. Here again, as pointed out in the section on agricultural output, the decrease in employment was accompanied by an increase in physical output.
The other changes were minor. Construction employment, which had declined sharply toward the end of 1943, remained at about one-third of the 1942 average. This reflects the completion of most of the necessary expansion of war plants and military facilities.
Employment in transportation and public utilities increased slightly during the year. Workers in Government and in retail and wholesale trade were virtually unchanged. The largest increases occurred in miscellaneous service industries, although employment in these industries was still below the 1942 peak.
Military Goals Met.
As contrasted with the decline in civilian employment, expansion of the military forces continued, though at a reduced pace. The Nation's armed forces at the year end reached a strength of 11.9 million men. The increase during the year was 1.5 million, markedly less than the 3.4 and 4.9 million additions in 1943 and 1942 respectively. The approach to peak strength was indicated by the fact that the increase in the last 6 months of 1944 was less than 25 percent of the growth during the first half of the year.
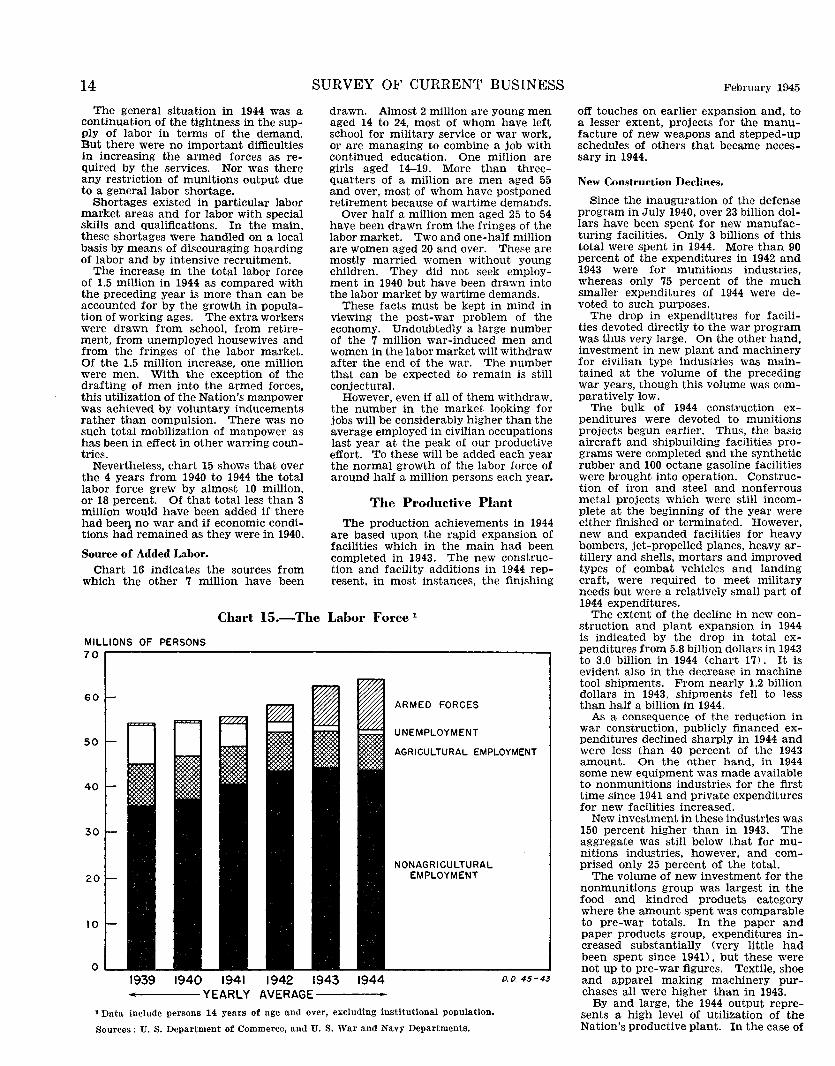
14
The general situation in 1944 was a continuation of the tightness in the supply of labor in terms of the demand. But there were no important difficulties In increasing the armed forces as required by the services. Nor was there any restriction of munitions output due to a general labor shortage.
Shortages existed in particular labor market areas and for labor with special skills and qualifications. In the main, these shortages were handled on a local basis by means of discouraging hoarding of labor and by intensive recruitment.
The increase in the total labor force of 1.5 million in 1944 as compared with the preceding year is more than can be accounted for by the growth in population of working ages. The extra workers were drawn from school, from retirement, from unemployed housewives and from the fringes of the labor market. Of the 1.5 million increase, one million were men. With the exception of the drafting of men into the armed forces, this utilization of the Nation's manpower was achieved by voluntary inducements rather than compulsion. There was no such total mobilization of manpower as has been in effect in other warring countries.
Nevertheless, chart 15 shows that over the 4 years from 1940 to 1944 the total labor force grew by almost 10 million, or 18 percent. Of that total less than 3 million would have been added if there had bee9. no war and if economic conditions had remained as they were in 1940.
Source of Added Labor.
Chart 16 indicates the sources from which the other 7 million have been
SURVEY OF CURRENT BUSINESS
drawn. Almost 2 million are young men aged 14 to 24, most of whom have left school for military service or war work, or are managing to combine a job with continued education. One million are girls aged 14-19. More than threequarters of a million are men aged 55 and over, most of whom have postponed retirement because of wartime demands.
Over half a million men aged 25 to 54 have been drawn from the fringes of the labor market. Two and one-half million are women aged 20 and over. These are mostly married women without young children. They did not seek employment in 1940 but have been drawn into the labor market by wartime demands.
These facts must be kept in mind in viewing the post-war problem of the economy. Undoubtedly a large number of the 7 million war-induced men and women in the labor market will withdraw after the end of the war. The number that can be expected to remain is still conjectural.
However, even if all of them withdraw, the number in the market looking for jobs will be considerably higher than the average employed in civilian occupations last year at the peak of our productive effort. To these will be added each year the normal growth of the labor force of around half a million persons each year.
The Productive Plant
The production achievements in 1944 are based upon the rapid expansion of facilities which in the main had been completed in 1943. The new construction and facility additions in 1944 represent, in most instances, the finishing
Chart 15.-The Labor Force 1
MILLIONS OF PERSONS 70
GO
50
40
30
20
10
0 1939 1940 1941 1942 1943 1944 ----YEARLY AVERAGE----
ARMED FORCES
UNEMPLOYMENT
AGRICULTURAL EMPLOYMENT
NONAGRICULTURAL EMPLOYMENT
D.O. 45-43
1 Data include persons 14 years of age and over, excluding institutional population.
Sources: U. S. Department of Commerce, and U. S. War and Navy Departments.
February 1945
off touches on earlier expansion and, to a lesser extent, projects for the manufacture of new weapons and stepped-up schedules of others that became necessary in 1944.
New Construction Declines.
Since the inauguration of the defense program in July 1940, over 23 billion dollars have been spent for new manufacturing facilities. Only 3 billions of this total were spent in 1944. More than 90 percent of the expenditures in 1942 and 1943 were for munitions industries, whereas only 75 percent of the much smaller expenditures of 1944 were devoted to such purposes.
The drop in expenditures for facilities devoted directly to the war program was thus very large. On the other hand, investment in new plant and machinery for civilian type industries was maintained at the volume of the preceding war years, though this volume was comparatively low.
The bulk of 1944 construction expenditures were devoted to munitions projects begun earlier. Thus, the basic aircraft and shipbuilding facilities programs were completed and the synthetic rubber and 100 octane gasoline facilities were brought into operation. Construction of iron and steel and nonferrous metal projects which were still incomplete at the beginning of the year were either finished or terminated. However, new and expanded facilities for heavy bombers, jet-propelled planes, heavy artillery and shells, mortars and improved types of combat vehicles and landing craft, were required to meet military needs but were a relatively small part of 1944 expenditures.
The extent of the decline in new construction and plant expansion in 1944 is indicated by the drop in total expenditures from 5.8 billion dollars in 1943 to 3.0 billion in 1944 (chart 17). It is evident also in the decrease in machine tool shipments. From nearly 1.2 billion dollars in 1943, shipments fell to less than half a billion in 1944.
As a consequence of the reduction in war construction, publicly financed expenditures declined sharply in 1944 and were less than 40 percent of the 1943 amount. On the other hand, in 1944 some new equipment was made available to nonmunitions industries for the first time since 1941 and private expenditures for new facilities increased.
New investment in these industries was 150 percent higher than in 1943. The aggregate was still below that for munitions industries, however, and comprised only 25 percent of the total.
The volume of new investment for the nonmunitions group was largest in the food and kindred products category where the amount spent was comparable to pre-war totals. In the paper and paper products group, expenditures increased substantially <very little had been spent since 1941), but these were not up to pre-war figures. Textile, shoe and apparel making machinery purchases all were higher than in 1943.
By and large, the 1944 output represents a high level of utilization of the Nation's productive plant. In the case of
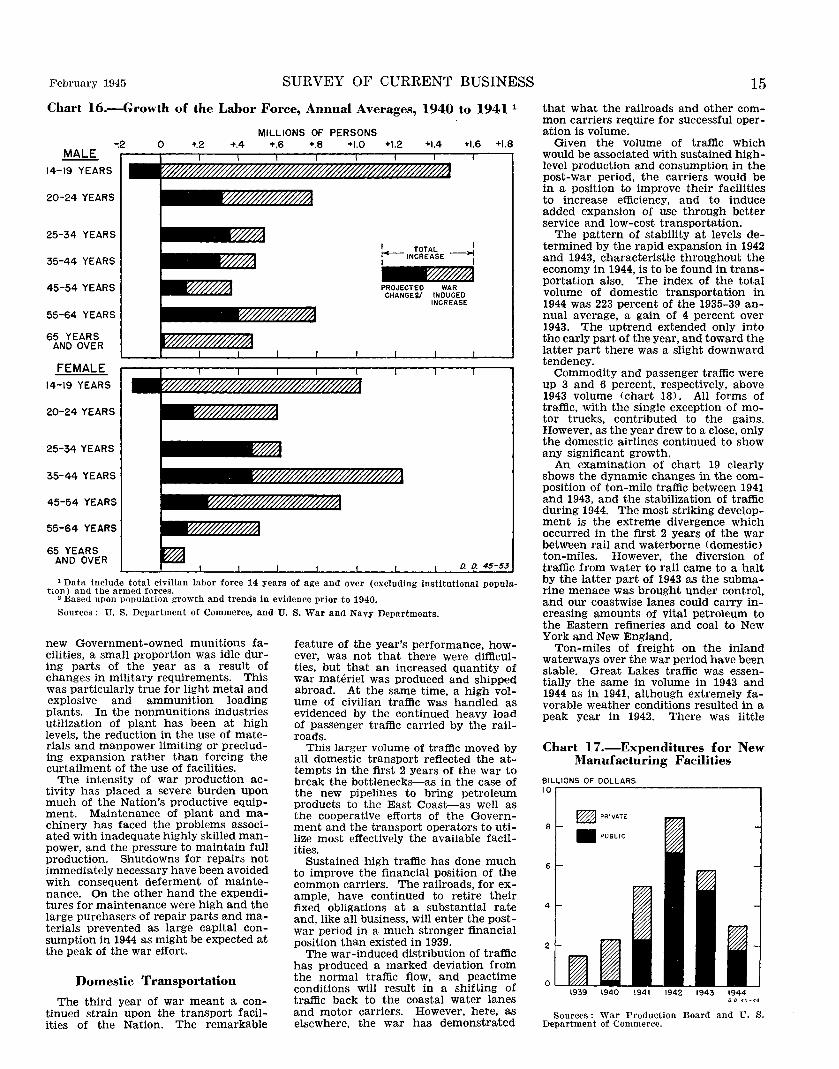
February 1945 SURVEY OF CURRENT BUSINESS
Chart 16.-Growth of the Labor Force, Annual Averages, 1940 to 1941 1
MILLIONS OF PERSONS
MALE 14-19 YEARS
-:2
20-24 YEARS
25-34 YEARS
35-44 YEARS
45-54 YEARS
55-64 YEARS
65 YEARS AND OVER
FEMALE 14-19 YEARS
20-24 YEARS
25-34 YEARS
35-44 YEARS
45-54 YEARS
55-64 YEARS
65 YEARS AND OVER
0 +.2 +.4 +.6 +.8 +1.0 +1.2 +1.4 +1.6 +1.8
I TOTAL I ~INCREASE~
PROJECTED WAR CHANGEY INDUCED
INCREASE
45-53
'Data include total civilian labor force 14 years of age and over (excluding institutional population) and the armed forces.
2 Based upon population growth and trends in evidence prior to 1940.
Sources: U. S. Department of Commerce, and U. S. War and Navy Departments.
new Government-owned munitions facilities, a small proportion was idle during parts of the year as a result of changes in military requirements. This was particularly true for light metal and explosive and ammunition loading plants. In the nonmunitions industries utilization of plant has been at high levels, the reduction in the use of materials and manpower limiting or precluding expansion rather than forcing the curtailment of the use of facilities.
The intensity of war production activity has placed a severe burden upon much of the Nation's productive equipment. Maintenance of plant and machinery has faced the problems associated with inadequate highly skilled manpower, and the pressure to maintain full production. Shutdowns for repairs not immediately necessary have been avoided with consequent deferment of maintenance. On the other hand the expenditures for maintenance were high and the large purchasers of repair parts and materials prevented as large capital consumption in 1944 as might be expected at the peak of the war effort.
Domestic Transportation
The third year of war meant a continued strain upon the transport facilities of the Nation. The remarkable
feature of the year's performance, however, was not that there were difficulties, but that an increased quantity of war materiel was produced and shipped abroad. At the same time, a high volume of civilian traffic was handled as evidenced by the continued heavy load of passenger traffic carried by the railroads.
This larger volume of traffic moved by all domestic transport reflected the attempts in the first 2 years of the war to break the bottlenecks-as in the case of the new pipelines to bring petroleum products to the East Coast-as well as the cooperative efforts of the Government and the transport operators to utilize most effectively the available facilities.
Sustained high traffic has done much to improve the financial position of the common carriers. The railroads, for example, have continued to retire their fixed obligations at a substantial rate and, like all business, will enter the postwar period in a much stronger financial position than existed in 1939.
The war-induced distribution of traffic has produced a marked deviation from the normal traffic fiow, and peactime conditions will result in a shifting of traffic back to the coastal water lanes and motor carriers. However, here, as elsewhere, the war has demonstrated
15 that what the railroads and other common carriers require for successful operation is volume.
Given the volume of traffic which would be associated with sustained highlevel production and consumption in the post-war period, the carriers would be in a position to improve their facilities to increase efficiency, and to induce added expansion of use through better service and low-cost transportation.
The pattern of stability at levels determined by the rapid expansion in 1942 and 1943, characteristic throughout the economy in 1944, is to be found in transportation also. The index of the total volume of domestic transportation in 1944 was 223 percent of the 1935-39 annual average, a gain of 4 percent over 1943. The uptrend extended only into the early part of the year, and toward the latter part there was a slight downward tendency.
Commodity and passenger traffic were up 3 and 6 percent, respectively, above 1943 volume <chart 18). All forms of traffic, with the single exception of motor trucks, contributed to the gains. However, as the year drew to a close, only the domestic airlines continued to show any significant growth.
An examination of chart 19 clearly shows the dynamic changes in the composition of ton-mile traffic between 1941 and 1943, and the stabilization of traffic during 1944. The most striking development is the extreme divergence which occurred in the first 2 years of the war between rail and waterborne <domestic) ton-miles. However, the diversion of traffic from water to rail came to a halt by the latter part of 1943 as the submarine menace was brought under control, and our coastwise lanes could carry increasing amounts of vital petroleum to the Eastern refineries and coal to New York and New England.
Ton-miles of freight on the inland waterways over the war period have been stable. Great Lakes traffic was essentially the same in volume in 1943 and 1944 as in 1941, although extremely favorable weather conditions resulted in a peak year in 1942. There was little
Chart 17.-Expenditures for New Manufacturing Facilities
BILLIONS OF DOLLARS 10
8
6
4
2
~PRIVATE
• PUBLIC
0.0 45-44
Sources: War Production Board and U. S. Department of Commerce.
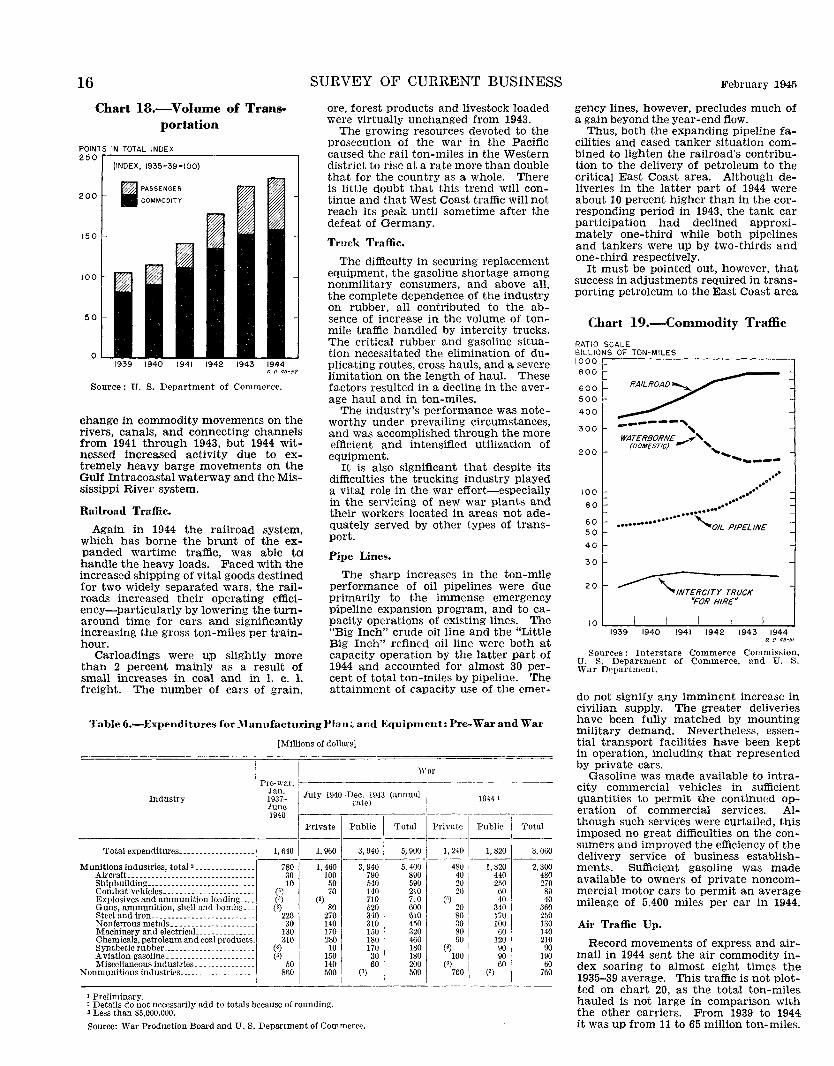
16
Chart 18.-Volume of Transportation
POINTS IN TOTAL INDEX 250
200
150
100
50
0
(INDEX, 1935-39=100)
I PASSENGER
COMMODITY
1939 1940 1941 1942 1943 1944 IJ. 0 4~-52
Source : U. S. Department of Commerce.
change in commodity movements on the rivers, canals, and connecting channels from 1941 through 1943, but 1944 witnessed increased activity due to extremely heavy barge movements on the Gulf Intracoastal waterway and the Mississippi River system.
Railroad Traffic.
Again in 1944 the railroad system, which has borne the brunt of the expanded wartime traffic, was able t~ handle the heavy loads. Faced with the increased shipping of vital goods destined for two widely separated wars, the railroads increased their operating efficiency-particularly by lowering the tumaround time for cars and significantly increasing the gross ton-miles per trainhour.
Carloadings were u;p slightly more than 2 percent mainly as a result of small increases in coal and in 1. c. 1. freight. The number of cars of grain,
SURVEY OF CURRENT BUSINESS
ore, forest products and livestock loaded were virtually unchanged from 1943.
The growing resources devoted to the prosecution of the war in the Pacific caused the rail ton-miles in the Western district to rise at a rate more than double that for the country as a whole. There is little doubt that this trend will continue and that West Coast traffic will not reach its peak until sometime after the defeat of Germany.
Truck Traffic.
The difficulty in securing replacement equipment, the gasoline shortage among nonmilitary consumers, and above all, the complete dependence of the industry on rubber, all contributed to the absence of increase in the volume of tonmile traffic handled by intercity trucks. The critical rubber and gasoline situation necessitated the elimination of duplicating routes, cross hauls, and a severe limitation on the length of haul. These factors resulted in a decline in the average haul and in ton-miles.
The industry's performance was noteworthy under prevailing circumstances, and was accomplished through the more efficient and intensified utilization of equipment.
It is also significant that despite its difficulties the trucking industry played a vital role in the war effort-especially in the servicing of new war plants and their workers located in areas not adequately served by other types of transport.
Pipe Lines.
The sharp increases in the ton-mile performance of oil pipelines were due primarily to the immense emergency pipeline expansion program, and to capacity operations of existing lines. The "Big Inch" crude oil line and the "Little Big Inch" refined oil line were both at capacity operation by the latter part of 1944 and accounted for almost 30 percent of total ton-miles by pipeline. The attainment of capacity use of the emer-
Table 6.-Expenditures for :Manufacturing Plan~ and Equipment: Pre-War and War
[Millions of dollars]
'I I Wu Pre-war, I
I {9a3~~ I July 1940-Dec. 1943 (annual \ 1944 1 I June rate) I
1940 -------------
Industry
! Private Public Total I Private I Public II Total
Totalexpenaitures _____________ ~=-~~~~~--~~~~r~~ Munitions industries, total'--------------- ----;:sQ ~ ~ -5, 400,---480-~"1,820~--2,300
~~~i~t~i~~~;~;~::::::::::::::::::::::l <'J8 1
~8 m ~~z ~8 , ~!z ~Is Explosives and ammunition loading____ (') (') 710 710 (3) 40 I 40
~t~l\~:f~~i:=~~:_s_~~l!_~n~-~-o-~-~~:::1 (')220 2~g ~~g ~~g ~g I ~i& I ~~g Nonferrousmetals _____________________
1
30 140 310 450 30 100 130 Machinery and electricaL_____________ 130 170 150 320 80 60 ' 140 Chemicals, petroleum and coal products. 310 280 180 460 90 I 120 ' 210 Syntheticrubber .•. --------------------~ (') 10 170 180 (') 90 90 Aviation gasoline ___________________ ... (') 150 30 180 100 90 190 Miscellaneousindustries_______________ 50 140 60 200 (3) 60 60
Nonmunitionsindustrics ___________________ 1
860 500 I (') 500 760, (') 760
1 Preliminary. ' Details do not necessarily add to totals because of rounding. • Less than $5,000,000.
Source: War Production Boud and U.S. Department of Commerce.
February 1945
gency lines, however, precludes much of a gain beyond the year-end flow.
Thus, both the expanding pipeline facilities and eased tanker situation combined to lighten the railroad's contribution to the delivery of petroleum to the critical East Coast area. Although deliveries in the latter part of 1944 were about 10 percent higher than in the corresponding period in 1943, the tank car participation had declined approximately one-third while both pipelines and tankers were up by two-thirds and one-third respectively.
It must be pointed out, however, that success in adjustments required in transporting petroleum to the East Coast area
Chart 19.-Commodity Traffic
RI\TIO SCALE BILLIONS OF TON-MILES 1000 800
600 ~ 500
400
300
200
______ ,, WATERBORNE_.,.,,,
(DOMESTIC) '-.... -------100
80 ······ ·········· ... .. ..
.. .. ..
60 50
40
······· '-•••••••• 'oiL PIP£L/N£
30
20~ "FOR HIRE"
0. 0 45-51
Sources: Interstate Commerce Commission, U. S. Department of Commerce, and U. S. War Department.
do not signify any imminent increase in civilian supply. The greater deliveries have been fully matched by mounting military demand. Nevertheless, essential transport facilities have been kept in operation, including that represented by private cars.
Gasoline was made available to intracity commercial vehicles in sufficient quantities to permit the continued operation of commercial services. Although such services were curtailed, this imposed no great difficulties on the consumers and improved the efficiency of the delivery service of business establishments. Sufficient gasoline was made available to owners of private noncommercial motor cars to permit an average mileage of 5,400 miles per car in 1944.
Air Traffic Up.
Record movements of express and airmail in 1944 sent the air commodity index soaring to almost eight times the 1935-39 average. This traffic is not plotted on chart 20, as the total ton-miles hauled is not large in comparison with the other carriers. From 1939 to 1944 it was up from 11 to 65 million ton-miles.
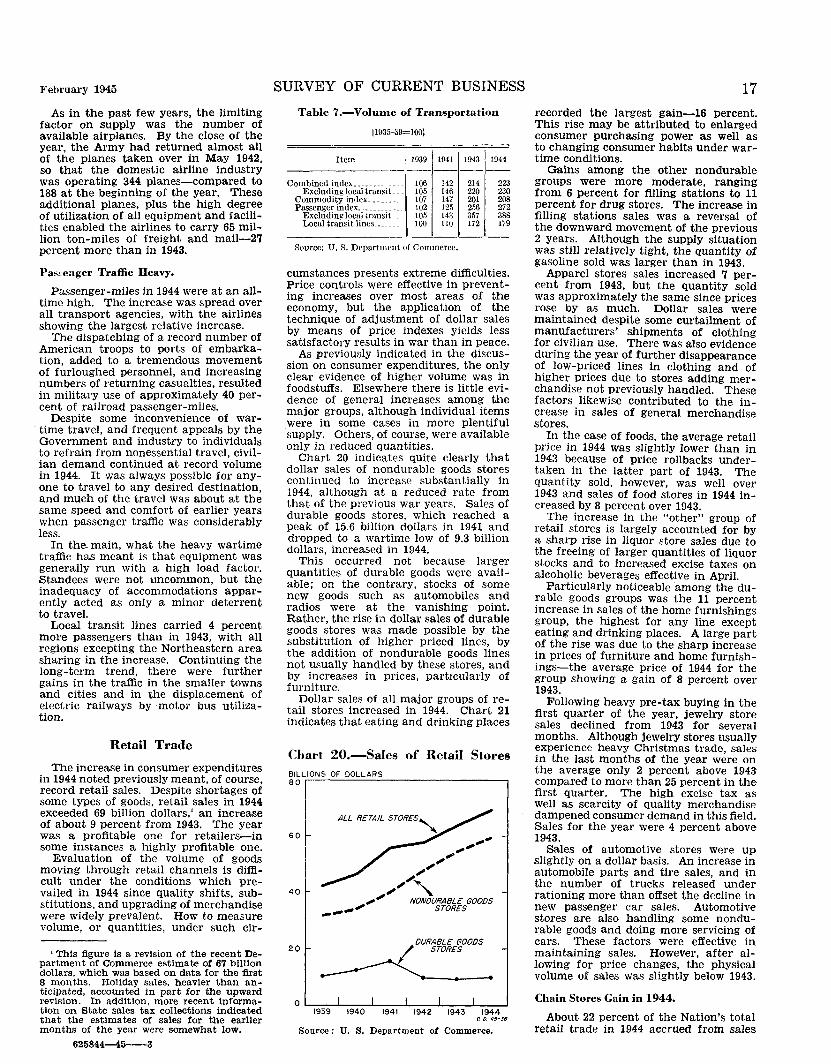
February 1945
As in the past few years, the limiting factor on supply was the number of available airplanes. By the close of the year the Army had returned almost all of the planes taken over in May 1942, so that the domestic airline industry was operating 344 planes-compared to 188 at the beginning of the year. These additional planes, plus the high degree of utilization of all equipment and facilities enabled the airlines to carry 65 million ton-miles of freight and mail-27 percent more than in 1943.
Pas,enger Traffic Heavy.
Passenger-miles in 1944 were at an alltime high. The increase was spread over all transport agencies, with the airlines showing the largest relative increase.
The dispatching of a record number of American troops to ports of embarkation added to a tremendous movement of f~rloughed personnel, and increasing numbers of returning casualties, resulted in military use of approximately 40 percent of railroad passenger-miles.
Despite some inconvenience of war-. time travel, and frequent appeals by the Government and industry to individuals to refrain from nonessential travel, civilian demand continued at record volume in 1944. It was always possible for anyone to travel to any desired destination, and much of the travel was about at the same speed and comfort of earlier years when passenger traffic was considerably less.
In the. main, what the heavy wartime traffic has meant is that equipment was generally run with a high load factor. Standees were not uncommon, but the inadequacy of accommodations apparently acted as only a minor deterrent to travel.
Local transit lines carried 4 percent more passengers than in 1943, with all regions excepting the Northeastern area sharing in the increase. Continuing the long-term trend, there were further gains in the traffic in the smaller towns and cities and in the displacement of electric railways by motor bus utilization.
Retail Trade
The increase in consumer expenditures in 1944 noted previously meant, of course, record retail sales. Despite shortages of some types of goods, retail sales in 1944 exceeded 69 billion dollars/ an increase of about 9 percent from 1943. The year was a profitable one for retailers-in some instances a highly profitable one.
Evaluation of the volume of goods moving through retail channels is difficult under the conditions which prevailed in 1944 since quality shifts, substitutions, and upgrading of merchandise were widely prevalent. How to measure volume, or quantities, under such cir-
1 This figure is a revision of the recent Department of Commerce estimate of 67 billion dollars, which was based on data for the first 8 months. Holiday sales, heavier than anticipated, accounted in part for the upward revision. In addition, more recent information on State sales tax collections indicated that the estimates of sales for the earlier months of the year were somewhat low.
625844-45-3
SURVEY OF CURRENT BUSINESS
Table 7.-Volume of Transportation
[1935-39=100]
Item 1939 1941 1943 1944
------------------Combined index _____________ 106 142 214 223
Excluding local transit. __ 105 146 220 230 Commodity index. ________ 107 147 201 208 Passenger index ____________ 102 125 256 272 Excludin~ local tr~nsit __ 105 143 357 388 Local transit lines ________ 100 110 172 179
Source: U. S. Department of Commerce.
cumstances presents extreme difficulties. Price controls were effective in preventing increases over most areas of the economy, but the application of the technique of adjustment of dollar sales by means of price indexes yields less satisfactory results in war than in peace.
As previously indicated in the discussion on consumer expenditures, the only clear evidence of higher volume was in foodstuffs. Elsewhere there is little evidence of general increases among the major groups, although individual items were in some cases in more plentiful supply. Others, of course, were available only in reduced quantities.
Chart 20 indicates quite clearly that dollar sales of nondurable goods stores continued to increase substantially in 1944, although at a reduced rate from that of the previous war years. Sales of durable goods stores, which reached a peak of 15.6 billion dollars in 1941 and dropped to a wartime low of 9.3 billion dollars, increased in 1944.
This occurred not because larger quantities of durable goods were available; on the contrary, stocks of some new goods such as automobiles and radios were at the vanishing point. Rather, the rise ia dollar sales of durable goods stores was made possible by the substitution of higher priced lines, by the addition of nondurable goods lines not usually handled by these stores, and by increases in prices, particularly of furniture.
Dollar sales of all major groups of retail stores increased in 1944. Chart 21 indicates that eating and drinking places
Chart 20.-Sales of Retail Stores BILLIONS OF DOLLARS 80
60
;" ;"
,, ,,
40 ,."""" ,, NONOURABL£ GOODS -~ STORES --
20
0 L-19_3_9-L----~--~~~~~~~1=9744~ () (). 45-J6
Source : U. S. Department of Commerce.
17 recorded the largest gain-16 percent. This rise may be attributed to enlarged consumer purchasing power as well as to changing consumer habits under wartime conditions.
Gains among the other nondurable groups were more moderate, ranging from 6 percent for filling stations to 11 percent for drug stores. The increase in filling stations sales was a reversal of the downward movement of the previous 2 years. Although the supply situation was still relatively tight, the quantity of gasoline sold was larger than in 1943.
Apparel stores sales increased 7 percent from 1943, but the quantity sold was approximately the same since prices rose by as much. Dollar sales were maintained despite some curtailment of manufacturers' shipments of clothing for civilian use. There was also evidence during the year of further disappearance of low-priced lines in clothing and of higher prices due to stores adding merchandise not previously handled. These factors likewise contributed to the increase in sales of general merchandise stores .
In the case of foods, the average retail price in 1944 was slightly lower than in 1943 because of price rollbacks undertaken in the latter part of 1943. The quantity sold, however, was well over 1943 and sales of food stores in 1944 increased by 8 percent over 1943.
The increase in the "other" group of retail stores is largely accounted for by a sharp rise in liquor store sales due to the freeing of larger quantities of liquor stocks and to increased excise taxes on alcoholic beverages effective in April.
Particularly noticeable among the durable goods groups was the 11 percent increase in sales of the home furnishings group, the highest for any line except eating and drinking places. A large part of the rise was due to the sharp increase in prices of furniture and home furnishings-the average price of 1944 for the group showing a gain of 8 percent over 1943.
Following heavy pre-tax buying in the first quarter of the year, jewelry store sales declined from 1943 for several months. Although jewelry stores usually experience heavy Christmas trade, sales in the last months of the year were on the average only 2 percent above 1943 compared to more than 25 percent in the first quarter. The high excise tax as well as scarcity of quality merchandise dampened consumer demand in this field. Sales for the year were 4 percent above 1943.
Sales of automotive stores were up slightly on a dollar basis. An increase in automobile parts and tire sales, and in the number of trucks released under rationing more than offset the decline in new passenger car sales. Automotive stores are also handling some nondurable goods and doing more servicing of cars. These factors were effective in maintaining sales. However, after allowing for price changes, the physical volume of sales was slightly below 1943.
Chain Stores Gain in 1944.
About 22 percent of the Nation's total retail trade in 1944 accrued from sales
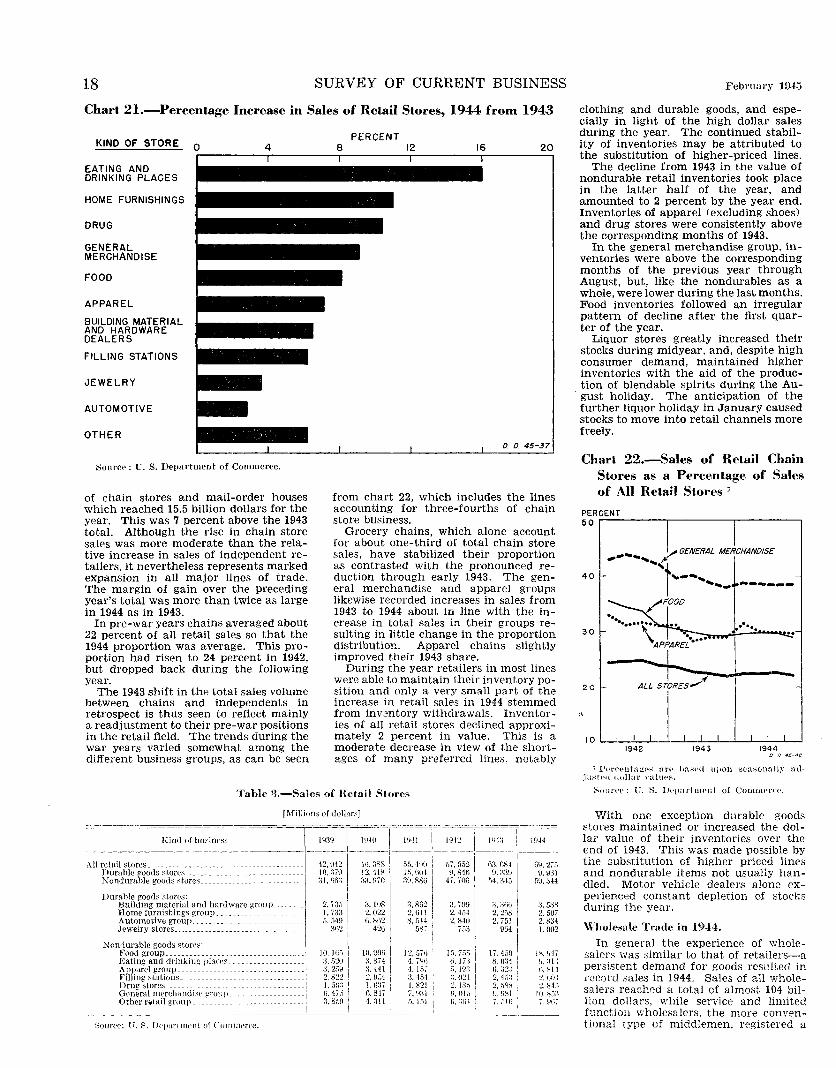
18 SURVEY OF CURRENT BUSINESS
Chart 21.-Percentage Increase in Sales of Retail Stores, 1944 from 1943
Som·c~: U. S. D~partment of Commerce.
of chain stores and mail-order houses which reached 15.5 billion dollars for the year. This was 7 percent above the 1943 total. Although the rise in chain store sales was more moderate than the relative increase in sales of independent retailers, it nevertheless represents marked expansion in all major lines of trade. The margin of gain over the preceding year's total was more than twice as large in 1944 as in 1943.
In pre-war years chains averaged about 22 percent of all retail sales so that the 1944 proportion was average. This proportion had risen to 24 percent in 1942, but dropped back during the following year.
The 1943 shift in the total sales volume between chains and independents in retrospect is thus seen to reflect mainly a readjustment to their pre-war positions in the retail field. The trends during the war years va1·ied somewhat among the different business groups, as can be seen
PERCENT 8 12 16 20
0. 0.. 45-37
from chart 22, which includes the lines accounting for three-fourths of chain store business.
Grocery chains, which alone account for about one-third of total chain store sales, have stabilized their proportion as contrasted with the pronounced reduction through early 1943. The general merchandise and apparel groups likewise recorded increases in sales from 1943 to 1944 about in line with the increase in total sales i:1 their groups resulting in little change in the proportion distribution. Apparel chains slightly improved their 1943 share.
During the year retailers in most lines were able to maintain their inventory position and only a very small part of the increase in retail sales in 1944 stemmed from inventory withdrawals. Inventories of all retail stores declined approximately 2 percent in value. This is a moderate decrease in view of the shortages of many preferred lines, notably
Table ll.-Sales of Retail Stores
[Millions of dollors] _-__:-: ---=~- -- _-..=_-::_-==-~-~-=------ ----
Kind of husine~s 1939 1 H~:! uq:l ~ HJ.!4
~~~~::~::;~~~~~~~~~~~~~~~~~~~ -t~~. ;.·l·~.-g3~--~~~~ -~~"~5. ·. f,··r-';~1, ~-~~ "~; -~~. ~.!s.'~~~--~~; Durable goods stores______________________________ '2.418 \<,g!f\ """ D.9:ll l\'ondurablegoodsstores __________________________
1
3l,fili:J :J:l.\170 3".88u I 47./0G 54,:J-l5 f>V.344
Durable goods ston•s: I [. i Buildi~g ~atl:rial ~nd hardwarC' group _______ -~ 2. 'i:~.i i :1. lOS :3, 8G:2 , :~. 'iUU :{, ;)t~G I :), 0BS HomelurniShingsgroup______________________ 1.1:n 1 2.022 2.till i 2.4114 2,2;>~ 2,5Ui Automotive group____________________________ 5.549 I fi,BI\2 ~,;,q 2.X40 2. 75! 2.8:J4 Jewelry stores _________________________________ ! :J<;~ [' 42u 5s;: /.o:J 964 1[ 1.002
Non•lurable goods ston•s: 1
Food group _______________ ----------------·~:I lO.IOt> 1 UUJOF; 12,Q/'~ j I:i,/fi5 li.450 i ~ating fnd drinking plaecs_ _ __
1 ~!: ;~\! ! :1. ~74 4. 1 .-Jt, , ~: g;1 ~. 0:1-4 i
FRii~~~sl~~~~l:s- ::::: __ : ____ :: ·:: 2.s22 1 ~:!l~l tm i :um U?.:l: Drugstores_______________________ l 1.51/:{! 1,n:r1 1.~21 1 :Z.l8.1) 2,.18::s i Gt•neralmC'rchaudisl'group ----------] li.4'i.1 i fJ.81'i 1.~-1:n! !i,Ol:l ~J.\:Jt-:1 Other r~lail group_ ------------- -' ;), 8.SH : 4. :3} 1 fl. L}l I n, :)ti-l 'i. [Jlf) !
t.:louree; ll. S. Dt·parlment of ('ommerce.
l~">,tdi ~ j' :{ 1-l H. Hl1 2, ()t)4
2, R-l.i 10. ~;"');)
February 194;3
clothing and durable goods, and especially in light of the high dollar sales during the year. The continued stability of inventories may be attributed to the substitution of higher-priced lines.
The decline from 1943 in the value of nondurable retail inventories took place in the latter half of the year, and amounted to 2 percent by the year end. Inventories of apparel (excluding shoes) and drug stores were consistently above the corresponding months of 1943.
In the general merchandise group, inventories were above the corresponding months of the previous year through August, but, like the nondurables as a whole, were lower during the last months. Food inventories followed an irregular pattern of decline after the first quarter of the year.
Liquor stores greatly increased their stocks during midyear, and, despite high consumer demand, maintained higher inventories with the aid of the production of blendable spirits during the August holiday. The anticipation of the further liquor holiday in January caused stocks to move into retail channels more freely.
Chart 22.-Sales of Retail Chain Stores as a Percentage of Sales of All Retail Stores 1
PERCENT 50
,_..,. /GENERAL MERCHANDISE
40 , ......... ,t .... -...... ...... _ /FOOD
30
20 -
P 0 45-4C
1 l't•r<·<·nta:.!;p:-:; an• ha!-wd lli)Oll ~ea:->onn1lr :.u1-ju:-:tP4l dollar yalth-'~.
~ouree: C. S. IJpparhHPHt of Comnwrcr.
With one exception durable goods stores maintained or increased the dollar value of their inventories over the end of 1943. This was made possible by the substitution of higher priced lines and nondurable items not usually handled. Motor vehicle dealers alone experienced constant depletion of stocks during the year.
\Vholesale Tnule in 1944.
In general the experience of wholesalers was similar to that of retailers-a persistent demand for goods resdted in record sales in 1944. Sales of all \liholesalers reached a total of almost 104 billion dollars, while service and limited function wholesalers, the more conventi.onal type of middlemen, registered a
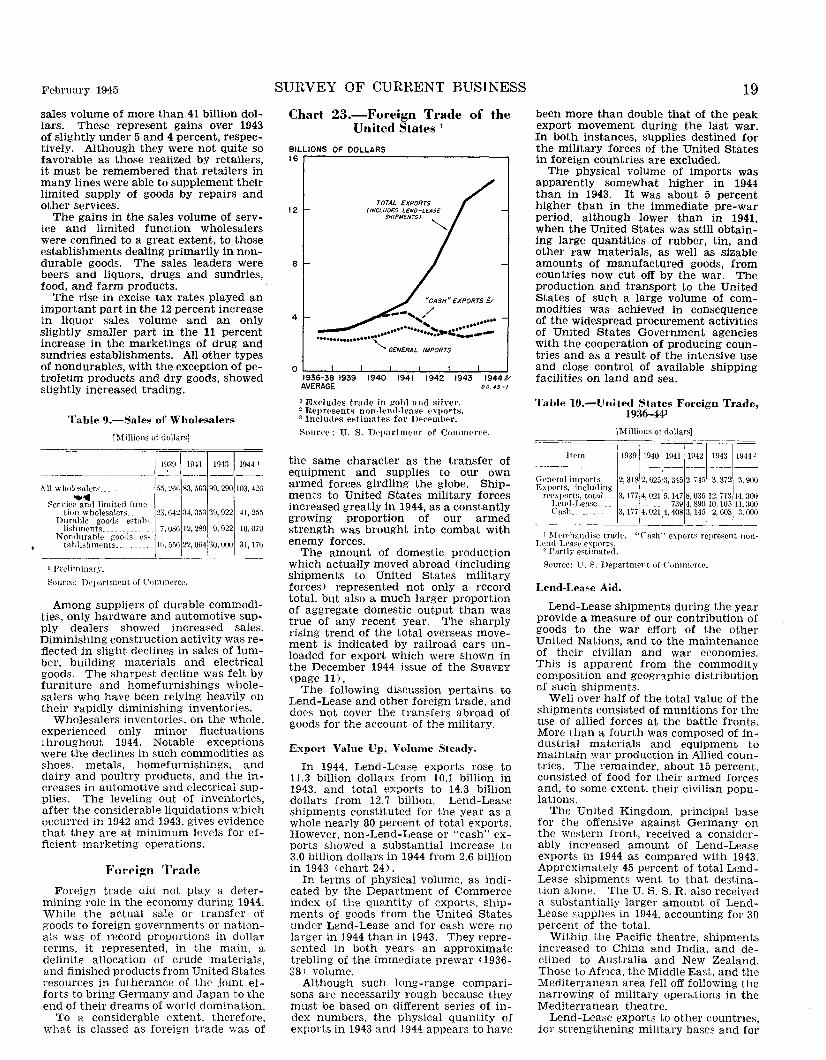
February 1945
sales volume of more than 41 billion dollars. These represent gains over 1943 of slightly under 5 and 4 percent, respectively. Although they were not quite so favorable as those realized by retailers, it must be remembered that retailers in many lines were able to supplement their limited supply of goods by repairs and other services.
The gains in the sales volume of service and limited function wholesalers were confined to a great extent, to those establishments dealing primarily in nondurable goods. The sales leaders were beers and liquors, drugs and sundries, food, and farm products.
The rise in excise tax rates played an important part in the 12 percent increase in liquor sales volume and an only slightly smaller part in the 11 percent increase in the marketings of drug and sundries establishments. All other types of nondurables, with the exception of petroleum products and dry goods, showed slightly increased trading.
Table 9.-Sales of Wholesalers
[Millions of dollarg]
- --
IJ9:l9 1941 1943 1944 I
--------------- _ _:__ --- --- ----
All wholc>salers_________ _ f.5,2Hfi ~3 • .163H9,290 103,426 "'Il 'Ill
Service and limited func-tion wholesalers _ 23. fi42 :J4, 35:l 39,922 41,255
Durable goods estab-lishmpnts __________ - _
Nondurable goods ps~ tahlishments __
t Prc·liminary.
7, 08(ill2, 289 9. 922 10,079
If\, 5!i0 22, 004 30, OOOI 31, 17G
Ron ret•: Dt.'partment of Commt•rce.
Among suppliers of durable commodities, only hardware and automotive supply dealers showed increased sales. Diminishing construction activity was reflected in slight declines in sales of lumber, building materials and electrical goods. The sharpest decline was felt by furniture and homefurnishings wholesalers who have been relying heavily on their rapidly diminishing inventories.
Wholesalers inventories, on the whole, experienced only minor fluctuations Lhroughout 1944. Notable exceptions were the declines in such commodities as shoes, metals, homefurnishings, and dairy and poultry products, and the increases in automotive and electrical supplies. The leveling out of inventories, after the considerable liquidations which occurred in 1942 and 1943, gives evidence that they are at minimum levels for efficient marketing operations.
Foreign Trade
Foreign trade did not play a determining role in the economy during 1944. While the actual sale or transfer of goods to foreign governments or nationals was of record proportions in dollar terms, it represented, in the main, a definite allocation of crude materials, and finished products from United States resources in futherance of the joint e±forts to bring Germany and Japan to the end of their dreams of world domination.
To a consider~ble extent, therefore, what is classed as foreign trade was of
SURVEY OF CURRENT BUSINESS
Chart 23.-Foreign Trade of the United States 1
BILLIONS OF DOLLARS 16
12
8
4
TOTAL EXPORTS (INCLUDES LEND-LEASE
SHIPMENTS)
"-...
"CASH" £XPORTS !./ .. -, / .... "", .......... . ··•······ ..... ::-.... ..:.:..., .... ... ················' GENERAL IMPORTS
0 ~--~--~----~--~--~--~--~ 1936-38 1939 1940 1941 1942 1943 1944£!/ AVERAGE DO 45 -I
1 Excludes trade in gohl and silver. 'Repr<•sents non-lend-leas(• pxport~. 3 Includes estimates for Dt•eember.
Source: U. S. Department of Commerce.
the same character as the transfer of equipment and supplies to our own armed forces girdling the globe. Shipments to United States military forces increased greatly in 1944, as a constantly growing proportion of our armed strength was brought into combat with enemy forces.
The amount of domestic production which actually moved abroad (including shipments to United States military forces) represented not only a record total, but also a much larger proportion of aggregate domestic output than was true of any recent year. The sharply rising trend of the total overseas movement is indicated by railroad cars unloaded for export which were shown in the December 1944 issue of the SURVEY (page 11).
The following discussion pertains to Lend-Lease and other foreign trade, and does not cover the transfers abroad of goods for the account of the military.
Expm·t Value Up, Volume Steady.
In 1944, Lend-Lease exports rose to 11.3 billion dollars from 10.1 billion in 1943, and total exports to 14.3 billion dollars from 12.7 billion. Lend-Lease shipments constituted for the year as a whole nearly 80 percent of total exports. However, non-Lend-Lease or "cash" exports showed a substantial increase to 3.0 billion dollars in 1944 from 2.6 billion in 1943 t chart 24).
In terms of physical volume, as indicated by the Department of Commerce index of the quantity of exports. shipments of goods from the United States under Lend-Lease and for cash were no larger in 1944 than in 1943. They represented in both years an approximate trebling of the immediate prewar (1936-38) volume.
Although such long-range comparisons are necessarily rough because they must be based on different series of index numbers, the physical quantity of exports in 1943 and 1944 appears to have
19
been more than double that of the peak export movement during the last war. In both instances, supplies destined for the military forces of the United States in foreign countries are excluded.
The physical volume of imports was apparently somewhat higher in 1944 than in 1943. It was about 5 percent higher than in the immediate pre-war period, although lower than in 1941, when the United States was still obtaining large quantities of rubber, tin, and other raw materials, as well as sizable amounts of manufactured goods, from countries now cut off by the war. The production and transport to the United States of such a large volume of commodities was achieved in consequence of the widespread procurement activities of United States Government agencies with the cooperation of producing countries and as a result of the intensive use and close control of available shipping facilities on land and sea.
Table 10.-United States Foreign Trade, 1936-441
[Millions of dollars]
__ _!~: ____ .::39 t.::~-1_::_4_1_1_::42 ~~~ .~~~ General imports. ___ 2, 318 2. 625
1
3, 34,) 2, 74fi 3. 372 3, 900 Exports, including I
reexp?rts, ,totaL __ 3, 177 4, 021 5, 147 8, 035
1
12, 713
1
14, ?OO Lei.d-Lcase __________ -----~ 7394.89010,10511,300 Cash ____________ 3,177 4.0214,4083,145 2,-~~_:~
I 1If'rchandise trade. "Cash" exports represent nonLend-Lease exports.
z Partly e~timated.
Source: U.S. Dcpartme11t of \omnwrce.
Lend.Lease Aid.
Lend-Lease shipments during the year provide a measure of our contribution of goods to the war effort of the other United Nations, and to the maintenance of their civilian and war economies. This is apparent from the commodity composition and geographic distribution of such shipments.
Well over half of the total value of the shipments consisted of munitions for the use of allied forces at the battle fronts. More than a fourth was composed of industrial materials and equipment to maintain war production in Allied countries. The remainder, about 15 percent, consisted of food for their armed forces and, to some extent, their civilian populations.
The United Kingdom, principal base for the offensive against Germany on the western front, received a considerably increased amount of Lend-Lease exports in 1944 as compared with 1943. Approximately 45 percent of total LendLease shipments went to that destination alone. The U. S. S. R. also received a substantially larger amount of LendLease supplies in 1944, accounting for 30 percent of the total.
Within the Pacific theatre, shipments increased to China and India, and declined to Australia and New Zealand. Those to Africa, the Middle East, and the Mediterranean area fell off following the narrowing of military operations in the Mediterranean theatre.
Lend-Lease exports to other countries, for strengthening military bases and for
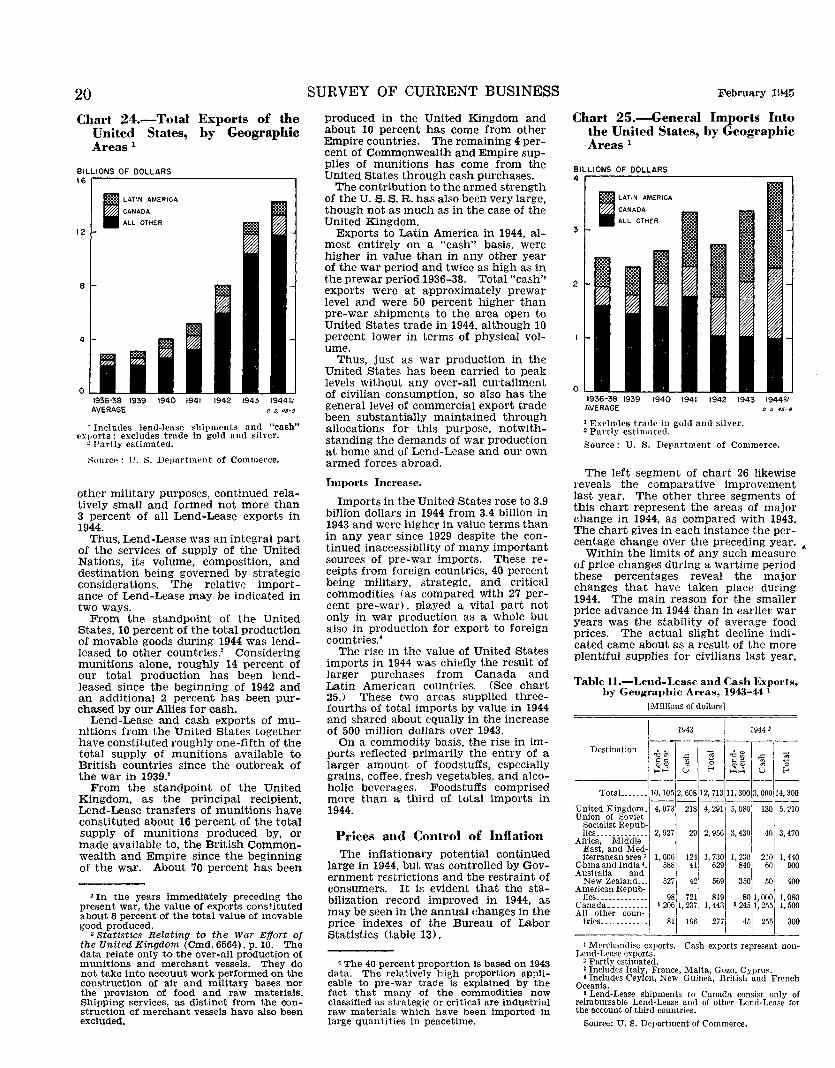
20
Chart 24.-Total Exports of the United States, by Geographic Areas 1
BILLIONS OF DOLLARS 16
12
B
4
0
I LATIN AMERICA
CANADA
ALL OTHER
1936·38 1939 1940 1941 1942 1943 1944Y AVERAGE o. o. 45·9
1 Includes lend-lease shipments and "cash" exports; excludes trade in gold and silver.
"Partly estimated.
Source; U. S. Departuwnt of Commerce.
other military purposes, continued relatively small and formed not more than 3 percent of all Lend-Lease exports in 1944.
Thus, Lend-Lease was an integral part of the services of supply of the United Nations, its volume, composition, and destination being governed by strategic considerations. The relative importance of Lend-Lease may be indicated in two ways.
From the standpoint of the United States, 10 percent of the total production of movable goods during 1944 was lendleased to other countries.' Considering munitions alone, roughly 14 percent of our total production has been lendleased since the beginning of 1942 and an additional 2 percent has been purchased by our Allies for cash.
Lend-Lease and cash exports of munitions from the United States together have constituted roughly one-fifth of the total supply of munitions available to British countries since the outbreak of the war in 1939."
From the standpoint of the United Kingdom, as the principal recipient, Lend-Lease transfers of munitions have constituted about 16 percent of the total supply of munitions produced by, or made available to, the British Commonwealth and Empire since the beginning of the war. About 70 percent has been
2 In the years immediately preceding the present war, the value of exports constituted about 8 percent of the total value of movable good produced.
3 Statistics Relating to the War Effort of the United Kingdom (Cmd. 6564), p. 10. The data relate only to the over-all production of munitions and merchant vessels. They do not take into account work performed on the construction of air and military bases nor the provision of food and raw materials. Shipping services, as distinct from the construction of merchant vessels have also been excluded.
SURVEY OF CURRENT BUSINESS
produced in the United Kingdom and about 10 percent has come from other Empire countries. The remaining 4 percent of Commonwealth and Empire supplies of munitions has come from the United States through cash purchases.
The contribution to the armed strength of the U. S. S. R. has also been very large, though not as much as in the case of the United Kingdom.
Exports to Latin America in 1944, almost entirely on a "cash'' basis, were higher in value than in any other year of the war period and twice as high as in the prewar period 1936-38. Total "cash'• exports were at approximately prewar level and were 50 percent higher than pre-war shipments to the area open to United States trade in 1944, although 10 percent lower in terms of physical volume.
Thus, just as war production in the United States has been carried to peak levels without any over-all curtailment of civilian consumption, so also has the general level of commercial export trade been substantially maintained through allocations for this purpose, notwithstanding the demands of war production at home and of Lend-Lease and our own armed forces abroad.
Imports Increase.
Imports in the United States rose to 3.9 billion dollars in 1944 from 3.4 billion in 1943 and were higher in value terms than in any year since 1929 despite the continued inaccessibility of many important sources of pre-war imports. These receipts from foreign countries, 40 percent being military, strategic, and critical commodities (as compared with 27 percent pre-war), played a vital part not only in war production as a whole but also in production for export to foreign countries!
The rise in the value of United States imports in 1944 was chiefly the result of larger purchases from Canada and Latin American countries. (See chart 25.) These two areas supplied threefourths of total imports by value in 1944 and shared about equally in the increase of 500 million dollars over 1943.
On a commodity basis, the rise in imports reflected primarily the entry of a larger amount of foodstuffs, especially grains, coffee, fresh vegetables, and alcoholic beverages. Foodstuffs comprised more than a third of total imports in 1944.
Prices and Control of Inflation The inflationary potential continued
large in 1944, but was controlled by Government restrictions and the restraint of consumers. It is evident that the stabilization record improved in 1944, as may be seen in the annual changes in the price indexes of the Bureau of Labor Statistics (table 13).
4 The 40 percent proportion Is based on 1943 data. The relatively high proportion applicable to pre-war trade is explained by the fact that many of the commodities now classified as strategic or critical are industrial raw materials which have been imported in large quantities in peacetime.
February 1945
Chart 25.-General Imports Into the United States, by Geographic Areas 1
BILLIONS OF DOLLARS 4
3
2
0
I LATIN AMERICA
CANADA
ALL OTHER
1936-38 1939 1940 1941 1942 1943 1944Y AVERAGE o o 45·8
1 Excludes trade in gold and silver. 2 Partly estimatetl. Source ; li. S. Department of Commerce.
The left segment of chart 26 likewise reveals the comparative improvement last year. The other three segments of this chart represent the areas of major change in 1944, as compared with 1943. The chart gives in each instance the percentage change over the preceding year. ""
Within the limits of any such measure of price changes during a wartime period these percentages reveal the major changes that have taken place during 1944. The main reason for the smaller price advance in 1944 than in earlier war years was the stability of average food prices. The actual slight decline indicated came about as a result of the more plentiful supplies for civilians last year,
Table 11.-Lend-Lease and Cash Exports, by Geographic Areas, 1943-44 1
[Millions of dollars]
I 1943 1944,
Destination ~~·~ ~ -~ ;-~ ~ ~ ;-~-i-~H V ~ HH 0 8
-------------------~--TotaL_._ ..• ,IO, 105 2, 608 12,713 11,300 3, oooi~· 300
United Kingdom. 4, 073 218 4, 291 5, 080 130•
1
5, 210 Union of Soviet
Socialist Repub· lies.·---·-·-··-· 2,927 29 2,956 3,430 4013,470
Africa, Middle I East, and Med· . iterranean area' I, 606 124 1, 730 I, 230 210! I, 440
Chinaandindia•_ 588' 41 629 840 60[ 900 Australia and
New Zealand___ 527 42 569 350 50) 400 American Repub·
lies_____________ 98 721 819 801,0001
1,080 Canada .. ________ '2061,237 1,443 '245.1,255! 1,500
Altl . otber conn· 81 96 2-,71 4 I I 300 nes._ .......... 1 I 5I 255!
' Merchandise exports. Cash exports represent non· Lend-Lease exports.
' Partly estimated. 3 Includes Italy, France, Malta, Gozo, Cyprus. • Includes Ceylon, New Guinea, British and French
Oceania. 'Lend-Lease shipments to Canada consist only of
reimbursable Lend·Lease and of other Lend-Lease for the account of third countries.
Source: U. S. Department of Commerce.
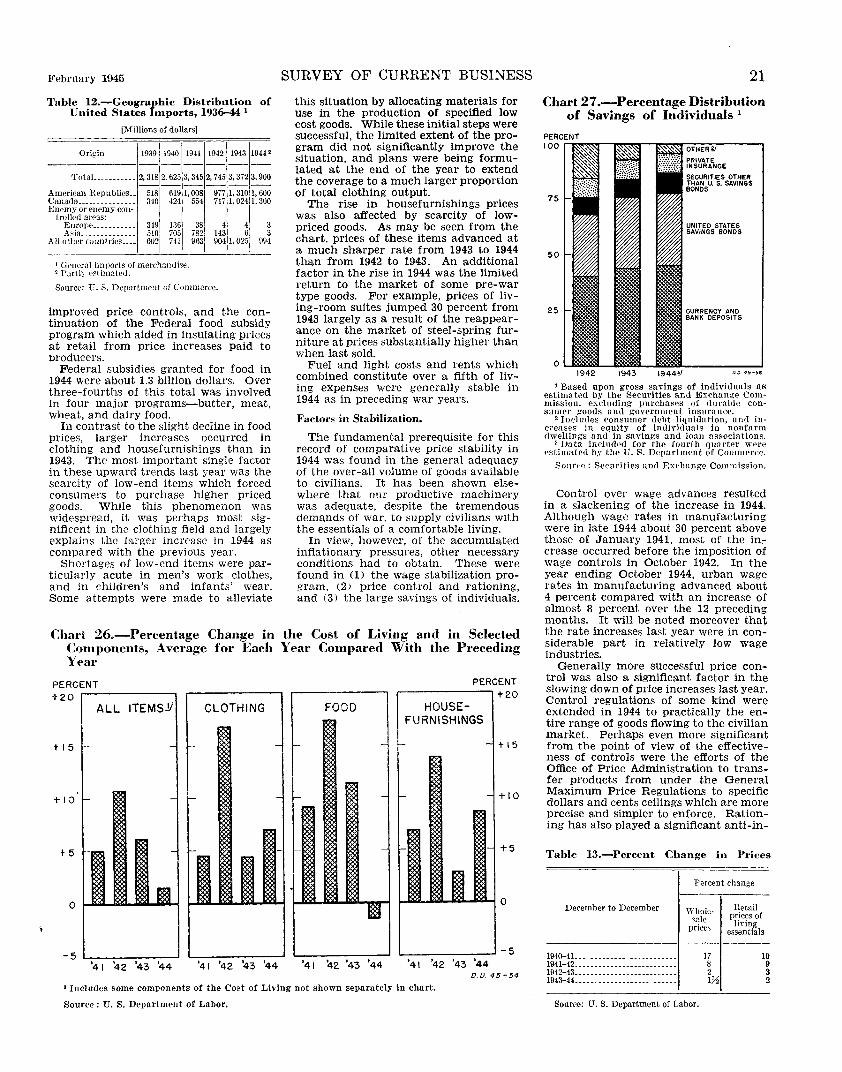
February 1945
Table 12.-Geographic Distribution of United States Imports, 1936-44 I
[Millions of dollars]
Origin 1939 1940 1941 1942 1943 1944.
TotaL _________ 2,318 2, 625 3, 345 2, 745 3, 372 3,900
American Republics __ --;Jgl(llii 1, 008 m 1, 310 1, 600 Canada_____ _________ 340 424 554 7171,0241.300 Enemy or e-nemy con- I
trolled areas: Europe___________ 349 136 38 4 4 3 Asia_ ____________ 510
1
705 782 143 6 3 All other countries____ 602 741 963 904 1, 02.5 994
----------'---'--'----___;,--'---'--
t General imports of merehandise. ' Partly estimated.
Source: l". S. Department of Commerce.
improved price controls, and the continuation of the Federal food subsidy program which aided in insulating prices at retail from price increases paid to producers.
Federal subsidies granted for food in 1944 were about 1.3 billion dollars. Over three-fourths of this total was involved in four major programs-butter, meat, wheat, and dairy food.
In contrast to the slight decline in food prices, larger increases occurred in clothing and housefurnishings than in 1943. The most important single factor in these upward trends last year was the scarcity of low-end items which forced consumers to purchase higher priced goods. While this phenomenon was widespread, it was perhaps most significent in the clothing field and largely explains the larger increase in 1944 as compared with the previous year.
Shortages of low-end items were particularly acute in men's work clothes, and in children's and infants' wear. Some attempts were made to alleviate
SURVEY OF CURRENT BUSINESS
this situation by allocating materials for use in the production of specified low cost goods. While these initial steps were successful, the limited extent of the program did not significantly improve the situation, and plans were being formulated at the end of the year to extend the coverage to a much larger proportion of total clothing output.
The rise in housefurnishings prices was also affected by scarcity of lowpriced goods. As may be seen from the chart, prices of these items advanced at a much sharper rate from 1943 to 1944 than from 1942 to 1943. An additional factor in the rise in 1944 was the limited return to the market of some pre-war type goods. For example, prices of living-room suites jumped 30 percent from 1943 largely as a result of the reappearance on the market of steel-spring furniture at prices substantially higher than when last sold.
Fuel and light costs and rents which combined constitute over a fifth of living expenses were generally stable in 1944 as in preceding war years.
Factors in Stabilization.
The fundamental prerequisite for this record of comparative price stability in 1944 was found in the general adequacy of the over-all volume of goods available to civilians. It has been shown elsewhere that our productive machinery was adequate, despite the tremendous demands of war, to supply civilians with the essentials of a comfortable living.
In view, however, of the accumulated inflationary pressures, other necessary conditions had to obtain. These were found in (1) the wage stabilization program, (2) price control and rationing, and (3) the large savings of individuals.
f:hart 26.-Percentage Change in the Cost of Living and in Selected (:omponents, Average for Each Year Compared With the Preceding Year
PERCENT +20
ALL ITEMSY
+15 t- -
+10 I- -
+5 -
0 m
-5 '41 '42 '43 '44
CLOTHING
t- -
f-- -
t-
'41 '42 '43 '44
PERCENT
FOOD
t- -
+20
~ HOUSE-FURNISHINGS-
+15
t- - 1- - +10
- +5
. I!
.__ _____ __. - 5
'41 42 '43 '44 '41 '42 '43 '44 D.O. 45-54
1 Includes some components of the Cost of Living not shown separately in chart.
Source : U. S. Department of Labor.
21 Chart 27.-Percentage Distribution
of Savings of Individuals 1
'Based upon gross savings of individuals as estimated by the Securities and Exchange Commission, excluding purchases of durable consumer goods nnd government insurance.
2 Ineludes consumer debt liquidation, and increasPs in equity of indiYhluals in nonfarm rlwellings and in sa\·ings and loan associations.
3 Data included for the fourth quarter were cstimatccluy the U.S. Department of Commerce.
!'onr~e: Sceurities anrl Exchange Commission.
Control over wage advances resulted in a slackening of the increase in 1944. Although wage rates in manufacturing were in late 1944 about 30 percent above those of January 1941, most of the in~ crease occurred before the imposition of wage controls in October 1942. In the year ending October 1944, urban wage rates in manufacturing advanced about 4 percent compared with an increase of almost 8 percent over the 12 preceding months. It will be noted moreover that the rate increases last year were in considerable part in relatively low wage industries.
Generally more successful price control was also a significant factor in the slowing down of price increases last year. Control regulations of some kind were extended in 1944 to practically the entire range of goods flowing to the civilian market. Perhaps even more significant from the point of view of the effectiveness of controls were the efforts of the Office of Price Administration to transfer products from under the General Maximum Price Regulations to specific dollars and cents ceilings which are more precise and simpler to enforce. Rationing has also played a significant anti-in-
Table 13.-Percent Change in Prices
December to December
194Q--4!_ __ --------- ------------1941--42 _________________________ _
1942-43 __ -- ----------------------1943-44 _____ ------------- ------
Percent change
Wholesale
prices
17 8 2 172
Retail prices of
living essentials
10 9 3 2
Source: U.S. Department of Labor.
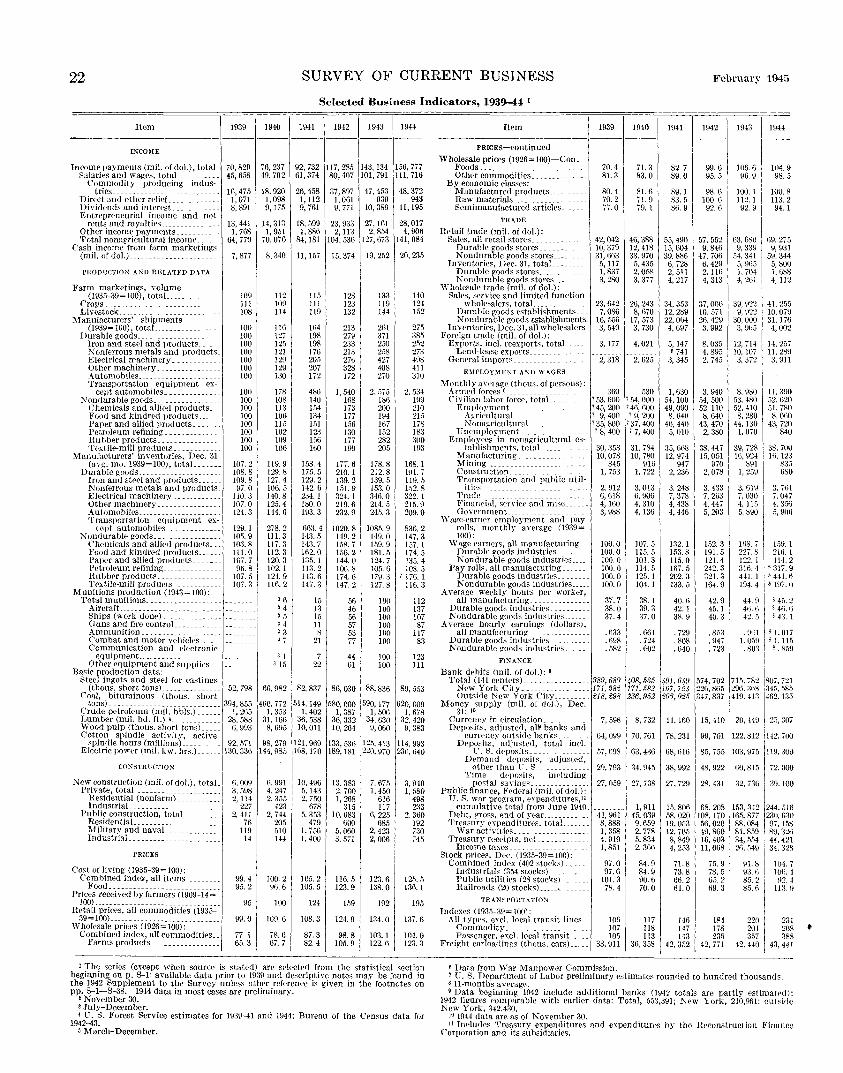
22 SURVEY OF CURRENT BUSINESS February 194::i
Selected Business Indicators, 1939-44 I
_______ u_e_m ________ ~~-~ 1941 ~~~ 1944
!XCOME
Income payments (mil. of dol.), totaL Salaries and wages, total _________ _
Commodity j)roducing indus-tries. _________________________ _
Direct and other relief. _______ .. __ _ l)ividends and intPrest ___________ _ Entrepreneurial income and net
rents and royalties __ Other income paymrnts __________ _ Total nonagricultural income ____ _
Cash income from farm marketings (mil. of dol.) _____________________ _
l'RODUCTION AND RELATED DATA
Farm marketings, volume (1935--39=100), totaL ___ _
Crops. ____ .. _._ .. _ ....... . Livestock ______________ .. __ _
Manufacturers' shipments (1939=100), totaL ___________ _
Durable goods._. _______ _ Iron and steel and products. __ C\lonferrous metals and products. Electrical machinery ___ . _ Other machinery __________ _ Automobiles ___________________ _ Transportation equipment ex-
cept automobiles_. Nondurable goods .. _____ .... _____ _
Chemicals and allied products._ Food and kindred products ___ _ Pappr and allied products __ _ Petroleum refining _____________ _ Rubber products. _____________ _ T<•xtile-mill products _____ _
lVIanufacturers' invPntories, Dec. 31 (avg. mo. !939=100), totaL _____ _
Durable goods __________________ _ Iron and steel and products. ____ _ Nonferrous metals and products. Electrical rn.achinery __________ _ Other machmery _______________ . Automobiles __________________ . Transportation equipment cx-
70,829 45,658
16,475 1,071 8, 891
13,441 1. 768
64,779
7,877
109 Ill 108
100 100 100 100 100 100 100
100
100 I 100 100 100 100 100 100
107. 2 108.8 109.8
~·· 0 110. 3 107.0 124.3
<·rpt automobilPs .............. _ 129.1 }!ondurable goods_________________ 105.9
Chemicals and allied products... 10:3.8 Food and kindred products...... 111.0 Paper and allied products.______ 1G7. 7 Petroleum refining_______________ 96.8
1
Rubber products._______________ 107. 5 Textile-mill products ____________ 107.3
M.~~mo:;su~W~~~~ti~-~_<_1::~-~-~-o~!~--- ______ _ A1rcraft. ______ ------------------ _ --------1
~':1~~ ~;;-~rilrg~~~lti-01:::::::::::: --------1 Ammunition ___ ----------------- _______ _ Combat ami motor vehicles_. ___ _ Communication and electronic
equipment ___________________________ _ Other equipment and supplies ___ .. _____ _
Basic production data: Steel ingots aud step! for castings
(thous. short tons) _______________ 52.798 Coal, bituminous (thous. short
c:~:J~l iJei;oieum -<lilii.-i)l)l8:)~:::::\39f: ~g~ Lumber (mil. hd. ft.) •------------- 28.588 Wood pulp (thous. short tons) ____ . 6, 993 Cotton spind1e activity, active
spindle hours (millions) __________ 92,571 Electric pow<'r (mil. kw. hrs.) ______ 130,336
CONSTRCCTIO~
New construetion (mil. of dol.), totaL Private, total ____________________ _
Residential (nonfarm) __________ _ Industrial._. ________________ _
l'ublie construction, totaL ..... __ _ ResidentiaL ____________________ _ Military and navaL ... _________ _ Industrial. __ ---------------
PRICES
Cost of living (1935-39= 100): Combined index, all items
Food .... _______________________ _ Prices received by farmers (1909-14=
100). ______________________________ _ Retail prices, all commodities (1935--
39= 100) ---------------------------Wholesale prices (1926= 100):
Combined index, all commoditips __ Farms products. __ --------------
6,009 3. 598 2, 114
227 2. 411
76 119 14
99.4 95.2
95
99.0
77. 1 65.3
76, 237 49,702
92, 732 117, 285 143, 134 1156, 777 61,374 80,407 101,791 Ill, 716
18,920 1.098 9,175
26,458 I. Jl2 9, 761
37,897 1,061 9, 771
47, 453 939
10,389
48,372 943
11, 195
14,313 18,.199 23.933 27, H\1 28,017 I, 951
70. 076 I, 886 2, 113 2, 854 4, 906
84, 181 104.536 127,673 141,084
8, 340 11, !57 15,374 19, 2.>2 20,235
112 109 114
llu I 127 125 121 129 129 130
178 108 113 JO(i 115 102 109 106
119. g !20. 8 127. 4 106. ·' 140.8 125.4 IH.G
278.2 111.3 117. 3 112.3 120.3 102.1 124. g 116.2
115 lll 119
Hi4 198 198 176 20.1 207 172
486 140 !54 J:l4 !51 12~ !56 160
!58. 4 17.1. 5 129.2 142.6 2:l4. I 180.0 1\13.3
!\G3. 4 143. 5 143.7 162.0 13-5. I 113. 2 143.6 147.3
15 13 15 11 8
21
, 1 I 7 3 15 22
66. 982 I 82. 837
460,772 M4, 149 1. 353 I, 402
31. 166 36, 538 8, (i95 10, 011
128 123 132
213 279 2:33 21:l 276 328 172
I, 540 168 173 177 !.56 130 177 199
177.6 210. I 139.2 151.9 324.1 219.6 232.9
1020.8 149.2 158.7 156.2 144.0 106.8 174.6 147.2
50 46 56 57 53 77
44 61
86,030
580,000 I, 387
36,332 10, 264
13:3 119 144
2()! 371 250 2.18 427 408 270
2 •. o75 186 200 194 167 152 282 205
178.8 212.8 139. s 15.3. 0 346.0 214.5 245.3
1085. g 149.0 159. g 181.5 124. 7 105.6 179.3 127. 8
100 100 100 100 100 100
100 100
88,836
590, 177 I, 506
34,630 9, 060
140 124 !52
275 385 252 273 498 411 311J
2. 534 199 210 215 178 183 ~00 1\)3
168. 1 191.7 119. ,o 1.12. 8 322. 1 215.9 209.0
836.2 147. 3 loi. 1 174.5 135. 4 108.5
2 l/(). 1 116. 3
112 137 107 87
117 83
123 Ill
89, 553
620, 000 I, 678
32.420 9, 383
98,279 121.969 133,536 125,413 114,993 144,985 168,170 189, 181 220,970 1230,040
6, 991 4, 247 2. 355
423 2. 744
205 .110 144
10,496 5.143 2. 750
678 5. 353
479 I. 756 I, 400
13.383 2. 700 1, 268
315 10,683
tiOO 5, 060 3, 5i!
100.2 105.2 116.5 90. 6 105. 5 123.9
100 124 159
100. 6 108. 3 124. 9
78. 6 87. 3 98. 8 67. 7 82. 4 105. g
7, 675 I, 4.10
616 117
6, 225 685
2, 423 2, 006
3. 940 1, 580
498 2.13
2, 360 192 730 745
123.6 125.5 138. 0 136. I
192 195
134.0 137.6
103. I 104.0 122. 6 123. 3
t The series (except when source is stated) arc selectee! from the statistical section beginning on p. S-1; available data prior to 1939 and d~scriptive notes may be found in the 1942 Supplement to the Survey unless other reference is given in the footnotes on pp. S-1-S-38. 1944 data in most cases are preliminary.
'November 30. s July-December. • U. S. Forest Service estimates for 1939-41 and 1941; Bureau of the Census data for
1942-43. 'March-December.
Item
PRICES-continued
Wholesale prices (1926= 100)-Con. Foods .. _. _____________ ... ----- ..
1939 ~~ ~~-i~ _1943 -~~~~-70 4 71. 3 82 7 99. 6 106 6 104 9
Other commodities _____________ _ 81. 3 83. 0 89. 0 95. 5 96. 9 98. 5 By economic classes:
Manufactured products ________ _ Raw materials _______________ .... Semimanufactured articles.
TRADE
Retail trade (mil. of dol.): Sales, all retail stores ________ _
Durable goods stores ______ _ Nondurable goods stores .... ____ _
Inventories, Dec. 31, totaL ....... . Durable goods stores _______ _ Nondurable goods stores ....
Wholesale trade (mil. of dol.): Sales, service and limited funetion
wholesalers, total.. __________ _ Durable goods establishments .. _ Nondurable goods establishments.
Inventories, Dec. 31, all wholesalers Foreign trade (mil. of dol.):
Exvorts, incl. reexports, totaL .... Lend-lease exports __
General imports_
EMPLOYME!\T A"S"D \VAGES
Monthly avc1age (thous. of persons):
80.4 70.2 77.0
42,042 10, 379 31, 6n3 5, 117 1, 837 3, 280
23,642 7,086
16,556 3, 549
3, 177
2; 3113
Armed forcps '-- _________ . 360 Civilian labor force, totaL _ 7 53,600
Employment.__ _ 7 45, 200 Agricultural ___ 7 9. 400 NonagriculturaL. '35, 800
Un<'mployment __________________ 7 8, 400 Employees in nonagrieultural es-
tablishments, total
~~i~~~turin_~ ~ .. ~ _::::::: ...... . Construetion _ _ _ _ _ _ _ _____ -.--Transportation and public util-
itif'S_ Trade _______________ . _. _______ _ Financial, servie(' and mise _____ _ Govrrnn1ent __________________ _
""age-earner rmployment and pay rolls, monthly aYCrage (1939= 100):
'\rage earners, all manufacturing __ _ Durable goods industries ___ . __ _ Nondurable goods industries ..... .
Pay rolls, all manufacturing ______ _ Durable goods industries. ______ _ Nondurable goods industries ____ _
Average weekly hours per worker, all manufacturing ______________ _
Durable goods industries _________ _ Nondurable goor!s in<lustries ..... .
A vcrage hourly earnings (dollars), all manufarturing ___ _
Durable voods industries ___ _ Nondurable g'oods industries __
FINANCE
Bank debits (mil. of dol.): '
30. 353 10,078
845 1, 7.~3
2. 912 6, 018 4,160 3, 988
100.0 100.0 100.0 100.0 100.0 100.0
37.7 38.0 37.4
• 633 .698 . 582
81.6 71.9 79. I
46,388 12,418 33, 970
5, 435 2,058 3, 377
26, 243 8, 670
17, 573 3, 730
4,021
2. 625
530 1 54.000 146,600 19,200 '37, 400 1 7, 400
31,784 10, 780
916 1. 722
3, 013 6. 906 4. 310 4,136
107 .. ) 115. 5 101.3 114. 5 125.1 104. I
38. I 39.3 37.0
.661
. 724
.eo2
89.1 83.5 86.9
55, 490 15,604 39,886
6, 728 2, 511 4, 217
34, 353 12,289 22,064 4, 697
5.147 '741
3, 345
1, 630 54, 100 49,090
8. 640 40, 440
5, 010
35, 6!\8 12.974
947 2, z;~n
3. 248 7, 378 4, 438 4, 440
132.1 153.8 115.0 11\7.5 202.3 133. 5
40.fi 42. I 38.9
. 729
. 808
. 640
98.6 100.6 92.6
57, 552 9, 846
47, 706 6. 429 2, 116 4, 313
37.000 10.571 26.429 3, 992
8. 035 4, 895 2. 745
3. 940 54, 500 52, 110 8, t\40
43,470 2, 380
38. 447 15,051
970 2, 078
3, 433 7, 2!\3 4, 447 5, 203
152.3 191.5 121.4 242.3 321.3 164. g
42. g 45. I 40.3
.s;;~
. 947
. 723
100.1 112. I 92.9
63.1\80 9. 3:)9
54.341 5. 965 I. 704 4, 261
12, 714 10,107
3, 372
8. 980 53. 480 52, 410
8, 280 44. 130
1.070
100.8 113. 2 94. I
1\9, 275 9, 931
59.344 5, 800 I, 688 4, 112
14. 257 II. 289 3. 911
11. 3!)1) .oz. ozo 51. 780
8, 01\ll 43. 720
840
38. 7111) 39. 728 16.921
891 1, 259
I If>. 123
8:3.)
I 6~0 3. 619
1
~.7tH
~: n~ ~: ~~b 5, 890 5. 906
1G8. 7 I 159. 1 227. 8 211\. I 122. l 114.2 3Hi. 4 I ; 317.9 441.1 1 '44u 194. 4 1 s 197. 0
44. 9 I , 4,,_ 2 46. f, I ~ 4fi. H 42. 51 s 4:3. 1
.0(1 51.017 I. 05\1 i s I. l!5 . 80:3 i s. 8.19
Total (141 centers) ________ _ New York City _________ _ Outside New York City _______ _
Money supply (mil. of dol.), Dec. 31: 10
389.680 408. 585 1,91, 61,9 574, 702 715, 782 171.382 171, .?82 197,724 226,865 291\. :lfi!i 21B;29fi 236,952 293,92.? 347,837 419.413
l8o7, 121 134~. fiS~~
1462. 135
Currency in circulation ____ _ ~ _ _ _ _ _ _ 7, 598 Deposits, adjusted, al~ banks and
currency outside banks 64, 099 Deposits, adjusted, total incl.
l'. S. deposits____ 57,C98 Demand deposit~, adjust(ld,
other than U. S _ _ 29 793 Time dcpo!-'it.s. inetUdiflg- '
postal sa\·in~s_. _____________ 27,059 Public finance, Federal (mil. of dol.):
U.S. war program, expenditun:-s,II cumulative total from June 1940
Debt, 7ross, end of year _________ _ _ Treasury (•xpendittues. total ______ _
\Varactivities ____ _____________ _ Treasury receipts, net_ ______ _
Income taxes. Stock prices, Dec. (193.'>-39=100):
Combined index (402 stocks) .... Industrials (354 stocks) ____ _ Public utilities (28 stocks). _____ _ Railroads (20 stocks) ___ .• ______ _
TRAN~PORTATIO~
Indexes (1935-39= 100): All types. excl. local transit lines.
Commodity __________________ _ Passenger, excl. local transit. ___ _
Freight carloadings (thons. cars) ....
41,961 8,888 I, 358 4. 919 1, 851
97.0 97.6
101.3 78.4
lOG 107 105
33,911
'Data from War Manpower Commission.
8, 732
70, 761
63,436
34. 945
27, 738
1, 911 45. 039 9,659 2, 77~ .1. 834 2. 3Go
84. g 84.9 90.6 70.0
117 118 113
36,358
II, 160
78,231
68,616
38,992
27. 729
IS, 806 .18. 020 19.0.'i:1 12.70.1 8, 849 4, 2.53
71.8 73.8 66.2 61.0
146 147 143
42,352
15,410 20, HO 1 zo. 307 i
99,701 122.812 1142.700
85, 755 103,975 1119. 300
48, 922 1\0,815172.000
28. 431 32. 736 I 39. 100
f\8. 208 153,3421244 .. 510 108, 170 16.5, 877 230. 630 56, ozo 88, 084 97, 1.1s 1\l, 860 81, 859 R9. 32\i 16. 403 34, 554 i 44. 421 u. ol\8 26. 549 I 34. 328
7.1. g Pl. s I 104. 7 78. 5 93.1\ I lllf'."
69.3 s.o. 6 113. u 6.1. 2 85. 2 'I 92. 4
184 178 236
42,771
220 201 357
42, 440
I
231 2118 388
43,441
7 U. S. Department of Labor preliminary estimates rounded to hundred thousands. ll 11-months average. 'Data beginning 1942 i'!clude ~dditional banks (1942 totals are partly estimated):
1942 figures comparable wtth earher data: Total, 553,391; !\ew York, 210,961; outsic!e K ew York, 342,430.
10 1944 data are as of November 30. II Includes Treasury expenditures and expenditures by the Reconstruction Finance
Corporation and its suhsictiari('s.
•
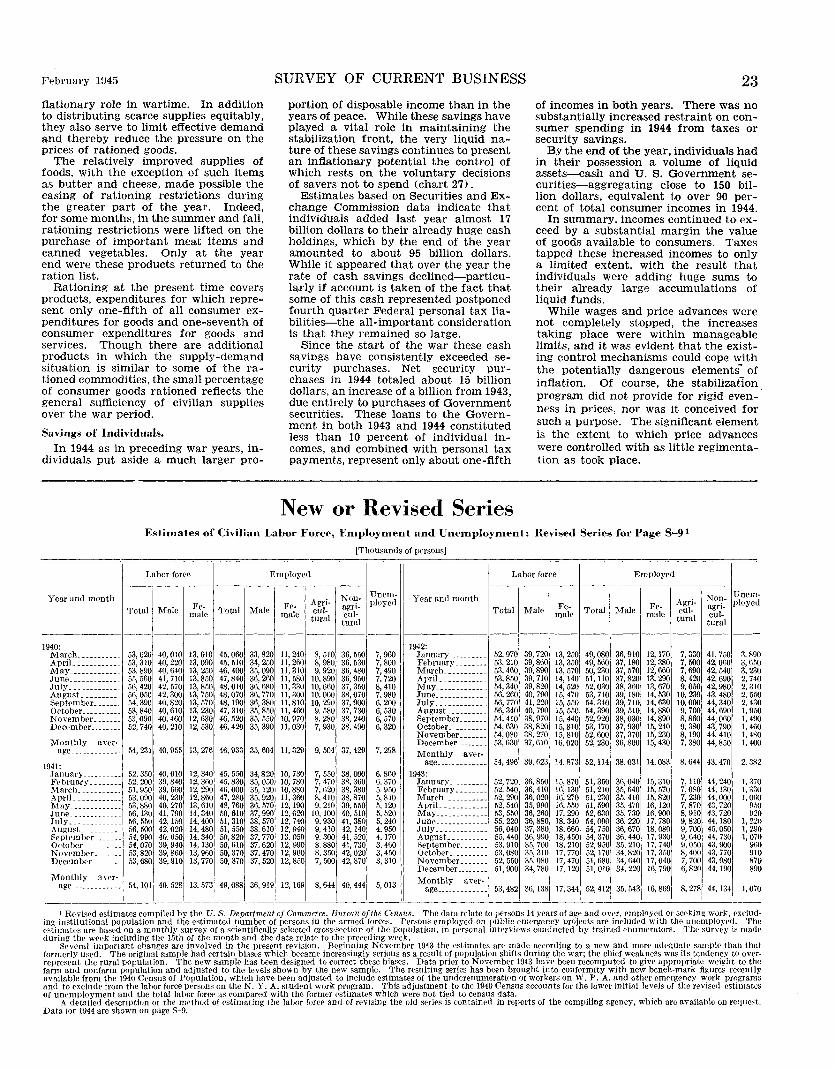
Februut·y HJ45
flationary role in wartime. In addition to distributing scarce supplies equitably, they also serve to limit effective demand and thereby reduce the pressure on the prices of rationed goods.
The relatively improved supplies of foods, with the exception of such items as butter and cheese, made possible the easing of rationing restrictions during the greater part of the year. Indeed, for some months, in the summer and fall, rationing restrictions were lifted on the purchase of important meat items and canned vegetables. Only at the year end were these products returned to the ration list.
Rationing at the present time covers products, expenditures for which represent only one-fifth of all consumer expenditures for goods and one-seventh of consumer expenditures for goods and services. Though there are additional products in which the supply-demand situation is similar to some of the rationed commodities, the small percentage of consumer goods rationed reflects the general sufficiency of civilian supplies over the war period.
Savings of Individuals.
In 1944 as in preceding war years, individuals put aside a much larger pro-
SURVEY OF CURRENT BUSINESS
portion of disposable income than in the years of peace. While these savings have played a vital role in maintaining the stabilization front, the very liquid nature of these savings continues to present an inflationary potential the control of which rests on the voluntary decisions of savers not to spend (chart 27).
Estimates based on Securities and Exchange Commission data indicate that individuals added last year almost 17 billion dollars to their already huge cash holdings, which by the end of the year amounted to about 95 billion dollars. While it appeared that over the year the rate of cash savings declined-particularly if account is taken of the fact that some of this cash represented postponed fourth quarter Federal personal tax liabilities-the all-important consideration is that they remained so large.
Since the start of the war these cash savings have consistently exceeded security purchases. Net security purchases in 1944 totaled about 15 billion dollars, an increase of a billion from 1943, due entirely to purchases of Government securities. These loans to the Government in both 1943 and 1944 constituted less than 10 percent of individual incomes, and combined with personal tax payments, represent only about one-fifth
New or Revised Series
23 of incomes in both years. There was no substantially increased restraint on consumer spending in 1944 from taxes or security savings.
By the end of the year, individuals had in their possession a volume of liquid assets-cash and U. S. Government securities-aggregating close to 150 billion dollars, equivalent to over 90 percent of total consumer incomes in 1944.
In summary, incomes continued to exceed by a substantial margin the value of goods available to consumers. Taxes tapped these increased incomes to only a limited extent, with the result that individuals were adding huge sums to their already large accumulations of liquid funds.
While wages and price advances were not completely stopped, the increases taking place were within manageable limits, and it was evident that the existing control mechanisms could cope with the potentially dangerous elements- of inflation. Of course, the stabilization program did not provide for rigid even- · ness in prices, nor was it conceived for such a purpose. The significant element is the extent to which price advances were controlled with as little regimentation as took place.
Estimates of Civilian Labor Force, Employment and Unemployment: Revised Series for Page S-9 1
[Thousands of persons]
Labor force Employed I --------------·----~-----~--Year and month I Non- Uu('nl- 1
Year and month Fe-
_:~j~:~ Fe- Agri- agri- ploycd I
Total Male cui-male male tural cui-tural
-------- ---
-:~:~-~:: -----------
1940: 1942: March ........... 53,020 40,010 13,010 45, 060 33, 820 II, 240 8, 510 January .......... ApriL _____ ...... 53,310 40,220 13,090 45, 510 34, 250 11,260 8, 980 36, 530 7' 800 February ________ May ............ 53,890 40,640 13, 250 46, 400 35, 090 11,310 9, 920 36, 480 7, 490 March. _____ .. ___ June ... _ .. -...... 5o, 560 41,710 13,850 4 7, 840 36, 260 11,580 10,890 36,950 7, 720 ApriL ________ .. _ July __ ........... 56,420 42, 570 13,850 48. 010 36, 680 11,330 10,660 37, 350 8, 410 May _____ .. ______ August. ......... 56, 050 42,300 13, 750 48,070 36,770 11,300 10,000 38,070 7.980 June ________ ..... SeptrnlbC'r _______ 54,390 40,820 13,570 48, 190 36,380 11,810 10,290 37,900 6,200 July __________ .. _ October __________ 53,840 40,610 13,230 47,310 35,8.50 11,460 9, .580 37,730 6, 530 August. ......... November _______ 5:l,o9o 40,460 12,630 46,520 35, 550 10.970 8. 280 38, 240 6, 570 September ___ .... December ........ 52,740 40,210 12,530 46,420 35, 390 11, 030 7, 930 38, 490 6, 320 October ..........
November------· Monthly aver· December ________
age __ . __________ 54,231 40,955 13,276 46,933 35,604 11, 329 9, 504 37,429 7, 298 Monthly SVt'f•
1941: age _____ ... __ ...
.T anuary __________ 52,350 40,010 12,340 45, 550 34,820 10, 730 7, 550 38,000 6.800 1943: February ________ 52, 200 39,840 12,360 45,830 3.5, 050 10, 780 7, 470 38, 360 6, 370 January __________ March ___________ 51.950 39. 660 12,290 46,000 35, 120 10,880 7, 620 38, 380 5 950 February ______ .. ApriL----------- 53,090 40,230 12,860 47,280 35,920 11, 360 8, 410 38,8701 5, 810 March _______ .... May ------------ 53,880 40, 270 13,610 48,760 36.570 12,190 9, 210 39,550 5,120 April ............ June_------------ 56, 130 41,790 14,340 50,610 37,990 12,620 10, 100 40, 510 5, 520 May _____________ July .. ___________ 56, 550 42, 150 14,400 51,310 38,570 12,740 9, 930 41, 380 5, 240 June .... _________ August. _________ 56, 500 42,020 14,480 51,550 38,610 12,940 9, 410 42, 140 4, 950 July __________ ... Septembrr _______ 54,990 40.650 14,340 50,820 37,770 13,050 9, 3001 41, 5201 4,170 August. _________ October __________ 54,070 39,940 14,130 50,610 37,620 12,990 8, 880 41, 730 3,460 September _______ November _______ 53,820 39,860 13,960 50,370 37,470 12, 900 8, 350 42,020 3, 450 October __________ December ________ 53,680 39,9101 13,770 50, 370 37,520 12,850 7, 500 42, 870 3,310 November .......
12, 1691
December ____ . ___ Monthly aY('f- Monthly aver-age .... _____ , __ 54.101 40.5281 13,573 49,088 36,919 8,644 40.444 5, 013 age _____________
Labor force ---------
I Fe-Total Male male
----------
52,970 39,720 13,250 5:l, 210 39,860 13,350 53,460 39,890 13, 570 53.850 39,710 14, 140 54,340 39,820 14,520 56,260 40,790 15,470 56, 770 41,220 15,550 56,340 40,790 15,550 54,410 38,970 15,440 54,630 38,820 15,810 54,080 38,270 15,810 53,630 37, 610 16,020
54,496 39,623 14, 873
52,720 36,850 15, 870 52.540 36,410 16,130 52,290 36,020 16,270 52.540 35,990 16,.550 53,550 36,260 17,290 55. 220 36,880 18,340 56,040 37,380 18,660 55,440 36,990 18,450 53,910 35,700 18,210 53,080 35. 310 17,770 52, 550 35,080 17.470 51,900 34, 780117, 120
53,482 36, 138 17, 344
Employed ------------------
Non-Fe- Agri- agri-Total Male cui-male tural cui-
tural --------- ------
49,080 36.910 12,170 7, 330 41,750 49, 560 37', 180 12,380 7, 500 42,060 50,230 37,570 12,660 7,690 42,540 51,110 37,820 13,290 8,420 42,690 52,030 38,360 13,670 9,050 42.980 53,710 39,180 14,530 10,230 43,480 54.340 39,710 14,630 10,000 44,340 54, 390 39,510 14,880 9, 700 44,690 52,920 38,030 14,890 8, 860 44,060 53,170 37,930 15,240 9,380 43,790 52,600 37,370 15, 230 8,190 44,410 52,230 36,800 15,430 7, 380 44,850
52,114 38,031 14,083 8, 644 43, 470
51, 350 36,040 15,310 7, 110 44,240 51,210 35,640 15.570 7,080 44.130 51,230 35.410 15:820 7, 2:!0 44,000 51,590 35,470 16,120 7,870 43, 720 .52, 630 35, 730 16,900 8, 910 43,720 54,000 36,220 17,780 9, 820 44,180 54, 750 36,670 18,080 9, 700 45, o.o;o 54,370 36.440 17,930 9, 640 44, 730 52,950 35. 210 17,740 9, 050 43,900 52,170 34,820 17,350 8, 400 43, 770 51,680 34,640 17,040 7, 700 43,980 51,010 34, 220 16,790 6,820 44,190
52,412 35,543 16,869 8, 278 44,134
Uncm ployc<
--
3, 89 0 iO 0 0 0 0 0 0
3, Gr 3, 23 2, 74 2, 31 2, 5.5 2, 43 1,91i 1, 4 1, 4fl
90 iO 0 0
1. 48 1, 40
2, 38
1, 37 0 {) ], 33
l. Oli 9.5 U2
0 ()
0 I)
0 0 I)
0 0 0
I, 22 I, 29 1, 07
9tl 91 87 89
0 1,07
1 Revised estimates compiled by the U. 8. Department of Commerce, Bureau off he Censu.•. The data relate to ]Wrsons 14 years of age and over, employed or see kin~ work, ex eluding institutional population and the estimated number of persons in the armed forces. Persons employed on public emergency projects are included with the unemployed. 'I' he estimates are based on a monthly survey of a scientifically selected cross-section of the population, in personal intt-rviews conducted by trained ennml'rators. The survey is ma<lc during the week inclndin!( the 15th of the month and the data relate to the preceding week.
Several important changes are involved in the present revision. Beginning November 1943 the. estimates are made according to a new and more adN!Uate sample than that formerly used. The original sample had certain biases which became increasingly serious as a result of population shifts during the war; the chief weakness was its tendency to overrepresent the rural population. The new sample bas been designed to correct these biases. Data prior to November 1943 have been recomputed to give appropriate weight to the farm and nonfarm population and adjnste.d to the levels shown by the new sample. The resulting series has been brought into conformity with new bench-mark figures recently available from the !940 Census of Population, which have been adjusted to include estimates of the underenumeration of worke.rs on W. P. A. and other emPrgency work programs and to exclude from the labor force persons on theN. Y. A. student work program. This adjustment to the !940 Census accounts for the lower initial levels of the revised estimates of unemployment and the total labor force as compared with the former estimates which were not tied to census data.
A detailed description of the method of estimating the labor force and of revising the old series is contained in reports of the compiling agency, which arc available on rcque't. Data for 1944 are shown on page S-9.
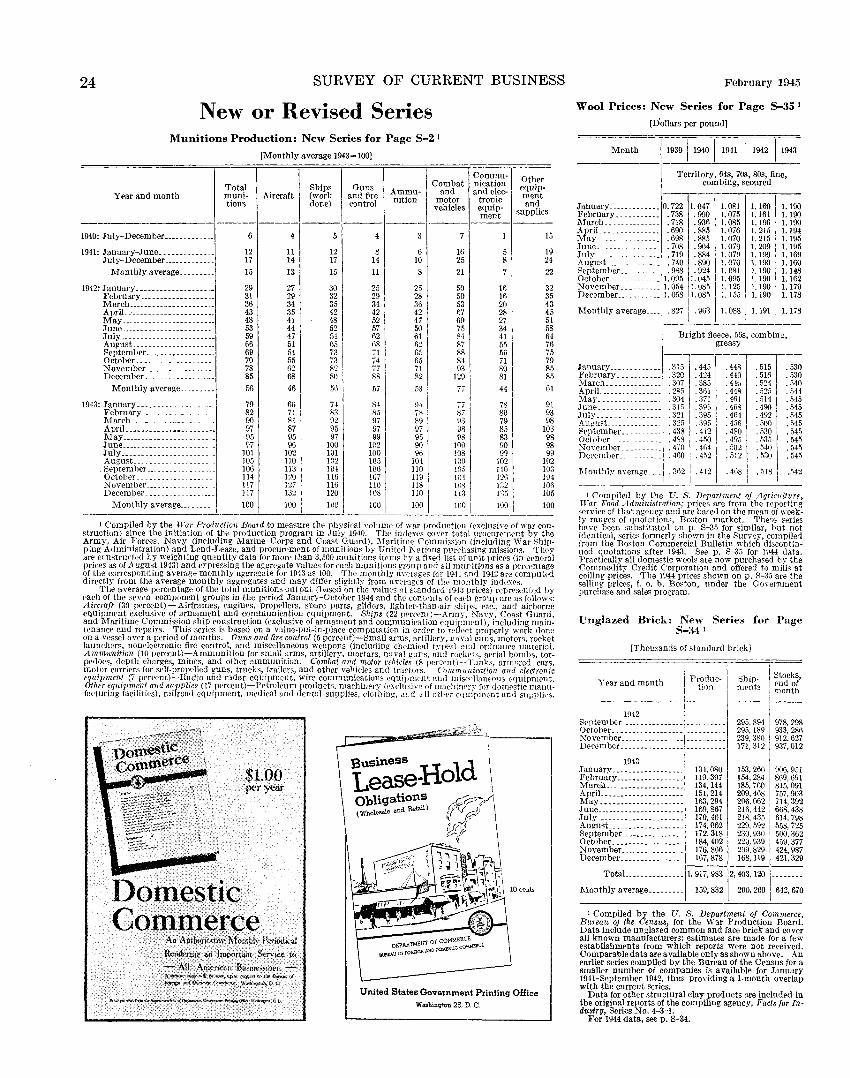
24 SURVEY OF CURRENT BUSINESS
New or Revised Series Munitions Production: New Series for Page 5-21
[Monthly average 1943= 100]
Commu- Other Total Ships Guns Combat nication equip-Ammu- and and elec-Year and month muni- Aircraft (work and fire nition motor tronic ment tions done) control vehicles equip- and
ment supplies
---------------- ----- ---------------- -------- -----1940: July-December _____________ 6 4 5 4 3 7 1 15
1941: January-June ______________ 12 11 12 8 6 16 5 19 July-December------------- 17 14 17 14 10 25 8 24
Monthly average _________ 15 13 15 11 8 21 7 22
1942: January- ____ ------_-- .• __ -· 29 27 30 25 2.1 50 16 32 February _____ -------------- 31 29 32 29 28 50 16 0.5 March ______ ------._ ... ___ -- 36 34 35 34 36 53 20 43 ApriL---------------------- 43 35 42 42 42 67 28 45 May __________________________ 48 41 48 52 47 69 27 51 June .... ------------------- 53 44 52 57 50 ! 75 34 58 July ________________________ 59 47 5"1 62 61 84 41 64 August. __ ---------- ________ 66 51 65 63 f\2 87 55 76 September------ ____________ 69 54 i3 71 65 88 56 75 October __ ------------------ 70 55 73 74 65 84 71 79 November ________________ .. 78 62 82 77 71 g~ 80 85 December ___________________ 85 68 so 88 82 129 81 85
Monthly average. ________ 56 46 56 57 53 77 44 61
1943: JanuarY-------------------- 79 66 74 84 9-\ 77 78 91 February ________________ .. 82 71 83 85
I '" 87 80 93 March ______________________ 90 81 92 97 89 rq 79 98 ApriL .•••• _____ -··- ______ -- 97 87 95 97 97 98 85 103 l\Iay ________ ---------------- 9.5 95 97 99 95 98 83 98 June ___________________ .. 97 96 100 102 90 100 go 98 July ______________________ 101 102 101 100 96 !08 99 99 August. ________ -------- 105 110 102 105 104 109 102 lfJ2 September ... ____ 106 113 101 106 110 10.5 110 103 October_. ______ ----- 114 120 116 107 119 101 12fi J\)4 November ____ ._ -- -·-- 117 127 116 110 118 108 )'F)
"" 106 December. _____ -- --· --- ll7 132 120 108 110 113 I
1:)5
I 105
:Monthly average ... _._ .. 100 100 100 100 100 100 I 100 100 ---- --
1 Compiled by the u·ar Production Board to measure the physical volume of war production (exclusive of war construction) since the initiation of tbc production program in July 1940. 'fhe indexes co.-or total procurement by the Army, Air Forces, Navy (including Marine Corps and Coast Guard), 1Iaritime Commission (including War Shipping Administration) and Lend-Lease, and procurement of munitions by United Nations purchasing missions. They are construetcd by weighting quantity data for more than 3,500 munitions items by a fixed list of unit prices (in general prices as of August 1943) and expressing the aggregate values for each munitions group and all munitions as a percentage of the corresponding average monthly aggregate for 1943 as 100. The monthly a\"cragcs for 1941 and 1942 are computed directly from the average monthly agi(rcgates and may differ slightly from averages of th<• monthly in<h,xcs.
'l'he average percentage of the total munitions output (based on the values at standarcl 1943 prices) represented by each of the seven component groups in the period January-October 1944 and the contents of each group arc as follows: Aircraft (30 percent) -Airframes, engines, Propellers, spare Parts, gliders, lighter-than-air ships, etc., and airborne equipment exclusive of armament and communication equipment. Ships (22 IJf'rcent)-Arrny, Navy, Coast Gunrd, and Maritime Commission ship construction (exclusive of armament and communication eqnipmc·nt), ineluding maintenance and repairs. This series is basc;d on a value-put-in-place computation in order to reflect properly work done on a vessel over a period of months. n'uns and fire control (5 pcrcent)-Small arms, artillery, naval guns, motors, rocket launchers, nonelectronic fire control, and miscellaneous weapons (including chemical typrs) aed ordnance material. Amm1mition (10 percent)-Amniunition for small arms, artillery, n1ortars, naval guns, and reekcis, arrial bon1bs, tor~ pedoes, depth charges, mines, and other ammunition. Combat and motor •·ehicles (8 percent)-Tanks, armored cars, motor carri0rs for sc1f~propelled guns, trueks, trailers, and other vehicles and tractors. Communication and electronic equipment (7 prrrf'nt)-Radio and radar equipment, wire conimunications equipm('nt and misP~'linnN'US c~quipmcnt. Other eq1dprnrnt a'lld supplies (17 pcrcent)-Petrolrum produets. machinrry (ex<'1nsiV(' of macllinE'ry for domrstic mauuf:wturiug facilities), railroati equipment, m~dieal and dental supplies, clo1 hing, ar d all other t•quipmL·nt ond supplit'S.
$1.00 per year
Domestic Commerce
Ao. Authoritative i\·lonth!y Periodical Rendetin~ ao lomtlrtam ~rvice to
'-- All American Busiflt'.,1llen -A~OOJ)}'"'·illllf~,~~ r~t<:>dll'~(l( ~>Wd.~{',.-~,_\~'AAh\~lJ:\,.UC.
United Stales Government Printing Office Washington 25, D. C.
February 1945
Wool Prices: New Series for Page 5-35 t
[Dollars per pound]
--~onth __ l193911940 11941 11942 11943
Territory, 64s, 70S, 80s, fine, com bing, scoured
January _____________ 0. 722 1.047 1.081 1.160 1.190 February ___________ .738 .990 1.075 1.161 1.190 March ______________ .718 .936 1.085 1.196 Ll90 ApriL _____________ .690 .885 1.076 1.215 1.194 May________ .698 .885 1.070 1.215 1.195 June ________________ . 708 .904 1.070 1.209 1.195 July _________________ .719 .884 1.070 Ll90 1.169 August__ ____________ .740 .890 1.070 1.190 1.160 September __________ .988 .924 J.OR1 l.l90 1.148 October _____________ 1.095 1.045 1.095 1.190 1.162 November __________ 1.054 1.08511.125 1.190 1.170 December _________ 1.058 1.085
1
1.155 1.190 1.178
Monthly average·---~~~L 963 -~~~~~-1. 178
I Bright fleece, 56s, combing, ( greasy
January _____________ .315- .44.51
1
~:;-~--~~ February ___________ .320 .424 .440 .516 .530 March ____ ·--------- . 307 . 385 . 441! . 524 . !i40 ApriL__ 1 • 285 . 3131 . 448 . 525 . 544 May___ -~' .304 .371 .461 ··"14 .545 June____ --:::::.: .31'i .3Q5 .468 .490 .545 July ______________
1
, .321 .395 .464 .492 .545 August. . 325
1
. 395 . 4!iG . fiiJQ • !i45 i"rptember... ----t .4~l8 .412 .480 .o30 .54-'> October ____________ , .483 .450 .49.5 .• 135 .545 November ..... _. __ --_-_1·470 .4G4 .:0021 .540 .545 December___
1
.4fi0 I .4.52
1
.512 .530 .54.5
Honthlyaverage .... \.362 i .412 .4f>8l .. 518 .. 142
' Compiled by the U. S. Department of Agricullure, War Food Administration; prices are from the reporting service of that agency and are based on the mean of weekly ranges of quotations, Boston market. The'e ''eries have been substituted on p. S-35 for similar, but not identical, series formerly shown in the Survey, compiled from the Boston Commercial Bulletin which discontinued quotations after 1943. See p. S-35 for 1944 data. Practically all domestic wools are now purchased by the Commodity Credit Corporation and offered to mill.' at ceiling prices. The 1944 prices shown on p. S-3.5 are the selling pricC-'S, f. o. b. Boston, under the 0 overnrnent purchase and sales program.
Unglazed Brick: New Series for Page S-34 1
[Thousands of standard brick]
li Produc- I Ship· I Stocks, Year and month . - I end of
I tiOn rnE>nts l month
---·~--------·-\----- ------i-~--1942 .
r;~:;; '"'" 1 1ft m 1 frl ffi
January __________________ ' 134,080 153,260 1906,951 February_________________ 119,397 154,284 869,691 March____________________ 134,144 185,760 815,091 ApriL___________________ 151,214 209,468 757,903 May--------------------- 163,294 206.062 714,392 June______________________ 169,867 216,442, 668,438 July______________________ 170,461 21S, 435 i 614,798 August___________________ 174,062 229,592 1 558,725 September________________ 172,318 230,930 1 500,362 October__________________ 184,402 220,9391459,377 November________________ 176,866 209,829 424,987 December._______________ 167,878 168,119 421,329
------------TotaL _____________ 1, 917,983 2,403,120 1--------
:r.Iont.hly average_________ 159,832 200,260 [ 642,670
1 Compiled by the U. S. Department of Commerce, Burean oj the Census, for the War Production Board. Data include unglazed common and face brick and cover all known manufacturers: estimates are made for a few establishments from which reports were not received. Comparable data are available only as shown above. An earlier series compiled by the Bureau of the Census for a smaller number or companies is available for January 1941-September 1942, thus providing a !-month overlap with the current series.
Data for other structural clay products are included in the original reports of the compiling agency, Facts for Industry, Series No. 4-3-1.
For 1944 data, see p, S-34.
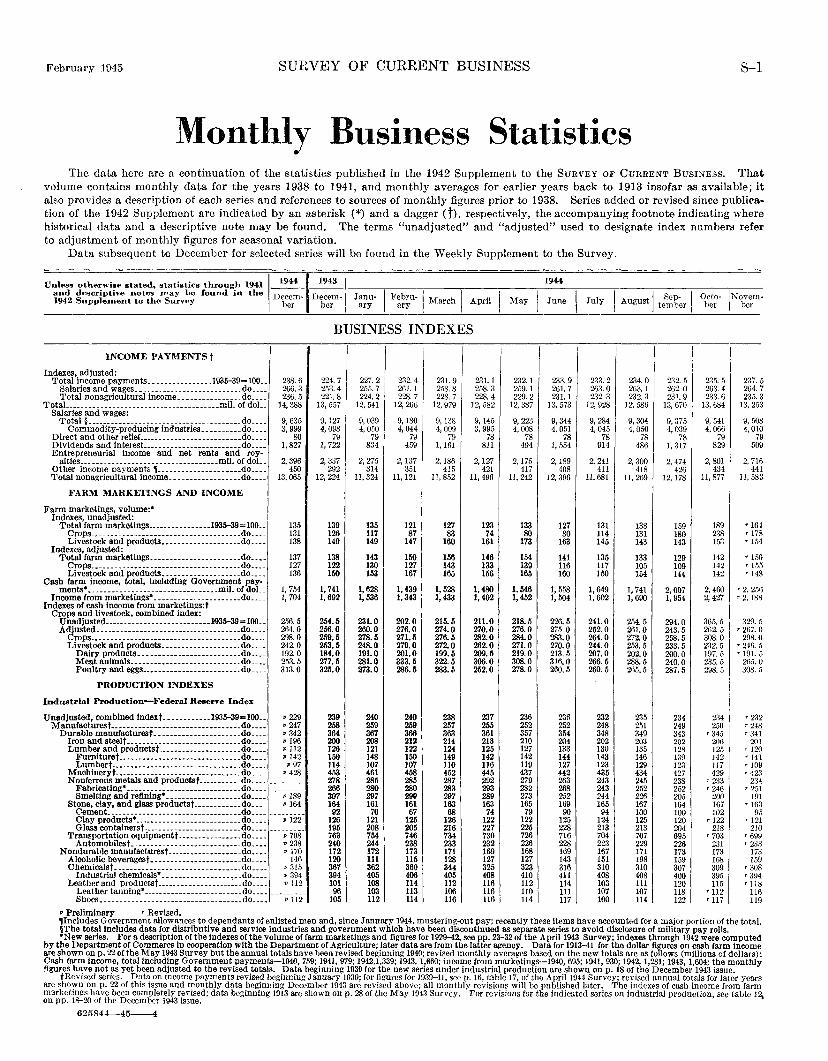
February Hl45 SURVEY OF CURRENT BUSINESS S-1
~Ionthly Business Statistics The data here are a continuation of the statistics published in the 1942 Supplement to the SuRVEY OF CuRRENT BusiNEss. That
volume contains monthly data for the years 1938 to 1941, and monthly averages for earlier years back to 1913 insofar as available; it also provides a description of each series and references to sources of monthly figures prior to 1938. Series added or revised since publication of the 1942 Supplement are indicated by an asterisk (*) and a dagger <t), respectively, the accompanying footnote indicating where historical data and a descriptive note may be found. The terms "unadjusted" and "adjusted" used to designate index numbers refer to adjustment of monthly figures for seasonal variation.
Data subsequent to December for selected series will be found in the Weekly Supplement to the Survey.
Unlesl!l otherwise stated,. statistics through 1941 and descriptive notes may be found in the 194·2 Supplement to the Survey
INCOME P AYMENTSt
Indexes, adjusted: Total income payments._ ------------- .. 1935-39= 100.-
Salaries and wages _____ _ --------------------.do ____ Total nonagricultural in TotaL ____________________ _
come. _______________ do ____ ________________ mil. or doL
Salaries and wages: Total§ _________________ _ ------------· ________ do ____ Commodity-producing industries. _________ do ____
Direct and other relief. ___ _ ---------------------do ____ Dividends and interest ___ _ ---------------------do. ___ Entrepreneurial income
altles _________ ----------and net rents and roy-________________ mil. of doL --- __ .---------- _____ do ____ Other income payments ,
Total nonagricultural inco me. _________________ do ____
FARM MARKETIN GS AND INCOME
Farm marketings, volume:• Indexes, unadjusted:
Total farm marketings __ --------- _____ 1935-39= 100_-Crops ____ -------------Livestock and product
Indexes, adjusted: Total farm marketings._
Crops ____ -------------Livestock and product
Cash farm income, total, In
---------------------do ____ s. _________ ------ ___ .do .. __
_____________________ do. ___ _____________________ do. ___ s ____________________ do ____
eluding Government pay-ments•------------------ _______________ miJ. of doL
---------··-----------do ____ marketings:t ined index:
Income from marketings• _ Indexes of cash Income from
Crops and livestock, comb Unadjusted------------Adjusted ....•...• ~-----
-------------- 1'935-39= 100 .. ----------------------do ____ Crops _______________ -- ---------------------do ____
Livestock and products ___ --- _. ___ . ____ •... do. ___ Dairy products ____ _ Meat animals ______ _
• __ •• _ ------- __ ---- .. do ____ ---------------------do ..••
Poultry and eggs ___ _ • ----- __ ----------- .. do ____
PRODUCTIO N INDEXES
Industrial Production-F ederal ReserYe Index
t-- __________ 1935-39=100 .. Unadjusted, combined Index Manufacturest-----------
Durable manufacturest _ Iron and steelt-------Lumber and products
Furnituret---------Lumbert-----------
Macbineryt-----------
__________ ------- __ •• do •.•• ---------------------do ____ ---------------------do ••••
t ------------- .. ______ do. ___ ---------------------do ____ ---------------------do ____ ---------------------do ____ productst-----------do ____ ---------------------do ____
N ouferrous metals and Fabricating• -------Smelting and rellnin g• _---- ______________ do ____
Stone, clay, and glass p roductst------------do ___ Cement ___ ----------Clay products• -----Glass contalnerst----
---------------------do ____ --------------------.do. ___ ____ . ________________ do. ___ entt --- __ •• ___ ---- •. do ____ Transportation equipm
Automobilest ------Nondurable manufactures
Alcoholic beveragest __ Chemicalst. ---------
Industrial chemicals Leather and productst
. -- .... -----.------ .. do.---t -------------------do •.•.
---- .. --------------.do. __ . ____ -------- _________ do ____ . --------------------do ____ ___________________ : __ do ____ Leather tanning• __ _ __ _ _ __ __ __ _ ________ •.. do ____ Shoes. _________ .. __ --. _ -- .. __ --. _____ •.•. do ..••
• Preliminary • Revised.
1
1944,19431
Decem~ Decem- Janu- I Febru-1 March ] April ber ber ary ary
BUSINESS INDEXES
I I 238.6 224.7 227.2 232.4 231.9 231.1 266.3 253.4 255.7 261. 1 258.8 258.3 236.5 221.8 224.2 228.7 228.7 228.4
14,388 13,557 12,541 12, 206 12,979 12, 582
9, 635 9,127 9, 039 9,180 9, 1:Js 9, 145 3, 999 4,098 4, 050 4, 044 4, 009 3, 995
80 79 79 79 79 78 1,827 1, 722 834 459 1,161 811
2,396 2, 337 2, 275 2,137 2,186 2,127 450 292 314 351 415 421
13,065 12,224 11,324 11, 121 11,852 11,496
135 139 135 121 127 123 131 126 117 87 83 74 138 149 149 147 160 161
137 138 143 150 156 146 127 122 130 127 143 133 136 150 153 167 165 156
1, 754 1, 741 1,628 1,439 1, 528 1,480 1, 704 1,692 1,536 1,343 1,433 1,402
256.5 254.5 231.0 202.0 215.5 211.0 264.0 256.0 260.0 276.0 274.0 270.0 298.0 259.5 278.5 271.5 276.5 282.0 242.0 253.5 248.0 279.0 272.0 262.0 192.0 184.0 191.0 201.0 199.5 209.5 253.5 277.5 281.0 333.5 322.5 306.0 313.0 325.0 273.0 286.5 283.5 252.0
•229 239 240 240 238 237 • 247 258 259 259 257 255 • 342 364 367 366 363 361 •196 200 208 212 214 213 •112 126 121 122 124 125 •142 150 148 150 149 142 • 97 114 107 107 110 116
•428 453 461 458 452 445 --------- 278 285 285 287 292 --------- 266 280 280 283 293
•189 307 297 299 297 289 • 164 164 161 161 163 163
--------- 92 70 67 68 74 • 122 126 121 125 126 122
--------- 195 208 205 216 227 • 708 763 754 746 734 730 • 238 240 244 238 233 232 • 170 172 172 173 171 169
146 120 111 115 128 127 • 315 367 362 360 344 325 • 394 394 405 406 405 408 • 112 101 108 114 112 116
--------- 96 103 113 106 116 • 112 105 112 114 116 116
1944
I May
' I I I
232.1 233.9 233.2 259.1 261.7 263.0 229.2 231.1 232.3
12, 387 13,573 12,928
9. 223 9, 344 9,284 4,008 4,051 4, 045
78 78 78 494 1, 554 914
2,175 2,189 2, 241 417 408 411
11, 242 12,396 11,681
133 127 131 80 80 114
173 163 145
154 141 135 139 116 117 165 160 150
1,546 1, 558 1,649 1,452 1,504 1,602
218.5 226.5 241.0 276.0 275.0 252.0 284.0 283.0 264.0 271.0 270.0 244.0 219.0 213.5 207.0 308.0 316.11 266.5 278.0 260.5 260.5
236 236 232 252 252 248 357 354 348 210 204 202 127 133 130 142 144 143 119 127 123 437 442 435 279 263 243 282 268 243 273 252 244 165 169 165 79 90 94
122 125 124 225 228 213 726 716 704 226 228 223 168 169 167 127 143 151 323 316 310 410 411 408 112 114 103 110 111 107 114 117 100
234.0 232.5 263.1 262.0 232.3 231.9
12, 586 13,670
9, 304 9,375 4, 0.56 4,039
78 78 486 1, 317
2, 300 2, 474 418 426
11,269 12, 178
138 159 131 180 143 143
133 129 105 109 154 144
1, 741 2,007 1, 690 1, 954
254.5 294.0 261.0 243.5 272.0 258.5 253.5 233.5 202.0 200.0 288.5 240.0 265.5 287.5
235 234 251 249 349 343 203 202 135 128 146 139 129 123 434 427 245 238 252 252 226 205 167 164 100 100 125 120 213 204 707 695 229 226 171 173 198 159 310 307 408 400 111 120 107 118 114 122
235.5 263.4 233.6
13,684
9, 541 4,066
79 829
2,801 434
11, 877
189 238 153
142 142 142
2, 460 2. 427
365.5 262.5 308.0 232.5 197.5 235.5 298.5
234 250
'345 206 12.5 142 117 429
'2.33 '246
200 167 102
'122 218
'703 231 173 168 309 395 115
'112 '117
237.5 264.7 235.3
13,253
9, 508 4,010
79 509
2, 716 441
11,583
'164 '178 '154
'150 '1.55 '148
'2, 256 '2, 188
329.5 '267. 0
298. () '246. 5 '191. 5
26fi.O 308.5
'232 '248 '341
201 '120 r 141 '109 '42:l
z:l4 '2.51
191 '163
95 r 121
210 '699 'z:J3
173 !59
'308 '394 '118
116 119
,Includes Government allowances to dependants of enlisted men and, since January 1944, mustering-out pay; recently these items have accounted for a major portion of the total. §The total includes data for distributive and service industries and government which have been discontinued as separate series to avoid disclosure of military pay rolls. •New series. For a description of the indexes of the volume of farm marketings and figures for 1929-42, see pp. 23-32 of the April1943 Survey; indexes through 1942 were computed
by the Department of Commerce In cooperation with the Department of Agriculture; later data are from the latter agency. Data for 1913-41 for the dollar figures on cash farm income are shown on p. 22 of the May 1943 Survey but the annual totals have been revised beginning 1940; revised monthly averages based on the new totals are as follows (millions of dollars): Cash farm income, total including Government payments-1940, 759; 1941, 979; 1942,1,339; 1943, 1,660; income from marketings-1940, 695; 1941, 930; 1942, 1,281; 1943, 1,604; the monthly figures have not as yet been adjusted to the revised totals. Data beginning 1939 for the new series under industrial production are shown on p. 18 of the December 1943 issue.
tRevised series. Data on income payments revised beginning January 1939; for figures for 1939--41, seep. 16, table 17, of the April 1944 Survey; revised annual totals for later years are shown on p. 22 of this issue and monthly data beginning December 1943 are revised above; all monthly revisions will be published later. The indexes of cash income from farm marketings have been completely revised; data beginning 1913 are shown on p. 28 of the May 1943 Survey. For revisions for the indicated series on industrial production, see table 12, on pp. lil--20 of the December 1943 issue.
625844--45-4
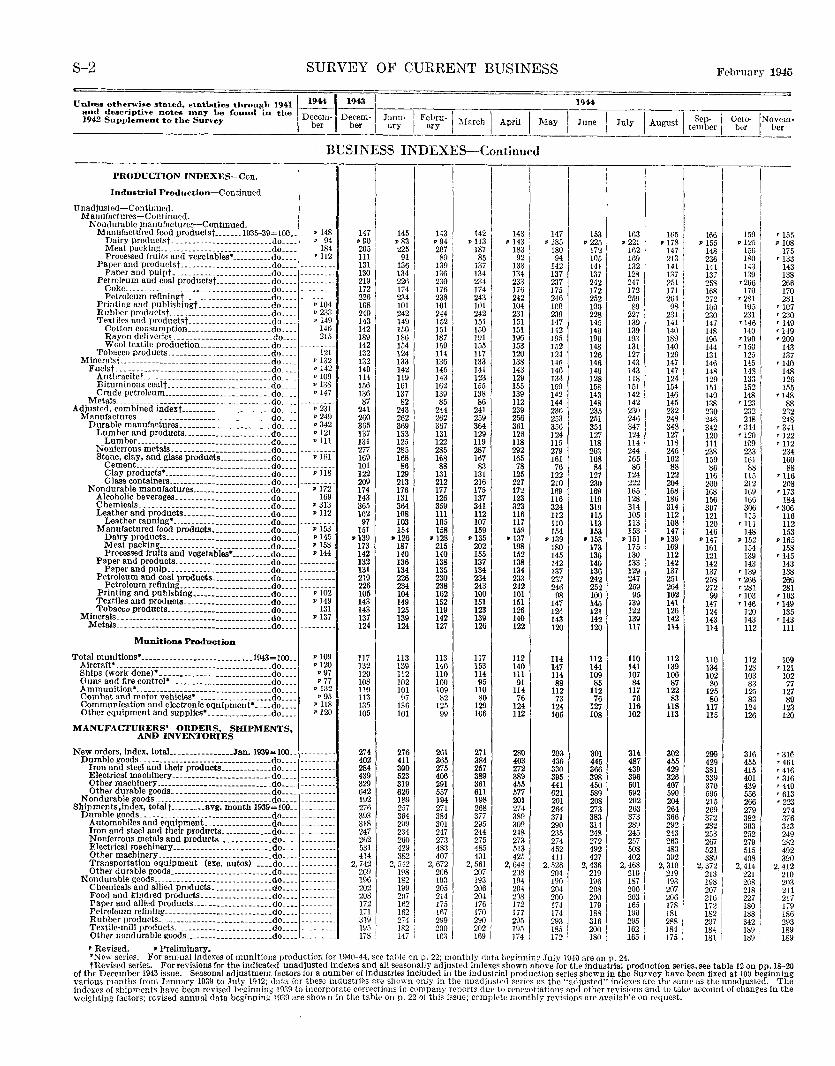
S-2 SURVEY OF CURRENT BUSINESS February 1945
Unless otherwi~e stated, statistics through 1941 \~,~~ 1944 and descriptive notes Jnay be found in t;he Decent~ Deeem~ Janu-
J F;~~u-1 March I April I May June July I August I te~b~r I Octo- INovem-1942 Supple=ent to the Survey ber be'r ary ber 1
ber
BUSINESS INDEXES-Continued
I I I
I
I PRODUCTION INDEXES-Con. I
I I
Industrial Production-Continued
I I I 143 I
I
lJ Unadjusted -·Con tinned.
1421
I Manufactures-Continued. Nondurable manufactures-Continued.
1591 Manufactured food productst-...•.. 1935-39=100 •. • 148 147 145 1431 147 153 163 165 r 155 Dairy productst _------------------····---do ____ . 94 •90 • 83 • 94 1 •1131 . ~i~ I p 185 • 225 • 221 • 178 p 155 j • ~;~ i • 108 Meat packing __ ._ .. ----------------------do .... 184 205 225 2~b I 187 ISO 172 162 147 148 I 175 Processed fruits and vegetables•.---------do .... '112 Ill 91 85 94 105 169 213 236 180 I '133
Paper and productst -----------------------do .... --------- 131 136 139 137 138 142
WI 132 141
141 I 1431 143 Paper and pulpt _________________________ do .... --------- 130 134 136 134 134 137 128 137 137 139 !38 Petroleum and coal productst .............. .do .... --------- 219 226 230 234 233 237 242 247 251 25S •266 266
Coke ... ___ .. _______ ------------- ----------do .. __ 172 174 176 174 176 175 172 1721
171 16il 170 I 170 Petroleum refiningt ---------------------do .... --------- 226 234 238 243 242 246 252 259 254 ib~ I
, 2s1 1 281 Printing and publishingt------------------do .... • 104 108 101 101 101 104 100 100 89 98
~i I '107
Rubber produrtst. ------------------------.do .. __ p 2:3~) 240 242 244 I 242 231 230 228 227 231 23o I '2.30 Textiles and productst---------------------do .... p 149 143 I 149 152 I 151 151 147 145 139 141 147 '146 '149 Cotton consumption __________________ ... do .. __ 146 142 150 151 150 151 142 140 139 140 148 140 '149
Rayon deliveries._. __ ---------------- .... do ____ 215 189 186 187 191 196 195 196 193 189 196 '199 '209 Wool textile production __________________ do .... 142 154 159 155 153 152 148 131 140 144 '150 143 Tobacco products ___________ ---------------do .... 121 132 124 114 117 120 124 126 127 129 131 125 I 137 Mineralst _______________ --------------- ________ do .. __ p 132 132 133 136 133 138 146 146 143 147 146 14.) '140 Fuelst _____ -------------------- ________ ...... do ... _ p 142 140 142 145 I 141 143 146 146 143 g~ I 148 148 148 Anthracitet ___ -----------------------------do ____ p 109 114 119 143 123 129 134 128 118 129 133 126 Bituminous coalt --------------------------do .. _ • 138 156 161 162 155 155 159 158 151 154 151 152 155 Crude petroleum ___________________________ do .... p 147 136 137 139 138 139 142 143 142 146 149 148 '148
Metals .. _______ ------------------------------do .... 87 82 85 86 112 144 148 142 145 138 '123 88 Adjusterl, combined indext-------------- --------.do .. __ • 231 241 243 2H 241 239 236 235 230 232 230 232 232 Manufactures _______ -------------- ___________ .do .... p 249 260 262 262 259 256 253 251 246 248 246 248 248
Durable manufactures._------------------- .. do .... p 342 365 3fi9 367 364 361 356 354 347 348 342 '344 '341 Lumber and products ______________________ do .... • 121 137 133 131 129 126 124 127 124 127 120 '120 '122 Lumber ___ . __________ .•• _. _________ . ___ . .do .. __ pIll 131 125 122 119 118 115 ll8 114 118 111 109 '112 Nonferrous metals .. _ ----------------------do .... --------- 277 285 285 287 292 279 263 244 245 23~ 233 234 Stone, clay, and glass products ............. do .... p 161 169 168 168 167 165 161 168 165 1~~ I 159 161 160 Cement. ____________ ----- __ •• __ •... _____ .do. ___ --------- 101 86 88 83 78 76 84 86 86 88 88 Clay products• -------- _____ ------ _______ .do. ___ • 118 122 129 131 131 125 122 127 124 122 116 115 '116 0 lass containers _____ . ____ ------ __ •. _____ .do. ___ ---;,-172- 209 213 212 216 227 210 230 222 204 200 212 208
Nondurable manufactures ....•....•......... .do .... 174 176 177 175 172 169 169 165 168 168 169 '173 Alcoholic beverages. ----------------------.do .. __ 109 143 131 126 137 123 116 119 128 186 156 166 184 Chemicals .. ____ . --------------------------do .. __ • 313 36.5 364 359 341 323 324 319 314 314 307 306 '306 Leather and products .•..•.•..•.•...•...... do .... •112 102 108 111 112 116 112 115 105 112 121 115 116 Leather tanning• _______ •... -------- ____ .. do. ___ ----;,-153" 97 103 105 107 117 110 113 113 108 120 '111 112 ManuFactured food prodncts •.••.•.••.•.... do .... 151 154 158 159 158 !54 153 153 147 146 148 153
Dairy products .•. -----------------------do .... p 145 P139 •126 •128 •135 •137 •139 •153 •151 •139 •147 p 152 • 165 Meat packing ____________________________ do .... • 158 173 187 215 202 198 180 173 175 169 161 154 158 Processed fruits and vegetables• ....•••... do .... • 144 142 140 140 155 152 145 136 !30 112 121 139 '145
Paper and products .......•.....••.••...... do .... 132 136 138 137 138 142 140 133 142 142 143 143 Paper and pulP--------------------------do .•.. 131 134 135 134 134 137 136 129 137 137 '139 138
Petroleum and coal products ....•.••.•.•... do ...• 219 226 230 234 233 237 242 247 251 258 '266 200 Petroleum refining ••.••.•.•......•.•.•.•. do .... ----;,-ioz- 226 234 238 243 242 246 252 259 254 272 '281 281
Printing and pnblshing •..•.•..••.•••..•.•• do .... 105 104 102 100 101 98 100 95 102 99 '103 '103 Textiles and products .....•••.............. do ____ p 149 143 149 152 151 151 147 145 139 141 147 '146 '149 Tobacco products ...•.• ----·----------- .... do. ___ 131 143 125 119 123 126 12: 121 122 126 124 120 135
Minerals._----·-- •. ------- ••..• ------- ________ .do. ___ • 137 137 139 142 139 140 143 142 13~ 142 143 143 '143 Metals ... ------------------------------------do .... 124 124 127 126 122 120 120 117 114 114 112 111
Munitions Production
Total munitions• _ -------- ___ .•• ____ •.• _ ••... 1943 = 100. _ • 109 117 113 113 117 112 114 112 110 112 110 112 109 A ircratt•. _______ .. ________________ .. __________ .do. ___ • 120 132 139 140 153 140 147 144 141 139 134 128 '121 Ships (work done)*_ ---------------------------do .... • 97 120 112 110 114 111 114 109 107 106 102 103 102 Oun' and fire control• _. ___ --------------------do .... •77 108 102 100 95 91 88 85 84 87 80 83 77 Ammunition*._---------------- ________________ do ____ •132 no 101 109 no 114 112 112 117 122 125 125 127 Combat and motor vehicles• ------------------.do .... • 95 113 97 82 80 76 73 76 76 83 80 83 89 Communication and electronic equipment• .... do .... • 118 13.5 136 125 129 124 124 127 116 118 117 124 123 Other equipment and supplies*_ ---------------do .... •120 105 101 99 106 112 105 108 102 113 115 126 120
MANUFACTURERS' ORDERS, SWPMENTS, AND INVENTORIES
New orders, Index, totaL .........••.•. Jan. 1939-100 .. --------- 274 276 261 271 280 293 301 314 302 299 316 '31c Durable goods._ -------------------------------do. ___ --------- 402 411 365 384 403 436 445 487 455 429 455 '461
Iron and steel and their products .....••...... do .... 284 300 275 257 272 330 366 439 429 381 415 '416 Electrical ma,chinery __ -------------. _________ do .. __ 439 523 406 389 389 395 398 396 326 339 401 '316 Other machinery------------------------ ____ .do .... --------- 329 319 291 361 455 441 450 501 407 370 439 '440 Other durable goods._. ----------------------do .... --------- 642 626 557 611 577 621 589 592 590 595 556 '613 N endurable goods _____ ---------------------- __ .do. ___ --------- 192 189 194 198 201 201 208 202 204 215 266 '223 Shipments,index, totalt---------BVg. month 1939=100 .. 276 257 271 268 274 264 273 263 264 269 279 274
Durable goods .. _. -----------------------------do .... 393 364 384 377 389 371 383 373 366 372 382 376 Automobiles and equipment. .....•.•••...•.. do ..•. 318 299 301 295 309 290 314 289 292 282 303 313 Iron and steel and their products .•.•••.•••.•. do .... 247 234 247 244 248 235 248 245 243 253 252 249 Nonferrous metals and products .•..••••..... do .... 262 260 273 275 273 274 272 257 263 267 279 282 Electrical machinery ___ .. -------- ....•• _____ .do._._ 531 429 483 485 513 452 492 508 483 521 515 492 Other machinery_ ----------------------------do .. __ --------- 414 382 407 401 425 411 427 402 392 389 408 390 Transportation equipment (exc. autos) ..•. do .... --------· 2, 742 2, o42 2, 672 2, 561 2, 644 2, .526 2,436 2,468 2, 310 2, 372 2, 414 2, 412 Other durable goods.-------------------------do .... --------- 209 198 206 207 208 204 219 210 219 213 221 210
Nondurable goods._ ---------------------------.do .... --------- 106 182 193 193 194 190 196 187 193 198 208 203 Chemicals and allied products. --------------do .... 202 199 205 206 204 204 208 200 207 207 218 211 Food and kindred products __________________ do ..•. --------- 208 207 214 204 208 200 200 203 206 216 227 217 PapN and allied products ....•••.........•.•. do ..•. -------- 172 162 175 176 I 172 !74 179 165 178 172 I 180 ' 179 Petroleum refining ___ .. ____ ------ ... _ ... __ .• .do .•• ---------- 171 162 167 170 177 174 188 190 181 1 182 I 188 I 186 Rubber products __ --------------------------.do .•.•. ---.---- 3191 2i4 I 299 ~~~ I 295 293 3161 295
2881 2971 s12 I 293 Textile-mill products .. ------------------------do ...• ______ . __ 195 182 : 200 195 185 200 162 184 184 189 ' 189 Other nondurable goods ______________________ do ...• --------- 178 147 : w:J 169 I 174 172 I 180 ' 165 175 181 I 189 I 189 r Revised. • Preliminary, *Now series. For annual indexes of munitions production for 1940-44, sec tnllle on p. 22; monthly dnt.a bcginnin~ July 1940 are on p. 24. tReviscd s~.ries. For revisions for the indicated unadjusted indexes a_nd all s~as?nally adjusted Indexes shown above forttte industrial production series, see table 12 on pp_. 18:-20
of the December 1943 issue. Seasonal adjustment factors for a number of mdustnes mcluded m the mdustnal productJon senes shown m tho Survey have been fixed at 100 begmmng various rnonths from January 1939 to July 19-42; ctnta for these industries are shO\Yll only in the nnadju:3ted srriPs as the "adjusted" in(Iexes arc the same as the unadJusted .. The indl'XC'S of shipments have been revised beginning 1939 to incorporate corn;·ctions in company reports dup to renrgotiations and other revisions and to take account of changes In the weighting factors; revised annual data beginning 1939 are shov.n in the tsble on p. 22 of this issue; complete monthly revbions are available on request.
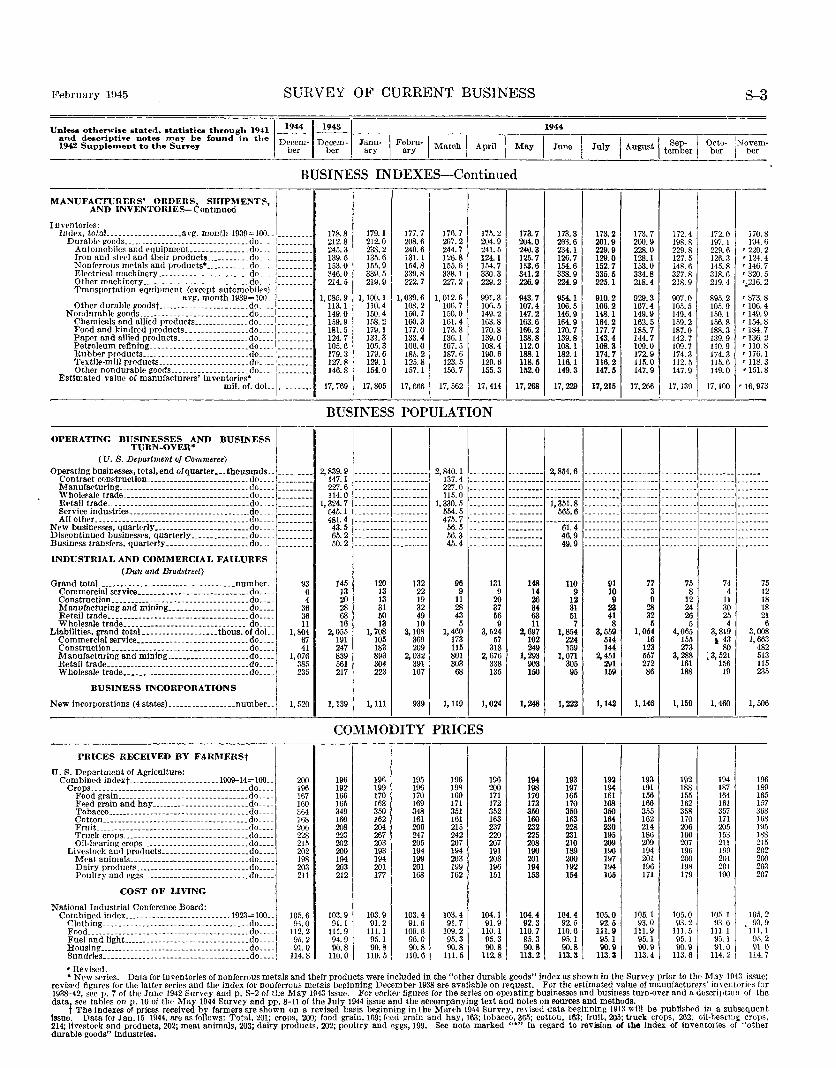
February 1945 SURVEY OF CURRENT BUSINESS S-3
Unless otherwioe state<l, statistic.. through 1941 ~~~~~ 1944
and descriptive notes may he found in t.he I . I I I ,. I I I I ~~--1942 Supplement to the Survey Decem- Decem- Janu- FebiU- March April May Sep Octo- -Novem--~ ~.~ ~ ~ ~ ~~~~ ~~~
--~--~--~--~----L---~--~--~--~---
BUSINESS INDEXES-Continued
MANUFACTURERS' ORIJERS, SHIPMENTS, ANIJ INVENTORIES-Continued
Inventories: Index, totaL ................. avg. month 1939=100. ----------
Durable goods ....... -- .. __ .. -----------------. do .... Automobiles and equipment_ ______________ do_ .. Iron and steel and their products ___________ do_ .
{:::::::: N onlerrous metals and products• _________ .. do ... Electrical machinery------------- -------~ .. do ...
·1::::::::: Other machinery ______ .. ___ ..... _________ -~do ... -~---------
Transportation equipment (except automobiles) -~---------
I avg. month 1939= 100. Other durable g-oodst ........... ._ __________ do. __
Nondurable goods ___ ., _______________________ do_ .. Chemicals and allied products .............. do .. .. r======= Food and kindred products ________________ do.~. Paper and allied products __________________ do ___ _
-1::::::::: Petroleum refining_ ... ------------------ __ .do ...
~---------
---------Rubber products_ ... ----------------------- do~ ___ I ---------
I Textile-mill products ..... _. ____ • __ ._. __ . ___ do ... _ Other nondurable goods .................... do ...
~---------
Estimated value of manufacturers' inventories• mil. of. doL _[~:::~~
OPERATING BUSINESSES AND BUSINESS TURN-OVER*
( U. S. Department of Commerce)
I
Operating businesses, total, end of quarter ___ thousands. __ Contract construction __________________________ do. __ . ---------M anufarturing _____ ------- ___ ---- ___ • ---- _____ .do .... ____ . ___ _ Wholesale trade _________ . ___ . ______ .------._._ .do ... ________ . __ Retail trade .. ----------------------------------do .... ----·----Service industries _______________________________ do. __ _ All other _______________________________________ do. ~------ --
New businesses, quartrrly ________________________ do. :: ::::::::: Discontinued businesses, quarterly _______________ do .. Business transfers, quarterly _____________________ do.
INDUSTRIAL AND COMMERCIAL FAILURES (Dun and Bradstreet)
Grand total -------------------------------- .. number._ Commercial service ____________________________ do ____ Construction ___________________________________ do .... Manufacturing and mining _____________________ do ____ Retail trade ____ ----- __ . _____ . ___ ------ _______ .. do .. _. Wholesale trade _______________________________ do ....
Liabilities, grand tota) ___________________ thous. of doL Commercial service _________ ... ______________ .. do .. __ Construction----------. _______ ._. ___ .. ----- ___ .do .. __ Manufacturing and mining .. ___________________ do .... Retail trade __ ------- __ . _____ . _______ . __________ do .. _. Wholesale trade ______ ------------------------ .. do. __
BUSINESS INCORPORATIONS I New Incorporations (4 states) _________________ number .. i
PRICES RECEIVE}) BY FARl\fERSt
U. S. Department of Agriculture: Combined indext--------------- --------1909-14= 100 ..
Crops._ ... _ ... _____ .. -.--._.-.- .... -- __ . __ ._ .do.- .. Food grain ..... ____________________________ do .. .. Feed grain and hay _________________________ do ... . Tobacco ________ . _____ .----- __ ... _._. ______ .do ... . Cotton _________ .... ____________ . __ • ___ .. ___ do. __ _ Fruit ... _._ .. ____ ---- _______ . ____________ .. _ do. __ _ Truck crops ..... _. __________ .. ____________ . do ... . Oil-hearing crops ____ --------------------- .. do ... .
Livestock and products ______________________ do .. .. Meat animals._. __ ... __ _. _____ ----_-----_ ... do ... . Dairy products _____________________________ do ___ _ Poultry and eggs ___________________________ do ....
COST OF LIVING
National Industrial Conference Board: Combined index ________________ ........... 1923=100 ..
Clothing. ___ . ____ ..... _._. ____ ._. __ ._. ___ .... do ... . Food._ .. _.---------------- ... ________________ do .... ,
f:7~r?i_-~~~~=~~== == ::: = = ::: == ::::::::::: :J~= ::: 1
• Revised.
93 6 4
36 36 11
1, 804 67 41
1,076 385 235
I, .520
200 196 167 160 364 168 206 228 215 202 198 203 211
10.5. 6 94.0
112.2 95.2 91.0
114.8
178.8 179.1 177.7 176.7 175.2 173.7 212.8 212.0 208.6 207.2 204.9 204.0 24,1),3 238.2 240.6 244.7 241.5 240.3 139.5 135.6 j3J.1 126.8 124.1 125.7 153.0 155.9 154.8 155.6 154.7 153.6 346.0 339.5 339.8 338.1 330.3 341.2 214.5 219.9 222.7 227.2 229.2 2'.!6. 9
1, 085.9 1,100. 1 1, 039.6 1, 012.6 991.3 943.7 113.1 110.4 108.2 106.7 106.5 107.4 149.0 150.4 150.7 !50.0 149.2 147.2 159.9 158.2 160.3 161.4 163.8 163.6 181.5 179.1 177.0 173.8 170.8 166.2 124.7 131.3 133.4 136.1 139.0 138.8 105.6 105.3 106.0 107.5 108.4 112.0 179.3 179.6 185.2 187.6 190.6 188.1 127.8 129.1 125.8 123.5 120.6 118.5 146.8 154.0 157.1 156.7 155.3 152.0
17,769 17,805 17,666 17,562 17,414 17,268
173.3 173.2 173.7 2fl3.6 201.9 200.9 234.1 229.9 228.0 126.7 129.0 128.1 154.6 152.7 153.0 338.9 335.5 334.8 224.9 225.1 218.4
954.1 910.2 929.3 106.5 106.2 107.4 146.9 148. 1 149.9 164.9 164.2 162.5 170.7 177.7 185.7 139.8 143.4 144.7 108.1 108.3 109.0 182.1 174.7 172.9 116.1 116.2 115.0 149.3 147.5 147.9
17,229 17,215 17,266
'
172.4 172.0 198.8 197.1 229.8 229.6 127.5 126.3 14R. 6 145.8 327.8 318.6 218.9 219.4
907.0 895.2 105.5 105.9 149.4 150. 1 159.2 156.8 187.0 188.3 142.7 139.9 109.7 110.9 174.3 174.3 112.5 115.6 147.9 149.0
17,139 17,100
170. 194.
'220.
8 6 2
'124. 4 '146. 7 '320. 5 •,216. 2
'873. 8 '106.4 '149. 9 '154. 8 '184. 7 '136. 2 '110. 8 '176. 1 '118. 3 '151. 8
r 16,973
BUSINESS POPULATION
2,839. 9 147.1 227.6 114.0
1, 324. 7 545.1 481.4 43.5 65.2 50.2
145 13 20 28 68 16
2,055 191 247 839 561 217
1,139
120 132 13 22 13 19 31 32 50 49 13 10
1, 708 3,108 105 369 183 209 893 2,032 304 391 223 107
1,111 939
COMMODITY
196 196 195 192 199 196 166 170 170 165 168 169 349 350 348 160 162 161 208 204 206 223 267 247 202 203 205 200 193 194 194 194 199 203 201 201 212 177 168
103.9 103.9 103.4 91. 1
1~l: I I 91.6 111.9 109.6 94.9 9.1.1 96.0 90.8 90.8 90.8
110.0 110.5 110.6
2, 840.1 137.4 227.0 1!5. 0
1, 330 .• 5 554.5 475.7 56.5 56.3 45.4
96 9
11 28 43 5
1,460 173 115 801 303 68
1,119
--------- --------- 2,854.6 --------- --------- ------------------ ------
--------- --------- 1, 351.8 --------- --------- --------- --------- ----------------- --------- 565.6 --------- --------- --------- --------- --------
::::::::: ::::::::: ""6i~4- ::::::::: ::::::::: ::::::::~ ::::::::: :::::::: --------- --------- 46.9 --------- --------- --------- --------- ----------------- --------- 49.9 --------- --------- --------- --------- --------
131 148 110 91 77 75 74 75 9 14 9 10 3 8 4 12
20 26 12 ll 9 12 11 18 37 34 31 23 28 24 30 18 56 63 51 41 32 26 25 21 9 11 7 8 5 5 4 6
3, 524 2,697 1,854 3,559 1,054 4,065 3,819 3,008 57 102 224 514 16 155 l 43 1, 663
318 249 159 144 123 273 80 482 2, 676 1,293 1,071 2, 451 557 3,288 ; 3, 521 513
338 903 305 291 272 161 156 115 135 150 95 159 86 188 19 235
1,024 1,248 1,222 1,142 1,146 1,159 1,460 1, 506
PRICES
196 196 194 193 192 198 200 198 197 194 169 171 170 165 161 171 172 173 170 168 351 352 350 350 350 161 163 160 163 164 215 237 232 228 230 242 220 225 231 195 207 207 208 210 209 194 191 190 189 190 203 203 201 200 197 199 196 194 192 194 162 151 153 154 16/i
103.4 104.1 104.4 104.4 105.0 91.7 91.9 92.3 92.5 92.5
109.2 110.1 110.7 110.61
111.9 95.3 95.3 95.3 9-S.l 95.1 90.8 90.8 90.8 90.8 90.9
111.5 112.8 113.2 113.3 113.3
193 192 191 188 156 155 166 162 3.55 358 162 170 214 206 186 166 209 207 194 196 ?All 200 196 198 171 179
105.1 105.0 93.0 93.2
111.9 111.5 95.1 95.1 I 90.9 90.9
113.4 113.6
194 187 164 161 357 171 205 !53 211 199 201 201 190
105.1 93.6
111.1 9o.l 91.0
114.2 1
19 18 16 15 36 16
6 9 5 7 8 8
195 188 215 20 2
2 00
3 7
20. 20
105. 2 9 ' 93 ..
J11.1 95. 91.
114.
2 0 7
• New series. Data for inventories of nonferrous metals and their products were included in the "other durable goods" index as shown in the Survey prior to the May Hl43 issue; revised figures for the latter series and the index for nonferrous metals beginning December 1938 are available on request. For the estimated value of manufacturers' inver:tori<·s for 1938-42, see p. 7 of the June 1942 Survey and p. S-2 of the May 1943 issue. For earlier figures for the series on operating businesses and business turn-over and a description of the data, see tables on p. 10 of the May 1944 Survey and pp. 8-11 of the July 1944 issue and the accompanying text and notes on ~ources and methods.
t The indexes of prices received by farmers are shown on a revised basis beginning in tbe March 1944 Survey; revised data beginning 19T:l will he published in a subsequent Issue. Data for Jau.15 1944. are as follows: Total, 201; crops, 200; food grain,169; feed grain and hay, 163; tobacco, 365; cotton, 163; fruit, 205; truck crops, 262; oil-beariiJ~ crops, 214; livestork and products, 202; meat animals, 203; dairy products, 202; poultry and eggs, 199. See note marked "*" in regard to revision of the index of inventories of "other durable goods" industries.
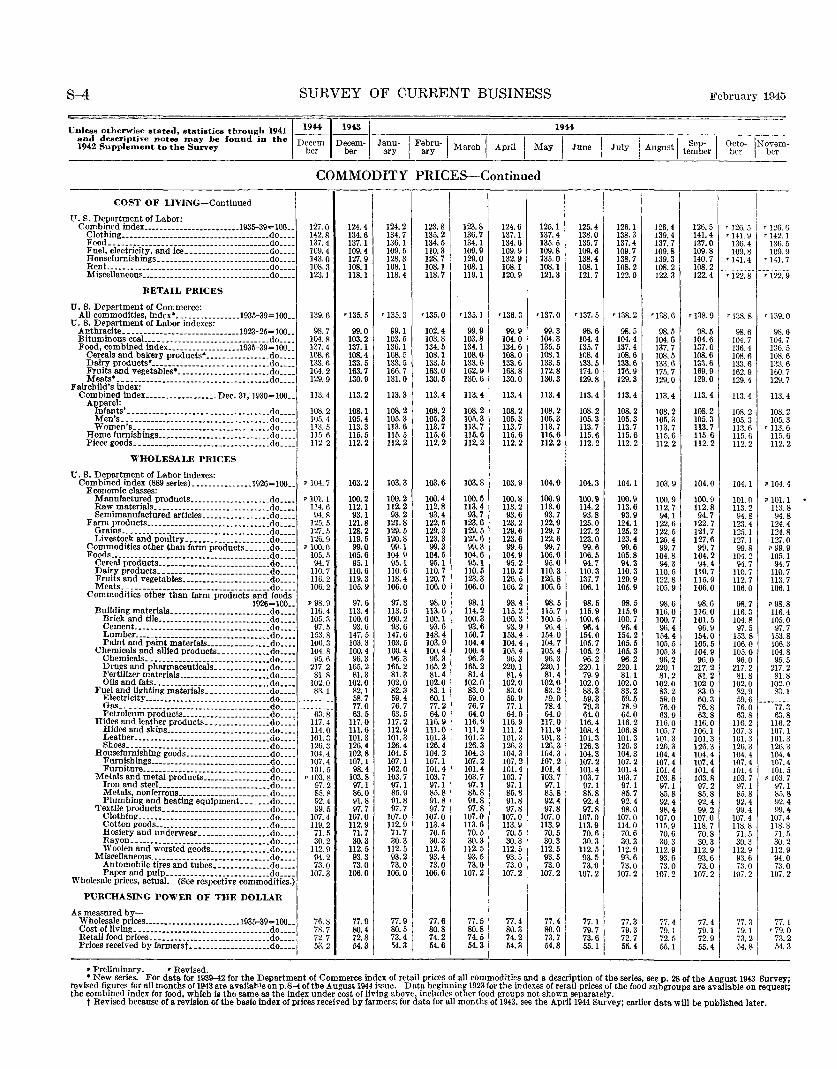
S-4 SURVEY OF CURRENT BUSINESS February Hl45
1944 Unless otherwise stat.,d, statistics through 1941 ~~~~~
and descriptive notes may be found in the Decem Decem- Janu~ I 194.2 Supplement to the Survey ber ber ary Fi~~u-j March I April I May I June I July I August I te~~~r I 0~~t ~N~~~m-
COMMODITY PRICES--Continued
COST OF LIVING-Continued
I I I I
•J26J U. S. Department of Labor:
126.4 I Combined index .•••• -------------------1935-39= 100 .. 127.0 124.4 124.2 123.8 123.8 124.6 125.1 125.4 126.1 126.5 '126. 6 Clothing_._ .•. _._._ .. ___________ ._. _______ • _ _do. ___ 142.8 134.6 134.7 135.2 136.7 137.1 137.4 138.0 138.3 139.4 141.4 •141.9 '142.1 Food ________________ .----------- ____________ do ____ 137.4 137.1 136.1 134.5 134.1 134.6 135.5 135.7 137.4 137.7 137.0 136.4 136.5 Fuel, electricity, and ice. ____________________ do ____ 109.4 109.4 109.5 110.3 109.9 109.9 109.8 109.6 109.7 109.8 109.8 109.8 109.9 H ousefurnlsh ings ________ • ____________ • _____ .do. ___ 143.0 127.9 128.3 128.7 129.0 132.9 135.0 138.4 138.7 139.3 140.7 '141.4 '141. 7 Reu t_ _ ••• _. _. ___________________ • _. _______ ._.do •• __ 108.3 108.1 108.1 108.1 108.1 108.1 108.1 108.1 108.2 108.2 108.2 --------- --------Miscellaneous ___ ._. ______ ._. ___ ._. _________ •. do ____ 123.1 118.1 118.4 118.7 119.1 120.9 121.3 121.7 122.0 122.3 122.4 '122. 8 '122. 9
RETAIL PRICES
U. S. Department of Commerce: '135. 0 '135.1 •136.3 •137. 0 •137.5 '138. 2 '138.6 •n8.9 All commodities, fndex•----------------1935-39=100 .. 139.6 '135. 5 '135. 3 '138. 8 '139.0
U. B. Department of Labor indexes: 99.1 102.4 99.9 99.9 99.3 98.6 98.5 98.5 Anthracite _____ ----- ___ ------- _________ 1923-25= 100 .. 98.7 99.0 98.5 98.6 98.6
Bituminous coaL ___ ---------------------------do ____ 104.8 103.2 103.5 103.8 103.8 104.0 104.3 104.4 104.4 104.6 104.6 104.7 104.7 Food, combined fndex __________________ 1935-39=100 __ 137.4 137.1 136.1 134.5 134.1 134.6 135.5 135.7 137.4 137.7 137.0 136.4 136.5
Cereals and bakery products• ________________ do ____ 108.6 108.4 108.5 108.1 108.0 108.0 108.1 108.4 108.6 108.5 108.6 108.6 108.6 Dairy products• _____ ----------- ___ • _______ .. do ____ 133.6 133.5 133.5 133.5 133.6 133.6 133.5 133.5 133.6 133.6 133.6 133.6 133.6 Fruits and vegetables• _______________________ do ____ 164.2 163.7 166.7 163.0 162.9 168.8 172.8 174.0 176.9 175.7 169.9 162.9 160.7 Meats• ___ • ----------------- _________ ........ do ____ 129.9 130.9 131.0 130.5 130.6 130.0 130.3 129.8 129.3 129.0 129.0 129.4 129.7
Fairchild's index: Combined lndex __________________ Dec. 31, 1930=100 __ 113.4 113.2 113.3 113.4 113.4 113.4 113.4 113.4 113.4 113.4 113.4 113.4 113.4 A¥Ef:~~~· ___________________________________ do ____ 108.2 108.1 108.2 108.2 108.2 108.2 108.2 108.2 108.2 108.2 108.2 108.2 108.2
Men's. __ ------------------------- _________ do ____ 105.4 105.4 105.3 105.3 105.3 105.3 105.3 105.3 105.3 105.3 105. 3 105.3 105.3 Women's ________ • ____ • __ • _____ • _. _. __ • __ •• do ____ 113.5 113.3 1!3. 6 113.7 113.7 113.7 113.7 113.7 113.7 1!3. 7 113.7 113.6 '113. 6 Home furnishings _____ -------------------- ___ do ____ 115.6 1!5. 5 115.5 115.6 115.6 115.6 115.6 115.6 115.6 ll5.6 115.6 115.6 115.6 Piece goods._------------------. _____ ------- .do ____ 112.2 112.2 112.2 112.2 112.2 112.2 112.2 112.2 112.2 112.2 112.2 112.2 !l2. 2
WHOLESALE PRU:ES
U. B. Department of Labor Indexes: Combined index (889 series) _______________ 1926=100 __ p 104. 7 103.2 103.3 103.6 103.8
Economic classes: 103.9 104.0 104.3 104. 1 103.9 104.0 104.1 p 104. 4
Manufactured products ________________ • __ .do .... p 101.1 100.2 100.2 100.4 100.5 100.8 100.9 100.~ 100.9 100.9 100.9 101.0 p 101.1 Raw materials __________________ • ________ .. do .... 114.6 112.1 112.2 112.8 113.4 113.2 113.0 114.2 1]3.6 112.7 112.8 113.2 113.8 Bemimanufactured articles _________________ do ____ 94.8 93.1 93.2 93.4 93.7 93.6 93.7 93.8 93.9 94.1 94.7 94.8 94.8 Farm products _______________________________ do •.•• 125.5 121.8 121.8 122.5 123.6 123.2 122.9 125.0 124.1 122.6 122.7 123.4 124.4 Grains ___ ----------------------- .. -------- .do ____ 127.5 128.2 129.5 129.3 129.5 129.6 129.7 127.2 125.2 122.5 121.7 125. I 124.8 Livestock and poultry _____________________ do ____ 126.9 1!9.5 120.8 123.3 125.6 123.6 122.6 123.0 123.4 125.4 127.6 127. I 127.0
Commodities other than farm products ______ do ____ p 100.0 99.0 99.1 99.3 99.3 99.6 99.7 99.6 99.6 99.7 99.7 99.8 p 99.9 Foods .. ______ ._._. __ ... __ • __ •• ______________ .do. __ • 105.5 105.6 104.9 104.5 104.6 104.9 105.0 106.5 105.8 104.8 104.2 104. 2 105.1 Cereal products ____________________________ do. ___ 94.7 95.1 95.1 95.1 95.1 95.2 95.0 94.7 94.3 94.3 94.4 94.7 94.7 Dairy products __ ------------- _____________ do ____ 1!0. 7 110.6 1!0. 6 110.7 110.5 110.2 110.3 110.3 110.3 llO. 5 110.7 110.7 l!O. 7 Fruits and vegetables _____________________ _cto ____ 1!6. 2 1!9.3 118.4 120.7 123.3 126.5 126.8 137.7 129.9 122.8 115.9 112.7 113.7 Meats ___ ------------ _________ ---------- __ .do ____ 106.2 105.9 106.0 106.0 106.0 106.2 106.6 106.1 105.9 105.9 106.0 106.0 106.1
Commodities other than farm products and foods p 98.9 97.6 97.8 98.0 98.1 98.4 98.5 98.5 98.5 98.6 98.6 98.7 p 98.8
Building materials ••• __________________ 1_9_2_6_d~~~== 116.4 113.4 113.5 113.6 1!4.2 115.2 !15. 7 115.9 115.9 !l6. 0 116.0 116.3 116.4 Brick and tile. ___________________________ do .... 105.3 100.0 100.2 100.1 100.3 100.3 100.5 100.6 100.7 100.7 101.5 104.8 105.0
Cement_ __ •••• ___ ----- __ .... ___ ... _. _____ do_. __ 97.5 93.6 93.6 93.6 93.6 93.9 96.4 96.4 96.4 96.4 96.9 97.5 97.7 Lumber ___ ._. ______ .. _____ •• ___ • __ • __ ._ •• do •• __ 153.8 147.5 147.6 148.4 150.7 153.4 154.0 154.0 154.2 154.4 154.0 153.8 153.8 Paint and paint materials ________________ do ____ 106.3 103.3 103.5 103.9 104.4 104.4 104.7 105.7 105.5 105.5 105.5 106.0 106.3 Chemicals and allied products _____________ do ____ 104. 8 100.4 100.4 100.4 100.4 105.4 105.4 105. 2 105.3 105.3 104.9 105.0 104.8
Chemicals __ .--------------------- _______ do ____ 95.6 96.3 96.3 96.3 96.3 96.3 96.3 96.2 96.2 96.2 96.0 96.0 95.5 Drugs and pharmaceutlcals .............. do ____ 217.2 165.2 165.2 165.2 165.2 220.1 220.1 220.1 220.1 220.1 217.2 217.2 217.2 Fertilizer materlals _______________________ do •.•. 81.8 81.3 81.3 81.4 81.4 81.4 81.4 79.9 81.1 81.2 81.2 81.8 81.8 Oils and fats ____________________________ _do .... 102.0 102.0 102.0 102.0 102.0 102.0 102.0 102.0 102.0 102.0 102.0 102.0 102.0
Fuel and lighting materials ________________ do ____ 83.1 82.1 82.3 83.1 83.0 83.0 83.2 83.3 83.2 83.2 83.0 82.9 83.1 Electricity--------- ______________________ do ____ 58.7 59.4 60.1 59.0 59.9 59.0 59.3 59.5 59.0 60.3 59.6 ""77~3 Gas _____ --------------------------------do .... 77.0 76.7 77.2 76.7 77.1 78.4 79.3 78.9 76.0 76.8 76.0
Petroleum products ___ ------- ____________ do ____ 63.8 63.5 63.5 64.0 64.0 64.0 64.0 64.0 64.0 63.9 63.8 63.8 6.1. 8 Hides and leather products ________________ do ... ~ ll7.4 117.0 117.2 116.9 116.9 116.9 117.0 116.4 116.2 116.0 116.0 116.2 116.2 Hides sud skins __________________________ do ____ 114.0 111.6 112.9 111.0 111.2 111.2 111.9 108.4 106.8 105.7 106.1 107.3 107.1
Leather------------------- _______________ do ____ 101.3 101.3 101.3 101.3 101.3 101.3 101.3 101.3 101.3 101.3 101.3 101.3 101.3 Shoes __ .. -------- ____________ • ___________ do ____ 126.3 126.4 126.4 126.4 126.3 126.3 126.3 126.3 126.3 126.3 126.3 126.3 126.3 Housefurnishfng goods _____________________ do .... 104.4 102.8 104.5 104.2 104.3 104.3 104.3 104.3 104.3 104.4 104.4 104.4 104.4 Furnish iugs ______ • _. ____ • _. ___________ ••• do ____ 107.4 107.1 107.1 107.1 107.2 107.2 107.2 107.2 107.2 107.4 107.4 107.4 107.4 Furniture. _______________ •• _. ___ •• _. _____ do __ ._ 101.5 98.4 102.0 101.4 101.4 101.4 101.4 101.4 101.4 101.4 101.4 101.4 101.5 Metals and metal products _________________ do ____ p 103. 8 103.8 103.7 103.7 103.7 103.7 103.7 103.7 103.7 103.8 103.8 103.7 p 103. 7 Iron and steeL ___________________________ do ____ 97.2 97.1 97.1 97.1 97.1 97.1 97.1 97.1 97.1 97.1 97.2 97. 1 97.1 Metals, nonferrous ______________ . _______ .do .... 85.8 86.0 85.9 85.8 85.8 85.8 85.8 85.8 85.7 85.8 85.8 85.8 85.8 Plumbmg and heating equipment_ _____ .do .... 92.4 91.8 91.8 91.8 91.8 91.8 92.4 92.4 92.4 92.4 92.4 92.4 92.4
Textile products_---------- _______________ .do ____ 99.5 97.7 97.7 97.7 97.8 97.8 97.8 97.8 98.0 98.4 99.2 99.4 99.4 Cloth in!( _____________ ••• _. ___ •• __ ._. _____ do. ___ 107.4 107.0 107.0 107.0 107.0 107.0 107.0 107.0 107.0 107.0 107.0 107.4 107.4 Cotton goods ________ ----------------- ___ .do ... _ 119.2 112.9 112.9 113.4 113.6 113.9 113.9 113.9 114.0 115.9 118.7 118.8 118.8 Hosiery and underwear __________________ do ____ 71.5 71.7 71.7 70.5 70.5 70.5 70.5 70.6 70.6 70.6 70.8 71.5 71.5 Rayon __ ---- _____ • ________ • _. _. _. __ • __ ._.do ____ 30.2 30.3 30.3 30.3 30.3 30.3 30.3 30.3 30.3 30.3 30.3 30.3 30.2 Woolen and worsted goods _______________ do ____ 112.9 112.5 112.5 112.5 112.5 112.5 112.5 112.5 112.9 112.9 112.9 112.9 112.9
Miscellaneous .. ________ ••• _________________ do. ___ 94.2 93.3 93.2 93.4 ll3. 5 93.5 93.5 93.5 93.6 93.6 93.6 93.6 94.0 Automobile tires and tubes ______________ do .... 73.0 73.0 73.0 73.0 73.0 73.0 73.0 73.0 73.0 73.0 73.0 73.0 73.0 Paper and pulp __________________________ do ____ 107.3 106.0 106.0 106.6 107.2 107.2 107.2 107.2 107.2 107.2 107.2 107. 2 107.2
Wholesale prices, actual. (See respective commodities.)
PURCHASING POWER OF THE DOLLAR
As measured by-Wholesale prices._ _____ ···--· ........... 1935-39= 100 •. 76.8 77.9 77.9 77.6 77.5 77.4 77.4 77. 1 77.3 77.4
77.41 77.3 77. 1
Cost of Jiving_ ---------------------------------do .... 78.7 80.4 80.5 80.8 80.8 80.3 80.0 79.7 79.31 79. 1 79.1 79.1 '79. 0 Retail food prices ______________________________ do ____ 72.7 72.8 73.4 74.2 74.51 74.2 73.7 73.6 72.7 72.5 72.9 73.2 73.2 Prices received by farmerst--------------------do ____ 53.2 54.3 54.3 54.6 54.3 54.3 54.8 55.1 55.4 55.1 55.4 54.8 54.3
• Preliminary. r Revised. • New series. For data for 1939-42 for the Department of Commerce Index of retail prices of all commodities and a description of the series, seep. 28 of the August 1943 Survey;
revised ligures for all month• or 1943 are available on p.B-4 oftbe August 1944 issue. Data beginning 1923 lor the indexes of retail prices of the food subgroups are available on request; the combined index for food, which is the same as the index under cost of living above, includes other food !(l'oups not shown separately.
t Revised because of a revision of the basic Index of prices received by farmers; for data for all months of 1943. see the April1944 Survey; earlier data will be published later.
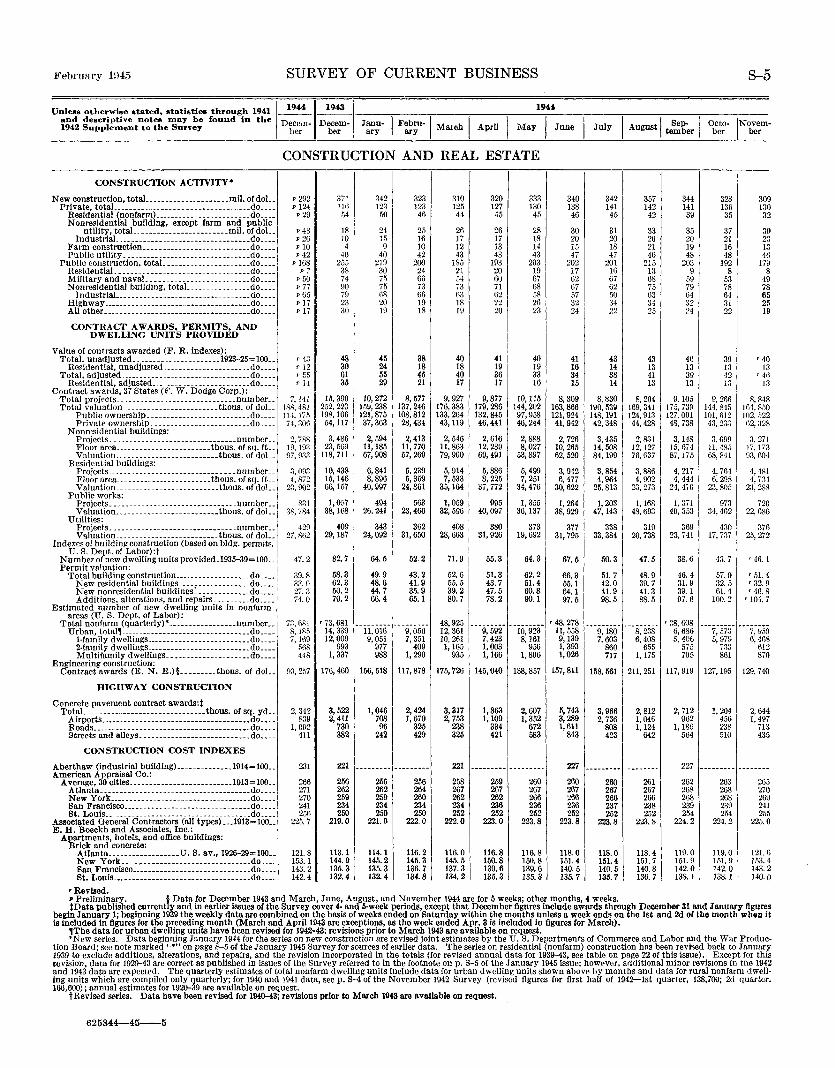
February 1V45 SURVEY OF CURRENT BUSINESS S-5
Unle8s otherwise atated, statistics through 1941 1 1944 ~~~ 194"
and descriptive notes may be found in the Decem- Decem- Janu- I Febru-1 l . I I I I S I 0 t IN 1942 Supplement to the Survey ber ber ary ary March Apnl May June July August ter:i~er ~et <;,~;m·
~~--~----~--~----~--~----~--~----~--
CONSTRUCTION AND REAL ESTATE
CONSTRUCTION ACTIVITY* I New construction, totaJ _____________________ mil. of doL p 292 371 342 323 310 320 333 340 342 357 344 328 309
Private, totaL .. ____ ._------ _____ ---- ________ .do ...• p 124 116 123 123 125 127 130 138 141 142 141 136 130 Residential (nonfarm) ________________________ do ____ p 29 54 50 46 44 45 45 46 45 42 39 35 32 Nonresidential building, except farm and public
utility, totaJ ________________________ mil. of doL p 43 18 24 25 26 26 28 30 31 33 35 37 39 IndustriaL_ --------------------------------do ____ p 26 10 15 16 17 17 18 20 20 20 20 21 23
Farm construction _____ ------------ ----------do ____ p 10 4 9 10 12 13 14 15 18 21 19 16 13 Public utility _________ -----------------------do ____ p 42 40 40 42 43 43 43 47 47 46 48 48 46
Public construction, totaL _____________________ do ____ p 168 255 219 200 !85 193 203 202 201 21.5 203 192 li9 Residential. _______ . ________________________ _cto ____ p 7 38 30 24 21 20 19 17 16 13 9 8 8 Military and navaL _________________________ do ____ p 50 74 75 66 54 60 67 62 67 68 59 53 49 Nonresidential building, totaL .... __________ do ____ •77 90 75 73 73 71 68 67 ()2 75 79 78 78 IndustriaJ __________________________________ do ____ •6.1 79 68 66 63 62 58 57 50 63 64 64 65
~tg~:L~~:::::: ::::::::::::::~=======~====~~::::I p 17 23 20 19 181 22 26 32 34 34 32 31 25 p 17 30 19 18 19 20 23 24 22 25 24 22 19
I
CONTRACT AWARDS, PERMITS, AND
I DWELLING UNITS PROVIDED
Value of contracts awarded (F. R. Indexes): Total, unadjusted. _____________________ 1923-25=100 .. p 43 48 45 38 40 41 40 41 43 43 40 39 '40
Residential, unadjusted--------------------_ .do ____ p 12 30 ' 24 18 1 18 19 19 16 14 13 13 13 13 Total, adjusted. _________ . ----------------------do .. __ p 55 61 55 45 I 40 36 33 34 38 41 39 42 r 46
Residential, adjusted. ______________________ do____ PH 35 29 21 17 17 16 I 15 14 13 13 13 n Contract awards, 37 States (F. W. Dodge Corp.):
15,390 10,272 R, 577 I 9, 927 9,877 Total projects _____________________________ number .. I 7, 141 10,115 8, 309 8,830 8, 204 9,105 9, 261) 8, 848 Total valuation ________________________ thous. of doL 188, 4~! 252, 223 159,238 137,246 176,38:3 179,286 144,202 163,866 190,539 169, 341 175,739 144,845 16-1,850
PubliC ownership_ -------------------------do____ 11-l, 11 o 198, 106 121,875 108,812 133, 264 132, 845 97,958 121,924 148, !91 !24, 913 127,001 101, 612 102,522 Private ownership_ ------------------------do____ 74,306 54,117 37,363 28,434 43, 119 46,441 46,244 41,942 42,348 44,428 48,738 43,233 G2, 32S
Nonresidential buildings: Projects ... ---------- -------------------number __ 2, iRS 3,486 2,594 2,413 2,516 2,616 2,888 2, 726 3,435 2,831 3, 148 3,099 3, 271 Floor area ________________________ tbons. of sq. ft .. !9, !93 23,569 11, 185 11,770 11,863 12, 289 8,027 10,265 14,508 12,127 15,674 11,485 17, J7:l Valuation ... _______________________ thous. of doL 97, 9:3:~ l18, 7!1 67,908 57,269 79,960 69,491 53,897 62,520 84, 199 76,637 87,175 68,841 93,604
Residential buildings: Projects ____ ------------------------- __ .number __ 3, 093 10,438 6,841 5, 239 5, 914 5,886 5,499 3, 942 3, 854 3,886 4, 217 4, 764 4, 481 Floor area ________________________ tbous. of sq. ft._ 4, 872 15, 146 8,896 5, 359 7, 533 8, 225 7, 251 6, 477 4,964 4, 902 4, 444 6, 298 4, 734 Valuation. ___ ----·-----------------thous. of doL 23,902 66, 157 40,997 24,861 35, 164 37, 772 34,476 30,622 25, 813 23, 273 24,410 23,805 2:l, 288
Public works: Projects._------- -----------------------number __
1
8.11 1,057 494 663 1,059 995 1, 355 I, 264 1, 203 I, !68 1, 371 973 720 Valuation __________________________ thous. of doL 38,784 38, 168 26.241 23,466 32,596 40,097 36, 137 38,929 47, 143 48,093 40,353 34,462 22, ()86
uw;~J~~is_-- ----------------------------.number-- 429 409 343 362 408 380 373 377 338 319 369 4:!0 :!76 Valuation ... -----------------------tbons. of doL 27,862 29, 187 I 24,092 31,650 28,663 31,926 19,692 31,795 33,384 20,738 23, 741 17,737 25,272
Indexes of building construction (based on bldg. permits, I U. S. Dept. of Labor) :t
82.7 52.2 71.9 64.3 Number of new dwelling units provided.1935-39= 100. -~ 47.2 64.5 55.3 I 67.5 50.3 47.5 38.6 43. i '46.1 Permit valuation:
Total buii<;Jing ~onstf1!Ct_ion __________________ _cto ____ 39.8 58.3 49.9 43.2 52.6 51.3 62.2 66.3 51.7 48.9 46.4 57.0 '51. 4 New re~ldential bmldmgs _________________ do ____ 33.0 62.3 48.6 41.9 55.5 43.7 51.4 55.1 42.0 39.7 31.9 32.5 '32. 9 New nonresidential buildings: ____________ _cto ____ l 27.3 50.2 44.7 35.9 39.2 47.5 60.8 64.1 4!. 9 41.3 39. 1 61.4 '46.8 Additions, alterations, and repairs ________ _cto ____ 74.0 70.2 66.4 65.1 80.7 78.2 00.1 97.5 98.5 88.5 97.6 100.2 '104. 7
Estimated number of new dwelling units In nonfarm
--ii;ois·l---9;o5o-areas (U. s. Dept. or Labor):
'48, 278 Total nonfarm (quarterlyl*------------------number __ 73,681 '73,681 48,925 ---9;592" --io;ii:za· ~-------- -------·- '38, 608 ""7;573" --------Urban, total, _______________________ --------_ .do ____ 8,185 14,339 12,361 11,558 9,180 8, 2,18 6,686 7, 950 !-family dwellings __________________________ do ____ 7,169 12,009 9, 051 7. 351 10,261 7, 423 8,161 9,139 7.603 6,408 5, 406 5, 979 6, 408 2-family dwellings __________________________ do ____ 568 993 977 409 1, 165 1,003 956 1, 393 860 6.55 575 7:l3 612 Multifamily dwellings _____________________ do ____ 448 1, 337 988 1, 290 935 1, 166 1,806 1,026 717 1, 175 70.5 861 870
Engineering construction: 157,811 Contract awards (E. N. R.)§ _________ tbous. of doL. 93,257 176,460 156,518 117,878 175,726 145,040 138,857 158,561 211, 251 117, 9!9 127, 195 129,740
HIGHWAY CONSTRUCTION
Concrete pavement contract awards:t 3, 522 1,046 2,424 3, 317 1,863 2,607 5, 743 TotaL ... ---------------------------thous. or sq. yd .• 2, 342 3,966 2,812 2, 712 1, 204 2, 644
Airports.-------------------------------------do .•.. 839 2, 411 708 1,670 2, 753 1,109 1,352 3,289 2, 736 I, 046 962 456 1,497 Roads .. ____ ---_-_------------------------ ••• .do •• -- 1, 092 730 96 325 238 334 672 1,611 808 1,124 1,186 238 713 Streets and alleys_-------------- _____________ do ____ 411 382 242 429 325 421 583 843 423 642 564 510 435
CONSTRUCTION COST INDEXES
Aberthaw (industrial buildlng) ______________ l914=100 .. 231 221 ·-------A --------- 221 --------- --------- 227 --------- --------- 227 --------- --------American Appraisal Co.:
256 256 256 258 259 260 260 262 Average, 30 cities. ------------·------------1913=100 .. 266 260 261 263 265 Atlanta ______________________________________ do ••.. 271 262 262 264 267 267 267 267 267 267 268 268 270 New York ____________________________________ do ____ 270 259 259 260 262 262 266 266 266 266 268 268 269 San Francisco ________________________________ do ____ 241 234 234 234 234 236 236 236 237 238 239 239 241 St. Louis .. ___ ---------------.------ .. ______ .do ____ 256 250 250 250 252 252 252 252 252 252 254 254 255
Associated General Contractors (a.ll types) ..• 1913=100 .• E. H. Boeckb and Associates, Inc.:
225.7 219.0 221.0 222.0 222.0 223.0 223.8 223.8 223.8 223.8 224.2 224.2 225.0
Apartments, hotels, and office buildings: Brick and concrete:
Atlanta __ ----------------U.S. av., 1926-29=100 •• 121.8 113.1 114.1 116.2 116.0 116.8 116.8 118.0 118.0 118.4 119.0 119.0 121.6 New York ••. -----------------------------do ____ !53.1 144.9 145.2 145.3 145.5 150.8 150.8 151.4 151.4 151.7 151.9 151.9 153.4 San Francisco ____ -------------- __ -------- __ do_. __ 143.2 135.3 135.3 136.7 137.3 139.6 139.6 140.5 140.5 140.8 142.0 142.0 143.2 St. Louis ________ ------------------------- .. do. __ . 142.4 132.4 !32. 4 134.8 134.2 135.3 135.3 135.7 135.7 136.7 138.1 138.1 140.0
• Revised. 'Preliminary. §Data for December 1943 and March, June, August, and November 1944 are for 5 weeks; other months, 4 weeks. tData published currently and in earlier issues of the Survey cover 4- and 5-week periods, except that December figures Include awards through December 31 and January figures
begin January 1; beginning 1939 the weekly data are combined on tbe basis of weeks ended on Saturday within tbe months unless a week ends on the 1st and 2d of tbe month when it is included in figures for tbe preceding month (March and April1943 are exceptions, as tbe week ended Apr. 3 is Included In figures for March).
,Tbe data for urban dwelling units bave been revised for 1942-43; revisions prior to March 1943 are available on request. *New series. Data beginning Jan nary 1944 for the series on new construction are revised joint estimates by the U. S. Departments of Commerce and Labor and the War Produc
tion Board; see note marked'-*" on page S-5 of the January 1945 Survey for sources of earlier data. Tbe series on residential (nonfarm) construction has been revised back to January 1939 to exclude additions, alterations, and repairs, and the revision incorporated in tbe totals (for revised annual data for 1939-43, see table on page 22 of tbis issue). Except for this revision, data for 1929-43 are correct as published in issues of tbe Survey referred to in the footnote on p. S-5 of the January 1945 issue: however, additional minor reviswns in the 1942 and 1943 data are expected. The quarterly estimates of total nonfarm dwelling units include data for urban dwelling units shown above by months and data for rural nonfarm dwelling units which are compiled only quarterly; for 1940 and 1941 data, seep. S-4 of the November 1942 Survey (revised figures for first half of 1942-1st quarter, 138,700; 2d quarter. 166,600); annual estimates for 1921)-39 are available on request.
tRevised series. Data have been revised for 1940-43; revisions prior to Mareh 1943 are available on request.
625844-45--5
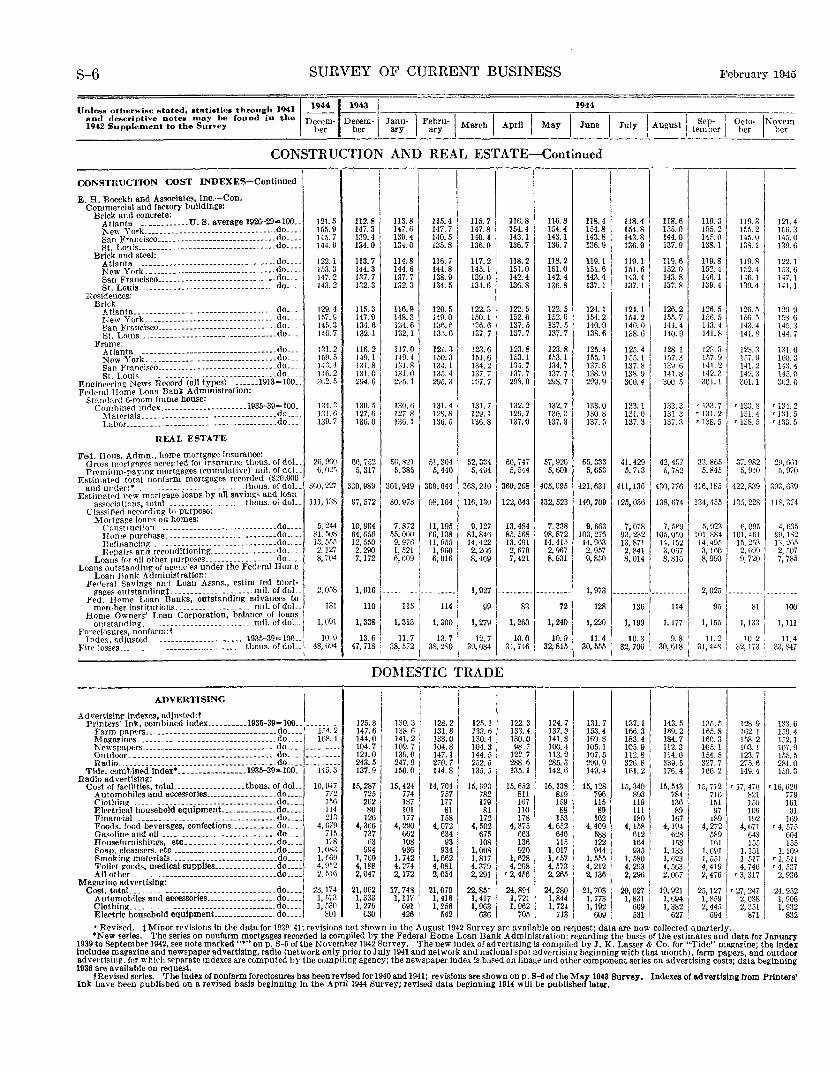
S-6
Unless otherwise stated, statiatics through 1941 and descriptive notes may be found in the 1942 iupplement to thf' Survey
SURVEY OF CURRENT BUSINESS
1
1944
1
1943 •
1 -Decem- Decem- Janu- l Febru-1 March I April I May ~ ~ ~y ~y I •
1944
CONSTRUCTION AND REAL EST ATE-Continued
CONSTRUCTION COST INDEXES-Continued i I I E. II. Boeckh and Associates,_ !~c.-Con. I I
I Commercial and factory bmldmgs: I I Brick and concrete: 116.81 116.8 Atlanta .. __________ u, B. average 1926-29=100 .. 121.5 112.8 113.8 i 115.4 115.7 118.41
~~~lo~f.~~s~~~=-=·==·=·=·=·=·=·=·=·=·====·=·=·=·=·=·=·=·=·=-:·:::~g:::: 155.9 147.3
147.61 147. 7 147.8 154.4 154. 4 154.8
145.7 139.4 139.4 140.5 140.4 143.1 143.1 143.8 144.9 134.0 134.0 1:l5. 8 136.0 136.7 136.7 136.9
Brick and steel: 122. 1 113.7 114.8 116. 7 117.2 118.2 118.2 119. 1
r~~~~~!~~~~~ ~ ~ ~ ~~ ~ ~ ~ ~ ~ ~ ~ ~ ~ ~ ~ ~ ~ ~ ~ ~ ~~ ~ ~ ~ ~ ~ ~~~ = ~: 153.3 144.3 144.6 144.8 145. 1 151.0 151.0 151.6 147.2 137.7 137.7 138.9 139.0 142.4 142.4 143.4 143.2 132.3 132.3 134.5 134.6 136.8 136.8 137.1
Regidenccs:
Bi?:;~~~~~~~~~~~ ~ ~~~~~= ~~~~~~~:~~~~~~~ ~~~ ~~~r- ~: 129.4 ll5. 3 116. Q 120.5 122.3 122.5 122.5 ' 124.1 157. g 147.9 H8.3 149.0 150.1 152.6 152.6 154.2 145.3 m:~! 134.6 136. fi 136.6 137.5 137.5 140.0 146.7 132.1 13.\.6 137.7 137.7 137.7 138.6
Frr~~~t{~~i;~~~~ ~ ~~~~~ ~:~ ~~ ~~~~~~~~~~~~~~~~=~~~: ~ • 131.2 116. 2 117.0 121.1 123.6 123.8 123.8 125.4 ]5(1. 5 149. 1 149.4 !50. 3 151.6 153.1 153.1 155.1 )4:~. 4 l:ll. 8 131.81 134. I 134.2 134.7 134.7 137.8 HG.2 131.0 131.0 135.4 137. 7 137. 7 137.7 138.9
En~ine~ring News Record (all t¥p_es) .. 0 ..... 1913=100 .. 2L:?. 5 294.6 295.1 I 295.3 ~tl7. 7 298.0 298.7 299. g Federal Hom~ Loan Bank Admimstratwn:
Stannard 6-room frame house: I
Cum hinecl index ...................... 1935-39= 100. !34. 3 m:il 130.6 131.1 131.7 132.2 132.7 133.0
t~~g;:~:~~ ~ ~=: ~~~ ~::: = ==: ~ == ==~== == ::::::: =~~= =:-1~1. 6 127.8 128.8 129. I 129.7 130.3 130.8 139.7 136.0 136.1 136.5 136.8 137.0 137.3 137. 5
REAL ESTATE
Fed. Bnns. Admn., home mortgage insurance: 2f., ~GO 52,334 ' 60,747 57,926 Gross mort gages aceepled for inmran~e thou~. of doL- 66, 752 5n, 8.21 51,304 65, 333
Premium-payin~ mortgages (cumulatJVe) m1l. of doL- 6,02!j 5, 317 5, 385 5, 440 5, 494 I 5, 544 5, 601 5, 653 Estimated total nonfarm mortgages recorded ($20,000
3fi0, 227 sao, 9s9
1
3o1, 949 I so9, 644 368, 240 1 369, 268 4015,095 and ur.der)• _____________________ .... _ .thous. of doL. 421,631 Estimatl'd new mortgage loans by all saving' and loan
assorintiong, totaL ___________________ tho us. of doL_ 111, 1:18 97, 572 SO, 978 98,164 ""· '" I "'· M' 132,523 140,709
Clas:-::.ifted acrorOing t0 purpose: Mortgage loans on homes:
5,24-1 10,9041 7, 872 11, 195 9, 127 13,484 7. 338 9, 663 ('onstrurt ion ______ ---------~--- ___________ do ____
~ ~~~e8g~\~~:~se~:::::::::: ::::::::::::: ::::~~:::: 8!, 51)8 64,656 55,0011 f6,138 81, 84fi 85, 568 98, 872 103. 276 13,555
12. 550 I 9, !176 L 11, 955 14. 422,13,401 14,415 14,963 Repair< and recond!tloning _________________ do ____ 2.127 2, 290 1, s21 I 1, 960 2, 266 2, fo79 2, 967 2, 957
Loans for Rll other purposes. ___ . ___ .--- ______ do ____ 8, 704 7,172 t5,t09 I 6, 916 8. 469 7,421 8, 931 9,850 Loans outstanding of agcnc es under the Federal Home
I Loan Bank Administration: ' Fe('eral Savings an'! Loan Assns., estim"ted mort·
2,058 1, 916 I I
··: 1- -~ -~I ~a~es outstandingt ____ . ___ ------- mil of dol •J··-----i 1, 973 Fed. nome Loan Banks, outstanding advances to
member institutions ________ -------- mil. of doL 131 110 115 ! 114 I 128 Home Owners' Loan Corporation, balance of loans
1, 091 outstanding _________ ------------------mil. of doL 1,338 1,312 ' 1,300: 1, 279 ' 1, 260 I 1, 240 I 1,220 Fort'dosures, nonrarrn:t I I Index, adjusted _______________________ •. 1935-39= 100 .. 10.9 13.6 11.7 I 13.7 i 11.4 Fire losses ___________________ .... ---------- tho us. of doL. ·!8, 694 38, 5 72 ! 38, 2SO 30,555
February 1945
118.4 118".6 119.3 119.3 121.4 154.8 155.0 155.2 15fi. 2 156.3 143.8 144.0 141'.0 145.0 145.0 136.9 137.9 138. 1 138.1 139.6
119.1 119.6 119.8 119.8 122. 1 151.6 152.0 152.4 trl2.4 ][>3. 6 143.4 143 8 146.1 146.1 147.1 137.1 137.8 139.4 139.4 141.1
124.1 126.2 !26. 5 126.5 129. 9 154.2 155. 7 156.5 156. 5 !58. 6 140.0 141.4 143. 4 143.4 Hf>.:~ 138.6 140.9 141.8 141.8 144.7
125.4 128. 1 128.3 128. ~ 131.6 1.55. I 157.3 !57. 9 E7. Q IG0.3 137.8 139. G 141.2 141.2 143.4 138.9 141.8 142.2 142.3 145.0 3G0.4 300 .. ) 301.1 301.1 302.0
133.31 133. 1 ' !33. 7 , 133.8 '134. 2 131.0 131. :J 1 '131. 2 1:11.4 '1:ll. 5 137.3 137.3 '138. 5 '138 .. ) '139. 5
41' 429 ) 42, 457 33, 865 37.982 2tl, 661 5, 7131 5, 7821 5, 845 5, 910 5, 970
411,136 430,776 416,185 422,839 39~. 639
138,6741 125,036 !34, 4[5 135, 228 llS, 374
5, 923 7,078 7, 5Rg 6. 095 4,G% 93,232 105, oc.o 101, ~84 101, 41il 90,182 13,871 14. 152 14,495 15. 2S3 p., 2{)/) 2, 841 3, 067 3, lflO
H~~ 2, f>Oi
8, 014 8,815 8,993 7, 785
-----~~;r---~;~-2,025 --------- --------I .
95 ' 81 ! 100
1,199 1 1.111 1 1,1551 1,133! 1,111
' I 11.21 10.2 I 10. 3 i 9.8 1 II. 4
32,706 \ 31, 448 ' 32, 173 : 33,847 12. i I 10.0 I 10.9 I
47,718 I 3o. o84 3•, 746 32, s15 I 30,618 : I I
----------------------------~--------~--~------~--~------------~--~------DOMESTIC TRADE
ADVERTISING I I : I
I I ' Adv";rtislnf indexes, adjust~d:t i
122.31 Prmters Ink, combmed mdex .......... 1935-39=100 .. _ .... ---- 125.8 130. 3
m1l 125. 1 124.7 ! 131.7 137.1 143.5 135.5 128.9 13:l. 6
~;~~g~:;~~~~ ~~~~~~~ ~~~~~~~~~~~~~~~~~~~~~~ -~~~~ ~~ ': ::~~= ~: 147.6 138.1) 133.6 133.4 i 137. a 1 153.4 166.3 ]~fl. 2 165.8 162.1 159.4 144.0 141. 2 138.0 130.4 t3o.o I 141.81 160.8 183.4 184.7 160.3 158. 2 152. I 104.7 109.7 104.8 104.3 9S. 7
1
100.4 105.1 w.s. 9 1 112.3 105. 1 103. I 107.9 121.0 139.0 147.1 144.5 122.7 113.2 107.5 112.81 114.0 154. 5 123.7 155. 5 Radio ________________________________________ do ____ --------- 243.5 247.9 270.7 252.5 288.6 285.31 299.9 326.8 339.5 327.7 27.0. 6 281.0
Tide, comhined index• ................. 1935-39=100 .. 145.3 137.0 150.0 144.81 135.5 135.1 1 142.6 149.4 Hi1.2 176.4 166 2 149.4 150.3 Radio ad vertisin!!:
15, 652 ! Cost of fadlities, totaL ................. thous. of doL_ 16, 047 15,287 15,424 14, 704 15, !J93 16,138 I 15, 128 15,340 15,543 15,7121 '17, 470 r 16,62fl Automobiles and accessories __________________ do ... _ 772 725 774
7571 782 811 1
!~I 796 893 784 716 821 779
Clothing ____ ------------------------------do ____ 156 202 187 177 179 167 115 119 136 151 150 161 Electrical household equipment .............. do .... 114 80 101 81 81 110 I 89 111 89 97 105 91 Financial . ________________ ._ .. ______________ do .... 213 126 177 158 172 178 I 153 162 180 167 189 I 102 109 FoOO•. '""'>ore""', ooiD<cl>o~--"-------"'"--" I 4, G79 4, 366 4, 290 4,072 i 4, 502 4, 375 1 4, 652 4,1~ I 4, 158 4,194 4,272 I 4,671 f' 4,575 Oasolin~ and oil---· ________________________ do ____ 715 737 662 6~i' 675 f·63 I 640 612 628 589 643 604 Bousefnrnishings, etc ....................... do •... 178 f-3 108 108 136 11.5 I 122 164 158 161 1 155 155 Soap, cleansers. etc .......................... do .... 1,083 994 936 n41 1,008 920 . 1, 0171 944 935 1,133 1,091 ' 1,151 1, 109 Smoking materials_. _________________________ do .. __ 1, fG9 1, 7CO 1, 742
l:~l 1,817 1, 6281 1, f>57 1.55.5 I 1, 580 1, 623 1, 551 1, 517 'I, 511
Toilet roods, medical supplies ................ do .... 4, 9f.2 4,188 4, 274 4,379 4, 208 4, 573 I 4, 2121 4. 293 4, .563 4, 419 4, 746 '4, 537 All other_ . _______________________________ do .... 2, 516 2,047 2,172 2,054 2,291 r 2, 4[6 , 2,2M I 2,136 2, 296 2, 067 2,476 '3, 317 2, 936 Magazine adv'ftlslnl!:
24, 8941 Cost. total_. _____ ------------ .................. do .... 23,174 21,062 17, 74~ 21,079 22,851 24,280 21,7031 20,027 19,921 2.5, 127 ' 27, 247 24,952 Automobiles and accessories __________________ do .... 1, 573 I, 333 1,11'i 1, 4161 1,417 1 1, 721 1,844 I 1, 773 1, 831 1, 694 1,859 2,038 1, 906 Clothing ____ . __ ______ .-------------------do ... _ 1, 5~0 1, 276 691 i 1, 256
1, ~~~ I I, 962 , 1, 724 ! 1,192 609 1, 382 2, 445 2, 351 1, 932 Electric housebold equipment.. ............. do .... 801 eao 426 I 542 705 713 I 009 I 531 627 694 I 871 832
'Revised. tMinor revisions In the data for 1939-41; revisiom nnt shown in the Augnst 1942 Snrvey ~e available on request; data ~e now collected quarterly. •New series. The series on nonfarm mortgages recorded Is compiled by the Federal Home Loan Bank Administration; regarding the basis of the estimates and data for January
1939 to Septemher 1942, see note marked "•" on p. S-5 of the Novemher 1942 Survey. The new index of advertising is compiled by J. K. Lasser & Co. for "Tide" magazine; the index Includes magazine and newspaper advertising, radio (network only prior to July 1941 and network and national spot advertising beginning with that month), farm papers, and outdoor advertisin~. for which s~parate indexes are computed by the compiling agency; the newspaper index is ha$ed on linage and other component series on advertising costs; data beginning 1936 are available on request.
tRevised series. The index of nonfarm foreclosures has been revised for 1940 and 1941; revisions are shown on p. 8-6 of the May 1943 Survey. Indexes of advertising from Printers' Ink have been pnblished on a revised basis beginning in the April 1944 Survey; revised data beginning 1914 will be published later.
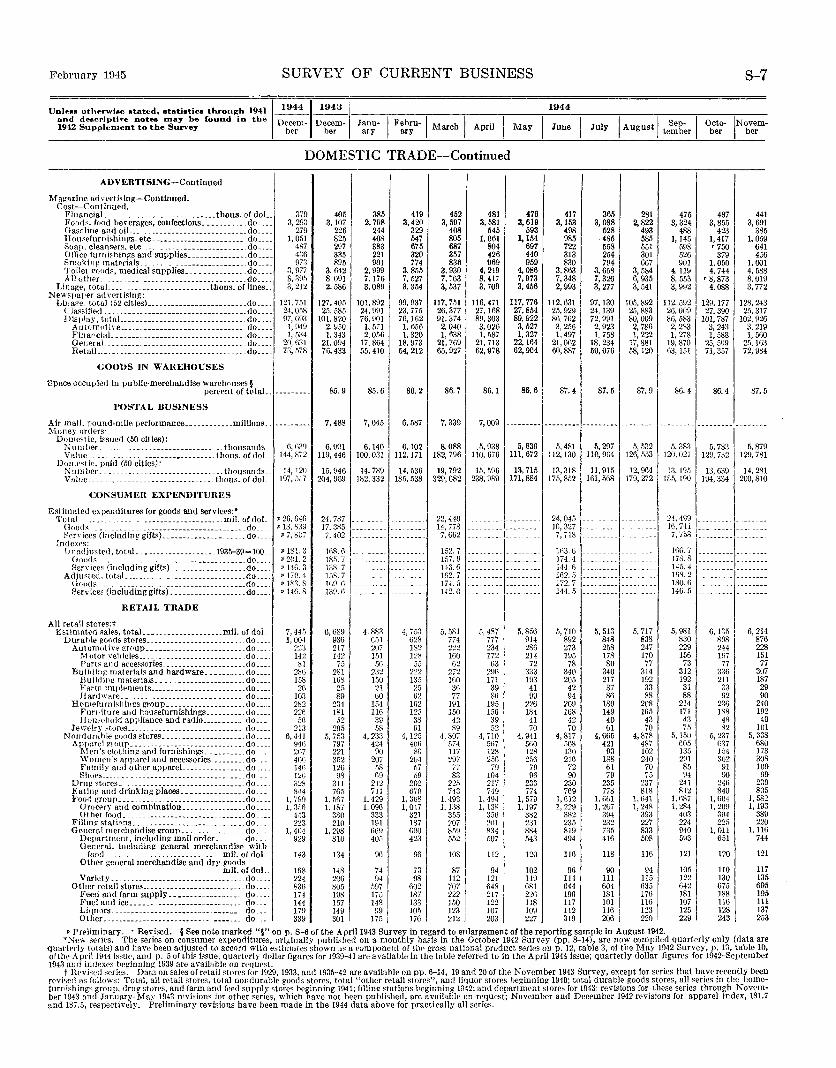
February 1D45 SURVEY OF CURRENT BUSINESS
1944 Unless oth~rwise stated., statistics through 1941 and des(",riptive notes may be found in the 1942 Supplement to the Survey
1
1944,1943 '
Decem- Decem-/ ber her J:~- I F~~;u-1 March I April I May 1une I July
DOMESTIC TRADE-Continued
ADVERTISING-Continued
I Magazine advertising-Continued. Cost-Cont!uued. I FinanciaL ----------------------thous. of doL 379
Foods. rood bHerages, confections. ________ .. do. ___ 3, 29:l Oasolint? and uiL~- __________________________ do ____ 279 Ilou~rfurnishings, etc.---------------------- do ____ 1, 051 Soap, cleansers, etc ___________________________ do ____ 487 omce furnishings and supplies _______________ do ____ 4:l6 Smoking matnrinls. __ ------------~------~---do ____ 97:l rroilet g-oods, medica] supplies ___ ----------- _do ____ 3, 977 Allother. ___ . ___ --------------------------do ____ 8, 3fl5
Linage, totaL __ ---- ·----· ----------- tbous. of lines .. 3, 212 Newspaper arhertislng:
Lilla!'C. total (.>2 c!tiesL ... ···------------- _____ .do. ___ 121,751 Classified ___ --------------------------------·do .... 24, 058 Display, totaL .. ---------------_---------- __ do. ___ 97, 693
A utomot lve ___ ------------- ________________ do ____ 1, 949 Fina"cial. _ ------------------------------- do. ___ l,D:H GeneraL . ---------------------------------_do ____ 20, n:n Hetail.. _________________ . _______ ------ _____ do. __ 73, 578
eoons IN WAHEHOUSES ,
Space ocCUJ-•ied in public-merchandise warehouse~§ I percent of totaL.---------
l'OSTAL BUSINESS
Air mail, pound-mile perrormauce •. __________ mill!ons .. ---------!\-loney ordPrs·
Domestic, issued (50 cities): ~ut11her __ ··-. ________ ----------------- thousands 6, G;:g Va!ue _____________ ------------------thous. of dol 144, 872
Domr<tic, paid (50 cities): Number_ ____ ----· __ -------------------- thou~ands_ _ 14, 120 VHluo. --··--------- ---------------- tlwus. of doL 197, 5[J7
CONSUMER EXPENDITl:UES
Estimated ex~Jenditures for goods 8lld services:• Total ..... _____ ----------------------mil. Mdol.
Goods ___________________ ---··-------------- __ do. __ f'en ices (Including gifts)---------------- _____ do. __
Indexf"'s: unadjusted, totaL ____ ---------- ..... 1935-39= 100. _ (lood~. ___ _ ___________________________ do ___ _
Ser\'ices (i11cluding girts).-----------------_ .do. __ Adjusted, totaL ..... ------------------------ .do ...
(Joods _ _ _ _ _ ___________ ---------- __________ do. __ Services (including gifts). __ ---------- _____ .do ... _
RETAIL TRADE
All retail stores:t Estimatt>d sales, total. ___________________ mll. of dol
Durahle goncts stores ______________________ . do .... Automot iYf' group ___ -------- ____ --------- _do ___
Motor vehiclPs ____ ---------------------- do. ___ Part~ and acce.ssories ______________ ------_do ____
Building materinb and hardware _______ .. do .... Building mHteria1s _____ -----------------do ____ Farm itniiiPiuents ________________________ do ____ HardwHre __ -----------------------.do ....
E omefurn isl1 ingS -iroup ____________________ do.-··_ Fumiture and housefurnishings __________ do .... 1lou,rhold appliance and radio __________ do ...
Jewrlry 'to res .. _____ . __ ------------------- do ... _ N ondunthlt~ goDds stores ____ .--~~_~---------- do._-~
Apparel group _____ ----------------------- do ____ l\1 en's cloth in~ and furnishings __________ do ___ \\'omen':-: apparel and accessories _________ do ___ Family and other appareL _______________ do .... Shot:s ________ -----------~----------- ____ do ____
Druf! stores_ -·----------------------------do .... :Eatin~ and drinking places ________________ do ..•. Foo1i group ___________ . --------------------do ____
Grocery and combination ________________ do .... Other food ______ -------------------------do. ___
Fill in~ stat irons ___________ --------------- __ do ____ General merchandise group _______________ .do ____
Department, inclndinf! mail order__ _ do __ ._ Ger.eral, Including general merchandise with
rood mil. of doL. Other ge~eral merchandis;; and (iry goods
mil. or doL VarietY ______ ._---------------------. ___ do._ ..
Other retail stores ... _ .. --------------_. __ . do .... Feed and !arm supply------------------ do .... Fuel and ice ______ --------------------- do Liq_uors ________________ ---------. ------ do __ Other_-------------------------- ------- do ...
p 26, 646 p 18. 839
p 7, 807
P lSL a v 2(}1. 2 PHD. a •170 4 p ]R.). s p 146.8
7, 44.) 1,00!
22:~ 142 81
286 158 2(\
103 2H2 226
5(i 213
6, 441 940 2(i7 40G 14G !2(i 328 844
1, 799 1, 3f)6
443 223
!, 4C4 929
143
168 224 836 174 144 179 339
I 4051
3,107 226 825 297 335 895
3. 642 8. 09! 2. 586
127.405 2o, 585
!01, 820 2. 950 l. 343
21.0114 76,433
85.9
7, 488
6,()01 119, 446
15, f•46 204,969
21. 787 17,385 7, 402
lfi8. G
385 2, 798
244 408 383 221 901
2. 999 7.176 3.089
101,892 24, 99! 76.901
!, 571 2.056
17,864 55,410
85.6
7,04511
6,140 wo. o31 1
14,789 182, 332
18.). 7 i_- -------
1:18. 7,. ------]f,S. 7 ______ _
1(;9.6 ---------139.6 ' ----- --
6,689 4. 883 936 651 217 20i 142 151
75 .)G
281 232 168 !50 25 21 89 GO
234 154 1~1 116 52 39
20.1 58 5, 7.o3 4, 233
797 424 221 90 352 207 126 58 98 69
311 212 765 711
1. 5H71 !, 429
1.187 1.096 3~~0 333 210 191
1, 298 I 669 810 405
134 96
148 74 206 9·1 805 597 198 175 157 148 149 gg 301 17.0 I
419 3,420
329 547 675 320 774
3. 855 7. 527 3, 354
99,937 23, 77.5 76,162 I. 656 I, 320
18.973 54,212
86.2
6, 5871
6,102 112, 171
14. 536 185, .538
4, 753 628 !82 128
55 222 135 25 62
1G2 125 3S 61
4,125 40G 8fl
20-1 57 .19
202 670
1, 368 !, 047
321 187 690 423
96
73 98
602 187 133 10-5 176
452 3, 597
408 805 687 357 836
3, 930 7, 763 3, 537
117,751 26,377
91,3741 2. 040 1, 638
21, 7t)9 65,927
86.7
7, 339
8,088 182, 796
19. 792 329,082
22,440 14, 778 7,662
152.7 157. g 143. G 1G2. 7 li4. 5 142.0
5, 581 774 20') 160 62
272 wo 3(i 77
191 !50 42 89
4, 807 574 117 297
77 83
22.5 743
1.493 1, 138
355 207 8.)9 552
!OS
87 112 707 222 150 123 212
481 3, 581
545 1,061
804 426 969
4, 219 8, 417 3, 709
116,471 27,168 89,303 3, 026 I, 587
21,713 62,978
86.1
7,009
5, 938 110, 676
Hi,5g6 238,989
5, 4S7 777 234 172 63
296 171 39 86
195 156 39 52
4, 710 5t>7 128 256
,-g 104 217 749
1. 494 !, 13R
356 201 834 507
ll2
94 121 648 217 122 107 203
476 ..,1
365 281 3,619 3,153 3, 088 2, 822
593 498 528 493 1,154 985 485 585
697 722 558 551 440 313 254 301 959 830 794 667
4,086 3.863 3,658 3,584 7,973 7, 348 7,326 6, 935 3,456 2,993 3, 277 3,541
"'·"'I ... ro. 97, 130 105,892
27. 854 25, 929 24,139 25,883 89, 922 86, 702 72,991 80,009 3, 527 3, 256 2, 923 2, 786 1, 327 !, 497 1, 758 1, 222
22, 164 21,062 18, 234 17,881 62,904 60,887 50,076 58,120
86.6 87.4 87.5 87.9
---·---1--------- --------- ---5, 639 I 5. 481 5, 297 s. 532
111, 6721112, 130 110, f!64 126, 553
13,715 1:!,318 11,915 12,964 171,884 175,852 161,.568 179,272
5. 856 914 286 214
72 333 193 41 99
226 184 41 70
4, 941 5fl0 128 2fi6
79 gr,
233 774
1, 5/9 1, 197
382 231 884 543
1~0
102 119 GRI 226 118 109 227
24,045 !G, 327
7, 71S
lfl3. G 174.4 144.6 IH2. 5 172. 7 144. 5
5, 710 892 273 195 78
3·!0 205 42 94
209 168 42 70
4,817 508 130 216 72 90
230 7(19
1,612 1, 229
382 235 819 494
116
96 114 644 196 117 112 319
• .•. . . . . . I
5, 513 5, 717 848 838 258 247 178 170 80 77
340 314 217 192 37 33 86 88
189 208 149 165 40 43 61 70
4,6fl5 4,878 421 487
93 102 188 240 61 70 79 75
235 237 778 818
1, 661 1. 641 1, 267 1, 248
394 393 232 227 735 833 416 508
118 116
90 94 111 1!5 604 635 181 17fl 101 llfl !Hi 123 206 220
S-7
475 497 441 3, 324 3, 85.5 3, 691
488 423 385 1,145 1, 417 1,059
598 '750 641 526 379 456 901 1. 050 1,001
4.119 4, 744 4, 588 8, 553 r 8, 873 8,019 3, 992 4,088 3, 772
112, 592 129, 177 128,243 26,009 27.390 25.317 86, 583 101,787 102.926
2, 2~3 3, 243 3, 219 1, 278 1, 588 1, 560
19,870 25, 5\J9 25,163 63,151 71, 357 72,984
86.4 86.4 87.5
-- -~-- ~8~- ---~:~::r-~::~~ 120, 02! 129, 7321129, 781
!3, 19.1 13, 639 14, 281 !8ii, Jlll.l 194, 3:l4 200,810
:!4,409 ----- ·--- --------
1~:~~~ ~~-~-:::== ===~===-100. 7,_ -------- --------178. R _ ·-·----- _______ _ 145.4 --------- --------lli~. 2 --------- --------180.f. 146.5 ---------- ------
5, 981 6, ~~~ :
6, 214 830 876 229 244 228 156 !G7 !51
73 77 77 312 336 307 192 211 187 31 33 29 88 92 90
214 23"> 240 171 !88 192 43 48 49 75 82 101
5,150 5, 237 5,333 (05 f:37 680 135 JM 173 291 302 308 85 91 100 94 90 99
241 246 239 812 840 805
1,687 1, 604 I, 582 1, 284 !, 209 1,193
4m 394 389 224 225 220 940 1, Oll !,JIG 5\13 651 744
121 120 121
105 I 110 117 122 130 135 642 675 695 181 188 195
1071 116 111
125 128 137 229 243 253
• Preliminary. ' Revised. §See note marked 'T' on p. S-6 of the April1943 Survey In regard to enlar~ement of the reporting sample iu August 1942. *New series. The series ou consumer expenditures, originally publish<•d on a monthly basis in the October 1942 Survey (pp. 8-14), are now compiled quarterly only (data are
quartPrly totals) and have been adjusted to accord with estimates shown as a component of tho gross national product series on p. 12, table 3, of the May 1942 Survey, p. 13, table 10, of the April1944 issue, and p. 5 of this issue, quarterly dollar figures for 1939-41 are available in the table referred to in the April1944 issue; quarterly dollar figures for 1942-Septernber 1943 and indexes beginning 1939 are available on request.
tHe vised series. Datn on sales or retail stores !or 1929, 1933, and 1935-42 are available on pp. 6-14, 19 and 20 of the November 1943 Survey, except for series that have recently been revised as follows: Total, all retail stores, total nondurable ~oods stores, total "other retail stores", and liquor stores beginning 1910; total durable goods stores, all series in the home-furnishings group, drug stores, and farm and feed supply stores brginning 1941; filling statiom heginning 1942; and department stores !or 1943; revisions for 1 hese series through Novem-ber 1943 and January-May 1943 revisions for other series, which have not been published, are available on request; November and December 1942 revisions for apparel index, 181.7 and 187.5, respectively. Preliminary revisions have been made in the 1944 data above for practically all series.
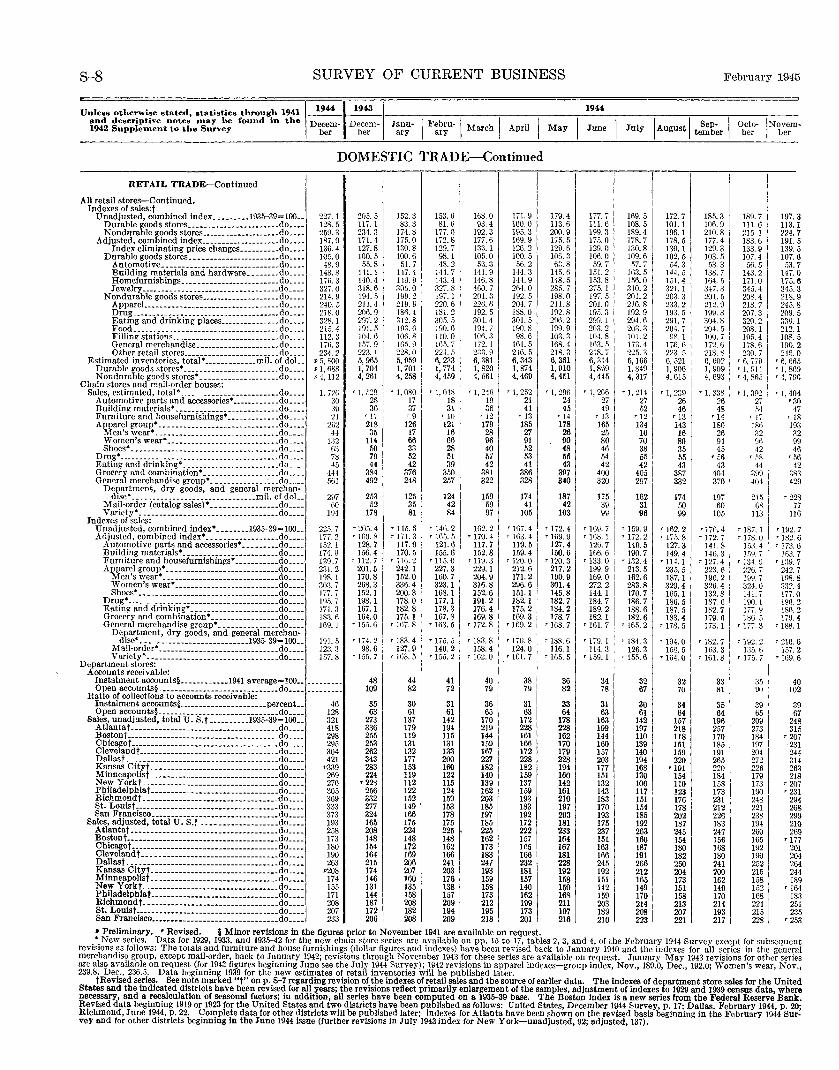
S-8 SURVEY OF CURRENT BUSINESS February 1945
Unless otherwise stated, statistics through 1941 I 1944 ~~~ 1944
and descriptive notes may be found in the Decem- Decem- Janu· I Febru I I I I I' I I Sep I Octo INovem 1942 Supplement to the Survey ber her ary ary · March April May June July August temb~r ber • ber •
DOMESTIC TRADE-Continued
RETAIL TRADE-Continued
I I
I All retail stores-Continued. Indexes of sales:t
I Unadjusted, combined index _________ l93&-39=100 •• 227. I 205.5 152.3 153.6 168.0 171.9 179.4 177.7 I 169.5
Durable goods stores _______________________ do •.•• 128.5 117. 1 83.3 81.6 93.4 100.0 113.6 111.6 108.5 Nondurable goods stores ___________________ .do •.•• 259.3 234. 3 174.8 177.0 192.3 195.3 200.9 199.3 189.4
Adjusted, combined index .•.......•.•...•.••. do •••. 187.9 171.4 175.0 172.8 177.6 169.9 175.5 I 175.0 178.7
I 172.7 185.31 189. 7 197. 3 101. 1 106.9 111.6 113.1 196.1 210.8 215.1 224.7 178.5 177.4 183.6 191.5
Index eliminating price changes .•••...•.• do .••. 136.4 127.8 130.8 129.7 133. I 126.2 129. 6 129.0 130.8 Durable goods stores •••••••••••.....•...••• do .••• 105.0 100.5 100.6 98.1 105.0 100.5 106.3 106.0 109.6
Automotive ••........••••••.•••••...•.... do ..•• 48.9 55.8 51. 7 48.2 53.3 56. 2 63.8 59.7 57.7
130.1 129. 3 133.9 139.5 102.5 103. 5 107.4 107.6 54.3 53.3 56.5 .13. 7
Building materials and hardware •..•.•.. do ...• 148.8 141.1 147.4 144.7 141.9 144. 3 14.5. 6 151.2 IG3. 5 144. 5 138.7 143.2 147.0 Homefurnishings •.•.....•...•••.••••••... do •.•. 1ifi. 3 140.4 Hll. 9 143.4 146.8 144.9 148.5 153.8 156.0 Jewelry ...••••...•.....••.•.....•.•....•.. do ..•. 327.0 318.6 306.0 327.8 460.7 2fi4. 0 285. 7 275.1 310.2
Nondurable goods stores ••••.••.•.•..•.•.•.• do •.•. 214.9 194. 5 199.2 197. I 201.3 192.5 198.0 197.5 201.2
151.4 164. 5 171.0 175.6 321. I 347.3 345.4 345.3 203.3 201.5 208.4 218.9
AppareL •.•.•••.•.....•••...•....••..... do •.•. 240.5 211.4 219.9 220.6 226.fi 204.7 211.8 201.0 2!G. 8 Drug ...••.••.•.••....... ----·-·· .•.•••••• do .••. 218.0 206.9 18il. 4 181.2 192.5 !88.0 192.8 19.5. 31 192.9 Eating and drinking places .•..•.•....•••• do .•.• 328. I 297.2 312.8 305. 5 301. 4 301.5 2ntl. 2 299. 1 294.6 Food .... _ .... ___ .••••••••.•.•.•.......•.• do ...• 215.4 191.5 193. f> 190.6 194. 7 !90. 8 199.9 203.2 I 203.3 Filling stations .....••••••.•••.•........•• do ...• 112. 3 104. fl 106.8 110.0 IC6. 3 98.6 103.3 104.8
! 101.2
General merchandise •••.•••...•••.•...••• do ...• 170. 3 !.57. 9 !05. 9 JG.5. 7 172. I 161.5 168.4 163. 5 173.4
233.2 212.9 218.7 245.8 193.5 199.3 207.3 209.5 291.7 304.8 320.2 336. I 204.7 204.5 208. I 2!2. 1 GS.! 100.7 105.4 108.5
176.1\ 172.6 178.6 190.2 Other retail stores ••..•.•...•...•.•.•..... do .... 234.2 223. I 228.0 224. 5 z:ng 216. 5 218.3 218. 7 225. 3 223. 5 218.8 230.7 2·16. 0
Estimated inventories, total• ••.•••••.••.• mil. of doL. r .o, BOO 5, 965 5, 959 6, 233 6,381 I 6,343 6, 361 6, 314 6,166 Durable goods stores• .••.•••.•..........•.... do ..•• r I, 688 I, 704 I, 701 1, 774 1, 820 1, 874 1, 910 I, 869 !, 849 Nondurable goods stores• .•••...•...•......•. do ...• p 4, 112 4, 261 4, 258 4, 459 4, 661 4,469 4, 451 4,445 4, 317
Chain stores and mail-order houses: Sales, estimated, total• .... . •......•.•.•.••.•• do ..•• 1, 72() r 1, ,129 '1,080 • 1, 048 r 1, 24G T 1, 252 I T 1, 29fi T 1, 2G6 '1. 214
Automotive parts and accessories• ••.•••.•.•.. do •.•. 30 26 17 18 19 21 24 27 27 Building materials* .••.......•.....•.•...••.. do •.•• 3\1 36 37 31 36 41 45 49 52 Furniture and bousefurnishings* .•.....••.•.• do .... 21 rJ7 '9 •10 '12 •13 ' 14 '13 '12 Apparel group* .•..•.•.....•.•.•.•. - ...••••.. do •.•• 2G2 218 126 121 179 185 178 165 !34
6, 521 6, 602 r 6, 77f) '6. 61\5 1, 906 !, 909 '!, 914 r 1, 869 4, 615 4, 693 r 4, S65 r 4, 796
'!, 2391 'I. 338 "~· 3[>2 I • I, 404 26 26 27 I '30 46 48 .54 1 47
'13 '14 ·~k~ I '18 143 180 193
Men's wear• ...••.••.•.•.•.•...........•.•• do .•.. 44 35 17 16 28 27 26 25 16 16 26 32 ! 32 Women's wear• ----------------------------do ____ 1:}2 114 66 66 96 91 90 80 70 80 94 96 ' 99 Shoes•. ·····························-······do ...• 63 50 33 28 40 52 48 46 38 35 45 42 46
Drug• ··········-···········-··-·······-······do ...• 78 79 52 51 57 53 55 54 55 Eating and drinking• ......•...•......••..•.•. do .... 45 44 42 39 42 41 I 43 42 42 Grocery and combination• •..•.•••........... do .•.. 144 384 376 350 381 386 397 400 405
55 r £6 r 58 •56 43 43 44 42
387 404 ~gg 383 General merchandise group• ••••.••.......... do ..•. 50! 492 248 257 322 328 340 320 297
Department, dry goods, and general mercban· 253 125 I 124 159 174 187 175 162 dise•. ············------·-··········mil. of doL. 297 I Mail-order (catalog sales)• .••.••.•.••••.••• do .••. t10 52 35
I 42 59 41 42 39 31
Variety• ..•.••••••••.....•..••...•••...•.•• do ..•• IDI 178 8! 84 97 105 103 99 96 Indexes of sales: I
332 370 404 429
174 197 215 '228 50 60 68 77 99 105 113 116
Unadjusted, combined index• •••.•••. 193&-39=100 .• 22ti. 7 r 205.4 r 145.6 '140. 2 !62. 2 rl{lj, 4
I r 172. 4 r 169.7 • 159. g
Adjusted, combined index• ........••.••••••. do .••. 177.2 'WO.R r 171.3 • !65. 5 '170. 4 T W3. 4 '1r.9. 9 '168.1 r 172.2 Automotive parts and accessories• ••.•.•.•• do .•.. 152. 1 128.7 117.9 !21.6 117.7 119. 5 127.4 126.7 140.5 Building materials* ..............•.••.••.. .do .... 174. g !56. 4 170.5 155.6 !52. 8 159.4 150.6 166.6 !90. 7
r 162.2 '171\4 '187.1 r 192.7 T 175.8 T 172. 7 r 178.0 '182.6
127.3 141.8 !.53. 4 '173. 6 149.4 146.3 J.\9. 7 163.7
Furniture and bousefurnishings• .•••••••... do ..•• 13~).7 T 112.7 '116. 2 • 115.0 '119. 3 '120. 0 '120. 3 '133. 0 '132. 4 Apparel group• ....••••••.•.. ~-----········do .••• 231.2 201.5 242. I 227.3 229.1 212.6 217.2 199.9 2!3. 5
Men's wear* -----------------------------do ____ !9R. I 170.8 152.0 160.7 204.9 171.2 190.9 169. 0 162.6 Women's wear* --------------------------do ____ ~o:t 7 268.3 336.4 323.1 316.8 296.6 301.4 272.2 283.8 Shoes• ••........•••••..............•.•.•• do .... 177.7 152. 1 200.3
I 168.1 152.6 151.1 145.8 144.1 170.7
Drug• ...•..........••.•.•.•.•..........••.. do .... I9.o. 7 198. 1 178.0 177.1 191.2 !82. I 182. i 184. 7 186.7 Eating and drinking• •....•................ do .... 171.3 167. 1 182.8 178.3 176.4 175.2 184.2 189.2 188.6 Grocery and combination• ...........•...•. do .... 18:1. (i 164.0 175.1 167.8 169.8 169.3 178.7 182.1 182.6 General merchandise group•. ··--------·-··do •.•. 169. I r 155.6 '167. 8 r 163.5 '172. 8 '!60. 2 '168. 7 '161. 7 '165. 2
Department, dry goods, and general merchan· '!83. 8 '170. 8 dise•... • __ ... __ .... _ ....•..... 193&-39= 100 .. 191.5 T 1/4. 2 '183. 4 r 175. 5 '188. 6 '1 79. 1 r 184. 3
Mail-order• •.•...••••. _ .................. do .... 123. 3 98.6 127.9 140.2 158.4 124.0 116.1 114.3 126.3 Variety• ...•..•.••....•...........•...... do .... !57. 8 r 155. 7 '!G3. 5 '155. 2 '162. 0 '101. 7 '165. 5 '159.1 • 155.6
Department stores: Accounts receivable:
'114. 1 r 127.4 T 134.0 '139. 7 235.5 223.6 226. 7 242.7 187. I 196.2 199. 7 198.8 329.4 326.4 324.0 332.4 165. 1 132.8 141.7 177.0 186.5 187.6 190.1 190.2 187.5 182.7 177. g 180.2 183.4 179.1\ 186.5 179.4
'178. 5 173. 1 ,. 177.3 '!88. I
'194. 0 '182. 7 I ,. 192. 2 '210. 6 !58. 5 1\\3.3 1~.1. f, 157.2
'164. 0 '161. 8 ,. 175.7 '169. 6
Instalment accounts§ •..•.••••••• 1941 average=100 •• --------- 48 44 41 40 38 36 34 32 Open accounts§ ·······-···············-·--··do •••. 109 82 72 79 79
I 82 78 67
Ratio of collections to accounts receivable: Instalment aecounts§ .......•••.•.••••.•••• percent •• 46 35 30 31 36 31 33 31 30 Open accounts§ ......•..........••.•••••••.•. do ..•• 128 63 61 61 65 63 64 63 61
Sales, unadjusted, total U. S.t .••.•.•.•. 1931>-39=100 •• :l21 273 137 142 170 172 178 163 142 Atlantat •..•..•.••.•...•.••.•.•.•............ do .... 418 336 179 194 219 228 228 199 197 Bostont ···········-·-················--------do .... 298 255 119 115 144 161 162 144 110 Chicagof .•••.•.••.•.••..•.••••••••••. _._ ..•.• do .••. 295 253 131 131 159 166 170 160 139 Clevelandf ...•••.•.....•......•.•............ do .... 304 262 132 133 167 172 179 157 140 Dallast .. ···········-··············-····-····do •.•. 421 343 177 200 227 228 228 203 194 Kansas Cityt ..•.....•......•.••.•.•.•.•.••.. do .••• •339 283 153 160 182 182 194 177 168 Minneapolisf. _ •••...••.••.••••••...•........ do .... 269 224 119 122 140 159 160 151 130 New Yorkt ..•.......•........••••••.•.•..•.. do •••• 270 '228 112 115 139 137 142 132 100 Pbiladelpbiat •••••.•...•.•••••.••...•.•....•. do .... 305 256 122 124 162 159 161 143 117 Richmondf •.•..•.••••....•••••••••••.•.•.•.. do •.•. 369 332 152 159 203 193 210 183 151 St. Louist ·············------·-··············-do •••• 333 277 149 153 185 183 197 170 154 San Francisco ..•.....•....•.•.•••••••••.•••.• do •... 373 324 166 178 197 192 203 193 185
Sales, adjusted, total U. S.t .••.•••••••.•...... do ..•. 193 165 175 175 185 172 181 175 192 Atlantat •••.•..•.•.•••....•••••••••••••.•.•.• do ..•. 258 208 224 225 225 222 233 237 263 Bostont ••••••...•.•.•••••.•••••••••••••.••••. do ..•. 173 148 148 148 162 157 164 151 160 Chicagof •••....••••.•••.•.•••••••••••••...... do ..•• 180 !54 172 162 173 IB5 167 163 187 Clevelandt .•. ················-·-·-··········do ..•• 190 164 169 166 183 166 181 166 191 Dallast ....•••••••.•..••••••...••...•..•••.•. do •••• 26.3 215 206 241 241 232 228 245 266 Kansas Cityf. ····-············-·············do •••• •208 174 207 203 193 181 192 192 212
w~~f~~l~s! ~: == == == = = = =: = ==: = :: = = == = = = = = =:: ~~:: = = 174 146 160 176 159 157 158 !51 165 155 131 135 138 158 140 150 142 149
Philadelpbiat ••••••••••••••••••••••.•••.•..•. do •••• 171 144 158 157 173 162 168 159 170
ftt;:Et~~~::::::::::::::::::::::::::::::J~::::I 208 187 208 209 2!2 199 211 203 214 207 172 182 194 195 173 197 189 208 233 206 I 208 209 218 201 216 210 223
32 33 35 40 70 81 90 102
34 35 39 39 64 64 65 67
157 196 209 248 2!8 257 273 315 118 170 184 '207 151 185 197 231 159 191 204 244 220 265 272 314
'191 220 226 263 154 184 179 2!8 110 158 173 '207 123 173 190 '23! 176 231 248 294 178 212 221 268 202 226 238 299 187 183 194 210 245 247 260 269 154 !56 165 '177 180 168 !92 201 182 180 190 204 250 241 252 264 204 200 215 244 173 162 !58 189 !51 149 !52 '164 158 170 168 183 213 214 224 251 207 193 215 235 221 217 228 '253
• Preliminary. 'Revised. §Minor revisions in the figures prior to November 1941 are available on request. • New series. Data for 1929, 1933, and 1935-42 for the new chain store series are available on pp. 15 to 17, tables 2, 3, and 4, of the February 1944 Survey except for subsequent
revisions as follows: The totals and furniture and bouse furnishings (dollar figures and indexes) have been revised back to January 1940 and the indexes for ~til series in the general merchandise group, except mail-order, back to January 1942; revisions through November 1943 for these series are available on request. January-May 1943 revisions for other series are also available on request (for 1943 figures beginning June see the July 1944 Survey); 1942 revisions in apparel indexes-group index, Nov., 189.0, Dec., 192.0; Women's wear, Nov., 239.8, Dec., 236.5. Data beginning 1939 for the new estimates of retail inventories will be published later.
tRevlsed series. See note marked "t" on p. S-7 regarding revision of the Indexes of retail sales and the soun-e of earlier data. The Indexes of department store sales for the United States and the indicated districts have been revised for all years; the revisions reflect primarily enlargement of the samples, adjustment of indexes to 1929 and 1939 census data, where necessary, and a recalculation or SE>asonal factors; in addition, all series have been computed on a 1931>-39 base. The Boston index Is a new series from the Federal Reserve Bank. Revised data beginning 1919 or 1923 for the United States anrl two districts have been published as follows: United States, December 1944 Survey, p. 17; Dallas, February 1944, p. 20; Richmond, June 1944, p. 22. Complete data for other districts will be published later; indexes for Atlanta have been shown on the revised basis beginning in the February 1944 Survey and for other districts beginning In the June 1944 issue (further revisions in July 1943 index for New York-unadjusted, 92; adjusted, 137).
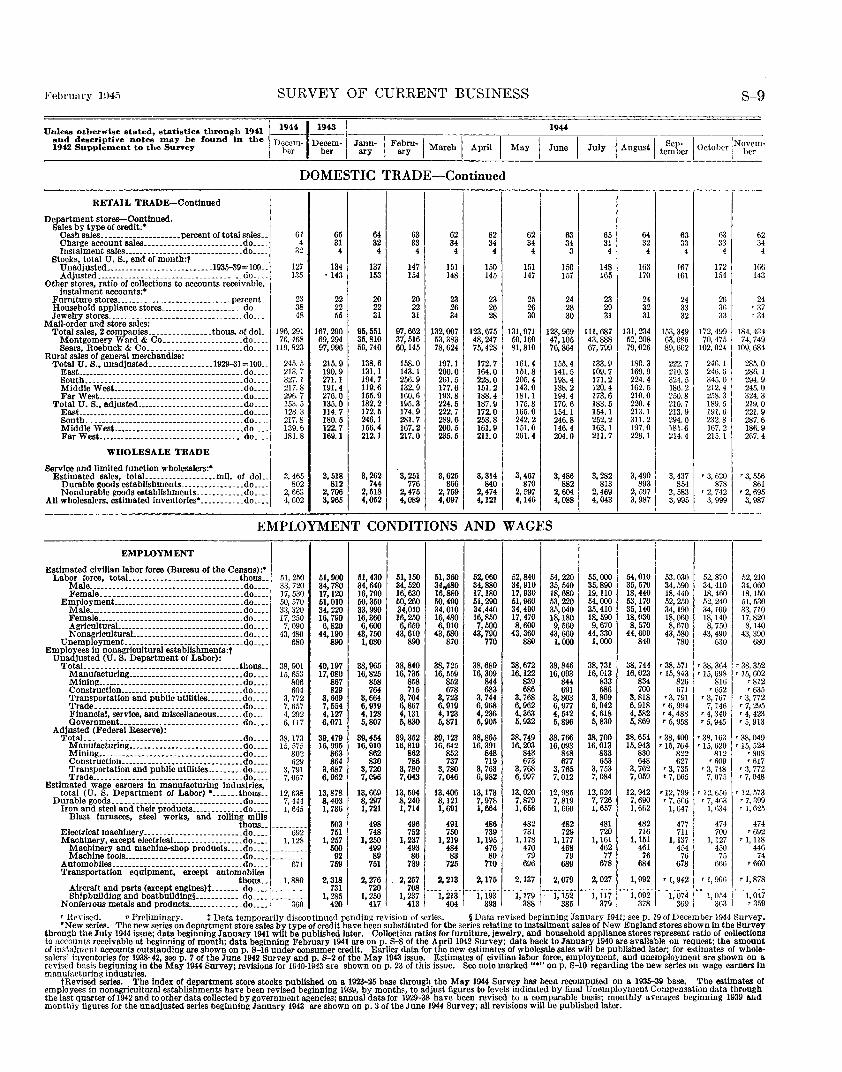
February Ul45 SURVEY OF CURRENT BUSINESS S-9
1944 Unless o~herwise s~a~ed, s~a~is~ics ~hrough 1941 ~~~ 1943 I
and descrip~ive no~es may be found in ~he Decem- Decem- Janu- I Febru-1 I - I 1942 Supplemen~ to ~he Survey ber ber ary ary March April May I June I July I August I te~~~r l October ~N~e~m-
DOMESTIC TRADE-Continued
RETAIL TRADE-Continued
Department stores-Continued. Sales by type of credit:•
Cash sales ...•••••.••••••••••• percent of total sales •• 64 65 64 63 62 62 62 63 Charge account sales ......................... do .... 4 31 32 33 34 34 34 34 Instalment sales ............. _ ....... _ ....... _ do .... 32 4 4 4 4 4 4 3
Stocks, total U. S., end of month:t Unadjusted ...... __ .. __ ............... 1935-39= 100 .• 127 134 137 147 151 150 151 150 Adjusted ....... --------- ___ .. ---------- ___ .•. do .... 135 • 143 153 154 148 145 147 157
Other stores, ratio of collections to accounts receivable, instalment accounts:•
Furniture stores ...... __ ................ _. ___ percent.. 23 22 20 20 23 23 25 24 Household appliance stores ................... _. do._. 38 22 22 22 26 26 26 28 Jewelry stores .. _ .. __ ._ .. ______ ........... _. __ .. do._ .. 48 55 31 31 34 28 30 30
Mail-order and store sales: Total sales, 2 cow,anies ...... ---------- thous. of doL 196, 291 167,290 95,551 97,662 132,007 123,675 131,971 123,969
Montgomery ard & Co .................... do .... 76,468 69,294 35,810 37, 516 53,383 48,247 50,160 47, 105 Sears, Roebuck & Co ........................ do .... 119,823 97,996 59,740 60,145 78,624 75,428 81,810 76,864
Rural sales of general merchandise: Total U.S., unadjusted ................ 1929-31 =100.. 245.5 215.9 138.6 158.0 197.1 172.7 161.4 155.4
East .......... __ .. _______ ... _ ......... ____ ._ .. do._ •. 213.7 190.9 131.1 143. 1 200.0 164.0 151.8 141.5 South ........ _____ .• ------·-- •• ____ .... _ .... _ do. __ . 327. 1 271.1 194.7 256.9 261.5 228.0 205.4 198.4 Middle WesL ............................... do .... 217.8 191.4 119.6 132.9 177.6 151.2 143.0 138.2 Far West ........... ----------- ......•. _ ....•. do ... _ 296.7 276.0 155.9 160.6 19R.8 188.4 181.1 194.4
Total U.S., adjusted ........................... do .... 153.5 135.0 182.2 195.3 224.5 187.9 175.8 170.6 East. ......................................... do ____ 128.3 114.7 172.5 174.9 222.7 172.0 165.0 154.1 South .. ---------- ............................ do .... 217.8 180.5 246.1 281.7 289.6 258.8 242.2 246.8 Middle West ....................... _. _______ .do .... 139.6 122.7 156.4 167.2 200.5 161.9 151.0 146.4 Far West ..................................... do .... 181.8 169.1 212.1 217.0 235.5 211.0 201.4 204.0
WHOLESALE TRADE
Service and limited function wholesalers:• Estimated sales, total.. ................ mll. of doL 3, 465 3,518 3,262 3,251 3,625 3, 314 3-~~b I 3,486
Durable goods establ!shments ................ do .... l 802 812 744 776 866 840 882 Nondurable goods establishments ............ do .... 2,663 2, 706 2,518 2,475 2, 759 2,474 2,597 2,604
All wholesalers, estimated inventories• ........... do .... 4, 002 3,965 4,052 4,089 4,097 4,121 4,146 4,088
EMPLOYMENT CONDITIONS AND WAGES
EMPLOYMENT
Estimated civilian labor force (Bureau of the Census):• Labor force, total ............................ thous ..
Male ....................................... do ... . Female ................... _ ............. __ .do •.•.
Employment ................ _ .......... _____ .do .. .. Male .................... _ ............. _ .... do .. .. Female ...... _____ . __ ..... ______ .. __ ........ do ... . AgriculturaL. .............................. do ..•. Nonagricultural ............................ do .•..
Unemployment ....•...........•....••....... do ..•• Employees In nonagricultural establlshments:t
Unadjusted (U. S. Department of Labor): TotaL .•• _---------------------------------- tho us ..
~rgi~~-~~~=~~~::==========================:~~==== Construction ...... _ ........................ do •• __ Transportation and public utilities ......... do .... Trade .. ______ ............ _. ___ .. _ .......... do ..•. Financial, service, and miscellaneous ....... do .... Government ............................... do .•••
Adjusted (Federal Reserve): TotaL ..... -------------------------------- .. do ....
M anufacturlng .................. _. __ ....... do •••• Mining ..................................... do ••.. Construction. _____ ......................... do ..•. Transportation and public utllitles ......... do .. .. Trade ................. _ ..... _ .... _. ____ .... do ... .
Estimated wage earners In manufacturing Industries, total (U. S. Department of Labor) • ....... thous ..
Durable goods ... __ . ____ . __ ._ ... __ .. ____ .. _._ .. do .. .. Iron and steel and their products ............. do .. ..
Blast furnaces, steel works, and rolling mills thous ..
51,250 33, 720 17, 530 50, 570 33,320 17,250
7, 090 43, 480
680
38,901 15, 653
806 604
3, 772 7, 657 4, 292 6,117
38,173 15,575
802 629
3, 791 7, 057
12,638 7,444 1, 645
Electrical machinery ____ ..................... do.... 692 Machinery, except electricaL ................. do.... 1, 128
Machinery and machine-shop products .... do .. .. Machine tools ......... _. _____ . ____ ......... do ... _
Automobiles ... __ .... ___________ . __ ..... _._._ do.... 671
51,900 34,780 17,120 51,010 34,220 16,790 6,820
44,190 890
40,197 17,080
867 829
3,669 7,554 4,127 6,071
39,479 16,995
863 864
3,687 6,962
13,878 8,403 1, 736
503 751
1, 257 500 92
759
51,430 34,640 16,790 50,350 33,990 16,360 6,600
43,750 1,080
38,965 16,825
858 764
3,664 6,919 4,128 5,807
39,454 16,910
862 830
3, 720 7,096
13,669 8,297 1, 721
498 748
1,250 499 89
751
51,150 34,520 16,630 50,260 34,010 16,250 6,650
43,610 890
38,840 16,735
858 715
3, 704 6,867 4, 131 5,830
39,352 16,819
862 786
3, 780 7,043
13,594 8,240 1, 714
496 752
1,237 493 86
739
51,360 34,.480 16,880 50,490 34,010 16,480 6,910
43,580 870
38,725 16,559
852 678
3, 723 6,919 4,123 5,871
39,123 16, 642
852 737
3, 780 7,046
13,406 8,121 1,691
491 750
1,219 484 83
725
52,060 34,880 17,180 51,290 34,440 16,850 7,500
43,790 770
38,689 16,309
844 683
3, 744 6,968 4,236 5,905
38,865 16,391
848 719
3, 763 6,982
13,173 7,978 1,664
486 739
1,195 476 80
710
52,840 34,910 17,930 51,960 34,490 17, 470 8,600
43,360 880
38,672 16,122
839 686
3, 768 6,962 4,363 5,932
38,749 16,203
843 673
3, 768 6, 997
13,020 7,879 1, 656
482 731
1,178 470 79
696
54,220 35,540 18,680 53,220 35,040 18,180 9,560
43,660 1,000
38,846 16,093
844 691
3,803 6,977 4, 542 5,896
38,766 16,093
848 677
3, 765 7,012
12,985 7,819 1, 660
482 729
1,177 468 79
689
65 31 4
148 165
23 29 31
111,687 43,888 67,799
133.9 109.7 171.2 120.4 173.6 183.5 154. 1 252.2 163.1 211.7
3, 282 813
2,469 4,043
55,000 35,890 19, 110 54,000 35,410 18,590 9,670
44,330 1,000
38,731 16,013
833 686
3, 809 6, 942 4,618 5,830
38,700 16,013
833 653
3, 753 7, 084
12,924 7, 726 1,657
481 720
1,161 462 77
678
64 32 4
163 170
24 32 31
131, 234 52,208 79,026
180.3 169.9 224.4 162.5 210.0 220.4 213.1 311.2 197.0 228.1
3,490 893
2, 597 3, 987
54,010 35,570 18,440 53, 170 35,140 18,030 8, 570
44,600 840
38,744 16,023
834 700
3,818 6, 918 4,582 5,869
38,654 15,943
830 648
3, 762 7,059
12,942 7,690 I, 662
482 716
1, 151 461
76 684
I
63 33 4
lfl7 161
24 33 32
153,349 63,686 89,662
222.7 210.3 324.5 186.2 250.8 210.7 213.9 294.0 181.6 214.4
3,437 854
2, 583 3, 995
53,030 34,590 18,440 52,250 34,190 18,060 8,670
43,580 780
fl3 33 4
172 154
26 36 33
172, 499 70,475
102,024
246.1 246.6 345.0 212.4 2.18. 3 189.5 191.6 2.32. 8 167.2 215. I
• 3, 620 878
• 2, 742 3, 999
52,870 34,410 18,460 52, 240 34, 100 18,140 8, 750
43,490 630
' 38, 571 • 38, 364 ' 15, 843 • 15, 698
826 816 671 • 652
•3. 791 '3, 767 '6, 994 7, 146 • 4, 488 • 4, 340 ' 5, 958 ' 5, 945
' 38, 400 • 38, 163 ' 15, 764 • 15, 620
822 812 627 • 609
• 3, 735 • 3, 748 '7, 065 7, 075
• 12, 799 • 12, 656 • 7, 566 • 7, 463
I, 647 1, 634
477 711
1, 137 454
76 678
474 700
I, 127 450
75 666
6 2 4 4
3
16 6 3 14
2 •3 • 3
184,43 4 9 4
74,74 109,68
285. 286. 294. 245. 324 ..
0 I 9 0 3 0 9 6 9 4
219. 221. 287. 186. 267.
• 3, 55 86
• 2, 69 3, 98
52, 210 34,060 18,150 51,530 33,710 17,820 8,140
43,390 680
• 38,352 • 15,602
•812 • 6.35
• 3, 772 r 7, 295 • 4,423 '5, 913
• 38,049 • 15,524
• 808 • 617
• 3, 772 • 7,048
• 12,573 • 7, 399 r 1,625
474 • 692
• 1, 118 446
74 • 660
Transportation equipment, except automobiles thous.. 1, 880 2,318
731 1, 285
420
2,276 720
I, 250 417
2, 257 2, 213 2, 175 2, 137 2, 079 2, 027 1, 992 ' 1, 942 • 1, 906 ' 1, 878 Aircraft and parts (except engines)t ........ do .... ---------Shipbuilding and boatbulldlng§ ............ do .... ________ _
Nonferrous metals and products .............. do.... 360 ~.~~~ ---i.!~- ---i:Atr ---i:~~r --T~~r ---i:Hr ---i.-~~r ---i:~m---i.~Mf-i;·g~~
' Revised. • Preliminary. t Data temporarily discontinued pending revision of series. §Data revised beginning January 1941; see p. 19 of December 1944 Survey. •New series. The new series on department. store sales by type of credit have been substituted for the series relating to installment sales of New England stores shown in the Survey
through the July 1944issue; data beginning January 1941 will be published later. Collection ratios for furniture, jewelry, and household appliance stores represent ratio of collections to accounts receivable at beginning of month; data beginning February 1941 are on p. S-8 of the April 1942 Survey; data back to January 1940 are available on request; the amount of instalment accounts outstanding are shown on p. S-16 under consumer credit. Earlier data for the new estimates of wholesale sales will be published later; for estimates of wholesalers' inventories for 1938-42, see p. 7 of the June 1942 Survey and p, S-2 of the May 1943 issue. Estimates of civilian labor force, employment, and unemployment are shown on a revised basis beginning in the May 1944 Survey; revisions for 1940·1943 are shown on p. 23 of this issue. See note marked "•" on p. S-10 regarding the new series on wage earners in manufacturing industries.
tRevised series. The Index of department store stocks published on a 1923-25 base through the May 1944 Survey has been recomputed on a 1935-39 base. The estimates of employees in nonagricultural establishments have been revised beginning 1939, by months, to adjust figures to levels indicated by final Unemployment Compensation data through the last quarter of 1942 and to other data collected by government agencies; annual data for 1929-38 have been revised to a comparable basis; monthly averages beginning 1939 and monthly figures for the unadjusted series beginning January 1943 are shown on p. 3 of the June 1944 Survey; all revisions will be published later.
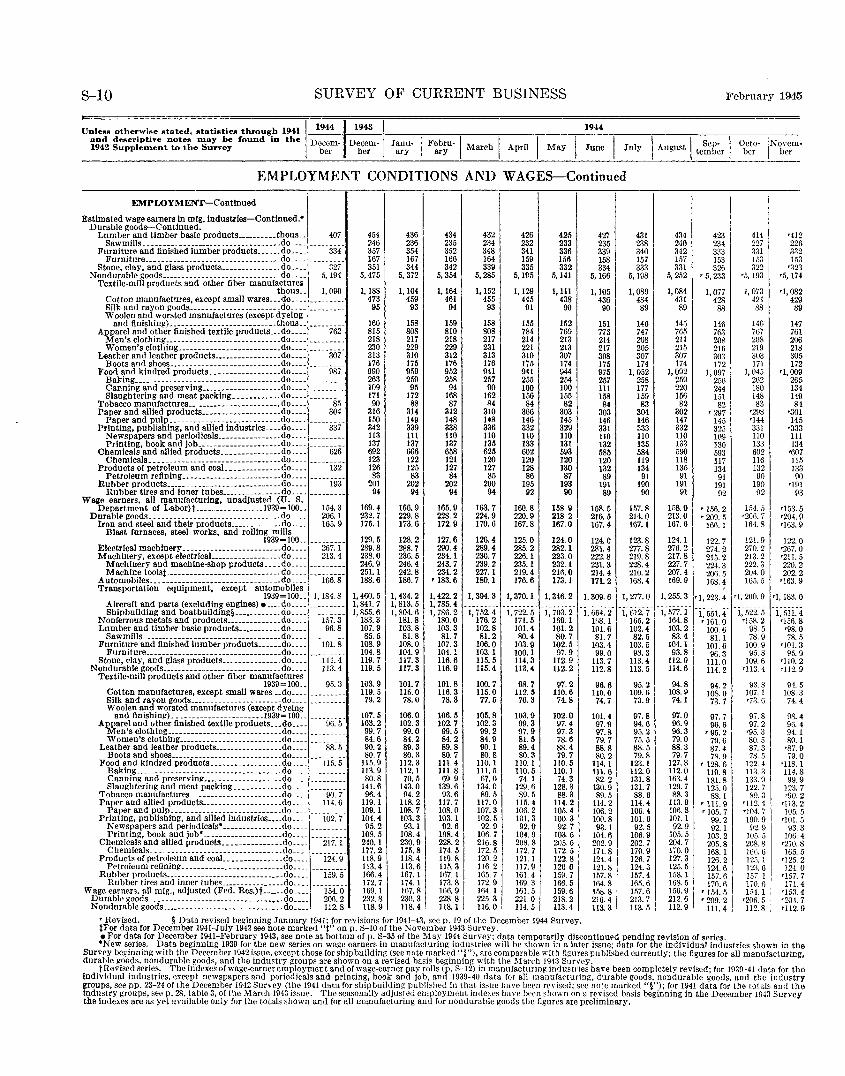
S-10 SURVEY OF CURRENT BUSINESS February 1945
1944 Unless otherwise stated~ statistics through 1941 and descriptive notes may be found in the 1942 Supplement to the Survey 1~.1~' Decem- Decem- i Janu- I Febru-1 March I April I May
ber ber 1 ary ary
EMPLOYMENT CONDITIONS AND WAGEs-Continued
EMPWYMENT-Contlnued
Estimated wage earners In mfg. Industries-Continued.• Durable goods-Continued.
Lumber and timber basic prodncts __________ thous.. 407 Sawmills ......... ----------- ---------------do ..•.
Furniture and finished lumber products •...•. do.... 334 Furniture •. _._. _____ . _________ -------- _____ do.-_.
Stone, clay, and glass products _______________ do.... :l27 Nondurable goods .... ------------------------· do.... 5,194
Textile-mill products and other fiber manufactures thous.. 1,090
Cotton manufactures, except small wares •. .do ...• Silk and rayon goods-----------------------do ..•. Woolen and worsted manufactures (except dyeing
and finishing) ___________ . __ ------------. thous .. ---------Apparel and other finished textile products_ .. do____ 762
Men's clothing _____________________________ do ... . Women's clothing __________________________ do .... ________ _
Leather and leather products _________________ do.... 307 Boots and shoes----------------------------do ....
Food and kindred products __________________ .do.... 987 Baking ______________________ --------- ___ -- .do.---Canning and preserving ____________________ do ... . Slaughtering and meat packlng ____________ do .... ---------
Tobacco manufactures .•. ·-------------------· do.... 85 Paper and allied products ____________________ do.... 304 Paper and pulp ____________________________ do .... ---------
Printing, publishing, and allied industries ..•. do.... 337 Newspapers and periodicals ________________ do ... . Printing, book and job _____________________ do ...... ______ _
Chemicals and allied products _______________ do.... 626 Chemicals._. ___ .... --------------------- .. do ....
Products of petroleum and coal ___________ ... do.... 132 Petroleum refining ________________________ .do .... ---------
Rubber products ...... -- __ ._-- ________ ---_ ... do .. _. 193 Rubber tires and inner tubes _______________ do .... ---------
Wage earners, all manufacturing, unadjusted (U. S. Department of LaborH-----------------1939=100 ..
Durable goods._.---- .. ------------------------do ... . Iron and steel and their products ____________ .do ... .
Blast furnaces, steel works, and rolling mills
154.3 206. 1 165.9
1939=100 .. ---------Electrical machinery -------------------------do____ 267. 1 Machinery, except electricaL •. ----------···--do.... 213.4
Machinery and machine-shop products .... do ....
A~:~~ibtle;~~~~~:: :::::::::::::::::::::::: ::~~~:::: - ·- ii;i;~ 8-Transportation equipment, except automobiles
1939= 100.. 1, 184. 8 Aircraft and parts (excludin_g engines) • __ .. do .. .. Shipbuilding and boatbuildmg§ ____________ do .... _______ __
Nonferrous metals and products ______________ do.... 157.3 Lumber and timber basic products ........... do.... 96.8
Sawmills.------- ..... ----------------------do .... Furniture and finished lumber products ...... do.... 101.8
Furniture ...... _ ......... _ .. ________ ....... do ... . Stone, clay, and glass products ... ----------- .do.... 111. 4
Nondurable goods .............................. do.... 113.4 Textile-mill products and other fiber manufactures
1939= 100.. 95. 3 Cotton manufactures, except small wares __ do .... __ ..... __ Silk and rayon goods ....................... do .. .. Woolen and worsted manufactures (except dyeing
and lin ish in~) .... ------------------ .1939= 100 .. ____ .. __ _
A~:~~~aclgtgf~:~-~~!~~~~:~~:~~~~_r~-~~~:~:::ag:::: 96. 5 Women's clothing __________________________ do .... _ .... ___ _
Leather and leather products _________________ do.... 88.5 Boots and shoes----------------------------do ....
Food and kindred products __________________ do... 115.5 Baking _________ ... ----------------------- .. do ... _ Canning and preserving ____________________ do .. .. Slaughtering and meat packing ____________ do .... ________ _
Tobacco manufactures _______________________ do.... 90. 7 Paper and allied products ___________________ .do.... 114. 6
Paper and pulp ............................ do .... _______ __ Printing, publishing, and allied industries .•.• do... 102.7
Newspapers and periodicals• _______________ do .. ____ ...... _ Printing, book and job• ____________________ do ............ .
Chemicals and allied products ............... do.... 217.1 Chemicals ............ ------------------· .. do ... _
Products of petroleum and coaL ______________ do.... 124.9 Petroleum retlning __________________________ do .... _______ __
Rubber products ______________________________ do.... 159.5 Rubber tires and inner tube< ________________ do ....
Wage earners, all mfg., adjusted (Fed. Res.)f ...... do .••. l 154.0 Durable goods ... ----------------------------.--do.... 206. 2 Nondurable goods .. --------------------------.--do.... 112.8
454 246 357 167 351
5,475
1, 188 473 95
160 815 218 230 313 176 990 263 109 171 90
316 150 342 113 137 692 123 126 83
201 94
169.4 232.7 175.1
129.5 289.8 238.0 246.9 251.1 188.6
1, 460. 5 1,841. 7 1,855. 6
183.3 107.9 85.5
108.9 104.8 119.7 119.5
103.9 119.5 79.2
107.5 103.2 99.7 84.6 90.2 80.7
115.9 113.9 80.8
141.6 96.4
119.1 109. 1 104.4 95.2
108.5 240.1 177. 2 118.9 113.4 166.4 172.7 169. 1 232.8 118.9
436 236 354 167 344
5, 372
1, 164 459 93
158 808 217 229 310 175 959 259 95
172 88
314 149 339 111 137 6(;6 122 125 83
202 94
166.9 229.8 173.6
128.2 288.7 236.5 246.4 242.8 186.7
1, 434.2 1, 813.5 1, 804.6
181.8 103.8 81.8
108.0 104.9 117.3 117.3
101.7 116.0 78.0
106.0 102. 3 99.0 84.2 89.3 80.3
112.3 112. 1 70.5
143.0 94.2
118.2 108.7 103.3 93.1
108.4 230.9 175.8 118.4 113.6 167. 1 174. 1 167.8 230.3 118.4 .
434 235 352 166 342
5, 354
1, 164 461
94
159 810 218 229 312 176 952 258 94
168 87
312 148 338 110 137 658 121 127 84
202 94
165.9 228.2 172.9
127.6 290.4 234. 1 243.7 234.2
•183. 6
1, 422.2 1, 785.4 1, 786.2
180.0 103.3 81.7
107.3 104.1 116.6 116.9
101.8 116.3 78.3
106.5 102.7 99.5 84.2 89.8 80.7
111.4 111.8 69.9
139.6 93.6
117.7 108.0 103. 1 92.6
108.4 228.2 174.5 119.8 115. 3 167. 1 173.8 166.9
i~:~ I
432 234 348 164 339
5,285
1, 152 455
93
158 808 217 231 313 176 941 257 90
162 84
310 148 336 110 135 625 120 127 85
200 94
163.7 224.9 170.6
126.4 289.4 230.7 239.2 227.1 180.1
1, 394.3
1, 752. 4 176.2 102.8 81.2
106.0 103. 1 115. 5 115.4
100.7 115.0 77.5
105.8 102.3 99.2 84.9 90.1 80.8
110. 1 111.5 67.0
134.0 89.5
117.0 107.3 102.5 92.9
106.7 216.8 172.5 120.2 116. 2 165.7 172.9 164.1 225.3 116.0
426 232 341 159 335
5,195
1, 129 445 91
155 784 214 221 310 175 941 255 100 156 84
306 146 332 110 133 602 120 128 86
195 92
160.8 220.9 167.8
125.0 285.2 226.1 235.1 219.4 176.6
1, 370. 1
1, 722.5 171.5 101.4 80.4
103.9 100.1 114.3 113.4
98.7 ll2. 5 76.3
103.9 99.3 97.9 81.5 89.4 80.3
110. 1 110.5
74. 1 129. 6 89.5
115.4 106.2 101.3 92.9
104.9 208.8 172. 7 121.1 117.9 161.4 169.3 161.5 22!. 0 114. 5
425 233 336 156 332
5, 141
1,111 438
90
152 769 213 213 307 174 944 254 100 155 82
303 145 329 110 131 593 120 130 87
193 90
158.9 218.2 167.0
124.0 282.1 223.0 232.1 216.0 173.1
427 235 339 158 334
5, 166
1,105 436 90
151 773 214 217 308 175 975 257 111 158 84
303 146 331 110 132 585 120 132 89
191 89
158.5 216.5 167.4
124.0 281.4 222.8 231.3 214.4 171.2
431 238 340 157 333
5,198
1, 089 434 89
146 747 208 205 307 174
1, 052 258 177 159 83
304 146 333 110 135 584 119 134
91 190 90
157.8 214.0 167.1
123.8 277.8 219.8 228.4 210.2 168.4
434 240 342 157 331
5, 252
1,084 431 89
145 765 211 215 307 174
1,092 259 220 156 82
302 147 332 110 133 590 118 135
91 191 91
1-'8. 0 213.0 167.6
124.1 276.2 217.8 227.7 207.4 169.9
423 234 333 153 326
'5, 233
1,077 428 88
146 763 208 216 303 172
1, 097 256 244 151 82
'297 145 325 109 130 593 117 134 91
191 92
'156. 2 '209. 5
166. 1
122.7 274.2 215.2 224.3 206.5 168.4
J 227 331 !53 322
•5,193
1, 073 424 88
146 767 208 219 303 171
1, 045 262 180 148 83
'298 •144 331 110 133 602 116 132 90
190 92
154. 5 I
'206. 7 164.8
121.9 270.2 213.2 222.3 204.0 165.5
•412 226 332 153
'323 •5, 174
'1,~~~ 8S
147 761 206 218 305 172
•1.gg; 134 149 84
r3Ql 145
'333 111 134
•607 115 133 90
'191 93
•153. 5 '204. 9 '163. 9
122.0 '267. 0 •211. 5 220.2 202.2
'163. 9
1, 346.2 1, 309. 6 1, 277. 0 1, 255. 3 '1, 223. 4 •1, 200. 9 '1, 183. 0
·i;7ii:i:2- -i. 664. 2· Tiii2~7- ·i;577~i- ·i;55i:4· ·1;522:.5 Tsii.-4 169.1 lli8. 1 165. 2 164. 8 ' 161. 0 '158. 2 >156. 8 101. 2 101. 6 102. 4 103. 2 100. 6 98. 5 >98. 0 80. 7 81. 7 82. 5 83. 4 81. 1 78. 9 78. 5
102. 5 103.4 103. 5 104. 1 101. 6 100. 9 >101. 3 97. 9 99. 0 98. 3 93. 8 96. 3 9.5. 8 95. 9
112.9 113.7 113.4 112.9 111.0 109.6 >110. 2 112.2 112.8 113. 5 114. 6 114. 2 •113. 4 '112. 9
97.2 llO. 6 74.8
102.0 97.4 97.3 78.6 88.4 79.7
110.5 110.1 74.3
128.3 88.3
114.2 105.4 100.3 92.7
103.6 205.6 172.5 122.8 120 0 159.7 166.5 159.6 218. 2 113.4
96.6 110.0 74.7
101.4 97.9 97.8 79.7 88.8 80.2
114. 1 111.6 82.2
130.9 89.5
114.2 106.2 100.8 93.1
104.6 202.9 171.8 124.4 121.8 157.8 164.8 158.8 216.4 113.3
95.2 109.6 73.9
97.8 94.6 95.2 75.5 88.5 79.8
123.1 112.0 131.8 131.7 88.6
114.4 106.4 101.6 92.5
106.9 202.7 170.9 126.7 124.3 157.4 165.6 157.6 213.7 113.5
94.8 108.9 74.1
97.0 96.9 96.3 79.0 88.3 79.7
127.8 112.0 163.4 129.7 88.3
113.9 106.8 101.1 92.9
10.'). 5 204.7 170.0 127.3 125.5 158.1 168.5 156.9
m:SI
94. 2 93. 8 94. 5 108. 0 107. 1 108. 3 73.7 >73.6 74.4
97.7 97.8 96.6 97. 2
' 95. 2 >9.5. 3 79.6 80. 5 87.4 87.3 78.9 78.5
• 128. 6 122. 4 110. 8 113. 3 181.8 133. g 12.5. 0 122. 7 88. 1 89.3
' 111.9 •112. 4 • 105. 7 '104. 7
99.2 100.9 92. 1 92.9
103. 2 105 .. 5 205.8 208. 8 168. 1 166. 6 126.2 12.1. 1 124. 6 123. 6 157. 6 1.57. 1 170.6 170.6
' 154 .. 5 154. 1 • 209. 2 >206. 5
111. 4 112. 8
98.4 96.4 94.1 80.1
>87. 9 79.0
'118. 1 114.8 99.9
123. 7 >90. 2
'113. 2 !05. 5
'101. 5 93.3
106.4 '210. 8 165.5
•125. 2 124.0
•!57. 7 171.4
>153. 4 >204. 7 •112. 9
'Revised. § Data revised beginning January 1941; for revisions for 1941-43, seep. 19 of the December 1944 Survey. tFor data for December 1941-July 1942 see note marked "t" on p. S-10 of the ~ovember 1943 Survey. • For data for December 1941-February 1943, see note at bottom of p. S-35 of the May 1944 Survey; data temporarily discontinued pending revision or series. •New series. Data beginning 1939 for the new series on wage earners iu manufacturing industries will be shown in a later issue; flats for the individual industries shown in the
Survey beginning with the December 1942issue, except those for shipbuilding (see note marked"§"), are comparable with figures published currently; the figures for all manufacturing, durable goods, nondurable goods, and the industry groups are shown on a revised basis beginning with the 1\Iarch 1943 Survey.
tRevised series. The indexes of wage-earner employment and of wage-earner pay rolls (p. S-12) in manufacturing industries have bee.n completely revised; for 1939-41 data for the individual industries, except newspapers and periodicals and printing, book and job, and 1939-40 data for all manufacturing, durable goods, nondurable goods, and the industry groups, see pp. 23-24 of the December 1942 Survey (the 1941 data for shipbuilding published in that issue have been revised; see note marked"§"); lor 1941 data for the totals and the industry groups, seep. 28, table 3, of the March 1943 issue. The seasonally adjusted employment indexes have been shown on a revised basis beginning in the December 1943 Survey· the Indexes are as yet available only for the totals shown and for all manufacturing aud for nondurable goods the figures are preliminary.
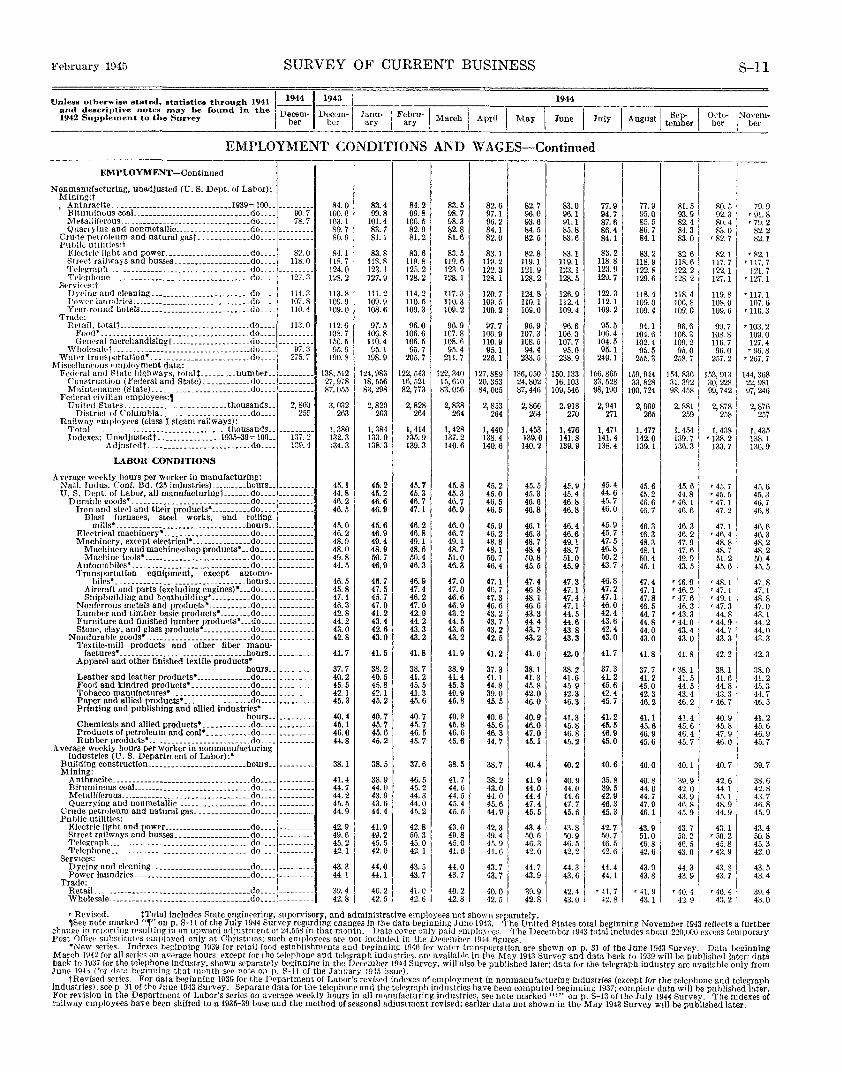
February 1045 SURVEY OF CURRENT BUSINESS S-11
1944 Unless othe•·wise stated, statistics through 1941 and descriptive notes may he found in the 1942 Supplement to the Survey
~~~~~ I' Decem- Decem-~1
Janu- I Febru-1 March I April I May June I I I Sep· I Octo· 1.:\fovem· her bcr ary ary , • · 1
July August 1
tember bcr • ber ----------------------------~-----~--~----~ ----~--~----~--~----~--~----~--~----
EMPLOYMENT CONDITIONS Al\'D WAGES-Continued
EMPLOYMENT-Continued
Nonmanuf~cturing, unadjusted (U.S. Dept. of Labor): Mining:t , Anthrac-ite. ·-------·-··-··-·-···-·-·-··1939= 100 .. --··-----
Bituminous coaL ....•...................•.•. do____ DO. 7 MctallifProus .. --·--·-----·--····-·-·-·····---do.... 78.7 Quarry in~ and nonmetallic ................... do .... -------··
Crurle pctrnh•um and natural gast _ ............. do .... ---------Public utilities:t
F.Jcetric light and power ...................... do.... 82.0 Strec•t railways and busses._ ................. do .. __ 118.0 Tclegraph .... ---------·--·------------------·do .... -------·-'1\•l,.:phone ___________________________________ do____ 127.3
Serviees:t Dyeing and c1eaning ......................... do __ __ Powc•r laundries. ____ ------------------- ______ do ___ _ Ycnr-round hotels ............................ do ... .
Trade:
114. :J 107.8 110.4
Retail, totalt ................................. do.... 113.0 Fond• ________ --------.---------------------do. ____ ---------Geneml merchandisingt. ................... do .... ---------
Wholesaiet ... __ ... ------------------------ ... do.... 97. :l 'Vater transportation•. ________________________ do____ 275.7
Miscellanl'OilS pmplnyment data: Federal aud !'tate highways, totalt------ ... number __ ---------
Construction (Ferleral and State) ............ clo ____ ---------M niutcnance (State). ________________________ do ....
}'e<lcral civilian employees:, United States. _________________________ thousands.. 2, 860
District of Columbla _______________________ do.... 255 Railway employees (class I steam railways):
TotaL .. __ ............................. thousands .. ---------Indexes: Unadjustedt ________________ 1935-39= 100.. 137. 2
Adjustedt. _ ........................ do.... 139.4
LABOR CONDITIONS
Average weekly hours per worker in mannfacturing: Nat!. Indus. Conf. Bd. (25 industries) ......... hours •. ---------U.S. Dept. of Labor, all manufacturingt ....... do ____ ·--------
Durable troods* .............................. do ........... .. Iron and steel and their products• .......... do ____ ---------
Blast furnaces, steel works, and rolling mills*._ .. _______ .. _._ ................. hours ..
Electrical machinery• .......... - ........... do ____ ---------Machinery, except electrical* ............... do .... ---------
Machinery and machine-shop prodncts• .. do ......... _____ _ Machine tools• ........................... do ___ _
Automobiles• -----------------··-----·-----do ____ ---------Transportation equipment, except automo-
biles• _------·-------------------------hours ... ---------Aircraft and parts (excluding engines)* ... do .. .. Shiphmlding and boatbuilding• .......... do .... ---------
Nonferrous metals and products• ........... do .... ---------Lumber and timber basic products• ........ do ... . Furniture and finished lumber produets• ... do .. .. Stone, clay, and glass products• ............ do ... .
Nondurable goons• __________________________ do .. .. 1'extile-mill products and other fiber manu-
factures• --------·- ...................... hours .......... . Apparel and other finished textile products•
hours __ ---------Leather and leather Produrts• .............. do .... ---------Foorl and kindred products• ............... do ____ ---------Tobacco manufactures• ................... do .... ---------Paper and allied products*-----------------do ............ . Printing and publishing and allied Industries•
hours ......... .. Chemicals and allied products• __ .......... do ........... .. Products of petroleum and coal* ........... do .... ·--------Rubber products• .. ------·----------------do ..... ---------
Average weekly hours per worker in nonmanufacturing industries (U.S. Department of Labor):•
Building construction ......................... hours .. ---------Mining:
Anthracite ................................... do ............ . Bituminous coaL ............................ do .... ·--------Metalliferous ................................. do .... ·--------Quarrying and nonmetallic ................... do •... ---------
Crude petroleum and natnral gas .............. do .... ---------Puhlic utilities:
Elt'ctric li~ht and power ...................... do .... ···------Street railways and busses ................... do ........... .. Telegraph ____________________________________ do .... ---------Telephone .• _ .............. __________________ do .... ----- ___ _
Services: Dyeing and rleaning ......................... do .... ---------Power laundries .............................. do .... ---------
Trade: RetaiL. . ................................... do .. __ Wholesale .................................... do •• __ , ________ _
84.0 100.6 103. 1 89.7 80.9
84.1 \\8.7 124.0 128.2
113.8 109.9 109.0
\12.6 108.7 156.5 95.9
190.8
\38,512 27, 978 87,055
3, 032 263
1,380 132.3 134.3
45.1 44.8 46.2 46.5
45.0 46.2 48.9 48.0 49.8 44.5
46./j 45.8 47.1 46.3 42.8 44.2 43.0 42.8
41.7
37.7 40.2 45.5 42.1 45.3
40.4 45.1 46.0 44.8
38.1
41.4 44.7 44.2 45.5 44.9
42.9 49.6 45.2 42. 1
43.3 44. 1
39.4 42.8
83.4 99.8
101.4 83.7 81.1
83.8 llR. 8 123. 1 127.9
111.2 109.9 108.6
97.5 lOG. 8 110.4 95.1
198.9
124,983 18,556 83,298
2,820 263
1, 384 133.0 138.3
45.2 45.2 46.6 46.9
45.6 46.9 49.4 48.9 50.7 46.9
46.7 47.5 45.7 47.0 41.2 43.4 42.6 43.0
41.5
38.2 40.5 45.8 42.1 45.2
40.7 45.7 45.6 45.2
38.5
38.9 44.0 43.9 43.6 44.4
41.9 49.2 45.5 42.0
44.0 44.1
40.2 42.5
84.2 99.8
!00. 5 82.9 81.2
83.6 119.8 125.2 128.2
114.2 110.5 109.3
96.0 106.6 106.5 95.7
205.7
122,543 16, 521 82,773
2,828 264
1, 414 135.9 139.3
45.7 45.3 46.7 47.1
46.2 46.8 49.1 48.6 50.4 46.3
46.9 47.4 46.2 47.0 42.9 44.2 43.3 43.2
41.8
38.7 41.2 45.5 41.3 45.6
40.7 45.7 46.5 45.7
37.6
46.5 45.2 44.3 44.0 45.2
42.8 50. :l 45.0 42.1
43.5 43.7
41.0 42.6
83.5 98.7 98.3 82.8 81.6
83.5 119.6 123.9 128.1
117.3 110.3 109.2
96.9 107.8 108.6 95.4
211. 7
122,340 1.o, 610 83,056
2,838 264
1, 428 137.2 140.6
45.8 45.3 46.7 46.9
46.0 46.7 49.1 48.7 51.0 46.3
47.0 47.0 46.6 46.9 43.2 44.5 43.6 43.2
41.9
38.9 41.4 45.3 40.9 45.8
40.8 45.8 46.6 45.6
38.5
41.7 44.6 44.5 45.4 45.5
43.0 49.8 45.0 41.6
44.0 43.7
40.2 42.8
82.6 97.1 96.2 84. 1 82.0
83.1 11\J. 2 122.3 128.1
120.7 109.5 109.2
97.7 106.9 110.9 95.1
228.1
127,889 20,353 84,005
2,853 264
1,440 138.4 140.6
45.2 45.0 46.5 46.5
45.9 46.2 48.8 48.1 50.7 46.4
47.1 46.7 47.3 46.6 43.2 43.7 43.2 42.5
41.2
37.3 41.1 44.8 39.0 45.5
40.6 45.6 46.3 44.7
38.7
38.2 43.0 44.0 45.6 44.9
42.3 49.4 45.9 41.61
:nl 40.0 42.5
82.7 96.0 93.6 84.5 82.5
82.8 ll9.1 121.9 128.2
124.8 110.1 109.0
96.9 107.3 108.5 94.4
233.5
136,050 24,802 87,446
2,866 2M
1, 453 139.6 140.2
45.5 45.3 46.6 46.8
46.1 46.3 48.7 48.4 50.8 45.5
47.4 46.8 48. 1 46.6 43.3 44.4 43.7 43.2
41.6
38.1 41.3 45.8 42.0 46.0
40.9 46.0 47.0 45.1
40.4
41.9 44.0 44.4 47.4 45.5
43.4 50.6 46.3 42.0
44.7 43.9
39.9 42.8 I
83.0 96.1 91.1 85.8 83.6
83.1 119.1 123.1 128.5
126.9 112.4 109.4
96.6 106.3 107.7 95.0
238.9
150,133 16,103
109,546
2. 918 270
1, 476 141.8 139.9
45.9 45.4 46.8 46.8
46.4 46.6 49.1 48.7 51.0 45.9
47.3 47.1 47.4 47.1 44.5 44.6 43.8 43.3
42.0
38.2 41.6 45.9 42.3 46.3
41.3 45.8 46.8 45.2
40.2
40.9 44.0 41.6 47.7 45.6
4~. 8 50.9 46.5 42.2
44.3 43.6
42.4 43.0
77.9 94.7 87.6 86.4 84. 1
83.2 118.8 123.9
129.71 122.3 112.1 109.21
1~~: ~ I 104.5 95.1
249.1
156,865 33,528 98, 190
2,941 271
1, 471 141.4 138.4
45.4 44.6 45.7 46.0
45.9 45.7 47.5 46.8 50.2 43.7
46.8 47.2 47. 1 46.0 42.4 43.6 42.4 43.0
41.7
37.3 41.2 45.6 42. ~ 45.7
41.2 46.~ 46.9 45.0
40.6
35.8 39.5 42.9 46.3 45.3
42.7 50.7 46.5 42.6
44.4 44.1
'41. 7 42.8
77. g 95.0 85.5 86.7 84.1
83.2 118.9 122.8 129.6
118. 4 109.0 109.4
94.1 104.6 102.4 95.5
255.3
159.944 33,828
100,724
2, 909 265
1,477 142.0 139.1
45.6 45.2 46.6 46.7
46.3 46.3 48.3 48.1 50.4 45.1
47.4 47.1 47.8 46.5 44.7 44.8 44.0 43.0
41.8
37.7 41.2 45.0 42.3 46.2
41.1 45.6 46.9 45.6
40.0
40.8 44.0 44.7 47.9 46.1
43.9 51.0 46.8 42.6
43.9 43.8
'41. 9 43.1
81.5 93.9 82.4 84.3 83.0
82.6 l!R. 6 122.2 128.2
118.4 106.8 109.0
96.6 106.3 109.2 95.0
258.7
154, 836 31, 392 98,458
2, 881 259
l, 454 139.7 136.3
45.6 44.8
'46.1 46.6
46.3 46. 2 47.9 47.6 49.9 43.5
'46.9 '46.2 '47. 6
46.3 '43. 3 '44.0
43.4 43.0
41.8
'38.1 41.5 44.5 43.4 46.2
41.4 45.6 46.4 45.7
40.1
39.9 42.0 43.9 46.8 45.9
43.7 50.2 46. ,) 43.0
44.3
43.91 r 40.4
42. 9
80.5 92.:1 80.4 8.1. 0
'82. 7
82. 1 117.7 122.1 127.1
119.8 108.0 109.6
99.7 108.8 116.7 96.0
257.2
153, 9l:l 30, 228 99,742
2,878 258
1, 4:l8 '138. 2
133.7
'45. 7 '45. 5 '47.1
47.2
47.1 '46. 4
48.8 48.7 51.2 45.6
'48.1 '47.1 '49.1 '47.3
44.8 '44. 9
44.7 43.3
42.2
38.1 41.6 44.8 43.3
'46. 7
40.9 45.8 47.9 46.0
40.7
42.6 44. 1 45.1 48.9 44.9
43. 1 '50. 2
45.8 r 42.9
4:1.8 43.7
'40. 4 43.2
79.9 '91. 8 '79.2
82.2 82.1
'82.1 '117. 7
121.7 '127.1
'117.1 107.6
'110.3
'103. 2 109.0 127.4 '96. 8
'267. 7
144,368 22, 981 97, 246
2, 876 257
1, 435 1:l8. 1 1:J6. 9
45.6 45.3 46.7 46.8
46.6 46.3 48.2 48.2 50.4 45.5
47.8 47.1 48.8 47.0 43.1 44.2 44.0 43.3
42.3
:l8.0 41.2 45.3 44.7 46.5
41.2 45.6 46.9 45.7
39.7
38.6 42.8 43.7 46.8 45.9
43.4 50.8 45.3 42.0
43.5 43.4
39.4 43.0
'Revised. tTotal inclndes State engineering, supervisory, and administrative employees not shown separately. ,See note marked 'T' on p. S-11 of the July 1944 Survey regarding changes in the data beginning June 1943. 'I' he United States total beginning November 1943 reflects a further
chang(• in reporting resulting in an upward adjustment of 24,558 in that month. Data cover only paid employees. The December !943 total includes about 220,000 excess temporary Post 0flicP snhstitutrs rmpioycd only at Christmas; such employres are not included in the Decrmbrr 1944 figures.
•New series. IndPxrs heginning 1939 for retail food establishments and heginning 1940 for wat.T transportation are shown on p. 31 of the June 1943 Survey. Data beginning March HJ42 for all s<•rirs on average hours. except for the telephone anr! telegraph industries, are availahl" in the 1\fay 1943 Survey and data back to 1939 will be published later: data back to 1937 for the t<>lephone industry, shown separately bnginning in the December 1944 Survey, will also be published later; data for the telegraph industry are available only from JunP 194:~ (for data h<•J!inning that month SP(' notP- on p. 8-11 of the January 194,1 issur).
tRevised series. For data beginning 1939 for the Department of La nor's revised indexes of employment in nonmanufacturing industries (except for the telephone and telegraph industries), seep. 31 of the .June 1943 Survey. Separate data for the telephone and the telegraph industries have been computed beginning 1937; complete data will be published later. For revision in the Department of Labor's series on average weekly hours in all manufacturing industries, see note marked "t" on p. 8-13 of the July 1944 Survey. 'I' he indexes of railway employees have been shifted to a 1935-39 base and the method of seasonal adjustment revised: earlier data not shown in the May 1943 Survey will be published later.
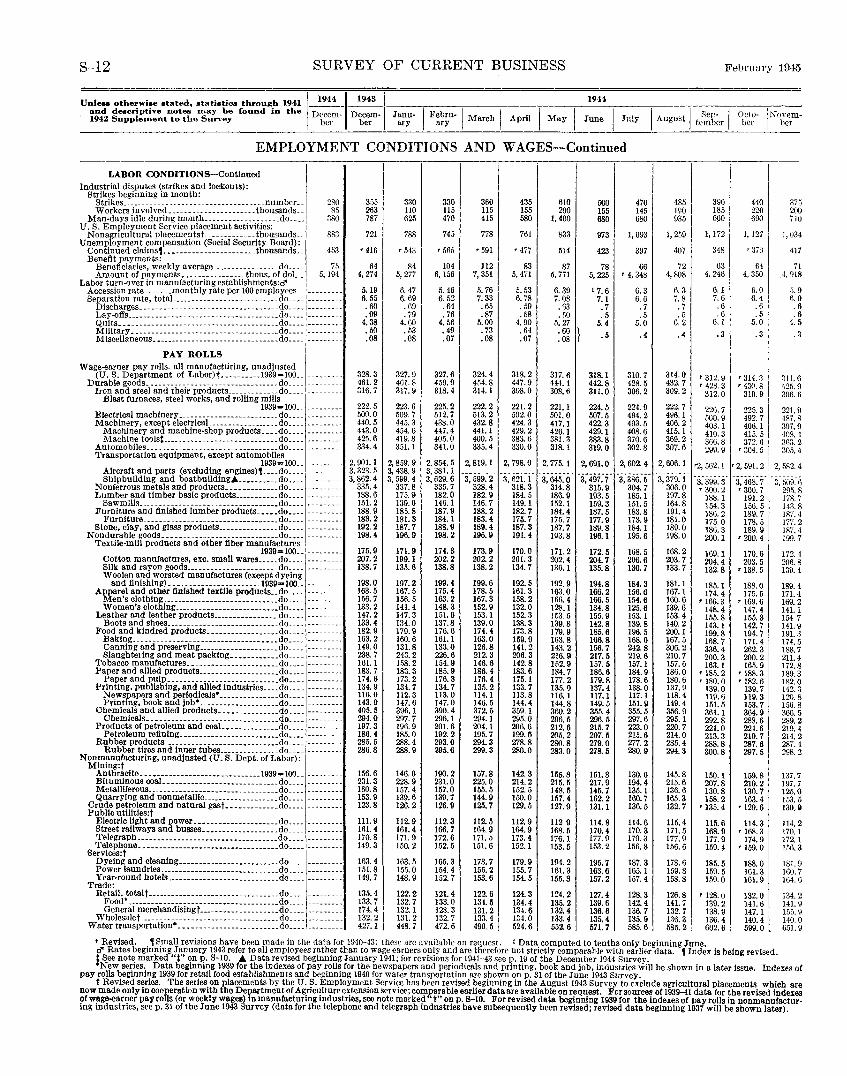
S-12 SURVEY OF CURRENT BUSINESS February 1945
Unless otherwise stated, .statistics through 1941 11944,19431 1944 and deecriptive notes may be found in the Decem- Decem- Janu- I F:~~u-j March I April I May June I July I I Sop. I Octo- jNovem-1942 Supplement to the Suney ber ber ary August tember ber ber
EMPLOYMENT CONDITIONS AND WAGES-Continued
LABOR CONDITIONS-Continued Industrial disputes (strikes and lockouts):
Strikes beginning in month: Strikes ______ . _____ --- _____________________ number __ 280 3fi5 330 330 360 435 610 000 470 485 390 440 375 Workers involved.-----. __ ----·-------- thousands-. 85 263 110 115 115 155 290 155 145 190 185 220 200
Man-days idle during month ___________________ do ____ 380 787 62.1 470 415 580 1, 400 680 680 935 6!)0 690 710 U. B. Employment Service placement activities:
Nonagricultural placementst. ___ . ---.---.thousands .. Unemployment compensation (Social Security Board):
883 721 788 745 778 761 833 973 1, 093 1,259 1, 172 1, 127 1, 034
Continued claims,_.·-------------------_ thousands-- 453 '416 '543 '565 '591 '477 514 423 397 407 348 r ~370 417 Benefit payments:
75 64 84 104 ll2 83 87 78 66 72 63 64 71 Beneficiaries, weekly average _________________ do ____ Amount of payments •. --------------thous. of doL_ 5,194 4, 274 5, 277 6,156 7, 351 5, 471 6, 771 5, 225 '4, 348 4,808 4, 246 4, 350 4, 918
Labor turn-over in manufacturing establishments:d" 5. 19 6. 47 5. 46 5. 76 5.53 6. 39 '7.6 6. 3 6.3 6.1 6.0 5. 9 Accession rate .. __ .. _monthly rate per 100 employees
Separation rate, totaL _____ ------------- ·-------do ____ --------- 6.55 6.69 6. 52 7.33 6. 78 7. 08 7.1 6. 6 7.8 7. 6 6.1 6.0
P!~~~s~~~:::::::::::::::::::::::::::::::::::~~:::: . 60 . 69 . 64 .65 • 59 . 63 .7 . 7 .7 .6 . 6 .6 .99 . 79 . 76 .87 . 58 . 50 .5 .5 . 5 .6 . 5 .6
~~t~~ii~~~~~~ :_:_~ ~==::::::::::::::::::::::::: ~g=::: 4.38 4. 60 4.56 5.00 4. 90 5.27 5. 4 5.0 6. 2 6.1 5.0 4.5 . 50 . 53 . 49 . 73 . 64 .60 .5 .4 .4 , 3 .3 . 3 .08 .08 .07 .08 .07 .OS
PAY ROLLS Wage-earner pay rolls. all manufacturing, unadjusted
328.3 327.9 327.6 324.4 318.2 317.6 318.1 310.7 314.0 (U.S. Department of Labor)t ··--------1939=100 __ --------- '312. 9 '314. 3 311.6 Durable goods_-·----------------.------------ -do_ ... 461.2 461.8 4.59. 9 454.8 447.9 444. 1 442.8 428.5 432.7 '428. 3 '430.8 •125. 9 Iron and steel and their products _____________ do ___ . 316.7 317.9 318.4 314. 1 308.0 308.6 311.0 306.2 309.2 312.0 310.9 306.6 Blast furnaces, steel works, and rolling mills
222 5 223.6 225.2 222.2 221.2 221.1 224.5 224.9 222.7 1939=100 .. --------- 226.7 225.3 221.9 Electrical machinery __ ------------------- ____ do ____ --------- 500.0 509.7 512.7 513.2 502.0 50!, 0 507.5 494.2 496.1 500.9 492.7 487.8 Machinery, except electricaJ. _________________ do_. __ --------- 440.5 445.3 438.0 432.8 424.3 417.1 422.3 403.5 406.2 403.1 406.1 397.9 Machinery and machine-shop products .• _.do ____ 443.0 454.6 447.4 441.1 429.2 426.1 429.1 408.6 H5.1 410.3 415.5 408.4 Machine toolst.----- --------- -·-. -- __ ---- __ do __ ._ 425.6 419.8 405.0 400.5 383.6 381.3 383.8 370.6 369.2 366.8 372.6 363.2 Automobiles •.. ----------------------------- _do_--- 334.4 351.1 341.0 335.4 330.0 318. 1 319.0 302.8 307.6 299.9' '304. 5 305.4 Transportation equipment, except automobiles
2,901.1 2, 859.9 2, 854.5 2,819.1 2, 798.0 2, 775. 1 2, 691.0 2, 602.4 2, 606.1 1939=100 __ --------- r2, 562.1 '2, 591.2 2, 582.4 Aircraft and parts (excluding engines), ____ do ____ --------- 3, 323.5 3, 438.9 3, 381.1 --------- --------- T497:7· -3,-386.-~- -----------------Shipbuilding and boatbuildingA __________ do ____ 3, 862.4 3, 599.4 3, 629. 6 3, 599.2 3, 621. I 3,645.0 3, 379.1 3, 399.3 3, 468.7 3, 509.6 Nonferrous metals and products ____________ _cto ____ 335.4 337.8 335.7 328.4 318.3 314.8 315.9 304.7 306.0 '300.2 '300. 7 295.8 Lumber and timber basic products ___________ do ____ 188.6 175.9 182.0 182.9 184.5 186.9 193.5 185.1 197.8 188.1 191.2 178.7 Sawmills ___ .. __ ----------· .. -------· _______ do ____ ·-------- 1.51. 2 139.0 146. 1 146.7 149.1 152. 1 159.3 151.5 164.8 154.3 156. 5 143.8 Furniture and finished lumber products_ •••• do •• -- --------- 188.9 185.8 187.9 188.2 182.7 184.4 187.5 183.8 191.4 186.2 189.7 187.4 Furniture. ____ --.---------------- ••• --·- ___ do ____ --------- 183.2 181.3 184.1 183.4 175.7 175.7 177,9 173.9 181.0 175.0 178.5 177.2 Stone, clay, and glass products _______________ do ____ --------- 192.2 187.7 188.9 189.4 187.3 187.7 189.8 184.1 189.0 186.3 189.9 187.4 Nondurable goods ••• -·------------ ____________ do ____ --------- 198.4 196.9 198.2 196.9 191.4 103.8 196.1 195.6 198.0 200.1 '200.4 199.7 Textile-mill products and other fiber manufactures 175.9 171.9 174.3 173.9 170.0 171.2 172.5 168.5 168.2 1939=100 __ 169.1 170.6 172.4 Cotton manufactures, exc. small wares_. ___ do ____ --------- 207.2 199.1 202.2 202.2 201.3 202.4 204.7 206.6 203.7 204.4 203.5 206.8 Silk and rayon goods _______________________ do ____ --------- 138.7 135.6 138.8 138.2 134.7 136. 1 135.8 130.7 133.7 132.8 '138. 5 139.4 Woolen and worsted manufactures (except dyeing 198.0 197.2 199.4 199.6 192.5 192.9 194.8 184.3 181.1 and finishing) •••. ---------------- ---1939-100.- --------- 185. 1 188.0 189.4
A~!~~! ~~~h~~~e~ -~~!~~~~ _t~:.t!~~ -~~~~~~-t~::~~:::: --------- 163.5 167.5 175.4 178.5 161.3 163.0 166.2 156.6 167.1 174.4 175.5 171.4 156.7 156.5 163.2 167.3 158.2 166.4 166.5 154.6 160.6 '166.3 '169.6 169.2 Women's clothlng __________________________ do ____ 133.2 141.4 148.3 152.9 132.0 128.1 134.8 125.6 139.6 148.4 147.4 141.1 Leather and leather products ________________ do ____ 147.2 147.3 151.6 153.1 152.3 153.5 155.9 153.1 153.4 lli5. 8 155.3 154 7
Boots and shoes.-----------------··--------do. ___ --------- 133.4 13{. 0 137.8 139.0 138.3 139.8 142.8 139.8 140.2 143. 1 142.7 141.9 Food and kindred products __________________ do. ___ --------- 182.9 179.9 176.6 174.4 173.8 179.9 185.6 196.5 200.1 199.8 194.7 191.3 Baking ____ . ___ -.. __________ -·--_·-·--_ •••• do. ___ --------- 163.2 160.6 161.1 163.0 159.9 16.3. 8 166.8 168.0 167.5 168.7 171.4 174.5 Canning and preserving ____________________ do ____ 149.0 131.8 133.0 126.8 141.2 Ha. 2 156.7 242.8 306.2 336.4 262.3 188.7 Slaughtering and meat packing •• __________ do ____ 238.7 243.2 226.6 212.3 206.3 216.9 217.5 219.6 210.7 200.3 200.2 211.4 Tobacco manufactures. -----·-----------···--do ____ --------- 161.1 158.2 154.9 146.6 142.8 152.9 157. 5 157.1 157.6 163. 1 165.9 172.8 Paper and allied products ____________________ do ____ --------- 183.7 183.3 185.9 186.4 183.6 184.7 186.6 184.9 186.0 '185.2 '188.3 189.3 Paper and pnlP----------------·----·-·-·--do ____ --------- 174.6 173.2 176.3 176.4 175.1 177.2 179.8 178.6 180.6 '180.0 '182.6 182.0 Printing, publishing, and allied industries ____ do ____ 134.9 134.7 134.7 135.2 133.7 135.0 137.4 138.0 137.9 139.0 139.7 142.3 Newspapers and periodicaJs• _______________ do ____ 116.0 112.3 113.0 114.1 113.8 116.1 117.1 117.1 118.4 119.6 119.3 120.8 Printing, book and job• .. __________________ do. ___ 143.9 147.6 147.0 146.5 144.4 144.8 149.5 151.9 149.4 151.5 153,7 156.8 Chemicals and allied products _______________ do ____ 405.5 396.1 390.4 372.5 359.1 360.2 355.4 355.5 356.9 361.1 364.9 366.5 Chemicals __ •• ____ -- __ ··--· ________________ do. ___ --------- 294.0 297.7 296.1 294.1 295.0 296.5 296.5 297.6 295.1 292.8 288.6 289.2 Products of petroleum and coaL ••• __________ do ____ --------- 197.3 196.9 201.6 204.1 206.6 212.6 215.7 223.0 220.7 221.0 ~i~:~ I
219.4 Petroleum refining.····---··- __ -· ____ •••••• do •• ·- 186.4 185.0 192.2 195.7 199.6 205.2 207.5 215.6 214.0 213.3 214.2
Rubber products --------------------------·-clo ____ --------- 285.5 288.4 293.0 294.3 278.8 280.8 279.0 277.2 285.4 288.8 287.6 287.4 Rubber tires and Inner tubes _______________ do ____ 286.8 288.9 295.6 299.3 280.0 283.0 278.5 280.9 294.3 800.8 297.5 298.2 N onmanulacturing, unadjusted (U. B. Dept. of Labor):
Mlning:t 156.6 146.0 190.2 157.8 142.3 155.8 151.8 130.6 145.8 Anthracite •••• __ --·----- __ -··-_-·.·-· ___ 1939= 100 __ --------- 150.1 159.8 137.7
Bituminous coaL.·--··---------··------- ____ do ____ --------- 231.3 228.9 231.0 225.0 214.2 215.5 217.9 194.4 215.6 207.8 210.2 197.7 Metalliferous_ ..•. -.--- ___ .-·-·----·. _________ do ____ --------- 160.8 157.4 157.0 155.5 152.5 148.5 145.7 135.1 136.6 130.8 130.7 125.0 Quarrying and nonmetalllc ___________________ do ____ --------- 153.9 139.6 139.7 144.9 150.0 157.4 162.2 160.7 165.3 158.2 163.4 153.5 Crude petroleum and natural gast •••• _________ do ____ 123.8 126.2 126.9 125,7 129.5 127.9 131.1 136.5 132.7 '135. 4 '129.6 130.U Public utillties:t
112.5 Electric light and power ····---·-··----·-----do ____ --------- 111.9 112.9 112.3 112.9 1129 114.8 114.6 115.4 115.6 114.3 114. 2 Street railways and busses ••••• _____________ _cto ____ 161.4 161.4 166.7 164.9 164.9 168.5 170.4 170.3 171.5 168.9 '168. 3 170.1 Telegraph. __ -··-·-··-- ____ ··--· •• ·---·-_·-_ .do ____ --------- 170.8 171.9 172.6 1il.IJ 173.4 176. 1 177.9 179.3 177.9 177.9 174.9 172.1 Telephone_. ···--··----·-·--·······-·-·--····do ____ --------- 149.3 150.2 152.5 151.6 152.1 153.5 153.2 156.8 156.6 159.4 '159. 0 156.3
Services:t I 163.4 163.5 165.3 173.7 179.9 194.2 195.7 187.3 178.6 125.5 188.0 181.9 f~:~~~:~gd~\:~u!~~::::::::::::: ::::::::::::~~::::I::::::::: 151.8 155.0 154.4 155.2 155.7 161.3 163.6 165.1 159.8 159.5 161.3 160.7 Year-round hotels ___________________________ _do ___ -~-- __ ----- 149.7 148.9 152.7 153.6 154.5 155.3 157.2 157.4 158.8 159.0 161.9 164.6
Tr:it~i~n. totalt ·------------···-·-------·-------do.--. --------- 135.4 122.2 121.4 122.6 124.3 124.2 127,4 128.3 126.8 '128.0 132.0 134.2 Food*----·-------------------·-··- _________ do. __ .~---- ____ - 133.7 132.7 133.0 134.6 134.4 135.2 139.6 142.4 141.7 139.2 141.6 141.9 General merchandisingt ------··-·------- ___ do. ___ --------- 174.4 132. 1 128.3 131.2 134.6 132.4 136.6 136.7 132.7 138.9 147.1 155.9
Wholesalet ______ .---- .. --- ------------ __ -·- __ do ____ --- ___ --- 132.2 131.2 132.7 133.4 134.0 133.4 135.4 135.9 136.3 136.4 140.4 140.0 Water transportation• _________________________ do ____ --------- 427.1 448. 7 472.6 490.5 524.6 552.6 571.7 585.6 585.2 602.6 599.0 l 651.9
• Revised. , Small revisions have been made in the data for 1940-43; these are available on request. t Data computed to tenths only beginning June, d" Rates beginning January 1943 refer to all employees rather than to wage earners only and are therefore not strictly comparable with earlier data. , Index is being revised, t See note marked "t" on p. S-10. A Data revised beginning January 1941; for revisions for 1941-43 seep. 19 of the December 1944 Survey. •New series. Data beginning 1939 for the indexes of pay rolls lor the newspapers and periodicals and printing, book and job, industries will be shown in a later issue, Indexes of
pay rolls beginning 1939 for retail food establishments and beginning 1940 for water transportation are shown on p. 31 of the June 1943 Survey. t Revised series. The series on placements by tbe U. B. Employment Service has been revised beginning in the August 1943 Survey to exclude agricultural placements which are
now made only in cooReratlon with the Department of Agriculture extension service; comparable earlier data are available on reQuest. For sources of 1939-41 data for the revised Indexes of wage-earner payro s (or weekly wages) In manufacturing industries, see note marked • t" on p. S-10. For revised data beginning 1939 for the indexes of pay rolls in nonmannfactur· lug industries, seep. 31 of the June 1943 Survey (data for the telephone and telegraph industries have subsequently been revised; revised data beginning 1937 will be shown later).
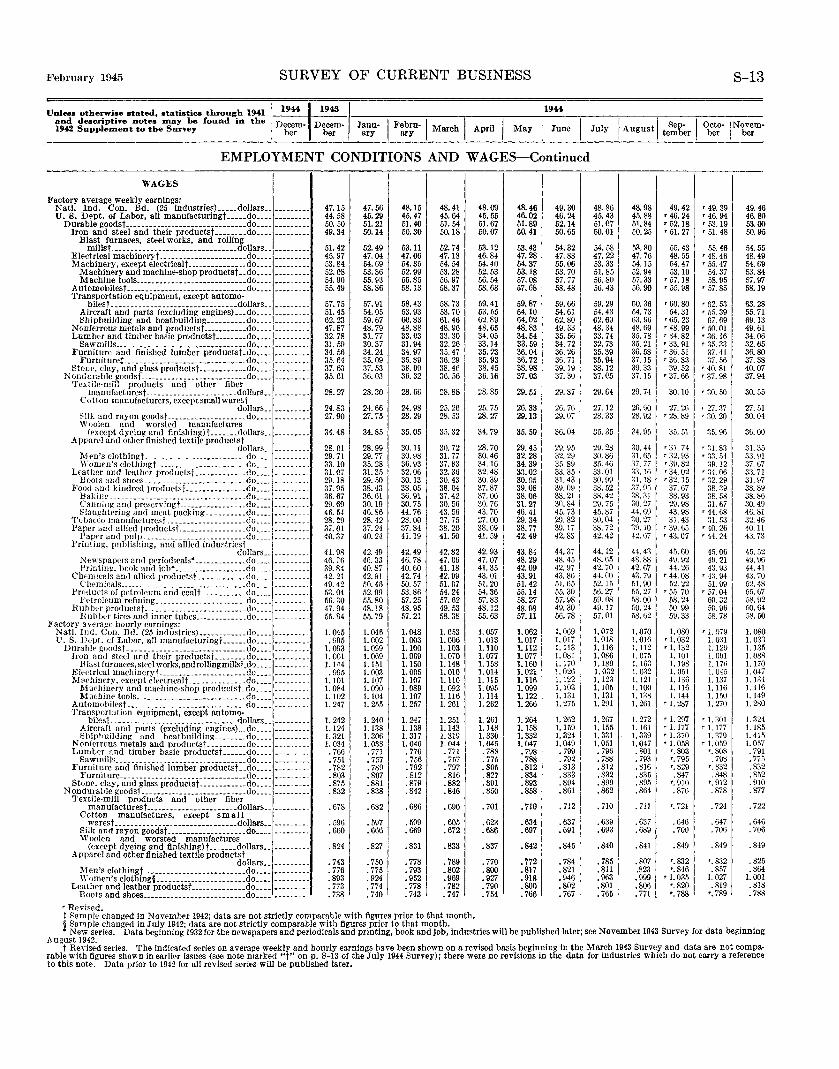
February 1945
Unless otherwise stated, •tatistics through 1941 and descriptive notes may be found in the 1942 Supplement to the Survey
SURVEY OF CURRENT BUSINESS
1
1944
11943 I
Decem· Decem· Jann· I Febrn·l March I April I May ber ber ary ary
1944
EMPLOYMENT CONDITIONS AND WAGES-Continued
WAGES I I
Factory average weekly earnings: Nat!. Ind. Con. Bd. (25 industries) •.... dollars •. --------- 47.15 47.56 48.15 48.41 48.09 48.46 49.30 U. 8. Dept. of Labor, all manufacturingt ••.•• do •.•. 44.58 45.29 45.47 45.64 45.55 46.02 46.24
Durable goodst ...•.•.• -----·---· .••......•••. do •••. --------- 50.50 51.21 51.40 51.54 51.67 51.89 52.14 Iron and steel and their productst •.•...•. do .••. 49.34 50.14 50.30 50.18 50.07 60.41 50.65
Blast furnar~s. steel works, and rolling millst ..•.•.•.•.....•...•...•.•.•••.•. dollars .. 51.42 52.49 53.11 52.74 53.12 53.43 54.32
Electrical machineryt .•...•...•.•••.•••.•.. do •.•. --------- 45.97 47.04 47.06 47.18 46.84 47.28 47.88 Machinery, except electricalt ....•.•.•.•.•..• do •.•. --------- 53.84 54.69 54.35 54.54 54.40 54.37 55.06
Machinery and machine-shop productst •. do •.•. 52.08 53.36 52.99 53.28 52.53 53.18 53.70 Machine tools ...•••••.•.•..•..•.•.•.•.•.. do .... 54.90 55.93 55.85 56.97 56.54 57.08 57.77
A utomobilest ...•...•.••....•.•.....•...•... do •.•. --------- 55.49 58.86 58.13 58.37 58.68 67.68 58.48 Transportation equipment, except automo·
bilest .....•.....•...•.•.•...........• dollars •. --------- 57.75 57.91 58.43 58.73 59.41 59.87 59.66 Aircraft and parts (excluding engines) ••. do •.•. --------- 51.45 54.05 53.93 53.70 53.55 54.10 54.61 Shipbuilding and boatbuilding •••••••••. do •... 62.23 59.67 60.83 61.46 62.89 64.02 62.80
Nonferrous metals and productst ....•.••... do .... 47.87 48.79 48.88 48.96 48.65 48.83 49.33 Lumb~r and timber basic productst ...•.... do •••. 32.78 31.77 33.03 33.30 34.05 34.54 35.56
Sawmills ..... _ ... _. ___ ._._._ •.•.•.•.•...• do •.•. 31.59 30.37 31.94 32.26 33.14 33.59 34.72 Furniture and finished lumber productst .do •.•.
~-- ------ 34.56 34.24 34.97 35.47 35.23 36.04 36.26 Funlituret .•.........•...•.....••....•... do •.•. 35.64 35.09 3.5. 89 36.29 35.93 36.72 36.71
Stout>. clay, and glass productst .•.•••.•.•.. do •.•. --------- 37.63 37.53 38.00 38.46 38.45 38.98 39.19 Nondurable goodst ........•.•.•.•.•.•••.•. __ .do ..•. 35.61 36.03 36.32 36.56 36.16 37.03 37.30
Textile-mill products and other fiber manufacturest ... __ .................. dollars •. --------- 28.27 28.30 28.66 28.88 28.85 29.51 29.87
Cotton manufacturers, except small warest dollars ..
___ ,. _____ 24.83 24.66 24.98 25.26 25.75 26.33 26.76
Silk and rayon goodst ..•.....••..•...•... do ••.. --------- 27.90 27.75 28.29 28.53 28.27 29.13 29.07 Woolen and worsted manufactures
<except dyeing and finishing)t ....... dollars •. 34.48 34.85 35.05 35.32 34.79 35.50 36.04 Apparel and other finished textile productst
dollars .. 28.01 28.99 30. 11 30.72 28.70 29.45 29.95 Men's clothingt. _ ..............•.......... do .... ------·-- 29.71 29.77 30.98 31.77 30.46 32.28 32.29 Women's clothingt ____ .••.........•..... .(lo. ___ --------- 33.10 35.28 36.93 37.83 34.16 34.39 35.89
Leather and leather productst ..•.•...•.... do .•.. 31.07 31.35 32.06 32.36 32.48 33.02 33.35 Boots and shoes ..•• __ .......••......•... do .... 29.18 29.50 30.13 30.43 30.39 30.95 31.43
Food and kindred productst ..•••.•.•.•.... do .... --------- 37.95 38.43 38.05 38.04 37.87 39.08 39.09 Bakin~. ________ .......••......•..• __ ••.. do .... 36.67 36.61 36.91 37.42 37.00 38.06 38.21 Canning and preservingt---·-····--------do ..•. --------- 29.69 30.19 30.75 30.56 30.76 31.27 30.84 Slaughtering and meat packing ......•.•. do •.•. 46.54 46.86 44.76 43.56 43.70 46.41 45.73
'T'obacco manufacturest .....•..•..•........ do .... 28.29 28.42 28.00 27.75 27.00 29.34 29.82 Paper and allied productst ....•............ do •... 37. OJ 37.24 37.84 38.20 38.09 38.77 39.17
Paper and pulp ...........•.............. do .... 40.37 40.24 41.19 41.50 41.59 42.49 42.83 Printing, publishing, and allied industriest
dollars __ .. -------- 41.98 42.49 42.49 42.82 42.93 43.8·! 44.37 Newspapers and periodicals• .......•...•. do ..•. --------- 46.76 46.33 46. 78 47.06 47.07 48.29 48.45 Pdnting, book and job* __________________ do ____ 39.84 40.87 40.60 41.18 41.35 42.09 42.97
Chf·m ieals and allied productst .•..•••••.•. do .... 42. 21 42.91 42.74 42.99 43.01 43.91 43.86 Chemicals. ______ ._. __ ......•..••.•....•.. do. __ . 49.42 50.46 50.57 51.07 51.20 51.42 .51.65
Products of petroleum and coalt ___ ....•••. do .... --------- 53.04 52.99 53.86 54.24 54.36 55.14 55.30 J'f'tro!€'-um refining _______________________ do ____ 56.30 55.80 57.25 57.62 57.83 58.27 57.98
Hllhbcr productst .............•••...•...•.. do ..•. 47.94 48.18 48.95 49.53 48.12 48.98 49.30 Rubber tires and inner tnbes ...........•. do •.•. 55.84 55.79 57.21 58.38 55.63 57.11 56.78
Factory anrage hourly earnings: Nat!. Illd. Con. Bd. (25 industries) •••••.•..... do .... --------- 1. 045 I. 046 1.048 1. 053 1.057 1.062 1.069 U. S. Dept. of Labor, all manufacturingt ...... do ____ .995 1.002 1. 003 1. 006 1. 013 1.017 1.017
Durable goodst .•.. __ ..............•.•.•..... do •••• 1. 093 1. 099 1.100 1.103 1.110 1.112 1.113 Jrou and steel and their productst •....... do •••• --------- 1. 061 1.069 1. OG9 1. 070 1.077 1.077 1. 081
Blast furnaces, steel works,androllingmillst.d'l .... 1.144 1. 151 1.150 1.148 1.158 1.160 1.170 El<'etrical machincryj .....•...••......••... do ..•• . 995 1. 003 1. 005 1. 010 1. 014 1. 021 1.026 Mnrhinery, except electriralt .........•.... do ...•. 1.101 1.107 1.107 1.110 1. 1!5 1.116 1.122
Mnrhinery and machine-shop productst.do .... 1. 084 J.OOO 1. 089 1. 092 1. 095 1.099 1.103 Mocbine tools .. ---·······-·······--------do .... 1.102 1. 104 1.107 1.116 1.114 1.122 1.131
Automobilest .••. _. _ .. __ . __ .. __ ••••••...•.. do ..• _ ---~-- --- 1. 247 1. 255 1. 257 1. 261 1. 262 1. 266 1. 275
Transportation equipment, except automo-bilest --------·---· ...•.....•...•.•.• .<lollars .. --------- ]. 242 1. 240 1. 247 1. 251 1. 261 1. 264 1. 262
Aircraft and parts (excluding engincs) ... do .... --------- 1.124 1.138 1.138 1.143 1.148 1.158 1.159 Shipbuilding and boathuilding ........ do .... l. 321 1.306 1.317 l. 319 1. 330 1.332 1. 324
Nonferrous metals and productst •.•.•••... do •.•. 1. 034 1.038 1.040 1.044 1. 045 1.047 1.049 Lumber and timber basic productst ..•.•. do •••. . 766 . 771 . 770 . 771 . 788 • 798 • 799
Sawmills._ •.............•... __ ....•. ____ .. do •.•. • 751 I • 7~7 • 756 • 757 .775 . 788 . 792 Furniture and finished lumber productst .. do ..•. --------- . 7821 . 789 • 792 . 797 .805 .812 .813
Furniture ....... __ ••.••.........•...... _ .do •.•. .803 .807 .812 . 816 .827 .834 .833 Stone. clay, and glass productst .......•.... do .... --------- .875 .881 .879 .882 .891 .893 .894
Nondurable goodst ----·-----·-·····-·-······-do .... . 832 .838 .842 .846 .850 .858 .861 Textile·mill products and other fiber
man ufacturest ..•.•••.•••••...•.•.. _.dollars .. .678 .f>82 .686 .690 • 701 .710 .712 Cotton manufactures, except small
warest ....•..•••.•.•. ·--· •.•••••.•••. dollars __ --------- • 596 • 597 .599 .605 .623 .634 .637 Silk and rayon goodst ..•.....•.•.•.•.•.•• do ____ --------- .660 .666 .669 .672 .686 .697 .691 Woolen and worsted manufactures
(except dyeing and finishing)t ....... dollars •. --------- .824 .827 .831 .833 .837 .842 .845 Apparel and other finished textile productst
• 789 . 770 dollars •. • 743 • 750 • 778 • 772 . 784 Men's clothingt ----·- •••••.•••.•••.•...•. do •.•.
., ________ • 776 • 775 • 793 .802 .800 .817 .821
Women's clothing§ .•.•.••....•••••.•.•.•. do .••.•..•.•.•. .893 . 924 • 952 .969 . 927 .918 .946 Leather and leather productst .•..•••••••... do ••••••....... • 773 • 774 . 778 • 782 • 790 .800 .802
Boots and shoes •••.•••.•.•.•••.•.••....•. do •.•.•........ . 738 I • 740 . 743 • 747 • 754 • 766 . 767
r Revised.
48.86 48.98 49.42 45.43 45.88 '46. 24 51.07 51.84 '52.18 50.01 50.25 '51. 27
54.58 53.~0 55.43 47.22 47.76 48.55 53.33 54.15 54.47 51.85 52.94 53.10 56.80 57.33 '57.18 56.43 56.90 r 55.98
59.29 60.36 '60. 80 54.43 54.73 54.31 62.69 63.96 •65. 23 48.34 48.69 '48. 99 33.74 35.78 '34. 82 32.73 35.21 • 33.91 35.39 36.58 '36. 51 35.94 37.15 '36. 83 38.12 39.33 39.52 37.05 37.15 '37. 66
29.64 29.74 30.10
27.121 26. GO 27.26 28.33 28.92 '2S. 89
35.351 34.95 35.51
29.28 30.44 '31. 74 30.86 31. fl5 r 32. 93 35.46 37.77 '39.82 33.01 33.16 '34.02 30.99 :H.IS '32. 15 38. 52 37.95 37.67 3R. 42 38.31 38.93 29.75 30.27 29.98 45.87 44.69 43.98 30.04 30.27 31.43 38.72 39.10 '39. (,5 42.42 42.67 '43.07
44.12 41.43 45. GO 48.65 48.88 49.92 42.70 42.67 44.26 44. co 43.79 '44.08 52.15 -'1.90 52.22 56.27 55.27 r 55.70 59.08 58.00 58.24 49.17 50.24 50.99 57.01 58.62 59.33
1.072 1.070 1.080 1. 018 1.016 '1.032 1.116 1.112 '1.132 1.086 l. 07., 1.101 1.189 I. 163 1.198 I. 032 1.032 I. 051 1.123 1.121 1.136 1.105 1.100 1.1!6 1. 131 1.138 1.144 1. 291 1. 261 '1. 287
1. 267 1. 272 '1. 297 1.155 1.161 '1.177 1. 331 1.339 'I. 370 1. 051 1.047 '1.058 • 796 . 801 '.803 . 788 . 793 "· 795 .812 .816 '· 829 .832 .835 . 847 .899 .895 '· 910 .862 .864 .876
.710 . 711 "· 721
.639 . 637 . 646
.693 .689 . 700
.840 .841 .849
• 785 .807 •.832 . 811 .823 •.846 . 963 .999 '1.035 .801 .806 •.820 . 765 • 771 '· 788
'49.39 '46.94 '53.19 '51. 48
55.46 '48. 46 r 55.47
54.37 58.95
'57. 85
'62. 53 '55. 39
67.69 '50. 01 '36.16 r 35.33
37.41 37. 56
'40. 81 '37. 98
'30. 50
'27. 37 T 00. 20
:l5. 96
'~H. 8.3 , 33.54
:l9. 12 ,. 34.06 '32. 2\J
38.39 38.58 31.67
'44. 68 31. .13
'40. 26 '44. 24
4.1. 06 4\J. 21 4:3. g;J
'4:3. 94 51.99
r 57.04 60.32 50.96 58. 7g
r 1. 079 l. 0~1 1.129 1. Ofll 1.17fi I. 045 I. 137 1.116 1.150 1. 270
'l. 301 'I. 177
I. 379 'l. 059
'· 808 . 798
'· 832 .848
'· 912 . 878
. 724
. 647
. 706
.849
'· 832 . 857
l. 027 . 819
'· 789
S-13
49.4 6 80 00
46. 53. 50.9 5
54.5 5 9 9 4 7 9
48.4 54.6 53.8 57.9 58.1
63.2 8 1 3
55.7 69.1 49.61 34.0 32.6
6 5
36. 37.3
80 8 7 4
40.0 37.9
30. 5"
27.51 30.04
36.0 0
31. 3' :;:;. 91 :l7. ti7 3:l. 71 31.97 38.8 9 38.86 :JO. 49 46.81 32.46 40.11 4:l. 73
45.52 49.9 6 44.41 43.70 52.4 8 55.67 58.\J 50.64 58. 50
0 3 5
1.08 1.03 1.13 1.088 1.170 1.047 1.134 1.116 I. 14\l 1. 280
1.324 1.185 1. 415 1.057 . 791 .775 .832 .852 . 910 • 877
. 722
. 646
. 706
. 849
. 82.)
. 864 1.001 .818 . 788
t Sample chan~ed in November 1942; data are not strictly rom parable with figures prior to that month. § Sample changed in .Tuly 1942; data are not strictly comparable with figures prior to that month. • New series. Data beginning 1932 for the newspapers and periodicals and printing, book and job, industries will be published later; see November 1943 Survey for data beginning
August 1942. t ReYised series. The indicated series on average weekly and hourly earnings have been shown on a revised basis beginning In the March 1943 Survey and data are not compa·
rable with figures shown in earlier issues (see note marked "t" on p. S-13 of the July 1944 Survey); there were no revisions in the data for industries whi~h do not carry a reference to this note. Data prior to 1942 for all revised series will be published later.
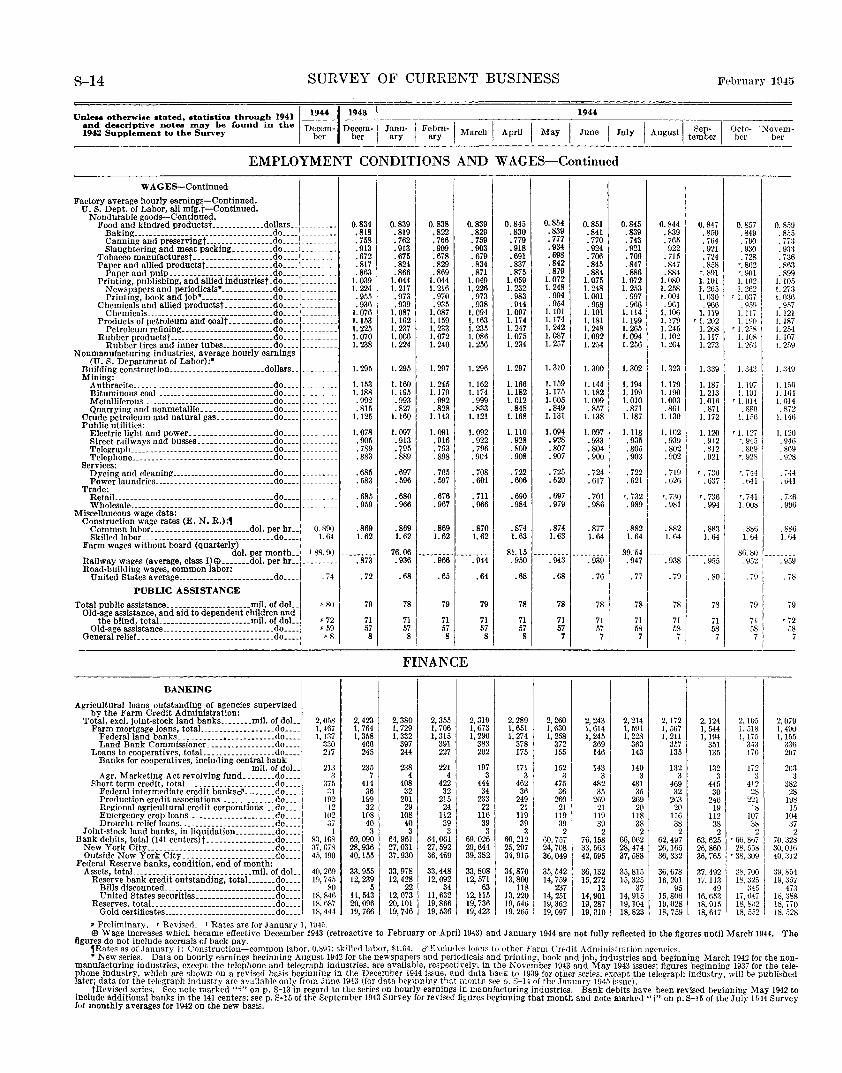
S-14 SURVEY OF CURRENT BUSINESS
EMPLOYMENT CONDITIONS AND WAGES-Continued
WAGEs--Continued
Factory average hourly earnings-Continued. U. S. Dept. of Labor, all mfg. t-Continued.
Nondurable goods-Continued. 0.838 0. 839 0.845 0.854 0.851 Food and kindred productst-------------dollars __ --------- 0.834 0.839
Baking ___________________ ---- ____________ do ____ I ________ • .818 .819 .822 .829 .830 .839 .841 Canning and preservingt-----------------do _____________ . 758 • 762 • 7fj6 . 759 . 779 • 777 . 770 Slaughtering and meat packing __________ do ____ --------- • 913 .913 .909 . 903 .918 .934 .924
Tobacco manufacturest _-------------------do ____ --------- .672 .675 .678 . 679 . 691 .698 . 706 Paper and allied productst-----·-----------do _____________ .817 . 824 .829 . 834 .837 .842 .845
Paper and pulp __________________________ do. ____________ .863 . 866 .869 . 871 .875 . 879 .884 Printing, publishing, and allied industriest .do ____
1
__ ------- 1.039 I. 044 1.044 I. 049 1.059 1.072 1.075 Newspapers and periodica!s• _____________ do _____________ I. 224 1. 217 1. 216 I. 226 I. 232 1. 248 I. 248 Printing, hook and job*------------------do _____________ . 955 .973 . 970 .973 . 983 . 994 1. 001
c~~:;,~~~1~~~-~~!~~~-~~~~-~~~~t_-_:::::::::::~~:::: I::::::::: . 936 . 939 . 935 . 938 . 944 .954 . 958 I. 076 1. 087 1. 087 1.094 1. 097 1.101 1.101
Products of petroleum and coalt-----------do ____ --------- l. 153 1.162 1.159 1.163 1.174 1.174 1.181
"""""m re'"'"'- ----------------------"----~-_ ... --- I. 225 I. 237 I. 233 i. 235 I. 247 I. 242 I. 248 Rubber productst ____ ----------------------do ... _ . ----.--- 1. 070 I. 066 I. 072 I. 086 1.07.> 1.087 1.092
Rubber tires and inner tubes _____________ do ____ --------- 1. 238 1. 224 1. 240 1. 256 1. 234 I. 257 1.254 Nonmanufacturing industries, average hourly earnings
(U.S. Department of Labor):• 1. 295 1. 295 1.297 I. 296 1. 297 1. 3!0 1. 300 Building construction ________________________ dollars .. _
Mining: 1.160 1. 245 1.162 1.166 1.159 Anthracite. ___ . _____________ ----- ____ ------ __ do. ____ 1.153 1.144
Bituminous coaJ. _____________________________ do _____ 1.188 1.195 1.179 1.174 1.182 1.175 1.182 Metalliferous ____________ . ____________________ do. __ . --------- . 992 . 993 . 992 .999 1. 012 1.005 1.009 Quarrying and nonmetallic __________________ do ____ --------- . 815 . 827 .828 . 833 .848 .849 . 857
Crude petroleum and natural gas. _____________ do ____ 1.125 1.160 1.143 1.121 1.168 1.131 1.138 Public utilities: Electric light and power_ ____________________ do ____ --------- I. 078 I. 097 1. 091 1. 092 1.110 1.094 1.097
Street railways and busses ___________________ do ____ . 905 . 913 .916 . 922 . 928 .928 . 933
~:J:~~.fn~---_-_-_-_-_-_-_-_-_-_-_-_-_-_-_-_-_-_·_-_·_-_-_-_-_·_-_~------~:::~~:::: . 789 . 795 . 793 . 796 .800 .807 .804 .883 .889 .898 . 904 . 908 .907 . 900
Services: Dyeing and cleaning __________________________ do ____ --------- .685 .697 . 705 . 708 . 722 . 725 . 724 Power laundries.-----------------------------do ____ . 583 .596 . 597 . 601 .606 .620 . 617
Trade: RetaiL.--------------------------------------do ____ --------- . 685 .680 . 676 . 711 .690 . 697 . 701 Wbolesale ____________________________________ do ____ --------- • 959 . 966 .967 .966 .984 .979 . 986
Miscellaneous wage data: Construction wage rates {E. N. R.) ,,
.869 .869 .869 .870 .874 .874 Common labor _________________________ dol. per br __ 0. 890 . 877 Skilled labor ---------------------------------do ____ I. 64 1.62 1.62 1.62 1. 62 1. 63 1.63 1.64
Farm wages without board (quarterly) l 88.90 76.06 81.15 dol. per month __ ----:966' --------- --------- ---------
Railway wages (average, class !)<!) _______ dol. per hr .. .873 .936 . 944 . 950 . 943 . 939 Road-building wages, common labor:
.68 .68 United States average ________________________ do ____ . 74 . 72 .68 .65 .64 . 76
PUBLIC ASSISTANCE
Total public assistance. --------------------mil. of doL. p 80 79 78 79 79 78 78 78 Old-age assistance, and aid to dependent children and
71 71 71 71 71 the blind, totaL _____________________ mll. of doL p 72 71 71 I Old-age asBistance. _____________________ -----.do ____ p 59 .17 57 57 57 57 57 57
General relief._ .. _________ ------- ____ ---- _____ .do ____ P8 8 8 81 8 8 7 7
FINANCE
BANKING I Agricultural loans outstanding of agencies supervised
by the Farm Credit Administration: Total, excl. joint-stock land banks ________ mil. of doL. 2,058 2,423 2, 380 2,355 2, 319 2, 289 2, 260 2, 243
Farm mortgage loans, totaJ. __________________ do ____ I, 467 I, 764 1, 729 1, 706 1, 673 1, 651 1, 630 1,614 Federal land banks ___________ , ____________ do .... I, 137 1, 358 1, 332 1, 315 1, 290 1, 274 !, 2.18 1, 245 Land Bank Commissioner _________________ do ____ 330 406 397 391 383 378 372 369
Loans to cooperatives, totaL _________________ do ____ 217 245 244 227 202 175 155 146 Banks for cooperatives, including central bank
mil. of doL 213 235 238 221 197 171 152 143 A gr. Marketing Act revolving fund. _______ do ..•• 3 7 4 4 3 3 3 3
Short term credit, totaJ. _____________________ do ____ 375 414 408 422 444 462 475 482 Federal intermediate credit banksci"--------do ____ :n 36 32 32 34 36 36 35 Production credit associations ______________ do .... 192 199 201 215 233 249 260 269 Regional agricultural credit corporations ___ do ____ 12 32 29 24 22 21 21 21 Emergency crop loans ______________________ do .... 102 108 108 112 116 119 119 119 Drought relief loans ________________________ do .... 37 40 40 39 39 39 39 39
Joint-stock land banks, in liquidation __________ do •••. I 3 3 3 3 3 2 2 Bank debits, total (141 centers)t -----------------do ____ 83, lfJ8 69,090 64,961 64,061 69,026 60,212 ilO, 757 76,158
New York CitY--------------------------------do ____ 37, 678 28,936 27,031 27,592 29,644 25,297 24,708 33,563 Outside New York City _______________________ do .... 45,490 40,155 37,930 36,469 39,382 34,915 36,049 42,595
Federal Reserve banks, condition, end of month: 33,978 33,448 33,808 Assets, totaL ____________________________ mil. of doL 40,269 33,955 34,870 35,542 36,132
Reserve bank credit outstanding, totaL ..•••. do ____ 19,745 12,239 12,428 12,092 12, 571 13,800 14,759 15,272 Bills discounted ____________________________ do ____ so 5 22 34 63 118 237 13 United States securities ____________________ do .••. l 18,846 11,543 12,073 11,632 12,115 13,220 14,251 14,901
R~~~~e~er\i~~it"es·.~:::::: :=:: :::::::::::::: J~:::: I 18,687 20,096 20,101 19,866 19,736 19,546 19,362 19, 287 18,444 19, 766 19,746 19,536 19,423 19,265 19,097 19,010
P Preliminary. r Revi~rd. I Rates are for January 1, Hl45.
0.845 0.844 .839 .839 . 743 . 765 . 921 . 922 • 709 .715 .847 . 847 .886 .884
I. 072 l. 080 1. 253 1.258 . 997 I. 001 . 966 . 961
1. 114 1.106 1.199 1.179 1.265 I. 24.5 1.094 1.102 1. 256 1.2()4
1. 302 1. 323
1.194 1.179 1.199 1.190 1. 010 1.003 . 871 . 861
1.187 1.130
1.118 I.lll2 . 935 . 939 .805 . 802 .903 . 902
. 722 . 719
. 621 . 626
'· 7:)2 '·no .989 . 981
.882 .882 1.64 I. 64
89.54 . 947 . 938
. 77 . 79
78 78
71 71 58 58 7 7
2, 214 2, li2 1, 591 I, 567 1, 228 I, 211
363 357 143 135
140 132 3 3
481 469 3.) 32
269 2G3 20 20
118 116 38 38 2 2
66,062 62,497 28,474 2n,165 37,!i88 36, 332
35, 815 36,678 15,325 16,201
37 95 14,915 15,806 19,104 19,028 18,823 18,759
Fl'bruary 1945
0.847 . 850 . 764 .921 . 724 . 858
r, 891 1.101 1. 265 1.030 .966
1.119 'I. 202
I. 268 1. 117 1. 273
1. 339
1.187 I 1. 213 1. OlR I
.871 1.172
1.120 . 912 . 812 .921
r. 736 .637
'. 736 . 994
.883 1. 64
. 955
. 80
78
71 58 7
2.124 I, 544 1,194
351 135
1321
44~ 1 30
246 19
112 38
2 63,625 26,860
0. 857 0. 859 . 849 . 85.) . 790 . 77:3 . 930 .9:l:l . 728 . 736
'· 862 . 863 '· 901 . 899 I. 102 1.105 I. 262 I. 273
'1.037 I.O:lG . 9."in 1 • 9!)7
1. 117 I 1.121 I.HlO I. 187
r 1. 2;"iS 1 I. 254 I. 108 1. 107 1. 203 ]. 2f,9
I. 343 ].:319
1.197 I l.lf,r, J.Hll I LIG-1
' I. 014 I. 014 . 880 .Ri2
1.156 1.146
r 1. 12i 1.120 ~. 945 .946 . 809 . 809
r. 92S .928
'· 74-t .744 . ti41 . ti41
'· 741 . 7:l6 I. 008 . 996
. 8b6 . 886 l. 64 l. 1}4
86.80 ~--------. 902 • 9.59
. 79 I
79
71
"~ I
I I
2,105 I. 518 1.175
34~l 176
172 :J
4121 28 221
18 107 38 2
r 66, 867 28,.558
. 78
79
r 72 .\8
7
2, 079 I, 490 I, !55
3:36 207
20:l ;j
382 28
198 15
104 :37
36, 765 I ' 38, 309
2 70,328 30,0H) 40, :ll2
37, 492 17, 113
49 16,653 18,915 1 18,647
38,700 18,32.1
:l45 ' 17,6471 18, &02 18, 552
39, 8:J4 19, :)57
47:3 18, :)88 18, i'i"O 18,.\28
$Wage increases which became effective December 1943 (retroactive to February or April 1943) and January 1944 are not fully reflected in the figures until March' 1944. The figures do not include accruals of back pay.
1Rates as of January 1: Construction-common labor, 0.891; skilled labor, $U\4. ci'F:xclud<'s lofins to other Farm Credit Administration ageneirs. • New series. Data on hourly earnings beginning August 1942 for the newspapers and periodicals and printing, book and job, industries and beginning March 1942 for the non
manufacturing industries, except the telephone and telegraph industries, are available, respectively, in the November 1943 and May 1943 issues; figures beginning 1937 for the telephone industry, which are ~hown on a revised basis beginning in the December 1944 issue, and data back to 1939 for other series. except the telegraph industry, will be published later; data for the telegraph mdustry arc avmlable only from June 1943 (for data he~mnmg that month seep. S-14 of the January 19·!5 issue).
tRevised series. See note marked "t" on p. S-13 in regard to the series on hourly earnings in manufacturing industries. Bank debits have been revised beginning May 1942 to include additional banks in the 141 centers; seep. S-15 of the September 1943 Survey for revised figures beginning that month and note marked "t" on p. S-15 of the Jui~- 1944 Survey for monthly averages for 1942 on the new basis.
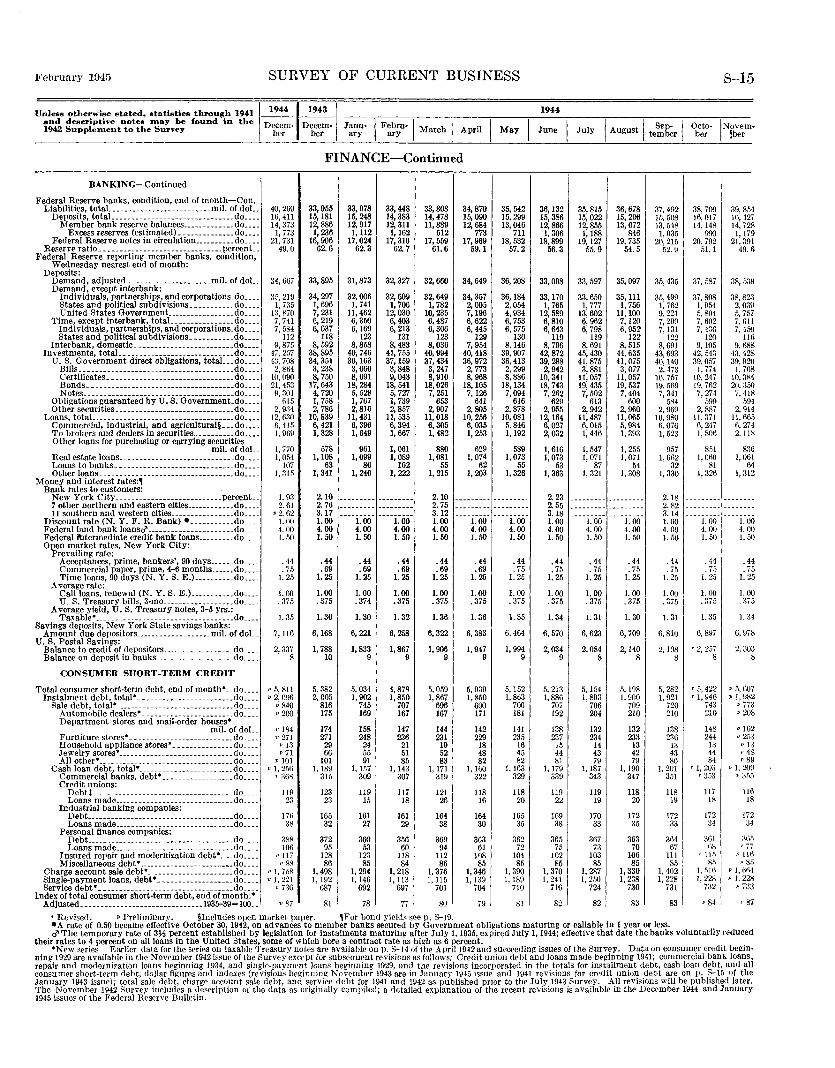
February 1D45 SURVEY OF CURRENT BUSINESS S-15
1944 Unless otherwise stated, statistics through 1941 and descriptive notes may be found in the 1942 Supplement to the Survey
1
1944119431 Decem-- Decem- Janu- I Febru-1 March I Ap il
ber ber ary ary r I May I June I July I August I te~~r I 0~Jt INlbe~m-
FINANCE-Continued
BANKING-Continued
Federal Reserve banks, condition, end of month-Con. Liabilities, totaL. ________________________ mil. of doL 40,269 33,955 33,978 33,448 33,808 34,870
Deposits, totaL ...... __ ._ .. _. ____ ....•.•.••.. do .... 16,411 15,181 15, 248 14,383 14,478 15,090 Member bank reserve balances ____________ .do ..•. 14,373 12,886 12, 917 12, 311 11,889 12, 684
Excess reserves (estimated) ______________ do •.•. 1, 773 1, 236 1,112 1,162 512 773 Federal Reserve notes in circulation __________ do ..•. 21,731 16,906 17,024 17,316 17,559 17,969
Reserve ratio_ .• ----------------------------Percent__ 49.0 62.6 62.3 62.7 61.6 59.1 Federal Reserve reporting member banks, condition,
Wednesday nearest end of month: Deposits:
Demand, adjusted _____________________ mil. of doL Demand, except interbank:
34,667 33,895 31,873 32,327 32,660 34,649
Individuals, partnerships, and corporations. do ____ 35,219 34,297 32,006 32,609 32,649 34,357 States and political subdivisions ___________ do ____ 1, 7a5 1, 696 1, 741 1, 706 1, 782 2, 005 United States Government _________________ do ____ 1:l, 870 7, 231 11,462 12,030 10,235 7,196
Time, except interbank, totaL _______________ do ____ 7, 741 6,219 6,350 6,403 6,487 6, 622 Individuals, partnerships, and corporations.do ____ 7, 584 6,037 6,169 6, 213 6,306 6, 445 States and political subdivisions ___________ do ____ 112 118 123 131 123 129
Interbank, domestic_ -----------------------.do ____ 9, 875 8, 592 8,858 8, 483 8,036 7,954 Investments, totaL _______ --------- ____________ do ____ 47, 257 38,895 40,746 41,755 40,994 40,418
U. S. Government direct obligations, totaL.do ____ 43,708 34, 351 36, 163 37, 159 37,434 36,972 Bills _________ -----------------------------.do ____ 2, 864 3, 238 3,660 3,848 3, 247 2, 773 Certificates ____________________ • ___________ do ____ 10,090 8, 750 8,691 9,043 8, 910 8, 968 Bonds ______ , ___ . ______ • _____ • _____________ do ____ 21,4.13 17,643 18,284 18,541 18,026 18, 105 Notes _________________ • ____________________ do ____ 9, 301 4, 720 5, 528 5, 727 7, 251 7,126
Obligations guaranteed by U.S. Government_do ____ 615 1, 758 1, 767 1, 739 653 641 Other securities. ___________ ------ __ ------ ____ do ____ 2, 9:l4 2, 786 2,816 2,857 2,907 2,805
Loans, totaL _____________ ------- ______________ do ____ 12,630 10,839 11,431 11,535 11, 018 10,256 Commercial, industrial, and agricultural§ ___ do ____ 6, 415 6, 421 6, 396 6, 394 6,305 6,035 To brokers and dealers in securities __________ do ____ 1, Q69 1, 328 1, 649 1, 667 1,482 1, 253 Other loans for purchasing or carrying securities
mil. of doL 1, 770 578 961 1, 061 880 629 Real estate loans _____________________________ do ____ 1, 054 1,108 1,099 1,089 1, 081 1,074 Loans to banks_ -----------------------------do ____ 107 63 86 102 55 62 Other loans __ --------------------------------do ____
Money and interest rates:, I, 315 1, 341 1, 240 1, 222 1, 215 1, 203
Bank rates to customers: New York City ___________________________ percent __ 1. 93 2.10 -------·- ----~----
2.10 ---------7 other northern and eastern cities ____________ do ____ 2. 61 2. 76 --------- --------- 2. 75 ---------11 southern and western cities ________________ do ____ p 2. 62 3.17 --·-i:oo- --------- 3.12 ---------Discount rate (N.Y. F. R. Bank) •-----------do ____ 1.00 1.00 1.00 1.00 1.00 Federal land bank loansci'---------------------_do ____ 4. ()() 4.00 4.00 4.00 4.00 4.00 Federallhtermediate credit bank loans ________ _cto ____ !.50 1.50 1.50 1. 50 1.50 1.50 Open market rates, New York City:
Prevailing rate: Acceptances, prime, bankers', 90 days ______ do ____ . 44 .44 .44 .44 .44 .44 Commercial paper, prime, 4-6 months ______ do ____ . 75 .69 .69 .69 .69 .69 Time loans, 90 days (N.Y. S. E.) __________ do ____ I. 25 1.25 I. ~5 1.25 1. 25 1.25
Average rate: Call loans, renewal (N.Y. S. E.) ___________ do ____ 1.00 1.00 1.00 1.00 1.00 1.00 U.S. Treasury bills, 3-mo __________________ do ____ . 375 .375 .374 .375 .375 .375
Average yield, U.S. Treasury notes, 3-5 yrs.: Taxable• ________________________ - ___ . ______ do ____ 1.35 1.30 1.30 I. 32 1. 36 1.36 Savings deposits, New York State savings banks:
Amount due depositors ___________________ mll. of doL 7,116 6,168 6, 221 6, 258 6,322 6, 383 U. S. Postal Savings:
Balance to credit of depositors __________________ do ____ 2, 3~7 1, 788 1,833 1,867 1, 906 1,947 Balance on deposit in banks ____________________ do .. __ 8 lO 9 9 9 9
CONSUMER SHORT-TERM CREDIT
Total consumer short-term debt, end of month • __ do ____ p 5, 811 5, 382 5, 034 4,878 5,059 5, 039 Instalment debt, total• ________________________ do ____ p 2, 096 2, 005 1, 902 1, 850 1,867 1,850
Sale debt, total• ____________ -------------- ____ do ____ p 840 816 745 707 696 690 Automobile dealers• _______________________ do ____ p 200 175 169 167 167 171 Department stores and mail-order houses•
mil. of doL p 184 174 158 147 144 142 Furniture stores• _____________ ------- ______ do ____ p 271 271 248 236 231 229 Household appliance stores• _______________ do ____ J!};) 29 24 21 19 18 Jewelry stores• _____________________________ do ____ p 71 66 55 51 52 48 All other• ____ . --------------------------- .. do ____ p 101 101 91 85 83 82
Cash loan debt, total• ________________________ do ____ PI, 256 1, 189 1, 107 1, 143 1, 171 1,160 Commercial banks, debt• __________________ do ____ p 368 315 309 307 319 322 Credit unions: Debtt. __________ . _______ . ________________ do ____ 119 123 119 117 121 118 Loans made. _____________________________ do ____ 23 23 15 18 26 16 Industrial banking companies: Debt _____________________________________ do ____ 17fi 165 161 161 164 164 Loans made ______________________________ do ____ 38 32 27 29 38 30 Personal finance companies:
Debt ______ ---------------------- _________ do __ ._ 388 372 360 356 369 363 Loans made ______________________________ do ____ 106 95 53 60 94 61 Insured repair and modernization debt* ... do ____ p J17 128 123 118 112 1'l8 Miscellaneous debt• ____________________ .. ___ do ____ p 88 86 85 84 86 85
Charge account sale debt• ______________________ do ____ p 1. 758 1, 498 1, 294 1, 218 1,376 I, 346 Single-payment loans, debt• ___________________ do ____ vI, 221 1,192 1,146 1, 113 !, 115 I, 139 Service debt• _ ------------ _____ ---- ___________ _do ____ p 736 687 692 697 701 704
Index of total consumer short-term debt, end of month:* Adjusted. ________ .. ____________________ 1935-39= 100 __ p 87 81 78 77 ~0 79
'Revised. • Preliminary. §Includes open market paper. ,For bond yields seep, S-!9.
35,542 36,132 35,815 36,6781 15,299 15,386 15,022 15,206 13,046 12,866 12,855 13,072
711 1, 306 1,188 846 18,532 18,899 19, 127 19,735
57.2 56.3 55.9 54.5
36,208 33,008 33,597 35,097
36,184 33,170 33,650 35, 111 2,054 1, 765 1, 777 1, 756 4, 934 12, 589 13,602 11, 100 6, 753 6,810 6, 962 7,120 6, 575 6,643 6, 798 6, 952
130 119 119 122 8,146 8, 796 8,691 8, 515
39,907 42,872 45,430 44,635 36,413 39,288 41,875 41,075
2, 299 2,942 3,881 3, 077 8,886 10,341 11,057 11,057
18,134 18,743 19,435 19,537 7,094 7, 262 7,502 7,404
616 629 613 600 2,878 2,955 2, 942 2,960
10,081 12, 164 11,487 11,065 .1,846 6,027 6,015 5, 984 1,192 2,032 1, 446 1, 393
589 1, 616 1,547 1, 255 1,073 I, 073 1,071 1,071
55 53 87 54 1,326 1,363 1, 321 1, 308
--------· 2. 23 --------- ------------------ 2.55 --------- ------------------ 3.18 --------- ---------
1.00 1.00 1.00 1.00 4.00 4.00 4.00 4.00 1.50 I. 50 1. 50 I. 50
.44 .44 • 44 .44
. 75 . 75 . 75 . 75 1. 25 1. 25 1. 25 1. 25
1.00 1.00 1.00 1.00 .375 .375 . 375 . 375
1. 35 1. 34 1. 31 1. 30
6,464 6, 570 6,623 6, 709
1, 994 2,034 2,084 2,140 9 9 8 8
5,152 5, 213 5,154 5,198 1, 86:3 1, 886 1,893 I, 900
700 707 706 709 181 192 204 210
141 138 132 132 235 237 234 233
16 15 14 13 45 44 43 42 82 81 79 79
1,163 1,179 1,187 1,190 329 339 343 347
118 ll9 Jl9 118 20 22 19 20
165 169 170 172 35 38 33 35
362 365 367 363 72 75 73 70
104 102 103 106 85 85 85 85
1, 390 1, 370 1, 287 1,330 I, 189 I, 241 I I, 250 1, 238
710 7161 724 730
81 82 82 83
37, 492 38, 700 15,508 16,017 13, 548 14,148 1, 035 990
20,215 20,792 52.9 51.1
35,435 37, 587
35,499 37,808 1, 762 1, 954 9, 221 5, 804 7, 299 7, 602 7,131 7, 4:36
122 120 8, 691 9,105
43,693 42,543 40,140 39,057 2, 473 I, 774
10, 757 10, 247 19,569 19, 762 7, 341 7, 274
584 599 2, 969 2,887
10,980 11, 371 6,076 6, 247 1, 523 1, 806
957 851 1, 062 1, OliO
32 81 1, 330 I, 326
2.18 ---------2.82 ---------3.14 ---------I. 00 1. 00 4. 00 4. 00 1. 50 1. 50
.44 . 44
. 75 . 75 I. 25 1. 25
1. 00 1. 00 . 375 . 375
l. 31 1.35
6,810 6, sg7
2,198 r 2, 257 8 8
5, 282 '5,422 1, 921 r 1, 946
720 743 210 210
138 148 236 244
13 13 43 44 80 84
1, 201 '1, 20:J 351 '353
118 117 19 18
172 172 33 34
364 361 67 68
111 '115 85 85
1, 402 1, 516 1, 228 1, 228
731 732
83 p 84
39,85 4 7 8 9 I 6
Ill, 42 14,72
I, 17 21,39
49.
38,53
38,82: 2,03' 5, 751 7. f>l 7. 45(
1 J 6 8 8
II 9,68
43,42 39,9 I. 7!i 10,3~ 20. :J5(
20 8 4 )
8 4 4 ,
7, 41 59
2, 91 11, 66. !\, 27 2, II
83
4 ~
1,06 6 I 4 2
6 I, 31
---------------------
I. 4. (
00 JO 50 1.<
. 4 4 , . 7, 1.2 5
1. 00 5 . :~7
1.3
6, ~7 8
l 8
2, 30:
v 5, flO 7 2 3 8
• I, 98 p 7i' p 20
p 16' p 25: l
3 8 9 J
pI' P4 P8
p 1, 20f '' :35r
II 1 6 8
17( 34
:lG' T 77
vI If ) 5 4 s 3
,, g, p 1,61) p J, 22
,, 7:3'
P8
• A rate of 0.50 became effective October 30, 1942, on advances to member banks secured by Government obligations maturing or callable in I year or less. . ci' The temporary rate of 3H percent established by legislation for instalments maturing after July 1, 1935, expired July 1, 1944; effective that date the banks voluntarily reduced
their rates to 4 percent on all loans in the United States, some of which bore a contract rate as high as 6 percent. . . •New series Earlier <lata for the series on taxable Treasury notes are av•ilable on p. S-14 of the Apri11942 and succeeding issues of tbe Survey. Data on consumer credit begm
ning 1929 are availahle in the November 1942 issue of the Survey except for subsequent revisions as follows: Credit union debt and loans made beginning 1941; commercial bank loans, repair and modernization loans beginning 1934, and single-payment loans beginning 1929, and the revisions incorporated in the totals for installment debt, cash loan debt, and all consumer short-term debt, dollar figures and indexes (revisions beginning November 1943 are in January 1945 issue and 1941 revisions for credit union debt are on p. S-15 of the January 1943 issue); total sale debt, charge account sale debt, and service debt for 1941 and 1942 as published prior to the July 1943 Survey. All revisions will be published later. The November 1942 Survey includes a rlescription of the data as originally compiled; a detailed explanation of the recent revisions is available in the December 1944 and January 1945 issues of the Federal Reserve Bulletin.
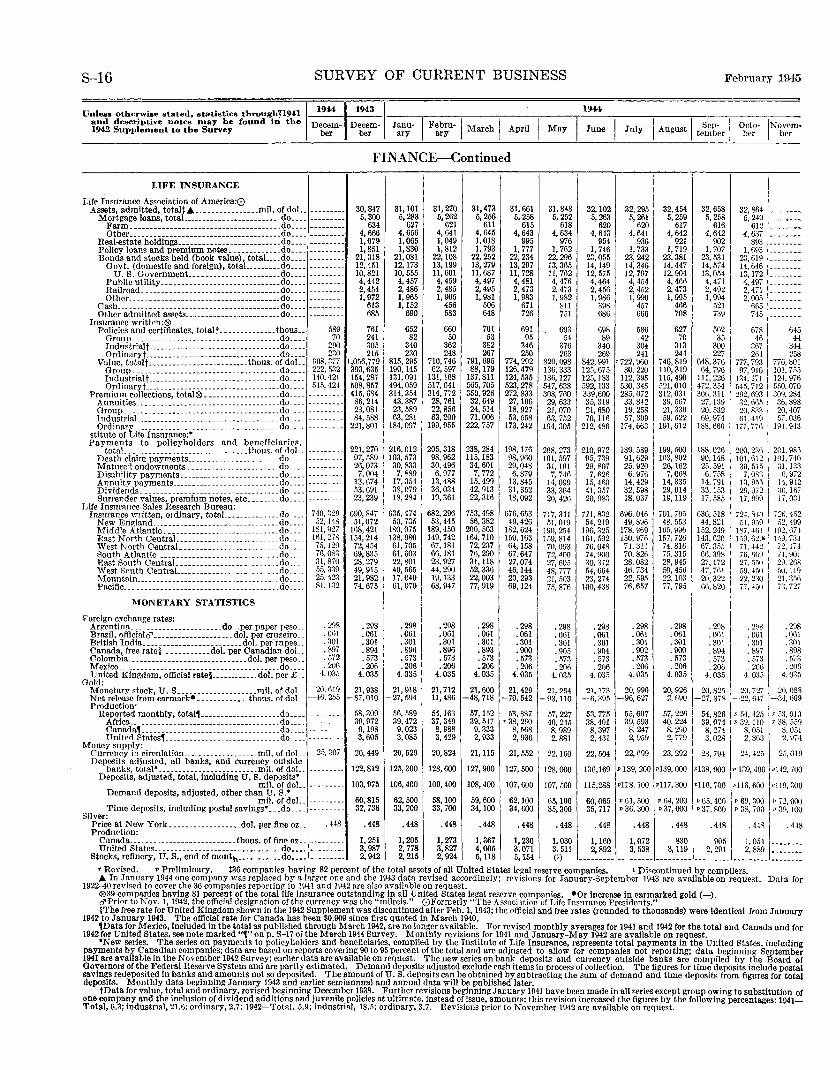
S-16 SURVEY OF CURRENT BUSINESS
Unless otherwise stated, statisties through~l941 ~~~~~ and descriptive notes Jnay be found in the Decem- Decem- Janu- ] Febru·l I · 1942 Supplement to the Survey ber ber ary ary March April
FINANCE-Continued
LIFE INSURANCE
31,661 I Life Insurance Association of America:0 Assets, admitted, totalt .._ ________________ mil. of doL --------- 30,847 31,101 31,270 31,473 31,848
Mortgage loans, total. ________________________ do ____ 5, 300 5,283 5,262 5,256 5,258 5, 252 Farm. ________ ----- _______________ ------ __ .do ____ 634 627 621 611 615 618 Other ______________________ ----------- ____ .do. ___ --------- 4, 666 4,656 4, 641 4, 645 4,643 4, 634
Real-estate holdings .. _______ ••.••• ---------- .do .. __ --------- 1,071.1 1,065 1,049 1, 018 995 976 Policy loans and premium notes _____________ do. ___ 1, 851 1,830 1, 812 1, 793 1, 777 1, 762 Bonds and stocks held (book value), totaL .. do ____ 21,318 21,081 22, 108 22,252 22,234 22,296
Oovt. (domestic and foreign), totaL _______ do ____ 12,451 12, 173 13, 199 13,279 13, 297 13,365 U.S. Oovernment _______________________ do .... 10,821 10, 555 11,601 11,687 11,728 11, 762
A~R~~a~~i!~~~ ~ ~: :::::::::::::::::::::::::: :~g:: :: --------- 4,442 4,457 4, 459 4,497 4, 481 4, 476 2,454 2, 486 2, 485 2, 495 2,473 2, 473
Other ______ • _______ • ____________ •• _____ ...• do. ___ --------- !, 972 1, 965 1, 965 1, 981 1, 983 1,982 Cash ______________ • _________________ • _______ _cto ____ --------- 613 1, 152 456 506 671 811 Other admitted assets ________________________ do ____ --------- 685 690 583 648 726 ' 751
Insurance written:® 589 761 652 660 701 691 693 Policies and certificates, totalf ______________ thous ..
~i~!~:;~!~::::::::::::::::::::::::::::::::~t::: 70 241 82 50 53 95 54
290 305 340 362 382 346 376 2.'l0 215 230 248 267 250 263
Value, totalf-------------------------thous. of doL gos, 377 1,056,779 815, 295 710,746 791,695 774,292 820,098
~~iY!t;it~::::::::::::::::::::::::::::::::i~:::: 222,532 393,635 190, 145 62,597 88,179 126,479 136,333 140,421 154,287 131,091 131,108 137,811 124,535 136,127 545,424 508,857 494,059 517,0H 565,705 523,278 547,638
Premium co!lections, total0-------------------do ____ 415,684 314,354 314,772 350,926 272.833 308,760 Annuities_. ____________ ._ .. _______ ._ .. ___ . __ .do_._. 86,214 43,387 28,761 32,649 27, 106 29, 633 Group _______ ------------- ___________________ do ____ --------- 23.081 I 23, 589 22,856 24,514 18,927 21,070 IndustriaL .. ---------------------- ______ ._. _do .. ___ 84,588 63,281 63,200 71,006 53,558 63, 752 Ordinary _____________ ------- _____ .------ _____ do ___ . --------- 221,801 184,097 199,955 222, 757 173,242 194,305
stitute of Life Insurance:• Payments to policyholders and beneficiaries,
238,284 totaL ______________________________ thous. of doL --------- 221,270 216,012 205, 318 198,176 208,273 Death ciRim payments _______________________ do ____ ____ M ____ 97,589 103,5731 98,962 115, 183 98,960 101, 597 Matured endowments __ • _________ .----- _____ do ____ 26,073 30,833 30,496 34,601 29,048 31,101 Disability payments _________ . __ . ____________ do ____ --------- 7,004 7, 889 6, 977 7, 772 6,879 7, 746
JS7~ct~;d~~:rn~~t_s_-~::::::::::::::::::::::::: ~~:::: 13, 674 17,3M 13,488 15,499 13,845 14,099 53,691 38,079 36,034 42,913 31, 352 33, 304
Surrender values, premium notes, etc ________ do ____ 23,239 18,284 19,361 22,316 18,092 20,426 Life Insnrance Sales Research Bureau:
740, 329 635,474 682,296 753,498 676,653 Insnrance written, ordinary, totaL ____________ do ___ 690,847 717,311 New Eng!and ________________________________ do ____ 52, 14S 51,072 50,735 53,445 56,382 49,426 .11, 019 Middle Atlantic. __ ------------ ___ ------- ____ do __ .. 181, 927 168,421 180,975 189,450 200,503 182,624 190, 254 East North CentraL ________________________ do ____ 161, 278 154,214 138,980 149,742 164,710 150, 163 1.59, 814 West North CentraL--------- _______________ do ____ 75, 129 72,454 61, 705 67,181 72,237 64,158 70,093 South Atlantic ------------------------------do ____ 76,083 69,835 61,603 66, 181 76,290 67,647 72,400 East South CentraL-----------------· _______ do ____ 31,870 28,279 22,801 23,927 31,118 27,074 27, 605 West South CeutraL _________________________ do ____ 55,3:19 49,915 40,565 I 44,290 ,;2, 336 46,144 48, 777 Monntain _____________________________________ do ____ 25, 42:l 21,982 17,040 19, 133 22,003 20, 293 2I,m3 Pacific ____________ -------------- _____________ do ____ ~1. J:\2 74,675 61,070 68,947 77,919 69,124 7fi, 876
MONETARY STATISTICS
Foreign exchange rates: . 298 . 298
i Ar!(entina ___ . ___________________ do .per paper peso __ . 298 . 298 .298 '2981 • 298
Brazil, offic!alci' ____________________ dol. per cruzeiro __ .1161 .061 .061 .061 .061 .061 .061 British India _________________________ dol. per-rupee __ -:]OJ .301 .301 .301 . 301 .301 '301 Canada, free rato§ ___________ dol. per Canadian dol__ .897 .894 . 896 .896 .893 .ooo I . 90.1 Co!ombia ______________________________ dol. per peso_ .. .m2 . 573 .573 .573 .573 .573 . -573 Mexico _. _______________ ----- ______ ------ _____ .do. ___ . 20fi .206 .206 .206 .206
.2061 .206 United Kingdom, official rate§ ____________ dol. per£ 4. 035 4.035 4.035 4.035 4.035 4. 035 4. 035 Oold:
Monetary stock, U.S_ -------------------mil. of doL 20. f>19 21,938 21,918 21,712 21,600 21, 429 21, 264 Net release from earmark• _____________ thous. of doL ---46. 255 -87,010 -27,594 11,486 -48,718 -70, 542 -93, 110 Production:
53, AA7 I Reported monthly, tota11------------------- do ____ --------- 58,309 56, 589 54,163 57,152 57,227 Africa ________________________ ------- _____ •. do ___ --------- 39,972 39,472 37,349 39,547 • 38, 2cO [ 40, 245 Canada, ________ ._--------- ________________ do ____ --------- 9,198 9,023 8, 988 9. 333 8,1)68 8, 989 United States, ____ ---------------- _________ do ____ -------·-· 3,605 3,085 3, 429 2, 933 2, 936 I 2, 881
Money supply: Currency in clrculation ___________________ m!l. of doL_ 25,307 20,449 20,529 20,824 21, 115 21,552 22,160 Deposits adjusted, ali banks, and currency outside
122,812 125,300 128,600 127,900 127,500 banks, total* ___________ ----------- ___ mil. of doL --------- 128,000 Deposits, adjusted, total, including U.S. deposits•
103,975 106, 400 109,400 108,400 I 107,600 mil. of doL --------- 107, 500 Demand deposits, adjusted, other than U. s.•
60,815 62,500 58,100 59,600 62, 100 65, 100 mil. of doL ---------Time deposits, including postal savings• ... do ____ --------- 32,736 33,200 33,700 34,100 34, GOO 35,300
Silver: Price at New York __________________ dol. per fine oz._ • 448 .448 .448 .448 .448 .448 .448 Production:
B~!:'e~asiaie1!.~~~--~--~~------~~~--~~~--~~~~~~~-~f-~~Jo~~=::::::::::: 1, 251 1,205 1, 273 1,367 1. 230 I 1,030 3, 987 2, 778 3,827 4,005 3,071 3, 511 2,942 2, 215 2,924 5,118 5,154 (1) Stocks, refinery, U.S., end of mont ___________ do •.•• ---------h
I
1944
32,102 32,295 32,454 5, 263 5, 261 5, 259
620 620 617 4, 643 4,641 4,642
954 936 921 1, 746 1, 733 1, 719
23,055 23, 242 23,381 14,149 14, 346 14,447 12, 575 12,797 12,904 4,464 4,454 4,466 2,456 2,452 2,473 !, 986 1,990 1, 995
398 457 466 686 666 708
698 586 627 89 42 70
340 304 313 269 241 244
842,991 •i22, 960 746,819 125, 675 80,220 110, 319 125,183 112,395 115,490 592, 133 530,345 521,010 339,600 285,072 312,031 35,319 33.8-12 39, 567 21,680 19,258 21,330 70,116 57, 309 59.522
212,486 174,663 191,612
210,972 !89, 589 199,500 95,739 91,629 103,802 29,807 25,920 26, 162 7,~26 6, 976 7,06R
15,460 14,429 14, 335 41,357 32,598 29,014 20,983 18,037 19,119
701, 70.? 771, 832 696, 046 54,219 49,896 48, 553
196,325 178, 969 165, 996 161,592 150, 976 157, 726 76,048 71, 311 74,816 74,900 70,826 75,315 31), 372 28,082 28, 945 54,664 46, 734 50, 456 23, 274 22,595 22, wa
100, 4:l8 76,657 77, 795
• 298 . 298 . 298 .061 .061 .061 . 301 .301 . 301 . 904 .902 .900 . 573 . 573 . 573 . 206 . 206 . 206
4. 035 4. 035 4. 035
21,173 20,996 20,926 -6,395 -96,627 2, 690
53, 775 55,607 57,226 38,401 39,593 40,224 8,397 8, 247 8. 290 2, 431 2, 959 2, 779
22,504 22,699 23,292
136,169 p 139, 200 •139, 000
115,288 •118, 100 •117, 300
60,065 p 61,500 p 64, zoo 35,717 p 36,300 p 37,000
.448 .448 .4481
1,160 1, 072 830 2,892 3, 538 3,119
I
February 1945
32,658 5, 258
616 4, 642
902 1, 707
23,531 14,574 13,054 4,471 2, 492 1, 994
521 739
562 35
300 227
648,376 64,796
111, 226 472,354 306, 311
27, 139 20,532 69,974
188,666
188,026 90,148 25,591 6, 758
14, 791 33, 153 17,585
636,518 44,821
152,249 143,620 67, 35.\ 66, 39S 27, 172 47, 7!\l 20,322 66,820
. 298
.061
.301
. 894
. 573
. 206 4.035
20,825 -27,378
54,826 39,074 8, 274 3,028
2:J, 79,!
P!38, 900
Pll(), 700
p 65,400 p 37,800
. 448
905 2, 291
32, 8R4 5, 249
612 4, 637
89:3 I, 693
23,619 14,646 13,172 4, 497 2, 471 2,00ii
li65 745
678 46
367 264
777, 793 97,910
134, Iii 545,712 292,693 32,665 2o,o:n 61, 419
177,776
200,236 101,612 30, 515 7, 083
1~, 9.j3 29,072 li, !199
72-1. Slfl 51,959
187,461 1-19. 629i 71.442 76, 669 2i .. 550 .50, 450 22,2311 77, 450
. 2~~s
. 001
. 301
. 897
.5n
. 206 4. 035
20,727 -22,647
p 54, 42.:') p 39,110
8,0.\1 2, 863
24. 425
p 139, 400
____ .,. ___ .................. ------------------------------------------------------------------------------------------------
645 44
344 258
776,801 101, 7.o,5 124, 976 550, 070 309,284 36,898 20,407 57,036
19~. 943
201, 98.) lO!,HO ~H.l33 6, 972
14,942 ;JI), 167 li, 031
720, 4.5_ 52, 499
1?2, 674 1'>9. i:J4
72, 174 74,901 29. 2fl8 50,119 21,356 j:~, 727
. 298
. 061
. 301
.89
. 57. 8 3 6 . 20
4. 03
20, fl8 -3-1,66
p .1:1, 91 p 38, 55
0 9 1 4
8, 0.1 2, fl7
25,01
P142, 7
•116,600 1•119,30
p 69, 300 p 72, " 38, 1oo I Jl 3~), 1
00
0
000 00
.448 I .4!
I 1,054 , _______
2, 889 1---------------- --------- --------- --------- --------- -------
, Revised. • Preliminary. t36 companies having 82 percent of the total assets of all United States !ega! reserve companies. 1 Discontinued by compilers. A In January 1944 one company was replaced by a larger one and the 1943 data revised accordingly; revisions for January-September 1943 are available on request. Data for
1922-40 revised to cover the 36 companies reporting in 1941 and 1942 are also available on request. 039 companies having 81 percent of the total life insurance outstanding In ali United States legal reserve companies. •or increase in earmarked gold(-). ci'Prior to Nov. 1, 1942, the official designation of the currency was the "mi!reis." 0Former!y "The Association of Life Insurance Presidents." §The free rate for United Kingdom shown in the 1942 Supplement was discontinued after Feb. 1, 1943; the official and free rates (rounded to thousands) were Identical from January
1942 to January 1943. The official rate for Canada has been $0.909 since first quoted in March 1940. ,Data for Mexico, Included in the total as published through March 1942, are no longer available. For revised monthly averages for 1941 and 1942 for the total and Canada and for
1942 for United States, see note marked "1" on p. S-17 of the March 1944 Survey. Monthly revisions for 1941 and January-May 1942 are available on request. *New series. The series ou payments to policyholders and beneficiaries, compiled by the Institute of IAfe Insurance, represents total payments in the United States, including
payments by Canadian companies; data are based on reports covering 90 to 95 percent of the total and are adjusted to aliow for companies not reporting; data beginning September 1941 are available in the November 1942 Survey; earller data are available on request. The new series on bank deposits and currency outside banks are compiled by the Board of Governors of the Federal Reserve System and are partly estimated. Demand deposits adjusted exclude cash items in process of collection. The figures for time deposits include postal savings redeposited in banks and amounts not so deposited. The amount of U. S. deposits can be obtained by subtracting the sum of demand and time deposits from figures for total deposits. Monthly data beginn!n~: January 1943 and earlier semiannual and annual data will be published later.
tData for value, total and ordinary, revised beginning December 1938. Further revisions beginning January 1941 have been made in all series except group owing to substitution or one company and the inclusion of dividend additions and juvenile policies at ultimate, instead of issue, amounts; tbis revision increas~d the figures by the following percentages: 1941-Total, 6.3; industrial, 21.6; ordinary, 2.7; 1942-Total, 5.9; industrial, 18.1i; ordinary, 3.7. Revisions prior to November 1942 are available on request.
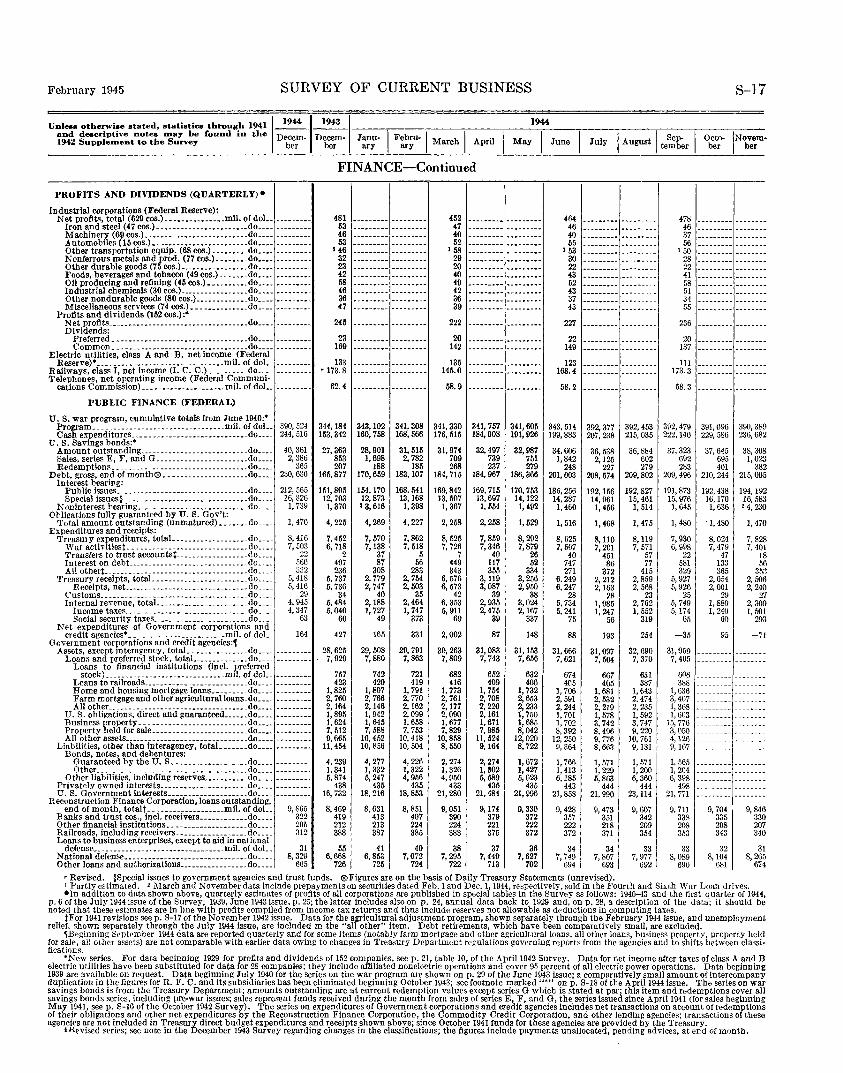
February 1945 SURVEY OF CURRENT BUSINESS S-17
Unless otherwise stated, statistics through 1941
1
1944!1943 I 1944 and descriptive notes n1ay be found in the Decem- Decem- Janu- I Febru- I I I I I I August I te::b~r I Octo- JNovem· 1942 Supplement to the Survey ber ber ary ary March April May June July ber ber
FINANCE-Continued
PROFITS AND DIVIDENDS (QUARTERLY) •
Industrial corporations (Federal Reserve): Net profits, total (629 cos.) ••••.•.•.•.•.•. mll. of doL ~--·----- 481 --------- --------- 452 --------- --------- 464 --------- --------- 478 --------- --------
Iron and steel (47 cos.) •.•.•••••.•.•.•••••.•.• do •••• 53 --------- --------- 47 --------- --------- 46 --------- --------- 46 --------- --------Machinery (69 cos.) •.•.•.•.•••.•.•.•.•.•.•.•. do •.•• 46 --------- --------- 40 --------- --·------ 40 --------- -----·--- 37 --------- --------Automobiles (15 cos.). ---·-·····-------·---·-do •••• 53 --------- --------- 52 --------- .................. 55 --------- --------- 56 --------- --------Other transportation equip. (68 cos.) .•.•.•.•. do •.•. 146 --------- --------- I 58 --------- -------·- I 53 ----·---- -- ... --. ~ -- 150 --------- --------Nonferrous metals and prod. (77cos.) ..•.•••. do •.•. 32 --------- --------- 29 --------- ·-------- 30 --------- --------- 28 --------- --------Other durable goods (75 cos.) ...•.•.•.•...•.•. do •.•. 23 --------- --------- 20 --------- --------- 22 --------- --------- 22 --------- --------Foods, beverages and tobacco (49cos.) .•..••. do •.•• 42 --------- --------- 40 --------- --------- 43 --------- ------- 41 --------- --------Oil producing and refining (45 cos.) __________ do •.•. 58 --------- --------- 49 --------- ..................... 52 --------- -------· 58 --------- --------Industrial chemicals (30 cos.) .....•.•.•.•.•.•. do .••. 46 --------- --------- 42 --------- --------- 43 --------- ------- 51 --------- --------Other nondurable ~oods (80 cos.) .•••.•.•.•.•. do .... --------- 36 --------- --------- 36 --------- --------- 37 --------- ------·- 34 --------- --------Miscellaneous serv1ces (74 cos.) •...•••.•.•.•. do ____ 47 --------- --------- 39 --------- --------- 43 --------- --------- 55 --------- -- ~-- ~--
Profits and dividends (162 cos.) :• Net profits .....•.•.•...•...•.•.•...•.•.••..•. do .••. --------- 245 --------- --------- 222 --------- ----·---- 227 . -- ~-- --- --------- 236 --------- --------Dividends:
Preferred_ •..•... --------.- •.•.•.•...• -..•. do •••• -----·--- 23 --~------ --------- 20 -------·- --------- 22
-~------- --------- 20 --------- --------Common._. -·---·-----·---·-·-·-·--··-·---do •... --------- 169 -------·- ----·--·- 142 --------- .,. ________ 149 --------- ------ ~ -- 137 --------- --------
Electric utilities, class A and B, net Income (Federal Reserve)• -----··-------------·- __________ mil. of doL. --------- 133 --------- -------·- 135 --------- --------- 123 --------- --------- 111 --------- --------
Railways, class I, net Income (I. C. C.) ......... _do .... '173.8 --------- -~---- --- 146.0 --------- --------- 168.4 --------- --------- 173.3 --------- --------Telephones, net operating income (Federal Communi·
cations Commission) --··-···-·-·-···-···-mil. of doL 62.4 --------- --------- 58.9 --------- --------- 58.2 --------- --------- 58.3 --------- --------PUBLIC FINANCE (FEDERAL)
U. S. war program, cumulative totals from June 1940:•
~~f:~vendftilies.-_-_-~:::::::::::::::::::~~:-~~~~~:: 390,524 344, 184 343,102 341,308 341,330 341, 757 341,605 343, 514 392,377 392,453 392,479 391,096 390,389 244,516 153, 342 160,758 168,566 176, 515 184,008 191,926 199,883 207,238 215,035 222,140 229,586 236,682
U.S. Savings bonds:• Amount outstanding .....• _ •.•.... _ •.•.•.•.• _ •. do._._ 40, 361 27,363 28,901 31, 515 31,974 32,497 32,987 34,606 36,538 36,884 37,323 37, 645 38,308 Sales·, series E, F, and G----------------·------do .... 2, 386 853 1,698 2, 782 709 739 751 1,842 2,125 602 692 695 1,023 Redemptions .. --------.------------------- ..•. do ..•. 365 207 188 185 258 237 279 248 227 279 283 401 382
Debt, gross, end of month0---·-------·---------do ..•. 230,630 165,877 170,659 183,107 184, 715 184,967 186,356 201,003 208,574 209,802 209,496 210,244 215,005 Interest bearing:
Public Issues .......•...... ---- .. _ •...•....... do ..•. 212,565 161,805 154, 170 158,541 169,842 169, 716 170,753 185,256 192, 156 192,827 191,873 192,438 194, 192 Spe.cial issues§ ..... ----------·-----·------- •. do ..•. 16,326 12,703 12,873 13,168 13, 507 13,697 14,122 14,287 14,961 15,461 15,976 16,170 16,583
N oninterest hearing •. _ .............•.•.•...•.•. do ..•. I, 739 1,370 • 3,616 1,398 1, 367 1, 554 1,492 1,460 1, 456 1, 614 1, 645 1, 636 '4, 230 Obligations fully guaranteed by U. S. Gov't:
Total amount outstanding (unmatured) •.••••. do ..•. 1, 470 4,225 4,269 4,227 2,258 2,258 1,529 1, 516 1,468 1, 475 1,480 1, 480 1, 470 Expenditures and receipts:
Treasmy expenditures, totaL .•..•.•.......•.•. do ..•. 8,416 7,452 7, 570 7,862 8,525 7, 859 8,292 8,625 8,110 8,119 7, 930 8,024 7, 828 War activ1t1est ... --------- ••.. --·-----------do ..•. 7, 503 6, 718 7,138 7, 518 7, 726 7,346 7,879 7,567 7,201 7, 571 6, 998 7, 479 7, 401 Transfers to trust accounwt------------------do ..•. 22 2 37 5 7 40 26 40 451 57 22 47 18 Interest on debt. .......•.....•.• ---·--·---- •. do ..•. .160 497 87 56 449 117 52 747 86 77 581 133 56 All othert .......... -- ..•.....•.•.•.•.•...•.•. do ... _ 332 236 308 283 343 356 334 271 372 415 329 365 353
Treasury receipts, totaL ..•.... ________________ do .... 5,418 5, 737 2, 779 2, 754 6, 576 3,119 3, 256 6, 249 2,212 2,859 5, 927 2,054 2, 506 Receipts, net. .•....• ------ ... ------ •.••..•. do .... 5,416 6, 736 2, 747 2, 603 6, 573 3,087 2, 950 6, 247 2,163 2, 568 5,926 2, 001 2, 240
Customs. ____ ------·--··-----------·-·--- .... do .... 2D 34 40 35 42 39 38 28 28 23 25 29 27 Internal revenue, totaL •...•.............•... do .... 4, 945 5, 484 2,188 2,464 6, 353 2,935 3,024 5, 734 1, 985 2, 702 5, 749 1,880 2, 300
Income taxes .....•.•.•.••• -----------·----do .... 4, 347 5,040 1, 727 1, 747 5, 911 2,475 2,167 5, 241 1, 247 1, 552 5, 174 1, 240 1, 501 Social security taxes ..•.....•.•...........•. do .... 63 60 49 373 69 39 337 75 56 319 65 60 293
Net expenditures of Government corporations and 164 credit agencies• ___ --·------------------mil. of doL. 427 165 331 2,002 87 148 88 193 254 -35 95 -71
Government corporations and credit agencies:, Assets, except interagency, totaL_ ·--·-·-·--·--do ..•. 28,625 29,508 29,791 30,263 31, 083 31,153 31,666 31,097 32,690 31,959 --------- --------
Loans and preferred stock, totaL ..........•. do .... 7,929 7,880 7,863 7,809 7, 743 7, 6li6 7, 621 7, 504 7, 370 7,405 -----··--- --------Loans to financial institutions (Incl. preferred
stock) ------------·····-··------·-·-m•l. of doL 757 742 721 582 652 632 674 667 631 606 --------- --------Loans to railroads ______ --·--- --------------do .... 423 420 419 416 409 406 405 405 387 388 --------- --------Home and housing mortgage loans _________ do .... 1,826 1,807 1, 791 1, 773 1, 754 I, 732 1, 706 1,681 1, 643 1, 636 --------- --------Farm mortgage and other agricultural loans. do •.. _ --------- 2, 760 2, 766 2, 770 2, 761 2, 708 2,653 2,591 2, 532 2, 474 3,407 --------- --------All other .. --------------- •...•.•.....•.•.•. do •.•. --------- 2,164 2,146 2,162 2,177 2,220 2, 233 2, 244 2, 219 2, 235 1, 368 --------- --------
U.S. obligations, direct and guaranteed ....•. do ____ --------- 1,895 1, 942 2,099 2,090 2,161 1, 750 1, 701 1, .578 1, 592 1,603 --------- --------Business property ... ----·-------------------do ..•. 1,624 1, 645 1, 658 1, 677 1,671 1,685 1, 702 3, 742 3, 747 15,776 --------- --------Property held for sale ..•••••.•...•.....•..... do ..•. 7,512 7, 588 7, 753 7,829 7,985 8,042 8,392 8, 496 9, 220 3,050 --------- --------All other assets·------------------·-·-······--do .••. 9,665 10,452 10,418 10,858 11,524 12,020 12,250 9, 776 10,761 4,126 --------- --------
Liabilities, other than interagency, totaL •••••. do •.•. 11,454 10, 856 10,504 8,550 9,164 8, 722 9,364 8, 663 9,131 9,167 --------- --------Bonds, notes, and debentures:
Guaranteed by the U. S •.•....•.•.•.....•. do •.•• --------- 4, 239 4, 277 4, 226 2, 274 2,274 1,672 1, 766 1, 571 1, 571 1, 565 --------- --------Other ... -·-----------·---------·-·······---do .... --------- 1, 341 1, 332 1, 322 1, 326 1, 302 1, 427 1,413 1,229 1,200 l, 204
~:~~~~~~r~::~~~ Other liabilities, including reserves ••...•.•••. do. ___ --------- 6, 874 5, 247 4,956 4, 950 5, 589 5,623 6,185 5,863 6,360 6, 398
Privately owned interests.---------------·-----do ••.. 438 435 435 433 435 435 443 444 444 498 U. S. Government intercsts ..•.....•...•....... do .... 16, 732 18,216 18,853 21,280 21,484 21,996 21,858 21,990 23, 114 21, 771
Reconstruction Finance Corporation, loans outstanding, end of month, totalt- _.---·------------mil. of doL. 9,865 8,469 8, 631 8,851 9,051 9,174 9,330 9, 428 9, 473 9, 607 9, 711 9, 704 9, 846
Banks and trust cos., incl. receivers ..•.•....... do ____ 322 419 413 407 390 379 372 357 351 342 338 335 330 Other financial institutions __ ··-··----·--·---- .do .•.. 205 212 213 224 224 221 222 222 218 209 208 208 207 Railroads, including receivers.--------------- __ do ____ 312 388 387 385 383 375 372 372 371 354 353 343 340 Loans to business enterprises, except to aid in national
defense .... ---------·- ---·--·-----·---·-mil. of doL. 31 55 41 40 38 37 36 34 34 33 33 32 31 National defense ••••.•.•••...•.....•.•.•.•••.•. do ..•. 8,329 6,668 6, 853 7,072 7, 295 7,449 7,627 7, 749 7,807 7, 977 8,089 8,104 8,265 Other loans and authorizations ..•.............. do .... 665 726 725 724 722 713 702 694 693 692 690 681 674
'Revised. §Special issues to government agencies and trust funds. ®Figures are on the basis of Daily Treasury Statements (unrevised). ' Partly estimated. ' March and November data include prepayments on securities dated Feb. 1 and Dec. 1, 1944, respectively, sold in the Fourth and Sixth War Loau drives. •In addition to data showu above, quarterly estimates of profits of all corporations are published in special tables in the Survey as follows: 1940-43 and the first quarter of 1944,
p. 6 of the July 1944 issue of the Survey; 1939, June 1943 issue, p. 25; the latter includes also on p. 24, annual data back to 1929 aud, ou p. 28, a description of the data; it should be noted that these estimates ar~ in line with profits compiled from income tax returns and thus include reserves not allowable as deductions in computing taxes.
tFor 1941 revisions seep. S-17 of the November 1942 issue. Data for the agricultural adjustment program, shown sep!ll"ately through the February 1944 issue, and unemployment relief, shown separately through the July 1944 issue, are included in the "all other" item. Debt retirPments, which have been comparatively small, are excluded.
,Beginning September 1944 data are reported quarterly and for some items (notably farm mortgage and other agricultural loans, all other loans, business property, property held for sale, all other assets) are not comparable with earlier data owing to changes iu Treasury Department regulations governing reports from the agencies and to shifts between classi· fications.
*New series. For data beginning 1929 for profits and dividends of 152 companies, seep. 21, table 10, of the April1942 Survey. Data for net income after taxes of class A and B electric utilities have been substituted for data for 28 companies; they include affiliated nonelectric operations and cover 95 percent of all electric power operations. Data beginning 1939 are available on request. Data beginning July 1940 for the series on the war program are shown on p. 29 of the June 1943 issue; a comparatively small amount of intercompany duplication in the figures for R. :F. C. and Its subsidiaries has been eliminated beginning October 1943; see footnote marked'"" on p. S-18 of the April1944 issue. The series on war savings bonds is from the Treasury Department; amounts outstanding are at current redemption values except series G which is staled at par; this item and redemptions cover all savings bonds series, including pre-war issues; sales represent funds received during the month from sales of series E, F, and G, the series issued since April1941 (for sales beginning May 1941, seep. S-16 of the October 1942 Survey). The series on expenditures of Government corporations and credit agencies includes net transactions on account of redemptions of their obligations and other net expenditures by the Reconstruction Finance Corporation, the Commodity Credit Corporation, and other lending agencies; transactions of these agencies are not included in Treasury direct budget expenditures and receipts shown above; since October 1941 funds for these agencies are provided by the Treasury.
iRe vised series; see note in the December 1943 Survey regarding changes in the classifications; the figures include payments unallocated, pending ad vices, at end of month.
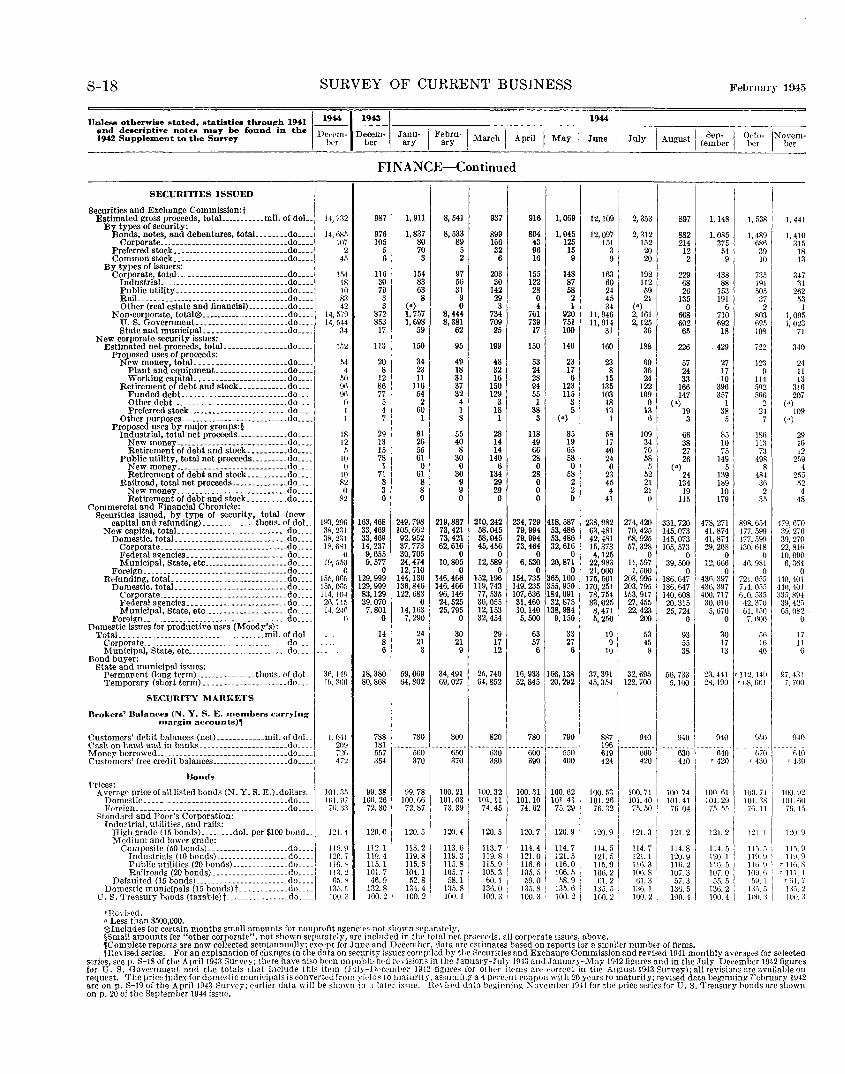
S-18 SURVEY OF CURRENT BUSINESS February 1945
Unless otherwise stated, statistics through 1941 1 1944 ~~~ and descriptive notes may he found in the Decem- Decem· Janu· I Febru- I I . 1942 Supplement to the Survey ber ber ary ary March Apnl I May I
SECURITIES ISSUED
Securities and Exchange Commission:t Estimated gross proceeds, totaL ...•..•.•. mil. of doL.
By types of security: Bonds, notes, and debentures, totaL ....... do ..••
Corporate ...••.•..•.••.•...•..••.•... _ ... do .... Preferred stock •.....•.....•••..•••••.•..... do ..•• Common stock •...........•••••••.•..•..•.. do .•..
By types of issuers: Corporate, totaL ........••...........•..... do ..••
Industrial .. _ .... _._ ••.•..••.•••..•••..... do._ •. Public utility •..........•••••.•••.....•.. do ... . Rail .............•.... -------········· ..•. do ... . Other (real estate and financial) ......•... do ... .
Non-corporate, total® .••.•.•.....•......•... do ... . U.S. Oovernment ..•.••...........•..... do .••. State and munlcipaL •••...••.••••....... do ....
New corporate security issues: Estimated net proceeds, total. .......•...•... do •.•.
Proposed uses of proceeds: New money, totaL .•..•........•..•..... do ... .
Plant and equipment. -----------------do ... . Working capitaL ______________________ do ... .
Retirement of debt and stock •• __________ do ... . Funded debt..--------------------- .... do ... _ Other debt ... -------- ...... ____ ........ do ... . Preferred stock .•.•••• ·----- __________ .. do._._
Other pnrposes ___________________________ do .... Proposed uses by major groups:§
Industrial, total net proceeds ............. do ..•. New moneY----------------------------do •... Retirement of debt and stock ••••..•.•• do ••..
Public utility, total net proceeds ....••.•. do ... . New moneY----------------------------do ... . Retirement of debt and stock .......... do ... .
Railroad, total net proceeds ..•..•.•.•..•. do ... . New moneY----------------------------do .•.. Retirement of debt and stock .....•.... do .••.
Commercial and Financial Chronicle: Securities issued, by type of security, total (new
capital and refunding) ... __________ thous. of doL. New capital, total. ••.•.••.•............•.••. do ....
Domestic, total. .•. _ ... ___ .---------- .••.•. do ..• _ Corporate .. ----------·------------- ...... do ..•. Federal agencies .•. __ ---------------- .... do .•.. Municipal, State, etc .•..••••••••......... do .•..
Foreign .. _. ___ .. _.------- .•...••..••.. -- ... do .•.. Refunding, totaL ........ -------------- ...... do ... .
Domestic, total._. -------------------------do ... . Corporate .... __ . __ .. __ . __ ...••. _ .•..•.... do .. __ Federal agencies .•. --------------------- .do ... . Municipal, State, etc ...••.•.••...•.••.... do ... .
Foreign __ ---------------------- ____________ do ... . Domestic issues for productive uses (Moody's):
TotaL .. _ --------------------------------mil. of doL Corporate ... ______ .. ___ .• _._. ___ .. ___ ._ •. _._ .do_._. Municipal, State, etc ......................... do ... .
Bond buyer: State and municipal issues:
Permanent (long term) _______________ thous. of doL Temporary (short term) ..................... do ___ I
SECURITY MARKETS I Brokers~ Balances (N.Y. S. E. members carrying
margin accounts),
Customers' debit balances (net) ............ mil. of doL. Cash on hand and in banks ...................... do ... . Money borrowed ..... __ ..... _____ ..... _____ ...... do .. .. C'ustomers' free credit balances ___________________ do .. ..
Bonds Prices:
Average price of all listed bonds (N.Y. S. E.).dollars .. Domestic ... ___________ -------- __ . _______ ... .do ... _ Foreign _____________ ....... __ ... _ ........... .do ... .
Standard and Poor's Corporation: Industrial, utilities, and rails:
High grade (15 bonds) ........ dol. per $100 bond .. Medium and lower grade:
Composite (50 bonds) ____________________ do ... . Industrials (10 bonds) _________________ do ... . Public utilities (20 honds) ______________ do .... l Railroads (20 bonds) _____ .----------- .. do.---~
Defaulted (15 bonds) ______ .---------- ...... do ... . Domestic municipals (15 bonds)t __ .......... do ... .
U.S. 'Treasury bonds (taxable)t ................ do .... l rJtodscd. a Less than $500,000.
14, 732
14,68!) 107
2 45
!54 IR 10 83 42
14,579 14,544
3-1
!52
54 4
.00 n(i 96
0 I I
18 12 !j
10 0
10 82 0
82
193,296 3s.nr 38,231 18,681
0 19,M)O
c 1-'5, 065 155.065 114, 104 21\715 14. 2411
0
3B, 14(1 IH, 3t~n
I. 041 2()() 720 4/Z
101. ~!i 101. Hi 1n. :1a
1~l. 4
lit). 0 120. "i liD.~ 113.2 55.~
r:lo. '• 100. :l
FINANCE-Continued
987
976 105
5 6
116 30 79 3 3
872 853
17
113
20 8
12 86 77
5 4 7
29 13 15 78 1
71 3 3 0
163,468 33,469 33,469 14,237 9,655 9,577
0 129,999 121), 999 83,129 39.070 7,801
0
14 8 6
18,380 80,868
788 181 557 354
99.38 100.26 72.30
120.0
112.1 119.4 115.1 101.7 46.9
132.8 i
100.2 '
1, 911
1, 837 80 70
3
154 83 63 8
(•) 1, 757 1,698
59
150
34 23 11
116 54
2 60
1
81 26 55 61 0
61 8 8 0
249,798 105,662 92,952 37,773 30,705 24,474 12,710
144,136 136,846 122.683
0 14, 163 7, 21)0
24 21 3
59,069 64,802
8,541
8,533 89
5 2
97 56 31
9 0
8,444 8, 381
62
95
49 18 31 37 32 4 1 8
55 40 8
30 0
30 9 9 0
219,887 73,421 73,421 62,616
0 10,805
0 146,466 146,466 96,146 24,525 25,795
0
30 21 9
34, 491 69,027
937
899 166 32 6
203 30
142 29 3
734 709 25
199
48 32 16
150 121)
3 18 1
28 14 14
140 6
134 29 21l 0
210,242 58,045 58,045 45,456
0 12,589
0 152, 196 119, 743 77,.535 30,055 12, 153 32,454
21l 17 12
25,740 64,852
780 1 800 820
-----~~r ~-----~~s-1·----~~r
99. 78 100. 21 1100. 32 100. 66 101.03 101. 11 72. 87 73. 39 i 74.45
120.5
113.2 119.8 115. 5 104.1 52.8
134.4 100.2
120.4
113.6 119.3 115.8 105.7
58.1
~~3: ~ i
120.5
113.7 119. 8 115.9 105.3 60.1
136.0 100. 3
9161
804 43 96 16
155 122 28 0 4
761 739
17
150
53 24 28 94 55 1
38 3
118 49 66 28 0
28 0 0 0
234,729 79,994 79,994 73,464
0 6, 530
0 154,735 149,235 107,636 31,460 10, 140
5, 500
63 57 6
16,933 52,845
I 1,0691
1, 045 125 15 9
148 87 58
2 1
920 751 100
146
23 17 6
123 115
3 5
(•)
85 19 65
5~ I 58 2 2 0
418,587 53,486 53,486 32,616
0 20,871
0 365, 100 355,950 184,091 32,875
138,984 9, 150
33 27 6
166,ras I 20, 21)21
i
780 790 I --------1
600 550 I 390 400
100.31 101.10 74.62
i 100.621 101.41 75.29 I
120. 7 120. 91 114.1 I 12r.5 1
116.0 ' 106.5 !
114.4 121.0 116.6 105.5 59.0
135.8 100.3
58.9 i 13.5. 6 1 100.2 l
®Includes for certain months small amounts for nonprofit agencies not shown separately.
1944
June
12,109
12,097 !51
3 9
163 60 24 45 34
11,946 11,914
31
160
23 8
15 135 103
18 13
1
58 17 40 24 0
23 45 4
41
2,'!8, 982 63,481 42,481 15,373 4,125
22,983 21,000
175,501 170,251 78,754 83,025
8, 471 5, 250
19 9
10
2, 353
2, 312 152
20 20
192 112 59 21
(•) 2,161 2,125
36
188
60 36 24
122 109
0 13 6
109 34 70 58
5 52 21 21 0
274,420 70,425 68, 925 57,328
0 11,597
1, 500 203,995 203,795 153, 917 27,455 22,423
200
53 I 45 1
81
897
882 214
12 2
221) 68 26
135 0
668 602 65
226
57 24 33
166 147
(•) 19 3
66 38 27 26
(•) 24
134 19
115
331,720 145,073 145,073 105,573
0 39,500
0 186,647 186,647 140,608 20.315 25, 724
0
93 55 38
1, 148
1, 085 375
54 9
438 88
153 191
6 710 692 18
429
27 17 10
396 357
1 38
5
8,5 10 75
149 5
139 189 10
179
478, 271 41.874 41,874 21), 208
0 12, 666
0 43f>, 397 436,397 400,717 30,010
5, 670 0
30 17 13
1, 538
1,489 686 39 10
735 WI 50.5 37
2 803 f,9,)
108
722
123 9
114 ,192 51\1\
2 2!
7
lSI\ 113 73
498 8
484 31\ 2
35
89~. 654 177.599 177,599 130.618
0 46,981
0 721' 05.5 714. Q.)f,
f>10, 535 42,370 61.1511
7. 000
50 Hi 40
~~: ~;! ~~~: ?gg I 5g: ;g~ ~~: i~~ '}A~: 1\~i) I I
~g~ \-----=~~-~-----=~~-~---- ~4o ___ n5o_ 619 600 ' 630 fo40 (i70 424 I 420 I 410 ' 420 ' 430
100.53 II 100.71 I 100.74 100.61 101. 26 101. 40 1 101. 41 101. 29
76. 32 75. 50 1 76. 04 7.5 .. 55
120.9/i 121.3 i 121.2 121.2
114.5 ' 114.7 114.8 114.5 121.5 i 121. 1 120.9 1~0. 1 115.9! 116.3 1Hi.2 IIG.5 106.21 105.8 107.3 107.0
1>1. 2 51. 3 57. 3 55. 5 135. 5 i 136. 1 136. 5 136. 2 100. 2 l 100. 2 ' 100. 4 100. 4
100. 71 101. :ls /II. 11
121. I
1 Ui. 5 119. ~ !It\. 9 lOU. I) .5\l.l
§Small amounts for "other corporate", not shown separately, are included in the total net proceeds, all corporate issues, above. ,complete reports are now collected semiannually; except for June and December, data are estimates based on reports for a smaller number of firms.
1, 441
I, 410 315
18 13
347 31
262 53
I 1, 095 1, 023
71
340
24 11 13
316 207
(•) 109
(•)
29 16 12
259 4
2.55 52 4
48
479. 670 39, 270 39,270 22, 8Hi 10.090 6, 364
0 .\40,401 440,401 33ii, 894
39, 42.> G.), 082
0
17 II (\
97.431 I, 100
1140
f:40 '4:lO
100. !>2 !Ill. 60 7fi. 15
120.9
1 I.~. 9 11\J. 9
r 1 HI.~ '111.1
r HI. 7 n:\2 100.:1
tRevised series. For an explanation of changes in the data on security issues compiled by the Securities and Exchange Commission and revised 1941 monthly averages for selectea series, seep. S-18 of the Apri11943 Survey; there have also been unpublished revisions in the January-July 1943 and January-May 1942 figures and in the July-December 1942 figures (or li. S. Government and the totals that include this item (Ju!y-I>,•cember 1942 fi~ures for otlwr items are correct in the August 1943 Survey\; all revisions are available on request. The price index for dome.stic municipals is convert('drrom yidd~ to maturity. assumin? a 4 percent coupon with 20 years to maturity; revised data bpginning February 1942 are on p. S-19 of the April1943 Survey; earlit'r data will be shown in'' later issue. Revised data beginning i\ovember 1941 for the price series for U.S. Treasury bonds are shown on p. 20 of the September 1944 issue.
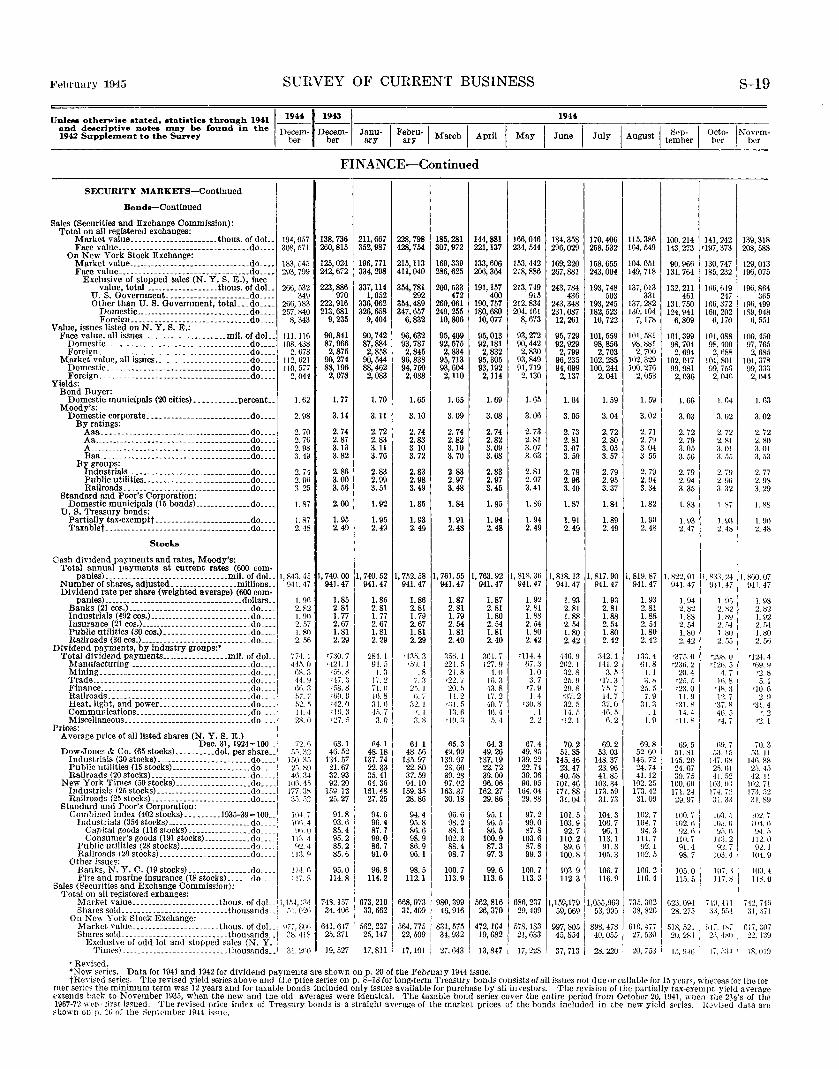
February 1945 SURVEY OF CURRENT BUSINESS S-19
Unless otherwise stated, statistics through 1941 and descriptive notes D1ay be found in the 1942 Supplement to the Survey
1
1944,1943 I Decem- Decem- Janu- I Febru-1 March I April
ber ber ary ary
SECURITY MARKETS-Continued
Bonds-Continued
Sales (Securities and Exchange Commission): Total on all registered exchanges:
Market value ______________________ thous. of doL Face value _______________________________ .. do ....
On New York Stock Exchange: Market value _____________________________ .. do. __ _ Face value ______________ --------- ______ .... do __ __
Exclusive of stopped sales (N.Y. s. E.), face value, total __________________ thous. of doL.
U.S. Oovernment _____________________ do .. .. Other than U.S. Government, totaL .. do .. .. Domestic _____________________________ do ___ _
Foreign _____________________________ .do. ___ Value, issues listed on N.Y. S. E.:
Face value, all issues _____________________ mll. of doL. Domestic _____________________________________ do ___ _ Foreign _____________________________________ .do. ___
Market value, all issues ________________________ do .... Domestic. ___________________________________ do __ __ Foreign ___ . ___ -------------------------------do __ __
Yields: Bond Buyer:
Domestic municipals (20 cities) ___________ percent .. Moody's:
Domestic corporate. -------------------------do __ __ By ratings: Aaa. ____________________________________ .do. __ _
Aa ________________________________________ do ___ _ A_-------- _______________________________ .do. ___ Baa ______________________________________ do __ __
By groups: Industrials _______________________________ do ___ _ Public utilities... _______________________ .do __ __ Railroads. ______________________________ .do .. __
Standard and Poor's Corporation: Domestic municipals (15 bonds) ______________ do ....
U. S. Treasury bonds: Partially tax·exemptt ________________________ do __ __ Taxablet _-----------------------------------.do ....
Stocks
Cash dividend payments and rates, Moody's: 'l'otal annual payments at current rates (600 com·
194,057 308, 571
183, 545 293,799
266, 532 349
266,183 257, R40
8, 343
111, 116 108.438
2. 678 112, 621 110, 577
2, 044
1.62
2. 98
2. 70 2. 76 2.98 3. 49
2. 74 2. 9fl 3 25
1. 87
1. 87 2. 48
FINANCE-Continued
138,736 260,815
125,024 242,672
223,886 970
222,916 213,681
9, 235
90,841 87,966 2,875
90,274 88, 196 2,078
l. 77
3.14
2. 74 2.87 3.13 3.82
2.86 3.00 3. 56
2.00
1. 95 2.49
211,667 352,987
196,771 334,298
337,114 1,052
336,062 326,658
9,404
90,742 87,884 2,858
90,544 88,462 2,083
l. 70
3.11
2. 72 2.83 3.11 3. 76
2. 83 2. 99 3. 51
1.92
1. 95 2. 49
228,798 428,754
215, 113 411,040
354, 781 292
354,489 347,657
6,832
96,632 93,787 2,845
96,838 94,750 2,088
1.65
3.10
2. 74 2.83 3. 10 3. 72
2.83 2.98 3. 49
1.85
l. 93 2.49
185,281 307,972
169,339 286,625
260,533 472
260,061 249,255 10,806
95,409 92,575 2,834
95,713 93,604 2,110
1.65
3. 09
2. 74 2.82 3. 10 3. 70
2.83 2. 97 3. 48
l. 84
1. 91 2.48
144,881 221,137
133,606 206.364
191, 157 400
190,757 180,680 10,077
95,013 92,181 2,832
95,305 93,192 2,114
I. 69
3.08
2. 74 2.82 3.09 3.68
2.83 2. 97 3.45
l. 85
1. 94 2.48
1944
I May I June I July I August I te~~~r I O~~t jNob~~m-
166,046 234,544
153,442 218,886
213, 749 915
212,834 204,161
8,673
93,272 90,442
2, 830 93,849 91,719 2,130
I. 65
3. 06
2. 73 2.81 3.07 3. 63
2. 81 2. 97 3. 41
1.86
I. 94 2.49
184,358 170, 406 115,386 296, 029 258, 532 164, 549
169,220 267,881
243,784 436
243,348 231,087 12, 261
95,729 92,929
2, 799 96,235 94,099 2,137
1.64
3.05
2. 73 2.81 3.07 3. 59
2. 79 2.96 3. 40
1. 87
1. 91 2.49
158,655 243,004
193, 748 503
193, 245 182,523 10,722
101, 559 98,856 2, 703
102,285 100,244
2,041
I. 59
3. 04
2. 72 2.80 3.05 3.57
2. 79 2. 95 3. 37
l. 84
l. 89 2. 49
104,051 149, 718
137, 613 331
137,282 130, 104
7, 178
101, Sfi! 98,881
2, 700 102,329 100,276
2,053
1. 59
3.02
2. 71 2. 79 3. 04 3 55
2. 79 2. 94 3. 34
1.82
1. 90 2. 48
100,214 141,242 143,273 •197, 373
90,966 131,764
132,211 461
131,750 124,941
6,809
101, 399 98,704 2,694
102, 0!7 99,981
2,036
1.66
3.03
2. 72 2. 79 3. 05 3. 56
2. 79 2.94 3. 35
1. 83
1. 93 2. 47
130,747 185, 232
166,619 247
166,372 160,202
6, liO
JDI, 088 98,400
2, ti88 101,801 99, 75G 2,04ti
1.04
3. 02
2. iH 2. 9ii ~l. :12
1 9:J 2. 48
139,31R 208,588
129,013 196,075
196,864 31i5
i96, 499 JS9, 948
6, 551
100, 41i0 97, 7(;5
2, 685 101,378 99, :l33 2,044
l. 63
3.02
2. 72 2. 80 :uH 3. 53
2. 77 2. 98 3. 29
l.XS
1. 90 2. 48
panies) _______________________________ mil. of doL 1, 843.4.1 Number of shares, adjusted _________________ millions__ 941.47
l, 740.00 1, 740.52 I, 752.58 1, 761,55 1, 763.92 I, SIS. 36 I, 818.13 !, 817.90 I, 819.87 1, 822. OJ I, S~J;l. 24 I, sno. 07 941.47 941.47 941.47 941.47 941.47 941.47 941.47 941.47 941.47 941.47 U·\1.47 941.47
Dividend rate per share (weighted average) (600 com· panies) _____ --- _____ • --- _- _- _- _. ________ .. dollars __
Banks (21 cos.) -------------------------------do __ __ Industrials ( 492 cos.)---------- _______________ .do __ __ Insurance (21 cos.l--------------------- _______ do __ __ Public utilities f30 cos.) ______________________ do ___ _ Railroads (36 cos.) ______ -------- ______________ do ....
Dividend payments, by industry groups:• 'fotal dividend payments _________________ mil. of doL
Manufacturing ___________________ • _________ .do. __ _ Mining. ___________________________________ .. do .. _. 'frade .. ____________________________________ .. do. __ _ Finance. ________________________ • ___________ .do. __ _ Railroads.------------------------ ___________ do ..... Heat. light, and power _______________________ do ___ _ Communications. ______ • _________________ .... do .. __ Miscellaneous ________________________________ do ___ _
Prices: Average price of all listed shares (N. Y. 8. E.)
Dec. 31, 1924=100 . Dow-Jones & Co. (65 stocks) .......... dol. per share ..
Industrials (30 stocks) ______ ------------------do __ __ Public utilities (15 stocks) ____________________ do .... Railroads (20 stocks) ___ -------------- __ ...... do .. __
New York Times (50 stocks) ___________________ do __ __ Industrials 125 stocks)---------- ______________ do .... Railroads (25 stocks) ... _____ -----------------do __ __
Standard and Poor's Corporation: Combined index (402 stocks) _________ 1935-39=100 ..
Industrials (354 stocks) _____________________ do __ __ Capital goods (116 stocks). _______________ do __ __ Consumer's goods (191 stocks) ____________ do .. ..
Railroads (20 stocks)------------ ___________ do __ __ Other issues:
1. gr, 2.82 1. 90 2. 57 1.80 z .. o6
17"1. 1 44.o. o
fi8. :l 44. u l)fi. 3 57. 7 fl'2.Fi 11. 4 28.0
72. {) fifi. :)2
lflll. :-);:. 2;1. xo 41\, :)4
10!\. 45 177. :1X 3!). 112
lll4. 7 \{If), 4 Ht). 0
Jl:l.-1 02.4
Jl:J. g Public utilities (28 stocks) __________________ do .... l
Banks, N.Y. C. (19stocks) ________________ do _____
1
114.11 Fire and marine insurance (18 stocks) ______ do____ 117. ~
Sales (Securities and Exchange Commission): I 'I'otal on all registered exhanges:
Market value ____ . _____ -- __ -- ______ thous. of doL_ 11, 1.o~,J:14 Shares sold ___________________________ thousands __ : ;jJ, O:?t;
On New York Stock Exchange: I Market Yahte ______________________ thous. of doL.; \177, SOli Shares sold ___________________________ thousands .. l 2~. -118
Exclusive of odd lot and stopped sales (N. Y. Times) _____ -------_-------· ______ thousands.. 31, 2r·.o
'RPvised.
1.85 2.81 1.77 2. 67 1. 81 2. 29
r/:)0. i '·!21. l
r5H. B r!7. ;~
'o08.8 'iiO. 9 •-12.0 r1(;. 3 r;27. f)
63.1 46.52
134. f\7 21.67 32.93 92.20
159. 13 25.27
91.8 03.6 I
85.41 95.2 8.). 2 85.6
95.0 114.8
748, 157 34,406
641,617 25,871
19, 527
l. 85 2.81 1. 77 2.67 1. 81 2. 29
284.1 94. 5
1.3 ] 7. 2 71. () lli. ~ :ll.li -lb. 7
:l.O
64. 1 48.18
137.74 22.33 35.41 94.36
161.48 27.25
94.6 96.4 87.7 99.0 86.7 91.0
1.86 2.81 1. 79 2. 67 1.81 2.29
'13.o. 3 r5U. 4
. s i. :~
:!t). 1 fi. 7
32. 1 •.1 ;l.S
6-J. 1 48.56
13.). 97 22.80 37.59 94.10
159.35 28.86
94.4 95.8 86.6 98.9 86.9 96.1
96.8 98.5 114.2 112.1
673, 210 668,973 33,662 31,409
562,227 25, 147
li, 811
564, 775 22,509
17,101
1.87 2. 81 1. 79 2. 54 1. 81 2. 40
3.ifi. 1 221.5 21.8
r2:2. 7 20 .. 5 14. 2
''ll. 5 t:l.fl
•JO.:J
65.31 49.99 139.07 23.60 39. zs I 97.l'21 163.87 30.18
96.6 1
98.2 1 88.1
102.3 88.4 98.7
1.87 2.81 1.80 2. 54 1.81 2. 40
301.7 127. 9
4. 0 !G. 3 43.8 li. 2 .;o. 1 4fl. 4
5. 4
64.3 49.26
137.19 22.72 39.00 96.06
162. 27 29.86
95. 1 96.5 86.5
100.9 87.3 97.3
100.7 99.6 113.9 113.6
98o. 399 I 562, s16 46, 916 26, 370
831. 575 472, 164 34. 932 19, 682
27,643 i 13,847
I. 92 2. 81 l. 88 2. 54 1.80 2. 42
'll4. 4 67. a
1.0 3. 7
'7. 9 1.4
'30. 8 .1
2. 2
67.4 49.85
139. 22 22.74 39.36 96.95
164.04 29.88
97. 2 99.0 87.8
103.6 87.8 99.3
100.7 113.3
1. 93 2. 81 1.88 2. 54 1.80 2. 42
446.9 21i2. 1 32.8 25.9 29.8 r:n. 2 32.5 14.5
'12.1
70.2 51.85
145.46 23.47 40.58
101.46 171.88 31.04
101.5 103.9 92.7
110.2 89.6
100.8
103.9 112.3
1. 93 2. 81 1.88 2.54 1.80 2. 42
:HZ.! 141.2
3. 5 r}7.;)
7!5. i 11. 7 37.0 4G. 5 0. 2
69.2 53.03
148.37 23.96 41.85
103.34 173. 59 31.73
104.3 106.7 96.1
113.1 91.3
105.3
106.7 116.9
1. 93 2.81 1.88 2. 54 1.80 2. 42
1:33.4 (il.8
1.1 3."
25.5 7. 9
31. ~ .l
1.9
69.8 52. uo
146.72 24.74 41.12
102. 25 173.42 31.09
102.7 104.7 94.3
111.7 92.1
)1)2. 5
106.2 116.4
1. 94 2. 82 1.88 2. 54 1.80 2. 42
'375. 0 •z:m. 2
20.4 r2fl. f1
r2:to 11.\1
':ll. s 14.4
'II. S
69.5 51.81
145.20 24.07 39.75
100. (jl) 171. 2-1
29.97
100.7 1112.6 92. fi
!10. 7 91.4 98. 7
105.0 115. 5
1. Hf) 2. H:? ],,'\\1 2.:14 1. kiJ 2 .. )5
'2118. () rJ2f). ,1)
4. 7 Hi. 8
•!>l.:l 12. 7
r:)/, H 46.5 r.J. j
nn. 7 ;,:t !f'l
147.1iS 2f'l, ()J
41. f>2 103.11') 174. 7:~ :ll. ;J:)
10:1. !i IO:l. n ur •. ti
II:). 2 9:!. 7
w:~. 4
107. :; 117. s
686, 237 1,159,179 1,055,963 735, 302 29, 409 59, 069 53, 995 38, 820
623, 094 28, 275
7411,411 ;):~ .. ii:l4
578, 183 21,633
17,228
997,805 898, 478 45, 854 40, 055
37, 713 i 28, 220 :
610.477 I filS, 521 (ill, hi 27, 530 20, 2~4 2.\, 4.\11
I 20,753 I 15,9HI; 17,t):;l ~
1. 98 2. 82 1. 92 2. fi4 1. 80 2. 5fi
'124. 4 r()9.9 '2. 8 5.1
rto. () 2. \)
'31.4 •. 2
r2. 1
70. 3 rla. 11
14fi. 88 2R. 4S 42. 11
102. 71 1n.02 :11. S9
1112. 7 llll.fi
Ucf. !l 112.0
H:2. 1 104.9
10\1.4 tl~.u
74:2, 74fl ~{ 1, :r;-1
(il7, ~~07 2:?, l::SU
JS, 01!1
'New series. Data for 1941 and 1942 for dividend payments are shown on p. 20 of the February 1944 issue. t Revised series. The revised yield series above and the price series on p. S-18 for long-term Treasury bonds consists of all issues not due or callable for 15 year,, w lwreas for the for
mer series the minimum term was 12 years and for taxable bonds included only issues available for purchase by all investors. The revision of the partially t.ax-exempt vield average extends back to November 1935, when the new and the old averages were identical. The taxable bond series cover the entire period from October 20, 1941, wbcn the 2'·!!'s of the 1967-72 '"'r·· tlrst issued. 'l'he revised priee index of 'Treasury bonds is a straight average of the market prices of the bonds included in the new yield s<'ries. Hc•vised data are ~bown on p. 20 of the Seph•mher Hl44 i'>sue.
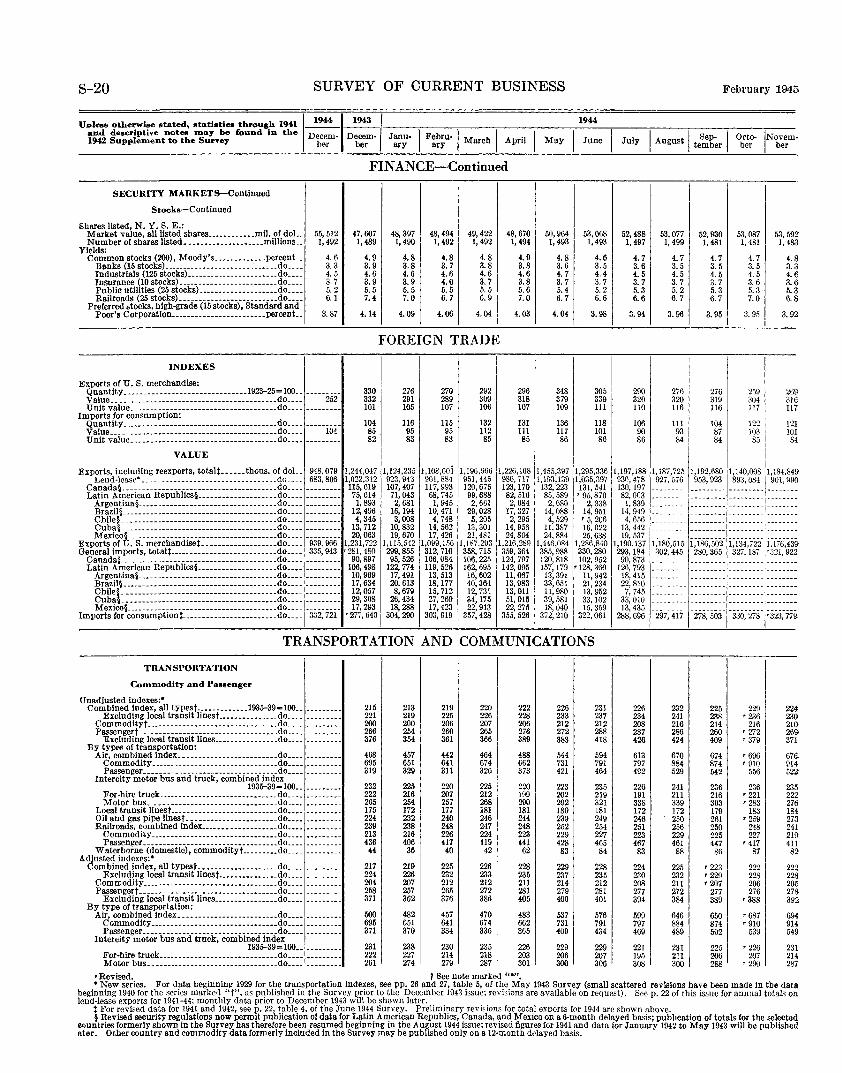
S-20 SURVEY OF CURRENT BUSINESS
Unleas otherwise stated, statistics through 1941 1 1944 ~~~ and descriptive notes may be found in the Decem- Decem- Janu• I Febru·l I . 1942 SuppleD>ent to the Survey ber ber ary ary March April
FINANCE-Continued
SECURITY MARKETs-Continued
Stocks-Continued
Shares listed, N.Y. S. E.: Market value, all listed shares ..•••....••. mil. of doL. 55,512 47,607 48,397 48,494 49,422 48,670 Number of shares listed ••.•••..•..•••.••.•. millions .. 1, 492 1,489 1,490 1,492 1, 492 1, 494
Yields: Common stocks (200), Moody's .••..•••.•••. percent.. 4.6 4.9 4.8 4.8 4.8 4.9
Banks (15 stocksl----------·-·----·-------·---do ..•. 3.3 3. 9 3.8 3. 7 3.8 3.8 Industrials (125 stocks) •.•............•...•... do .••. 4. 5 4. 6 4. 6 4.6 4.6 4.6 Insurance (10 stocks) •...•.••••..••..•..•••••. do ..•. 3. 7 3. 9 3.9 4.0 3. 7 3.8 Public utilities (25 stocks) .••••••.•.••.•.••••. do •... 5. 2 5.5 5.5 5.5 5. 5 5.6 Railroads (25 stocks) .••..••.•••••••••.•..•.•. do ••.. 6.1 7.4 7.0 6. 7 6. 9 7.0
Preferred stocks, high-grade (15 stocks), Standard and Poor's Corporation ••.••.•.••.••••.•••••••• percent •. 3. 87 4.14 4.09 4.06 4.04 4.03
FOREIGN TRADE
INDEXES
I Exports of U.S. merchandise:
~~r:et!~:: :::.-_-_-_-_-_-_-_._-_-_-_-_-_·_-_-_-_-_·_-_-_-_-_._._._-_~9-~---~d.~~=: -----252- 330 332 101
276 270 l 292 296 I
Unit value .......•..•.....••..•••.••.•.••....•• do .... ---------Imports for consumption:
~~fu~t-i~~_-.-::::: :::::::::::::::::::::::::::::: ::~~: ::: ----- io4-Unit value ....•. ---------------··-------- ..•.•. do •.•. ------ __ _
VALUE
104 85 82
Exports, including reexports, totalt •••••• thous. of doL 948,079 1,244,047 Lend-lease* ............... ------ ............. do.... 683,806 1,022,312
Canada§ .... ----------------·-------·----------do .... ------·-· 115,619 Latin American Republics§ .....•.•..•......... do .•.. --------- 75,614
~~~~m~~~~--============================:=====~~==== ::::::::: 1~: ~~~ g~~:\: ========:======================:======~~==== ::::::::: 1~: m Mexico§ ......... -----------·------·--------·-do.... ........ .. 20,063
Exports of U.S. merchandiset .••..••.••.•..••••• do .•.. 939,966 1,231,722 General imports, totalt ..•••....•.••••..•.••.••••• do .... 335,943 •281, 480
Canada§ ...............•...••.••.•.••.•.••.••••• do.... ...•..... 90,897 Latin American Republics§ ..•••••••.•••...•••• do ..•• --------- 106,498
~~~f~~~-~~~:::::::::::::::::::::::::::::::::Jt:: ::::::::: i~: ~~~ Cuba§ .• -----------------------·--·-····-----do.... ....•.. .. 29, 308 Mexico§ ...... ----------------·-·-------------do ....
1
... ...... 17,293 Imports for consumptiont .. ----------------------do.... 332,721 '277, 640 _
291 105
116 95 83
1,124,235 923,943 107,407 71,043 2, 681
16, 194 3,008
10,832 19, 670
1,115,M2 299,855 95,526
122,774 17,491 20.613 8,679
26,434 18,288
304,290
289 309 318 107 106 107
115 132 131 95 112 Ill 83 85 85
I
.I , 1,108,001 1,196,956 '1,226,108 901,884 951,445 986,717 117,993 120,675 123,170 68,745 99.688 82,516
1, 945 2, 661 2,084 10,471 29,028 17, 327 4, 748 5, 205 2, 295
14.562 13,301 14.956 17. 426 21,481 24,804
1,099,1.56 1,187,293 1,216,289 312,710 358,715 359,364 106,084 106,225 124,797 119,526 162,695 142,095 13, 513 16,602 11,067 18,177 40,364 13,983 15,712 12,731 13,011 27,269 34,175 51,015 17,423 22,913 22,275
303, 919 I 357,428 355.526
50,964 1,493
4.8 3.6 4. 7 3. 7 5.4 6. 7
4.04
348 379 109
136 117 86
1,455,397 1,193,139 !32, 223 85,589 2,680
14,088 4, .129
11, 387 24,884
1,446,084 385,988 120,818 157,179 13,391 33,651 11,980 39,581 18,040
372,210
1944
53,068 1,493
4.6 3. 5 4.4 3. 7 5.2 6.6
3.98
305 339 111
118 101 86
1,295,336 1,035,397 131,541 '95, 870
2, 338 14,951 '5, 206 16,022 25,638
1.286,840 330,280 102, 952
'128, 360 11,942 21,234 13,952 33, 102 15, 359
322.061
TRANSPORTATION AND COMMUNICATIONS
TRANSPORTATION
Commodity and Passenger
Unadjusted indexes:• Combined index, all typest ..••••.••.••. 1935-39=100 .• ·-------- 215 213 219 220 222 226 231
Excluding local transit linest .••••••..•..... do .... 221 219 225 226 228 233 237 CommoditYf--------------·--·-··----------·-do .... --------- 200 200 206 207 206 212 212 Passengert ...••.•..••••.•••.•....•.....•..•.. do ..•. --------- 266 254 260 265 276 272 288
Excluding local transit lines ..•.••..•.•.•.•. do .... 376 354 361 366 389 383 418 By types of transportation:
Air, combined index ..••..••..••.•.••.•.••... do .•.. 468 457 442 464 488 544 594 Commodity. _____ -------------- •••.•.•.•••. do •••. --------- 695 651 641 674 662 731 791 Passenger ...............•..•. ------ ........ do •.•. --------- 319 329 311 326 373 421 464
Intercity motor bus and truck, combined index 1935-39=100 •. 232 225 220 225 220 223 235
For-hire truck ............••........•.•••••. do •... --------- 222 216 207 212 199 202 219 Motor bus. ··--·-····--------·----·-·-----do ..•• --------- 265 254 257 268 290 292 321
Local transit Jinest •..•..•.•••••••••••......•. do •.•. --------- 175 172 177 181 181 180 181 Oil and gas pipe linest ••.•••••••.•.•••.•.••.. do •.•• --------- 224 232 240 246 244 239 249 Railroads, combined index •.•.•••••.•...••••• do •••• 239 238 248 247 248 252 254
Commodity ...•.••..•....•• -------- •••••••. do ..•• ·-------- 213 216 226 224 223 229 227 Passenger ..••...•..... ___ •......•••••..•.•. do ..•. --------- 436 406 417 419 441 428 465
Waterborne (domestic), commodityt ..•..•.•• do ..•. 44 36 40 42 62 83 84 Adjusted indexes:•
Combined index, all typest .• ··----------------do .... 217 219 225 226 228 229 228 Excluding local transit linest •.•••••••••..•. do .... 224 226 232 233 235 237 235
CommoditY---·--·-------------···-····------do ..•• --------- 204 207 212 212 211 214 212 Passengert ...•.•..••.•.••.•••••..•..••.•.•••. do .••• --------- 258 257 265 272 281 279 281
Excluding local transit lines .•••••••••••..•. do ..•. 371 362 376 386 405 400 401 By type of transportation:
Air, combined index •••••..•••.••••.•.••••.• .do ...• -------·- 500 482 457 470 483 537 576 Commodity •••...••..•••.••••••••••••••.••• do •.•• ~--- ....•. 695 651 641 674 662 731 791 Passenger __ ..•......... ___ ..••...........•. do ..••.•.....•. 371 370 334 336 365 409 434
Intercity motor bus and truck, combined index 1935-39= 100 •• ·------·- 231 238 230 235 226 229 229
~~t~~t~~~~===~=: :: ::::::::=:: :::::::=== =~~= = :: 1::::::::: 222 227 214 218 203 206 207 261 274 279 287 301 300 306
• Revised. t See note marked "•".
52,488 1, 497
4. 7 3.6 4. 5 3. 7 5. 3 6.6
3. 94
290 320 110
106 90 86
1,197,188 936,478 130, 197 82,003
I, 839 14,919 4, 656
13,442 19, 537
1,190,137 293,184 90,873
126, 793 18, 415 22,810
7, 745 33, 010 13,435
288,696
226 234 208 287 426
613 797 492
226 191 338 172 246 251 223 467 83
224 230 208 277 394
599 797 469
221 195 308
I
53,077 1, 499
4. 7 3.5 4.5 3. 7 5. 2 6. 7
3. 96
276 320 116
111 93 84
February 1945
52,930 53,087 1, 481 1, 481
4. 7 4. 7 3.5 3.5 4. 5 4. 5 3. 7 3. 6 5. 3 5. 3 6. 7 7.0
3. 95 3. 95 I
27J 2.19 I 319 116 m1 104 122 ! 87 103 i 84 85 I
I
53,59 z 83 1, 4
4. 3. 3
8
6 6
4. 3. 5. 3 6.8
3. 92
269 316 117
121 101 84
'·'"'·"" I' ·"'·""'I''' ro,ooo ''·"'~'" 927, 576 953,923 893, o84 1 901.990 --------- --------- ---------~--------
:::=:===[:=::::::::::::::::::::=: --------- _________ , ________
' --- --------- ---------:--------i;i8o,5-i5- i~is6,:5o2· i;l:i4.722"[ i:ii6,439 302,445 280,365 327, 187 '' 321, 922
--------- ~ - ------.. --------- --------- --------:::::::::1:::::::::1::::::::
--------- --------- :::::::::1:::::::: "297; 4i7 -27s;5oii· "ii3o;278T32:i;779
232 225 229 224 241 238 '236 230 216 214 216 210 286 260 '272 26\} 424 409 '379 371
670 674 '696 676, 884 874 '910 914 529 542 556 522
241 236 236 235 211 216 '221 222 339 303 '283 276 172 179 183 184 250 261 '259 273 256 250 248 241 229 225 227 219 461 447 '417 411 88 86 87 82
225 '223 222 222 232 '229 228 228 211 '207 206 205 272 277 276 278 384 389 '388 392
646 650 '687 694 884 874 '910 914 489 502
539 I 549
231 225 '226 231 211 206 207 214 300 288 '290 287
• New series. For data beginning 1929 for the transportation indexes, see pp. 26 and 27, table 5, of the May 1943 Survey (small scattered revisions have been made in the data beginning 1940 for the series marked "t", as published in the Survey prior to the December 1943 issue; revisions are available on request). Seep. 22 of this issue for annual totals on lend-lease exports for 1941-44; monthly data prior to December 1943 will be shown later.
t For revised data for 1941 and 1942, seep. 22, table 4, of the June 1944 Survey. Preliminary revisions for total exports for 1944 are shown above. § Revised security regulations now permit publication of data for Latin American Republics, Canada, and Mexico on a 6-month delayed basis; publication of totals for the selected
eountries formerly shown in the Survey has therefore been resumed beginning in the August 1944 issue; revised figures for 1941 and data for January 1942 to May 1943 will be published ater. Other country and commodity data formerly included in the Survey may be published only on a 12-montb delayed basis.
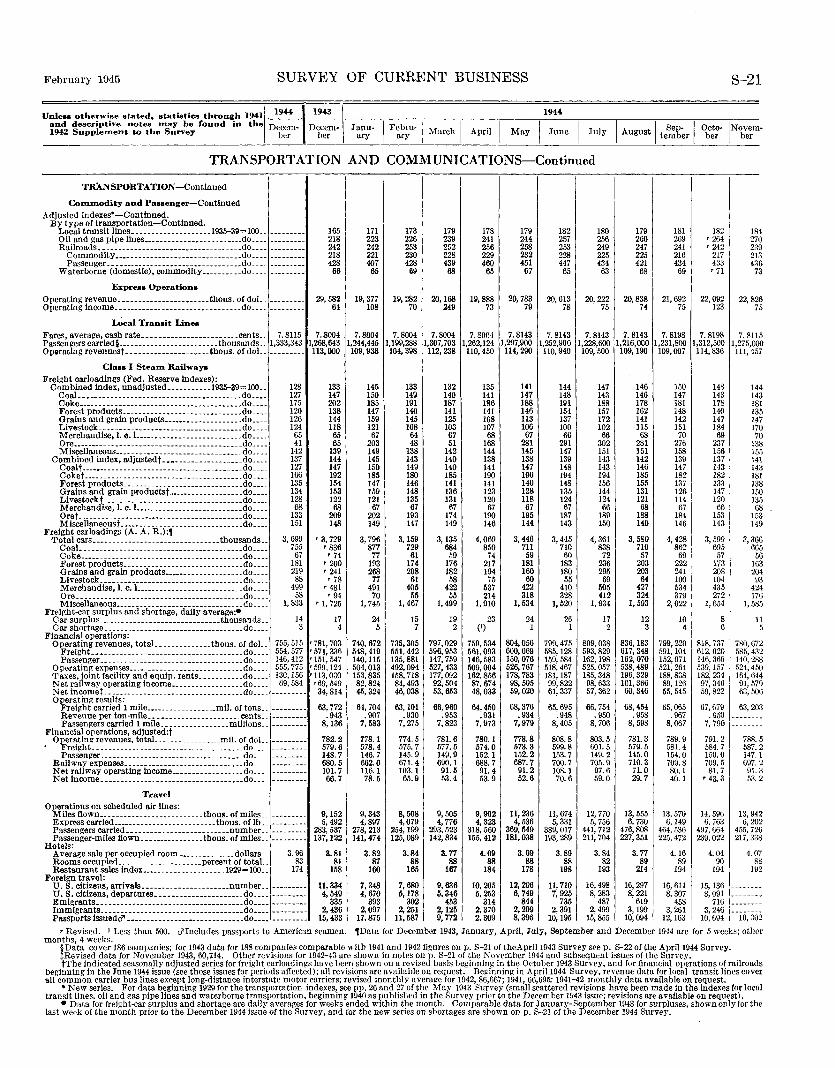
February 1945 SURVEY OF CURRENT BUSINESS
Unless otherwise stated, statistics through 1941~~~~~ and descriptive notes may be found in the Decem· Decem· 1942 Supplement to the Survey ber ber Janu- I Febru-1 March I April I ary ary
1944.
TRANSPORTATION AND COMMUNICATIONS-Continued
TRANSPORTATION-Continued
Commodity and Passenger-Continued
Adjusted indexes*-Continued. By type of transportation-Continued.
Local transit lines. -------------------1935-39= 100 .. --------- 165 171 173 179 178 179 182 180 Oil and gas pipe iines ......................... do ____ --------- 218 223 226 239 241 244 257 256 Railroads ............ ------- •.•• _________ . __ .do. ___ --------- 242 242 253 252 256 258 253 249
CommoditY--------------------------------do .... --------- 218 221 230 228 229 232 228 225 Passenger __ .------ -------------------------do. __ --------- 428 407 428 439 460 451 447 434
Waterborne (domestic), commodity .......... do .... -··------- 66 65 69 68 65 67 65 63
Express Operations
Operating revenue ....................... thous. of doL --------- 29,582 19,377 19,282 20,168 19,888 20,783 20,613 20,222 Operating Income •• _---- _____ -------- •.•......... do .... 64 108 70 249 73 79 78 75
u;cal Transit Lines Fares, average, cash rate ........................ cents __ 7. 8115 7.8004 7.8004 7. 8004 7.8004 7. 8004 7. 8143 7. 8143 7. 8143 Passengers carried§ •••••..•....••• ______ . __ . thousands .. 1,333,343 1,268,643 1,244,445 1,199,288 1,307,703 1,262,124 1,297,900 1,252,900 1,228,600 Operating revenuest---------------------thous. of doL 113,000 109,938 104,398 112,238 no, 450 114,290 110,940 109,500
Class I Steam Railways
Freight carloadlngs (Fed. Reserve indexes): Combined index, unadjusted ........... 1935-39=100 .. 128 133 145 133 132 135 141 144 147
CoaL_·-- __ ..•... ____ .....•.•...•. ___ ...•..•. do ..•. 127 147 150 149 140 141 147 148 143 Coke •••...•.....•.. __ .. __ . __ ...•.•••.. ------ .do ..•. 175 202 185 191 187 186 188 191 188 Forest products ......•....•......... ___ ._. __ .do ... _ 120 138 147 140 141 141 146 154 157 Grains and grain products ••.••.•..........•.. do .... 126 144 159 145 125 108 113 137 172 Livestock .... __ ....•..•.•.•. ______ .•... _____ .do .... 124 118 121 108 103 107 106 100 102 Merchandise, I. c. L ........................ -do .... 65 65 67 64 67 68 67 66 66 Ore ••...•....••......••......•................ do_ ... 41 65 203 48 51 168 281 291 302 Miscellaneous ••..... ___ .••. ------ ...•...••.. _do •.. _ 142 139 149 138 142 144 145 147 151
Combined index, adjustedt--------------------do ... _ 137 144 145 143 140 138 138 139 143 Coalt -------- •...............••.......•• __ . __ .do .... 127 147 150 149 140 141 147 148 143 Coket .••.. _ .... -----------·------------------do .•.. 166 192 185 180 185 190 190 194 194 Forest products_ .........• _.------ •........•. do .•. _ 135 154 147 146 141 141 140 148 156 Grains and grain productst-------------------do •••. 134 153 !59 148 136 123 128 135 144 Livestoekt ....•... _ .• _. __ .•..•......... __ •... do .... 128 122 121 135 131 120 118 124 124 Merchandise, I. c. L •••..... __________________ do .... 68 68 67 67 67 67 67 67 66 Oret ---- ....... --- ...•.•••................• _._do .... 133 209 202 193 174 190 195 187 189 Miscellaneoust ••••• __ .... __ .--------------- .. do .... 151 148 149 147 149 146 144 143 150
Freight car loadings (A. A. R.):1 3, 699 Total cars •.•• __ -------------------- ...... thousands .. '3, 729 3, 796 3,159 3,135 4,069 3,446 3, 445 4, 361
Coal. •........• ------------------ ___ ......... do .... 755 '836 877 729 684 850 711 710 838 Coke .••.......•.. ___ .... __ .......•........... do .••. 67 '74 77 61 59 74 59 60 72 Forest products .•.......•....••.............. do .... 181 '200 193 174 176 217 181 183 236 Grains and grain products ••••••.............. do ____ 219 '241 268 208 182 194 160 180 295 Livestock_------------··--·----------------- .do .... 88 '78 77 61 58 75 60 55 69 Merchandise,!. c. L--------------------------do .... 499 '481 491 405 422 537 422 410 505 Ore .. _._ ..... -- .••.. -- .••.••...........•.•.•. do .•. _ 58 '94 70 55 55 214 318 328 412 Miscellaneous •..... __ ........... -----------_ .do .•. _ 1,833 '1, 725 1, 745 1, 467 1,499 1, 910 1, 534 1, 520 I, 934
Freight-car surplus and shortage, daily average:• 14 15 19 23 26 17 Car surplus _______________________________ thousands __ 17 24 24
Car shortage._ ... __ .....•.. __ ----- •..•...•..... de ... _ 3 4 5 7 2 (') 1 1 2 Financial operations:
755, 515 797,029 804,056 Operating revenues, total .............. thous. of doL. '781, 703 740, 672 735,305 759,534 799,475 809,038 Freight •••... ___ ...................... _ ...... do .... 554,577 '571, 336 548,419 551,442 596,953 561,093 600,069 585, 128 593,829 Pass~nger .•.... __ ....•••. ___ ------------- __ .. do •... 146,412 '151, 547 140, 115 135,881 147,759 146,583 150,076 159,584 162, 198
Operating expenses •..•...••. ___ •.....•• ________ do. __ . 555,775 '599, 124 504,013 492,094 527,433 509,004 526,767 518,467 525,057 Taxes, joint facility and equip. rents ........... do .... 130, 156 •H3, 030 153,835 158,718 177,092 162,856 178,783 181, 187 185,348 Net railway operating income .................. do .... 69,584 •69, 549 82,824 84,493 92,504 87,674 98,505 99,822 98,633 Net in comet ...•• ------------·- ______ ....••.... do ... _ --------- 34,814 45,324 46,038 53, 653 48,033 59,020 61,337 57,362 Operating results:
66,960 68,376 65,695 Freight carried 1 mile ....... ___________ mil. of tons __ --------- 63,772 64,704 63, 101 64,450 66,754 Revenue per ton-mlle _______________________ cents .. .943 0 907 .930 .953 0 931 .934 .948 • 950 Passengers carried 1 mile .•.......... _____ millions .. --------- 8,136 7,583 7,275 7,823 7,973 7,979 8,405 8, 706
Financial operations, adjusted:t 778.8 Operating revenues, totaL __ .. ________ .... mil. of doL. --------- 782.2 778.1 774.5 781.6 780.1 808.8 803.5
Freight .••. ___ .------- ................ _ ..•... do ... _ --------- 579.6 578.4 575.7 577.5 574.0 573.3 599.8 601.5 Passenger __ ....... _ --------------------------do •. __ --------- 148.7 146.7 145.9 149.9 152.1 152.2 153.7 149. 2
Railway expenses •..... ____ --------------------do .. __ --------- 680.5 662.0 671.4 690.1 688.7 687.7 700.7 705.9 Net railway operating income •....••.•......... do .... 101.7 116.1 103.1 91.5 91.4 91.2 108.1 97.6 Net income .................................... do .•.. --------- 66.7 78.5 65.9 53.4 53.9 52.6 70.6 59.0
Travel Operations on scheduled air lines:
Miles flown .......................... thous. of miles __ --------- 9,152 9,343 8, 508 9,505 9,902 11,236 11,674 12,770 Express carried .•.•.... ______ .. ---------- tbous. of lb __ --------- 5,492 4,897 4,079 4, 776 4, 323 4,536 5, 331 5, 756 Passengers carried ................••....•... number .. --------- 283,537 278,213 254, 199 293,523 318,560 369,649 389,017 441,712 Passenger-miles tlown .•..••.•........ thous. of miles .. 137, 122 141,474 125,089 142,834 155,412 181,038 193,289 211,704
Hotels: Average sale per occupied room ___ •... _ ..... _dollars_ 3. 96 ll. 81 3.82 3.84 3. 77 4.09 3.69 3. 89 3.84 Rooms occupied .... __ ---------------Percent of totaL 83 81 87 88 88 88 88 88 82 Restaurant sales index. .................... 1929=100 .. 174 158 160 165 167 184 178 198 193
Foreign travel: 12,206 U. B. citizens, arrivals ...................... number •. --------- 11,334 7,348 7,680 9,636 10,205 11,710 16,498
U. B. citizens, departures •••••..•...••••....... do .... --------- 4,549 4,670 5,178 5,346 5,253 6, 749 7, 925 8,283 Emigrants .•. ____ ..• -------._. __ ...• ---- •.•.•• _do ____ --------- 335 393 302 453 314 844
7351 487
Immigrants ..••. ------- •... ____ •.. -------------do •••.. -------- 2,436 2,097 2, 251 2,125 2,370 2,209 2,391 2,499 Passports lssuedd" ----------------·-------------do ..•• --------- 15,433 17,875 11,587 9, 772 2. 309 8,396 10, 195 15,855
I '
179 181 260 269 247 241 225 216 421 434
68 69
20,838 21,692 74 75
7. 8143 7.8198 1,216,0CO 1,231,800 109, 190 109,007
146 !50 146 147 178 181 162 148 141 142 115 151 68 70
281 276 151 158 142 139 146 147 185 182 155 137 131 126 121 114 68 67
188 184 149 146
3, 580 4,428 710 862 57 69
203 222 203 241 64 100
427 534 324 379
1, 593 2,022
12 10 3 4
836, 183 799,229 617,348 591, 104 162,070 152,971 538,489 521,264 196,329 188,838 101,366 89,126 60,346 55,545
68,454 65,065 0 958 0 967
8, 598 8,067
781.3 789.9 .579. 5 581.4 145.0 154.0 710.3 709.8 71.0 80.1 29.7 40.1
13,555 13, 570 6, 730 6,149
476,808 464,536 227,351 225,472
3. 77 4.16 89 89
214 194
16,297 16,611 8, 221 8, 307
619 458 3,199 3, 261
10,094 12, 163
182 '264 '242
217 433 '71
22,092 123
7. 8198 1,312,500 ll4, 836
148 143 178 140 147 184 69
237 156 137 143 182 133 147 120 66
153 143
3, 599 695 57
173 208 104 435 272
1, 654
8 6
818,737 612,020 146,369 539, 157 182, 234 97, 346 59,822
67,679 0 ~59
7, 790
791.2 584.7 150.0 709.5 81.7
'43.3
14,596 6, 763
497,664 239,022
4.04 90
194
15, 136 8,091
716 3, 246
10,694
S-21
18 4 0 9 3 6 3
27 2:3 21 43 7
22,82 6 5 7
7. 811 5 0 7
1,275,00 Ill, 45
14 14.
4 3 1 5 7 0 0 8 5 1 3 1 8 0 5 8 3 9
18 13, 14 17 7
13 15. 14 14 18 13 15 13 6
15 14
3,36 6 5 6 3 4 3
24
66 5
16 20 9
4 17 6
5 1, 58
1
780, 67' 2 2 585, 43
140, 524,45
288 0 4 g
164,64 91,57 63,50 6
3 &1,20. --------------
788. 587. 147.
5 2 1 2 3 2
697.' 91.0 53.
13,94 6,20
2 2 6 8
455,72 217,33
4. 0 8
19
----------------------------
7 8
10, 30'
'Revised. t Less than 500. d"Includes passports to American seamen. ,Data for December 1943, January, April, July, September and Decemher 1944 are for 5 weeks; other months, 4 weeks.
§Data cover 186 companies; for 1943 data for 188 companies comparable with 1941 and 1942 figures on p. S-21 of theAprill943 Survey s~e p, S-22 of the April1944 Survey. tRevised data for November 1943, 60,714. Other revisions for 1942-43 are shown in notes on p. S-21 of the November 1944 and subsequent issues of the Survey, tThe indicated seasonally adjusted series for freight carloadings have been shown on a revised basis beginning in the October 1943 Survey, and for financial operations of railroads
beginning in the June 1944 issue (see those issues for periods affected); all revisions are available on request. Beginning in Apri\1944 Survey, revenue data for local transit lines cover all common carrier bus lines except long-distance interstate motor carriers; revised monthly average for 1942, 86,667; 1941, 66,695; 1941-42 monthly data available on request.
• New series. For data beginning 1929 for the transportation indexes, see pp. 26 and 27 of the May !943 Survey (small scattered revisions have been made in the indexes for local transit lines. oil and gas pipe lines and waterborne transportation, beginning 1940 as published in the Survey prior to the December 1943 issue; revisions are available on request).
• Data for freight-car surplus and shortage are daily averages for weeks ended within the month. Comparable data for January-September 1943 for surpluses, shown only for the last week of the month prior to the December 1944 issue of the Survey, and for the new series on shortages are shown on p. 8-21 of the December 1944 Survey.
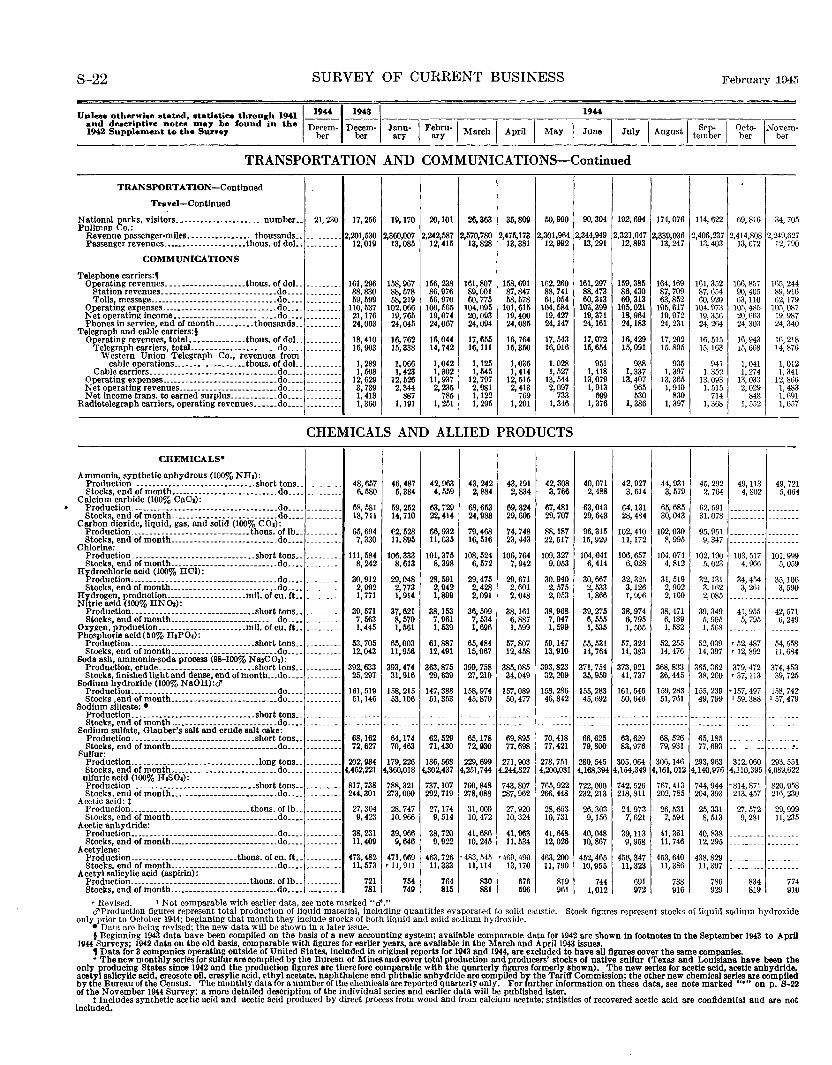
S-22 SURVEY OF CURRENT BUSINESS February 1945
Unle,. otherwiee etated, etatiatiea throu,;h 1941 119« 1 19
•3
1 19
•• and deecriptiYe note• Dlay be found in the Decem- Decem- J I F b I I I I I I I S I 0 t IN 19<i2 Supplement to the Sur..ey ber ber :~- ~r~- March April May June July August teJ~~~r bet 'b~~m-
TRANSPORTATION AND COMMUNICATIONS-Continued
TRANSPORTATION-Continued
Tranl-Contlnued
National parks, visitors.------------------- •. number __ Pullman Co.:
21,230 17,256 19,170 20,101 26,363 35,809 50,990 90,304 192,694
Revenue passenger-miles.---------------_ thousands .• --· ------ 2,201,530 2,360,007 2,242,587 2,570,780 2,475,173 2,301,964 2,344,949 2,321,047 Passenger revenues .•••• ----------------thous. of dol •• 12,019 13,085 12,415 Ia, 828 13,381 12,992 13,291 12,893
COMMUNICATIONS
Telephone carriers:, Operating revenues. -------------------thous. of doL. --------- 161,296 158,967 156,238 161,807 158,691 162,260 161,297 159,385
Station revenues.-------- --------------------do .. __ 88,830 88,578 86,976 89,001 87,847 88,741 88,473 86,430 Tolls, message ________________________________ do ____ --------- 59,599 58,219 56,970 60,775 58,578 61,054 60,313 60,313
Operating expenses. ____________________________ do ____ --------- 110,537 102,066 100,565 104,095 101,615 104,584 103,399 105,021 Net operating income __________________________ do ..•• 21,176 19,765 19,074 20,093 19,400 19,427 19, 371 18,964 Phones in service, end of month __________ thousands •. 24,003 24,045 24,067 24,094 24,085 24,147 24, 161 24,183
Telegraph and cable carriers:§ OJ¥'rating revenues, totaL _____________ thous. of doL. 18,410 16,762 16,044 17,655 16,764 17,543 17,072 16,429
elegraph carriers, totaL __________________ .•. do ____ 16,903 15,338 14,742 16,111 15,350 16,016 15,654 15,091 Western Union Telegraph Co., revenues from
cable operations __________________ thous. of doL 1,289 1,066 1,042 1,125 1,036 1,028 951 938 Cable carriers. __ ----- ___ ------------- __ ---- •. do ..•. 1,508 1,423 1,302 1,545 1,414 I, 527 1, 418 l, 337 Operating expenses. ____________________________ do ____ --------- 12,629 12,526 11,937 12,797 12,515 13,544 13,079 13,407
Net operating revenues-------------------------do ____ 3, 739 2,344 2,235 2,981 2,413 2,097 1, 913 965 Net income trans. to earned surplus ____________ do ____ 1, 413 887 785 1,122 769 733 699 530
Radiotelegraph carriers, operating revenues •.•••• do •••. 1,360 1,191 l, 251 1, 295 1, 201 1,346 1, 376 1, 386
CHEMICALS AND ALLIED PRODUCTS
CHEMICALS•
Ammonia, synthetic anhydrous (100% NH,): Production-------------------------------short tons .. --------- 48,657 46,487 42,963 43,242 43,191 42,308 40,071 42,927 Stocks, end of month ______ ----------- __________ do ____ --------·· 6,580 5,384 4, 559 2,884 2,834 3, 766 2,488 3,614
Calcium carbide (100% CaCs): Production.------------------------------------do ____ --------- 68, 581 59,252 63,729 68,653 69,324 67,481 63,043 64,131 Stocks, end of month ___________________________ do •••• --------- 18,711 14,710 22,414 24,988 29,605 29,707 29,643 28,484
Carbon dioxide, liquid, gas, and solid (100% COs): Production ________ ---------------------- thous. of lb •• 65,694 ~2. 528 66,932 79,468 74.748 88,187 96,315 102, 410 Stocks, end of month---------------------------do ____
Chlorine: --------- 7,330 11,895 11,635 16,516 23,443 22, 517 15,929 11,172
Production _______________________________ short tons •. --------- 111,584 106,333 101,375 108,524 106,764 109,327 104,841 106,657 Stocks, end of month ______ ---------------------do ..•• --------- 8,242 8,613 8,398 6,572 7,942 9, 053 6, 414 6,028
H~~~~~d~~~-~~~~-~~~~-~-~!~: __________________ do ..•. 30,912 29,048 28,591 29,475 29,671 30.940 30,667 32,325 Stocks, end of month ________ --------- __________ do •.•• --------- 2,992 2, 773 2,942 2,428 2, 601 2, 575 2, 533 3,126
Hf.drogen, production ____________________ m!J. of cu. ft •• 1, 771 1,914 1,899 2,091 2,048 2,053 1,866 l, 996 Nitric acid (100% HNO,): Production _______________________________ short tons •• 39,571 37,621 38,153 36,509 38,161 38,968 39,275 38,974
Stocks, end of month·------------------------- .do ..•• --------- 7, 563 8,570 7,961 7,534 6,887 7,047 6, 555 6, 795 Oxygen, production ______________________ m!l. of cu.lt •• 1,445 1,561 1,539 1,696 1,599 1,599 1, 535 1, 505 Phosphoric acid(50% n,po,):
Productlon _______________________________ short tons •. 53,705 65,003 61,887 65,484 57,807 59,147 55,531 57,324 Stocks, end ol month .••.• ----------------------do ____ --------- 12,043 11,956 12,491 15,067 12,458 13,910 14,764 14,383
Soda ash, ammonia-soda process (98-100% Na,cO,): Production, cmde ________________________ short tons .. 392,633 393,474 363,875 399,758 385,085 393,823 371,754 373,921 Stocks, finished light and dense, end of month ... do ..•• 25,297 31,916 29,639 27,210 34,049 32,209 35,959 41,737
Sodium hydroxide (100% NaOH):d" 158,286 Production .. _________________________________ • .do. ___ 161,519 158,215 147,388 158,974 157,089 155,283 161, 546
Stocks ,end of month .•••• ---------- ____________ do •.•. ~ -------- 51,146 53,106 lil, 353 45,870 50,477 46,842 45,692 50,646
Sodium silicate: • Production. ___________________ -----_---_ .short tons .. --------- --------- --------- --------- --------- ---------- --------- ---------Stocks, end ofmonth·-----------------------·--do ..•. --------- --------- --------- --------- --------- --------- --------- --------- ---------
Sodium sulfate, Glauber's salt and crude salt cake: Production._. ___________ ------------- ___ .short tons •• 68,162 64,174 62,529 65,178 69,895 70,418 66,625 63,629 Stocks, end ofmonth ___________________________ do ____ --------- 72,627 70,463 71,430 72,930 77,698 77,421 79,800 83,976
Sulfur: Production .• ____________________ --- __ ---- .long tons._ --------- 202,984 179,226 186,568 229,699 271,903 278,751 280,545 305,064 Stocks, end of month ___________________________ do ..•. --------- 4,462,221 4,360,018 4,302,437 4,251,744 4,244,827 4,200,031 4,168,394 4,154,349
ulfuric acid (100% HtSOt): Production ------------------------------short tons .• 817,738 788,321 737,107 760,848 743,807 765,922 722,000 742, 526 Stocks, end of month ___________________________ do ..•. --------- 244,301 273,000 292,719 278,088 287,962 266,448 232, 213 218,811
Acetic acid: t Production _______ ----------------------- thous. of lb .. --------- 27,304 28,747 27, 174 31,009 27,920 28,663 26,303 24,973 Stocks, end of month ___________________________ do ____ --------- 9,423 10,966 9,514 10,472 10,324 10,731 9,156 7, 621
Acetic anhydride: Production __________________ ---_----- _________ .do. ___ --------- 38,231 39,966 38,720 41,686 41,963 41,648 40,048 39,113 Stocks, end of month---------------------------do ____ --------- 11,409 9,646 9,922 10,245 11,534 12,026 10,867 9, 958
Acetylene: Production---------------------------thous. of cu. ft •. --------- 473,482 471,669 463,726 •483, 545 •469, 490 463,200 452,465 456,347 Stocks, end of month ___________________________ do ____ --------- 11,573 ' ll, 911 11,333 11,114 13, 170 ll, 790 10,955 11,323
Acetyl salicylic acid (aspirin): Production _____ -------------------------thous. of lb •• 721 75. 764 830 676 8191 744 691 Stocks, end ol month ___________________________ do •.•• .... ______ 781 I 749 815 881 596 961 1,012 972
'Revised. 'Not comparable with earlier data, see note marked "d"."
174,076 114,622
2,339,036 2,406,237 13, 247 13, 403
164, 169 161,352 87, 709 87, 654 63,852 60,920
105, 617 104,973 19,972 19,356 24,231 24,264
17,202 16, 515 15. 805 15,163
935 941 I. 397 I, 352
13,365 13,093 1, 940 I, 515
830 714 1, 397 l, 368
44, 931 45, 292 3, 579 2, 764
65,685 62, i\91 30,043 31,078
102,030 95,951 8, 995 9, 347
104,074 102,190 4, 812 5, 023
31,519 32,131 2, 902 3,162 2,100 2, 085
38,471 39,349 6,189 5, 905 1, 582 l, 568
52,255 52,039 14,476 14,397
368,833 365,362 36,445 38,260
159,283 155, 239 51,761 49, 799
------------------------------------
68,526 65, 185 79,931 77, 693
306, 146 293,963 4,161, 012 4,140,976
767,413 744,944 202,785 204,393
26, 531 25,331 7, 594 8, 513
41,361 40,838 11,746 12,295
453,640 438,829 ll, 386 11,397
738 786 916 929
69,816
2,414,808 13,672
166, 857 90,405 63, 110
105,485 20,6f\3 24,303
16,943 15,668
1, 041 1, 274
13,o:n 2,029
848 1, 552
49, 113 4, 802
------------------
------------------103,517
4, 966
34, 454 3, 261
---------41,955
5, 79.5
'52, 487 ,. 12,892
379,472 ' 37, 113
'157, 497 l 59,388
34,70
2,249,62 7 0 12,79
165,24 89.91 62, 17
4 6 9 7 7 0
105,08 19.98 24,34
16,21 14,87
1,01
8 6
I, 341 z 6 3 1 7
12,86 1, 48 1,69 1,65
49,721 5,064
----------------
----------------101,999
5,059
35,106 3, 590
--------42,571 6, 249
54,558 11,684
374,453 39,725
158, 742 I 57,479
----------- --------------
--------- --------312,060 293,551
4,110,395 4,089,622
•814,871 820,958 213,457 216,230
27,572 29,999 9, 281 11,235
--------- ----------------- ----------------- --------
------- --------834 774 819 910
d'Production figures represent total production of liquid material, including quantities evaporated to solid caustic. Stock figures represent stocks of liquid sodium hydroxide only prior to October 1944; beginning that month they include sto~ks of both liquid and solid sodium hydroxide.
• Data are being revised; the new data will be shown in a later issue. § Beginning 1943 data have been compiled on the basis of a new accounting system; available comparaole data for 1942 are shown in footnotes In the September 1943 to April
1944 Surveys; 1942 data on the old basis, comparable with figures for earlier years, are available in the March and April 1943 issues. , Data for 3 companies operating outside of United States, included in original reports for 1943 and 1944, are excluded to have all figures cover the same companies. • The new monthly series for sullur are compiled by the Bureau of Mines and cover total production and producers' stocks of native sulfur (Texas and Louisiana have been the
only producing States since 1942 and the production figures are therefore comparable with the quarterly figures formerly shown). The new series for acetic acid, acetic anhydride, acetyl salicylic acid, creosote oll, cresylic acid, ethyl acetate, naphthalene and phthalic anhydride are compiled by the Tariff Commission; the other new chemical series are compiled by the Bureau of the Census. The monthly data for a number of the chemicals are reported quarterly only. For further information on these data, see note marked "*" on p. 8-22 of the November 1944 Survey; a more detailed description of the individual series and earlier data will be published later.
t Includes synthetic acetic acid and acetic acid produced by direct process from wood and from calcium acetate; statistics of recovered acetic acid are confidential and are not included.
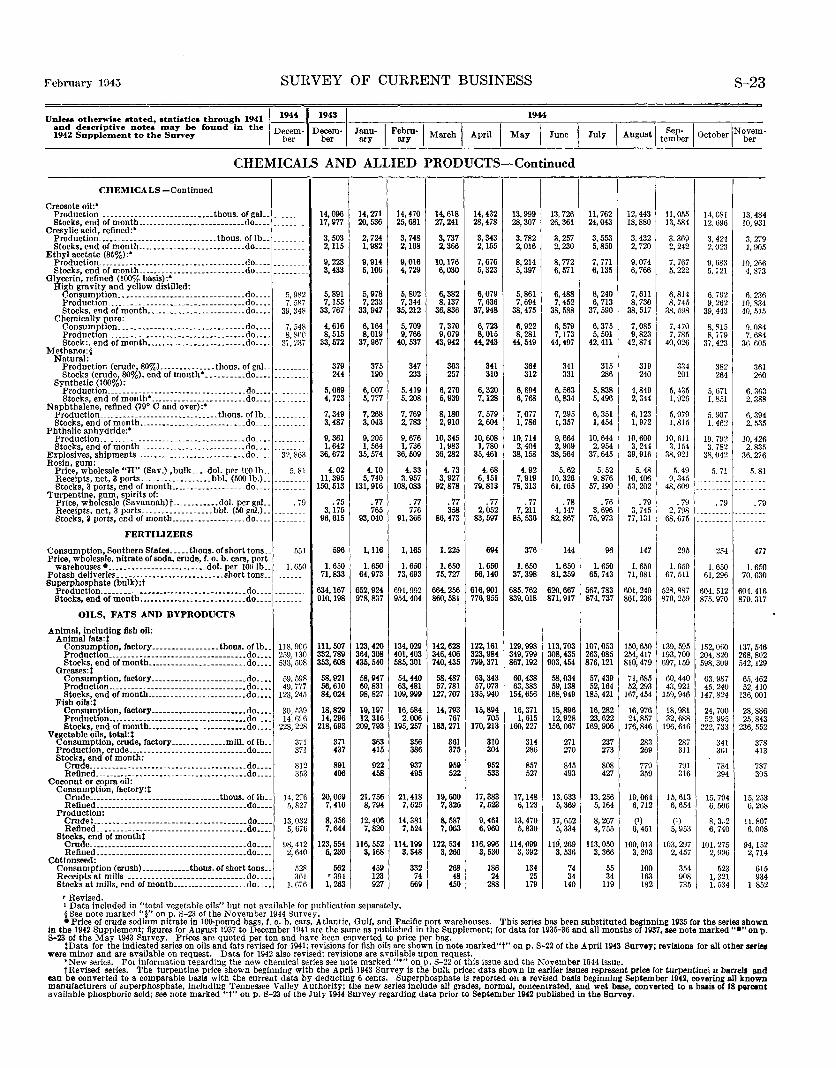
February 1945 SURVEY OF CURRENT BUSINESS
1944 Unless otherwise stated, statistics through 1941 1
1944 ~~~ and descriptive notes may be found in the Decem- Decem~ 1942 Supplement to the Survey ber ber Janu- I Febru-~ March I April I May I June ary ary
CHEMICALS AND ALLIED PRODUCTS-Continued
CHEMICALS -Continued
c reosote oil:• Production _____________________________ thous. or gaL. _ ------· 14,096 14,271 14,470 Stocks, end of month ___________________________ do ..••.. ---- 17, g77 20,536 25,681
Cresylic acid, refined:* Production .•••.. __ ---------------------- thous. of lb .• ---- .. 3, 503 2, 724 3, 748 Stocks, end or month---------------------------do .... ---- ---- 2,115 1, 982 2,108
Ethyl acetate (85%) :• Production. _______ •••.•••. ---- __ ._ •.• ___ •...•.. do. ___ --------- 9,228 9,914 9,016 Stocks, end of month .. -------------------------do •... --------- 3,433 5,106 4, 729
Glycerin, refined (100% basis) :• High gravity and yellow distilled:
5,978 Consumption .•• _------------- ___ .• __ . __ •••.. do ..•. 5. 982 5,891 5, 802 Production _______ ._. __________ ------ __ •...•.. do ..•. 7. 5R7 7, 155 7,233 7,344 Stocks, end of month-------------------------do •.•. 39,348 33,767 33,947 35,212
Chemically pure: 4,616 5, 709 Consumption ... -----------------------------do •.•. 7, 548 6,164
Production _____ . _ •• ------- _ -----_ •.•.....•.• do.--- 8,Rro 8,515 8,019 9, 766 Stock:. end of month _________________________ do .••.
Methanol:§ 3'i, 23i 33,572 37,967 40,537
Natural: Production (crude, 80%!--------------thons. of gaL --------- 379 375 347 Stocks (crude, 80%). end of month* _________ .do •.•. ---· 244 190 233
Synthetic (100%): Production __________ -------------· .• ___ •...•. do ..••. -- ---- 5,069 6,007 5,419 Stocks, end of month*------------------------do ..•. --- ----· 4, 723 5, 777 5,208
Naphthalene, refined (79° C and over):• Production .... -------------------------- thous. of lb .. -- ---- 7,349 7, 268 7, 769 Stocks, end of month ___________________________ do ....
---- ---- 3,487 3,043 2, 783 Phthalic anhydride:•
9, 361 9,205 9,676 Production .. ___ ._ .. _ .. ---- .. __ ._------------ __ .do ..•.. -- ----Stocks, end of month ___________________________ do •••. ---- ---· 1,642 1, 564 1, 736 Explosives, shipments----------------------------do .... 32, 863 36,672 35,574 36,609 Rosin, gum:
4.02 4.10 Price, wholesale "H" (Sav.) ,bulk ..•. dol. per 100 lb .. 5. 81 4.33 Receipts, net, 3 ports __________________ bbl. (500 lb.) .. --------· 11,395 5, 740 3, 957 Stocks, 3 ports, end of month ___________________ do .... -------- 150,513 131,916 108,083
Turpentine, gum, spirits of: Price, wholesale (Savannah)t ....•.•.••• .dol. per gaL .79 0 75 0 77 .77 Receipts, net, 3 ports __________________ bbl. (50 gal.) .. -- ----- 3,175 765 776 Stocks, 3 ports, end of month ___________________ do .... -------- 96,615 93,040 91,366
FERTIUZERS
Consumption, Southern States ..... thons. of short tons .• 551 596 1, 116 1,165 Price, wholesale, nitrate of soda, crude, f. o. b. cars, port
1.650 1.650 1.650 warehouses •-------------------------dol. per 100 lb .. 1, 650 Potash deliveries. __ ------------------------short tons .. ------- 71,833 64,973 73,693 Superphosphate (bulk):t
Production_.---.-------------------------- •••.• do .••. -------· 634,167 652,924 691,992 Stocks, end of month •••••••••••••.•.••••••••••• do ••.. ---- -- 910,198 978,837 954,404
OILS, FATS AND BYPRODUCTS
Animal, including fish oil: Animal fats:t
Consumption, factory _________________ thous. of lb •. !l8. 906 111,507 123,420 134,029 Production .•.. __ ._._._._ ••• ___ • _____ • _____ ••• do._ •• 2!)9, 130 332,789 364,308 401,403 Stoeks, end of month _________________________ do •.•. 533,508 353,608 435,540 585,301
Oreases:t Consumption, factory------------------ __ •.• .do ..•• 59, 59S 58,921 58, g47 54,440 Production ...... __ ._--- ____ ------------- ..•.• do .••• 49. 777 56,610 60,831 63,481 Stocks, end of month _________________________ do ••••
Fish oils:t 123,245 84,024 98,827 109,999
Consumption, factory •••••.•••..•..••..•••••• do •••• 30, 539 18,829 19,197 16,584 Production .••...• _.------- __________ •.•.••••• do. ___ 14.696 14,296 12,316 2,006 Stocks, end of month •.•.•...•.•.•..••.••••••• do •••. 228,228 218,693 209,793 195,257
Vegetable oils, total:t Consumption, crude, factory ______________ mill. oflb •• 371 371 363 356 Production, crude ...•...•.•••.•.•. ____ -------- .do .••• 371 437 415 386 Stocks, end of month:
Crude .. ________ ._ •••••••.• _._._. ____ •••••• _._ do .••• 812 891 922 937 Refined. ________ ._ ••....•.• _._._._ •••.•.•.• _ •. do. __ • 353 406 458 495
Coconut or copra oil: Consumption, factory:t
Crude .. ·------------------------------thous. of lb .• 14,276 20,059 21,756 21,418 Refined--------------------------------------do •••. 5, 827 7,410 8, 794 7, 625
Production: Crudet---------------------------------------do .••. 13,032 8, 356 12,406 14,381 Refined .. __ -----. ______________ •. ____________ do •.•. 5, 676 7,644 7,820 7, 524
Stocks, end of montht Crude ..•• _ •••.••..................••...•.••• _ do •••• 98,412 123,554 116,552 114,199 Refined •••••••• ------------------------------do •••• 2, 640 5,230 3,168 3, 348
Cottonseed: Consumption (crush) ..•...•.••.• thous. of short tons •. 528 562 459 332 Receipts at. mills ------------------------------do ..•• 361 '301 123 74 Stocks at mills, end or montb ___________________ do ...• 1. 676 1. 263 927 669
'Revised. t Data included in "total vegetable oils" but not available for publication separately. §See note marked"§" on p. S-23 of the November 1944 Survey,
14,618 14,432 13,999 13,726 27,241 28,478 28,307 26,361
3, 737 3, 343 3, 782 3, 257 2,366 2,155 2,016 2, 230
10, 176 7,676 8, 214 8, 772 6,030 5,323 5,397 6, 571
6,382 6,079 5,861 6, 488 8, 137 7,636 7,694 7, 452
36,836 37,948 38,475 38,588
7,370 6,723 6, 922 6, 579 9,079 8,015 8, 281 7,173
43,942 44,243 44,549 44,497
363 341 364 341 257 310 312 331
6,270 6,320 6, 694 6, 563 5, 939 7,128 6, 768 6,834
8,180 7,579 7,077 7, 295 2,910 2,604 1, 786 1, 357
10,345 10,608 10,714 9, 664 1, 983 1, 780 2,404 2,909
36,282 35,461 38,158 38,564
4. 73 4.68 4.92 5.62 3,927 6,151 7,919 10,326
92,878 79,813 78,313 61,165
0 77 0 77 . 77 0 78 358 2,052 7, 211 4,147
86,473 83,597 85,536 82,867
1, 225 694 376 144
1.650 1. 650 1.650 1.650 75,727 56,140 37,398 81,359
664,256 616,901 685,762 620,667 860,581 776,955 839,018 871,917
142,628 122, 161 129,998 113,703 346,406 323,984 349,799 308,435 740,435 799,371 867, 192 903,454
58,487 63,343 60,438 58,034 57,781 57,073 63,383 59, 138
127,707 135,940 154,656 168,949
14,793 15,894 16,371 15,896 767 705 1,615 12,928
183,271 170,213 160,227 156,067
361 310 314 271 375 304 286 270
gso 952 857 845 522 533 527 493
19,600 17,383 17,148 13,633 7,326 7,523 6,123 5, 369
8,587 9,461 13,470 17,652 7,063 6,960 5,830 5, 334
122, 534 116,996 114,099 119,269 3, 260 3,530 3, 392 3, 536
268 186 134 74 48 24 25 34
450 288 179 140
S-23
Jul I A I Sep- I b INovem-y ugust tern ber Octo er ber
11,762 12, 443 11,055 24,043 18,880 13,584
3, 5!)3 3,432 3. 369 5,859 2, 720 2, 242
7, 771 9,074 7, 767 6,135 6, 766 5, 222
6, 240 7,611 6,814 6, 713 8, 730 8, 745
37,590 38,517 38, 598
6,375 7,085 7, 470 5, 501 9,823 7, 785
42,411 42,874 40,026
315 319 334 286 240 201
5,838 4,849 5, 435 5,496 2, 344 1, 926
6,351 6,123 5, 979 1, 454 1, 972 l, 815
10,644 10,600 10, 611 2,954 3, 244 3,154
37,645 39,916 38,921
5. 52 5. 48 5. 49 9,876 10,406 9, 345
57, 190 53,202 48,609
0 76 0 79 0 79 3,696 3, 745 2, 798
76,973 77,131 68,675
96 147 295
1. 650 1. 650 1. 650 65,743 71,981 67, 511
567,783 601,240 528,887 874,737 861,236 870,259
107,053 150,650 139,595 263,085 254,417 193,700 876, 121 810,479 697, 159
57,439 71,685 60,440 52, 164 52,293 43,921
185,421 167,454 159, 946
16,282 16,976 18,981 23,622 24,857 32,688
169,906 176,846 196,646
237 283 287 273 269 311
808 779 791 427 359 316
13, 256 19,064 15,613 5, 164 6, 712 6,654
8, 267 (1) (1) 4, 755 6,451 5, 953
113,050 100, 013 103,297 3,366 3, 293 2,457
55 100 354 34 163 908
119 182 735
11, CS1 13,484 12. 696 10,931
3, 424 3, 279 2,023 1, 905
9, 683 10, 266 5.:21 4, 873
6. 792 6. 236 9, 262 10,834
39, 443 40, 51,S
8, ~15 9,084 R, 'i79 7, 684
37,423 36 605
382 361 264 260
5, 671 6, 363 1.851 2, 388
5. 907 6, 394 1. 462 2, 535
10. 792 10,426 3. 782 2, 835
3R, 042 36,2/6
5. 71 5. 81 --------- ----
---- ----
0 79 ------------------
254
]. 650 61,296
604, 512 875.970
1-52,060 204,820 598,309
63.987 45.240
147,824
24,700 52.995
222, 733
341 361
784 294
15, 794 6, 506
8, 3 .. 2 6, 740
101.275 2, 996
523 1, 321 1, 534
--------
0 79 ------
--------
477
1.650 70,630
604.416 879.317
137,546 268,802 542,129
6.0, 462 52, 410
136,001
28,886 25,843
236, 552
378 413
787 30 5
15,25 3 8 6,26
11,80. 6,00
94,15 2, 71
61 93
8
2 4
5 4 2 1 85
• Price of crude sodium nitrate in 100-pound bags, f. o. b. cars, Atlantic, Gulf, and Pacific port warehouses. This series has been substituted beginning 1935 for the series shown in the 1942 Supplement; figures for August 1937 to December 1941 are the same as published in the Supplement; for data for 1935-36 and all months of 1937, see note marked "•" on p. S-23 of the May 1943 Survey. Prices are quoted per ton and have been converted to price per bag.
tData for the indicated series on oils and fats revised for 1941; revisions for fish oils are shown in note marked"t" on p. S-22 of the April1943 Survey; revisionB Cor all other series were minor and are available ou request. Data for 1942 also revised; revisions are available upon request.
*New series. For information regarding the new chemical series see note marked"*" on p. S-22 of this issue and the November 1944 issue. tRevised series. The turpentine price shown beginning with the April 1943 Survey is tbe bulk price; data shown in earlier issues represent price for turpentinei n harrell and
can be converted to a comparable baois with the current data by deducting 6 cents. Superphosphate is reported on a revised basis beginning September 1942, coverinll all known manufacturers of superphosphate, including Tennessee VaHey Authority; the new series include all grades, normal, concentrated, and wet base, converted to a baais of 18 pereent available phosphoric acid; see note marked "t" on p. S-23 of the July 1944 Survey regarding data prior to September 1942 published in the Survey.
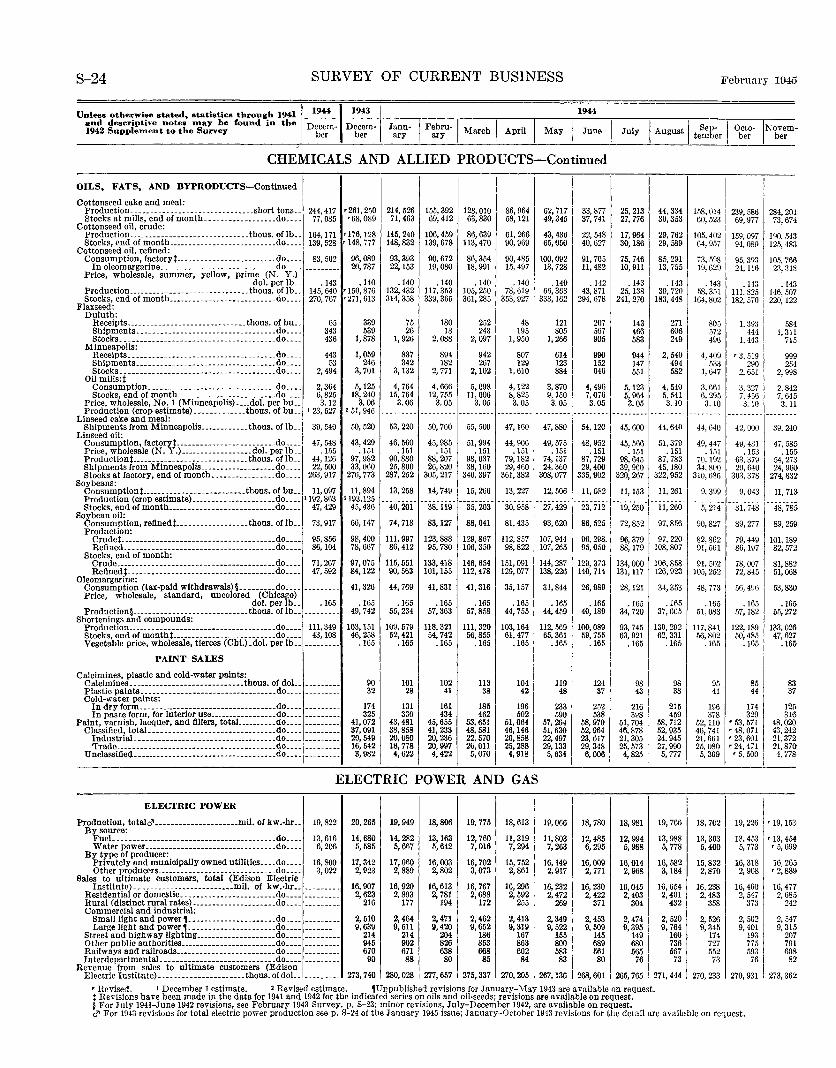
S-24 SURVEY OF CURRENT BUSINESS
Unless otherwise stated, Btatisties through 1941 ~~~~~ and descriptive notes may he found in the Decem- Decem· Janu- I Febru·l I · I 1942 Supplement to the Survey . ber ber ary ary March Apnl May
1944
I June
CHEMICALS AND ALLIED PRODUCTS-Continued
I I I
I I
OILS, FATS, AND BYPROoucrs-contlnued
Cottonseed cake and meal: 155, 392 I 12s, o10 Production ...•......•................•... short tons .. 244,417 •261,250 214, 526 86,964 . 62,717 33,877 25,213 44,334
Stocks at mills, end of month .......•...•...•.. do ...• 77,085 '68, 089 71, 463 69,412 63,830 58, 121 49,345 37, 741 27, 776 30,353 Cottonseed oil, crude:
Production .......•.....•.•.•.....•...... thous. of lb •• 164, 171 '176,128,145, 240 106,459 86,639 61,266 43,436 22, 548 17,964 29, 762 Stocks, end of month ___________________________ do .•.. 139, 528 ' 148, 777 148, 832 139,678 113,470 90,969 65,050 40,627 30,186 29, 589
Cottonseed oil, refined: Consumption, factoryt-------------------------do.... 83,502 96,089 93,393 90,672 86,354 90,485 100,092 91, 705 75, 746 85,291
In oleomargarine ..... _--------------------- .. do. __ . ___ ------ 20,787 22, 153 19,080 18,991 15,497 13,728 11,482 10,911 13, 755 Price, wholesale, summer, yellow, prime (N. Y.)
dol. per lb .. .143 .140 .140 .140 .140 .140 .140 .142 .143 .143 Production ______________________________ thous. of lb .. 145,640 '!50, 876 132,432 117,353 105,250 78,619 66,363 43,871 25, 138 30,720 Stocks, end of month ___________________________ do .... 270,767 •2i1,613 314,358 339,365 361,285 353,927 333, 162 294,678 241,270 183,448
Flaxseed: Duluth:
Receipts ..•. _------------------- ______ thous. of bu .. 65 339 75 180 252 48 121 207 143 271 Shipments. _____ ------------- ________ ----- __ .do. ___ 343 539 26 18 243 19.) 805 567 466 606 Stocks._ -------------------------------------do .... 436 1,878 I, 926 2,088 2, 097 I, 950 1,266 905 583 249
Minneapolis: Receipts. _________________ --------------. ____ do .• __ 443 1,059 837 894 942 807 614 990 944 2, 540 Shipments. ______________ ------------ ___ ..•.• do .• __ 53 246 342 182 267 129 123 !52 147 494 Stocks. __ • _________________ ----- ___ -- __ •• __ .. do .• __ 2,494 3, 701 3,132 2, 771 2,102 1, 610 884 646 551 582
Oil mills:~ Consumption ________________________________ do .••. 2,364 5,125 4, 764 4,666 5,098 4,122 3,870 4, 496 5,123 4, 540 Stocks, end of month _________________________ do .•.. 6,825 18,240 15, 764 12,755 11,006 8,825 9,150 7,076 5, 964 5, 541
Price, wholesale, No.1 (Minneapolis) .... dol. per bu .. 3.12 3.06 3. 06 3. 05 3. 05 3. 05 3. 05 3.05 3.05 3.10 Production (crop estimate) _____________ thous. of bu .. 1 2.3, 527 2 51,946 --------- --------- ----·----- --------- --------- --------- --------- --------
Linseed cake and meal: Shipments from Minneapolis ____________ thous. oflb .. l 30,540 50, 520 53,220 50,760 55,.500 47, 160 47,880 54, 120 45.600 44,640
Linseed oil: Consumption, factoryt-------------------------do .... 47,548 43,429 46,560 45,985 51,994 44,906 49,575 48,952 45,566 51,379 Price, wholesale (N. Y.) __________________ dol. per lb .. .155 .151 .151 .151 .151 .151 .151 . 151 .151 .151 Production~------- ----------------------thous. of lb .. 44,126 97,982 90,880 88,207 98,037 79,182 74,137 87,729 98,645 87, 783 Shipments from MinneapoJis ___________________ do .... 22, 500 33,060 25,800 26,820 38,160 29,460 24,300 29,400 39,960 45,!80 Stocks at factory, end of month. _______________ do .... 263,917 276,773 287,252 305, 217 340,397 361,382 308,077 335,902 320,267 322,952
Soybeans: Consumptiont--------------------------thous. or bu .. 11,097 11,894 13,258 14,749 15, 266 13, 227 12,506 11,082 11, 153 11, 261 Production (crop estimate) _____________________ do .... ll192, 863 '193,125 --------- --------- --------- --------- -------- --------- --------- --------Stocks, eud or month ___________________________ do.... 47,429 45,436 40,201 38, 119 35,203 30,958 27,429 23,712 19,250 11,260
Soybean oil: Consumption, refinedt------------------thous. of lb .. 73,917 66,147 74,718 83,127 88,041 81,435 93,620 86,525 72,852 97,856 Production:
Crudet---------------------------------------do ____ 95,856 98,400 Ill, 997 123,888 129,867 112,857 107,944 96.298. 96,379 97,220 Refiued ______________________________________ do ____ 86,104 78,667 86,412 95,780 106,350 98,822 107,265 95,050 88,179 108,807 Stocks, end of month:
Crude. _______ ._. __ .------------------------_ .do ..•. 71,267 97,075 115,551 133,418 146,654 !51, 091 144,287 129, 373 134,000 106, 858 Refined~-------------------------------------do .... 47,592 84,122 90,563 101, 155 112,478 129,077 138,226 140,714 131, 117 126,923
Oleomargarine: Consumption (tax-paid withdrawals)§ _________ do .... 41,326 44,769 41,831 41,316 35, 157 31,844 26,989 28, 121 34,353 Price, wholesale, standard, uncolored (Chicago)
dol. per lb __ .!65 .165 .165 .165 .165 .165 .165 .165 .165 .165 Production§ _____________ ---------------- tho us. of lb .. --------- 49,742 55, 234 57,363 57,858 44,755 44,459 40,189 34,720 37,665
Shortenings and compounds: Production. ____ ._ ....• ---•••• --•. -----•. -.---.-do.- •• 111,349 103, 151 109,579 118,321 111,320 103, 164 112,569 100,089 93,745 130, 292 Stocks, end of montht---·----------------------do .... 43,108 46,258 52,421 54,742 56,855 61,477 65,361 59,755 63, 921 62, 331 Vegetable price, wholesale, tierces (Chl.).dol. per lb .. .165 .165 .165 .165 .165 .165 .165 .165 .165
PAINT SALES
Calcimines, plastic and cold-water paints: Calcimines _________________________ •••• thous. of doL --------- 90 101 102 113 104 119 124 98 98 Plastic paints. ____________ -------- __ -- ____ --- •. do .... --------- 32 28 41 38 42 48 37 43 38 Cold-water paints:
In dry form .... -----------------------------·-do ..•• 174 131 161 185 196 233 252 216 215 In paste form, for interior use _________________ do •.•. 325 330 434 462 502 590 538 398 459
Paint. varnish, lacquer, and fillers, totaL ..•...... do ...• 41,072 43,481 45,655 53,651 51,064 57,264 58,970 51, 704 58,712 Classified, totaL ___ ------.------------------ ... do ...• 37,091 38,858 41,233 48,581 46,146 51,630 52,964 46,878 52,935
IndustriaL _______ ._ .. --.----------------.-- •. do .... 20,549 20,080 20,236 22,570 20,858 22,497 23,617 21, 305 24,945 Trade. _________ •••.•.•. -•......•...•.•.....•. do .... --------- 16,542 18,778 20,997 26,011 25,288 29,133 29, 348 25,573 27,990
Unclassified._-------------------------------- .. do ..•. 1 .. - _ ..... 3,982 4,622 4,422 5,070 4,918 5, 634 6,006 4,825 5, 777
ELECTRIC POWER AND GAS
ELEcrRIC POWER
Production, totald'---------------------mil. of kw.·hr .• 19,822 20,265 19,949 18,806 19, 775 18,613 19,066 18,780 18,981 19,766 By source:
FueL ______ ----_----------------------- ••.••. do •.•• 13,616 14,680 14,282 13,163 12, 760 II, 319 11,803 12,485 12,994 13,988 Water power_-- __ -- __ ------------·---- __ • ___ .do •.• _ 6,206 5, 585 5,667 5,642 7,016 7, 294 7,263 6, 295 5,988 5, 778
By type of producer: Privately and municipally owned utilities .... do ____ 16,800 17,342 17,060 16,003 16,702 15, 752 16,149 16,009 16,014 16,582 Other producers ______________________ ------ .. do .... 3,022 2, 923 2,889 2,802 3,073 2,861 2,917 2, 771 2, 968 3,184
Sales to ultimate customers, total (Edison Electric Institute) _________________________ miJ. of kw.-hr •• --------- 16,907 16,920 16,613 16,767 16,296 16,232 16,230 16,045 16,654
Residential or domestic .. ----------------------do .... 2, 623 2,893 2, 781 2,688 2, 592 2,472 2,422 2,403 2,401 Rural (distinct rural rates). ____________________ do .... --------- 216 177 194 172 255 269 371 304 432 Commercial and industrial:
Small light and power, ______________________ do ____ --------- 2, 510 2,464 2,471 2,462 2,413 2,349 2,453 2,474 2, 520 Large light and power1----------------------do ..•. ------- 9,639 9,511 9,420 9,652 9, 319 9,522 9, 509 9,395 9, 764
Street and highway lightiug ____________________ do ____ 214 214 204 186 167 155 145 149 160 Other public autborities ________________________ do ..•. --------- 945 902 826 853 863 800 689 680 736 Railways and railroads·-·----------------------do .... 670 671 638 668 602 583 561 565 567 Interdepartmental. ____ -------.---- __ --_ .••.... do._-- 90 88 80 85 84 83 so 76 73
Revenue from sales to ultimate customers (Edison Electric Institute)---------------------- tho us. of doL --------- 273,740 280,028 277,657 275,337 270,205 267,136 268,601 265,765 271,444
'Revised. I December I estimate. 'Revised estimate. ,Unpublished revisions for January-May 1943 are available on request.
Febmary 1045
I I 158,014 I 239, 5861284, 201 60, 5231 69,977 73,674
105, 402 159, 097 190, 543 64, 957 I 94. 089 125, 483
73, 598 i 95, 393 10.5, 766 19,629 24, 116 23,318
.143 .143 I .143 58,351 111,825 I 146, 507
164,802 182, 570 i 220, 122
805 1, ao:; 584 .572 444 I, 311 496 I, 4<13 715
4, 409 '3, .019 999 533 290 254
1,647 2, 651 2, 998
3.661 3, 327 2, 842 6, 295 7, 4.56 7, 645
3. 10 3.10 3.11 ------ --------- --------
44,640 42, 000 39, 24()
·19,447 49,431 47, 585 . 151 . 153 .155
10,1n 63,379 54,273 34,800 29,640 24,960
310,686 303,378 274,832
9. 399 9, 013 11,713
5, 214 --31;748 !"48;785
90,827 89,277 89,259
82,862 79,449 101, 189 91, 56! 86, 197 82,572
91.502 78,007 81,882 105,252 72,845 51,068
48,773 56,496 53,830
. 165 .165 .165 51, 083 57, 182 55,272
117.841 122,189 133, 026 56,802 50,485 47,627
.165 .1U5 .165
95 85 83 41 44 37
196 174 125 378 329 316
52,110 '53, 571 48,020 46,741 '48, 071 43,242 2!,fi61 '23, 601 21,372 25. oso I • 24,471 21,870
5, 369 ' 5, 500 i 4, 778 I
18,702 19, 226
13,303 13, 453 5,400 5, 773
15,832 16,318 2,870 2,908
16,238 16,460 2,483 2, 547
358 373
2, 526 2, 502 9,345 9, 401
174 193 727 775 552 593
73 76
270,233 270,931
r 19,
r 13, '5,
16, '2,
16, 2,
2, 9,
273,
153
454 699
26.> 889
477 685 242
547 315 207 791 608 82
362
t Revisions have been made in the data for 1941 and 1942 for the indicated series on oils and oil-seeds; revisions are available on request. §For July 1941-June 1942 revisions, see February 1943 Survey, p. S-23; minor revisions, July-December 1942, are available on request. d' For 1943 revisions for total electric power production seep. S-24 of the January 1945 issue; January-Octo her 1943 revisions for the detail are available on request.
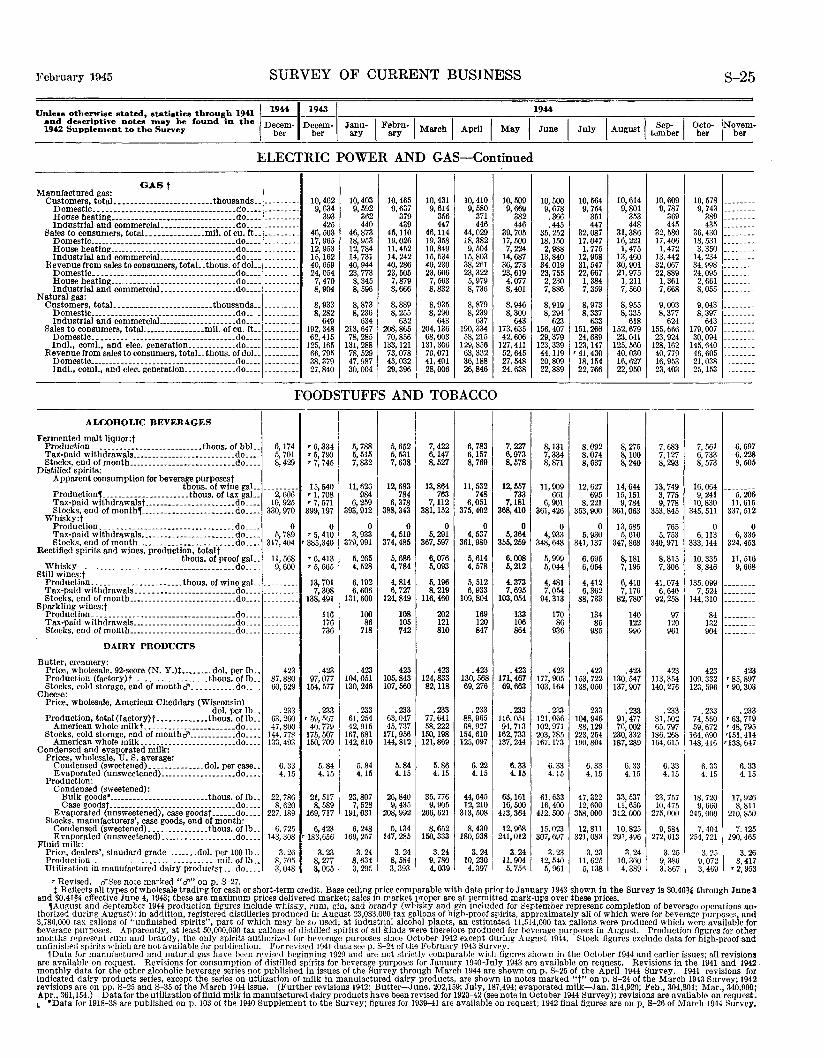
February 1945 SURVEY OF CURRENT BUSINESS
Unle•e otherwise stated, 11tatiRtice through 1941 and d~criptive notes m.ay be found in the 1942 Supplement to the Survey
1
1944,19431 Decem- Decem- Janu- I Febru·l March I April I May
ber ber ary ary
ELECTRIC POWER AND GAS-Continued
Manufactured gas: G.ASt
Customers, totaL •• -------------- •••••••• thousands .. --------- 10,462 10,403 10,465 10,431 10,410 10,509 Domestic._.------------·--------- -----------do ..•• --------- 9,634 9, 592 9,637 9,614 9,580 9,669 House heating _______ --------------------- •••. do ..•. --------- 393 362 379 356 371 382 Industrial and commerciaL ••.•.•.•.•••.•.•.• do .... 425 440 439 447 446 446
Sales to consumers, total _______________ mil. of cu. ft .• --------- 46,503 46,873 45,110 46,114 44,029 39,705 Domestic. _________ ._. _____ • _________________ .do._._ --------- 17,965 18,953 19,026 19,358 18,382 17,500 House heating ____________ ------ ______________ do .••• --------- 12,953 12,784 11,452 10,849 9, 504 7,224 Industrial and commerciaL __________________ .do .... --------- 15,162 14,731 14,242 15,534 15,803 14,687
Revenue from sales to consumers, totaL.thous. of doL. --------- 40,659 40,944 40,286 40,230 38,261 36,273 Domestic •. ______ --------------------- ___ •••. do .•.• 24,054 23,773 23,505 23,606 23,322 23,619 House heating ___________ ---------- __ -------- .do ..•• --------- 7, 470 8,345 7,879 7,563 5,979 4;077 Industrial and commerciaL------------------do .... 8,904 8,596 8, 666 8,832 8, 736 8, 401
Natural gas: Customers, totaL.------------- •• --------thousands .• --------- 8, 933 8,873 8,889 8, 935 8, 879 8, 946
Domestic .... ___ • _____________ ---------- _____ .do .. --------- 8,282 8,236 8,255 8, 290 8, 239 8, 300 Industrial and commerciaL __________________ do ... : 649 634 632 643 637 643
Sales to consumers, totaL _______________ mil. of cu. ft .. --------- 192,348 213,647 208,865 204,136 190,334 173,635 Domestic.-------- • _______ ... ______ •. ____ •.. do .... --------- 62,415 78,285 70,856 68,003 58,215 42,606 Indl., com!., and elec. generatlon ____________ do .... --------- 125,165 131,288 133, 121 131,306 129,856 127,411
Revenue from sales to consumers, totaL. thous. of doL. 66,795 78, 529 73,078 70,071 63,332 52,645 Domestic ..•... -------------------------------do •.•• --------- 38, 379 47,987 43,032 41,401 36,188 27,548 Jndl., com!., and elec. generation .•.•••.•.••.. do •.•• --------- 27,840 30,004 29,396 I 28,006 26,846 24,638
FOODSTUFFS AND TOBACCO
ALCOHOLIC BEVERAGES
I Fermented malt liquor:t Production .. --------------------------thous. of bbL. 6,174 '6,3341 5, 738 5,652 7,422 6, 783 7,227 Tax-paid withdrawals __________________________ do .••. 5, 701 '5, 790 5, 515 5, 531 6, 147 6,157 6,973 Stocks, end of month ___________________________ do .... 8,429 '7, 745 7,832 7,638 8,527 8, 769 8, 578
Distilled spirits: Apparent consumption for beverage purposest
thous. of wine gaL. --------- 15,540 11,626 12,683 13,864 11,532 12,557 Production, ______________________ thous. of tax gaL 2,606 '1, 708 984 784 763 748 733 Tax-paid withdrawalst.----------------------do ...• 10,925 '7, 571 6, 259 6, 378 7,112 6,051 7,181 Stocks, end of month, ________________________ do .•.. 330,970 399, 197 393,912 388,343 381, 152 375,402 368,410
Whisky:t Production. ___ ------------------------------do .... 0 0 0 0 0 0 0 Tax-paid withdrawals ________________________ do ..•• 5, 789 '5, 410 3, 933 4, 510 5, 291 4, 537 5,364 Stocks, end of month _________________________ do ..•. 317,404 '385,340 379,991 374,485 367,597 361,980 355,259
Rectified spirits and wines, production, totalt 6,008 thous. of proof gaL ll, 568 '6,413 5, 265 5,686 6,076 5,614
Whisky __ . __ . _______________ ---- __ ------ ______ .do .... 9, 600 '5,665 4,528 4, 784 5,093 4, 578 0, 212 Still wines:t
Production .. ---------------------thous. of wine gaL. --------- 13, 701 6,192 4, 814 5,196 5, 512 4,373 Tax-paid withdrawals. ___ • --------------------do .... 7, 308 6,606 6, 727 8, 219 6, 933 7,695 Stocks, end of month ___________________________ do .••. --------- 138,491 131,600 124,849 116,460 109,804 103,054
Sparkling wines:t Production. ____ -------------------------------do .... --------- 116 100 108 202 169 133 Tax-paid withdrawals __________________________ do .... --------- 176 86 105 121 120 106 Stocks, end o/ month ___________________________ do .... --------- 736 718 742 810 847 864
DAIRY PRODUCTS
Butter, creamery: Price, wholesale, 92-score (N. Y.)t •.•••.•. dol. per lb •• 423 .423 .423 423 .423 .423 .423 Production (factory)t _ ------------------thous. of lb .. 87,380 97,077 104,051 105,843 124,833 130,568 171,467 Stocks, cold storage, end of monthci' ___ .•...... do .... 60,529 154,577 130, 246 107.560 82, 118 69, 276 69,663
Cheese: Price, wholesale, American Cheddars (Wisconsin)
dol. per lb .• . 233 .233 .233 . 233 .233 . 233 . 233 Production, total (factory)t. ------------thous. of lb .. 63,260 '59, 567 61,254 63,047 77,641 88,965 1!6, 051
American whole mllkt. ----------------------do .... 47,800 40,779 42,915 45,737 58,222 68,927 94,713 Stocks. cold storage, end of monthci'------------do ..•• 144, 77~ 175,507 167, 681 171,956 150, 198 154, 6!0 162,733
American whole milk ________________________ do ..•• 133,493 150,709 142,610 144,812 121,869 125,097 137,244 Condensed and evaporated milk:
Prices, wholesale, U.S. average: Condensed (sweetened) ______________ dol. per case •• 6. 33 5.84 5.84 5.84 5. 86 6. 22 6.33 Evaporated (unsweetened) ___________________ do •.•• 4.15 4.15 4.15 4.15 4.15 4.15 4.15
Production: Condensed (sweetened):
Bulk goods*-------------------------thous. of lb .• 22,786 21,517 23,807 26,840 35,776 44,645 63, 161 Case goodst __ . ____ •. __ •. ______ .• ________ .. .do. ___ 8, 620 8, 589 7, 528 9, 435 9, 905 12, 210 16,500
Evaporated (unsweetened), case goodst ..•... do .••. 227, 189 169, 717 191,031 208,992 266, 621 313,508 413,364 Stocks, manufacturers', case goods, end of month:
Condensed (sweetened). ______________ thous. of lb .. 6, 725 6, 423 6, 248 6,134 8,652 8, 430 12,968 Evaporated (unsweetened) ___________________ do .... 143, 308 '183,656 169, 257 147,285 150,333 180,938 241,012
Fluid milk: Price, dealers', standard grade .....••. dol. per 100 lb .• 3. 26 3. 231 3. 24 3. 24 3.24 3.24 3. 24 Production _____ --------------------------.mil. of lb •• 8, 705 8, 277 8,634 8,584 I 9, 780 10,230 11,904 Utilization in manufactured dairy productst ... do .... 3,048 3, 065 3, 295 3, 393 I 4,039 4, 397 5, 7513
'Revised. ci'See note marked "ci'" on p. S-27.
1944
10,500 10,564 10,614 9,678 9, 754 9, 801
.366 351 353
.445 447 448 35,252 32,087 31,386 18,150 17,047 16,221 2,988 1, 775 1, 475
13,840 12,958 13,460 34.019 31,547 30,901 23,755 22,667 21,975 2, 230 1, 384 1, 211 7,886 7,359 7, 560
8, 919 8,973 8, 955 8, 294 8, 337 8, 335
623 633 618 156,407 151,266 152,679 29,379 24,689 23,041
123,339 123,147 125,560 44,119 '41,430 40,030 20,809 18, 154 16,627 22,389 22,766 22,950
8,131 8,092 8,275 7, 334 8,074 8,100 8, 871 8, 637 8,240
11,909 12,627 14,644 661 695 15,151
6, 901 8, 221 9, 784 361,426 353,900 361,063
0 0 13,585 4, 933 5,930 5,610
348,648 341, 137 347,868
5, 999 6, 695 8,181 5,044 6,054 7,195
4,481 4, 412 6,410 7,054 6,362 7,176
94,313 88,733 82, 780"
170 134 140 86 85 122
936 985 996
.423 .423 .423 177,905 153,722 130,547 103,164 138,050 137,907
. 233 233 .233 121,066 104,946 91,477 102,971 88, 129 76,002 203,785 223,254 230,332 167,173 190,804 187,289
6. 33 6.33 6. 33 4.15 4. 15 4.15
61,633 47,322 33,537 16,400 12,600 11,650
412,500 358,000 312,000
15,023 12,811 10,825 30i, 697 321,083 291,496
3. 23 3. 23 3. 24 12,540 ll, 625 10,360
5, 961 5,138 4, 389
10,609 10, 578 9, 787 9, 743
369 389 445 435
32,580 36,430 17,406 18,531 1,472 3, 350
13, 442 14, 234 32,067 34,998 22,889 24,095
1, 361 2, 661 7,668 8,055
9,003 9,043 8,377 8,397
624 643 155, 666 179,007 23,924 30,094
128, 162 145,640 40,779 46,605 16,953 21,038 23,403 25, 153
7,683 7, 561 7,127 6, 733 8,293 8, 573
13,749 16,064 3, 775 9, 241 9, 778 10,830
353,845 345, 511
765 0 5, 753 6, 1!3
340,971 333,144
8,815 10, 335 7,306 8,846
41,074 13.5, 099 6,640 7, 524
92,258 144,310
97 84 120 132 961 904
423 423 1!3, 354 100,332 140,276 123, 596
. 233 . 233 81,502 74,560 65,797 59,672
186,268 164,690 164,615 148,416
6.33 6. 33 4.15 4.15
23, 757 18,720 10,475 9, 660
275,000 24.5, 000
9, 584 7,404 272,613 254, 721
3. 25 3. 2!) 9,380 9,072 3. 867 3, 469
S-25
--------------------------------------------------·----------------------------------------------
------------------------------------------------------------------ -----
-
6, 697 6,228 8, 505
--------5, 206
1!,615 337,512
0 6, 335
324,453
11,516 9, 668
------------------------
------------------------
423 '85, 897 '90, 303
. 233 '63, 719 '48, 795 '151, 41 4
7 '138, 64
6.33 4. 15
17,92 6
0 8, 811
210,85
7,125 190, 465
3. 2 8,41
6 7 3 '2, 95
~Reflects all types of wholesale trading for cash or short-term credit. Base ceiling price comparable with data prior to January 1943 shown in the Survey is $0.46~o through June3 and $0.41% effective June 4, 1943; these are maximum prices delivered market; sales in market proper are at permitted mark-ups over these prices.
,August and September 1944 production figures include whisky, rum, gin, and brandy (whisky and gin included for September represent completion of beverage operations authorized during August); in addition, registered distilleries produced in August 23,083,000 tax gallons of high-proof spirits, approximately all of which were for beverage purposes, and 3,786,000 tax ;mllons of "unfinished spirits", part of which may be so used; at industrial alcohol plants, an estimated 11,514,000 tax gallons were produced which were available for beverage purposes. Apparently, at least 50,000,000 tax gallons of distilled spirits of all kinds were therefore produced for beverage purposes in August. Production figures for other months reprPsent rum and brandy, the only spirits authorized for beverage purposes since October 1942 except during August 1944. Stock figures exclude data for high-proof and unfinished spirits which are not available for publication. For revised 1941 data seep. S-24 of the February 1943 Survey.
tData for manufactured and natural gas have been revised beginning 1929 and are not strictly comparable with figures shown in the October 1944 and earlier issues; all revisions are available. on request. Revisions for consumption of distilled spirits for beverage purposes for January 1940-July 1943 are available on request. Revisions in the 1941 and 1942. monthly data for the other alcoholic beverage series not published in issues of the Survey through March 1944 are shown on p. S-25 of the April 1944 Survey. 1941 revisions for indicated dairy products series, except the series on utilization of milk in manufactured dairy products, are shown iu notes marked "t" on p. S-24 of the March 1943 Survey; 1942 revisions are on pp. S-25 and S-35 of the March 1944 issue. (Further revisions 1942: Butter-June, 202,159; July, 187,494; evaporated milk-Jan. 314,920; Feb., 304,804; Mar., 340,999; Apr., 361,154.) Data for the utilization of fluid milk in manufactured dairy products have been revised for 1920-42 (see note in October 1944 Survey); revisions are available on request. L •Data for 1918-38 are published on p. 103 of the 1940 Supplement to the Survey; figures for 1939-41 are available on request; 1942 final figures are on P. S-26 of March 1944 Survey.
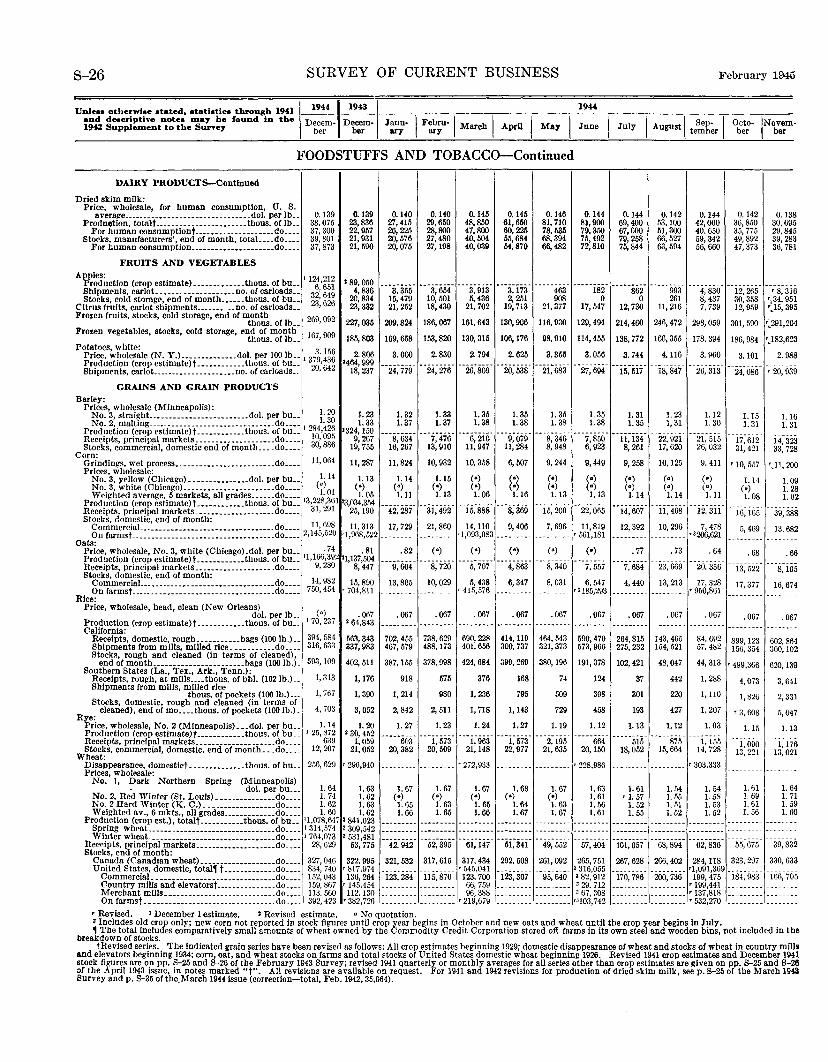
S-26 SURVEY OF CURRENT BUSINESS February 1945
Unleoa otherwioe etated, atatiotica through 1941 ~~~ 1943 I 1944
and deacriptive note• Dlay he found in the Decem· Decem· Janu 1 Febru I I I I l I I S I 0 t IN m 1942 SuppleD>ent to the Suney ber ber ary • ary • March AprU May June July August te,;b~r be~- ~~ ·
FOODSTUFFS AND TOBACCo-Continued
DAIRY PRODUCTS-Continued
Dried skim milk: Price, wholesale, for human consumption, U. S.
average .....•.•.•••••.•••••.•••..•••••. dol. per lb •• Production, totalt ..••...•..••••••••••.•• thous. of lb ••
For human consumptiont ....•••.....•.•...•. do .... Stocks, manufacturers', end or month, total. .•• do .••.
For human consumption .••.•••.•.•••.•..•.•. do .••.
FRUITS AND VEGETABLES
0.139 38,075 37,300 39,801 37,873
Apples: 1 124 212 Production (crop estimate) .•••••.•••••. thous. of bu.. 6 • 651 Shipments, carlot. .•....•..•••.••.••. no. of carloads.. 32• 649 Stocks, cold storage, end of month .•.•.. thous. of bu.. 23• 626 Citrus fruits, carlot shipments ......•... no. of carloads.. •
Frozen fruits, stocks, cold storage, end or month 269, 092 thous. of lb .. Frozen vegetables, stocks, cold storage, e~%o~s~r'lt~. 167,909
0.139 23,836 22,957 21,931 21,590
227,035
185,803
0.140 27,415 26,225 20,576 20,075
209,824
169,658
0.140 29,650 28,800 27,480 27,198
186,067
153,820
0.145 48,850 47,800 40,504 40,039
161,643
130, 315
0.145 61,650 60,225 55,684 54,870
130,906
106,176
0.146 81,710 78,535 68,394 66,482
116,930
98,910
0.144 81,900 79,350 75,492 72,810
129,494
114,455 Potatoes, white: 3 150 Price,wholesale(N.Y.) .••.••••••.••. dol.perlOOib .. 13.9 436 2.806 3.000 2.830 2.794 2.625 3.355 3.056
0.144 69,400 67,000 79,258 75,844
214,460
138,772
3. 744
0.142 53.100 51,300 66,527 63,594
0.144 42,000 40.650 59,342 56,660
0.142 36,850 35, 775 49,892 47,373
0.138 30,695 29,845 39, 283 36,781
246,472 298, 059 301, 590 •,291,204
166,355 178, 394 186, 984 •)82,623
4.116 3. 960 3.101 2. 988 Production (crop estimate)t .•.•••...... thous. of bu.. ~0 •642 2464,999 • .• • •...........•.....••.•........•.....•....... Shipments, carlot.. ..••.•..•..•••.• _ •. no. of carloads.. • 18, 237 .. 24, 779- 24, 276 26, 809 20, 538 21, 683 27, 694 .. i5;5i7. --is; 847 --26; 3i3- ·-24; osii. ·; 2o, 939
GRAINS AND GRAIN PRODUCTS Barley:
Prices, wholesale (Minneapolis): 1 20 No.3, strai15ht ..•..••..••.•••.•••.••..• dol. per bu.. 1· 30 No. 2,_maltmg ...•..............•••...•.•..••. do .••• 1 284 426 Prod~ctwn (cr'?P estimate)t ..••.•••..•• thous. of bu.. 10 •09,
Recetpts, prmctpal markets ......••••••.....••. do.... 30
• 88
(, Stocks, commercial, domestic end of month .... do.... •
1. 23 1. 33
'324, 150 9,267
19,755
1.32 1.37
1. 33 1.37
1. 35 1.38
Corn: 11, 064 Grindings, wet process •.......•••••••.••....••. do.... 11,287 11,824 10,932 10,358
1.35 1. 38
6, 507
1. 35 1. 38
9, 244
1. 35 1. 38
9,449
1. 31 1. 35
9, 258
1. 23 1, 31
10, 125
1.12 1. 30
21.515 26,032
9. 411
1. 15 1. 31
17,612 31,421
1. 16 1. 31
14,323 33,728
' 10, 557 '.11, 200 Prices, wholesale: 1. 14 No.3,yellow(Chkago) ••••...•••.•••• dol.perbu •. () 1.13 1.14 1.15 (•) (•) (•) (•) (•) (•) (•) 1.14 1.09
No .. 3, white (Chicago) ...•.••.•.•..•....••••. do.... ~ 01
(•) (•) (•) (•) (•) (•) (•) (•) (•) (•J (•) 1. 28 Wetgh_tedaverage,_5markets,allgrades .••... do ..•. ,
3228
361 1.05 1.11 1.13 1.06 1.16 1.13 1.13 1.14 1.14 1.11 1.08 1.02
RProd~ctwn (crop esttmate)t~-----------thous. odrbu .... '31 :W1 23'~'3J4o --42,-287-- --ai,-492- --i5,-88f ---s.-369- --i5.-200- --22,-065- -·1·4·,·6·0·7-- --1-i,-46_8 __ --1-2.·3·1-i- --------- ---ecetpts, principal markets ...•••.•.•••••.•.•.. o.... • ,1 16,165 39,388
Stocks, dom_estic, end of month: 11 698 CommerctaL ..•..•••••••.••.•.•••••.•.•••... do .••.
2 145 520 11,313 17,729 21,860 14,110 9, 406 7, 696 11,819 12,392 10, 296 7, 478
On farmst .....••.......•..••..•..••••••••.... do .••. • • •1,968,522 _________ •1,093,083 ·-------- _________ '561,181 -----·--- _________ ''206,621 5, 469 13,682
Oats: Price, w)tolesale, No, 3, white (Chicago).dol. per bu .. 11166 ~~2 2
.81 ProductiOn (cr<!P esttmate)t .•••••..••.• thous. of bu.. •
9 280
1,137,504 Receipts, prmctpal markets .•.•••.••..•••••••.. do.... • 8, 447
.82 (•) (•)
St~~~~~rcl~~~~~·-~~-~-~~~~~-t~= .•••.•••••••.•.. do.... 14,982 15,890 13,805 10,029 S, 438 6, 347 8, 031 6, 547 Onfarmst ..•.•....•..••..•••.•....••.••••.... do .•.. 750,454 •704,811 --·-·---- _________ '415,576 ·-------- _________ ''185,293
Rice: Price, wholesale, head, clean (New Orleans)
dol.perlb__ (•) .067 .067 . 067 .067 . 067 .067 .067
. 77 .73 . 64
7, 684 23,669 20.356
4,440 13,213 17,328 '950,861
. 067 .067 . 067 Production (crop estimate)t ..•••...•••• thous. of bu .. 1 70,237 2 64,843 --------- --------- -------·- --------- --------- --------- --------- --------- ---------California:
. 68 .66
13, 522 8,105
17, 377 16,674
. 067 .067 -----------------
Receipts, domestic, rough .•..•...••. bags (100 lb.).. 394, 584 563,343 702, 455 738, 629 690, 228 414, 119 464, 543 590,470 264,815 143, 465 84. 692 899, 123 602, 864 Shipments from mills, milled rice ..••..••... do.... 316, 633 337,983 467, 579 488, 173 401, 656 300, 737 321,373 573,966 275, 232 154, 521 57, 482 156,354 300, 102 Stocks, rough and cleaned (in terms of cleaned),
end of month ...••..•••.••••••..•... bags (100 lb.). 593,109 402, 511 387.155 378,998 424,684 399,269 380, 196 191,378 102,421 48,047 44, 313 , 499,366 620, 13g Southern States (La., Tex., Ark., 'l'enn.):
Receipts, rough, at mills .... thous. of bbl. (162lb.).. 1, 313 Shipments from mills, milled rice
1,176
thons. of pockets (100 lb.)... 1, 767 Stocks, domestic, rough and cleaned (in terms of
1,390
Rye: cleaned), end of mo •••. thous. of pockets (100 lb.)_ 4, 703 3,052
Price, wholesale, No.2 (Minneapolis) .•. dol. per bu .. Production (crop estiruate)f ••••••..•••. thous. of bu .. Receipts, principal markets ..•.•.....•••...•... do ... . Stocks, commercial, domestic, end of month ... do ... .
Wheat:
1.14 1. 20 1 25, 872 2 30, 452
639 l, 059 12, 207 21,052
Disappearance, domestict ....••••..••.. thous. of bu .. 256,629 '296,940 Prices, whoiMale:
No. 1, Dark Northern Spring (Minneapolis) · dol. per bu... 1. 64 1. 63
No.2, Red Winter (St. Louls) .....•••••••... do.... 1. 74 1. 62 No.2 Hard Winter (K. C.) ...•..•...•..••... do.... 1. 62 1. 63
918
1, 214
2, 842
1. 27
1. 67 (•) 1. 65 1.66
575
980
2, 511
1. 23
1. 67 (•) 1.63 1.65
376
1,236
1, 718
1.24
'2i2,933
1. 67 (•) 1. 65 1.66
168
795
1,143
1.27
1.68 (•)
1.64 1.67
74
509
729
1.19
1. 67 (•) 1. 63 1. 67
124
398
458
1.12
'228,986
1. 63 1. 61 1. 56 1. 61
37
301
193
1. 13
1. 61 '1.57
1. 52 1. 55
442 1, 288
220 1,110
427 1, 207
1.12 1.03
--------- '303,333
1.54 !. 55 1. 51 1. 52
1.54 1.58 1. 53 1. 52
4, 073
1, 826
'3, 608
1. 15
1,090 13,221
1. 61 I. 69 I. 61 I. 56
3, 641
2, 331
5,047
1.13
1,176 13,021
1. 64 1.71 1. 59 I. 60 Weighted av., 6 mkts., all grades ...••........ do.... 1. 60 1. 62
Production (crop est.), totalt .••.••••••• thous. of bu .• 11,078,647 • 841,023 ••..•......•.•........•..•...•.•.... ----···-- ......•.....••..••.....•............ _________ --------Spring wheat ....••.•.••..•...•••.•••••..••.. do .••• 1314,574 '309,542 ...•...•..••••••••.•.•••••..••••••••....•.•....•..•......•...............•.•..... ---·----- ....... .
R!i~t;:, ;~~~~iiiii"iiiaili:eis::::::::::::::::::::~g:::: 1 7~i:g~~ 2 5li;i~~ ··42:942· ··52;395· ··oi;i47- ·-51;341. ··49;552· --57;4o4- ·ioi;ii57. --68;894. --62;836- --55;675- --39;832 Stocks, end of month:
Canada (Canadian wheat) ........•.••....... do .... United States, domestic, total, t ............. do .•..
Commercial. .•...••••..•.. _ ..•••••••••••.. do •.•• Country mills and elevatorst ...•••.•...•... do .•.. Merchant mills .••....••.•.•••..........•.. do .••. On farmst •....•••.••..•••••••.••.......... do .•..
327,046 834, 740 152, 043 !59, 867 113, 560 392,423
322.995 '817,974 136,264
'145,454 112. 130
'382,726
321, 532 317, 615 317, 434 ------- •545,041
123,284 115, 870 123, 700 --------- --------- 66,759 --------- -------·- 96,388 --------- ---------·•219,679
292. 508 261,092 265, 751 - ---------------- '316,055 123,307 95, 640 a 82,912
--------- -·--·--·- 3 29,712 . --------- 3 67,308
--·------ --------- •'103,742
267, 628 266, 402 284, 118 323, 297 330, 633 --------- --------- •1,091,369 --·------
170, 786 200, 736 199, 475 184,983 166, 705
::::::::1::::::: :mJt~ ::::::::: :::::_:= 'Revised. • December 1 estimate. 2 Revised estimate. • No quotation. 3 Includes old crop only; new corn not reported in stock figures until crop year begins in October and new oats and wheat until the crop year begins in July. , The total includes comparatively small amounts of wheat owned by the Commodity Credit Corporation stored ot! farms in its own steel and wooden bins, not included in the
breakdown of stocks. tRevised series. The indicated grain series have been revised as follows: All crop estimates beginning 1929; domestic disappearance of wheat and stocks of wheat in country mills
and elevators beginning 1934; corn, oat, and wheat stocks on farms and total stocks of United States domestic wheat beginning 1926. Revised 1941 crop estimates and December 1941 stock figures are on pp. S-25 and S-26 of the February 1G43 Survey; revised 1941 quarterly or monthly averages for all series other than crop estimates are given on pp. 8-25 and S-26 of the April 194~ issue, in notes marked "t". All revisicns are available on request. For 1941 and 1942 revisions for production of dried skim milk, seep. S-25 of the March 1943 Survey and p. 8-35 of the. March 1944issue (correction-total, Feb. 1942, 35,064).
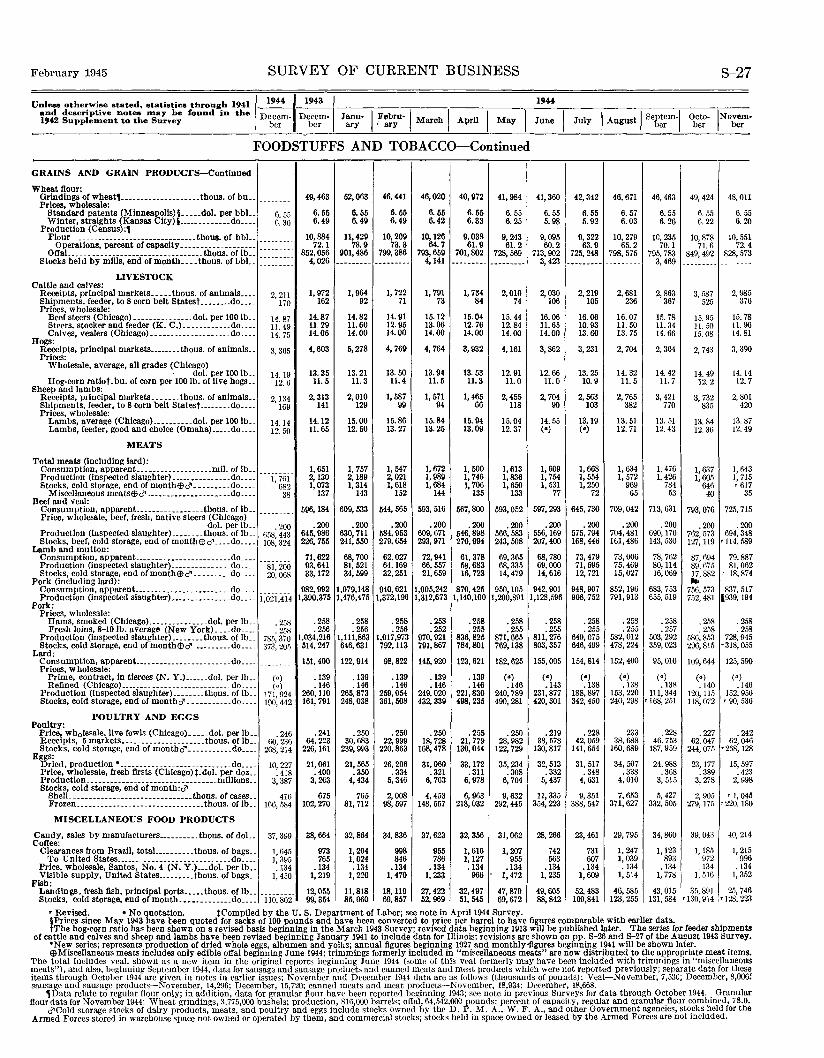
February 1945 SURVEY OF CURRENT BUSINESS
Unleu otherwise stated., statistics through 1941 and descriptive notea may be found in the 1942 Supplement to the Survey !>er ber ary • ary 1
1944,1943 I Decem- Decem-, Janu- I Febru-1 March I April I May I
----------------------------------~----~
FOODSTUFFS AND TOBACCO-Continued
GRAINS AND GRAIN PRODUCTS-Continued
Wheat flour: Grindings of wheat1--------------------thous. of bu .. --------- 49,463 52,063 46,441 46,020 40,972 41,984 Prices, wholesale:
Standard patents (Minnea8olis) §_ •••• dol. per bbL. 6. 55 6. 55 6.55 6. 55 6. 55 6.55 6. 55 Winter, straights (Kansas ity)i _____________ do ..•. 6. 30 6.49 6.49 6.49 6.42 6.33 6.25
Production (Census):1 Flour ... ---------------------------thous. of bbL. 10,884 11,429 10,209 10,126 9,038 9, 243
Operations, percent of capacitY------------------- 72.1 78.9 73.3 64.7 61.9 61.2 OffaL .... ---------------------------- tbous. of lb .. 852,056 901,486 799,386 793,659 701,802 728,569
Stocks held by mllls, end of month •••. thous. of bbL. 4,026 --------- --------- 4,141 --------- ---------LIVESTOCK
Cattle and calves: Receipts, principal markets ..... thous. of animals ____ 2, 211 1, 972 1,964 1, 722 1, 791 1, 734 2,010 Shipments, feeder, to 8 corn belt Statest ________ do •.•. 170 162 92 71 73 84 74 Prices, wholesale:
Beef steers (Chicago) _______________ dol. per 100 lb __ 14.87 14.87 14.82 14.91 15.12 15.04 15.44 Steers, stocker and feeder (K. C,) ____________ do ____ II. 49 11.29 11.60 12.95 13.06 12.76 12.84 Calves, vealers (Chicago) ____________________ do ____ 14.75 14.06 14.00 14.00 14.00 14.00 14.00
Hogs: Receipts, principal markets .•••••.. thous. of animals .. 3, 365 4,603 5,278 4, 769 4, 764 3,932 4,161 Prices:
Wholesale, average, all grades (Chicago) 13.94 dol. per 100 lb .. 14.19 13.35 13.21 13.50 13. 53 12.91
Hog-corn ratiot. bu. of corn per 100 lb. of live hogs .. 12.6 11.5 11.3 11.4 11.5 11.3 11.0 Sheep and lambs:
Receipts, principal markets ....... tho us. of animals .. 2,134 2,313 2,010 1, 587 1, 571 1,465 2,455 Shipments, feeder, to 8 corn belt Statest ........ do .... 169 141 129 99 94 66 118 Prices, wholesale:
15.84 Lambs, average (Chlcago) .......... dol. per 100 lb .. 14.14 14.12 15.00 15.86 15.94 15.04 Lambs, feeder, good and choice (Omaha) ..... do .... 12.50 11.65 12.50 13.27 13.25 13.09 12.37
MEATS
Total meats (Including lard): 1,672 Consumption, spparent. .................. mil. of lb .. 1, 651 1, 757 1, 547 1, 500 1, 613
Production (inspected slaughter)_ .............. do .... I, 761 2,130 2,189 2,021 1, 989 1, 746 1,836 Stocks, cold storage, end of month$d" ......... do .... 682 1,073 1, 314 1,618 1,684 1, 706 1,650
Miscellaneous meats$d" ..................... do .... 38 137 143 152 144 135 133 Beef and veal:
Consumption, apparent. ................ thous. of lb .. --------· 596, 184 609,533 544, 565 593, 516 567,800 593,052 Price, wholesale, beef, fresh, native steers (Chicago)
dol. per lb .. . 200 .200 .200 .200 .200 .200 .200 Production (inspected slaughter) ___ .. ___ tho us. of lb .. 658,443 645,986 630,711 584,953 609,671 546,898 566,583 Stocks, beef, cold storage, end of month$d" .... do .... 108,324 226,755 241,550 279,654 293,971 270,994 243,508
Lamb and mutton: Consumption, apparent .... ___ ................. do .... 71,622 68,700 62,027 72,941 61,378 69,365 Production (inspected slaughter) .............. .do .... 81,200 93,641 81,521 64,169 66,557 58,683 68,335 Stocks, cold storage, end ofmonth$d" ......... do .... 20,068 33,172 34,599 32,251 21,659 16,723 14,479
Pork (Including lard): Consumption, apparent ________________________ do .... 982,992 1,079,148 940,621 1,005,242 870,425 950,105 Production (inspected slaughter) ............... do .... 1,021,414 1,390,375 1,476,475 1,372,196 1,312,673 1,140,100 1,200,891
Pork: Prices, wholesale:
Hams, smoked (Chlcago) ............... dol. per lb .. . 258 .258 .258 .258 .258 .258 .258 Fresh loins, 8-10 lb. average (New York) .... do .... . 25R . 256 . 256 .256 .252 .255 .255
Production (inspected slaughter) ........ thous. oflb __ 785,370 1,034,216 1,111,863 1,017,973 970,921 836,825 871,665 Stocks, cold storage, end of monthE!ld"----------do .... 373, 20.1 514,247 646,631 792,113 791,867 784,801 769,138
Lard: Consumption, apparent ............ ________ .... do .... --------- 151, 400 122,914 98,822 145,920 123, 621 182,625 Prices, wholesale:
Prime, contract, In tlerces (N, Y.) ...... dol. per lb .. (•) .139 .139 .139 . 139 .139 (•) Refined (Chicago) ________ -------------- ____ .. do .... (•) .146 .146 .146 .146 .146 .146
Production (inspected slaughter) ........ thous. of lb .. 171,924 260, 110 265,873 259,054 249,020 221,830 240,789 Stocks, cold storage, end of monthd" ........... do .... 100,442 161, 791 248,038 361,508 432,339 498,235 490,281
POULTRY AND EGGS Poultry:
Price, wh0 Jesale.live fowls (Chicago) .... _dol. per lb .. . 246 .241 . 250 .250 . 250 • 255 . 250 Receipts, 5 markets ..................... thous. of lb .. 60, 236 64,223 30,683 22,999 18,728 21,779 28,982 Stocks, cold storage, end of monthd" ........... do .... 268,214 226,161 239,993 220,863 168,478 130,044 122,729
Eggs: Dried, production • .. __________________________ do .... 10,227 21,061 21,565 26,206 31,060 33,172 35,234 Price, wholesale, fresh firsts (Chicago):. dol. per doz .. . 418 .400 .350 .334 .321 . 311 .308 Production ................... _ •.... ____ .... millions._ 3,387 3, 263 4,434 5,346 6, 763 6, 978 6, 704 Stocks, cold storage, end of month:d"
ShelL .............................. thous. of cases .. 416 675 765 2,008 4,453 6,963 9,632 Frozen ................................ tho us. of lb .. 166, 584 102,270 81, 712 98,597 148,557 218,032 292,445
MISCELLANEOUS FOOD PRODUCTS
Candy, sales by manufacturers .......... thous. of doL. 37,399 Coffee:
38,664 32,864 34,836 37,623 32,356 31,062
Clearances from Brazil, totaL ......... thous. of bags .. 1,645 973 1,204 998 955 1, 616 1,207 To United States ....... ______________________ do ____ I, 3P5 765 1,024 846 786 1,127 955
Price, wholesale, Santos, No.4 (N. Y.) ... dol. per lb .. .134 .134 .134 .134 .134 .134 .134 Visible supply, United States ......... thous. of bags .. 1, 450 1, 219 1, 220 1,470 1, 233 966 1,472
Fish: Landtn~s. fresh fish, principal ports ..... thous. of lb .. 12,055 11,818 18, 119 27,422 32,497 47,879 Stocks, cold storage, end of month ............. do .... 110,802 99,354 85,060 69,857 52,969 51,545 69,672
• Revised. • No quotation. tCompiled by the U.S. Department of Labor; see note in Aprll1944 Survey.
1944
41,360 42,342 46,671
6. 55 6. 55 6.57 5.98 5. 92 6.03
9,095 9, 322 10,279 60.2 63.9 65.2
713,902 725,248 798,575 3,423 --------- ---------
2,030 2,219 2,681 106 105 236
16.06 16.06 16.07 11.65 10.93 11.50 14.00 13.60 13.75
3, 862 3,231 2, 704
12.66 13.25 14.32 11.0 10.9 11.5
2, 704 2,563 2, 765 90 103 382
14.55 13.19 13.51 (•) (•) 12. 71
1, 609 1, 668 1, 634 1, 754 1, 554 1, 572 1, 531 1,250 969
77 72 65
597,293 645,730 709,042
.200 . 200 .200 556, 169 575,794 704,481 207,400 168,446 161,486
68,780 73,479 73,006 69,000 71,595 75,469 14,616 12,721 15,027
942,901 948,907 852, 196 1,128,596 906,752 791,913
. 258 . 258 . 258
.255 .255 . 255 811,276 649,075 582,012 803,357 646,499 478,224
155,005 154,814 152,400
(•) (•) (•) .143 .138 .138
231,877 188,897 153,220 420,301 342,450 240,298
.219 . 228 233 38,578 42,059 38,688
130,817 141,654 160,689
32,513 31, 517 34,507 . 332 . 348 .338
5, 437 4, 631 4,010
11,335 9, 351 7,653 354,223 388,547 371,627
28,266 23,461 29,795
742 731 1, 247 563 607 1, 039
.134 .134 .134 1, 235 1,609 1, 514
49,605 52,483 46,585 88,842 109,841 123,255
46,463
6.55 6.26
10,235 70.1
795,783 3, 469
2, 863 367
15.78 11.34 14.66
2, 304
14.42 11. 7
3, 421 770
13. 51 12.43
1, 476 1, 426
784 53
713, 631
.200 690, 170 143,530
78,762 80, 114 16,069
683,753 655,519
. 258
.257 503,292 359,023
95,010
(•) .138
111,344 '168, 251
. 228 46, 753
187,959
24,988 .368
3, 515
5, 427 332,505
34,860
1,123 893
.134 1, 778
43,015 131, 584
49,424
6. 55 6. 22
10,878 71.6
849,492 ---------
3, .187 525
!5. 95 11.50 15.08
2, 743
!4. 49 12.2
3, 732 835
13.84 12.30
1,637 1, 60.5
646 40
793,076
.200 762,573 127, 119
87,694 89,675 17,882 ..
756.573 752,481
. 2.58
.258 586,853 296,815
109,644
(•) . 140
120, 115 118,072
. 227 62,047
244,075
23, 177 . 389
3, 278
2, 905 279, !7.5
39, 043
1,185 972
. 134 1, 516
35,891
S-27
48,01
6. 5 5 6. 20
10,55 1 4 3
72. 828,57
--- ---
2, 98 37
5 6
15.7 8 96 11.
!4. 8
3, 39
14.1 12.
1
0
4 7
2, 80 I 20 4
13.8 !2. 4
1,64 I, 71 '61
3
3 5 7 5
725,71
694,34 '114, 58
200 8 9
79,88 81,06
' 18,87
837,51 (939, !9
7 2 4
7 4
.25
.2 728,94
•318,05
8 58
5 5
125,5 90
(•) .14
152,95 '90, 53
6 6 6
. 24 2 6 8
62,04 •268, 12
15,59 .42
2, 99
'1,04 •220. 18
7 3 8
5 0
40, 21
I, 21
4
5 6 4 2
99 . 13
1,35
25,74 6 23 '130, 914 ,'}28, 2°
§Prices since May 1943 have been quoted for sacks of 100 pounds and have been converted to price per barrel to have figures comparable with earlier data. tThe hog-corn ratio has been shown on a revised basis beginning in the March 1943 Survey; revised data beginning 1913 will be published later. The series for feeder shipments
of cattle and calves and sheep and lambs have been revised beginning January 1941 to include data for Illinois; revisions are shown on pp. S-26 and S-27 of the Aurust 1943 Survey. •New series; represents production of dried whole eggs, albumen and yolks; annual figures beginning 1927 and monthly•figures beginning 1941 will be shown later. $Miscellaneous meats includes only edible offal beginning June 1944; trimmings formerly included in "miscellaneous meats" are now distributed to the appropriate meat items.
The total includes veal, shown as a new item in the original reports beginning June 1944 (some of this veal formerly may have been included with trimmings in "miscellaneous meats"), and also, beginning September 1944, data for sausage and sausage products and canned meats and meat products which were not reported previously; separate data for these items through October 1944 are given in notes in earlier issues; November and December 1944 data are as follows (thousands of pounds): Veal-November, 7,53C; December, 8,006! sausage and sausage products-November, 14,296; December, 15,i20; canned meats and meat products-November, 18,934; December, 18,668.
,Data relate to regular flour only; in addition, data for granular flour have been reported beginning 1943; see note in previous Surveys for data through October 1944 .. Granular fiourdata for November 1944: Wheat grindings, ~.775,000 bushels; production, 816,000 barrels; offal, 64,.542,000 pounds; percent of capacity, regular and granular flour combmed, 78.0,
d"Cold storage stocks of dairy products, meats, and poultry and eggs include stocks owned by the D.P. M.A., W. F. A., and other Government agencies, sto.cks held for the Armed Forces stored in warehouse space not owned or operated by them, and commercial stocks; stocks held in space owned or leased by the Armed Forces are not mcluded.
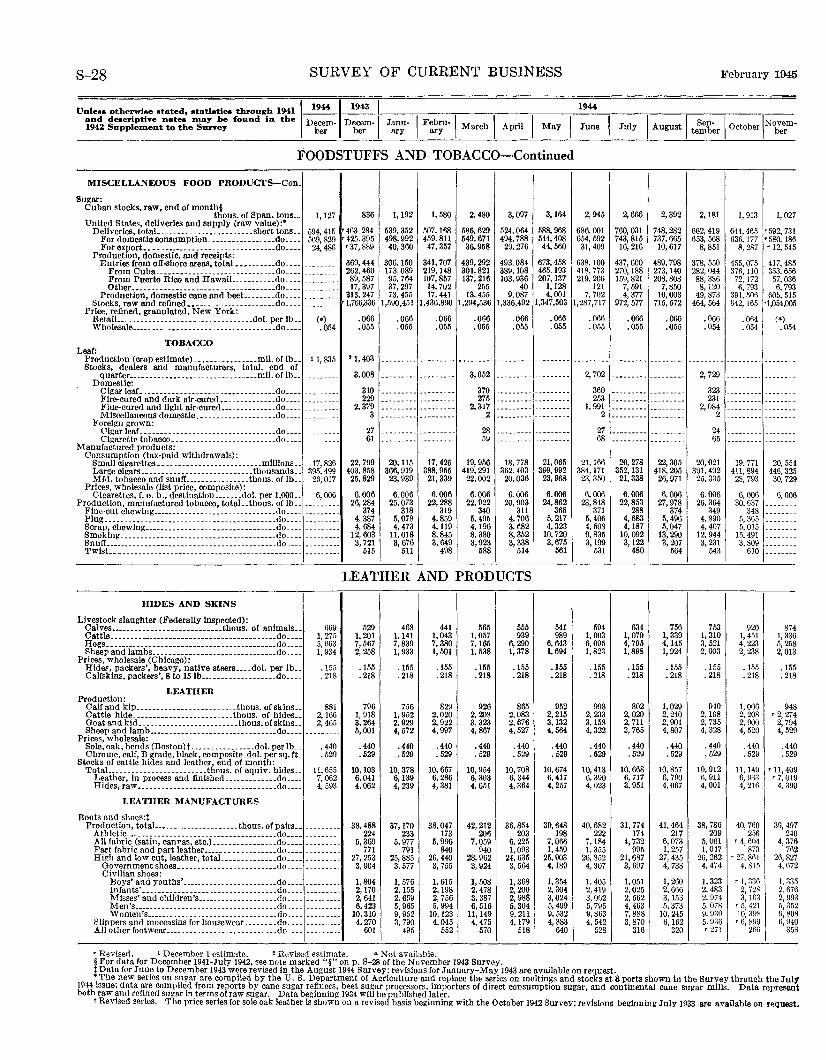
S-28 SURVEY OF CURRENT BUSINESS February 1945
Unless o~herwise sta~ed, s~tls~ics through 1941 1 1944
and descriptive ne~es may be found in ~he Decem-1942 Supplement ~o ~he Survey ber
1943 1 1944 Decem-~--J-an-u--'lc-F-eb_r_u __ -,c-M-a_r_c_h-.,-A-p_r_i_l ,..,-M_a_y-.,.,-Ju_n_e-.-,-J-u-ly-TI_A_u_g_u_s_t ,,-S-e-p-----.,-0-c-t-ob_e_r,,-N-o-v-em--
ber ary ary tember ber
FOODSTUFFS AND TOBACCO-Continued
MISCELLANEOUS FOOD PRODUCTS-Con.
Sugar: Cuban stocks, raw, end or month§
thous. of Span. tons ... 1,127 United States, deliveries and supply (raw value) :•
Deliveries, totaL .............. ________ .short tons .. 594,415 For domestic consumption .. ____ ........... do .... 5ti9, 829 For export .... -------------- ____ . ___ ....... do .... 24,486
ProductiOn, domestic, and receipts: Entries from off-shore areas, total .......... do .... ---------
From Cuba .......... __________ .......... do .... ---------From Puerto Rico and Hawa!L ......... do .... ---------Other ...... _ ........... __ .... _ ........... do .... ---------
Production, domestic cane and beet ........ do .... ---------Stocks, raw and refined ...................... do ....
Price, refined, granulated, New York: RetaiL .. ---------------------------- .. dol. per lb .. (•) Wholesale ............................ _ ....... do .... .054
TOBACCO Leaf:
Production (crop estimate) ................ mil. of lb.. 11,835 Stocks, dealers and manufacturers, total, end of
quarter-------------------------- ...... mil. or lb .. Domestic:
Cigar leaf. ----------------- ................ do .... _______ __ Fire-cured and dark air-cured .............. do .... ________ _ Flue-cured and light alr-cured .............. do .... ________ _ Miscellaneous domestic ... _________________ do .... ________ _
Foreign grown: Cigar leaL._---------- ... __ ................ do .... __ ... _ .. . Cigarette tobacco ........ __________ . _____ .. do .... ________ .
Manufactured products: Consumption (tax-paid withdrawals):
Small cigarettes _________ ---------- _____ .. millions .. Large cigars .. __ .. _____________ ....... __ thousands .. Mfd. tobacco and snuff .. ______________ thous. of lb ..
Prices, wholesale (list price, composite):
17,826 395.499 26,017
Cigarettes, f. o. b., destination ....... dol. per 1,000.. 6,006 Production, manufactured tobacco, totaL.thous. of lb .. ---------
Fine-cut chewing ____________________ ........... do .... ________ _ Plug.------------ __________ . ___ ................ do .... ________ _ Scrap, chewing ________________ ................. do .... ______ .. . Smoking _____ ........... _ .... _ ...•..• __ ........ do ... ________ . _ Snuff ..................... _ ... ___________ ....... do .... _____ . __ _ Twist..----------------------_------- ______ .-------- ______ . __ _
HIDES AND SKINS
Livestock slaughter (Federally inspected): Calves ............................ thous. of animals .. f\69 Cattle .. __ ............................ ____ .. __ .. do .... 1,27.0 Hogs .......................................... _do._ .. 5,663 Sheep and lambs __ .------------ _____ ........... do ____ 1, 934
Prices, wholesale (Chicago): Hide~. packers', heavy, native steers .... dol. per lb .. . 155 Calfskins, packers', 8 to 15lb ................... do .... .218
LEATHER Production:
Calf and kip ....................... _. thous. of skins .. 881 Cattle hlde ......................... thous. of hides .. 2,166 Goat and kid .. ______ ... ________ ...... thous. of skios .. 2, 465 Sheep and lamb ............ _______ ............ .do ....
Prices, wholesale: Sole, oak, bends (Boston)t ____ ............ dol. per lb._ .440 Chrome, calf, B grade, black, composite. dol. per sq. ft. . 529
Stocks of cattle hides and leather, end of month: TotaL .. ______________________ thous. of equiv. hides .. 11,655
Leather, In process and finished ............. do .... 7, 062 Hides, raw .... -------- ___ .. ______ ----------- .do .... 4, 593
LEATHER MANUFACTURES
Boots and shoes:t Production, totaL .............. ------· tho us. of pairs .• ---------Athletic ____ ..... ___ ... ____ . ____ • _________ • __ .do .. __
All fabric (satin, canvas, etc.) ................ do .... Part fabric and part leather .................. do ....
---------
High and low cut, leather, totaL ............. do .... Government shoes •. ____ . ___ ....... _____ ... do ....
---------
Civilian shoes: Boys' and youths' _____ ...... ___________ .. do .... ---------Infants' ______ .. _________ ----------- _____ .do __ .. ---------Misses' and children's .................... do .... ---------Men's------------------------------------do .... ---------Women's _________________________________ do .... ---------
Slippers and moccasins for housewear ........ do .... ---------All other footwear ............................ do .... ---------
836 1, 192 1, 580
'463. 284 539,352 507, 168 '425. 395 498,992 459,811 •37, 889 40,360 47,357
369,444 306,150 341,707 262,460 173,089 219, 148 89,587 95, 764 107, 857 17,397 37, 297 14,702
313,247 73, 455 17,441 '1,766,336 1,590,451 1,436.890
.066 .066 .066
.055 .055 .055
'1, 403
3.008 -~-- ----- ---------310 --------- ---------229 --------- ---------
2,379 --------- ---------3 --------- ---------
27 --------- ---------61 --------- ---------
22,799 20, 115 17,425 403,858 366,919 388,955 25,829 23,939 21,339
6.006 6.006 6.006 26,284 25,073 22,288
374 318 319 4, 387 5,078 4,859 4, 684 4,473 4,119
12,603 11.018 8,845 3, 721 3,676 3,649
515 511 498
LEATHER AND
529 468 441 }, 201 1, 141 1,043 7,567 7,839 7, 380 2, 258 1, 933 1, 501
.155 .155 .155
.218 .218 . 218
796 756 829 1, 918 1, 952 2,020 3, 264 2.929 2, 922 5,001 4,572 4, 997
.440 .440 .440
.li29 .529 . 529
10,103 10,378 10,667 6,041 6,139 6, 286 4,062 4, 239 4, 381
38,488 37, 170 38,047 224 233 173
5,369 5, 977 5, 996 771 791 840
27, 2.53 25,885 26, 440 3, 904 3,577 3, 755
1,804 1, 576 1, 615 2,170 2, 155 2,198 2, 641 2, 659 2, 756 6,423 5, 965 5, 994
10, 310 9, 952 10,123 4.270 3, 790 I 4.045
601 495 552
'Revised. t December 1 estimate. 'Revised estimate. • Not available.
2, 480 3,097
586,629 524,064 549,671 494,788 36,958 29.276
439,292 493,084 301,821 389, 108 137,216 103.936
255 40 13,455 9,087
1,294,536 1,336,492
.066 .066
.055 .055
3,052 ---------370 ---------275 ---------
2,317 ---------2 ---------
28 ---------59 ---------
19,956 18,778 419,291 362.403 22,002 20,036
6.006 6.006 22,922 20,903
340 311 5, 495 4. 706 4,196 3, 682 8, 380 8, 352 3,923 3,338
588 514
PRODUCTS
I 565 555
1, 057 939 7, 165 6,290 1, 538 1, 378
.155 .155
.218 . 218
926 865 2, 208 2,083 3, 323 2, 676 4, 867 4,527
.440 .440
. 529 . 529
10,954 10,708 6, 303 6, 344 4, 651 4, 364
42,212 36,854 206 203
7,059 6, 225 940 1, 093
28,962 24,635 3, 924 3, 564
1,508 1,368 2,478 2,200 3, 387 2, 988 6, 516 5,304
11,149 9, 211 4, 475 4,179
570 518
§For data for December 1941-July 1942, see note marked"§" on p. S-28 of the November 1943 Survey.
3,164 2, 945
588,968 686.001 544,408 654,592 44,560 31,409
673,458 638. 100 465, 193 418, 773 207, 137 219, 206
1, 128 121 4,001 7, 702
1,347,503 1,287,717
.066 .066
.055 .055
--------- 2, 702
--------- 360 --------- 253 --------- 1, 991 --------- 2
--------- 27 --------- 68
21,065 21, 166 399,992 384, 171 23,968 23,350
6.006 6.006 24,862 23,848
365 371 5, 217 5,406 4,323 4, 508
10,720 9,835 3,675 3,199
561 531
541 594 989 1, 003
6, 643 6,095 1,694 1, 823
.155 .155
.218 . 218
952 998 2, 215 2, 233 3,132 3,158 4, 564 4,322
.440 .440
. 529 . 529
10,674 10,413 6,417 6,390 4, 257 4, 023
39,648 40,682 198 222
7,066 7, 184 1,459 1, 355
25,903 26,852 4,189 4, 307
1,354 1, 405 2, 304 2, 419 3,024 3, 062 5,499 5, 795 9,532 9,863 4,383 4, 542
640 528
2,666 2,392 2, 181 1, 913 1, 027
760,031 748,282 662,419 644,465 '592, 731 743,815 737,665 653, 568 636, 177 •580, 186 16,216 10,617 8,851 R, 287 '12, 545
437,600 489,798 378,550 455,075 417,485 270, 188 273, 140 282,044 376, 110 3.53. 656 159,821 208,808 88,386 72, 172 57, 036
7, 591 7,850 8,120 6, 793 6, 793 4,377 10,003 49,873 391,506 fiOb, 515
972,577 715,572 464,564 642, !65 rl,054,005
.066 .066 .066 .Ofl4 (•)
.055 .055 .054 .054 .054
--------- --------- 2, 729
--------- --------- 323 --------- --------- 231 --------- ----------------- --------- 2,084 --------- --------- 2
--------- --------- 24 --------- --------- 65
20,278 22,305 20,021 19. 771 20,554 352, 131 418,205 391,492 411,894 446, 325 21,338 26,971 25,335 28, 793 30, 729
6.006 6.006 6.006 6,006 6,006 22,853 27,978 26,364 30. 637
288 374 349 348 4,683 5,496 4,890 5, 36.5 4,187 5,047 4, 407 5, 015
10,092 13,290 12,944 15,491 3,122 3,207 3, 231 3,809
480 564 543 610
634 756 753 920 874 1,079 1,339 1, 310 1, 451 I, 336 4, 795 4,145 3, 521 4. 223 5, 258 1,898 1, 924 2, 003 2, 238 2,013
.155 .155 .155 .155 .155
.218 .218 .218 .218 .218
802 1, 029 940 1, 006 948 2,020 2,240 2,198 2, 208 '2, 274 2, 711 2,901 2, 735 2,900 2, 794 3, 765 4,807 4, 328 4, 520 4,529
.440 .440 . 440 .440 .440
. 529 . 529 . 529 . 529 .529
10,668 10,857 10,912 11, 149 '11, 409 6, 717 6, 790 6, 911 6, 933 '7, 019 3, 951 4,067 4,001 4, 216 4, 390
31,774 41,464 38, 786 40, 760 39,497 174 217 209 256 240
4, 732 6,073 5, 061 '4, 604 4, 376 995 1, 257 1, 047 873 762
21, 687 27,435 26,262 '27, 861 26,827 3, 697 4, 738 4, 474 4, 815 4, 672
1,051 1, 260 1,323 '1, 3:)6 1, 335 2, 025 2,666 2. 483 2, 728 2,676 2, 562 3, 153 2, 974 3, 163 2, 993 4, 463 5, 373 5, 078 '5, 421 5,352 7,888 10,245 9, 930 10, 398 9, 808 3, 870 6,162 5. 9361 '6, 899 6, 940
316 320 r 271 266 353
tData for June to December 1943 w~re revised in the August 1944 Survey; revisions for January-May 1943 are available on request. • The new series on S)lgar are compiled by the U. S. Department of Agriculture and replace the series on meltiogs and stocks at 8 ports shown In the Survey through the July
1914 Issue; data are compiled from reports by cane sugar refiners, beet sugar processors, importers of direct consumption sugar, and contioental cane sugar mills. Data represent both raw !'nd retirted sugar In terms of raw sugar. Data beginning 1934 will be published later.
t Revtsed senes. 'l'be price series for sole oak leather is shown on a revised basis beginning with the October 1942 Survey; revisions be1:!nniog July 1933 are available on request.
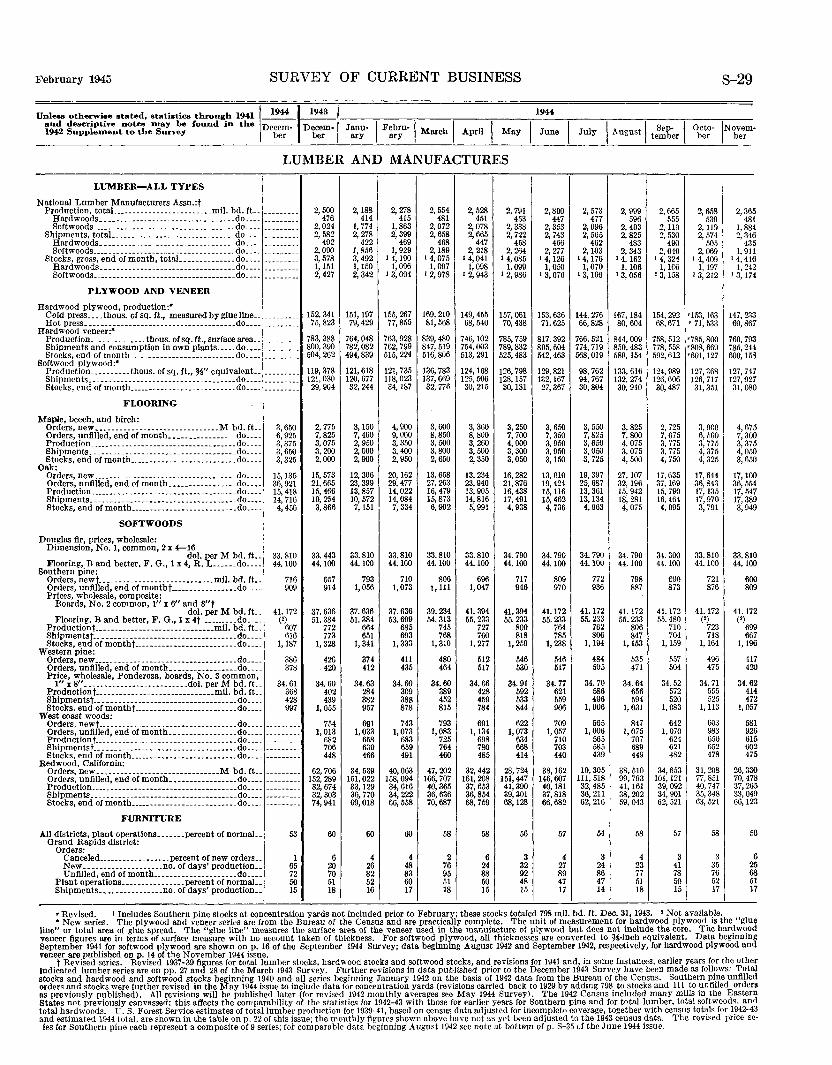
February 1945 SURVEY OF CURRENT BUSINESS S-29
Unleas otherwise stated, atatiatiea through 1941 1 1944 ~~~----.---~~--~---,-----;--1~944 __ ,---,----,----,----,-----and descriptive notes ~nay be found in the Decem- Decem- Janu- I Febrn-1 I I I I I I S I 0 t IN 19~ Supplement to the Survey her her sry ary March April May June July August te,:i~~r be~- b~~m-
LUMBER AND MANUFACTURES
LUMBER-ALL TYPES
National Lumber Manufacturers Assn.:t Production, totaL.----------------------mil. bd. ft •. --------- 2, 500 2,188 2, 278 2,554 2, 528 2, 791
Hardwoods._ •. ___ .•. _______ ...•.•.••• ___ •... do. ___ --------- 476 414 415 481 451 453 Softwoods ...• ______ • _________ • ______________ .do. ___ --------- 2,024 1, 774 1,863 2,072 2, 078 2,338 Shipments, totaJ. _____________________________ .do .... --------- 2, 582 2, 278 2, 399 2,658 2, 665 2, 722
Hardwoods .• __________ ----- __ • __ • ___________ do._-_ --------- 492 422 469 468 447 458 Softwoods __________ • ________________________ .do._-- --------- 2,090 1, 856 1, 929 2,189 2, 218 2, 264 Stocks, gross, end of month, totaJ. _____________ do .... --------- 3, 578 3, 492 I 4,190 I 4, 075 I 4,041 14,085
Hardwoods .••.• ___ •• ----- _____ ._. _________ •. do .... --------- 1, 151 1, 150 1,096 1,097 1,098 1,099 Softwoods .... --------------------------------do ..•• --------- 2, 427 2, 342 I 3, 094 I 2,978 I 2, 943 12,986
PLYWOOD AND VENEER
Hardwood plywood, production:• Cold press. ___ thous. of sq. ft., measured by glue line .. --------- !52, 341 151, 197 155, 267 169,210 149,455 157,061 Hot press. ____________ •• ____ . ________________ •. do ..• _ 75,823 79,429 77,855 81,568 68,540 70,438
Hardwood veneer:• Production ______________ thous. of sq. ft., surface area •. --------- 783,388 764,048 763,928 839,480 746, 102 785,759 Shipments and consumption in own plants ..... do .... 800,390 782,082 762,799 847, 519 754,003 789,832 Stocks, end of month ___________________________ do ____ 504,262 494,839 515, 224 516,806 513,291 525,483
Softwood plywood :• Production __________ thous. of sq. ft.,%" equivalent._ --------- 119,378 121, 618 121, 735 136,783 124, 168 !26, 798 Shipments._ .... ___ ... __ .• , ________ ... ______ ... do ____ 121,030 120, 677 118,023 137,669 !25, 506 !28, 157 Stocks, end of month _____________________ , _____ do. ___ --------- 29,904 32, 244 34,187 32, 776 30,215 30, 131
FLOORING
Maple, beech, and birch: Orders, new •• , ----------------------------M bd. ft .. 3,650 2, 775 3,150 4, 900 3, 600 3, 360 3, 250 Orders, unfilled, end of month ...... ,. _______ do ... _ 6, 925 7,825 7,400 9,000 8,850 8,800 7, 700 Production _____ . ____ .. _, .. ____ ......... __ ...... do __ ._ 3,375 3, 075 2, 950 3, 350 3,500 3, 260 4,000 Shipments .. _ ... ___ ... __ .. __ .,_._ ... ____ .• __ .. _ do._._ 3,650 3, 200 2,000 3, 400 3, 800 3, 500 3, 300 Stocks, end of month ___________________________ do ____ 3,325 2,000 2,900 2, 950 2,650 2, 350 3,050
Oak: Orders, new ______ ._ .. __ . ___ .. ___ .....••.•• _ .... do._ •. 15, 135 15,573 12,306 20,162 13,658 13,234 16,282 Orders, unfilled, end of month ................. do .... 36,921 21,665 23,399 29,477 27,263 23,940 21,876 Production _______ , ______________________ , ______ do ..•. 15,418 15,466 13,857 14,022 16, 479 13,905 16,438 Shipments. __ ...... _ .•.• ______ ......... __ ._ ••. _ do .... 14,716 19,254 10, 572 14,084 15,873 14,816 17,491 Stocks, end of montb ___________________________ do .... 4,456 3,866 7, 151 7, 334 6,902 5, 991 4, 938
SOFI'WOODS
Douglas fir, prices, wholesale: Dimension, No.1, common, 2 x 4-16
dol. perM bd. ft.. 33.810 33.443 33.810 33.810 33.810 33.810 34.790 Flooring, Band better, F. G., 1 x 4, R. L ...... do .... 44.100 44.100 44.100 44.100 44.100 44.100 44. 100
Southern pine: Orders, newf_ ____________________________ miJ. bd. ft.. 716 657 793 710 806 696 717 Orders, unfilled, end of montht ................. do .... 909 914 1,056 1,073 1, 111 1, 047 946 Prices, wholesale, composite:
Boards, No.2 common, 1" x 6" and 8"t dol. perM bd. ft.. 41.172 37.636 37.636 37.636 39.234 41.394 41.394
Flooring, Band better, F. G., 1 x 4t ......... do .... (') 51.384 51.384 53.699 54.313 55.233 55.233 Productiont------------------------------mil. bd. ft.. 607 772 664 685 745 727 800 Shipmentst •...• _., ___ .. ____ ...... ____ ---------do .... 616 773 651 693 768 760 818 Stocks, end of montht.-------------------------do .... 1,187 1, 328 1, 341 I, 333 1, 310 1, 277 1,259
Western pine: Orders, new ____ .. ____ ..... _ ..• ____ .... _______ .. do .. __ 386 426 374 411 480 512 546 Orders, unfilled, end ofmonth ................. do ____ 378 420 412 435 464 517 530 Price, wholesale, Ponderosa, boards, No. 3 common,
1" x 8" . .,_, _____________________ dol. perM bd. ft.. 34.61 34.60 34.63 34.60 34.60 34.66 34.91 Productiont------------------------------mil. bd. fL 368 402 284 309 389 428 592 Shipmentst, •.••.• ___ ....• _____ •. --·-·--. __ ... _do •.•. 428 439 382 388 452 459 533 Stocks. end of montht .. ------------------------do .... 997 1,055 957 878 815 784 844
West coast woods: Orders, newt _____ ... _._. ________ ...... __ ....... do .... --------- 754 691 743 793 691 622 Orders, unfilled, end ofmonth ................. do .... --------- 1,013 1,033 1,073 1,083 I, 134 1,073 Production t---- __ . _. _. ____________ .-----. __ .... do. __ . 682 658 683 725 698 634 Shipmentst. ..• __ . ______ .• _. __ •..•.•...•.. ___ •. do •.• _ 706 639 659 764 780 668 Stocks, end of month ___________ , _______________ do ____ 448 466 491 460 485 414
Redwood, California: Orders, new. __ ----------------------------M bd. ft •. --------- 62,706 34,539 40,063 47,202 32,442 28,724 Orders, unfilled, end of month ................. do .... 152,289 151,022 !58, 094 166,707 161,208 151,447 Production __________ .•• __ ---- •• __ ........ __ ,_ .. do .... 32,674 33,129 34,616 40,365 37,653 41,390 Shipments •. __ .. __ . __ ., __ • ___ •••.•. __ ..•. __ ., ,.do .... --------- 32,303 36,770 34,222 36,636 36,854 39,301 Stocks, end of month ___________________________ do .... --------- 74,941 69,018 66,558 70,687 68,759 68,128
FURNITURE
All districts, plant operations ....... percent of normaL. 53 60 60 60 58 58 56 Grand Rapids district:
Orders: Canceled __________________ percent of new orders .. 1 6 4 4 2 6 3 New ___ , ________________ no. of days' production,. 65 20 26 48 76 24 32 Unfilled, end ofmontb _____________________ do ____ 72 70 82 83 95 88 92
Plant operations----------------Percent of normaL. 50 51 52 60 51 50 48 Shipments ................ no. of days' production .. 15 18 16 17 18 15 15
2,800 2, 573 2, 999 447 477 596
2,353 2, 096 2, 403 2, 743 2, 565 2, 825
466 462 483 2, 277 2,103 2, 343
I 4,126 14,176 I 4, 162 I, 050 1,070 1, 106
I 3,076 I 3,106 13,056
153,636 144,276 167, 184 71,625 66,828 80,604
817,392 766,521 844,009 805,604 774,719 850,483 542,463 568,019 589, 154
129,821 98,762 133, 616 132, 167 94,767 132, 274 27,367 30,804 30, 910
3, 650 3, 550 3, 825 7,350 7,825 7,800 3, 950 3, 650 4, 075 3, 950 3,050 3, 075 3,150 3, 725 4, 500
13,010 19, 397 27, 107 19,424 25,687 32, 196 15, 116 13,361 15,942 15,462 13, 134 18, 281 4, 736 4, 963 4, 075
34.790 34. 790 34. 790 44.100 44.100 44.100
809 772 798 970 936 887
41.172 41. 172 41. 172 55.233 55.233 55.233
764 762 806 785 806 847
1,238 I, 194 1,153
546 484 535 517 505 471
34.77 34.70 34.64 621 586 656 559 496 594 906 1, 006 I, 031
709 565 847 1,057 1,006 1, 075
710 565 707 703 585 689 440 439 449
38,162 19,305 38,510 146,607 111, 518 99,793 40,181 32,485 41,161 37,818 36,211 38,202 66,682 62,216 59,043
57 54 58
4 3 4 27 24 23 89 86 77 47 47 51 17 14 18
2,665 2, 658 555 539
2,110 2,119 2, 530 2, 574
490 505 2,040 2, 069
14,324 1 4,409 1, 1f.6 1, 197
13,158 13,212
154,292 '153, 163 68,671 '71, 533
758, 512 '785, 800 778, 558 '808, 669 592,612 '601, 127
124,989 127,368 126,606 126,717 30,487 31,351
2, 725 3, 9CO 7,075 6, 500 3, 775 3, 775 3, 775 4,375 4, 750 4,325
17,635 17,644 37,169 36,843 15,790 17, 135 16,464 17,970 4,095 3, 791
34.300 33.810 44.100 44.100
eoo 721 873 876
41.172 41.172 55.480 (2)
710 723 704 718
1,159 1, 164
557 496 504 475
34.52 34.71 572 555 520 525
I, 083 1,113
642 603 1,070 983
624 650 621 652 482 478
34,653 31,208 101,121 77, 851 39,092 40, 747 34,901 35,348 62,521 63,521
57 58
3 3 41 35 78 76 50 52 15 17
2,36 5 1 4 6 5 1 6 2 4
48 1, 88 2, 34
43 I, 91
1 4, 41 1, 24
I 3,17
147,23 3 7 69,86
760,79 3 4 8
785,24 600,15
127,74 7 7 0
127,92 31,08
4, 67 5 7,3 00
5 0
50
3,37 4,05 3, 6
17, 10 0 36,5 54
7 9 9
17,54 17,38 3, 94
33.81 0 00 44.1
6 8
00 09
41. 17 2
9 7 6
(') 69 66
1,19
41 7 20 4
34.6 41 47
I, 05
2 4 2 7
58 92 61 60 47
26,33
1 6 5 2 5
70,47 0 8 5 9 3
37,26 33,04 66,12
5 6
5 1
6 25 68
I 7
'Revised. I Includes Southern pine stocks at concentration yards not included prior to February; these stocks totaled 798 mil. bd. ft. Dec. 31, 1943. 'Not available. • New series. The plywood and veneer series are from the Bureau of the Census and are practically complete. The unit of measurement for hardwood plywood is the "glue
line" or total area of glue spread. The "glue line" measures the surface area of the veneer used in the manufacture of plywood but does not include the core. The hardwood veneer figures are in terms of surface measure with no account taken or thickness. For softwood plywood, ail thicknesses are converted to %-inch equivalent. Data beginning September 1941 for softwood plywood are shown on p. 16 of the September 1944 Survey; data beginning August 1942 and September 1942, respectively, for hardwood plywood and veneer are published on p. 14 of the November 1944 issue.
t Revised series. Revised 1937-39 figures for total lumber stocks, hardwood stocks and softwood stocks, and revisions for 1941 and, iu some instances, earlier years for the other Indicated lumber series are on pp. 27 and 28 of the March 1943 Survey. Further revisions in data published prior to the December 1943 Survey have been made as follows: Total stocks and hardwood and softwood stocks beginning 1940 and all series beginning January 1942 on the basis of 1942 data from the Bureau of the Census. Southern pine unfilled orders and stocks were further revised in the May 1944 issue to include data for concentration yards (revisions carried back to 1929 by adding 798 to stocks and 111 to unfilled orders as previously published). All revisions will be published later (for revised 1942 monthly averages see May 1944 Survey). Tbe 1942 Census included many mills in the Eastern States nnt previously canvassed: this affects the comparability of the statistics for 1942-43 with those for ParliPr years for Southern pine and for total lumber, total softwood,, an <I total hardwoods. U. S. Forest Service estimates of total lumber production for 1939-41, based on census data adjusted for incomplete coverage, together with census totals for 1942-43 and estimated 1944 total, are shown in the table on p. 22 of this issue; the monthly figures shown above have not as yet been adjusted to the 1943 census data. 'l'he revised price se· ies for Southern pine eacb represent a composite of9 series; foi' comparable data beginning August 1942 see note at bottem of p. S-35 of the June 1944 issue.
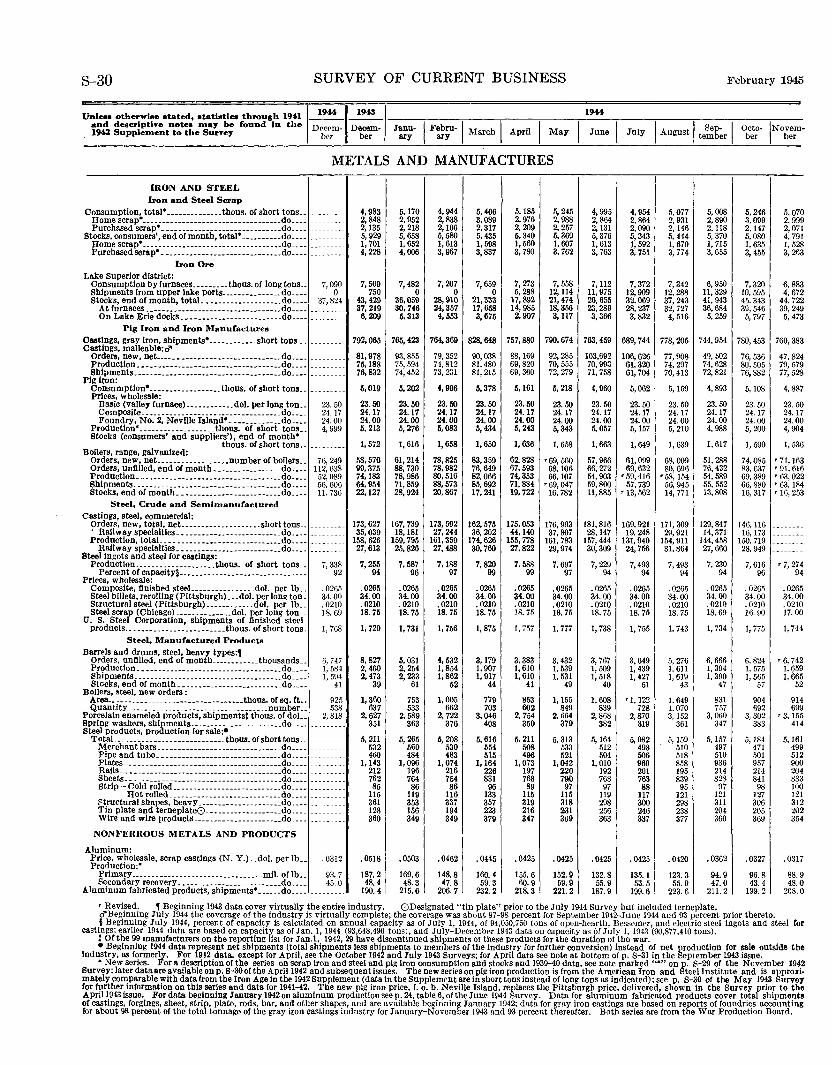
8-30 SURVEY OF CURRENT BUSINESS
Unle•• otherwiee •tated, •tatietiea through 1941 1 1944 ~~~ and deecripth•e notee ntay be found in the Decem- Decem- Janu- I Febru-1 I I 1942 Supplen1ent to the Surny be.r ber ary ary March April May
METALS AND MANUFACTURES
IRON AND STEEL Iron and Steel Scrap
Consumption, total*--------------thous. of short tous ..
~~~~:sc:g~ci-8j)•~=============================~~==:: Stocks, consumers', end of month, total* ...•.....• do ..•.
L
0 c
Home scrap•-----------------------------------do .•.. Purchased scrap•. --------------------- .•..••.. do ....
Iron Ore ake Superior district: Consumption byfurnaces ....•..•. thous. of long tons .. Shipments from upper lake ports ....•.•••.••... do ...• Stocks, end of month, total.. ------------------do ..•.
At furnaces ____ ---------------- .••••• ____ •••• do .... On Lake Erie docks .•••.••...•..•.••.•..•... do ..•.
Pig Iron and Iron Manufactures
astlngs, gray Iron, shipments• ------------short tons •. astings, malleable: d'
~~~d~~tr::.· _ ~~~~~---_-_: = ==:: == = =::::: =:: =::: =: =: ~~=: =: Shlpments.------------------------------------do ..•.
p lgii'Qn: Consumption• ------------------thous. of short tons .• Prices, wholesale:
Basic (valley furnace) ..•••••...•• dol. per long ton .. Composite ..•... __ . ______ ..••.• ____ ----- .•••. do .... Foundry, No.2, Neville Island•. ------------do .•••
Productlon•.------------------thous. of short tons ..
- -------
------
7,090 0
37,824 -----------------
--------
---·-- -------- ---- ----
23.50 24. 17 24.00 4, 999
Stocks (consumers' and suppliers'), end of month• thous. of short tons •. __ ------
oilers, range, galvanized: Orders, new, net .•.......••..••.•• number of boilers .. Orders, unfilled, end of month •................ do .•.. Production ..•• ______ ------ ••••• ----- ____ .• ___ .do .•. _
B
Shipments ..• ------. ___ .• ---------- ...••. __ ••.. do .•.. Stocks, end of month._ ------------------------do ••..
Steel, Crude and Semimanufactured .astlngs, steel, commercial: Orders, new, total, net ......•....•....•.•. short tons ..
c • Railway specialties .• ------------------------do .•.. Production, totaL ... ---------------- .......••. do ..•.
Railway specialties •• -------------- __________ do .... teel ingots and steel lor castings: Productlon .............••.•... thous. of short tons ..
B
p Percent of capacity§ ..•..• ---------------------- ____
rices, wholesale: Composite, finished steel. •..••.••••...•. dol. per lb .• Steel billets, rerolling (Pittsburgh)_ •. dol. per long ton. Structural steel (Pittsburgh) .••.••.•..•. dol. per lb .. Steel scrar (Chlcago) .......•.••.•. dol. per long ton .. . S. Stee Corporation, shipments of finished steel Products ... ----------------------thous. of short tons.
u
Steel, Manufactured Products arrels and drums, steel, heavy types:, Orders, unfllled, end of month ...••••..... thousands .. Production .• -------------------------- .•..•.•. do ...•
B
B
Shipments ..•..•..• ___________________ • ____ ..•. do. __ • Stocks, end of month .• ------------------------do .••• oilers, steel, new orders :
~~~iiii~::::::~====~~===~===~~~~=~=:~~~:;~~b!~~: orcelain enameled products, shipments: thous. of doL. prlng washers, shlgments-----------------------do ..•• teel products, pro uctlon for sale:•
p B s
TotaL ... ______ -------------- .... thous. of short tons .• Merchant bars.---------------------- ..••.•.. do .... Pipe and tube _______________________________ do .... Plates ..• ------------ __ -------------- ..•.••.. do ...• Rails ..•• -------------- ----------------------do .•.• Sheets ..• ~.------ ____ ---------------------- .. do ..•. Strip-Cold rolled .. --------------------- .... do .•••
Hot rolled .. ___ ----------·-----------.do .... 8tructural shapes, heavy--------------- ...... do .... Tin plate and terneplate0-------------------do .... Wire and wire products ..•....•...•.......•.. do ....
NONFERROUS METALS AND PRODUCTS
Aluminum: Price, wholesale, scrap castings (N. Y.) .. dol. per lb .. Production:•
PrimarY---------------------------------mil. ollb •. Secondary recovery .•.. ------ ________ .•..•... do .•..
luminum fabricated products, shipments• •••... do .• __ A
76,249 112,638 52,089 56.606 11. 736
---------
7, 3as 92
.0265 34.00 .02!0 18.69
1, 768
5, 747 1, 584 1, 594
41
925 .138
2,818
----- --' ---- ---
-------------- -----------------------~ -------- ----
-- .. ---
.0312
93. 7 45.0
--------
4,983 5,170 4,944 5,406 5,185 5, 245 2,848 2,952 2,838 3,089 2,976 2.988 2,135 2, 218 2,106 2,317 2, 209 2,257 5,929 5,658 5,580 5,435 5,340 5,369 1, 701 1,652 1, 613 1,598 !, 560 1, 607 4, 228 4,006 3, 967 3,837 3, 780 3, 762
7,273 7,509 7,482 7,207 7,659 7,558 750 0 0 0 5,288 12, 114
43,429 36,059 28,910 21,333 17,892 21,474 37,219 30,746 24,357 17,658 14,985 18,356 6, 209 5,313 4,553 3,675 2.907 3,117
792,065 765,423 764,369 828,648 757,880 790,674
81,978 93,855 79,352 90,038 88,169 92,285 75,188 75,594 74,812 81,480 69,820 70,555 76,832 74,452 73, 231 81,215 69,360 72,279
5,019 5,202 4,996 5,378 5,161 5. 218
23.50 23.50 23.50 23.50 23.50 23.50 24.17 24.17 24.17 24.17 24.17 24.17 24.00 24.00 24.00 24.00 24.00 24.00 5, 213 5, 276 5,083 5,434 5, 243 5,343
1,572 1, 616 1,658 1,650 1,636 1, 658
58,570 61,214 78,825 83,359 62,828 •69, 560 99,375 88,730 78,982 76,649 67,593 68, 106 74, 183 78,986 80,516 82,066 74,353 66, 107 64,954 71,859 88,573 85,692 71,884 '69, 047 22, !27 28,924 20,867 17,241 19,722 16,782
173,627 167,739 173,592 162,575 175,053 176,993 35,039 18,181 27,244 36, 202 44,140 37,807
158,626 159,795 161,359 174,626 155,778 161,783 27,613 25,826 27,488 30,760 27.822 29,974
7,255 7,587 7,188 7,820 7. 588 7, 697 94 96 97 99 99 97
.0265 .0265 .0265 .0265 .0265 .0265 34.00 34.00 34.00 34.00 34.00 34.00 .0210 .0210 .0210 .0210 .0210 .0210 18.75 18.75 18. 75 18.75 18.75 18.75
1, 720 1, 731 1, 756 1,875 1, 757 !, 777
8,827 5, 031 4,532 3,179 3,383 3, 432 2, 460 2, 254 1,854 1,907 1,610 1,539 2,473 2,233 1,862 1, 917 1,610 !, 531
39 61 52 44 41 49
1,360 753 1,005 779 853 1,155 637 533 662 703 602 849
2,627 2,589 2, 722 3,046 2, 754 2. 664 351 363 376 408 350 379
5, 211 5, 265 5,208 5,616 5, 211 5, 313 532 560 530 554 508 533 460 484 483 515 496 521
1,143 1,096 1,074 1, 164 1,073 1,042 212 196 216 226 197 220 762 764 754 831 768 700 85 86 86 96 89 97
115 119 116 133 1!5 1!5 361 353 337 357 319 318 128 156 194 223 2!6 231 360 349 349 379 347 369
.0518 .0503 .0462 .0445 .0425 .0425
!87.2 169.6 148.8 160.4 155.6 152.9 48.4 48.3 47.8 59.3 60.9 59.9
190.4 215.6 206.7 232.2 218.3 221.2
February 1945
1944
I
4,995 4,954 5,077 5, 008 5,246 5. 070 2,864 2,864 2, 931 2,890 3,099 2.999 2,131 2,090 2,146 2,118 2,147 2,0il 5,376 5,343 5,444 5, 370 5,080 4. 791 1, 613 1, 592 1, 670 1, 715 1, 635 1, 528 3, 763 3, 751 3, 774 3,655 3, 455 3,2fi3
7,112 7,372 7, 342 6, 950 7,320 6,883 11,975 12,909 12,288 11,329 10, 595 4, 672 26,655 32,069 37,243 41,943 45.343 44.722 23,289 28,237 32,727 36,684 39,546 39,249 3,366 3,832 4, 516 5, 259 5, 797 5, 473
763,459 689,744 778,205 i44, 954 780,453 760,383
103,692 106,626 77,908 49, 502 76,536 47,824 70,993 61,320 74,297 74,628 80,505 79,.';79 71,758 6!, 704 70,413 72,821 76,882 77,528
4, 960 5,062 5, !59 4,893 5,108 4, 887
23.50 23.50 23.50 23.50 23.50 23.50 24.17 24.17 24. 17 24.17 24.17 24.17 24.00 24.00 24.00 24.00 24.00 24.00 5, 057 5, 157 5, 210 4, 988 5, 200 4, 904
1, 663 1,649 !, 639 1, 617 !, 590 1, 536
57,966 61,099 68,009 51,288 74,085 '71,!63 66,272 69,632 80,696 76,432 83, ea7 •91.616 54,903 '59,416 •58,154 54,589 69,389 • oa, 022 59,800 57,739 56,945 55,552 66,880 '63,184 11,885 '13, 562 14,771 13,808 16, 317 '16, 253
181,816 169,921 171,309 129,847 146, 116 --------28,147 19. 248 29,921 14,371 16, 173 --------
157,444 131,940 !54, 911 144,458 150,719 --------30,309 24,756 31,864 27,660 28,949 --------
7, 229 7,493 7, 493 7, 230 7,616 '7, 274 94 94 94 94 96 94
.0265 .0265 . 0265 .0265 . 026.1 .0265 34.00 34.00 34.00 34.00 34.00 34.00 .0210 .0210 .0210 .0210 .0210 .0210 18.75 18.75 18.75 18.69 16.90 17.00
1, 738 1, 755 1, 743 1, 734 1, i75 !, 744
3, 767 3,649 5, 276 6, 666 6,824 '6, 742 1, 509 1, 439 1.611 1, 394 1, 575 1,659 1, 518 1,427 1, 619 I, 390 1, 565 !, 665
40 51 43 47 57 52
1, 608 r 1, 122 !, 649 831 904 Pl4 839 728 !, 070 757 692 699
2,868 2,870 3,152 3, 060 3, 302 '3.155 382 319 361 347 383 414
5,164 5, 082 5,!59 5,157 5,184 5,161 512 498 510 497 471 499 504 506 518 510 -101 512
1, 010 969 858 936 957 900 192 201 !95 214 214 204 768 763 839 828 841 833 97 88 95 97 98 100
119 1!7 121 121 127 121 298 300 298 311 306 312 256 246 238 204 205 202 363 337 377 360 369 354
.0425 . 0425 .0420 .0362 .0327 .0317
132.8 135. 1 123.3 94.9 96.8 88.9 55.9 53.5 55.9 47.0 43.4 48.0
187.9 199.6 223.6 211.2 199.2 208.0
'Revised. , Beginning 1943 data cover virtually the entire industry. 0Designated "tin plate" prior to the July 1944 Survey but included terneplate. d'Beginning July 1944 the coverage of the industry is virtually complete; the coverage was about 97-98 percent for September 1942--June 1944 and 93 percent prior thereto.
_§ Beginn_ing July 1944, percent of capacity is calculated on annual capacity as of July 1, 1944, of 94,050,750 tons of open-hearth, Bessemer, and electric steel ingots and steel for castmgs; earlier 1944 data are based on capacity as of Jan. 1, 1944 (93,648,490 tons), and July-December 1943 data on capacity as 61 July I, 1943 (90,877,410 tons).
! Of the 99 manufacturers on the reporting list for Jan. t, 1942, 29 have discontinued shipments o! these products for the duration o! tho war. • Beginning 1944 data represent net shipments (total shipments Jess shipments to members of the industry for further conversion) instead of net production ror sale outside the
Industry, as formerly. For 1912 data, except for April, see the October 1942 and July 1943 Surveys; (or April data see note at bottom of p. S-31 in the September 1943 issue. • New series. For a description of the series on scrap iron and steel and pig iron consumption and stocks and 1939-40 data, see note marked"*" on p. S-29 of the November 1942
Survey; later data are available on p. S-·30ofthe Apri11942 and subsequent issues. The new series on pig iron production is from the American Iron and Steel Institute and Is approximately comparable with data from the Iron Age in the 1942Supplement (data in the Supplement are in short tons instead of long tons as indicated); see p. S-30 of the May 1943 Survey lor further information on this series and data for 1941-42. The new pig iron price, f. o. b. Neville Island, replaces the Pittsburgh price, delivered, shown in the Survey prior to the Aprill943 issue. For data beginning January 1942 on aluminum production seep. 24, table 6, of the June 1944 Survey. Data for aluminum fabricated products cover total shipments of castings, forgings, sheet, strip, plate, rods, bar, and other shapes, and are available beginning January 1942; data for gray iron castings are based on reports of foundries accounting lor about 98 percent of the total tonnagA of the gray iron castings industry for January-November 1943 and 93 percent thereafter. Botb series are from the War Production Board.
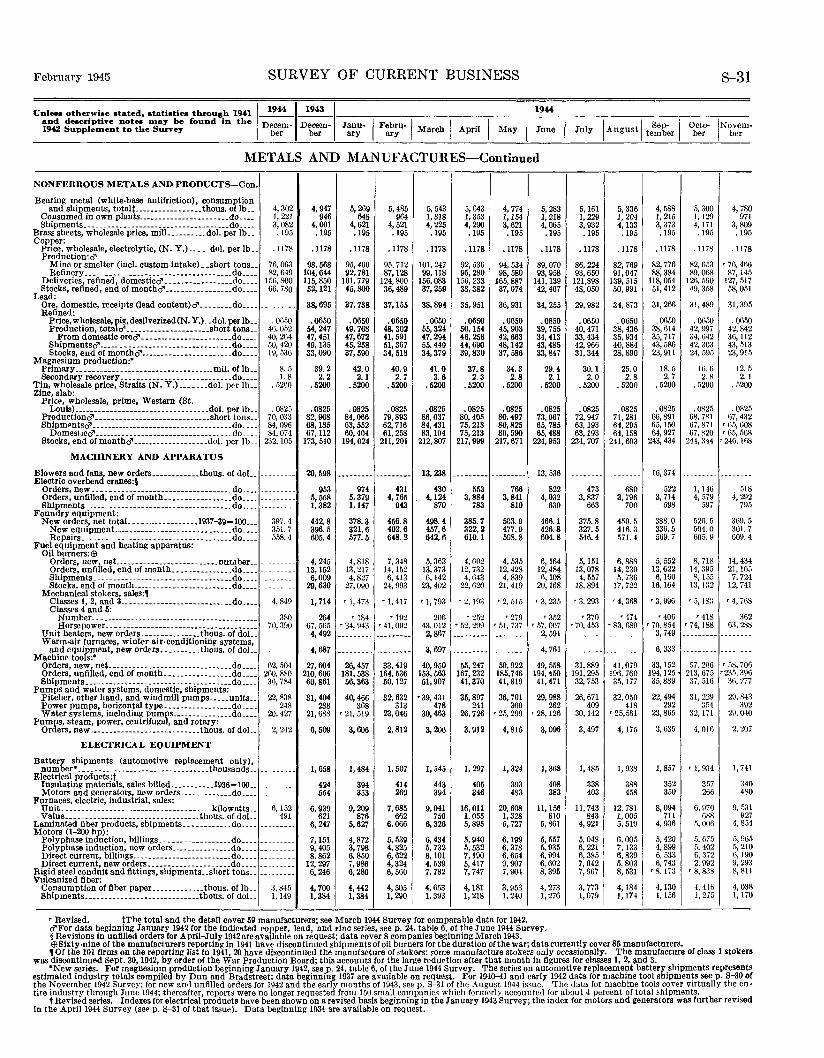
February 1945 SURVEY OF CURRENT BUSINESS S-31
1944 Unleas otherwise stated, atatistics through 1941 ~~~~~
and descriptive notes may be found in the Decem- Decem- ]ann- I Febru-1 I · I 1942 Supplement to the Survey ber ber ary ary March Apnl May I I I Sep· I' Octo- INovem-]une July August tember ber ber
METALS AND MANUFACTURES-Continued
NONFERROUS METALS AND PRODUCTS-Con.
Bearing metal (white-base antifriction), consumption and shipments, totalt ....••....•••.•.. thous. of lb .• 4, 302 4,947 5, 269 5,485 5, 543 5,643 4, 774 5, 283 5, 161 5, 336 4, 588 5, 300 4, 780
Consumed in own plants ..•••........•.•....•.. do .••. 1,221 946 648 964 1,318 1,353 I, 154 1, 218 1,229 1, 204 1,215 1,129 971 Shipments .... __ ....•.. ____ ... --------- ••...... do •... 3,082 4,001 4,621 4, 521 4, 225 4, 290 3,621 4,065 3, 932 4,133 3,373 4,171 3,809
Brass sheets, wholesale price, milL •........ dol. per lb .. . 195 .195 .195 .195 .195 .195 .195 .195 .195 .195 .195 . 195 . 195 Copper:
Price, wholesale, electrolytic, (N.Y.) .... dol. per lb .. .1178 .1178 .1178 .1178 .1178 .1178 .1178 .1178 .1178 .ll78 .1178 .ll78 .1178 Production:d"
Mine or smelter (incl. custom Intake)_ .short tons .. 76, OH3 98,568 95,400 95.712 101,247 92,530 94,534 89,070 86,224 82,769 82,776 82,653 '76, 466 Refinery ..... _. ___ . ________________ ----_ ..... do .•.. 82,649 104,644 92.781 87,128 99,118 95,280 98,580 93,958 93,650 91,047 88,384 89,068 87, 145
Deliveries, refined, domesticd"----------------.do .... 156,800 115,850 101,779 124,800 156,083 156, 233 165,887 141,139 121,898 139,515 118,054 126.590 127,517 Stocks, refined, end of monthd"-----------------do .... 66, 780 52,121 45,800 36,489 37,259 38,382 37,074 42,467 48,050 50,991 51,412 ·19, 358 58,051
Lead: Ore, domestic, receipts (lead content)d" ........ do .... Refined:
--------- 38,695 37,738 37,155 38,894 35,951 36,931 34,255 29,982 34,873 31,266 ~I. 489 31,395
Price, wholesale, flg,desilverized(N. Y.) .. dol. per lb .. . 0650 .0650 .0650 .0650 .0650 .0650 .0650 .0650 .0650 . 0650 .0650 . Of\50 . 0650 Production, tota d" ---------------------short tons .. 46.052 54,247 49,768 48.302 55,324 50, 154 45,903 39,755 40,471 38,436 38,614 42,997 42,842
From domestic ored"-----------------------do .... 40,264 47, 451 47,672 41,591 47.294 46,258 42,663 34,413 33,434 35,934 35,717 34.642 36, 112 Shipmeutsd" ........ _ ------ .... ------ _____ ._.do ..•. 50, 420 49, 135 45,258 51,367 55,449 44,690 48,142 43,485 42,966 40,884 43,586 42.303 43,.513 Stocks, end of monthd"-----------------------do .... 19,536 33,090 37,590 34,518 34,379 39,830 37,586 33,847 31,344 28,890 23,911 24, 595 23, 9!.5
Magnesium production:• Primary -----------------------------------mil. of lb .. 8. 5 39.2 42.0 40.9 41.0 37.8 34.3 29.4 30.1 25.0 18.5 If>. 6 12.5 Secondary recovery._._ .... _ ....... __ ------- ... do .... 1.8 2.2 2.1 2. 7 3. 6 2. 3 2.8 2.1 2.0 2. 8 2. 7 2. 8 2.1
Tin, wholesale price, Straits (N. Y.) ....... dol. per lb .. . 5200 .5200 .5200 .6200 .5200 .5200 .5200 .5200 • 5200 . 5200 .5200 . 5200 .5200 Zinc, slab:
Pric~. wholesale, prime, Western (St. Louls) __________________________________ dol. per lb .. .0825 .0825 .0825 .082fi .0825 .0825 .0825 .0825 .0825 . 0825 .0825 . 0~25 . 0825 Productiond" -----------------------------short tons .. 70,033 82,968 84,066 79,893 86,037 80,40ii so. 497 73,067 72,947 71,281 66,891 68,781 67,432 ShlpmPntsd" .. ---------- __ .. ------- ____ •• __ ..... do .... 84,096 68,185 63,552 62,716 84,431 75,213 80,R25 65, 785 63, 193 64,295 65,150 67, 871 '65, 608
Domes1.1Cd" .• ______ • _. ----.---- .•• ---- ....•... do .... 84,074 67, 112 60,404 f\1, 258 83, 104 75,213 80,590 65,488 63,193 64,158 64,927 67,820 '65, 568 Stocks, end ofmonthd"-------------------dol. per lb .. 232, 105 173,510 194,024 211,201 212,807 217,999 217,671 224,953 234,707 241,693 243,434 2!4, :l44 '2!6, 168
MACHINERY AND APPARATUS
Blowers and fans, new orders ............ thous. of doL. --------- 20,598 --------- --------- 13,238 --------- --------- 13, 536 --------- --------- 16,374 ·-------- --------Electric overhead cranes:§
Orders, new .•.. ------------------------------.do .... 953 974 431 430 553 766 822 473 680 522 I, 146 518 Orders, unfilled, end of month .. _______________ do .... 5,558 5,379 4, 765 4,124 3,884 3,841 4,032 3,837 3, 796 3, 714 4, 579 4, 292 Shipments ........... -- ................ ____ ---. do ••.. -------- 1,382 1,147 943 870 783 810 630 663 700 598 597 795
Foundry equipment: New orders, net totaL ................. 1937-39=100 ... 397.4 442.8 378.3 456.8 498.4 385.7 503.9 466.1 375.8 450.5 388.0 526.5 369.5
New equipment ______________________________ do .•.. 351.7 396.5 321.6 402.6 457.6 322.2 477.0 426.8 327.5 416.3 336.5 504.0 301.7 Repairs ............................... ___ ._ .. do .... 558.4 605.4 577.5 648.2 642.6 610.1 598.8 604.8 546.4 571.4 569.7 605.9 609.4
Fuel equipment and beating apparatus: Oil burners:$
Orders, new, net .......................... nuwber ... -··---- 4, 245 4, 818 7, 348 5,363 4, 002 4, 535 6,164 5,151 6,888 5, 552 8, 718 14,434 Orders, unfilled, end of month ______________ .do ..... ------ 13, 152 13,217 14,152 13,373 12,732 12,428 12,484 13,078 14, 230 13,622 14,395 21,105 Shipments.----------------------------------do .... --------- 6,009 4.827 6,413 6,142 4, 643 4,839 6,108 4, 557 5, 736 6,160 8,155 7, 724 Stocks, end of month ......................... do .•.. --------- 29,630 27,090 24,993 23.402 22,620 21,419 20,168 18,894 17,722 16, 164 13,132 12,741
Mechanical stokers, sales:, Classes I, 2, and 3 ...... ----------------------do .•.• Classes 4 and 5:
4, 849 1, 714 '1, 473 '1, 417 '1, 793 '2, 193 '2, 515 '3, 235 '3, 293 '4, 368 '3, 996 r 5,183 '4, 7()8
Number .... ------ ____ .. ____ --------- _____ .. _ ..... 380 264 '184 '192 206 '252 '279 '352 '370 '474 '406 '418 362 Horsepower .. ------------------------------------ 70,390 67, 565 '34, 943 '41, 092 43,012 '52, 299 '51, 737 '57, 007 '70, 453 '83, 689 r 70,854 r 74,188 63,288
Unit heaters, new orders ............... thous. of doL. 4,492 --~------ --------- 2,867 --------- --------- 2,591 --------- -------- 3, 749 ----------- ·----
Warm-air furnaces, winter air-conditioning systems, and equipment, new orders .......... thous. of doL. --------- 4, 687 --------- --------- 3, 697 --------- --------- 4, 761 --------- --------- 6, 333 --------- ---- ...
Machine tools:• Orders, new, net ............................... do .... 62, 504 27,604 26,457 33,419 40,950 55,247 59,922 49,558 31,889 41,079 33, 152 f.7, 206 'S8, 706 Orders, unfilled, end of month ................. do .... 260,880 210,606 181,538 164,536 153,563 167,232 185,746 194,450 191, 295 196,760 194, 125 213, 675 '235, 396 Shipments ....• --- __ --- .... -- .................. do .... 36,784 60,861 56,363 50,127 51,907 41,370 41,819 41,471 32,753 35, 177 35,889 37, f>l6 3H, ?77
Pumps and water systems, domestic, shipments: 22,494 29, cl43 Pitcher, other hand, and windmill pumps ..... nnits .. 22, ~38 31,404 40,466 32,632 '39, 431 35,897 36,701 29,988 26,671 32,050 31,229
Power pumps, horizontal type ................. do .... 248 288 368 313 478 241 300 262 409 418 292 354 392 Water systems, including pumps ............... do .••. 20.127 21,688 '21, 519 23,046 30,463 26,726 '25, 299 '28, 126 30, 142 '25,561 23,865 32, 171 29,040
Pumps, steam, power, centrifugal, and rotary: 3,635 2, 207 Orders, new----------------------------thous. of doL 2, 212 6,509 3, 606 2, 812 3, 206 3,912 4,815 3,096 3, 497 4, 175 4,oH;
ELECTRICAL EQUIPMENT
Battery shipments (automotive replacement only), I, 857 I, 741 num ber•. _ .. ---- ... ----- .. ___ ....... --- .. thousands .... ------- 1,658 1, 484 1, 507 1, 545 1,297 1, 324 1, 368 1, 485 1, 938 r 1, 934
Electrical products:t Insulating materials, sales bllled ........... 1936=100 .. --------- 424 394 414 443 405 393 408 338 388 352 357 340 Motors and generators, new orders ............. do .... --------- 554 353 269 394 346 483 383 403 458 350 266 480
Furnaces, electric, industrial, sales: 8, 094 6, 970 9, 531 Unit ....•.. --------------------- .•.. ----- .kilowatts .. 6, !52 6,939 9, 209 7,685 9,041 16,011 20,608 11, !56 11,743 12.781
Value .................................. thous. of doL 491 621 876 662 750 1,055 1,328 810 843 1,005 711 688 927 Laminated fiber products, shipments ............ do .... --------- 6,247 5,627 6,066 6,326 5,895 5, 727 5,861 4,921 5,519 4, 936 5, 006 4, 854 Motors· (1-200 hp):
5, 065 Polyphase induction, billings_ .. _______________ do .... 7,151 4,872 5,539 6, 434 5,940 6,199 5, 557 5,048 6,005 5, 420 .5, 675 Polyphase induction, new orders ............... do .... 9, 405 3, 798 4,825 5, 732 5,532 6, 378 5, 935 6, 221 7,133 4,899 5, 402 5, 210 Direct current, billings ......................... do .... 8,862 6.850 6,622 8, 101 7,190 6,654 6, 994 6, 385 6,839 6, 533 6, 372 6,190 Direct current, new orders ..................... do .... --------- 12,297 7,986 4,324 4, 539 5, 417 9, 907 6, 602 7, 042 5, 803 6, 743 2, 992 9, 293
Rigid steel conduit and fittings, shipments .. short tons .. 6,246 6,280 6,560 7, 782 7, 747 7, 901 8, 395 7, 967 8, 531 '8. 173 '8,838 8, 811 Vulcanized fiber:
Consumption of fiber paper ...... ___ .... thous. of lb .. 3, 84.1 4,700 4,442 4, 505 4, 653 4,181 3,953 4, 273 3, 773 4,184 4,130 4, 416 4, 038 Shipments .... -------------------------tbous. of doL 1,149 1,384 1,384 1, 290 I I, 393 I, 218 1, 240 1, 276 I, 079 1, 174 1, 156 1, 275 1,170
' Revised. tThe total and the detail cover 59 manufacturers; see March 1944 Survey for comparable data for 1942. d"For data beginning January 1942 for the indicated copper, lead, and tine series, seep. 24, table 6, of the June 1944 Survey. §Revisions in unfilled orders for April-July 1942 are available on request; data cover 8 companies beginning March 1943. $Sixty-nine of the manufacturers reporting in 1941 have discontinued shipments of oil burners for the duration of the war; data currently cover 85 manufacturers. , or the 101 firms on the reporting list In 1941, 20 have discontinued the manufacture of stokers: some manufacture stokers only occasionally. The manufacture of class 1 stokers
was discontinued Sept. 30, 1942, by order of the War Production Board; this accounts for the large reduction after that month in figures for classes 1, 2, ~nd 3. •New series. For magnesium production beginning January 1942, seep. 24, table 6, of the June 1944 Survey. The series on automotive replacement battery shipments represents
estimated industry totals compiled by Dun and- Bradstreet; data beginning 1937 are available on request. For 194()--41 and early 1942 data for machine tool shipments seep. S-30 of the November 1942 Survey; for new and unfilled orders for 1942 and the early months of 1943, seep. S-31 of the August 1944 issue. The data for machine tools cover virtually the en-tire industry through June 1944; thereafter, reports were no longer requested from 150 small companies which formerly accounted for about 4 percent of total shipments. .
t Re..-ised sertes. Indexes for electrical products have been shown on a revised basis beginning in the January 1943 Survey; the index for motors and generators was further revised In the April 1944 Survey (s~ p. S-31 of that issue). Data beginning 1934 are available on request.
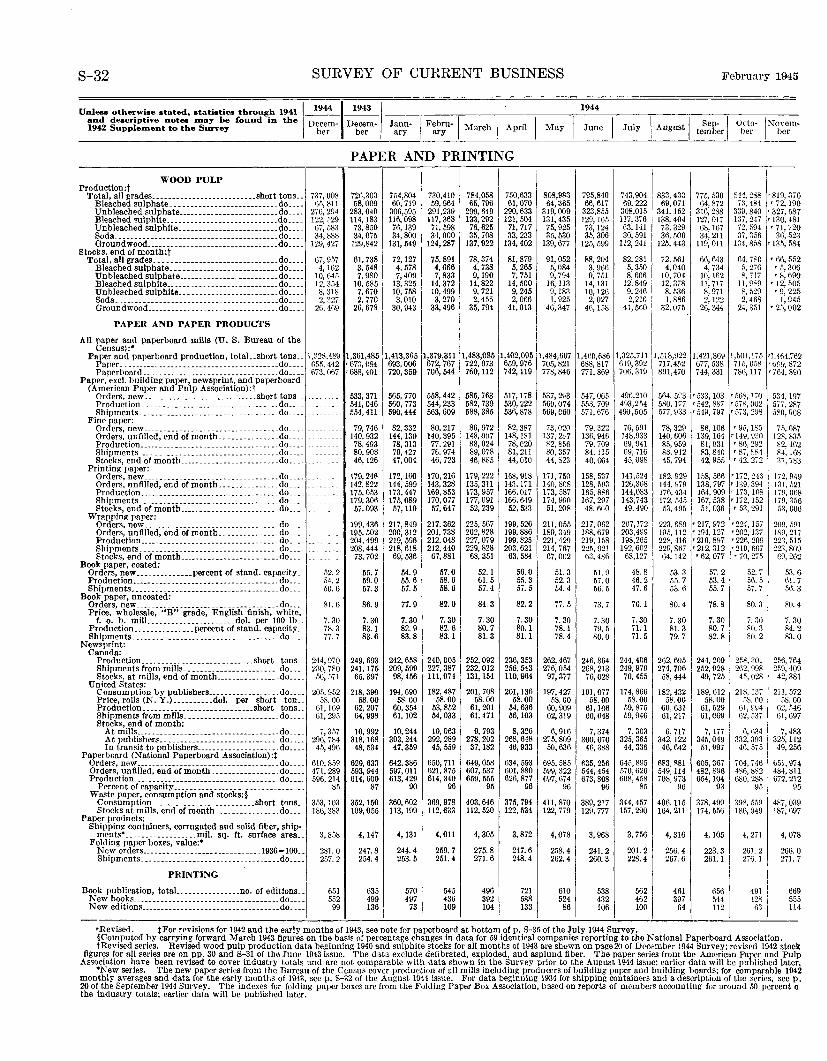
S-32 SURVEY OF CURRENT BUSINESS February 1945
Unless otherwise stated, statistics through 1941 ~~~~~ 1944
and descriptive notes tnay be found in the Decem~ Deceme J I F b I I I I I I I Sep I Octo INo em 1942 Supplement to the Survey ber ber :~r ~r~u- March April May June July August temb~r b~r- b~r •
WOOD PULP Product!on:t
Total, all grades __________________________ short tons .. Bleached sulphate._.----------------------- .do .... Unbleached sulphate .... ______________ ._._._ .do ..•. Bleached sulphite .. ___ .. _____________________ do ... . Unbleached sulphite. _____ . ________ . __ ....... <;lo ... . Soda .........•.........•.........•.........•. do ... . Groundwood ...........•....••.•...•.•....... do ... .
Stocks, end of month:t Total, all grades ...•.•.•.•.•.•.•...•.......•... do ..•.
Bleached sulphate .....••......••.•..••...... do ... . Unbleached sulphate •.•........•...•••...... .do ... . Bleached sulphite ........................... .do .. __ Unbleached sulphite .... _ .................... do ... . Soda .......................•........... _ ..•... do ..•. Groundwood .............................•.•. do ..• _
PAPER AND PAPER PRODUCTS
All paper and paperboard mills (U. S. Bureau of the Census):•
737,008 65, 811
276,294 122,529 Gi, 58:l 34,888
129,427
67,957 4,162
10,645 12, 35<1 8, 318 2, :J27
26, 4(i9
Paper and paperboard production, totaL.short tons .. 1,328,489 Paper._ ...................................... do.... 055, 442 Paperboard ... _ .... _ ......................... do.... 6i3, 067
Paper, excl. building paper, newsprint, and paperboard (American Paper and Pulp Association):t
Orders, new ----------------------------short tons .. Production ........................... _____ .. do ... . Shipments ............................ _ ..... _ do ..... .
Fine paper: Orders, new .................................. do ...... __ Orders, unfilled, end of month ............... do ... . Production ................ _ ............. _ .... do ........ . Shipments ..... _ .. ---------------------- .... do ... . Stocks, end of month .......•.•............... do ... .
Printing paper: Orders, new .................................. do ...... _. _. _. Orders, unfilled, end of month ............... do ........... . Production •....... _ ....... _ •.............•... do ... . Shipments .... _ .............................. do ..... . Stocks, end of month ......................... do .... __
Wrapping paper: Orders, new ... ----------------------------- do .... __ Orders, unfilled, end of month ............. __ do .... ___ . Production ....... _ ...• _._._ ............... _._ do ... . Shipments .................................. do .... _ .. Stocks, end of month ............ _______ . ___ .. do .. __
Book paper, coated: Orders, new ...... _ ....... percent of stand. capacity_ Production ........... _ ....... _._ ........... _ ... do .. . Shipments ............ ------------------ ....... do ... _
Book paper, uncoated: Orders, new ....................... ______ .... __ . do ... . Price, wholesale, "B" grade, English finish, white,
f. o. b. miiL .................... dol. per 100 lb .. Production _______________ percent of stand. capacity __ Shipments .............. ------------- .......... do ... _
Newsprint: Canada:
fi2. 2 54. 2 50.6
81.6
7. 30 78. 3 7i. 7
PAPER AND PRINTING
726,3031 58,009
283,040 114, !83 73,850 34, Oi5
129,842
61,738 3, 548 7, 980
10,585 7,6i0 2, 770
26, 678
754,804 60,719
306,595 116,098 76,139 34,800
131, 549
72,127 4. 578 7,409
13,325 10, 758 3,010
30,943
730,410 59,964
291,239 117,368 71,598 34,000
124,287
75,891 4,666 7,833
14,372 10,499 3, 270
33,496
I I 784,0581 750,633 65, 796 61, OiO
299, 649 290, 633 133, 292 121, 504
76, 625 71, 717 35, i08 33, 233
137, 922 134, 402
78,374 4, 738 9,190
14,822 9, 721 2, 455
35, 794
81, 8i9 5, 265 7, 751
14,500 9, 245 2,066
41,013
808,9~3 64, ~65
319,009 131,435 75,925 35,530
139, 677
91,052 5,084 9, 794
16, 113 9,183 I. 925
46,347
1,361,485 1,413,365 '673, 084 693, 006 '688, 401 720, 359
I I I 1,379,311 1,483,08511,402,095 1,484,667 672, 767 722, 973 659, 976 70.5, 821 706, 544 760, 112 742, 119 778,846
533,371 541,046 554,411
79, 746 140,932 78,493 80,908 46,126
179, 24~ I !42, 822 175,053 179,306 57,093
199,436 195, 502 204, 499 208,444
73, 702
55.7 59.0 57.3
86.9
7. 30 83.1 83.6
565, 770 558, 442 585, 763 560, 773 544, 233 582, 739 590, 444 563, 609 588, 385
82,332 !44, 139 78,313 79,427 47,004
172, !60 !44, 599 173,447 175,089 57,110
217,849 200,312 219, 596 218,6!8 69,536
54.9 55.6 57. 5
77.9
7. 30 8?. 9 83.8
80, 217 140,395 77,291 76, 974 46,723
170,216 143,328 169,853 170,077 57,647
217,362 201, 738 212,048 212,440 67,881
57.0 58.6 58.6
82.0
7.30 82.6 83. I
86,972 148,007 88,024 89,078 46, ~1'5
179,222 135, 311 li3, 957 Iii, 091 52,239
225, 567 202,828 227,079 229,828 68,351
52.1 61.5 57.4
84.3
7. 30 80.7 81.3
517, liS 530,222 536,878
82,387 148, 181 78,020 81,211 44,010
168,918 143, Iii 166,017 166,649 52,533
199, 526 !99, 886 199,825 203, 621 63,584 i
56.0 55.3 57. 5
82.2
7.30 80.1 81.1
537,293 569,074 569, C60
73,020 137, 2<:-7 ~2. 856 80,357 44, &23
171,750 140, scs 173,587 174, 990 51,208
211,055 189,349 . 22!, 429 214, 76i 67,002
51.3 52.3 54.4
77. 5
7. 30 78,1 78.4
Production .......... ______ --------- ... short tons .. Shipments from mills ........................ do ..•.
244, 9i0 249, 693 242, 658 240, 005 2:l0, 780 241, 175 209, 599 227, 387
252, 092 236, 353 232, 012 256, 543 131, 154 110, 964
262,467 276,054 97,377 Stocks, at mills, end of month ................ do ... _ 56, 5i1 65, 397 98, 456 Ill, 074
United States: Consumption by publishers .................. do ... . Price, rolls (N. Y.) .......... dol. per short ton __ Production. ___ .... _._ ................. short tons._ Shipments from mills ........................ do ... . Stocks, end of month:
At mills .................................... do. __ _ At publishers ... _---------------------· .... do ... . In transit to pnblishers ..................... do ... .
Paperboard (National Paperboard Association):t Orders, new ___________________________________ .do ___ _ Orders, unfilled, end of month ................. do ..•. Production ..... ____ ---------------- ........... do ... .
Percent of capacity ________________ ------------ ____ _
205,952 58.00
61, ]f,g 61,295
7, 357 296, 7b4 45,496
610,8.59 471,289 596,214
85 Waste paper, consumption and stocks:§
Consumption .......................... short tons .. 353,103 Stocks at mills, end of month. _______________ do.... 186,383
Paper products: Shippin!!' containers, corrugated and solid fiber, ship-
ments• .................. mil. sq. ft. surface area.. 3,858 Folding paper boxes, value:•
New orders .............................. 1936=!00.. 281.0 Shipments ................................... do.... 25i.?
PRINTING
BHt:~;ft~i~~~-~~;;;;;::::::::::::::::~~=:~~:e:<~~~g~~::i 6.51 552 99
218,390 58.00
62,207 64,998
10,992 3!8, 168 48,534
629,633 593,944 614,600
87
352, 150 109,055
4,147
247.8 254.4
635 499 136
194,690 58.00
60,354 61,102
10,244 303,244 47,359
182,487 58.00
53,852 54,033
201, 708 58.00
61,201 61, 471
I 0, 063 9, 793 292, 289 278, 202 45, 559 37, 182
642, 386 650, 711 597, Oll 621, 875 613,429 614,340
649,058 607,537 659,555
90 96 95
360,602 113, 199
4,131
244.4 253.5
570 497
73
369, 978 403, 646 112, 633 112, 520
4,011
259.7 251.4
545 436 109
4, 305
275.8 271. 6 I
496 392 104
201, 136 58.00
54,636 56, 103
8, 326 268,648 46,933
634,593 601,880 626,877
96
375,794 122,534
3,872
247.6 248.4
721 588 133
197,427 58.00
60,909 62,319
6,916 2i5, 809 50,636
695, 585 599,322 697,674
96
411,870 122, 7i9
4,0781 258.4 262.4
610 524
86
795,840 66,617
323,855 129, 165 73,124 35,306
125,599
88,204 3, 966 9, 751
14,131 10,126
2, 027 4{i, !58
743,904 69. 222
308,015 117,376 63,141 30,591
112,241
82,281 5, 350 8,606
12,849 9, 246 2,21G
41, 5eo
833,433 69,071
341.152 138,404 i3, 329 36,500
125,443
72.561 4,040
!0, i04 12,378 8, 536 1,886
32,075
775, 530 64,872
316,288 127,017 68,167 3'1, 211
119,011
66,643 4, i34
10,162 ll,7li 8, 971 2,122
26,344
844. 288 73, 4ol
339,840 137, 247 72, 594 3i, 351)
134, sos
64, if:O 5, 276 8. 717
ll, 9f.9 8, 529 2, 468
24,351
'819, 3i6 r 72,190
'327, 587 '130, 481 r 71, 720
36, -523 '135, 584
T 66,552 '.1, 306 T 8,(i90
'12, .105 '9 225
1:945 '25, 002
1,4!'0,686 1,325,711 1,518,922 1,421,869 1,501,!i5 •l,4C4,762 688, 817 619, 392 717,482 67i, 538 715,058 '6(:9, &72 771,869 706,319 801,470 i44, 331 786,117 •iC4, 890
547,005 55:J, 709 571, (l76
79.322 136,946 79, i09 84, Jl5 40, C64
!58, 537 128. 593 165,886 167, 297 48. 600
217, 062 1~8. 6i9 219,158 225, 921 63,486
51.9 57.0 56.5
73.7
7. 30 79.5 80.0
246,864 268,213 76,028
191,077 58.00
61,106 60,f>48
496,210 493,254 490,505
76,691 148,933 69,941 69, il6 45,098
141,524 126,368 144,083 143,743 49,490
207,172 203,499 198,265 192,602
68,127
48.8 46.2 4i. 6
70.1
i. 30 71.1 71.5
564, 5P3 ;' 533, !03 I• 568, 170 580, 177 i' 542, 887 '5i8, 002 577, 9331'' 549, 797 '5i3, 298
78, 329 86, 106 ' 95, 18.) !40, 606 . !39, 164 , 149, no 85, 959 8!, 931 ' 86, 292 83, 912 83,840 '87, S~4 45, i94 42, 955 ' 42. 272
182. 929 !58, 5661' 172, 2-13 144, 9i9 138, 79i ,, 139, 394 Ii6, 434 164,909 I• Ii3, 108 1 172, 545 167,538 'li2, 152 53, 495 51, 036 ' 53, 291
223,689 I' 211,972 •224,15i 195, JJ2 I' 194, 127 • 202, 137 228, 416 I' 210, 8~7 • 22n, 209 229,867 •212,312 •219,6fii 64, 142 '62, 077 • iO, 2i5
53. 3 55.7 53.6
80.4
7. 30 81.3 79. i
57. 21 53.4 1 55.7
78.8
7. 30 80.7 82.8
52.7 56.5 57.7
80. 3 1
i. ~0 'D.3 so. 2
244, 406 262, 695 249, 979 274, 706
244,209 252,928
49, 725
258,301 262, 998 4.',028 70, 455 58, 444
174,866 58.00
59, 875 59,946
182, 432 58.00
60,631 61,217
189,612 58.00
61,529 61,069
218, 137 58. 00
61,994 62, 537
7, 374 7, 303 6, 717 7, 177 345,049 51,997
6, 634 332,393
4(), 575 300, OiO 325, 365 342, 122 46, 388 44, 336 46, 642
534, 197 57i, 287 580,908
i.\ 087 128,835
:::2, 4f,2 ~4. 168 37, 783
1 i2, 949 181, 52! 17~. 068 li9, 356 58,006
2il9,1i91 18~, 217 22:l, 515 223,809 C9,262
53.6 61.7 5ti. 3
so. 4
7. 30 84.2 83.0
256, i64 259,409 42,381
211, 572 58.00
62, 546 61,697
7,483 325, 112 49,256
~35, 256 645, 895 683, R8! 544, 454 570, 626 549, 114 673, 808 608, 458 i08, 9i3
605, 367 i04, 7 46 651' 97 4 482,896 4S6, ~'2 484, Sll 654, 104 680, 288 6i2, 212
96 85 96 93 95 95
389, 217 344,457 406, 115 378, 499 398, li.S? 4F7, 039 129,777 157,290 164.211 li4, 556 186,949 lSi, 697
3, 968
241.2 260.3
538 432 106
3, 756
201.2 228.4
562 462 100
4, 3!6
256.4 267.6
461
39i I 64
4,105
223.3 261. I
656
5441 112
'1, 2il
261.2 276. I
491 -l2S
63
4, 078
266.0 2il. 7
669 555 114
'Revised. tFor revisions for 1942 and the early months of 1943, see note for paperboard at bottom o! p. S-35 of the July 1944 Survey. §Computed by carrying forward March 1943 figures on the basis of percentage changes in data for 59 identical companies reporting to the National Paperboard Association. tRevised series. Revised wood pulp production data beginning 1940 and sulphite stocks for all months of 1943 are shown on page20 of December 1944 Survey; revisPd 1942 stock
figures for all series are on pp. 30 and S-31 of the June 1943 issue. The data exclude defibrated, exploded, and asplund fiber. The paper series from the American Paper and Pulp Association have been revised to cover industry totals and are not comparable with data shown in the Survey prior to the August 1944 issue: earlier data will be published later.
•New series. The new paper series from the Bureau of the Census cover production of all mills including producers of building paper and building boards; for comparable 1942 monthly averages and data for the early months of 1943, seep. S-32 of the August 1944 issue. For data beginning 1934 for shipping containers and a description of the series, see p, 20 of the September 1944 Survey. Tbe indexes for folding paper boxes are from the Folding Paper Box Association, based on reports of members accounting for around 50 percent o the industry totals; earlier data will be published later.
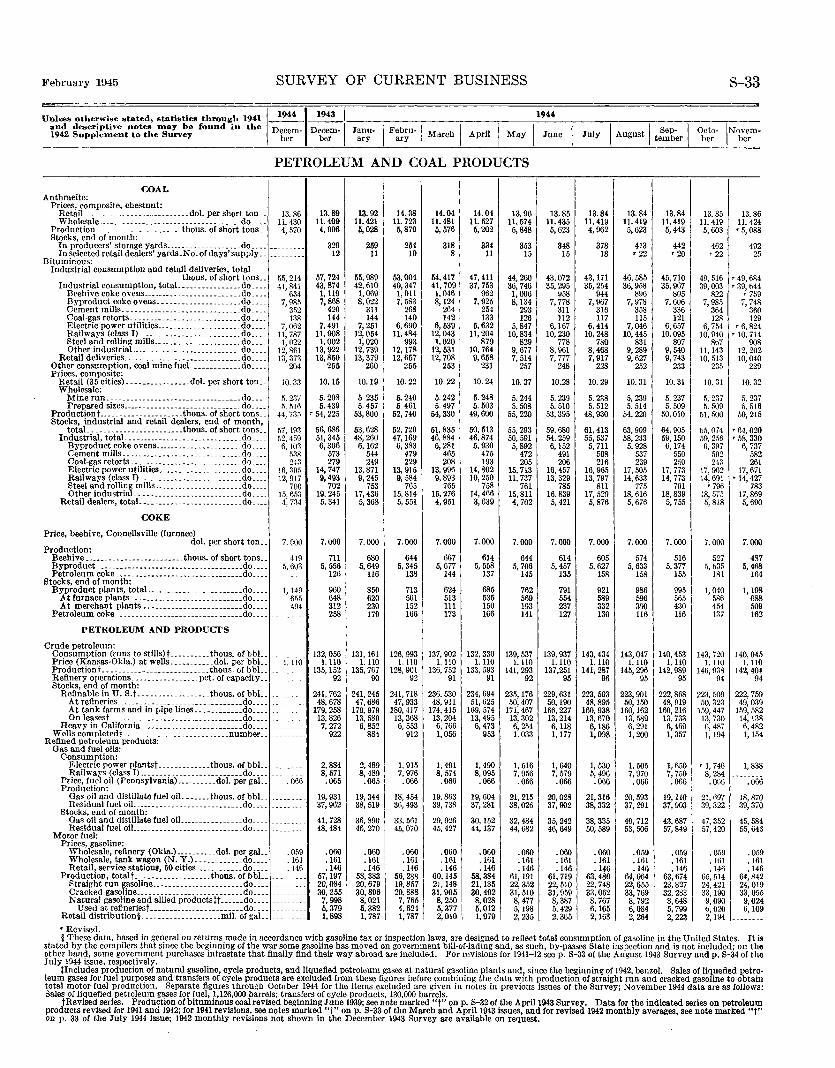
February 1945 SURVEY OF CURRENT BUSINESS
Unless otherwise stated, statistics through 1941 and descriptive notes Inay be found in the 1942 Supplement to the Survey
1
194411943 1
Decem- ~~ Janu- I Febru-1 March I April I May ber ber ary ary
1
PETROLEUM AND COAL PRODUCTS
COAL Antbraeite:
Prices, composite, chestnut: RetaiL .. _______________________ dol. per short ton .. 13.86 13.89 13.92 14.38 14.04 14.04 13.96 Wholesale ___________________________________ .do. ___ 11.430 11.409 11.421 11.723 11.481 11. 527 11.574
Production _____________________ tbous. of short tons __ 4, 570 4,996 6,028 Stocks, end of month:
6,879 5, 576 6,202 5,848
In producers' storage yards __________________ .do ____ --------- 329 259 254 318 334 353 In selected retail dealers' yards.N o. of days' supply __ 12 11 10 8 11 15
Bituminous: Industrial consumption and retail deliveries, total
47,411 thous. of short tons __ 55,214 57,724 55,989 53,004 54,417 44,260 Industrial consumption, totaL _______________ do ____ 41,841 43,874 42,610 40,347 41,709 37,753 36,746
Beehive coke ovens _________ ------------ __ .. do ____ 634 1,119 1,0!\9 1, 011 1,046 962 1,006 Byproduct coke ovens .. ------- ____________ do ____ 7, 985 7, 868 8,022 7, 583 8,124 7, 925 8, 134 Cement mills._.------------------------ ... do .... 352 420 311 268 264 254 293 Coal-gas retorts. ___________________________ do .... 138 144 144 140 142 133 126 Electric power utilities _____________________ do ____ 7, 062 7,491 7,251 6,690 6,539 5, 632 5,847 Railways (class I)---------------------- __ .. do ____ 11, 787 11,908 12,054 11,484 12,043 11,204 10,834 Steel and rolling miiJs__ ____________________ do ____ 1, 022 1,002 1,020 993 1,020 879 829 Other industriaL __________________________ do .... 12,861 13,922 12,739 12, 178 12, 631 10,764 9,677
Retail deliverie.~. ____________________________ .do ____ 13, 373 13,850 13,379 12,657 12,708 9,658 7, 514 Other consumption, coal mine fueL ____________ do ____ 204 255 260 255 253 231 257 Prices, composite:
Retail (35 cities) ________________ dol. per short ton __ 10.33 10.15 10.19 10.22 10.22 10.24 10.27 Wholesale:
Mine run. __ ------------- __ ------------ .... do ____ 5. 237 5.208 5 235 6.240 5. 242 5. 248 5. 244 rrepared sizes ____________________ --------- .do ____ 5. 5Hl 6. 439 5.457 6 461 5.497 6. 503 5.508
Productiont .... _________________ thous. of short tons __ 44,735 Stocks, industrial and retsil dealers, end of month,
'54, 225 53,800 62,740 54,330 49,600 55,220
totaL _______________________ tbous. of short tons __ 57, 1~3 66,686 53,628 52,720 51,835 50.513 55,293 Industrial, total. ________ -------- ___________ .. do ____ 52,459 51, 345 48,260 47, 169 46,884 46,874 50,591
Byproduct coke ovens _____________________ . do ____ 6, 103 6,306 6,162 6, 383 6, 281 5. 930 5,892 Cement mills .. __ -------------- ____________ do ____ 538 573 544 479 465 475 472 Coal-gas retorts. __ ------------ ____________ .do ___ 243 279 249 229 208 193 205 Electric power utilities ____________________ .do ____ 16, 305 14,747 13,871 13,915 13,996 14,802 15,713 Railways (class I)---------------------- __ .. do ____ 12,9\7 9,493 9, 245 9, 584 9,893 10,250 ll,737 Steel and rolling mills ______________________ do ____ 700 702 753 765 765 758 761 Other industriaL ___ --------------- ______ .. do ____ 15,653 19, 245 17,436 15,814 15, 276 14,466 15,811
Retsil dealers, totaL ____________ ------------ .do ____ 4, 734 5, 341 5, 368 5, 551 4, 951 3,639 4, 702
COKE
Price, beehive, Connellsville (furnace) dol. per short ton __ 7. 000 7.000 7.000 7.000 7.000 7.000 7. 000
Production: Beehive _________________________ thous. of short tons .. 419 711 680 644 667 614 644 Byproduct -------------------------- __________ do ____ 5, 603 5, 556 5,649 5, 345 5, 677 5, 558 5, 706 Petroleum coke __ -------------------------- .... do. ___
~- .. ---- 126 116 138 144 137 145 Stocks, end of month:
Byproduct plants, totaL .. ____________________ do ____ 1, 149 960 850 713 624 685 762 At furnace plants. ___________________________ do ____ 655 648 620 561 513 635 569 At merchant plants .. _______________________ do ____ 494 312 230 152 111 150 193
Petroleum coke.------------------------- ______ do ____ -- ---- 258 179 166 173 166 141
PETROLEUM AND PRODUCTS
Crude petroleum: Consumption (runs to stllls)f __________ thous. ofbbL --- ----- 132,056 131, 161 126,993 137,902 132,330 139, 537 Price (Kansas-Okla.) at wells ___________ dol. per bbL. I. 110 1.110 1.110 1. 110 1.110 1.110 1.110 Productiont ___________________________ thous. of bbL -- -- 135, 152 135, 767 128,901 136, 752 133, 593 141, 293 Refinery operations _________________ pet. of capacity __ ------- 92 90 92 91 91 92 Stocks, end of month:
Refinable in U. S.t __________________ thous. of bbL. -- ------ 241,762 241, 245 241,718 236,530 234,694 235, 176 At refineries ______________ - ____ ----------- .. do ____ --------- 48,678 47,686 47,933 48,911 51,625 50,407 At tank farms and in ~,olpe lines ____________ do ____ ------ -- 179,258 179, 979 180,417 174,415 169, 574 171,467 On leasest _________ --------------------- .... do ____ ------ -- 13,826 13, 580 13,368 13,204 13,495 13,302
Heavy in California __________________________ do ____ ···-- -- 7,272 6, 852 6, 553 6, 766 6,473 6, 254
Wells completedt _____________ ------- ______ .number __ ----- -- 922 884 912 1,056 953 1.033 Refined petroleum products:
Gas and fuel oils: Consumption:
Electric power plantst _____________ thous. of bbL -- ----- 2,884 2,489 1, 915 1, 491 1. 490 1, 516 Railways (class I) ______ ---- __ -------- ______ do ____ ---- 8, 571 8, 489 7, 976 8, 574 8,095 7,956
Price, fuel oil (Pennsylvsnia) __________ dol. per gaL 0 066 .065 .065 .066 .066 .066 .066 Production:
Gas oil and distillate fuel oiL-- ____ tho us. of bbL _ ·------- 19, 931 19,344 18,454 19,863 19,604 21,215 Residual fuel oiL __________ -------- ______ .. do .... 37,962 38,519 36,493 39,738 37,281 38,026
Stocks, end of month: Gas oil and distillate fuel o!L ______________ do ____ --------- 41,728 36,890 33, 561 29,926 30,152 32,484 Residual fuel oil ____________________________ do .. __ ------·-- 48,484 46,270 45,070 45, 427 44, 137 44,682
Motor fuel: Prices, gasoline:
Wholesale, refinery (Okla.) __________ dol. per gaL .059 .060 .060 .060 .060 .060 .060 Wholesale, tank wagon (N. Y.) ____________ do ____ 0161 .161 .161 .161 .161 0 161 .161 Retail, service stations, 60 cities __________ .. do ____ .145 .146 .146 .146 .146 .146 .146
Production, totalt ___________________ tbous. of bbL. 57,197 58,383 56,288 60, 145 58,384 61, 191 Straight run gasoline _______________________ do ____ --------- 20,084 20,6791 19,857 21,148 21, 185 22,352 Cracked gasoline __________ ---- ____________ .do ... 30,255 30,896 29,888 31,906 30,492 31,510 Natural gasoline and allied productsH ______ do ___ 7,998 8,021 7, 765 8,250 8,028 8,477
Used at refineriesf ________________________ do ___ ------- 5, 379 5, 382 . 4,624 6,377 6,012 5,198 Retail distribution§ ____________________ miL of gaL. _ ----- 1,898 1, 787 I 1, 787 2,010 1, 979 2,235
• Revised.
1944
13.85 13.84 13.84 11.435 11.419 11.419 5,623 4,962 5,623
348 378 413 15 18 '22
43,072 43,171 46,585 35,295 35,254 36,958
958 944 896 7, 778 7,967 7,978
311 316 358 112 117 115
6,167 6,414 7,046 10,230 10,248 10,445
778 780 831 8, 961 8,468 9, 289 7, 777 7, 917 9, 627
248 228 252
10.28 10.29 10.31
5. 239 5. 238 5, 239 5. 510 5. 512 5. 514
53,395 48,930 54,220
59,680 61,413 63,909 54,259 55,537 58,233 6, !52 5, 7ll 5, 928
491 508 537 206 216 239
16, 457 16,965 17,505 13, 329 13, 797 14,633
785 811 775 16.839 17,529 18,616
5, 421 5,876 5,676
7.000 7.000 7.000
614 605 574 5,457 5, 627 5,633
135 158 158
791 921 986 554 589 596 237 332 390 127 130 116
139,937 143,434 143,047 1.110 1.110 1.110
137,251 141,287 145,296 95 96 95
229,631 223,503 223,901 50,190 48,895 50,150
166,227 160,938 160, 162 13,214 13,670 13,589 6,118 6,186 6, 291 1,177 1,098 1, 200
1, 640 1, 530 1, 505 7, 579 5,496 7,970 .066 .066 .066
20,028 21,316 20,593 37,902 38,332 37, 291
35,242 38,335 40,712 46,649 50,589 53,506
.060 .060 .059
.161 .161 .161
.146 .146 .146 61,719 63,480 64,064 22,510 22,748 22,655 31,959 33,062 33,769 8,387 8, 767 8, 792 5,429 6,165 6,084 2, 305 2,163 2, 264
13.84 13.85 ll. 419 11.419 5,443 5,603
442 462 •20 '22
45,710 49,516 35,967 39,003
805 822 7,606 7, 985
336 364 121 128
6,657 6, 754 10,095 10,940
807 8b7 9, 540 11,143 9, 743 10,513
233 235
10.31 10.31
5. 237 5. 237 5. 509 5. 509
50,010 51,500
64,905 65,074 59,150 59, 256 6,174 6, 397
550 592 250 243
17,773 17,952 14,773 14,691
791 '796 18,839 ~8, 57:'i 5, 755 5, 818
7.000 7. 000
516 527 5, 377 5, 635
155 181
995 1,040 565 586 430 454 116 137
140,453 143,720 1.110 1.110
142,989 !46, 938 95 94
222,868 223,500 48,919 50,323
160,216 159,447 13,733 13,730 6,469 6,487 1, 357 1, 194
1,650 '1, 746 7, 750 8, 284 .066 .065
19,110 21,697 37,903 39,322
43,687 47,352 57,849 57,420
.059 0 059
.161 0161
.146 0146 63,674 65,514 23,827 24,421 32,283 33, 190 8,648 9,090 5, 799 b,020 2, 223 2,194
S-33
1 13.86 1. 424 5,088 '
492 25
'4 9,684 9, fi44 '759
7, 748
•3
' •I
360 129
6, 824 0, 714
908 1 1 2,202 0,040
5
'6 '5
1 '1
229
10.32
5. 237 5. 516 0,215
4,020 8, 330 6, 737
582 261
7,671 4,427
783 1 7,869 5.690
14
7.000
487 5,468
164
1, 198 688 509 162
0, 045 1.110 2, 404 14
22 4
15 1
---
I
94
2, 759 9,039 9,582 4,138 6,482 1, !54
1, 838
.066
8,870 9, 370 3
45,584 55,643
.059 0 161 .146
64,842 24,019 33,055 9,024 6,109
---
§ These data, based in general on returns made in accordance with gasoline tax or inspection laws, are designed to reflect total consumption of gasoline in the United States. It is stated by the compilers that since the beginning of the war some gasoline bas moved on government bill-of-lading and, as such, by-passes State inspection and is not included; on the other hand, some government purchases intrastate that finally find their way abroad are included. For revisions for 1941-42 see p. S-33 of the August 1943 Survey and p, S-34 of the July 1944 issue, respectively.
tincludes production of natural gasoline, cycle products, and liquefied petroleum gases at natural gasoline plants and, since the beginning of 1942, benzol. Sales of liquefied petroleum gases for fuel purposes and transfers of cycle products are excluded from these figures before combining the data with production of straight run and cracked gasoline to obtain total motor fuel production. Separate figures through October 1944 for the items excluded are given in notes in previous issues of the Survey; November 1944 data are as follows: Sales of liquefied petroleum gases for fuel, 1,126,000 barrels; transfers of cycle products, 130,000 barrels.
tRevised series. Production of bituminous coal revised beginning June 1939; see note marked "t" on p. S-32 of the April 1943 Survey. Data for the indicated series on petroleum products revised for 1941 and 1942; for 1941 revisions, see notes marked "t" on p. S-33 of the March and April1943 issues, and for revised 1942 monthly averages, see note marked "t" on p. 33 of the July 1944 issue; 1942 monthly revisions not shown in the December 1943 Survey are available on request.
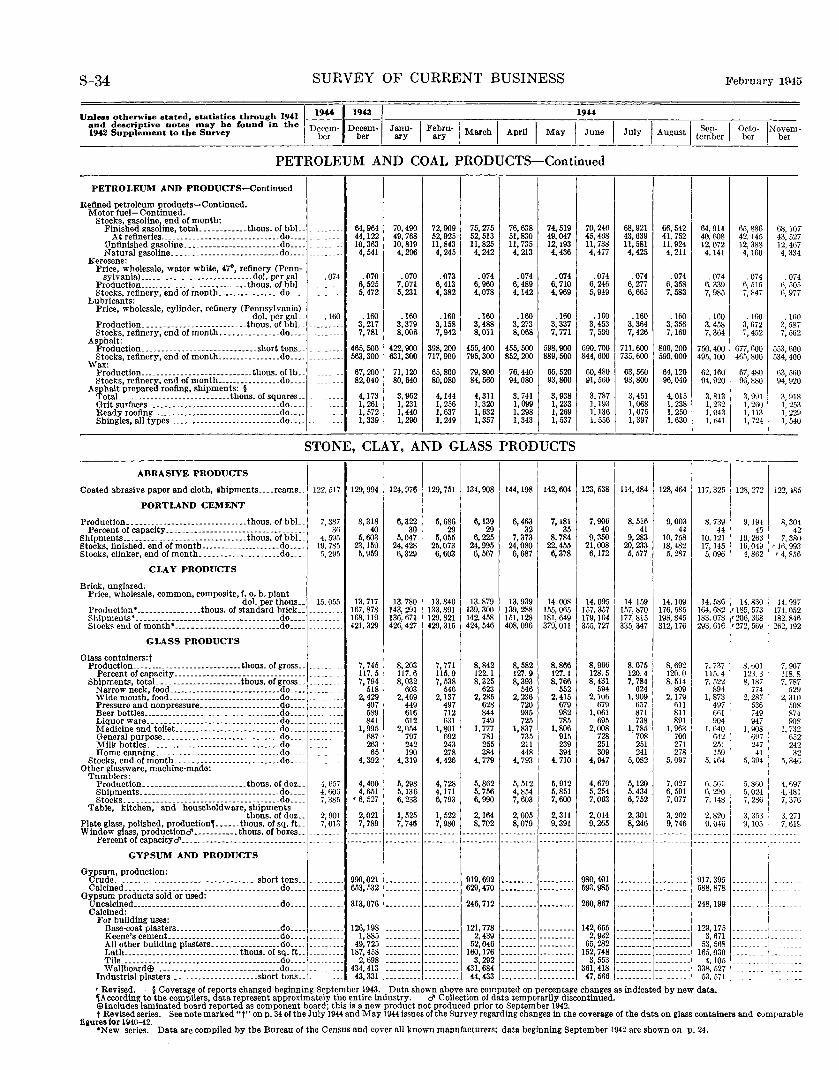
S-34 SURVEY OF CURRENT BUSINESS February 1945
Unless o~herwise ata~ed, a~a~ia~ies ~hrough 1941 ~~~~~ and deserip~ive no~es may be found in ~he Decem- Decem- Janu- I Febru-1 I · I 1942 Supplement to ~he Survey ber ber ary ary March April May
1944
PETROLEUM AND COAL PRODUCTS-Continued
PETROLEUM AND PRODUCI'S-Continued
I Refined petroleum products-Continued. Motor fuel-Continued.
Stocks, gasoline, end of month: Finished gasoline, tota). ___________ thous. of bbL .. ------- 64,964 70,490 72,909 75,275 76,638 74,519 70,246 68,921 66,542 64,914
At refineries ... _-------------- ____________ do ____ . ------- 44,122 49,768 52,925 52,513 51,830 49,047 45,468 43,639 41, 752 40,608 Unfinished gasoline .. ----------------------do ____ . _ ------ 10,363 10,819 11,843 11,825 11,735 12,193 11,738 11,581 11,924 12,072 Natural gasoline. __ .. _-------------------- .do ____ --- ----- 4,541 4,296 4, 245 4, 242 4, 213 4,436 4,477 4,425 4, 211 4,141
Kerosene: Price, wholesale, water white, 47°, refinery (Penn-sylvania) ____________________________ dol. per gaL . 074 .070 .070 .073 .074 .074 .074 .074 .074 .074 .074 Production ___________________________ thous. of bbL. 6,525 7,071 6,413 6,960 6,489 6, 710 6, 246 6, 27i 6, 358 6, 339 Stocks, refinery, end ofmonth ________________ do ____ --- ----- 5,472 5, 231 4,382 4,078 4,142 4,969 5, 949 6,665 7, 583 7, 985
Lubricants: Price, wholesale, cylinder, refinery (Pennsylvania)
.160 dol. per gaL .IUD .160 .160 .160 .160 .160 .160 .160 . 160 .160 Production __________________________ thous. ofbhL . ---- -- 3, 217 3,379 3,158 3,488 3, 273 3,337 3,453 3, 364 3, 356 3, 458 Stocks, refinery, end ofmonth _______________ do _____ ------- 7, 781 8,006 7,942 8,01l 8,068 7, 771 7, 590 7, 426 7,169 7, 364
Asphalt: Production. __ ---------------- __________ short tons .. --------- 465,500 422,900 398,200 455,400 455,500 598,900 690,700 711,600 800,200 750,400 Stocks, refinery, end of month ________________ do ..•.
Wax: --------- 563,300 631,300 717,900 795,300 852,200 889,500 844,600 735,600 590.000 495,100
Production ____ ------------------------ thous. of lb .. --------- 67,200 71,120 65,800 79,800 76,440 65,520 60,480 63,560 64, 120 62, lf>O Stocks, refinery, end of month ________________ do ____ --------- 82,040 80,640 80,080 84,560 94,080 93,800 91,560 93,800 96,040 94,920
Asphalt prepared roofing, shipments: § TotaL ___________________________ thous. of squares .... ------ 4,173 3, 962 4,144 4, 311 3, 741 3, 938 3, 787 3,451 4,015 3, 813 Grit surfaces.--------------- _________________ do _____ ----- 1, 261 1, 231 I, 256 1, 320 1,099 1, 233 1, 193 1, 068 1, 238 1, 232 Ready roofing ________________________________ do ____ --- --- 1, 572 1,440 1,637 1, 632 1,298 1, 269 1, 136 I, 075 1, 250 I, 043 Shingles, all types ____________________________ do ..•.. ----- 1, 339 1, 290 1,249 1,357 1,343 1,537 i, 556 1, 397 I, 630 1, ti41
I
STONE, CLAY, AND GLASS PRODUCTS I
ABRASIVE PRODUCI'S I
Coated abrasive paper and cloth, shipments .... reams ... 122,517 129,994 124,976 129,751 134,908 144, 198 142,604 123,538 114,484 I
128,464 117,325
PORTLAND CEMENT
Production._----- --------------------·--thous. of bbL. 7, 387 8,318 6,322 5,686 6,139 6,463 7,181 7,906 8, 516 9,003 8, 739 Percent of capacity-------------------------- _________ 3f) 4() 30 29 29 32 35 40 41 44 44
Shipments ... ---·-- __ -------·------------thous. of bbL. 4, 595 5,603 5,047 5,055 6, 225 7,373 8, 784 9,350 9,283 10.758 10,121 Stocks, finished, end of month ____________________ do .•.. 19, 785 23,159 24,428 25,073 24,995 24,080 22,455 21,008 20,233 18, 482 17, 145 Stocks, clinker, end of month. -------------------do ____ fi, 295 5,959 6,329 6,603 6, 567 6,687 6,378 6,172 5, 577 5, 287 5, 096
CLAY PRODUCTS
Brick, unglazed. Price, whole.sale, common, composite, f. o. b. plant
dol. per thous •• 15. 05.1 13.717 13.780 13.840 13.879 13.939 14.008 14.095 14.159 14.109 14.586 Production• ________________ thous. of standard brick __ 167,878 143,291 133,891 139, 300 139,288 155.065 157.357 157,870 176,585 164,682 Shipments• _________________________ -"- ________ do .. __ 163, 119 136,671 129, 821 142,4.18 151,128 181, 649 li9, 104 177,815 198,845 183,078 Stocks end of month* --------------------------do ____ 421, 329 426,427 429,315 424, 546 408,096 379,011 3.15, 727 335, 347 312, 176 293,616
GLASS PRODUCTS
Glass containers:t Production ________________________ --- .thous. of gross._ 7, 745 8, 203 7, 771 8,842 8, 582 8,866 8,966 8, 075 8,692 7. 737
Percent of capacity--------------------------------- 117.5 117.6 115.9 122.1 127. g 127.1 128.5 120.4 120.0 115.4 Shipments, totaL ____________________ thous. of gross .. 7, 794 8,032 7,538 8,325 8,393 8, 766 8,431 7, 784 8, 514 7. 522 Narrow neck, food ____________________________ do ____ -------- 518 603 546 623 546 552 594 624 809 894 Wide mouth, food ____________________________ do ____ 2,429 2,469 2,137 2, 285 2, 236 2,415 2,106 1, 909 2,179 1, 873
Pressure and nonpressure ____________________ do .... ---- 407 449 497 628 720 679 679 657 611 497 Beer bottles ____ -------------------- __________ do .. __ --------- 589 616 712 844 935 982 1,061 871 811 Gf)1 Liquor ware. ____ ---------------------- ______ do .... --- 841 612 631 749 725 785 695 738 R91 904 Medicine and toilet __________________________ do ____ -- 1, 995 2,054 1,801 1, 777 1, 837 1,806 2,008 1, 785 I, 963 1,640 General purpose. __ -----------------·------- .do ____ ---- 687 797 692 781 735 915 728 708 700 f>12 Milk bottles. _____ ---------------------------do .... 263 242 243 255 211 239 251 251 271 251 Home canning _______________________________ do ____ 65 190 278 384 448 394 309 241 278 159
Stocks, end of month. __ ----------------------·do .... Other glassware, machine-made:
-- 4, 392 4, 319 4,426 4, 779 4, 793 4, 710 4,947 5,082 5, 097 5,1fl4
Tumblers: Production._------- _________________ thous. of doz .. 4. G57 4,400 5, 298 4, 728 5,862 5, 512 5, 912 4, 679 5,120 7,027 6, 561
~r~g~e~~~::: ::::::::::::::::::::::::::::::: =~~:::: 4, 606 4,651 5,136 4, 171 5, 756 4,854 5,851 5,2.14 5,434 6, 591 6, 2!10 7,385 '6, 527 6, 233 6, 793 6, 990 7,603 7,600 7,063 6, 752 7,077 7,148
Table, kitchen, and household ware, shipments thous. of doz._ 2, 901 2,021 1, 525 1, 522 2,164 2,005 2,311 2,014 2,301 3. 202 2, 820
Plate glass, polished, production, ______ thous. of sq. ft.. 7, 013 7, 789 7, 746 7, 980 8, 702 8,079 9,391 9,265 8, 246 9, 746 9, 046 Window glass, productiond'-----------thous. of boxes .. --------- --------- --------- --------- --------- --------- --------- --------- ---------
Percent of capacityd' ------------------------------- ---------- --------- --------- --------- --------- --------- --------- --------- --------- ---------GYPSUM AND PRODUCI'S
Gypsum, production: Crude ____________________________________ short tons ... 990,021 --------- --------- 919,692 --------- --------- 980,401 --------- --------- 917, 395 Calcined.-------- __ ----------------------------do .••• _ 653,532 --------- --------- 629,470 --------- --------- 593,985 --------- --------- 588,878
Gypsum products sold or used: Uncalcined _____________________________________ do ____ -- 313,076 --------- --------- 246,712 --------- --------- 260,867 --------- --------- 248, 199
Calcined: For building uses:
Base-coat plasters .•. --------------- ________ do ____ --- 126,198 --------- --------- 121,778 --------- --------- 142,655 --------- --------- 129,175 Keene's cement ____________________________ do .... --- 1,885 --------- --------- 2,439 --------- --------- 2, 9J2 --------- --------- 3, 671 All other building plasters _________________ do •... --------- 49,725 --------- --------- 52,046 --------- --------- 65,282 --------- --------- 53,568 Lath----------------------------· thous. of sq. ft.. --------- 187,458 --------- --------- 160,176 --------- --------- 152,748 --------- --------- 165,030 Tile .. __________________ ------------------- .do .. __ ------- 2,698 --------- --------- 3, 292 --------- --------- 3, 553 --------- --------- 4.105 Wallboard$ _______________________________ do ____
-- ------ 434,413 --------- --------- 431,684 --------- --------- 361,418 --------- --------- 338, 527 Industrial plasters ______________________ short tons .. -- 43, 331 --------- --------- 44,433 --------- --------- 47,566 --------- --------- 53, 571
'Revised. §Coverage of reports changed beginning September 1943. Data shown above are computed on percentage changes as indicated by new data. ,According to the compilers, data represent approximately the entire industry. d' Collection of data temporarily discontinued.
65,886 42.145 12,388 4,160
.074 6, 515 7,847
. !flO 3, 672 7, 452
677,600 465,800
67,480 96,880
3, 991 1, 260 I, 113 I, 724
128, 272
9, 194 45
10, 263 16, 049 4, 81)2
14.830 '185, 573 •206, 368 •272, 569
8, tiOI 123.3 8,187
774 2, 287
536 749 947
I, 908 697 247
41 5, 394
5, 860 5, 024 7, 286
3, 3fi3 9,105
68,101 43,521 12,467 4, 334
. Oi4 6, 50. f), 97,
. lllO ?, 581 7, 562
553,60 534,40
0 0
63,56 0 0 94,92
3, 91 1, 25.
8 3 9 0
1, 22 1, 54
122,485
8, 304 42
7, 380 '16, 993 '4,856
14.997 174,052 182,846 262, 192
7, 967 118.8 7. 787
529 2,310
.)08 874 908
I, 732 652 242 32
·'· 346
4,697 4, 481 7, 376
3, 271 7, 61\,
-~-
I , _____
- -
.:::::::I
$Includes laminated board reported as component board; this is a new product not produced prior to September 1942. t Revised series. See note marked "t" on p. 34 of the July 1944 and May 1944 issues of the Survey regarding changes in the coverage of the data on glass containers and comparable
fi&ures for 1940-42. •New series. Data are compiled by the Bureau of the Census and cover all known manufacturers; data beginning September 1942 are shown on p. 24.
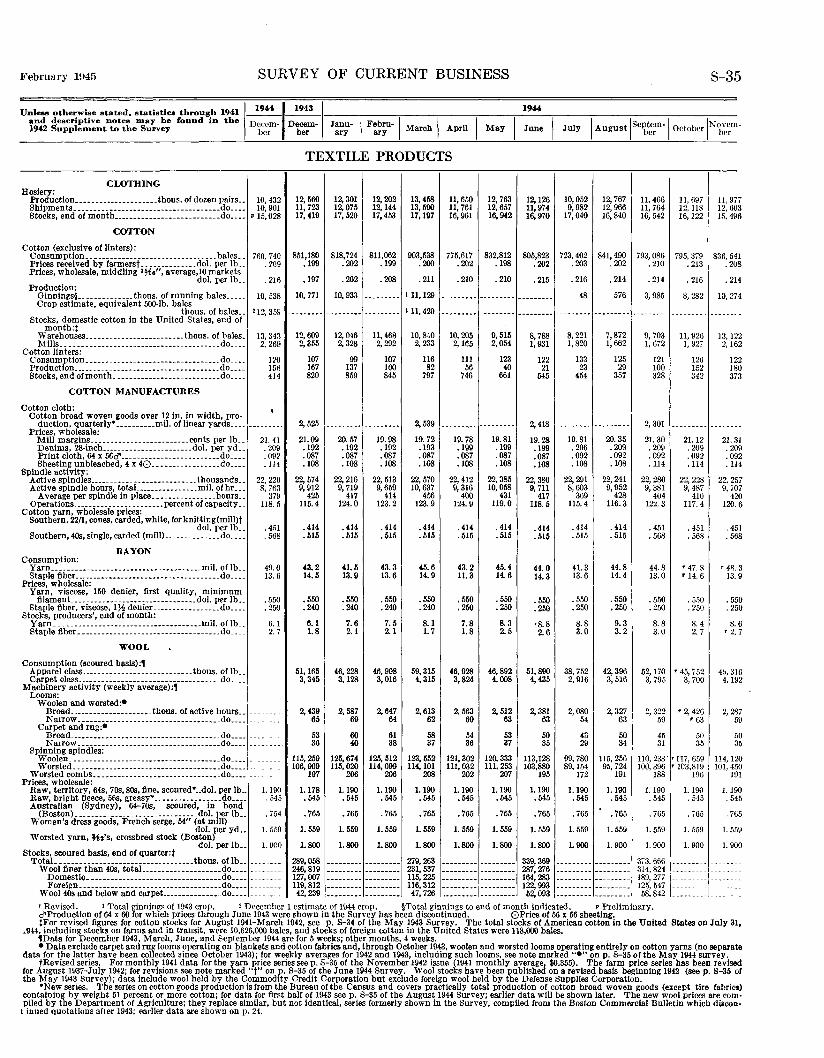
February 1D45 SURVEY OF CURRENT BUSINESS S-35
19.U Unless otherwise stated, otatistica through 1941 ~~~~~
and d.escriptive notes ~nay be found in the Decem- Decem· 1942 Supplement to the Survey her her Janu- I Febru-1 March I .April I May I June I July I August ISeptem-1 October INovem-ary ary ber ber
CLOTHING Hosiery:
Production _____________________ thous. of dozen pairs.. 10,432 Shipments _________ ---------------------- ______ do____ 10, 901 Stocks, end of montb ___________________________ do ____ •15,028
COTTON
Cotton (exclusive of linters): Consumption._------------------------------. bales._ 760, 740 Prices received by farmerst ______________ dol. per lb.. . 209 Prices, wholesale, middling l~i•"• average,10 markets
dol. per lb.. . 216 Production:
Ginnings§ ______________ thous. of running bales ____ _ Crop estimate, equivalent 500-lb. bales
thous. of bales._ Stocks, domestic cotton in tbe United States, end of
month:t Warehouses _________________________ thous. of bales. Mills ______ ----------------------------------do ___ _
Cotton linters: Consumption._---- ____________ ---------------- do. __ _ Production _____________________________________ do ___ _
Stocks, end of month. --------------------------do ___ _
COTTON MANUFACTURES
Cotton cloth: Cotton broad woven goods over 12 in. in width, pro-
10,538
'12, 359
13, 343 2. 269
120 156 414
duction, quarterly• __________ mil. of linear yards ____ ---------Prices, wholesale:
Mill margins _________________________ cents per lb __ Denims, 28-inch ______________________ .dol. per yd __ Print cloth, 64 x 560"-------------------------do ___ _ Sheeting unbleached, 4 x 40--- ______________ do ___ _
Spindle activity: Active spindles _____________ ------ ________ thousands._ Active spindle hours, totaL ______________ mil. ofhr __ _
Average per spindle in place ________________ hours .. Operations --------- _____________ percent of capacity __
Cotton yarn, wholesale prices: Southern, 22/1, cones, carded, white, for knitting(mill)t
dol. per lb .. Southern, 40s, single, carded (mill) ______________ do. __ _
RAYON Consumption:
Yarn--------------------------------------mil. of lb .. Staple fiber---------------------------- ________ .do .• __
Prices, wholesale: Yarn, viscose, 150 denier, first quality, minimum filament ________________________________ dol. per lb •. Staple fiber, viscose, IJ,i! denier _________________ do ___ _
Stocks, producers', end of month: Yarn. __ --------------------------·-------mil. of lb .• Staple fiber_ -----------------------------------do. __ _
WOOL
Consumption (scoured basis):,
21. 41 . 209 . 092 .114
22, 220 8, 763
379 118. 5
.4M • 568
49.0 13.6
. 550
. 250
6.1 2. 7
Apparel class ____________________________ thous. of lb .. ____ . Carpet class ____________________________________ do ____ ..
Machinery activity (weekly average):, Looms:
Woolen and worsted:• Broad _____________________ thous. of active hours _____ _ Narrow_ ·----------------------------------do _______ _
Carpet and rug:• Broad ___________________________ ----- ____ . .do. ______ _ Narrow_ -----------------------------------do _______ _
Spinning spindles: Woolen. -------------------------------------do ______ _ Worsted. __ ----------------------------------do ______ .
Worsted combs._-------------------- __________ do •••• __ Prices, wholesale:
Raw, territory, 64s, 70s, 80s, fine, scoured* .. dol. per lb.. I. 190 Raw, bright fleece, 568, greasy• .. _______________ do.... . 545 .Australian (Sydney), 64-70s, scoured, in bond
(Boston)----------------------- ________ dol. per lb .. Women's dress goods, French serge, 54" (at mill)
dol. per yd •• Worsted yarn, ~.·s, crossbred stock (Boston)
. 754
1. 559
dol. per lb.. I. 900 Stocks, scoured basis, end of quarter:t
TotaL_ ---------------------------------thous. of lb .. _______ _ Wool finer than 40s, totaL ___________________ do ___________ _ Domestic. ___ ---------------- ________ ----- .do ___________ _ Foreign ____________________________________ do ___________ _
Wool40s and below and carpet _______________ do ___________ _
TEXTILE PRODUCTS
12,560 11,723 17,419
851,180 .199
.197
12,301 12,075 17,520
818,724 .202
.202
10, 771 10, 933
12,202 12,144 17,453
811,062 .199
.208
12, 609 12,046 11,468 2, 355 2. 328 2, 292
107 99 107 167 137 100 820 859 845
2,525
21.09 .192 .087 .108
22, 574 9, 912
425 115.4
.414
. 515
43.2 14.5
• 550 .240
6.1 1.8
51,165 3,345
2,439 65
53 36
115,259 106,009
197
1.178 .545
• 765
1.559
1.800
289,058 246,819 127,007 119,812 42,239
20.57 .192 .087 .108
22, 216 9, 719
417 124.0
.414 • 515
41.5 13.9
.550
.240
7.6 2.1
46,228 3,128
2, 587 69
60 40
125,674 115,020
206
1.100 . 545
• 765
1. 559
1.800
19.98 .192 .087 .108
22,513 9,659
414 123.2
. 414
.515
43.3 13.6
.550
.240
7.5 2.1
46,908 3,016
2, 647 64
61 38
125, 512 114,099
206
1.100 .545
. 765
1.559
1.800
13,458 13,500 17, 197
003,538 .200
.211
I 11,129
I 11,429
10,840 2,233
116 82
797
2,539
19.72 .193 .087 .108
22, 570 10,637
456 123.9
.414
. 515
45.6 14.9
.550
.240
8.1 1.7
59, 315 4,315
2, 613 62
58 37
123,552 114, 101
208
1.100 .545
• 765
1.559
1.800
279,263 231,537 115,225 116,312 47,726
11.650 I 11, 761 16,961
775,617 .202
. 210
10,205 2,165
111 56
746
19.78 .199 .087 .108
22,412 9, 316
400 124.9
. 414
. 515
43.2 11.3
.550
.250
7.8 1.8
46,928 3,824
2. 563 60
54 36
121,302 111,032
202
1.100 .545
• 765
1. 559
1.800
12,763 12,657 16,942
832,812 .198
. 210
9, 515 2,054
123 40
661
19.81 .199 .087 .108
22,385 10,058
431 119.0
. 414
.515
45.4 14.6
.550
. 250
8. 3 2.5
46,892 4,008
2,512 63
53 37
120,333 111,253
207
1.100 .545
• 765
1.559
1.800
12,126 11,974 16,970
805,823 .202
.215
8, 788 1, 931
122 21
545
2,418
19.28 .199 .087 .108
22,380 9, 711
417 118.5
.414
. 515
44.0 14.3
.550
.250
•8.8 2.6
51,800 4,435
2, 381 63
50 35
113,128 103,880
195
1.100 .545
• 765
1.559
1.800
339,369 287,276 164,283 122,993 52,093
10,052 9, 982
17,040
12,767 12,966 16,840
723, 402 841, 490 .203 .202
. 216 . 214
48
8,221 1,820
133 23
454
19.81 .206 .092 .108
22,291 8,603
369 115.4
.414
. 515
41.3 13.6
.550
.250
8.8 3.0
38,752 2, 916
2,080 54
43 29
99,780 89,154
172
1.100 .545
. 765
1. 559
1.900
576
7,872 1,662
125 29
357
20.35 .209 .092 .108
22,241 9,952
428 116.3
.414
. 515
44.8 14.4
.550
.250
9.3 3.2
42,396 3, 516
2,327 63
50 34
115,256 95,724
191
1.190 .545
• 765
I. 559
1. 900
11,466 11,764 16,542
11, 697 12, 118 16,122
11,977 12.603 15.496
793, 086 795, 379 836, 541 . 210 . 213 . 208
• 214
3, 985
9, 703 1, 672
121 100 328
2, 301
21.30 .209 .092 .114
22,280 9, 381
404 12~. 3
.451
.568
44.8 13.0
. 550
. 250
8. 8 3.0
.216
8,282
11,926 I, 927
126 152 342
21.12 . 209 .092 .114
22,228 9, 487
410 117.4
. 451
. 56S
'47. 8 r 14.6
. 550
. 250
8.4 2. 7
. 214
10,274
13.122 2,162
122 180 373
21.31 . 209 .092 .114
22,257 9, i07
420 120.6
. 451
. 568
'4S. 3 13.9
.550
. 250
8.6 r 2. 7
52, 170 '45, i52 4.1, 316 3, 795 3, 700 4. 192
2, 322 ' 2, 426 2, 2~7 59 •63 59
45 50 50 31 35 35
110,238 •117,659 100. 396 ' 103,819
188 196
1. 190 . 545
. 765
I. 559
1. 900
373.666 314,824 189, 277 125, 547 58,842
1.190 . 545
. 765
I. 559
1. 900
114, 120 101, 450
191
1.190 . 545
. 765
!. 559
!. 900
'Revised. I Total ginnin~s of 1943 crop. 'December 1 estimate of 1944 crop. §Total ginnings to end of month indicated. • Preliminary. ci"Production of 64 x 60 for which prices through June 1943 were shown in the Survey has been discontinued. 0Price of 56 x 56 sheeting. tFor revised figures for cotton stocks for August 1941-March 1942, see p. S-34 of the May 1943 Survey. The total stocks of American cotton in the United States on July 31,
.944, including stocks on farms and in transit, were 10,626,000 bales, and stocks of foreign cotton in the United States were 118,000 bales. 1Data for December 1943, March, June, and September 1944 are for 5 weeks; other months, 4 weeks. • Data exclude carpet and rug looms operating on plankets and cotton fabrics and, through October 1943, woolen and worsted looms operating entirely on cotton yarns (no separate
data for the latter have been collected since October 1943); for weekly averages for 1942 and 1943, including such looms, see note marked "•" on p. S-35 of the May 1944 survey. tRevised series. For monthly 1941 data for the yarn price series seep. S-35 of the November 1942 issue (1941 monthly average, $0.355). The farm price series has been revised
for August 1937-July 1942; for revisions see note marked "t" on p. S-35 of the June 1944 Survey. Wool stocks have been published on a revised basis beginning 1942 (seep. 8-35 of the May 1943 Survey); data include wool held by the Commodity Credit Corporation but exclude foreign wool held by the Defense Supplies Corporation.
•New series. The series on cotton goods production is from the Bureau of the Census and covers practically total production of cotton broad woven goods (except tire fabrics) containing by weight 51 percent or more cotton; for data for first half of 1943 see p. S-35 of the August 1944 Survey; earlier data will be shown later. The new wool prices are compiled by the Department of Agriculture; they replace similar, but not identical, series formerly shown in the Survey, compiled from the Boston Commercial Bulletin which discon
t inned quotations after 1943; earlier data are shown on p. 24.
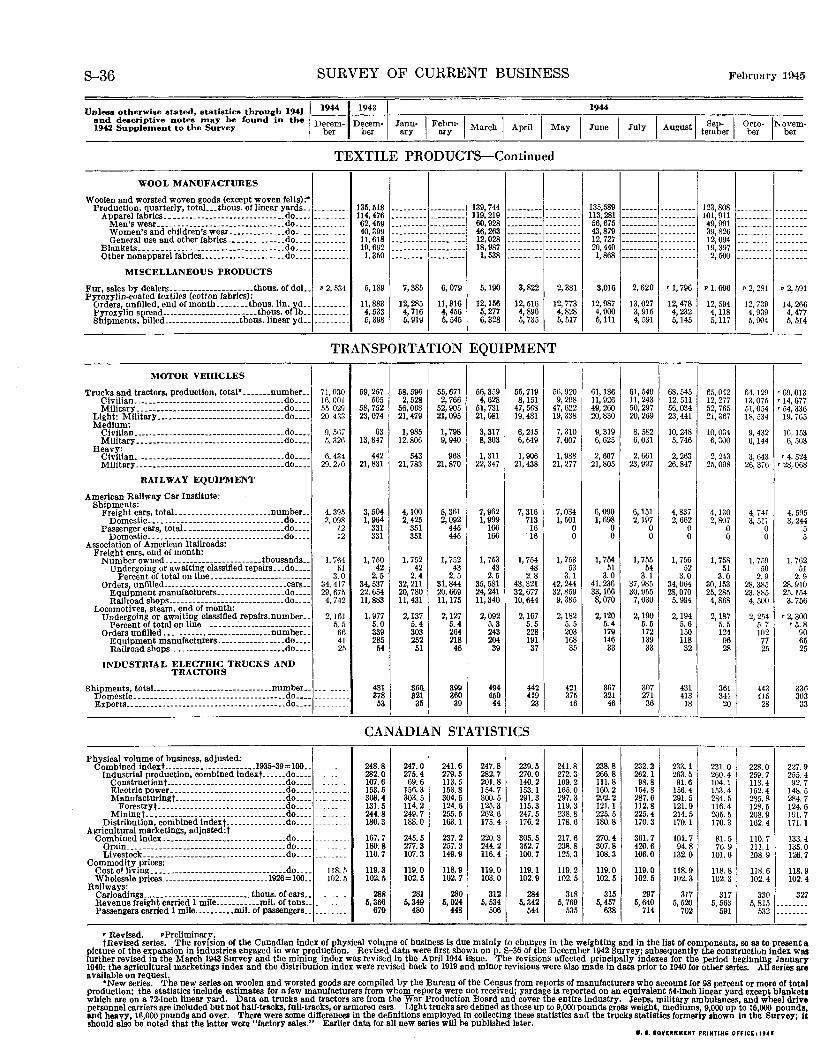
S-36 SURVEY OF CURRENT BUSINESS
Unle.os otherwise stated, statistics through 1941 1 1944 ~~~ and descriptive notes may he found in the Decem- Decem· Ianu- I Febru·l I · I 1942 Supplement to the Survey ber ber ary ary March Apnl May
TEXTILE PRODUCTs-Continued
WOOL MANUFACTURES
Woolen and worsted woven goods (except woven felts) :• Production, quarterly, totaL .. thous. of linear yards ......... .
A~:~~~ ~~~~':_8_-_~ ==::::::::::::::::::::::::::~~=::: =:::::::. Women's and children's wear ..••..•....... do ..••........ General use and other fabries. _____________ do .•..........
Blankets ..•.•...............•.....•......... do •........... Other nonapparel fabrics •••..•.••..•.•.•..... do •...........
MISCELLANEOUS PRODUCTS
Fur, sales by dealers ....•....•...•.•..... thous. of doL. • 2, 534 Pyroxylin-coated textiles (cotton fabrics):
Orders, unfilled, end of month .••.•••. thons. lin. yd .. Pyroxylin spread ..•••.....•••...•.•..... thous. of lb •• Shipments, billed ..•..••....•.•.•.•. thous. linear yd •.
135,518 114,476 62,459 40,399 11,618 19,692 1,350
5,189
11,883 4,533 5,398
7,385 6,079
12,285 11,816 4, 716 4,456 5,919 5,545
139,744 ll9, 219 60,928 46,263 12,028 18,987 1,538
5,190
12, 156 5, 277 6,328
3,822 2,381
12,516 12,773 4,896 4,828 5, 735 5, 517
TRANSPORTATION EQUIPMENT I
58,5961
MOTOR VEHICLES
Trucks and tractors, production, total• ...••.. number .• 71,030 59,257 55,671 56,359 55,719 56,920 Civilian •.....•...••••••.•......•...•...•••••. do .••• 16,C01 505 2,528 2, 766 4,628 8, 151 9, 208 Military ....•••..•...•...•.•...•...•.....•.•. do •••• 55 029 58,752 56,068 52,905 51, 731 47,568 47,622
Light: Military ••.•••••......•......•.......... do .•.. 20 433 23,074 21,479 21,095 21,081 19,481 19,338 Medium:
Civilian ..••..•.•..........•......•........... do .••. 9, 567 63 1,985 I, 798 3,317 6, 245 7, 310 Military ••.••••......•.......•.....•......... do .••. 5, 326 13,847 12,806 9,940 8, 303 6, 649 7,007
Heavy: Civilian •••..•••.....•...•••••...•.•........• do .•.• 6, 434 442 543 968 1, 311 1,906 I, 988 MilitarY------·······························do .•.• 29,210 21,831 21,78.3 21,870 22,347 21, 438 21,277
RAILWAY EQUIPMENT
American Railway Car Institute: Shipments:
3,504 5,361 7, 962 Freight cars, totaL ..••...•.....•.......•. number .. 4, 395 4,100 7,316 7,034 Domestic .•.•......••.......•....•.•.••••.. do .... 3, 098 1, 964 2, 425 2,092 1,999 713 I, 501
Passenger cars, totaL ••..••..••....•.•...•.•. do .•.. 12 331 351 445 166 16 0 Domestic ........•..........•..••......••. .do .... 12 331 351 445 166 "16 0
Association of American Railroads: Freight cars, end of month:
Number owned_ .•..................... thousands .. 1. 764 I, 750 I, 752 I, 752 1, 753 I, 754 I, 753 Undergoing or awaiting classified repairs .•. do ..•• 51 42 42 43 43 48 53
Percent of total on line •.•.••••.........•.....•• 3. 0 2.5 2.4 2.5 2. 5 2.8 3.1 Orders, untllled .•..............•....•••.••.... cars .. 34,417 34,537 32,211 31,844 35,581 43,321 42,244
Equipment manufacturers .••..........•... do .... 29, 675 22,654 20,780 20,669 24,241 32,677 32,859 Railroad shops ...............••..••......•. do .... 4, 742 11,883 11, 431 II,175 11,340 10,644 9, 385
Locomotives, steam, end of month: Undergoing or awaiting classified repairs.number .. 2,161 1, 977 2,137 2,127 2,092 2,167 2,182
Percent of total on line ....••.•.•................. 5. 5 5.0 5. 4 5.4 5. 3 5.5 5. 5 Orders unfilled ••.....••.••••••...••.•••.. number .• 66 339 303 264 243 228 203
Equipment manufacturers ...........•••••• do .••. 41 285 252 218 204 191 168 Railroad shops ..•....•...•.•••.•.•..••..••• do .•.. 25 54 51 46 39 37 35
INDUSTRIAL ELECTRIC TRUCKS AND TRACTORS
Shipments, totaL •........•.....•.....•....... number •. ... ---- 43I 356. 399 494 442 421 Domestic .•..........•••.••......•.......•.•••. do .•.• 378 321 360 450 419 375 Exports ........•.•...••......•.•.•.••..•.•...•. do ..•• --------· 53 35 39 44 23 46
CANADIAN STATISTICS
Physical volume of business, adjusted: Combined lndext .•••.....•...........•. I935-39=100 •. -------- 248.8 247.0 241.6 247.8 239.5 241.8
Industrial production, combined indext ..•.• -do .... 282.0 275.4 279.5 282.7 270.0 272.3 Construction t ........•....•......•.•....... do .... 107.6 69.6 II3. 5 201.8 140,2 109.2 Electric power .......•.....•.••....•......• do ..•. 153.5 156.3 !53. 8 154.7 153. I 165.0 Manufacturingt ...•..•.......••............ do .... 308.4 303.5 304.5 300.5 291.3 297.3
M1~r:~\~~! ~: = = =: = = =: =::::::::::::::::::::: ~~::: = 131.5 114.2 124.6 125.3 115.3 119.3 244.8 249.7 255.5 262.6 247.5 238.8
Distribution, combined indext ........•..•.•. do ..•. 180.3 188.0 163.1 175.4 176.2 178.6 Agricultural marketings, adjusted:t
Combined index •. _ •.•.•••...•.••......••...... do .••• !67. 7 245.5 237.2 220.3 305.5 217.6 Grain ..................•.••..•.....•...••.... do ..•. --------- 180.8 277.3 257.3 244.2 352.7 238.8 Livestock •...••..•.••.••.•....•..........•••. do ...• --------- no. 7 107.3 149.9 116.4 100.7 125.3
Commodity prices: Cost of living .••.•..•....••....•..•........•.•• do. ___ 118.5 119.3 119.0 118.9 I19.0 119.1 119.2 Wholesale prices_ ....•.••.•..•••.....•.•... 1926=100 .• 102.5 102.5 102.5 102.7 103.0 102.9 102.5
Railways: 280 Carloadings .••......•.•.•.•.•.•••.•••• thous. of cars •• 288 281 312 284 318
Revenue freight carried I mile •....•..... mil. of tons •. 5,366 5,349 5,024 5,534 5,342 5, 769 Passengers carried 1 mile ..•.•.•••• mil. of passengers .. 679 480 448 506 544 535
I
1944
135,589 l13, 281 56,675 43,879 12,727 20,440 1,868
3,016
12,987 4,900 5, Ill
61, 186 11,926 49,260 20,830
9, 319 6, 625
2, 607 21,805
6,090 I, 698
0 0
1, 754 51
3.0 41,236 33, 166 8,070
2,120 5.4 179 146 33
367 321 46
238.8 266.8 II1.8 160.2 292.2 121. I 225.5 180.8
270.4 307.8 108.3
119.0 102.5
315 5, 457
638
2,620
13,027 3, 915 4, 591
61,540 11,243 50,297 20,269
8, 582 6, 031
2,661 23,997
6,151 2,197
0 0
1, 755 54
3.1 37,985 30,9.55 7,030
2,190 5.5 172 139 33
307 271 36
232.2 262.1 98.8
154.8 287.6
. 112.8 225.4 170.3
361.7 420.6 106.0
119.0 102.5
297 5,640
714
• I, 796
12,478 4,232 5,145
68,545 12, 511 56,034 23,441
10,248 5, 746
2,263 26,847
4,837 2,662
0 0
I, 756 52
3.0 34,064 28,070 5, 994
2,194 5. 6 !50 118 32
431 413 18
233. I 263.5 91.6
156.4 291.5 121.9 214.5 170.1
101.7 94.8
132.0
I18. 9 102.3
317 5,520
702
February 1945
123,808 101,911 49,991 39,826 12,094 19,397 2, 500
•1. 606
12, 594 4,118 5,117
65,042 12,277 52,765 21,367
10,034 6,300
2, 243 25,098
4,130 2,807
0 0
1, 75R 51
3.0 30, !53 25,285 4,868
2,187 5. 5 124 96 28
361 341 20
231.0 260.4 104.1 !53. 4 284.5 116.4 205.5 170.3
81.5 76.9
101.6
Il8.8 102.3
317 5,563
591
• 2, 281
12,739 4. 939 5, 904
64,129 13,07.1 51,054 18, 534
9, 432 6,144
3, 643 26,376
4, 741 3, 51;
0 0
1, 7.o9 50
2.9 28,385 23,885 4, 500
2, 254 5. 7 !02 77 25
443 415
28
228.0 259.7 II3. 4 152.4 285.8 128.5 208.9 162.4
llO. 7 111.1 108.9
118.6 102.4
330 5, 815
532
• 2, 591
14,266 4,477 5, 514
• 69,013 • 14,677 • 54,336
19, 765
10,153 6, .)03
• 4. 524 • 28,068
4, 59 3, 24
5 4 5 5
I, 762 51
2. g 28,910 25, 154
3, 75
• 2,3 • 5.
9 6 2
6
00 8 0 5 5
33 30 3
6 3 3
227.9 255.4 92.7
148. 5 284.7 124.6 191.7 171. 1
133.4 135.0 126.7
118.9 102.4
327
• Revised. •Preliminary. tRevised series. The revision of the Canadian index of physical volume of business Is due mainly to changes in the weighting and in the list of components, so as to present a
picture of the expansion in industries engaged in war production. Revised data were first shown on p. S-36 of the December 1942 Survey; subsequently the construction index was further revised in the March 1943 Survey and the mining index was revised In the Aprili944 issue. The revisions affected priDclpally indexes for the period beginning January 1940; the agricultural marketings index and the distribution index were revised back to 1919 and minor revisions were also made In data prior to 1940 for other series. All series are available on request.
•New series. The new series on woolen and worsted goods are compiled by the Bureau of the Census from reports of manufacturers who account for 98 percent or more of total production; the statistics include estimates for a few manufacturers from whom reports were not received; yardage is reported on an equivalent 54-iDch linear yard except blankets which are on a 72-inch linear yard. Data on trucks and tractors are from the War Production Board and cover the entire Industry. Jeeps, military ambulances, and wheel drive personnel carriers are included but not half-tracks, full-tracks, or armorea cars. Light trucks are defined as those up to 9,000 pounds gross weight, mediums, 9,000 up to 16,000 pounds, and heavy, 16,000 pounds and over. There were some differences in the definitions employed in collecting these statistics and the trucks statistics formerly ahown ill the Survey; it should also be noted that the latter were "factory sales." Earlier data for all new series will he published later.
U. I. GOVERNMENT PRINTING OFFICE: 1945
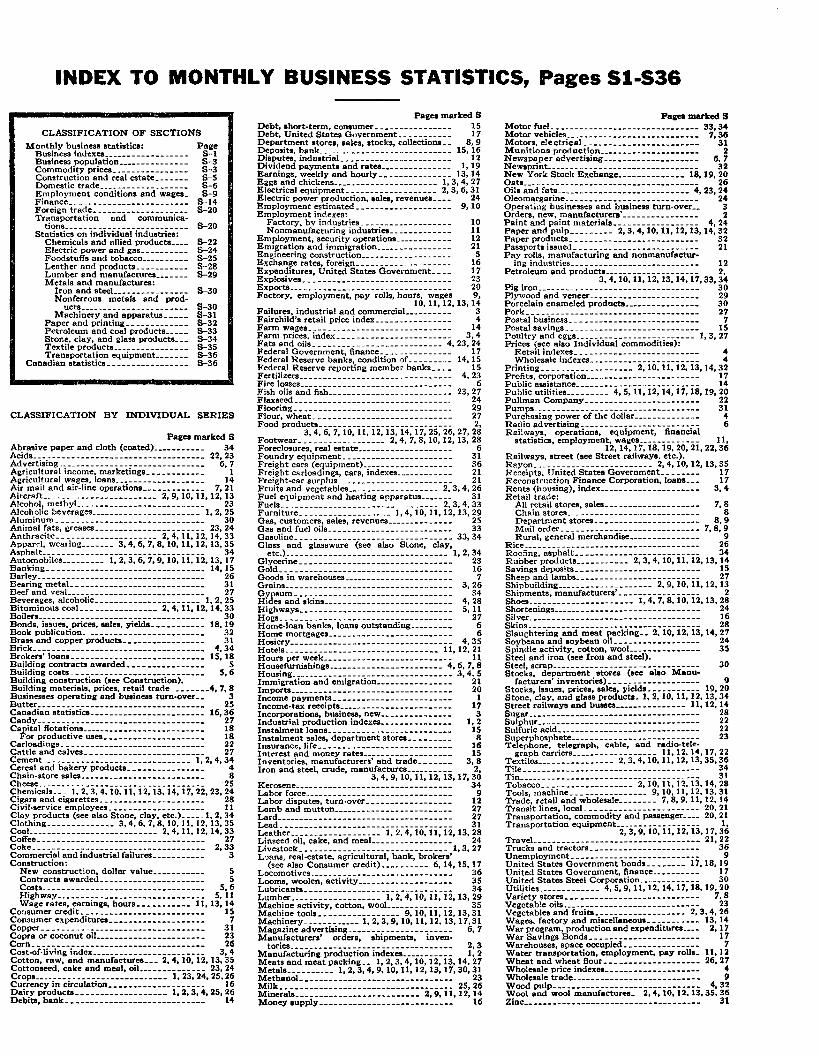
INDEX TO MONTHLY BUSINESS STATISTICS, Pages S1-S36
CLASSIFICATION OF SECTIONS
Monthly bu•iness statistics: Business indexes _____________ -----Business population ______________ _ Commodity prices _______________ _ Construction and real estate ______ _ Domestic trade _________ ----------Employment conditions and wa&es. Finance ... __ .... --------------- ........ Foreign trade. ______ ------ __ -----Transportation and communica·
tiona _________ .. __ --------- .......... Statistics on individual industries:
Chemicals and allied products ___ _ Electric power and gas .................. .. Foodstuffs and tobacco _________ _ Leather and products __________ _ Lumber end manufactures ............ .. Metals and manufactures:
Iron and steeL--------------Nonferrous metals and prod-
ucts _________ -----_----- ...... Machinery and apparatus ____ _
Paper and printing ____________ _ Petroleum and coal products ____ _ Stone, clay, and glass products __ _ Textile products _______________ _ Transportation equipment ______ _
Canadian statistics._---------------
Page S-1 S-3 S-3 S-5 S-6 s-9
s-t4 S-20
S-20
S-22 S-24 S-25 S-28 s-29
S-30
S-30 S-31 S-32 S-33 s-34 S-35 s-36 S-36
CLASSIFICATION BY INDIVIDUAL SERIES
Pages marked S Abrasive paper and cloth (coated)___________ 34 Acids ..• _--------.----------------------- 22, 23 Advertising·------------------------------ 6, 7 Agriculture! income, marketings____________ 1 Agricultural wages, loans.------------------ 14 Air mail and air-line operation•------------- 7, 21 Aircraft.----------------------- 2, 9,10,11,12, 13 Alcohol, methy'--------------------------- 23 Alcoholic beverages _______________________ 1, 2, 25 Aluminum _______ ------------------------ 30 Animal fats, greases·---------------------- 23,24 Anthracite. _____ -------- ___ ---_ 2, 4, 11, 12, 14, 33 Appard, wearing _______ 3, 4, 6, 7, 8, 10, 11, 12, 13,35 Asphalt.. _________ --------_______________ 34 Automobiles _________ 1, 2, 3, 6, 7, 9,10, 11, 12, 13, 17 Banking·-------------------------------- 14,15 Barley _______ ---------------------------- 26 Bearing meta'---------------------------- 31 Beef and vea'----------------------------- 27 Beverages, alcoholic ............................................ 1, 2, 25 Bituminous coaL •• ------------- 2, 4, 11, 12, 14, 33 Boilers ____________ ----------------------_ 30 Bonds, issues, prices, sales, yield•----------- 18, 19 Book publication. ------------------------ 32 Brass and copper products_________________ 31 Brick.----------------------------------- 4,34 Brokers' loans •. -------------------------- 15, 18 Building contracts awarded________________ 5 Building costs.--------------------------- 5, 6 Building construction (see Construction). Building materials, prices, retail trade _______ 4, 7, 8 Businesses operating and business turn-over__ 3 Butter __________ ------------------------- 25 Canadian statistiCS------------------------ 16,36 CandY----------------------------------- 27 Capital flotations .. ------------------------ 18
For productive uses--------------------- 18 Carloadings. ____ ------------------------- 22 Cattle and calves_________________________ 27 Cement. ________ ---------------------- 1, 2, 4, 34 Cereal and bakery product•---------------- 4 Chain-store sales-------------------------- 8 Cheese. _________ ----_____________________ 25 Chemicals ___ I, 2, 3, 4,10,11,12,13,14,17, 22, 23,24 Cigars and cigarettes______________________ 28 Civil·service employees ____ ----- ______ ----- 11 Clay products (see also Stone, clay, etc.) ••••. l, 2, 34 Clothing ______________ 3, 4, 6, 7, 8, 10, 11, 12, 13,35 CoaL-------------------------- 2, 4, 11, 12, 14,33 Coffee •• __ ------------------------------- 27 Coke •• ---------------------------------- 2,33 Commercial and industrial failures___________ 3 Construction:
New construction, dollar value___________ 5 Contracts awarded·--------------------- 5 Cost•---------------------------------- 5, 6 HighwaY------------------------------- 5, 11 Wage rates, earnings, hours ___ .., _______ 11, 13,14
Consumer credit. ____ --------------------- 15 Consumer expenditures____________________ 7 Copper·--------------------------------- 31 Copra or coconut oi'----------------------- 23 Corn.----------------------------------- 26 Cost-of-living indeX------------------------ 3, 4 Cotton, raw, and manufactures ___ 2, 4, 10, 12, 13,35 Cottonseed, cake and meal, oiL.------------ 23,24 Crops.--------------------------- 1, 23, 24,25,26 Currency in circulation •• -----------_______ 16 Dairy products------------------- 1, 2, 3, 4, 25,26 Debits, bank----------------------------- 14
Pages marked S Debt, short-term, consumer________________ 15 Debt, United States Government___________ 17 Department stores, sales, stocks, collections_ _ 8, 9 Deposits, bank .. ---------------··---------- 15, 16 Disputes, industriaL ••• ------------------- 12 Dividend payments and rates_______________ 1,19 Earnings, weekly and hourly _______________ 13,14 Eggs and chickens ______________________ 1, 3, 4, 27 Electrical equipment. _______________ --_ 2, 3, 6, 31 Electric power production, aalea, revenues____ 24 Employment estimated •• -------··---------- 9,10 Employment indexes:
Factory, by industries--------··---------- 10 Nonmanufacturing industries...................................... 11
Employment, security operations.------_---- 12 Emigration and immigration............................................... 21 Engineering construction___________________ 5 Exchange rates, foreign____________________ 16 Expenditures, United States Government. __ - 17 Explosives. __ ---------------------_______ 23 Exports _________________________ -----____ 20 Factory, employment, pay rolls, hours, wages 9,
10, 11, 12, 13, 14 Failures, industrial and commerciaL_________ 3 Fairchild's retail price index________________ 4 Farm wages ...... ---------------------------- 14 Farm prices, index ......... --------------------- 3, 4 Fats and oil•--------------------------- 4, 23,24 Federal Government, finance. ___ ----------- 17 Federal Reserve banks, condition of. ________ 14,15 Federal Reserve reporting member banks____ 15 Fertilizers ... ----------------------------- 4, 23 Fire losses________________________________ 6 Fish oils and fish-------------------------- 23,27 Flaxseed._------ ____ -------- __ .---_______ 24 Flooring ________ ------------ ________ ----_ 29 Flour, wheat.---------------------------- 27 Food products._---- ____ ---- _____ --------- 2,
3, 4, 6, 7, 10, 11, 12,13, 14, 17, 25, 26, 27,28 Footwear ___________ ------- 2,4, 7,8,10,12,13, 28 Foreclosures, real estate____________________ 6 Foundry equipment._--------------------- 31 Freight cars (equipment>------------------- 36 Freight carloadings, cars, indexes____________ 21 Freight-car surplu•------------------------ 21 Fruita and vegetables.------------------ 2,3,4, 26 Fuel equipment and heating apparatus_______ 31 Fuels _________________________________ 2, 3, 4, 33 Furniture ______________ ----- 1, 4, 10, 11, 12, 13, 29 Gas, customers~ sales, revenues--~----------- 25 Gas and fuel oil•-------------------------- 33 Gasoline ______________ ---- _____ ---------- 33, 34 Glass and glassware (see also Stone, clay,
etc.>---------------------------------- 1, 2, 34 Glycerine .. ------------------------------ 23 Gold ___________ ------------------------- 16 Goods in warehouses_______________________ 7 Grain•----------------------------------- 3,26 Gypsum_________________________________ 34 Hides and skin•--------------------------- 4, 28 Highways·------------------------------- 5, 11 Hog•------------------------------------ 27 Home-loan banks, loans outstanding_________ 6 Home mortgage•-------------------------- 6 HosierY---------------------------------- 4, 35 Hotels-------------------------------- 11,12, 21 Hours per week--------------------------- 11 Housefurnishing•------------------------ 4, 6, 7, 8 Housing·--------------------------------- 3, 4, 5 Immigration and emigration---------------- 21 Imports ________ -------------------------- 20 Income payments .• ----------------------- 1 Income-tax reeeipts.----------------------- 17 Incorporations, business, new_______________ 3 Industrial production indexe•--------------- 1, 2 Instalment loans •• __ .--------------------- 15 Instalment sales, department stores_________ 8 Insurance, life_--------------------------- 16 Interest and money rates___________________ 15 Inventories, manufacturers' and trade_______ 3, 8 Iron and steel, crude, manufactures__________ 2,
3, 4, 9, 10, 11, 12, 13, 17, 30 Kerosene _____ • ____________ --------- ___ --- 34 Labor force ... ---------------------------- 9 Labor disputes, turn-over------------------ 12 Lamb and mutton·------------------------ 27 Lard------------------------------------- 27 Lead------------------------------------ 31 Leather ___________________ 1, 2, 4, 10, 11, 12, 13,28 Linseed oil, cake, and meat_________________ 24 Livestock.------------------------------ 1,3,27 L•Jans, real-estate, agricultural, bank, brokers'
(see also Consumer credit) __________ 6, 14, 15, 17 Locomotives·-----_-------------------.--- 36 Looms, woolen, activitY-------------------- 35 Lubricants._----------------------------- 34 Lumber ___________________ 1, 2,4,10,11,12,13, 29 Machine activity, cotton, wooL_____________ 35 Machine tools----------------- 9, 10, 11, 12, 13,31 Machinery ____________ 1, 2, 3, 9, 10, 11, 12, 13, 17,31 Magazine advertising______________________ 6, 7 Manufacturer•' orders, shipments, inven·
tories. ______ ----- __ ----- ____ -------- _ -- 2, 3 Manufacturing production indexes___________ I, 2 Meats and meat packing._ I, 2, 3, 4, 10, 12, 13, 14, 27 Metals __________ 1, 2, 3, 4, 9, 10, 11, 12, 13, 17, 30,31 MethanoL __ ----------------------------- 23 Milk •• ---------------------------------- 25,26 Minerals-------------------------- 2, 9,11,12,14 Money supply---------------------------- 16
Pa1ea marked S Motor fueL_----------------------------- 33,34 Motor vehicles ... ------------------------- 7, 36 Motors, electrical_----------------------- 31 Munitions production .................................... ________ 2 Newspaper advertising____________________ 6, 7 Newsprint_ ____________ ------------------- 32 New York Stock Exchange ______________ 18,19, 20 Oats __________ --------------------------- 26 Oils and fats ____________________________ 4, 23, 24 Oleomargarine. __ ---------- ____ .---------- 24 Operating businesses and business turn-over.... 3 Orders, new, manufaeturera' ---------------- 2 Paint and paint materials.----------------- 4, 24 Paper and pulp _________ 2, 3, 4,10,11,12,13,14, 32 Paper products ___ ------------------------ 32 Passporta issued _____ ------ __ ---- _____ -_-- 21 P~y r~lls, ma.nufacturing and nonmanufactur•
1ng tndustnes___________________________ 12 Petroleum and products-------------------- 2,
3,4,10,11,12,13,14,17,33,34 Pig iron ____________ ---------------------- 30 Plywood and veneer----------------------- 29 Porcelain enameled products________________ 30
Pork ..•. -------------------------------- 27 Postal business.-------------------------- 7 Postal savings _____ ----------- ___ --------- 15 Poultry and eggs _________________________ 1, 3, 27 Prices (see also Individual commodities): Retail indexes ________________________ .- 4
Wholesale indexes----------------------- 4 Printing ___________________ 2,10,11,12,13,14,32 Profits, corporation _____ ------------------- 17 Public assistance.------------------------- 14 Public utilities _________ 4, 5,11,12, 14, 17,18, 19,20 Pullman CompanY------------------------ 22 Pumps. _____ - ___ ------------------------- 31 Purchasing power of the dollar______________ 4 Radio advertising_________________________ 6 Railways, operations, equipment, financial
statistics, employment, wages_____________ 11, 12, 14, 17, 18, 19, 20, 21, 22, 36
Railways, street (see Street railways, etc.). RRyon .•• ---------------------- 2,4,10,12,13,35 Receipts, United State• Government._______ 17 Reconstruction Finance Corporation, loans___ 17 Rents (housing), indeX--------------------- 3, 4 Retail trade:
AU retail stores, sales-------------------- 7, 8 Chain stores ... ------------------------- 8 Department stores.--------------------- 8, 9 Mail order ______ ----------------------- 7, 8, 9 Rural, general merchandise_______________ 9
Rice ________ -- __ ------------------------- 26 Roo5ng, asphalt.------------------------- 34 Rubber products ___________ 2, 3, 4, 10, 11, 12, 13,14 Savings deposits-------------------------- 15 Sheep and lambs •• ------------------------ 27 Shipbuilding ____________________ 2, 9,10,11,12,13 Shipments, manufacturers'----------------- 2 Shoes .• -------------------- 1,4,7,8,10,12,13,28
~n~~;~~~~~~---------= = = ==== == ==== == = = = = == = = = = = ~~ Skin•------------------------------------ 28 Slaughtering and meat packing __ 2, 10, 12, 13, 14, 27 Soybeans and soybean oiL.---------------- 24 Spindle activity, cotton, woo'--------------- 35 Steel and iron (see Iron and steel), Steel, scrap ______ ----------------.-------- 30 Stocks, department stores (see also Manu-
facturers' inventories) _____ -------------- 9 Stocks, issues, prices, aalea, yield•----------- 19,20 Stone, clay, and glass products. 1, 2, 10, 11, 12, 13, 34 Street railways and busaes _______________ 11, 12, 14
!~iiiY~~;~i~:::::::::::::::::::::::::::::: ~~ Superphosphate ____ ----.------------------ 23 Telephone, telegraph, cable, and radio.tele-
graph carriers •••• -------------- 11, 12, 14,17, 22 Textiles ________ ----- ___ 2, 3, 4, 10, 11, 12, 13, 35,36 Tile.------------------------------------ 34 Tin _______ ------------------------------- 31 Tobacco .•• ---------------- 2,10, 11,12,13, 14,28 Tools, machine ________________ 9, 10, 11,12, 13,31 Trade, retail and wholesale ________ 7, 8, 9, 11, 12, 14 Transit lines, locaL----------------------- 20,21 Transportation, commodity and passenger ____ 20, 21 Transportation equipment------------------ 1,
2, 3, 9, 10, 11, 12, 13, 17,36 TraveL.--------------------------------- 21,22 Trucks and tractors.---------------------- 36 Unemployment._------------------------- 9 United States Government bond•-------- 17,18,19 United States Government, finance__________ 17 United States Steel Corporation.------------ 30 Utilities.------------ 4, 5, 9,11,12,14,17,18,19, 20
~:;~t?bf:cir::_-_~: = == == =: = == === == ====== == = 7 2~
Vegetables and fruits.------------------ 2, 3, 4, 26 Wages, factory and miscellaneoua ___________ 13,14 War program, production and expenditures____ 2, 17 War Savings Bonds ••• -------------------- 17 Warehouses, space occupied •• -------------- 7 Water transportation, employment, pay rolla. 11, 12 Wheat and wheat flour-------------------- 26,27 Wholesale price index""-------------------- 4 Wholesale trade.-------------------------- 9 Wocd pulP------------------------------- 4, 32 Wool and wool manufactures. 2, 4, 10, 12, 13, 35, 36 Zinc _______ ------------------------------ 31
$6.00 per year
Foreign Commerce
w~~at11v
Foreign Commerce Weekly contains feature articles on timely subjects of particular interest to the foreign trader. Regular departments include news items by countries and commodities with sections devoted to foreign exchange, finance, tariff's and trade controls, wartime commodity controls, commercial-law notes, book reviews.
A oample copy will be oent upon requeot to the
Bureau of Foreign and Domeotic Commerce
Washington 25, D. C.
156,00 per year, from the Superintendent of Documentl, Government Printiq Office. Wuhinston.
Related Documents