GNH Survey Findings 2010 The Centre for Bhutan Studies

Survey Findings 2010
Dec 03, 2015
SURVEY
Welcome message from author
This document is posted to help you gain knowledge. Please leave a comment to let me know what you think about it! Share it to your friends and learn new things together.
Transcript

GNH Survey Findings 2010
The Centre for Bhutan Studies

Demographics
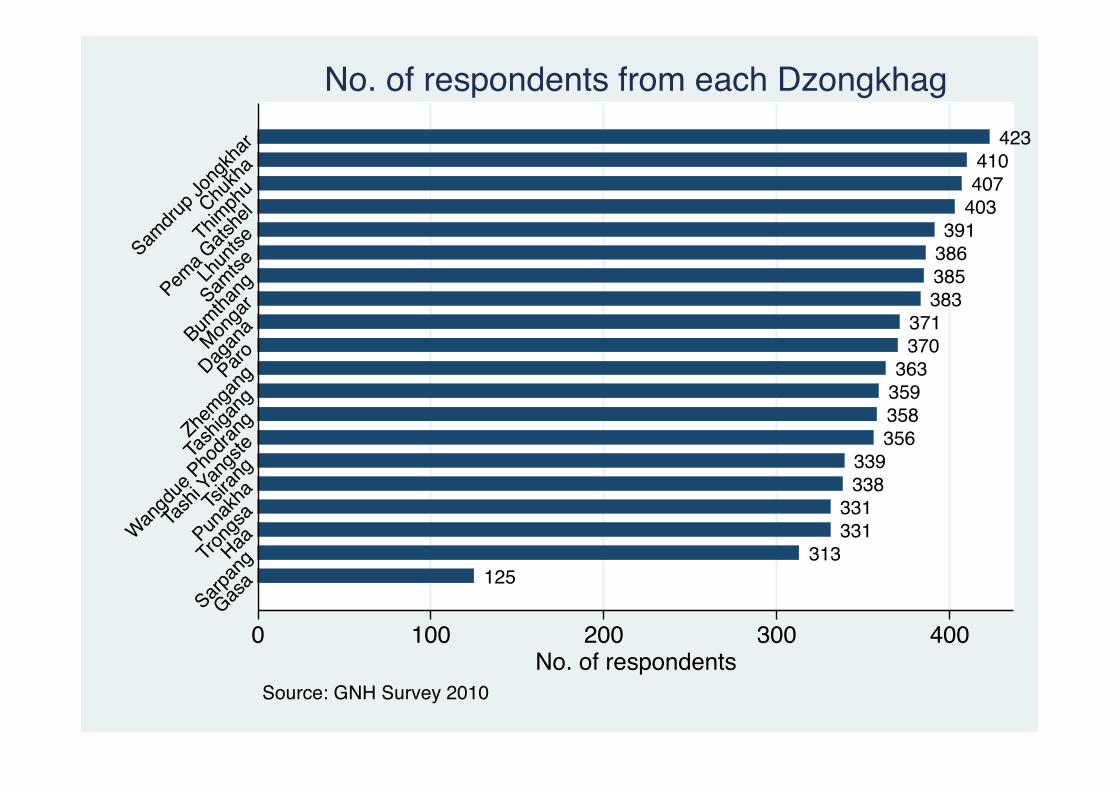
125313
331331
338339
356358359363
370371
383385386391
403407410
423
0 100 200 300 400No. of respondents
Gasa
Sarpan
gHaaTrong
saPun
akhaTsi
rang
Tash
i Yan
gste
Wangd
ue Pho
drang
Tash
igang
Zhemga
ngParoDagan
aMon
gar
Bumtha
ngSamtseLh
untse
Pema G
atshe
lThim
phu
Chukh
a
Samdru
p Jon
gkha
r
Source: GNH Survey 2010
No. of respondents from each Dzongkhag
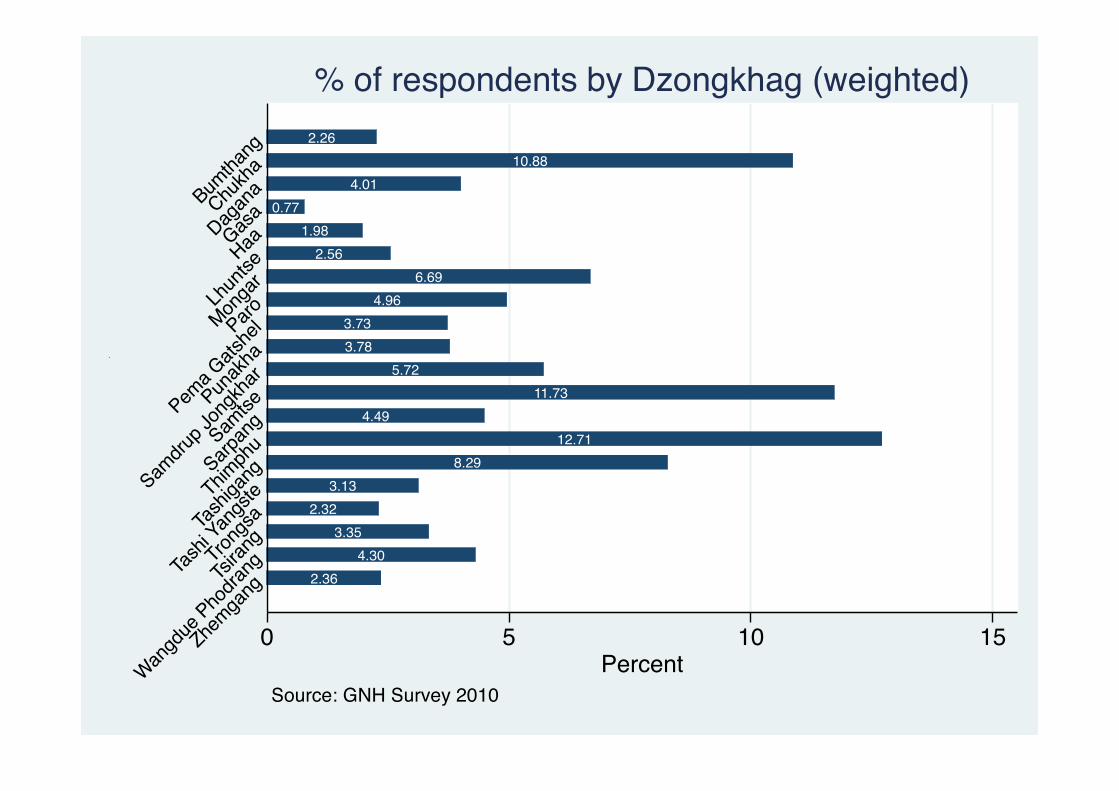
2.364.30
3.352.32
3.138.29
12.714.49
11.735.72
3.783.73
4.966.69
2.561.98
0.774.01
10.882.26
0 5 10 15Percent
Zhemga
ng
Wangd
ue Pho
drangTsi
rang
Trong
sa
Tash
i Yan
gste
Tash
igang
Thimph
uSarp
ang
Samtse
Samdru
p Jon
gkha
rPun
akha
Pema G
atshe
lParoMonga
rLh
untse
HaaGasa
Dagan
aChu
kha
Bumtha
ng
Name of the Dzongkhag
Source: GNH Survey 2010
% of respondents by Dzongkhag (weighted)

50.17%49.83%
Male FemaleSource: GNH Survey 2010
% of respondents by sex
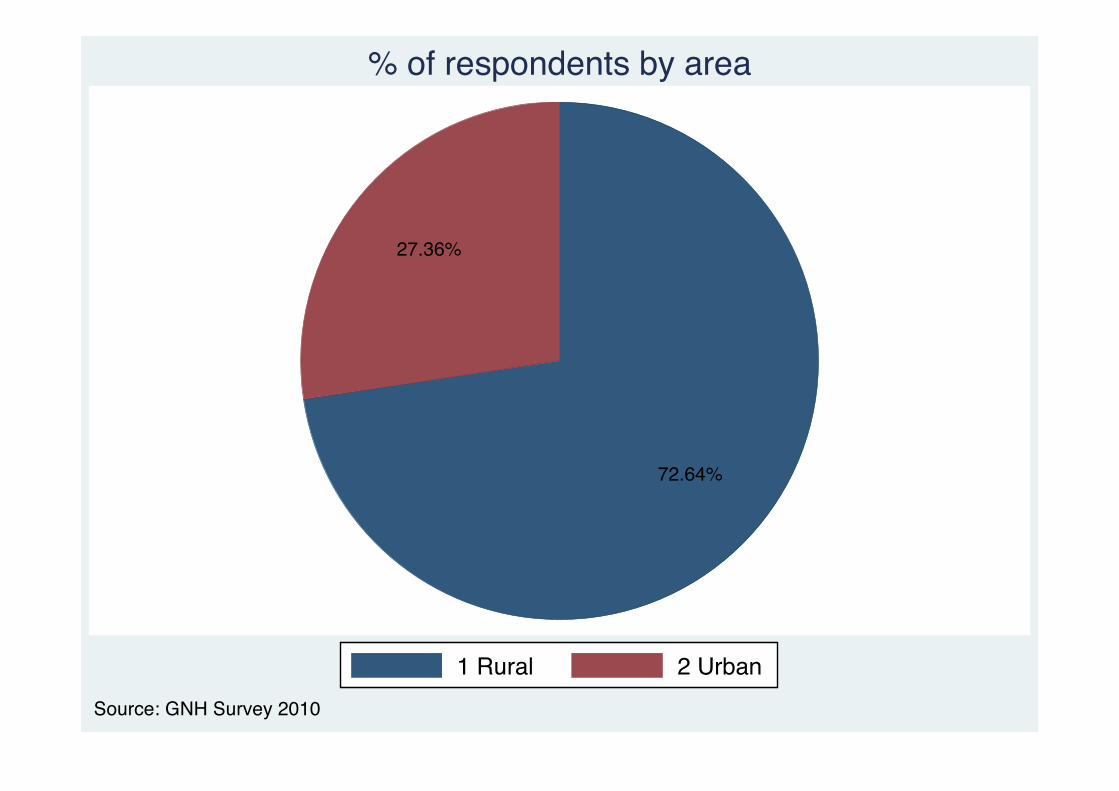
72.64%
27.36%
1 Rural 2 UrbanSource: GNH Survey 2010
% of respondents by area
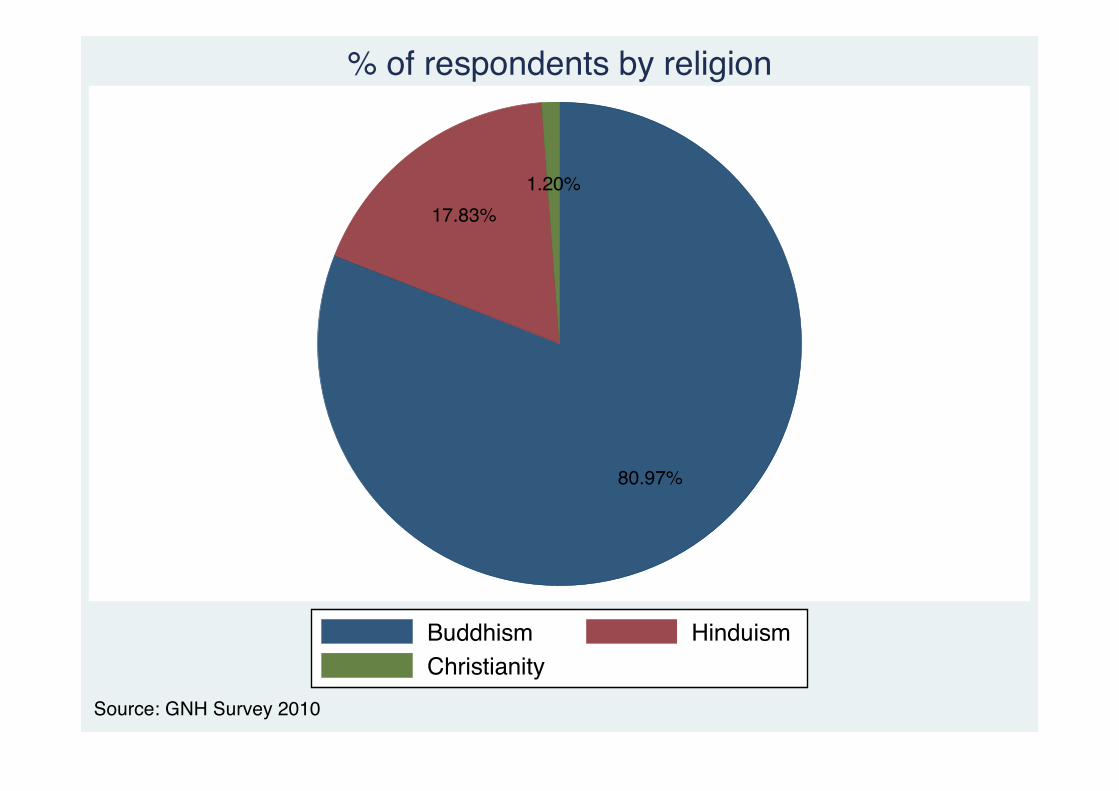
80.97%
17.83%1.20%
Buddhism HinduismChristianity
Source: GNH Survey 2010
% of respondents by religion

62.70%14.12%
5.84%
8.23%4.84%
0.80%2.88%
0.58%
No formal education Primary education (VI)LS education (VIII) MS education (X)HS education (till degree 2nd yr) Diploma/CertificateBachelors Degree Post Graduate
Source: GNH Survey 2010
% of respondents by educational attainment
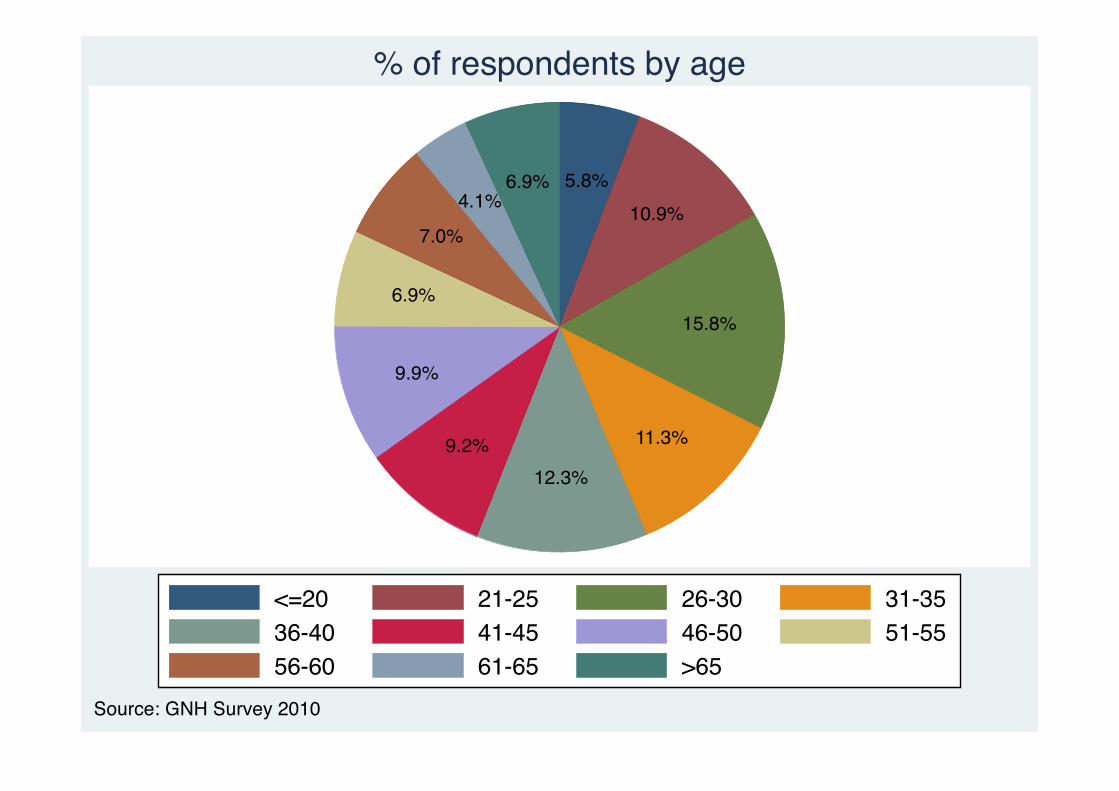
5.8%10.9%
15.8%
11.3%
12.3%9.2%
9.9%
6.9%
7.0%
4.1%6.9%
<=20 21-25 26-30 31-3536-40 41-45 46-50 51-5556-60 61-65 >65
Source: GNH Survey 2010
% of respondents by age

1.55%
24.58%
46.75%
21.45%
5.67%
Single member hh 2-3 member hh4-5 member hh 6-7 member hh>7 member hh
Source: GNH Survey 2010
% of respondents by household size
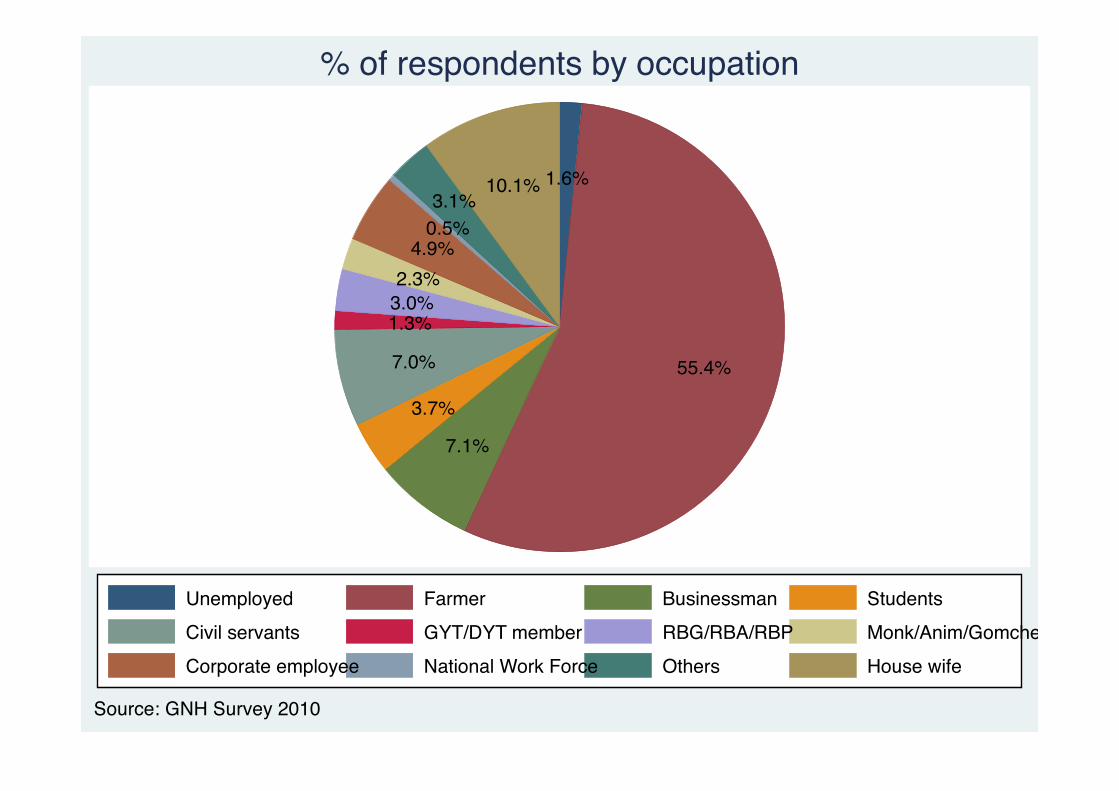
1.6%
55.4%
7.1%
3.7%
7.0%
1.3%3.0%2.3%
4.9%0.5%3.1%
10.1%
Unemployed Farmer Businessman StudentsCivil servants GYT/DYT member RBG/RBA/RBP Monk/Anim/GomchenCorporate employee National Work Force Others House wife
Source: GNH Survey 2010
% of respondents by occupation

44.6%
55.4%
Non-farmers FarmersSource: GNH Survey 2010
% of respondents by occupation
Psychological Wellbeing
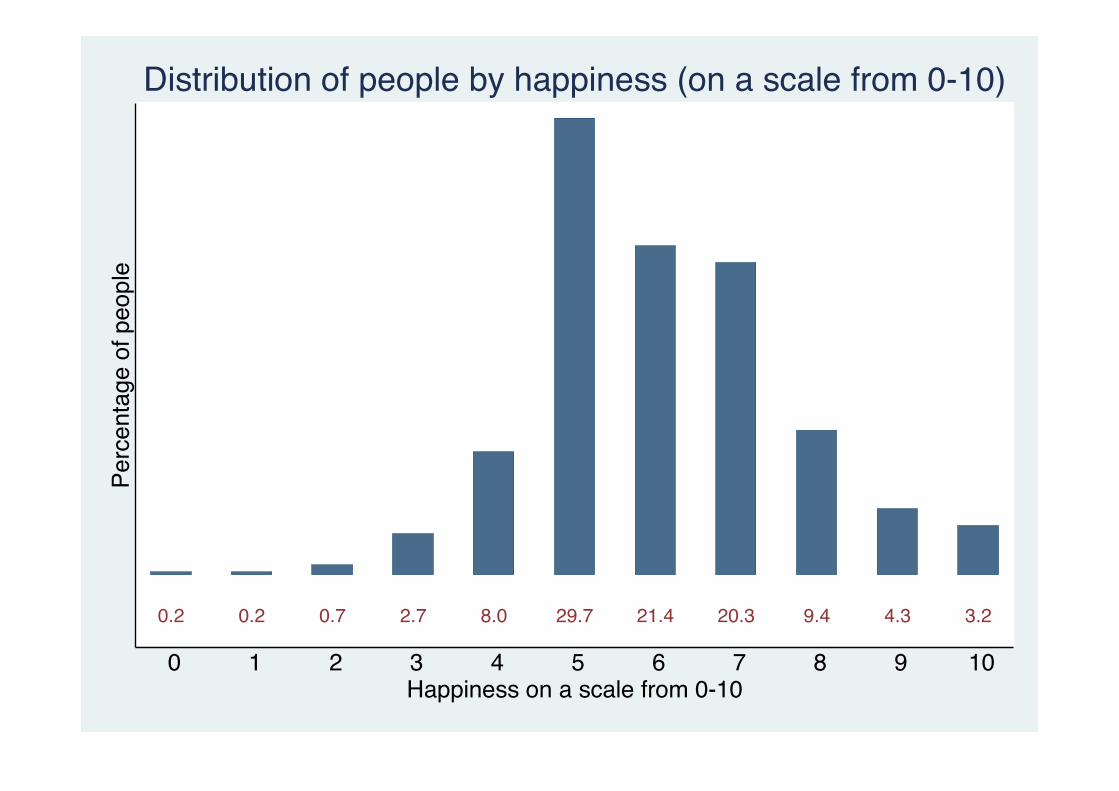
0.2 0.2 0.7 2.7 8.0 29.7 21.4 20.3 9.4 4.3 3.2
Perc
enta
ge o
f peo
ple
0 1 2 3 4 5 6 7 8 9 10Happiness on a scale from 0-10
Distribution of people by happiness (on a scale from 0-10)

6.105.81
6.486.21
02
46
Hap
pine
ss (0
-10)
1 Rural 2 UrbanMale Female Male Female
Source: GNH Survey 2010
Mean appiness by sex and area

6.49 6.45 6.41 6.30 6.26 6.21 6.17 6.16 6.16 6.08 6.08 6.07 6.04 6.01 5.93 5.91 5.81 5.80 5.71 5.610
24
6H
appi
ness
(0-1
0)
HaaGas
a
Sarpan
g
Wangd
ue Pho
drang
Bumtha
ng
Tsiran
g
Thimph
u
Tash
igang
Punak
ha
Tash
i Yan
gste
Chukh
aParo
Samtse
Trong
sa
Dagan
a
Zhemga
ng
Lhun
tse
Monga
r
Samdru
p Jon
gkha
r
Pema G
atshe
l
Source: GNH Survey 2010
Mean happiness by Dzongkhag
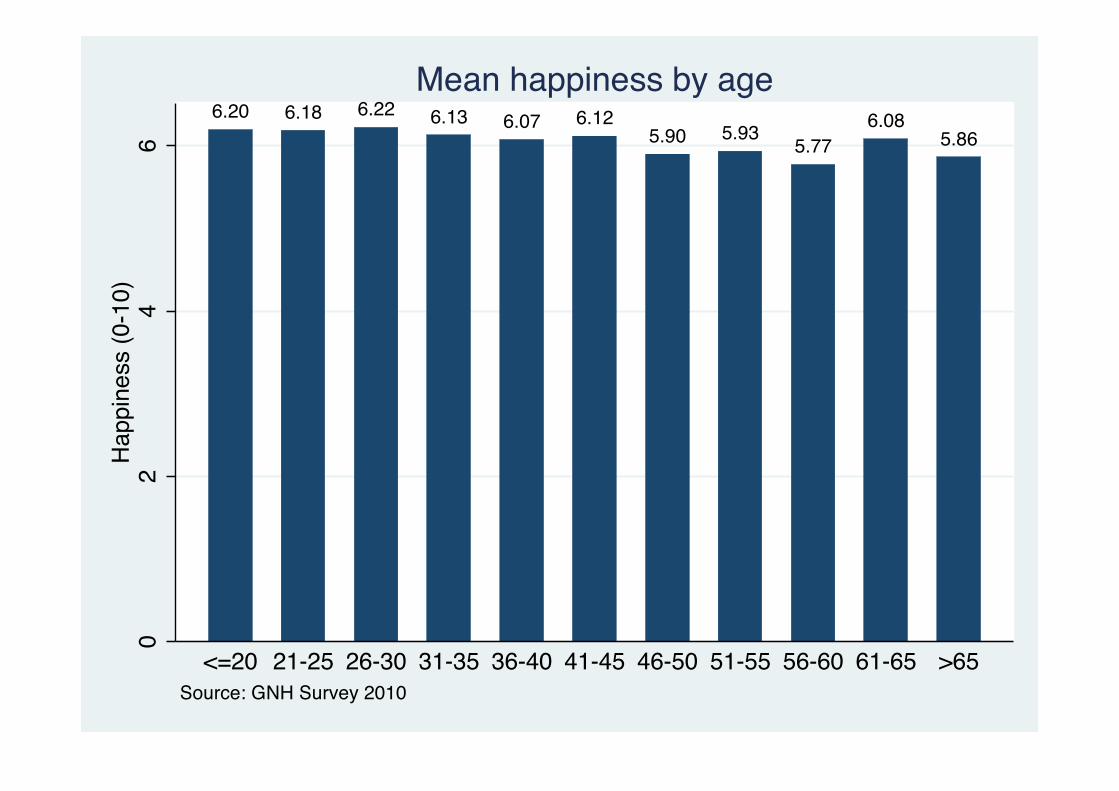
6.20 6.18 6.22 6.13 6.07 6.125.90 5.93 5.77
6.085.86
02
46
Hap
pine
ss (0
-10)
<=20 21-25 26-30 31-35 36-40 41-45 46-50 51-55 56-60 61-65 >65Source: GNH Survey 2010
Mean happiness by age

5.856.17 6.32 6.52 6.64 6.80 7.01
7.480
24
68
Hap
pine
ss (0
-10)
No form
al ed
ucati
on
Primary
educ
ation
(VI)
LS ed
ucati
on (V
III)
MS educ
ation
(X)
HS educ
ation
(till d
egree
2nd y
r)
Diploma/C
ertific
ate
Bache
lors D
egree
Post G
radua
te
Source: GNH Survey 2010
Mean happiness by educational attainment

6.94 6.67 6.58 6.48 6.45 6.40 6.26 6.15 6.10 6.07 5.805.39
02
46
8Ha
ppin
ess
(0-1
0)
Civil se
rvants
Monk/A
nim/G
omch
en
Studen
ts
Busine
ssman
RBG/RBA/RBP
GYT/DYT mem
ber
Unemplo
yed
Others
House
wife
Corpora
te em
ploye
e
Farmer
Nation
al Work
Force
Source: GNH Survey 2010
Mean happiness by occupation
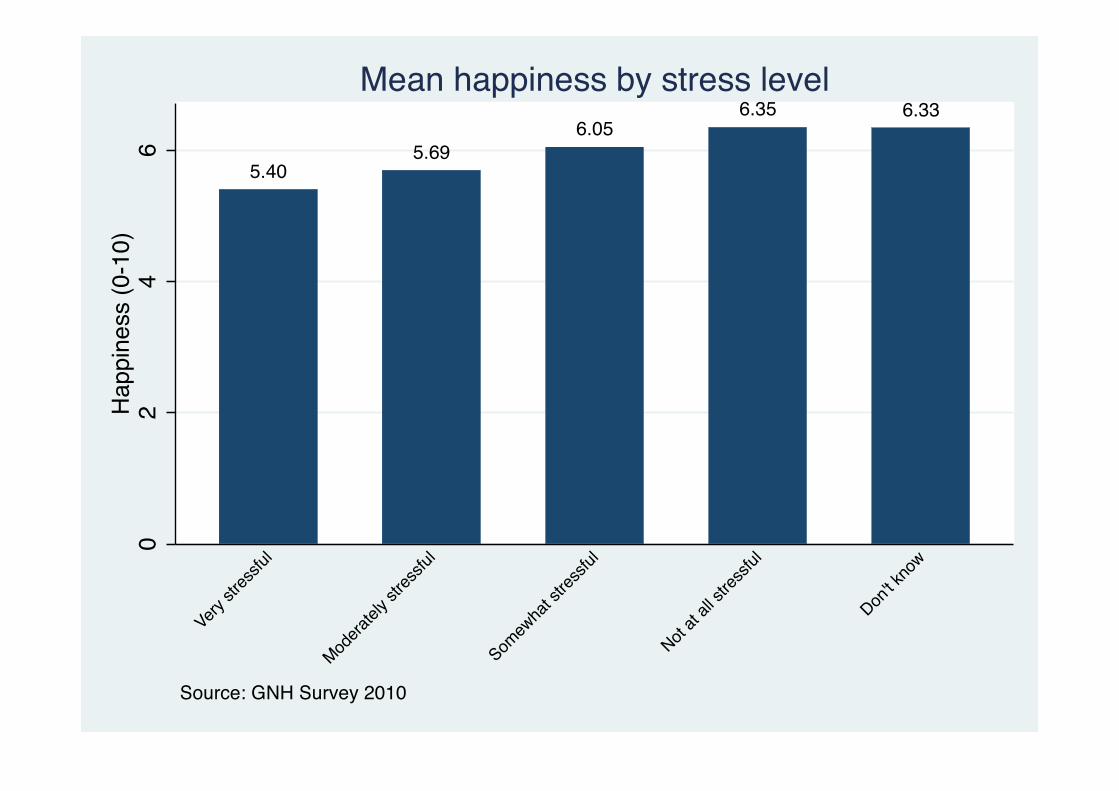
5.405.69
6.056.35 6.33
02
46
Hap
pine
ss (0
-10)
Very st
ressfu
l
Modera
tely s
tressf
ul
Somew
hat s
tressf
ul
Not at
all str
essfu
l
Don't k
now
Source: GNH Survey 2010
Mean happiness by stress level
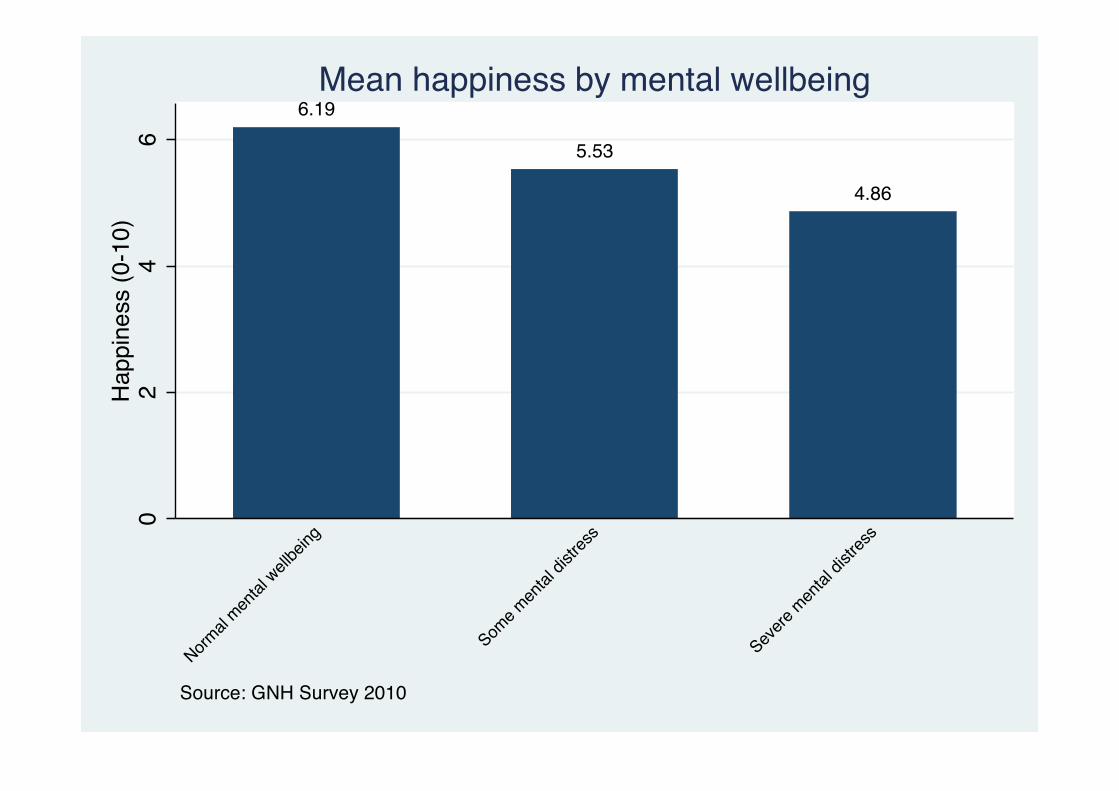
6.19
5.53
4.86
02
46
Hap
pine
ss (0
-10)
Normal
mental
wellbein
g
Some m
ental
distr
ess
Severe
men
tal di
stres
s
Source: GNH Survey 2010
Mean happiness by mental wellbeing

6.105.90 5.89
02
46
Hap
pine
ss (0
-10)
Buddh
ism
Hinduis
m
Christia
nity
Source: GNH Survey 2010
Mean happiness by religion

5.676.03 6.13 6.02 6.13
02
46
Hap
pine
ss (0
-10)
Single
membe
r hh
2-3 m
embe
r hh
4-5 m
embe
r hh
6-7 m
embe
r hh
>7 m
embe
r hh
Source: GNH Survey 2010
Mean happiness by household size
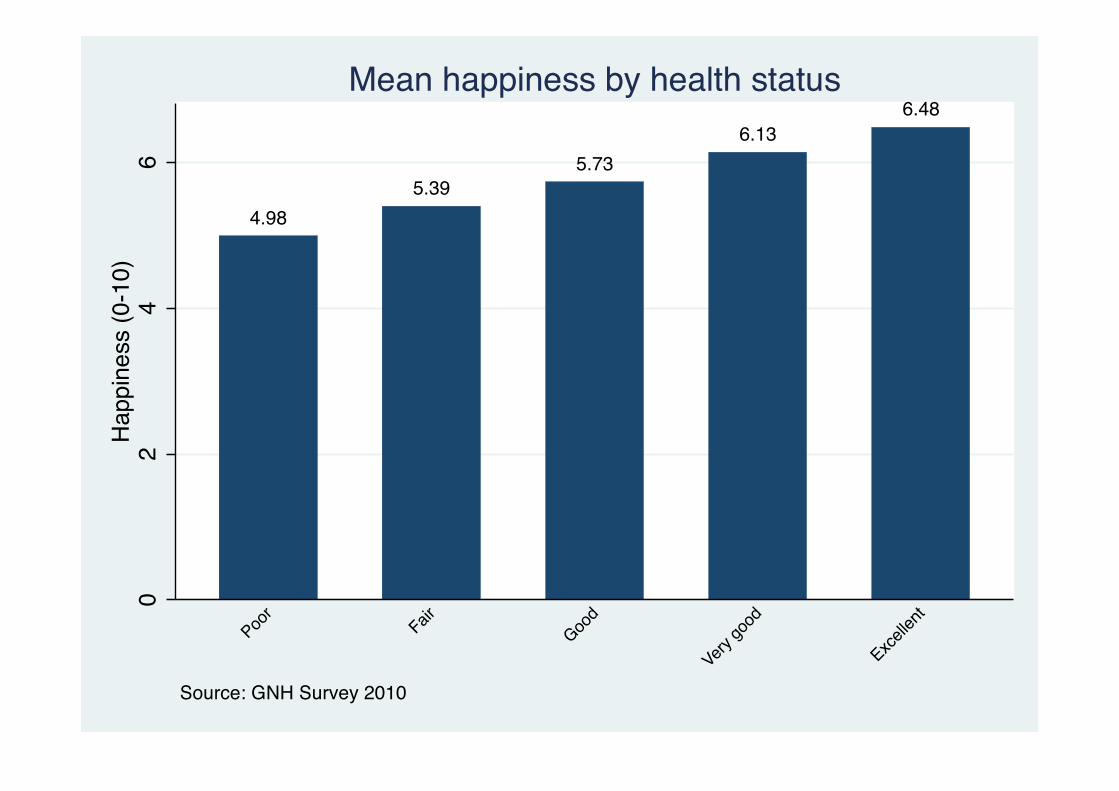
4.985.39
5.736.13
6.48
02
46
Hap
pine
ss (0
-10)
Poor
FairGoo
d
Very go
od
Excellen
t
Source: GNH Survey 2010
Mean happiness by health status

4.90
5.395.73
5.916.25 6.24
02
46
Hap
pine
ss (0
-10)
None 1-2 3-5 6-8
More th
an 8
Don't k
now
Source: GNH Survey 2010
Mean happiness by no. of people you can count on if you are sick
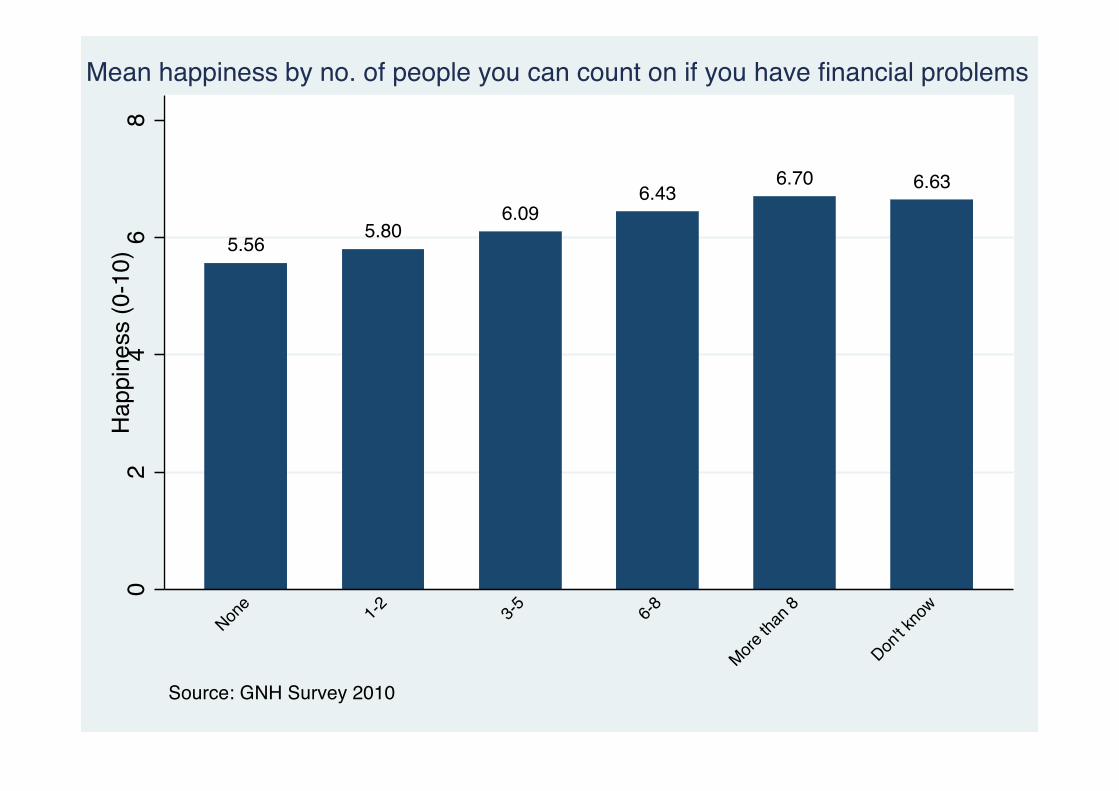
5.565.80
6.096.43
6.70 6.63
02
46
8H
appi
ness
(0-1
0)
None 1-2 3-5 6-8
More th
an 8
Don't k
now
Source: GNH Survey 2010
Mean happiness by no. of people you can count on if you have financial problems

3.43
4.645.18
6.116.85
02
46
8H
appi
ness
(0-1
0)
Very di
ssatisfi
ed
Dissati
sfied
Neithe
r sati
sfied n
or dis
satisfi
ed
Satisfie
d
Very sa
tisfied
Source: GNH Survey 2010
Mean happiness by satisfaction with your livelihood
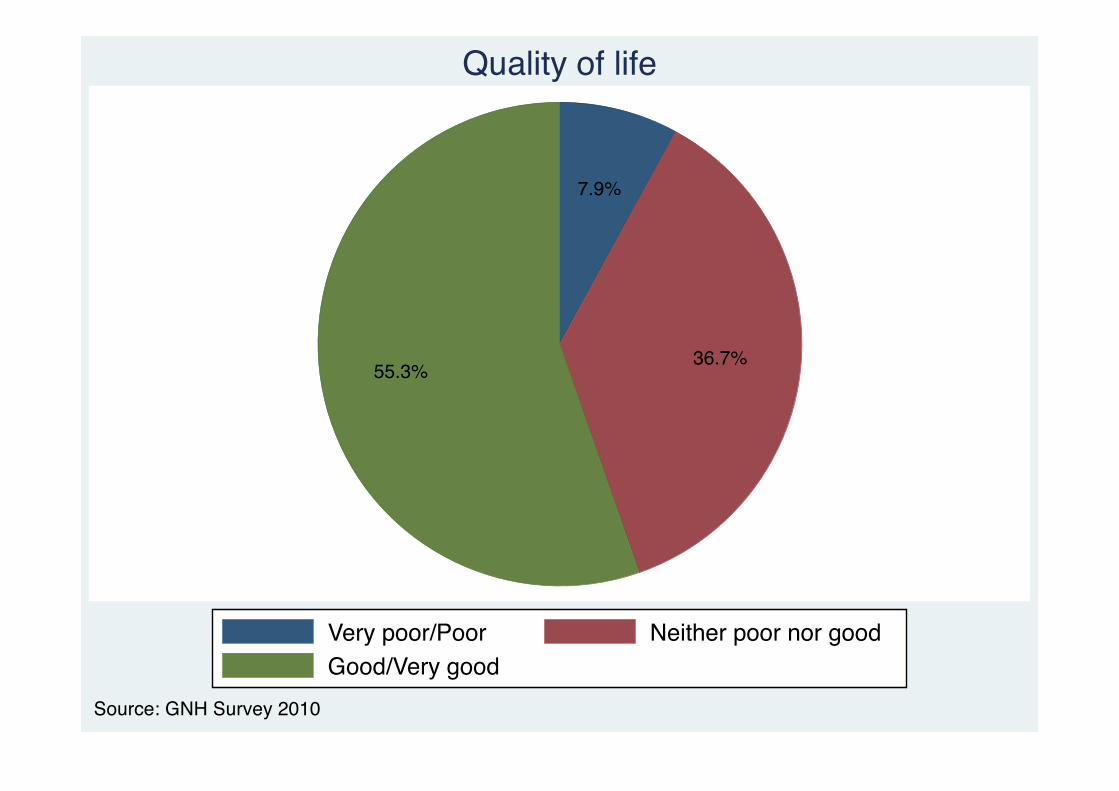
7.9%
36.7%55.3%
Very poor/Poor Neither poor nor goodGood/Very good
Source: GNH Survey 2010
Quality of life
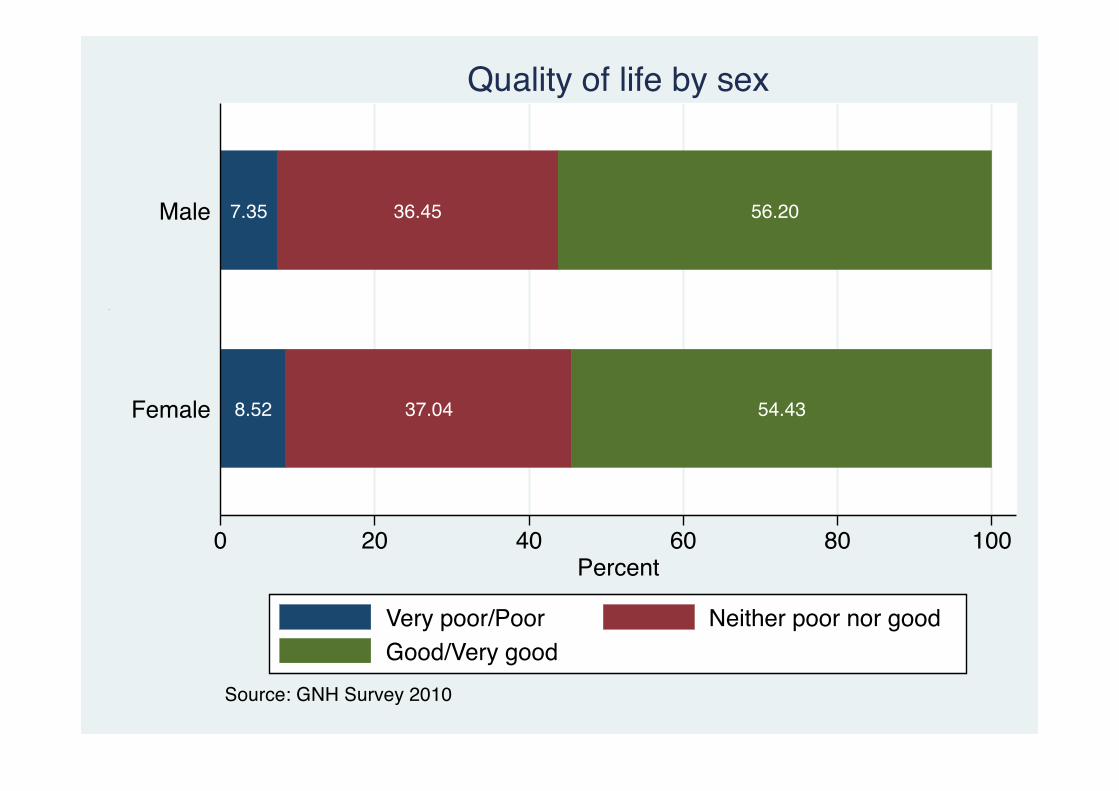
8.52 37.04 54.43
7.35 36.45 56.20
0 20 40 60 80 100Percent
Female
Male
Quality of life
Source: GNH Survey 2010
Quality of life by sex
Very poor/Poor Neither poor nor goodGood/Very good
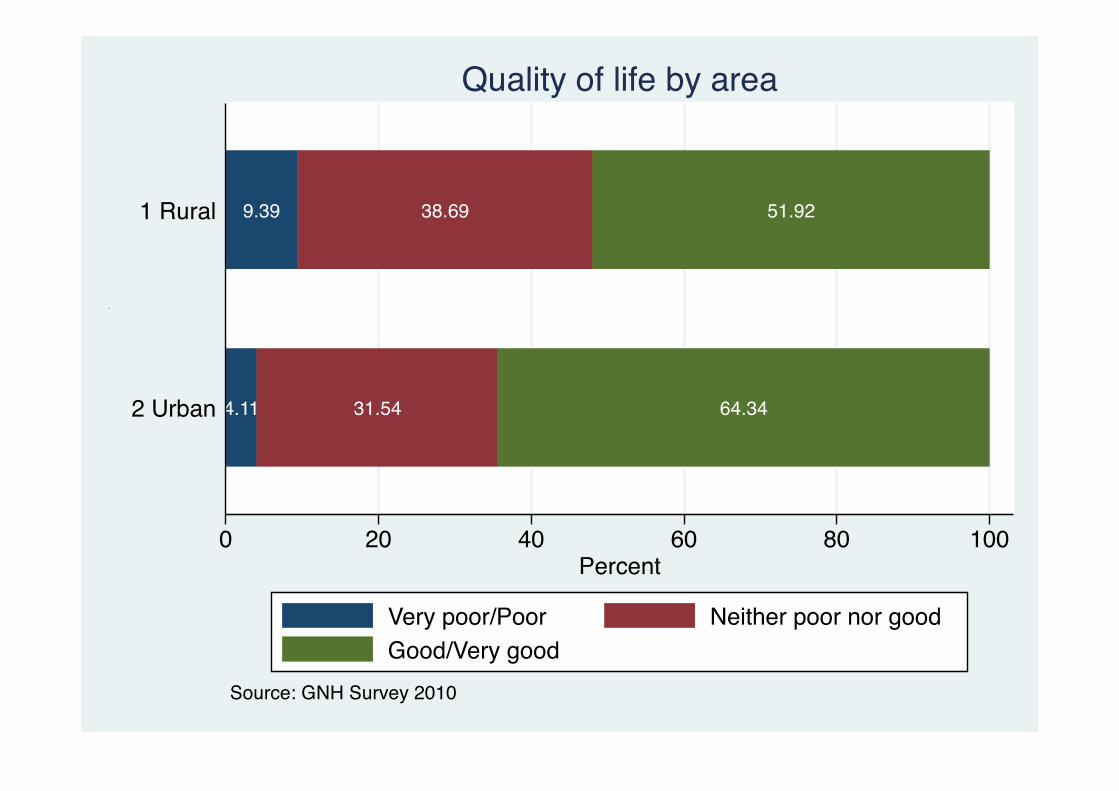
4.11 31.54 64.34
9.39 38.69 51.92
0 20 40 60 80 100Percent
2 Urban
1 Rural
Quality of life
Source: GNH Survey 2010
Quality of life by area
Very poor/Poor Neither poor nor goodGood/Very good
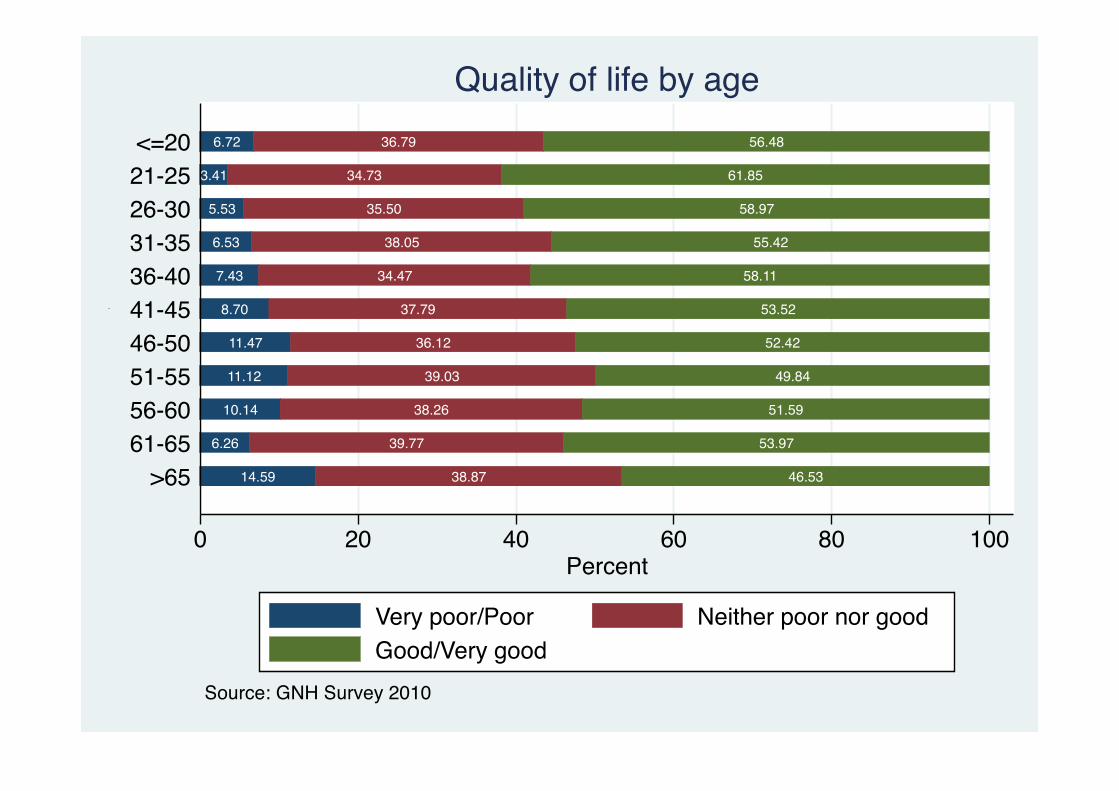
14.59 38.87 46.53
6.26 39.77 53.97
10.14 38.26 51.59
11.12 39.03 49.84
11.47 36.12 52.42
8.70 37.79 53.52
7.43 34.47 58.11
6.53 38.05 55.42
5.53 35.50 58.97
3.41 34.73 61.85
6.72 36.79 56.48
0 20 40 60 80 100Percent
>6561-6556-6051-5546-5041-4536-4031-3526-3021-25<=20
Quality of life
Source: GNH Survey 2010
Quality of life by age
Very poor/Poor Neither poor nor goodGood/Very good
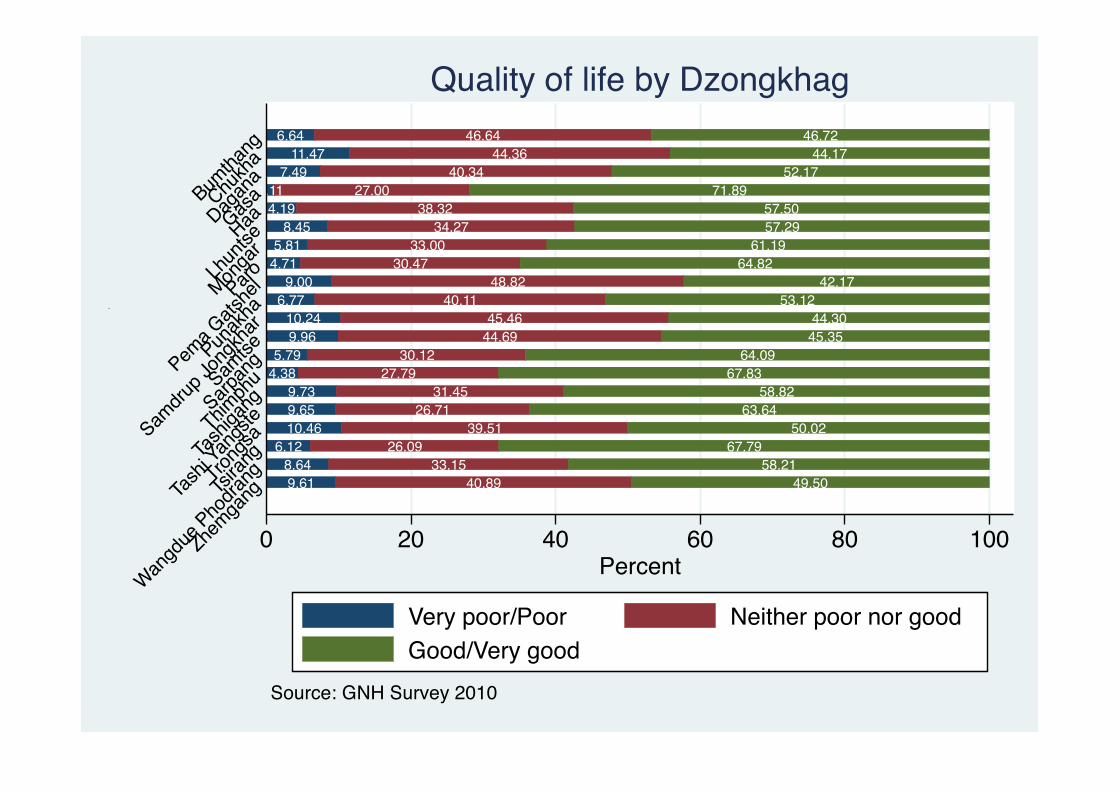
9.61 40.89 49.508.64 33.15 58.21
6.12 26.09 67.7910.46 39.51 50.029.65 26.71 63.649.73 31.45 58.82
4.38 27.79 67.835.79 30.12 64.09
9.96 44.69 45.3510.24 45.46 44.30
6.77 40.11 53.129.00 48.82 42.17
4.71 30.47 64.825.81 33.00 61.19
8.45 34.27 57.294.19 38.32 57.50
1.11 27.00 71.897.49 40.34 52.17
11.47 44.36 44.176.64 46.64 46.72
0 20 40 60 80 100Percent
Zhemga
ng
Wangd
ue Pho
drangTsi
rang
Trong
sa
Tash
i Yan
gste
Tash
igang
Thimph
uSarp
ang
Samtse
Samdru
p Jon
gkha
rPun
akha
Pema G
atshe
lParoMonga
rLh
untseHaaGasa
Dagan
aChu
kha
Bumtha
ng
Quality of life
Source: GNH Survey 2010
Quality of life by Dzongkhag
Very poor/Poor Neither poor nor goodGood/Very good

6.6%
46.6%46.7%
11.5%
44.4%
44.2%
7.5%
40.3%52.2%
1.1%27.0%
71.9%
4.2%
38.3%57.5%
8.4%
34.3%57.3%
5.8%
33.0%61.2%
4.7%
30.5%
64.8%
9.0%
48.8%
42.2%
6.8%
40.1%53.1%
10.2%
45.5%
44.3%
10.0%
44.7%45.3%
5.8%
30.1%
64.1%
4.4%27.8%
67.8%
9.7%
31.4%58.8%
9.6%
26.7%63.6%
10.5%
39.5%50.0%
6.1%26.1%
67.8%
8.6%
33.2%58.2%
9.6%
40.9%49.5%
Bumthang Chukha Dagana Gasa Haa
Lhuntse Mongar Paro Pema Gatshel Punakha
Samdrup Jongkhar Samtse Sarpang Thimphu Tashigang
Tashi Yangste Trongsa Tsirang Wangdue Phodrang Zhemgang
Very poor/Poor Neither poor nor goodGood/Very good
Source: GNH Survey 2010
Quality of life by Dzongkhag
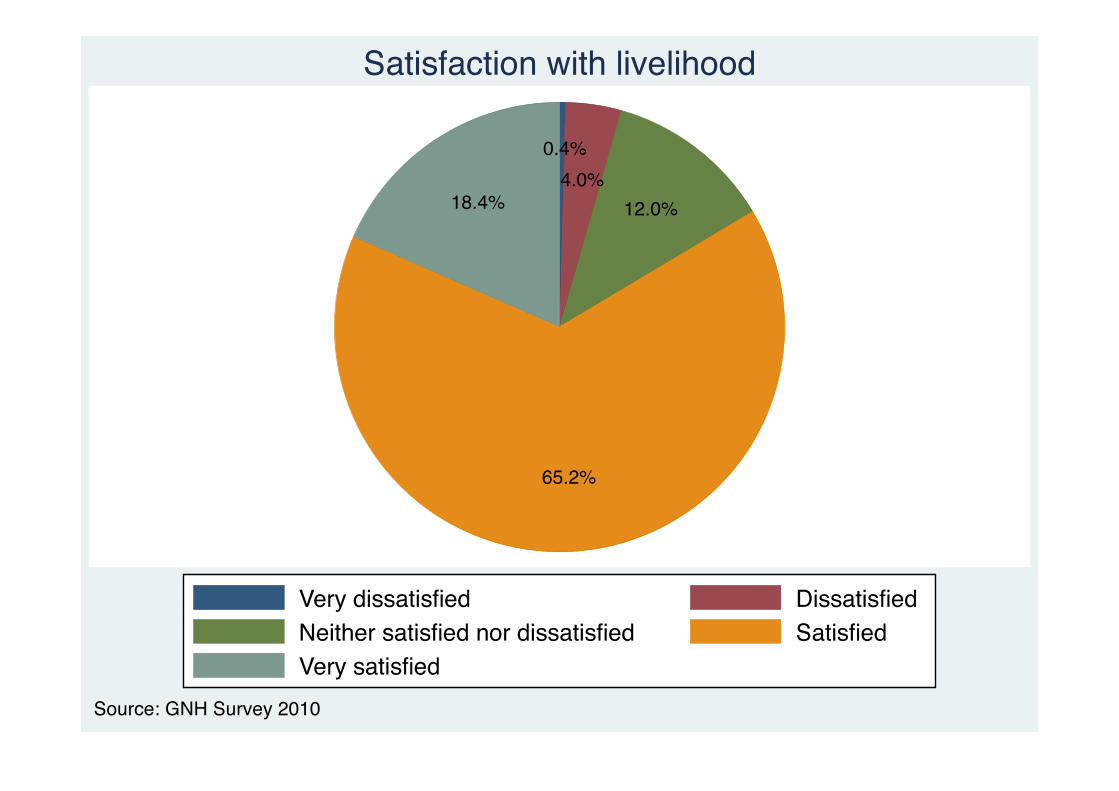
0.4%4.0%
12.0%
65.2%
18.4%
Very dissatisfied DissatisfiedNeither satisfied nor dissatisfied SatisfiedVery satisfied
Source: GNH Survey 2010
Satisfaction with livelihood

0.54.9
11.5 65.4 17.7
0.33.1
12.5 65.0 19.1
0 20 40 60 80 100Percent
Female
Male
Satisfaction with livelihood
Source: GNH Survey 2010
Satisfaction with livelihood by sex
Very dissatisfied DissatisfiedNeither satisfied nor dissatisfied SatisfiedVery satisfied

0.22.3
6.7 68.5 22.3
0.54.7
14.0 64.0 16.9
0 20 40 60 80 100Percent
2 Urban
1 Rural
Satisfaction with livelihood
Source: GNH Survey 2010
Satisfaction with livelihood by area
Very dissatisfied DissatisfiedNeither satisfied nor dissatisfied SatisfiedVery satisfied
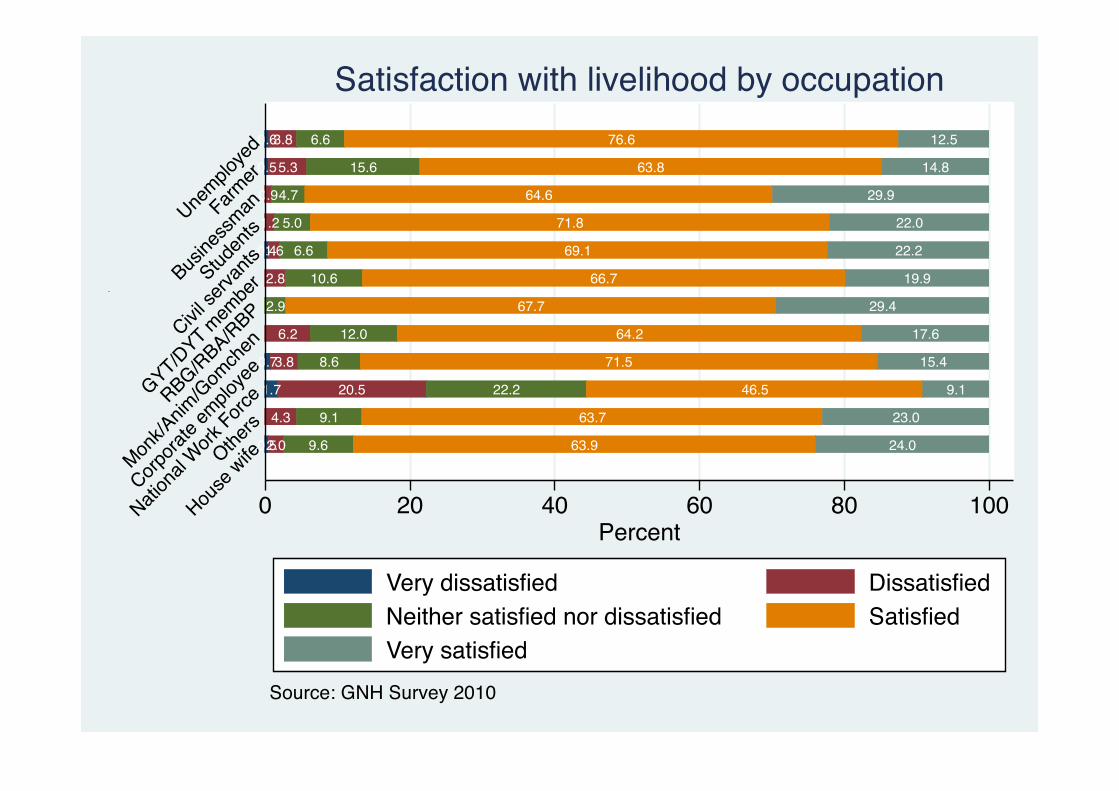
0.52.0 9.6 63.9 24.0
4.3 9.1 63.7 23.0
1.7 20.5 22.2 46.5 9.1
0.73.8 8.6 71.5 15.4
6.2 12.0 64.2 17.6
2.9 67.7 29.4
2.8 10.6 66.7 19.9
0.41.6 6.6 69.1 22.2
1.2 5.0 71.8 22.0
0.94.7 64.6 29.9
0.55.3 15.6 63.8 14.8
0.63.8 6.6 76.6 12.5
0 20 40 60 80 100Percent
House
wifeOthers
Nation
al Work
Force
Corpora
te em
ploye
e
Monk/A
nim/G
omch
en
RBG/RBA/RBP
GYT/DYT mem
ber
Civil se
rvantsStud
ents
Busine
ssmanFarmer
Unemplo
yed
Satisfaction with livelihood
Source: GNH Survey 2010
Satisfaction with livelihood by occupation
Very dissatisfied DissatisfiedNeither satisfied nor dissatisfied SatisfiedVery satisfied
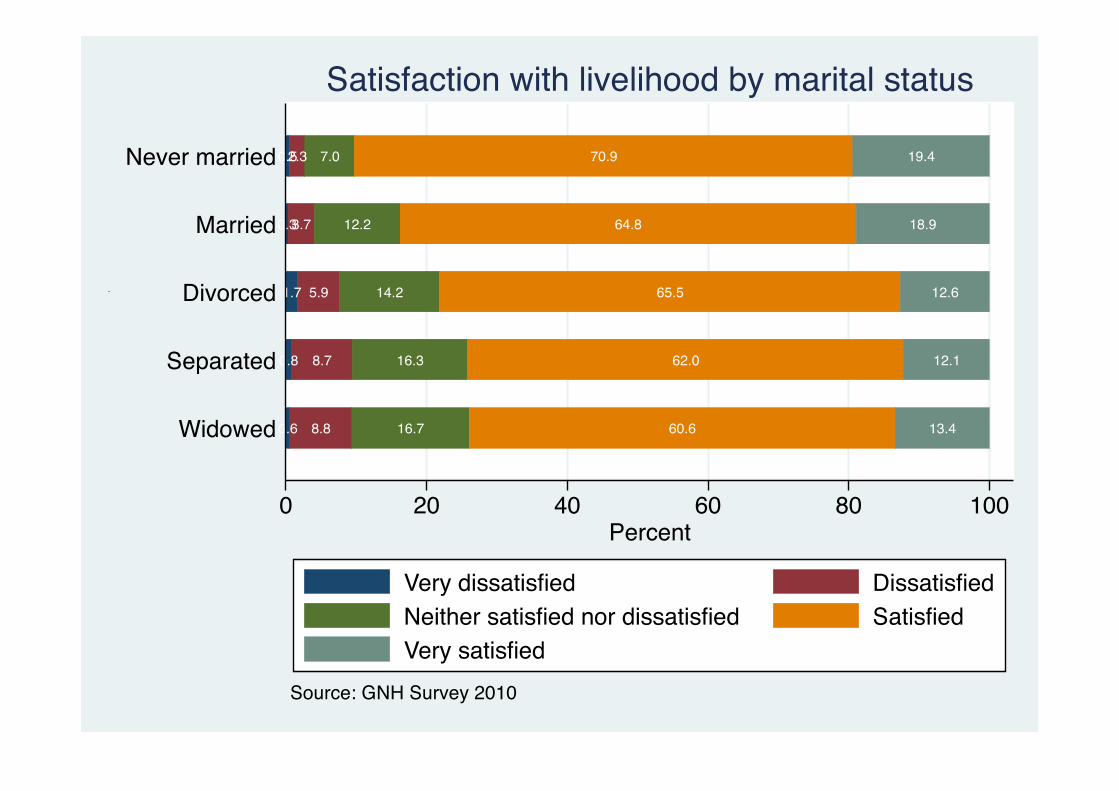
0.6 8.8 16.7 60.6 13.4
0.8 8.7 16.3 62.0 12.1
1.7 5.9 14.2 65.5 12.6
0.33.7 12.2 64.8 18.9
0.52.3 7.0 70.9 19.4
0 20 40 60 80 100Percent
Widowed
Separated
Divorced
Married
Never married
Satisfaction with livelihood
Source: GNH Survey 2010
Satisfaction with livelihood by marital status
Very dissatisfied DissatisfiedNeither satisfied nor dissatisfied SatisfiedVery satisfied
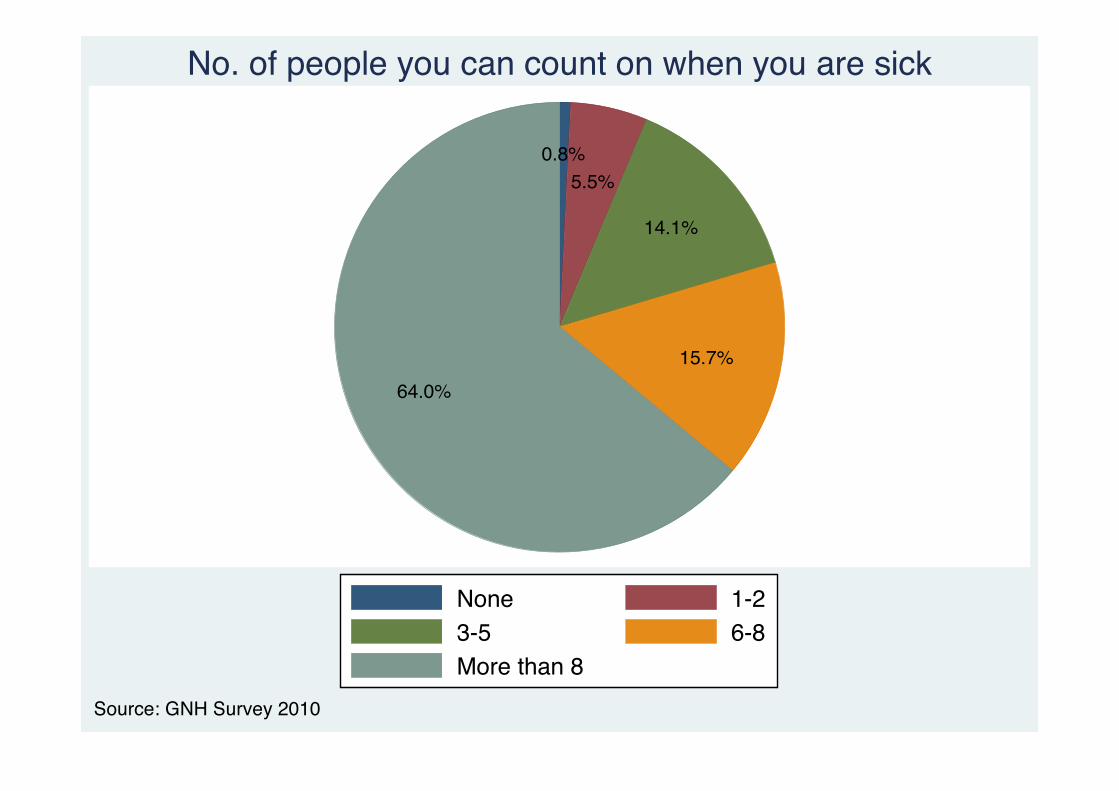
0.8%5.5%
14.1%
15.7%64.0%
None 1-23-5 6-8More than 8
Source: GNH Survey 2010
No. of people you can count on when you are sick

0.97.2 16.3 16.6 59.0
0.73.8
11.8 14.8 68.9
0 20 40 60 80 100Percent
Female
Male
Are sick
Source: GNH Survey 2010
No. of people you can count on when you are sick by sex
None 1-23-5 6-8More than 8

0.95.8 14.7 18.6 60.0
0.75.4 13.8 14.5 65.5
0 20 40 60 80 100Percent
2 Urban
1 Rural
Are sick
Source: GNH Survey 2010
No. of people you can count on when you are sick by area
None 1-23-5 6-8More than 8

0.8 6.5 15.0 19.2 58.6
0.8 8.5 11.8 16.0 63.0
1.7 7.9 26.5 32.0 31.8
1.4 5.8 19.2 18.0 55.5
2.6 7.3 14.0 76.1
0.3 3.7 8.8 10.8 76.4
1.1 5.4 19.8 73.7
1.1 6.3 11.3 22.7 58.5
0.4 6.6 18.0 19.8 55.2
0.9 4.1 12.1 15.9 67.0
0.8 5.4 14.3 13.8 65.6
6.6 22.2 12.4 58.7
0 20 40 60 80 100Percent
House
wifeOthers
Nation
al Work
Force
Corpora
te em
ploye
e
Monk/A
nim/G
omch
en
RBG/RBA/RBP
GYT/DYT mem
ber
Civil se
rvantsStud
ents
Busine
ssmanFarmer
Unemplo
yed
Are sick
Source: GNH Survey 2010
No. of people you can count on when you are sick by occupation
None 1-23-5 6-8More than 8

1.6 12.2 18.2 12.5 55.5
7.0 8.1 16.1 20.6 48.3
3.5 12.0 21.3 16.5 46.7
0.54.4 13.2 15.5 66.4
1.1 8.4 16.3 18.1 56.1
0 20 40 60 80 100Percent
Widowed
Separated
Divorced
Married
Never married
Are sick
Source: GNH Survey 2010
No. of people you can count on when you are sick by marital status
None 1-23-5 6-8More than 8

0.2 3.9 8.4 9.3 78.2
0.4 7.7 15.2 12.4 64.3
5.1 13.2 17.8 63.9
2.1 6.1 16.4 12.7 62.8
2.3 6.5 22.5 16.5 52.2
1.0 5.5 18.2 17.2 58.1
0.8 6.9 18.4 19.3 54.7
4.9 11.4 12.7 71.0
0.33.1 6.5 12.2 78.0
1.1 9.6 23.4 15.8 50.2
0.9 5.2 15.3 16.3 62.4
1.6 5.9 15.5 14.6 62.3
1.2 7.4 16.7 17.6 57.1
0.9 7.5 19.0 16.8 55.8
1.2 7.5 19.3 12.7 59.3
0.3 4.3 8.3 12.3 74.8
9.0 10.7 16.2 64.1
0.20.9 5.2 7.8 85.9
0.9 3.7 7.0 20.2 68.2
0.62.6 11.8 16.0 69.0
0 20 40 60 80 100Percent
Zhemga
ng
Wangd
ue Pho
drangTsi
rang
Trong
sa
Tash
i Yan
gste
Tash
igang
Thimph
uSarp
ang
Samtse
Samdru
p Jon
gkha
rPun
akha
Pema G
atshe
lParoMonga
rLh
untseHaaGasa
Dagan
aChu
kha
Bumtha
ngAre sick
Source: GNH Survey 2010
No. of people you can count on when you are sick by Dzongkhag
None 1-23-5 6-8More than 8

14.5%
27.8%
30.4%
12.8%
13.3%1.2%
None 1-23-5 6-8More than 8 Don't know
Source: GNH Survey 2010
No. of people you can count on when you have financial problems

16.0 30.8 30.7 11.7 9.71.1
13.0 24.9 30.1 13.9 16.9 1.3
0 20 40 60 80 100Percent
Female
Male
Have financial problems
Source: GNH Survey 2010
No. of people you can count on when you have financial problems by sex
None 1-23-5 6-8More than 8 Don't know
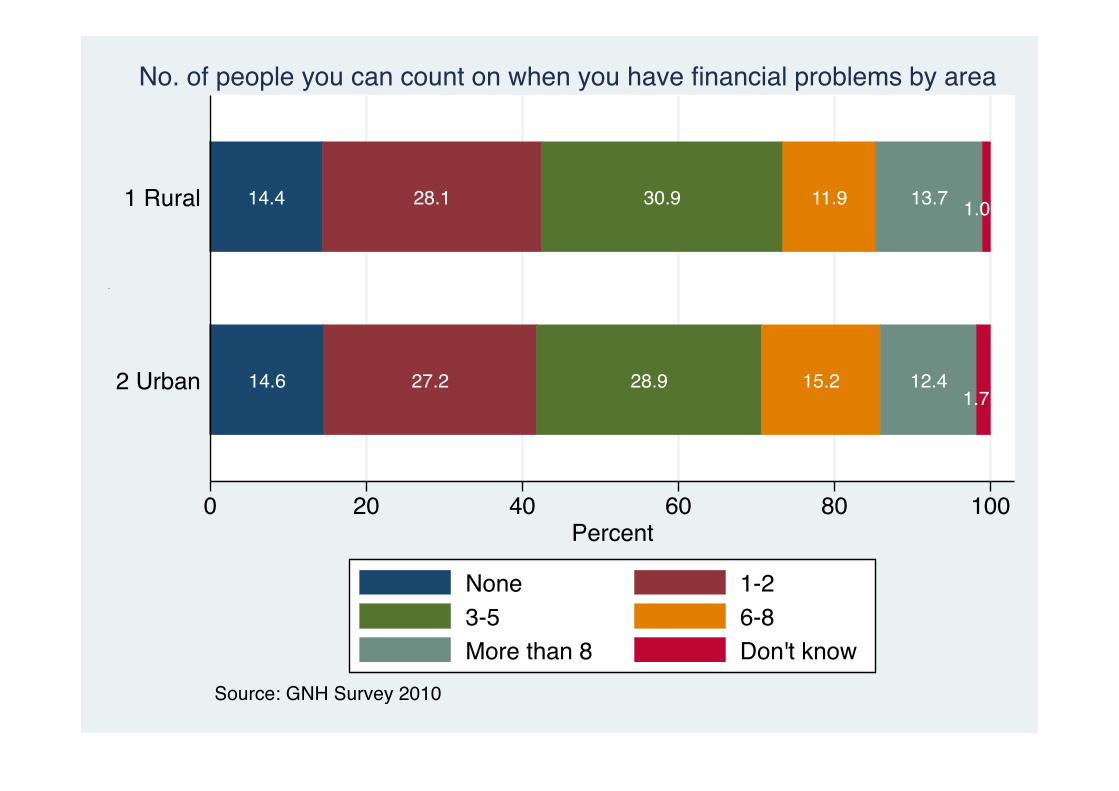
14.6 27.2 28.9 15.2 12.41.7
14.4 28.1 30.9 11.9 13.7 1.0
0 20 40 60 80 100Percent
2 Urban
1 Rural
Have financial problems
Source: GNH Survey 2010
No. of people you can count on when you have financial problems by area
None 1-23-5 6-8More than 8 Don't know
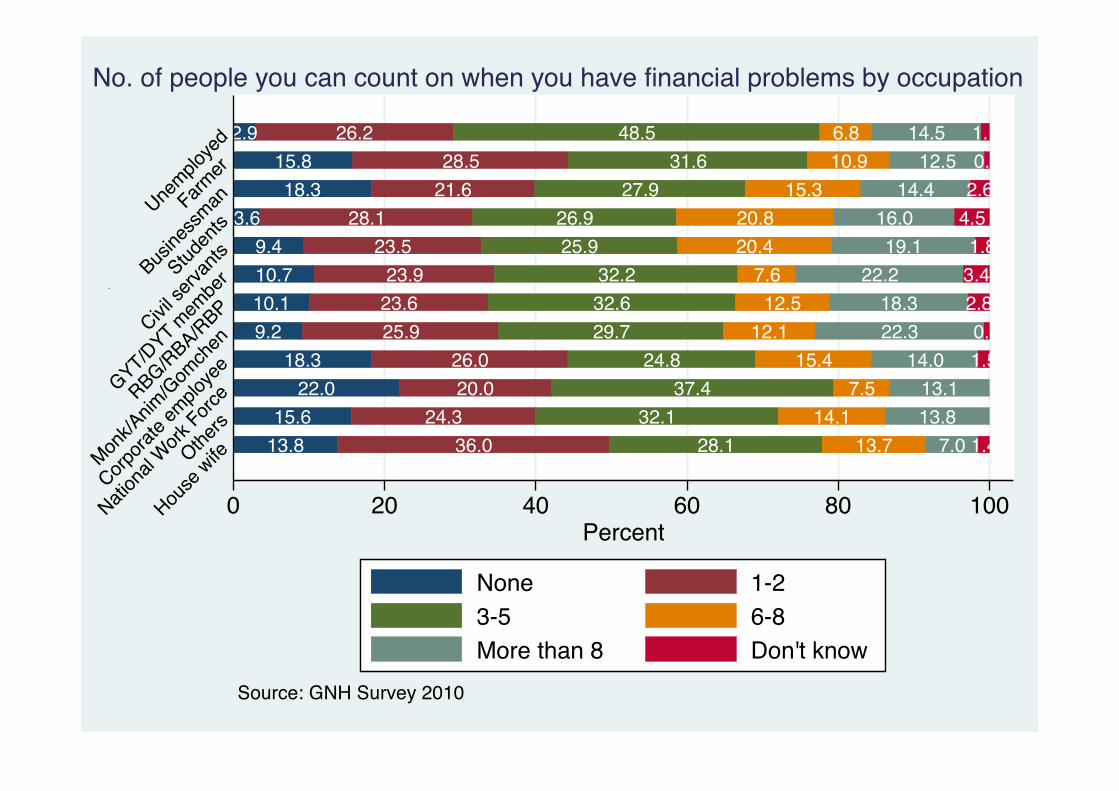
13.8 36.0 28.1 13.7 7.0 1.415.6 24.3 32.1 14.1 13.8
22.0 20.0 37.4 7.5 13.118.3 26.0 24.8 15.4 14.0 1.5
9.2 25.9 29.7 12.1 22.3 0.710.1 23.6 32.6 12.5 18.3 2.810.7 23.9 32.2 7.6 22.2 3.49.4 23.5 25.9 20.4 19.1 1.8
3.6 28.1 26.9 20.8 16.0 4.518.3 21.6 27.9 15.3 14.4 2.6
15.8 28.5 31.6 10.9 12.5 0.62.9 26.2 48.5 6.8 14.5 1.1
0 20 40 60 80 100Percent
House
wifeOthers
Nation
al Work
Force
Corpora
te em
ploye
e
Monk/A
nim/G
omch
en
RBG/RBA/RBP
GYT/DYT mem
ber
Civil se
rvantsStud
ents
Busine
ssmanFarmer
Unemplo
yed
Have financial problems
Source: GNH Survey 2010
No. of people you can count on when you have financial problems by occupation
None 1-23-5 6-8More than 8 Don't know

20.8 29.6 30.8 9.1 9.7 0.1
19.9 33.1 24.8 11.2 9.2 1.9
23.8 34.1 24.3 7.4 7.1 3.3
14.5 27.2 30.6 12.9 13.8 1.0
7.6 29.6 30.5 15.5 14.0 2.8
0 20 40 60 80 100Percent
Widowed
Separated
Divorced
Married
Never married
Have financial problems
Source: GNH Survey 2010
No. of people you can count on when you have financial problems by marital status
None 1-23-5 6-8More than 8 Don't know

16.4 32.7 26.8 10.3 11.2 2.718.4 31.6 28.6 9.2 11.5 0.7
6.8 24.5 31.8 19.3 16.8 0.820.5 28.8 26.6 12.9 9.5 1.7
16.2 29.6 26.9 12.0 15.314.8 29.6 29.4 11.8 14.1 0.3
17.7 28.2 26.9 14.4 11.6 1.38.1 26.2 33.6 14.3 16.8 0.98.8 30.6 33.7 7.0 17.9 2.0
18.0 27.7 30.4 11.5 11.1 1.220.3 24.9 23.9 16.3 13.8 0.8
13.3 27.2 33.4 13.7 12.2 0.310.3 29.8 31.9 14.7 10.7 2.6
14.6 28.2 32.3 13.0 10.3 1.515.6 28.3 28.8 13.4 13.6 0.3
12.2 23.2 21.8 23.6 18.9 0.215.8 22.8 29.2 20.4 11.7
12.2 24.8 36.3 14.2 12.1 0.416.4 24.7 32.2 12.3 12.8 1.616.2 24.0 30.9 14.3 13.5 1.1
0 20 40 60 80 100Percent
ZhemgangWangdue Phodrang
TsirangTrongsa
Tashi YangsteTashigang
ThimphuSarpangSamtse
Samdrup JongkharPunakha
Pema GatshelParo
MongarLhuntse
HaaGasa
DaganaChukha
BumthangHave financial problems
Source: GNH Survey 2010
No. of people you can count on when you have financial problems by Dzongkhag
None 1-23-5 6-8More than 8 Don't know

86.0%
8.9%5.0%
Normal mental wellbeing Some mental distressSevere mental distress
Source: GNH Survey 2010
Mental wellbeing (GHQ-12)

82.4 10.8 6.8
89.6 7.1 3.3
0 20 40 60 80 100Percent
Female
Male
GHQ-12
Source: GNH Survey 2010
Mental wellbeing (GHQ-12) by sex
Normal mental wellbeing Some mental distressSevere mental distress
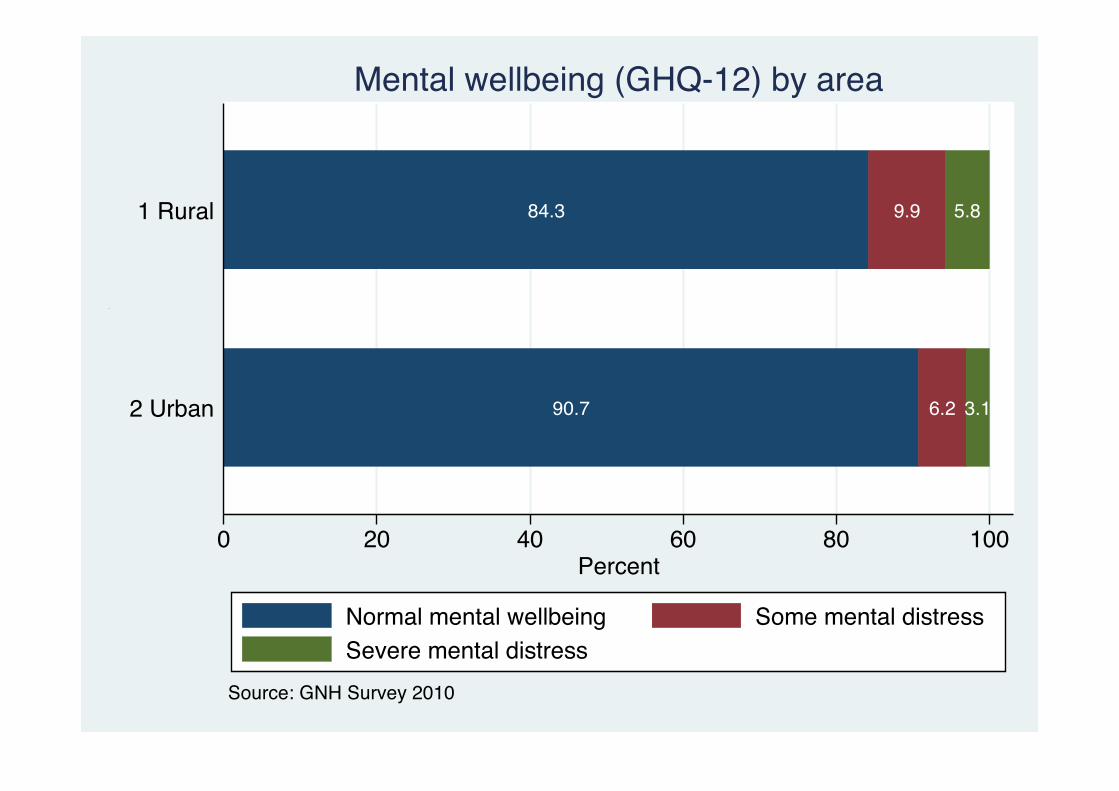
90.7 6.2 3.1
84.3 9.9 5.8
0 20 40 60 80 100Percent
2 Urban
1 Rural
GHQ-12
Source: GNH Survey 2010
Mental wellbeing (GHQ-12) by area
Normal mental wellbeing Some mental distressSevere mental distress
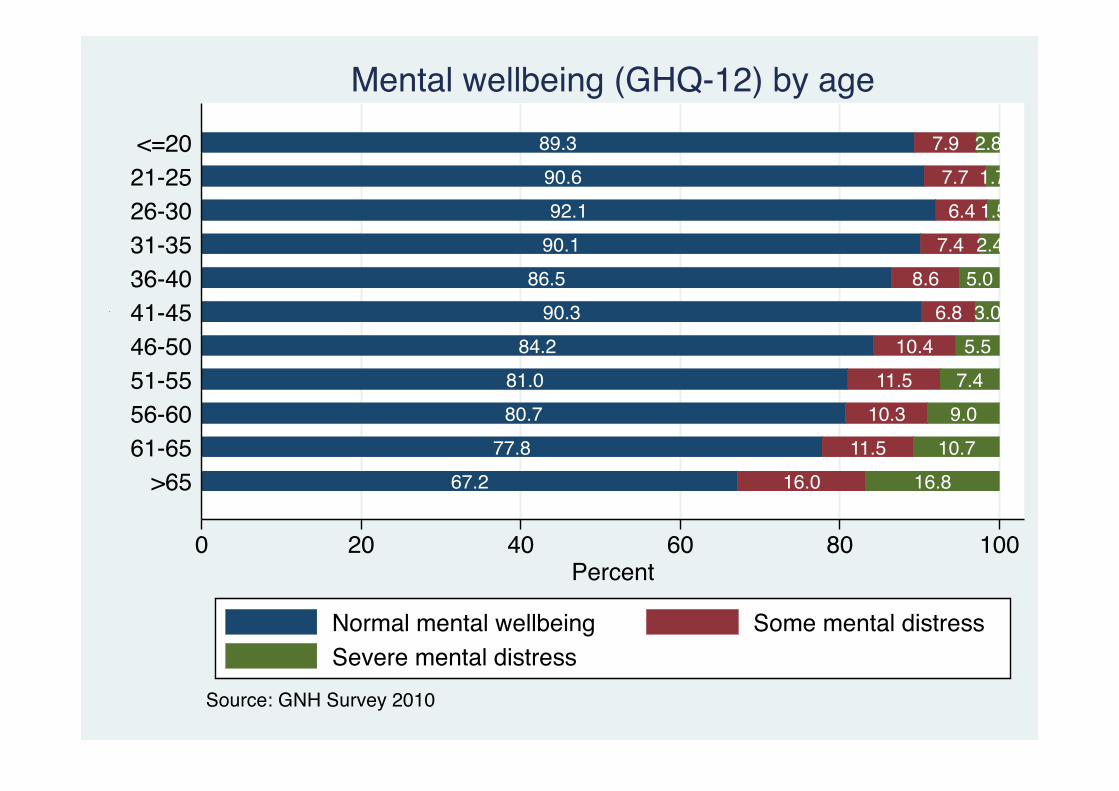
67.2 16.0 16.877.8 11.5 10.7
80.7 10.3 9.081.0 11.5 7.4
84.2 10.4 5.590.3 6.8 3.0
86.5 8.6 5.090.1 7.4 2.492.1 6.4 1.5
90.6 7.7 1.789.3 7.9 2.8
0 20 40 60 80 100Percent
>6561-6556-6051-5546-5041-4536-4031-3526-3021-25<=20
GHQ-12
Source: GNH Survey 2010
Mental wellbeing (GHQ-12) by age
Normal mental wellbeing Some mental distressSevere mental distress
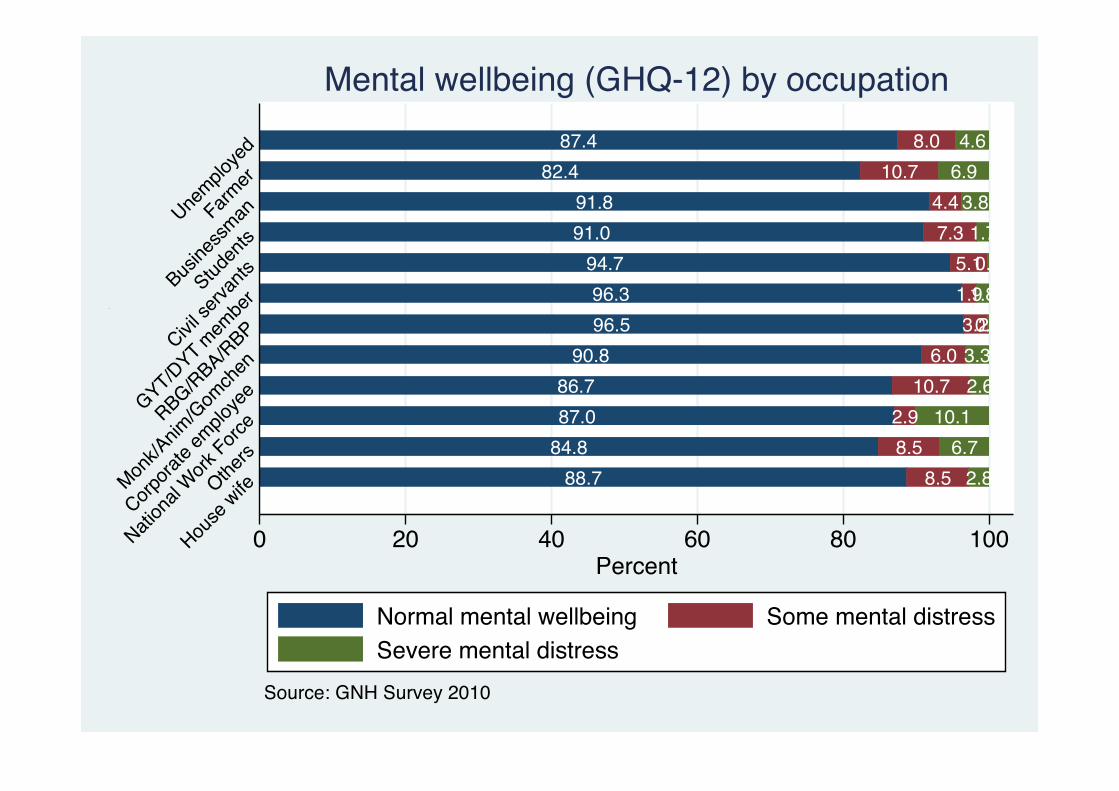
88.7 8.5 2.884.8 8.5 6.787.0 2.9 10.186.7 10.7 2.6
90.8 6.0 3.396.5 3.20.396.3 1.91.8
94.7 5.10.291.0 7.3 1.791.8 4.4 3.8
82.4 10.7 6.987.4 8.0 4.6
0 20 40 60 80 100Percent
House
wifeOthers
Nation
al Work
Force
Corpora
te em
ploye
e
Monk/A
nim/G
omch
en
RBG/RBA/RBP
GYT/DYT mem
ber
Civil se
rvantsStud
ents
Busine
ssmanFarmer
Unemplo
yed
GHQ-12
Source: GNH Survey 2010
Mental wellbeing (GHQ-12) by occupation
Normal mental wellbeing Some mental distressSevere mental distress
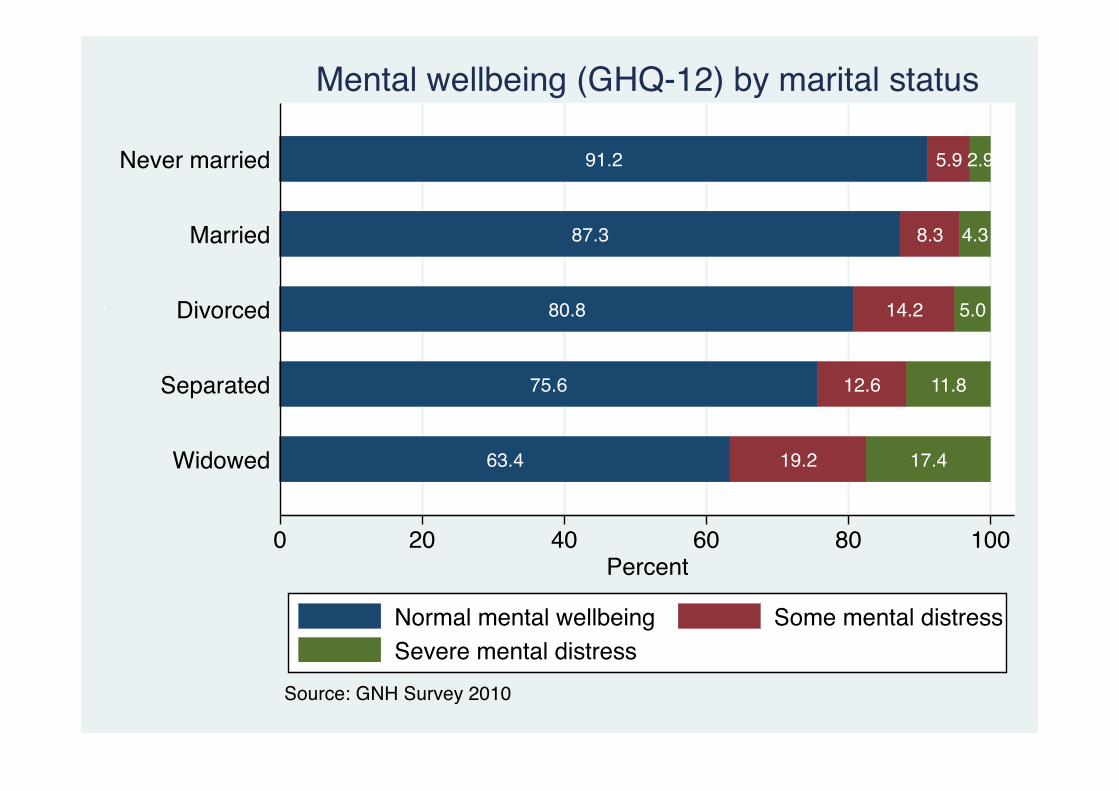
63.4 19.2 17.4
75.6 12.6 11.8
80.8 14.2 5.0
87.3 8.3 4.3
91.2 5.9 2.9
0 20 40 60 80 100Percent
Widowed
Separated
Divorced
Married
Never married
GHQ-12
Source: GNH Survey 2010
Mental wellbeing (GHQ-12) by marital status
Normal mental wellbeing Some mental distressSevere mental distress

89.9 6.1 4.081.9 10.7 7.4
85.3 9.7 5.080.3 12.8 7.080.3 12.0 7.7
79.1 13.1 7.892.0 4.8 3.2
86.7 10.5 2.891.0 7.0 1.9
80.8 10.7 8.584.1 8.7 7.2
79.3 10.8 10.090.0 6.1 3.989.6 4.9 5.4
82.7 8.2 9.188.3 7.5 4.189.3 6.6 4.1
93.5 4.8 1.682.9 13.5 3.5
78.9 13.2 8.0
0 20 40 60 80 100Percent
Zhemga
ng
Wangd
ue Pho
drangTsi
rang
Trong
sa
Tash
i Yan
gste
Tash
igang
Thimph
uSarp
ang
Samtse
Samdru
p Jon
gkha
rPun
akha
Pema G
atshe
lParoMonga
rLh
untseHaaGasa
Dagan
aChu
kha
Bumtha
ng
GHQ-12
Source: GNH Survey 2010
Mental wellbeing (GHQ-12) by Dzongkhag
Normal mental wellbeing Some mental distressSevere mental distress

11.2%
13.2%
30.4%
45.2%
Very stressful Moderately stressfulSomewhat stressful Not at all stressful
Source: GNH Survey 2010
Self-reported stress level

13.56 14.07 29.78 42.59
8.89 12.31 30.95 47.85
0 20 40 60 80 100Percent
Female
Male
Stress
Source: GNH Survey 2010
Self-reported stress level by sex
Very stressful Moderately stressfulSomewhat stressful Not at all stressful
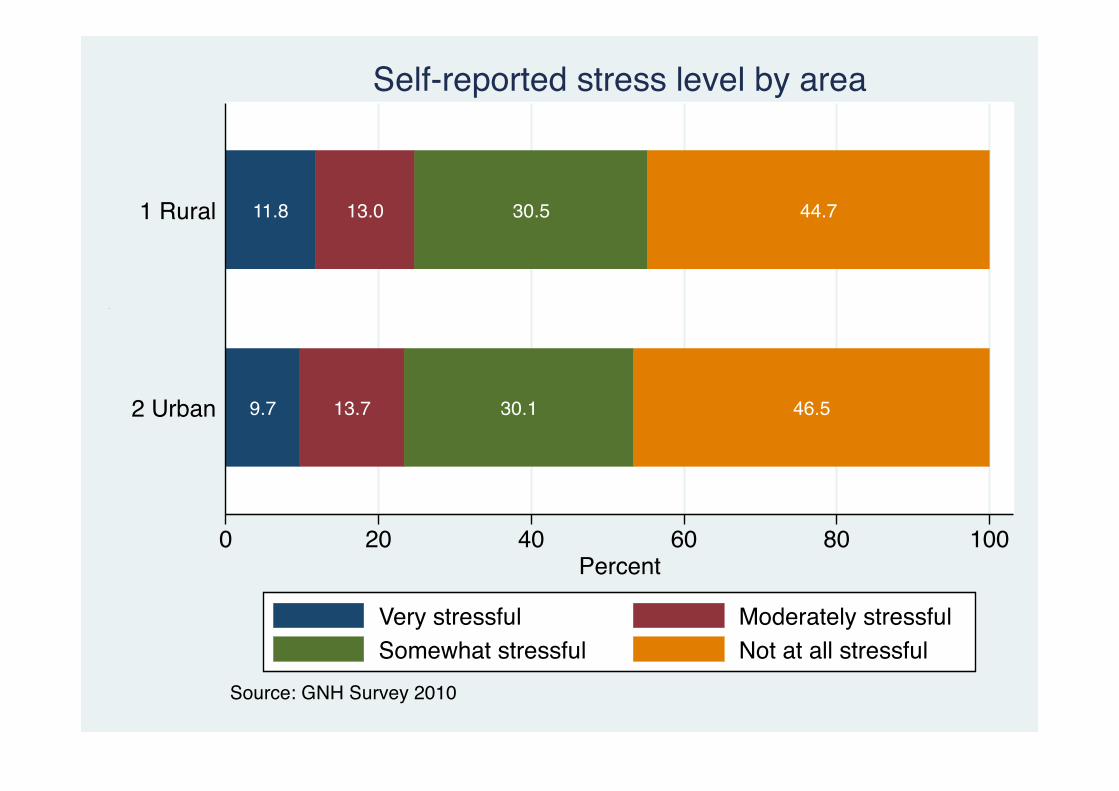
9.7 13.7 30.1 46.5
11.8 13.0 30.5 44.7
0 20 40 60 80 100Percent
2 Urban
1 Rural
Stress
Source: GNH Survey 2010
Self-reported stress level by area
Very stressful Moderately stressfulSomewhat stressful Not at all stressful

26.5 14.7 26.0 32.8
21.7 21.3 29.3 27.8
18.8 18.5 26.5 36.1
10.1 12.4 31.0 46.5
8.3 15.8 29.1 46.8
0 20 40 60 80 100Percent
Widowed
Separated
Divorced
Married
Never married
Stress
Source: GNH Survey 2010
Self-reported stress level by marital status
Very stressful Moderately stressfulSomewhat stressful Not at all stressful
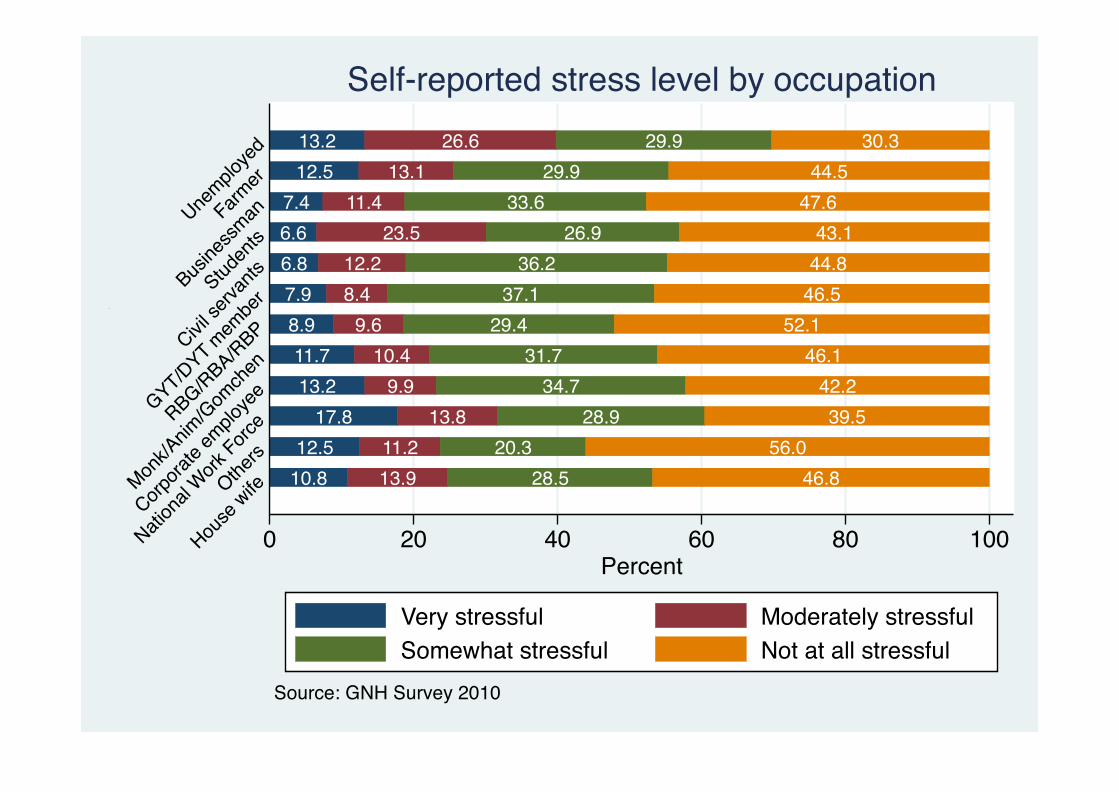
10.8 13.9 28.5 46.812.5 11.2 20.3 56.0
17.8 13.8 28.9 39.513.2 9.9 34.7 42.211.7 10.4 31.7 46.1
8.9 9.6 29.4 52.17.9 8.4 37.1 46.56.8 12.2 36.2 44.86.6 23.5 26.9 43.17.4 11.4 33.6 47.6
12.5 13.1 29.9 44.513.2 26.6 29.9 30.3
0 20 40 60 80 100Percent
House
wifeOthers
Nation
al Work
Force
Corpora
te em
ploye
e
Monk/A
nim/G
omch
en
RBG/RBA/RBP
GYT/DYT mem
ber
Civil se
rvantsStud
ents
Busine
ssmanFarmer
Unemplo
yed
Stress
Source: GNH Survey 2010
Self-reported stress level by occupation
Very stressful Moderately stressfulSomewhat stressful Not at all stressful
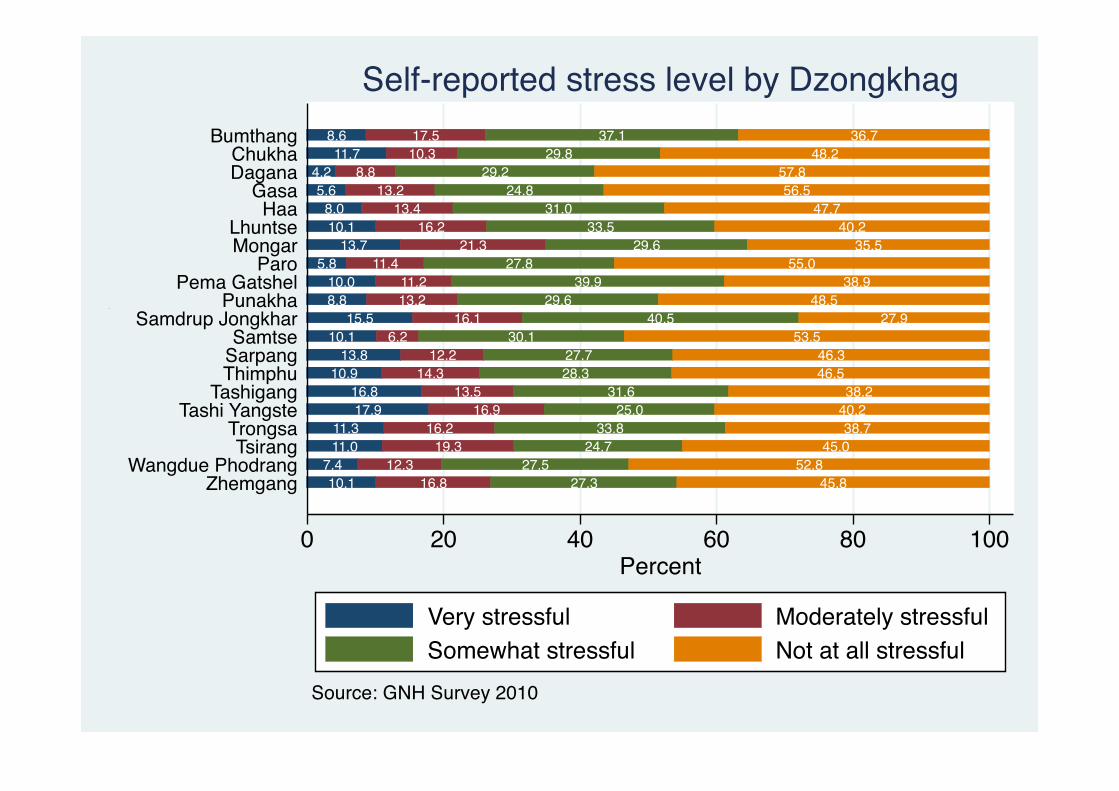
10.1 16.8 27.3 45.87.4 12.3 27.5 52.8
11.0 19.3 24.7 45.011.3 16.2 33.8 38.7
17.9 16.9 25.0 40.216.8 13.5 31.6 38.2
10.9 14.3 28.3 46.513.8 12.2 27.7 46.3
10.1 6.2 30.1 53.515.5 16.1 40.5 27.9
8.8 13.2 29.6 48.510.0 11.2 39.9 38.9
5.8 11.4 27.8 55.013.7 21.3 29.6 35.5
10.1 16.2 33.5 40.28.0 13.4 31.0 47.7
5.6 13.2 24.8 56.54.2 8.8 29.2 57.8
11.7 10.3 29.8 48.28.6 17.5 37.1 36.7
0 20 40 60 80 100Percent
ZhemgangWangdue Phodrang
TsirangTrongsa
Tashi YangsteTashigang
ThimphuSarpangSamtse
Samdrup JongkharPunakha
Pema GatshelParo
MongarLhuntse
HaaGasa
DaganaChukha
BumthangStress
Source: GNH Survey 2010
Self-reported stress level by Dzongkhag
Very stressful Moderately stressfulSomewhat stressful Not at all stressful
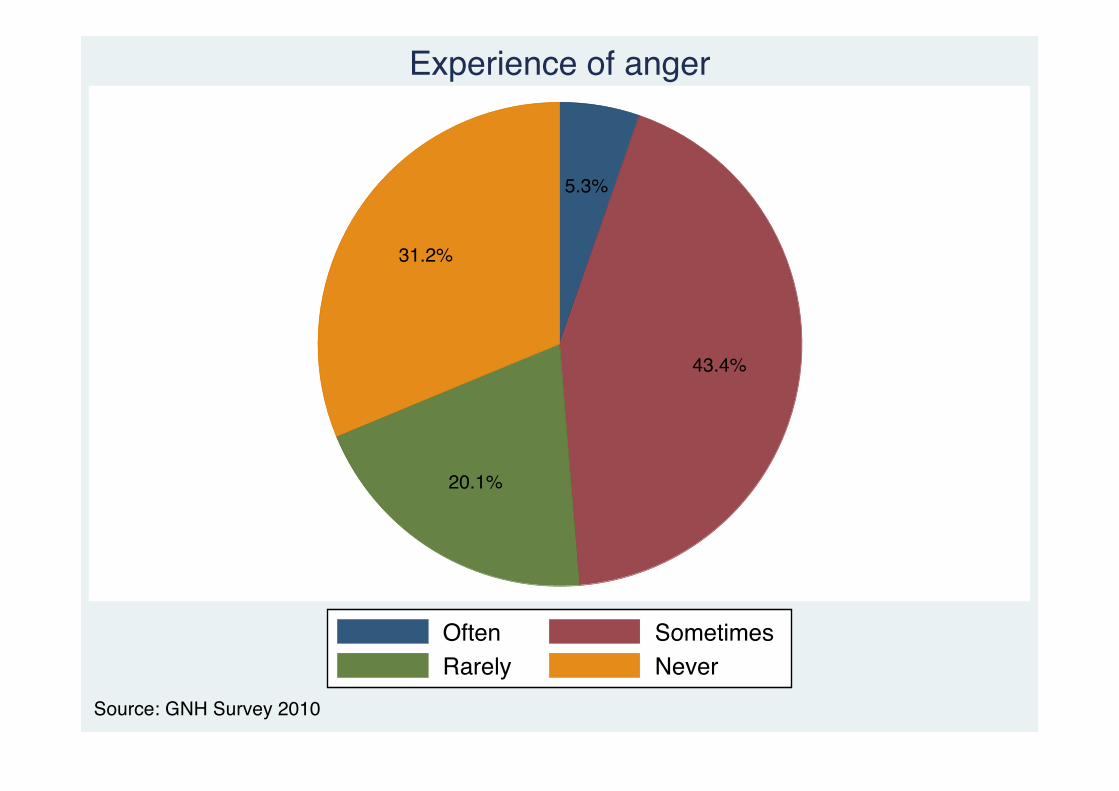
5.3%
43.4%
20.1%
31.2%
Often SometimesRarely Never
Source: GNH Survey 2010
Experience of anger
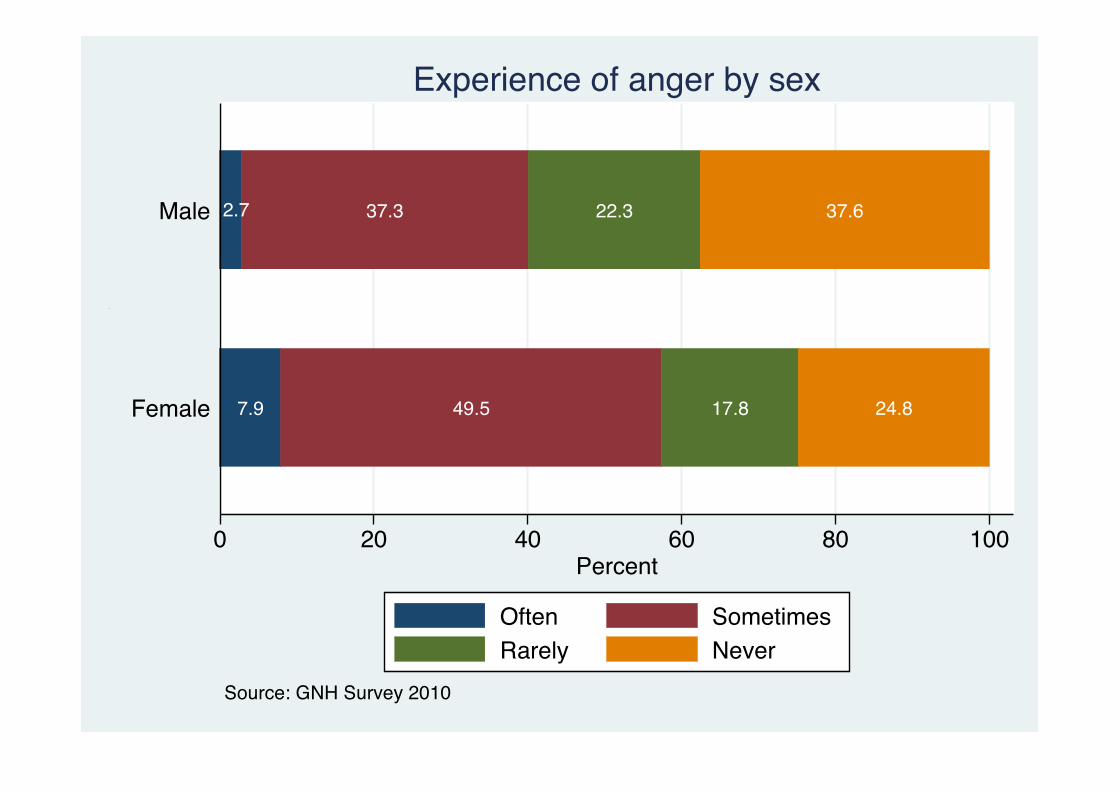
7.9 49.5 17.8 24.8
2.7 37.3 22.3 37.6
0 20 40 60 80 100Percent
Female
Male
Anger
Source: GNH Survey 2010
Experience of anger by sex
Often SometimesRarely Never

6.9 45.5 20.9 26.7
4.7 42.6 19.8 32.9
0 20 40 60 80 100Percent
2 Urban
1 Rural
Anger
Source: GNH Survey 2010
Experience of anger by area
Often SometimesRarely Never

6.2 41.1 22.8 29.9
5.2 51.4 20.1 23.4
6.3 50.3 16.5 26.8
5.3 42.2 20.2 32.3
4.7 50.5 18.8 26.1
0 20 40 60 80 100Percent
Widowed
Separated
Divorced
Married
Never married
Anger
Source: GNH Survey 2010
Experience of anger by marital status
Often SometimesRarely Never

3.2 41.3 20.0 35.56.3 42.8 22.7 28.3
1.4 35.6 29.6 33.44.4 50.1 22.5 23.15.2 52.0 15.1 27.75.2 43.0 19.7 32.1
8.2 47.7 18.4 25.82.7 38.4 25.2 33.86.1 30.7 22.6 40.65.1 52.1 17.3 25.65.0 51.8 18.9 24.3
2.6 47.9 12.8 36.76.1 58.1 16.0 19.8
4.2 44.5 12.6 38.72.2 39.7 19.0 39.24.5 44.1 27.0 24.4
2.1 37.4 30.7 29.93.5 39.8 16.6 40.0
6.7 37.4 24.2 31.77.7 54.0 22.3 15.9
0 20 40 60 80 100Percent
ZhemgangWangdue Phodrang
TsirangTrongsa
Tashi YangsteTashigang
ThimphuSarpangSamtse
Samdrup JongkharPunakha
Pema GatshelParo
MongarLhuntse
HaaGasa
DaganaChukha
BumthangAnger
Source: GNH Survey 2010
Experience of anger by Dzongkhag
Often SometimesRarely Never
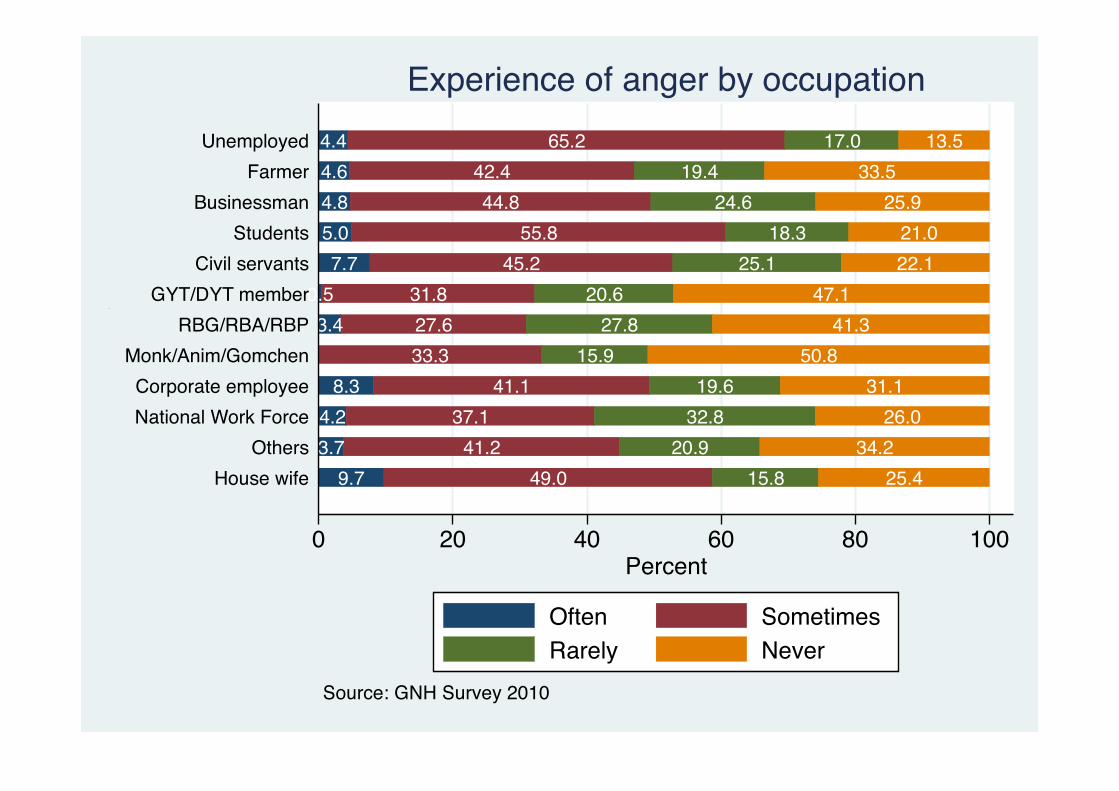
9.7 49.0 15.8 25.43.7 41.2 20.9 34.24.2 37.1 32.8 26.0
8.3 41.1 19.6 31.133.3 15.9 50.8
3.4 27.6 27.8 41.30.5 31.8 20.6 47.1
7.7 45.2 25.1 22.15.0 55.8 18.3 21.04.8 44.8 24.6 25.94.6 42.4 19.4 33.54.4 65.2 17.0 13.5
0 20 40 60 80 100Percent
House wifeOthers
National Work ForceCorporate employee
Monk/Anim/GomchenRBG/RBA/RBP
GYT/DYT memberCivil servants
StudentsBusinessman
FarmerUnemployed
Anger
Source: GNH Survey 2010
Experience of anger by occupation
Often SometimesRarely Never

7.0 45.4 21.3 26.3
6.2 46.8 22.0 25.0
4.4 45.5 21.0 29.1
5.1 43.5 21.2 30.2
4.8 41.3 21.1 32.8
4.8 42.9 18.9 33.4
4.9 40.8 17.2 37.1
0 20 40 60 80 100Percent
>225,000
150,001-225,000
100,001-150,000
75,001-100,000
50,001-75,000
25,001-50,000
0-25,000
Anger
Source: GNH Survey 2010
Experience of anger by household income
Often SometimesRarely Never
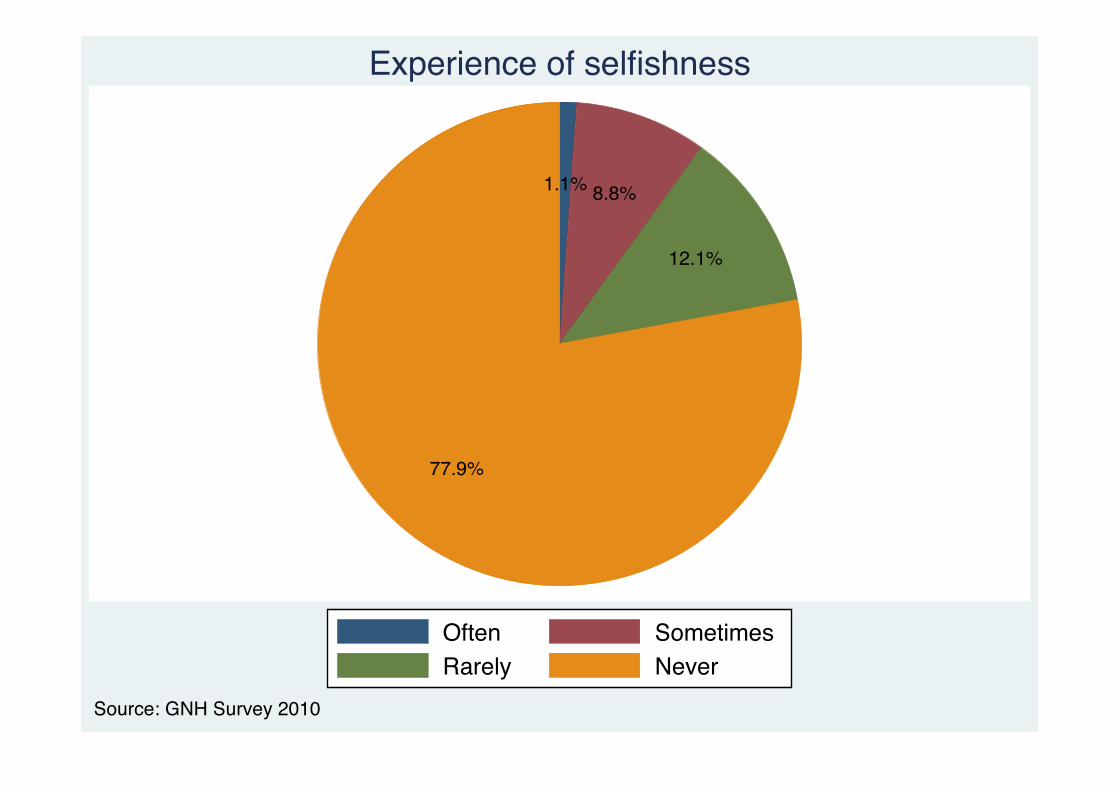
1.1% 8.8%
12.1%
77.9%
Often SometimesRarely Never
Source: GNH Survey 2010
Experience of selfishness

1.2 9.4 12.3 77.2
1.18.2 12.0 78.7
0 20 40 60 80 100Percent
Female
Male
Selfishness
Source: GNH Survey 2010
Experience of selfishness by sex
Often SometimesRarely Never
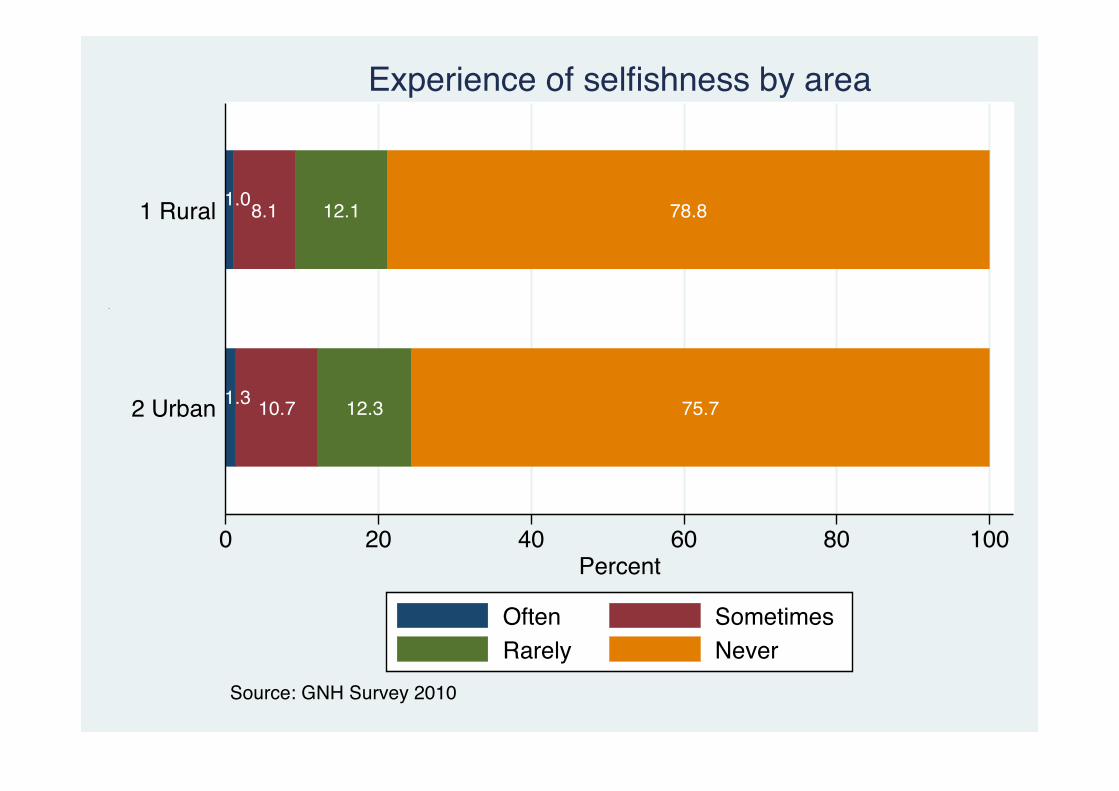
1.3 10.7 12.3 75.7
1.08.1 12.1 78.8
0 20 40 60 80 100Percent
2 Urban
1 Rural
Selfishness
Source: GNH Survey 2010
Experience of selfishness by area
Often SometimesRarely Never
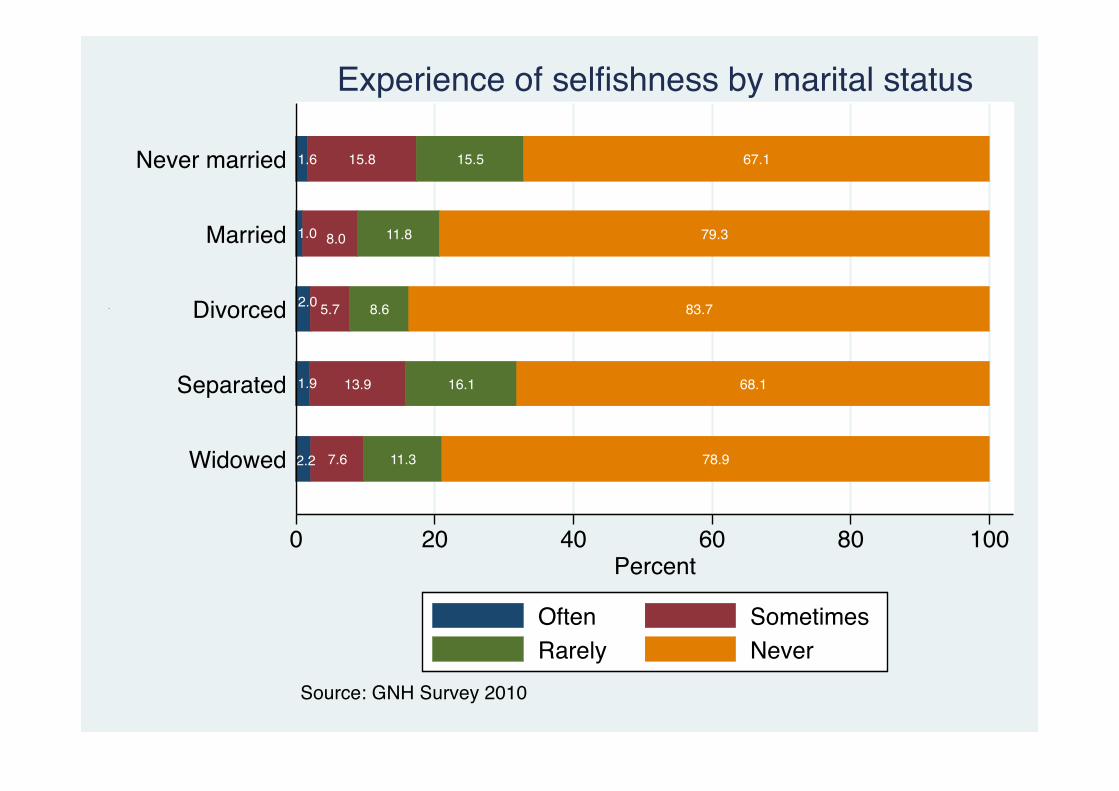
2.2 7.6 11.3 78.9
1.9 13.9 16.1 68.1
2.0 5.7 8.6 83.7
1.0 8.0 11.8 79.3
1.6 15.8 15.5 67.1
0 20 40 60 80 100Percent
Widowed
Separated
Divorced
Married
Never married
Selfishness
Source: GNH Survey 2010
Experience of selfishness by marital status
Often SometimesRarely Never
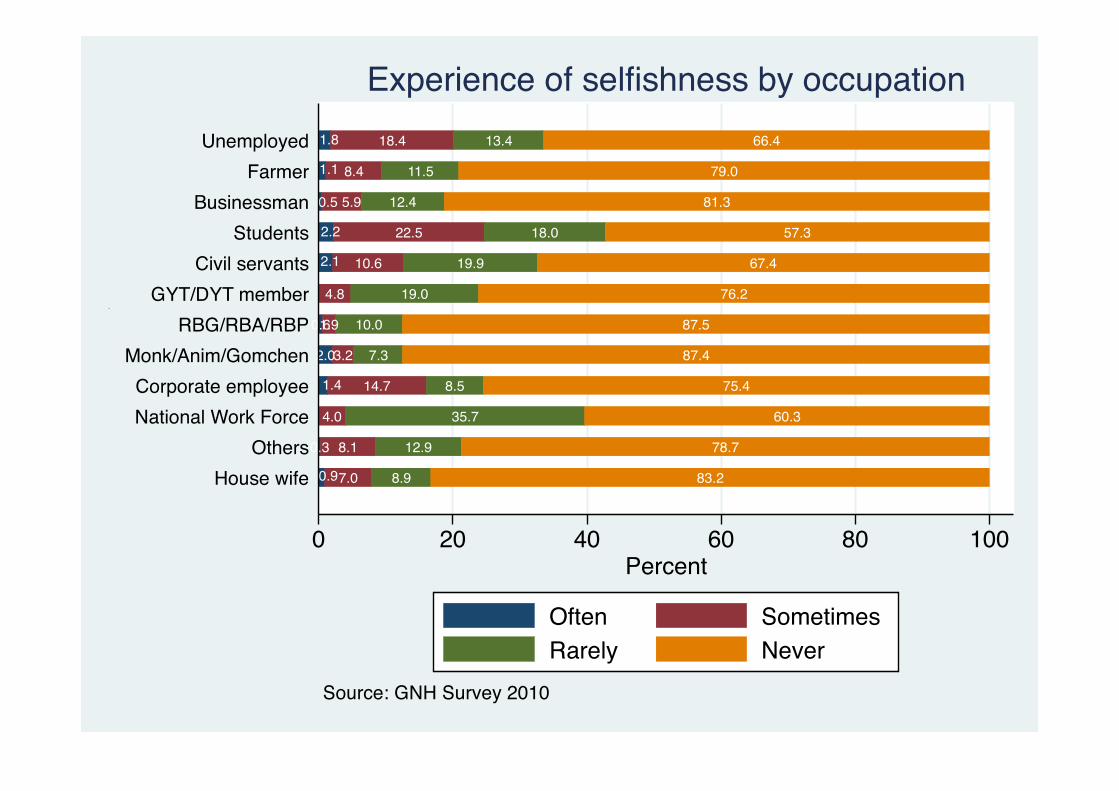
0.97.0 8.9 83.2
0.3 8.1 12.9 78.7
4.0 35.7 60.3
1.4 14.7 8.5 75.4
2.03.2 7.3 87.4
0.61.9 10.0 87.5
4.8 19.0 76.2
2.1 10.6 19.9 67.4
2.2 22.5 18.0 57.3
0.5 5.9 12.4 81.3
1.1 8.4 11.5 79.0
1.8 18.4 13.4 66.4
0 20 40 60 80 100Percent
House wifeOthers
National Work ForceCorporate employee
Monk/Anim/GomchenRBG/RBA/RBP
GYT/DYT memberCivil servants
StudentsBusinessman
FarmerUnemployed
Selfishness
Source: GNH Survey 2010
Experience of selfishness by occupation
Often SometimesRarely Never
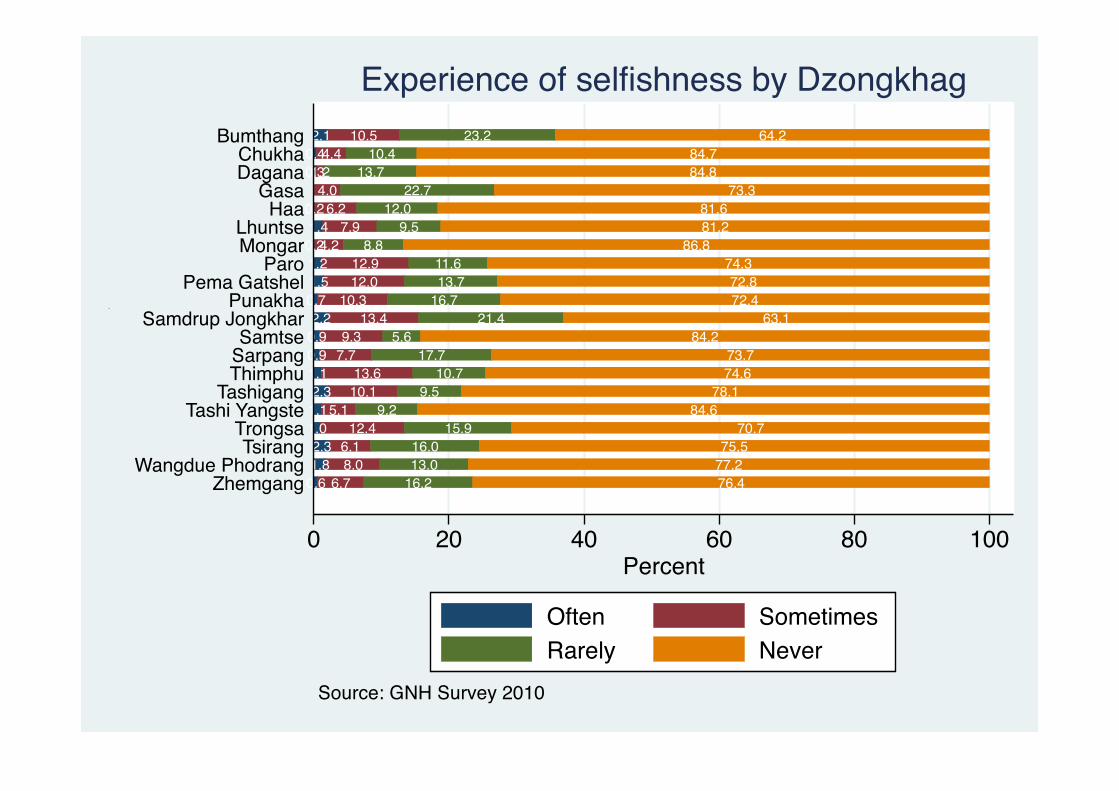
0.6 6.7 16.2 76.41.8 8.0 13.0 77.22.3 6.1 16.0 75.5
1.0 12.4 15.9 70.71.15.1 9.2 84.62.3 10.1 9.5 78.11.1 13.6 10.7 74.60.9 7.7 17.7 73.70.9 9.3 5.6 84.22.2 13.4 21.4 63.1
0.7 10.3 16.7 72.41.5 12.0 13.7 72.81.2 12.9 11.6 74.30.24.2 8.8 86.81.4 7.9 9.5 81.2
0.2 6.2 12.0 81.64.0 22.7 73.3
0.31.2 13.7 84.80.44.4 10.4 84.72.1 10.5 23.2 64.2
0 20 40 60 80 100Percent
ZhemgangWangdue Phodrang
TsirangTrongsa
Tashi YangsteTashigang
ThimphuSarpangSamtse
Samdrup JongkharPunakha
Pema GatshelParo
MongarLhuntse
HaaGasa
DaganaChukha
BumthangSelfishness
Source: GNH Survey 2010
Experience of selfishness by Dzongkhag
Often SometimesRarely Never
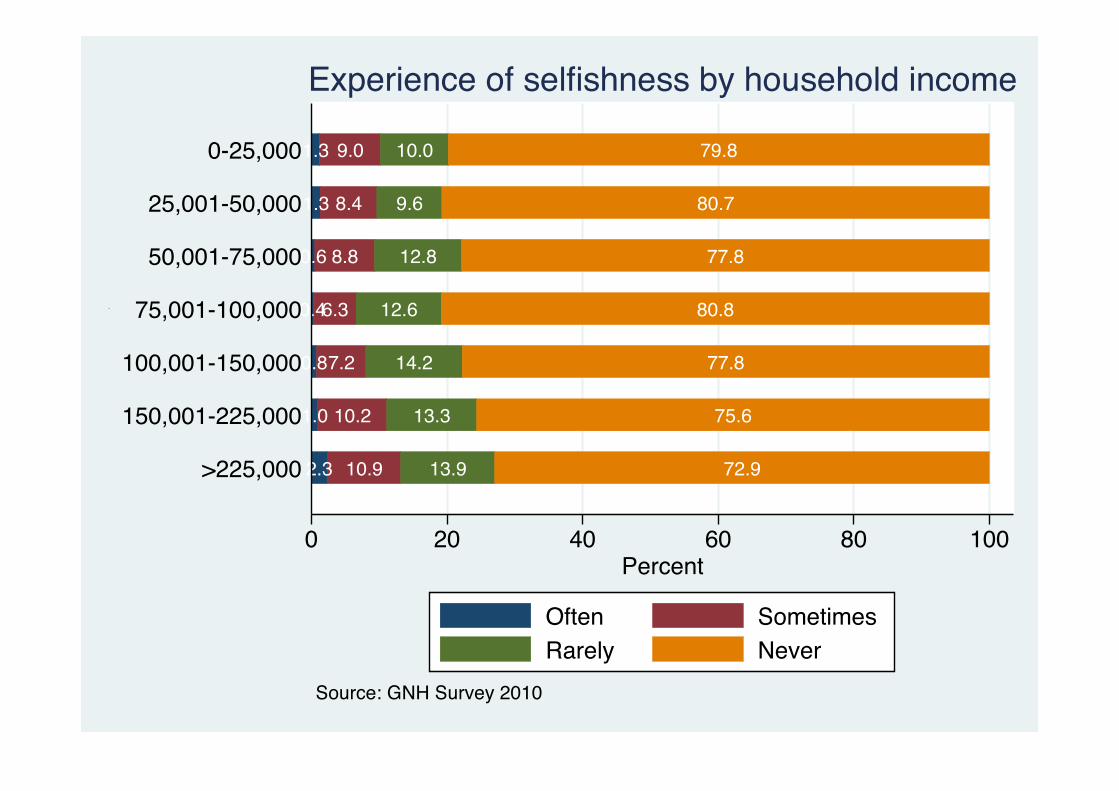
2.3 10.9 13.9 72.9
1.0 10.2 13.3 75.6
0.87.2 14.2 77.8
0.46.3 12.6 80.8
0.6 8.8 12.8 77.8
1.3 8.4 9.6 80.7
1.3 9.0 10.0 79.8
0 20 40 60 80 100Percent
>225,000
150,001-225,000
100,001-150,000
75,001-100,000
50,001-75,000
25,001-50,000
0-25,000
Selfishness
Source: GNH Survey 2010
Experience of selfishness by household income
Often SometimesRarely Never

0.7%6.2%
9.3%
83.7%
Often SometimesRarely Never
Source: GNH Survey 2010
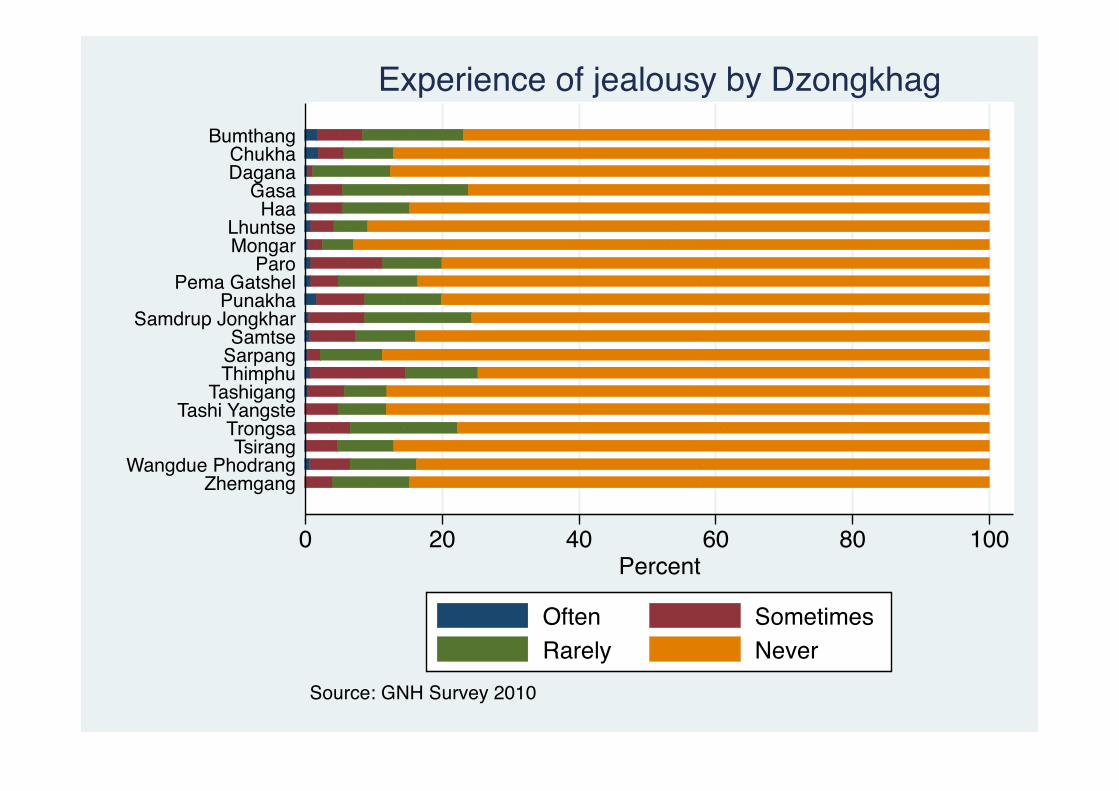
Experience of jealousy
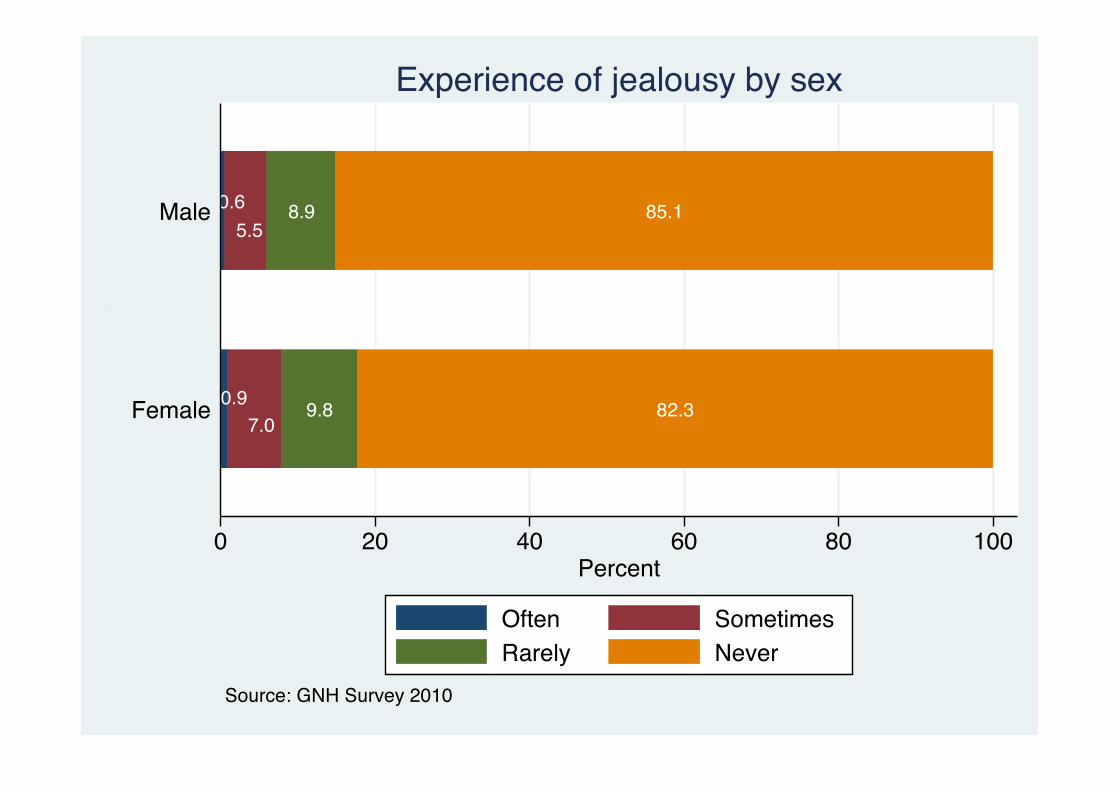
0.97.0
9.8 82.3
0.65.5
8.9 85.1
0 20 40 60 80 100Percent
Female
Male
Jealousy
Source: GNH Survey 2010
Experience of jealousy by sex
Often SometimesRarely Never
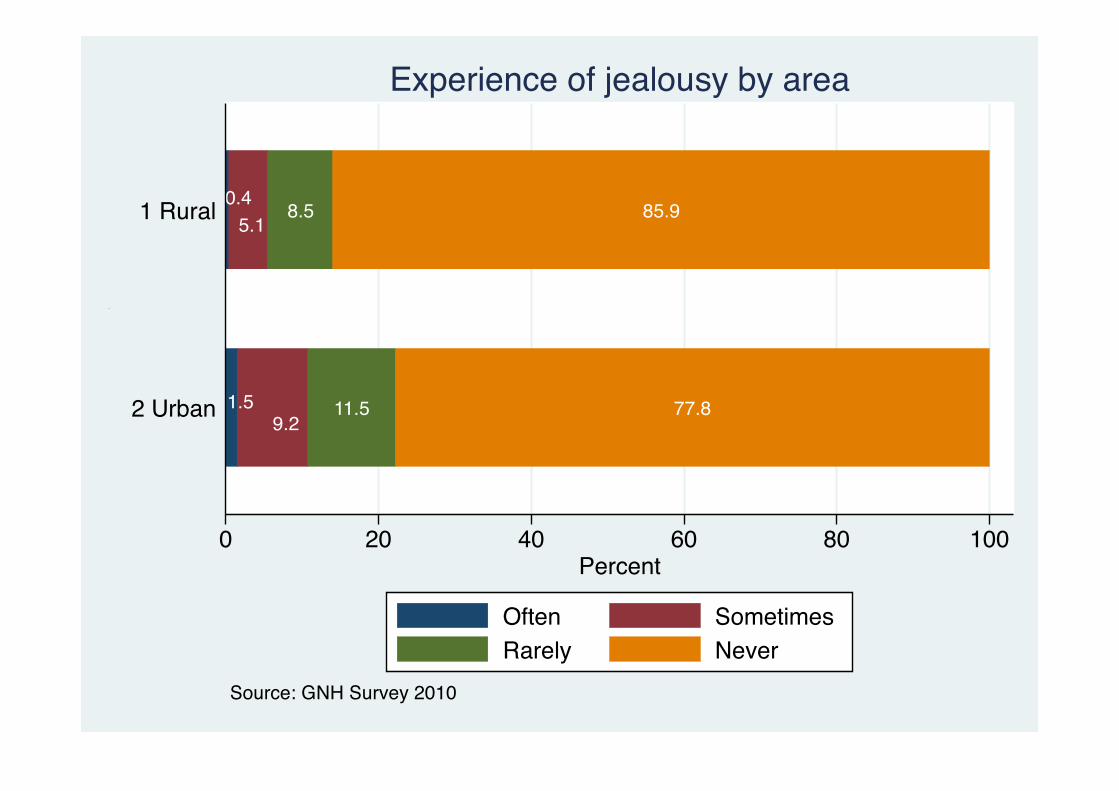
1.59.2
11.5 77.8
0.45.1
8.5 85.9
0 20 40 60 80 100Percent
2 Urban
1 Rural
Jealousy
Source: GNH Survey 2010
Experience of jealousy by area
Often SometimesRarely Never
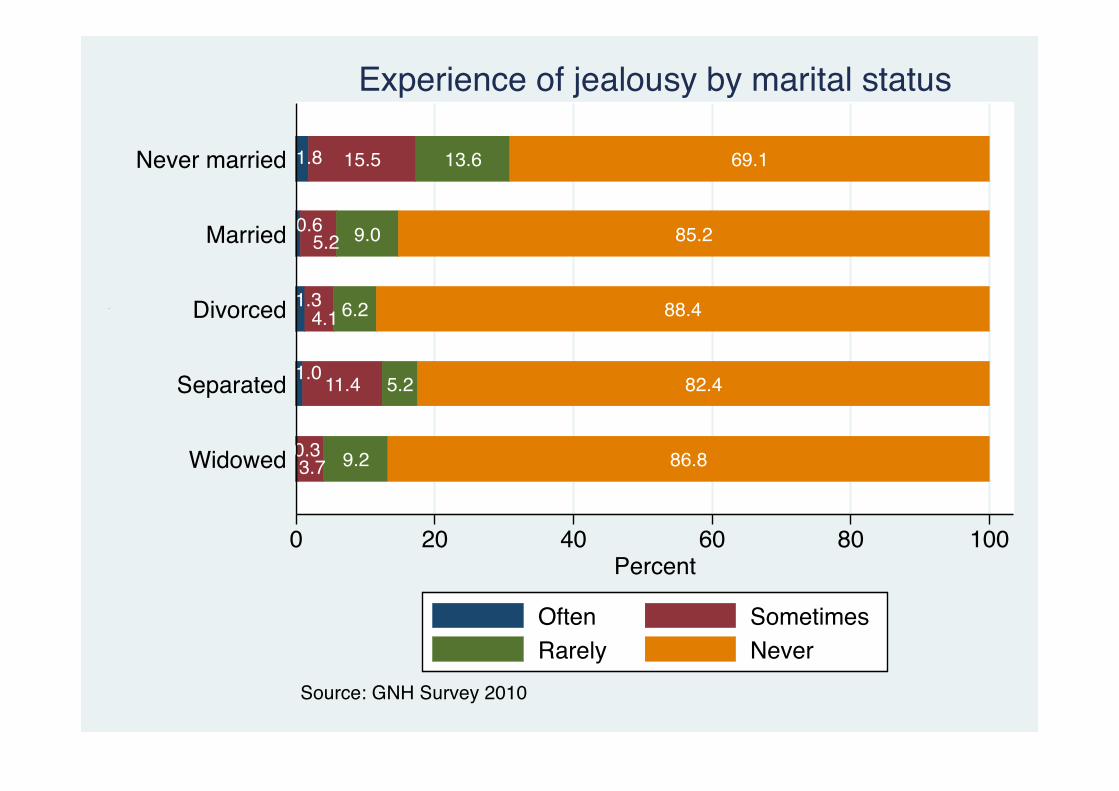
0.33.7 9.2 86.8
1.0 11.4 5.2 82.4
1.34.1 6.2 88.4
0.65.2 9.0 85.2
1.8 15.5 13.6 69.1
0 20 40 60 80 100Percent
Widowed
Separated
Divorced
Married
Never married
Jealousy
Source: GNH Survey 2010
Experience of jealousy by marital status
Often SometimesRarely Never
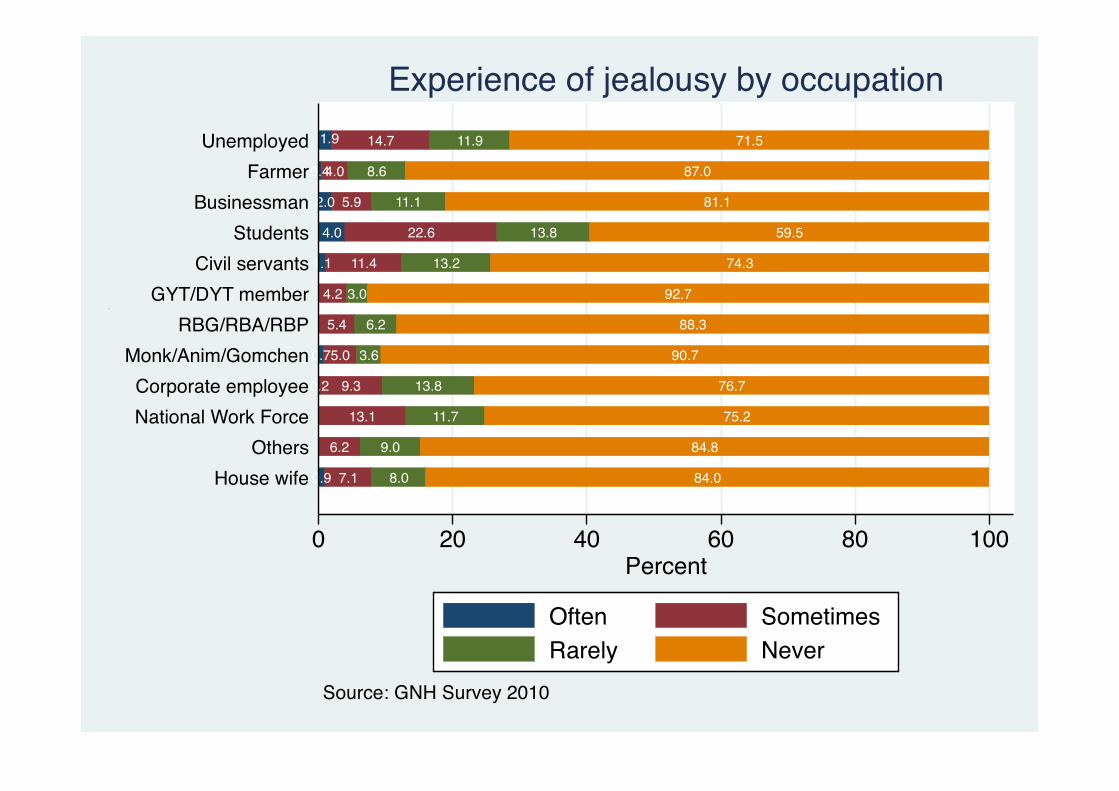
0.9 7.1 8.0 84.0
6.2 9.0 84.8
13.1 11.7 75.2
0.2 9.3 13.8 76.7
0.75.0 3.6 90.7
5.4 6.2 88.3
4.2 3.0 92.7
1.1 11.4 13.2 74.3
4.0 22.6 13.8 59.5
2.0 5.9 11.1 81.1
0.44.0 8.6 87.0
1.9 14.7 11.9 71.5
0 20 40 60 80 100Percent
House wifeOthers
National Work ForceCorporate employee
Monk/Anim/GomchenRBG/RBA/RBP
GYT/DYT memberCivil servants
StudentsBusinessman
FarmerUnemployed
Jealousy
Source: GNH Survey 2010
Experience of jealousy by occupation
Often SometimesRarely Never

1.9 9.7 13.3 75.1
1.4 7.3 9.9 81.3
0.4 6.2 9.6 83.7
0.6 4.3 11.0 84.1
0.5 5.6 7.7 86.2
0.14.5 8.2 87.1
0.7 5.9 7.4 86.0
0 20 40 60 80 100Percent
>225,000
150,001-225,000
100,001-150,000
75,001-100,000
50,001-75,000
25,001-50,000
0-25,000
Source: GNH Survey 2010
Experience of jealousy by household income
Often SometimesRarely Never
4.0 11.2 84.7
0.6 5.9 9.7 83.8
0.1 4.5 8.3 87.0
0.2 6.4 15.6 77.8
4.9 6.9 88.2
0.4 5.3 6.2 88.1
0.7 13.9 10.6 74.8
0.3 1.8 9.1 88.8
0.6 6.8 8.7 84.0
0.5 8.2 15.6 75.7
1.7 7.0 11.2 80.1
0.8 4.0 11.6 83.6
0.8 10.6 8.7 80.0
0.4 2.1 4.5 93.0
0.8 3.4 4.9 90.8
0.7 4.8 9.7 84.8
0.6 4.9 18.3 76.2
0.3 0.8 11.4 87.5
1.9 3.7 7.2 87.1
1.8 6.6 14.8 76.9
0 20 40 60 80 100Percent
ZhemgangWangdue Phodrang
TsirangTrongsa
Tashi YangsteTashigang
ThimphuSarpangSamtse
Samdrup JongkharPunakha
Pema GatshelParo
MongarLhuntse
HaaGasa
DaganaChukha
Bumthang
Source: GNH Survey 2010
Experience of jealousy by Dzongkhag
Often SometimesRarely Never
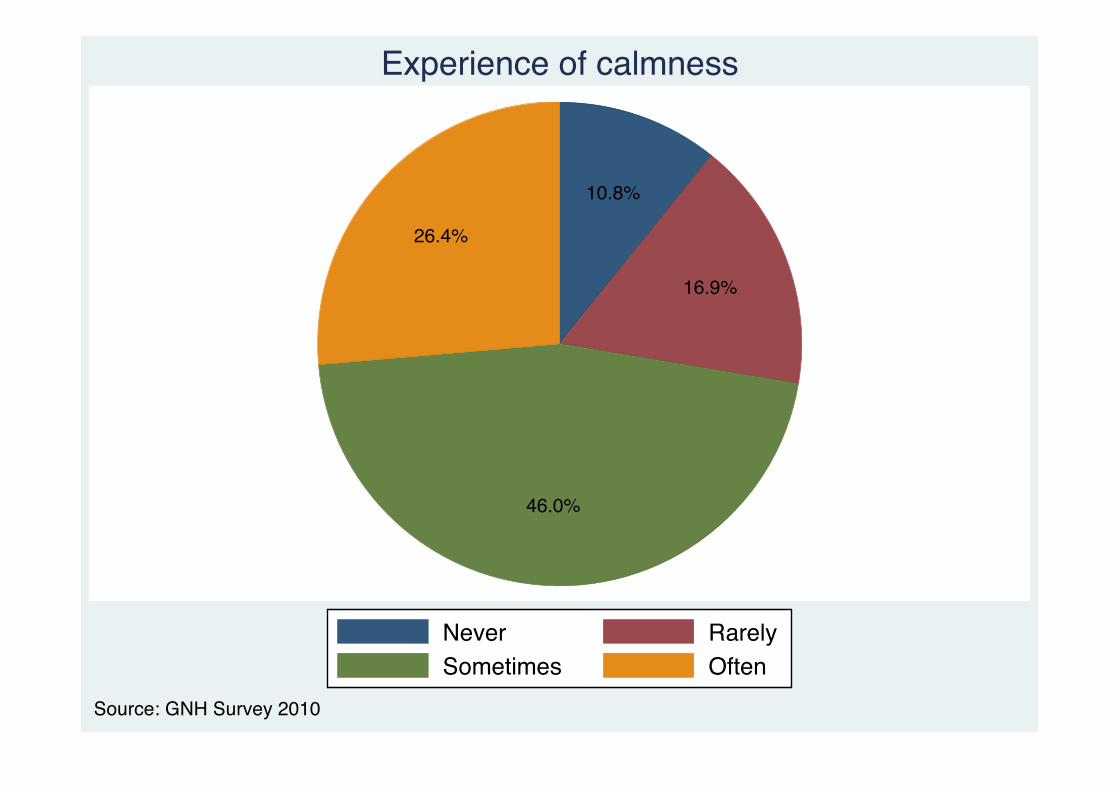
10.8%
16.9%
46.0%
26.4%
Never RarelySometimes Often
Source: GNH Survey 2010
Experience of calmness

10.7 17.5 47.6 24.2
10.8 16.2 44.4 28.6
0 20 40 60 80 100Percent
Female
Male
Source: GNH Survey 2010
Experience of calmness by sex
Never RarelySometimes Often
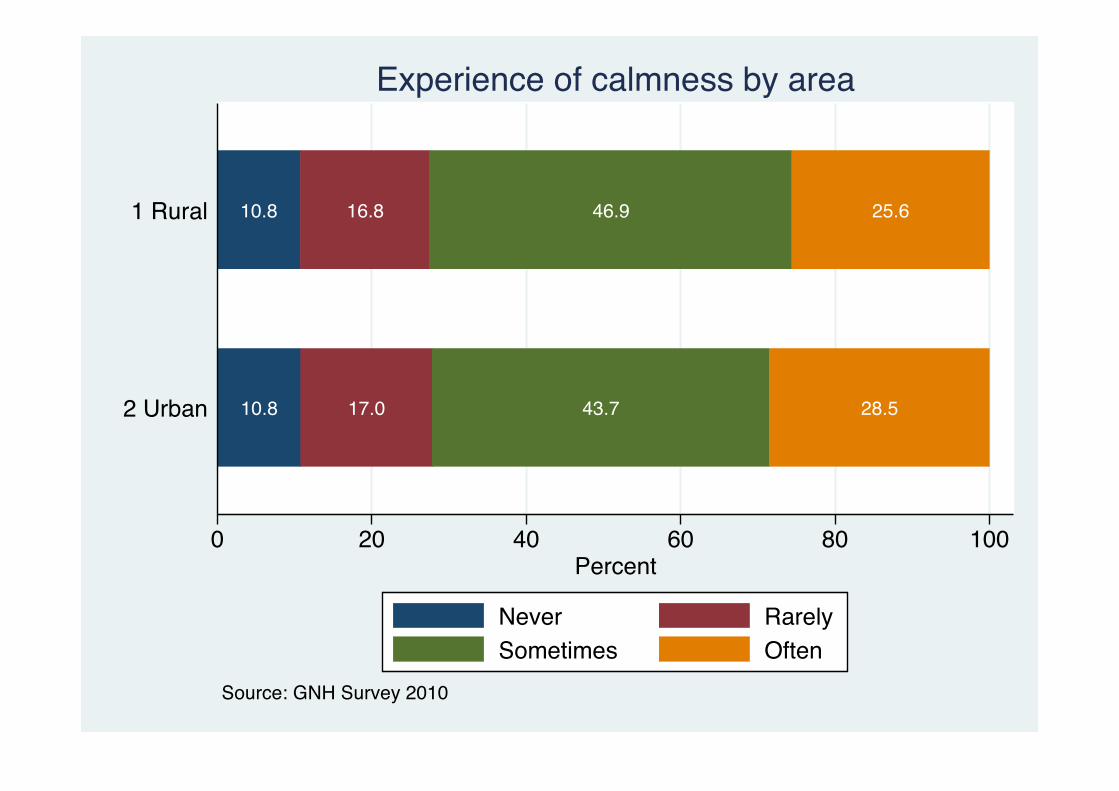
10.8 17.0 43.7 28.5
10.8 16.8 46.9 25.6
0 20 40 60 80 100Percent
2 Urban
1 Rural
Source: GNH Survey 2010
Experience of calmness by area
Never RarelySometimes Often

10.1 18.0 45.4 26.5
12.2 19.0 52.6 16.2
14.1 18.9 42.0 25.0
10.6 16.6 45.8 27.0
11.8 17.2 47.9 23.1
0 20 40 60 80 100Percent
Widowed
Separated
Divorced
Married
Never married
Source: GNH Survey 2010
Experience of calmness by marital status
Never RarelySometimes Often

9.3 16.4 44.4 29.910.0 20.5 42.0 27.411.9 11.3 64.2 12.6
10.0 13.4 49.1 27.513.9 14.1 34.5 37.5
12.0 14.6 40.7 32.77.2 11.8 45.0 36.010.9 14.7 44.3 30.112.5 19.9 45.6 21.9
10.5 18.4 42.7 28.311.0 17.2 47.2 24.6
7.5 19.7 57.9 14.9
0 20 40 60 80 100Percent
House wifeOthers
National Work ForceCorporate employee
Monk/Anim/GomchenRBG/RBA/RBP
GYT/DYT memberCivil servants
StudentsBusinessman
FarmerUnemployed
Source: GNH Survey 2010
Experience of calmness by occupation
Never RarelySometimes Often
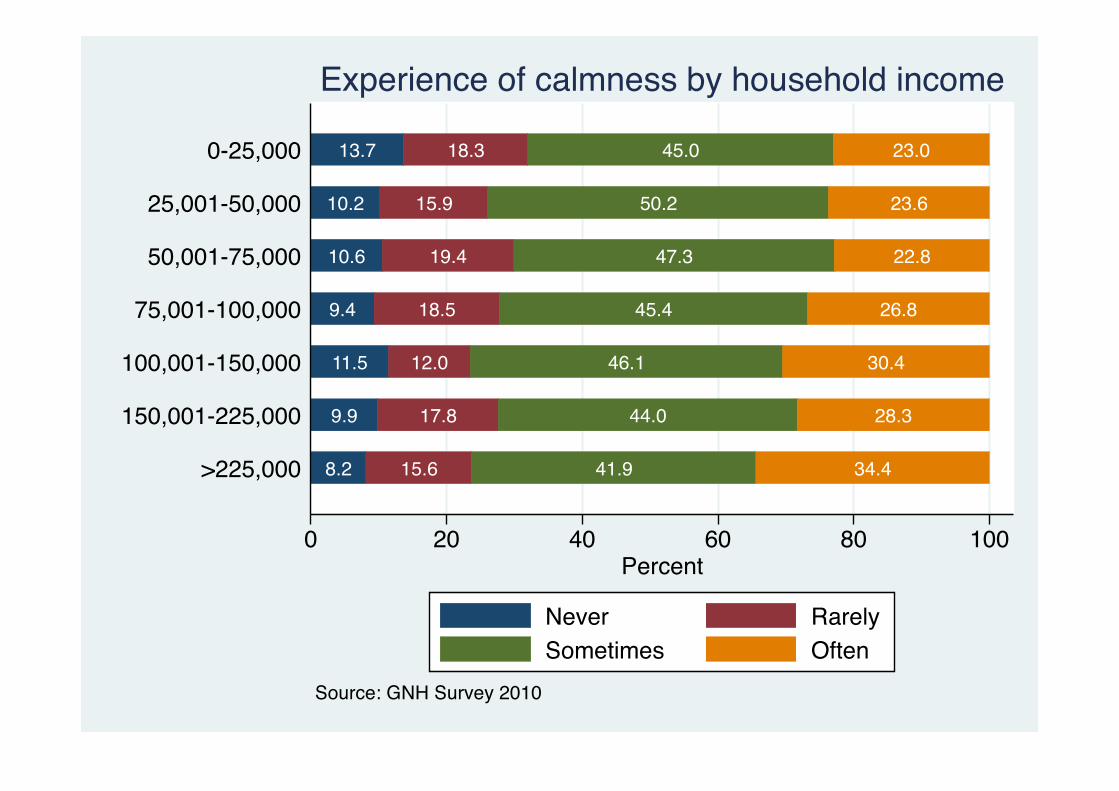
8.2 15.6 41.9 34.4
9.9 17.8 44.0 28.3
11.5 12.0 46.1 30.4
9.4 18.5 45.4 26.8
10.6 19.4 47.3 22.8
10.2 15.9 50.2 23.6
13.7 18.3 45.0 23.0
0 20 40 60 80 100Percent
>225,000
150,001-225,000
100,001-150,000
75,001-100,000
50,001-75,000
25,001-50,000
0-25,000
Source: GNH Survey 2010
Experience of calmness by household income
Never RarelySometimes Often
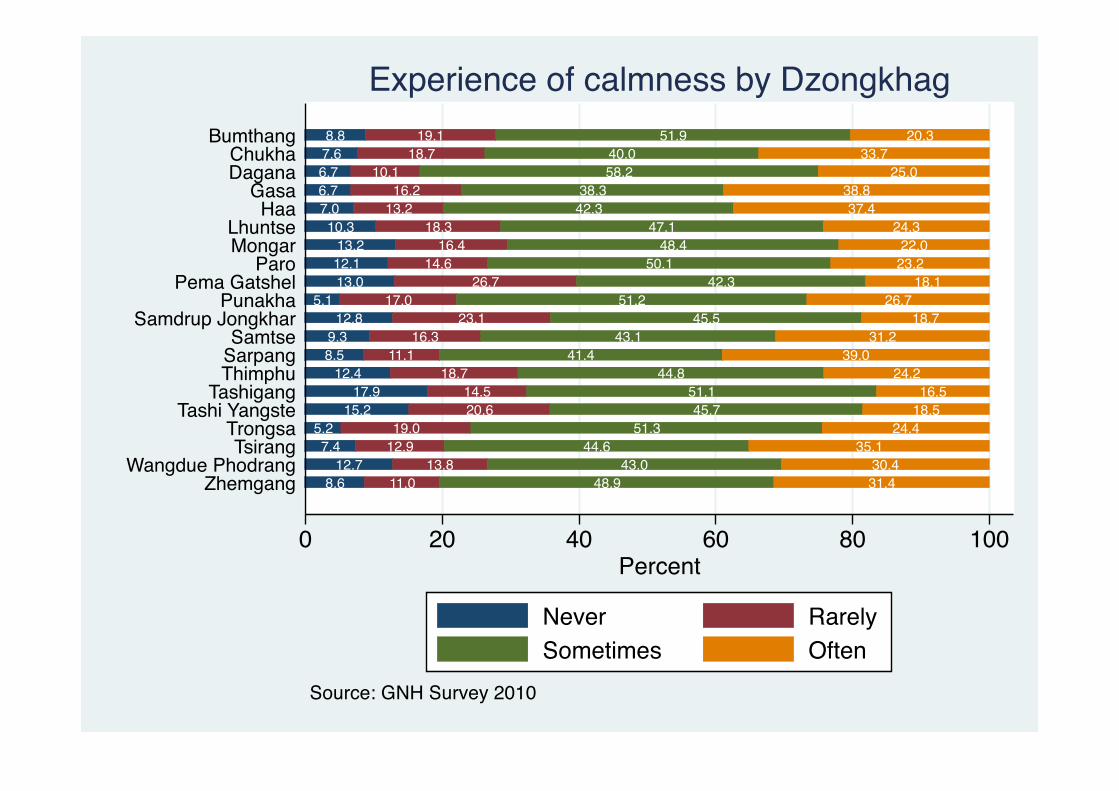
8.6 11.0 48.9 31.412.7 13.8 43.0 30.4
7.4 12.9 44.6 35.15.2 19.0 51.3 24.4
15.2 20.6 45.7 18.517.9 14.5 51.1 16.5
12.4 18.7 44.8 24.28.5 11.1 41.4 39.09.3 16.3 43.1 31.2
12.8 23.1 45.5 18.75.1 17.0 51.2 26.7
13.0 26.7 42.3 18.112.1 14.6 50.1 23.213.2 16.4 48.4 22.0
10.3 18.3 47.1 24.37.0 13.2 42.3 37.46.7 16.2 38.3 38.86.7 10.1 58.2 25.07.6 18.7 40.0 33.78.8 19.1 51.9 20.3
0 20 40 60 80 100Percent
ZhemgangWangdue Phodrang
TsirangTrongsa
Tashi YangsteTashigang
ThimphuSarpangSamtse
Samdrup JongkharPunakha
Pema GatshelParo
MongarLhuntse
HaaGasa
DaganaChukha
Bumthang
Source: GNH Survey 2010
Experience of calmness by Dzongkhag
Never RarelySometimes Often

16.3%
19.1%
43.3%
21.3%
Never RarelySometimes Often
Source: GNH Survey 2010
Experience of contentment

16.9 19.9 44.1 19.2
15.7 18.4 42.4 23.4
0 20 40 60 80 100Percent
Female
Male
Source: GNH Survey 2010
Experience of contentment by sex
Never RarelySometimes Often

17.9 18.6 42.6 20.9
15.7 19.3 43.5 21.5
0 20 40 60 80 100Percent
2 Urban
1 Rural
Source: GNH Survey 2010
Experience of contentment by area
Never RarelySometimes Often

15.2 17.3 42.6 24.9
13.6 18.6 47.6 20.2
22.9 17.3 37.8 22.0
15.9 19.4 43.3 21.4
18.6 18.1 44.7 18.6
0 20 40 60 80 100Percent
Widowed
Separated
Divorced
Married
Never married
Source: GNH Survey 2010
Experience of contentment by marital status
Never RarelySometimes Often
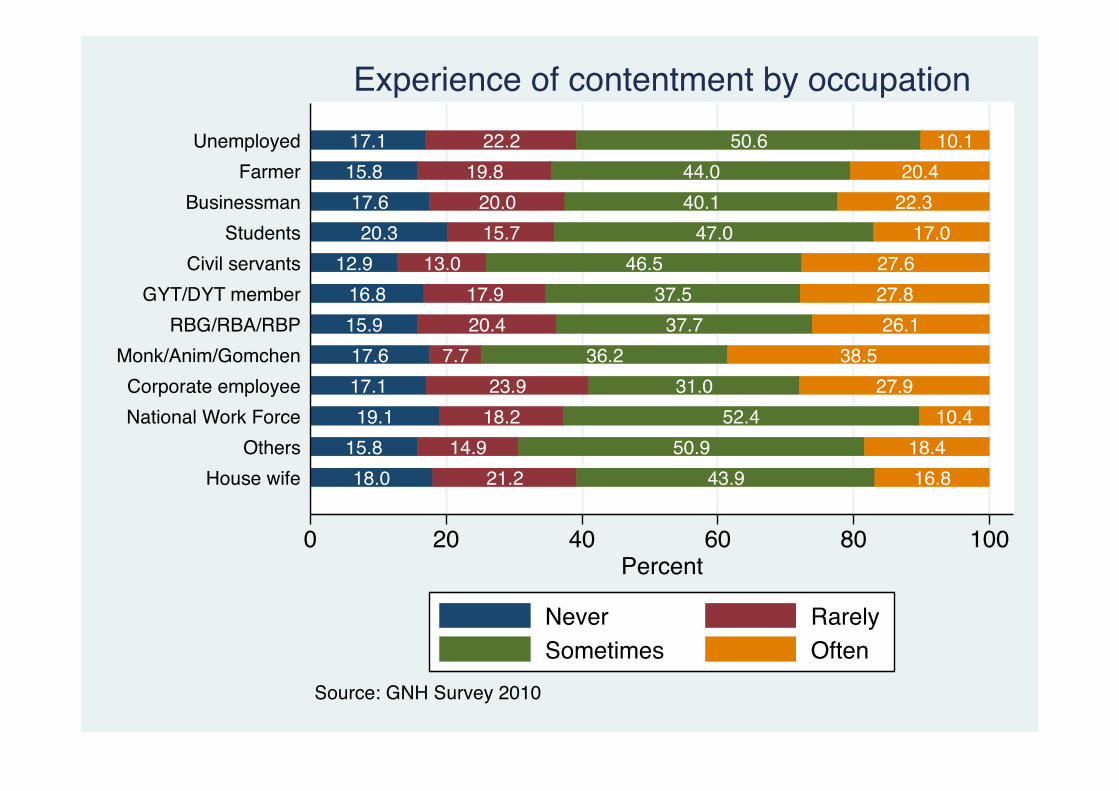
18.0 21.2 43.9 16.815.8 14.9 50.9 18.4
19.1 18.2 52.4 10.417.1 23.9 31.0 27.917.6 7.7 36.2 38.5
15.9 20.4 37.7 26.116.8 17.9 37.5 27.8
12.9 13.0 46.5 27.620.3 15.7 47.0 17.0
17.6 20.0 40.1 22.315.8 19.8 44.0 20.417.1 22.2 50.6 10.1
0 20 40 60 80 100Percent
House wifeOthers
National Work ForceCorporate employee
Monk/Anim/GomchenRBG/RBA/RBP
GYT/DYT memberCivil servants
StudentsBusinessman
FarmerUnemployed
Source: GNH Survey 2010
Experience of contentment by occupation
Never RarelySometimes Often
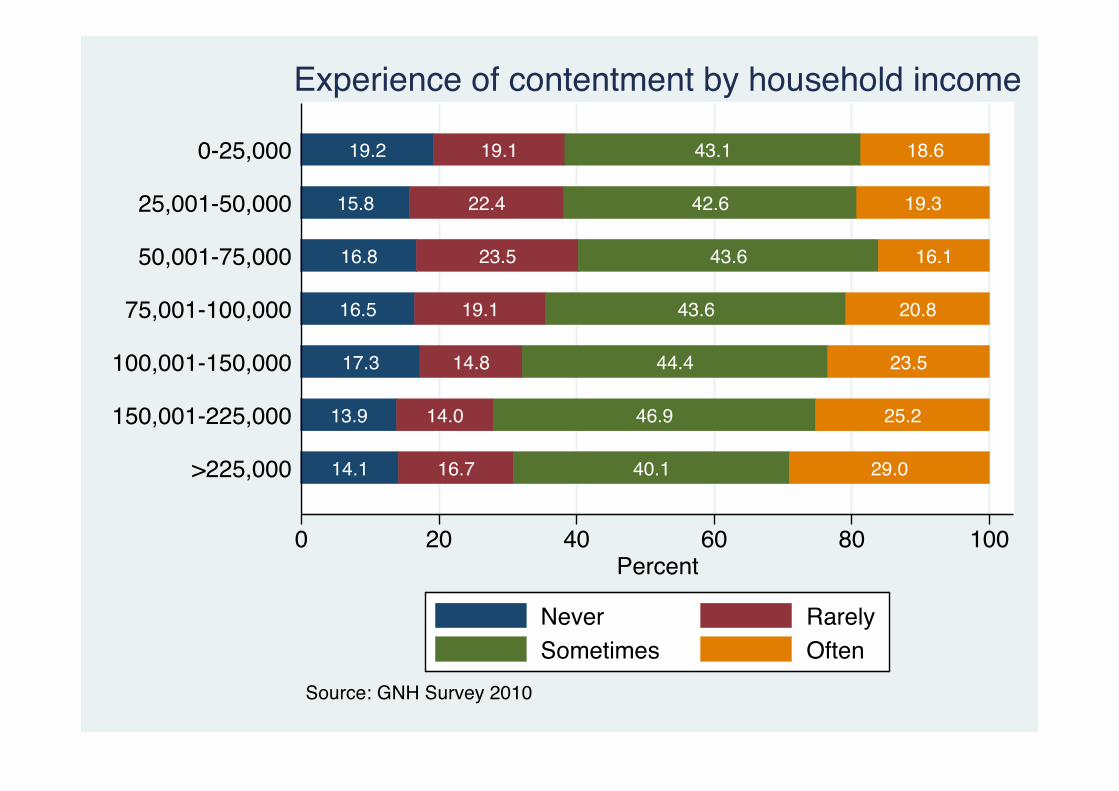
14.1 16.7 40.1 29.0
13.9 14.0 46.9 25.2
17.3 14.8 44.4 23.5
16.5 19.1 43.6 20.8
16.8 23.5 43.6 16.1
15.8 22.4 42.6 19.3
19.2 19.1 43.1 18.6
0 20 40 60 80 100Percent
>225,000
150,001-225,000
100,001-150,000
75,001-100,000
50,001-75,000
25,001-50,000
0-25,000
Source: GNH Survey 2010
Experience of contentment by household income
Never RarelySometimes Often

13.4 15.4 44.4 26.716.7 12.9 43.2 27.2
10.6 13.7 50.2 25.514.2 13.1 52.7 20.0
6.7 15.7 54.1 23.56.7 18.4 52.7 22.2
19.1 18.5 47.2 15.29.3 20.6 49.2 20.9
16.9 28.3 33.9 20.918.9 23.3 45.6 12.2
8.7 14.8 45.0 31.421.5 26.0 41.4 11.1
18.4 16.6 44.8 20.237.7 15.3 33.3 13.6
30.5 18.6 35.0 15.914.1 12.4 41.5 32.0
8.5 16.6 40.8 34.11.9 7.1 59.9 31.2
17.0 24.2 31.2 27.612.6 15.2 49.2 23.1
0 20 40 60 80 100Percent
ZhemgangWangdue Phodrang
TsirangTrongsa
Tashi YangsteTashigang
ThimphuSarpangSamtse
Samdrup JongkharPunakha
Pema GatshelParo
MongarLhuntse
HaaGasa
DaganaChukha
Bumthang
Source: GNH Survey 2010
Experience of contentment by Dzongkhag
Never RarelySometimes Often

6.39%
12.46%
49.54%
31.60%
Never RarelySometimes Often
Source: GNH Survey 2010
Experience of generosity
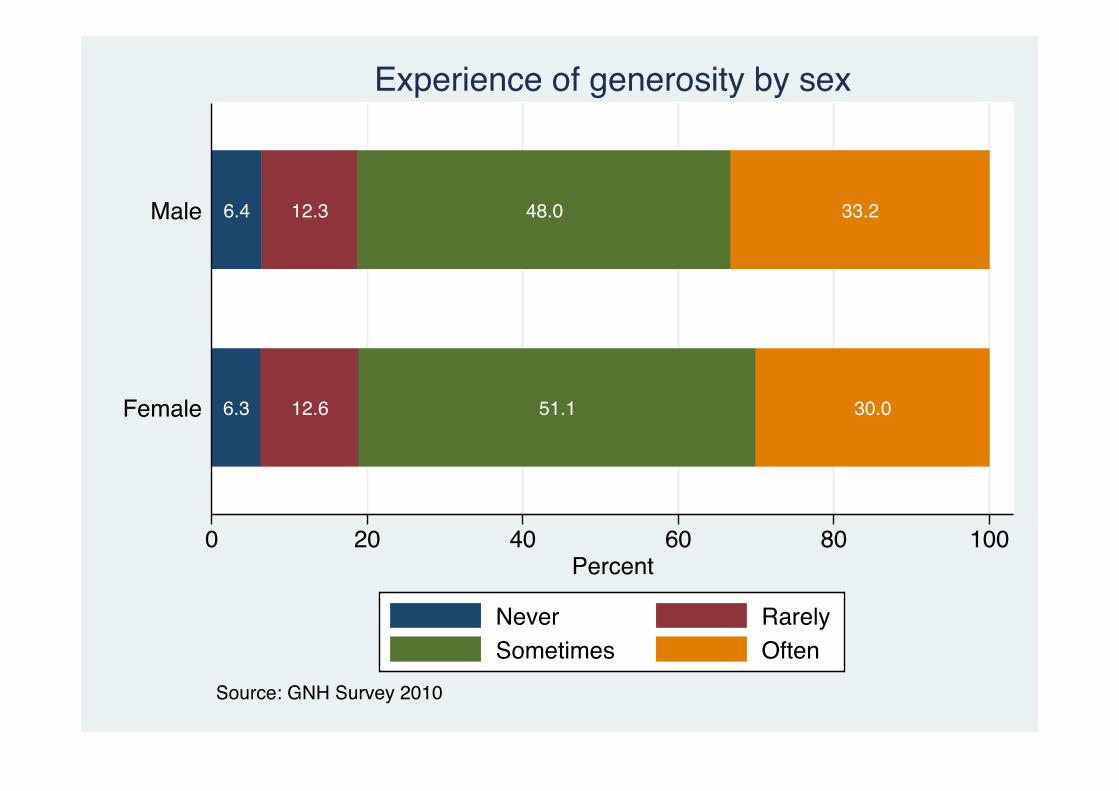
6.3 12.6 51.1 30.0
6.4 12.3 48.0 33.2
0 20 40 60 80 100Percent
Female
Male
Source: GNH Survey 2010
Experience of generosity by sex
Never RarelySometimes Often
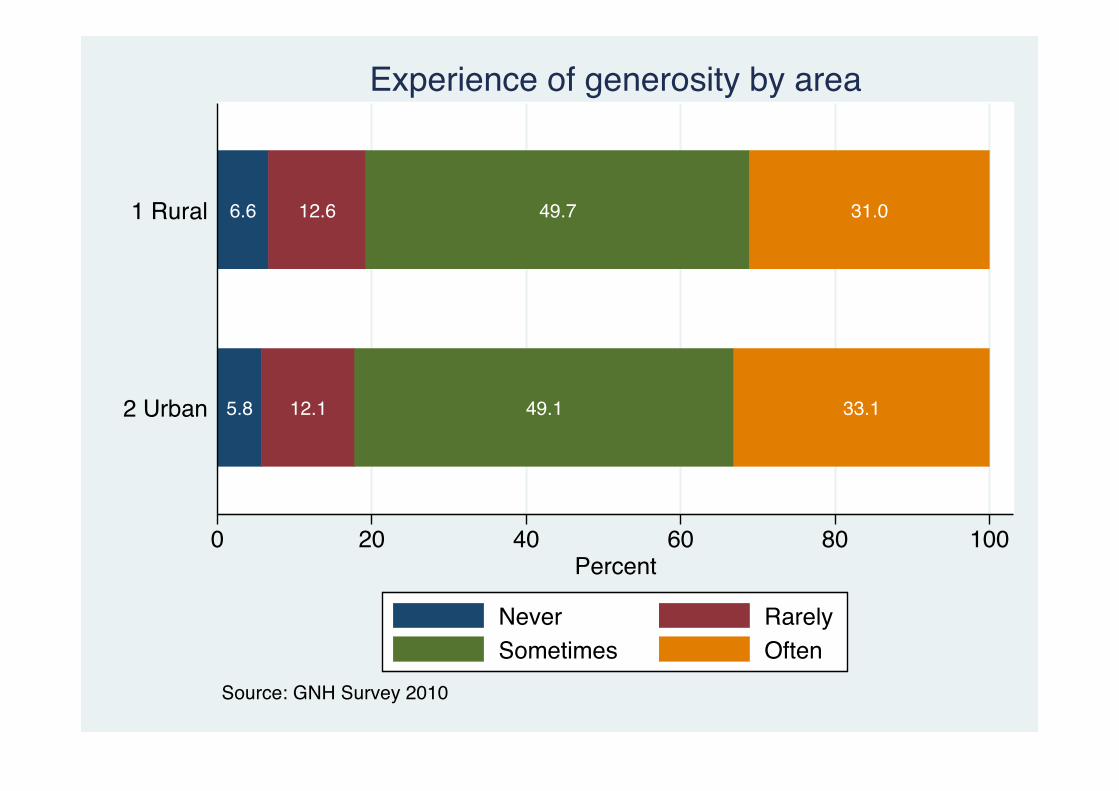
5.8 12.1 49.1 33.1
6.6 12.6 49.7 31.0
0 20 40 60 80 100Percent
2 Urban
1 Rural
Source: GNH Survey 2010
Experience of generosity by area
Never RarelySometimes Often
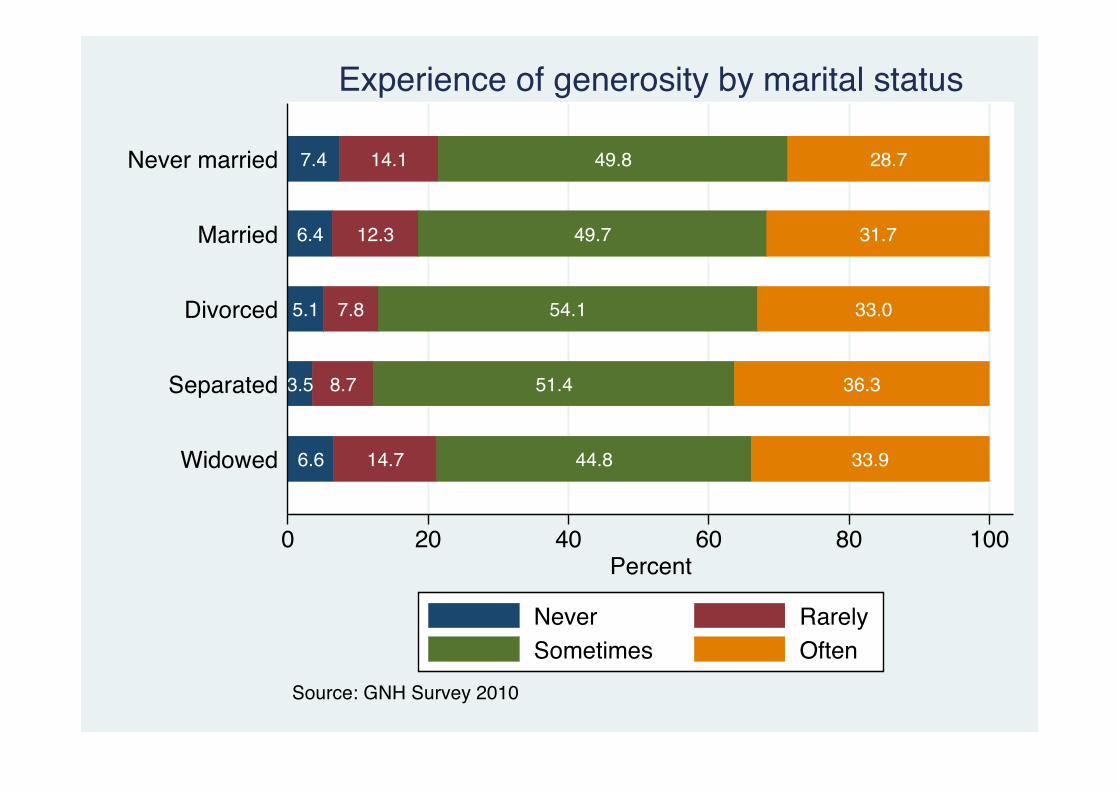
6.6 14.7 44.8 33.9
3.5 8.7 51.4 36.3
5.1 7.8 54.1 33.0
6.4 12.3 49.7 31.7
7.4 14.1 49.8 28.7
0 20 40 60 80 100Percent
Widowed
Separated
Divorced
Married
Never married
Source: GNH Survey 2010
Experience of generosity by marital status
Never RarelySometimes Often
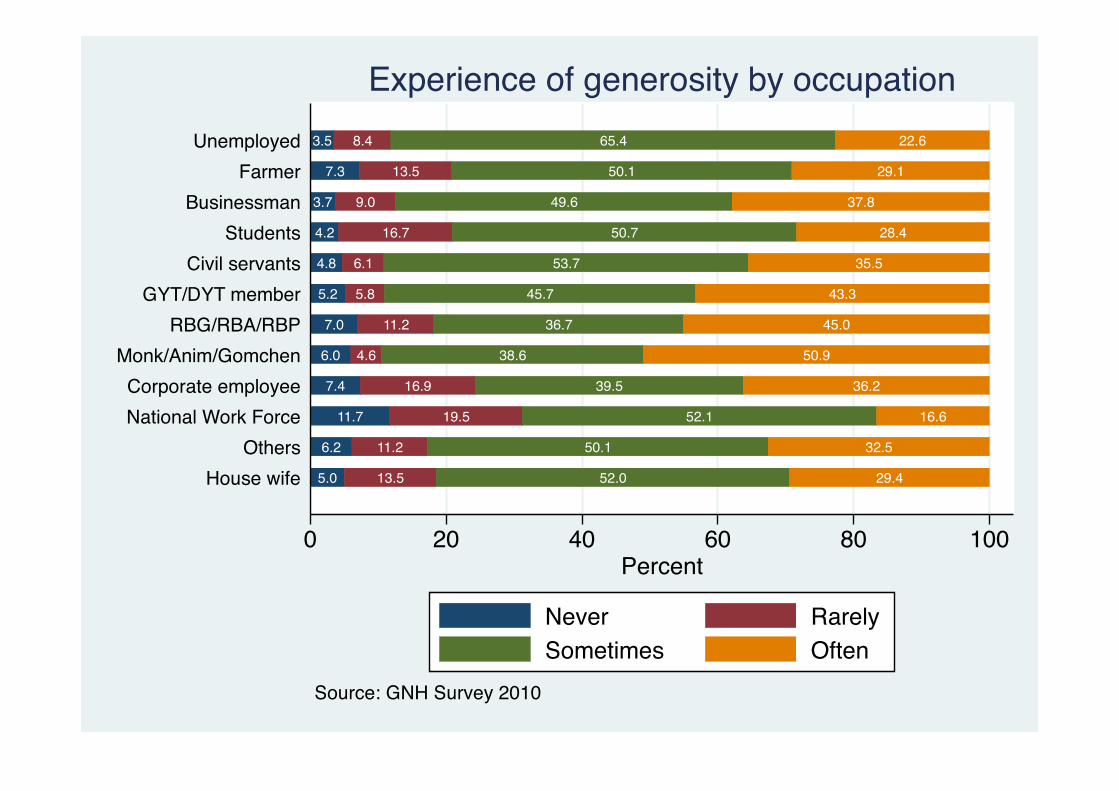
5.0 13.5 52.0 29.4
6.2 11.2 50.1 32.5
11.7 19.5 52.1 16.6
7.4 16.9 39.5 36.2
6.0 4.6 38.6 50.9
7.0 11.2 36.7 45.0
5.2 5.8 45.7 43.3
4.8 6.1 53.7 35.5
4.2 16.7 50.7 28.4
3.7 9.0 49.6 37.8
7.3 13.5 50.1 29.1
3.5 8.4 65.4 22.6
0 20 40 60 80 100Percent
House wifeOthers
National Work ForceCorporate employee
Monk/Anim/GomchenRBG/RBA/RBP
GYT/DYT memberCivil servants
StudentsBusinessman
FarmerUnemployed
Source: GNH Survey 2010
Experience of generosity by occupation
Never RarelySometimes Often

3.7 8.8 45.5 41.9
4.8 8.6 49.7 36.8
4.3 10.0 50.7 35.0
6.5 13.8 51.1 28.6
7.0 14.7 51.5 26.8
6.5 14.3 49.5 29.7
9.6 14.2 48.7 27.5
0 20 40 60 80 100Percent
>225,000
150,001-225,000
100,001-150,000
75,001-100,000
50,001-75,000
25,001-50,000
0-25,000
Source: GNH Survey 2010
Experience of generosity by household income
Never RarelySometimes Often
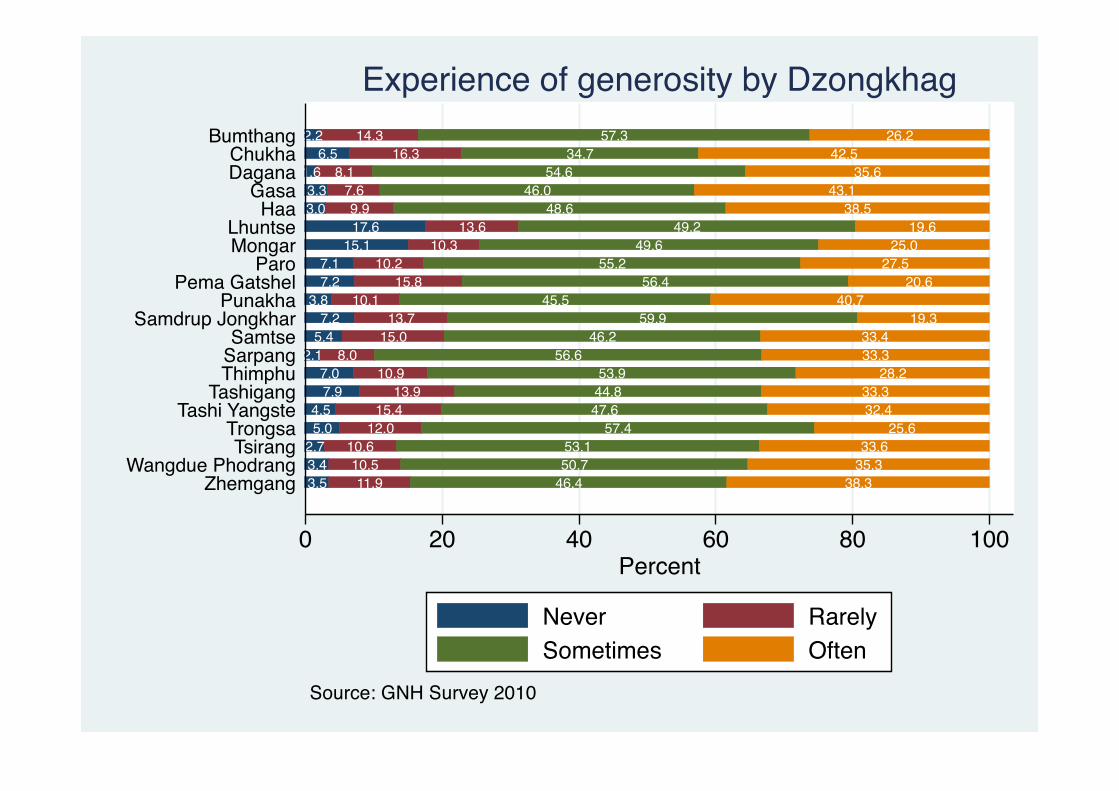
3.5 11.9 46.4 38.33.4 10.5 50.7 35.32.7 10.6 53.1 33.65.0 12.0 57.4 25.64.5 15.4 47.6 32.4
7.9 13.9 44.8 33.37.0 10.9 53.9 28.2
2.1 8.0 56.6 33.35.4 15.0 46.2 33.47.2 13.7 59.9 19.3
3.8 10.1 45.5 40.77.2 15.8 56.4 20.67.1 10.2 55.2 27.5
15.1 10.3 49.6 25.017.6 13.6 49.2 19.6
3.0 9.9 48.6 38.53.3 7.6 46.0 43.1
1.6 8.1 54.6 35.66.5 16.3 34.7 42.5
2.2 14.3 57.3 26.2
0 20 40 60 80 100Percent
ZhemgangWangdue Phodrang
TsirangTrongsa
Tashi YangsteTashigang
ThimphuSarpangSamtse
Samdrup JongkharPunakha
Pema GatshelParo
MongarLhuntse
HaaGasa
DaganaChukha
Bumthang
Source: GNH Survey 2010
Experience of generosity by Dzongkhag
Never RarelySometimes Often

Health

1.4%6.6%
18.4%
53.4%
20.3%
Poor FairGood Very goodExcellent
Source: GNH Survey 2010
Self-rated health status

1.9 7.7 20.0 54.1 16.3
0.95.4 16.8 52.6 24.3
0 20 40 60 80 100Percent
Female
Male
Source: GNH Survey 2010
Self-rated health status by sex
Poor FairGood Very goodExcellent

0.84.0 14.1 57.3 23.8
1.67.5 20.0 51.9 19.0
0 20 40 60 80 100Percent
2 Urban
1 Rural
Source: GNH Survey 2010
Self-rated health status by area
Poor FairGood Very goodExcellent

4.9 15.1 33.9 39.9 6.2
3.8 12.2 22.4 48.6 13.0
2.3 12.6 21.5 50.7 12.9
2.2 9.4 22.7 52.2 13.5
1.8 6.0 21.8 51.3 19.1
0.5 6.6 14.8 56.0 22.1
0.6 7.4 16.0 53.1 22.9
0.6 4.8 13.6 55.3 25.6
0.82.1 17.0 55.4 24.8
0.23.0 13.7 61.3 21.9
0.82.6 15.7 53.6 27.4
0 20 40 60 80 100Percent
>6561-6556-6051-5546-5041-4536-4031-3526-3021-25<=20
Source: GNH Survey 2010
Self-rated health status by age
Poor FairGood Very goodExcellent

2.0 4.6 16.8 59.1 17.6
0.1 7.8 11.1 54.5 26.5
1.70.9 9.2 71.4 16.9
0.62.7 18.6 51.3 26.8
0.7 8.3 19.4 44.8 26.8
1.51.3 12.2 40.3 44.8
7.6 14.8 44.2 33.4
2.2 13.5 61.3 23.0
0.22.3 12.8 59.8 24.9
0.44.2 16.4 55.2 23.8
1.9 8.6 20.8 51.8 17.0
7.1 17.0 58.1 17.8
0 20 40 60 80 100Percent
House wifeOthers
National Work ForceCorporate employee
Monk/Anim/GomchenRBG/RBA/RBP
GYT/DYT memberCivil servants
StudentsBusinessman
FarmerUnemployed
Source: GNH Survey 2010
Self-rated health status by occupation
Poor FairGood Very goodExcellent
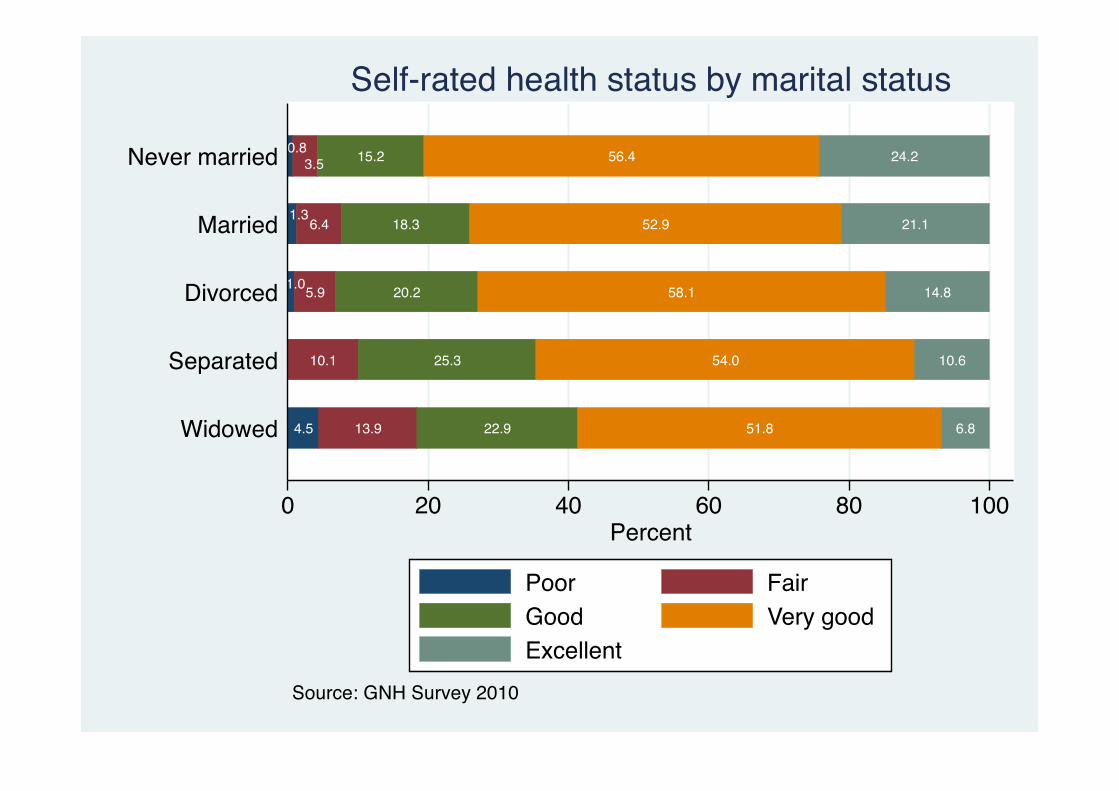
4.5 13.9 22.9 51.8 6.8
10.1 25.3 54.0 10.6
1.05.9 20.2 58.1 14.8
1.36.4 18.3 52.9 21.1
0.83.5 15.2 56.4 24.2
0 20 40 60 80 100Percent
Widowed
Separated
Divorced
Married
Never married
Source: GNH Survey 2010
Self-rated health status by marital status
Poor FairGood Very goodExcellent

0.33.8 14.8 57.9 23.2
1.14.0 15.2 56.6 23.1
0.55.6 15.7 57.8 20.5
1.54.1 14.7 55.6 24.1
1.2 5.8 18.7 51.3 23.0
1.2 7.7 22.0 52.1 17.0
3.0 10.8 22.7 47.9 15.7
0 20 40 60 80 100Percent
>225,000
150,001-225,000
100,001-150,000
75,001-100,000
50,001-75,000
25,001-50,000
0-25,000
Source: GNH Survey 2010
Self-rated health status by household income
Poor FairGood Very goodExcellent
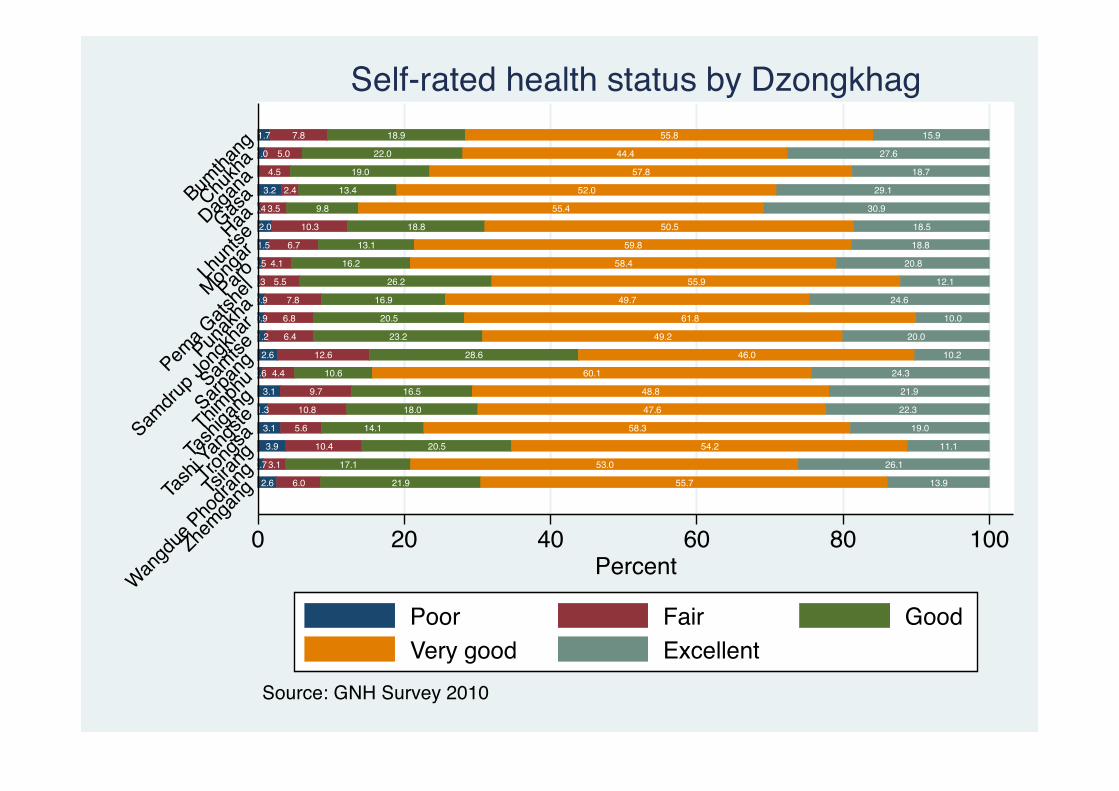
2.6 6.0 21.9 55.7 13.9
0.73.1 17.1 53.0 26.1
3.9 10.4 20.5 54.2 11.1
3.1 5.6 14.1 58.3 19.0
1.3 10.8 18.0 47.6 22.3
3.1 9.7 16.5 48.8 21.9
0.6 4.4 10.6 60.1 24.3
2.6 12.6 28.6 46.0 10.2
1.2 6.4 23.2 49.2 20.0
0.9 6.8 20.5 61.8 10.0
0.9 7.8 16.9 49.7 24.6
0.3 5.5 26.2 55.9 12.1
0.5 4.1 16.2 58.4 20.8
1.5 6.7 13.1 59.8 18.8
2.0 10.3 18.8 50.5 18.5
0.4 3.5 9.8 55.4 30.9
3.2 2.4 13.4 52.0 29.1
4.5 19.0 57.8 18.7
1.0 5.0 22.0 44.4 27.6
1.7 7.8 18.9 55.8 15.9
0 20 40 60 80 100Percent
Zhemga
ng
Wangd
ue Pho
drangTsi
rang
Trong
sa
Tash
i Yan
gste
Tash
igang
Thimph
uSarp
ang
Samtse
Samdru
p Jon
gkha
rPun
akha
Pema G
atshe
lParoMonga
rLh
untseHaaGasa
Dagan
aChu
kha
Bumtha
ng
Source: GNH Survey 2010
Self-rated health status by Dzongkhag
Poor Fair GoodVery good Excellent

26.325.0
28.127.0
010
2030
Hea
lthy
days
(0-3
0)
1 Rural 2 UrbanMale Female Male Female
Source: GNH Survey 2010
Mean healthy days by sex and area

22.7
23.4
25.1
24.7
26.3
26.3
26.8
26.6
27.5
27.1
27.6
0 10 20 30Healthy days (0-30)
>6561-6556-6051-5546-5041-4536-4031-3526-3021-25<=20
Source: GNH Survey 2010
Mean healthy days by age

24.9
25.4
26.5
26.5
26.6
27.1
27.2
27.7
27.7
27.9
28.0
28.1
0 10 20 30Healthy days (0-30)
Monk/Anim/GomchenFarmer
GYT/DYT memberHouse wife
National Work ForceBusinessman
StudentsCivil servants
RBG/RBA/RBPCorporate employee
UnemployedOthers
Source: GNH Survey 2010
Mean healthy days by occupation

22.4
23.3
26.1
26.4
27.2
0 10 20 30Healthy days (0-30)
Widowed
Separated
Divorced
Married
Never married
Source: GNH Survey 2010
Mean healthy days by marital status
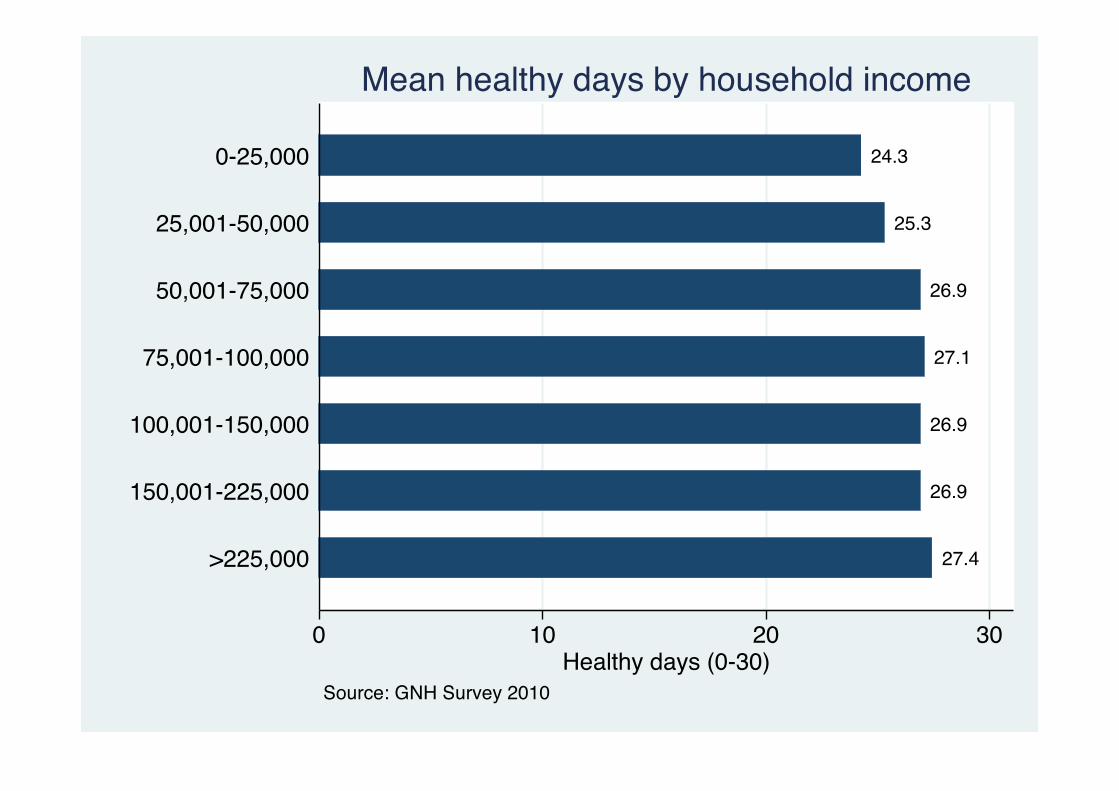
27.4
26.9
26.9
27.1
26.9
25.3
24.3
0 10 20 30Healthy days (0-30)
>225,000
150,001-225,000
100,001-150,000
75,001-100,000
50,001-75,000
25,001-50,000
0-25,000
Source: GNH Survey 2010
Mean healthy days by household income

23.424.224.2
24.824.8
25.325.425.826.026.326.326.526.726.826.927.127.327.527.627.9
0 10 20 30Healthy days (0-30)
Samdrup JongkharLhuntse
Tashi YangsteTrongsa
TashigangBumthang
Pema GatshelMongar
PunakhaWangdue Phodrang
ParoTsirangSamtseChukha
SarpangZhemgang
DaganaGasaHaa
Thimphu
Source: GNH Survey 2010
Mean healthy days by Dzongkhag

12.6%
87.4%
Yes NoSource: GNH Survey 2010
Long-term disability
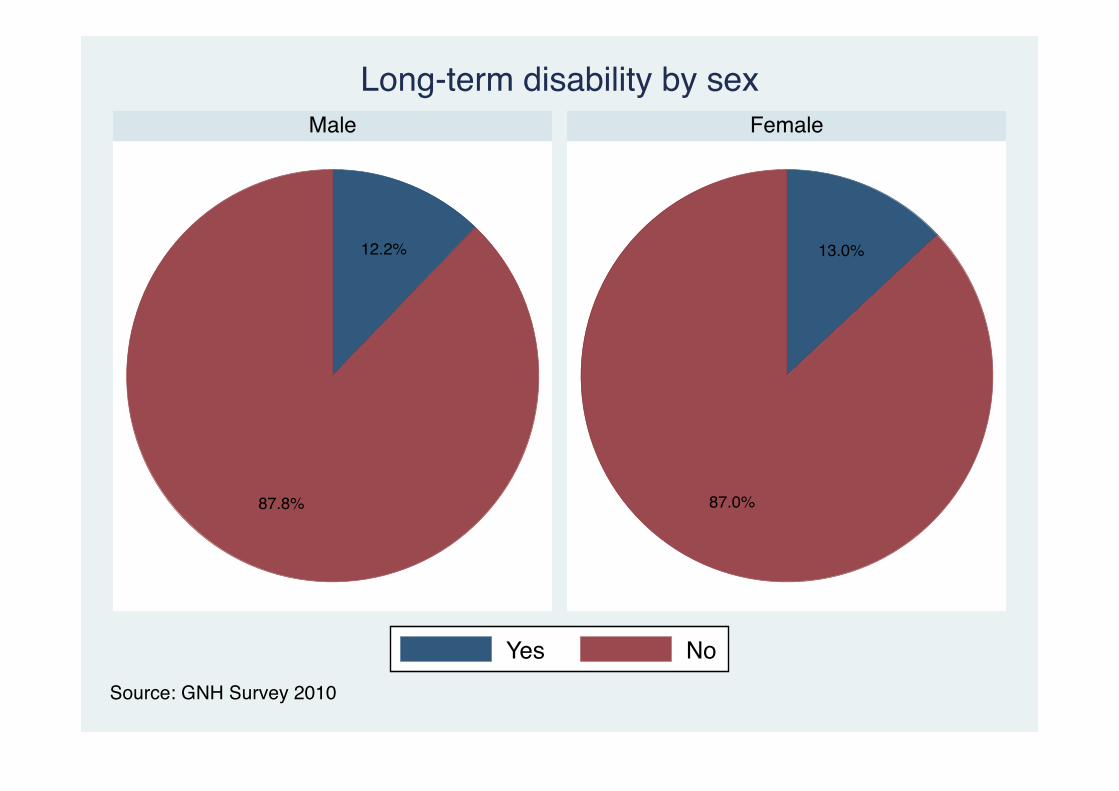
12.2%
87.8%
13.0%
87.0%
Male Female
Yes NoSource: GNH Survey 2010
Long-term disability by sex

14.1%
85.9%
8.8%
91.2%
1 Rural 2 Urban
Yes NoSource: GNH Survey 2010
Long-term disability by stratum
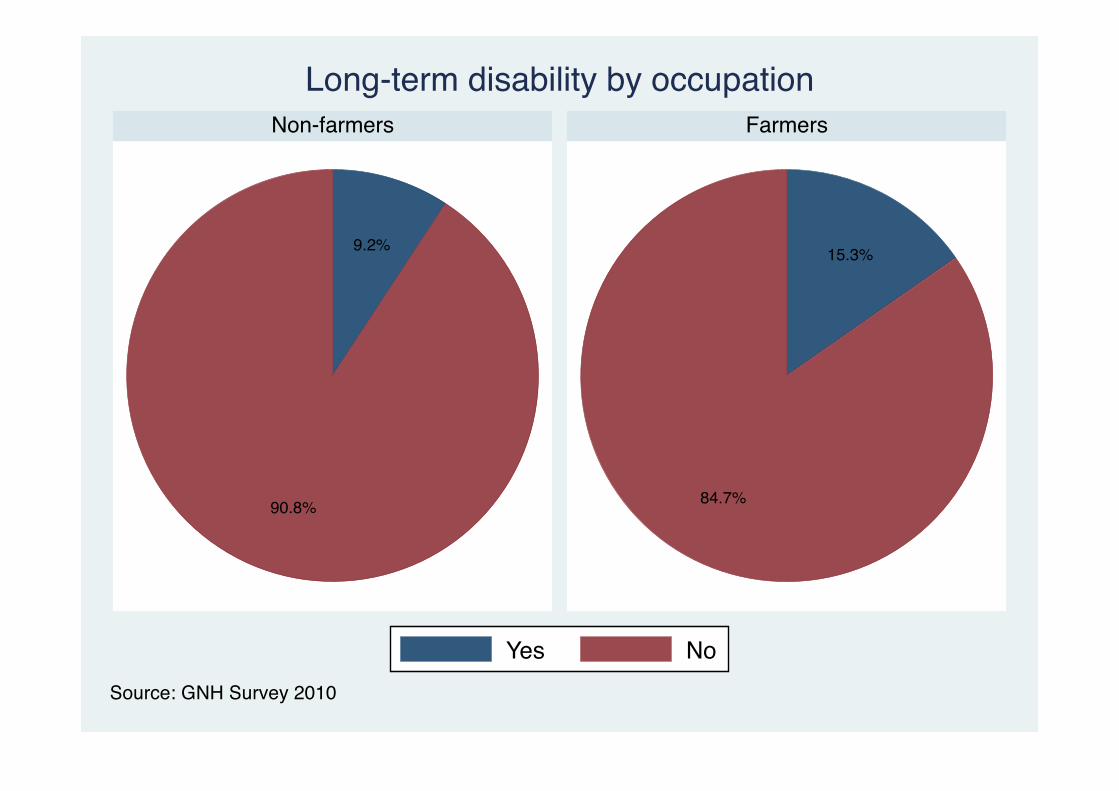
9.2%
90.8%
15.3%
84.7%
Non-farmers Farmers
Yes NoSource: GNH Survey 2010
Long-term disability by occupation
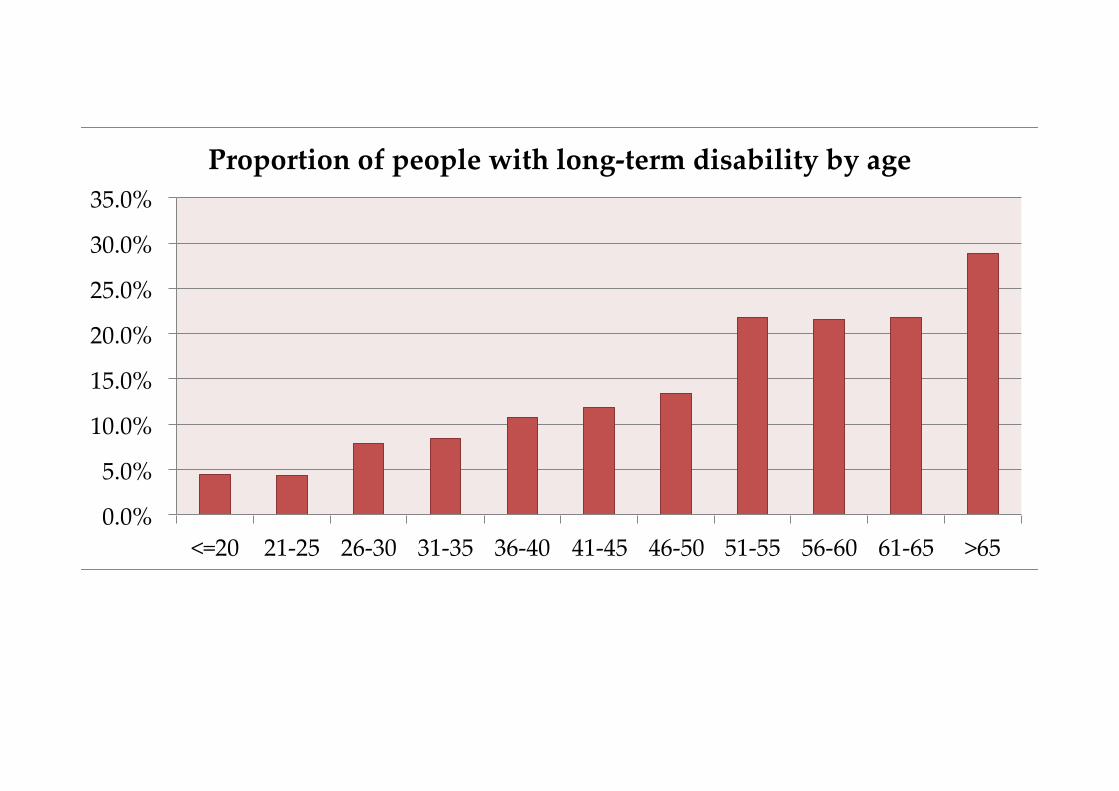
0.0%
5.0%
10.0%
15.0%
20.0%
25.0%
30.0%
35.0%
<=20 21-‐‑25 26-‐‑30 31-‐‑35 36-‐‑40 41-‐‑45 46-‐‑50 51-‐‑55 56-‐‑60 61-‐‑65 >65
Proportion of people with long-‐‑term disability by age

0.0%
5.0%
10.0%
15.0%
20.0%
25.0% Proportion of people with disability by Dzongkhag
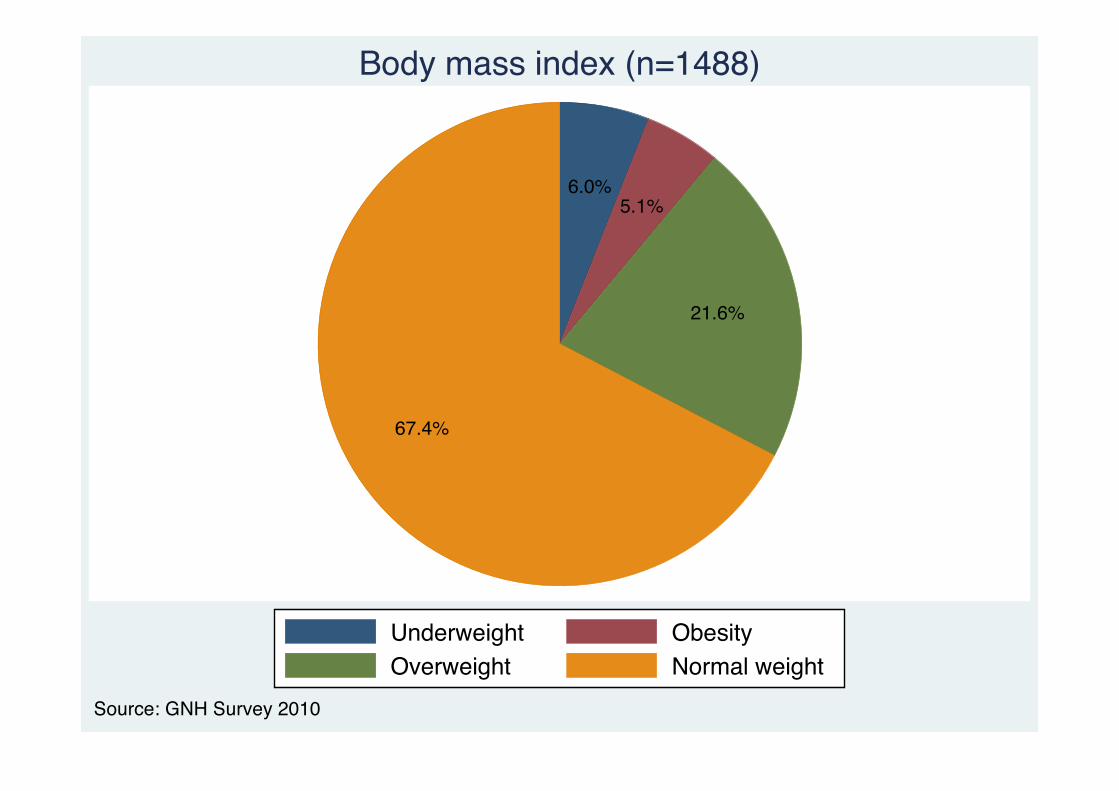
6.0%5.1%
21.6%
67.4%
Underweight ObesityOverweight Normal weight
Source: GNH Survey 2010
Body mass index (n=1488)
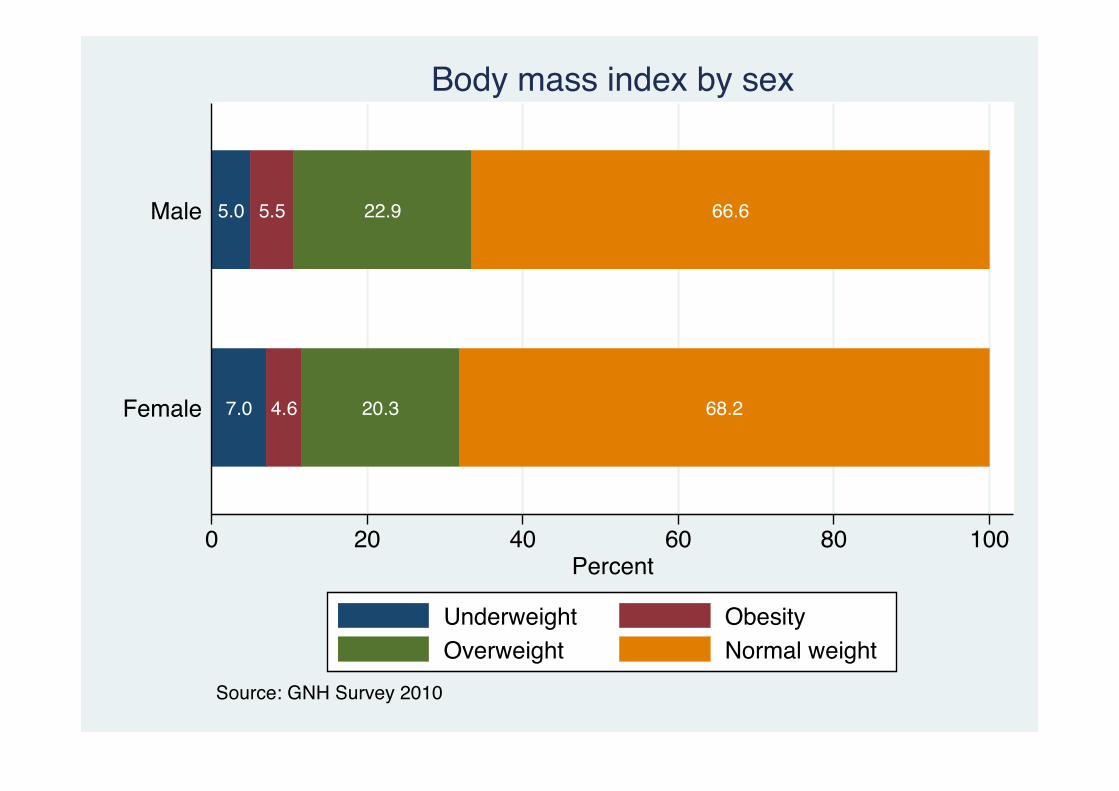
7.0 4.6 20.3 68.2
5.0 5.5 22.9 66.6
0 20 40 60 80 100Percent
Female
Male
Source: GNH Survey 2010
Body mass index by sex
Underweight ObesityOverweight Normal weight
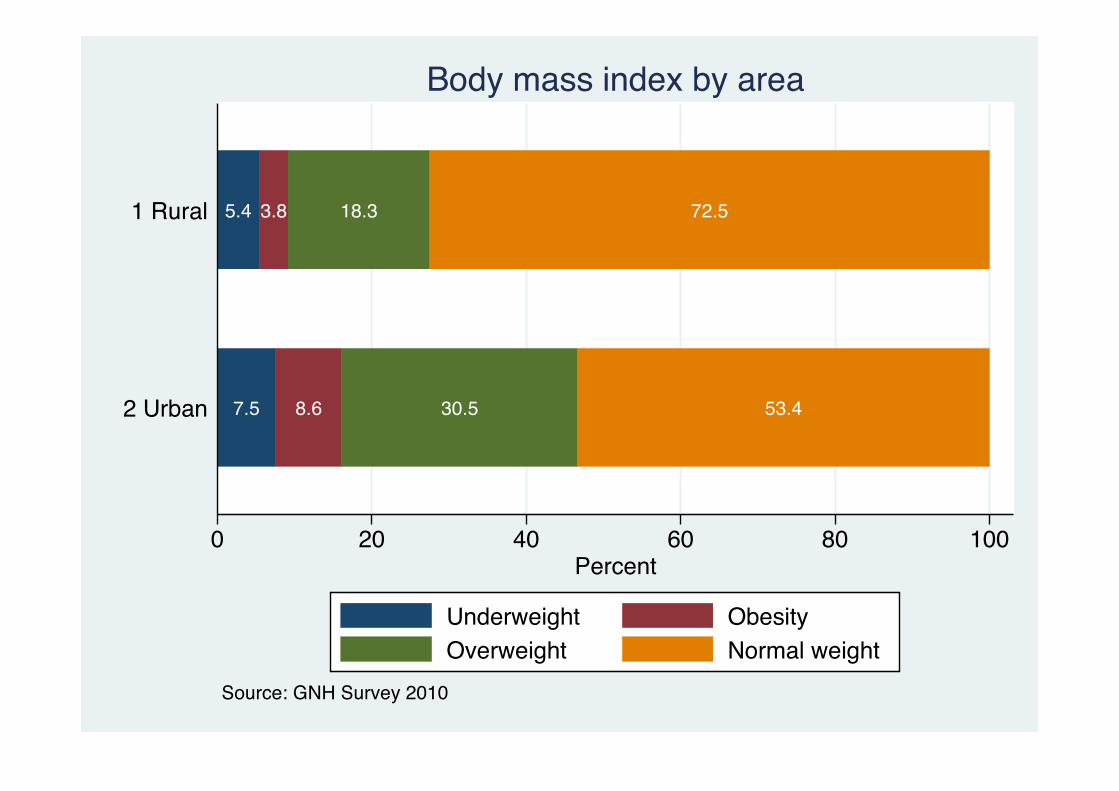
7.5 8.6 30.5 53.4
5.4 3.8 18.3 72.5
0 20 40 60 80 100Percent
2 Urban
1 Rural
Source: GNH Survey 2010
Body mass index by area
Underweight ObesityOverweight Normal weight

5.3 4.0 15.6 75.1
5.7 0.9 21.5 71.9
12.9 6.8 16.8 63.5
4.5 5.3 25.8 64.4
3.9 4.2 26.3 65.5
2.9 3.7 25.3 68.2
5.9 4.3 21.6 68.3
4.8 7.7 29.8 57.7
1.3 8.9 21.4 68.4
11.5 3.0 14.1 71.4
14.6 11.6 73.8
0 20 40 60 80 100Percent
>6561-6556-6051-5546-5041-4536-4031-3526-3021-25<=20
Source: GNH Survey 2010
Body mass index by age
Underweight ObesityOverweight Normal weight

8.0 7.0 17.0 68.11.63.9 13.8 80.6
7.4 2.9 12.9 76.83.4 6.6 21.2 68.85.5 1.5 14.9 78.1
11.1 23.9 65.08.5 2.9 19.9 68.6
12.8 4.4 33.8 49.03.9 3.9 20.0 72.23.1 4.8 29.4 62.6
10.7 4.5 11.6 73.25.9 6.9 22.1 65.1
11.1 5.1 21.9 61.91.1 12.4 19.8 66.7
4.2 24.9 71.00.63.4 13.7 82.3
6.7 13.8 79.55.5 2.8 16.4 75.3
8.3 6.5 27.2 57.99.4 5.1 26.5 59.0
0 20 40 60 80 100Percent
ZhemgangWangdue Phodrang
TsirangTrongsa
Tashi YangsteTashigang
ThimphuSarpangSamtse
Samdrup JongkharPunakha
Pema GatshelParo
MongarLhuntse
HaaGasa
DaganaChukha
Bumthang
Source: GNH Survey 2010
Body mass index by Dzongkhag
Underweight ObesityOverweight Normal weight

0 10 20 30 40 50 60 70 80 90
Percent
Alcohol consumption in life and in past 12 months by Dzongkhag
Life Current
The area under the green shade represents the proportion who have quiDed the habit
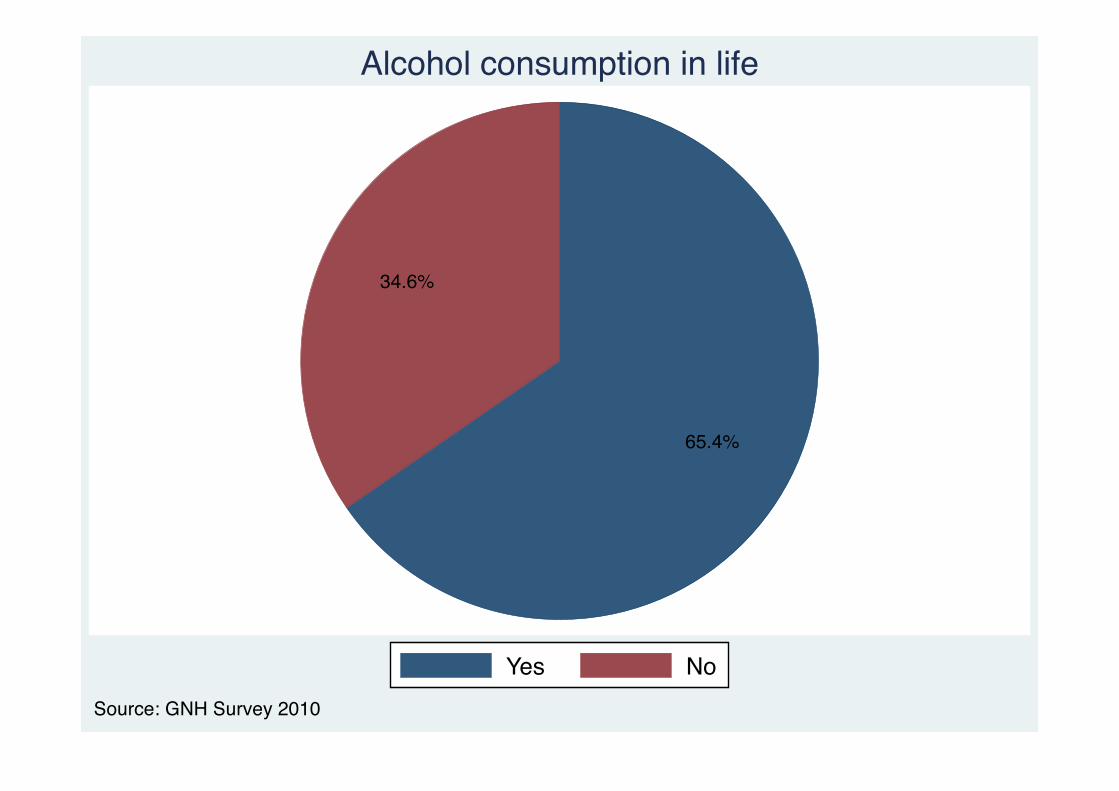
65.4%
34.6%
Yes NoSource: GNH Survey 2010
Alcohol consumption in life
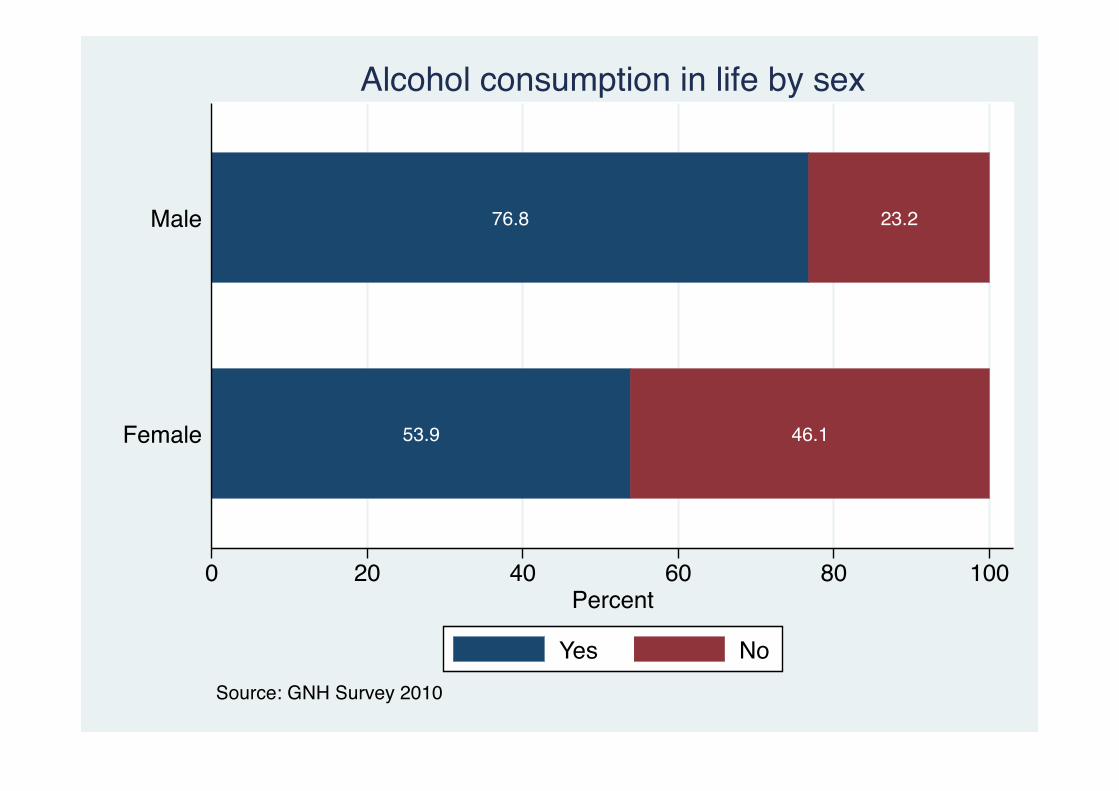
53.9 46.1
76.8 23.2
0 20 40 60 80 100Percent
Female
Male
Source: GNH Survey 2010
Alcohol consumption in life by sex
Yes No
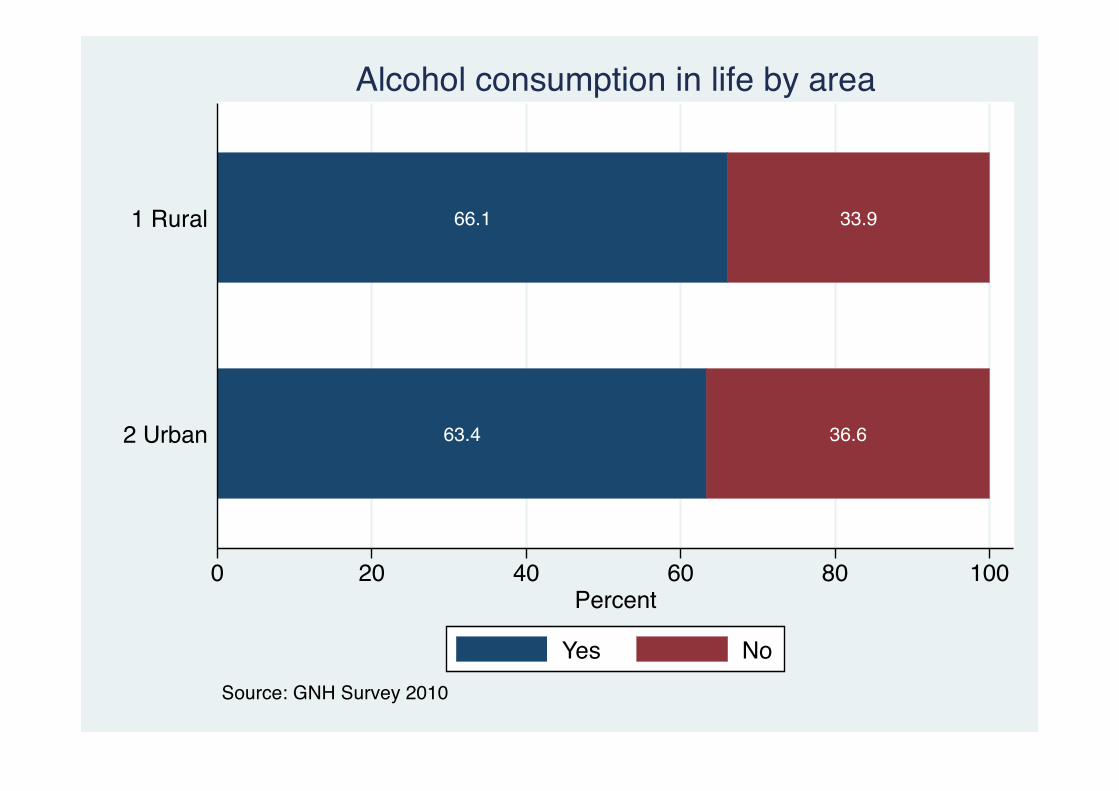
63.4 36.6
66.1 33.9
0 20 40 60 80 100Percent
2 Urban
1 Rural
Source: GNH Survey 2010
Alcohol consumption in life by area
Yes No

70.8 29.2
76.7 23.3
76.3 23.7
70.5 29.5
74.9 25.1
67.1 32.9
68.2 31.8
67.0 33.0
62.2 37.8
52.7 47.3
35.5 64.5
0 20 40 60 80 100Percent
>6561-6556-6051-5546-5041-4536-4031-3526-3021-25<=20
Source: GNH Survey 2010
Alcohol consumption in life by age
Yes No

57.1 42.969.2 30.8
65.5 34.574.6 25.4
70.7 29.378.6 21.477.5 22.5
74.4 25.633.2 66.8
64.0 36.066.3 33.7
49.3 50.7
0 20 40 60 80 100Percent
House wifeOthers
National Work ForceCorporate employee
Monk/Anim/GomchenRBG/RBA/RBP
GYT/DYT memberCivil servants
StudentsBusinessman
FarmerUnemployed
Source: GNH Survey 2010
Alcohol consumption in life by occupation
Yes No

73.6 26.451.9 48.1
73.5 26.555.4 44.6
76.5 23.575.9 24.1
64.5 35.573.9 26.1
65.0 35.069.5 30.5
53.6 46.477.9 22.1
44.5 55.578.6 21.4
73.5 26.545.9 54.1
35.2 64.865.3 34.7
59.0 41.061.2 38.8
0 20 40 60 80 100Percent
ZhemgangWangdue Phodrang
TsirangTrongsa
Tashi YangsteTashigang
ThimphuSarpangSamtse
Samdrup JongkharPunakha
Pema GatshelParo
MongarLhuntse
HaaGasa
DaganaChukha
Bumthang
Source: GNH Survey 2010
Alcohol consumption in life by Dzongkhag
Yes No
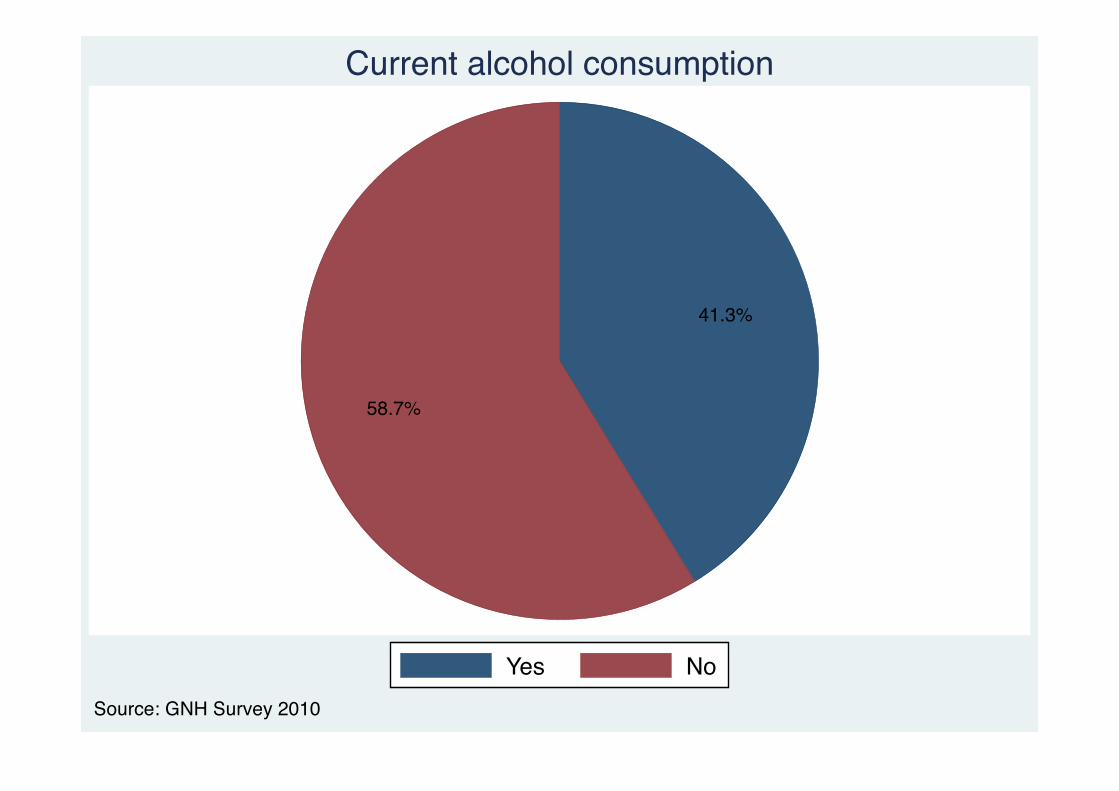
41.3%
58.7%
Yes NoSource: GNH Survey 2010
Current alcohol consumption
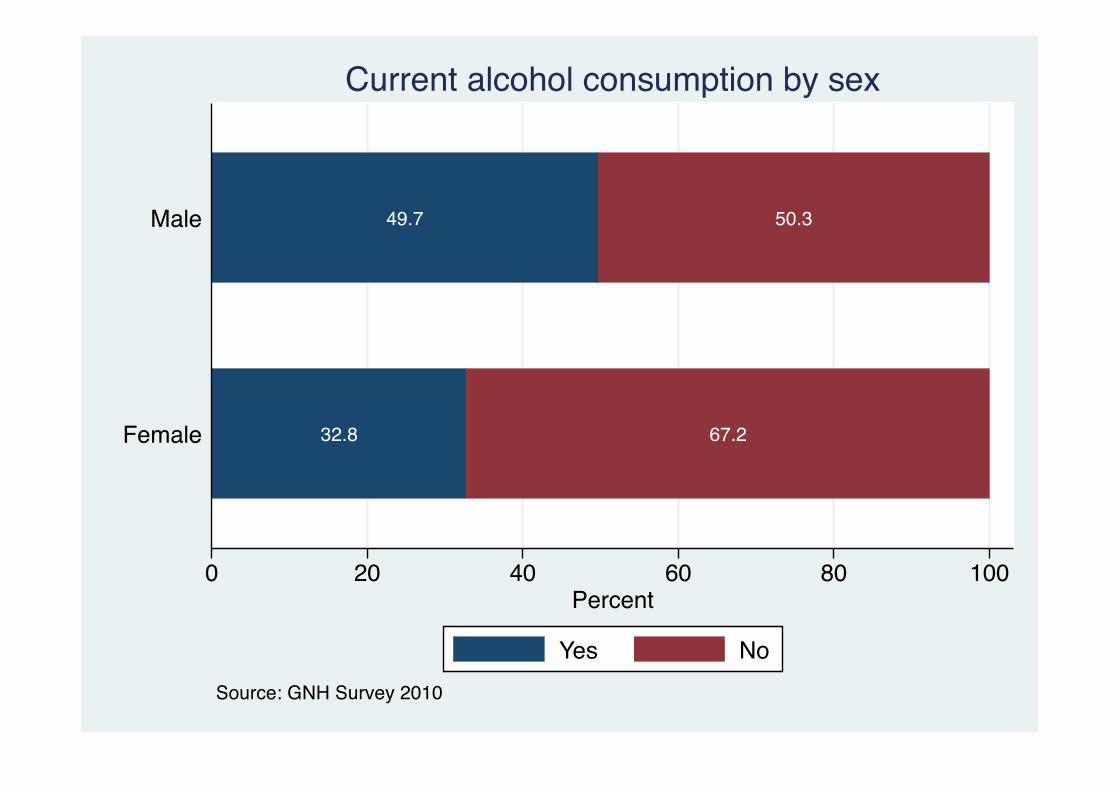
32.8 67.2
49.7 50.3
0 20 40 60 80 100Percent
Female
Male
Source: GNH Survey 2010
Current alcohol consumption by sex
Yes No
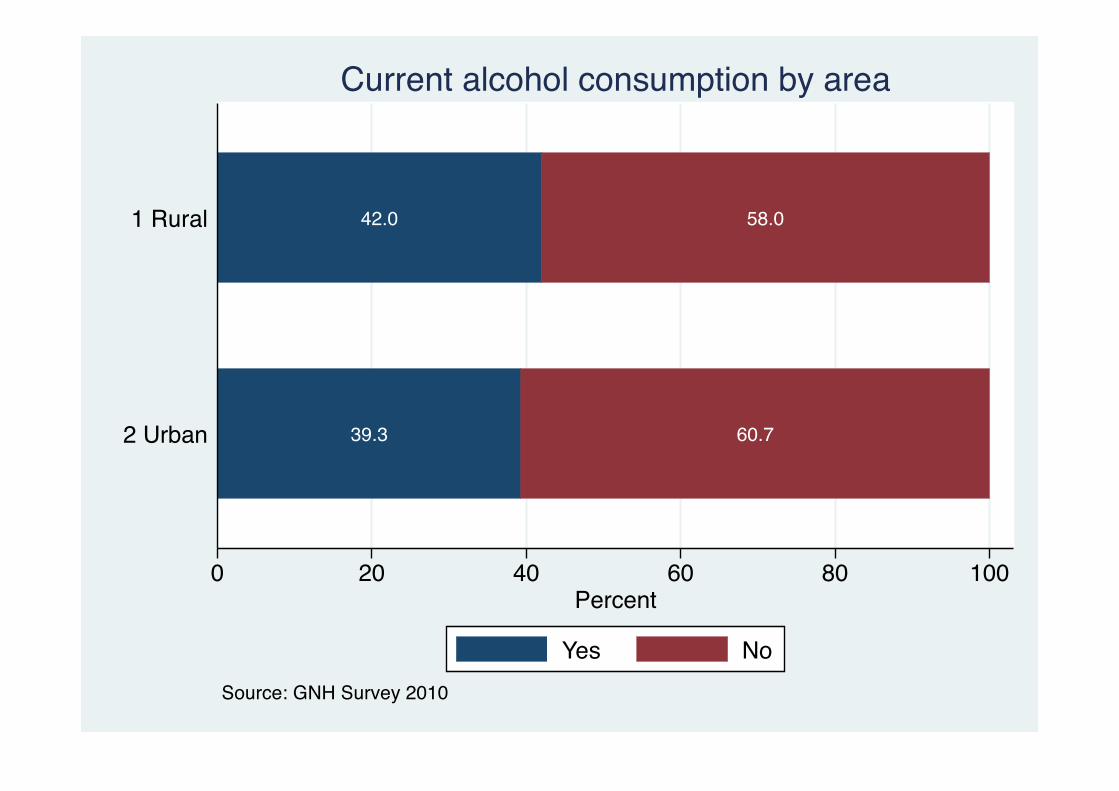
39.3 60.7
42.0 58.0
0 20 40 60 80 100Percent
2 Urban
1 Rural
Source: GNH Survey 2010
Current alcohol consumption by area
Yes No

44.0 56.0
45.3 54.7
42.6 57.4
40.8 59.2
45.7 54.3
40.4 59.6
46.3 53.7
44.2 55.8
42.8 57.2
33.9 66.1
20.6 79.4
0 20 40 60 80 100Percent
>6561-6556-6051-5546-5041-4536-4031-3526-3021-25<=20
Source: GNH Survey 2010
Current alcohol consumption by age
Yes No
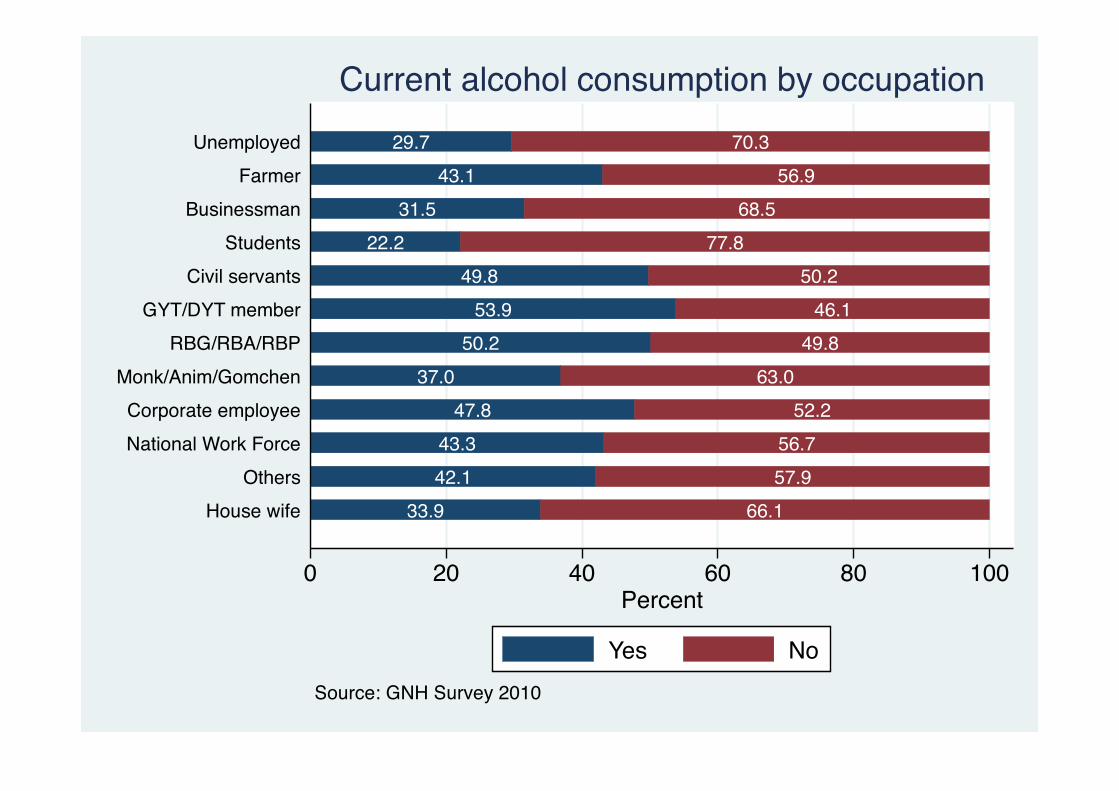
33.9 66.142.1 57.943.3 56.7
47.8 52.237.0 63.0
50.2 49.853.9 46.1
49.8 50.222.2 77.8
31.5 68.543.1 56.9
29.7 70.3
0 20 40 60 80 100Percent
House wifeOthers
National Work ForceCorporate employee
Monk/Anim/GomchenRBG/RBA/RBP
GYT/DYT memberCivil servants
StudentsBusinessman
FarmerUnemployed
Source: GNH Survey 2010
Current alcohol consumption by occupation
Yes No
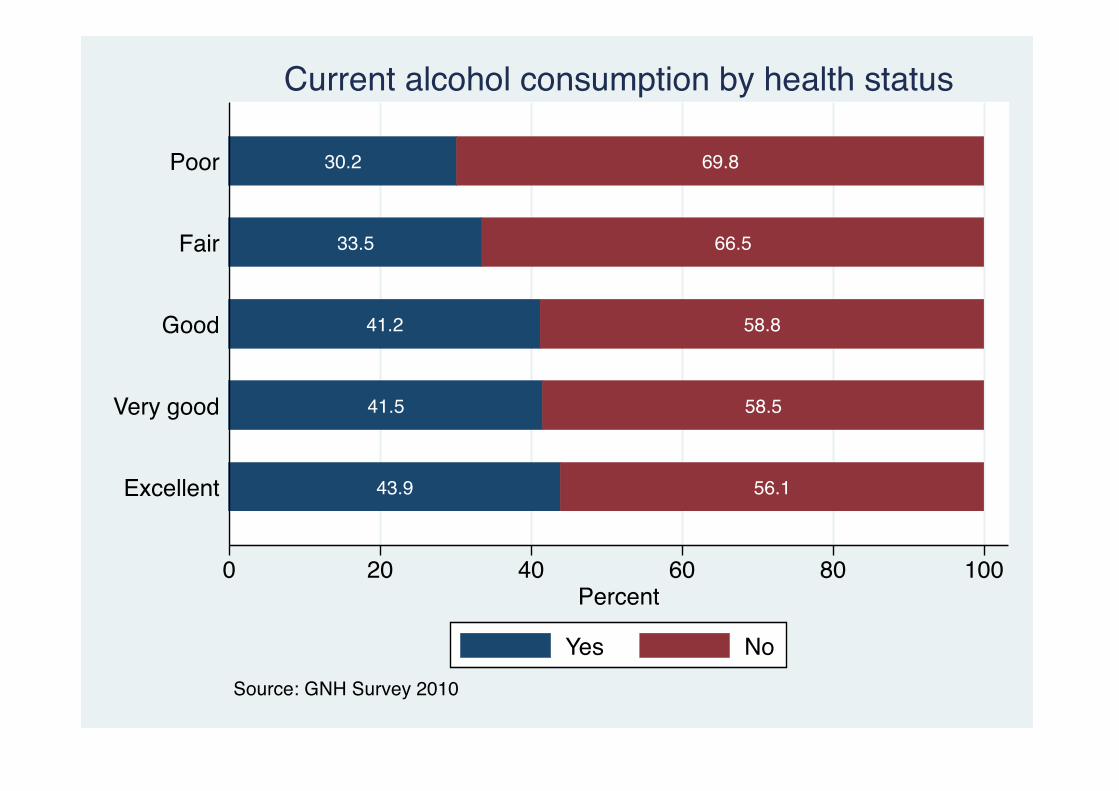
43.9 56.1
41.5 58.5
41.2 58.8
33.5 66.5
30.2 69.8
0 20 40 60 80 100Percent
Excellent
Very good
Good
Fair
Poor
Source: GNH Survey 2010
Current alcohol consumption by health status
Yes No

57.5 42.536.5 63.539.2 60.838.0 62.0
46.0 54.044.5 55.5
36.3 63.745.1 54.9
41.3 58.745.9 54.1
33.7 66.360.4 39.6
22.1 77.954.4 45.6
50.2 49.827.1 72.9
23.4 76.646.2 53.8
35.3 64.741.5 58.5
0 20 40 60 80 100Percent
ZhemgangWangdue Phodrang
TsirangTrongsa
Tashi YangsteTashigang
ThimphuSarpangSamtse
Samdrup JongkharPunakha
Pema GatshelParo
MongarLhuntse
HaaGasa
DaganaChukha
Bumthang
Source: GNH Survey 2010
Current alcohol consumption by Dzongkhag
Yes No

20.821.5 21.5 22.1
05
1015
20Ag
e
1 Rural 2 UrbanMale Female Male Female
Source: GNH Survey 2010
Mean alcohol initiation age by sex and area
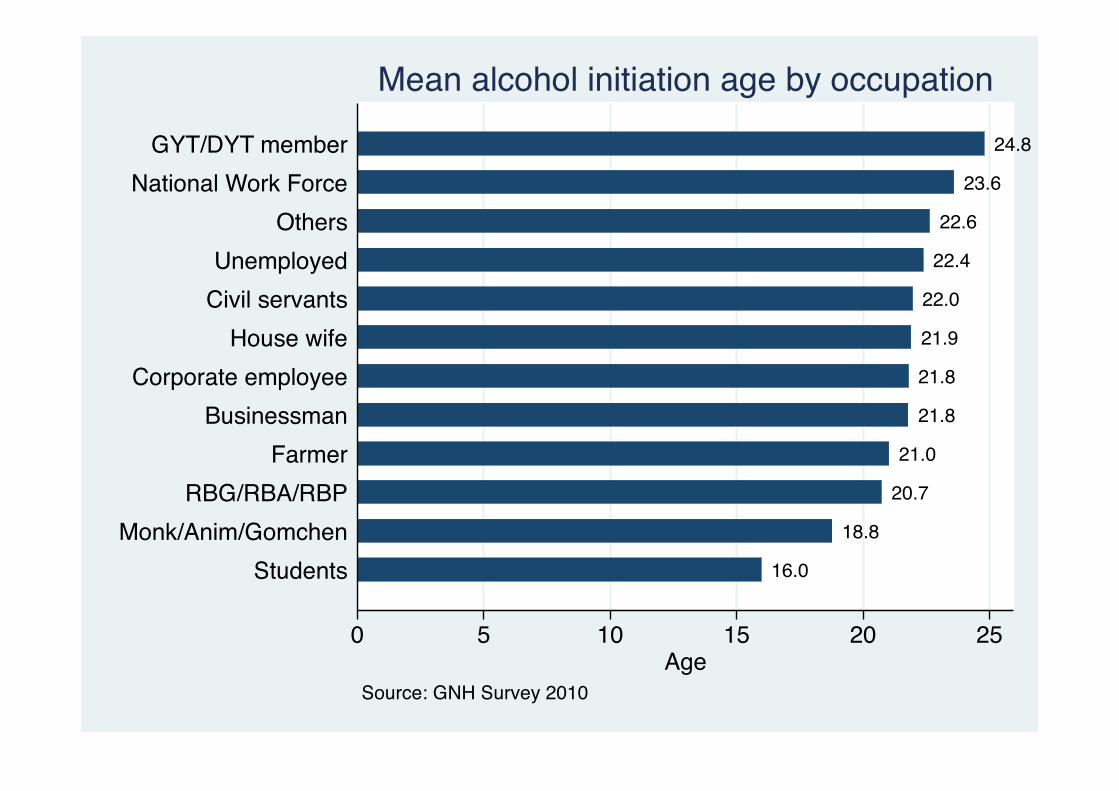
16.0
18.8
20.7
21.0
21.8
21.8
21.9
22.0
22.4
22.6
23.6
24.8
0 5 10 15 20 25Age
StudentsMonk/Anim/Gomchen
RBG/RBA/RBPFarmer
BusinessmanCorporate employee
House wifeCivil servantsUnemployed
OthersNational Work Force
GYT/DYT member
Source: GNH Survey 2010
Mean alcohol initiation age by occupation

23.0
21.6
21.6
20.0
20.6
20.7
21.1
0 5 10 15 20 25Age
>225,000
150,001-225,000
100,001-150,000
75,001-100,000
50,001-75,000
25,001-50,000
0-25,000
Source: GNH Survey 2010
Mean alcohol initiation age household income
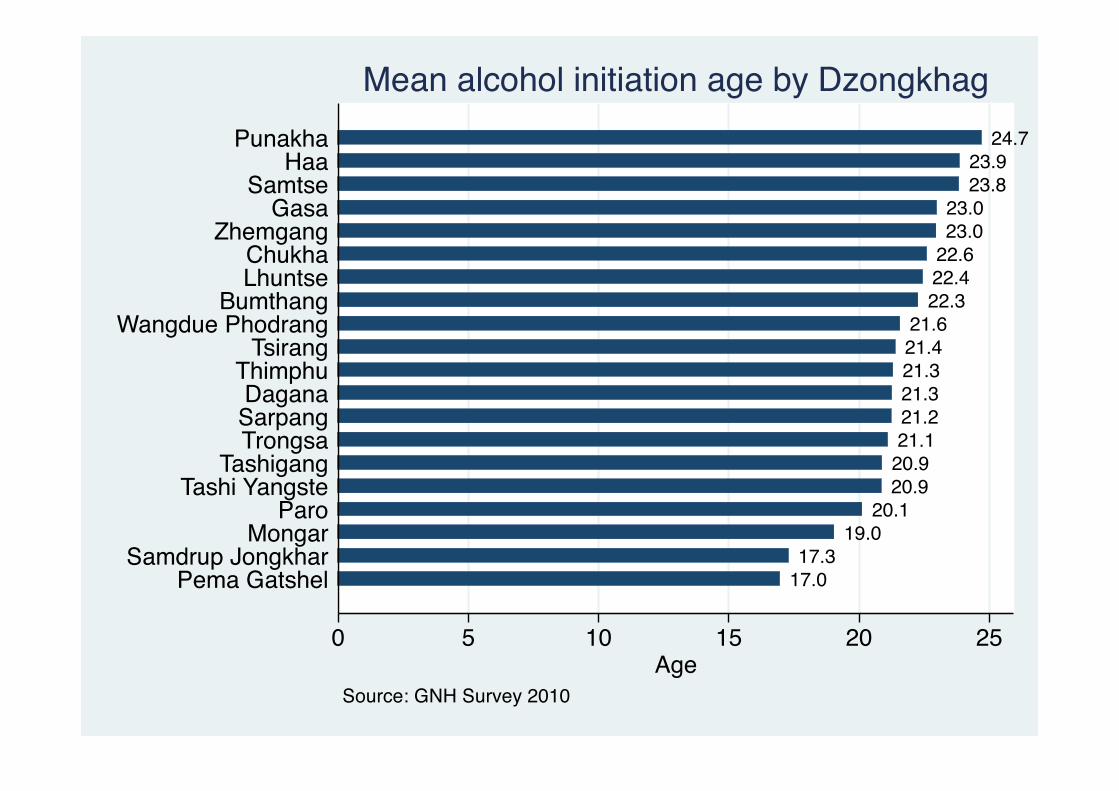
17.017.3
19.020.1
20.920.921.121.221.321.321.421.6
22.322.422.623.023.0
23.823.9
24.7
0 5 10 15 20 25Age
Pema GatshelSamdrup Jongkhar
MongarParo
Tashi YangsteTashigang
TrongsaSarpangDagana
ThimphuTsirang
Wangdue PhodrangBumthang
LhuntseChukha
ZhemgangGasa
SamtseHaa
Punakha
Source: GNH Survey 2010
Mean alcohol initiation age by Dzongkhag
0
5
10
15
20
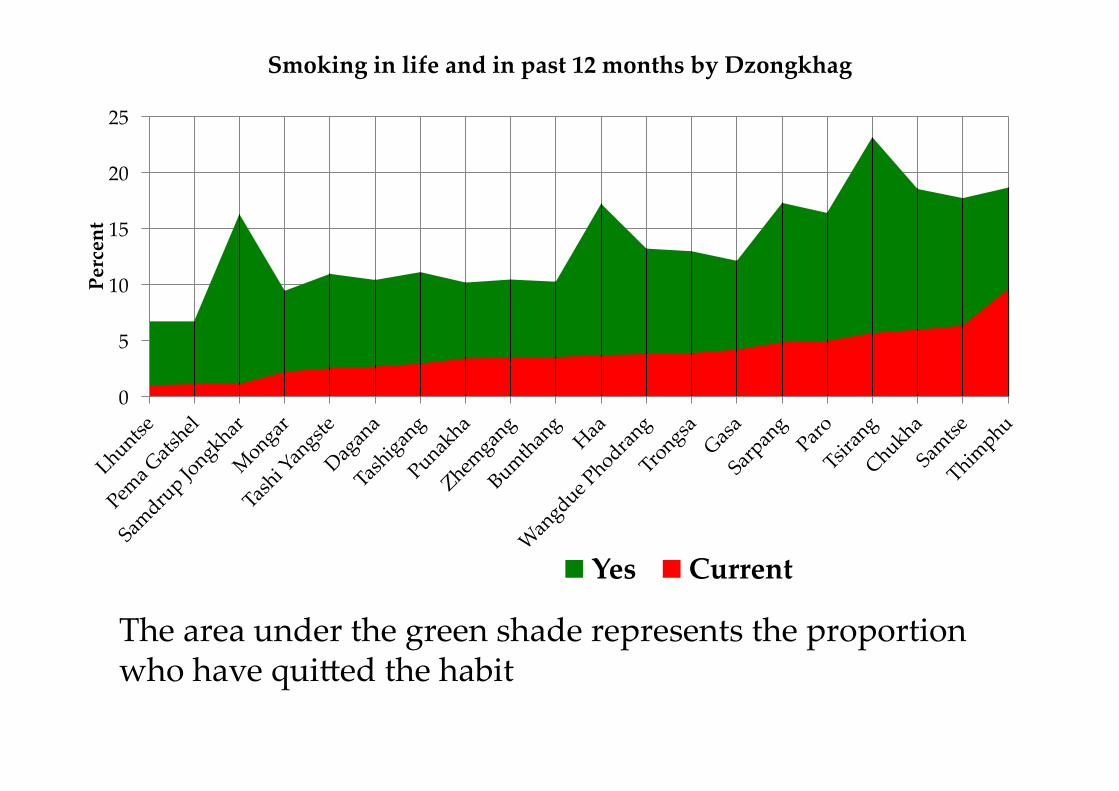
25 Percent
Smoking in life and in past 12 months by Dzongkhag
Yes Current
The area under the green shade represents the proportion who have quiDed the habit
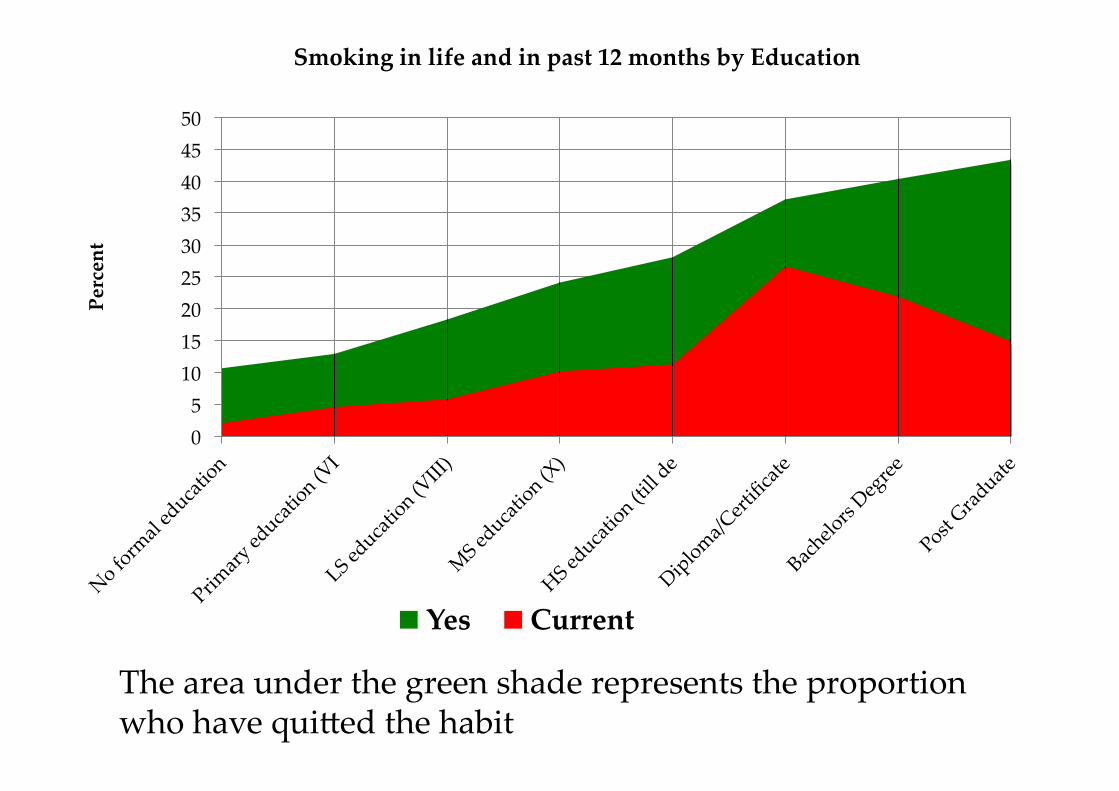
0 5 10 15 20 25 30 35 40 45 50
Percent
Smoking in life and in past 12 months by Education
Yes Current
The area under the green shade represents the proportion who have quiDed the habit
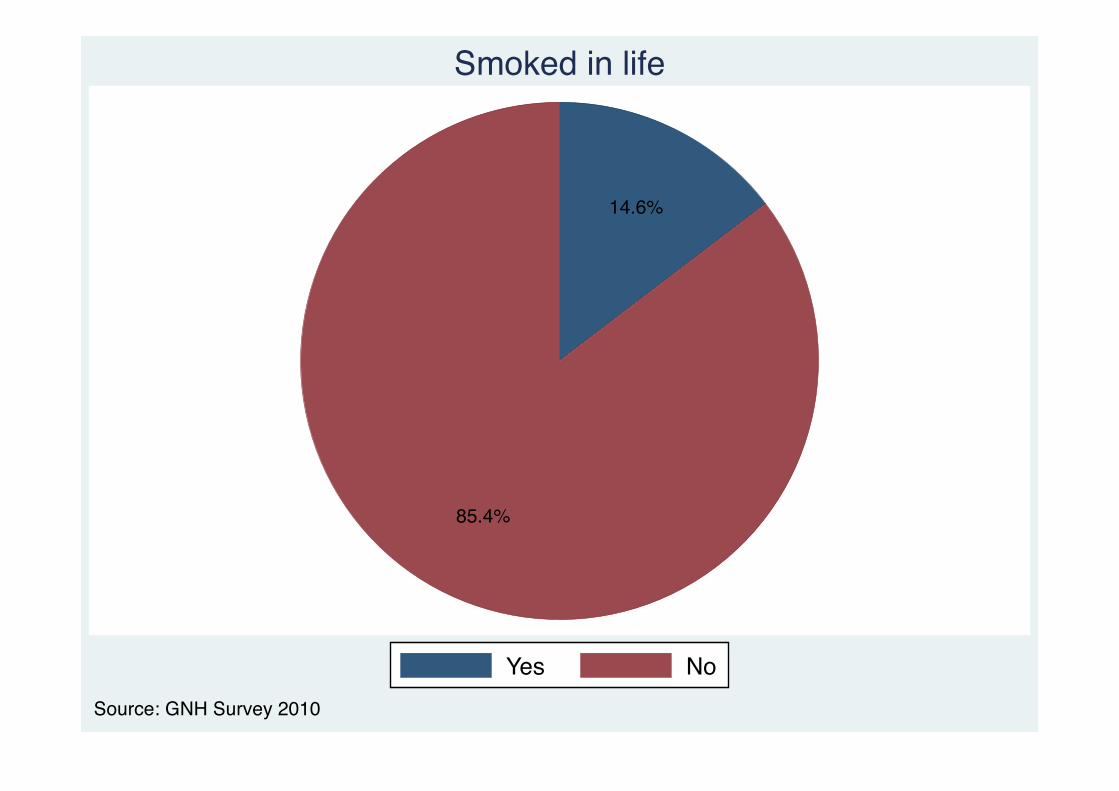
14.6%
85.4%
Yes NoSource: GNH Survey 2010
Smoked in life
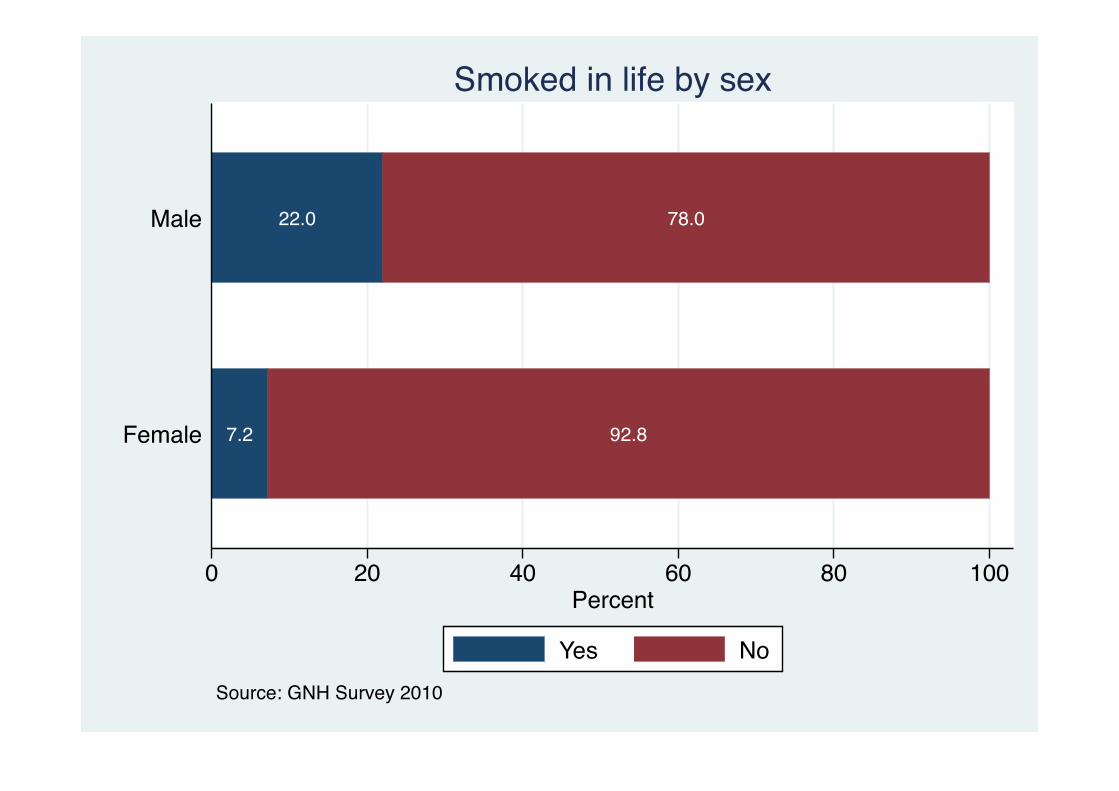
7.2 92.8
22.0 78.0
0 20 40 60 80 100Percent
Female
Male
Source: GNH Survey 2010
Smoked in life by sex
Yes No
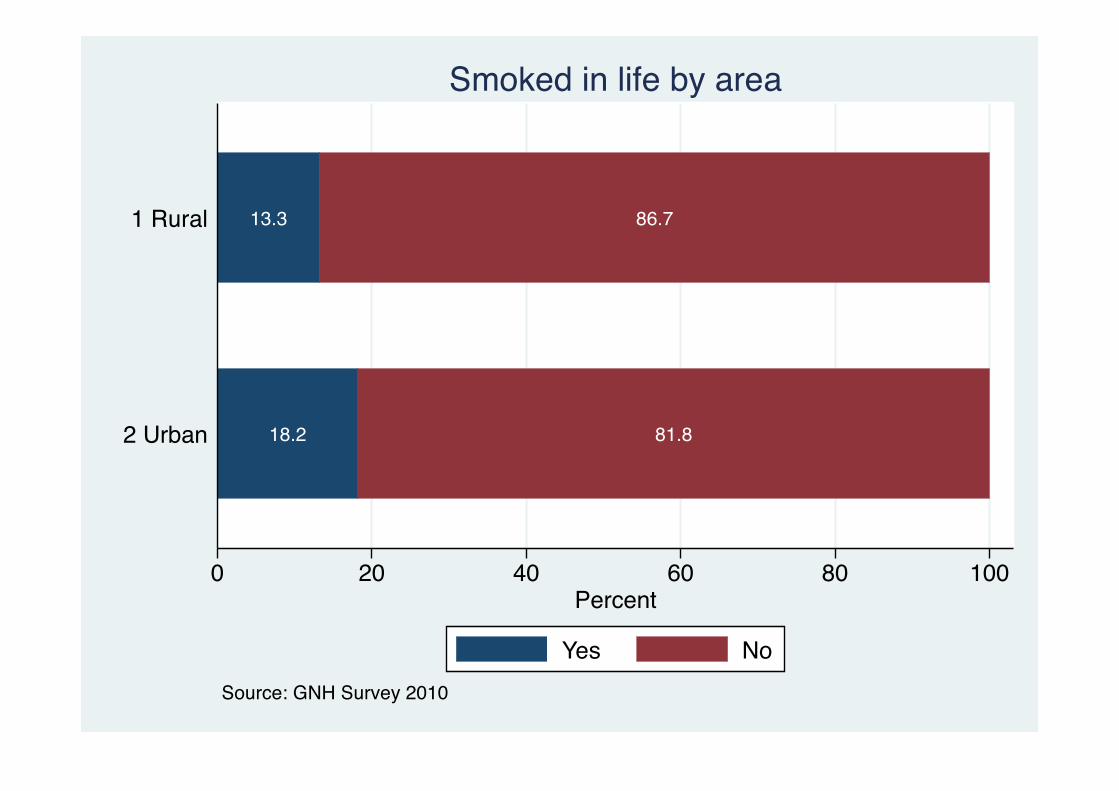
18.2 81.8
13.3 86.7
0 20 40 60 80 100Percent
2 Urban
1 Rural
Source: GNH Survey 2010
Smoked in life by area
Yes No
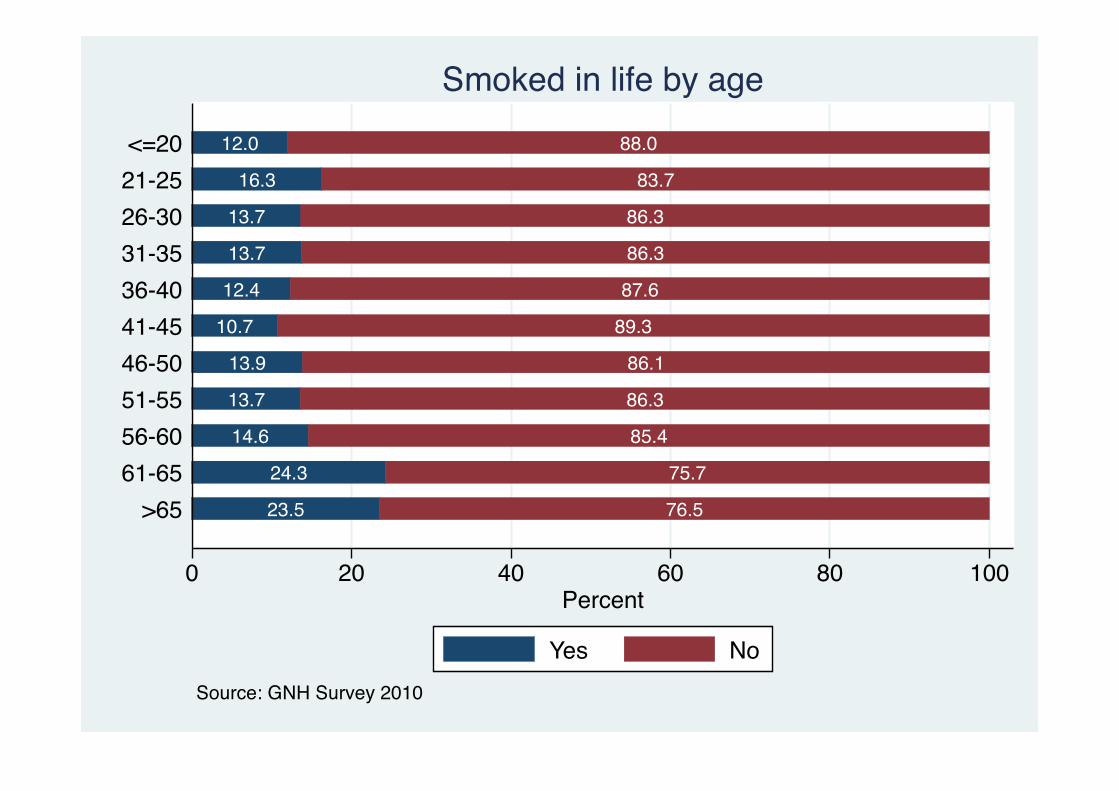
23.5 76.5
24.3 75.7
14.6 85.4
13.7 86.3
13.9 86.1
10.7 89.3
12.4 87.6
13.7 86.3
13.7 86.3
16.3 83.7
12.0 88.0
0 20 40 60 80 100Percent
>6561-6556-6051-5546-5041-4536-4031-3526-3021-25<=20
Source: GNH Survey 2010
Smoked in life by age
Yes No
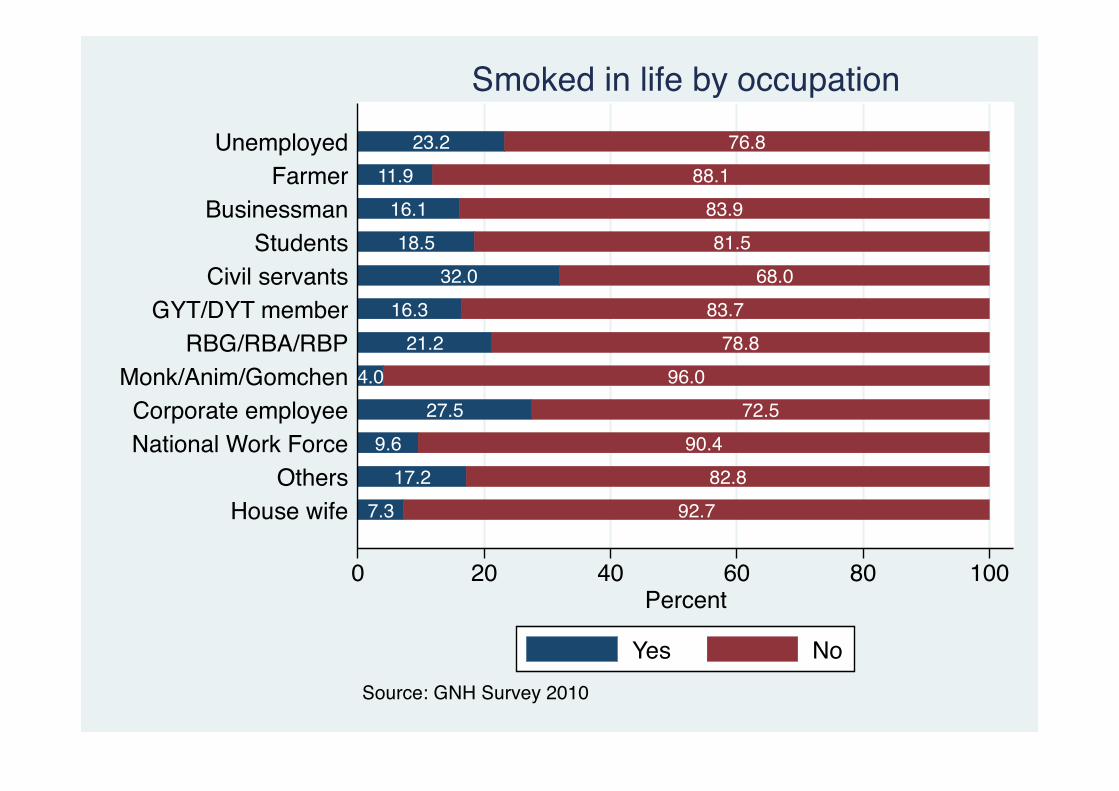
7.3 92.717.2 82.8
9.6 90.427.5 72.5
4.0 96.021.2 78.8
16.3 83.732.0 68.0
18.5 81.516.1 83.9
11.9 88.123.2 76.8
0 20 40 60 80 100Percent
House wifeOthers
National Work ForceCorporate employee
Monk/Anim/GomchenRBG/RBA/RBP
GYT/DYT memberCivil servants
StudentsBusinessman
FarmerUnemployed
Source: GNH Survey 2010
Smoked in life by occupation
Yes No
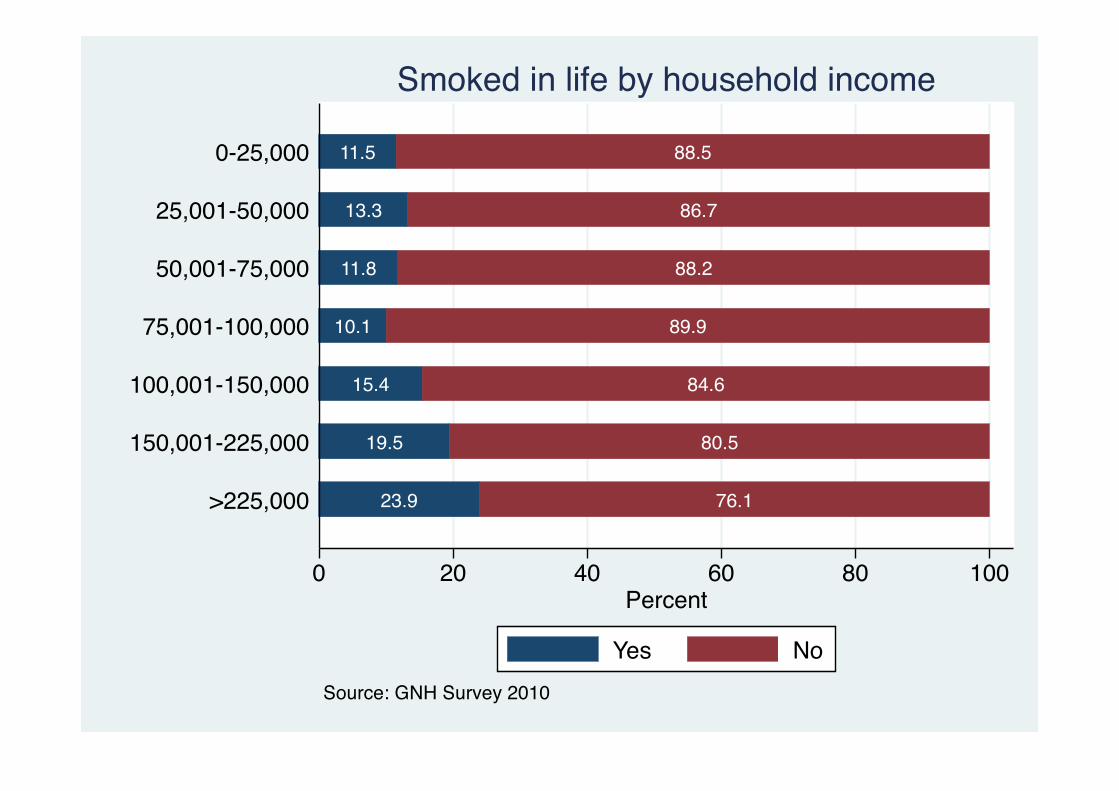
23.9 76.1
19.5 80.5
15.4 84.6
10.1 89.9
11.8 88.2
13.3 86.7
11.5 88.5
0 20 40 60 80 100Percent
>225,000
150,001-225,000
100,001-150,000
75,001-100,000
50,001-75,000
25,001-50,000
0-25,000
Source: GNH Survey 2010
Smoked in life by household income
Yes No
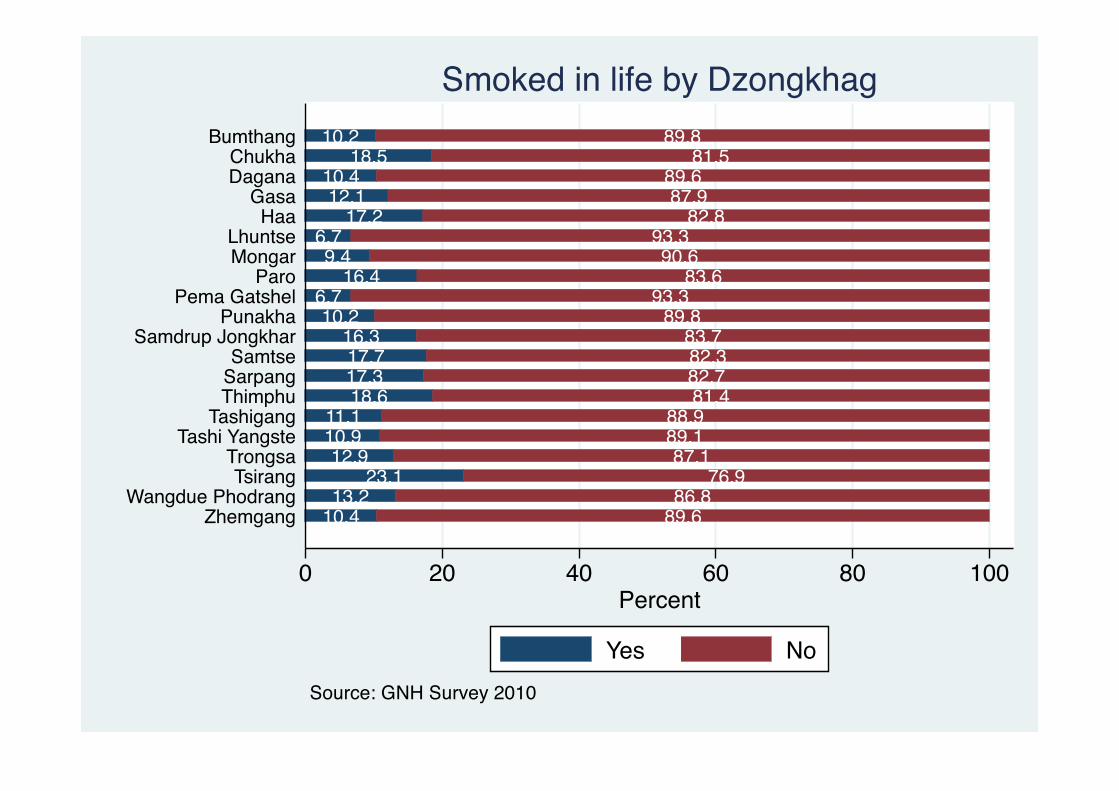
10.4 89.613.2 86.8
23.1 76.912.9 87.1
10.9 89.111.1 88.9
18.6 81.417.3 82.717.7 82.316.3 83.7
10.2 89.86.7 93.3
16.4 83.69.4 90.6
6.7 93.317.2 82.8
12.1 87.910.4 89.6
18.5 81.510.2 89.8
0 20 40 60 80 100Percent
ZhemgangWangdue Phodrang
TsirangTrongsa
Tashi YangsteTashigang
ThimphuSarpangSamtse
Samdrup JongkharPunakha
Pema GatshelParo
MongarLhuntse
HaaGasa
DaganaChukha
Bumthang
Source: GNH Survey 2010
Smoked in life by Dzongkhag
Yes No

4.6%
95.4%
Yes NoSource: GNH Survey 2010
Current smoking
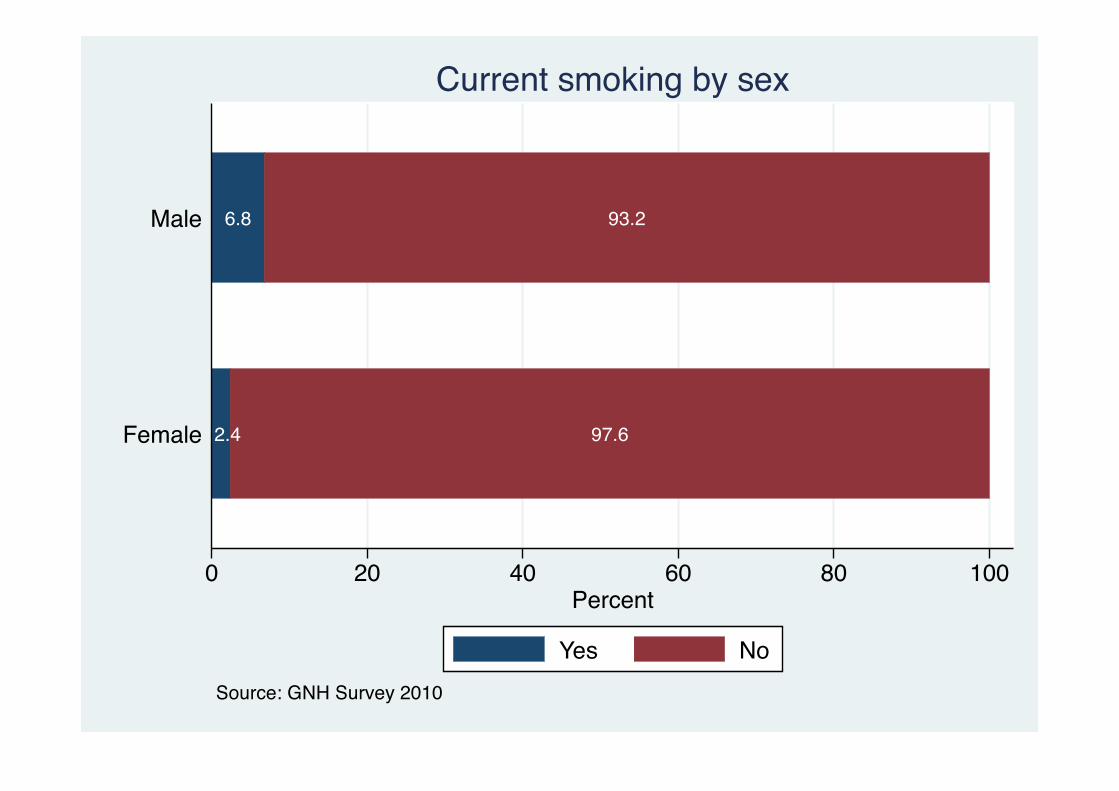
2.4 97.6
6.8 93.2
0 20 40 60 80 100Percent
Female
Male
Source: GNH Survey 2010
Current smoking by sex
Yes No

7.7 92.3
3.4 96.6
0 20 40 60 80 100Percent
2 Urban
1 Rural
Source: GNH Survey 2010
Current smoking by area
Yes No

4.1 95.9
5.2 94.8
2.9 97.1
1.3 98.7
3.0 97.0
1.6 98.4
3.4 96.6
4.3 95.7
7.0 93.0
9.2 90.8
5.7 94.3
0 20 40 60 80 100Percent
>6561-6556-6051-5546-5041-4536-4031-3526-3021-25<=20
Source: GNH Survey 2010
Current smoking by age
Yes No
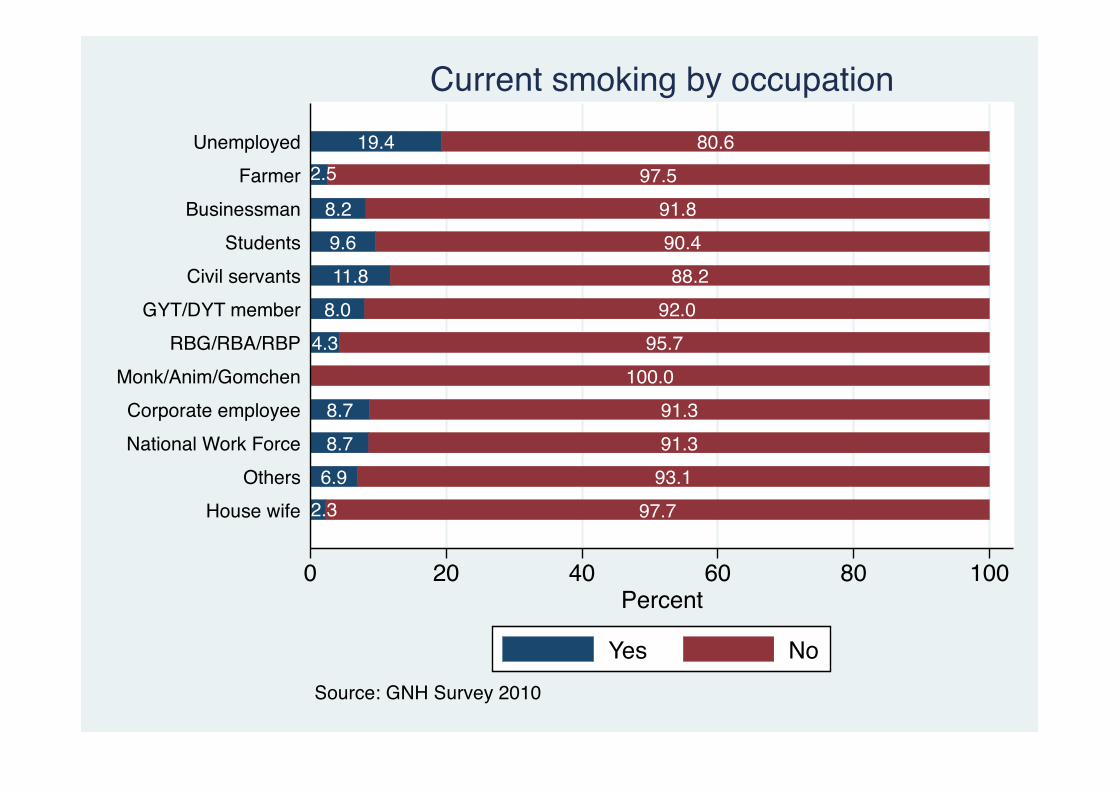
2.3 97.76.9 93.18.7 91.38.7 91.3
100.04.3 95.7
8.0 92.011.8 88.29.6 90.48.2 91.8
2.5 97.519.4 80.6
0 20 40 60 80 100Percent
House wifeOthers
National Work ForceCorporate employee
Monk/Anim/GomchenRBG/RBA/RBP
GYT/DYT memberCivil servants
StudentsBusinessman
FarmerUnemployed
Source: GNH Survey 2010
Current smoking by occupation
Yes No

9.9 90.1
6.5 93.5
5.6 94.4
4.0 96.0
3.7 96.3
2.5 97.5
2.3 97.7
0 20 40 60 80 100Percent
>225,000
150,001-225,000
100,001-150,000
75,001-100,000
50,001-75,000
25,001-50,000
0-25,000
Source: GNH Survey 2010
Current smoking by household income
Yes No
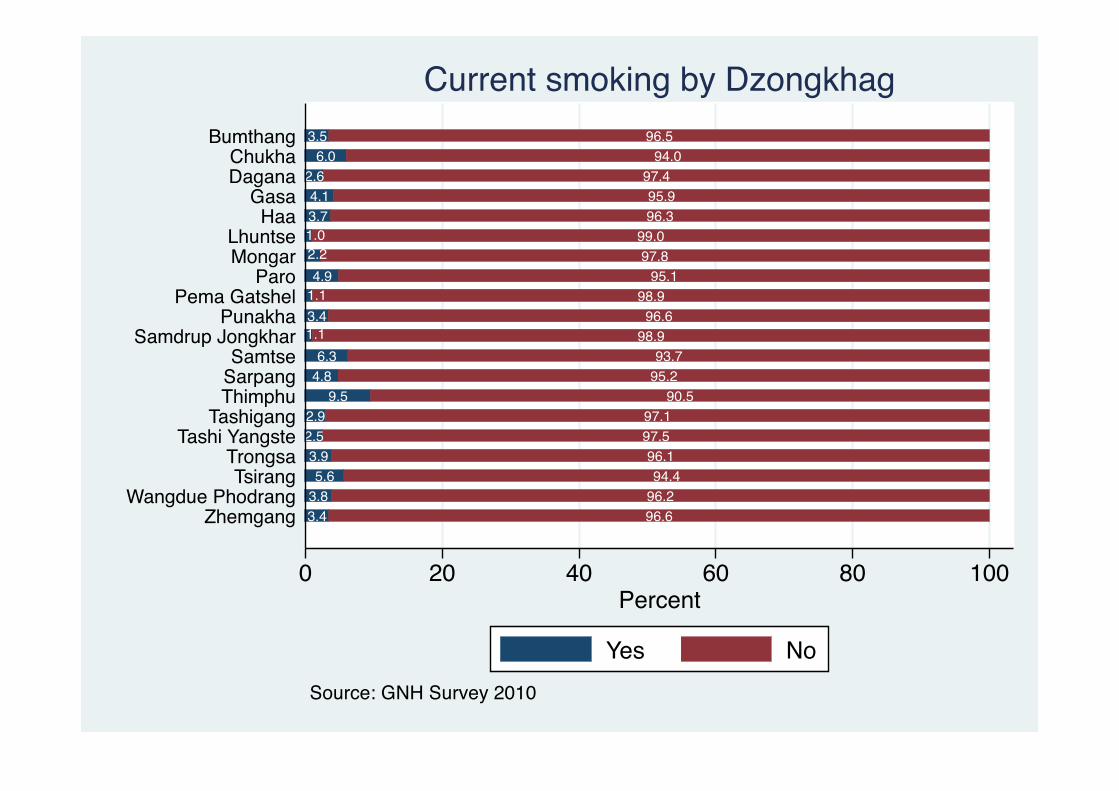
3.4 96.63.8 96.25.6 94.4
3.9 96.12.5 97.52.9 97.1
9.5 90.54.8 95.26.3 93.7
1.1 98.93.4 96.61.1 98.94.9 95.1
2.2 97.81.0 99.03.7 96.34.1 95.9
2.6 97.46.0 94.0
3.5 96.5
0 20 40 60 80 100Percent
ZhemgangWangdue Phodrang
TsirangTrongsa
Tashi YangsteTashigang
ThimphuSarpangSamtse
Samdrup JongkharPunakha
Pema GatshelParo
MongarLhuntse
HaaGasa
DaganaChukha
Bumthang
Source: GNH Survey 2010
Current smoking by Dzongkhag
Yes No

21.520.2 20.8
19.40
510
1520
Age
1 Rural 2 UrbanMale Female Male Female
Source: GNH Survey 2010
Mean smoking initiation age by sex and area

16.7
18.5
18.8
19.0
19.5
20.0
21.2
21.6
22.0
22.5
23.5
24.1
0 5 10 15 20 25Age
Students
House wife
Unemployed
Others
RBG/RBA/RBP
Monk/Anim/Gomchen
Farmer
Civil servants
Businessman
Corporate employee
National Work Force
GYT/DYT member
Source: GNH Survey 2010
Mean smoking initiation age by occupation

20.9
19.8
19.3
21.4
20.7
20.0
23.3
0 5 10 15 20 25Age
>225,000
150,001-225,000
100,001-150,000
75,001-100,000
50,001-75,000
25,001-50,000
0-25,000
Source: GNH Survey 2010
Mean smoking initiation age household income
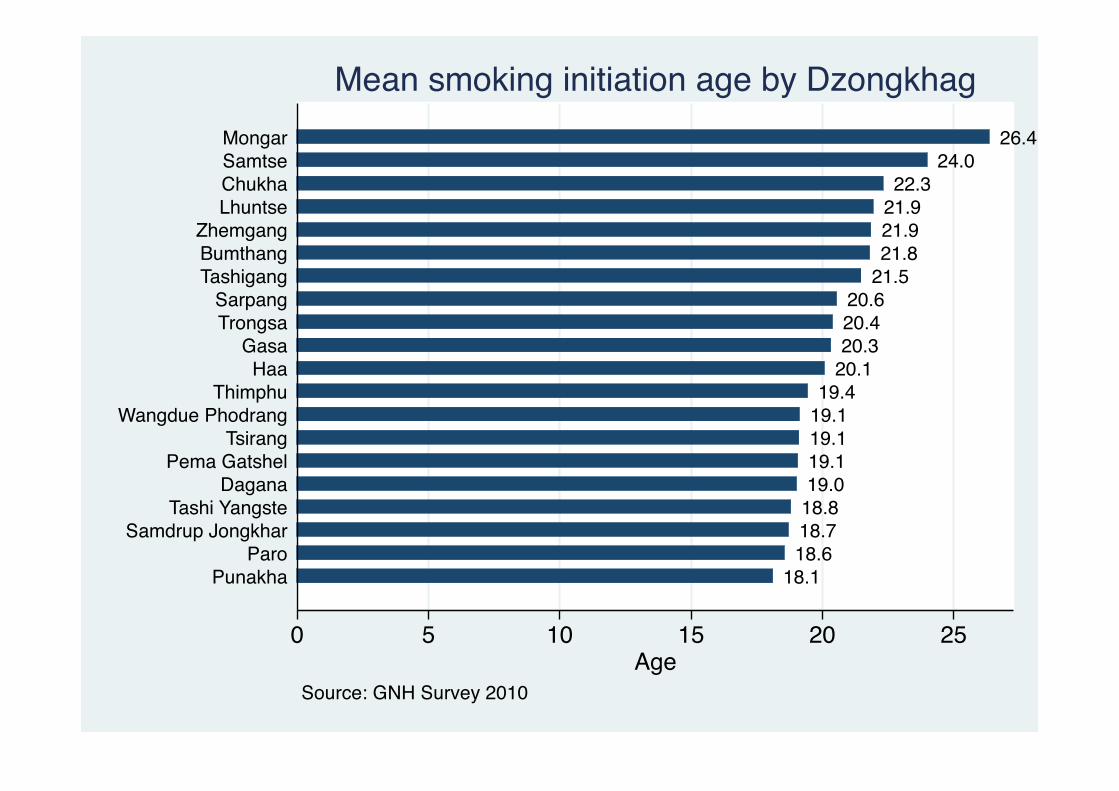
18.118.618.718.819.019.119.119.119.4
20.120.320.420.6
21.521.821.921.922.3
24.026.4
0 5 10 15 20 25Age
PunakhaParo
Samdrup JongkharTashi Yangste
DaganaPema Gatshel
TsirangWangdue Phodrang
ThimphuHaa
GasaTrongsaSarpang
TashigangBumthangZhemgang
LhuntseChukhaSamtseMongar
Source: GNH Survey 2010
Mean smoking initiation age by Dzongkhag

0 10 20 30 40 50 60 70 80 90
Percent
Doma chewing in life and in past 12 months by Dzongkhag
Life Current
The area under the green shade represents the proportion who have quiDed the habit
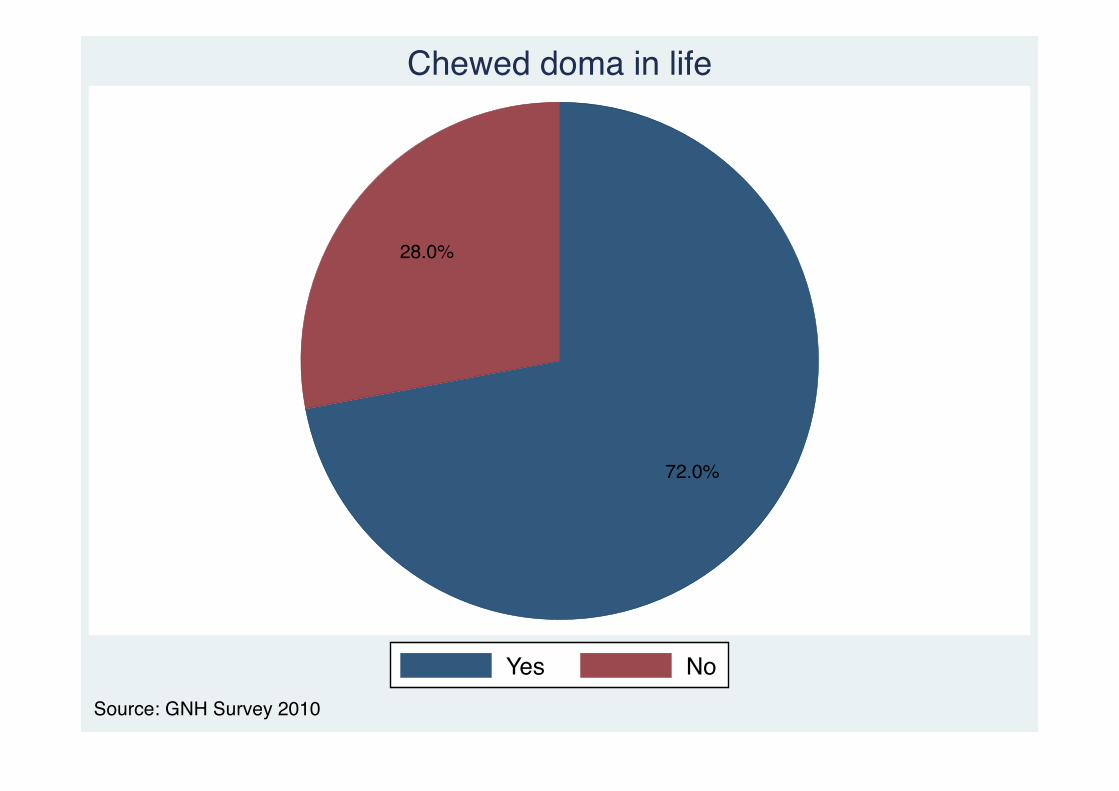
72.0%
28.0%
Yes NoSource: GNH Survey 2010
Chewed doma in life

71.6 28.4
72.5 27.5
0 20 40 60 80 100Percent
Female
Male
Source: GNH Survey 2010
Chewed doma in life by sex
Yes No

70.8 29.2
72.5 27.5
0 20 40 60 80 100Percent
2 Urban
1 Rural
Source: GNH Survey 2010
Chewed doma in life by area
Yes No
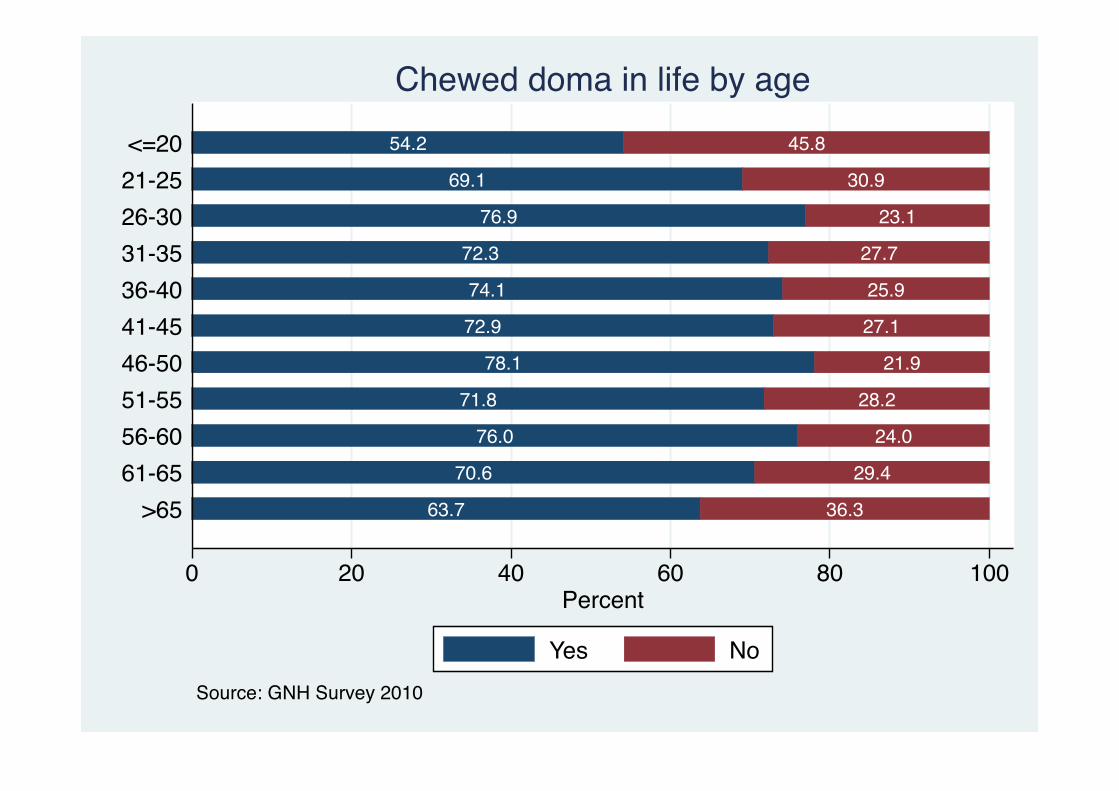
63.7 36.3
70.6 29.4
76.0 24.0
71.8 28.2
78.1 21.9
72.9 27.1
74.1 25.9
72.3 27.7
76.9 23.1
69.1 30.9
54.2 45.8
0 20 40 60 80 100Percent
>6561-6556-6051-5546-5041-4536-4031-3526-3021-25<=20
Source: GNH Survey 2010
Chewed doma in life by age
Yes No
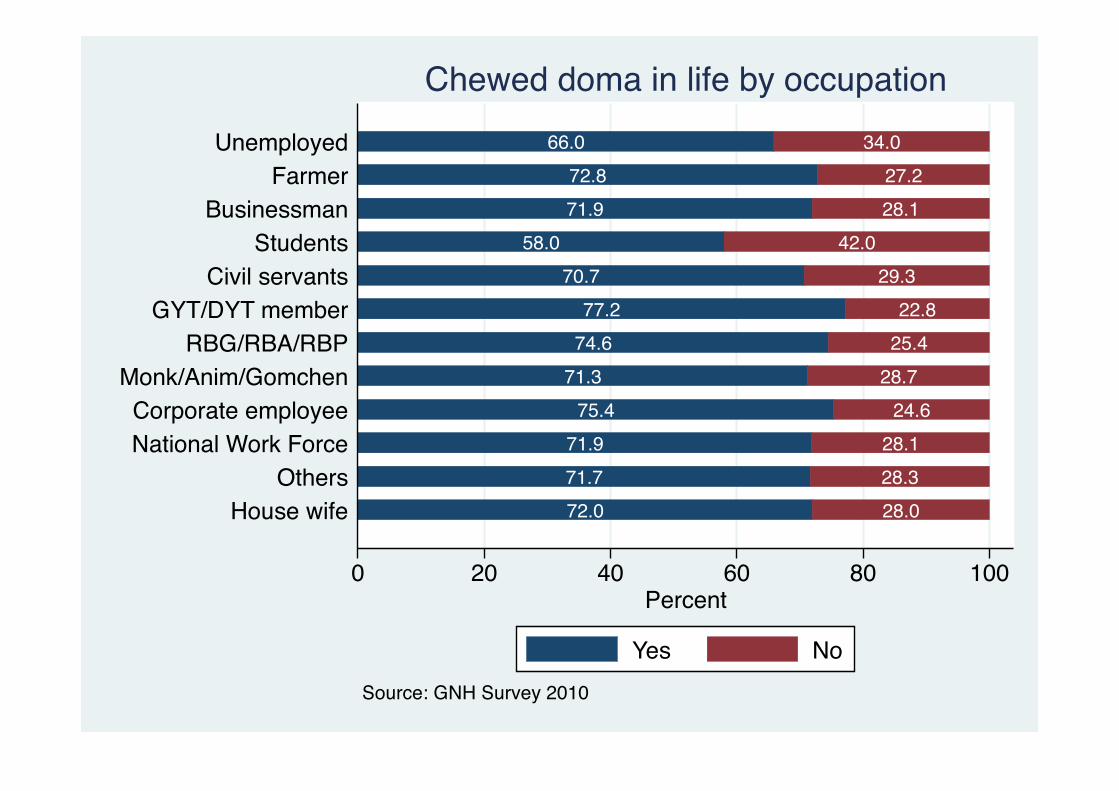
72.0 28.071.7 28.371.9 28.1
75.4 24.671.3 28.774.6 25.477.2 22.8
70.7 29.358.0 42.0
71.9 28.172.8 27.2
66.0 34.0
0 20 40 60 80 100Percent
House wifeOthers
National Work ForceCorporate employee
Monk/Anim/GomchenRBG/RBA/RBP
GYT/DYT memberCivil servants
StudentsBusinessman
FarmerUnemployed
Source: GNH Survey 2010
Chewed doma in life by occupation
Yes No
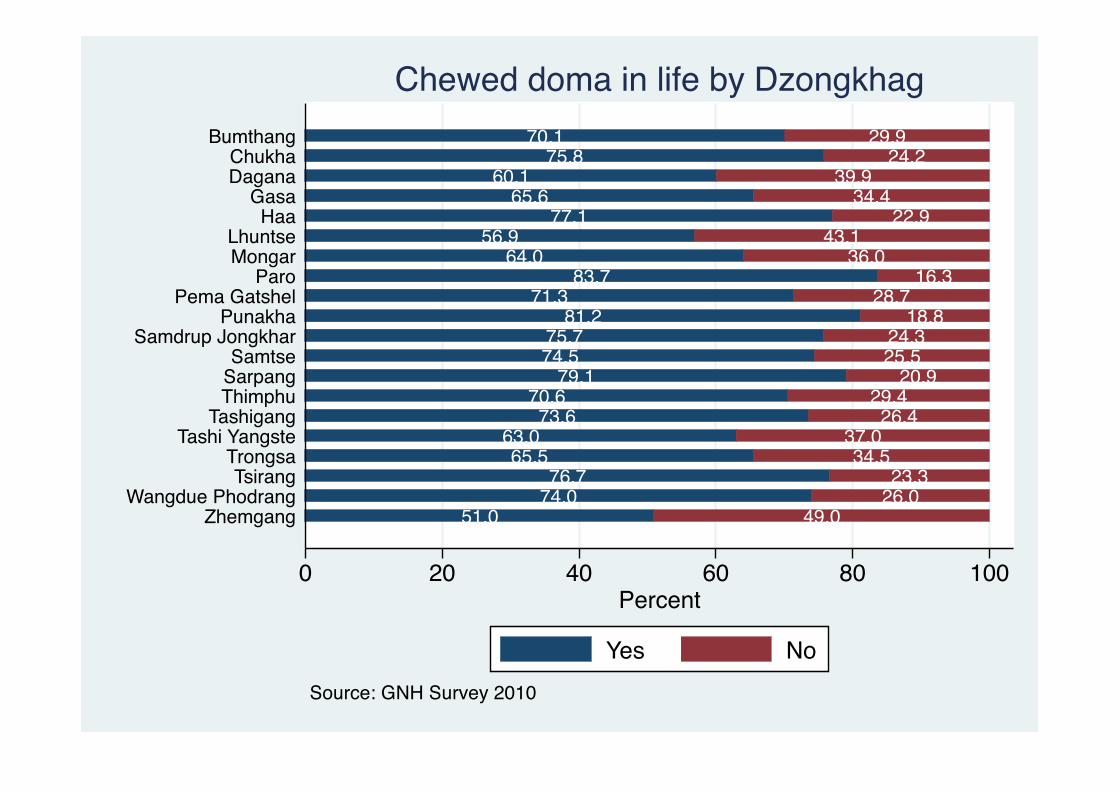
51.0 49.074.0 26.076.7 23.3
65.5 34.563.0 37.0
73.6 26.470.6 29.4
79.1 20.974.5 25.575.7 24.3
81.2 18.871.3 28.7
83.7 16.364.0 36.0
56.9 43.177.1 22.9
65.6 34.460.1 39.9
75.8 24.270.1 29.9
0 20 40 60 80 100Percent
ZhemgangWangdue Phodrang
TsirangTrongsa
Tashi YangsteTashigang
ThimphuSarpangSamtse
Samdrup JongkharPunakha
Pema GatshelParo
MongarLhuntse
HaaGasa
DaganaChukha
Bumthang
Source: GNH Survey 2010
Chewed doma in life by Dzongkhag
Yes No

60.0%
40.0%
Yes NoSource: GNH Survey 2010
Current doma chewing
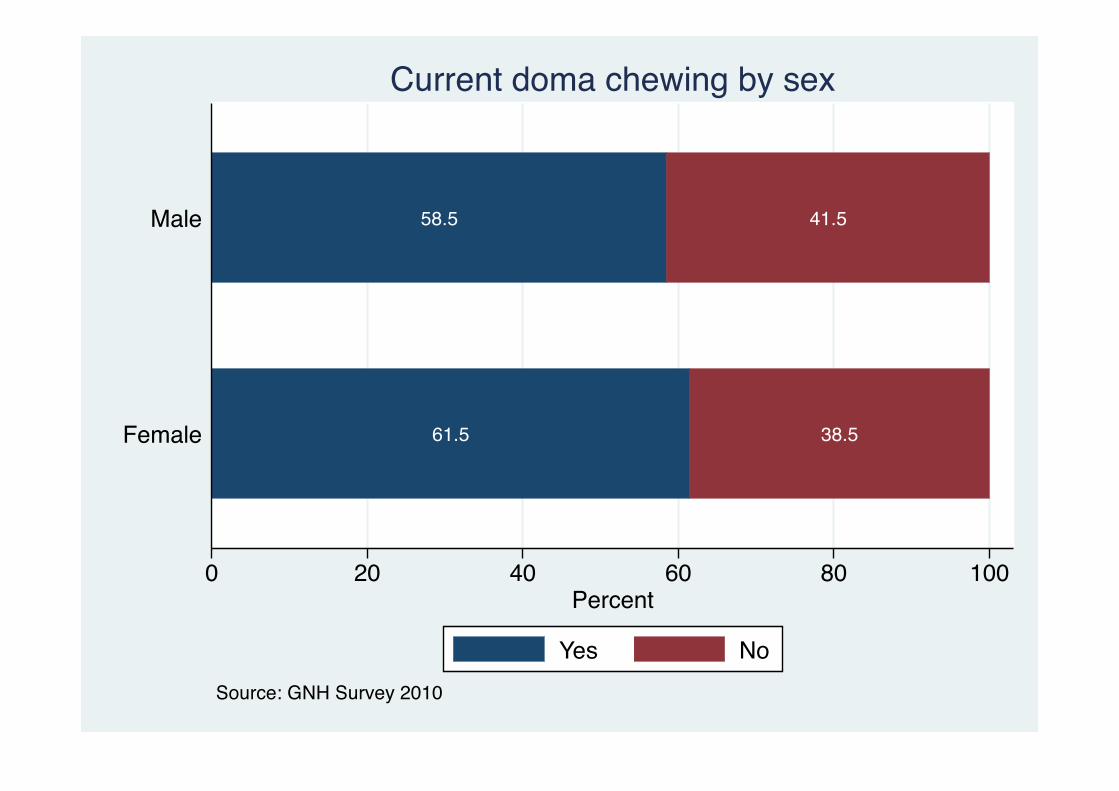
61.5 38.5
58.5 41.5
0 20 40 60 80 100Percent
Female
Male
Source: GNH Survey 2010
Current doma chewing by sex
Yes No

57.7 42.3
60.9 39.1
0 20 40 60 80 100Percent
2 Urban
1 Rural
Source: GNH Survey 2010
Current doma chewing by area
Yes No
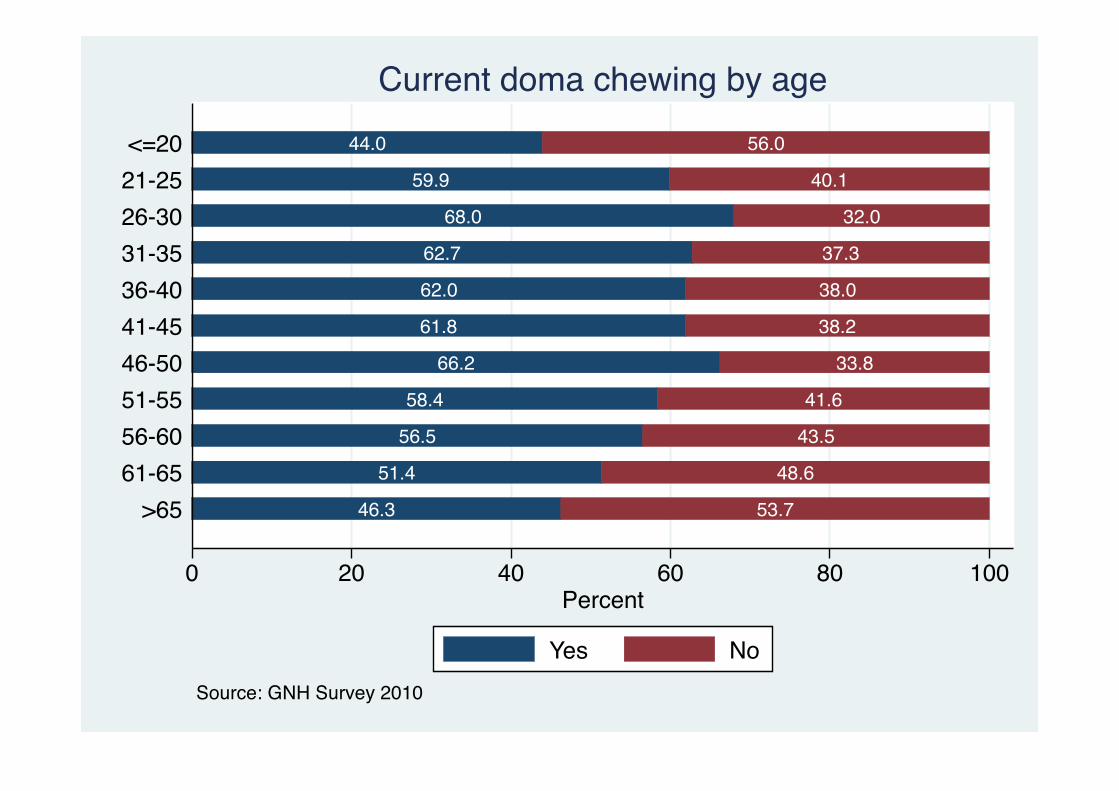
46.3 53.7
51.4 48.6
56.5 43.5
58.4 41.6
66.2 33.8
61.8 38.2
62.0 38.0
62.7 37.3
68.0 32.0
59.9 40.1
44.0 56.0
0 20 40 60 80 100Percent
>6561-6556-6051-5546-5041-4536-4031-3526-3021-25<=20
Source: GNH Survey 2010
Current doma chewing by age
Yes No
62.2 37.860.0 40.0
70.8 29.258.4 41.6
52.9 47.162.1 37.9
69.8 30.257.0 43.0
45.6 54.457.3 42.7
61.3 38.760.0 40.0
0 20 40 60 80 100Percent
House wifeOthers
National Work ForceCorporate employee
Monk/Anim/GomchenRBG/RBA/RBP
GYT/DYT memberCivil servants
StudentsBusinessman
FarmerUnemployed
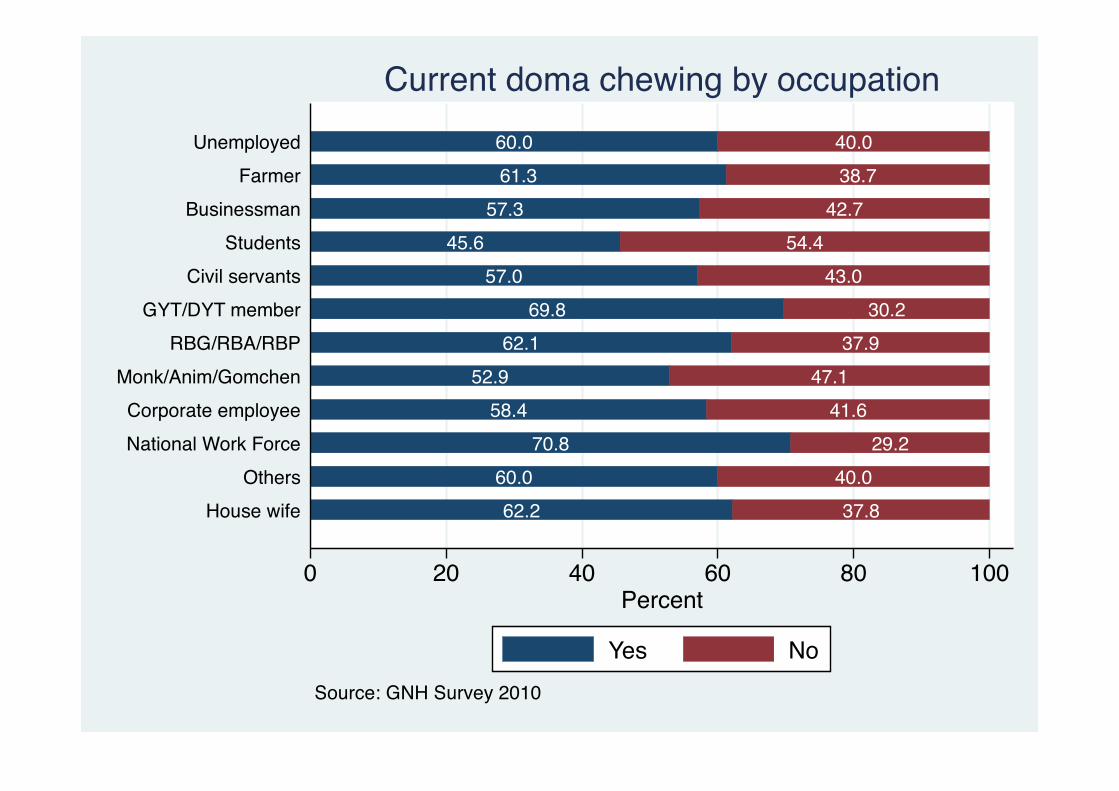
Source: GNH Survey 2010
Current doma chewing by occupation
Yes No

46.2 53.867.1 32.9
55.9 44.155.9 44.1
48.1 51.958.1 41.958.1 41.9
61.8 38.265.3 34.765.8 34.2
76.2 23.863.1 36.9
71.6 28.447.9 52.1
46.1 53.965.9 34.1
56.6 43.449.3 50.7
61.2 38.862.6 37.4
0 20 40 60 80 100Percent
ZhemgangWangdue Phodrang
TsirangTrongsa
Tashi YangsteTashigang
ThimphuSarpangSamtse
Samdrup JongkharPunakha
Pema GatshelParo
MongarLhuntse
HaaGasa
DaganaChukha
Bumthang
Source: GNH Survey 2010
Current doma chewing by Dzongkhag
Yes No
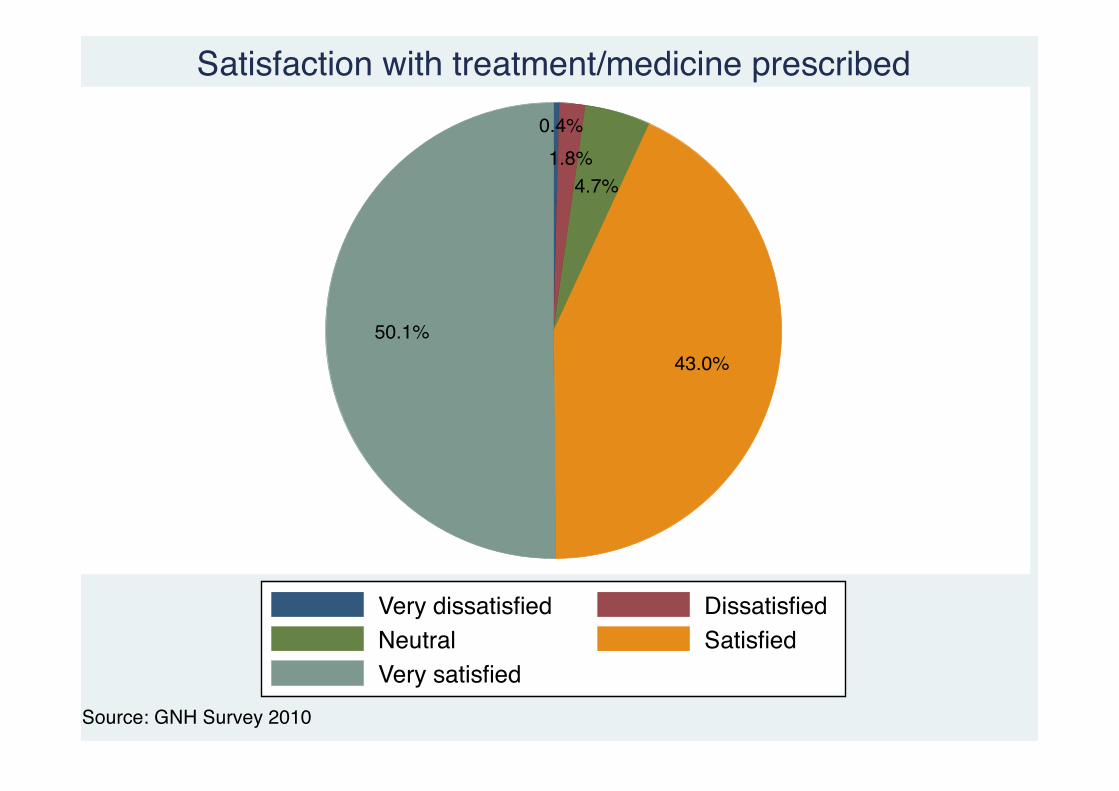
0.4%1.8%
4.7%
43.0%50.1%
Very dissatisfied DissatisfiedNeutral SatisfiedVery satisfied
Source: GNH Survey 2010
Satisfaction with treatment/medicine prescribed

0.41.94.2 41.9 51.5
0.41.8 5.1
44.0 48.7
0 20 40 60 80 100Percent
Female
Male
Source: GNH Survey 2010
Satisfaction with treatment/medicine prescribed by sex
Very dissatisfied DissatisfiedNeutral SatisfiedVery satisfied
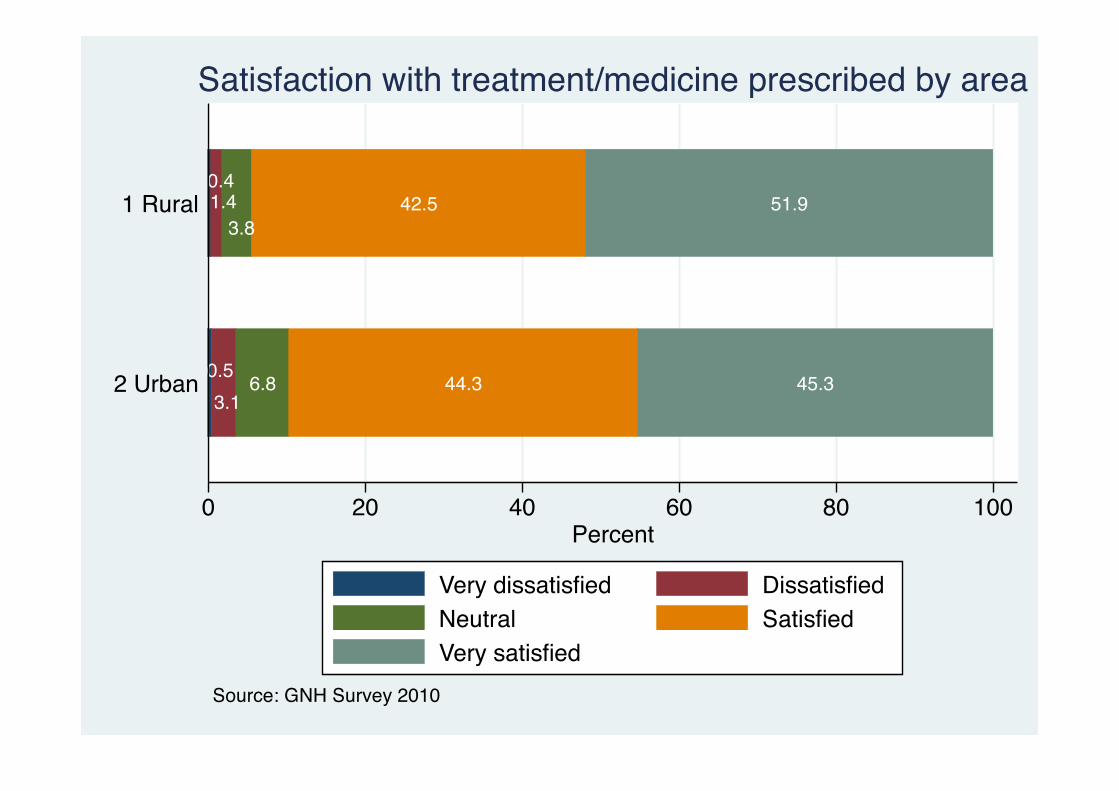
0.53.1
6.8 44.3 45.3
0.41.4
3.842.5 51.9
0 20 40 60 80 100Percent
2 Urban
1 Rural
Source: GNH Survey 2010
Satisfaction with treatment/medicine prescribed by area
Very dissatisfied DissatisfiedNeutral SatisfiedVery satisfied

0.1 0.6 2.9 42.9 53.5
0.8 0.8 4.2 31.6 62.6
0.2 2.3 3.1 42.1 52.3
0.9 3.2 40.7 55.2
0.2 0.7 4.0 43.7 51.4
0.1 1.5 4.8 43.2 50.4
0.2 2.0 5.5 44.8 47.5
0.4 0.7 4.4 42.8 51.6
1.0 2.9 5.7 44.2 46.2
0.5 2.9 5.7 44.5 46.5
0.8 3.9 5.3 44.3 45.7
0 20 40 60 80 100Percent
>6561-6556-6051-5546-5041-4536-4031-3526-3021-25<=20
Source: GNH Survey 2010
Satisfaction with treatment/medicine prescribed by age
Very dissatisfied DissatisfiedNeutral SatisfiedVery satisfied
0.3 2.0 5.5 38.7 53.5
0.1 0.9 4.3 37.9 56.8
48.1 51.9
0.2 2.0 10.0 50.9 36.8
5.1 35.6 59.3
0.8 5.7 42.0 51.6
0.7 6.5 35.1 57.6
1.1 4.3 10.0 54.4 30.2
1.3 4.2 7.6 50.8 36.1
0.5 3.4 6.6 44.4 45.1
0.3 1.2 2.9 41.3 54.3
1.9 5.9 5.0 57.2 29.9
0 20 40 60 80 100Percent
House wifeOthers
National Work ForceCorporate employee
Monk/Anim/GomchenRBG/RBA/RBP
GYT/DYT memberCivil servants
StudentsBusinessman
FarmerUnemployed
Source: GNH Survey 2010
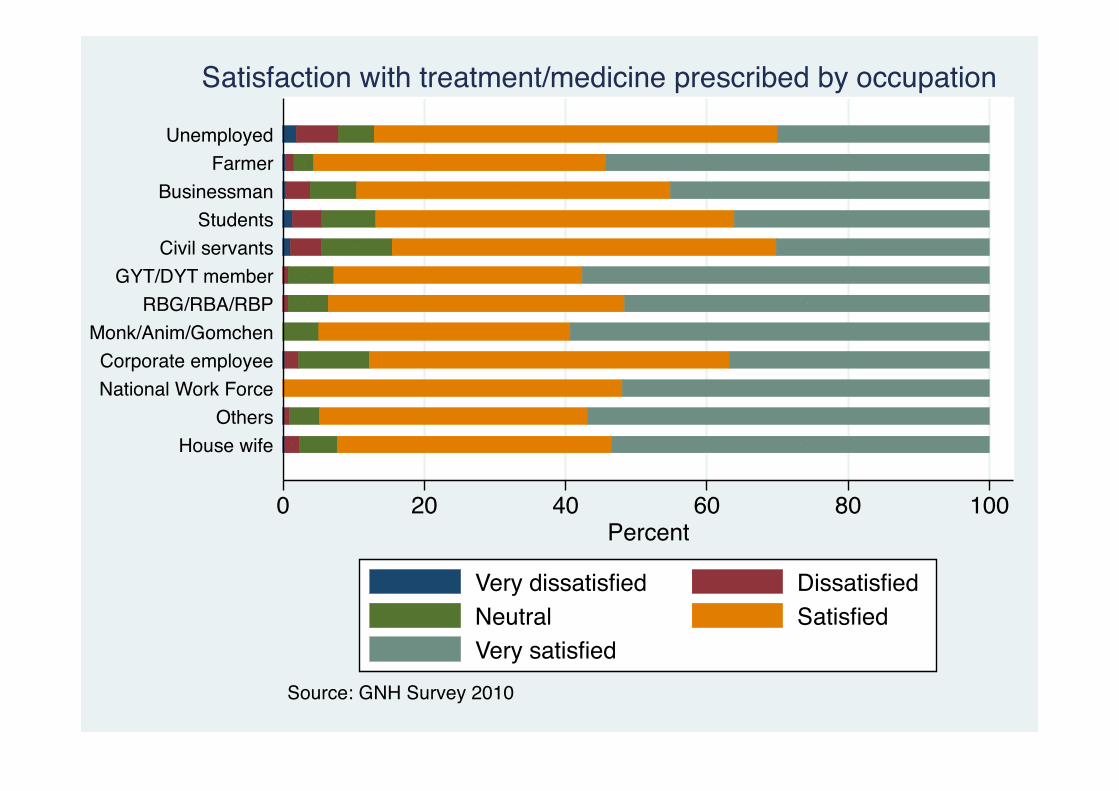
Satisfaction with treatment/medicine prescribed by occupation
Very dissatisfied DissatisfiedNeutral SatisfiedVery satisfied
1.2 3.4 8.8 49.6 37.0
0.5 3.8 8.1 47.0 40.6
0.4 2.1 5.8 45.3 46.5
0.1 1.4 2.7 42.0 53.8
0.1 1.5 2.6 46.3 49.6
0.4 0.6 3.7 38.6 56.6
0.1 1.0 3.1 37.4 58.4
0 20 40 60 80 100Percent
>225,000
150,001-225,000
100,001-150,000
75,001-100,000
50,001-75,000
25,001-50,000
0-25,000
Source: GNH Survey 2010
Satisfaction with treatment/medicine prescribed by household income
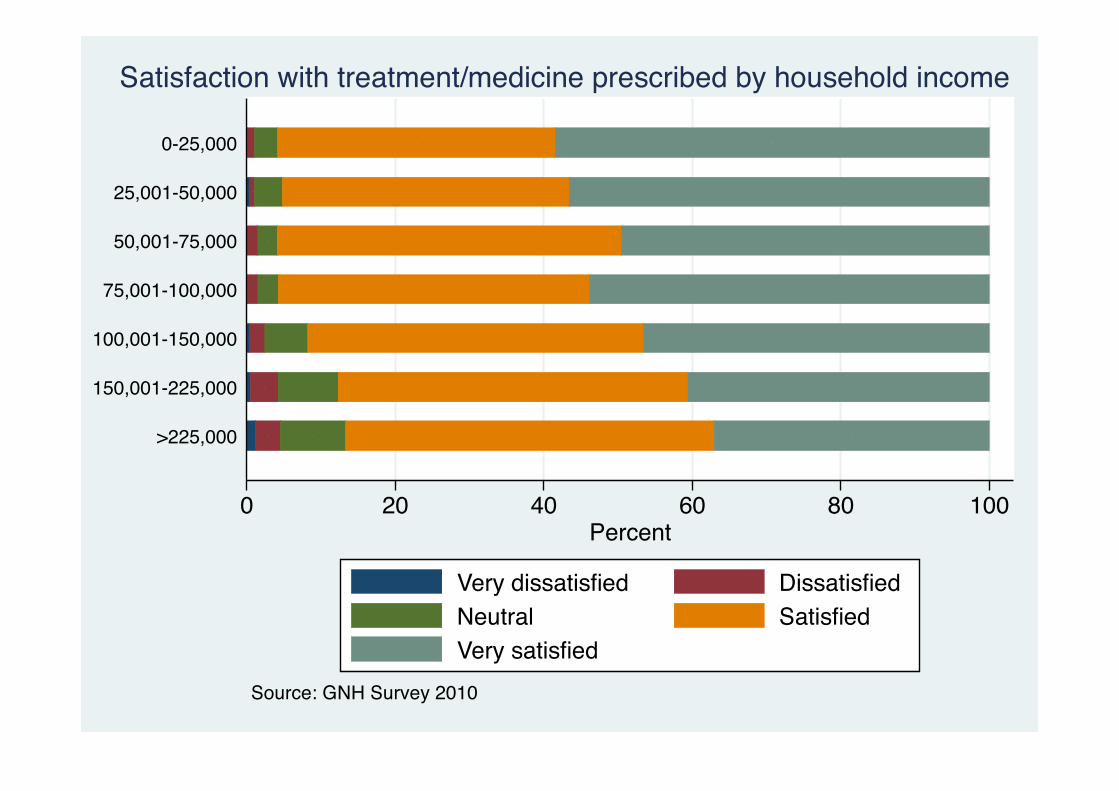
Very dissatisfied DissatisfiedNeutral SatisfiedVery satisfied
24.0 63.7 12.3
3.4 8.0 21.1 57.0 10.4
6.7 15.4 61.6 16.3
0.5 5.8 6.6 56.6 30.5
1.0 3.1 9.0 47.4 39.5
0.1 1.6 3.0 48.3 47.0
0.3 1.1 4.1 43.7 50.8
0.2 1.2 3.1 39.7 55.7
0 20 40 60 80 100Percent
Post Graduate
Bachelors Degree
Diploma/Certificate
HS education (till degree 2nd yr)
MS education (X)
LS education (VIII)
Primary education (VI)
No formal education
Source: GNH Survey 2010
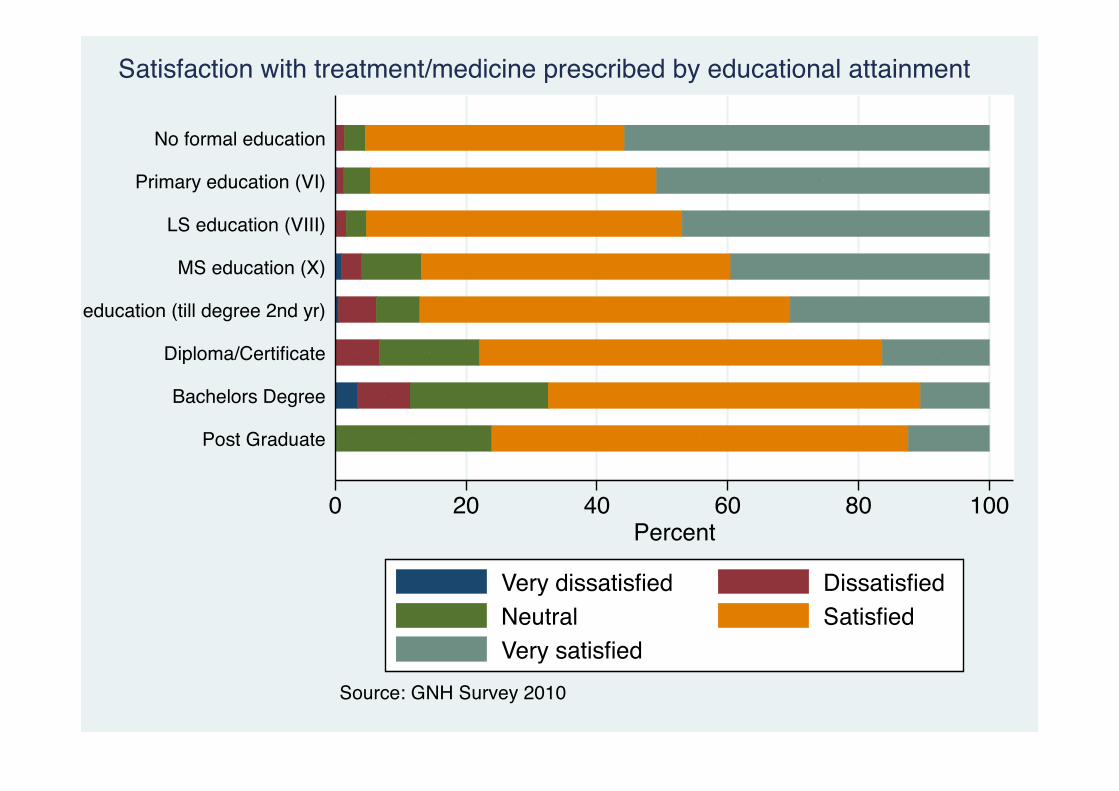
Satisfaction with treatment/medicine prescribed by educational attainment
Very dissatisfied DissatisfiedNeutral SatisfiedVery satisfied

2.1 4.6 47.6 45.7
1.42.2 6.2 42.4 47.8
0.70.7 5.9 43.9 48.8
0.8 5.6 49.0 44.6
0.31.20.4 22.8 75.4
0.32.1 28.8 68.8
0.7 3.2 6.0 35.4 54.7
0.50.92.1 45.0 51.5
0.82.7 6.0 49.4 41.0
0.12.7 4.6 65.2 27.4
1.0 3.0 3.8 41.1 51.0
0.21.12.0 66.4 30.4
0.3 4.6 3.8 50.3 41.0
0.22.9 21.2 75.8
0.92.2 33.2 63.7
0.63.2 42.4 53.8
0.7 4.3 47.3 47.8
0.21.2 7.0 55.5 36.1
0.11.2 7.5 45.9 45.3
0.82.9 3.7 49.4 43.2
0 20 40 60 80 100Percent
ZhemgangWangdue Phodrang
TsirangTrongsa
Tashi YangsteTashigang
ThimphuSarpangSamtse
Samdrup JongkharPunakha
Pema GatshelParo
MongarLhuntse
HaaGasa
DaganaChukha
Bumthang
Source: GNH Survey 2010
Satisfaction with treatment/medicine prescribed by Dzongkhag
Very dissatisfied Dissatisfied NeutralSatisfied Very satisfied
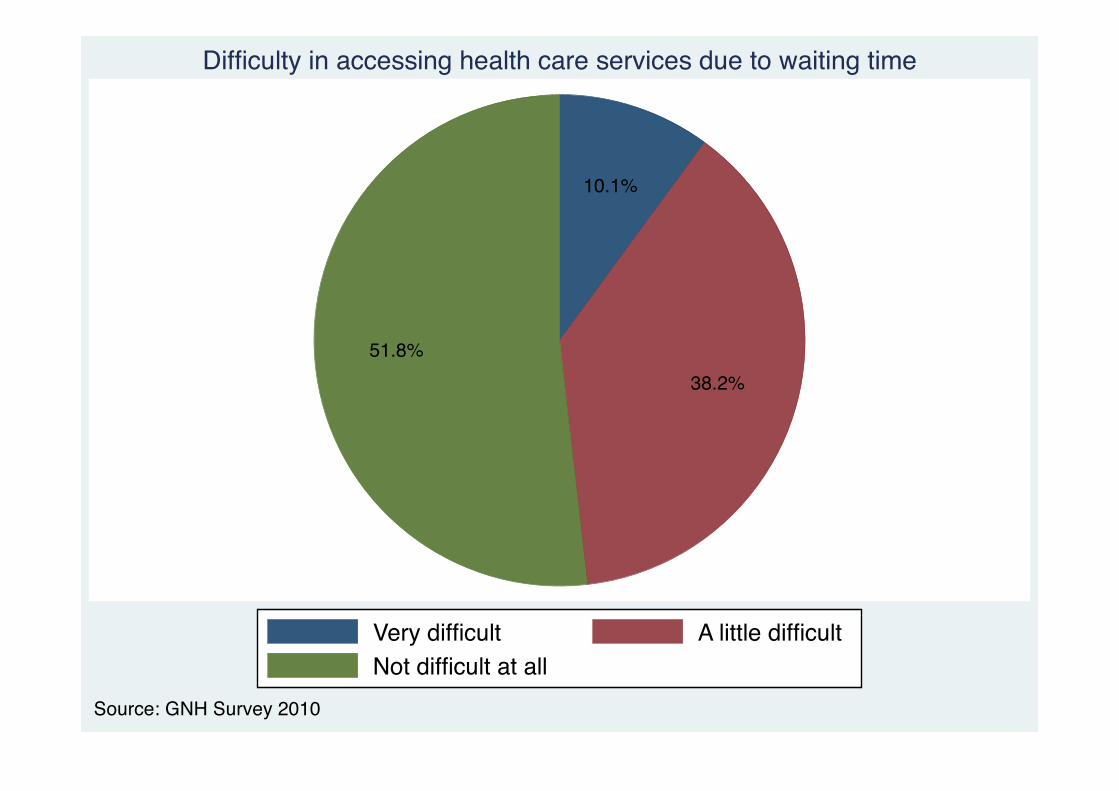
10.1%
38.2%51.8%
Very difficult A little difficultNot difficult at all
Source: GNH Survey 2010
Difficulty in accessing health care services due to waiting time
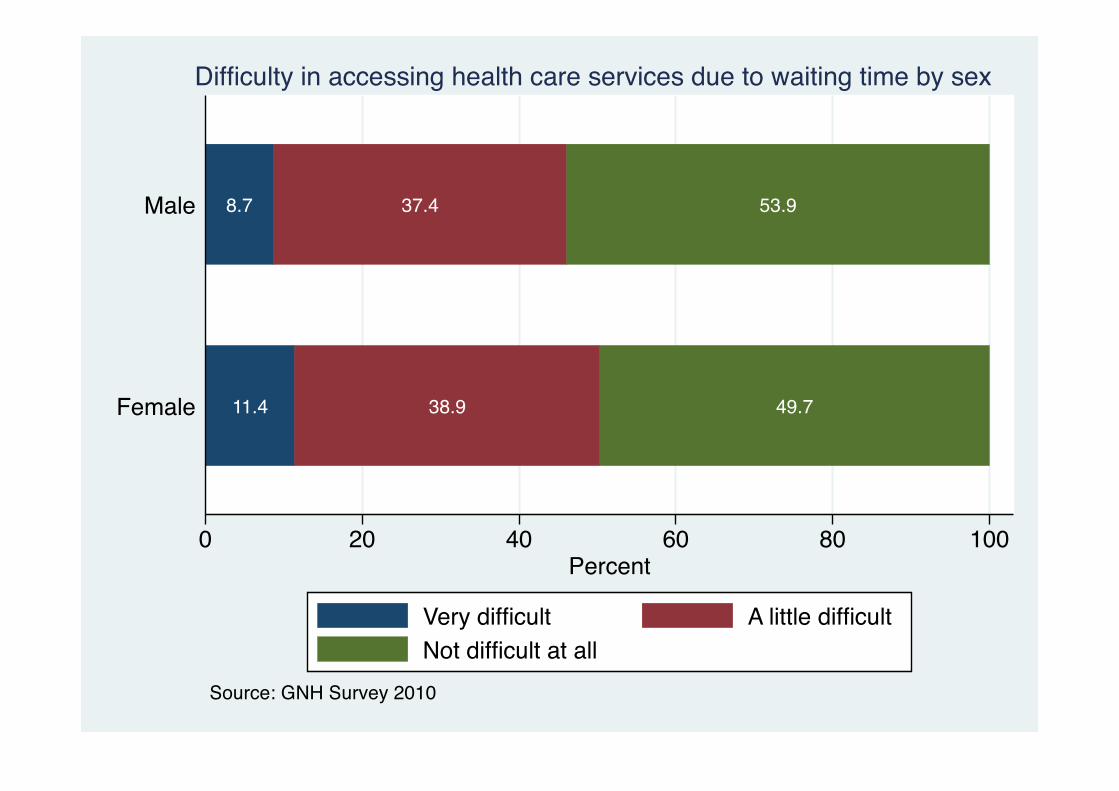
11.4 38.9 49.7
8.7 37.4 53.9
0 20 40 60 80 100Percent
Female
Male
Source: GNH Survey 2010
Difficulty in accessing health care services due to waiting time by sex
Very difficult A little difficultNot difficult at all
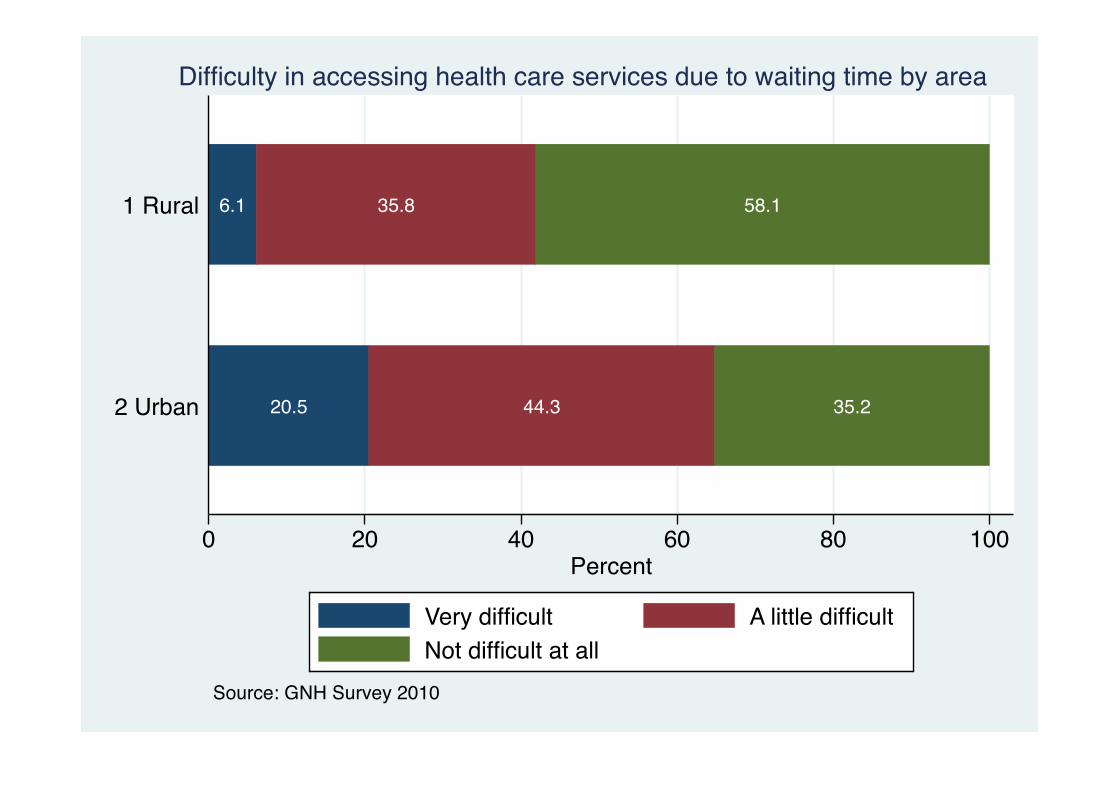
20.5 44.3 35.2
6.1 35.8 58.1
0 20 40 60 80 100Percent
2 Urban
1 Rural
Source: GNH Survey 2010
Difficulty in accessing health care services due to waiting time by area
Very difficult A little difficultNot difficult at all
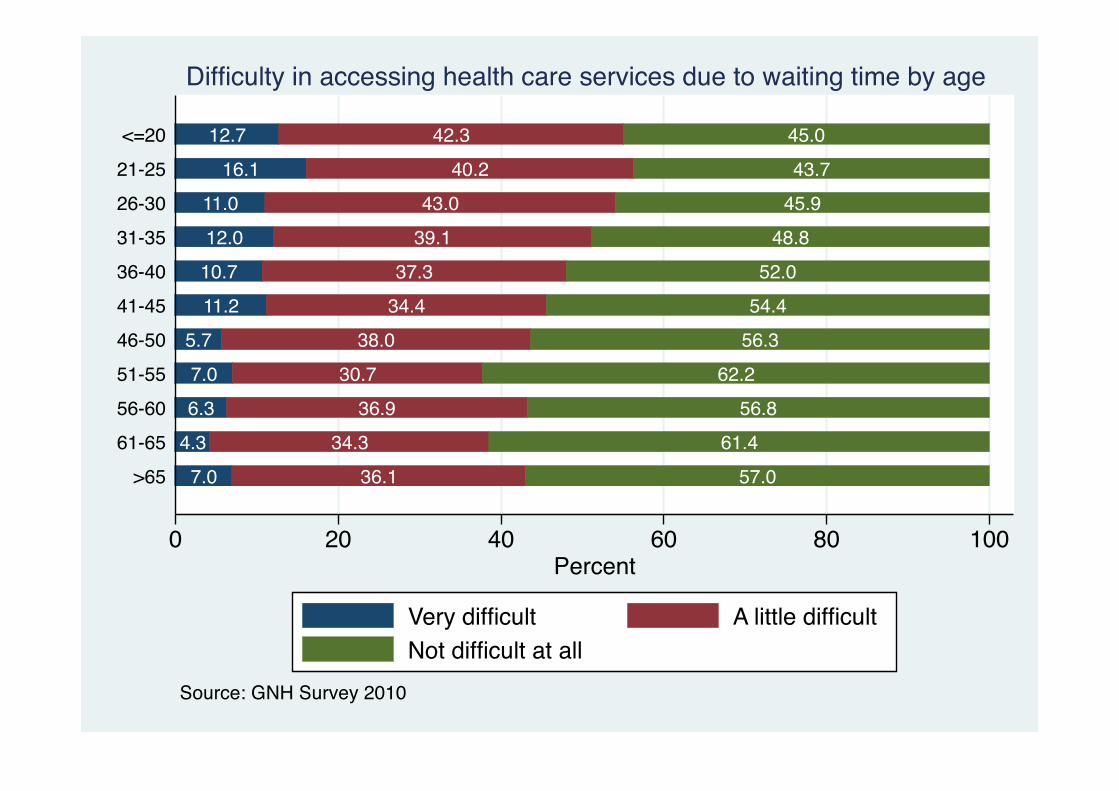
7.0 36.1 57.04.3 34.3 61.46.3 36.9 56.87.0 30.7 62.2
5.7 38.0 56.311.2 34.4 54.410.7 37.3 52.012.0 39.1 48.811.0 43.0 45.9
16.1 40.2 43.712.7 42.3 45.0
0 20 40 60 80 100Percent
>6561-6556-6051-5546-5041-4536-4031-3526-3021-25<=20
Source: GNH Survey 2010
Difficulty in accessing health care services due to waiting time by age
Very difficult A little difficultNot difficult at all
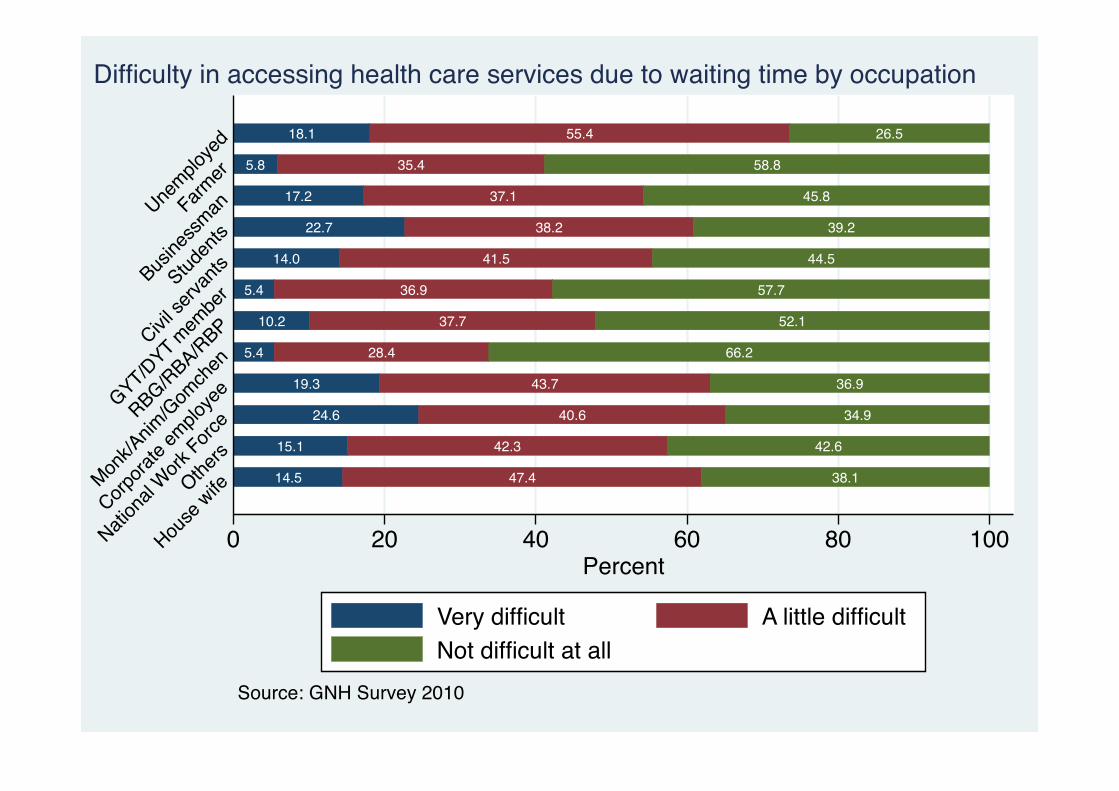
14.5 47.4 38.1
15.1 42.3 42.6
24.6 40.6 34.9
19.3 43.7 36.9
5.4 28.4 66.2
10.2 37.7 52.1
5.4 36.9 57.7
14.0 41.5 44.5
22.7 38.2 39.2
17.2 37.1 45.8
5.8 35.4 58.8
18.1 55.4 26.5
0 20 40 60 80 100Percent
House
wifeOthers
Nation
al Work
Force
Corpora
te em
ploye
e
Monk/A
nim/G
omch
en
RBG/RBA/RBP
GYT/DYT mem
ber
Civil se
rvantsStud
ents
Busine
ssmanFarmer
Unemplo
yed
Source: GNH Survey 2010
Difficulty in accessing health care services due to waiting time by occupation
Very difficult A little difficultNot difficult at all

17.7 41.5 40.8
14.4 38.6 47.0
10.7 42.2 47.1
11.2 38.0 50.9
7.4 40.1 52.5
6.2 40.1 53.7
7.3 30.4 62.3
0 20 40 60 80 100Percent
>225,000
150,001-225,000
100,001-150,000
75,001-100,000
50,001-75,000
25,001-50,000
0-25,000
Source: GNH Survey 2010
Difficulty in accessing health care services due to waiting time by household income
Very difficult A little difficultNot difficult at all

42.4 39.3 18.4
22.2 43.2 34.6
19.9 46.0 34.1
23.0 40.3 36.7
13.7 42.9 43.4
12.8 43.1 44.0
7.3 36.8 55.9
8.0 36.9 55.2
0 20 40 60 80 100PercentPos
t Grad
uate
Bache
lors D
egree
Diploma/C
ertific
ate
HS educ
ation
(till d
egree
2nd y
r)
MS educ
ation
(X)
LS ed
ucati
on (V
III)
Primary
educ
ation
(VI)
No form
al ed
ucati
on
Source: GNH Survey 2010
Difficulty in accessing health care services due to waiting time by educational attainment
Very difficult A little difficultNot difficult at all

2.5 22.4 75.1
8.4 37.9 53.6
2.4 34.5 63.1
6.5 35.2 58.3
6.0 28.9 65.1
5.3 32.4 62.3
35.1 43.3 21.6
2.7 22.2 75.1
7.2 45.1 47.7
10.1 57.2 32.7
5.6 46.1 48.3
4.7 58.8 36.4
12.8 50.5 36.7
2.3 20.5 77.1
5.5 27.4 67.1
0.6 28.0 71.4
2.1 25.9 72.1
3.0 36.4 60.6
10.5 34.5 55.0
7.0 39.7 53.2
0 20 40 60 80 100Percent
ZhemgangWangdue Phodrang
TsirangTrongsa
Tashi YangsteTashigang
ThimphuSarpangSamtse
Samdrup JongkharPunakha
Pema GatshelParo
MongarLhuntse
HaaGasa
DaganaChukha
Bumthang
Source: GNH Survey 2010
Difficulty in accessing health care services due to waiting time by Dzongkhag
Very difficult A little difficultNot difficult at all
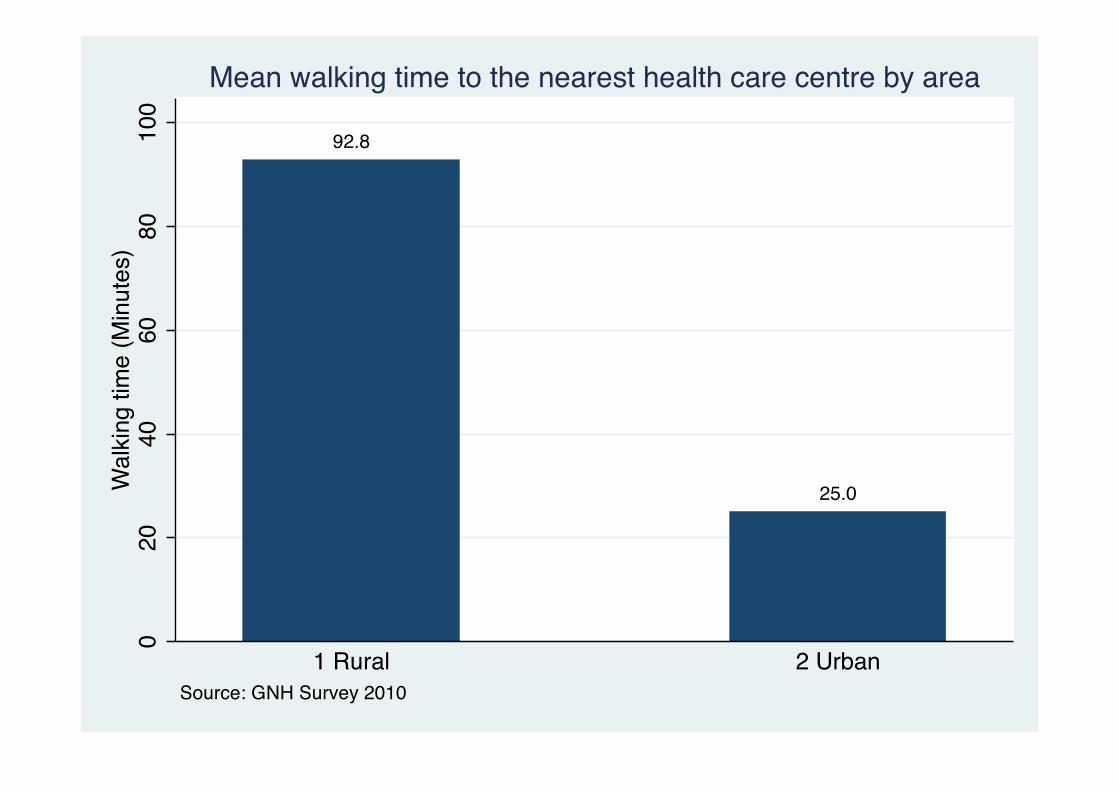
92.8
25.0
020
4060
8010
0W
alki
ng ti
me
(Min
utes
)
1 Rural 2 UrbanSource: GNH Survey 2010
Mean walking time to the nearest health care centre by area
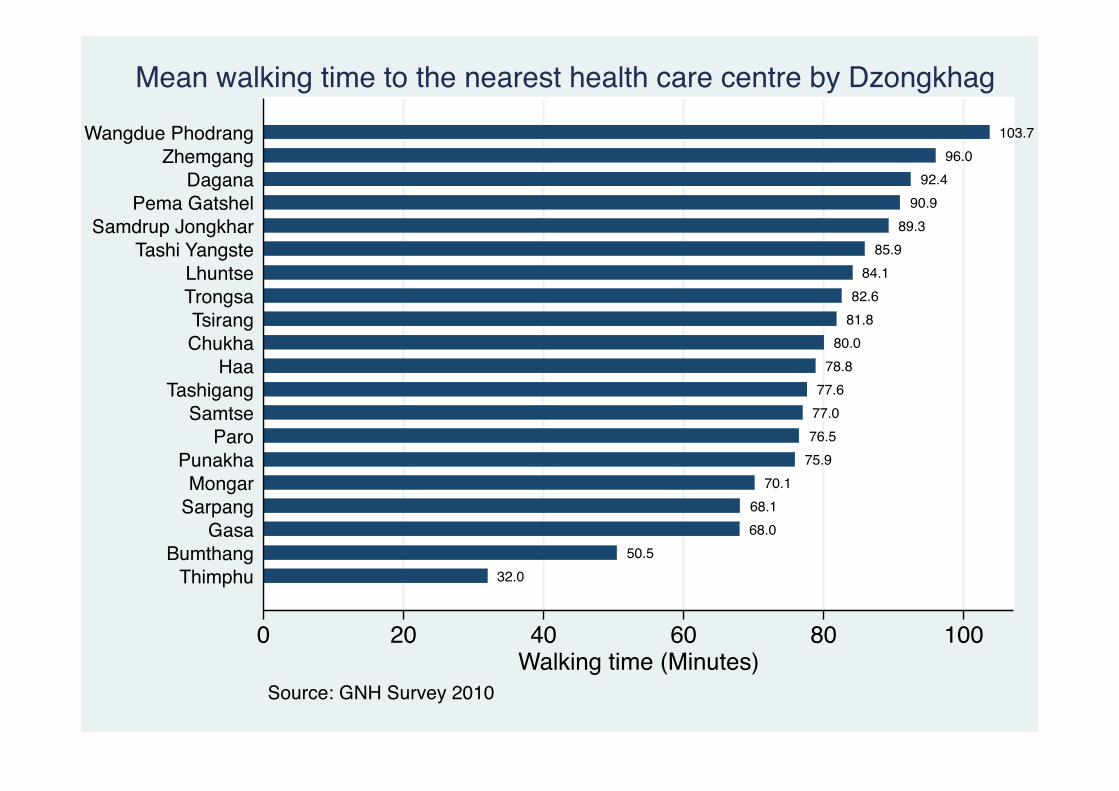
32.050.5
68.068.1
70.175.976.577.077.6
78.880.0
81.882.6
84.185.9
89.390.9
92.496.0
103.7
0 20 40 60 80 100Walking time (Minutes)
ThimphuBumthang
GasaSarpangMongar
PunakhaParo
SamtseTashigang
HaaChukhaTsirang
TrongsaLhuntse
Tashi YangsteSamdrup Jongkhar
Pema GatshelDagana
ZhemgangWangdue Phodrang
Source: GNH Survey 2010
Mean walking time to the nearest health care centre by Dzongkhag

5.6%
94.4%
Yes NoSource: GNH Survey 2010
Suicidal ideation in life
3.4%
96.6%
Yes NoSource: GNH Survey 2010
Suicidal ideation in past 12 months
0.9%
99.1%
Yes NoSource: GNH Survey 2010
Suicidal attempt in life
0.5%
99.5%
Yes NoSource: GNH Survey 2010
Suicidal attempt in past 12 months
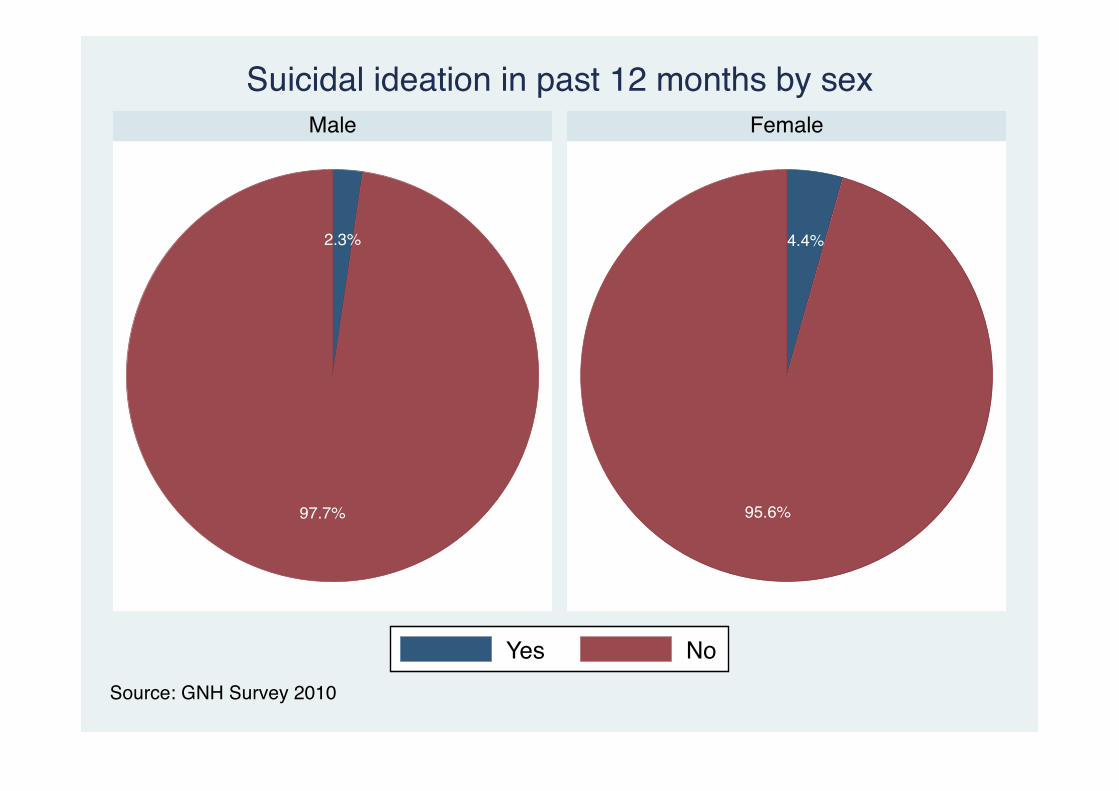
2.3%
97.7%
4.4%
95.6%
Male Female
Yes NoSource: GNH Survey 2010
Suicidal ideation in past 12 months by sex

4.0%
96.0%
1.7%
98.3%
1 Rural 2 Urban
Yes NoSource: GNH Survey 2010
Suicidal ideation in past 12 months by area
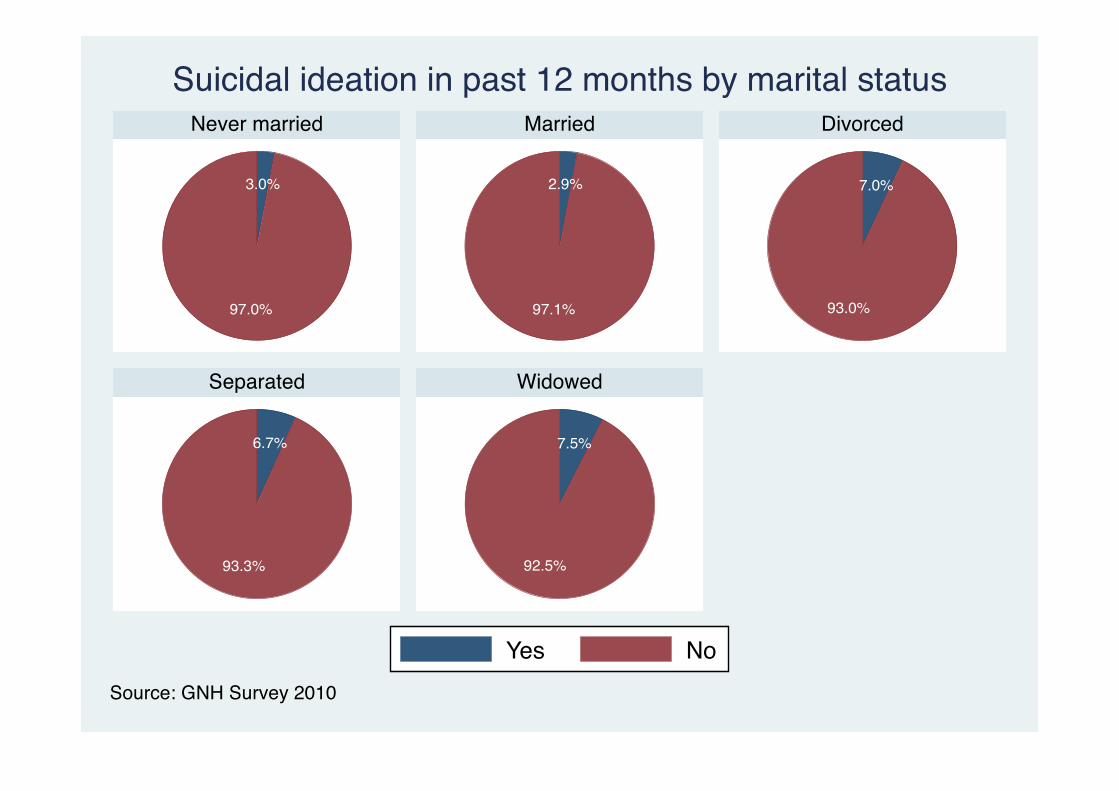
3.0%
97.0%
2.9%
97.1%
7.0%
93.0%
6.7%
93.3%
7.5%
92.5%
Never married Married Divorced
Separated Widowed
Yes NoSource: GNH Survey 2010
Suicidal ideation in past 12 months by marital status

15.3 84.7
8.3 91.7
2.1 97.9
0 20 40 60 80 100Percent
Severe mental distress
Some mental distress
Normal mental wellbeing
Source: GNH Survey 2010
Suicidal ideation in past 12 months by mental wellbeing
Yes No
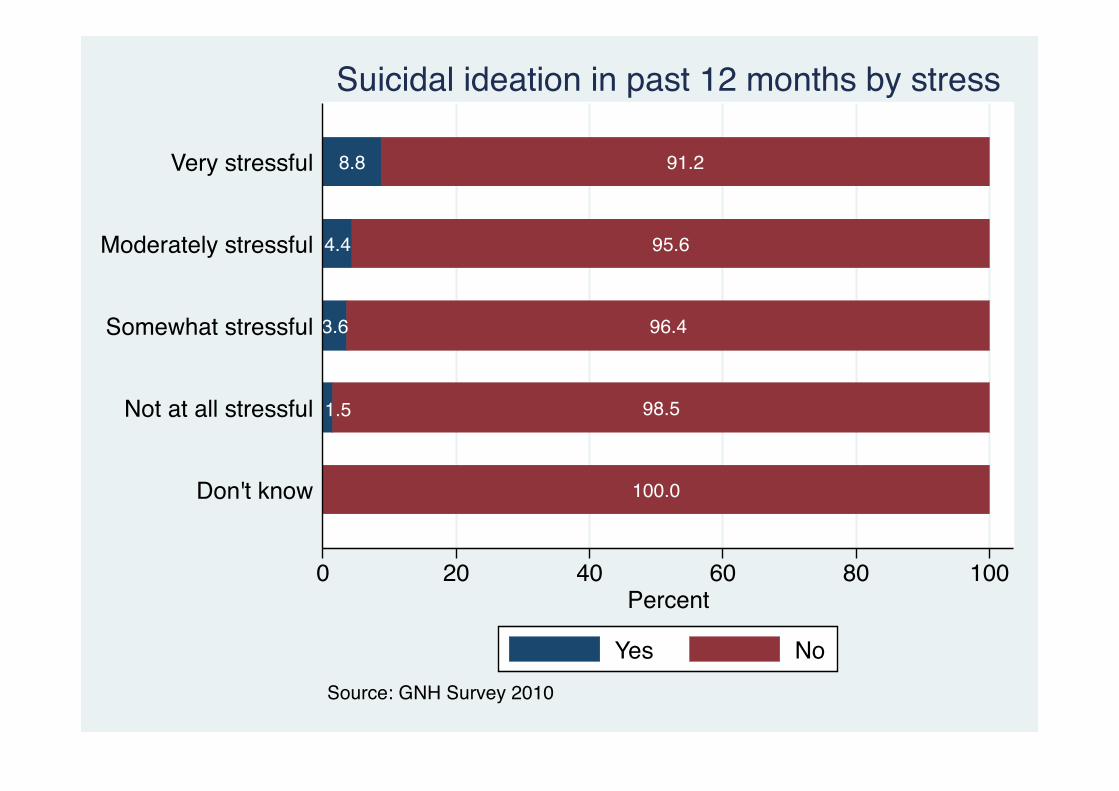
100.0
1.5 98.5
3.6 96.4
4.4 95.6
8.8 91.2
0 20 40 60 80 100Percent
Don't know
Not at all stressful
Somewhat stressful
Moderately stressful
Very stressful
Source: GNH Survey 2010
Suicidal ideation in past 12 months by stress
Yes No
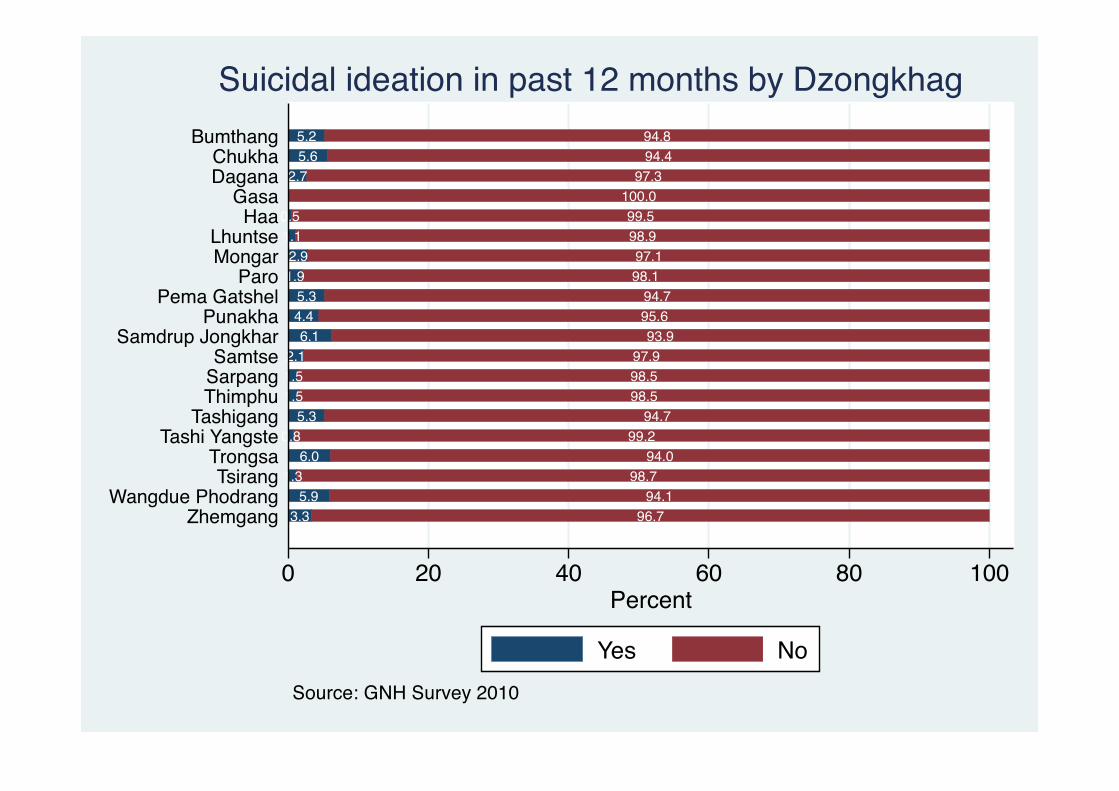
3.3 96.75.9 94.1
1.3 98.76.0 94.0
0.8 99.25.3 94.7
1.5 98.51.5 98.52.1 97.9
6.1 93.94.4 95.65.3 94.7
1.9 98.12.9 97.1
1.1 98.90.5 99.5
100.02.7 97.3
5.6 94.45.2 94.8
0 20 40 60 80 100Percent
ZhemgangWangdue Phodrang
TsirangTrongsa
Tashi YangsteTashigang
ThimphuSarpangSamtse
Samdrup JongkharPunakha
Pema GatshelParo
MongarLhuntse
HaaGasa
DaganaChukha
Bumthang
Source: GNH Survey 2010
Suicidal ideation in past 12 months by Dzongkhag
Yes No

0.3%
99.7%
0.7%
99.3%
Male Female
Yes NoSource: GNH Survey 2010
Suicidal attempt in past 12 months by sex

0.5%
99.5%
0.3%
99.7%
1 Rural 2 Urban
Yes NoSource: GNH Survey 2010
Suicidal attempt in past 12 months by area

0.6%
99.4%
0.4%
99.6%
0.3%
99.7%
1.5%
98.5%
1.2%
98.8%
Never married Married Divorced
Separated Widowed
Yes NoSource: GNH Survey 2010
Suicidal attempt in past 12 months by marital status
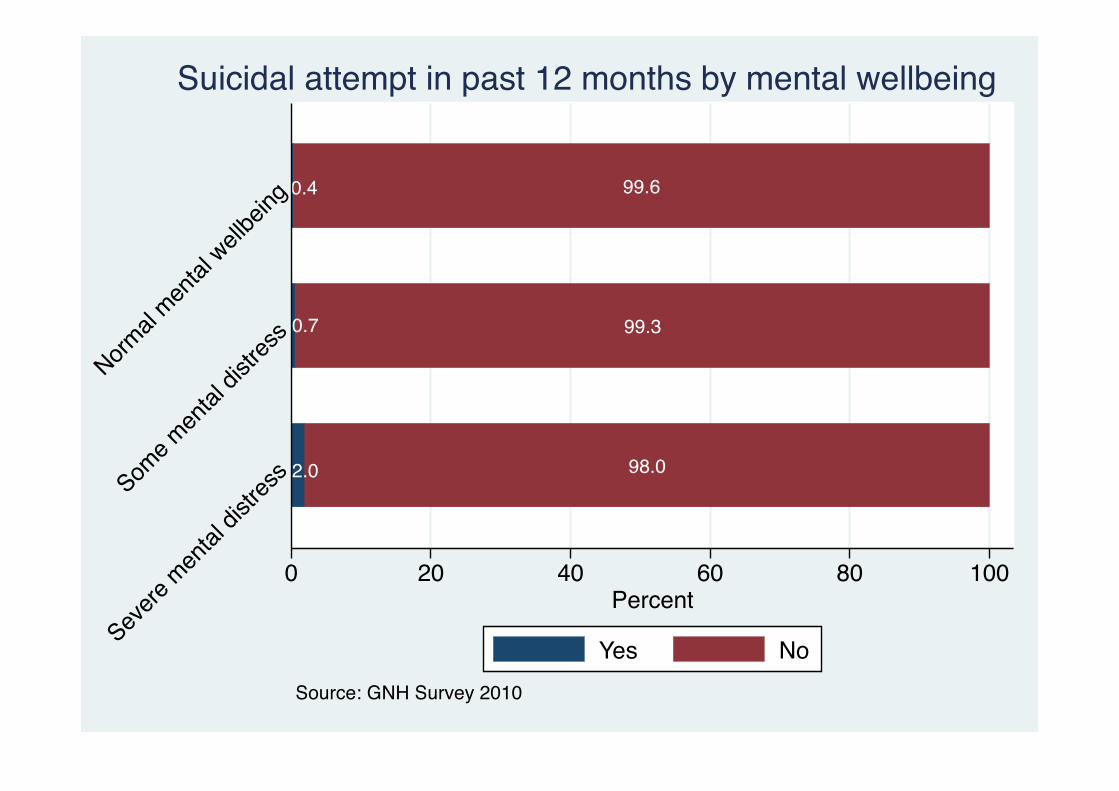
2.0 98.0
0.7 99.3
0.4 99.6
0 20 40 60 80 100Percent
Severe
men
tal di
stres
sSome m
ental
distr
ess
Normal
mental
wellbein
g
Source: GNH Survey 2010
Suicidal attempt in past 12 months by mental wellbeing
Yes No
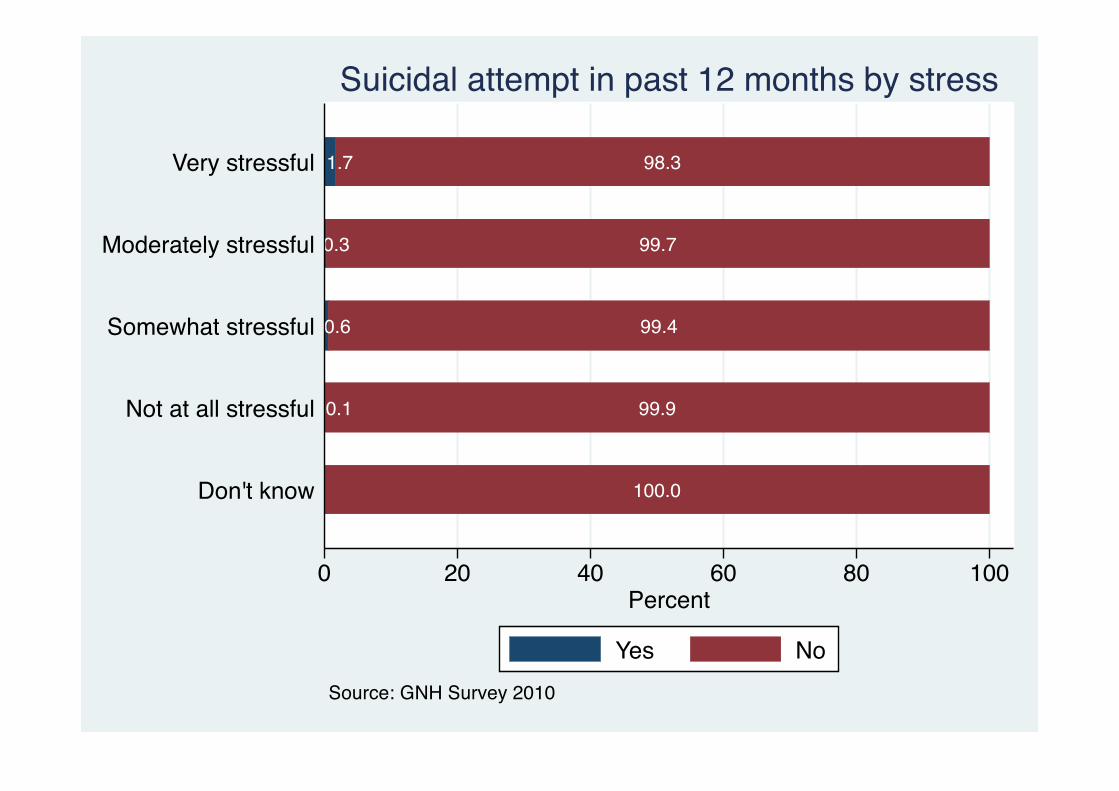
100.0
0.1 99.9
0.6 99.4
0.3 99.7
1.7 98.3
0 20 40 60 80 100Percent
Don't know
Not at all stressful
Somewhat stressful
Moderately stressful
Very stressful
Source: GNH Survey 2010
Suicidal attempt in past 12 months by stress
Yes No
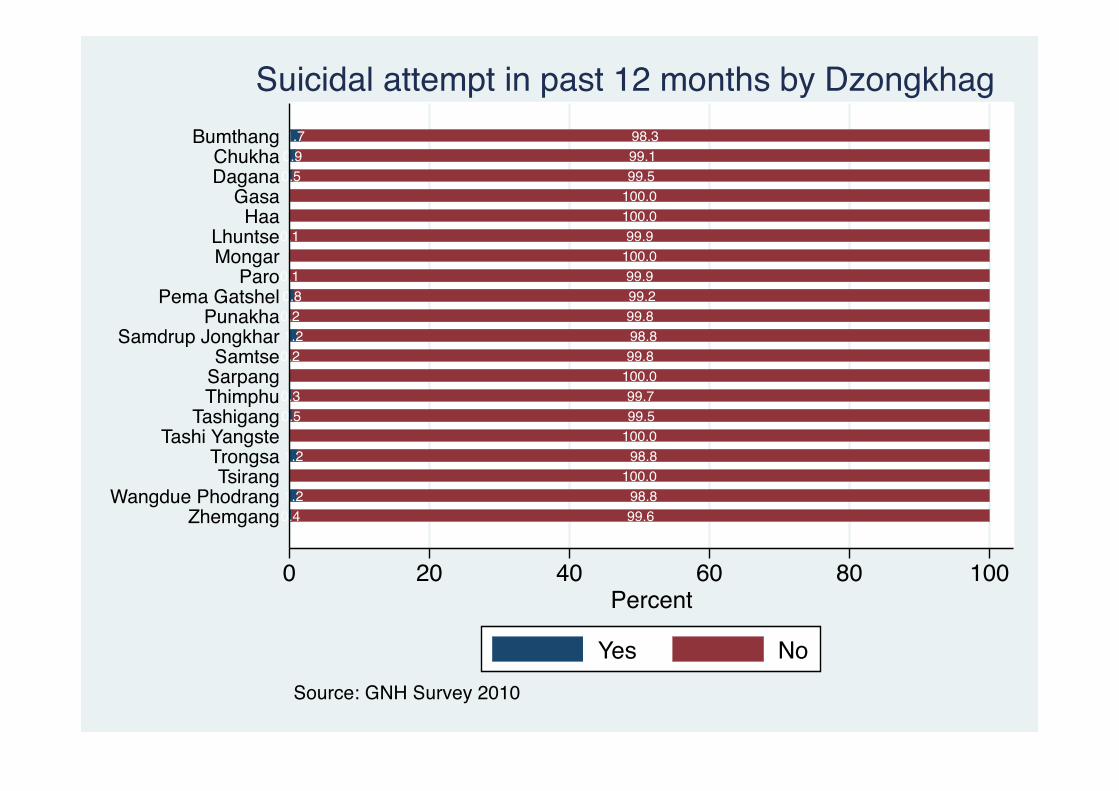
0.4 99.61.2 98.8
100.01.2 98.8
100.00.5 99.50.3 99.7
100.00.2 99.81.2 98.80.2 99.80.8 99.20.1 99.9
100.00.1 99.9
100.0100.0
0.5 99.50.9 99.11.7 98.3
0 20 40 60 80 100Percent
ZhemgangWangdue Phodrang
TsirangTrongsa
Tashi YangsteTashigang
ThimphuSarpangSamtse
Samdrup JongkharPunakha
Pema GatshelParo
MongarLhuntse
HaaGasa
DaganaChukha
Bumthang
Source: GNH Survey 2010
Suicidal attempt in past 12 months by Dzongkhag
Yes No

Time Use and Balance
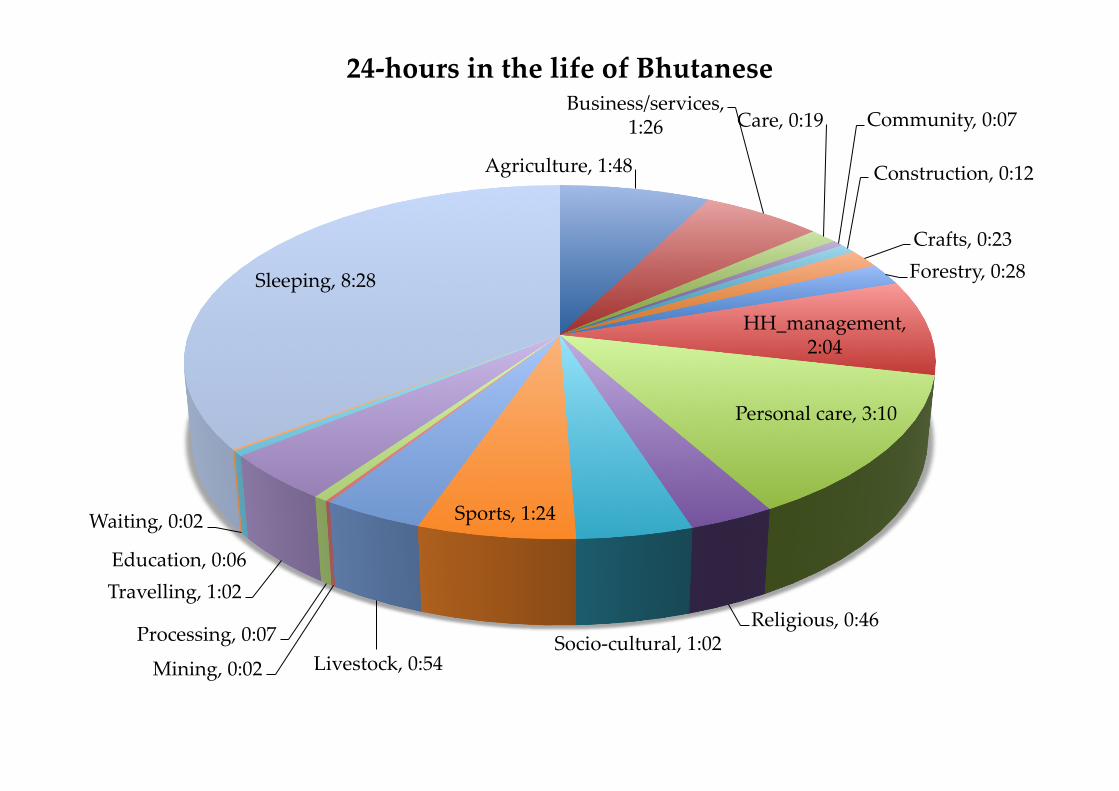
Agriculture, 1:48
Business/services, 1:26 Care, 0:19 Community, 0:07
Construction, 0:12
Crafts, 0:23 Forestry, 0:28
HH_management, 2:04
Personal care, 3:10
Religious, 0:46 Socio-‐‑cultural, 1:02
Sports, 1:24
Livestock, 0:54 Mining, 0:02
Processing, 0:07
Travelling, 1:02 Education, 0:06
Waiting, 0:02
Sleeping, 8:28
24-‐‑hours in the life of Bhutanese
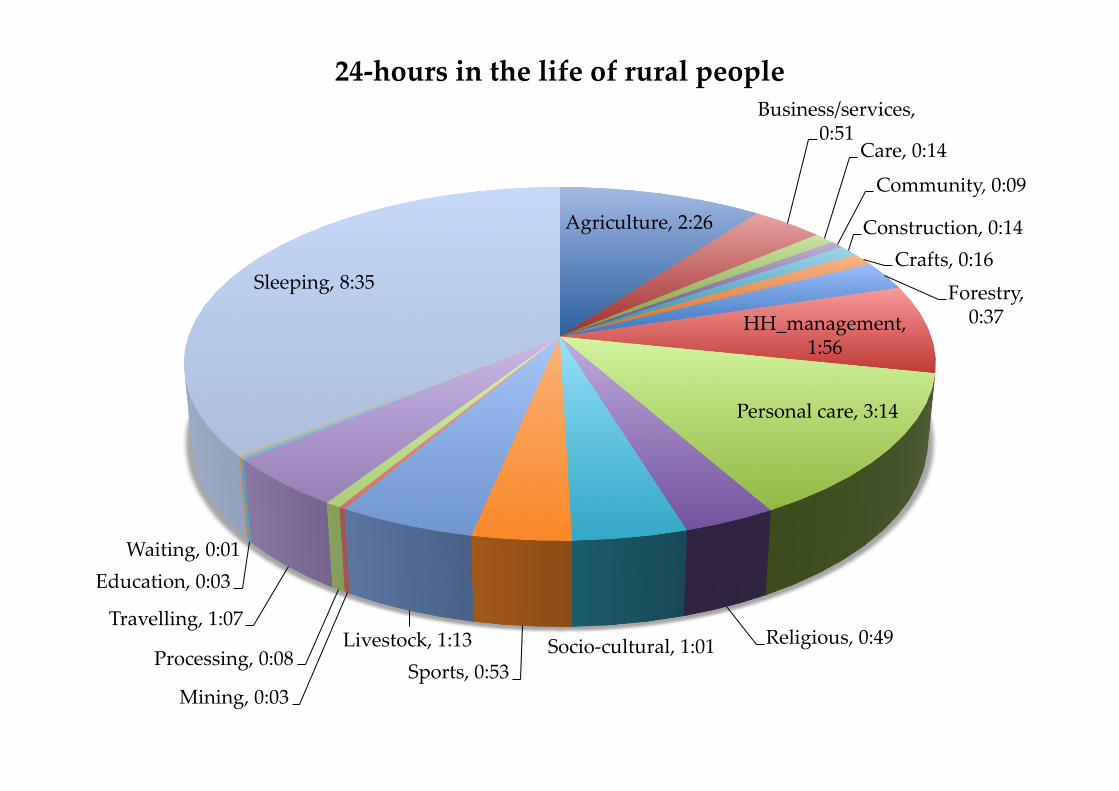
Agriculture, 2:26
Business/services, 0:51
Care, 0:14
Community, 0:09
Construction, 0:14 Crafts, 0:16
Forestry, 0:37 HH_management,
1:56
Personal care, 3:14
Religious, 0:49 Socio-‐‑cultural, 1:01 Sports, 0:53
Livestock, 1:13
Mining, 0:03
Processing, 0:08
Travelling, 1:07
Education, 0:03 Waiting, 0:01
Sleeping, 8:35
24-‐‑hours in the life of rural people

Agriculture, 0:07
Business/services, 2:58
Care, 0:33 Community, 0:03
Construction, 0:06
Crafts, 0:43 Forestry, 0:03
HH_management, 2:27
Personal care, 3:00
Religious, 0:36 Socio-‐‑cultural, 1:04
Sports, 2:49
Livestock, 0:02
Mining, 0:00
Processing, 0:04 Travelling, 0:49
Education, 0:15
Waiting, 0:03
Sleeping, 8:09
24-‐‑hours in the life of urban people
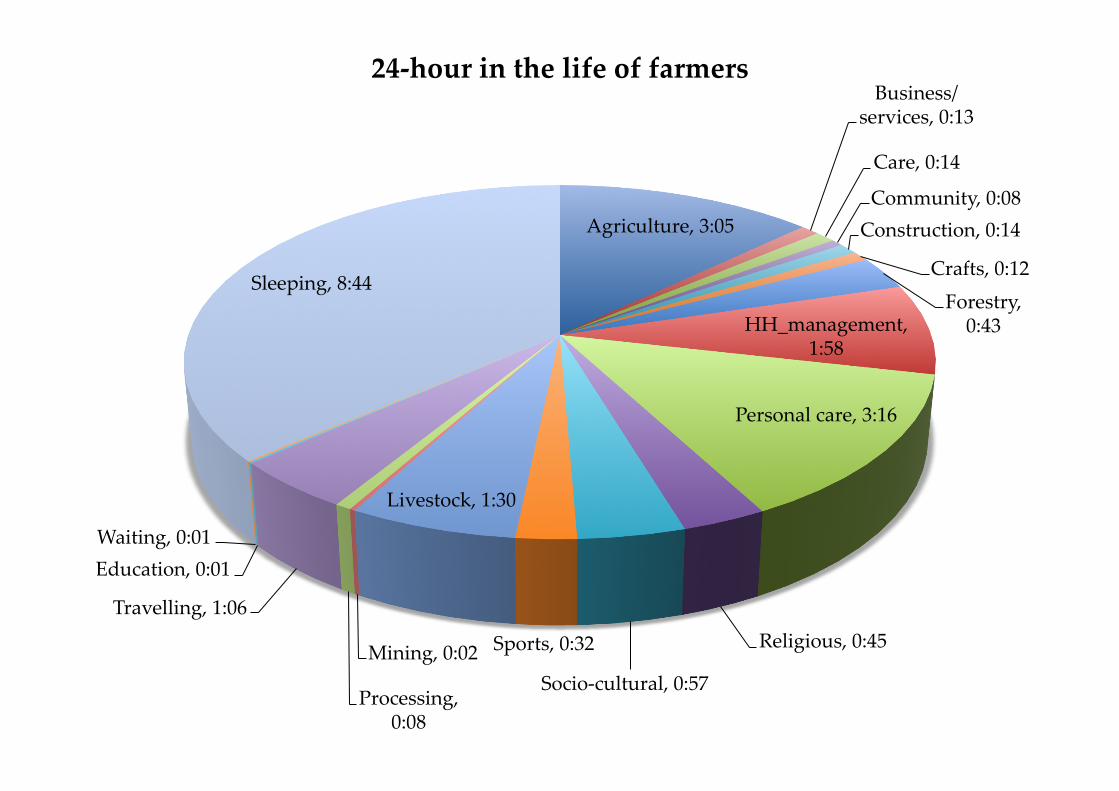
Agriculture, 3:05
Business/services, 0:13
Care, 0:14
Community, 0:08 Construction, 0:14
Crafts, 0:12 Forestry, 0:43 HH_management,
1:58
Personal care, 3:16
Religious, 0:45
Socio-‐‑cultural, 0:57
Sports, 0:32
Livestock, 1:30
Mining, 0:02
Processing, 0:08
Travelling, 1:06
Education, 0:01 Waiting, 0:01
Sleeping, 8:44
24-‐‑hour in the life of farmers
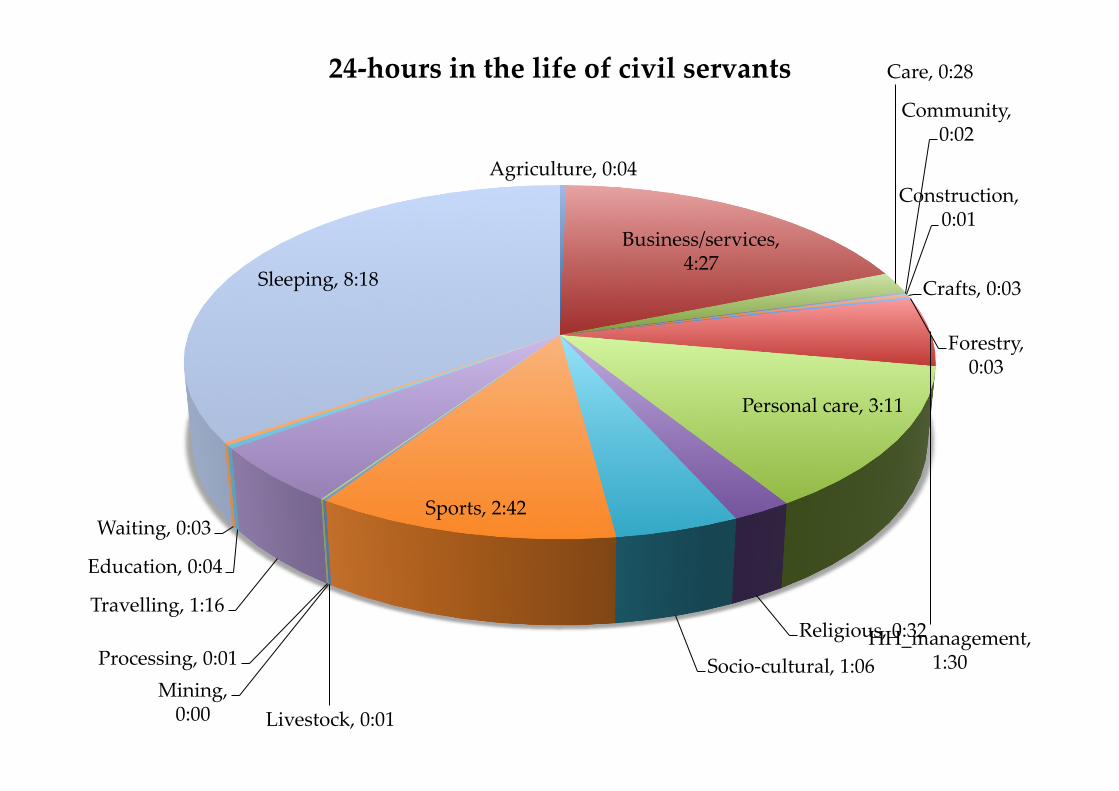
Agriculture, 0:04
Business/services, 4:27
Care, 0:28
Community, 0:02
Construction, 0:01
Crafts, 0:03
Forestry, 0:03
HH_management, 1:30
Personal care, 3:11
Religious, 0:32
Socio-‐‑cultural, 1:06
Sports, 2:42
Livestock, 0:01 Mining, 0:00
Processing, 0:01
Travelling, 1:16
Education, 0:04
Waiting, 0:03
Sleeping, 8:18
24-‐‑hours in the life of civil servants
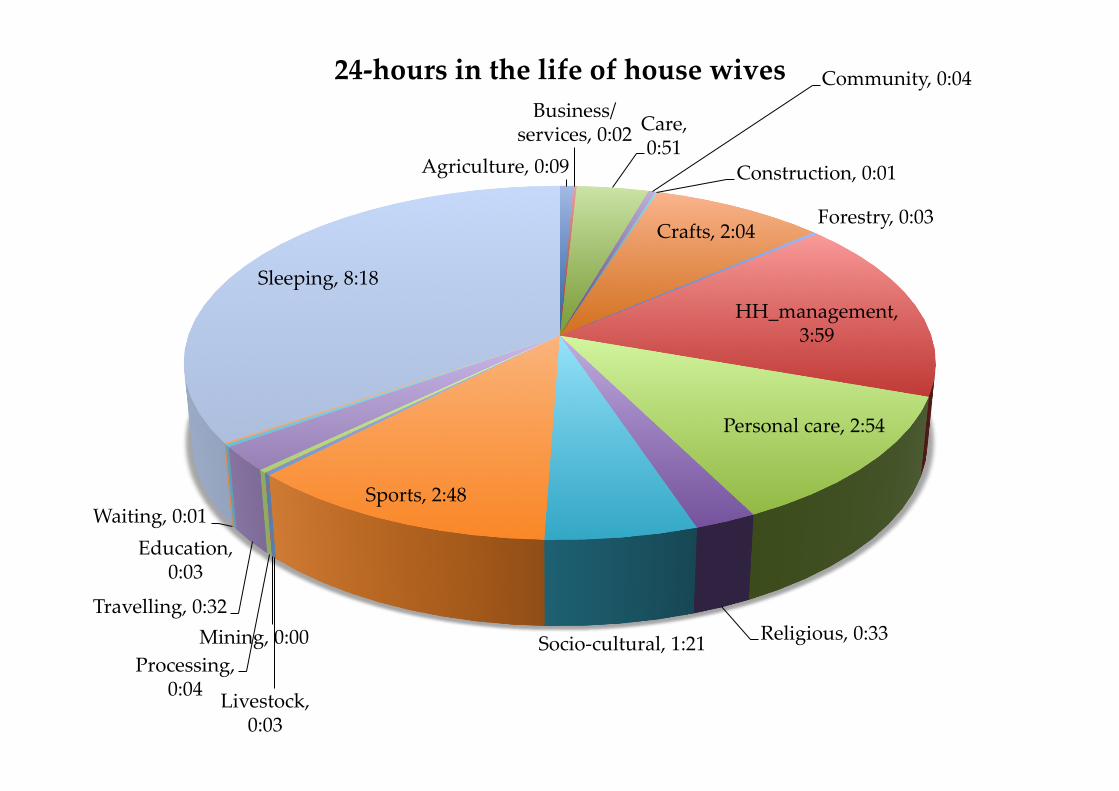
Agriculture, 0:09
Business/services, 0:02 Care, 0:51
Community, 0:04
Construction, 0:01
Crafts, 2:04 Forestry, 0:03
HH_management, 3:59
Personal care, 2:54
Religious, 0:33 Socio-‐‑cultural, 1:21
Sports, 2:48
Livestock, 0:03
Mining, 0:00 Processing,
0:04
Travelling, 0:32
Education, 0:03
Waiting, 0:01
Sleeping, 8:18
24-‐‑hours in the life of house wives

32.59%
32.13%
35.28%
work nonworksleeptime
Source: GNH Survey 2010
Time spent on work, nonwork and sleep
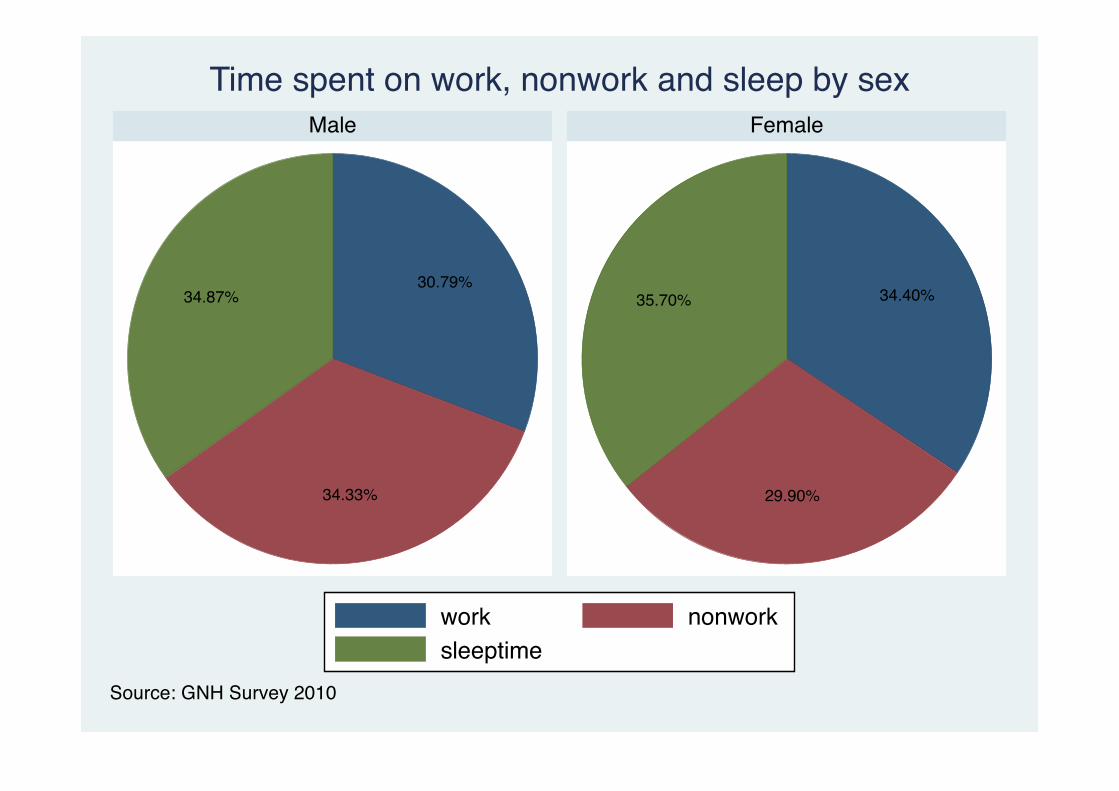
30.79%
34.33%
34.87% 34.40%
29.90%
35.70%
Male Female
work nonworksleeptime
Source: GNH Survey 2010
Time spent on work, nonwork and sleep by sex
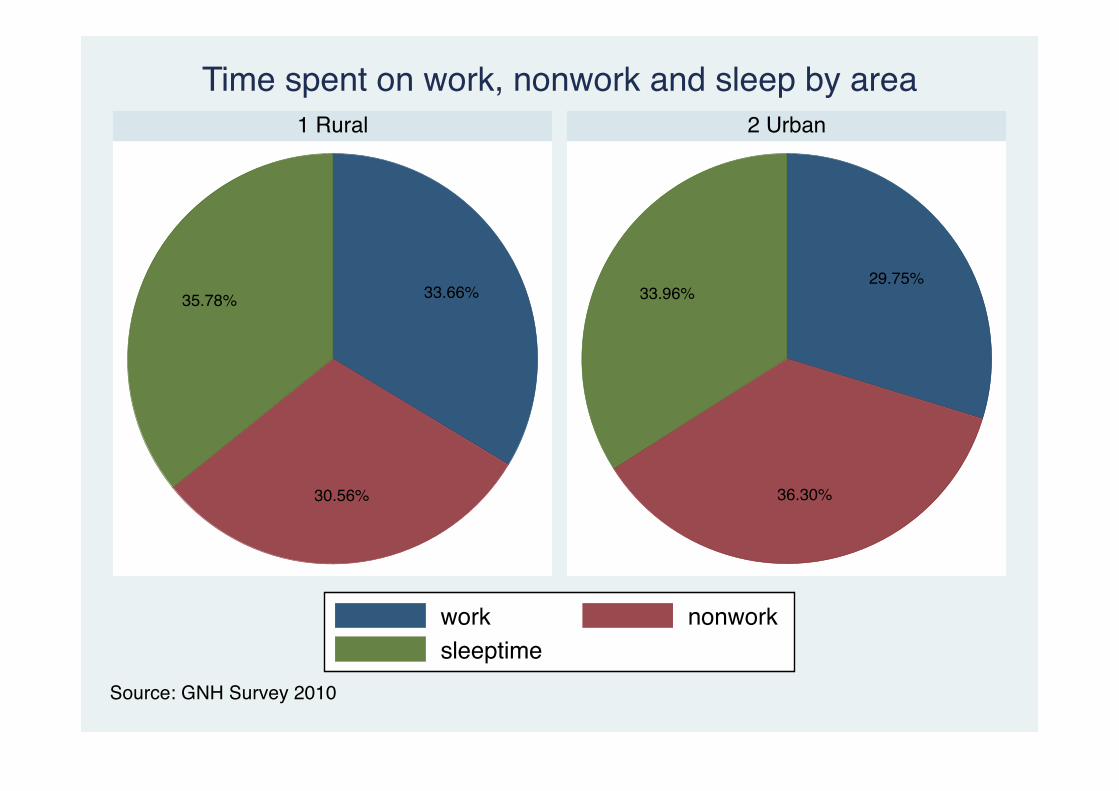
33.66%
30.56%
35.78%29.75%
36.30%
33.96%
1 Rural 2 Urban
work nonworksleeptime
Source: GNH Survey 2010
Time spent on work, nonwork and sleep by area

467
524
424445
010
020
030
040
050
0Ti
me
(in m
inut
es)
1 Rural 2 UrbanMale Female Male Female
Source: GNH Survey 2010
Mean time spent on work by sex and area
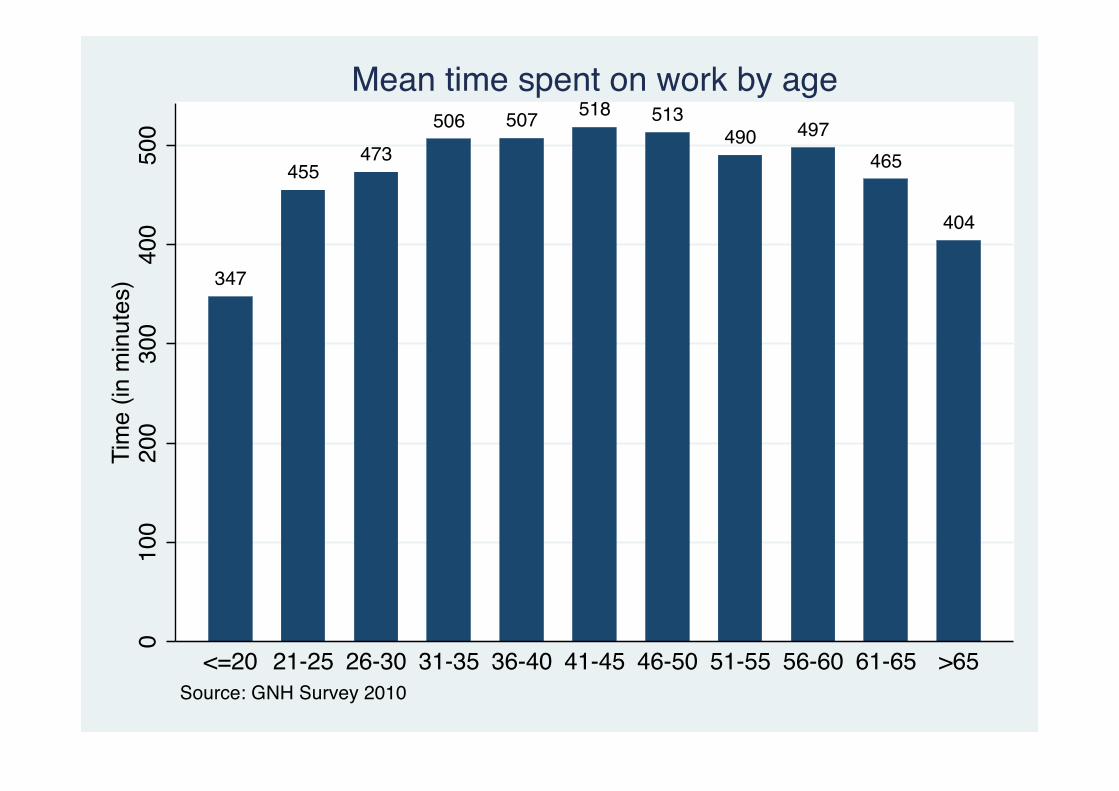
347
455473
506 507 518 513490 497
465
404
010
020
030
040
050
0Ti
me
(in m
inut
es)
<=20 21-25 26-30 31-35 36-40 41-45 46-50 51-55 56-60 61-65 >65Source: GNH Survey 2010
Mean time spent on work by age
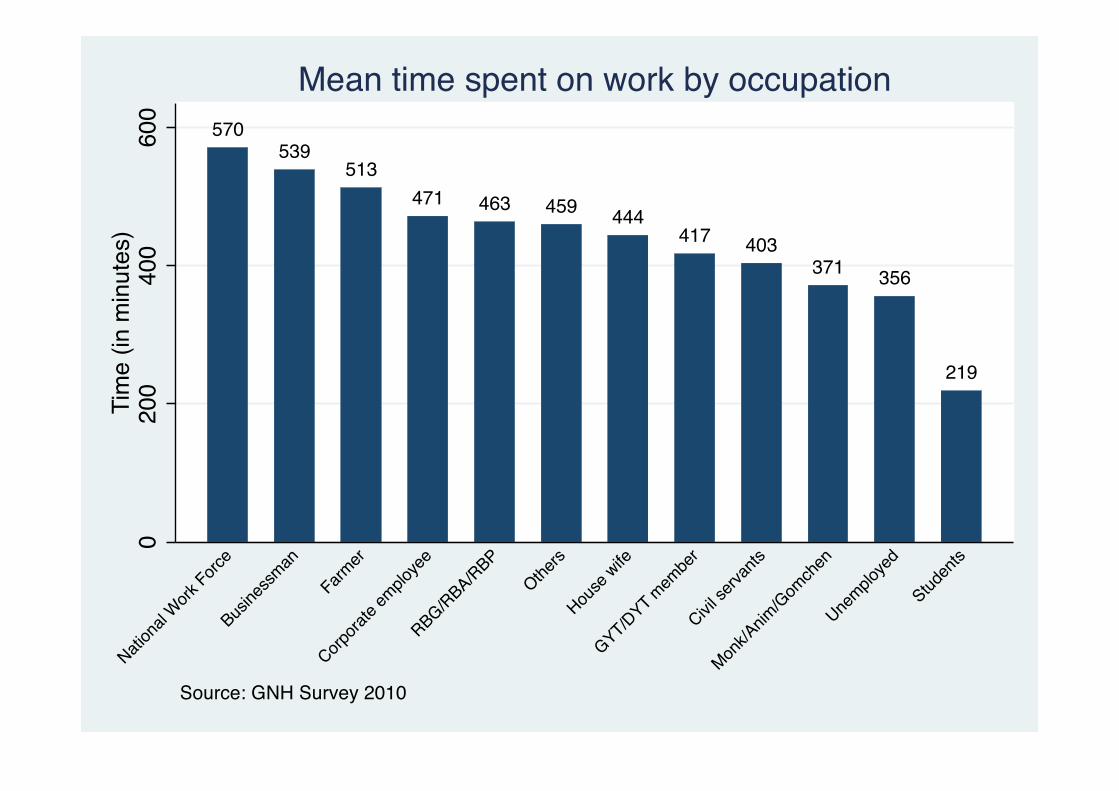
570539
513471 463 459 444
417 403371 356
219
020
040
060
0Ti
me
(in m
inut
es)
Nation
al Work
Force
Busine
ssman
Farmer
Corpora
te em
ploye
e
RBG/RBA/RBPOthe
rs
House
wife
GYT/DYT mem
ber
Civil se
rvants
Monk/A
nim/G
omch
en
Unemplo
yed
Studen
ts
Source: GNH Survey 2010
Mean time spent on work by occupation

504 487
432 421
348 353395 382
010
020
030
040
050
0Ti
me
(in m
inut
es)
No form
al ed
ucati
on
Primary
educ
ation
(VI)
LS ed
ucati
on (V
III)
MS educ
ation
(X)
HS educ
ation
(till d
egree
2nd y
r)
Diploma/C
ertific
ate
Bache
lors D
egree
Post G
radua
te
Source: GNH Survey 2010
Mean time spent on work by educational attainment

499475 480 472
511
010
020
030
040
050
0Ti
me
(in m
inut
es)
Very st
ressfu
l
Modera
tely s
tressf
ul
Somew
hat s
tressf
ul
Not at
all str
essfu
l
Don't k
now
Source: GNH Survey 2010
Mean time spent on work by stress level

480 477 4620
100
200
300
400
500
Tim
e (in
min
utes
)
Normal
mental
wellbein
g
Some m
ental
distr
ess
Severe
men
tal di
stres
s
Source: GNH Survey 2010
Mean time spent on work by mental wellbeing

521504
486 477452 444
422
010
020
030
040
050
0Ti
me
(in m
inut
es)
0-25,0
00
25,00
1-50,0
00
50,00
1-75,0
00
75,00
1-100
,000
100,0
01-15
0,000
150,0
01-22
5,000
>225
,000
Source: GNH Survey 2010
Mean time spent on work by household income

362
492509
474 4800
100
200
300
400
500
Tim
e (in
min
utes
)
Never
married
Married
Divorce
d
Separa
ted
Widowed
Source: GNH Survey 2010
Mean time spent on work by marital status

424
482 484 481455
010
020
030
040
050
0Ti
me
(in m
inut
es)
Single
membe
r hh
2-3 m
embe
r hh
4-5 m
embe
r hh
6-7 m
embe
r hh
>7 m
embe
r hh
Source: GNH Survey 2010
Mean time spent on work by household size

568543 532 524
506 504 503 500 498 490 484 479 473 462 459 446 444423 420
404
020
040
060
0Ti
me
(in m
inut
es)
Tash
i Yan
gste
Monga
r
Tash
igang
Samdru
p Jon
gkha
r
Tsiran
g
Trong
sa
Pema G
atshe
l
Lhun
tseGas
a
Sarpan
g
Bumtha
ng Haa
Samtse
Chukh
a
Wangd
ue Pho
drang
Dagan
a
Zhemga
ng
Thimph
u
Punak
ha Paro
Source: GNH Survey 2010
Mean time spent on work by Dzongkhag

478
397
552
502
020
040
060
0Ti
me
(in m
inut
es)
1 Rural 2 UrbanMale Female Male Female
Source: GNH Survey 2010
Mean time spent on nonwork by sex and area
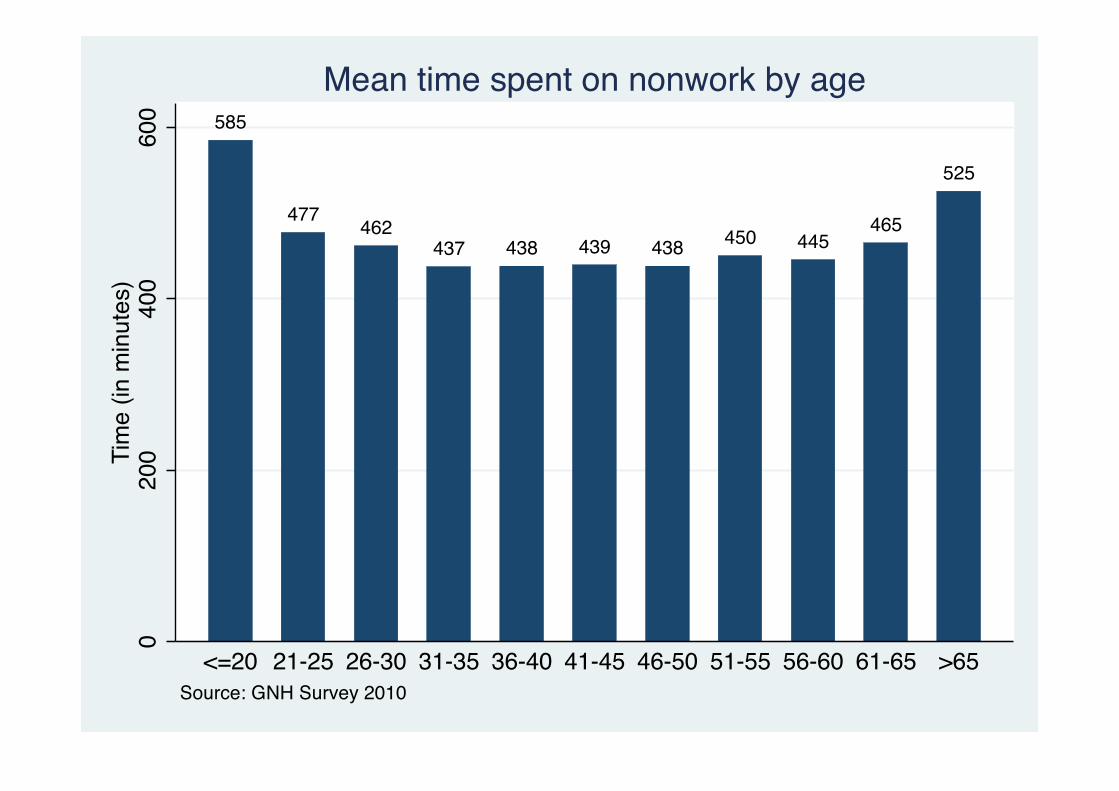
585
477 462437 438 439 438 450 445
465
5250
200
400
600
Tim
e (in
min
utes
)
<=20 21-25 26-30 31-35 36-40 41-45 46-50 51-55 56-60 61-65 >65Source: GNH Survey 2010
Mean time spent on nonwork by age
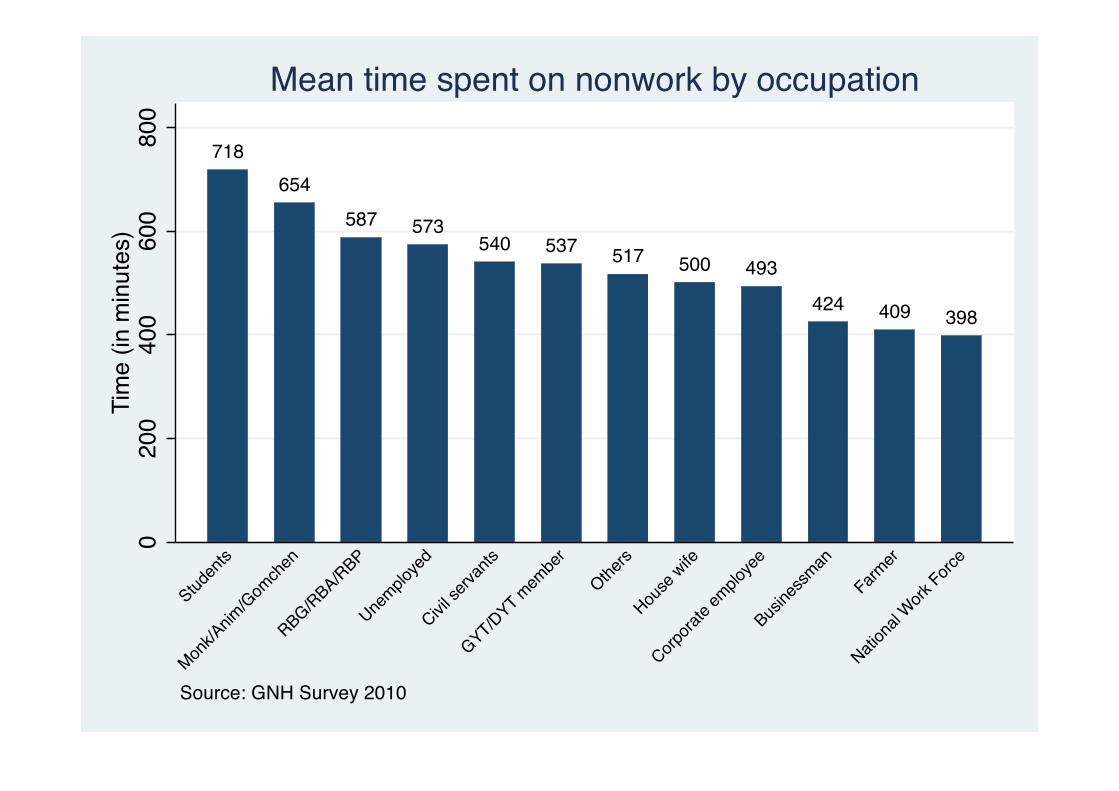
718654
587 573540 537 517 500 493
424 409 398
020
040
060
080
0Ti
me
(in m
inut
es)
Studen
ts
Monk/A
nim/G
omch
en
RBG/RBA/RBP
Unemplo
yed
Civil se
rvants
GYT/DYT mem
ber
Others
House
wife
Corpora
te em
ploye
e
Busine
ssman
Farmer
Nation
al Work
Force
Source: GNH Survey 2010
Mean time spent on nonwork by occupation
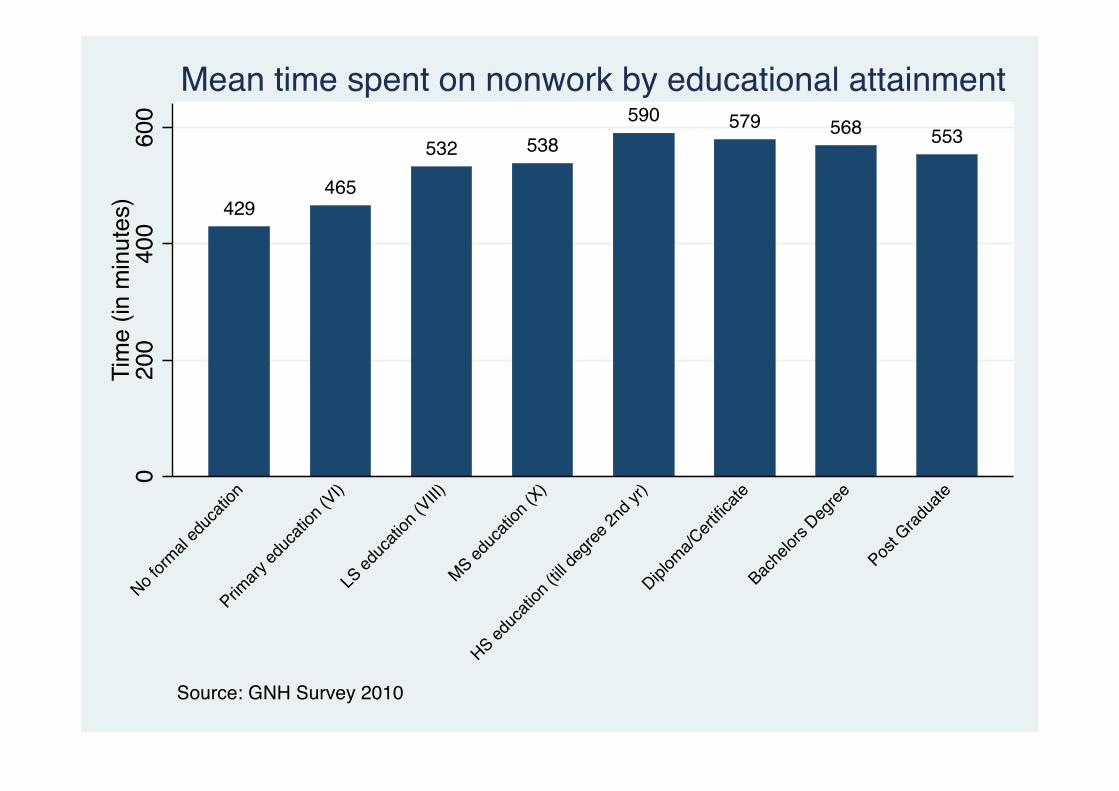
429465
532 538590 579 568 553
020
040
060
0Ti
me
(in m
inut
es)
No form
al ed
ucati
on
Primary
educ
ation
(VI)
LS ed
ucati
on (V
III)
MS educ
ation
(X)
HS educ
ation
(till d
egree
2nd y
r)
Diploma/C
ertific
ate
Bache
lors D
egree
Post G
radua
te
Source: GNH Survey 2010
Mean time spent on nonwork by educational attainment
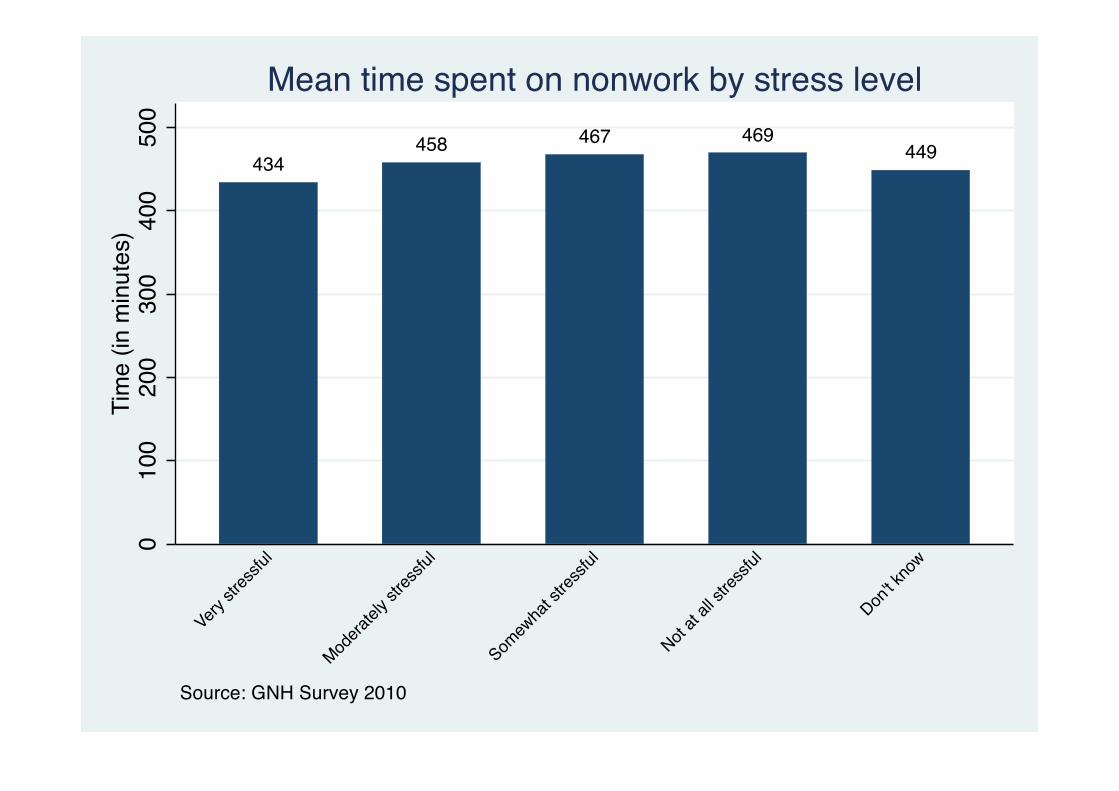
434458 467 469
4490
100
200
300
400
500
Tim
e (in
min
utes
)
Very st
ressfu
l
Modera
tely s
tressf
ul
Somew
hat s
tressf
ul
Not at
all str
essfu
l
Don't k
now
Source: GNH Survey 2010
Mean time spent on nonwork by stress level

464446 456
010
020
030
040
050
0Ti
me
(in m
inut
es)
Normal
mental
wellbein
g
Some m
ental
distr
ess
Severe
men
tal di
stres
s
Source: GNH Survey 2010
Mean time spent on nonwork by mental wellbeing

397429
458 468502 508
5370
200
400
600
Tim
e (in
min
utes
)
0-25,0
00
25,00
1-50,0
00
50,00
1-75,0
00
75,00
1-100
,000
100,0
01-15
0,000
150,0
01-22
5,000
>225
,000
Source: GNH Survey 2010
Mean time spent on nonwork by household income
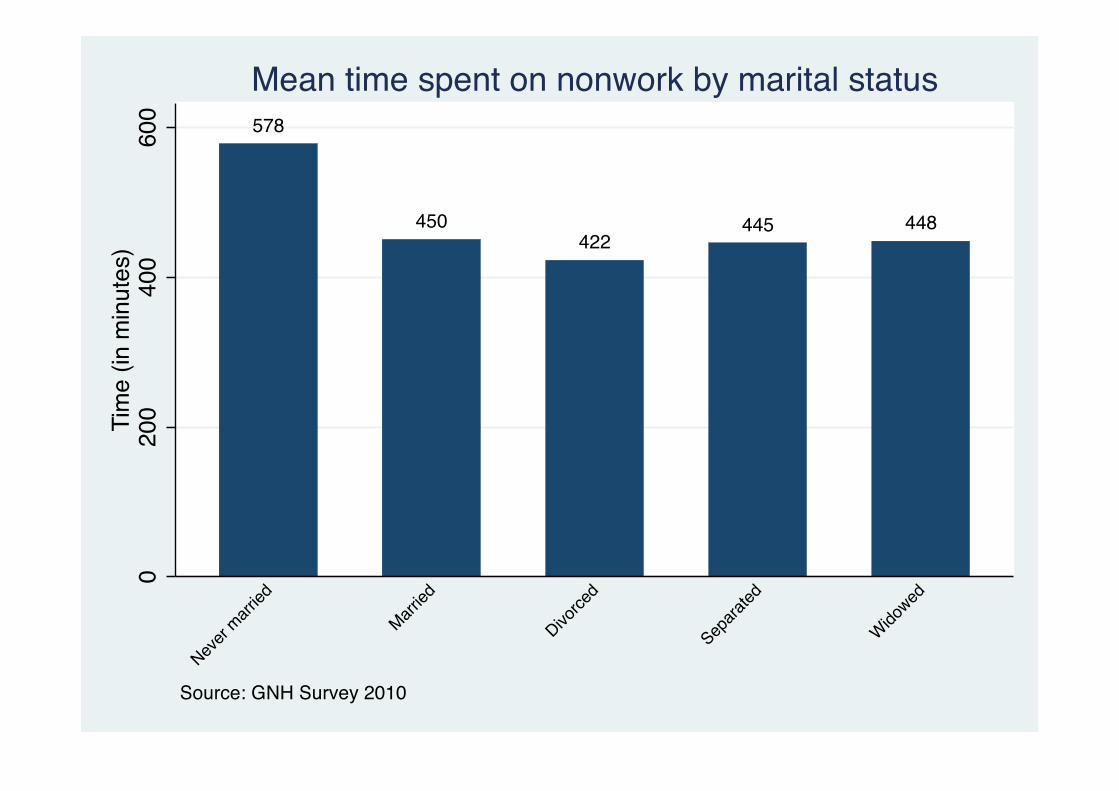
578
450422
445 448
020
040
060
0Ti
me
(in m
inut
es)
Never
married
Married
Divorce
d
Separa
ted
Widowed
Source: GNH Survey 2010
Mean time spent on nonwork by marital status
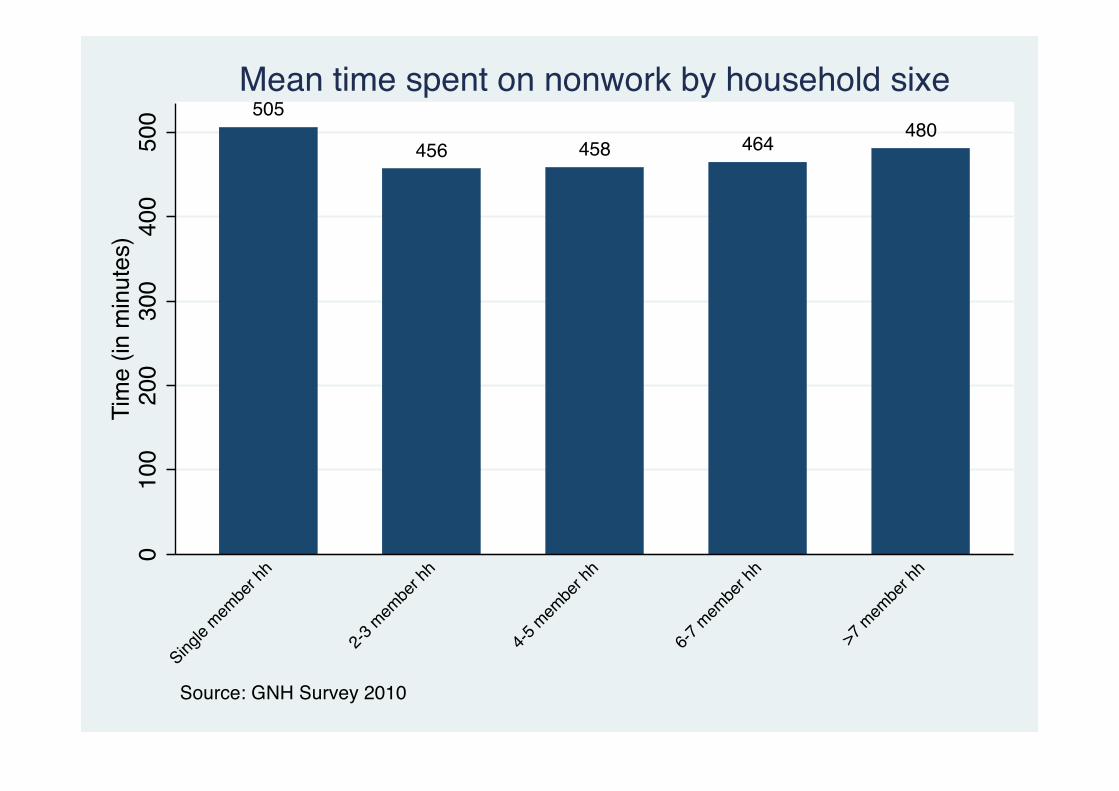
505
456 458 464480
010
020
030
040
050
0Ti
me
(in m
inut
es)
Single
membe
r hh
2-3 m
embe
r hh
4-5 m
embe
r hh
6-7 m
embe
r hh
>7 m
embe
r hh
Source: GNH Survey 2010
Mean time spent on nonwork by household sixe

529 528 516 504485 477 477 472 469 463 455
430 421 419 415 412 411 402 390351
010
020
030
040
050
0Ti
me
(in m
inut
es)
Thimph
uParo
Punak
ha
Chukh
a
Sarpan
g
Dagan
a
Samtse
Zhemga
ng
Wangd
ue Pho
drang Haa
Bumtha
ng
Tsiran
g
Pema G
atshe
l
Trong
saGas
a
Samdru
p Jon
gkha
r
Lhun
tse
Monga
r
Tash
igang
Tash
i Yan
gste
Source: GNH Survey 2010
Mean time spent on nonwork by Dzongkhag
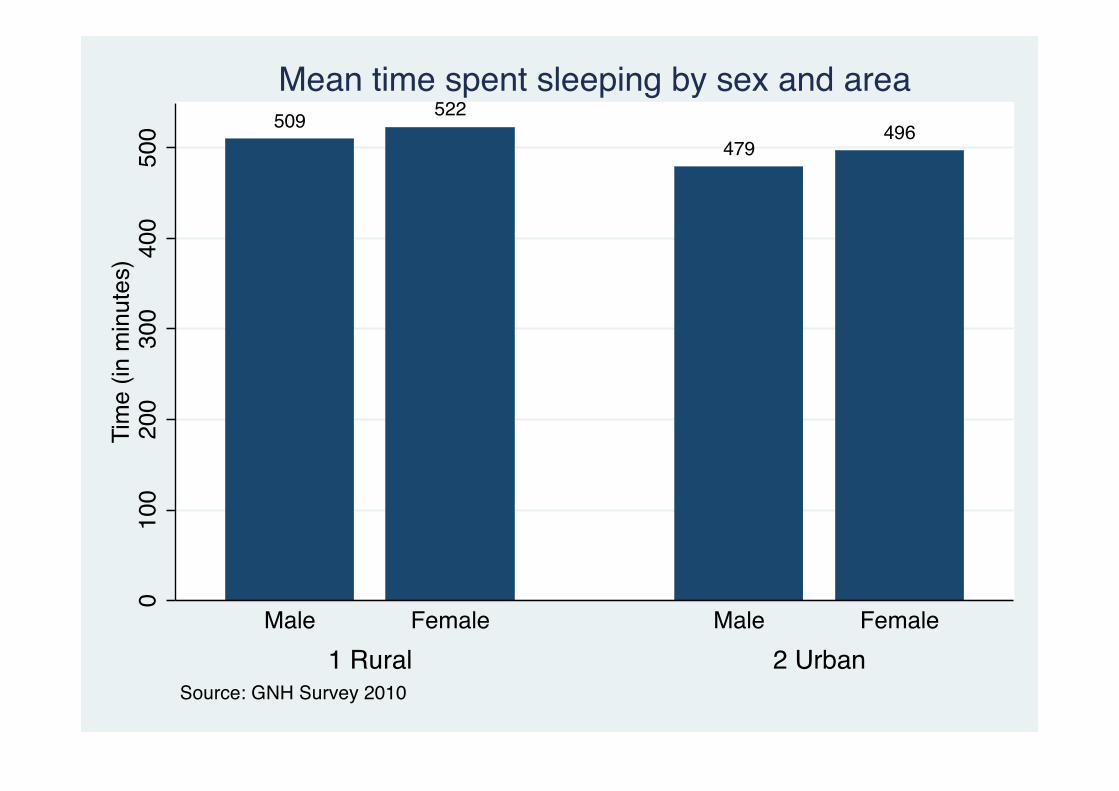
509 522
479496
010
020
030
040
050
0Ti
me
(in m
inut
es)
1 Rural 2 UrbanMale Female Male Female
Source: GNH Survey 2010
Mean time spent sleeping by sex and area

519 516 510 501 502 491 503 503 508526 531
010
020
030
040
050
0Ti
me
(in m
inut
es)
<=20 21-25 26-30 31-35 36-40 41-45 46-50 51-55 56-60 61-65 >65Source: GNH Survey 2010
Mean time spent sleeping by age
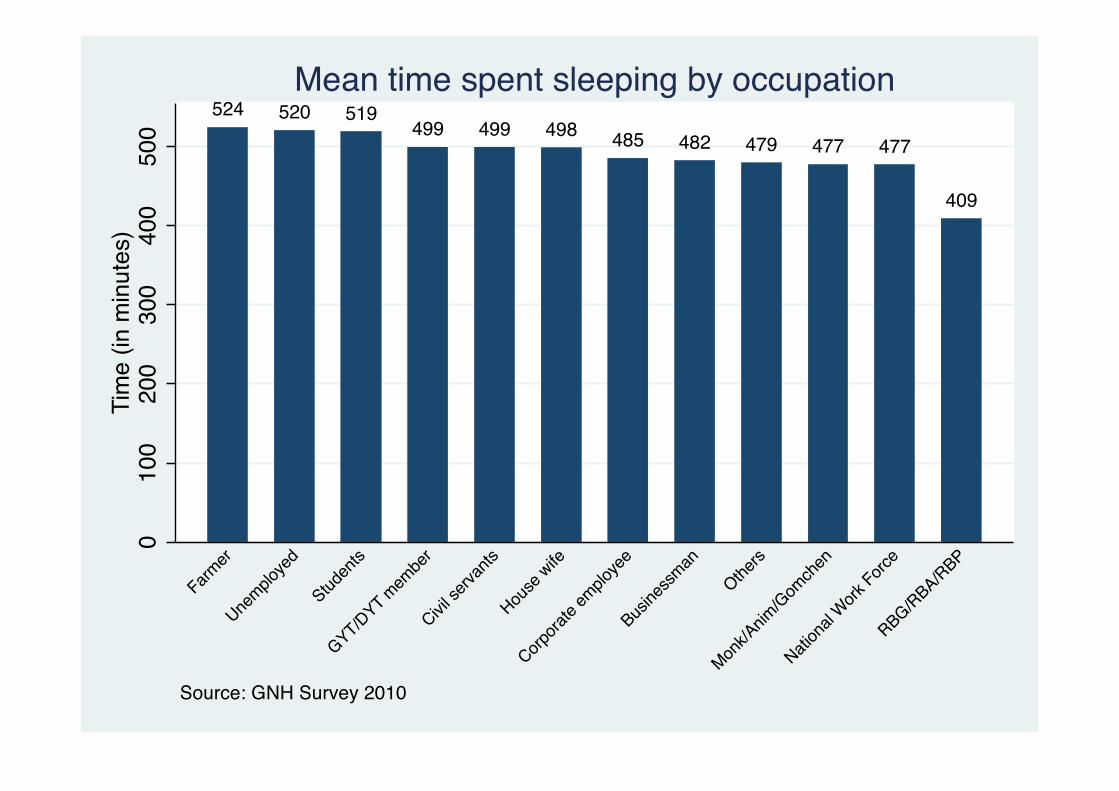
524 520 519499 499 498 485 482 479 477 477
409
010
020
030
040
050
0Ti
me
(in m
inut
es)
Farmer
Unemplo
yed
Studen
ts
GYT/DYT mem
ber
Civil se
rvants
House
wife
Corpora
te em
ploye
e
Busine
ssman
Others
Monk/A
nim/G
omch
en
Nation
al Work
Force
RBG/RBA/RBP
Source: GNH Survey 2010
Mean time spent sleeping by occupation
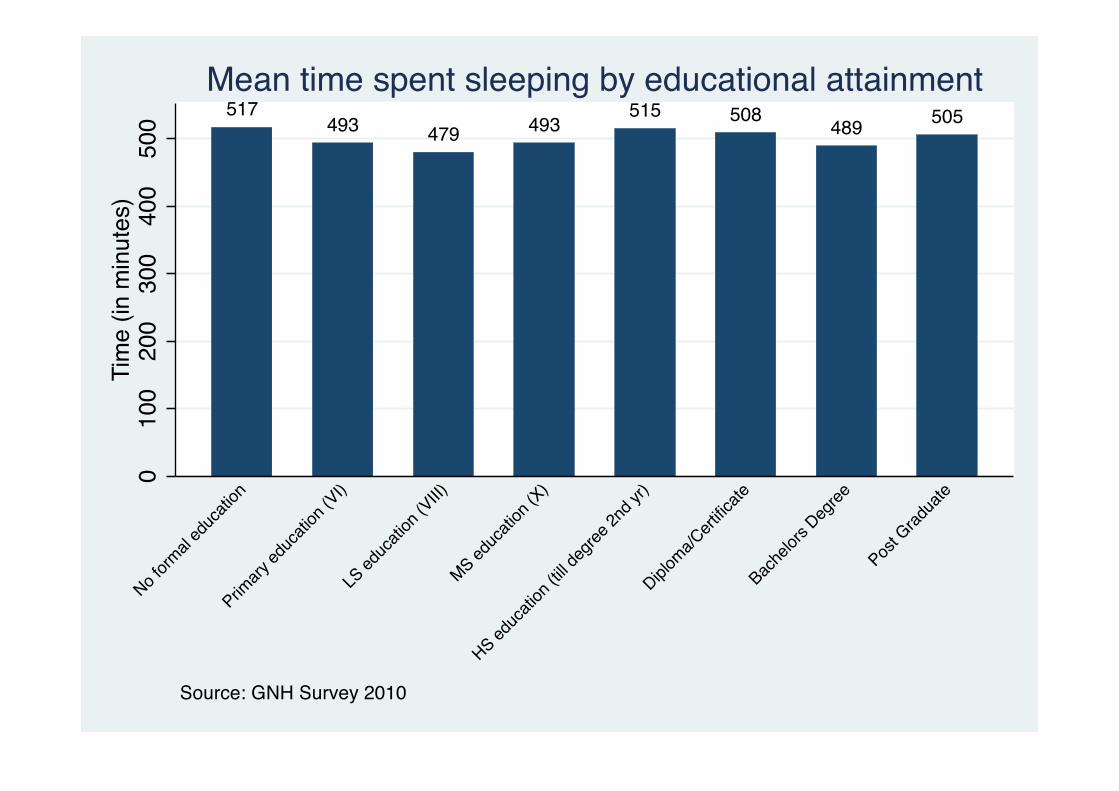
517493 479 493
515 508 489 5050
100
200
300
400
500
Tim
e (in
min
utes
)
No form
al ed
ucati
on
Primary
educ
ation
(VI)
LS ed
ucati
on (V
III)
MS educ
ation
(X)
HS educ
ation
(till d
egree
2nd y
r)
Diploma/C
ertific
ate
Bache
lors D
egree
Post G
radua
te
Source: GNH Survey 2010
Mean time spent sleeping by educational attainment
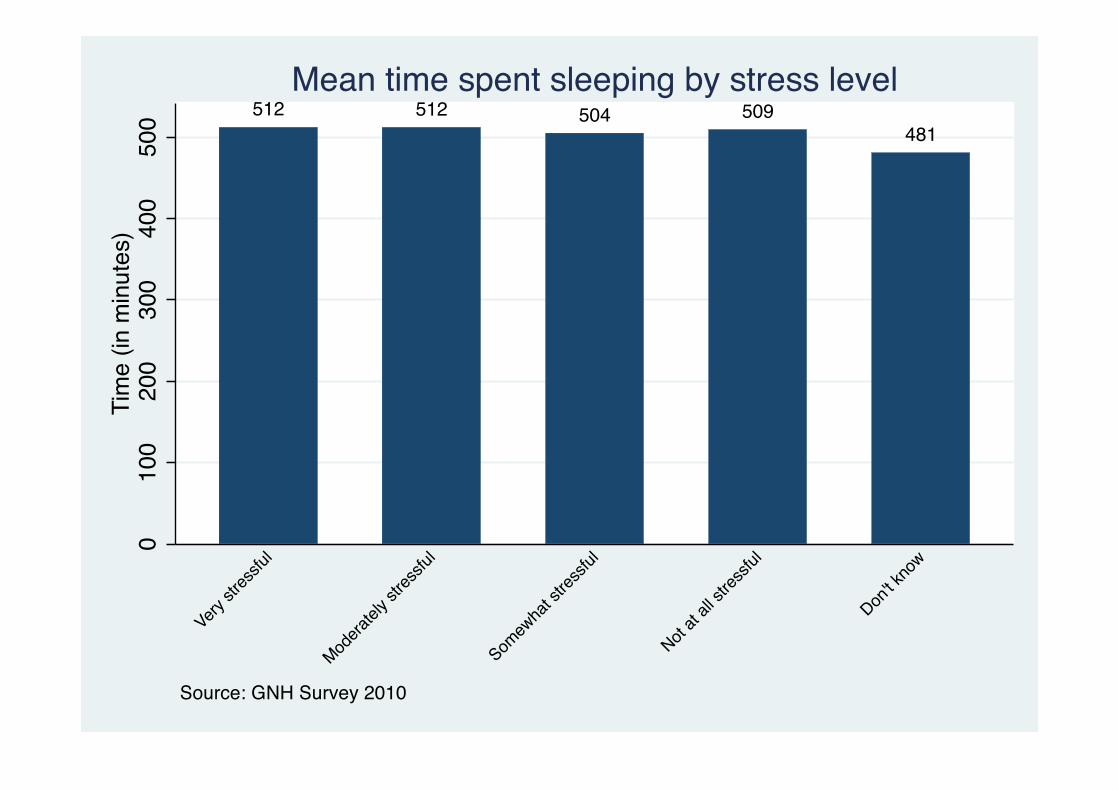
512 512 504 509481
010
020
030
040
050
0Ti
me
(in m
inut
es)
Very st
ressfu
l
Modera
tely s
tressf
ul
Somew
hat s
tressf
ul
Not at
all str
essfu
l
Don't k
now
Source: GNH Survey 2010
Mean time spent sleeping by stress level
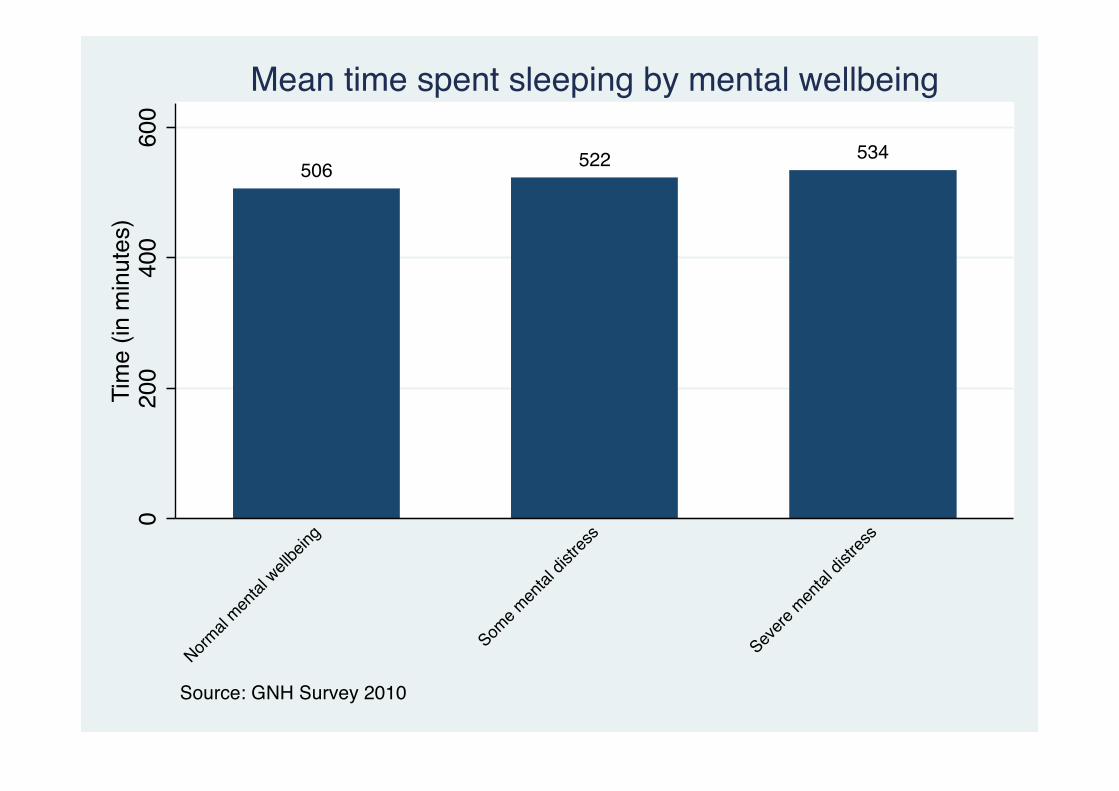
506 522 5340
200
400
600
Tim
e (in
min
utes
)
Normal
mental
wellbein
g
Some m
ental
distr
ess
Severe
men
tal di
stres
s
Source: GNH Survey 2010
Mean time spent sleeping by mental wellbeing
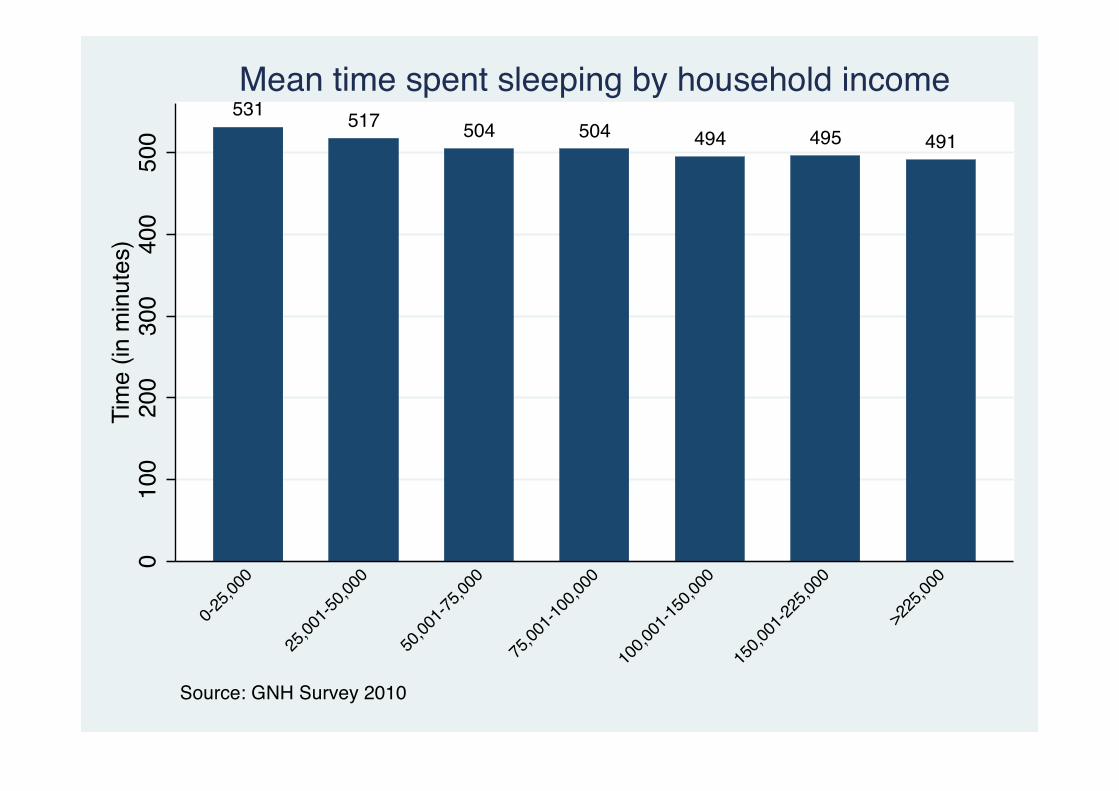
531 517 504 504 494 495 4910
100
200
300
400
500
Tim
e (in
min
utes
)
0-25,0
00
25,00
1-50,0
00
50,00
1-75,0
00
75,00
1-100
,000
100,0
01-15
0,000
150,0
01-22
5,000
>225
,000
Source: GNH Survey 2010
Mean time spent sleeping by household income

513 506 515 527 526
010
020
030
040
050
0Ti
me
(in m
inut
es)
Never
married
Married
Divorce
d
Separa
ted
Widowed
Source: GNH Survey 2010
Mean time spent sleeping by marital status
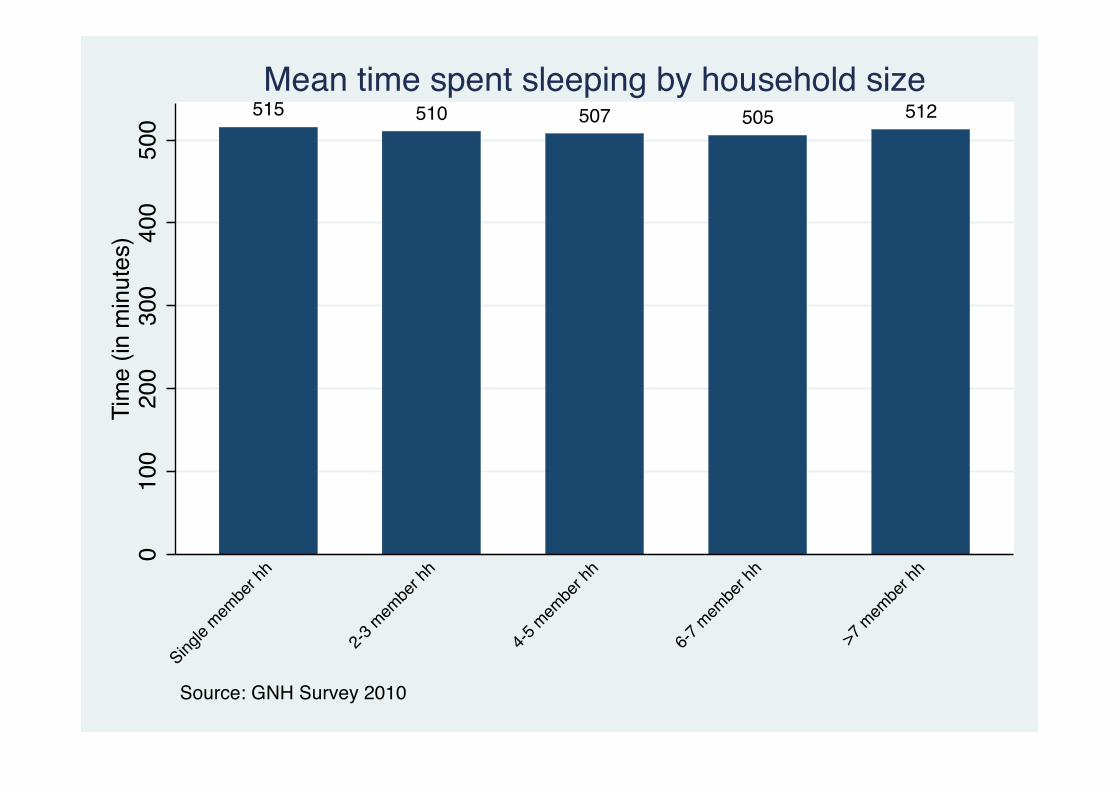
515 510 507 505 512
010
020
030
040
050
0Ti
me
(in m
inut
es)
Single
membe
r hh
2-3 m
embe
r hh
4-5 m
embe
r hh
6-7 m
embe
r hh
>7 m
embe
r hh
Source: GNH Survey 2010
Mean time spent sleeping by household size

538 536 535 533 530 527 521 520 519 514 513 508 507 506 506 506 497 496 484 471
020
040
060
0Ti
me
(in m
inut
es)
Pema G
atshe
l
Tash
igang
Lhun
tse
Zhemga
ng
Tash
i Yan
gste
Gasa
Trong
sa
Dagan
a
Wangd
ue Pho
drang
Samdru
p Jon
gkha
rParo
Punak
ha
Tsiran
g
Monga
r
Bumtha
ng Haa
Thimph
u
Samtse
Chukh
a
Sarpan
g
Source: GNH Survey 2010
Mean time spent sleeping by Dzongkhag
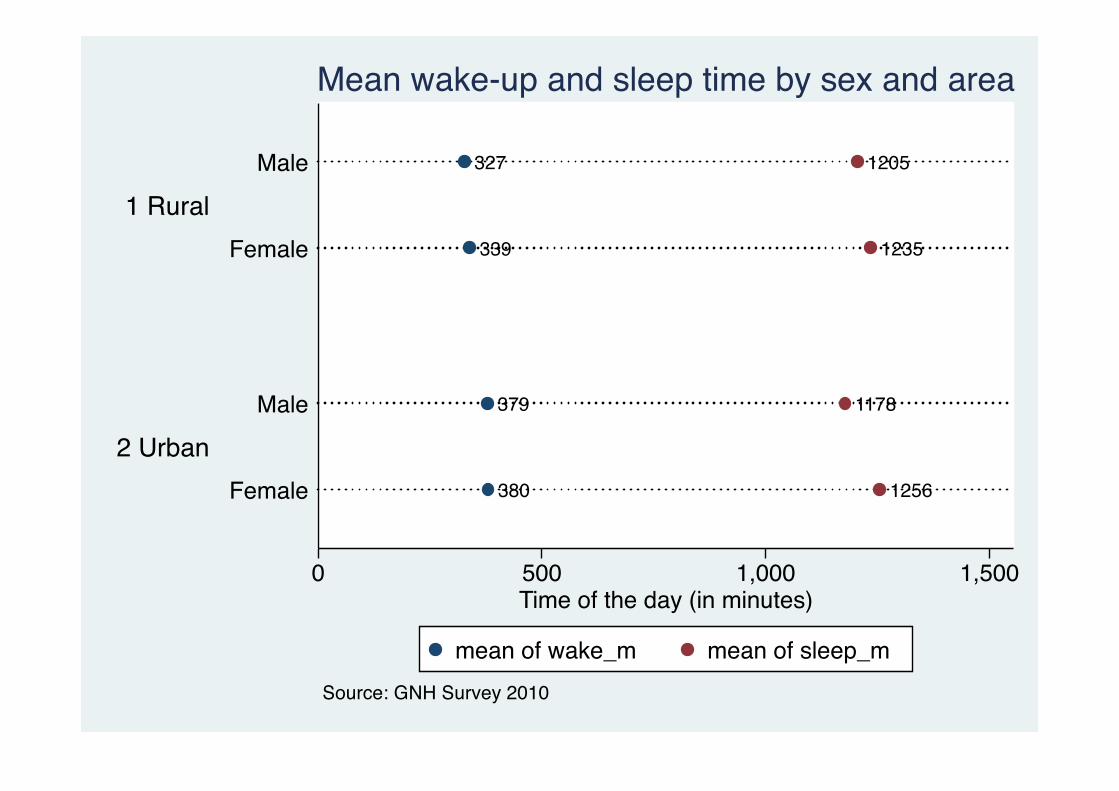
1256380
1178379
1235339
1205327
0 500 1,000 1,500Time of the day (in minutes)
2 Urban
1 Rural
Female
Male
Female
Male
Source: GNH Survey 2010
Mean wake-up and sleep time by sex and area
mean of wake_m mean of sleep_m

1218327
1232327
1235325
1239320
1214328
1231327
1236341
1202347
1239367
1188381
1189380
0 500 1,000 1,500Time of the day (in minutes)
>6561-6556-6051-5546-5041-4536-4031-3526-3021-25<=20
Source: GNH Survey 2010
Mean wake-up and sleep time by age
mean of wake_m mean of sleep_m

12532901262298
11663261088327
122232812253441243368
12813711233378
11873841170412
1072423
0 500 1,000 1,500Time of the day (in minutes)
Monk/A
nim/G
omch
en
Nation
al Work
Force
GYT/DYT mem
ber
RBG/RBA/RBPFarmerOthers
Busine
ssman
House
wife
Civil se
rvants
Corpora
te em
ploye
eStuden
tsUne
mploye
d
Source: GNH Survey 2010
Mean wake-up and sleep time by occupation
mean of wake_m mean of sleep_m
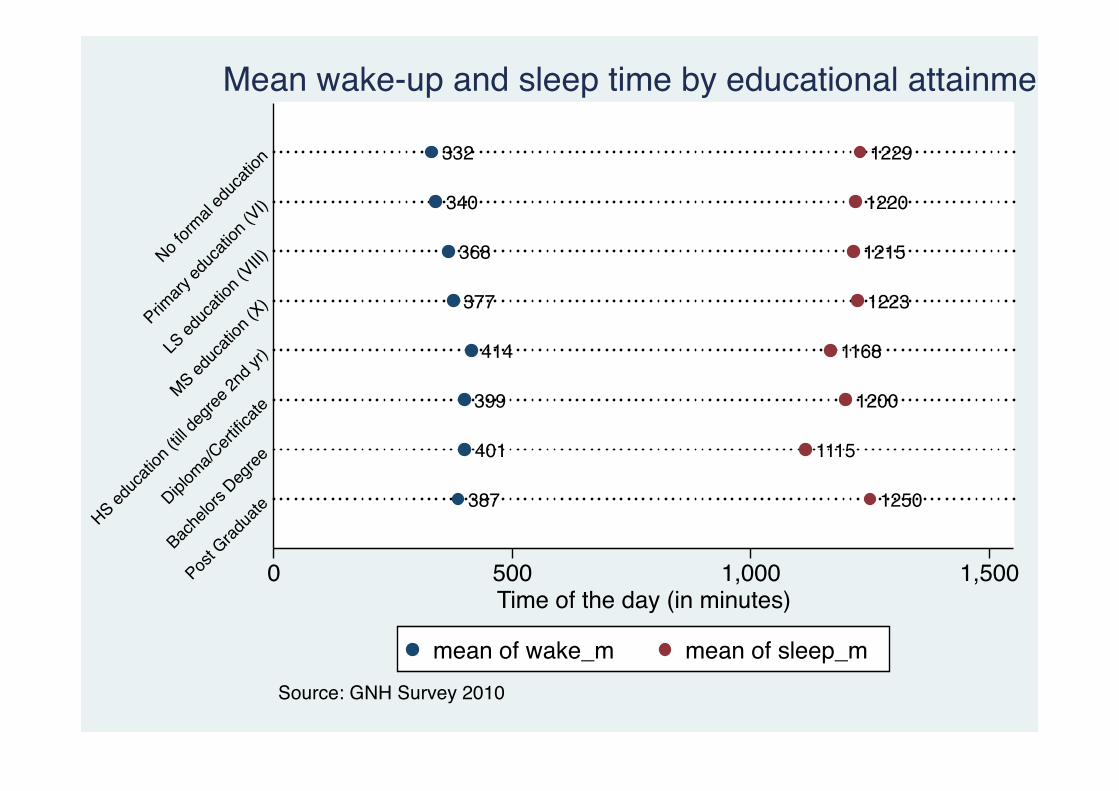
1250387
1115401
1200399
1168414
1223377
1215368
1220340
1229332
0 500 1,000 1,500Time of the day (in minutes)
Post G
radua
te
Bache
lors D
egree
Diploma/C
ertific
ate
HS educ
ation
(till d
egree
2nd y
r)
MS educ
ation
(X)
LS ed
ucati
on (V
III)
Primary
educ
ation
(VI)
No form
al ed
ucati
on
Source: GNH Survey 2010
Mean wake-up and sleep time by educational attainment
mean of wake_m mean of sleep_m

1215381
1229367
1238357
1209348
1209337
1229329
1216324
0 500 1,000 1,500Time of the day (in minutes)
>225
,000
150,0
01-22
5,000
100,0
01-15
0,000
75,00
1-100
,000
50,00
1-75,0
0025,00
1-50,0
000-2
5,000
Source: GNH Survey 2010
Mean wake-up and sleep time by household income
mean of wake_m mean of sleep_m
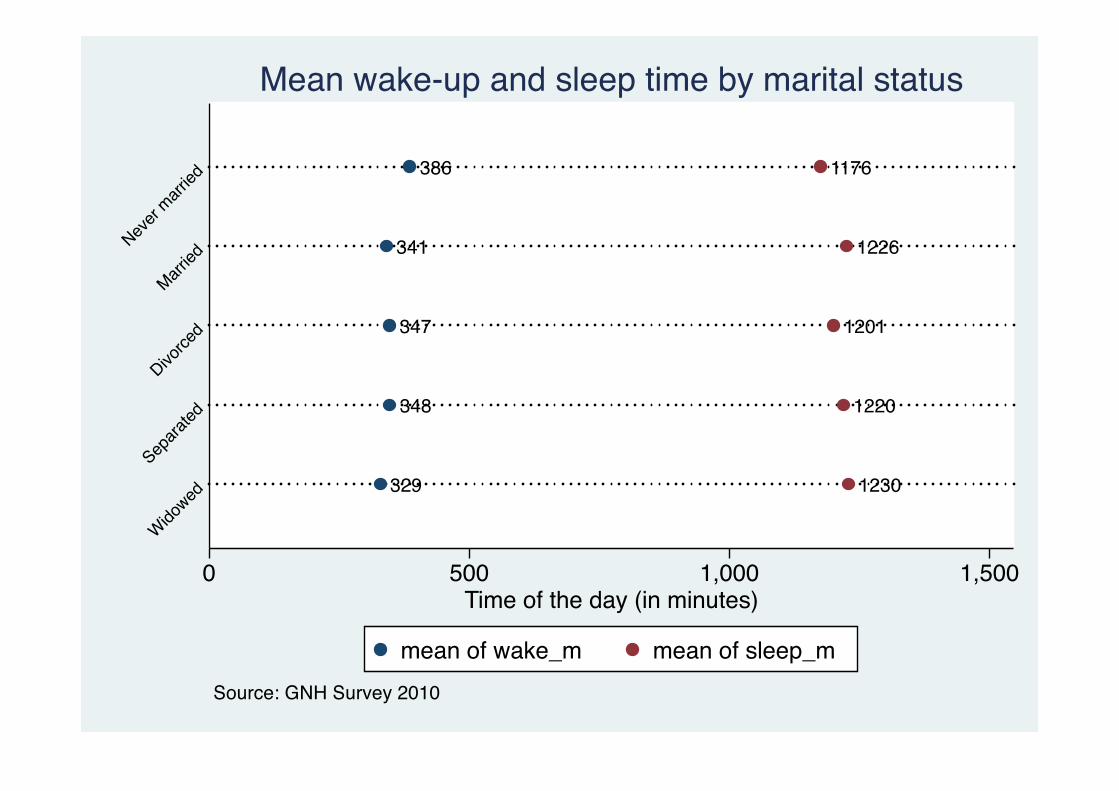
1230329
1220348
1201347
1226341
1176386
0 500 1,000 1,500Time of the day (in minutes)
Widowed
Separa
ted
Divorce
d
Married
Never
married
Source: GNH Survey 2010
Mean wake-up and sleep time by marital status
mean of wake_m mean of sleep_m

12113161235320
122032412083251221326
11933291214331123133212283331229337
121133812173481230349123735212373531243357
1225358121837112093911202393
0 500 1,000 1,500Time of the day (in minutes)
Sarpan
g
Samdru
p Jon
gkha
rMon
gar
Pema G
atshe
l
Tash
igangTsi
rang
Tash
i Yan
gsteDag
ana
SamtseLh
untse
Zhemga
ngTrong
saChukh
aPun
akha
Bumtha
ngHaa
Wangd
ue Pho
drangGasaParoThim
phu
Source: GNH Survey 2010
Mean wake-up and sleep time by Dzongkhag
mean of wake_m mean of sleep_m
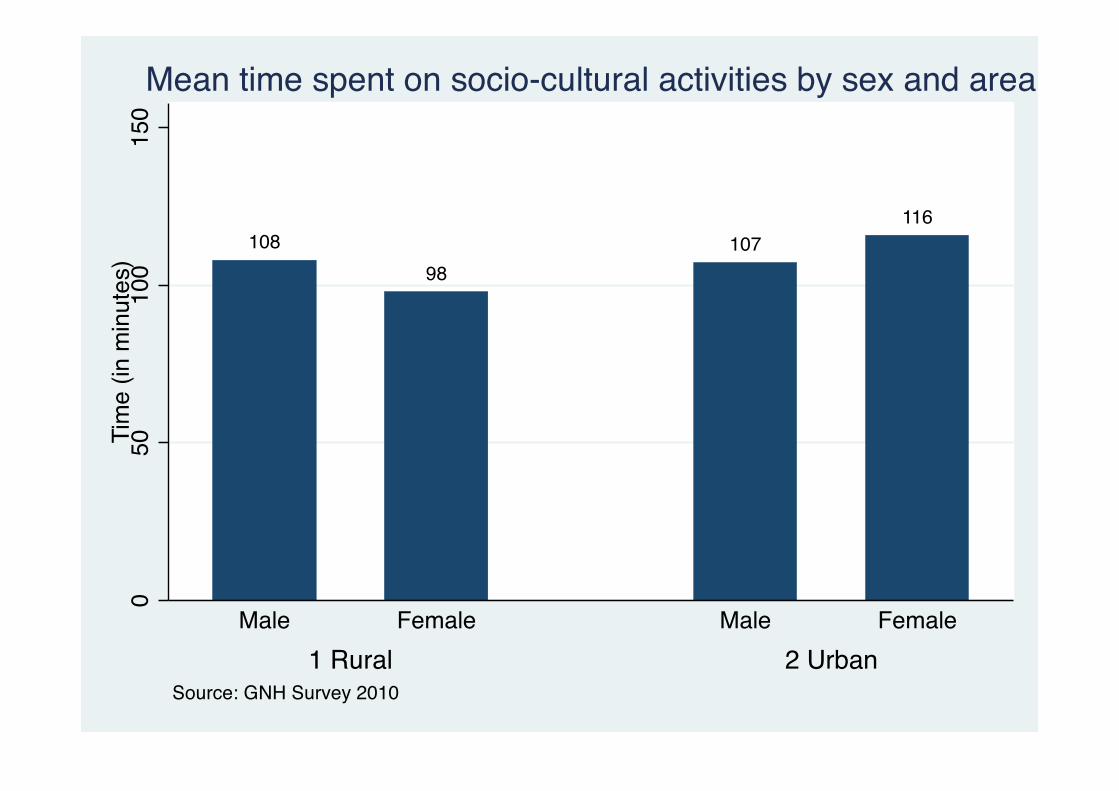
10898
107116
050
100
150
Tim
e (in
min
utes
)
1 Rural 2 UrbanMale Female Male Female
Source: GNH Survey 2010
Mean time spent on socio-cultural activities by sex and area
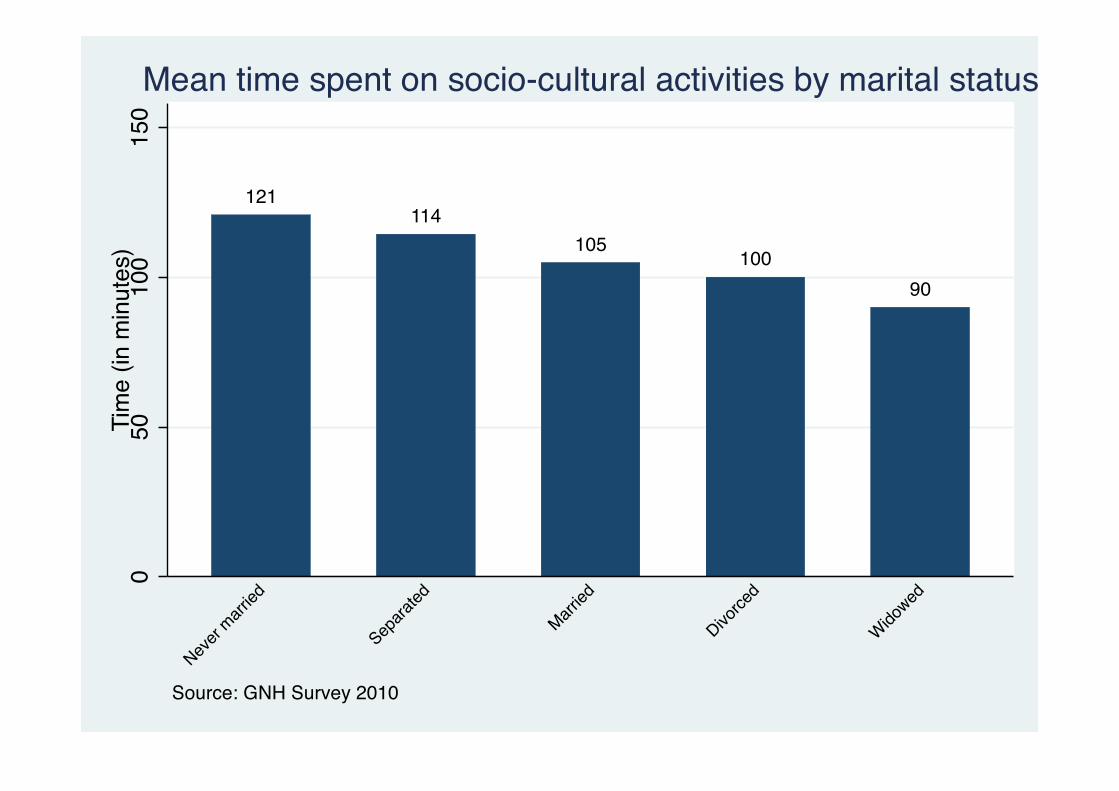
121114
105100
90
050
100
150
Tim
e (in
min
utes
)
Never
married
Separa
ted
Married
Divorce
d
Widowed
Source: GNH Survey 2010
Mean time spent on socio-cultural activities by marital status
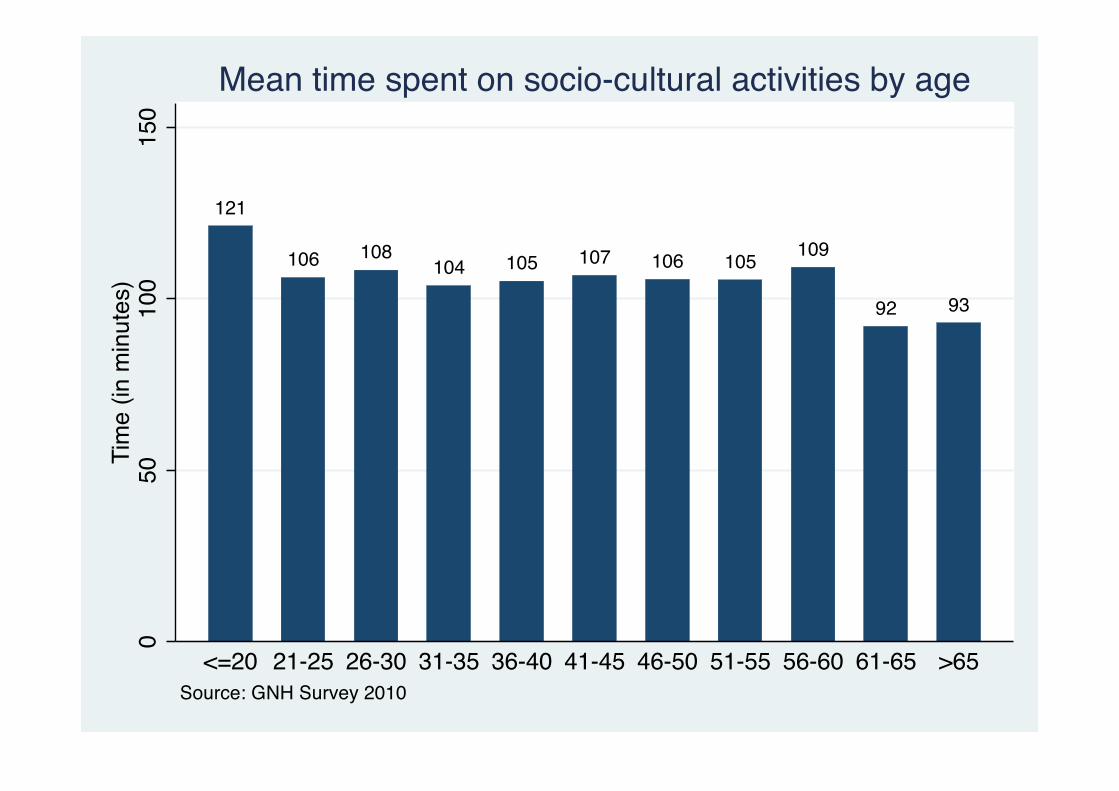
121
106 108104 105 107 106 105 109
92 93
050
100
150
Tim
e (in
min
utes
)
<=20 21-25 26-30 31-35 36-40 41-45 46-50 51-55 56-60 61-65 >65Source: GNH Survey 2010
Mean time spent on socio-cultural activities by age

116
105
109
103
101
107
101
0 50 100 150Time (in minutes)
>225,000
150,001-225,000
100,001-150,000
75,001-100,000
50,001-75,000
25,001-50,000
0-25,000
Source: GNH Survey 2010
Mean time spent on socio-cultural activities by household income

70
94
98
106
107
111
116
117
119
122
139
171
0 50 100 150 200Time (in minutes)
Nation
al Work
ForceOthersFarmer
Busine
ssman
Corpora
te em
ploye
eCivil
serva
ntsUne
mploye
dStuden
tsHou
se wife
Monk/A
nim/G
omch
en
RBG/RBA/RBP
GYT/DYT mem
ber
Source: GNH Survey 2010
Mean time spent on socio-cultural activities by occupation
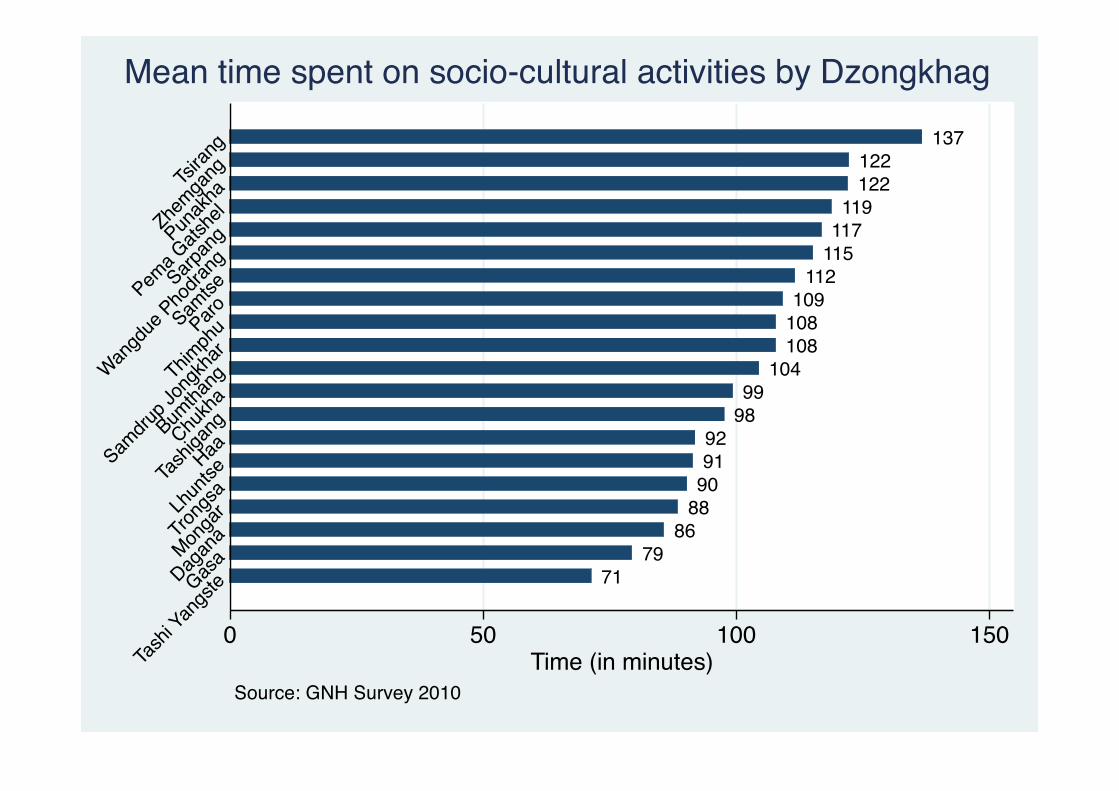
7179
8688909192
9899
104108108109
112115117119
122122
137
0 50 100 150Time (in minutes)Ta
shi Y
angs
teGasa
Dagan
aMon
gar
Trong
saLhun
tseHaa
Tash
igangChu
kha
Bumtha
ng
Samdru
p Jon
gkha
rThim
phuParoSam
tse
Wangd
ue Pho
drangSarp
ang
Pema G
atshe
lPun
akha
Zhemga
ngTsiran
g
Source: GNH Survey 2010
Mean time spent on socio-cultural activities by Dzongkhag
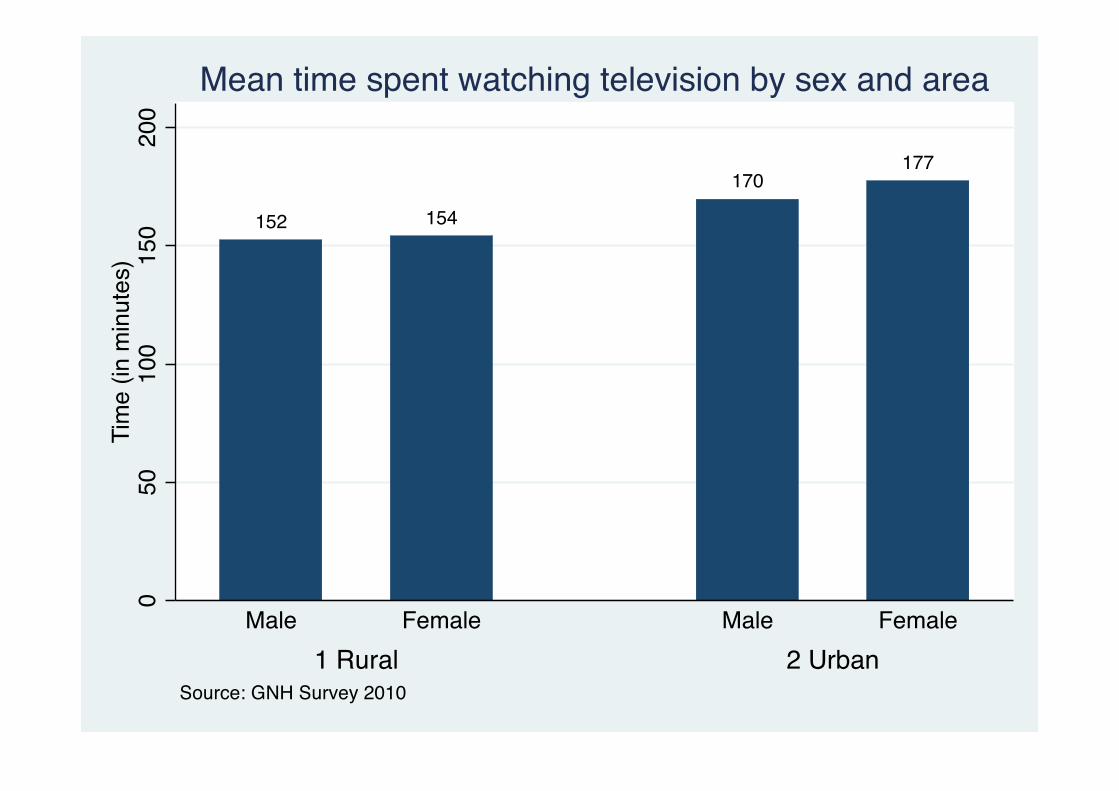
152 154
170177
050
100
150
200
Tim
e (in
min
utes
)
1 Rural 2 UrbanMale Female Male Female
Source: GNH Survey 2010
Mean time spent watching television by sex and area

171
142
147
150
144
145
143
179
161
191
201
0 50 100 150 200Time (in minutes)
>6561-6556-6051-5546-5041-4536-4031-3526-3021-25<=20
Source: GNH Survey 2010
Mean time spent watching television by age
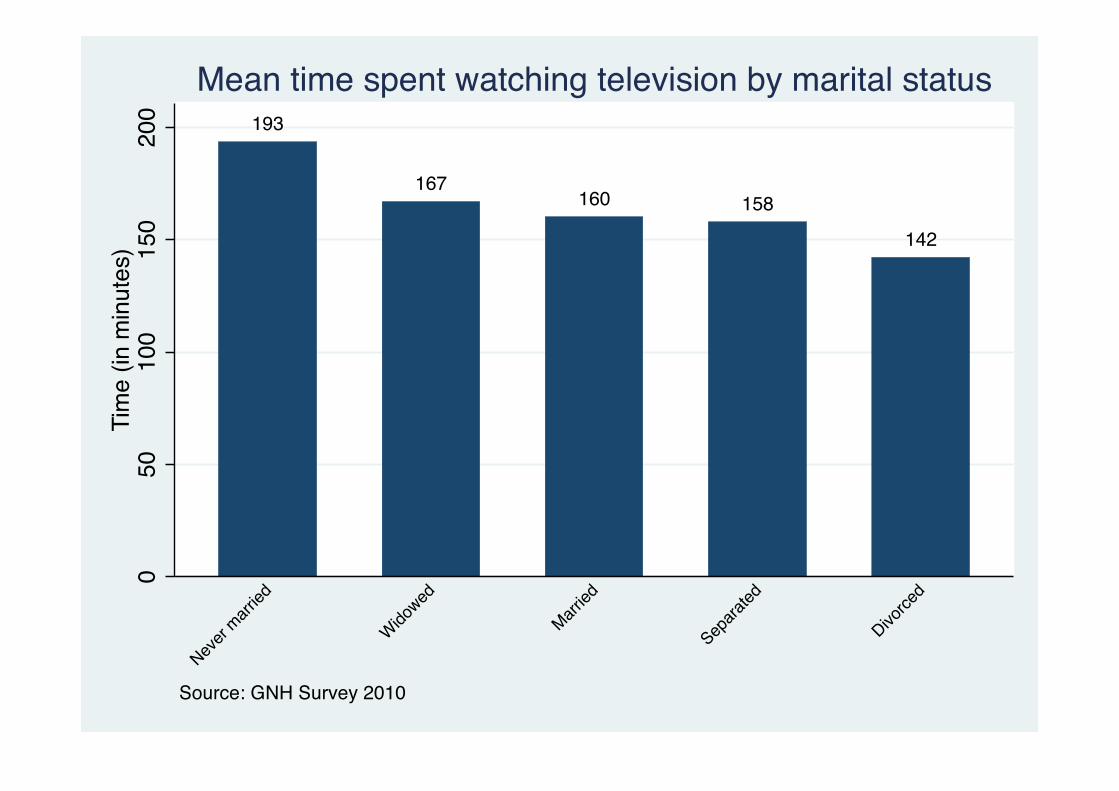
193
167160 158
142
050
100
150
200
Tim
e (in
min
utes
)
Never
married
Widowed
Married
Separa
ted
Divorce
d
Source: GNH Survey 2010
Mean time spent watching television by marital status
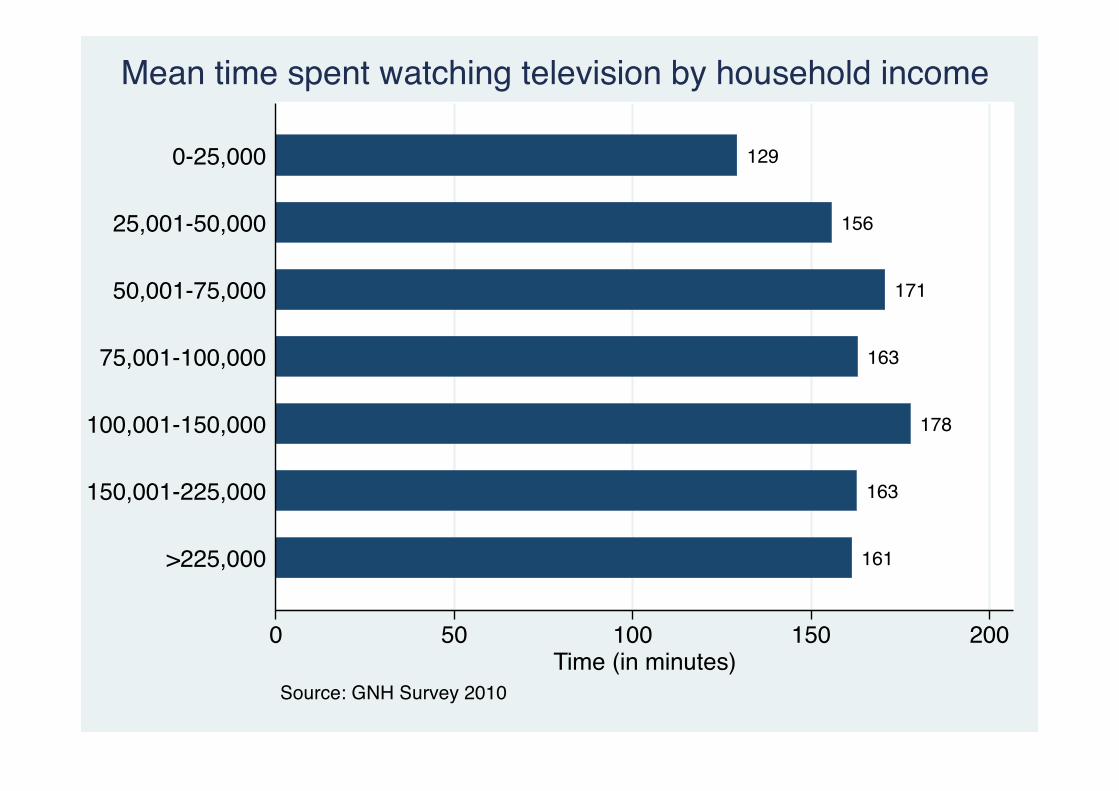
161
163
178
163
171
156
129
0 50 100 150 200Time (in minutes)
>225,000
150,001-225,000
100,001-150,000
75,001-100,000
50,001-75,000
25,001-50,000
0-25,000
Source: GNH Survey 2010
Mean time spent watching television by household income

116
117
125
138
140
149
154
170
188
191
230
230
0 50 100 150 200 250Time (in minutes)
Monk/A
nim/G
omch
en
Nation
al Work
Force
GYT/DYT mem
berFarm
er
Busine
ssman
Civil se
rvants
Corpora
te em
ploye
e
RBG/RBA/RBPHou
se wifeOthe
rsStuden
ts
Unemplo
yed
Source: GNH Survey 2010
Mean time spent watching television by occupation

125129131134
138140
144147148149149
158159160
166166167168
183186
0 50 100 150 200Time (in minutes)
Lhun
tse
Zhemga
ngDag
ana
Bumtha
ngGasa
Pema G
atshe
l
Wangd
ue Pho
drang
Punak
ha
Tash
igang
Samdru
p Jon
gkha
rTsi
rangHaaChu
kha
Sarpan
gTro
ngsaSamtseMonga
r
Tash
i Yan
gsteParo
Thimph
u
Source: GNH Survey 2010
Mean time spent watching television by Dzongkhag

100
79 77
67
020
4060
8010
0Ti
me
(in m
inut
es)
1 Rural 2 UrbanMale Female Male Female
Source: GNH Survey 2010
Mean time spent parying by sex and area

36 4051 47
5462
6975
83
150
216
050
100
150
200
Tim
e (in
min
utes
)
<=20 21-25 26-30 31-35 36-40 41-45 46-50 51-55 56-60 61-65 >65Source: GNH Survey 2010
Mean time spent parying by age
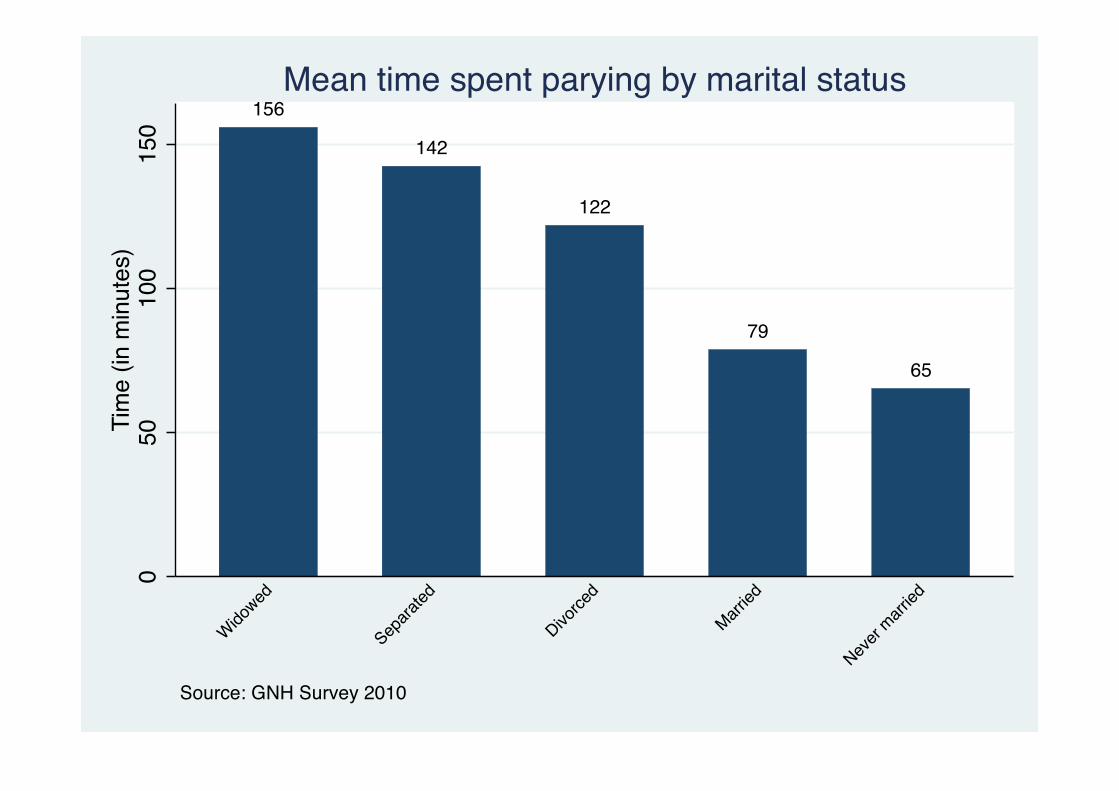
156
142
122
79
65
050
100
150
Tim
e (in
min
utes
)
Widowed
Separa
ted
Divorce
d
Married
Never
married
Source: GNH Survey 2010
Mean time spent parying by marital status

74
68
59
81
72
96
122
0 50 100 150Time (in minutes)
>225,000
150,001-225,000
100,001-150,000
75,001-100,000
50,001-75,000
25,001-50,000
0-25,000
Source: GNH Survey 2010
Mean time spent praying by household income

33
42
43
48
53
53
55
59
76
87
132
228
0 50 100 150 200 250Time (in minutes)
Studen
ts
RBG/RBA/RBP
Unemplo
yed
Nation
al Work
Force
Civil se
rvants
Corpora
te em
ploye
e
GYT/DYT mem
ber
House
wife
Busine
ssmanFarmerOthers
Monk/A
nim/G
omch
en
Source: GNH Survey 2010
Mean time spent praying by occupation
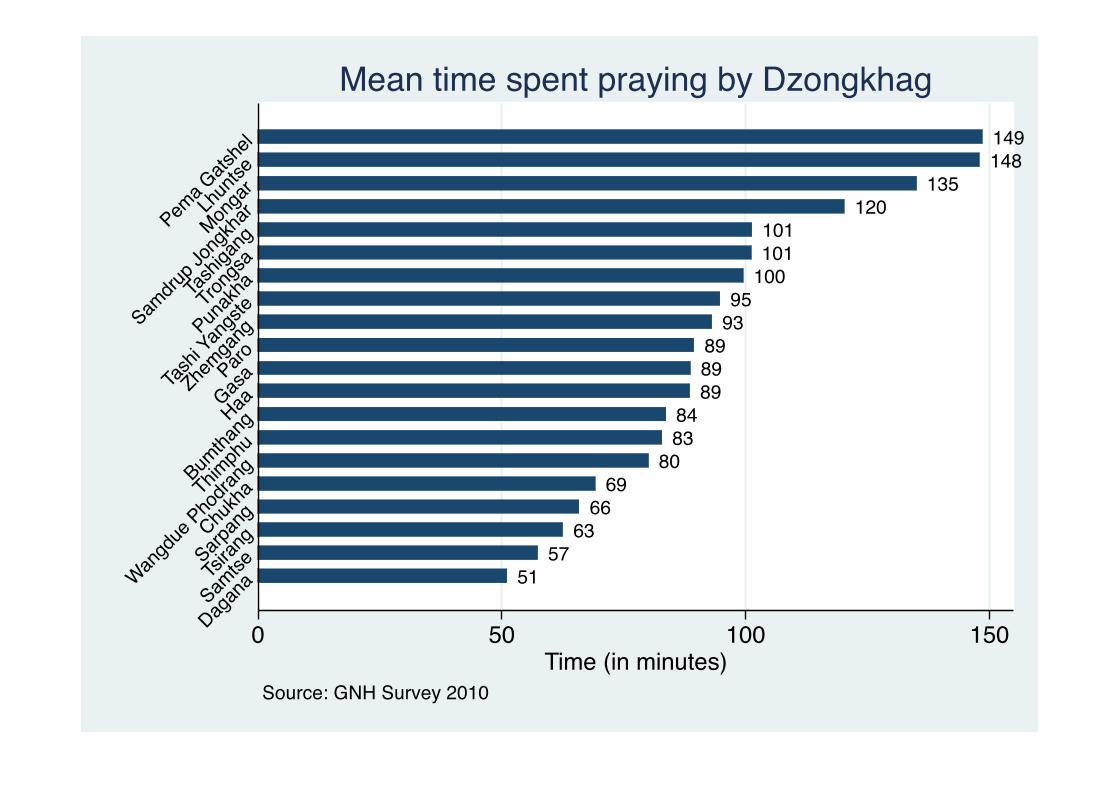
5157
6366
6980
8384
898989
9395
100101101
120135
148149
0 50 100 150Time (in minutes)
Dagan
aSam
tseTsiran
gSarp
ang
Chukh
a
Wangd
ue Pho
drang
Thimph
uBum
thangHaaGasaParo
Zhemga
ng
Tash
i Yan
gste
Punak
haTrong
saTa
shiga
ng
Samdru
p Jon
gkha
rMon
gar
Lhun
tse
Pema G
atshe
l
Source: GNH Survey 2010
Mean time spent praying by Dzongkhag

Bumthang
Chukha
Dagana
Gasa
Haa
Lhuntse
Mongar
Paro
Pema Gatshel
PunakhaSamdrup Jongkhar
Samtse
Sarpang
Thimphu
Tashigang
Tashi Yangste
Trongsa
Tsirang
Wangdue Phodrang
Zhemgang46
048
050
052
054
0Ti
me
spen
t sle
epin
g (in
min
utes
)
120 140 160 180 200Time spent watching TV (in minutes)
Source: GNH Survey 2010
Sleeping and Watching TV
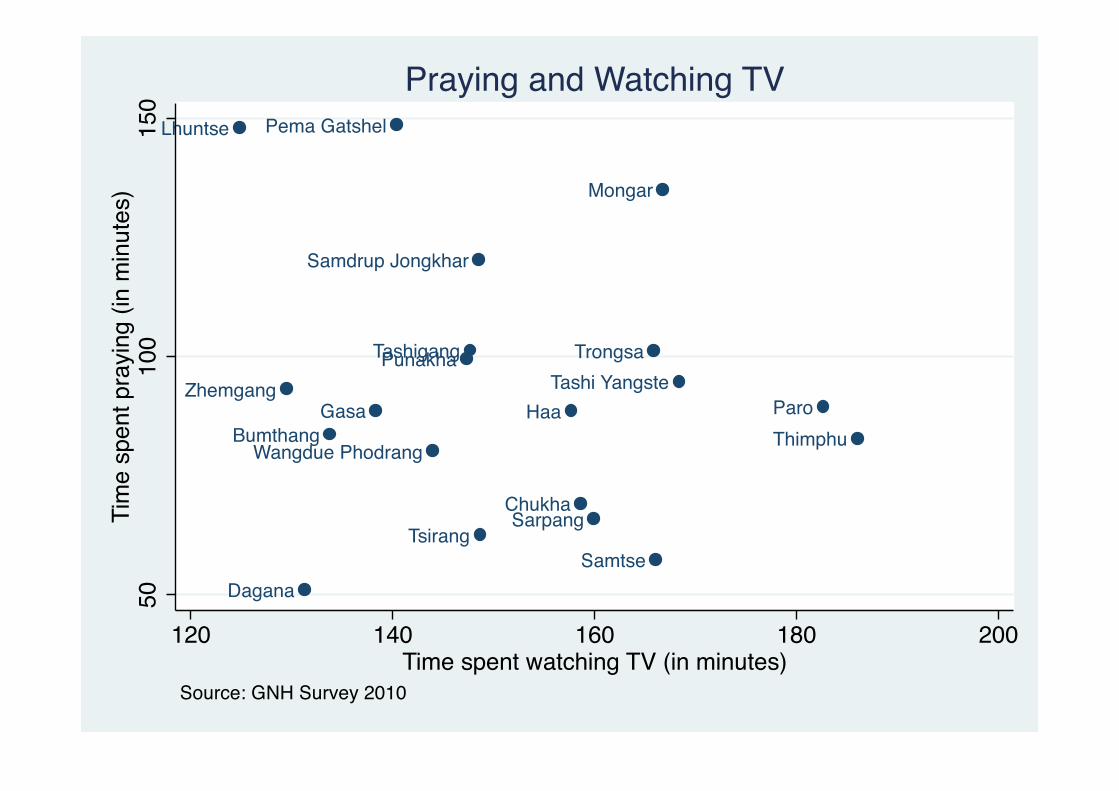
Bumthang
Chukha
Dagana
Gasa Haa
Lhuntse
Mongar
Paro
Pema Gatshel
Punakha
Samdrup Jongkhar
Samtse
Sarpang
Thimphu
TashigangTashi Yangste
Trongsa
Tsirang
Wangdue Phodrang
Zhemgang
5010
015
0Ti
me
spen
t pra
ying
(in
min
utes
)
120 140 160 180 200Time spent watching TV (in minutes)
Source: GNH Survey 2010
Praying and Watching TV

Bumthang
Chukha
Dagana
Gasa
Haa
Lhuntse
Mongar
Paro
Pema Gatshel
Punakha
Samdrup Jongkhar
Samtse
Sarpang
Thimphu
Tashigang
Tashi Yangste
TrongsaTsirang
Wangdue Phodrang
Zhemgang
400
450
500
550
600
Tim
e sp
ent w
orki
ng (i
n m
inut
es)
120 140 160 180 200Time spent watching TV (in minutes)
Source: GNH Survey 2010
Working and Watching TV
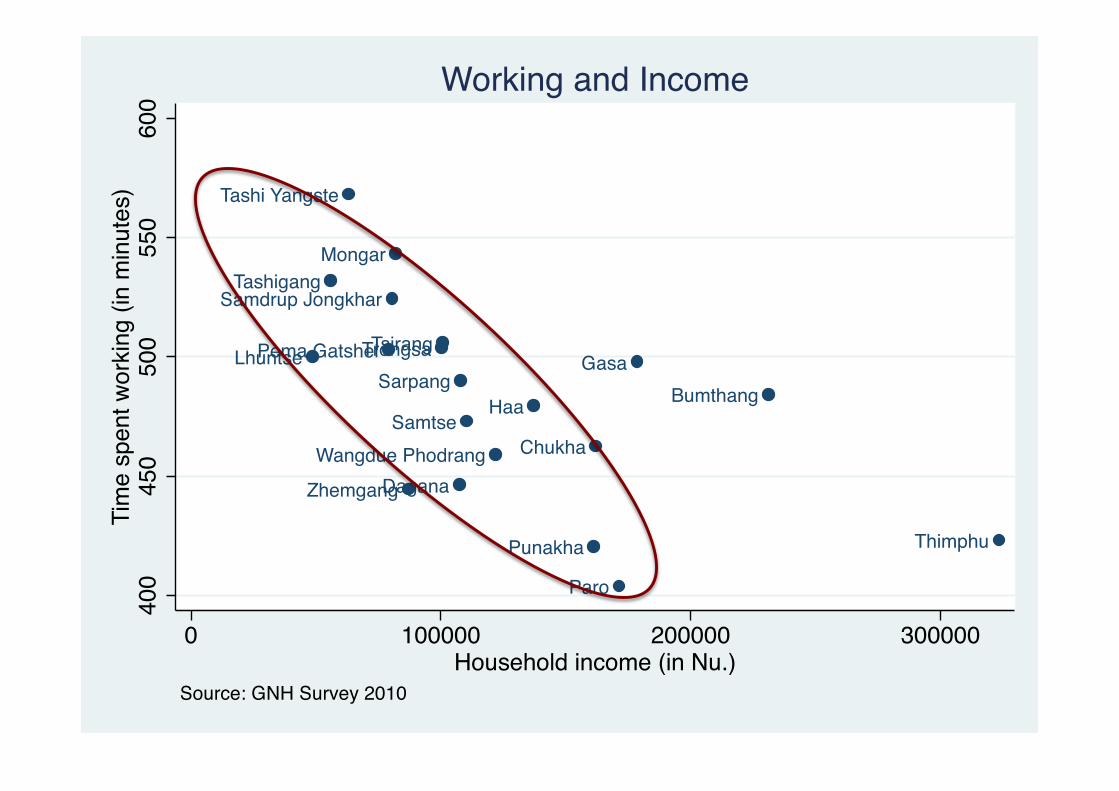
Bumthang
Chukha
Dagana
Gasa
Haa
Lhuntse
Mongar
Paro
Pema Gatshel
Punakha
Samdrup Jongkhar
Samtse
Sarpang
Thimphu
Tashigang
Tashi Yangste
TrongsaTsirang
Wangdue Phodrang
Zhemgang
400
450
500
550
600
Tim
e sp
ent w
orki
ng (i
n m
inut
es)
0 100000 200000 300000Household income (in Nu.)
Source: GNH Survey 2010
Working and Income
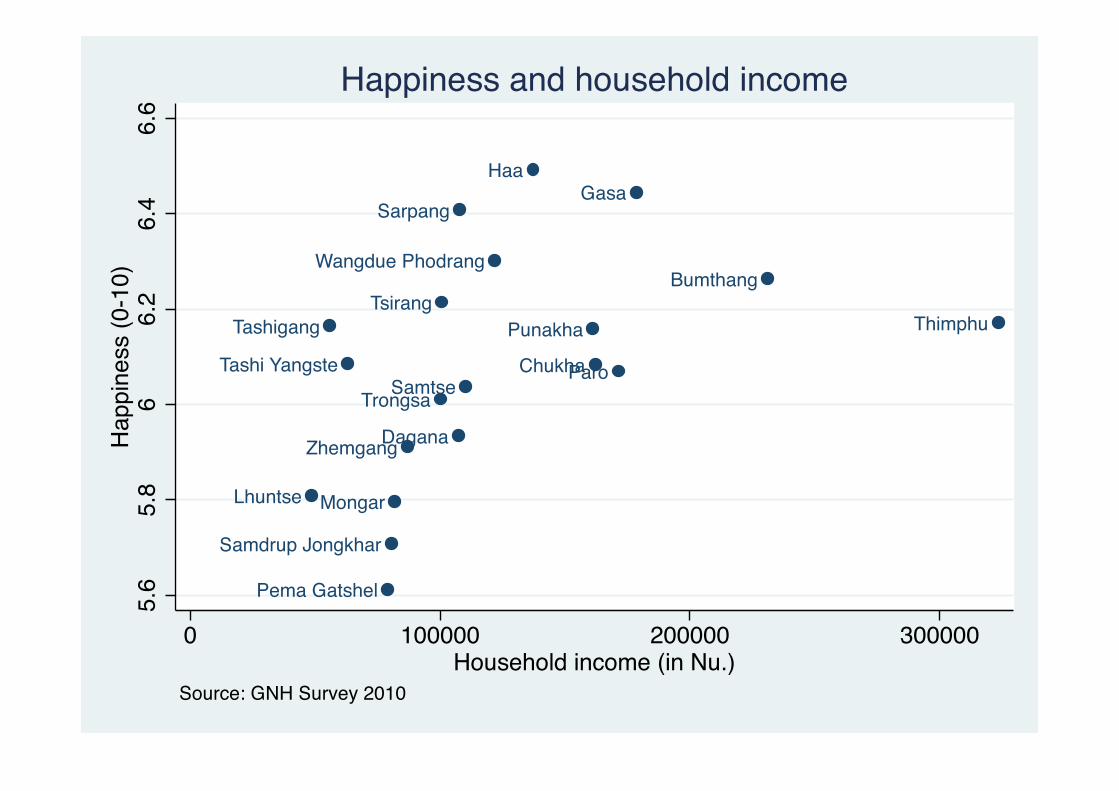
Bumthang
Chukha
Dagana
GasaHaa
Lhuntse Mongar
Paro
Pema Gatshel
Punakha
Samdrup Jongkhar
Samtse
Sarpang
ThimphuTashigang
Tashi Yangste
Trongsa
Tsirang
Wangdue Phodrang
Zhemgang
5.6
5.8
66.
26.
46.
6H
appi
ness
(0-1
0)
0 100000 200000 300000Household income (in Nu.)
Source: GNH Survey 2010
Happiness and household income

Education
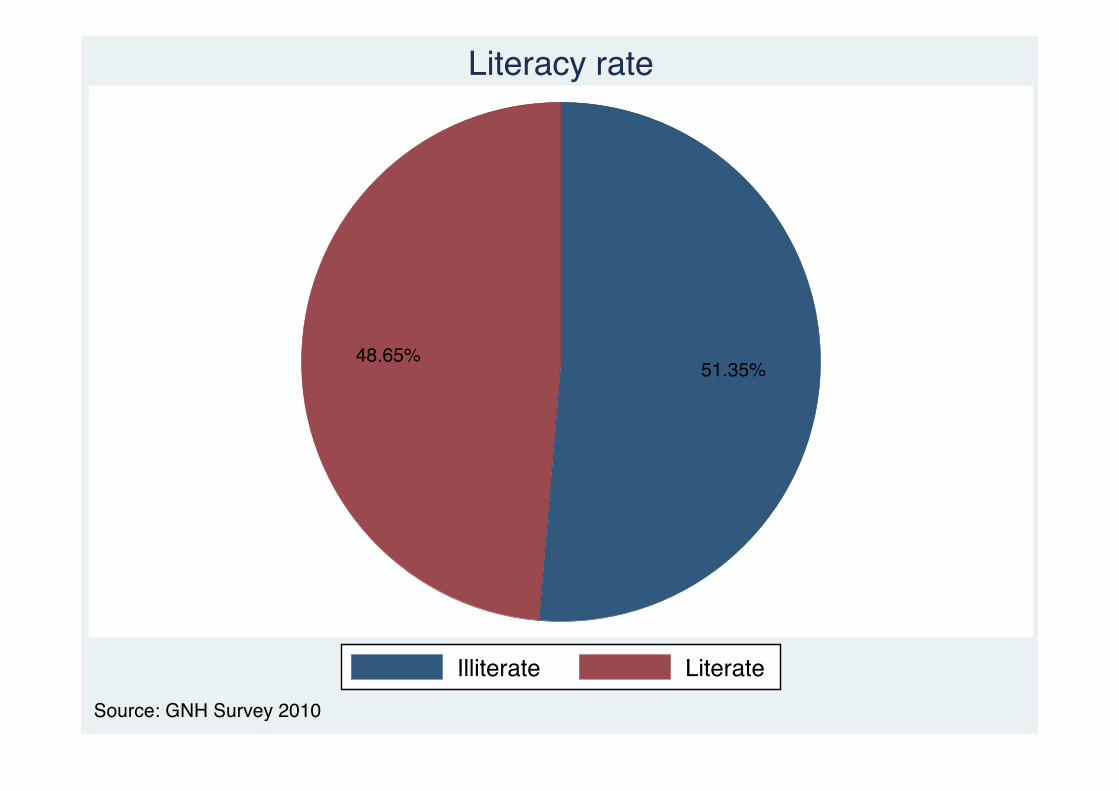
51.35%48.65%
Illiterate LiterateSource: GNH Survey 2010
Literacy rate

40.19%
59.81% 62.62%
37.38%
Source: GNH Survey 2010 Source: GNH Survey 2010
Male Female
Illiterate LiterateGraphs by Sex of the respondent
Literacy by sex

59.77%
40.23%
29.00%
71.00%
Source: GNH Survey 2010 Source: GNH Survey 2010
1 Rural 2 Urban
Illiterate LiterateGraphs by Rural/urban stratum
Literacy by area
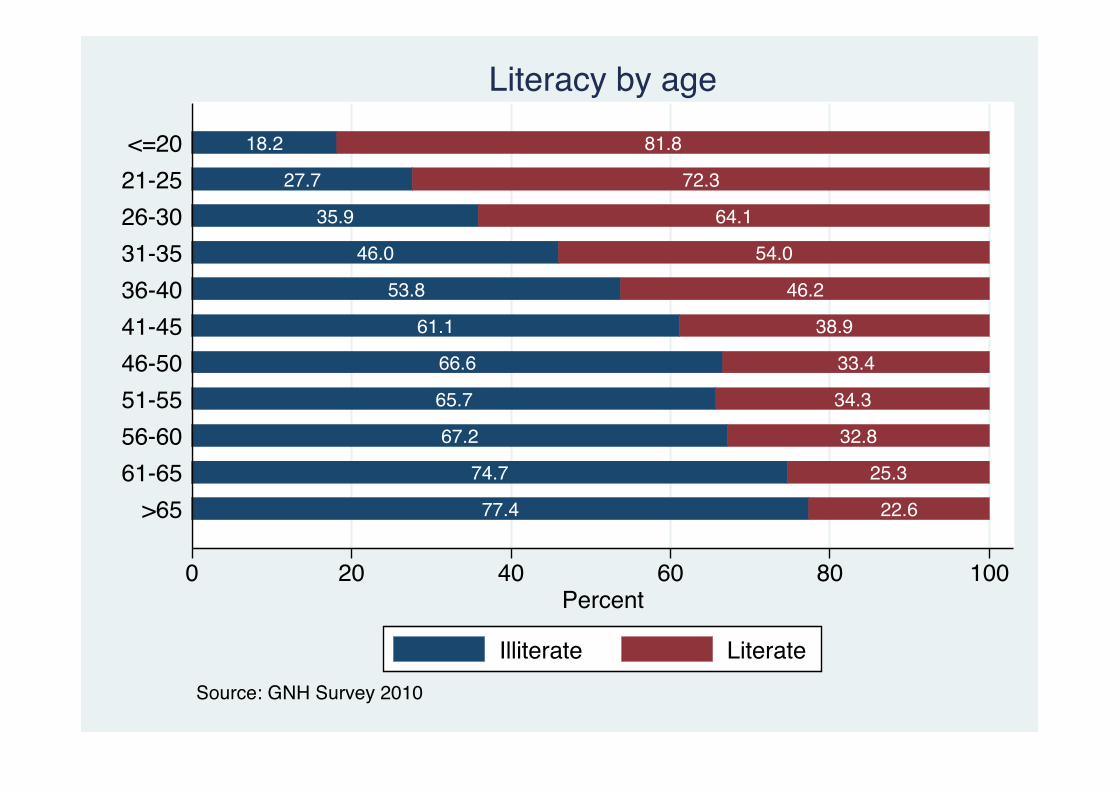
77.4 22.6
74.7 25.3
67.2 32.8
65.7 34.3
66.6 33.4
61.1 38.9
53.8 46.2
46.0 54.0
35.9 64.1
27.7 72.3
18.2 81.8
0 20 40 60 80 100Percent
>6561-6556-6051-5546-5041-4536-4031-3526-3021-25<=20
Source: GNH Survey 2010
Literacy by age
Illiterate Literate

22.1 77.9
28.1 71.9
41.4 58.6
50.9 49.1
55.7 44.3
62.4 37.6
74.9 25.1
0 20 40 60 80 100Percent
>225,000
150,001-225,000
100,001-150,000
75,001-100,000
50,001-75,000
25,001-50,000
0-25,000
Source: GNH Survey 2010
Literacy by household income
Illiterate Literate
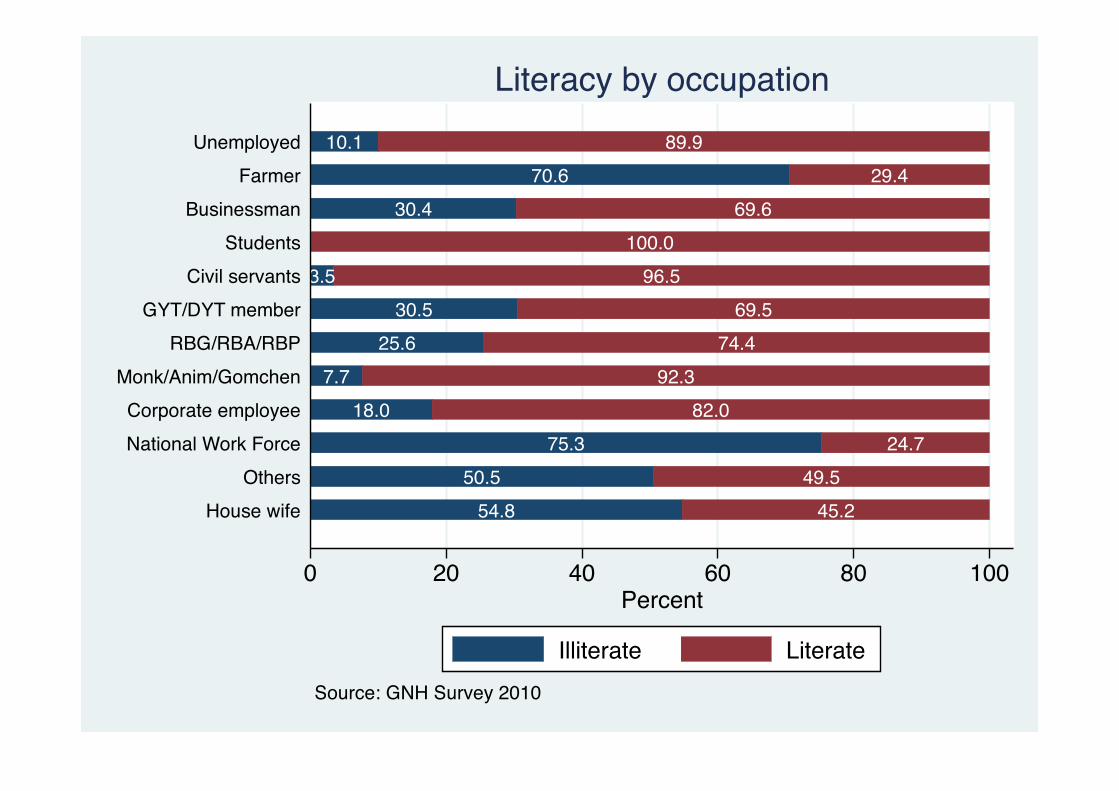
54.8 45.250.5 49.5
75.3 24.718.0 82.0
7.7 92.325.6 74.4
30.5 69.53.5 96.5
100.030.4 69.6
70.6 29.410.1 89.9
0 20 40 60 80 100Percent
House wifeOthers
National Work ForceCorporate employee
Monk/Anim/GomchenRBG/RBA/RBP
GYT/DYT memberCivil servants
StudentsBusinessman
FarmerUnemployed
Source: GNH Survey 2010
Literacy by occupation
Illiterate Literate

57.5 42.560.5 39.5
57.9 42.158.1 41.9
62.9 37.165.0 35.0
27.6 72.449.2 50.851.0 49.0
54.6 45.453.6 46.4
60.7 39.347.4 52.6
60.1 39.960.7 39.3
55.9 44.159.6 40.4
53.9 46.144.2 55.8
52.9 47.1
0 20 40 60 80 100Percent
ZhemgangWangdue Phodrang
TsirangTrongsa
Tashi YangsteTashigang
ThimphuSarpangSamtse
Samdrup JongkharPunakha
Pema GatshelParo
MongarLhuntse
HaaGasa
DaganaChukha
Bumthang
Source: GNH Survey 2010
Literacy by Dzongkhag
Illiterate Literate
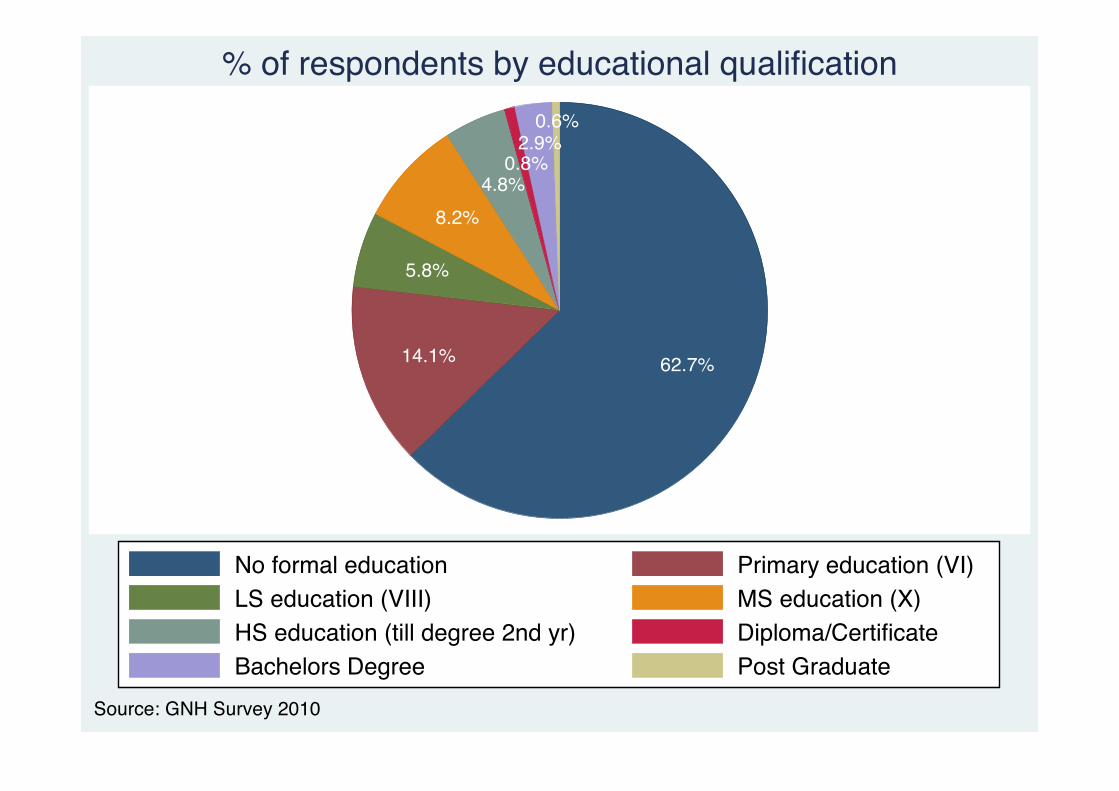
62.7%14.1%
5.8%
8.2%4.8%
0.8%2.9%
0.6%
No formal education Primary education (VI)LS education (VIII) MS education (X)HS education (till degree 2nd yr) Diploma/CertificateBachelors Degree Post Graduate
Source: GNH Survey 2010
% of respondents by educational qualification
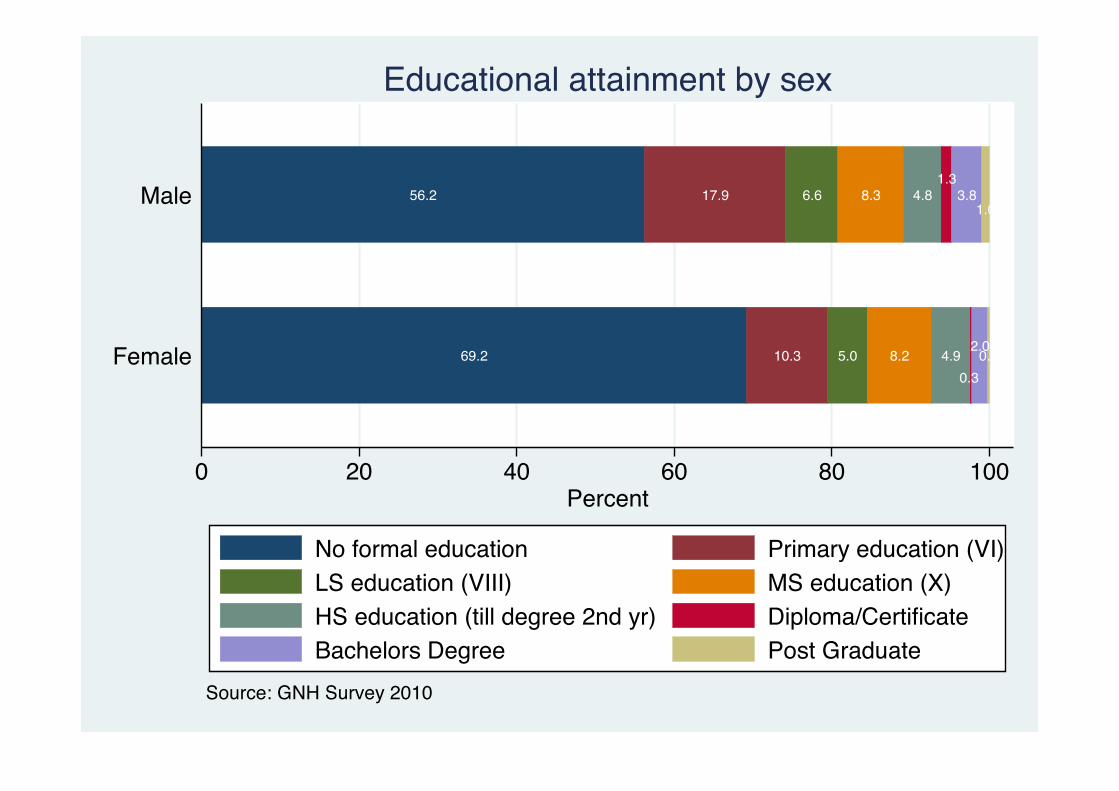
69.2 10.3 5.0 8.2 4.90.3
2.00.2
56.2 17.9 6.6 8.3 4.81.3
3.81.0
0 20 40 60 80 100Percent
Female
Male
Source: GNH Survey 2010
Educational attainment by sex
No formal education Primary education (VI)LS education (VIII) MS education (X)HS education (till degree 2nd yr) Diploma/CertificateBachelors Degree Post Graduate

35.2 14.4 11.2 17.7 11.2 2.0 6.8 1.5
73.1 14.0 3.8 4.7 2.50.31.40.2
0 20 40 60 80 100Percent
2 Urban
1 Rural
Source: GNH Survey 2010
Educational attainment by area
No formal education Primary education (VI)LS education (VIII) MS education (X)HS education (till degree 2nd yr) Diploma/CertificateBachelors Degree Post Graduate
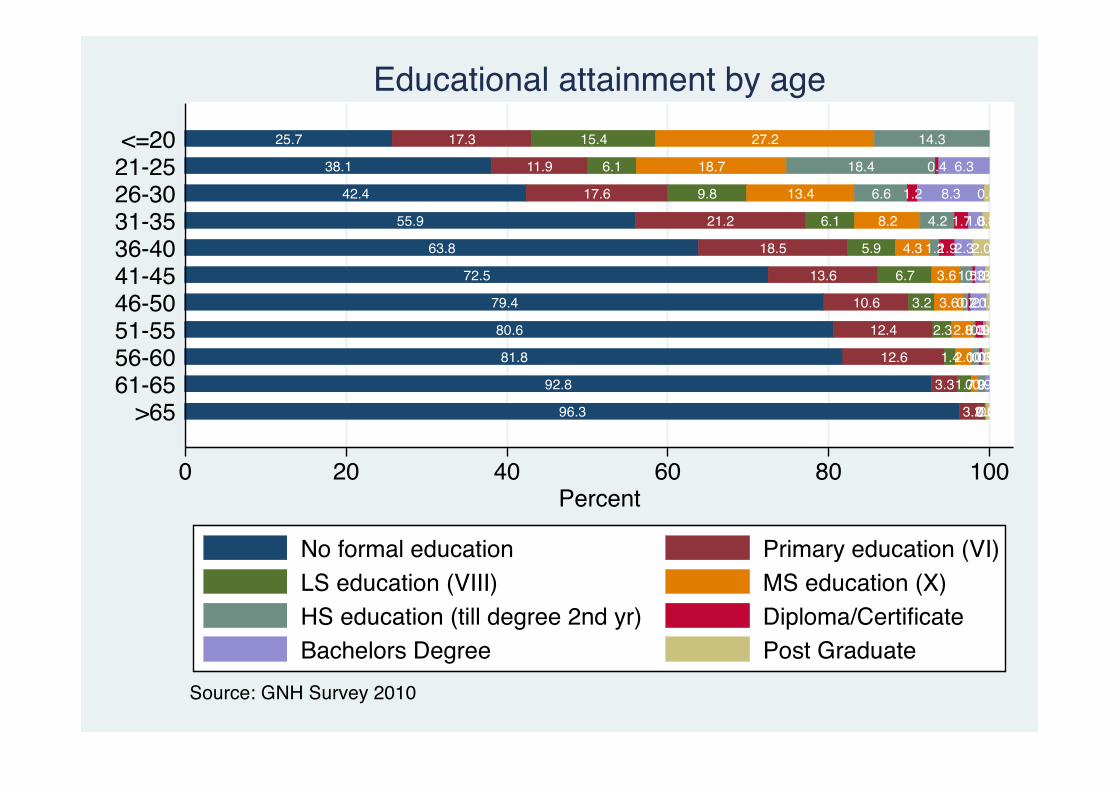
96.3 3.20.00.20.3
92.8 3.31.70.90.90.5
81.8 12.6 1.42.01.00.30.30.5
80.6 12.4 2.32.80.30.90.40.4
79.4 10.6 3.2 3.60.70.22.10.3
72.5 13.6 6.7 3.61.50.31.30.4
63.8 18.5 5.9 4.3 1.21.92.32.0
55.9 21.2 6.1 8.2 4.2 1.71.80.8
42.4 17.6 9.8 13.4 6.6 1.2 8.3 0.6
38.1 11.9 6.1 18.7 18.4 0.4 6.3
25.7 17.3 15.4 27.2 14.3
0 20 40 60 80 100Percent
>6561-6556-6051-5546-5041-4536-4031-3526-3021-25<=20
Source: GNH Survey 2010
Educational attainment by age
No formal education Primary education (VI)LS education (VIII) MS education (X)HS education (till degree 2nd yr) Diploma/CertificateBachelors Degree Post Graduate
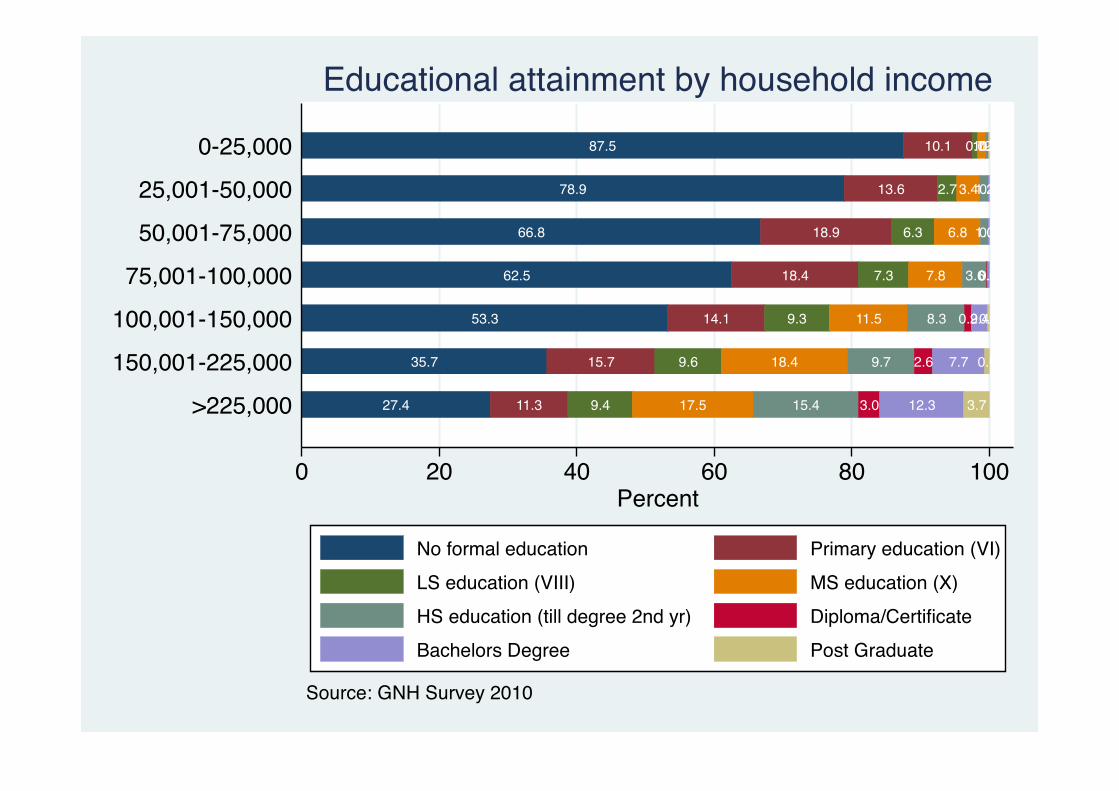
27.4 11.3 9.4 17.5 15.4 3.0 12.3 3.7
35.7 15.7 9.6 18.4 9.7 2.6 7.7 0.6
53.3 14.1 9.3 11.5 8.3 0.92.40.2
62.5 18.4 7.3 7.8 3.60.00.3
66.8 18.9 6.3 6.8 1.00.2
78.9 13.6 2.73.41.20.1
87.5 10.1 0.71.20.30.10.1
0 20 40 60 80 100Percent
>225,000
150,001-225,000
100,001-150,000
75,001-100,000
50,001-75,000
25,001-50,000
0-25,000
Source: GNH Survey 2010
Educational attainment by household income
No formal education Primary education (VI)LS education (VIII) MS education (X)HS education (till degree 2nd yr) Diploma/CertificateBachelors Degree Post Graduate
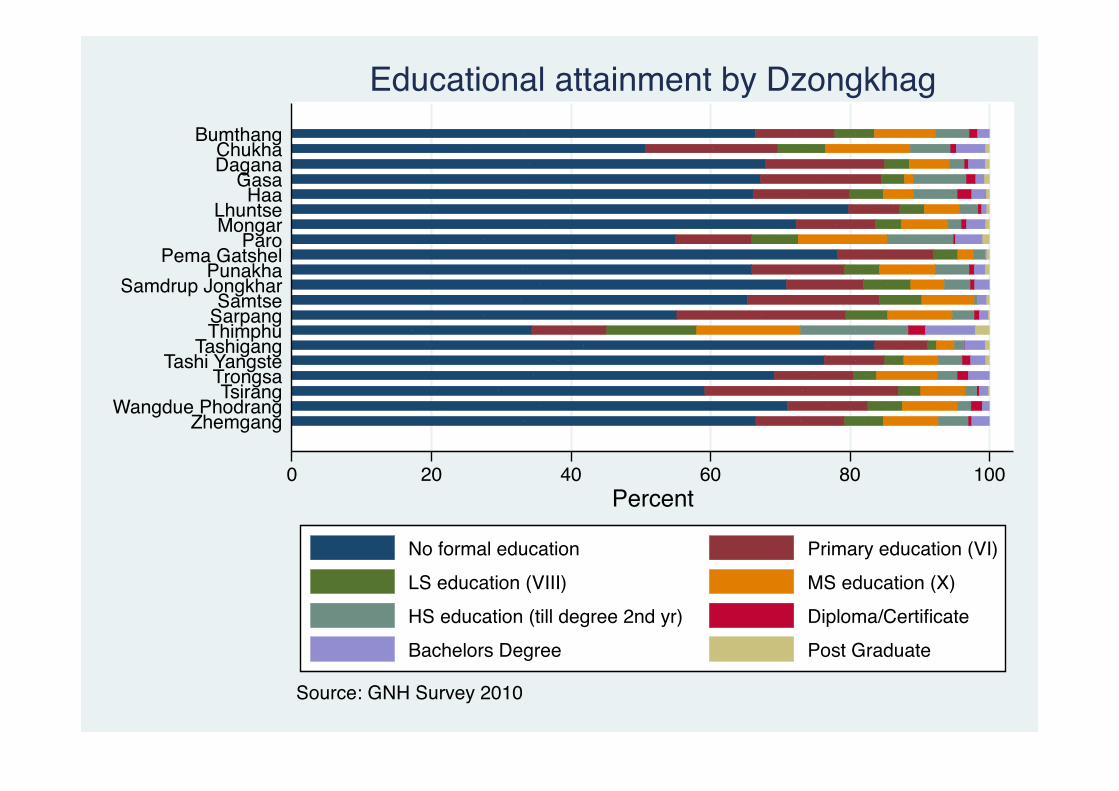
66.5 12.7 5.6 8.0 4.3 0.5 2.5
71.0 11.6 4.9 8.0 2.0 1.5 1.0
59.2 27.8 3.1 6.4 1.7 0.3 1.3 0.1
69.3 11.3 3.4 8.7 2.9 1.5 3.0
76.4 8.6 2.7 5.0 3.4 1.1 2.2 0.5
83.6 7.6 1.2 2.6 1.4 0.1 3.0 0.6
34.4 10.8 12.9 14.8 15.5 2.3 7.2 2.0
55.2 24.3 6.0 9.3 3.1 0.6 1.3 0.1
65.3 19.0 6.0 7.6 0.4 1.3 0.3
71.0 11.0 6.8 4.8 3.7 0.6 2.1
66.0 13.3 5.0 8.0 4.9 0.6 1.6 0.6
78.2 13.8 3.5 2.2 1.6 0.3 0.4
55.1 10.9 6.7 12.7 9.6 0.3 3.9 0.9
72.4 11.3 3.8 6.6 2.0 0.7 2.8 0.5
79.9 7.3 3.5 5.1 2.7 0.5 0.8 0.3
66.2 13.9 4.7 4.4 6.3 2.0 2.1 0.4
67.2 17.4 3.3 1.2 7.7 1.3 1.3 0.6
67.9 17.1 3.5 5.9 2.1 0.5 2.4 0.6
50.7 19.0 6.8 12.1 5.8 0.8 4.2 0.5
66.5 11.4 5.6 8.8 4.8 1.2 1.7
0 20 40 60 80 100Percent
ZhemgangWangdue Phodrang
TsirangTrongsa
Tashi YangsteTashigang
ThimphuSarpangSamtse
Samdrup JongkharPunakha
Pema GatshelParo
MongarLhuntse
HaaGasa
DaganaChukha
Bumthang
Source: GNH Survey 2010
Educational attainment by Dzongkhag
No formal education Primary education (VI)LS education (VIII) MS education (X)HS education (till degree 2nd yr) Diploma/CertificateBachelors Degree Post Graduate

76.38%
23.62%
No YesSource: GNH Survey 2010
Know names of their great-grandparents
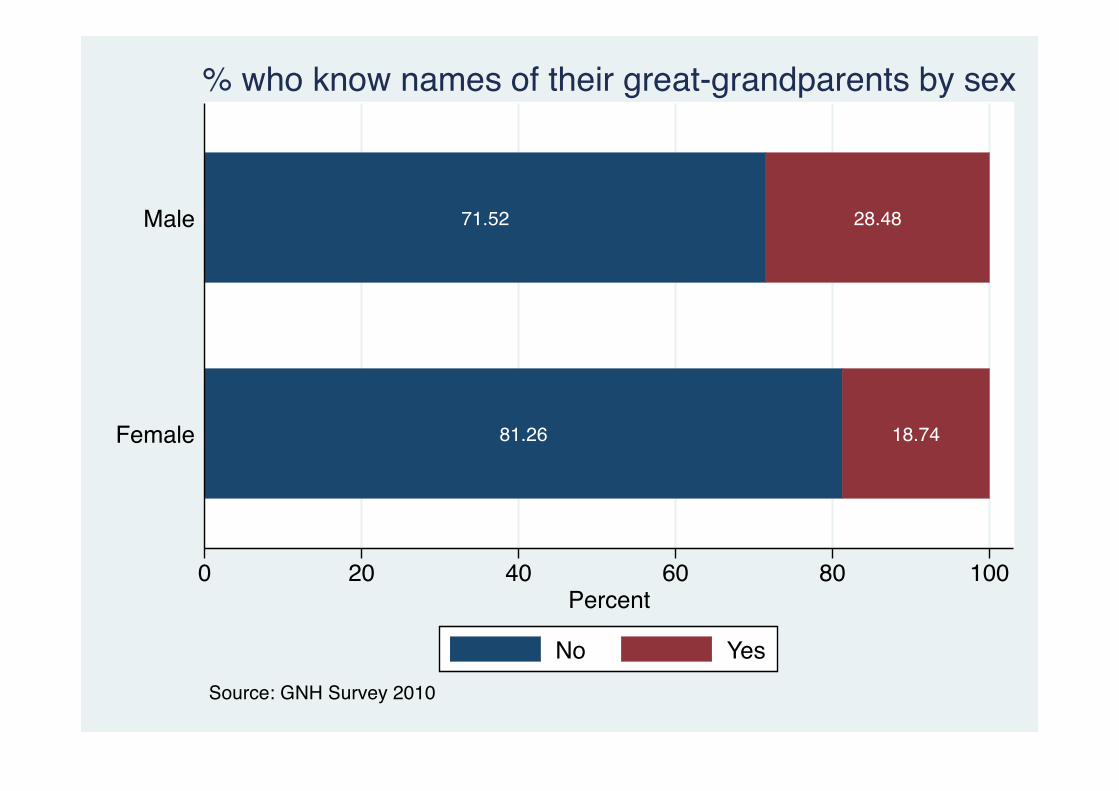
81.26 18.74
71.52 28.48
0 20 40 60 80 100Percent
Female
Male
Source: GNH Survey 2010
% who know names of their great-grandparents by sex
No Yes

84.07 15.93
75.30 24.70
0 20 40 60 80 100Percent
2 Urban
1 Rural
Source: GNH Survey 2010
% who know names of their great-grandparents by area
No Yes

0
5
10
15
20
25
30
35
40
<=20 21-‐‑25 26-‐‑30 31-‐‑35 36-‐‑40 41-‐‑45 46-‐‑50 51-‐‑55 56-‐‑60 61-‐‑65 >65
Percent
Age
% of respondents who knows the names of their great-‐‑grandparents by age

49.10 50.90
64.84 35.16
66.13 33.87
78.44 21.56
81.96 18.04
79.45 20.55
76.47 23.53
76.09 23.91
0 20 40 60 80 100PercentPos
t Grad
uate
Bache
lors D
egree
Diploma/C
ertific
ate
HS educ
ation
(till d
egree
2nd y
r)
MS educ
ation
(X)
LS ed
ucati
on (V
III)
Primary
educ
ation
(VI)
No form
al ed
ucati
on
Source: GNH Survey 2010
% who know names of their great-grandparents by education
No Yes

76.0 24.069.4 30.6
76.6 23.463.3 36.765.0 35.0
62.0 38.082.9 17.182.1 17.983.5 16.5
81.5 18.563.1 36.9
88.9 11.180.2 19.8
82.5 17.576.6 23.4
73.9 26.168.5 31.5
64.9 35.179.3 20.7
60.1 39.9
0 20 40 60 80 100Percent
Zhemga
ng
Wangd
ue Pho
drangTsi
rang
Trong
sa
Tash
i Yan
gste
Tash
igang
Thimph
uSarp
ang
Samtse
Samdru
p Jon
gkha
rPun
akha
Pema G
atshe
lParoMonga
rLh
untseHaaGasa
Dagan
aChu
kha
Bumtha
ng
Source: GNH Survey 2010
Know names of their great-grandparents by Dzongkhag
No Yes
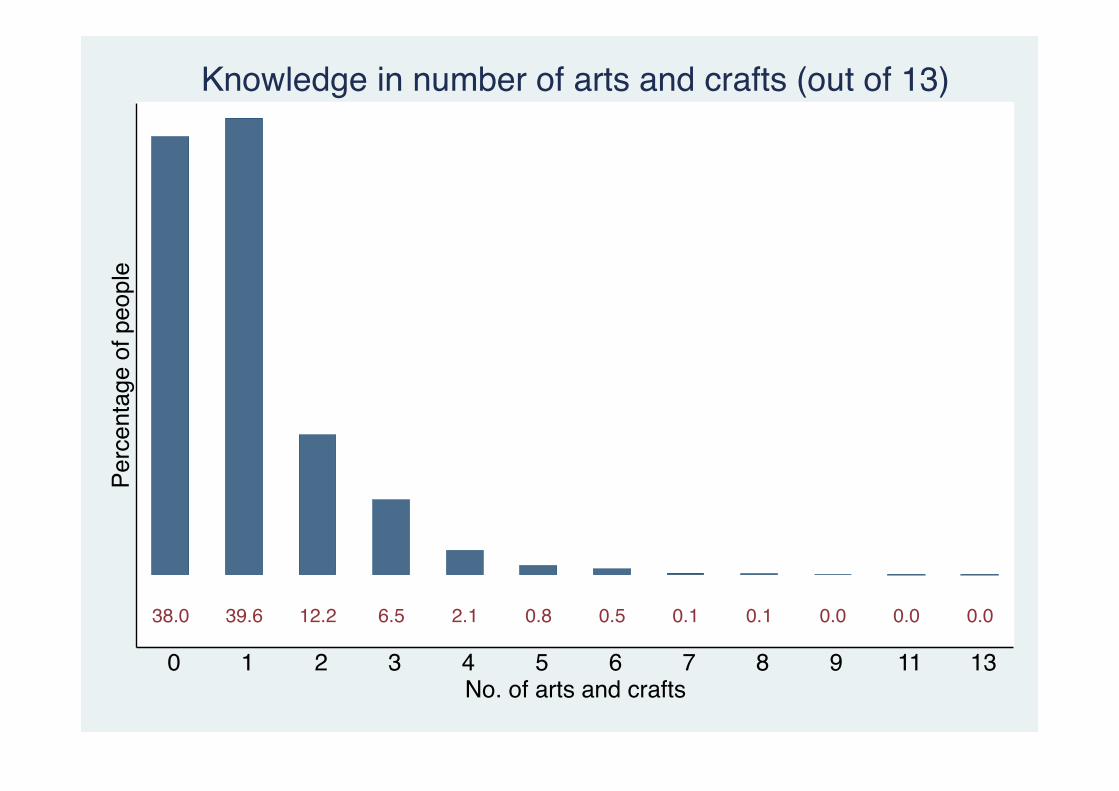
38.0 39.6 12.2 6.5 2.1 0.8 0.5 0.1 0.1 0.0 0.0 0.0
Perc
enta
ge o
f peo
ple
0 1 2 3 4 5 6 7 8 9 11 13No. of arts and crafts
Knowledge in number of arts and crafts (out of 13)
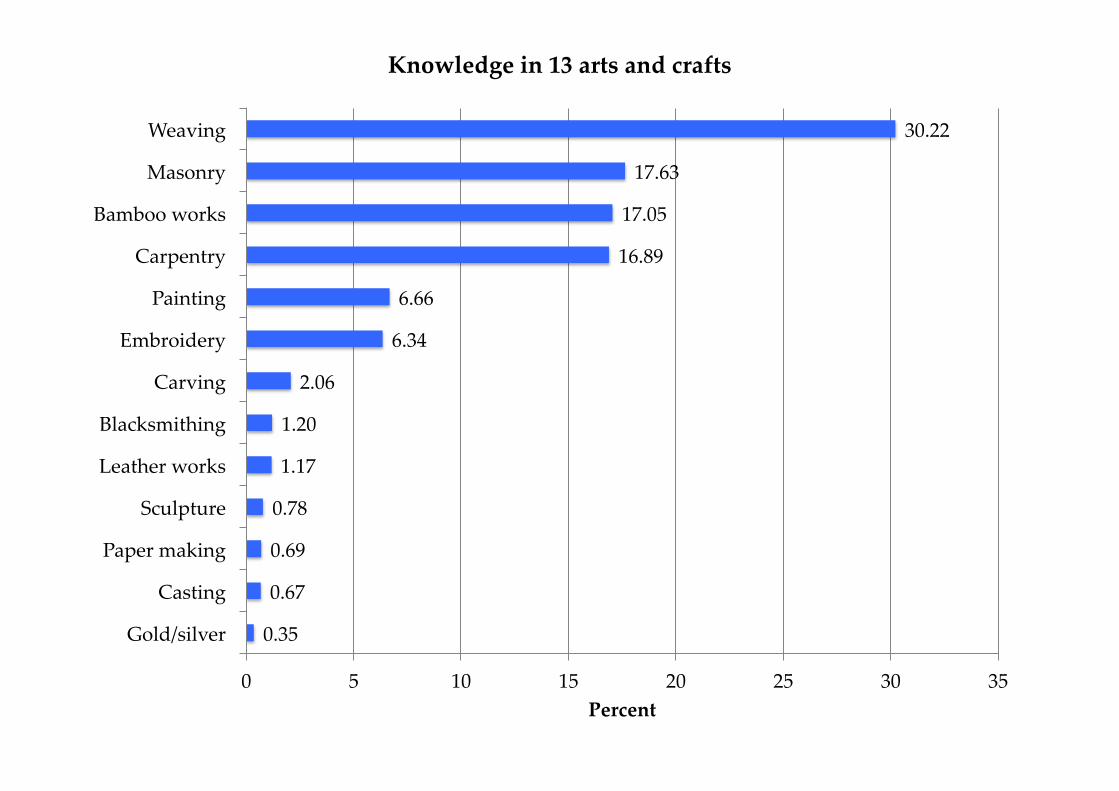
0.35
0.67
0.69
0.78
1.17
1.20
2.06
6.34
6.66
16.89
17.05
17.63
30.22
0 5 10 15 20 25 30 35
Gold/silver
Casting
Paper making
Sculpture
Leather works
Blacksmithing
Carving
Embroidery
Painting
Carpentry
Bamboo works
Masonry
Weaving
Percent
Knowledge in 13 arts and crafts

34.86%
65.14%
Don't know KnowSource: GNH Survey 2010
Knowledge on voting age

28.77%
71.23%
40.99%
59.01%
Male Female
Don't know KnowSource: GNH Survey 2010
Knowledge on voting age by sex

37.38%
62.62%
28.19%
71.81%
1 Rural 2 Urban
Don't know KnowSource: GNH Survey 2010
Knowledge on voting age by area
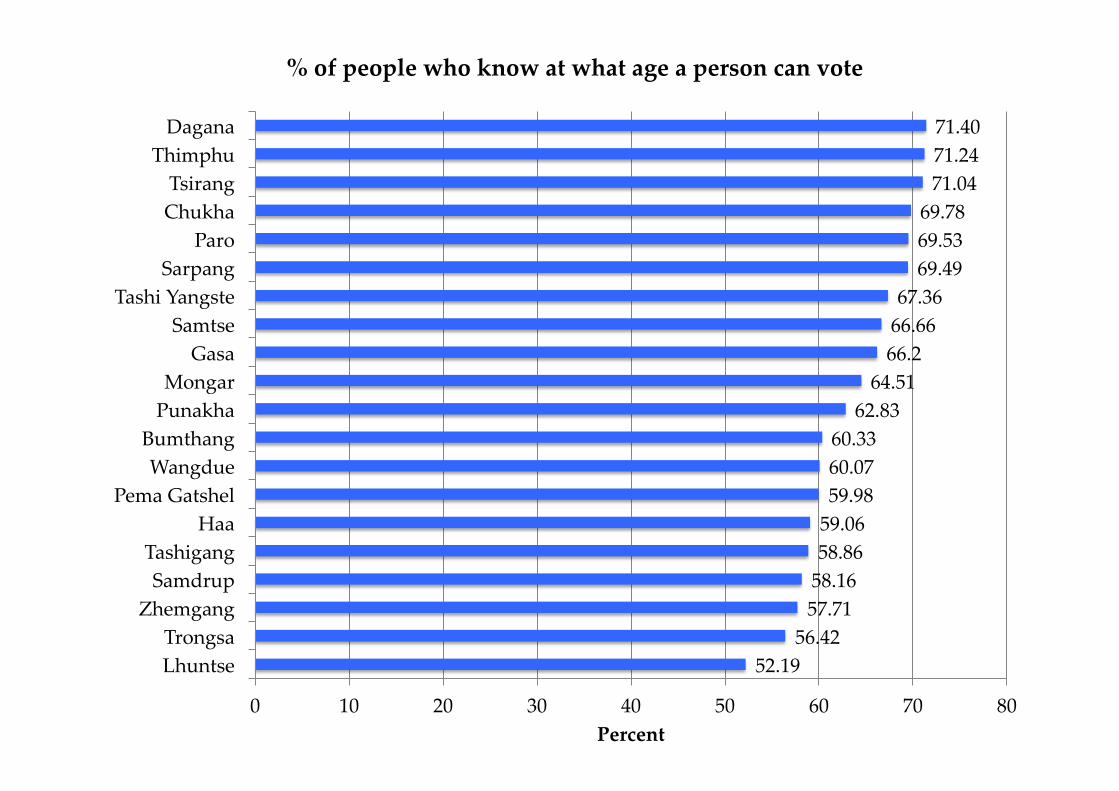
52.19 56.42 57.71 58.16 58.86 59.06 59.98 60.07 60.33
62.83 64.51 66.2 66.66 67.36 69.49 69.53 69.78 71.04 71.24 71.40
0 10 20 30 40 50 60 70 80
Lhuntse Trongsa
Zhemgang Samdrup Tashigang
Haa Pema Gatshel
Wangdue Bumthang Punakha Mongar
Gasa Samtse
Tashi Yangste Sarpang
Paro Chukha Tsirang
Thimphu Dagana
Percent
% of people who know at what age a person can vote

77.57 75.7 72.92
65.25 67.59 65.6
59.26 63.15
58.61
48.1
41.63
0
10
20
30
40
50
60
70
80
90
<=20 21-‐‑25 26-‐‑30 31-‐‑35 36-‐‑40 41-‐‑45 46-‐‑50 51-‐‑55 56-‐‑60 61-‐‑65 >65
Percent
Age
% of respondents who know at what age a person can vote

53.51%
46.49%
Don't know KnowSource: GNH Survey 2010
Knowledge on exclusive breastfeeding
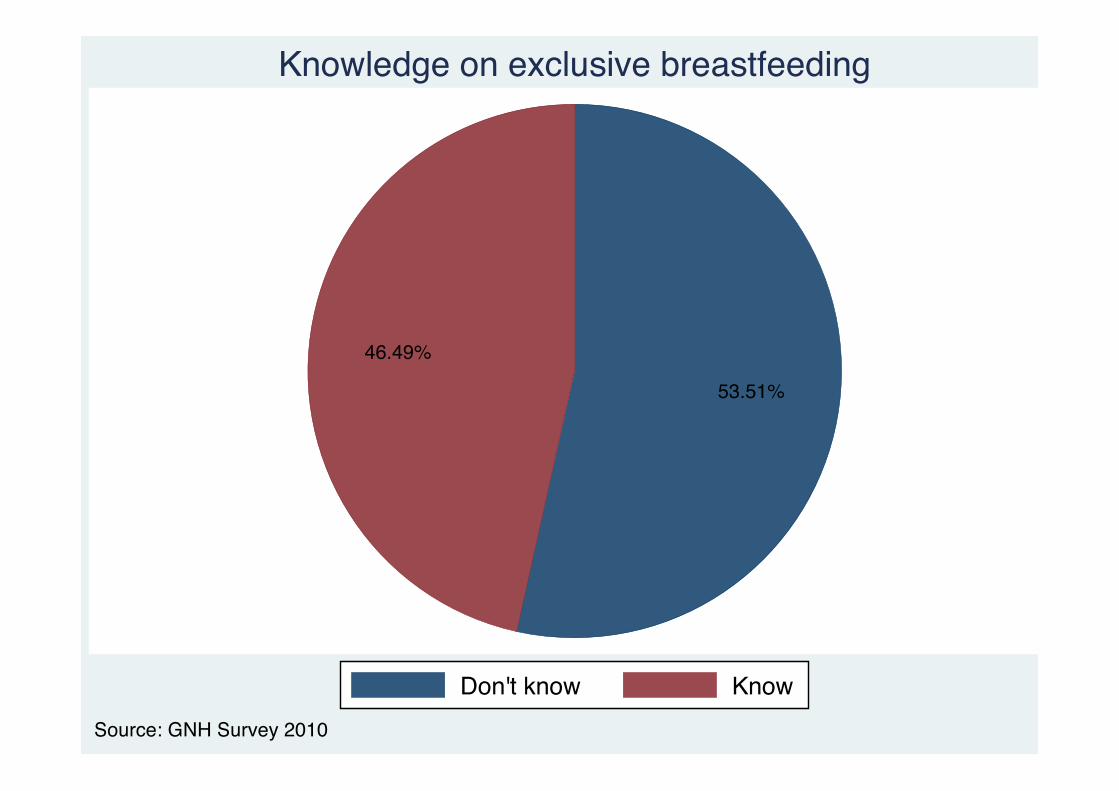
53.51%
46.49%
Don't know KnowSource: GNH Survey 2010
Knowledge on exclusive breastfeeding

54.46%
45.54%
52.58%47.42%
Male Female
Don't know KnowSource: GNH Survey 2010
Knowledge on exclusive breastfeeding by sex
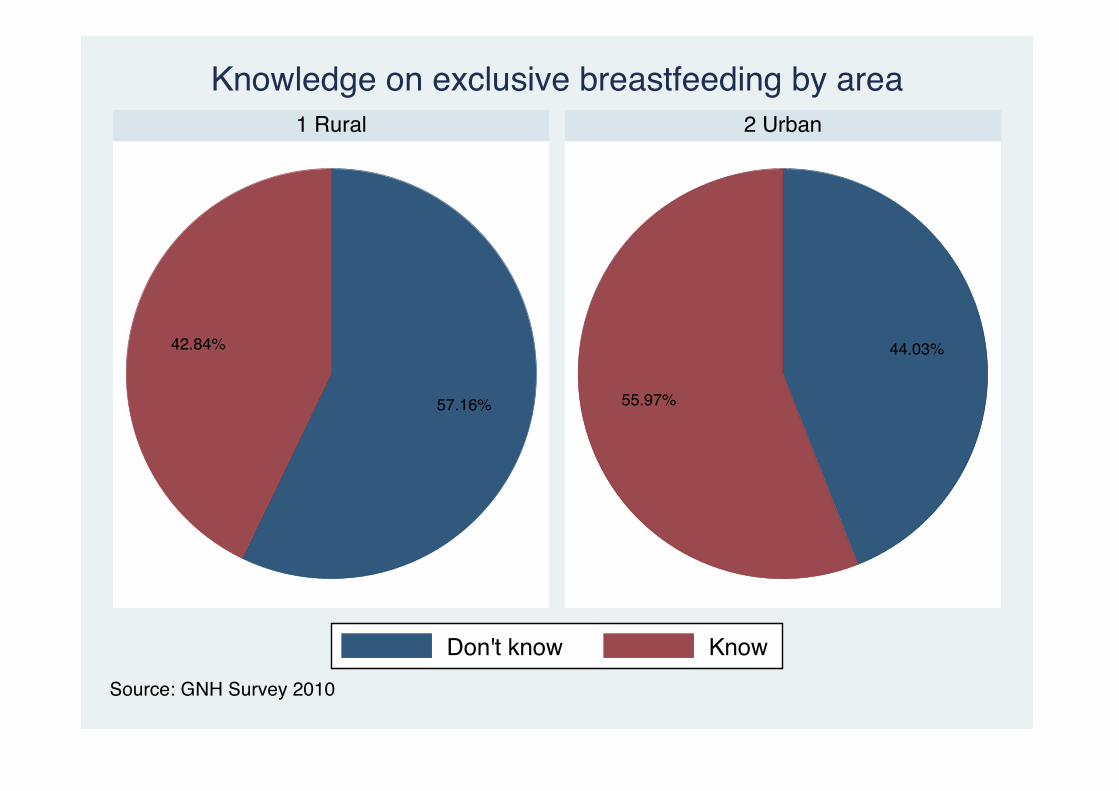
57.16%
42.84% 44.03%
55.97%
1 Rural 2 Urban
Don't know KnowSource: GNH Survey 2010
Knowledge on exclusive breastfeeding by area

26.86 31.76 31.96 33 34.87
37.68 37.85
40.29 41.1 41.87
44.98 45.84 46.42 47.05
51.09 54.82 55.07 57.06 58.89 59.04
0 10 20 30 40 50 60 70
Lhuntse Tashigang Samdrup
Pema Gatshel Tashi Yangste
Trongsa Wangdue Mongar
Zhemgang Bumthang
Dagana Punakha
Paro Haa Gasa
Sarpang Thimphu Tsirang Chukha Samtse
Percent
Knowledge of how long a child should be breastfed exclusively

26.49 28.68
33.25 35.76 35.86 36.78 37.26
40.08 42.49 42.8 43.13
47.58 48.52 49.5
51.91 55.59
58.75 59.08 60.04 60.65
0 10 20 30 40 50 60 70
Tashigang Lhuntse
Pema Samdrup Trongsa
Tashi Zhemgang Wangdue Bumthang
Mongar Punakha
Gasa Haa Paro
Dagana Sarpang Samtse
Thimphu Tsirang Chukha
Percent
Knowledge on exclusive breastfeeding (female)
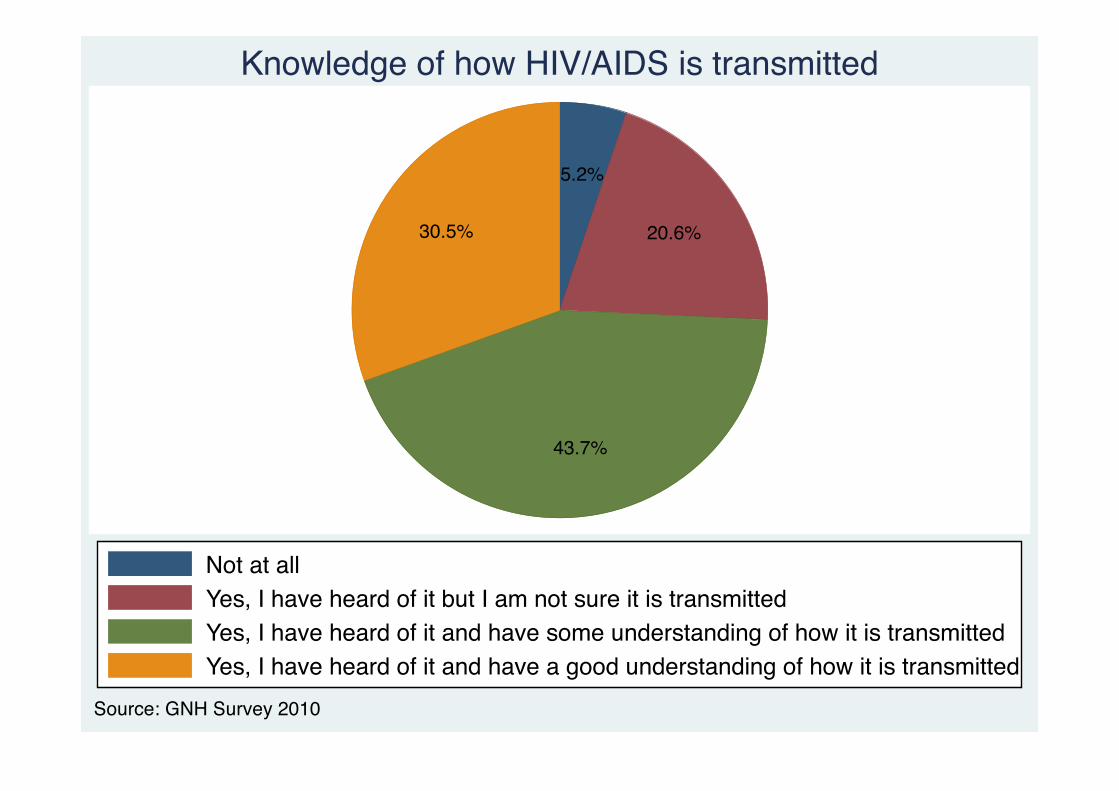
5.2%
20.6%
43.7%
30.5%
Not at allYes, I have heard of it but I am not sure it is transmittedYes, I have heard of it and have some understanding of how it is transmittedYes, I have heard of it and have a good understanding of how it is transmitted
Source: GNH Survey 2010
Knowledge of how HIV/AIDS is transmitted

5.5 22.7 44.1 27.6
4.8 18.4 43.4 33.3
0 20 40 60 80 100Percent
Female
Male
Source: GNH Survey 2010
Knowledge of how HIV/AIDS is transmitted by sex
Not at allYes, I have heard of it but I am not sure it is transmittedYes, I have heard of it and have some understanding of how it is transmittedYes, I have heard of it and have a good understanding of how it is transmitted
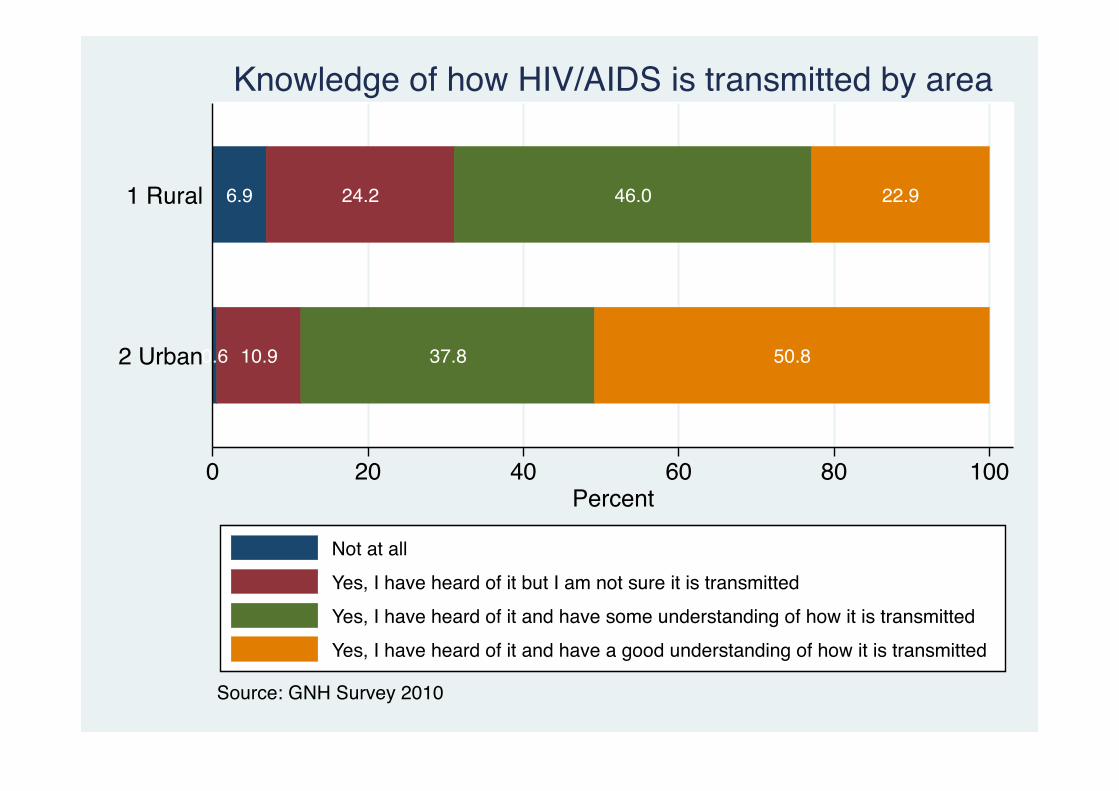
0.6 10.9 37.8 50.8
6.9 24.2 46.0 22.9
0 20 40 60 80 100Percent
2 Urban
1 Rural
Source: GNH Survey 2010
Knowledge of how HIV/AIDS is transmitted by area
Not at allYes, I have heard of it but I am not sure it is transmittedYes, I have heard of it and have some understanding of how it is transmittedYes, I have heard of it and have a good understanding of how it is transmitted

11.8%
19.2%
31.1%
29.1%
8.7%
Very poor PoorAverage GoodVery good
Source: GNH Survey 2010
Knowledge and understanding of local festivals
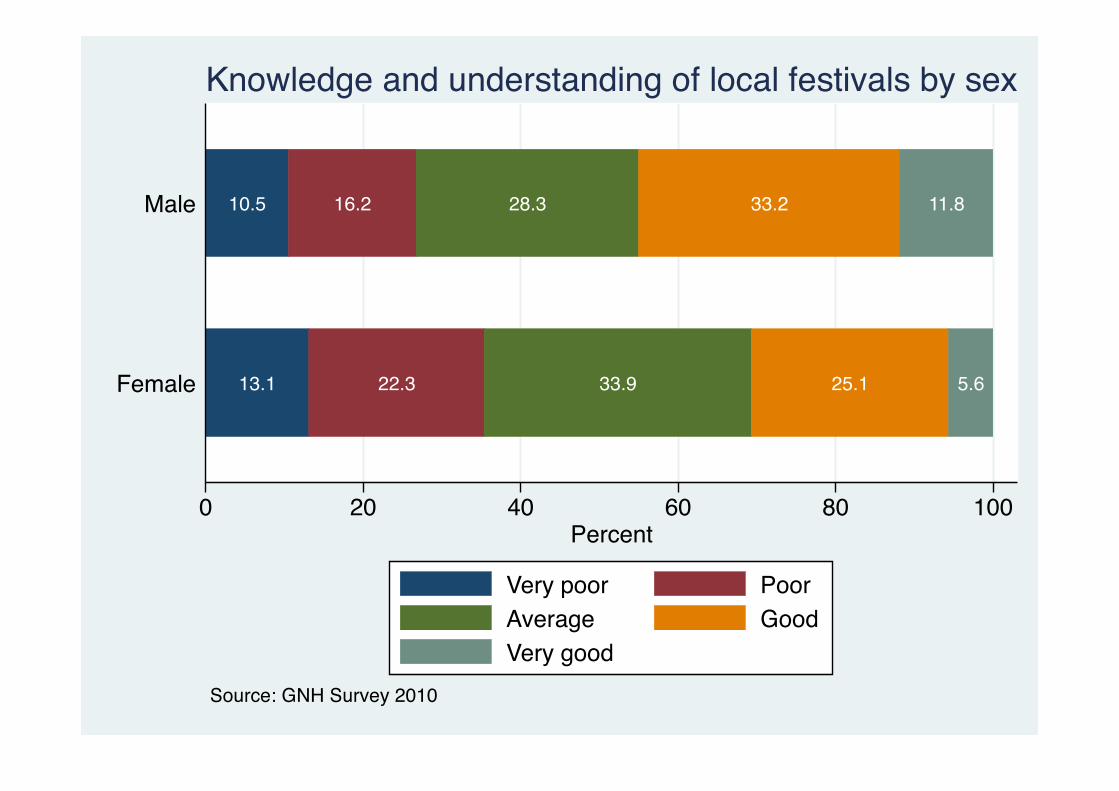
13.1 22.3 33.9 25.1 5.6
10.5 16.2 28.3 33.2 11.8
0 20 40 60 80 100Percent
Female
Male
Source: GNH Survey 2010
Knowledge and understanding of local festivals by sex
Very poor PoorAverage GoodVery good

10.9 20.0 36.0 25.9 7.2
12.2 19.0 29.2 30.3 9.3
0 20 40 60 80 100Percent
2 Urban
1 Rural
Source: GNH Survey 2010
Knowledge and understanding of local festivals by area
Very poor PoorAverage GoodVery good

19.4%
26.0%
29.5%
20.3%
4.8%
Very poor PoorAverage GoodVery good
Source: GNH Survey 2010
Knowledge and understanding of masked and other dances

20.6 29.8 30.8 16.9 1.8
18.3 22.1 28.2 23.6 7.8
0 20 40 60 80 100Percent
Female
Male
Source: GNH Survey 2010
Knowledge and understanding of masked and other dances by sex
Very poor PoorAverage GoodVery good
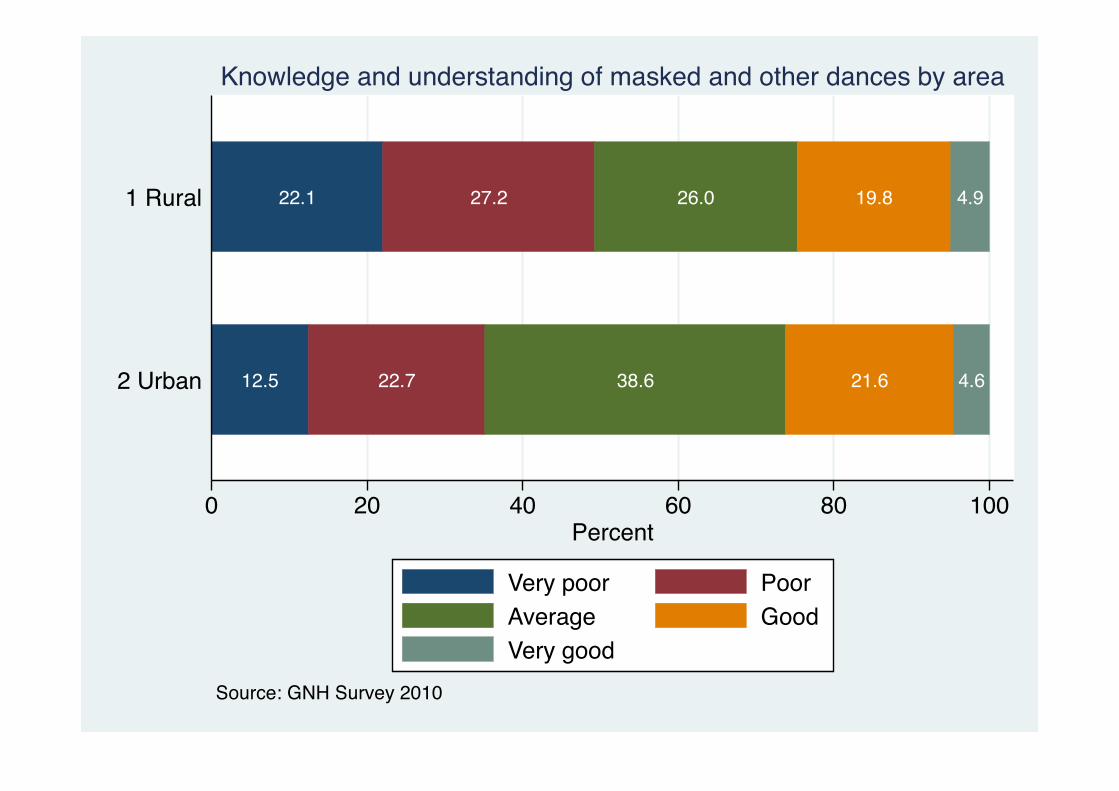
12.5 22.7 38.6 21.6 4.6
22.1 27.2 26.0 19.8 4.9
0 20 40 60 80 100Percent
2 Urban
1 Rural
Source: GNH Survey 2010
Knowledge and understanding of masked and other dances by area
Very poor PoorAverage GoodVery good

33.4%
24.9%
21.1%
16.6%
4.0%
Very poor PoorAverage GoodVery good
Source: GNH Survey 2010
Knowledge and understanding of traditional Bhutanese songs

32.5 25.4 21.9 16.7 3.5
34.4 24.4 20.2 16.4 4.6
0 20 40 60 80 100Percent
Female
Male
Source: GNH Survey 2010
Knowledge and understanding of traditional Bhutanese songs by sex
Very poor PoorAverage GoodVery good
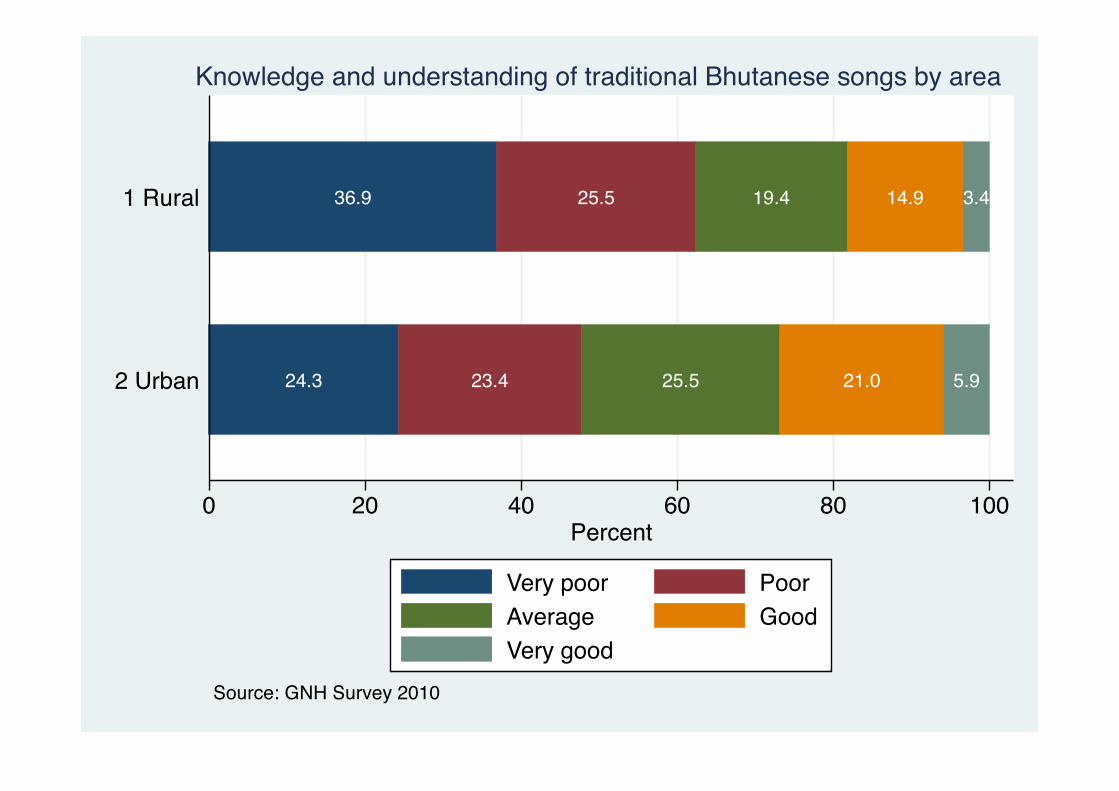
24.3 23.4 25.5 21.0 5.9
36.9 25.5 19.4 14.9 3.4
0 20 40 60 80 100Percent
2 Urban
1 Rural
Source: GNH Survey 2010
Knowledge and understanding of traditional Bhutanese songs by area
Very poor PoorAverage GoodVery good
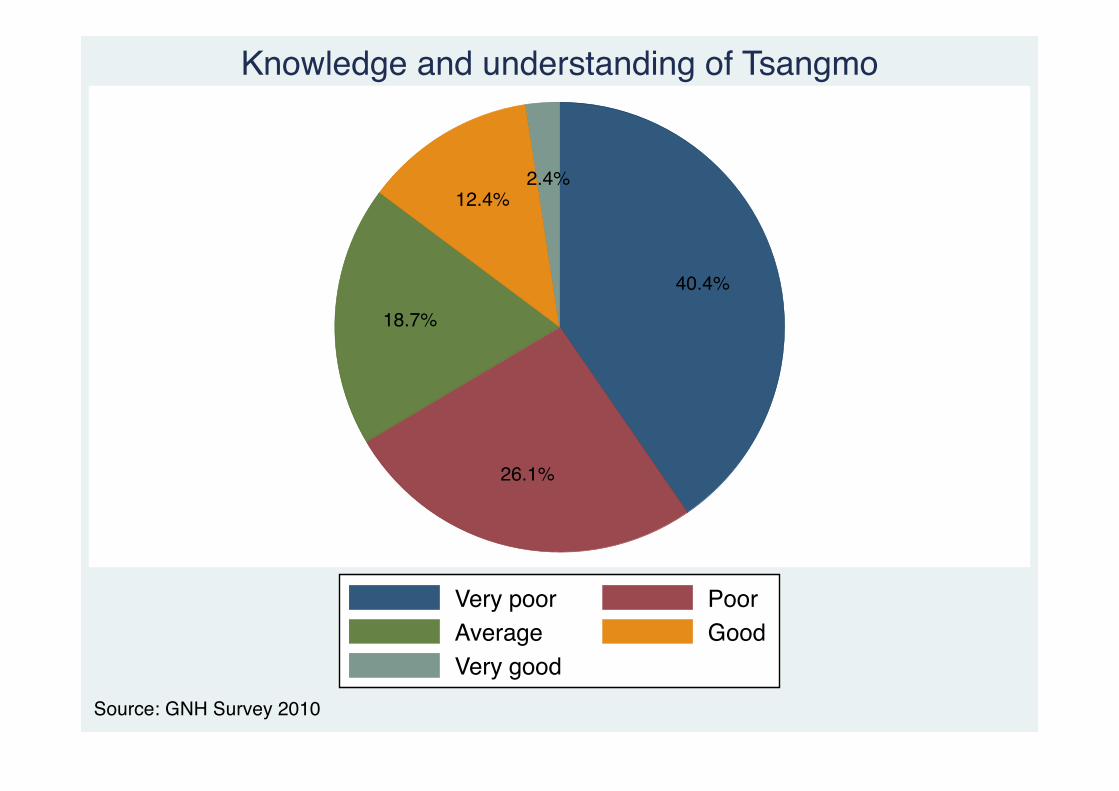
40.4%
26.1%
18.7%
12.4%2.4%
Very poor PoorAverage GoodVery good
Source: GNH Survey 2010
Knowledge and understanding of Tsangmo

40.7 27.2 18.8 11.6 1.7
40.1 24.9 18.7 13.1 3.1
0 20 40 60 80 100Percent
Female
Male
Source: GNH Survey 2010
Knowledge and understanding of Tsangmo by sex
Very poor PoorAverage GoodVery good

32.3 26.5 23.3 15.0 2.9
43.5 25.9 17.0 11.4 2.2
0 20 40 60 80 100Percent
2 Urban
1 Rural
Source: GNH Survey 2010
Knowledge and understanding of Tsangmo by area
Very poor PoorAverage GoodVery good
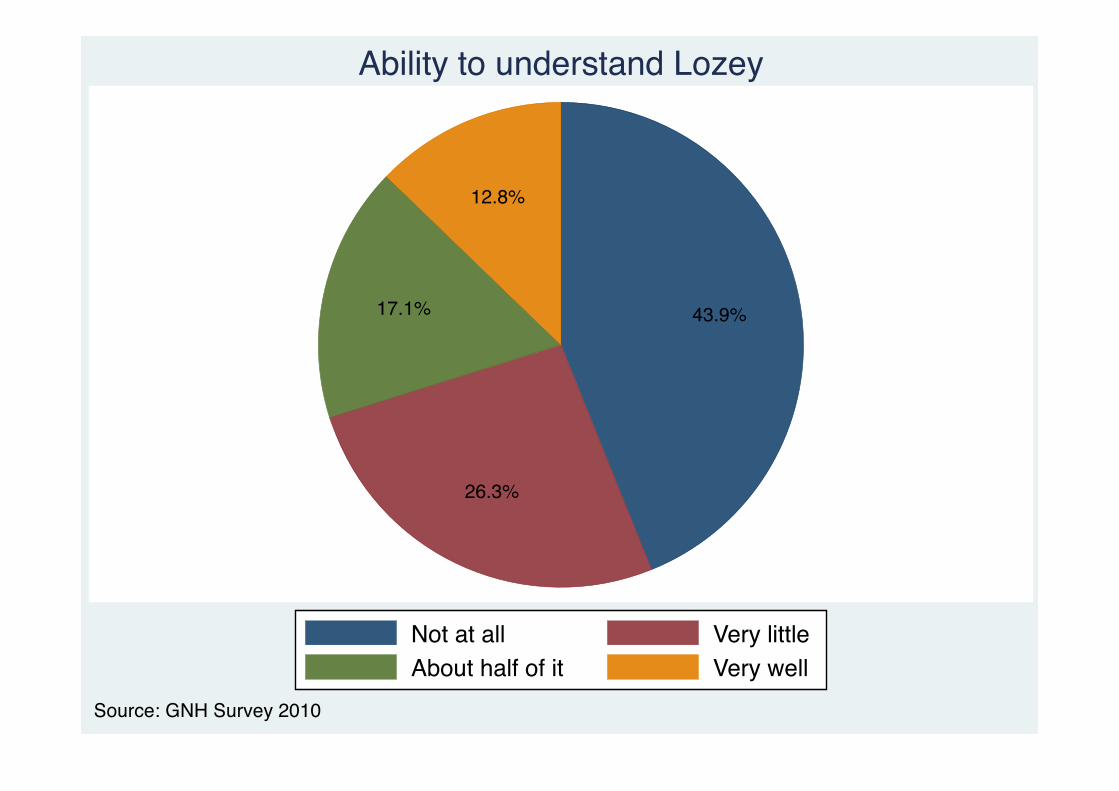
43.9%
26.3%
17.1%
12.8%
Not at all Very littleAbout half of it Very well
Source: GNH Survey 2010
Ability to understand Lozey

46.0 27.9 15.9 10.2
41.8 24.7 18.2 15.3
0 20 40 60 80 100Percent
Female
Male
Source: GNH Survey 2010
Ability to understand Lozey by sex
Not at all Very littleAbout half of it Very well
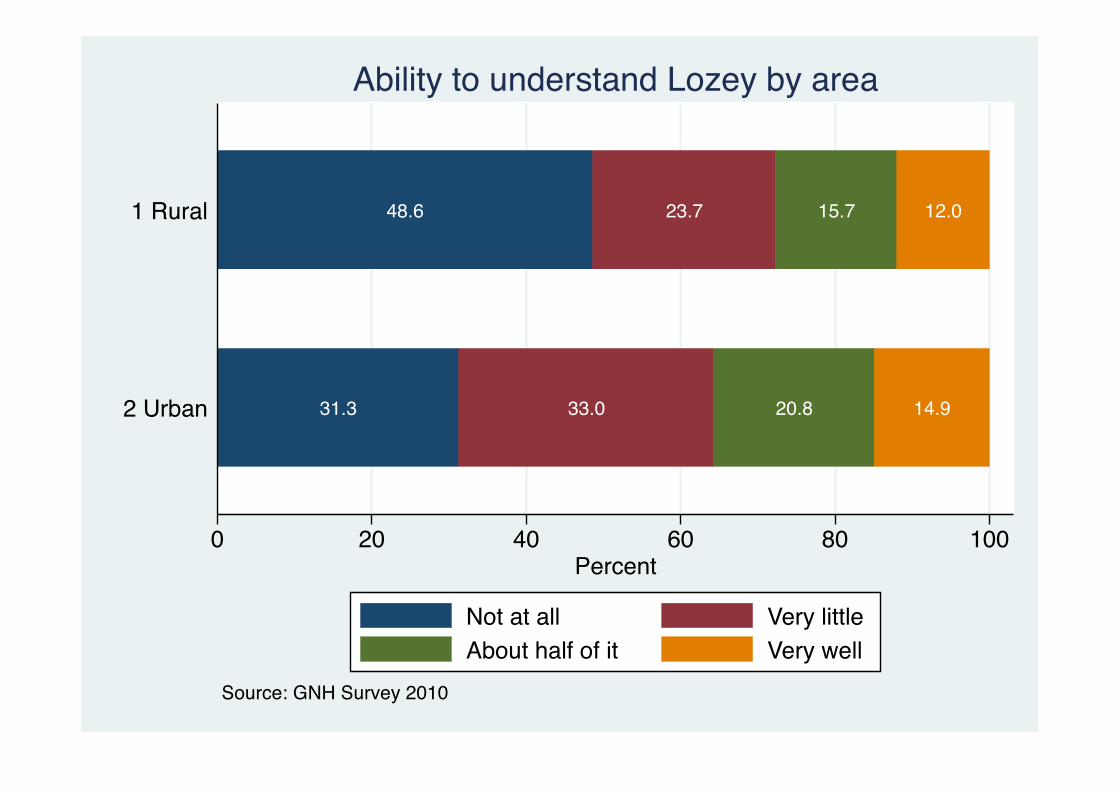
31.3 33.0 20.8 14.9
48.6 23.7 15.7 12.0
0 20 40 60 80 100Percent
2 Urban
1 Rural
Source: GNH Survey 2010
Ability to understand Lozey by area
Not at all Very littleAbout half of it Very well

33.4%
28.9%
23.8%
12.3%1.6%
Very poor PoorAverage GoodVery good
Source: GNH Survey 2010
Knowledge and understanding of the Constitution
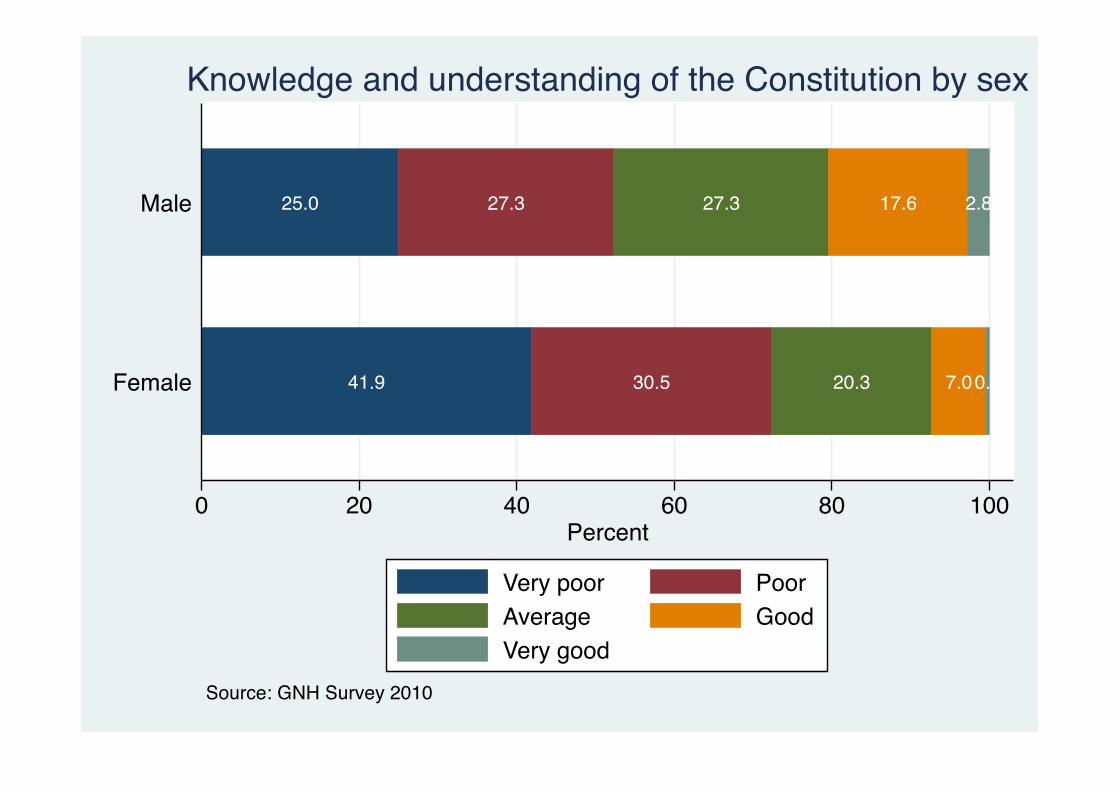
41.9 30.5 20.3 7.00.4
25.0 27.3 27.3 17.6 2.8
0 20 40 60 80 100Percent
Female
Male
Source: GNH Survey 2010
Knowledge and understanding of the Constitution by sex
Very poor PoorAverage GoodVery good
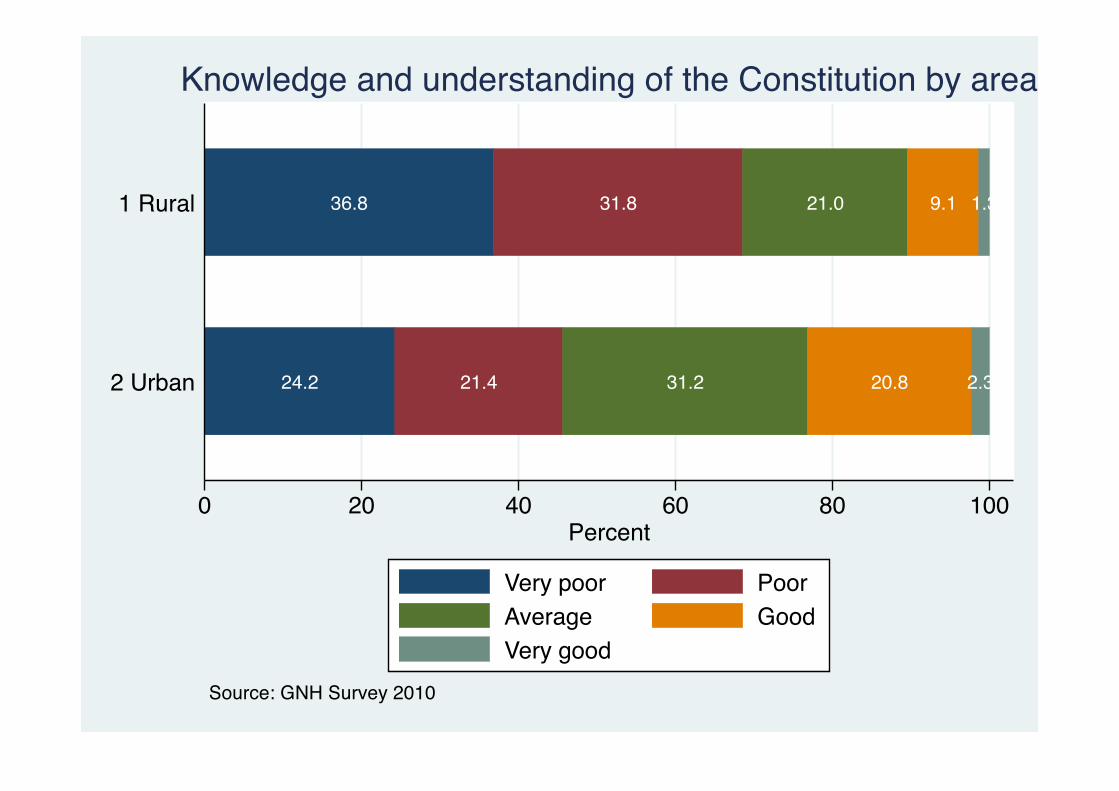
24.2 21.4 31.2 20.8 2.3
36.8 31.8 21.0 9.1 1.3
0 20 40 60 80 100Percent
2 Urban
1 Rural
Source: GNH Survey 2010
Knowledge and understanding of the Constitution by area
Very poor PoorAverage GoodVery good

35.0%
29.6%
20.4%
12.4%2.7%
Very poor PoorAverage GoodVery good
Source: GNH Survey 2010
Knowledge and understanding of the difference between NC and NA
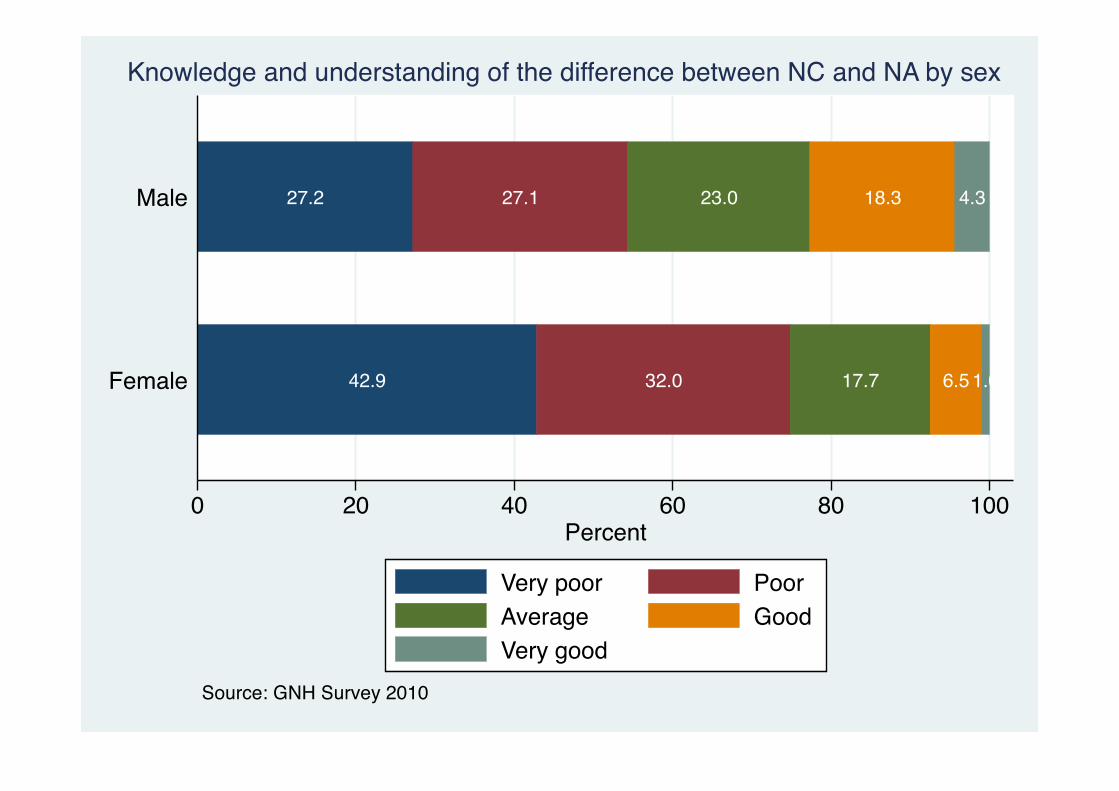
42.9 32.0 17.7 6.5 1.0
27.2 27.1 23.0 18.3 4.3
0 20 40 60 80 100Percent
Female
Male
Source: GNH Survey 2010
Knowledge and understanding of the difference between NC and NA by sex
Very poor PoorAverage GoodVery good

23.6 23.4 26.8 21.7 4.5
39.3 31.9 17.9 8.9 2.0
0 20 40 60 80 100Percent
2 Urban
1 Rural
Source: GNH Survey 2010
Knowledge and understanding of the difference between NC and NA by area
Very poor PoorAverage GoodVery good

30.9%
27.6%
23.1%
15.4%3.1%
Very poor PoorAverage GoodVery good
Source: GNH Survey 2010
Knowledge and understanding of the roles and responsibilities of MPs

39.0 30.1 20.6 9.0 1.2
22.8 25.0 25.4 21.8 4.9
0 20 40 60 80 100Percent
Female
Male
Source: GNH Survey 2010
Knowledge and understanding of the roles and responsibilities of MPs by sex
Very poor PoorAverage GoodVery good

21.4 20.8 28.1 24.9 4.8
34.5 30.2 21.1 11.8 2.4
0 20 40 60 80 100Percent
2 Urban
1 Rural
Source: GNH Survey 2010
Knowledge and understanding of the roles and responsibilities of MPs by area
Very poor PoorAverage GoodVery good
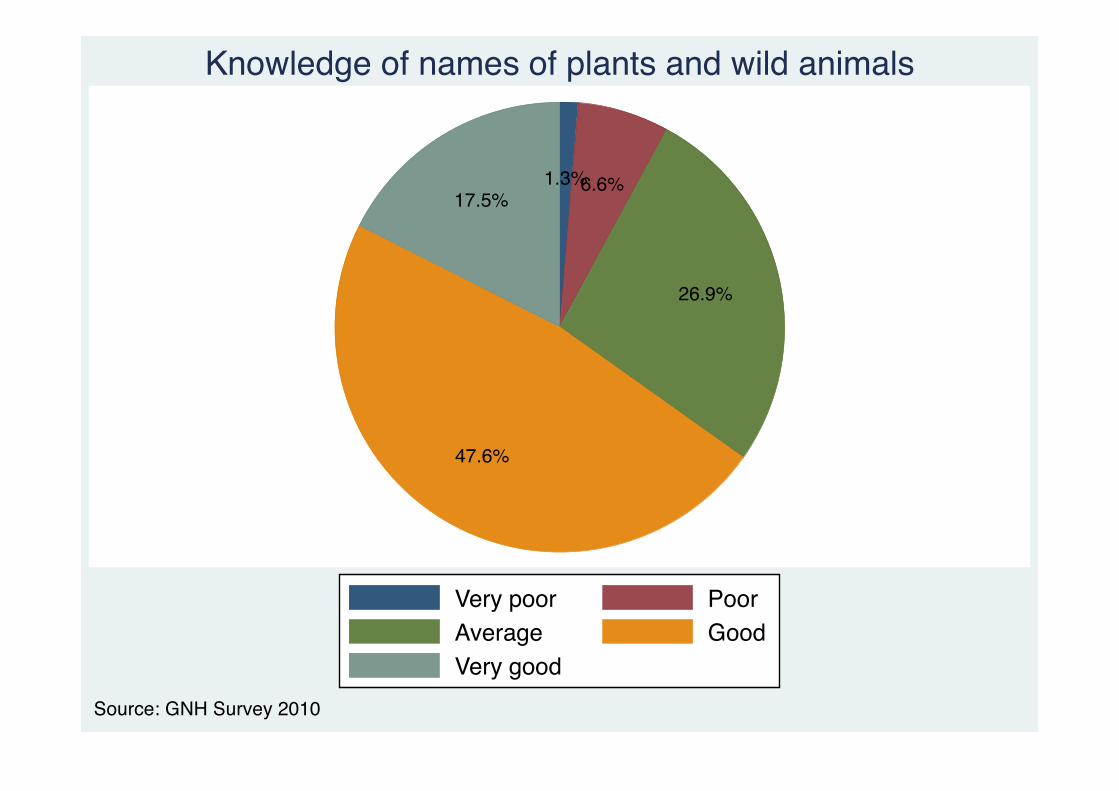
1.3%6.6%
26.9%
47.6%
17.5%
Very poor PoorAverage GoodVery good
Source: GNH Survey 2010
Knowledge of names of plants and wild animals
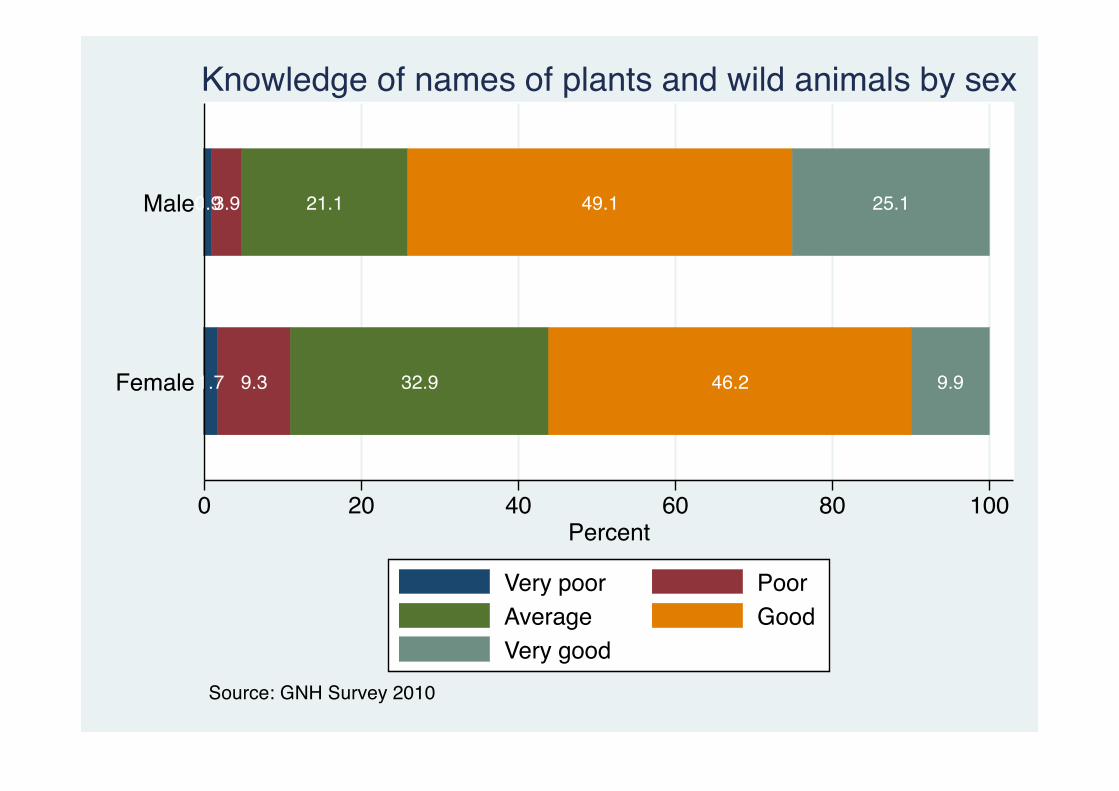
1.7 9.3 32.9 46.2 9.9
0.93.9 21.1 49.1 25.1
0 20 40 60 80 100Percent
Female
Male
Source: GNH Survey 2010
Knowledge of names of plants and wild animals by sex
Very poor PoorAverage GoodVery good

3.2 15.2 37.9 36.9 6.8
0.63.4 22.9 51.6 21.6
0 20 40 60 80 100Percent
2 Urban
1 Rural
Source: GNH Survey 2010
Knowledge of names of plants and wild animals by area
Very poor PoorAverage GoodVery good
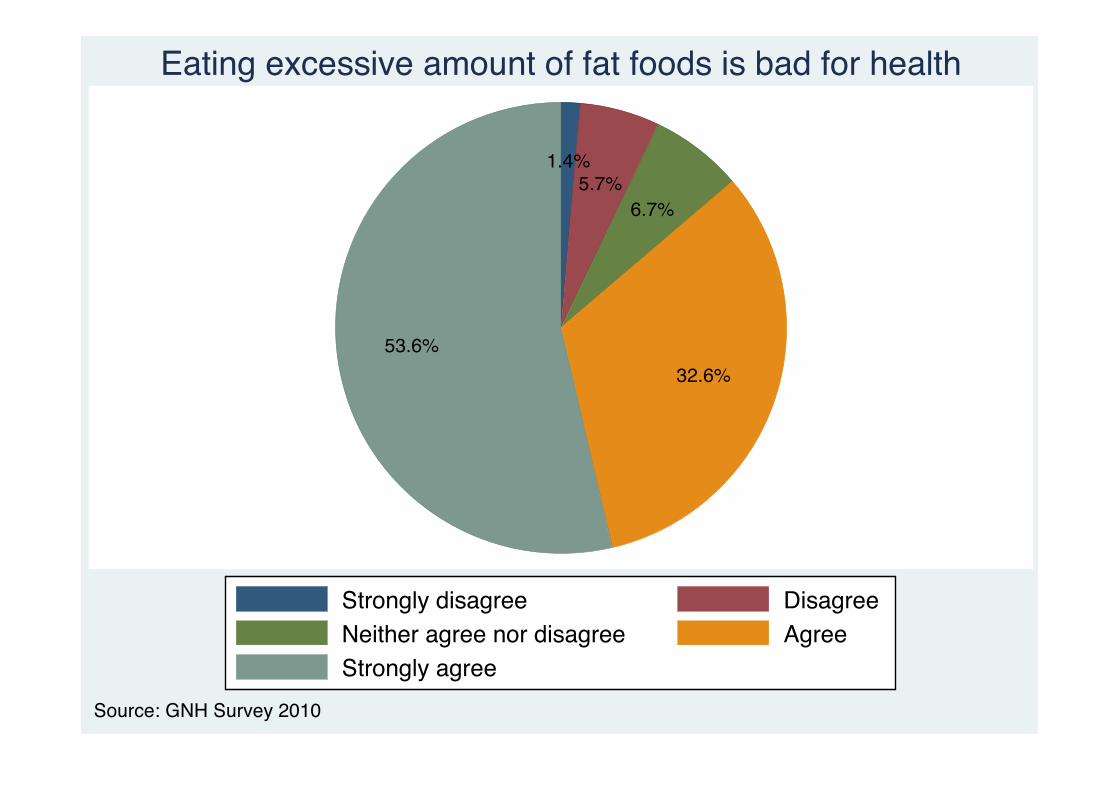
1.4%5.7%
6.7%
32.6%53.6%
Strongly disagree DisagreeNeither agree nor disagree AgreeStrongly agree
Source: GNH Survey 2010
Eating excessive amount of fat foods is bad for health
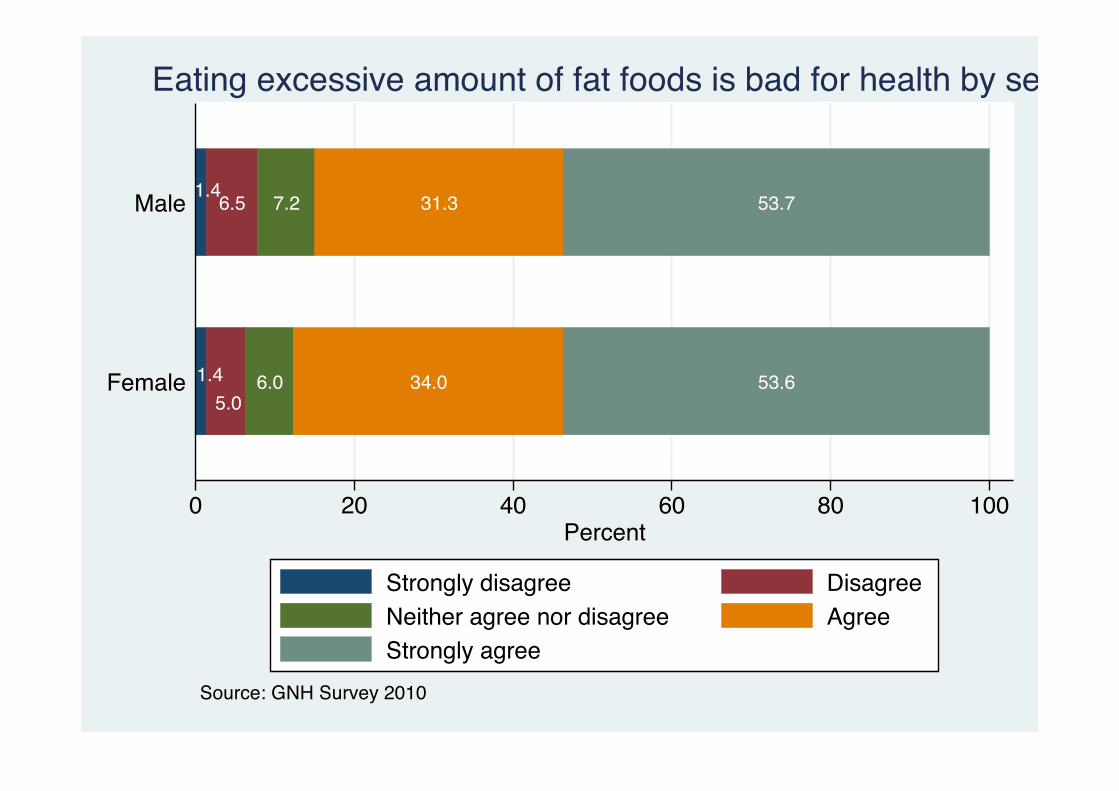
1.45.0
6.0 34.0 53.6
1.46.5 7.2 31.3 53.7
0 20 40 60 80 100Percent
Female
Male
Source: GNH Survey 2010
Eating excessive amount of fat foods is bad for health by sex
Strongly disagree DisagreeNeither agree nor disagree AgreeStrongly agree
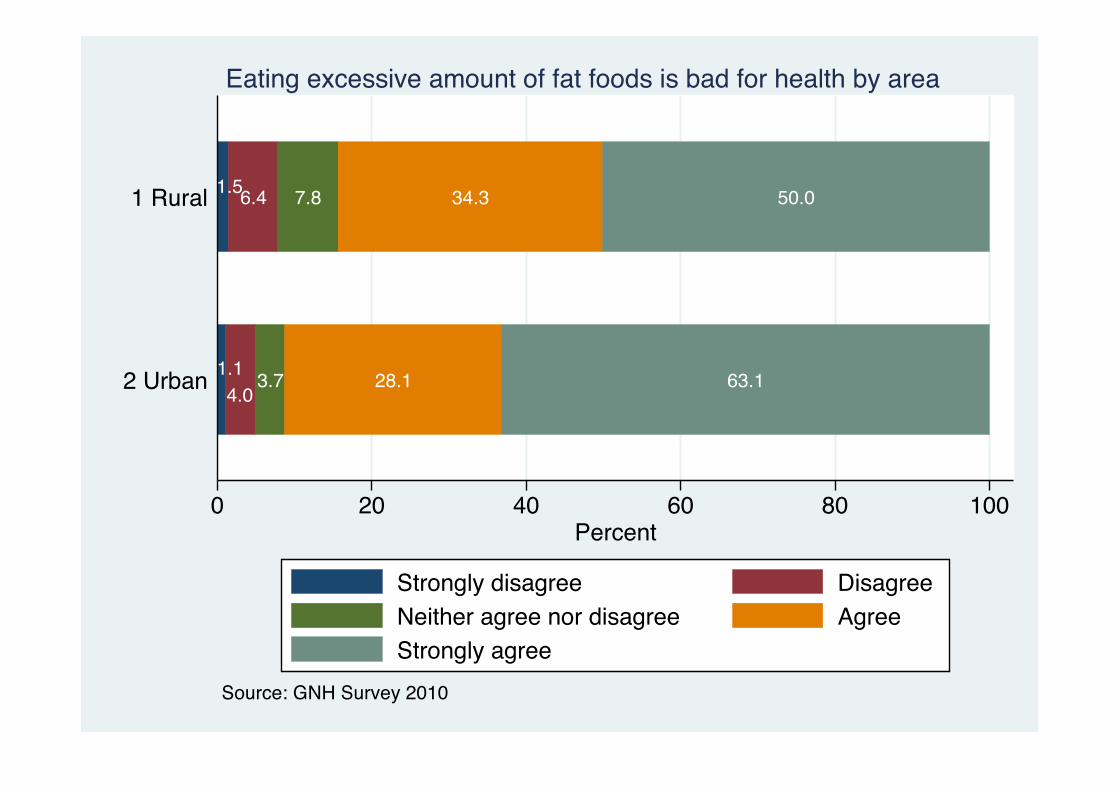
1.14.0
3.7 28.1 63.1
1.56.4 7.8 34.3 50.0
0 20 40 60 80 100Percent
2 Urban
1 Rural
Source: GNH Survey 2010
Eating excessive amount of fat foods is bad for health by area
Strongly disagree DisagreeNeither agree nor disagree AgreeStrongly agree

Cultural Diversity

0.3%
0.7%3.8%
95.2%
Not at all Only a littleQuite well Very well
How well can you speak your mother tongue now?
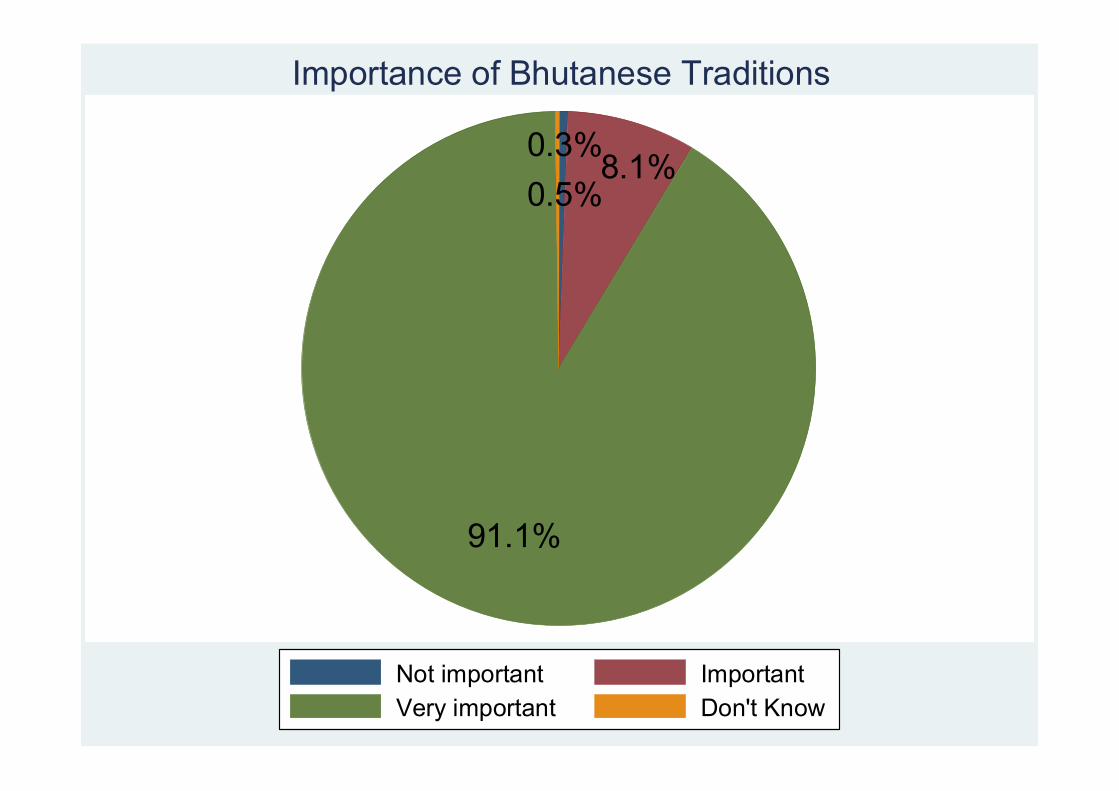
0.5%8.1%
91.1%
0.3%
Not important ImportantVery important Don't Know
Importance of Bhutanese Traditions

1.6%
27.5%
45.0%
25.8%
Not at all A littleQuite a lot A lot
Do you think children respect elders?

1.2%19.2%
44.4%
35.2%
Not at all A littleQuite a lot A lot
Do you think children respect parents?

1.8%
28.3%
44.8%
25.0%
Not at all A littleQuite a lot A lot
Do you think children practice discipline(drig)?

1.7%
33.5%
44.7%
20.1%
Not at all A littleQuite a lot A lot
Do you think children practice honesty?

6.4%
42.3%
36.0%
15.3%
Not at all A littleQuite a lot A lot
Do you think children practice tolerance?

1.1%
24.7%
45.4%
28.9%
Not at all A littleQuite a lot A lot
Do you think children work hard?
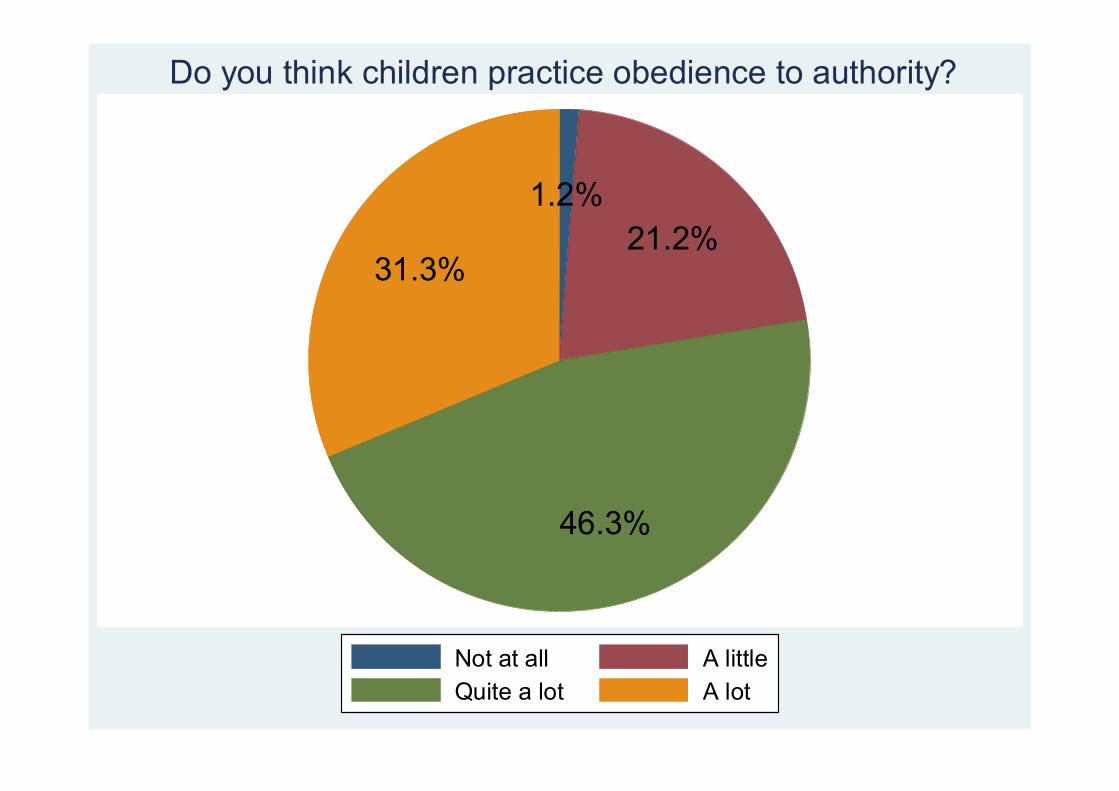
1.2%21.2%
46.3%
31.3%
Not at all A littleQuite a lot A lot
Do you think children practice obedience to authority?

0.7%17.3%
45.5%
36.5%
Not at all A littleQuite a lot A lot
Do you think children take care of family members and relatives?

1.3%
27.4%
47.8%
23.5%
Not at all A littleQuite a lot A lot
Do you think children help others?

7.6%
30.4%
39.5%
22.5%
Not at all A littleQuite a lot A lot
Do you think children practice impartiality towards rich, poor, etc?
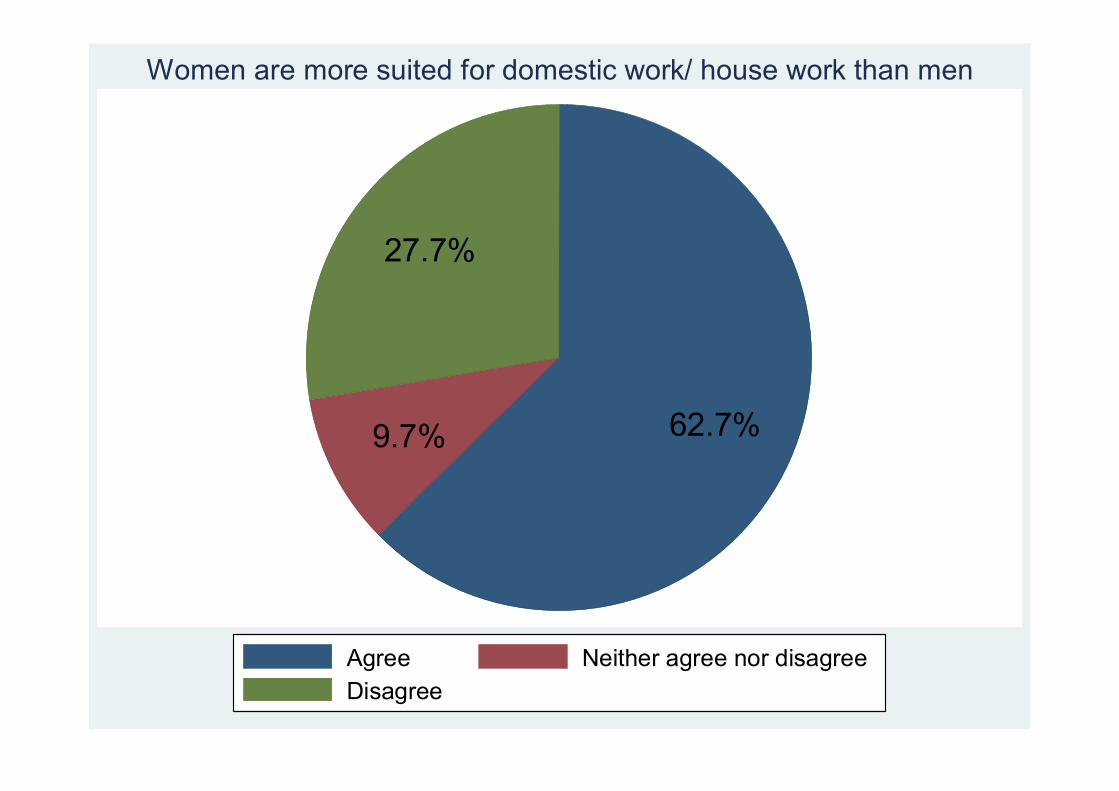
62.7%9.7%
27.7%
Agree Neither agree nor disagreeDisagree
Women are more suited for domestic work/ house work than men
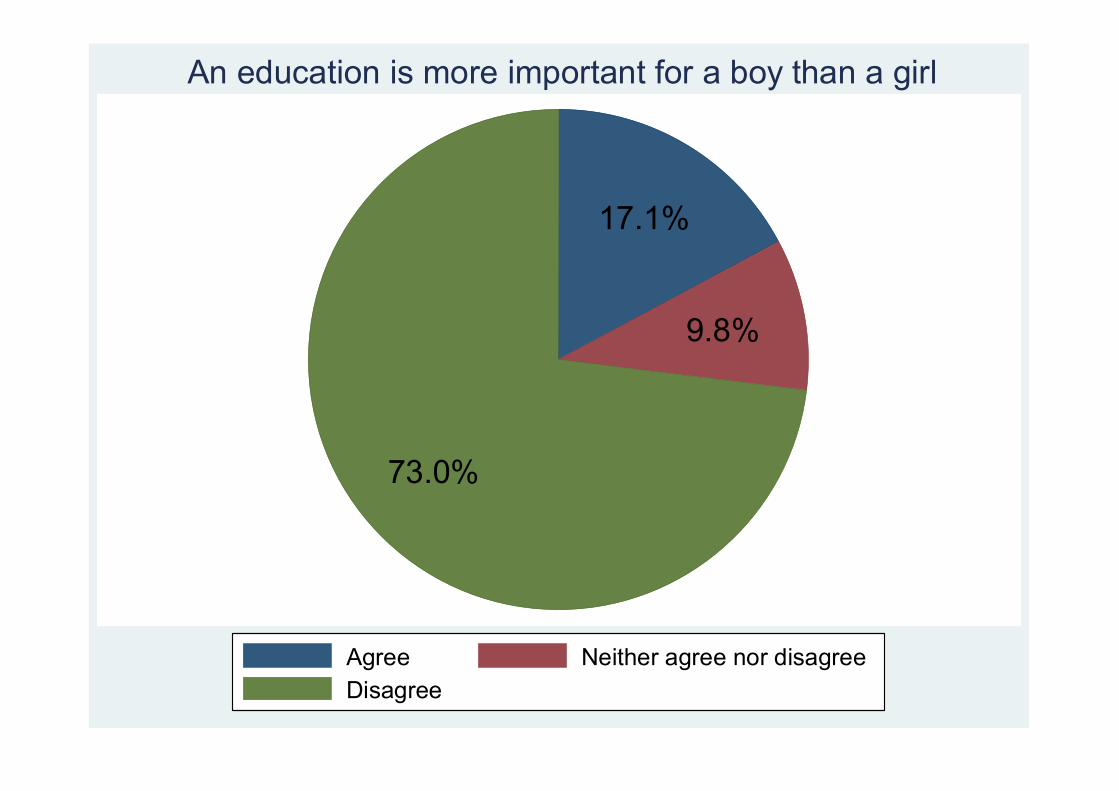
17.1%
9.8%
73.0%
Agree Neither agree nor disagreeDisagree
An education is more important for a boy than a girl

30.2%
15.9%
54.0%
Agree Neither agree nor disagreeDisagree
On the whole, men make better leaders than women do
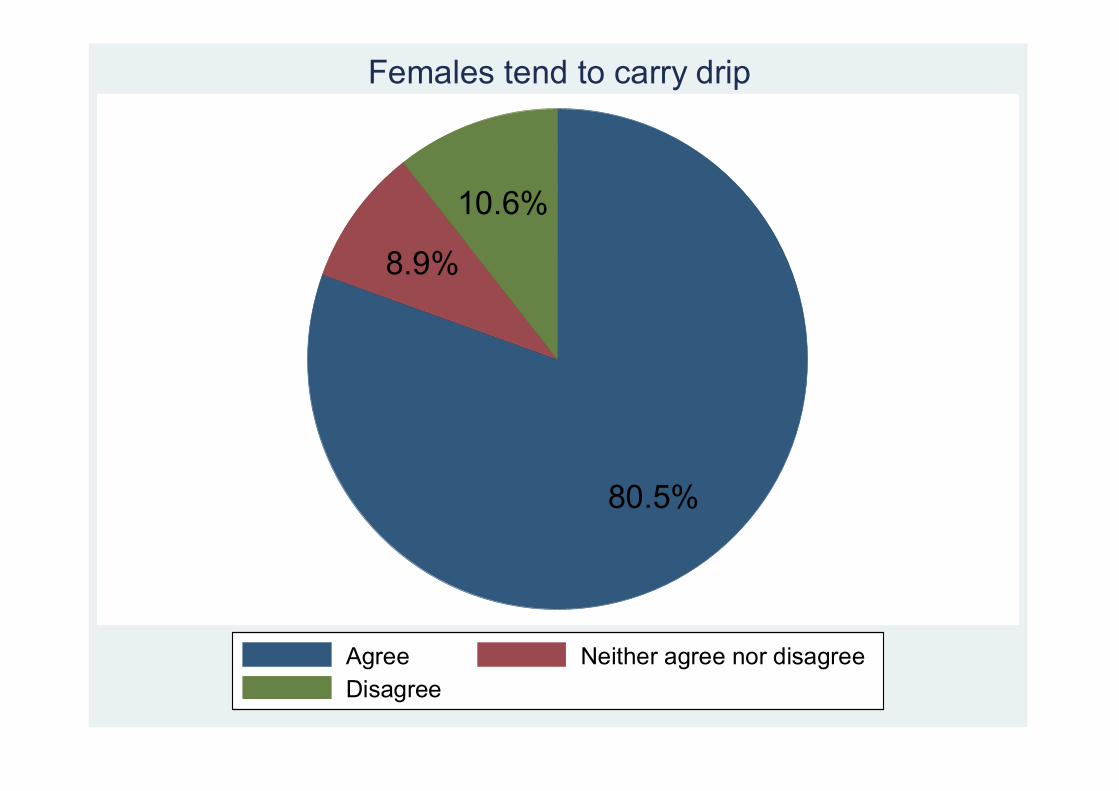
80.5%
8.9%
10.6%
Agree Neither agree nor disagreeDisagree
Females tend to carry drip

5.9%
42.8%51.3%
Never SometimesAlways
Do you take part in local festivals in your community?

5.7%
60.6%
20.1%
6.7%6.9%
None 1-5 days6-12 days 13-20 days+20 days
In a year, how many days do you spend attending social and cultural activities?
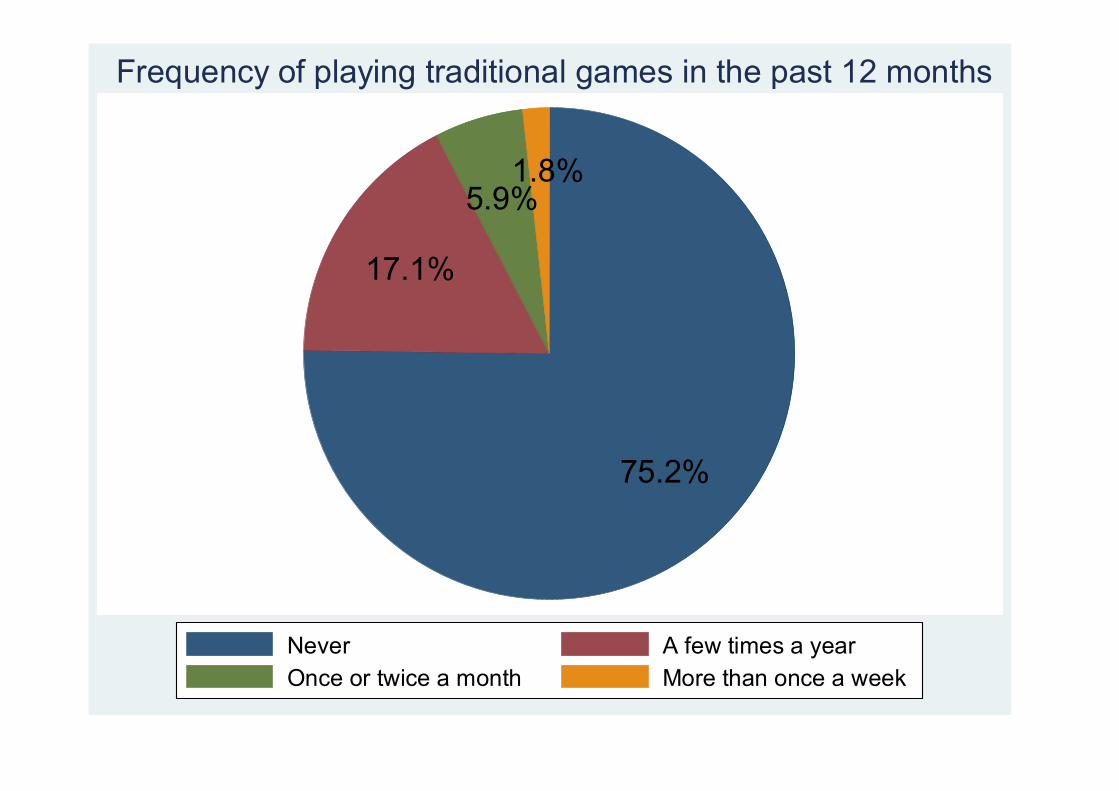
75.2%
17.1%
5.9%1.8%
Never A few times a yearOnce or twice a month More than once a week
Frequency of playing traditional games in the past 12 months
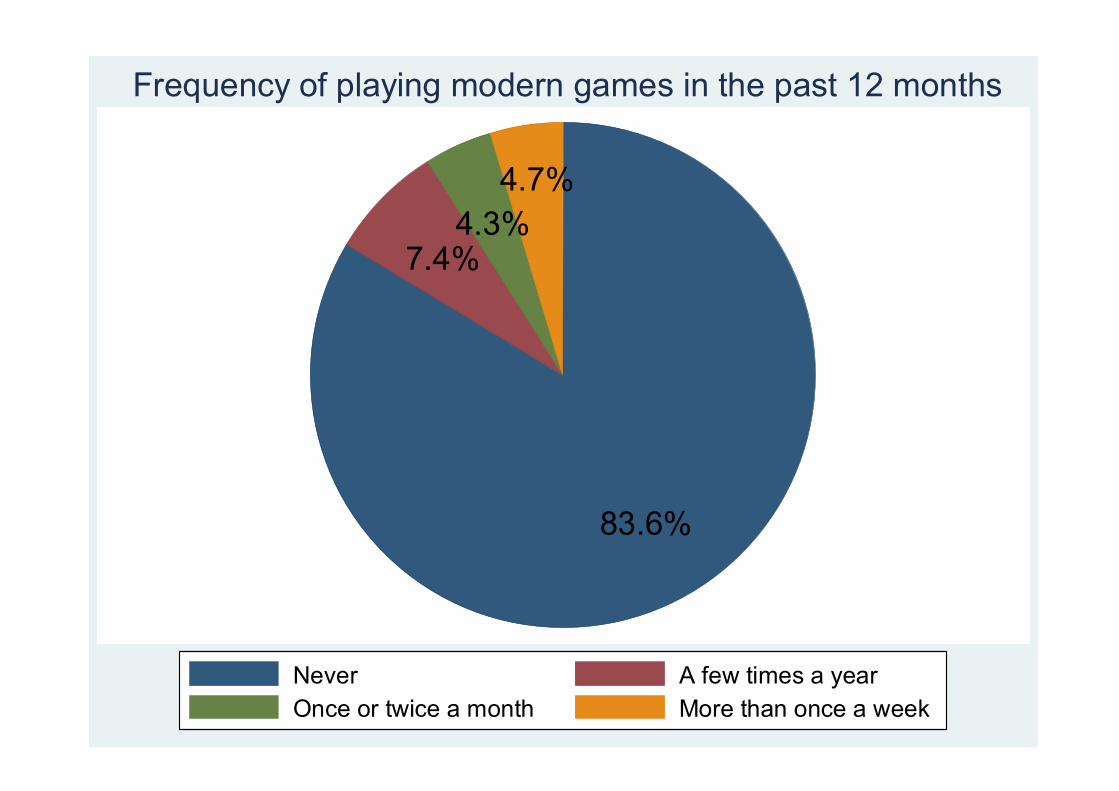
83.6%
7.4%4.3%
4.7%
Never A few times a yearOnce or twice a month More than once a week
Frequency of playing modern games in the past 12 months

0.5%6.1%
93.4%
Not important ImportantVery important
Is Driglam Namzha (etiquette) important?
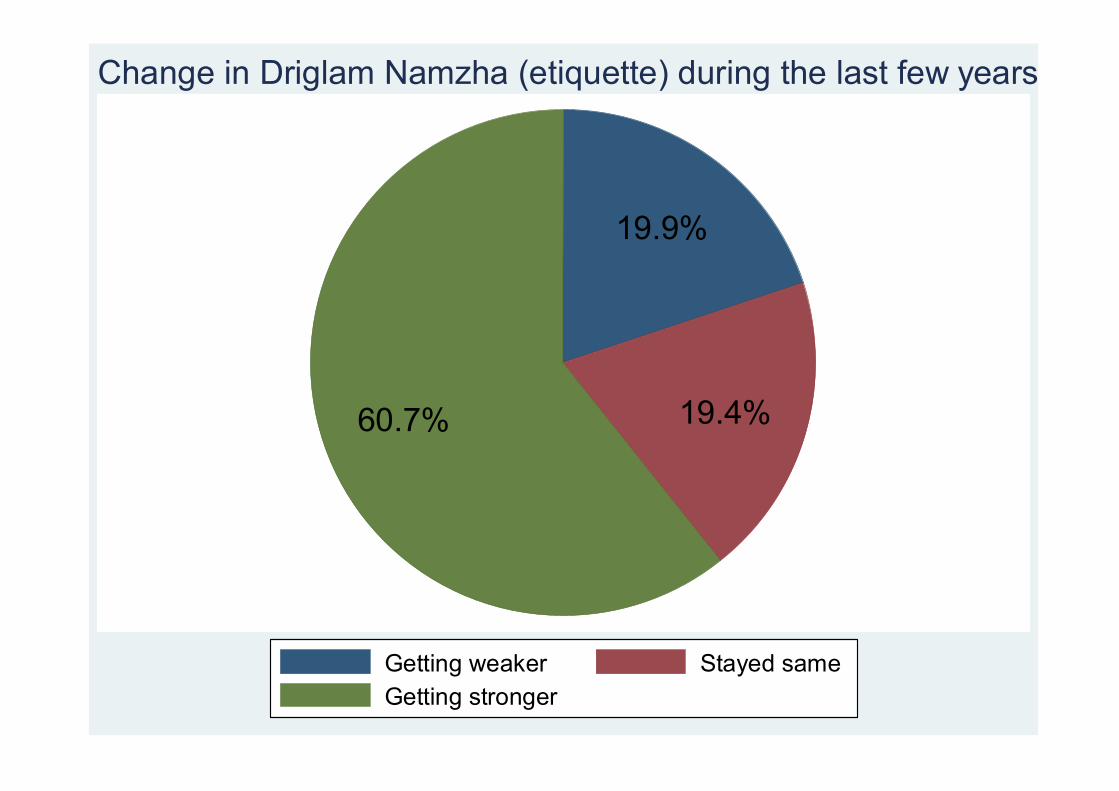
19.9%
19.4%60.7%
Getting weaker Stayed sameGetting stronger
Change in Driglam Namzha (etiquette) during the last few years

11.4%
24.4%
64.2%
Less compassionate Stayed the sameMore compassionate
GNH Survey 2010
During the last few years, most people in Bhutan have become

87.8%
10.3%1.9%
More concerned about material wealth Stayed the sameLess concerned about material wealth
GNH Survey 2010
During the last few years, most people in Bhutan have become

51.7%
32.1%
16.1%
More selfish Stayed the sameLess selfish
GNH Survey 2010
During the last few years, most people in Bhutan have become

28.3%
37.3%
34.4%
Less honest Stayed the sameMore honest
GNH Survey 2010
During the last few years, most people in Bhutan have become
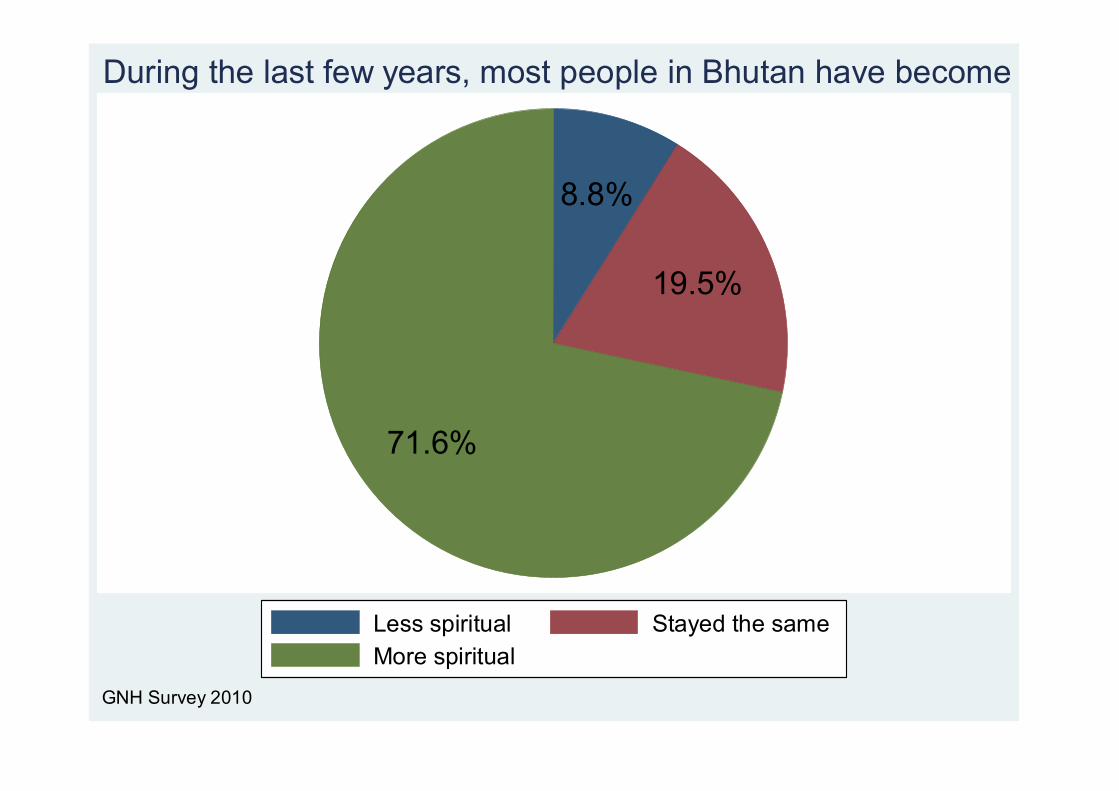
8.8%
19.5%
71.6%
Less spiritual Stayed the sameMore spiritual
GNH Survey 2010
During the last few years, most people in Bhutan have become

22.5%
38.0%
39.5%
Less tolerant Stayed the sameMore tolerant
GNH Survey 2010
During the last few years, most people in Bhutan have become
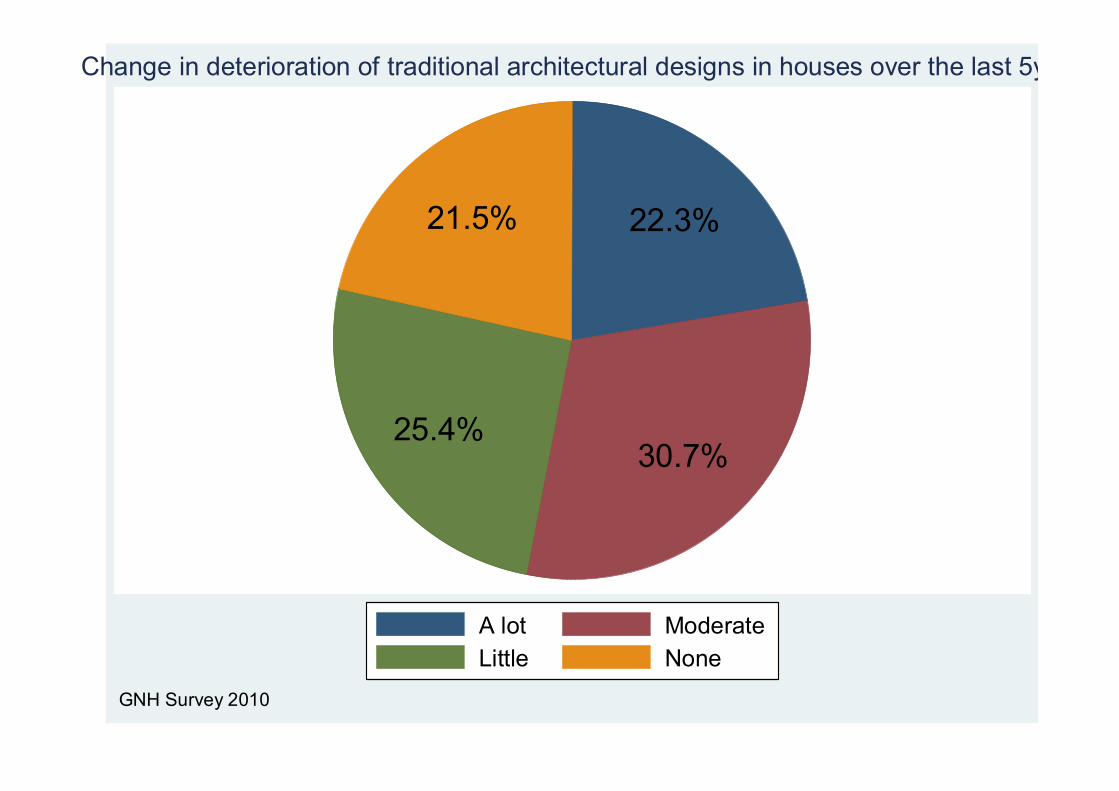
22.3%
30.7%25.4%
21.5%
A lot ModerateLittle None
GNH Survey 2010
Change in deterioration of traditional architectural designs in houses over the last 5yrs
Good Governance

40%
60%
No Yes
Did you attend zomdue in the past 12 months?
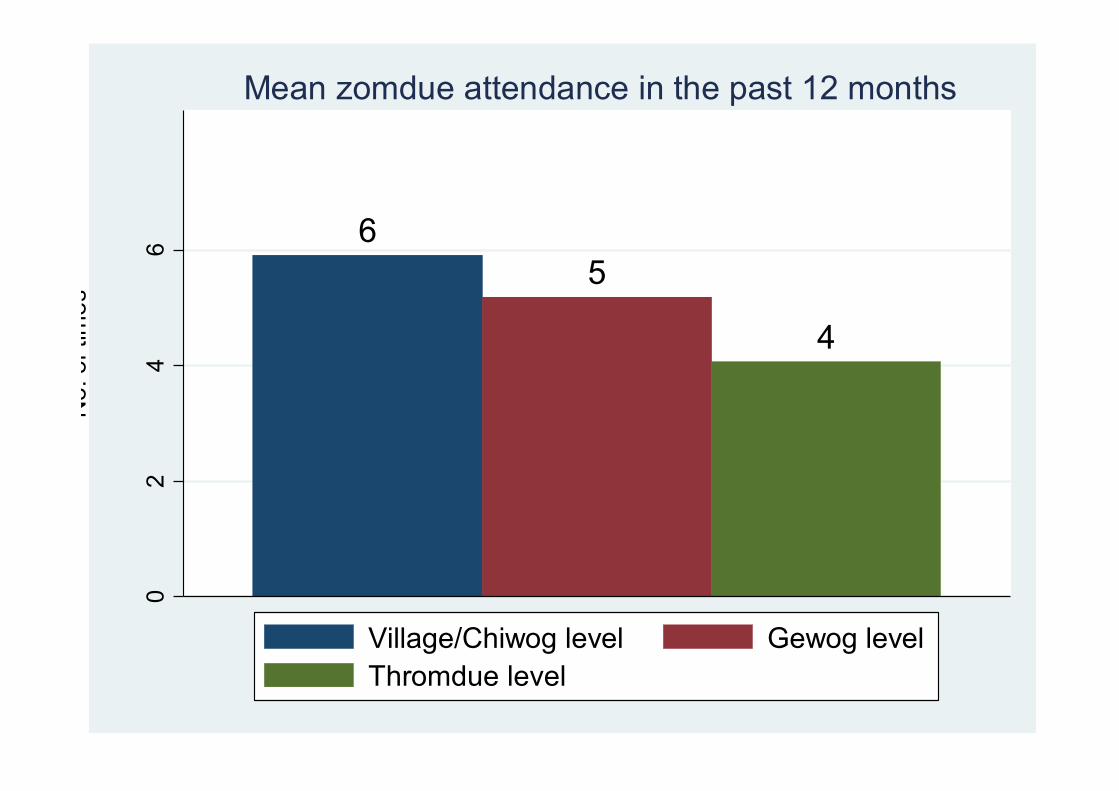
65
4
02
46
No.
of t
imes
Mean zomdue attendance in the past 12 months
Village/Chiwog level Gewog levelThromdue level

0.1%0.5%
5.2%
42.5%51.8%
Very poor PoorAverage GoodVery good
Performance of the dzongdag in the past 12 months

1%2%
11%
45%
41%
Very poor PoorAverage GoodVery good
Performance of the MP (National Assembly) in the past 12 months

1%3%
11%
45%
41%
Very poor PoorAverage GoodVery good
Performance of the MP (National Council) in the past 12 months
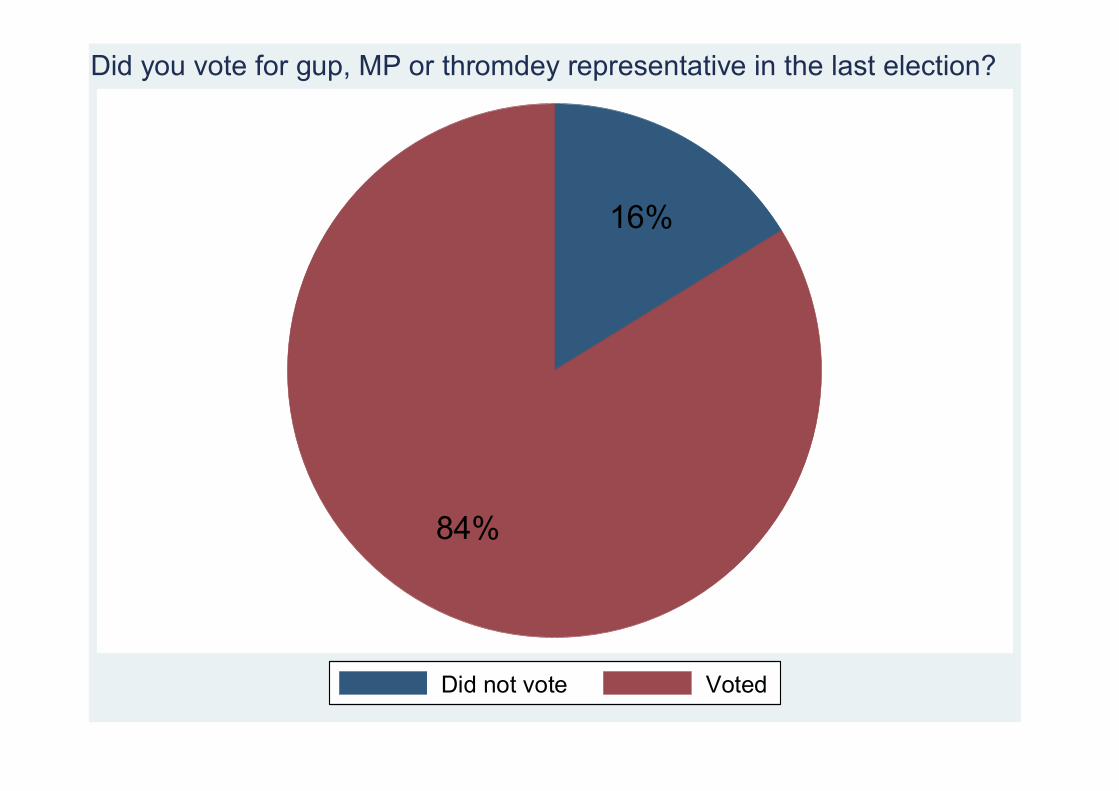
16%
84%
Did not vote Voted
Did you vote for gup, MP or thromdey representative in the last election?

13%
87%
19%
81%
Male Female
Did not vote Voted
GNH Survey 2010
Voter turnout by gender
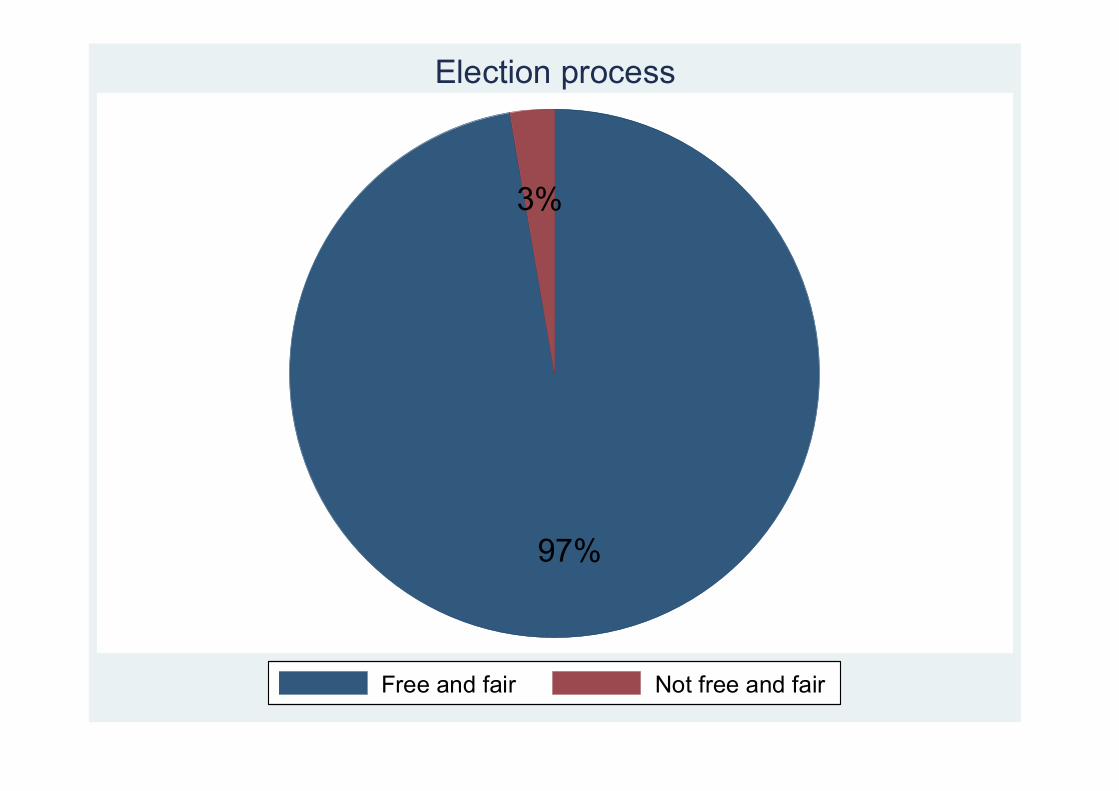
97%
3%
Free and fair Not free and fair
Election process

8%
92%
Yes No
Involved in case before the court in the past five years

15%
39%34%
12%
Not free Quite freeCompletely free Don't Know
Freedom of media from government influences

18%
82%
No Yes
Do you have access to BBS Radio
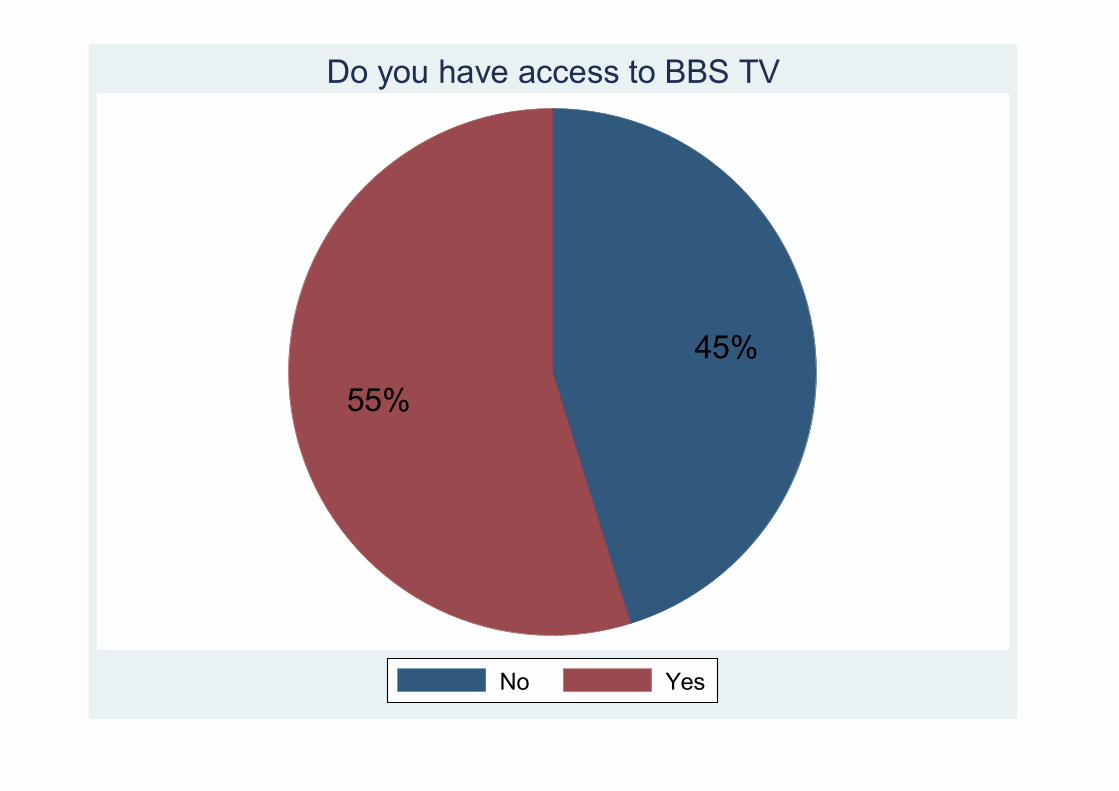
45%55%
No Yes
Do you have access to BBS TV
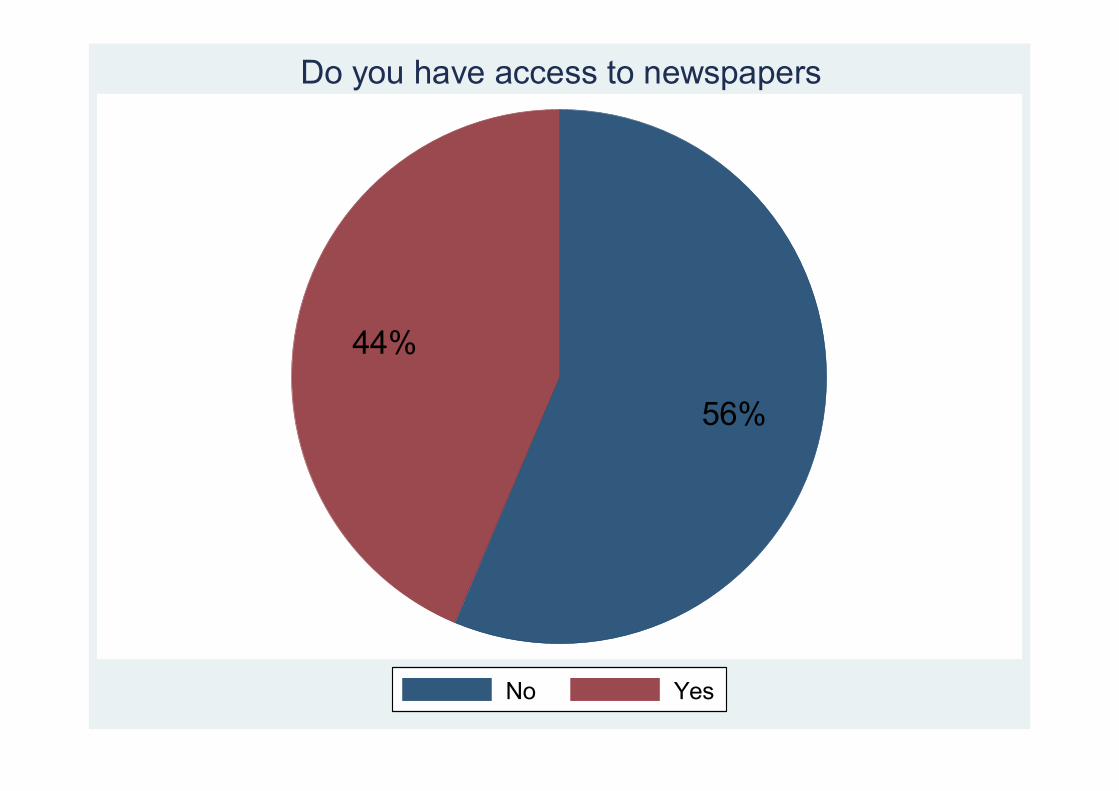
56%
44%
No Yes
Do you have access to newspapers
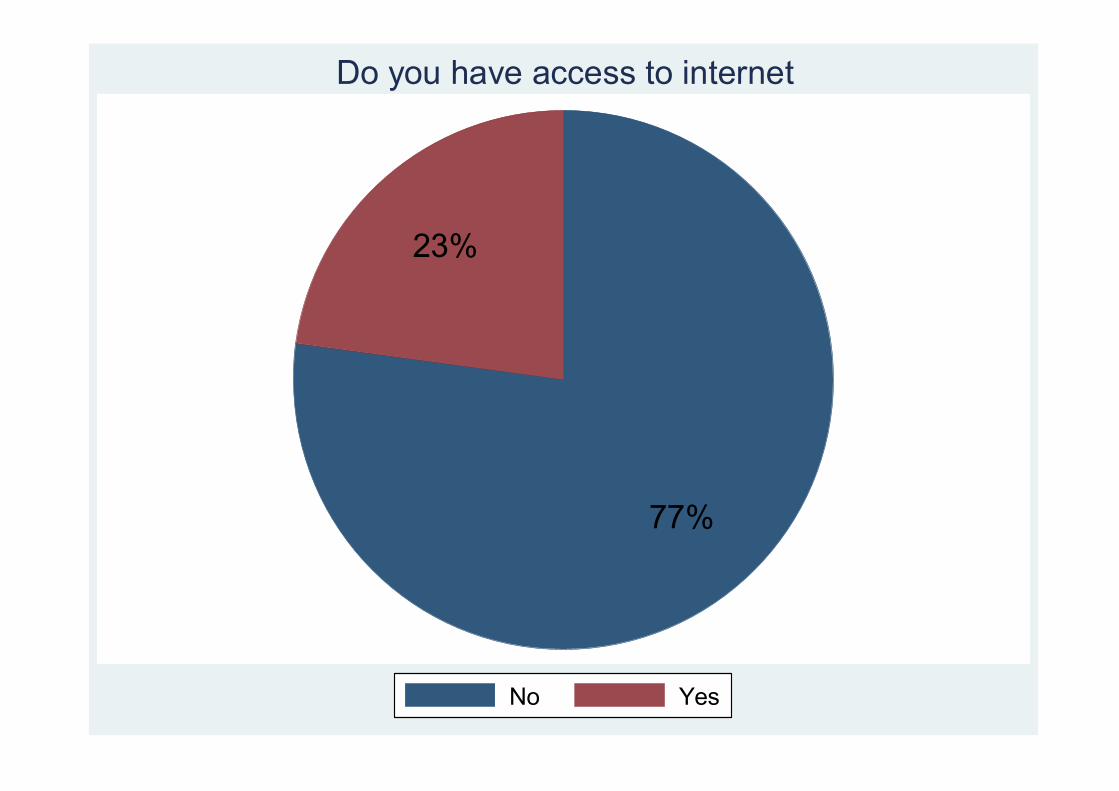
77%
23%
No Yes
Do you have access to internet

59%25%
17%
Common Not commonDon't Know
Perception of corruption

1.7%
27.8%
48.8%
5.3%
16.4%
All MostA few NoneDon't Know
No. of people involved in corruption in government sectors
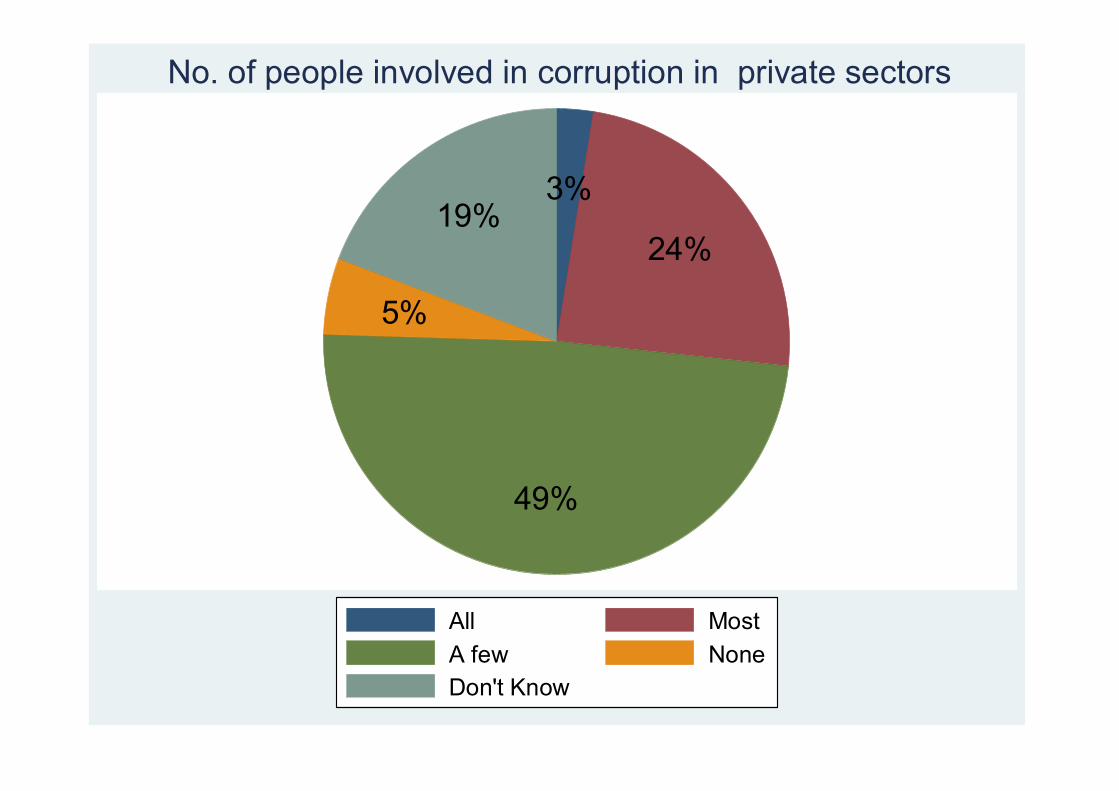
3%
24%
49%
5%
19%
All MostA few NoneDon't Know
No. of people involved in corruption in private sectors
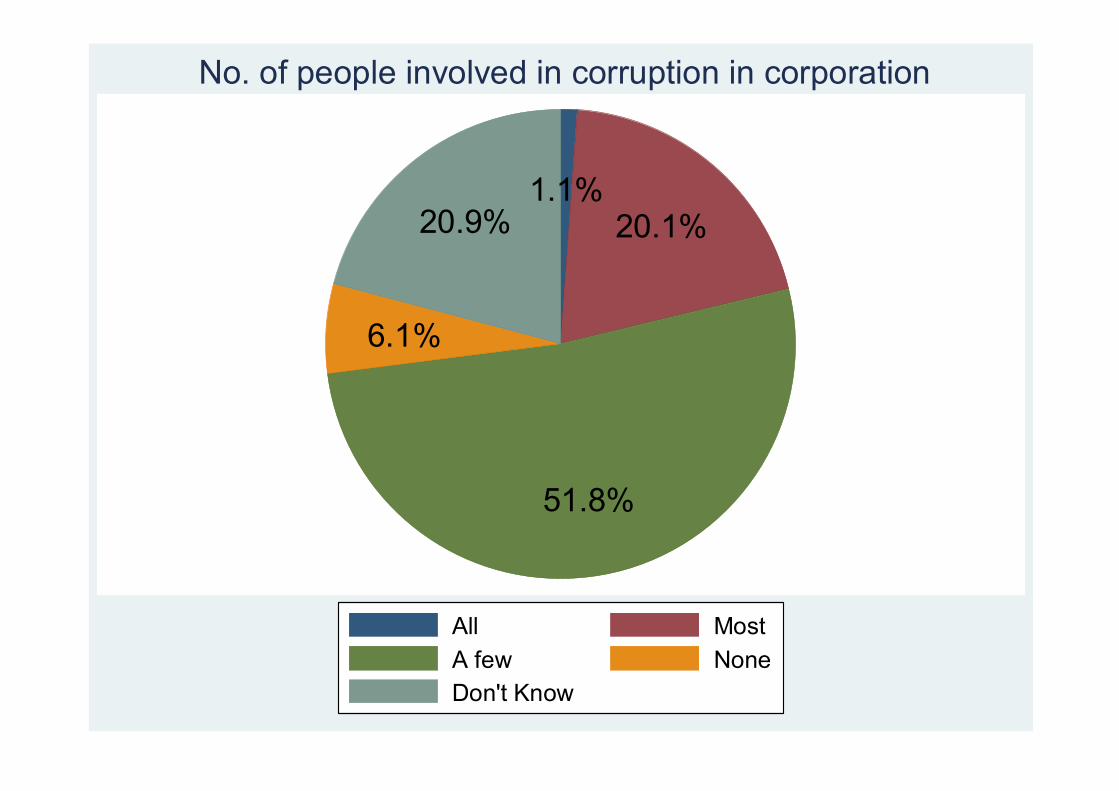
1.1%20.1%
51.8%
6.1%
20.9%
All MostA few NoneDon't Know
No. of people involved in corruption in corporation
Community Vitality

3836
3432 32
30 30 30 30 29 29 29 28 28 2826
24
21 21
13
010
2030
40
Mea
n of
yea
rs
Pema G
atshe
l
Tashig
ang
Gasa
Tashi
Yangs
te
Lhun
tse
Tsiran
g
Punak
ha
Wangd
ue P
hodra
ng
Monga
r
Trongs
aHaa
Zhemga
ng
Bumtha
ng
Samtse
Dagan
a
Samdru
p Jon
gkha
rParo
Sarpan
g
Chukh
a
Thimph
u
Duration of stay in the community by dzongkhag

32
23
18 17
010
2030
Mea
n of
yea
rs
Trust m
ost o
f them
Trust s
ome o
f them
Trust a
few of
them
Trust n
one o
f them
Duration of stay in the community by trust in neighbours

1.4%19.1%
12.6%
66.9%
Less than 1 year 1-5 yearsGreater than 5 to 10 years More than 10 years
Duration of stay in the community (in years)
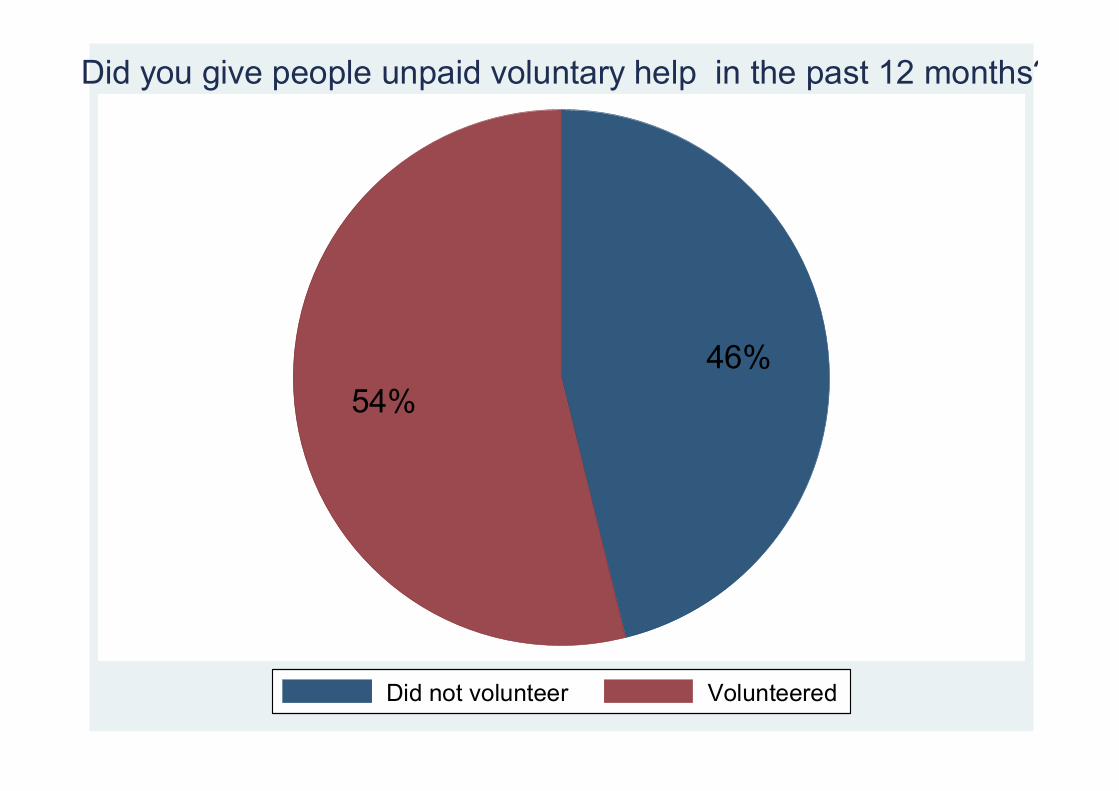
46%54%
Did not volunteer Volunteered
Did you give people unpaid voluntary help in the past 12 months?
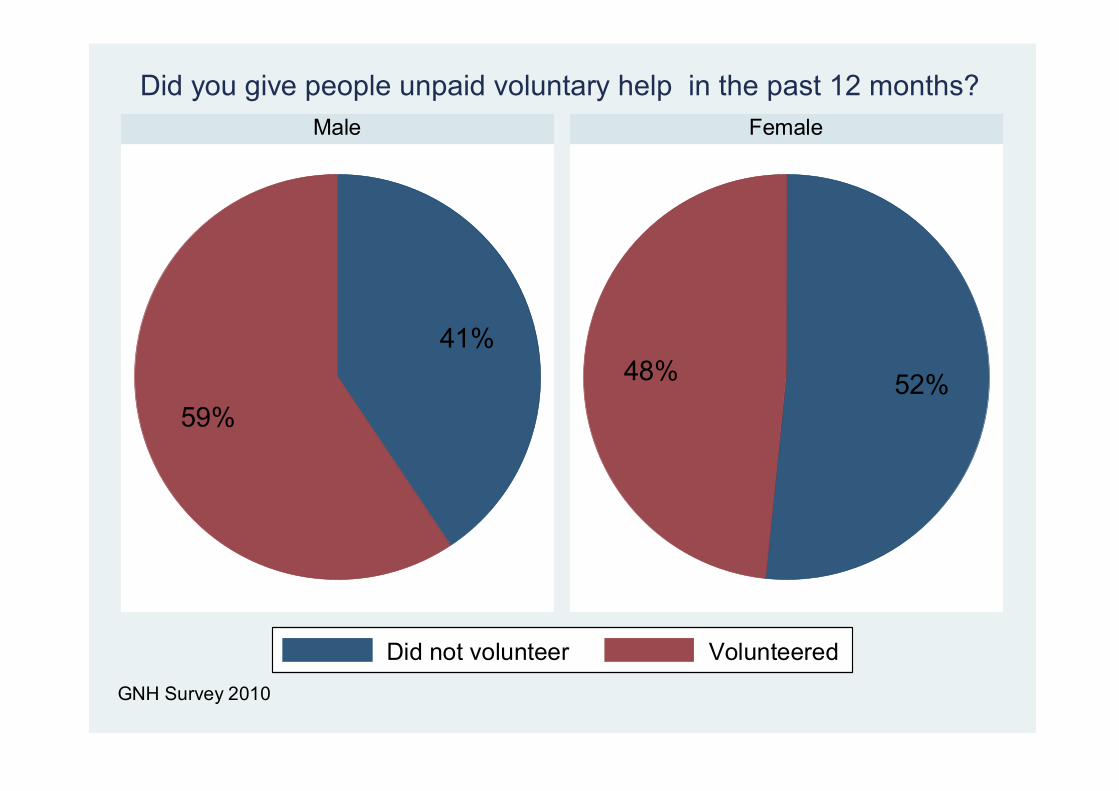
41%
59%52%48%
Male Female
Did not volunteer Volunteered
GNH Survey 2010
Did you give people unpaid voluntary help in the past 12 months?
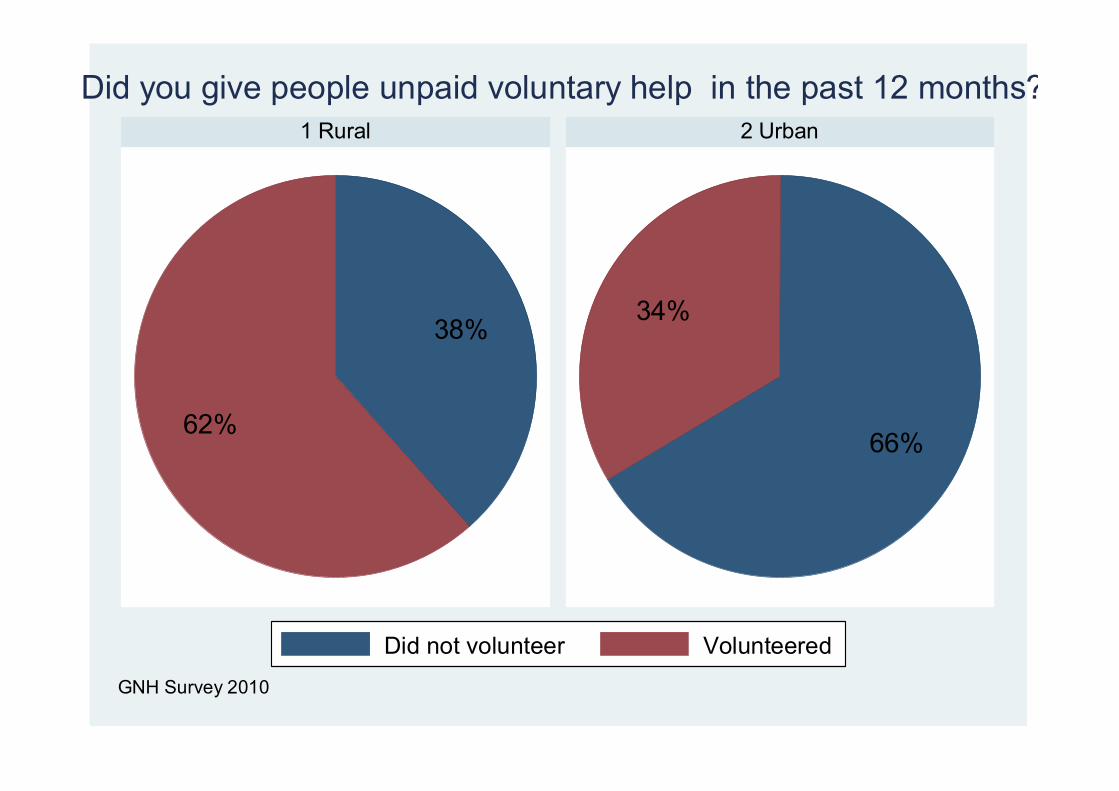
38%
62%66%
34%
1 Rural 2 Urban
Did not volunteer Volunteered
GNH Survey 2010
Did you give people unpaid voluntary help in the past 12 months?
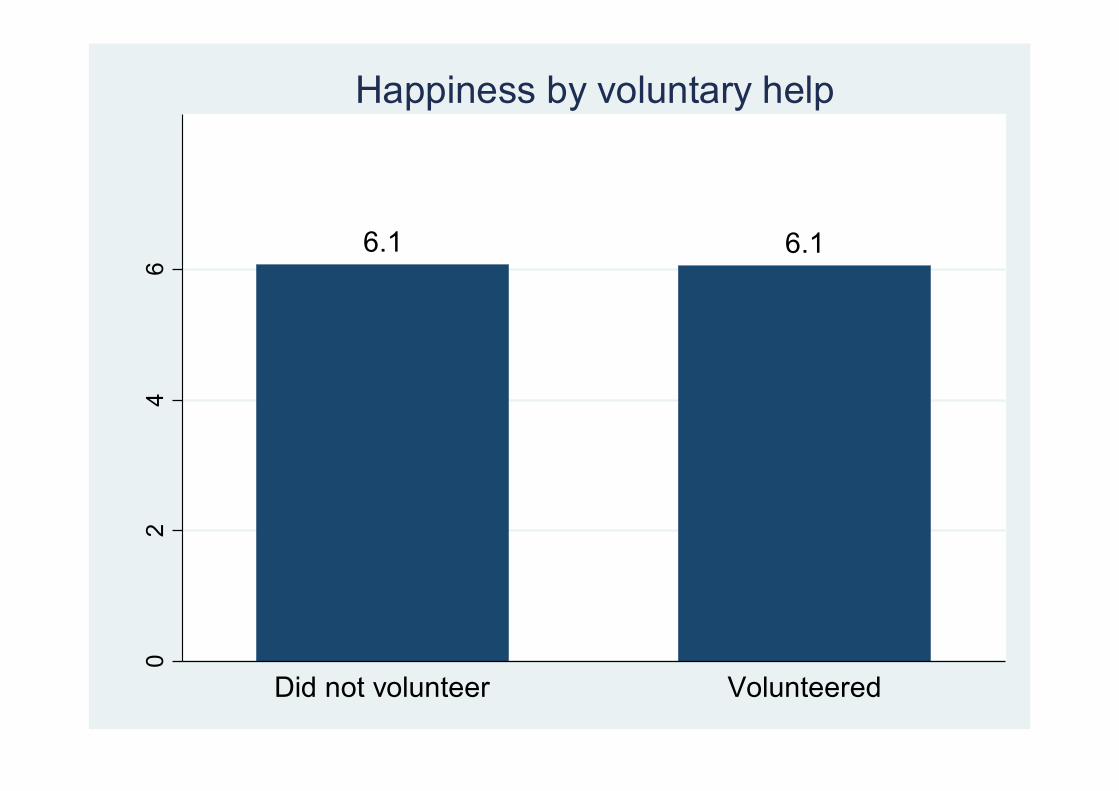
6.1 6.1
02
46
Mea
n ha
ppin
ess
leve
l
Did not volunteer Volunteered
Happiness by voluntary help

10%
90%
Did not provide donation Provided donation
In the past 12 months, did you donate money or goods?
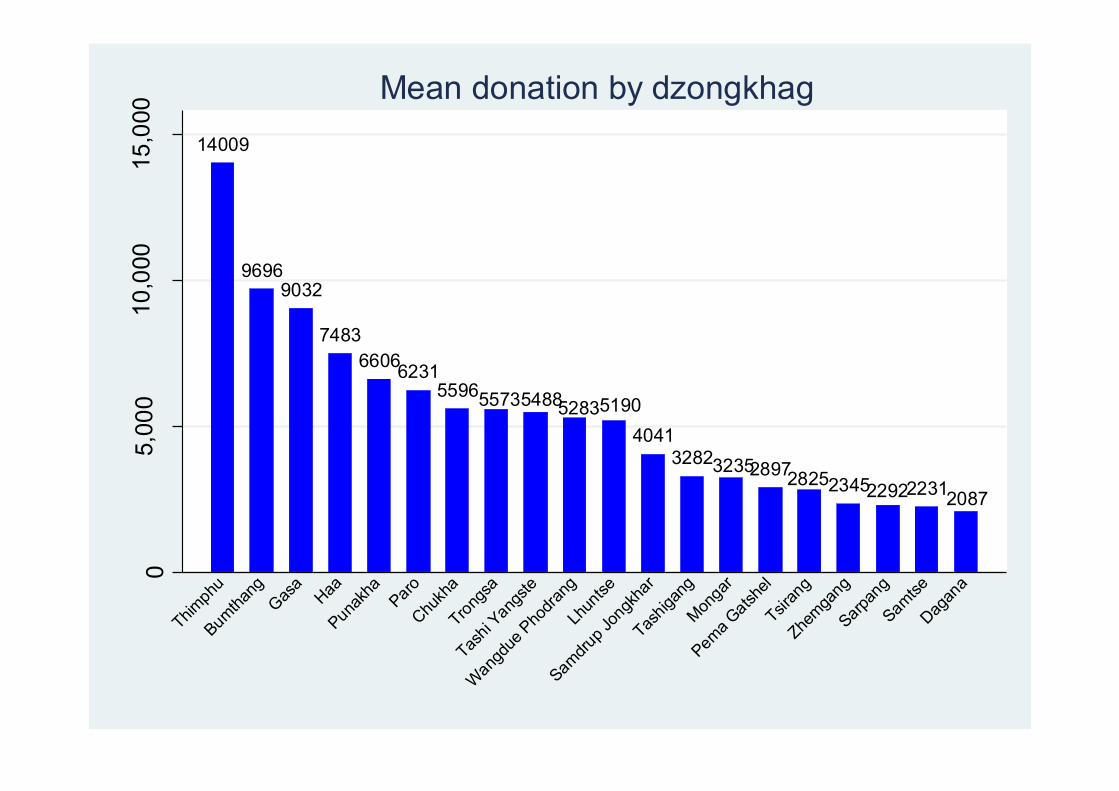
14009
96969032
748366066231
559655735488528351904041
32823235289728252345229222312087
05,
000
10,0
0015
,000
Mea
n do
natio
n (in
Nu)
Thimph
u
Bumtha
ngGas
aHaa
Punak
haParo
Chukh
a
Trongs
a
Tashi
Yangs
te
Wangd
ue P
hodra
ng
Lhun
tse
Samdru
p Jon
gkha
r
Tashig
ang
Monga
r
Pema G
atshe
l
Tsiran
g
Zhemga
ng
Sarpan
g
Samtse
Dagan
a
Mean donation by dzongkhag
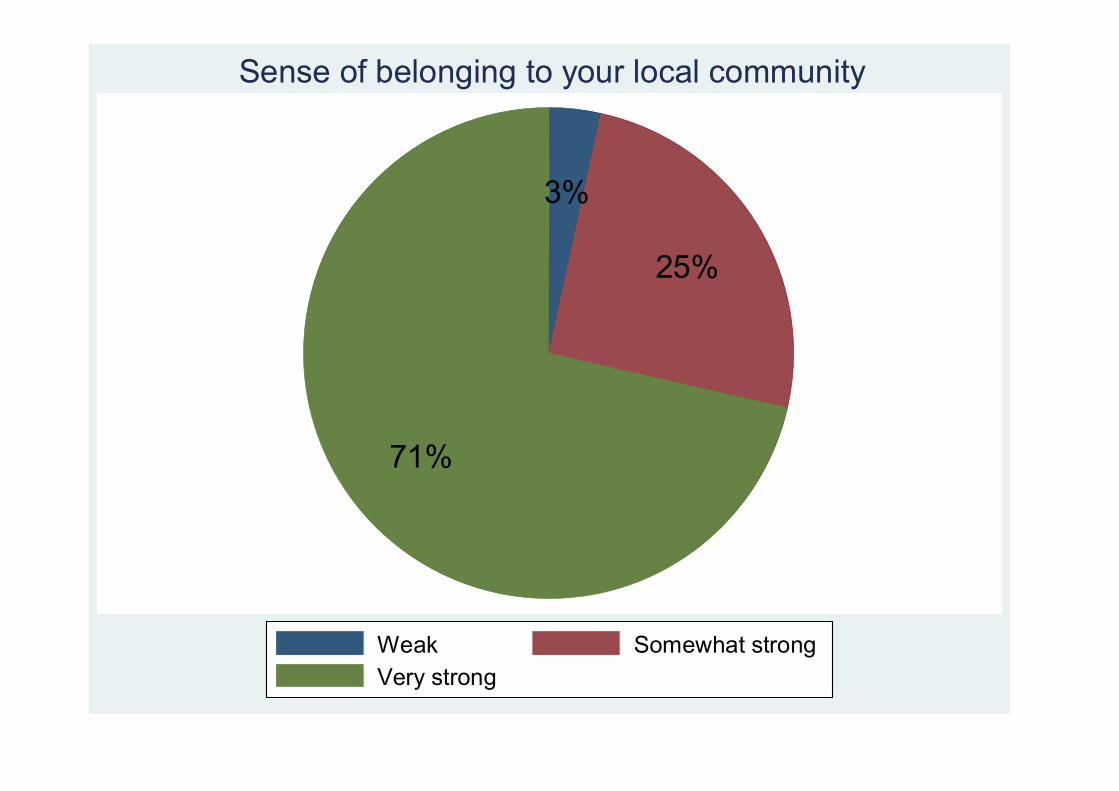
3%
25%
71%
Weak Somewhat strongVery strong
Sense of belonging to your local community
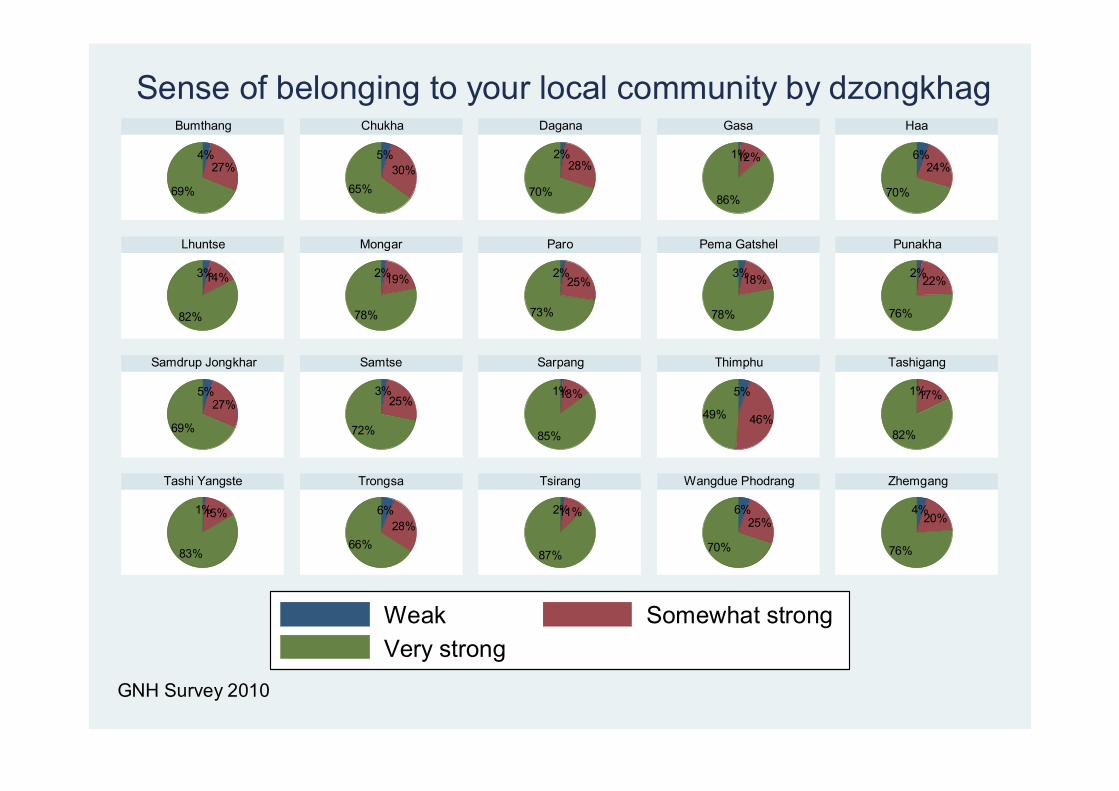
4%27%
69%
5%30%
65%
2%28%
70%
1%12%
86%
6%24%
70%
3%14%
82%
2%19%
78%
2%25%
73%
3%18%
78%
2%22%
76%
5%27%
69%
3%25%
72%
1%13%
85%
5%
46%49%
1%17%
82%
1%15%
83%
6%28%
66%
2%11%
87%
6%25%
70%
4%20%
76%
Bumthang Chukha Dagana Gasa Haa
Lhuntse Mongar Paro Pema Gatshel Punakha
Samdrup Jongkhar Samtse Sarpang Thimphu Tashigang
Tashi Yangste Trongsa Tsirang Wangdue Phodrang Zhemgang
Weak Somewhat strongVery strong
GNH Survey 2010
Sense of belonging to your local community by dzongkhag

60%40%
54%46%
43%57%
Weak Somewhat strong
Very strong
Did not volunteer Volunteered
GNH Survey 2010
Sense of belonging to the community and voluntary help

1%21%
47%
31%
Trust none of them Trust a few of themTrust some of them Trust most of them
How much do you trust Bhutanese people in general?

1%19%
46%
35%
2%23%
48%
28%
Male Female
Trust none of them Trust a few of themTrust some of them Trust most of them
GNH Survey 2010
Trust in Bhutanese people in general by gender
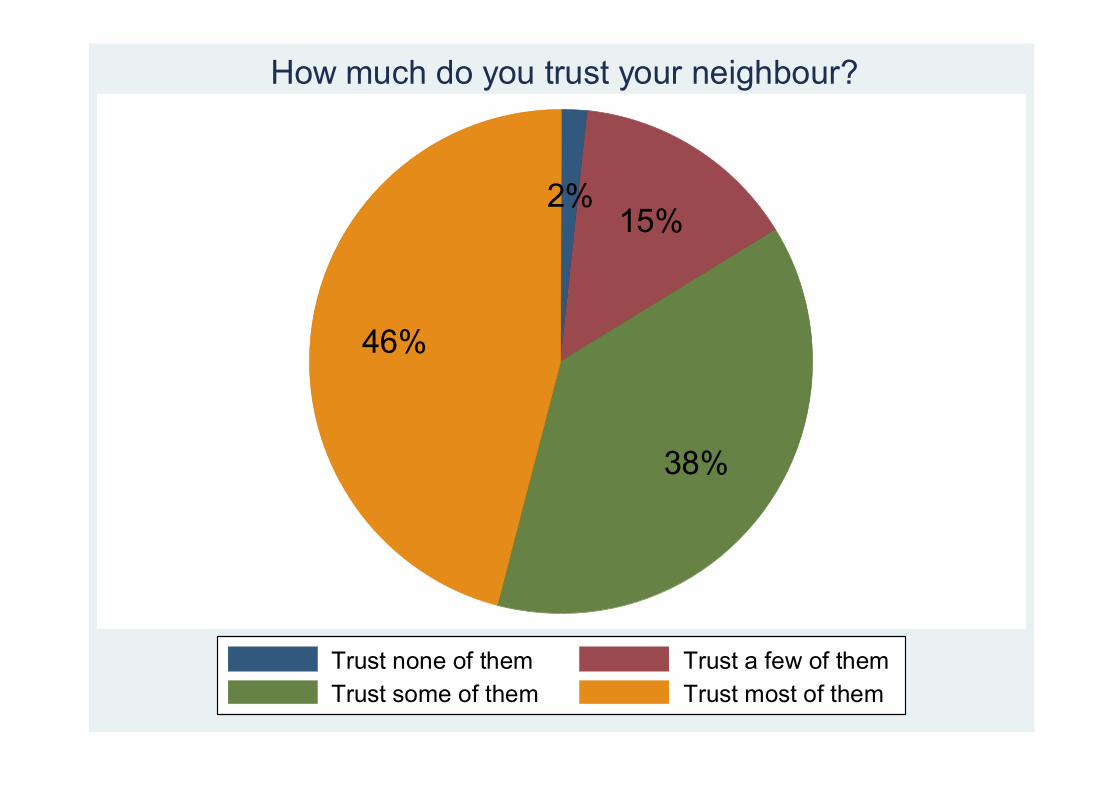
2%15%
38%
46%
Trust none of them Trust a few of themTrust some of them Trust most of them
How much do you trust your neighbour?

1% 12%
36%
51%
2%17%
40%
41%
Male Female
Trust none of them Trust a few of themTrust some of them Trust most of them
GNH Survey 2010
Trust in neighbour by gender

0.4%3.0%
27.8%
68.7%
Never RarelySometimes Always
People in this community treat you fairly
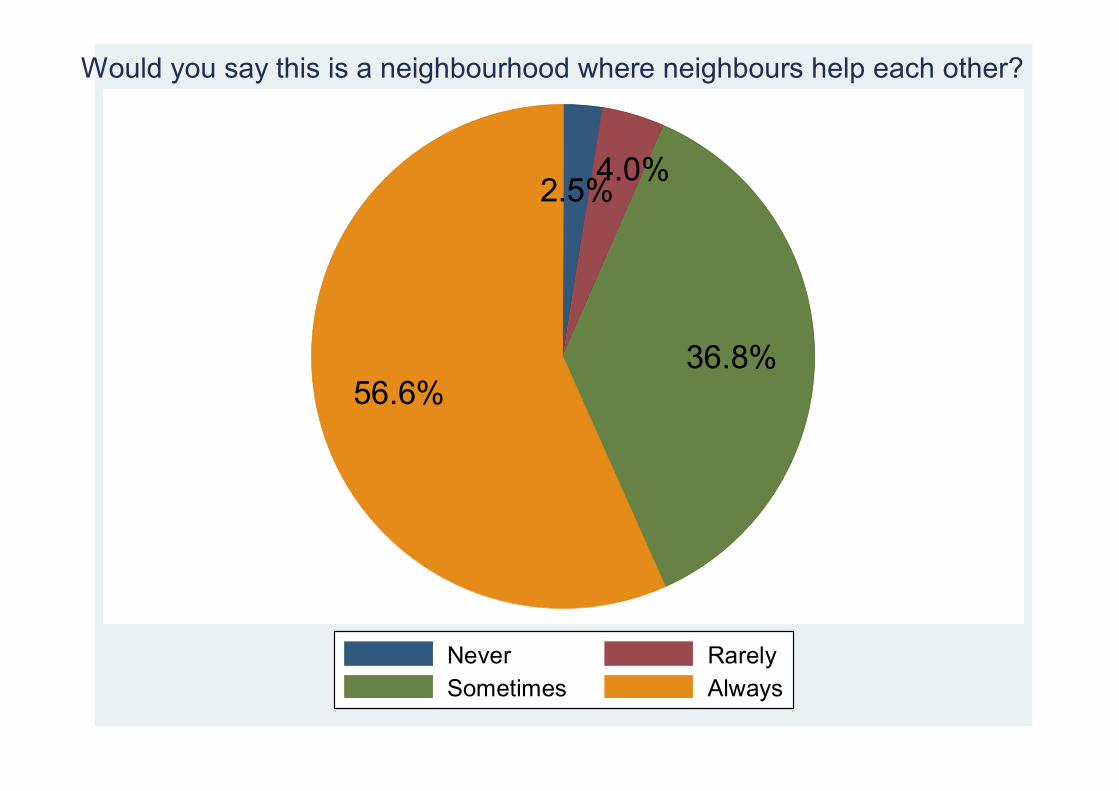
2.5%4.0%
36.8%56.6%
Never RarelySometimes Always
Would you say this is a neighbourhood where neighbours help each other?
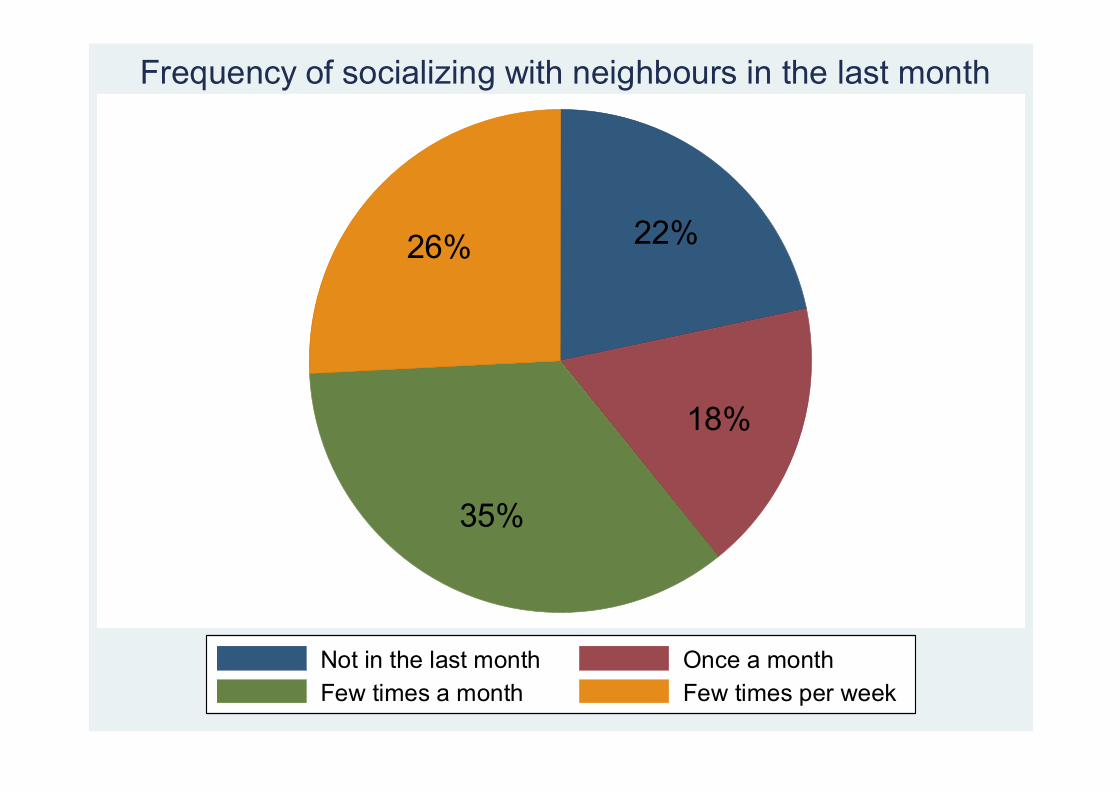
22%
18%
35%
26%
Not in the last month Once a monthFew times a month Few times per week
Frequency of socializing with neighbours in the last month

21%
18%
37%
23% 22%
17%
33%
28%
Male Female
Not in the last month Once a monthFew times a month Few times per week
GNH Survey 2010
Frequency of socializing with neighbours by gender

34%
20%
34%
12%
Not in the last month Once a monthFew times a month Few times per week
Frequency of socializing with relatives in the last month
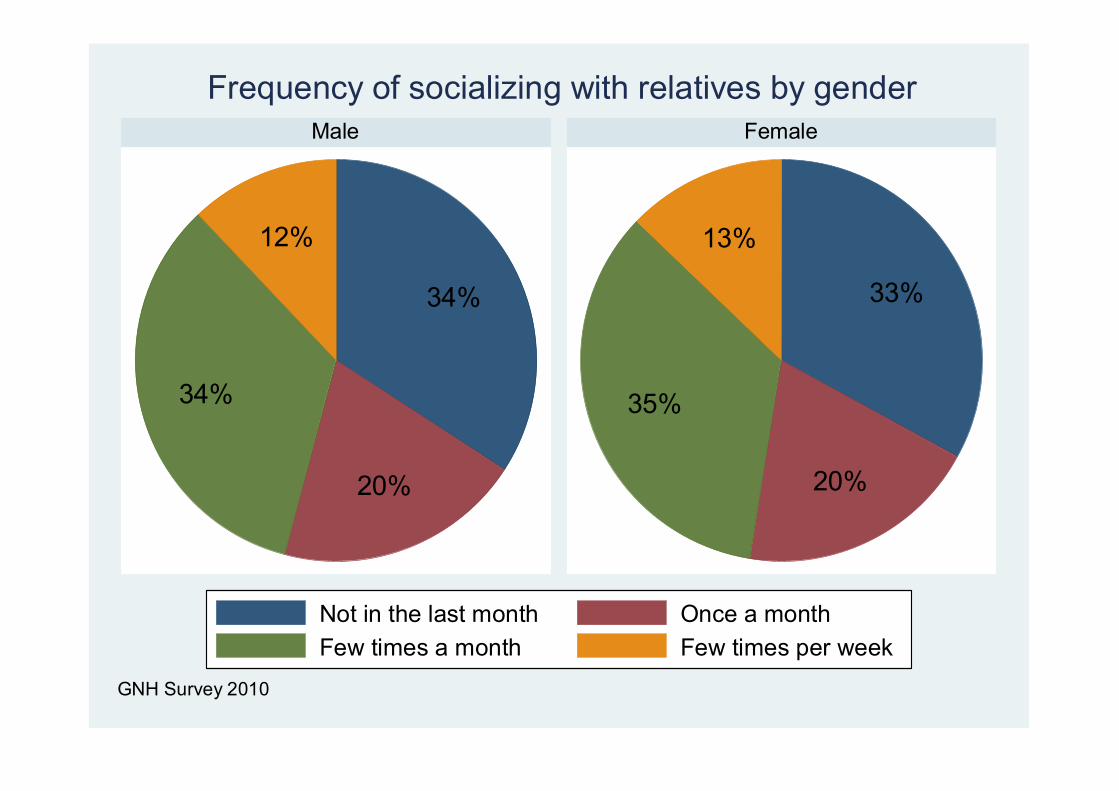
34%
20%
34%
12%
33%
20%
35%
13%
Male Female
Not in the last month Once a monthFew times a month Few times per week
GNH Survey 2010
Frequency of socializing with relatives by gender

11%
89%
Yes No
Enmity in the community in the past 12 months

1%3%
96%
Disagree NeutralAgree
Members of your family really care about each other

2%2%
96%
Agree NeutralDisagree
You wish you were not part of your family

4%17%
79%
Agree NeutralDisagree
Members of your family argue too much
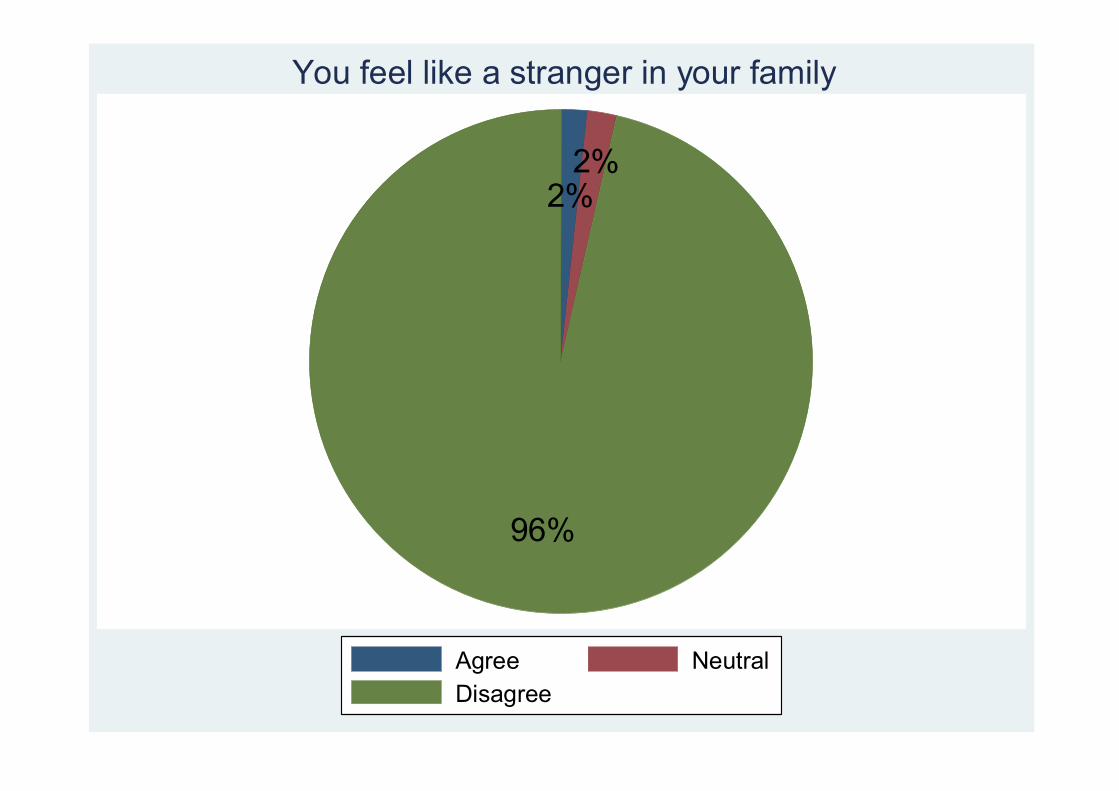
2%2%
96%
Agree NeutralDisagree
You feel like a stranger in your family

7%
26%
68%
Disagree NeutralAgree
You have enough time to spend with your family

2%10%
89%
Disagree NeutralAgree
There is a lot of understanding in your family

3%6%
92%
Disagree NeutralAgree
Your family is a real source of comfort to you
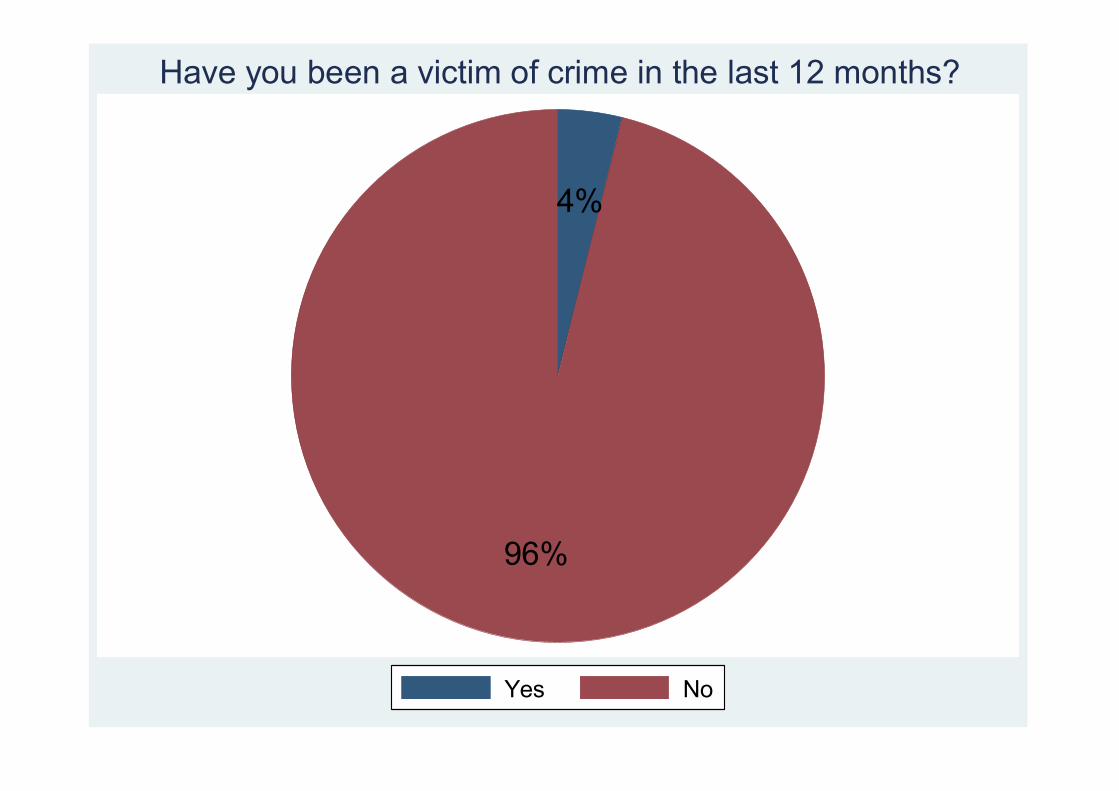
4%
96%
Yes No
Have you been a victim of crime in the last 12 months?

20%
80%
Yes No
Did you see/know other people being victimized of crime in the last 12 months?
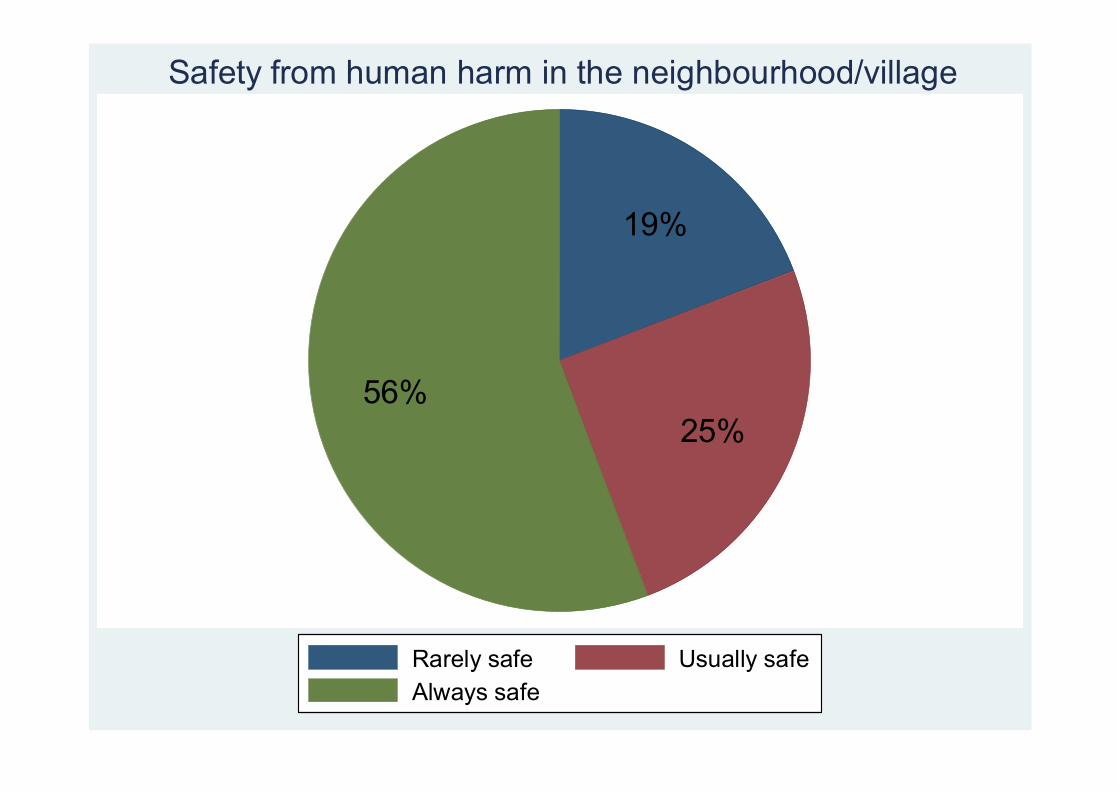
19%
25%56%
Rarely safe Usually safeAlways safe
Safety from human harm in the neighbourhood/village
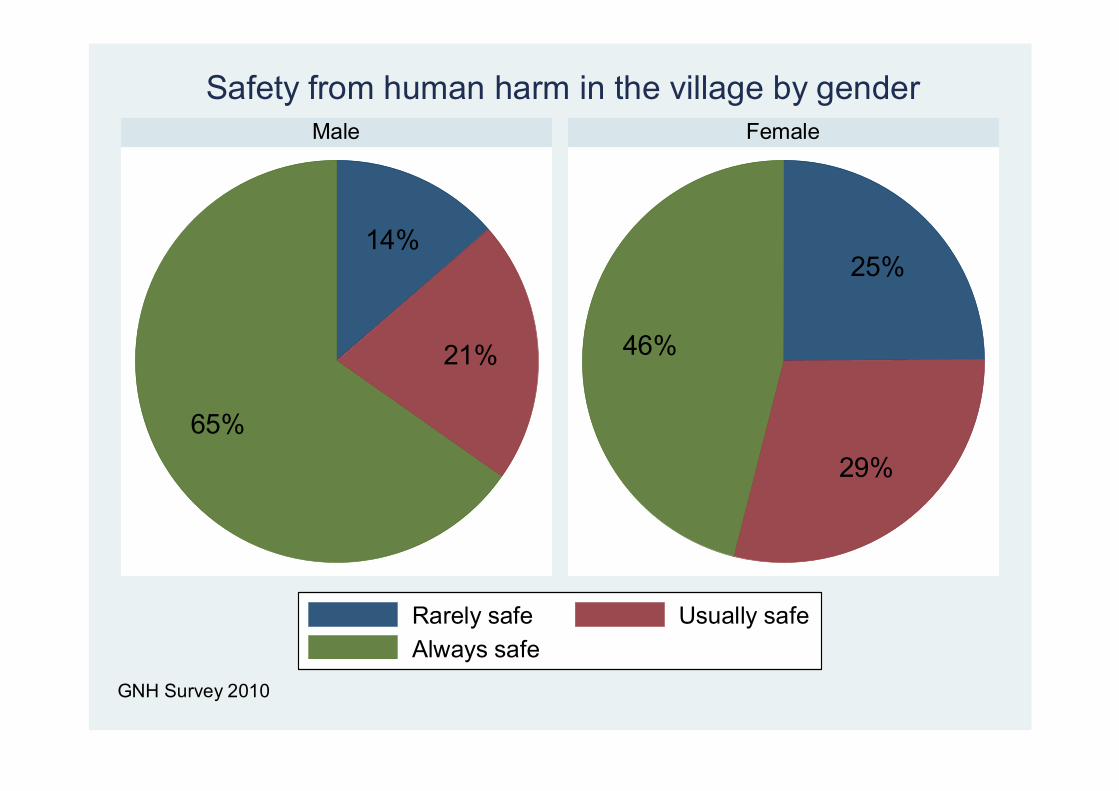
14%
21%
65%
25%
29%
46%
Male Female
Rarely safe Usually safeAlways safe
GNH Survey 2010
Safety from human harm in the village by gender

20%
28%
52%
Rarely safe Usually safeAlways safe
Safety from wild animals in the neighbourhood/village

20%
28%
52%
Rarely safe Usually safeAlways safe
Safety from ghosts in the neighbourhood/village
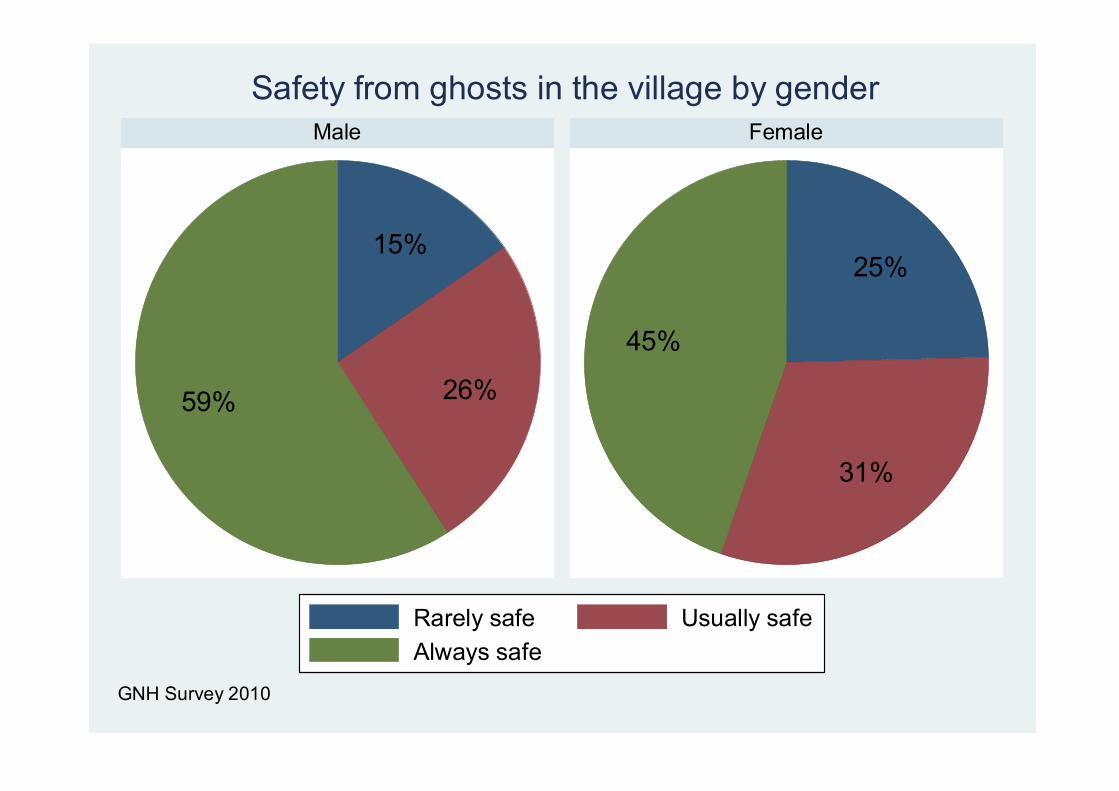
15%
26%59%
25%
31%
45%
Male Female
Rarely safe Usually safeAlways safe
GNH Survey 2010
Safety from ghosts in the village by gender

Ecological Diversity
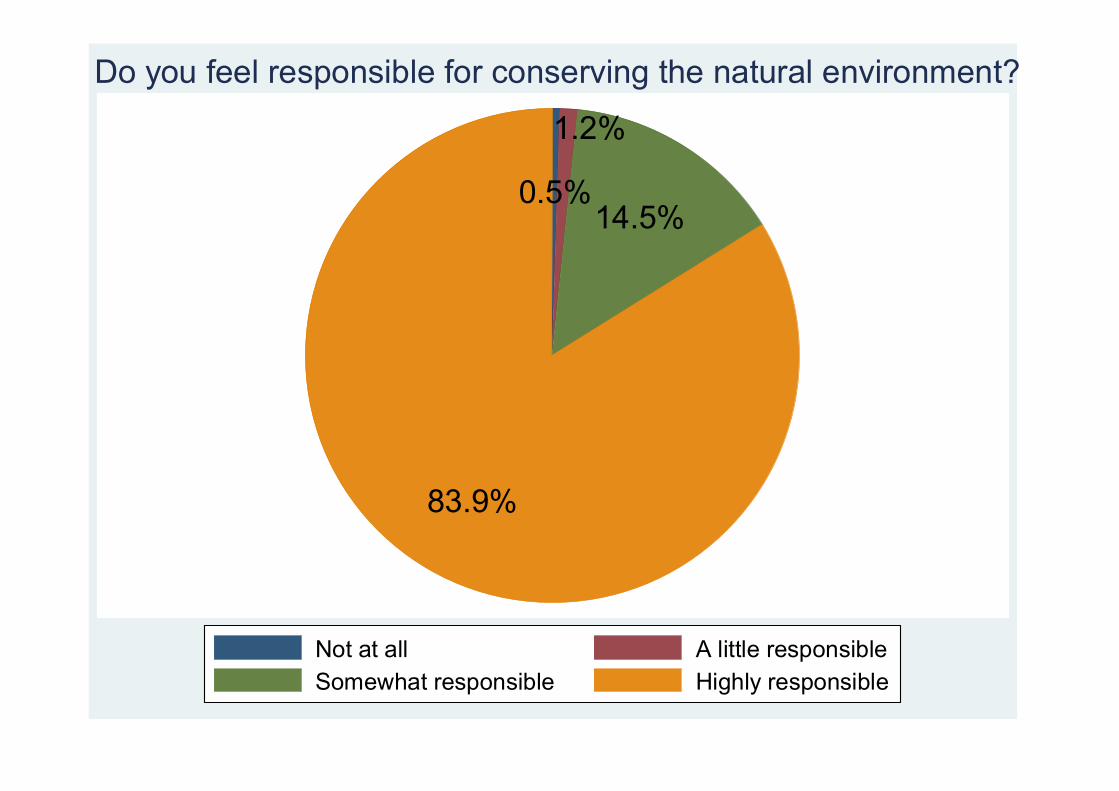
0.5%
1.2%
14.5%
83.9%
Not at all A little responsibleSomewhat responsible Highly responsible
Do you feel responsible for conserving the natural environment?

0.6%3.0%
40.2%56.2%
Disagree Neither Agree nor DisagreeAgree Strongly Agree
There should be tougher anti-pollution law
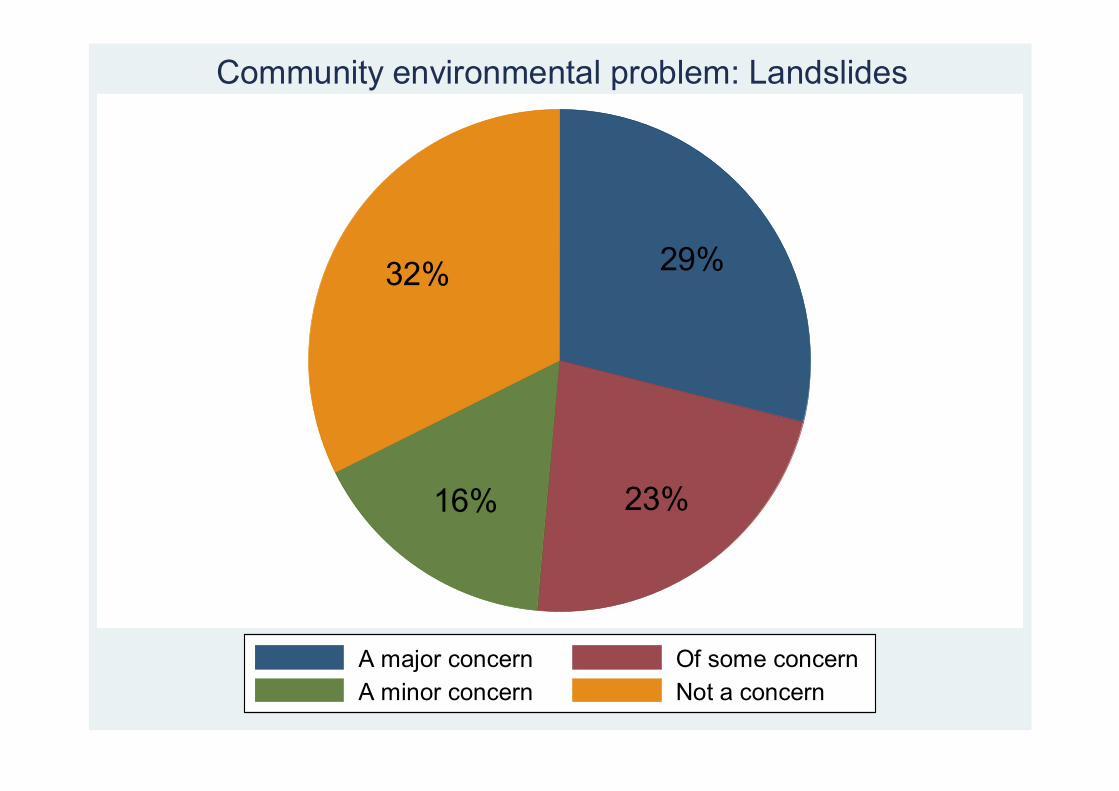
29%
23%16%
32%
A major concern Of some concernA minor concern Not a concern
Community environmental problem: Landslides

26%
19%
14%
41%
A major concern Of some concernA minor concern Not a concern
Community environmental problem: Floods

29%
37%
21%
13%
A major concern Of some concernA minor concern Not a concern
Community environmental problem: Erratic weather patterns

27%
24%21%
29%
A major concern Of some concernA minor concern Not a concern
Community environmental problem: Littering

18%
35%25%
22%
Never SometimesMost of the times Always
How often did you reuse materials in the past 12 months?
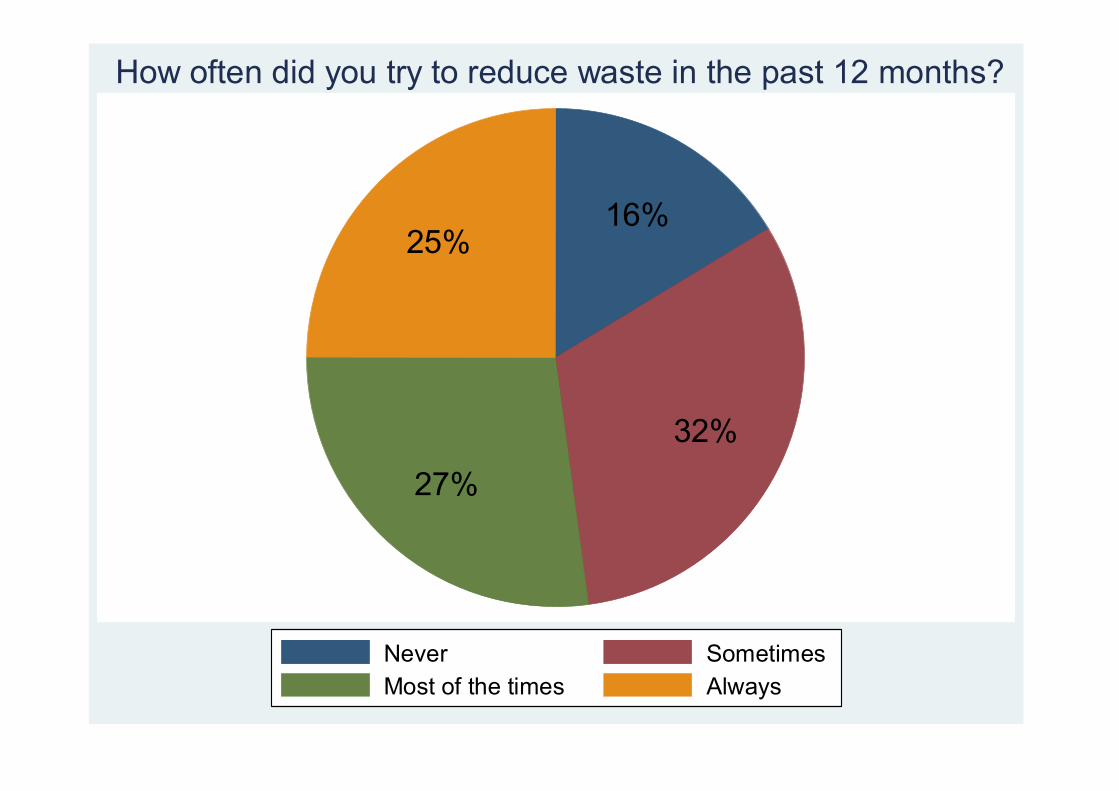
16%
32%27%
25%
Never SometimesMost of the times Always
How often did you try to reduce waste in the past 12 months?

30%
20%20%
30%
Never SometimesMost of the times Always
How often did you segregate waste in the past 12 months?
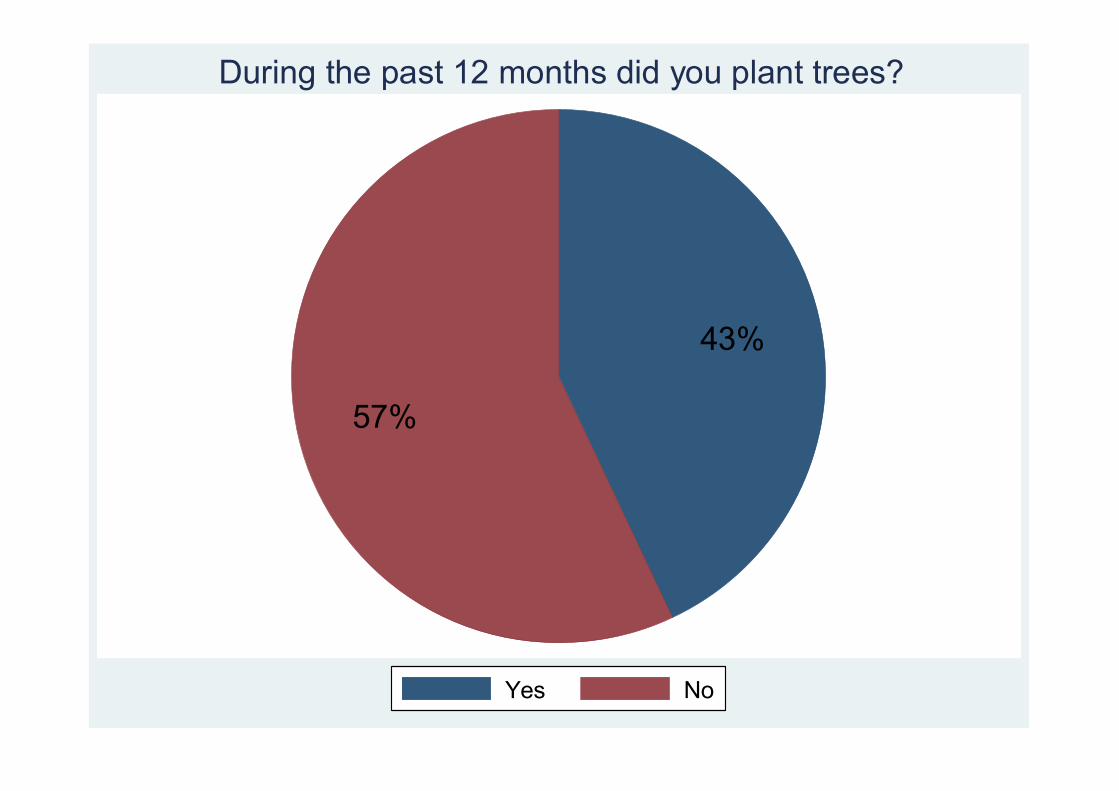
43%
57%
Yes No
During the past 12 months did you plant trees?

9%
53%
37%
Yes NoNot Applicable
Agricultural land lost to development by farmers in the last 5yrs
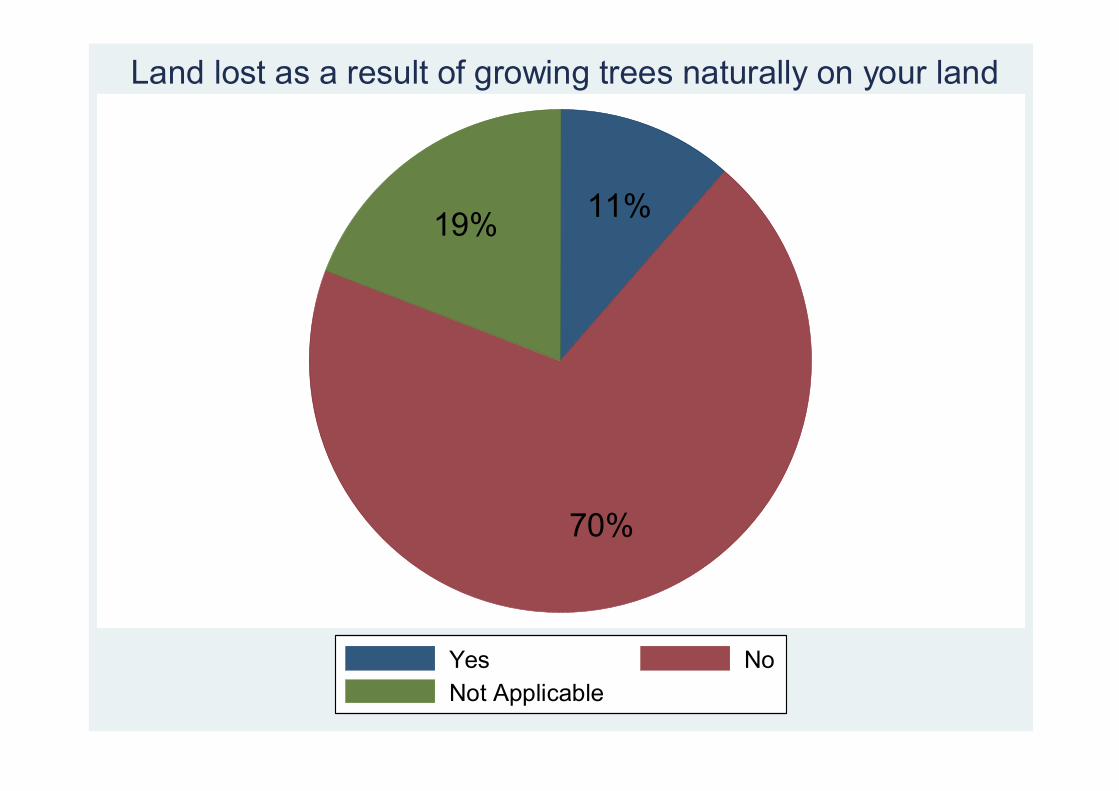
11%
70%
19%
Yes NoNot Applicable
Land lost as a result of growing trees naturally on your land
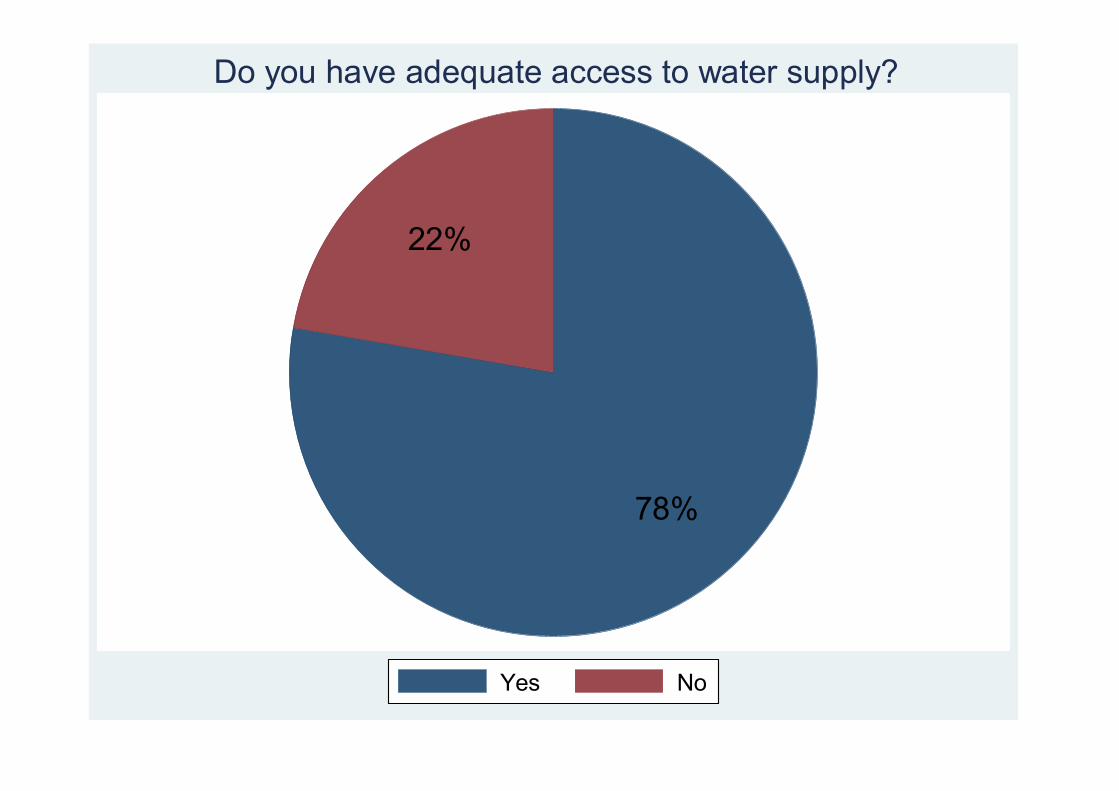
78%
22%
Yes No
Do you have adequate access to water supply?

91%
9%
79%
21%
85%
15%
87%
13%
91%
9%
82%
18%
78%
22%
75%
25%
64%
36%
74%
26%
72%
28%
81%
19%
70%
30%
78%
22%
77%
23%
79%
21%
83%
17%
80%
20%
67%
33%
81%
19%
Bumthang Chukha Dagana Gasa Haa
Lhuntse Mongar Paro Pema Gatshel Punakha
Samdrup Jongkhar Samtse Sarpang Thimphu Tashigang
Tashi Yangste Trongsa Tsirang Wangdue Phodrang Zhemgang
Yes No
GNH Survey 2010
By dzongkhag: Do you have adequate access to water supply?

2% 5%
11%
45%
37%
Very poor PoorNeither good nor poor GoodVery good
Quality of drinking water

35%
65%
Yes No
Do you own a vehicle?
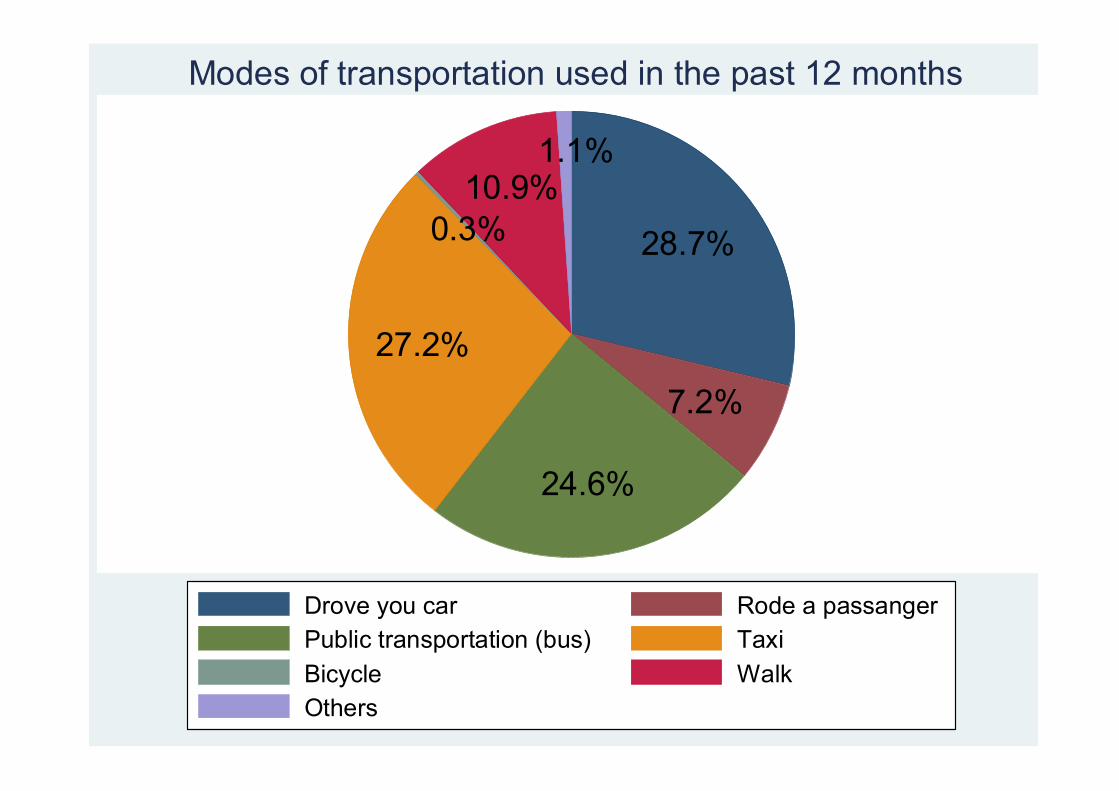
28.7%
7.2%
24.6%
27.2%
0.3%10.9%
1.1%
Drove you car Rode a passangerPublic transportation (bus) TaxiBicycle WalkOthers
Modes of transportation used in the past 12 months

60%24%
8%5%
2%
Hardly ever Once a monthMore than once a month Once a weekEveryday
Use of public transport in last month
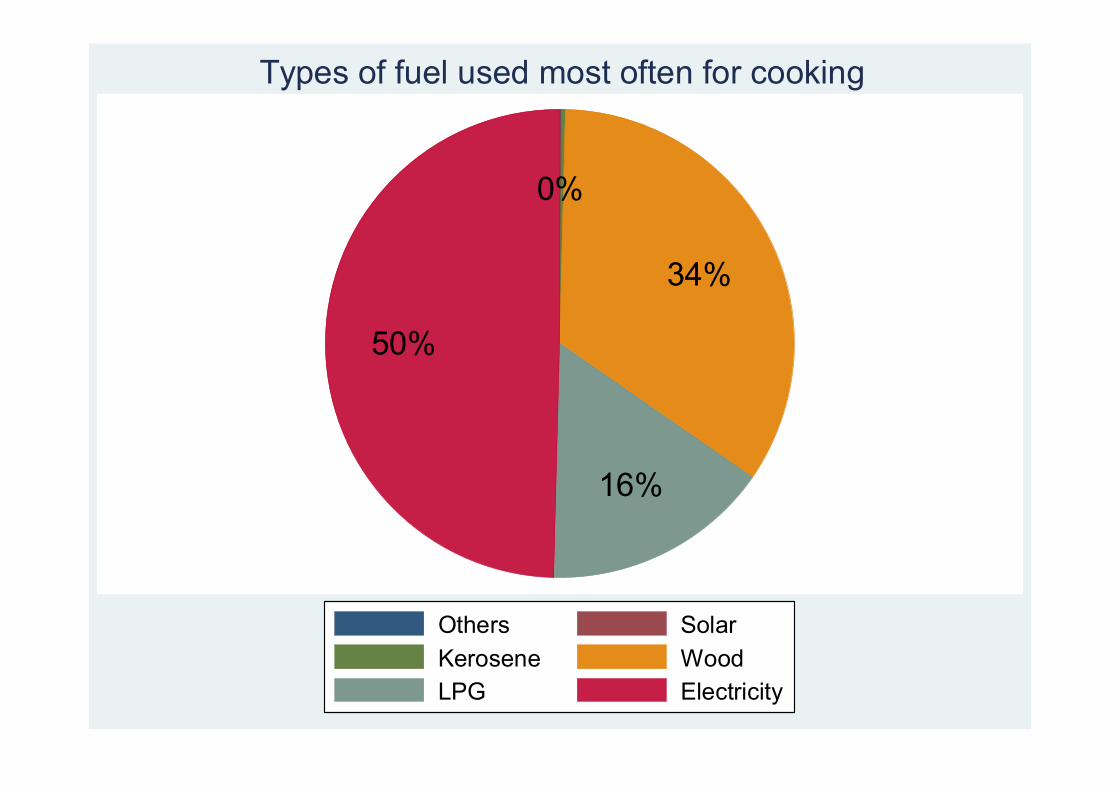
0%
34%
16%
50%
Others SolarKerosene WoodLPG Electricity
Types of fuel used most often for cooking
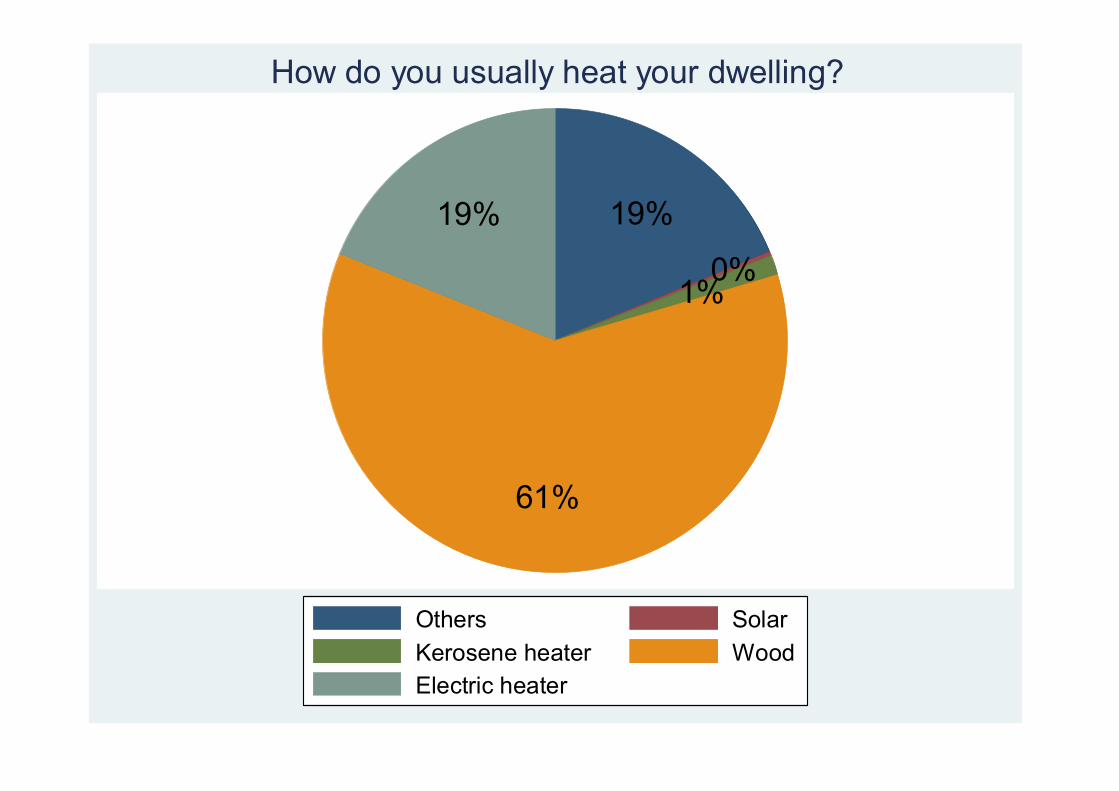
19%
0%1%
61%
19%
Others SolarKerosene heater WoodElectric heater
How do you usually heat your dwelling?
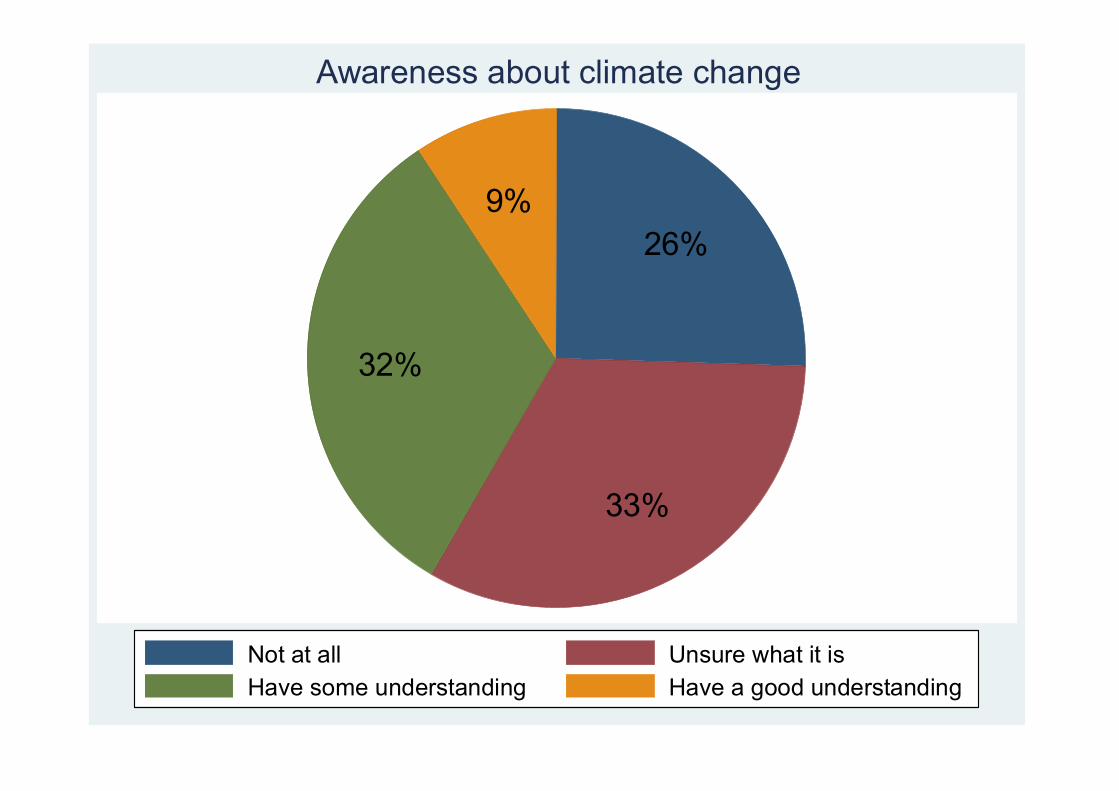
26%
33%
32%
9%
Not at all Unsure what it isHave some understanding Have a good understanding
Awareness about climate change
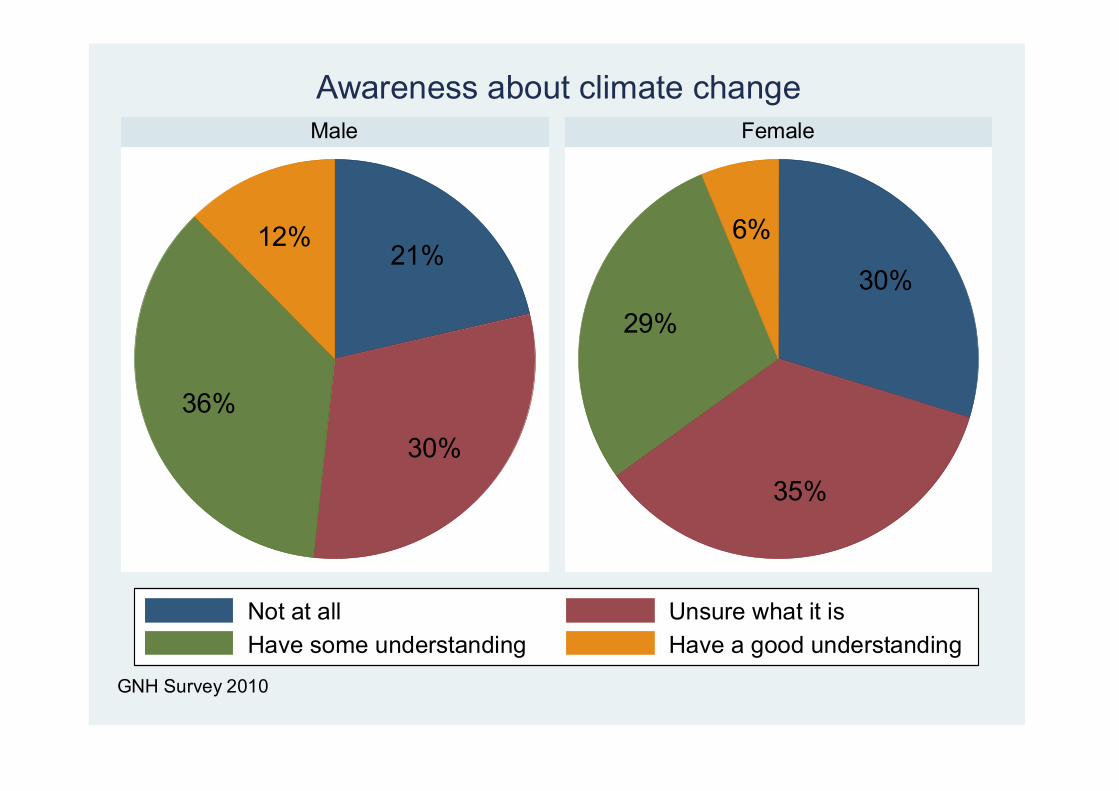
21%
30%36%
12%30%
35%
29%
6%
Male Female
Not at all Unsure what it isHave some understanding Have a good understanding
GNH Survey 2010
Awareness about climate change
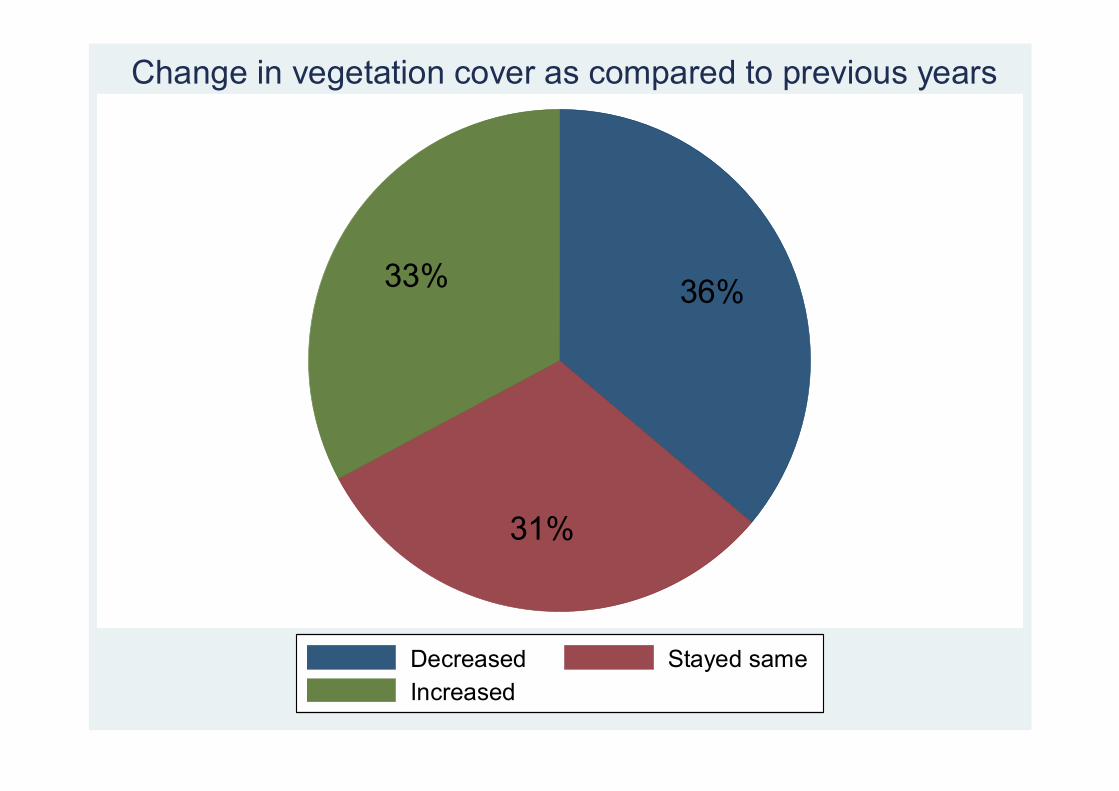
36%
31%
33%
Decreased Stayed sameIncreased
Change in vegetation cover as compared to previous years

0.7%
0.9%
1.1%0.8%
19.8%
52.2%
24.4%
Others Dump on open airDump in forest Dump in rivers/streamsMunicipal garbage pick-up BurningComposting
Mode of household waste disposal

1%4%
16%
58%
21%
Very poor PoorNeither good nor poor GoodVery good
Quality of agricultural land of farmers

51%
21%
10%
18%
Major constraint Some constraintMinor constraint Never
Agricultural constraints: Wild life
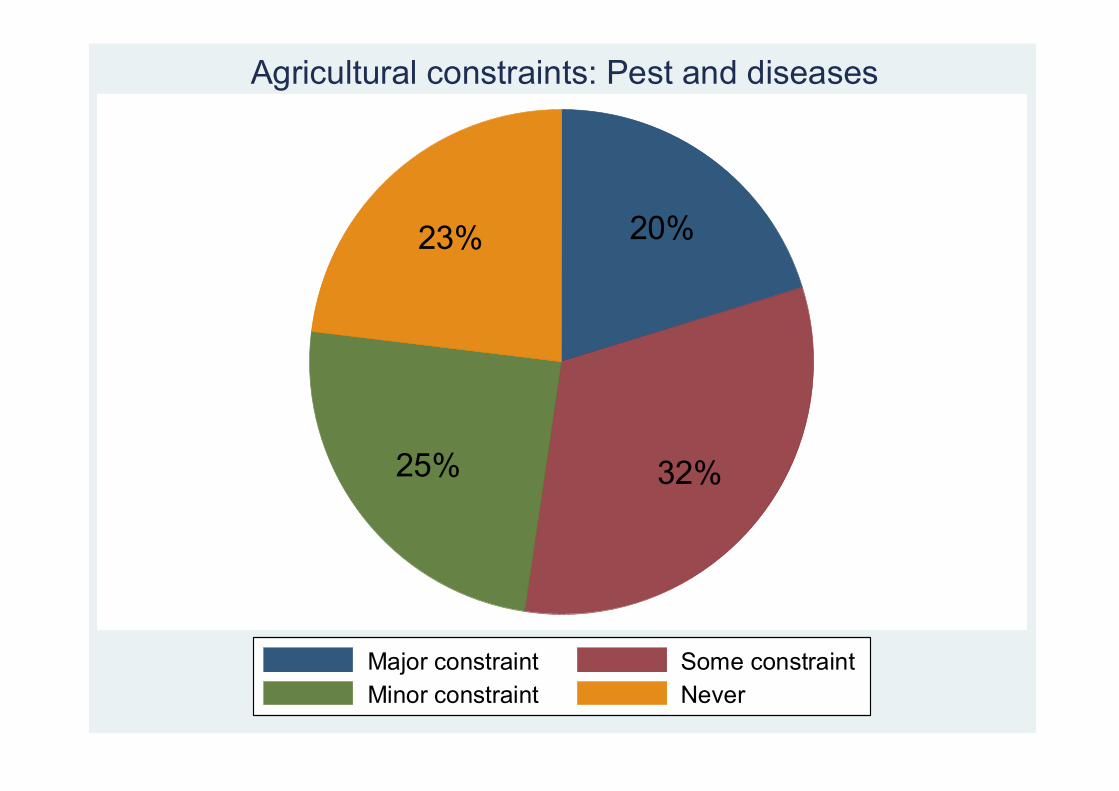
20%
32%25%
23%
Major constraint Some constraintMinor constraint Never
Agricultural constraints: Pest and diseases
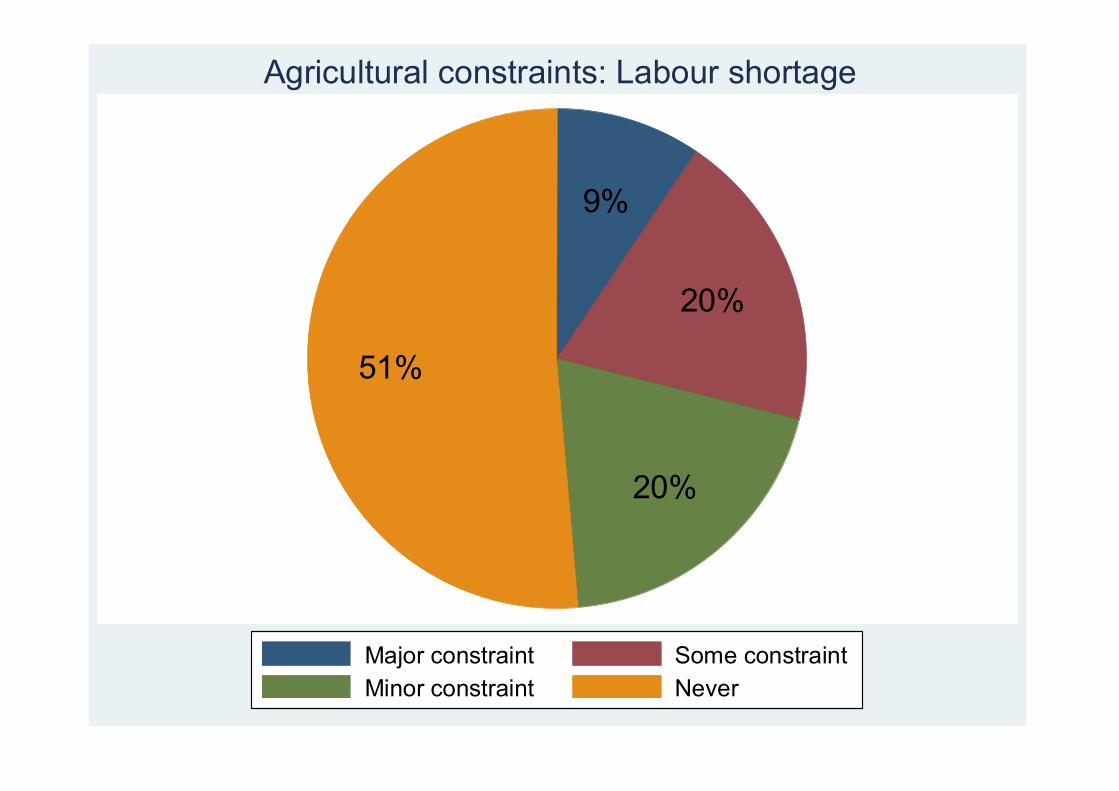
9%
20%
20%
51%
Major constraint Some constraintMinor constraint Never
Agricultural constraints: Labour shortage

38%
25%
16%
21%
A lot SomeLittle Not at all
Extent of damages caused by wild animals to crops
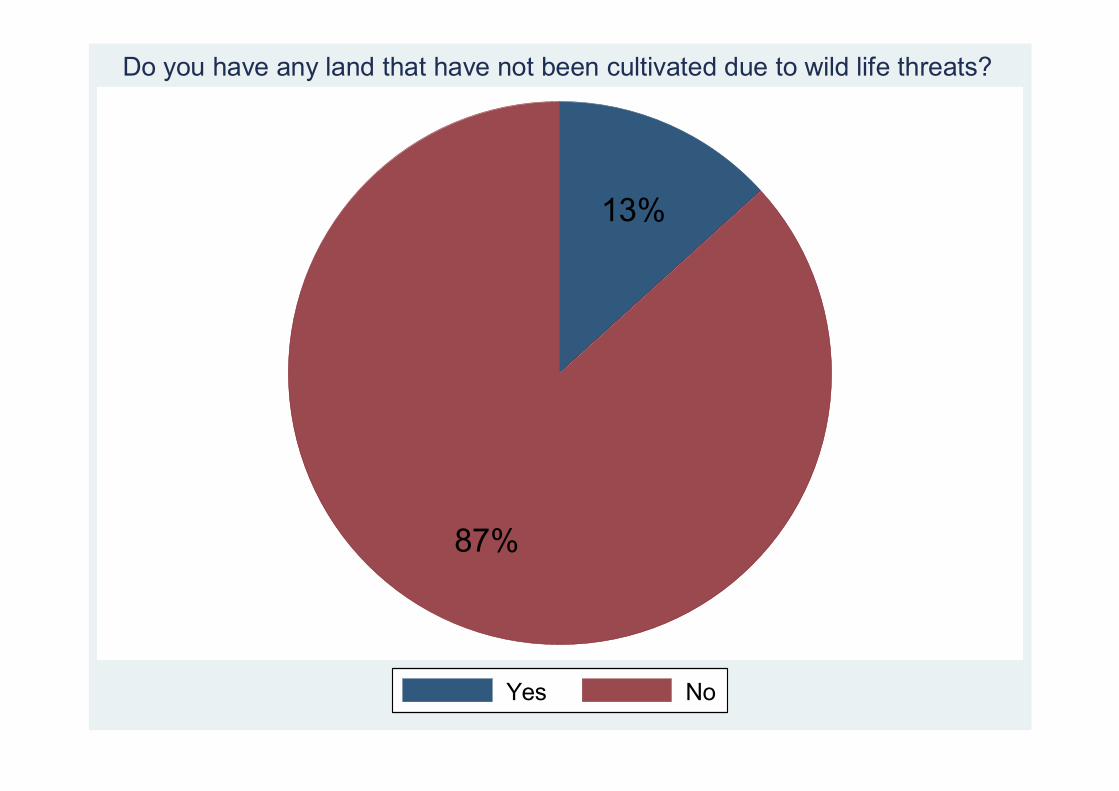
13%
87%
Yes No
Do you have any land that have not been cultivated due to wild life threats?

2%3%3%
8%
85%
More than 5 4-52-3 1-2Not at all
Have you lost any livestock to predators?
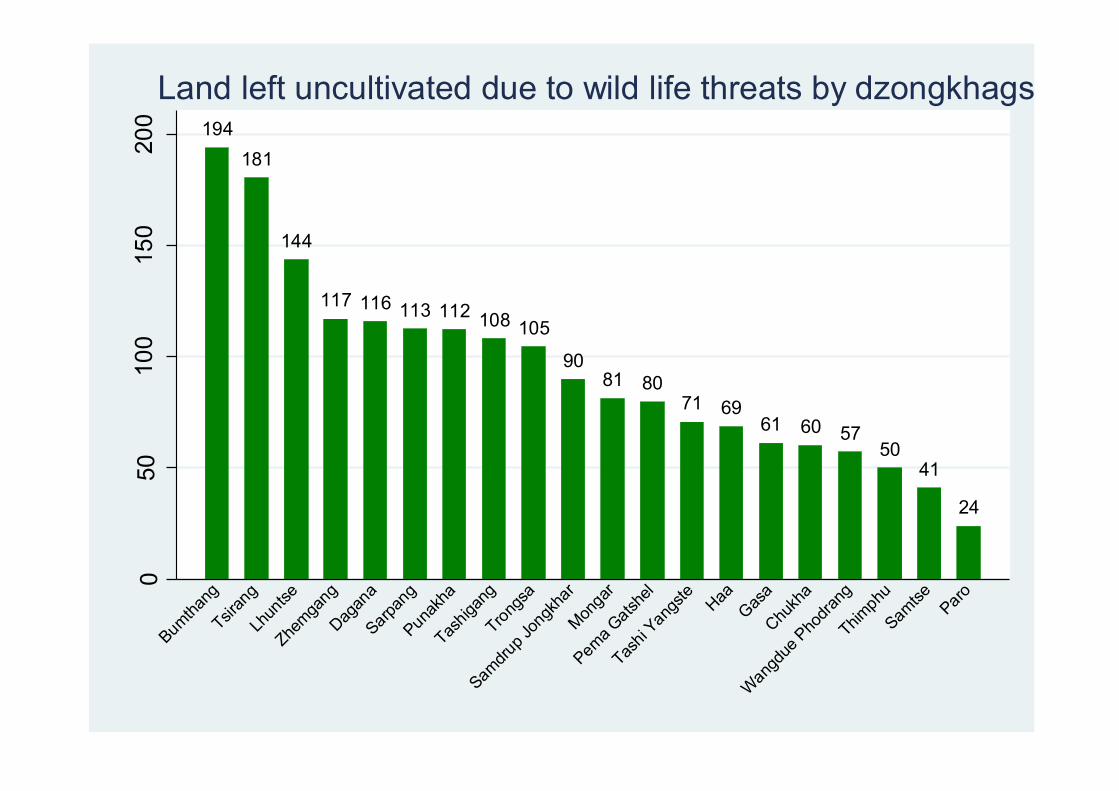
194181
144
117 116 113 112 108 105
9081 80
71 6961 60 57
5041
24
050
100
150
200
Mea
n ac
reag
e (in
dec
imal
)
Bumtha
ng
Tsiran
g
Lhun
tse
Zhemga
ng
Dagan
a
Sarpan
g
Punak
ha
Tashig
ang
Trongs
a
Samdru
p Jon
gkha
r
Monga
r
Pema G
atshe
l
Tashi
Yangs
teHaa
Gasa
Chukh
a
Wangd
ue P
hodra
ng
Thimph
u
Samtse Paro
Land left uncultivated due to wild life threats by dzongkhags

Living Standard
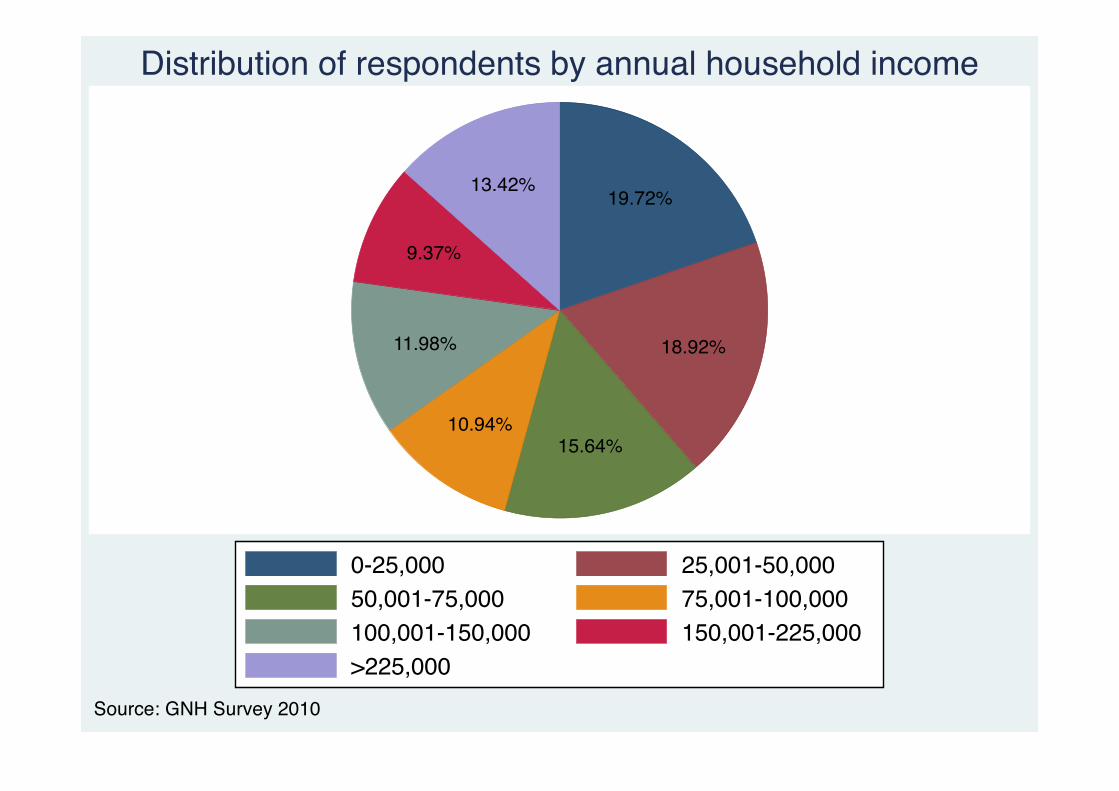
19.72%
18.92%
15.64%10.94%
11.98%
9.37%
13.42%
0-25,000 25,001-50,00050,001-75,000 75,001-100,000100,001-150,000 150,001-225,000>225,000
Source: GNH Survey 2010
Distribution of respondents by annual household income
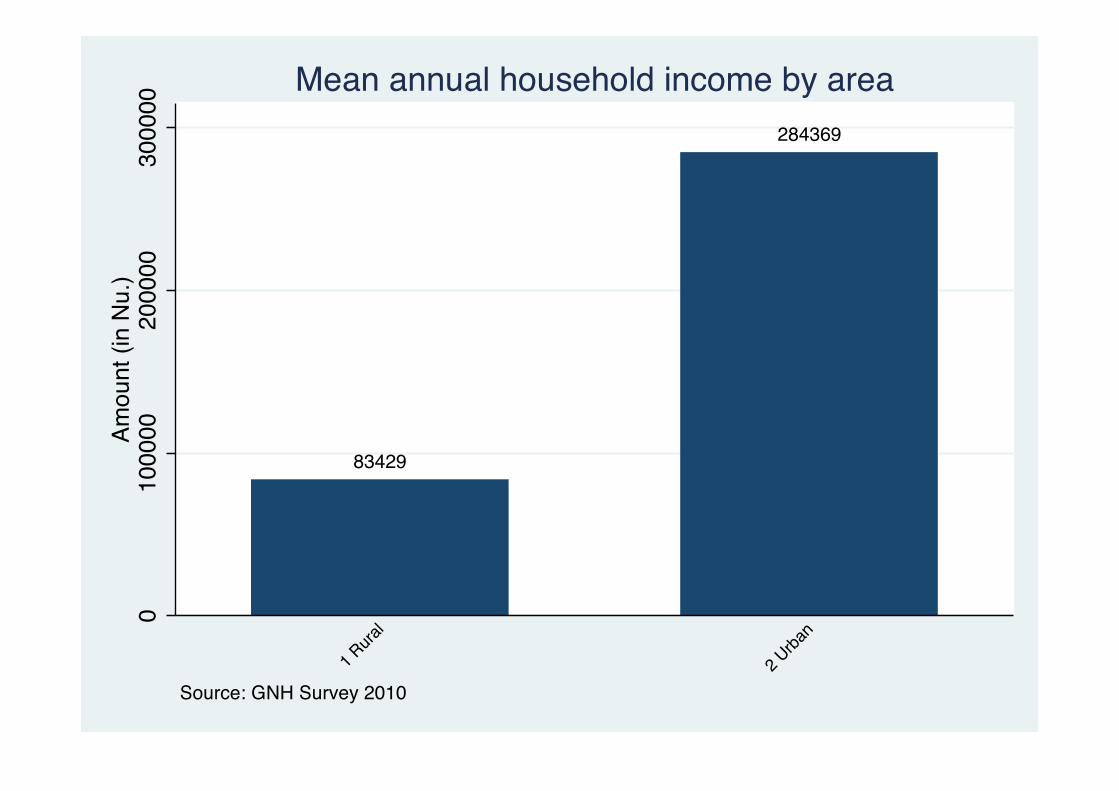
83429
2843690
1000
0020
0000
3000
00Am
ount
(in
Nu.
)
1 Rura
l
2 Urba
n
Source: GNH Survey 2010
Mean annual household income by area

551379
315235
237935
200528179352
153610 153292
112808 106867 9267262034 48625
020
0000
4000
0060
0000
Amou
nt (i
n Nu
.)
Busine
ssman
Unemplo
yed
Civil se
rvants
Studen
ts
Corpora
te em
ploye
eOthe
rs
House
wife
RBG/RBA/RBP
GYT/DYT mem
ber
Nation
al Work
Force
Farmer
Monk/A
nim/G
omch
en
Source: GNH Survey 2010
Mean annual household income by occupation
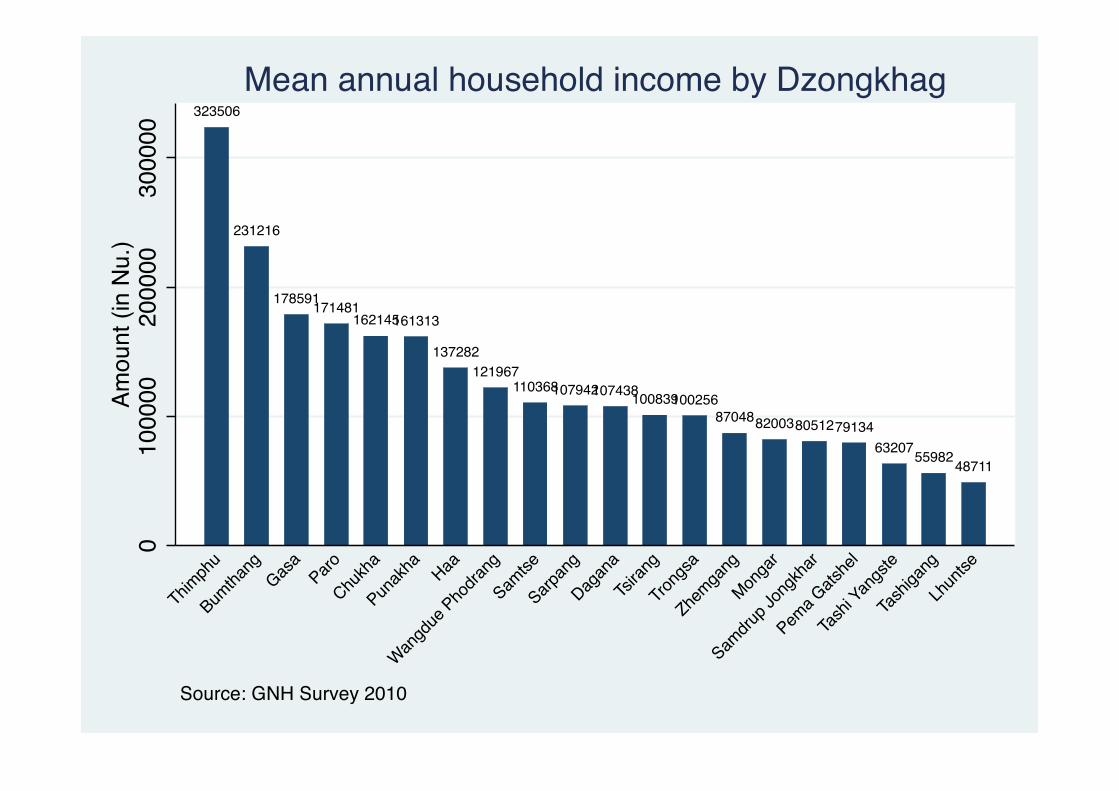
323506
231216
178591171481162145161313
137282121967
11036810794210743810083910025687048820038051279134
632075598248711
010
0000
2000
0030
0000
Amou
nt (i
n N
u.)
Thimph
u
Bumtha
ngGas
aParo
Chukh
a
Punak
ha Haa
Wangd
ue Pho
drang
Samtse
Sarpan
g
Dagan
a
Tsiran
g
Trong
sa
Zhemga
ng
Monga
r
Samdru
p Jon
gkha
r
Pema G
atshe
l
Tash
i Yan
gste
Tash
igang
Lhun
tse
Source: GNH Survey 2010
Mean annual household income by Dzongkhag
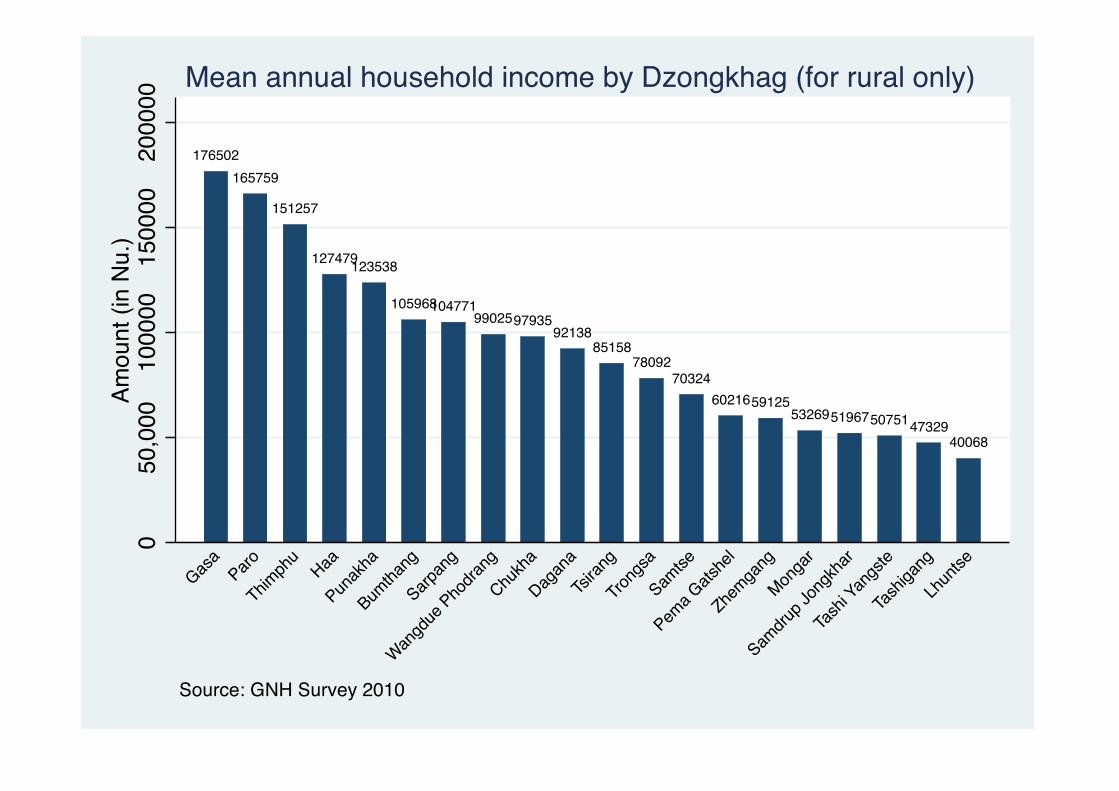
176502165759
151257
127479123538
1059681047719902597935
9213885158
7809270324
602165912553269519675075147329
40068
050
,000
1000
0015
0000
2000
00Am
ount
(in
Nu.
)
Gasa
Paro
Thimph
uHaa
Punak
ha
Bumtha
ng
Sarpan
g
Wangd
ue Pho
drang
Chukh
a
Dagan
a
Tsiran
g
Trong
sa
Samtse
Pema G
atshe
l
Zhemga
ng
Monga
r
Samdru
p Jon
gkha
r
Tash
i Yan
gste
Tash
igang
Lhun
tse
Source: GNH Survey 2010
Mean annual household income by Dzongkhag (for rural only)
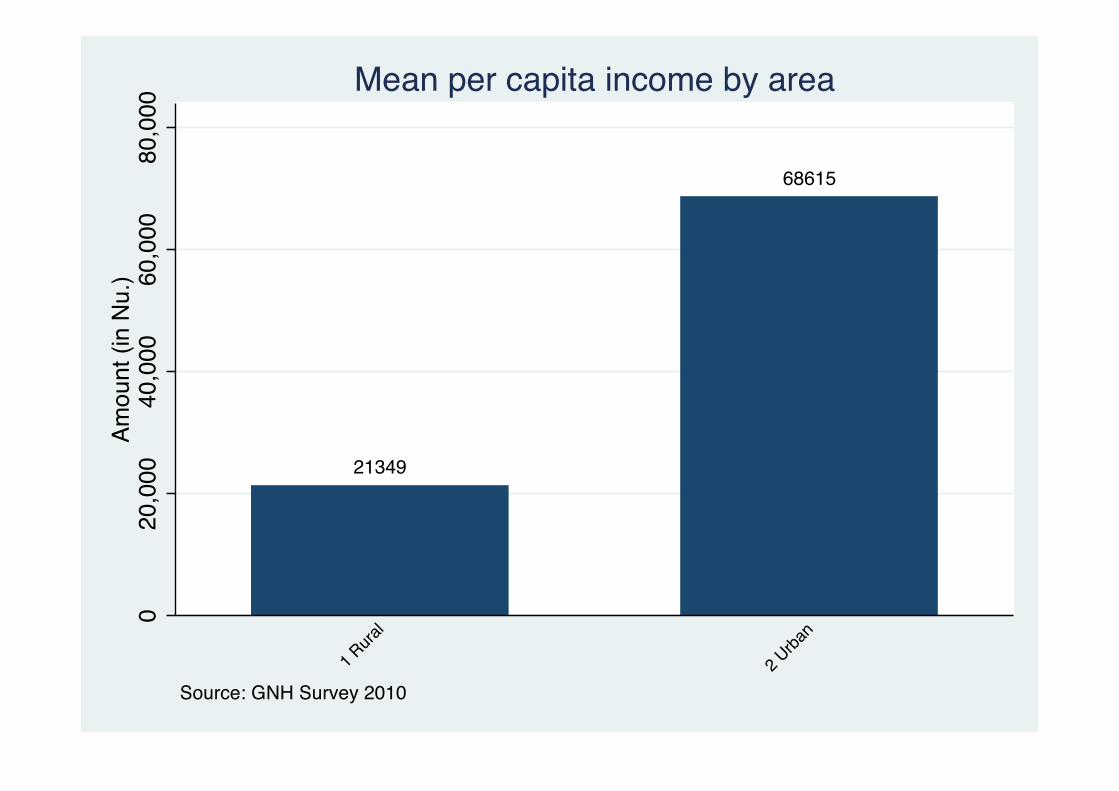
21349
686150
20,0
0040
,000
60,0
0080
,000
Amou
nt (i
n N
u.)
1 Rura
l
2 Urba
n
Source: GNH Survey 2010
Mean per capita income by area

127570
75688
61925
47646 4488838938 36395
29336 2802822895
15092 11929
050
,000
1000
0015
0000
Amou
nt (i
n Nu
.)
Busine
ssman
Civil se
rvants
Unemplo
yed
Corpora
te em
ploye
e
Studen
tsOthe
rs
House
wife
RBG/RBA/RBP
Nation
al Work
Force
GYT/DYT mem
ber
Farmer
Monk/A
nim/G
omch
en
Source: GNH Survey 2010
Mean per capita income by occupation

73322
48923447704351542774
4051338659
33445319323064626840256272525423919
2085619953196131848216452
12667
020
,000
40,0
0060
,000
80,0
00Am
ount
(in
Nu.
)
Thimph
u
Bumtha
ngGas
a
Punak
ha Paro Haa
Chukh
a
Wangd
ue Pho
drang
Trong
sa
Dagan
a
Samtse
Sarpan
g
Tsiran
g
Monga
r
Zhemga
ng
Samdru
p Jon
gkha
r
Pema G
atshe
l
Tash
i Yan
gste
Tash
igang
Lhun
tse
Source: GNH Survey 2010
Mean per capita income by Dzongkhag

4146539947
37700
35076
31344
28707
247622427224142235172195921765
16694159571569515084140341364613037
9672
010
,000
20,0
0030
,000
40,0
00Am
ount
(in
Nu.
)
Paro Gasa
Haa
Thimph
u
Punak
ha
Wangd
ue Pho
drang
Sarpan
g
Dagan
a
Bumtha
ng
Chukh
a
Trong
sa
Tsiran
g
Samtse
Monga
r
Pema G
atshe
l
Tash
i Yan
gste
Samdru
p Jon
gkha
r
Zhemga
ng
Tash
igang
Lhun
tse
Source: GNH Survey 2010
Mean per capita income by Dzongkhag (for rural only)
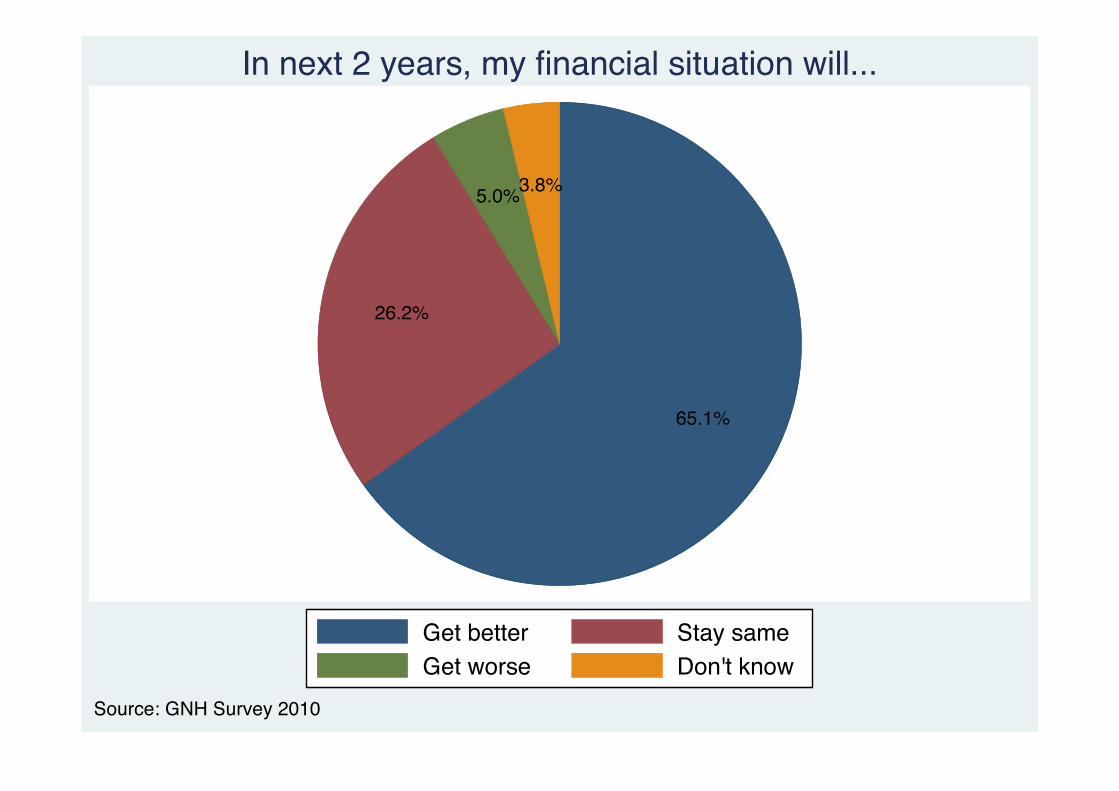
65.1%
26.2%
5.0%3.8%
Get better Stay sameGet worse Don't know
Source: GNH Survey 2010
In next 2 years, my financial situation will...

68.2%
23.7%
4.5%3.6%
61.9%
28.7%
5.5%3.9%
Male Female
Get better Stay sameGet worse Don't know
Source: GNH Survey 2010
In next 2 years, my financial situation will... by sex
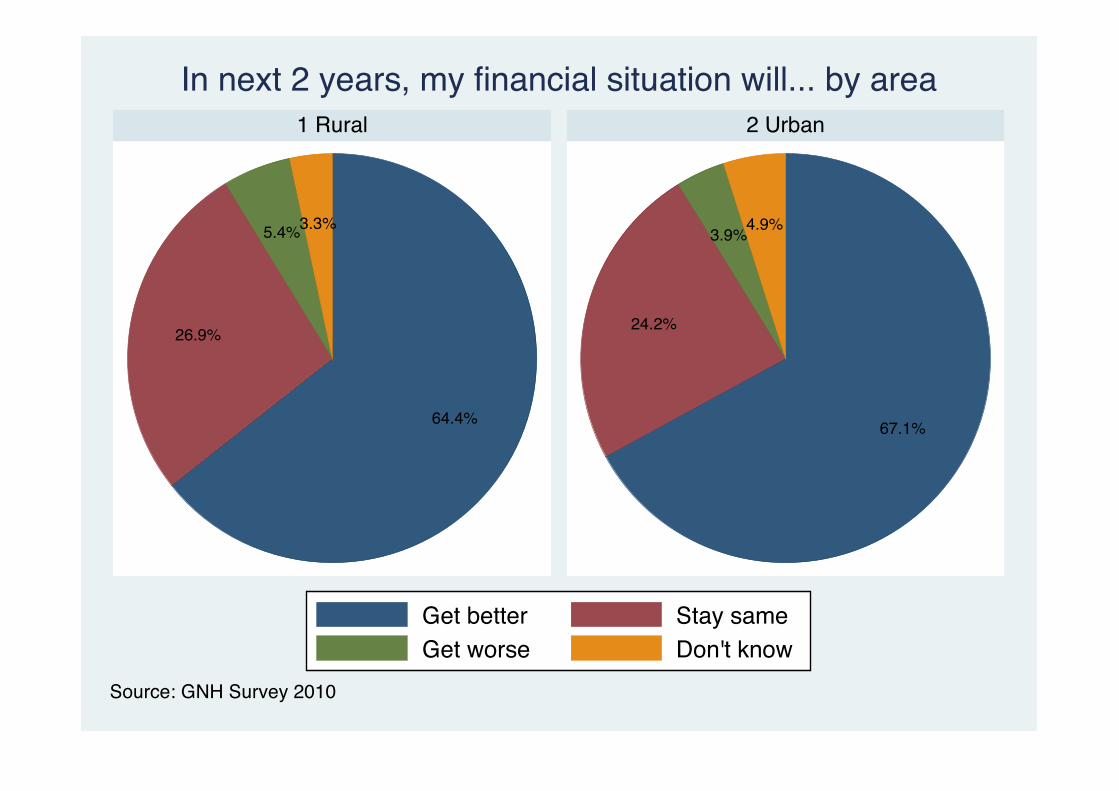
64.4%
26.9%
5.4%3.3%
67.1%
24.2%
3.9%4.9%
1 Rural 2 Urban
Get better Stay sameGet worse Don't know
Source: GNH Survey 2010
In next 2 years, my financial situation will... by area
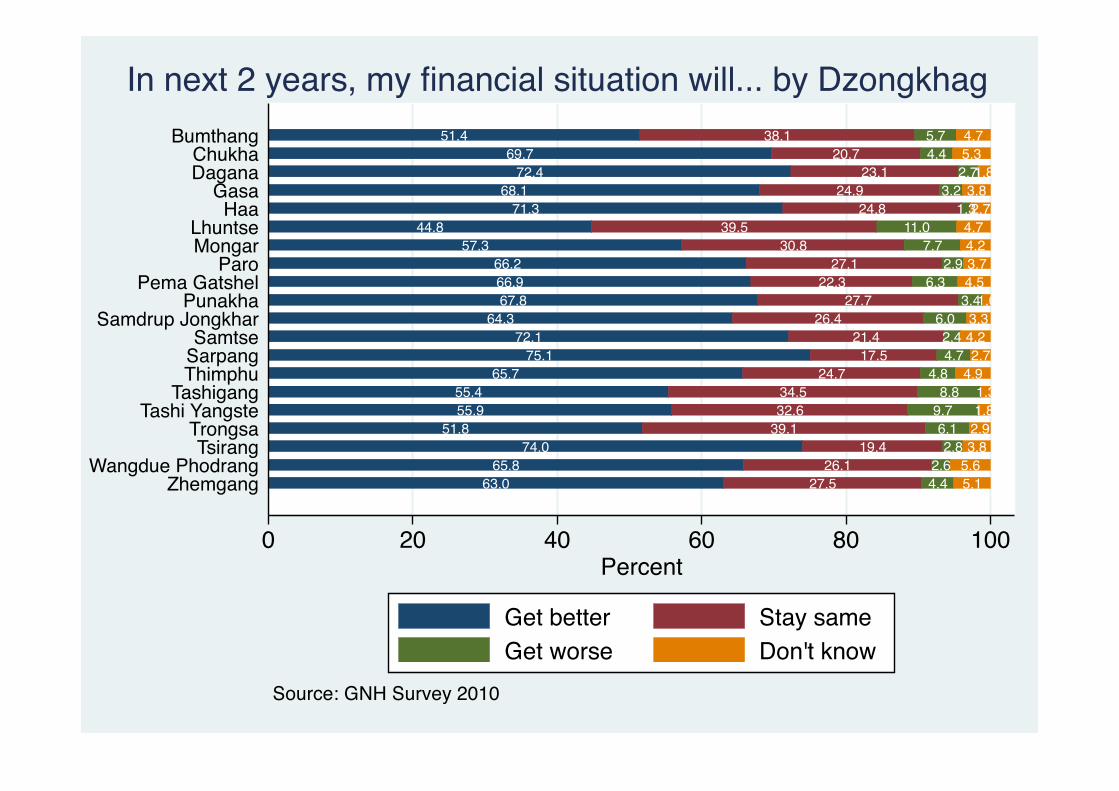
63.0 27.5 4.4 5.165.8 26.1 2.6 5.6
74.0 19.4 2.8 3.851.8 39.1 6.1 2.9
55.9 32.6 9.7 1.855.4 34.5 8.8 1.3
65.7 24.7 4.8 4.975.1 17.5 4.7 2.7
72.1 21.4 2.4 4.264.3 26.4 6.0 3.3
67.8 27.7 3.41.066.9 22.3 6.3 4.566.2 27.1 2.9 3.7
57.3 30.8 7.7 4.244.8 39.5 11.0 4.7
71.3 24.8 1.32.768.1 24.9 3.2 3.8
72.4 23.1 2.71.869.7 20.7 4.4 5.3
51.4 38.1 5.7 4.7
0 20 40 60 80 100Percent
ZhemgangWangdue Phodrang
TsirangTrongsa
Tashi YangsteTashigang
ThimphuSarpangSamtse
Samdrup JongkharPunakha
Pema GatshelParo
MongarLhuntse
HaaGasa
DaganaChukha
Bumthang
Source: GNH Survey 2010
In next 2 years, my financial situation will... by Dzongkhag
Get better Stay sameGet worse Don't know

8.7%
71.0%
20.3%
Not enough Just enoughMore than enough
Source: GNH Survey 2010
My total household income is...

8.4%
72.5%
19.1%9.0%
69.6%
21.4%
Male Female
Not enough Just enoughMore than enough
Source: GNH Survey 2010
My total household income is...by sex
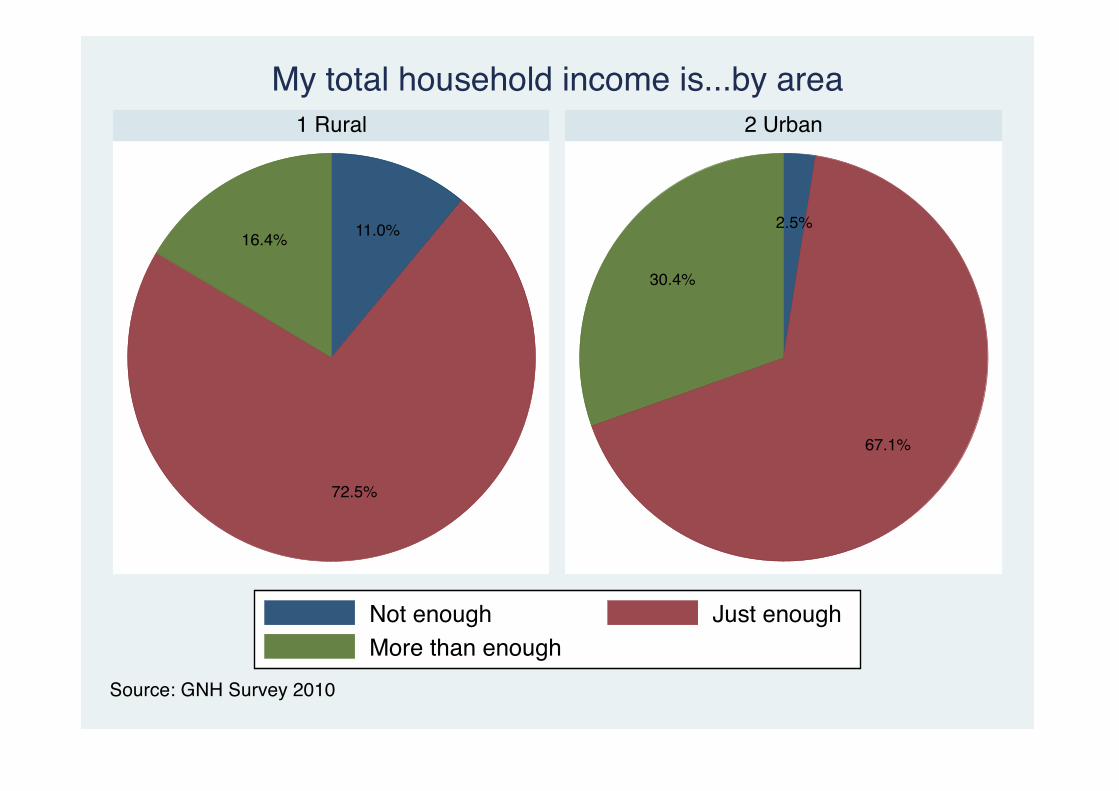
11.0%
72.5%
16.4%2.5%
67.1%
30.4%
1 Rural 2 Urban
Not enough Just enoughMore than enough
Source: GNH Survey 2010
My total household income is...by area
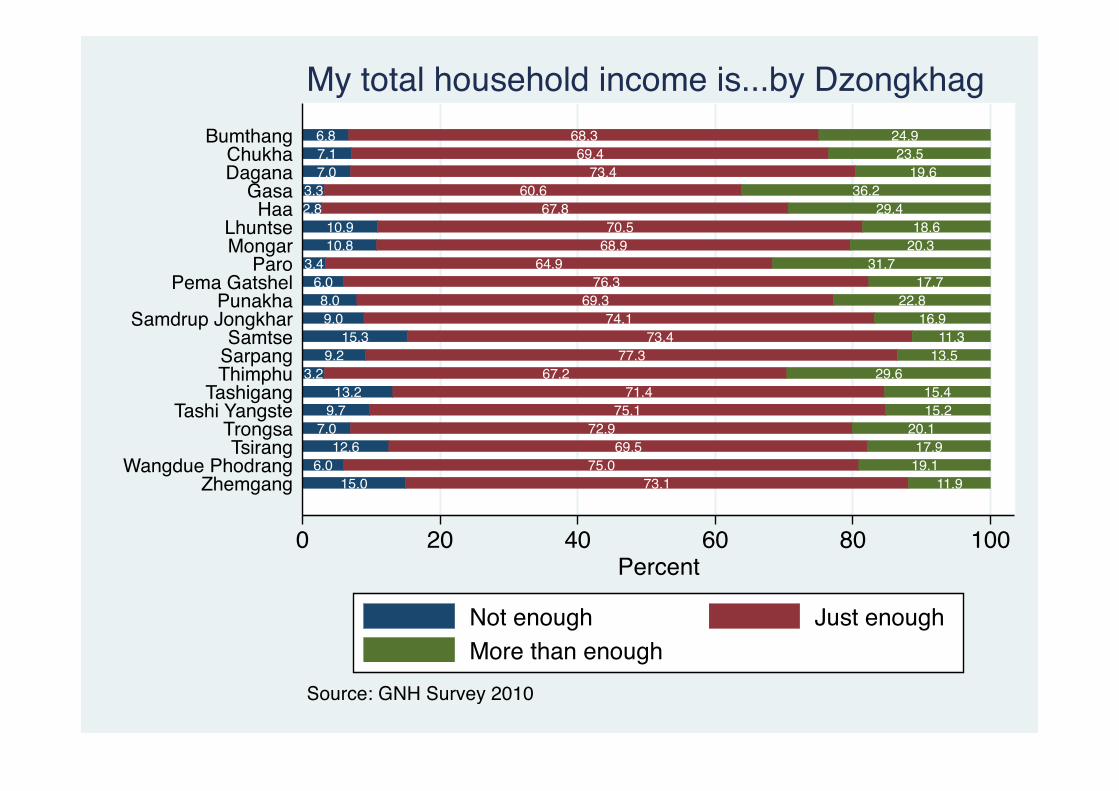
15.0 73.1 11.96.0 75.0 19.1
12.6 69.5 17.97.0 72.9 20.1
9.7 75.1 15.213.2 71.4 15.4
3.2 67.2 29.69.2 77.3 13.5
15.3 73.4 11.39.0 74.1 16.98.0 69.3 22.8
6.0 76.3 17.73.4 64.9 31.7
10.8 68.9 20.310.9 70.5 18.6
2.8 67.8 29.43.3 60.6 36.2
7.0 73.4 19.67.1 69.4 23.56.8 68.3 24.9
0 20 40 60 80 100Percent
ZhemgangWangdue Phodrang
TsirangTrongsa
Tashi YangsteTashigang
ThimphuSarpangSamtse
Samdrup JongkharPunakha
Pema GatshelParo
MongarLhuntse
HaaGasa
DaganaChukha
Bumthang
Source: GNH Survey 2010
My total household income is...by Dzongkhag
Not enough Just enoughMore than enough

0.1%0.4%
2.9%
96.6%
Always Most of the timesSometimes Never
Source: GNH Survey 2010
% of people reporting degree of food insecurity

4.63%
95.37%
Unaffordable AffordableSource: GNH Survey 2010
Housing affordability

0.5%
99.5%
15.5%
84.5%
1 Rural 2 Urban
Unaffordable AffordableSource: GNH Survey 2010
Housing affordability

0.5 99.54.9 95.1
1.0 99.01.5 98.50.7 99.30.9 99.1
20.6 79.40.6 99.4
100.02.1 97.91.8 98.2
100.04.9 95.1
1.6 98.40.2 99.81.8 98.20.6 99.41.2 98.8
8.5 91.52.4 97.6
0 20 40 60 80 100Percent
ZhemgangWangdue Phodrang
TsirangTrongsa
Tashi YangsteTashigang
ThimphuSarpangSamtse
Samdrup JongkharPunakha
Pema GatshelParo
MongarLhuntse
HaaGasa
DaganaChukha
Bumthang
Source: GNH Survey 2010
Housing affordability by Dzongkhag
Unaffordable Affordable
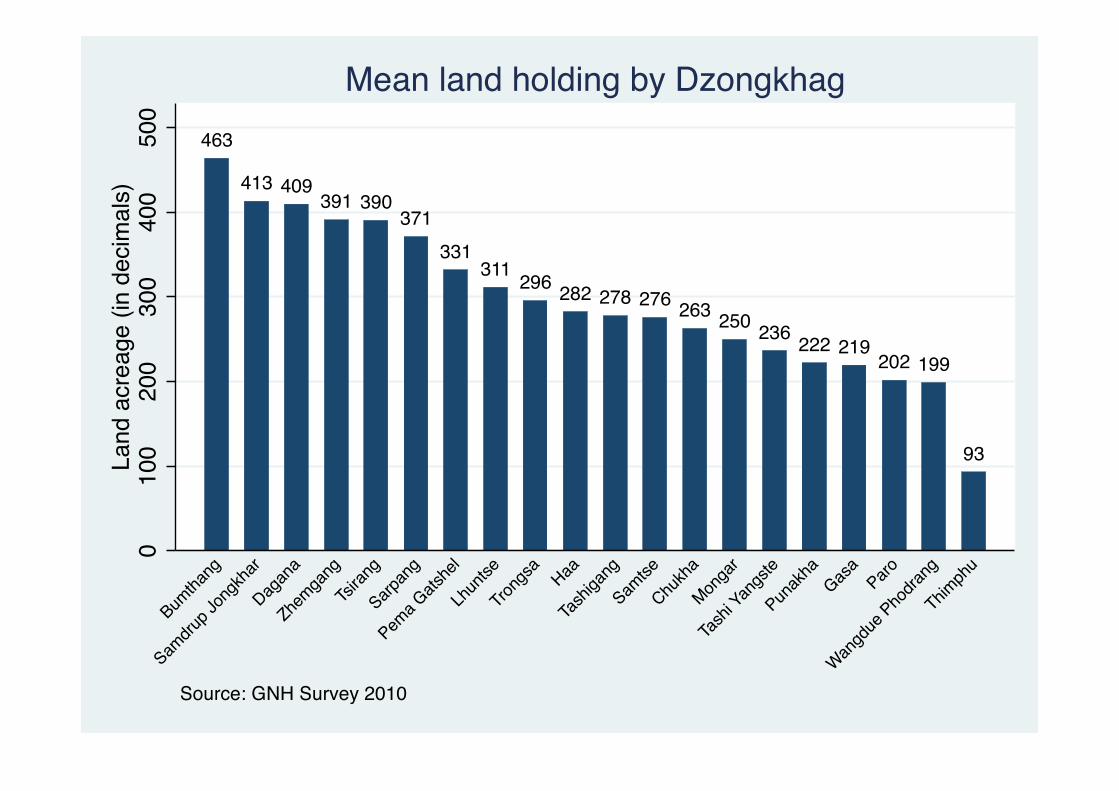
463
413 409391 390
371331
311 296 282 278 276 263 250 236 222 219202 199
93
010
020
030
040
050
0La
nd a
crea
ge (i
n de
cim
als)
Bumtha
ng
Samdru
p Jon
gkha
r
Dagan
a
Zhemga
ng
Tsiran
g
Sarpan
g
Pema G
atshe
l
Lhun
tse
Trong
sa Haa
Tash
igang
Samtse
Chukh
a
Monga
r
Tash
i Yan
gste
Punak
haGas
aParo
Wangd
ue Pho
drang
Thimph
u
Source: GNH Survey 2010
Mean land holding by Dzongkhag
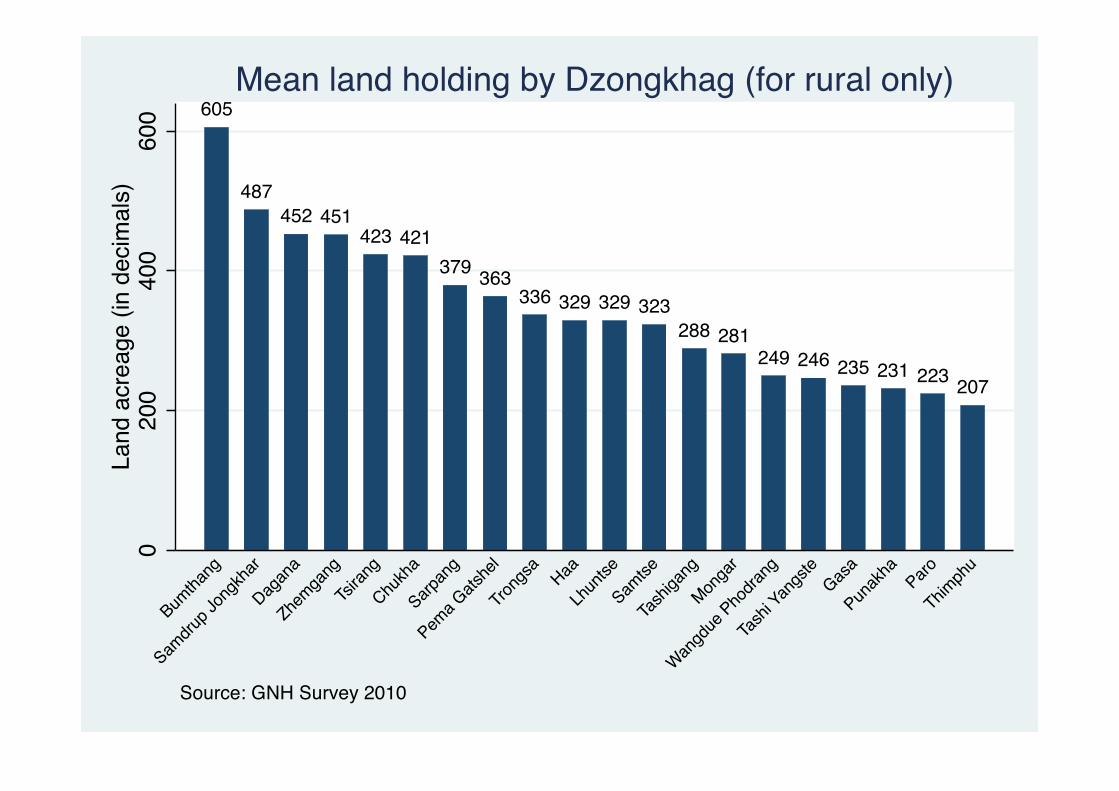
605
487452 451
423 421379 363
336 329 329 323288 281
249 246 235 231 223 207
020
040
060
0La
nd a
crea
ge (i
n de
cim
als)
Bumtha
ng
Samdru
p Jon
gkha
r
Dagan
a
Zhemga
ng
Tsiran
g
Chukh
a
Sarpan
g
Pema G
atshe
l
Trong
sa Haa
Lhun
tse
Samtse
Tash
igang
Monga
r
Wangd
ue Pho
drang
Tash
i Yan
gste
Gasa
Punak
ha Paro
Thimph
u
Source: GNH Survey 2010
Mean land holding by Dzongkhag (for rural only)

36.0%
41.1%
13.5%
4.8%4.6%
1 or less person/room 2 persons/room3 persons/room 4 persons/room5 persons/room
Source: GNH Survey 2010
% of people with persons per room

35.5%
38.2%
14.6%
5.8%5.9%
37.4%
48.9%
10.4%2.2%
1.2%
1 Rural 2 Urban
1 or less person/room 2 persons/room3 persons/room 4 persons/room5 persons/room
Source: GNH Survey 2010
% of people with persons per room by area
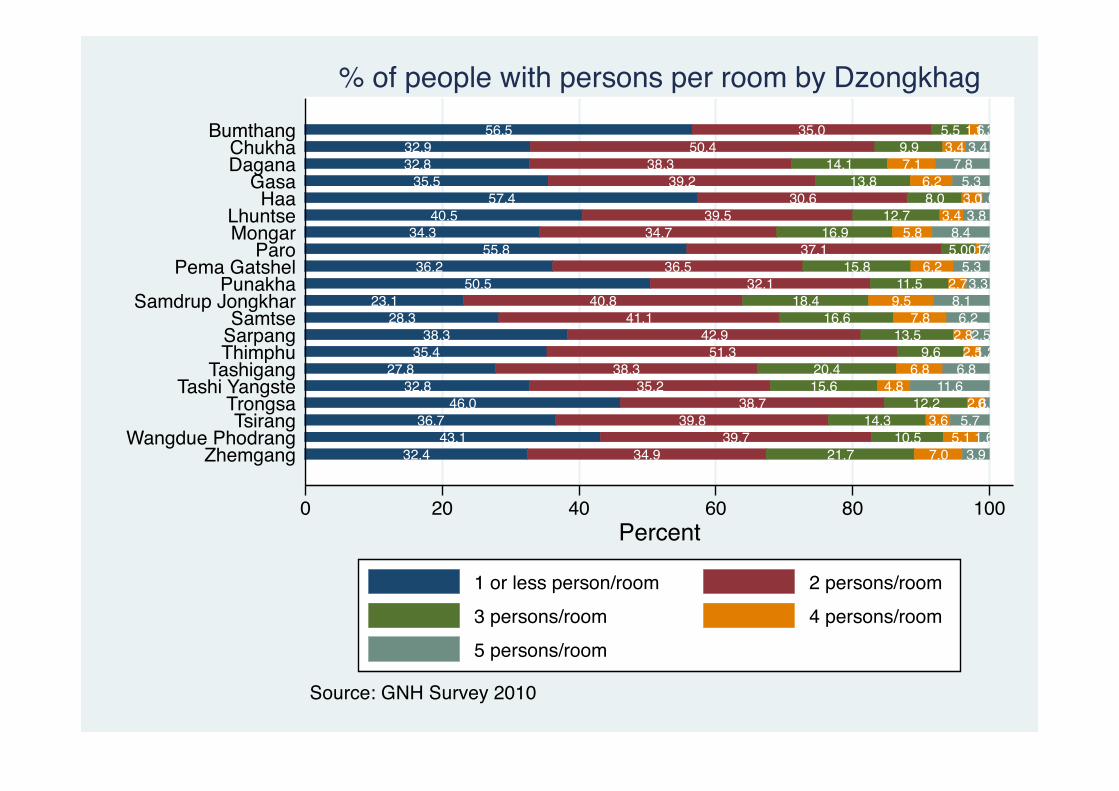
32.4 34.9 21.7 7.0 3.943.1 39.7 10.5 5.1 1.6
36.7 39.8 14.3 3.6 5.746.0 38.7 12.2 2.60.6
32.8 35.2 15.6 4.8 11.627.8 38.3 20.4 6.8 6.8
35.4 51.3 9.6 2.51.238.3 42.9 13.5 2.82.5
28.3 41.1 16.6 7.8 6.223.1 40.8 18.4 9.5 8.1
50.5 32.1 11.5 2.73.336.2 36.5 15.8 6.2 5.3
55.8 37.1 5.00.71.334.3 34.7 16.9 5.8 8.4
40.5 39.5 12.7 3.4 3.857.4 30.6 8.0 3.01.0
35.5 39.2 13.8 6.2 5.332.8 38.3 14.1 7.1 7.832.9 50.4 9.9 3.4 3.4
56.5 35.0 5.5 1.61.3
0 20 40 60 80 100Percent
ZhemgangWangdue Phodrang
TsirangTrongsa
Tashi YangsteTashigang
ThimphuSarpangSamtse
Samdrup JongkharPunakha
Pema GatshelParo
MongarLhuntse
HaaGasa
DaganaChukha
Bumthang
Source: GNH Survey 2010
% of people with persons per room by Dzongkhag
1 or less person/room 2 persons/room3 persons/room 4 persons/room5 persons/room
Related Documents


