Public Policy Institute of California STATEWIDE STATEWIDE NOVEMBER 2002 PPIC PPIC SURVEY SURVEY Special Survey on Land Use part of the Growth, Land Use, and Environment Series in collaboration with The William and Flora Hewlett Foundation The James Irvine Foundation The David and Lucile Packard Foundation Mark Baldassare Research Director & Survey Director

Welcome message from author
This document is posted to help you gain knowledge. Please leave a comment to let me know what you think about it! Share it to your friends and learn new things together.
Transcript

������������������ ������������
������������������
� � � � � � � � �
������
���� ����
������������� ���������������������������� ���������������������������
������������������
���������������� ������������ �����
���������������� �����
����������������������������� �����
���������������������������������������������
○ ○ ○ ○ ○

�������������� �������������������� ��� ��� �������������������� ��������������������� �
��������������������������� �����!"�#������"������ ���������������������������������
����������������������������������$���%����$�������������������"
�� �&����������������������������������������������'�����������$�������$��������������
��������������"��(�������������������������������)��������������������������������
��������&�� ������$� ������������������ ��������� ����� ����� ������$� ��������������$
����������$���������$���������������$��������$�������������$�������������������������"
�� �����������������������������������*������ �����!"�#������$�!����� "�#����$����+�%���,������������*������������������-�����%������������������������������������������������"���������������������������������&���������������������������������������������������
���������������������������-���������������������������������������������
����������������������"��� �������������-���������������������������������������������������
������������������������������������������������������������������������������������������
����"
.���� "�/��������������������������������0)������1���������� �"��!�������/"� �������
���������������2��������.������"
��������������� � � ��������������������������� ������� ����������� ���������������������������
��������������� �!��"���������#������� �!��"�������$����%�����&&&%����%��
- i -
Preface
The PPIC Statewide Survey series is designed to provide policymakers, the media, and the general public with objective, advocacy-free information on the perceptions, opinions and public policy preferences of Californians. Begun in April 1998, the survey series has generated a database that includes the responses of more than 60,000 Californians.
This survey on Californians and land use issues—a collaborative effort of the Public Policy Institute of California and The William and Flora Hewlett Foundation, The James Irvine Foundation, and The David and Lucile Packard Foundation—is a special edition of the PPIC Statewide Survey. This is the fourth in a series of eight surveys—two per year for four years—launched in May 2001. The intent of the surveys is to inform policymakers, encourage discussion, and raise public awareness about the growth, land use, and environmental issues facing the state. The current survey focuses in particular on the public’s perceptions, priorities, and policy preferences regarding land use and development issues.
This special edition presents the responses of 2,010 adult residents throughout the state. It examines in detail the public’s views on housing and on neighborhood, regional, and statewide issues related to land use and development. Some of the questions are repeated from PPIC’s Special Survey on Land Use conducted in November 2001. More specifically, we examine the following issues:
• Californians’ perceptions of their own residential conditions, including their satisfaction with housing, neighborhood, and commute to work; their perceptions of the problems facing lower-income and minority residents; their ratings of the problem seriousness of traffic, housing, jobs, growth, air pollution, and parks in their regions; and their perceptions of the major causes and ideal solutions to their region’s land use and development problems.
• The public’s priorities with regard to residential choices, including their willingness to make tradeoffs among choices such as housing size, length of commute, automobile use, and type of neighborhood; land use and development issues, such as local authority versus regional cooperation, compact development versus suburban sprawl, local planning versus state guidelines, and local government decisionmaking versus local citizens’ initiatives.
• Specific policy preferences, such as the relative importance Californians place on various types of infrastructure and surface transportation projects; their willingness to support more local spending on roads and infrastructure by reducing the supermajority vote requirement, passing local sales taxes, and using the state’s general fund for infrastructure projects.
• Variations in perceived conditions, public priorities, and policy preferences across the four major regions of the state (Central Valley, San Francisco Bay Area, Los Angeles area, and Other Southern California), between Latinos and non-Hispanic whites, and across age and the socioeconomic and political spectrum.
Copies of this report may be ordered by e-mail ([email protected]) or phone (415-291-4400). Copies of this and earlier reports are posted on the publications page of the PPIC web site (www.ppic.org). For questions about the survey, please contact [email protected].


- iii -
Contents
Preface i
Press Release v
Perceived Conditions 1
Public Priorities 7
Policy Preferences 13
Survey Methodology 19
Survey Questions and Results 21
Survey Advisory Committee 27


- v -
Press Release
— SPECIAL SURVEY ON LAND USE —
NOT MY PROBLEM: CALIFORNIANS SEE BUT DON’T FEEL PAIN OF GROWTH-RELATED CHALLENGES FACING STATE
Little Consensus About Solutions, Government’s Role in Managing Growth; Most Say Low-Income Neighborhoods Have Greater Needs, Fewer Resources
SAN FRANCISCO, California, November 14, 2002 — Californians recognize the challenges facing this fast-growing state – from too much traffic congestion to too little affordable housing – but most do not experience these troubles in their everyday lives, according to a new survey released today by the Public Policy Institute of California (PPIC) and the Hewlett, Irvine, and Packard Foundations. The result? Residents are deeply ambivalent about their own part – as well as their government’s role – in creating solutions.
The survey of 2,010 Californians finds that most residents believe quality of life is at serious risk in their region of the state. Strong majorities say traffic congestion (81%), housing affordability (69%), population growth and development (63%), air pollution (60%), and the opportunity for well-paying jobs (59%) are at least somewhat of a problem in their area. The level of concern varies by region: Los Angeles County (61%) and San Francisco Bay Area (59%) residents are more likely than residents of other regions to view traffic as a big problem, while residents of the Central Valley and other Southern California counties (31% each) are more inclined than others to see the availability of jobs as a big problem. Nearly one in four Los Angeles (38%) and Central Valley (37%) residents say air pollution is a big concern in their region, and 59 percent of people living in the Bay Area say affordable housing is a big problem. Surprisingly, 67 percent of residents statewide say that the availability of recreational parks and open space is not a problem in their region.
Driving Alone (And Liking It) Although they have macro-level concerns about the consequences of growth and development in their regions, Californians are generally satisfied with their own circumstances, from their housing and neighborhood to their commute. Sixty-two percent say they are very satisfied with the house or apartment they currently live in, and 29 percent are somewhat satisfied. Homeowners and those who live in single-family detached houses (96% each) are more likely than renters (82%) and apartment dwellers (77%) to be very or somewhat satisfied with their housing. Indeed, the American dream remains strong in California: While 65 percent say they currently live in a single-family detached home, 86 percent of state residents say they would prefer to live in one.
Most residents are also pleased with their surroundings: 89 percent say they are very (57%) or somewhat (32%) satisfied with the neighborhood they live in. Safety (37%), followed by living space (20%) and schools (16%), are what matter most to residents in choosing a house and community.
And contrary to popular belief, most Californians – including suburban and urban dwellers – are pleased with their commute to work: 82 percent say they are very (54%) or somewhat (28%) satisfied with their commute. The vast majority of employed residents (75%) say they drive alone to work, while 11 percent carpool, 6 percent ride public transportation, and 5 percent walk or bicycle. These numbers vary little across regions, although Bay Area residents are less likely than residents in other regions to carpool (6%) and more likely to use public transit (12%).
“Californians prize their freedom and this is reflected in the state’s ‘driving alone’ culture,” says PPIC Statewide Survey Director Mark Baldassare. “But it is remarkable that residents are so content with their
Press Release
- vi -
quality of life, at the same time as they perceive looming regional problems. This disconnect creates a challenging policy environment for state and local leaders.”
No Common Vision for Solutions to Growth-Related Problems Indeed, there is little consensus about how to handle regional challenges: Support is divided between slowing the pace of growth and development (22%), greater coordination between local governments (19%), improving local land use planning (18%), and more public funds (15%), while 16 percent believe that only better economic conditions will lessen the problems. Residents are also less than convinced about making personal lifestyle changes, even if those actions might reduce regional congestion or sprawl:
• While 49 percent of Californians say they would choose to live in a small home with a small backyard if it means a short commute to work, 47 percent would choose to live in a large home with a large backyard, even if it means a longer ride to work. Bay Area (56%) and Los Angeles (51%) residents are more likely than others to choose the small home/short commute option.
• Half (50%) of state residents would choose to live in a residential-only neighborhood, even if it means driving to stores, schools, and other services, while 47% would prefer a mixed-use neighborhood within walking distance of such amenities. Residents of the Central Valley (54%) and other Southern California counties (52%) are more likely than others to choose a residential-only neighborhood, and Latinos (52%) are more likely than non-Hispanic whites (43%) to prefer mixed-use neighborhoods.
• Two-thirds (66%) of Californians – and majorities across all regions – say they prefer to live in a low-density neighborhood where they would have to drive their car to travel locally, while only 31 percent would choose a high-density neighborhood where it was convenient to use public transit to travel locally.
State residents are no more united when asked where new development in their region should occur: 50 percent say local governments should steer growth to already developed areas in their region in order to preserve open space and encourage the use of public transit, but 44 percent support allowing growth in undeveloped areas to avoid high density and traffic congestion. In an interesting contradiction – created perhaps by low levels of confidence in government – most residents support local governments working together to develop a common plan for regional land use and development (74%) at the same time as they say that voters, not local elected officials, should be making local land use decisions (77%).
Although relatively few residents say they have attended citizens’ meetings (31%), public hearings (27%), or have written local public officials (18%) about land use or development issues, nearly half (47%) have voted at the ballot box, and 41 percent have signed a petition on local land use issues. “The level of citizen awareness and involvement in local ballot-box planning is encouraging,” says Mary Bitterman, President of The James Irvine Foundation. “Now, we need to help create more opportunities for local leaders and residents to work together on these issues of common concern.”
Infrastructure: I Support It When I See It Although only 22 percent of Californians say they know a lot about the term “infrastructure,” residents are clear about their priorities for state projects: Consistent with recent statewide surveys that place education at the top of residents’ concerns, 48 percent say that school facilities should be the top infrastructure priority, followed by surface transportation (23%), water systems (16%), sewer systems (5%), and airports (3%). However, residents are divided about infrastructure funding, given the state budget crunch: 44 percent support continuing funding at current levels, while 43 percent favor a reduction. Republicans (58%) are more likely than Democrats (42%) to advocate maintaining funding levels. How do Californians think the state should pay for infrastructure improvements? Forty-two percent support setting aside a percentage of the

Press Release
- vii -
state budget, while fewer prefer issuing state bonds (18%), using only surplus budget funds (12%), increasing user fees (10%), and increasing taxes (8%). Consistent with the stronger support for a set-aside, 56 percent say they would support a measure like ACA 11 – a constitutional amendment currently scheduled for the 2004 ballot – that would create a state infrastructure fund using money set aside from the general fund.
When asked specifically about surface transportation, residents are divided about the types of projects that should receive priority, with a greater number supporting funding for freeways and highways (36%) than public transit systems (31%), local streets and roads (24%), and walkways and bicycle paths (7%). Although majorities say they would support ballot measures to extend the existing local sales tax for transportation projects (58%) and increase the local sales tax for transportation projects by one-half cent (57%), public support falls short of the two-thirds supermajority required for local tax extensions or increases. In fact, 69 percent of Californians say the two-thirds supermajority requirement is a good thing, and only 49 percent would support reducing the requirement to a 55 percent majority.
Inequality Across Neighborhoods: Low-Income, Minority Communities Lose No matter where they live, Californians have strong opinions on community equity issues: Most believe that low-income and minority neighborhoods have greater development needs yet receive fewer resources than more affluent communities. Seventy-one percent say that low-income communities are more likely than other neighborhoods in their region to have school facilities (71%) and roads and other transportation infrastructure (64%) that are in need of repair. Despite the need, strong majorities also say that less affluent neighborhoods receive fewer government resources aimed at revitalizing residential and commercial areas (61%) and are less likely to have new housing and commercial development (68%). Although there is consensus across the racial/ethnic and income spectrums on these issues, whites and those earning over $80,000 annually are less likely than Latinos and those with household incomes under $40,000 to perceive a problem.
About the survey This land use survey is a special edition of the PPIC Statewide Survey. It is the fourth in a four-year, multisurvey series on growth, land use, and the environment, produced in collaboration with The William and Flora Hewlett Foundation, The James Irvine Foundation, and The David and Lucile Packard Foundation. The purpose of this series is to inform policymakers, encourage discussion, and raise public awareness about the critical growth, development, and environmental challenges facing the state. Findings of the current survey are based on a telephone survey of 2,010 California adult residents interviewed from October 17 to October 28, 2002. Interviews were conducted in English or Spanish. The sampling error for the total sample is +/- 2% and for the 993 likely voters is +/- 3%. For more information on survey methodology, see page 19.
Dr. Mark Baldassare is Research Director at PPIC, where he also holds the Arjay and Frances Fearing Miller Chair in Public Policy. He is founder and director of the PPIC Statewide Survey, which he has conducted since 1998. His most recent book, A California State of Mind: The Conflicted Voter in a Changing World, is available at www.ppic.org.
PPIC is a private, nonprofit organization dedicated to improving public policy through objective, nonpartisan research on the economic, social, and political issues that affect Californians. The Institute was established in 1994 with an endowment from William R. Hewlett. PPIC does not take or support positions on any ballot measure or state and federal legislation nor does it endorse or support any political parties or candidates for public office.
This report will appear on PPIC’s website (www.ppic.org) on November 14. See graphics next page.
###

What matters most in choosing house and neighborhood?
37
2016
9 94
0
10
20
30
40
Safety
Living
spac
e
Schoo
ls
Parks &
open
spac
es
Leng
th of
commute
Stores
& shop
s
Perc
ent
Percent All Adults
What causes regional land use problems?
34
17 16 15
8
0
10
20
30
40
Pop. g
rowth
& dev.
Econo
mic co
nditio
ns
Lack
of pu
blic f
unds
Poor p
lannin
g
Gov
't com
petiti
on
Perc
ent
Percent All Adults
What type of infrastructure do you think should have the top
priority for public funding?
48%
16%
23%
8%
School facilities Water systemsSurface transportation Other
Percent All Adults
Preferred housing choice
86%
8%4% 2%
Single-family detached home Attached homeApartment Other type of dwelling
Percent All Adults
How do you usually commute to work?
75
116 5 3
0
20
40
60
80
Drive a
lone
Carpoo
l
Public
bus o
r tran
sit
Walking
and b
icycle
Other
Perc
ent
Percent All Adults
How should the state government pay for roads and
other infrastructure?
42
1812 10 8 10
0
10
20
30
40
50
Genera
l fund
set-a
side
State b
onds
Surplus
budg
et fun
ds
Increa
se us
er fee
s
Increa
se ta
xes
Other/d
on't k
now
Perc
ent
Percent All Adults

- 1 -
Perceived Conditions Housing
Despite widespread concern about availability and affordability of housing in the state, most Californians say they are satisfied with their current housing: 62 percent are very satisfied, 29 percent are somewhat satisfied, while only 9 percent say they are somewhat or very dissatisfied. However, owners (75%) are much more likely than renters (42%), and people who live in single-family detached homes (72%) are much more likely than apartment dwellers (35%), to say they are very satisfied with their housing.
Housing satisfaction does not vary much across the state’s major regions, or between men and women, but it does increase with age and household income. Latinos, who have a lower income and younger age profile than non-Hispanic whites, are less likely than non-Hispanic whites (59% to 66%) to be very satisfied with their current housing. The housing satisfaction of residents varies only slightly across types of residential location—that is, large cities, suburbs, small cities, towns, and rural areas.
Even though most Californians are satisfied with their current housing, a significant percentage are not living in the type of housing they would prefer: 65 percent of Californians live in single-family detached homes, but 86 percent would prefer that kind of housing, if they had the choice—a gap of 21 percent. The gap between current housing and the ideal of a single-family detached home is particularly wide for renters, those who live in central city areas, those with incomes under $40,000, residents under 35 years of age, and those who have lived at their residences for less than five years. There are no differences in housing preferences across regions and racial and ethnic groups.
"Overall, how satisfied are you with the house or apartment you live in?"
All
Adults Single-Family
Detached Home
Housing Type Attached
Home Apartment
Homeownership
Own Rent
Very satisfied 62% 72% 59% 35% 75% 42%
Somewhat satisfied 29 24 31 42 21 40
Somewhat dissatisfied 6 3 8 15 3 12
Very dissatisfied 3 1 2 8 1 6
"Ideal housing and current housing …"
All Adults Renters
Live in Central City
Under 35 years old
Income Under $40K
< 5 years at address
Want to live in a single-family detached home 86% 80% 81% 84% 80% 85%
Live in a single-family detached home 65 34 54 54 49 54

Perceived Conditions
- 2 -
Neighborhoods
Although Californians are less positive about their neighborhoods than they are about their housing, 57 percent report being very satisfied and 32 percent somewhat satisfied with their neighborhoods. Homeowners (66%) are more likely than renters (45%), and people who live in suburbs (59%) and other locations (62%) are more likely than people in large cities (52%), to be very satisfied with the neighborhood.
Men (56%) and women (58%), and residents in every region of the state express similar levels of satisfaction with their neighborhoods. Non-Hispanic whites are more likely than Latinos to say they are very satisfied with their neighborhoods (62% to 52%). Neighborhood satisfaction increases significantly with age, education, and income and with years at current residence—from 53 percent for those with fewer than 5 years to 61 percent for those with five or more years. It does not vary much by whether there are children in the home or not (54% to 59%).
"Overall, how satisfied are you with the neighborhood you live in?"
All
Adults Large City
Location
Suburb Other
Homeownership
Own Rent
Very satisfied 57% 52% 59% 62% 66% 45%
Somewhat satisfied 32 35 31 29 28 38
Somewhat dissatisfied 8 10 7 6 5 13
Very dissatisfied 3 3 3 3 1 4
When it comes to neighborhood conditions, a majority of residents believe that low-income and minority communities have fewer residential and commercial revitalization resources (61%) and less new development (68%). Latinos more often than non-Hispanic whites, and lower-income residents more often than others, hold these two perceptions about neighborhoods. Many Californians also believe that lower income and minority neighborhoods are more likely than other communities to have more roads and other transportation (64%) and more school facilities (71%) in need of repair and replacement.
Household Income Race and Ethnicity
All
Adults < $40K $40,000- $79,999
$80K or more White Latino
When it comes to government efforts to revitalize the residential and commercial areas in your region, would you say that low-income and minority neighborhoods get fewer resources than other neighborhoods?
Yes 61% 68% 60% 50% 51% 76%
No 29 23 30 40 37 17
Don’t know 10 9 10 10 12 7
Are low-income and minority communities less likely to have new housing and commercial development than other neighborhoods?
Yes 68% 71% 68% 65% 63% 76%
No 26 23 27 29 30 19
Don’t know 6 6 5 6 7 5

Perceived Conditions
- 3 - November 2002
Commuting to Work Despite campaigns around the state promoting alternatives, 75 percent of employed
Californians drive to work alone. Among the remaining percentage of the state’s workforce, 11 percent say they typically carpool, 6 percent take buses or public transit, 5 percent either walk or bicycle, and 3 percent give other answers (e.g., work at home). At least seven in 10 employed residents in every major region of the state drive to work alone. Residents of Los Angeles and the San Francisco Bay Area are the most likely to say they use alternatives such as carpools, transit, or walking or biking.
Working Californians who live in older (81%) and newer (88%) suburbs are more likely than large city dwellers (70%) to drive alone to work. The tendency to drive alone increases with age, education, and income. Although both groups rely heavily on solo driving, the practice is higher among non-Hispanic whites than among Latinos (78% to 67%).
"How do you usually commute to work?"
Region
All Employed
Adults Central Valley
SF Bay Area
Los Angeles
Other Southern California
Drive alone 75% 76% 71% 72% 76%
Carpool 11 15 6 13 12
Public transit 6 1 12 7 3
Walk / Bicycle 5 4 5 6 4
Other 3 4 6 2 5
How do Californians feel about their commutes to work? Eighty-two percent are very (54%) or somewhat (28%) satisfied, while 17 percent are somewhat (10%) or very (7%) dissatisfied. There are no significant differences in satisfaction across age, education, gender, income, or racial and ethnic groups. Central Valley residents (13%) are less likely than others to express dissatisfaction with their commute. While residents across all types of residential location express satisfaction with their commutes, suburban residents are the most likely to be dissatisfied. Of those who drive alone to work, 81 percent are very (53%) or somewhat (28%) satisfied with their commutes.
"Overall, how satisfied are you with your commute to work?"
Location Type of Commute
All Adults Large City Suburb Other
Drive Alone Other
Very satisfied 54% 55% 50% 54% 53% 56%
Somewhat satisfied 28 29 27 28 28 30
Somewhat dissatisfied 10 10 10 10 11 8
Very dissatisfied 7 5 12 7 8 4
Don’t know 1 1 1 1 0 2

Perceived Conditions
- 4 -
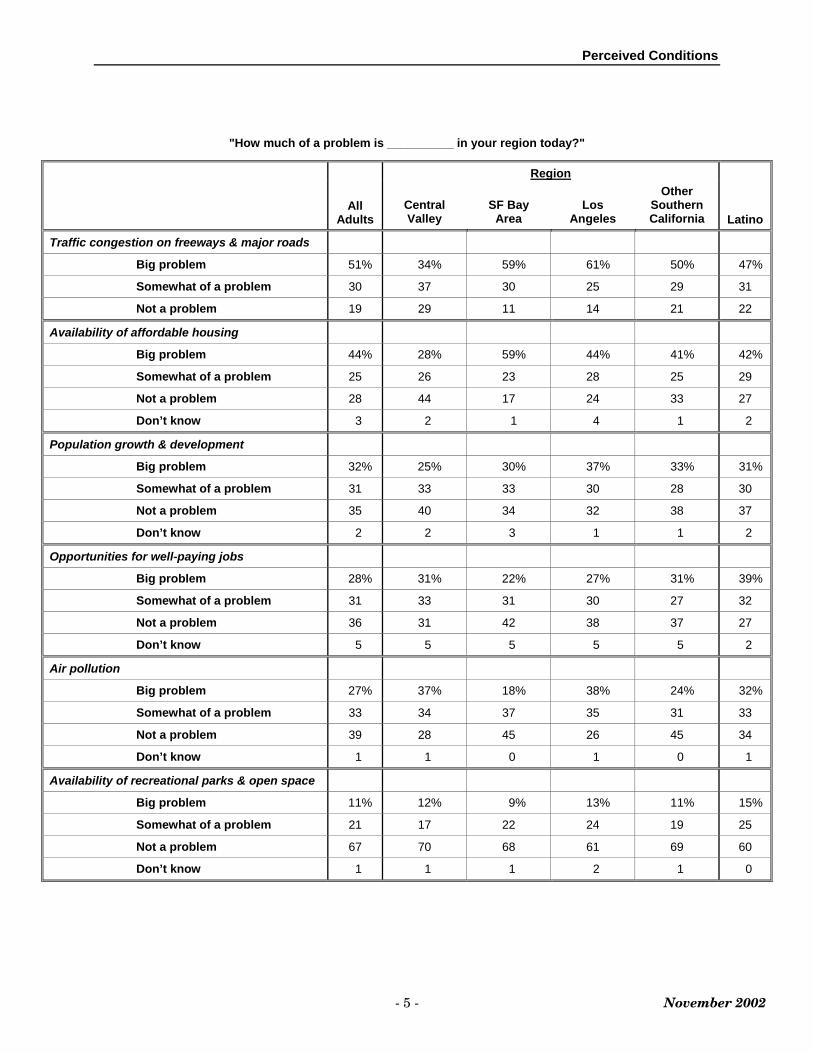
Regional Problems
We asked residents to rank the seriousness of six problems in their geographic regions. Majorities of Californians rank traffic congestion (81%), housing affordability (69%), population growth and development (63%), air pollution (60%), and the availability of jobs (59%) as at least somewhat of a problem in their region. However, 67 percent say that the availability of recreational parks and open space is not a regional problem.
About half of California residents say that traffic congestion (51%) and the availability of affordable housing (44%) are big problems in their region. However, fewer residents see a big regional problem with growth and development (32%), air pollution (27%), availability of well-paying jobs (28%), and availability of recreational parks and open space (11%).
"How much of a problem is __________ in your region today?"
Big
problem Somewhat of
a problem Not a
problem Don’t know
Traffic congestion on freeways and major roads 51% 30% 19% --
Availability of affordable housing 44 25 28 3
Population growth and development 32 31 35 2
Opportunities for well-paying jobs 28 31 36 5
Air pollution 27 33 39 1
Availability of recreational parks and open space 11 21 67 1
Perception of regional problems varies considerably across different types of locales. People living in large cities and their surrounding suburbs are much more likely than people in other locales (e.g., small cities, towns, rural areas) to see traffic congestion (57%), housing affordability (49%), growth (35%), and air pollution (34%) as big problems in their regions. Residents of large cities (25%) and their suburbs (19%) are less likely than those living in smaller locales (35%) to say that the availability of well-paying jobs is a big problem. However, the availability of recreational parks and open space was rarely perceived as a big problem in any type of locale.
Ratings of these six issues vary considerably across regions of the state. Los Angeles (61%) and San Francisco Bay Area (59%) residents express greater concerns than others about traffic congestion. San Francisco Bay Area residents (59%) are more likely than others to say that availability of affordable housing is a big problem. Central Valley residents are the least likely to say that there are big problems with traffic congestion (34%), housing affordability (28%), or growth and development (25%). Central Valley residents (37%) and Los Angeles residents (38%) are about equally likely, while San Francisco Bay Area residents (18%) are the least likely, to rate air pollution as a big problem for their region.
Non-Hispanic whites and Latinos differ on the seriousness of four regional problems. Non-Hispanic whites are somewhat more likely than Latinos to see traffic congestion as a big problem (52% to 47%). Latinos are more likely than non-Hispanic whites to see the availability of well-paying jobs (39% to 24%), air pollution (32% to 25%), and the availability of recreational parks and open space (15% to 10%) as big regional problems. However, the two groups are equally likely to see big problems with housing affordability (42% to 45%) and population growth and development (31% to 33%).
Perceived Conditions
- 5 - November 2002
"How much of a problem is __________ in your region today?"
Region
All
Adults
Central Valley
SF Bay
Area
Los
Angeles
Other Southern California
Latino
Traffic congestion on freeways & major roads
Big problem 51% 34% 59% 61% 50% 47%
Somewhat of a problem 30 37 30 25 29 31
Not a problem 19 29 11 14 21 22
Availability of affordable housing
Big problem 44% 28% 59% 44% 41% 42%
Somewhat of a problem 25 26 23 28 25 29
Not a problem 28 44 17 24 33 27
Don’t know 3 2 1 4 1 2
Population growth & development
Big problem 32% 25% 30% 37% 33% 31%
Somewhat of a problem 31 33 33 30 28 30
Not a problem 35 40 34 32 38 37
Don’t know 2 2 3 1 1 2
Opportunities for well-paying jobs
Big problem 28% 31% 22% 27% 31% 39%
Somewhat of a problem 31 33 31 30 27 32
Not a problem 36 31 42 38 37 27
Don’t know 5 5 5 5 5 2
Air pollution
Big problem 27% 37% 18% 38% 24% 32%
Somewhat of a problem 33 34 37 35 31 33
Not a problem 39 28 45 26 45 34
Don’t know 1 1 0 1 0 1
Availability of recreational parks & open space
Big problem 11% 12% 9% 13% 11% 15%
Somewhat of a problem 21 17 22 24 19 25
Not a problem 67 70 68 61 69 60
Don’t know 1 1 1 2 1 0

Perceived Conditions
- 6 -
Causes and Solutions
Where do Californians place the blame for regional problems with traffic, housing, development, open space, and air pollution, and where do they look for solutions?
Thirty-four percent place the blame on too much growth and development. Fewer identify current economic conditions (17%), lack of public funds (16%), poor local land use planning (15%), or too much competition between local governments (8%) as the main cause of their region’s problems. Growth is more often seen as the culprit across age, education, and income groups and the major regions of the state. Non-Hispanic whites are more likely than Latinos to say the problems arise from too much growth (38% to 27%), while Latinos are more likely than non-Hispanic white to say the cause is a lack of public funding (24% to 13%). In general, mention of public funds declines with age, education, and income. There are no significant partisan differences on what causes problems. The belief that poor local land use planning is the major cause of problems is lowest in Los Angeles and Other Southern California.
There is no consensus about what is needed to solve the problems. While 22 percent of Californians say that slowing down growth and development would be most effective, an almost equal percentage mention more coordination between local governments (19%) and improving local land use planning (18%). Sixteen percent identify a change in economic conditions and 15 percent say that more public funds are what is most needed to solve regional problems. Non-Hispanic whites are more likely than Latinos to say that slowing down growth and development is the solution (27% to 15%), while Latinos are more likely than non-Hispanic whites to name more public funding (23% to 12%). The belief that slowing down development is most needed increases with age, education, and length of residence in the community. San Francisco Bay Area residents are the most likely to point to the benefit of slowing down development, while Central Valley residents most often suggest that improving local land use planning is the solution. Of those who think that too much growth is the primary cause of their region’s problems, 43 percent believe that slowing down growth and development is most needed to solve these problems.
"What do you think [contributes the most to / is most needed to solve] the problems your region is having with issues such as traffic, housing, development, open space, and air pollution?"
Causes All Adults Solutions All
Adults
Too much growth and development 34% Slowing down growth and development 22%
Current economic conditions 17 Change in economic conditions 16
Lack of public funds 16 More public funds 15
Poor local land use planning 15 Improving local land use planning 18
Too much competition between local governments 8 More coordination between local
governments 19
Other / Don’t know 10 Other / Don’t know 10

- 7 -
Public Priorities Residential Priorities
When asked what matters most in choosing a house and neighborhood, most Californians say that safety (37%) comes first, followed by living space (20%) and schools (16%). Fewer mention parks and open space (9%), length of commute (9%), and stores and shops (4%) as their most important concern.
Latinos are more likely than non-Hispanic whites (43% to 32%) and women are somewhat more likely than men (39% to 34%) to name safety as their top priority. Although safety is the most important issue in all age, education, and income groups, younger and lower income residents are the most likely to say that safety matters more than other considerations when choosing a house and neighborhood.
While safety is the primary concern in all regions, Los Angeles residents are the most likely to mention this as their first concern. San Francisco Bay Area residents are more likely than those in other regions to mention schools and parks as a priority when they choose a home and neighborhood, and Latinos are more likely than non-Hispanic whites (21% to 14%) to name schools as their top concern.
Not surprisingly, adults with children are more likely than those without children (29% to 7%) to say that schools matter the most. However, among both residents with children (36%) and without children (37%), safety remains the top priority.
In sum, when it comes to choosing a home and neighborhood, two issues remain consistently at the top of the list for all residents—safety and living space. These two considerations are named as the most important priorities by those living in large cities, suburbs, and smaller locales, by homeowners and renters, by those currently living in detached homes, attached homes, and apartments, and by those who prefer to live in a detached home.
. "If price were not an issue, what would you say are the top two things that matter
to you in choosing a house and neighborhood?" (first mention below)
Region
All Adults
CentralValley
SF Bay
Area
Los
Angeles
Other Southern California
Latino
Safety 37% 39% 31% 42% 37% 43%
Living space 20 20 20 19 20 19
Schools 16 16 18 16 15 21
Parks and open space 9 7 11 7 8 4
Length of commute 9 9 10 9 9 5
Stores and shops 4 5 4 4 4 3
Other / Don’t know 5 4 6 3 7 5

Public Priorities
- 8 -
Homes, Neighborhoods, and Transportation
In choosing a place to live, most people face tradeoffs involving different types of housing, neighborhoods, and transportation. As policymakers consider alternatives to the current low-density, suburban-style of development, it is important to understand what kinds of tradeoffs Californians are willing to make should different styles of development become more readily available. We find that a vast majority want to live in a single-family detached home and drive their own automobiles rather than use public transit. However, residents are divided when it comes to tradeoffs between the size of their home and their commute and also when it comes to the type of neighborhood they prefer.
Residents are evenly split when given the choice between living in a small home with a small backyard in order to have a short commute to work (49%) and living in a large home with a large backyard but a long commute (47%). A larger share of San Francisco Bay Area residents prefer a small home and short commute (56%) compared to residents in Los Angeles (51%), Other Southern California (43%), and the Central Valley (42%). Most women (54%) favor a small home with a short commute, while most men (53%) prefer a large home and will take the long commute. A majority of residents under age 35 (55%) would choose a larger home, even if it meant being far from work, while residents 55 and older favor shorter trips to work from small homes (55%). Those with children in the home favor large homes, despite a long commute (55%), while those without children (52%) favor a small home with a short commute. College graduates (53%) are more likely to prefer a small home with a short commute compared to those without college degrees (46%). There are no significant differences across income categories or race and ethnicity. Renters (52%) are more likely than homeowners (46%) to prefer a small home with a short commute. A majority of those who drive alone to work, and a majority of those who prefer to live in a detached home, say they would choose to live in a large home with a large backyard, even if it means having a long commute to work.
"How do you feel about the following tradeoff, other things being equal?"
Region
All Adults
Central Valley
SF Bay
Area
Los
Angeles
Other SouthernCalifornia
Latino
Would you choose to live in a small home with a small backyard, if it means you have a short commute to work?
49% 42% 56% 51% 43% 46%
Would you choose to live in a large home with a large backyard, even if it means you would have a long commute to work?
47 54 39 44 53 51
Don’t know 4 4 5 5 4 3
Residents are also divided between their preference for mixed-use and residential neighborhoods. Fifty percent say they would rather live in a residential-only neighborhood and drive to stores and services, compared to 47 percent who say they would choose to live in a mixed-use neighborhood where they can walk to stores, schools, and services. San Francisco Bay Area residents express a preference for mixed-used neighborhoods (55%), while people in Los Angeles (49%), the Central Valley (42%), and Other Southern California (44%) are less inclined to choose this option. Latinos would prefer to live in a mixed-used neighborhood (52% to 46%), while non-Hispanic whites prefer to live in a residential-only neighborhood (53% to 43%). Preferences for mixed-use

Public Priorities
- 9 - November 2002
neighborhoods are higher among renters and younger, less educated, and lower-income residents. Residents with children show a preference for residential-only areas rather than mixed-use neighborhoods (53% to 45%), while others are evenly divided on the choice between residential-only and mixed-use neighborhoods (48% to 48%). A majority of homeowners, full-time employees, and those who drive alone and a slight majority of those who prefer detached dwellings prefer residential-only neighborhoods, even if it means driving to stores, schools, and services.
"How do you feel about the following tradeoff, other things being equal?"
Region
All Adults
Central Valley
SF Bay
Area
Los
Angeles
Other SouthernCalifornia
Latino
Would you choose to live in a mixed-use neighborhood where you can walk to stores, schools, and services?
47% 42% 55% 49% 44% 52%
Would you choose to live in a residential-only neighborhood, even if it means you have to drive a car to stores, schools, and services?
50 54 44 49 52 46
Don’t know 3 4 1 2 4 2
Californians show a clear preference when it comes to high-density versus low-density neighborhoods. Two in three (66%) would prefer to live in a low-density area. Across regions, San Francisco Bay Area residents (39%) are the most likely to say they would be willing to live in a high-density neighborhood and use public transit rather than their own car for local travel, while Central Valley and Other Southern California residents prefer this option the least (26% each). Latinos are more willing to choose high-density neighborhoods with public transit than non-Hispanic whites (39% to 24%) but nonetheless, both groups strongly favor the low-density area. Californians with children in their households are more likely to want to live in a low-density neighborhood than those without children (71% to 64%). Renters and homeowners alike prefer the low-density and automobile-oriented neighborhood, as do residents in large cities, suburbs, and other locales. Residents with lower incomes and those with less education are more likely to prefer high-density and public transit than are people with higher incomes and more education. People who say that safety and living space are most important when choosing a home and neighborhood generally prefer a low-density neighborhood.
"How do you feel about the following tradeoff, other things being equal?"
Region
All Adults
Central Valley
SF Bay
Area
Los
Angeles
Other Southern California
Latino
Would you choose to live in a high-density neighborhood where it was convenient to use public transit when you travel locally?
31% 26% 39% 33% 26% 39%
Would you choose to live in a low-density neighborhood where you would have to drive your car when you travel locally?
66 71 57 65 70 59
Don’t know 3 3 4 2 4 2
Public Priorities
- 10 -
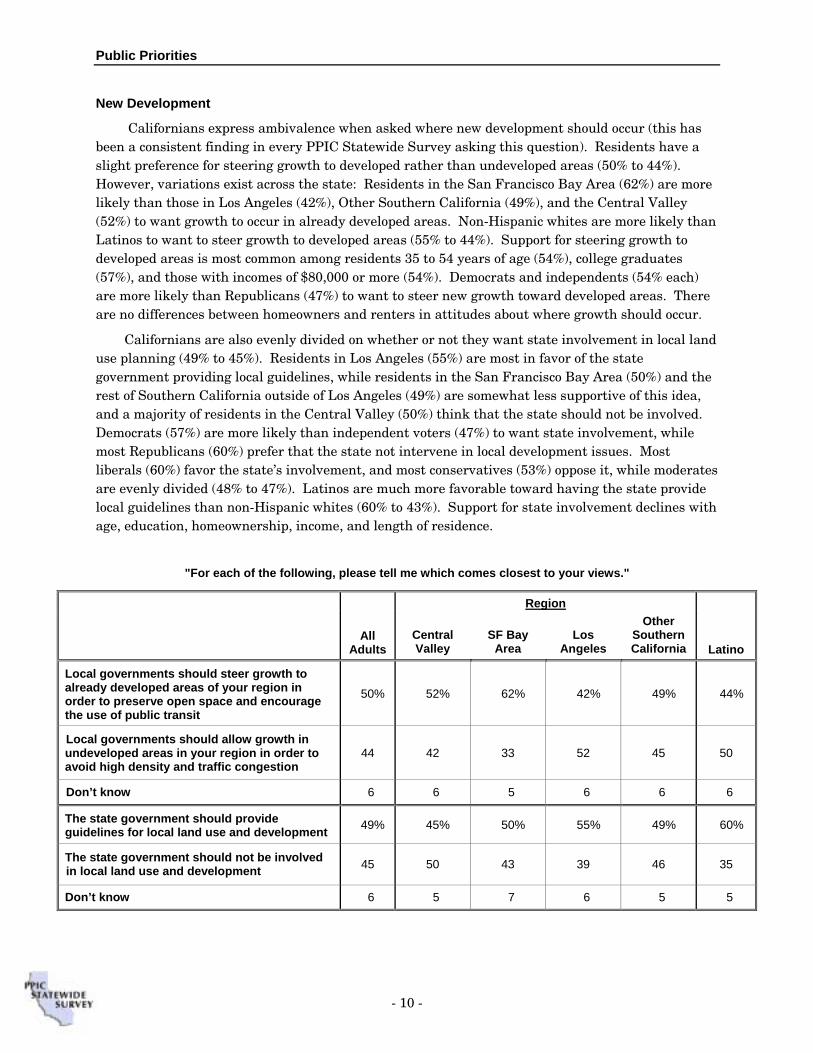
New Development
Californians express ambivalence when asked where new development should occur (this has been a consistent finding in every PPIC Statewide Survey asking this question). Residents have a slight preference for steering growth to developed rather than undeveloped areas (50% to 44%). However, variations exist across the state: Residents in the San Francisco Bay Area (62%) are more likely than those in Los Angeles (42%), Other Southern California (49%), and the Central Valley (52%) to want growth to occur in already developed areas. Non-Hispanic whites are more likely than Latinos to want to steer growth to developed areas (55% to 44%). Support for steering growth to developed areas is most common among residents 35 to 54 years of age (54%), college graduates (57%), and those with incomes of $80,000 or more (54%). Democrats and independents (54% each) are more likely than Republicans (47%) to want to steer new growth toward developed areas. There are no differences between homeowners and renters in attitudes about where growth should occur.
Californians are also evenly divided on whether or not they want state involvement in local land use planning (49% to 45%). Residents in Los Angeles (55%) are most in favor of the state government providing local guidelines, while residents in the San Francisco Bay Area (50%) and the rest of Southern California outside of Los Angeles (49%) are somewhat less supportive of this idea, and a majority of residents in the Central Valley (50%) think that the state should not be involved. Democrats (57%) are more likely than independent voters (47%) to want state involvement, while most Republicans (60%) prefer that the state not intervene in local development issues. Most liberals (60%) favor the state’s involvement, and most conservatives (53%) oppose it, while moderates are evenly divided (48% to 47%). Latinos are much more favorable toward having the state provide local guidelines than non-Hispanic whites (60% to 43%). Support for state involvement declines with age, education, homeownership, income, and length of residence.
"For each of the following, please tell me which comes closest to your views."
Region
All Adults
Central Valley
SF Bay
Area
Los
Angeles
Other SouthernCalifornia
Latino
Local governments should steer growth to already developed areas of your region in order to preserve open space and encourage the use of public transit
50% 52% 62% 42% 49% 44%
Local governments should allow growth in undeveloped areas in your region in order to avoid high density and traffic congestion
44 42 33 52 45 50
Don’t know 6 6 5 6 6 6
The state government should provide guidelines for local land use and development 49% 45% 50% 55% 49% 60%
The state government should not be involved in local land use and development 45 50 43 39 46 35
Don’t know 6 5 7 6 5 5

Public Priorities
- 11 - November 2002
Governance
Although residents may be ambivalent about state involvement in local land use issues, they do see a need for a more regional approach. Three-quarters of Californians (74%) believe that local governments should work together and develop a common plan for regional land use and development. Roughly seven in ten residents in every region of the state prefer a regional approach rather than local governments acting independently. Residents in the San Francisco Bay Area (81%) are the most likely to favor local governments working together. Preference for regional governance is also seen across all voting groups—Democrats (80%), Republicans (72%), and independents (71%).
Non-Hispanic whites are more likely than Latinos (76% to 71%) to favor a regional approach. There are no differences between homeowners or renters or between residents in large cities, suburbs, and other locales.
While Californians want local governments to work together at the regional level, they strongly prefer to make local decisions on land use and development themselves. Seventy-seven percent of all adults and 78 percent of likely voters want to settle local land use issues at the ballot box, rather than have their elected officials make such decisions. There are no differences in this preference across regions of the state, racial and ethnic groups, or demographic categories such as age, education, homeownership, income, or length of residence. Democrats (77%), Republicans (82%), and independent voters (84%), and liberals (77%), moderates (80%), and conservatives (77%) all strongly prefer to have voters rather than elected officials make local land use and development decisions.
Of those who want voters rather than elected officials to make local decisions, 73 percent favor local governments working together on a regional plan, and 50 percent want to steer growth to already developed areas.
"For each of the following, please tell me which comes closest to your views."
Region
All Adults
Central Valley
SF Bay
Area
Los
Angeles
Other Southern California
Latino
Local governments should work together and have a common plan for regional land use and development
74% 70% 81% 71% 73% 71%
Local governments should work independently and each have their own plan for local land use and development
22 26 15 25 23 25
Don’t know 4 4 4 4 4 4
Local elected officials should make local land use and development decisions 18% 17% 21% 19% 16% 20%
Local voters should be making local land use and development decisions at the ballot box 77 78 74 77 80 75
Don’t know 5 5 5 4 4 5

Public Priorities
- 12 -
Local Participation
Californians have been considerably involved in the local ballot-box planning they value so highly. By contrast, their contact with local government officials concerning land use and development issues has been fairly limited.
Almost half of all residents (47%) say they have voted on a local land use and development initiative, and 41 percent have signed a petition dealing with such issues. Roughly one in three (31%) have at one time or another attended a meeting and 27 percent a public hearing concerned with such matters. Less than two in ten (18%) say they have ever written or e-mailed a local public official about a land use or development issue.
Local participation in land use issues is higher among those who are registered to vote than those who are not. Those who are most likely to vote are especially active in voting on local land use decisions (67%) and signing petitions (53%); however, they are much less likely to have attended a meeting (44%) or public hearing (38%), and only 25 percent have ever written or e-mailed a local public official about a land use and development issue.
Latinos are much less likely than non-Hispanic whites to get involved in local land use decisions. Particularly noteworthy is the lack of Latino participation in areas in which non-Hispanic whites are highly active, such as voting on local land use decisions (26% to 57%) and signing petitions concerning local development issues (25% to 48%); however, the racial/ethnic gap is also evident in other areas—writing or e-mailing a local official (11% to 20%), attending hearings on land use issues (18% to 31%), and attending a meeting on land use and development (21% to 34%).
Participation in all kinds of local land use and development activities tends to increase with income, age, education, homeownership, and years of residence. For the most part, men and women are equally as likely to get involved, although women are slightly more likely than men to sign petitions (44% to 37%).
Most of those who have signed local petitions (81%) and voted on local initiatives (79%) favor the citizens’ initiative process over local elected officials making land use and development decisions.
"Please tell me whether you have ever done any of the following."
All Adults
Likely Voters <$40K
Income $40,000-79,999 $80K+
Race/Ethnicity Non-Hispanic White Latino
Voted on a land use or development initiative on the local ballot? 47% 67% 33% 51% 63% 57% 26%
Signed a petition concerning a local land use or development issue? 41 53 30 46 52 48 25
Attended a meeting organized by local residents about a local land use and development issue?
31 44 22 31 43 34 21
Attended a public hearing held by a local public official about a local land use or development issue?
27 38 17 30 37 31 18
Written or e-mailed a local public official about a local land use or development issue?
18 25 14 17 25 20 11
- 13 -
Policy Preferences Infrastructure
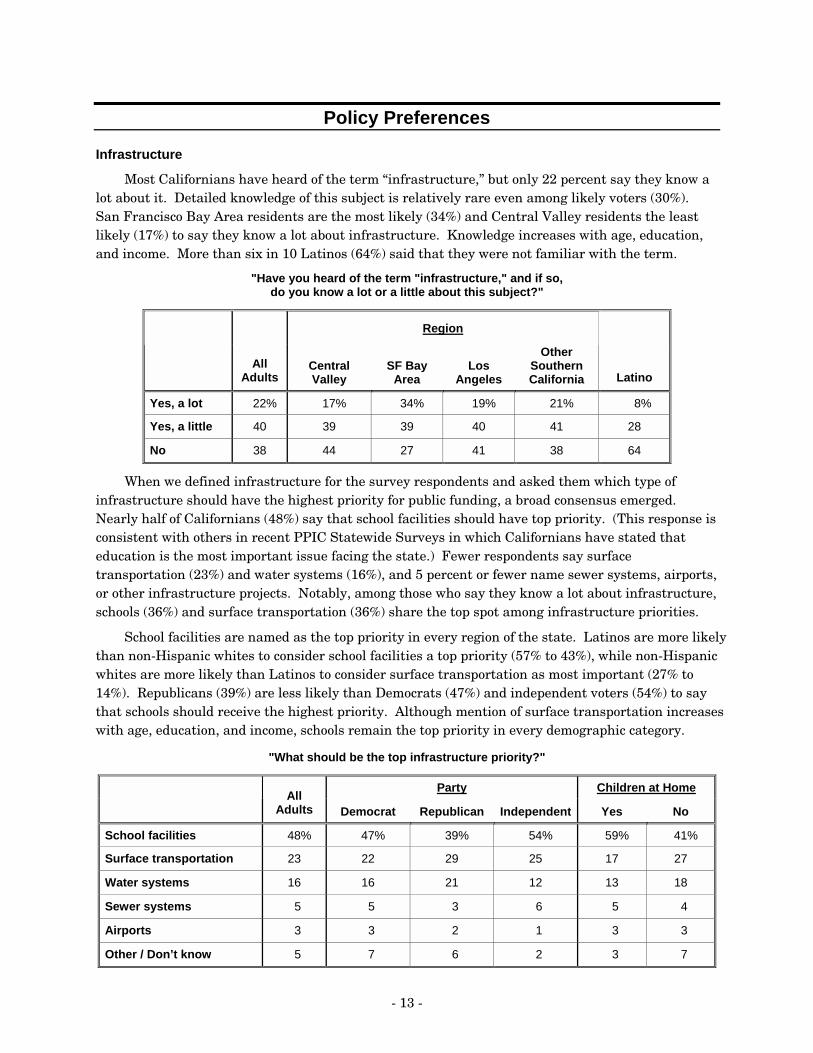
Most Californians have heard of the term “infrastructure,” but only 22 percent say they know a lot about it. Detailed knowledge of this subject is relatively rare even among likely voters (30%). San Francisco Bay Area residents are the most likely (34%) and Central Valley residents the least likely (17%) to say they know a lot about infrastructure. Knowledge increases with age, education, and income. More than six in 10 Latinos (64%) said that they were not familiar with the term.
"Have you heard of the term "infrastructure," and if so, do you know a lot or a little about this subject?"
Region
All
Adults Central Valley
SF Bay Area
Los Angeles
Other Southern California Latino
Yes, a lot 22% 17% 34% 19% 21% 8%
Yes, a little 40 39 39 40 41 28
No 38 44 27 41 38 64
When we defined infrastructure for the survey respondents and asked them which type of infrastructure should have the highest priority for public funding, a broad consensus emerged. Nearly half of Californians (48%) say that school facilities should have top priority. (This response is consistent with others in recent PPIC Statewide Surveys in which Californians have stated that education is the most important issue facing the state.) Fewer respondents say surface transportation (23%) and water systems (16%), and 5 percent or fewer name sewer systems, airports, or other infrastructure projects. Notably, among those who say they know a lot about infrastructure, schools (36%) and surface transportation (36%) share the top spot among infrastructure priorities.
School facilities are named as the top priority in every region of the state. Latinos are more likely than non-Hispanic whites to consider school facilities a top priority (57% to 43%), while non-Hispanic whites are more likely than Latinos to consider surface transportation as most important (27% to 14%). Republicans (39%) are less likely than Democrats (47%) and independent voters (54%) to say that schools should receive the highest priority. Although mention of surface transportation increases with age, education, and income, schools remain the top priority in every demographic category.
"What should be the top infrastructure priority?"
Party Children at Home
All
Adults Democrat Republican Independent Yes No
School facilities 48% 47% 39% 54% 59% 41%
Surface transportation 23 22 29 25 17 27
Water systems 16 16 21 12 13 18
Sewer systems 5 5 3 6 5 4
Airports 3 3 2 1 3 3
Other / Don’t know 5 7 6 2 3 7

Policy Preferences
- 14 -
Surface Transportation
One of the most controversial issues in infrastructure planning is the allocation of public funds for surface transportation projects such as freeways and highways, local streets and roads, and public transit systems. Each of these three types of transportation projects has substantial public support. While the largest share of California residents believes that freeways and highways should have the highest priority for funding (36%), nearly one-third of respondents say that public transit should receive primary consideration (31%), and nearly one in four Californians indicates that local streets and roads should have precedence (24%).
San Francisco Bay Area residents are particularly committed to public transit, with 44 percent claiming this should receive highest priority and only 35 percent saying that freeways and highways are most important. Fewer than three in 10 residents in the state’s other regions indicate that public transit should receive highest priority among surface infrastructure projects.
Democrats (38%) and independents (34%) are much more supportive of public transit than Republicans (22%). On the other hand, Republicans are more focused than other political groups on freeways and highways. There are no significant differences by age, education, or race and ethnicity in how residents rank surface infrastructure projects.
Residents of large cities who live outside the central core (35%) and those in suburbs (36%) place the highest emphasis on public transit. Town and rural area residents rank local streets and roads as a higher priority than public transportation systems.
"Which of the following types of surface transportation projects
do you think should have top priority for public funding?"
Party Region
All
Adults Dem Rep Ind Central Valley
SF Bay Area
Los Angeles
Other Southern California
Freeways and highways 36% 30% 45% 34% 31% 35% 36% 40%
Public transit systems 31 38 22 34 27 44 29 26
Local streets and roads 24 23 27 21 31 12 26 25
Walkways and bicycle paths 7 7 5 7 9 7 7 7
Other / Don’t know 2 2 1 4 2 2 2 2
Most residents view infrastructure as an important issue. When asked how important roads and other infrastructure are to their quality of life and the economic vitality of their region, 59 percent of respondents said that they were very important, nearly four in 10 (37%) said they were somewhat important, and only 3 percent rated them as unimportant. This response was consistent across all demographic groups and regions of the state. However, only about half of the residents of small cities and towns said that roads and infrastructure are very important to quality of life, compared to more than 60 percent of the residents in large cities, suburbs, and rural areas.

Policy Preferences
- 15 - November 2002
Local Taxes for Transportation While roads are seen as important to the quality of life and to the economy, are people willing to
pay for them? The local sales tax is one of the major funding sources for local transportation projects, and majorities of Californians say that they would vote to extend the current transportation sales tax (58%) and would vote for a one-half cent increase in the tax (57%). Moreover, probable voters are just as likely as Californians overall to support both the tax extension (59% to 58%) and the increase (56% to 57%). Most of those who support an extension of the local sales tax would also support a half-cent increase of the local sales tax for transportation purposes.
Support for local transportation taxes is unrelated to familiarity with the term “infrastructure,” but there are significant differences across Californians with different infrastructure priorities. For instance, of those who think that roads and other infrastructure are very important to the quality of life and economic vitality of the region, 61 percent support a sales tax extension and 57 percent favor a one-half cent sales tax increase for local transportation purposes. Those Californians who name surface transportation as the state’s top infrastructure priority for public funding strongly support the hypothetical sales tax extension (67%) and a one-half cent sales tax increase (66%). Those who highlight public transit as the top surface transportation priority are also strongly in favor of both extending (68%) and increasing (67%) the local sales tax.
The sales tax extension receives similar support from men (59%) and women (57%) and from non-Hispanic whites (58%) and Latinos (60%), as well as consistent majority support across age, education, income, homeownership, and length of residence categories. The same trends are evident for the question pertaining to increasing the local sales tax for transportation by one-half cent.
Across the state, San Francisco Bay Area residents are more likely than residents in the state’s other major regions to support both the tax extension (63%) and the increase (62%). Democrats give strong support for the tax extension (65%) and the increase (64%), while Republicans give slim majority support to the extension (54%) and are evenly divided on the increase (49% to 48%). Independents give slim majority support to both the tax extension (54%) and increase (55%). Similar to the support by party, liberals are much more likely than conservatives to support the tax extension (65% to 53%) and the tax increase (65% to 50%).
"Would you vote yes or no if there was a measure on your local ballot to …"
Region
All
Adults Central Valley
SF Bay Area
Los Angeles
Other Southern California
Likely Voters
Extend the existing sales tax for transportation projects for another 10 years?
Yes 58% 55% 63% 57% 57% 59%
No 34 38 28 35 35 34
Don't know 8 7 9 8 8 7
Increase the local sales tax for transportation projects by one-half cent?
Yes 57% 52% 62% 57% 56% 56%
No 38 41 32 39 39 39
Don't know 5 7 6 4 5 5

Policy Preferences
- 16 -
The Supermajority Vote for Local Transportation
Although solid majorities of Californians, including likely voters, say they would vote to extend and increase by one-half cent the local sales tax for local transportation projects, California state law currently requires a two-thirds supermajority vote in any locality in order to approve either local tax extensions or local tax increases. Only in the San Francisco Bay Area does support for the local tax extension (63%) and local increase (62%) approach the two-thirds support required to pass.
Even though the supermajority vote requirement might stand in the way of funding for local transportation projects, nearly seven in 10 Californians (69%) think that the two-thirds mandate is a good thing. Most Californians, regardless of partisanship, political ideology, gender, race/ethnicity, or region, believe that the supermajority requirement for local transportation sales taxes is a good thing.
However, there are some interesting differences in opinion on the supermajority requirement, although none is indicative of a sufficient willingness to alter the current law. For example, although a solid majority of Democrats (65%) think that the two-thirds requirement is a good thing, they are significantly less likely than Republicans (73%) to think so. Likewise, liberals (64%) are less likely than conservatives (74%) to say that the supermajority law is a good thing. San Francisco Bay Area residents (65%)—the state’s residents most supportive of extending and increasing local transportation sales taxes—are the least likely to say that the two-thirds requirement is a good thing.
"Do you think that requiring a two-thirds majority vote—instead of a simple majority or 50 percent-plus-one vote—for passing a local sales tax for local transportation projects is a good thing or bad thing?"
Party
All
Adults Democrat Republican IndependentLikely Voters
Good thing 69% 65% 73% 69% 68%
Bad thing 25 31 24 26 29
Don’t know 6 4 3 5 3
Californians’ attachment to the supermajority requirement translates into only lukewarm support for a hypothetical initiative that would reduce the two-thirds requirement to a 55 percent threshold. Forty-nine percent of Californians say they would vote yes on this initiative, and 45 percent say they would vote no. Latinos give solid majority support to the idea of reducing the supermajority requirement (63%), especially compared to non-Hispanic whites (45%). Democrats (54%), independents (48%), liberals (56%), and renters (55%) offer narrow majority support to the initiative. As might be expected, 69 percent of those who think that the two-thirds requirement is a bad thing support reducing the requirement to 55 percent.
"Would you vote yes or no on a measure to change the two-thirds majority to a 55 percent majority for passing local sales taxes for transportation projects?"
Party
All
Adults Democrat Republican Independent Likely Voters
Yes 49% 54% 41% 48% 47%
No 45 41 56 47 49
Don’t know 6 5 3 5 3

Policy Preferences
- 17 - November 2002
State Infrastructure Funding
When asked whether the state should continue to fund infrastructure programs at current levels in the face of a large budget deficit that will require program cuts, 44 percent of Californians say yes—the state should continue to fund infrastructure programs at current levels—while 43 percent say no. However, a majority of likely voters (51%) say that infrastructure funding should be maintained at current levels, compared to only 37 percent who think it should be reduced.
A majority of Republicans (58%) say that infrastructure spending should continue as is, even at the expense of other state programs. By contrast, Democrats are evenly divided between continuing (42%) and reducing (45%) funding, and independents are more likely to favor spending reductions (46%) than continued funding (39%). Older and more educated Californians are more likely than younger and less educated respondents to support continued infrastructure funding.
"The state is facing a large budget deficit next year, and program cuts are needed to balance the budget. Should the state continue to fund roads and other infrastructure projects at current levels, even if it
means fewer funds are available for other programs, or should it reduce funding for roads and other infrastructure projects, so that more funds are available for other state programs?"
Party
All
Adults Democrat Republican Independent Latino
Continue current funding 44% 42% 58% 39% 33%
Reduce funding 43 45 32 46 59
Other / Don’t know 13 13 10 15 8
One way that the state can fund infrastructure at current levels is to cut funding elsewhere, but new infrastructure programs may require additional funding sources. Moreover, with tax increases and extensions dubious propositions, it is essential that the state explore alternative ways to finance local transportation projects specifically and infrastructure more generally.
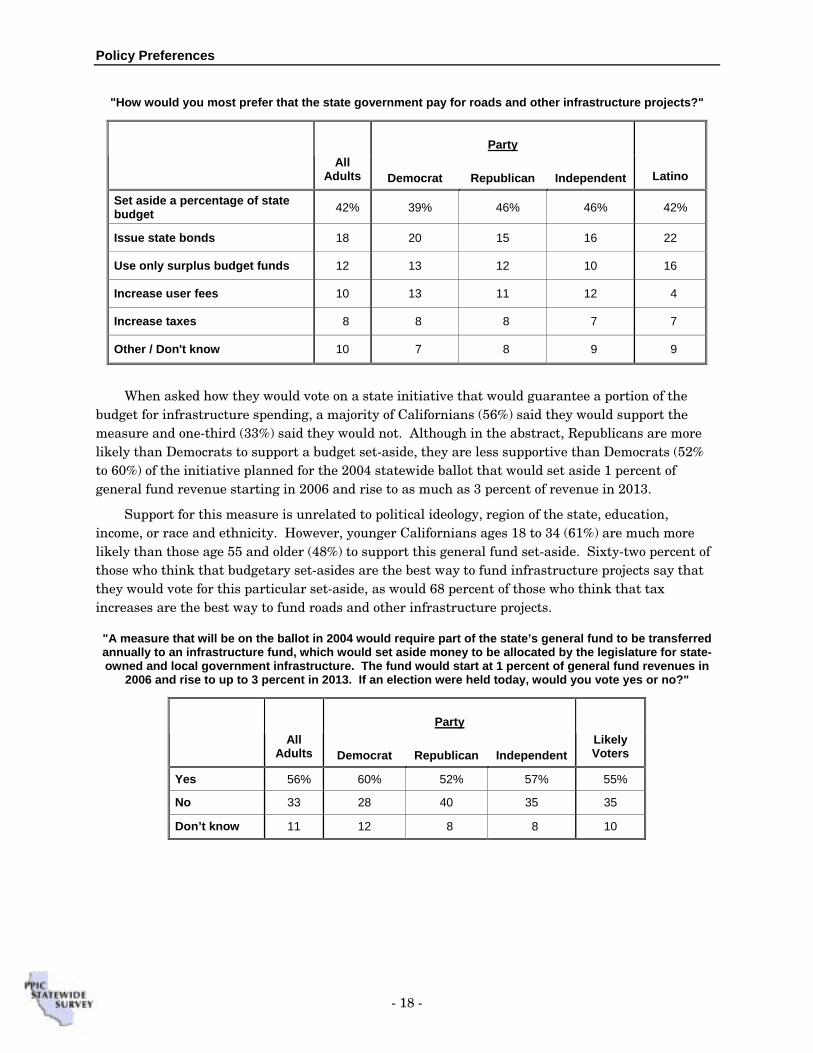
And how do Californians think the state should pay for infrastructure improvements? A large plurality (42%) thinks that the state should set aside a percentage of the state budget. Nearly one in five (18%) thinks that the state should pay for infrastructure improvements by issuing bonds, 12 percent think that only surplus budget funds should be used, and 10 percent say that the state should increase user fees. Only 8 percent think that the state should increase taxes.
Preference for a percentage of the budget being set-aside is highest in Other Southern California (46%) and Central Valley (46%). In contrast, residents of Los Angeles (39%) and the San Francisco Bay Area (37%) are less likely to think that a set-aside is the way to go, although this is still the preferred means of funding in both regions. Los Angeles residents are the most likely to say that only surplus budget funds should be used (16%), and San Francisco Bay Area residents are the most likely to say that the state should increase taxes (10%) or user fees (16%) to pay for infrastructure improvements.
Interestingly, while there are no significant differences in preferred funding methods between liberals and conservatives, there are partisan differences. Republicans (46%) are more likely than Democrats (39%) to favor a budget set-aside, and Democrats (20%) are more likely than Republicans (15%) to favor state bonds. Women (46%) are more likely than men (37%) to support set-asides. Non-Hispanic whites (13%) are more likely than Latinos (4%) to say user fees but less likely to prefer using only budget surpluses (9% to 16%) or state bonds (18% to 22%).
Policy Preferences
- 18 -
"How would you most prefer that the state government pay for roads and other infrastructure projects?"
Party
All
Adults Democrat Republican Independent Latino
Set aside a percentage of state budget 42% 39% 46% 46% 42%
Issue state bonds 18 20 15 16 22
Use only surplus budget funds 12 13 12 10 16
Increase user fees 10 13 11 12 4
Increase taxes 8 8 8 7 7
Other / Don't know 10 7 8 9 9
When asked how they would vote on a state initiative that would guarantee a portion of the budget for infrastructure spending, a majority of Californians (56%) said they would support the measure and one-third (33%) said they would not. Although in the abstract, Republicans are more likely than Democrats to support a budget set-aside, they are less supportive than Democrats (52% to 60%) of the initiative planned for the 2004 statewide ballot that would set aside 1 percent of general fund revenue starting in 2006 and rise to as much as 3 percent of revenue in 2013.
Support for this measure is unrelated to political ideology, region of the state, education, income, or race and ethnicity. However, younger Californians ages 18 to 34 (61%) are much more likely than those age 55 and older (48%) to support this general fund set-aside. Sixty-two percent of those who think that budgetary set-asides are the best way to fund infrastructure projects say that they would vote for this particular set-aside, as would 68 percent of those who think that tax increases are the best way to fund roads and other infrastructure projects.
"A measure that will be on the ballot in 2004 would require part of the state’s general fund to be transferred annually to an infrastructure fund, which would set aside money to be allocated by the legislature for state-owned and local government infrastructure. The fund would start at 1 percent of general fund revenues in
2006 and rise to up to 3 percent in 2013. If an election were held today, would you vote yes or no?"
Party
All
Adults Democrat Republican Independent Likely Voters
Yes 56% 60% 52% 57% 55%
No 33 28 40 35 35
Don’t know 11 12 8 8 10
- 19 -
Survey Methodology The PPIC Statewide Survey is directed by Mark Baldassare, research director at the Public Policy
Institute of California, with assistance in research and writing from Jon Cohen, survey research manager, and Dorie Apollonio, Lisa Cole, and Eliana Kaimowitz, survey research associates. The survey was conducted in collaboration with The William and Flora Hewlett Foundation, The James Irvine Foundation, and The David and Lucile Packard Foundation and benefited from discussions with staff at the foundations and their grantees and colleagues at other institutions; however, the survey methods, questions, and content of the report were solely determined by Mark Baldassare.
The findings of this survey are based on a telephone survey of 2,010 California adult residents interviewed from October 17 to October 28, 2002. Interviewing took place on weekend days and weekday nights, using a computer-generated random sample of telephone numbers, ensuring that both listed and unlisted telephone numbers were called. All telephone exchanges in California were eligible for calling. Telephone numbers in the survey sample were called up to five times to increase the likelihood of reaching eligible households. Once a household was reached, an adult respondent (18 or older) was randomly chosen for interviewing by using the “last birthday method” to avoid biases in age and gender. Each interview took an average of 20 minutes to complete. Interviewing was conducted in English or Spanish. Casa Hispana translated the survey into Spanish.
We used recent U.S. Census and state figures to compare the demographic characteristics of the survey sample with characteristics of California’s adult population. The survey sample was closely comparable to the census and state figures. The survey data in this report were statistically weighted to account for any demographic differences.
The sampling error for the total sample of 2,010 adults is +/- 2 percent at the 95 percent confidence level. This means that 95 times out of 100, the results will be within 2 percentage points of what they would be if all adults in California were interviewed. The sampling error for subgroups is larger. The sampling error for the 1,427 registered voters is +/- 2.5 percent. The sampling error for the 913 likely voters is +/- 3 percent. Sampling error is just one type of error to which surveys are subject. Results may also be affected by factors such as question wording, question order, and survey timing.
Throughout the report, we refer to four geographic regions. “Central Valley” includes Butte, Colusa, Fresno, Glenn, Kern, Kings, Madera, Merced, Placer, Sacramento, San Joaquin, Shasta, Stanislaus, Sutter, Tehama, Tulare, Yolo, and Yuba Counties. “SF Bay Area” includes Alameda, Contra Costa, Marin, Napa, San Francisco, San Mateo, Santa Clara, Solano, and Sonoma Counties. “Los Angeles” refers to Los Angeles County, and “Other Southern California” includes the mostly suburban regions of Orange, Riverside, San Bernardino, and San Diego Counties. These four regions were chosen for analysis because they are the major population centers of the state, accounting for approximately 90 percent of the state population; moreover, the growth of the Central Valley and “Other Southern California” regions have given them increasing political significance.
We present specific results for Latinos because they account for about 28 percent of the state’s adult population and constitute one of the fastest growing voter groups. The sample sizes for the African American and Asian subgroups are not large enough for separate statistical analysis. We do contrast the opinions of registered Democrats, Republicans, and independents. The “independents” category includes those who are registered to vote as “decline to state.”
We used earlier PPIC Statewide Surveys to analyze trends over time in California, including our November 2001 Special Survey on Land Use.

- 20 -
- 21 -
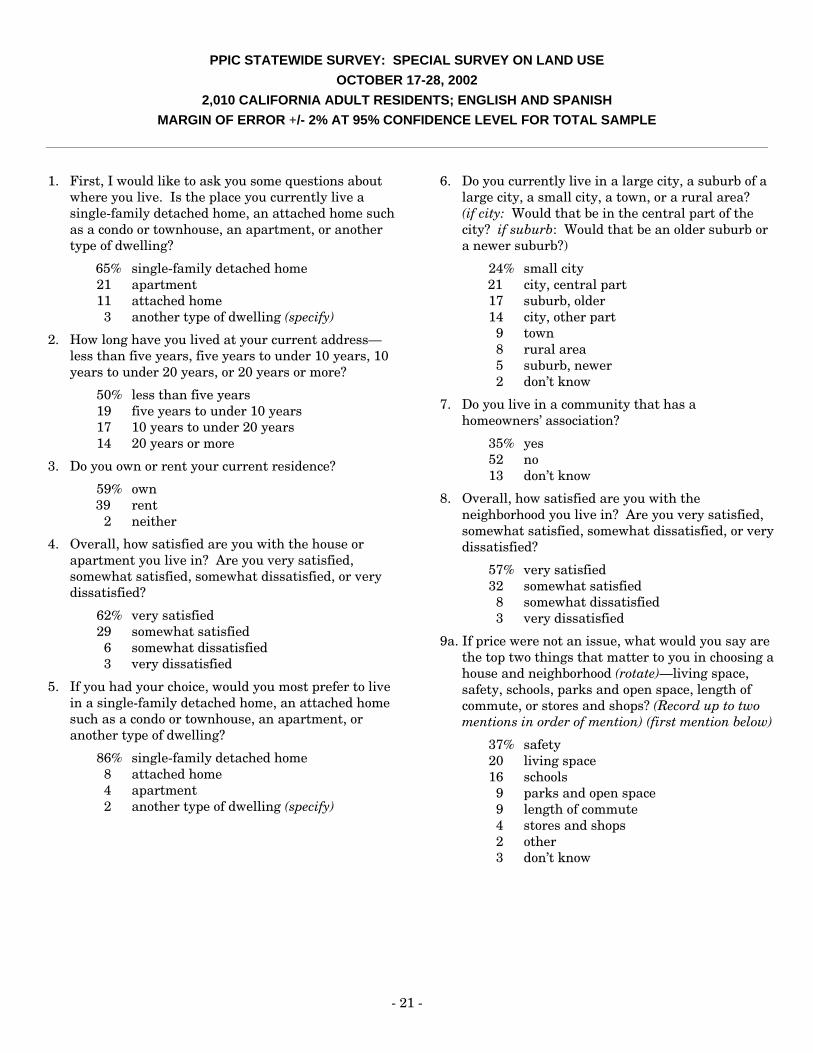
PPIC STATEWIDE SURVEY: SPECIAL SURVEY ON LAND USE OCTOBER 17-28, 2002
2,010 CALIFORNIA ADULT RESIDENTS; ENGLISH AND SPANISH MARGIN OF ERROR +/- 2% AT 95% CONFIDENCE LEVEL FOR TOTAL SAMPLE
1. First, I would like to ask you some questions about
where you live. Is the place you currently live a single-family detached home, an attached home such as a condo or townhouse, an apartment, or another type of dwelling?
65% single-family detached home 21 apartment 11 attached home 3 another type of dwelling (specify)
2. How long have you lived at your current address—less than five years, five years to under 10 years, 10 years to under 20 years, or 20 years or more?
50% less than five years 19 five years to under 10 years 17 10 years to under 20 years 14 20 years or more
3. Do you own or rent your current residence?
59% own 39 rent 2 neither
4. Overall, how satisfied are you with the house or apartment you live in? Are you very satisfied, somewhat satisfied, somewhat dissatisfied, or very dissatisfied?
62% very satisfied 29 somewhat satisfied 6 somewhat dissatisfied 3 very dissatisfied
5. If you had your choice, would you most prefer to live in a single-family detached home, an attached home such as a condo or townhouse, an apartment, or another type of dwelling?
86% single-family detached home 8 attached home 4 apartment 2 another type of dwelling (specify)
6. Do you currently live in a large city, a suburb of a large city, a small city, a town, or a rural area? (if city: Would that be in the central part of the city? if suburb: Would that be an older suburb or a newer suburb?)
24% small city 21 city, central part 17 suburb, older 14 city, other part 9 town 8 rural area 5 suburb, newer 2 don’t know
7. Do you live in a community that has a homeowners’ association?
35% yes 52 no 13 don’t know
8. Overall, how satisfied are you with the neighborhood you live in? Are you very satisfied, somewhat satisfied, somewhat dissatisfied, or very dissatisfied?
57% very satisfied 32 somewhat satisfied 8 somewhat dissatisfied 3 very dissatisfied
9a. If price were not an issue, what would you say are the top two things that matter to you in choosing a house and neighborhood (rotate)—living space, safety, schools, parks and open space, length of commute, or stores and shops? (Record up to two mentions in order of mention) (first mention below)
37% safety 20 living space 16 schools 9 parks and open space 9 length of commute 4 stores and shops 2 other 3 don’t know

- 22 -
9b. (second mention) If price were not an issue, what would you say are the top two things that matter to you in choosing a house and neighborhood (rotate)—living space, safety, schools, parks and open space, length of commute, or stores and shops?
22% safety 21 schools 15 living space 14 length of commute 13 parks and open space 13 stores and shops 2 other
Many people say they face tradeoffs when choosing a place to live—meaning that they have to give up some things in order to have other things. How do you feel about the following tradeoffs? Other things being equal … (rotate questions 10 to 12; also rotate pairs)
10. (a) Would you choose to live in a small home with a small backyard, if it means you have a short commute to work, or (b) Would you choose to live in a large home with a large backyard, even if it means you would have a long commute to work?
49% small home, short commute 47 large home, long commute 4 don’t know
11. (a) Would you choose to live in a mixed-use neighborhood where you can walk to stores, schools, and services, or (b) Would you choose to live in a residential-only neighborhood even if it means you have to drive a car to stores, schools, and services?
47% mixed-use neighborhood 50 residential-only neighborhood 3 don’t know
12. (a) Would you choose to live in a high-density neighborhood where it was convenient to use public transit when you travel locally, or (b) Would you choose to live in a low-density neighborhood where you would have to drive your car when you travel locally?
31% high-density neighborhood, use public transit
66 low-density neighborhood, drive a car 3 don’t know
Next, we are interested in your opinions about the region or broader geographic area that you live in. I am going to read you a list of problems other people have told us about. For each one, please tell me if you think this is a big problem, somewhat of a problem, or not a problem in your region. (rotate questions 13 to 18)
13. How about traffic congestion on freeways and major roads?
51% big problem 30 somewhat of a problem 19 not a problem
14. How about the availability of housing that you can afford?
44% big problem 25 somewhat of a problem 28 not a problem 3 don’t know
15. How about population growth and development?
32% big problem 31 somewhat of a problem 35 not a problem 2 don’t know
16. How about the availability of recreational parks and open space?
11% big problem 21 somewhat of a problem 67 not a problem 1 don’t know
17. How about the lack of opportunities for well-paying jobs?
28% big problem 31 somewhat of a problem 36 not a problem 5 don’t know
18. How about air pollution?
27% big problem 33 somewhat of a problem 39 not a problem 1 don’t know

- 23 - November 2002
19. Which of the following do you think contributes the most to problems your region is having with issues such as traffic, housing, development, open space, and air pollution? (rotate)
34% too much growth and development 17 current economic conditions 16 lack of public funds 15 poor local land use planning 8 too much competition between local
governments 1 other 9 don’t know
20. And what do you think is most needed to solve problems your region is having with issues such as traffic, housing, development, open space, and air pollution? (rotate)
22% slowing down growth and development 19 more coordination between local
governments 18 improving local land use planning 16 change in economic conditions 15 more public funds 1 other 9 don’t know
21. In general, how confident are you that your local governments can solve the problems that are facing your region—very confident, somewhat confident, not too confident, or not at all confident?
7% very confident 41 somewhat confident 31 not too confident 19 not at all confident 2 don’t know
22. Would you say that your region is in an economic recession or not? (if yes: Do you think that it is in a serious, a moderate, or a mild recession?)
13% yes, serious recession 23 yes, moderate recession 11 yes, mild recession 49 no 4 don’t know
23. Thinking about the quality of life in your region, how do you think things are going—very well, somewhat well, somewhat badly, or very badly?
21% very well 61 somewhat well 15 somewhat badly 3 very badly
Many people say there are tradeoffs involved in land use and development issues—meaning that you have to give up some things in order to have other things. For each of the following, please tell me which comes closest to your views. (rotate questions 24 to 27; also rotate pairs)
24. (a) Local governments should work together and have a common plan for regional land use and development, or (b) Local governments should work independently and each have their own plan for local land use and development.
74% local government should work together 22 local governments should work
independently 4 don’t know
25. (a) Local governments should steer growth to already developed areas of your region in order to preserve open space and encourage the use of public transit, or (b) Local governments should allow growth in undeveloped areas in your region, in order to avoid high density and traffic congestion.
50% steer growth to already developed areas 44 allow growth in undeveloped areas 6 don’t know
26. (a) The state government should provide guidelines for local land use and development, or (b) The state government should not be involved in local land use and development.
49% state government should provide guidelines
45 state government should not be involved 6 don’t know
27. (a) Local elected officials should make local land use and development decisions, or (b) Local voters should be making local land use and development decisions at the ballot box.
18% local officials make decisions 77 local voters make decisions 5 don’t know
28. Next, I am going to ask you about a term that not everyone will have heard of. Have you heard about “infrastructure”? (if yes: Do you know a lot or a little about it?)
22% yes, a lot 40 yes, a little 38 no

- 24 -
29. You may know the term “infrastructure” refers to a variety of public works projects—such as surface transportation, water systems, school facilities, sewers, and airports—what type of infrastructure do you think should have the top priority for public funding?
48% school facilities 23 surface transportation 16 water systems 5 sewer systems 3 airports 1 other 4 don’t know
30. Which of the following types of surface transportation projects do you think should have top priority for public funding?
36% freeways and highways 31 public transit systems 24 local streets and roads 7 walkways and bicycle paths 2 don’t know
31. How important is the condition of the roads and other infrastructure to the quality of life and economic vitality in your region—is it very important, somewhat important, or not important?
59% very important 37 somewhat important 3 not important 1 don’t know
32. Which level of government should have the primary responsibility for roads and other infrastructure in your region—the federal, state, regional, county, or city government?
27% state 26 city 23 county 12 regional 6 federal 6 don’t know
33. On another topic, the local sales tax that is collected by local governments is one of the major funding sources for local transportation projects, and state law requires that it must be approved by two-thirds of the voters in a local election. Do you think that requiring a two-thirds majority vote—instead of a simple majority or 50 percent-plus-one vote—for passing a local sales tax for local transportation projects is a good thing or a bad thing?
69% good thing 25 bad thing 6 don’t know
34. What if there was a state measure that would change the two-thirds majority to a 55 percent majority vote for passing local sales tax for transportation projects? Would you vote yes or no?
49% yes 45 no 6 don’t know
35. What if there was a measure on your local ballot to extend the existing local sales tax for transportation projects for another 10 years? Would you vote yes or no?
58% yes 34 no 8 don’t know
36. What if there was a measure on your local ballot to increase the local sales tax for transportation projects by one-half cent? Would you vote yes or no?
57% yes 38 no 5 don’t know
37. On another topic, how would you most prefer that the state government pay for roads and other infrastructure projects (rotate) (a) use only surplus budget funds, (b) set aside a percentage of the state’s general fund for roads and infrastructure, (c) increase taxes, (d) increase user fees, or (e) issue state bonds.
42% set aside a percentage of the state general fund
18 issue state bonds 12 use only surplus budget funds 10 increase user fees 8 increase taxes 1 other 9 don’t know
38. A measure that will be on the ballot in 2004 would require part of the state’s general fund to be transferred annually to an infrastructure fund, which would set aside money to be allocated by the legislature for state-owned and local government infrastructure. The fund would start at 1 percent of general fund revenues in 2006 and rise to up to 3 percent in 2013. If an election were held today, would you vote yes or no?
56% yes 33 no 11 don’t know

- 25 - November 2002
39. The state is facing a large budget deficit next year, and program cuts are needed to balance the state budget. Should the state (rotate) (a) continue to fund roads and other infrastructure projects at current levels, even if it means fewer funds are available for other state programs, or (b) reduce funding for roads and other infrastructure projects, so that more funds are available for other state programs?
44% continue to fund at current level 43 reduce funding 1 other 12 don’t know
40. On another topic, do you think that low-income and minority neighborhoods are more likely than other neighborhoods in your region to have roads and other transportation infrastructure that are in need of repair and replacement?
64% yes 30 no 6 don’t know
41. Are low-income and minority neighborhoods more likely than other neighborhoods in your region to have school facilities that are in need of repair and replacement?
71% yes 23 no 6 don’t know
42. How about when it comes to government efforts to revitalize the residential and commercial areas in your region—would you say that low-income and minority neighborhoods get fewer resources than other neighborhoods?
61% yes 29 no 10 don’t know
43. And in your region, are low-income and minority neighborhoods less likely to have new housing and commercial development than other neighborhoods?
68% yes 26 no 6 don’t know
44. On another topic, do you think that things in California are generally going in the right direction or the wrong direction?
49% right direction 41 wrong direction 10 don’t know
45. Turning to economic conditions in California, do you think that during the next 12 months we will have good times financially or bad times?
44% good times 46 bad times 10 don’t know
46. On another topic, some people are registered to vote and others are not. Are you absolutely certain that you are registered to vote? (if yes: Are you registered as a Democrat, a Republican, another party, or as an independent?)
35% Yes, Democrat (skip to q.48) 24 Yes, Republican (skip to q.49) 4 Yes, other party (skip to q.50) 14 Yes, independent (ask q.47) 23 No, not registered (ask q.47)
47. (if independent, not registered, don’t know on q.46) Do you think of yourself as closer to the Republican party or Democratic party?
25% Republican party (skip to q.50) 35 Democratic party (skip to q.50) 30 neither (volunteered)(skip to q.50) 10 don’t know (skip to q.50)
48. (if Democrat) Would you call yourself a strong Democrat or not a very strong Democrat?
53% strong (skip to q.50) 45 not very strong (skip to q.50) 2 don’t know (skip to q.50)
49. (if Republican) Would you call yourself a strong Republican or not a very strong Republican?
56% strong (ask q.50) 42 not very strong (ask q.50) 2 don’t know (ask q.50)
[50-51: November election questions]
52. Would you consider yourself to be politically very liberal, somewhat liberal, middle-of-the-road, somewhat conservative, or very conservative?
11% very liberal 22 somewhat liberal 30 middle-of-the-road 24 somewhat conservative 10 very conservative 3 don’t know
53. Generally speaking, how much interest would you say you have in politics—a great deal, a fair amount, only a little, or none?
19% great deal 42 fair amount 31 only a little 8 none

- 26 -
54. How often would you say you vote—always, nearly always, part of the time, seldom, or never?
49% always 21 nearly always 10 part of the time 6 seldom 14 never
55. Do you plan to vote in the election on November 5th? (if yes: Will you vote at your local polling place or by absentee ballot? if absentee: Have you already mailed in your absentee ballot?)
57% yes, local polling place 7 yes, absentee ballot—already mailed in 13 yes, absentee ballot—not yet mailed in 18 no 5 don’t know
The next set of questions is about your local activities. Please tell me whether you have ever done any of the following. (rotate questions 56 to 60)
56. Written or e-mailed a local public official about a local land use or development issues?
18% yes 82 no
57. Signed a petition concerning a local land use or development issue?
41% yes 59 no
58. Attended a public hearing held by a local public official about a local land use or development issue?
27% yes 73 no
59. Attended a meeting organized by local residents about a local land use or development issue?
31% yes 69 no
60. Voted on a land use or development initiative on the local ballot?
47% yes 53 no
61. Do you recall seeing, reading, or hearing about any recent controversies or conflicts over local land use or development issues in your city or community?
58% yes 42 no
62. Where do you get most of your news and information about land use and development issues? (rotate)
43% newspapers 28 television 11 talking to people 6 radio 5 magazines and newsletters 4 the Internet 3 don’t know
[63-65: demographic questions]
66. (asked of all employed adults) How do you usually commute to work—drive alone, carpool, public bus or transit, walking, or bicycle?
75% drive alone 11 carpool 6 public bus or transit 5 walking and bicycle 3 other (volunteered)
67. (asked of all employed adults) Overall, how satisfied are you with your commute to work? Are you very satisfied, somewhat satisfied, somewhat dissatisfied, or very dissatisfied?
54% very satisfied 28 somewhat satisfied 10 somewhat dissatisfied 7 very dissatisfied 1 don’t know
[68-74: demographic questions]
- 27 -
PPIC STATEWIDE SURVEY
Advisory Committee
Mary Bitterman President The James Irvine Foundation
Angela Blackwell President Policy Link
Paul Brest President The William and Flora Hewlett Foundation
Mollyann Brodie Vice President Kaiser Family Foundation
Bruce E. Cain Director Institute of Governmental Studies University of California, Berkeley
Matt Fong Chairman Pension Benefit Guaranty Corporation Advisory Committee
William Hauck President California Business Roundtable
Sherry Bebitch Jeffe Senior Scholar School of Policy, Planning, and Development University of Southern California
Monica Lozano President and Chief Operating Officer La Opinión
Donna Lucas President NCG Porter Novelli
Max Neiman Director Center for Social and Behavioral Research University of California, Riverside
Dan Rosenheim News Director KPIX-TV
Richard Schlosberg President and CEO The David and Lucile Packard Foundation
Carol Stogsdill President Stogsdill Consulting
Cathy Taylor Vice President and Editorial Commentary Director Orange County Register
Raymond L. Watson Vice Chairman of the Board The Irvine Company
Carol Whiteside President Great Valley Center

�������������������� �������������
���������������
������������ �������������������������� �������������������������
����������������� ������������������������������� ���������� �
��������������� ��������!��������"������������#������������$
��� ����������� ������������ ���������#��������"�������������!��������
�!�����������������������%&������������������������� ����� ����
�"�����"� ��#�������� �������� ���������'���(���� ���#�(����������#������)��& ���
$�%��#����������%�����*��������������� ������������� ���+��������
���&�"����'����(������'���(��(������*����#���������
$��$������� ,��������� �(���������#������������� ����� ����
���� ��������������-����������#������������.���
("��������&� ������������%&���� ��� � �����������������
�� "���$��(��������������� ����������+� #��������� �'�������
�������"� �������������*����������������
�������#�������������������%���������/$������*���������
����& ���������0�������#����������'��(�����,��� �
������������)��!����������������������������������(+���������� ����� ������'����
������� "�)������ �(���������#������������� ����� ����
��������������#����������� �������������� �%�������+���������� ����� �����������
$���*�����+��*������������������������ �������������+���������� ����� ��������0�����& ����� �������������
�������,� "�����-���� �#������������& ����1"�����2����������������� �����,�������
#��������� ���� ������ �����#�������� �������������+���������� ����� ���������������
�� ���&�"��-����������(�%��������������������
+��������&�� "������%�������"#3�
��� ����������

�������������������� ������������������������� ������� ���������������� ����������������������������
��������������� ��������������!����������� ����"""#$$��#����� ������%$$��#��
Related Documents


