Welcome message from author
This document is posted to help you gain knowledge. Please leave a comment to let me know what you think about it! Share it to your friends and learn new things together.
Transcript
1
Table of Contents
Acknowledgements ........................................................................................................................................ 2
Acronyms ....................................................................................................................................................... 3
Introduction ................................................................................................................................................... 4
Characteristics of an ideal malaria elimination surveillance system.................................................................... 5
A. Rapid and complete reporting ............................................................................................................. 6
B. Incorporation of additional data .......................................................................................................... 8
C. Accessible data storage and management............................................................................................ 9
D. Analysis.............................................................................................................................................. 9
E. Customized output and feedback ...................................................................................................... 10
F. Targeted response ............................................................................................................................ 11
Description of existing IT/surveillance systems ............................................................................................... 11
A. Existing malaria surveillance systems ................................................................................................ 11
B. Linkage between national, regional and global surveillance systems .................................................... 17
Conclusions and recommendations ............................................................................................................... 17
Appendix A: Interview guide for surveillance systems to facilitate malaria elimination...................................... 21
Appendix B: Selected malaria surveillance systems functioning at scale ........................................................... 22
References ................................................................................................................................................... 29
2
Acknowledgements
This background paper is a rapid synthesis of current evidence prepared for the Bill & Melinda Gates Foundation to inform strategy development.
This report was authored by Colin Ohrt, Kathryn Roberts, Hugh Sturrock, Jennifer Wegbreit and Roly Gosling of the Global Health Group at the University of California, San Francisco (UCSF) and Bruce Lee (Johns Hopkins University).
We acknowledge with thanks the contributions of the many people who have participated in the collection and
exploration of information contained in this report: Ahmed Mohammad Abdalla (National Malaria Control
Program, United Arab Emirates), Patrick Blair and Bradley Ringerson (Defense Threat Reduction Agency), Daniel
Bridges and Anna Winters (Akros Global Health), Keith Carter (Pan American Health Organization), Richard
Cibulskis and Raman Velayudhan (World Health Organization [WHO]), Rajeev Colaco, Richard Reithinger and
Gordon Cressman (RTI), Michael Coleman (Liverpool School of Tropical Medicine), Peggy D’Adamo (USAID),
Mitiku Aychiluhim Damtew, Kaddu Ssentamu Simon and Ella Watson-Stryker (WHO, Sierra Leone), Eric Hale
(Solomon Islands Ministry of Health [MoH]), Herdie Hizon (Philippines MoH), Eduardo Jezierski, Dennis Israelski
and Channe Suy (InSTEDD), Jun Cao (Jiangsu Institute of Parasitic Diseases), Jaranit Kaewkungwal and Amnat
Khamsiriwatchara (Mahidol University), Gerard Kelly (University of Queensland), Jirapat Ketkaew, Apinya
Niramitramtipong, Duangdeun Puangmanee and Wittaya Saipromsut (Thailand MoH), Dysoley Lek and Siv
Sovannaroth (Cambodia MoH), Adam Liederman (Fio Corporation), John Miller and Rick Steketee (PATH:
MACEPA), Mwiyini I. Msellem (Zanzibar Malaria Elimination Program), Rose Nani Mudin (Malaysia MoH), Duc
Thang Ngo (Vietnam MoH), Nyasatu Ntshalintshali (Clinton Health Access Initiative [CHAI] Swaziland), Elvieda
Saraiwati, Budi Pramono and Mienerva Theodora (Indonesia MoH), Chris Schwabe (Medical Care Development
International), David Sintasath (FHI 360), Mark Smolinski and Jennifer Orton (Skoll Global Threats Fund), Jeff
Tackle and Kathleen Poer (Abt Associates), Marcel Tanner (Swiss Tropical and Public Health Institute), and
Allison Tatarsky (CHAI Botswana).
We acknowledge the participants of the Asia Pacific Malaria Elimination Network Surveillance and Response Thematic Group for their insightful discussions on the program requirements for malaria elimination surveillance systems.
The following individuals reviewed the report and provided important assistance and feedback: Chris Cotter (UCSF Global Health Group), Gerard Kelly (University of Queensland), Richard Reithinger (RTI), Arantxa Roca
(Malaria Consortium), Chris Schwabe (MCDI), David Sintasath (FHI 360) and Rick Steketee (PATH: MACEPA).
We thank Kerstin Svendsen (UCSF Global Health Group) for her work on the graphic design of this report.
The authors are responsible for any errors or omissions.
3
Acronyms
ACD – Active Case Detection
CHAI – Clinton Health Access Initiative
CHW – Community Health Worker
D0AS – Day 0 Alert System
D3AS – Day 3 Alert System
DOT – Directly Observed Therapy
GIS – Geographic Information System
GPS – Global Positioning System
HMIS - Health Management Information System
ICT – Information and Communication Technology
IDNS – Immediate Disease Notification System
IRS – Indoor Residual Spraying
ITN – Insecticide-treated Net
LAMP – Loop Mediated Isothermal Amplification
MCDI – Medical Care Development International
MCN – Malaria Case Notification
MEEDS – Malaria Early Epidemic Detection System
MIS – Malaria Information System
MoH – Ministry of Health
NMCP – National Malaria Control Program
PCD – Passive Case Detection
PCR – Polymerase Chain Reaction
PDA – Personal Digital Assistant
Pf – Plasmodium falciparum
RDT – Rapid Diagnostic Test
SDSS – Spatial Decision Support System
SMS – Short Message Service
UCSF – University of California, San Francisco
USAID – U.S. Agency for International Development
USSD – Unstructured Supplementary Service Data
VHF – Very High Frequency (Radio)
WHO – World Health Organization
4
Introduction Robust and responsive surveillance systems are critical for the success of malaria control and elimination.1–5 In elimination settings, surveillance must be an intervention in which immediate action is taken in response to case identification.6 Data collection, analysis, output and response must occur quickly to identify symptomatic and asymptomatic cases, prevent onward transmission and reduce vectorial capacity. Information needs to flow from the community, be analyzed, and return to the local level framed as specific actions to identify and prevent additional cases. Access to data and ease of reporting at all levels are essential to ensure that local
implementers can target interventions quickly and effectively.
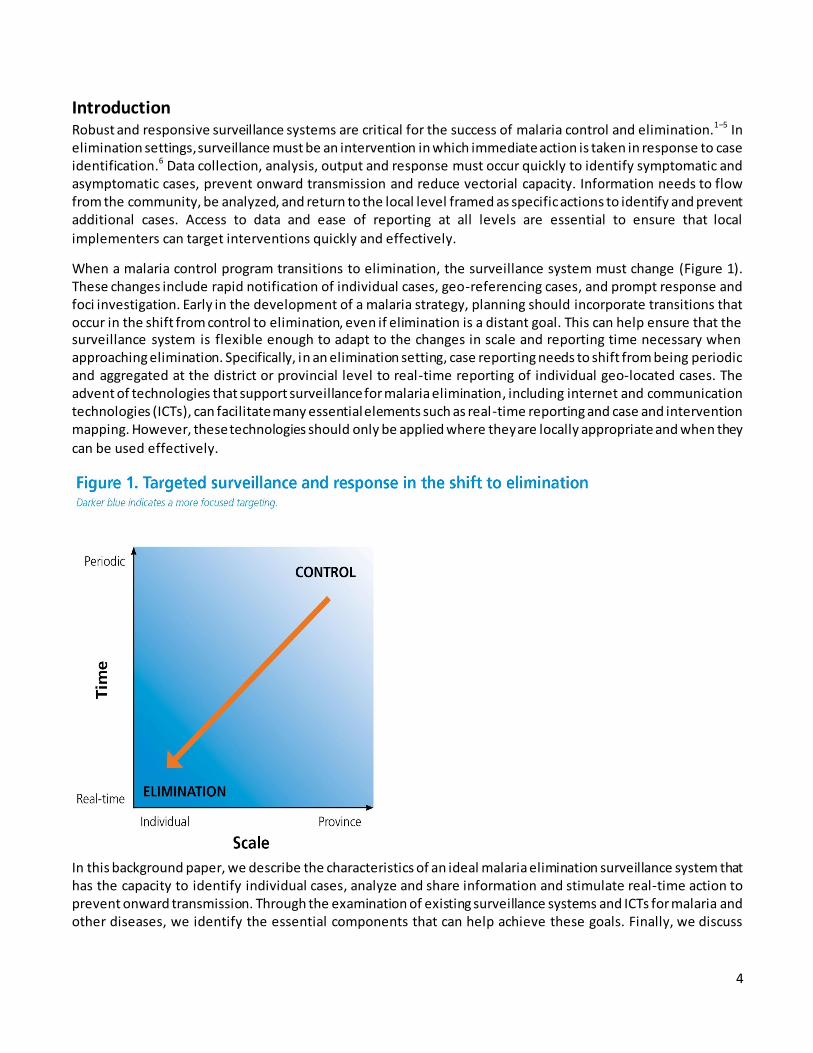
When a malaria control program transitions to elimination, the surveillance system must change (Figure 1). These changes include rapid notification of individual cases, geo-referencing cases, and prompt response and foci investigation. Early in the development of a malaria strategy, planning should incorporate transitions that occur in the shift from control to elimination, even if elimination is a distant goal. This can help ensure that the surveillance system is flexible enough to adapt to the changes in scale and reporting time necessary when approaching elimination. Specifically, in an elimination setting, case reporting needs to shift from being periodic and aggregated at the district or provincial level to real-time reporting of individual geo-located cases. The advent of technologies that support surveillance for malaria elimination, including internet and communication technologies (ICTs), can facilitate many essential elements such as real-time reporting and case and intervention mapping. However, these technologies should only be applied where they are locally appropriate and when they
can be used effectively.
In this background paper, we describe the characteristics of an ideal malaria elimination surveillance system that has the capacity to identify individual cases, analyze and share information and stimulate real-time action to prevent onward transmission. Through the examination of existing surveillance systems and ICTs for malaria and other diseases, we identify the essential components that can help achieve these goals. Finally, we discuss
5
challenges and opportunities for building an action-oriented surveillance system and provide recommendations
for a system that functions as an intervention for malaria elimination.7,8
This paper was informed by a review of published and grey literature, as well as key informant interviews with members of malaria control and elimination programs and experts in surveillance and information technology.
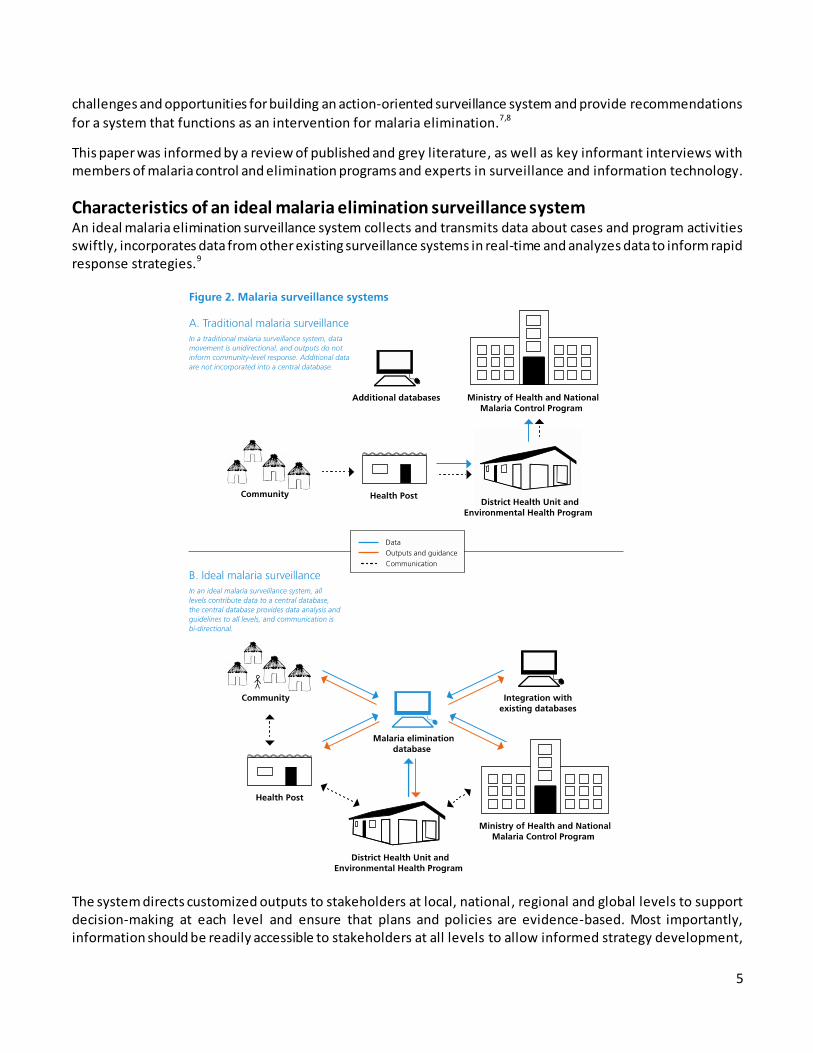
Characteristics of an ideal malaria elimination surveillance system An ideal malaria elimination surveillance system collects and transmits data about cases and program activities swiftly, incorporates data from other existing surveillance systems in real-time and analyzes data to inform rapid response strategies.9
The system directs customized outputs to stakeholders at local, national, regional and global levels to support decision-making at each level and ensure that plans and policies are evidence-based. Most importantly, information should be readily accessible to stakeholders at all levels to allow informed strategy development,
6
coordination between levels of the system, and local action. This type of broad access allows the system to bypass traditional vertical reporting structures (Figure 2). Once data analysis is complete, results can be shared
directly with individuals working in communities and at the district, national and regional levels.
The system described above could be considered a modified version of a vertical single-disease surveillance system whereby parts of the system operate separately from an integrated health surveillance system. This separation is essential for malaria elimination to ensure that activities such as indoor residual spraying (IRS) or reactive case detection are carried out optimally. The vertical elements of this system, including data gathering and response, can be integrated into the larger health system once elimination has been achieved, as many of
the specialized tasks required to achieve elimination are no longer required during prevention of reintroduction.
In addition to the individual elements of an ideal surveillance system for malaria elimination described below, attention to human resource capacity and sustained financial commitment are essential for successful implementation and sustainability of this comprehensive system. (For further discussion of human resources for malaria elimination, see UCSF Global Health Group Background Paper Program Management Issues in Implementation of Elimination Strategies, 2014).
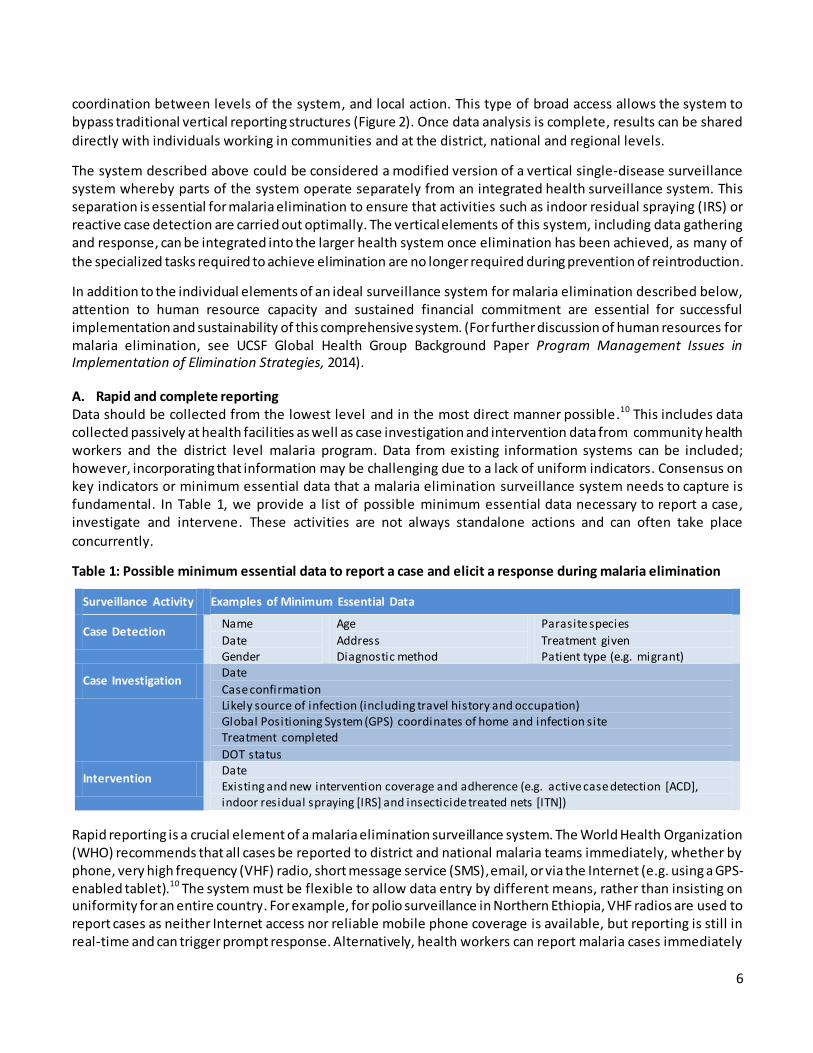
A. Rapid and complete reporting Data should be collected from the lowest level and in the most direct manner possible.10 This includes data collected passively at health facilities as well as case investigation and intervention data from community health workers and the district level malaria program. Data from existing information systems can be included; however, incorporating that information may be challenging due to a lack of uniform indicators. Consensus on key indicators or minimum essential data that a malaria elimination surveillance system needs to capture is fundamental. In Table 1, we provide a list of possible minimum essential data necessary to report a case, investigate and intervene. These activities are not always standalone actions and can often take place
concurrently.
Table 1: Possible minimum essential data to report a case and elicit a response during malaria elimination
Surveillance Activity Examples of Minimum Essential Data
Case Detection Name
Date Gender
Age
Address Diagnostic method
Parasite species
Treatment given Patient type (e.g. migrant)
Case Investigation Date
Case confirmation Likely source of infection (including travel history and occupation) Global Positioning System (GPS) coordinates of home and infection site Treatment completed
DOT status
Intervention Date Existing and new intervention coverage and adherence (e.g. active case detection [ACD], indoor residual spraying [IRS] and insecticide treated nets [ITN])
Rapid reporting is a crucial element of a malaria elimination surveillance system. The World Health Organization (WHO) recommends that all cases be reported to district and national malaria teams immediately, whether by phone, very high frequency (VHF) radio, short message service (SMS), email, or via the Internet (e.g. using a GPS-enabled tablet).10 The system must be flexible to allow data entry by different means, rather than insisting on uniformity for an entire country. For example, for polio surveillance in Northern Ethiopia, VHF radios are used to report cases as neither Internet access nor reliable mobile phone coverage is available, but reporting is still in real-time and can trigger prompt response. Alternatively, health workers can report malaria cases immediately
7
using SMS in locations where mobile phone network coverage is available.11,12 The sustainability of each system is anchored by the use of available ICTs that do not require extensive maintenance by outside experts. What is most important is that methods for capturing data must be rapid, locally appropriate, feasible and sustainable by the malaria program. An additional consideration for the appropriateness of ICTs is whether they could potentially place users in danger. For example, using a tablet in an area with a high crime rate could place malaria surveillance staff at risk.
Complete, timely reporting is an essential element of a malaria elimination surveillance system. However, barriers exist to timely reporting, such as ease of access to standardized reporting forms, availability of telephone credit to call or send an SMS to report cases, and overburdened healthcare workers. Every effort should be made to reduce these barriers by making access to reporting methods as simple as possible . One
example includes the provision of free or subsidized communication.
Capturing non-public sector sources of data is necessary for complete malaria reporting. In some populations, cases may present to traditional healers, religious leaders, military health services, informal drug sellers, or private pharmacies and healthcare providers before, or instead of, approaching public health facilities that are included in the surveillance system.13,14 Countries have implemented a range of approaches to capture cases that present outside of the public sector, including restricting access to antimalarials, making malaria a notifiable disease and incorporating private health facilities into the surveillance system. Oman, South Korea and Brazil regulate antimalarial drugs by ensuring they are available only in public sector health facilities which report to the national surveillance system.15 Swaziland and China have made malaria a notifiable disease to try to increase reporting and encourage more sectors to utilize the malaria elimination surveillance system. 16,17 Malaria should be made a notifiable disease once incidence is low enough that malaria surveillance teams can investigate and report every individual case. Outreach campaigns should be conducted to ensure that both public and private providers are aware of changes to the infectious disease reporting system and understand how to identify and
report cases.
Another approach is the inclusion of private providers, pharmacies, and laboratories in the network of reporting facilities. Pharmacies must keep detailed stock records and laboratories have diagnostic test results, and this data can be reported into the public surveillance system. However, this approach may encounter quality assurance difficulties as private sector testing practices may be monitored less close ly for diagnostic errors. Working with intermediaries such as independent drug sellers or members of pharmacy franchises has been successful, exemplified by Tanzania’s Accredited Drug Dispensing Outlets Program.18 Another option is to capture cases that present at private health care or pharmacy facilities by sending MoH staff to collect data on recent diagnoses or prescribing practices from non-traditional and private sector medical personnel.19,20 In all of these examples, strategies to encourage or enforce participation in the surveillance system may be necessary . Which strategies will be most effective depends on the local health care environment and the prevalence of malaria cases. However, without active engagement, data from these groups will be missed, hindering malaria
elimination efforts. 21,22
Another means of improving reporting is to institute a ‘zero reporting’ policy. WHO recommends this policy for diseases targeted or considered for elimination, such as neonatal tetanus or polio . ‘Zero reporting’ requires that all reporting sites communicate the status of cases regularly, regardless of whether a new case has been detected.23 This is an essential component of the polio surveillance system as it allows monitoring of ongoing activity, reduces missed data and helps identify locations where reporting is irregular or incomplete. 24 An example of the value of ‘zero reporting’ for malaria can be found in the reemergence of P. vivax on the island of Aneityum, Vanuatu. Had negative malaria diagnostic test results been part of routine reporting, the reintroduction of malaria may have been detected earlier and the subsequent outbreak possibly prevented.25 In
8
locations where malaria may be close to elimination, a zero reporting policy could help prevent the tendency to
become lax in surveillance as cases become rare.
A surveillance system should include monitoring of compliance and completeness. Comparing case reports from the malaria elimination surveillance system with antimalarial medication records from health facilities can help ensure that most cases are captured. Reporting completeness is an integral outcome measure for monitoring of elimination interventions and could be added to automated bulletins and reports. The closer a location is to elimination, the more important capturing each case will be, since a single case could lead to an outbreak and a
resurgence of malaria.
An ideal malaria elimination surveillance system should support quality assurance of diagnostics. This is particularly important in low transmission settings, where the proportion of false positives will increase. Therefore, all positive results through passive case detection should be confirmed using additional diagnostic methods such as microscopy, polymerase chain reaction (PCR) or loop mediated isothermal amplification (LAMP). Additionally, attention should be paid to false negative results, as these can lead to untreated cases and an increase in the transmission reservoir. Each laboratory technician’s ability to perform malaria diagnostic tests should be documented regularly, and external quality assurance methods must be in place. Other elements of quality assurance of diagnostics include ensuring that tests are performed correctly, and that results are input into the surveillance system. New technologies are emerging to improve diagnostic quality. For example, a point-of care rapid diagnostic test (RDT) reader that can give a quality assured result and transmit it rapidly is being developed and can potentially help improve data quality, the impact of which will likely be greatest in the
private sector.26
Finally, it is essential to discuss goals for monitoring antimalarial resistance and treatment effectiveness. A surveillance system that documents parasitemia after treatment (e.g. Days 3, 28, 42) can detect emerging drug resistance, indicate a lack of adherence where treatment is not provided through directly observed therapy (DOT), and have much greater implications than traditional therapeutic efficacy trials in sentinel sites. This data can then be used to inform strategies to address resistance and adherence challenges.
B. Incorporation of additional data Incorporating external data into the malaria elimination surveillance system will allow decision-making to be based on a holistic set of indicators rather than exclusively on data collected by the malaria elimination program. Supplementary information could include:
Entomological surveillance data
Quality control data for diagnostic tests
Supply chain data for testing and treatment supplies Prescription data from pharmacy databases
Human population data, including census data
Ecological data, such as land use and aquatic maps from the agricultural and forestry services Weather and climate data
Human movement data
Other useful data exist, but may be more challenging to obtain and use. This includes:
Counterfeit drug monitoring
Real-time human movement data using mobile phone records Monitoring of inappropriate and ineffective drug prescribing practices
The malaria elimination surveillance system must be flexible enough to receive information from and export to external databases to ensure that malaria data are included in other systems as needed. However, including too
9
many inputs has the potential to overwhelm both the surveillance system and those who receive and interpret the system outputs. Information should be added to the system only when it is valuable for informing decisions and action. On Bioko Island, Equatorial Guinea, the malaria control program is working to incorporate ten years of historical data into its surveillance database, including household level census data, routine passive cases from the National Health Information System, cases detected through Focal Screening and Treatment campaigns, data from the annual Malaria Indicator Survey, entomological information, IRS monitoring, ITN distribution and coverage, stock control, human resources supply and training, quality assurance tracking and household level mapping using geographic information systems (GIS). The malaria control program is starting to use this data to inform decision-making and measure progress. However, the process of entering data, checking for errors and utilizing the data has been lengthy and has required the input of technical specialists.
C. Accessible data storage and management In all settings, data should be accessible to key members of the health system.10,20,27 The database should be secure, available for use, sufficient for the quantity of data and appropriate for the context. 11,28,29 In some locations, a cloud-based database will make the most sense because anyone with Internet access and administrative clearance can submit and obtain data in real-time. However, in locations where consistent access to the Internet is unavailable, a local database may be the best solution to ensure that work can continue during Internet outages. Such a system could link to the Internet whenever possible to synchronize data with the central database and ensure essential information is disseminated to stakeholders. If the Internet is entirely unavailable, data sharing can occur via regular visits, phone calls, SMS or VHF radio messages. Other system requirements should be considered, such as the need for a backup generator in case of power failure.16,30 Regardless of the type of data storage used, guidelines for timeliness of reporting must be established, such as the requirement in China and Swaziland that malaria cases be reported within 24 hours.16,17 Guidelines will depend upon the program’s needs, resources and capacity to respond.
Data storage and management systems must be computer-based and should include a plan for ongoing maintenance.10 Ideally, software programs for storage and management of malaria surveillance data will be open-source, modifiable and easily maintained. In addition to technological requirements, there is a need for systems application developers and ICT specialists based in the government to maintain and modify the database as needed.
D. Analysis - automated and expert
A malaria elimination surveillance system should include automated data analysis to ensure timely outputs, as well as expert analysis for larger decisions about policy and programming strategies.7,10,11 Automation is vital because a malaria elimination surveillance system must receive and analyze data and output results quickly to identify outbreaks and inform response. Additionally, such a system will generate considerable amounts of data that could overwhelm available resources and personnel. The analysis and output from such an automated system will only be as good as the algorithms upon which they are based. Thus, technical expertise is necessary during development. It is essential to incorporate technical assistance and capacity building for malaria program
staff at all levels to ensure the database is used effectively.
An example of automated analyses in malaria elimination is the Spatial Decision Support System (SDSS) in Vanuatu and the Solomon Islands.31 This GIS uses the time and place of malaria cases and intervention coverage to automatically classify areas according to risk and then generate specific response recommendations. More complex spatial modeling of case data with environmental and ecological variables (e.g. rainfall, altitude, vegetation) is possible, but has yet to be automated and incorporated into a surveillance system.32
An important part of expert analysis is operations research, which uses data from the surveillance system to ensure that the most impactful and cost-effective interventions are used.3,28 Experts can design operations
10
research simulation models for malaria using surveillance data to generate a virtual representation of malaria activity and available interventions. Similar modeling was conducted in Haiti as part of an assessment of the feasibility of malaria elimination. Parasite prevalence data were used to better understand the optimal
interventions and treatment strategies for various populations and locations.33
Local malaria experts should participate in analysis, particularly in the interpretation of results. Local expert participation may include the operationalization of automated outputs to ensure that recommended interventions are feasible and reflect local conditions. Important factors such as political context or recent changes in land use can be difficult to capture in a surveillance-response system, and it is essential that local knowledge is incorporated in the analysis phase.
E. Customized output and feedback An ideal malaria surveillance system should generate outputs automatically, including visualizations of analyzed data, work task lists, and reports for both internal use and external organizations and donors. However, not all data and analyses should be transmitted to all levels. Only the minimum essential results and feedback to generate response at the appropriate level is necessary. All outputs should be tailored to the level receiving them to ensure that they are neither lacking nor in excess. It is likely that this fine balance will need to be
adjusted as the country moves toward elimination.
Once data have been analyzed, visualizing results is essential for effective targeting.7,34,35 Maps, graphs and tables allow easy interpretation of trends, summaries and work task lists. Outputs should demonstrate data trends at the lowest level possible so that cases can be tracked to the health center, village and household levels. Spatial representations of data using maps will range from simple plots of cases to predicted-risk maps based on geospatial models. Regular bulletins of results from the local, district and national levels should be distributed to inform malaria elimination teams of progress and emphasize their participation in a larger elimination strategy.10 If possible, this analysis should be automated so outputs can be distributed to key stakeholders regularly.
Outputs to the local level, including to surveillance officers and health facilities, should include specific work task lists to target local issues. For example, this could include instructions about reporting cases, conducting reactive case detection, and scaling up education or ITN distribution to anticipate the arrival of migrants. A good example of automated feedback exists in Cambodia where the system sends SMS to identify patients that are symptomatic after three days of treatment with artemisinin-based combination therapies. Based on that data,
the surveillance system alerts appropriate health officials to investigate possible drug resistance.12
Communicating newly detected cases to the district level must happen as quickly as possible, whether via Internet, SMS or manually via telephone or VHF radio. This ensures that district-level malaria officers know when a case is identified and can conduct reactive case detection. Additionally, outputs at the district level should include monthly or quarterly reports of visualized trends so members of the malaria team can track incidence and understand changes over time. Easy-to-understand tables with dynamic information such as stock
levels, number of malaria tests performed and staffing over time should be distributed and discussed regularly.10
At the national level, outputs are broader, showing trends in case incidence or drug resistance over time. An annual malaria report should be produced to compare current and previous data, using findings to inform program planning.10 Monitoring and evaluation of data are necessary to measure the value added of the malaria elimination surveillance system itself and understand how the system can be improved.
11
F. Targeted response Response to malaria elimination surveillance system outputs needs to be timely, effective and targeted.10,20,36 At the local level, once community health staff receive outputs, including a work task list, they must take immediate action.37,38 This list may include case detection, checking ITN coverage and use, IRS and education about malaria prevention and response strategies. In addition, the responses carried out and their key operational details (e.g. timing, coverage, supply tracking) should be reported back to the surveillance system for supervision and monitoring purposes. Connecting outputs from surveillance systems to action is one of the
weakest elements of most existing surveillance systems.
At the district level, responses include supervision, coordination, supply chain and intervention decisions. The outputs identify locations of highest incidence, weaknesses in implementation and where the district malaria office needs to take action.10 Responses may include ITN, RDT or medication distribution, or IRS team deployment.10 Additionally, supervision is simplified because district level staff receive reports of what village
level staff should have done, which they can monitor and assess, feeding results back to the surveillance system.
At the national level, responses to surveillance outputs guide the larger malaria elimination strategy. Senior staff can interpret results to identify gaps, capacity-building needs or to change recommended response activities.
Additionally, they can make decisions about how to address outbreaks.
The system with the most potential to guide targeted, rapid response to malaria surveillance data is the SDSS in Vanuatu and the Solomon Islands. Households are mapped using personal digital assistants (PDA) equipped with GIS and GPS.7 The surveillance system uses these data points to create automated maps of households, including coverage, incidence and additional geographic and entomologic data. Work task lists are generated for intervention and case management teams for each geo-located house they should visit. An SDSS that operates at the community and household levels is particularly appropriate in an elimination setting where targeted response is vital. However, despite the sophistication of this SDSS, resource and program management issues hinder effective use of detailed response recommendations.39
Description of existing IT/surveillance systems Currently, few comprehensive malaria surveillance systems exist that can collect, store and analyze real -time information. Many existing systems are limited in their geographic coverage, do not collect sufficient data to informed rapid response or are not connected to decision-making. We describe a number of these systems below to demonstrate the strengths and challenges of systems that already exist. Next, we discuss the links between local, national and regional surveillance systems and their importance for ensuring information sharing
and coordination.
A. Existing malaria surveillance systems Here we discuss the successful components of the existing surveillance systems in China, Swaziland and Zanzibar. While none of these systems are perfect, each contains elements of what an ideal system might look like and offer valuable lessons on how to conduct effective surveillance . Comparisons of these and other
systems are highlighted in Table 2 and in more detail in Appendix B.
China The strength of the Chinese Information System for Disease Control and Prevention is its timeliness, ease of reporting and intuitive 1-3-7 monitoring framework. The 1-3-7 framework dictates that malaria cases must be reported within one day, case investigation must occur within three days and foci investigation and increased prevention measures are implemented by day seven. The system is web-based, with all local health facilities reporting up to the level of commune hospital. Clear reporting and response guidelines are accessible to both malaria elimination teams and the public, emphasizing early detection and direct connection of reporting with
12
action. Recommended strategies vary by endemicity, with active fever screening every 10 days indicated in
areas with high incidence, and passive and reactive case detection indicated in all areas.17
Swaziland The strengths of Swaziland’s malaria surveillance system include rapid case reporting through the Immediate Disease Notification System (IDNS), a surveillance system integrated with the notifiable disease system and surveillance outputs rapidly relayed to a team that can initiate a response. The health facility staff members use a toll-free phone number and promptly report cases to the IDNS. The system then automatically sends an SMS to the local NMCP program manager, as well as the surveillance team, with details of the case. Members of this group investigate the case within 48 hours. During the seasonal peak in malaria, additional surveillance agents were added for the first time in 2013 to improve case investigation and rate and timeliness of follow-up. Case details are collected at the health facility and include address and mobile phone number where available. The surveillance team then visits the case, collects additional information and conducts a response when necessary. All data are recorded on computer tablets that have built in GPS software and satellite maps, both of which support the surveillance team in locating households that need to be screened in response to a confirmed case. Confirmed cases and details of case investigations are reported weekly and monthly to the Health Management Information System, to ensure that it contains malaria data. Weekly goals, feedback and prioritization are
provided to the surveillance officers to improve coverage rates and speed of follow-up and screening.
Zanzibar The strengths of Zanzibar’s Malaria Case Notification (MCN) are its rapid reporting and analysis outputs detailing geo-location of cases, through the Coconut Surveillance, a mobile application that guides and reports case follow-up. In 2008, the Malaria Early Epidemic Detection System (MEEDS) was established in Zanzibar, which involved weekly electronic reporting of malaria data using mobile phones. With the decline of malaria cases, MCN was started in 2012, which enables follow-up of all malaria cases, testing and treatment of household contacts and provision of preventive interventions and health information. MCN and Coconut Surveillance work together, cases are reported in real-time and then the tablet-based Coconut Surveillance platform alerts district malaria officers to follow-up, guiding them to visit the appropriate households to conduct reactive case detection and collect relevant information. In this system, surveillance is an intervention, where mobile reporting allows the collection of data in real-time that are used to guide a local response.11 Additionally, MEEDS data feeds into malaria commodity supply information, informing procurement and reducing stockouts of commodities.40 For example, RDT procurement is determined by the number of patients tested for malaria in the previous reporting period, which helps ensure that health centers are well supplied. 11
13
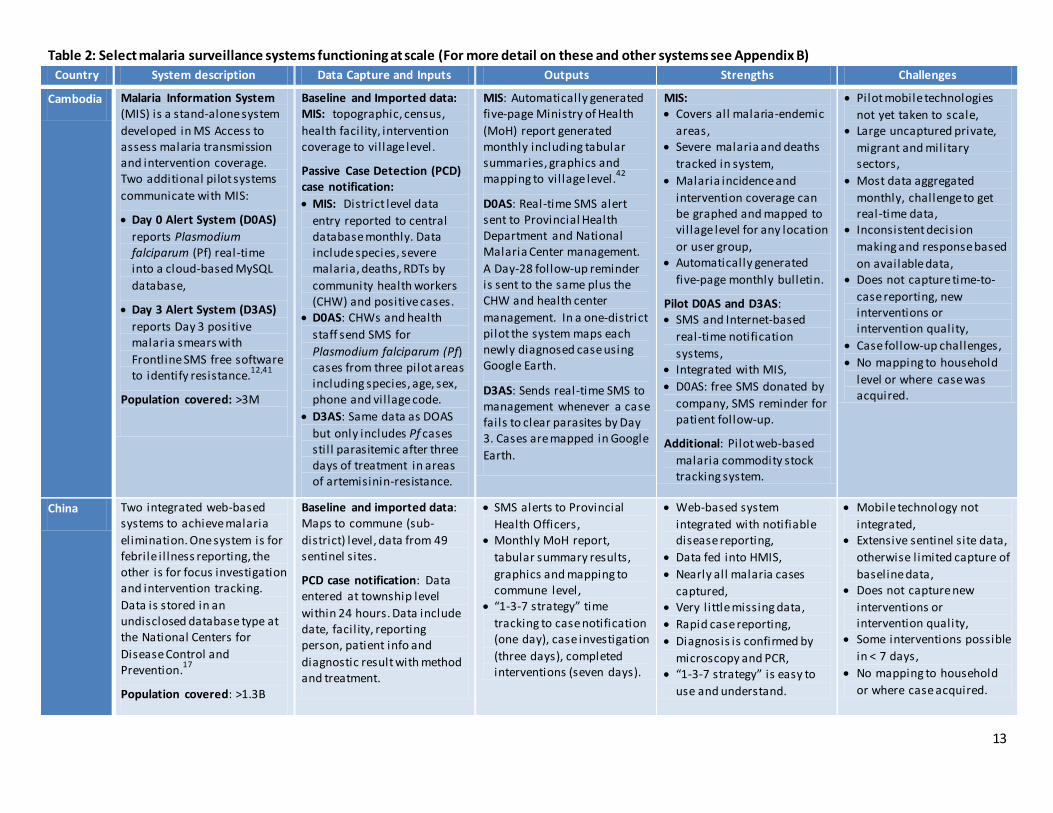
Table 2: Select malaria surveillance systems functioning at scale (For more detail on these and other systems see Appendix B)
Country System description Data Capture and Inputs Outputs Strengths Challenges
Cambodia Malaria Information System (MIS) is a stand-alone system
developed in MS Access to assess malaria transmission and intervention coverage. Two additional pilot systems
communicate with MIS:
Day 0 Alert System (D0AS)
reports Plasmodium falciparum (Pf) real-time into a cloud-based MySQL
database,
Day 3 Alert System (D3AS)
reports Day 3 positive malaria smears with
Frontline SMS free software to identify resistance.
12,41
Population covered: >3M
Baseline and Imported data: MIS: topographic, census,
health facil ity, intervention coverage to vil lage level.
Passive Case Detection (PCD) case notification:
MIS: District level data
entry reported to central database monthly. Data include species, severe malaria, deaths, RDTs by
community health workers (CHW) and positive cases.
D0AS: CHWs and health
staff send SMS for
Plasmodium falciparum (Pf) cases from three pilot areas including species, age, sex, phone and vil lage code.
D3AS: Same data as DOAS
but only includes Pf cases stil l parasitemic after three days of treatment in areas of artemisinin-resistance.
MIS: Automatically generated five-page Ministry of Health
(MoH) report generated monthly including tabular summaries, graphics and mapping to vil lage level.
42
D0AS: Real-time SMS alert sent to Provincial Health Department and National Malaria Center management.
A Day-28 follow-up reminder is sent to the same plus the CHW and health center
management. In a one-district pilot the system maps each newly diagnosed case using Google Earth.
D3AS: Sends real-time SMS to management whenever a case fails to clear parasites by Day 3. Cases are mapped in Google
Earth.
MIS: Covers all malaria-endemic
areas, Severe malaria and deaths
tracked in system,
Malaria incidence and
intervention coverage can be graphed and mapped to vil lage level for any location
or user group, Automatically generated
five-page monthly bulletin.
Pilot D0AS and D3AS: SMS and Internet-based
real-time notification
systems, Integrated with MIS,
D0AS: free SMS donated by
company, SMS reminder for patient follow-up.
Additional: Pilot web-based
malaria commodity stock tracking system.
Pilot mobile technologies
not yet taken to scale, Large uncaptured private,
migrant and military sectors,
Most data aggregated
monthly, challenge to get real-time data,
Inconsistent decision
making and response based
on available data, Does not capture time-to-
case reporting, new interventions or intervention quality,
Case follow-up challenges,
No mapping to household
level or where case was acquired.
China Two integrated web-based systems to achieve malaria
elimination. One system is for febrile i l lness reporting, the other is for focus investigation and intervention tracking.
Data is stored in an undisclosed database type at the National Centers for
Disease Control and Prevention.
17
Population covered: >1.3B
Baseline and imported data: Maps to commune (sub-
district) level, data from 49 sentinel sites.
PCD case notification: Data entered at township level
within 24 hours. Data include date, facil ity, reporting person, patient info and
diagnostic result with method and treatment.
SMS alerts to Provincial
Health Officers, Monthly MoH report,
tabular summary results,
graphics and mapping to commune level,
“1-3-7 strategy” time
tracking to case notification (one day), case investigation
(three days), completed interventions (seven days).
Web-based system
integrated with notifiable disease reporting,
Data fed into HMIS,
Nearly all malaria cases
captured, Very l ittle missing data,
Rapid case reporting,
Diagnosis is confirmed by
microscopy and PCR, “1-3-7 strategy” is easy to
use and understand.
Mobile technology not
integrated, Extensive sentinel site data,
otherwise l imited capture of
baseline data, Does not capture new
interventions or intervention quality,
Some interventions possible
in < 7 days,
No mapping to household
or where case acquired.
14
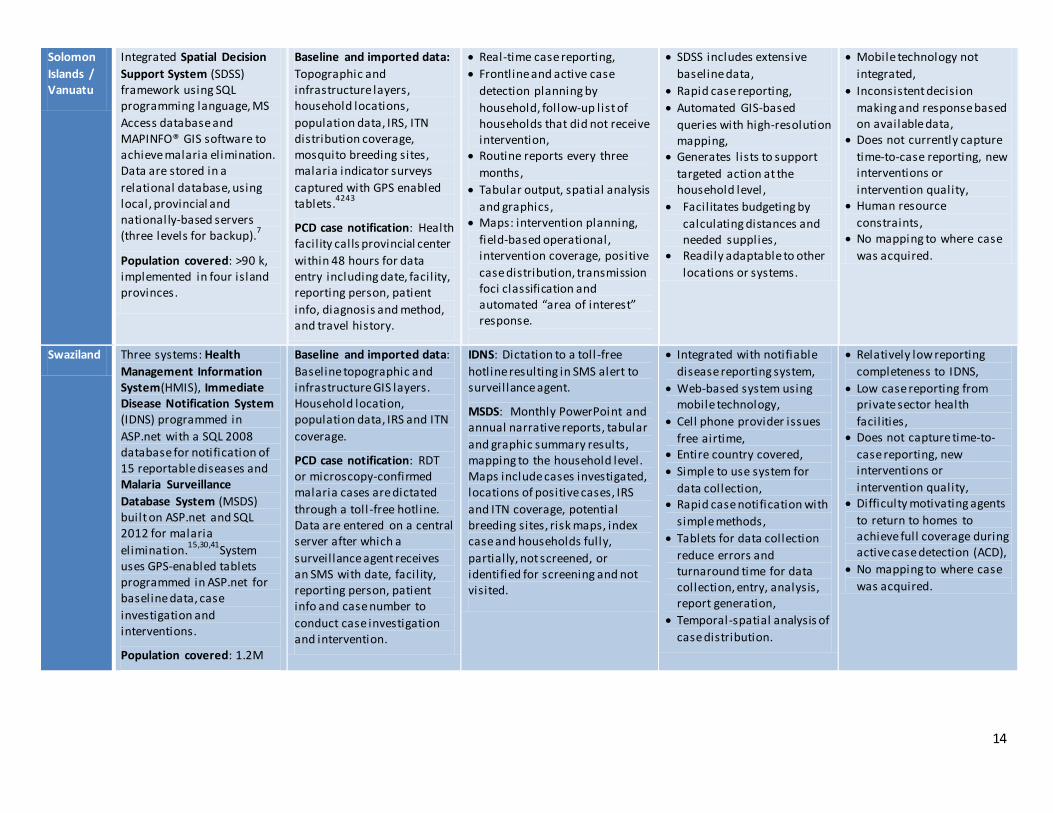
Solomon
Islands / Vanuatu
Integrated Spatial Decision
Support System (SDSS) framework using SQL programming language, MS
Access database and MAPINFO® GIS software to achieve malaria elimination. Data are stored in a
relational database, using local, provincial and national ly-based servers (three levels for backup).
7
Population covered: >90 k, implemented in four island provinces.
Baseline and imported data:
Topographic and infrastructure layers, household locations,
population data, IRS, ITN distribution coverage, mosquito breeding sites, malaria indicator surveys
captured with GPS enabled tablets.
4243
PCD case notification: Health facil ity calls provincial center
within 48 hours for data entry including date, facil ity, reporting person, patient
info, diagnosis and method, and travel history.
Real-time case reporting,
Frontline and active case
detection planning by
household, follow-up list of households that did not receive intervention,
Routine reports every three
months,
Tabular output, spatial analysis
and graphics, Maps: intervention planning,
field-based operational, intervention coverage, positive
case distribution, transmission foci classification and automated “area of interest” response.
SDSS includes extensive
baseline data,
Rapid case reporting,
Automated GIS-based
queries with high-resolution mapping,
Generates l ists to support
targeted action at the household level ,
Facilitates budgeting by
calculating distances and needed supplies,
Readily adaptable to other
locations or systems.
Mobile technology not
integrated,
Inconsistent decision
making and response based on available data,
Does not currently capture
time-to-case reporting, new interventions or
intervention quality, Human resource
constraints, No mapping to where case
was acquired.
Swaziland Three systems: Health
Management Information System(HMIS), Immediate Disease Notification System (IDNS) programmed in
ASP.net with a SQL 2008 database for notification of 15 reportable diseases and Malaria Surveillance
Database System (MSDS) built on ASP.net and SQL 2012 for malaria
elimination.15,30,41
System uses GPS-enabled tablets programmed in ASP.net for baseline data, case
investigation and interventions.
Population covered: 1.2M
Baseline and imported data: Baseline topographic and infrastructure GIS layers. Household location, population data, IRS and ITN
coverage.
PCD case notification: RDT or microscopy-confirmed malaria cases are dictated
through a toll -free hotline. Data are entered on a central server after which a
surveillance agent receives an SMS with date, facil ity, reporting person, patient info and case number to
conduct case investigation and intervention.
IDNS: Dictation to a toll -free
hotline resulting in SMS alert to surveillance agent.
MSDS: Monthly PowerPoint and annual narrative reports, tabular
and graphic summary results, mapping to the household level. Maps include cases investigated, locations of positive cases, IRS
and ITN coverage, potential breeding sites, risk maps, index case and households fully,
partially, not screened, or identified for screening and not visited.
Integrated with notifiable
disease reporting system,
Web-based system using mobile technology,
Cell phone provider issues
free airtime, Entire country covered,
Simple to use system for
data collection, Rapid case notification with
simple methods,
Tablets for data collection
reduce errors and turnaround time for data collection, entry, analysis, report generation,
Temporal-spatial analysis of
case distribution.
Relatively low reporting
completeness to IDNS,
Low case reporting from private sector health
facil ities, Does not capture time-to-
case reporting, new interventions or
intervention quality, Difficulty motivating agents
to return to homes to achieve full coverage during active case detection (ACD),
No mapping to where case
was acquired.
15
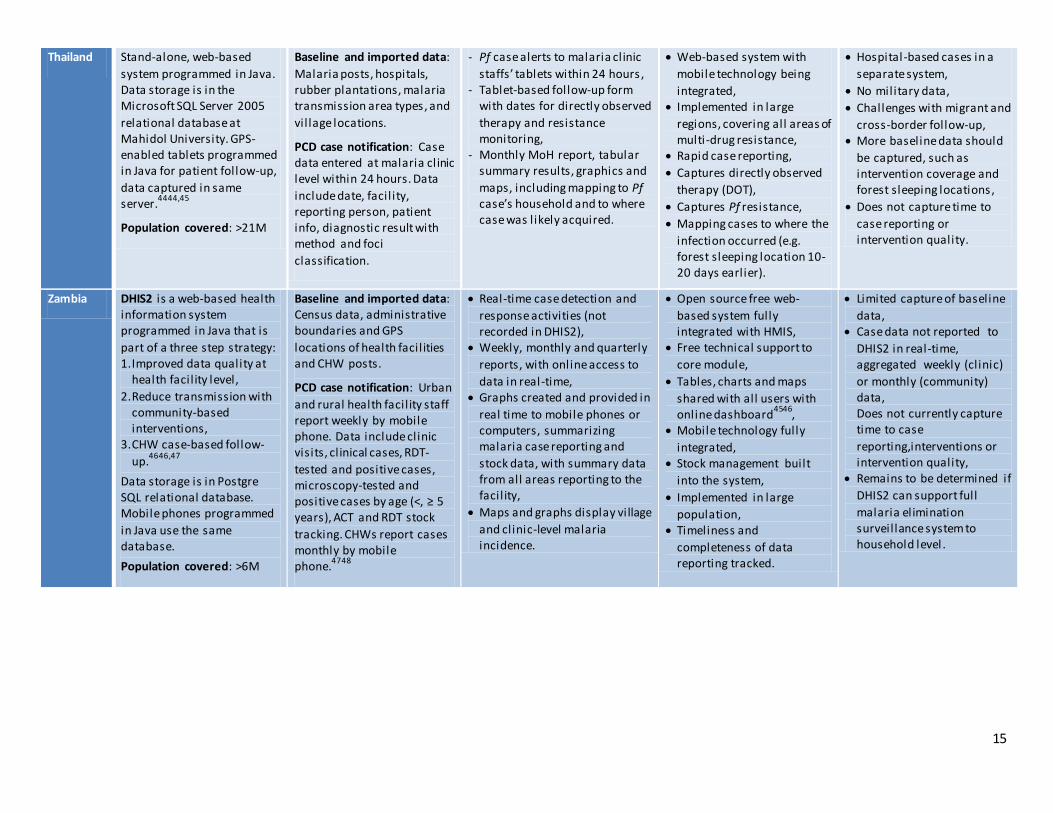
Thailand Stand-alone, web-based
system programmed in Java. Data storage is in the Microsoft SQL Server 2005
relational database at Mahidol University. GPS-enabled tablets programmed in Java for patient follow-up,
data captured in same server.
4444,45
Population covered: >21M
Baseline and imported data:
Malaria posts, hospitals, rubber plantations, malaria transmission area types, and
vil lage locations.
PCD case notification: Case data entered at malaria clinic level within 24 hours. Data
include date, facil ity, reporting person, patient info, diagnostic result with method and foci
classification.
- Pf case alerts to malaria clinic
staffs’ tablets within 24 hours , - Tablet-based follow-up form
with dates for directly observed
therapy and resistance monitoring,
- Monthly MoH report, tabular summary results, graphics and
maps, including mapping to Pf case’s household and to where case was likely acquired.
Web-based system with
mobile technology being
integrated, Implemented in large
regions, covering all areas of multi-drug resistance,
Rapid case reporting,
Captures directly observed
therapy (DOT),
Captures Pf resistance,
Mapping cases to where the
infection occurred (e.g. forest sleeping location 10-20 days earlier).
Hospital-based cases in a
separate system,
No military data,
Challenges with migrant and
cross-border follow-up, More baseline data should
be captured, such as intervention coverage and forest sleeping locations,
Does not capture time to
case reporting or intervention quality.
Zambia DHIS2 is a web-based health information system programmed in Java that is
part of a three step strategy: 1. Improved data quality at
health facil ity level,
2. Reduce transmission with community-based interventions,
3. CHW case-based follow-
up.4646,47
Data storage is in Postgre SQL relational database. Mobile phones programmed
in Java use the same database.
Population covered: >6M
Baseline and imported data: Census data, administrative boundaries and GPS
locations of health facil ities and CHW posts.
PCD case notification: Urban
and rural health facil ity staff report weekly by mobile phone. Data include clinic visits, clinical cases, RDT-
tested and positive cases, microscopy-tested and positive cases by age (<, ≥ 5 years), ACT and RDT stock
tracking. CHWs report cases monthly by mobile phone.
4748
Real-time case detection and
response activities (not recorded in DHIS2),
Weekly, monthly and quarterly
reports, with online access to
data in real-time, Graphs created and provided in
real time to mobile phones or computers, summarizing malaria case reporting and
stock data, with summary data from all areas reporting to the facil ity,
Maps and graphs display village
and clinic-level malaria incidence.
Open source free web-
based system fully integrated with HMIS,
Free technical support to
core module,
Tables, charts and maps
shared with all users with online dashboard
4546,
Mobile technology fully
integrated, Stock management built
into the system,
Implemented in large
population, Timeliness and
completeness of data reporting tracked.
Limited capture of baseline
data, Case data not reported to
DHIS2 in real-time, aggregated weekly (clinic)
or monthly (community) data, Does not currently capture time to case
reporting,interventions or intervention quality,
Remains to be determined if
DHIS2 can support full
malaria elimination surveillance system to household level .
16
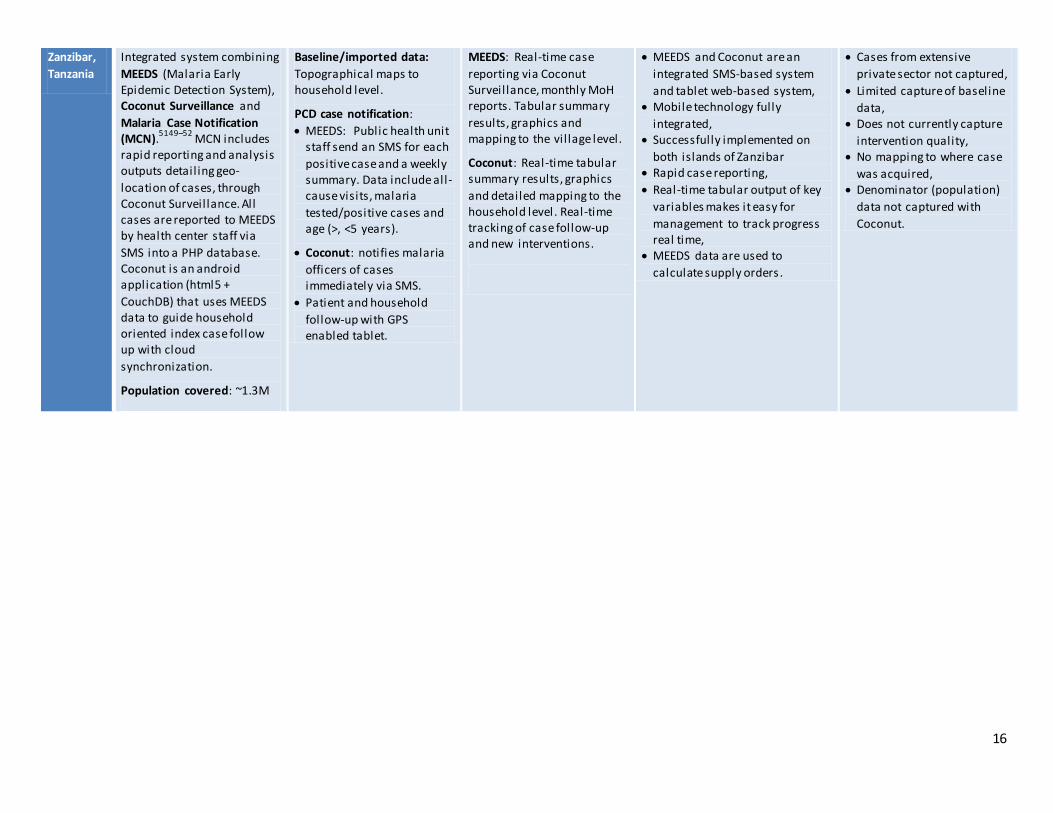
Zanzibar,
Tanzania
Integrated system combining
MEEDS (Malaria Early Epidemic Detection System), Coconut Surveillance and
Malaria Case Notification (MCN).
5149–52 MCN includes
rapid reporting and analysis outputs detail ing geo-
location of cases, through Coconut Surveillance. All cases are reported to MEEDS by health center staff via
SMS into a PHP database. Coconut is an android application (html5 +
CouchDB) that uses MEEDS data to guide household oriented index case follow up with cloud
synchronization.
Population covered: ~1.3M
Baseline/imported data:
Topographical maps to household level.
PCD case notification:
MEEDS: Public health unit staff send an SMS for each
positive case and a weekly summary. Data include all-cause visits, malaria
tested/positive cases and age (>, <5 years).
Coconut: notifies malaria
officers of cases immediately via SMS.
Patient and household
follow-up with GPS enabled tablet.
MEEDS: Real-time case
reporting via Coconut Surveillance, monthly MoH reports. Tabular summary
results, graphics and mapping to the vil lage level.
Coconut: Real-time tabular summary results, graphics
and detailed mapping to the household level . Real-time tracking of case follow-up and new interventions.
MEEDS and Coconut are an
integrated SMS-based system
and tablet web-based system, Mobile technology fully
integrated, Successfully implemented on
both islands of Zanzibar Rapid case reporting,
Real-time tabular output of key
variables makes it easy for
management to track progress real time,
MEEDS data are used to
calculate supply orders.
Cases from extensive
private sector not captured,
Limited capture of baseline
data, Does not currently capture
intervention quality, No mapping to where case
was acquired, Denominator (population)
data not captured with
Coconut.
17
B. Linkage between national, regional and global surveillance systems
Ideally, national malaria control and elimination systems would link seamlessly with related regional and global structures, providing real-time intelligence about outbreaks and areas of transmission. This would lead to appropriate allocation of national and regional resources and more timely targeted action. Such linkages could prevent outbreaks from spreading locally, regionally and internationally and reduce risks of malaria reintroduction. However, to achieve these goals, sufficient resources for data analysis as well as significant political and financial commitment are all necessary to ensure timely sharing of useful data with participating
countries.
There have been attempts to introduce regional and global databases for infectious diseases, such as the dengue surveillance system established by WHO. This system began as DengueNet, which collected and aggregated data globally, but due to difficulties with reporting and countries’ reluctance to share data publically, current dengue surveillance is organized regionally and data are not openly available. However, this system is being expanded to the global level to aggregate regional data and estimate the global burden of dengue. To avoid pitfalls of the initial global system, WHO is engaging a broad range of stakeholders to reach consensus on the minimum essential data and outputs at the national level. The creation of a global system could be useful and influential for policy and advocacy since its purpose is to track larger multi-national trends and offer support through technical assistance and financing when needed during outbreaks. The challenges of establishing and implementing the global dengue surveillance system should be kept in mind if a similar system for malaria is
considered.
The two most successful international disease databases are based on reporting of syndromes: acute flaccid paralysis for polio and flu-like syndrome for influenza. The Global Influenza Surveillance and Response System is a prime example of global organization for outbreak response. This system has existed for 60 years and collects global data on suspected and confirmed influenza cases to inform outbreak response and contribute to vaccine development. The online platform, FluID, is in the early rollout phase, demonstrating the evolution of a
surveillance system to include information technology advances.53
In efforts to facilitate international malaria data sharing, WHO now coordinates a situation room that is focused on the ten African countries with the highest malaria burden, bringing country representatives together virtually every two weeks to discuss stock control, funding issues and to track current and potential outbreaks. Regional “situation rooms” would also be helpful for malaria eliminating regions. Data sharing where populations are moving across borders will facilitate the ability to eliminate the disease. We believe this approach would be useful for regional cooperation for malaria elimination. At the global level, WHO is in the process of convening international malaria experts to discuss the minimum essential data for surveillance which ultimately could also
facilitate and encourage cross border data sharing.
Database linkage between countries and within regions is difficult and often lacking, yet this is not entirely surprising given that within some countries multiple unlinked surveillance databases exist. However, as more countries move towards elimination and cross-border and regional malaria elimination initiatives are implemented, data sharing should be encouraged, whether the NMCP encourages informal information sharing between malaria program officers, or publicly or privately between countries.
Conclusions and recommendations After reviewing the evidence of what is needed for a robust and action-oriented malaria elimination surveillance
system, we believe that the following recommendations should be implemented:
1. Malaria must be a notifiable disease. In countries pursuing malaria elimination, real-time reporting must be required by law and appropriately enforced in all sectors caring for malaria patients, including the private
18
sector and militaries. This should include integration into a notifiable disease reporting database and negative diagnostic test reporting. Such actions will help achieve elimination and ensure that malaria does not resurge.
2. Expert epidemiological and information technology oversight of surveillance is crucial. Committed, qualified and motivated surveillance staff at the NMCP and provincial levels is critical. Human resources to support data analysis, including surveillance database managers and epidemiologists who can program database queries, analyze and interpret data, are required. Monthly surveillance review meetings led by surveillance officers will create an opportunity for feedback and discussion of best practices. Human resource capacity and on-going training are essential for the long-term success of elimination efforts, and will support disease control more generally within the health system. Minimum and ideal human resource and training requirements must be outlined and implemented.
3. The malaria elimination database must be manageable by the NMCP. A malaria elimination database cannot be unnecessarily technical. The database must provide a framework to guide strategic decision making and support the effective management, coordination, and implementation of interventions, particularly at the administrative levels of the NMCP. While it must be able to effectively cross-talk with the notifiable disease-reporting database for case reporting, it does not necessarily need to be integrated within the notifiable disease database. All levels of the malaria control program, from the communi ty to the national level, should receive information from the system, though the server and database should be fully managed by the NMCP.
4. Standardized methods for malaria surveillance with targeted response are needed. A key element of malaria elimination programs is rapid and appropriate response to malaria cases. Standardized and streamlined methods and indicators will improve consistency and decision-making. The interventions will vary by location and population, but standardized operating procedures must be developed and implemented in all locations to eliminate the disease. In addition to minimum essential indicators, a common reporting format to facilitate data sharing is important. We recommend standardized methods be adapted to existing surveillance systems.
5. An effective surveillance system must feed information back to the communities. In this review, we found few examples of systems that rapidly fed back surveillance findings to the community-level stakeholders. For surveillance to function as an intervention, real -time feedback and effective response are essential. Intervention timing, coverage and effectiveness must be captured and monitored as part of the system.
6. A surveillance system is only as good as the data captured and reported. Accurate malaria diagnosis is critical to ensure the system functions as an effective intervention. Case confirmation is critical and will be a key method to track quality in the system. WHO has developed several standardized strategies to improve diagnostics quality, such as microscopist accreditation, standardized rapid diagnostic test training, slide cross-checking and external quality assurance.
7. A geographic information system (GIS) and decision support system are crucial. Malaria elimination surveillance systems must include spatial data at the likely location of transmission whenever possible. Mapping cases will guide effective, targeted response, which is currently lacking in most regions. We recommend the GIS and SDSS being used in Vanuatu and the Solomon Islands as the model system to be taken to scale in SE Asia. The system will need to be adapted to forest malaria and to capture mobile and migrant populations.
8. Operations research. A dozen or more potential interventions are available, ranging from the standard ITN, IRS and ACTs to insecticide-treated clothing, repellants, mass drug administration and chemoprevention. Operations research, which should not be confused with operational research, is used routinely by industry
19
to optimize manufacturing methods and it has not been used effectively in public health. We recommend experts design an operations research model for malaria elimination initially using existing epidemiology and intervention data. Operations research will allow the selection of the best combination of interventions to implement initially and then, based on actual effectiveness reported by the surveillance system, the malaria program can iteratively add or change interventions until elimination is achieved. The approach will allow for continuous learning and adaptation (see UCSF Global Health Group Background Paper Program Management Issues in Implementation of Elimination Strategies, 2014).
9. Adherence and resistance monitoring should be a routine part of the surveillance system . The surveillance system can provide improved treatment outcomes by monitoring medication adherence. Information about emerging drug resistance can be collected by sampling for parasitemia after treatment (e.g. Days 3, 28 and/or 42). When treatment is provided through DOT, such sampling will indicate emerging drug resistance and have a much larger reach than traditional therapeutic efficacy trials in sentinel sites. If treatment is not given under DOT such sampling would provide evidence of emerging drug resistance or lack of adherence. Molecular markers can define P. falciparum treatment failures; standard and emerging markers for drug resistance are available.54 This approach will contribute to understanding about drug resistance and medication adherence, informing strategies to address these challenges.
10. Locally appropriate technologies can help support data quality improvements. New Internet and communication technologies, such as mobile phone and web-based systems, can help improve reporting rates, timeliness and data quality. Such technologies need to be appropriate to the local context.
11. Communication for all working on malaria surveillance should be free of charge. Open communication between all levels of the surveillance system is essential, including communication with community health workers. Impediments to open communication must be minimized. We identified a few examples of companies donating mobile phone minutes or data transmission to support malaria elimination efforts. Such mobile phone minutes could be used as incentives to improve reporting and response.
12. Real time sharing of malaria data across borders is needed for malaria elimination to be successful . Regional collaboration must be implemented effectively in most of the world for malaria elimination to be successful. This is particularly urgent in SE Asia, where untreatable malaria is emerging again and migrants are likely to be the primary malaria transmission reservoir. Currently there are few functioning cross-border collaborations. Ideally, surveillance systems would be unified across countries. This is unlikely to actually occur because current surveillance systems have evolved differently. However, establishing standard measurements, such as the location of the transmission event and targeted intervention coverage and effectiveness, could be communicated routinely. Regional “situation rooms” in elimination areas, including the Greater Mekong sub-region, could contribute to effective and meaningful cooperation.
13. Ensure political and financial commitment. Harmonizing existing surveillance systems will require both political and financial commitments in the short and long-term. In the short-term, commitment is needed to bring stakeholders together to develop political and financial capital for malaria elimination surveillance systems. In the longer term, commitment is needed to maintain a cadre of workers who can work with the software and adapt it to fit changing circumstances. Involving stakeholders in the development of the system and giving them ownership will smooth adoption and sustain funding.
Many new technology developments to improve surveillance for malaria elimination appear attractive for investment. However, an investment in ICTs is not a panacea; a surveillance system is only as good as its implementation. An excellent surveillance system should be at the core of malaria elimination programs to
20
ensure that all cases are detected and responded to in an effective and timely manner. Investment in robust,
response-focused systems is essential to achieve elimination goals.
21
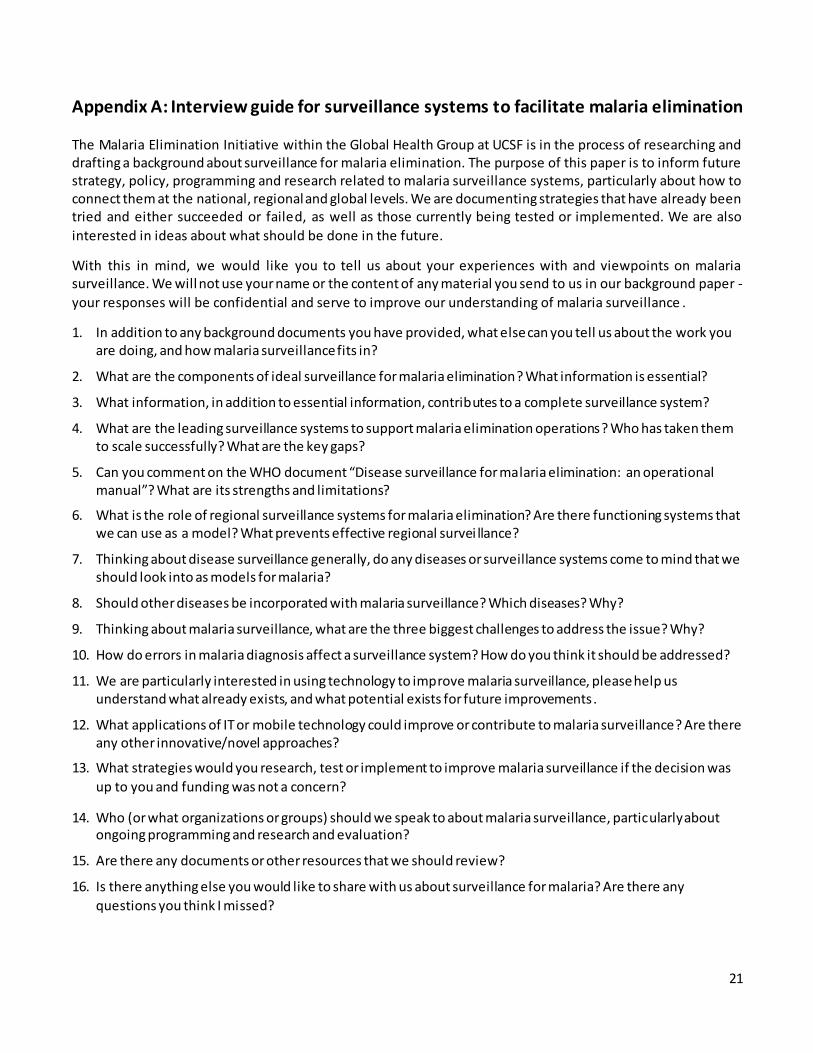
Appendix A: Interview guide for surveillance systems to facilitate malaria elimination
The Malaria Elimination Initiative within the Global Health Group at UCSF is in the process of researching and drafting a background about surveillance for malaria elimination. The purpose of this paper is to inform future strategy, policy, programming and research related to malaria surveillance systems, particularly about how to connect them at the national, regional and global levels. We are documenting strategies that have already been tried and either succeeded or failed, as well as those currently being tested or implemented. We are also
interested in ideas about what should be done in the future.
With this in mind, we would like you to tell us about your experiences with and viewpoints on malaria surveillance. We will not use your name or the content of any material you send to us in our background paper -
your responses will be confidential and serve to improve our understanding of malaria surveillance .
1. In addition to any background documents you have provided, what else can you tell us about the work you are doing, and how malaria surveillance fits in?
2. What are the components of ideal surveillance for malaria elimination? What information is essential?
3. What information, in addition to essential information, contributes to a complete surveillance system?
4. What are the leading surveillance systems to support malaria elimination operations? Who has taken them to scale successfully? What are the key gaps?
5. Can you comment on the WHO document “Disease surveillance for malaria elimination: an operational manual”? What are its strengths and limitations?
6. What is the role of regional surveillance systems for malaria elimination? Are there functioning systems that we can use as a model? What prevents effective regional survei llance?
7. Thinking about disease surveillance generally, do any diseases or surveillance systems come to mind that we should look into as models for malaria?
8. Should other diseases be incorporated with malaria surveillance? Which diseases? Why?
9. Thinking about malaria surveillance, what are the three biggest challenges to address the issue? Why?
10. How do errors in malaria diagnosis affect a surveillance system? How do you think it should be addressed?
11. We are particularly interested in using technology to improve malaria surveillance, please help us understand what already exists, and what potential exists for future improvements.
12. What applications of IT or mobile technology could improve or contribute to malaria surveillance? Are there any other innovative/novel approaches?
13. What strategies would you research, test or implement to improve malaria surveillance if the decision was
up to you and funding was not a concern?
14. Who (or what organizations or groups) should we speak to about malaria surveillance, particularly about ongoing programming and research and evaluation?
15. Are there any documents or other resources that we should review?
16. Is there anything else you would like to share with us about surveillance for malaria? Are there any
questions you think I missed?
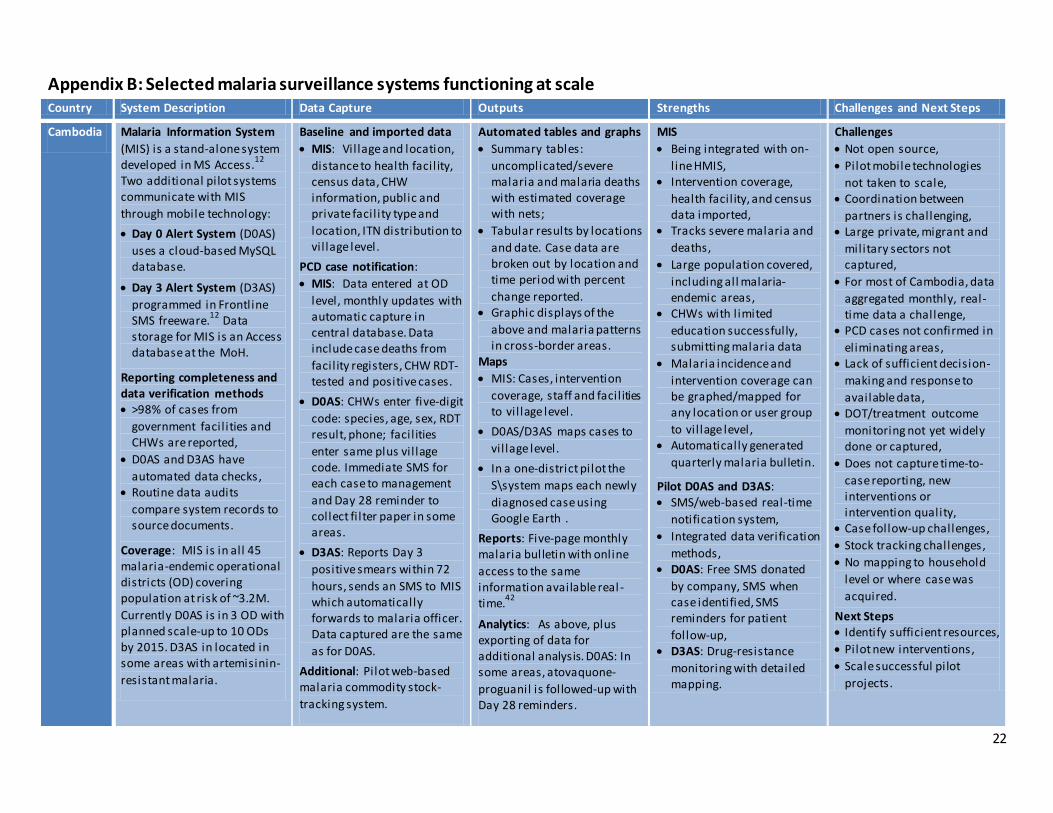
22
Appendix B: Selected malaria surveillance systems functioning at scale Country System Description Data Capture Outputs Strengths Challenges and Next Steps
Cambodia Malaria Information System
(MIS) is a stand-alone system developed in MS Access.
12
Two additional pilot systems communicate with MIS
through mobile technology:
Day 0 Alert System (D0AS)
uses a cloud-based MySQL database.
Day 3 Alert System (D3AS)
programmed in Frontline SMS freeware.
12 Data
storage for MIS is an Access database at the MoH.
Reporting completeness and data verification methods >98% of cases from
government facil ities and CHWs are reported,
D0AS and D3AS have
automated data checks, Routine data audits
compare system records to source documents.
Coverage: MIS is in all 45 malaria-endemic operational districts (OD) covering population at risk of ~3.2M.
Currently D0AS is in 3 OD with planned scale-up to 10 ODs by 2015. D3AS in located in some areas with artemisinin-
resistant malaria.
Baseline and imported data
MIS: Vil lage and location,
distance to health facil ity, census data, CHW information, public and private facil ity type and
location, ITN distribution to vil lage level.
PCD case notification:
MIS: Data entered at OD
level, monthly updates with automatic capture in central database. Data include case deaths from
facil ity registers, CHW RDT-tested and positive cases.
D0AS: CHWs enter five-digit
code: species, age, sex, RDT result, phone; facil ities
enter same plus vil lage code. Immediate SMS for each case to management
and Day 28 reminder to collect fi lter paper in some areas.
D3AS: Reports Day 3
positive smears within 72
hours, sends an SMS to MIS which automatically forwards to malaria officer. Data captured are the same
as for D0AS.
Additional: Pilot web-based malaria commodity stock-
tracking system.
Automated tables and graphs
Summary tables:
uncomplicated/severe malaria and malaria deaths with estimated coverage with nets;
Tabular results by locations
and date. Case data are broken out by location and time period with percent
change reported. Graphic displays of the
above and malaria patterns in cross-border areas.
Maps
MIS: Cases, intervention
coverage, staff and facil ities to vil lage level.
D0AS/D3AS maps cases to
vil lage level.
In a one-district pilot the
S\system maps each newly
diagnosed case using Google Earth .
Reports: Five-page monthly malaria bulletin with online
access to the same information available real -time.
42
Analytics: As above, plus exporting of data for additional analysis. D0AS: In some areas, atovaquone-
proguanil is followed-up with Day 28 reminders.
MIS
Being integrated with on-
line HMIS, Intervention coverage,
health facil ity, and census data imported,
Tracks severe malaria and
deaths,
Large population covered,
including all malaria-endemic areas,
CHWs with l imited
education successfully, submitting malaria data
Malaria incidence and
intervention coverage can be graphed/mapped for any location or user group
to vil lage level, Automatically generated
quarterly malaria bulletin.
Pilot D0AS and D3AS: SMS/web-based real-time
notification system,
Integrated data verification
methods, D0AS: Free SMS donated
by company, SMS when case identified, SMS reminders for patient
follow-up, D3AS: Drug-resistance
monitoring with detailed mapping.
Challenges
Not open source,
Pilot mobile technologies
not taken to scale, Coordination between
partners is challenging, Large private, migrant and
military sectors not captured,
For most of Cambodia, data
aggregated monthly, real-time data a challenge,
PCD cases not confirmed in
eliminating areas, Lack of sufficient decision-
making and response to
available data, DOT/treatment outcome
monitoring not yet widely done or captured,
Does not capture time-to-
case reporting, new interventions or intervention quality,
Case follow-up challenges,
Stock tracking challenges,
No mapping to household
level or where case was
acquired.
Next Steps Identify sufficient resources,
Pilot new interventions,
Scale successful pilot
projects.

23
System Description Data Capture Outputs Strengths Challenges and Next Steps
China Two integrated web-based systems with the aim to achieve malaria elimination. One system is for febrile
i l lness reporting and the other is for focus investigation and intervention tracking. Data
storage is in a relational database at the national Centers for Disease Control.
17
Reporting completeness and
data verification methods Nearly 100% of malaria
cases are entered into the system,
Automated algorithms of
various types do data
checks, Call backs by malaria staff
to complete missing and check inconsistent data,
Routine data audits.
Coverage: All of China
covered (population 1.4B) with > 90% febrile diseases captured, including 3815
malaria cases between Jan. and Oct. in 2013 (26,873 malaria cases in 2008).
Baseline and imported data Maps to commune level,
Data from 49 sentinel sites
includes entomology, serology and drug resistance surveillance.
PCD case notification: Health staff submits hard copy data at the township level within 24 hours. SMS alerts are
immediately sent to Provincial Health Officers. Data include date, facil ity, reporting
person, patient info, diagnostic result with method, and treatment.
Case investigation: One-page
form completed within three days. Data entered as above, and include repeat
microscopy or PCR, and travel history.
Interventions Focus investigation/
intervention (e.g. ACD,
vector control, health education) within seven days.
Active fever screening
every 10 days in areas with
high incidence.
Automated tables and graphs Malaria incidence by species, proportion of cases confirmed, proportion of
cases imported, number of deaths, blood examination rate, slide positive rate,
annual parasite index, provincial/seasonal/gender distribution.
Sentinel sites: human biting
rate, proportion of particular vector, treatment failure rate.
Maps: Spatial disease distribution from the
commune to the country level.
Reports: Monthly ministry of
health report and annual WHO report.
Analytics: As above, data can be exported for additional
analysis.
Web-based system
integrated with notifiable disease reporting,
1-3-7 is an easy-to-use
framework that tracks time to case notification (Day 1),
case investigation (Day 3), focus investigation and interventions (Day 7),
>80% febrile i l lness and
nearly 100% of malaria
cases captured, Successfully implemented
in all of China, Data quality checks,
Real-time case reporting by
SMS to surveillance officer,
Case confirmation with
repeat microscopy and PCR,
Malaria case and focus
investigation data are automatically fed into
HMIS, Malaria maps to commune
level.
Challenges Not open source,
Mobile technology not
integrated, Although extensive sentinel
site data, there is otherwise l imited capture of baseline
data, Does not capture new
interventions or intervention quality,
Some interventions are
possible in less than seven
days, No mapping to household
level or to where case was acquired.
Next Steps Expand functionality to
household level and include spatial decision support system (SDSS),
SDSS to guide case
investigation, focus investigation and interventions using spatial and temporal information.
24
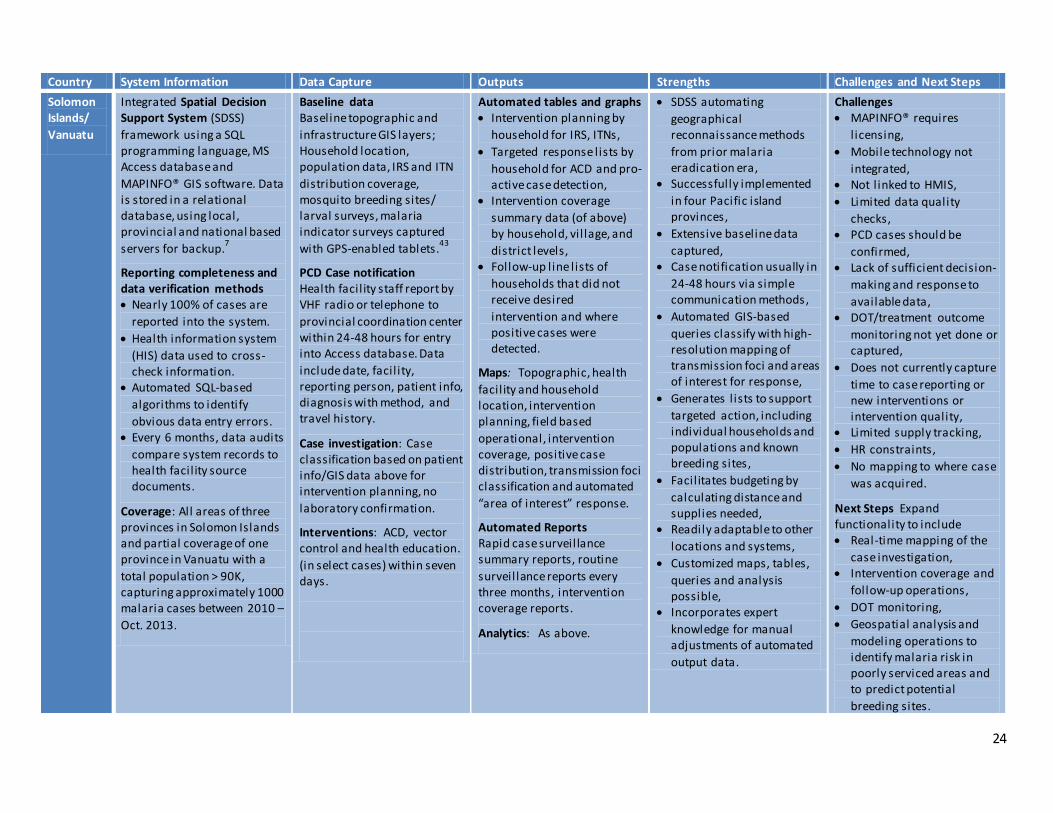
Country System Information Data Capture Outputs Strengths Challenges and Next Steps
Solomon Islands/
Vanuatu
Integrated Spatial Decision Support System (SDSS)
framework using a SQL programming language, MS Access database and
MAPINFO® GIS software. Data is stored in a relational database, using local, provincial and national based
servers for backup.7
Reporting completeness and data verification methods Nearly 100% of cases are
reported into the system.
Health information system
(HIS) data used to cross-check information.
Automated SQL-based
algorithms to identify
obvious data entry errors. Every 6 months, data audits
compare system records to health facil ity source documents.
Coverage: All areas of three provinces in Solomon Islands and partial coverage of one province in Vanuatu with a
total population > 90K, capturing approximately 1000 malaria cases between 2010 –
Oct. 2013.
Baseline data Baseline topographic and
infrastructure GIS layers; Household location, population data, IRS and ITN
distribution coverage, mosquito breeding sites/ larval surveys, malaria indicator surveys captured
with GPS-enabled tablets.43
PCD Case notification Health facil ity staff report by VHF radio or telephone to
provincial coordination center within 24-48 hours for entry into Access database. Data
include date, facil ity, reporting person, patient info, diagnosis with method, and travel history.
Case investigation: Case classification based on patient info/GIS data above for intervention planning, no
laboratory confirmation.
Interventions: ACD, vector control and health education.
(in select cases) within seven days.
Automated tables and graphs Intervention planning by
household for IRS, ITNs,
Targeted response lists by
household for ACD and pro-active case detection,
Intervention coverage
summary data (of above) by household, vil lage, and
district levels, Follow-up line l ists of
households that did not receive desired
intervention and where positive cases were detected.
Maps: Topographic, health
facil ity and household location, intervention planning, field based
operational, intervention coverage, positive case distribution, transmission foci classification and automated
“area of interest” response.
Automated Reports Rapid case surveillance summary reports, routine
surveillance reports every three months, intervention coverage reports.
Analytics: As above.
SDSS automating
geographical reconnaissance methods
from prior malaria eradication era,
Successfully implemented
in four Pacific island provinces,
Extensive baseline data
captured, Case notification usually in
24-48 hours via simple communication methods,
Automated GIS-based
queries classify with high-resolution mapping of transmission foci and areas of interest for response,
Generates l ists to support
targeted action, including individual households and populations and known breeding sites,
Facilitates budgeting by
calculating distance and supplies needed,
Readily adaptable to other
locations and systems,
Customized maps, tables,
queries and analysis possible,
Incorporates expert
knowledge for manual adjustments of automated
output data.
Challenges MAPINFO® requires
l icensing,
Mobile technology not
integrated, Not linked to HMIS,
Limited data quality
checks, PCD cases should be
confirmed, Lack of sufficient decision-
making and response to
available data, DOT/treatment outcome
monitoring not yet done or captured,
Does not currently capture
time to case reporting or new interventions or intervention quality,
Limited supply tracking,
HR constraints,
No mapping to where case
was acquired.
Next Steps Expand functionality to include Real-time mapping of the
case investigation, Intervention coverage and
follow-up operations,
DOT monitoring,
Geospatial analysis and
modeling operations to identify malaria risk in poorly serviced areas and to predict potential
breeding sites.
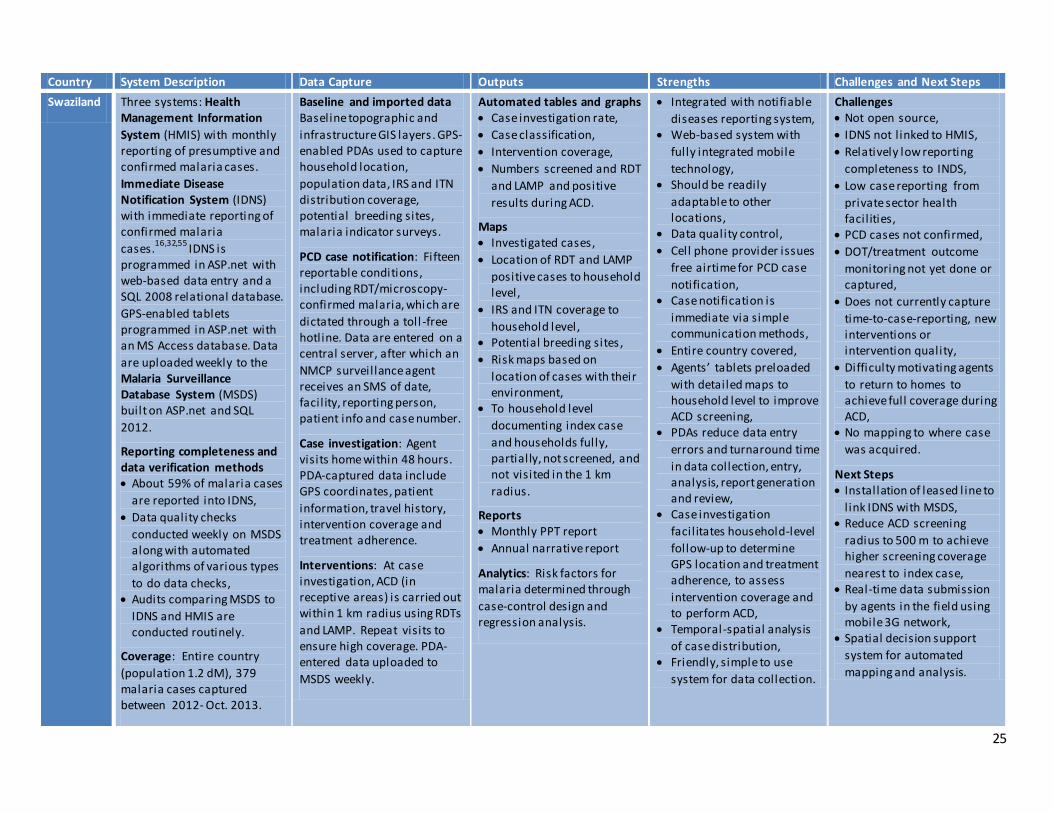
25
Country System Description Data Capture Outputs Strengths Challenges and Next Steps
Swaziland Three systems: Health Management Information
System (HMIS) with monthly reporting of presumptive and confirmed malaria cases.
Immediate Disease Notification System (IDNS) with immediate reporting of confirmed malaria
cases.16,32,55
IDNS is programmed in ASP.net with web-based data entry and a SQL 2008 relational database.
GPS-enabled tablets programmed in ASP.net with an MS Access database. Data
are uploaded weekly to the Malaria Surveillance Database System (MSDS) built on ASP.net and SQL
2012.
Reporting completeness and data verification methods About 59% of malaria cases
are reported into IDNS,
Data quality checks
conducted weekly on MSDS along with automated algorithms of various types
to do data checks, Audits comparing MSDS to
IDNS and HMIS are conducted routinely.
Coverage: Entire country
(population 1.2 dM), 379 malaria cases captured between 2012- Oct. 2013.
Baseline and imported data Baseline topographic and
infrastructure GIS layers. GPS-enabled PDAs used to capture household location,
population data, IRS and ITN distribution coverage, potential breeding sites, malaria indicator surveys.
PCD case notification: Fifteen reportable conditions, including RDT/microscopy-confirmed malaria, which are
dictated through a toll -free hotline. Data are entered on a central server, after which an
NMCP surveillance agent receives an SMS of date, facil ity, reporting person, patient info and case number.
Case investigation: Agent visits home within 48 hours. PDA-captured data include GPS coordinates, patient
information, travel history, intervention coverage and treatment adherence.
Interventions: At case investigation, ACD (in receptive areas) is carried out within 1 km radius using RDTs
and LAMP. Repeat visits to ensure high coverage. PDA- entered data uploaded to
MSDS weekly.
Automated tables and graphs Case investigation rate,
Case classification,
Intervention coverage,
Numbers screened and RDT
and LAMP and positive
results during ACD.
Maps Investigated cases,
Location of RDT and LAMP
positive cases to household level,
IRS and ITN coverage to
household level, Potential breeding sites,
Risk maps based on
location of cases with their environment,
To household level
documenting index case
and households fully, partially, not screened, and not visited in the 1 km
radius.
Reports Monthly PPT report
Annual narrative report
Analytics: Risk factors for malaria determined through
case-control design and regression analysis.
Integrated with notifiable
diseases reporting system, Web-based system with
fully integrated mobile
technology, Should be readily
adaptable to other locations,
Data quality control,
Cell phone provider issues
free airtime for PCD case
notification, Case notification is
immediate via simple communication methods,
Entire country covered,
Agents’ tablets preloaded
with detailed maps to household level to improve ACD screening,
PDAs reduce data entry
errors and turnaround time
in data collection, entry, analysis, report generation and review,
Case investigation
facil itates household-level
follow-up to determine GPS location and treatment adherence, to assess
intervention coverage and to perform ACD,
Temporal-spatial analysis
of case distribution, Friendly, simple to use
system for data collection.
Challenges Not open source,
IDNS not l inked to HMIS,
Relatively low reporting
completeness to INDS,
Low case reporting from
private sector health facil ities,
PCD cases not confirmed,
DOT/treatment outcome
monitoring not yet done or captured,
Does not currently capture
time-to-case-reporting, new interventions or intervention quality,
Difficulty motivating agents
to return to homes to achieve full coverage during ACD,
No mapping to where case
was acquired.
Next Steps Installation of leased l ine to
l ink IDNS with MSDS, Reduce ACD screening
radius to 500 m to achieve higher screening coverage
nearest to index case, Real-time data submission
by agents in the field using mobile 3G network,
Spatial decision support
system for automated
mapping and analysis.
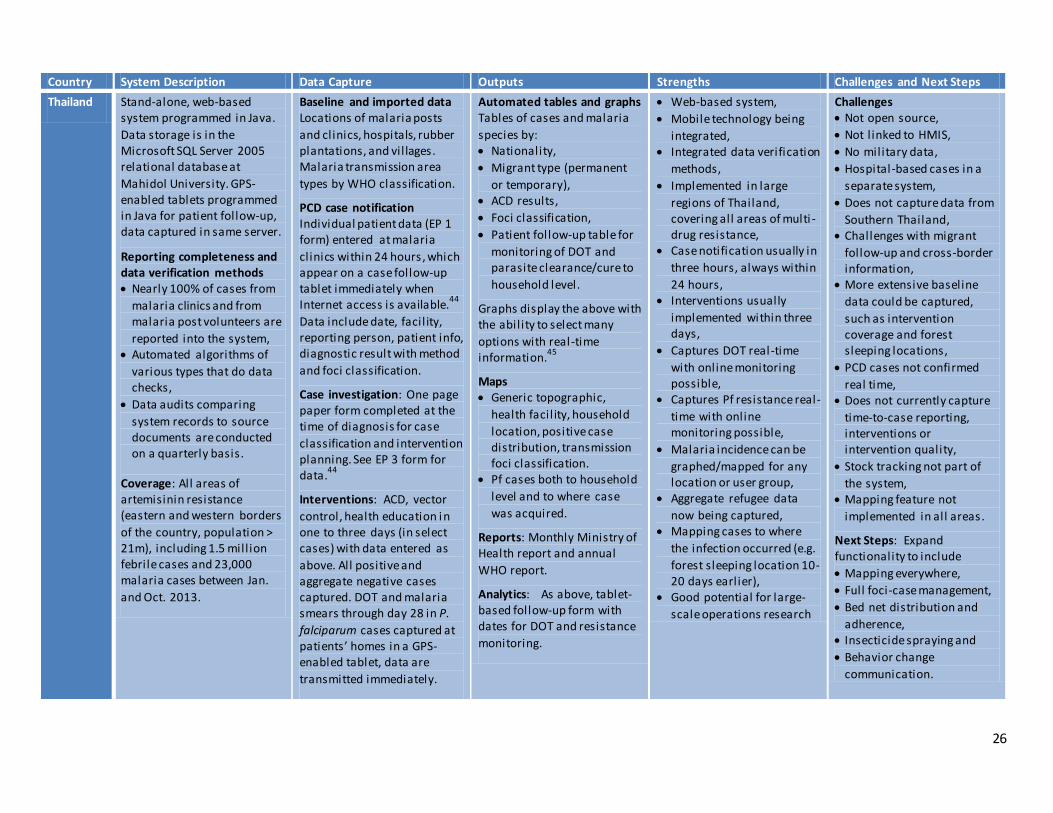
26
Country System Description Data Capture Outputs Strengths Challenges and Next Steps
Thailand Stand-alone, web-based system programmed in Java.
Data storage is in the Microsoft SQL Server 2005 relational database at
Mahidol University. GPS-enabled tablets programmed in Java for patient follow-up, data captured in same server.
Reporting completeness and data verification methods Nearly 100% of cases from
malaria clinics and from malaria post volunteers are
reported into the system, Automated algorithms of
various types that do data checks,
Data audits comparing
system records to source documents are conducted on a quarterly basis.
Coverage: All areas of artemisinin resistance (eastern and western borders
of the country, population > 21m), including 1.5 mill ion febrile cases and 23,000 malaria cases between Jan.
and Oct. 2013.
Baseline and imported data Locations of malaria posts
and clinics, hospitals, rubber plantations, and vil lages. Malaria transmission area
types by WHO classification.
PCD case notification Individual patient data (EP 1 form) entered at malaria
clinics within 24 hours, which appear on a case follow-up tablet immediately when Internet access is available.
44
Data include date, facil ity, reporting person, patient info, diagnostic result with method
and foci classification.
Case investigation: One page paper form completed at the time of diagnosis for case
classification and intervention planning. See EP 3 form for data.
44
Interventions: ACD, vector
control, health education in one to three days (in select cases) with data entered as
above. All positive and aggregate negative cases captured. DOT and malaria smears through day 28 in P.
falciparum cases captured at patients’ homes in a GPS-enabled tablet, data are
transmitted immediately.
Automated tables and graphs Tables of cases and malaria
species by: Nationality,
Migrant type (permanent
or temporary), ACD results,
Foci classification,
Patient follow-up table for
monitoring of DOT and parasite clearance/cure to
household level.
Graphs display the above with the ability to select many
options with real-time information.
45
Maps Generic topographic,
health facil ity, household
location, positive case distribution, transmission foci classification.
Pf cases both to household
level and to where case
was acquired.
Reports: Monthly Ministry of Health report and annual
WHO report.
Analytics: As above, tablet-based follow-up form with dates for DOT and resistance
monitoring.
Web-based system,
Mobile technology being
integrated, Integrated data verification
methods,
Implemented in large
regions of Thailand, covering all areas of multi -drug resistance,
Case notification usually in
three hours, always within
24 hours, Interventions usually
implemented within three days,
Captures DOT real-time
with online monitoring possible,
Captures Pf resistance real-
time with online monitoring possible,
Malaria incidence can be
graphed/mapped for any location or user group,
Aggregate refugee data
now being captured, Mapping cases to where
the infection occurred (e.g.
forest sleeping location 10-20 days earlier),
Good potential for large-
scale operations research
Challenges Not open source,
Not linked to HMIS,
No military data,
Hospital-based cases in a
separate system,
Does not capture data from
Southern Thailand, Challenges with migrant
follow-up and cross-border information,
More extensive baseline
data could be captured,
such as intervention coverage and forest sleeping locations,
PCD cases not confirmed
real time, Does not currently capture
time-to-case reporting, interventions or intervention quality,
Stock tracking not part of
the system, Mapping feature not
implemented in all areas.
Next Steps: Expand functionality to include
Mapping everywhere,
Full foci‐case management,
Bed net distribution and
adherence, Insecticide spraying and
Behavior change
communication.
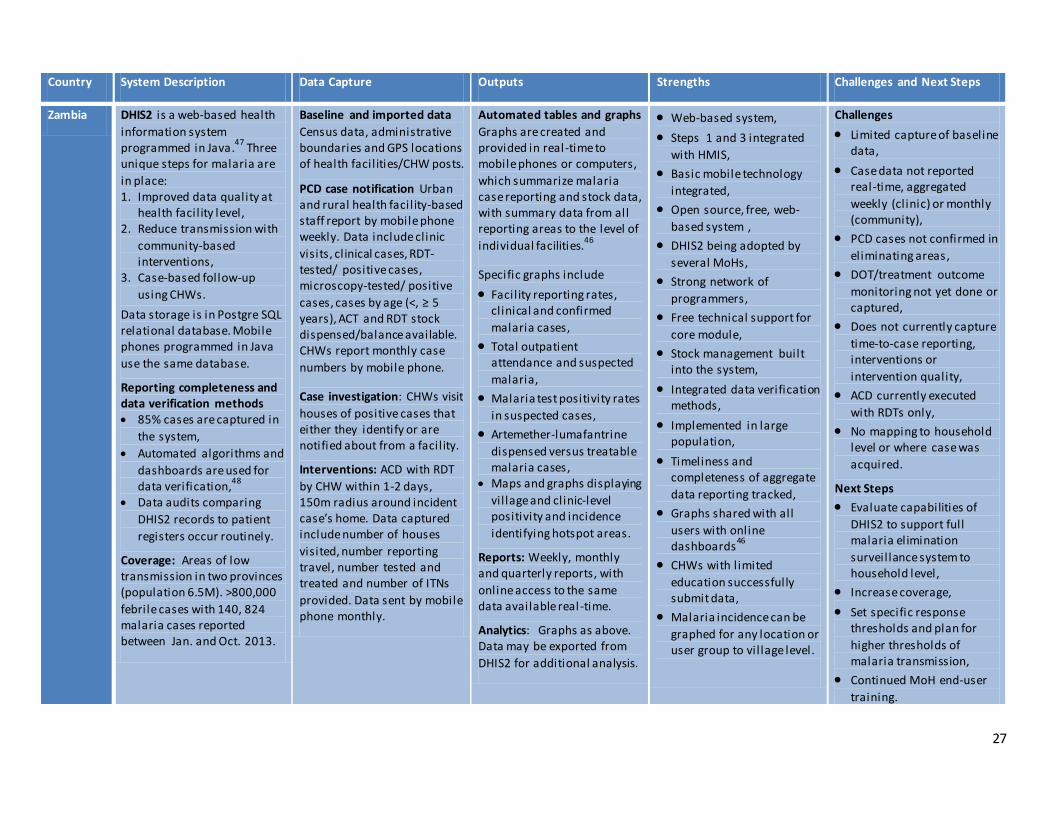
27
Country System Description Data Capture Outputs Strengths Challenges and Next Steps
Zambia DHIS2 is a web-based health
information system programmed in Java.
47 Three
unique steps for malaria are
in place: 1. Improved data quality at
health facil ity level, 2. Reduce transmission with
community-based interventions,
3. Case-based follow-up
using CHWs.
Data storage is in Postgre SQL relational database. Mobile phones programmed in Java
use the same database.
Reporting completeness and data verification methods 85% cases are captured in
the system,
Automated algorithms and
dashboards are used for data verification,
48
Data audits comparing
DHIS2 records to patient
registers occur routinely.
Coverage: Areas of low transmission in two provinces (population 6.5M). >800,000
febrile cases with 140, 824 malaria cases reported between Jan. and Oct. 2013.
Baseline and imported data
Census data, administrative boundaries and GPS locations of health facil ities/CHW posts.
PCD case notification Urban and rural health facil ity-based staff report by mobile phone weekly. Data include clinic
visits, clinical cases, RDT-tested/ positive cases, microscopy-tested/ positive
cases, cases by age (<, ≥ 5 years), ACT and RDT stock dispensed/balance available. CHWs report monthly case
numbers by mobile phone.
Case investigation: CHWs visit
houses of positive cases that either they identify or are notified about from a facil ity.
Interventions: ACD with RDT
by CHW within 1-2 days, 150m radius around incident case’s home. Data captured include number of houses
visited, number reporting travel, number tested and treated and number of ITNs
provided. Data sent by mobile phone monthly.
Automated tables and graphs
Graphs are created and provided in real-time to mobile phones or computers,
which summarize malaria case reporting and stock data, with summary data from all reporting areas to the level of
individual facilities.46
Specific graphs include
Facility reporting rates, clinical and confirmed
malaria cases,
Total outpatient attendance and suspected
malaria,
Malaria test positivity rates
in suspected cases,
Artemether-lumafantrine
dispensed versus treatable malaria cases,
Maps and graphs displaying
vil lage and clinic-level positivity and incidence
identifying hotspot areas.
Reports: Weekly, monthly and quarterly reports, with
online access to the same data available real-time.
Analytics: Graphs as above. Data may be exported from
DHIS2 for additional analysis.
Web-based system,
Steps 1 and 3 integrated
with HMIS,
Basic mobile technology
integrated,
Open source, free, web-
based system ,
DHIS2 being adopted by
several MoHs,
Strong network of
programmers,
Free technical support for
core module,
Stock management built into the system,
Integrated data verification methods,
Implemented in large population,
Timeliness and completeness of aggregate
data reporting tracked,
Graphs shared with all
users with online dashboards
46
CHWs with l imited
education successfully submit data,
Malaria incidence can be
graphed for any location or user group to vil lage level.
Challenges
Limited capture of baseline data,
Case data not reported real-time, aggregated
weekly (clinic) or monthly (community),
PCD cases not confirmed in
eliminating areas,
DOT/treatment outcome
monitoring not yet done or captured,
Does not currently capture
time-to-case reporting, interventions or
intervention quality,
ACD currently executed
with RDTs only,
No mapping to household level or where case was
acquired.
Next Steps
Evaluate capabilities of
DHIS2 to support full malaria elimination
surveillance system to household level,
Increase coverage,
Set specific response thresholds and plan for
higher thresholds of malaria transmission,
Continued MoH end-user
training.
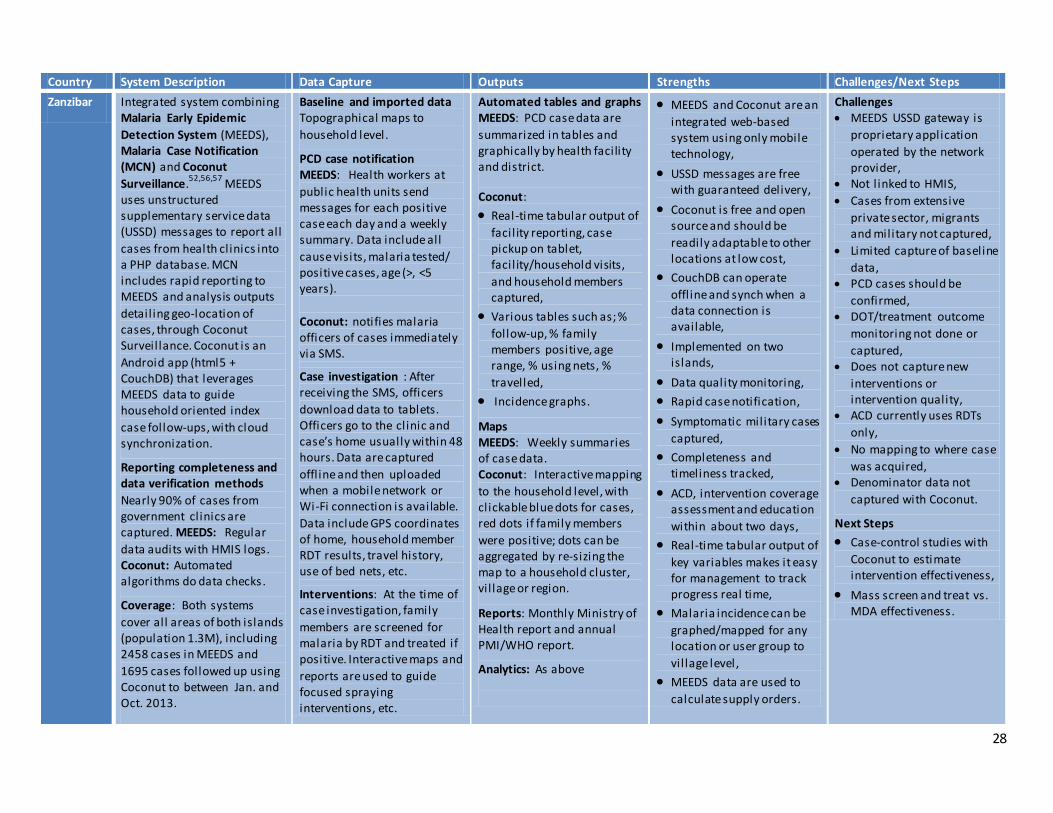
28
Country System Description Data Capture Outputs Strengths Challenges/Next Steps
Zanzibar Integrated system combining Malaria Early Epidemic
Detection System (MEEDS), Malaria Case Notification (MCN) and Coconut
Surveillance.52,56,57
MEEDS uses unstructured supplementary service data (USSD) messages to report all
cases from health clinics into a PHP database. MCN includes rapid reporting to MEEDS and analysis outputs
detail ing geo-location of cases, through Coconut Surveillance. Coconut is an
Android app (html5 + CouchDB) that leverages MEEDS data to guide household oriented index
case follow-ups, with cloud synchronization.
Reporting completeness and data verification methods
Nearly 90% of cases from government clinics are captured. MEEDS: Regular
data audits with HMIS logs. Coconut: Automated algorithms do data checks.
Coverage: Both systems
cover all areas of both islands (population 1.3M), including 2458 cases in MEEDS and
1695 cases followed up using Coconut to between Jan. and Oct. 2013.
Baseline and imported data Topographical maps to
household level.
1) PCD case notification 2) MEEDS: Health workers at
public health units send messages for each positive case each day and a weekly summary. Data include all
cause visits, malaria tested/ positive cases, age (>, <5 years).
3)
4) Coconut: notifies malaria officers of cases immediately via SMS.
5)
6) Case investigation : After receiving the SMS, officers
download data to tablets. Officers go to the clinic and case’s home usually within 48 hours. Data are captured
offline and then uploaded when a mobile network or Wi-Fi connection is available.
Data include GPS coordinates of home, household member RDT results, travel history, use of bed nets, etc.
7)
8) Interventions: At the time of case investigation, family
members are screened for malaria by RDT and treated if positive. Interactive maps and
reports are used to guide focused spraying interventions, etc.
Automated tables and graphs MEEDS: PCD case data are
summarized in tables and graphically by health facility and district.
Coconut:
Real-time tabular output of
facil ity reporting, case pickup on tablet, facil ity/household visits,
and household members captured,
Various tables such as; %
follow-up, % family members positive, age range, % using nets, %
travelled,
Incidence graphs.
Maps MEEDS: Weekly summaries of case data. Coconut: Interactive mapping
to the household level, with clickable blue dots for cases, red dots if family members
were positive; dots can be aggregated by re-sizing the map to a household cluster, vil lage or region.
Reports: Monthly Ministry of Health report and annual PMI/WHO report.
Analytics: As above
MEEDS and Coconut are an
integrated web-based system using only mobile technology,
USSD messages are free with guaranteed delivery,
Coconut is free and open source and should be
readily adaptable to other locations at low cost,
CouchDB can operate
offl ine and synch when a data connection is available,
Implemented on two islands,
Data quality monitoring,
Rapid case notification,
Symptomatic military cases
captured,
Completeness and timeliness tracked,
ACD, intervention coverage assessment and education
within about two days,
Real-time tabular output of
key variables makes it easy for management to track progress real time,
Malaria incidence can be
graphed/mapped for any location or user group to
vil lage level,
MEEDS data are used to
calculate supply orders.
Challenges MEEDS USSD gateway is
proprietary application
operated by the network provider,
Not linked to HMIS,
Cases from extensive
private sector, migrants and military not captured,
Limited capture of baseline
data, PCD cases should be
confirmed, DOT/treatment outcome
monitoring not done or
captured, Does not capture new
interventions or intervention quality,
ACD currently uses RDTs
only,
No mapping to where case
was acquired, Denominator data not
captured with Coconut.
Next Steps
Case-control studies with
Coconut to estimate intervention effectiveness,
Mass screen and treat vs. MDA effectiveness.
29
References
1 Feachem RG, Phillips AA, Targett GA, Snow RW. Call to action: priorities for malaria elimination. The Lancet 6; 376: 1517–21.
2 Tanner M, de Savigny D. Malaria eradication back on the table. Bull World Health Organ 2008; 86: 82.
3 Alonso PL, Brown G, Arevalo-Herrera M, et al. A research agenda to underpin malaria eradication. PLoS Med 2011; 8: e1000406.
4 Hay SI, Smith DL, Snow RW. Measuring malaria endemicity from intense to interrupted transmission. Lancet Infect Dis 2008; 8: 369–78.
5 Nájera JA, González-Silva M, Alonso PL. Some Lessons for the Future from the Global Malaria Eradication Programme (1955–1969). PLoS Med 2011; 8: e1000412.
6 The malERA Consultative Group on Monitoring E. A Research Agenda for Malaria Eradication: Monitoring, Evaluation, and Surveillance. PLoS Med 2011; 8: e1000400.
7 Kelly GC, Tanner M, Vallely A, Clements A. Malaria elimination: moving forward with spatial decision support systems. Trends Parasitol 2012; 28: 297–304.
8 Forgionne GA, Gupta JND, Mora M, editors. Decision-Making Support Systems: Achievements and Challenges for the New Decade. , IGI Global, 2002http://www.igi-global.com/book/decision-making-support-systems/243 (accessed 23 Sep2013).
9 M’ikanatha NM, Lynfield R, Julian KG, Van Beneden CA, Valk H de. Infectious disease surveillance: a cornerstone for prevention and control. In: M’ikanatha NM, Lynfield R, Beneden CAV, Valk H de, eds. Infectious Disease Surveillance. , John Wiley & Sons Ltd, 2013: 1–20.
10 World Health Organization, Global Malaria Programme. Disease surveillance for malaria elimination an operational manual. Geneva, World Health Organization, 2012.
11 Zanzibar Malaria Control Program. Zanzibar Malaria Epidemic Early Detection System: Biannual Report - 2011. Zanzibar, Tanzania, 2011.
12 Malaria Consoritum, Cambodian Malaria Control Program, World Health Organization. Moving Towards Malaria Elimination: Tools for Strengthening Malaria Surveillance in Cambodia. http://www.malariaconsortium.org/userfiles/file/Resistance-Resources/Surveillance%20Tools%20-%20Moving%20Towards%20Malaria%20Elimination.pdf (accessed 25 Sep2013).
13 McCombie SC. Treatment seeking for malaria: A review of recent research. Soc Sci Med 1996; 43: 933–45.
14 Mwenesi H, Harpham T, Snow RW. Child malaria treatment practices among mothers in Kenya. Soc Sci Med 1995; 40: 1271–7.
15 Moonen B, Cohen JM, Snow RW, et al. Operational strategies to achieve and maintain malaria elimination. The Lancet 6; 376: 1592–603.
30
16 Novotny J. Swaziland Malaria Elimination Update 2012 - 2013. 2013.
17 Qi G. 1, 3, 7 New Malaria Elimination Strategy Implementation in China. .
18 TANZANIA_Final_ADDO.pdf. http://projects.msh.org/seam/reports/TANZANIA_Final_ADDO.pdf (accessed 6 Dec2013).
19 Deshpande J, Ram M, Durrani S, Wenger J. Detecting polio through surveillance for acute flaccid paralysis (AFP). J Indian Med Assoc 2005; 103: 671–5.
20 Sahal N, Reintjes R, Aro AR. Review Article: Communicable diseases surveillance lessons learned from developed and developing countries: Literature review. Scand J Public Health 2009; 37: 187–200.
21 Sean Murphy. Military health engagement--lest we forget. [Mil Med. 2011] - PubMed - NCBI. Mil Med 2011; 9: 176.
22 Sanders K, Rundi C, Jelip J, Rashman Y, Smith-Gueye C, Gosling R. Eliminating Malaria: the Role of Private-Public Partnerships in Sabah, Malaysia. 2013.
23 WHO | Immunization surveillance, assessment and monitoring. WHO. http://www.who.int/immunization/monitoring_surveillance/en/ (accessed 5 Dec2013).
24 Harris BN, Dürrheim DN, Ogunbanjo GA. Polio eradication – the validity of surveillance indicators. Trop Med Int Health 2003; 8: 386–91.
25 Kaneko A, Chaves LF, Taleo G, et al. Characteristic Age Distribution of Plasmodium vivax Infections after Malaria Elimination on Aneityum Island, Vanuatu. Infect Immun 2014; 82: 243–52.
26 Fio Corporation. http://www.fio.com/ (accessed 11 Sep2013).
27 Van Beneden CA, Arvay M, Thamthitiwat S, Lynfield R. Active, population-based surveillance for infectious diseases. In: M’ikanatha NM, Lynfield R, Beneden CAV, Valk H de, eds. Infectious Disease Surveillance. , John Wiley & Sons Ltd, 2013: 93–108.
28 Breman JG, Alilio MS, Mills A, Breman JG, Alilio MS. Conquering the intolerable burden of malaria: what’s new, what’s needed: a summary. 2004.http://www.ncbi.nlm.nih.gov/books/NBK3750/ (accessed 12 Aug2013).
29 Zhou X-N, Bergquist R, Tanner M. Elimination of tropical disease through surveillance and response. Infect Dis Poverty 2013; 2: 1.
30 Khosa E, Kuonza LR, Kruger P, Maimela E. Towards the elimination of malaria in South Africa: a review of surveillance data in Mutale Municipality, Limpopo Province, 2005 to 2010. Malar J 2013; 12: 7.
31 Kelly GC, Hale E, Donald W, et al. A high-resolution geospatial surveillance-response system for malaria elimination in Solomon Islands and Vanuatu. Malar J 2013; 12: 108.
32 Cohen JM, Dlamini S, Novotny JM, Kandula D, Kunene S, Tatem AJ. Rapid case -based mapping of seasonal malaria transmission risk for strategic elimination planning in Swaziland. Malar J 2013; 12: 61.
31
33 Clinton Health Access Initiative. Malaria Elimination in Haiti. 2013.
34 Bousema T, Griffin JT, Sauerwein RW, et al. Hitting Hotspots: Spatial Targeting of Malaria for Control and Elimination. PLoS Med 2012; 9: e1001165.
35 Clements AC, Reid HL, Kelly GC, Hay SI. Further shrinking the malaria map: how can geospatial science help to achieve malaria elimination? Lancet Infect Dis 2013; 13: 709–18.
36 The Roll Back Malaria Partnership. Eliminating malaria: learning from the past, looking ahead. Geneva, World Health Organization, 2011.
37 WHO | Malaria programme reviews: a manual for reviewing the performance of malaria control and elimination programmes. WHO. http://www.who.int/malaria/publications/atoz/whomprmalariaprogramperformancemanual/en/ (accessed 27 Sep2013).
38 WHO | Malaria case management: operations manual. WHO. http://www.who.int/malaria/publications/atoz/9789241598088/en/ (accessed 27 Sep2013).
39 Ministry of Health and Medical Services. Solomon Islands Malaria Programme Performance Review. 2013.
40 Chanda E, Mukonka VM, Mthembu D, Kamuliwo M, Coetzer S, Shinondo CJ. Using a geographical -information-system-based decision support to enhance malaria vector control in Zambia. J Trop Med 2012; 2012.http://www.hindawi.com/journals/jtm/2012/363520/abs/ (accessed 15 Sep2013).
41 Mellor S. Making Malaria History. , Malaria Consotrium, 2013http://www.makingmalariahistory.org/toolkit_author/mellor-s/ (accessed 26 Jan2014).
42 Cambodia’s National Centre for Parasitology, Entomology and Malaria Control. Cambodia Malaria Bulletin Jan-Jun 2013. 2013.http://www.cnm.gov.kh/userfiles/file/Buletin/Malaria%20Bulletin%20Jan-Jun%202013_23Jul2013.pdf (accessed 3 Jan2014).
43 Kelly GC, Hii J, Batarii W, et al. Modern geographical reconnaissance of target populations in malaria elimination zones. Malar J 2010; 9: 289.
44 Thailand Bureau of Vector-borne Disease. National Monitoring and Evaluation Plan for Malaria Control and Elimination in Thailand, 2011 - 2016. 2010.1. http://whothailand.healthrepository.org/bitstream/123456789/1443/1/Thailand%20Malaria%20Plan.pdf (accessed 3 Jan2014).
45 Biophics, Thailand Malaria Control and Elimination Program. Thailand - The Single Stream Funding Malaria. Single Stream Funding - Malar. http://www.biophics.org/malariaR10/ (accessed 3 Jan2014).
46 Zambia Ministry of Health. Zambia DHIS2 Rapid Reporting Web Dashboard. http://dhis.co.zm/R/dash?&organisationunitid=3829 (accessed 3 Jan2014).
47 DHIS2. http://www.dhis2.org/ (accessed 3 Jan2014).
32
48 Littrell M, Miller JM, Ndhlovu M, et al. Documenting malaria case management coverage in Zambia: a systems effectiveness approach. Malar J 2013; 12: 371.
49 Nyeletsa Malaria. Final Report on the Malaria Early Epidemic Detection System (MEEDS) Pilot Project in Chobe District, Botwana. Botswana, Ministry of Health, Republic of Botswana, 2012.
50 MEEDS Tanzania and MCN. 2012.
51 RTI. Malaria Surveillance - Coconut Surveillance. ICT Edge. http://ictedge.org/coconut-surveillance (accessed 3 Jan2014).
52 Coconut Surveillance. , 2013http://www.youtube.com/watch?v=woIKGWmrQPU&feature=youtube_gdata_player (accessed 3 Jan2014).
53 WHO | FluID - a global influenza epidemiological data sharing platform. WHO. http://www.who.int/influenza/surveillance_monitoring/fluid/en/ (accessed 8 Oct2013).
54 Ohrt C, Mirabelli-Primdahl L, Looareesuwan S, Wilairatana P, Walsh D, Kain KC. Determination of Failure of Treatment of Plasmodium falciparum Infection by Using Polymerase Chain Reaction Single-Strand Conformational Polymorphism Fingerprinting. Clin Infect Dis 1999; 28: 847–52.
55 Hsiang MS, Hwang J, Kunene S, et al. Surveillance for malaria elimination in Swaziland: a national cross-sectional study using pooled PCR and serology. PloS One 2012; 7: e29550.
56 RTI. Malaria Detection in Zanzibar. ICT Edge. http://www.ictedge.org/meeds (accessed 1 Apr2014).
57 Use of Technology in Malaria Prevention and Control Activities | USAID Impact. http://blog.usaid.gov/2013/05/use-of-technology-in-malaria-prevention-and-control-activities/ (accessed 3 Jan2014).
Related Documents