RESEARCH ARTICLE Surmising synchrony of sound and sight: Factors explaining variance of audiovisual integration in hurdling, tap dancing and drumming Nina Heins ID 1,2☯ , Jennifer Pomp ID 1,2☯ , Daniel S. Kluger ID 2,3 , Stefan Vinbru ¨x 4 , Ima Trempler 1,2 , Axel Kohler 2 , Katja Kornysheva 5 , Karen Zentgraf 6 , Markus Raab 7,8 , Ricarda I. Schubotz ID 1,2 * 1 Department of Psychology, University of Muenster, Muenster, Germany, 2 Otto Creutzfeldt Center for Cognitive and Behavioral Neuroscience, University of Muenster, Muenster, Germany, 3 Institute for Biomagnetism and Biosignal Analysis, University Hospital Muenster, Muenster, Germany, 4 Institute of Sport and Exercise Sciences, Human Performance and Training, University of Muenster, Muenster, Germany, 5 School of Psychology and Bangor Neuroimaging Unit, Bangor University, Wales, United Kingdom, 6 Department of Movement Science and Training in Sports, Institute of Sport Sciences, Goethe University Frankfurt, Frankfurt, Germany, 7 Institute of Psychology, German Sport University Cologne, Cologne, Germany, 8 School of Applied Sciences, London South Bank University, London, United Kingdom ☯ These authors contributed equally to this work. * [email protected] Abstract Auditory and visual percepts are integrated even when they are not perfectly temporally aligned with each other, especially when the visual signal precedes the auditory signal. This window of temporal integration for asynchronous audiovisual stimuli is relatively well exam- ined in the case of speech, while other natural action-induced sounds have been widely neglected. Here, we studied the detection of audiovisual asynchrony in three different whole-body actions with natural action-induced sounds–hurdling, tap dancing and drum- ming. In Study 1, we examined whether audiovisual asynchrony detection, assessed by a simultaneity judgment task, differs as a function of sound production intentionality. Based on previous findings, we expected that auditory and visual signals should be integrated over a wider temporal window for actions creating sounds intentionally (tap dancing), compared to actions creating sounds incidentally (hurdling). While percentages of perceived synchrony differed in the expected way, we identified two further factors, namely high event density and low rhythmicity, to induce higher synchrony ratings as well. Therefore, we systemati- cally varied event density and rhythmicity in Study 2, this time using drumming stimuli to exert full control over these variables, and the same simultaneity judgment tasks. Results suggest that high event density leads to a bias to integrate rather than segregate auditory and visual signals, even at relatively large asynchronies. Rhythmicity had a similar, albeit weaker effect, when event density was low. Our findings demonstrate that shorter asynchro- nies and visual-first asynchronies lead to higher synchrony ratings of whole-body action, pointing to clear parallels with audiovisual integration in speech perception. Overconfidence in the naturally expected, that is, synchrony of sound and sight, was stronger for intentional PLOS ONE PLOS ONE | https://doi.org/10.1371/journal.pone.0253130 July 22, 2021 1 / 23 a1111111111 a1111111111 a1111111111 a1111111111 a1111111111 OPEN ACCESS Citation: Heins N, Pomp J, Kluger DS, Vinbru ¨x S, Trempler I, Kohler A, et al. (2021) Surmising synchrony of sound and sight: Factors explaining variance of audiovisual integration in hurdling, tap dancing and drumming. PLoS ONE 16(7): e0253130. https://doi.org/10.1371/journal. pone.0253130 Editor: Alice Mado Proverbio, University of Milano- Bicocca, ITALY Received: October 2, 2020 Accepted: May 31, 2021 Published: July 22, 2021 Peer Review History: PLOS recognizes the benefits of transparency in the peer review process; therefore, we enable the publication of all of the content of peer review and author responses alongside final, published articles. The editorial history of this article is available here: https://doi.org/10.1371/journal.pone.0253130 Copyright: © 2021 Heins et al. This is an open access article distributed under the terms of the Creative Commons Attribution License, which permits unrestricted use, distribution, and reproduction in any medium, provided the original author and source are credited. Data Availability Statement: All files are available from the OSF database: Schubotz, Ricarda. 2020. “AVIA - Audiovisual Integration in Hurdling, Tap

Welcome message from author
This document is posted to help you gain knowledge. Please leave a comment to let me know what you think about it! Share it to your friends and learn new things together.
Transcript

RESEARCH ARTICLE
Surmising synchrony of sound and sight:
Factors explaining variance of audiovisual
integration in hurdling, tap dancing and
drumming
Nina HeinsID1,2☯, Jennifer PompID
1,2☯, Daniel S. KlugerID2,3, Stefan Vinbrux4,
Ima Trempler1,2, Axel Kohler2, Katja Kornysheva5, Karen Zentgraf6, Markus Raab7,8,
Ricarda I. SchubotzID1,2*
1 Department of Psychology, University of Muenster, Muenster, Germany, 2 Otto Creutzfeldt Center for
Cognitive and Behavioral Neuroscience, University of Muenster, Muenster, Germany, 3 Institute for
Biomagnetism and Biosignal Analysis, University Hospital Muenster, Muenster, Germany, 4 Institute of Sport
and Exercise Sciences, Human Performance and Training, University of Muenster, Muenster, Germany,
5 School of Psychology and Bangor Neuroimaging Unit, Bangor University, Wales, United Kingdom,
6 Department of Movement Science and Training in Sports, Institute of Sport Sciences, Goethe University
Frankfurt, Frankfurt, Germany, 7 Institute of Psychology, German Sport University Cologne, Cologne,
Germany, 8 School of Applied Sciences, London South Bank University, London, United Kingdom
☯ These authors contributed equally to this work.
Abstract
Auditory and visual percepts are integrated even when they are not perfectly temporally
aligned with each other, especially when the visual signal precedes the auditory signal. This
window of temporal integration for asynchronous audiovisual stimuli is relatively well exam-
ined in the case of speech, while other natural action-induced sounds have been widely
neglected. Here, we studied the detection of audiovisual asynchrony in three different
whole-body actions with natural action-induced sounds–hurdling, tap dancing and drum-
ming. In Study 1, we examined whether audiovisual asynchrony detection, assessed by a
simultaneity judgment task, differs as a function of sound production intentionality. Based on
previous findings, we expected that auditory and visual signals should be integrated over a
wider temporal window for actions creating sounds intentionally (tap dancing), compared to
actions creating sounds incidentally (hurdling). While percentages of perceived synchrony
differed in the expected way, we identified two further factors, namely high event density
and low rhythmicity, to induce higher synchrony ratings as well. Therefore, we systemati-
cally varied event density and rhythmicity in Study 2, this time using drumming stimuli to
exert full control over these variables, and the same simultaneity judgment tasks. Results
suggest that high event density leads to a bias to integrate rather than segregate auditory
and visual signals, even at relatively large asynchronies. Rhythmicity had a similar, albeit
weaker effect, when event density was low. Our findings demonstrate that shorter asynchro-
nies and visual-first asynchronies lead to higher synchrony ratings of whole-body action,
pointing to clear parallels with audiovisual integration in speech perception. Overconfidence
in the naturally expected, that is, synchrony of sound and sight, was stronger for intentional
PLOS ONE
PLOS ONE | https://doi.org/10.1371/journal.pone.0253130 July 22, 2021 1 / 23
a1111111111
a1111111111
a1111111111
a1111111111
a1111111111
OPEN ACCESS
Citation: Heins N, Pomp J, Kluger DS, Vinbrux S,
Trempler I, Kohler A, et al. (2021) Surmising
synchrony of sound and sight: Factors explaining
variance of audiovisual integration in hurdling, tap
dancing and drumming. PLoS ONE 16(7):
e0253130. https://doi.org/10.1371/journal.
pone.0253130
Editor: Alice Mado Proverbio, University of Milano-
Bicocca, ITALY
Received: October 2, 2020
Accepted: May 31, 2021
Published: July 22, 2021
Peer Review History: PLOS recognizes the
benefits of transparency in the peer review
process; therefore, we enable the publication of
all of the content of peer review and author
responses alongside final, published articles. The
editorial history of this article is available here:
https://doi.org/10.1371/journal.pone.0253130
Copyright: © 2021 Heins et al. This is an open
access article distributed under the terms of the
Creative Commons Attribution License, which
permits unrestricted use, distribution, and
reproduction in any medium, provided the original
author and source are credited.
Data Availability Statement: All files are available
from the OSF database: Schubotz, Ricarda. 2020.
“AVIA - Audiovisual Integration in Hurdling, Tap

(vs. incidental) sound production and for movements with high (vs. low) rhythmicity, presum-
ably because both encourage predictive processes. In contrast, high event density appears
to increase synchronicity judgments simply because it makes the detection of audiovisual
asynchrony more difficult. More studies using real-life audiovisual stimuli with varying event
densities and rhythmicities are needed to fully uncover the general mechanisms of audiovi-
sual integration.
Introduction
From simple percepts like the ticking of a clock to complex stimuli like a song played on a gui-
tar–in our physical world we usually perceive visual and auditory components alongside each
other. The multisensory nature of our world has many advantages–it increases the reliability of
sensory signals [1] and helps us navigate noisy environments, e.g. when one of the senses is
compromised [2]. On the other hand, multimodality poses a challenge to our brains. Percepts
from different senses have to be monitored to decide whether they belong to the same event
and have to be integrated or segregated.
The impression of unity, i.e. the feeling that percepts belong to the same event, depends on
many factors [3], one of them being the temporal coincidence of stimuli. For instance, we usu-
ally perceive visual and auditory speech as occurring at the same time, although these signals
differ both in their neural processing time (10 ms for auditory signals vs. 50 ms for visual sig-
nals) and their physical “travel time” (330 m/sec for auditory signals, 300.000.000 m/sec for
visual signals). Indeed, there seems to be a temporal window for the integration of audiovisual
signals (temporal binding window: e.g. [2, 4]. Although the much cited notion that visual
speech naturally leads auditory speech [5] has been recently revised [6], the temporal binding
window seems to favor the visual channel leading the auditory channel. This is reflected in
audio-first asynchronies (where the auditory signal leads the visual signal) being detected at
smaller delays than visual-first asynchronies (where the visual signal leads the auditory signal:
e.g. [7]. Also, the so-called McGurk effect—an illusion where the perception of an visual
speech component and a different auditory speech component leads to the perception of a
third auditory component [8]—is prevalent for larger visual-first than audio-first asynchronies
[2]. This effect is suggested to show that visual speech acts as a predictor for auditory speech
[9]. Visual speech aids auditory speech recognition even when visual and auditory signals are
asynchronous, up to the boundaries of the temporal binding window [10]. Consequently, a
coherent perception can be maintained for relatively large temporal asynchronies [7].
Although generally asymmetric, the width of temporal binding windows depends on differ-
ent stimulus properties. For instance, this width seems to be up to five times wider for speech
signals compared to simple flash and beep stimuli [11], more symmetrical for speech [12] and
generally wider for more complex stimuli [4]. Experience seems to shape the width of the tem-
poral binding window as well: Musicians have narrower temporal binding windows [13] and
the window can be widened when participants are continuously presented with asynchronous
stimuli [11, 14].
Notably, research on the audiovisual perception has so far focused on speech [2, 9, 15, 16],
whereas other types of stimuli have been largely neglected [17]. There are only a few studies
looking at the audiovisual perception of musical stimuli [18–20] and object-directed actions,
e.g. a hammer hitting a peg [21], a soda can being crashed [22], hand claps and spoon taps
[23], and a chess playing sequence [24]. These studies mostly find that non-speech sounds
PLOS ONE Audiovisual integration in hurdling, tap dancing and drumming
PLOS ONE | https://doi.org/10.1371/journal.pone.0253130 July 22, 2021 2 / 23
Dancing and Drumming.” OSF. October 2. osf.io/
ksma6. " The DOI is 10.17605/OSF.IO/KSMA6.
Funding: Author: RIS; Grant number: SCHU1439/
4-2; Name of funder: German Research Foundation
(DFG, Deutsche Forschungsgemeinschaft); URL:
https://www.dfg.de/en/index.jsp. The funders had
no role in study design, data collection and
analysis, decision to publish, or preparation of the
manuscript.
Competing interests: The authors have declared
that no competing interests exist.

have a narrower temporal binding window than speech, i.e. asynchronies are detected at
smaller temporal delays. This is explained by the more predictable moments of impact [24]
which is also in line with a better asynchrony detection for the more visually salient bilabial
speech syllables [25].
Although audiovisual integration of our own and other people’s actions is omnipresent in
our everyday life the same way speech is, it is not nearly as well explored. It is an open issue
whether effects that have been observed for the audiovisual integration in language and music
generalize to the breadth of self-generated sounds we are familiar with [17]. Also, aberrant
audiovisual integration in psychiatric diseases [26] and neurological impairments [27] may
well apply beyond speech and music, and thus affect the perception and control of own action.
To fully understand audiovisual integration, we need to consider this phenomenon in its entire
range, from human-specific speech and music to sounds that we, as all animals, generate just
by moving and contacting the environment.
The two studies we present here were motivated by the observation that speech and music
are both actions that generate sounds intentionally. Moreover, both speech and musical sounds
score particularly high on two further properties: event density and rhythmicity. Therefore, in
order to examine the potential generalizability of audiovisual integration from these domains to
other natural sound-inducing actions, we were interested to find out whether incidentally
action-induced sounds would show comparable patterns of audiovisual integration as inten-
tionally action-induced sounds (Study 1); and whether audiovisual integration is modulated by
variable event density and rhythmicity (Study 2). In two recent fMRI studies, we observed that
brain networks for processing intentionally produced sounds differ from those for incidentally
produced action sounds. Interestingly, rather than triggering higher auditory attention, inten-
tional sound production more so than incidental sound production encouraged predictive pro-
cesses leading to the typical attenuation pattern in primary auditory cortex [28, 29].
Study 1
In the first study, we used two types of non-speech auditory stimuli created by whole-body
actions, namely hurdling and tap dancing. We decided to use two different types of sporting
action that allowed us to study the processing of natural movement sounds in an ecologically
valid context. This also had the particular advantage that the subjects’ attention was not
directed in any direction, since we created a completely natural perceptual situation. We
applied a total of eight different asynchronies (ranging from a 400 ms lead of the auditory
track to a 400 ms lead of the visual track) and a synchronous condition with a simultaneity
judgment task. In addition to using new, more ecologically valid stimuli, we examined the
influence of intentionality of sound generation. We have the intention to generate sounds by a
tap dancing action (just like speaking, or playing a musical instrument, etc.), while sounds gen-
erated by a hurdling action (or by placing a chess piece on the board, for instance) are rather
an incidental by-product of the action. Based on a previous study [28], demonstrating that the
cerebral and behavioral processing of action-induced sounds significantly differs for inten-
tionally and incidentally generated sounds, perceived audiovisual synchrony of tap dancing
stimuli may yield similar effects as speech stimuli, and hurdling similar effects as object-
directed actions.
Accordingly, we set out to test the following specific hypotheses: We expected shorter asyn-
chronies to be generally perceived as synchronous more often than longer asynchronies
(Hypothesis 1). Additionally, we expected visual-first asynchronies to be perceived as synchro-
nous more often than corresponding audio-first asynchronies in both types of action (Hypoth-
esis 2). Moreover, suggesting that tap dancing is comparable to speech production in having a
PLOS ONE Audiovisual integration in hurdling, tap dancing and drumming
PLOS ONE | https://doi.org/10.1371/journal.pone.0253130 July 22, 2021 3 / 23

larger temporal binding window than incidentally produced action sounds, we expected that
this synchrony bias vanishes for the longer delays in hurdling but still persists for tap dancing
(Hypothesis 3). This should manifest in significant differences between visual-first and audio-
first delays in the larger delay types (i.e. 320–400 ms) in tap dancing, but not in hurdling.
Materials and methods–Study 1
Participants
The sample consisted of 22 participants (12 males, 10 females) with an age range from 20 to 32
years (M = 23.9, SD = 2.9), including only right-handers. We recruited only participants who
never had a training in tap dancing or hurdling. Participants signed an informed consent
explaining the procedure of the experiment and the anonymity of the collected data. Partici-
pants studying psychology received course credit for their participation. The study was
approved by the Local Ethics Committee at the University of Munster, Germany, in accor-
dance with the Declaration of Helsinki.
Stimuli
The stimuli used in this study stem from a previous fMRI study [28] and consisted of point-
light displays (PLDs) of hurdling and tap dancing with their matching sounds (Fig 1A; see also
Fig 1. Stimuli and task. Screenshots of the stimuli used in (A.) Study 1 and (B.) Study 2. The lower panel (C.) shows a
schema of the trial and required responses. Participants were presented with videos showing PLDs of hurdling, tap
dancing, or drumming. Subsequently, they were asked to judge, in a dual forced choice setting, whether the
audiovisual presentation was synchronous or not. In case of a negative decision, participants had to furthermore judge
whether sound was leading video or vice versa.
https://doi.org/10.1371/journal.pone.0253130.g001
PLOS ONE Audiovisual integration in hurdling, tap dancing and drumming
PLOS ONE | https://doi.org/10.1371/journal.pone.0253130 July 22, 2021 4 / 23

Supplementary Material for exemplary videos). Note that tap dancing and hurdling share a
basic property, that is, all sounds generated by these actions are caused by foot-ground contact.
Fourteen passive (retroreflective) markers placed symmetrical on the left and the right shoul-
ders, elbows, wrists, hip bones, knees, ankles, and toes (over the second metatarsal head). Nine
optical motion capture cameras (Qualisys opus 400 series) of the Qualisys Motion Capture Sys-
tem (https://www.qualisys.com; Qualisys, Gothenburg, Sweden) were used for kinematic mea-
surements. The sound generated by hurdling was recorded using in-ear microphones (Sound-
man OKM Classic II) and by a sound recording app on a mobile phone for tap dancing. The
mobile phone was hand-held by a student assistant sitting about one meter behind the tap
dancing participant.
After recording, PLDs were processed using the Qualisys Track Manager software (QTM
2.14), ensuring visibility of all 14 recorded point-light markers during the entire recording
time. Sound data were processed using Reaper v5.28 (Cockos Inc., New York, United States).
In a first step, stimulus intensities of hurdling and tap dancing recordings were normalized
separately. In order to equalize the spectral distributions of both types of recordings, the fre-
quency profiles of hurdling and tap dancing sounds were then captured using the Reaper
plugin Ozone 5 (iZotope Inc, Cambridge, United States). Finally, the difference curve (hur-
dling–tap dancing) was used by the plugin’s match function to adjust the tap dancing spectrum
to the hurdling reference. PLDs and sound were synchronized, and the subsequent videos
were cut using Adobe Premiere Pro CC (Adobe Systems Software, Dublin, Ireland). All videos
had a final duration of 5.12 seconds. Note that we employed the 0 ms lag condition as an
experimental anchor point, being aware that if the observer watched actions from the distance
of the camera there would have been a very slight positive lag of audio of about 14 ms. This
time lag was the same for both the hurdling and tap dancing stimuli, so that no experimental
confound was induced. The final videos had a size of 640x400 pixels, a sampling rate of 25
frames per second and an audio sampling rate of 44 100 Hz. Due to the initial distance between
the hurdling participant and the camera system, the hurdling sounds were audible before cor-
responding PLDs were fully visible. To offset this marked difference between hurdling and tap
dancing stimuli in the visual domain, we employed a visual fade-in and fade-out of 1000 ms
(25 frames) using Adobe Premiere, while the auditory track was presented without fading.
The stimulus set used here consisted of four hurdling and four tap dancing videos, each of
which was presented at nine different “asynchronies” of the sound respective to the PLD (±400 / 320 / 200 / 120 ms, and 0 ms), with negative values indicating that the audio track was
leading the visual track (audio-first) and positive values indicating that the visual track was
leading the audio track (visual-first)), resulting in a total of 72 different stimuli (exemplary vid-
eos are provided in the Supplementary Material). Asynchrony sizes were chosen based on sim-
ilar values used in previous studies (e.g. [22, 24]. Finally, prepared videos had an average
length of 6 s.
A separate set of 40 hurdling and 40 tap dancing videos with a lag of 0 ms (synchronous)
was used to familiarize participants with the synchronous PLDs. All stimuli had a duration of
4000 ms. Videos showed three hurdling transitions for the hurdling stimuli and a short tap
dancing sequence for the tap dancing stimuli.
Acoustic feature extraction: Event density and rhythmicity. Core acoustic features of
the 16 newly recorded drumming videos as well as the 8 original videos from Study 1 were
extracted using the MIRtoolbox (version 1.7.2) for Matlab [30]. The toolbox first computes a
detection curve (amplitude over time) from the audio track of each video. Form this detection
curve, a peak detection algorithm then determines the occurrence of distinct acoustical events
(such as the sound of a single step). The number of distinct events per second quantifies the
event density of a particular recording.
PLOS ONE Audiovisual integration in hurdling, tap dancing and drumming
PLOS ONE | https://doi.org/10.1371/journal.pone.0253130 July 22, 2021 5 / 23

Acoustic events vary in amplitude, with accentuated events being louder than less accentu-
ated ones. Therefore, we computed within-recording variance of the detection curve (normal-
ized by the total number of events) to quantify to what extent each recording contained both
accentuated and less accentuated events (see Fig 2): A recording with equally spaced, clearly
accentuated events was defined as more rhythmic than a recording whose events are more or
less equal in loudness (i.e., with low variation between events). An illustrative example of this
approach is shown in S1 Fig. To allow comparison of rhythmicity across videos (independently
of mean loudness), amplitude variability was computed as the coefficient of amplitude varia-tion, i.e. the standard deviation of amplitude divided by its mean.
Assessment of motion energy (ME). The overall motion energy for hurdling and tap
dancing videos was quantified using Matlab (Version R2019b). For each video, the total
amount of motion was quantified using frame-to-frame difference images for all consecutive
frames of each video. Difference images were binarized, classifying pixels with more than 10
units luminance change as moving and those pixels below 10 units luminance as not moving.
Above-threshold (“moving”) pixels were finally summed up for each video, providing its
motion energy [31]. This approach yielded comparable levels for our experimental conditions,
with a mean motion energy of 1189 for hurdling and 1220 for tap dancing (S2 Fig).
Procedure
The experiment was conducted in a noise-shielded and light-dimmed laboratory. Participants
received a short instruction about the procedure of the experiment and signed the informed
written consent before the experiment started. Participants were seated with a distance of
approximately 75 cm to the computer screen. All stimuli were presented using the Presenta-
tion software (Neurobehavioral Systems Inc., CA). Headphones were used for the presentation
of the auditory stimuli.
The experiment consisted of four blocks. The first block contained synchronous videos (0
ms lag) to familiarize participants with the PLD. To ensure their attention, participants were
Fig 2. Auditory stimulus features, Study 1 and 2. Left panel shows the event density measured in the videos showing hurdling (H), tap dancing
(H) (Study 1) and in the four sub-conditions of the drumming videos implementing combinations of high and low event density (D-, D+) and
high and low rhythmicity (R+, R-) (Study 2). Each dot represents one recording. Right panel shows a measure of rhythmicity for the same set of
recordings, operationalized as the variability of each recording’s amplitude envelope. Amplitude variation is shown as the coefficient of variation,
i.e. the standard deviation of amplitude normalized by mean amplitude.
https://doi.org/10.1371/journal.pone.0253130.g002
PLOS ONE Audiovisual integration in hurdling, tap dancing and drumming
PLOS ONE | https://doi.org/10.1371/journal.pone.0253130 July 22, 2021 6 / 23

engaged in a cover task during this first block: They were asked to rate, by a dual forced-choice
button press (male/female), the assumed gender of the person performing the hurdling or tap
dancing action. There were no hypotheses concerning the gender judgment task and this part
of the study was not analyzed any further.
Three blocks with the experimental task were presented thereafter. Within each of these
blocks, all the 72 stimuli (four hurdling and four tap dancing videos, each with nine different
audiovisual asynchronies) were presented twice, resulting in 144 trials per block and 432 trials
in total. A pseudo-randomization guaranteed that no more than three videos of the same delay
type (audio-first vs. visual-first) were presented in a row to prevent adaptation to one or the
other. Additionally, it was controlled that no more than two videos of the same asynchrony
were presented directly after each other.
A trial schema of the experimental task is given in Fig 1C. After presentation of each video
(4000 ms) participants had to indicate whether they perceived the visual and auditory input as
“synchronous” or “not synchronous”, pressing either the left key (for synchronous) or the
right key (for not synchronous) on the response panel with their left and right index finger. If
they decided that picture and sound were “not synchronous”, there was a follow-up question
concerning the assumed order of the asynchrony (“sound first” or “picture first”, correspond-
ing to the delay types audio-first and visual-first, respectively). We opted for a simultaneity
judgment tasks rather than a temporal order judgment, because simultaneity judgment tasks
are easier to perform for participants and have a higher ecological validity [32]. Responses
were self-paced, but participants were instructed to decide intuitively and as fast as possible. A
1000 ms fixation cross was presented at the middle of the screen before the next video started.
Experimental design
The study employed a three-factorial within-subjects design. The dependent variable was the
percentage of trials perceived as synchronous. Trials with a reaction time above 3000 ms were
discarded from the analyses. The first factor was ACTION with the factor levels hurdling and tapdancing. The different delays were generated by combinations of the factor ASYNCHRONY SIZE
(120 ms, 200 ms, 320 ms, 400 ms) and ASYNCHRONY TYPE (audio-first, visual first). Note that all
delays where the auditory track was leading the visual track were labeled audio-first, while all
delays where the visual track was leading the auditory track were labeled visual-first. For this
analysis, we did not include the 0 ms lag (synchronous) condition, as it could not be assigned
to either the audio-first or the visual-first condition. A 2 x 4 x 2 ANOVA was calculated.
Results—Study 1
Trials with response times that exceeded 3000 ms were excluded from the analyses (470 out of
9504). Mauchly’s test indicated that the assumption of sphericity was violated for ASYNCHRONY
SIZE (Χ2(5) = 14.89, p = .011). Therefore, degrees of freedom were corrected using Greenhouse-
Geisser estimates of sphericity (ε = .72). Behavioral results are depicted in Figs 3 and 4.
The ANOVA revealed a main effect of ASYNCHRONY SIZE (F(2.2,45.3) = 197.96, p< .001). As
expected (Hypothesis 1), trials with the 120 ms asynchrony were rated as synchronous signifi-
cantly more often (M = 68.8%, SD = 11.9%) than trials with the 200 ms asynchrony
(M = 53.4%, SD = 14.0%, t(21) = 8.8, p< .001), which were in turn rated as synchronous more
often than trials with the 320 ms asynchrony (M = 34.0%, SD = 11.8%, t(21) = 13.2, p< .001),
and those were rated as synchronous more often than trials with the 400 ms asynchrony
(M = 29.5%, SD = 8.7%, t(21) = 3.7, p = .001).
The main effect of ASYNCHRONY TYPE was significant as well (F(1,21) = 198.87, p< .001), with
visual-first asynchronies (M = 59.2%, SD = 11.7%) being rated as synchronous significantly
PLOS ONE Audiovisual integration in hurdling, tap dancing and drumming
PLOS ONE | https://doi.org/10.1371/journal.pone.0253130 July 22, 2021 7 / 23

more often than audio-first asynchronies (M = 33.7%, SD = 10.9%), as expected (Hypothesis
2).
Unexpectedly, the main effect of ACTION TYPE was also significant with F(1, 21) = 64.55, p<.001, driven by overall more synchronous ratings in the tap dancing condition (M = 58.9%,
SD = 14.9%) compared to the hurdling condition (M = 34.0%, SD = 10.1%). Note that this
finding motivated Study 2, as outlined below.
In line with Hypothesis 3, the interaction of ASYNCHRONY SIZE, ASYNCHRONY TYPE, and ACTION
TYPE was significant (F(3,63) = 10.51, p< .001). Bonferroni-corrected pairwise post-hoc t-tests
comparing the respective audio-first and visual-first conditions revealed that visual-first condi-
tions in tap dancing were perceived as synchronous more often for the 120 ms asynchrony
(M = 88.0%, SD = 11.30%, M = 49.9%, SD = 19.0%, t(21) = 11.8, p< .001), the 200 ms asyn-
chrony (M = 75.5%, SD = 22.5%, M = 49.4%, SD = 19.8%, t(21) = 6.0, p< .001), the 320 ms
asynchrony (M = 59.5%, SD = 19.8%, M = 44.5%, SD = 18.9%, t(21) = 5.2, p< .001) and the
400 ms asynchrony (M = 60.1%, SD = 16.2%, M = 44.0%, SD = 16.0%, t(21) = 4.4, p = .001). In
hurdling, visual-first conditions were perceived as synchronous more often than their respec-
tive audio-first conditions for the 120 ms asynchrony (M = 91.4%, SD = 10.5%, M = 45.9%,
SD = 23.5%, t(21) = 10.4, p< .001), the 200 ms asynchrony (M = 68.2%, SD = 18.0%,
M = 20.6%, SD = 17.1%, t(21) = 12.6, p< .001), the 320 ms asynchrony (M = 23.1%,
SD = 16.7%, M = 9.1%, SD = 8.7%, t(21) = 4.0, p< .001), but not for the 400 ms asynchrony
(M = 7.7%, SD = 9.7%, M = 6.4%, SD = 8.9%, t(21) = 0.6, p = .588). This was in accordance
with our assumption that the visual-first bias is observed even at very long asynchronies for
tap dancing but vanishes for hurdling.
Furthermore, the interaction of ACTION TYPE and ASYNCHRONY SIZE (F(3,63) = 88.71, p< .001)
and the interaction of ASYNCHRONY SIZE and ASYNCHRONY TYPE (F(3,63) = 51.31, p< .001) were
Fig 3. Main effects of audiovisual (a)synchrony ratings, Study 1. Displayed are the mean percentages of trials perceived as
synchronous, aggregated for the factors asynchrony size, asynchrony type, and action type. Error bars show standard deviations.
Statistically significant differences (p< .001) are marked with asterisks.
https://doi.org/10.1371/journal.pone.0253130.g003
PLOS ONE Audiovisual integration in hurdling, tap dancing and drumming
PLOS ONE | https://doi.org/10.1371/journal.pone.0253130 July 22, 2021 8 / 23

both significant, whereas the interaction of ACTION TYPE and ASYNCHRONY TYPE was not (F(1,21)
= 1.75, p = .20).
Interim discussion—Study 1
A consistent finding over all studies examining audiovisual asynchrony processing is that per-
ceived synchrony rates of visual-first conditions are higher compared to audio-first conditions
Fig 4. Mean percentages of trials perceived as synchronous, Study 1. Asynchronies (in ms) are displayed on the x-axis,
with negative values indicating that the auditory channel preceded the visual channel (audio-first) and positive values
indicating that the visual channel preceded the auditory channel (visual-first). Error bars show standard error of the
mean. The upper panel shows all scores, fanned out for the level combinations of the factors asynchrony size, asynchrony
type, and action type. The lower panel illustrates the significant action x asynchrony size x asynchrony type interaction.
https://doi.org/10.1371/journal.pone.0253130.g004
PLOS ONE Audiovisual integration in hurdling, tap dancing and drumming
PLOS ONE | https://doi.org/10.1371/journal.pone.0253130 July 22, 2021 9 / 23

[11]. Study 1 corroborated this finding for both hurdling and tap dancing stimuli, suggesting
that asynchrony perception does not fundamentally differ for whole-body movements. How-
ever, perceived synchrony of visual-first compared to audio-first asynchronies was found for
larger asynchrony sizes in the tap dancing condition compared to the hurdling condition, as
we expected. That is, in tap dancing, audio-first and visual-first perceived synchrony ratings
were not only significantly different from each other in the smaller delay types (120 ms, 200
ms), but also in the larger ones (320 ms, 400 ms), whereas in the hurdling conditions, the same
difference was found for the 120 ms, 200 ms and 320 ms conditions, but not for the 400 ms
condition. This aligns with our assumption that intentionality of sound production leads to
differences in the perception of tap dancing and hurdling [28]. We suggest this finding to
reflect a wider temporal integration window for our tap dancing condition compared to our
hurdling condition. The same mechanism might be at work whenever the temporal integration
window for language or music are compared to those for object-related action-induced
sounds. For instance, Eg and Behne [24] found a wider temporal integration window for lan-
guage and music than for chess playing.
Our findings suggest that whole-body movement synchrony perception does not princi-
pally differ from other previously examined types of synchrony perception. At the same time,
they also point to differences in synchrony perception depending on the intentionality of the
produced sounds, with intentional sounds generally being perceived as more synchronous
with their visual actions, or having a higher acceptance range, compared to action-induced
sound occurring only incidentally.
These results also suggest diverging effects of audiovisual asynchrony on action perception
and action execution. In the case of action execution, visual-first asynchronies, i.e. temporal
delays of sound, have a disruptive effect on the execution of speaking [33], singing [34] and
playing a musical instrument [35], but not on the execution of hurdling [36]. In the case of
action perception, on the other hand, those same phase shifts are accepted as synchronous
more often in language and music compared to simple object actions [22, 24]. Thus, while
asynchronies seem to disrupt action execution for actions intentionally creating sounds, asyn-
chronies for these actions are usually integrated even for relatively large temporal offsets in
action perception. Considering that self-initiated sounds during action execution are usually
attenuated when compared to externally generated sounds (e.g. [37–40], most likely due to the
fact that they are expected [41], the disruption of action execution through experimentally
induced audiovisual asynchronies might reflect a heightened sensitivity for unexpectedly
delayed sounds in self-performed vs. only observed action.
In sum, Study 1 suggests that characteristics of audiovisual integration in the perception of
speech and music may generalize to other types of intentionally sound-generating actions but
not to those which create sounds rather incidentally.
Unexpectedly, asynchrony was generally more accurately judged for hurdling than for tap
dancing, as reflected by a significant main effect. While this finding does not relativize the
reported evidence for a widened temporal window of integration in tap dancing, as suggested
by the 400 ms lag condition, it motivates the assumption that it was also more difficult to detect
audiovisual asynchrony in tap dancing than in hurdling. Building on these findings in Study 2,
we turned to event density and rhythmicity as factors potentially modulating audiovisual inte-
gration; specifically, we sought to test whether they confound our experimental conditions in
Study 1. As outlined in the Methods section, we performed a Matlab-based acoustic feature
extraction to objectively quantify event density and rhythmicity based on which we conducted
the following two post hoc analyses.
Firstly, tap dancing trials had a higher event density (ranging from 3.19 to 4.18; M = 3.74
Hz, SD = .41) compared to hurdling trials (ranging from 2.19 to 2.99; M = 2.69 Hz, SD = .35;
PLOS ONE Audiovisual integration in hurdling, tap dancing and drumming
PLOS ONE | https://doi.org/10.1371/journal.pone.0253130 July 22, 2021 10 / 23
Mann-Whitney-U-test: U = 0.00, exact p = .029). Event density, i.e. the number of distinguish-
able auditory sounds occurring per second, or the frequency of distinct events has an influence
on the detection performance of audiovisual asynchrony. Visual speech, for example, is inte-
grated roughly at the syllable rate of 4–5 Hz [2, 42, 43]. Temporal frequencies above 4 Hz seem
to be difficult to rate in terms of their (a)synchrony [44]. In light of these findings, we post-hoc
investigated the effect of event density on synchronicity judgments. To this end, we included
EVENT DENSITY as ordinal variable to replace ACTION TYPE in our original ANOVA. This analysis
showed a main effect of EVENT DENSITY (F(2.9,61.8) = 71.64, p< .001, Greenhouse-Geisser cor-
rected; χ2(14) = 40.60, p< .001, ε = .59), which could mirror our reported main effect of
ACTION TYPE. Bonferroni-corrected post-hoc pairwise comparisons of the event density levels
showed that differences in performance levels, however, did not mirror the separation point
between actions. Instead, no difference in performance was found between the four hurdling
videos and one tap dancing video (all p� .52), which were all lower in performance than the
three tap dancing videos with the highest event densities (all p< .001), while the video with
the highest event density again significantly differed from all others (all p< .001). To see
whether EVENT DENSITY fully explains the original effect of ACTION TYPE, we calculated another
ANOVA including ACTION TYPE and EVENT DENSITY (as ordinal variable within an action) as well
as ASYNCHRONY TYPE and ASYNCHRONY SIZE. Here, we found significant main effects of both EVENT
DENSITY (F(2,42) = 71.09, p< .001) and ACTION TYPE (F(1,21) = 74.26, p< .001) as well as their
interaction (F(2,42) = 68.69, p< .001). These findings suggested that higher synchronicity rat-
ings of tap dancing (vs. hurdling) could not be explained by higher event density in this action
type. Moreover, event density did not have the same effect on judging audiovisual synchrony
of intentionally and incidentally generated action sounds. As these were post-hoc analyses, we
do not further elucidate the other main and interaction effects here. All in all, a direct experi-
mental manipulation and investigation of event density as variable was motivated by these
data patterns.
Secondly, tap dancing trials were less rhythmically structured compared to hurdling
sounds. Although the overall amplitude of the soundtrack was balanced (i.e. adjusted) between
the tap dancing and the hurdling condition, loudness of steps was less variable within tap
dancing as compared to hurdling. As the latter was accentuated by three heavy landing steps
after hurdle clearance embedded in a sequence of lighter running steps, hurdling might have
also led to a more structured percept than tap dancing sounds. A post-hoc Mann-Whitney-U-
test showed that the measure of rhythmicity that we explored, the mean amplitude variation
coefficient, was lower in tap dancing (M = .47, SD = .10) than in hurdling (M = .91, SD = .14;
U = 0.00, exact p = .029). This is, the four lower mean amplitude variation coefficients allocated
to the tap dancing stimuli and the four higher mean amplitude variation coefficients allocated
to the hurdling stimuli. In line with the post-hoc analyses for event density reported above, we
investigated the effect of rhythmicity operationalized as the mean amplitude variation coeffi-
cient on synchronicity judgments in Study 1. The ANOVA including RHYTHMICITY (8), ASYN-
CHRONY TYPE (2) and ASYNCHRONY SIZE (4) revealed a significant main effect of RHYTHMICITY (F(3.5,73.1) = 43.62, p< .001, Greenhouse-Geisser corrected; χ2(27) = 74.27, p< .001, ε = .50).
Bonferroni-corrected post-hoc pairwise comparisons showed that the stimuli with the five
highest mean amplitude variation coefficients (all hurdling stimuli and one tap dancing stimu-
lus) did not differ in their synchronicity judgments (all p� .968) but were significantly lower
than the three stimuli with the lowest mean amplitude variation coefficients. Within those
three stimuli the second lowest differed significantly from the first and the third (all p� .042).
Here, again, the main effect does not mirror the separation point between actions. To see
whether RHYTHMICITY fully explains the original effect of ACTION TYPE, we calculated an ANOVA
including ACTION TYPE (2), RHYTHMICITY (4), ASYNCHRONY TYPE (2) and ASYNCHRONY SIZE (4). Just as
PLOS ONE Audiovisual integration in hurdling, tap dancing and drumming
PLOS ONE | https://doi.org/10.1371/journal.pone.0253130 July 22, 2021 11 / 23

we found for event density, this analysis showed a main effect of ACTION TYPE (F(1,21) = 66.18,
p< .001), a main effect of RHYTHMICITY (F(3,63) = 28.47, p< .001) and the interaction of both
(F(3,63) = 33.79, p< .001). These findings suggested that rhythmicity neither had the same
effect on intentionally and incidentally generated action sounds. As these were post-hoc analy-
ses, we do not further elucidate the other main and interaction effects here. Results of Study 1
gave rise to the direct experimental manipulation and investigation of rhythmicity, further
motivated by the fact that to our knowledge, there is so far no study examining the impact of
rhythmicity on perception of audiovisual synchrony.
To summarize these considerations, we found in Study 1 that tap dancing stimuli received
generally higher audiovisual synchrony ratings than hurdling stimuli. Since tap dancing videos
differed from hurdling videos also with regard to higher event density and lower rhythmicity,
both factors were potential sources of confound. To address the potential impact of these fac-
tors on audiovisual integration, we conducted Study 2, in which we employed PLDs of drum-
ming sequences with variable event density and rhythmicity. Employing drumming PLDs
enabled a direct control of event density and rhythmicity in an otherwise natural human
motion stimulus. Note that using drumming actions, we kept intentionality of sound produc-
tion constant while varying event density and rhythmicity as independent experimental fac-
tors. Since PLD markers were restricted to the upper body of the drummer, and since sounds
were produced by handheld drumsticks in Study 2 as in contrast to sounds produced by feet in
Study 2, we refrained from directly comparing conditions from Study 1 with Study 2.
Study 2
We recorded PLDs of drumming actions which matched and re-combined parameters of the
event density and rhythmicity of the stimuli used in Study 1. Four conditions were generated
by instructing the drummer to generate one sequence matching the original hurdling condi-
tion in Study 1 (low event density, high rhythmicity, labelled D-R+ hereafter), another match-
ing the original tap dancing stimuli (high event density, low rhythmicity, D+R-), and two
sequences with new level combinations of these factors (low event density, low rhythmicity,
D-R-, and high event density, high rhythmicity, D+R+).
To investigate whether high event density and low rhythmicity are relevant factors for the
temporal binding of multisensory percepts, we applied the same synchrony rating judgment
task to our four different classes of drumming stimuli. Based on results from Study 1, we
expected that for all stimuli, synchrony ratings are higher for short asynchronies compared to
longer asynchronies (120 ms> 200 ms> 320 ms> 400 ms, Hypothesis 1) and visual-first
asynchronies to be perceived as synchronous more often than their respective audio-first asyn-
chronies (Hypothesis 2). Regarding the newly introduced factors of event density and rhyth-
micity, we tested whether higher synchrony ratings are observed for higher event density
(Hypothesis 3) and lower rhythmicity (Hypothesis 4).
Materials and methods–Study 2
Many details regarding participants, the stimulus material and the procedure were the same as
in Study 1. Therefore, we here only report aspects that were different between the two studies.
Participants
The sample consisted of 31 right-handed participants (2 males, 29 females) with an age range
from 19 to 29 years (M = 24.0, SD = 2.7), and all of them were right-handers, as obtained by
personal questioning. We recruited only participants who never had a training in drumming.
Participants signed an informed consent explaining the procedure of the experiment and the
PLOS ONE Audiovisual integration in hurdling, tap dancing and drumming
PLOS ONE | https://doi.org/10.1371/journal.pone.0253130 July 22, 2021 12 / 23

anonymity of the collected data. Participants studying psychology received course credit for
their participation. The study was approved by the Local Ethics Committee at the University of
Munster, Germany, in accordance with the Declaration of Helsinki.
Stimuli
The stimuli used in this study were PLD of drumming actions with matching sound, per-
formed by a professional drum teacher. As in Study 1, PLD were recorded using the Qualisys
Motion Capture System and in-ear microphones. Fifteen markers were placed symmetrical on
the left and the right shoulders, elbows, and wrists, and on three points of the drumstick and
three points of the drum (Fig 1B; exemplary videos can be found in the Supplementary Mate-
rial). Further processing steps of the video material matched those for Study 1. Finally pre-
pared videos had an average length of 6 s for each of the four factor level combinations (i.e.,
D-R+, D+R-, D-R-, D+R+), with the length of the videos varying from 4.9 s to 6.8 s (M = 5.9 s).
The final stimulus set used here consisted of four different types of drumming videos with dif-
ferent event density and rhythmicity parameters as outlined above (D-R+, D+R-, D-R-, D+R+). For the conditions replicating our previous hurdling and tap dancing stimuli in event den-
sity and rhythmicity (D-R+, D+R-), the drummer was familiarized with these stimuli and
asked to replicate them on the drums. For the two new conditions (D-R-and D+R+), he was
asked to play the previously played sequences either less (D-R-) or more (D+R+) accentuated.
For each of these four sub-conditions, four separate videos were selected, each of which was
presented at nine different levels of asynchrony of the sound respective to the visual channel
(± 400 / 320 / 200 / 120 ms, and 0 ms). Again, negative values indicated that the audio track
was leading the visual track (audio-first) and positive values indicated that the visual track was
leading the audio track (visual-first), resulting in 144 different stimuli. All videos included a
1000 ms visual fade-in and fade-out.
To ensure that the 16 newly recorded drumming videos implemented the four different fac-
tor level combinations (D-R+, D+R-, D-R-, D+R+), we used the same MIRtoolbox as in Study
1 to extract core acoustic features. Fig 2 shows that drumming videos successfully imple-
mented the two experimental factors of mean event density (Hz) and rhythmicity (mean
amplitude variation coefficient), resulting in the following combinations: D-R+ (D 2.192, R
0.694), D+R- (D 3.264, R 0.215), D-R- (D 2.538, R 0.162) and D+R+ (D 3.191, R 0.772). Thus,
videos with a high event density (D+) had an event frequency of 3.23 Hz, those with low den-
sity (D-) 2.37 Hz on average. Videos with a high rhythmicity (R+) had a coefficient of ampli-
tude variation of 0.733, whereas videos with a low rhythmicity (R-) had a coefficient of
amplitude variation of 0.189.
As in Study 2, we assessed the mean motion energy (ME) score for all drumming videos
(see Methods section of Study 1). This approach yielded a mean ME of 1052 for drumming
videos, which was slightly lower than the ME for hurdling (1189) and tap dancing (1220) in
Study 1 (S2 Fig). A Kruskal-Wallis test by ranks showed no significant difference between
motion energy in hurdling, tap dancing and drumming (χ2(2) = 4.2, p = .12).
Procedure
The experiment consisted of four experimental blocks. Within each of these blocks, each of the
144 stimuli (four D-R+, four D+R-, four D-R-, and four D+R+ videos, each with nine different
levels of audiovisual asynchrony) were presented once, resulting in 576 trials in total. A
pseudo-randomization guaranteed that no more than three videos of the same type of asyn-
chrony (audio-first vs. visual-first) were presented in a row to prevent adaptation to one or the
PLOS ONE Audiovisual integration in hurdling, tap dancing and drumming
PLOS ONE | https://doi.org/10.1371/journal.pone.0253130 July 22, 2021 13 / 23
other. Additionally, it was controlled that no more than two videos of the exact same level of
asynchrony were presented directly after each other. We employed the same task as in Study 1.
Experimental design
The study was implemented with a four-factorial within-subject design with the two-level fac-
tor EVENT DENSITY (low, high) and RHYTHMICITY (low, high), the four-level factor ASYNCHRONY SIZE
(120 ms, 200 ms, 320 ms, 400 ms) and the two-level factor ASYNCHRONY TYPE (audio first, visualfirst). The dependent variable was the percentage of the trials perceived as synchronous. Corre-
spondingly, a 2 x 2 x 4 x 2 ANOVA was calculated.
Results–Study 1
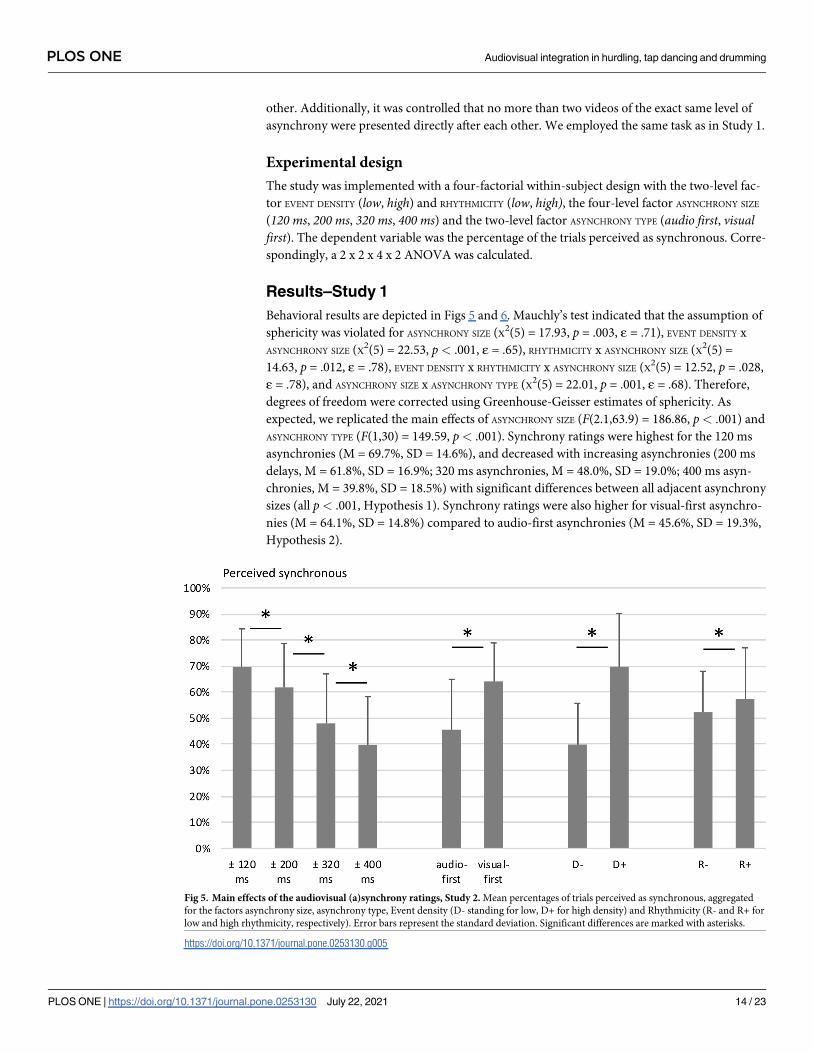
Behavioral results are depicted in Figs 5 and 6. Mauchly’s test indicated that the assumption of
sphericity was violated for ASYNCHRONY SIZE (Χ2(5) = 17.93, p = .003, ε = .71), EVENT DENSITY x
ASYNCHRONY SIZE (Χ2(5) = 22.53, p< .001, ε = .65), RHYTHMICITY x ASYNCHRONY SIZE (Χ2(5) =
14.63, p = .012, ε = .78), EVENT DENSITY x RHYTHMICITY x ASYNCHRONY SIZE (Χ2(5) = 12.52, p = .028,
ε = .78), and ASYNCHRONY SIZE x ASYNCHRONY TYPE (Χ2(5) = 22.01, p = .001, ε = .68). Therefore,
degrees of freedom were corrected using Greenhouse-Geisser estimates of sphericity. As
expected, we replicated the main effects of ASYNCHRONY SIZE (F(2.1,63.9) = 186.86, p< .001) and
ASYNCHRONY TYPE (F(1,30) = 149.59, p< .001). Synchrony ratings were highest for the 120 ms
asynchronies (M = 69.7%, SD = 14.6%), and decreased with increasing asynchronies (200 ms
delays, M = 61.8%, SD = 16.9%; 320 ms asynchronies, M = 48.0%, SD = 19.0%; 400 ms asyn-
chronies, M = 39.8%, SD = 18.5%) with significant differences between all adjacent asynchrony
sizes (all p< .001, Hypothesis 1). Synchrony ratings were also higher for visual-first asynchro-
nies (M = 64.1%, SD = 14.8%) compared to audio-first asynchronies (M = 45.6%, SD = 19.3%,
Hypothesis 2).
Fig 5. Main effects of the audiovisual (a)synchrony ratings, Study 2. Mean percentages of trials perceived as synchronous, aggregated
for the factors asynchrony size, asynchrony type, Event density (D- standing for low, D+ for high density) and Rhythmicity (R- and R+ for
low and high rhythmicity, respectively). Error bars represent the standard deviation. Significant differences are marked with asterisks.
https://doi.org/10.1371/journal.pone.0253130.g005
PLOS ONE Audiovisual integration in hurdling, tap dancing and drumming
PLOS ONE | https://doi.org/10.1371/journal.pone.0253130 July 22, 2021 14 / 23

We found a main effect for EVENT DENSITY (F(1,30) = 122.30, p< .001), with higher event
density resulting in higher synchrony ratings (M = 69.8%, SD = 20.4%) compared to lower
event density (M = 39.9%, SD = 15.8%, Hypothesis 3). We found a main effect for RHYTHMICITY
as well (F(1,30) = 5.48, p = .026), but contrary to our hypothesis (Hypothesis 4), synchrony rat-
ings for lower rhythmicity were lower (M = 52.3%, SD = 15.7%) than those for higher rhyth-
micity (M = 57.4%, SD = 19.6%).
Interaction effects were significant for EVENT DENSITY x RHYTHMICITY (F(1,30) = 22.59, p<.001), EVENT DENSITY x ASYNCHRONY SIZE (F(1.9,58.0) = 42.86, p< .001), RHYTHMICITY x ASYN-
CHRONY SIZE (F(2.3,70.1) = 6.26, p = .002), EVENT DENSITY x RHYTHMICITY x ASYNCHRONY SIZE (F(2.3,70.1) = 34.63, p< .001), EVENT DENSITY x ASYNCHRONY TYPE (F(1,30) = 87.11, p< .001),
RHYTHMICITY x ASYNCHRONY TYPE (F(1,30) = 4.58, p = .041), EVENT DENSITY x RHYTHMICITY x ASYN-
CHRONY TYPE (F(1,30) = 4.85, p = .036), ASYNCHRONY SIZE x ASYNCHRONY TYPE (F(2.0,61.3) = 65.22,
p< .001), EVENT DENSITY x ASYNCHRONY SIZE x ASYNCHRONY TYPE (F(3,90) = 99.52, p< .001),
RHYTHMICITY x ASYNCHRONY SIZE x ASYNCHRONY TYPE (F(3,90) = 4.82, p = .004), and EVENT DENSITY
x RHYTHMICITY x ASYNCHRONY SIZE x ASYNCHRONY TYPE (F(3,90) = 9.76, p< .001).
Bonferroni-corrected post-hoc pairwise comparisons inspecting the interaction of EVENT
DENSITY and RHYTHMICITY showed significant increases between low and high event densities at
both low (p< .001) and high (p< .001) rhythmicity. Rhythmicity levels increased significantly
only for low event density (p< .001) but not for high event density (p = .32).
General discussion
Visual and auditory signals often occur concurrently and aid a more reliable perception of
events that cause these signals. Audiovisual integration depends on several factors which have
Fig 6. Mean percentages of trials perceived as synchronous, Study 2. On the left hand side, all scores are fanned out for the level
combinations of the factors asynchrony size, asynchrony type, Event density and Rhythmicity. The right hand side chart illustrates the
significant Event Density x Rhythmicity interaction.
https://doi.org/10.1371/journal.pone.0253130.g006
PLOS ONE Audiovisual integration in hurdling, tap dancing and drumming
PLOS ONE | https://doi.org/10.1371/journal.pone.0253130 July 22, 2021 15 / 23
been thoroughly investigated using the example of spoken language or music, but remain
largely unexplored regarding their generalizability beyond these domains. In two behavioral
studies, we examined the impact of audiovisual stimulus properties that are characteristic for
both speech and music, and hence are particularly suited to address the issue of generalizabil-
ity. In Study 1, we compared audiovisual signals from PLDs which were created intentionally,
via tap dancing, and those which were created incidentally, via hurdling. In Study 2, we exam-
ined event density and rhythmicity as two properties describing drumming actions and their
corresponding sounds.
In line with previous research [11, 22, 24], we found in both Study 1 and 2 that smaller
asynchronies tended to be perceived as synchronous more often than larger asynchronies, and
that visual-first asynchronies received higher synchrony ratings than their respective audio-
first asynchronies. These effects were consistently observed for both, actions that create sounds
intentionally as well as incidentally. Interestingly, the average synchrony ratings received for
the drumming stimuli (55%) were comparable to those recorded in Study 1 for tap dancing
(59%) rather than hurdling (34%), corroborating the interpretation that intentionally action-
induced sounds are perceived differently from merely incidentally action-induced sounds. In
two previous fMRI study addressing this issue [28, 29], behavioral and brain activity pointed
towards stronger auditory expectations (but, importantly, not towards enhanced auditory
attention) when observing intentional as compared to incidental sound production. Thus, par-
ticularly strong auditory expectations may tend to overrun actual perceptual evidence (e.g. of
asynchrony), leading to a pronounced audiovisual integration bias in intentional sound pro-
duction such as in spoken language. It is well-known that strong prior expectations, while
being often helpful for perception, can lead to misperception of degraded sensory signals, caus-
ing for instance so-called “slips of the ear” in speech perception and visual illusions [45]. In
terms of the predictive coding account, such misperceptions reflect a failure to adjust prior
expectations to the current stimulus, either because these prior beliefs are not strong enough
or the prediction error is not strong enough [46]. Importantly, part of the generative model is
the precision of incoming sensory input and hence potential prediction errors: this expected
precision modulates how much the prediction error is weighted in updating predictions. Nor-
mally, when we see and hear an actor performing sound-generating movements, sound and
sight are synchronous (accepting a slight visual lead because the visual signal always travels
slightly faster than the sound). Under normal conditions, when the environment is not partic-
ularly noisy, and movement patterns are familiar, the internal models are weighted high and
the prediction error relatively low. Temporal regularities, prominent in speech and music, as
well as skilled human movement sequences, e.g. tap dancing and hurdling, are particularly
powerful cues to enable cross-sensory prediction [47]. Hence, in line with aforementioned
fMRI findings on tap dancing and hurdling [28, 29], we suggest that while predictive processes
favor the (mis)perception of synchroneity for both hurdling and tap dancing, a more elabo-
rated generative model of to-be-produced sounds may amplify this bias even further. We
come back to this assumption below when discussing the effect of rhythmicity.
Study 2 was conducted to figure out whether the effect of intentionality could be partly
explained by event density and/or rhythmicity, keeping the intentionality of sound production
(in drumming) constant. Here we found that synchrony ratings significantly increased for sti-
muli with a high event density. That is, the more events occurred per second, the stronger par-
ticipants were biased towards audiovisual integration—even at very large asynchronies (400
ms). This observation fits well with asynchrony detection collapsing for high event density sti-
muli, as reported for both speech [2] and audiovisual flash-beep pairings [44]. Petrini and co-
workers [18, 48] found that this bias is reduced by practice, as expert drummers outperform
novices in audiovisual asynchrony perception for both slow and fast tempi. Importantly, data
PLOS ONE Audiovisual integration in hurdling, tap dancing and drumming
PLOS ONE | https://doi.org/10.1371/journal.pone.0253130 July 22, 2021 16 / 23

of Study 1 suggested that both intentionality and event density had significant effects on
increasing the portion of synchronous judgments of actually asynchronous audiovisual sti-
muli, meaning the effect of intentionality could not be reduced to differences in event density.
Since these findings were only derived from a post-hoc comparison treating event density as
an ordinal variable, a more reliable test of event density was provided by Study 2, corroborat-
ing a main effect of event density on perceived audiovisual synchroneity.
Why does increasing event density disrupt audiovisual asynchrony detection so effectively?
A straightforward explanation may be that increasing the event density narrows the width of
empty intervals between filled intervals, may they be clicks, tones, or sounds. If we take an
average event density of 2.5 Hz, the average onset-to-onset interval between events amounts to
400 ms on average, meaning that a 400 ms asynchrony manipulation shifts the delayed audi-
tory event to coincide with the visual event (or vice versa). Consequently, a 400 ms asynchrony
in an audiovisual signal with an event density of 2.5 Hz can only be detected in either of two
cases: Either (a), other stimulus features such as amplitude, pitch or spectral frequency are var-
iable enough to indicate a mismatch between the coinciding, phase-shifted visual event (or
vice versa). Or (b), the temporal variance between the onset-to-onset intervals is high enough
to include longer intervals, bringing a phase-shifted auditory event onto a visual event gap (or
vice versa). In the current Study 2, (b) were met by all conditions, and both (a) and (b) in the
case of increasing rhythmicity, entailing more variable beat accentuation. For the high event
density condition (3.23 Hz), the outcome of higher rhythmicity was negligible. Thus, high
event density effectively disturbed asynchrony judgements, independent of the level of rhyth-
micity. Focusing on this part of the results, one may expect that rhythmicity could only have
an effect if event density was not too high, enabling the detection of asynchrony by the fact
that the probability of an phase-shifted auditory event to fall into a visual event gap was higher
when event density was low enough. And indeed, increasing rhythmicity had a comparably
clear effect when event density was low (2.37 Hz).
Contrary to the expected, this higher rhythmicity did not enhance asynchrony detection;
thus, synchrony ratings were actually lower for more rhythmic trials in Study 2. Note that,
while both main effects—density and rhythmicity—were statistically significant, the overall
impact on perceived synchronicity was far stronger for density (low: 40% vs. high: 70%) than
for rhythmicity (low: 52% vs. high: 57%). Still, the significant interaction of these factors
revealed that at the level of low event density, rhythmicity noticeably increased perceived syn-
chronicity from 34% (low rhythmicity) to 47% (high rhythmicity). Two conclusions can be
drawn from this finding: first, rhythmicity had a significant effect, but only under the condi-
tion that event density did not exceed a certain level. Second, rhythmicity could be ruled out as
a confounding factor in Study 1, as tap dancing was less rhythmic than hurdling but lead to
higher synchroneity ratings. In other words, the participants’ bias to misjudge asynchronous
audiovisual PLDs as being synchronous was not explained by the lower rhythmic structure of
tap dancing, as compared to hurdling.
To our knowledge, there is no study to date which explicitly examined the influences of
temporal structure/rhythmicity on audiovisual asynchrony detection. Thus, it is hard to pin-
point why our more rhythmic stimuli, featuring more distinct events with more discernable
moments of impact, led to higher synchrony ratings than the less rhythmic stimuli. At first
sight, the opposite would have been plausible, given that, for instance, rhythmicity enhances
the detection of auditory stimuli in noisy environments [49]. Since less accurate asynchrony
detection has been reported for more complex stimuli in previous studies [4], it is possible that
both rhythmicity and density increased overall stimulus’ complexity, explaining increased syn-
chrony ratings for both highly dense and highly rhythmic stimuli. However, a worthwhile
alternative hypothesis regarding the impact of rhythmicity on audiovisual integration may be
PLOS ONE Audiovisual integration in hurdling, tap dancing and drumming
PLOS ONE | https://doi.org/10.1371/journal.pone.0253130 July 22, 2021 17 / 23

that increasing rhythmicity promotes general predictability of the stimulus based on chunking
and patterns of accented and unaccented events [50]. Regularity in the stimulus stream and
especially a rhythmical event structure is among the most effective sources for temporal pre-
dictions [51, 52]. Metrical congruency between the visual and the auditory stream are known
to make a slight temporal deviant less noticeable, for instance when we observe dancing to
music [53]. Factors promoting predictability therefore may increase our proneness to neglect
smaller audiovisual asynchronies [54]. We hence propose that both, intentionally produced
sounds and more rhythmically structured sounds, increased (undue) confidence in synchrony.
Both effects may be related to increased reliance on top-down predictive models, entailing that
asynchronous trials go more often undetected.
Limitations
Tap dancing, hurdling, and drumming are quite different types of action that may introduce
further sources of variance than those we were focusing on in the current studies.
Firstly, the amount of motion may differ between these types of action. The experiments
reported here focused on how natural motion sounds are processed. As reported, we assessed
this factor in terms of motion energy, and our statistical analysis suggested no significant dif-
ferences of motion energy in the three tested types of action. Still, the impact of further and
more fine-grained parameters describing motion on audiovisual integration, including for
instance movement velocity, acceleration, smoothness or entropy (hence predictability) [55] as
well as dynamic features related to rhythmic structure in movements [56], remains to be fur-
ther examined using sound-generating whole-body movements.
Secondly, tap dancing and hurdling may differ with regard to the perceived arousal or the
emotional responses they may trigger. In a previous study [28] in which the stimulus set
included the videos used in Study 1 we asked participants to indicate whether they found
either hurdling or tap dancing more difficult, and to rate the quality of the performance in
each single trial. These previous ratings did not reveal any significant differences between tap
dancing and hurdling videos. While hurdling and tap dancing are comparable sports in many
respects, they differ in terms of expressive or aesthetic appeal. Our studies reported here can-
not rule out the influence of this factor, which should be the subject of future investigation.
Finally, one may expect tap dancing videos to increase more auditory attention than hur-
dling videos. To be sure, in the current study, participants were instructed to deliver an explicit
judgement on synchrony of the audiovisual stimuli, obviously entailing attention to both
modalities. However, one may speculate that auditory attention would still be higher when we
observe tap dancing simply because sounds are produced intentionally in this condition. Two
previous fMRI studies including the videos used in Study 1 did not support such an attentional
bias for tap dancing [28, 29]. Attention has been found to reverse the typical BOLD attenuation
effects observed for predicted stimuli, leading to rather enhanced responses in primary sensory
cortices [57]. Contrary to an attentional bias hypothesis, primary auditory cortex was actually
significantly and replicable attenuated in tap dancing compared to hurdling in both fMRI
studies [28, 29]. These findings are difficult to reconcile with an attentional interpretation of
the stronger synchrony bias in tap dancing. Rather, and in line with the fMRI effects, we
assume that predictability of the auditory signal plays a crucial role, making intentionally pro-
duced sounds more prone to be integrated with their respective visual motion patterns than
incidentally produced sounds.
Although it would have been possible to investigate audiovisual integration in the percep-
tion of intentionally and incidentally produced sounds using artificially generated stimuli, for
the current series of experiments, the focus was on investigating natural movement sounds in
PLOS ONE Audiovisual integration in hurdling, tap dancing and drumming
PLOS ONE | https://doi.org/10.1371/journal.pone.0253130 July 22, 2021 18 / 23

an ecologically valid context. This also had the particular advantage of not biasing subjects’
attention in any direction, since we were generating a quite natural perceptual situation.
Another approach would have been to combine identical natural actions with intentional and
incidental sounds. Here, however, we expected a confound in the sense that subjects would
have expected the intentionally produced sound and not the incidental one. Thus, surprise or
even irritation effects would have occurred in the incidental condition and would probably
have strongly biased the comparison.
Conclusions
While almost all our physical actions produce sounds, the existing research on audiovisual per-
ception is largely restricted to language and music, and only a handful of studies consider
sounds created by object manipulations. However, since speech and music apparently stand
out as intentionally produced sounds, it is unclear whether they can be considered as being
representatives of action-induced sounds and their audiovisual integration in general. Our
present studies contribute to the still very limited number of studies that examine audiovisual
integration of natural non-speech stimuli (e.g. [19, 21–24, 48]. Study 1 showed that typical
effects reported for audiovisual speech integration extend to the perception of audiovisual
asynchrony in whole-body actions, with shorter asynchronies leading to higher synchrony rat-
ings, and an asymmetric temporal integration window favoring integration at visual-first asyn-
chronies. As expected, these effects were even stronger for intentionally as compared to
incidentally generated action sounds. Study 2 suggested that high event density effectively dis-
turbs the discrimination of audiovisual asynchronies. As auditory event density of speech
excels those achieved by most other types of action-induced sounds, it remains to be investi-
gated whether the considerable bias for integrating asynchronous audiovisual speech stimuli is
(at least partly) due to its exceptionally high event density. At low event densities, also stronger
rhythmicity increased the overall audiovisual integration bias. We suggest that rhythmicity
and intentionality of sound production promote (undue) trust in synchroneity because both
foster reliance on a predictive mode of processing. It remains to be tested whether event den-
sity and/or rhythmicity have the same effect in incidentally generated action sounds. To clarify
this question, and to further our understanding of common principles of audiovisual integra-
tion beyond speech and music [17], more research is needed addressing audiovisual integra-
tion in incidentally generated action sounds and more real-life audiovisual stimuli,
considering the full range of sound features contributing to the variance of audiovisual integra-
tion biases.
Supporting information
S1 Fig. Example of drumming sequence with high and low rhythmicity (Study 2). Rhyth-
micity was operationalized as variation of the amplitude envelope, shown here for two exem-
plary drumming sequences. While the event density of both recordings is virtually identical
(3.42 and 3.39, respectively), the auditory events in the left recording are highly similar in loud-
ness, resulting in low rhythmicity overall (v = 0.25). In contrast, the auditory events within the
right recording vary more strongly in loudness, with almost equidistant duplets of loud (i.e.
accentuated) events intersected with less accentuated events. This resulted in high rhythmicity
overall (v = 0.78).
(TIFF)
S2 Fig. Motion energy, Study 1 and 2. The amount of motion quantified by the amount of
moving pixels per video for all PLD videos employed to generate different audio-visual
PLOS ONE Audiovisual integration in hurdling, tap dancing and drumming
PLOS ONE | https://doi.org/10.1371/journal.pone.0253130 July 22, 2021 19 / 23
asynchronous stimuli in Study 1 and Study 2. Each black marker depict the motion energy for
one video (see Methods of Study 1 for details).
(TIFF)
S1 Video. Sample video Study 1. Hurdling, auditory first, 120 ms asynchrony.
(MP4)
S2 Video. Sample video Study 1. Hurdling, auditory first, 400 ms asynchrony.
(MP4)
S3 Video. Sample video Study 1. Hurdling, visual first, 120 ms asynchrony.
(MP4)
S4 Video. Sample video Study 1. Hurdling, visual first, 400 ms asynchrony.
(MP4)
S5 Video. Sample video Study 1. Tap dancing, auditory first, 120 ms asynchrony.
(MP4)
S6 Video. Sample video Study 1. Tap dancing, auditory first, 400 ms asynchrony.
(MP4)
S7 Video. Sample video Study 1. Tap dancing, visual first, 120 ms asynchrony.
(MP4)
S8 Video. Sample video Study 1. Tap dancing, visual first, 400 ms asynchrony.
(MP4)
S9 Video. Sample video Study 2. Drumming, high event density, high rhythmicity.
(MP4)
S10 Video. Sample video Study 2. Drumming, high event density, low rhythmicity.
(MP4)
S11 Video. Sample video Study 2. Drumming, low event density, high rhythmicity.
(MP4)
S12 Video. Sample video Study 2. Drumming, low event density, low rhythmicity.
(MP4)
Acknowledgments
We would like to thank Monika Mertens and Marie Kleinbielen for their help during data col-
lection, Theresa Eckes, Alina Eisele, Marie Kleinbielen, and Katharina Thiel for their assistance
during filming and with creating the stimulus material, and Niklas Petersen for calculating the
motion energy scores. Finally, we would like to thank Nadiya El-Sourani, Amelie Huebner,
Klara Hagelweide, Laura Quante, Marlen Roehe and Lena Schliephake for rewarding
discussions.
Author Contributions
Conceptualization: Nina Heins, Daniel S. Kluger, Karen Zentgraf, Markus Raab, Ricarda I.
Schubotz.
Data curation: Stefan Vinbrux.
Formal analysis: Nina Heins, Jennifer Pomp, Stefan Vinbrux.
PLOS ONE Audiovisual integration in hurdling, tap dancing and drumming
PLOS ONE | https://doi.org/10.1371/journal.pone.0253130 July 22, 2021 20 / 23
Funding acquisition: Markus Raab, Ricarda I. Schubotz.
Investigation: Nina Heins, Daniel S. Kluger, Stefan Vinbrux.
Methodology: Stefan Vinbrux.
Project administration: Nina Heins.
Resources: Karen Zentgraf, Markus Raab, Ricarda I. Schubotz.
Supervision: Daniel S. Kluger, Ima Trempler, Axel Kohler, Markus Raab, Ricarda I. Schubotz.
Validation: Ima Trempler.
Writing – original draft: Nina Heins, Ricarda I. Schubotz.
Writing – review & editing: Jennifer Pomp, Daniel S. Kluger, Stefan Vinbrux, Ima Trempler,
Axel Kohler, Katja Kornysheva, Karen Zentgraf, Markus Raab.
References1. Ernst MO, Bulthoff HH. Merging the senses into a robust percept. Trends in Cognitive Sciences. 2004;
8(4):162–9. https://doi.org/10.1016/j.tics.2004.02.002 PMID: 15050512
2. van Wassenhove V, Grant KW, Poeppel D. Temporal window of integration in auditory-visual speech
perception. Neuropsychologia. 2007; 45(3):598–607. https://doi.org/10.1016/j.neuropsychologia.2006.
01.001 PMID: 16530232
3. Chen YC, Spence C. Assessing the role of the “unity assumption” on multisensory integration: A review.
Frontiers in Psychology. 2017; 8:445. https://doi.org/10.3389/fpsyg.2017.00445 PMID: 28408890
4. Zhou H yu, Cheung EFC, Chan RCK. Audiovisual temporal integration: Cognitive processing, neural
mechanisms, developmental trajectory and potential interventions. Neuropsychologia. 2020;
140:107396. https://doi.org/10.1016/j.neuropsychologia.2020.107396 PMID: 32087206
5. Chandrasekaran C, Trubanova A, Stillittano S, Caplier A, Ghazanfar AA. The natural statistics of audio-
visual speech. PLoS Computational Biology. 2009; 5(7). https://doi.org/10.1371/journal.pcbi.1000436
PMID: 19609344
6. Schwartz JL, Savariaux C. No, There Is No 150 ms Lead of Visual Speech on Auditory Speech, but a
Range of Audiovisual Asynchronies Varying from Small Audio Lead to Large Audio Lag. PLoS Compu-
tational Biology. 2014; 10(7). https://doi.org/10.1371/journal.pcbi.1003743 PMID: 25079216
7. Grant KW, Van Wassenhove V, Poeppel D. Detection of auditory (cross-spectral) and auditory-visual
(cross-modal) synchrony. Speech Communication. 2004; 44(1–4 SPEC. ISS.):43–53.
8. McGurk H, MacDonald J. Hearing lips and seeing voices. Nature. 1976; 264(5588):746–8. https://doi.
org/10.1038/264746a0 PMID: 1012311
9. Venezia JH, Thurman SM, Matchin W, George SE, Hickok G. Timing in audiovisual speech perception:
A mini review and new psychophysical data. Attention, Perception, and Psychophysics. 2016; 78
(2):583–601.
10. Grant KW, Greenberg S. Speech Intelligibility Derived from Asynchronous Processing of Auditory-
Visual Information. Proceedings of the Conference on Auditory-Visual Speech Processing (AVSP).
2001;(1):132–7.
11. Vroomen J, Keetels M. Perception of intersensory synchrony: A tutorial review. Attention Perception &
Psychophysics. 2010; 72(4):871–84. https://doi.org/10.3758/APP.72.4.871 PMID: 20436185
12. Stevenson RA, Wallace MT. Multisensory temporal integration: Task and stimulus dependencies.
Experimental Brain Research. 2013; 227(2):249–61. https://doi.org/10.1007/s00221-013-3507-3
PMID: 23604624
13. Jicol C, Proulx MJ, Pollick FE, Petrini K. Long-term music training modulates the recalibration of audiovi-
sual simultaneity. Experimental Brain Research. 2018; 236(7):1869–80. https://doi.org/10.1007/
s00221-018-5269-4 PMID: 29687204
14. Fujisaki W, Shimojo S, Kashino M, Nishida S. Recalibration of audiovisual simultaneity. Nature Neuro-
science. 2004; 7(7):773–8. https://doi.org/10.1038/nn1268 PMID: 15195098
15. Massaro DW, Cohen MM, Smeele PMT. Perception of asynchronous and conflicting visual and auditory
speech. The Journal of the Acoustical Society of America. 1996 Sep; 100(3):1777–86. https://doi.org/
10.1121/1.417342 PMID: 8817903
PLOS ONE Audiovisual integration in hurdling, tap dancing and drumming
PLOS ONE | https://doi.org/10.1371/journal.pone.0253130 July 22, 2021 21 / 23

16. Navarra J, Vatakis A, Zampini M, Soto-Faraco S, Humphreys W, Spence C. Exposure to asynchronous
audiovisual speech extends the temporal window for audiovisual integration. Cognitive Brain Research.
2005; 25(2):499–507. https://doi.org/10.1016/j.cogbrainres.2005.07.009 PMID: 16137867
17. Schutz M, Gillard J. On the generalization of tones: A detailed exploration of non-speech auditory per-
ception stimuli. Scientific Reports. 2020; 10(1):1–14. https://doi.org/10.1038/s41598-019-56847-4
PMID: 31913322
18. Petrini K, Pollick FE, Dahl S, McAleer P, McKay L, Rocchesso D, et al. Action expertise reduces brain
activity for audiovisual matching actions: An fMRI study with expert drummers. NeuroImage. 2011; 56
(3):1480–92. https://doi.org/10.1016/j.neuroimage.2011.03.009 PMID: 21397699
19. Petrini K, Dahl S, Rocchesso D, Waadeland CH, Avanzini F, Puce A, et al. Multisensory integration of
drumming actions: Musical expertise affects perceived audiovisual asynchrony. Experimental Brain
Research. 2009; 198(2–3):339–52. https://doi.org/10.1007/s00221-009-1817-2 PMID: 19404620
20. Love SA, Petrini K, Cheng A, Pollick FE. A Psychophysical Investigation of Differences between Syn-
chrony and Temporal Order Judgments. PLoS ONE. 2013; 8(1):e54798. https://doi.org/10.1371/
journal.pone.0054798 PMID: 23349971
21. Dixon NF, Spitz L. The detection of auditory visual desynchrony. Perception. 1980; 9(6):719–21. https://
doi.org/10.1068/p090719 PMID: 7220244
22. Vatakis A, Spence C. Audiovisual synchrony perception for speech and music assessed using a tempo-
ral order judgment task. Neuroscience Letters. 2006; 393(1):40–4. https://doi.org/10.1016/j.neulet.
2005.09.032 PMID: 16213656
23. Stekelenburg JJ, Vroomen J. Neural correlates of multisensory integration of ecologically valid audiovi-
sual events. Journal of cognitive neuroscience. 2007 Dec; 19(12):1964–73. https://doi.org/10.1162/
jocn.2007.19.12.1964 PMID: 17892381
24. Eg R, Behne DM. Perceived synchrony for realistic and dynamic audiovisual events. Frontiers in Psy-
chology. 2015; 6:736. https://doi.org/10.3389/fpsyg.2015.00736 PMID: 26082738
25. Vatakis A, Maragos P, Rodomagoulakis I, Spence C. Assessing the effect of physical differences in the
articulation of consonants and vowels on audiovisual temporal perception. Frontiers in Integrative Neu-
roscience. 2012; 6(OCTOBER 2012):1–18. https://doi.org/10.3389/fnint.2012.00001 PMID: 22319479
26. Noel J-P, Stevenson RA, Wallace MT. Atypical Audiovisual Temporal Function in Autism and Schizo-
phrenia: Similar Phenotype, Different Cause. European Journal of Neuroscience. 2018; 47(10):1230–
41.
27. Van der Stoep N, Van der Stigchel S, Van Engelen RC, Biesbroek J, Nijboer TC. Impairments in Multi-
sensory Integration after Stroke. Journal of Cognitive Neuroscience. 2019; 31(6):885–99. https://doi.
org/10.1162/jocn_a_01389 PMID: 30883294
28. Heins N, Pomp J, Kluger DS, Trempler I, Zentgraf K, Raab M, et al. Incidental or Intentional? Different
Brain Responses to One’ s Own Action Sounds in Hurdling vs. Tap Dancing. Frontiers in neuroscience.
2020; 14:483. https://doi.org/10.3389/fnins.2020.00483 PMID: 32477059
29. Heins N, Trempler I, Zentgraf K, Raab M, Schubotz RI. Too Late! Influence of Temporal Delay on the
Neural Processing of One’s Own Incidental and Intentional Action-Induced Sounds. Froniers in Neuro-
science. 2020; 14:573970. https://doi.org/10.3389/fnins.2020.573970 PMID: 33250704
30. Lartillot O, Toiviainen P. A Matlab toolbox for musical feature extraction from audio. Proceedings of the
8th International Conference on Music Information Retrieval, ISMIR 2007. 2007;September.
31. Nishimoto S, VU AT, Naselaris T, Benjamin Y, Yu B, Gallant JL. Reconstructing visual experiences
from brain activity evoked by natural movies. Curr Biol. 2011; 21(19):1641–6. https://doi.org/10.1016/j.
cub.2011.08.031 PMID: 21945275
32. Eg R, Griwodz C, Halvorsen P, Behne D. Audiovisual robustness: exploring perceptual tolerance to
asynchrony and quality distortion. Multimedia Tools and Applications. 2014; 74(2):345–65.
33. Tourville J a., Reilly KJ, Guenther FH. Neural mechanisms underlying auditory feedback control of
speech. NeuroImage. 2008; 39(3):1429–43. https://doi.org/10.1016/j.neuroimage.2007.09.054 PMID:
18035557
34. Keough D, Jones J a. The sensitivity of auditory-motor representations to subtle changes in auditory
feedback while singing. The Journal of the Acoustical Society of America. 2009; 126(2):837–46. https://
doi.org/10.1121/1.3158600 PMID: 19640048
35. Pfordresher PQ, Beasley RTE. Making and monitoring errors based on altered auditory feedback. Fron-
tiers in Psychology. 2014; 5(August):914. https://doi.org/10.3389/fpsyg.2014.00914 PMID: 25191294
36. Kennel C, Streese L, Pizzera A, Justen C, Hohmann T, Raab M. Auditory reafferences: the influence of
real-time feedback on movement control. Frontiers in Psychology. 2015; 6(January):1–6. https://doi.
org/10.3389/fpsyg.2015.00001 PMID: 25688217
PLOS ONE Audiovisual integration in hurdling, tap dancing and drumming
PLOS ONE | https://doi.org/10.1371/journal.pone.0253130 July 22, 2021 22 / 23

37. Horvath J, Maess B, Baess P. Action–Sound Coincidences Suppress Evoked Responses of the Human
Auditory Cortex in EEG and MEG. 2012;1919–31.
38. Baess P, Horvath J, Jacobsen T, Schroger E. Selective suppression of self-initiated sounds in an audi-
tory stream: An ERP study. Psychophysiology. 2011; 48(9):1276–83. https://doi.org/10.1111/j.1469-
8986.2011.01196.x PMID: 21449953
39. Aliu SO, Houde JF, Nagarajan SS. Motor-induced suppression of the auditory cortex. Journal of Cogni-
tive Neuroscience. 2009; 21(4):791–802. https://doi.org/10.1162/jocn.2009.21055 PMID: 18593265
40. Straube B, Van Kemenade BM, Arikan BE, Fiehler K, Leube DT, Harris LR, et al. Predicting the multi-
sensory consequences of one’s own action: Bold suppression in auditory and visual cortices. PLoS
ONE. 2017; 12(1):1–25. https://doi.org/10.1371/journal.pone.0169131 PMID: 28060861
41. Kaiser J, Schutz-Bosbach S. Sensory attenuation of self-produced signals does not rely on self-specific
motor predictions. European Journal of Neuroscience. 2018; 47(11):1303–10.
42. Arai T, Greenberg S. The temporal properties of spoken Japanese are similar to those of English. Proc
Eurospeech’97. 1997; 2(February):1011–4.
43. Greenberg S. A Multi-Tier Framework for Understanding Spoken Language. In: Listening to speech: An
auditory perspective. Mahwah, NJ, US: Lawrence Erlbaum Associates Publishers; 2006. p. 411–33.
44. Fujisaki W, Nishida S. Temporal frequency characteristics of synchrony-asynchrony discrimination of
audio-visual signals. Experimental Brain Research. 2005; 166(3–4):455–64. https://doi.org/10.1007/
s00221-005-2385-8 PMID: 16032402
45. Nour MM, Nour JM. Perception, illusions and Bayesian inference. Psychopathology. 2015; 48(4):217–
21. https://doi.org/10.1159/000437271 PMID: 26279057
46. Blank H, Spangenberg M, Davis MH. Neural prediction errors distinguish perception and misperception
of speech. Journal of Neuroscience. 2018; 38(27):6076–89. https://doi.org/10.1523/JNEUROSCI.
3258-17.2018 PMID: 29891730
47. Noppeney U, Lee HL. Causal inference and temporal predictions in audiovisual perception of speech
and music. Annals of the New York Academy of Sciences. 2018; 1423(1):102–16.
48. Petrini K, Dahl S, Rocchesso D, Waadeland CH, Avanzini F, Puce A, et al. Multisensory integration of
drumming actions: musical expertise affects perceived audiovisual asynchrony. Experimental Brain
Research. 2009; 198(2–3):339–52. https://doi.org/10.1007/s00221-009-1817-2 PMID: 19404620
49. ten Oever S, Schroeder CE, Poeppel D, van Atteveldt N, Zion-Golumbic E. Rhythmicity and cross-
modal temporal cues facilitate detection. Neuropsychologia. 2014; 63:43–50. https://doi.org/10.1016/j.
neuropsychologia.2014.08.008 PMID: 25128589
50. Hardesty J. Building Blocks of Rhythmic Expectation. MUME 2016—The Fourth International Workshop
on Musical Metacreation. 2016;(September).
51. Henry MJ, Obleser J. Frequency modulation entrains slow neural oscillations and optimizes human lis-
tening behavior. Proceedings of the National Academy of Sciences of the United States of America.
2012; 109(49):20095–100. https://doi.org/10.1073/pnas.1213390109 PMID: 23151506
52. Cravo AM, Rohenkohl G, Wyart V, Nobre AC. Temporal expectation enhances contrast sensitivity by
phase entrainment of low-frequency oscillations in visual cortex. Journal of Neuroscience. 2013; https://
doi.org/10.1523/JNEUROSCI.4675-12.2013 PMID: 23447609
53. Su YH. Metrical congruency and kinematic familiarity facilitate temporal binding between musical and
dance rhythms. Psychonomic Bulletin and Review. 2018; 25(4):1416–22. https://doi.org/10.3758/
s13423-018-1480-3 PMID: 29766450
54. De Lange FP, Heilbron M, Kok P. How Do Expectations Shape Perception? Perceptual Consequences
of Expectation. Trends in Cognitive Sciences. 2018;1–16.
55. Orlandi A, Cross ES, Orgs G. Timing is everything: Dance aesthetics depend on the complexity of
movement kinematics. Cognition. 2020; 205(September):104446. https://doi.org/10.1016/j.cognition.
2020.104446 PMID: 32932073
56. Su YH. Peak velocity as a cue in audiovisual synchrony perception of rhythmic stimuli. Cognition. 2014;
131(3):330–44. https://doi.org/10.1016/j.cognition.2014.02.004 PMID: 24632323
57. Kok P, Rahnev D, Jehee JFM, Lau HC, de Lange FP. Attention reverses the effect of prediction in
silencing sensory signals. Cerebral Cortex. 2012 Sep; 22(9):2197–206. https://doi.org/10.1093/cercor/
bhr310 PMID: 22047964
PLOS ONE Audiovisual integration in hurdling, tap dancing and drumming
PLOS ONE | https://doi.org/10.1371/journal.pone.0253130 July 22, 2021 23 / 23
Related Documents